UNITED STATES
SECURITIES AND EXCHANGE COMMISSION
Washington, D.C. 20549
FORM N-CSR
CERTIFIED SHAREHOLDER REPORT OF REGISTERED MANAGEMENT
INVESTMENT COMPANIES
Investment Company Act file number 811-22838
The KP Funds
(Exact name of registrant as specified in charter)
SEI Investments
One Freedom Valley Drive
Oaks, PA 19456
(Address of principal executive offices) (Zip code)
SEI Investments
One Freedom Valley Drive
Oaks, PA 19456
(Name and address of agent for service)
Registrant’s telephone number, including area code: 800-342-5734
Date of fiscal year end: December 31, 2017
Date of reporting period: December 31, 2017
| Item 1. | Reports to Stockholders. |
| | |
| The KP Funds | |  |

KP Retirement Path 2015 Fund: KPRAX
KP Retirement Path 2020 Fund: KPRBX
KP Retirement Path 2025 Fund: KPRCX
KP Retirement Path 2030 Fund: KPRDX
KP Retirement Path 2035 Fund: KPREX
KP Retirement Path 2040 Fund: KPRFX
KP Retirement Path 2045 Fund: KPRGX
KP Retirement Path 2050 Fund: KPRHX
KP Retirement Path 2055 Fund: KPRIX
KP Retirement Path 2060 Fund: KPRJX
KP Large Cap Equity Fund: KPLCX
KP Small Cap Equity Fund: KPSCX
KP International Equity Fund: KPIEX
KP Fixed Income Fund: KPFIX
Annual Report
December 31, 2017
| | |
| THE KP FUNDS | | December 31, 2017 |
The Funds file their complete schedules of investments with the Securities and Exchange Commission (the “Commission”) for the first and third quarters of each fiscal year on Form N-Q within sixty days after period end. The Funds’ Forms N-Q are available on the Commission’s website at http://www.sec.gov, and may be reviewed and copied at the Commission’s Public Reference Room in Washington, D.C. Information on the operation of the Public Reference Room may be obtained by calling 1-800-SEC-0330.
A description of the policies and procedures that the Funds use to determine how to vote proxies relating to portfolio securities, as well as information relating to how the Funds voted proxies relating to portfolio securities during the most recent 12-month period ended June 30, is available (i) without charge, upon request, by calling 855-457-3637 (855-4KPFNDS); and (ii) on the Commission’s website at http://www.sec.gov.
| | |
| THE KP FUNDS | | December 31, 2017 |
Dear Shareholder,
2017 was a very favorable year for investment market participants of all types. Stock markets hit a number of record highs, adding trillions of dollars to global market capitalization. U.S. consumer confidence remained near a 17-year high and unemployment at a 17-year low. Risk appetite was robust, fueling returns for traditional and non-traditional assets. In the public realm, emerging market equities outperformed developed markets. High yield corporate bonds posted the best returns within fixed income. Large Cap US stocks as measured by the Russell 1000 Index returned 21.69% for the year. Non-US equity markets fared even better with the MSCI ACWI ex-US IMI Equity Index gaining 27.81% for the year and the MSCI Emerging Markets Equity Index returning 37.75%. Fixed income returns were positive for the year with the Bloomberg Barclays Aggregate Index returning 3.54%. US REITs (as measured by the MSCI US REIT Index) returned 5.07% for the year, while Commodities (as measured by the Bloomberg Commodity Index) increased by 0.75%. The year closed with the passage of the largest tax reform bill in 30 years, lending further support to stocks given the significant cut in corporate tax rates. Estimates as to the likely effect of the package on U.S. annual GDP growth vary from "negligible" to upwards of 3%, while the package is expected to add $1.5 trillion to the budget deficit over 10 years.
The KP Retirement Path Funds were launched during the early part of January 2014 to provide participants in KP-sponsored defined contribution plans with diversified exposure to all of these asset classes, as well as a number of others including small cap US equity, natural resource equity, global listed infrastructure, Treasury Inflation Protected Securities, floating rate bank loans, emerging market debt, and short term bonds. Each of the 10 KP Retirement Path Funds is designed with a specific retirement date in mind, and the asset allocation is automatically adjusted over time to help shareholders achieve the appropriate balance between long-term capital growth, inflation protection, capital preservation and current income for each stage of their savings and investing career.
Since the KP Retirement Path Funds’ inception we have been pleased with the performance of the operational infrastructure that was assembled to coordinate the activities of the 21 different investment management organizations responsible for the management of the Funds’ assets. We have also been satisfied from an investment performance perspective. In terms of absolute performance, fiscal year 2017 was characterized by strong returns across the major asset classes. Consequently the returns for the KP Retirement Path Funds were all positive for the year, ranging from 10.03% (2015 Fund) to 21.66% (2060 Fund). The Funds outperformed their strategic benchmarks in fiscal year 2017, and as a result, also outperformed their benchmarks by between 0.03%-0.17% since their inception in January of 2014 (through December 31, 2017).
We continue to believe that the KP Retirement Path Funds are well-designed and include a diverse set of complementary asset classes and strategies managed by a highly capable team of sub-advisors. We remain confident that the Funds are well-positioned to achieve their objectives going into 2018 and beyond.
Respectfully Submitted,
| | | | |
 | |  | | |
| | |
| Gregory C. Allen | | Ivan S. Cliff, CFA | | |
| Portfolio Manager | | Portfolio Manager | | |
| CEO, President, Chief Research Officer | | Director of Research | | |
The performance data quoted represents past performance. Past performance does not guarantee future results. The investment return and principal value of an investment will fluctuate so that an investor's shares, when redeemed, may be worth less than their original cost and current performance may be lower than the performance quoted. Returns greater than one year are average annual total returns. For performance data current to the most recent month end, please call 855-4-KPFNDS.
1
| | |
| THE KP FUNDS | | December 31, 2017 |
| | |
| MANAGEMENT DISCUSSION AND FUND PERFORMANCE (Unaudited): | | |
Performance for the KP Retirement Path Funds for Fiscal Year 2017 was positive across the board on an absolute basis as well as relative to the Funds’ strategic benchmarks. In order to better understand the sources of outperformance for the year, it is helpful to review the design of the Funds.
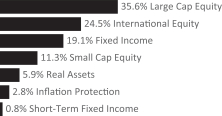
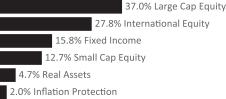
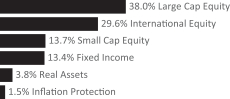
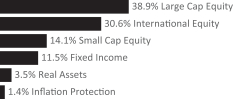
Each of the KP Retirement Path Funds is itself a “fund-of-funds”. This means that each of the Funds is composed of a collection of sub-funds, each with a specific purpose that contributes to the overall design. At the highest level these sub-funds can be grouped into six major categories which include: large cap US equities, small cap US equities, international equities, broad fixed income, real (or inflation sensitive) assets, and short-term fixed income. Each of the KP Retirement Path Funds varies its exposure to these asset categories over time to ensure that it is achieving the appropriate balance of capital appreciation, current income, inflation protection, and capital preservation. The 2060 Fund, for example, is primarily invested in large cap US equity, small cap US equity, and international equity. The 2015 Fund, on the other hand, has a much greater emphasis on broad fixed income, real assets, and short-term fixed income.
The performance of each Fund is compared to its own strategic benchmark. The strategic benchmarks are designed to reflect the target asset allocation for each Fund, while also assuming that each of the underlying asset classes is implemented using a passive index. While Management makes extensive use of passive strategies in the Funds’ implementation to keep costs low, we also employ a number of active strategies in our attempt to add value relative to the strategic benchmarks. Management does not attempt to add value by trying to time markets using tactical asset allocation. As a result, most of the relative performance of the Funds versus their strategic benchmarks can be explained by the relative performance of the strategies within each of the six underlying asset classes. Given this understanding, we can now put the relative performance of the KP Retirement Path Funds into perspective by examining the relative performance of each of the underlying asset classes.
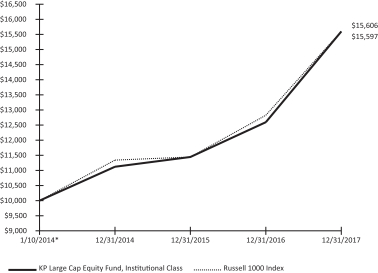
The KP Retirement Path Funds achieve their large cap US equity exposure through the use of the KP Large Cap Equity Fund. This Fund is benchmarked to the Russell 1000 Index. The Fund employs five strategies including: a passive S&P 500 index strategy; an active large cap growth strategy; an active large cap value strategy; and two active large cap blend strategies. The Fund returned 23.84% for the year versus 21.69% for the benchmark. This outperformance of 2.15% at the Fund level was largely explained by the outperformance of the active large cap growth strategy and the active large cap value strategy. These strategies beat their benchmarks for the year by 8.26% and 4.76% respectively. Since large cap is a significant part of the asset allocation for all of the KP Retirement Path Funds, this was a meaningful source of outperformance across the entire fund family.
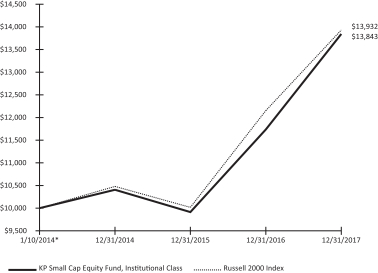
The KP Retirement Path Funds achieve their small cap US equity exposure through the use of the KP Small Cap Equity Fund. This Fund is benchmarked to the Russell 2000 Index. The Fund employs seven strategies including a passive S&P 600 strategy, two active small cap growth strategies, two active small cap value strategies, and two active small cap blend strategies. The Fund returned 17.95% for the year versus 14.65% for the benchmark. The outperformance of 3.30% was largely explained by the outperformance of one active growth strategy, both of the actively managed value strategies, and one of the active small cap blend strategies. These strategies beat their benchmarks by a range of 4.57% to 13.09% with an average outperformance of 7.89%. Small cap is a relatively small part of the asset allocation for the KP Retirement Path Funds, but in combination with the relatively large outperformance versus its index, this contributed to the outperformance across the fund family.
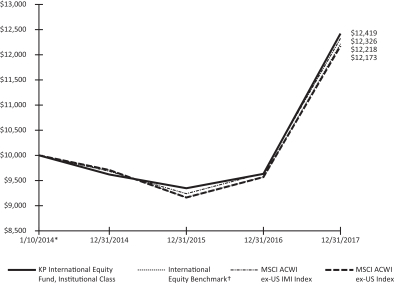
The KP Retirement Path Funds achieve their international equity exposure through the use of the KP International Equity Fund. This Fund is benchmarked to the MSCI ACWI ex-US IMI Index. The Fund employs seven strategies including two passive strategies: MSCI World ex-US and MSCI World ex-US Small Cap Index strategies. The Fund also employs five active strategies including two active MSCI EAFE strategies, an active MSCI ACWI ex-US strategy, and two active emerging markets strategies. The Fund returned 28.95% for the year versus 27.66% for the benchmark. This outperformance of 1.29% was largely attributable to an active EAFE strategy which outpaced its benchmark by 3.92% and an emerging markets strategy, which outperformed its benchmark by 4.32%. Because international equity is a large part of the asset allocation for the KP Retirement Path Funds, this was a noteworthy source of relative outperformance across the fund family.
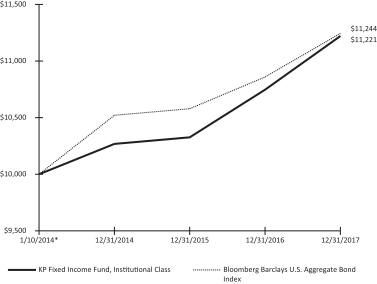
The KP Retirement Path Funds achieve their broad fixed income exposure through the use of the KP Fixed Income Fund. This Fund is benchmarked to the Bloomberg Barclays Capital US Aggregate Bond Index. The Fund employs four strategies including a passive Bloomberg Barclays Capital US Aggregate Bond Index strategy, an active Bloomberg
2
| | |
| THE KP FUNDS | | December 31, 2017 |
| | |
| MANAGEMENT DISCUSSION AND FUND PERFORMANCE (Unaudited): | | |
Barclays Aggregate strategy, an active emerging markets debt strategy, and an active bank loan strategy. The KP Fixed Income Fund returned 4.41% for the year versus 3.54% for the benchmark. This outperformance of 0.87% was primarily due to the outperformance of the active emerging markets debt strategy, which outperformed its benchmark by 2.56%, as well as the contributions of the active Bloomberg Barclays and active bank loan strategies. Because fixed income is a large part of the asset allocation for the KP Retirement Path Funds, this outperformance had a positive impact on the relative performance of the KP Retirement Path Fund series.
The KP Retirement Path Funds achieve their real assets exposure through the use of a diversified collection of non-affiliated sub-funds each specializing in a different inflation-sensitive strategy. Collectively these strategies returned 7.26% over the measurement period versus 8.52% for their composite benchmark. The seven underlying real assets funds had a wide range of returns, from 2.73% for the commodities fund to 20.80% for the global listed infrastructure fund. Because real assets are a relatively small part of the asset allocation for the KP Retirement Path Funds, they had only a modest impact on the relative performance across the series.
The KP Retirement Path Funds achieve their short-term fixed income exposure through the use of low-cost index strategies. These sub-funds performed in line with their benchmarks and did not have a material effect on the relative performance across the series.
The tables that follow detail the performance of each of the KP Retirement Path Funds over various periods ended December 31, 2017.
To determine if one of these funds is an appropriate investment for you, carefully consider the fund's investment objectives, risk factors, charges, and expenses before investing. This and other information may be found in the fund's summary and full prospectuses, which may be obtained by calling (855)4-KPFNDS or by visiting the website at www.kp-funds.com. Please read the prospectus carefully before investing.
The KP Retirement Path Funds and the KP Core Funds are mutual funds. They are part of The KP Funds Series Trust, an open-end management investment company that offers shares of diversified portfolios. The funds are advised by Callan LLC, a registered investment advisor. They are administered by SEI Investments Global Funds Services and distributed by SEI investments Distribution Co., which are not affiliated with Callan LLC.
Only participants in the Kaiser Permanente defined contribution plans and 403(b) plans can invest in the funds.
There can be no assurance that a Fund will achieve its stated objectives. An investor may experience losses, at any time, including near, at or after the Fund's target year. In addition, there is no guarantee that an investor's investment in the fund will provide any income at or through the years following the Fund's target year in amounts adequate to meet the investor's goals or retirement needs.
Investing involves risk including loss of principal. Bond and bond funds are subject to interest rate risk and will decline in value as interest rates rise. Mortgage-backed securities are subject to pre-payment and extension risk and therefore react differently to changes in interest rates than other bonds. Small movements in interest rates may quickly and significantly reduce the value of certain mortgage-backed securities. Non-investment grade bonds involve greater risks of default and are more volatile than investment grade securities, due to the speculative nature of the investment. International investments involve risk of capital loss from unfavorable fluctuation in currency values, from differences in generally accepted accounting principles or from social, economic or political instability in other nations. These risks are heightened when investing in emerging markets or in a single state.
Currency risk is the risk that foreign currencies will decline in value relative to the U.S. dollar or, in the case of hedging positions, that the U.S. dollar will decline in value relative to the currency hedged. In either event, the dollar value of an investment in the Underlying Fund would be adversely affected. The use of leverage by the fund managers may accelerate the velocity of potential losses. Furthermore, the use of derivatives are often more volatile than other investments and magnify the Fund's gains or losses. Diversification does not protect against market loss.
The performance data quoted represents past performance. Past performance does not guarantee future results. The investment return and principal value of an investment will fluctuate so that an investor's shares, when redeemed, may be worth less than their original cost and current performance may be lower than the performance quoted. Returns greater than one year are average annual total returns. For performance data current to the most recent month end, please call 855-4-KPFNDS.
3
| | |
| THE KP FUNDS | | December 31, 2017 |
| | |
| MANAGEMENT DISCUSSION AND FUND PERFORMANCE (Unaudited): | | |
Definition of Comparitive Indices
The Russell 1000 Index measures the performance of the large-cap segment of the U.S. equity universe. It is a subset of the Russell 3000® Index and includes approximately 1,000 of the largest securities based on a combination of their market cap and current index membership. The Russell 1000 represents approximately 92% of the Russell 3000 Index.
The Russell 2000 Index measures the performance of the small-cap segment of the U.S. equity universe. The Russell 2000 Index is a subset of the Russell 3000® Index representing approximately 8% of the total market capitalization of that index. It includes approximately 2,000 of the smallest securities based on a combination of their market cap and current index membership.
The MSCI ACWI ex-US Index captures large and mid cap representation across 22 of 23 Developed Markets countries (excluding the United States) and 24 Emerging Markets countries. With 1,866 constituents, the index covers approximately 85% of the global equity opportunity set outside the US.
The MSCI ACWI ex-US Investable Market Index (IMI) captures large, mid and small cap representation across 22 of 23 Developed Markets countries (excluding the United States) and 24 Emerging Markets countries. With 6,216 constituents, the index covers approximately 99% of the global equity opportunity set outside the US.
The MSCI EAFE Index captures large, mid, small and micro cap representation across 21 Developed Markets countries (excluding Canada and the United States).
The MSCI Emerging Markets Equity Index is a free float-adjusted market capitalization index that is designed to measure equity market performance in the global emerging markets.
The Bloomberg Barclays U.S. Aggregate Bond Index is a broad-based and measures the performance of the U.S. investment grade bond market. It invests in a wide spectrum of public, investment-grade, taxable, fixed income securities in the United States – including government, corporate, and international dollar-denominated bonds, as well as mortgage-backed and asset-backed securities, all with maturities of more than 1 year.
The S&P 500 Index is based on market capitalizations of 500 large companies having common stock listed on the New York Stock Exchange or NASDAQ.
4
| | |
| THE KP FUNDS | | December 31, 2017 |
| | |
| KP Retirement Path 2015 Fund | | |
| MANAGEMENT DISCUSSION AND FUND PERFORMANCE (Unaudited): | | |
Growth of a $10,000 Investment
| | | | | | | | | | | | | | | | |
| | | | | | AVERAGE ANNUAL TOTAL RETURN
FOR THE YEAR ENDED
DECEMBER 31, 2017* | |
| | | | | | One Year Return | | | Three Year Return | | | Annualized Inception
to Date | |
KP Retirement Path 2015 Fund, Institutional Class | | | | | | | 10.03 | % | | | 5.06 | % | | | 4.78 | % |
S&P 500 Index | | | | | | | 21.83 | % | | | 11.41 | % | | | 12.13 | % |
Custom Retirement 2015 Fund Benchmark | | | | | | | 9.17 | % | | | 4.49 | % | | | 4.62 | % |
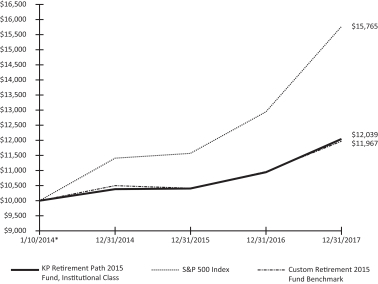
| * | The Fund commenced operations on January 10, 2014. |
The performance data quoted herein represents past performance and the return and value of an investment in the Fund will fluctuate so that, when redeemed, may be worth less than its original cost.
The Fund’s performance assumes the reinvestment of dividends and capital gains. Index returns assume reinvestment of dividends and, unlike a Fund’s returns, do not reflect any fees or expenses. If such fees and expenses were included in the index returns, the performance would have been lower. Please note that one cannot invest directly in an unmanaged index.
There are no assurances that the Fund will meet its stated objectives. The Fund’s holdings and allocations are subject to change because it is actively managed and should not be considered recommendations to buy individual securities.
Returns shown do not reflect the deduction of taxes that a shareholder would pay on Fund distributions or the redemption of Fund shares.
See definition of comparative indices on page 4.
5
| | |
| THE KP FUNDS | | December 31, 2017 |
| | |
| KP Retirement Path 2020 Fund | | |
| MANAGEMENT DISCUSSION AND FUND PERFORMANCE (Unaudited): | | |
Growth of a $10,000 Investment
| | | | | | | | | | | | | | | | |
| | | | | | AVERAGE ANNUAL TOTAL RETURN
FOR THE YEAR ENDED
DECEMBER 31, 2017* | |
| | | | | | One Year Return | | | Three Year Return | | | Annualized Inception
to Date | |
KP Retirement Path 2020 Fund, Institutional Class | | | | | | | 12.04 | % | | | 5.84 | % | | | 5.40 | % |
S&P 500 Index | | | | | | | 21.83 | % | | | 11.41 | % | | | 12.13 | % |
Custom Retirement 2020 Fund Benchmark | | | | | | | 10.98 | % | | | 5.24 | % | | | 5.23 | % |
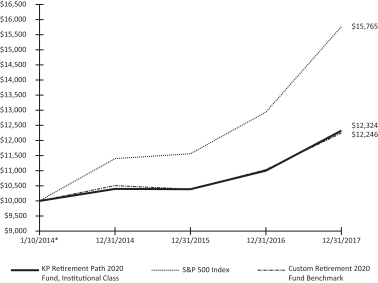
| * | The Fund commenced operations on January 10, 2014. |
The performance data quoted herein represents past performance and the return and value of an investment in the Fund will fluctuate so that, when redeemed, may be worth less than its original cost.
The Fund’s performance assumes the reinvestment of dividends and capital gains. Index returns assume reinvestment of dividends and, unlike a Fund’s returns, do not reflect any fees or expenses. If such fees and expenses were included in the index returns, the performance would have been lower. Please note that one cannot invest directly in an unmanaged index.
There are no assurances that the Fund will meet its stated objectives. The Fund’s holdings and allocations are subject to change because it is actively managed and should not be considered recommendations to buy individual securities.
Returns shown do not reflect the deduction of taxes that a shareholder would pay on Fund distributions or the redemption of Fund shares.
See definition of comparative indices on page 4.
6
| | |
| THE KP FUNDS | | December 31, 2017 |
| | |
| KP Retirement Path 2025 Fund | | |
| MANAGEMENT DISCUSSION AND FUND PERFORMANCE (Unaudited): | | |
Growth of a $10,000 Investment
| | | | | | | | | | | | | | | | |
| | | | | | AVERAGE ANNUAL TOTAL RETURN
FOR THE YEAR ENDED
DECEMBER 31, 2017* | |
| | | | | | One Year Return | | | Three Year Return | | | Annualized Inception
to Date | |
KP Retirement Path 2025 Fund, Institutional Class | | | | | | | 14.59 | % | | | 6.79 | % | | | 6.11 | % |
S&P 500 Index | | | | | | | 21.83 | % | | | 11.41 | % | | | 12.13 | % |
Custom Retirement 2025 Fund Benchmark | | | | | | | 13.27 | % | | | 6.18 | % | | | 5.95 | % |

| * | The Fund commenced operations on January 10, 2014. |
The performance data quoted herein represents past performance and the return and value of an investment in the Fund will fluctuate so that, when redeemed, may be worth less than its original cost.
The Fund’s performance assumes the reinvestment of dividends and capital gains. Index returns assume reinvestment of dividends and, unlike a Fund’s returns, do not reflect any fees or expenses. If such fees and expenses were included in the index returns, the performance would have been lower. Please note that one cannot invest directly in an unmanaged index.
There are no assurances that the Fund will meet its stated objectives. The Fund’s holdings and allocations are subject to change because it is actively managed and should not be considered recommendations to buy individual securities.
Returns shown do not reflect the deduction of taxes that a shareholder would pay on Fund distributions or the redemption of Fund shares.
See definition of comparative indices on page 4.
7
| | |
| THE KP FUNDS | | December 31, 2017 |
| | |
| KP Retirement Path 2030 Fund | | |
| MANAGEMENT DISCUSSION AND FUND PERFORMANCE (Unaudited): | | |
Growth of a $10,000 Investment
| | | | | | | | | | | | | | | | |
| | | | | | AVERAGE ANNUAL TOTAL RETURN
FOR THE YEAR ENDED
DECEMBER 31, 2017* | |
| | | | | | One Year Return | | | Three Year Return | | | Annualized Inception
to Date | |
KP Retirement Path 2030 Fund, Institutional Class | | | | | | | 16.93 | % | | | 7.67 | % | | | 6.73 | % |
S&P 500 Index | | | | | | | 21.83 | % | | | 11.41 | % | | | 12.13 | % |
Custom Retirement 2030 Fund Benchmark | | | | | | | 15.53 | % | | | 7.08 | % | | | 6.64 | % |

| * | The Fund commenced operations on January 10, 2014. |
The performance data quoted herein represents past performance and the return and value of an investment in the Fund will fluctuate so that, when redeemed, may be worth less than its original cost.
The Fund’s performance assumes the reinvestment of dividends and capital gains. Index returns assume reinvestment of dividends and, unlike a Fund’s returns, do not reflect any fees or expenses. If such fees and expenses were included in the index returns, the performance would have been lower. Please note that one cannot invest directly in an unmanaged index.
There are no assurances that the Fund will meet its stated objectives. The Fund’s holdings and allocations are subject to change because it is actively managed and should not be considered recommendations to buy individual securities.
Returns shown do not reflect the deduction of taxes that a shareholder would pay on Fund distributions or the redemption of Fund shares.
See definition of comparative indices on page 4.
8
| | |
| THE KP FUNDS | | December 31, 2017 |
| | |
| KP Retirement Path 2035 Fund | | |
| MANAGEMENT DISCUSSION AND FUND PERFORMANCE (Unaudited): | | |
Growth of a $10,000 Investment
| | | | | | | | | | | | | | | | |
| | | | | | AVERAGE ANNUAL TOTAL RETURN
FOR THE YEAR ENDED
DECEMBER 31, 2017* | |
| | | | | | One Year Return | | | Three Year Return | | | Annualized Inception
to Date | |
KP Retirement Path 2035 Fund, Institutional Class | | | | | | | 18.93 | % | | | 8.42 | % | | | 7.31 | % |
S&P 500 Index | | | | | | | 21.83 | % | | | 11.41 | % | | | 12.13 | % |
Custom Retirement 2035 Fund Benchmark | | | | | | | 17.37 | % | | | 7.84 | % | | | 7.24 | % |
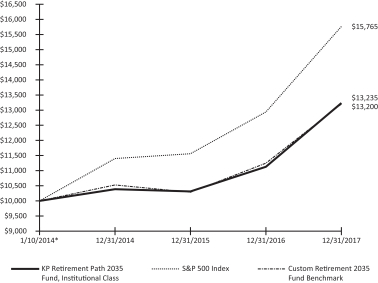
| * | The Fund commenced operations on January 10, 2014. |
The performance data quoted herein represents past performance and the return and value of an investment in the Fund will fluctuate so that, when redeemed, may be worth less than its original cost.
The Fund’s performance assumes the reinvestment of dividends and capital gains. Index returns assume reinvestment of dividends and, unlike a Fund’s returns, do not reflect any fees or expenses. If such fees and expenses were included in the index returns, the performance would have been lower. Please note that one cannot invest directly in an unmanaged index.
There are no assurances that the Fund will meet its stated objectives. The Fund’s holdings and allocations are subject to change because it is actively managed and should not be considered recommendations to buy individual securities.
Returns shown do not reflect the deduction of taxes that a shareholder would pay on Fund distributions or the redemption of Fund shares.
See definition of comparative indices on page 4.
9
| | |
| THE KP FUNDS | | December 31, 2017 |
| | |
| KP Retirement Path 2040 Fund | | |
| MANAGEMENT DISCUSSION AND FUND PERFORMANCE (Unaudited): | | |
Growth of a $10,000 Investment
| | | | | | | | | | | | | | | | |
| | | | | | AVERAGE ANNUAL TOTAL RETURN
FOR THE YEAR ENDED
DECEMBER 31, 2017* | |
| | | | | | One Year Return | | | Three Year Return | | | Annualized Inception
to Date | |
KP Retirement Path 2040 Fund, Institutional Class | | | | | | | 20.28 | % | | | 8.89 | % | | | 7.68 | % |
S&P 500 Index | | | | | | | 21.83 | % | | | 11.41 | % | | | 12.13 | % |
Custom Retirement 2040 Fund Benchmark | | | | | | | 18.58 | % | | | 8.31 | % | | | 7.60 | % |
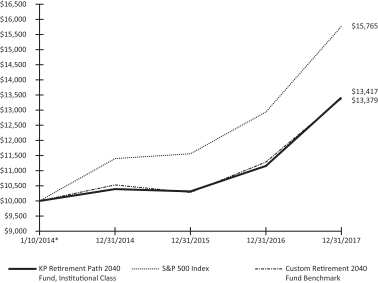
| * | The Fund commenced operations on January 10, 2014. |
The performance data quoted herein represents past performance and the return and value of an investment in the Fund will fluctuate so that, when redeemed, may be worth less than its original cost.
The Fund’s performance assumes the reinvestment of dividends and capital gains. Index returns assume reinvestment of dividends and, unlike a Fund’s returns, do not reflect any fees or expenses. If such fees and expenses were included in the index returns, the performance would have been lower. Please note that one cannot invest directly in an unmanaged index.
There are no assurances that the Fund will meet its stated objectives. The Fund’s holdings and allocations are subject to change because it is actively managed and should not be considered recommendations to buy individual securities.
Returns shown do not reflect the deduction of taxes that a shareholder would pay on Fund distributions or the redemption of Fund shares.
See definition of comparative indices on page 4.
10
| | |
| THE KP FUNDS | | December 31, 2017 |
| | |
| KP Retirement Path 2045 Fund | | |
| MANAGEMENT DISCUSSION AND FUND PERFORMANCE (Unaudited): | | |
Growth of a $10,000 Investment
| | | | | | | | | | | | | | | | |
| | | | | | AVERAGE ANNUAL TOTAL RETURN
FOR THE YEAR ENDED
DECEMBER 31, 2017* | |
| | | | | | One Year Return | | | Three Year Return | | | Annualized Inception to Date | |
KP Retirement Path 2045 Fund, Institutional Class | | | | | | | 21.00 | % | | | 9.14 | % | | | 7.82 | % |
S&P 500 Index | | | | | | | 21.83 | % | | | 11.41 | % | | | 12.13 | % |
Custom Retirement 2045 Fund Benchmark | | | | | | | 19.29 | % | | | 8.57 | % | | | 7.79 | % |
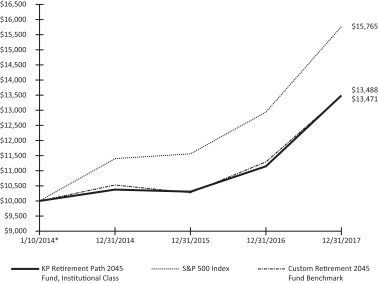
| * | The Fund commenced operations on January 10, 2014. |
The performance data quoted herein represents past performance and the return and value of an investment in the Fund will fluctuate so that, when redeemed, may be worth less than its original cost.
The Fund’s performance assumes the reinvestment of dividends and capital gains. Index returns assume reinvestment of dividends and, unlike a Fund’s returns, do not reflect any fees or expenses. If such fees and expenses were included in the index returns, the performance would have been lower. Please note that one cannot invest directly in an unmanaged index.
There are no assurances that the Fund will meet its stated objectives. The Fund’s holdings and allocations are subject to change because it is actively managed and should not be considered recommendations to buy individual securities.
Returns shown do not reflect the deduction of taxes that a shareholder would pay on Fund distributions or the redemption of Fund shares.
See definition of comparative indices on page 4.
11
| | |
| THE KP FUNDS | | December 31, 2017 |
| | |
| KP Retirement Path 2050 Fund | | |
| MANAGEMENT DISCUSSION AND FUND PERFORMANCE (Unaudited): | | |
Growth of a $10,000 Investment
| | | | | | | | | | | | | | | | |
| | | | | | AVERAGE ANNUAL TOTAL RETURN
FOR THE YEAR ENDED
DECEMBER 31, 2017* | |
| | | | | | One Year Return | | | Three Year Return | | | Annualized Inception
to Date | |
KP Retirement Path 2050 Fund, Institutional Class | | | | | | | 21.52 | % | | | 9.32 | % | | | 7.95 | % |
S&P 500 Index | | | | | | | 21.83 | % | | | 11.41 | % | | | 12.13 | % |
Custom Retirement 2050 Fund Benchmark | | | | | | | 19.72 | % | | | 8.71 | % | | | 7.90 | % |
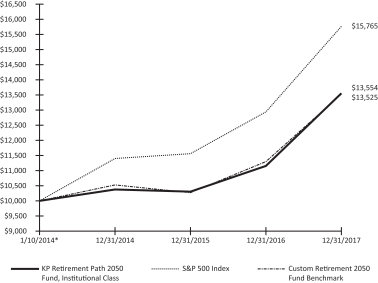
| * | The Fund commenced operations on January 10, 2014. |
The performance data quoted herein represents past performance and the return and value of an investment in the Fund will fluctuate so that, when redeemed, may be worth less than its original cost.
The Fund’s performance assumes the reinvestment of dividends and capital gains. Index returns assume reinvestment of dividends and, unlike a Fund’s returns, do not reflect any fees or expenses. If such fees and expenses were included in the index returns, the performance would have been lower. Please note that one cannot invest directly in an unmanaged index.
There are no assurances that the Fund will meet its stated objectives. The Fund’s holdings and allocations are subject to change because it is actively managed and should not be considered recommendations to buy individual securities.
Returns shown do not reflect the deduction of taxes that a shareholder would pay on Fund distributions or the redemption of Fund shares.
See definition of comparative indices on page 4.
12
| | |
| THE KP FUNDS | | December 31, 2017 |
| | |
| KP Retirement Path 2055 Fund | | |
| MANAGEMENT DISCUSSION AND FUND PERFORMANCE (Unaudited): | | |
Growth of a $10,000 Investment
| | | | | | | | | | | | | | | | |
| | | | | | AVERAGE ANNUAL TOTAL RETURN
FOR THE YEAR ENDED
DECEMBER 31, 2017* | |
| | | | | | One Year Return | | | Three Year Return | | | Annualized Inception
to Date | |
KP Retirement Path 2055 Fund, Institutional Class | | | | | | | 21.59 | % | | | 9.36 | % | | | 8.00 | % |
S&P 500 Index | | | | | | | 21.83 | % | | | 11.41 | % | | | 12.13 | % |
Custom Retirement 2055 Fund Benchmark | | | | | | | 19.85 | % | | | 8.75 | % | | | 7.93 | % |

| * | The Fund commenced operations on January 10, 2014. |
The performance data quoted herein represents past performance and the return and value of an investment in the Fund will fluctuate so that, when redeemed, may be worth less than its original cost.
The Fund’s performance assumes the reinvestment of dividends and capital gains. Index returns assume reinvestment of dividends and, unlike a Fund’s returns, do not reflect any fees or expenses. If such fees and expenses were included in the index returns, the performance would have been lower. Please note that one cannot invest directly in an unmanaged index.
There are no assurances that the Fund will meet its stated objectives. The Fund’s holdings and allocations are subject to change because it is actively managed and should not be considered recommendations to buy individual securities.
Returns shown do not reflect the deduction of taxes that a shareholder would pay on Fund distributions or the redemption of Fund shares.
See definition of comparative indices on page 4.
13
| | |
| THE KP FUNDS | | December 31, 2017 |
| | |
| KP Retirement Path 2060 Fund | | |
| MANAGEMENT DISCUSSION AND FUND PERFORMANCE (Unaudited): | | |
Growth of a $10,000 Investment
| | | | | | | | | | | | | | | | |
| | | | | | AVERAGE ANNUAL TOTAL RETURN
FOR THE YEAR ENDED
DECEMBER 31, 2017* | |
| | | | | | One Year Return | | | Three Year Return | | | Annualized Inception
to Date | |
KP Retirement Path 2060 Fund, Institutional Class | | | | | | | 21.66 | % | | | 9.37 | % | | | 8.04 | % |
S&P 500 Index | | | | | | | 21.83 | % | | | 11.41 | % | | | 12.13 | % |
Custom Retirement 2060 Fund Benchmark | | | | | | | 19.85 | % | | | 8.75 | % | | | 7.93 | % |
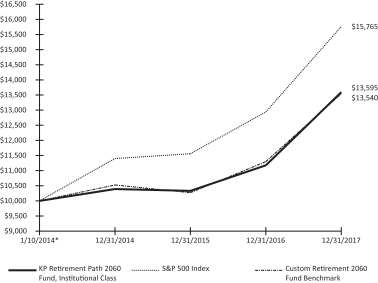
| * | The Fund commenced operations on January 10, 2014. |
The performance data quoted herein represents past performance and the return and value of an investment in the Fund will fluctuate so that, when redeemed, may be worth less than its original cost.
The Fund’s performance assumes the reinvestment of dividends and capital gains. Index returns assume reinvestment of dividends and, unlike a Fund’s returns, do not reflect any fees or expenses. If such fees and expenses were included in the index returns, the performance would have been lower. Please note that one cannot invest directly in an unmanaged index.
There are no assurances that the Fund will meet its stated objectives. The Fund’s holdings and allocations are subject to change because it is actively managed and should not be considered recommendations to buy individual securities.
Returns shown do not reflect the deduction of taxes that a shareholder would pay on Fund distributions or the redemption of Fund shares.
See definition of comparative indices on page 4.
14
| | |
| THE KP FUNDS | | December 31, 2017 |
| | |
| KP Large Cap Equity Fund | | |
| MANAGEMENT DISCUSSION AND FUND PERFORMANCE (Unaudited): | | |
Growth of a $10,000 Investment
| | | | | | | | | | | | | | | | |
| | | | | | AVERAGE ANNUAL TOTAL RETURN
FOR THE YEAR ENDED
DECEMBER 31, 2017* | |
| | | | | | One Year Return | | | Three Year Return | | | Annualized Inception
to Date | |
KP Large Cap Equity Fund, Institutional Class | | | | | | | 23.84 | % | | | 11.93 | % | | | 11.84 | % |
Russell 1000 Index | | | | | | | 21.69 | % | | | 11.23 | % | | | 11.85 | % |
| * | The Fund commenced operations on January 10, 2014. |
The performance data quoted herein represents past performance and the return and value of an investment in the Fund will fluctuate so that, when redeemed, may be worth less than its original cost.
The Fund’s performance assumes the reinvestment of dividends and capital gains. Index returns assume reinvestment of dividends and, unlike a Fund’s returns, do not reflect any fees or expenses. If such fees and expenses were included in the index returns, the performance would have been lower. Please note that one cannot invest directly in an unmanaged index.
There are no assurances that the Fund will meet its stated objectives. The Fund’s holdings and allocations are subject to change because it is actively managed and should not be considered recommendations to buy individual securities.
Returns shown do not reflect the deduction of taxes that a shareholder would pay on Fund distributions or the redemption of Fund shares.
See definition of comparative indices on page 4.
15
| | |
| THE KP FUNDS | | December 31, 2017 |
| | |
| KP Small Cap Equity Fund | | |
| MANAGEMENT DISCUSSION AND FUND PERFORMANCE (Unaudited): | | |
Growth of a $10,000 Investment
| | | | | | | | | | | | | | | | |
| | | | | | AVERAGE ANNUAL TOTAL RETURN
FOR THE YEAR ENDED
DECEMBER 31, 2017* | |
| | | | | | One Year Return | | | Three Year Return | | | Annualized Inception
to Date | |
KP Small Cap Equity Fund, Institutional Class | | | | | | | 17.95 | % | | | 9.98 | % | | | 8.53 | % |
Russell 2000 Index | | | | | | | 14.65 | % | | | 9.96 | % | | | 8.70 | % |
| * | The Fund commenced operations on January 10, 2014. |
The performance data quoted herein represents past performance and the return and value of an investment in the Fund will fluctuate so that, when redeemed, may be worth less than its original cost.
The Fund’s performance assumes the reinvestment of dividends and capital gains. Index returns assume reinvestment of dividends and, unlike a Fund’s returns, do not reflect any fees or expenses. If such fees and expenses were included in the index returns, the performance would have been lower. Please note that one cannot invest directly in an unmanaged index.
There are no assurances that the Fund will meet its stated objectives. The Fund’s holdings and allocations are subject to change because it is actively managed and should not be considered recommendations to buy individual securities.
Returns shown do not reflect the deduction of taxes that a shareholder would pay on Fund distributions or the redemption of Fund shares.
See definition of comparative indices on page 4.
16
| | |
| THE KP FUNDS | | December 31, 2017 |
| | |
| KP International Equity Fund | | |
| MANAGEMENT DISCUSSION AND FUND PERFORMANCE (Unaudited): | | |
Growth of a $10,000 Investment
| | | | | | | | | | | | | | | | |
| | | | | | AVERAGE ANNUAL TOTAL RETURN
FOR THE YEAR ENDED
DECEMBER 31, 2017* | |
| | | | | | One Year Return | | | Three Year Return | | | Annualized Inception
to Date | |
KP International Equity Fund, Institutional Class | | | | | | | 28.95 | % | | | 8.90 | % | | | 5.60 | % |
International Equity Benchmark† | | | | | | | 27.66 | % | | | 7.96 | % | | | 5.17 | % |
MSCI ACWI ex-US IMI Index | | | | | | | 27.81 | % | | | 8.38 | % | | | 5.40 | % |
MSCI ACWI ex-US Index | | | | | | | 27.19 | % | | | 7.83 | % | | | 5.07 | % |
| * | The Fund commenced operations on January 10, 2014. |
| † | The Fund changed its benchmark index to the MSCI ACWI ex-US IMI Index as of April 1, 2017. The International Equity Benchmark consists of the MSCI ACWI ex-US Index through March 31, 2017 and MSCI ACWI ex-US IMI Index going forward. The new benchmark index more closely aligns with the strategy and investments of the Fund. |
The performance data quoted herein represents past performance and the return and value of an investment in the Fund will fluctuate so that, when redeemed, may be worth less than its original cost.
The Fund’s performance assumes the reinvestment of dividends and capital gains. Index returns assume reinvestment of dividends and, unlike a Fund’s returns, do not reflect any fees or expenses. If such fees and expenses were included in the index returns, the performance would have been lower. Please note that one cannot invest directly in an unmanaged index.
There are no assurances that the Fund will meet its stated objectives. The Fund’s holdings and allocations are subject to change because it is actively managed and should not be considered recommendations to buy individual securities.
Returns shown do not reflect the deduction of taxes that a shareholder would pay on Fund distributions or the redemption of Fund shares.
See definition of comparative indices on page 4.
17
| | |
| THE KP FUNDS | | December 31, 2017 |
| | |
| KP Fixed Income Fund | | |
| MANAGEMENT DISCUSSION AND FUND PERFORMANCE (Unaudited): | | |
Growth of a $10,000 Investment
| | | | | | | | | | | | | | | | |
| | | | | | AVERAGE ANNUAL TOTAL RETURN
FOR THE YEAR ENDED
DECEMBER 31, 2017* | |
| | | | | | One Year Return | | | Three Year Return | | | Annualized Inception
to Date | |
KP Fixed Income Fund, Institutional Class | | | | | | | 4.41 | % | | | 3.00 | % | | | 2.94 | % |
Bloomberg Barclays U.S. Aggregate Bond Index | | | | | | | 3.54 | % | | | 2.24 | % | | | 2.99 | % |
| * | The Fund commenced operations on January 10, 2014. |
The performance data quoted herein represents past performance and the return and value of an investment in the Fund will fluctuate so that, when redeemed, may be worth less than its original cost.
The Fund’s performance assumes the reinvestment of dividends and capital gains. Index returns assume reinvestment of dividends and, unlike a Fund’s returns, do not reflect any fees or expenses. If such fees and expenses were included in the index returns, the performance would have been lower. Please note that one cannot invest directly in an unmanaged index.
There are no assurances that the Fund will meet its stated objectives. The Fund’s holdings and allocations are subject to change because it is actively managed and should not be considered recommendations to buy individual securities.
Returns shown do not reflect the deduction of taxes that a shareholder would pay on Fund distributions or the redemption of Fund shares.
See definition of comparative indices on page 4.
18
| | |
| THE KP FUNDS | | December 31, 2017 |
| | |
| KP Retirement Path 2015 Fund | | |
|
| SECTOR WEIGHTINGS† (unaudited) |
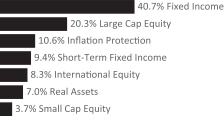
| † | Percentages based on total investments. |
| | | | | | | | |
| Description | | Shares | | | Value
(000) | |
AFFILIATED REGISTERED INVESTMENT COMPANIES — 73.0% | |
KP Fixed Income Fund | | | 17,816,627 | | | $ | 179,057 | |
KP International Equity Fund | | | 3,269,944 | | | | 36,623 | |
KP Large Cap Equity Fund | | | 6,883,016 | | | | 89,342 | |
KP Small Cap Equity Fund | | | 1,338,309 | | | | 16,167 | |
| | | | | | | | |
Total Affiliated Registered Investment Companies
(Cost $298,681) (000) | | | | 321,189 | |
| | | | | | | | |
UNAFFILIATED REGISTERED INVESTMENT COMPANIES — 27.0% | |
DFA Commodity Strategy Portfolio | | | 727,914 | | | | 4,338 | |
DFA International Real Estate Securities Portfolio | | | 869,267 | | | | 4,520 | |
Lazard Global Listed Infrastructure Portfolio | | | 264,119 | | | | 4,226 | |
T. Rowe Price Institutional Floating Rate Fund | | | 424,537 | | | | 4,254 | |
| | | | | | | | |
| Description | | Shares | | | Value
(000) | |
T. Rowe Price New Era Fund, Cl I | | | 122,909 | | | $ | 4,486 | |
Vanguard Inflation-Protected Securities Fund | | | 1,287,745 | | | | 13,431 | |
Vanguard REIT Index Fund | | | 491,610 | | | | 8,943 | |
Vanguard Short-Term Bond Index Fund | | | 4,000,162 | | | | 41,522 | |
Vanguard Short-Term Inflation-Protected Securities Index Fund | | | 1,339,957 | | | | 32,802 | |
| | | | | | | | |
Total Unaffiliated Registered Investment Companies
(Cost $116,625) (000) | | | | 118,522 | |
| | | | | | | | |
Total Investments In Securities — 100.0%
(Cost $415,306) (000) | | | $ | 439,711 | |
| | | | | | | | |
Percentages are based on Net Assets of $439,687 (000).
Cl — Class
REIT — Real Estate Investment Trust
As of December 31, 2017, all of the Fund’s investments were considered Level 1 in accordance with the authoritative guidance on fair value measurements and disclosure under U.S. generally accepted accounting principles.
For the year ended December 31, 2017, there were no transfers between Level 1, Level 2 and Level 3 assets and liabilities. All transfers, if any, are recognized by the Fund at the end of the year. During the year ended December 31, 2017, there were no Level 3 investments.
For further financial information on individual registered investment companies, available upon request at no charge, please go to the Securities Exchange Commission’s website at http://www.sec.gov or the individual registered investment company’s website.
The following is a summary of the transactions with affiliates for the year ended December 31, 2017 (000):
| | | | | | | | | | | | | | | | | | | | | | | | | | | | | | | | |
| | | Value
12/31/2016 | | | Purchases
at Cost | | | Proceeds
from Sales | | | Change in
Unrealized
Appreciation
(Depreciation) | | | Realized
Gain
(Loss) | | | Value
12/31/2017 | | | Dividend
Income | | | Capital Gain
Distributions | |
| KP Fixed Income Fund | | $ | 159,878 | | | $ | 66,534 | | | $ | (50,705 | ) | | $ | 2,707 | | | $ | 643 | | | $ | 179,057 | | | $ | 4,206 | | | $ | 53 | |
| KP International Equity Fund | | | 27,218 | | | | 14,044 | | | | (12,954 | ) | | | 7,385 | | | | 930 | | | | 36,623 | | | | 839 | | | | 161 | |
| KP Large Cap Equity Fund | | | 79,257 | | | | 23,145 | | | | (26,504 | ) | | | 7,560 | | | | 5,884 | | | | 89,342 | | | | 1,182 | | | | 4,580 | |
| KP Small Cap Equity Fund | | | 13,182 | | | | 6,382 | | | | (4,666 | ) | | | 372 | | | | 897 | | | | 16,167 | | | | 84 | | | | 1,345 | |
| | | | | | | | | | | | | | | | | | | | | | | | | | | | | | | | |
| Totals | | $ | 279,535 | | | $ | 110,105 | | | $ | (94,829 | ) | | $ | 18,024 | | | $ | 8,354 | | | $ | 321,189 | | | $ | 6,311 | | | $ | 6,139 | |
| | | | | | | | | | | | | | | | | | | | | | | | | | | | | | | | |
The accompanying notes are an integral part of the financial statements.
19
| | |
| THE KP FUNDS | | December 31, 2017 |
| | |
| KP Retirement Path 2020 Fund | | |
|
| SECTOR WEIGHTINGS† (unaudited) |
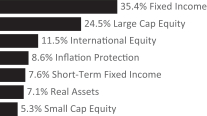
| † | Percentages based on total investments. |
| | | | | | | | |
| Description | | Shares | | | Value
(000) | |
AFFILIATED REGISTERED INVESTMENT COMPANIES — 76.7% | |
KP Fixed Income Fund | | | 30,834,878 | | | $ | 309,890 | |
KP International Equity Fund | | | 9,044,483 | | | | 101,298 | |
KP Large Cap Equity Fund | | | 16,590,079 | | | | 215,339 | |
KP Small Cap Equity Fund | | | 3,844,911 | | | | 46,447 | |
| | | | | | | | |
Total Affiliated Registered Investment Companies
(Cost $615,588) (000) | | | | 672,974 | |
| | | | | | | | |
UNAFFILIATED REGISTERED INVESTMENT COMPANIES — 23.3% | |
DFA Commodity Strategy Portfolio | | | 1,488,030 | | | | 8,869 | |
DFA International Real Estate Securities Portfolio | | | 1,773,858 | | | | 9,224 | |
Lazard Global Listed Infrastructure Portfolio | | | 539,675 | | | | 8,635 | |
T. Rowe Price Institutional Floating Rate Fund | | | 867,419 | | | | 8,692 | |
| | | | | | | | |
| Description | | Shares | | | Value
(000) | |
T. Rowe Price New Era Fund, Cl I | | | 250,913 | | | $ | 9,158 | |
Vanguard Inflation-Protected Securities Fund | | | 2,496,573 | | | | 26,039 | |
Vanguard REIT Index Fund | | | 952,829 | | | | 17,331 | |
Vanguard Short-Term Bond Index Fund | | | 6,436,374 | | | | 66,810 | |
Vanguard Short-Term Inflation-Protected Securities Index Fund | | | 2,036,260 | | | | 49,848 | |
| | | | | | | | |
Total Unaffiliated Registered Investment Companies
(Cost $201,960) (000) | | | | 204,606 | |
| | | | | | | | |
Total Investments In Securities — 100.0%
(Cost $817,548) (000) | | | $ | 877,580 | |
| | | | | | | | |
Percentages are based on Net Assets of $877,534 (000).
Cl — Class
REIT — Real Estate Investment Trust
As of December 31, 2017, all of the Fund’s investments were considered Level 1 in accordance with the authoritative guidance on fair value measurements and disclosure under U.S. generally accepted accounting principles.
For the year ended December 31, 2017, there were no transfers between Level 1, Level 2 and Level 3 assets and liabilities. All transfers, if any, are recognized by the Fund at the end of the year. During the year ended December 31, 2017, there were no Level 3 investments.
For further financial information on individual registered investment companies, available upon request at no charge, please go to the Securities Exchange Commission’s website at http://www.sec.gov or the individual registered investment company’s website.
The following is a summary of the transactions with affiliates for the year ended December 31, 2017 (000):
| | | | | | | | | | | | | | | | | | | | | | | | | | | | | | | | |
| | | Value
12/31/2016 | | | Purchases
at Cost | | | Proceeds
from Sales | | | Change in
Unrealized
Appreciation
(Depreciation) | | | Realized
Gain
(Loss) | | | Value
12/31/2017 | | | Dividend
Income | | | Capital Gain
Distributions | |
| KP Fixed Income Fund | | $ | 243,375 | | | $ | 98,937 | | | $ | (37,085 | ) | | $ | 4,172 | | | $ | 491 | | | $ | 309,890 | | | $ | 7,276 | | | $ | 90 | |
| KP International Equity Fund | | | 78,221 | | | | 25,522 | | | | (24,087 | ) | | | 19,701 | | | | 1,941 | | | | 101,298 | | | | 2,320 | | | | 443 | |
| KP Large Cap Equity Fund | | | 150,728 | | | | 73,551 | | | | (37,720 | ) | | | 20,138 | | | | 8,642 | | | | 215,339 | | | | 2,848 | | | | 10,986 | |
| KP Small Cap Equity Fund | | | 42,361 | | | | 9,080 | | | | (8,384 | ) | | | 1,708 | | | | 1,682 | | | | 46,447 | | | | 239 | | | | 3,845 | |
| | | | | | | | | | | | | | | | | | | | | | | | | | | | | | | | |
| Totals | | $ | 514,685 | | | $ | 207,090 | | | $ | (107,276 | ) | | $ | 45,719 | | | $ | 12,756 | | | $ | 672,974 | | | $ | 12,683 | | | $ | 15,364 | |
| | | | | | | | | | | | | | | | | | | | | | | | | | | | | | | | |
The accompanying notes are an integral part of the financial statements.
20
| | |
| THE KP FUNDS | | December 31, 2017 |
| | |
| KP Retirement Path 2025 Fund | | |
|
| SECTOR WEIGHTINGS† (unaudited) |
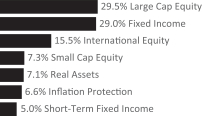
| † | Percentages based on total investments. |
| | | | | | | | |
| Description | | Shares | | | Value
(000) | |
AFFILIATED REGISTERED INVESTMENT COMPANIES — 81.4% | |
KP Fixed Income Fund | | | 30,612,325 | | | $ | 307,654 | |
KP International Equity Fund | | | 14,720,255 | | | | 164,867 | |
KP Large Cap Equity Fund | | | 24,148,051 | | | | 313,441 | |
KP Small Cap Equity Fund | | | 6,414,296 | | | | 77,485 | |
| | | | | | | | |
Total Affiliated Registered Investment Companies
(Cost $778,219) (000) | | | | 863,447 | |
| | | | | | | | |
UNAFFILIATED REGISTERED INVESTMENT COMPANIES — 18.6% | |
DFA Commodity Strategy Portfolio | | | 1,813,076 | | | | 10,806 | |
DFA International Real Estate Securities Portfolio | | | 2,160,657 | | | | 11,235 | |
Lazard Global Listed Infrastructure Portfolio | | | 657,656 | | | | 10,522 | |
T. Rowe Price Institutional Floating Rate Fund | | | 1,057,036 | | | | 10,592 | |
| | | | | | | | |
| Description | | Shares | | | Value
(000) | |
T. Rowe Price New Era Fund, Cl I | | | 305,590 | | | $ | 11,154 | |
Vanguard Inflation-Protected Securities Fund | | | 2,973,717 | | | | 31,016 | |
Vanguard REIT Index Fund | | | 1,134,769 | | | | 20,642 | |
Vanguard Short-Term Bond Index Fund | | | 5,111,473 | | | | 53,057 | |
Vanguard Short-Term Inflation-Protected Securities Index Fund | | | 1,589,117 | | | | 38,901 | |
| | | | | | | | |
Total Unaffiliated Registered Investment Companies
(Cost $195,309) (000) | | | | 197,925 | |
| | | | | | | | |
Total Investments In Securities — 100.0%
(Cost $973,528) (000) | | | $ | 1,061,372 | |
| | | | | | | | |
Percentages are based on Net Assets of $1,061,313 (000).
Cl — Class
REIT — Real Estate Investment Trust
As of December 31, 2017, all of the Fund’s investments were considered Level 1 in accordance with the authoritative guidance on fair value measurements and disclosure under U.S. generally accepted accounting principles.
For the year ended December 31, 2017, there were no transfers between Level 1, Level 2 and Level 3 assets and liabilities. All transfers, if any, are recognized by the Fund at the end of the year. During the year ended December 31, 2017, there were no Level 3 investments.
For further financial information on individual registered investment companies, available upon request at no charge, please go to the Securities Exchange Commission’s website at http://www.sec.gov or the individual registered investment company’s website.
The following is a summary of the transactions with affiliates for the year ended December 31, 2017 (000):
| | | | | | | | | | | | | | | | | | | | | | | | | | | | | | | | |
| | | Value
12/31/2016 | | | Purchases
at Cost | | | Proceeds
from Sales | | | Change in
Unrealized
Appreciation
(Depreciation) | | | Realized
Gain
(Loss) | | | Value
12/31/2017 | | | Dividend
Income | | | Capital Gain
Distributions | |
| KP Fixed Income Fund | | $ | 219,574 | | | $ | 99,287 | | | $ | (15,279 | ) | | $ | 3,822 | | | $ | 250 | | | $ | 307,654 | | | $ | 7,207 | | | $ | 89 | |
| KP International Equity Fund | | | 141,328 | | | | 24,904 | | | | (35,501 | ) | | | 32,142 | | | | 1,994 | | | | 164,867 | | | | 3,771 | | | | 719 | |
| KP Large Cap Equity Fund | | | 196,194 | | | | 111,437 | | | | (33,234 | ) | | | 31,199 | | | | 7,845 | | | | 313,441 | | | | 4,139 | | | | 15,955 | |
| KP Small Cap Equity Fund | | | 71,689 | | | | 16,806 | | | | (16,303 | ) | | | 2,386 | | | | 2,907 | | | | 77,485 | | | | 399 | | | | 6,400 | |
| | | | | | | | | | | | | | | | | | | | | | | | | | | | | | | | |
| Totals | | $ | 628,785 | | | $ | 252,434 | | | $ | (100,317 | ) | | $ | 69,549 | | | $ | 12,996 | | | $ | 863,447 | | | $ | 15,516 | | | $ | 23,163 | |
| | | | | | | | | | | | | | | | | | | | | | | | | | | | | | | | |
The accompanying notes are an integral part of the financial statements.
21
| | |
| THE KP FUNDS | | December 31, 2017 |
| | |
| KP Retirement Path 2030 Fund | | |
|
| SECTOR WEIGHTINGS† (unaudited) |
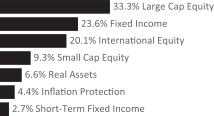
| † | Percentages based on total investments. |
| | | | | | | | |
| Description | | Shares | | | Value (000) | |
AFFILIATED REGISTERED INVESTMENT COMPANIES — 86.3% | |
KP Fixed Income Fund | | | 23,771,810 | | | $ | 238,907 | |
KP International Equity Fund | | | 18,192,363 | | | | 203,754 | |
KP Large Cap Equity Fund | | | 25,987,145 | | | | 337,314 | |
KP Small Cap Equity Fund | | | 7,799,680 | | | | 94,220 | |
| | | | | | | | |
Total Affiliated Registered Investment Companies
(Cost $776,445) (000) | | | | 874,195 | |
| | | | | | | | |
UNAFFILIATED REGISTERED INVESTMENT COMPANIES — 13.7% | |
DFA Commodity Strategy Portfolio | | | 1,631,110 | | | | 9,721 | |
DFA International Real Estate Securities Portfolio | | | 1,943,561 | | | | 10,106 | |
Lazard Global Listed Infrastructure Portfolio | | | 591,658 | | | | 9,467 | |
T. Rowe Price Institutional Floating Rate Fund | | | 951,166 | | | | 9,531 | |
| | | | | | | | |
| Description | | Shares | | | Value (000) | |
T. Rowe Price New Era Fund, Cl I | | | 274,789 | | | $ | 10,030 | |
Vanguard Inflation-Protected Securities Fund | | | 2,644,108 | | | | 27,578 | |
Vanguard REIT Index Fund | | | 1,008,896 | | | | 18,351 | |
Vanguard Short-Term Bond Index Fund | | | 2,603,643 | | | | 27,026 | |
Vanguard Short-Term Inflation-Protected Securities Index Fund | | | 711,996 | | | | 17,430 | |
| | | | | | | | |
Total Unaffiliated Registered Investment Companies
(Cost $136,938) (000) | | | | 139,240 | |
| | | | | | | | |
Total Investments In Securities — 100.0%
(Cost $913,383) (000) | | | $ | 1,013,435 | |
| | | | | | | | |
Percentages are based on Net Assets of $1,013,379 (000).
Cl — Class
REIT — Real Estate Investment Trust
As of December 31, 2017, all of the Fund’s investments were considered Level 1 in accordance with the authoritative guidance on fair value measurements and disclosure under U.S. generally accepted accounting principles.
For the year ended December 31, 2017, there were no transfers between Level 1, Level 2 and Level 3 assets and liabilities. All transfers, if any, are recognized by the Fund at the end of the year. During the year ended December 31, 2017, there were no Level 3 investments.
For further financial information on individual registered investment companies, available upon request at no charge, please go to the Securities Exchange Commission’s website at http://www.sec.gov or the individual registered investment company’s website.
The following is a summary of the transactions with affiliates for the year ended December 31, 2017 (000):
| | | | | | | | | | | | | | | | | | | | | | | | | | | | | | | | |
| | | Value
12/31/2016 | | | Purchases
at Cost | | | Proceeds
from Sales | | | Change in
Unrealized
Appreciation
(Depreciation) | | | Realized
Gain
(Loss) | | | Value
12/31/2017 | | | Dividend
Income | | | Capital Gain
Distributions | |
| KP Fixed Income Fund | | $ | 155,165 | | | $ | 90,654 | | | $ | (9,898 | ) | | $ | 2,788 | | | $ | 198 | | | $ | 238,907 | | | $ | 5,590 | | | $ | 69 | |
| KP International Equity Fund | | | 190,200 | | | | 33,375 | | | | (62,092 | ) | | | 40,821 | | | | 1,450 | | | | 203,754 | | | | 4,656 | | | | 888 | |
| KP Large Cap Equity Fund | | | 210,598 | | | | 112,088 | | | | (26,246 | ) | | | 34,655 | | | | 6,219 | | | | 337,314 | | | | 4,450 | | | | 17,160 | |
| KP Small Cap Equity Fund | | | 89,053 | | | | 22,414 | | | | (23,530 | ) | | | 2,314 | | | | 3,969 | | | | 94,220 | | | | 485 | | | | 7,777 | |
| | | | | | | | | | | | | | | | | | | | | | | | | | | | | | | | |
| Totals | | $ | 645,016 | | | $ | 258,531 | | | $ | (121,766 | ) | | $ | 80,578 | | | $ | 11,836 | | | $ | 874,195 | | | $ | 15,181 | | | $ | 25,894 | |
| | | | | | | | | | | | | | | | | | | | | | | | | | | | | | | | |
The accompanying notes are an integral part of the financial statements.
22
| | |
| THE KP FUNDS | | December 31, 2017 |
| | |
| KP Retirement Path 2035 Fund | | |
|
| SECTOR WEIGHTINGS† (unaudited) |
| † | Percentages based on total investments. |
| | | | | | | | |
| Description | | Shares | | | Value (000) | |
AFFILIATED REGISTERED INVESTMENT COMPANIES — 90.5% | |
KP Fixed Income Fund | | | 21,591,121 | | | $ | 216,991 | |
KP International Equity Fund | | | 24,750,672 | | | | 277,208 | |
KP Large Cap Equity Fund | | | 31,100,176 | | | | 403,680 | |
KP Small Cap Equity Fund | | | 10,589,761 | | | | 127,924 | |
| | | | | | | | |
Total Affiliated Registered Investment Companies
(Cost $900,158) (000) | | | | 1,025,803 | |
| | | | | | | | |
UNAFFILIATED REGISTERED INVESTMENT COMPANIES — 9.5% | |
DFA Commodity Strategy Portfolio | | | 1,623,450 | | | | 9,676 | |
DFA International Real Estate Securities Portfolio | | | 1,934,539 | | | | 10,060 | |
Lazard Global Listed Infrastructure Portfolio | | | 588,924 | | | | 9,423 | |
T. Rowe Price Institutional Floating Rate Fund | | | 946,743 | | | | 9,486 | |
| | | | | | | | |
| Description | | Shares | | | Value (000) | |
T. Rowe Price New Era Fund, Cl I | | | 273,496 | | | $ | 9,983 | |
Vanguard Inflation-Protected Securities Fund | | | 2,638,166 | | | | 27,516 | |
Vanguard REIT Index Fund | | | 1,006,562 | | | | 18,308 | |
Vanguard Short-Term Bond Index Fund | | | 830,590 | | | | 8,622 | |
Vanguard Short-Term Inflation-Protected Securities Index Fund | | | 176,623 | | | | 4,324 | |
| | | | | | | | |
Total Unaffiliated Registered Investment Companies
(Cost $104,972) (000) | | | | 107,398 | |
| | | | | | | | |
Total Investments In Securities — 100.0%
(Cost $1,005,130) (000) | | | $ | 1,133,201 | |
| | | | | | | | |
Percentages are based on Net Assets of $1,133,140 (000).
Cl — Class
REIT — Real Estate Investment Trust
As of December 31, 2017, all of the Fund’s investments were considered Level 1 in accordance with the authoritative guidance on fair value measurements and disclosure under U.S. generally accepted accounting principles.
For the year ended December 31, 2017, there were no transfers between Level 1, Level 2 and Level 3 assets and liabilities. All transfers, if any, are recognized by the Fund at the end of the year. During the year ended December 31, 2017, there were no Level 3 investments.
For further financial information on individual registered investment companies, available upon request at no charge, please go to the Securities Exchange Commission’s website at http://www.sec.gov or the individual registered investment company’s website.
The following is a summary of the transactions with affiliates for the year ended December 31, 2017 (000):
| | | | | | | | | | | | | | | | | | | | | | | | | | | | | | | | |
| | | Value
12/31/2016 | | | Purchases
at Cost | | | Proceeds
from Sales | | | Change in
Unrealized
Appreciation
(Depreciation) | | | Realized
Gain
(Loss) | | | Value
12/31/2017 | | | Dividend
Income | | | Capital Gain
Distributions | |
| KP Fixed Income Fund | | $ | 132,082 | | | $ | 89,991 | | | $ | (7,672 | ) | | $ | 2,443 | | | $ | 147 | | | $ | 216,991 | | | $ | 5,085 | | | $ | 63 | |
| KP International Equity Fund | | | 248,350 | | | | 46,186 | | | | (73,415 | ) | | | 54,715 | | | | 1,372 | | | | 277,208 | | | | 6,342 | | | | 1,209 | |
| KP Large Cap Equity Fund | | | 263,591 | | | | 116,601 | | | | (24,911 | ) | | | 42,566 | | | | 5,833 | | | | 403,680 | | | | 5,332 | | | | 20,547 | |
| KP Small Cap Equity Fund | | | 115,902 | | | | 31,996 | | | | (28,293 | ) | | | 3,537 | | | | 4,782 | | | | 127,924 | | | | 659 | | | | 10,565 | |
| | | | | | | | | | | | | | | | | | | | | | | | | | | | | | | | |
| Totals | | $ | 759,925 | | | $ | 284,774 | | | $ | (134,291 | ) | | $ | 103,261 | | | $ | 12,134 | | | $ | 1,025,803 | | | $ | 17,418 | | | $ | 32,384 | |
| | | | | | | | | | | | | | | | | | | | | | | | | | | | | | | | |
The accompanying notes are an integral part of the financial statements.
23
| | |
| THE KP FUNDS | | December 31, 2017 |
| | |
| KP Retirement Path 2040 Fund | | |
|
| SECTOR WEIGHTINGS† (unaudited) |
| † | Percentages based on total investments. |
| | | | | | | | |
| Description | | Shares | | | Value
(000) | |
AFFILIATED REGISTERED INVESTMENT COMPANIES — 93.3% | |
KP Fixed Income Fund | | | 16,391,554 | | | $ | 164,735 | |
KP International Equity Fund | | | 25,930,409 | | | | 290,421 | |
KP Large Cap Equity Fund | | | 29,734,507 | | | | 385,954 | |
KP Small Cap Equity Fund | | | 10,955,463 | | | | 132,342 | |
| | | | | | | | |
Total Affiliated Registered Investment Companies
(Cost $849,451) (000) | | | | 973,452 | |
| | | | | | | | |
UNAFFILIATED REGISTERED INVESTMENT COMPANIES — 6.7% | |
DFA Commodity Strategy Portfolio | | | 1,209,582 | | | | 7,209 | |
DFA International Real Estate Securities Portfolio | | | 1,441,482 | | | | 7,496 | |
Lazard Global Listed Infrastructure Portfolio | | | 438,820 | | | | 7,021 | |
| | | | | | | | |
| Description | | Shares | | | Value
(000) | |
T. Rowe Price Institutional Floating Rate Fund | | | 705,519 | | | $ | 7,069 | |
T. Rowe Price New Era Fund, Cl I | | | 203,738 | | | | 7,436 | |
Vanguard Inflation-Protected Securities Fund | | | 1,961,531 | | | | 20,459 | |
Vanguard REIT Index Fund | | | 748,298 | | | | 13,612 | |
| | | | | | | | |
Total Unaffiliated Registered Investment Companies
(Cost $68,347) (000) | | | | 70,302 | |
| | | | | | | | |
Total Investments In Securities — 100.0%
(Cost $917,798) (000) | | | $ | 1,043,754 | |
| | | | | | | | |
Percentages are based on Net Assets of $1,043,698 (000).
Cl — Class
REIT — Real Estate Investment Trust
As of December 31, 2017, all of the Fund’s investments were considered Level 1 in accordance with the authoritative guidance on fair value measurements and disclosure under U.S. generally accepted accounting principles.
For the year ended December 31, 2017, there were no transfers between Level 1, Level 2 and Level 3 assets and liabilities. All transfers, if any, are recognized by the Fund at the end of the period. During the year ended December 31, 2017, there were no Level 3 investments.
For further financial information on individual registered investment companies, available upon request at no charge, please go to the Securities Exchange Commission’s website at http://www.sec.gov or the individual registered investment company’s website.
The following is a summary of the transactions with affiliates for the year ended December 31, 2017 (000):
| | | | | | | | | | | | | | | | | | | | | | | | | | | | | | | | |
| | | Value
12/31/2016 | | | Purchases
at Cost | | | Proceeds
from
Sales | | | Change in
Unrealized
Appreciation
(Depreciation) | | | Realized
Gain
(Loss) | | | Value
12/31/2017 | | | Dividend
Income | | | Capital Gain
Distributions | |
| KP Fixed Income Fund | | $ | 88,789 | | | $ | 80,686 | | | $ | (6,622 | ) | | $ | 1,749 | | | $ | 133 | | | $ | 164,735 | | | $ | 3,860 | | | $ | 48 | |
| KP International Equity Fund | | | 248,249 | | | | 52,293 | | | | (67,622 | ) | | | 56,163 | | | | 1,338 | | | | 290,421 | | | | 6,644 | | | | 1,266 | |
| KP Large Cap Equity Fund | | | 261,814 | | | | 100,312 | | | | (22,017 | ) | | | 40,745 | | | | 5,100 | | | | 385,954 | | | | 5,098 | | | | 19,652 | |
| KP Small Cap Equity Fund | | | 113,607 | | | | 36,372 | | | | (25,957 | ) | | | 3,903 | | | | 4,417 | | | | 132,342 | | | | 681 | | | | 10,934 | |
| | | | | | | | | | | | | | | | | | | | | | | | | | | | | | | | |
| Totals | | $ | 712,459 | | | $ | 269,663 | | | $ | (122,218 | ) | | $ | 102,560 | | | $ | 10,988 | | | $ | 973,452 | | | $ | 16,283 | | | $ | 31,900 | |
| | | | | | | | | | | | | | | | | | | | | | | | | | | | | | | | |
The accompanying notes are an integral part of the financial statements.
24
| | |
| THE KP FUNDS | | December 31, 2017 |
| | |
| KP Retirement Path 2045 Fund | | |
|
| SECTOR WEIGHTINGS† (unaudited) |
| † | Percentages based on total investments. |
| | | | | | | | |
| Description | | Shares | | | Value (000) | |
AFFILIATED REGISTERED INVESTMENT COMPANIES — 94.7% | |
KP Fixed Income Fund | | | 10,251,299 | | | $ | 103,026 | |
KP International Equity Fund | | | 20,268,054 | | | | 227,002 | |
KP Large Cap Equity Fund | | | 22,421,360 | | | | 291,029 | |
KP Small Cap Equity Fund | | | 8,680,151 | | | | 104,856 | |
| | | | | | | | |
Total Affiliated Registered Investment Companies
(Cost $634,648) (000) | | | | 725,913 | |
| | | | | | | | |
UNAFFILIATED REGISTERED INVESTMENT COMPANIES — 5.3% | |
DFA Commodity Strategy Portfolio | | | 711,795 | | | | 4,242 | |
DFA International Real Estate Securities Portfolio | | | 847,657 | | | | 4,408 | |
Lazard Global Listed Infrastructure Portfolio | | | 258,151 | | | | 4,130 | |
| | | | | | | | |
| Description | | Shares | | | Value (000) | |
T. Rowe Price Institutional Floating Rate Fund | | | 415,042 | | | $ | 4,159 | |
T. Rowe Price New Era Fund, Cl I | | | 119,854 | | | | 4,375 | |
Vanguard Inflation-Protected Securities Fund | | | 1,132,835 | | | | 11,815 | |
Vanguard REIT Index Fund | | | 432,143 | | | | 7,861 | |
| | | | | | | | |
Total Unaffiliated Registered Investment Companies
(Cost $39,851) (000) | | | | 40,990 | |
| | | | | | | | |
Total Investments In Securities — 100.0%
(Cost $674,499) (000) | | | $ | 766,903 | |
| | | | | | | | |
Percentages are based on Net Assets of $766,861 (000).
Cl — Class
REIT — Real Estate Investment Trust
As of December 31, 2017, all of the Fund’s investments were considered Level 1 in accordance with the authoritative guidance on fair value measurements and disclosure under U.S. generally accepted accounting principles.
For the year ended December 31, 2017, there were no transfers between Level 1, Level 2 and Level 3 assets and liabilities. All transfers, if any, are recognized by the Fund at the end of the period. During the year ended December 31, 2017, there were no Level 3 investments.
For further financial information on individual registered investment companies, available upon request at no charge, please go to the Securities Exchange Commission’s website at http://www.sec.gov or the individual registered investment company’s website.
The following is a summary of the transactions with affiliates for the year ended December 31, 2017 (000):
| | | | | | | | | | | | | | | | | | | | | | | | | | | | | | | | |
| | | Value
12/31/2016 | | | Purchases
at Cost | | | Proceeds
from Sales | | | Change in
Unrealized
Appreciation
(Depreciation) | | | Realized
Gain
(Loss) | | | Value
12/31/2017 | | | Dividend
Income | | | Capital Gain
Distributions | |
| KP Fixed Income Fund | | $ | 45,430 | | | $ | 61,135 | | | $ | (4,605 | ) | | $ | 975 | | | $ | 91 | | | $ | 103,026 | | | $ | 2,415 | | | $ | 30 | |
| KP International Equity Fund | | | 186,139 | | | | 48,360 | | | | (50,807 | ) | | | 42,664 | | | | 646 | | | | 227,002 | | | | 5,195 | | | | 988 | |
| KP Large Cap Equity Fund | | | 195,581 | | | | 78,140 | | | | (16,216 | ) | | | 29,795 | | | | 3,729 | | | | 291,029 | | | | 3,846 | | | | 14,792 | |
| KP Small Cap Equity Fund | | | 80,834 | | | | 32,449 | | | | (14,677 | ) | | | 3,597 | | | | 2,653 | | | | 104,856 | | | | 540 | | | | 8,648 | |
| | | | | | | | | | | | | | | | | | | | | | | | | | | | | | | | |
| Totals | | $ | 507,984 | | | $ | 220,084 | | | $ | (86,305 | ) | | $ | 77,031 | | | $ | 7,119 | | | $ | 725,913 | | | $ | 11,996 | | | $ | 24,458 | |
| | | | | | | | | | | | | | | | | | | | | | | | | | | | | | | | |
The accompanying notes are an integral part of the financial statements.
25
| | |
| THE KP FUNDS | | December 31, 2017 |
| | |
| KP Retirement Path 2050 Fund | | |
|
| SECTOR WEIGHTINGS† (unaudited) |
| † | Percentages based on total investments. |
| | | | | | | | |
| Description | | Shares | | | Value (000) | |
AFFILIATED REGISTERED INVESTMENT COMPANIES — 95.1% | |
KP Fixed Income Fund | | | 4,729,993 | | | $ | 47,536 | |
KP International Equity Fund | | | 11,304,959 | | | | 126,616 | |
KP Large Cap Equity Fund | | | 12,416,162 | | | | 161,162 | |
KP Small Cap Equity Fund | | | 4,820,316 | | | | 58,229 | |
| | | | | | | | |
Total Affiliated Registered Investment Companies
(Cost $348,269) (000) | | | | 393,543 | |
| | | | | | | | |
UNAFFILIATED REGISTERED INVESTMENT COMPANIES — 4.9% | |
DFA Commodity Strategy Portfolio | | | 361,358 | | | | 2,154 | |
DFA International Real Estate Securities Portfolio | | | 429,939 | | | | 2,236 | |
Lazard Global Listed Infrastructure Portfolio | | | 131,030 | | | | 2,096 | |
| | | | | | | | |
| Description | | Shares | | | Value (000) | |
T. Rowe Price Institutional Floating Rate Fund | | | 210,627 | | | $ | 2,110 | |
T. Rowe Price New Era Fund, Cl I | | | 60,826 | | | | 2,220 | |
Vanguard Inflation-Protected Securities Fund | | | 556,564 | | | | 5,805 | |
Vanguard REIT Index Fund | | | 212,297 | | | | 3,862 | |
| | | | | | | | |
Total Unaffiliated Registered Investment Companies
(Cost $19,953) (000) | | | | 20,483 | |
| | | | | | | | |
Total Investments In Securities — 100.0%
(Cost $368,222) (000) | | | $ | 414,026 | |
| | | | | | | | |
Percentages are based on Net Assets of $414,001 (000).
Cl — Class
REIT — Real Estate Investment Trust
As of December 31, 2017, all of the Fund’s investments were considered Level 1 in accordance with the authoritative guidance on fair value measurements and disclosure under U.S. generally accepted accounting principles.
For the year ended December 31, 2017, there were no transfers between Level 1, Level 2 and Level 3 assets and liabilities. All transfers, if any, are recognized by the Fund at the end of the period. During the year ended December 31, 2017, there were no Level 3 investments.
For further financial information on individual registered investment companies, available upon request at no charge, please go to the Securities Exchange Commission’s website at http://www.sec.gov or the individual registered investment company’s website.
The following is a summary of the transactions with affiliates for the year ended December 31, 2017 (000):
| | | | | | | | | | | | | | | | | | | | | | | | | | | | | | | | |
| | | Value
12/31/2016 | | | Purchases
at Cost | | | Proceeds
from Sales | | | Change in
Unrealized
Appreciation
(Depreciation) | | | Realized
Gain
(Loss) | | | Value
12/31/2017 | | | Dividend
Income | | | Capital Gain
Distributions | |
| KP Fixed Income Fund | | $ | 20,319 | | | $ | 28,827 | | | $ | (2,015 | ) | | $ | 364 | | | $ | 41 | | | $ | 47,536 | | | $ | 1,115 | | | $ | 14 | |
| KP International Equity Fund | | | 90,509 | | | | 37,376 | | | | (23,783 | ) | | | 22,377 | | | | 137 | | | | 126,616 | | | | 2,899 | | | | 549 | |
| KP Large Cap Equity Fund | | | 95,036 | | | | 57,380 | | | | (8,377 | ) | | | 15,179 | | | | 1,944 | | | | 161,162 | | | | 2,131 | | | | 8,174 | |
| KP Small Cap Equity Fund | | | 38,852 | | | | 22,950 | | | | (6,683 | ) | | | 1,917 | | | | 1,193 | | | | 58,229 | | | | 300 | | | | 4,793 | |
| | | | | | | | | | | | | | | | | | | | | | | | | | | | | | | | |
| Totals | | $ | 244,716 | | | $ | 146,533 | | | $ | (40,858 | ) | | $ | 39,837 | | | $ | 3,315 | | | $ | 393,543 | | | $ | 6,445 | | | $ | 13,530 | |
| | | | | | | | | | | | | | | | | | | | | | | | | | | | | | | | |
The accompanying notes are an integral part of the financial statements.
26
| | |
| THE KP FUNDS | | December 31, 2017 |
| | |
| KP Retirement Path 2055 Fund | | |
|
| SECTOR WEIGHTINGS† (unaudited) |

| † | Percentages based on total investments. |
| | | | | | | | |
| Description | | Shares | | | Value
(000) | |
AFFILIATED REGISTERED INVESTMENT COMPANIES — 95.1% | |
KP Fixed Income Fund | | | 1,190,474 | | | $ | 11,964 | |
KP International Equity Fund | | | 3,091,412 | | | | 34,624 | |
KP Large Cap Equity Fund | | | 3,384,114 | | | | 43,926 | |
KP Small Cap Equity Fund | | | 1,300,588 | | | | 15,711 | |
| | | | | | | | |
Total Affiliated Registered Investment Companies
(Cost $95,877) (000) | | | | 106,225 | |
| | | | | | | | |
UNAFFILIATED REGISTERED INVESTMENT COMPANIES — 4.9% | |
DFA Commodity Strategy Portfolio | | | 100,907 | | | | 601 | |
DFA International Real Estate Securities Portfolio | | | 119,778 | | | | 623 | |
Lazard Global Listed Infrastructure Portfolio | | | 36,551 | | | | 585 | |
| | | | | | | | |
| Description | | Shares | | | Value
(000) | |
T. Rowe Price Institutional Floating Rate Fund | | | 58,755 | | | $ | 589 | |
T. Rowe Price New Era Fund, Cl I | | | 16,964 | | | | 619 | |
Vanguard Inflation-Protected Securities Fund | | | 144,761 | | | | 1,510 | |
Vanguard REIT Index Fund | | | 55,196 | | | | 1,004 | |
| | | | | | | | |
Total Unaffiliated Registered Investment Companies
(Cost $5,450) (000) | | | | 5,531 | |
| | | | | | | | |
Total Investments In Securities —100.0%
(Cost $101,327) (000) | | | $ | 111,756 | |
| | | | | | | | |
Percentages are based on Net Assets of $111,748 (000).
Cl — Class
REIT — Real Estate Investment Trust
As of December 31, 2017, all of the Fund’s investments were considered Level 1 in accordance with the authoritative guidance on fair value measurements and disclosure under U.S. generally accepted accounting principles.
For the year ended December 31, 2017, there were no transfers between Level 1, Level 2 and Level 3 assets and liabilities. All transfers, if any, are recognized by the Fund at the end of the period. During the year ended December 31, 2017, there were no Level 3 investments.
For further financial information on individual registered investment companies, available upon request at no charge, please go to the Securities Exchange Commission’s website at http://www.sec.gov or the individual registered investment company’s website.
The following is a summary of the transactions with affiliates for the year ended December 31, 2017 (000):
| | | | | | | | | | | | | | | | | | | | | | | | | | | | | | | | |
| | | Value
12/31/2016 | | | Purchases
at Cost | | | Proceeds
from Sales | | | Change in
Unrealized
Appreciation
(Depreciation) | | | Realized
Gain
(Loss) | | | Value
12/31/2017 | | | Dividend
Income | | | Capital Gain
Distributions | |
| KP Fixed Income Fund | | $ | 4,327 | | | $ | 8,225 | | | $ | (654 | ) | | $ | 66 | | | $ | — | | | $ | 11,964 | | | $ | 281 | | | $ | 3 | |
| KP International Equity Fund | | | 19,263 | | | | 15,671 | | | | (5,657 | ) | | | 5,263 | | | | 84 | | | | 34,624 | | | | 795 | | | | 150 | |
| KP Large Cap Equity Fund | | | 20,224 | | | | 22,299 | | | | (2,533 | ) | | | 3,567 | | | | 369 | | | | 43,926 | | | | 581 | | | | 2,219 | |
| KP Small Cap Equity Fund | | | 8,265 | | | | 8,578 | | | | (1,814 | ) | | | 467 | | | | 215 | | | | 15,711 | | | | 81 | | | | 1,288 | |
| | | | | | | | | | | | | | | | | | | | | | | | | | | | | | | | |
| Totals | | $ | 52,079 | | | $ | 54,773 | | | $ | (10,658 | ) | | $ | 9,363 | | | $ | 668 | | | $ | 106,225 | | | $ | 1,738 | | | $ | 3,660 | |
| | | | | | | | | | | | | | | | | | | | | | | | | | | | | | | | |
The accompanying notes are an integral part of the financial statements.
27
| | |
| THE KP FUNDS | | December 31, 2017 |
| | |
| KP Retirement Path 2060 Fund | | |
|
| SECTOR WEIGHTINGS† (unaudited) |
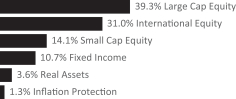
| † | Percentages based on total investments. |
| | | | | | | | |
| Description | | Shares | | | Value
(000) | |
| | | | | | | | |
AFFILIATED REGISTERED INVESTMENT COMPANIES — 95.1% | |
KP Fixed Income Fund | | | 244,981 | | | $ | 2,462 | |
KP International Equity Fund | | | 636,009 | | | | 7,123 | |
KP Large Cap Equity Fund | | | 695,827 | | | | 9,032 | |
KP Small Cap Equity Fund | | | 267,460 | | | | 3,231 | |
| | | | | | | | |
Total Affiliated Registered Investment Companies (Cost $20,285) (000) | | | | 21,848 | |
| | | | | | | | |
UNAFFILIATED REGISTERED INVESTMENT COMPANIES — 4.9% | |
DFA Commodity Strategy Portfolio | | | 21,445 | | | | 128 | |
DFA International Real Estate Securities Portfolio | | | 25,416 | | | | 132 | |
Lazard Global Listed Infrastructure Portfolio | | | 7,762 | | | | 124 | |
| | | | | | | | |
| Description | | Shares | | | Value
(000) | |
T. Rowe Price Institutional Floating Rate Fund | | | 12,479 | | | $ | 125 | |
T. Rowe Price New Era Fund, Cl I | | | 3,601 | | | | 131 | |
Vanguard Inflation-Protected Securities Fund | | | 28,660 | | | | 299 | |
Vanguard REIT Index Fund | | | 10,925 | | | | 199 | |
| | | | | | | | |
Total Unaffiliated Registered Investment Companies
(Cost $1,125) (000) | | | | 1,138 | |
| | | | | | | | |
Total Investments In Securities — 100.0%
(Cost $21,410) (000) | | | $ | 22,986 | |
| | | | | | | | |
Percentages are based on Net Assets of $22,985 (000).
Cl — Class
REIT — Real Estate Investment Trust
As of December 31, 2017, all of the Fund’s investments were considered Level 1 in accordance with the authoritative guidance on fair value measurements and disclosure under U.S. generally accepted accounting principles.
For the year ended December 31, 2017, there were no transfers between Level 1, Level 2 and Level 3 assets and liabilities. All transfers, if any, are recognized by the Fund at the end of the period. During the year ended December 31, 2017, there were no Level 3 investments.
For further financial information on individual registered investment companies, available upon request at no charge, please go to the Securities Exchange Commission’s website at http://www.sec.gov or the individual registered investment company’s website.
The following is a summary of the transactions with affiliates for the year ended December 31, 2017 (000):
| | | | | | | | | | | | | | | | | | | | | | | | | | | | | | | | |
| | | Value
12/31/2016 | | | Purchases
at Cost | | | Proceeds
from Sales | | | Change in
Unrealized
Appreciation
(Depreciation) | | | Realized
Gain
(Loss) | | | Value
12/31/2017 | | | Dividend
Income | | | Capital Gain
Distributions | |
| KP Fixed Income Fund | | $ | 718 | | | $ | 2,063 | | | $ | (326 | ) | | $ | 3 | | | $ | 4 | | | $ | 2,462 | | | $ | 58 | | | $ | 1 | |
| KP International Equity Fund | | | 3,197 | | | | 4,589 | | | | (1,642 | ) | | | 774 | | | | 205 | | | | 7,123 | | | | 163 | | | | 30 | |
| KP Large Cap Equity Fund | | | 3,356 | | | | 6,225 | | | | (1,245 | ) | | | 512 | | | | 184 | | | | 9,032 | | | | 118 | | | | 452 | |
| KP Small Cap Equity Fund | | | 1,371 | | | | 2,366 | | | | (618 | ) | | | (22 | ) | | | 134 | | | | 3,231 | | | | 17 | | | | 263 | |
| | | | | | | | | | | | | | | | | | | | | | | | | | | | | | | | |
| Totals | | $ | 8,642 | | | $ | 15,243 | | | $ | (3,831 | ) | | $ | 1,267 | | | $ | 527 | | | $ | 21,848 | | | $ | 356 | | | $ | 746 | |
| | | | | | | | | | | | | | | | | | | | | | | | | | | | | | | | |
The accompanying notes are an integral part of the financial statements.
28
| | |
| THE KP FUNDS | | December 31, 2017 |
|
| SECTOR WEIGHTINGS† (unaudited) |

| † | Percentages based on total investments. |
| | | | | | | | |
| Description | | Shares | | | Value
(000) | |
COMMON STOCK — 98.1% | | | | | | | | |
Consumer Discretionary — 12.5% | | | | | | | | |
Advance Auto Parts | | | 6,533 | | | $ | 651 | |
Amazon.com* | | | 50,842 | | | | 59,458 | |
AMC Networks, Cl A* | | | 13,063 | | | | 706 | |
Aptiv* | | | 82,267 | | | | 6,979 | |
AutoZone* | | | 832 | | | | 592 | |
Bed Bath & Beyond | | | 6,790 | | | | 149 | |
Best Buy | | | 36,617 | | | | 2,507 | |
BorgWarner | | | 5,697 | | | | 291 | |
Brunswick | | | 10,048 | | | | 555 | |
Burlington Stores* | | | 3,621 | | | | 446 | |
CalAtlantic Group | | | 2,811 | | | | 159 | |
CarMax* | | | 5,489 | | | | 352 | |
Carnival | | | 44,109 | | | | 2,928 | |
CBS, Cl B | | | 10,641 | | | | 628 | |
Charter Communications, Cl A* | | | 5,800 | | | | 1,949 | |
Chipotle Mexican Grill, Cl A* | | | 751 | | | | 217 | |
Comcast, Cl A | | | 389,529 | | | | 15,601 | |
Darden Restaurants | | | 14,123 | | | | 1,356 | |
Delphi Technologies | | | 24,846 | | | | 1,304 | |
Discovery Communications, Cl A* | | | 4,793 | | | | 107 | |
Discovery Communications, Cl C* | | | 5,393 | | | | 114 | |
DISH Network, Cl A* | | | 6,700 | | | | 320 | |
Dollar General | | | 83,614 | | | | 7,777 | |
Dollar Tree* | | | 21,611 | | | | 2,319 | |
Domino's Pizza | | | 4,452 | | | | 841 | |
DR Horton | | | 13,544 | | | | 692 | |
| | | | | | | | |
| Description | | Shares | | | Value
(000) | |
Expedia | | | 15,496 | | | $ | 1,856 | |
Extended Stay America | | | 56,847 | | | | 1,080 | |
Foot Locker | | | 7,174 | | | | 336 | |
Ford Motor | | | 133,257 | | | | 1,664 | |
Fossil Group* | | | 700 | | | | 5 | |
GameStop, Cl A | | | 6,188 | | | | 111 | |
Gap | | | 6,762 | | | | 230 | |
Garmin | | | 3,349 | | | | 200 | |
General Motors | | | 72,321 | | | | 2,964 | |
Genuine Parts | | | 4,215 | | | | 400 | |
Goodyear Tire & Rubber | | | 6,830 | | | | 221 | |
Graham Holdings, Cl B | | | 341 | | | | 190 | |
H&R Block | | | 27,978 | | | | 734 | |
Hanesbrands | | | 92,111 | | | | 1,926 | |
Harley-Davidson | | | 16,878 | | | | 859 | |
Hasbro | | | 37,265 | | | | 3,387 | |
Hilton Worldwide Holdings | | | 76,271 | | | | 6,091 | |
Home Depot | | | 72,828 | | | | 13,803 | |
Hyatt Hotels, Cl A* | | | 4,976 | | | | 366 | |
International Game Technology | | | 9,210 | | | | 244 | |
Interpublic Group of Companies | | | 135,525 | | | | 2,732 | |
John Wiley & Sons, Cl A | | | 30,743 | | | | 2,021 | |
Johnson Controls International | | | 207,103 | | | | 7,893 | |
Kohl's | | | 5,151 | | | | 279 | |
L Brands | | | 7,325 | | | | 441 | |
Las Vegas Sands | | | 27,058 | | | | 1,880 | |
Lear | | | 10,129 | | | | 1,789 | |
Leggett & Platt | | | 4,046 | | | | 193 | |
Lennar, Cl A | | | 6,095 | | | | 385 | |
Live Nation Entertainment* | | | 33,314 | | | | 1,418 | |
LKQ* | | | 8,800 | | | | 358 | |
Lowe's | | | 81,294 | | | | 7,555 | |
Macy's | | | 14,137 | | | | 356 | |
Marriott International, Cl A | | | 9,134 | | | | 1,240 | |
Mattel | | | 9,790 | | | | 151 | |
McDonald's | | | 39,275 | | | | 6,760 | |
MGM Resorts International | | | 15,000 | | | | 501 | |
Michael Kors Holdings* | | | 31,964 | | | | 2,012 | |
Michaels* | | | 68,002 | | | | 1,645 | |
Mohawk Industries* | | | 1,901 | | | | 525 | |
Netflix* | | | 30,070 | | | | 5,772 | |
Newell Brands | | | 50,852 | | | | 1,571 | |
News, Cl A | | | 11,668 | | | | 189 | |
News, Cl B | | | 3,100 | | | | 51 | |
NIKE, Cl B | | | 72,551 | | | | 4,538 | |
Nordstrom | | | 3,649 | | | | 173 | |
Norwegian Cruise Line Holdings* | | | 5,100 | | | | 272 | |
The accompanying notes are an integral part of the financial statements.
29
| | |
| THE KP FUNDS | | December 31, 2017 |
| | | | | | | | |
| Description | | Shares | | | Value
(000) | |
NVR* | | | 489 | | | $ | 1,716 | |
Omnicom Group | | | 92,623 | | | | 6,746 | |
O'Reilly Automotive* | | | 2,469 | | | | 594 | |
priceline.com* | | | 12,132 | | | | 21,082 | |
PulteGroup | | | 8,202 | | | | 273 | |
PVH | | | 28,499 | | | | 3,910 | |
Ralph Lauren, Cl A | | | 24,979 | | | | 2,590 | |
Restaurant Brands International | | | 50,000 | | | | 3,074 | |
Ross Stores | | | 57,772 | | | | 4,636 | |
Royal Caribbean Cruises | | | 20,836 | | | | 2,485 | |
Scripps Networks Interactive, Cl A | | | 2,791 | | | | 238 | |
Signet Jewelers | | | 1,800 | | | | 102 | |
Skechers U.S.A., Cl A* | | | 24,090 | | | | 912 | |
Starbucks | | | 45,246 | | | | 2,599 | |
Tapestry | | | 8,289 | | | | 367 | |
Target | | | 16,102 | | | | 1,051 | |
TEGNA | | | 27,851 | | | | 392 | |
Tesla* | | | 10,350 | | | | 3,223 | |
Thor Industries | | | 3,796 | | | | 572 | |
Tiffany | | | 2,992 | | | | 311 | |
Time Warner | | | 41,207 | | | | 3,769 | |
TJX | | | 33,872 | | | | 2,590 | |
Tractor Supply | | | 3,743 | | | | 280 | |
TripAdvisor* | | | 2,893 | | | | 100 | |
Tupperware Brands | | | 10,622 | | | | 666 | |
Twenty-First Century Fox | | | 13,100 | | | | 447 | |
Twenty-First Century Fox, Cl A | | | 46,814 | | | | 1,617 | |
Ulta Beauty* | | | 1,700 | | | | 380 | |
Under Armour, Cl A* | | | 4,700 | | | | 68 | |
Under Armour, Cl C* | | | 4,720 | | | | 63 | |
Vail Resorts | | | 673 | | | | 143 | |
VF | | | 9,514 | | | | 704 | |
Viacom, Cl B | | | 14,096 | | | | 434 | |
Visteon* | | | 8,348 | | | | 1,045 | |
Walt Disney | | | 68,253 | | | | 7,338 | |
Whirlpool | | | 10,844 | | | | 1,829 | |
Wyndham Worldwide | | | 3,065 | | | | 355 | |
Wynn Resorts | | | 2,291 | | | | 386 | |
Yum! Brands | | | 46,959 | | | | 3,832 | |
| | | | | | | | |
| | | | | | | 281,284 | |
| | | | | | | | |
Consumer Staples — 7.2% | | | | | | | | |
Altria Group | | | 108,394 | | | | 7,740 | |
Archer-Daniels-Midland | | | 172,089 | | | | 6,897 | |
Brown-Forman, Cl B | | | 5,764 | | | | 396 | |
Bunge | | | 21,605 | | | | 1,449 | |
Campbell Soup | | | 22,443 | | | | 1,080 | |
| | | | | | | | |
| Description | | Shares | | | Value
(000) | |
Church & Dwight | | | 7,200 | | | $ | 361 | |
Clorox | | | 3,725 | | | | 554 | |
Coca-Cola | | | 137,584 | | | | 6,312 | |
Colgate-Palmolive | | | 25,831 | | | | 1,949 | |
Conagra Brands | | | 120,282 | | | | 4,531 | |
Constellation Brands, Cl A | | | 7,040 | | | | 1,609 | |
Costco Wholesale | | | 12,847 | | | | 2,391 | |
Coty, Cl A | | | 89,400 | | | | 1,778 | |
CVS Health | | | 130,217 | | | | 9,441 | |
Danone | | | 21,953 | | | | 1,842 | |
Diageo | | | 123,798 | | | | 4,555 | |
Dr Pepper Snapple Group | | | 5,230 | | | | 508 | |
Estee Lauder, Cl A | | | 6,671 | | | | 849 | |
General Mills | | | 106,067 | | | | 6,289 | |
Hershey | | | 4,061 | | | | 461 | |
Hormel Foods | | | 7,670 | | | | 279 | |
Ingredion | | | 10,157 | | | | 1,420 | |
JM Smucker | | | 15,409 | | | | 1,914 | |
Kellogg | | | 7,203 | | | | 490 | |
Kimberly-Clark | | | 10,387 | | | | 1,253 | |
Kraft Heinz | | | 17,739 | | | | 1,379 | |
Kroger | | | 26,300 | | | | 722 | |
McCormick | | | 3,630 | | | | 370 | |
Molson Coors Brewing, Cl B | | | 6,965 | | | | 572 | |
Mondelez International, Cl A | | | 65,264 | | | | 2,793 | |
Monster Beverage* | | | 12,020 | | | | 761 | |
Nestle | | | 72,476 | | | | 6,233 | |
Nu Skin Enterprises, Cl A | | | 16,481 | | | | 1,124 | |
PepsiCo | | | 128,069 | | | | 15,358 | |
Philip Morris International | | | 229,456 | | | | 24,242 | |
Pilgrim's Pride* | | | 24,085 | | | | 748 | |
Pinnacle Foods | | | 44,353 | | | | 2,638 | |
Procter & Gamble | | | 149,029 | | | | 13,693 | |
Reckitt Benckiser Group | | | 22,284 | | | | 2,082 | |
Rite Aid* | | | 11,397 | | | | 22 | |
Sysco | | | 34,189 | | | | 2,076 | |
Tyson Foods, Cl A | | | 78,189 | | | | 6,339 | |
Walgreens Boots Alliance | | | 40,521 | | | | 2,943 | |
Wal-Mart Stores | | | 120,451 | | | | 11,895 | |
| | | | | | | | |
| | | | | | | 162,338 | |
| | | | | | | | |
Energy — 4.4% | |
Anadarko Petroleum | | | 68,356 | | | | 3,667 | |
Andeavor | | | 4,232 | | | | 484 | |
Apache | | | 10,896 | | | | 460 | |
Baker Hughes | | | 18,209 | | | | 576 | |
Cabot Oil & Gas | | | 48,202 | | | | 1,379 | |
The accompanying notes are an integral part of the financial statements.
30
| | |
| THE KP FUNDS | | December 31, 2017 |
| | | | | | | | |
| Description | | Shares | | | Value
(000) | |
Chesapeake Energy* | | | 28,581 | | | $ | 113 | |
Chevron | | | 96,205 | | | | 12,044 | |
Cimarex Energy | | | 2,800 | | | | 342 | |
Concho Resources* | | | 4,400 | | | | 661 | |
ConocoPhillips | | | 96,693 | | | | 5,307 | |
Devon Energy | | | 76,823 | | | | 3,180 | |
Energen* | | | 4,196 | | | | 242 | |
EOG Resources | | | 55,001 | | | | 5,935 | |
EQT | | | 7,363 | | | | 419 | |
ExxonMobil | | | 259,921 | | | | 21,740 | |
Halliburton | | | 78,740 | | | | 3,848 | |
Helmerich & Payne | | | 3,287 | | | | 212 | |
Hess | | | 7,896 | | | | 375 | |
Kinder Morgan | | | 57,023 | | | | 1,030 | |
Marathon Oil | | | 134,690 | | | | 2,280 | |
Marathon Petroleum | | | 48,921 | | | | 3,228 | |
Murphy Oil | | | 6,989 | | | | 217 | |
National Oilwell Varco | | | 11,046 | | | | 398 | |
Newfield Exploration* | | | 5,837 | | | | 184 | |
Noble Energy | | | 14,126 | | | | 412 | |
Occidental Petroleum | | | 62,678 | | | | 4,617 | |
ONEOK | | | 11,160 | | | | 596 | |
Phillips 66 | | | 12,545 | | | | 1,269 | |
Pioneer Natural Resources | | | 6,795 | | | | 1,175 | |
QEP Resources* | | | 29,377 | | | | 281 | |
Range Resources | | | 6,085 | | | | 104 | |
Schlumberger | | | 135,693 | | | | 9,144 | |
Southwestern Energy* | | | 146,777 | | | | 819 | |
TechnipFMC | | | 13,112 | | | | 411 | |
Valero Energy | | | 78,408 | | | | 7,206 | |
Williams | | | 133,294 | | | | 4,064 | |
World Fuel Services | | | 29,607 | | | | 833 | |
| | | | | | | | |
| | | | | | | 99,252 | |
| | | | | | | | |
Financials — 16.0% | |
Affiliated Managers Group | | | 1,600 | | | | 328 | |
Aflac | | | 31,653 | | | | 2,779 | |
Allstate | | | 71,422 | | | | 7,479 | |
American Express | | | 97,949 | | | | 9,727 | |
American Financial Group | | | 4,627 | | | | 502 | |
American International Group | | | 26,633 | | | | 1,587 | |
Ameriprise Financial | | | 36,402 | | | | 6,169 | |
Annaly Capital Management‡ | | | 64,020 | | | | 761 | |
Aon | | | 55,043 | | | | 7,376 | |
Arch Capital Group* | | | 4,044 | | | | 367 | |
Arthur J Gallagher | | | 5,100 | | | | 323 | |
Assurant | | | 13,018 | | | | 1,313 | |
| | | | | | | | |
| Description | | Shares | | | Value
(000) | |
Assured Guaranty | | | 51,977 | | | $ | 1,760 | |
Axis Capital Holdings | | | 14,487 | | | | 728 | |
Bank of America | | | 692,161 | | | | 20,433 | |
Bank of New York Mellon | | | 109,668 | | | | 5,907 | |
BB&T | | | 25,410 | | | | 1,263 | |
Berkshire Hathaway, Cl B* | | | 91,925 | | | | 18,221 | |
BlackRock, Cl A | | | 12,941 | | | | 6,648 | |
Brighthouse Financial* | | | 2,732 | | | | 160 | |
Capital One Financial | | | 43,214 | | | | 4,303 | |
Cboe Global Markets | | | 3,400 | | | | 424 | |
Charles Schwab | | | 77,198 | | | | 3,966 | |
Chimera Investment‡ | | | 79,811 | | | | 1,475 | |
Chubb | | | 89,320 | | | | 13,052 | |
Cincinnati Financial | | | 4,257 | | | | 319 | |
Citigroup | | | 239,369 | | | | 17,811 | |
Citizens Financial Group | | | 107,969 | | | | 4,533 | |
CME Group, Cl A | | | 10,050 | | | | 1,468 | |
Comerica | | | 10,504 | | | | 912 | |
Discover Financial Services | | | 45,473 | | | | 3,498 | |
E*TRADE Financial* | | | 7,801 | | | | 387 | |
Everest Re Group | | | 17,366 | | | | 3,842 | |
Federated Investors, Cl B | | | 30,034 | | | | 1,084 | |
Fifth Third Bancorp | | | 21,614 | | | | 656 | |
First Horizon National | | | 37,840 | | | | 756 | |
FNF Group | | | 45,623 | | | | 1,790 | |
Franklin Resources | | | 66,308 | | | | 2,873 | |
Goldman Sachs Group | | | 50,217 | | | | 12,793 | |
Hanover Insurance Group | | | 7,490 | | | | 810 | |
Hartford Financial Services Group | | | 23,117 | | | | 1,301 | |
Huntington Bancshares | | | 31,348 | | | | 456 | |
Intercontinental Exchange | | | 91,710 | | | | 6,471 | |
Invesco | | | 12,173 | | | | 445 | |
JPMorgan Chase | | | 378,796 | | | | 40,508 | |
KeyCorp | | | 31,863 | | | | 643 | |
Leucadia National | | | 9,447 | | | | 250 | |
Lincoln National | | | 10,807 | | | | 831 | |
Loews | | | 8,033 | | | | 402 | |
M&T Bank | | | 9,800 | | | | 1,676 | |
Marsh & McLennan | | | 15,101 | | | | 1,229 | |
MetLife | | | 117,317 | | | | 5,932 | |
Moody's | | | 23,732 | | | | 3,503 | |
Morgan Stanley | | | 156,783 | | | | 8,226 | |
Morningstar | | | 588 | | | | 57 | |
Nasdaq | | | 50,061 | | | | 3,846 | |
Navient | | | 7,808 | | | | 104 | |
Northern Trust | | | 6,292 | | | | 629 | |
Old Republic International | | | 12,430 | | | | 266 | |
The accompanying notes are an integral part of the financial statements.
31
| | |
| THE KP FUNDS | | December 31, 2017 |
| | | | | | | | |
| Description | | Shares | | | Value
(000) | |
People's United Financial | | | 9,454 | | | $ | 177 | |
PNC Financial Services Group | | | 99,464 | | | | 14,352 | |
Popular | | | 5,331 | | | | 189 | |
Principal Financial Group | | | 7,977 | | | | 563 | |
Progressive | | | 17,262 | | | | 972 | |
Prudential Financial | | | 52,446 | | | | 6,030 | |
Raymond James Financial | | | 3,700 | | | | 330 | |
Regions Financial | | | 74,625 | | | | 1,290 | |
Reinsurance Group of America, Cl A | | | 16,363 | | | | 2,551 | |
S&P Global | | | 33,087 | | | | 5,605 | |
State Street | | | 65,539 | | | | 6,397 | |
SunTrust Banks | | | 70,147 | | | | 4,531 | |
Synchrony Financial | | | 50,898 | | | | 1,965 | |
Synovus Financial | | | 39,933 | | | | 1,914 | |
T Rowe Price Group | | | 24,321 | | | | 2,552 | |
TD Ameritrade Holding | | | 64,660 | | | | 3,306 | |
Torchmark | | | 3,187 | | | | 289 | |
Travelers | | | 90,154 | | | | 12,228 | |
Unum Group | | | 6,555 | | | | 360 | |
US Bancorp | | | 216,681 | | | | 11,610 | |
Voya Financial | | | 25,590 | | | | 1,266 | |
Wells Fargo | | | 430,039 | | | | 26,090 | |
Western Alliance Bancorp* | | | 23,750 | | | | 1,345 | |
Willis Towers Watson | | | 22,409 | | | | 3,377 | |
WR Berkley | | | 23,371 | | | | 1,675 | |
XL Group | | | 7,593 | | | | 267 | |
Zions Bancorporation | | | 41,438 | | | | 2,106 | |
| | | | | | | | |
| | | | | | | 360,695 | |
| | | | | | | | |
Health Care — 14.9% | |
Abbott Laboratories | | | 143,759 | | | | 8,204 | |
AbbVie | | | 69,039 | | | | 6,677 | |
Aetna | | | 31,568 | | | | 5,695 | |
Agilent Technologies | | | 51,201 | | | | 3,429 | |
Alexion Pharmaceuticals* | | | 44,624 | | | | 5,337 | |
Align Technology* | | | 2,200 | | | | 489 | |
Allergan | | | 18,645 | | | | 3,050 | |
Alnylam Pharmaceuticals* | | | 23,799 | | | | 3,024 | |
AmerisourceBergen, Cl A | | | 4,801 | | | | 441 | |
Amgen | | | 50,561 | | | | 8,793 | |
Anthem | | | 33,510 | | | | 7,540 | |
Baxter International | | | 119,927 | | | | 7,752 | |
Becton Dickinson | | | 46,759 | | | | 10,009 | |
Biogen* | | | 33,676 | | | | 10,728 | |
Bioverativ* | | | 9,449 | | | | 509 | |
Boston Scientific* | | | 40,528 | | | | 1,005 | |
Bristol-Myers Squibb | | | 93,207 | | | | 5,712 | |
| | | | | | | | |
| Description | | Shares | | | Value
(000) | |
Cardinal Health | | | 9,295 | | | $ | 569 | |
Celgene* | | | 79,073 | | | | 8,252 | |
Centene* | | | 41,395 | | | | 4,176 | |
Cerner* | | | 9,215 | | | | 621 | |
Charles River Laboratories International* | | | 1,935 | | | | 212 | |
Cigna | | | 91,282 | | | | 18,538 | |
Cooper | | | 1,400 | | | | 305 | |
Danaher | | | 121,855 | | | | 11,311 | |
DaVita* | | | 4,448 | | | | 321 | |
DENTSPLY SIRONA | | | 6,649 | | | | 438 | |
Edwards Lifesciences* | | | 6,282 | | | | 708 | |
Eli Lilly | | | 60,665 | | | | 5,124 | |
Envision Healthcare* | | | 3,366 | | | | 116 | |
Exelixis* | | | 39,889 | | | | 1,213 | |
Express Scripts Holding* | | | 122,870 | | | | 9,171 | |
Gilead Sciences | | | 127,676 | | | | 9,147 | |
HCA Healthcare* | | | 8,500 | | | | 747 | |
Henry Schein* | | | 4,600 | | | | 321 | |
Hill-Rom Holdings | | | 12,701 | | | | 1,071 | |
Hologic* | | | 8,200 | | | | 350 | |
Humana | | | 36,701 | | | | 9,104 | |
IDEXX Laboratories* | | | 2,500 | | | | 391 | |
Illumina* | | | 4,300 | | | | 939 | |
Incyte* | | | 24,007 | | | | 2,274 | |
Intuitive Surgical* | | | 28,612 | | | | 10,442 | |
IQVIA Holdings* | | | 4,200 | | | | 411 | |
Johnson & Johnson | | | 230,993 | | | | 32,274 | |
Laboratory Corp of America Holdings* | | | 2,952 | | | | 471 | |
McKesson | | | 40,723 | | | | 6,351 | |
Medtronic | | | 178,863 | | | | 14,443 | |
Merck | | | 292,313 | | | | 16,448 | |
Mettler-Toledo International* | | | 800 | | | | 496 | |
Mylan* | | | 15,767 | | | | 667 | |
Novartis | | | 10,430 | | | | 882 | |
Patterson | | | 2,145 | | | | 77 | |
PerkinElmer | | | 3,296 | | | | 241 | |
Perrigo | | | 3,932 | | | | 343 | |
Pfizer | | | 552,044 | | | | 19,995 | |
Quest Diagnostics | | | 3,954 | | | | 389 | |
Regeneron Pharmaceuticals* | | | 3,259 | | | | 1,225 | |
ResMed | | | 4,300 | | | | 364 | |
Roche Holding | | | 4,193 | | | | 1,061 | |
Stryker | | | 47,784 | | | | 7,399 | |
Thermo Fisher Scientific | | | 36,147 | | | | 6,864 | |
United Therapeutics* | | | 5,995 | | | | 887 | |
UnitedHealth Group | | | 120,857 | | | | 26,644 | |
The accompanying notes are an integral part of the financial statements.
32
| | |
| THE KP FUNDS | | December 31, 2017 |
| | | | | | | | |
| Description | | Shares | | | Value
(000) | |
Universal Health Services, Cl B | | | 2,500 | | | $ | 283 | |
Varian Medical Systems* | | | 2,729 | | | | 303 | |
Vertex Pharmaceuticals* | | | 68,221 | | | | 10,224 | |
Waters* | | | 2,335 | | | | 451 | |
WellCare Health Plans* | | | 4,075 | | | | 819 | |
Zimmer Biomet Holdings | | | 5,898 | | | | 712 | |
Zoetis, Cl A | | | 14,472 | | | | 1,043 | |
| | | | | | | | |
| | | | | | | 336,022 | |
| | | | | | | | |
Industrials — 10.1% | |
3M | | | 54,399 | | | | 12,804 | |
Acuity Brands | | | 1,200 | | | | 211 | |
AECOM* | | | 14,602 | | | | 542 | |
AGCO | | | 1,573 | | | | 112 | |
Alaska Air Group | | | 34,854 | | | | 2,562 | |
Allegion | | | 2,856 | | | | 227 | |
Allison Transmission Holdings | | | 22,214 | | | | 957 | |
American Airlines Group | | | 126,229 | | | | 6,568 | |
AMETEK | | | 6,827 | | | | 495 | |
AO Smith | | | 4,100 | | | | 251 | |
Arconic | | | 12,755 | | | | 348 | |
Boeing | | | 121,987 | | | | 35,975 | |
BWX Technologies, Cl W | | | 17,422 | | | | 1,054 | |
Canadian National Railway | | | 24,266 | | | | 2,002 | |
Caterpillar | | | 41,455 | | | | 6,533 | |
CH Robinson Worldwide | | | 4,064 | | | | 362 | |
Cintas | | | 2,476 | | | | 386 | |
Crane | | | 28,209 | | | | 2,517 | |
CSX | | | 26,104 | | | | 1,436 | |
Cummins | | | 16,037 | | | | 2,833 | |
Deere | | | 9,467 | | | | 1,482 | |
Delta Air Lines | | | 51,139 | | | | 2,864 | |
Dover | | | 4,697 | | | | 474 | |
Dun & Bradstreet | | | 15,929 | | | | 1,886 | |
Eaton | | | 61,306 | | | | 4,844 | |
Emerson Electric | | | 51,618 | | | | 3,597 | |
Equifax | | | 20,481 | | | | 2,415 | |
Expeditors International of Washington | | | 5,158 | | | | 334 | |
Fastenal | | | 8,576 | | | | 469 | |
FedEx | | | 13,436 | | | | 3,353 | |
Flowserve | | | 4,043 | | | | 170 | |
Fluor | | | 4,185 | | | | 216 | |
Fortive | | | 36,517 | | | | 2,642 | |
Fortune Brands Home & Security | | | 4,500 | | | | 308 | |
General Dynamics | | | 8,122 | | | | 1,652 | |
General Electric | | | 335,957 | | | | 5,862 | |
HD Supply Holdings* | | | 18,319 | | | | 733 | |
| | | | | | | | |
| Description | | Shares | | | Value
(000) | |
Honeywell International | | | 87,942 | | | $ | 13,487 | |
Huntington Ingalls Industries | | | 7,891 | | | | 1,860 | |
IHS Markit* | | | 10,800 | | | | 488 | |
Illinois Tool Works | | | 30,435 | | | | 5,078 | |
Ingersoll-Rand | | | 83,158 | | | | 7,417 | |
ITT | | | 17,606 | | | | 940 | |
Jacobs Engineering Group | | | 13,822 | | | | 912 | |
JB Hunt Transport Services | | | 2,500 | | | | 287 | |
Kansas City Southern | | | 14,557 | | | | 1,532 | |
KAR Auction Services | | | 2,593 | | | | 131 | |
L3 Technologies | | | 13,888 | | | | 2,748 | |
Lockheed Martin | | | 19,697 | | | | 6,324 | |
ManpowerGroup | | | 10,681 | | | | 1,347 | |
Masco | | | 9,222 | | | | 405 | |
MSC Industrial Direct, Cl A | | | 1,224 | | | | 118 | |
Nielsen Holdings | | | 9,700 | | | | 353 | |
Norfolk Southern | | | 22,296 | | | | 3,231 | |
Northrop Grumman | | | 25,192 | | | | 7,732 | |
Oshkosh | | | 4,584 | | | | 417 | |
Owens Corning | | | 14,882 | | | | 1,368 | |
PACCAR | | | 16,183 | | | | 1,150 | |
Parker-Hannifin | | | 3,860 | | | | 770 | |
Pentair | | | 4,747 | | | | 335 | |
Quanta Services* | | | 4,576 | | | | 179 | |
Raytheon | | | 17,261 | | | | 3,243 | |
Regal Beloit | | | 10,305 | | | | 789 | |
Republic Services, Cl A | | | 9,610 | | | | 650 | |
Robert Half International | | | 23,429 | | | | 1,301 | |
Rockwell Automation | | | 10,830 | | | | 2,126 | |
Rockwell Collins | | | 4,736 | | | | 642 | |
Roper Technologies | | | 2,973 | | | | 770 | |
Ryder System | | | 2,294 | | | | 193 | |
Snap-on | | | 1,729 | | | | 301 | |
Southwest Airlines | | | 44,151 | | | | 2,890 | |
Spirit AeroSystems Holdings, Cl A | | | 54,236 | | | | 4,732 | |
Stanley Black & Decker | | | 18,797 | | | | 3,190 | |
Stericycle* | | | 2,621 | | | | 178 | |
Terex | | | 9,059 | | | | 437 | |
Textron | | | 7,590 | | | | 430 | |
Timken | | | 5,356 | | | | 263 | |
TransDigm Group | | | 1,400 | | | | 384 | |
TransUnion* | | | 23,714 | | | | 1,303 | |
Union Pacific | | | 64,265 | | | | 8,618 | |
United Continental Holdings* | | | 20,428 | | | | 1,377 | |
United Parcel Service, Cl B | | | 42,584 | | | | 5,074 | |
United Rentals* | | | 3,957 | | | | 680 | |
United Technologies | | | 71,645 | | | | 9,140 | |
The accompanying notes are an integral part of the financial statements.
33
| | |
| THE KP FUNDS | | December 31, 2017 |
| | | | | | | | |
| Description | | Shares | | | Value
(000) | |
Valmont Industries | | | 2,272 | | | $ | 377 | |
Verisk Analytics, Cl A* | | | 4,700 | | | | 451 | |
WABCO Holdings* | | | 1,314 | | | | 189 | |
Waste Connections | | | 53,850 | | | | 3,820 | |
Waste Management | | | 29,528 | | | | 2,548 | |
WESCO International* | | | 6,683 | | | | 455 | |
WW Grainger | | | 1,565 | | | | 370 | |
Xylem | | | 5,222 | | | | 356 | |
| | | | | | | | |
| | | | | | | 227,362 | |
| | | | | | | | |
Information Technology — 24.0% | |
Accenture, Cl A | | | 111,444 | | | | 17,061 | |
Activision Blizzard | | | 59,434 | | | | 3,763 | |
Adobe Systems* | | | 46,770 | | | | 8,196 | |
Advanced Micro Devices* | | | 23,600 | | | | 243 | |
Akamai Technologies* | | | 10,408 | | | | 677 | |
Alibaba Group Holding ADR* | | | 58,200 | | | | 10,035 | |
Alliance Data Systems | | | 1,380 | | | | 350 | |
Alphabet, Cl A* | | | 36,762 | | | | 38,725 | |
Alphabet, Cl C* | | | 28,833 | | | | 30,171 | |
Amdocs | | | 27,597 | | | | 1,807 | |
Amphenol, Cl A | | | 8,852 | | | | 777 | |
Analog Devices | | | 21,804 | | | | 1,941 | |
ANSYS* | | | 2,500 | | | | 369 | |
Apple | | | 397,232 | | | | 67,224 | |
Applied Materials | | | 160,137 | | | | 8,186 | |
ARRIS International* | | | 27,839 | | | | 715 | |
ASML Holding, Cl G | | | 9,600 | | | | 1,669 | |
Autodesk* | | | 6,508 | | | | 682 | |
Automatic Data Processing | | | 12,968 | | | | 1,520 | |
Avnet | | | 4,287 | | | | 170 | |
Booz Allen Hamilton Holding, Cl A | | | 4,847 | | | | 185 | |
Broadcom | | | 33,362 | | | | 8,571 | |
CA | | | 53,248 | | | | 1,772 | |
Cadence Design Systems* | | | 47,965 | | | | 2,006 | |
CDW | | | 10,585 | | | | 736 | |
Cisco Systems | | | 226,592 | | | | 8,678 | |
Citrix Systems* | | | 17,963 | | | | 1,581 | |
Cognizant Technology Solutions, Cl A | | | 58,290 | | | | 4,140 | |
CoreLogic* | | | 17,435 | | | | 806 | |
Corning | | | 25,923 | | | | 829 | |
CSRA | | | 4,957 | | | | 148 | |
Dell Technologies, Cl V* | | | 16,588 | | | | 1,348 | |
Dolby Laboratories, Cl A | | | 20,122 | | | | 1,248 | |
DST Systems | | | 5,966 | | | | 370 | |
DXC Technology | | | 42,130 | | | | 3,998 | |
eBay* | | | 96,725 | | | | 3,650 | |
| | | | | | | | |
| Description | | Shares | | | Value
(000) | |
Electronic Arts* | | | 37,772 | | | $ | 3,968 | |
F5 Networks* | | | 16,942 | | | | 2,223 | |
Facebook, Cl A* | | | 249,607 | | | | 44,046 | |
Fidelity National Information Services | | | 70,626 | | | | 6,645 | |
First Solar* | | | 11,059 | | | | 747 | |
Fiserv* | | | 26,332 | | | | 3,453 | |
FLIR Systems | | | 28,655 | | | | 1,336 | |
Fortinet* | | | 16,468 | | | | 719 | |
Gartner* | | | 2,600 | | | | 320 | |
Genpact | | | 7,853 | | | | 249 | |
Global Payments | | | 41,912 | | | | 4,201 | |
Harris | | | 3,586 | | | | 508 | |
Hewlett Packard Enterprise | | | 47,845 | | | | 687 | |
HP | | | 76,310 | | | | 1,603 | |
IAC* | | | 14,297 | | | | 1,748 | |
Intel | | | 202,223 | | | | 9,335 | |
International Business Machines | | | 59,158 | | | | 9,076 | |
Intuit | | | 44,102 | | | | 6,958 | |
Juniper Networks | | | 56,827 | | | | 1,620 | |
KLA-Tencor | | | 48,616 | | | | 5,108 | |
Lam Research | | | 16,245 | | | | 2,990 | |
Mastercard, Cl A | | | 27,438 | | | | 4,153 | |
Maxim Integrated Products | | | 42,869 | | | | 2,241 | |
Microchip Technology | | | 6,946 | | | | 610 | |
Micron Technology* | | | 104,902 | | | | 4,314 | |
Microsoft | | | 717,930 | | | | 61,412 | |
Motorola Solutions | | | 4,685 | | | | 423 | |
NCR* | | | 22,163 | | | | 753 | |
NetApp | | | 7,794 | | | | 431 | |
NVIDIA | | | 27,962 | | | | 5,411 | |
ON Semiconductor* | | | 60,999 | | | | 1,277 | |
Oracle | | | 169,404 | | | | 8,009 | |
Paychex | | | 9,367 | | | | 638 | |
PayPal Holdings* | | | 132,362 | | | | 9,744 | |
Qorvo* | | | 3,900 | | | | 260 | |
QUALCOMM | | | 65,711 | | | | 4,207 | |
Red Hat* | | | 64,328 | | | | 7,726 | |
salesforce.com* | | | 89,530 | | | | 9,153 | |
Seagate Technology | | | 8,669 | | | | 363 | |
ServiceNow* | | | 29,841 | | | | 3,891 | |
Shopify, Cl A* | | | 13,249 | | | | 1,338 | |
Skyworks Solutions | | | 14,413 | | | | 1,369 | |
Symantec | | | 18,537 | | | | 520 | |
Synopsys* | | | 24,861 | | | | 2,119 | |
Take-Two Interactive Software* | | | 4,736 | | | | 520 | |
TE Connectivity | | | 10,415 | | | | 990 | |
Tencent Holdings ADR | | | 97,800 | | | | 5,078 | |
The accompanying notes are an integral part of the financial statements.
34
| | |
| THE KP FUNDS | | December 31, 2017 |
| | | | | | | | |
| Description | | Shares | | | Value
(000) | |
Teradata* | | | 17,864 | | | $ | 687 | |
Teradyne | | | 20,942 | | | | 877 | |
Texas Instruments | | | 150,004 | | | | 15,666 | |
Total System Services | | | 69,101 | | | | 5,465 | |
Twitter* | | | 9,350 | | | | 225 | |
VeriSign* | | | 2,557 | | | | 293 | |
Visa, Cl A | | | 211,301 | | | | 24,093 | |
VMware, Cl A* | | | 37,797 | | | | 4,737 | |
Western Digital | | | 30,684 | | | | 2,440 | |
Western Union | | | 13,763 | | | | 262 | |
Workday, Cl A* | | | 19,000 | | | | 1,933 | |
Xerox | | | 44,814 | | | | 1,306 | |
Xilinx | | | 48,048 | | | | 3,239 | |
Zynga, Cl A* | | | 158,277 | | | | 633 | |
| | | | | | | | |
| | | | | | | 540,693 | |
| | | | | | | | |
Materials — 2.6% | |
Air Products & Chemicals | | | 21,274 | | | | 3,491 | |
Albemarle | | | 3,200 | | | | 409 | |
Alcoa | | | 14,929 | | | | 804 | |
AptarGroup | | | 4,359 | | | | 376 | |
Avery Dennison | | | 2,668 | | | | 306 | |
Ball | | | 10,104 | | | | 382 | |
Cabot | | | 35,175 | | | | 2,166 | |
Celanese, Cl A | | | 35,955 | | | | 3,850 | |
CF Industries Holdings | | | 6,850 | | | | 291 | |
Chemours | | | 29,679 | | | | 1,486 | |
Crown Holdings* | | | 31,334 | | | | 1,763 | |
DowDuPont | | | 91,060 | | | | 6,485 | |
Eastman Chemical | | | 17,934 | | | | 1,661 | |
Ecolab | | | 7,709 | | | | 1,034 | |
FMC | | | 3,932 | | | | 372 | |
Freeport-McMoRan* | | | 66,375 | | | | 1,259 | |
Graphic Packaging Holding | | | 28,533 | | | | 441 | |
Huntsman | | | 31,406 | | | | 1,046 | |
International Flavors & Fragrances | | | 2,242 | | | | 342 | |
International Paper | | | 11,976 | | | | 694 | |
LyondellBasell Industries, Cl A | | | 44,984 | | | | 4,963 | |
Martin Marietta Materials | | | 1,800 | | | | 398 | |
Monsanto | | | 29,985 | | | | 3,502 | |
Mosaic | | | 9,981 | | | | 256 | |
Newmont Mining | | | 22,925 | | | | 860 | |
Nucor | | | 9,355 | | | | 595 | |
Olin | | | 16,748 | | | | 596 | |
Packaging Corp of America | | | 2,800 | | | | 338 | |
PPG Industries | | | 70,009 | | | | 8,178 | |
Praxair | | | 8,414 | | | | 1,302 | |
| | | | | | | | |
| Description | | Shares | | | Value
(000) | |
Sealed Air | | | 5,542 | | | $ | 273 | |
Sherwin-Williams | | | 10,611 | | | | 4,351 | |
Vulcan Materials | | | 3,827 | | | | 491 | |
WestRock | | | 45,054 | | | | 2,848 | |
WR Grace | | | 6,573 | | | | 461 | |
| | | | | | | | |
| | | | | | | 58,070 | |
| | | | | | | | |
Real Estate — 1.8% | |
Alexandria Real Estate Equities‡ | | | 2,900 | | | | 379 | |
American Tower, Cl A‡ | | | 12,588 | | | | 1,796 | |
Apartment Investment & Management, Cl A‡ | | | 4,754 | | | | 208 | |
AvalonBay Communities‡ | | | 4,012 | | | | 716 | |
Boston Properties‡ | | | 4,567 | | | | 594 | |
Brixmor Property Group‡ | | | 24,482 | | | | 457 | |
CBRE Group, Cl A* | | | 22,045 | | | | 955 | |
Crown Castle International‡ | | | 54,582 | | | | 6,059 | |
Digital Realty Trust‡ | | | 6,100 | | | | 695 | |
Duke Realty‡ | | | 46,779 | | | | 1,273 | |
Equinix‡ | | | 2,294 | | | | 1,040 | |
Equity LifeStyle Properties‡ | | | 35,062 | | | | 3,121 | |
Equity Residential‡ | | | 10,984 | | | | 700 | |
Essex Property Trust‡ | | | 1,932 | | | | 466 | |
Extra Space Storage‡ | | | 3,600 | | | | 315 | |
Federal Realty Investment Trust‡ | | | 2,200 | | | | 292 | |
Gaming and Leisure Properties‡ | | | 37,790 | | | | 1,398 | |
GGP‡ | | | 18,643 | | | | 436 | |
HCP‡ | | | 13,595 | | | | 354 | |
Host Hotels & Resorts‡ | | | 21,518 | | | | 427 | |
Iron Mountain‡ | | | 8,486 | | | | 320 | |
Kimco Realty‡ | | | 12,145 | | | | 220 | |
Liberty Property Trust‡ | | | 14,160 | | | | 609 | |
Macerich‡ | | | 3,145 | | | | 207 | |
Mid-America Apartment Communities‡ | | | 3,400 | | | | 342 | |
Park Hotels & Resorts‡ | | | 73,555 | | | | 2,115 | |
Prologis‡ | | | 71,151 | | | | 4,590 | |
Public Storage‡ | | | 11,158 | | | | 2,332 | |
Realty Income‡ | | | 8,400 | | | | 479 | |
Regency Centers‡ | | | 4,500 | | | | 311 | |
Retail Properties of America, Cl A‡ | | | 13,028 | | | | 175 | |
SBA Communications, Cl A‡ * | | | 15,107 | | | | 2,468 | |
Simon Property Group‡ | | | 9,104 | | | | 1,563 | |
SL Green Realty‡ | | | 2,900 | | | | 293 | |
UDR‡ | | | 7,600 | | | | 293 | |
Ventas‡ | | | 10,413 | | | | 625 | |
Vornado Realty Trust‡ | | | 5,003 | | | | 391 | |
Weingarten Realty Investors‡ | | | 6,722 | | | | 221 | |
The accompanying notes are an integral part of the financial statements.
35
| | |
| THE KP FUNDS | | December 31, 2017 |
| | | | | | | | |
| Description | | Shares | | | Value
(000) | |
Welltower‡ | | | 10,803 | | | $ | 689 | |
Weyerhaeuser‡ | | | 21,882 | | | | 772 | |
| | | | | | | | |
| | | | | | | 40,696 | |
| | | | | | | | |
Telecommunication Services — 1.3% | |
AT&T | | | 331,844 | | | | 12,902 | |
CenturyLink | | | 29,030 | | | | 484 | |
T-Mobile US* | | | 58,900 | | | | 3,741 | |
Verizon Communications | | | 220,526 | | | | 11,673 | |
| | | | | | | | |
| | | | | | | 28,800 | |
| | | | | | | | |
Utilities — 3.3% | |
AES | | | 19,337 | | | | 209 | |
Alliant Energy | | | 6,500 | | | | 277 | |
Ameren | | | 102,087 | | | | 6,022 | |
American Electric Power | | | 92,534 | | | | 6,808 | |
American Water Works | | | 27,600 | | | | 2,525 | |
Avangrid | | | 26,032 | | | | 1,317 | |
CenterPoint Energy | | | 112,226 | | | | 3,183 | |
CMS Energy | | | 8,164 | | | | 386 | |
Consolidated Edison | | | 25,466 | | | | 2,163 | |
Dominion Energy | | | 19,115 | | | | 1,549 | |
DTE Energy | | | 29,893 | | | | 3,272 | |
Duke Energy | | | 79,189 | | | | 6,661 | |
Edison International | | | 98,606 | | | | 6,236 | |
Entergy | | | 35,477 | | | | 2,888 | |
Eversource Energy | | | 12,173 | | | | 769 | |
Exelon | | | 115,705 | | | | 4,560 | |
FirstEnergy | | | 13,233 | | | | 405 | |
Hawaiian Electric Industries | | | 42,898 | | | | 1,551 | |
NextEra Energy | | | 18,691 | | | | 2,919 | |
NiSource | | | 9,446 | | | | 243 | |
NRG Energy | | | 8,364 | | | | 238 | |
PG&E | | | 48,881 | | | | 2,191 | |
Pinnacle West Capital | | | 23,367 | | | | 1,990 | |
PPL | | | 19,899 | | | | 616 | |
Public Service Enterprise Group | | | 80,807 | | | | 4,162 | |
SCANA | | | 4,045 | | | | 161 | |
Sempra Energy | | | 28,096 | | | | 3,004 | |
Southern | | | 61,924 | | | | 2,978 | |
Vistra Energy* | | | 73,435 | | | | 1,345 | |
WEC Energy Group | | | 9,220 | | | | 613 | |
Xcel Energy | | | 46,708 | | | | 2,247 | |
| | | | | | | | |
| | | | | | | 73,488 | |
| | | | | | | | |
Total Common Stock
(Cost $1,766,166) (000) | | | | | | | 2,208,700 | |
| | | | | | | | |
| | | | | | | | |
| Description | | Shares | | | Value
(000) | |
PREFERRED STOCK — 0.2% | |
Air BNB, Ser D* (A) (B) | | | 11,406 | | | $ | 1,335 | |
Air BNB, Ser E* (A) (B) | | | 6,939 | | | | 812 | |
Dropbox, Cl A* (A) (B) | | | 29,866 | | | | 350 | |
Dropbox, Cl C* (A) (B) | | | 1,097 | | | | 13 | |
Flipkart Online Services* (A) (B) | | | 579 | | | | 51 | |
Flipkart Online Services, Ser A* (A) (B) | | | 199 | | | | 17 | |
Flipkart Online Services, Ser C* (A) (B) | | | 349 | | | | 30 | |
Flipkart Online Services, Ser E* (A) (B) | | | 650 | | | | 57 | |
Flipkart Online Services, Ser G* (A) (B) | | | 3,027 | | | | 358 | |
Magic Leap* (A) (B) | | | 5,553 | | | | 150 | |
Magic Leap, Ser C* (A) (B) | | | 13,521 | | | | 365 | |
Uber Technologies, Cl E* (A) (B) | | | 21,072 | | | | 727 | |
Uber Technologies, Cl G* (A) (B) | | | 7,921 | | | | 273 | |
| | | | | | | | |
Total Preferred Stock
(Cost $3,817) (000) | | | | | | | 4,538 | |
| | | | | | | | |
EXCHANGE TRADED FUND — 0.1% | |
iShares Russell 1000 ETF | | | 13,405 | | | | 1,992 | |
| | | | | | | | |
Total Exchange Traded Fund
(Cost $1,957) (000) | | | | | | | 1,992 | |
| | | | | | | | |
SHORT-TERM INVESTMENT — 1.5% | |
State Street Institutional Treasury Money Market Fund, Cl Institutional, 1.160% (C) | | | 32,637,039 | | | | 32,637 | |
| | | | | | | | |
Total Short-Term Investment
(Cost $32,637) (000) | | | | | | | 32,637 | |
| | | | | | | | |
Total Investments In Securities — 99.9%
(Cost $1,804,577) (000) | | | $ | 2,247,867 | |
| | | | | | | | |
Percentages are based on net assets of $2,250,917 (000).
A list of the open futures contracts held by the Fund at December 31, 2017, is as follows (000):
| | | | | | | | | | | | | | | | | | |
| Type of Contract | | Number
of
Contracts
Long | | | Expiration
Date | | Notional
Amount | | | Value | | | Unrealized
Appreciation | |
| S&P 500 Index E-MINI | | | 151 | | | Mar-2018 | | $ | 19,980 | | | $ | 20,204 | | | $ | 224 | |
| | | | | | | | | | | | | | | | | | |
| * | Non-income producing security. |
| ‡ | Real Estate Investment Trust |
| (A) | Level 3 security is fair valued using methods determined in good faith by the Fair Value Committee of the Board of Trustees. The total value of such securities as of December 31, 2017, was $4,538 (000) and represented 0.2% of Net Assets. |
| (B) | Currently, no stated interest rate. |
| (C) | The rate reported is the 7-day effective yield as of December 31, 2017. |
The accompanying notes are an integral part of the financial statements.
36
| | |
| THE KP FUNDS | | December 31, 2017 |
ADR — American Depositary Receipt
Cl — Class
ETF — Exchange Traded Fund
S&P — Standard & Poor’s
Ser — Series
The following is a list of the level of inputs used as of December 31, 2017, in valuing the Fund’s investments and other financial instruments carried at value (000):
| | | | | | | | | | | | | | | | |
| Investments in Securities | | Level 1 | | | Level 2 | | | Level 3^ | | | Total | |
Common Stock | | $ | 2,208,700 | | | $ | — | | | $ | — | | | $ | 2,208,700 | |
Preferred Stock | | | — | | | | — | | | | 4,538 | | | | 4,538 | |
Exchange Traded Fund | | | 1,992 | | | | — | | | | — | | | | 1,992 | |
Short-Term Investment | | | 32,637 | | | | — | | | | — | | | | 32,637 | |
| | | | | | | | | | | | | | | | |
Total Investments in Securities | | $ | 2,243,329 | | | $ | — | | | $ | 4,538 | | | $ | 2,247,867 | |
| | | | | | | | | | | | | | | | |
| | | | |
| Other Financial Instruments | | Level 1 | | | Level 2 | | | Level 3 | | | Total | |
Futures Contracts** | | | | | | | | | | | | | |
Unrealized Appreciation | | $ | 224 | | | $ | — | | | $ | — | | | $ | 224 | |
| | | | | | | | | | | | | | | | |
Total Other Financial Instruments | | $ | 224 | | | $ | — | | | $ | — | | | $ | 224 | |
| | | | | | | | | | | | | | | | |
| ** | Futures contracts are valued at the unrealized appreciation on the instrument. |
| ^ | A reconciliation of Level 3 investments and disclosures of significant unobservable inputs are presented when the Fund has a significant amount of Level 3 investments at the beginning and/or end of the year in relation to net assets. Management has concluded that Level 3 investments are not material in relation to net assets. |
For the year ended December 31, 2017, there were no transfers between Level 1 and Level 2 assets and liabilities. For the year ended December 31, 2017 there were no transfers in and out of Level 3. All transfers, if any, are recognized by the Fund at the end of the year.
Amounts designated as “—” are $0 or have been rounded to $0.
The accompanying notes are an integral part of the financial statements.
37
| | |
| THE KP FUNDS | | December 31, 2017 |
|
| Sector Weightings† (unaudited) |
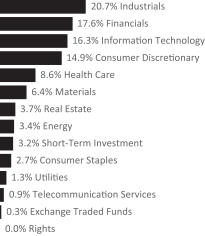
| † | Percentages based on total investments. |
| | | | | | | | |
| Description | | Shares | | | Value
(000) | |
COMMON STOCK — 96.7% | | | | | | | | |
Consumer Discretionary — 14.9% | | | | | | | | |
1-800-Flowers.com, Cl A* | | | 178,221 | | | $ | 1,907 | |
Abercrombie & Fitch, Cl A | | | 16,444 | | | | 287 | |
Acushnet Holdings | | | 122,970 | | | | 2,592 | |
Adtalem Global Education* | | | 17,405 | | | | 732 | |
AH Belo, Cl A | | | 197,880 | | | | 950 | |
American Axle & Manufacturing Holdings* | | | 23,721 | | | | 404 | |
American Eagle Outfitters | | | 66,980 | | | | 1,259 | |
American Public Education* | | | 3,665 | | | | 92 | |
Asbury Automotive Group* | | | 4,452 | | | | 285 | |
Ascena Retail Group* | | | 38,430 | | | | 90 | |
Barnes & Noble | | | 12,889 | | | | 86 | |
Barnes & Noble Education* | | | 8,826 | | | | 73 | |
Belmond, Cl A* | | | 20,230 | | | | 248 | |
Big 5 Sporting Goods | | | 5,300 | | | | 40 | |
Biglari Holdings* | | | 234 | | | | 97 | |
BJ's Restaurants | | | 4,236 | | | | 154 | |
BMC Stock Holdings* | | | 44,593 | | | | 1,128 | |
BorgWarner | | | 37,218 | | | | 1,901 | |
Boyd Gaming | | | 19,670 | | | | 689 | |
Bravo Brio Restaurant Group* | | | 78,090 | | | | 195 | |
Buckle | | | 6,505 | | | | 154 | |
Caleres | | | 97,239 | | | | 3,256 | |
Callaway Golf | | | 22,741 | | | | 317 | |
Capella Education | | | 2,724 | | | | 211 | |
Career Education* | | | 15,857 | | | | 192 | |
| | | | | | | | |
| Description | | Shares | | | Value
(000) | |
Carter's | | | 23,273 | | | $ | 2,734 | |
Cato, Cl A | | | 5,313 | | | | 85 | |
Cavco Industries* | | | 2,043 | | | | 312 | |
Century Casinos* | | | 93,014 | | | | 849 | |
Chegg* | | | 256,320 | | | | 4,183 | |
Chico's FAS | | | 30,780 | | | | 271 | |
Children's Place | | | 4,173 | | | | 607 | |
Chuy's Holdings* | | | 121,042 | | | | 3,395 | |
Columbia Sportswear | | | 32,811 | | | | 2,358 | |
Conn's* | | | 27,105 | | | | 964 | |
Cooper Tire & Rubber | | | 105,372 | | | | 3,725 | |
Cooper-Standard Holdings* | | | 3,809 | | | | 467 | |
Core-Mark Holding | | | 11,091 | | | | 350 | |
Crocs* | | | 16,422 | | | | 208 | |
Darden Restaurants | | | 12,674 | | | | 1,217 | |
Dave & Buster's Entertainment* | | | 9,866 | | | | 544 | |
Del Frisco's Restaurant Group* | | | 144,546 | | | | 2,204 | |
DineEquity | | | 4,340 | | | | 220 | |
Dixie Group* | | | 214,108 | | | | 824 | |
Dorman Products* | | | 7,080 | | | | 433 | |
DR Horton | | | 62,238 | | | | 3,178 | |
DSW, Cl A | | �� | 61,621 | | | | 1,319 | |
El Pollo Loco Holdings* | | | 6,356 | | | | 63 | |
Ethan Allen Interiors | | | 6,111 | | | | 175 | |
EW Scripps, Cl A* | | | 13,363 | | | | 209 | |
Express* | | | 229,574 | | | | 2,330 | |
Fiesta Restaurant Group* | | | 6,155 | | | | 117 | |
Finish Line, Cl A | | | 9,150 | | | | 133 | |
Five Below* | | | 13,162 | | | | 873 | |
Floor & Decor Holdings, Cl A* | | | 17,693 | | | | 861 | |
Fossil Group* | | | 10,026 | | | | 78 | |
Fox Factory Holding* | | | 9,043 | | | | 351 | |
Francesca's Holdings* | | | 8,462 | | | | 62 | |
Fred's, Cl A* | | | 10,499 | | | | 42 | |
FTD* | | | 5,124 | | | | 37 | |
Gannett | | | 27,351 | | | | 317 | |
Genesco* | | | 4,822 | | | | 157 | |
Gentherm* | | | 8,834 | | | | 280 | |
G-III Apparel Group* | | | 181,262 | | | | 6,687 | |
Goodyear Tire & Rubber | | | 106,000 | | | | 3,425 | |
Grand Canyon Education* | | | 17,285 | | | | 1,548 | |
Group 1 Automotive | | | 4,709 | | | | 334 | |
Guess? | | | 208,648 | | | | 3,522 | |
Habit Restaurants, Cl A* | | | 214,478 | | | | 2,048 | |
Haverty Furniture | | | 4,912 | | | | 111 | |
Hibbett Sports* | | | 4,899 | | | | 100 | |
Installed Building Products* | | | 5,041 | | | | 383 | |
The accompanying notes are an integral part of the financial statements.
38
| | |
| THE KP FUNDS | | December 31, 2017 |
| | | | | | | | |
| Description | | Shares | | | Value
(000) | |
iRobot* | | | 6,692 | | | $ | 513 | |
JC Penney* | | | 74,994 | | | | 237 | |
John Wiley & Sons, Cl A | | | 81,592 | | | | 5,365 | |
Kirkland's* | | | 188,173 | | | | 2,251 | |
La-Z-Boy, Cl Z | | | 11,625 | | | | 363 | |
LCI Industries | | | 5,981 | | | | 778 | |
LGI Homes* | | | 4,154 | | | | 312 | |
Lindblad Expeditions Holdings* | | | 139,872 | | | | 1,369 | |
Lions Gate Entertainment, Cl A* | | | 42,407 | | | | 1,434 | |
Lithia Motors, Cl A | | | 5,763 | | | | 655 | |
Lululemon Athletica* | | | 14,987 | | | | 1,178 | |
Lumber Liquidators Holdings* | | | 31,474 | | | | 988 | |
M/I Homes* | | | 6,497 | | | | 223 | |
Marcus | | | 4,360 | | | | 119 | |
MarineMax* | | | 5,534 | | | | 105 | |
Marriott Vacations Worldwide | | | 5,643 | | | | 763 | |
MDC Holdings | | | 108,978 | | | | 3,474 | |
MDC Partners, Cl A* | | | 131,666 | | | | 1,284 | |
Melco Resorts & Entertainment ADR | | | 79,400 | | | | 2,306 | |
Meredith | | | 26,740 | | | | 1,766 | |
Meritage Homes* | | | 9,105 | | | | 466 | |
Modine Manufacturing* | | | 189,141 | | | | 3,821 | |
Mohawk Industries* | | | 7,477 | | | | 2,063 | |
Monarch Casino & Resort* | | | 2,567 | | | | 115 | |
Monro | | | 34,815 | | | | 1,983 | |
Motorcar Parts of America* | | | 4,759 | | | | 119 | |
Movado Group | | | 3,551 | | | | 114 | |
Nautilus* | | | 7,867 | | | | 105 | |
New Media Investment Group | | | 12,872 | | | | 216 | |
Nexstar Media Group, Cl A | | | 35,816 | | | | 2,801 | |
Norwegian Cruise Line Holdings* | | | 57,107 | | | | 3,041 | |
Nutrisystem | | | 7,219 | | | | 380 | |
Ollie's Bargain Outlet Holdings* | | | 11,789 | | | | 628 | |
Oxford Industries | | | 6,301 | | | | 474 | |
Penn National Gaming* | | | 20,035 | | | | 628 | |
Penske Automotive Group | | | 52,769 | | | | 2,525 | |
Perry Ellis International* | | | 2,900 | | | | 73 | |
PetMed Express | | | 4,970 | | | | 226 | |
Pier 1 Imports | | | 467,861 | | | | 1,937 | |
Planet Fitness, Cl A* | | | 45,455 | | | | 1,574 | |
Polaris Industries | | | 15,043 | | | | 1,865 | |
Red Robin Gourmet Burgers* | | | 3,166 | | | | 179 | |
Regis* | | | 7,934 | | | | 122 | |
Rent-A-Center, Cl A* | | | 13,743 | | | | 153 | |
RH* | | | 4,517 | | | | 389 | |
Ruth's Hospitality Group | | | 6,701 | | | | 145 | |
Scholastic | | | 6,639 | | | | 266 | |
| | | | | | | | |
| Description | | Shares | | | Value
(000) | |
Scientific Games, Cl A* | | | 51,135 | | | $ | 2,623 | |
SeaWorld Entertainment* | | | 239,560 | | | | 3,251 | |
Shake Shack, Cl A* | | | 4,429 | | | | 191 | |
Shoe Carnival | | | 2,568 | | | | 69 | |
Shutterfly* | | | 8,008 | | | | 398 | |
Skechers U.S.A., Cl A* | | | 60,406 | | | | 2,286 | |
Sleep Number* | | | 9,489 | | | | 357 | |
Sonic | | | 9,595 | | | | 264 | |
Sonic Automotive, Cl A | | | 6,360 | | | | 117 | |
Standard Motor Products | | | 4,754 | | | | 213 | |
Steven Madden* | | | 12,719 | | | | 594 | |
Strayer Education | | | 2,489 | | | | 223 | |
Sturm Ruger | | | 20,015 | | | | 1,118 | |
Superior Industries International | | | 5,299 | | | | 79 | |
Tailored Brands | | | 11,851 | | | | 259 | |
Texas Roadhouse, Cl A | | | 10,670 | | | | 562 | |
Tile Shop Holdings | | | 7,998 | | | | 77 | |
Time | | | 23,925 | | | | 441 | |
TopBuild* | | | 34,583 | | | | 2,619 | |
Tractor Supply | | | 9,118 | | | | 682 | |
Unifi* | | | 3,879 | | | | 139 | |
Universal Electronics* | | | 3,304 | | | | 156 | |
Vail Resorts | | | 10,477 | | | | 2,226 | |
Vera Bradley* | | | 4,356 | | | | 53 | |
Vista Outdoor* | | | 253,821 | | | | 3,698 | |
Visteon* | | | 9,355 | | | | 1,171 | |
Vitamin Shoppe* | | | 6,954 | | | | 31 | |
Wendy's | | | 30,665 | | | | 503 | |
William Lyon Homes, Cl A* | | | 6,732 | | | | 196 | |
Wingstop, Cl A | | | 7,009 | | | | 273 | |
Winnebago Industries | | | 72,884 | | | | 4,052 | |
Wolverine World Wide | | | 22,949 | | | | 732 | |
World Wrestling Entertainment, Cl A | | | 75,877 | | | | 2,320 | |
Wynn Resorts | | | 16,700 | | | | 2,815 | |
Yum China Holdings | | | 45,300 | | | | 1,813 | |
Zumiez* | | | 4,073 | | | | 85 | |
| | | | | | | | |
| | | | | | | 160,606 | |
| | | | | | | | |
Consumer Staples — 2.7% | | | | | | | | |
Andersons | | | 128,980 | | | | 4,018 | |
B&G Foods | | | 101,682 | | | | 3,574 | |
Bob Evans Farms | | | 4,820 | | | | 380 | |
Calavo Growers | | | 3,700 | | | | 312 | |
Cal-Maine Foods* | | | 7,163 | | | | 318 | |
Central Garden & Pet* | | | 2,327 | | | | 91 | |
Central Garden & Pet, Cl A* | | | 8,405 | | | | 317 | |
Chefs' Warehouse* | | | 57,460 | | | | 1,178 | |
The accompanying notes are an integral part of the financial statements.
39
| | |
| THE KP FUNDS | | December 31, 2017 |
| | | | | | | | |
| Description | | Shares | | | Value
(000) | |
Coca-Cola Bottling Consolidated | | | 1,105 | | | $ | 238 | |
Darling Ingredients* | | | 239,767 | | | | 4,347 | |
Energizer Holdings | | | 58,660 | | | | 2,815 | |
Flowers Foods | | | 164,653 | | | | 3,179 | |
Herbalife* | | | 14,398 | | | | 975 | |
Inter Parfums | | | 38,677 | | | | 1,681 | |
J&J Snack Foods | | | 3,584 | | | | 544 | |
John B Sanfilippo & Son | | | 2,253 | | | | 142 | |
Medifast | | | 2,538 | | | | 177 | |
Nu Skin Enterprises, Cl A | | | 19,014 | | | | 1,297 | |
Seneca Foods, Cl A* | | | 1,835 | | | | 56 | |
SpartanNash | | | 8,916 | | | | 238 | |
SUPERVALU* | | | 8,931 | | | | 193 | |
Universal | | | 53,422 | | | | 2,805 | |
WD-40 | | | 3,293 | | | | 389 | |
| | | | | | | | |
| | | | | | | 29,264 | |
| | | | | | | | |
Energy — 3.4% | |
Archrock | | | 17,183 | | | | 180 | |
Ardmore Shipping* | | | 326,539 | | | | 2,612 | |
Bill Barrett* | | | 22,971 | | | | 118 | |
Bristow Group* | | | 7,236 | | | | 97 | |
Callon Petroleum* | | | 337,270 | | | | 4,098 | |
Capital Product Partners (A) | | | 129,622 | | | | 436 | |
CARBO Ceramics* | | | 6,259 | | | | 64 | |
Carrizo Oil & Gas* | | | 18,595 | | | | 396 | |
Cloud Peak Energy* | | | 17,000 | | | | 76 | |
CONSOL Energy* | | | 6,200 | | | | 245 | |
Denbury Resources* | | | 97,124 | | | | 215 | |
Diamondback Energy* | | | 28,489 | | | | 3,597 | |
Dorian LPG* | | | 15,631 | | | | 128 | |
Eclipse Resources* | | | 621,143 | | | | 1,491 | |
Energen* | | | 63,730 | | | | 3,669 | |
Era Group* | | | 5,800 | | | | 62 | |
Exterran* | | | 7,682 | | | | 241 | |
Geospace Technologies* | | | 3,914 | | | | 51 | |
Green Plains | | | 8,956 | | | | 151 | |
Gulf Island Fabrication | | | 3,100 | | | | 42 | |
Helix Energy Solutions Group* | | | 33,465 | | | | 252 | |
Jones Energy, Cl A* | | | 2 | | | | — | |
Keane Group* | | | 57,394 | | | | 1,091 | |
Matador Resources* | | | 54,490 | | | | 1,696 | |
Matrix Service* | | | 6,071 | | | | 108 | |
McDermott International* | | | 67,939 | | | | 447 | |
Newpark Resources* | | | 20,777 | | | | 179 | |
Noble* | | | 59,029 | | | | 267 | |
Oceaneering International* | | | 25,220 | | | | 533 | |
| | | | | | | | |
| Description | | Shares | | | Value
(000) | |
Oil States International* | | | 12,287 | | | $ | 348 | |
Par Pacific Holdings* | | | 5,800 | | | | 112 | |
Patterson-UTI Energy | | | 51,355 | | | | 1,182 | |
PDC Energy* | | | 15,795 | | | | 814 | |
Pioneer Energy Services* | | | 22,674 | | | | 69 | |
Resolute Energy* | | | 64,803 | | | | 2,039 | |
REX American Resources* | | | 1,475 | | | | 122 | |
Ring Energy* | | | 124,054 | | | | 1,724 | |
RPC | | | 43,742 | | | | 1,117 | |
RSP Permian* | | | 34,975 | | | | 1,423 | |
SEACOR Holdings* | | | 74,580 | | | | 3,447 | |
SRC Energy* | | | 158,439 | | | | 1,351 | |
TETRA Technologies* | | | 26,276 | | | | 112 | |
Unit* | | | 12,736 | | | | 280 | |
| | | | | | | | |
| | | | | | | 36,682 | |
| | | | | | | | |
Financials — 17.7% | | | | | | | | |
Access National | | | 76,817 | | | | 2,139 | |
American Equity Investment Life Holding | | | 62,055 | | | | 1,907 | |
American Financial Group | | | 34,955 | | | | 3,794 | |
Ameris Bancorp | | | 8,895 | | | | 429 | |
AMERISAFE | | | 58,666 | | | | 3,614 | |
Apollo Commercial Real Estate Finance‡ | | | 22,963 | | | | 424 | |
ARMOUR Residential‡ | | | 10,090 | | | | 260 | |
Aspen Insurance Holdings | | | 105,672 | | | | 4,290 | |
Atlantic Capital Bancshares* | | | 91,851 | | | | 1,617 | |
Banc of California | | | 57,575 | | | | 1,189 | |
Bank Mutual | | | 9,633 | | | | 103 | |
Bank of Hawaii | | | 40,050 | | | | 3,432 | |
Banner | | | 25,860 | | | | 1,425 | |
Berkshire Hills Bancorp | | | 34,993 | | | | 1,281 | |
BofI Holding* | | | 13,490 | | | | 403 | |
Boston Private Financial Holdings | | | 20,273 | | | | 313 | |
Brookline Bancorp | | | 18,456 | | | | 290 | |
Byline Bancorp* | | | 47,342 | | | | 1,087 | |
Capstar Financial Holdings* | | | 114,728 | | | | 2,383 | |
Capstead Mortgage‡ | | | 23,201 | | | | 201 | |
Carolina Financial | | | 38,539 | | | | 1,432 | |
Central Pacific Financial | | | 7,000 | | | | 209 | |
Chemical Financial | | | 23,861 | | | | 1,276 | |
City Holding | | | 3,764 | | | | 254 | |
Civista Bancshares | | | 56,665 | | | | 1,247 | |
CoBiz Financial | | | 147,041 | | | | 2,939 | |
Cohen & Steers | | | 11,614 | | | | 549 | |
Columbia Banking System | | | 32,079 | | | | 1,394 | |
Comerica | | | 41,380 | | | | 3,592 | |
The accompanying notes are an integral part of the financial statements.
40
| | |
| THE KP FUNDS | | December 31, 2017 |
| | | | | | | | |
| Description | | Shares | | | Value
(000) | |
Commerce Bancshares | | | 60,984 | | | $ | 3,405 | |
Commerce Union Bancshares | | | 35,582 | | | | 912 | |
Community Bank System | | | 12,083 | | | | 649 | |
Community Bankers Trust* | | | 222,324 | | | | 1,812 | |
Customers Bancorp* | | | 66,824 | | | | 1,737 | |
CVB Financial | | | 174,165 | | | | 4,103 | |
Dime Community Bancshares | | | 7,083 | | | | 148 | |
Donnelley Financial Solutions* | | | 7,700 | | | | 150 | |
E*TRADE Financial* | | | 65,456 | | | | 3,245 | |
Eagle Bancorp Montana | | | 34,296 | | | | 719 | |
East West Bancorp | | | 35,100 | | | | 2,135 | |
eHealth* | | | 3,700 | | | | 64 | |
Employers Holdings | | | 7,801 | | | | 346 | |
Encore Capital Group* | | | 27,287 | | | | 1,149 | |
Enova International* | | | 8,572 | | | | 130 | |
Entegra Financial* | | | 12,505 | | | | 366 | |
Equity Bancshares, Cl A* | | | 42,562 | | | | 1,507 | |
Evans Bancorp | | | 40,747 | | | | 1,707 | |
Evercore, Cl A | | | 9,259 | | | | 833 | |
EZCORP, Cl A* | | | 11,734 | | | | 143 | |
FB Financial* | | | 36,813 | | | | 1,546 | |
Fidelity Southern | | | 5,012 | | | | 109 | |
Financial Engines | | | 15,148 | | | | 459 | |
First BanCorp* | | | 43,810 | | | | 223 | |
First Bancorp NC | | | 21,139 | | | | 746 | |
First Commonwealth Financial | | | 23,463 | | | | 336 | |
First Financial Bancorp | | | 54,946 | | | | 1,448 | |
First Financial Bankshares | | | 15,773 | | | | 711 | |
First Horizon National | | | 93,473 | | | | 1,869 | |
First Internet Bancorp | | | 55,908 | | | | 2,133 | |
First Midwest Bancorp | | | 99,534 | | | | 2,390 | |
FirstCash | | | 65,276 | | | | 4,403 | |
FNB | | | 298,792 | | | | 4,129 | |
Glacier Bancorp | | | 18,571 | | | | 732 | |
Great Western Bancorp | | | 27,086 | | | | 1,078 | |
Green Bancorp* | | | 27,249 | | | | 553 | |
Green Dot, Cl A* | | | 50,443 | | | | 3,040 | |
Greenhill | | | 5,550 | | | | 108 | |
Guaranty Bancorp | | | 88,647 | | | | 2,451 | |
Guaranty Bancshares | | | 17,868 | | | | 548 | |
Hanmi Financial | | | 7,814 | | | | 237 | |
Hannon Armstrong Sustainable Infrastructure Capital‡ | | | 95,319 | | | | 2,293 | |
Hanover Insurance Group | | | 5,922 | | | | 640 | |
HCI Group | | | 1,800 | | | | 54 | |
Heritage Commerce | | | 126,496 | | | | 1,938 | |
Heritage Financial | | | 122,480 | | | | 3,772 | |
| | | | | | | | |
| Description | | Shares | | | Value
(000) | |
HomeStreet* | | | 6,497 | | | $ | 188 | |
Hope Bancorp | | | 30,896 | | | | 564 | |
Horace Mann Educators | | | 27,915 | | | | 1,231 | |
IBERIABANK | | | 53,501 | | | | 4,146 | |
Independent Bank | | | 6,592 | | | | 460 | |
Infinity Property & Casualty | | | 2,581 | | | | 274 | |
International. FCStone* | | | 3,597 | | | | 153 | |
Invesco Mortgage Capital‡ | | | 26,700 | | | | 476 | |
Investar Holding | | | 37,567 | | | | 905 | |
Investment Technology Group | | | 89,578 | | | | 1,724 | |
LegacyTexas Financial Group | | | 10,124 | | | | 427 | |
LendingTree* | | | 1,797 | | | | 612 | |
LPL Financial Holdings | | | 26,660 | | | | 1,523 | |
Luther Burbank* | | | 33,014 | | | | 398 | |
Maiden Holdings | | | 16,265 | | | | 107 | |
MarketAxess Holdings | | | 4,072 | | | | 822 | |
Meta Financial Group | | | 2,194 | | | | 203 | |
National Bank Holdings, Cl A | | | 81,306 | | | | 2,637 | |
Navigators Group | | | 5,433 | | | | 265 | |
NBT Bancorp | | | 10,436 | | | | 384 | |
NMI Holdings, Cl A* | | | 12,890 | | | | 219 | |
Northfield Bancorp | | | 11,267 | | | | 192 | |
Northwest Bancshares | | | 24,559 | | | | 411 | |
OFG Bancorp | | | 10,009 | | | | 94 | |
Old Line Bancshares | | | 44,383 | | | | 1,307 | |
Old National Bancorp | | | 120,799 | | | | 2,108 | |
OM Asset Management | | | 160,338 | | | | 2,686 | |
Opus Bank* | | | 62,458 | | | | 1,705 | |
Oritani Financial | | | 8,986 | | | | 147 | |
Orrstown Financial Services | | | 15,045 | | | | 380 | |
Pacific Premier Bancorp* | | | 9,200 | | | | 368 | |
PacWest Bancorp | | | 25,169 | | | | 1,269 | |
Piper Jaffray | | | 3,420 | | | | 295 | |
PRA Group* | | | 10,887 | | | | 361 | |
Primerica | | | 40,650 | | | | 4,128 | |
ProAssurance | | | 12,742 | | | | 728 | |
Prosperity Bancshares | | | 59,756 | | | | 4,187 | |
Provident Financial Services | | | 14,508 | | | | 391 | |
Radian Group | | | 90,900 | | | | 1,873 | |
RLI | | | 9,308 | | | | 565 | |
S&T Bancorp | | | 8,374 | | | | 333 | |
Safety Insurance Group | | | 3,664 | | | | 295 | |
Santander Consumer USA Holdings | | | 108,750 | | | | 2,025 | |
Selective Insurance Group | | | 13,899 | | | | 816 | |
ServisFirst Bancshares | | | 10,809 | | | | 449 | |
Shore Bancshares | | | 55,922 | | | | 934 | |
Sierra Bancorp | | | 12,985 | | | | 345 | |
The accompanying notes are an integral part of the financial statements.
41
| | |
| THE KP FUNDS | | December 31, 2017 |
| | | | | | | | |
| Description | | Shares | | | Value
(000) | |
Simmons First National, Cl A | | | 9,396 | | | $ | 537 | |
SmartFinancial* | | | 19,959 | | | | 433 | |
Solar Capital | | | 52,347 | | | | 1,058 | |
Southern First Bancshares* | | | 4,601 | | | | 190 | |
Southern National Bancorp of Virginia | | | 121,976 | | | | 1,955 | |
Southside Bancshares | | | 6,654 | | | | 224 | |
State Auto Financial | | | 32,498 | | | | 946 | |
State Bank Financial | | | 86,828 | | | | 2,591 | |
Sterling Bancorp* | | | 51,396 | | | | 653 | |
Stewart Information Services | | | 5,723 | �� | | | 242 | |
Sunshine Bancorp* | | | 47,384 | | | | 1,087 | |
SVB Financial Group* | | | 7,690 | | | | 1,798 | |
Synovus Financial | | | 37,840 | | | | 1,814 | |
TCF Financial | | | 100,510 | | | | 2,060 | |
Texas Capital Bancshares* | | | 5,965 | | | | 530 | |
Third Point Reinsurance* | | | 20,934 | | | | 307 | |
Tompkins Financial | | | 2,902 | | | | 236 | |
TriCo Bancshares | | | 26,853 | | | | 1,017 | |
TrustCo Bank | | | 23,196 | | | | 213 | |
UMB Financial | | | 26,712 | | | | 1,921 | |
Umpqua Holdings | | | 192,967 | | | | 4,014 | |
United Community Banks | | | 17,294 | | | | 487 | |
United Fire Group | | | 5,103 | | | | 233 | |
United Insurance Holdings | | | 5,302 | | | | 91 | |
Universal Insurance Holdings | | | 7,471 | | | | 204 | |
Veritex Holdings* | | | 20,727 | | | | 572 | |
Virtus Investment Partners | | | 1,677 | | | | 193 | |
Waddell & Reed Financial, Cl A | | | 20,011 | | | | 447 | |
Walker & Dunlop* | | | 6,718 | | | | 319 | |
WashingtonFirst Bankshares | | | 48,489 | | | | 1,661 | |
WesBanco | | | 42,008 | | | | 1,708 | |
Westamerica Bancorporation | | | 36,806 | | | | 2,192 | |
Western Alliance Bancorp* | | | 31,555 | | | | 1,787 | |
WisdomTree Investments | | | 27,662 | | | | 347 | |
World Acceptance* | | | 1,494 | | | | 121 | |
Zions Bancorporation | | | 62,000 | | | | 3,151 | |
| | | | | | | | |
| | | | | | | 190,128 | |
| | | | | | | | |
Health Care — 8.6% | | | | | | | | |
Abaxis | | | 5,491 | | | | 272 | |
Acadia Healthcare* | | | 32,258 | | | | 1,053 | |
Aceto | | | 6,810 | | | | 70 | |
Acorda Therapeutics* | | | 11,268 | | | | 242 | |
Aerie Pharmaceuticals* | | | 38,622 | | | | 2,308 | |
Almost Family* | | | 2,900 | | | | 161 | |
AMAG Pharmaceuticals* | | | 9,091 | | | | 120 | |
Amedisys* | | | 6,855 | | | | 361 | |
| | | | | | | | |
| Description | | Shares | | | Value
(000) | |
AMN Healthcare Services* | | | 11,467 | | | $ | 565 | |
Amphastar Pharmaceuticals* | | | 8,112 | | | | 156 | |
Analogic | | | 2,917 | | | | 244 | |
AngioDynamics* | | | 8,403 | | | | 140 | |
ANI Pharmaceuticals* | | | 2,047 | | | | 132 | |
Anika Therapeutics* | | | 3,399 | | | | 183 | |
AxoGen* | | | 56,766 | | | | 1,606 | |
BioTelemetry* | | | 7,415 | | | | 222 | |
Bluebird Bio* | | | 11,456 | | | | 2,040 | |
Cambrex* | | | 7,715 | | | | 370 | |
Cantel Medical | | | 8,546 | | | | 879 | |
Catalent* | | | 36,080 | | | | 1,482 | |
Charles River Laboratories International* | | | 10,614 | | | | 1,162 | |
Chemed | | | 12,611 | | | | 3,065 | |
Community Health Systems* | | | 29,874 | | | | 127 | |
Computer Programs & Systems | | | 2,615 | | | | 79 | |
CONMED | | | 6,002 | | | | 306 | |
Corcept Therapeutics* | | | 22,400 | | | | 405 | |
CorVel* | | | 2,500 | | | | 132 | |
Cross Country Healthcare* | | | 115,459 | | | | 1,473 | |
CryoLife* | | | 60,619 | | | | 1,161 | |
Cutera* | | | 13,580 | | | | 616 | |
Cytokinetics* | | | 11,598 | | | | 95 | |
Depomed* | | | 14,885 | | | | 120 | |
Diplomat Pharmacy* | | | 11,625 | | | | 233 | |
Eagle Pharmaceuticals* | | | 1,944 | | | | 104 | |
Emergent BioSolutions* | | | 8,458 | | | | 393 | |
Enanta Pharmaceuticals* | | | 3,297 | | | | 193 | |
Ensign Group | | | 11,592 | | | | 257 | |
Envision Healthcare* | | | 37,108 | | | | 1,282 | |
FibroGen* | | | 17,010 | | | | 806 | |
Foundation Medicine* | | | 3,055 | | | | 208 | |
GenMark Diagnostics* | | | 275,086 | | | | 1,147 | |
Haemonetics* | | | 30,875 | | | | 1,793 | |
Halozyme Therapeutics* | | | 54,665 | | | | 1,107 | |
HealthEquity* | | | 12,339 | | | | 576 | |
HealthSouth | | | 111,413 | | | | 5,505 | |
HealthStream* | | | 5,977 | | | | 138 | |
Heska* | | | 1,541 | | | | 124 | |
HMS Holdings* | | | 48,408 | | | | 821 | |
ICU Medical* | | | 8,596 | | | | 1,857 | |
Impax Laboratories* | | | 17,839 | | | | 297 | |
Innoviva* | | | 17,151 | | | | 243 | |
Inogen* | | | 4,110 | | | | 489 | |
Insulet* | | | 41,364 | | | | 2,854 | |
Integer Holdings* | | | 6,784 | | | | 307 | |
The accompanying notes are an integral part of the financial statements.
42
| | |
| THE KP FUNDS | | December 31, 2017 |
| | | | | | | | |
| Description | | Shares | | | Value
(000) | |
Integra LifeSciences Holdings* | | | 15,245 | | | $ | 730 | |
Intersect ENT* | | | 25,960 | | | | 841 | |
Invacare | | | 7,493 | | | | 126 | |
K2M Group Holdings* | | | 77,145 | | | | 1,389 | |
Kindred Healthcare* | | | 20,387 | | | | 198 | |
Lannett* | | | 7,285 | | | | 169 | |
Lantheus Holdings* | | | 41,247 | | | | 843 | |
LeMaitre Vascular | | | 3,700 | | | | 118 | |
LHC Group* | | | 3,922 | | | | 240 | |
Ligand Pharmaceuticals* | | | 15,113 | | | | 2,069 | |
LivaNova* | | | 10,460 | | | | 836 | |
Luminex | | | 9,944 | | | | 196 | |
Magellan Health* | | | 5,771 | | | | 557 | |
Medicines* | | | 15,295 | | | | 418 | |
MEDNAX* | | | 31,468 | | | | 1,682 | |
Meridian Bioscience | | | 9,833 | | | | 138 | |
Merit Medical Systems* | | | 66,744 | | | | 2,883 | |
MiMedx Group* | | | 24,570 | | | | 310 | |
Momenta Pharmaceuticals* | | | 18,416 | | | | 257 | |
Myriad Genetics* | | | 16,633 | | | | 571 | |
NanoString Technologies* | | | 113,350 | | | | 847 | |
Natus Medical* | | | 7,620 | | | | 291 | |
Nektar Therapeutics, Cl A* | | | 57,462 | | | | 3,432 | |
Neogen* | | | 9,060 | | | | 745 | |
NeoGenomics* | | | 188,708 | | | | 1,672 | |
Neurocrine Biosciences* | | | 15,819 | | | | 1,227 | |
Novocure* | | | 42,785 | | | | 864 | |
Omnicell* | | | 37,765 | | | | 1,832 | |
OraSure Technologies* | | | 14,612 | | | | 276 | |
Orthofix International* | | | 4,381 | | | | 240 | |
Oxford Immunotec Global* | | | 107,713 | | | | 1,505 | |
PetIQ, Cl A* | | | 35,504 | | | | 775 | |
Phibro Animal Health, Cl A | | | 4,740 | | | | 159 | |
Portola Pharmaceuticals, Cl A* | | | 11,675 | | | | 568 | |
PRA Health Sciences* | | | 20,845 | | | | 1,898 | |
Prestige Brands Holdings* | | | 32,377 | | | | 1,438 | |
Progenics Pharmaceuticals* | | | 15,997 | | | | 95 | |
Providence Service* | | | 35,888 | | | | 2,130 | |
Puma Biotechnology* | | | 7,890 | | | | 780 | |
Quality Systems* | | | 11,435 | | | | 155 | |
Quidel* | | | 51,284 | | | | 2,223 | |
Quorum Health* | | | 6,400 | | | | 40 | |
Repligen* | | | 9,029 | | | | 328 | |
Sage Therapeutics* | | | 4,450 | | | | 733 | |
Sarepta Therapeutics* | | | 28,575 | | | | 1,590 | |
Select Medical Holdings* | | | 25,473 | | | | 450 | |
Spectrum Pharmaceuticals* | | | 21,775 | | | | 413 | |
| | | | | | | | |
| Description | | Shares | | | Value
(000) | |
Sucampo Pharmaceuticals, Cl A* | | | 6,000 | | | $ | 108 | |
Supernus Pharmaceuticals* | | | 12,136 | | | | 484 | |
Surmodics* | | | 3,000 | | | | 84 | |
Tabula Rasa HealthCare* | | | 35,570 | | | | 998 | |
Tactile Systems Technology* | | | 3,300 | | | | 96 | |
Teladoc* | | | 78,789 | | | | 2,746 | |
Tivity Health* | | | 8,187 | | | | 299 | |
US Physical Therapy | | | 3,008 | | | | 217 | |
Varex Imaging* | | | 9,069 | | | | 364 | |
WellCare Health Plans* | | | 17,560 | | | | 3,531 | |
| | | | | | | | |
| | | | | | | 92,285 | |
| | | | | | | | |
Industrials — 20.8% | | | | | | | | |
AAON | | | 9,717 | | | | 357 | |
AAR | | | 36,483 | | | | 1,433 | |
ABM Industries | | | 13,251 | | | | 500 | |
Actuant, Cl A | | | 14,386 | | | | 364 | |
Advanced Drainage Systems | | | 108,430 | | | | 2,586 | |
Aegion, Cl A* | | | 7,604 | | | | 193 | |
AerCap Holdings* | | | 42,490 | | | | 2,235 | |
Aerojet Rocketdyne Holdings* | | | 17,952 | | | | 560 | |
Aerovironment* | | | 5,109 | | | | 287 | |
Air Transport Services Group* | | | 141,765 | | | | 3,280 | |
Alamo Group | | | 2,277 | | | | 257 | |
Albany International, Cl A | | | 27,858 | | | | 1,712 | |
Allegiant Travel, Cl A | | | 2,962 | | | | 458 | |
Altra Industrial Motion | | | 59,999 | | | | 3,024 | |
American Woodmark* | | | 3,436 | | | | 448 | |
AMETEK | | | 50,800 | | | | 3,681 | |
Apogee Enterprises | | | 67,728 | | | | 3,097 | |
Applied Industrial Technologies | | | 9,315 | | | | 634 | |
ArcBest | | | 43,879 | | | | 1,569 | |
Astec Industries | | | 4,614 | | | | 270 | |
Atlas Air Worldwide Holdings* | | | 6,120 | | | | 359 | |
Axon Enterprise* | | | 12,733 | | | | 337 | |
AZZ | | | 19,927 | | | | 1,018 | |
Barnes Group | | | 38,247 | | | | 2,420 | |
Beacon Roofing Supply* | | | 20,640 | | | | 1,316 | |
Brady, Cl A | | | 11,538 | | | | 437 | |
Briggs & Stratton | | | 10,328 | | | | 262 | |
Brink's | | | 56,845 | | | | 4,474 | |
Builders FirstSource* | | | 92,725 | | | | 2,020 | |
BWX Technologies, Cl W | | | 24,525 | | | | 1,484 | |
CAI International* | | | 52,054 | | | | 1,474 | |
Casella Waste Systems, Cl A* | | | 79,693 | | | | 1,835 | |
Celadon Group | | | 354,458 | | | | 2,269 | |
Chart Industries* | | | 44,192 | | | | 2,071 | |
The accompanying notes are an integral part of the financial statements.
43
| | |
| THE KP FUNDS | | December 31, 2017 |
| | | | | | | | |
| Description | | Shares | | | Value
(000) | |
CIRCOR International | | | 3,816 | | | $ | 186 | |
Columbus McKinnon | | | 110,159 | | | | 4,404 | |
Comfort Systems USA | | | 8,768 | | | | 383 | |
Commercial Vehicle Group* | | | 158,875 | | | | 1,698 | |
Covanta Holding | | | 160,476 | | | | 2,712 | |
Covenant Transportation Group, Cl A* | | | 120,662 | | | | 3,467 | |
CPI Aerostructures* | | | 165,592 | | | | 1,482 | |
Cubic | | | 5,953 | | | | 351 | |
Daseke* | | | 52,485 | | | | 750 | |
Deluxe | | | 42,400 | | | | 3,258 | |
DXP Enterprises* | | | 90,152 | | | | 2,666 | |
Dycom Industries* | | | 20,905 | | | | 2,329 | |
Echo Global Logistics* | | | 100,198 | | | | 2,806 | |
EMCOR Group | | | 51,280 | | | | 4,192 | |
Encore Wire | | | 5,018 | | | | 244 | |
Engility Holdings* | | | 4,529 | | | | 128 | |
EnPro Industries | | | 23,424 | | | | 2,190 | |
ESCO Technologies | | | 6,212 | | | | 374 | |
Essendant | | | 8,525 | | | | 79 | |
Exponent | | | 6,201 | | | | 441 | |
Federal Signal | | | 14,400 | | | | 289 | |
Forrester Research | | | 2,211 | | | | 98 | |
Forward Air | | | 24,475 | | | | 1,406 | |
Franklin Electric | | | 9,206 | | | | 423 | |
FTI Consulting* | | | 9,000 | | | | 387 | |
GATX | | | 48,990 | | | | 3,045 | |
Generac Holdings* | | | 22,755 | | | | 1,127 | |
General Cable | | | 77,730 | | | | 2,301 | |
Genesee & Wyoming, Cl A* | | | 20,935 | | | | 1,648 | |
Gibraltar Industries* | | | 12,121 | | | | 400 | |
Global Brass & Copper Holdings | | | 20,814 | | | | 689 | |
Greenbrier | | | 6,901 | | | | 368 | |
Griffon | | | 6,978 | | | | 142 | |
Harsco* | | | 19,323 | | | | 360 | |
Hawaiian Holdings | | | 12,537 | | | | 500 | |
Healthcare Services Group | | | 17,405 | | | | 918 | |
Heartland Express | | | 12,062 | | | | 282 | |
Heidrick & Struggles International | | | 4,300 | | | | 106 | |
Herc Holdings* | | | 21,960 | | | | 1,375 | |
Hillenbrand | | | 15,120 | | | | 676 | |
HNI | | | 70,598 | | | | 2,723 | |
Hub Group, Cl A* | | | 93,334 | | | | 4,471 | |
InnerWorkings* | | | 180,409 | | | | 1,810 | |
Insperity | | | 8,909 | | | | 511 | |
Insteel Industries | | | 4,085 | | | | 116 | |
Interface, Cl A | | | 94,915 | | | | 2,387 | |
ITT | | | 155,248 | | | | 8,286 | |
| | | | | | | | |
| Description | | Shares | | | Value
(000) | |
John Bean Technologies | | | 33,037 | | | $ | 3,661 | |
Kaman | | | 6,687 | | | | 393 | |
KBR | | | 190,771 | | | | 3,783 | |
Kelly Services, Cl A | | | 7,314 | | | | 199 | |
Kennametal | | | 22,300 | | | | 1,080 | |
Korn | | | 13,543 | | | | 560 | |
Lindsay | | | 2,471 | | | | 218 | |
LSC Communications | | | 8,000 | | | | 121 | |
Lydall* | | | 4,162 | | | | 211 | |
Marten Transport | | | 150,155 | | | | 3,048 | |
Matson | | | 9,933 | | | | 296 | |
Matthews International, Cl A | | | 32,937 | | | | 1,739 | |
McGrath RentCorp | | | 117,749 | | | | 5,532 | |
Mercury Systems* | | | 71,886 | | | | 3,691 | |
Meritor* | | | 74,180 | | | | 1,740 | |
Middleby* | | | 15,124 | | | | 2,041 | |
Milacron Holdings* | | | 202,170 | | | | 3,870 | |
Mobile Mini | | | 84,650 | | | | 2,920 | |
Moog, Cl A* | | | 47,782 | | | | 4,150 | |
Mueller Industries | | | 13,804 | | | | 489 | |
Multi-Color | | | 3,351 | | | | 251 | |
MYR Group* | | | 3,800 | | | | 136 | |
National Presto Industries | | | 1,301 | | | | 129 | |
Navigant Consulting* | | | 10,783 | | | | 209 | |
Navistar International* | | | 27,675 | | | | 1,187 | |
On Assignment* | | | 76,722 | | | | 4,931 | |
Orbital ATK | | | 7,907 | | | | 1,040 | |
Orion Group Holdings* | | | 8,200 | | | | 64 | |
Owens Corning | | | 18,100 | | | | 1,664 | |
Patrick Industries* | | | 5,741 | | | | 399 | |
PGT Innovations* | | | 11,992 | | | | 202 | |
Powell Industries | | | 2,010 | | | | 58 | |
Proto Labs* | | | 5,946 | | | | 612 | |
Quanex Building Products | | | 8,393 | | | | 196 | |
Quanta Services* | | | 41,445 | | | | 1,621 | |
Raven Industries | | | 8,715 | | | | 299 | |
RBC Bearings* | | | 13,532 | | | | 1,710 | |
Resources Connection | | | 7,100 | | | | 110 | |
Revolution Lighting Technologies* | | | 231,829 | | | | 763 | |
Roadrunner Transportation Systems* | | | 8,889 | | | | 69 | |
RR Donnelley & Sons | | | 16,300 | | | | 152 | |
Rush Enterprises, Cl A* | | | 32,875 | | | | 1,670 | |
Saia* | | | 35,304 | | | | 2,498 | |
Simpson Manufacturing | | | 79,458 | | | | 4,562 | |
SkyWest | | | 12,399 | | | | 658 | |
Snap-on | | | 21,370 | | | | 3,725 | |
SP Plus* | | | 49,888 | | | | 1,851 | |
The accompanying notes are an integral part of the financial statements.
44
| | |
| THE KP FUNDS | | December 31, 2017 |
| | | | | | | | |
| Description | | Shares | | | Value
(000) | |
SPX* | | | 10,253 | | | $ | 322 | |
SPX FLOW* | | | 10,183 | | | | 484 | |
Standex International | | | 2,996 | | | | 305 | |
Steelcase, Cl A | | | 188,537 | | | | 2,866 | |
Student Transportation | | | 140,069 | | | | 860 | |
Team* | | | 73,622 | | | | 1,097 | |
Tennant | | | 4,292 | | | | 312 | |
Terex | | | 33,819 | | | | 1,631 | |
Tetra Tech | | | 13,370 | | | | 644 | |
Titan International | | | 11,351 | | | | 146 | |
Titan Machinery* | | | 23,000 | | | | 487 | |
TransUnion* | | | 28,700 | | | | 1,577 | |
Trex* | | | 7,045 | | | | 764 | |
Triton International | | | 39,535 | | | | 1,481 | |
Triumph Group | | | 135,738 | | | | 3,692 | |
TrueBlue* | | | 9,713 | | | | 267 | |
UniFirst | | | 3,754 | | | | 619 | |
Univar* | | | 46,000 | | | | 1,424 | |
Universal Forest Products | | | 14,684 | | | | 552 | |
US Ecology | | | 5,264 | | | | 268 | |
Valmont Industries | | | 9,340 | | | | 1,549 | |
Veritiv* | | | 2,473 | | | | 71 | |
Viad | | | 4,916 | | | | 272 | |
Vicor* | | | 3,700 | | | | 77 | |
Wabash National | | | 67,368 | | | | 1,462 | |
WABCO Holdings* | | | 21,379 | | | | 3,068 | |
Wabtec | | | 15,940 | | | | 1,298 | |
WageWorks* | | | 9,496 | | | | 589 | |
Watts Water Technologies, Cl A | | | 6,668 | | | | 506 | |
Werner Enterprises | | | 37,695 | | | | 1,457 | |
YRC Worldwide* | | | 225,381 | | | | 3,241 | |
| | | | | | | | |
| | | | | | | 223,601 | |
| | | | | | | | |
Information Technology — 16.3% | | | | | | | | |
2U* | | | 40,808 | | | | 2,633 | |
8x8* | | | 22,125 | | | | 312 | |
ACI Worldwide* | | | 111,155 | | | | 2,520 | |
ADTRAN | | | 11,603 | | | | 225 | |
Advanced Energy Industries* | | | 29,065 | | | | 1,961 | |
Agilysys* | | | 4,400 | | | | 54 | |
Alarm.com Holdings* | | | 6,000 | | | | 227 | |
Alpha & Omega Semiconductor* | | | 300 | | | | 5 | |
Amkor Technology* | | | 342,450 | | | | 3,442 | |
Anixter International* | | | 6,887 | | | | 523 | |
Applied Optoelectronics* | | | 4,734 | | | | 179 | |
Aspen Technology* | | | 17,405 | | | | 1,152 | |
Attunity* | | | 131,200 | | | | 916 | |
| | | | | | | | |
| Description | | Shares | | | Value
(000) | |
Axcelis Technologies* | | | 7,579 | | | $ | 218 | |
Badger Meter | | | 7,000 | | | | 335 | |
Bandwidth, Cl A* | | | 40,043 | | | | 926 | |
Barracuda Networks* | | | 9,815 | | | | 270 | |
Bazaarvoice* | | | 394,082 | | | | 2,148 | |
Bel Fuse, Cl B | | | 2,556 | | | | 64 | |
Belden | | | 25,332 | | | | 1,955 | |
Benchmark Electronics* | | | 44,768 | | | | 1,303 | |
Blucora* | | | 11,119 | | | | 246 | |
Bottomline Technologies* | | | 59,638 | | | | 2,068 | |
Box, Cl A* | | | 47,455 | | | | 1,002 | |
Brooks Automation | | | 16,713 | | | | 399 | |
Cabot Microelectronics | | | 6,086 | | | | 573 | |
CACI International, Cl A* | | | 5,904 | | | | 781 | |
CalAmp* | | | 80,597 | | | | 1,727 | |
Cardtronics* | | | 11,033 | | | | 204 | |
CEVA* | | | 5,121 | | | | 236 | |
Cognex | | | 28,984 | | | | 1,773 | |
Coherent* | | | 4,110 | | | | 1,160 | |
Cohu | | | 6,900 | | | | 151 | |
Comtech Telecommunications | | | 5,400 | | | | 119 | |
Control4* | | | 4,776 | | | | 142 | |
CoStar Group* | | | 6,295 | | | | 1,869 | |
Cray* | | | 9,751 | | | | 236 | |
Cree* | | | 25,200 | | | | 936 | |
CSG Systems International | | | 7,914 | | | | 347 | |
CTS | | | 7,986 | | | | 206 | |
Cypress Semiconductor | | | 94,950 | | | | 1,447 | |
Daktronics | | | 9,800 | | | | 89 | |
DHI Group* | | | 14,897 | | | | 28 | |
Diebold Nixdorf | | | 157,148 | | | | 2,569 | |
Digi International* | | | 6,116 | | | | 58 | |
Diodes* | | | 9,285 | | | | 266 | |
DSP Group* | | | 5,000 | | | | 62 | |
DST Systems | | | 50,800 | | | | 3,153 | |
Ebix | | | 24,846 | | | | 1,969 | |
Electro Scientific Industries* | | | 8,145 | | | | 175 | |
Electronics For Imaging* | | | 180,108 | | | | 5,319 | |
Envestnet* | | | 30,890 | | | | 1,540 | |
ePlus* | | | 3,388 | | | | 255 | |
Euronet Worldwide* | | | 25,535 | | | | 2,152 | |
Everi Holdings* | | | 297,936 | | | | 2,246 | |
ExlService Holdings* | | | 8,151 | | | | 492 | |
Extreme Networks* | | | 87,490 | | | | 1,095 | |
Fabrinet* | | | 9,059 | | | | 260 | |
FARO Technologies* | | | 26,294 | | | | 1,236 | |
First Solar* | | | 17,257 | | | | 1,165 | |
The accompanying notes are an integral part of the financial statements.
45
| | |
| THE KP FUNDS | | December 31, 2017 |
| | | | | | | | |
| Description | | Shares | | | Value
(000) | |
Five9* | | | 110,999 | | | $ | 2,762 | |
FLIR Systems | | | 59,145 | | | | 2,757 | |
Gartner* | | | 8,773 | | | | 1,080 | |
Glu Mobile* | | | 256,170 | | | | 932 | |
Gogo* | | | 141,973 | | | | 1,601 | |
GrubHub* | | | 34,145 | | | | 2,452 | |
GTT Communications* | | | 42,320 | | | | 1,987 | |
Harmonic* | | | 18,427 | | �� | | 77 | |
Hortonworks* | | | 86,560 | | | | 1,741 | |
IAC* | | | 13,400 | | | | 1,639 | |
II-VI* | | | 13,034 | | | | 612 | |
Infinera* | | | 74,211 | | | | 470 | |
Insight Enterprises* | | | 29,250 | | | | 1,120 | |
Integrated Device Technology* | | | 54,365 | | | | 1,616 | |
InterXion Holding* | | | 32,285 | | | | 1,903 | |
IPG Photonics* | | | 10,370 | | | | 2,221 | |
Itron* | | | 34,083 | | | | 2,324 | |
KEMET* | | | 11,859 | | | | 179 | |
Knowles* | | | 72,340 | | | | 1,060 | |
Kopin* | | | 17,900 | | | | 57 | |
Kulicke & Soffa Industries* | | | 17,000 | | | | 414 | |
Liquidity Services* | | | 40,039 | | | | 194 | |
LivePerson* | | | 94,321 | | | | 1,085 | |
Lumentum Holdings* | | | 14,858 | | | | 727 | |
ManTech International, Cl A | | | 6,210 | | | | 312 | |
Marvell Technology Group | | | 53,085 | | | | 1,140 | |
Mattersight* | | | 657,797 | | | | 1,677 | |
MaxLinear, Cl A* | | | 14,648 | | | | 387 | |
Methode Electronics | | | 8,809 | | | | 353 | |
Microsemi* | | | 48,636 | | | | 2,512 | |
MicroStrategy, Cl A* | | | 2,245 | | | | 295 | |
Mimecast* | | | 93,645 | | | | 2,685 | |
MKS Instruments | | | 23,937 | | | | 2,262 | |
Model N* | | | 77,781 | | | | 1,225 | |
Monotype Imaging Holdings | | | 10,062 | | | | 242 | |
MTS Systems | | | 4,288 | | | | 230 | |
Nanometrics* | | | 5,858 | | | | 146 | |
NETGEAR* | | | 7,595 | | | | 446 | |
New Relic* | | | 21,680 | | | | 1,252 | |
NIC | | | 15,964 | | | | 265 | |
Novanta* | | | 26,951 | | | | 1,348 | |
Nutanix, Cl A* | | | 31,530 | | | | 1,112 | |
Oclaro* | | | 40,659 | | | | 274 | |
OSI Systems* | | | 4,295 | | | | 277 | |
Park Electrochemical | | | 4,278 | | | | 84 | |
PDF Solutions* | | | 6,900 | | | | 108 | |
Perficient* | | | 8,081 | | | | 154 | |
| | | | | | | | |
| Description | | Shares | | | Value
(000) | |
PFSweb* | | | 83,652 | | | $ | 622 | |
Photronics* | | | 15,800 | | | | 135 | |
Plexus* | | | 8,062 | | | | 490 | |
Power Integrations | | | 7,112 | | | | 523 | |
Progress Software | | | 11,467 | | | | 488 | |
Proofpoint* | | | 8,495 | | | | 754 | |
Pure Storage, Cl A* | | | 74,605 | | | | 1,183 | |
Qualys* | | | 7,652 | | | | 454 | |
QuinStreet* | | | 8,000 | | | | 67 | |
Radware* | | | 53,965 | | | | 1,047 | |
Rambus* | | | 26,239 | | | | 373 | |
RealPage* | | | 43,345 | | | | 1,920 | |
RingCentral, Cl A* | | | 86,505 | | | | 4,187 | |
Rogers* | | | 34,325 | | | | 5,558 | |
Rudolph Technologies* | | | 7,265 | | | | 174 | |
Sanmina* | | | 17,304 | | | | 571 | |
ScanSource* | | | 6,152 | | | | 220 | |
Semtech* | | | 15,829 | | | | 541 | |
ServiceNow* | | | 12,054 | | | | 1,572 | |
Shopify, Cl A* | | | 7,963 | | | | 804 | |
Shutterstock* | | | 4,249 | | | | 183 | |
SMART Global Holdings* | | | 24,765 | | | | 835 | |
SolarEdge Technologies* | | | 8,694 | | | | 326 | |
Splunk* | | | 14,614 | | | | 1,211 | |
SPS Commerce* | | | 4,014 | | | | 195 | |
Square, Cl A* | | | 54,575 | | | | 1,892 | |
Stamps.com* | | | 3,899 | | | | 733 | |
Super Micro Computer* | | | 9,215 | | | | 193 | |
Sykes Enterprises* | | | 9,604 | | | | 302 | |
Synchronoss Technologies* | | | 11,214 | | | | 100 | |
Take-Two Interactive Software* | | | 7,623 | | | | 837 | |
TeleTech Holdings | | | 3,273 | | | | 132 | |
Teradyne | | | 81,075 | | | | 3,395 | |
TiVo | | | 65,300 | | | | 1,019 | |
Trimble* | | | 58,250 | | | | 2,367 | |
TTM Technologies* | | | 21,966 | | | | 344 | |
Universal Display | | | 45,962 | | | | 7,935 | |
USA Technologies* | | | 107,470 | | | | 1,048 | |
Varonis Systems* | | | 33,745 | | | | 1,638 | |
VASCO Data Security International* | | | 6,863 | | | | 95 | |
Veeco Instruments* | | | 11,143 | | | | 165 | |
VeriFone Systems* | | | 68,977 | | | | 1,222 | |
Viavi Solutions* | | | 54,397 | | | | 475 | |
Virtusa* | | | 29,940 | | | | 1,320 | |
Vishay Intertechnology | | | 167,020 | | | | 3,466 | |
Vocera Communications* | | | 82,882 | | | | 2,505 | |
XO Group* | | | 6,175 | | | | 114 | |
The accompanying notes are an integral part of the financial statements.
46
| | |
| THE KP FUNDS | | December 31, 2017 |
| | | | | | | | |
| Description | | Shares | | | Value
(000) | |
Xperi | | | 224,463 | | | $ | 5,477 | |
Zebra Technologies, Cl A* | | | 20,702 | | | | 2,149 | |
Zendesk* | | | 32,050 | | | | 1,085 | |
Zynga, Cl A* | | | 83,765 | | | | 335 | |
| | | | | | | | |
| | | | | | | 175,691 | |
| | | | | | | | |
Materials — 6.4% | | | | | | | | |
A Schulman | | | 7,148 | | | | 266 | |
AdvanSix* | | | 7,325 | | | | 308 | |
AK Steel Holding* | | | 75,605 | | | | 428 | |
Alamos Gold, Cl A | | | 60,822 | | | | 396 | |
American Vanguard | | | 5,985 | | | | 118 | |
AptarGroup | | | 35,260 | | | | 3,042 | |
Avery Dennison | | | 34,535 | | | | 3,967 | |
Balchem | | | 7,658 | | | | 617 | |
Bemis | | | 54,050 | | | | 2,583 | |
Boise Cascade | | | 9,265 | | | | 370 | |
Calgon Carbon | | | 12,244 | | | | 261 | |
Carpenter Technology | | | 17,438 | | | | 889 | |
Celanese, Cl A | | | 11,900 | | | | 1,274 | |
Century Aluminum* | | | 12,012 | | | | 236 | |
Chemours | | | 46,400 | | | | 2,323 | |
Clearwater Paper* | | | 3,972 | | | | 180 | |
Commercial Metals | | | 277,604 | | | | 5,918 | |
Compass Minerals International | | | 60,407 | | | | 4,364 | |
Deltic Timber | | | 2,573 | | | | 236 | |
Eagle Materials | | | 14,980 | | | | 1,697 | |
Ferroglobe* | | | 278,442 | | | | 4,511 | |
Flotek Industries* | | | 15,998 | | | | 75 | |
FMC | | | 49,500 | | | | 4,686 | |
FutureFuel | | | 6,638 | | | | 94 | |
Hawkins | | | 2,181 | | | | 77 | |
Haynes International | | | 2,865 | | | | 92 | |
HB Fuller | | | 12,010 | | | | 647 | |
Ingevity* | | | 10,059 | | | | 709 | |
Innophos Holdings | | | 4,714 | | | | 220 | |
Innospec | | | 5,771 | | | | 407 | |
Kaiser Aluminum | | | 4,015 | | | | 429 | |
KapStone Paper and Packaging | | | 20,925 | | | | 475 | |
KMG Chemicals | | | 11,279 | | | | 745 | |
Koppers Holdings* | | | 4,830 | | | | 246 | |
Kraton* | | | 63,218 | | | | 3,045 | |
LSB Industries* | | | 5,985 | | | | 52 | |
Materion | | | 4,833 | | | | 235 | |
Mercer International | | | 110,898 | | | | 1,586 | |
Myers Industries | | | 4,972 | | | | 97 | |
Neenah Paper | | | 4,044 | | | | 367 | |
| | | | | | | | |
| Description | | Shares | | | Value
(000) | |
Olin | | | 23,117 | | | $ | 822 | |
Olympic Steel | | | 2,649 | | | | 57 | |
PH Glatfelter | | | 169,463 | | | | 3,633 | |
Quaker Chemical | | | 3,194 | | | | 482 | |
Rayonier Advanced Materials | | | 12,482 | | | | 255 | |
Schweitzer-Mauduit International | | | 7,391 | | | | 335 | |
Silgan Holdings | | | 147,773 | | | | 4,343 | |
Steel Dynamics | | | 38,000 | | | | 1,639 | |
Stepan | | | 4,754 | | | | 375 | |
Summit Materials, Cl A* | | | 57,265 | | | | 1,800 | |
SunCoke Energy* | | | 15,568 | | | | 187 | |
TimkenSteel* | | | 9,121 | | | | 139 | |
Tredegar | | | 5,776 | | | | 111 | |
US Concrete* | | | 23,928 | | | | 2,002 | |
US Silica Holdings | | | 19,416 | | | | 632 | |
Westlake Chemical | | | 36,440 | | | | 3,882 | |
| | | | | | | | |
| | | | | | | 68,962 | |
| | | | | | | | |
Real Estate — 3.7% | | | | | | | | |
Acadia Realty Trust‡ | | | 19,977 | | | | 547 | |
Agree Realty‡ | | | 7,026 | | | | 361 | |
American Assets Trust‡ | | | 9,903 | | | | 379 | |
Armada Hoffler Properties‡ | | | 10,319 | | | | 160 | |
Brandywine Realty Trust‡ | | | 110,519 | | | | 2,010 | |
CareTrust‡ | | | 18,226 | | | | 306 | |
CatchMark Timber Trust, Cl A‡ | | | 128,973 | | | | 1,693 | |
CBL & Associates Properties‡ | | | 41,251 | | | | 234 | |
Cedar Realty Trust‡ | | | 19,754 | | | | 120 | |
Chatham Lodging Trust‡ | | | 10,945 | | | | 249 | |
Chesapeake Lodging Trust‡ | | | 14,445 | | | | 391 | |
Community Healthcare Trust‡ | | | 54,527 | | | | 1,532 | |
Cousins Properties‡ | | | 171,744 | | | | 1,589 | |
DiamondRock Hospitality‡ | | | 47,937 | | | | 541 | |
Easterly Government Properties‡ | | | 10,400 | | | | 222 | |
EastGroup Properties‡ | | | 8,185 | | | | 723 | |
Education Realty Trust‡ | | | 76,524 | | | | 2,672 | |
Four Corners Property Trust‡ | | | 14,722 | | | | 378 | |
Franklin Street Properties‡ | | | 25,831 | | | | 277 | |
Getty Realty‡ | | | 7,968 | | | | 216 | |
Government Properties Income Trust‡ | | | 23,821 | | | | 442 | |
Hersha Hospitality Trust, Cl A‡ | | | 8,987 | | | | 156 | |
HFF, Cl A* | | | 8,822 | | | | 429 | |
Independence Realty Trust‡ | | | 20,166 | | | | 204 | |
Kite Realty Group Trust‡ | | | 20,091 | | | | 394 | |
Lexington Realty Trust‡ | | | 51,782 | | | | 500 | |
LTC Properties‡ | | | 9,517 | | | | 415 | |
The accompanying notes are an integral part of the financial statements.
47
| | |
| THE KP FUNDS | | December 31, 2017 |
| | | | | | | | |
| Description | | Shares | | | Value
(000) | |
MedEquities Realty Trust‡ | | | 119,545 | | | $ | 1,341 | |
National Storage Affiliates Trust‡ | | | 11,723 | | | | 320 | |
Outfront Media‡ | | | 162,504 | | | | 3,770 | |
Pennsylvania‡ | | | 16,887 | | | | 201 | |
PS Business Parks‡ | | | 4,774 | | | | 597 | |
QTS Realty Trust, Cl A‡ | | | 43,620 | | | | 2,362 | |
Ramco-Gershenson Properties Trust‡ | | | 19,115 | | | | 282 | |
Rayonier‡ | | | 89,201 | | | | 2,821 | |
RE/MAX Holdings, Cl A | | | 4,128 | | | | 200 | |
Retail Opportunity Investments‡ | | | 215,525 | | | | 4,300 | |
RLJ Lodging Trust‡ | | | 92,457 | | | | 2,031 | |
Saul Centers‡ | | | 2,807 | | | | 173 | |
STAG Industrial‡ | | | 48,372 | | | | 1,322 | |
Summit Hotel Properties‡ | | | 25,020 | | | | 381 | |
Taubman Centers‡ | | | 35,205 | | | | 2,304 | |
Universal Health Realty Income Trust‡ | | | 2,938 | | | | 221 | |
Urstadt Biddle Properties, Cl A‡ | | | 6,803 | | | | 148 | |
Whitestone, Cl B‡ | | | 9,000 | | | | 130 | |
| | | | | | | | |
| | | | | | | 40,044 | |
| | | | | | | | |
Telecommunication Services — 0.9% | | | | | | | | |
ATN International | | | 2,565 | | | | 142 | |
Boingo Wireless* | | | 71,566 | | | | 1,610 | |
Cincinnati Bell* | | | 10,181 | | | | 212 | |
Cogent Communications Holdings | | | 9,942 | | | | 450 | |
Consolidated Communications Holdings | | | 15,535 | | | | 189 | |
Frontier Communications | | | 18,600 | | | | 126 | |
General Communication, Cl A* | | | 6,372 | | | | 249 | |
Hawaiian Telcom Holdco* | | | 18,385 | | | | 567 | |
Iridium Communications* | | | 20,082 | | | | 237 | |
Loral Space & Communications* | | | 68,830 | | | | 3,032 | |
Spok Holdings | | | 4,500 | | | | 71 | |
Vonage Holdings* | | | 244,945 | | | | 2,491 | |
| | | | | | | | |
| | | | | | | 9,376 | |
| | | | | | | | |
Utilities — 1.3% | | | | | | | | |
ALLETE | | | 40,817 | | | | 3,035 | |
American States Water | | | 8,816 | | | | 511 | |
AquaVenture Holdings* | | | 65,807 | | | | 1,021 | |
Avista | | | 15,333 | | | | 789 | |
California Water Service Group | | | 11,489 | | | | 521 | |
Dynegy, Cl A* | | | 347,566 | | | | 4,119 | |
El Paso Electric | | | 9,697 | | | | 537 | |
Northwest Natural Gas | | | 6,863 | | | | 409 | |
South Jersey Industries | | | 19,074 | | | | 596 | |
Spire | | | 11,485 | | | | 863 | |
| | | | | | | | |
| Description | | Shares | | | Value
(000) | |
Unitil | | | 24,861 | | | $ | 1,134 | |
| | | | | | | | |
| | | | | | | 13,535 | |
| | | | | | | | |
Total Common Stock
(Cost $895,225) (000) | | | | | | | 1,040,174 | |
| | | | | | | | |
EXCHANGE TRADED FUNDS — 0.3% | |
iShares Russell 2000 ETF | | | 10,889 | | | | 1,660 | |
iShares Russell 2000 Value ETF | | | 10,996 | | | | 1,383 | |
| | | | | | | | |
Total Exchange Traded Funds
(Cost $2,557) (000) | | | | | | | 3,043 | |
| | | | | | | | |
RIGHTS — 0.0% | | | | | | | | |
| | | Number of
Rights | | | | |
Chelsea Therapeutics International*† (B) | | | 2,000 | | | | — | |
Durata Therapeutics*† (B) | | | 900 | | | | — | |
Dyax, Expires 12/31/2019* (B) | | | 12,613 | | | | 31 | |
Media General*† (B) | | | 9,318 | | | | 1 | |
Tobira Therapeutics, Expires 12/31/2028* (B) | | | 900 | | | | — | |
| | | | | | | | |
Total Rights
(Cost $—) (000) | | | | | | | 32 | |
| | | | | | | | |
SHORT-TERM INVESTMENT — 3.2% | |
| | | Shares | | | | |
State Street Institutional Treasury Money Market Fund, Cl Institutional, 1.160% (C) | | | 34,334,138 | | | | 34,334 | |
| | | | | | | | |
Total Short-Term Investment
(Cost $34,334) (000) | | | | | | | 34,334 | |
| | | | | | | | |
Total Investments In Securities — 100.2%
(Cost $932,116) (000) | | | | | | $ | 1,077,583 | |
| | | | | | | | |
Percentages are based on net assets of $1,075,158 (000).
A list of the open futures contracts held by the Fund at December 31, 2017, is as follows (000):
| | | | | | | | | | | | | | | | | | |
| Type of Contract | | Number
of
Contracts
Long | | | Expiration
Date | | Notional
Amount | | | Value | | | Unrealized
Appreciation | |
| Russell 2000 Index E-MINI | | | 110 | | | Mar-2018 | | $ | 8,411 | | | $ | 8,451 | | | $ | 40 | |
| | | | | | | | | | | | | | | | | | |
| * | Non-income producing security. |
| ‡ | Real Estate Investment Trust |
| † | Currently, expiration date is unavailable. |
| (A) | Security considered Master Limited Partnership. At December 31, 2017, this security amounted to $436 (000) or 0.0% of Net Assets. |
| (B) | Level 3 security fair valued using methods determined in good faith by the Fair Value Committee of the Board of Trustees. The total value of such securities as of December 31, 2017, was $32 (000) and represented 0.0% of Net Assets. |
| (C) | The rate reported is the 7-day effective yield as of December 31, 2017. |
The accompanying notes are an integral part of the financial statements.
48
| | |
| THE KP FUNDS | | December 31, 2017 |
ADR — American Depositary Receipt
Cl — Class
ETF — Exchange Traded Fund
The following is a list of the level of inputs used as of December 31, 2017, in valuing the Fund’s investments and other financial instruments carried at value (000):
| | | | | | | | | | | | | | | | |
| Investments in Securities | | Level 1 | | | Level 2 | | | Level 3^ | | | Total | |
Common Stock | | $ | 1,040,174 | | | $ | — | | | $ | — | | | $ | 1,040,174 | |
Exchange Traded Funds | | | 3,043 | | | | — | | | | — | | | | 3,043 | |
Rights | | | — | | | | — | | | | 32 | | | | 32 | |
Short-Term Investment | | | 34,334 | | | | — | | | | — | | | | 34,334 | |
| | | | | | | | | | | | | | | | |
Total Investments in Securities | | $ | 1,077,551 | | | $ | — | | | $ | 32 | | | $ | 1,077,583 | |
| | | | | | | | | | | | | | | | |
| | | | |
| Other Financial Instruments | | Level 1 | | | Level 2 | | | Level 3 | | | Total | |
Futures Contracts** | | | | | | | | | | | | | | | | |
Unrealized Appreciation | | $ | 40 | | | $ | — | | | $ | — | | | $ | 40 | |
| | | | | | | | | | | | | | | | |
Total Other Financial Instruments | | $ | 40 | | | $ | — | | | $ | — | | | $ | 40 | |
| | | | | | | | | | | | | | | | |
| ** | Futures contracts are valued at the unrealized appreciation on the instrument. |
| ^ | A reconciliation of Level 3 investments and disclosures of significant unobservable inputs are presented when the Fund has a significant amount of Level 3 investments at the beginning and/or end of the year in relation to net assets. Management has concluded that Level 3 investments are not material in relation to net assets. |
For the year ended December 31, 2017, there were no transfers between Level 1 and Level 2 assets and liabilities. For the year ended December 31, 2017, there were no transfers in and out of Level 3. All transfers, if any, are recognized by the Fund at the end of the year.
Amounts designated as “—” are $0 or have been rounded to $0.
The accompanying notes are an integral part of the financial statements.
49
| | |
| THE KP FUNDS | | December 31, 2017 |
| | |
| KP International Equity Fund | | |
|
| SECTOR WEIGHTINGS† (unaudited) |
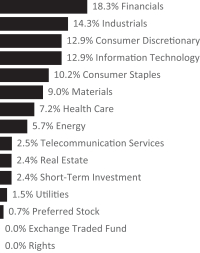
| † | Percentages based on total investments. |
| | | | | | | | |
| Description | | Shares | | | Value
(000) | |
COMMON STOCK — 96.1% | |
Australia — 3.0% | |
Abacus Property Group‡ | | | 18,202 | | | $ | 59 | |
Accent Group | | | 15,190 | | | | 10 | |
Aconex* | | | 8,021 | | | | 48 | |
Adelaide Brighton | | | 21,328 | | | | 109 | |
AGL Energy | | | 11,117 | | | | 211 | |
Ainsworth Game Technology* | | | 5,399 | | | | 9 | |
ALS | | | 140,835 | | | | 768 | |
Altium | | | 5,875 | | | | 61 | |
Alumina | | | 470,141 | | | | 891 | |
Amcor | | | 32,754 | | | | 394 | |
AMP | | | 50,603 | | | | 205 | |
Ansell | | | 7,351 | | | | 140 | |
APA Group | | | 18,722 | | | | 122 | |
APN Outdoor Group | | | 7,424 | | | | 29 | |
ARB | | | 3,836 | | | | 56 | |
Ardent Leisure Group | | | 22,473 | | | | 35 | |
Aristocrat Leisure | | | 9,435 | | | | 174 | |
Asaleo Care | | | 280,915 | | | | 329 | |
ASX | | | 3,148 | | | | 135 | |
Aurizon Holdings | | | 33,365 | | | | 129 | |
Ausdrill | | | 25,524 | | | | 52 | |
AusNet Services | | | 26,599 | | | | 37 | |
Austal | | | 12,906 | | | | 18 | |
Australia & New Zealand Banking Group | | | 166,512 | | | | 3,733 | |
| | | | | | | | |
| Description | | Shares | | | Value
(000) | |
Australian Agricultural* | | | 20,716 | | | $ | 21 | |
Australian Pharmaceutical Industries | | | 19,473 | | | | 26 | |
Automotive Holdings Group | | | 12,095 | | | | 34 | |
Aventus Retail Property Fund‡ | | | 11,201 | | | | 20 | |
Aveo Group | | | 21,860 | | | | 46 | |
Bank of Queensland | | | 6,607 | | | | 66 | |
Bapcor | | | 14,045 | | | | 62 | |
Beach Energy | | | 108,085 | | | | 105 | |
Bega Cheese | | | 8,574 | | | | 48 | |
Bellamy’s Australia* | | | 3,993 | | | | 33 | |
Bendigo & Adelaide Bank | | | 8,051 | | | | 73 | |
BHP Billiton | | | 68,359 | | | | 1,576 | |
Blackmores | | | 676 | | | | 89 | |
BlueScope Steel | | | 100,169 | | | | 1,200 | |
Boral | | | 20,132 | | | | 122 | |
Brambles | | | 26,961 | | | | 212 | |
Breville Group | | | 4,591 | | | | 45 | |
Brickworks | | | 4,260 | | | | 49 | |
BT Investment Management | | | 9,345 | | | | 82 | |
BWP Trust‡ | | | 30,570 | | | | 74 | |
Caltex Australia | | | 17,869 | | | | 475 | |
carsales.com | | | 57,124 | | | | 645 | |
Cedar Woods Properties | | | 2,353 | | | | 11 | |
Centuria Industrial‡ | | | 11,160 | | | | 22 | |
Challenger | | | 9,778 | | | | 107 | |
Charter Hall Group‡ | | | 22,471 | | | | 106 | |
Charter Hall Long Wale‡ | | | 5,923 | | | | 19 | |
Charter Hall Retail‡ | | | 16,316 | | | | 53 | |
CIMIC Group | | | 1,699 | | | | 68 | |
Cleanaway Waste Management | | | 858,909 | | | | 1,005 | |
Coca-Cola Amatil | | | 112,192 | | | | 745 | |
Cochlear | | | 935 | | | | 125 | |
Commonwealth Bank of Australia | | | 29,665 | | | | 1,860 | |
Computershare | | | 7,832 | | | | 100 | |
Corporate Travel Management | | | 3,588 | | | | 58 | |
Costa Group Holdings | | | 12,822 | | | | 66 | |
Credit Group | | | 2,528 | | | | 44 | |
Cromwell Property Group‡ | | | 74,113 | | | | 58 | |
Crown Resorts | | | 5,974 | | | | 61 | |
CSL | | | 7,764 | | | | 856 | |
CSR | | | 24,573 | | | | 91 | |
Dexus‡ | | | 17,094 | | | | 130 | |
Domain Holdings Australia* | | | 65,240 | | | | 175 | |
Domino’s Pizza Enterprises | | | 914 | | | | 33 | |
Donaco International | | | 25,064 | | | | 7 | |
Downer EDI | | | 30,087 | | | | 163 | |
DuluxGroup | | | 96,833 | | | | 578 | |
The accompanying notes are an integral part of the financial statements.
50
| | |
| THE KP FUNDS | | December 31, 2017 |
| | |
| KP International Equity Fund | | |
| | | | | | | | |
| Description | | Shares | | | Value
(000) | |
Eclipx Group | | | 12,958 | | | $ | 41 | |
Estia Health | | | 12,273 | | | | 33 | |
Evolution Mining | | | 58,645 | | | | 121 | |
Fairfax Media | | | 652,410 | | | | 398 | |
FlexiGroup | | | 14,134 | | | | 19 | |
Flight Centre Travel Group | | | 1,077 | | | | 37 | |
Folkestone Education Trust‡ | | | 8,496 | | | | 19 | |
Fortescue Metals Group | | | 26,803 | | | | 102 | |
Freedom Foods Group | | | 3,672 | | | | 15 | |
G8 Education | | | 20,732 | | | | 55 | |
Galaxy Resources* | | | 18,998 | | | | 57 | |
Gateway Lifestyle | | | 16,502 | | | | 28 | |
GDI Property Group‡ | | | 19,097 | | | | 19 | |
Genworth Mortgage Insurance Australia | | | 14,780 | | | | 35 | |
Goodman Group‡ | | | 30,546 | | | | 200 | |
GPT Group‡ | | | 30,983 | | | | 124 | |
GrainCorp, Cl A | | | 12,152 | | | | 77 | |
Greencross | | | 4,688 | | | | 23 | |
Growthpoint Properties Australia‡ | | | 13,544 | | | | 36 | |
GUD Holdings | | | 57,902 | | | | 551 | |
GWA Group | | | 7,400 | | | | 16 | |
Hansen Technologies | | | 6,846 | | | | 21 | |
Harvey Norman Holdings | | | 11,807 | | | | 38 | |
Healthscope | | | 33,196 | | | | 54 | |
HT&E | | | 13,604 | | | | 20 | |
IDP Education | | | 5,550 | | | | 27 | |
Iluka Resources | | | 48,185 | | | | 382 | |
Incitec Pivot | | | 28,454 | | | | 87 | |
Independence Group NL | | | 24,101 | | | | 90 | |
Infigen Energy* | | | 49,136 | | | | 26 | |
Inghams Group | | | 8,068 | | | | 22 | |
Insurance Australia Group | | | 40,117 | | | | 227 | |
Investa Office Fund‡* | | | 26,337 | | | | 94 | |
InvoCare | | | 5,573 | | | | 70 | |
IOOF Holdings | | | 14,794 | | | | 124 | |
IPH | | | 37,919 | | | | 163 | |
IRESS | | | 7,670 | | | | 69 | |
James Hardie Industries | | | 7,566 | | | | 134 | |
Japara Healthcare | | | 11,253 | | | | 17 | |
JB Hi-Fi | | | 5,744 | | | | 112 | |
Karoon Gas Australia* | | | 10,804 | | | | 11 | |
Lend Lease Group | | | 9,531 | | | | 122 | |
Link Administration Holdings | | | 23,073 | | | | 152 | |
Macquarie Atlas Roads Group | | | 29,949 | | | | 147 | |
Macquarie Group | | | 5,448 | | | | 424 | |
Magellan Financial Group | | | 5,960 | | | | 125 | |
| | | | | | | | |
| Description | | Shares | | | Value
(000) | |
Mantra Group | | | 15,612 | | | $ | 48 | |
Mayne Pharma Group* | | | 61,782 | | | | 34 | |
McMillan Shakespeare | | | 3,811 | | | | 52 | |
Medibank | | | 47,218 | | | | 121 | |
Mesoblast* | | | 16,915 | | | | 19 | |
Metcash | | | 170,755 | | | | 416 | |
Michael Hill International | | | 10,400 | | | | 10 | |
Mineral Resources | | | 7,968 | | | | 131 | |
Mirvac Group‡ | | | 63,705 | | | | 117 | |
Monadelphous Group | | | 4,546 | | | | 62 | |
Myer Holdings | | | 38,418 | | | | 20 | |
MYOB Group | | | 19,451 | | | | 55 | |
Nanosonics* | | | 14,941 | | | | 32 | |
National Australia Bank | | | 111,210 | | | | 2,565 | |
National Storage‡ | | | 32,269 | | | | 39 | |
Navitas | | | 12,319 | | | | 52 | |
Newcrest Mining | | | 51,254 | | | | 913 | |
NEXTDC* | | | 14,296 | | | | 67 | |
Nine Entertainment Holdings | | | 36,217 | | | | 43 | |
Northern Star Resources | | | 30,348 | | | | 144 | |
Nufarm | | | 12,548 | | | | 86 | |
OFX Group | | | 10,103 | | | | 11 | |
Oil Search | | | 23,064 | | | | 140 | |
oOh!media | | | 7,485 | | | | 26 | |
Orica | | | 130,293 | | | | 1,839 | |
Origin Energy* | | | 29,766 | | | | 219 | |
Orocobre* | | | 8,564 | | | | 47 | |
Orora | | | 91,113 | | | | 241 | |
OZ Minerals | | | 15,079 | | | | 108 | |
Pact Group Holdings | | | 11,705 | | | | 52 | |
Perpetual | | | 2,404 | | | | 91 | |
Pilbara Minerals* | | | 61,940 | | | | 54 | |
Platinum Asset Management | | | 11,702 | | | | 70 | |
Premier Investments | | | 5,104 | | | | 59 | |
Primary Health Care | | | 22,786 | | | | 64 | |
QBE Insurance Group | | | 63,750 | | | | 531 | |
Qube Holdings | | | 94,277 | | | | 191 | |
Ramsay Health Care | | | 2,379 | | | | 131 | |
REA Group | | | 970 | | | | 58 | |
Regis Healthcare | | | 9,607 | | | | 26 | |
Regis Resources | | | 23,419 | | | | 79 | |
Reliance Worldwide | | | 19,301 | | | | 59 | |
Resolute Mining | | | 32,105 | | | | 29 | |
Retail Food Group | | | 7,033 | | | | 14 | |
Rio Tinto | | | 7,151 | | | | 423 | |
Sandfire Resources NL | | | 8,287 | | | | 45 | |
Santos* | | | 58,486 | | | | 249 | |
The accompanying notes are an integral part of the financial statements.
51
| | |
| THE KP FUNDS | | December 31, 2017 |
| | |
| KP International Equity Fund | | |
| | | | | | | | |
| Description | | Shares | | | Value
(000) | |
Saracen Mineral Holdings* | | | 38,988 | | | $ | 51 | |
Scentre Group‡ | | | 89,934 | | | | 293 | |
SEEK | | | 5,755 | | | | 85 | |
Select Harvests | | | 3,187 | | | | 12 | |
Seven Group Holdings | | | 5,914 | | | | 71 | |
Seven West Media | | | 46,648 | | | | 22 | |
SG Fleet Group | | | 4,472 | | | | 14 | |
Shopping Centres Australasia Property Group‡ | | | 42,072 | | | | 76 | |
Sigma Healthcare | | | 193,146 | | | | 150 | |
Sims Metal Management | | | 8,463 | | | | 104 | |
Sirtex Medical | | | 2,990 | | | | 39 | |
SmartGroup | | | 4,068 | | | | 34 | |
Sonic Healthcare | | | 6,823 | | | | 122 | |
South32 | | | 82,516 | | | | 225 | |
Southern Cross Media Group | | | 39,666 | | | | 37 | |
Spark Infrastructure Group | | | 86,330 | | | | 170 | |
SpeedCast International | | | 9,445 | | | | 40 | |
St. Barbara | | | 25,708 | | | | 77 | |
Star Entertainment Grp | | | 39,579 | | | | 188 | |
Steadfast Group | | | 39,053 | | | | 86 | |
Stockland‡ | | | 39,328 | | | | 137 | |
Suncorp Group | | | 21,886 | | | | 237 | |
Super Retail Group | | | 6,649 | | | | 43 | |
Sydney Airport | | | 18,902 | | | | 104 | |
Syrah Resources* | | | 13,134 | | | | 46 | |
Tabcorp Holdings | | | 33,306 | | | | 145 | |
Tassal Group | | | 9,223 | | | | 27 | |
Technology One | | | 12,851 | | | | 50 | |
Telstra | | | 72,181 | | | | 205 | |
Tox Free Solutions | | | 8,146 | | | | 22 | |
TPG Telecom | | | 6,725 | | | | 34 | |
Transurban Group | | | 34,687 | | | | 336 | |
Treasury Wine Estates | | | 12,848 | | | | 160 | |
Vicinity Centres‡ | | | 57,907 | | | | 123 | |
Village Roadshow* | | | 3,387 | | | | 10 | |
Virtus Health | | | 3,028 | | | | 12 | |
Viva Energy‡ | | | 25,338 | | | | 45 | |
Vocus Communications | | | 32,193 | | | | 76 | |
Washington H Soul Pattinson | | | 8,510 | | | | 118 | |
Webjet | | | 4,926 | | | | 40 | |
Wesfarmers | | | 19,473 | | | | 674 | |
Western Areas | | | 12,164 | | | | 31 | |
Westfield‡ | | | 33,463 | | | | 247 | |
Westgold Resources* | | | 9,066 | | | | 13 | |
Westpac Banking | | | 58,167 | | | | 1,423 | |
Whitehaven Coal | | | 25,874 | | | | 90 | |
| | | | | | | | |
| Description | | Shares | | | Value
(000) | |
WiseTech Global | | | 4,090 | | | $ | 45 | |
Woodside Petroleum | | | 14,518 | | | | 375 | |
Woolworths Group | | | 149,518 | | | | 3,184 | |
WorleyParsons* | | | 12,750 | | | | 143 | |
WPP AUNZ | | | 14,271 | | | | 10 | |
| | | | | | | | |
| | | | | | | 44,145 | |
| | | | | | | | |
Austria — 0.2% | |
ANDRITZ | | | 4,428 | | | | 250 | |
AT&S Austria Technologie & Systemtechnik | | | 1,415 | | | | 40 | |
BUWOG* | | | 5,357 | | | | 185 | |
DO & CO | | | 293 | | | | 17 | |
Erste Group Bank* | | | 5,100 | | | | 221 | |
EVN | | | 2,278 | | | | 46 | |
FACC* | �� | | 847 | | | | 18 | |
Immobilien Anlagen | | | 4,026 | | | | 125 | |
IMMOFINANZ | | | 42,036 | | | | 108 | |
Kapsch TrafficCom | | | 173 | | | | 10 | |
Lenzing | | | 677 | | | | 86 | |
Oesterreichische Post | | | 7,890 | | | | 354 | |
OMV | | | 2,562 | | | | 162 | |
Porr Ag | | | 491 | | | | 16 | |
Raiffeisen Bank International* | | | 2,496 | | | | 90 | |
Rhi Magnesita* | | | 1,300 | | | | 68 | |
S IMMO | | | 2,508 | | | | 49 | |
Schoeller-Bleckmann Oilfield Equipment* | | | 570 | | | | 58 | |
Semperit Holding | | | 396 | | | | 11 | |
Telekom Austria, Cl A* | | | 8,717 | | | | 81 | |
UNIQA Insurance Group | | | 6,958 | | | | 74 | |
Vienna Insurance Group Wiener Versicherung Gruppe | | | 2,049 | | | | 63 | |
Voestalpine | | | 1,933 | | | | 116 | |
Wienerberger | | | 26,817 | | | | 648 | |
Zumtobel Group | | | 1,488 | | | | 18 | |
| | | | | | | | |
| | | | | | | 2,914 | |
| | | | | | | | |
Belgium — 0.6% | |
Ablynx* | | | 3,484 | | | | 87 | |
Ackermans & van Haaren | | | 1,189 | | | | 206 | |
Aedifica‡ | | | 836 | | | | 79 | |
Ageas | | | 3,280 | | | | 160 | |
AGFA-Gevaert* | | | 8,255 | | | | 38 | |
Anheuser-Busch InBev | | | 24,464 | | | | 2,734 | |
Barco | | | 490 | | | | 52 | |
Befimmo‡ | | | 1,222 | | | | 79 | |
Bekaert | | | 1,854 | | | | 81 | |
Biocartis* (A) | | | 861 | | | | 12 | |
The accompanying notes are an integral part of the financial statements.
52
| | |
| THE KP FUNDS | | December 31, 2017 |
| | |
| KP International Equity Fund | | |
| | | | | | | | |
| Description | | Shares | | | Value
(000) | |
bpost | | | 5,086 | | | $ | 155 | |
Cie d’Entreprises CFE | | | 388 | | | | 57 | |
Cofinimmo‡ | | | 1,140 | | | | 150 | |
Colruyt | | | 897 | | | | 47 | |
D’ieteren | | | 1,278 | | | | 58 | |
Econocom Group* | | | 6,368 | | | | 46 | |
Elia System Operator | | | 1,744 | | | | 100 | |
Euronav | | | 6,350 | | | | 58 | |
EVS Broadcast Equipment | | | 832 | | | | 29 | |
Exmar* | | | 1,664 | | | | 13 | |
Fagron* | | | 2,058 | | | | 28 | |
Gimv | | | 1,200 | | | | 73 | |
Greenyard | | | 625 | | | | 15 | |
Groupe Bruxelles Lambert | | | 1,312 | | | | 142 | |
Intervest Offices & Warehouses‡ | | | 370 | | | | 10 | |
Ion Beam Applications | | | 910 | | | | 26 | |
KBC Ancora | | | 1,710 | | | | 108 | |
KBC Group | | | 37,912 | | | | 3,235 | |
Kinepolis Group | | | 847 | | | | 57 | |
Melexis | | | 1,058 | | | | 107 | |
Nyrstar* | | | 3,628 | | | | 29 | |
Ontex Group | | | 4,363 | | | | 144 | |
Orange Belgium | | | 1,549 | | | | 33 | |
Proximus | | | 2,600 | | | | 85 | |
Sioen Industries | | | 310 | | | | 11 | |
Sofina | | | 786 | | | | 124 | |
Solvay | | | 1,288 | | | | 179 | |
Telenet Group Holding* | | | 923 | | | | 64 | |
Tessenderlo Group* | | | 1,528 | | | | 71 | |
UCB | | | 2,198 | | | | 175 | |
Umicore | | | 3,096 | | | | 147 | |
Van de Velde | | | 209 | | | | 11 | |
Warehouses De Pauw CVA‡ | | | 892 | | | | 100 | |
| | | | | | | | |
| | | | | | | 9,215 | |
| | | | | | | | |
Brazil — 1.7% | |
Ambev ADR | | | 676,472 | | | | 4,369 | |
Arezzo Industria e Comercio | | | 22,100 | | | | 364 | |
Atacadao Distribuicao Comercio e Industria Ltda* | | | 215,600 | | | | 991 | |
B2W Cia Digital* | | | 54,815 | | | | 339 | |
Banco Bradesco ADR* | | | 410,300 | | | | 4,201 | |
Banco BTG Pactual* | | | 51,079 | | | | 292 | |
Banco do Brasil* | | | 30,100 | | | | 289 | |
BM&FBovespa — Bolsa de Valores Mercadorias e Futuros* | | | 197,800 | | | | 1,358 | |
Embraer | | | 40,197 | | | | 242 | |
Estacio Participacoes | | | 49,600 | | | | 491 | |
| | | | | | | | |
| Description | | Shares | | | Value
(000) | |
Grendene | | | 122,100 | | | $ | 1,047 | |
IRB Brasil Resseguros S* | | | 20,000 | | | | 205 | |
Lojas Renner | | | 102,300 | | | | 1,095 | |
LPS Brasil Consultoria de Imoveis* | | | 120,635 | | | | 203 | |
Magazine Luiza | | | 9,100 | | | | 220 | |
MRV Engenharia e Participacoes | | | 187,200 | | | | 849 | |
Natura Cosmeticos | | | 113,827 | | | | 1,134 | |
Porto Seguro* | | | 103,313 | | | | 1,132 | |
Qualicorp | | | 28,200 | | | | 264 | |
Raia Drogasil* | | | 75,100 | | | | 2,079 | |
TOTVS | | | 81,400 | | | | 733 | |
Ultrapar Participacoes | | | 40,500 | | | | 916 | |
Vale* | | | 36,300 | | | | 441 | |
Vale, Cl B ADR* | | | 120,124 | | | | 1,469 | |
Via Varejo* | | | 105,000 | | | | 775 | |
Vulcabras Azaleia* | | | 13,000 | | | | 36 | |
| | | | | | | | |
| | | | | | | 25,534 | |
| | | | | | | | |
Canada — 4.5% | |
Advantage Oil & Gas* | | | 9,800 | | | | 42 | |
Aecon Group | | | 3,200 | | | | 51 | |
Ag Growth International | | | 900 | | | | 38 | |
AGF Management, Cl B | | | 3,300 | | | | 21 | |
Agnico Eagle Mines | | | 3,800 | | | | 175 | |
Agrium | | | 2,300 | | | | 265 | |
AGT Food & Ingredients | | | 1,100 | | | | 18 | |
Aimia* | | | 8,100 | | | | 24 | |
Alacer Gold* | | | 16,300 | | | | 29 | |
Alamos Gold, Cl A | | | 26,370 | | | | 172 | |
Alaris Royalty | | | 2,000 | | | | 33 | |
Algonquin Power & Utilities | | | 19,500 | | | | 219 | |
Alimentation Couche-Tard, Cl B | | | 26,058 | | | | 1,361 | |
Allied Properties‡ | | | 2,300 | | | | 77 | |
AltaGas | | | 3,000 | | | | 68 | |
Altius Minerals | | | 2,300 | | | | 27 | |
Altus Group | | | 1,800 | | | | 53 | |
Aphria* | | | 7,500 | | | | 112 | |
ARC Resources | | | 6,200 | | | | 73 | |
Aritzia* | | | 3,200 | | | | 32 | |
Artis‡ | | | 3,700 | | | | 42 | |
Atco, Cl I | | | 1,300 | | | | 47 | |
Athabasca Oil* | | | 23,900 | | | | 20 | |
Atlantic Power* | | | 6,900 | | | | 16 | |
ATS Automation Tooling Systems* | | | 3,900 | | | | 48 | |
Aurora Cannabis* | | | 17,800 | | | | 136 | |
AutoCanada | | | 1,400 | | | | 25 | |
Avigilon* | | | 2,100 | | | | 35 | |
The accompanying notes are an integral part of the financial statements.
53
| | |
| THE KP FUNDS | | December 31, 2017 |
| | |
| KP International Equity Fund | | |
| | | | | | | | |
| Description | | Shares | | | Value
(000) | |
B2Gold* | | | 48,800 | | | $ | 151 | |
Badger Daylighting | | | 1,900 | | | | 41 | |
Ballard Power Systems* | | | 10,900 | | | | 48 | |
Bank of Montreal | | | 11,100 | | | | 888 | |
Bank of Nova Scotia | | | 56,600 | | | | 3,653 | |
Barrick Gold | | | 69,157 | | | | 1,000 | |
Baytex Energy* | | | 13,200 | | | | 40 | |
BCE | | | 16,510 | | | | 793 | |
Birchcliff Energy | | | 11,900 | | | | 42 | |
Bird Construction | | | 2,100 | | | | 17 | |
BlackBerry* | | | 8,700 | | | | 97 | |
Boardwalk‡ | | | 1,100 | | | | 38 | |
Bombardier* | | | 33,500 | | | | 81 | |
Bonavista Energy | | | 13,700 | | | | 25 | |
Bonterra Energy | | | 1,100 | | | | 13 | |
Boralex | | | 3,000 | | | | 56 | |
Brookfield Asset Management, Cl A | | | 64,141 | | | | 2,792 | |
BRP | | | 2,100 | | | | 77 | |
CAE | | | 185,800 | | | | 3,451 | |
Cameco | | | 6,900 | | | | 64 | |
Canaccord Genuity Group | | | 6,500 | | | | 30 | |
Canacol Energy* | | | 7,100 | | | | 25 | |
Canada Goose Holdings* | | | 2,300 | | | | 73 | |
Canadian Apartment Properties‡ | | | 3,300 | | | | 98 | |
Canadian Imperial Bank of Commerce | | | 7,500 | | | | 731 | |
Canadian National Railway | | | 12,900 | | | | 1,064 | |
Canadian Natural Resources | | | 71,975 | | | | 2,572 | |
Canadian Pacific Railway | | | 7,582 | | | | 1,385 | |
Canadian Real Estate Investment Trust‡ | | | 1,800 | | | | 66 | |
Canadian Tire, Cl A | | | 1,100 | | | | 143 | |
Canadian Utilities, Cl A | | | 2,200 | | | | 65 | |
Canadian Western Bank | | | 4,500 | | | | 141 | |
Canfor* | | | 3,600 | | | | 71 | |
Canfor Pulp Products | | | 1,700 | | | | 18 | |
Canopy Growth* | | | 8,300 | | | | 195 | |
Capital Power | | | 5,300 | | | | 103 | |
Cara Operations | | | 1,400 | | | | 29 | |
Cardinal Energy | | | 5,400 | | | | 22 | |
Cascades | | | 3,500 | | | | 38 | |
CCL Industries, Cl B | | | 2,400 | | | | 110 | |
Celestica* | | | 6,000 | | | | 64 | |
Cenovus Energy | | | 18,200 | | | | 166 | |
Centerra Gold* | | | 11,300 | | | | 58 | |
CES Energy Solutions | | | 13,500 | | | | 69 | |
CGI Group, Cl A* | | | 3,500 | | | | 190 | |
| | | | | | | | |
| Description | | Shares | | | Value
(000) | |
China Gold International Resources* | | | 14,300 | | | $ | 27 | |
Choice Properties‡ | | | 2,300 | | | | 24 | |
Chorus Aviation | | | 1,500 | | | | 12 | |
CI Financial | | | 4,500 | | | | 107 | |
Cineplex | | | 3,200 | | | | 95 | |
Clearwater Seafoods | | | 2,200 | | | | 13 | |
Cogeco | | | 300 | | | | 22 | |
Cogeco Communications | | | 800 | | | | 55 | |
Colliers International Group | | | 1,700 | | | | 102 | |
Cominar‡ | | | 4,500 | | | | 52 | |
Computer Modelling Group | | | 4,600 | | | | 35 | |
Constellation Software | | | 1,770 | | | | 1,073 | |
Corby Spirit and Wine, Cl A | | | 600 | | | | 11 | |
Corus Entertainment | | | 6,000 | | | | 56 | |
Cott | | | 7,100 | | | | 119 | |
Crescent Point Energy | | | 9,500 | | | | 72 | |
Crew Energy* | | | 6,200 | | | | 16 | |
Crombie‡ | | | 2,200 | | | | 24 | |
CT‡ | | | 1,600 | | | | 18 | |
Descartes Systems Group* | | | 4,000 | | | | 114 | |
Detour Gold* | | | 8,900 | | | | 105 | |
DIRTT Environmental Solutions* | | | 5,300 | | | | 28 | |
Dollarama | | | 1,800 | | | | 225 | |
Dorel Industries, Cl B | | | 1,400 | | | | 35 | |
Dream Global‡ | | | 4,100 | | | | 40 | |
Dream Industrial‡ | | | 1,300 | | | | 9 | |
Dream Office‡ | | | 1,820 | | | | 32 | |
DREAM Unlimited, Cl A* | | | 3,900 | | | | 24 | |
ECN Capital | | | 20,000 | | | | 63 | |
Eldorado Gold | | | 40,900 | | | | 59 | |
Element Financial | | | 5,800 | | | | 44 | |
Emera | | | 1,100 | | | | 41 | |
Empire | | | 3,000 | | | | 58 | |
Enbridge | | | 28,200 | | | | 1,103 | |
Enbridge Income Fund Holdings | | | 5,900 | | | | 140 | |
Encana | | | 16,500 | | | | 220 | |
Endeavour Mining* | | | 3,600 | | | | 73 | |
Endeavour Silver* | | | 7,200 | | | | 17 | |
Enercare | | | 5,300 | | | | 86 | |
Enerflex | | | 4,400 | | | | 54 | |
Enerplus | | | 12,500 | | | | 122 | |
Enghouse Systems | | | 1,000 | | | | 49 | |
Ensign Energy Services | | | 7,500 | | | | 39 | |
Entertainment One | | | 19,514 | | | | 86 | |
Equitable Group | | | 700 | | | | 40 | |
Evertz Technologies | | | 1,000 | | | | 14 | |
Exchange Income | | | 400 | | | | 11 | |
The accompanying notes are an integral part of the financial statements.
54
| | |
| THE KP FUNDS | | December 31, 2017 |
| | |
| KP International Equity Fund | | |
| | | | | | | | |
| Description | | Shares | | | Value
(000) | |
Exco Technologies | | | 1,300 | | | $ | 10 | |
Extendicare | | | 4,500 | | | | 33 | |
Fairfax Financial Holdings | | | 5,670 | | | | 3,020 | |
Fiera Capital, Cl A | | | 2,700 | | | | 28 | |
Finning International | | | 2,600 | | | | 66 | |
First Capital Realty | | | 2,800 | | | | 46 | |
First Majestic Silver* | | | 8,500 | | | | 57 | |
First National Financial | | | 900 | | | | 21 | |
First Quantum Minerals | | | 11,800 | | | | 165 | |
FirstService | | | 1,700 | | | | 118 | |
Fortis | | | 7,100 | | | | 261 | |
Fortuna Silver Mines* | | | 8,500 | | | | 44 | |
Franco-Nevada | | | 9,953 | | | | 795 | |
Freehold Royalties | | | 5,100 | | | | 57 | |
Genworth MI Canada | | | 2,100 | | | | 73 | |
George Weston | | | 800 | | | | 69 | |
Gibson Energy | | | 6,900 | | | | 100 | |
Gildan Activewear | | | 14,424 | | | | 466 | |
Gluskin Sheff + Associates | | | 1,700 | | | | 23 | |
Goldcorp | | | 15,000 | | | | 191 | |
Granite‡ | | | 1,100 | | | | 43 | |
Great Canadian Gaming* | | | 2,600 | | | | 70 | |
Great-West Lifeco | | | 5,000 | | | | 140 | |
Guyana Goldfields* | | | 9,000 | | | | 36 | |
H&R‡ | | | 2,100 | | | | 36 | |
High Liner Foods | | | 1,200 | | | | 14 | |
Home Capital Group, Cl B* | | | 3,300 | | | | 45 | |
Hudbay Minerals | | | 13,900 | | | | 123 | |
Hudson’s Bay | | | 4,000 | | | | 36 | |
Husky Energy* | | | 6,100 | | | | 86 | |
Hydro One (A) | | | 5,100 | | | | 91 | |
IAMGOLD* | | | 23,100 | | | | 135 | |
IGM Financial | | | 1,300 | | | | 46 | |
Imperial Oil | | | 5,100 | | | | 159 | |
Industrial Alliance Insurance & Financial Services | | | 1,800 | | | | 86 | |
Innergex Renewable Energy | | | 5,100 | | | | 58 | |
Intact Financial | | | 2,300 | | | | 192 | |
Inter Pipeline | | | 6,100 | | | | 126 | |
Interfor* | | | 3,600 | | | | 60 | |
InterRent‡ | | | 1,600 | | | | 12 | |
Intertape Polymer Group | | | 2,900 | | | | 50 | |
Ivanhoe Mines, Cl A* | | | 31,300 | | | | 106 | |
Jean Coutu Group PJC, Cl A | | | 1,100 | | | | 21 | |
Just Energy Group | | | 4,900 | | | | 21 | |
Kelt Exploration* | | | 8,300 | | | | 47 | |
Keyera | | | 3,500 | | | | 99 | |
| | | | | | | | |
| Description | | Shares | | | Value
(000) | |
Killam Apartment‡ | | | 3,500 | | | $ | 40 | |
Kinaxis* | | | 1,100 | | | | 67 | |
Kinder Morgan Canada (A) | | | 6,000 | | | | 81 | |
Kinross Gold* | | | 21,600 | | | | 93 | |
Kirkland Lake Gold | | | 9,000 | | | | 138 | |
Klondex Mines* | | | 9,500 | | | | 25 | |
Knight Therapeutics* | | | 5,800 | | | | 39 | |
Labrador Iron Ore Royalty | | | 3,400 | | | | 74 | |
Laurentian Bank of Canada | | | 2,000 | | | | 90 | |
Linamar | | | 1,000 | | | | 58 | |
Lithium Americas* | | | 3,800 | | | | 34 | |
Loblaw | | | 26,336 | | | | 1,429 | |
Lucara Diamond | | | 15,500 | | | | 35 | |
Lundin Gold* | | | 4,300 | | | | 15 | |
Lundin Mining | | | 10,500 | | | | 70 | |
MAG Silver* | | | 3,800 | | | | 47 | |
Magellan Aerospace | | | 700 | | | | 12 | |
Magna International | | | 16,007 | | | | 907 | |
Major Drilling Group International* | | | 4,800 | | | | 27 | |
Manulife Financial | | | 34,000 | | | | 709 | |
Maple Leaf Foods | | | 4,400 | | | | 125 | |
Martinrea International | | | 4,900 | | | | 63 | |
Maxar Technologies | | | 2,900 | | | | 187 | |
Medical Facilities | | | 1,300 | | | | 15 | |
MEG Energy* | | | 12,500 | | | | 51 | |
Methanex | | | 1,500 | | | | 91 | |
Metro, Cl A | | | 3,700 | | | | 118 | |
Morguard‡ | | | 1,400 | | | | 15 | |
Morneau Shepell | | | 2,700 | | | | 48 | |
MTY Food Group | | | 900 | | | | 40 | |
Mullen Group | | | 5,500 | | | | 69 | |
National Bank of Canada | | | 5,900 | | | | 294 | |
Nevsun Resources | | | 16,900 | | | | 41 | |
New Flyer Industries | | | 2,600 | | | | 113 | |
New Gold* | | | 29,400 | | | | 97 | |
NexGen Energy* | | | 15,700 | | | | 40 | |
Norbord | | | 2,100 | | | | 71 | |
North West | | | 2,500 | | | | 60 | |
Northern Dynasty Minerals* | | | 16,900 | | | | 30 | |
Northland Power | | | 6,100 | | | | 114 | |
Northview Apartment‡ | | | 1,200 | | | | 24 | |
NorthWest Healthcare Properties‡ | | | 2,200 | | | | 20 | |
Novagold Resources* | | | 12,800 | | | | 50 | |
NuVista Energy* | | | 9,600 | | | | 61 | |
Obsidian Energy* | | | 26,600 | | | | 33 | |
OceanaGold | | | 31,100 | | | | 80 | |
Onex | | | 1,300 | | | | 95 | |
The accompanying notes are an integral part of the financial statements.
55
| | |
| THE KP FUNDS | | December 31, 2017 |
| | |
| KP International Equity Fund | | |
| | | | | | | | |
| Description | | Shares | | | Value
(000) | |
Open Text | | | 4,300 | | | $ | 153 | |
Osisko Gold Royalties | | | 5,900 | | | | 68 | |
Osisko Mining* | | | 8,300 | | | | 22 | |
Painted Pony Energy* | | | 7,400 | | | | 16 | |
Pan American Silver | | | 7,600 | | | | 118 | |
Paramount Resources, Cl A* | | | 3,793 | | | | 59 | |
Parex Resources* | | | 7,900 | | | | 114 | |
Parkland Fuel | | | 6,600 | | | | 141 | |
Pason Systems | | | 4,000 | | | | 58 | |
Pembina Pipeline | | | 8,472 | | | | 307 | |
Pengrowth Energy* | | | 25,600 | | | | 20 | |
Peyto Exploration & Development | | | 9,100 | | | | 109 | |
Potash Corp of Saskatchewan | | | 14,200 | | | | 291 | |
Power Corp of Canada | | | 5,900 | | | | 152 | |
Power Financial | | | 4,300 | | | | 118 | |
PrairieSky Royalty | | | 23,493 | | | | 599 | |
Precision Drilling* | | | 16,600 | | | | 50 | |
Premier Gold Mines* | | | 10,700 | | | | 31 | |
Premium Brands Holdings | | | 1,300 | | | | 107 | |
Pretium Resources* | | | 7,800 | | | | 89 | |
ProMetic Life Sciences* | | | 31,100 | | | | 32 | |
Pure Industrial‡ | | | 6,600 | | | | 36 | |
Quebecor, Cl B | | | 8,400 | | | | 158 | |
Raging River Exploration* | | | 12,000 | | | | 76 | |
Restaurant Brands International | | | 3,800 | | | | 234 | |
RioCan‡ | | | 2,400 | | | | 47 | |
Ritchie Bros Auctioneers | | | 33,631 | | | | 1,007 | |
Rogers Communications, Cl B | | | 18,541 | | | | 945 | |
Rogers Sugar | | | 4,600 | | | | 23 | |
Royal Bank of Canada | | | 33,618 | | | | 2,745 | |
Russel Metals | | | 3,400 | | | | 79 | |
Sandstorm Gold* | | | 8,400 | | | | 42 | |
Saputo | | | 3,600 | | | | 129 | |
Seabridge Gold* | | | 2,300 | | | | 26 | |
Secure Energy Services | | | 9,000 | | | | 63 | |
SEMAFO* | | | 17,600 | | | | 50 | |
Seven Generations Energy* | | | 4,400 | | | | 62 | |
Shaw Communications, Cl B | | | 7,100 | | | | 162 | |
ShawCor | | | 3,500 | | | | 76 | |
Shopify* | | | 1,400 | | | | 142 | |
Sienna Senior Living | | | 2,100 | | | | 30 | |
Sierra Wireless* | | | 1,700 | | | | 35 | |
Silvercorp Metals | | | 9,100 | | | | 24 | |
Sleep Country Canada Holdings (A) | | | 1,900 | | | | 50 | |
SmartCentres‡ | | | 900 | | | | 22 | |
SNC-Lavalin Group | | | 2,900 | | | | 132 | |
Spartan Energy* | | | 9,666 | | | | 55 | |
| | | | | | | | |
| Description | | Shares | | | Value
(000) | |
Spin Master* (A) | | | 1,385 | | | $ | 60 | |
Sprott | | | 9,400 | | | | 18 | |
SSR Mining* | | | 6,200 | | | | 55 | |
Stantec | | | 5,800 | | | | 162 | |
Stars Group* | | | 6,200 | | | | 144 | |
Stella-Jones | | | 2,300 | | | | 93 | |
Stornoway Diamond* | | | 30,200 | | | | 16 | |
Student Transportation | | | 4,800 | | | | 30 | |
Sun Life Financial | | | 10,600 | | | | 437 | |
Suncor Energy | | | 154,252 | | | | 5,663 | |
Superior Plus | | | 7,200 | | | | 68 | |
Surge Energy | | | 15,600 | | | | 26 | |
Tahoe Resources* | | | 15,700 | | | | 75 | |
Tamarack Valley Energy* | | | 4,700 | | | | 11 | |
Teck Resources, Cl B | | | 9,900 | | | | 259 | |
TELUS | | | 3,200 | | | | 121 | |
TFI International | | | 4,600 | | | | 120 | |
Thomson Reuters | | | 4,800 | | | | 209 | |
Timbercreek Financial | | | 3,700 | | | | 28 | |
TMAC Resources* | | | 1,800 | | | | 14 | |
TMX Group | | | 1,900 | | | | 106 | |
TORC Oil & Gas | | | 7,100 | | | | 43 | |
Torex Gold Resources* | | | 4,100 | | | | 39 | |
Toromont Industries | | | 4,000 | | | | 174 | |
Toronto-Dominion Bank | | | 59,050 | | | | 3,460 | |
Total Energy Services | | | 2,300 | | | | 27 | |
Tourmaline Oil* | | | 4,000 | | | | 72 | |
TransAlta | | | 15,100 | | | | 90 | |
TransAlta Renewables | | | 5,100 | | | | 54 | |
TransCanada | | | 26,500 | | | | 1,290 | |
Transcontinental, Cl A | | | 3,200 | | | | 63 | |
Trevali Mining* | | | 44,900 | | | | 54 | |
Trican Well Service* | | | 15,050 | | | | 49 | |
Tricon Capital Group | | | 6,100 | | | | 56 | |
Trinidad Drilling* | | | 16,400 | | | | 22 | |
Turquoise Hill Resources* | | | 15,100 | | | | 52 | |
Uni-Select | | | 1,900 | | | | 43 | |
Uranium Participation* | | | 7,200 | | | | 24 | |
Valeant Pharmaceuticals International* | | | 5,600 | | | | 117 | |
Valener | | | 1,900 | | | | 34 | |
Vermilion Energy | | | 2,000 | | | | 73 | |
Wajax | | | 1,000 | | | | 20 | |
West Fraser Timber | | | 1,100 | | | | 68 | |
Western Forest Products | | | 20,000 | | | | 39 | |
WestJet Airlines | | | 1,500 | | | | 31 | |
Westshore Terminals Investment | | | 2,800 | | | | 59 | |
The accompanying notes are an integral part of the financial statements.
56
| | |
| THE KP FUNDS | | December 31, 2017 |
| | |
| KP International Equity Fund | | |
| | | | | | | | |
| Description | | Shares | | | Value
(000) | |
Wheaton Precious Metals | | | 7,400 | | | $ | 164 | |
Whitecap Resources | | | 18,700 | | | | 133 | |
Winpak | | | 1,600 | | | | 60 | |
WPT Industrial‡ | | | 1,700 | | | | 22 | |
WSP Global | | | 4,400 | | | | 210 | |
Yamana Gold | | | 52,600 | | | | 164 | |
| | | | | | | | |
| | | | | | | 66,257 | |
| | | | | | | | |
Chile — 0.3% | |
CAP | | | 11,219 | | | | 143 | |
Cia Cervecerias Unidas | | | 60,116 | | | | 902 | |
Cia Cervecerias Unidas ADR | | | 9,921 | | | | 293 | |
Cia Sud Americana de Vapores* | | | 3,944,588 | | | | 213 | |
Empresas CMPC | | | 78,470 | | | | 267 | |
Enaex | | | 19,531 | | | | 289 | |
Quinenco | | | 301,074 | | | | 1,052 | |
Sociedad Quimica y Minera de Chile ADR | | | 20,011 | | | | 1,187 | |
| | | | | | | | |
| | | | | | | 4,346 | |
| | | | | | | | |
China — 2.1% | |
58.com ADR* | | | 3,507 | | | | 251 | |
Alibaba Group Holding ADR* | | | 66,300 | | | | 11,433 | |
Autohome ADR* | | | 19,444 | | | | 1,257 | |
Baidu ADR* | | | 13,491 | | | | 3,160 | |
CECEP COSTIN New Materials Group* | | | 1,134,000 | | | | 1 | |
China Lodging Group ADR | | | 5,896 | | | | 852 | |
China Resources Beer Holdings | | | 319,073 | | | | 1,145 | |
Ctrip.com International ADR* | | | 36,074 | | | | 1,591 | |
Momo ADR* | | | 3,242 | | | | 79 | |
NetEase ADR | | | 4,900 | | | | 1,691 | |
TAL Education Group ADR* | | | 47,194 | | | | 1,402 | |
Tsingtao Brewery, Cl H | | | 98,000 | | | | 506 | |
Weibo ADR* | | | 16,781 | | | | 1,736 | |
Yum China Holdings | | | 160,697 | | | | 6,431 | |
| | | | | | | | |
| | | | | | | 31,535 | |
| | | | | | | | |
Colombia — 0.1% | |
Almacenes Exito | | | 41,819 | | | | 232 | |
Bancolombia ADR | | | 15,279 | | | | 606 | |
Ecopetrol ADR | | | 4,300 | | | | 63 | |
| | | | | | | | |
| | | | | | | 901 | |
| | | | | | | | |
Czech Republic — 0.0% | |
Komercni Banka | | | 10,933 | | | | 470 | |
| | | | | | | | |
Denmark — 1.4% | |
ALK-Abello | | | 331 | | | | 39 | |
Alm Brand | | | 3,559 | | | | 46 | |
Ambu, Cl B | | | 1,489 | | | | 133 | |
| | | | | | | | |
| Description | | Shares | | | Value
(000) | |
AP Moeller — Maersk, Cl A | | | 65 | | | $ | 109 | |
AP Moeller — Maersk, Cl B | | | 111 | | | | 194 | |
Bang & Olufsen* | | | 1,871 | | | | 45 | |
Bavarian Nordic* | | | 1,647 | | | | 60 | |
Carlsberg, Cl B | | | 22,369 | | | | 2,686 | |
Chr Hansen Holding | | | 1,721 | | | | 161 | |
Coloplast, Cl B | | | 22,264 | | | | 1,772 | |
D/S Nordern* | | | 1,342 | | | | 25 | |
Danske Bank | | | 17,464 | | | | 680 | |
Dfds | | | 1,648 | | | | 88 | |
DSV | | | 3,215 | | | | 253 | |
FLSmidth | | | 2,002 | | | | 116 | |
Genmab* | | | 1,010 | | | | 167 | |
GN Store Nord | | | 43,460 | | | | 1,404 | |
H Lundbeck | | | 1,171 | | | | 60 | |
IC Group | | | 439 | | | | 10 | |
ISS | | | 7,306 | | | | 283 | |
Jyske Bank | | | 3,278 | | | | 187 | |
Matas | | | 2,098 | | | | 27 | |
Nets* (A) | | | 6,223 | | | | 164 | |
Nilfisk Holding* | | | 1,394 | | | | 81 | |
NKT* | | | 1,394 | | | | 64 | |
NNIT (A) | | | 484 | | | | 13 | |
Novo Nordisk, Cl B | | | 145,471 | | | | 7,843 | |
Novozymes, Cl B | | | 3,835 | | | | 220 | |
Orsted (A) | | | 3,287 | | | | 179 | |
Pandora | | | 1,854 | | | | 202 | |
Per Aarsleff Holding | | | 1,234 | | | | 39 | |
Rockwool International, Cl B | | | 421 | | | | 119 | |
Royal Unibrew | | | 2,448 | | | | 147 | |
Scandinavian Tobacco Group (A) | | | 3,243 | | | | 63 | |
Schouw | | | 612 | | | | 57 | |
SimCorp | | | 1,909 | | | | 109 | |
Solar, Cl B | | | 341 | | | | 22 | |
Spar Nord Bank | | | 4,602 | | | | 53 | |
Sydbank | | | 3,605 | | | | 145 | |
TDC | | | 13,694 | | | | 84 | |
Topdanmark* | | | 2,881 | | | | 125 | |
TORM | | | 974 | | | | 8 | |
Tryg | | | 2,135 | | | | 53 | |
Vestas Wind Systems | | | 26,737 | | | | 1,848 | |
William Demant Holding* | | | 37,245 | | | | 1,041 | |
Zealand Pharma* | | | 1,211 | | | | 17 | |
| | | | | | | | |
| | | | | | | 21,241 | |
| | | | | | | | |
Egypt — 0.0% | |
Telecom Egypt | | | 129,194 | | | | 99 | |
| | | | | | | | |
The accompanying notes are an integral part of the financial statements.
57
| | |
| THE KP FUNDS | | December 31, 2017 |
| | |
| KP International Equity Fund | | |
| | | | | | | | |
| Description | | Shares | | | Value
(000) | |
Finland — 0.8% | |
Amer Sports* | | | 16,355 | | | $ | 453 | |
Cargotec, Cl B | | | 1,974 | | | | 112 | |
Caverion* | | | 4,850 | | | | 34 | |
Citycon | | | 18,366 | | | | 47 | |
Cramo | | | 2,180 | | | | 51 | |
DNA | | | 3,122 | | | | 59 | |
Elisa | | | 2,439 | | | | 95 | |
Finnair | | | 2,745 | | | | 42 | |
Fortum | | | 7,223 | | | | 143 | |
F-Secure | | | 4,129 | | | | 19 | |
Huhtamaki | | | 4,606 | | | | 193 | |
Kemira | | | 5,541 | | | | 76 | |
Kesko, Cl B | | | 3,353 | | | | 182 | |
Kone, Cl B | | | 5,712 | | | | 307 | |
Konecranes, Cl A | | | 3,333 | | | | 153 | |
Lehto Group | | | 791 | | | | 12 | |
Metsa Board | | | 9,809 | | | | 84 | |
Metso | | | 1,965 | | | | 67 | |
Neste | | | 2,162 | | | | 138 | |
Nokia | | | 71,378 | | | | 333 | |
Nokian Renkaat | | | 67,930 | | | | 3,082 | |
Oriola, Cl B | | | 5,893 | | | | 20 | |
Orion, Cl B | | | 1,760 | | | | 66 | |
Outokumpu | | | 16,041 | | | | 149 | |
Outotec* | | | 7,346 | | | | 63 | |
Ponsse | | | 362 | | | | 11 | |
Ramirent | | | 4,456 | | | | 42 | |
Sampo, Cl A | | | 44,332 | | | | 2,436 | |
Sanoma | | | 4,368 | | | | 57 | |
Stockmann Abp, Cl B* | | | 1,290 | | | | 7 | |
Stora Enso, Cl R | | | 9,598 | | | | 152 | |
Technopolis | | | 8,502 | | | | 43 | |
Tieto | | | 2,939 | | | | 92 | |
Tikkurila | | | 93,507 | | | | 1,999 | |
Tokmanni Group | | | 1,866 | | | | 16 | |
UPM-Kymmene | | | 9,024 | | | | 281 | |
Uponor | | | 3,160 | | | | 64 | |
Valmet | | | 6,577 | | | | 130 | |
Wartsila, Cl B | | | 8,469 | | | | 534 | |
YIT | | | 6,213 | | | | 48 | |
| | | | | | | | |
| | | | | | | 11,892 | |
| | | | | | | | |
France — 6.4% | |
Accor | | | 3,267 | | | | 169 | |
Aeroports de Paris | | | 501 | | | | 95 | |
Air France-KLM* | | | 8,521 | | | | 139 | |
| | | | | | | | |
| Description | | Shares | | | Value
(000) | |
Air Liquide | | | 101,834 | | | $ | 12,837 | |
Airbus Group | | | 21,094 | | | | 2,101 | |
Albioma | | | 1,587 | | | | 40 | |
ALD* (A) | | | 5,636 | | | | 87 | |
Alstom | | | 2,594 | | | | 107 | |
Altamir | | | 1,526 | | | | 28 | |
Alten | | | 1,514 | | | | 126 | |
Altran Technologies | | | 7,745 | | | | 129 | |
Amundi (A) | | | 968 | | | | 82 | |
Arkema | | | 1,144 | | | | 139 | |
Assystem | | | 389 | | | | 14 | |
Atos | | | 1,602 | | | | 233 | |
AXA | | | 55,464 | | | | 1,646 | |
Axway Software | | | 357 | | | | 10 | |
Beneteau | | | 2,029 | | | | 49 | |
BioMerieux | | | 663 | | | | 59 | |
BNP Paribas | | | 35,275 | | | | 2,635 | |
Boiron | | | 395 | | | | 35 | |
Bollore | | | 14,811 | | | | 80 | |
Bonduelle SCA | | | 714 | | | | 38 | |
Bourbon | | | 1,188 | | | | 10 | |
Bouygues | | | 3,721 | | | | 193 | |
Bureau Veritas | | | 4,548 | | | | 124 | |
Capital Gemini | | | 2,713 | | | | 322 | |
Carrefour | | | 9,853 | | | | 213 | |
Casino Guichard Perrachon | | | 975 | | | | 59 | |
Cellectis* | | | 1,293 | | | | 37 | |
Chargeurs | | | 768 | | | | 23 | |
Cie de Saint-Gobain | | | 8,675 | | | | 479 | |
Cie des Alpes | | | 351 | | | | 14 | |
Cie Generale des Etablissements Michelin | | | 2,885 | | | | 414 | |
Cie Plastic Omnium | | | 2,976 | | | | 135 | |
CNP Assurances | | | 2,995 | | | | 69 | |
Coface* | | | 5,144 | | | | 55 | |
Credit Agricole | | | 19,211 | | | | 318 | |
Danone | | | 57,909 | | | | 4,860 | |
Dassault Aviation | | | 43 | | | | 67 | |
Dassault Systemes | | | 20,276 | | | | 2,155 | |
DBV Technologies* | | | 844 | | | | 43 | |
Derichebourg | | | 3,492 | | | | 38 | |
Devoteam | | | 206 | | | | 19 | |
Direct Energie | | | 409 | | | | 19 | |
Edenred | | | 21,920 | | | | 636 | |
Eiffage | | | 1,195 | | | | 131 | |
Electricite de France | | | 9,366 | | | | 117 | |
Elior Group (A) | | | 5,631 | | | | 116 | |
The accompanying notes are an integral part of the financial statements.
58
| | |
| THE KP FUNDS | | December 31, 2017 |
| | |
| KP International Equity Fund | | |
| | | | | | | | |
| Description | | Shares | | | Value
(000) | |
Elis* | | | 11,194 | | | $ | 311 | |
Engie | | | 213,879 | | | | 3,679 | |
Eramet* | | | 517 | | | | 61 | |
Essilor International Cie Generale d’Optique | | | 17,364 | | | | 2,396 | |
Esso Francaise* | | | 145 | | | | 10 | |
Euler Hermes Group | | | 827 | | | | 121 | |
Eurazeo | | | 666 | | | | 62 | |
Eurofins Scientific | | | 1,769 | | | | 1,078 | |
Europcar Groupe (A) | | | 4,513 | | | | 56 | |
Eutelsat Communications | | | 2,944 | | | | 68 | |
Faurecia | | | 1,216 | | | | 95 | |
FFP | | | 331 | | | | 40 | |
Fnac Darty* | | | 850 | | | | 103 | |
Fonciere Des Regions‡ | | | 581 | | | | 66 | |
Gaztransport Et Technigaz | | | 1,156 | | | | 69 | |
Gecina‡ | | | 766 | | | | 141 | |
Genfit* | | | 1,295 | | | | 37 | |
Getlink | | | 50,115 | | | | 645 | |
GL Events | | | 335 | | | | 10 | |
Groupe Crit | | | 109 | | | | 10 | |
Guerbet | | | 297 | | | | 28 | |
Haulotte Group | | | 555 | | | | 11 | |
Hermes International | | | 1,458 | | | | 781 | |
ICADE‡ | | | 562 | | | | 55 | |
ID Logistics Group* | | | 115 | | | | 19 | |
Iliad | | | 454 | | | | 109 | |
Imerys | | | 1,714 | | | | 162 | |
Ingenico Group | | | 985 | | | | 105 | |
Innate Pharma* | | | 2,180 | | | | 12 | |
Interparfums | | | 493 | | | | 20 | |
Ipsen | | | 634 | | | | 76 | |
IPSOS | | | 1,884 | | | | 69 | |
Jacquet Metal Service | | | 510 | | | | 17 | |
JCDecaux | | | 8,491 | | | | 342 | |
Kaufman & Broad | | | 709 | | | | 34 | |
Kering | | | 1,302 | | | | 614 | |
Klepierre‡ | | | 3,829 | | | | 169 | |
Korian | | | 2,360 | | | | 83 | |
LafargeHolcim* | | | 1,512 | | | | 85 | |
Lagardere | | | 1,990 | | | | 64 | |
Legrand | | | 45,417 | | | | 3,498 | |
LISI | | | 1,055 | | | | 51 | |
LNA Sante | | | 236 | | | | 17 | |
L’Oreal | | | 15,861 | | | | 3,520 | |
LVMH Moet Hennessy Louis Vuitton | | | 20,010 | | | | 5,892 | |
Maisons du Monde (A) | | | 2,182 | | | | 99 | |
| | | | | | | | |
| Description | | Shares | | | Value
(000) | |
Manitou BF | | | 418 | | | $ | 15 | |
Marie Brizard Wine & Spirits* | | | 691 | | | | 10 | |
Mercialys‡ | | | 3,076 | | | | 68 | |
Mersen | | | 603 | | | | 27 | |
Metropole Television | | | 1,525 | | | | 39 | |
MGI Coutier | | | 382 | | | | 15 | |
Natixis | | | 16,193 | | | | 128 | |
Naturex* | | | 348 | | | | 37 | |
Neopost | | | 9,252 | | | | 266 | |
Nexans | | | 1,511 | | | | 93 | |
Nexity | | | 2,241 | | | | 133 | |
Nokia | | | 26,897 | | | | 126 | |
Oeneo | | | 1,058 | | | | 13 | |
Orange | | | 34,281 | | | | 595 | |
Orpea | | | 2,098 | | | | 248 | |
Parrot* | | | 790 | | | | 8 | |
Pernod Ricard | | | 44,809 | | | | 7,095 | |
Peugeot | | | 9,979 | | | | 203 | |
Pierre & Vacances* | | | 189 | | | | 10 | |
Plastivaloire | | | 396 | | | | 9 | |
Publicis Groupe | | | 3,509 | | | | 239 | |
Rallye | | | 1,467 | | | | 26 | |
Remy Cointreau | | | 399 | | | | 55 | |
Renault | | | 3,244 | | | | 327 | |
Rexel | | | 5,114 | | | | 93 | |
Rubis SCA | | | 4,228 | | | | 299 | |
Safran | | | 5,732 | | | | 591 | |
Sanofi | | | 22,077 | | | | 1,904 | |
Sartorius Stedim Biotech | | | 1,373 | | | | 99 | |
Schneider Electric | | | 84,456 | | | | 7,180 | |
Science* | | | 1,023 | | | | 10 | |
SCOR | | | 2,976 | | | | 120 | |
SEB | | | 393 | | | | 73 | |
SES, Cl A | | | 6,287 | | | | 98 | |
Societe BIC | | | 426 | | | | 47 | |
Societe Generale | | | 13,177 | | | | 681 | |
Sodexo | | | 1,535 | | | | 206 | |
SOITEC* | | | 815 | | | | 58 | |
Solocal Group* | | | 26,668 | | | | 27 | |
Solutions 30* | | | 1,555 | | | | 48 | |
Sopra Steria Group | | | 758 | | | | 142 | |
SPIE | | | 5,668 | | | | 148 | |
SRP Groupe* (A) | | | 660 | | | | 5 | |
Stallergenes Greer* | | | 21 | | | | 1 | |
Ste Industrielle d’Aviation Latecoere* | | | 2,789 | | | | 19 | |
STMicroelectronics | | | 10,792 | | | | 236 | |
Suez | | | 6,329 | | | | 111 | |
The accompanying notes are an integral part of the financial statements.
59
| | |
| THE KP FUNDS | | December 31, 2017 |
| | |
| KP International Equity Fund | | |
| | | | | | | | |
| Description | | Shares | | | Value
(000) | |
Synergie | | | 300 | | | $ | 16 | |
Tarkett | | | 1,629 | | | | 68 | |
Technicolor | | | 18,675 | | | | 64 | |
TechnipFMC | | | 3,593 | | | | 111 | |
Teleperformance | | | 3,716 | | | | 532 | |
Television Francaise 1 | | | 2,239 | | | | 33 | |
Thales | | | 5,967 | | | | 643 | |
TOTAL | | | 183,140 | | | | 10,118 | |
Trigano | | | 395 | | | | 69 | |
Ubisoft Entertainment* | | | 1,010 | | | | 78 | |
Valeo | | | 4,049 | | | | 303 | |
Vallourec* | | | 32,278 | | | | 195 | |
Veolia Environnement | | | 8,123 | | | | 207 | |
Vicat | | | 3,338 | | | | 263 | |
Vinci | | | 8,657 | | | | 885 | |
Virbac* | | | 453 | | | | 67 | |
Vivendi | | | 17,773 | | | | 479 | |
Wendel | | | 476 | | | | 82 | |
Worldline* (A) | | | 1,932 | | | | 94 | |
X-Fab Silicon Foundries* (A) | | | 4,225 | | | | 49 | |
Zodiac Aerospace | | | 28,122 | | | | 841 | |
| | | | | | | | |
| | | | | | | 93,712 | |
| | | | | | | | |
Germany — 5.6% | |
Aareal Bank | | | 2,745 | | | | 124 | |
adidas | | | 7,335 | | | | 1,470 | |
ADLER Real Estate* | | | 791 | | | | 13 | |
ADO Properties (A) | | | 1,731 | | | | 88 | |
ADVA Optical Networking* | | | 1,691 | | | | 12 | |
AIXTRON* | | | 5,982 | | | | 83 | |
Allianz | | | 7,700 | | | | 1,770 | |
alstria office‡ | | | 7,154 | | | | 111 | |
Amadeus Fire | | | 328 | | | | 30 | |
AURELIUS Equity Opportunities & KGaA | | | 1,268 | | | | 87 | |
Aurubis | | | 1,724 | | | | 160 | |
Axel Springer | | | 10,724 | | | | 838 | |
BASF | | | 38,553 | | | | 4,244 | |
Bayer | | | 80,165 | | | | 10,003 | |
Bayerische Motoren Werke | | | 71,948 | | | | 7,495 | |
BayWa | | | 921 | | | | 35 | |
Bechtle | | | 1,682 | | | | 140 | |
Beiersdorf | | | 44,505 | | | | 5,228 | |
Bertrandt | | | 318 | | | | 39 | |
bet-at-home.com | | | 120 | | | | 15 | |
Bilfinger | | | 1,727 | | | | 82 | |
Borussia Dortmund GmbH & KGaA | | | 2,535 | | | | 19 | |
Brenntag | | | 16,638 | | | | 1,054 | |
| | | | | | | | |
| Description | | Shares | | | Value
(000) | |
CANCOM | | | 797 | | | $ | 66 | |
Capital Stage | | | 4,956 | | | | 38 | |
Carl Zeiss Meditec | | | 2,048 | | | | 128 | |
CECONOMY | | | 8,975 | | | | 136 | |
CENTROTEC Sustainable | | | 165 | | | | 3 | |
Cewe Stiftung & KGAA | | | 313 | | | | 33 | |
comdirect bank | | | 785 | | | | 11 | |
Commerzbank* | | | 17,997 | | | | 270 | |
CompuGroup Medical | | | 1,166 | | | | 77 | |
Continental | | | 1,892 | | | | 511 | |
Covestro (A) | | | 2,061 | | | | 213 | |
CTS Eventim & KGaA | | | 12,324 | | | | 574 | |
Daimler | | | 16,500 | | | | 1,402 | |
Deutsche Bank | | | 35,491 | | | | 676 | |
Deutsche Beteiligungs | | | 676 | | | | 38 | |
Deutsche Boerse | | | 3,253 | | | | 378 | |
Deutsche EuroShop | | | 2,388 | | | | 97 | |
Deutsche Lufthansa | | | 4,015 | | | | 148 | |
Deutsche Pfandbriefbank (A) | | | 5,991 | | | | 96 | |
Deutsche Post | | | 16,663 | | | | 795 | |
Deutsche Telekom | | | 111,162 | | | | 1,973 | |
Deutsche Wohnen | | | 5,999 | | | | 262 | |
Deutz | | | 5,203 | | | | 47 | |
DIC Asset | | | 3,070 | | | | 39 | |
Diebold Nixdorf | | | 388 | | | | 34 | |
DMG Mori | | | 884 | | | | 49 | |
Draegerwerk & KGaA | | | 73 | | | | 5 | |
Drillisch | | | 849 | | | | 70 | |
Duerr | | | 1,375 | | | | 176 | |
E.ON | | | 37,077 | | | | 404 | |
Elmos Semiconductor | | | 433 | | | | 12 | |
ElringKlinger | | | 1,480 | | | | 33 | |
Evonik Industries | | | 2,787 | | | | 105 | |
Evotec* | | | 6,134 | | | | 99 | |
Ferratum | | | 502 | | | | 18 | |
Fielmann | | | 2,484 | | | | 219 | |
Fraport Frankfurt Airport Services Worldwide | | | 723 | | | | 80 | |
Freenet | | | 6,278 | | | | 232 | |
Fresenius & KGaA | | | 7,146 | | | | 558 | |
Fresenius Medical Care & KGaA | | | 23,064 | | | | 2,429 | |
GEA Group | | | 6,062 | | | | 291 | |
Gerresheimer | | | 3,099 | | | | 257 | |
Gerry Weber International | | | 1,013 | | | | 12 | |
GFT Technologies | | | 660 | | | | 10 | |
Grammer | | | 505 | | | | 31 | |
Grand City Properties | | | 5,339 | | | | 126 | |
The accompanying notes are an integral part of the financial statements.
60
| | |
| THE KP FUNDS | | December 31, 2017 |
| | |
| KP International Equity Fund | | |
| | | | | | | | |
| Description | | Shares | | | Value
(000) | |
GRENKE | | | 1,335 | | | $ | 127 | |
H&R GmbH & KGaA* | | | 694 | | | | 12 | |
Hamborner‡ | | | 4,822 | | | | 57 | |
Hamburger Hafen und Logistik | | | 1,309 | | | | 37 | |
Hannover Rueck | | | 2,198 | | | | 277 | |
Hapag-Lloyd* (A) | | | 2,140 | | | | 86 | |
HeidelbergCement | | | 2,516 | | | | 272 | |
Heidelberger Druckmaschinen* | | | 13,201 | | | | 46 | |
Henkel & KGaA | | | 1,761 | | | | 211 | |
Hochtief | | | 325 | | | | 58 | |
Hornbach Baumarkt | | | 435 | | | | 16 | |
HUGO BOSS | | | 1,069 | | | | 91 | |
Hypoport* | | | 140 | | | | 24 | |
Indus Holding | | | 1,064 | | | | 76 | |
Infineon Technologies | | | 19,527 | | | | 534 | |
Innogy (A) | | | 2,382 | | | | 93 | |
Isra Vision | | | 171 | | | | 44 | |
Jenoptik | | | 2,663 | | | | 88 | |
Jungheinrich | | | 2,620 | | | | 124 | |
K+S | | | 3,228 | | | | 80 | |
KION Group | | | 1,221 | | | | 105 | |
Kloeckner | | | 3,893 | | | | 48 | |
Koenig & Bauer | | | 701 | | | | 53 | |
Krones | | | 798 | | | | 110 | |
KWS Saat | | | 109 | | | | 44 | |
LANXESS | | | 1,567 | | | | 125 | |
LEG Immobilien | | | 3,188 | | | | 364 | |
Leoni | | | 1,612 | | | | 121 | |
Linde* | | | 12,977 | | | | 3,031 | |
MAN | | | 614 | | | | 70 | |
Manz* | | | 231 | | | | 9 | |
Merck KGaA | | | 27,623 | | | | 2,975 | |
METRO | | | 3,146 | | | | 63 | |
MLP | | | 2,216 | | | | 15 | |
MorphoSys* | | | 1,372 | | | | 126 | |
MTU Aero Engines | | | 9,524 | | | | 1,707 | |
Muenchener Rueckversicherungs-Gesellschaft in Muenchen | | | 2,668 | | | | 578 | |
Nemetschek | | | 947 | | | | 85 | |
Nordex* | | | 2,995 | | | | 32 | |
Norma Group | | | 1,695 | | | | 114 | |
OHB | | | 258 | | | | 14 | |
OSRAM Licht | | | 1,637 | | | | 146 | |
PATRIZIA Immobilien* | | | 2,031 | | | | 47 | |
Pfeiffer Vacuum Technology | | | 369 | | | | 69 | |
ProSiebenSat.1 Media | | | 54,801 | | | | 1,887 | |
QIAGEN* | | | 39,213 | | | | 1,233 | |
| | | | | | | | |
| Description | | Shares | | | Value
(000) | |
Rational | | | 160 | | | $ | 103 | |
Rheinmetall | | | 2,233 | | | | 284 | |
RHOEN-KLINIKUM | | | 1,341 | | | | 48 | |
RIB Software | | | 1,897 | | | | 56 | |
Rocket Internet* (A) | | | 2,656 | | | | 67 | |
RWE* | | | 8,783 | | | | 179 | |
S&T | | | 1,839 | | | | 40 | |
SAF-Holland | | | 2,523 | | | | 54 | |
Salzgitter | | | 1,995 | | | | 114 | |
SAP | | | 107,851 | | | | 12,093 | |
Scout24 (A) | | | 5,628 | | | | 229 | |
Senvion* | | | 1,099 | | | | 14 | |
SGL Carbon* | | | 3,188 | | | | 44 | |
Siemens | | | 13,103 | | | | 1,826 | |
Siltronic* | | | 1,065 | | | | 155 | |
Sixt | | | 938 | | | | 84 | |
Sixt Leasing | | | 519 | | | | 12 | |
SLM Solutions Group* | | | 532 | | | | 30 | |
SMA Solar Technology | | | 569 | | | | 25 | |
Software | | | 2,678 | | | | 151 | |
Stabilus | | | 9,857 | | | | 886 | |
STADA Arzneimittel | | | 2,163 | | | | 229 | |
STO & KGaA | | | 96 | | | | 15 | |
STRATEC Biomedical | | | 209 | | | | 16 | |
Stroeer & KGaA | | | 1,423 | | | | 105 | |
Suedzucker | | | 3,679 | | | | 79 | |
Surteco | | | 337 | | | | 11 | |
Symrise | | | 7,421 | | | | 638 | |
TAG Immobilien | | | 5,802 | | | | 110 | |
Takkt | | | 1,685 | | | | 38 | |
Telefonica Deutschland Holding | | | 12,541 | | | | 63 | |
ThyssenKrupp | | | 7,392 | | | | 215 | |
TLG Immobilien | | | 4,512 | | | | 120 | |
TUI | | | 14,616 | | | | 301 | |
Uniper* | | | 3,223 | | | | 101 | |
United Internet | | | 2,000 | | | | 138 | |
VERBIO Vereinigte BioEnergie | | | 974 | | | | 10 | |
Volkswagen | | | 547 | | | | 111 | |
Vonovia | | | 8,175 | | | | 407 | |
Vossloh* | | | 602 | | | | 34 | |
VTG | | | 598 | | | | 34 | |
Wacker Chemie | | | 737 | | | | 143 | |
Wacker Neuson | | | 1,362 | | | | 49 | |
Washtec | | | 1,002 | | | | 95 | |
Wirecard | | | 1,991 | | | | 223 | |
Wuestenrot & Wuerttembergische | | | 1,183 | | | | 33 | |
XING | | | 157 | | | | 51 | |
The accompanying notes are an integral part of the financial statements.
61
| | |
| THE KP FUNDS | | December 31, 2017 |
| | |
| KP International Equity Fund | | |
| | | | | | | | |
| Description | | Shares | | | Value
(000) | |
Zalando* (A) | | | 1,877 | | | $ | 99 | |
zooplus* | | | 673 | | | | 122 | |
| | | | | | | | |
| | | | | | | 82,009 | |
| | | | | | | | |
Greece — 0.3% | |
Aegean Airlines | | | 27,543 | | | | 273 | |
Alpha Bank AE* | | | 92,360 | | | | 198 | |
Fourlis Holdings* | | | 54,497 | | | | 376 | |
Grivalia Properties REIC AE‡ | | | 86,436 | | | | 954 | |
Hellenic Petroleum | | | 8,507 | | | | 78 | |
JUMBO | | | 20,851 | | | | 373 | |
Motor Oil Hellas Corinth Refineries | | | 58,239 | | | | 1,312 | |
OPAP | | | 12,092 | | | | 152 | |
| | | | | | | | |
| | | | | | | 3,716 | |
| | | | | | | | |
Hong Kong — 5.7% | |
Agile Group Holdings | | | 204,000 | | | | 310 | |
Agricultural Bank of China, Cl H | | | 4,839,000 | | | | 2,254 | |
AIA Group | | | 1,456,600 | | | | 12,426 | |
Ajisen China Holdings | | | 483,000 | | | | 230 | |
ASM Pacific Technology | | | 4,600 | | | | 64 | |
Bank of China, Cl H | | | 6,656,000 | | | | 3,271 | |
Bank of East Asia | | | 20,604 | | | | 89 | |
Beijing Jingkelong, Cl H | | | 172,000 | | | | 49 | |
BOC Hong Kong Holdings | | | 62,500 | | | | 317 | |
Bright Smart Securities & Commodities Group | | | 32,000 | | | | 10 | |
Brightoil Petroleum Holdings* | | | 155,000 | | | | 30 | |
Brilliance China Automotive Holdings | | | 520,000 | | | | 1,391 | |
BYD Electronic International | | | 544,000 | | | | 1,185 | |
Cafe de Coral Holdings | | | 18,000 | | | | 49 | |
Champion‡ | | | 103,000 | | | | 76 | |
China Construction Bank, Cl H | | | 4,649,000 | | | | 4,285 | |
China Financial International Investments* | | | 310,000 | | | | 9 | |
China LNG Group* | | | 100,000 | | | | 16 | |
China Mengniu Dairy* | | | 315,000 | | | | 937 | |
China Merchants Holdings International | | | 84,253 | | | | 221 | |
China Mobile | | | 423,000 | | | | 4,291 | |
China National Materials | | | 221,000 | | | | 165 | |
China Overseas Grand Oceans Group | | | 226,000 | | | | 124 | |
China Overseas Land & Investment | | | 192,000 | | | | 619 | |
China Sunshine Paper Holdings | | | 134,000 | | | | 34 | |
China Trustful Group* | | | 36,000 | | | | 16 | |
Chong Hing Bank | | | 9,000 | | | | 19 | |
Chow Sang Sang Holdings International | | | 15,000 | | | | 36 | |
| | | | | | | | |
| Description | | Shares | | | Value
(000) | |
CITIC Telecom International Holdings | | | 71,000 | | | $ | 19 | |
CK Asset Holdings | | | 50,722 | | | | 443 | |
CK Hutchison Holdings | | | 180,384 | | | | 2,266 | |
CK Infrastructure Holdings | | | 11,000 | | | | 95 | |
CK Life Sciences Int’l Holdings | | | 126,000 | | | | 10 | |
CLP Holdings | | | 205,000 | | | | 2,097 | |
CMBC Capital Holdings* | | | 640,000 | | | | 44 | |
Convoy Global Holdings* | | | 402,000 | | | | 9 | |
Country Garden Holdings | | | 276,000 | | | | 526 | |
CSI Properties | | | 230,000 | | | | 12 | |
CSPC Pharmaceutical Group | | | 790,000 | | | | 1,596 | |
Dah Sing Banking Group | | | 25,200 | | | | 55 | |
Dah Sing Financial Holdings | | | 8,000 | | | | 51 | |
Digital Domain Holdings* | | | 620,000 | | | | 14 | |
Emperor Capital Group | | | 126,000 | | | | 9 | |
Emperor International Holdings | | | 48,000 | | | | 16 | |
Esprit Holdings* | | | 1,553,777 | | | | 832 | |
Fairwood Holdings | | | 2,500 | | | | 10 | |
Far East Consortium International | | | 72,000 | | | | 43 | |
FDG Kinetic* | | | 62,000 | | | | 6 | |
FIH Mobile | | | 320,000 | | | | 97 | |
First Pacific | | | 442,000 | | | | 300 | |
Freeman FinTech* | | | 260,000 | | | | 17 | |
Galaxy Entertainment Group* | | | 40,000 | | | | 321 | |
Geely Automobile Holdings | | | 564,000 | | | | 1,956 | |
Giordano International | | | 62,000 | | | | 33 | |
Global Brands Group Holding* | | | 260,000 | | | | 21 | |
Goodbaby International Holdings | | | 286,000 | | | | 157 | |
Great Eagle Holdings | | | 13,240 | | | | 69 | |
G-Resources Group* | | | 897,000 | | | | 11 | |
Guangnan Holdings | | | 210,000 | | | | 26 | |
Guotai Junan International Holdings | | | 137,000 | | | | 43 | |
Haitong International Securities Group | | | 110,908 | | | | 63 | |
Hang Lung Group | | | 15,000 | | | | 55 | |
Hang Lung Properties | | | 34,000 | | | | 83 | |
Hang Seng Bank | | | 12,900 | | | | 320 | |
Health and Happiness H&H International Holdings* | | | 13,500 | | | | 90 | |
Henderson Land Development | | | 20,982 | | | | 138 | |
Hengan International Group | | | 72,458 | | | | 805 | |
HK Electric Investments & HK Electric Investments (A) | | | 48,658 | | | | 45 | |
HKBN | | | 52,000 | | | | 66 | |
HKT Trust | | | 63,740 | | | | 80 | |
Hong Kong & China Gas | | | 141,917 | | | | 278 | |
The accompanying notes are an integral part of the financial statements.
62
| | |
| THE KP FUNDS | | December 31, 2017 |
| | |
| KP International Equity Fund | | |
| | | | | | | | |
| Description | | Shares | | | Value
(000) | |
Hong Kong Exchanges and Clearing | | | 20,111 | | | $ | 618 | |
Hongkong & Shanghai Hotels | | | 191,569 | | | | 284 | |
Hopewell Holdings | | | 31,000 | | | | 114 | |
HSBC Holdings | | | 739,875 | | | | 7,572 | |
Huarong International Financial Holdings* | | | 30,000 | | | | 10 | |
Hutchison Telecommunications Hong Kong Holdings | | | 62,000 | | | | 25 | |
Hysan Development | | | 11,000 | | | | 58 | |
Industrial & Commercial Bank of China, Cl H | | | 4,269,000 | | | | 3,438 | |
Johnson Electric Holdings | | | 18,000 | | | | 75 | |
Kerry Logistics Network | | | 35,000 | | | | 50 | |
Kerry Properties | | | 11,500 | | | | 52 | |
Kingboard Chemical Holdings | | | 314,500 | | | | 1,702 | |
Kingboard Laminates Holdings | | | 1,027,500 | | | | 1,602 | |
Kingston Financial Group | | | 66,000 | | | | 64 | |
Lai Sun Development | | | 9,600 | | | | 16 | |
Landing International Development* | | | 3,780,000 | | | | 150 | |
Langham Hospitality Investments and Langham Hospitality Investments | | | 32,000 | | | | 14 | |
Li & Fung | | | 100,000 | | | | 55 | |
Li Bao Ge Group | | | 10,000 | | | | 1 | |
Li Ning* | | | 1,050,791 | | | | 851 | |
Link‡ | | | 37,000 | | | | 343 | |
Liu Chong Hing Investment | | | 6,000 | | | | 10 | |
Luk Fook Holdings International | | | 18,000 | | | | 77 | |
Macau Legend Development* | | | 74,000 | | | | 11 | |
Man Wah Holdings | | | 77,600 | | | | 74 | |
Mason Group Holdings* | | | 1,040,000 | | | | 17 | |
Melco International Development | | | 38,000 | | | | 112 | |
Melco Resorts & Entertainment ADR | | | 4,173 | | | | 121 | |
MGM China Holdings | | | 14,000 | | | | 42 | |
Microport Scientific | | | 16,000 | | | | 15 | |
Minth Group | | | 12,000 | | | | 72 | |
MTR | | | 26,180 | | | | 153 | |
Neo Telemedia | | | 268,000 | | | | 8 | |
New World Development | | | 116,965 | | | | 176 | |
NewOcean Energy Holdings* | | | 38,000 | | | | 10 | |
Nine Dragons Paper Holdings | | | 7,000 | | | | 11 | |
NWS Holdings | | | 26,252 | | | | 47 | |
Pacific Basin Shipping* | | | 186,000 | | | | 40 | |
Pacific Textiles Holdings | | | 46,000 | | | | 49 | |
PCCW | | | 80,136 | | | | 47 | |
Ping An Insurance Group of China, Cl H | | | 390,500 | | | | 4,066 | |
| | | | | | | | |
| Description | | Shares | | | Value
(000) | |
Poly Property Group* | | | 135,000 | | | $ | 70 | |
Power Assets Holdings | | | 23,500 | | | | 198 | |
Prosperity‡ | | | 84,000 | | | | 36 | |
Regal‡ | | | 32,000 | | | | 10 | |
Regina Miracle International Holdings (A) | | | 15,000 | | | | 15 | |
Sa Sa International Holdings | | | 44,000 | | | | 17 | |
Sands China | | | 41,200 | | | | 213 | |
Scud Group* (B) (C) | | | 252,000 | | | | — | |
Shangri-La Asia | | | 22,000 | | | | 50 | |
Shenzhou International Group Holdings | | | 171,579 | | | | 1,635 | |
Shui On Land | | | 170,000 | | | | 47 | |
Shun Tak Holdings | | | 70,000 | | | | 27 | |
Sino Land | | | 55,554 | | | | 98 | |
Sino-Ocean Group Holding | | | 169,000 | | | | 117 | |
Sinotruk Hong Kong | | | 854,500 | | | | 962 | |
SITC International Holdings | | | 67,485 | | | | 67 | |
SJM Holdings | | | 43,000 | | | | 39 | |
SmarTone Telecommunications Holdings | | | 82,447 | | | | 99 | |
Stella International Holdings | | | 182,948 | | | | 276 | |
Sun Hung Kai | | | 19,000 | | | | 12 | |
Sun Hung Kai Properties | | | 24,893 | | | | 415 | |
SUNeVision Holdings | | | 43,000 | | | | 33 | |
Sunlight‡ | | | 65,000 | | | | 45 | |
Swire Pacific, Cl A | | | 8,500 | | | | 79 | |
Swire Properties | | | 19,800 | | | | 64 | |
Tai United Holdings | | | 65,000 | | | | 8 | |
Techtronic Industries | | | 23,500 | | | | 153 | |
Television Broadcasts | | | 130,500 | | | | 469 | |
Tencent Holdings | | | 134,500 | | | | 6,989 | |
Texwinca Holdings | | | 44,000 | | | | 24 | |
Tingyi Cayman Islands Holding | | | 527,014 | | | | 1,025 | |
Town Health International Medical Group | | | 154,000 | | | | 14 | |
United Laboratories International Holdings* | | | 30,000 | | | | 24 | |
Value Partners Group | | | 51,000 | | | | 54 | |
Vision Fame International Holding* | | | 140,000 | | | | 5 | |
VSTECS Holdings | | | 36,000 | | | | 22 | |
VTech Holdings | | | 8,400 | | | | 110 | |
Want Want China Holdings | | | 1,348,996 | | | | 1,131 | |
Weichai Power, Cl H | | | 153,000 | | | | 168 | |
WH Group (A) | | | 153,101 | | | | 173 | |
Wharf Holdings | | | 19,000 | | | | 66 | |
Wharf Real Estate Investment* | | | 21,000 | | | | 140 | |
Wheelock | | | 14,000 | | | | 100 | |
The accompanying notes are an integral part of the financial statements.
63
| | |
| THE KP FUNDS | | December 31, 2017 |
| | |
| KP International Equity Fund | | |
| | | | | | | | |
| Description | | Shares | | | Value
(000) | |
Wynn Macau | | | 26,800 | | | $ | 85 | |
Xinyi Glass Holdings | | | 94,000 | | | | 123 | |
Yue Yuen Industrial Holdings | | | 11,000 | | | | 43 | |
| | | | | | | | |
| | | | | | | 83,552 | |
| | | | | | | | |
Hungary — 0.1% | |
OTP Bank | | | 42,255 | | | | 1,749 | |
| | | | | | | | |
India — 2.6% | |
Asian Paints | | | 75,850 | | | | 1,377 | |
Axis Bank | | | 105,154 | | | | 929 | |
Bajaj Finance | | | 50,588 | | | | 1,392 | |
Bharti Airtel | | | 102,965 | | | | 854 | |
Bharti Infratel | | | 268,089 | | | | 1,591 | |
Eicher Motors | | | 2,733 | | | | 1,299 | |
HDFC Bank | | | 47,715 | | | | 1,400 | |
HDFC Bank ADR | | | 11,898 | | | | 1,210 | |
Hindalco Industries | | | 447,834 | | | | 1,919 | |
Hinduja Global Solutions | | | 7,976 | | | | 112 | |
Housing Development Finance | | | 207,468 | | | | 5,560 | |
Indian Oil | | | 282,132 | | | | 1,717 | |
Indraprastha Gas | | | 184,135 | | | | 969 | |
IndusInd Bank | | | 58,651 | | | | 1,515 | |
Infosys ADR | | | 204,500 | | | | 3,317 | |
Jindal Stainless Hisar* | | | 34,449 | | | | 122 | |
Maruti Suzuki India | | | 18,359 | | | | 2,799 | |
MRF | | | 1,761 | | | | 1,997 | |
NIIT Technologies | | | 17,799 | | | | 180 | |
Redington India | | | 151,579 | | | | 415 | |
Sharda Motor Industries | | | 943 | | | | 37 | |
Shriram Transport Finance | | | 12,797 | | | | 297 | |
Tata Consultancy Services | | | 98,929 | | | | 4,186 | |
Vakrangee | | | 339,984 | | | | 2,239 | |
Venky’s India | | | 7,651 | | | | 334 | |
Wipro | | | 97,369 | | | | 479 | |
| | | | | | | | |
| | | | | | | 38,246 | |
| | | | | | | | |
Indonesia — 0.6% | |
Adaro Energy | | | 1,540,100 | | | | 211 | |
Bank Negara Indonesia Persero | | | 3,501,400 | | | | 2,556 | |
Bank Pembangunan Daerah Jawa Timur | | | 467,000 | | | | 24 | |
Bank Rakyat Indonesia Persero | | | 7,083,700 | | | | 1,900 | |
Gudang Garam | | | 11,400 | | | | 70 | |
Media Nusantara Citra | | | 3,214,443 | | | | 304 | |
Telekomunikasi Indonesia Persero | | | 7,379,200 | | | | 2,416 | |
Unilever Indonesia | | | 326,200 | | | | 1,344 | |
| | | | | | | | |
| | | | | | | 8,825 | |
| | | | | | | | |
| | | | | | | | |
| Description | | Shares | | | Value
(000) | |
Ireland — 0.6% | |
AIB Group | | | 13,039 | | | $ | 86 | |
Bank of Ireland Group* | | | 108,095 | | | | 920 | |
C&C Group | | | 16,802 | | | | 57 | |
CRH | | | 153,283 | | | | 5,509 | |
Dalata Hotel Group* | | | 10,136 | | | | 77 | |
Glanbia | | | 9,278 | | | | 166 | |
Green‡ | | | 34,343 | | | | 64 | |
Hibernia‡ | | | 36,731 | | | | 67 | |
Irish Continental Group | | | 58,431 | | | | 404 | |
Irish Residential Properties‡ | | | 20,446 | | | | 37 | |
Origin Enterprises | | | 6,692 | | | | 51 | |
Paddy Power Betfair | | | 5,121 | | | | 609 | |
Permanent TSB Group Holdings* | | | 5,460 | | | | 15 | |
Ryanair Holdings ADR* | | | 496 | | | | 52 | |
Smurfit Kappa Group | | | 12,227 | | | | 414 | |
| | | | | | | | |
| | | | | | | 8,528 | |
| | | | | | | | |
Israel — 0.4% | |
Africa Israel Properties* | | | 517 | | | | 13 | |
Airport City* | | | 4,288 | | | | 54 | |
Alony Hetz Properties & Investments | | | 6,001 | | | | 64 | |
Amot Investments | | | 6,867 | | | | 41 | |
Azrieli Group | | | 625 | | | | 35 | |
B Communications* | | | 664 | | | | 12 | |
Bank Hapoalim | | | 18,249 | | | | 134 | |
Bank Leumi Le-Israel | | | 23,536 | | | | 142 | |
Bayside Land | | | 28 | | | | 14 | |
Bezeq The Israeli Telecommunication | | | 38,296 | | | | 59 | |
Big Shopping Centers | | | 184 | | | | 13 | |
Blue Square Real Estate | | | 240 | | | | 10 | |
Cellcom Israel* | | | 2,918 | | | | 30 | |
Check Point Software Technologies* | | | 29,947 | | | | 3,104 | |
Clal Insurance Enterprises Holdings* | | | 752 | | | | 14 | |
Delek Automotive Systems | | | 1,428 | | | | 11 | |
Delek Group | | | 245 | | | | 40 | |
Delta-Galil Industries | | | 384 | | | | 13 | |
El Al Israel Airlines | | | 14,890 | | | | 6 | |
Elbit Systems | | | 354 | | | | 47 | |
Electra | | | 78 | | | | 19 | |
First International Bank of Israel | | | 2,906 | | | | 60 | |
Formula Systems 1985 | | | 275 | | | | 11 | |
Frutarom Industries | | | 677 | | | | 64 | |
Gazit-Globe | | | 5,336 | | | | 57 | |
Harel Insurance Investments & Financial Services | | | 6,037 | | | | 44 | |
IDI Insurance | | | 284 | | | | 19 | |
Israel* | | | 184 | | | | 31 | |
The accompanying notes are an integral part of the financial statements.
64
| | |
| THE KP FUNDS | | December 31, 2017 |
| | |
| KP International Equity Fund | | |
| | | | | | | | |
| Description | | Shares | | | Value
(000) | |
Israel Chemicals | | | 7,468 | | | $ | 30 | |
Israel Discount Bank, Cl A* | | | 60,141 | | | | 176 | |
Jerusalem Economy* | | | 6,316 | | | | 17 | |
Jerusalem Oil Exploration* | | | 412 | | | | 25 | |
Kenon Holdings* | | | 723 | | | | 15 | |
Matrix IT | | | 1,358 | | | | 17 | |
Mazor Robotics* | | | 1,951 | | | | 52 | |
Melisron | | | 955 | | | | 45 | |
Menora Mivtachim Holdings | | | 953 | | | | 12 | |
Migdal Insurance & Financial Holding* | | | 13,597 | | | | 15 | |
Mizrahi Tefahot Bank | | | 2,061 | | | | 38 | |
Naphtha Israel Petroleum | | | 1,510 | | | | 11 | |
NICE-Systems | | | 1,017 | | | | 92 | |
Norstar Holdings | | | 544 | | | | 11 | |
Nova Measuring Instruments* | | | 1,849 | | | | 49 | |
Oil Refineries* | | | 76,027 | | | | 36 | |
Partner Communications* | | | 5,859 | | | | 37 | |
Paz Oil* | | | 381 | | | | 66 | |
Phoenix Holdings* | | | 2,422 | | | | 13 | |
Radware* | | | 2,566 | | | | 50 | |
Rami Levy Chain Stores Hashikma Marketing 2006 | | | 243 | | | | 13 | |
Reit 1‡ | | | 9,175 | | | | 40 | |
Sapiens International | | | 1,817 | | | | 21 | |
Shapir Engineering and Industry | | | 3,162 | | | | 13 | |
Shikun & Binui | | | 10,716 | | | | 23 | |
Shufersal | | | 2,454 | | | | 16 | |
Strauss Group | | | 2,648 | | | | 57 | |
Teva Pharmaceutical Industries ADR* | | | 5,253 | | | | 100 | |
Teva Pharmaceutical Industries* | | | 10,519 | | | | 198 | |
Tower Semiconductor* | | | 4,559 | | | | 156 | |
| | | | | | | | |
| | | | | | | 5,605 | |
| | | | | | | | |
Italy — 1.7% | |
A2A | | | 80,765 | | | | 149 | |
ACEA | | | 3,110 | | | | 57 | |
Amplifon | | | 4,506 | | | | 69 | |
Anima Holding (A) | | | 11,268 | | | | 81 | |
Ascopiave | | | 2,362 | | | | 10 | |
Assicurazioni Generali | | | 21,062 | | | | 384 | |
Astaldi | | | 1,845 | | | | 5 | |
ASTM | | | 2,348 | | | | 68 | |
Atlantia | | | 7,686 | | | | 243 | |
Autogrill | | | 6,330 | | | | 87 | |
Azimut Holding | | | 5,935 | | | | 114 | |
Banca Generali | | | 2,922 | | | | 97 | |
Banca IFIS | | | 1,181 | | | | 58 | |
Banca Mediolanum | | | 12,949 | | | | 112 | |
| | | | | | | | |
| Description | | Shares | | | Value
(000) | |
Banca Monte dei Paschi di Siena* | | | 14,128 | | | $ | 66 | |
Banca Popolare di Sondrio SCPA | | | 24,059 | | | | 88 | |
Banco BPM* | | | 77,186 | | | | 243 | |
Beni Stabili SIIQ‡ | | | 48,661 | | | | 45 | |
Biesse | | | 764 | | | | 39 | |
BPER Banca | | | 24,720 | | | | 125 | |
Brembo | | | 7,605 | | | | 116 | |
Brunello Cucinelli | | | 1,727 | | | | 56 | |
Buzzi Unicem | | | 4,903 | | | | 132 | |
Buzzi Unicem RSP | | | 2,149 | | | | 33 | |
Cairo Communication | | | 2,369 | | | | 11 | |
Cementir Holding | | | 1,553 | | | | 14 | |
Cerved Information Solutions | | | 9,854 | | | | 125 | |
CIR-Compagnie Industriali Riunite | | | 17,051 | | | | 24 | |
CNH Industrial | | | 134,871 | | | | 1,807 | |
Credito Emiliano | | | 4,286 | | | | 36 | |
Credito Valtellinese* | | | 4,834 | | | | 7 | |
Danieli & C Officine Meccaniche | | | 669 | | | | 16 | |
Danieli & C Officine Meccaniche RSP | | | 2,570 | | | | 43 | |
Datalogic | | | 1,158 | | | | 43 | |
Davide Campari-Milano | | | 36,442 | | | | 282 | |
De’ Longhi | | | 3,035 | | | | 92 | |
DiaSorin | | | 1,067 | | | | 95 | |
doBank* (A) | | | 3,802 | | | | 62 | |
Ei Towers | | | 928 | | | | 60 | |
El.En. | | | 474 | | | | 15 | |
Enav (A) | | | 16,201 | | | | 88 | |
Enel | | | 139,544 | | | | 859 | |
Eni | | | 194,050 | | | | 3,214 | |
ERG | | | 3,518 | | | | 65 | |
EXOR | | | 1,864 | | | | 114 | |
Falck Renewables | | | 6,160 | | | | 16 | |
Ferrari | | | 2,081 | | | | 218 | |
Fiat Chrysler Automobiles* | | | 18,162 | | | | 325 | |
Fila | | | 607 | | | | 14 | |
Fincantieri* | | | 28,316 | | | | 43 | |
FinecoBank Banca Fineco | | | 20,205 | | | | 207 | |
Geox | | | 3,289 | | | | 11 | |
Hera | | | 36,283 | | | | 127 | |
Immobiliare Grande Distribuzione SIIQ‡ | | | 20,608 | | | | 24 | |
Industria Macchine Automatiche | | | 870 | | | | 71 | |
Infrastrutture Wireless Italiane (A) | | | 12,834 | | | | 95 | |
Interpump Group | | | 3,517 | | | | 110 | |
Intesa Sanpaolo | | | 1,149,525 | | | | 3,822 | |
Intesa Sanpaolo RSP | | | 13,911 | | | | 44 | |
Iren | | | 31,236 | | | | 94 | |
The accompanying notes are an integral part of the financial statements.
65
| | |
| THE KP FUNDS | | December 31, 2017 |
| | |
| KP International Equity Fund | | |
| | | | | | | | |
| Description | | Shares | | | Value
(000) | |
Italgas | | | 24,393 | | | $ | 149 | |
Italmobiliare | | | 351 | | | | 10 | |
Juventus Football Club* | | | 19,509 | | | | 18 | |
La Doria | | | 707 | | | | 14 | |
Leonardo-Finmeccanica | | | 6,959 | | | | 83 | |
Luxottica Group | | | 32,385 | | | | 1,989 | |
Maire Tecnimont | | | 5,888 | | | | 30 | |
MARR | | | 1,816 | | | | 47 | |
Mediaset* | | | 24,396 | | | | 94 | |
Mediobanca | | | 9,725 | | | | 110 | |
Moncler | | | 8,476 | | | | 265 | |
OVS (A) | | | 7,389 | | | | 49 | |
Piaggio & C | | | 272,877 | | | | 753 | |
Poste Italiane (A) | | | 9,120 | | | | 69 | |
Prysmian | | | 3,472 | | | | 113 | |
RAI Way (A) | | | 4,576 | | | | 28 | |
Recordati | | | 1,763 | | | | 78 | |
Reply | | | 988 | | | | 55 | |
Safilo Group* | | | 1,581 | | | | 9 | |
Saipem* | | | 173,354 | | | | 791 | |
Salini Impregilo | | | 10,123 | | | | 39 | |
Salvatore Ferragamo | | | 2,673 | | | | 71 | |
Saras | | | 24,143 | | | | 58 | |
Snam | | | 420,740 | | | | 2,060 | |
Societa Cattolica di Assicurazioni SC | | | 7,623 | | | | 83 | |
Societa Iniziative Autostradali e Servizi | | | 3,996 | | | | 74 | |
Sogefi* | | | 2,114 | | | | 10 | |
Tamburi Investment Partners | | | 2,427 | | | | 16 | |
Technogym (A) | | | 4,689 | | | | 45 | |
Telecom Italia* | | | 198,200 | | | | 171 | |
Telecom Italia RSP | | | 101,659 | | | | 73 | |
Tenaris | | | 7,964 | | | | 126 | |
Terna Rete Elettrica Nazionale | | | 22,880 | | | | 133 | |
Tod’s | | | 534 | | | | 39 | |
UniCredit* | | | 95,389 | | | | 1,783 | |
Unione di Banche Italiane | | | 52,627 | | | | 230 | |
Unipol Gruppo | | | 20,262 | | | | 94 | |
UnipolSai | | | 19,210 | | | | 45 | |
Yoox Net-A-Porter Group, Cl A* | | | 2,672 | | | | 93 | |
Zignago Vetro | | | 1,102 | | | | 11 | |
| | | | | | | | |
| | | | | | | 24,778 | |
| | | | | | | | |
Japan — 14.6% | |
77 Bank | | | 3,600 | | | | 91 | |
ABC-Mart | | | 700 | | | | 40 | |
Achilles | | | 500 | | | | 11 | |
Acom* | | | 5,700 | | | | 24 | |
| | | | | | | | |
| Description | | Shares | | | Value
(000) | |
Activia Properties‡ | | | 30 | | | $ | 126 | |
Adastria | | | 1,300 | | | | 26 | |
ADEKA | | | 4,900 | | | | 86 | |
Advance Residence Investment‡ | | | 62 | | | | 152 | |
Advantest | | | 8,000 | | | | 148 | |
Aeon | | | 10,600 | | | | 180 | |
Aeon Delight | | | 2,400 | | | | 90 | |
Aeon Fantasy | | | 300 | | | | 13 | |
AEON Financial Service | | | 8,000 | | | | 187 | |
AEON Investment‡ | | | 73 | | | | 77 | |
Aeon Mall | | | 2,100 | | | | 41 | |
Ai Holdings | | | 1,900 | | | | 46 | |
Aica Kogyo | | | 2,700 | | | | 100 | |
Aichi | | | 2,400 | | | | 18 | |
Aichi Bank | | | 200 | | | | 9 | |
Aichi Steel | | | 600 | | | | 24 | |
Aida Engineering | | | 3,100 | | | | 38 | |
Aiful* | | | 16,700 | | | | 57 | |
Ain Holdings | | | 1,300 | | | | 78 | |
Air Water | | | 2,600 | | | | 55 | |
Aisan Industry | | | 2,000 | | | | 23 | |
Aisin Seiki | | | 2,900 | | | | 163 | |
Ajinomoto | | | 9,100 | | | | 171 | |
Akatsuki* | | | 200 | | | | 12 | |
Akebono Brake Industry* | | | 3,800 | | | | 10 | |
Akita Bank | | | 1,000 | | | | 28 | |
Alfresa Holdings | | | 32,400 | | | | 761 | |
Alpen | | | 1,000 | | | | 22 | |
Alpine Electronics | | | 2,200 | | | | 46 | |
Alps Electric | | | 3,400 | | | | 97 | |
Amada Holdings | | | 5,800 | | | | 79 | |
Amano | | | 3,200 | | | | 84 | |
Amuse | | | 400 | | | | 11 | |
ANA Holdings | | | 2,000 | | | | 84 | |
Anest Iwata | | | 1,000 | | | | 11 | |
Anicom Holdings* | | | 700 | | | | 23 | |
Anritsu | | | 7,000 | | | | 79 | |
AOKI Holdings | | | 2,400 | | | | 35 | |
Aomori Bank | | | 1,100 | | | | 35 | |
Aoyama Trading | | | 2,300 | | | | 86 | |
Aozora Bank | | | 2,000 | | | | 78 | |
Arcland Sakamoto | | | 1,500 | | | | 24 | |
Arcland Service Holdings | | | 600 | | | | 14 | |
Arcs | | | 2,400 | | | | 56 | |
Ardepro | | | 8,400 | | | | 7 | |
Ariake Japan | | | 1,000 | | | | 85 | |
As One | | | 900 | | | | 56 | |
The accompanying notes are an integral part of the financial statements.
66
| | |
| THE KP FUNDS | | December 31, 2017 |
| | |
| KP International Equity Fund | | |
| | | | | | | | |
| Description | | Shares | | | Value
(000) | |
Asahi Diamond Industrial | | | 2,200 | | | $ | 25 | |
Asahi Glass | | | 3,400 | | | | 147 | |
Asahi Group Holdings | | | 6,500 | | | | 322 | |
Asahi Holdings | | | 1,500 | | | | 28 | |
Asahi Intecc | | | 4,600 | | | | 158 | |
Asahi Kasei | | | 21,300 | | | | 275 | |
Asics | | | 3,200 | | | | 51 | |
ASKA Pharmaceutical | | | 700 | | | | 12 | |
ASKUL | | | 1,300 | | | | 37 | |
Astellas Pharma | | | 34,800 | | | | 444 | |
Ateam | | | 400 | | | | 10 | |
Atom | | | 3,900 | | | | 32 | |
Autobacs Seven | | | 3,700 | | | | 71 | |
Avex | | | 1,800 | | | | 26 | |
Awa Bank | | | 9,000 | | | | 57 | |
Axial Retailing | | | 900 | | | | 34 | |
Azbil | | | 9,800 | | | | 425 | |
Bando Chemical Industries | | | 2,200 | | | | 26 | |
Bank of Iwate | | | 1,000 | | | | 40 | |
Bank of Kyoto | | | 1,100 | | | | 57 | |
Bank of Nagoya | | | 800 | | | | 31 | |
Bank of Okinawa | | | 1,400 | | | | 57 | |
Bank of Saga | | | 500 | | | | 11 | |
Bank of the Ryukyus | | | 2,300 | | | | 35 | |
Belc | | | 600 | | | | 36 | |
Bell System24 Holdings | | | 1,100 | | | | 14 | |
Belluna | | | 2,500 | | | | 31 | |
Benefit One | | | 1,600 | | | | 33 | |
Benesse Holdings | | | 1,100 | | | | 39 | |
Bic Camera | | | 5,100 | | | | 74 | |
BML | | | 1,200 | | | | 30 | |
Bridgestone | | | 11,200 | | | | 521 | |
Broadleaf | | | 1,800 | | | | 17 | |
Bronco Billy | | | 400 | | | | 12 | |
Brother Industries | | | 4,000 | | | | 99 | |
Bunka Shutter | | | 3,200 | | | | 31 | |
Calbee | | | 1,500 | | | | 49 | |
Canon | | | 105,000 | | | | 3,914 | |
Canon Electronics | | | 800 | | | | 17 | |
Canon Marketing Japan | | | 2,800 | | | | 75 | |
Capcom | | | 2,200 | | | | 70 | |
Casio Computer | | | 11,700 | | | | 168 | |
Cawachi | | | 400 | | | | 10 | |
Central Glass | | | 2,000 | | | | 43 | |
Central Japan Railway | | | 2,440 | | | | 437 | |
Chiba Bank | | | 12,000 | | | | 100 | |
Chiyoda | | | 900 | | | | 24 | |
| | | | | | | | |
| Description | | Shares | | | Value
(000) | |
Chiyoda | | | 8,500 | | | $ | 63 | |
Chiyoda Integre | | | 500 | | | | 12 | |
Chofu Seisakusho | | | 1,300 | | | | 30 | |
Chubu Electric Power | | | 10,800 | | | | 134 | |
Chudenko | | | 2,000 | | | | 58 | |
Chugai Pharmaceutical | | | 3,800 | | | | 195 | |
Chugoku Bank | | | 10,800 | | | | 144 | |
Chugoku Electric Power | | | 4,700 | | | | 51 | |
Chugoku Marine Paints | | | 3,300 | | | | 28 | |
Chukyo Bank | | | 400 | | | | 8 | |
Ci:z Holdings | | | 1,400 | | | | 71 | |
Citizen Holdings | | | 14,900 | | | | 109 | |
CKD | | | 2,700 | | | | 61 | |
Clarion | | | 5,000 | | | | 19 | |
Coca-Cola Bottlers Japan Holdings | | | 2,100 | | | | 77 | |
cocokara fine | | | 900 | | | | 58 | |
COLOPL | | | 2,600 | | | | 28 | |
Colowide | | | 3,100 | | | | 63 | |
Comforia Residential‡ | | | 26 | | | | 56 | |
COMSYS Holdings | | | 5,500 | | | | 159 | |
Concordia Financial Group | | | 21,100 | | | | 127 | |
CONEXIO | | | 1,200 | | | | 25 | |
COOKPAD* | | | 2,500 | | | | 13 | |
Cosel | | | 800 | | | | 13 | |
Cosmo Energy Holdings | | | 2,900 | | | | 110 | |
Cosmos Pharmaceutical | | | 500 | | | | 105 | |
Create Restaurants Holdings | | | 1,600 | | | | 19 | |
Create SD Holdings | | | 1,500 | | | | 40 | |
Credit Saison | | | 2,600 | | | | 47 | |
CROOZ* | | | 500 | | | | 11 | |
CyberAgent | | | 5,200 | | | | 203 | |
CYBERDYNE* | | | 2,000 | | | | 34 | |
DA Consortium Holdings | | | 1,200 | | | | 24 | |
Dai Nippon Printing | | | 4,500 | | | | 100 | |
Daibiru | | | 2,800 | | | | 35 | |
Daicel | | | 4,900 | | | | 56 | |
Daido Metal | | | 1,100 | | | | 11 | |
Daido Steel | | | 1,400 | | | | 86 | |
Daifuku | | | 4,100 | | | | 223 | |
Daihen | | | 5,000 | | | | 47 | |
Daiho | | | 3,000 | | | | 15 | |
Daiichi Jitsugyo | | | 400 | | | | 12 | |
Dai-ichi Life Holdings | | | 92,600 | | | | 1,911 | |
Daiichi Sankyo | | | 9,600 | | | | 250 | |
Daiichikosho | | | 1,900 | | | | 95 | |
Daiken | | | 600 | | | | 16 | |
Daikin Industries | | | 31,600 | | | | 3,740 | |
The accompanying notes are an integral part of the financial statements.
67
| | |
| THE KP FUNDS | | December 31, 2017 |
| | |
| KP International Equity Fund | | |
| | | | | | | | |
| Description | | Shares | | | Value
(000) | |
Daikokutenbussan | | | 200 | | | $ | 9 | |
Daikyo | | | 1,800 | | | | 35 | |
Daikyonishikawa | | | 2,000 | | | | 32 | |
Dainichiseika Color & Chemicals Manufacturing | | | 600 | | | | 30 | |
Daio Paper | | | 3,800 | | | | 50 | |
Daiseki | | | 2,000 | | | | 56 | |
Daishi Bank | | | 1,500 | | | | 68 | |
Daito Trust Construction | | | 1,200 | | | | 245 | |
Daiwa House Industry | | | 12,900 | | | | 494 | |
Daiwa House Investment, Cl A‡ | | | 22 | | | | 52 | |
Daiwa Industries | | | 1,100 | | | | 13 | |
Daiwa Office Investment‡ | | | 18 | | | | 95 | |
Daiwa Securities Group | | | 27,000 | | | | 169 | |
Daiwabo Holdings | | | 900 | | | | 37 | |
DCM Holdings | | | 5,100 | | | | 48 | |
Dena* | | | 2,000 | | | | 41 | |
Denka | | | 4,400 | | | | 176 | |
Denki Kogyo | | | 400 | | | | 11 | |
Denso | | | 200,100 | | | | 12,009 | |
Dentsu | | | 3,700 | | | | 157 | |
Denyo | | | 600 | | | | 11 | |
Descente | | | 2,200 | | | | 38 | |
Dexerials | | | 2,300 | | | | 30 | |
DIC | | | 4,100 | | | | 155 | |
Digital Garage | | | 1,800 | | | | 48 | |
Dip | | | 1,600 | | | | 41 | |
Disco | | | 500 | | | | 111 | |
DMG Mori | | | 5,500 | | | | 114 | |
Don Quijote Holdings | | | 2,000 | | | | 105 | |
Doshisha | | | 1,200 | | | | 26 | |
Doutor Nichires Holdings | | | 2,100 | | | | 52 | |
Dowa Holdings | | | 2,600 | | | | 106 | |
DTS | | | 1,100 | | | | 36 | |
Duskin | | | 2,200 | | | | 58 | |
DyDo Group Holdings | | | 300 | | | | 16 | |
Eagle Industry | | | 1,000 | | | | 19 | |
Earth Chemical | | | 700 | | | | 35 | |
East Japan Railway | | | 16,500 | | | | 1,609 | |
Ebara | | | 5,100 | | | | 194 | |
EDION | | | 3,600 | | | | 42 | |
Ehime Bank | | | 800 | | | | 10 | |
Eighteenth Bank | | | 8,000 | | | | 21 | |
Eiken Chemical | | | 900 | | | | 43 | |
Eisai | | | 4,520 | | | | 257 | |
Eizo | | | 800 | | | | 38 | |
Elecom | | | 600 | | | | 14 | |
Electric Power Development | | | 2,500 | | | | 67 | |
| | | | | | | | |
| Description | | Shares | | | Value
(000) | |
en-japan | | | 1,300 | | | $ | 61 | |
Enplas | | | 400 | | | | 17 | |
EPS Holdings | | | 1,400 | | | | 32 | |
eRex | | | 1,500 | | | | 14 | |
euglena* | | | 3,100 | | | | 29 | |
Exedy | | | 1,600 | | | | 49 | |
Ezaki Glico | | | 2,200 | | | | 110 | |
F@N Communications | | | 1,800 | | | | 14 | |
FamilyMart | | | 1,400 | | | | 98 | |
Fancl | | | 1,900 | | | | 56 | |
FANUC | | | 17,680 | | | | 4,247 | |
Fast Retailing | | | 900 | | | | 358 | |
FC Residential Investments‡ | | | 65 | | | | 45 | |
FCC | | | 1,700 | | | | 45 | |
Ferrotec Holdings | | | 3,100 | | | | 63 | |
Financial Products Group | | | 3,400 | | | | 41 | |
Foster Electric | | | 1,000 | | | | 25 | |
FP | | | 1,200 | | | | 64 | |
Frontier Real Estate Investment‡ | | | 21 | | | | 82 | |
Fudo Tetra | | | 5,900 | | | | 10 | |
Fuji | | | 1,000 | | | | 22 | |
Fuji Electric | | | 9,000 | | | | 68 | |
Fuji Heavy Industries | | | 15,000 | | | | 477 | |
Fuji Kyuko | | | 1,000 | | | | 29 | |
Fuji Machine Manufacturing | | | 3,400 | | | | 65 | |
Fuji Media Holdings | | | 39,100 | | | | 616 | |
Fuji Oil Holdings | | | 2,800 | | | | 82 | |
Fuji Pharma | | | 300 | | | | 12 | |
Fuji Seal International | | | 2,300 | | | | 75 | |
Fuji Soft | | | 1,400 | | | | 45 | |
Fujibo Holdings | | | 400 | | | | 13 | |
Fujicco | | | 1,200 | | | | 27 | |
FUJIFILM Holdings | | | 40,700 | | | | 1,663 | |
Fujikura | | | 13,100 | | | | 116 | |
Fujimi | | | 700 | | | | 15 | |
Fujimori Kogyo | | | 800 | | | | 28 | |
Fujita Kanko | | | 300 | | | | 9 | |
Fujitec | | | 3,400 | | | | 49 | |
Fujitsu | | | 33,000 | | | | 235 | |
Fujitsu General | | | 3,000 | | | | 66 | |
Fujiya | | | 500 | | | | 12 | |
Fukuda | | | 400 | | | | 24 | |
Fukuda Denshi | | | 300 | | | | 22 | |
Fukui Computer Holdings | | | 300 | | | | 9 | |
Fukuoka Corp‡ | | | 34 | | | | 51 | |
Fukuoka Financial Group | | | 31,000 | | | | 174 | |
Fukushima Industries | | | 700 | | | | 31 | |
The accompanying notes are an integral part of the financial statements.
68
| | |
| THE KP FUNDS | | December 31, 2017 |
| | |
| KP International Equity Fund | | |
| | | | | | | | |
| Description | | Shares | | | Value
(000) | |
Fukuyama Transporting | | | 1,600 | | | $ | 60 | |
Funai Electric* | | | 1,300 | | | | 10 | |
Funai Soken Holdings | | | 1,650 | | | | 37 | |
Furukawa | | | 1,700 | | | | 35 | |
Furukawa Electric | | | 3,500 | | | | 173 | |
Fuso Chemical | | | 800 | | | | 22 | |
Futaba* | | | 1,900 | | | | 40 | |
Futaba Industrial | | | 2,500 | | | | 23 | |
Future | | | 1,200 | | | | 13 | |
Fuyo General Lease | | | 1,000 | | | | 66 | |
Geo Holdings | | | 1,400 | | | | 27 | |
Giken | | | 500 | | | | 13 | |
Global One Real Estate Investment‡ | | | 11 | | | | 39 | |
Glory | | | 2,900 | | | | 110 | |
GLP J-Reit‡ | | | 127 | | | | 137 | |
GMO internet | | | 3,700 | | | | 63 | |
GMO Payment Gateway | | | 800 | | | | 66 | |
GNI Group* | | | 5,000 | | | | 26 | |
Goldcrest | | | 600 | | | | 12 | |
Goldwin | | | 300 | | | | 24 | |
Gree | | | 5,900 | | | | 37 | |
GS Yuasa | | | 19,000 | | | | 95 | |
G-Tekt | | | 1,100 | | | | 23 | |
GungHo Online Entertainment* | | | 19,800 | | | | 54 | |
Gunma Bank | | | 17,000 | | | | 103 | |
Gunze | | | 900 | | | | 52 | |
Gurunavi | | | 1,400 | | | | 17 | |
H2O Retailing | | | 4,600 | | | | 96 | |
Hachijuni Bank | | | 8,100 | | | | 47 | |
Hakuhodo DY Holdings | | | 3,500 | | | | 45 | |
Halows | | | 100 | | | | 2 | |
Hamamatsu Photonics | | | 2,400 | | | | 81 | |
Hankyu Hanshin Holdings | | | 4,100 | | | | 165 | |
Hankyu Reit‡ | | | 27 | | | | 31 | |
Hanwa | | | 1,800 | | | | 83 | |
Harmonic Drive Systems | | | 1,400 | | | | 82 | |
Haseko | | | 13,700 | | | | 213 | |
Hazama Ando | | | 8,600 | | | | 67 | |
Hearts United Group | | | 700 | | | | 11 | |
Heiwa | | | 2,900 | | | | 54 | |
Heiwa Real Estate‡ | | | 49 | | | | 41 | |
Heiwa Real Estate | | | 2,200 | | | | 40 | |
Heiwado | | | 1,600 | | | | 33 | |
Hibiya Engineering | | | 1,200 | | | | 26 | |
Hiday Hidaka | | | 700 | | | | 21 | |
Hikari Tsushin | | | 400 | | | | 58 | |
Hino Motors | | | 4,300 | | | | 56 | |
| | | | | | | | |
| Description | | Shares | | | Value
(000) | |
Hiramatsu | | | 1,700 | | | $ | 9 | |
Hirata | | | 400 | | | | 41 | |
Hirose Electric | | | 8,400 | | | | 1,228 | |
Hiroshima Bank | | | 19,000 | | | | 165 | |
HIS | | | 2,100 | | | | 76 | |
Hisamitsu Pharmaceutical | | | 1,100 | | | | 67 | |
Hitachi | | | 280,000 | | | | 2,182 | |
Hitachi Capital | | | 2,600 | | | | 65 | |
Hitachi Chemical | | | 1,800 | | | | 46 | |
Hitachi Construction Machinery | | | 1,900 | | | | 69 | |
Hitachi High-Technologies | | | 1,300 | | | | 55 | |
Hitachi Kokusai Electric* | | | 2,700 | | | | 75 | |
Hitachi Maxwell | | | 1,900 | | | | 41 | |
Hitachi Metals | | | 3,200 | | | | 46 | |
Hitachi Transport System | | | 2,600 | | | | 68 | |
Hitachi Zosen | | | 8,600 | | | | 45 | |
Hogy Medical | | | 700 | | | | 53 | |
Hokkaido Electric Power* | | | 9,800 | | | | 65 | |
Hokkoku Bank | | | 1,200 | | | | 48 | |
Hokuetsu Bank | | | 1,100 | | | | 25 | |
Hokuetsu Kishu Paper | | | 6,900 | | | | 41 | |
Hokuhoku Financial Group | | | 6,300 | | | | 99 | |
Hokuriku Electric Power* | | | 7,700 | | | | 62 | |
Hokuto | | | 1,500 | | | | 27 | |
Honda Motor | | | 209,500 | | | | 7,180 | |
Horiba | | | 1,900 | | | | 114 | |
Hoshino Resorts‡ | | | 10 | | | | 49 | |
Hoshizaki Electric | | | 1,600 | | | | 142 | |
Hosiden | | | 3,200 | | | | 47 | |
House Foods Group | | | 3,300 | | | | 110 | |
Hoya | | | 134,700 | | | | 6,727 | |
Hulic | | | 4,500 | | | | 51 | |
Hulic‡ | | | 53 | | | | 77 | |
Hyakugo Bank | | | 12,000 | | | | 57 | |
Hyakujushi Bank | | | 13,000 | | | | 43 | |
Ibiden | | | 5,700 | | | | 85 | |
IBJ Leasing | | | 1,600 | | | | 41 | |
Ichibanya | | | 900 | | | | 36 | |
Ichigo | | | 12,100 | | | | 46 | |
Ichiyoshi Securities | | | 2,100 | | | | 24 | |
Icom | | | 400 | | | | 9 | |
Idec | | | 1,300 | | | | 31 | |
Idemitsu Kosan | | | 2,300 | | | | 92 | |
IDOM | | | 2,900 | | | | 21 | |
IHI | | | 2,600 | | | | 87 | |
Iida Group Holdings | | | 2,500 | | | | 47 | |
Iino Kaiun Kaisha | | | 5,000 | | | | 28 | |
The accompanying notes are an integral part of the financial statements.
69
| | |
| THE KP FUNDS | | December 31, 2017 |
| | |
| KP International Equity Fund | | |
| | | | | | | | |
| Description | | Shares | | | Value
(000) | |
Inaba Denki Sangyo | | | 1,600 | | | $ | 75 | |
Inabata | | | 2,600 | | | | 39 | |
Industrial & Infrastructure Fund Investment‡ | | | 19 | | | | 82 | |
Ines | | | 1,100 | | | | 11 | |
Infocom | | | 500 | | | | 12 | |
Infomart | | | 4,800 | | | | 29 | |
Information Services International-Dentsu | | | 400 | | | | 9 | |
Inpex | | | 16,500 | | | | 206 | |
Internet Initiative Japan | | | 1,700 | | | | 31 | |
Invesco Office‡ | | | 50 | | | | 49 | |
Investors Cloud | | | 1,000 | | | | 15 | |
Invincible Investment‡ | | | 190 | | | | 81 | |
Iriso Electronics | | | 1,000 | | | | 60 | |
Iseki | | | 1,000 | | | | 25 | |
Isetan Mitsukoshi Holdings | | | 37,600 | | | | 465 | |
Ishihara Sangyo Kaisha* | | | 1,500 | | | | 28 | |
Istyle | | | 1,900 | | | | 15 | |
Isuzu Motors | | | 9,000 | | | | 151 | |
Ito En | | | 2,800 | | | | 110 | |
ITOCHU | | | 32,900 | | | | 615 | |
Itochu Enex | | | 2,600 | | | | 25 | |
Itochu Techno-Solutions | | | 2,400 | | | | 104 | |
Itochu-Shokuhin | | | 100 | | | | 5 | |
Itoham Yonekyu Holdings | | | 7,500 | | | | 69 | |
Itoki | | | 1,500 | | | | 11 | |
Iwatani | | | 1,800 | | | | 58 | |
Iyo Bank | | | 12,200 | | | | 98 | |
Izumi | | | 1,800 | | | | 112 | |
J Front Retailing | | | 4,100 | | | | 77 | |
J Trust | | | 3,200 | | | | 21 | |
JAC Recruitment | | | 700 | | | | 14 | |
Jaccs | | | 1,400 | | | | 33 | |
Jafco* | | | 1,700 | | | | 99 | |
Jamco | | | 500 | | | | 12 | |
Japan‡ | | | 21 | | | | 100 | |
Japan Airlines | | | 4,600 | | | | 179 | |
Japan Airport Terminal | | | 1,000 | | | | 37 | |
Japan Asset Marketing* | | | 8,600 | | | | 10 | |
Japan Aviation Electronics Industry | | | 2,000 | | | | 34 | |
Japan Display* | | | 16,400 | | | | 33 | |
Japan Excellent‡ | | | 62 | | | | 72 | |
Japan Exchange Group | | | 9,100 | | | | 158 | |
Japan Hotel‡ | | | 190 | | | | 127 | |
Japan Lifeline | | | 2,200 | | | | 46 | |
Japan Logistics Fund‡ | | | 40 | | | | 74 | |
Japan Material | | | 900 | | | | 33 | |
| | | | | | | | |
| Description | | Shares | | | Value
(000) | |
Japan Petroleum Exploration | | | 1,600 | | | $ | 42 | |
Japan Post Bank | | | 6,900 | | | | 90 | |
Japan Post Holdings | | | 90,100 | | | | 1,033 | |
Japan Prime‡ | | | 14 | | | | 44 | |
Japan Pulp & Paper | | | 600 | | | | 23 | |
Japan Rental Housing Investments‡ | | | 97 | | | | 71 | |
Japan Retail Fund Investment‡ | | | 43 | | | | 79 | |
Japan Securities Finance | | | 6,100 | | | | 35 | |
Japan Steel Works | | | 3,100 | | | | 100 | |
Japan Tobacco | | | 93,600 | | | | 3,016 | |
Japan Wool Textile | | | 1,700 | | | | 16 | |
JCR Pharmaceuticals | | | 600 | | | | 28 | |
Jeol | | | 3,000 | | | | 17 | |
JFE Holdings | | | 28,200 | | | | 676 | |
JGC | | | 3,600 | | | | 70 | |
JIG-SAW* | | | 200 | | | | 9 | |
Jimoto Holdings | | | 5,700 | | | | 10 | |
JINS | | | 700 | | | | 37 | |
J-Oil Mills | | | 300 | | | | 10 | |
Joshin Denki | | | 1,000 | | | | 36 | |
Joyful Honda | | | 1,300 | | | | 40 | |
JSP | | | 500 | | | | 17 | |
JSR | | | 3,300 | | | | 65 | |
JTEKT | | | 3,800 | | | | 65 | |
Juroku Bank | | | 1,500 | | | | 44 | |
Justsystems | | | 1,600 | | | | 30 | |
JVC Kenwood | | | 8,400 | | | | 29 | |
JX Holdings | | | 52,100 | | | | 337 | |
kabu.com Securities | | | 8,300 | | | | 26 | |
Kadokawa Dwango | | | 2,700 | | | | 33 | |
Kaga Electronics | | | 700 | | | | 19 | |
Kagome | | | 3,900 | | | | 145 | |
Kajima | | | 15,000 | | | | 144 | |
Kakaku.com | | | 2,000 | | | | 34 | |
Kaken Pharmaceutical | | | 1,600 | | | | 83 | |
Kameda Seika | | | 700 | | | | 32 | |
Kamei | | | 800 | | | | 14 | |
Kamigumi | | | 2,000 | | | | 44 | |
Kanamoto | | | 1,400 | | | | 43 | |
Kandenko | | | 5,000 | | | | 53 | |
Kaneka | | | 5,000 | | | | 46 | |
Kanematsu | | | 4,000 | | | | 55 | |
Kanematsu Electronics | | | 700 | | | | 21 | |
Kansai Electric Power | | | 12,300 | | | | 150 | |
Kansai Paint | | | 3,500 | | | | 91 | |
Kansai Urban Banking | | | 800 | | | | 10 | |
Kanto Denka Kogyo | | | 1,800 | | | | 22 | |
The accompanying notes are an integral part of the financial statements.
70
| | |
| THE KP FUNDS | | December 31, 2017 |
| | |
| KP International Equity Fund | | |
| | | | | | | | |
| Description | | Shares | | | Value
(000) | |
Kao | | | 56,400 | | | $ | 3,815 | |
Kappa Create* | | | 200 | | | | 2 | |
Kasai Kogyo | | | 1,000 | | | | 16 | |
Katakura Industries | | | 900 | | | | 12 | |
Kato Sangyo | | | 1,400 | | | | 51 | |
Kato Works | | | 700 | | | | 21 | |
Kawasaki Heavy Industries | | | 2,600 | | | | 91 | |
Kawasaki Kisen Kaisha* | | | 4,600 | | | | 118 | |
KDDI | | | 31,100 | | | | 774 | |
Keihan Holdings | | | 1,700 | | | | 50 | |
Keihin* | | | 2,000 | | | | 41 | |
Keikyu | | | 4,000 | | | | 77 | |
Keio | | | 2,000 | | | | 88 | |
Keisei Electric Railway | | | 2,400 | | | | 77 | |
Keiyo | | | 1,500 | | | | 9 | |
Keiyo Bank | | | 12,000 | | | | 55 | |
Kenedix | | | 13,300 | | | | 81 | |
Kenedix Office Investment, Cl A‡ | | | 22 | | | | 125 | |
Kenedix Residential Investment‡ | | | 18 | | | | 52 | |
Kenedix Retail‡ | | | 26 | | | | 54 | |
Kenko Mayonnaise | | | 400 | | | | 14 | |
Kewpie | | | 5,300 | | | | 141 | |
Key Coffee | | | 500 | | | | 10 | |
Keyence | | | 1,700 | | | | 952 | |
KH Neochem | | | 1,200 | | | | 31 | |
Kikkoman | | | 2,500 | | | | 101 | |
Kinden | | | 6,700 | | | | 109 | |
Kintetsu Department Store* | | | 300 | | | | 11 | |
Kintetsu Group Holdings | | | 3,100 | | | | 119 | |
Kintetsu World Express | | | 2,000 | | | | 41 | |
Kirin Holdings | | | 75,700 | | | | 1,909 | |
Kisoji | | | 1,400 | | | | 35 | |
Kissei Pharmaceutical | | | 1,700 | | | | 48 | |
Kitz | | | 4,300 | | | | 33 | |
Kiyo Bank | | | 3,500 | | | | 58 | |
KLab* | | | 2,300 | | | | 37 | |
KNT-CT Holdings* | | | 500 | | | | 8 | |
Koa | | | 1,600 | | | | 33 | |
Kobayashi Pharmaceutical | | | 2,500 | | | | 162 | |
Kobe Bussan | | | 500 | | | | 19 | |
Kobe Steel* | | | 4,600 | | | | 43 | |
Koei Tecmo Holdings | | | 2,100 | | | | 42 | |
Kohnan Shoji | | | 1,600 | | | | 35 | |
Koito Manufacturing | | | 1,900 | | | | 134 | |
Kokuyo | | | 4,300 | | | | 80 | |
Komatsu | | | 101,900 | | | | 3,689 | |
KOMEDA Holdings | | | 2,000 | | | | 37 | |
| | | | | | | | |
| Description | | Shares | | | Value
(000) | |
Komeri | | | 1,700 | | | $ | 49 | |
Komori | | | 3,000 | | | | 42 | |
Konami Holdings | | | 1,600 | | | | 88 | |
Konica Minolta | | | 8,100 | | | | 78 | |
Konishi | | | 1,700 | | | | 32 | |
Konoike Transport | | | 1,100 | | | | 19 | |
Kose | | | 500 | | | | 78 | |
Koshidaka Holdings | | | 500 | | | | 23 | |
Kotobuki Spirits | | | 1,000 | | | | 56 | |
K’s Holdings | | | 3,800 | | | | 97 | |
Kubota | | | 162,700 | | | | 3,190 | |
Kumagai Gumi | | | 1,800 | | | | 50 | |
Kumiai Chemical Industry | | | 4,800 | | | | 32 | |
Kura | | | 600 | | | | 35 | |
Kurabo Industries | | | 10,000 | | | | 32 | |
Kuraray | | | 6,100 | | | | 115 | |
Kureha | | | 800 | | | | 58 | |
Kurita Water Industries | | | 57,400 | | | | 1,865 | |
Kusuri no Aoki | | | 700 | | | | 37 | |
KYB | | | 1,000 | | | | 58 | |
Kyocera | | | 67,500 | | | | 4,417 | |
Kyodo Printing | | | 300 | | | | 10 | |
Kyoei Steel | | | 1,300 | | | | 25 | |
Kyokuto Kaihatsu Kogyo | | | 1,500 | | | | 26 | |
Kyokuto Securities | | | 700 | | | | 10 | |
KYORIN Holdings | | | 2,200 | | | | 41 | |
Kyoritsu Maintenance | | | 1,600 | | | | 65 | |
Kyowa Exeo | | | 4,500 | | | | 116 | |
Kyowa Hakko Kirin | | | 4,400 | | | | 85 | |
Kyudenko | | | 2,100 | | | | 102 | |
Kyushu Electric Power | | | 7,300 | | | | 77 | |
Kyushu Financial Group | | | 6,700 | | | | 41 | |
Kyushu Railway | | | 2,700 | | | | 84 | |
LaSalle Logiport‡ | | | 65 | | | | 67 | |
Lasertec | | | 2,000 | | | | 51 | |
Lawson | | | 800 | | | | 53 | |
Leopalace21 | | | 12,600 | | | | 98 | |
Life | | | 400 | | | | 11 | |
LIFULL | | | 2,400 | | | | 21 | |
LINE* | | | 800 | | | | 33 | |
Linical | | | 700 | | | | 10 | |
Link And Motivation | | | 1,500 | | | | 12 | |
Lintec | | | 2,500 | | | | 70 | |
Lion | | | 3,800 | | | | 72 | |
LIXIL Group | | | 30,000 | | | | 812 | |
M&A Capital Partners* | | | 300 | | | | 20 | |
M3* | | | 3,600 | | | | 127 | |
The accompanying notes are an integral part of the financial statements.
71
| | |
| THE KP FUNDS | | December 31, 2017 |
| | |
| KP International Equity Fund | | |
| | | | | | | | |
| Description | | Shares | | | Value
(000) | |
Mabuchi Motor | | | 900 | | | $ | 49 | |
Macnica Fuji Electronics Holdings | | | 2,100 | | | | 46 | |
Macromill | | | 1,800 | | | | 43 | |
Maeda | | | 18,600 | | | | 257 | |
Maeda Kosen | | | 700 | | | | 13 | |
Maeda Road Construction | | | 3,000 | | | | 69 | |
Makino Milling Machine | | | 5,000 | | | | 51 | |
Makita | | | 3,800 | | | | 160 | |
Mandom | | | 2,000 | | | | 66 | |
Mani | | | 1,300 | | | | 40 | |
Mars Engineering | | | 500 | | | | 11 | |
Marubeni | | | 28,600 | | | | 207 | |
Marudai Food | | | 5,000 | | | | 22 | |
Maruha Nichiro | | | 2,100 | | | | 63 | |
Marui Group | | | 11,500 | | | | 211 | |
Maruichi Steel Tube | | | 1,200 | | | | 35 | |
Marusan Securities* | | | 3,500 | | | | 31 | |
Maruwa | | | 400 | | | | 27 | |
Maruzen Showa Unyu | | | 2,000 | | | | 9 | |
Marvelous | | | 1,200 | | | | 11 | |
Matsui Securities | | | 6,300 | | | | 53 | |
Matsumotokiyoshi Holdings | | | 7,200 | | | | 297 | |
Matsuya | | | 1,200 | | | | 17 | |
Matsuya Foods | | | 300 | | | | 11 | |
Max | | | 1,000 | | | | 14 | |
Mazda Motor | | | 9,700 | | | | 130 | |
McDonald’s Holdings Japan | | | 1,000 | | | | 44 | |
MCJ | | | 1,400 | | | | 15 | |
MCUBS MidCity Investment‡ | | | 75 | | | | 50 | |
Mebuki Financial Group | | | 17,200 | | | | 73 | |
Medipal Holdings | | | 2,600 | | | | 51 | |
Megachips* | | | 800 | | | | 24 | |
Megmilk Snow Brand | | | 2,500 | | | | 74 | |
Meidensha | | | 10,000 | | | | 41 | |
MEIJI Holdings | | | 2,100 | | | | 179 | |
Meiko Network Japan | | | 700 | | | | 8 | |
Meitec | | | 1,200 | | | | 63 | |
Melco Holdings | | | 300 | | | | 10 | |
Menicon | | | 1,000 | | | | 28 | |
METAWATER | | | 400 | | | | 10 | |
Micronics Japan* | | | 1,300 | | | | 13 | |
Mie Bank | | | 200 | | | | 4 | |
Milbon | | | 1,200 | | | | 40 | |
Mimasu Semiconductor Industry | | | 600 | | | | 12 | |
Minato Bank | | | 900 | | | | 17 | |
Minebea | | | 6,600 | | | | 138 | |
Ministop | | | 500 | | | | 11 | |
| | | | | | | | |
| Description | | Shares | | | Value
(000) | |
Miraca Holdings | | | 4,600 | | | $ | 197 | |
Mirait Holdings | | | 3,100 | | | | 46 | |
Miroku Jyoho Service | | | 800 | | | | 22 | |
MISUMI Group | | | 4,700 | | | | 137 | |
Mitsuba | | | 1,500 | | | | 23 | |
Mitsubishi | | | 48,660 | | | | 1,345 | |
Mitsubishi Chemical Holdings | | | 24,200 | | | | 266 | |
Mitsubishi Electric | | | 33,200 | | | | 550 | |
Mitsubishi Estate | | | 48,900 | | | | 850 | |
Mitsubishi Gas Chemical | | | 3,100 | | | | 89 | |
Mitsubishi Heavy Industries | | | 15,000 | | | | 560 | |
Mitsubishi Logisnext | | | 1,500 | | | | 13 | |
Mitsubishi Logistics | | | 12,700 | | | | 330 | |
Mitsubishi Materials | | | 1,900 | | | | 68 | |
Mitsubishi Motors | | | 11,300 | | | | 82 | |
Mitsubishi Pencil | | | 2,000 | | | | 44 | |
Mitsubishi Research Institute | | | 200 | | | | 7 | |
Mitsubishi Shokuhin | | | 900 | | | | 26 | |
Mitsubishi Steel Manufacturing | | | 1,000 | | | | 25 | |
Mitsubishi Tanabe Pharma | | | 3,800 | | | | 79 | |
Mitsubishi UFJ Financial Group | | | 227,900 | | | | 1,673 | |
Mitsubishi UFJ Lease & Finance | | | 8,100 | | | | 48 | |
Mitsuboshi Belting | | | 3,000 | | | | 41 | |
Mitsui | | | 29,400 | | | | 478 | |
Mitsui Chemicals | | | 3,200 | | | | 103 | |
Mitsui Engineering & Shipbuilding | | | 3,800 | | | | 57 | |
Mitsui Fudosan | | | 15,100 | | | | 338 | |
Mitsui Fudosan Logistics Park‡ | | | 10 | | | | 32 | |
Mitsui High-Tec | | | 1,100 | | | | 20 | |
Mitsui Mining & Smelting | | | 2,900 | | | | 170 | |
Mitsui OSK Lines | | | 2,000 | | | | 67 | |
Mitsui Sugar | | | 700 | | | | 30 | |
Mitsui-Soko Holdings* | | | 4,000 | | | | 14 | |
Miura | | | 4,600 | | | | 124 | |
Mixi | | | 800 | | | | 36 | |
Miyazaki Bank | | | 800 | | | | 27 | |
Mizuho Financial Group | | | 783,700 | | | | 1,423 | |
Mizuno | | | 1,000 | | | | 29 | |
Mochida Pharmaceutical | | | 700 | | | | 54 | |
Modec | | | 800 | | | | 21 | |
Monex Group | | | 9,800 | | | | 28 | |
MonotaRO | | | 3,100 | | | | 99 | |
Mori Hills Investment‡ | | | 77 | | | | 93 | |
Mori Trust Hotel‡ | | | 10 | | | | 13 | |
Mori Trust Sogo‡ | | | 48 | | | | 67 | |
Morinaga | | | 1,900 | | | | 96 | |
Morinaga Milk Industry | | | 1,800 | | | | 81 | |
The accompanying notes are an integral part of the financial statements.
72
| | |
| THE KP FUNDS | | December 31, 2017 |
| | |
| KP International Equity Fund | | |
| | | | | | | | |
| Description | | Shares | | | Value
(000) | |
Morita Holdings | | | 1,800 | | | $ | 34 | |
MOS Food Services | | | 1,600 | | | | 49 | |
MS&AD Insurance Group Holdings | | | 37,600 | | | | 1,273 | |
Murata Manufacturing | | | 3,300 | | | | 443 | |
Musashi Seimitsu Industry | | | 1,200 | | | | 38 | |
Musashino Bank | | | 1,500 | | | | 50 | |
Nabtesco | | | 1,900 | | | | 73 | |
Nachi-Fujikoshi | | | 9,000 | | | | 60 | |
Nagaileben | | | 1,500 | | | | 38 | |
Nagase | | | 5,600 | | | | 101 | |
Nagatanien Holdings | | | 1,000 | | | | 13 | |
Nagoya Railroad | | | 3,200 | | | | 81 | |
Nakanishi | | | 1,200 | | | | 63 | |
Namco Bandai Holdings | | | 31,200 | | | | 1,021 | |
Namura Shipbuilding | | | 2,000 | | | | 12 | |
Nankai Electric Railway | | | 5,200 | | | | 129 | |
NanoCarrier* | | | 1,600 | | | | 9 | |
Nanto Bank | | | 1,500 | | | | 40 | |
NEC | | | 22,200 | | | | 599 | |
NEC Capital Solutions | | | 100 | | | | 2 | |
NEC Networks & System Integration | | | 1,400 | | | | 37 | |
NET One Systems | | | 4,200 | | | | 65 | |
Neturen | | | 1,100 | | | | 12 | |
Nexon* | | | 3,300 | | | | 96 | |
NGK Insulators | | | 4,400 | | | | 83 | |
NGK Spark Plug | | | 2,800 | | | | 68 | |
NH Foods | | | 10,000 | | | | 244 | |
NHK Spring | | | 10,800 | | | | 119 | |
Nichias | | | 6,000 | | | | 80 | |
Nichicon | | | 2,500 | | | | 33 | |
Nichiden | | | 400 | | | | 8 | |
Nichiha | | | 1,400 | | | | 59 | |
NichiiGakkan | | | 1,500 | | | | 19 | |
Nichi-iko Pharmaceutical | | | 2,400 | | | | 37 | |
Nichirei | | | 5,900 | | | | 163 | |
Nidec | | | 4,100 | | | | 574 | |
Nifco | | | 2,100 | | | | 143 | |
Nihon Chouzai | | | 300 | | | | 9 | |
Nihon Kohden | | | 97,700 | | | | 2,267 | |
Nihon M&A Center | | | 3,300 | | | | 157 | |
Nihon Nohyaku | | | 1,800 | | | | 11 | |
Nihon Parkerizing | | | 5,000 | | | | 84 | |
Nihon Trim | | | 200 | | | | 9 | |
Nihon Unisys | | | 3,700 | | | | 77 | |
Nikkiso | | | 2,800 | | | | 31 | |
Nikkon Holdings | | | 2,800 | | | | 79 | |
Nikon | | | 39,100 | | | | 788 | |
| | | | | | | | |
| Description | | Shares | | | Value
(000) | |
Nintendo | | | 1,900 | | | $ | 695 | |
Nippo | | | 3,000 | | | | 70 | |
Nippon Accommodations Fund‡ | | | 22 | | | | 91 | |
Nippon Building Fund‡ | | | 23 | | | | 112 | |
Nippon Ceramic | | | 1,100 | | | | 28 | |
Nippon Chemi-Con | | | 700 | | | | 22 | |
Nippon Denko | | | 4,800 | | | | 20 | |
Nippon Densetsu Kogyo | | | 1,800 | | | | 39 | |
Nippon Electric Glass | | | 1,400 | | | | 53 | |
Nippon Express | | | 1,400 | | | | 93 | |
Nippon Flour Mills | | | 2,800 | | | | 43 | |
Nippon Gas | | | 1,800 | | | | 65 | |
NIPPON Investment‡ | | | 19 | | | | 55 | |
Nippon Kanzai | | | 600 | | | | 11 | |
Nippon Kayaku | | | 7,000 | | | | 104 | |
Nippon Koei | | | 500 | | | | 16 | |
Nippon Light Metal Holdings | | | 30,400 | | | | 87 | |
Nippon Paint Holdings | | | 2,800 | | | | 89 | |
Nippon Paper Industries | | | 5,400 | | | | 103 | |
Nippon Parking Development | | | 6,600 | | | | 11 | |
Nippon Prologis‡ | | | 31 | | | | 66 | |
Nippon Road | | | 200 | | | | 12 | |
Nippon Seiki | | | 2,500 | | | | 54 | |
Nippon Sheet Glass* | | | 4,600 | | | | 42 | |
Nippon Shinyaku | | | 2,500 | | | | 187 | |
Nippon Shokubai | | | 1,300 | | | | 88 | |
Nippon Signal | | | 7,400 | | | | 79 | |
Nippon Soda | | | 6,000 | | | | 40 | |
Nippon Steel & Sumikin Bussan | | | 800 | | | | 49 | |
Nippon Steel & Sumitomo Metal | | | 12,800 | | | | 328 | |
Nippon Suisan Kaisha | | | 61,300 | | | | 320 | |
Nippon Telegraph & Telephone | | | 53,200 | | | | 2,503 | |
Nippon Television Holdings | | | 31,220 | | | | 535 | |
Nippon Thompson | | | 2,300 | | | | 18 | |
Nippon Yusen* | | | 2,800 | | | | 68 | |
Nipro | | | 6,900 | | | | 102 | |
Nishimatsu Construction | | | 2,600 | | | | 73 | |
Nishimatsuya Chain | | | 2,500 | | | | 28 | |
Nishi-Nippon Financial Holdings | | | 7,000 | | | | 84 | |
Nishi-Nippon Railroad | | | 3,000 | | | | 81 | |
Nishio Rent All | | | 900 | | | | 29 | |
Nissan Chemical Industries* | | | 7,200 | | | | 287 | |
Nissan Motor | | | 48,100 | | | | 480 | |
Nissan Shatai | | | 4,100 | | | | 42 | |
Nissha | | | 1,800 | | | | 52 | |
Nisshin Oillio Group | | | 1,400 | | | | 42 | |
Nisshin Seifun Group | | | 3,400 | | | | 69 | |
The accompanying notes are an integral part of the financial statements.
73
| | |
| THE KP FUNDS | | December 31, 2017 |
| | |
| KP International Equity Fund | | |
| | | | | | | | |
| Description | | Shares | | | Value
(000) | |
Nisshin Steel | | | 2,500 | | | $ | 41 | |
Nisshinbo Holdings | | | 7,396 | | | | 100 | |
Nissin | | | 600 | | | | 17 | |
Nissin Electric | | | 2,600 | | | | 30 | |
Nissin Foods Holdings | | | 1,000 | | | | 73 | |
Nissin Kogyo | | | 2,000 | | | | 40 | |
Nitori Holdings | | | 1,400 | | | | 199 | |
Nitta | | | 1,200 | | | | 46 | |
Nittetsu Mining | | | 200 | | | | 15 | |
Nitto Boseki | | | 1,400 | | | | 40 | |
Nitto Denko | | | 2,800 | | | | 249 | |
Nitto Kogyo | | | 1,100 | | | | 18 | |
Nitto Kohki | | | 600 | | | | 15 | |
Nittoku Engineering | | | 1,600 | | | | 68 | |
Noevir Holdings | | | 800 | | | | 59 | |
NOF | | | 3,500 | | | | 94 | |
Nohmi Bosai | | | 1,200 | | | | 22 | |
Nojima | | | 1,400 | | | | 33 | |
NOK | | | 1,700 | | | | 40 | |
Nomura | | | 7,100 | | | | 162 | |
Nomura Holdings | | | 160,500 | | | | 948 | |
Nomura Real Estate Holdings | | | 2,400 | | | | 54 | |
Nomura Real Estate Master Fund‡ | | | 64 | | | | 79 | |
Nomura Research Institute | | | 2,300 | | | | 107 | |
Noritake | | | 500 | | | | 25 | |
Noritz | | | 1,600 | | | | 31 | |
North Pacific Bank | | | 14,600 | | | | 49 | |
NS Solutions | | | 1,900 | | | | 52 | |
NS United Kaiun Kaisha* | | | 500 | | | | 12 | |
NSD | | | 2,200 | | | | 47 | |
NSK | | | 6,500 | | | | 102 | |
NTN | | | 21,000 | | | | 104 | |
NTT Data | | | 101,000 | | | | 1,200 | |
NTT DOCOMO | | | 23,500 | | | | 555 | |
NTT Urban Development | | | 40,300 | | | | 465 | |
NuFlare Technology | | | 200 | | | | 12 | |
Obara Group | | | 600 | | | | 41 | |
Obayashi | | | 89,700 | | | | 1,087 | |
Obic | | | 2,960 | | | | 218 | |
OBIC Business Consultants | | | 600 | | | | 35 | |
Odakyu Electric Railway | | | 5,000 | | | | 107 | |
Ogaki Kyoritsu Bank | | | 1,600 | | | | 40 | |
Ohsho Food Service | | | 1,000 | | | | 48 | |
Oiles | | | 700 | | | | 14 | |
Oita Bank | | | 800 | | | | 31 | |
Oji Holdings | | | 15,000 | | | | 100 | |
Okabe | | | 1,100 | | | | 11 | |
| | | | | | | | |
| Description | | Shares | | | Value
(000) | |
Okamoto Industries | | | 3,000 | | | $ | 30 | |
Okamura | | | 3,400 | | | | 50 | |
Okasan Securities Group* | | | 8,000 | | | | 50 | |
Oki Electric Industry | | | 4,400 | | | | 62 | |
Okinawa Electric Power | | | 1,920 | | | | 50 | |
OKUMA | | | 1,200 | | | | 80 | |
Okumura | | | 1,600 | | | | 66 | |
Okuwa | | | 1,000 | | | | 10 | |
Olympus | | | 68,800 | | | | 2,638 | |
Omron | | | 80,500 | | | | 4,801 | |
OncoTherapy Science* | | | 5,000 | | | | 10 | |
Ono Pharmaceutical | | | 7,200 | | | | 168 | |
Onward Holdings | | | 31,000 | | | | 269 | |
Open House | | | 1,700 | | | | 91 | |
Optex Group | | | 600 | | | | 32 | |
Oracle Japan* | | | 700 | | | | 58 | |
Orient | | | 21,900 | | | | 35 | |
Oriental Land | | | 3,800 | | | | 347 | |
ORIX | | | 22,300 | | | | 378 | |
Orix JREIT‡ | | | 129 | | | | 179 | |
Osaka Gas | | | 6,400 | | | | 123 | |
Osaka Soda | | | 800 | | | | 20 | |
Osaka Steel | | | 1,000 | | | | 21 | |
OSAKA Titanium Technologies | | | 700 | | | | 13 | |
Osaki Electric | | | 1,500 | | | | 11 | |
OSG | | | 3,800 | | | | 82 | |
OSJB Holdings | | | 4,700 | | | | 14 | |
Otsuka | | | 900 | | | | 69 | |
Otsuka Holdings | | | 11,100 | | | | 487 | |
Outsourcing | | | 4,000 | | | | 73 | |
Oyo | | | 700 | | | | 9 | |
Pacific Industrial | | | 2,400 | | | | 37 | |
Pacific Metals* | | | 700 | | | | 19 | |
Pack | | | 500 | | | | 16 | |
PAL GROUP Holdings | | | 400 | | | | 13 | |
PALTAC | | | 1,400 | | | | 64 | |
Panasonic | | | 37,900 | | | | 555 | |
Paramount Bed Holdings | | | 900 | | | | 45 | |
Parco | | | 800 | | | | 11 | |
Park24 | | | 1,800 | | | | 43 | |
PC Depot | | | 1,400 | | | | 11 | |
Penta-Ocean Construction | | | 14,300 | | | | 107 | |
Pepper Food Service | | | 700 | | | | 31 | |
PeptiDream* | | | 3,600 | | | | 124 | |
Persol Holdings | | | 9,100 | | | | 228 | |
Pigeon | | | 6,000 | | | | 229 | |
Pilot | | | 1,800 | | | | 87 | |
The accompanying notes are an integral part of the financial statements.
74
| | |
| THE KP FUNDS | | December 31, 2017 |
| | |
| KP International Equity Fund | | |
| | | | | | | | |
| Description | | Shares | | | Value
(000) | |
Piolax | | | 1,400 | | | $ | 42 | |
Pioneer* | | | 15,600 | | | | 32 | |
Plenus | | | 1,000 | | | | 22 | |
Pola Orbis Holdings | | | 1,600 | | | | 56 | |
Premier Investment‡ | | | 74 | | | | 70 | |
Press Kogyo | | | 5,300 | | | | 32 | |
Pressance | | | 2,000 | | | | 27 | |
Prestige International | | | 2,000 | | | | 26 | |
Prima Meat Packers | | | 7,000 | | | | 51 | |
Proto | | | 600 | | | | 9 | |
Qol | | | 600 | | | | 11 | |
Raito Kogyo | | | 2,600 | | | | 30 | |
Rakuten* | | | 15,200 | | | | 139 | |
Recruit Holdings | | | 18,600 | | | | 463 | |
Relia | | | 1,700 | | | | 20 | |
Relo Group | | | 5,600 | | | | 153 | |
Renesas Electronics* | | | 38,700 | | | | 451 | |
Rengo | | | 9,100 | | | | 66 | |
Resona Holdings | | | 240,740 | | | | 1,439 | |
Resorttrust | | | 4,200 | | | | 96 | |
Ricoh | | | 74,200 | | | | 689 | |
Ricoh Leasing | | | 900 | | | | 31 | |
Riken | | | 500 | | | | 28 | |
Riken Vitamin | | | 300 | | | | 12 | |
Ringer Hut | | | 1,100 | | | | 25 | |
Rinnai | | | 600 | | | | 54 | |
Riso Kagaku | | | 1,300 | | | | 25 | |
Rock Field | | | 700 | | | | 13 | |
Rohm | | | 1,600 | | | | 177 | |
Rohto Pharmaceutical | | | 5,000 | | | | 134 | |
Rokko Butter | | | 500 | | | | 12 | |
Roland DG | | | 500 | | | | 13 | |
Round One | | | 3,500 | | | | 59 | |
Royal Holdings | | | 1,600 | | | | 44 | |
Ryobi | | | 1,400 | | | | 40 | |
Ryohin Keikaku | | | 800 | | | | 249 | |
Ryosan | | | 1,300 | | | | 50 | |
Ryoyo Electro | | | 800 | | | | 15 | |
S Foods | | | 700 | | | | 32 | |
Sac’s Bar Holdings | | | 800 | | | | 10 | |
Saeron Automotive | | | 4,087 | | | | 29 | |
Saizeriya | | | 1,500 | | | | 50 | |
Sakai Chemical Industry | | | 600 | | | | 16 | |
Sakai Moving Service | | | 500 | | | | 25 | |
Sakata INX | | | 2,000 | | | | 32 | |
Sakata Seed | | | 1,600 | | | | 56 | |
San-A, Cl A | | | 1,000 | | | | 48 | |
| | | | | | | | |
| Description | | Shares | | | Value
(000) | |
San-Ai Oil | | | 2,800 | | | $ | 41 | |
SanBio* | | | 800 | | | | 23 | |
Sanden Holdings* | | | 1,000 | | | | 20 | |
Sangetsu | | | 3,300 | | | | 61 | |
San-In Godo Bank | | | 7,700 | | | | 74 | |
Sanken Electric | | | 6,000 | | | | 43 | |
Sanki Engineering | | | 1,800 | | | | 22 | |
Sankyo | | | 800 | | | | 25 | |
Sankyo Tateyama | | | 800 | | | | 12 | |
Sankyu | | | 2,600 | | | | 112 | |
Sanrio | | | 2,600 | | | | 44 | |
Santen Pharmaceutical | | | 6,200 | | | | 97 | |
Sanwa Holdings | | | 10,300 | | | | 142 | |
Sanyo Chemical Industries | | | 700 | | | | 37 | |
Sanyo Denki | | | 400 | | | | 29 | |
Sanyo Special Steel | | | 1,200 | | | | 31 | |
Sapporo Holdings | | | 3,400 | | | | 104 | |
Sato Holdings | | | 1,400 | | | | 43 | |
Sawai Pharmaceutical | | | 3,700 | | | | 166 | |
SBI Holdings | | | 3,500 | | | | 73 | |
SCREEN Holdings | | | 2,100 | | | | 172 | |
SCSK | | | 6,200 | | | | 286 | |
Secom | | | 8,400 | | | | 633 | |
Sega Sammy Holdings | | | 3,200 | | | | 40 | |
Seibu Holdings | | | 3,600 | | | | 68 | |
Seikagaku | | | 2,100 | | | | 31 | |
Seiko Epson | | | 4,800 | | | | 113 | |
Seiko Holdings | | | 1,600 | | | | 47 | |
Seino Holdings | | | 6,800 | | | | 108 | |
Seiren | | | 2,500 | | | | 49 | |
Sekisui Chemical | | | 13,300 | | | | 267 | |
Sekisui House‡ | | | 50 | | | | 58 | |
Sekisui House | | | 10,000 | | | | 181 | |
Sekisui House Residential Investment‡ | | | 55 | | | | 55 | |
Sekisui Jushi | | | 2,200 | | | | 45 | |
Sekisui Plastics | | | 1,000 | | | | 13 | |
Senko | | | 14,200 | | | | 103 | |
Senshu Ikeda Holdings | | | 13,300 | | | | 49 | |
Septeni Holdings | | | 3,700 | | | | 11 | |
Seria | | | 1,900 | | | | 115 | |
Seven & i Holdings | | | 40,900 | | | | 1,701 | |
Seven Bank | | | 10,700 | | | | 37 | |
Sharp* | | | 2,500 | | | | 86 | |
Shibuya | | | 800 | | | | 33 | |
Shiga Bank | | | 12,000 | | | | 61 | |
Shikoku Bank | | | 2,400 | | | | 34 | |
Shikoku Chemicals | | | 2,000 | | | | 32 | |
The accompanying notes are an integral part of the financial statements.
75
| | |
| THE KP FUNDS | | December 31, 2017 |
| | |
| KP International Equity Fund | | |
| | | | | | | | |
| Description | | Shares | | | Value
(000) | |
Shikoku Electric Power | | | 8,600 | | | $ | 94 | |
Shima Seiki Manufacturing | | | 1,200 | | | | 76 | |
Shimachu | | | 2,300 | | | | 66 | |
Shimadzu | | | 4,300 | | | | 98 | |
Shimamura | | | 400 | | | | 44 | |
Shimano | | | 1,300 | | | | 184 | |
Shimizu | | | 51,300 | | | | 530 | |
Shindengen Electric Manufacturing | | | 400 | | | | 32 | |
Shin-Etsu Chemical | | | 36,200 | | | | 3,678 | |
Shin-Etsu Polymer | | | 1,700 | | | | 19 | |
Shinko Electric Industries | | | 3,600 | | | | 29 | |
Shinko Plantech | | | 1,300 | | | | 14 | |
Shinmaywa Industries | | | 4,000 | | | | 38 | |
Shinnihon | | | 1,300 | | | | 11 | |
Shinsei Bank | | | 2,800 | | | | 48 | |
Shionogi | | | 5,160 | | | | 279 | |
Ship Healthcare Holdings | | | 2,400 | | | | 80 | |
Shiseido | | | 12,400 | | | | 600 | |
Shizuoka Bank | | | 9,000 | | | | 93 | |
Shizuoka Gas | | | 2,800 | | | | 24 | |
SHO-BOND Holdings | | | 2,600 | | | | 185 | |
Shochiku | | | 600 | | | | 102 | |
Shoei Foods | | | 500 | | | | 21 | |
Showa | | | 2,400 | | | | 30 | |
Showa Denko | | | 6,900 | | | | 295 | |
Showa Sangyo | | | 1,200 | | | | 31 | |
Showa Shell Sekiyu | | | 2,800 | | | | 38 | |
Siix | | | 800 | | | | 34 | |
Sinko Industries | | | 1,100 | | | | 21 | |
Sintokogio | | | 1,700 | | | | 22 | |
SKY Perfect JSAT Holdings | | | 7,800 | | | | 36 | |
Skylark | | | 5,300 | | | | 75 | |
SMC | | | 1,000 | | | | 412 | |
SMK | | | 2,000 | | | | 11 | |
SMS* | | | 1,700 | | | | 54 | |
Sodick | | | 2,200 | | | | 29 | |
SoftBank Group | | | 20,900 | | | | 1,655 | |
Sogo Medical | | | 500 | | | | 26 | |
Sohgo Security Services | | | 1,100 | | | | 60 | |
Sojitz | | | 62,300 | | | | 191 | |
Sompo Holdings | | | 20,100 | | | | 778 | |
Sony | | | 21,700 | | | | 978 | |
Sony Financial Holdings | | | 3,000 | | | | 53 | |
Sosei Group* | | | 800 | | | | 78 | |
Sotetsu Holdings | | | 3,800 | | | | 100 | |
Sparx Group* | | | 5,200 | | | | 14 | |
Square Enix Holdings | | | 4,400 | | | | 209 | |
| | | | | | | | |
| Description | | Shares | | | Value
(000) | |
St. Marc Holdings | | | 1,100 | | | $ | 30 | |
Stanley Electric | | | 2,400 | | | | 97 | |
Star Micronics | | | 1,600 | | | | 28 | |
Start Today | | | 3,300 | | | | 100 | |
Starts | | | 1,600 | | | | 42 | |
Starzen | | | 200 | | | | 10 | |
Stella Chemifa | | | 400 | | | | 13 | |
Studio Alice | | | 400 | | | | 10 | |
Sugi Holdings | | | 1,900 | | | | 97 | |
SUMCO | | | 3,800 | | | | 97 | |
Sumitomo | | | 20,000 | | | | 340 | |
Sumitomo Bakelite | | | 9,000 | | | | 76 | |
Sumitomo Chemical | | | 66,200 | | | | 476 | |
Sumitomo Dainippon Pharma | | | 16,200 | | | | 241 | |
Sumitomo Densetsu | | | 600 | | | | 13 | |
Sumitomo Electric Industries | | | 21,100 | | | | 357 | |
Sumitomo Forestry | | | 6,900 | | | | 123 | |
Sumitomo Heavy Industries | | | 2,000 | | | | 85 | |
Sumitomo Metal Mining | | | 4,300 | | | | 198 | |
Sumitomo Mitsui Construction | | | 8,440 | | | | 47 | |
Sumitomo Mitsui Financial Group | | | 56,600 | | | | 2,446 | |
Sumitomo Mitsui Trust Holdings | | | 11,700 | | | | 464 | |
Sumitomo Osaka Cement | | | 19,000 | | | | 92 | |
Sumitomo Realty & Development | | | 6,000 | | | | 197 | |
Sumitomo Riko | | | 2,200 | | | | 24 | |
Sumitomo Rubber Industries | | | 3,100 | | | | 58 | |
Sumitomo Seika Chemicals | | | 400 | | | | 22 | |
Sumitomo Warehouse | | | 7,000 | | | | 51 | |
Sun Frontier Fudousan | | | 1,000 | | | | 11 | |
Sundrug | | | 1,200 | | | | 56 | |
Suntory Beverage & Food | | | 5,000 | | | | 222 | |
Suruga Bank | | | 3,000 | | | | 64 | |
Suzuken | | | 1,100 | | | | 45 | |
Suzuki Motor | | | 5,800 | | | | 336 | |
Sysmex | | | 2,620 | | | | 206 | |
Systena | | | 700 | | | | 22 | |
T&D Holdings | | | 8,900 | | | | 152 | |
Tachi-S, Cl S | | | 1,800 | | | | 33 | |
Tadano | | | 5,200 | | | | 86 | |
Taihei Dengyo Kaisha | | | 1,000 | | | | 26 | |
Taiheiyo Cement | | | 2,000 | | | | 86 | |
Taiho Kogyo, Cl A | | | 700 | | | | 10 | |
Taikisha | | | 1,400 | | | | 47 | |
Taisei | | | 3,400 | | | | 169 | |
Taisho Pharmaceutical Holdings | | | 500 | | | | 40 | |
Taiyo Holdings | | | 900 | | | | 40 | |
Taiyo Nippon Sanso* | | | 2,800 | | | | 39 | |
The accompanying notes are an integral part of the financial statements.
76
| | |
| THE KP FUNDS | | December 31, 2017 |
| | |
| KP International Equity Fund | | |
| | | | | | | | |
| Description | | Shares | | | Value
(000) | |
Taiyo Yuden | | | 5,500 | | | $ | 86 | |
Takamatsu Construction Group | | | 400 | | | | 11 | |
Takara Bio | | | 2,600 | | | | 36 | |
Takara Holdings | | | 8,300 | | | | 97 | |
Takara Leben | | | 3,200 | | | | 14 | |
Takara Standard | | | 2,100 | | | | 34 | |
Takasago International | | | 700 | | | | 23 | |
Takasago Thermal Engineering | | | 2,700 | | | | 49 | |
Takashimaya | | | 5,000 | | | | 53 | |
Takeda Pharmaceutical | | | 12,200 | | | | 692 | |
Takeuchi Manufacturing | | | 1,800 | | | | 43 | |
Takuma | | | 4,100 | | | | 57 | |
Tamron | | | 600 | | | | 13 | |
Tanseisha | | | 1,400 | | | | 16 | |
Tatsuta Electric Wire and Cable | | | 1,700 | | | | 14 | |
TDK | | | 4,100 | | | | 327 | |
TechnoPro Holdings | | | 3,700 | | | | 201 | |
Teijin | | | 3,300 | | | | 74 | |
Teikoku Sen-I, Cl I | | | 800 | | | | 16 | |
Tekken | | | 400 | | | | 12 | |
Tenma | | | 1,000 | | | | 20 | |
Terumo | | | 122,200 | | | | 5,791 | |
T-Gaia | | | 1,100 | | | | 26 | |
THK | | | 2,100 | | | | 79 | |
TIS | | | 4,100 | | | | 143 | |
TKC | | | 1,200 | | | | 44 | |
Toa | | | 500 | | | | 13 | |
Toagosei | | | 5,800 | | | | 74 | |
Tobu Railway | | | 3,300 | | | | 107 | |
TOC | | | 3,100 | | | | 26 | |
Tocalo | | | 600 | | | | 27 | |
Tochigi Bank | | | 5,300 | | | | 21 | |
Toda | | | 11,000 | | | | 88 | |
Toei | | | 400 | | | | 40 | |
Toei Animation | | | 200 | | | | 20 | |
Toenec | | | 400 | | | | 12 | |
Toho | | | 2,000 | | | | 69 | |
Toho Bank | | | 11,700 | | | | 41 | |
Toho Gas | | | 1,400 | | | | 38 | |
Toho Holdings | | | 2,500 | | | | 57 | |
Toho Titanium | | | 1,400 | | | | 15 | |
Toho Zinc | | | 600 | | | | 33 | |
Tohoku Electric Power | | | 54,900 | | | | 701 | |
Tokai | | | 800 | | | | 18 | |
Tokai Carbon | | | 9,700 | | | | 120 | |
TOKAI Holdings | | | 4,700 | | | | 40 | |
Tokai Rika | | | 2,800 | | | | 59 | |
| | | | | | | | |
| Description | | Shares | | | Value
(000) | |
Tokai Tokyo Financial Holdings | | | 11,400 | | | $ | 74 | |
Token | | | 400 | | | | 47 | |
Tokio Marine Holdings | | | 16,600 | | | | 757 | |
Tokushu Tokai Paper | | | 300 | | | | 11 | |
Tokuyama | | | 3,200 | | | | 104 | |
Tokyo Broadcasting System Holdings | | | 2,000 | | | | 50 | |
Tokyo Century | | | 2,100 | | | | 102 | |
Tokyo Dome | | | 4,800 | | | | 49 | |
Tokyo Electric Power Holdings* | | | 24,800 | | | | 98 | |
Tokyo Electron | | | 3,500 | | | | 634 | |
Tokyo Gas | | | 11,900 | | | | 273 | |
Tokyo Ohka Kogyo | | | 1,900 | | | | 82 | |
Tokyo Seimitsu | | | 2,000 | | | | 79 | |
Tokyo Steel Manufacturing | | | 4,700 | | | | 42 | |
Tokyo Tatemono | | | 3,100 | | | | 42 | |
Tokyo TY Financial Group | | | 1,400 | | | | 41 | |
Tokyotokeiba | | | 700 | | | | 26 | |
Tokyu‡ | | | 49 | | | | 61 | |
Tokyu | | | 9,300 | | | | 148 | |
Tokyu Construction | | | 4,500 | | | | 44 | |
Tokyu Fudosan Holdings | | | 9,000 | | | | 65 | |
TOMONY Holdings | | | 7,000 | | | | 36 | |
Tomy | | | 4,500 | | | | 61 | |
Topcon | | | 5,300 | | | | 115 | |
Toppan Forms | | | 3,100 | | | | 35 | |
Toppan Printing | | | 9,000 | | | | 81 | |
Topre | | | 1,800 | | | | 51 | |
Topy Industries | | | 800 | | | | 25 | |
Toray Industries | | | 84,100 | | | | 792 | |
Toridoll Holdings | | | 1,100 | | | | 41 | |
Torii Pharmaceutical | | | 500 | | | | 13 | |
Tosei | | | 1,200 | | | | 12 | |
Toshiba* | | | 110,000 | | | | 310 | |
Toshiba Machine | | | 7,000 | | | | 52 | |
Toshiba Plant Systems & Services | | | 2,400 | | | | 45 | |
Toshiba TEC | | | 7,000 | | | | 44 | |
Tosho | | | 600 | | | | 19 | |
Tosoh | | | 5,000 | | | | 113 | |
Totetsu Kogyo | | | 1,400 | | | | 46 | |
TOTO | | | 2,400 | | | | 142 | |
Towa Bank | | | 2,000 | | | | 27 | |
Towa Pharmaceutical | | | 500 | | | | 27 | |
Toyo Construction | | | 4,300 | | | | 25 | |
Toyo Engineering | | | 1,000 | | | | 12 | |
Toyo Ink SC Holdings | | | 11,000 | | | | 65 | |
Toyo Kanetsu | | | 300 | | | | 12 | |
Toyo Kohan | | | 2,100 | | | | 9 | |
The accompanying notes are an integral part of the financial statements.
77
| | |
| THE KP FUNDS | | December 31, 2017 |
| | |
| KP International Equity Fund | | |
| | | | | | | | |
| Description | | Shares | | | Value
(000) | |
Toyo Seikan Group Holdings | | | 23,400 | | | $ | 377 | |
Toyo Suisan Kaisha | | | 8,400 | | | | 359 | |
Toyo Tanso | | | 500 | | | | 16 | |
Toyo Tire & Rubber | | | 5,400 | | | | 112 | |
Toyobo | | | 4,500 | | | | 82 | |
Toyoda Gosei | | | 1,100 | | | | 28 | |
Toyota Boshoku | | | 3,600 | | | | 75 | |
Toyota Industries | | | 3,300 | | | | 212 | |
Toyota Motor | | | 80,900 | | | | 5,179 | |
Toyota Tsusho | | | 3,600 | | | | 145 | |
TPR | | | 1,200 | | | | 40 | |
Trancom | | | 300 | | | | 21 | |
Transcosmos* | | | 1,100 | | | | 28 | |
Trend Micro* | | | 2,000 | | | | 113 | |
Trusco Nakayama | | | 2,100 | | | | 61 | |
TS Tech | | | 2,500 | | | | 103 | |
TSI Holdings | | | 4,000 | | | | 29 | |
Tsubaki Nakashima | | | 3,300 | | | | 79 | |
Tsubakimoto Chain | | | 7,000 | | | | 57 | |
Tsugami | | | 3,000 | | | | 39 | |
Tsukishima Kikai | | | 1,700 | | | | 23 | |
Tsukuba Bank | | | 3,100 | | | | 11 | |
Tsukui | | | 2,100 | | | | 19 | |
Tsumura | | | 3,000 | | | | 100 | |
Tsuruha Holdings | | | 600 | | | | 82 | |
Tsurumi Manufacturing | | | 600 | | | | 11 | |
TV Asahi Holdings | | | 1,200 | | | | 24 | |
UACJ | | | 1,700 | | | | 44 | |
Ube Industries | | | 5,500 | | | | 162 | |
UKC Holdings | | | 600 | | | | 13 | |
Ulvac | | | 2,000 | | | | 126 | |
Unicharm | | | 7,000 | | | | 182 | |
Union Tool | | | 300 | | | | 11 | |
Unipres | | | 2,100 | | | | 57 | |
UNITED | | | 500 | | | | 16 | |
United Arrows | | | 1,200 | | | | 49 | |
United Super Markets Holdings | | | 2,900 | | | | 29 | |
United Urban Investment‡ | | | 52 | | | | 75 | |
Unitika* | | | 2,500 | | | | 18 | |
Universal Entertainment | | | 1,200 | | | | 44 | |
Unizo Holdings | | | 900 | | | | 24 | |
Ushio | | | 11,700 | | | | 167 | |
USS | | | 3,800 | | | | 80 | |
UT Group* | | | 2,200 | | | | 64 | |
V Technology | | | 200 | | | | 32 | |
Valor Holdings | | | 2,000 | | | | 47 | |
Vector* | | | 1,000 | | | | 15 | |
| | | | | | | | |
| Description | | Shares | | | Value
(000) | |
Vital KSK Holdings | | | 1,200 | | | $ | 11 | |
VT Holdings | | | 3,200 | | | | 16 | |
Wacoal Holdings | | | 2,500 | | | | 79 | |
Wacom* | | | 7,300 | | | | 40 | |
Wakita | | | 1,600 | | | | 20 | |
Warabeya Nichiyo Holdings | | | 400 | | | | 11 | |
WATAMI | | | 800 | | | | 12 | |
Welcia Holdings | | | 2,300 | | | | 100 | |
West Japan Railway | | | 23,500 | | | | 1,715 | |
Wowow | | | 100 | | | | 3 | |
W-Scope | | | 1,300 | | | | 27 | |
Xebio Holdings | | | 1,400 | | | | 27 | |
Yahagi Construction | | | 1,200 | | | | 10 | |
Yahoo Japan | | | 24,500 | | | | 113 | |
Yakult Honsha | | | 1,500 | | | | 113 | |
Yakuodo | | | 400 | | | | 11 | |
YAMABIKO | | | 1,600 | | | | 25 | |
Yamada Denki | | | 96,100 | | | | 529 | |
Yamagata Bank | | | 1,600 | | | | 35 | |
Yamaguchi Financial Group | | | 3,000 | | | | 36 | |
Yamaha | | | 2,900 | | | | 107 | |
Yamaha Motor | | | 4,600 | | | | 151 | |
Yamanashi Chuo Bank | | | 8,000 | | | | 35 | |
Yamato Holdings | | | 26,520 | | | | 534 | |
Yamato Kogyo | | | 2,000 | | | | 58 | |
Yamazaki Baking | | | 2,300 | | | | 45 | |
Yamazen | | | 3,200 | | | | 38 | |
Yaoko | | | 1,100 | | | | 54 | |
Yaskawa Electric | | | 4,300 | | | | 189 | |
Yellow Hat | | | 600 | | | | 18 | |
Yodogawa Steel Works | | | 1,200 | | | | 37 | |
Yokogawa Bridge Holdings | | | 1,300 | | | | 30 | |
Yokogawa Electric | | | 3,900 | | | | 75 | |
Yokohama Reito | | | 1,200 | | | | 12 | |
Yokohama Rubber | | | 2,000 | | | | 49 | |
Yondoshi Holdings | | | 700 | | | | 19 | |
Yonex | | | 2,800 | | | | 18 | |
Yorozu | | | 700 | | | | 15 | |
Yoshinoya Holdings | | | 3,400 | | | | 58 | |
Yuasa Trading* | | | 1,000 | | | | 36 | |
Yumeshin Holdings | | | 1,500 | | | | 14 | |
Yurtec | | | 2,100 | | | | 18 | |
Yushin Precision Equipment | | | 400 | | | | 11 | |
Zenkoku Hosho | | | 2,400 | | | | 103 | |
Zenrin | | | 1,300 | | | | 44 | |
Zensho Holdings | | | 4,900 | | | | 84 | |
Zeon | | | 8,700 | | | | 126 | |
The accompanying notes are an integral part of the financial statements.
78
| | |
| THE KP FUNDS | | December 31, 2017 |
| | |
| KP International Equity Fund | | |
| | | | | | | | |
| Description | | Shares | | | Value
(000) | |
ZERIA Pharmaceutical | | | 1,700 | | | $ | 33 | |
ZIGExN* | | | 1,400 | | | | 11 | |
Zojirushi | | | 2,400 | | | | 24 | |
| | | | | | | | |
| | | | | | | 214,058 | |
| | | | | | | | |
Kenya — 0.0% | |
East African Breweries | | | 70,678 | | | | 163 | |
Equity Group Holdings | | | 275,700 | | | | 106 | |
| | | | | | | | |
| | | | | | | 269 | |
| | | | | | | | |
Luxembourg — 0.1% | |
O’Key Group GDR | | | 54,998 | | | | 137 | |
RTL Group | | | 577 | | | | 46 | |
Ternium ADR | | | 46,079 | | | | 1,457 | |
| | | | | | | | |
| | | | | | | 1,640 | |
| | | | | | | | |
Malaysia — 0.3% | |
Allianz Malaysia | | | 7,300 | | | | 24 | |
Brem Holding | | | 213,616 | | | | 58 | |
Heineken Malaysia | | | 10,000 | | | | 47 | |
Hong Leong Bank | | | 17,900 | | | | 75 | |
Hong Leong Industries | | | 5,500 | | | | 13 | |
Insas | | | 330,800 | | | | 76 | |
K&N Kenanga Holdings* | | | 85,500 | | | | 12 | |
KSL Holdings* | | | 551,500 | | | | 145 | |
Lion Industries* | | | 217,100 | | | | 76 | |
Malayan Banking | | | 16,000 | | | | 39 | |
Malaysia Airports Holdings | | | 85,700 | | | | 186 | |
Malaysian Pacific Industries | | | 29,400 | | | | 92 | |
MISC | | | 92,100 | | | | 169 | |
Nestle Malaysia | | | 4,400 | | | | 112 | |
Padini Holdings | | | 564,500 | | | | 737 | |
Petron Malaysia Refining & Marketing | | | 121,500 | | | | 406 | |
Petronas Chemicals Group | | | 286,200 | | | | 545 | |
Shell Refining Federation of Malaya* | | | 63,000 | | | | 254 | |
Tenaga Nasional | | | 108,400 | | | | 409 | |
Top Glove | | | 123,100 | | | | 243 | |
Tropicana | | | 47 | | | | — | |
Uchi Technologies | | | 119,200 | | | | 97 | |
Unisem | | | 1,138,600 | | | | 1,027 | |
ViTrox | | | 67,000 | | | | 103 | |
| | | | | | | | |
| | | | | | | 4,945 | |
| | | | | | | | |
Mexico — 0.3% | |
Fomento Economico Mexicano ADR | | | 6,877 | | | | 646 | |
Grupo Aeroportuario del Pacifico, Cl B | | | 43,943 | | | | 451 | |
Grupo Elektra DE | | | 6,636 | | | | 237 | |
| | | | | | | | |
| Description | | Shares | | | Value
(000) | |
Grupo Financiero Banorte, Cl O | | | 385,425 | | | $ | 2,117 | |
Grupo Televisa ADR | | | 18,213 | | | | 340 | |
Industrias Bachoco | | | 58,034 | | | | 277 | |
Nemak (A) | | | 452,510 | | | | 328 | |
Vitro | | | 18,814 | | | | 67 | |
| | | | | | | | |
| | | | | | | 4,463 | |
| | | | | | | | |
Netherlands — 3.3% | |
Aalberts Industries | | | 5,022 | | | | 255 | |
ABN AMRO Group (A) | | | 7,166 | | | | 231 | |
Accell Group | | | 1,190 | | | | 33 | |
Aegon | | | 30,603 | | | | 195 | |
AerCap Holdings* | | | 2,402 | | | | 126 | |
Akzo Nobel | | | 62,341 | | | | 5,462 | |
Altice, Cl A* | | | 8,630 | | | | 91 | |
AMG Advanced Metallurgical Group | | | 1,376 | | | | 69 | |
APERAM | | | 2,388 | | | | 123 | |
Arcadis | | | 3,785 | | | | 87 | |
ArcelorMittal* | | | 28,148 | | | | 916 | |
ASM International | | | 2,389 | | | | 162 | |
ASML Holding | | | 8,109 | | | | 1,412 | |
ASR Nederland | | | 7,417 | | | | 305 | |
Basic-Fit* (A) | | | 1,573 | | | | 38 | |
BE Semiconductor Industries | | | 1,849 | | | | 155 | |
BinckBank | | | 1,954 | | | | 10 | |
Boskalis Westminster | | | 169,257 | | | | 6,383 | |
Brunel International | | | 766 | | | | 14 | |
Coca-Cola European Partners | | | 3,570 | | | | 142 | |
Corbion | | | 2,960 | | | | 96 | |
Eurocommercial Properties‡ | | | 2,862 | | | | 125 | |
Euronext (A) | | | 2,875 | | | | 179 | |
Flow Traders (A) | | | 1,443 | | | | 35 | |
ForFarmers | | | 816 | | | | 10 | |
Fugro* | | | 103,946 | | | | 1,620 | |
Galapagos* | | | 2,165 | | | | 205 | |
Gemalto | | | 4,382 | | | | 260 | |
Heineken | | | 18,375 | | | | 1,916 | |
Heineken Holding | | | 1,999 | | | | 198 | |
IMCD Group | | | 2,653 | | | | 167 | |
ING Groep | | | 411,462 | | | | 7,567 | |
Intertrust (A) | | | 3,412 | | | | 64 | |
Kendrion | | | 579 | | | | 28 | |
Koninklijke Ahold Delhaize | | | 55,263 | | | | 1,216 | |
Koninklijke BAM Groep | | | 10,282 | | | | 47 | |
Koninklijke DSM | | | 3,065 | | | | 293 | |
Koninklijke KPN | | | 271,129 | | | | 946 | |
Koninklijke Philips | | | 39,676 | | | | 1,501 | |
Koninklijke Volkerwessels | | | 2,661 | | | | 76 | |
The accompanying notes are an integral part of the financial statements.
79
| | |
| THE KP FUNDS | | December 31, 2017 |
| | |
| KP International Equity Fund | | |
| | | | | | | | |
| Description | | Shares | | | Value
(000) | |
Koninklijke Vopak | | | 1,047 | | | $ | 46 | |
NN Group | | | 5,159 | | | | 224 | |
NSI‡ | | | 1,170 | | | | 49 | |
OCI* | | | 3,700 | | | | 93 | |
Philips Lighting (A) | | | 4,599 | | | | 169 | |
PostNL | | | 20,980 | | | | 103 | |
Randstad Holding | | | 63,431 | | | | 3,900 | |
Refresco Group (A) | | | 2,721 | | | | 65 | |
Relx | | | 157,359 | | | | 3,618 | |
Royal Dutch Shell, Cl A | | | 24,014 | | | | 801 | |
SBM Offshore | | | 185,175 | | | | 3,260 | |
SIF Holding | | | 523 | | | | 11 | |
Takeaway.com* (A) | | | 943 | | | | 58 | |
TKH Group | | | 1,987 | | | | 126 | |
TomTom* | | | 6,266 | | | | 62 | |
Unibail-Rodamco‡ | | | 1,757 | | | | 442 | |
Unilever | | | 27,909 | | | | 1,572 | |
Vastned Retail‡ | | | 1,155 | | | | 57 | |
Wereldhave‡ | | | 2,081 | | | | 100 | |
Wessanen | | | 3,888 | | | | 80 | |
Wolters Kluwer | | | 5,105 | | | | 266 | |
| | | | | | | | |
| | | | | | | 47,860 | |
| | | | | | | | |
New Zealand — 0.2% | |
a2 Milk* | | | 32,914 | | | | 188 | |
Air New Zealand | | | 27,934 | | | | 63 | |
Argosy Property | | | 42,827 | | | | 33 | |
Auckland International Airport | | | 16,577 | | | | 76 | |
Chorus | | | 21,743 | | | | 65 | |
Contact Energy | | | 46,285 | | | | 182 | |
Fisher & Paykel Healthcare | | | 9,137 | | | | 93 | |
Fletcher Building | | | 12,176 | | | | 66 | |
Freightways | | | 9,444 | | | | 51 | |
Genesis Energy | | | 25,186 | | | | 45 | |
Goodman Property Trust‡ | | | 49,179 | | | | 48 | |
Infratil | | | 22,938 | | | | 54 | |
Kiwi Property Group‡ | | | 71,972 | | | | 71 | |
Mercury NZ | | | 14,657 | | | | 35 | |
Meridian Energy | | | 24,236 | | | | 50 | |
Metlifecare | | | 9,307 | | | | 40 | |
New Zealand Refining | | | 7,242 | | | | 14 | |
Precinct Properties New Zealand‡ | | | 53,513 | | | | 52 | |
Ryman Healthcare | | | 5,918 | | | | 45 | |
SKY Network Television | | | 19,059 | | | | 38 | |
SKYCITY Entertainment Group | | | 33,925 | | | | 100 | |
Spark New Zealand | | | 192,661 | | | | 496 | |
Summerset Group Holdings | | | 10,769 | | | | 42 | |
Trade Me Group | | | 22,642 | | | | 78 | |
| | | | | | | | |
| Description | | Shares | | | Value
(000) | |
Xero* | | | 4,475 | | | $ | 100 | |
Z Energy | | | 18,164 | | | | 98 | |
| | | | | | | | |
| | | | | | | 2,223 | |
| | | | | | | | |
Norway — 0.8% | |
Akastor* | | | 6,259 | | | | 13 | |
Aker, Cl A | | | 1,293 | | | | 63 | |
Aker BP | | | 5,086 | | | | 125 | |
Aker Solutions* | | | 7,544 | | | | 42 | |
Atea | | | 4,074 | | | | 57 | |
Austevoll Seafood | | | 4,906 | | | | 41 | |
B2Holding | | | 7,247 | | | | 18 | |
Bakkafrost P | | | 14,668 | | | | 621 | |
Borr Drilling* | | | 19,296 | | | | 81 | |
Borregaard | | | 5,268 | | | | 52 | |
BW LPG* (A) | | | 3,303 | | | | 16 | |
BW Offshore* | | | 4,079 | | | | 18 | |
DNB | | | 35,843 | | | | 664 | |
DNO* | | | 32,542 | | | | 38 | |
Entra (A) | | | 5,500 | | | | 82 | |
Europris (A) | | | 9,027 | | | | 37 | |
Frontline | | | 3,849 | | | | 18 | |
Gaming Innovation Group* | | | 15,179 | | | | 9 | |
Gjensidige Forsikring | | | 3,498 | | | | 66 | |
Golden Ocean Group* | | | 3,874 | | | | 31 | |
Grieg Seafood | | | 2,312 | | | | 20 | |
Hexagon Composites* | | | 3,456 | | | | 12 | |
Hoegh LNG Holdings | | | 2,572 | | | | 20 | |
IDEX* | | | 20,459 | | | | 13 | |
Kongsberg Automotive* | | | 22,873 | | | | 33 | |
Leroy Seafood Group | | | 15,607 | | | | 84 | |
Marine Harvest* | | | 7,136 | | | | 121 | |
Nordic Nanovector* | | | 1,782 | | | | 18 | |
Nordic Semiconductor* | | | 6,624 | | | | 34 | |
Norsk Hydro | | | 23,380 | | | | 178 | |
Norway Royal Salmon | | | 572 | | | | 9 | |
Norwegian Air Shuttle* | | | 1,343 | | | | 29 | |
Norwegian Finans Holding* | | | 5,293 | | | | 59 | |
Norwegian Property | | | 7,924 | | | | 10 | |
Ocean Yield | | | 1,825 | | | | 15 | |
Opera Software* | | | 5,434 | | | | 17 | |
Orkla | | | 13,256 | | | | 141 | |
Petroleum Geo-Services* | | | 15,069 | | | | 31 | |
Protector Forsikring | | | 3,416 | | | | 37 | |
REC Silicon* | | | 90,910 | | | | 15 | |
Salmar | | | 2,642 | | | | 79 | |
Sbanken (A) | | | 3,864 | | | | 38 | |
Scatec Solar (A) | | | 2,842 | | | | 17 | |
The accompanying notes are an integral part of the financial statements.
80
| | |
| THE KP FUNDS | | December 31, 2017 |
| | |
| KP International Equity Fund | | |
| | | | | | | | |
| Description | | Shares | | | Value
(000) | |
Schibsted, Cl A | | | 7,944 | | | $ | 227 | |
Schibsted, Cl B | | | 9,644 | | | | 256 | |
Selvaag Bolig | | | 2,183 | | | | 9 | |
Songa Offshore* | | | 6,193 | | | | 45 | |
SpareBank 1 Nord Norge | | | 5,094 | | | | 39 | |
SpareBank 1 SMN | | | 6,403 | | | | 64 | |
Statoil | | | 44,943 | | | | 958 | |
Stolt-Nielsen | | | 1,401 | | | | 19 | |
Storebrand | | | 23,130 | | | | 188 | |
Subsea 7* | | | 13,736 | | | | 206 | |
Telenor | | | 12,690 | | | | 272 | |
TGS NOPEC Geophysical | | | 5,102 | | | | 121 | |
Wallenius Wilhelmsen Logistics, Cl B* | | | 5,325 | | | | 39 | |
XXL (A) | | | 5,035 | | | | 52 | |
Yara International | | | 133,854 | | | | 6,142 | |
| | | | | | | | |
| | | | | | | 11,759 | |
| | | | | | | | |
Panama — 0.0% | |
Avianca Holdings ADR | | | 3,928 | | | | 31 | |
| | | | | | | | |
Peru — 0.2% | |
Cia de Minas Buenaventura ADR | | | 24,430 | | | | 344 | |
Credicorp | | | 9,200 | | | | 1,908 | |
| | | | | | | | |
| | | | | | | 2,252 | |
| | | | | | | | |
Philippines — 0.1% | |
Bloomberry Resorts* | | | 1,080,300 | | | | 236 | |
Cebu Air | | | 177,710 | | | | 356 | |
Energy Development | | | 316,009 | | | | 36 | |
Lopez Holdings | | | 910,100 | | | | 102 | |
Metro Retail Stores Group | | | 612,000 | | | | 48 | |
Pepsi-Cola Products Philippines | | | 214,000 | | | | 9 | |
San Miguel | | | 144,580 | | | | 323 | |
San Miguel Pure Foods | | | 3,390 | | | | 36 | |
| | | | | | | | |
| | | | | | | 1,146 | |
| | | | | | | | |
Poland — 0.4% | |
CD Projekt | | | 57,197 | | | | 1,594 | |
Grupa Lotos | | | 60,862 | | | | 1,009 | |
Jastrzebska Spolka Weglowa* | | | 6,115 | | | | 169 | |
Polski Koncern Naftowy Orlen | | | 64,848 | | | | 1,975 | |
Polskie Gornictwo Naftowe i Gazownictwo | | | 242,424 | | | | 438 | |
| | | | | | | | |
| | | | | | | 5,185 | |
| | | | | | | | |
Portugal — 0.1% | |
Altri SGPS | | | 3,105 | | | | 19 | |
Banco Comercial Portugues, Cl R* | | | 501,953 | | | | 165 | |
Banco Espirito Santo* (B) (C) | | | 46,916 | | | | — | |
Corticeira Amorim SGPS | | | 1,669 | | | | 21 | |
| | | | | | | | |
| Description | | Shares | | | Value
(000) | |
CTT-Correios de Portugal | | | 7,572 | | | $ | 32 | |
EDP-Energias de Portugal | | | 38,650 | | | | 134 | |
Galp Energia | | | 8,723 | | | | 160 | |
Jeronimo Martins | | | 4,245 | | | | 83 | |
Mota-Engil SGPS | | | 3,895 | | | | 17 | |
Navigator | | | 11,556 | | | | 59 | |
NOS SGPS | | | 13,416 | | | | 88 | |
REN — Redes Energeticas Nacionais SGPS | | | 17,281 | | | | 51 | |
Semapa-Sociedade de Investimento e Gestao | | | 862 | | | | 18 | |
Sonae SGPS | | | 32,660 | | | | 44 | |
| | | | | | | | |
| | | | | | | 891 | |
| | | | | | | | |
Qatar — 0.2% | |
Barwa Real Estate | | | 142,526 | | | | 1,266 | |
Mannai | | | 745 | | | | 12 | |
Ooredoo QPSC | | | 63,688 | | | | 1,588 | |
Qatar Islamic Bank SAQ | | | 7,532 | | | | 203 | |
Qatar National Bank SAQ | | | 10,797 | | | | 376 | |
United Development QSC | | | 36,420 | | | | 144 | |
| | | | | | | | |
| | | | | | | 3,589 | |
| | | | | | | | |
Russia — 0.3% | |
Lukoil PJSC ADR | | | 2,564 | | | | 148 | |
Magnitogorsk Iron & Steel Works PJSC GDR | | | 28,651 | | | | 279 | |
PhosAgro PJSC GDR | | | 31,204 | | | | 451 | |
Sberbank of Russia PJSC ADR | | | 225,562 | | | | 3,819 | |
Sberbank of Russia PJSC ADR | | | 418 | | | | 7 | |
| | | | | | | | |
| | | | | | | 4,704 | |
| | | | | | | | |
Singapore — 2.1% | |
Accordia Golf Trust | | | 27,900 | | | | 14 | |
Ascendas‡ | | | 41,900 | | | | 85 | |
Ascendas Hospitality Trust‡ | | | 21,400 | | | | 14 | |
Ascott Residence Trust‡ | | | 64,800 | | | | 59 | |
Asian Pay Television Trust | | | 72,100 | | | | 32 | |
Boustead Singapore | | | 15,300 | | | | 10 | |
Bumitama Agri | | | 19,400 | | | | 11 | |
Cache Logistics Trust‡ | | | 55,106 | | | | 35 | |
CapitaLand | | | 44,100 | | | | 116 | |
CapitaLand Commercial Trust‡ | | | 44,774 | | | | 65 | |
CapitaLand Mall Trust‡ | | | 43,300 | | | | 69 | |
CapitaLand Retail China Trust‡ | | | 32,600 | | | | 39 | |
CDL Hospitality Trusts‡ | | | 42,400 | | | | 54 | |
China Aviation Oil Singapore | | | 8,600 | | | | 10 | |
Chip Eng Seng | | | 18,600 | | | | 14 | |
City Developments | | | 6,900 | | | | 64 | |
ComfortDelGro | | | 38,000 | | | | 56 | |
The accompanying notes are an integral part of the financial statements.
81
| | |
| THE KP FUNDS | | December 31, 2017 |
| | |
| KP International Equity Fund | | |
| | | | | | | | |
| Description | | Shares | | | Value
(000) | |
COSCO Shipping International Singapore* | | | 45,000 | | | $ | 13 | |
Dairy Farm International Holdings | | | 16,800 | | | | 132 | |
DBS Group Holdings | | | 291,134 | | | | 5,410 | |
ESR-REIT‡ | | | 35,342 | | | | 15 | |
Ezion Holdings* | | | 129,800 | | | | 15 | |
Far East Hospitality Trust‡ | | | 30,900 | | | | 17 | |
First Real Estate Investment Trust‡ | | | 28,800 | | | | 30 | |
First Resources | | | 29,700 | | | | 42 | |
Frasers Centrepoint Trust‡ | | | 30,000 | | | | 50 | |
Frasers Commercial Trust‡ | | | 35,994 | | | | 40 | |
Frasers Logistics & Industrial Trust‡ | | | 62,300 | | | | 54 | |
Genting Singapore | | | 103,300 | | | | 101 | |
GL | | | 194,600 | | | | 123 | |
Global Logistic Properties | | | 45,700 | | | | 115 | |
Golden Agri-Resources | | | 142,300 | | | | 39 | |
Great Eastern Holdings | | | 38,100 | | | | 788 | |
Haw Par | | | 29,112 | | | | 247 | |
Hongkong Land Holdings | | | 555,100 | | | | 3,909 | |
Hutchison Port Holdings Trust, Cl U | | | 95,600 | | | | 40 | |
Indofood Agri Resources | | | 2,600 | | | | 1 | |
Japfa | | | 23,900 | | | | 9 | |
Jardine Cycle & Carriage | | | 1,733 | | | | 53 | |
Jardine Matheson Holdings | | | 92,300 | | | | 5,608 | |
Jardine Strategic Holdings | | | 3,600 | | | | 142 | |
Keppel | | | 23,700 | | | | 130 | |
Keppel‡ | | | 94,700 | | | | 89 | |
Keppel DC‡ | | | 52,500 | | | | 56 | |
Keppel Infrastructure Trust | | | 211,600 | | | | 91 | |
Lippo Malls Indonesia Retail Trust‡ | | | 97,300 | | | | 29 | |
M1 | | | 19,900 | | | | 27 | |
Manulife US‡ | | | 42,000 | | | | 38 | |
Mapletree Commercial Trust‡ | | | 94,300 | | | | 114 | |
Mapletree Greater China Commercial Trust‡ | | | 94,500 | | | | 87 | |
Mapletree Industrial Trust‡ | | | 69,400 | | | | 105 | |
Mapletree Logistics Trust‡ | | | 93,360 | | | | 92 | |
NetLink NBN Trust* | | | 222,400 | | | | 139 | |
Noble Group* | | | 54,580 | | | | 8 | |
OUE | | | 18,200 | | | | 25 | |
OUE Hospitality Trust‡ | | | 55,400 | | | | 35 | |
Oversea-Chinese Banking | | | 54,072 | | | | 501 | |
Parkway Life‡ | | | 20,000 | | | | 45 | |
QAF | | | 5,100 | | | | 4 | |
Raffles Medical Group | | | 43,200 | | | | 36 | |
RHT Health Trust | | | 21,500 | | | | 14 | |
Riverstone Holdings | | | 12,500 | | | | 10 | |
Sabana Shari’ah Compliant Industrial‡ | | | 34,300 | | | | 10 | |
| | | | | | | | |
| Description | | Shares | | | Value
(000) | |
SATS | | | 12,900 | | | $ | 50 | |
Sembcorp Industries | | | 14,500 | | | | 33 | |
Sembcorp Marine | | | 38,300 | | | | 52 | |
Sheng Siong Group | | | 19,400 | | | | 13 | |
SIIC Environment Holdings | | | 29,800 | | | | 11 | |
Silverlake Axis | | | 31,400 | | | | 14 | |
Singapore Airlines | | | 9,400 | | | | 75 | |
Singapore Exchange | | | 13,600 | | | | 76 | |
Singapore Post | | | 74,200 | | | | 69 | |
Singapore Press Holdings | | | 27,000 | | | | 53 | |
Singapore Technologies Engineering | | | 26,300 | | | | 64 | |
Singapore Telecommunications | | | 914,600 | | | | 2,441 | |
Soilbuild Business Space‡ | | | 28,000 | | | | 14 | |
SPH‡ | | | 38,400 | | | | 30 | |
Starhill Global‡ | | | 81,100 | | | | 47 | |
StarHub | | | 9,600 | | | | 20 | |
Suntec‡ | | | 43,900 | | | | 71 | |
United Engineers | | | 25,500 | | | | 50 | |
United Industrial | | | 16,648 | | | | 41 | |
United Overseas Bank | | | 393,918 | | | | 7,791 | |
UOL Group | | | 8,985 | | | | 60 | |
Venture | | | 13,900 | | | | 213 | |
Wilmar International | | | 27,000 | | | | 62 | |
Wing Tai Holdings | | | 24,600 | | | | 42 | |
Yangzijiang Shipbuilding Holdings | | | 41,800 | | | | 46 | |
Yanlord Land Group | | | 37,300 | | | | 45 | |
Yoma Strategic Holdings | | | 59,500 | | | | 24 | |
| | | | | | | | |
| | | | | | | 30,932 | |
| | | | | | | | |
South Africa — 2.1% | |
Alviva Holdings | | | 10,469 | | | | 16 | |
Anglo American | | | 30,091 | | | | 622 | |
Anglo American Platinum* | | | 13,174 | | | | 376 | |
Astral Foods | | | 3,160 | | | | 68 | |
Bid | | | 71,773 | | | | 1,746 | |
Bidvest Group | | | 136,046 | | | | 2,398 | |
Capitec Bank Holdings | | | 18,988 | | | | 1,685 | |
Cie Financiere Richemont | | | 41,636 | | | | 376 | |
Exxaro Resources | | | 4,777 | | | | 63 | |
FirstRand | | | 380,708 | | | | 2,069 | |
Grindrod* | | | 130,169 | | | | 144 | |
Kumba Iron Ore | | | 25,303 | | | | 775 | |
MMI Holdings | | | 87,990 | | | | 149 | |
Mondi | | | 49,008 | | | | 1,265 | |
MTN Group | | | 46,987 | | | | 519 | |
Murray & Roberts Holdings | | | 129,650 | | | | 127 | |
Naspers, Cl N | | | 13,787 | | | | 3,846 | |
Old Mutual | | | 115,736 | | | | 356 | |
The accompanying notes are an integral part of the financial statements.
82
| | |
| THE KP FUNDS | | December 31, 2017 |
| | |
| KP International Equity Fund | | |
| | | | | | | | |
| Description | | Shares | | | Value
(000) | |
Peregrine Holdings | | | 189,232 | | | $ | 390 | |
Sandown Capital Pty* | | | 189,232 | | | | 50 | |
Sasol | | | 111,050 | | | | 3,843 | |
Standard Bank Group | | | 291,467 | | | | 4,609 | |
Telkom | | | 136,525 | | | | 531 | |
Tiger Brands | | | 108,110 | | | | 4,020 | |
Tsogo Sun Holdings | | | 116,937 | | | | 230 | |
Wilson Bayly Holmes-Ovcon | | | 9,970 | | | | 125 | |
| | | | | | | | |
| | | | | | | 30,398 | |
| | | | | | | | |
South Korea — 3.1% | |
CJ O Shopping | | | 1,379 | | | | 298 | |
CKH Food & Health* | | | 122,645 | | | | 101 | |
Coway | | | 12,740 | | | | 1,163 | |
Dae Han Flour Mills | | | 86 | | | | 13 | |
Daeyang Electric* | | | 3,787 | | | | 43 | |
Dongyang E&P | | | 10,103 | | | | 117 | |
GS Home Shopping | | | 1,461 | | | | 296 | |
Hana Financial Group | | | 15,071 | | | | 701 | |
Hankook Tire | | | 25,911 | | | | 1,318 | |
Hite Jinro | | | 14,163 | | | | 319 | |
Hyundai Elevator | | | 6,399 | | | | 325 | |
Hyundai Motor | | | 5,127 | | | | 747 | |
KT | | | 17,542 | | | | 496 | |
Kwangju Bank | | | 5,257 | | | | 59 | |
LG | | | 10,469 | | | | 890 | |
LG Chemical | | | 3,508 | | | | 1,334 | |
LG Display | | | 945 | | | | 26 | |
LG Electronics | | | 23,137 | | | | 2,295 | |
LG Innotek | | | 713 | | | | 97 | |
LG Uplus | | | 46,249 | | | | 607 | |
Lotte | | | 2,631 | | | | 160 | |
LOTTE Himart | | | 3,321 | | | | 214 | |
Lotte Shopping | | | 2,054 | | | | 382 | |
Moorim Paper* | | | 35,210 | | | | 80 | |
POSCO | | | 5,514 | | | | 1,710 | |
POSCO ADR | | | 73,400 | | | | 5,734 | |
S-1, Cl 1 | | | 4,511 | | | | 451 | |
Sam Young Electronics | | | 1,907 | | | | 23 | |
Samsung Electronics | | | 6,616 | | | | 15,796 | |
Samsung Fire & Marine Insurance | | | 3,491 | | | | 871 | |
SeAH Holdings | | | 225 | | | | 32 | |
Shinhan Financial Group | | | 66,110 | | | | 3,050 | |
SK Hynix | | | 53,294 | | | | 3,811 | |
SK Telecom | | | 9,902 | | | | 2,471 | |
Tera Semicon | | | 8,127 | | | | 213 | |
UIL | | | 6,402 | | | | 39 | |
| | | | | | | | |
| | | | | | | 46,282 | |
| | | | | | | | |
| | | | | | | | |
| Description | | Shares | | | Value
(000) | |
Spain — 1.7% | |
Abertis Infraestructuras | | | 11,725 | | | $ | 261 | |
Acciona | | | 1,357 | | | | 111 | |
Acerinox | | | 43,323 | | | | 620 | |
ACS Actividades de Construccion y Servicios | | | 4,193 | | | | 164 | |
Aena SME (A) | | | 1,143 | | | | 232 | |
Almirall | | | 3,195 | | | | 32 | |
Amadeus IT Group, Cl A | | | 75,953 | | | | 5,477 | |
Applus Services | | | 7,178 | | | | 97 | |
Atresmedia de Medios de Comunicacion | | | 4,549 | | | | 47 | |
Axiare Patrimonio SOCIMI‡ | | | 3,575 | | | | 79 | |
Banco Bilbao Vizcaya Argentaria | | | 114,360 | | | | 976 | |
Banco de Sabadell | | | 92,642 | | | | 184 | |
Banco Santander | | | 1,253,945 | | | | 8,242 | |
Bankia | | | 128,305 | | | | 614 | |
Bankinter | | | 11,575 | | | | 110 | |
Bolsas y Mercados Espanoles SHMSF | | | 4,006 | | | | 128 | |
CaixaBank | | | 60,641 | | | | 283 | |
Cellnex Telecom (A) | | | 7,647 | | | | 196 | |
Cia de Distribucion Integral Logista Holdings | | | 2,099 | | | | 48 | |
CIE Automotive | | | 2,964 | | | | 86 | |
Codere* | | | 2,424 | | | | 23 | |
Construcciones y Auxiliar de Ferrocarriles | | | 1,029 | | | | 42 | |
Distribuidora Internacional de Alimentacion | | | 32,016 | | | | 165 | |
Ebro Foods | | | 3,513 | | | | 82 | |
Enagas | | | 3,897 | | | | 112 | |
Ence Energia y Celulosa | | | 7,406 | | | | 49 | |
Endesa | | | 5,438 | | | | 116 | |
Euskaltel (A) | | | 4,421 | | | | 36 | |
Faes Farma | | | 14,354 | | | | 51 | |
Ferrovial | | | 8,527 | | | | 195 | |
Financiera Alba | | | 582 | | | | 33 | |
Fomento de Construcciones y Contratas* | | | 3,976 | | | | 41 | |
Gas Natural SDG | | | 5,696 | | | | 132 | |
Gestamp Automocion* (A) | | | 9,587 | | | | 69 | |
Global Dominion Access* (A) | | | 2,132 | | | | 11 | |
Grifols | | | 5,197 | | | | 152 | |
Grupo Catalana Occidente | | | 1,907 | | | | 84 | |
Hispania Activos Inmobiliarios SOCIMI‡ | | | 5,992 | | | | 113 | |
Iberdrola | | | 97,601 | | | | 757 | |
Indra Sistemas* | | | 6,263 | | | | 86 | |
The accompanying notes are an integral part of the financial statements.
83
| | |
| THE KP FUNDS | | December 31, 2017 |
| | |
| KP International Equity Fund | | |
| | | | | | | | |
| Description | | Shares | | | Value
(000) | |
Industria de Diseno Textil | | | 18,735 | | | $ | 653 | |
Inmobiliaria Colonial Socimi‡ | | | 14,853 | | | | 148 | |
International Consolidated Airlines Group | | | 10,622 | | | | 92 | |
Lar Espana Real Estate Socimi‡ | | | 4,951 | | | | 53 | |
Liberbank* | | | 114,772 | | | | 61 | |
Mapfre | | | 18,908 | | | | 61 | |
Mediaset Espana Comunicacion | | | 36,153 | | | | 406 | |
Melia Hotels International | | | 5,755 | | | | 80 | |
Merlin Properties Socimi‡ | | | 17,849 | | | | 242 | |
Miquel y Costas & Miquel | | | 572 | | | | 25 | |
Neinor Homes* (A) | | | 4,233 | | | | 93 | |
NH Hotel Group | | | 10,986 | | | | 79 | |
Obrascon Huarte Lain* | | | 5,918 | | | | 35 | |
Papeles y Cartones de Europa | | | 2,544 | | | | 35 | |
Pharma Mar* | | | 9,923 | | | | 30 | |
Prosegur Cia de Seguridad | | | 14,056 | | | | 110 | |
Realia Business* | | | 8,256 | | | | 11 | |
Red Electrica | | | 7,530 | | | | 169 | |
Repsol | | | 20,600 | | | | 364 | |
Sacyr* | | | 19,183 | | | | 54 | |
Saeta Yield | | | 2,503 | | | | 29 | |
Siemens Gamesa Renewable Energy | | | 3,582 | | | | 49 | |
Talgo (A) | | | 5,020 | | | | 26 | |
Tecnicas Reunidas | | | 1,714 | | | | 54 | |
Telefonica | | | 77,827 | | | | 759 | |
Telepizza Group* (A) | | | 4,776 | | | | 27 | |
Tubacex* | | | 4,499 | | | | 18 | |
Unicaja Banco* (A) | | | 43,080 | | | | 68 | |
Viscofan | | | 12,116 | | | | 800 | |
Zardoya Otis | | | 9,926 | | | | 108 | |
| | | | | | | | |
| | | | | | | 25,075 | |
| | | | | | | | |
Sweden — 1.4% | |
AAK | | | 1,494 | | | | 128 | |
AcadeMedia* (A) | | | 2,399 | | | | 19 | |
AF, Cl B | | | 3,778 | | | | 83 | |
Ahlsell (A) | | | 13,209 | | | | 85 | |
Alfa Laval | | | 5,032 | | | | 119 | |
Alimak Group (A) | | | 1,701 | | | | 27 | |
Arcam* | | | 288 | | | | 12 | |
Arjo* | | | 11,651 | | | | 33 | |
Assa Abloy, Cl B | | | 97,859 | | | | 2,033 | |
Atlas Copco, Cl A | | | 11,549 | | | | 499 | |
Atlas Copco, Cl B | | | 6,603 | | | | 253 | |
Attendo (A) | | | 5,472 | | | | 58 | |
Avanza Bank Holding | | | 1,231 | | | | 52 | |
Axfood | | | 5,606 | | | | 108 | |
| | | | | | | | |
| Description | | Shares | | | Value
(000) | |
Bergman & Beving, Cl B | | | 1,105 | | | $ | 12 | |
Betsson | | | 6,109 | | | | 45 | |
Bilia, Cl A | | | 4,285 | | | | 42 | |
BillerudKorsnas | | | 8,637 | | | | 148 | |
BioGaia, Cl B | | | 824 | | | | 33 | |
Boliden | | | 4,762 | | | | 163 | |
Bonava, Cl B | | | 4,433 | | | | 62 | |
Bravida Holding (A) | | | 9,344 | | | | 62 | |
Bufab | | | 1,307 | | | | 17 | |
Bure Equity | | | 2,535 | | | | 30 | |
Byggmax Group | | | 3,223 | | | | 22 | |
Camurus* | | | 670 | | | | 11 | |
Capio (A) | | | 7,251 | | | | 39 | |
Castellum | | | 12,733 | | | | 214 | |
Catena Media* | | | 1,581 | | | | 20 | |
Cherry* | | | 2,522 | | | | 15 | |
Clas Ohlson, Cl B | | | 1,973 | | | | 27 | |
Cloetta, Cl B | | | 11,083 | | | | 40 | |
Collector* | | | 901 | | | | 9 | |
Com Hem Holding | | | 7,457 | | | | 114 | |
D Carnegie, Cl B* | | | 1,607 | | | | 24 | |
Dios Fastigheter | | | 5,544 | | | | 38 | |
Dometic Group (A) | | | 14,595 | | | | 149 | |
Dustin Group (A) | | | 2,977 | | | | 30 | |
Elanders, Cl B | | | 808 | | | | 8 | |
Electrolux | | | 4,043 | | | | 130 | |
Elekta, Cl B | | | 18,599 | | | | 154 | |
Eltel* (A) | | | 6,171 | | | | 22 | |
Essity, Cl B* | | | 71,424 | | | | 2,029 | |
Evolution Gaming Group (A) | | | 1,023 | | | | 72 | |
Fabege | | | 6,734 | | | | 143 | |
Fastighets Balder, Cl B* | | | 4,997 | | | | 134 | |
Fingerprint Cards, Cl B | | | 15,443 | | | | 30 | |
Getinge, Cl B | | | 3,481 | | | | 50 | |
Granges | | | 3,918 | | | | 40 | |
Gunnebo | | | 1,909 | | | | 8 | |
Haldex* | | | 2,147 | | | | 23 | |
Hansa Medical* | | | 1,022 | | | | 31 | |
Hemfosa Fastigheter | | | 8,219 | | | | 110 | |
Hennes & Mauritz, Cl B | | | 16,005 | | | | 330 | |
Hexagon, Cl B | | | 4,382 | | | | 220 | |
Hexpol | | | 11,886 | | | | 120 | |
Hoist Finance (A) | | | 3,722 | | | | 42 | |
Holmen, Cl B | | | 2,561 | | | | 136 | |
Hufvudstaden, Cl A | | | 5,701 | | | | 91 | |
Humana | | | 1,453 | | | | 10 | |
Husqvarna, Cl B | | | 7,257 | | | | 69 | |
The accompanying notes are an integral part of the financial statements.
84
| | |
| THE KP FUNDS | | December 31, 2017 |
| | |
| KP International Equity Fund | | |
| | | | | | | | |
| Description | | Shares | | | Value
(000) | |
ICA Gruppen | | | 1,202 | | | $ | 44 | |
Industrivarden, Cl C | | | 2,909 | | | | 72 | |
Indutrade | | | 4,450 | | | | 121 | |
Intrum Justitia | | | 3,593 | | | | 133 | |
Investment Oresund | | | 1,426 | | | | 23 | |
Investor, Cl B | | | 7,682 | | | | 350 | |
Inwido | | | 2,957 | | | | 30 | |
ITAB Shop Concept | | | 1,376 | | | | 9 | |
JM | | | 3,694 | | | | 84 | |
KappAhl | | | 3,435 | | | | 19 | |
Kindred Group | | | 11,004 | | | | 158 | |
Kinnevik | | | 4,002 | | | | 135 | |
Klovern, Cl B | | | 31,775 | | | | 42 | |
Kungsleden | | | 10,543 | | | | 76 | |
L E Lundbergforetagen, Cl B | | | 731 | | | | 55 | |
LeoVegas (A) | | | 3,366 | | | | 34 | |
Lindab International | | | 3,608 | | | | 30 | |
Loomis, Cl B | | | 3,709 | | | | 156 | |
Lundin Petroleum* | | | 3,250 | | | | 74 | |
Mekonomen | | | 1,374 | | | | 25 | |
Millicom International Cellular | | | 6,198 | | | | 419 | |
Modern Times Group, Cl B | | | 12,164 | | | | 511 | |
Mycronic | | | 3,321 | | | | 34 | |
NCC, Cl B | | | 4,039 | | | | 77 | |
NetEnt* | | | 9,260 | | | | 64 | |
New Wave Group, Cl B | | | 1,968 | | | | 13 | |
Nibe Industrier, Cl B | | | 17,310 | | | | 166 | |
Nobia | | | 6,234 | | | | 53 | |
Nobina (A) | | | 5,789 | | | | 38 | |
Nolato, Cl B | | | 1,047 | | | | 69 | |
Nordax Group (A) | | | 5,949 | | | | 38 | |
Nordea Bank | | | 84,391 | | | | 1,022 | |
Oriflame Holding | | | 2,008 | | | | 83 | |
Pandox, Cl B | | | 3,864 | | | | 75 | |
Paradox Interactive | | | 1,136 | | | | 13 | |
Peab | | | 9,155 | | | | 79 | |
Probi | | | 325 | | | | 13 | |
Ratos, Cl B | | | 11,922 | | | | 52 | |
RaySearch Laboratories* | | | 1,189 | | | | 25 | |
Recipharm, Cl B | | | 2,366 | | | | 29 | |
Resurs Holding (A) | | | 5,447 | | | | 39 | |
Rezidor Hotel Group | | | 2,640 | | | | 8 | |
Saab, Cl B | | | 3,256 | | | | 158 | |
Sandvik | | | 71,951 | | | | 1,260 | |
SAS* | | | 4,281 | | | | 11 | |
Scandi Standard | | | 1,887 | | | | 15 | |
Scandic Hotels Group (A) | | | 4,385 | | | | 63 | |
| | | | | | | | |
| Description | | Shares | | | Value
(000) | |
Securitas, Cl B | | | 5,281 | | | $ | 92 | |
Skandinaviska Enskilda Banken, Cl A | | | 25,652 | | | | 301 | |
Skanska, Cl B | | | 5,817 | | | | 121 | |
SKF, Cl B | | | 6,143 | | | | 136 | |
SkiStar | | | 1,147 | | | | 22 | |
SSAB* | | | 34,211 | | | | 153 | |
SSAB, Cl A* | | | 10,992 | | | | 60 | |
Starbreeze* | | | 11,079 | | | | 11 | |
Svenska Cellulosa, Cl B | | | 30,638 | | | | 316 | |
Svenska Handelsbanken, Cl A | | | 107,811 | | | | 1,474 | |
Sweco, Cl B | | | 3,426 | | | | 76 | |
Swedbank, Cl A | | | 15,269 | | | | 368 | |
Swedish Match | | | 10,350 | | | | 408 | |
Swedish Orphan Biovitrum* | | | 7,775 | | | | 107 | |
Tele2, Cl B | | | 6,271 | | | | 77 | |
Telefonaktiebolaget LM Ericsson, Cl B | | | 89,273 | | | | 586 | |
Telia | | | 45,062 | | | | 201 | |
Thule Group (A) | | | 5,327 | | | | 120 | |
Tobii* | | | 4,961 | | | | 21 | |
Trelleborg, Cl B | | | 12,240 | | | | 284 | |
Victoria Park, Cl B | | | 3,607 | | | | 13 | |
Vitrolife | | | 674 | | | | 51 | |
Volati | | | 1,272 | | | | 10 | |
Volvo, Cl B | | | 26,801 | | | | 498 | |
Wallenstam, Cl B | | | 9,515 | | | | 92 | |
Wihlborgs Fastigheter | | | 3,763 | | | | 90 | |
| | | | | | | | |
| | | | | | | 20,662 | |
| | | | | | | | |
Switzerland — 6.7% | |
ABB | | | 31,623 | | | | 848 | |
Adecco Group | | | 17,013 | | | | 1,302 | |
Allreal Holding | | | 654 | | | | 111 | |
ALSO Holding | | | 215 | | | | 30 | |
ams* | | | 3,261 | | | | 297 | |
APG SGA | | | 77 | | | | 36 | |
Arbonia* | | | 1,881 | | | | 31 | |
Aryzta | | | 4,654 | | | | 185 | |
Ascom Holding | | | 1,936 | | | | 50 | |
Autoneum Holding | | | 161 | | | | 46 | |
Bachem Holding, Cl B | | | 214 | | | | 34 | |
Baloise Holding | | | 835 | | | | 130 | |
Banque Cantonale Vaudoise | | | 154 | | | | 116 | |
Barry Callebaut* | | | 38 | | | | 79 | |
Basilea Pharmaceutica* | | | 649 | | | | 51 | |
Bell Food Group | | | 83 | | | | 37 | |
BKW | | | 568 | | | | 34 | |
Bobst Group | | | 447 | | | | 59 | |
Bossard Holding | | | 308 | | | | 73 | |
The accompanying notes are an integral part of the financial statements.
85
| | |
| THE KP FUNDS | | December 31, 2017 |
| | |
| KP International Equity Fund | | |
| | | | | | | | |
| Description | | Shares | | | Value
(000) | |
Bucher Industries | | | 345 | | | $ | 140 | |
Burckhardt Compression Holding | | | 155 | | | | 50 | |
Burkhalter Holding | | | 263 | | | | 34 | |
Cembra Money Bank | | | 1,516 | | | | 141 | |
Chocoladefabriken Lindt & Sprungli | | | 2 | | | | 145 | |
Chocoladefabriken Lindt & Sprungli PC | | | 17 | | | | 104 | |
Cie Financiere Richemont | | | 96,519 | | | | 8,746 | |
Clariant | | | 3,721 | | | | 104 | |
Coca-Cola | | | 3,115 | | | | 102 | |
Comet Holding | | | 363 | | | | 57 | |
Conzzeta | | | 73 | | | | 76 | |
COSMO Pharmaceuticals | | | 360 | | | | 54 | |
Credit Suisse Group | | | 41,683 | | | | 745 | |
Daetwyler Holding | | | 425 | | | | 82 | |
DKSH Holding | | | 3,743 | | | | 327 | |
dormakaba Holding | | | 171 | | | | 159 | |
Dufry* | | | 591 | | | | 89 | |
EFG International | | | 4,680 | | | | 49 | |
Emmi | | | 110 | | | | 79 | |
EMS-Chemie Holding | | | 138 | | | | 92 | |
Feintool International Holding | | | 78 | | | | 9 | |
Ferguson | | | 4,278 | | | | 308 | |
Flughafen Zurich | | | 1,007 | | | | 230 | |
Forbo Holding | | | 63 | | | | 97 | |
Galenica* (A) | | | 3,720 | | | | 191 | |
GAM Holding | | | 7,820 | | | | 126 | |
Geberit | | | 4,404 | | | | 1,940 | |
Georg Fischer | | | 204 | | | | 270 | |
Givaudan | | | 156 | | | | 361 | |
Gurit Holding | | | 15 | | | | 16 | |
Helvetia Holding | | | 529 | | | | 298 | |
Huber + Suhner | | | 637 | | | | 33 | |
Idorsia* | | | 6,038 | | | | 157 | |
Implenia | | | 815 | | | | 55 | |
Inficon Holding | | | 81 | | | | 51 | |
Intershop Holding | | | 41 | | | | 20 | |
Julius Baer Group | | | 3,793 | | | | 232 | |
Kardex | | | 337 | | | | 41 | |
Komax Holding | | | 201 | | | | 66 | |
Kudelski | | | 1,932 | | | | 24 | |
Kuehne + Nagel International | | | 8,207 | | | | 1,453 | |
LafargeHolcim* | | | 99,757 | | | | 5,625 | |
Landis+Gyr Group* | | | 1,747 | | | | 138 | |
LEM Holding | | | 37 | | | | 63 | |
Leonteq* | | | 489 | | | | 32 | |
Logitech International | | | 30,857 | | | | 1,042 | |
Lonza Group | | | 1,257 | | | | 339 | |
Meyer Burger Technology* | | | 26,356 | | | | 45 | |
| | | | | | | | |
| Description | | Shares | | | Value
(000) | |
Mobilezone Holding | | | 854 | | | $ | 11 | |
Mobimo Holding* | | | 381 | | | | 102 | |
Molecular Partners* | | | 442 | | | | 12 | |
Nestle | | | 217,449 | | | | 18,699 | |
Novartis | | | 191,359 | | | | 16,182 | |
OC Oerlikon | | | 10,756 | | | | 182 | |
Orior | | | 188 | | | | 15 | |
Panalpina Welttransport Holding | | | 541 | | | | 84 | |
Pargesa Holding | | | 651 | | | | 56 | |
Partners Group Holding | | | 301 | | | | 206 | |
PSP Swiss Property | | | 2,083 | | | | 198 | |
Rieter Holding | | | 183 | | | | 45 | |
Roche Holding | | | 44,743 | | | | 11,318 | |
Schindler Holding | | | 349 | | | | 79 | |
Schindler Holding | | | 709 | | | | 163 | |
Schmolz + Bickenbach* | | | 18,207 | | | | 16 | |
Schweiter Technologies | | | 53 | | | | 69 | |
SFS Group | | | 880 | | | | 102 | |
SGS | | | 91 | | | | 237 | |
Siegfried Holding | | | 192 | | | | 64 | |
Sika | | | 36 | | | | 286 | |
Sonova Holding | | | 3,834 | | | | 599 | |
St. Galler Kantonalbank | | | 142 | | | | 71 | |
Straumann Holding | | | 177 | | | | 125 | |
Sulzer* | | | 700 | | | | 85 | |
Sunrise Communications Group (A) | | | 1,739 | | | | 159 | |
Swatch Group | | | 941 | | | | 72 | |
Swatch Group BR | | | 16,984 | | | | 6,926 | |
Swiss Life Holding | | | 564 | | | | 200 | |
Swiss Prime Site | | | 1,228 | | | | 113 | |
Swiss Re | | | 5,409 | | | | 507 | |
Swisscom | | | 439 | | | | 233 | |
Swissquote Group Holding | | | 355 | | | | 14 | |
Tecan Group | | | 561 | | | | 117 | |
Temenos Group | | | 3,053 | | | | 392 | |
u-blox Holding | | | 332 | | | | 65 | |
UBS Group | | | 455,465 | | | | 8,386 | |
Valiant Holding | | | 841 | | | | 91 | |
Valora Holding | | | 148 | | | | 49 | |
VAT Group* (A) | | | 1,009 | | | | 150 | |
Vifor Pharma | | | 822 | | | | 105 | |
Vontobel Holding | | | 1,210 | | | | 76 | |
VZ Holding | | | 148 | | | | 50 | |
Ypsomed Holding | | | 182 | | | | 30 | |
Zehnder Group | | | 301 | | | | 12 | |
Zur Rose Group* | | | 317 | | | | 43 | |
Zurich Insurance Group | | | 9,924 | | | | 3,020 | |
| | | | | | | | |
| | | | | | | 98,002 | |
| | | | | | | | |
The accompanying notes are an integral part of the financial statements.
86
| | |
| THE KP FUNDS | | December 31, 2017 |
| | |
| KP International Equity Fund | | |
| | | | | | | | |
| Description | | Shares | | | Value
(000) | |
Taiwan — 1.8% | |
AU Optronics ADR | | | 603,609 | | | $ | 2,511 | |
Chroma ATE | | | 172,000 | | | | 936 | |
Delta Electronics | | | 103,516 | | | | 499 | |
Largan Precision | | | 10,000 | | | | 1,351 | |
PChome Online | | | 86,587 | | | | 399 | |
Ruentex Industries | | | 215,082 | | | | 366 | |
Taiwan Semiconductor Manufacturing ADR | | | 396,424 | | | | 15,719 | |
Taiwan Semiconductor Manufacturing | | | 350,000 | | | | 2,699 | |
Teco Electric and Machinery | | | 730,387 | | | | 699 | |
United Microelectronics ADR | | | 498,001 | | | | 1,190 | |
Yungtay Engineering | | | 492,000 | | | | 794 | |
| | | | | | | | |
| | | | | | | 27,163 | |
| | | | | | | | |
Thailand — 0.9% | |
Advanced Information Technology | | | 26,800 | | | | 25 | |
Airports of Thailand | | | 1,180,100 | | | | 2,462 | |
Bangchak NVDR | | | 160,900 | | | | 201 | |
Bangkok Bank | | | 147,100 | | | | 989 | |
Bangkok Bank NVDR | | | 21,200 | | | | 131 | |
Banpu NVDR | | | 496,500 | | | | 297 | |
BEC World | | | 472,300 | | | | 190 | |
CP ALL | | | 1,023,100 | | | | 2,417 | |
Kasikornbank | | | 46,200 | | | | 339 | |
KGI Securities Thailand NVDR | | | 747,900 | | | | 102 | |
MFEC NVDR | | | 160,200 | | | | 24 | |
PTT NVDR | | | 219,600 | | | | 2,965 | |
PTT Global Chemical | | | 103,200 | | | | 269 | |
PTT Global Chemical NVDR | | | 395,300 | | | | 1,031 | |
Sansiri | | | 1,538,500 | | | | 103 | |
Star Petroleum Refining NVDR | | | 1,491,400 | | | | 783 | |
Syntec Construction NVDR | | | 2,826,500 | | | | 481 | |
Thai Oil NVDR | | | 249,500 | | | | 792 | |
| | | | | | | | |
| | | | | | | 13,601 | |
| | | | | | | | |
Turkey — 0.6% | |
Albaraka Turk Katilim Bankasi | | | 44,267 | | | | 18 | |
Anadolu Cam Sanayii | | | 44,656 | | | | 31 | |
Dogan Sirketler Grubu Holding* | | | 1,398,951 | | | | 321 | |
Eregli Demir ve Celik Fabrikalari | | | 712,468 | | | | 1,883 | |
Indeks Bilgisayar Sistemleri Muhendislik Sanayi ve Ticaret | | | 20,606 | | | | 63 | |
KOC Holding | | | 318,941 | | | | 1,555 | |
Torunlar Gayrimenkul Yatirim Ortakligi‡ | | | 460,682 | | | | 405 | |
Tupras Turkiye Petrol Rafinerileri | | | 15,354 | | | | 492 | |
Turk Hava Yollari* | | | 368,130 | | | | 1,524 | |
Turkiye Garanti Bankasi | | | 821,950 | | | | 2,325 | |
| | | | | | | | |
| Description | | Shares | | | Value
(000) | |
Turkiye Sise ve Cam Fabrikalari | | | 421,191 | | | $ | 522 | |
Ulker Biskuvi Sanayi | | | 53,064 | | | | 275 | |
| | | | | | | | |
| | | | | | | 9,414 | |
| | | | | | | | |
United Arab Emirates — 0.1% | |
Aldar Properties PJSC | | | 979,657 | | | | 586 | |
Emaar Properties PJSC | | | 522,273 | | | | 986 | |
National Central Cooling PJSC | | | 265,588 | | | | 131 | |
| | | | | | | | |
| | | | | | | 1,703 | |
| | | | | | | | |
United Kingdom — 15.0% | |
3i Group | | | 109,745 | | | | 1,353 | |
888 Holdings | | | 23,422 | | | | 89 | |
AA | | | 30,247 | | | | 70 | |
Abcam | | | 9,574 | | | | 136 | |
Acacia Mining | | | 9,546 | | | | 26 | |
Admiral Group | | | 29,062 | | | | 786 | |
Advanced Medical Solutions Group | | | 10,453 | | | | 45 | |
Aggreko | | | 303,089 | | | | 3,269 | |
Aldermore Group* | | | 13,476 | | | | 56 | |
Allied Minds* | | | 13,370 | | | | 30 | |
Amerisur Resources* | | | 53,259 | | | | 13 | |
Anglo American | | | 325,720 | | | | 6,813 | |
Antofagasta | | | 47,989 | | | | 651 | |
AO World* | | | 14,060 | | | | 21 | |
Arrow Global Group | | | 8,590 | | | | 46 | |
Ascential | | | 20,930 | | | | 109 | |
Ashmore Group | | | 20,781 | | | | 114 | |
Ashtead Group | | | 8,454 | | | | 227 | |
ASOS* | | | 2,837 | | | | 257 | |
Associated British Foods | | | 6,033 | | | | 230 | |
Assura‡ | | | 114,424 | | | | 99 | |
AstraZeneca | | | 21,690 | | | | 1,500 | |
Auto Trader Group (A) | | | 49,520 | | | | 236 | |
AVEVA Group | | | 3,342 | | | | 125 | |
Aviva | | | 67,870 | | | | 464 | |
B&M European Value Retail | | | 43,017 | | | | 246 | |
Babcock International Group | | | 3,756 | | | | 36 | |
BAE Systems | | | 162,074 | | | | 1,254 | |
Balfour Beatty | | | 35,443 | | | | 142 | |
Bank of Ireland Group* | | | 11,295 | | | | 97 | |
Barclays | | | 1,569,254 | | | | 4,303 | |
Barratt Developments | | | 35,085 | | | | 307 | |
BBA Aviation | | | 51,421 | | | | 243 | |
Beazley | | | 26,649 | | | | 192 | |
Bellway | | | 6,196 | | | | 298 | |
Berkeley Group Holdings | | | 2,207 | | | | 125 | |
BGEO Group | | | 8,665 | | | | 416 | |
BHP Billiton | | | 321,199 | | | | 6,602 | |
The accompanying notes are an integral part of the financial statements.
87
| | |
| THE KP FUNDS | | December 31, 2017 |
| | |
| KP International Equity Fund | | |
| | | | | | | | |
| Description | | Shares | | | Value
(000) | |
Biffa (A) | | | 14,037 | | | $ | 50 | |
Big Yellow Group‡ | | | 7,606 | | | | 89 | |
Blue Prism Group* | | | 1,802 | | | | 31 | |
Bodycote | | | 10,261 | | | | 126 | |
boohoo.com* | | | 32,919 | | | | 84 | |
Booker Group | | | 84,376 | | | | 261 | |
Bovis Homes Group | | | 6,642 | | | | 105 | |
BP | | | 581,978 | | | | 4,107 | |
Brewin Dolphin Holdings | | | 15,759 | | | | 83 | |
British American Tobacco | | | 37,450 | | | | 2,536 | |
British American Tobacco ADR | | | 3,308 | | | | 222 | |
British Land‡ | | | 16,324 | | | | 152 | |
Britvic | | | 13,565 | | | | 149 | |
BT Group, Cl A | | | 144,935 | | | | 532 | |
BTG* | | | 19,523 | | | | 201 | |
Bunzl | | | 54,677 | | | | 1,530 | |
Burberry Group | | | 7,327 | | | | 177 | |
Burford Capital | | | 9,426 | | | | 147 | |
Cairn Energy* | | | 30,803 | | | | 89 | |
Cairn Homes* | | | 45,134 | | | | 106 | |
Capita | | | 92,688 | | | | 502 | |
Capital & Counties Properties | | | 37,563 | | | | 162 | |
Card Factory | | | 16,784 | | | | 67 | |
Carnival | | | 65,398 | | | | 4,320 | |
Centamin | | | 54,789 | | | | 117 | |
Centrica | | | 113,492 | | | | 210 | |
Chemring Group | | | 18,662 | | | | 46 | |
Cineworld Group | | | 10,477 | | | | 85 | |
Civitas Social Housing‡ | | | 10,035 | | | | 15 | |
Clinigen Group | | | 5,927 | | | | 82 | |
Close Brothers Group | | | 13,844 | | | | 272 | |
CMC Markets (A) | | | 5,271 | | | | 11 | |
Cobham* | | | 1,548,420 | | | | 2,640 | |
Compass Group | | | 377,758 | | | | 8,161 | |
ConvaTec Group (A) | | | 265,772 | | | | 737 | |
Conviviality | | | 8,687 | | | | 47 | |
Costain Group | | | 5,842 | | | | 37 | |
Countryside Properties (A) | | | 18,292 | | | | 87 | |
Countrywide* | | | 7,213 | | | | 12 | |
Crest Nicholson Holdings | | | 13,231 | | | | 97 | |
CRH | | | 3,314 | | | | 119 | |
Croda International | | | 2,254 | | | | 135 | |
CVS Group | | | 3,170 | | | | 45 | |
CYBG | | | 43,723 | | | | 201 | |
Daily Mail & General Trust, Cl A | | | 49,602 | | | | 399 | |
Dairy Crest Group | | | 7,519 | | | | 58 | |
Dart Group | | | 4,407 | | | | 40 | |
| | | | | | | | |
| Description | | Shares | | | Value
(000) | |
DCC | | | 10,289 | | | $ | 1,037 | |
De La Rue | | | 5,418 | | | | 47 | |
Debenhams | | | 62,228 | | | | 29 | |
Dechra Pharmaceuticals | | | 4,748 | | | | 134 | |
Derwent London‡ | | | 5,343 | | | | 225 | |
Devro | | | 60,282 | | | | 186 | |
DFS Furniture | | | 9,602 | | | | 25 | |
Diageo | | | 357,173 | | | | 13,141 | |
Dialight* | | | 996 | | | | 7 | |
Dialog Semiconductor* | | | 3,938 | | | | 123 | |
Dignity | | | 2,731 | | | | 67 | |
Diploma | | | 6,481 | | | | 109 | |
Direct Line Insurance Group | | | 23,644 | | | | 122 | |
Dixons Carphone | | | 48,694 | | | | 131 | |
Domino’s Pizza Group | | | 24,888 | | | | 116 | |
Drax Group | | | 20,466 | | | | 75 | |
DS Smith | | | 52,543 | | | | 367 | |
Dunelm Group | | | 5,192 | | | | 49 | |
easyJet | | | 24,055 | | | | 476 | |
EI Group* | | | 25,883 | | | | 49 | |
Electrocomponents | | | 22,984 | | | | 194 | |
Elementis | | | 23,287 | | | | 91 | |
Elis* | | | 11,038 | | | | 301 | |
EMIS Group | | | 3,112 | | | | 42 | |
Empiric Student Property‡ | | | 25,834 | | | | 32 | |
EnQuest* | | | 64,935 | | | | 25 | |
Equiniti Group (A) | | | 18,712 | | | | 72 | |
Essentra | | | 13,483 | | | | 96 | |
esure Group | | | 16,869 | | | | 57 | |
Evraz | | | 17,783 | | | | 82 | |
Experian | | | 168,486 | | | | 3,721 | |
Faroe Petroleum* | | | 12,437 | | | | 18 | |
Fenner | | | 9,648 | | | | 52 | |
Ferrexpo | | | 15,336 | | | | 61 | |
Fevertree Drinks | | | 4,663 | | | | 143 | |
Firstgroup* | | | 64,607 | | | | 96 | |
Forterra (A) | | | 9,207 | | | | 37 | |
Fresnillo | | | 3,858 | | | | 74 | |
G4S | | | 267,135 | | | | 963 | |
Galliford Try | | | 4,042 | | | | 70 | |
GB Group | | | 6,324 | | | | 37 | |
Genus | | | 3,115 | | | | 106 | |
GKN | | | 29,494 | | | | 127 | |
GlaxoSmithKline | | | 84,278 | | | | 1,505 | |
Glencore | | | 398,214 | | | | 2,097 | |
Global Ports Investments GDR* | | | 133,647 | | | | 508 | |
Globaltrans Investment GDR | | | 40,160 | | | | 377 | |
The accompanying notes are an integral part of the financial statements.
88
| | |
| THE KP FUNDS | | December 31, 2017 |
| | |
| KP International Equity Fund | | |
| | | | | | | | |
| Description | | Shares | | | Value
(000) | |
Go-Ahead Group | | | 2,167 | | | $ | 44 | |
Gocompare.Com Group | | | 12,466 | | | | 18 | |
Grafton Group | | | 11,482 | | | | 124 | |
Grainger | | | 21,591 | | | | 84 | |
Great Portland Estates‡ | | | 15,439 | | | | 144 | |
Greencore Group | | | 35,982 | | | | 112 | |
Greene King | | | 16,492 | | | | 124 | |
Greggs | | | 5,053 | | | | 95 | |
GVC Holdings* | | | 53,053 | | | | 663 | |
Halfords Group | | | 10,640 | | | | 50 | |
Halma | | | 19,813 | | | | 337 | |
Hammerson‡ | | | 13,588 | | | | 100 | |
Hansteen Holdings‡ | | | 17,517 | | | | 34 | |
Hargreaves Lansdown | | | 4,400 | | | | 107 | |
Hastings Group Holdings (A) | | | 13,244 | | | | 57 | |
Hays | | | 400,845 | | | | 990 | |
Helical | | | 4,205 | | | | 19 | |
Hikma Pharmaceuticals | | | 7,437 | | | | 114 | |
Hill & Smith Holdings | | | 3,688 | | | | 67 | |
Hiscox | | | 14,479 | | | | 286 | |
Hochschild Mining | | | 11,971 | | | | 43 | |
HomeServe | | | 110,610 | | | | 1,209 | |
Hon Hai Precision Industry GDR | | | 143,541 | | | | 908 | |
Hostelworld Group (A) | | | 4,521 | | | | 23 | |
Hotel Chocolat Group | | | 2,456 | | | | 12 | |
Howden Joinery Group | | | 32,681 | | | | 206 | |
HSBC Holdings | | | 344,025 | | | | 3,562 | |
Hunting* | | | 6,977 | | | | 57 | |
Hurricane Energy* | | | 77,676 | | | | 33 | |
Ibstock (A) | | | 19,158 | | | | 69 | |
IG Group Holdings | | | 70,865 | | | | 686 | |
IMI | | | 114,461 | | | | 2,060 | |
Imperial Brands | | | 16,463 | | | | 703 | |
Inchcape | | | 35,863 | | | | 379 | |
Indivior* | | | 35,915 | | | | 198 | |
Informa | | | 93,837 | | | | 915 | |
Inmarsat | | | 23,899 | | | | 158 | |
InterContinental Hotels Group | | | 3,131 | | | | 199 | |
Intermediate Capital Group | | | 14,710 | | | | 228 | |
International Personal Finance | | | 99,682 | | | | 266 | |
Intertek Group | | | 37,864 | | | | 2,653 | |
Intu Properties‡ | | | 44,832 | | | | 153 | |
Investec | | | 11,082 | | | | 80 | |
iomart Group | | | 3,109 | | | | 16 | |
IQE* | | | 40,510 | | | | 75 | |
ITE Group | | | 13,661 | | | | 34 | |
ITV | | | 424,090 | | | | 948 | |
| | | | | | | | |
| Description | | Shares | | | Value
(000) | |
IWG | | | 33,983 | | | $ | 118 | |
J D Wetherspoon | | | 4,480 | | | | 76 | |
J Sainsbury | | | 27,697 | | | | 90 | |
Jackpotjoy* | | | 2,897 | | | | 32 | |
JD Sports Fashion | | | 23,200 | | | | 105 | |
John Laing Group (A) | | | 19,757 | | | | 78 | |
John Menzies | | | 4,386 | | | | 40 | |
John Wood Group | | | 33,116 | | | | 292 | |
Johnson Matthey | | | 3,264 | | | | 136 | |
Jupiter Fund Management | | | 67,190 | | | | 570 | |
Just Eat* | | | 73,520 | | | | 775 | |
Just Group | | | 29,845 | | | | 69 | |
Kainos Group | | | 2,707 | | | | 12 | |
KAZ Minerals* | | | 12,346 | | | | 149 | |
KCOM Group | | | 25,392 | | | | 31 | |
Keller Group | | | 3,711 | | | | 49 | |
Kerry Group, Cl A | | | 2,678 | | | | 301 | |
Keywords Studios | | | 2,790 | | | | 60 | |
Kier Group | | | 5,030 | | | | 74 | |
Kingfisher | | | 37,134 | | | | 169 | |
Kingspan Group | | | 7,851 | | | | 343 | |
Ladbrokes | | | 72,794 | | | | 179 | |
Laird | | | 24,385 | | | | 45 | |
Lancashire Holdings | | | 10,620 | | | | 98 | |
Land Securities Group‡ | | | 12,890 | | | | 175 | |
Legal & General Group | | | 100,465 | | | | 371 | |
Lloyds Banking Group | | | 8,501,015 | | | | 7,811 | |
London Stock Exchange Group | | | 5,284 | | | | 271 | |
LondonMetric Property‡ | | | 32,975 | | | | 83 | |
Lonmin* | | | 12,070 | | | | 14 | |
Lookers | | | 16,438 | | | | 23 | |
Luceco (A) | | | 3,510 | | | | 5 | |
Lukoil PJSC ADR | | | 4,112 | | | | 235 | |
Majestic Wine | | | 2,479 | | | | 15 | |
Man Group | | | 81,556 | | | | 228 | |
Marks & Spencer Group | | | 27,922 | | | | 119 | |
Marshalls | | | 10,387 | | | | 64 | |
Marston’s | | | 34,963 | | | | 53 | |
McCarthy & Stone (A) | | | 63,332 | | | | 135 | |
Mediclinic International | | | 5,499 | | | | 48 | |
Meggitt | | | 13,083 | | | | 85 | |
Melrose Industries | | | 98,404 | | | | 283 | |
Merlin Entertainments (A) | | | 245,180 | | | | 1,201 | |
Metro Bank* | | | 3,886 | | | | 188 | |
Micro Focus International | | | 1,907 | | | | 65 | |
Micro Focus International ADR* | | | 5,456 | | | | 183 | |
Mitchells & Butlers | | | 10,783 | | | | 41 | |
The accompanying notes are an integral part of the financial statements.
89
| | |
| THE KP FUNDS | | December 31, 2017 |
| | |
| KP International Equity Fund | | |
| | | | | | | | |
| Description | | Shares | | | Value
(000) | |
Mitie Group | | | 18,791 | | | $ | 49 | |
Mondi | | | 6,392 | | | | 167 | |
Moneysupermarket.com Group | | | 90,377 | | | | 435 | |
Morgan Advanced Materials | | | 14,553 | | | | 66 | |
N Brown Group | | | 8,686 | | | | 32 | |
National Express Group | | | 44,675 | | | | 230 | |
National Grid | | | 80,436 | | | | 951 | |
NCC Group | | | 12,432 | | | | 39 | |
NewRiver‡ | | | 14,334 | | | | 65 | |
NEX Group | | | 97,460 | | | | 798 | |
Next | | | 2,561 | | | | 156 | |
NMC Health | | | 4,254 | | | | 166 | |
Non-Standard Finance (A) | | | 105,590 | | | | 102 | |
Northgate | | | 8,027 | | | | 41 | |
Nostrum Oil & Gas* | | | 3,702 | | | | 16 | |
Ocado Group* | | | 27,126 | | | | 145 | |
Old Mutual | | | 83,566 | | | | 261 | |
On the Beach Group (A) | | | 4,403 | | | | 28 | |
OneSavings Bank | | | 10,554 | | | | 59 | |
Ophir Energy* | | | 35,297 | | | | 32 | |
Oxford Instruments | | | 2,830 | | | | 33 | |
Paddy Power Betfair | | | 6,620 | | | | 789 | |
Pagegroup | | | 37,649 | | | | 238 | |
Pan African Resources | | | 86,747 | | | | 16 | |
Paragon Banking Group | | | 14,346 | | | | 95 | |
Pearson | | | 13,830 | | | | 137 | |
Pendragon | | | 64,794 | | | | 25 | |
Pennon Group | | | 20,250 | | | | 214 | |
Persimmon | | | 5,355 | | | | 198 | |
Petra Diamonds* | | | 25,399 | | | | 27 | |
Petrofac | | | 18,514 | | | | 127 | |
Pets at Home Group | | | 98,561 | | | | 235 | |
Phoenix Group Holdings | | | 18,656 | | | | 197 | |
Photo-Me International | | | 15,143 | | | | 38 | |
Playtech | | | 34,334 | | | | 399 | |
Plus500 | | | 4,138 | | | | 51 | |
Polypipe Group | | | 9,679 | | | | 51 | |
Premier Foods* | | | 25,884 | | | | 15 | |
Premier Oil* | | | 23,548 | | | | 24 | |
Primary Health Properties‡ | | | 29,439 | | | | 47 | |
Provident Financial | | | 33,543 | | | | 407 | |
Prudential | | | 113,865 | | | | 2,929 | |
Purplebricks Group* | | | 10,473 | | | | 59 | |
PZ Cussons | | | 16,517 | | | | 72 | |
QinetiQ Group | | | 28,318 | | | | 88 | |
Randgold Resources | | | 1,639 | | | | 164 | |
Rank Group | | | 9,405 | | | | 31 | |
| | | | | | | | |
| Description | | Shares | | | Value
(000) | |
Rathbone Brothers | | | 2,551 | | | $ | 88 | |
RDI‡ | | | 74,092 | | | | 37 | |
Reckitt Benckiser Group | | | 88,015 | | | | 8,222 | |
Redde | | | 16,074 | | | | 38 | |
Redrow | | | 12,446 | | | | 110 | |
RELX | | | 74,877 | | | | 1,758 | |
Renewi | | | 39,435 | | | | 55 | |
Renishaw | | | 1,926 | | | | 136 | |
Rentokil Initial | | | 94,574 | | | | 406 | |
Restaurant Group | | | 9,592 | | | | 39 | |
Restore | | | 6,121 | | | | 49 | |
Rightmove | | | 33,808 | | | | 2,054 | |
Rio Tinto | | | 88,934 | | | | 4,732 | |
Rolls-Royce Holdings | | | 245,683 | | | | 2,811 | |
Rotork | | | 70,461 | | | | 254 | |
Royal Bank of Scotland Group* | | | 60,500 | | | | 227 | |
Royal Dutch Shell, Cl A | | | 86,703 | | | | 2,903 | |
Royal Dutch Shell, Cl B | | | 314,213 | | | | 10,641 | |
Royal Mail | | | 15,518 | | | | 95 | |
RPC Group | | | 20,913 | | | | 249 | |
RPS Group | | | 11,843 | | | | 44 | |
RSA Insurance Group | | | 16,631 | | | | 142 | |
SafeCharge International Group | | | 2,887 | | | | 12 | |
Safestore Holdings‡ | | | 10,995 | | | | 74 | |
Saga | | | 59,448 | | | | 101 | |
Sage Group | | | 18,747 | | | | 202 | |
Samsung Electronics GDR | | | 4,860 | | | | 5,822 | |
Savills | | | 7,536 | | | | 101 | |
Scapa Group | | | 7,435 | | | | 44 | |
Schroder‡ | | | 14,710 | | | | 12 | |
Schroders | | | 2,126 | | | | 101 | |
Segro‡ | | | 16,822 | | | | 133 | |
Senior | | | 22,243 | | | | 78 | |
Serco Group* | | | 400,181 | | | | 534 | |
Severn Trent | | | 4,052 | | | | 118 | |
Shaftesbury‡ | | | 12,053 | | | | 170 | |
Shire | | | 15,585 | | | | 822 | |
SIG | | | 30,237 | | | | 72 | |
Sirius Minerals* | | | 198,656 | | | | 63 | |
Sky* | | | 36,326 | | | | 496 | |
Smart Metering Systems | | | 3,366 | | | | 40 | |
Smith & Nephew | | | 23,336 | | | | 406 | |
Smiths Group | | | 78,907 | | | | 1,587 | |
Soco International | | | 7,102 | | | | 11 | |
Softcat | | | 6,095 | | | | 43 | |
SolGold* | | | 30,651 | | | | 12 | |
Sophos Group (A) | | | 14,715 | | | | 113 | |
The accompanying notes are an integral part of the financial statements.
90
| | |
| THE KP FUNDS | | December 31, 2017 |
| | |
| KP International Equity Fund | | |
| | | | | | | | |
| Description | | Shares | | | Value
(000) | |
Sound Energy, Cl A* | | | 34,244 | | | $ | 24 | |
South32 | | | 5,924 | | | | 16 | |
Spectris | | | 23,245 | | | | 781 | |
Spirax-Sarco Engineering | | | 3,777 | | | | 287 | |
Spire Healthcare Group (A) | | | 15,002 | | | | 51 | |
Sports Direct International* | | | 11,796 | | | | 60 | |
SSE | | | 16,844 | | | | 300 | |
SSP Group | | | 149,892 | | | | 1,382 | |
St. James’s Place | | | 35,811 | | | | 593 | |
St. Modwen Properties | | | 10,025 | | | | 55 | |
Staffline Group | | | 768 | | | | 11 | |
Stagecoach Group | | | 125,004 | | | | 278 | |
Standard Chartered* | | | 140,790 | | | | 1,483 | |
Standard Life Aberdeen | | | 45,325 | | | | 267 | |
Standard Life Investment Property Income Trust‡ | | | 21,212 | | | | 27 | |
State Bank of India GDR | | | 53,780 | | | | 2,619 | |
Stobart Group | | | 16,271 | | | | 62 | |
Stock Spirits Group | | | 8,523 | | | | 31 | |
SuperGroup | | | 2,748 | | | | 73 | |
Synthomer | | | 13,541 | | | | 90 | |
TalkTalk Telecom Group | | | 26,648 | | | | 55 | |
Tate & Lyle | | | 24,743 | | | | 235 | |
Taylor Wimpey | | | 56,977 | | | | 159 | |
Ted Baker | | | 1,694 | | | | 62 | |
Telecom Plus | | | 3,257 | | | | 53 | |
Telford Homes | | | 4,691 | | | | 27 | |
Telit Communications | | | 5,676 | | | | 11 | |
Tesco | | | 2,072,381 | | | | 5,856 | |
Thomas Cook Group | | | 543,301 | | | | 902 | |
TP ICAP | | | 29,200 | | | | 210 | |
Travis Perkins | | | 267,094 | | | | 5,651 | |
Tritax Big Box‡ | | | 70,661 | | | | 142 | |
TUI | | | 47,214 | | | | 982 | |
Tullow Oil* | | | 70,259 | | | | 196 | |
UBM | | | 19,972 | | | | 201 | |
UDG Healthcare | | | 12,737 | | | | 145 | |
Ultra Electronics Holdings | | | 4,154 | | | | 76 | |
Unilever | | | 50,752 | | | | 2,827 | |
UNITE Group‡ | | | 11,718 | | | | 127 | |
United Utilities Group | | | 11,659 | | | | 131 | |
Vectura Group* | | | 30,948 | | | | 49 | |
Vedanta Resources | | | 4,030 | | | | 44 | |
Vesuvius | | | 11,153 | | | | 88 | |
Victoria* | | | 6,230 | | | | 70 | |
Victrex | | | 10,135 | | | | 360 | |
Virgin Money Holdings UK | | | 14,963 | | | | 57 | |
Vodafone Group | | | 569,187 | | | | 1,806 | |
Watkin Jones | | | 7,565 | | | | 22 | |
| | | | | | | | |
| Description | | Shares | | | Value
(000) | |
Weir Group | | | 126,581 | | | $ | 3,629 | |
WH Smith | | | 32,619 | | | | 1,033 | |
Whitbread | | | 3,190 | | | | 172 | |
William Hill | | | 43,186 | | | | 188 | |
WM Morrison Supermarkets | | | 38,173 | | | | 113 | |
Workspace Group‡ | | | 6,322 | | | | 86 | |
Worldpay Group (A) | | | 92,707 | | | | 534 | |
WPP | | | 346,794 | | | | 6,279 | |
ZPG (A) | | | 14,387 | | | | 64 | |
| | | | | | | | |
| | | | | | | 220,968 | |
| | | | | | | | |
United States — 1.0% | |
Consumer Discretionary — 0.0% | |
SodaStream International* | | | 948 | | | | 67 | |
| | | | | | | | |
Financials — 0.0% | |
Banco Bradesco ADR* | | | 65,900 | | | | 675 | |
| | | | | | | | |
Industrials — 0.5% | |
Caesarstone* | | | 1,222 | | | | 27 | |
Canadian National Railway | | | 64,379 | | | | 5,310 | |
Copa Holdings, Cl A | | | 13,300 | | | | 1,783 | |
Kornit Digital* | | | 1,466 | | | | 24 | |
| | | | | | | | |
| | | | | | | 7,144 | |
| | | | | | | | |
Information Technology — 0.4% | | | | | |
CyberArk Software* | | | 1,606 | | | | 66 | |
Genpact | | | 12,433 | | | | 394 | |
InterXion Holding* | | | 3,730 | | | | 220 | |
Ituran Location and Control | | | 923 | | | | 32 | |
NXP Semiconductors* | | | 5,859 | | | | 686 | |
Orbotech* | | | 2,343 | | | | 118 | |
Wix.com* | | | 1,702 | | | | 98 | |
Yandex, Cl A* | | | 107,991 | | | | 3,537 | |
| | | | | | | | |
| | | | | | | 5,151 | |
| | | | | | | | |
Materials — 0.1% | | | | | | | | |
Southern Copper | | | 34,644 | | | | 1,644 | |
| | | | | | | | |
| | | | | | | 14,681 | |
| | | | | | | | |
Total Common Stock (Cost $1,196,460) (000) | | | | | | | 1,413,165 | |
| | | | | | | | |
PREFERRED STOCK (D) — 0.7% | |
Alpargatas | | | 264,198 | | | | 1,390 | |
Banco Bradesco | | | 44,847 | | | | 458 | |
Banco do Estado do Rio Grande do Sul | | | 88,900 | | | | 399 | |
Bayerische Motoren Werke | | | 924 | | | | 83 | |
Biotest | | | 1,045 | | | | 25 | |
Draegerwerk & KGaA | | | 522 | | | | 45 | |
FUCHS PETROLUB | | | 1,216 | | | | 65 | |
Henkel & KGaA | | | 3,002 | | | | 397 | |
The accompanying notes are an integral part of the financial statements.
91
| | |
| THE KP FUNDS | | December 31, 2017 |
| | |
| KP International Equity Fund | | |
| | | | | | | | |
| Description | | Shares | | | Value
(000) | |
Itau Unibanco Holding | | | 157,700 | | | $ | 2,024 | |
Itausa - Investimentos Itau | | | 180,297 | | | | 588 | |
Petroleo Brasileiro | | | 576,400 | | | | 2,797 | |
Porsche Automobil Holding | | | 2,596 | | | | 217 | |
Randon Implementos e Participacoes | | | 22,000 | | | | 48 | |
Sartorius | | | 1,797 | | | | 172 | |
Schaeffler | | | 2,461 | | | | 44 | |
Sixt | | | 857 | | | | 54 | |
Volkswagen | | | 8,170 | | | | 1,632 | |
| | | | | | | | |
Total Preferred Stock (Cost $9,083) (000) | | | | | | | 10,438 | |
| | | | | | | | |
EXCHANGE TRADED FUND — 0.0% | |
P2P Global Investments* | | | 4,390 | | | | 48 | |
| | | | | | | | |
Total Exchange Traded Fund (Cost $43) (000) | | | | | | | 48 | |
| | | | | | | | |
| | |
| | | Number of
Rights | | | | |
RIGHTS — 0.0% | | | | | | | | |
Cleanaway Waste Management, Expires 1/24/2018* | | | 22,894 | | | | 3 | |
Faes Farma †* | | | 14,354 | | | | 2 | |
Repsol†* | | | 20,600 | | | | 9 | |
Transurban Group, Expires 1/22/2018* | | | 2,710 | | | | 2 | |
| | | | | | | | |
Total Rights (Cost $—) (000) | | | | | | | 16 | |
| | | | | | | | |
SHORT-TERM INVESTMENT — 2.4% | |
| | |
| | | Shares | | | | |
State Street Institutional Treasury Money Market Fund, Cl Institutional, 1.160% (E) | | | 34,972,024 | | | | 34,972 | |
| | | | | | | | |
Total Short-Term Investment (Cost $34,972) (000) | | | | | | | 34,972 | |
| | | | | | | | |
Total Investments In Securities — 99.2% (Cost $1,240,558) (000) | | | | | | $ | 1,458,639 | |
| | | | | | | | |
Percentages are based on net assets of $1,469,968 (000).
A list of the open futures contracts held by the Fund at December 31, 2017, is as follows (000):
| | | | | | | | | | | | | | | | | | | | |
| Type of Contract | | Number of
Contracts
Long | | | Expiration
Date | | | Notional
Amount | | | Value | | | Unrealized
Appreciation | |
| MSCI EAFE Index E-MINI | | | 214 | | | | Mar-2018 | | | $ | 21,537 | | | $ | 21,887 | | | $ | 350 | |
| S&P TSX 60 Index | | | 14 | | | | Mar-2018 | | | | 2,078 | | | | 2,132 | | | | 7 | |
| | | | | | | | | | | | | | | | | | | | |
| | | | | | | | | | $ | 23,615 | | | $ | 24,019 | | | $ | 357 | |
| | | | | | | | | | | | | | | | | | | | |
| * | Non-income producing security. |
| ‡ | Real Estate Investment Trust |
| † | Currently, expiration date is unavailable. |
| (A) | Security sold within terms of a private placement memorandum, exempt from registration under Section 144A of the Securities Act of 1933, as amended, and may be sold only to dealers in that program or other “accredited investors.” The total value of these securities at December 31, 2017 was $10,316 (000) and represented 0.7% of Net Assets. |
| (B) | Security is fair valued using methods determined in good faith by the Fair Value Committee of the Board of Trustees. The total value of such securities as of December 31, 2017, was $45,135 (000) and represented 3.1% of Net Assets. |
| (C) | Level 3 security in accordance with fair value hierarchy. |
| (D) | Currently, no stated interest rate. |
| (E) | The rate reported is the 7-day effective yield as of December 31, 2017. |
ADR — American Depositary Receipt
Cl — Class
EAFE — Europe, Australasia and Far East
GDR — Global Depositary Receipt
MSCI — Morgan Stanley Capital International
NVDR — Non-Voting Depositary Receipt
PJSC — Public Joint Stock Company
REIT — Real Estate Investment Trust
S&P — Standard & Poor’s
TSX — Toronto Stock Exchange
The following is a list of the level of inputs used as of December 31, 2017, there in valuing the Fund’s investments and other financial instruments carried at value (000):
| | | | | | | | | | | | | | | | |
| Investments In Securities | | Level 1 | | | Level 2 | | | Level 3^ | | | Total | |
Common Stock | | | | | | | | | | | | | | | | |
Australia | | $ | 44,145 | | | $ | — | | | $ | — | | | $ | 44,145 | |
Austria | | | 2,914 | | | | — | | | | — | | | | 2,914 | |
Belgium | | | 9,215 | | | | — | | | | — | | | | 9,215 | |
Brazil | | | 25,534 | | | | — | | | | — | | | | 25,534 | |
Canada | | | 66,257 | | | | — | | | | — | | | | 66,257 | |
Chile | | | 4,346 | | | | — | | | | — | | | | 4,346 | |
China | | | 31,534 | | | | 1 | | | | — | | | | 31,535 | |
Colombia | | | 901 | | | | — | | | | — | | | | 901 | |
Czech Republic | | | 470 | | | | — | | | | — | | | | 470 | |
Denmark | | | 21,241 | | | | — | | | | — | | | | 21,241 | |
Egypt | | | — | | | | 99 | | | | — | | | | 99 | |
Finland | | | 11,892 | | | | — | | | | — | | | | 11,892 | |
France | | | 93,712 | | | | — | | | | — | | | | 93,712 | |
Germany | | | 82,009 | | | | — | | | | — | | | | 82,009 | |
Greece | | | 3,716 | | | | — | | | | — | | | | 3,716 | |
Hong Kong | | | 83,552 | | | | — | | | | — | | | | 83,552 | |
Hungary | | | 1,749 | | | | — | | | | — | | | | 1,749 | |
India | | | 38,246 | | | | — | | | | — | | | | 38,246 | |
Indonesia | | | 8,825 | | | | — | | | | — | | | | 8,825 | |
Ireland | | | 8,528 | | | | — | | | | — | | | | 8,528 | |
Israel | | | 3,532 | | | | 2,073 | | | | — | | | | 5,605 | |
Italy | | | 24,778 | | | | — | | | | — | | | | 24,778 | |
Japan | | | 214,058 | | | | — | | | | — | | | | 214,058 | |
Kenya | | | 269 | | | | — | | | | — | | | | 269 | |
Luxembourg | | | 1,640 | | | | — | | | | — | | | | 1,640 | |
Malaysia | | | 4,945 | | | | — | | | | — | | | | 4,945 | |
Mexico | | | 4,463 | | | | — | | | | — | | | | 4,463 | |
Netherlands | | | 47,860 | | | | — | | | | — | | | | 47,860 | |
New Zealand | | | 2,223 | | | | — | | | | — | | | | 2,223 | |
Norway | | | 11,759 | | | | — | | | | — | | | | 11,759 | |
Panama | | | 31 | | | | — | | | | — | | | | 31 | |
Peru | | | 2,252 | | | | — | | | | — | | | | 2,252 | |
The accompanying notes are an integral part of the financial statements.
92
| | |
| THE KP FUNDS | | December 31, 2017 |
| | |
| KP International Equity Fund | | |
| | | | | | | | | | | | | | | | |
| Investments In Securities | | Level 1 | | | Level 2 | | | Level 3^ | | | Total | |
Philippines | | $ | 1,146 | | | $ | — | | | $ | — | | | $ | 1,146 | |
Poland | | | 5,185 | | | | — | | | | — | | | | 5,185 | |
Portugal | | | 891 | | | | — | | | | — | | | | 891 | |
Qatar | | | 144 | | | | 3,445 | | | | — | | | | 3,589 | |
Russia | | | 4,704 | | | | — | | | | — | | | | 4,704 | |
Singapore | | | 30,917 | | | | 15 | | | | — | | | | 30,932 | |
South Africa | | | 30,398 | | | | — | | | | — | | | | 30,398 | |
South Korea | | | 8,464 | | | | 37,818 | | | | — | | | | 46,282 | |
Spain | | | 25,075 | | | | — | | | | — | | | | 25,075 | |
Sweden | | | 20,662 | | | | — | | | | — | | | | 20,662 | |
Switzerland | | | 98,002 | | | | — | | | | — | | | | 98,002 | |
Taiwan | | | 27,163 | | | | — | | | | — | | | | 27,163 | |
Thailand | | | 13,601 | | | | — | | | | — | | | | 13,601 | |
Turkey | | | 9,414 | | | | — | | | | — | | | | 9,414 | |
United Arab Emirates | | | — | | | | 1,703 | | | | — | | | | 1,703 | |
United Kingdom | | | 220,968 | | | | — | | | | — | | | | 220,968 | |
United States | | | 14,681 | | | | — | | | | — | | | | 14,681 | |
| | | | | | | | | | | | | | | | |
Total Common Stock | | | 1,368,011 | | | | 45,154 | | | | — | | | | 1,413,165 | |
| | | | | | | | | | | | | | | | |
Preferred Stock | | | 10,438 | | | | — | | | | — | | | | 10,438 | |
Exchange Traded Fund | | | 48 | | | | — | | | | — | | | | 48 | |
Rights | | | 11 | | | | 5 | | | | — | | | | 16 | |
Short-Term Investment | | | 34,972 | | | | — | | | | — | | | | 34,972 | |
| | | | | | | | | | | | | | | | |
Total Investments in Securities | | $ | 1,413,480 | | | $ | 45,159 | | | $ | — | | | $ | 1,458,639 | |
| | | | | | | | | | | | | | | | |
| | | | |
| Other Financial Instruments | | Level 1 | | | Level 2 | | | Level 3 | | | Total | |
Futures Contracts** | | | | | | | | | | | | | | | | |
Unrealized Appreciation | | $ | 357 | | | $ | — | | | $ | — | | | $ | 357 | |
| | | | | | | | | | | | | | | | |
Total Other Financial Instruments | | $ | 357 | | | $ | — | | | $ | — | | | $ | 357 | |
| | | | | | | | | | | | | | | | |
| ** | Futures contracts are valued at the unrealized appreciation on the instrument. |
| ^ | A reconciliation of Level 3 investments and disclosures of significant unobservable inputs are presented when the Fund has a significant amount of Level 3 investments in at the beginning and/or end of the year in relation to net assets. Management has concluded that Level 3 investments are not material in relation to net assets. |
For the year ended December 31, 2017, there were transfers between Level 1 and Level 2 assets and liabilities. Changes in the classifications between Levels 1 and 2 occur when foreign equity securities are fair valued using other observable market based inputs in place of the closing exchange price due to events occurring after the close of the exchange or market on which the investment is principally traded. Transfers, if any, between levels are considered to have occurred as of the end of the year.
For the year ended December 31, 2017, securities with a total value of $2,785 (000) transferred from Level 2 to Level 1 as a result of fair valuation of foreign equity securities. For the year ended December 31, 2017, securities with a total value of $106 (000) transferred from Level 1 to Level 2. For the year ended December 31, 2017 there were no transfers in and out of Level 3.
Amounts designated as “—” are $0 or have been rounded to $0.
The accompanying notes are an integral part of the financial statements.
93
| | |
| THE KP FUNDS | | December 31, 2017 |
|
| SECTOR WEIGHTINGS† (unaudited) |
| † | Percentages based on total investments. |
| | | | | | | | |
| Description | | Face Amount
(000) | | | Value
(000) | |
| | | | | | | | |
CORPORATE OBLIGATIONS — 25.2% | |
Consumer Discretionary — 2.1% | | | | | | | | |
21st Century Fox America | |
6.400%, 12/15/35 | | $ | 973 | | | $ | 1,293 | |
6.150%, 02/15/41 | | | 500 | | | | 664 | |
4.500%, 02/15/21 | | | 100 | | | | 105 | |
3.700%, 10/15/25 | | | 20 | | | | 21 | |
Amazon.com | | | | | | | | |
4.800%, 12/05/34 | | | 300 | | | | 352 | |
3.875%, 08/22/37 (A) | | | 100 | | | | 106 | |
American Honda Finance | | | | | | | | |
2.600%, 11/16/22 | | | 50 | | | | 50 | |
2.450%, 09/24/20 | | | 100 | | | | 100 | |
1.950%, 07/20/20 | | | 45 | | | | 45 | |
1.700%, 02/22/19 | | | 25 | | | | 25 | |
Aptiv | | | | | | | | |
3.150%, 11/19/20 | | | 100 | | | | 102 | |
Arcos Dorados Holdings | | | | | | | | |
5.875%, 04/04/27 (A) | | | 330 | | | | 349 | |
AutoNation | | | | | | | | |
3.800%, 11/15/27 | | | 25 | | | | 25 | |
AutoZone | | | | | | | | |
3.750%, 06/01/27 | | | 100 | | | | 101 | |
Bed Bath & Beyond | | | | | | | | |
3.749%, 08/01/24 | | | 25 | | | | 25 | |
Block Financial | | | | | | | | |
4.125%, 10/01/20 | | | 200 | | | | 206 | |
CBS | | | | | | | | |
3.375%, 03/01/22 | | | 150 | | | | 152 | |
3.375%, 02/15/28 | | | 1,235 | | | | 1,190 | |
2.900%, 06/01/23 (A) | | | 100 | | | | 98 | |
Charter Communications Operating | | | | | | | | |
6.484%, 10/23/45 | | | 150 | | | | 175 | |
6.384%, 10/23/35 | | | 247 | | | | 288 | |
| | | | | | | | |
| Description | | Face Amount
(000)(1) | | | Value (000) | |
| | | | | | | | |
5.375%, 05/01/47 | | | 536 | | | $ | 550 | |
3.579%, 07/23/20 | | | 200 | | | | 204 | |
Cleveland Clinic Foundation | | | | | | | | |
4.858%, 01/01/14 | | | 648 | | | | 729 | |
Comcast | | | | | | | | |
4.400%, 08/15/35 | | | 100 | | | | 109 | |
4.250%, 01/15/33 | | | 500 | | | | 545 | |
4.049%, 11/01/52 | | | 427 | | | | 437 | |
4.000%, 08/15/47 | | | 200 | | | | 209 | |
3.375%, 02/15/25 | | | 125 | | | | 128 | |
3.150%, 03/01/26 | | | 50 | | | | 50 | |
3.150%, 02/15/28 | | | 1,668 | | | | 1,673 | |
2.750%, 03/01/23 | | | 100 | | | | 101 | |
Delphi | | | | | | | | |
4.150%, 03/15/24 | | | 40 | | | | 42 | |
Diageo Investment | | | | | | | | |
2.875%, 05/11/22 | | | 100 | | | | 101 | |
Discovery Communications | | | | | | | | |
5.000%, 09/20/37 | | | 150 | | | | 155 | |
3.800%, 03/13/24 | | | 50 | | | | 51 | |
2.950%, 03/20/23 | | | 50 | | | | 50 | |
Dollar General | | | | | | | | |
4.150%, 11/01/25 | | | 25 | | | | 26 | |
DR Horton | | | | | | | | |
4.000%, 02/15/20 | | | 35 | | | | 36 | |
3.750%, 03/01/19 | | | 25 | | | | 25 | |
Expedia | | | | | | | | |
4.500%, 08/15/24 | | | 100 | | | | 105 | |
Ford Motor | | | | | | | | |
7.450%, 07/16/31 | | | 779 | | | | 1,018 | |
5.291%, 12/08/46 | | | 150 | | | | 163 | |
4.346%, 12/08/26 | | | 45 | | | | 47 | |
Ford Motor Credit | | | | | | | | |
5.875%, 08/02/21 | | | 200 | | | | 220 | |
3.339%, 03/28/22 | | | 200 | | | | 202 | |
2.425%, 06/12/20 | | | 200 | | | | 199 | |
2.343%, 11/02/20 | | | 5,458 | | | | 5,406 | |
General Motors | | | | | | | | |
6.750%, 04/01/46 | | | 250 | | | | 315 | |
5.150%, 04/01/38 | | | 1,585 | | | | 1,690 | |
General Motors Financial | | | | | | | | |
4.300%, 07/13/25 | | | 100 | | | | 104 | |
4.000%, 01/15/25 | | | 100 | | | | 103 | |
4.000%, 10/06/26 | | | 50 | | | | 51 | |
3.700%, 05/09/23 | | | 100 | | | | 102 | |
3.100%, 01/15/19 | | | 100 | | | | 100 | |
2.450%, 11/06/20 | | | 812 | | | | 806 | |
2.350%, 10/04/19 | | | 50 | | | | 50 | |
Grupo Televisa | | | | | | | | |
7.250%, 05/14/43 (MXN) | | | 2,840 | | | | 109 | |
5.000%, 05/13/45 | | | 200 | | | | 205 | |
Hasbro | | | | | | | | |
3.500%, 09/15/27 | | | 30 | | | | 29 | |
Home Depot | | | | | | | | |
4.400%, 04/01/21 | | | 100 | | | | 106 | |
4.250%, 04/01/46 | | | 100 | | | | 112 | |
The accompanying notes are an integral part of the financial statements.
94
| | |
| THE KP FUNDS | | December 31, 2017 |
| | | | | | | | |
| Description | | Face Amount
(000) | | | Value (000) | |
| | | | | | | | |
2.800%, 09/14/27 | | $ | 50 | | | $ | 49 | |
2.625%, 06/01/22 | | | 100 | | | | 101 | |
2.000%, 06/15/19 | | | 100 | | | | 100 | |
2.000%, 04/01/21 | | | 100 | | | | 99 | |
1.800%, 06/05/20 | | | 71 | | | | 70 | |
Lear | | | | | | | | |
5.250%, 01/15/25 | | | 45 | | | | 48 | |
Lowe's | | | | | | | | |
4.625%, 04/15/20 | | | 100 | | | | 104 | |
4.050%, 05/03/47 | | | 793 | | | | 844 | |
3.100%, 05/03/27 | | | 100 | | | | 101 | |
2.500%, 04/15/26 | | | 50 | | | | 48 | |
1.150%, 04/15/19 | | | 20 | | | | 20 | |
Macy's Retail Holdings | | | | | | | | |
3.625%, 06/01/24 | | | 100 | | | | 96 | |
Magna International | | | | | | | | |
3.625%, 06/15/24 | | | 50 | | | | 52 | |
Marriott International | | | | | | | | |
3.125%, 10/15/21 | | | 100 | | | | 101 | |
McDonald's | | | | | | | | |
4.450%, 03/01/47 | | | 150 | | | | 163 | |
3.500%, 03/01/27 | | | 100 | | | | 103 | |
3.375%, 05/26/25 | | | 100 | | | | 103 | |
2.750%, 12/09/20 | | | 20 | | | | 20 | |
NBCUniversal Media | | | | | | | | |
4.375%, 04/01/21 | | | 100 | | | | 106 | |
Newell Brands | | | | | | | | |
5.500%, 04/01/46 | | | 100 | | | | 119 | |
4.000%, 12/01/24 | | | 50 | | | | 52 | |
3.150%, 04/01/21 | | | 150 | | | | 152 | |
NIKE | | | | | | | | |
2.375%, 11/01/26 | | | 200 | | | | 191 | |
Nordstrom | | | | | | | | |
5.000%, 01/15/44 | | | 100 | | | | 96 | |
4.000%, 03/15/27 | | | 30 | | | | 30 | |
Omnicom Group | | | | | | | | |
3.600%, 04/15/26 | | | 100 | | | | 101 | |
O'Reilly Automotive | | | | | | | | |
3.550%, 03/15/26 | | | 50 | | | | 51 | |
Priceline Group | | | | | | | | |
2.750%, 03/15/23 | | | 50 | | | | 50 | |
QVC | | | | | | | | |
4.450%, 02/15/25 | | | 65 | | | | 66 | |
Scripps Networks Interactive | | | | | | | | |
2.750%, 11/15/19 | | | 100 | | | | 100 | |
Starbucks | | | | | | | | |
2.450%, 06/15/26 | | | 200 | | | | 193 | |
Target | | | | | | | | |
4.000%, 07/01/42 | | | 200 | | | | 207 | |
Time Warner | | | | | | | | |
4.875%, 03/15/20 | | | 100 | | | | 105 | |
4.750%, 03/29/21 | | | 100 | | | | 107 | |
3.600%, 07/15/25 | | | 100 | | | | 100 | |
2.100%, 06/01/19 | | | 100 | | | | 100 | |
| | | | | | | | |
| Description | | Face Amount
(000) | | | Value
(000) | |
| | | | | | | | |
Time Warner Cable | | | | | | | | |
8.250%, 04/01/19 | | $ | 200 | | | $ | 214 | |
7.300%, 07/01/38 | | | 216 | | | | 271 | |
5.875%, 11/15/40 | | | 500 | | | | 542 | |
4.000%, 09/01/21 | | | 100 | | | | 103 | |
TJX | | | | | | | | |
2.750%, 06/15/21 | | | 100 | | | | 101 | |
Toyota Motor Credit | | | | | | | | |
4.250%, 01/11/21 | | | 100 | | | | 105 | |
2.750%, 05/17/21 | | | 100 | | | | 101 | |
2.250%, 10/18/23 | | | 50 | | | | 49 | |
2.100%, 01/17/19 | | | 150 | | | | 150 | |
1.550%, 10/18/19 | | | 2,986 | | | | 2,960 | |
USJ Acucar e Alcool | | | | | | | | |
9.875%, 11/09/21 (A) | | | 305 | | | | 261 | |
Viacom | | | | | | | | |
6.875%, 04/30/36 | | | 100 | | | | 114 | |
4.375%, 03/15/43 | | | 216 | | | | 187 | |
3.450%, 10/04/26 | | | 150 | | | | 143 | |
Walt Disney | | | | | | | | |
3.150%, 09/17/25 | | | 100 | | | | 102 | |
1.850%, 05/30/19 | | | 150 | | | | 150 | |
Wesleyan University | | | | | | | | |
4.781%, 07/01/16 | | | 726 | | | | 771 | |
Whirlpool | | | | | | | | |
4.000%, 03/01/24 | | | 60 | | | | 63 | |
Wyndham Worldwide | | | | | | | | |
4.250%, 03/01/22 | | | 50 | | | | 51 | |
| | | | | | | | |
| | | | | | | 32,521 | |
| | | | | | | | |
Consumer Staples — 1.5% | | | | | | | | |
Adecoagro | | | | | | | | |
6.000%, 09/21/27 (A) | | | 550 | | | | 545 | |
Altria Group | | | | | | | | |
9.250%, 08/06/19 | | | 200 | | | | 222 | |
5.375%, 01/31/44 | | | 100 | | | | 121 | |
Anheuser-Busch InBev Finance | | | | | | | | |
4.900%, 02/01/46 | | | 1,935 | | | | 2,243 | |
3.650%, 02/01/26 | | | 350 | | | | 361 | |
2.650%, 02/01/21 | | | 215 | | | | 216 | |
Anheuser-Busch InBev Worldwide | | | | | | | | |
7.750%, 01/15/19 | | | 100 | | | | 106 | |
5.375%, 01/15/20 | | | 100 | | | | 106 | |
4.950%, 01/15/42 | | | 500 | | | | 579 | |
4.439%, 10/06/48 | | | 100 | | | | 109 | |
2.500%, 07/15/22 | | | 100 | | | | 99 | |
Archer-Daniels-Midland | | | | | | | | |
3.750%, 09/15/47 | | | 100 | | | | 102 | |
BAT Capital | | | | | | | | |
4.540%, 08/15/47 (A) | | | 483 | | | | 508 | |
4.390%, 08/15/37 (A) | | | 1,400 | | | | 1,470 | |
3.557%, 08/15/27 (A) | | | 100 | | | | 100 | |
3.222%, 08/15/24 (A) | | | 50 | | | | 50 | |
2.764%, 08/15/22 (A) | | | 50 | | | | 50 | |
2.297%, 08/14/20 (A) | | | 50 | | | | 50 | |
The accompanying notes are an integral part of the financial statements.
95
| | |
| THE KP FUNDS | | December 31, 2017 |
| | | | | | | | |
| Description | | Face Amount
(000) | | | Value
(000) | |
| | | | | | | | |
Bunge Finance | | | | | | | | |
3.250%, 08/15/26 | | $ | 120 | | | $ | 114 | |
3.000%, 09/25/22 | | | 30 | | | | 30 | |
Central American Bottling | | | | | | | | |
5.750%, 01/31/27 (A) | | | 195 | | | | 205 | |
Church & Dwight | | | | | | | | |
2.450%, 08/01/22 | | | 100 | | | | 99 | |
CK Hutchison International 17 | | | | | | | | |
2.250%, 09/29/20 (A) | | | 957 | | | | 948 | |
Clorox | | | | | | | | |
3.500%, 12/15/24 | | | 50 | | | | 52 | |
Coca-Cola | | | | | | | | |
3.300%, 09/01/21 | | | 100 | | | | 103 | |
2.875%, 10/27/25 | | | 50 | | | | 50 | |
2.550%, 06/01/26 | | | 50 | | | | 49 | |
2.450%, 11/01/20 | | | 50 | | | | 50 | |
1.875%, 10/27/20 | | | 50 | | | | 50 | |
Colgate-Palmolive | | | | | | | | |
1.750%, 03/15/19 | | | 100 | | | | 100 | |
Constellation Brands | | | | | | | | |
6.000%, 05/01/22 | | | 20 | | | | 22 | |
4.250%, 05/01/23 | | | 50 | | | | 53 | |
3.875%, 11/15/19 | | | 10 | | | | 10 | |
3.750%, 05/01/21 | | | 15 | | | | 16 | |
2.650%, 11/07/22 | | | 2,701 | | | | 2,672 | |
Costco Wholesale | | | | | | | | |
1.700%, 12/15/19 | | | 100 | | | | 99 | |
CVS Health | | | | | | | | |
5.125%, 07/20/45 | | | 200 | | | | 229 | |
3.875%, 07/20/25 | | | 120 | | | | 124 | |
2.875%, 06/01/26 | | | 50 | | | | 48 | |
2.125%, 06/01/21 | | | 50 | | | | 49 | |
CVS Pass-Through Trust | | | | | | | | |
4.163%, 08/11/36 (A) | | | 588 | | | | 593 | |
General Mills | | | | | | | | |
5.650%, 02/15/19 | | | 100 | | | | 104 | |
Hershey | | | | | | | | |
2.300%, 08/15/26 | | | 50 | | | | 47 | |
Ingredion | | | | | | | | |
3.200%, 10/01/26 | | | 50 | | | | 49 | |
JM Smucker | | | | | | | | |
2.500%, 03/15/20 | | | 100 | | | | 100 | |
Kellogg | | | | | | | | |
4.000%, 12/15/20 | | | 100 | | | | 105 | |
3.400%, 11/15/27 | | | 25 | | | | 25 | |
Kimberly-Clark | | | | | | | | |
2.750%, 02/15/26 | | | 100 | | | | 99 | |
Kraft Heinz Foods | | | | | | | | |
5.000%, 06/04/42 | | | 150 | | | | 161 | |
3.950%, 07/15/25 | | | 150 | | | | 155 | |
3.500%, 07/15/22 | | | 200 | | | | 204 | |
2.000%, 07/02/18 | | | 735 | | | | 735 | |
Kroger | | | | | | | | |
3.300%, 01/15/21 | | | 100 | | | | 102 | |
2.650%, 10/15/26 | | | 200 | | | | 186 | |
| | | | | | | | |
| Description | | Face Amount
(000) | | | Value
(000) | |
| | | | | | | | |
McCormick | | | | | | | | |
3.150%, 08/15/24 | | $ | 100 | | | $ | 101 | |
Mead Johnson Nutrition | | | | | | | | |
3.000%, 11/15/20 | | | 30 | | | | 30 | |
MHP | | | | | | | | |
7.750%, 05/10/24 (A) | | | 270 | | | | 292 | |
Molson Coors Brewing | | | | | | | | |
4.200%, 07/15/46 | | | 200 | | | | 204 | |
1.450%, 07/15/19 | | | 25 | | | | 25 | |
Mondelez International | | | | | | | | |
5.375%, 02/10/20 | | | 200 | | | | 211 | |
PepsiCo | | | | | | | | |
3.600%, 03/01/24 | | | 100 | | | | 105 | |
3.450%, 10/06/46 | | | 200 | | | | 194 | |
3.000%, 10/15/27 | | | 50 | | | | 50 | |
2.850%, 02/24/26 | | | 100 | | | | 99 | |
2.375%, 10/06/26 | | | 200 | | | | 190 | |
2.000%, 04/15/21 | | | 50 | | | | 50 | |
Philip Morris International | | | | | | | | |
4.500%, 03/26/20 | | | 100 | | | | 105 | |
3.375%, 08/11/25 | | | 100 | | | | 102 | |
2.500%, 11/02/22 | | | 100 | | | | 99 | |
1.875%, 02/25/21 | | | 200 | | | | 196 | |
Procter & Gamble | | | | | | | | |
3.500%, 10/25/47 | | | 802 | | | | 810 | |
2.450%, 11/03/26 | | | 50 | | | | 48 | |
2.150%, 08/11/22 | | | 100 | | | | 99 | |
1.900%, 11/01/19 | | | 100 | | | | 100 | |
Reynolds American | | | | | | | | |
8.125%, 06/23/19 | | | 100 | | | | 108 | |
4.450%, 06/12/25 | | | 150 | | | | 160 | |
2.300%, 06/12/18 | | | 3,807 | | | | 3,812 | |
Sysco | | | | | | | | |
2.600%, 10/01/20 | | | 50 | | | | 50 | |
2.500%, 07/15/21 | | | 35 | | | | 35 | |
1.900%, 04/01/19 | | | 30 | | | | 30 | |
Tyson Foods | | | | | | | | |
4.875%, 08/15/34 | | | 200 | | | | 225 | |
Unilever Capital | | | | | | | | |
4.250%, 02/10/21 | | | 150 | | | | 158 | |
2.200%, 05/05/22 | | | 100 | | | | 99 | |
Walgreens Boots Alliance | | | | | | | | |
3.450%, 06/01/26 | | | 165 | | | | 163 | |
2.700%, 11/18/19 | | | 100 | | | | 101 | |
Wal-Mart Stores | | | | | | | | |
4.250%, 04/15/21 | | | 125 | | | | 132 | |
3.625%, 12/15/47 | | | 250 | | | | 262 | |
3.300%, 04/22/24 | | | 100 | | | | 104 | |
2.650%, 12/15/24 | | | 50 | | | | 50 | |
1.900%, 12/15/20 | | | 300 | | | | 298 | |
| | | | | | | | |
| | | | | | | 23,771 | |
| | | | | | | | |
Energy — 3.5% | | | | | | | | |
Abu Dhabi Crude Oil Pipeline | | | | | | | | |
4.600%, 11/02/47 (A) | | | 1,501 | | | | 1,544 | |
The accompanying notes are an integral part of the financial statements.
96
| | |
| THE KP FUNDS | | December 31, 2017 |
| | | | | | | | |
| Description | | Face Amount
(000) | | | Value
(000) | |
| | | | | | | | |
Anadarko Petroleum | | | | | | | | |
6.950%, 06/15/19 | | $ | 2,744 | | | $ | 2,914 | |
6.600%, 03/15/46 | | | 200 | | | | 257 | |
6.450%, 09/15/36 | | | 633 | | | | 775 | |
Andeavor | | | | | | | | |
4.500%, 04/01/48 | | | 519 | | | | 525 | |
3.800%, 04/01/28 | | | 670 | | | | 671 | |
Andeavor Logistics | | | | | | | | |
5.200%, 12/01/47 | | | 150 | | | | 156 | |
3.500%, 12/01/22 | | | 25 | | | | 25 | |
Apache | | | | | | | | |
3.250%, 04/15/22 | | | 100 | | | | 101 | |
Baker Hughes a GE | | | | | | | | |
4.080%, 12/15/47 (A) | | | 1,039 | | | | 1,057 | |
3.337%, 12/15/27 (A) | | | 100 | | | | 100 | |
2.773%, 12/15/22 (A) | | | 1,016 | | | | 1,014 | |
Boardwalk Pipelines | | | | | | | | |
4.950%, 12/15/24 | | | 50 | | | | 54 | |
BP Capital Markets | | | | | | | | |
3.561%, 11/01/21 | | | 200 | | | | 208 | |
2.500%, 11/06/22 | | | 250 | | | | 248 | |
2.237%, 05/10/19 | | | 100 | | | | 100 | |
2.112%, 09/16/21 | | | 100 | | | | 99 | |
1.676%, 05/03/19 | | | 20 | | | | 20 | |
Buckeye Partners | | | | | | | | |
3.950%, 12/01/26 | | | 200 | | | | 197 | |
Canadian Natural Resources | | | | | | | | |
6.450%, 06/30/33 | | | 186 | | | | 227 | |
5.900%, 02/01/18 | | | 495 | | | | 497 | |
4.950%, 06/01/47 | | | 459 | | | | 514 | |
3.850%, 06/01/27 | | | 100 | | | | 102 | |
2.950%, 01/15/23 | | | 1,256 | | | | 1,250 | |
Cenovus Energy | | | | | | | | |
5.700%, 10/15/19 | | | 25 | | | | 26 | |
5.250%, 06/15/37 | | | 200 | | | | 206 | |
4.450%, 09/15/42 | | | 40 | | | | 37 | |
3.000%, 08/15/22 | | | 20 | | | | 20 | |
Chevron | | | | | | | | |
2.954%, 05/16/26 | | | 50 | | | | 50 | |
2.566%, 05/16/23 | | | 50 | | | | 50 | |
2.355%, 12/05/22 | | | 150 | | | | 149 | |
2.193%, 11/15/19 | | | 90 | | | | 90 | |
2.100%, 05/16/21 | | | 50 | | | | 49 | |
1.961%, 03/03/20 | | | 50 | | | | 50 | |
1.561%, 05/16/19 | | | 50 | | | | 50 | |
Cimarex Energy | | | | | | | | |
3.900%, 05/15/27 | | | 100 | | | | 102 | |
CNOOC Finance 2015 USA | | | | | | | | |
3.500%, 05/05/25 | | | 200 | | | | 202 | |
Concho Resources | | | | | | | | |
4.375%, 01/15/25 | | | 50 | | | | 52 | |
ConocoPhillips | | | | | | | | |
6.500%, 02/01/39 | | | 300 | | | | 420 | |
4.200%, 03/15/21 | | | 40 | | | | 42 | |
Devon Energy | | | | | | | | |
3.250%, 05/15/22 | | | 100 | | | | 102 | |
| | | | | | | | |
| Description | | Face Amount
(000) | | | Value
(000) | |
| | | | | | | | |
Ecopetrol | | | | | | | | |
7.375%, 09/18/43 | | $ | 200 | | | $ | 240 | |
5.875%, 09/18/23 | | | 100 | | | | 111 | |
Emera US Finance | | | | | | | | |
4.750%, 06/15/46 | | | 200 | | | | 219 | |
Enable Midstream Partners | | | | | | | | |
2.400%, 05/15/19 | | | 50 | | | | 50 | |
Enbridge | | | | | | | | |
4.000%, 10/01/23 | | | 576 | | | | 600 | |
3.700%, 07/15/27 | | | 1,769 | | | | 1,776 | |
Enbridge Energy Partners | | | | | | | | |
5.875%, 10/15/25 | | | 100 | | | | 113 | |
Encana | | | | | | | | |
3.900%, 11/15/21 | | | 50 | | | | 51 | |
Energy Transfer | | | | | | | | |
6.625%, 10/15/36 | | | 1,179 | | | | 1,358 | |
6.125%, 12/15/45 | | | 150 | | | | 163 | |
4.500%, 11/01/23 | | | 100 | | | | 103 | |
4.200%, 04/15/27 | | | 200 | | | | 199 | |
EnLink Midstream Partners | | | | | | | | |
5.450%, 06/01/47 | | | 150 | | | | 159 | |
2.700%, 04/01/19 | | | 800 | | | | 799 | |
Enterprise Products Operating | | | | | | | | |
5.950%, 02/01/41 | | | 100 | | | | 124 | |
3.700%, 02/15/26 | | | 250 | | | | 256 | |
3.350%, 03/15/23 | | | 100 | | | | 102 | |
2.850%, 04/15/21 | | | 30 | | | | 30 | |
EOG Resources | | | | | | | | |
3.150%, 04/01/25 | | | 100 | | | | 99 | |
2.625%, 03/15/23 | | | 100 | | | | 99 | |
Equities | | | | | | | | |
3.900%, 10/01/27 | | | 1,013 | | | | 1,007 | |
3.000%, 10/01/22 | | | 2,008 | | | | 1,987 | |
ExxonMobil | | | | | | | | |
4.114%, 03/01/46 | | | 150 | | | | 168 | |
3.043%, 03/01/26 | | | 50 | | | | 51 | |
2.726%, 03/01/23 | | | 35 | | | | 35 | |
2.709%, 03/06/25 | | | 150 | | | | 149 | |
2.222%, 03/01/21 | | | 20 | | | | 20 | |
1.708%, 03/01/19 | | | 50 | | | | 50 | |
Fermaca Enterprises | | | | | | | | |
6.375%, 03/30/38 (A) | | | 188 | | | | 203 | |
Halliburton | | | | | | | | |
5.000%, 11/15/45 | | | 100 | | | | 115 | |
3.500%, 08/01/23 | | | 100 | | | | 103 | |
Hess | | | | | | | | |
4.300%, 04/01/27 | | | 200 | | | | 200 | |
Husky Energy | | | | | | | | |
4.000%, 04/15/24 | | | 100 | | | | 104 | |
KazMunayGas National JSC | | | | | | | | |
5.750%, 04/19/47 (A) | | | 690 | | | | 735 | |
Kinder Morgan | | | | | | | | |
5.550%, 06/01/45 | | | 300 | | | | 328 | |
3.050%, 12/01/19 | | | 50 | | | | 51 | |
The accompanying notes are an integral part of the financial statements.
97
| | |
| THE KP FUNDS | | December 31, 2017 |
| | | | | | | | |
| Description | | Face Amount
(000) | | | Value
(000) | |
| | | | | | | | |
Kinder Morgan Energy Partners | | | | | | | | |
6.375%, 03/01/41 | | $ | 150 | | | $ | 174 | |
5.500%, 03/01/44 | | | 100 | | | | 107 | |
3.500%, 03/01/21 | | | 20 | | | | 20 | |
Magellan Midstream Partners | | | | | | | | |
4.250%, 02/01/21 | | | 100 | | | | 104 | |
Marathon Petroleum | | | | | | | | |
4.750%, 09/15/44 | | | 1,275 | | | | 1,332 | |
3.400%, 12/15/20 | | | 657 | | | | 671 | |
MPLX | | | | | | | | |
5.200%, 03/01/47 | | | 200 | | | | 219 | |
4.125%, 03/01/27 | | | 65 | | | | 67 | |
4.000%, 02/15/25 | | | 25 | | | | 26 | |
National Oilwell Varco | | | | | | | | |
2.600%, 12/01/22 | | | 100 | | | | 98 | |
Noble Energy | | | | | | | | |
4.950%, 08/15/47 | | | 1,294 | | | | 1,385 | |
4.150%, 12/15/21 | | | 100 | | | | 104 | |
Occidental Petroleum | | | | | | | | |
4.400%, 04/15/46 | | | 200 | | | | 221 | |
3.400%, 04/15/26 | | | 70 | | | | 72 | |
Odebrecht Drilling Norbe VIII/IX | | | | | | | | |
6.350%, 12/01/21 (A) (G) | | | 140 | | | | 66 | |
6.350% cash/7.350% PIK, 12/01/26 (A) (G) | | | 165 | | | | 78 | |
Odebrecht Oil & Gas Finance | | | | | | | | |
0.511%, 01/03/66 (A) (B) (G) | | | 97 | | | | 45 | |
ONEOK | | | | | | | | |
4.000%, 07/13/27 | | | 30 | | | | 30 | |
ONEOK Partners | | | | | | | | |
6.850%, 10/15/37 | | | 603 | | | | 752 | |
3.375%, 10/01/22 | | | 100 | | | | 101 | |
Petrobras Global Finance BV | | | | | | | | |
7.375%, 01/17/27 | | | 420 | | | | 463 | |
6.125%, 01/17/22 | | | 20 | | | | 21 | |
4.375%, 05/20/23 | | | 1,165 | | | | 1,152 | |
Petroleos de Venezuela | | | | | | | | |
9.000%, 11/17/21 (C) | | | 660 | | | | 183 | |
8.500%, 10/27/20 (A) | | | 184 | | | | 150 | |
6.000%, 11/15/26 (A) (C) | | | 385 | | | | 84 | |
5.375%, 04/12/27 (C) | | | 365 | | | | 85 | |
Petroleos del Peru | | | | | | | | |
4.750%, 06/19/32 (A) | | | 935 | | | | 945 | |
Petroleos Mexicanos | | | | | | | | |
8.000%, 05/03/19 | | | 250 | | | | 267 | |
6.875%, 08/04/26 | | | 50 | | | | 57 | |
6.750%, 09/21/47 | | | 1,518 | | | | 1,585 | |
6.625%, 06/15/35 | | | 410 | | | | 438 | |
6.500%, 03/13/27 (A) | | | 930 | | | | 1,017 | |
6.500%, 06/02/41 | | | 350 | | | | 360 | |
6.375%, 02/04/21 | | | 50 | | | | 54 | |
6.375%, 01/23/45 | | | 190 | | | | 191 | |
5.625%, 01/23/46 | | | 1,019 | | | | 943 | |
5.500%, 02/04/19 | | | 30 | | | | 31 | |
5.500%, 01/21/21 | | | 2,962 | | | | 3,143 | |
5.500%, 06/27/44 | | | 160 | | | | 147 | |
| | | | | | | | |
| Description | | Face Amount
(000) | | | Value (000) | |
| | | | | | | | |
4.875%, 01/24/22 | | $ | 620 | | | $ | 646 | |
4.625%, 09/21/23 | | | 200 | | | | 206 | |
3.500%, 07/23/20 | | | 100 | | | | 101 | |
3.500%, 01/30/23 | | | 455 | | | | 445 | |
Phillips 66 | | | | | | | | |
4.650%, 11/15/34 | | | 300 | | | | 329 | |
Phillips 66 Partners | | | | | | | | |
3.605%, 02/15/25 | | | 25 | | | | 25 | |
Pioneer Natural Resources | | | | | | | | |
3.450%, 01/15/21 | | | 100 | | | | 102 | |
Plains All American Pipeline | | | | | | | | |
4.900%, 02/15/45 | | | 168 | | | | 161 | |
4.650%, 10/15/25 | | | 150 | | | | 155 | |
4.500%, 12/15/26 | | | 1,280 | | | | 1,297 | |
Sabine Pass Liquefaction | | | | | | | | |
5.625%, 02/01/21 | | | 140 | | | | 150 | |
5.625%, 03/01/25 | | | 85 | | | | 94 | |
Shell International Finance | | | | | | | | |
6.375%, 12/15/38 | | | 845 | | | | 1,178 | |
4.550%, 08/12/43 | | | 400 | | | | 455 | |
4.000%, 05/10/46 | | | 943 | | | | 1,005 | |
3.250%, 05/11/25 | | | 150 | | | | 154 | |
2.875%, 05/10/26 | | | 100 | | | | 100 | |
1.875%, 05/10/21 | | | 200 | | | | 197 | |
Sinopec Group Overseas Development | | | | | | | | |
3.500%, 05/03/26 (A) | | | 580 | | | | 584 | |
Spectra Energy Partners | | | | | | | | |
3.500%, 03/15/25 | | | 100 | | | | 100 | |
State Oil of the Azerbaijan Republic | | | | | | | | |
4.750%, 03/13/23 | | | 705 | | | | 714 | |
Statoil | | | | | | | | |
3.950%, 05/15/43 | | | 200 | | | | 209 | |
3.700%, 03/01/24 | | | 100 | | | | 105 | |
2.450%, 01/17/23 | | | 125 | | | | 125 | |
Stoneway Capital | | | | | | | | |
10.000%, 03/01/27 (A) | | | 330 | | | | 351 | |
Suncor Energy | | | | | | | | |
6.500%, 06/15/38 | | | 150 | | | | 203 | |
Sunoco Logistics Partners Operations | | | | | | | | |
4.400%, 04/01/21 | | | 100 | | | | 104 | |
Total Capital Canada | | | | | | | | |
2.750%, 07/15/23 | | | 100 | | | | 101 | |
Total Capital International | | | | | | | | |
2.700%, 01/25/23 | | | 100 | | | | 101 | |
TransCanada PipeLines | | | | | | | | |
4.875%, 01/15/26 | | | 100 | | | | 112 | |
4.625%, 03/01/34 | | | 300 | | | | 335 | |
Valero Energy | | | | | | | | |
9.375%, 03/15/19 | | | 29 | | | | 31 | |
3.650%, 03/15/25 | | | 100 | | | | 103 | |
Williams Partners | | | | | | | | |
6.300%, 04/15/40 | | | 1,185 | | | | 1,458 | |
The accompanying notes are an integral part of the financial statements.
98
| | |
| THE KP FUNDS | | December 31, 2017 |
| | | | | | | | |
| Description | | Face Amount
(000)(1) | | | Value (000) | |
| | | | | | | | |
5.250%, 03/15/20 | | | 250 | | | $ | 264 | |
3.600%, 03/15/22 | | | 100 | | | | 102 | |
YPF | | | | | | | | |
16.500%, 05/09/22 (ARS) (A) | | | 6,000 | | | | 303 | |
| | | | | | | | |
| | | | | | | 55,502 | |
| | | | | | | | |
Financials — 6.2% | | | | | | | | |
Aflac | | | | | | | | |
3.625%, 06/15/23 | | | 100 | | | | 104 | |
AIA Group | | | | | | | | |
2.250%, 03/11/19 (A) | | | 424 | | | | 422 | |
AIG Global Funding | | | | | | | | |
1.950%, 10/18/19 (A) | | | 1,400 | | | | 1,388 | |
Allstate | | | | | | | | |
4.200%, 12/15/46 | | | 200 | | | | 218 | |
American Express | | | | | | | | |
2.500%, 08/01/22 | | | 100 | | | | 99 | |
American Express Credit | | | | | | | | |
2.700%, 03/03/22 | | | 100 | | | | 100 | |
2.375%, 05/26/20 | | | 100 | | | | 100 | |
2.250%, 05/05/21 | | | 100 | | | | 99 | |
2.200%, 03/03/20 | | | 100 | | | | 100 | |
American Financial Group | | | | | | | | |
3.500%, 08/15/26 | | | 35 | | | | 35 | |
American International Group | | | | | | | | |
4.700%, 07/10/35 | | | 200 | | | | 221 | |
4.500%, 07/16/44 | | | 461 | | | | 496 | |
3.875%, 01/15/35 | | | 200 | | | | 201 | |
Ameriprise Financial | | | | | | | | |
5.300%, 03/15/20 | | | 100 | | | | 106 | |
Aon | | | | | | | | |
5.000%, 09/30/20 | | | 100 | | | | 106 | |
Ares Capital | | | | | | | | |
3.875%, 01/15/20 | | | 60 | | | | 61 | |
Assurant | | | | | | | | |
4.000%, 03/15/23 | | | 74 | | | | 76 | |
Australia & New Zealand Banking Group NY | | | | | | | | |
2.625%, 05/19/22 | | | 250 | | | | 249 | |
Banco BTG Pactual | | | | | | | | |
5.500%, 01/31/23 (A) | | | 490 | | | | 489 | |
Banco de Costa Rica | | | | | | | | |
5.250%, 08/12/18 (A) | | | 540 | | | | 541 | |
Banco Nacional de Costa Rica | | | | | | | | |
5.875%, 04/25/21 (A) | | | 460 | | | | 479 | |
4.875%, 11/01/18 (A) | | | 550 | | | | 553 | |
Banco Santander | | | | | | | | |
3.125%, 02/23/23 | | | 200 | | | | 199 | |
Bank of America | | | | | | | | |
5.000%, 01/21/44 | | | 250 | | | | 302 | |
4.450%, 03/03/26 | | | 130 | | | | 139 | |
4.244%, VAR ICE LIBOR USD 3 Month+1.814%, 04/24/38 | | | 100 | | | | 108 | |
4.200%, 08/26/24 | | | 165 | | | | 174 | |
| | | | | | | | |
| Description | | Face Amount
(000)(1) | | | Value (000) | |
| | | | | | | | |
4.183%, 11/25/27 | | | 250 | | | $ | 261 | |
4.100%, 07/24/23 | | | 100 | | | | 106 | |
4.000%, 01/22/25 | | | 5,333 | | | | 5,548 | |
3.950%, 04/21/25 | | | 200 | | | | 207 | |
3.500%, 04/19/26 | | | 50 | | | | 51 | |
3.419%, VAR ICE LIBOR USD 3 Month+1.040%, 12/20/28 (A) | | | 112 | | | | 112 | |
3.093%, VAR ICE LIBOR USD 3 Month+1.090%, 10/01/25 | | | 100 | | | | 100 | |
3.004%, VAR ICE LIBOR USD 3 Month+0.790%, 12/20/23 (A) | | | 2,268 | | | | 2,274 | |
2.881%, VAR ICE LIBOR USD 3 Month+1.021%, 04/24/23 | | | 200 | | | | 200 | |
2.503%, 10/21/22 | | | 100 | | | | 99 | |
2.250%, 04/21/20 | | | 250 | | | | 250 | |
2.151%, 11/09/20 | | | 100 | | | | 100 | |
Bank of Georgia JSC | | | | | | | | |
11.000%, 06/01/20 (GEL) (A) | | | 1,370 | | | | 531 | |
Bank of Montreal | | | | | | | | |
2.100%, 12/12/19 | | | 65 | | | | 65 | |
2.100%, 06/15/20 | | | 100 | | | | 99 | |
Bank of New York Mellon | | | | | | | | |
3.550%, 09/23/21 | | | 100 | | | | 104 | |
3.300%, 08/23/29 | | | 100 | | | | 100 | |
3.000%, 02/24/25 | | | 100 | | | | 100 | |
2.500%, 04/15/21 | | | 100 | | | | 100 | |
2.450%, 11/27/20 | | | 50 | | | | 50 | |
2.450%, 08/17/26 | | | 50 | | | | 47 | |
Bank of Nova Scotia | | | | | | | | |
2.800%, 07/21/21 | | | 100 | | | | 101 | |
2.450%, 03/22/21 | | | 50 | | | | 50 | |
2.150%, 07/14/20 | | | 200 | | | | 199 | |
1.950%, 01/15/19 | | | 50 | | | | 50 | |
1.650%, 06/14/19 | | | 50 | | | | 50 | |
Barclays | | | | | | | | |
4.375%, 01/12/26 | | | 200 | | | | 208 | |
2.875%, 06/08/20 | | | 250 | | | | 251 | |
Barrick North America Finance | | | | | | | | |
4.400%, 05/30/21 | | | 37 | | | | 39 | |
BB&T | | | | | | | | |
2.750%, 04/01/22 | | | 200 | | | | 201 | |
2.450%, 01/15/20 | | | 100 | | | | 100 | |
2.150%, 02/01/21 | | | 1,092 | | | | 1,082 | |
Berkshire Hathaway | | | | | | | | |
3.125%, 03/15/26 | | | 200 | | | | 202 | |
Berkshire Hathaway Finance | | | | | | | | |
4.300%, 05/15/43 | | | 200 | | | | 224 | |
1.300%, 08/15/19 | | | 35 | | | | 34 | |
BGEO Group JSC | | | | | | | | |
6.000%, 07/26/23 (A) | | | 550 | | | | 571 | |
BlackRock | | | | | | | | |
5.000%, 12/10/19 | | | 100 | | | | 105 | |
The accompanying notes are an integral part of the financial statements.
99
| | |
| THE KP FUNDS | | December 31, 2017 |
| | | | | | | | |
| Description | | Face Amount
(000) | | | Value (000) | |
| | | | | | | | |
BNP Paribas | | | | | | | | |
3.500%, 11/16/27 (A) | | $ | 1,891 | | | $ | 1,882 | |
2.375%, 05/21/20 | | | 200 | | | | 200 | |
BOC Aviation | | | | | | | | |
3.875%, 04/27/26 (A) | | | 200 | | | | 201 | |
Brighthouse Financial | | | | | | | | |
3.700%, 06/22/27 (A) | | | 50 | | | | 49 | |
Canadian Imperial Bank of Commerce | | | | | | | | |
1.600%, 09/06/19 | | | 50 | | | | 49 | |
Capital One | | | | | | | | |
1.650%, 02/05/18 | | | 2,642 | | | | 2,642 | |
Capital One Financial | | | | | | | | |
3.750%, 07/28/26 | | | 100 | | | | 100 | |
3.300%, 10/30/24 | | | 100 | | | | 99 | |
3.200%, 02/05/25 | | | 50 | | | | 50 | |
3.050%, 03/09/22 | | | 150 | | | | 151 | |
2.450%, 04/24/19 | | | 100 | | | | 100 | |
Cboe Global Markets | | | | | | | | |
1.950%, 06/28/19 | | | 30 | | | | 30 | |
Charles Schwab | | | | | | | | |
4.450%, 07/22/20 | | | 100 | | | | 105 | |
Chubb INA Holdings | | | | | | | | |
3.350%, 05/15/24 | | | 100 | | | | 103 | |
3.350%, 05/03/26 | | | 150 | | | | 153 | |
Citibank | | | | | | | | |
2.125%, 10/20/20 | | | 2,588 | | | | 2,563 | |
Citigroup | | | | | | | | |
8.125%, 07/15/39 | | | 250 | | | | 400 | |
4.450%, 09/29/27 | | | 896 | | | | 949 | |
4.400%, 06/10/25 | | | 1,040 | | | | 1,098 | |
4.281%, VAR ICE LIBOR USD 3 Month+1.839%, 04/24/48 | | | 100 | | | | 108 | |
4.125%, 07/25/28 | | | 85 | | | | 88 | |
3.887%, VAR ICE LIBOR USD 3 Month+1.563%, 01/10/28 | | | 200 | | | | 207 | |
3.750%, 06/16/24 | | | 100 | | | | 104 | |
3.668%, VAR ICE LIBOR USD 3 Month+1.390%, 07/24/28 | | | 100 | | | | 101 | |
3.520%, VAR ICE LIBOR USD 3 Month+1.151%, 10/27/28 | | | 200 | | | | 201 | |
3.500%, 05/15/23 | | | 100 | | | | 102 | |
3.300%, 04/27/25 | | | 100 | | | | 101 | |
2.900%, 12/08/21 | | | 100 | | | | 101 | |
2.876%, VAR ICE LIBOR USD 3 Month+0.950%, 07/24/23 | | | 3,295 | | | | 3,278 | |
2.750%, 04/25/22 | | | 100 | | | | 100 | |
2.650%, 10/26/20 | | | 100 | | | | 100 | |
2.500%, 07/29/19 | | | 100 | | | | 100 | |
2.400%, 02/18/20 | | | 100 | | | | 100 | |
| | | | | | | | |
| Description | | Face Amount
(000)(1) | | | Value (000) | |
| | | | | | | | |
Citigroup Global Markets Holdings | | | | | | | | |
24.750%, 03/03/21
(GHS) (A) (D) (H) | | | 2,060 | | | $ | 539 | |
21.603%, 02/01/18
(EGP) (A) (B) (H) | | | 8,000 | | | | 444 | |
21.323%, 01/25/18
(EGP) (A) (B) (H) | | | 11,800 | | | | 657 | |
19.533%, 03/08/18
(EGP) (A) (B) (H) | | | 8,200 | | | | 446 | |
17.881%, 03/22/18
(EGP) (A) (B) (H) | | | 15,800 | | | | 856 | |
17.332%, 04/12/18
(EGP) (A) (B) (H) | | | 14,000 | | | | 750 | |
17.135%, 06/16/18 (NGN) (B) (H) | | | 161,000 | | | | 414 | |
16.756%, 05/19/18 (NGN) (B) (H) | | | 153,000 | | | | 400 | |
Citizens Bank | | | | | | | | |
2.200%, 05/26/20 | | | 250 | | | | 248 | |
Citizens Financial Group | | | | | | | | |
2.375%, 07/28/21 | | | 30 | | | | 30 | |
CME Group | | | | | | | | |
3.000%, 03/15/25 | | | 150 | | | | 152 | |
CNA Financial | | | | | | | | |
5.875%, 08/15/20 | | | 100 | | | | 108 | |
Comerica | | | | | | | | |
2.125%, 05/23/19 | | | 50 | | | | 50 | |
Cooperatieve Rabobank UA | | | | | | | | |
3.375%, 05/21/25 | | | 250 | | | | 257 | |
2.250%, 01/14/20 | | | 250 | | | | 250 | |
Credit Agricole | | | | | | | | |
3.250%, 10/04/24(A) | | | 1,371 | | | | 1,362 | |
Credit Suisse Group Funding Guernsey | | | | | | | | |
4.875%, 05/15/45 | | | 250 | | | | 288 | |
3.125%, 12/10/20 | | | 250 | | | | 253 | |
Credit Suisse New York | | | | | | | | |
3.625%, 09/09/24 | | | 250 | | | | 259 | |
Deutsche Bank | | | | | | | | |
3.700%, 05/30/24 | | | 85 | | | | 86 | |
2.950%, 08/20/20 | | | 100 | | | | 100 | |
Deutsche Bank NY | | | | | | | | |
2.700%, 07/13/20 | | | 150 | | | | 149 | |
Discover Bank | | | | | | | | |
3.100%, 06/04/20 | | | 250 | | | | 253 | |
Discover Financial Services | | | | | | | | |
4.100%, 02/09/27 | | | 40 | | | | 41 | |
Fibria Overseas Finance | | | | | | | | |
5.500%, 01/17/27 | | | 25 | | | | 27 | |
Fifth Third Bancorp | | | | | | | | |
2.875%, 07/27/20 | | | 250 | | | | 253 | |
First Republic Bank | | | | | | | | |
4.625%, 02/13/47 | | | 200 | | | | 214 | |
FMS Wertmanagement AoeR | | | | | | | | |
1.375%, 06/08/21 | | | 200 | | | | 194 | |
The accompanying notes are an integral part of the financial statements.
100
| | |
| THE KP FUNDS | | December 31, 2017 |
| | | | | | | | |
| Description | | Face Amount
(000) | | | Value (000) | |
| | | | | | | | |
FS Investment | | | | | | | | |
4.250%, 01/15/20 | | $ | 30 | | | $ | 31 | |
Goldman Sachs Group | | | | | | | | |
6.750%, 10/01/37 | | | 200 | | | | 268 | |
5.150%, 05/22/45 | | | 350 | | | | 406 | |
4.750%, 10/21/45 | | | 662 | | | | 758 | |
4.017%, VAR ICE LIBOR USD 3 Month+1.373%, 10/31/38 | | | 150 | | | | 154 | |
3.750%, 05/22/25 | | | 100 | | | | 103 | |
3.750%, 02/25/26 | | | 250 | | | | 257 | |
3.691%, VAR ICE LIBOR USD 3 Month+1.510%, 06/05/28 | | | 165 | | | | 168 | |
3.625%, 01/22/23 | | | 1,200 | | | | 1,240 | |
3.272%, VAR ICE LIBOR USD 3 Month+1.201%, 09/29/25 | | | 75 | | | | 75 | |
2.908%, VAR ICE LIBOR USD 3 Month+1.053%, 06/05/23 | | | 100 | | | | 99 | |
2.876%, VAR ICE LIBOR USD 3 Month+0.821%, 10/31/22 | | | 100 | | | | 100 | |
2.750%, 09/15/20 | | | 75 | | | | 75 | |
2.625%, 04/25/21 | | | 100 | | | | 100 | |
2.600%, 04/23/20 | | | 100 | | | | 100 | |
2.600%, 12/27/20 | | | 100 | | | | 100 | |
2.550%, 10/23/19 | | | 200 | | | | 200 | |
2.350%, 11/15/21 | | | 45 | | | | 44 | |
2.300%, 12/13/19 | | | 85 | | | | 85 | |
Hanover Insurance Group | | | | | | | | |
4.500%, 04/15/26 | | | 100 | | | | 104 | |
HSBC Finance | | | | | | | | |
6.676%, 01/15/21 | | | 29 | | | | 32 | |
HSBC Holdings | | | | | | | | |
6.500%, 09/15/37 | | | 250 | | | | 329 | |
4.250%, 08/18/25 | | | 200 | | | | 207 | |
4.041%, VAR ICE LIBOR USD 3 Month+1.546%, 03/13/28 | | | 1,819 | | | | 1,896 | |
4.000%, 03/30/22 | | | 100 | | | | 105 | |
3.600%, 05/25/23 | | | 200 | | | | 206 | |
3.262%, VAR ICE LIBOR USD 3 Month+1.055%, 03/13/23 | | | 2,686 | | | | 2,723 | |
3.033%, VAR ICE LIBOR USD 3 Month+0.923%, 11/22/23 | | | 2,562 | | | | 2,567 | |
2.950%, 05/25/21 | | | 200 | | | | 201 | |
Industrial & Commercial Bank of China | | | | | | | | |
2.905%, 11/13/20 | | | 250 | | | | 249 | |
Intercontinental Exchange | | | | | | | | |
4.000%, 10/15/23 | | | 150 | | | | 159 | |
Jefferies Group | | | | | | | | |
6.875%, 04/15/21 | | | 100 | | | | 112 | |
| | | | | | | | |
| Description | | Face Amount
(000)(1) | | | Value (000) | |
| | | | | | | | |
JPMorgan Chase | | | | | | | | |
5.600%, 07/15/41 | | | 250 | | | $ | 322 | |
4.350%, 08/15/21 | | | 250 | | | | 265 | |
4.260%, VAR ICE LIBOR USD 3 Month+1.580%, 02/22/48 | | | 709 | | | | 767 | |
3.964%, VAR ICE LIBOR USD 3 Month+1.380%, 11/15/48 | | | 1,354 | | | | 1,398 | |
3.882%, VAR ICE LIBOR USD 3 Month+1.360%, 07/24/38 | | | 725 | | | | 745 | |
3.625%, 05/13/24 | | | 100 | | | | 104 | |
3.540%, VAR ICE LIBOR USD 3 Month+1.380%, 05/01/28 | | | 200 | | | | 203 | |
3.300%, 04/01/26 | | | 100 | | | | 101 | |
3.220%, VAR ICE LIBOR USD 3 Month+1.155%, 03/01/25 | | | 160 | | | | 161 | |
3.200%, 06/15/26 | | | 100 | | | | 100 | |
3.125%, 01/23/25 | | | 150 | | | | 151 | |
2.776%, VAR ICE LIBOR USD 3 Month+0.935%, 04/25/23 | | | 75 | | | | 75 | |
2.750%, 06/23/20 | | | 300 | | | | 303 | |
2.700%, 05/18/23 | | | 100 | | | | 99 | |
2.550%, 10/29/20 | | | 180 | | | | 181 | |
2.400%, 06/07/21 | | | 50 | | | | 50 | |
JPMorgan Chase Bank | | | | | | | | |
8.375%, 03/17/34 (IDR) (A) (H) | | | 3,000,000 | | | | 247 | |
KeyBank | | | | | | | | |
2.400%, 06/09/22 | | | 250 | | | | 247 | |
KeyCorp | | | | | | | | |
5.100%, 03/24/21 | | | 150 | | | | 162 | |
KFW | | | | | | | | |
2.500%, 11/20/24 | | | 650 | | | | 649 | |
1.875%, 06/30/20 | | | 200 | | | | 199 | |
1.875%, 11/30/20 | | | 200 | | | | 198 | |
1.250%, 09/30/19 | | | 150 | | | | 148 | |
1.000%, 07/15/19 | | | 100 | | | | 99 | |
Landwirtschaftliche Rentenbank | | | | | | | | |
2.500%, 11/15/27 | | | 150 | | | | 148 | |
1.750%, 04/15/19 | | | 100 | | | | 100 | |
Lazard Group | | | | | | | | |
3.750%, 02/13/25 | | | 50 | | | | 51 | |
Lima Metro Line 2 Finance | | | | | | | | |
5.875%, 07/05/34 (A) | | | 790 | | | | 854 | |
Lincoln National | | | | | | | | |
3.625%, 12/12/26 | | | 100 | | | | 102 | |
Lloyds Banking Group | | | | | | | | |
4.582%, 12/10/25 | | | 200 | | | | 210 | |
2.907%, VAR ICE LIBOR USD 3 Month+0.810%, 11/07/23 | | | 200 | | | | 198 | |
Loews | | | | | | | | |
2.625%, 05/15/23 | | | 100 | | | | 99 | |
The accompanying notes are an integral part of the financial statements.
101
| | |
| THE KP FUNDS | | December 31, 2017 |
| | | | | | | | |
| Description | | Face Amount
(000) | | | Value (000) | |
| | | | | | | | |
Markel | | | | | | | | |
3.500%, 11/01/27 | | $ | 50 | | | $ | 50 | |
Marsh & McLennan | | | | | | | | |
2.750%, 01/30/22 | | | 30 | | | | 30 | |
2.350%, 09/10/19 | | | 75 | | | | 75 | |
MetLife | | | | | | | | |
6.400%, 12/15/36 | | | 300 | | | | 345 | |
3.600%, 04/10/24 | | | 100 | | | | 105 | |
3.600%, 11/13/25 | | | 50 | | | | 52 | |
Mitsubishi UFJ Financial Group | | | | | | | | |
3.850%, 03/01/26 | | | 200 | | | | 207 | |
3.287%, 07/25/27 | | | 50 | | | | 50 | |
2.665%, 07/25/22 | | | 50 | | | | 49 | |
Mizuho Financial Group | | | | | | | | |
2.601%, 09/11/22 | | | 200 | | | | 197 | |
Moody's | | | | | | | | |
2.750%, 07/15/19 | | | 100 | | | | 101 | |
Morgan Stanley | | | | | | | | |
6.375%, 07/24/42 | | | 200 | | | | 278 | |
4.875%, 11/01/22 | | | 100 | | | | 108 | |
3.971%, VAR ICE LIBOR USD 3 Month+1.455%, 07/22/38 | | | 1,479 | | | | 1,532 | |
3.875%, 01/27/26 | | | 200 | | | | 208 | |
3.591%, VAR ICE LIBOR USD 3 Month+1.340%, 07/22/28 | | | 150 | | | | 151 | |
3.125%, 07/27/26 | | | 1,836 | | | | 1,811 | |
2.800%, 06/16/20 | | | 100 | | | | 101 | |
2.650%, 01/27/20 | | | 100 | | | | 100 | |
2.375%, 07/23/19 | | | 550 | | | | 551 | |
MUFG Americas Holdings | | | | | | | | |
3.000%, 02/10/25 | | | 200 | | | | 197 | |
Nasdaq | | | | | | | | |
3.850%, 06/30/26 | | | 150 | | | | 154 | |
National Australia Bank | | | | | | | | |
2.625%, 01/14/21 | | | 250 | | | | 251 | |
National Rural Utilities Cooperative Finance | | | | | | | | |
2.700%, 02/15/23 | | | 100 | | | | 100 | |
New York Life Global Funding | | | | | | | | |
1.950%, 09/28/20 (A) | | | 2,487 | | | | 2,461 | |
Northern Trust | | | | | | | | |
3.375%, VAR ICE LIBOR USD 3 Month+1.131%, 05/08/32 | | | 63 | | | | 63 | |
Oesterreichische Kontrollbank | | | | | | | | |
1.875%, 01/20/21 | | | 150 | | | | 148 | |
ORIX | | | | | | | | |
2.900%, 07/18/22 | | | 30 | | | | 30 | |
PNC Bank | | | | | | | | |
2.450%, 07/28/22 | | | 250 | | | | 248 | |
2.400%, 10/18/19 | | | 250 | | | | 250 | |
1.450%, 07/29/19 | | | 250 | | | | 247 | |
Pricoa Global Funding I | | | | | | | | |
1.900%, 09/21/18 (A) | | | 736 | | | | 736 | |
| | | | | | | | |
| Description | | Face Amount
(000)(1) | | | Value (000) | |
| | | | | | | | |
Principal Financial Group | | | | | | | | |
3.400%, 05/15/25 | | | 100 | | | $ | 101 | |
Private Export Funding | | | | | | | | |
2.250%, 03/15/20 | | | 200 | | | | 200 | |
Progressive | | | | | | | | |
4.125%, 04/15/47 | | | 100 | | | | 108 | |
Prudential Financial | | | | | | | | |
4.600%, 05/15/44 | | | 200 | | | | 227 | |
Regions Financial | | | | | | | | |
3.200%, 02/08/21 | | | 50 | | | | 51 | |
2.750%, 08/14/22 | | | 50 | | | | 50 | |
Royal Bank of Canada | | | | | | | | |
2.150%, 03/15/19 | | | 200 | | | | 200 | |
2.150%, 10/26/20 | | | 3,396 | | | | 3,374 | |
1.875%, 02/05/20 | | | 250 | | | | 248 | |
1.625%, 04/15/19 | | | 150 | | | | 149 | |
Royal Bank of Scotland Group | | | | | | | | |
3.498%, VAR ICE LIBOR USD 3 Month+1.480%, 05/15/23 | | | 200 | | | | 200 | |
S&P Global | | | | | | | | |
4.000%, 06/15/25 | | | 100 | | | | 105 | |
Santander Holdings USA | | | | | | | | |
4.400%, 07/13/27 (A) | | | 25 | | | | 26 | |
2.700%, 05/24/19 | | | 50 | | | | 50 | |
2.650%, 04/17/20 | | | 100 | | | | 100 | |
Santander UK | | | | | | | | |
2.375%, 03/16/20 | | | 100 | | | | 100 | |
Santander UK Group Holdings | | | | | | | | |
3.125%, 01/08/21 | | | 100 | | | | 101 | |
Standard Chartered Bank | | | | | | | | |
11.000%, 08/05/24 (LKR) (A) (H) | | | 69,000 | | | | 470 | |
11.000%, 08/05/25 (LKR) (A) (H) | | | 79,000 | | | | 538 | |
10.750%, 03/03/21 (LKR) (A) (H) | | | 132,000 | | | | 882 | |
8.250%, 05/19/36 (IDR) (A) (H) | | | 13,160,000 | | | | 1,082 | |
7.610%, 05/13/30
(INR) (A) (D) (H) | | | 24,000 | | | | 375 | |
Sumitomo Mitsui Financial Group | | | | | | | | |
3.784%, 03/09/26 | | | 50 | | | | 52 | |
3.446%, 01/11/27 | | | 50 | | | | 50 | |
3.364%, 07/12/27 | | | 100 | | | | 100 | |
2.934%, 03/09/21 | | | 250 | | | | 252 | |
2.846%, 01/11/22 | | | 50 | | | | 50 | |
2.784%, 07/12/22 | | | 50 | | | | 50 | |
2.778%, 10/18/22 | | | 50 | | | | 50 | |
SunTrust Banks | | | | | | | | |
2.900%, 03/03/21 | | | 50 | | | | 51 | |
2.700%, 01/27/22 | | | 150 | | | | 150 | |
2.500%, 05/01/19 | | | 50 | | | | 50 | |
Svensk Exportkredit | | | | | | | | |
1.125%, 08/28/19 | | | 200 | | | | 197 | |
Svenska Handelsbanken | | | | | | | | |
1.950%, 09/08/20 | | | 250 | | | | 247 | |
The accompanying notes are an integral part of the financial statements.
102
| | |
| THE KP FUNDS | | December 31, 2017 |
| | | | | | | | |
| Description | | Face Amount
(000) | | | Value (000) | |
| | | | | | | | |
Synchrony Financial | | | | | | | | |
4.500%, 07/23/25 | | $ | 100 | | | $ | 104 | |
3.000%, 08/15/19 | | | 100 | | | | 101 | |
TC Ziraat Bankasi | | | | | | | | |
5.125%, 05/03/22 (A) | | | 200 | | | | 198 | |
TD Ameritrade Holding | | | | | | | | |
3.300%, 04/01/27 | | | 30 | | | | 30 | |
Toronto-Dominion Bank | | | | | | | | |
2.125%, 07/02/19 | | | 100 | | | | 100 | |
2.125%, 04/07/21 | | | 50 | | | | 50 | |
1.950%, 04/02/20 (A) | | | 473 | | | | 469 | |
1.900%, 10/24/19 | | | 100 | | | | 99 | |
1.800%, 07/13/21 | | | 100 | | | | 98 | |
Travelers | | | | | | | | |
3.900%, 11/01/20 | | | 100 | | | | 104 | |
Turkiye Garanti Bankasi | | | | | | | | |
6.125%, VAR USD Swap Semi 30/360 5 Year Curr+4.220%, 05/24/27 (A) | | | 510 | | | | 509 | |
UBS | | | | | | | | |
2.450%, 12/01/20 (A) | | | 2,170 | | | | 2,163 | |
2.350%, 03/26/20 | | | 250 | | | | 250 | |
Unum Group | | | | | | | | |
4.000%, 03/15/24 | | | 50 | | | | 52 | |
US Bancorp | | | | | | | | |
2.375%, 07/22/26 | | | 250 | | | | 235 | |
Voya Financial | | | | | | | | |
3.125%, 07/15/24 | | | 50 | | | | 50 | |
Wells Fargo | | | | | | | | |
4.900%, 11/17/45 | | | 714 | | | | 808 | |
4.750%, 12/07/46 | | | 454 | | | | 507 | |
4.650%, 11/04/44 | | | 350 | | | | 382 | |
4.125%, 08/15/23 | | | 200 | | | | 211 | |
3.584%, VAR ICE LIBOR USD 3 Month+1.310%, 05/22/28 | | | 325 | | | | 331 | |
3.550%, 09/29/25 | | | 100 | | | | 103 | |
3.000%, 01/22/21 | | | 100 | | | | 102 | |
3.000%, 02/19/25 | | | 100 | | | | 99 | |
3.000%, 04/22/26 | | | 100 | | | | 98 | |
3.000%, 10/23/26 | | | 250 | | | | 245 | |
2.625%, 07/22/22 | | | 1,351 | | | | 1,344 | |
2.550%, 12/07/20 | | | 85 | | | | 85 | |
Wells Fargo Bank | | | | | | | | |
2.150%, 12/06/19 | | | 250 | | | | 250 | |
Westpac Banking | | | | | | | | |
2.700%, 08/19/26 | | | 100 | | | | 96 | |
2.600%, 11/23/20 | | | 150 | | | | 151 | |
2.250%, 01/17/19 | | | 100 | | | | 100 | |
2.000%, 08/19/21 | | | 50 | | | | 49 | |
1.600%, 08/19/19 | | | 100 | | | | 99 | |
Willis North America | | | | | | | | |
3.600%, 05/15/24 | | | 50 | | | | 51 | |
XLIT | | | | | | | | |
5.750%, 10/01/21 | | | 74 | | | | 81 | |
| | | | | | | | |
| | | | | | | 98,746 | |
| | | | | | | | |
| | | | | | | | |
| Description | | Face Amount
(000) | | | Value (000) | |
| | | | | | | | |
Health Care — 2.0% | | | | | | | | |
Abbott Laboratories | | | | | | | | |
4.900%, 11/30/46 | | $ | 200 | | | $ | 229 | |
3.400%, 11/30/23 | | | 50 | | | | 51 | |
2.900%, 11/30/21 | | | 2,837 | | | | 2,870 | |
2.800%, 09/15/20 | | | 150 | | | | 151 | |
2.350%, 11/22/19 | | | 70 | | | | 70 | |
AbbVie | | | | | | | | |
4.700%, 05/14/45 | | | 200 | | | | 224 | |
4.500%, 05/14/35 | | | 200 | | | | 220 | |
4.300%, 05/14/36 | | | 276 | | | | 296 | |
3.200%, 11/06/22 | | | 100 | | | | 101 | |
2.900%, 11/06/22 | | | 6,434 | | | | 6,453 | |
2.850%, 05/14/23 | | | 50 | | | | 50 | |
2.500%, 05/14/20 | | | 1,757 | | | | 1,762 | |
2.300%, 05/14/21 | | | 50 | | | | 50 | |
Aetna | | | | | | | | |
2.800%, 06/15/23 | | | 25 | | | | 25 | |
2.750%, 11/15/22 | | | 150 | | | | 148 | |
Agilent Technologies | | | | | | | | |
3.050%, 09/22/26 | | | 65 | | | | 63 | |
Allergan Funding SCS | | | | | | | | |
4.550%, 03/15/35 | | | 300 | | | | 318 | |
3.800%, 03/15/25 | | | 190 | | | | 193 | |
AmerisourceBergen | | | | | | | | |
3.400%, 05/15/24 | | | 100 | | | | 102 | |
Amgen | | | | | | | | |
4.563%, 06/15/48 | | | 300 | | | | 335 | |
2.200%, 05/11/20 | | | 1,757 | | | | 1,747 | |
2.125%, 05/01/20 | | | 200 | | | | 199 | |
1.850%, 08/19/21 | | | 200 | | | | 195 | |
Anthem | | | | | | | | |
3.650%, 12/01/27 | | | 65 | | | | 66 | |
3.350%, 12/01/24 | | | 150 | | | | 152 | |
3.300%, 01/15/23 | | | 200 | | | | 203 | |
AstraZeneca | | | | | | | | |
2.375%, 11/16/20 | | | 150 | | | | 150 | |
2.375%, 06/12/22 | | | 100 | | | | 99 | |
1.950%, 09/18/19 | | | 100 | | | | 99 | |
Baxalta | | | | | | | | |
3.600%, 06/23/22 | | | 100 | | | | 102 | |
Baxter International | | | | | | | | |
2.600%, 08/15/26 | | | 100 | | | | 95 | |
Becton Dickinson | | | | | | | | |
4.685%, 12/15/44 | | | 200 | | | | 219 | |
4.669%, 06/06/47 | | | 131 | | | | 142 | |
3.700%, 06/06/27 | | | 50 | | | | 50 | |
3.000%, 05/15/26 (G) | | | 50 | | | | 49 | |
2.404%, 06/05/20 | | | 20 | | | | 20 | |
Biogen | | | | | | | | |
3.625%, 09/15/22 | | | 100 | | | | 104 | |
Boston Scientific | | | | | | | | |
3.375%, 05/15/22 | | | 100 | | | | 101 | |
2.850%, 05/15/20 | | | 100 | | | | 101 | |
Bristol-Myers Squibb | | | | | | | | |
2.000%, 08/01/22 | | | 100 | | | | 98 | |
The accompanying notes are an integral part of the financial statements.
103
| | |
| THE KP FUNDS | | December 31, 2017 |
| | | | | | | | |
| Description | | Face Amount
(000) | | | Value (000) | |
| | | | | | | | |
Cardinal Health | | | | | | | | |
3.200%, 03/15/23 | | $ | 100 | | | $ | 100 | |
3.079%, 06/15/24 | | | 150 | | | | 148 | |
Celgene | | | | | | | | |
5.000%, 08/15/45 | | | 250 | | | | 284 | |
3.875%, 08/15/25 | | | 100 | | | | 103 | |
Cigna | | | | | | | | |
4.000%, 02/15/22 | | | 100 | | | | 105 | |
3.875%, 10/15/47 | | | 100 | | | | 100 | |
Danaher | | | | | | | | |
3.350%, 09/15/25 | | | 30 | | | | 31 | |
Eli Lilly | | | | | | | | |
3.100%, 05/15/27 | | | 49 | | | | 50 | |
2.350%, 05/15/22 | | | 100 | | | | 99 | |
Express Scripts Holding | | | | | | | | |
4.800%, 07/15/46 | | | 200 | | | | 213 | |
4.750%, 11/15/21 | | | 100 | | | | 106 | |
Gilead Sciences | | | | | | | | |
4.750%, 03/01/46 | | | 1,184 | | | | 1,370 | |
4.600%, 09/01/35 | | | 400 | | | | 451 | |
4.000%, 09/01/36 | | | 206 | | | | 218 | |
2.550%, 09/01/20 | | | 150 | | | | 151 | |
2.500%, 09/01/23 | | | 35 | | | | 34 | |
2.350%, 02/01/20 | | | 20 | | | | 20 | |
1.950%, 03/01/22 | | | 15 | | | | 15 | |
GlaxoSmithKline Capital | | | | | | | | |
2.850%, 05/08/22 | | | 100 | | | | 102 | |
2.800%, 03/18/23 | | | 125 | | | | 126 | |
Humana | | | | | | | | |
4.950%, 10/01/44 | | | 200 | | | | 230 | |
Johnson & Johnson | | | | | | | | |
3.625%, 03/03/37 | | | 150 | | | | 158 | |
3.400%, 01/15/38 | | | 1,831 | | | | 1,875 | |
2.900%, 01/15/28 | | | 150 | | | | 150 | |
2.625%, 01/15/25 | | | 100 | | | | 100 | |
2.450%, 12/05/21 | | | 100 | | | | 101 | |
2.450%, 03/01/26 | | | 200 | | | | 195 | |
Kaiser Foundation Hospitals | | | | | | | | |
3.150%, 05/01/27 | | | 25 | | | | 25 | |
Laboratory Corp of America Holdings | | | | | | | | |
3.250%, 09/01/24 | | | 100 | | | | 100 | |
2.625%, 02/01/20 | | | 100 | | | | 100 | |
McKesson | | | | | | | | |
4.750%, 03/01/21 | | | 100 | | | | 106 | |
2.284%, 03/15/19 | | | 100 | | | | 100 | |
Medtronic | | | | | | | | |
4.625%, 03/15/45 | | | 200 | | | | 233 | |
4.375%, 03/15/35 | | | 200 | | | | 226 | |
2.750%, 04/01/23 | | | 100 | | | | 100 | |
2.500%, 03/15/20 | | | 150 | | | | 151 | |
Merck | | | | | | | | |
2.750%, 02/10/25 | | | 200 | | | | 199 | |
1.850%, 02/10/20 | | | 150 | | | | 149 | |
| | | | | | | | |
| Description | | Face Amount
(000) | | | Value (000) | |
| | | | | | | | |
Mylan | | | | | | | | |
5.250%, 06/15/46 | | $ | 200 | | | $ | 219 | |
3.750%, 12/15/20 | | | 100 | | | | 102 | |
New York and Presbyterian Hospital | | | | | | | | |
4.763%, 08/01/16 | | | 669 | | | | 712 | |
Novartis Capital | | | | | | | | |
3.400%, 05/06/24 | | | 100 | | | | 104 | |
3.000%, 11/20/25 | | | 50 | | | | 50 | |
2.400%, 05/17/22 | | | 50 | | | | 50 | |
1.800%, 02/14/20 | | | 25 | | | | 25 | |
Novartis Securities Investment | | | | | | | | |
5.125%, 02/10/19 | | | 100 | | | | 103 | |
Partners Healthcare System | | | | | | | | |
3.765%, 07/01/48 | | | 466 | | | | 463 | |
Pfizer | | | | | | | | |
5.200%, 08/12/20 | | | 100 | | | | 108 | |
4.000%, 12/15/36 | | | 250 | | | | 274 | |
3.000%, 06/15/23 | | | 100 | | | | 102 | |
Quest Diagnostics | | | | | | | | |
2.500%, 03/30/20 | | | 150 | | | | 150 | |
Shire Acquisitions Investments Ireland DAC | | | | | | | | |
3.200%, 09/23/26 | | | 60 | | | | 59 | |
2.875%, 09/23/23 | | | 50 | | | | 49 | |
1.900%, 09/23/19 | | | 100 | | | | 99 | |
Stryker | | | | | | | | |
4.625%, 03/15/46 | | | 100 | | | | 114 | |
3.500%, 03/15/26 | | | 25 | | | | 26 | |
3.375%, 11/01/25 | | | 50 | | | | 51 | |
2.000%, 03/08/19 | | | 30 | | | | 30 | |
Teva Pharmaceutical Finance Netherlands III BV | | | | | | | | |
4.100%, 10/01/46 | | | 200 | | | | 152 | |
2.800%, 07/21/23 | | | 215 | | | | 187 | |
1.700%, 07/19/19 | | | 20 | | | | 20 | |
Thermo Fisher Scientific | | | | | | | | |
3.600%, 08/15/21 | | | 100 | | | | 104 | |
3.200%, 08/15/27 | | | 100 | | | | 99 | |
2.950%, 09/19/26 | | | 30 | | | | 29 | |
UnitedHealth Group | | | | | | | | |
4.625%, 07/15/35 | | | 200 | | | | 233 | |
4.250%, 04/15/47 | | | 100 | | | | 110 | |
3.750%, 07/15/25 | | | 50 | | | | 53 | |
2.950%, 10/15/27 | | | 150 | | | | 150 | |
2.875%, 03/15/22 | | | 100 | | | | 101 | |
2.300%, 12/15/19 | | | 50 | | | | 50 | |
1.950%, 10/15/20 | | | 1,252 | | | | 1,240 | |
Zimmer Biomet Holdings | | | | | | | | |
3.550%, 04/01/25 | | | 150 | | | | 150 | |
Zoetis | | | | | | | | |
3.250%, 02/01/23 | | | 50 | | | | 51 | |
3.000%, 09/12/27 | | | 50 | | | | 49 | |
| | | | | | | | |
| | | | | | | 31,494 | |
| | | | | | | | |
The accompanying notes are an integral part of the financial statements.
104
| | |
| THE KP FUNDS | | December 31, 2017 |
| | | | | | | | |
| Description | | Face Amount
(000) | | | Value (000) | |
| | | | | | | | |
Industrials — 2.8% | | | | | | | | |
3M | | | | | | | | |
1.625%, 06/15/19 | | $ | 100 | | | $ | 100 | |
AerCap Ireland Capital | | | | | | | | |
4.625%, 10/30/20 | | | 225 | | | | 236 | |
4.500%, 05/15/21 | | | 4,617 | | | | 4,849 | |
3.750%, 05/15/19 | | | 175 | | | | 177 | |
Air Lease | | | | | | | | |
3.375%, 01/15/19 | | | 150 | | | | 151 | |
2.125%, 01/15/20 | | | 50 | | | | 50 | |
Allegion US Holding | | | | | | | | |
3.550%, 10/01/27 | | | 50 | | | | 49 | |
American Airlines, Pass-Through Trust, Ser 2013-2, Cl A | | | | | | | | |
4.950%, 01/15/23 | | | 146 | | | | 155 | |
Boeing | | | | | | | | |
2.350%, 10/30/21 | | | 150 | | | | 151 | |
2.125%, 03/01/22 | | | 50 | | | | 49 | |
Burlington Northern Santa Fe | | | | | | | | |
4.900%, 04/01/44 | | | 200 | | | | 240 | |
3.750%, 04/01/24 | | | 200 | | | | 212 | |
3.050%, 03/15/22 | | | 100 | | | | 102 | |
Canadian National Railway | | | | | | | | |
5.550%, 03/01/19 | | | 100 | | | | 104 | |
Canadian Pacific Railway | | | | | | | | |
2.900%, 02/01/25 | | | 100 | | | | 99 | |
Caterpillar | | | | | | | | |
5.200%, 05/27/41 | | | 100 | | | | 126 | |
3.900%, 05/27/21 | | | 50 | | | | 53 | |
3.400%, 05/15/24 | | | 100 | | | | 104 | |
Caterpillar Financial Services | | | | | | | | |
2.550%, 11/29/22 | | | 2,324 | | | | 2,317 | |
1.350%, 05/18/19 | | | 200 | | | | 198 | |
Cintas No. 2 | | | | | | | | |
3.700%, 04/01/27 | | | 200 | | | | 208 | |
CNH Industrial Capital | | | | | | | | |
4.875%, 04/01/21 | | | 10 | | | | 11 | |
4.375%, 11/06/20 | | | 15 | | | | 16 | |
4.375%, 04/05/22 | | | 10 | | | | 10 | |
3.875%, 10/15/21 | | | 10 | | | | 10 | |
3.375%, 07/15/19 | | | 10 | | | | 10 | |
CSX | | | | | | | | |
3.800%, 11/01/46 | | | 200 | | | | 199 | |
3.250%, 06/01/27 | | | 50 | | | | 50 | |
Delta Air Lines | | | | | | | | |
2.600%, 12/04/20 | | | 45 | | | | 45 | |
DP World | | | | | | | | |
6.850%, 07/02/37 (A) | | | 386 | | | | 475 | |
Eaton | | | | | | | | |
3.103%, 09/15/27 | | | 100 | | | | 98 | |
Embraer Netherlands Finance BV | | | | | | | | |
5.400%, 02/01/27 | | | 65 | | | | 70 | |
| | | | | | | | |
| Description | | Face Amount
(000) | | | Value (000) | |
| | | | | | | | |
Emerson Electric | | | | | | | | |
2.625%, 02/15/23 | | $ | 100 | | | $ | 100 | |
Eskom Holdings | | | | | | | | |
6.750%, 08/06/23 (A) | | | 200 | | | | 203 | |
5.750%, 01/26/21 (A) | | | 410 | | | | 406 | |
FedEx | | | | | | | | |
4.750%, 11/15/45 | | | 100 | | | | 112 | |
3.200%, 02/01/25 | | | 200 | | | | 203 | |
Fortive | | | | | | | | |
3.150%, 06/15/26 | | | 150 | | | | 149 | |
GE Capital International Funding Unlimited | | | | | | | | |
4.418%, 11/15/35 | | | 848 | | | | 918 | |
2.342%, 11/15/20 | | | 250 | | | | 249 | |
General Dynamics | | | | | | | | |
2.250%, 11/15/22 | | | 100 | | | | 99 | |
General Electric | | | | | | | | |
6.875%, 01/10/39 | | | 500 | | | | 721 | |
3.450%, 05/15/24 | | | 100 | | | | 103 | |
Georgian Oil and Gas JSC | | | | | | | | |
6.750%, 04/26/21 (A) | | | 200 | | | | 213 | |
Georgian Railway | | | | | | | | |
7.750%, 07/11/22 (A) | | | 1,100 | | | | 1,229 | |
Honeywell International | | | | | | | | |
4.250%, 03/01/21 | | | 125 | | | | 132 | |
2.500%, 11/01/26 | | | 150 | | | | 145 | |
Huntington Ingalls Industries | | | | | | | | |
3.483%, 12/01/27 (A) | | | 1,983 | | | | 1,978 | |
Illinois Tool Works | | | | | | | | |
1.950%, 03/01/19 | | | 100 | | | | 100 | |
Ingersoll-Rand Global Holding | | | | | | | | |
4.250%, 06/15/23 | | | 100 | | | | 107 | |
John Deere Capital | | | | | | | | |
3.350%, 06/12/24 | | | 100 | | | | 103 | |
2.800%, 03/04/21 | | | 100 | | | | 101 | |
2.800%, 03/06/23 | | | 50 | | | | 50 | |
2.800%, 09/08/27 | | | 50 | | | | 49 | |
2.650%, 06/24/24 | | | 100 | | | | 99 | |
Johnson Controls International | | | | | | | | |
4.500%, 02/15/47 | | | 150 | | | | 165 | |
3.625%, 07/02/24 (E) | | | 43 | | | | 44 | |
Kazakhstan Temir Zholy National JSC | | | | | | | | |
4.850%, 11/17/27 (A) | | | 810 | | | | 844 | |
L3 Technologies | | | | | | | | |
5.200%, 10/15/19 | | | 125 | | | | 131 | |
Latam Airlines, Pass-Through Trust, Ser 2015-1, Cl A | | | | | | | | |
4.200%, 11/15/27 | | | 547 | | | | 551 | |
Lima Metro Line 2 Finance | | | | | | | | |
5.875%, 07/05/34 | | | 200 | | | | 216 | |
Lockheed Martin | | | | | | | | |
4.700%, 05/15/46 | | | 150 | | | | 175 | |
2.900%, 03/01/25 | | | 100 | | | | 100 | |
2.500%, 11/23/20 | | | 5,266 | | | | 5,299 | |
The accompanying notes are an integral part of the financial statements.
105
| | |
| THE KP FUNDS | | December 31, 2017 |
| | | | | | | | |
| Description | | Face Amount
(000) | | | Value (000) | |
| | | | | | | | |
Masco | | | | | | | | |
4.500%, 05/15/47 | | $ | 100 | | | $ | 102 | |
4.375%, 04/01/26 | | | 40 | | | | 42 | |
3.500%, 04/01/21 | | | 50 | | | | 51 | |
Mexico City Airport Trust | | | | | | | | |
5.500%, 07/31/47 (A) | | | 895 | | | | 884 | |
Norfolk Southern | | | | | | | | |
3.250%, 12/01/21 | | | 100 | | | | 103 | |
3.150%, 06/01/27 | | | 25 | | | | 25 | |
2.900%, 06/15/26 | | | 35 | | | | 34 | |
Northrop Grumman | | | | | | | | |
4.030%, 10/15/47 | | | 1,369 | | | | 1,431 | |
3.500%, 03/15/21 | | | 100 | | | | 103 | |
3.250%, 08/01/23 | | | 50 | | | | 51 | |
2.550%, 10/15/22 | | | 3,883 | | | | 3,855 | |
Owens Corning | | | | | | | | |
4.200%, 12/01/24 | | | 100 | | | | 105 | |
PACCAR Financial | | | | | | | | |
1.950%, 02/27/20 | | | 60 | | | | 59 | |
1.300%, 05/10/19 | | | 20 | | | | 20 | |
Parker-Hannifin | | | | | | | | |
3.300%, 11/21/24 | | | 150 | | | | 153 | |
Pitney Bowes | | | | | | | | |
4.125%, 05/15/22 | | | 50 | | | | 46 | |
Republic Services | | | | | | | | |
2.900%, 07/01/26 | | | 150 | | | | 147 | |
Rockwell Collins | | | | | | | | |
3.200%, 03/15/24 | | | 150 | | | | 151 | |
Ryder System | | | | | | | | |
2.800%, 03/01/22 | | | 30 | | | | 30 | |
2.550%, 06/01/19 | | | 95 | | | | 95 | |
Southwest Airlines | | | | | | | | |
2.750%, 11/06/19 | | | 50 | | | | 50 | |
Stanley Black & Decker | | | | | | | | |
2.900%, 11/01/22 | | | 100 | | | | 101 | |
Textron | | | | | | | | |
3.650%, 03/15/27 | | | 100 | | | | 102 | |
TTX | | | | | | | | |
2.250%, 02/01/19 (A) | | | 922 | | | | 920 | |
Union Pacific | | | | | | | | |
3.799%, 10/01/51 | | | 200 | | | | 204 | |
3.646%, 02/15/24 | | | 100 | | | | 105 | |
3.600%, 09/15/37 | | | 2,466 | | | | 2,555 | |
United Airlines, Pass-Through Trust, Ser 2014-2, Cl A | | | | | | | | |
3.750%, 09/03/26 | | | 89 | | | | 92 | |
United Parcel Service | | | | | | | | |
5.125%, 04/01/19 | | | 100 | | | | 103 | |
3.750%, 11/15/47 | | | 1,378 | | | | 1,423 | |
3.125%, 01/15/21 | | | 45 | | | | 46 | |
3.050%, 11/15/27 | | | 100 | | | | 100 | |
2.500%, 04/01/23 | | | 4,180 | | | | 4,157 | |
United Technologies | | | | | | | | |
3.750%, 11/01/46 | | | 150 | | | | 150 | |
3.100%, 06/01/22 | | | 100 | | | | 102 | |
| | | | | | | | |
| Description | | Face Amount
(000) | | | Value (000) | |
| | | | | | | | |
2.650%, 11/01/26 | | $ | 130 | | | $ | 125 | |
2.300%, 05/04/22 | | | 100 | | | | 99 | |
1.950%, 11/01/21 | | | 50 | | | | 49 | |
1.500%, 11/01/19 | | | 50 | | | | 49 | |
Verisk Analytics | | | | | | | | |
4.000%, 06/15/25 | | | 50 | | | | 52 | |
Waste Management | | | | | | | | |
3.500%, 05/15/24 | | | 100 | | | | 104 | |
| | | | | | | | |
| | | | | | | 43,993 | |
| | | | | | | | |
Information Technology — 1.4% | |
Activision Blizzard | | | | | | | | |
3.400%, 09/15/26 | | | 50 | | | | 51 | |
Alibaba Group Holding | | | | | | | | |
4.200%, 12/06/47 | | | 1,404 | | | | 1,462 | |
2.800%, 06/06/23 | | | 250 | | | | 249 | |
Alphabet | | | | | | | | |
3.375%, 02/25/24 | | | 100 | | | | 104 | |
Apple | | | | | | | | |
4.650%, 02/23/46 | | | 1,373 | | | | 1,608 | |
4.500%, 02/23/36 | | | 350 | | | | 401 | |
3.850%, 08/04/46 | | | 1,529 | | | | 1,593 | |
3.750%, 09/12/47 | | | 150 | | | | 154 | |
3.450%, 05/06/24 | | | 100 | | | | 104 | |
3.000%, 06/20/27 | | | 25 | | | | 25 | |
3.000%, 11/13/27 | | | 100 | | | | 99 | |
2.850%, 05/06/21 | | | 200 | | | | 203 | |
2.500%, 02/09/22 | | | 50 | | | | 50 | |
2.400%, 01/13/23 | | | 2,605 | | | | 2,583 | |
2.300%, 05/11/22 | | | 100 | | | | 99 | |
2.250%, 02/23/21 | | | 50 | | | | 50 | |
2.150%, 02/09/22 | | | 250 | | | | 247 | |
1.700%, 02/22/19 | | | 20 | | | | 20 | |
1.550%, 08/04/21 | | | 50 | | | | 49 | |
Applied Materials | | | | | | | | |
3.300%, 04/01/27 | | | 25 | | | | 25 | |
2.625%, 10/01/20 | | | 50 | | | | 51 | |
Arrow Electronics | | | | | | | | |
3.500%, 04/01/22 | | | 100 | | | | 101 | |
Automatic Data Processing | | | | | | | | |
2.250%, 09/15/20 | | | 50 | | | | 50 | |
Broadcom | | | | | | | | |
3.875%, 01/15/27 (A) | | | 100 | | | | 98 | |
3.625%, 01/15/24 (A) | | | 100 | | | | 100 | |
3.000%, 01/15/22 (A) | | | 100 | | | | 99 | |
2.375%, 01/15/20 (A) | | | 100 | | | | 99 | |
Cisco Systems | | | | | | | | |
4.950%, 02/15/19 | | | 100 | | | | 103 | |
4.450%, 01/15/20 | | | 200 | | | | 209 | |
3.625%, 03/04/24 | | | 100 | | | | 106 | |
3.500%, 06/15/25 | | | 50 | | | | 52 | |
2.950%, 02/28/26 | | | 50 | | | | 50 | |
2.500%, 09/20/26 | | | 100 | | | | 97 | |
1.850%, 09/20/21 | | | 100 | | | | 98 | |
Dell International | | | | | | | | |
6.020%, 06/15/26 (A) | | | 260 | | | | 287 | |
The accompanying notes are an integral part of the financial statements.
106
| | |
| THE KP FUNDS | | December 31, 2017 |
| | | | | | | | |
| Description | | Face Amount
(000) | | | Value (000) | |
| | | | | | | | |
5.450%, 06/15/23 (A) | | $ | 85 | | | $ | 92 | |
4.420%, 06/15/21 (A) | | | 100 | | | | 104 | |
eBay | | | | | | | | |
2.750%, 01/30/23 | | | 250 | | | | 248 | |
Fidelity National Information Services | | | | | | | | |
5.000%, 10/15/25 | | | 28 | | | | 31 | |
3.625%, 10/15/20 | | | 200 | | | | 205 | |
Fiserv | | | | | | | | |
2.700%, 06/01/20 | | | 100 | | | | 101 | |
Harris | | | | | | | | |
5.054%, 04/27/45 | | | 100 | | | | 118 | |
2.700%, 04/27/20 | | | 35 | | | | 35 | |
Hewlett Packard Enterprise | | | | | | | | |
4.900%, 10/15/25 | | | 100 | | | | 106 | |
HP | | | | | | | | |
4.650%, 12/09/21 | | | 100 | | | | 106 | |
IBM Credit | | | | | | | | |
1.800%, 01/20/21 | | | 100 | | | | 98 | |
Intel | | | | | | | | |
4.100%, 05/19/46 | | | 250 | | | | 276 | |
3.700%, 07/29/25 | | | 25 | | | | 26 | |
3.150%, 05/11/27 | | | 100 | | | | 102 | |
2.875%, 05/11/24 | | | 150 | | | | 151 | |
2.450%, 07/29/20 | | | 60 | | | | 61 | |
International Business Machines | | | | | | | | |
4.000%, 06/20/42 | | | 150 | | | | 159 | |
3.450%, 02/19/26 | | | 50 | | | | 51 | |
3.375%, 08/01/23 | | | 200 | | | | 207 | |
2.250%, 02/19/21 | | | 50 | | | | 50 | |
Juniper Networks | | | | | | | | |
4.500%, 03/15/24 | | | 50 | | | | 52 | |
Keysight Technologies | | | | | | | | |
3.300%, 10/30/19 | | | 100 | | | | 101 | |
Lam Research | | | | | | | | |
2.800%, 06/15/21 | | | 50 | | | | 50 | |
Mastercard | | | | | | | | |
2.950%, 11/21/26 | | | 50 | | | | 50 | |
Microsoft | | | | | | | | |
4.250%, 02/06/47 | | | 500 | | | | 572 | |
4.100%, 02/06/37 | | | 200 | | | | 223 | |
3.750%, 02/12/45 | | | 1,093 | | | | 1,151 | |
3.450%, 08/08/36 | | | 300 | | | | 309 | |
3.300%, 02/06/27 | | | 60 | | | | 62 | |
3.125%, 11/03/25 | | | 100 | | | | 102 | |
2.875%, 02/06/24 | | | 35 | | | | 36 | |
2.650%, 11/03/22 | | | 150 | | | | 151 | |
2.400%, 08/08/26 | | | 100 | | | | 96 | |
1.850%, 02/06/20 | | | 100 | | | | 100 | |
Motorola Solutions | | | | | | | | |
3.500%, 09/01/21 | | | 100 | | | | 102 | |
NetApp | | | | | | | | |
3.375%, 06/15/21 | | | 50 | | | | 51 | |
Oracle | | | | | | | | |
5.375%, 07/15/40 | | | 648 | | | | 819 | |
| | | | | | | | |
| Description | | Face Amount
(000) | | | Value (000) | |
| | | | | | | | |
4.300%, 07/08/34 | | $ | 500 | | | $ | 556 | |
3.800%, 11/15/37 | | | 2,842 | | | | 2,981 | |
2.950%, 05/15/25 | | | 100 | | | | 100 | |
2.500%, 05/15/22 | | | 150 | | | | 150 | |
2.400%, 09/15/23 | | | 50 | | | | 49 | |
2.375%, 01/15/19 | | | 150 | | | | 151 | |
1.900%, 09/15/21 | | | 90 | | | | 89 | |
QUALCOMM | | | | | | | | |
4.300%, 05/20/47 | | | 150 | | | | 151 | |
3.250%, 05/20/27 | | | 50 | | | | 49 | |
3.000%, 05/20/22 | | | 100 | | | | 100 | |
2.600%, 01/30/23 | | | 200 | | | | 195 | |
Seagate HDD Cayman | | | | | | | | |
4.750%, 01/01/25 | | | 100 | | | | 98 | |
Texas Instruments | | | | | | | | |
2.750%, 03/12/21 | | | 75 | | | | 76 | |
Total System Services | | | | | | | | |
4.800%, 04/01/26 | | | 100 | | | | 108 | |
Tyco Electronics Group | | | | | | | | |
3.125%, 08/15/27 | | | 25 | | | | 25 | |
Visa | | | | | | | | |
4.300%, 12/14/45 | | | 150 | | | | 171 | |
3.150%, 12/14/25 | | | 200 | | | | 204 | |
2.800%, 12/14/22 | | | 100 | | | | 102 | |
VMware | | | | | | | | |
2.950%, 08/21/22 | | | 100 | | | | 100 | |
Xerox | | | | | | | | |
3.625%, 03/15/23 | | | 100 | | | | 98 | |
Xilinx | | | | | | | | |
2.125%, 03/15/19 | | | 50 | | | | 50 | |
| | | | | | | | |
| | | | | | | 22,733 | |
| | | | | | | | |
Materials — 1.1% | | | | | | | | |
Agrium | | | | | | | | |
6.125%, 01/15/41 | | | 150 | | | | 191 | |
Airgas | | | | | | | | |
3.650%, 07/15/24 | | | 100 | | | | 104 | |
Anglo American Capital | | | | | | | | |
4.750%, 04/10/27 (A) | | | 1,050 | | | | 1,099 | |
Barrick | | | | | | | | |
5.250%, 04/01/42 | | | 150 | | | | 173 | |
BHP Billiton Finance USA | | | | | | | | |
5.000%, 09/30/43 | | | 100 | | | | 123 | |
Braskem Finance | | | | | | | | |
6.450%, 02/03/24 | | | 660 | | | | 739 | |
Celanese US Holdings | | | | | | | | |
5.875%, 06/15/21 | | | 20 | | | | 22 | |
4.625%, 11/15/22 | | | 20 | | | | 21 | |
Celulosa Arauco y Constitucion | | | | | | | | |
3.875%, 11/02/27 (A) | | | 358 | | | | 356 | |
Dow Chemical | | | | | | | | |
8.550%, 05/15/19 | | | 1,600 | | | | 1,733 | |
Ecolab | | | | | | | | |
3.250%, 01/14/23 | | | 100 | | | | 102 | |
The accompanying notes are an integral part of the financial statements.
107
| | |
| THE KP FUNDS | | December 31, 2017 |
| | | | | | | | |
| Description | | Face Amount
(000) | | | Value (000) | |
| | | | | | | | |
EI du Pont de Nemours | | | | | | | | |
4.625%, 01/15/20 | | $ | 100 | | | $ | 105 | |
4.150%, 02/15/43 | | | 150 | | | | 154 | |
2.200%, 05/01/20 | | | 17 | | | | 17 | |
Goldcorp | | | | | | | | |
3.700%, 03/15/23 | | | 50 | | | | 51 | |
International Paper | | | | | | | | |
5.150%, 05/15/46 | | | 150 | | | | 174 | |
LyondellBasell Industries | | | | | | | | |
5.000%, 04/15/19 | | | 200 | | | | 205 | |
Martin Marietta Materials | | | | | | | | |
4.250%, 12/15/47 | | | 100 | | | | 99 | |
Mexichem | | | | | | | | |
5.875%, 09/17/44 (A) | | | 690 | | | | 714 | |
5.500%, 01/15/48 (A) | | | 625 | | | | 609 | |
Monsanto | | | | | | | | |
4.700%, 07/15/64 | | | 200 | | | | 209 | |
Mosaic | | | | | | | | |
4.050%, 11/15/27 | | | 100 | | | | 100 | |
Nacional del Cobre de Chile | | | | | | | | |
3.625%, 08/01/27 (A) | | | 350 | | | | 350 | |
Newmont Mining | | | | | | | | |
3.500%, 03/15/22 | | | 100 | | | | 102 | |
Nexa Resources | | | | | | | | |
5.375%, 05/04/27 (A) | | | 650 | | | | 689 | |
Packaging Corp of America | | | | | | | | |
3.650%, 09/15/24 | | | 100 | | | | 103 | |
3.400%, 12/15/27 | | | 35 | | | | 35 | |
2.450%, 12/15/20 | | | 35 | | | | 35 | |
Potash Corp of Saskatchewan | | | | | | | | |
3.625%, 03/15/24 | | | 100 | | | | 103 | |
PPG Industries | | | | | | | | |
2.300%, 11/15/19 | | | 100 | | | | 100 | |
Rio Tinto Finance USA | | | | | | | | |
3.750%, 06/15/25 | | | 200 | | | | 210 | |
Sherwin-Williams | | | | | | | | |
3.450%, 08/01/25 | | | 100 | | | | 101 | |
2.750%, 06/01/22 | | | 2,130 | | | | 2,122 | |
Southern Copper | | | | | | | | |
5.875%, 04/23/45 | | | 150 | | | | 181 | |
3.875%, 04/23/25 | | | 30 | | | | 31 | |
Vale | | | | | | | | |
5.625%, 09/11/42 | | | 100 | | | | 110 | |
Vale Overseas | | | | | | | | |
8.250%, 01/17/34 | | | 390 | | | | 515 | |
6.875%, 11/21/36 | | | 799 | | | | 979 | |
5.875%, 06/10/21 | | | 1,050 | | | | 1,143 | |
4.375%, 01/11/22 | | | 2,282 | | | | 2,360 | |
Vulcan Materials | | | | | | | | |
4.500%, 06/15/47 | | | 1,070 | | | | 1,092 | |
Westlake Chemical | | | | | | | | |
3.600%, 08/15/26 | | | 100 | | | | 101 | |
| | | | | | | | |
| Description | | Face Amount
(000) | | | Value (000) | |
| | | | | | | | |
WestRock RKT | | | | | | | | |
4.450%, 03/01/19 | | $ | 100 | | | $ | 102 | |
| | | | | | | | |
| | | | | | | 17,664 | |
| | | | | | | | |
Real Estate — 0.7% | | | | | | | | |
Alexandria Real Estate Equities | | | | | | | | |
3.450%, 04/30/25 | | | 25 | | | | 25 | |
2.750%, 01/15/20 | | | 50 | | | | 50 | |
American Tower | | | | | | | | |
4.000%, 06/01/25 | | | 200 | | | | 207 | |
2.250%, 01/15/22 | | | 50 | | | | 49 | |
AvalonBay Communities | | | | | | | | |
3.500%, 11/15/24 | | | 100 | | | | 103 | |
Boston Properties | | | | | | | | |
3.850%, 02/01/23 | | | 100 | | | | 104 | |
3.650%, 02/01/26 | | | 150 | | | | 153 | |
Brixmor Operating Partnership | | | | | | | | |
3.875%, 08/15/22 | | | 30 | | | | 31 | |
3.250%, 09/15/23 | | | 100 | | | | 98 | |
CBL & Associates | | | | | | | | |
5.250%, 12/01/23 | | | 150 | | | | 142 | |
Crown Castle International | | | | | | | | |
5.250%, 01/15/23 | | | 100 | | | | 109 | |
3.700%, 06/15/26 | | | 35 | | | | 35 | |
2.250%, 09/01/21 | | | 55 | | | | 54 | |
DDR | | | | | | | | |
3.500%, 01/15/21 | | | 100 | | | | 101 | |
Digital Realty Trust | | | | | | | | |
3.625%, 10/01/22 | | | 100 | | | | 103 | |
Duke Realty | | | | | | | | |
3.750%, 12/01/24 | | | 100 | | | | 103 | |
EPR Properties | | | | | | | | |
4.750%, 12/15/26 | | | 50 | | | | 51 | |
ERP Operating | | | | | | | | |
4.625%, 12/15/21 | | | 120 | | | | 128 | |
Essex Portfolio | | | | | | | | |
3.375%, 04/15/26 | | | 100 | | | | 99 | |
HCP | | | | | | | | |
5.375%, 02/01/21 | | | 200 | | | | 215 | |
Healthcare Trust of America Holdings | | | | | | | | |
3.750%, 07/01/27 | | | 100 | | | | 100 | |
Hospitality Properties Trust | | | | | | | | |
5.250%, 02/15/26 | | | 100 | | | | 107 | |
5.000%, 08/15/22 | | | 100 | | | | 107 | |
Host Hotels & Resorts | | | | | | | | |
3.750%, 10/15/23 | | | 100 | | | | 102 | |
Kilroy Realty | | | | | | | | |
3.450%, 12/15/24 | | | 50 | | | | 50 | |
Kimco Realty | | | | | | | | |
3.300%, 02/01/25 | | | 80 | | | | 79 | |
3.200%, 05/01/21 | | | 50 | | | | 51 | |
Liberty Property | | | | | | | | |
4.125%, 06/15/22 | | | 100 | | | | 105 | |
The accompanying notes are an integral part of the financial statements.
108
| | |
| THE KP FUNDS | | December 31, 2017 |
| | | | | | | | |
| Description | | Face Amount
(000) | | | Value (000) | |
| | | | | | | | |
Mid-America Apartments | | | | | | | | |
3.600%, 06/01/27 | | $ | 25 | | | $ | 25 | |
National Retail Properties | | | | | | | | |
4.000%, 11/15/25 | | | 35 | | | | 36 | |
3.600%, 12/15/26 | | | 100 | | | | 99 | |
Omega Healthcare Investors | | | | | | | | |
4.375%, 08/01/23 | | | 50 | | | | 51 | |
Realty Income | | | | | | | | |
3.250%, 10/15/22 | | | 100 | | | | 102 | |
Regency Centers | | | | | | | | |
3.600%, 02/01/27 | | | 30 | | | | 30 | |
Select Income | | | | | | | | |
4.250%, 05/15/24 | | | 50 | | | | 50 | |
Senior Housing Properties Trust | | | | | | | | |
3.250%, 05/01/19 | | | 150 | | | | 151 | |
Simon Property Group | | | | | | | | |
3.375%, 10/01/24 | | | 125 | | | | 128 | |
3.375%, 12/01/27 | | | 1,941 | | | | 1,950 | |
3.300%, 01/15/26 | | | 100 | | | | 100 | |
2.750%, 06/01/23 | | | 4,119 | | | | 4,106 | |
2.200%, 02/01/19 | | | 150 | | | | 150 | |
UDR | | | | | | | | |
4.000%, 10/01/25 | | | 50 | | | | 52 | |
Ventas Realty | | | | | | | | |
4.250%, 03/01/22 | | | 100 | | | | 105 | |
3.750%, 05/01/24 | | | 50 | | | | 51 | |
2.700%, 04/01/20 | | | 100 | | | | 101 | |
VEREIT Operating Partnership | | | | | | | | |
4.875%, 06/01/26 | | | 20 | | | | 21 | |
4.600%, 02/06/24 | | | 15 | | | | 16 | |
4.125%, 06/01/21 | | | 10 | | | | 10 | |
3.000%, 02/06/19 | | | 25 | | | | 25 | |
Welltower | | | | | | | | |
5.250%, 01/15/22 | | | 100 | | | | 109 | |
Weyerhaeuser | | | | | | | | |
4.625%, 09/15/23 | | | 100 | | | | 107 | |
WP Carey | | | | | | | | |
4.600%, 04/01/24 | | | 50 | | | | 52 | |
| | | | | | | | |
| | | | | | | 10,288 | |
| | | | | | | | |
Telecommunication Services — 1.0% | | | | | |
America Movil | | | | | | | | |
6.125%, 03/30/40 | | | 250 | | | | 318 | |
AT&T | | | | | | | | |
5.250%, 03/01/37 | | | 2,170 | | | | 2,295 | |
5.150%, 03/15/42 | | | 191 | | | | 198 | |
4.900%, 08/14/37 | | | 1,280 | | | | 1,296 | |
4.350%, 06/15/45 | | | 600 | | | | 553 | |
4.300%, 02/15/30 (A) | | | 333 | | | | 332 | |
4.125%, 02/17/26 | | | 200 | | | | 205 | |
4.100%, 02/15/28 (A) | | | 253 | | | | 254 | |
3.900%, 08/14/27 | | | 100 | | | | 101 | |
3.800%, 03/01/24 | | | 200 | | | | 205 | |
3.400%, 05/15/25 | | | 2,552 | | | | 2,509 | |
| | | | | | | | |
| Description | | Face Amount
(000) | | | Value (000) | |
| | | | | | | | |
Cox Communications | | | | | | | | |
4.600%, 08/15/47 (A) | | $ | 552 | | | $ | 557 | |
Deutsche Telekom International Finance BV | | | | | | | | |
8.750%, 06/15/30 | | | 100 | | | | 148 | |
2.225%, 01/17/20 (A) | | | 1,009 | | | | 1,004 | |
Digicel | | | | | | | | |
6.000%, 04/15/21 (A) | | | 280 | | | | 276 | |
Orange | | | | | | | | |
5.375%, 07/08/19 | | | 200 | | | | 209 | |
4.125%, 09/14/21 | | | 100 | | | | 106 | |
RELX Capital | | | | | | | | |
3.125%, 10/15/22 | | | 100 | | | | 101 | |
Rogers Communications | | | | | | | | |
2.900%, 11/15/26 | | | 50 | | | | 48 | |
Telefonica Emisiones SAU | | | | | | | | |
5.462%, 02/16/21 | | | 110 | | | | 119 | |
5.213%, 03/08/47 | | | 150 | | | | 170 | |
Thomson Reuters | | | | | | | | |
3.350%, 05/15/26 | | | 100 | | | | 100 | |
Verizon Communications | | | | | | | | |
5.250%, 03/16/37 | | | 441 | | | | 485 | |
5.150%, 09/15/23 | | | 1,004 | | | | 1,117 | |
4.862%, 08/21/46 | | | 750 | | | | 781 | |
4.812%, 03/15/39 | | | 100 | | | | 105 | |
4.400%, 11/01/34 | | | 400 | | | | 408 | |
4.272%, 01/15/36 | | | 1,428 | | | | 1,420 | |
3.376%, 02/15/25 (A) | | | 150 | | | | 150 | |
3.125%, 03/16/22 | | | 150 | | | | 152 | |
2.946%, 03/15/22 | | | 102 | | | | 103 | |
2.625%, 08/15/26 | | | 135 | | | | 127 | |
Vodafone Group | | | | | | | | |
4.375%, 02/19/43 | | | 300 | | | | 309 | |
2.500%, 09/26/22 | | | 100 | | | | 99 | |
| | | | | | | | |
| | | | | | | 16,360 | |
| | | | | | | | |
Utilities — 2.9% | | | | | | | | |
Abengoa Transmision | | | | | | | | |
6.875%, 04/30/43 (A) | | | 249 | | | | 276 | |
AEP Transmission | | | | | | | | |
3.100%, 12/01/26 | | | 150 | | | | 150 | |
Ameren Illinois | | | | | | | | |
3.700%, 12/01/47 | | | 851 | | | | 871 | |
American Electric Power | | | | | | | | |
3.200%, 11/13/27 | | | 1,235 | | | | 1,226 | |
2.150%, 11/13/20 | | | 2,213 | | | | 2,203 | |
American Water Capital | | | | | | | | |
3.400%, 03/01/25 | | | 100 | | | | 103 | |
Appalachian Power | | | | | | | | |
4.450%, 06/01/45 | | | 1,376 | | | | 1,527 | |
Arizona Public Service | | | | | | | | |
4.500%, 04/01/42 | | | 200 | | | | 226 | |
3.150%, 05/15/25 | | | 50 | | | | 50 | |
Atmos Energy | | | | | | | | |
3.000%, 06/15/27 | | | 65 | | | | 65 | |
The accompanying notes are an integral part of the financial statements.
109
| | |
| THE KP FUNDS | | December 31, 2017 |
| | | | | | | | |
| Description | | Face Amount
(000) | | | Value (000) | |
| | | | | | | | |
Berkshire Hathaway Energy | | | | | | | | |
3.750%, 11/15/23 | | $ | 100 | | | $ | 104 | |
Celeo Redes Operacion Chile | | | | | | | | |
5.200%, 06/22/47 (A) | | | 690 | | | | 699 | |
CenterPoint Energy | | | | | | | | |
2.500%, 09/01/22 | | | 50 | | | | 49 | |
CenterPoint Energy Houston Electric | | | | | | | | |
2.250%, 08/01/22 | | | 100 | | | | 99 | |
Cleco Corporate Holdings | | | | | | | | |
3.743%, 05/01/26 | | | 100 | | | | 100 | |
CMS Energy | | | | | | | | |
6.250%, 02/01/20 | | | 100 | | | | 108 | |
3.000%, 05/15/26 | | | 40 | | | | 39 | |
Comision Federal de Electricidad | | | | | | | | |
4.750%, 02/23/27 (A) | | | 400 | | | | 418 | |
Consolidated Edison of New York | | | | | | | | |
4.450%, 03/15/44 | | | 150 | | | | 171 | |
3.875%, 06/15/47 | | | 100 | | | | 104 | |
Delmarva Power & Light | | | | | | | | |
4.150%, 05/15/45 | | | 423 | | | | 463 | |
Dominion Energy | | | | | | | | |
4.050%, 09/15/42 | | | 150 | | | | 154 | |
2.962%, 07/01/19 | | | 1,600 | | | | 1,613 | |
2.750%, 01/15/22 | | | 100 | | | | 100 | |
2.579%, 07/01/20 | | | 45 | | | | 45 | |
Dominion Energy Gas Holdings | | | | | | | | |
2.500%, 12/15/19 | | | 1,300 | | | | 1,302 | |
DTE Electric | | | | | | | | |
3.750%, 08/15/47 | | | 100 | | | | 104 | |
DTE Energy | | | | | | | | |
2.400%, 12/01/19 | | | 100 | | | | 100 | |
Duke Energy | | | | | | | | |
3.750%, 09/01/46 | | | 350 | | | | 346 | |
Duke Energy Carolinas | | | | | | | | |
5.300%, 02/15/40 | | | 300 | | | | 377 | |
3.700%, 12/01/47 | | | 100 | | | | 103 | |
2.950%, 12/01/26 | | | 50 | | | | 50 | |
Duke Energy Florida | | | | | | | | |
2.100%, 12/15/19 | | | 996 | | | | 995 | |
Edison International | | | | | | | | |
2.400%, 09/15/22 | | | 80 | | | | 78 | |
Enel Generacion Chile | | | | | | | | |
4.250%, 04/15/24 | | | 50 | | | | 52 | |
Energuate Trust | | | | | | | | |
5.875%, 05/03/27 (A) | | | 200 | | | | 207 | |
Entergy | | | | | | | | |
4.000%, 07/15/22 | | | 50 | | | | 52 | |
Entergy Arkansas | | | | | | | | |
3.500%, 04/01/26 | | | 100 | | | | 103 | |
Eversource Energy | | | | | | | | |
2.750%, 03/15/22 | | | 2,273 | | | | 2,277 | |
| | | | | | | | |
| Description | | Face Amount
(000) | | | Value (000) | |
| | | | | | | | |
Exelon | | | | | | | | |
5.625%, 06/15/35 | | $ | 160 | | | $ | 197 | |
3.400%, 04/15/26 | | | 100 | | | | 100 | |
Exelon Generation | | | | | | | | |
5.600%, 06/15/42 | | | 600 | | | | 658 | |
FirstEnergy | | | | | | | | |
3.900%, 07/15/27 | | | 30 | | | | 31 | |
FirstEnergy Transmission | | | | | | | | |
5.450%, 07/15/44 (A) | | | 772 | | | | 917 | |
Florida Power & Light | | | | | | | | |
3.700%, 12/01/47 | | | 100 | | | | 104 | |
Fortis | | | | | | | | |
3.055%, 10/04/26 | | | 2,761 | | | | 2,666 | |
2.100%, 10/04/21 | | | 150 | | | | 146 | |
Georgia Power | | | | | | | | |
4.300%, 03/15/42 | | | 300 | | | | 319 | |
2.000%, 09/08/20 | | | 115 | | | | 114 | |
ITC Holdings | | | | | | | | |
5.300%, 07/01/43 | | | 351 | | | | 423 | |
3.650%, 06/15/24 | | | 25 | | | | 26 | |
3.350%, 11/15/27 (A) | | | 1,384 | | | | 1,385 | |
2.700%, 11/15/22 (A) | | | 1,669 | | | | 1,666 | |
Jersey Central Power & Light | | | | | | | | |
7.350%, 02/01/19 | | | 824 | | | | 865 | |
4.700%, 04/01/24 (A) | | | 2,341 | | | | 2,535 | |
Kansas City Power & Light | | | | | | | | |
3.650%, 08/15/25 | | | 100 | | | | 102 | |
Listrindo Capital BV | | | | | | | | |
4.950%, 09/14/26 (A) | | | 450 | | | | 455 | |
Metropolitan Edison | | | | | | | | |
7.700%, 01/15/19 | | | 100 | | | | 105 | |
MidAmerican Energy | | | | | | | | |
3.950%, 08/01/47 | | | 250 | | | | 267 | |
2.400%, 03/15/19 | | | 138 | | | | 139 | |
Minejesa Capital BV | | | | | | | | |
5.625%, 08/10/37 (A) | | | 670 | | | | 714 | |
National Fuel Gas | | | | | | | | |
3.950%, 09/15/27 | | | 50 | | | | 50 | |
New England Power | | | | | | | | |
3.800%, 12/05/47 (A) | | | 714 | | | | 730 | |
NextEra Energy Capital Holdings | | | | | | | | |
3.550%, 05/01/27 | | | 100 | | | | 102 | |
2.700%, 09/15/19 | | | 1,439 | | | | 1,448 | |
NiSource Finance | | | | | | | | |
4.375%, 05/15/47 | | | 100 | | | | 109 | |
2.650%, 11/17/22 | | | 20 | | | | 20 | |
Northern States Power | | | | | | | | |
2.600%, 05/15/23 | | | 100 | | | | 100 | |
2.200%, 08/15/20 | | | 50 | | | | 50 | |
NSTAR Electric | | | | | | | | |
2.375%, 10/15/22 | | | 100 | | | | 98 | |
Oncor Electric Delivery | | | | | | | | |
7.000%, 09/01/22 | | | 100 | | | | 118 | |
The accompanying notes are an integral part of the financial statements.
110
| | |
| THE KP FUNDS | | December 31, 2017 |
| | | | | | | | |
| Description | | Face Amount
(000) | | | Value (000) | |
| | | | | | | | |
ONE Gas | | | | | | | | |
2.070%, 02/01/19 | | $ | 74 | | | $ | 74 | |
Pacific Gas & Electric | | | | | | | | |
6.050%, 03/01/34 | | | 400 | | | | 504 | |
2.950%, 03/01/26 | | | 50 | | | | 49 | |
Pinnacle West Capital | | | | | | | | |
2.250%, 11/30/20 | | | 1,009 | | | | 1,004 | |
PPL Capital Funding | | | | | | | | |
4.000%, 09/15/47 | | | 100 | | | | 103 | |
3.500%, 12/01/22 | | | 150 | | | | 154 | |
Progress Energy | | | | | | | | |
7.750%, 03/01/31 | | | 1,808 | | | | 2,531 | |
7.050%, 03/15/19 | | | 1,225 | | | | 1,293 | |
PSEG Power | | | | | | | | |
3.000%, 06/15/21 | | | 50 | | | | 50 | |
Public Service Enterprise Group | | | | | | | | |
2.650%, 11/15/22 | | | 150 | | | | 149 | |
Puget Energy | | | | | | | | |
6.500%, 12/15/20 | | | 100 | | | | 111 | |
Sempra Energy | | | | | | | | |
9.800%, 02/15/19 | | | 1,135 | | | | 1,229 | |
3.750%, 11/15/25 | | | 100 | | | | 103 | |
3.550%, 06/15/24 | | | 100 | | | | 103 | |
Southern | | | | | | | | |
2.350%, 07/01/21 | | | 1,789 | | | | 1,778 | |
1.850%, 07/01/19 | | | 100 | | | | 100 | |
Southern California Edison | | | | | | | | |
3.500%, 10/01/23 | | | 150 | | | | 155 | |
Southern Gas Capital | | | | | | | | |
3.250%, 06/15/26 | | | 30 | | | | 30 | |
Southwestern Electric Power | | | | | | | | |
2.750%, 10/01/26 | | | 50 | | | | 48 | |
State Grid Overseas Investment 2013 | | | | | | | | |
3.125%, 05/22/23 (A) | | | 1,115 | | | | 1,114 | |
Union Electric | | | | | | | | |
3.500%, 04/15/24 | | | 150 | | | | 156 | |
Virginia Electric & Power | | | | | | | | |
3.500%, 03/15/27 | | | 100 | | | | 103 | |
3.100%, 05/15/25 | | | 100 | | | | 101 | |
2.750%, 03/15/23 | | | 100 | | | | 100 | |
WEC Energy Group | | | | | | | | |
1.650%, 06/15/18 | | | 1,109 | | | | 1,108 | |
Wisconsin Power & Light | | | | | | | | |
3.050%, 10/15/27 | | | 100 | | | | 100 | |
Xcel Energy | | | | | | | | |
3.350%, 12/01/26 | | | 100 | | | | 101 | |
| | | | | | | | |
| | | | | | | 46,319 | |
| | | | | | | | |
Total Corporate Obligations
(Cost $394,235) (000) | | | | | | | 399,391 | |
| | | | | | | | |
| | | | | | | | |
| Description | | Face Amount
(000) | | | Value (000) | |
| | | | | | | | |
U.S. Treasury Obligations — 24.6% | |
U.S. Treasury Bonds | | | | | | | | |
5.375%, 02/15/31 | | $ | 1,000 | | | $ | 1,329 | |
5.000%, 05/15/37 | | | 2,240 | | | | 3,071 | |
4.750%, 02/15/37 | | | 10,315 | | | | 13,742 | |
4.625%, 02/15/40 | | | 500 | | | | 665 | |
4.375%, 02/15/38 | | | 1,200 | | | | 1,534 | |
3.875%, 08/15/40 | | | 500 | | | | 603 | |
3.750%, 11/15/43 | | | 6,500 | | | | 7,745 | |
3.500%, 02/15/39 | | | 3,400 | | | | 3,883 | |
3.375%, 05/15/44 | | | 6,000 | | | | 6,733 | |
3.000%, 02/15/47-11/15/45 | | | 15,390 | | | | 16,181 | |
2.875%, 11/15/46 | | | 6,344 | | | | 6,508 | |
2.750%, 08/15/47-11/15/47 | | | 7,459 | | | | 7,469 | |
2.500%, 05/15/46 | | | 834 | | | | 793 | |
2.250%, 08/15/46 | | | 3,950 | | | | 3,563 | |
U.S. Treasury Notes | | | | | | | | |
3.625%, 02/15/20 | | | 1,750 | | | | 1,813 | |
3.500%, 05/15/20 | | | 750 | | | | 777 | |
3.375%, 11/15/19 | | | 1,000 | | | | 1,027 | |
3.125%, 05/15/19 | | | 1,500 | | | | 1,526 | |
2.750%, 02/15/24 | | | 1,000 | | | | 1,026 | |
2.625%, 11/15/20-08/15/20 | | | 2,750 | | | | 2,799 | |
2.500%, 05/15/24-08/15/23 | | | 3,100 | | | | 3,138 | |
2.375%, 08/15/24-05/15/27 | | | 4,400 | | | | 4,419 | |
2.250%, 11/15/27-03/31/21 | | | 21,244 | | | | 21,055 | |
2.125%, 11/30/24-03/31/24 | | | 23,967 | | | | 23,692 | |
2.000%, 12/31/21-09/30/20 | | | 43,144 | | | | 42,744 | |
1.875%, 09/30/22-02/28/22 | | | 38,738 | | | | 38,293 | |
1.750%, 06/30/22-09/30/22 | | | 19,430 | | | | 19,175 | |
1.625%, 05/15/26-11/15/22 | | | 36,788 | | | | 35,638 | |
1.500%, 10/31/19-03/31/23 | | | 36,148 | | | | 35,289 | |
1.375%, 09/30/20-09/30/23 | | | 39,371 | | | | 38,730 | |
1.250%, 10/31/21-04/30/19 | | | 27,796 | | | | 27,155 | |
1.125%, 09/30/21-08/31/21 | | | 13,970 | | | | 13,583 | |
1.000%, 09/30/19 | | | 800 | | | | 788 | |
0.875%, 04/15/19 | | | 1,000 | | | | 988 | |
0.750%, 07/15/19-02/15/19 | | | 2,250 | | | | 2,214 | |
| | | | | | | | |
Total U.S. Treasury Obligations
(Cost $391,154) (000) | | | | | | | 389,688 | |
| | | | | | | | |
MORTGAGE-BACKED SECURITIES — 24.5% | |
Agency Mortgage-Backed Obligations — 22.8% | |
FHLMC | | | | | | | | |
5.000%, 02/01/39 | | | 817 | | | | 882 | |
4.500%, 08/01/43-12/01/45 | | | 2,510 | | | | 2,686 | |
4.000%, 11/01/47-07/01/24 | | | 7,905 | | | | 8,269 | |
3.500%, 03/01/47-04/01/47 | | | 8,522 | | | | 8,771 | |
3.000%, 01/01/47-11/01/42 | | | 21,642 | | | | 21,708 | |
2.500%, 02/01/32-01/01/32 | | | 2,512 | | | | 2,509 | |
FHLMC TBA | | | | | | | | |
4.000%, 01/15/41 | | | 6,345 | | | | 6,635 | |
3.500%, 01/01/41 | | | 17,935 | | | | 18,418 | |
3.000%, 01/15/43-01/01/27 | | | 3,425 | | | | 3,447 | |
2.500%, 01/15/28 | | | 750 | | | | 749 | |
FHLMC, Ser 2011-3830, Cl DZ | | | | | | | | |
4.000%, 12/15/30 | | | 991 | | | | 1,047 | |
The accompanying notes are an integral part of the financial statements.
111
| | |
| THE KP FUNDS | | December 31, 2017 |
| | | | | | | | |
| Description | | Face Amount
(000) | | | Value (000) | |
| | | | | | | | |
FHLMC Multifamily Structured Pass-Through Certificates,
Ser K029, Cl A2 | | | | | | | | |
3.320%, 02/25/23 (D) | | $ | 1,000 | | | $ | 1,040 | |
FHLMC Multifamily Structured Pass-Through Certificates,
Ser K055, Cl A2 | | | | | | | | |
2.673%, 03/25/26 | | | 400 | | | | 397 | |
FHLMC Multifamily Structured Pass-Through Certificates,
Ser K068, Cl A2 | | | | | | | | |
3.244%, 08/25/27 | | | 553 | | | | 569 | |
FHLMC Multifamily Structured Pass-Through Certificates,
Ser K069, Cl A2 | | | | | | | | |
3.187%, 09/25/27 (D) | | | 1,356 | | | | 1,390 | |
FHLMC Multifamily Structured Pass-Through Certificates,
Ser K070, Cl A2 | | | | | | | | |
3.303%, 11/25/27 (D) | | | 338 | | | | 349 | |
FHLMC Multifamily Structured Pass-Through Certificates,
Ser K726, Cl A2 | | | | | | | | |
2.905%, 07/25/49 | | | 1,545 | | | | 1,571 | |
FHLMC Multifamily Structured Pass-Through Certificates,
Ser K728, Cl A2 | | | | | | | | |
3.064%, 08/25/24 (D) | | | 1,535 | | | | 1,573 | |
FNMA | | | | | | | | |
5.500%, 09/01/40-11/01/34 | | | 2,152 | | | | 2,380 | |
5.000%, 11/01/44-02/01/38 | | | 3,041 | | | | 3,293 | |
4.500%, 02/01/46-01/01/30 | | | 5,010 | | | | 5,360 | |
4.000%, 03/01/47-09/01/43 | | | 28,485 | | | | 29,910 | |
3.500%, 07/01/47-10/01/46 | | | 41,992 | | | | 43,281 | |
3.000%, 01/01/47-10/01/46 | | | 19,927 | | | | 20,043 | |
2.500%, 11/25/45-10/01/32 | | | 5,491 | | | | 5,458 | |
FNMA TBA | | | | | | | | |
4.500%, 01/01/38 | | | 10,145 | | | | 10,794 | |
4.000%, 11/15/34 | | | 21,165 | | | | 22,133 | |
3.500%, 01/01/41 | | | 29,490 | | | | 30,295 | |
3.000%, 01/15/43 | | | 11,605 | | | | 11,605 | |
2.500%, 01/01/26 | | | 8,160 | | | | 8,147 | |
FNMA, Ser 2013-101, Cl A | | | | | | | | |
3.000%, 09/25/30 | | | 436 | | | | 442 | |
FNMA, Ser 2015-M11, Cl A2 | | | | | | | | |
2.835%, 04/25/25 (D) | | | 850 | | | | 854 | |
FNMA, Ser 2017-41, Cl MD | | | | | | | | |
4.000%, 05/25/53 | | | 1,503 | | | | 1,572 | |
FNMA, Ser 2017-71, Cl AB | | | | | | | | |
3.000%, 08/25/44 | | | 2,178 | | | | 2,193 | |
FNMA, Ser M3, Cl A3 | | | | | | | | |
4.332%, 03/25/20 (D) | | | 591 | | | | 609 | |
GNMA | | | | | | | | |
5.000%, 11/20/46-09/20/46 | | | 1,196 | | | | 1,285 | |
4.500%, 04/20/47-01/20/47 | | | 2,184 | | | | 2,299 | |
4.000%, 02/20/47-05/20/47 | | | 6,911 | | | | 7,215 | |
| | | | | | | | |
| Description | | Face Amount
(000) | | | Value (000) | |
| | | | | | | | |
3.500%, 02/20/47-07/20/47 | | $ | 13,646 | | | $ | 14,121 | |
3.000%, 02/20/47-08/20/47 | | | 10,416 | | | | 10,521 | |
2.500%, 12/20/46 | | | 468 | | | | 457 | |
GNMA TBA | | | | | | | | |
4.500%, 01/15/40 | | | 3,540 | | | | 3,713 | |
4.000%, 01/01/40 | | | 10,395 | | | | 10,836 | |
3.500%, 01/15/41 | | | 11,605 | | | | 11,997 | |
3.000%, 01/15/43 | | | 17,330 | | | | 17,487 | |
| | | | | | | | |
| | | | | | | 360,310 | |
| | | | | | | | |
Non-Agency Mortgage-Backed Obligations — 1.7% | |
Alternative Loan Trust, Ser 2003-22CB, Cl 3A1 | | | | | | | | |
6.000%, 12/25/33 | | | 784 | | | | 786 | |
BAMLL Commercial Mortgage Securities Trust,
Ser 2012-PARK, Cl A | | | | | | | | |
2.959%, 12/10/30 (A) | | | 1,171 | | | | 1,184 | |
BANK, Ser 2017-BNK8, Cl A4 | | | | | | | | |
3.488%, 11/15/50 | | | 90 | | | | 92 | |
BANK, Ser 2017-BNK8, Cl B | | | | | | | | |
3.931%, 11/15/50 | | | 50 | | | | 51 | |
BANK, Ser 2017-BNK9, Cl A4 | | | | | | | | |
3.538%, 11/15/54 | | | 324 | | | | 334 | |
CD Mortgage Trust,
Ser 2017-CD6, Cl A5 | | | | | | | | |
3.456%, 11/13/50 | | | 558 | | | | 574 | |
Citigroup Commercial Mortgage Trust, Ser 2013-GC17, Cl A4 | | | | | | | | |
4.131%, 11/10/46 | | | 388 | | | | 414 | |
Citigroup Commercial Mortgage Trust, Ser 2016-P6, Cl A5 | | | | | | | | |
3.720%, 11/10/26 | | | 140 | | | | 147 | |
Citigroup Commercial Mortgage Trust, Ser 2017-P7, Cl A4 | | | | | | | | |
3.712%, 04/14/50 | | | 500 | | | | 522 | |
COMM Mortgage Trust,
Ser 2013-CCRE9, Cl A4 | | | | | | | | |
4.238%, 07/10/45 (D) | | | 845 | | | | 905 | |
COMM Mortgage Trust,
Ser 2013-CR11, Cl A3 | | | | | | | | |
3.983%, 08/10/50 | | | 1,064 | | | | 1,125 | |
COMM Mortgage Trust,
Ser 2013-CR7, Cl A4 | | | | | | | | |
3.213%, 03/10/46 | | | 451 | | | | 460 | |
COMM Mortgage Trust,
Ser 2013-CR8, Cl A5 | | | | | | | | |
3.612%, 06/10/46 (D) | | | 90 | | | | 93 | |
COMM Mortgage Trust,
Ser 2013-LC6, Cl A4 | | | | | | | | |
2.941%, 01/10/46 | | | 718 | | | | 723 | |
COMM Mortgage Trust,
Ser 2015-DC1, Cl A5 | | | | | | | | |
3.350%, 02/10/48 | | | 1,000 | | | | 1,018 | |
The accompanying notes are an integral part of the financial statements.
112
| | |
| THE KP FUNDS | | December 31, 2017 |
| | | | | | | | |
| Description | | Face Amount
(000) | | | Value (000) | |
| | | | | | | | |
COMM Mortgage Trust,
Ser CR12, Cl A3 | | | | | | | | |
3.765%, 10/10/46 | | $ | 1,152 | | | $ | 1,208 | |
COMM Mortgage Trust,
Ser CR16, Cl A4 | | | | | | | | |
4.051%, 04/10/47 | | | 613 | | | | 650 | |
Commercial Mortgage Trust, Ser 2015-3BP, Cl A | | | | | | | | |
3.178%, 02/10/35 (A) | | | 13 | | | | 13 | |
Credit Suisse First Boston Mortgage Securities, Ser 2004-AR2, Cl 5A1 | | | | | | | | |
3.431%, 03/25/34 (D) | | | 55 | | | | 57 | |
CSAIL Commercial Mortgage Trust, Ser 2016-C7, Cl A4 | | | | | | | | |
3.210%, 11/15/49 | | | 500 | | | | 503 | |
CSAIL Commercial Mortgage Trust, Ser 2016-C7, Cl A5 | | | | | | | | |
3.502%, 11/15/49 | | | 756 | | | | 775 | |
CSFB Mortgage-Backed Pass-Through Certificates,
Ser 2003-27, Cl 4A4 | | | | | | | | |
5.750%, 11/25/33 | | | 84 | | | | 86 | |
GS Mortgage Securities II,
Ser 2015-GC30, Cl A4 | | | | | | | | |
3.382%, 05/10/50 | | | 249 | | | | 256 | |
GS Mortgage Securities Trust, Ser 2012-SHOP, Cl A | | | | | | | | |
2.933%, 06/05/31 (A) | | | 1,578 | | | | 1,591 | |
GS Mortgage Securities Trust, Ser 2013-GC16, Cl A4 | | | | | | | | |
4.271%, 11/10/46 | | | 23 | | | | 25 | |
GS Mortgage Securities Trust, Ser 2013-GCJ12, Cl A4 | | | | | | | | |
3.135%, 06/10/46 | | | 242 | | | | 246 | |
GS Mortgage Securities Trust, Ser 2015-GC32, Cl A4 | | | | | | | | |
3.764%, 07/10/48 | | | 500 | | | | 526 | |
GS Mortgage Securities Trust, Ser GC18, Cl A3 | | | | | | | | |
3.801%, 01/10/47 | | | 1,540 | | | | 1,613 | |
GSR Mortgage Loan Trust,
Ser 2005-4F, Cl 6A1 | | | | | | | | |
6.500%, 02/25/35 | | | 39 | | | | 39 | |
HarborView Mortgage Loan Trust, Ser 2004-3, Cl 1A | | | | | | | | |
3.577%, 05/19/34 (D) | | | 44 | | | | 45 | |
JPMCC Commercial Mortgage Securities Trust,
Ser 2017-JP5, Cl A2 | | | | | | | | |
3.240%, 03/15/50 | | | 400 | | | | 410 | |
JPMorgan Mortgage Trust,
Ser 2003-A2, Cl 3A1 | | | | | | | | |
3.104%, 11/25/33 (D) | | | 150 | | | | 144 | |
| | | | | | | | |
| Description | | Face Amount
(000) | | | Value (000) | |
| | | | | | | | |
JPMorgan Mortgage Trust,
Ser 2005-A1, Cl 6T1 | | | | | | | | |
3.663%, 02/25/35 (D) | | $ | 214 | | | $ | 212 | |
JPMorgan Mortgage Trust,
Ser 2005-A2, Cl 3A2 | | | | | | | | |
3.468%, 04/25/35 (D) | | | 60 | | | | 60 | |
JPMorgan Mortgage Trust,
Ser 2005-A3, Cl 4A1 | | | | | | | | |
3.664%, 06/25/35 (D) | | | 89 | | | | 90 | |
MLCC Mortgage Investors,
Ser 2006-2, Cl 2A | | | | | | | | |
3.183%, 05/25/36 (D) | | | 261 | | | | 263 | |
Morgan Stanley Bank of America Merrill Lynch Trust,
Ser 2013-C10, Cl A4 | | | | | | | | |
4.082%, 07/15/46 (D) | | | 315 | | | | 335 | |
Morgan Stanley Bank of America Merrill Lynch Trust,
Ser 2013-C12, Cl A4 | | | | | | | | |
4.259%, 10/15/46 (D) | | | 452 | | | | 484 | |
Morgan Stanley Bank of America Merrill Lynch Trust,
Ser 2014-C14, Cl A4 | | | | | | | | |
3.787%, 01/15/47 | | | 491 | | | | 514 | |
Morgan Stanley Bank of America Merrill Lynch Trust,
Ser 2014-C14, Cl A5 | | | | | | | | |
4.064%, 02/15/47 | | | 189 | | | | 201 | |
Morgan Stanley Bank of America Merrill Lynch Trust,
Ser 2014-C19, Cl AS | | | | | | | | |
3.832%, 12/15/47 | | | 500 | | | | 515 | |
Morgan Stanley Bank of America Merrill Lynch Trust,
Ser 2015-C20, Cl A4 | | | | | | | | |
3.249%, 02/15/48 | | | 762 | | | | 772 | |
Morgan Stanley Capital I Trust, Ser 2014-CPT, Cl A | | | | | | | | |
3.350%, 07/13/29 (A) | | | 1,104 | | | | 1,129 | |
Structured Adjustable Rate Mortgage Loan Trust, Ser 2004-6, Cl 1A | | | | | | | | |
3.361%, 06/25/34 (D) | | | 257 | | | | 254 | |
Wells Fargo Commercial Mortgage Trust, Ser 2015-C27, Cl A4 | | | | | | | | |
3.190%, 02/15/48 | | | 185 | | | | 187 | |
Wells Fargo Commercial Mortgage Trust, Ser 2015-C28, Cl A4 | | | | | | | | |
3.540%, 05/15/48 | | | 1,000 | | | | 1,033 | |
Wells Fargo Commercial Mortgage Trust, Ser 2015-C31, Cl A4 | | | | | | | | |
3.695%, 11/15/48 | | | 797 | | | | 832 | |
The accompanying notes are an integral part of the financial statements.
113
| | |
| THE KP FUNDS | | December 31, 2017 |
| | | | | | | | |
| Description | | Face Amount
(000) | | | Value (000) | |
| | | | | | | | |
Wells Fargo Commercial Mortgage Trust, Ser 2016-LC25, Cl A4 | | | | | | | | |
3.640%, 12/15/59 | | $ | 546 | | | $ | 566 | |
Wells Fargo Commercial Mortgage Trust, Ser 2017-C42 | | | | | | | | |
3.589%, 12/15/50 | | | 847 | | | | 874 | |
Wells Fargo Mortgage Backed Securities Trust,
Ser 2003-J, Cl 1A9 | | | | | | | | |
3.595%, 10/25/33 (D) | | | 597 | | | | 604 | |
Wells Fargo Mortgage Backed Securities Trust,
Ser 2005-AR10, Cl 2A4 | | | | | | | | |
3.473%, 05/01/35 (D) | | | 139 | | | | 143 | |
WFRBS Commercial Mortgage Trust, Ser 2013-C13, Cl A3 | | | | | | | | |
2.749%, 05/15/45 | | | 500 | | | | 500 | |
WFRBS Commercial Mortgage Trust, Ser 2013-C14, Cl A4 | | | | | | | | |
3.073%, 06/15/46 | | | 584 | | | | 593 | |
WFRBS Commercial Mortgage Trust, Ser 2013-C14, Cl A5 | | | | | | | | |
3.337%, 06/15/46 | | | 60 | | | | 61 | |
| | | | | | | | |
| | | | | | | 26,837 | |
| | | | | | | | |
Total Mortgage-Backed Securities
(Cost $387,692) (000) | | | | | | | 387,147 | |
| | | | | | | | |
LOAN PARTICIPATIONS — 10.0% | |
Aerospace/Defense — 0.0% | | | | | | | | |
Sequa Mezzanine Holdings LLC, Initial Term Loan | | | | | | | | |
6.807%, VAR LIBOR+5.500%, 11/28/17 | | | 1 | | | | 1 | |
6.549%, VAR LIBOR+
5.500%, 11/28/17 | | | 353 | | | | 355 | |
| | | | | | | | |
| | | | | | | 356 | |
| | | | | | | | |
Airlines — 0.1% | | | | | | | | |
American Airlines, 2017 Replacement Term Loan | | | | | | | | |
3.552%, VAR LIBOR+2.000%, 06/27/20 | | | 1,242 | | | | 1,243 | |
| | | | | | | | |
Automotive — 0.1% | | | | | | | | |
Dayco, Term Loan B, 1st Lien | | | | | | | | |
6.479%, VAR LIBOR+5.000%, 05/08/23 | | | 697 | | | | 702 | |
Horizon Global, 1st Lien | | | | | | | | |
6.069%, 03/30/21 (D) | | | 244 | | | | 245 | |
TI Group Automotive Systems, LLC, Initial US Term Loan | | | | | | | | |
4.319%, VAR LIBOR+2.750%, 06/30/22 | | | 503 | | | | 505 | |
| | | | | | | | |
| | | | | | | 1,452 | |
| | | | | | | | |
| | | | | | | | |
| Description | | Face��Amount
(000) | | | Value (000) | |
| | | | | | | | |
Building Materials — 0.3% | | | | | | | | |
American Builders & Contractors Supply, Additional Term B-1 Loan, 1st Lien | | | | | | | | |
4.069%, VAR LIBOR+2.500%, 10/31/23 | | $ | 1,114 | | | $ | 1,118 | |
Beacon Roofing, Term Loan B, 1st Lien | | | | | | | | |
0.000%, 10/11/24 (F) | | | 1,250 | | | | 1,253 | |
PGT, Initial Term Loan, 1st Lien | | | | | | | | |
6.374%, 02/16/22 (D) | | | 49 | | | | 50 | |
6.229%, 02/16/22 (D) | | | 69 | | | | 69 | |
6.182%, 02/16/22 (D) | | | 13 | | | | 13 | |
6.173%, 02/16/22 (D) | | | 236 | | | | 239 | |
Priso Acquisition (aka PrimeSource Building Products), Term B Loan, 1st Lien | | | | | | | | |
4.569%, VAR LIBOR+3.000%, 05/08/22 | | | 737 | | | | 740 | |
SRS Distribution, Term B-4 Loan, 1st Lien | | | | | | | | |
4.600%, VAR LIBOR+3.250%, 08/25/22 | | | 457 | | | | 459 | |
4.583%, VAR LIBOR+3.250%, 08/25/22 | | | 323 | | | | 324 | |
| | | | | | | | |
| | | | | | | 4,265 | |
| | | | | | | | |
Chemicals — 1.2% | | | | | | | | |
Allnex (Luxembourg) & Cy S.C.A. (f/k/a AI Chem & Cy S.C.A.), Tranche B-2 Term Loan, 1st Lien | | | | | | | | |
4.712%, VAR LIBOR+3.250%, 09/13/23 | | | 705 | | | | 709 | |
Allnex (Luxembourg) & Cy S.C.A. (f/k/a AI Chem & Cy S.C.A.), Tranche B-3 Term Loan, 1st Lien | | | | | | | | |
4.712%, VAR LIBOR+3.250%, 06/02/23 | | | 531 | | | | 534 | |
Ascend Performance Materials Operations LLC, Term B Loan, 1st Lien | | | | | | | | |
6.943%, VAR LIBOR+5.250%, 08/12/22 | | | 496 | | | | 499 | |
ASP Chromaflo Intermediate Holdings, Initial Tranche B-1 Term Loan, 1st Lien | | | | | | | | |
5.569%, VAR LIBOR+4.000%, 11/20/23 | | | 404 | | | | 406 | |
ASP Chromaflo Intermediate Holdings, Initial Tranche B-2 Term Loan, 1 Lien | | | | | | | | |
5.569%, VAR LIBOR+4.000%, 11/20/23 | | | 525 | | | | 527 | |
The accompanying notes are an integral part of the financial statements.
114
| | |
| THE KP FUNDS | | December 31, 2017 |
| | | | | | | | |
| Description | | Face Amount
(000) | | | Value (000) | |
| | | | | | | | |
Avantor, Initial Dollar Term Loan, 1st Lien | | | | | | | | |
5.511%, VAR LIBOR+4.000%, 09/20/24 | | $ | 1,000 | | | $ | 1,004 | |
Axalta Coating Systems Dutch Holding B B.V. (Axalta Coating Systems U.S. Holdings), Term B-2 Dollar Loan, 1st Lien | | | | | | | | |
3.693%, VAR LIBOR+2.000%, 06/21/24 | | | 1,076 | | | | 1,080 | |
Ferro, Term Loan B, 1st Lien | | | | | | | | |
4.069%, 02/08/24 (D) | | | 777 | | | | 781 | |
Flint Group, Term Loan, 1st Lien | | | | | | | | |
4.365%, 09/07/21 (D) | | | 744 | | | | 647 | |
H.B. Fuller, Commitment, 1st Lien | | | | | | | | |
3.751%, VAR LIBOR+2.250%, 10/20/24 | | | 998 | | | | 1,000 | |
Ineos US Finance LLC, New 2024 Dollar Term Loan | | | | | | | | |
3.569%, VAR LIBOR+2.000%, 03/31/24 (F) | | | 750 | | | | 750 | |
Nexeo Solutions, LLC, Term Loan B-1, 1st Lien | | | | | | | | |
0.000%, 06/09/23 (D) | | | 741 | | | | 743 | |
Orion Engineered Carbons GmbH, Initial Dollar Term Loan | | | | | | | | |
4.193%, VAR LIBOR+2.500%, 07/25/24 | | | 1,369 | | | | 1,375 | |
Plastipak Holdings, Tranche B Term Loan, 1st Lien | | | | | | | | |
4.450%, VAR LIBOR+2.750%, 10/10/24 | | | 1,000 | | | | 1,005 | |
Pregis Holding I, Term Loan, 1st Lien | | | | | | | | |
5.193%, VAR LIBOR+3.500%, 05/20/21 | | | 742 | | | | 742 | |
Ravago Holdings America, Term Loan, 2nd Lien | | | | | | | | |
4.450%, VAR LIBOR+2.750%, 07/13/23 | | | 667 | | | | 670 | |
Ring Container, Term Loan, 1st Lien | | | | | | | | |
4.319%, 10/31/24 (D) | | | 750 | | | | 751 | |
Solenis International, LP (Solenis Holdings 3 LLC), Initial Dollar Term Loan | | | | | | | | |
4.729%, VAR LIBOR+3.250%, 07/31/21 | | | 483 | | | | 484 | |
Solenis, Term Loan, 2nd Lien | | | | | | | | |
8.229%, 07/31/22 (D) | | | 500 | | | | 477 | |
Tricorbraun Holdings, Closing Date Term Loan | | | | | | | | |
5.443%, 11/30/23 (D) | | | 767 | | | | 764 | |
| | | | | | | | |
| Description | | Face Amount
(000) | | | Value (000) | |
| | | | | | | | |
Tricorbraun Holdings, Delayed Draw Term Loan, 1st Lien | | | | | | | | |
5.392%, VAR LIBOR+3.750%, 11/30/23 | | $ | 77 | | | $ | 77 | |
Tronox Limited, Blocked Dollar Term Loan | | | | | | | | |
4.693%, VAR LIBOR+3.000%, 09/23/24 | | | 453 | | | | 456 | |
Tronox Limited, Initial Dollar Term Loan | | | | | | | | |
4.693%, VAR LIBOR+3.000%, 09/23/24 | | | 1,047 | | | | 1,052 | |
U.S. Farathane, LLC, Term B-4 Loan, 1st Lien | | | | | | | | |
5.193%, VAR LIBOR+3.500%, 12/31/21 | | | 469 | | | | 470 | |
Univar USA, Term B-3 Loan, 1st Lien | | | | | | | | |
4.069%, VAR LIBOR+2.500%, 07/01/24 | | | 970 | | | | 973 | |
Vantage Specialty, Term Loan, 1st Lien | | | | | | | | |
5.371%, 10/20/24 (D) | | | 1,000 | | | | 1,006 | |
Vantage Specialty, Term Loan, 2nd Lien | | | | | | | | |
9.621%, 10/20/25 (D) | | | 205 | | | | 201 | |
Wilsonart LLC, Tranche D Term Loan, 1st Lien | | | | | | | | |
4.950%, VAR LIBOR+3.250%, 12/19/23 | | | 498 | | | | 500 | |
| | | | | | | | |
| | | | | | | 19,683 | |
| | | | | | | | |
Computers & Electronics — 1.7% | |
Applied Systems, Initial Term Loan, 1st Lien | | | | | | | | |
4.943%, VAR LIBOR+3.250%, 09/19/24 | | | 998 | | | | 1,007 | |
Aricent Technologies, Initial Term Loan, 1st Lien | | | | | | | | |
5.972%, VAR LIBOR+4.500%, 04/14/21 | | | 447 | | | | 448 | |
Aricent Technologies, Initial Term Loan, 2nd Lien | | | | | | | | |
9.972%, VAR LIBOR+8.500%, 04/14/22 | | | 550 | | | | 553 | |
Brooks Automation, Term Loan B, 1st Lien | | | | | | | | |
4.010%, 10/04/24 (D) | | | 1,500 | | | | 1,500 | |
Campaign Monitor Finance Property Limited, Initial Term Loan, 1st Lien | | | | | | | | |
6.943%, VAR LIBOR+5.250%, 03/18/21 | | | 47 | | | | 46 | |
The accompanying notes are an integral part of the financial statements.
115
| | |
| THE KP FUNDS | | December 31, 2017 |
| | | | | | | | |
| Description | | Face Amount
(000) | | | Value (000) | |
| | | | | | | | |
Cavium, Term Loan B-1, 1st Lien | | | | | | | | |
3.819%, VAR LIBOR+2.250%, 08/16/22 | | $ | 748 | | | $ | 749 | |
CPI International, Initial Term Loan, 1st Lien | | | | | | | | |
5.069%, VAR LIBOR+3.500%, 07/26/24 | | | 367 | | | | 369 | |
Cypress Intermediate Holdings III (fka Jaguar Holding), Initial Term Loan, 1st Lien | | | | | | | | |
4.570%, VAR LIBOR+3.000%, 04/29/24 | | | 1,000 | | | | 1,001 | |
Dell International LLC (EMC), Replacement Term A-2 Loan | | | | | | | | |
3.100%, VAR LIBOR+1.750%, 09/07/21 | | | 481 | | | | 481 | |
Electrical Components International, Initial Term Loan, 1st Lien | | | | | | | | |
6.443%, VAR LIBOR+4.750%, 05/28/21 | | | 630 | | | | 633 | |
Epicor Software, Term Loan B, 1st Lien | | | | | | | | |
5.320%, VAR LIBOR+3.750%, 06/01/22 | | | 748 | | | | 749 | |
Exceiltas, Term Loan, 1st Lien | | | | | | | | |
5.161%, 12/02/24 (D) | | | 1,000 | | | | 1,007 | |
EZE Software Group LLC, New Loan, 1st Lien | | | | | | | | |
8.193%, VAR LIBOR+6.500%, 04/05/21 | | | 750 | | | | 749 | |
Go Daddy Operating LLC (GD Finance), Tranche B-1 Term Loan, 1st Lien | | | | | | | | |
3.819%, VAR LIBOR+2.250%, 02/15/24 | | | 994 | | | | 996 | |
Infor (US) (fka Lawson Software), Tranche B-6 Term Loan, 1st Lien | | | | | | | | |
4.443%, VAR LIBOR+2.750%, 02/01/22 | | | 1,199 | | | | 1,203 | |
Kronos, Incremental Term Loan, 1st Lien | | | | | | | | |
4.903%, VAR LIBOR+3.500%, 11/01/23 | | | 1,036 | | | | 1,043 | |
MA Financeco, LLC, Tranche B-2 Term Loan, 1st Lien | | | | | | | | |
4.069%, VAR LIBOR+2.500%, 11/19/21 | | | 195 | | | | 195 | |
MACOM Technology Solutions Holdings (fka M/A-COM Technology Solutions Holdings), Initial Term Loan, 1st Lien | | | | | | | | |
3.802%, VAR LIBOR+2.250%, 05/07/24 | | | 1,081 | | | | 1,077 | |
| | | | | | | | |
| Description | | Face Amount
(000) | | | Value (000) | |
| | | | | | | | |
Micro Focus, Term Loan B, 1st Lien | | | | | | | | |
4.319%, VAR LIBOR+2.750%, 06/21/24 | | $ | 128 | | | $ | 128 | |
Micro Holdings (Internet Brands), Term Loan, 2nd Lien | | | | | | | | |
9.089%, VAR LIBOR+7.500%, 08/15/25 | | | 244 | | | | 244 | |
Microsemi, Term B Loan, 1st Lien | | | | | | | | |
3.383%, VAR LIBOR+2.000%, 01/13/23 | | | 1,299 | | | | 1,303 | |
Misys Limited, Dollar Term Loan, 1st Lien | | | | | | | | |
4.979%, VAR LIBOR+3.500%, 06/13/24 | | | 1,175 | | | | 1,177 | |
Misys Limited, Dollar Term Loan, 2nd Lien | | | | | | | | |
8.729%, VAR LIBOR+7.250%, 04/28/25 | | | 208 | | | | 208 | |
Oberthur Technologies Holding, Term Loan B-1, 1st Lien | | | | | | | | |
5.443%, VAR LIBOR+3.750%, 01/10/24 | | | 631 | | | | 623 | |
Omnitracs, LLC (Coronado Holdings, LLC), Term Loan, 2nd Lien | | | | | | | | |
9.450%, VAR LIBOR+7.750%, 05/25/21 | | | 500 | | | | 500 | |
ON Semiconductor, 2017 New Replacement Term B-2 Loan | | | | | | | | |
3.569%, VAR LIBOR+2.000%, 03/31/23 | | | 438 | | | | 440 | |
Project Alpha Intermediate Holding, Term Loan, 1st Lien | | | | | | | | |
5.040%, VAR LIBOR+3.500%, 04/19/24 | | | 586 | | | | 573 | |
Project Ruby Ultimate Parent, Closing Date Term Loan, 1st Lien | | | | | | | | |
5.069%, VAR LIBOR+3.750%, 02/09/24 | | | 1,592 | | | | 1,600 | |
Seattle SpinCo, Initial Term Loan, 1st Lien | | | | | | | | |
4.319%, VAR LIBOR+2.750%, 06/21/24 | | | 866 | | | | 866 | |
Solera, LLC (Solera Finance), Dollar Term Loan, 1st Lien | | | | | | | | |
4.818%, VAR LIBOR+3.250%, 03/03/23 | | | 742 | | | | 747 | |
Spectrum Brands, 2017 Refinanced USD Term Loan | | | | | | | | |
3.624%, VAR LIBOR+2.000%, 06/23/22 | | | 373 | | | | 375 | |
3.423%, VAR LIBOR+2.000%, 06/23/22 | | | 320 | | | | 321 | |
The accompanying notes are an integral part of the financial statements.
116
| | |
| THE KP FUNDS | | December 31, 2017 |
| | | | | | | | |
| Description | | Face Amount
(000) | | | Value (000) | |
| | | | | | | | |
3.397%, VAR LIBOR+2.000%, 06/23/22 | | $ | 300 | | | $ | 301 | |
SS&C Technologies Holdings, 2017 Refinancing New Term B-1 Loan, 1st Lien | | | | | | | | |
3.819%, VAR LIBOR+2.250%, 07/08/22 | | | 590 | | | | 594 | |
SS&C Technologies Holdings, 2017 Refinancing New Term B-2 Loan, 1st Lien | | | | | | | | |
3.819%, VAR LIBOR+2.250%, 07/08/22 | | | 11 | | | | 11 | |
TeamViewer, Term Loan B, 1st Lien | | | | | | | | |
6.443%, 02/22/24 | | | 500 | | | | 501 | |
Vertiv Group (fka Cortes NP Acquisition), Term B Loan, 1st Lien | | | | | | | | |
5.350%, VAR LIBOR+4.000%, 11/30/23 | | | 1,203 | | | | 1,201 | |
Wall Street Systems Delaware, Initial Dollar Term Loan, 1st Lien | | | | | | | | |
4.569%, VAR LIBOR+3.000%, 11/21/24 | | | 626 | | | | 626 | |
| | | | | | | | |
| | | | | | | 26,145 | |
| | | | | | | | |
Construction — 0.1% | | | | | | | | |
Brand Energy & Infrastructure Services (fka FR Brand Acquisition), Initial Term Loan, 1st Lien | | | | | | | | |
5.628%, VAR LIBOR+4.250%, 06/14/24 | | | 159 | | | | 160 | |
5.613%, VAR LIBOR+4.250%, 06/14/24 | | | 836 | | | | 838 | |
Pike, Initial Term Loan (2017) | | | | | | | | |
5.070%, VAR LIBOR+3.500%, 09/20/24 | | | 622 | | | | 630 | |
| | | | | | | | |
| | | | | | | 1,628 | |
| | | | | | | | |
Consumer Nondurables — 0.1% | |
Acuity Specialty Products, Initial Term Loan | | | | | | | | |
5.380%, VAR LIBOR+4.000%, 08/12/24 | | | 492 | | | | 496 | |
Plaze, Cove-Lite Term Loan, 1st Lien | | | | | | | | |
5.193%, 07/31/22 (D) | | | 350 | | | | 352 | |
4.834%, 07/31/22 (D) | | | 30 | | | | 30 | |
Prestige Brands, Term B-4 Loan, 1st Lien | | | | | | | | |
4.319%, VAR LIBOR+2.750%, 01/20/24 | | | 1,037 | | | | 1,043 | |
| | | | | | | | |
| | | | | | | 1,921 | |
| | | | | | | | |
| | | | | | | | |
| Description | | Face Amount
(000) | | | Value (000) | |
| | | | | | | | |
Educational Services — 0.0% | | | | | | | | |
Education Management II LLC, Tranche A Term Loan, 1st Lien | | | | | | | | |
5.849%, VAR LIBOR+4.500%, 07/02/20 | | $ | 109 | | | $ | 31 | |
Education Management II LLC, Tranche B Term Loan, 1st Lien | | | | | | | | |
8.849%, VAR LIBOR+7.500%, 07/02/20 | | | 246 | | | | 3 | |
| | | | | | | | |
| | | | | | | 34 | |
| | | | | | | | |
Entertainment & Leisure — 0.1% | |
AMC Entertainment, Initial Term Loan, 1st Lien | | | | | | | | |
3.727%, VAR LIBOR+2.250%, 12/15/22 | | | 714 | | | | 716 | |
BC Equity Ventures LLC, Term Loan, 1st Lien | | | | | | | | |
8.070%, VAR LIBOR+6.500%, 08/31/22 | | | 494 | | | | 499 | |
Intrawest Resorts Holdings, Initial Bluebird Term Loan | | | | | | | | |
4.819%, VAR LIBOR+3.250%, 07/31/24 | | | 1,000 | | | | 1,007 | |
| | | | | | | | |
| | | | | | | 2,222 | |
| | | | | | | | |
Financial Services — 0.4% | | | | | | | | |
Altisource Solutions SARL, Term Loan B, 1st Lien | | | | | | | | |
5.069%, VAR LIBOR+3.500%, 12/09/20 | | | 929 | | | | 909 | |
Citco Funding LLC, 2017 Term Loan, 1st Lien | | | | | | | | |
4.569%, VAR LIBOR+3.000%, 03/23/22 | | | 964 | | | | 970 | |
Freedom Mortgage, Initial Term Loan, 1st Lien | | | | | | | | |
6.956%, VAR LIBOR+5.500%, 02/17/22 | | | 735 | | | | 744 | |
Jefferies Finance LLC (JFIN Co-Issuer), Term Loan, 1st Lien | | | | | | | | |
4.438%, VAR LIBOR+3.000%, 08/02/24 | | | 750 | | | | 751 | |
NXT Capital (NXT Capital, LLC), Term Loan | | | | | | | | |
5.070%, VAR LIBOR+3.500%, 11/23/22 | | | 744 | | | | 752 | |
Virtus Investment 2/17 Term Loan, 1st Lien | | | | | | | | |
4.861%, 03/03/24 (D) | | | 998 | | | | 1,006 | |
The accompanying notes are an integral part of the financial statements.
117
| | |
| THE KP FUNDS | | December 31, 2017 |
| | | | | | | | |
| Description | | Face Amount
(000) | | | Value (000) | |
| | | | | | | | |
Walter Investment Management, Tranche B Term Loan, 1st Lien | | | | | | | | |
5.319%, VAR LIBOR+3.750%, 12/18/20 (C) | | $ | 586 | | | $ | 559 | |
| | | | | | | | |
| | | | | | | 5,691 | |
| | | | | | | | |
Food & Beverage — 0.2% | | | | | | | | |
Constellation/Arterra Wines, Cov-Lite Term Loan | | | | | | | | |
4.376%, 12/15/23 (D) | | | 496 | | | | 498 | |
Darling International, Term Loan B, 1st Lien | | | | | | | | |
0.000%, 12/12/24 (D) | | | 1,000 | | | | 1,008 | |
JBS USA Lux S.A. (fka JBS USA, LLC), Initial Term Loan, 1st Lien | | | | | | | | |
4.100%, VAR LIBOR+2.500%, 10/30/22 | | | 702 | | | | 689 | |
US Foods (aka U.S. Foodservice), Initial Term Loan, 1st Lien | | | | | | | | |
4.069%, VAR LIBOR+2.500%, 06/27/23 | | | 981 | | | | 986 | |
| | | | | | | | |
| | | | | | | 3,181 | |
| | | | | | | | |
Forest Products — 0.1% | | | | | | | | |
ProAmpac PG Borrower LLC, Initial Term Loan, 1st Lien | | | | | | | | |
5.436%, VAR LIBOR+4.000%, 11/17/23 | | | 136 | | | | 137 | |
5.380%, VAR LIBOR+4.000%, 11/17/23 | | | 106 | | | | 107 | |
5.001%, VAR LIBOR+4.000%, 11/17/23 | | | 214 | | | | 215 | |
4.907%, VAR LIBOR+4.000%, 11/17/23 | | | 40 | | | | 41 | |
ProAmpac PG Borrower LLC, Initial Term Loan, 2nd Lien | | | | | | | | |
9.936%, VAR LIBOR+8.500%, 11/18/24 | | | 225 | | | | 228 | |
| | | | | | | | |
| | | | | | | 728 | |
| | | | | | | | |
Gaming & Hotels — 0.5% | | | | | | | | |
Belmond Interfin Ltd., Term Loan B, 1st Lien | | | | | | | | |
4.319%, 07/03/24 (D) | | | 995 | | | | 995 | |
CBAC Borrower, LLC, Term B Loan, 1st Lien | | | | | | | | |
5.350%, VAR LIBOR+4.000%, 07/08/24 | | | 509 | | | | 513 | |
Gateway Casinos & Entertainment Limited, Initial Tranche B-1 Term Loan, | | | | | | | | |
5.443%, VAR LIBOR+3.750%, 02/22/23 | | | 746 | | | | 752 | |
| | | | | | | | |
| Description | | Face Amount
(000) | | | Value (000) | |
| | | | | | | | |
Golden Nugget, Initial B Term Loan, 1st Lien | | | | | | | | |
4.857%, VAR LIBOR+3.250%, 10/04/23 | | $ | 608 | | | $ | 613 | |
4.656%, VAR LIBOR+3.250%, 10/04/23 | | | 461 | | | | 464 | |
Hanjin/Wilshire Grand, Term Loan B, 1st Lien | | | | | | | | |
3.854%, 09/20/20 (D) | | | 1,000 | | | | 1,003 | |
Hilton Worldwide Finance LLC, Ser B-2 Term Loan, 1st Lien | | | | | | | | |
3.552%, VAR LIBOR+2.000%, 10/25/23 | | | 978 | | | | 982 | |
Las Vegas Sands, LLC, Refinancing Term Loan (2017), 1st Lien | | | | | | | | |
3.569%, VAR LIBOR+2.000%, 03/20/24 | | | 1,486 | | | | 1,493 | |
MGM Growth Properties Operating Partnership LP, Term Loan B, 1st Lien | | | | | | | | |
3.819%, VAR LIBOR+2.250%, 04/25/23 | | | 266 | | | | 267 | |
Playa Resorts Holding, Initial Term Loan, 1st Lien | | | | | | | | |
4.370%, VAR LIBOR+3.000%, 04/05/24 | | | 1,111 | | | | 1,115 | |
4.310%, VAR LIBOR+3.000%, 04/05/24 | | | 5 | | | | 5 | |
| | | | | | | | |
| | | | | | | 8,202 | |
| | | | | | | | |
Health Care — 0.6% | | | | | | | | |
Catalent Pharma Solutions, Term Loan B, 1st Lien | | | | | | | | |
3.819%, 05/20/24 (D) | | | 750 | | | | 752 | |
Endo Luxembourg Finance I SARL, Initial Term Loan, 1st Lien | | | | | | | | |
5.875%, VAR LIBOR+4.250%, 04/29/24 | | | 891 | | | | 895 | |
Grifols Worldwide Operations Limited, Tranche B Term Loan, 1st Lien | | | | | | | | |
3.739%, VAR LIBOR+2.250%, 01/31/25 | | | 1,051 | | | | 1,053 | |
HCA, Tranche B-9 Term Loan, 1st Lien | | | | | | | | |
3.569%, VAR LIBOR+2.000%, 03/17/23 | | | 494 | | | | 496 | |
Onex Carestream Finance LP, Initial Term Loan, 1st Lien | | | | | | | | |
5.693%, VAR LIBOR+4.000%, 06/07/19 | | | 207 | | | | 208 | |
Pharmerica Term Loan | | | | | | | | |
9.153%, 09/26/25 (D) | | | 500 | | | | 501 | |
The accompanying notes are an integral part of the financial statements.
118
| | |
| THE KP FUNDS | | December 31, 2017 |
| | | | | | | | |
| Description | | Face Amount
(000) | | | Value (000) | |
| | | | | | | | |
Prospect Medical Holdings, Term Loan | | | | | | | | |
7.500%, 06/30/22 (D) | | $ | 996 | | | $ | 1,006 | |
Sterigenics-Nordion Holdings, LLC, Incremental Term Loan, 1st Lien | | | | | | | | |
4.569%, VAR LIBOR+3.000%, 05/15/22 | | | 750 | | | | 749 | |
Surgery Center Holdings, Initial Term Loan, 1st Lien | | | | | | | | |
4.820%, VAR LIBOR+3.250%, 09/02/24 | | | 889 | | | | 878 | |
Tecostar Holdings, 2017 Term Loan | | | | | | | | |
7.000%, VAR LIBOR+3.500%, 05/01/24 | | | 1 | | | | 1 | |
5.131%, VAR LIBOR+3.500%, 05/01/24 | | | 302 | | | | 305 | |
Valeant Pharmaceuticals International, Ser F Tranche B Term Loan, 1st Lien | | | | | | | | |
4.940%, VAR LIBOR+3.500%, 04/01/22 | | | 1,073 | | | | 1,087 | |
Western Dental Services | | | | | | | | |
6.819%, 06/30/23 (D) | | | 1,211 | | | | 1,216 | |
Zest Holdings, LLC, Replaced Term Loan | | | | | | | | |
5.820%, VAR LIBOR+4.250%, 08/16/23 | | | 496 | | | | 499 | |
| | | | | | | | |
| | | | | | | 9,646 | |
| | | | | | | | |
Home Furnishings — 0.1% | | | | | | | | |
Comfort Holding, LLC, Initial Term Loan, 1st Lien | | | | | | | | |
11.432%, VAR LIBOR+10.000%, 01/31/25 | | | 292 | | | | 236 | |
6.182%, VAR LIBOR+4.750%, 02/05/24 | | | 348 | | | | 314 | |
Serta Simmons Bedding, LLC, Initial Term Loan | | | | | | | | |
4.897%, VAR LIBOR+3.500%, 10/20/23 | | | 232 | | | | 212 | |
4.835%, VAR LIBOR+3.500%, 10/20/23 | | | 836 | | | | 763 | |
| | | | | | | | |
| | | | | | | 1,525 | |
| | | | | | | | |
Insurance — 0.4% | | | | | | | | |
Acrisure, LLC, Term Loan B-2, 1st Lien | | | | | | | | |
5.647%, VAR LIBOR+4.250%, 11/22/23 | | | 1,086 | | | | 1,095 | |
Alliant Holdings Intermediate LLC, Initial Term Loan, 1st Lien | | | | | | | | |
4.802%, VAR LIBOR+3.250%, 08/12/22 | | | 1,164 | | | | 1,168 | |
| | | | | | | | |
| Description | | Face Amount
(000) | | | Value (000) | |
| | | | | | | | |
AmWINS Group, Term Loan, 1st Lien | | | | | | | | |
4.319%, VAR LIBOR+2.750%, 01/25/24 | | $ | 704 | | | $ | 706 | |
4.182%, VAR LIBOR+2.750%, 01/25/24 | | | 286 | | | | 287 | |
Hyperion Insurance, Term Loan B, 1st Lien | | | | | | | | |
0.000%, 12/13/24 (F) | | | 734 | | | | 734 | |
NFP, Term Loan B, 1st Lien | | | | | | | | |
5.069%, VAR LIBOR+3.500%, 01/08/24 | | | 1,212 | | | | 1,217 | |
Sedgwick Claims Management Services, 2016 New Term Loan, 1st Lien | | | | | | | | |
4.943%, VAR LIBOR+3.250%, 03/01/21 | | | 741 | | | | 741 | |
Sedgwick Claims Management Services, New Term Loan, 1st Lien | | | | | | | | |
0.000%, 02/28/21 (F) | | | 411 | | | | 410 | |
| | | | | | | | |
| | | | | | | 6,358 | |
| | | | | | | | |
Leasing — 0.2% | | | | | | | | |
Avolon TLB Borrower 1 (US) LLC, Initial Term B-2 Loan, 1st Lien | | | | | | | | |
3.751%, VAR LIBOR+2.250%, 03/21/22 | | | 1,385 | | | | 1,374 | |
BakerCorp International (f/k/a B-Corp Holdings), Refinanced Term Loan, 1st Lien | | | | | | | | |
4.380%, VAR LIBOR+3.000%, 02/07/20 | | | 595 | | | | 588 | |
Fly Funding II SARL, Loan, 1st Lien | | | | | | | | |
3.410%, VAR LIBOR+2.000%, 02/09/23 | | | 701 | | | | 701 | |
USS Ultimate Holdings, Initial Term Loan | | | | | | | | |
5.319%, VAR LIBOR+3.750%, 08/09/24 | | | 367 | | | | 369 | |
| | | | | | | | |
| | | | | | | 3,032 | |
| | | | | | | | |
Machinery — 0.1% | | | | | | | | |
Blount International, Refinancing Term Loan, 1st Lien | | | | | | | | |
5.611%, VAR LIBOR+4.250%, 04/12/23 | | | 750 | | | | 758 | |
Clark Equipment Company, Tranche B Term Loan, 1st Lien | | | | | | | | |
4.193%, VAR LIBOR+2.500%, 05/18/24 | | | 690 | | | | 693 | |
Douglas Dynamics, Initial Term Loan, 1st Lien | | | | | | | | |
4.570%, 12/31/21 (D) | | | 444 | | | | 446 | |
The accompanying notes are an integral part of the financial statements.
119
| | |
| THE KP FUNDS | | December 31, 2017 |
| | | | | | | | |
| Description | | Face Amount
(000) | | | Value (000) | |
| | | | | | | | |
SiteOne Landscape Supply, LLC, Tranche D Term Loan, 1st Lien | | | | | | | | |
4.320%, VAR LIBOR+2.750%, 04/29/22 | | $ | 339 | | | $ | 340 | |
| | | | | | | | |
| | | | | | | 2,237 | |
| | | | | | | | |
Manufacturing — 0.0% | | | | | | | | |
Aristocrat Leisure, New Incremental Term Loan B, 1st Lien | | | | | | | | |
0.000%, 10/19/24 (F) | | | 467 | | | | 467 | |
PLZ Aeroscience Corp | | | | | | | | |
5.089%, 07/31/22 (D) | | | 116 | | | | 117 | |
| | | | | | | | |
| | | | | | | 584 | |
| | | | | | | | |
Media — 0.5% | | | | | | | | |
ABG Intermediate Holdings 2 LLC, Initial Term Loan | | | | | | | | |
9.443%, VAR LIBOR+7.750%, 09/29/25 | | | 500 | | | | 505 | |
Charter Communications Operating, LLC (aka CCO Safari LLC), Term I-1 Loan, 1st Lien | | | | | | | | |
3.600%, VAR LIBOR+2.250%, 04/30/25 | | | 936 | | | | 936 | |
3.350%, VAR LIBOR+2.000%, 04/30/25 | | | 497 | | | | 497 | |
CSC Holdings, LLC (fka CSC Holdings), March 2017 Refinancing Term Loan, 1st Lien | | | | | | | | |
3.741%, VAR LIBOR+2.250%, 07/17/25 | | | 261 | | | | 260 | |
EMI Music Publishing, Term Loan, 1st Lien | | | | | | | | |
3.741%, 08/21/23 (D) | | | 1,346 | | | | 1,348 | |
Entravision, Term Loan B, 1st Lien | | | | | | | | |
4.319%, 11/29/24 | | | 750 | | | | 752 | |
Mission Broadcasting, Term Loan B2, 1st Lien | | | | | | | | |
3.861%, VAR LIBOR+2.500%, 01/17/24 | | | 118 | | | | 118 | |
Nexstar Broadcasting, Term B-2 Loan, 1st Lien | | | | | | | | |
3.861%, VAR LIBOR+2.500%, 01/17/24 | | | 936 | | | | 938 | |
Numericable U.S. LLC, USD TLB-12 Term Loan, 1st Lien | | | | | | | | |
4.349%, VAR LIBOR+3.000%, 01/31/26 | | | 1,000 | | | | 961 | |
Technicolor S.A., First Incremental U.S. Term Loan, 1st Lien | | | | | | | | |
4.229%, VAR LIBOR+2.750%, 12/06/23 | | | 496 | | | | 496 | |
| | | | | | | | |
| Description | | Face Amount
(000) | | | Value (000) | |
| | | | | | | | |
Ziggo Secured Finance Partnership, Term Loan E Facility, 1st Lien | | | | | | | | |
3.977%, VAR LIBOR+2.500%, 04/15/25 | | $ | 1,000 | | | $ | 991 | |
| | | | | | | | |
| | | | | | | 7,802 | |
| | | | | | | | |
Metals & Mining — 0.0% | | | | | | | | |
Dynacast International LLC, Term B-1 Loan, 1st Lien | | | | | | | | |
4.943%, VAR LIBOR+3.250%, 01/28/22 | | | 497 | | | | 499 | |
| | | | | | | | |
Oil & Gas — 0.1% | | | | | | | | |
BCP Raptor, LLC, Initial Term Loan, 1st Lien | | | | | | | | |
5.729%, VAR LIBOR+4.250%, 06/24/24 | | | 471 | | | | 473 | |
Limetree Bay Terminals, LLC, Advance, 1st Lien | | | | | | | | |
5.501%, VAR LIBOR+4.000%, 02/15/24 | | | 746 | | | | 742 | |
Philadelphia Energy Solutions Refining and Marketing LLC, Term Loan B, 1st Lien | | | | | | | | |
8.500%, VAR Prime Rate by Country+4.000%, 04/04/18 | | | 690 | | | | 514 | |
Seadrill Operating LP (Seadrill Partners Finco LLC), Initial Term Loan, 1st Lien | | | | | | | | |
4.693%, VAR LIBOR+3.000%, 02/21/21 | | | 361 | | | | 291 | |
Traverse Midstream Partners LLC, Advance, 1st Lien | | | | | | | | |
5.850%, VAR LIBOR+4.000%, 09/27/24 | | | 278 | | | | 281 | |
| | | | | | | | |
| | | | | | | 2,301 | |
| | | | | | | | |
Personal Services — 0.1% | | | | | | | | |
William Morris Endeavor Entertainment, LLC (IMG Worldwide Holdings, LLC), Term Loan, 1st Lien | | | | | | | | |
4.640%, VAR LIBOR+3.250%, 05/06/21 | | | 1,235 | | | | 1,240 | |
4.570%, VAR LIBOR+3.250%, 05/06/21 | | | 3 | | | | 3 | |
| | | | | | | | |
| | | | | | | 1,243 | |
| | | | | | | | |
Professional & Business Services — 0.9% | | | | | |
Allied Universal Holdco LLC (f/k/a USAGM Holdco, LLC), Initial Term Loan | | | | | | | | |
5.443%, VAR LIBOR+3.750%, 07/28/22 | | | 997 | | | | 989 | |
BCP Renaissance (Rover), Term Loan B, 1st Lien | | | | | | | | |
5.380%, 10/31/24 (D) | | | 717 | | | | 725 | |
The accompanying notes are an integral part of the financial statements.
120
| | |
| THE KP FUNDS | | December 31, 2017 |
| | | | | | | | |
| Description | | Face Amount
(000) | | | Value (000) | |
| | | | | | | | |
Bright Horizons Family Solutions LLC, Term Loan B, 1st Lien | | | | | | | | |
3.569%, VAR LIBOR+2.000%, 11/07/23 | | $ | 967 | | | $ | 971 | |
Casmar Holdings (Australia) Pty Limited, Initial Term Loan | | | | | | | | |
6.193%, VAR LIBOR+4.500%, 12/20/23 | | | 495 | | | | 494 | |
Change Healthcare Holdings (fka Emdeon), Closing Date Term Loan, 1st Lien | | | | | | | | |
4.319%, VAR LIBOR+2.750%, 03/01/24 | | | 1,390 | | | | 1,392 | |
Duff & Phelps, Restatement Term Loan, 1st Lien | | | | | | | | |
4.943%, VAR LIBOR+3.250%, 10/05/24 | | | 494 | | | | 494 | |
Evertec, Term Loan A, 1st Lien | | | | | | | | |
3.932%, 01/20/18 (D) | | | 1,070 | | | | 1,037 | |
Explorer Holdings, Initial Term Loan, 1st Lien | | | | | | | | |
5.130%, VAR LIBOR+3.750%, 04/12/23 | | | 252 | | | | 254 | |
FinCo I LLC, Initial Term Loan, 1st Lien | | | | | | | | |
2.750%, VAR LIBOR+2.750%, 06/10/22 | | | 1,500 | | | | 1,515 | |
Flex Acquisition, Initial Term Loan, 1st Lien | | | | | | | | |
4.335%, VAR LIBOR+3.000%, 12/29/23 | | | 995 | | | | 999 | |
Focus Financial Partners, LLC, Initial Term Loan | | | | | | | | |
4.943%, VAR LIBOR+3.250%, 05/22/24 | | | 488 | | | | 492 | |
Greenrock Finance, Initial USD Term B Loan | | | | | | | | |
5.193%, VAR LIBOR+3.500%, 06/05/24 | | | 500 | | | | 501 | |
Harbourvest Partners LP, Initial Term Loan, 1st Lien | | | | | | | | |
3.859%, VAR LIBOR+2.500%, 02/04/21 | | | 299 | | | | 299 | |
Infinity Acquisition LLC, Initial Term Loan, 1st Lien | | | | | | | | |
4.693%, VAR LIBOR+3.000%, 08/06/21 | | | 1,147 | | | | 1,147 | |
iPayment, Term Loan B, 1st Lien | | | | | | | | |
6.618%, 04/11/23 | | | 517 | | | | 521 | |
Team Health Holdings, Initial Term Loan | | | | | | | | |
4.319%, VAR LIBOR+2.750%, 02/06/24 | | | 745 | | | | 725 | |
Tempo Acquisition, LLC, Initial Term Loan, 1st Lien | | | | | | | | |
4.569%, VAR LIBOR+3.000%, 05/01/24 | | | 748 | | | | 744 | |
| | | | | | | | |
| Description | | Face Amount
(000) | | | Value (000) | |
| | | | | | | | |
WEX, Term B-2 Loan, 1st Lien | | | | | | | | |
4.319%, VAR LIBOR+2.750%, 06/30/23 | | $ | 1,000 | | | $ | 1,004 | |
| | | | | | | | |
| | | | | | | 14,303 | |
| | | | | | | | |
Real Estate — 0.3% | | | | | | | | |
Capital Automotive LP, Term Loan B, 1st Lien | | | | | | | | |
4.070%, VAR LIBOR+2.500%, 03/21/24 | | | 1,247 | | | | 1,250 | |
Capital Automotive LP, Term Loan, 2nd Lien | | | | | | | | |
7.570%, VAR LIBOR+6.000%, 03/21/25 | | | 232 | | | | 237 | |
DTZ US Borrower LLC, Initial Term Loan, 1st Lien | | | | | | | | |
4.943%, VAR LIBOR+3.250%, 11/04/21 | | | 53 | | | | 52 | |
4.729%, VAR LIBOR+3.250%, 11/04/21 | | | 859 | | | | 847 | |
4.630%, VAR LIBOR+3.250%, 11/04/21 | | | 386 | | | | 381 | |
iStar, Initial Term Loan, 1st Lien | | | | | | | | |
4.511%, VAR LIBOR+3.000%, 07/01/20 | | | 188 | | | | 189 | |
4.392%, VAR LIBOR+3.000%, 07/01/20 | | | 187 | | | | 189 | |
Packers Sanitation Services, Term Loan, 1st Lien | | | | | | | | |
4.737%, 11/18/24 (D) | | | 750 | | | | 752 | |
RE/MAX, LLC (fka RE/MAX International, LLC), Term Loan, 1st Lien | | | | | | | | |
4.443%, VAR LIBOR+2.750%, 12/15/23 | | | 494 | | | | 491 | |
RHP Hotel Properties, LP, Tranche B Term Loan, 1st Lien | | | | | | | | |
3.670%, VAR LIBOR+2.250%, 05/11/24 | | | 746 | | | | 749 | |
| | | | | | | | |
| | | | | | | 5,137 | |
| | | | | | | | |
Retail Food & Drug — 0.1% | | | | | | | | |
BJ's Wholesale Club, Tranche B Term Loan, 1st Lien | | | | | | | | |
4.953%, VAR LIBOR+3.500%, 02/03/24 | | | 559 | | | | 549 | |
PharMerica, Initial Term Loan | | | | | | | | |
4.903%, VAR LIBOR+3.500%, 09/26/24 | | | 363 | | | | 364 | |
| | | | | | | | |
| | | | | | | 913 | |
| | | | | | | | |
The accompanying notes are an integral part of the financial statements.
121
| | |
| THE KP FUNDS | | December 31, 2017 |
| | | | | | | | |
| Description | | Face Amount
(000) | | | Value (000) | |
| | | | | | | | |
Retailing — 0.3% | | | | | | | | |
1011778 B.C. Unlimited Liability (New Red Finance) (aka Burger King/Tim Hortons), Term B-3 Loan, 1st Lien | | | | | | | | |
3.943%, VAR LIBOR+2.250%, 02/16/24 | | $ | 537 | | | $ | 536 | |
3.819%, VAR LIBOR+2.250%, 02/16/24 | | | 838 | | | | 838 | |
Aramark Intermediate HoldCo, U.S. Term B-1 Loan, 1st Lien | | | | | | | | |
3.569%, VAR LIBOR+2.000%, 03/07/25 | | | 522 | | | | 525 | |
Belron Finance US LLC, Initial Term B Loan, 1st Lien | | | | | | | | |
3.892%, VAR LIBOR+2.500%, 10/25/24 | | | 1,000 | | | | 1,009 | |
HD Supply, Term B-4 Loan, 1st Lien | | | | | | | | |
4.193%, VAR LIBOR+2.500%, 10/17/23 | | | 744 | | | | 750 | |
Trugreen Limited Partner | | | | | | | | |
5.536%, 04/13/23 (D) | | | 494 | | | | 500 | |
| | | | | | | | |
| | | | | | | 4,158 | |
| | | | | | | | |
Securities & Trusts — 0.2% | | | | | | | | |
AssuredPartners, 2017 September Refinancing Term Loan | | | | | | | | |
5.069%, VAR LIBOR+3.500%, 10/22/24 | | | 750 | | | | 754 | |
RPI Finance Trust, Initial Term Loan B-6, 1st Lien | | | | | | | | |
3.693%, VAR LIBOR+2.000%, 03/27/23 | | | 742 | | | | 745 | |
TCW Group, Term Loan B, 1st Lien | | | | | | | | |
3.621%, 12/13/24 (D) | | | 635 | | | | 636 | |
Vistra, Term Loan, 1st Lien | | | | | | | | |
4.600%, 10/26/22 (D) | | | 748 | | | | 748 | |
| | | | | | | | |
| | | | | | | 2,883 | |
| | | | | | | | |
Shipping & Ship Building — 0.2% | |
AI Mistral Holdco Limited, Initial Term Loan | | | | | | | | |
4.569%, VAR LIBOR+3.000%, 01/17/24 | | | 744 | | | | 740 | |
International Seaways Operating, Term Loan, 1st Lien | | | | | | | | |
6.850%, VAR LIBOR+5.500%, 05/30/22 | | | 745 | | | | 745 | |
Navios Maritime Partners LP, Initial Term Loan, 1st Lien | | | | | | | | |
6.540%, VAR LIBOR+5.000%, 09/14/20 | | | 963 | | | | 959 | |
| | | | | | | | |
| Description | | Face Amount
(000) | | | Value (000) | |
| | | | | | | | |
OSG Bulk Ships, Initial Term Loan, 1st Lien | | | | | | | | |
5.650%, VAR LIBOR+4.250%, 08/05/19 | | $ | 400 | | | $ | 385 | |
| | | | | | | | |
| | | | | | | 2,829 | |
| | | | | | | | |
Steel — 0.1% | | | | | | | | |
Zekelman Industries (fka JMC Steel Group), Term Loan, 1st Lien | | | | | | | | |
4.073%, VAR LIBOR+2.750%, 06/14/21 | | | 836 | | | | 839 | |
| | | | | | | | |
Telecommunications — 0.8% | | | | | | | | |
Altice Financing, March 2017 Refinancing Term Loan | | | | | | | | |
4.109%, VAR LIBOR+2.750%, 07/15/25 | | | 950 | | | | 929 | |
CenturyLink, Initial Term B Loan, 1st Lien | | | | | | | | |
4.319%, VAR LIBOR+2.750%, 01/31/25 | | | 1,250 | | | | 1,204 | |
Ciena, Refinancing Term Loan, 1st Lien | | | | | | | | |
4.001%, VAR LIBOR+2.500%, 01/26/22 | | | 1,195 | | | | 1,198 | |
CPI International, Initial Term Loan, 1st Lien | | | | | | | | |
8.819%, 07/25/25 (D) | | | 313 | | | | 313 | |
Digicel International Finance Limited, Initial Term B Loan, 1st Lien | | | | | | | | |
5.080%, VAR LIBOR+3.750%, 05/27/24 | | | 360 | | | | 361 | |
Greeneden U.S. Holdings I, LLC, Tranche B-2 Dollar Term Loan | | | | | | | | |
5.443%, VAR LIBOR+3.750%, 12/01/23 | | | 937 | | | | 942 | |
Level 3 Financing, Tranche B 2024 Term Loan | | | | | | | | |
3.696%, VAR LIBOR+2.250%, 02/22/24 | | | 1,670 | | | | 1,670 | |
Lumos Networks, Delayed Term Loan, 1st Lien | | | | | | | | |
0.000%, 10/27/24 (F) | | | 300 | | | | 300 | |
Lumos Networks, Term Loan B, 1st Lien | | | | | | | | |
4.819%, VAR LIBOR+3.250%, 10/27/24 | | | 806 | | | | 809 | |
Radiate Holdco, LLC, Closing Date Term Loan, 1st Lien | | | | | | | | |
4.569%, VAR LIBOR+3.000%, 02/01/24 | | | 993 | | | | 984 | |
SBA Finance, Incremental Term Loan, 1st Lien | | | | | | | | |
3.600%, VAR LIBOR+2.250%, 06/10/22 (F) | | | 500 | | | | 501 | |
The accompanying notes are an integral part of the financial statements.
122
| | |
| THE KP FUNDS | | December 31, 2017 |
| | | | | | | | |
| Description | | Face Amount
(000)(1) | | | Value (000) | |
| | | | | | | | |
SBA Senior Finance II LLC, Incremental Tranche B-1 Term Loan, 1st Lien | | | | | | | | |
3.820%, VAR LIBOR+2.250%, 03/24/21 | | | 727 | | | $ | 729 | |
Sprint Communications, Initial Term Loan | | | | | | | | |
4.125%, VAR LIBOR+2.500%, 02/02/24 | | | 1,294 | | | | 1,293 | |
Syniverse Holdings, Tranche B Term Loan, 1st Lien | | | | | | | | |
4.569%, VAR LIBOR+3.000%, 04/23/19 | | | 390 | | | | 383 | |
Zayo Group LLC (Zayo Capital), 2017 Incremental Refinancing B-2 Term Facility | | | | | | | | |
3.802%, VAR LIBOR+2.250%, 01/19/24 | | | 1,136 | | | | 1,139 | |
| | | | | | | | |
| | | | | | | 12,755 | |
| | | | | | | | |
Transportation — 0.1% | | | | | | | | |
Agro Merchants North America Holdings, Effective Date Loan, 1st Lien | | | | | | | | |
5.319%, VAR LIBOR+3.750%, 11/15/24 | | | 1,000 | | | | 1,005 | |
XPO Logistics, Refinanced Term Loan, 1st Lien | | | | | | | | |
3.599%, VAR LIBOR+2.250%, 11/01/21 | | | 931 | | | | 936 | |
| | | | | | | | |
| | | | | | | 1,941 | |
| | | | | | | | |
Total Loan Participations
(Cost $158,004) (000) | | | | | | | 157,736 | |
| | | | | | | | |
SOVEREIGN DEBT — 9.1% | | | | | | | | |
1MDB Global Investments | | | | | | | | |
4.400%, 03/09/23 | | | 3,100 | | | | 3,008 | |
African Development Bank | | | | | | | | |
2.125%, 11/16/22 | | | 50 | | | | 49 | |
1.375%, 02/12/20 | | | 100 | | | | 99 | |
1.125%, 09/20/19 | | | 100 | | | | 98 | |
Andina de Fomento | | | | | | | | |
4.375%, 06/15/22 | | | 100 | | | | 107 | |
Argentine Bonos del Tesoro | | | | | | | | |
18.200%, 10/03/21 (ARS) | | | 17,523 | | | | 960 | |
Argentine Republic Government International Bond | | | | | | | | |
8.280%, 12/31/33 | | | 2,032 | | | | 2,395 | |
7.500%, 04/22/26 | | | 1,310 | | | | 1,483 | |
7.125%, 07/06/36 (A) | | | 560 | | | | 607 | |
7.125%, 06/28/17 (A) | | | 360 | | | | 371 | |
6.875%, 04/22/21 | | | 195 | | | | 212 | |
5.625%, 01/26/22 | | | 750 | | | | 791 | |
2.500%, 03/31/19 (E) | | | 1,519 | | | | 1,117 | |
Armenia International Bond | | | | | | | | |
6.000%, 09/30/20 (A) | | | 876 | | | | 930 | |
| | | | | | | | |
| Description | | Face Amount
(000)(1) | | | Value (000) | |
| | | | | | | | |
Asian Development Bank | | | | | | | | |
2.375%, 08/10/27 | | | 100 | | | $ | 98 | |
2.000%, 01/22/25 | | | 100 | | | | 97 | |
1.750%, 03/21/19 | | | 100 | | | | 100 | |
1.750%, 06/08/21 | | | 200 | | | | 197 | |
1.625%, 08/26/20 | | | 100 | | | | 99 | |
1.625%, 03/16/21 | | | 200 | | | | 197 | |
1.375%, 01/15/19 | | | 100 | | | | 99 | |
1.000%, 08/16/19 | | | 100 | | | | 98 | |
Azerbaijan Government International Bond | | | | | | | | |
4.750%, 03/18/24 (A) | | | 1,765 | | | | 1,822 | |
Bahamas Government International Bond | | | | | | | | |
6.000%, 11/21/28 (A) | | | 1,210 | | | | 1,258 | |
Banco Nacional de Desenvolvimento Economico e Social | | | | | | | | |
4.750%, 05/09/24 (A) | | | 715 | | | | 720 | |
Brazil Notas do Tesouro Nacional Serie F | | | | | | | | |
10.000%, 01/01/21 (BRL) | | | 1,230 | | | | 381 | |
10.000%, 01/01/23 (BRL) | | | 3,425 | | | | 1,045 | |
10.000%, 01/01/25 (BRL) | | | 1,100 | | | | 331 | |
Brazilian Government International Bond | �� | | | | | | | |
6.000%, 04/07/26 | | | 1,440 | | | | 1,609 | |
5.625%, 01/07/41 | | | 370 | | | | 378 | |
4.875%, 01/22/21 | | | 365 | | | | 387 | |
4.625%, 01/13/28 | | | 770 | | | | 774 | |
4.250%, 01/07/25 | | | 1,105 | | | | 1,124 | |
2.625%, 01/05/23 | | | 515 | | | | 496 | |
Canada Government International Bond | | | | | | | | |
2.000%, 11/15/22 | | | 100 | | | | 99 | |
1.625%, 02/27/19 | | | 100 | | | | 99 | |
Chile Government International Bond | | | | | | | | |
3.860%, 06/21/47 | | | 658 | | | | 676 | |
3.125%, 01/21/26 | | | 107 | | | | 108 | |
Colombia Government International Bond | | | | | | | | |
7.375%, 03/18/19 | | | 100 | | | | 106 | |
7.375%, 09/18/37 | | | 945 | | | | 1,277 | |
6.125%, 01/18/41 | | | 600 | | | | 724 | |
5.000%, 06/15/45 | | | 860 | | | | 909 | |
4.500%, 01/28/26 | | | 340 | | | | 363 | |
4.375%, 07/12/21 | | | 200 | | | | 211 | |
4.000%, 02/26/24 | | | 970 | | | | 1,006 | |
3.875%, 04/25/27 | | | 1,617 | | | | 1,646 | |
Costa Rica Government International Bond | | | | | | | | |
7.158%, 03/12/45 (A) | | | 700 | | | | 735 | |
7.000%, 04/04/44 (A) | | | 390 | | | | 403 | |
Council of Europe Development Bank | | | | | | | | |
1.750%, 11/14/19 | | | 100 | | | | 99 | |
The accompanying notes are an integral part of the financial statements.
123
| | |
| THE KP FUNDS | | December 31, 2017 |
| | | | | | | | |
| Description | | Face Amount
(000) | | | Value (000) | |
| | | | | | | | |
Croatia Government International Bond | | | | | | | | |
6.375%, 03/24/21 | | $ | 460 | | | $ | 506 | |
Dominican Republic International Bond | | | | | | | | |
7.450%, 04/30/44 (A) | | | 915 | | | | 1,091 | |
6.875%, 01/29/26 (A) | | | 990 | | | | 1,130 | |
6.850%, 01/27/45 (A) | | | 250 | | | | 281 | |
6.600%, 01/28/24 (A) | | | 290 | | | | 325 | |
5.950%, 01/25/27 (A) | | | 800 | | | | 864 | |
5.500%, 01/27/25 (A) | | | 365 | | | | 387 | |
Ecuador Government International Bond | | | | | | | | |
10.750%, 03/28/22 (A) | | | 790 | | | | 923 | |
9.650%, 12/13/26 (A) | | | 560 | | | | 643 | |
8.875%, 10/23/27 (A) | | | 700 | | | | 770 | |
8.750%, 06/02/23 (A) | | | 440 | | | | 487 | |
7.950%, 06/20/24 (A) | | | 1,220 | | | | 1,296 | |
7.950%, 06/20/24 | | | 210 | | | | 223 | |
Egypt Government International Bond | | | | | | | | |
8.500%, 01/31/47 (A) | | | 500 | | | | 574 | |
7.500%, 01/31/27 (A) | | | 860 | | | | 951 | |
6.125%, 01/31/22 (A) | | | 790 | | | | 826 | |
El Salvador Government International Bond | | | | | | | | |
8.625%, 02/28/29 (A) | | | 880 | | | | 1,030 | |
7.650%, 06/15/35 (A) | | | 1,375 | | | | 1,490 | |
7.375%, 12/01/19 (A) | | | 365 | | | | 386 | |
6.375%, 01/18/27 (A) | | | 320 | | | | 326 | |
European Bank for Reconstruction & Development | | | | | | | | |
1.750%, 11/26/19 | | | 150 | | | | 149 | |
1.500%, 03/16/20 | | | 200 | | | | 197 | |
0.875%, 07/22/19 | | | 200 | | | | 197 | |
European Investment Bank | | | | | | | | |
3.250%, 01/29/24 | | | 250 | | | | 260 | |
2.375%, 05/24/27 | | | 250 | | | | 246 | |
2.250%, 03/15/22 | | | 150 | | | | 149 | |
2.125%, 10/15/21 | | | 200 | | | | 199 | |
2.125%, 04/13/26 | | | 100 | | | | 97 | |
2.000%, 12/15/22 | | | 150 | | | | 147 | |
1.875%, 03/15/19 | | | 150 | | | | 150 | |
1.375%, 06/15/20 | | | 150 | | | | 147 | |
1.375%, 09/15/21 | | | 100 | | | | 97 | |
1.250%, 05/15/19 | | | 100 | | | | 99 | |
1.250%, 12/16/19 | | | 300 | | | | 295 | |
Export Credit Bank of Turkey | | | | | | | | |
5.875%, 04/24/19 (A) | | | 200 | | | | 206 | |
Export Development Canada | | | | | | | | |
2.000%, 05/17/22 | | | 200 | | | | 197 | |
Export-Import Bank of Korea | | | | | | | | |
2.875%, 01/21/25 | | | 200 | | | | 195 | |
2.500%, 05/10/21 | | | 200 | | | | 197 | |
| | | | | | | | |
| Description | | Face Amount
(000) | | | Value (000) | |
| | | | | | | | |
Georgia Government International Bond | | | | | | | | |
6.875%, 04/12/21 (A) | | $ | 1,260 | | | $ | 1,409 | |
Ghana Government International Bond | | | | | | | | |
10.750%, 10/14/30 (A) | | | 970 | | | | 1,334 | |
9.250%, 09/15/22 (A) | | | 490 | | | | 555 | |
7.875%, 08/07/23 (A) | | | 1,210 | | | | 1,329 | |
Hashemite Kingdom of Jordan Government AID Bond | | | | | | | | |
2.503%, 10/30/20 | | | 200 | | | | 203 | |
Honduras Government International Bond | | | | | | | | |
8.750%, 12/16/20 (A) | | | 670 | | | | 751 | |
7.500%, 03/15/24 (A) | | | 200 | | | | 223 | |
6.250%, 01/19/27 (A) | | | 330 | | | | 352 | |
Hungary Government International Bond | | | | | | | | |
5.750%, 11/22/23 | | | 900 | | | | 1,029 | |
5.375%, 03/25/24 | | | 1,540 | | | | 1,742 | |
Indonesia Government International Bond | | | | | | | | |
8.500%, 10/12/35 (A) | | | 1,410 | | | | 2,113 | |
8.500%, 10/12/35 | | | 260 | | | | 389 | |
5.875%, 01/15/24 (A) | | | 785 | | | | 892 | |
5.250%, 01/17/42 (A) | | | 400 | | | | 448 | |
5.250%, 01/08/47 (A) | | | 280 | | | | 317 | |
4.350%, 01/11/48 | | | 1,180 | | | | 1,197 | |
4.125%, 01/15/25 (A) | | | 360 | | | | 374 | |
3.850%, 07/18/27 (A) | | | 500 | | | | 513 | |
3.700%, 01/08/22 (A) | | | 210 | | | | 216 | |
Inter-American Development Bank | | | | | | | | |
2.375%, 07/07/27 | | | 100 | | | | 98 | |
2.125%, 11/09/20 | | | 250 | | | | 250 | |
2.125%, 01/15/25 | | | 125 | | | | 123 | |
1.875%, 03/15/21 | | | 150 | | | | 149 | |
1.750%, 04/14/22 | | | 150 | | | | 147 | |
1.750%, 09/14/22 | | | 100 | | | | 97 | |
1.625%, 05/12/20 | | | 150 | | | | 148 | |
1.000%, 05/13/19 | | | 100 | | | | 99 | |
International Bank for Reconstruction & Development | | | | | | | | |
2.500%, 11/25/24 | | | 100 | | | | 100 | |
2.500%, 07/29/25 | | | 150 | | | | 150 | |
2.250%, 06/24/21 | | | 50 | | | | 50 | |
2.125%, 12/13/21 | | | 200 | | | | 199 | |
2.125%, 02/13/23 | | | 100 | | | | 99 | |
2.000%, 01/26/22 | | | 200 | | | | 198 | |
1.875%, 03/15/19 | | | 200 | | | | 200 | |
1.875%, 10/07/19 | | | 200 | | | | 199 | |
1.875%, 04/21/20 | | | 200 | | | | 199 | |
1.625%, 03/09/21 | | | 150 | | | | 147 | |
1.375%, 09/20/21 | | | 300 | | | | 291 | |
1.250%, 07/26/19 | | | 100 | | | | 99 | |
International Finance | | | | | | | | |
2.000%, 10/24/22 | | | 50 | | | | 49 | |
The accompanying notes are an integral part of the financial statements.
124
| | |
| THE KP FUNDS | | December 31, 2017 |
| | | | | | | | |
| Description | | Face Amount
(000)(1) | | | Value (000) | |
| | | | | | | | |
1.625%, 07/16/20 | | | 100 | | | $ | 99 | |
1.125%, 07/20/21 | | | 100 | | | | 97 | |
Israel Government International Bond | | | | | | | | |
3.150%, 06/30/23 | | | 200 | | | | 205 | |
Ivory Coast Government International Bond | | | | | | | | |
6.125%, 06/15/33 (A) | | | 810 | | | | 824 | |
5.750%, 12/31/32 (A) | | | 679 | | | | 678 | |
5.375%, 07/23/24 (A) | | | 450 | | | | 458 | |
Jamaica Government International Bond | | | | | | | | |
8.000%, 03/15/39 | | | 250 | | | | 306 | |
Japan Bank for International Cooperation | | | | | | | | |
2.500%, 06/01/22 | | | 200 | | | | 199 | |
2.375%, 04/20/26 | | | 200 | | | | 194 | |
2.250%, 11/04/26 | | | 200 | | | | 192 | |
2.125%, 07/21/20 | | | 200 | | | | 199 | |
Jordan Government International Bond | | | | | | | | |
7.375%, 10/10/47 (A) | | | 1,300 | | | | 1,354 | |
5.750%, 01/31/27 (A) | | | 370 | | | | 367 | |
Kazakhstan Government International Bond | | | | | | | | |
6.500%, 07/21/45 (A) | | | 540 | | | | 693 | |
Korea Development Bank | | | | | | | | |
2.500%, 01/13/21 | | | 200 | | | | 197 | |
Korea International Bond | | | | | | | | |
7.125%, 04/16/19 | | | 100 | | | | 106 | |
2.750%, 01/19/27 | | | 200 | | | | 196 | |
Kreditanstalt fuer Wiederaufbau | | | | | | | | |
2.125%, 03/07/22 | | | 150 | | | | 149 | |
1.750%, 03/31/20 | | | 500 | | | | 497 | |
1.750%, 09/15/21 | | | 200 | | | | 196 | |
1.625%, 05/29/20 | | | 250 | | | | 247 | |
Lebanon Government International Bond | | | | | | | | |
8.250%, 04/12/21 | | | 760 | | | | 791 | |
6.750%, 11/29/27 | | | 215 | | | | 205 | |
6.650%, 11/03/28 | | | 160 | | | | 150 | |
6.650%, 02/26/30 | | | 610 | | | | 561 | |
6.600%, 11/27/26 | | | 450 | | | | 429 | |
6.375%, 03/09/20 | | | 285 | | | | 285 | |
6.200%, 02/26/25 | | | 390 | | | | 368 | |
6.100%, 10/04/22 | | | 440 | | | | 427 | |
6.000%, 01/27/23 | | | 505 | | | | 484 | |
5.450%, 11/28/19 | | | 530 | | | | 526 | |
Malaysia Government Bond | | | | | | | | |
4.254%, 05/31/35 (MYR) | | | 3,650 | | | | 867 | |
3.844%, 04/15/33 (MYR) | | | 2,510 | | | | 580 | |
Mexico Government International Bond | | | | | | | | |
5.550%, 01/21/45 | | | 500 | | | | 562 | |
4.600%, 02/10/48 | | | 878 | | | | 867 | |
4.150%, 03/28/27 | | | 510 | | | | 529 | |
4.125%, 01/21/26 | | | 200 | | | | 209 | |
| | | | | | | | |
| Description | | Face Amount
(000)(1) | | | Value (000) | |
| | | | | | | | |
Mongolia Government International Bond | | | | | | | | |
10.875%, 04/06/21 (A) | | | 2,100 | | | $ | 2,466 | |
8.750%, 03/09/24 (A) | | | 200 | | | | 230 | |
5.625%, 05/01/23 (A) | | | 530 | | | | 535 | |
5.125%, 12/05/22 (A) | | | 805 | | | | 797 | |
5.125%, 12/05/22 | | | 490 | | | | 485 | |
Nigeria Government International Bond | | | | | | | | |
7.875%, 02/16/32 (A) | | | 720 | | | | 813 | |
7.625%, 11/28/47 (A) | | | 570 | | | | 611 | |
6.750%, 01/28/21 (A) | | | 220 | | | | 234 | |
6.500%, 11/28/27 (A) | | | 580 | | | | 605 | |
Nordic Investment Bank | | | | | | | | |
1.500%, 09/29/20 | | | 200 | | | | 197 | |
Oman Government International Bond | | | | | | | | |
6.500%, 03/08/47 (A) | | | 660 | | | | 661 | |
5.375%, 03/08/27 (A) | | | 1,235 | | | | 1,246 | |
4.750%, 06/15/26 (A) | | | 465 | | | | 451 | |
3.875%, 03/08/22 (A) | | | 300 | | | | 302 | |
3.625%, 06/15/21 (A) | | | 200 | | | | 200 | |
Oman Sovereign Sukuk SAOC | | | | | | | | |
4.397%, 06/01/24 (A) | | | 620 | | | | 619 | |
Panama Government International Bond | | | | | | | | |
9.375%, 04/01/29 | | | 455 | | | | 689 | |
6.700%, 01/26/36 | | | 1,385 | | | | 1,844 | |
5.200%, 01/30/20 | | | 100 | | | | 105 | |
4.500%, 05/15/47 | | | 200 | | | | 215 | |
Peru Government Bond | | | | | | | | |
6.150%, 08/12/32 (PEN) (A) | | | 1,820 | | | | 597 | |
Perusahaan Penerbit SBSN Indonesia III | | | | | | | | |
4.150%, 03/29/27 (A) | | | 490 | | | | 506 | |
Peruvian Government International Bond | | | | | | | | |
7.350%, 07/21/25 | | | 100 | | | | 130 | |
6.950%, 08/12/31 (PEN) (A) | | | 1,000 | | | | 352 | |
6.550%, 03/14/37 | | | 715 | | | | 967 | |
5.625%, 11/18/50 | | | 905 | | | | 1,161 | |
Philippine Government International Bond | | | | | | | | |
7.750%, 01/14/31 | | | 209 | | | | 298 | |
6.375%, 10/23/34 | | | 1,030 | | | | 1,378 | |
5.500%, 03/30/26 | | | 200 | | | | 236 | |
4.200%, 01/21/24 | | | 200 | | | | 217 | |
3.700%, 02/02/42 | | | 300 | | | | 298 | |
Poland Government International Bond | | | | | | | | |
6.375%, 07/15/19 | | | 200 | | | | 212 | |
4.000%, 01/22/24 | | | 125 | | | | 133 | |
3.000%, 03/17/23 | | | 150 | | | | 153 | |
Province of Alberta Canada | | | | | | | | |
2.200%, 07/26/22 | | | 100 | | | | 98 | |
1.900%, 12/06/19 | | | 200 | | | | 199 | |
The accompanying notes are an integral part of the financial statements.
125
| | |
| THE KP FUNDS | | December 31, 2017 |
| | | | | | | | |
| Description | | Face Amount
(000)(1) | | | Value (000) | |
| | | | | | | | |
Province of British Columbia Canada | | | | | | | | |
2.000%, 10/23/22 | | | 100 | | | $ | 98 | |
Province of Manitoba Canada | | | | | | | | |
2.125%, 06/22/26 | | | 500 | | | | 470 | |
2.050%, 11/30/20 | | | 150 | | | | 149 | |
Province of Ontario Canada | | | | | | | | |
2.500%, 04/27/26 | | | 500 | | | | 490 | |
2.450%, 06/29/22 | | | 200 | | | | 199 | |
2.000%, 01/30/19 | | | 250 | | | | 250 | |
1.875%, 05/21/20 | | | 150 | | | | 149 | |
1.625%, 01/18/19 | | | 100 | | | | 100 | |
1.250%, 06/17/19 | | | 150 | | | | 148 | |
Province of Quebec Canada | | | | | | | | |
2.875%, 10/16/24 | | | 100 | | | | 101 | |
2.625%, 02/13/23 | | | 200 | | | | 200 | |
2.500%, 04/20/26 | | | 600 | | | | 587 | |
Provincia de Buenos Aires | | | | | | | | |
7.875%, 06/15/27 (A) | | | 685 | | | | 760 | |
6.500%, 02/15/23 (A) | | | 450 | | | | 484 | |
Provincia de Cordoba | | | | | | | | |
7.125%, 06/10/21 (A) | | | 170 | | | | 184 | |
Republic of Belarus International Bond | | | | | | | | |
6.875%, 02/28/23 (A) | | | 680 | | | | 731 | |
Republic of Italy Government International Bond | | | | | | | | |
5.375%, 06/15/33 | | | 300 | | | | 352 | |
Republic of South Africa Government Bond | | | | | | | | |
8.750%, 02/28/48 (ZAR) | | | 5,500 | | | | 403 | |
Romanian Government International Bond | | | | | | | | |
6.750%, 02/07/22 (A) | | | 910 | | | | 1,042 | |
4.375%, 08/22/23 (A) | | | 540 | | | | 578 | |
Russian Federal Bond - OFZ | | | | | | | | |
8.150%, 02/03/27(RUB) | | | 81,100 | | | | 1,482 | |
Russian Foreign Bond - Eurobond | | | | | | | | |
5.625%, 04/04/42 (A) | | | 400 | | | | 448 | |
5.250%, 06/23/47 (A) | | | 800 | | | | 837 | |
4.875%, 09/16/23 (A) | | | 400 | | | | 433 | |
4.750%, 05/27/26 | | | 1,000 | | | | 1,061 | |
Saudi Government International Bond | | | | | | | | |
3.625%, 03/04/28 (A) | | | 760 | | | | 753 | |
Senegal Government International Bond | | | | | | | | |
8.750%, 05/13/21 (A) | | | 1,025 | | | | 1,182 | |
6.250%, 07/30/24 (A) | | | 300 | | | | 324 | |
6.250%, 05/23/33 (A) | | | 580 | | | | 612 | |
Serbia Government International Bond | | | | | | | | |
7.250%, 09/28/21 (A) | | | 1,075 | | | | 1,229 | |
| | | | | | | | |
| Description | | Face Amount
(000)(1) | | | Value (000) | |
| | | | | | | | |
South Africa Government International Bond | | | | | | | | |
4.300%, 10/12/28 | | | 1,750 | | | $ | 1,688 | |
Sri Lanka Government International Bond | | | | | | | | |
6.850%, 11/03/25 (A) | | | 445 | | | | 491 | |
6.825%, 07/18/26 (A) | | | 430 | | | | 473 | |
6.200%, 05/11/27 (A) | | | 1,430 | | | | 1,510 | |
6.125%, 06/03/25 (A) | | | 220 | | | | 232 | |
5.875%, 07/25/22 (A) | | | 295 | | | | 311 | |
Turkey Government International Bond | | | | | | | | |
8.000%, 02/14/34 | | | 436 | | | | 538 | |
7.375%, 02/05/25 | | | 610 | | | | 702 | |
6.875%, 03/17/36 | | | 630 | | | | 702 | |
6.000%, 03/25/27 | | | 1,200 | | | | 1,278 | |
5.750%, 05/11/47 | | | 715 | | | | 697 | |
5.625%, 03/30/21 | | | 1,080 | | | | 1,137 | |
4.250%, 04/14/26 | | | 740 | | | | 705 | |
Ukraine Government AID Bonds | | | | | | | | |
1.471%, 09/29/21 | | | 200 | | | | 195 | |
Ukraine Government International Bond | | | | | | | | |
7.750%, 09/01/21 (A) | | | 214 | | | | 228 | |
7.750%, 09/01/22 (A) | | | 1,184 | | | | 1,259 | |
7.750%, 09/01/23 (A) | | | 1,284 | | | | 1,362 | |
7.750%, 09/01/24 (A) | | | 394 | | | | 414 | |
7.750%, 09/01/25 (A) | | | 1,019 | | | | 1,063 | |
7.750%, 09/01/26 (A) | | | 454 | | | | 469 | |
7.750%, 09/01/27 (A) | | | 215 | | | | 222 | |
7.375%, 09/25/32 (A) | | | 1,130 | | | | 1,110 | |
2.984%, 05/31/40 (A) (D) | | | 314 | | | | 173 | |
Ukreximbank Via Biz Finance | | | | | | | | |
9.625%, 04/27/22 (A) | | | 345 | | | | 368 | |
Uruguay Government International Bond | | | | | | | | |
9.875%, 06/20/22 (UYU) (A) | | | 5,900 | | | | 217 | |
8.500%, 03/15/28 (UYU) (A) | | | 3,940 | | | | 137 | |
5.100%, 06/18/50 | | | 1,943 | | | | 2,156 | |
4.500%, 08/14/24 | | | 544 | | | | 590 | |
4.375%, 10/27/27 | | | 2,045 | | | | 2,190 | |
Venezuela Government International Bond | | | | | | | | |
7.750%, 10/13/19 (C) | | | 515 | | | | 116 | |
7.650%, 04/21/25 (C) | | | 362 | | | | 72 | |
7.000%, 03/31/38 | | | 422 | | | | 87 | |
Zambia Government International Bond | | | | | | | | |
8.970%, 07/30/27 (A) | | | 200 | | | | 225 | |
8.500%, 04/14/24 (A) | | | 1,105 | | | | 1,220 | |
5.375%, 09/20/22 (A) | | | 680 | | | | 663 | |
| | | | | | | | |
Total Sovereign Debt
(Cost $138,718) (000) | | | | 144,577 | |
| | | | | | | | |
The accompanying notes are an integral part of the financial statements.
126
| | |
| THE KP FUNDS | | December 31, 2017 |
| | | | | | | | |
| Description | | Face Amount
(000) | | | Value (000) | |
| | | | | | | | |
ASSET-BACKED SECURITIES — 6.3% | |
Automotive — 3.6% | | | | | | | | |
AmeriCredit Automobile Receivables Trust, Ser 2017-1, Cl A2A | | | | | | | | |
1.510%, 05/18/20 | | $ | 895 | | | $ | 894 | |
AmeriCredit Automobile Receivables Trust, Ser 2017-4, Cl A2A | | | | | | | | |
1.830%, 05/18/21 | | | 3,907 | | | | 3,903 | |
AmeriCredit Automobile Receivables Trust, Ser 2017-4, Cl A3 | | | | | | | | |
2.040%, 07/18/22 | | | 335 | | | | 334 | |
AmeriCredit Automobile Receivables Trust, Ser 2017-4, Cl B | | | | | | | | |
2.360%, 12/19/22 | | | 1,319 | | | | 1,316 | |
BMW Vehicle Lease Trust, Ser 2017-1, Cl A3 | | | | | | | | |
1.980%, 05/20/20 | | | 350 | | | | 349 | |
Capital Auto Receivables Asset Trust, Ser 2016-3, Cl A2A | | | | | | | | |
1.360%, 04/22/19 | | | 92 | | | | 92 | |
Capital Auto Receivables Asset Trust, Ser 2017-1, Cl A2 | | | | | | | | |
1.760%, 06/22/20 (A) | | | 1,753 | | | | 1,750 | |
CarFinance Capital Auto Trust, Ser 2015-1A, Cl A | | | | | | | | |
1.750%, 06/15/21 (A) | | | 229 | | | | 228 | |
CarMax Auto Owner Trust, Ser 2016-4, Cl A4 | | | | | | | | |
1.600%, 06/15/22 | | | 250 | | | | 245 | |
CarMax Auto Owner Trust, Ser 2017-3, Cl A2A | | | | | | | | |
1.640%, 09/15/20 | | | 2,076 | | | | 2,072 | |
CarMax Auto Owner Trust, Ser 2017-4, Cl A3 | | | | | | | | |
2.110%, 10/17/22 | | | 892 | | | | 887 | |
CarMax Auto Owner Trust, Ser 2017-4, Cl A4 | | | | | | | | |
2.330%, 05/15/23 | | | 545 | | | | 542 | |
CPS Auto Receivables Trust, Ser 2015-A, Cl A | | | | | | | | |
1.530%, 07/15/19 (A) | | | 2 | | | | 2 | |
CPS Auto Receivables Trust, Ser 2015-B, Cl A | | | | | | | | |
1.650%, 11/15/19 (A) | | | 17 | | | | 17 | |
CPS Auto Receivables Trust, Ser 2016-B, Cl A | | | | | | | | |
2.070%, 11/15/19 (A) | | | 262 | | | | 262 | |
CPS Auto Receivables Trust, Ser 2016-C, Cl A | | | | | | | | |
1.620%, 01/15/20 (A) | | | 707 | | | | 706 | |
| | | | | | | | |
| Description | | Face Amount
(000) | | | Value (000) | |
| | | | | | | | |
CPS Auto Receivables Trust, Ser 2017-C, Cl A | | | | | | | | |
1.780%, 09/15/20 (A) | | $ | 885 | | | $ | 882 | |
CPS Auto Trust, Ser 2016-D, Cl A | | | | | | | | |
1.500%, 06/15/20 (A) | | | 855 | | | | 853 | |
Drive Auto Receivables Trust, Ser 2017-1, Cl A2A | | | | | | | | |
1.670%, 05/15/19 | | | 720 | | | | 720 | |
Drive Auto Receivables Trust, Ser 2017-2, Cl A2A | | | | | | | | |
1.630%, 08/15/19 | | | 1,334 | | | | 1,333 | |
Drive Auto Receivables Trust, Ser 2017-2, Cl B | | | | | | | | |
2.250%, 06/15/21 | | | 1,532 | | | | 1,530 | |
Drive Auto Receivables Trust, Ser 2017-3, Cl A1 | | | | | | | | |
1.450%, 11/15/18 | | | 897 | | | | 897 | |
Drive Auto Receivables Trust, Ser 2017-3, Cl B | | | | | | | | |
2.300%, 05/17/21 | | | 1,343 | | | | 1,340 | |
Drive Auto Receivables Trust, Ser 2017-BA, Cl A2 | | | | | | | | |
1.590%, 12/17/18 (A) | | | 126 | | | | 126 | |
Drive Auto Receivables Trust, Ser 2017-BA, Cl B | | | | | | | | |
2.200%, 05/15/20 (A) | | | 733 | | | | 733 | |
DT Auto Owner Trust, Ser 2016-4A, Cl A | | | | | | | | |
1.440%, 11/15/19 (A) | | | 162 | | | | 162 | |
DT Auto Owner Trust, Ser 2017-2A, Cl A | | | | | | | | |
1.720%, 05/15/20 (A) | | | 1,880 | | | | 1,879 | |
DT Auto Owner Trust, Ser 2017-3A, Cl A | | | | | | | | |
1.730%, 08/17/20 (A) | | | 2,027 | | | | 2,024 | |
DT Auto Owner Trust, Ser 2017-4A, Cl A | | | | | | | | |
1.850%, 08/17/20 (A) | | | 4,734 | | | | 4,716 | |
Exeter Automobile Receivables Trust, Ser 2016-1A, Cl A | | | | | | | | |
2.350%, 07/15/20 (A) | | | 54 | | | | 54 | |
Exeter Automobile Receivables Trust, Ser 2016-3A, Cl A | | | | | | | | |
1.840%, 11/16/20 (A) | | | 769 | | | | 768 | |
Exeter Automobile Receivables Trust, Ser 2017-3A, Cl A | | | | | | | | |
2.050%, 12/15/21 (A) | | | 2,076 | | | | 2,073 | |
First Investors Auto Owner Trust, Ser 2016-2A, Cl A1 | | | | | | | | |
1.530%, 11/16/20 (A) | | | 454 | | | | 453 | |
Flagship Credit Auto Trust, Ser 2015-1, Cl A | | | | | | | | |
1.630%, 06/15/20 (A) | | | 1 | | | | 1 | |
The accompanying notes are an integral part of the financial statements.
127
| | |
| THE KP FUNDS | | December 31, 2017 |
| | | | | | | | |
| Description | | Face Amount
(000) | | | Value (000) | |
| | | | | | | | |
Flagship Credit Auto Trust, Ser 2015-3, Cl A | | | | | | | | |
2.380%, 10/15/20 (A) | | $ | 151 | | | $ | 151 | |
Flagship Credit Auto Trust, Ser 2016-2, Cl A1 | | | | | | | | |
2.280%, 05/15/20 (A) | | | 99 | | | | 99 | |
Flagship Credit Auto Trust, Ser 2016-3, Cl A1 | | | | | | | | |
1.610%, 12/15/19 (A) | | | 353 | | | | 353 | |
Flagship Credit Auto Trust, Ser 2016-4, Cl A1 | | | | | | | | |
1.470%, 03/16/20 (A) | | | 1,678 | | | | 1,676 | |
Ford Credit Auto Owner Trust, Ser 2017-A, Cl A4 | | | | | | | | |
1.920%, 04/15/22 | | | 3,427 | | | | 3,403 | |
Ford Credit Auto Owner Trust, Ser 2017-B, Cl A2A | | | | | | | | |
1.490%, 05/15/20 | | | 2,491 | | | | 2,487 | |
Ford Credit Auto Owner Trust, Ser 2017-B, Cl A3 | | | | | | | | |
1.690%, 11/15/21 | | | 145 | | | | 145 | |
Ford Credit Auto Owner Trust, Ser 2017-C, Cl A3 | | | | | | | | |
2.010%, 03/15/22 | | | 1,197 | | | | 1,193 | |
GM Financial Consumer Automobile, Ser 2017-1A, Cl A3 | | | | | | | | |
1.780%, 10/18/21 (A) | | | 1,814 | | | | 1,803 | |
GM Financial Consumer Automobile Receivables Trust, Ser 2017-3A, Cl A3 | | | | | | | | |
1.970%, 05/16/22 (A) | | | 3,096 | | | | 3,078 | |
Honda Auto Receivables Owner Trust, Ser 2017-4, Cl A3 | | | | | | | | |
2.050%, 11/22/21 | | | 1,102 | | | | 1,099 | |
Nissan Auto Receivables Owner Trust, Ser 2017-C, Cl A4 | | | | | | | | |
2.280%, 02/15/24 | | | 1,586 | | | | 1,582 | |
Santander Drive Auto Receivables Trust, Ser 2015-2, Cl B | | | | | | | | |
1.830%, 01/15/20 | | | 35 | | | | 35 | |
Santander Drive Auto Receivables Trust, Ser 2017-1, Cl A2 | | | | | | | | |
1.490%, 02/18/20 | | | 359 | | | | 359 | |
Santander Retail Auto Lease Trust, Ser 2017-A, Cl A3 | | | | | | | | |
2.220%, 01/20/21 (A) | | | 1,495 | | | | 1,488 | |
Toyota Auto Receivables Owner Trust, Ser 2017-A, Cl A2A | | | | | | | | |
1.420%, 09/16/19 | | | 2,023 | | | | 2,020 | |
Westlake Automobile Receivables Trust, Ser 2016-2A, Cl A2 | | | | | | | | |
1.570%, 06/17/19 (A) | | | 1,100 | | | | 1,100 | |
| | | | | | | | |
| Description | | Face Amount
(000) | | | Value (000) | |
| | | | | | | | |
Westlake Automobile Receivables Trust, Ser 2017-1A, Cl A2 | | | | | | | | |
1.780%, 04/15/20 (A) | | $ | 1,665 | | | $ | 1,664 | |
| | | | | | | | |
| | | | | | | 57,878 | |
| | | | | | | | |
Credit Card — 1.7% | | | | | | | | |
American Express Credit Account Master Trust, Ser 2017-1, Cl A | | | | | | | | |
1.930%, 09/15/22 | | | 2,449 | | | | 2,438 | |
American Express Credit Account Master Trust, Ser 2017-6, Cl A | | | | | | | | |
2.040%, 05/15/23 | | | 3,176 | | | | 3,165 | |
American Express Credit Account Master Trust, Ser 2017-7, Cl A | | | | | | | | |
2.350%, 05/15/25 | | | 1,014 | | | | 1,011 | |
BA Credit Card Trust, Ser 2017-A1, Cl A1 | | | | | | | | |
1.950%, 08/15/22 | | | 2,168 | | | | 2,158 | |
Capital One Multi-Asset Execution Trust, Ser 2016-A3, Cl A3 | | | | | | | | |
1.340%, 04/15/22 | | | 250 | | | | 247 | |
Capital One Multi-Asset Execution Trust, Ser 2017-A4, Cl A4 | | | | | | | | |
1.990%, 07/17/23 | | | 1,177 | | | | 1,170 | |
Citibank Credit Card Issuance Trust, Ser 2014-A1, Cl A1 | | | | | | | | |
2.880%, 01/23/23 | | | 200 | | | | 204 | |
Citibank Credit Card Issuance Trust, Ser 2017-A2, Cl A2 | | | | | | | | |
1.740%, 01/19/21 | | | 5,146 | | | | 5,134 | |
Citibank Credit Card Issuance Trust, Ser 2017-A7, Cl A7 | | | | | | | | |
1.777%, VAR LIBOR USD 1 Month+0.370%, 08/08/24 | | | 2,242 | | | | 2,251 | |
Citibank Credit Card Issuance Trust, Ser 2017-A8, Cl A8 | | | | | | | | |
1.860%, 08/08/22 | | | 250 | | | | 248 | |
Discover Card Execution Note Trust, Ser 2016-A4, Cl A4 | | | | | | | | |
1.390%, 03/15/22 | | | 270 | | | | 267 | |
Discover Card Execution Note Trust, Ser 2017-A6, Cl A6 | | | | | | | | |
1.880%, 02/15/23 | | | 3,706 | | | | 3,673 | |
Discover Card Execution Note Trust, Ser 2017-A7, Cl A7 | | | | | | | | |
1.837%, VAR LIBOR USD 1 Month+0.360%, 04/15/25 | | | 2,059 | | | | 2,068 | |
The accompanying notes are an integral part of the financial statements.
128
| | |
| THE KP FUNDS | | December 31, 2017 |
| | | | | | | | |
| Description | | Face Amount
(000) | | | Value (000) | |
| | | | | | | | |
World Financial Network Credit Card Master Trust, Ser 2017-C, Cl A | | | | | | | | |
2.310%, 08/15/24 | | $ | 2,747 | | | $ | 2,736 | |
| | | | | | | | |
| | | | | | | 26,770 | |
| | | | | | | | |
Other Asset-Backed Securities — 1.0% | | | | | |
AJAX Mortgage Loan Trust, Ser 2016-C, Cl A | | | | | | | | |
4.000%, 10/25/57 (A) | | | 694 | | | | 699 | |
AJAX Mortgage Loan Trust, Ser 2017-A, Cl A | | | | | | | | |
3.470%, 04/25/57 (A) | | | 290 | | | | 290 | |
Bayview Opportunity Master Fund IIIa Trust, Ser 2017-RN7, Cl A1 | | | | | | | | |
3.105%, 09/28/32 (A) | | | 1,172 | | | | 1,170 | |
Bayview Opportunity Master Fund IIIa Trust, Ser 2017-RN8, Cl A1 | | | | | | | | |
3.352%, 11/28/32 (A) | | | 1,732 | | | | 1,732 | |
Bayview Opportunity Master Fund IIIb Trust, Ser 2017-RN2, Cl A1 | | | | | | | | |
3.475%, 04/28/32 (A) (D) | | | 608 | | | | 610 | |
Bayview Opportunity Master Fund IIIb Trust, Ser 2017-RN3, Cl A1 | | | | | | | | |
3.228%, 05/28/32 (A) | | | 208 | | | | 208 | |
Bayview Opportunity Master Fund IVb Trust, Ser 2017-NPL1, Cl A1 | | | | | | | | |
3.598%, 01/28/32 (A) | | | 267 | | | | 268 | |
CAM Mortgage Trust, Ser 2016-2, Cl A1 | | | | | | | | |
3.250%, 06/15/57 (A) | | | 32 | | | | 32 | |
Ford Credit Floorplan Master Owner Trust A, Ser 2017-3, Cl A | | | | | | | | |
2.480%, 09/15/24 | | | 150 | | | | 149 | |
GCAT, Ser 2017-2, Cl A1 | | | | | | | | |
3.500%, 04/25/47 (A) | | | 787 | | | | 788 | |
GCAT, Ser 2017-3, Cl A1 | | | | | | | | |
3.352%, 04/25/47 (A) | | | 375 | | | | 375 | |
GCAT, Ser 2017-5, Cl A1 | | | | | | | | |
3.228%, 07/25/47 (A) | | | 275 | | | | 275 | |
NYMT Residential, Ser 2016g-RP1A, Cl A | | | | | | | | |
4.000%, 03/25/21 (A) | | | 99 | | | | 99 | |
Oak Hill Advisors Residential Loan Trust, Ser 2017-NPL1, Cl A1 | | | | | | | | |
3.000%, 06/25/57 (A) | | | 759 | | | | 757 | |
| | | | | | | | |
| Description | | Face Amount
(000) | | | Value (000) | |
| | | | | | | | |
Oak Hill Advisors Residential Loan Trust, Ser 2017-NPL2, Cl A1 | | | | | | | | |
3.000%, 07/25/57 (A) | | $ | 1,118 | | | $ | 1,117 | |
PRPM, Ser 2017-2A, Cl A1 | | | | | | | | |
3.500%, 09/25/22 (A) | | | 1,075 | | | | 1,072 | |
RCO Mortgage, Ser 2017-1, Cl A1 | | | | | | | | |
3.375%, 08/25/22 (A) | | | 2,042 | | | | 2,044 | |
Verizon Owner Trust, Ser 2017-3A, Cl A1A | | | | | | | | |
2.060%, 04/20/22 (A) | | | 1,941 | | | | 1,931 | |
VOLT LVI, Ser 2017-NPL3, Cl A1 | | | | | | | | |
3.500%, 03/25/47 (A) | | | 620 | | | | 622 | |
VOLT LVII, Ser 2017-NPL4, Cl A1 | | | | | | | | |
3.375%, 04/25/47 (A) | | | 264 | | | | 265 | |
VOLT LXI, Ser 2017-NPL8, Cl A1 | | | | | | | | |
3.125%, 06/25/47 (A) | | | 906 | | | | 906 | |
VOLT XXXVIII, Ser 2015-NP12, Cl A1 | | | | | | | | |
3.875%, 09/25/45 (A) | | | 65 | | | | 65 | |
| | | | | | | | |
| | | | | | | 15,474 | |
| | | | | | | | |
Total Asset-Backed Securities
(Cost $100,350) (000) | | | | | | | 100,122 | |
| | | | | | | | |
COMMERCIAL PAPER — 1.0% | | | | | | | | |
American Honda Finance | | | | | | | | |
1.401%, 01/10/18 | | | 3,911 | | | | 3,909 | |
Bank of Tokyo-Mitsubishi UFJ NY | | | | | | | | |
1.481%, 01/03/18 | | | 3,892 | | | | 3,891 | |
National Rural Utilities Cooperative Finance | | | | | | | | |
1.582%, 01/25/18 | | | 3,809 | | | | 3,805 | |
Province of British Columbia Canada | | | | | | | | |
1.431%, 01/11/18 | | | 3,421 | | | | 3,419 | |
| | | | | | | | |
Total Commercial Paper
(Cost $15,026) (000) | | | | | | | 15,024 | |
| | | | | | | | |
U.S. GOVERNMENT AGENCY OBLIGATIONS — 0.8% | |
FFCB | | | | | | | | |
1.680%, 10/13/20 | | | 100 | | | | 99 | |
1.550%, 05/08/20 | | | 200 | | | | 198 | |
FHLB | | | | | | | | |
2.750%, 12/13/24 | | | 300 | | | | 305 | |
2.300%, 07/19/22 | | | 200 | | | | 199 | |
2.260%, 10/04/22 | | | 150 | | | | 149 | |
2.160%, 08/17/22 | | | 100 | | | | 98 | |
2.150%, 09/26/22 | | | 200 | | | | 197 | |
1.875%, 11/29/21 | | | 150 | | | | 149 | |
1.375%, 11/15/19 | | | 125 | | | | 124 | |
The accompanying notes are an integral part of the financial statements.
129
| | |
| THE KP FUNDS | | December 31, 2017 |
| | | | | | | | |
| Description | | Face Amount
(000) | | | Value (000) | |
| | | | | | | | |
1.250%, 01/16/19 | | $ | 250 | | | $ | 248 | |
1.125%, 06/21/19 | | | 300 | | | | 297 | |
1.000%, 09/26/19 | | | 250 | | | | 246 | |
0.875%, 08/05/19 | | | 100 | | | | 98 | |
FHLMC | | | | | | | | |
6.250%, 07/15/32 | | | 1,176 | | | | 1,650 | |
2.375%, 01/13/22 | | | 2,311 | | | | 2,332 | |
1.600%, 07/26/19 | | | 250 | | | | 249 | |
1.330%, 12/30/20 | | | 400 | | | | 388 | |
1.250%, 08/01/19 | | | 500 | | | | 495 | |
1.125%, 04/15/19 | | | 300 | | | | 297 | |
FNMA | | | | | | | | |
6.625%, 11/15/30 | | | 300 | | | | 422 | |
2.625%, 09/06/24 | | | 1,252 | | | | 1,269 | |
2.125%, 04/24/26 | | | 200 | | | | 193 | |
1.875%, 12/28/20 | | | 131 | | | | 130 | |
1.750%, 06/20/19 | | | 300 | | | | 299 | |
1.650%, 01/27/20 | | | 300 | | | | 298 | |
1.500%, 07/30/20-06/22/20 | | | 927 | | | | 915 | |
1.375%, 01/28/19 | | | 200 | | | | 199 | |
1.000%, 08/28/19 | | | 250 | | | | 246 | |
Tennessee Valley Authority | | | | | | | | |
5.250%, 09/15/39 | | | 200 | | | | 270 | |
2.875%, 02/01/27 | | | 250 | | | | 255 | |
| | | | | | | | |
Total U.S. Government Agency Obligations
(Cost $12,204) (000) | | | | 12,314 | |
| | | | | | | | |
MUNICIPAL BONDS — 0.5% | |
Bay Area Toll Authority RB | | | | | | | | |
6.263%, 04/01/49 | | | 200 | | | | 296 | |
California State GO | | | | | | | | |
7.300%, 10/01/39 | | | 325 | | | | 485 | |
California State, Department of Water Resources, Power Supply Revenue RB | | | | | | | | |
2.000%, 05/01/22 | | | 100 | | | | 98 | |
Florida State, Hurricane Catastrophe Fund RB | | | | | | | | |
2.995%, 07/01/20 | | | 150 | | | | 152 | |
Illinois State 1060118 GO | | | | | | | | |
5.100%, 06/01/33 | | | 1,710 | | | | 1,707 | |
New Jersey State, Transportation Trust Fund RB | | | | | | | | |
5.754%, 12/15/28 | | | 1,050 | | | | 1,205 | |
Permanent University Fund - Texas A&M University System RB | | | | | | | | |
3.660%, 07/01/47 | | | 100 | | | | 100 | |
South Carolina State, Public Service Authority RB | | | | | | | | |
2.388%, 12/01/23 | | | 100 | | | | 95 | |
State of California GO | | | | | | | | |
7.500%, 04/01/34 | | | 1,225 | | | | 1,814 | |
State of Illinois GO | | | | | | | | |
5.877%, 03/01/19 | | | 495 | | | | 510 | |
| | | | | | | | |
| Description | | Face Amount
(000) | | | Value (000) | |
| | | | | | | | |
State of Wisconsin RB | | | | | | | | |
3.154%, 05/01/27 | | $ | 200 | | | $ | 203 | |
University of California RB | | | | | | | | |
4.858%, 05/15/12 | | | 200 | | | | 223 | |
University of Texas System RB | | | | | | | | |
3.354%, 08/15/47 | | | 250 | | | | 251 | |
| | | | | | | | |
Total Municipal Bonds
(Cost $6,943) (000) | | | | | | | 7,139 | |
| | | | | | | | |
| | |
| | | Shares | | | | |
PREFERRED STOCK — 0.0% | |
Education Management* (G) (J) | | | 1,550,903 | | | | 2 | |
| | | | | | | | |
Total Preferred Stock
(Cost $188) (000) | | | | | | | 2 | |
| | | | | | | | |
SHORT-TERM INVESTMENT — 8.0% | | | | | |
State Street Institutional Treasury Money Market Fund, Cl Institutional, 1.160% (I) | | | 126,387,186 | | | | 126,387 | |
| | | | | | | | |
Total Short-Term Investment
(Cost $126,387) (000) | | | | | | | 126,387 | |
| | | | | | | | |
Total Investments In Securities — 110.0%
(Cost $1,730,901) (000) | | | $ | 1,739,527 | |
| | | | | | | | |
Percentages are based on net assets of $1,581,880 (000).
A list of the open forward foreign currency contracts held by the Fund at December 31, 2017 is as follows (000):
| | | | | | | | | | | | | | | | | | |
Counterparty | | Maturity
Date | | Currency
to Deliver | | | Currency to
Receive | | | Unrealized
Appreciation
(Depreciation) | |
| HSBC | | 01/22/18 | | USD | | | 182 | | | PEN | | | 592 | | | $ | 1 | |
| Barclays PLC | | 01/23/18 | | GBP | | | 874 | | | USD | | | 1,155 | | | | (26 | ) |
| BNP Paribas | | 02/12/18 | | USD | | | 748 | | | KRW | | | 811,000 | | | | 13 | |
| BNP Paribas | | 02/12/18 | | KRW | | | 1,701,000 | | | USD | | | 1,527 | | | | (68 | ) |
| HSBC | | 03/02/18 | | USD | | | 1,093 | | | IDR | | | 14,886,000 | | | | 3 | |
| Barclays PLC | | 03/14/18 | | INR | | | 25,410 | | | USD | | | 391 | | | | (4 | ) |
| HSBC | | 03/20/18 | | USD | | | 821 | | | COP | | | 2,474,000 | | | | 2 | |
| BNP Paribas | | 04/24/18 | | USD | | | 437 | | | ARS | | | 8,460 | | | | (10 | ) |
| Barclays PLC | | 05/10/18 | | USD | | | 898 | | | MYR | | | 3,794 | | | | 34 | |
| Barclays PLC | | 06/13/18 | | USD | | | 802 | | | KZT | | | 276,000 | | | | 4 | |
| | | | | | | | | | | | | | | | | | |
| | | | | | | | | | | | | | | | $ | (51 | ) |
| | | | | | | | | | | | | | | | | | |
| * | Non-income producing security. |
| (1) | In U.S. dollars unless otherwise indicated. |
| (A) | Security sold within terms of a private placement memorandum, exempt from registration under Section 144A of the Securities Act of 1933, as amended, and may be sold only to dealers in that program or other |
The accompanying notes are an integral part of the financial statements.
130
| | |
| THE KP FUNDS | | December 31, 2017 |
| | "accredited investors." The total value of these securities at December 31, 2017 was $182,338 (000) and represents 11.5% of Net Assets. |
| (B) | Zero coupon security. The rate reported on the Schedule of Investments is the effective yield at time of purchase. |
| (C) | Security in default on interest payments. |
| (D) | Variable or floating rate security, the interest rate of which adjusts periodically based on changes in current interest rates and prepayments on the underlying pool of assets. |
| (E) | Step Bonds-The rate reflected on the Schedule of Investments is the effective yield on December 31, 2017. The coupon on a step bond changes on a specified date. |
| (F) | Unsettled bank loan. Interest rate not available. |
| (G) | Level 3 security fair valued using methods determined in good faith by the Fair Value Committee of the Board of Trustees. The total value of such securities as of December 31, 2017, was $240 (000) and represented 0.0% of Net Assets. |
| (I) | The rate reported is the 7-day effective yield as of December 31, 2017. |
| (J) | Currently, no stated interest rate. |
AID — Agency for International Development
ARS — Argentine Peso
BRL — Brazilian Real
Cl — Class
COP — Colombian Peso
EGP — Egyptian Pound
FFCB — Federal Farm Credit Bank
FHLB — Federal Home Loan Bank
FHLMC — Federal Home Loan Mortgage Corporation
FNMA — Federal National Mortgage Association
GBP — British Pound Sterling
GEL — Georgian Lari
GHS — Ghana Cedi
GNMA — Government National Mortgage Association
GO — General Obligation
ICE — Intercontinental Exchange
IDR — Indonesian Rupiah
INR — Indian Rupee
KRW — South Korean Won
KZT — Kazakhstan Tenge
LIBOR — London Interbank Offered Rate
LKR — Sri Lanka Rupee
LLC — Limited Liability Company
LP — Limited Partnership
Ltd. — Limited
MXN — Mexican Peso
MYR — Malaysian Ringgit
NGN — Nigerian Naira
PEN — Peruvian Sol
PIK — Payment-in-Kind
PLC — Public Limited Company
RB — Revenue Bond
RUB — Russian Ruble
Ser — Series
TBA — To Be Announced
TLB — Term Loan B
USD — U.S. Dollar
UYU — Uruguayan Peso
VAR — Variable
ZAR — South African Rand
The following is a list of the level of inputs used as of December 31, 2017, in valuing the Fund’s investments and other financial instruments carried at value (000):
| | | | | | | | | | | | | | | | |
Investments in
Securities | | Level 1 | | | Level 2 | | | Level 3^ | | | Total | |
Corporate Obligations | | $ | — | | | $ | 399,153 | | | $ | 238 | | | $ | 399,391 | |
U.S. Treasury Obligations | | | — | | | | 389,688 | | | | — | | | | 389,688 | |
Mortgage-Backed Securities | | | — | | | | 387,147 | | | | — | | | | 387,147 | |
Loan Participations | | | — | | | | 157,736 | | | | — | | | | 157,736 | |
Sovereign Debt | | | — | | | | 144,577 | | | | — | | | | 144,577 | |
Asset-Backed Securities | | | — | | | | 100,122 | | | | — | | | | 100,122 | |
Commercial Paper | | | — | | | | 15,024 | | | | — | | | | 15,024 | |
U.S. Government Agency Obligations | | | — | | | | 12,314 | | | | — | | | | 12,314 | |
Municipal Bonds | | | — | | | | 7,139 | | | | — | | | | 7,139 | |
Preferred Stock | | | — | | | | — | | | | 2 | | | | 2 | |
Short-Term Investment | | | 126,387 | | | | — | | | | — | | | | 126,387 | |
| | | | | | | | | | | | | | | | |
Total Investments in Securities | | $ | 126,387 | | | $ | 1,612,900 | | | $ | 240 | | | $ | 1,739,527 | |
| | | | | | | | | | | | | | | | |
Other Financial
Instruments | | Level 1 | | | Level 2 | | | Level 3 | | | Total | |
Forward Foreign Currency Contracts** | | | | | | | | | | | | | | | | |
Unrealized Appreciation | | $ | — | | | $ | 57 | | | $ | — | | | $ | 57 | |
Unrealized Depreciation | | | — | | | | (108 | ) | | | — | | | | (108 | ) |
| | | | | | | | | | | | | | | | |
Total Other Financial Instruments | | $ | — | | | $ | (51 | ) | | $ | — | | | $ | (51 | ) |
| | | | | | | | | | | | | | | | |
| ^ | A reconciliation of Level 3 investments and disclosures of significant unobservable inputs are presented when the Fund has a significant amount of Level 3 investments at the beginning and/or end of the year in relation to net assets. Management has concluded that Level 3 investments are not material in relation to net assets. |
| ** | Forward foreign currency contracts are valued at the unrealized appreciation/(depreciation) on the instrument. |
For the year ended December 31, 2017, there were no transfers between Level 2 and Level 1 assets and liabilities. For the year ended December 31, 2017, there were no transfers between Level 2 and Level 3 assets and liabilities or Level 1 and Level 3 assets and liabilities. All transfers, if any, are recognized by the Fund at the end of the year.
Amounts designated as “—“ are $0 or have been rounded to $0.
The accompanying notes are an integral part of the financial statements.
131
| | |
| THE KP FUNDS | | December 31, 2017 |
|
| STATEMENTS OF ASSETS AND LIABILITIES (000) |
| | | | | | | | | | | | | | | | |
| | | KP
Retirement
Path 2015
Fund | | | KP
Retirement
Path 2020
Fund | | | KP
Retirement
Path 2025
Fund | | | KP
Retirement
Path 2030
Fund | |
| | | | | | | | | | | | | | | | |
Assets: | | | | | | | | | | | | | | | | |
Affiliated Investments at Cost | | $ | 298,681 | | | $ | 615,588 | | | $ | 778,219 | | | $ | 776,445 | |
Unaffiliated Investments at Cost | | | 116,625 | | | | 201,960 | | | | 195,309 | | | | 136,938 | |
| | | | | | | | | | | | | | | | |
Affiliated Investments at Fair Value | | $ | 321,189 | | | $ | 672,974 | | | $ | 863,447 | | | $ | 874,195 | |
Unaffiliated Investments at Fair Value | | | 118,522 | | | | 204,606 | | | | 197,925 | | | | 139,240 | |
Receivable for Investment Securities Sold | | | 164 | | | | 385 | | | | — | | | | — | |
Dividends Receivable | | | 56 | | | | 90 | | | | 72 | | | | 37 | |
Receivable for Capital Shares Sold | | | — | | | | — | | | | 110 | | | | 1,001 | |
Prepaid Expenses | | | 13 | | | | 25 | | | | 29 | | | | 27 | |
| | | | | | | | | | | | | | | | |
Total Assets | | | 439,944 | | | | 878,080 | | | | 1,061,583 | | | | 1,014,500 | |
| | | | | | | | | | | | | | | | |
Liabilities: | | | | | | | | | | | | | | | | |
Payable for Capital Shares Redeemed | | | 162 | | | | 380 | | | | — | | | | — | |
Due to Custodian | | | 56 | | | | 90 | | | | 72 | | | | 37 | |
Payable due to Administrator | | | 9 | | | | 19 | | | | 23 | | | | 22 | |
Payable due to Adviser | | | 5 | | | | 8 | | | | 8 | | | | 5 | |
Chief Compliance Officer Fees Payable | | | 1 | | | | 2 | | | | 2 | | | | 2 | |
Payable for Investment Securities Purchased | | | — | | | | — | | | | 104 | | | | 995 | |
Other Accrued Expenses | | | 24 | | | | 47 | | | | 61 | | | | 60 | |
| | | | | | | | | | | | | | | | |
Total Liabilities | | | 257 | | | | 546 | | | | 270 | | | | 1,121 | |
| | | | | | | | | | | | | | | | |
Net Assets | | $ | 439,687 | | | $ | 877,534 | | | $ | 1,061,313 | | | $ | 1,013,379 | |
| | | | | | | | | | | | | | | | |
NET ASSETS: | | | | | | | | | | | | | | | | |
Paid-in Capital | | $ | 409,239 | | | $ | 802,606 | | | $ | 951,768 | | | $ | 890,514 | |
Accumulated Net Realized Gain on Investments | | | 6,043 | | | | 14,896 | | | | 21,701 | | | | 22,813 | |
Net Unrealized Appreciation on Investments | | | 24,405 | | | | 60,032 | | | | 87,844 | | | | 100,052 | |
| | | | | | | | | | | | | | | | |
Net Assets | | $ | 439,687 | | | $ | 877,534 | | | $ | 1,061,313 | | | $ | 1,013,379 | |
| | | | | | | | | | | | | | | | |
Institutional Class Shares: | | | | | | | | | | | | | | | | |
Net Assets | | $ | 439,687 | | | $ | 877,534 | | | $ | 1,061,313 | | | $ | 1,013,379 | |
Outstanding Shares of Beneficial Interest
(unlimited authorization — no par value)† | | | 41,828,773 | | | | 80,507,874 | | | | 94,624,249 | | | | 88,546,087 | |
Net Asset Value, Offering and Redemption Price Per Share* | | $ | 10.51 | | | $ | 10.90 | | | $ | 11.22 | | | $ | 11.44 | |
| | | | | | | | | | | | | | | | |
| | † | Shares are presented unrounded. |
| | * | The net asset value is calculated by dividing the unrounded net assets by the unrounded shares. |
Amounts designated as “—“ are $0 or have been rounded to $0.
The accompanying notes are an integral part of the financial statements.
132
| | |
| THE KP FUNDS | | December 31, 2017 |
|
| STATEMENTS OF ASSETS AND LIABILITIES (000) |
| | | | | | | | | | | | |
| | | KP
Retirement
Path 2035
Fund | | | KP
Retirement
Path 2040
Fund | | | KP
Retirement
Path 2045
Fund | |
| | | | | | | | | | | | |
Assets: | | | | | | | | | | | | |
Affiliated Investments at Cost | | $ | 900,158 | | | $ | 849,451 | | | $ | 634,648 | |
Unaffiliated Investments at Cost | | | 104,972 | | | | 68,347 | | | | 39,851 | |
| | | | | | | | | | | | |
Affiliated Investments at Fair Value | | $ | 1,025,803 | | | $ | 973,452 | | | $ | 725,913 | |
Unaffiliated Investments at Fair Value | | | 107,398 | | | | 70,302 | | | | 40,990 | |
Receivable for Capital Shares Sold | | | 58 | | | | 73 | | | | — | |
Dividends Receivable | | | 12 | | | | — | | | | — | |
Receivable for Investment Securities Sold | | | — | | | | — | | | | 153 | |
Prepaid Expenses | | | 30 | | | | 28 | | | | 20 | |
| | | | | | | | | | | | |
Total Assets | | | 1,133,301 | | | | 1,043,855 | | | | 767,076 | |
| | | | | | | | | | | | |
Liabilities: | | | | | | | | | | | | |
Payable for Investment Securities Purchased | | | 53 | | | | 67 | | | | — | |
Payable due to Administrator | | | 24 | | | | 22 | | | | 16 | |
Due to Custodian | | | 12 | | | | — | | | | — | |
Payable due to Adviser | | | 4 | | | | 3 | | | | 2 | |
Chief Compliance Officer Fees Payable | | | 2 | | | | 2 | | | | 2 | |
Payable for Capital Shares Redeemed | | | — | | | | — | | | | 149 | |
Other Accrued Expenses | | | 66 | | | | 63 | | | | 46 | |
| | | | | | | | | | | | |
Total Liabilities | | | 161 | | | | 157 | | | | 215 | |
| | | | | | | | | | | | |
Net Assets | | $ | 1,133,140 | | | $ | 1,043,698 | | | $ | 766,861 | |
| | | | | | | | | | | | |
NET ASSETS: | | | | | | | | | | | | |
Paid-in Capital | | $ | 977,700 | | | $ | 891,483 | | | $ | 654,954 | |
Accumulated Net Realized Gain on Investments | | | 27,369 | | | | 26,259 | | | | 19,503 | |
Net Unrealized Appreciation on Investments | | | 128,071 | | | | 125,956 | | | | 92,404 | |
| | | | | | | | | | | | |
Net Assets | | $ | 1,133,140 | | | $ | 1,043,698 | | | $ | 766,861 | |
| | | | | | | | | | | | |
Institutional Class Shares: | | | | | | | | | | | | |
Net Assets | | $ | 1,133,140 | | | $ | 1,043,698 | | | $ | 766,861 | |
Outstanding Shares of Beneficial Interest
(unlimited authorization — no par value)† | | | 97,037,691 | | | | 88,246,039 | | | | 64,427,032 | |
Net Asset Value, Offering and Redemption Price Per Share* | | $ | 11.68 | | | $ | 11.83 | | | $ | 11.90 | |
| | | | | | | | | | | | |
| | † | Shares are presented unrounded. |
| | * | The net asset value is calculated by dividing the unrounded net assets by the unrounded shares. |
Amounts designated as “—“ are $0 or have been rounded to $0.
The accompanying notes are an integral part of the financial statements.
133
| | |
| THE KP FUNDS | | December 31, 2017 |
|
| STATEMENTS OF ASSETS AND LIABILITIES (000) |
| | | | | | | | | | | | |
| | | KP
Retirement
Path 2050
Fund | | | KP
Retirement
Path 2055
Fund | | | KP
Retirement
Path 2060
Fund | |
| | | | | | | | | | | | |
Assets: | | | | | | | | | | | | |
Affiliated Investments at Cost | | $ | 348,269 | | | $ | 95,877 | | | $ | 20,285 | |
Unaffiliated Investments at Cost | | | 19,953 | | | | 5,450 | | | | 1,125 | |
| | | | | | | | | | | | |
Affiliated Investments at Fair Value | | $ | 393,543 | | | $ | 106,225 | | | $ | 21,848 | |
Unaffiliated Investments at Fair Value | | | 20,483 | | | | 5,531 | | | | 1,138 | |
Receivable for Investment Securities Sold | | | 22 | | | | 267 | | | | — | |
Receivable for Capital Shares Sold | | | — | | | | — | | | | 16 | |
Prepaid Expenses | | | 10 | | | | 3 | | | | 1 | |
| | | | | | | | | | | | |
Total Assets | | | 414,058 | | | | 112,026 | | | | 23,003 | |
| | | | | | | | | | | | |
Liabilities: | | | | | | | | | | | | |
Payable for Capital Shares Redeemed | | | 20 | | | | 267 | | | | — | |
Payable due to Administrator | | | 9 | | | | 2 | | | | — | |
Payable due to Adviser | | | 1 | | | | — | | | | — | |
Chief Compliance Officer Fees Payable | | | 1 | | | | — | | | | — | |
Payable for Investment Securities Purchased | | | — | | | | — | | | | 16 | |
Other Accrued Expenses | | | 26 | | | | 9 | | | | 2 | |
| | | | | | | | | | | | |
Total Liabilities | | | 57 | | | | 278 | | | | 18 | |
| | | | | | | | | | | | |
Net Assets | | $ | 414,001 | | | $ | 111,748 | | | $ | 22,985 | |
| | | | | | | | | | | | |
NET ASSETS: | | | | | | | | | | | | |
Paid-in Capital | | $ | 357,577 | | | $ | 98,661 | | | $ | 20,969 | |
Accumulated Net Realized Gain on Investments | | | 10,620 | | | | 2,658 | | | | 440 | |
Net Unrealized Appreciation on Investments | | | 45,804 | | | | 10,429 | | | | 1,576 | |
| | | | | | | | | | | | |
Net Assets | | $ | 414,001 | | | $ | 111,748 | | | $ | 22,985 | |
| | | | | | | | | | | | |
Institutional Class Shares: | | | | | | | | | | | | |
Net Assets | | $ | 414,001 | | | $ | 111,748 | | | $ | 22,985 | |
Outstanding Shares of Beneficial Interest
(unlimited authorization — no par value)† | | | 34,481,941 | | | | 9,292,907 | | | | 1,915,847 | |
Net Asset Value, Offering and Redemption Price Per Share* | | $ | 12.01 | | | $ | 12.03 | | | $ | 12.00 | |
| | | | | | | | | | | | |
| | † | Shares are presented unrounded. |
| | * | The net asset value is calculated by dividing the unrounded net assets by the unrounded shares. |
Amounts designated as “—“ are $0 or have been rounded to $0.
The accompanying notes are an integral part of the financial statements.
134
| | |
| THE KP FUNDS | | December 31, 2017 |
|
| STATEMENTS OF ASSETS AND LIABILITIES (000) |
| | | | | | | | | | | | | | | | |
| | | KP
Large Cap
Equity Fund | | | KP
Small Cap
Equity Fund | | | KP
International
Equity Fund | | | KP
Fixed
Income
Fund | |
| | | | | | | | | | | | | | | | |
Assets: | | | | | | | | | | | | | | | | |
Investments at Cost | | $ | 1,804,577 | | | $ | 932,116 | | | $ | 1,240,558 | | | $ | 1,730,901 | |
Cost of Foreign Currency | | | — | | | | — | | | | 8,549 | | | | 91 | |
| | | | | | | | | | | | | | | | |
Investments at Fair Value | | $ | 2,247,867 | | | $ | 1,077,583 | | | $ | 1,458,639 | | | $ | 1,739,527 | |
Cash | | | 68 | | | | 36 | | | | 18 | | | | 2,328 | |
Foreign Currency at Value | | | — | | | | — | | | | 8,706 | | | | 92 | |
Dividends and Interest Receivable | | | 2,112 | | | | 867 | | | | 1,749 | | | | 9,604 | |
Receivable for Investment Securities Sold | | | 1,394 | | | | 1,177 | | | | 459 | | | | 55,842 | |
Due from Broker on Futures Contracts | | | 680 | | | | 325 | | | | 1,519 | | | | — | |
Receivable for Capital Shares Sold | | | 404 | | | | 256 | | | | 249 | | | | 354 | |
Reclaims Receivable | | | 187 | | | | 8 | | | | 2,317 | | | | 22 | |
Unrealized Appreciation on Forward Foreign Currency Contracts | | | — | | | | — | | | | — | | | | 57 | |
Prepaid Expenses | | | 7 | | | | 6 | | | | 6 | | | | 5 | |
| | | | | | | | | | | | | | | | |
Total Assets | | | 2,252,719 | | | | 1,080,258 | | | | 1,473,662 | | | | 1,807,831 | |
| | | | | | | | | | | | | | | | |
Liabilities: | | | | | | | | | | | | | | | | |
Payable for Investment Securities Purchased | | | 716 | | | | 4,382 | | | | 1,944 | | | | 224,946 | |
Payable due to Sub-Advisers | | | 387 | | | | 379 | | | | 365 | | | | 253 | |
Payable for Capital Shares Redeemed | | | 294 | | | | 87 | | | | 191 | | | | 342 | |
Payable due to Adviser | | | 86 | | | | 41 | | | | 55 | | | | 61 | |
Variation Margin Payable on Futures Contracts | | | 73 | | | | 72 | | | | — | | | | — | |
Payable due to Administrator | | | 71 | | | | 34 | | | | 45 | | | | 50 | |
Chief Compliance Officer Fees Payable | | | 2 | | | | 1 | | | | 1 | | | | 1 | |
Unrealized Depreciation on Forward Foreign Currency Contracts | | | — | | | | — | | | | — | | | | 108 | |
Accrued Foreign Capital Gains Tax | | | — | | | | — | | | | 643 | | | | — | |
Other Accrued Expenses | | | 173 | | | | 104 | | | | 450 | | | | 190 | |
| | | | | | | | | | | | | | | | |
Total Liabilities | | | 1,802 | | | | 5,100 | | | | 3,694 | | | | 225,951 | |
| | | | | | | | | | | | | | | | |
Net Assets | | $ | 2,250,917 | | | $ | 1,075,158 | | | $ | 1,469,968 | | | $ | 1,581,880 | |
| | | | | | | | | | | | | | | | |
NET ASSETS: | | | | | | | | | | | | | | | | |
Paid-in Capital | | $ | 1,807,177 | | | $ | 915,372 | | | $ | 1,252,330 | | | $ | 1,574,849 | |
Undistributed/(Distributions in Excess of) Net Investment Income | | | 63 | | | | 222 | | | | (4,491 | ) | | | 18 | |
Accumulated Net Realized Gain/(Loss) on Investments | | | 160 | | | | 14,057 | | | | 4,226 | | | | (1,559 | ) |
Net Unrealized Appreciation on Investments | | | 443,290 | | | | 145,467 | | | | 218,081 | | | | 8,626 | |
Net Unrealized Appreciation on Futures Contracts | | | 224 | | | | 40 | | | | 357 | | | | — | |
Net Unrealized Appreciation/(Depreciation) on Forward Contracts and Foreign Currency Transactions and Translation of other Assets and Liabilities Denominated in Foreign Currencies | | | 3 | | | | — | | | | 108 | | | | (54 | ) |
Accumulated Foreign Capital Gains Tax on Appreciated Securities | | | — | | | | — | | | | (643 | ) | | | — | |
| | | | | | | | | | | | | | | | |
Net Assets | | $ | 2,250,917 | | | $ | 1,075,158 | | | $ | 1,469,968 | | | $ | 1,581,880 | |
| | | | | | | | | | | | | | | | |
Institutional Class Shares: | | | | | | | | | | | | | | | | |
Net Assets | | $ | 2,250,917 | | | $ | 1,075,158 | | | $ | 1,469,968 | | | $ | 1,581,880 | |
Outstanding Shares of Beneficial Interest
(unlimited authorization — no par value)† | | | 173,360,438 | | | | 89,033,705 | | | | 131,208,560 | | | | 157,435,062 | |
Net Asset Value, Offering and Redemption Price Per Share* | | $ | 12.98 | | | $ | 12.08 | | | $ | 11.20 | | | $ | 10.05 | |
| | | | | | | | | | | | | | | | |
| | † | Shares are presented unrounded. |
| | * | The net asset value is calculated by dividing the unrounded net assets by the unrounded shares. |
Amounts designated as “—“ are $0 or have been rounded to $0.
The accompanying notes are an integral part of the financial statements.
135
| | |
| THE KP FUNDS | | For the year ended December 31, 2017 |
| | |
|
| STATEMENTS OF OPERATIONS (000) |
| | | | | | | | | | | | | | | | |
| | | KP
Retirement
Path 2015
Fund | | | KP
Retirement
Path 2020
Fund | | | KP
Retirement
Path 2025
Fund | | | KP
Retirement
Path 2030
Fund | |
Investment Income: | | | | | | | | | | | | | | | | |
Income Distributions from Affiliated Registered Investment Companies | | $ | 6,311 | | | $ | 12,683 | | | $ | 15,516 | | | $ | 15,181 | |
Income Distributions from Unaffiliated Registered Investment Companies | | | 2,384 | | | | 4,124 | | | | 4,151 | | | | 3,099 | |
| | | | | | | | | | | | | | | | |
Total Investment Income | | | 8,695 | | | | 16,807 | | | | 19,667 | | | | 18,280 | |
| | | | | | | | | | | | | | | | |
Expenses: | | | | | | | | | | | | | | | | |
Administration Fees | | | 113 | | | | 209 | | | | 242 | | | | 228 | |
Investment Advisory Fees | | | 57 | | | | 90 | | | | 82 | | | | 56 | |
Trustees' Fees | | | 12 | | | | 22 | | | | 25 | | | | 24 | |
Chief Compliance Officer Fees | | | 4 | | | | 7 | | | | 9 | | | | 8 | |
Custodian Fees/Transfer Agent Fees | | | 43 | | | | 82 | | | | 95 | | | | 90 | |
Professional Fees | | | 31 | | | | 58 | | | | 67 | | | | 63 | |
Printing Fees | | | 25 | | | | 49 | | | | 59 | | | | 56 | |
Registration Fees | | | 21 | | | | 36 | | | | 46 | | | | 44 | |
Other Fees | | | 8 | | | | 15 | | | | 16 | | | | 15 | |
| | | | | | | | | | | | | | | | |
Total Expenses | | | 314 | | | | 568 | | | | 641 | | | | 584 | |
| | | | | | | | | | | | | | | | |
Net Investment Income | | | 8,381 | | | | 16,239 | | | | 19,026 | | | | 17,696 | |
| | | | | | | | | | | | | | | | |
Net Realized and Unrealized Gain/(Loss) on Investments: | | | | | | | | | | | | | | | | |
Net Realized Gain on Affiliated Investments | | | 8,354 | | | | 12,756 | | | | 12,996 | | | | 11,836 | |
Net Realized Gain on Unaffiliated Investments | | | 254 | | | | 437 | | | | 494 | | | | 131 | |
Distributions of Realized Gains from Affiliated Registered Investment Company Shares | | | 6,139 | | | | 15,364 | | | | 23,163 | | | | 25,894 | |
Distributions of Realized Gains from Unaffiliated Registered Investment Company Shares | | | 324 | | | | 583 | | | | 670 | | | | 610 | |
Net Change in Unrealized Appreciation on Affiliated Investments | | | 18,024 | | | | 45,719 | | | | 69,549 | | | | 80,578 | |
Net Change in Unrealized Appreciation on Unaffiliated Investments | | | 1,088 | | | | 1,891 | | | | 2,254 | | | | 2,408 | |
| | | | | | | | | | | | | | | | |
Net Realized and Unrealized Gain on Investments | | | 34,183 | | | | 76,750 | | | | 109,126 | | | | 121,457 | |
| | | | | | | | | | | | | | | | |
Net Increase in Net Assets Resulting from Operations | | $ | 42,564 | | | $ | 92,989 | | | $ | 128,152 | | | $ | 139,153 | |
| | | | | | | | | | | | | | | | |
The accompanying notes are an integral part of the financial statements.
136
| | |
| THE KP FUNDS | | For the year ended December 31, 2017 |
| | |
|
| STATEMENTS OF OPERATIONS (000) |
| | | | | | | | | | | | |
| | | KP
Retirement
Path 2035
Fund | | | KP
Retirement
Path 2040
Fund | | | KP
Retirement
Path 2045
Fund | |
| | | | | | | | | | | | |
Investment Income: | | | | | | | | | | | | |
Income Distributions from Affiliated Registered Investment Companies | | $ | 17,418 | | | $ | 16,283 | | | $ | 11,996 | |
Income Distributions from Unaffiliated Registered Investment Companies | | | 2,623 | | | | 1,817 | | | | 955 | |
| | | | | | | | | | | | |
Total Investment Income | | | 20,041 | | | | 18,100 | | | | 12,951 | |
| | | | | | | | | | | | |
Expenses: | | | | | | | | | | | | |
Administration Fees | | | 252 | | | | 230 | | | | 165 | |
Investment Advisory Fees | | | 42 | | | | 27 | | | | 16 | |
Trustees' Fees | | | 26 | | | | 24 | | | | 17 | |
Chief Compliance Officer Fees | | | 9 | | | | 8 | | | | 6 | |
Custodian Fees/Transfer Agent Fees | | | 100 | | | | 91 | | | | 66 | |
Professional Fees | | | 70 | | | | 64 | | | | 46 | |
Printing Fees | | | 63 | | | | 58 | | | | 42 | |
Registration Fees | | | 48 | | | | 44 | | | | 33 | |
Other Fees | | | 16 | | | | 15 | | | | 9 | |
| | | | | | | | | | | | |
Total Expenses | | | 626 | | | | 561 | | | | 400 | |
| | | | | | | | | | | | |
Net Investment Income | | | 19,415 | | | | 17,539 | | | | 12,551 | |
| | | | | | | | | | | | |
Net Realized and Unrealized Gain/(Loss) on Investments: | | | | | | | | | | | | |
Net Realized Gain on Affiliated Investments | | | 12,134 | | | | 10,988 | | | | 7,119 | |
Net Realized Gain/(Loss) on Unaffiliated Investments | | | 16 | | | | (73 | ) | | | 68 | |
Distributions of Realized Gains from Affiliated Registered Investment Company Shares | | | 32,384 | | | | 31,900 | | | | 24,458 | |
Distributions of Realized Gains from Unaffiliated Registered Investment Company Shares | | | 580 | | | | 419 | | | | 244 | |
Net Change in Unrealized Appreciation on Affiliated Investments | | | 103,261 | | | | 102,560 | | | | 77,031 | |
Net Change in Unrealized Appreciation on Unaffiliated Investments | | | 2,612 | | | | 2,005 | | | | 1,142 | |
| | | | | | | | | | | | |
Net Realized and Unrealized Gain on Investments | | | 150,987 | | | | 147,799 | | | | 110,062 | |
| | | | | | | | | | | | |
Net Increase in Net Assets Resulting from Operations | | $ | 170,402 | | | $ | 165,338 | | | $ | 122,613 | |
| | | | | | | | | | | | |
The accompanying notes are an integral part of the financial statements.
137
| | |
| THE KP FUNDS | | For the year ended December 31, 2017 |
| | |
|
| STATEMENTS OF OPERATIONS (000) |
| | | | | | | | | | | | |
| | | KP
Retirement
Path 2050
Fund | | | KP
Retirement
Path 2055
Fund | | | KP
Retirement
Path 2060
Fund | |
Investment Income: | | | | | | | | | | | | |
Income Distributions from Affiliated Registered Investment Companies | | $ | 6,445 | | | $ | 1,738 | | | $ | 356 | |
Income Distributions from Unaffiliated Registered Investment Companies | | | 525 | | | | 139 | | | | 29 | |
| | | | | | | | | | | | |
Total Investment Income | | | 6,970 | | | | 1,877 | | | | 385 | |
| | | | | | | | | | | | |
Expenses: | | | | | | | | | | | | |
Administration Fees | | | 85 | | | | 21 | | | | 4 | |
Trustees' Fees | | | 9 | | | | 2 | | | | — | |
Investment Advisory Fees | | | 8 | | | | 2 | | | | — | |
Chief Compliance Officer Fees | | | 3 | | | | 1 | | | | — | |
Custodian Fees/Transfer Agent Fees | | | 34 | | | | 8 | | | | 2 | |
Professional Fees | | | 24 | | | | 6 | | | | 1 | |
Printing Fees | | | 22 | | | | 6 | | | | 1 | |
Registration Fees | | | 19 | | | | 6 | | | | 1 | |
Other Fees | | | 5 | | | | 1 | | | | — | |
| | | | | | | | | | | | |
Total Expenses | | | 209 | | | | 53 | | | | 9 | |
| | | | | | | | | | | | |
Net Investment Income | | | 6,761 | | | | 1,824 | | | | 376 | |
| | | | | | | | | | | | |
Net Realized and Unrealized Gain/(Loss) on Investments: | | | | | | | | | | | | |
Net Realized Gain on Affiliated Investments | | | 3,315 | | | | 668 | | | | 527 | |
Net Realized Gain on Unaffiliated Investments | | | 160 | | | | 56 | | | | 10 | |
Distributions of Realized Gains from Affiliated Registered Investment Company Shares | | | 13,530 | | | | 3,660 | | | | 746 | |
Distributions of Realized Gains from Unaffiliated Registered Investment Company Shares | | | 121 | | | | 32 | | | | 7 | |
Net Change in Unrealized Appreciation on Affiliated Investments | | | 39,837 | | | | 9,363 | | | | 1,267 | |
Net Change in Unrealized Appreciation on Unaffiliated Investments | | | 372 | | | | 70 | | | | 12 | |
| | | | | | | | | | | | |
Net Realized and Unrealized Gain on Investments | | | 57,335 | | | | 13,849 | | | | 2,569 | |
| | | | | | | | | | | | |
Net Increase in Net Assets Resulting from Operations | | $ | 64,096 | | | $ | 15,673 | | | $ | 2,945 | |
| | | | | | | | | | | | |
Amounts designated as “—“ are $0 or have been rounded to $0.
The accompanying notes are an integral part of the financial statements.
138
| | |
| THE KP FUNDS | | For the year ended December 31, 2017 |
| | |
|
| STATEMENTS OF OPERATIONS (000) |
| | | | | | | | | | | | | | | | |
| | | KP
Large Cap
Equity Fund | | | KP
Small Cap
Equity Fund | | | KP
International
Equity Fund | | | KP
Fixed
Income
Fund | |
Investment Income: | | | | | | | | | | | | | | | | |
Dividend Income | | $ | 35,003 | | | $ | 9,172 | | | $ | 36,888 | | | $ | 920 | |
Interest Income | | | — | | | | — | | | | — | | | | 39,964 | |
Less: Foreign Taxes Withheld | | | (64 | ) | | | (8 | ) | | | (3,109 | ) | | | — | |
| | | | | | | | | | | | | | | | |
Total Investment Income | | | 34,939 | | | | 9,164 | | | | 33,779 | | | | 40,884 | |
| | | | | | | | | | | | | | | | |
Expenses: | | | | | | | | | | | | | | | | |
Sub-Advisory Fees | | | 4,065 | | | | 4,041 | | | | 4,203 | | | | 2,680 | |
Investment Advisory Fees | | | 905 | | | | 449 | | | | 611 | | | | 641 | |
Administration Fees | | | 733 | | | | 364 | | | | 495 | | | | 519 | |
Trustees' Fees | | | 24 | | | | 13 | | | | 16 | | | | 13 | |
Chief Compliance Officer Fees | | | 10 | | | | 5 | | | | 7 | | | | 4 | |
Custodian Fees/Transfer Agent Fees | | | 199 | | | | 150 | | | | 704 | | | | 136 | |
Professional Fees | | | 85 | | | | 42 | | | | 57 | | | | 57 | |
Printing Fees | | | 47 | | | | 23 | | | | 31 | | | | 32 | |
Registration Fees | | | 39 | | | | 16 | | | | 7 | | | | 55 | |
Other Fees | | | 55 | | | | 43 | | | | 349 | | | | 203 | |
| | | | | | | | | | | | | | | | |
Total Expenses | | | 6,162 | | | | 5,146 | | | | 6,480 | | | | 4,340 | |
| | | | | | | | | | | | | | | | |
Net Investment Income | | | 28,777 | | | | 4,018 | | | | 27,299 | | | | 36,544 | |
| | | | | | | | | | | | | | | | |
Net Realized and Unrealized Gain/(Loss) on Investments: | | | | | | | | | | | | | | | | |
Net Realized Gain on Investments | | | 111,264 | | | | 102,911 | | | | 54,727 | | | | 4,429 | |
Net Realized Gain/(Loss) on Futures Contracts | | | 3,615 | | | | 923 | | | | 3,306 | | | | (9 | ) |
Net Realized Gain/(Loss) on Forward Contracts and Foreign Currency Transactions | | | (4 | ) | | | — | | | | 578 | | | | (370 | ) |
Net Change in Unrealized Appreciation on Investments | | | 272,364 | | | | 55,529 | | | | 246,265 | | | | 18,237 | |
Net Change in Unrealized Appreciation/(Depreciation) on Futures Contracts | | | 331 | | | | 237 | | | | 486 | | | | (64 | ) |
Net Change in Unrealized Appreciation/(Depreciation) on Forward Contracts and Foreign Currency Transactions and Translation of other Assets and Liabilities Denominated in Foreign Currencies | | | 13 | | | | — | | | | 243 | | | | (154 | ) |
Change in Accrued Foreign Capital Gains Tax on Appreciated Securities | | | — | | | | — | | | | (401 | ) | | | — | |
| | | | | | | | | | | | | | | | |
Net Realized and Unrealized Gain on Investments | | | 387,583 | | | | 159,600 | | | | 305,204 | | | | 22,069 | |
| | | | | | | | | | | | | | | | |
Net Increase in Net Assets Resulting from Operations | | $ | 416,360 | | | $ | 163,618 | | | $ | 332,503 | | | $ | 58,613 | |
| | | | | | | | | | | | | | | | |
Amounts designated as “—“ are $0 or have been rounded to $0.
The accompanying notes are an integral part of the financial statements.
139
|
| STATEMENTS OF CHANGES IN NET ASSETS (000) |
| | | | | | | | | | | | | | | | |
| | | KP Retirement Path 2015 Fund | | | KP Retirement Path 2020 Fund | |
| | | Year ended
December 31,
2017 | | | Year ended
December 31,
2016 | | | Year ended
December 31,
2017 | | | Year ended
December 31,
2016 | |
Operations: | | | | | | | | | | | | | | | | |
Net Investment Income | | $ | 8,381 | | | $ | 8,126 | | | $ | 16,239 | | | $ | 13,349 | |
Net Realized Gain on Affiliated and Unaffiliated Investments | | | 8,608 | | | | 1,529 | | | | 13,193 | | | | 1,514 | |
Distributions of Realized Gains from Affiliated and Unaffiliated Registered Investment Company Shares | | | 6,463 | | | | 4,007 | | | | 15,947 | | | | 6,752 | |
Net Change in Unrealized Appreciation on Affiliated and Unaffiliated Investments | | | 19,112 | | | | 11,306 | | | | 47,610 | | | | 21,525 | |
| | | | | | | | | | | | | | | | |
Net Increase in Net Assets Resulting from Operations | | | 42,564 | | | | 24,968 | | | | 92,989 | | | | 43,140 | |
| | | | | | | | | | | | | | | | |
Distributions to Shareholders: | | | | | | | | | | | | | | | | |
Investment Income | | | (9,790 | ) | | | (9,953 | ) | | | (19,678 | ) | | | (16,115 | ) |
Net Realized Gains | | | (8,432 | ) | | | (4,267 | ) | | | (12,841 | ) | | | (6,369 | ) |
| | | | | | | | | | | | | | | | |
Total Distributions to Shareholders | | | (18,222 | ) | | | (14,220 | ) | | | (32,519 | ) | | | (22,484 | ) |
| | | | | | | | | | | | | | | | |
Capital Share Transactions: | | | | | | | | | | | | | | | | |
Institutional Shares: | | | | | | | | | | | | | | | | |
Issued | | | 20,469 | | | | 38,233 | | | | 86,658 | | | | 88,216 | |
Reinvestment of Distributions | | | 18,221 | | | | 14,219 | | | | 32,519 | | | | 22,484 | |
Redeemed | | | (85,648 | ) | | | (84,189 | ) | | | (74,224 | ) | | | (66,991 | ) |
| | | | | | | | | | | | | | | | |
Increase/(Decrease) in Net Assets from Capital Share Transactions | | | (46,958 | ) | | | (31,737 | ) | | | 44,953 | | | | 43,709 | |
| | | | | | | | | | | | | | | | |
Total Increase/(Decrease) in Net Assets | | | (22,616 | ) | | | (20,989 | ) | | | 105,423 | | | | 64,365 | |
| | | | | | | | | | | | | | | | |
Net Assets: | | | | | | | | | | | | | | | | |
Beginning of Year | | | 462,303 | | | | 483,292 | | | | 772,111 | | | | 707,746 | |
| | | | | | | | | | | | | | | | |
End of Year | | $ | 439,687 | | | $ | 462,303 | | | $ | 877,534 | | | $ | 772,111 | |
| | | | | | | | | | | | | | | | |
Undistributed Net Investment Income | | $ | — | | | $ | — | | | $ | — | | | $ | — | |
| | | | | | | | | | | | | | | | |
Share Transactions: | | | | | | | | | | | | | | | | |
Institutional Shares: | | | | | | | | | | | | | | | | |
Issued | | | 1,953 | | | | 3,836 | | | | 8,096 | | | | 8,792 | |
Reinvestment of Distributions | | | 1,717 | | | | 1,418 | | | | 2,958 | | | | 2,214 | |
Redeemed | | | (8,246 | ) | | | (8,375 | ) | | | (6,980 | ) | | | (6,639 | ) |
| | | | | | | | | | | | | | | | |
Net Increase/(Decrease) in Shares Outstanding from Share Transactions | | | (4,576 | ) | | | (3,121 | ) | | | 4,074 | | | | 4,367 | |
| | | | | | | | | | | | | | | | |
Amounts designated as “—“ are $0 or have been rounded to $0.
The accompanying notes are an integral part of the financial statements.
140
|
| STATEMENTS OF CHANGES IN NET ASSETS (000) |
| | | | | | | | | | | | | | | | |
| | | KP Retirement Path 2025 Fund | | | KP Retirement Path 2030 Fund | |
| | | Year ended
December 31,
2017 | | | Year ended
December 31,
2016 | | | Year ended
December 31,
2017 | | | Year ended
December 31,
2016 | |
Operations: | | | | | | | | | | | | | | | | |
Net Investment Income | | $ | 19,026 | | | $ | 14,476 | | | $ | 17,696 | | | $ | 13,292 | |
Net Realized Gain on Affiliated and Unaffiliated Investments | | | 13,490 | | | | 1,441 | | | | 11,967 | | | | 1,160 | |
Distributions of Realized Gains from Affiliated and Unaffiliated Registered Investment Company Shares | | | 23,833 | | | | 7,573 | | | | 26,504 | | | | 7,134 | |
Net Change in Unrealized Appreciation on Affiliated and Unaffiliated Investments | | | 71,803 | | | | 27,563 | | | | 82,986 | | | | 30,249 | |
| | | | | | | | | | | | | | | | |
Net Increase in Net Assets Resulting from Operations | | | 128,152 | | | | 51,053 | | | | 139,153 | | | | 51,835 | |
| | | | | | | | | | | | | | | | |
Distributions to Shareholders: | | | | | | | | | | | | | | | | |
Investment Income | | | (24,188 | ) | | | (17,023 | ) | | | (23,531 | ) | | | (15,171 | ) |
Net Realized Gains | | | (13,568 | ) | | | (8,060 | ) | | | (13,250 | ) | | | (8,679 | ) |
| | | | | | | | | | | | | | | | |
Total Distributions to Shareholders | | | (37,756 | ) | | | (25,083 | ) | | | (36,781 | ) | | | (23,850 | ) |
| | | | | | | | | | | | | | | | |
Capital Share Transactions: | | | | | | | | | | | | | | | | |
Institutional Shares: | | | | | | | | | | | | | | | | |
Issued | | | 130,169 | | | | 116,073 | | | | 134,916 | | | | 115,617 | |
Reinvestment of Distributions | | | 37,756 | | | | 25,082 | | | | 36,781 | | | | 23,850 | |
Redeemed | | | (39,741 | ) | | | (43,150 | ) | | | (34,582 | ) | | | (32,733 | ) |
| | | | | | | | | | | | | | | | |
Increase in Net Assets from Capital Share Transactions | | | 128,184 | | | | 98,005 | | | | 137,115 | | | | 106,734 | |
| | | | | | | | | | | | | | | | |
Total Increase in Net Assets | | | 218,580 | | | | 123,975 | | | | 239,487 | | | | 134,719 | |
| | | | | | | | | | | | | | | | |
Net Assets: | | | | | | | | | | | | | | | | |
Beginning of Year | | | 842,733 | | | | 718,758 | | | | 773,892 | | | | 639,173 | |
| | | | | | | | | | | | | | | | |
End of Year | | $ | 1,061,313 | | | $ | 842,733 | | | $ | 1,013,379 | | | $ | 773,892 | |
| | | | | | | | | | | | | | | | |
Undistributed Net Investment Income | | $ | — | | | $ | — | | | $ | — | | | $ | — | |
| | | | | | | | | | | | | | | | |
Share Transactions: | | | | | | | | | | | | | | | | |
Institutional Shares: | | | | | | | | | | | | | | | | |
Issued | | | 11,949 | | | | 11,583 | | | | 12,265 | | | | 11,636 | |
Reinvestment of Distributions | | | 3,339 | | | | 2,458 | | | | 3,187 | | | | 2,339 | |
Redeemed | | | (3,653 | ) | | | (4,301 | ) | | | (3,125 | ) | | | (3,278 | ) |
| | | | | | | | | | | | | | | | |
Net Increase in Shares Outstanding from Share Transactions | | | 11,635 | | | | 9,740 | | | | 12,327 | | | | 10,697 | |
| | | | | | | | | | | | | | | | |
Amounts designated as “—“ are $0 or have been rounded to $0.
The accompanying notes are an integral part of the financial statements.
141
|
| STATEMENTS OF CHANGES IN NET ASSETS (000) |
| | | | | | | | | | | | | | | | |
| | | KP Retirement Path 2035 Fund | | | KP Retirement Path 2040 Fund | |
| | | Year ended
December 31,
2017 | | | Year ended
December 31,
2016 | | | Year ended
December 31,
2017 | | | Year ended
December 31,
2016 | |
Operations: | | | | | | | | | | | | | | | | |
Net Investment Income | | $ | 19,415 | | | $ | 14,290 | | | $ | 17,539 | | | $ | 12,534 | |
Net Realized Gain on Affiliated and Unaffiliated Investments | | | 12,150 | | | | 1,326 | | | | 10,915 | | | | 1,426 | |
Distributions of Realized Gains from Affiliated and Unaffiliated Registered Investment Company Shares | | | 32,964 | | | | 8,023 | | | | 32,319 | | | | 7,291 | |
Net Change in Unrealized Appreciation on Affiliated and Unaffiliated Investments | | | 105,873 | | | | 36,650 | | | | 104,565 | | | | 34,783 | |
| | | | | | | | | | | | | | | | |
Net Increase in Net Assets Resulting from Operations | | | 170,402 | | | | 60,289 | | | | 165,338 | | | | 56,034 | |
| | | | | | | | | | | | | | | | |
Distributions to Shareholders: | | | | | | | | | | | | | | | | |
Investment Income | | | (26,789 | ) | | | (15,935 | ) | | | (24,829 | ) | | | (13,659 | ) |
Net Realized Gains | | | (14,563 | ) | | | (10,502 | ) | | | (13,825 | ) | | | (10,209 | ) |
| | | | | | | | | | | | | | | | |
Total Distributions to Shareholders | | | (41,352 | ) | | | (26,437 | ) | | | (38,654 | ) | | | (23,868 | ) |
| | | | | | | | | | | | | | | | |
Capital Share Transactions: | | | | | | | | | | | | | | | | |
Institutional Shares: | | | | | | | | | | | | | | | | |
Issued | | | 154,433 | | | | 131,864 | | | | 156,449 | | | | 130,554 | |
Reinvestment of Distributions | | | 41,352 | | | | 26,437 | | | | 38,654 | | | | 23,868 | |
Redeemed | | | (37,597 | ) | | | (38,161 | ) | | | (40,860 | ) | | | (35,450 | ) |
| | | | | | | | | | | | | | | | |
Increase in Net Assets from Capital Share Transactions | | | 158,188 | | | | 120,140 | | | | 154,243 | | | | 118,972 | |
| | | | | | | | | | | | | | | | |
Total Increase in Net Assets | | | 287,238 | | | | 153,992 | | | | 280,927 | | | | 151,138 | |
| | | | | | | | | | | | | | | | |
Net Assets: | | | | | | | | | | | | | | | | |
Beginning of Year | | | 845,902 | | | | 691,910 | | | | 762,771 | | | | 611,633 | |
| | | | | | | | | | | | | | | | |
End of Year | | $ | 1,133,140 | | | $ | 845,902 | | | $ | 1,043,698 | | | $ | 762,771 | |
| | | | | | | | | | | | | | | | |
Undistributed Net Investment Income | | $ | — | | | $ | — | | | $ | — | | | $ | — | |
| | | | | | | | | | | | | | | | |
Share Transactions: | | | | | | | | | | | | | | | | |
Institutional Shares: | | | | | | | | | | | | | | | | |
Issued | | | 13,876 | | | | 13,338 | | | | 13,942 | | | | 13,235 | |
Reinvestment of Distributions | | | 3,510 | | | | 2,587 | | | | 3,239 | | | | 2,333 | |
Redeemed | | | (3,362 | ) | | | (3,872 | ) | | | (3,617 | ) | | | (3,590 | ) |
| | | | | | | | | | | | | | | | |
Net Increase in Shares Outstanding from Share Transactions | | | 14,024 | | | | 12,053 | | | | 13,564 | | | | 11,978 | |
| | | | | | | | | | | | | | | | |
Amounts designated as “—“ are $0 or have been rounded to $0.
The accompanying notes are an integral part of the financial statements.
142
|
| STATEMENTS OF CHANGES IN NET ASSETS (000) |
| | | | | | | | | | | | | | | | |
| | | KP Retirement Path 2045 Fund | | | KP Retirement Path 2050 Fund | |
| | | Year ended
December 31,
2017 | | | Year ended
December 31,
2016 | | | Year ended
December 31,
2017 | | | Year ended
December 31,
2016 | |
Operations: | | | | | | | | | | | | | | | | |
Net Investment Income | | $ | 12,551 | | | $ | 8,775 | | | $ | 6,761 | | | $ | 4,149 | |
Net Realized Gain on Affiliated and Unaffiliated Investments | | | 7,187 | | | | 829 | | | | 3,475 | | | | 336 | |
Distributions of Realized Gains from Affiliated and Unaffiliated Registered Investment Company Shares | | | 24,702 | | | | 5,126 | | | | 13,651 | | | | 2,442 | |
Net Change in Unrealized Appreciation on Affiliated and Unaffiliated Investments | | | 78,173 | | | | 24,715 | | | | 40,209 | | | | 11,698 | |
| | | | | | | | | | | | | | | | |
Net Increase in Net Assets Resulting from Operations | | | 122,613 | | | | 39,445 | | | | 64,096 | | | | 18,625 | |
| | | | | | | | | | | | | | | | |
Distributions to Shareholders: | | | | | | | | | | | | | | | | |
Investment Income | | | (18,256 | ) | | | (9,281 | ) | | | (9,852 | ) | | | (4,419 | ) |
Net Realized Gains | | | (9,454 | ) | | | (7,428 | ) | | | (4,674 | ) | | | (3,080 | ) |
| | | | | | | | | | | | | | | | |
Total Distributions to Shareholders | | | (27,710 | ) | | | (16,709 | ) | | | (14,526 | ) | | | (7,499 | ) |
| | | | | | | | | | | | | | | | |
Capital Share Transactions: | | | | | | | | | | | | | | | | |
Institutional Shares: | | | | | | | | | | | | | | | | |
Issued | | | 140,447 | | | | 112,696 | | | | 109,506 | | | | 81,707 | |
Reinvestment of Distributions | | | 27,710 | | | | 16,708 | | | | 14,527 | | | | 7,499 | |
Redeemed | | | (32,035 | ) | | | (29,789 | ) | | | (17,190 | ) | | | (15,001 | ) |
| | | | | | | | | | | | | | | | |
Increase in Net Assets from Capital Share Transactions | | | 136,122 | | | | 99,615 | | | | 106,843 | | | | 74,205 | |
| | | | | | | | | | | | | | | | |
Total Increase in Net Assets | | | 231,025 | | | | 122,351 | | | | 156,413 | | | | 85,331 | |
| | | | | | | | | | | | | | | | |
Net Assets: | | | | | | | | | | | | | | | | |
Beginning of Year | | | 535,836 | | | | 413,485 | | | | 257,588 | | | | 172,257 | |
| | | | | | | | | | | | | | | | |
End of Year | | $ | 766,861 | | | $ | 535,836 | | | $ | 414,001 | | | $ | 257,588 | |
| | | | | | | | | | | | | | | | |
Undistributed Net Investment Income | | $ | — | | | $ | 39 | | | $ | — | | | $ | — | |
| | | | | | | | | | | | | | | | |
Share Transactions: | | | | | | | | | | | | | | | | |
Institutional Shares: | | | | | | | | | | | | | | | | |
Issued | | | 12,444 | | | | 11,444 | | | | 9,642 | | | | 8,265 | |
Reinvestment of Distributions | | | 2,307 | | | | 1,636 | | | | 1,200 | | | | 731 | |
Redeemed | | | (2,831 | ) | | | (3,026 | ) | | | (1,503 | ) | | | (1,511 | ) |
| | | | | | | | | | | | | | | | |
Net Increase in Shares Outstanding from Share Transactions | | | 11,920 | | | | 10,054 | | | | 9,339 | | | | 7,485 | |
| | | | | | | | | | | | | | | | |
Amounts designated as “—“ are $0 or have been rounded to $0.
The accompanying notes are an integral part of the financial statements.
143
|
| STATEMENTS OF CHANGES IN NET ASSETS (000) |
| | | | | | | | | | | | | | | | |
| | | KP Retirement Path 2055 Fund | | | KP Retirement Path 2060 Fund | |
| | | Year ended
December 31,
2017 | | | Year ended
December 31,
2016 | | | Year ended
December 31,
2017 | | | Year ended
December 31,
2016 | |
Operations: | | | | | | | | | | | | | | | | |
Net Investment Income | | $ | 1,824 | | | $ | 883 | | | $ | 376 | | | $ | 148 | |
Net Realized Gain/(Loss) on Affiliated and Unaffiliated Investments | | | 724 | | | | (209 | ) | | | 537 | | | | (197 | ) |
Distributions of Realized Gains from Affiliated and Unaffiliated Registered Investment Company Shares | | | 3,692 | | | | 505 | | | | 753 | | | | 85 | |
Net Change in Unrealized Appreciation on Affiliated and Unaffiliated Investments | | | 9,433 | | | | 2,531 | | | | 1,279 | | | | 597 | |
| | | | | | | | | | | | | | | | |
Net Increase in Net Assets Resulting from Operations | | | 15,673 | | | | 3,710 | | | | 2,945 | | | | 633 | |
| | | | | | | | | | | | | | | | |
Distributions to Shareholders: | | | | | | | | | | | | | | | | |
Investment Income | | | (2,656 | ) | | | (940 | ) | | | (544 | ) | | | (157 | ) |
Net Realized Gains | | | (935 | ) | | | (476 | ) | | | (370 | ) | | | (99 | ) |
| | | | | | | | | | | | | | | | |
Total Distributions to Shareholders | | | (3,591 | ) | | | (1,416 | ) | | | (914 | ) | | | (256 | ) |
| | | | | | | | | | | | | | | | |
Capital Share Transactions: | | | | | | | | | | | | | | | | |
Institutional Shares: | | | | | | | | | | | | | | | | |
Issued | | | 47,091 | | | | 28,855 | | | | 14,049 | | | | 6,088 | |
Reinvestment of Distributions | | | 3,591 | | | | 1,416 | | | | 914 | | | | 256 | |
Redeemed | | | (5,835 | ) | | | (4,834 | ) | | | (3,106 | ) | | | (3,372 | ) |
| | | | | | | | | | | | | | | | |
Increase in Net Assets from Capital Share Transactions | | | 44,847 | | | | 25,437 | | | | 11,857 | | | | 2,972 | |
| | | | | | | | | | | | | | | | |
Total Increase in Net Assets | | | 56,929 | | | | 27,731 | | | | 13,888 | | | | 3,349 | |
| | | | | | | | | | | | | | | | |
Net Assets: | | | | | | | | | | | | | | | | |
Beginning of Year | | | 54,819 | | | | 27,088 | | | | 9,097 | | | | 5,748 | |
| | | | | | | | | | | | | | | | |
End of Year | | $ | 111,748 | | | $ | 54,819 | | | $ | 22,985 | | | $ | 9,097 | |
| | | | | | | | | | | | | | | | |
Undistributed Net Investment Income | | $ | — | | | $ | — | | | $ | — | | | $ | — | |
| | | | | | | | | | | | | | | | |
Share Transactions: | | | | | | | | | | | | | | | | |
Institutional Shares: | | | | | | | | | | | | | | | | |
Issued | | | 4,142 | | | | 2,927 | | | | 1,231 | | | | 614 | |
Reinvestment of Distributions | | | 296 | | | | 138 | | | | 75 | | | | 25 | |
Redeemed | | | (509 | ) | | | (494 | ) | | | (275 | ) | | | (342 | ) |
| | | | | | | | | | | | | | | | |
Net Increase in Shares Outstanding from Share Transactions | | | 3,929 | | | | 2,571 | | | | 1,031 | | | | 297 | |
| | | | | | | | | | | | | | | | |
Amounts designated as “—“ are $0 or have been rounded to $0.
The accompanying notes are an integral part of the financial statements.
144
|
| STATEMENTS OF CHANGES IN NET ASSETS (000) |
| | | | | | | | | | | | | | | | |
| | | KP Large Cap Equity Fund | | | KP Small Cap Equity Fund | |
| | | Year ended
December 31,
2017 | | | Year ended
December 31,
2016 | | | Year ended
December 31,
2017 | | | Year ended
December 31,
2016 | |
Operations: | | | | | | | | | | | | | | | | |
Net Investment Income | | $ | 28,777 | | | $ | 22,108 | | | $ | 4,018 | | | $ | 7,050 | |
Net Realized Gain on Investments and Futures Contracts | | | 114,879 | | | | 30,821 | | | | 103,834 | | | | 11,118 | |
Net Realized Loss on Foreign Currency Transactions | | | (4 | ) | | | (5 | ) | | | — | | | | — | |
Net Change in Unrealized Appreciation on Investments and Futures Contracts | | | 272,695 | | | | 84,571 | | | | 55,766 | | | | 130,810 | |
Net Change in Unrealized Appreciation/(Depreciation) on Forward Contracts and Foreign Currency Transactions and Translation of other Assets and Liabilities Denominated in Foreign Currencies | | | 13 | | | | (2 | ) | | | — | | | | — | |
| | | | | | | | | | | | | | | | |
Net Increase in Net Assets Resulting from Operations | | | 416,360 | | | | 137,493 | | | | 163,618 | | | | 148,978 | |
| | | | | | | | | | | | | | | | |
Distributions to Shareholders: | | | | | | | | | | | | | | | | |
Investment Income | | | (29,727 | ) | | | (22,148 | ) | | | (5,537 | ) | | | (7,022 | ) |
Net Realized Gains | | | (114,518 | ) | | | (33,245 | ) | | | (88,899 | ) | | | — | |
| | | | | | | | | | | | | | | | |
Total Distributions to Shareholders | | | (144,245 | ) | | | (55,393 | ) | | | (94,436 | ) | | | (7,022 | ) |
| | | | | | | | | | | | | | | | |
Capital Share Transactions: | | | | | | | | | | | | | | | | |
Institutional Shares: | | | | | | | | | | | | | | | | |
Issued | | | 556,932 | | | | 255,927 | | | | 156,258 | | | | 130,410 | |
Reinvestment of Distributions | | | 144,245 | | | | 55,394 | | | | 94,435 | | | | 7,022 | |
Redeemed | | | (199,003 | ) | | | (156,489 | ) | | | (175,532 | ) | | | (129,425 | ) |
| | | | | | | | | | | | | | | | |
Increase in Net Assets from Capital Share Transactions | | | 502,174 | | | | 154,832 | | | | 75,161 | | | | 8,007 | |
| | | | | | | | | | | | | | | | |
Total Increase in Net Assets | | | 774,289 | | | | 236,932 | | | | 144,343 | | | | 149,963 | |
| | | | | | | | | | �� | | | | | | |
Net Assets: | | | | | | | | | | | | | | | | |
Beginning of Year | | | 1,476,628 | | | | 1,239,696 | | | | 930,815 | | | | 780,852 | |
| | | | | | | | | | | | | | | | |
End of Year | | $ | 2,250,917 | | | $ | 1,476,628 | | | $ | 1,075,158 | | | $ | 930,815 | |
| | | | | | | | | | | | | | | | |
Undistributed Net Investment Income | | $ | 63 | | | $ | 449 | | | $ | 222 | | | $ | 767 | |
| | | | | | | | | | | | | | | | |
Share Transactions: | | | | | | | | | | | | | | | | |
Institutional Shares: | | | | | | | | | | | | | | | | |
Issued | | | 46,225 | | | | 23,953 | | | | 13,147 | | | | 13,210 | |
Reinvestment of Distributions | | | 10,965 | | | | 4,879 | | | | 7,755 | | | | 624 | |
Redeemed | | | (15,767 | ) | | | (14,288 | ) | | | (14,823 | ) | | | (12,661 | ) |
| | | | | | | | | | | | | | | | |
Net Increase in Shares Outstanding from Share Transactions | | | 41,423 | | | | 14,544 | | | | 6,079 | | | | 1,173 | |
| | | | | | | | | | | | | | | | |
Amounts designated as “—“ are $0 or have been rounded to $0.
The accompanying notes are an integral part of the financial statements.
145
|
| STATEMENTS OF CHANGES IN NET ASSETS (000) |
| | | | | | | | | | | | | | | | |
| | | KP International Equity Fund | | | KP Fixed Income Fund | |
| | | Year ended
December 31,
2017 | | | Year ended
December 31,
2016 | | | Year ended
December 31,
2017 | | | Year ended
December 31,
2016 | |
Operations: | | | | | | | | | | | | | | | | |
Net Investment Income | | $ | 27,299 | | | $ | 24,690 | | | $ | 36,544 | | | $ | 23,773 | |
Net Realized Gain/(Loss) on Investments and Futures Contracts | | | 58,033 | | | | (25,243 | ) | | | 4,420 | | | | 8,970 | |
Net Realized Gain/(Loss) on Forward Contracts and Foreign Currency Transactions | | | 578 | | | | (753 | ) | | | (370 | ) | | | (94 | ) |
Net Change in Unrealized Appreciation on Investments and Futures Contracts | | | 246,751 | | | | 38,085 | | | | 18,173 | | | | 5,582 | |
Net Change in Unrealized Appreciation/(Depreciation) on Forward Contracts and Foreign Currency Transactions and Translation of other Assets and Liabilities Denominated in Foreign Currencies | | | 243 | | | | (29 | ) | | | (154 | ) | | | 75 | |
Change in Accrued Foreign Capital Gains Tax on Appreciated Securities | | | (401 | ) | | | — | | | | — | | | | — | |
| | | | | | | | | | | | | | | | |
Net Increase in Net Assets Resulting from Operations | | | 332,503 | | | | 36,750 | | | | 58,613 | | | | 38,306 | |
| | | | | | | | | | | | | | | | |
Distributions to Shareholders: | | | | | | | | | | | | | | | | |
Investment Income | | | (33,624 | ) | | | (23,849 | ) | | | (37,093 | ) | | | (23,968 | ) |
Net Realized Gains | | | (6,402 | ) | | | — | | | | (461 | ) | | | (10,691 | ) |
| | | | | | | | | | | | | | | | |
Total Distributions to Shareholders | | | (40,026 | ) | | | (23,849 | ) | | | (37,554 | ) | | | (34,659 | ) |
| | | | | | | | | | | | | | | | |
Capital Share Transactions: | | | | | | | | | | | | | | | | |
Institutional Shares: | | | | | | | | | | | | | | | | |
Issued | | | 262,294 | | | | 247,397 | | | | 588,784 | | | | 253,012 | |
Reinvestment of Distributions | | | 40,026 | | | | 23,848 | | | | 37,554 | | | | 34,659 | |
Redeemed | | | (357,559 | ) | | | (78,329 | ) | | | (134,858 | ) | | | (142,299 | ) |
| | | | | | | | | | | | | | | | |
Increase/(Decrease) in Net Assets from Capital Share Transactions | | | (55,239 | ) | | | 192,916 | | | | 491,480 | | | | 145,372 | |
| | | | | | | | | | | | | | | | |
Total Increase in Net Assets | | | 237,238 | | | | 205,817 | | | | 512,539 | | | | 149,019 | |
| | | | | | | | | | | | | | | | |
Net Assets: | | | | | | | | | | | | | | | | |
Beginning of Year | | | 1,232,730 | | | | 1,026,913 | | | | 1,069,341 | | | | 920,322 | |
| | | | | | | | | | | | | | | | |
End of Year | | $ | 1,469,968 | | | $ | 1,232,730 | | | $ | 1,581,880 | | | $ | 1,069,341 | |
| | | | | | | | | | | | | | | | |
Undistributed/(Distributions in Excess of) Net Investment Income | | $ | (4,491 | ) | | $ | (1,055 | ) | | $ | 18 | | | $ | 216 | |
| | | | | | | | | | | | | | | | |
Share Transactions: | | | | | | | | | | | | | | | | |
Institutional Shares: | | | | | | | | | | | | | | | | |
Issued | | | 25,765 | | | | 28,040 | | | | 58,589 | | | | 24,893 | |
Reinvestment of Distributions | | | 3,589 | | | | 2,696 | | | | 3,739 | | | | 3,509 | |
Redeemed | | | (36,183 | ) | | | (8,871 | ) | | | (13,378 | ) | | | (13,957 | ) |
| | | | | | | | | | | | | | | | |
Net Increase/(Decrease) in Shares Outstanding from Share Transactions | | | (6,829 | ) | | | 21,865 | | | | 48,950 | | | | 14,445 | |
| | | | | | | | | | | | | | | | |
Amounts designated as “—“ are $0 or have been rounded to $0.
The accompanying notes are an integral part of the financial statements.
146
For the year or period ended December 31,
For a share outstanding throughout the periods
| | | | | | | | | | | | | | | | | | | | | | | | | | | | | | | | | | | | | | | | | | | | | | | | | | | | |
| | | Net Asset
Value,
Beginning
of Year or
Period | | | Net
Investment
Income† | | | Net Realized
and
Unrealized
Gain/
(Loss) on
Investments | | | Total
from
Operations | | | Distributions
from
Investment
Income | | | Distributions
from
Net Realized
Capital
Gains | | | Total
Distributions | | | Net Asset
Value, End
of Year
or Period | | | Total
Return‡ | | | Net Assets
End of Year
or Period (000) | | | Ratio of
Expenses
to Average
Net Assets†† | | | Ratio of Net
Investment
Income to
Average
Net Assets | | | Portfolio
Turnover‡ | |
| | | | | | | | | | | | | | | | | | | | | | | | | | | | | | | | | | | | | | | | | | | | | | | | | | | | |
KP Retirement Path 2015 Fund* - Institutional Shares | |
2017 | | $ | 9.96 | | | $ | 0.20 | | | $ | 0.80 | | | $ | 1.00 | | | $ | (0.24 | ) | | $ | (0.21 | ) | | $ | (0.45 | ) | | $ | 10.51 | | | | 10.03 | % | | $ | 439,687 | | | | 0.07 | % | | | 1.89 | % | | | 28 | % |
2016 | | $ | 9.76 | | | $ | 0.17 | | | $ | 0.34 | | | $ | 0.51 | | | $ | (0.22 | ) | | $ | (0.09 | ) | | $ | (0.31 | ) | | $ | 9.96 | | | | 5.24 | % | | $ | 462,303 | | | | 0.08 | % | | | 1.69 | % | | | 15 | % |
2015 | | $ | 10.07 | | | $ | 0.15 | | | $ | (0.13 | ) | | $ | 0.02 | | | $ | (0.20 | ) | | $ | (0.13 | ) | | $ | (0.33 | ) | | $ | 9.76 | | | | 0.14 | % | | $ | 483,292 | | | | 0.08 | % | | | 1.45 | % | | | 24 | % |
2014@ | | $ | 10.00 | | | $ | 0.18 | | | $ | 0.20 | | | $ | 0.38 | | | $ | (0.24 | ) | | $ | (0.07 | ) | | $ | (0.31 | ) | | $ | 10.07 | | | | 3.82 | % | | $ | 522,066 | | | | 0.10 | % | | | 1.81 | % | | | 23 | % |
| | | | | | | | | | | | | | | | | | | | | | | | | | | | | | | | | | | | | | | | | | | | | | | | | | | | |
KP Retirement Path 2020 Fund* - Institutional Shares | |
2017 | | $ | 10.10 | | | $ | 0.21 | | | $ | 1.01 | | | $ | 1.22 | | | $ | (0.25 | ) | | $ | (0.17 | ) | | $ | (0.42 | ) | | $ | 10.90 | | | | 12.04 | % | | $ | 877,534 | | | | 0.07 | % | | | 1.98 | % | | | 25 | % |
2016 | | $ | 9.82 | | | $ | 0.18 | | | $ | 0.40 | | | $ | 0.58 | | | $ | (0.21 | ) | | $ | (0.09 | ) | | $ | (0.30 | ) | | $ | 10.10 | | | | 5.92 | % | | $ | 772,111 | | | | 0.08 | % | | | 1.79 | % | | | 13 | % |
2015 | | $ | 10.11 | | | $ | 0.16 | | | $ | (0.17 | ) | | $ | (0.01 | ) | | $ | (0.20 | ) | | $ | (0.08 | ) | | $ | (0.28 | ) | | $ | 9.82 | | | | (0.10 | )% | | $ | 707,746 | | | | 0.07 | % | | | 1.56 | % | | | 19 | % |
2014@ | | $ | 10.00 | | | $ | 0.19 | | | $ | 0.21 | | | $ | 0.40 | | | $ | (0.25 | ) | | $ | (0.04 | ) | | $ | (0.29 | ) | | $ | 10.11 | | | | 3.96 | % | | $ | 679,151 | | | | 0.09 | % | | | 1.92 | % | | | 11 | % |
| | | | | | | | | | | | | | | | | | | | | | | | | | | | | | | | | | | | | | | | | | | | | | | | | | | | |
KP Retirement Path 2025 Fund* - Institutional Shares | |
2017 | | $ | 10.15 | | | $ | 0.22 | | | $ | 1.26 | | | $ | 1.48 | | | $ | (0.26 | ) | | $ | (0.15 | ) | | $ | (0.41 | ) | | $ | 11.22 | | | | 14.59 | % | | $ | 1,061,313 | | | | 0.07 | % | | | 2.00 | % | | | 19 | % |
2016 | | $ | 9.81 | | | $ | 0.19 | | | $ | 0.46 | | | $ | 0.65 | | | $ | (0.21 | ) | | $ | (0.10 | ) | | $ | (0.31 | ) | | $ | 10.15 | | | | 6.64 | % | | $ | 842,733 | | | | 0.07 | % | | | 1.87 | % | | | 10 | % |
2015 | | $ | 10.11 | | | $ | 0.17 | | | $ | (0.21 | ) | | $ | (0.04 | ) | | $ | (0.21 | ) | | $ | (0.05 | ) | | $ | (0.26 | ) | | $ | 9.81 | | | | (0.35 | )% | | $ | 718,758 | | | | 0.07 | % | | | 1.64 | % | | | 12 | % |
2014@ | | $ | 10.00 | | | $ | 0.20 | | | $ | 0.20 | | | $ | 0.40 | | | $ | (0.26 | ) | | $ | (0.03 | ) | | $ | (0.29 | ) | | $ | 10.11 | | | | 3.92 | % | | $ | 650,003 | | | | 0.09 | % | | | 1.98 | % | | | 8 | % |
| | | | | | | | | | | | | | | | | | | | | | | | | | | | | | | | | | | | | | | | | | | | | | | | | | | | |
KP Retirement Path 2030 Fund* - Institutional Shares | |
2017 | | $ | 10.15 | | | $ | 0.22 | | | $ | 1.50 | | | $ | 1.72 | | | $ | (0.27 | ) | | $ | (0.16 | ) | | $ | (0.43 | ) | | $ | 11.44 | | | | 16.93 | % | | $ | 1,013,379 | | | | 0.07 | % | | | 1.98 | % | | | 18 | % |
2016 | | $ | 9.76 | | | $ | 0.19 | | | $ | 0.52 | | | $ | 0.71 | | | $ | (0.20 | ) | | $ | (0.12 | ) | | $ | (0.32 | ) | | $ | 10.15 | | | | 7.32 | % | | $ | 773,892 | | | | 0.07 | % | | | 1.91 | % | | | 9 | % |
2015 | | $ | 10.09 | | | $ | 0.17 | | | $ | (0.22 | ) | | $ | (0.05 | ) | | $ | (0.22 | ) | | $ | (0.06 | ) | | $ | (0.28 | ) | | $ | 9.76 | | | | (0.52 | )% | | $ | 639,173 | | | | 0.07 | % | | | 1.70 | % | | | 9 | % |
2014@ | | $ | 10.00 | | | $ | 0.20 | | | $ | 0.17 | | | $ | 0.37 | | | $ | (0.26 | ) | | $ | (0.02 | ) | | $ | (0.28 | ) | | $ | 10.09 | | | | 3.78 | % | | $ | 580,413 | | | | 0.08 | % | | | 2.02 | % | | | 8 | % |
| | | | | | | | | | | | | | | | | | | | | | | | | | | | | | | | | | | | | | | | | | | | | | | | | | | | |
KP Retirement Path 2035 Fund* - Institutional Shares | |
2017 | | $ | 10.19 | | | $ | 0.22 | | | $ | 1.71 | | | $ | 1.93 | | | $ | (0.28 | ) | | $ | (0.16 | ) | | $ | (0.44 | ) | | $ | 11.68 | | | | 18.93 | % | | $ | 1,133,140 | | | | 0.06 | % | | | 1.96 | % | | | 16 | % |
2016 | | $ | 9.75 | | | $ | 0.19 | | | $ | 0.58 | | | $ | 0.77 | | | $ | (0.20 | ) | | $ | (0.13 | ) | | $ | (0.33 | ) | | $ | 10.19 | | | | 7.91 | % | | $ | 845,902 | | | | 0.07 | % | | | 1.89 | % | | | 9 | % |
2015 | | $ | 10.10 | | | $ | 0.18 | | | $ | (0.25 | ) | | $ | (0.07 | ) | | $ | (0.23 | ) | | $ | (0.05 | ) | | $ | (0.28 | ) | | $ | 9.75 | | | | (0.70 | )% | | $ | 691,910 | | | | 0.06 | % | | | 1.71 | % | | | 7 | % |
2014@ | | $ | 10.00 | | | $ | 0.20 | | | $ | 0.19 | | | $ | 0.39 | | | $ | (0.27 | ) | | $ | (0.02 | ) | | $ | (0.29 | ) | | $ | 10.10 | | | | 3.86 | % | | $ | 620,600 | | | | 0.08 | % | | | 2.01 | % | | | 7 | % |
| | | | | | | | | | | | | | | | | | | | | | | | | | | | | | | | | | | | | | | | | | | | | | | | | | | | |
KP Retirement Path 2040 Fund* - Institutional Shares | |
2017 | | $ | 10.21 | | | $ | 0.22 | | | $ | 1.85 | | | $ | 2.07 | | | $ | (0.29 | ) | | $ | (0.16 | ) | | $ | (0.45 | ) | | $ | 11.83 | | | | 20.28 | % | | $ | 1,043,698 | | | | 0.06 | % | | | 1.94 | % | | | 15 | % |
2016 | | $ | 9.75 | | | $ | 0.18 | | | $ | 0.61 | | | $ | 0.79 | | | $ | (0.19 | ) | | $ | (0.14 | ) | | $ | (0.33 | ) | | $ | 10.21 | | | | 8.14 | % | | $ | 762,771 | | | | 0.07 | % | | | 1.86 | % | | | 8 | % |
2015 | | $ | 10.10 | | | $ | 0.17 | | | $ | (0.25 | ) | | $ | (0.08 | ) | | $ | (0.22 | ) | | $ | (0.05 | ) | | $ | (0.27 | ) | | $ | 9.75 | | | | (0.73 | )% | | $ | 611,633 | | | | 0.06 | % | | | 1.68 | % | | | 7 | % |
2014@ | | $ | 10.00 | | | $ | 0.20 | | | $ | 0.20 | | | $ | 0.40 | | | $ | (0.27 | ) | | $ | (0.03 | ) | | $ | (0.30 | ) | | $ | 10.10 | | | | 3.91 | % | | $ | 543,274 | | | | 0.08 | % | | | 2.02 | % | | | 8 | % |
| | | | | | | | | | | | | | | | | | | | | | | | | | | | | | | | | | | | | | | | | | | | | | | | | | | | |
KP Retirement Path 2045 Fund* - Institutional Shares | |
2017 | | $ | 10.20 | | | $ | 0.22 | | | $ | 1.92 | | | $ | 2.14 | | | $ | (0.29 | ) | | $ | (0.15 | ) | | $ | (0.44 | ) | | $ | 11.90 | | | | 21.00 | % | | $ | 766,861 | | | | 0.06 | % | | | 1.93 | % | | | 14 | % |
2016 | | $ | 9.74 | | | $ | 0.19 | | | $ | 0.60 | | | $ | 0.79 | | | $ | (0.18 | ) | | $ | (0.15 | ) | | $ | (0.33 | ) | | $ | 10.20 | | | | 8.15 | % | | $ | 535,836 | | | | 0.07 | % | | | 1.89 | % | | | 9 | % |
2015 | | $ | 10.09 | | | $ | 0.18 | | | $ | (0.25 | ) | | $ | (0.07 | ) | | $ | (0.22 | ) | | $ | (0.06 | ) | | $ | (0.28 | ) | | $ | 9.74 | | | | (0.66 | )% | | $ | 413,485 | | | | 0.06 | % | | | 1.71 | % | | | 9 | % |
2014@ | | $ | 10.00 | | | $ | 0.21 | | | $ | 0.17 | | | $ | 0.38 | | | $ | (0.27 | ) | | $ | (0.02 | ) | | $ | (0.29 | ) | | $ | 10.09 | | | | 3.76 | % | | $ | 354,753 | | | | 0.08 | % | | | 2.06 | % | | | 8 | % |
| | | | | | | | | | | | | | | | | | | | | | | | | | | | | | | | | | | | | | | | | | | | | | | | | | | | |
KP Retirement Path 2050 Fund* - Institutional Shares | |
2017 | | $ | 10.24 | | | $ | 0.23 | | | $ | 1.97 | | | $ | 2.20 | | | $ | (0.29 | ) | | $ | (0.14 | ) | | $ | (0.43 | ) | | $ | 12.01 | | | | 21.52 | % | | $ | 414,001 | | | | 0.06 | % | | | 2.02 | % | | | 13 | % |
2016 | | $ | 9.75 | | | $ | 0.20 | | | $ | 0.60 | | | $ | 0.80 | | | $ | (0.18 | ) | | $ | (0.13 | ) | | $ | (0.31 | ) | | $ | 10.24 | | | | 8.25 | % | | $ | 257,588 | | | | 0.07 | % | | | 1.98 | % | | | 10 | % |
2015 | | $ | 10.09 | | | $ | 0.19 | | | $ | (0.26 | ) | | $ | (0.07 | ) | | $ | (0.22 | ) | | $ | (0.05 | ) | | $ | (0.27 | ) | | $ | 9.75 | | | | (0.70 | )% | | $ | 172,257 | | | | 0.06 | % | | | 1.82 | % | | | 9 | % |
2014@ | | $ | 10.00 | | | $ | 0.22 | | | $ | 0.16 | | | $ | 0.38 | | | $ | (0.27 | ) | | $ | (0.02 | ) | | $ | (0.29 | ) | | $ | 10.09 | | | | 3.76 | % | | $ | 124,388 | | | | 0.08 | % | | | 2.19 | % | | | 10 | % |
The accompanying notes are an integral part of the financial statements.
147
For the year or period ended December 31,
For a share outstanding throughout the periods
| | | | | | | | | | | | | | | | | | | | | | | | | | | | | | | | | | | | | | | | | | | | | | | | | | | | | | | | |
| | | Net Asset
Value,
Beginning
of Year or
Period | | | Net
Investment
Income† | | | Net Realized
and
Unrealized
Gain/
(Loss) on
Investments | | | Total
from
Operations | | | Distributions
from
Investment
Income | | | Distributions
from
Net Realized
Capital
Gains | | | Return of
Capital | | | Total
Distributions | | | Net Asset
Value, End
of Year
or Period | | | Total
Return‡ | | | Net Assets
End of Year
or Period (000) | | | Ratio of
Expenses
to Average
Net Assets†† | | | Ratio of Net
Investment
Income to
Average
Net Assets | | | Portfolio
Turnover‡ | |
| | | | | | | | | | | | | | | | | | | | | | | | | | | | | | | | | | | | | | | | | | | | | | | | | | | | | | | | |
KP Retirement Path 2055 Fund* - Institutional Shares | |
2017 | | $ | 10.22 | | | $ | 0.26 | | | $ | 1.94 | | | $ | 2.20 | | | $ | (0.29 | ) | | $ | (0.10 | ) | | $ | — | | | $ | (0.39 | ) | | $ | 12.03 | | | | 21.59 | % | | $ | 111,748 | | | | 0.06 | % | | | 2.24 | % | | | 15 | % |
2016 | | $ | 9.70 | | | $ | 0.22 | | | $ | 0.58 | | | $ | 0.80 | | | $ | (0.18 | ) | | $ | (0.10 | ) | | $ | — | | | $ | (0.28 | ) | | $ | 10.22 | | | | 8.28 | % | | $ | 54,819 | | | | 0.07 | % | | | 2.26 | % | | | 16 | % |
2015 | | $ | 10.07 | | | $ | 0.23 | | | $ | (0.30 | ) | | $ | (0.07 | ) | | $ | (0.21 | ) | | $ | (0.09 | ) | | $ | — | | | $ | (0.30 | ) | | $ | 9.70 | | | | (0.66 | )% | | $ | 27,088 | | | | 0.06 | % | | | 2.19 | % | | | 21 | % |
2014@ | | $ | 10.00 | | | $ | 0.24 | | | $ | 0.15 | | | $ | 0.39 | | | $ | (0.27 | ) | | $ | (0.05 | ) | | $ | — | | | $ | (0.32 | ) | | $ | 10.07 | | | | 3.81 | % | | $ | 12,658 | | | | 0.10 | % | | | 2.44 | % | | | 28 | % |
| | | | | | | | | | | | | | | | | | | | | | | | | | | | | | | | | | | | | | | | | | | | | | | | | | | | | | | | |
KP Retirement Path 2060 Fund* - Institutional Shares | |
2017 | | $ | 10.27 | | | $ | 0.28 | | | $ | 1.94 | | | $ | 2.22 | | | $ | (0.29 | ) | | $ | (0.20 | ) | | $ | — | | | $ | (0.49 | ) | | $ | 12.00 | | | | 21.66 | % | | $ | 22,985 | | | | 0.07 | % | | | 2.43 | % | | | 27 | % |
2016 | | $ | 9.78 | | | $ | 0.21 | | | $ | 0.59 | | | $ | 0.80 | | | $ | (0.18 | ) | | $ | (0.13 | ) | | $ | — | | | $ | (0.31 | ) | | $ | 10.27 | | | | 8.18 | % | | $ | 9,097 | | | | 0.07 | % | | | 2.10 | % | | | 51 | % |
2015 | | $ | 10.12 | | | $ | 0.22 | | | $ | (0.28 | ) | | $ | (0.06 | ) | | $ | (0.22 | ) | | $ | (0.06 | ) | | $ | — | | | $ | (0.28 | ) | | $ | 9.78 | | | | (0.60 | )% | | $ | 5,748 | | | | 0.06 | % | | | 2.09 | % | | | 100 | % |
2014@ | | $ | 10.00 | | | $ | 0.20 | | | $ | 0.19 | ^ | | $ | 0.39 | | | $ | (0.27 | ) | | $ | — | | | $ | — | | | $ | (0.27 | ) | | $ | 10.12 | | | | 3.92 | % | | $ | 2,452 | | | | 0.15 | % | | | 1.98 | % | | | 340 | % |
| | | | | | | | | | | | | | | | | | | | | | | | | | | | | | | | | | | | | | | | | | | | | | | | | | | | | | | | |
KP Large Cap Equity Fund* - Institutional Shares | |
2017 | | $ | 11.19 | | | $ | 0.18 | | | $ | 2.49 | | | $ | 2.67 | | | $ | (0.17 | ) | | $ | (0.71 | ) | | $ | — | | | $ | (0.88 | ) | | $ | 12.98 | | | | 23.84 | % | | $ | 2,250,917 | | | | 0.31 | % | | | 1.47 | % | | | 41 | % |
2016 | | $ | 10.56 | | | $ | 0.18 | | | $ | 0.88 | | | $ | 1.06 | | | $ | (0.17 | ) | | $ | (0.26 | ) | | $ | — | | | $ | (0.43 | ) | | $ | 11.19 | | | | 10.04 | % | | $ | 1,476,628 | | | | 0.34 | % | | | 1.65 | % | | | 50 | % |
2015 | | $ | 10.82 | | | $ | 0.15 | | | $ | 0.17 | | | $ | 0.32 | | | $ | (0.15 | ) | | $ | (0.43 | ) | | $ | — | | | $ | (0.58 | ) | | $ | 10.56 | | | | 2.91 | % | | $ | 1,239,696 | | | | 0.35 | % | | | 1.38 | % | | | 126 | % |
2014@ | | $ | 10.00 | | | $ | 0.16 | | | $ | 0.96 | | | $ | 1.12 | | | $ | (0.15 | ) | | $ | (0.15 | ) | | $ | — | | | $ | (0.30 | ) | | $ | 10.82 | | | | 11.21 | % | | $ | 1,142,880 | | | | 0.35 | % | | | 1.62 | % | | | 126 | % |
| | | | | | | | | | | | | | | | | | | | | | | | | | | | | | | | | | | | | | | | | | | | | | | | | | | | | | | | |
KP Small Cap Equity Fund* - Institutional Shares | |
2017 | | $ | 11.22 | | | $ | 0.05 | | | $ | 1.97 | | | $ | 2.02 | | | $ | (0.06 | ) | | $ | (1.10 | ) | | $ | — | | | $ | (1.16 | ) | | $ | 12.08 | | | | 17.95 | % | | $ | 1,075,158 | | | | 0.53 | % | | | 0.41 | % | | | 100 | % |
2016 | | $ | 9.55 | | | $ | 0.08 | | | $ | 1.68 | | | $ | 1.76 | | | $ | (0.09 | ) | | $ | — | | | $ | — | | | $ | (0.09 | ) | | $ | 11.22 | | | | 18.38 | % | | $ | 930,815 | | | | 0.53 | % | | | 0.86 | % | | | 91 | % |
2015 | | $ | 10.32 | | | $ | 0.07 | | | $ | (0.55 | ) | | $ | (0.48 | ) | | $ | (0.07 | ) | | $ | (0.22 | ) | | $ | — | (1) | | $ | (0.29 | ) | | $ | 9.55 | | | | (4.73 | )% | | $ | 780,852 | | | | 0.55 | % | | | 0.68 | % | | | 154 | % |
2014@ | | $ | 10.00 | | | $ | 0.09 | | | $ | 0.32 | | | $ | 0.41 | | | $ | (0.09 | ) | | $ | — | | | $ | — | | | $ | (0.09 | ) | | $ | 10.32 | | | | 4.06 | % | | $ | 448,240 | | | | 0.59 | % | | | 0.97 | % | | | 212 | % |
| | | | | | | | | | | | | | | | | | | | | | | | | | | | | | | | | | | | | | | | | | | | | | | | | | | | | | | | |
KP International Equity Fund* - Institutional Shares | |
2017 | | $ | 8.93 | | | $ | 0.21 | | | $ | 2.37 | | | $ | 2.58 | | | $ | (0.26 | ) | | $ | (0.05 | ) | | $ | — | | | $ | (0.31 | ) | | $ | 11.20 | | | | 28.95 | % | | $ | 1,469,968 | | | | 0.49 | % | | | 2.06 | % | | | 125 | % |
2016 | | $ | 8.84 | | | $ | 0.20 | | | $ | 0.07 | | | $ | 0.27 | | | $ | (0.18 | ) | | $ | — | | | $ | — | | | $ | (0.18 | ) | | $ | 8.93 | | | | 3.03 | % | | $ | 1,232,730 | | | | 0.49 | % | | | 2.22 | % | | | 23 | % |
2015 | | $ | 9.30 | | | $ | 0.20 | | | $ | (0.46 | ) | | $ | (0.26 | ) | | $ | (0.19 | ) | | $ | — | | | $ | (0.01 | ) | | $ | (0.20 | ) | | $ | 8.84 | | | | (2.79 | )% | | $ | 1,026,913 | | | | 0.50 | % | | | 2.13 | % | | | 21 | % |
2014@ | | $ | 10.00 | | | $ | 0.26 | | | $ | (0.64 | ) | | $ | (0.38 | ) | | $ | (0.22 | ) | | $ | (0.08 | ) | | $ | (0.02 | ) | | $ | (0.32 | ) | | $ | 9.30 | | | | (3.83 | )% | | $ | 940,105 | | | | 0.54 | % | | | 2.61 | % | | | 115 | % |
| | | | | | | | | | | | | | | | | | | | | | | | | | | | | | | | | | | | | | | | | | | | | | | | | | | | | | | | |
KP Fixed Income Fund* - Institutional Shares | |
2017 | | $ | 9.86 | | | $ | 0.27 | | | $ | 0.16 | | | $ | 0.43 | | | $ | (0.24 | ) | | $ | — | | | $ | — | | | $ | (0.24 | ) | | $ | 10.05 | | | | 4.41 | % | | $ | 1,581,880 | | | | 0.31 | % | | | 2.63 | % | | | 547 | % |
2016 | | $ | 9.79 | | | $ | 0.24 | | | $ | 0.16 | | | $ | 0.40 | | | $ | (0.23 | ) | | $ | (0.10 | ) | | $ | — | | | $ | (0.33 | ) | | $ | 9.86 | | | | 4.08 | % | | $ | 1,069,341 | | | | 0.32 | % | | | 2.37 | % | | | 484 | % |
2015 | | $ | 10.00 | | | $ | 0.21 | | | $ | (0.16 | ) | | $ | 0.05 | | | $ | (0.21 | ) | | $ | (0.05 | ) | | $ | — | (1) | | $ | (0.26 | ) | | $ | 9.79 | | | | 0.57 | % | | $ | 920,322 | | | | 0.34 | % | | | 2.10 | % | | | 533 | % |
2014@ | | $ | 10.00 | | | $ | 0.20 | | | $ | 0.07 | | | $ | 0.27 | | | $ | (0.18 | ) | | $ | (0.09 | ) | | $ | — | | | $ | (0.27 | ) | | $ | 10.00 | | | | 2.68 | % | | $ | 825,908 | | | | 0.36 | % | | | 1.99 | % | | | 496 | % |
| * | Commenced operations on January 10, 2014. |
| @ | For the period ended December 31, 2014. All ratios for the period have been annualized. |
| † | Per share calculations were performed using the average shares method. |
| †† | Ratio does not include the expenses of the underlying funds, as applicable. |
| ‡ | Total return and portfolio turnover are for the period indicated and have not been annualized. Returns shown do not reflect the deduction of taxes that a shareholder would pay of Fund distributions or the redemption of Fund shares. |
| ^ | The amount shown for a share outstanding throughout the period does not accord with the aggregate net realized and unrealized losses on investments for the period because of the sales and repurchases of Fund shares in relation to fluctuating market value of the investments of the Fund. |
| (1) | Amount less than $0.01 per share. |
Amounts designated as “—“ are $0 or have been rounded to $0.
The accompanying notes are an integral part of the financial statements.
148
| | |
| THE KP FUNDS | | December 31, 2017 |
|
| NOTES TO FINANCIAL STATEMENTS |
1. Organization
The KP Funds (the “Trust”), was organized on March 25, 2013 as a statutory trust under the laws of the Commonwealth of Massachusetts. The Trust is an open-end registered management investment company comprised of fourteen funds: KP Retirement Path 2015 Fund, KP Retirement Path 2020 Fund, KP Retirement Path 2025 Fund, KP Retirement Path 2030 Fund, KP Retirement Path 2035 Fund, KP Retirement Path 2040 Fund, KP Retirement Path 2045 Fund, KP Retirement Path 2050 Fund, KP Retirement Path 2055 Fund, and KP Retirement Path 2060 Fund (collectively, the “Target Date Funds”); and the KP Large Cap Equity Fund, KP Small Cap Equity Fund, KP International Equity Fund, and KP Fixed Income Fund (collectively, the “Asset Class Funds” and collectively with the Target Date Funds, the “Funds” and each a “Fund”). The investment objective of the Target Date Funds is to seek a balance of long-term capital growth, inflation protection, and current income. The investment objective of KP Large Cap Equity, KP Small Cap Equity and KP International Equity Funds is to seek long-term capital appreciation. The investment objective of KP Fixed Income Fund is to provide current income consistent with the preservation of capital. The Funds are diversified for purposes of the Investment Company Act of 1940, as amended (the “1940 Act”). The assets of each Fund of the Trust are segregated, and a shareholder’s interest is limited to the Fund in which shares are held. The Funds are registered to offer Institutional Class Shares.
Callan LLC serves as the Funds’ investment adviser (the “Adviser”). The Adviser will engage a number of sub-advisers (the “Sub-Advisers”) to manage a portion of the Asset Class Funds’ assets. On September 3, 2013, the Trust was seeded with an issuance of 10,000 shares of the Institutional Class Shares of the KP Fixed Income Fund at an aggregate purchase price of $100,000. The Funds commenced operations on January 10, 2014.
2. Significant Accounting Policies
The following are significant accounting policies, which are consistently followed in the preparation of its financial statements of the Funds. The Funds are investment companies that apply the accounting and reporting guidance issued in Topic 946 by the U.S. Financial Accounting Standards Board (“FASB”).
Use of Estimates in the Preparation of Financial Statements — The preparation of financial statements in conformity with accounting principles generally accepted in the United States of America (“U.S. GAAP”) requires management to make estimates and assumptions that affect the fair value of assets, the reported amount of assets and liabilities and disclosure of contingent assets and liabilities at the date of the financial statements and the reported amounts of increases and decreases in net assets from operations during the reporting period. Actual results could differ from those estimates and such differences could be material.
Security Valuation — Securities listed on a securities exchange, market or automated quotation system for which quotations are readily available (except for securities traded on NASDAQ), including securities traded over the counter, are valued at the last quoted sale price on an exchange or market (foreign or domestic) on which they are traded on valuation date (or at approximately 4:00 pm ET if a security’s primary exchange is normally open at that time), or, if there is no such reported sale on the valuation date, at the most recent quoted bid price. For securities traded on NASDAQ, the NASDAQ Official Closing Price will be used. If available, debt securities are priced based upon valuations provided by independent, third-party pricing agents. Such values generally reflect the last reported sales price if the security is actively traded. The third-party pricing agents may also value debt securities at an evaluated bid price by employing methodologies that utilize actual market transactions, broker-supplied valuations, or other methodologies designed to identify the market value for such securities. Such methodologies generally consider such factors as security prices, yields, maturities, call features, ratings and developments relating to specific securities in arriving at valuations. On the first day a new debt security purchase is recorded, if a price is not available on the automated pricing feeds from our primary and secondary pricing vendors nor is it available from an independent broker, the security may be valued at its purchase price. Each day thereafter, the debt security will be valued according to the Trust’s Fair Value Procedures until an independent source can be secured. Debt obligations with remaining maturities of sixty days or less may be valued at their amortized cost, provided that it is determined the amortized cost continues to approximate fair value. Should existing credit, liquidity or interest rate conditions in the relevant markets and issuer specific circumstances suggest that amortized cost does not approximate fair value, then the amortized cost method may not be used. The prices for foreign securities are reported in local currency and converted to U.S. dollars using currency exchange rates.
149
| | |
| THE KP FUNDS | | December 31, 2017 |
Investments in open-end and closed-end registered investment companies that do not trade on an exchange are valued at the end of day net asset value per share. Investments in open-end and closed-end registered investment companies that trade on an exchange are valued at the last sales price or official closing price as of the close of the customary trading session on the exchange where the security is principally traded.
Securities for which market prices are not available through the above methods are valued in accordance with Fair Value Procedures established by the Funds’ Board of Trustees (the “Board”). The Funds’ Fair Value Procedures are implemented through a Fair Value Pricing Committee (the “Committee”) designated by the Funds’ Board. Some of the more common reasons that may necessitate that a security be valued using Fair Value Procedures include: the security’s trading has been halted or suspended; the security has been delisted from a national exchange; the security’s primary trading market is temporarily closed at a time when under normal conditions it would be open; or the security’s primary pricing source is not able or willing to provide a price. When a security is valued in accordance with the Fair Value Procedures, the Committee will determine the value after taking into consideration relevant information reasonably available to the Committee. As of December 31, 2017, KP Large Cap Equity, KP International Equity and KP Fixed Income Funds had securities valued in accordance with fair value procedures. Refer to the schedule of investments for further details.
For securities that principally trade on a foreign market or exchange, a significant gap in time can exist between the time of a particular security’s last trade and the time at which the Fund calculates its net asset value. The closing prices of such securities may no longer reflect their market value at the time the Fund calculates its net asset value if an event that could materially affect the value of those securities (a “Significant Event”) has occurred between the time of the security’s last close and the time that the Fund calculates net asset value. A Significant Event may relate to a single issuer or to an entire market sector. If the Adviser of the Fund becomes aware of a Significant Event that has occurred with respect to a security or group of securities after the closing of the exchange or market on which the security or securities principally trade, but before the time at which the Fund calculates its net asset value, it may request that a Committee meeting be called.
KP International Equity Fund uses MarkIt Fair Value (“MarkIt”) as a third party fair valuation vendor. MarkIt provides a fair value for foreign securities held by KP International Equity Fund based on certain factors and methodologies (involving, generally, tracking valuation correlations between the U.S. market and each non-U.S. security) applied by MarkIt in the event that there is a movement in the U.S. market that exceeds a specific threshold established by the Committee. The Committee establishes a “confidence interval” which is used to determine the level of correlation between the value of a foreign security and movements in the U.S. market before a particular security is fair valued when the threshold is exceeded. In the event that the threshold established by the Committee is exceeded on a specific day, KP International Equity Fund values its non-U.S. securities that exceed the applicable “confidence interval” based upon the fair values provided by MarkIt. In such event, it is not necessary to hold a Committee meeting. In the event that the Adviser believes that the fair values provided by MarkIt are not reliable, the Adviser may contact SEI Global Fund Services (the “Administrator”) to request that a meeting of the Committee be held.
If a local market in which KP International Equity Fund owns securities is closed for one or more days, the Fund shall value all securities held in that corresponding currency based on the fair value prices provided by MarkIt using the predetermined confidence interval discussed above.
In accordance with the authoritative guidance on fair value measurement under U.S. GAAP, the Funds disclose fair value of their investments in a hierarchy that prioritizes the inputs to valuation techniques used to measure the fair value. The objective of a fair value measurement is to determine the price that would be received to sell an asset or paid to transfer a liability in an orderly transaction between market participants at the measurement date (an exit price). Accordingly, the fair value hierarchy gives the highest priority to quoted prices (unadjusted) in active markets for identical assets or liabilities (Level 1) and the lowest priority to unobservable inputs (Level 3). The three levels of the fair value hierarchy are described below:
| | • | | Level 1 — Unadjusted quoted prices in active markets for identical, unrestricted assets or liabilities that the Funds have the ability to access at the measurement date; |
| | • | | Level 2 — Other significant observable inputs (including quoted prices for similar securities, interest rates, prepayment speeds, credit risk, referenced indices, quoted prices in inactive markets, adjusted quoted prices in active markets, adjusted quoted prices on foreign equity securities that were adjusted in accordance with pricing procedures approved by the Board, etc.); and |
| | • | | Level 3 — Prices, inputs or exotic modeling techniques which are both significant to the fair value measurement and unobservable (supported by little or no market activity). |
150
| | |
| THE KP FUNDS | | December 31, 2017 |
Investments are classified within the level of the lowest significant input considered in determining fair value. Investments classified within Level 3 whose fair value measurement considers several inputs may include Level 1 or Level 2 inputs as components of the overall fair value measurement. For the year ended December 31, 2017, there have been no significant changes to the Funds’ fair value methodologies.
Federal Income Taxes — It is each Fund’s intention to continue to qualify as a regulated investment company for Federal income tax purposes by complying with the appropriate provisions of Subchapter M of the Internal Revenue Code of 1986, as amended, and to distribute substantially all of its income to shareholders. Accordingly, no provision for Federal income taxes has been made in the financial statements.
The Funds evaluate tax positions taken or expected to be taken in the course of preparing the Funds’ tax returns to determine whether it is “more-likely-than-not” (i.e., greater than 50-percent) that each tax position will be sustained upon examination by a taxing authority based on the technical merits of the position. Tax positions not deemed to meet the more-likely-than-not threshold are recorded as a tax benefit or expense in the current year. The Funds did not record any tax provision in the current period. However, management’s conclusions regarding tax positions taken may be subject to review and adjustment at a later date based on factors including, but not limited to, examination by tax authorities (i.e., the last 3 open tax year ends, as applicable), on-going analysis of and changes to tax laws, regulations and interpretations thereof.
KP International Equity Fund may be subject to taxes imposed by countries in which it invests. Such taxes are generally based on either income or gains earned or repatriated. KP International Equity Fund accrues and applies such taxes to net investment income, net realized gains and net unrealized gains as income and/or capital gains are earned. Tax is monitoring and accruing foreign capital cap gains for $643 (000), please refer to the Statement of Assets and Liabilities.
As of and during the year ended December 31, 2017, the Funds did not have a liability for any unrecognized tax benefits. The Funds recognize interest and penalties, if any, related to unrecognized tax benefits as income tax expense in the Statements of Operations. During the year ended December 31, 2017 the Funds did not incur any interest or penalties.
Security Transactions and Investment Income — Security transactions are accounted for on trade date for financial reporting purposes. Costs used in determining realized gains and losses on the sales of investment securities are based on the specific identification method. Dividend income is recorded on the ex-dividend date, and interest income is recognized on the accrual basis from settlement date and includes the amortization of premiums and the accretion of discount calculated using the effective interest method. Realized gains (losses) on paydowns of mortgage-backed and asset-backed securities are recorded as an adjustment to interest income.
Foreign Currency Translation — The books and records of the Funds are maintained in U.S. dollars. Investment securities and other assets and liabilities denominated in a foreign currency are translated into U.S. dollars on the date of valuation. The Funds generally bifurcate that portion of realized gains (losses) on investments in debt securities which is attributed to changes in foreign exchange rates from that which is due to changes in market prices of debt securities. These gains and losses are included in net realized and gains and losses on investments and net change in unrealized appreciation (depreciation) on investments on the Statement of Operations. Net realized and unrealized gains and losses on foreign currency transactions represent net foreign exchange gains or losses from foreign currency exchange contracts, disposition of foreign currencies, currency gains or losses realized between trade and settlement dates on securities transactions and the difference between the amount of the investment income and foreign withholding taxes recorded on the Funds’ books and the U.S. dollar equivalent amounts actually received or paid.
Forward Foreign Currency Exchange Contracts — The Funds may enter into forward foreign currency exchange contracts to protect the value of securities held and related receivables and payables against changes in future foreign exchange rates. A forward currency contract is an agreement between two parties to buy and sell currency at a set price on a future date. The market value of the contract will fluctuate with changes in currency exchange rates. The contract is marked-to-market daily using the current forward rate and the change in market value is recorded by the Funds as unrealized gain or loss. The Funds recognize realized gains or losses when the contract is closed, equal to the difference between the value of the contract at the time it was opened and the value at the time it was closed. Any realized or unrealized gains (losses) during the year are presented on the Statements of Operations. Refer to each Fund’s Schedule of Investments for details regarding open forward foreign currency contracts.
151
| | |
| THE KP FUNDS | | December 31, 2017 |
For the year ended December 31, 2017, the average balances of forward foreign currency exchange contracts were as follows (000):
| | | | | | | | |
| | | KP International
Equity Fund | | | KP Fixed
Income Fund | |
Average Monthly Notional Contracts Purchased | | $ | (2,718 | ) | | $ | (3,256 | ) |
Average Monthly Notional Contracts Sold | | | 4,538 | | | | 4,235 | |
Futures Contracts — To the extent consistent with its investment objective and strategies, the Funds may use futures contracts for tactical hedging purposes as well as to enhance the Fund’s returns. Initial margin deposits of cash or securities are made upon entering into futures contracts. The contracts are marked to market daily and the resulting changes in value are accounted for as unrealized gains and losses. Variation margin payments are paid or received, depending upon whether unrealized gains or losses are incurred. When the contract is closed, the Funds record a realized gain or loss equal to the difference between the proceeds from (or cost of) the closing transaction and the amount invested in the contract.
Risks of entering into futures contracts include the possibility that there will be an imperfect price correlation between the futures and the underlying securities. Second, it is possible that a lack of liquidity for futures contracts could exist in the secondary market, resulting in an inability to close a position prior to its maturity date. Third, the futures contract involves the risk that a Fund could lose more than the original margin deposit required to initiate a futures transaction.
Finally, the risk exists that losses could exceed amounts disclosed on the Statements of Assets and Liabilities. Refer to each Fund’s Schedule of Investments for details regarding open futures contracts as of December 31, 2017, if applicable.
For the year ended December 31, 2017, the average monthly notional amount of futures contracts held were as follows (000):
| | | | | | | | | | | | | | | | |
| | | KP Large Cap
Equity Fund | | | KP Small Cap
Equity Fund | | | KP International
Equity Fund | | | KP Fixed
Income Fund | |
Average Monthly Notional Value Balance Long | | $ | 22,484 | | | $ | 10,223 | | | $ | 16,982 | | | $ | — | |
Average Monthly Notional Value Balance Short | | | — | | | | — | | | | — | | | | (1,901 | ) |
Master Netting Arrangements — A fund is subject to various netting arrangements with select counterparties (“Master Agreements”). Master Agreements govern the terms of certain transactions, and reduce the counterparty risk associated with relevant transactions by specifying credit protection mechanisms and providing standardization that improves legal certainty. Since different types of transactions have different mechanics and are sometimes traded out of different legal entities of a particular counterparty organization, each type of transaction may be covered by a different Master Agreement, resulting in the need for multiple agreements with a single counterparty. As the Master Agreements are specific to unique operations of different asset types, they allow a fund to close out and net its total exposure to a specific counterparty entity in the event of a default with respect to all the transactions governed under a single agreement with a specific counterparty entity.
Master Agreements can also help limit counterparty risk by specifying collateral posting arrangements at pre arranged exposure levels. Under the Master Agreements, collateral is routinely transferred if the total net exposure to certain transactions (net of existing collateral already in place) governed under the relevant Master Agreement with a counterparty in a given account exceeds a specified threshold, which typically ranges from zero to $250,000 depending on the counterparty and the type of Master Agreement. United States Treasury Securities and U.S. dollar cash are generally the preferred forms of collateral. Securities and cash pledged as collateral are reflected as assets in the Statement of Assets and Liabilities as either a component of investments at value (securities) or deposits due from counterparties (cash). Cash collateral received is not typically held in a segregated account and as such is reflected as a liability in the Statement of Assets and Liabilities as deposits due to counterparties. The market value of any securities received as collateral is not reflected as a component of net asset value. A fund’s overall exposure to counterparty risk can change substantially within a short period, as it is affected by each transaction subject to the relevant Master Agreement.
It is the Funds’ policy to present the variation margin of the futures contracts separately on the Statements of Assets and Liabilities as the Funds do not have master netting agreements with the counterparties to the futures contracts. Refer to each Fund’s Schedule of Investments for details regarding futures contracts as of December 31, 2017, if applicable.
152
| | |
| THE KP FUNDS | | December 31, 2017 |
International Swaps and Derivatives Association, Inc. Master Agreements and Credit Support Annexes (“ISDA Master Agreements”) generally govern OTC financial derivative transactions entered into by a fund and select counterparties. ISDA Master Agreements maintain provisions for general obligations, representations, agreements, collateral and events of default or termination. Events of termination include conditions that may entitle counterparties to elect to terminate early and cause settlement of all outstanding transactions under the applicable ISDA Master Agreement. Any election to terminate early could be material to the financial statements. In limited circumstances, the ISDA Master Agreement may contain additional provisions that add additional counterparty protection beyond coverage of existing daily exposure if the counterparty has a decline in credit quality below a predefined level. These amounts, if any, may be segregated with a third party custodian.
As of December 31, 2017, there were no securities pledged as collateral for financial derivative instruments as governed by ISDA master agreements.
The following is a summary by counterparty of the market value of OTC financial derivative instruments and collateral (received)/pledged for the Funds as of December 31, 2017 (000):
| | | | | | | | | | | | | | | | | | | | | | | | | | | | |
| | | Financial Derivative Assets | | | Financial Derivative Liabilities | | | | | | | | | | |
| Counterparty | | Forward
Foreign
Currency
Contracts | | | Total
Over the
Counter | | | Forward
Foreign
Currency
Contracts | | | Total
Over the
Counter | | | Net Market
Value of OTC
Derivatives | | | Collateral
(Received)/
Pledged | | | Net
Exposures† | |
Barclays PLC | | $ | 38 | | | $ | 38 | | | $ | (30 | ) | | $ | (30 | ) | | $ | 8 | | | $ | — | | | $ | 8 | |
BNP Paribas | | | 13 | | | | 13 | | | | (78 | ) | | | (78 | ) | | | (65 | ) | | | — | | | | (65 | ) |
HSBC | | | 6 | | | | 6 | | | | — | | | | — | | | | 6 | | | | — | | | | 6 | |
| | | | | | | | | | | | | | | | | | | | |
Total over the counter | | $ | 57 | | | $ | 57 | | | $ | (108 | ) | | $ | (108 | ) | | | | | | | | | | | | |
| | | | | | | | | | | | | | | | | | | | |
| † | Net Exposure represents the net receivable/(payable) that would be due from/to the counterparty in the event of default. Exposure from OTC financial derivative instruments can only be netted across transactions governed under the same master agreement with the same legal entity. |
Investments in Real Estate Investment Trusts (“REITs”) — Dividend income is recorded based on the income included in distributions received from the REIT investments using published REIT reclassifications including some management estimates when actual amounts are not available. Distributions received in excess of this estimated amount are recorded as a reduction of the cost of investments or reclassified to capital gains. The actual amounts of income, return of capital, and capital gains are only determined by each REIT after its fiscal year-end, and may differ from the estimated amounts.
Master Limited Partnerships (“MLPs”) — Entities commonly referred to as “MLPs” are generally organized under state law as limited partnerships or limited liability companies. The Fund intends to invest in MLPs receiving partnership taxation treatment under the Internal Revenue Code of 1986 (the “Code”), and whose interests or “units” are traded on securities exchanges like shares of corporate stock. To be treated as a partnership for U.S. federal income tax purposes, an MLP whose units are traded on a securities exchange must receive at least 90% of its income from qualifying sources such as interest, dividends, real estate rents, gain from the sale or disposition of real property, income and gain from mineral or natural resources activities, income and gain from the transportation or storage of certain fuels, and, in certain circumstances, income and gain from commodities or futures, forwards and options with respect to commodities. Mineral or natural resources activities include exploration, development, production, processing, mining, refining, marketing and transportation (including pipelines) of oil and gas, minerals, geothermal energy, fertilizer, timber or industrial source carbon dioxide. An MLP consists of a general partner and limited partners (or in the case of MLPs organized as limited liability companies, a managing member and members). The general partner or managing member typically controls the operations and management of the MLP and has an ownership stake in the partnership. The limited partners or members, through their ownership of limited partner or member interests, provide capital to the entity, are intended to have no role in the operation and management of the entity and receive cash distributions. The MLPs themselves generally do not pay U.S. federal income taxes. Thus, unlike investors in corporate securities, direct MLP investors are generally not subject to double taxation (i.e., corporate level tax and tax on corporate dividends). Currently, most MLPs operate in the energy and/or natural resources sector.
Expenses — Expenses of the Trust can be directly attributed to a particular Fund are borne by that Fund. Expenses which cannot be directly attributed to a Fund are apportioned among the Funds of the Trust based on
153
| | |
| THE KP FUNDS | | December 31, 2017 |
the number of funds and/or relative net assets. In addition to the expenses reflected on the Statement of Operations, the Target Date Funds indirectly bear expenses of the underlying funds (registered investment companies) in which they invest. Because each of the underlying funds have varied expense and fee levels, and the Target Date Funds may own different amounts of shares of these funds at different times, the amount of fees and expenses incurred indirectly will vary.
Dividends and Distributions to Shareholders — The Funds will distribute substantially all of their net investment income and net realized capital gains, if any, at least annually. All dividends and distributions are recorded on ex-dividend date.
3. Administration, Distribution, Transfer Agent and Custody Agreements:
The Funds and the Administrator are parties to an Administration Agreement under which the Administrator provides administrative services to the Funds. For these services, the Administrator is paid an asset based fee which will vary depending on the average daily net assets of the Funds. For the year ended December 31, 2017, the Funds were charged as follows for these services (000):
| | | | | | | | | | |
| Fund | | Administration Fee | | | Fund | | Administration Fee | |
KP Retirement Path 2015 Fund | | $ | 113 | | | KP Retirement Path 2050 Fund | | $ | 85 | |
KP Retirement Path 2020 Fund | | $ | 209 | | | KP Retirement Path 2055 Fund | | $ | 21 | |
KP Retirement Path 2025 Fund | | $ | 242 | | | KP Retirement Path 2060 Fund | | $ | 4 | |
KP Retirement Path 2030 Fund | | $ | 228 | | | KP Large Cap Equity Fund | | $ | 733 | |
KP Retirement Path 2035 Fund | | $ | 252 | | | KP Small Cap Equity Fund | | $ | 364 | |
KP Retirement Path 2040 Fund | | $ | 230 | | | KP International Equity Fund | | $ | 495 | |
KP Retirement Path 2045 Fund | | $ | 165 | | | KP Fixed Income Fund | | $ | 519 | |
The Trust and SEI Investments Distribution Co. (the “Distributor”) are parties to a Distribution Agreement. The Distributor receives no fees under the agreement.
Certain officers of the Trust are also officers of the Administrator, which is a wholly-owned subsidiary of SEI Investments Company, and/or the Distributor. Such officers are paid no fees by the Trust, other than the Chief Compliance Officer (“CCO”) as described below, for serving as officers of the Trust.
A portion of the services provided by the CCO and his staff, whom are employees of the Administrator, are paid for by the Trust as incurred. The services include regulatory oversight of the Trust’s Advisors and service providers as required by SEC regulations. The CCO’s services and fees have been approved by and are reviewed by the Board.
Northeast Retirement Services, Inc. serves as the Transfer Agent and dividend disbursing agent for the Funds under a transfer agency agreement.
State Street Bank and Trust Company serves as custodian (the “Custodian”) for the Funds. The Custodian plays no role in determining the investment policies of the Funds or which securities are to be purchased and sold by the Funds.
4. Investment Advisory Agreements:
The Trust will pay to the Adviser as compensation for the Adviser’s services rendered, a fee (the “Advisory Fee”), determined in accordance with the calculation methodology set forth below. The Advisory Fee will be computed and accrued daily on an estimated basis by the Administrator and paid monthly in arrears based on a final determination by the Administrator.
The Advisory Fee payable by each Fund for any particular period will equal its pro rata portion of the total fee calculated by applying the Effective Fee Rate (defined below) to the Fund Asset Base (defined below), with each Fund’s pro rata portion determined by dividing the net assets of such Fund that are included in the Fund Asset Base by the total Fund Asset Base. The “Effective Fee Rate” will be determined by applying the following fee schedule to the Fund Asset Base:
0.05% on the first $4,000,000,000 of the Fund Asset Base;
0.04% on the Fund Asset Base between $4,000,000,001 and $7,000,000,000;
0.03% on the Fund Asset Base between $7,000,000,001 and $10,000,000,000; and
0.025% on the Fund Asset Base over $10,000,000,000.
154
| | |
| THE KP FUNDS | | December 31, 2017 |
The “Fund Asset Base” equals the Core Funds Asset Base (defined below) plus the Target Date Funds Asset Base (defined below). The “Core Funds Asset Base” equals the sum of the net assets of each Core Fund. The “Target Date Funds Asset Base” equals the sum of the net assets of each Target Date Fund invested in investment companies to which the Adviser does not serve as investment adviser. The Fund Asset Base will be estimated daily and determined monthly based on the preceding methodology, in all cases based on the net assets as of the close of business on the preceding day in the case of the daily estimate and based on the average daily net assets average daily net assets in the month for the monthly calculation.
The Effective Fee Rate determined at the beginning of a month shall be used throughout the month for purposes of the daily estimate, and shall be recalculated for the month to make the final determination. In the event that the estimated daily fee for a Fund differs from the final determination by an amount sufficient to require an adjustment to the Net Asset Value of the Fund for any day, such difference shall be treated as a pricing error under the Trust’s policy.
The Adviser has entered into sub-advisory agreements with each sub-adviser under which the sub-adviser makes investment decisions for the assets it has been allocated to manage. For its service, each sub-adviser receives a fee based on the specified percentage of that portion of the Fund’s assets allocated to that sub-adviser. The total fees paid to sub-advisors directly are labeled as “Sub-Advisory Fees” on the Statements of Operations.
As of December 31, 2017, the Adviser has entered into investment sub-advisory agreements with the following parties:
| | |
| Investment Sub-Adviser | | |
| KP Large Cap Equity Fund | | KP International Equity Fund |
| AQR Capital Management, LLC | | Acadian Asset Management LLC |
| MFS Investment Management | | Marathon Asset Management LLP |
| PanAgora Asset Management, Inc. | | MFS Investment Management |
| SSgA Funds Management, Inc. | | Sprucegrove Investment Management Ltd. |
| T. Rowe Price | | SSgA Funds Management, Inc. |
KP Small Cap Equity Fund Aristotle Capital Boston, LLC CastleArk Management, LLC Columbus Circle Investors DePrince Race & Zollo, Inc. PENN Capital Management Company, Inc. SSgA Funds Management, Inc. Walthausen & Co., LLC | | William Blair & Company, LLC |
| | KP Fixed Income Fund |
| | Credit Suisse Asset Management |
| | Loomis, Sayles & Company, LP |
| | Payden & Rygel |
| | SSgA Funds Management, Inc. |
| | |
| | |
| | |
5. Investment Transactions:
For the year ended December 31, 2017, the Funds had purchases and sales of investment securities other than long-term U.S. Government and short-term securities as follows (000):
| | | | | | | | |
| | | Purchases | | | Sales and
Maturities | |
KP Retirement Path 2015 Fund | | $ | 124,333 | | | $ | 174,845 | |
KP Retirement Path 2020 Fund | | | 249,029 | | | | 204,687 | |
KP Retirement Path 2025 Fund | | | 309,163 | | | | 176,166 | |
KP Retirement Path 2030 Fund | | | 304,859 | | | | 160,589 | |
KP Retirement Path 2035 Fund | | | 325,849 | | | | 156,873 | |
KP Retirement Path 2040 Fund | | | 298,570 | | | | 133,285 | |
KP Retirement Path 2045 Fund | | | 237,999 | | | | 92,324 | |
KP Retirement Path 2050 Fund | | | 157,201 | | | | 44,510 | |
KP Retirement Path 2055 Fund | | | 58,765 | | | | 11,997 | |
KP Retirement Path 2060 Fund | | | 16,315 | | | | 4,245 | |
KP Large Cap Equity Fund | | | 1,174,910 | | | | 789,014 | |
KP Small Cap Equity Fund | | | 933,677 | | | | 934,399 | |
KP International Equity Fund | | | 1,602,480 | | | | 1,671,684 | |
KP Fixed Income Fund | | | 1,077,157 | | | | 929,742 | |
155
| | |
| THE KP FUNDS | | December 31, 2017 |
In addition, KP Fixed Income Fund had purchases and sales of long-term U.S. Government securities of $6,105,027 (000) and $5,838,433 (000), respectively.
6. Federal Tax Information:
Dividends from net investment income and distributions from net realized capital gains are determined in accordance with U.S. Federal income tax regulations, which may differ from those amounts determined under U.S. GAAP. These book/tax differences are either temporary or permanent in nature. To the extent these differences are permanent, they are charged or credited to paid-in capital, undistributed net investment income or accumulated net realized gain, as appropriate, in the period that the differences arise.
The following permanent differences primarily attributable to the reclassification of short-term capital gains from affiliated registered investment companies, excess distributions, REIT adjustments, PFIC gain reclass, investment in partnerships, reclass of distributions, non-deductible excise tax, paydowns and foreign exchange gain/(loss), have been reclassified to/from the following accounts during the year ended December 31, 2017 (000):
| | | | | | | | | | | | |
| | | Paid-in
Capital | | | Undistributed
Net Investment
Income/(Loss) | | | Accumulated
Net Realized
Gain/(Loss) | |
KP Retirement Path 2015 Fund | | $ | — | | | $ | 1,409 | | | $ | (1,409 | ) |
KP Retirement Path 2020 Fund | | | — | | | | 3,439 | | | | (3,439 | ) |
KP Retirement Path 2025 Fund | | | — | | | | 5,162 | | | | (5,162 | ) |
KP Retirement Path 2030 Fund | | | — | | | | 5,835 | | | | (5,835 | ) |
KP Retirement Path 2035 Fund | | | — | | | | 7,374 | | | | (7,374 | ) |
KP Retirement Path 2040 Fund | | | — | | | | 7,290 | | | | (7,290 | ) |
KP Retirement Path 2045 Fund | | | — | | | | 5,666 | | | | (5,666 | ) |
KP Retirement Path 2050 Fund | | | — | | | | 3,091 | | | | (3,091 | ) |
KP Retirement Path 2055 Fund | | | — | | | | 832 | | | | (832 | ) |
KP Retirement Path 2060 Fund | | | — | | | | 168 | | | | (168 | ) |
KP Large Cap Equity Fund | | | — | | | | 564 | | | | (564 | ) |
KP Small Cap Equity Fund | | | (1 | ) | | | 974 | | | | (973 | ) |
KP International Equity Fund | | | (9 | ) | | | 2,889 | | | | (2,880 | ) |
KP Fixed Income Fund | | | (1 | ) | | | 351 | | | | (350 | ) |
These reclassifications have no impact on net assets or net asset value per share of the Funds.
The tax character of dividends and distributions declared during the year or period ended December 31, 2017 and December 31, 2016 were as follows (000):
| | | | | | | | | | | | | | | | | | | | |
| | | Year | | | Ordinary
Income | | | Long-Term
Capital Gain | | | Return of
Capital | | | Total | |
KP Retirement Path 2015 Fund | | | 2017 | | | $ | 9,850 | | | $ | 8,372 | | | $ | — | | | $ | 18,222 | |
| | | 2016 | | | | 10,031 | | | | 4,189 | | | | — | | | | 14,220 | |
KP Retirement Path 2020 Fund | | | 2017 | | | | 19,759 | | | | 12,760 | | | | — | | | | 32,519 | |
| | | 2016 | | | | 16,016 | | | | 6,468 | | | | — | | | | 22,484 | |
KP Retirement Path 2025 Fund | | | 2017 | | | | 24,305 | | | | 13,451 | | | | — | | | | 37,756 | |
| | | 2016 | | | | 16,914 | | | | 8,169 | | | | — | | | | 25,083 | |
KP Retirement Path 2030 Fund | | | 2017 | | | | 23,651 | | | | 13,130 | | | | — | | | | 36,781 | |
| | | 2016 | | | | 15,070 | | | | 8,780 | | | | — | | | | 23,850 | |
KP Retirement Path 2035 Fund | | | 2017 | | | | 26,847 | | | | 14,505 | | | | — | | | | 41,352 | |
| | | 2016 | | | | 15,839 | | | | 10,598 | | | | — | | | | 26,437 | |
KP Retirement Path 2040 Fund | | | 2017 | | | | 24,877 | | | | 13,777 | | | | — | | | | 38,654 | |
| | | 2016 | | | | 13,607 | | | | 10,261 | | | | — | | | | 23,868 | |
KP Retirement Path 2045 Fund | | | 2017 | | | | 18,295 | | | | 9,415 | | | | — | | | | 27,710 | |
| | | 2016 | | | | 9,281 | | | | 7,428 | | | | — | | | | 16,709 | |
KP Retirement Path 2050 Fund | | | 2017 | | | | 9,875 | | | | 4,651 | | | | — | | | | 14,526 | |
| | | 2016 | | | | 4,402 | | | | 3,097 | | | | — | | | | 7,499 | |
KP Retirement Path 2055 Fund | | | 2017 | | | | 2,677 | | | | 914 | | | | — | | | | 3,591 | |
| | | 2016 | | | | 946 | | | | 470 | | | | — | | | | 1,416 | |
156
| | |
| THE KP FUNDS | | December 31, 2017 |
| | | | | | | | | | | | | | | | | | | | |
| | | Year | | | Ordinary
Income | | | Long-Term
Capital Gain | | | Return of
Capital | | | Total | |
KP Retirement Path 2060 Fund | | | 2017 | | | $ | 556 | | | $ | 358 | | | $ | — | | | $ | 914 | |
| | | 2016 | | | | 162 | | | | 94 | | | | — | | | | 256 | |
KP Large Cap Equity Fund | | | 2017 | | | | 45,798 | | | | 98,447 | | | | — | | | | 144,245 | |
| | | 2016 | | | | 22,452 | | | | 32,941 | | | | — | | | | 55,393 | |
KP Small Cap Equity Fund | | | 2017 | | | | 37,010 | | | | 57,426 | | | | — | | | | 94,436 | |
| | | 2016 | | | | 7,022 | | | | — | | | | — | | | | 7,022 | |
KP International Equity Fund | | | 2017 | | | | 35,737 | | | | 4,289 | | | | — | | | | 40,026 | |
| | | 2016 | | | | 23,849 | | | | — | | | | — | | | | 23,849 | |
KP Fixed Income Fund | | | 2017 | | | | 37,108 | | | | 446 | | | | — | | | | 37,554 | |
| | | 2016 | | | | 34,544 | | | | 115 | | | | — | | | | 34,659 | |
As of December 31, 2017, the components of distributable earnings/(accumulated losses) on a tax basis were as follows (000):
| | | | | | | | | | | | | | | | | | | | | | | | | | | | |
| | | Undistributed
Ordinary
Income | | | Undistributed
Long-Term
Capital Gain | | | Post
October
Losses | | | Late-Year
Loss
Referral | | | Unrealized
Appreciation | | | Other
Temporary
Differences | | | Total Distributable
Earnings | |
KP Retirement Path 2015 Fund | | $ | — | | | $ | 8,086 | | | $ | — | | | $ | — | | | $ | 22,360 | | | $ | 2 | | | $ | 30,448 | |
KP Retirement Path 2020 Fund | | | — | | | | 17,850 | | | | — | | | | — | | | | 57,078 | | | | — | | | | 74,928 | |
KP Retirement Path 2025 Fund | | | — | | | | 24,365 | | | | — | | | | — | | | | 85,177 | | | | 3 | | | | 109,545 | |
KP Retirement Path 2030 Fund | | | — | | | | 25,491 | | | | — | | | | — | | | | 97,373 | | | | 1 | | | | 122,865 | |
KP Retirement Path 2035 Fund | | | — | | | | 30,293 | | | | — | | | | — | | | | 125,147 | | | | — | | | | 155,440 | |
KP Retirement Path 2040 Fund | | | — | | | | 28,916 | | | | — | | | | — | | | | 123,299 | | | | — | | | | 152,215 | |
KP Retirement Path 2045 Fund | | | — | | | | 21,871 | | | | — | | | | — | | | | 90,035 | | | | 1 | | | | 111,907 | |
KP Retirement Path 2050 Fund | | | — | | | | 11,837 | | | | — | | | | — | | | | 44,587 | | | | — | | | | 56,424 | |
KP Retirement Path 2055 Fund | | | — | | | | 3,179 | | | | — | | | | — | | | | 9,910 | | | | (2 | ) | | | 13,087 | |
KP Retirement Path 2060 Fund | | | — | | | | 656 | | | | — | | | | — | | | | 1,359 | | | | 1 | | | | 2,016 | |
KP Large Cap Equity Fund | | | 2,665 | | | | 15,128 | | | | — | | | | — | | | | 425,946 | | | | 1 | | | | 443,740 | |
KP Small Cap Equity Fund | | | 7,936 | | | | 15,733 | | | | — | | | | — | | | | 136,117 | | | | — | | | | 159,786 | |
KP International Equity Fund | | | 6,459 | | | | 25,535 | | | | — | | | | — | | | | 185,646 | | | | (2 | ) | | | 217,638 | |
KP Fixed Income Fund | | | — | | | | — | | | | (219 | ) | | | (68 | ) | | | 7,232 | | | | 86 | | | | 7,031 | |
Post-October losses represent losses realized on investment transactions from November 1, 2017 through December 31, 2017, that, in accordance with Federal income tax regulations, the Funds elect to defer and treat as having arisen in the following fiscal year.
For Federal income tax purposes, capital loss carryforwards may be carried forward and applied against all future capital gains. Under the Regulated Investment Company Modernization Act of 2010, Funds are permitted to carry forward capital losses incurred in taxable years beginning after December 22, 2010 for an unlimited period. Additionally, post-enactment capital losses that are carried forward will retain their character as either short-term or long-term capital losses rather than being considered all short-term as under previous law. During the year ended December 31, 2017, the KP International Equity Fund utilized $21,564 of capital loss carryforwards to offset capital gains.
The Federal tax cost and aggregate gross unrealized appreciation and depreciation on investments for Federal income tax purposes at December 31, 2017, were as follows (000):
| | | | | | | | | | | | | | | | |
| | | Federal
Tax Cost | | | Aggregated Gross
Unrealized
Appreciation | | | Aggregated Gross
Unrealized
Depreciation | | | Net Unrealized
Appreciation | |
KP Retirement Path 2015 Fund | | $ | 417,351 | | | $ | 25,106 | | | $ | (2,746 | ) | | $ | 22,360 | |
KP Retirement Path 2020 Fund | | | 820,502 | | | | 61,440 | | | | (4,362 | ) | | | 57,078 | |
KP Retirement Path 2025 Fund | | | 976,195 | | | | 89,398 | | | | (4,221 | ) | | | 85,177 | |
KP Retirement Path 2030 Fund | | | 916,062 | | | | 101,091 | | | | (3,718 | ) | | | 97,373 | |
KP Retirement Path 2035 Fund | | | 1,008,054 | | | | 128,923 | | | | (3,776 | ) | | | 125,147 | |
KP Retirement Path 2040 Fund | | | 920,455 | | | | 126,376 | | | | (3,077 | ) | | | 123,299 | |
KP Retirement Path 2045 Fund | | | 676,868 | | | | 92,523 | | | | (2,488 | ) | | | 90,035 | |
KP Retirement Path 2050 Fund | | | 369,439 | | | | 45,992 | | | | (1,405 | ) | | | 44,587 | |
KP Retirement Path 2055 Fund | | | 101,846 | | | | 10,503 | | | | (593 | ) | | | 9,910 | |
157
| | |
| THE KP FUNDS | | December 31, 2017 |
| | | | | | | | | | | | | | | | |
| | | Federal
Tax Cost | | | Aggregated Gross
Unrealized
Appreciation | | | Aggregated Gross
Unrealized
Depreciation | | | Net Unrealized
Appreciation | |
KP Retirement Path 2060 Fund | | $ | 21,627 | | | $ | 1,598 | | | $ | (239 | ) | | $ | 1,359 | |
KP Large Cap Equity Fund | | | 1,842,126 | | | | 472,496 | | | | (46,550 | ) | | | 425,946 | |
KP Small Cap Equity Fund | | | 949,916 | | | | 180,547 | | | | (44,430 | ) | | | 136,117 | |
KP International Equity Fund | | | 1,296,430 | | | | 243,487 | | | | (57,841 | ) | | | 185,646 | |
KP Fixed Income Fund | | | 1,732,240 | | | | 18,188 | | | | (10,955 | ) | | | 7,233 | |
7. Risks:
As with all mutual funds, a shareholder of a fund is subject to the risk that his or her investment could lose money. The Funds are subject to the principal risks noted below, any of which may adversely affect the fund’s net asset value and ability to meet its investment objective. A more complete description of principal risks is included in the prospectus under the heading “Principal Risks”.
Credit Risk — Credit risk is the risk that the issuer of a security or the counterparty to a contract will default or otherwise become unable to honor a financial obligation.
Credit-Linked Notes Risk — Credit-linked securities typically are issued by a limited purpose trust or other vehicle that, in turn, invests in a derivative instrument or basket of derivative instruments, such as credit default swaps or interest rate swaps, to obtain exposure to certain fixed-income markets or to remain fully invested when more traditional income producing securities are not available. Like an investment in a bond, an investment in credit-linked notes represents the right to receive periodic income payments (in the form of distributions) and payment of principal at the end of the term of the security. However, these payments are conditioned on the issuer’s receipt of payments from, and the issuer’s potential obligations to, the counterparties to certain derivative instruments entered into by the issuer of the credit-linked note. An investor holding a credit-linked note generally receives a fixed or floating coupon and the note’s par value upon maturity, unless the referenced creditor defaults or declares bankruptcy, in which case the investor receives the amount recovered. In effect, investors holding credit-linked notes receive a higher yield in exchange for assuming the risk of a specified credit event.
Fixed Income Market Risk — Fixed income market risk is the risk that the prices of a fund’s fixed income securities, including structured notes, respond to economic developments, particularly interest rate changes, as well as to perceptions about the creditworthiness of individual issuers, including governments and their agencies. In the case of foreign securities, price fluctuations will reflect international economic and political events, as well as changes in currency valuations relative to the U.S. dollar.
Interest Rate Risk — Interest rate risk is the risk that the value of fixed income securities, including U.S. Government securities, will fall due to rising interest rates.
Derivatives Risk — A fund’s use of futures contracts and forward contracts is subject to market risk, leverage risk, correlation risk and liquidity risk. Leverage risk is the risk that the use of leverage may amplify the effects of market volatility on a fund’s share price and may also cause a fund to liquidate portfolio positions when it would not be advantageous to do so in order to satisfy its obligations. Liquidity risk is the risk that certain securities may be difficult or impossible to sell at the time and the price that a fund would like. A fund may have to lower the price, sell other securities instead or forego an investment opportunity, any of which could have a negative effect on a fund’s management or performance. Correlation risk is the risk that changes in the value of the derivative may not correlate perfectly with the underlying asset, rate or index. A fund’s use of forward contracts is also subject to credit risk and valuation risk. Credit risk is described above. Valuation risk is the risk that the derivative may be difficult to value and/or valued incorrectly. Each of these risks could cause a fund to lose more than the principal amount invested in a derivative instrument.
Foreign Currency Risk — Foreign currency risk may arise from unanticipated movements in the value of a foreign currency relative to the U.S. dollar. Risks may also arise upon entering into these contracts from the potential inability of counterparties to meet the terms of their contracts and are generally limited to the amount of unrealized gain on the contracts at the date of default.
Foreign Investment Risk — The risk that non-U.S. securities may be subject to additional risks due to, among other things, political, social and economic developments abroad, currency movements, and different legal, regulatory and tax environments. These additional risks may be heightened with respect to emerging market countries since political turmoil and rapid changes in economic conditions are more likely to occur in these countries.
158
| | |
| THE KP FUNDS | | December 31, 2017 |
8. Indemnifications:
In the normal course of business, the Funds enter into contracts with third-party service providers that contain a variety of representations and warranties and that provide general indemnifications. Additionally, under the Funds’ organizational documents, the officers and trustees are indemnified against certain liabilities arising out of the performance of their duties to the Funds. The Funds’ maximum exposure under these arrangements is unknown, as it involves possible future claims that may or may not be made against the Funds. Based on experience, the Adviser is of the view that the risk of loss to the Funds in connection with the Funds’ indemnification obligation is remote; however, there can be no assurance that such obligations will not result in material liabilities that adversely affect the Funds.
9. Other:
At December 31, 2017, the percentage of total shares outstanding held by shareholders each owning 10% or greater of the aggregate total shares outstanding for each Fund, which are comprised of an omnibus account that are held on behalf of various individual shareholders, was as follows:
| | | | | | | | | | | | | | | | |
| | | Number of
affiliated
shareholders | | | % of
outstanding
shares held | | | Number of
non-affiliated
shareholders | | | % of
outstanding
shares held | |
KP Retirement Path 2015 Fund | | | — | | | | 0% | | | | 1 | | | | 100% | |
KP Retirement Path 2020 Fund | | | — | | | | 0% | | | | 1 | | | | 100% | |
KP Retirement Path 2025 Fund | | | — | | | | 0% | | | | 1 | | | | 100% | |
KP Retirement Path 2030 Fund | | | — | | | | 0% | | | | 1 | | | | 100% | |
KP Retirement Path 2035 Fund | | | — | | | | 0% | | | | 1 | | | | 100% | |
KP Retirement Path 2040 Fund | | | — | | | | 0% | | | | 1 | | | | 100% | |
KP Retirement Path 2045 Fund | | | — | | | | 0% | | | | 1 | | | | 100% | |
KP Retirement Path 2050 Fund | | | — | | | | 0% | | | | 1 | | | | 100% | |
KP Retirement Path 2055 Fund | | | — | | | | 0% | | | | 1 | | | | 100% | |
KP Retirement Path 2060 Fund | | | — | | | | 0% | | | | 1 | | | | 100% | |
KP Large Cap Equity Fund | | | 5 | | | | 77% | | | | — | | | | 0% | |
KP Small Cap Equity Fund | | | 2 | | | | 24% | | | | 1 | | | | 37% | |
KP International Equity Fund | | | 5 | | | | 79% | | | | — | | | | 0% | |
KP Fixed Income Fund | | | 6 | | | | 90% | | | | — | | | | 0% | |
10. Regulatory Matters:
In October 2016, the U.S. Securities and Exchange Commission adopted new rules and amended existing rules (together, final rules) intended to modernize the reporting and disclosure of information by registered investment companies. In part, the final rules amended Regulation S-X and require standardized, enhanced disclosures about derivatives in investment company financial statements, as well as other amendments. As of August 1, 2017, management has implemented the amendments to Regulation S-X, which did not have a material impact on the Funds’ financial statements and related disclosures or impact the Funds’ net assets or results of operations.
11. Subsequent Events:
The Funds have evaluated the need for additional disclosures and/or adjustments resulting from subsequent events through the date the financial statements were issued. Based on this evaluation, no additional disclosures and/or adjustments were required to the financial statements.
159
| | |
| THE KP FUNDS | | December 31, 2017 |
|
| REPORT OF INDEPENDENT REGISTERED PUBLIC ACCOUNTING FIRM |
To the Board of Trustees of
The KP Funds and Shareholders of
KP Retirement Path 2015 Fund
KP Retirement Path 2020 Fund
KP Retirement Path 2025 Fund
KP Retirement Path 2030 Fund
KP Retirement Path 2035 Fund
KP Retirement Path 2040 Fund
KP Retirement Path 2045 Fund
KP Retirement Path 2050 Fund
KP Retirement Path 2055 Fund
KP Retirement Path 2060 Fund
KP Large Cap Equity Fund
KP Small Cap Equity Fund
KP International Equity Fund and
KP Fixed Income Fund:
Opinions on the Financial Statements
We have audited the accompanying statements of assets and liabilities, including the schedules of investments, of KP Retirement Path 2015 Fund, KP Retirement Path 2020 Fund, KP Retirement Path 2025 Fund, KP Retirement Path 2030 Fund, KP Retirement Path 2035 Fund, KP Retirement Path 2040 Fund, KP Retirement Path 2045 Fund, KP Retirement Path 2050 Fund, KP Retirement Path 2055 Fund, KP Retirement Path 2060 Fund, KP Large Cap Equity Fund, KP Small Cap Equity Fund, KP International Equity Fund and KP Fixed Income Fund (constituting The KP Funds, hereafter collectively referred to as the "Funds") as of December 31, 2017, the related statements of operations for the year ended December 31, 2017, the statements of changes in net assets for each of the two years in the period ended December 31, 2017, including the related notes, and the financial highlights for each of the periods indicated therein (collectively referred to as the “financial statements”). In our opinion, the financial statements present fairly, in all material respects, the financial position of each of the Funds as of December 31, 2017, the results of each of their operations for the year then ended, the changes in each of their net assets for each of the two years in the period ended December 31, 2017 and each of the financial highlights for each of the periods indicated therein in conformity with accounting principles generally accepted in the United States of America.
Basis for Opinions
These financial statements are the responsibility of the Funds’ management. Our responsibility is to express an opinion on the Funds’ financial statements based on our audits. We are a public accounting firm registered with the Public Company Accounting Oversight Board (United States) (“PCAOB”) and are required to be independent with respect to the Funds in accordance with the U.S. federal securities laws and the applicable rules and regulations of the Securities and Exchange Commission and the PCAOB.
We conducted our audits of these financial statements in accordance with the standards of the PCAOB. Those standards require that we plan and perform the audit to obtain reasonable assurance about whether the financial statements are free of material misstatement, whether due to error or fraud.
Our audits included performing procedures to assess the risks of material misstatement of the financial statements, whether due to error or fraud, and performing procedures that respond to those risks. Such procedures included examining, on a test basis, evidence regarding the amounts and disclosures in the financial statements. Our audits also included evaluating the accounting principles used and significant estimates made by management, as well as evaluating the overall presentation of the financial statements. Our procedures included confirmation of securities owned as of December 31, 2017 by correspondence with the custodian, transfer agents and brokers; when replies were not received from brokers, we performed other auditing procedures. We believe that our audits provide a reasonable basis for our opinions.
/s/ PricewaterhouseCoopers LLP
Philadelphia, Pennsylvania
February 27, 2018
We have served as the auditor of one or more investment companies in Callan LLC since 2013.
160
This page is intentionally left blank.
| | |
| THE KP FUNDS | | December 31, 2017 |
|
| TRUSTEES AND OFFICERS OF THE TRUST (Unaudited) |
Set forth below are the names, years of birth, position with the Trust, length of term of office, and the principal occupations for the last five years of each of the persons currently serving as Trustees and Officers of the Trust. Unless otherwise noted, the business address of each Trustee is SEI Investments Company, 1 Freedom Valley Drive, Oaks, Pennsylvania 19456. Trustees who are deemed not to be “interested persons” of the Trust are referred to as “Independent Trustees.” Messrs. Nesher and Doran are Trustees who may be deemed to be “interested” persons of
| | | | |
| | |
Name and Year of Birth | | Position with the Trust and Length of Time Served1 | | Principal Occupation During the Past 5 Years |
INTERESTED TRUSTEES2,3 | | | | |
| | |
ROBERT A. NESHER (Born: 1946) | | Chairman of the Board of Trustees (Since 1991) | | SEI employee 1974 to present; currently performs various services on behalf of SEI Investments for which Mr. Nesher is compensated. |
WILLIAM M. DORAN (Born: 1940) | | Trustee (Since 1991) | | Self-Employed Consultant since 2003. Partner at Morgan, Lewis & Bockius LLP (law firm) from 1976 to 2003. Counsel to the Trust, SEI Investments, SIMC, the Administrator and the Distributor. |
| 1 | Each Trustee shall hold office during the lifetime of this Trust until the election and qualification of his or her successor, or until he or she sooner dies, resigns, or is removed in accordance with the Trust’s Declaration of Trust. |
| 2 | Denotes Trustees who may be deemed to be “interested” persons of the Fund as that term is defined in the 1940 Act by virtue of their affiliation with the Distributor and/or its affiliates. |
| 3 | Trustees oversee 14 funds in the KP Funds Trust. |
162
| | |
| THE KP FUNDS | | December 31, 2017 |
the Fund as that term is defined in the 1940 Act by virtue of their affiliation with the Trust’s Distributor. The Trust’s Statement of Additional Information (“SAI”) includes additional information about the Trustees and Officers. The SAI may be obtained without charge by calling 1-855-457-3637. The following chart lists Trustees and Officers as of December 31, 2017.
|
|
Other Directorships
Held in the
Past Five Years4 |
|
Current Directorships: Trustee of The Advisors’ Inner Circle Fund, The Advisors’ Inner Circle Fund II, Bishop Street Funds, SEI Daily Income Trust, SEI Institutional International Trust, SEI Institutional Investments Trust, SEI Institutional Managed Trust, SEI Asset Allocation Trust, SEI Tax Exempt Trust, Adviser Managed Trust, New Covenant Funds SEI Insurance Products Trust and SEI Catholic Values Trust. Director of SEI Structured Credit Fund, LP, SEI Global Master Fund plc, SEI Global Assets Fund plc, SEI Global Investments Fund plc, SEI Investments – Global Funds Services, Limited, SEI Investments Global, Limited, SEI Investments (Europe) Ltd., SEI Investments – Unit Trust Management (UK) Limited, SEI Multi-Strategy Funds PLC and SEI Global Nominee Ltd. Former Directorships: Trustee of SEI Liquid Asset Trust to 2016. |
Current Directorships: Trustee of The Advisors’ Inner Circle Fund, The Advisors’ Inner Circle Fund II, The Advisors’ Inner Circle Fund III, Bishop Street Funds, Winton Diversified Opportunities Fund (closed-end investment company), Gallery Trust, Schroder Series Trust, Schroder Global Series Trust, SEI Daily Income Trust, SEI Institutional International Trust, SEI Institutional Investments Trust, SEI Institutional Managed Trust, SEI Asset Allocation Trust, SEI Tax Exempt Trust, Adviser Managed Trust, New Covenant Funds, SEI Insurance Products Trust and SEI Catholic Values Trust. Director of SEI Investments (Europe), Limited, SEI Investments – Global Funds Services, Limited, SEI Investments Global, Limited, SEI Investments (Asia), Limited, SEI Global Nominee Ltd. and SEI Investments – Unit Trust Management (UK) Limited. Director of the Distributor since 2003. Former Directorships: Trustee of O’Connor EQUUS (closed-end investment company) to 2016. Trustee of SEI Liquid Asset Trust to 2016. Trustee of Winton Series Trust to 2017. |
| 4 | Directorships of Companies required to report to the securities and Exchange Commission under the Securities Exchange act of 1934 (i.e., “public companies”) or other investment companies under the 1940 Act. |
163
| | |
| THE KP FUNDS | | December 31, 2017 |
|
| TRUSTEES AND OFFICERS OF THE TRUST (Unaudited) |
| | | | |
| | |
Name and
Year of Birth | | Position
with the Trust and Length of Time Served1 | | Principal Occupation During the Past 5 Years |
INDEPENDENT TRUSTEES2 | | | | |
| | |
JOHN K. DARR (Born: 1944) | | Trustee (Since 2008) | | Retired. Chief Executive Officer, Office of Finance, Federal Home Loan Banks, from 1992 to 2007. |
JOSEPH T. GRAUSE JR. (Born: 1952) | | Trustee (Since 2011) | | Self-employed consultant since January 2012. Director of Endowments and Foundations, Morningstar Investment Management, Morningstar, Inc., 2010 to 2011; Director of International Consulting and Chief Executive Officer of Morningstar Associates Europe Limited, Morningstar, Inc., 2007 to 2010; Country Manager – Morningstar UK Limited, Morningstar, Inc., 2005 to 2007. |
MITCHELL A. JOHNSON (Born: 1942) | | Trustee (Since 2005) | | Retired. Private Investor since 1994. |
BETTY L. KRIKORIAN (Born: 1943) | | Trustee (Since 2005) | | Vice President, Compliance, AARP Financial Inc. from 2008 to 2010. Self-Employed Legal and Financial Services Consultant since 2003. |
| 1 | Each Trustee shall hold office during the lifetime of this Trust until the election and qualification of his or her successor, or until he or she sooner dies, resigns, or is removed in accordance with the Trust’s Declaration of Trust. |
| 2 | Trustees oversee 14 funds in the KP Funds Trust. |
164
| | |
| THE KP FUNDS | | December 31, 2017 |
|
|
Other Directorships
Held in the
Past Five Years3 |
|
Current Directorships: Trustee of The Advisors’ Inner Circle Fund, The Advisors’ Inner Circle Fund II and Bishop Street Funds. Director of Federal Home Loan Bank of Pittsburgh, Meals on Wheels, Lewes/Rehoboth Beach and West Rehoboth Land Trust. |
Current Directorships: Trustee of The Advisors’ Inner Circle Fund, The Advisors’ Inner Circle Fund II and Bishop Street Funds. Director of The Korea Fund, Inc. |
Current Directorships: Trustee of The Advisors’ Inner Circle Fund, The Advisors’ Inner Circle Fund II, Bishop Street Funds, SEI Asset Allocation Trust, SEI Daily Income Trust, SEI Institutional International Trust, SEI Institutional Managed Trust, SEI Institutional Investments Trust, SEI Tax Exempt Trust, Adviser Managed Trust, New Covenant Funds, SEI Insurance Products Trust and SEI Catholic Values Trust. Director, Federal Agricultural Mortgage Corporation (Farmer Mac) since 1997. Former Directorships: Trustee of SEI Liquid Asset Trust to 2016. |
Current Directorships: Trustee of The Advisors’ Inner Circle Fund, The Advisors’ Inner Circle Fund II and Bishop Street Funds. |
| 3 | Directorships of Companies required to report to the securities and Exchange Commission under the Securities Exchange act of 1934 (i.e., “public companies”) or other investment companies under the 1940 Act. |
165
| | |
| THE KP FUNDS | | December 31, 2017 |
|
| TRUSTEES AND OFFICERS OF THE TRUST (Unaudited) |
| | | | |
| | |
Name and
Year of Birth | | Position
with the Trust
and Length of
Time Served1 | | Principal Occupation During the Past 5 Years |
INDEPENDENT TRUSTEES2 | | | | |
| | |
BRUCE R. SPECA (Born: 1956) | | Trustee (Since 2011) | | Global Head of Asset Allocation, Manulife Asset Management (subsidiary of Manulife Financial), 2010 to 2011; Executive Vice President – Investment Management Services, John Hancock Financial Services (subsidiary of Manulife Financial), 2003 to 2010. |
GEORGE J. SULLIVAN, JR. (Born: 1942) | | Trustee Lead Independent Trustee (Since 1999) | | Retired since January 2012. Self-employed Consultant, Newfound Consultants Inc. April 1997 to December 2011. |
| OFFICERS | | | | |
| | |
MICHAEL BEATTIE (Born: 1965) | | President (Since 2011) | | Director of Client Service, SEI Investments, since 2004. |
JOHN BOURGEOIS (Born: 1973) | | Assistant Treasurer (Since 2017) | | Fund Accounting Manager, SEI Investments, since 2000. |
STEPHEN CONNORS (Born: 1984) | | Treasurer, Controller and Chief Financial Officer (Since 2015) | | Director, SEI Investments, Fund Accounting since 2014. Audit Manager, Deloitte & Touche LLP, from 2011 to 2014. |
| 1 | Each Trustee shall hold office during the lifetime of this Trust until the election and qualification of his or her successor, or until he or she sooner dies, resigns, or is removed in accordance with the Trust’s Declaration of Trust. |
| 2 | Trustees oversee 14 funds in the KP Funds Trust. |
166
| | |
| THE KP FUNDS | | December 31, 2017 |
|
|
Other Directorships
Held in the
Past Five Years3 |
|
Current Directorships: Trustee of The Advisors’ Inner Circle Fund, The Advisors’ Inner Circle Fund II and Bishop Street Funds. |
Current Directorships: Trustee/ Director of State Street Navigator Securities Lending Trust, The Advisors’ Inner Circle Fund, The Advisors’ Inner Circle Fund II, Bishop Street Funds, SEI Structured Credit Fund, LP, SEI Daily Income Trust, SEI Institutional International Trust, SEI Institutional Investments Trust, SEI Institutional Managed Trust, SEI Asset Allocation Trust, SEI Tax Exempt Trust, Adviser Managed Trust, New Covenant Funds, SEI Insurance Products Trust and SEI Catholic Values Trust. Former Directorships: Trustee of SEI Liquid Asset Trust to 2016. Member of the independent review committee for SEI’s Canadian-registered mutual funds. |
|
None. |
None. |
None. |
| 3 | Directorships of Companies required to report to the securities and Exchange Commission under the Securities Exchange act of 1934 (i.e., “public companies”) or other investment companies under the 1940 Act. |
167
| | |
| THE KP FUNDS | | December 31, 2017 |
|
| TRUSTEES AND OFFICERS OF THE TRUST (Unaudited) |
| | | | |
| | |
Name and
Year of Birth | | Position
with the Trust
and Length of
Time Served | | Principal Occupation During the Past 5 Years |
| OFFICERS (continued) | | | | |
| | |
DIANNE M. DESCOTEAUX (Born: 1977) | | Vice President and Secretary (Since 2011) | | Counsel at SEI Investments since 2010. |
RUSSELL EMERY (Born: 1962) | | Chief Compliance Officer (Since 2006) | | Chief Compliance Officer of SEI Structured Credit Fund, LP since June 2007. Chief Compliance Officer of The Advisors’ Inner Circle Fund, The Advisors’ Inner Circle Fund II, Bishop Street Funds, The Advisors’ Inner Circle Fund III, Winton Diversified Opportunities Fund (closed-end investment company), Gallery Trust, Schroder Series Trust, Schroder Global Series Trust, SEI Institutional Managed Trust, SEI Asset Allocation Trust, SEI Institutional International Trust, SEI Institutional Investments Trust, SEI Daily Income Trust, SEI Tax Exempt Trust, Adviser Managed Trust, New Covenant Funds, SEI Insurance Products Trust and SEI Catholic Values Trust. Chief Compliance Officer of O’Connor EQUUS (closed-end investment company) to 2016. Chief Compliance Officer of SEI Liquid Asset Trust to 2016. Chief Compliance Officer of Winton Series Trust to 2017. |
ROBERT MORROW (Born: 1968) | | Vice President (Since 2017) | | Account Manager, SEI Investments, since 2007. |
BRIDGET E. SUDALL (Born: 1980) | | Anti-Money Laundering Compliance Officer and Privacy Officer (Since 2015) | | Senior Associate and AML Officer, Morgan Stanley Alternative Investment Partners from April 2011 to March 2015. |
LISA WHITTAKER (Born: 1978) | | Vice President and Assistant Secretary (Since 2013) | | Attorney, SEI Investments (2012-present). Associate Counsel and Compliance Officer, The Glenmede Trust Company, N.A. (2011-2012). |
168
| | |
| THE KP FUNDS | | December 31, 2017 |
|
|
Other Directorships
Held in the Past Five Years |
|
None. |
None. |
None. |
None. |
None. |
169
| | |
| THE KP FUNDS | | December 31, 2017 |
|
| DISCLOSURE OF FUND EXPENSES (Unaudited) |
All mutual funds have operating expenses. As a shareholder of a mutual fund, your investment is affected by these ongoing costs, which include (among others) costs for portfolio management, administrative services, and shareholder reports like this one. It is important for you to understand the impact of these costs on your investment returns.
Operating expenses such as these are deducted from the mutual fund‘s gross income and directly reduce your final investment return. These expenses are expressed as a percentage of the mutual fund’s average net assets; this percentage is known as the mutual fund’s expense ratio.
The following examples use the expense ratio and are intended to help you understand the ongoing costs (in dollars) of investing in your Fund and to compare these costs with those of other mutual funds. The examples are based on an investment of $1,000 invested on July 1, 2017 and held for the six-month period ended December 31, 2017.
The table on the next page illustrates your Fund’s costs in two ways:
• Actual Fund Return. This section helps you to estimate the actual expenses after fee waivers that your Fund incurred over the period. The “Expenses Paid During Period” column shows the actual dollar expense cost incurred by a $1,000 investment in the Fund, and the “Ending Account Value” number is derived from deducting that expense cost from the Fund’s gross investment return.
You can use this information, together with the actual amount you invested in your Fund, to estimate the expenses you paid over that period. Simply divide your actual starting account value by $1,000 to arrive at a ratio (for example, an $8,600 account value divided by $1,000 = 8.6), then multiply that ratio by the number shown for your Fund under “Expenses Paid During Period.”
• Hypothetical 5% Return. This section helps you compare your Fund’s costs with those of other mutual funds. It assumes that your Fund had an annual 5% return before expenses during the year, but that the expense ratio (Column 3) is unchanged. This example is useful in making comparisons because the Securities and Exchange Commission requires all mutual funds to make this 5% calculation. You can assess your Fund’s comparative cost by comparing the hypothetical result for your Fund in the “Expense Paid During Period” column with those that appear in the same charts in the shareholder reports for other mutual funds.
NOTE: Because the return is set at 5% for comparison purposes — NOT your Fund’s actual return — the account values shown do not apply to your specific investment.
170
| | |
| THE KP FUNDS | | December 31, 2017 |
|
| DISCLOSURE OF FUND EXPENSES (Unaudited) (Continued) |
| | | | | | | | | | | | | | | | |
| | | Beginning
Account
Value
7/1/2017 | | | Ending
Account
Value
12/31/2017 | | | Annualized
Expense
Ratios | | | Expenses
Paid
During
Period* | |
KP Retirement Path 2015 Fund | |
Actual Fund Return | | $ | 1,000.00 | | | $ | 1,048.70 | | | | 0.07 | % | | $ | 0.36 | |
Hypothetical 5% Return | | $ | 1,000.00 | | | $ | 1,024.85 | | | | 0.07 | % | | $ | 0.36 | |
KP Retirement Path 2020 Fund | |
Actual Fund Return | | $ | 1,000.00 | | | $ | 1,058.50 | | | | 0.07 | % | | $ | 0.36 | |
Hypothetical 5% Return | | $ | 1,000.00 | | | $ | 1,024.85 | | | | 0.07 | % | | $ | 0.36 | |
KP Retirement Path 2025 Fund | |
Actual Fund Return | | $ | 1,000.00 | | | $ | 1,070.00 | | | | 0.07 | % | | $ | 0.37 | |
Hypothetical 5% Return | | $ | 1,000.00 | | | $ | 1,024.85 | | | | 0.07 | % | | $ | 0.36 | |
KP Retirement Path 2030 Fund | |
Actual Fund Return | | $ | 1,000.00 | | | $ | 1,079.90 | | | | 0.07 | % | | $ | 0.37 | |
Hypothetical 5% Return | | $ | 1,000.00 | | | $ | 1,024.85 | | | | 0.07 | % | | $ | 0.36 | |
KP Retirement Path 2035 Fund | |
Actual Fund Return | | $ | 1,000.00 | | | $ | 1,089.80 | | | | 0.06 | % | | $ | 0.32 | |
Hypothetical 5% Return | | $ | 1,000.00 | | | $ | 1,024.90 | | | | 0.06 | % | | $ | 0.31 | |
KP Retirement Path 2040 Fund | |
Actual Fund Return | | $ | 1,000.00 | | | $ | 1,095.50 | | | | 0.06 | % | | $ | 0.32 | |
Hypothetical 5% Return | | $ | 1,000.00 | | | $ | 1,024.90 | | | | 0.06 | % | | $ | 0.31 | |
KP Retirement Path 2045 Fund | |
Actual Fund Return | | $ | 1,000.00 | | | $ | 1,098.10 | | | | 0.06 | % | | $ | 0.32 | |
Hypothetical 5% Return | | $ | 1,000.00 | | | $ | 1,024.90 | | | | 0.06 | % | | $ | 0.31 | |
| | | | | | | | | | | | | | | | |
| | | Beginning
Account
Value
7/1/2017 | | | Ending
Account
Value
12/31/2017 | | | Annualized
Expense
Ratios | | | Expenses
Paid
During
Period* | |
KP Retirement Path 2050 Fund | |
Actual Fund Return | | $ | 1,000.00 | | | $ | 1,101.20 | | | | 0.06 | % | | $ | 0.32 | |
Hypothetical 5% Return | | $ | 1,000.00 | | | $ | 1,024.90 | | | | 0.06 | % | | $ | 0.31 | |
KP Retirement Path 2055 Fund | |
Actual Fund Return | | $ | 1,000.00 | | | $ | 1,101.70 | | | | 0.07 | % | | $ | 0.37 | |
Hypothetical 5% Return | | $ | 1,000.00 | | | $ | 1,024.85 | | | | 0.07 | % | | $ | 0.36 | |
KP Retirement Path 2060 Fund | |
Actual Fund Return | | $ | 1,000.00 | | | $ | 1,101.80 | | | | 0.07 | % | | $ | 0.37 | |
Hypothetical 5% Return | | $ | 1,000.00 | | | $ | 1,024.85 | | | | 0.07 | % | | $ | 0.36 | |
KP Large Cap Equity Fund | |
Actual Fund Return | | $ | 1,000.00 | | | $ | 1,116.70 | | | | 0.32 | % | | $ | 1.71 | |
Hypothetical 5% Return | | $ | 1,000.00 | | | $ | 1,023.59 | | | | 0.32 | % | | $ | 1.63 | |
KP Small Cap Equity Fund | |
Actual Fund Return | | $ | 1,000.00 | | | $ | 1,109.30 | | | | 0.53 | % | | $ | 2.82 | |
Hypothetical 5% Return | | $ | 1,000.00 | | | $ | 1,022.53 | | | | 0.53 | % | | $ | 2.70 | |
KP International Equity Fund | |
Actual Fund Return | | $ | 1,000.00 | | | $ | 1,116.90 | | | | 0.51 | % | | $ | 2.72 | |
Hypothetical 5% Return | | $ | 1,000.00 | | | $ | 1,022.63 | | | | 0.51 | % | | $ | 2.60 | |
KP Fixed Income Fund | |
Actual Fund Return | | $ | 1,000.00 | | | $ | 1,018.20 | | | | 0.31 | % | | $ | 1.58 | |
Hypothetical 5% Return | | $ | 1,000.00 | | | $ | 1,023.64 | | | | 0.31 | % | | $ | 1.58 | |
| * | Expenses are equal to the Fund’s annualized expense ratio multiplied by the average account value over the period, multiplied by 184/365 (to reflect the one-half year period shown). |
171
| | |
| THE KP FUNDS | | December 31, 2017 |
|
| BOARD CONSIDERATIONS IN APPROVING AND RENEWING THE ADVISORY AND SUB-ADVISOR AGREEMENTS (Unaudited) |
Board Considerations in Renewing the Advisory and Sub-Advisor Agreements for the Funds
Pursuant to Section 15 of the Investment Company Act of 1940 (the “1940 Act”), the Funds’ advisory and sub-advisory agreements must be renewed at least annually after their initial two-year term: (i) by the vote of the Board of Trustees (the “Board” or the “Trustees”) of The KP Funds (the “Trust”) or by a vote of a majority of the shareholders of the Funds; and (ii) by the vote of a majority of the Trustees who are not parties to the agreements or “interested persons” of any party thereto, as defined in the 1940 Act (the “Independent Trustees”), cast in person at a meeting called for the purpose of voting on such renewal.
Board meetings were held on August 14, 2017 and November 15, 2017 to decide whether to renew the following agreements (the “Agreements”) for additional one-year terms:
| | • | | the investment advisory agreement between Callan LLC (the “Adviser”) and the Trust, on behalf of the Funds; |
| | • | | the sub-advisory agreements between the Adviser and certain sub-advisers (each, a “Sub-Adviser” and together, the “Sub-Advisers”), pursuant to which the Sub-Advisers serve as investment sub-advisers to the Funds, as set forth in the following table: |
| | |
| Sub-Adviser | | Fund(s) |
| AQR Capital Management, LLC | | KP Large Cap Equity Fund |
| PanAgora Asset Management, Inc. | | KP Large Cap Equity Fund |
| SSgA Funds Management, Inc. | | KP Large Cap Equity Fund KP Small Cap Equity Fund KP International Equity Fund KP Fixed Income Fund |
| T. Rowe Price Associates, Inc. | | KP Large Cap Equity Fund |
| Marathon Asset Management LLP | | KP International Equity Fund |
| Columbus Circle Investors | | KP Small Cap Equity Fund |
| MFS Investment Management | | KP Large Cap Equity Fund KP International Equity Fund |
| DePrince Race & Zollo, Inc. | | KP Small Cap Equity Fund |
| Walthausen & Co., LLC | | KP Small Cap Equity Fund |
| CastleArk Management LLC | | KP Small Cap Equity Fund |
| Acadian Asset Management LLC | | KP International Equity Fund |
| Payden & Rygel | | KP Fixed Income Fund |
| Loomis, Sayles & Company, L.P. | | KP Fixed Income Fund |
| Aristotle Capital Boston, LLC | | KP Small Cap Equity Fund |
| PENN Capital Management Company, Inc. | | KP Small Cap Equity Fund |
In preparation for the meetings, the Trustees requested that the Adviser and the Sub-Advisers furnish information necessary to evaluate the terms of the Agreements. Prior to the meetings, the Independent Trustees of the Funds met to review and discuss the information provided and submitted a request for additional information to the Adviser and the Sub-Advisers, and information was provided in response to this request. The Trustees used this information, as well as other information that the Adviser, the Sub-Advisers and other service providers of the Funds presented or submitted to the Board at the meetings and other meetings held during the prior year, to help them decide whether to renew the Agreements for an additional year.
Specifically, the Board requested and received written materials from the Adviser, the Sub-Advisers and other service providers of the Funds regarding: (i) the nature, extent and quality of the Adviser’s and the Sub-Advisers’ services; (ii) the Adviser’s and the Sub-Advisers’ investment management personnel; (iii) the Adviser’s and the Sub-Advisers’ operations and financial condition; (iv) the Adviser’s and the Sub-Advisers’ brokerage practices (including any soft dollar arrangements) and investment strategies; (v) the Funds’ advisory fees paid to the Adviser and the Sub-Advisers and overall fees and operating expenses compared with peer groups of mutual funds; (vi) the level of the Adviser’s and the Sub-Advisers’ profitability from their relationships with the Funds, including both direct and indirect benefits accruing to the Adviser and the Sub-Advisers and their affiliates; (vii) the Adviser’s and the Sub-Advisers’ potential economies of scale; (viii) the Adviser’s and the Sub-Advisers’ compliance programs, including
172
| | |
| THE KP FUNDS | | December 31, 2017 |
|
| BOARD CONSIDERATIONS IN APPROVING AND RENEWING THE ADVISORY AND SUB-ADVISOR AGREEMENTS (Unaudited) (Continued) |
a description of material compliance matters and material compliance violations; (ix) the Adviser’s and the Sub-Advisers’ policies on and compliance procedures for personal securities transactions; and (x) the Funds’ performance compared with peer groups of mutual funds and the Funds’ benchmark indices.
Representatives from the Adviser and the Sub-Advisers, along with other Fund service providers, presented additional information and participated in question and answer sessions at the Board meetings to help the Trustees evaluate the Adviser’s and the Sub-Advisers’ services, fees and other aspects of the Agreements. The Independent Trustees received advice from independent counsel and met in executive sessions outside the presence of Fund management, the Adviser and the Sub-Advisers.
At the Board meetings, the Trustees, including all of the Independent Trustees, based on their evaluation of the information provided by the Adviser, the Sub-Advisers and other service providers of the Funds, renewed the Agreements. In considering the renewal of the Agreements, the Board considered various factors that they determined were relevant, including: (i) the nature, extent and quality of the services provided by the Adviser and the Sub-Advisers; (ii) the investment performance of the Funds and the Adviser and the Sub-Advisers; (iii) the costs of the services provided and profits realized by the Adviser and the Sub-Advisers from their relationships with the Funds, including both direct and indirect benefits accruing to the Adviser and the Sub-Advisers and their affiliates; (iv) the extent to which economies of scale are being realized by the Adviser and the Sub-Advisers; and (v) whether fee levels reflect such economies of scale for the benefit of Fund investors, as discussed in further detail below.
Nature, Extent and Quality of Services Provided by the Adviser and the Sub-Advisers
In considering the nature, extent and quality of the services provided by the Adviser and the Sub-Advisers, the Board reviewed the portfolio management services provided by the Adviser and the Sub-Advisers to the Funds, including the quality and continuity of the Adviser’s and the Sub-Advisers’ portfolio management personnel, the resources of the Adviser and the Sub-Advisers, and the Adviser’s and the Sub-Advisers’ compliance histories and compliance programs. The Trustees reviewed the terms of the Agreements. The Trustees also reviewed the Adviser’s and the Sub-Advisers’ investment and risk management approaches for the Funds. The Trustees considered that the Adviser supervises and monitors the performance of the Sub-Advisers. The most recent investment adviser registration forms (“Form ADV”) for the Adviser and the Sub-Advisers were provided to the Board, as were the responses of the Adviser and the Sub-Advisers to a detailed series of questions which included, among other things, information about the investment advisory services provided by the Adviser and the Sub-Advisers to the Funds.
The Trustees also considered other services provided to the Funds by the Adviser and the Sub-Advisers such as selecting broker-dealers for executing portfolio transactions, monitoring adherence to the Funds’ investment restrictions, and monitoring compliance with various Fund policies and procedures and with applicable securities laws and regulations. Based on the factors above, as well as those discussed below, the Board concluded, within the context of its full deliberations, that the nature, extent and quality of the services provided to the Funds by the Adviser and the Sub-Advisers were sufficient to support renewal of the Agreements.
Investment Performance of the Funds, the Adviser and the Sub-Advisers
The Board was provided with regular reports regarding the Funds’ performance over various time periods, including since their inception, and information regarding the Funds’ performance since the Agreements were last renewed. The Trustees also reviewed reports prepared by the Funds’ administrator comparing the Funds’ performance to their benchmark indices and peer groups of mutual funds as classified by Lipper, an independent provider of investment company data, over various periods of time. Representatives from the Adviser and the Sub-Advisers provided information regarding and led discussions of factors impacting the performance of the Funds, outlining current market conditions and explaining their expectations and strategies for the future. The Trustees determined that the Funds’ performance was satisfactory, or, where the Funds’ performance was materially below their benchmarks and/or peer groups, the Trustees were satisfied by the reasons for the underperformance and/or the steps taken by the Adviser and the Sub-Advisers in an effort to improve the performance of the Funds. Based on this information, the Board concluded, within the context of its full deliberations, that the investment results that the Adviser and the Sub-Advisers had been able to achieve for the Funds were sufficient to support renewal of the Agreements.
173
| | |
| THE KP FUNDS | | December 31, 2017 |
|
| BOARD CONSIDERATIONS IN APPROVING AND RENEWING THE ADVISORY AND SUB-ADVISOR AGREEMENTS (Unaudited) (Continued) |
Costs of Advisory Services, Profitability and Economies of Scale
In considering the advisory fees payable by the Funds to the Adviser and the Sub-Advisers, the Trustees reviewed, among other things, a report of the advisory fees paid to the Adviser and the Sub-Advisers. The Trustees also reviewed reports prepared by the Funds’ administrator comparing the Funds’ net and gross expense ratios and advisory fees to those paid by peer groups of mutual funds as classified by Lipper. The Trustees reviewed the management fees charged by certain Sub-Advisers to other clients with comparable mandates. The Trustees considered any differences in management fees and took into account the respective demands, resources and complexity associated with the Funds and other client accounts as well as the extensive regulatory, compliance and tax regimes to which the Funds are subject. The Trustees also considered that the fees payable to the Sub-Advisers reflected arms-length negotiations between the Adviser and the Sub-Advisers. The Board concluded, within the context of its full deliberations, that the advisory fees were reasonable in light of the nature and quality of the services rendered by the Adviser and the Sub-Advisers.
The Trustees reviewed the costs of services provided by and the profits realized by the Adviser and the Sub-Advisers from their relationship with the Funds, including both direct benefits and indirect benefits, such as research and brokerage services received under soft dollar arrangements, accruing to the Adviser and the Sub-Advisers and their affiliates. The Trustees considered how the Adviser’s and the Sub-Advisers’ profitability was affected by factors such as their organizational structures and methods for allocating expenses. The Trustees concluded that the profit margins of the Adviser and the Sub-Advisers with respect to the management of the Funds were not unreasonable. The Board also considered the Adviser’s and the Sub-Advisers’ commitment to managing the Funds.
The Trustees considered the Adviser’s and Sub-Advisers’ views relating to economies of scale in connection with the Funds as Fund assets grow and the extent to which the benefits of any such economies of scale are shared with the Funds and Fund shareholders. The Board considered the existence of any economies of scale and whether those were passed along to the Funds’ shareholders through a graduated advisory fee schedule or other means, including fee waivers. The Trustees recognized that economies of scale are difficult to identify and quantify and are rarely identifiable on a fund-by-fund basis. Based on this evaluation, the Board concluded that the advisory fees were reasonable in light of the information that was provided to the Trustees by the Adviser and the Sub-Advisers with respect to economies of scale.
Renewal of the Agreements
Based on the Board’s deliberations and its evaluation of the information described above and other factors and information it believed relevant in the exercise of its reasonable business judgment, the Board, including all of the Independent Trustees, with the assistance of Fund counsel and Independent Trustees’ counsel, unanimously concluded that the terms of the Agreements, including the fees payable thereunder, were fair and reasonable and agreed to renew the Agreements for another year. In its deliberations, the Board did not identify any absence of information as material to its decision, or any particular factor (or conclusion with respect thereto) or single piece of information that was all-important, controlling or determinative of its decision, but considered all of the factors together, and each Trustee may have attributed different weights to the various factors (and conclusions with respect thereto) and information.
174
| | |
| THE KP FUNDS | | December 31, 2017 |
|
| BOARD CONSIDERATIONS IN APPROVING AND RENEWING THE ADVISORY AND SUB-ADVISOR AGREEMENTS (Unaudited) (Continued) |
Board Considerations in Approving the New Sub-Advisory Agreement for the KP International Equity Fund
Pursuant to Section 15 of the Investment Company Act of 1940 (the “1940 Act”), the Fund’s sub-advisory agreement must be approved: (i) by a vote of a majority of the shareholders of the Fund; and (ii) by the vote of a majority of the members of the Board of Trustees (the “Board” or the “Trustees”) of The KP Funds (the “Trust”) who are not parties to the agreement or “interested persons” of any party thereto, as defined in the 1940 Act (the “Independent Trustees”), cast in person at a meeting called for the purpose of voting on such approval.
A Board meeting was held on February 28, 2017 to decide whether to approve a sub-advisory agreement (the “Agreement”) for an initial two-year term between the Adviser and William Blair & Company, LLC (the “Sub-Adviser”) on behalf of the KP International Equity Fund.
In preparation for the meeting, the Trustees requested that the Adviser and the Sub-Adviser furnish information necessary to evaluate the terms of the Agreement. The Trustees used this information, as well as other information that the Adviser, the Sub-Adviser and other service providers of the Fund presented or submitted to the Board at the meeting, to help them decide whether to approve the Agreement for an initial two-year term.
Specifically, the Board requested and received written materials from the Adviser, the Sub-Adviser and other service providers of the Fund regarding, among other things: (i) the nature, extent and quality of the services to be provided by the Sub-Adviser; (ii) the Sub-Adviser’s investment management personnel; (iii) the Sub-Adviser’s operations and financial condition; (iv) the Sub-Adviser’s brokerage practices (including any soft dollar arrangements) and investment strategies; (v) the Fund’s proposed sub-advisory fee to be paid to the Sub-Adviser and overall fees and operating expenses; (vi) the Sub-Adviser’s compliance program, including a description of material compliance matters and material compliance violations; (vii) the Sub-Adviser’s policies on and compliance procedures for personal securities transactions; (viii) the Sub-Adviser’s investment experience; (ix) the Adviser’s rationale for recommending the Sub-Adviser; and (x) the Sub-Adviser’s performance in managing similar accounts.
Representatives from the Adviser and the Sub-Adviser, along with other Fund service providers, presented additional information and participated in question and answer sessions at the meeting to help the Trustees evaluate the Sub-Adviser’s services, fee and other aspects of the Agreement. The Independent Trustees received advice from independent counsel and met in executive session outside the presence of Fund management, the Adviser and the Sub-Adviser.
At the Board meeting, the Trustees, including all of the Independent Trustees, based on their evaluation of the information provided by the Adviser, the Sub-Adviser and other service providers of the Fund, approved the Agreement. In considering the approval of the Agreement, the Board considered various factors that they determined were relevant, including: (i) the nature, extent and quality of the services to be provided by the Sub-Adviser; and (ii) the fee to be paid to the Sub-Adviser, as discussed in further detail below.
Nature, Extent and Quality of Services Provided by the Sub-Adviser
In considering the nature, extent and quality of the services to be provided by the Sub-Adviser, the Board reviewed the portfolio management services to be provided by the Sub-Adviser to the Fund, including the quality and continuity of the Sub-Adviser’s portfolio management personnel, the resources of the Sub-Adviser and the Sub-Adviser’s compliance history and compliance program. The Trustees reviewed the terms of the proposed Agreement. The Trustees also reviewed the Sub-Adviser’s proposed investment and risk management approaches for the Fund. The Trustees considered that the Adviser would supervise and monitor the performance of the Sub-Adviser. The most recent investment adviser registration form (“Form ADV”) for the Sub-Adviser was provided to the Board, as was the response of the Sub-Adviser to a detailed series of questions which included, among other things, information about the investment advisory services to be provided by the Sub-Adviser to the Fund.
The Trustees also considered other services to be provided to the Fund by the Sub-Adviser such as selecting broker-dealers for executing portfolio transactions, monitoring adherence to the Fund’s investment restrictions, and monitoring compliance with various Fund policies and procedures and with applicable securities laws and regulations. Based on the factors above, as well as those discussed below, the Board concluded, within the context of its full deliberations, that the nature, extent and quality of the services to be provided to the Fund by the Sub-Adviser would be satisfactory.
175
| | |
| THE KP FUNDS | | December 31, 2017 |
|
| BOARD CONSIDERATIONS IN APPROVING AND RENEWING THE ADVISORY AND SUB-ADVISOR AGREEMENTS (Unaudited) (Concluded) |
Costs of Advisory Services
In considering the sub-advisory fee payable to the Sub-Adviser, the Trustees reviewed, among other things, the proposed sub-advisory fee to be paid to the Sub-Adviser. The Trustees also reviewed pro forma fee and expense information, as well as the management fees charged by the Sub-Adviser to other clients with comparable mandates. The Trustees considered any differences in management fees and took into account the respective demands, resources and complexity associated with the Fund and other client accounts as well as the extensive regulatory, compliance and tax regimes to which the Fund is subject. The Trustees also considered that the fee payable to the Sub-Adviser would reflect an arms-length negotiation between the Adviser and the Sub-Adviser. The Board concluded, within the context of its full deliberations, that the sub-advisory fee was reasonable in light of the nature and quality of the services expected to be rendered by the Sub-Adviser. The Board also considered the Sub-Adviser’s commitment to managing the Fund.
Investment Performance, Profitability and Economies of Scale
Because the Sub-Adviser is new to the Fund and had not managed Fund assets, it did not yet have an investment performance record with respect to the Fund and it was not possible to determine the profitability that the Sub-Adviser might achieve with respect to the Fund or the extent to which economies of scale would be realized by the Sub-Adviser as the assets of the Fund grow. Accordingly, the Trustees did not make any conclusions regarding the Sub-Adviser’s investment performance with respect to the Fund, the Sub-Adviser’s profitability, or the extent to which economies of scale would be realized by the Sub-Adviser as the assets of the Fund grow, but will do so during future considerations of the Agreement.
Approval of the Agreement
Based on the Board’s deliberations and its evaluation of the information described above and other factors and information it believed relevant in the exercise of its reasonable business judgment, the Board, including all of the Independent Trustees, with the assistance of Fund counsel and Independent Trustees’ counsel, unanimously concluded that the terms of the Agreement, including the fee to be paid thereunder, were fair and reasonable and agreed to approve the Agreement for an initial term of two years. In its deliberations, the Board did not identify any absence of information as material to its decision, or any particular factor (or conclusion with respect thereto) or single piece of information that was all-important, controlling or determinative of its decision, but considered all of the factors together, and each Trustee may have attributed different weights to the various factors (and conclusions with respect thereto) and information.
176
| | |
| THE KP FUNDS | | December 31, 2017 |
|
| NOTICE TO SHAREHOLDERS (Unaudited) |
For shareholders that do not have a December 31, 2017 taxable year end, this notice is for informational purposes only. For shareholders with a December 31, 2017 tax year end, please consult your tax adviser as to the pertinence of this notice.
For the fiscal period ended December 31, 2017 the Funds are designating the following with regard to distributions paid during the period:
| | | | | | | | | | | | | | | | | | | | |
| Fund | | | | | Return of
Capital
(Tax Basis) | | | Long-Term
Capital Gains
Distributions
(Tax Basis) | | | Ordinary
Income
Distributions
(Tax Basis) | | | Total
Distributions
(Tax Basis) | |
KP Retirement Path 2015 Fund | | | | | | | 0.00% | | | | 45.94% | | | | 54.06% | | | | 100.00% | |
KP Retirement Path 2020 Fund | | | | | | | 0.00% | | | | 39.24% | | | | 60.76% | | | | 100.00% | |
KP Retirement Path 2025 Fund | | | | | | | 0.00% | | | | 35.62% | | | | 64.38% | | | | 100.00% | |
KP Retirement Path 2030 Fund | | | | | | | 0.00% | | | | 35.70% | | | | 64.30% | | | | 100.00% | |
KP Retirement Path 2035 Fund | | | | | | | 0.00% | | | | 35.08% | | | | 64.92% | | | | 100.00% | |
KP Retirement Path 2040 Fund | | | | | | | 0.00% | | | | 35.64% | | | | 64.36% | | | | 100.00% | |
KP Retirement Path 2045 Fund | | | | | | | 0.00% | | | | 33.98% | | | | 66.02% | | | | 100.00% | |
KP Retirement Path 2050 Fund | | | | | | | 0.00% | | | | 32.02% | | | | 67.98% | | | | 100.00% | |
KP Retirement Path 2055 Fund | | | | | | | 0.00% | | | | 25.45% | | | | 74.55% | | | | 100.00% | |
KP Retirement Path 2060 Fund | | | | | | | 0.00% | | | | 39.19% | | | | 60.81% | | | | 100.00% | |
KP Large Cap Equity Fund | | | | | | | 0.00% | | | | 68.25% | | | | 31.75% | | | | 100.00% | |
KP Small Cap Equity Fund | | | | | | | 0.00% | | | | 60.81% | | | | 39.19% | | | | 100.00% | |
KP International Equity Fund | | | | | | | 0.00% | | | | 10.72% | | | | 89.28% | | | | 100.00% | |
KP Fixed Income Fund | | | | | | | 0.00% | | | | 1.19% | | | | 98.82% | | | | 100.00% | |
| | | | |
| | | | | | | | | | | | Foreign Investors | |
| Fund | | Corporate
Dividends
Received
Deduction(1) | | | Qualifying
Dividend
Income(2) | | | U.S.
Government
Interest(3) | | | Interest
Related
Dividends(4) | | | Short-Term
Capital
Gains
Dividends(5) | |
KP Retirement Path 2015 Fund | | | 0.00% | | | | 0.00% | | | | 0.00% | | | | 0.00% | | | | 100.00% | |
KP Retirement Path 2020 Fund | | | 0.00% | | | | 0.00% | | | | 0.00% | | | | 0.00% | | | | 100.00% | |
KP Retirement Path 2025 Fund | | | 0.00% | | | | 0.00% | | | | 0.00% | | | | 0.00% | | | | 100.00% | |
KP Retirement Path 2030 Fund | | | 0.00% | | | | 0.00% | | | | 0.00% | | | | 0.00% | | | | 100.00% | |
KP Retirement Path 2035 Fund | | | 0.00% | | | | 0.00% | | | | 0.00% | | | | 0.00% | | | | 100.00% | |
KP Retirement Path 2040 Fund | | | 0.00% | | | | 0.00% | | | | 0.00% | | | | 0.00% | | | | 100.00% | |
KP Retirement Path 2045 Fund | | | 0.00% | | | | 0.00% | | | | 0.00% | | | | 0.00% | | | | 100.00% | |
KP Retirement Path 2050 Fund | | | 0.00% | | | | 0.00% | | | | 0.00% | | | | 0.00% | | | | 100.00% | |
KP Retirement Path 2055 Fund | | | 0.00% | | | | 0.00% | | | | 0.00% | | | | 0.00% | | | | 100.00% | |
KP Retirement Path 2060 Fund | | | 0.00% | | | | 0.00% | | | | 0.00% | | | | 0.00% | | | | 100.00% | |
KP Large Cap Equity Fund | | | 0.00% | | | | 0.00% | | | | 0.00% | | | | 0.00% | | | | 100.00% | |
KP Small Cap Equity Fund | | | 0.00% | | | | 0.00% | | | | 0.00% | | | | 0.00% | | | | 100.00% | |
KP International Equity Fund | | | 0.00% | | | | 0.00% | | | | 0.00% | | | | 0.00% | | | | 100.00% | |
KP Fixed Income Fund | | | 0.00% | | | | 0.00% | | | | 0.00% | | | | 0.00% | | | | 0.00% | |
| (1) | Qualifying dividends represent dividends which qualify for the corporate dividends received deduction and is reflected as a percentage of ordinary income distributions (the total of short term capital gain and net investment income distributions). |
| (2) | The percentage in this column represents the amount of “Qualifying Dividend Income” as created by the Jobs and Growth Relief Reconciliation Act of 2003 and its reflected as a percentage of ordinary income distributions (the total of short term capital gain and net investment income distributions). It is the intention of each of the aforementioned funds to designate the maximum amount permitted by law. |
| (3) | “U.S. Government Interest represents the amount of interest that was derived from U.S. Government obligations and distributed during the fiscal year. This amount is reflected as a percentage of total ordinary income distributions (the total of short term capital gain and net investment income distributions). Generally, interest from direct U.S. Government obligations is exempt from state income tax. However, for shareholders of the Funds who are residents of California, Connecticut and New York, the statutory threshold requirements were not satisfied to permit exemption of these amounts from state income. |
177
| | |
| THE KP FUNDS | | December 31, 2017 |
|
| NOTICE TO SHAREHOLDERS (Unaudited) (Continued) |
| (4) | The percentage in this column represents the amount of “Interest Related Dividends” and is reflected as a percentage of ordinary income distribution. Interest related dividends are exempt from U.S. withholding tax when paid for foreign investors. |
| (5) | The percentage in this column represents the amount of “Short-Term Capital Gain Dividends” and is reflected as a percentage of short-term capital gain distribution that is exempt from U.S. withholding tax when paid to foreign investors. |
The following KP Funds designate long term capital gains for December 31, 2016, calendar year end:
| | | | |
| Fund | | Long Term
Capital Gain | |
KP Retirement Path 2015 Fund | | $ | 2,704,665 | |
KP Retirement Path 2020 Fund | | | 4,674,950 | |
KP Retirement Path 2025 Fund | | | 5,652,337 | |
KP Retirement Path 2030 Fund | | | 5,741,844 | |
KP Retirement Path 2035 Fund | | | 6,853,202 | |
KP Retirement Path 2040 Fund | | | 6,452,755 | |
KP Retirement Path 2045 Fund | | | 4,762,997 | |
KP Retirement Path 2050 Fund | | | 2,333,616 | |
KP Retirement Path 2055 Fund | | | 453,617 | |
KP Retirement Path 2060 Fund | | | 71,125 | |
KP Large Cap Equity Fund | | | 14,314,211 | |
KP Small Cap Equity Fund | | | 5,034,032 | |
KP International Equity Fund | | | — | |
KP Fixed Income Fund | | | — | |
178
The KP Funds
Investment Adviser
Callan LLC
600 Montgomery Street, Suite 800
San Francisco, CA 94111
Administrator
SEI Investments
Global Funds Services
One Freedom Valley Drive
Oaks, Pennsylvania 19456
Distributor
SEI Investments Distribution Co.
One Freedom Valley Drive
Oaks, Pennsylvania 19456
Legal Counsel
Morgan, Lewis & Bockius LLP
1701 Market Street
Philadelphia, Pennsylvania 19103-2921
More information about the Funds is available, without charge, through the following:
Statement of Additional Information (“SAI”): The SAI includes detailed information about the Funds. The SAI is on file with the SEC and is incorporated by reference into this prospectus. This means that the SAI, for legal purposes, is a part of this prospectus.
Annual and Semi-Annual Reports: These reports list the Funds’ holdings and contain information from the Adviser about investment strategies, and recent market conditions and trends and their impact on Fund performance. The reports also contain detailed financial information about the Funds.
To Obtain an SAI, Annual or Semi-Annual Report, or More Information:
| | |
| By Telephone: | | 855-457-3637 (855-4KPFNDS) |
| |
| By Mail: | | The KP Funds |
| | c/o SEI Investments |
| | One Freedom Valley Drive |
| | Oaks, PA 19546 |
| |
| By Internet: | | www.kp-funds.com |
From the SEC: You can also obtain the SAI or the Annual and Semi-Annual Reports, as well as other information about The KP Funds, from the EDGAR Database on the SEC’s website at: http://www.sec.gov. You may review and copy documents at the SEC Public Reference Room in Washington, DC (for information on the operation of the Public Reference Room, call 202-551-8090). You may request documents by mail from the SEC, upon payment of a duplicating fee, by writing to: U.S. Securities and Exchange Commission, Public Reference Section, Washington, DC 20549-1520. You may also obtain this information, upon payment of a duplicating fee, by e-mailing the SEC at the following address: publicinfo@sec.gov.
The Trust’s Investment Company Act registration number is 811-22838
KPF-AR-001-0400
The Registrant has adopted a code of ethics that applies to the Registrant’s principal executive officer, principal financial officer, controller or principal accounting officer, and any person who performs a similar function. There have been no amendments to or waivers granted to this code of ethics.
| Item 3. | Audit Committee Financial Expert. |
(a)(1) The Registrant’s board of trustees has determined that the Registrant has at least one audit committee financial expert serving on the audit committee.
(a)(2) The audit committee financial experts are John Darr and George Sullivan, and they are independent as defined in Form N-CSR Item 3(a)(2).
| Item 4. | Principal Accountant Fees and Services. |
Fees billed by PricewaterhouseCoopers LLP (“PwC”) related to the Trust
PwC billed the Trust aggregate fees for services rendered to the Trust for the last two fiscal years were as follows:
| | | | | | | | | | | | | | | | | | | | | | | | | | |
| | | 2017 | | | 2016 | |
| | | | | All fees and
services to
the Trust
that were
pre-approved | | | All fees and
services to service
affiliates that
were pre-approved | | | All other fees
and services to
service affiliates that
did not require
pre-approval | | | All fees and
services to
the Trust
that were
pre-approved | | | All fees and
services to service
affiliates that
were pre-approved | | | All other fees
and services to
service affiliates that
did not require
pre-approval | |
(a) | | Audit Fees | | $ | 236,425 | | | $ | 0 | | | $ | 0 | | | $ | 231,900 | | | $ | 0 | | | $ | 0 | |
(b) | | Audit-Related Fees | | | N/A | | | $ | 0 | | | $ | 0 | | | | N/A | | | $ | 0 | | | $ | 0 | |
(c) | | Tax Fees | | | N/A | | | $ | 0 | | | $ | 0 | | | | N/A | | | $ | 0 | | | $ | 0 | |
(d) | | All Other Fees | | | N/A | | | $ | 0 | | | $ | 0 | | | | N/A | | | $ | 0 | | | $ | 0 | |
(e)(1)
All requests or applications for services to be provided by the independent auditor shall be submitted to the Chief Financial Officer (“CFO”) of the Registrant and must include a detailed description of the services proposed to be rendered. The Registrant ‘s CFO will determine whether such services (1) require specific pre-approval, (2) are included within the list of services that have received the general pre-approval of the audit committee or (3) have been previously pre-approved in connection with the independent auditor’s annual engagement letter for the applicable year or otherwise.
Requests or applications to provide services that require specific pre-approval by the audit committee will be submitted to the audit committee by the CFO. The audit committee will be informed by the CFO on a quarterly basis of all services rendered by the independent auditor. The audit committee has delegated specific pre-approval authority to either the audit committee chair or financial experts, provided that the estimated fee for any such proposed pre-approved service does not exceed $100,000 and any pre-approval decisions are reported to the audit committee at its next regularly scheduled meeting.
All services to be provided by the independent auditor shall be provided pursuant to a signed written engagement letter with the Registrant, the investment advisor or applicable control affiliate (except that matters as to which an engagement letter would be impractical because of timing issues or because the matter is small may not be the subject of an engagement letter) that sets forth both the services to be provided by the independent auditor and the total fees to be paid to the independent auditor for those services.
In addition, the audit committee has determined to take additional measures on an annual basis to meet its responsibility to oversee the work of the independent auditor and to assure the auditor’s independence from the Registrant, such as reviewing a formal written statement from the independent auditor delineating all relationships between the independent auditor and the Registrant, and discussing with the independent auditor its methods and procedures for ensuring independence.
(e)(2) Percentage of fees billed applicable to non-audit services approved pursuant to the “de minimus” exception of Rule 2-01(c)(7)(i)(C) were as follows (PwC):
| | | | | | | | |
| | | 2017 | | | 2016 | |
Audit-Related Fees | | | 0 | % | | | 0 | % |
Tax Fees | | | 0 | % | | | 0 | % |
All Other Fees | | | 0 | % | | | 0 | % |
(f) Not applicable.
(g) The aggregate non-audit fees and services billed by PwC for services rendered to the Registrant, and rendered to the Registrant’s investment adviser (not including any sub-adviser whose role is primarily portfolio management and is subcontracted with or overseen by another investment adviser), and any entity controlling, controlled by, or under common control with the adviser that provides ongoing services to the Registrant for the last two fiscal years were $0 and $0 for 2017 and 2016, respectively.
(h) During the past fiscal year, all non-audit services provided by Registrant’s principal accountant to either Registrant’s investment adviser or to any entity controlling, controlled by, or under common control with Registrant’s investment adviser that provides ongoing services to Registrant were pre-approved by the audit committee of Registrant’s Board of Trustees. Included in the audit committee’s pre-approval was the review and consideration as to whether the provision of these non-audit services is compatible with maintaining the principal accountant’s independence.
| Item 5. | Audit Committee of Listed Registrants. |
Not applicable to open-end management investment companies.
| Item 6. | Schedule of Investments. |
Schedule of Investments is included as part of the Report to Shareholders filed under Item 1 of this form.
| Item 7. | Disclosure of Proxy Voting Policies and Procedures for Closed-End Management Investment Companies. |
Not applicable to open-end management investment companies.
| Item 8. | Portfolio Managers of Closed-End Management Investment Companies. |
Not applicable. Effective for closed-end management investment companies for fiscal years ending on or after December 31, 2005.
| Item 9. | Purchases of Equity Securities by Closed-End Management Company and Affiliated Purchasers. |
Not applicable to open-end management investment companies.
| Item 10. | Submission of Matters to a Vote of Security Holders. |
There have been no changes to the procedures by which shareholders may recommend nominees to the Registrant’s Board of Trustees during the period covered by this report.
| Item 11. | Controls and Procedures. |
(a) The Registrant’s principal executive and principal financial officers, or persons performing similar functions, have concluded that the Registrant’s disclosure controls and procedures (as defined in Rule 30a-3(c) under the Act (17 CFR 270.30a-3(c))) as of a date within 90 days of the filing date of the report, are effective based on the evaluation of these controls and procedures required by Rule 30a-3(b) under the Act (17 CFR 270.30a-3(b)) and Rules 13a-15(b) or 15d-15(b) under the Exchange Act (17 CFR 240.13a-15(b) or 240.15d-15(b)).
(b) There has been no change in the Registrant’s internal control over financial reporting (as defined in Rule 30a-3(d) under the Act (17 CFR 270.30a-3(d)) that occurred during the second fiscal quarter of the period covered by this report that has materially affected, or is reasonably likely to materially affect, the Registrant’s internal control over financial reporting.
(a)(1) Code of Ethics attached hereto.
(a)(2) A separate certification for the principal executive officer and the principal financial officer of the Registrant as required by Rule 30a-2(a) under the Investment Company Act of 1940, as amended (17 CFR 270.30a-2(a)), are filed herewith.
(b) Officer certifications as required by Rule 30a-2(b) under the Investment Company Act of 1940, as amended (17 CFR 270.30a-2(b)) also accompany this filing as an exhibit.
SIGNATURES
Pursuant to the requirements of the Securities Exchange Act of 1934 and the Investment Company Act of 1940, the registrant has duly caused this report to be signed on its behalf by the undersigned, thereunto duly authorized.
| | | | | | |
| (Registrant) | | | | | | The KP Funds |
| | | |
| By (Signature and Title) | | | | | | /s/ Michael Beattie |
| | | | | | Michael Beattie, President |
Date: March 9, 2018
Pursuant to the requirements of the Securities Exchange Act of 1934 and the Investment Company Act of 1940, this report has been signed below by the following persons on behalf of the registrant and in the capacities and on the dates indicated.
| | | | | | |
| By (Signature and Title) | | | | | | /s/ Michael Beattie |
| | | | | | Michael Beattie, President |
Date: March 9, 2018
| | | | | | |
| By (Signature and Title) | | | | | | /s/ Stephen Connors, |
| | | | | | Stephen Connors, |
| | | | | | Treasurer, Controller & CFO |
Date: March 9, 2018