STRICTLY CONFIDENTIAL Project Dawn Presentation to Diamond and the Diamond Board of Directors August 21, 2019
STRICTLY CONFIDENTIAL Disclaimer This presentation has been prepared by Moelis & Company LLC (“Moelis”) for exclusive use of the Board of Directors of Diamond (the “Company”) in considering the transaction described herein based on information provided by the Company and upon information from third party sources. Moelis has not assumed any responsibility for independently verifying the accuracy of such information, and disclaims any liability with respect to the information herein. In this presentation, Moelis, at the Company’s direction, has used certain projections, forecasts or other forward-looking statements with respect to the Company and/or other parties involved in the transaction which were provided to Moelis by the Company and/or such other parties and which Moelis has assumed, at the Company’s direction, were prepared based on the best available estimates and judgments of the management of the Company and/or such other parties as to the future performance of the Company and/or such other parties. This presentation is provided as of the date hereof and Moelis assumes no obligation to update it or correct any information herein. This presentation is solely for informational purposes. This presentation is not intended to provide the sole basis for any decision on any transaction and is not a recommendation with respect to any transaction. The recipient should make its own independent business decision based on all other information, advice and the recipient’s own judgment. This presentation is not an offer to sell or a solicitation of an offer to buy any business, security, option, commodity, future, loan or currency. It is not a commitment to underwrite any security, to loan any funds or to make any investment. Moelis does not offer tax, accounting, actuarial or legal advice. Absent Moelis’ prior written consent, this material, whether in whole or in part, may not be copied, photocopied, or duplicated in any form by any means, or redistributed. Moelis and its related investment banking entities provide mergers and acquisitions, recapitalization, restructuring, corporate finance and other financial advisory services to clients and affiliates of Moelis provide investment management services to clients. Personnel of Moelis or such affiliates may make statements or provide advice that is contrary to information included in this material. The proprietary interests of Moelis or its affiliates may conflict with your interests. In addition, Moelis and its affiliates and their personnel may from time to time have positions in or effect transactions in securities referred to in this material (or derivatives of such securities), or serve as a director of companies referred to in this presentation. Moelis and its affiliates may have advised, may seek to advise and may in the future advise or invest in companies referred to in this presentation. [ 1 ]
STRICTLY CONFIDENTIAL I. Executive Summary
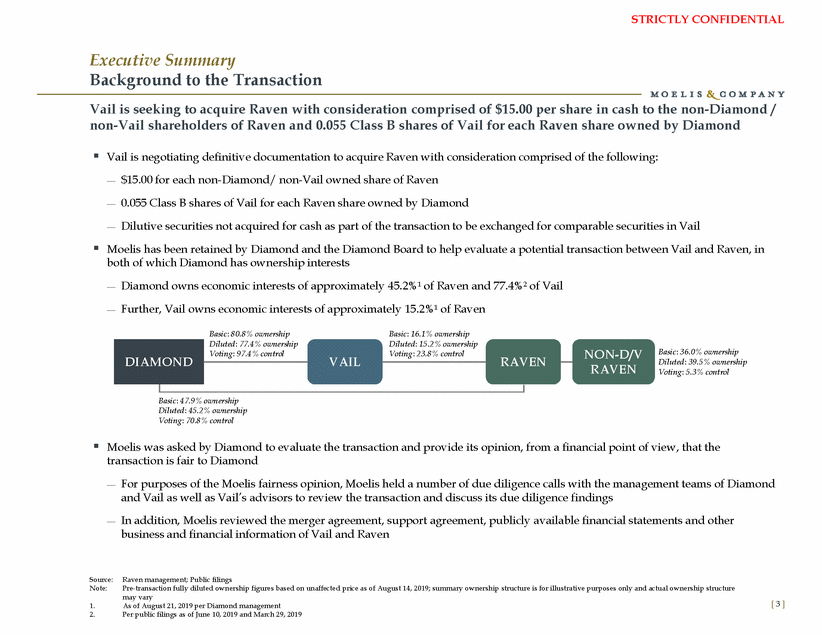
STRICTLY CONFIDENTIAL Executive Summary Background to the Transaction Vail is seeking to acquire Raven with consideration comprised of $15.00 per share in cash to the non-Diamond / non-Vail shareholders of Raven and 0.055 Class B shares of Vail for each Raven share owned by Diamond Vail is negotiating definitive documentation to acquire Raven with consideration comprised of the following: $15.00 for each non-Diamond/ non-Vail owned share of Raven 0.055 Class B shares of Vail for each Raven share owned by Diamond Dilutive securities not acquired for cash as part of the transaction to be exchanged for comparable securities in Vail Moelis has been retained by Diamond and the Diamond Board to help evaluate a potential transaction between Vail and Raven, in both of which Diamond has ownership interests Diamond owns economic interests of approximately 45.2%¹ of Raven and 77.4%² of Vail Further, Vail owns economic interests of approximately 15.2%¹ of Raven Basic: 80.8% ownership Basic: 16.1% ownership NON-D/V RAVEN Basic: 36.0% ownership Diluted: 39.5% ownership Voting: 5.3% control AVEN Basic: 47.9% ownership Diluted: 45.2% ownership Voting: 70.8% control Moelis was asked by Diamond to evaluate the transaction and provide its opinion, from a financial point of view, that the transaction is fair to Diamond For purposes of the Moelis fairness opinion, Moelis held a number of due diligence calls with the management teams of Diamond and Vail as well as Vail’s advisors to review the transaction and discuss its due diligence findings In addition, Moelis reviewed the merger agreement, support agreement, publicly available financial statements and other business and financial information of Vail and Raven Source: Note: Raven management; Public filings Pre-transaction fully diluted ownership figures based on unaffected price as of August 14, 2019; summary ownership structure is for illustrative purposes only and actual ownership structure may vary As of August 21, 2019 per Diamond management Per public filings as of June 10, 2019 and March 29, 2019 [ 3 ] 1. 2. DIAMOND Diluted: 77.4% ownership Voting: 97.4% control Diluted: 15.2% ownership Voting: 23.8% control VAILR
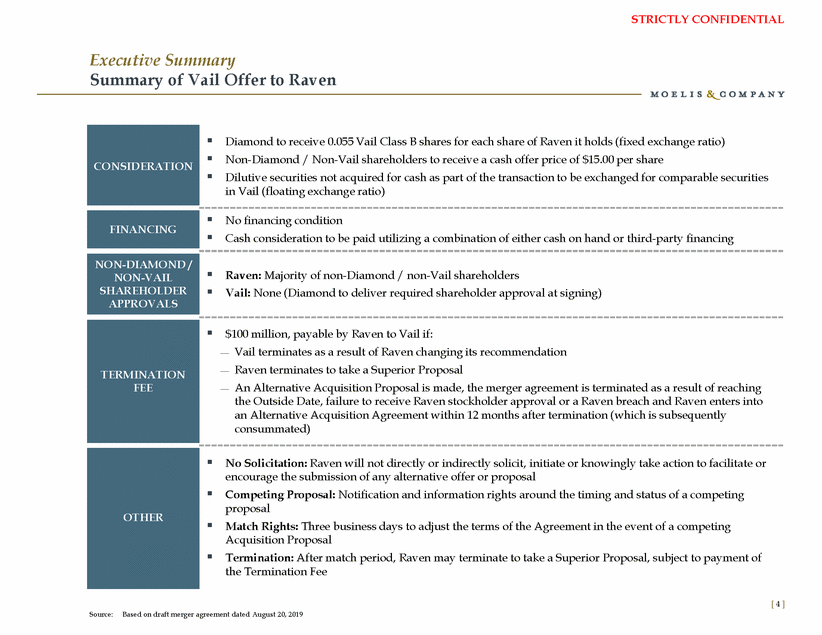
STRICTLY CONFIDENTIAL Executive Summary Summary of Vail Offer to Raven Cash consideration to be paid utilizing a combination of either cash on hand or third-party financing Match Rights: Three business days to adjust the terms of the Agreement in the event of a competing [ 4 ] Source: Based on draft merger agreement dated August 20, 2019 CONSIDERATION Diamond to receive 0.055 Vail Class B shares for each share of Raven it holds (fixed exchange ratio) Non-Diamond / Non-Vail shareholders to receive a cash offer price of $15.00 per share Dilutive securities not acquired for cash as part of the transaction to be exchanged for comparable securities in Vail (floating exchange ratio) FINANCING No financing condition NON-DIAMOND / NON-VAIL SHAREHOLDER APPROVALS Raven: Majority of non-Diamond / non-Vail shareholders Vail: None (Diamond to deliver required shareholder approval at signing) TERMINATION FEE $100 million, payable by Raven to Vail if: Vail terminates as a result of Raven changing its recommendation Raven terminates to take a Superior Proposal An Alternative Acquisition Proposal is made, the merger agreement is terminated as a result of reaching the Outside Date, failure to receive Raven stockholder approval or a Raven breach and Raven enters into an Alternative Acquisition Agreement within 12 months after termination (which is subsequently consummated) OTHER No Solicitation: Raven will not directly or indirectly solicit, initiate or knowingly take action to facilitate or encourage the submission of any alternative offer or proposal Competing Proposal: Notification and information rights around the timing and status of a competing proposal Acquisition Proposal Termination: After match period, Raven may terminate to take a Superior Proposal, subject to payment of the Termination Fee
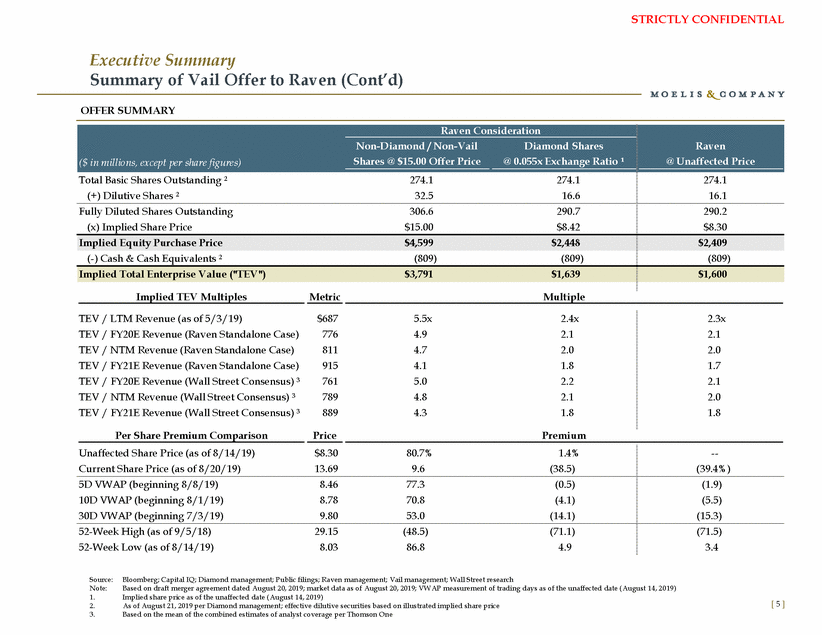
STRICTLY CONFIDENTIAL Executive Summary Summary of Vail Offer to Raven (Cont’d) OFFER SUMMARY Total Basic Shares Outstanding ² (+) Dilutive Shares ² 274.1 32.5 274.1 16.6 274.1 16.1 Fully Diluted Shares Outstanding (x) Implied Share Price 306.6 $15.00 290.7 $8.42 290.2 $8.30 (-) Cash & Cash Equivalents ² (809) (809) (809) Implied TEV Multiples Metric Multiple TEV / LTM Revenue (as of 5/3/19) TEV / FY20E Revenue (Raven Standalone Case) TEV / NTM Revenue (Raven Standalone Case) TEV / FY21E Revenue (Raven Standalone Case) TEV / FY20E Revenue (Wall Street Consensus) ³ TEV / NTM Revenue (Wall Street Consensus) ³ TEV / FY21E Revenue (Wall Street Consensus) ³ $687 776 811 915 761 789 889 5.5x 4.9 4.7 4.1 5.0 4.8 4.3 2.4x 2.1 2.0 1.8 2.2 2.1 1.8 2.3x 2.1 2.0 1.7 2.1 2.0 1.8 Per Share Premium Comparison Price Premium Unaffected Share Price (as of 8/14/19) Current Share Price (as of 8/20/19) $8.30 13.69 80.7% 9.6 1.4% (38.5) --(39.4%) 5D VWAP (beginning 8/8/19) 10D VWAP (beginning 8/1/19) 30D VWAP (beginning 7/3/19) 8.46 8.78 9.80 77.3 70.8 53.0 (0.5) (4.1) (14.1) (1.9) (5.5) (15.3) 52-Week High (as of 9/5/18) 52-Week Low (as of 8/14/19) 29.15 8.03 (48.5) 86.8 (71.1) 4.9 (71.5) 3.4 Source: Note: 1. 2. 3. Bloomberg; Capital IQ; Diamond management; Public filings; Raven management; Vail management; Wall Street research Based on draft merger agreement dated August 20, 2019; market data as of August 20, 2019; VWAP measurement of trading days as of the unaffected date (August 14, 2019) Implied share price as of the unaffected date (August 14, 2019) As of August 21, 2019 per Diamond management; effective dilutive securities based on illustrated implied share price Based on the mean of the combined estimates of analyst coverage per Thomson One [ 5 ] Implied Total Enterprise Value ("TEV")$3,791$1,639$1,600 Implied Equity Purchase Price$4,599$2,448$2,409 ($ in millions, except per share figures) Raven Consideration Non-Diamond / Non-VailDiamond SharesRaven Shares @ $15.00 Offer Price@ 0.055x Exchange Ratio ¹@ Unaffected Price
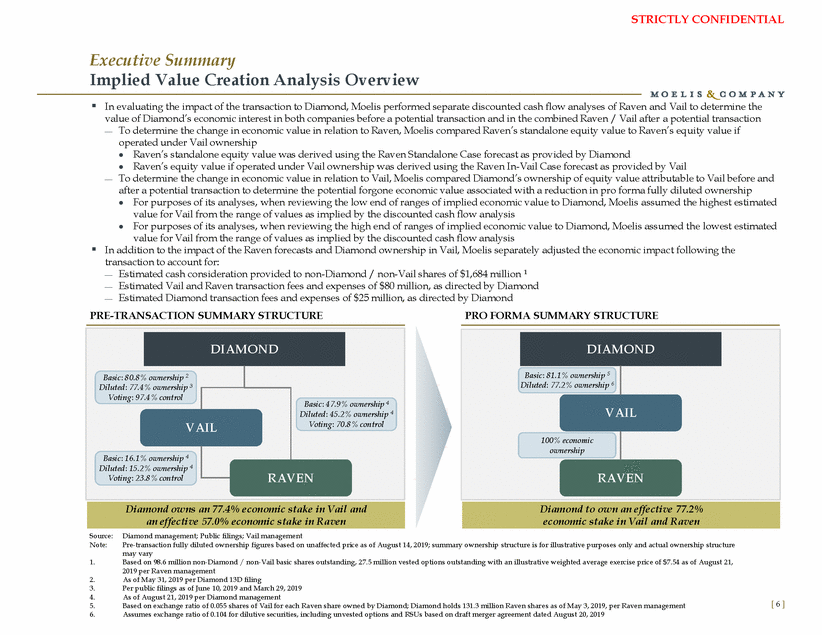
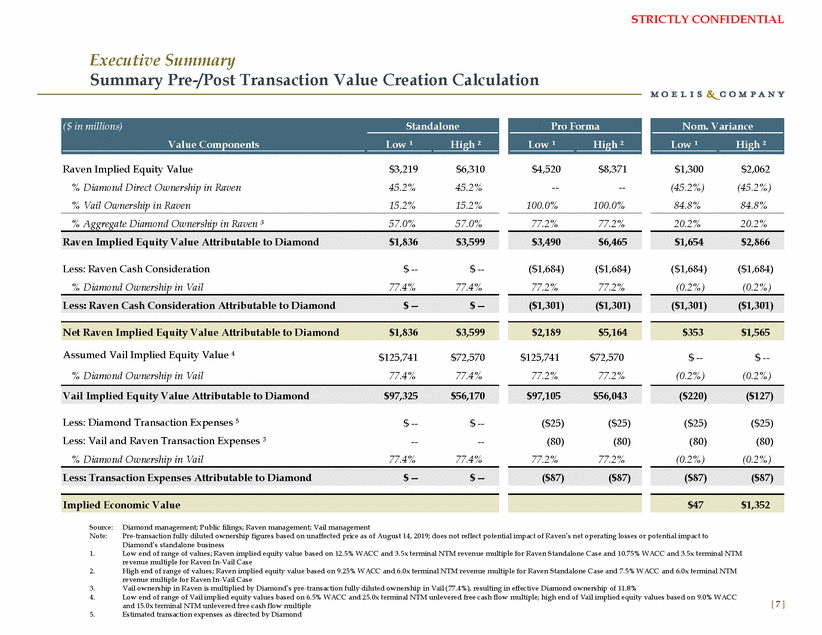
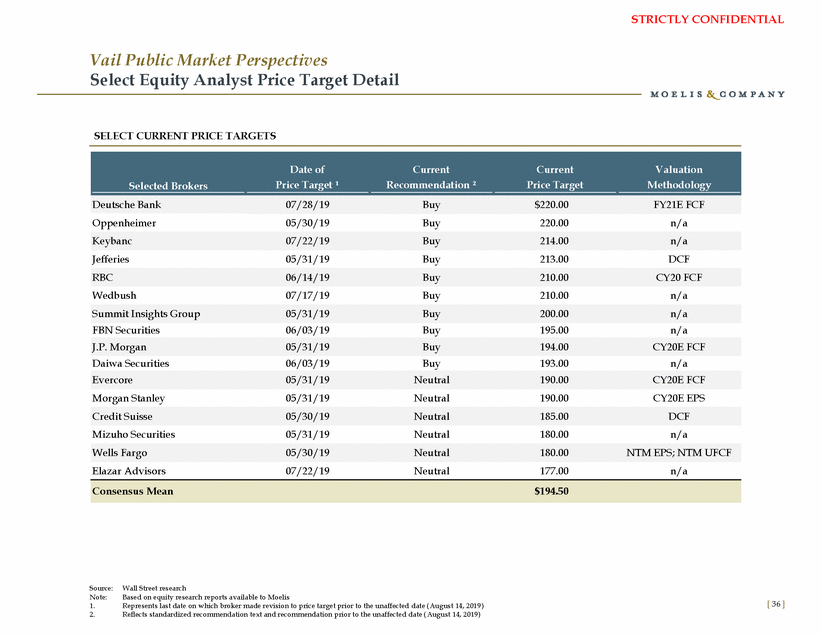
STRICTLY CONFIDENTIAL Executive Summary Implied Value Creation Analysis Overview In evaluating the impact of the transaction to Diamond, Moelis performed separate discounted cash flow analyses of Raven and Vail to determine the value of Diamond’s economic interest in both companies before a potential transaction and in the combined Raven / Vail after a potential transaction To determine the change in economic value in relation to Raven, Moelis compared Raven’s standalone equity value to Raven’s eq uity value if operated under Vail ownership Raven’s standalone equity value was derived using the Raven Standalone Case forecast as provided by Diamond Raven’s equity value if operated under Vail ownership was derived using the Raven In-Vail Case forecast as provided by Vail To determine the change in economic value in relation to Vail, Moelis compared Diamond’s ownership of equity value attributable to Vail before and after a potential transaction to determine the potential forgone economic value associated with a reduction in pro forma fully diluted ownership For purposes of its analyses, when reviewing the low end of ranges of implied economic value to Diamond, Moelis assumed the highest estimated value for Vail from the range of values as implied by the discounted cash flow analysis For purposes of its analyses, when reviewing the high end of ranges of implied economic value to Diamond, Moelis assumed the lowest estimated value for Vail from the range of values as implied by the discounted cash flow analysis In addition to the impact of the Raven forecasts and Diamond ownership in Vail, Moelis separately adjusted the economic impac t following the transaction to account for: Estimated cash consideration provided to non-Diamond / non-Vail shares of $1,684 million 1 Estimated Vail and Raven transaction fees and expenses of $80 million, as directed by Diamond Estimated Diamond transaction fees and expenses of $25 million, as directed by Diamond PRE-TRANSACTION SUMMARY STRUCTURE PRO FORMA SUMMARY STRUCTURE Diluted: 77.4% ownership 3 % ownership 4 RAVEN Voting: 23.8% control Source: Note: Diamond management; Public filings; Vail management Pre-transaction fully diluted ownership figures based on unaffected price as of August 14, 2019; summary ownership structure is for illustrative purposes only and actual ownership structure may vary Based on 98.6 million non-Diamond / non-Vail basic shares outstanding, 27.5 million vested options outstanding with an illustrative weighted average exercise price of $7.54 as of August 21, 2019 per Raven management As of May 31, 2019 per Diamond 13D filing Per public filings as of June 10, 2019 and March 29, 2019 As of August 21, 2019 per Diamond management Based on exchange ratio of 0.055 shares of Vail for each Raven share owned by Diamond; Diamond holds 131.3 million Raven shar es as of May 3, 2019, per Raven management Assumes exchange ratio of 0.104 for dilutive securities, including unvested options and RSUs based on draft merger agreement dated August 20, 2019 1. 2. 3. 4. 5. 6. [ 6 ] Basic: 80.8% ownership 2 Voting: 97 Diluted: 45.2% ownership 4 VAILVoting: 70.8% control Basic: 16.1% ownership 4 Diluted: 15.2% ownership 4 Diamond owns an 77.4% economic stake in Vail and an effective 57.0% economic stake in Raven DIAMOND .4% control Basic: 47.9 DIAMOND Basic: 81.1% ownership 5 Diluted: 77.2% ownership 6 VAIL 100% economic ownership RAVEN Diamond to own an effective 77.2% economic stake in Vail and Raven
STRICTLY CONFIDENTIAL Executive Summary Summary Pre-/Post Transaction Value Creation Calculation Raven Implied Equity Value % Diamond Direct Ownership in Raven % Vail Ownership in Raven $3,219 45.2% 15.2% $6,310 45.2% 15.2% $4,520 --100.0% $8,371 --100.0% $1,300 (45.2%) 84.8% $2,062 (45.2%) 84.8% % Aggregate Diamond Ownership in Raven ³ 57.0% 57.0% 77.2% 77.2% 20.2% 20.2% Less: Raven Cash Consideration % Diamond Ownership in Vail $ --77.4% $ --77.4% ($1,684) 77.2% ($1,684) 77.2% ($1,684) (0.2%) ($1,684) (0.2%) Assumed Vail Implied Equity Value % Diamond Ownership in Vail $125,741 77.4% $72,570 77.4% $125,741 77.2% $72,570 77.2% $ --(0.2%) $ --(0.2%) Less: Diamond Transaction Expenses Less: Vail and Raven Transaction Expenses % Diamond Ownership in Vail $ ---- 77.4% $��---- 77.4% ($25) (80) 77.2% ($25) (80) 77.2% ($25) (80) (0.2%) ($25) (80) (0.2%) Source: Note: Diamond management; Public filings; Raven management; Vail management Pre-transaction fully diluted ownership figures based on unaffected price as of August 14, 2019; does not reflect potential impact of Raven’s net o perating losses or potential impact to Diamond’s standalone business Low end of range of values; Raven implied equity value based on 12.5% WACC and 3.5x terminal NTM revenue multiple for Raven Standalone Case and 10.75% WACC and 3.5x terminal NTM revenue multiple for Raven In-Vail Case High end of range of values; Raven implied equity value based on 9.25% WACC and 6.0x terminal NTM revenue multiple for Raven Standalone Case and 7.5% WACC and 6.0x terminal NTM revenue multiple for Raven In-Vail Case Vail ownership in Raven is multiplied by Diamond’s pre-transaction fully diluted ownership in Vail (77.4%), resulting in effective Diamond ownership of 11.8% Low end of range of Vail implied equity values based on 6.5% WACC and 25.0x terminal NTM unlevered free cash flow multiple; high end of Vail implied equity values based on 9.0% WACC and 15.0x terminal NTM unlevered free cash flow multiple Estimated transaction expenses as directed by Diamond 1. 2. 3. 4. [ 7 ] 5. $47$1,352 Implied Economic Value ($87)($87) ($87)($87) Less: Transaction Expenses Attributable to Diamond$ --$ --($220)($127) $97,105$56,043 Vail Implied Equity Value Attributable to Diamond$97,325$56,170 $353$1,565 $2,189$5,164 Net Raven Implied Equity Value Attributable to Diamond$1,836$3,599 ($1,301)($1,301) ($1,301)($1,301) Less: Raven Cash Consideration Attributable to Diamond$ --$ --$1,654$2,866 $3,490$6,465 Raven Implied Equity Value Attributable to Diamond$1,836$3,599 Nom. Variance Low ¹High ² Pro Forma Low ¹High ² ($ in millions) Value Components Standalone Low ¹High ²
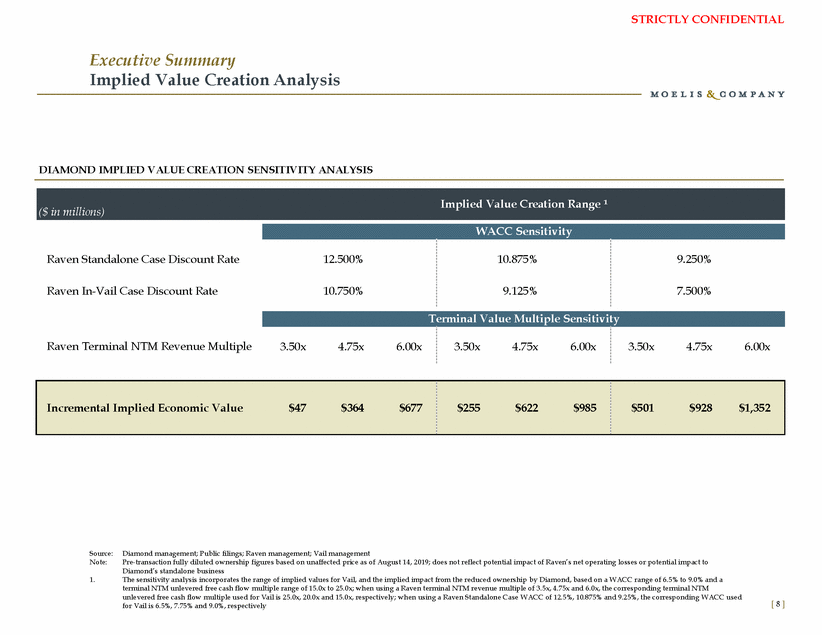
STRICTLY CONFIDENTIAL Executive Summary Implied Value Creation Analysis DIAMOND IMPLIED VALUE CREATION SENSITIVITY ANALYSIS ($ in millions) Raven Standalone Case Discount Rate 12.500% 10.875% 9.250% Raven In-Vail Case Discount Rate 10.750% 9.125% 7.500% Raven Terminal NTM Revenue Multiple 3.50x 4.75x 6.00x 3.50x 4.75x 6.00x 3.50x 4.75x 6.00x Source: Note: Diamond management; Public filings; Raven management; Vail management Pre-transaction fully diluted ownership figures based on unaffected price as of August 14, 2019; does not reflect potential impact of Raven’s net operating losses or potential impact to Diamond’s standalone business The sensitivity analysis incorporates the range of implied values for Vail, and the implied impact from the reduced ownership by Diamond, based on a WACC range of 6.5% to 9.0% and a terminal NTM unlevered free cash flow multiple range of 15.0x to 25.0x; when using a Raven terminal NTM revenue multiple of 3.5x, 4.75x and 6.0x, the corresponding terminal NTM unlevered free cash flow multiple used for Vail is 25.0x, 20.0x and 15.0x, respectively; when using a Raven Standalone Case WACC of 12.5%, 10.875% and 9.25%, the corresponding WACC used for Vail is 6.5%, 7.75% and 9.0%, respectively 1. [ 8 ] Incremental Implied Economic Value$47$364$677$255$622$985$501$928$1,352 Terminal Value Multiple Sensitivity WACC Sensitivity Implied Value Creation Range ¹
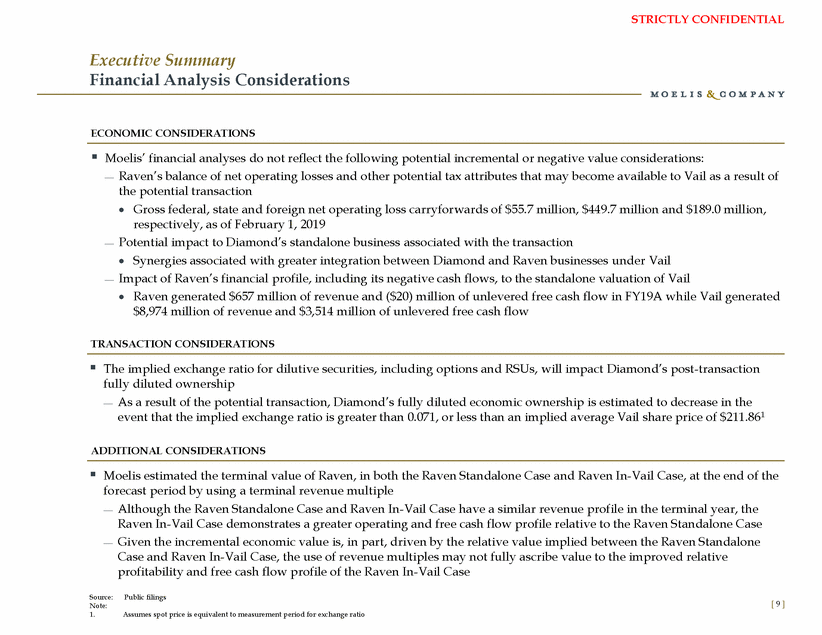
STRICTLY CONFIDENTIAL Executive Summary Financial Analysis Considerations ECONOMIC CONSIDERATIONS Moelis’ financial analyses do not reflect the following potential incremental or negative value considerations: Raven’s balance of net operating losses and other potential tax attributes that may become available to Vail as a result of the potential transaction Gross federal, state and foreign net operating loss carryforwards of $55.7 million, $449.7 million and $189.0 million, respectively, as of February 1, 2019 Potential impact to Diamond’s standalone business associated with the transaction Synergies associated with greater integration between Diamond and Raven businesses under Vail Impact of Raven’s financial profile, including its negative cash flows, to the standalone valuation of Vail Raven generated $657 million of revenue and ($20) million of unlevered free cash flow in FY19A while Vail generated $8,974 million of revenue and $3,514 million of unlevered free cash flow TRANSACTION CONSIDERATIONS The implied exchange ratio for dilutive securities, including options and RSUs, will impact Diamond’s post-transaction fully diluted ownership As a result of the potential transaction, Diamond’s fully diluted economic ownership is estimated to decrease in the event that the implied exchange ratio is greater than 0.071, or less than an implied average Vail share price of $211.861 ADDITIONAL CONSIDERATIONS Moelis estimated the terminal value of Raven, in both the Raven Standalone Case and Raven In-Vail Case, at the end of the forecast period by using a terminal revenue multiple Although the Raven Standalone Case and Raven In-Vail Case have a similar revenue profile in the terminal year, the Raven In-Vail Case demonstrates a greater operating and free cash flow profile relative to the Raven Standalone Case Given the incremental economic value is, in part, driven by the relative value implied between the Raven Standalone Case and Raven In-Vail Case, the use of revenue multiples may not fully ascribe value to the improved relative profitability and free cash flow profile of the Raven In-Vail Case Source:Public filings Note: [ 9 ] 1. Assumes spot price is equivalent to measurement period for exchange ratio
STRICTLY CONFIDENTIAL II. Raven Discounted Cash Flow Analysis
STRICTLY CONFIDENTIAL Raven Discounted Cash Flow Analysis Raven Discounted Cash Flow Methodology Overview A discounted cash flow analysis is designed to provide an implied value of a company by calculating the present value of the estimated future cash flows and estimated present value of the terminal value of such company For purposes of this analysis, unlevered free cash flows were calculated as non-GAAP operating income, less cash taxes, plus non-GAAP depreciation and amortization expenses, less capital expenditures, less increases in net working capital and other cash items, less stock based compensation The forecasts utilized reflect a fiscal year ending January 31 and were supplied by Vail and Diamond management Assuming a valuation date of October 31, 2019, Moelis calculated the estimated present value of the standalone unlevered free cash flows that Raven is estimated to generate during the forecast period as well as during the terminal period For the Raven Standalone Case and Raven In-Vail Case, the projection period consists of the three remaining months of FY20E through FY30E Moelis estimated the terminal value of Raven at the end of the forecast period by using a terminal revenue multiple of 3.5x – 6.0x The terminal revenue multiple was applied to the estimated revenue for the next twelve month period following the last year of the forecast period, which, as directed by Diamond management, was informed based on the revenue growth estimates of the last year of the forecast period The selected terminal revenue multiple range was informed by considering the historical trading range of Raven as well as the TEV / NTM revenue multiples of the selected publicly traded companies With respect to the Raven Standalone Case, the cash flows and terminal value were then discounted to present value as of October 31, 2019 using discount rates ranging from 9.25% to 12.5% based on a weighted average cost of capital calculation for Raven standalone Risk-free rate of 1.84% based on 20-year US Treasures (as of 8/20/19) Long-horizon equity risk premium (supply-side) of 6.14% per the 2018 Duff & Phelps Valuation Handbook Size premium of 1.39% calculated using the average of the 5th and 6th decile provided by the 2018 Duff & Phelps Valuation Handbook, based on companies with an equity value between ~$2.0 billion and ~$4.5 billion Projected marginal tax rate of 25.0% per Diamond management 5.8% cost of debt based on median of the effective interest rates for the liability component of the following selected publicly traded companies’ convertible notes: Splunk, FireEye and New Relic Debt / total capitalization based on Raven’s selected publicly traded companies [ 11 ] Source: 2018 Duff & Phelps Valuation Handbook; Bloomberg; Capital IQ; Diamond management; Public filings; U.S. Department of the Treasury; Vail management Note: Market data as of August 20, 2019
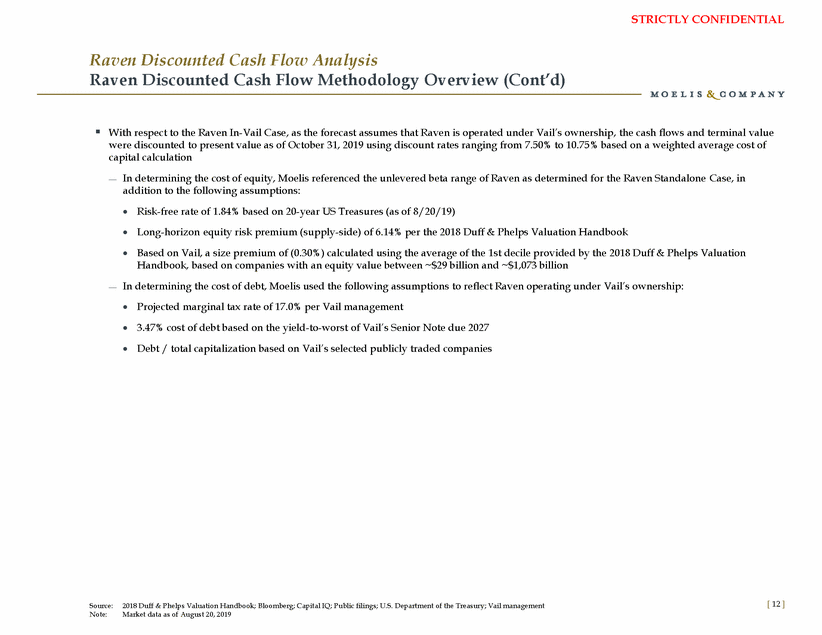
STRICTLY CONFIDENTIAL Raven Discounted Cash Flow Analysis Raven Discounted Cash Flow Methodology Overview (Cont’d) With respect to the Raven In-Vail Case, as the forecast assumes that Raven is operated under Vail’s ownership, the cash flows and terminal value were discounted to present value as of October 31, 2019 using discount rates ranging from 7.50% to 10.75% based on a weighted average cost of capital calculation In determining the cost of equity, Moelis referenced the unlevered beta range of Raven as determined for the Raven Standalone Case, in addition to the following assumptions: Risk-free rate of 1.84% based on 20-year US Treasures (as of 8/20/19) Long-horizon equity risk premium (supply-side) of 6.14% per the 2018 Duff & Phelps Valuation Handbook Based on Vail, a size premium of (0.30%) calculated using the average of the 1st decile provided by the 2018 Duff & Phelps Valuation Handbook, based on companies with an equity value between ~$29 billion and ~$1,073 billion In determining the cost of debt, Moelis used the following assumptions to reflect Raven operating under Vail’s ownership: Projected marginal tax rate of 17.0% per Vail management 3.47% cost of debt based on the yield-to-worst of Vail’s Senior Note due 2027 Debt / total capitalization based on Vail’s selected publicly traded companies [ 12 ] Source: Note: 2018 Duff & Phelps Valuation Handbook; Bloomberg; Capital IQ; Public filings; U.S. Department of the Treasury; Vail management Market data as of August 20, 2019
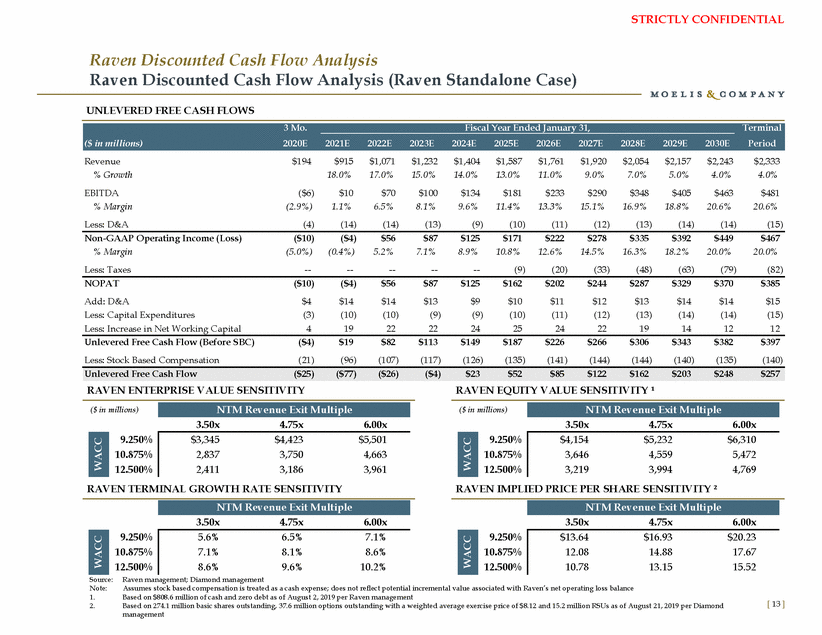
STRICTLY CONFIDENTIAL Raven Discounted Cash Flow Analysis Raven Discounted Cash Flow Analysis (Raven Standalone Case) UNLEVERED FREE CASH FLOWS Revenue % Growth EBITDA % Margin Less: D&A $194 $915 18.0% $10 1.1% (14) $1,071 17.0% $70 6.5% (14) $1,232 15.0% $100 8.1% (13) $1,404 14.0% $134 9.6% (9) $1,587 13.0% $181 11.4% (10) $1,761 11.0% $233 13.3% (11) $1,920 9.0% $290 15.1% (12) $2,054 7.0% $348 16.9% (13) $2,157 5.0% $405 18.8% (14) $2,243 4.0% $463 20.6% (14) $2,333 4.0% $481 20.6% (15) ($6) (2.9%) (4) Non-GAAP Operating Income (Loss) % Margin Less: Taxes ($10) (5.0%) --($4) (0.4%) --$56 5.2% --$87 7.1% --$125 8.9% --$171 10.8% (9) $222 12.6% (20) $278 14.5% (33) $335 16.3% (48) $392 18.2% (63) $449 20.0% (79) $467 20.0% (82) NOPAT Add: D&A Less: Capital Expenditures Less: Increase in Net Working Capital ($10) $4 (3) 4 ($4) $14 (10) 19 $56 $14 (10) 22 $87 $13 (9) 22 $125 $9 (9) 24 $162 $10 (10) 25 $202 $11 (11) 24 $244 $12 (12) 22 $287 $13 (13) 19 $329 $14 (14) 14 $370 $14 (14) 12 $385 $15 (15) 12 Unlevered Free Cash Flow (Before SBC) Less: Stock Based Compensation ($4) (21) $19 (96) $82 (107) $113 (117) $149 (126) $187 (135) $226 (141) $266 (144) $306 (144) $343 (140) $382 (135) $397 (140) RAVEN ENTERPRISE VALUE SENSITIVITY RAVEN EQUITY VALUE SENSITIVITY ¹ ($ in millions) ($ in millions) 3.50x 4.75x 6.00x 3.50x 4.75x 6.00x 9.250% 10.875% 12.500% 9.250% 10.875% 12.500% RAVEN TERMINAL GROWTH RATE SENSITIVITY RAVEN IMPLIED PRICE PER SHARE SENSITIVITY ² 3.50x 4.75x 6.00x 3.50x 4.75x 6.00x 9.250% 10.875% 12.500% 9.250% 10.875% 12.500% Source: Note: 1. 2. Raven management; Diamond management Assumes stock based compensation is treated as a cash expense; does not reflect potential incremental value associated with Raven’s net operating loss balance Based on $808.6 million of cash and zero debt as of August 2, 2019 per Raven management Based on 274.1 million basic shares outstanding, 37.6 million options outstanding with a weighted average exercise price of $8.12 and 15.2 million RSUs as of August 21, 2019 per Diamond management [ 13 ] WACC WACC WACC WACC $13.64$16.93$20.23 12.0814.8817.67 10.7813.1515.52 5.6%6.5%7.1% 7.1%8.1%8.6% 8.6%9.6%10.2% NTM Revenue Exit Multiple NTM Revenue Exit Multiple $4,154$5,232$6,310 3,6464,5595,472 3,2193,9944,769 $3,345$4,423$5,501 2,8373,7504,663 2,4113,1863,961 NTM Revenue Exit Multiple NTM Revenue Exit Multiple Unlevered Free Cash Flow($25)($77)($26)($4)$23$52$85$122$162$203$248$257 3 Mo.Fiscal Year Ended January 31,Terminal ($ in millions)2020E2021E2022E2023E2024E2025E2026E2027E2028E2029E2030EPeriod
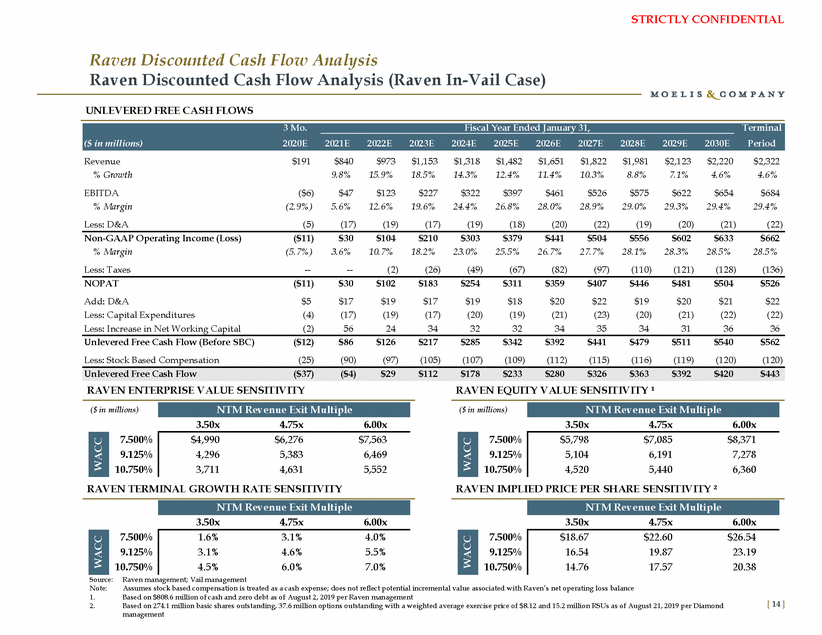
STRICTLY CONFIDENTIAL Raven Discounted Cash Flow Analysis Raven Discounted Cash Flow Analysis (Raven In-Vail Case) UNLEVERED FREE CASH FLOWS Revenue % Growth EBITDA % Margin Less: D&A $191 $840 9.8% $47 5.6% (17) $973 15.9% $123 12.6% (19) $1,153 18.5% $227 19.6% (17) $1,318 14.3% $322 24.4% (19) $1,482 12.4% $397 26.8% (18) $1,651 11.4% $461 28.0% (20) $1,822 10.3% $526 28.9% (22) $1,981 8.8% $575 29.0% (19) $2,123 7.1% $622 29.3% (20) $2,220 4.6% $654 29.4% (21) $2,322 4.6% $684 29.4% (22) ($6) (2.9%) (5) Non-GAAP Operating Income (Loss) % Margin Less: Taxes ($11) (5.7%) --$30 3.6% --$104 10.7% (2) $210 18.2% (26) $303 23.0% (49) $379 25.5% (67) $441 26.7% (82) $504 27.7% (97) $556 28.1% (110) $602 28.3% (121) $633 28.5% (128) $662 28.5% (136) NOPAT Add: D&A Less: Capital Expenditures Less: Increase in Net Working Capital ($11) $5 (4) (2) $30 $17 (17) 56 $102 $19 (19) 24 $183 $17 (17) 34 $254 $19 (20) 32 $311 $18 (19) 32 $359 $20 (21) 34 $407 $22 (23) 35 $446 $19 (20) 34 $481 $20 (21) 31 $504 $21 (22) 36 $526 $22 (22) 36 Unlevered Free Cash Flow (Before SBC) Less: Stock Based Compensation ($12) (25) $86 (90) $126 (97) $217 (105) $285 (107) $342 (109) $392 (112) $441 (115) $479 (116) $511 (119) $540 (120) $562 (120) RAVEN ENTERPRISE VALUE SENSITIVITY RAVEN EQUITY VALUE SENSITIVITY ¹ ($ in millions) ($ in millions) 3.50x 4.75x 6.00x 3.50x 4.75x 6.00x 7.500% 9.125% 10.750% 7.500% 9.125% 10.750% RAVEN TERMINAL GROWTH RATE SENSITIVITY RAVEN IMPLIED PRICE PER SHARE SENSITIVITY ² 3.50x 4.75x 6.00x 3.50x 4.75x 6.00x 7.500% 9.125% 10.750% 7.500% 9.125% 10.750% Source: Note: 1. 2. Raven management; Vail management Assumes stock based compensation is treated as a cash expense; does not reflect potential incremental value associated with Raven’s net operating loss balance Based on $808.6 million of cash and zero debt as of August 2, 2019 per Raven management Based on 274.1 million basic shares outstanding, 37.6 million options outstanding with a weighted average exercise price of $ 8.12 and 15.2 million RSUs as of August 21, 2019 per Diamond management [ 14 ] WACC WACC WACC WACC $18.67$22.60$26.54 16.5419.8723.19 14.7617.5720.38 1.6%3.1%4.0% 3.1%4.6%5.5% 4.5%6.0%7.0% NTM Revenue Exit Multiple NTM Revenue Exit Multiple $5,798$7,085$8,371 5,1046,1917,278 4,5205,4406,360 $4,990$6,276$7,563 4,2965,3836,469 3,7114,6315,552 NTM Revenue Exit Multiple NTM Revenue Exit Multiple Unlevered Free Cash Flow($37)($4)$29$112$178$233$280$326$363$392$420$443 3 Mo.Fiscal Year Ended January 31,Terminal ($ in millions)2020E2021E2022E2023E2024E2025E2026E2027E2028E2029E2030EPeriod
STRICTLY CONFIDENTIAL III. Vail Discounted Cash Flow Analysis
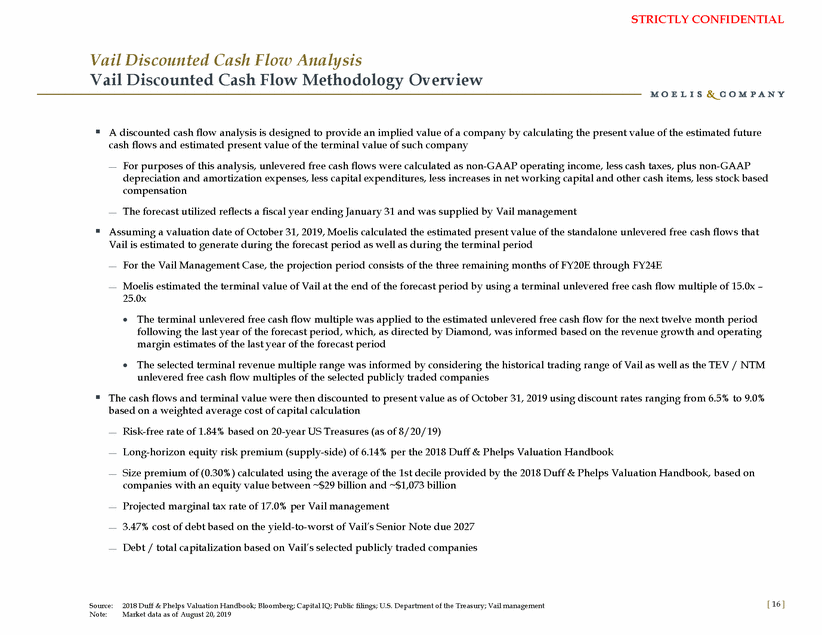
STRICTLY CONFIDENTIAL Vail Discounted Cash Flow Analysis Vail Discounted Cash Flow Methodology Overview A discounted cash flow analysis is designed to provide an implied value of a company by calculating the present value of the estimated future cash flows and estimated present value of the terminal value of such company For purposes of this analysis, unlevered free cash flows were calculated as non-GAAP operating income, less cash taxes, plus non-GAAP depreciation and amortization expenses, less capital expenditures, less increases in net working capital and other cash items, less stock based compensation The forecast utilized reflects a fiscal year ending January 31 and was supplied by Vail management Assuming a valuation date of October 31, 2019, Moelis calculated the estimated present value of the standalone unlevered free cash flows that Vail is estimated to generate during the forecast period as well as during the terminal period For the Vail Management Case, the projection period consists of the three remaining months of FY20E through FY24E Moelis estimated the terminal value of Vail at the end of the forecast period by using a terminal unlevered free cash flow multiple of 15.0x – 25.0x The terminal unlevered free cash flow multiple was applied to the estimated unlevered free cash flow for the next twelve month period following the last year of the forecast period, which, as directed by Diamond, was informed based on the revenue growth and operating margin estimates of the last year of the forecast period The selected terminal revenue multiple range was informed by considering the historical trading range of Vail as well as the TEV / NTM unlevered free cash flow multiples of the selected publicly traded companies The cash flows and terminal value were then discounted to present value as of October 31, 2019 using discount rates ranging from 6.5% to 9.0% based on a weighted average cost of capital calculation Risk-free rate of 1.84% based on 20-year US Treasures (as of 8/20/19) Long-horizon equity risk premium (supply-side) of 6.14% per the 2018 Duff & Phelps Valuation Handbook Size premium of (0.30%) calculated using the average of the 1st decile provided by the 2018 Duff & Phelps Valuation Handbook, based on companies with an equity value between ~$29 billion and ~$1,073 billion Projected marginal tax rate of 17.0% per Vail management 3.47% cost of debt based on the yield-to-worst of Vail’s Senior Note due 2027 Debt / total capitalization based on Vail’s selected publicly traded companies [ 16 ] Source: 2018 Duff & Phelps Valuation Handbook; Bloomberg; Capital IQ; Public filings; U.S. Department of the Treasury; Vail management Note: Market data as of August 20, 2019
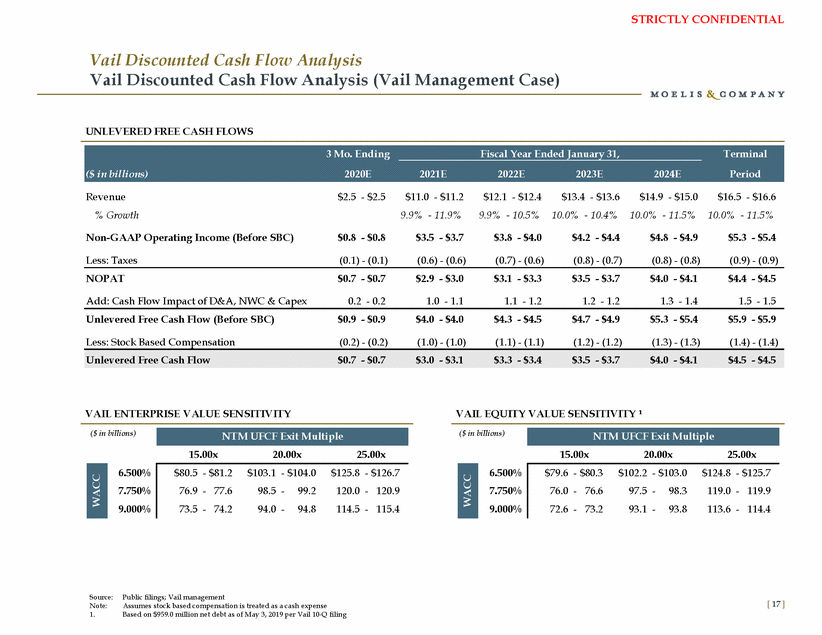
STRICTLY CONFIDENTIAL Vail Discounted Cash Flow Analysis Vail Discounted Cash Flow Analysis (Vail Management Case) UNLEVERED FREE CASH FLOWS Revenue % Growth $2.5 - $2.5 $11.0 - $11.2 9.9% - 11.9% $12.1 - $12.4 9.9% - 10.5% $13.4 - $13.6 10.0% - 10.4% $14.9 - $15.0 10.0% - 11.5% $16.5 - $16.6 10.0% - 11.5% Non-GAAP Operating Income (Before SBC) $0.8 - $0.8 $3.5 - $3.7 $3.8 - $4.0 $4.2 - $4.4 $4.8 - $4.9 $5.3 - $5.4 Less: Taxes (0.1) - (0.1) (0.6) - (0.6) (0.7) - (0.6) (0.8) - (0.7) (0.8) - (0.8) (0.9) - (0.9) NOPAT $0.7 - $0.7 $2.9 - $3.0 $3.1 - $3.3 $3.5 - $3.7 $4.0 - $4.1 $4.4 - $4.5 Add: Cash Flow Impact of D&A, NWC & Capex 0.2 - 0.2 1.0 - 1.1 1.1 - 1.2 1.2 - 1.2 1.3 - 1.4 1.5 - 1.5 Unlevered Free Cash Flow (Before SBC) $0.9 - $0.9 $4.0 - $4.0 $4.3 - $4.5 $4.7 - $4.9 $5.3 - $5.4 $5.9 - $5.9 Less: Stock Based Compensation (0.2) - (0.2) (1.0) - (1.0) (1.1) - (1.1) (1.2) - (1.2) (1.3) - (1.3) (1.4) - (1.4) VAIL ENTERPRISE VALUE SENSITIVITY VAIL EQUITY VALUE SENSITIVITY ¹ ($ in billions) ($ in billions) 15.00x 20.00x 25.00x 15.00x 20.00x 25.00x 6.500% 7.750% 9.000% 6.500% 7.750% 9.000% Source: Note: 1. Public filings; Vail management Assumes stock based compensation is treated as a cash expense Based on $959.0 million net debt as of May 3, 2019 per Vail 10-Q filing [ 17 ] WACC WACC $79.6 - $80.3$102.2 - $103.0$124.8 - $125.7 76.0 - 76.697.5 -98.3119.0 - 119.9 72.6 - 73.293.1 -93.8113.6 - 114.4 $80.5 - $81.2$103.1 - $104.0$125.8 - $126.7 76.9 - 77.698.5 -99.2120.0 - 120.9 73.5 - 74.294.0 -94.8114.5 - 115.4 NTM UFCF Exit Multiple NTM UFCF Exit Multiple Unlevered Free Cash Flow$0.7 - $0.7$3.0 - $3.1$3.3 - $3.4$3.5 - $3.7$4.0 - $4.1$4.5 - $4.5 3 Mo. EndingFiscal Year Ended January 31,Terminal ($ in billions)2020E2021E2022E2023E2024EPeriod
STRICTLY CONFIDENTIAL Appendix
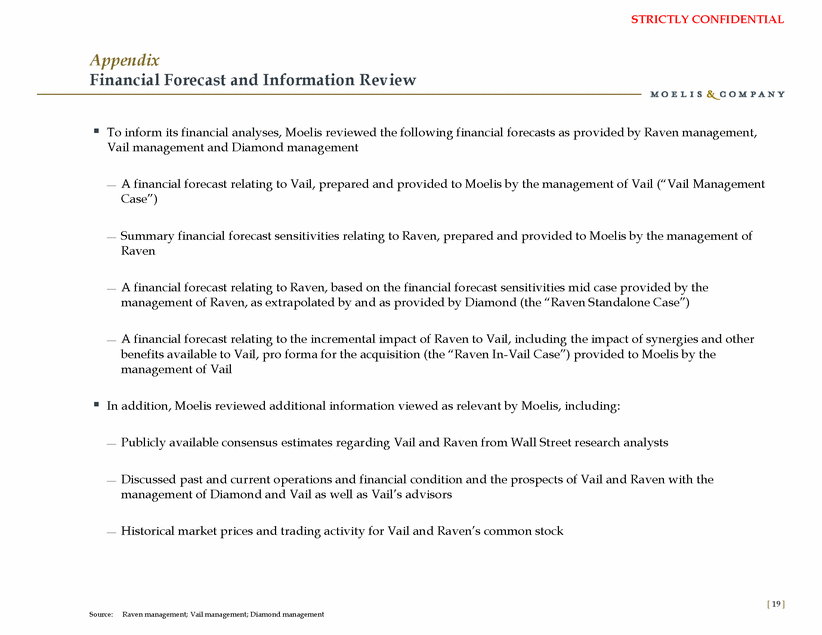
STRICTLY CONFIDENTIAL Appendix Financial Forecast and Information Review To inform its financial analyses, Moelis reviewed the following financial forecasts as provided by Raven management, Vail management and Diamond management A financial forecast relating to Vail, prepared and provided to Moelis by the management of Vail (“Vail Management Case”) Summary financial forecast sensitivities relating to Raven, prepared and provided to Moelis by the management of Raven A financial forecast relating to Raven, based on the financial forecast sensitivities mid case provided by the management of Raven, as extrapolated by and as provided by Diamond (the “Raven Standalone Case”) A financial forecast relating to the incremental impact of Raven to Vail, including the impact of synergies and other benefits available to Vail, pro forma for the acquisition (the “Raven In-Vail Case”) provided to Moelis by the management of Vail In addition, Moelis reviewed additional information viewed as relevant by Moelis, including: Publicly available consensus estimates regarding Vail and Raven from Wall Street research analysts Discussed past and current operations and financial condition and the prospects of Vail and Raven with the management of Diamond and Vail as well as Vail’s advisors Historical market prices and trading activity for Vail and Raven’s common stock [ 19 ] Source: Raven management; Vail management; Diamond management
STRICTLY CONFIDENTIAL A. Raven Public Market Perspectives
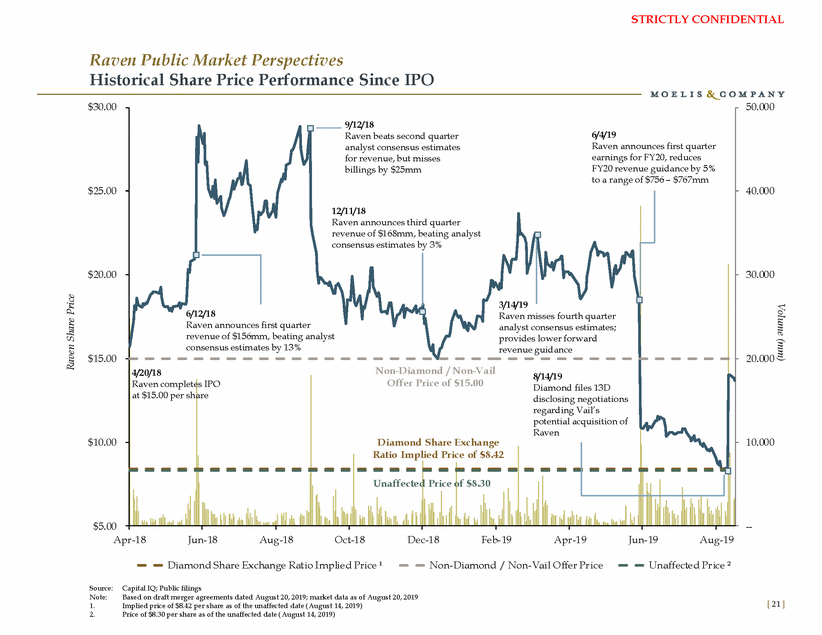
STRICTLY CONFIDENTIAL Raven Public Market Perspectives Historical Share Price Performance Since IPO $30.00 50.000 $25.00 40.000 $20.00 30.000 6/12/18 Raven misses fourth quarter revenue of $156mm, beating analyst provides lower forward $15.00 20.000 disclosing negotiations $10.00 10.000 Ratio Implied Price of $8.42 d Price of $8.30 $5.00 --Apr -18 Jun-18 Aug-18 Oct-18 Dec-18 Feb-19 Apr -19 Jun-19 Aug-19 Diamond Share Exchange Ratio Implied Price ¹ Non-Diamond / Non-Vail Offer Pr ice Unaffected Pr ice ² Source: Note: 1. 2. Capital IQ; Public filings Based on draft merger agreements dated August 20, 2019; market data as of August 20, 2019 Implied price of $8.42 per share as of the unaffected date (August 14, 2019) Price of $8.30 per share as of the unaffected date (August 14, 2019) [ 21 ] Volume (mm) Raven Share Price 9/12/18 Raven beats second quarter6/4/19 analyst consensus estimatesRaven announces first quarter for revenue, but missesearnings for FY20, reduces billings by $25mmFY20 revenue guidance by 5% to a range of $756 – $767mm 12/11/18 Raven announces third quarter revenue of $168mm, beating analyst consensus estimates by 3% 3/14/19 Raven announces first quarteranalyst consensus estimates; consensus estimates by 13%revenue guidance 4/20/18Non-Diamond / Non-Vail 8/14/19 Raven complete at $15.00 per sh s IPO are Offer Price of $15.00 Diamond files 13D regarding Vail’s potential acquisition of Raven Diamond Share Exchange Unaffecte
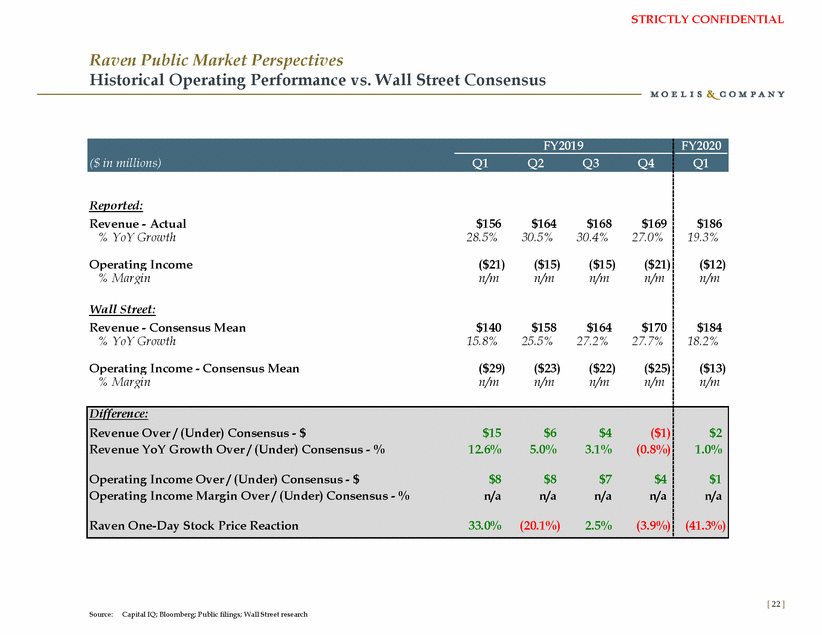
STRICTLY CONFIDENTIAL Raven Public Market Perspectives Historical Operating Performance vs. Wall Street Consensus [ 22 ] Source: Capital IQ; Bloomberg; Public filings; Wall Street research ($ in millions) FY2019 FY2020 Q1Q2Q3Q4 Q1 Reported: Revenue - Actual$156$164$168$169 % YoY Growth28.5%30.5%30.4%27.0% Operating Income($21)($15)($15)($21) % Marginn/mn/mn/mn/m Wall Street: Revenue - Consensus Mean$140$158$164$170 % YoY Growth15.8%25.5%27.2%27.7% Operating Income - Consensus Mean($29)($23)($22)($25) % Marginn/mn/mn/mn/m $186 19.3% ($12) n/m $184 18.2% ($13) n/m Difference: Revenue Over / (Under) Consensus - $$15$6$4($1) Revenue YoY Growth Over / (Under) Consensus - %12.6%5.0%3.1%(0.8%) Operating Income Over / (Under) Consensus - $$8$8$7$4 Operating Income Margin Over / (Under) Consensus - %n/an/an/an/a Raven One-Day Stock Price Reaction33.0%(20.1%)2.5%(3.9%) $2 1.0% $1 n/a (41.3%)
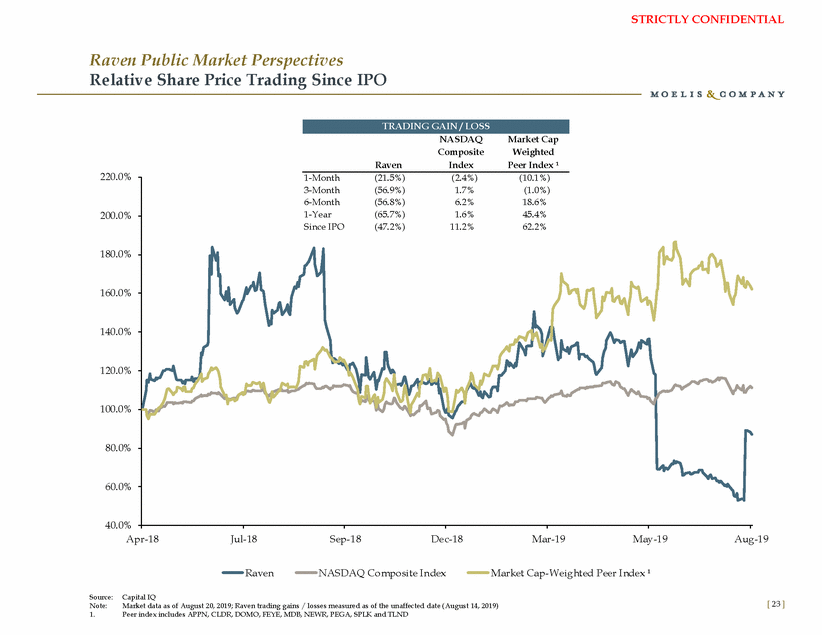
STRICTLY CONFIDENTIAL Raven Public Market Perspectives Relative Share Price Trading Since IPO NASDAQ Composite Index Market Cap Weighted Peer Index ¹ Raven 220.0% 1-Month (21.5%) (2.4%) (10.1%) 200.0% 180.0% 160.0% 140.0% 120.0% 100.0% 80.0% 60.0% 40.0% Apr -18 Jul-18 Sep-18 Dec-18 Mar -19 May-19 Aug-19 Raven NASD AQ Co mpo site Index Mar ket Cap-Weighted Peer Index ¹ Source: Note: 1. Capital IQ Market data as of August 20, 2019; Raven trading gains / losses measured as of the unaffected date (August 14, 2019) Peer index includes APPN, CLDR, DOMO, FEYE, MDB, NEWR, PEGA, SPLK and TLND [ 23 ] 3-Month(56.9%)1.7%(1.0%) 6-Month(56.8%)6.2%18.6% 1-Year(65.7%)1.6%45.4% Since IPO(47.2%)11.2%62.2% TRADING GAIN / LOSS
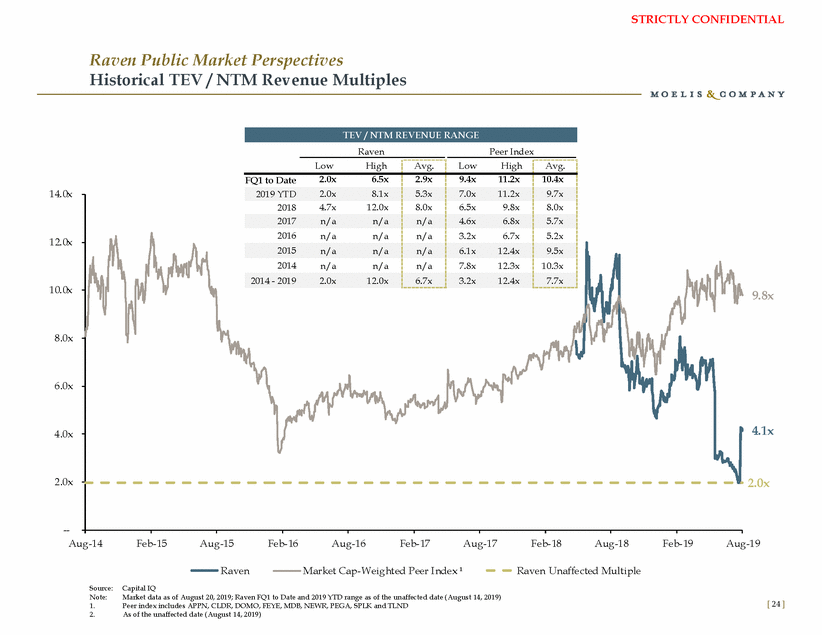
STRICTLY CONFIDENTIAL Raven Public Market Perspectives Historical TEV / NTM Revenue Multiples Raven Peer Index 14.0x 12.0x 10.0x 9.8x 8.0x 6.0x 4.1x 4.0x 2.0x 2.0x --Aug-14 Feb-15 Aug-15 Feb-16 Aug-16 Feb-17 Aug-17 Feb-18 Aug-18 Feb-19 Aug-19 Raven Mar ket Cap-Weighted Peer Index ¹ Raven Unaffected Multiple Source: Note: 1. 2. Capital IQ Market data as of August 20, 2019; Raven FQ1 to Date and 2019 YTD range as of the unaffected date (August 14, 2019) Peer index includes APPN, CLDR, DOMO, FEYE, MDB, NEWR, PEGA, SPLK and TLND As of the unaffected date (August 14, 2019) [ 24 ] LowHigh Avg. LowHigh Avg. FQ1 to Date2.0x6.5x 2.9x 9.4x11.2x 10.4x 2019 YTD2.0x8.1x 5.3x 7.0x11.2x 9.7x 20184.7x12.0x 8.0x 6.5x9.8x 8.0x 2017n/an/a n/a 4.6x6.8x 5.7x 2016n/an/a n/a 3.2x6.7x 5.2x 2015n/an/a n/a 6.1x12.4x 9.5x 2014n/an/a n/a 7.8x12.3x 10.3x 2014 - 20192.0x12.0x 6.7x 3.2x12.4x 7.7x TEV / NTM REVENUE RANGE
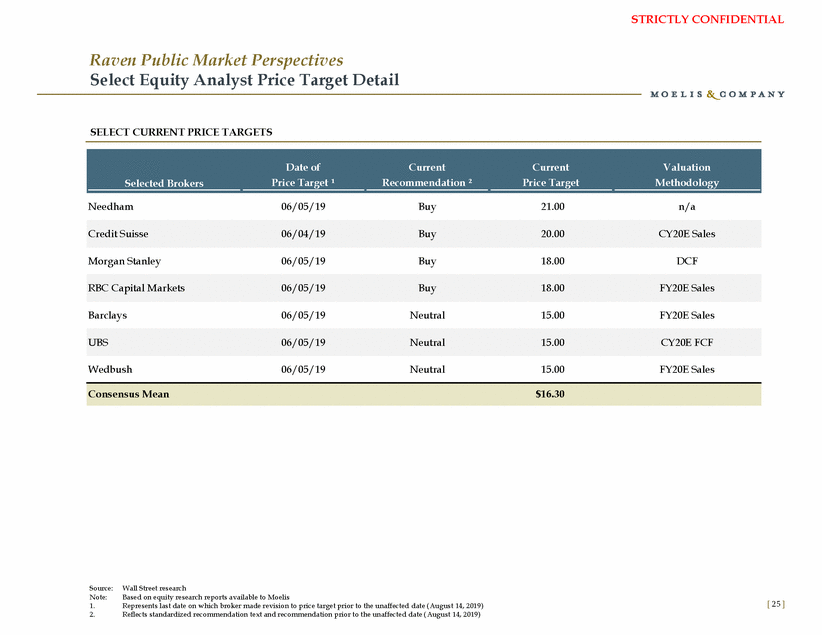
STRICTLY CONFIDENTIAL Raven Public Market Perspectives Select Equity Analyst Price Target Detail SELECT CURRENT PRICE TARGETS Needham 06/05/19 Buy 21.00 n/a Morgan Stanley 06/05/19 Buy 18.00 DCF Barclays 06/05/19 Neutral 15.00 FY20E Sales Wedbush 06/05/19 Neutral 15.00 FY20E Sales Source: Note: 1. 2. Wall Street research Based on equity research reports available to Moelis Represents last date on which broker made revision to price target prior to the unaffected date (August 14, 2019) Reflects standardized recommendation text and recommendation prior to the unaffected date (August 14, 2019) [ 25 ] Consensus Mean$16.30 UBS06/05/19Neutral15.00CY20E FCF RBC Capital Markets06/05/19Buy18.00FY20E Sales Credit Suisse06/04/19Buy20.00CY20E Sales Selected Brokers Date ofCurrentCurrentValuation Price Target ¹Recommendation ²Price TargetMethodology
STRICTLY CONFIDENTIAL B. Raven Financial Review
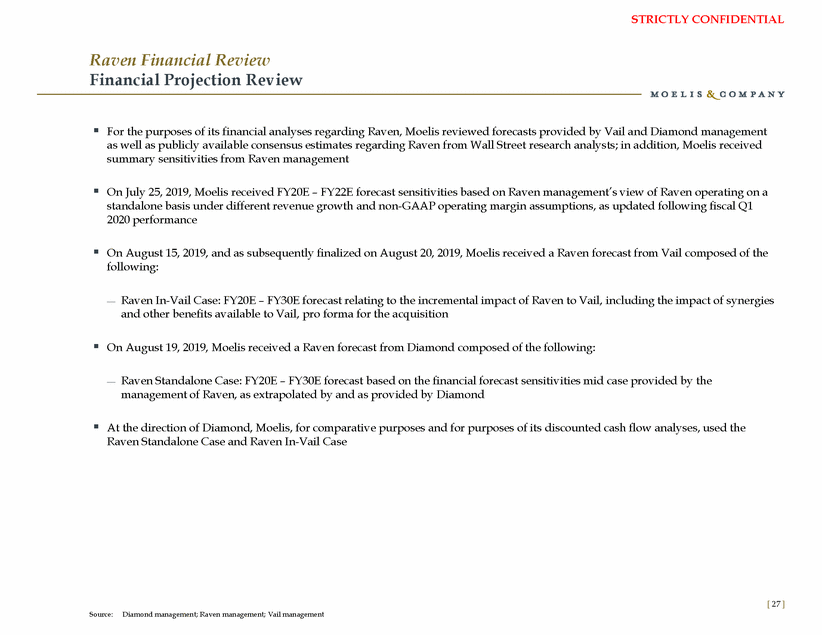
STRICTLY CONFIDENTIAL Raven Financial Review Financial Projection Review For the purposes of its financial analyses regarding Raven, Moelis reviewed forecasts provided by Vail and Diamond management as well as publicly available consensus estimates regarding Raven from Wall Street research analysts; in addition, Moelis received summary sensitivities from Raven management On July 25, 2019, Moelis received FY20E – FY22E forecast sensitivities based on Raven management’s view of Raven operating on a standalone basis under different revenue growth and non-GAAP operating margin assumptions, as updated following fiscal Q1 2020 performance On August 15, 2019, and as subsequently finalized on August 20, 2019, Moelis received a Raven forecast from Vail composed of the following: Raven In-Vail Case: FY20E – FY30E forecast relating to the incremental impact of Raven to Vail, including the impact of synergies and other benefits available to Vail, pro forma for the acquisition On August 19, 2019, Moelis received a Raven forecast from Diamond composed of the following: Raven Standalone Case: FY20E – FY30E forecast based on the financial forecast sensitivities mid case provided by the management of Raven, as extrapolated by and as provided by Diamond At the direction of Diamond, Moelis, for comparative purposes and for purposes of its discounted cash flow analyses, used the Raven Standalone Case and Raven In-Vail Case [ 27 ] Source: Diamond management; Raven management; Vail management
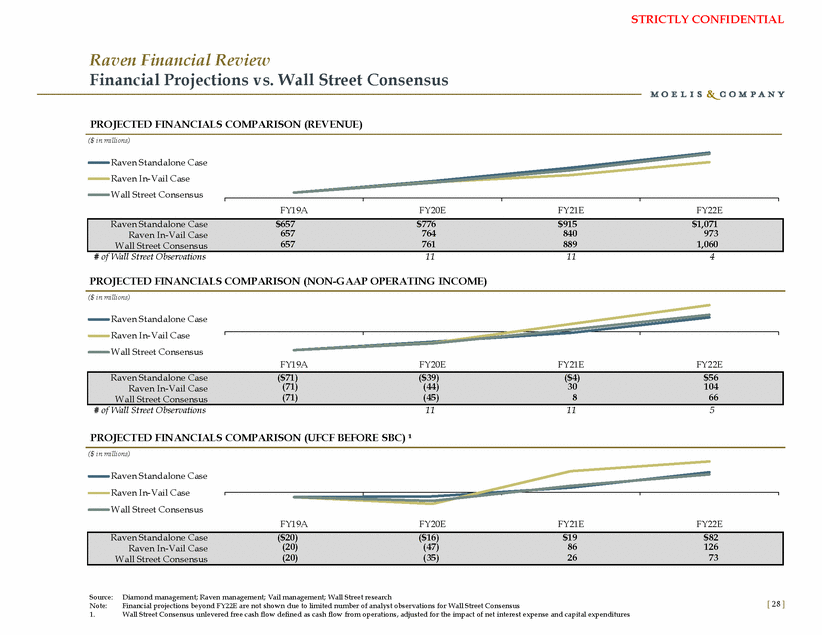
STRICTLY CONFIDENTIAL Raven Financial Review Financial Projections vs. Wall Street Consensus PROJECTED FINANCIALS COMPARISON (REVENUE) ($ in millions) Raven Standalone Case Raven In-Vail Case Wall Street Consensus FY19A FY20E FY21E FY22E 657 764 840 973 Raven In-Vail Case # of Wall Street Observations 11 11 4 PROJECTED FINANCIALS COMPARISON (NON-GAAP OPERATING INCOME) ($ in millions) Raven Standalone Case Raven In-Vail Case Wall Street Consensus FY19A FY20E FY21E FY22E (71) (44) 30 104 Raven In-Vail Case # of Wall Street Observations 11 11 5 PROJECTED FINANCIALS COMPARISON (UFCF BEFORE SBC) ¹ ($ in millions) Raven Standalone Case Raven In-Vail Case Wall Street Consensus FY19A FY20E FY21E FY22E (20) (47) 86 126 Raven In-Vail Case Source: Note: 1. Diamond management; Raven management; Vail management; Wall Street research Financial projections beyond FY22E are not shown due to limited number of analyst observations for Wall Street Consensus Wall Street Consensus unlevered free cash flow defined as cash flow from operations, adjusted for the impact of net interest expense and capital expenditures [ 28 ] Raven Standalone Case($20)($16)$19$82 Wall Street Consensus(20)(35)2673 Raven Standalone Case($71)($39)($4)$56 Wall Street Consensus(71)(45)866 Raven Standalone Case$657$776$915$1,071 Wall Street Consensus6577618891,060
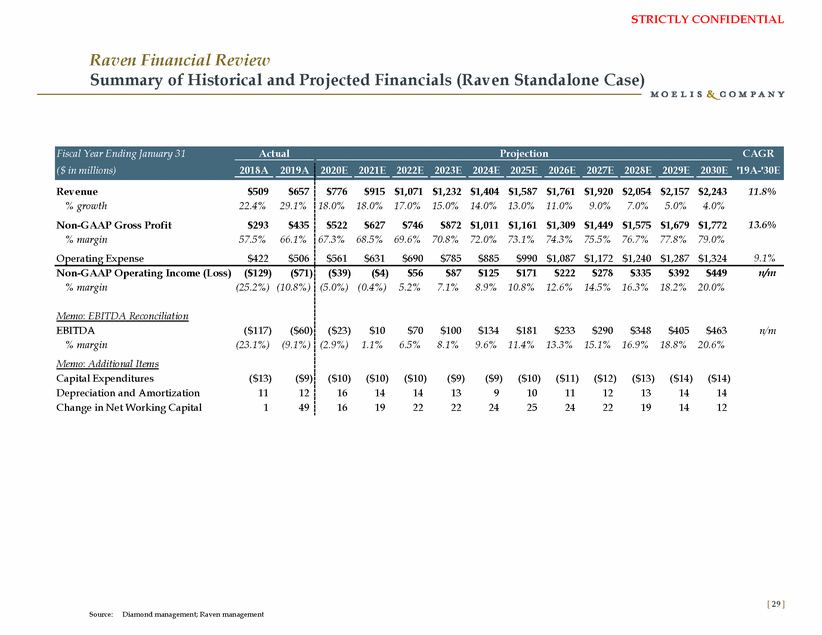
STRICTLY CONFIDENTIAL Raven Financial Review Summary of Historical and Projected Financials (Raven Standalone Case) [ 29 ] Source: Diamond management; Raven management Fiscal Year Ending January 31 ($ in millions) ActualProjection CAGR '19A-'30E 2018A2019A 2020E2021E2022E2023E2024E2025E2026E2027E2028E2029E2030E Revenue$509$657 % growth22.4%29.1% Non-GAAP Gross Profit$293$435 % margin57.5%66.1% Operating Expense$422$506 $776$915 $1,071 $1,232 $1,404 $1,587 $1,761 $1,920 $2,054 $2,157 $2,24311.8% 18.0%18.0%17.0%15.0%14.0%13.0%11.0%9.0%7.0%5.0%4.0% $522$627$746$872 $1,011 $1,161 $1,309 $1,449 $1,575 $1,679 $1,77213.6% 67.3%68.5%69.6%70.8%72.0%73.1%74.3%75.5%76.7%77.8%79.0% $561$631$690$785$885$990 $1,087 $1,172 $1,240 $1,287 $1,3249.1% Non-GAAP Operating Income (Loss)($129)($71) % margin(25.2%) (10.8%) Memo: EBITDA Reconciliation EBITDA($117)($60) % margin(23.1%)(9.1%) Memo: Additional Items Capital Expenditures($13)($9) Depreciation and Amortization11 12 Change in Net Working Capital149 ($39)($4)$56$87$125$171$222$278$335$392$449n/m (5.0%) (0.4%)5.2%7.1%8.9%10.8%12.6%14.5%16.3%18.2%20.0% ($23)$10$70$100$134$181$233$290$348$405$463n/m (2.9%)1.1%6.5%8.1%9.6%11.4%13.3%15.1%16.9%18.8%20.6% ($10)($10)($10)($9)($9)($10)($11)($12)($13)($14)($14) 161414139101112131414 1619222224252422191412
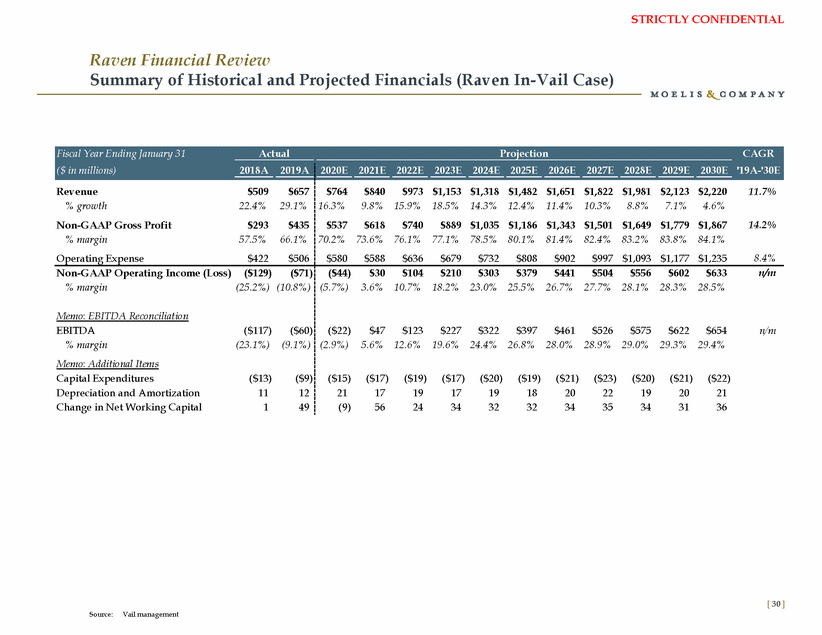
STRICTLY CONFIDENTIAL Raven Financial Review Summary of Historical and Projected Financials (Raven In-Vail Case) [ 30 ] Source: Vail management Fiscal Year Ending January 31 ($ in millions) ActualProjection CAGR '19A-'30E 2018A2019A 2020E2021E2022E2023E2024E2025E2026E2027E2028E2029E2030E Revenue$509$657 % growth22.4%29.1% Non-GAAP Gross Profit$293$435 % margin57.5%66.1% Operating Expense$422$506 $764$840$973 $1,153 $1,318 $1,482 $1,651 $1,822 $1,981 $2,123 $2,22011.7% 16.3%9.8%15.9%18.5%14.3%12.4%11.4%10.3%8.8%7.1%4.6% $537$618$740$889 $1,035 $1,186 $1,343 $1,501 $1,649 $1,779 $1,86714.2% 70.2%73.6%76.1%77.1%78.5%80.1%81.4%82.4%83.2%83.8%84.1% $580$588$636$679$732$808$902$997 $1,093 $1,177 $1,2358.4% Non-GAAP Operating Income (Loss)($129)($71) % margin(25.2%) (10.8%) Memo: EBITDA Reconciliation EBITDA($117)($60) % margin(23.1%)(9.1%) Memo: Additional Items Capital Expenditures($13)($9) Depreciation and Amortization11 12 Change in Net Working Capital149 ($44)$30$104$210$303$379$441$504$556$602$633n/m (5.7%)3.6%10.7%18.2%23.0%25.5%26.7%27.7%28.1%28.3%28.5% ($22)$47$123$227$322$397$461$526$575$622$654n/m (2.9%)5.6%12.6%19.6%24.4%26.8%28.0%28.9%29.0%29.3%29.4% ($15)($17)($19)($17)($20)($19)($21)($23)($20)($21)($22) 21 17 1917 19 1820 22 1920 21 (9)56243432323435343136
STRICTLY CONFIDENTIAL C. Vail Public Market Perspectives
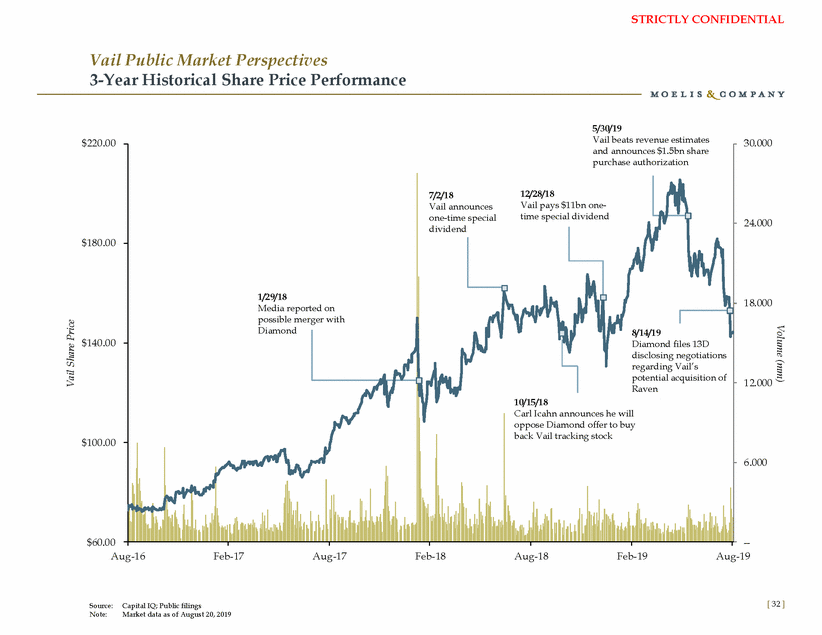
STRICTLY CONFIDENTIAL Vail Public Market Perspectives 3-Year Historical Share Price Performance 5/30/19 Vail beats revenue estimates $220.00 30.000 24.000 $180.00 18.000 $140.00 12.000 Carl Icahn announces he will $100.00 6.000 $60.00 --Aug-16 Feb-17 Aug-17 Feb-18 Aug-18 Feb-19 Aug-19 [ 32 ] Source: Capital IQ; Public filings Note: Market data as of August 20, 2019 Volume (mm) Vail Share Price and announces $1.5bn share purchase authorization 1/29/18 Media reported on possible merger with 7/2/1812/28/18 Vail announcesVail pays $11bn one-one-time specialtime special dividend dividend 8/14/19 Diamond files 13D disclosing negotiations regarding Vail’s potential acquisition of Diamond Raven 10/15/18 oppose Diamond offer to buy back Vail tracking stock
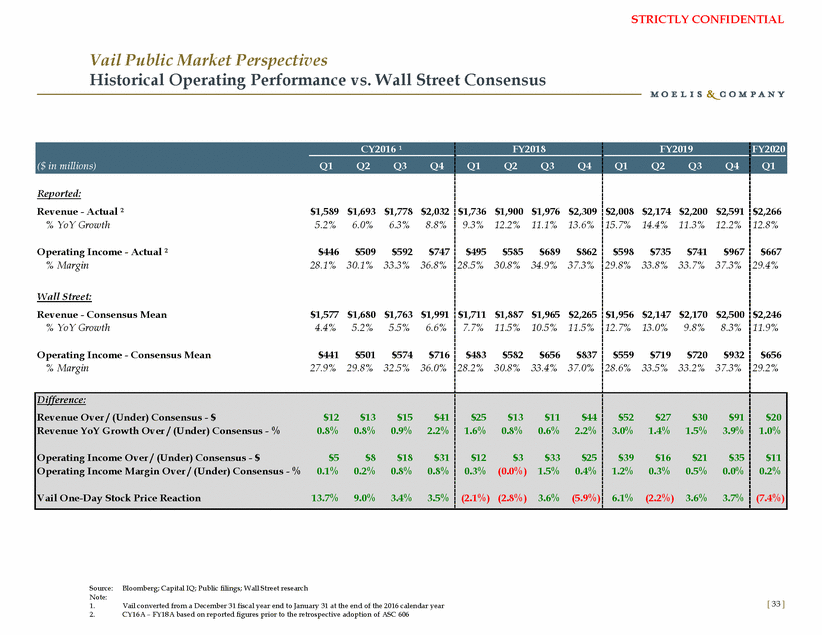
STRICTLY CONFIDENTIAL Vail Public Market Perspectives Historical Operating Performance vs. Wall Street Consensus Reported: Revenue - Actual ² % YoY Growth $1,589 5.2% $1,693 6.0% $1,778 6.3% $2,032 8.8% $1,736 9.3% $1,900 12.2% $1,976 11.1% $2,309 13.6% $2,008 15.7% $2,174 14.4% $2,200 11.3% $2,591 12.2% $2,266 12.8% Operating Income - Actual ² % Margin $446 28.1% $509 30.1% $592 33.3% $747 36.8% $495 28.5% $585 30.8% $689 34.9% $862 37.3% $598 29.8% $735 33.8% $741 33.7% $967 37.3% $667 29.4% Wall Street: Revenue - Consensus Mean % YoY Growth $1,577 4.4% $1,680 5.2% $1,763 5.5% $1,991 6.6% $1,711 7.7% $1,887 11.5% $1,965 10.5% $2,265 11.5% $1,956 12.7% $2,147 13.0% $2,170 9.8% $2,500 8.3% $2,246 11.9% Operating Income - Consensus Mean % Margin $441 27.9% $501 29.8% $574 32.5% $716 36.0% $483 28.2% $582 30.8% $656 33.4% $837 37.0% $559 28.6% $719 33.5% $720 33.2% $932 37.3% $656 29.2% Source: Note: 1. 2. Bloomberg; Capital IQ; Public filings; Wall Street research [ 33 ] Vail converted from a December 31 fiscal year end to January 31 at the end of the 2016 calendar year CY16A – FY18A based on reported figures prior to the retrospective adoption of ASC 606 CY2016 ¹ ($ in millions) Q1 Q2 Q3 Q4 FY2018 FY2019 FY2020 Q1 Q2 Q3 Q4 Q1 Q2 Q3 Q4 Q1 Difference: Revenue Over / (Under) Consensus - $ $12 $13 $15 $41 Revenue YoY Growth Over / (Under) Consensus - % 0.8% 0.8% 0.9% 2.2% Operating Income Over / (Under) Consensus - $ $5 $8 $18 $31 Operating Income Margin Over / (Under) Consensus - % 0.1% 0.2% 0.8% 0.8% Vail One-Day Stock Price Reaction 13.7% 9.0% 3.4% 3.5% $25 $13 $11 $44 1.6% 0.8% 0.6% 2.2% $12 $3 $33 $25 0.3% (0.0%) 1.5% 0.4% (2.1%) (2.8%) 3.6% (5.9%) $52 $27 $30 $91 3.0% 1.4% 1.5% 3.9% $39 $16 $21 $35 1.2% 0.3% 0.5% 0.0% 6.1% (2.2%) 3.6% 3.7% $20 1.0% $11 0.2% (7.4%)
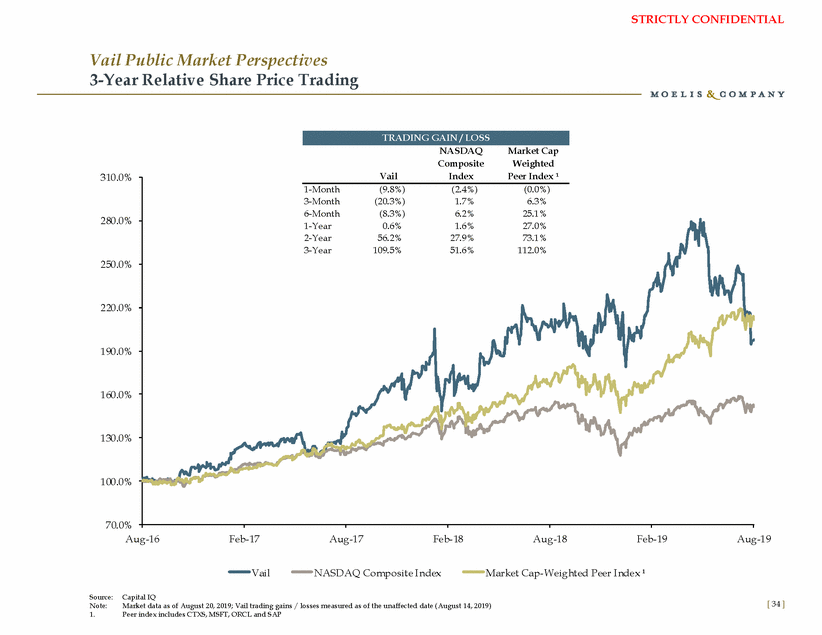
STRICTLY CONFIDENTIAL Vail Public Market Perspectives 3-Year Relative Share Price Trading NASDAQ Composite Index Market Cap Weighted Peer Index ¹ Vail 310.0% 280.0% 250.0% 220.0% 190.0% 160.0% 130.0% 100.0% 70.0% Aug-16 Fe b-17 Aug-17 Fe b-18 Aug-18 Fe b-19 Aug-19 Vail NASD AQ Co mpo site Index Mar ket Cap-Weighted Peer Index ¹ Source: Note: 1. Capital IQ Market data as of August 20, 2019; Vail trading gains / losses measured as of the unaffected date (August 14, 2019) Peer index includes CTXS, MSFT, ORCL and SAP [ 34 ] 1-Month(9.8%)(2.4%)(0.0%) 3-Month(20.3%)1.7%6.3% 6-Month(8.3%)6.2%25.1% 1-Year0.6%1.6%27.0% 2-Year56.2%27.9%73.1% 3-Year109.5%51.6%112.0% TRADING GAIN / LOSS
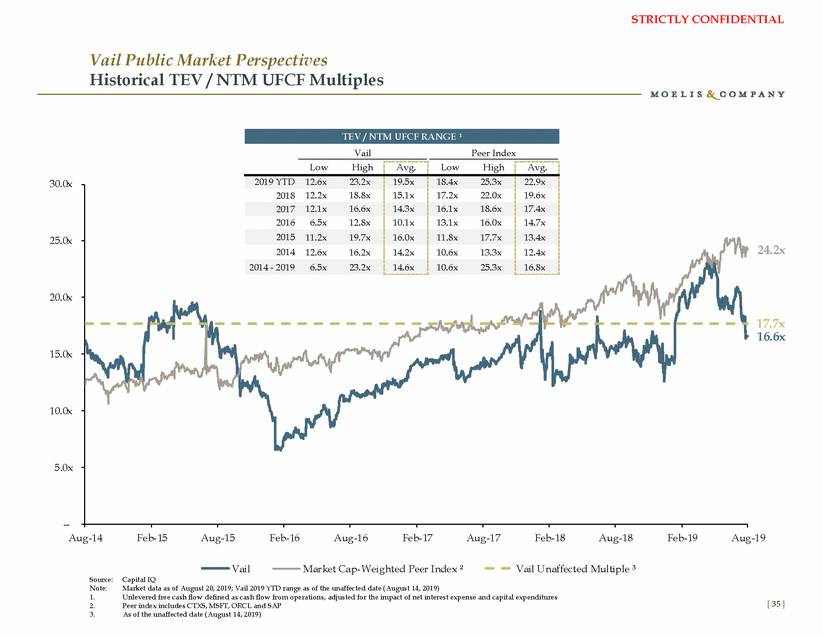
STRICTLY CONFIDENTIAL Vail Public Market Perspectives Historical TEV / NTM UFCF Multiples Vail Peer Index 30.0x 25.0x 24.2x 20.0x 17.7x 16.6x 15.0x 10.0x 5.0x --Aug-14 Feb-15 Aug-15 Feb-16 Aug-16 Feb-17 Aug-17 Feb-18 Aug-18 Feb-19 Aug-19 Vail Mar ket Cap-Weighted Peer Index ² Vail U naffected Multiple ³ Source: Note: 1. 2. 3. Capital IQ Market data as of August 20, 2019; Vail 2019 YTD range as of the unaffected date (August 14, 2019) Unlevered free cash flow defined as cash flow from operations, adjusted for the impact of net interest expense and capital expenditures Peer index includes CTXS, MSFT, ORCL and SAP As of the unaffected date (August 14, 2019) [ 35 ] LowHigh Avg. LowHigh Avg. 2019 YTD12.6x23.2x 19.5x 18.4x25.3x 22.9x 201812.2x18.8x 15.1x 17.2x22.0x 19.6x 201712.1x16.6x 14.3x 16.1x18.6x 17.4x 20166.5x12.8x 10.1x 13.1x16.0x 14.7x 201511.2x19.7x 16.0x 11.8x17.7x 13.4x 201412.6x16.2x 14.2x 10.6x13.3x 12.4x 2014 - 20196.5x23.2x 14.6x 10.6x25.3x 16.8x TEV / NTM UFCF RANGE ¹
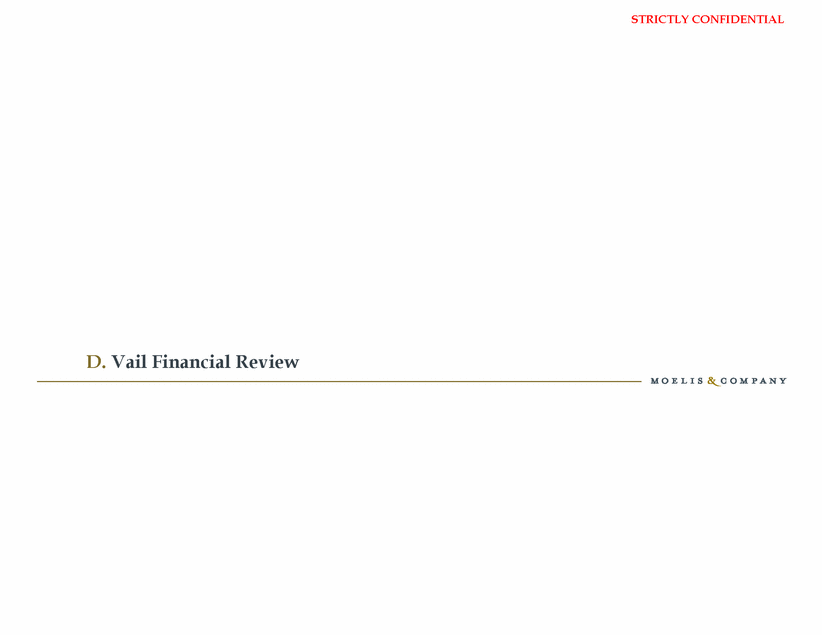
STRICTLY CONFIDENTIAL Vail Public Market Perspectives Select Equity Analyst Price Target Detail SELECT CURRENT PRICE TARGETS Oppenheimer 05/30/19 Buy 220.00 n/a Jefferies 05/31/19 Buy 213.00 DCF Wedbush 07/17/19 Buy 210.00 n/a FBN Securities 06/03/19 Buy 195.00 n/a Daiwa Securities 06/03/19 Buy 193.00 n/a Morgan Stanley 05/31/19 Neutral 190.00 CY20E EPS Mizuho Securities 05/31/19 Neutral 180.00 n/a Elazar Advisors 07/22/19 Neutral 177.00 n/a Source: Note: 1. 2. Wall Street research Based on equity research reports available to Moelis Represents last date on which broker made revision to price target prior to the unaffected date (August 14, 2019) Reflects standardized recommendation text and recommendation prior to the unaffected date (August 14, 2019) [ 36 ] Consensus Mean$194.50 Wells Fargo05/30/19Neutral180.00NTM EPS; NTM UFCF Credit Suisse05/30/19Neutral185.00DCF Evercore05/31/19Neutral190.00CY20E FCF J.P. Morgan05/31/19Buy194.00CY20E FCF Summit Insights Group05/31/19Buy200.00n/a RBC06/14/19Buy210.00CY20 FCF Keybanc07/22/19Buy214.00n/a Date ofCurrentCurrentValuation Selected Brokers Price Target ¹Recommendation ²Price TargetMethodology Deutsche Bank07/28/19Buy$220.00FY21E FCF
STRICTLY CONFIDENTIAL D. Vail Financial Review
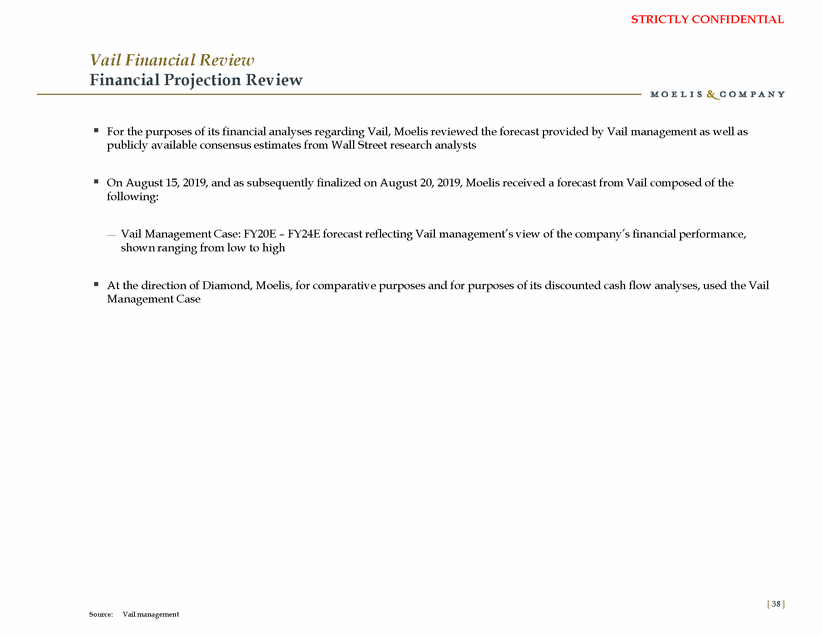
STRICTLY CONFIDENTIAL Vail Financial Review Financial Projection Review For the purposes of its financial analyses regarding Vail, Moelis reviewed the forecast provided by Vail management as well as publicly available consensus estimates from Wall Street research analysts On August 15, 2019, and as subsequently finalized on August 20, 2019, Moelis received a forecast from Vail composed of the following: Vail Management Case: FY20E – FY24E forecast reflecting Vail management’s view of the company’s financial performance, shown ranging from low to high At the direction of Diamond, Moelis, for comparative purposes and for purposes of its discounted cash flow analyses, used the Vail Management Case [ 38 ] Source: Vail management
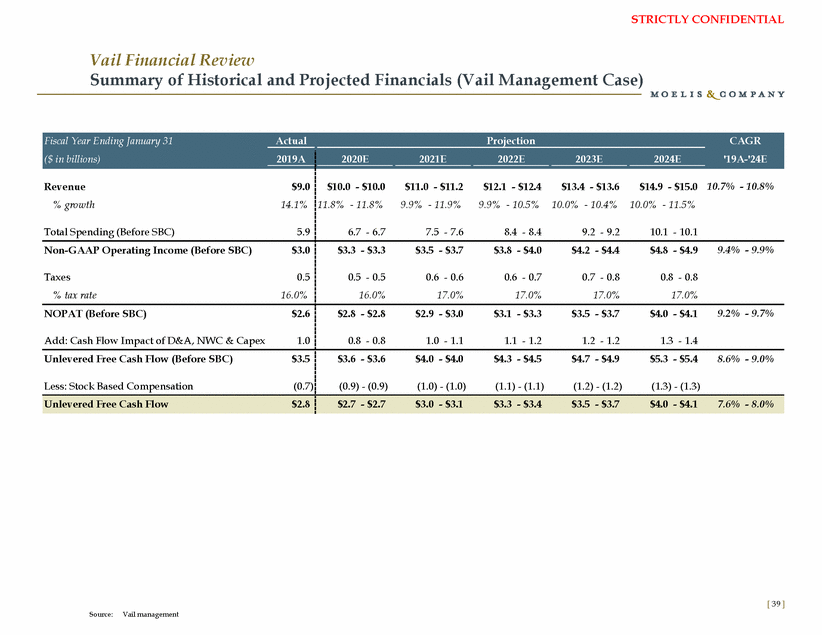
STRICTLY CONFIDENTIAL Vail Financial Review Summary of Historical and Projected Financials (Vail Management Case) [ 39 ] Source: Vail management Fiscal Year Ending January 31 ($ in billions) ActualProjection CAGR '19A-'24E 2019A 2020E2021E2022E2023E2024E Revenue$9.0 % growth14.1% Total Spending (Before SBC)5.9 $10.0 - $10.0$11.0 - $11.2$12.1 - $12.4$13.4 - $13.6$14.9 - $15.0 10.7% - 10.8% 11.8% - 11.8%9.9% - 11.9%9.9% - 10.5%10.0% - 10.4%10.0% - 11.5% 6.7 - 6.77.5 - 7.68.4 - 8.49.2 - 9.210.1 - 10.1 Non-GAAP Operating Income (Before SBC)$3.0 Taxes0.5 % tax rate16.0% $3.3 - $3.3$3.5 - $3.7$3.8 - $4.0$4.2 - $4.4$4.8 - $4.99.4% - 9.9% 0.5 - 0.50.6 - 0.60.6 - 0.70.7 - 0.80.8 - 0.8 16.0%17.0%17.0%17.0%17.0% NOPAT (Before SBC)$2.6 Add: Cash Flow Impact of D&A, NWC & Capex1.0 $2.8 - $2.8$2.9 - $3.0$3.1 - $3.3$3.5 - $3.7$4.0 - $4.19.2% - 9.7% 0.8 - 0.81.0 - 1.11.1 - 1.21.2 - 1.21.3 - 1.4 Unlevered Free Cash Flow (Before SBC)$3.5 Less: Stock Based Compensation(0.7) $3.6 - $3.6$4.0 - $4.0$4.3 - $4.5$4.7 - $4.9$5.3 - $5.48.6% - 9.0% (0.9) - (0.9)(1.0) - (1.0)(1.1) - (1.1)(1.2) - (1.2)(1.3) - (1.3) Unlevered Free Cash Flow$2.8 $2.7 - $2.7$3.0 - $3.1$3.3 - $3.4$3.5 - $3.7$4.0 - $4.17.6% - 8.0%
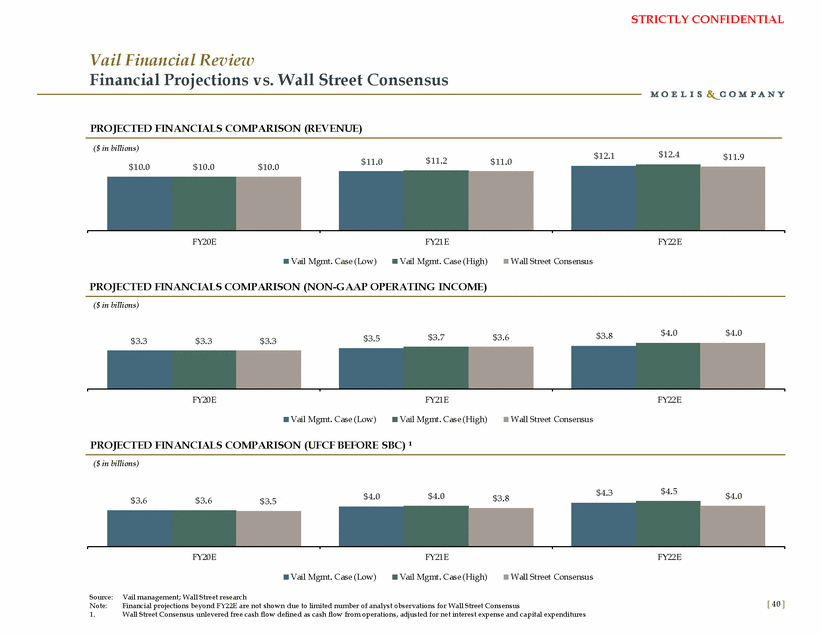
STRICTLY CONFIDENTIAL Vail Financial Review Financial Projections vs. Wall Street Consensus PROJECTED FINANCIALS COMPARISON (REVENUE) ($ in billions) $12.4 $12.1 $11.9 $11.2 $11.0 $11.0 $10.0 $10.0 $10.0 FY20E FY21E FY22E Vail Mgmt. Case (Low) Vail Mgmt. Case (High) Wall Street Consensus PROJECTED FINANCIALS COMPARISON (NON-GAAP OPERATING INCOME) ($ in billions) $4.0 $4.0 $3.8 $3.7 $3.6 $3.5 $3.3 $3.3 $3.3 FY20E FY21E FY22E Vail Mgmt. Case (Low) Vail Mgmt. Case (High) Wall Street Consensus PROJECTED FINANCIALS COMPARISON (UFCF BEFORE SBC) ¹ ($ in billions) $4.5 $4.3 $4.0 $4.0 $4.0 $3.8 $3.6 $3.6 $3.5 FY20E FY21E FY22E Vail Mgmt. Case (Low) Vail Mgmt. Case (High) Wall Street Consensus Source: Note: 1. Vail management; Wall Street research Financial projections beyond FY22E are not shown due to limited number of analyst observations for Wall Street Consensus Wall Street Consensus unlevered free cash flow defined as cash flow from operations, adjusted for net interest expense and ca pital expenditures [ 40 ]
STRICTLY CONFIDENTIAL E. Selected Publicly Traded Companies Analysis
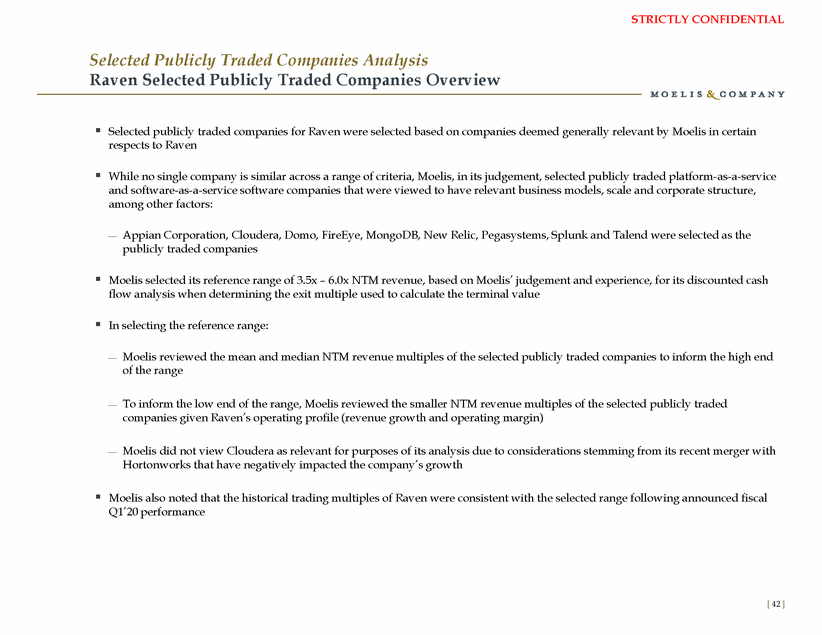
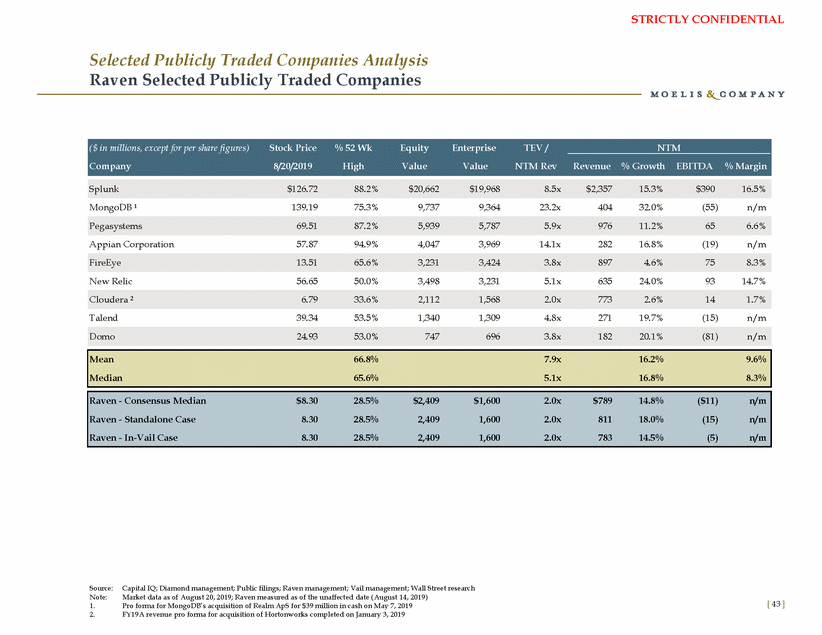
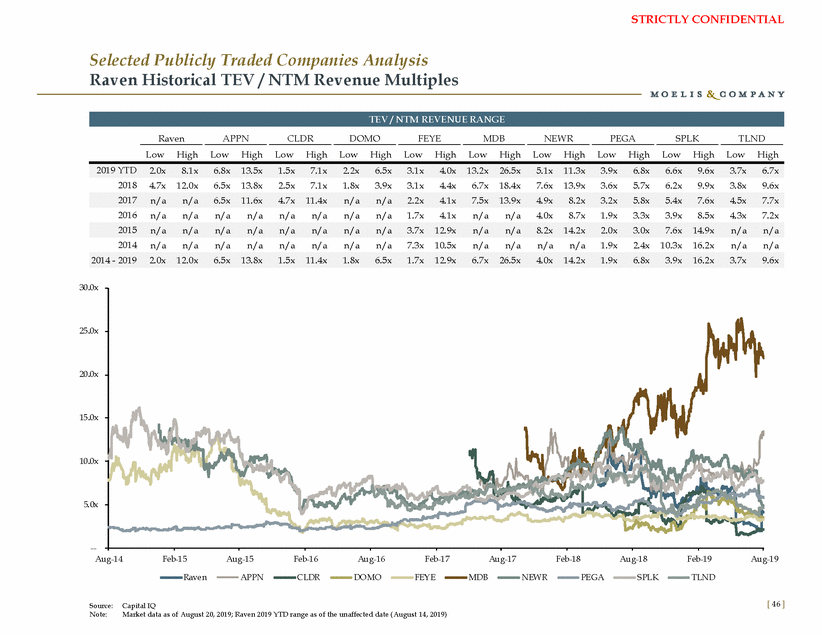
STRICTLY CONFIDENTIAL Selected Publicly Traded Companies Analysis Raven Selected Publicly Traded Companies Overview Selected publicly traded companies for Raven were selected based on companies deemed generally relevant by Moelis in certain respects to Raven While no single company is similar across a range of criteria, Moelis, in its judgement, selected publicly traded platform-as-a-service and software-as-a-service software companies that were viewed to have relevant business models, scale and corporate structure, among other factors: Appian Corporation, Cloudera, Domo, FireEye, MongoDB, New Relic, Pegasystems, Splunk and Talend were selected as the publicly traded companies Moelis selected its reference range of 3.5x – 6.0x NTM revenue, based on Moelis’ judgement and experience, for its discounted cash flow analysis when determining the exit multiple used to calculate the terminal value In selecting the reference range: Moelis reviewed the mean and median NTM revenue multiples of the selected publicly traded companies to inform the high end of the range To inform the low end of the range, Moelis reviewed the smaller NTM revenue multiples of the selected publicly traded companies given Raven’s operating profile (revenue growth and operating margin) Moelis did not view Cloudera as relevant for purposes of its analysis due to considerations stemming from its recent merger with Hortonworks that have negatively impacted the company’s growth Moelis also noted that the historical trading multiples of Raven were consistent with the selected range following announced fiscal Q1’20 performance [ 42 ]
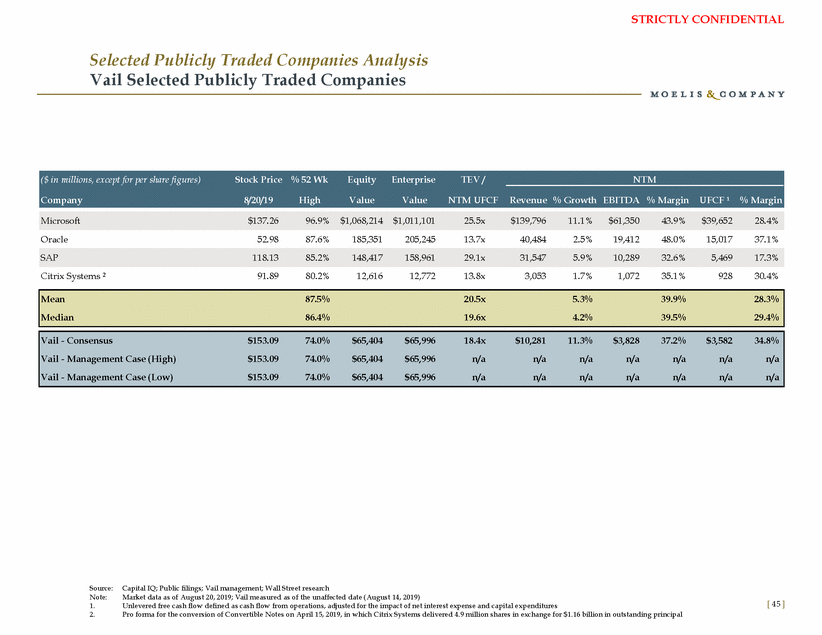
STRICTLY CONFIDENTIAL Selected Publicly Traded Companies Analysis Raven Selected Publicly Traded Companies MongoDB ¹ 139.19 75.3% 9,737 9,364 23.2x 404 32.0% (55) n/m Appian Corporation 57.87 94.9% 4,047 3,969 14.1x 282 16.8% (19) n/m New Relic 56.65 50.0% 3,498 3,231 5.1x 635 24.0% 93 14.7% Talend 39.34 53.5% 1,340 1,309 4.8x 271 19.7% (15) n/m Source: Note: 1. 2. Capital IQ; Diamond management; Public filings; Raven management; Vail management; Wall Street research Market data as of August 20, 2019; Raven measured as of the unaffected date (August 14, 2019) Pro forma for MongoDB’s acquisition of Realm ApS for $39 million in cash on May 7, 2019 FY19A revenue pro forma for acquisition of Hortonworks completed on January 3, 2019 [ 43 ] Mean66.8%7.9x16.2%9.6% Median65.6%5.1x16.8%8.3% Raven - Consensus Median$8.3028.5%$2,409$1,6002.0x$78914.8%($11)n/m Raven - Standalone Case8.3028.5%2,4091,6002.0x81118.0%(15)n/m Raven - In-Vail Case8.3028.5%2,4091,6002.0x78314.5%(5)n/m Domo24.9353.0%7476963.8x18220.1%(81)n/m Cloudera ²6.7933.6%2,1121,5682.0x7732.6%141.7% FireEye13.5165.6%3,2313,4243.8x8974.6%758.3% Pegasystems69.5187.2%5,9395,7875.9x97611.2%656.6% Splunk$126.7288.2%$20,662$19,9688.5x$2,35715.3%$39016.5% ($ in millions, except for per share figures)Stock Price% 52 WkEquityEnterpriseTEV / Company8/20/2019HighValueValueNTM Rev NTM Revenue% GrowthEBITDA% Margin
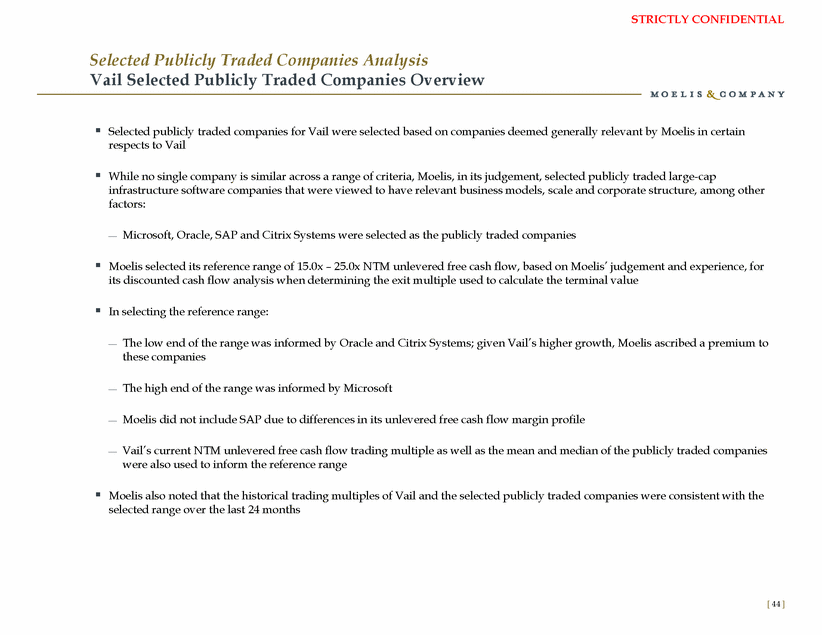
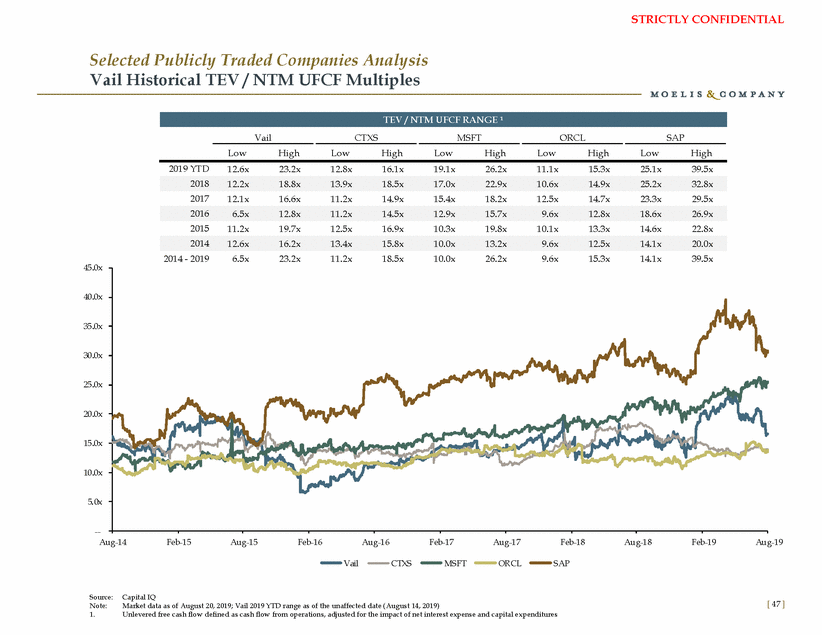
STRICTLY CONFIDENTIAL Selected Publicly Traded Companies Analysis Vail Selected Publicly Traded Companies Overview Selected publicly traded companies for Vail were selected based on companies deemed generally relevant by Moelis in certain respects to Vail While no single company is similar across a range of criteria, Moelis, in its judgement, selected publicly traded large-cap infrastructure software companies that were viewed to have relevant business models, scale and corporate structure, among other factors: Microsoft, Oracle, SAP and Citrix Systems were selected as the publicly traded companies Moelis selected its reference range of 15.0x – 25.0x NTM unlevered free cash flow, based on Moelis’ judgement and experience, for its discounted cash flow analysis when determining the exit multiple used to calculate the terminal value In selecting the reference range: The low end of the range was informed by Oracle and Citrix Systems; given Vail’s higher growth, Moelis ascribed a premium to these companies The high end of the range was informed by Microsoft Moelis did not include SAP due to differences in its unlevered free cash flow margin profile Vail’s current NTM unlevered free cash flow trading multiple as well as the mean and median of the publicly traded companies were also used to inform the reference range Moelis also noted that the historical trading multiples of Vail and the selected publicly traded companies were consistent with the selected range over the last 24 months [ 44 ]
STRICTLY CONFIDENTIAL Selected Publicly Traded Companies Analysis Vail Selected Publicly Traded Companies Oracle 52.98 87.6% 185,351 205,245 13.7x 40,484 2.5% 19,412 48.0% 15,017 37.1% Citrix Systems ² 91.89 80.2% 12,616 12,772 13.8x 3,053 1.7% 1,072 35.1% 928 30.4% Source: Note: 1. 2. Capital IQ; Public filings; Vail management; Wall Street research Market data as of August 20, 2019; Vail measured as of the unaffected date (August 14, 2019) Unlevered free cash flow defined as cash flow from operations, adjusted for the impact of net interest expense and capital ex penditures Pro forma for the conversion of Convertible Notes on April 15, 2019, in which Citrix Systems delivered 4.9 million shares in exchange for $1.16 billion in outstanding principal [ 45 ] Mean87.5%20.5x5.3%39.9%28.3% Median86.4%19.6x4.2%39.5%29.4% Vail - Consensus$153.0974.0%$65,404$65,99618.4x$10,28111.3%$3,82837.2%$3,58234.8% Vail - Management Case (High)$153.0974.0%$65,404$65,996n/an/an/an/an/an/an/a Vail - Management Case (Low)$153.0974.0%$65,404$65,996n/an/an/an/an/an/an/a SAP118.1385.2%148,417158,96129.1x31,5475.9%10,28932.6%5,46917.3% Microsoft$137.2696.9% $1,068,214 $1,011,10125.5x$139,79611.1%$61,35043.9%$39,65228.4% ($ in millions, except for per share figures)Stock Price % 52 WkEquityEnterpriseTEV / Company8/20/19HighValueValueNTM UFCF NTM Revenue % Growth EBITDA % MarginUFCF ¹ % Margin
STRICTLY CONFIDENTIAL Selected Publicly Traded Companies Analysis Raven Historical TEV / NTM Revenue Multiples Raven APPN CLDR DOMO FEYE MDB NEWR PEGA SPLK TLND Low High Low High Low High Low High Low High Low High Low High Low High Low High Low High 2018 4.7x 12.0x 6.5x 13.8x 2.5x 7.1x 1.8x 3.9x 3.1x 4.4x 6.7x 18.4x 7.6x 13.9x 3.6x 5.7x 6.2x 9.9x 3.8x 9.6x 2016 n/a n/a n/a n/a n/a n/a n/a n/a 1.7x 4.1x n/a n/a 4.0x 8.7x 1.9x 3.3x 3.9x 8.5x 4.3x 7.2x 2014 n/a n/a n/a n/a n/a n/a n/a n/a 7.3x 10.5x n/a n/a n/a n/a 1.9x 2.4x 10.3x 16.2x n/a n/a 30.0x 25.0x 20.0x 15.0x 10.0x 5.0x --Aug-14 Feb-15 Aug-15 Feb-16 Aug-16 Feb-17 Aug-17 Feb-18 Aug-18 Feb-19 Aug-19 Rave n APPN CLDR DOMO FEYE MDB NEWR PEGA SPLK TLND [ 46 ] Source: Capital IQ Note: Market data as of August 20, 2019; Raven 2019 YTD range as of the unaffected date (August 14, 2019) 2014 - 20192.0x12.0x6.5x13.8x1.5x11.4x1.8x6.5x1.7x12.9x6.7x26.5x4.0x14.2x1.9x6.8x3.9x16.2x3.7x9.6x 2015n/an/an/an/an/an/an/an/a3.7x12.9xn/an/a8.2x14.2x2.0x3.0x7.6x14.9xn/an/a 2017n/an/a6.5x11.6x4.7x11.4xn/an/a2.2x4.1x7.5x13.9x4.9x8.2x3.2x5.8x5.4x7.6x4.5x7.7x 2019 YTD2.0x8.1x6.8x13.5x1.5x7.1x2.2x6.5x3.1x4.0x13.2x26.5x5.1x11.3x3.9x6.8x6.6x9.6x3.7x6.7x TEV / NTM REVENUE RANGE
STRICTLY CONFIDENTIAL Selected Publicly Traded Companies Analysis Vail Historical TEV / NTM UFCF Multiples Vail CTXS MSFT ORCL SAP Low High Low High Low High Low High Low High 2019 YTD 12.6x 23.2x 12.8x 16.1x 19.1x 26.2x 11.1x 15.3x 25.1x 39.5x 2017 12.1x 16.6x 11.2x 14.9x 15.4x 18.2x 12.5x 14.7x 23.3x 29.5x 2015 11.2x 19.7x 12.5x 16.9x 10.3x 19.8x 10.1x 13.3x 14.6x 22.8x 2014 - 2019 6.5x 23.2x 11.2x 18.5x 10.0x 26.2x 9.6x 15.3x 14.1x 39.5x 45.0x 40.0x 35.0x 30.0x 25.0x 20.0x 15.0x 10.0x 5.0x --Aug-14 Feb-15 Aug-15 Feb-16 Aug-16 Feb-17 Aug-17 Feb-18 Aug-18 Feb-19 Aug-19 Vail CTXS MSFT ORCL SAP Source: Note: 1. Capital IQ Market data as of August 20, 2019; Vail 2019 YTD range as of the unaffected date (August 14, 2019) Unlevered free cash flow defined as cash flow from operations, adjusted for the impact of net interest expense and capital ex penditures [ 47 ] 201412.6x16.2x13.4x15.8x10.0x13.2x9.6x12.5x14.1x20.0x 20166.5x12.8x11.2x14.5x12.9x15.7x9.6x12.8x18.6x26.9x 201812.2x18.8x13.9x18.5x17.0x22.9x10.6x14.9x25.2x32.8x TEV / NTM UFCF RANGE ¹
STRICTLY CONFIDENTIAL Contact Information Moelis & Company LLC 399 Park Ave., 5th Floor New York, NY 10022 Tel: (212) 883-3800 1999 Avenue of the Stars Suite 1900 Los Angeles, CA 90067 Tel: (310) 443-2300 [ 48 ]