SECTION 1 Overview 2 CONFIDENTIAL
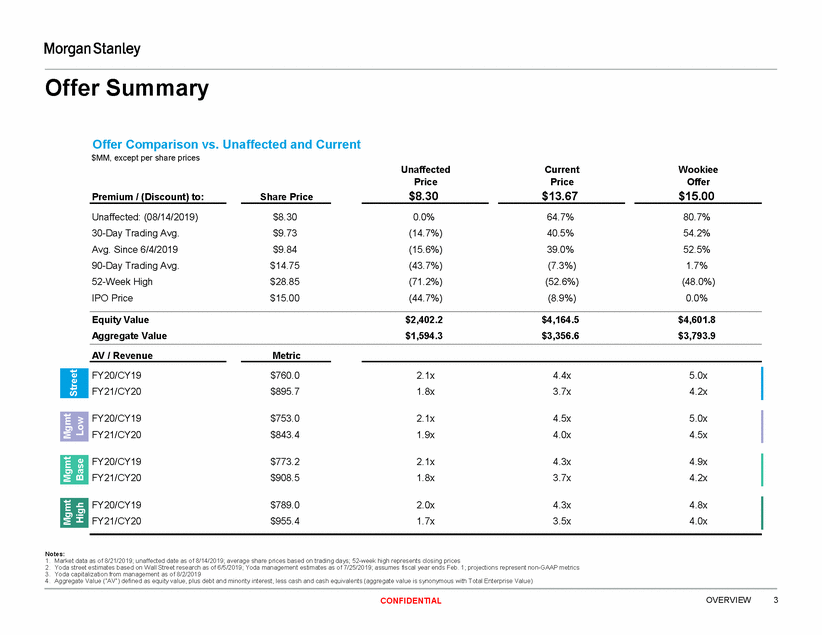
Offer Summary Offer Comparison vs. Unaffected and Current $MM, except per share prices Unaffected Price $8.30 Current Price $13.67 Wookiee Offer $15.00 Premium / (Discount) to: Share Price Unaffected: (08/14/2019) 30-Day Trading Avg. Avg. Since 6/4/2019 90-Day Trading Avg. 52-Week High IPO Price $8.30 $9.73 $9.84 $14.75 $28.85 $15.00 0.0% (14.7%) (15.6%) (43.7%) (71.2%) (44.7%) 64.7% 40.5% 39.0% (7.3%) (52.6%) (8.9%) 80.7% 54.2% 52.5% 1.7% (48.0%) 0.0% Equity Value Aggregate Value $2,402.2 $1,594.3 $4,164.5 $3,356.6 $4,601.8 $3,793.9 AV / Revenue Metric FY20/CY19 FY21/CY20 $760.0 $895.7 2.1x 1.8x 4.4x 3.7x 5.0x 4.2x FY20/CY19 FY21/CY20 $753.0 $843.4 2.1x 1.9x 4.5x 4.0x 5.0x 4.5x FY20/CY19 FY21/CY20 $773.2 $908.5 2.1x 1.8x 4.3x 3.7x 4.9x 4.2x FY20/CY19 FY21/CY20 $789.0 $955.4 2.0x 1.7x 4.3x 3.5x 4.8x 4.0x Notes: 1. Market data as of 8/21/2019; unaffected date as of 8/14/2019; average share prices based on trading days; 52-week high represents closing prices 2. Yoda street estimates based on Wall Street research as of 6/5/2019; Yoda management estimates as of 7/25/2019; assumes fiscal year ends Feb. 1; projections represent non-GAAP metrics 3. Yoda capitalization from management as of 8/2/2019 4. Aggregate Value (“AV”) defined as equity value, plus debt and minority interest, less cash and cash equivalents (aggregate value is synonymous with Total Enterprise Value) OVERVIEW 3 CONFIDENTIAL High Mgmt Mgmt Base Mgmt Low Street
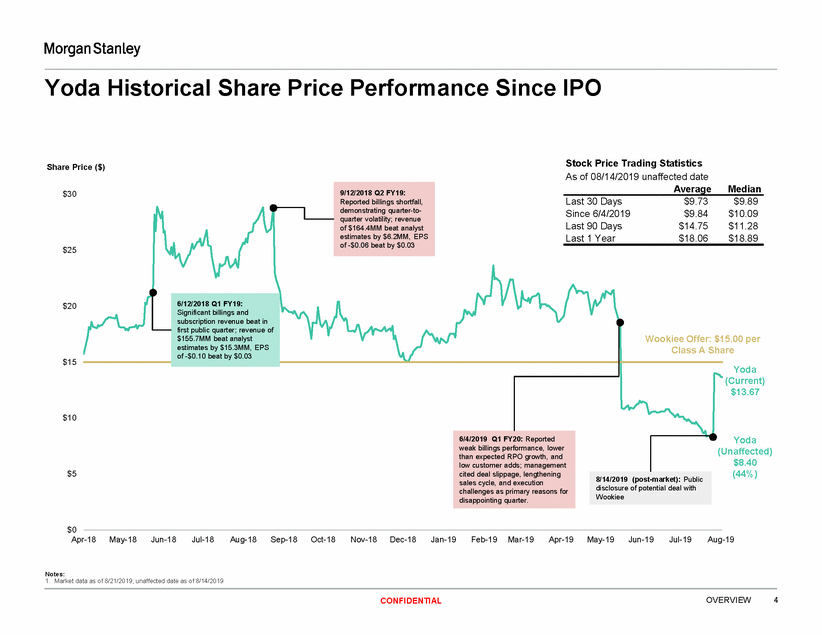
Yoda Historical Share Price Performance Since IPO Stock Price Trading Statistics As of 08/14/2019 unaffected date Average Share Price ($) Median $30 Last 30 Days Since 6/4/2019 Last 90 Days Last 1 Year $9.73 $9.84 $14.75 $18.06 $9.89 $10.09 $11.28 $18.89 $25 $20 $15.00 per are $15 Yoda (Current) $13.67 $10 Yoda (Unaffected) $8.40 (44%) $5 sales cycle, and execution disappointing quarter. $0 Apr-18 May-18 Jun-18 Jul-18 Aug-18 Sep-18 Oct-18 Nov-18 Dec-18 Jan-19 Feb-19 Mar-19 Apr-19 May-19 Jun-19 Jul-19 Aug-19 Notes: 1. Market data as of 8/21/2019; unaffected date as of 8/14/2019 OVERVIEW 4 CONFIDENTIAL 6/12/2018 Q1 FY19: Significant billings and subscription revenue beat in first public quarter; revenue of $155.7MM beat analyst estimates by $15.3MM, EPS of -$0.10 beat by $0.03 Wookiee Offer: Class A Sh 6/4/2019 Q1 FY20: Reported weak billings performance, lower than expected RPO growth, and low customer adds; management cited deal slippage, lengthening challenges as primary reasons for 8/14/2019 (post-market): Public disclosure of potential deal with Wookiee 9/12/2018 Q2 FY19: Reported billings shortfall, demonstrating quarter-to-quarter volatility; revenue of $164.4MM beat analyst estimates by $6.2MM, EPS of -$0.06 beat by $0.03
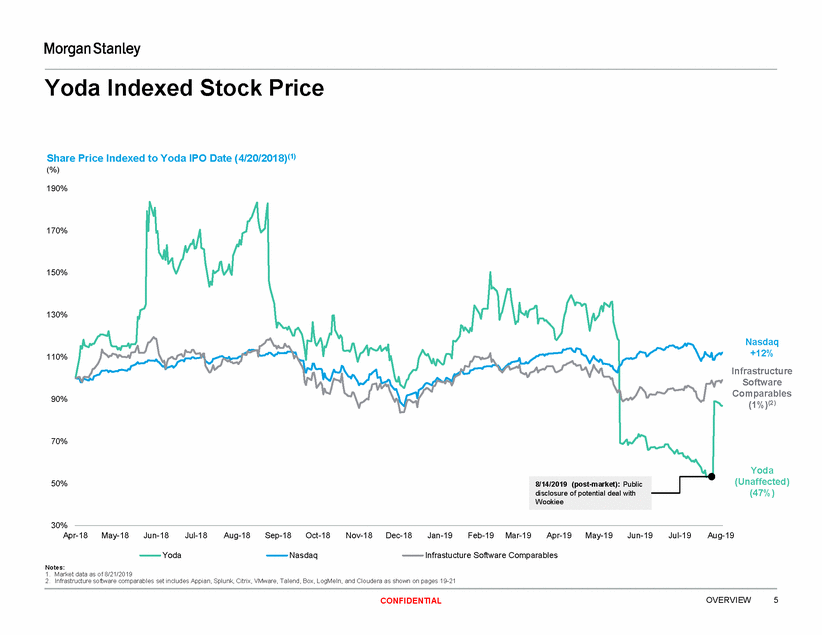
Yoda Indexed Stock Price Share Price Indexed to Yoda IPO Date (4/20/2018)(1) (%) 190% 170% 150% 130% Nasdaq +12% Infrastructure Software Comparables (1%)(2) 110% 90% 70% Yoda (Unaffected) (47%) 50% 30% Apr-18 May-18Jun-18 Jul-18 Aug-18 Sep-18 Oct-18 Nov-18 Dec-18 Jan-19 Feb-19Mar-19 Apr-19 May-19 Jun-19 Jul-19 Aug-19 Yoda Nasdaq Infrastucture Software Comparables Notes: 1. Market data as of 8/21/2019 2. Infrastructure software comparables set includes Appian, Splunk, Citrix, VMware, Talend, Box, LogMeIn, and Cloudera as shown on pages 19-21 OVERVIEW 5 CONFIDENTIAL 8/14/2019 (post-market): Public disclosure of potential deal with Wookiee
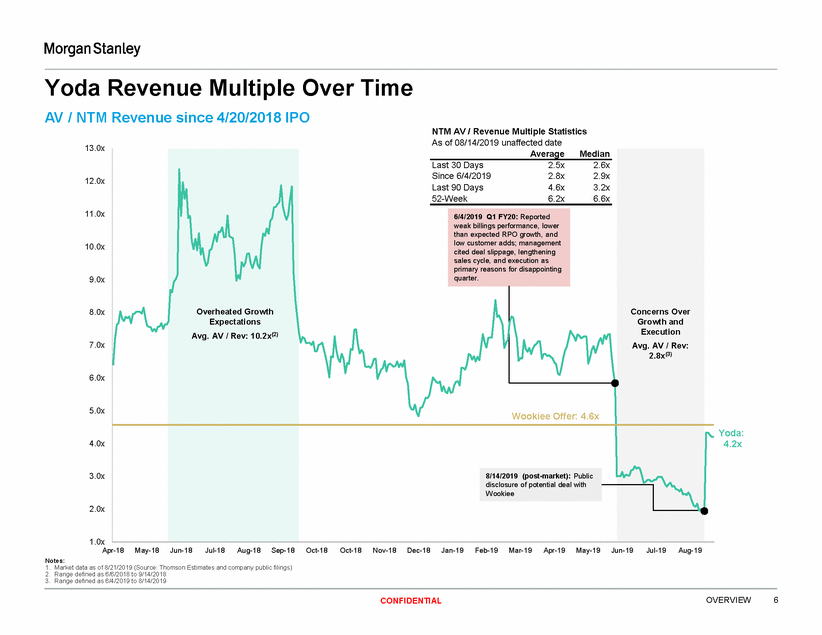
Yoda Revenue Multiple Over AV / NTM Revenue since 4/20/2018 IPO Time NTM AV / Revenue Multiple Statistics As of 08/14/2019 unaffected date 13.0x 12.0x 11.0x 10.0x 9.0x 8.0x 7.0x 6.0x 5.0x Yoda: 4.2x 4.0x 3.0x 2.0x 1.0x Apr-18 May-18Jun-18 Jul-18Aug-18Sep-18Oct-18 Oct-18Nov-18Dec-18Jan-19Feb-19Mar-19Apr-19 May-19 Jun-19 Jul-19Aug-19 Notes: 1. Market data as of 8/21/2019 (Source: Thomson Estimates and company public filings) 2. Range defined as 6/6/2018 to 9/14/2018 3. Range defined as 6/4/2019 to 8/14/2019 OVERVIEW 6 CONFIDENTIAL Overheated Growth Expectations Avg. AV / Rev: 10.2x(2) AverageMedian Last 30 Days 2.5x 2.6x Since 6/4/2019 2.8x 2.9x Last 90 Days 4.6x 3.2x 52-Week 6.2x 6.6x Concerns Over Growth and Execution Avg. AV / Rev: 2.8x(3) 6/4/2019 Q1 FY20: Reported weak billings performance, lower than expected RPO growth, and low customer adds; management cited deal slippage, lengthening sales cycle, and execution as primary reasons for disappointing quarter. Wookiee Offer: 4.6x 8/14/2019 (post-market): Public disclosure of potential deal with Wookiee
SECTION 2 Case Comparison 7 CONFIDENTIAL
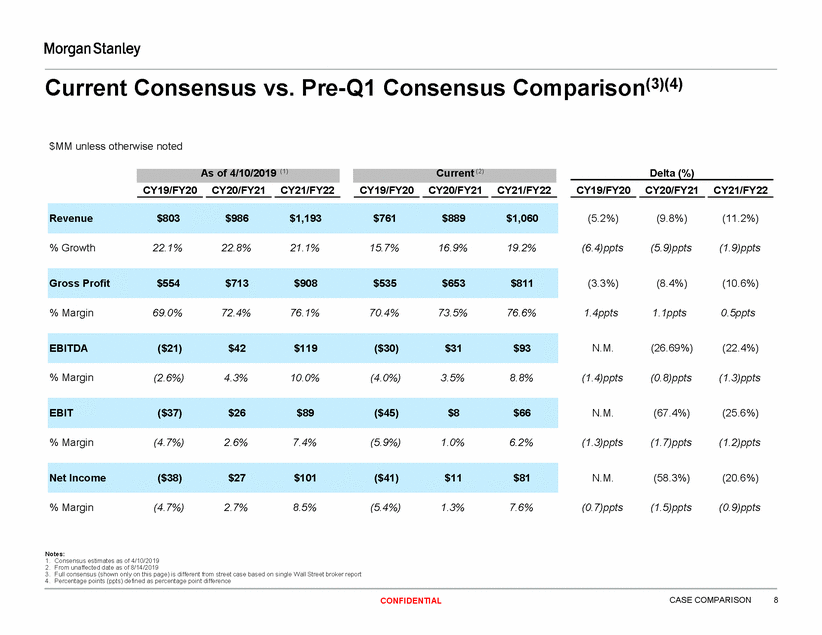
Current Consensus vs. Pre-Q1 Consensus Comparison(3)(4) $MM unless otherwise noted Delta (%) CY19/FY20 CY20/FY21 CY21/FY22 CY19/FY20 CY20/FY21 CY21/FY22 CY19/FY20 CY20/FY21 CY21/FY22 (5.2%) (9.8%) (11.2%) % Growth 22.1% 22.8% 21.1% 15.7% 16.9% 19.2% (6.4)ppts (5.9)ppts (1.9)ppts (3.3%) (8.4%) (10.6%) % Margin 69.0% 72.4% 76.1% 70.4% 73.5% 76.6% 1.4ppts 1.1ppts 0.5ppts N.M. (26.69%) (22.4%) % Margin (2.6%) 4.3% 10.0% (4.0%) 3.5% 8.8% (1.4)ppts (0.8)ppts (1.3)ppts N.M. (67.4%) (25.6%) % Margin (4.7%) 2.6% 7.4% (5.9%) 1.0% 6.2% (1.3)ppts (1.7)ppts (1.2)ppts N.M. (58.3%) (20.6%) % Margin (4.7%) 2.7% 8.5% (5.4%) 1.3% 7.6% (0.7)ppts (1.5)ppts (0.9)ppts Notes: 1. Consensus estimates as of 4/10/2019 2. From unaffected date as of 8/14/2019 3. Full consensus (shown only on this page) is different from street case based on single Wall Street broker report 4. Percentage points (ppts) defined as percentage point difference CASE COMPARISON 8 CONFIDENTIAL Net Income ($38) $27 $101 ($41) $11 $81 EBIT ($37) $26 $89 ($45) $8 $66 EBITDA ($21) $42 $119 ($30) $31 $93 Gross Profit $554 $713 $908 $535 $653 $811 Revenue $803 $986 $1,193 $761 $889 $1,060 Current (2) As of 4/10/2019 (1)
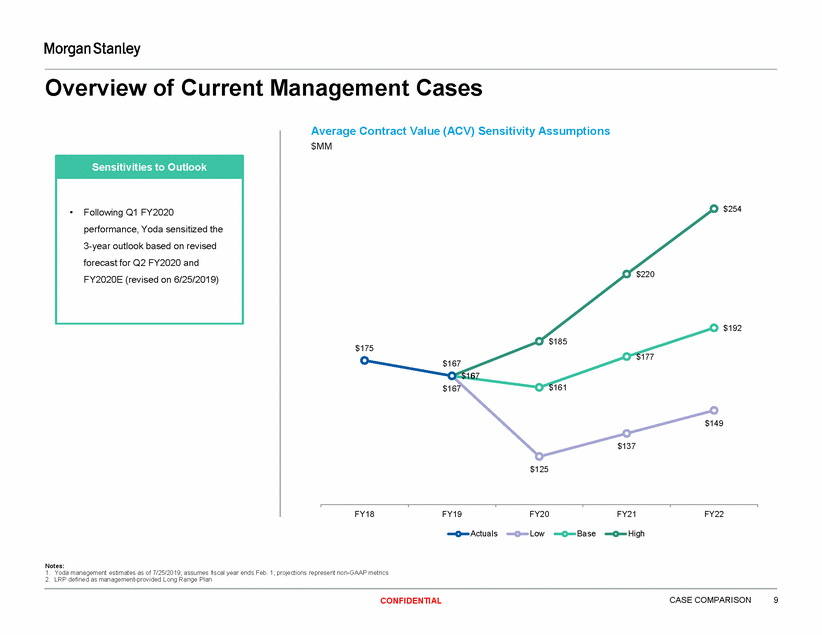
Overview of Current Management Cases Average Contract Value (ACV) Sensitivity Assumptions $MM $254 $220 $192 $185 $175 $177 $167 $167 $161 $167 $149 $137 $125 FY18 FY19 FY20 FY21 FY22 Actuals Low Base High Notes: 1. Yoda management estimates as of 7/25/2019; assumes fiscal year ends Feb. 1; projections represent non-GAAP metrics 2. LRP defined as management-provided Long Range Plan CASE COMPARISON 9 CONFIDENTIAL Sensitivities to Outlook •Following Q1 FY2020 performance, Yoda sensitized the 3-year outlook based on revised forecast for Q2 FY2020 and FY2020E (revised on 6/25/2019)
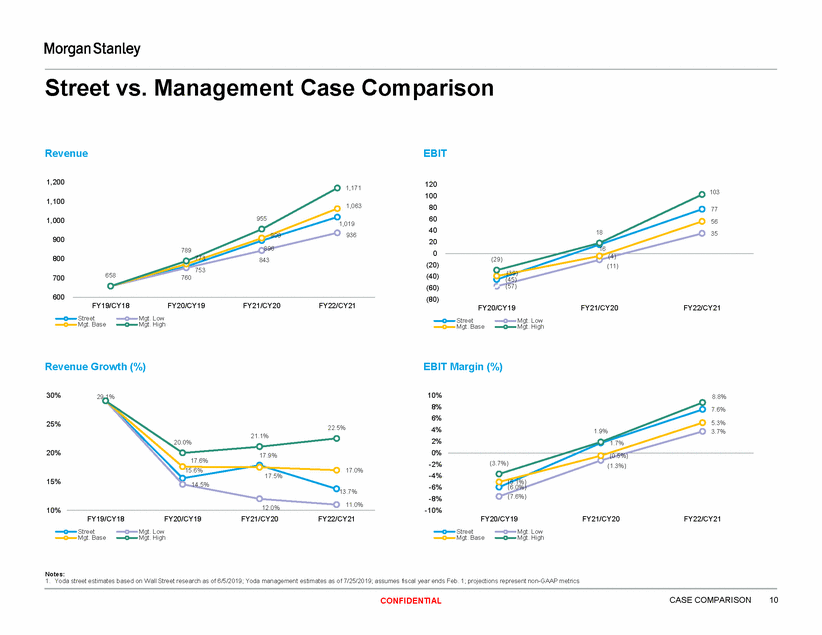
Street vs. Management Case Comparison Revenue EBIT 1,200 120 100 80 60 40 20 0 (20) (40) (60) (80) 1,171 103 1,100 1,063 77 56 35 955 1,000 1,019 936 18 909 900 896 843 16 789 (4) 800 773 753 (29) (11) (39) (45) (57) 658 700 760 600 FY19/CY18 FY20/CY19 FY21/CY20 FY22/CY21 FY20/CY19 FY21/CY20 FY22/CY21 Street Mgt. Base Mgt. Low Mgt. High Street Mgt. Base Mgt. Low Mgt. High Revenue Growth (%) EBIT Margin (%) 30% 10% 8% 6% 4% 2% 0% -2% -4% -6% -8% -10% 29.1% 8.8% 7.6% 25% 5.3% 3.7% 22.5% 1.9% 21.1% 20.0% 1.7% 20% 17.9% (0.5%) 17.6% 15.6% (3.7%) (1.3%) 17.0% 17.5% 15% (5.1%) (6.0%) (7.6%) 14.5% 13.7% 12.0% 11.0% 10% FY19/CY18 FY20/CY19 FY21/CY20 FY22/CY21 FY20/CY19 FY21/CY20 FY22/CY21 Street Mgt. Base Mgt. Low Mgt. High Street Mgt. Base Mgt. Low Mgt. High Notes: 1. Yoda street estimates based on Wall Street research as of 6/5/2019; Yoda management estimates as of 7/25/2019; assumes fiscal year ends Feb. 1; projections represent non-GAAP metrics CASE COMPARISON 10 CONFIDENTIAL
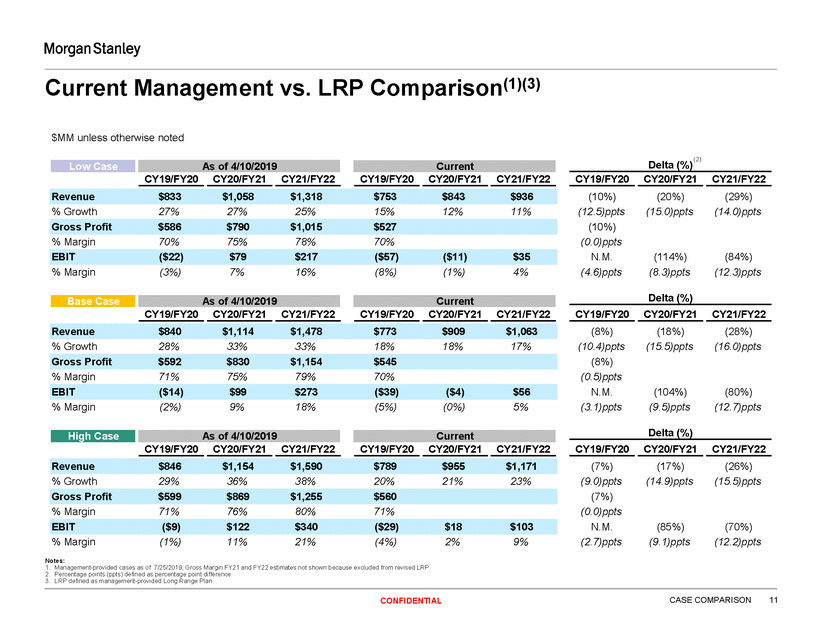
Current Management vs. LRP Comparison(1)(3) $MM unless otherwise noted (2) Delta (%) CY19/FY20 CY20/FY21 CY21/FY22CY19/FY20 CY20/FY21 CY21/FY22 CY19/FY20 CY20/FY21 CY21/FY22 (10%) (12.5)ppts (10%) (0.0)ppts N.M. (4.6)ppts (20%) (15.0)ppts (29%) (14.0)ppts % Growth 27% 27% 25% 15% 12% 11% % Margin 70% 75% 78% 70% (114%) (8.3)ppts (84%) (12.3)ppts % Margin (3%) 7% 16% (8%) (1%) 4% Delta (%) CY19/FY20 CY20/FY21 CY21/FY22 CY19/FY20 CY20/FY21 CY21/FY22 CY19/FY20 CY20/FY21 CY21/FY22 (8%) (10.4)ppts (8%) (0.5)ppts N.M. (3.1)ppts (18%) (15.5)ppts (28%) (16.0)ppts % Growth 28% 33% 33% 18% 18% 17% % Margin 71% 75% 79% 70% (104%) (9.5)ppts (80%) (12.7)ppts % Margin (2%) 9% 18% (5%) (0%) 5% Delta (%) CY19/FY20 CY20/FY21 CY21/FY22 CY19/FY20 CY20/FY21 CY21/FY22 CY19/FY20 CY20/FY21 CY21/FY22 (7%) (9.0)ppts (7%) (0.0)ppts N.M. (2.7)ppts (17%) (14.9)ppts (26%) (15.5)ppts % Growth 29% 36% 38% 20% 21% 23% % Margin 71% 76% 80% 71% (85%) (9.1)ppts (70%) (12.2)ppts % Margin Notes: (1%) 11% 21% (4%) 2% 9% 1. Management-provided cases as of 7/25/2019; Gross Margin FY21 and FY22 estimates not shown because excluded from revised LRP 2. Percentage points (ppts) defined as percentage point difference 3. LRP defined as management-provided Long Range Plan CASE COMPARISON 11 CONFIDENTIAL EBIT($9)$122$340($29)$18$103 Gross Profit$599$869$1,255$560 Revenue$846$1,154$1,590$789$955$1,171 Current High Case As of 4/10/2019 EBIT($14)$99$273($39)($4)$56 Gross Profit$592$830$1,154$545 Revenue$840$1,114$1,478$773$909$1,063 Current Base Case As of 4/10/2019 EBIT($22)$79$217($57)($11)$35 Gross Profit$586$790$1,015$527 Revenue$833$1,058$1,318$753$843$936 Current Low Case As of 4/10/2019
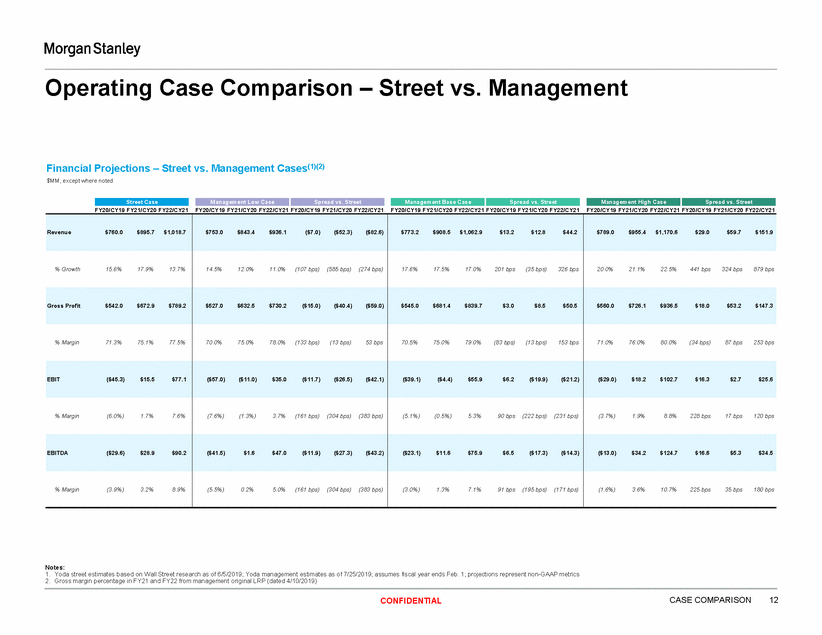
Operating Case Comparison – Street vs. Management Financial Projections – Street vs. Management Cases(1)(2) $MM, except where noted FY20/CY19 FY21/CY20 FY22/CY21 FY20/CY19 FY21/CY20 FY22/CY21 FY20/CY19 FY21/CY20 FY22/CY21 FY20/CY19 FY21/CY20 FY22/CY21 FY20/CY19 FY21/CY20 FY22/CY21 FY20/CY19 FY21/CY20 FY22/CY21 FY20/CY19 FY21/CY20 FY22/CY21 Notes: 1. Yoda street estimates based on Wall Street research as of 6/5/2019; Yoda management estimates as of 7/25/2019; assumes fiscal year ends Feb. 1; projections represent non-GAAP metrics 2. Gross margin percentage in FY21 and FY22 from management original LRP (dated 4/10/2019) CASE COMPARISON 12 CONFIDENTIAL Revenue $760.0 $895.7 $1,018.7 $753.0 $843.4 $936.1 ($7.0) ($52.3) ($82.6) $773.2 $908.5 $1,062.9 $13.2 $12.8 $44.2 $789.0 $955.4 $1,170.6 $29.0 $59.7 $151.9 % Growth 15.6% 17.9% 13.7% 14.5% 12.0% 11.0% (107 bps) (585 bps) (274 bps) 17.6% 17.5% 17.0% 201 bps (35 bps) 326 bps 20.0% 21.1% 22.5% 441 bps 324 bps 879 bps Gross Profit $542.0 $672.9 $789.2 $527.0 $632.5 $730.2 ($15.0) ($40.4) ($59.0) $545.0 $681.4 $839.7 $3.0 $8.5 $50.5 $560.0 $726.1 $936.5 $18.0 $53.2 $147.3 % Margin 71.3% 75.1% 77.5% 70.0% 75.0% 78.0% (133 bps) (13 bps) 53 bps 70.5% 75.0% 79.0% (83 bps) (13 bps) 153 bps 71.0% 76.0% 80.0% (34 bps) 87 bps 253 bps EBIT ($45.3) $15.5 $77.1 ($57.0) ($11.0) $35.0 ($11.7) ($26.5) ($42.1) ($39.1) ($4.4) $55.9 $6.2 ($19.9) ($21.2) ($29.0) $18.2 $102.7 $16.3 $2.7 $25.6 % Margin (6.0%) 1.7% 7.6% (7.6%) (1.3%) 3.7% (161 bps) (304 bps) (383 bps) (5.1%) (0.5%) 5.3% 90 bps (222 bps) (231 bps) (3.7%) 1.9% 8.8% 228 bps 17 bps 120 bps EBITDA ($29.6) $28.9 $90.2 ($41.5) $1.6 $47.0 ($11.9) ($27.3) ($43.2) ($23.1) $11.6 $75.9 $6.5 ($17.3) ($14.3) ($13.0) $34.2 $124.7 $16.6 $5.3 $34.5 % Margin (3.9%) 3.2% 8.9% (5.5%) 0.2% 5.0% (161 bps) (304 bps) (383 bps) (3.0%) 1.3% 7.1% 91 bps (195 bps) (171 bps) (1.6%) 3.6% 10.7% 225 bps 35 bps 180 bps Management High Case Spread vs. Street Management Base Case Spread vs. Street Management Low Case Spread vs. Street Street Case
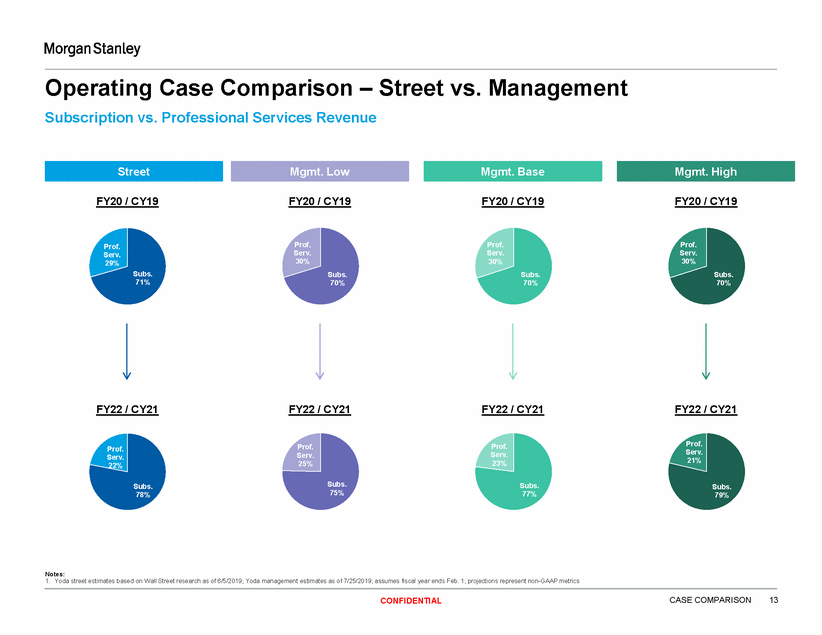
Operating Case Comparison – Street Subscription vs. Professional Services Revenue vs. Management FY20 / CY19 FY20 / CY19 FY20 / CY19 FY20 / CY19 Prof. Serv. 30% Prof. Serv. 30% Prof. Serv. 30% Prof. Serv. 29% Subs. 71% Subs. 70% Subs. 70% Subs. 70% FY22 / CY21 FY22 / CY21 FY22 / CY21 FY22 / CY21 Prof. Serv. 21% Prof. Serv. 23% Prof. Serv. 25% Prof. Serv. 22% Subs. 75% Subs. 77% Subs. 78% Subs. 79% Notes: 1. Yoda street estimates based on Wall Street research as of 6/5/2019; Yoda management estimates as of 7/25/2019; assumes fiscal year ends Feb. 1; projections represent non-GAAP metrics CASE COMPARISON 13 CONFIDENTIAL Mgmt. High Mgmt. Base Mgmt. Low Street

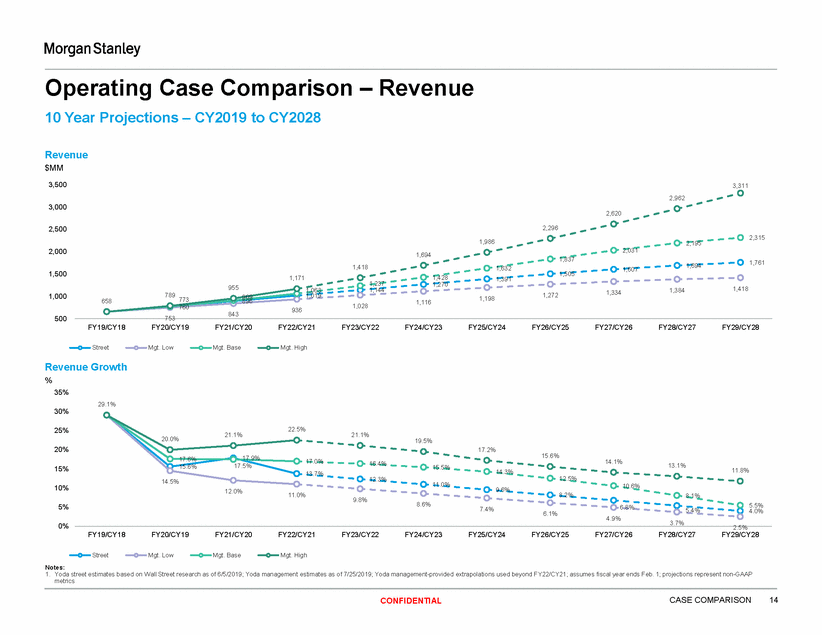
Operating Case Comparison 10 Year Projections – CY2019 to CY2028 – Revenue Revenue $MM 3,500 3,311 2,962 3,000 2,620 2,296 2,500 2,315 1,986 2,195 2,000 2,031 1,761 1,694 1,418 1,632 1,607 1,500 1,171 1,428 1,391 955 1,418 84 1,334 1,000 789 1,019 1,272 909 1,198 773 760 658 896 1,116 1,028 936 753 843 500 FY19/CY18 FY20/CY19 FY21/CY20 FY22/CY21 FY23/CY22 FY24/CY23 FY25/CY24 FY26/CY25 FY27/CY26 FY28/CY27 FY29/CY28 Street Mgt. Low Mgt. Base Mgt. High Revenue Growth % 35% 29.1% 30% 22.5% 25% 21.1% 21.1% 20.0% 19.5% 20% 17.2% 15.6% 17.9% 17.5% 17.6% 15.6% 17.0% 14.1% 16.4% 13.1% 15.5% 15% 11.8% 14.3% 13.7% 12.3% 14.5% 11.0% 10.6% 10% 9.6% 12.0% 11.0% 8.2% 8.1% 9.8% 8.6% 5.5% 4.0% 5% 6.8% 7.4% 5.4% 6.1% 4.9% 3.7% 0% 2.5% FY19/CY18 FY20/CY19 FY21/CY20 FY22/CY21 FY23/CY22 FY24/CY23 FY25/CY24 FY26/CY25 FY27/CY26 FY28/CY27 FY29/CY28 Street Mgt. Low Mgt. Base Mgt. High Notes: 1. Yoda street estimates based on Wall Street research as of 6/5/2019; Yoda management estimates as of 7/25/2019; Yoda management-provided extrapolations used beyond FY22/CY21; assumes fiscal year ends Feb. 1; projections represent non-GAAP metrics CASE COMPARISON 14 CONFIDENTIAL 12.5% 1,694 1,837 1,505 1,237 1,270 1,3 1,063 1,144
Operating Case Comparison 10 Year Projections – CY2019 to CY2028 – EBITDA EBITDA $MM 1,000 891 791 800 661 533 600 592 419 404 446 338 400 305 389 292 312 331 246 203 222 172 275 200 125 140 221 157 200 34 116 90 -13 76 79 29 2 12 47 0 -342023 FY20/CY19 FY21/CY20 FY22/CY21 FY23/CY22 FY24/CY23 FY25/CY24 FY26/CY25 FY27/CY26 FY28/CY27 FY29/CY28 (200) Street Mgt. Low Mgt. Base Mgt. High EBITDA Margin % 30% 26.9% 26.7% 25.6% 25.3% 23.2% 25.2% 25.5% 25% 21.1% 8% 20% 19.1% 18.3% 15% 10.7% 11.3% 13.6% 11.2% 10% 3.6% 5% 7.7% 3.2% 1.3% (1.6%) 5.0% 0% FY20/CY19 FY21/CY20 FY22/CY21 FY23/CY22 FY24/CY23 FY25/CY24 FY26/CY25 FY27/CY26 FY28/CY27 FY29/CY28 (3.90%) 0.2% -5% (5.5%) -10% Street Mgt. Low Mgt. Base Mgt. High Notes: 1. Yoda street estimates based on Wall Street research as of 6/5/2019; Yoda management estimates as of 7/25/2019; Yoda management-provided extrapolations used beyond FY22/CY21; assumes fiscal year ends Feb. 1; projections represent non-GAAP metrics CASE COMPARISON 15 CONFIDENTIAL 24.1% 23.0% 22.0% 18.0% 20.6% 23. 14.3% 21.1% 15.6% 15.9% 18.4% 15.8% 8.9% 13.1% 7.1% 10.4% 128 489 560
SECTION 3 Valuation Analysis 16 CONFIDENTIAL
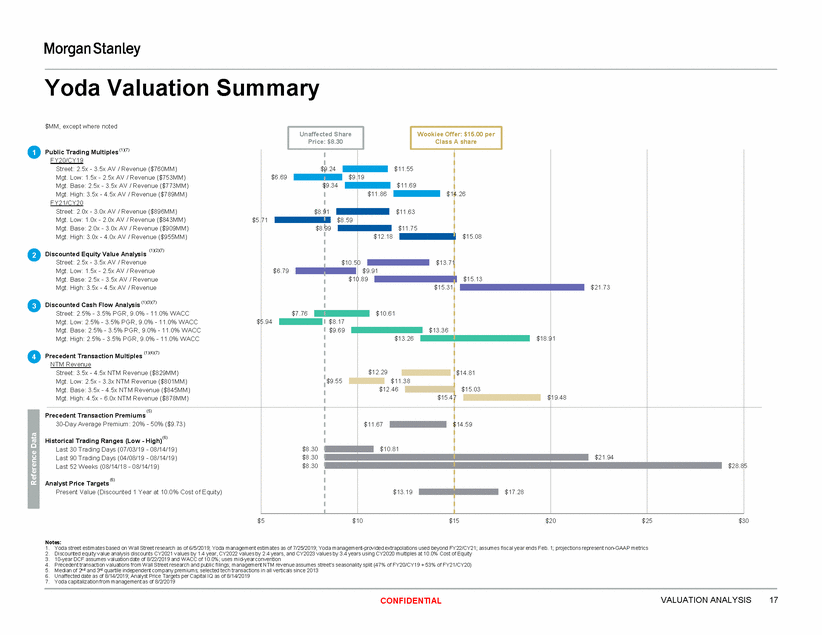
Yoda Valuation Summary $MM, except where noted Public Trading Multiples (1)(7) 1 $9.24 $11.86 $14.26 $11.63 $8.59 $11.75 Discounted Equity Value Analysis 2 50 $6.79 1 .89 Discounted Cash Flow Analysis 3 $5.94 Precedent Transaction Multiples 4 2.29 47 Precedent Transaction Premiums Historical Trading Ranges (Low - High) Analyst Price Targets $5 $10 $15 $20 $25 $30 Notes: 1. Yoda street estimates based on Wall Street research as of 6/5/2019; Yoda management estimates as of 7/25/2019; Yoda management-provided extrapolations used beyond FY22/CY21; assumes fiscal year ends Feb. 1; projections represent non-GAAP metrics 2. Discounted equity value analysis discounts CY2021 values by 1.4 year, CY2022 values by 2.4 years, and CY2023 values by 3.4 years using CY2020 multiples at 10.0% Cost of Equity 3. 10-year DCF assumes valuation date of 8/22/2019 and WACC of 10.0%; uses mid-year convention 4. Precedent transaction valuations from Wall Street research and public filings; management NTM revenue assumes street’s seasonality split (47% of FY20/CY19 + 53% of FY21/CY20) 5. Median of 2nd and 3rd quartile independent company premiums; selected tech transactions in all verticals since 2013 6. Unaffected date as of 8/14/2019; Analyst Price Targets per Capital IQ as of 8/14/2019 7. Yoda capitalization from management as of 8/2/2019 VALUATION ANALYSIS 17 CONFIDENTIAL Reference Data Unaffected Share Price: $8.30 $1 $ $12.18 Wookiee Offer: $15.00 per Class A share FY20/CY19 Street: 2.5x - 3.5x AV / Revenue ($760MM) Mgt. Low: 1.5x - 2.5x AV / Revenue ($753MM) Mgt. Base: 2.5x - 3.5x AV / Revenue ($773MM) Mgt. High: 3.5x - 4.5x AV / Revenue ($789MM) FY21/CY20 Street: 2.0x - 3.0x AV / Revenue ($896MM) Mgt. Low: 1.0x - 2.0x AV / Revenue ($843MM) $5. Mgt. Base: 2.0x - 3.0x AV / Revenue ($909MM) Mgt. High: 3.0x - 4.0x AV / Revenue ($955MM) (1)(2)(7) Street: 2.5x - 3.5x AV / Revenue Mgt. Low: 1.5x - 2.5x AV / Revenue Mgt. Base: 2.5x - 3.5x AV / Revenue Mgt. High: 3.5x - 4.5x AV / Revenue (1)(3)(7) Street: 2.5% - 3.5% PGR, 9.0% - 11.0% WACC Mgt. Low: 2.5% - 3.5% PGR, 9.0% - 11.0% WACC Mgt. Base: 2.5% - 3.5% PGR, 9.0% - 11.0% WACC Mgt. High: 2.5% - 3.5% PGR, 9.0% - 11.0% WACC (1)(4)(7) NTM Revenue Street: 3.5x - 4.5x NTM Revenue ($829MM) Mgt. Low: 2.5x - 3.3x NTM Revenue ($801MM) Mgt. Base: 3.5x - 4.5x NTM Revenue ($845MM) Mgt. High: 4.5x - 6.0x NTM Revenue ($878MM) $ 71 6.69 1.55 11.69 $15.08 $15.13 $21.73 $9.19 $ $8.9 9.34 1 99 $ $8. $10. $9.9 $13.71 7.76 $10 $10.61 $13. $11.3 $12.46 26 8 $15.31 $13.36 $18.9 $ 1 19.48 $8.17 $9.69 $1 $9.55 $14.81 $15.03 $15. (5) 30-Day Average Premium: 20% - 50% ($9.73) (6) Last 30 Trading Days (07/03/19 - 08/14/19) Last 90 Trading Days (04/08/19 - 08/14/19) Last 52 Weeks (08/14/18 - 08/14/19) (6) Present Value (Discounted 1 Year at 10.0% Cost of Equity) $8.30 $8.30 $8.30 $11. 67 $10.81 $14.59 $21.94 $28.8 5 $13.19 $17.28
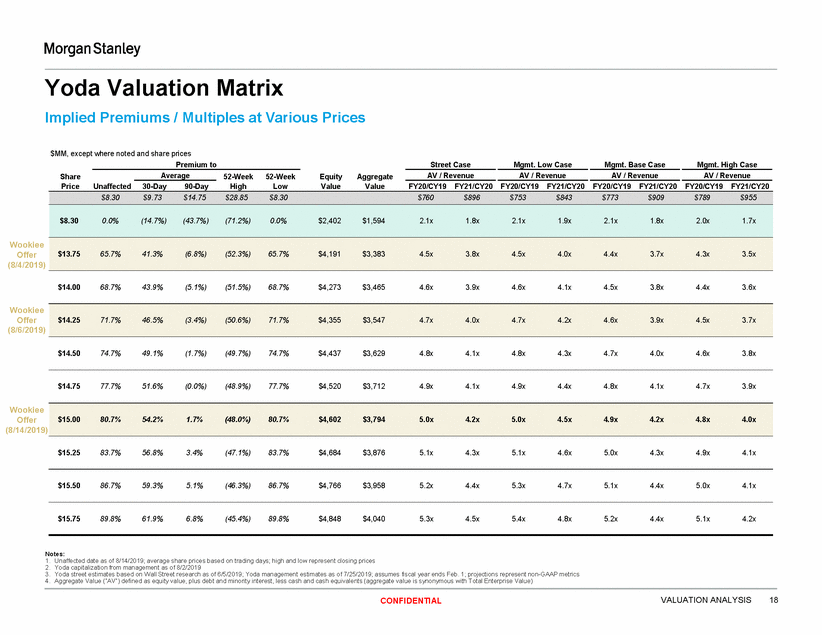
Yoda Valuation Matrix Implied Premiums / Multiples at Various Prices $MM, except where noted and share prices Premium to Street Case Mgmt. Low Case Mgmt. Base Case Mgmt. High Case Average AV / Revenue AV / Revenue AV / Revenue AV / Revenue Share Price 52-Week High 52-Week Low Equity Value Aggregate Value Unaffected 30-Day 90-Day FY20/CY19 FY21/CY20 FY20/CY19 FY21/CY20 FY20/CY19 FY21/CY20 FY20/CY19 FY21/CY20 Wookiee Offer (8/4/2019) $14.00 68.7% 43.9% (5.1%) (51.5%) 68.7% $4,273 $3,465 4.6x 3.9x 4.6x 4.1x 4.5x 3.8x 4.4x 3.6x Wookiee Offer (8/6/2019) $14.50 74.7% 49.1% (1.7%) (49.7%) 74.7% $4,437 $3,629 4.8x 4.1x 4.8x 4.3x 4.7x 4.0x 4.6x 3.8x $14.75 77.7% 51.6% (0.0%) (48.9%) 77.7% $4,520 $3,712 4.9x 4.1x 4.9x 4.4x 4.8x 4.1x 4.7x 3.9x Wookiee Offer (8/14/2019) $15.25 83.7% 56.8% 3.4% (47.1%) 83.7% $4,684 $3,876 5.1x 4.3x 5.1x 4.6x 5.0x 4.3x 4.9x 4.1x $15.50 86.7% 59.3% 5.1% (46.3%) 86.7% $4,766 $3,958 5.2x 4.4x 5.3x 4.7x 5.1x 4.4x 5.0x 4.1x $15.75 89.8% 61.9% 6.8% (45.4%) 89.8% $4,848 $4,040 5.3x 4.5x 5.4x 4.8x 5.2x 4.4x 5.1x 4.2x Notes: 1. Unaffected date as of 8/14/2019; average share prices based on trading days; high and low represent closing prices 2. Yoda capitalization from management as of 8/2/2019 3. Yoda street estimates based on Wall Street research as of 6/5/2019; Yoda management estimates as of 7/25/2019; assumes fiscal year ends Feb. 1; projections represent non-GAAP metrics 4. Aggregate Value (“AV”) defined as equity value, plus debt and minority interest, less cash and cash equivalents (aggregate value is synonymous with Total Enterprise Value) VALUATION ANALYSIS 18 CONFIDENTIAL $15.00 80.7% 54.2% 1.7% (48.0%) 80.7% $4,602 $3,794 5.0x 4.2x 5.0x 4.5x 4.9x 4.2x 4.8x 4.0x $14.25 71.7% 46.5% (3.4%) (50.6%) 71.7% $4,355 $3,547 4.7x 4.0x 4.7x 4.2x 4.6x 3.9x 4.5x 3.7x $8.30 $9.73 $14.75 $28.85 $8.30 $760 $896 $753 $843 $773 $909 $789 $955 $8.30 0.0% (14.7%) (43.7%) (71.2%) 0.0% $2,402 $1,594 2.1x 1.8x 2.1x 1.9x 2.1x 1.8x 2.0x 1.7x $13.75 65.7% 41.3% (6.8%) (52.3%) 65.7% $4,191 $3,383 4.5x 3.8x 4.5x 4.0x 4.4x 3.7x 4.3x 3.5x
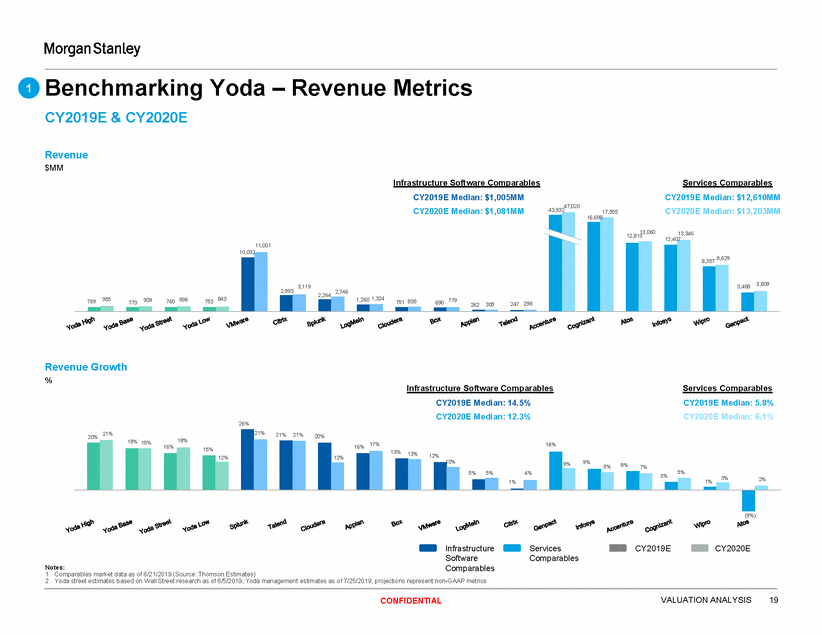
Benchmarking CY2019E & CY2020E Yoda – Revenue Metrics 1 Revenue $MM Infrastructure Software Comparables Services Comparables CY2019E Median: $1,005MM CY2020E Median: $1,081MM CY2019E Median: $12,610MM CY2020E Median: $13,203MM 47,020 43,932 17,555 16,689 13,060 12,813 13,346 12,407 8,357 8,629 3,809 3,488 Revenue Growth % Infrastructure Software Comparables Services Comparables CY2019E Median: 14.5% CY2020E Median: 12.3% CY2019E Median: 5.8% CY2020E Median: 6.1% 26% 21% 21% 21% 20% 18% 18% 18% 16% 17% 16% 9% 9% 8% 8% 7% 5% 3% 3% 2% 1% (9%) Infrastructure Software Comparables Services Comparables CY2019E CY2020E Notes: 1. Comparables market data as of 8/21/2019 (Source: Thomson Estimates) 2. Yoda street estimates based on Wall Street research as of 6/5/2019; Yoda management estimates as of 7/25/2019; projections represent non-GAAP metrics VALUATION ANALYSIS 19 CONFIDENTIAL 20% 21% 16%15% 12% 12% 13% 13%12% 10% 5% 5%4% 1% 11,001 10,032 3,119 2,264 2,746 262 305247 298 2,993 789 955773 909760 896753 8431,260 1,324751 838690 779
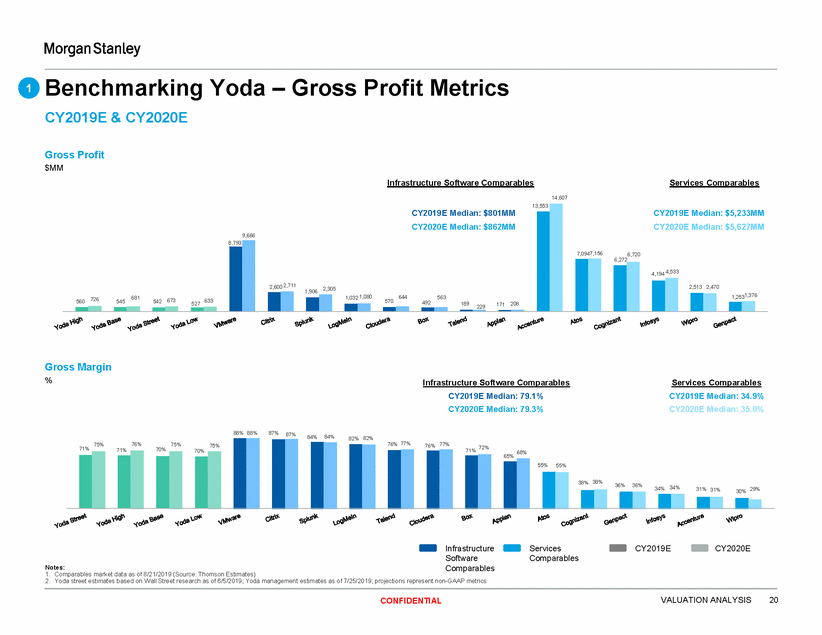
Benchmarking CY2019E & CY2020E Yoda – Gross Profit Metrics 1 Gross Profit $MM Infrastructure Software Comparables Services Comparables 14,607 13,553 CY2019E Median: $5,233MM CY2020E Median: $5,627MM 7,0947,156 6,720 6,272 4,194 4,533 2,513 2,470 1,2531,376 Gross Margin % Infrastructure Software Comparables Services Comparables CY2019E Median: 79.1% CY2020E Median: 79.3% CY2019E Median: 34.9% CY2020E Median: 35.0% 88% 88%87% 87% 84% 84% 82% 82% 76% 77% 76% 77% 71% 72% 65% 68% 55% 55% 38% 38% 36% 36% 34% 34% 31% 31% 30% 29% Infrastructure Software Comparables Services Comparables CY2019E CY2020E Notes: 1. Comparables market data as of 8/21/2019 (Source: Thomson Estimates) 2. Yoda street estimates based on Wall Street research as of 6/5/2019; Yoda management estimates as of 7/25/2019; projections represent non-GAAP metrics VALUATION ANALYSIS 20 CONFIDENTIAL 75%76%75%75% 71%71%70%70% CY2019E Median: $801MM CY2020E Median: $862MM 9,666 8,793 2,600 2,711 6811,032 1,080644563 229171 1,906 2,305 560 726545542 673527 633570492189208
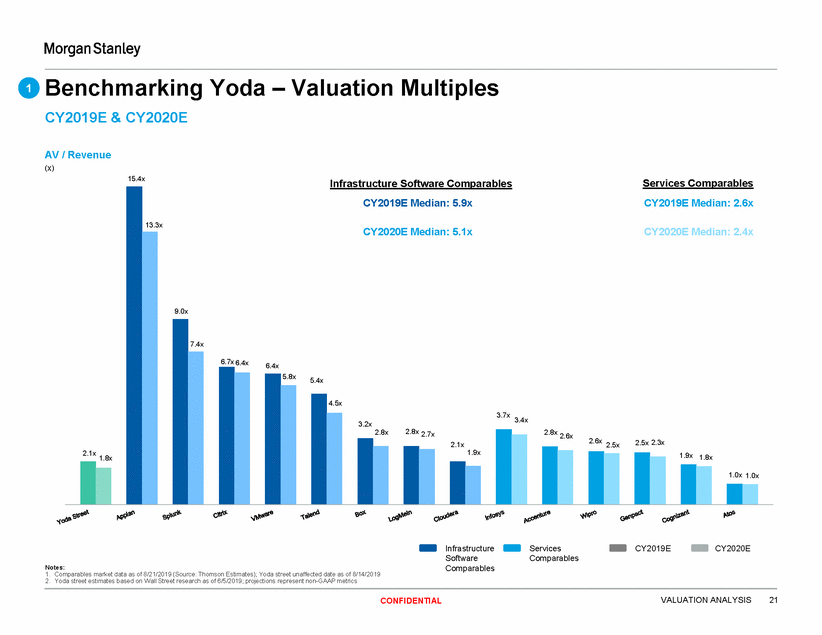
Benchmarking CY2019E & CY2020E Yoda – Valuation Multiples 1 AV / Revenue (x) 15.4x Infrastructure Software Comparables Services Comparables CY2019E Median: 5.9x CY2019E Median: 2.6x 13.3x CY2020E Median: 5.1x CY2020E Median: 2.4x 9.0x 7.4x 6.7x 6.4x 6.4x 5.8x 5.4x 4.5x 3.7x 3.4x 3.2x 2.8x 2.6x 2.6x 2.5x 2.5x 2.3x 1.9x 1.8x 1.0x 1.0x Infrastructure Software Comparables Services Comparables CY2019E CY2020E Notes: 1. Comparables market data as of 8/21/2019 (Source: Thomson Estimates); Yoda street unaffected date as of 8/14/2019 2. Yoda street estimates based on Wall Street research as of 6/5/2019; projections represent non-GAAP metrics VALUATION ANALYSIS 21 CONFIDENTIAL 2.1x 1.8x 2.8x2.8x 2.7x 2.1x 1.9x
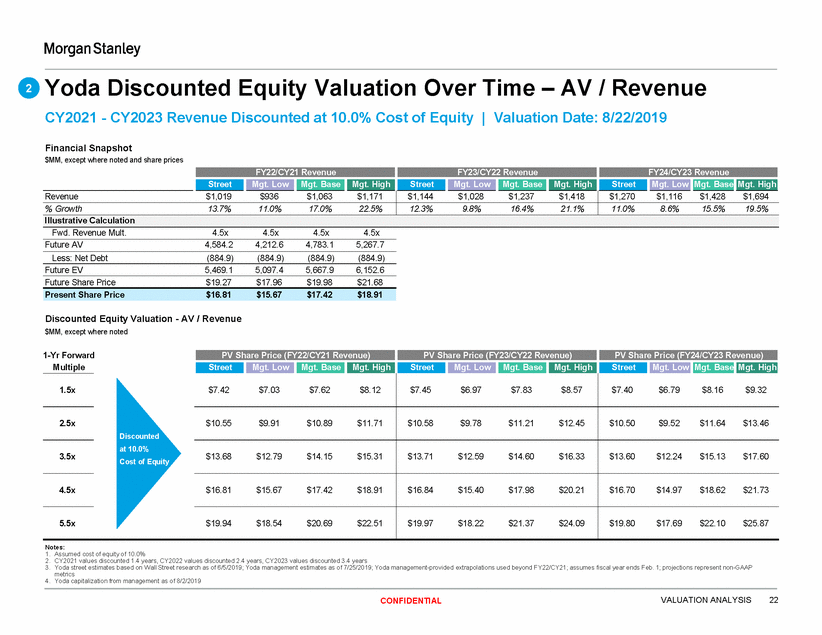
Yoda Discounted Equity Valuation Over CY2021 - CY2023 Revenue Discounted at 10.0% Cost of Equity Time – AV / Revenue 2 | Valuation Date: 8/22/2019 Financial Snapshot $MM, except where noted and share prices Fwd. Revenue Mult. 4.5x 4.5x 4.5x 4.5x Future AV 4,584.2 4,212.6 4,783.1 5,267.7 Less: Net Debt (884.9) (884.9) (884.9) (884.9) Future EV 5,469.1 5,097.4 5,667.9 6,152.6 Future Share Price $19.27 $17.96 $19.98 $21.68 Discounted Equity Valuation - AV / Revenue $MM, except where noted Notes: 1. Assumed cost of equity of 10.0% 2. CY2021 values discounted 1.4 years, CY2022 values discounted 2.4 years, CY2023 values discounted 3.4 years 3. Yoda street estimates based on Wall Street research as of 6/5/2019; Yoda management estimates as of 7/25/2019; Yoda management-provided extrapolations used beyond FY22/CY21; assumes fiscal year ends Feb. 1; projections represent non-GAAP metrics 4. Yoda capitalization from management as of 8/2/2019 VALUATION ANALYSIS 22 CONFIDENTIAL 1-Yr Forward Multiple PV Share Price (FY22/CY21 Revenue) PV Share Price (FY23/CY22 Revenue) PV Share Price (FY24/CY23 Revenue) Street Mgt. Low Mgt. Base Mgt. High Street Mgt. Low Mgt. Base Mgt. High Street Mgt. Low Mgt. Base Mgt. High 1.5x 2.5x Discounted at 10.0% 3.5x Cost of Equity 4.5x 5.5x $7.42 $7.03 $7.62 $8.12 $7.45 $6.97 $7.83 $8.57 $7.40 $6.79 $8.16 $9.32 $10.55 $9.91 $10.89 $11.71 $10.58 $9.78 $11.21 $12.45 $10.50 $9.52 $11.64 $13.46 $13.68 $12.79 $14.15 $15.31 $13.71 $12.59 $14.60 $16.33 $13.60 $12.24 $15.13 $17.60 $16.81 $15.67 $17.42 $18.91 $16.84 $15.40 $17.98 $20.21 $16.70 $14.97 $18.62 $21.73 $19.94 $18.54 $20.69 $22.51 $19.97 $18.22 $21.37 $24.09 $19.80 $17.69 $22.10 $25.87 Present Share Price $16.81 $15.67 $17.42 $18.91 FY22/CY21 Revenue FY23/CY22 Revenue FY24/CY23 Revenue Street Mgt. Low Mgt. Base Mgt. High Street Mgt. Low Mgt. Base Mgt. High Street Mgt. Low Mgt. Base Mgt. High Revenue $1,019 $936 $1,063 $1,171 $1,144 $1,028 $1,237 $1,418 $1,270 $1,116 $1,428 $1,694 % Growth 13.7% 11.0% 17.0% 22.5% 12.3% 9.8% 16.4% 21.1% 11.0% 8.6% 15.5% 19.5% Illustrative Calculation
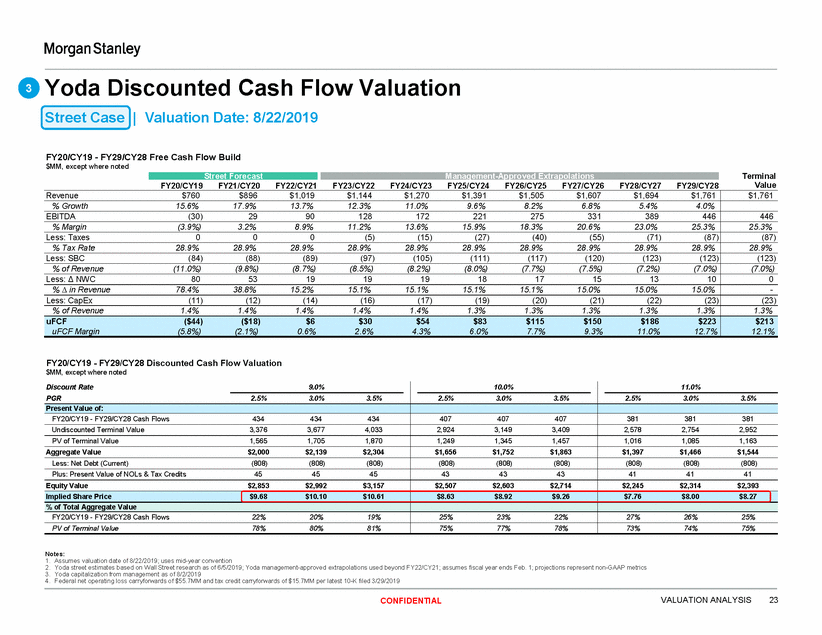
Yoda Discounted Cash Flow Valuation Street Case | Valuation Date: 8/22/2019 3 FY20/CY19 - FY29/CY28 Free Cash Flow Build $MM, except where noted Terminal Value FY20/CY19 FY21/CY20 FY22/CY21 FY23/CY22 FY24/CY23 FY25/CY24 FY26/CY25 FY27/CY26 FY28/CY27 FY29/CY28 FY20/CY19 - FY29/CY28 Discounted Cash Flow Valuation $MM, except where noted Notes: 1. Assumes valuation date of 8/22/2019; uses mid-year convention 2. Yoda street estimates based on Wall Street research as of 6/5/2019; Yoda management-approved extrapolations used beyond FY22/CY21; assumes fiscal year ends Feb. 1; projections represent non-GAAP metrics 3. Yoda capitalization from management as of 8/2/2019 4. Federal net operating loss carryforwards of $55.7MM and tax credit carryforwards of $15.7MM per latest 10-K filed 3/29/2019 VALUATION ANALYSIS 23 CONFIDENTIAL Discount Rate 9.0% PGR 2.5% 3.0% 3.5% 10.0% 2.5% 3.0% 3.5% 11.0% 2.5% 3.0% 3.5% Present Value of: FY20/CY19 - FY29/CY28 Cash Flows 434 434 434 407 407 407 381 381 381 Undiscounted Terminal Value 3,376 3,677 4,033 2,924 3,149 3,409 2,578 2,754 2,952 PV of Terminal Value 1,565 1,705 1,870 1,249 1,345 1,457 1,016 1,085 1,163 Aggregate Value $2,000 $2,139 $2,304 $1,656 $1,752 $1,863 $1,397 $1,466 $1,544 Less: Net Debt (Current) (808) (808) (808) (808) (808) (808) (808) (808) (808) Plus: Present Value of NOLs & Tax Credits 45 45 45 43 43 43 41 41 41 Equity Value $2,853 $2,992 $3,157 $2,507 $2,603 $2,714 $2,245 $2,314 $2,393 Implied Share Price $9.68 $10.10 $10.61 $8.63 $8.92 $9.26 $7.76 $8.00 $8.27 % of Total Aggregate Value FY20/CY19 - FY29/CY28 Cash Flows 22% 20% 19% 25% 23% 22% 27% 26% 25% PV of Terminal Value 78% 80% 81% 75% 77% 78% 73% 74% 75% Revenue $760 $896 $1,019 $1,144 $1,270 $1,391 $1,505 $1,607 $1,694 $1,761 $1,761 % Growth 15.6% 17.9% 13.7% 12.3% 11.0% 9.6% 8.2% 6.8% 5.4% 4.0% EBITDA (30) 29 90 128 172 221 275 331 389 446 446 % Margin (3.9%) 3.2% 8.9% 11.2% 13.6% 15.9% 18.3% 20.6% 23.0% 25.3% 25.3% Less: Taxes 0 0 0 (5) (15) (27) (40) (55) (71) (87) (87) % Tax Rate 28.9% 28.9% 28.9% 28.9% 28.9% 28.9% 28.9% 28.9% 28.9% 28.9% 28.9% Less: SBC (84) (88) (89) (97) (105) (111) (117) (120) (123) (123) (123) % of Revenue (11.0%) (9.8%) (8.7%) (8.5%) (8.2%) (8.0%) (7.7%) (7.5%) (7.2%) (7.0%) (7.0%) Less: NWC 80 53 19 19 19 18 17 15 13 10 0 % in Revenue 78.4% 38.8% 15.2% 15.1% 15.1% 15.1% 15.1% 15.0% 15.0% 15.0% - Less: CapEx (11) (12) (14) (16) (17) (19) (20) (21) (22) (23) (23) % of Revenue 1.4% 1.4% 1.4% 1.4% 1.4% 1.3% 1.3% 1.3% 1.3% 1.3% 1.3% uFCF ($44) ($18) $6 $30 $54 $83 $115 $150 $186 $223 uFCF Margin (5.8%) (2.1%) 0.6% 2.6% 4.3% 6.0% 7.7% 9.3% 11.0% 12.7% $213 12.1% Street Forecast Management-Approved Extrapolations
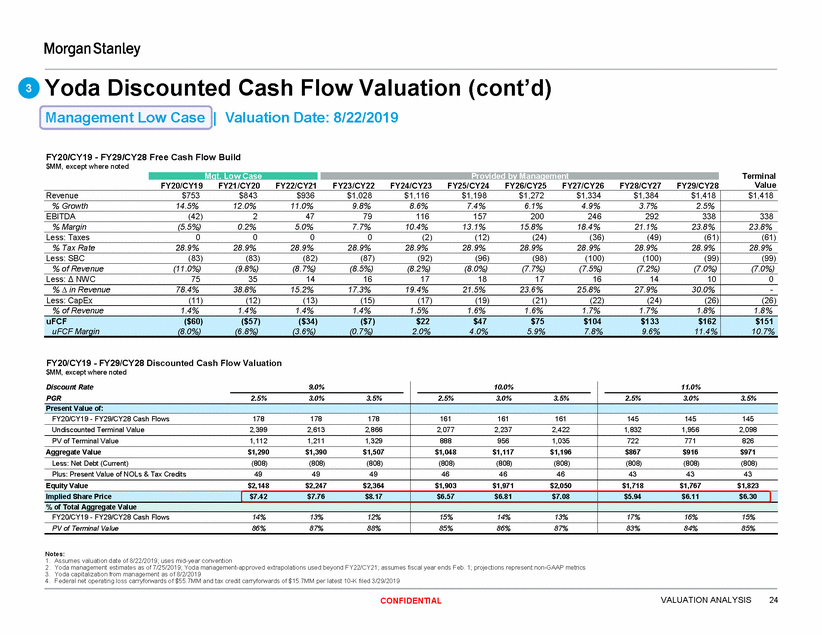
Yoda Discounted Cash Flow Valuation (cont’d) Management Low Case | Valuation Date: 8/22/2019 3 FY20/CY19 - FY29/CY28 Free Cash Flow Build $MM, except where noted Terminal Value FY20/CY19 FY21/CY20 FY22/CY21 FY23/CY22 FY24/CY23 FY25/CY24 FY26/CY25 FY27/CY26 FY28/CY27 FY29/CY28 FY20/CY19 - FY29/CY28 Discounted Cash Flow Valuation $MM, except where noted Notes: 1. Assumes valuation date of 8/22/2019; uses mid-year convention 2. Yoda management estimates as of 7/25/2019; Yoda management-approved extrapolations used beyond FY22/CY21; assumes fiscal year ends Feb. 1; projections represent non-GAAP metrics 3. Yoda capitalization from management as of 8/2/2019 4. Federal net operating loss carryforwards of $55.7MM and tax credit carryforwards of $15.7MM per latest 10-K filed 3/29/2019 VALUATION ANALYSIS 24 CONFIDENTIAL Discount Rate 9.0% PGR 2.5% 3.0% 3.5% 10.0% 2.5% 3.0% 3.5% 11.0% 2.5% 3.0% 3.5% Present Value of: FY20/CY19 - FY29/CY28 Cash Flows 178 178 178 161 161 161 145 145 145 Undiscounted Terminal Value 2,399 2,613 2,866 2,077 2,237 2,422 1,832 1,956 2,098 PV of Terminal Value 1,112 1,211 1,329 888 956 1,035 722 771 826 Aggregate Value $1,290 $1,390 $1,507 $1,048 $1,117 $1,196 $867 $916 $971 Less: Net Debt (Current) (808) (808) (808) (808) (808) (808) (808) (808) (808) Plus: Present Value of NOLs & Tax Credits 49 49 49 46 46 46 43 43 43 Equity Value $2,148 $2,247 $2,364 $1,903 $1,971 $2,050 $1,718 $1,767 $1,823 Implied Share Price $7.42 $7.76 $8.17 $6.57 $6.81 $7.08 $5.94 $6.11 $6.30 % of Total Aggregate Value FY20/CY19 - FY29/CY28 Cash Flows 14% 13% 12% 15% 14% 13% 17% 16% 15% PV of Terminal Value 86% 87% 88% 85% 86% 87% 83% 84% 85% Revenue $753 $843 $936 $1,028 $1,116 $1,198 $1,272 $1,334 $1,384 $1,418 $1,418 % Growth 14.5% 12.0% 11.0% 9.8% 8.6% 7.4% 6.1% 4.9% 3.7% 2.5% EBITDA (42) 2 47 79 116 157 200 246 292 338 338 % Margin (5.5%) 0.2% 5.0% 7.7% 10.4% 13.1% 15.8% 18.4% 21.1% 23.8% 23.8% Less: Taxes 0 0 0 0 (2) (12) (24) (36) (49) (61) (61) % Tax Rate 28.9% 28.9% 28.9% 28.9% 28.9% 28.9% 28.9% 28.9% 28.9% 28.9% 28.9% Less: SBC (83) (83) (82) (87) (92) (96) (98) (100) (100) (99) (99) % of Revenue (11.0%) (9.8%) (8.7%) (8.5%) (8.2%) (8.0%) (7.7%) (7.5%) (7.2%) (7.0%) (7.0%) Less: NWC 75 35 14 16 17 18 17 16 14 10 0 % in Revenue 78.4% 38.8% 15.2% 17.3% 19.4% 21.5% 23.6% 25.8% 27.9% 30.0% - Less: CapEx (11) (12) (13) (15) (17) (19) (21) (22) (24) (26) (26) % of Revenue 1.4% 1.4% 1.4% 1.4% 1.5% 1.6% 1.6% 1.7% 1.7% 1.8% 1.8% uFCF ($60) ($57) ($34) ($7) $22 $47 $75 $104 $133 $162 uFCF Margin (8.0%) (6.8%) (3.6%) (0.7%) 2.0% 4.0% 5.9% 7.8% 9.6% 11.4% $151 10.7% Mgt. Low Case Provided by Management
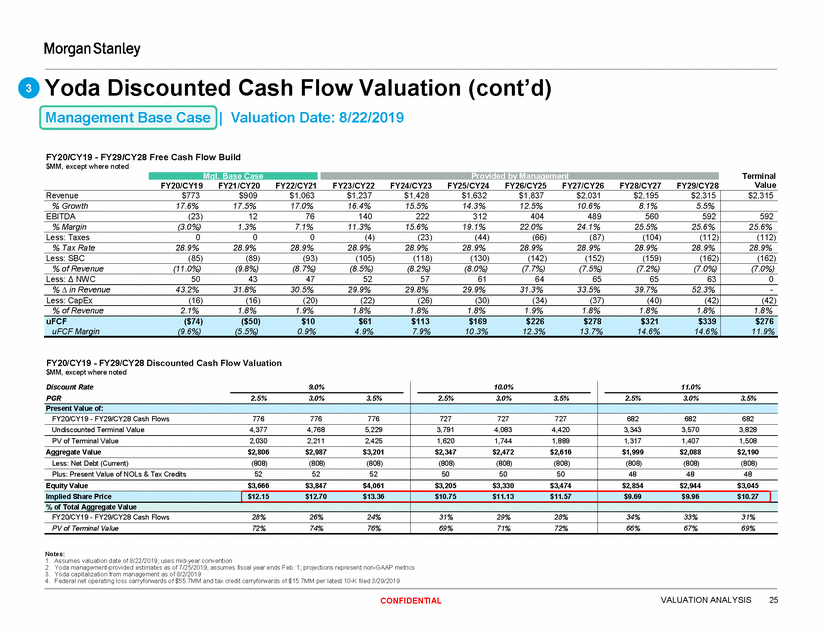
Yoda Discounted Cash Flow Valuation (cont’d) Management Base Case | Valuation Date: 8/22/2019 3 FY20/CY19 - FY29/CY28 Free Cash Flow Build $MM, except where noted Terminal Value FY20/CY19 FY21/CY20 FY22/CY21 FY23/CY22 FY24/CY23 FY25/CY24 FY26/CY25 FY27/CY26 FY28/CY27 FY29/CY28 FY20/CY19 - FY29/CY28 Discounted Cash Flow Valuation $MM, except where noted Notes: 1. Assumes valuation date of 8/22/2019; uses mid-year convention 2. Yoda management-provided estimates as of 7/25/2019; assumes fiscal year ends Feb. 1; projections represent non-GAAP metrics 3. Yoda capitalization from management as of 8/2/2019 4. Federal net operating loss carryforwards of $55.7MM and tax credit carryforwards of $15.7MM per latest 10-K filed 3/29/2019 VALUATION ANALYSIS 25 CONFIDENTIAL Discount Rate 9.0% PGR 2.5% 3.0% 3.5% 10.0% 2.5% 3.0% 3.5% 11.0% 2.5% 3.0% 3.5% Present Value of: FY20/CY19 - FY29/CY28 Cash Flows 776 776 776 727 727 727 682 682 682 Undiscounted Terminal Value 4,377 4,768 5,229 3,791 4,083 4,420 3,343 3,570 3,828 PV of Terminal Value 2,030 2,211 2,425 1,620 1,744 1,889 1,317 1,407 1,508 Aggregate Value $2,806 $2,987 $3,201 $2,347 $2,472 $2,616 $1,999 $2,088 $2,190 Less: Net Debt (Current) (808) (808) (808) (808) (808) (808) (808) (808) (808) Plus: Present Value of NOLs & Tax Credits 52 52 52 50 50 50 48 48 48 Equity Value $3,666 $3,847 $4,061 $3,205 $3,330 $3,474 $2,854 $2,944 $3,045 Implied Share Price $12.15 $12.70 $13.36 $10.75 $11.13 $11.57 $9.69 $9.96 $10.27 % of Total Aggregate Value FY20/CY19 - FY29/CY28 Cash Flows 28% 26% 24% 31% 29% 28% 34% 33% 31% PV of Terminal Value 72% 74% 76% 69% 71% 72% 66% 67% 69% Revenue $773 $909 $1,063 $1,237 $1,428 $1,632 $1,837 $2,031 $2,195 $2,315 $2,315 % Growth 17.6% 17.5% 17.0% 16.4% 15.5% 14.3% 12.5% 10.6% 8.1% 5.5% EBITDA (23) 12 76 140 222 312 404 489 560 592 592 % Margin (3.0%) 1.3% 7.1% 11.3% 15.6% 19.1% 22.0% 24.1% 25.5% 25.6% 25.6% Less: Taxes 0 0 0 (4) (23) (44) (66) (87) (104) (112) (112) % Tax Rate 28.9% 28.9% 28.9% 28.9% 28.9% 28.9% 28.9% 28.9% 28.9% 28.9% 28.9% Less: SBC (85) (89) (93) (105) (118) (130) (142) (152) (159) (162) (162) % of Revenue (11.0%) (9.8%) (8.7%) (8.5%) (8.2%) (8.0%) (7.7%) (7.5%) (7.2%) (7.0%) (7.0%) Less: NWC 50 43 47 52 57 61 64 65 65 63 0 % in Revenue 43.2% 31.8% 30.5% 29.9% 29.8% 29.9% 31.3% 33.5% 39.7% 52.3% - Less: CapEx (16) (16) (20) (22) (26) (30) (34) (37) (40) (42) (42) % of Revenue 2.1% 1.8% 1.9% 1.8% 1.8% 1.8% 1.9% 1.8% 1.8% 1.8% 1.8% uFCF ($74) ($50) $10 $61 $113 $169 $226 $278 $321 $339 uFCF Margin (9.6%) (5.5%) 0.9% 4.9% 7.9% 10.3% 12.3% 13.7% 14.6% 14.6% $276 11.9% Mgt. Base Case Provided by Management
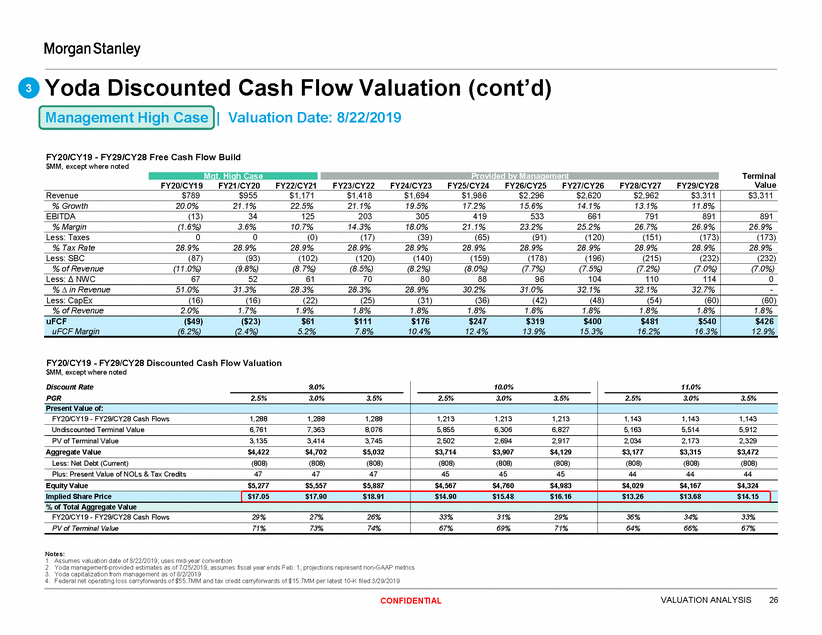
Yoda Discounted Cash Flow Valuation (cont’d) Management High Case | Valuation Date: 8/22/2019 3 FY20/CY19 - FY29/CY28 Free Cash Flow Build $MM, except where noted Terminal Value FY20/CY19 FY21/CY20 FY22/CY21 FY23/CY22 FY24/CY23 FY25/CY24 FY26/CY25 FY27/CY26 FY28/CY27 FY29/CY28 FY20/CY19 - FY29/CY28 Discounted Cash Flow Valuation $MM, except where noted Notes: 1. Assumes valuation date of 8/22/2019; uses mid-year convention 2. Yoda management-provided estimates as of 7/25/2019; assumes fiscal year ends Feb. 1; projections represent non-GAAP metrics 3. Yoda capitalization from management as of 8/2/2019 4. Federal net operating loss carryforwards of $55.7MM and tax credit carryforwards of $15.7MM per latest 10-K filed 3/29/2019 VALUATION ANALYSIS 26 CONFIDENTIAL Discount Rate 9.0% PGR 2.5% 3.0% 3.5% 10.0% 2.5% 3.0% 3.5% 11.0% 2.5% 3.0% 3.5% Present Value of: FY20/CY19 - FY29/CY28 Cash Flows 1,288 1,288 1,288 1,213 1,213 1,213 1,143 1,143 1,143 Undiscounted Terminal Value 6,761 7,363 8,076 5,855 6,306 6,827 5,163 5,514 5,912 PV of Terminal Value 3,135 3,414 3,745 2,502 2,694 2,917 2,034 2,173 2,329 Aggregate Value $4,422 $4,702 $5,032 $3,714 $3,907 $4,129 $3,177 $3,315 $3,472 Less: Net Debt (Current) (808) (808) (808) (808) (808) (808) (808) (808) (808) Plus: Present Value of NOLs & Tax Credits 47 47 47 45 45 45 44 44 44 Equity Value $5,277 $5,557 $5,887 $4,567 $4,760 $4,983 $4,029 $4,167 $4,324 Implied Share Price $17.05 $17.90 $18.91 $14.90 $15.48 $16.16 $13.26 $13.68 $14.15 % of Total Aggregate Value FY20/CY19 - FY29/CY28 Cash Flows 29% 27% 26% 33% 31% 29% 36% 34% 33% PV of Terminal Value 71% 73% 74% 67% 69% 71% 64% 66% 67% Revenue $789 $955 $1,171 $1,418 $1,694 $1,986 $2,296 $2,620 $2,962 $3,311 $3,311 % Growth 20.0% 21.1% 22.5% 21.1% 19.5% 17.2% 15.6% 14.1% 13.1% 11.8% EBITDA (13) 34 125 203 305 419 533 661 791 891 891 % Margin (1.6%) 3.6% 10.7% 14.3% 18.0% 21.1% 23.2% 25.2% 26.7% 26.9% 26.9% Less: Taxes 0 0 (0) (17) (39) (65) (91) (120) (151) (173) (173) % Tax Rate 28.9% 28.9% 28.9% 28.9% 28.9% 28.9% 28.9% 28.9% 28.9% 28.9% 28.9% Less: SBC (87) (93) (102) (120) (140) (159) (178) (196) (215) (232) (232) % of Revenue (11.0%) (9.8%) (8.7%) (8.5%) (8.2%) (8.0%) (7.7%) (7.5%) (7.2%) (7.0%) (7.0%) Less: NWC 67 52 61 70 80 88 96 104 110 114 0 % in Revenue 51.0% 31.3% 28.3% 28.3% 28.9% 30.2% 31.0% 32.1% 32.1% 32.7% - Less: CapEx (16) (16) (22) (25) (31) (36) (42) (48) (54) (60) (60) % of Revenue 2.0% 1.7% 1.9% 1.8% 1.8% 1.8% 1.8% 1.8% 1.8% 1.8% 1.8% uFCF ($49) ($23) $61 $111 $176 $247 $319 $400 $481 $540 uFCF Margin (6.2%) (2.4%) 5.2% 7.8% 10.4% 12.4% 13.9% 15.3% 16.2% 16.3% $426 12.9% Mgt. High Case Provided by Management
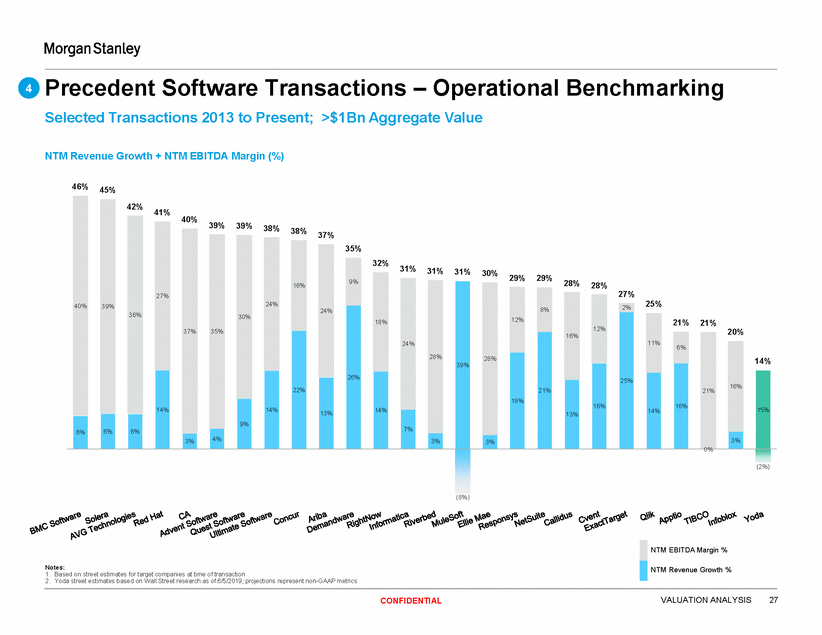
Precedent Software Transactions – Operational Benchmarking Selected Transactions 2013 to Present; >$1Bn Aggregate Value 4 NTM Revenue Growth + NTM EBITDA Margin (%) 46% 45% 41% 39% 39% 38% 38% 37% 31% 31% 31% 30% 29% 29% 28% 28% 27% 20% 0% (2%) (8%) NTM EBITDA Margin % Notes: 1. Based on street estimates for target companies at time of transaction 2. Yoda street estimates based on Wall Street research as of 6/5/2019; projections represent non-GAAP metrics NTM Revenue Growth % VALUATION ANALYSIS 27 CONFIDENTIAL 40% 39% 42% 36% 40% 27% 37% 35% 30% 24% 16% 24% 35% 9% 32% 18% 24% 28% 39% 26% 22% 14%14%13%14% 9% 3%4%3% 28% 12% 8% 16% 12% 2% 25% 25% 11% 21%21% 21% 6% 21% 16% 14% 18% 16% 16% 15% 14% 13% 7% 6% 6% 6% 3% 3%
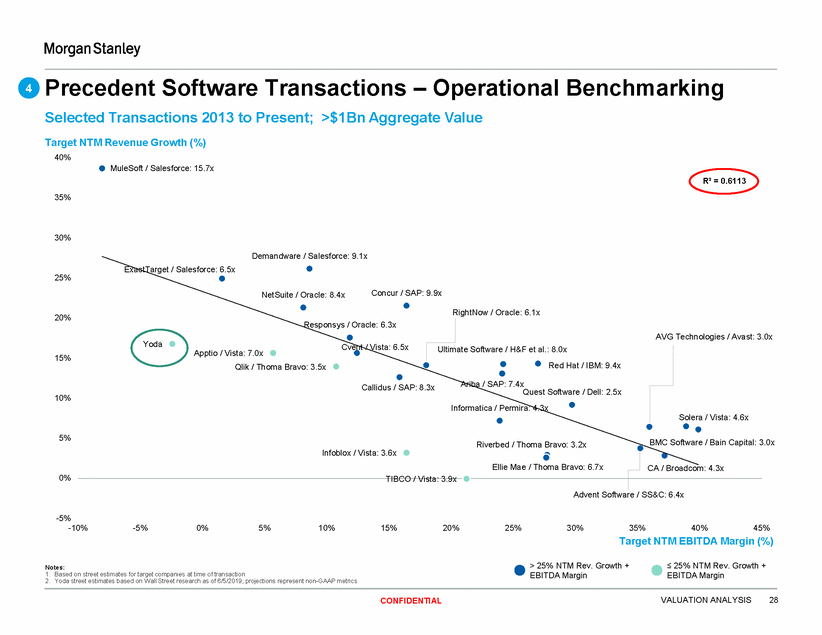
Precedent Software Transactions – Operational Selected Transactions 2013 to Present; >$1Bn Aggregate Value Target NTM Revenue Growth (%) 40% MuleSoft / Salesforce: 15.7x Benchmarking 4 R² = 0.6113 35% 30% Demandware / Salesforce: 9.1x ExactTarget / Salesforce: 6.5x 25% Concur / SAP: 9.9x NetSuite / Oracle: 8.4x RightNow / Oracle: 6.1x 20% Responsys / Oracle: 6.3x AVG Technologies / Avast: 3.0x Yoda Cvent / Vista: 6.5x ate Software / H&F et al.: 8.0x Red Hat / IBM: 9.4x Apptio / Vista: 7.0x Qlik / Thoma Bravo: 3.5x 15% Ariba / SAP: 7.4x Quest Software / Dell: 2.5x Informatica / Permira: 4.3x Callidus / SAP: 8.3x 10% Solera / Vista: 4.6x 5% BMC Software / Bain Capital: 3.0x Riverbed / Thoma Bravo: 3.2x 0% TIBCO / Vista: 3.9x Advent Software / SS&C: 6.4x -5% -10% -5% 0% 5% 10% 15% 20% 25% 30% 35% 40% 45% Target NTM EBITDA Margin (%) > 25% NTM Rev. Growth + EBITDA Margin < 25% NTM Rev. Growth + EBITDA Margin Notes: 1. Based on street estimates for target companies at time of transaction 2. Yoda street estimates based on Wall Street research as of 6/5/2019; projections represent non-GAAP metrics VALUATION ANALYSIS 28 CONFIDENTIAL Infoblox / Vista: 3.6x Ellie Mae / Thoma Bravo: 6.7x CA / Broadcom: 4.3x Ultim
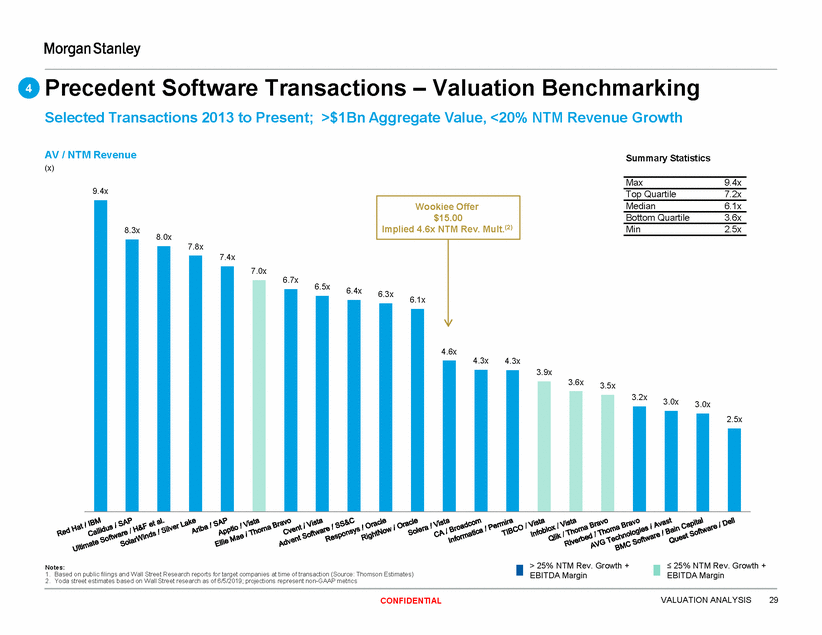
Precedent Software Transactions – Valuation Benchmarking 4 Selected Transactions 2013 to Present; >$1Bn Aggregate Value, <20% NTM Revenue Growth AV / NTM Revenue (x) Summary Statistics Max 9.4x 9.4x Top Quartile 7.2x Median 6.1x Bottom Quartile 3.6x Min 2.5x 8.3x 8.0x 7.8x 7.4x 7.0x 6.7x 6.5x 6.4x 6.1x 4.6x 4.3x 4.3x 3.9x 3.6x 3.5x 3.2x 3.0x 3.0x 2.5x > 25% NTM Rev. Growth + EBITDA Margin < 25% NTM Rev. Growth + EBITDA Margin Notes: 1. Based on public filings and Wall Street Research reports for target companies at time of transaction (Source: Thomson Estimates) 2. Yoda street estimates based on Wall Street research as of 6/5/2019; projections represent non-GAAP metrics VALUATION ANALYSIS 29 CONFIDENTIAL Wookiee Offer $15.00 Implied 4.6x NTM Rev. Mult.(2) 6.3x
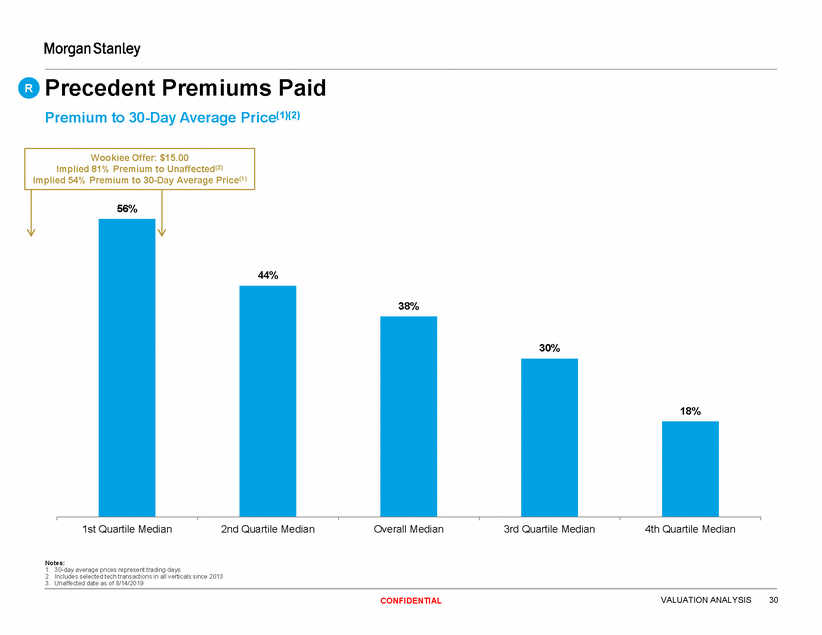
Precedent Premiums Paid Premium to 30-Day Average Price(1)(2) R 1st Quartile Median 2nd Quartile Median Overall Median 3rd Quartile Median 4th Quartile Median Notes: 1. 30-day average prices represent trading days 2. Includes selected tech transactions in all verticals since 2013 3. Unaffected date as of 8/14/2019 VALUATION ANALYSIS 30 CONFIDENTIAL 44% 38% 30% 18% Wookiee Offer: $15.00 Implied 81% Premium to Unaffected(3) Implied 54% Premium to 30-Day Average Price(1) 56%
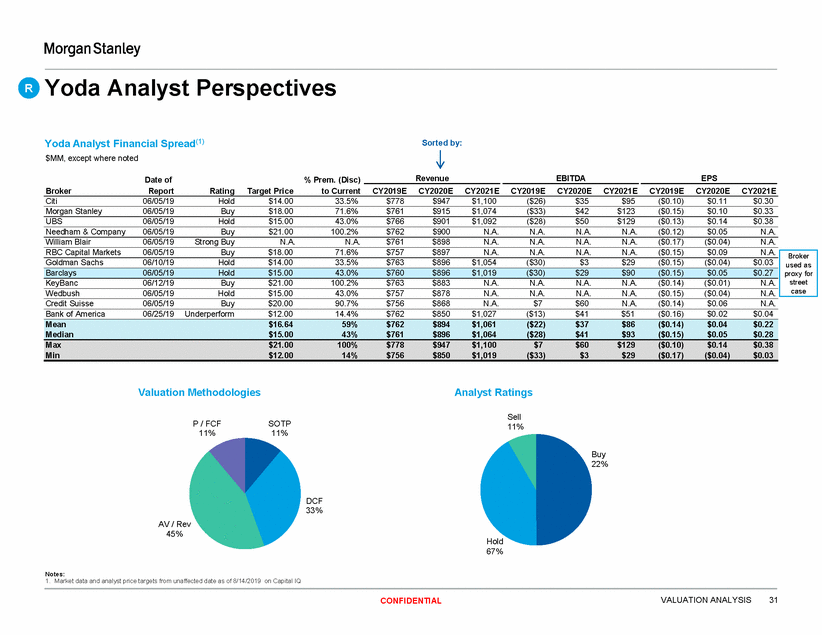
Yoda Analyst Perspectives R Yoda Analyst Financial Spread(1) $MM, except where noted Sorted by: % Prem. (Disc) Revenue EBITDA EPS Date of Report Broker Rating Target Price to Current CY2019E CY2020E CY2021E CY2019E CY2020E CY2021E CY2019E CY2020E CY2021E Citi 06/05/19 Hold $14.00 33.5% $778 $947 $1,100 ($26) $35 $95 ($0.10) $0.11 $0.30 Morgan Stanley 06/05/19 Buy $18.00 71.6% $761 $915 $1,074 ($33) $42 $123 ($0.15) $0.10 $0.33 UBS 06/05/19 Hold $15.00 43.0% $766 $901 $1,092 ($28) $50 $129 ($0.13) $0.14 $0.38 Needham & Company 06/05/19 Buy $21.00 100.2% $762 $900 N.A. N.A. N.A. N.A. ($0.12) $0.05 N.A. William Blair 06/05/19 Strong Buy N.A. N.A. $761 $898 N.A. N.A. N.A. N.A. ($0.17) ($0.04) N.A. used as Credit Suisse 06/05/19 Buy $20.00 90.7% $756 $868 N.A. $7 $60 N.A. ($0.14) $0.06 N.A. Bank of America 06/25/19 Underperform $12.00 14.4% $762 $850 $1,027 ($13) $41 $51 ($0.16) $0.02 $0.04 Valuation Methodologies Analyst Ratings Sell 11% P / FCF 11% SOTP 11% Buy 22% DCF 33% AV / Rev 45% Hold 67% Notes: 1. Market data and analyst price targets from unaffected date as of 8/14/2019 on Capital IQ VALUATION ANALYSIS 31 CONFIDENTIAL Mean $16.64 59% $762 $894 $1,061 ($22) $37 $86 ($0.14) $0.04 $0.22 Median $15.00 43% $761 $896 $1,064 ($28) $41 $93 ($0.15) $0.05 $0.28 Max $21.00 100% $778 $947 $1,100 $7 $60 $129 ($0.10) $0.14 $0.38 Min $12.00 14% $756 $850 $1,019 ($33) $3 $29 ($0.17) ($0.04) $0.03 RBC Capital Markets 06/05/19 Buy $18.00 71.6% $757 $897 N.A. N.A. N.A. N.A. ($0.15) $0.09 N.A. Goldman Sachs 06/10/19 Hold $14.00 33.5% $763 $896 $1,054 ($30) $3 $29 ($0.15) ($0.04) $0.03 Broker proxy for street case Barclays 06/05/19 Hold $15.00 43.0% $760 $896 $1,019 ($30) $29 $90 ($0.15) $0.05 $0.27 KeyBanc 06/12/19 Buy $21.00 100.2% $763 $883 N.A. N.A. N.A. N.A. ($0.14) ($0.01) N.A. Wedbush 06/05/19 Hold $15.00 43.0% $757 $878 N.A. N.A. N.A. N.A. ($0.15) ($0.04) N.A.
APPENDIX A Supplemental Materials 32 CONFIDENTIAL
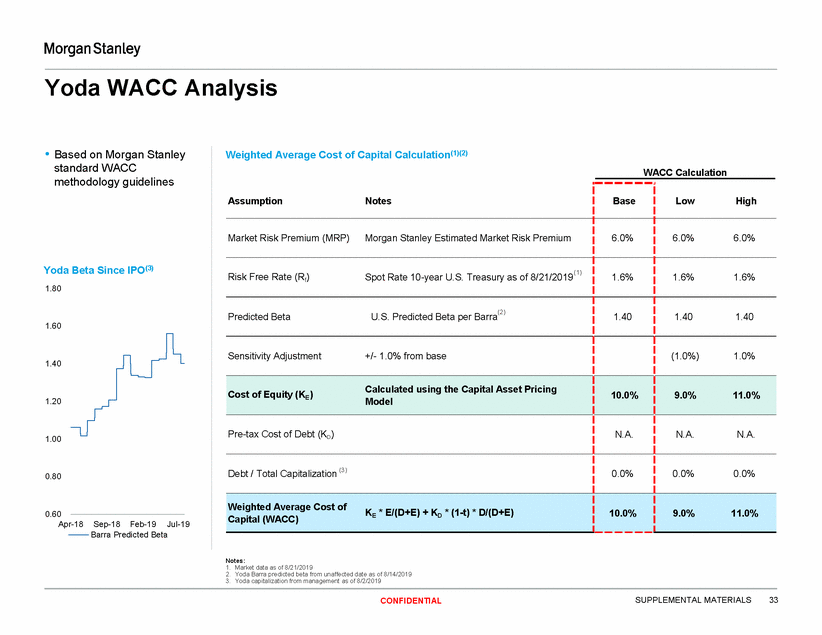
Yoda WACC Analysis • Based on Morgan Stanley standard WACC methodology guidelines Weighted Average Cost of Capital Calculation(1)(2) WACC Calculation Yoda Beta Since IPO(3) 1.80 1.60 1.40 1.20 1.00 0.80 0.60 E D Capital (WACC) Apr-18 Sep-18 Feb-19 Jul-19 Barra Predicted Beta Notes: 1. Market data as of 8/21/2019 2. Yoda Barra predicted beta from unaffected date as of 8/14/2019 3. Yoda capitalization from management as of 8/2/2019 SUPPLEMENTAL MATERIALS 33 CONFIDENTIAL Assumption Notes Base Low High Market Risk Premium (MRP) Morgan Stanley Estimated Market Risk Premium 6.0% 6.0% 6.0% (1) Risk Free Rate (Rf) Spot Rate 10-year U.S. Treasury as of 8/21/2019 1.6% 1.6% 1.6% Predicted Beta U.S. Predicted Beta per Barra(2) 1.40 1.40 1.40 Sensitivity Adjustment +/-1.0% from base (1.0%) 1.0% Calculated using the Capital Asset Pricing Cost of Equity (KE) Model 10.0% 9.0% 11.0% Pre-tax Cost of Debt (KD) N.A. N.A. N.A. Debt / Total Capitalization (3) 0.0% 0.0% 0.0% Weighted Average Cost of K * E/(D+E) + K * (1-t) * D/(D+E) 10.0% 9.0% 11.0%
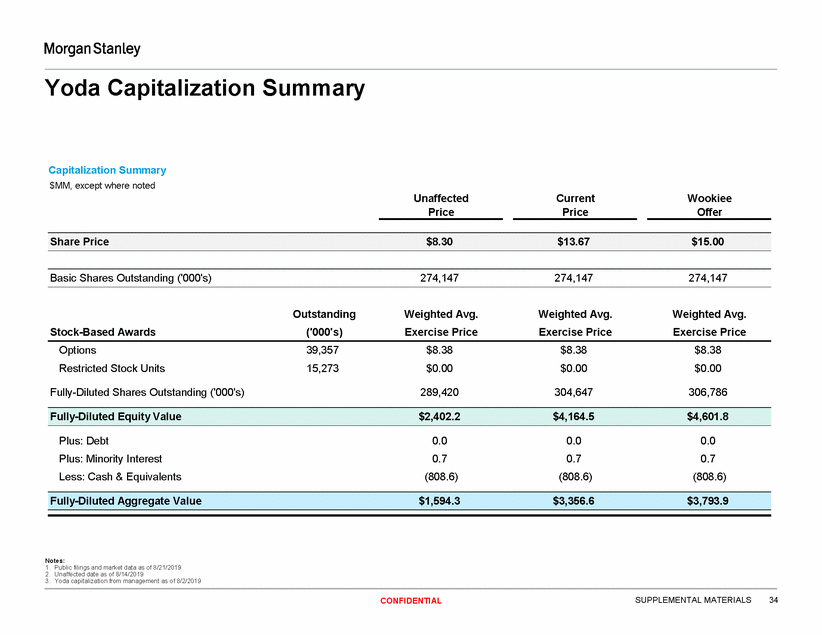
Yoda Capitalization Summary Capitalization Summary $MM, except where noted Unaffected Price Current Price Wookiee Offer Basic Shares Outstanding ('000's) 274,147 274,147 274,147 Outstanding ('000's) Weighted Avg. Exercise Price Weighted Avg. Exercise Price Weighted Avg. Exercise Price Stock-Based Awards Options Restricted Stock Units 39,357 15,273 $8.38 $0.00 $8.38 $0.00 $8.38 $0.00 Fully-Diluted Shares Outstanding ('000's) 289,420 304,647 306,786 Plus: Debt Plus: Minority Interest Less: Cash & Equivalents 0.0 0.7 (808.6) 0.0 0.7 (808.6) 0.0 0.7 (808.6) Notes: 1. Public filings and market data as of 8/21/2019 2. Unaffected date as of 8/14/2019 3. Yoda capitalization from management as of 8/2/2019 SUPPLEMENTAL MATERIALS 34 CONFIDENTIAL Fully-Diluted Aggregate Value $1,594.3 $3,356.6 $3,793.9 Fully-Diluted Equity Value $2,402.2 $4,164.5 $4,601.8 Share Price $8.30 $13.67 $15.00
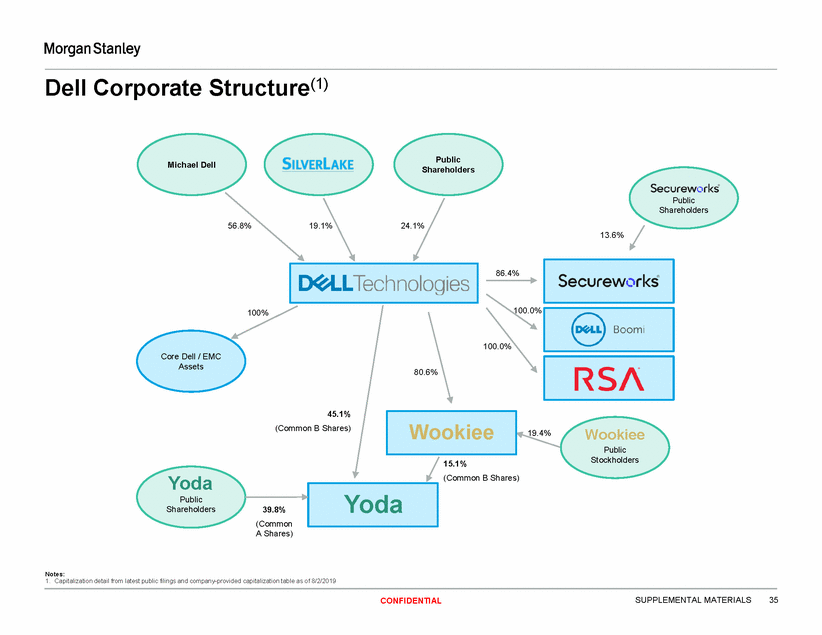
Dell Corporate Structure(1) Public Shareholders Michael Dell Public Shareholders 56.8% 19.1% 24.1% 13.6% 86.4% 100.0% 100% 100.0% Core Dell / EMC Assets 80.6% 45.1% (Common B Shares) Wookiee Public Stockholders 19.4% 15.1% (Common B Shares) Yoda Public Shareholders 39.8% (Common A Shares) Notes: 1. Capitalization detail from latest public filings and company-provided capitalization table as of 8/2/2019 SUPPLEMENTAL MATERIALS 35 CONFIDENTIAL Yoda Wookiee
Legal Disclaimer We have prepared this document solely for informational purposes. You should not definitively rely upon it or use it to form the definitive basis for any decision, contract, commitment or action whatsoever, with respect to any proposed transaction or otherwise. You and your directors, officers, employees, agents and affiliates must hold this document and any oral information provided in connection with this document in strict confidence and may not communicate, reproduce, distribute or disclose it to any other person, or refer to it publicly, in whole or in part at any time except with our prior written consent. If you are not the intended recipient of this document, please delete and destroy all copies immediately. We have prepared this document and the analyses contained in it based, in part, on certain assumptions and information obtained by us from the recipient, its directors, officers, employees, agents, affiliates and/or from other sources. Our use of such assumptions and information does not imply that we have independently verified or necessarily agree with any of such assumptions or information, and we have assumed and relied upon the accuracy and completeness of such assumptions and information for purposes of this document. Neither we nor any of our affiliates, or our or their respective officers, employees or agents, make any representation or warranty, express or implied, in relation to the accuracy or completeness of the information contained in this document or any oral information provided in connection herewith, or any data it generates and accept no responsibility, obligation or liability (whether direct or indirect, in contract, tort or otherwise) in relation to any of such information. We and our affiliates and our and their respective officers, employees and agents expressly disclaim any and all liability which may be based on this document and any errors therein or omissions therefrom. Neither we nor any of our affiliates, or our or their respective officers, employees or agents, make any representation or warranty, express or implied, that any transaction has been or may be effected on the terms or in the manner stated in this document, or as to the achievement or reasonableness of future projections, management targets, estimates, prospects or returns, if any. Any views or terms contained herein are based on financial, economic, market and other conditions prevailing as of the date of this document and are therefore subject to change. We undertake no obligation or responsibility to update any of the information contained in this document. Past performance does not guarantee or predict future performance. We have (i) assumed that any forecasted financial information contained herein reflects the best available estimates of future financial performance, and (ii) not made any independent valuation or appraisal of the assets or liabilities of any company involved in any proposed transaction, nor have we been furnished with any such valuations or appraisals. The purpose of this document is to provide the recipient with an explanation of the basis upon which Morgan Stanley is issuing a financial opinion letter in relation to the proposed transaction. This document should be read in conjunction with and is subject to the terms of such financial opinion. This document supersedes any previous documents or presentations delivered by Morgan Stanley to the recipient in connection with the proposed transaction. This document and the information contained herein do not constitute an offer to sell or the solicitation of an offer to buy any security, commodity or instrument or related derivative, nor do they constitute an offer or commitment to lend, syndicate or arrange a financing, underwrite or purchase or act as an agent or advisor or in any other capacity with respect to any transaction, or commit capital, or to participate in any trading strategies, and do not constitute legal, regulatory, accounting or tax advice to the recipient. We recommend that the recipient seek independent third party legal, regulatory, accounting and tax advice regarding the contents of this document. This document is not a research report and was not prepared by the research department of Morgan Stanley or any of its affiliates. Notwithstanding anything herein to the contrary, each recipient hereof (and their employees, representatives, and other agents) may disclose to any and all persons, without limitation of any kind from the commencement of discussions, the U.S. federal and state income tax treatment and tax structure of the proposed transaction and all materials of any kind (including opinions or other tax analyses) that are provided relating to the tax treatment and tax structure. For this purpose, "tax structure" is limited to facts relevant to the U.S. federal and state income tax treatment of the proposed transaction and does not include information relating to the identity of the parties, their affiliates, agents or advisors. This document is provided by Morgan Stanley & Co. LLC and/or certain of its affiliates, which may include Morgan Stanley Realty Incorporated, Morgan Stanley Senior Funding, Inc., Morgan Stanley Bank, N.A., Morgan Stanley & Co. International plc, Morgan Stanley & Co. Limited, Morgan Stanley Bank International (Milan Branch), Morgan Stanley Saudi Arabia, Morgan Stanley South Africa (PTY) Limited, Morgan Stanley Securities Limited, Morgan Stanley Bank AG, Morgan Stanley MUFG Securities Co., Ltd, Mitsubishi UFJ Morgan Stanley Securities Co., Ltd, Morgan Stanley India Company Private Limited, Morgan Stanley Asia Limited, Morgan Stanley Australia Limited, Morgan Stanley Asia (Singapore) Pte., Morgan Stanley Services Limited, Morgan Stanley & Co. International plc, Seoul Branch, Morgan Stanley Canada Limited, Banco Morgan Stanley S.A. and/or Morgan Stanley, SV, SAU. Unless governing law permits otherwise, you must contact an authorized Morgan Stanley entity in your jurisdiction regarding this document or any of the information contained herein. © Morgan Stanley and/or certain of its affiliates. All rights reserved. © Morgan Stanley and/or certain of its affiliates. All rights reserved. 36 CONFIDENTIAL