Counter Offer Considerations Project Falcon August 5, 2019 CONFIDENTIAL PRELIMINARY DRAFT
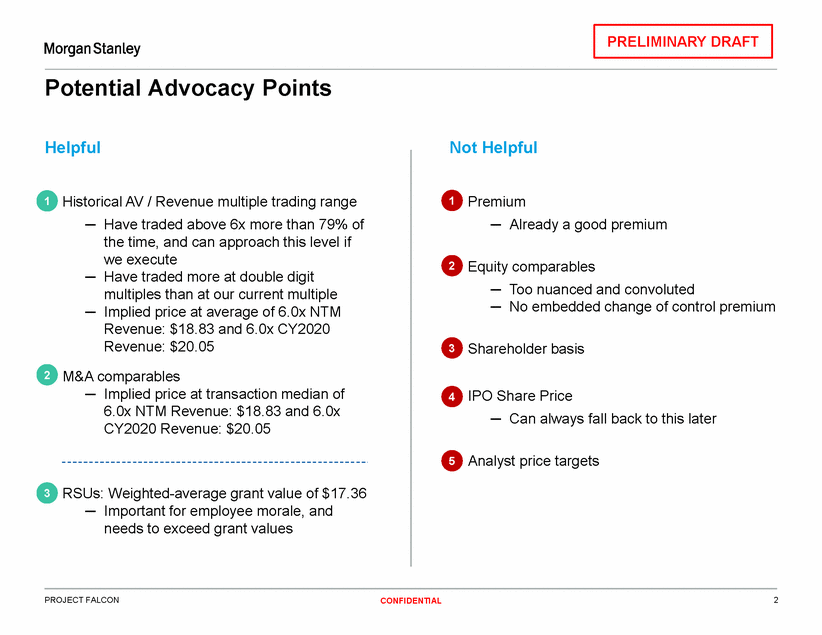
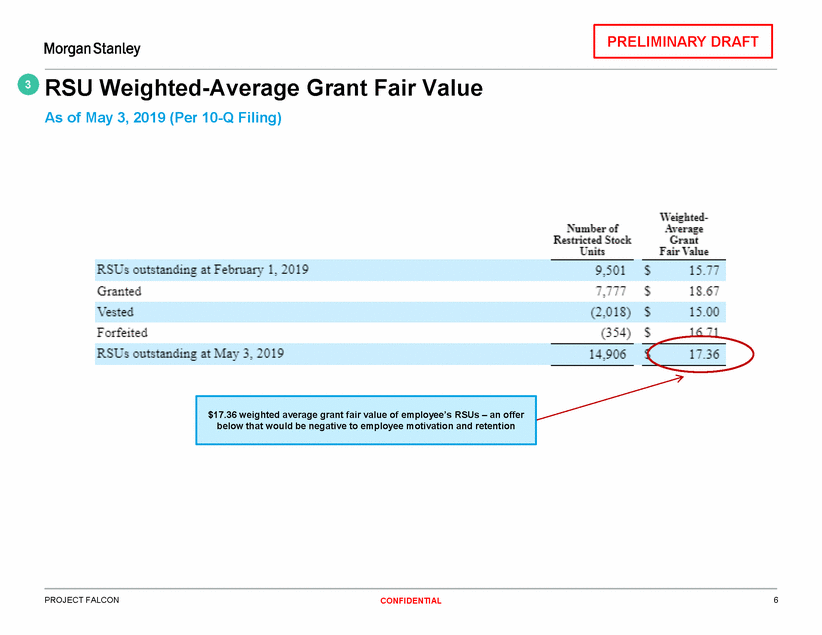
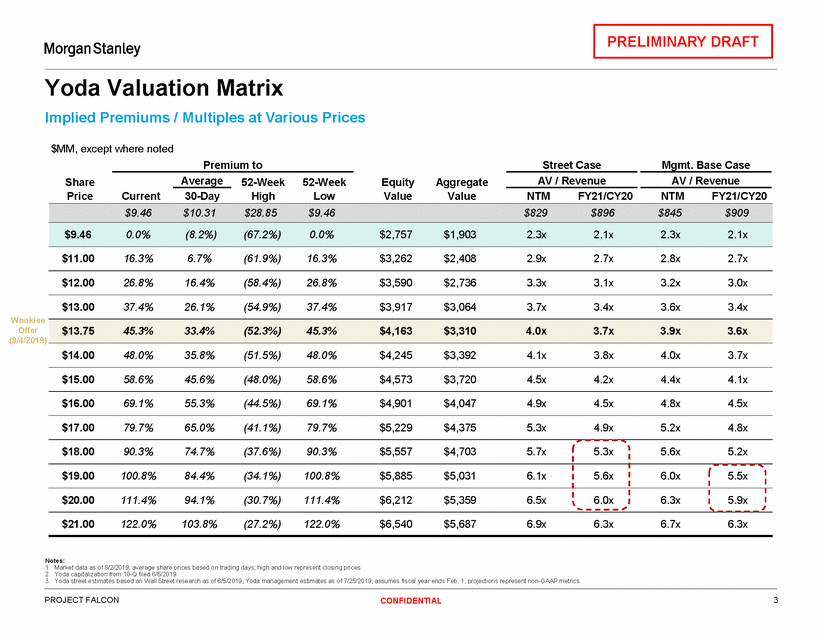
Potential Advocacy Points Helpful Not Helpful Historical AV / Revenue multiple trading range 1 . Premium Already a good premium 1 Have traded above 6x more than 79% of the time, and can approach this level if we execute Have traded more at double digit multiples than at our current multiple Implied price at average of 6.0x NTM Revenue: $18.83 and 6.0x CY2020 Revenue: $20.05 2 . Equity comparables Too nuanced and convoluted No embedded change of control premium 3 . Shareholder basis 12 . M&A comparables Implied price at transaction median of 6.0x NTM Revenue: $18.83 and 6.0x CY2020 Revenue: $20.05 4 . IPO Share Price Can always fall back to this later 5 . Analyst price targets 13 . RSUs: Weighted-average grant value of $17.36 Important for employee morale, and needs to exceed grant values PROJECT FALCON 2 CONFIDENTIAL PRELIMINARY DRAFT
Yoda Valuation Matrix Implied Premiums / Multiples at Various Prices $MM, except where noted Premium to Street Case Mgmt. Base Case Average AV / Revenue AV / Revenue Share Price 52-Week High 52-Week Low Equity Value Aggregate Value Current 30-Day NTM FY21/CY20 NTM FY21/CY20 $11.00 16.3% 6.7% (61.9%) 16.3% $3,262 $2,408 2.9x 2.7x 2.8x 2.7x $12.00 26.8% 16.4% (58.4%) 26.8% $3,590 $2,736 3.3x 3.1x 3.2x 3.0x $13.00 37.4% 26.1% (54.9%) 37.4% $3,917 $3,064 3.7x 3.4x 3.6x 3.4x Wookiee Offer (8/4/2019) $14.00 48.0% 35.8% (51.5%) 48.0% $4,245 $3,392 4.1x 3.8x 4.0x 3.7x $15.00 58.6% 45.6% (48.0%) 58.6% $4,573 $3,720 4.5x 4.2x 4.4x 4.1x $16.00 69.1% 55.3% (44.5%) 69.1% $4,901 $4,047 4.9x 4.5x 4.8x 4.5x $17.00 79.7% 65.0% (41.1%) 79.7% $5,229 $4,375 5.3x 4.9x 5.2x 4.8x $18.00 90.3% 74.7% (37.6%) 90.3% $5,557 $4,703 5.7x 5.3x 5.6x 5.2x $19.00 100.8% 84.4% (34.1%) 100.8% $5,885 $5,031 6.1x 5.6x 6.0x 5.5x $20.00 111.4% 94.1% (30.7%) 111.4% $6,212 $5,359 6.5x 6.0x 6.3x 5.9x $21.00 122.0% 103.8% (27.2%) 122.0% $6,540 $5,687 6.9x 6.3x 6.7x 6.3x Notes: 1. Market data as of 8/2/2019; average share prices based on trading days; high and low represent closing prices 2. Yoda capitalization from 10-Q filed 6/6/2019 3. Yoda street estimates based on Wall Street research as of 6/5/2019; Yoda management estimates as of 7/25/2019; assumes fiscal year ends Feb. 1; projections represent non-GAAP metrics PROJECT FALCON 3 CONFIDENTIAL $13.75 45.3% 33.4% (52.3%) 45.3% $4,163 $3,310 4.0x 3.7x 3.9x 3.6x $9.46 $10.31 $28.85 $9.46 $829 $896 $845 $909 $9.46 0.0% (8.2%) (67.2%) 0.0% $2,757 $1,903 2.3x 2.1x 2.3x 2.1x PRELIMINARY DRAFT
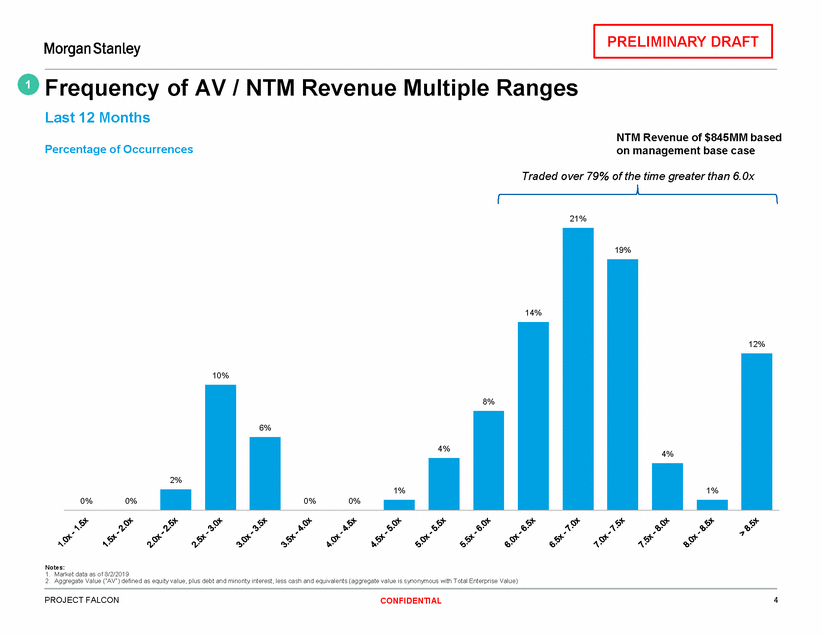
Frequency of AV Last 12 Months / NTM Revenue Multiple Ranges 1 NTM Revenue of $845MM based on management base case Percentage of Occurrences Traded over 79% of the time greater than 6.0x 21% 19% 12% Notes: 1. Market data as of 8/2/2019 2. Aggregate Value (“AV”) defined as equity value, plus debt and minority interest, less cash and equivalents (aggregate value is synonymous with Total Enterprise Value) PROJECT FALCON 4 CONFIDENTIAL 14% 10% 8% 6% 4% 2% 1% 0%0%0%0% 4% 1% PRELIMINARY DRAFT
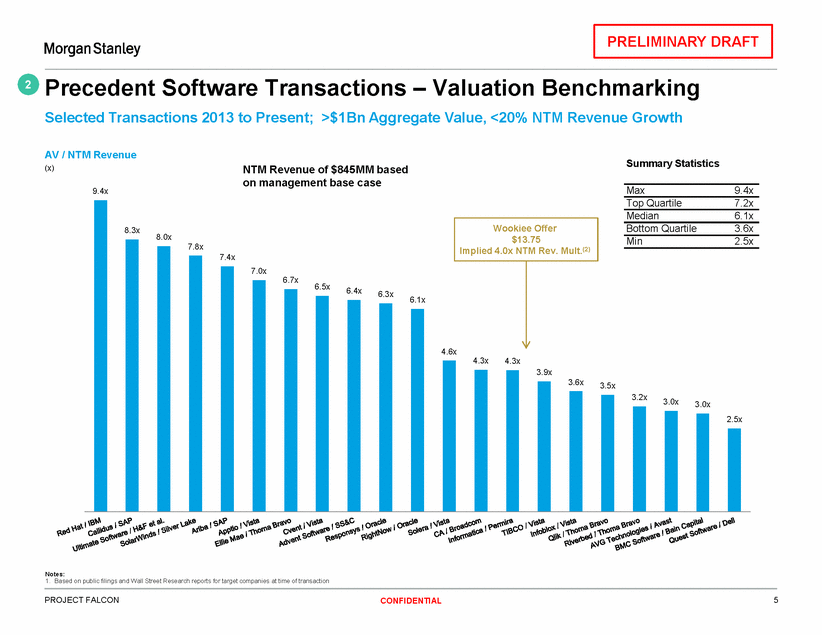
Precedent Software Transactions – Valuation Benchmarking Selected Transactions 2013 to Present; >$1Bn Aggregate Value, <20% NTM Revenue Growth 2 AV / NTM Revenue (x) Summary Statistics NTM Revenue of $845MM based on management base case Max 9.4x 9.4x Top Quartile 7.2x Median 6.1x Bottom Quartile 3.6x 8.3x 8.0x Min 2.5x 7.8x 7.4x 7.0x 6.7x 6.5x 6.4x 6.3x 6.1x 4.6x 4.3x 4.3x 3.9x 3.6x 3.5x 3.2x 3.0x 3.0x 2.5x Notes: 1. Based on public filings and Wall Street Research reports for target companies at time of transaction PROJECT FALCON 5 CONFIDENTIAL Wookiee Offer $13.75 Implied 4.0x NTM Rev. Mult.(2) PRELIMINARY DRAFT
RSU Weighted-Average As of May 3, 2019 (Per 10-Q Filing) Grant Fair Value 3 PROJECT FALCON 6 CONFIDENTIAL $17.36 weighted average grant fair value of employee’s RSUs – an offer below that would be negative to employee motivation and retention PRELIMINARY DRAFT