DRAFT C O N F I D E N T I A L 3 0 J U L Y 2 0 1 9 Project Raven V A L U A T I O N A N A L Y S I S
DRAFT C O N F I D E N T I A L P R O J E C T R A V E N Disclaimer The information herein has been prepared by Lazard based upon information supplied by Vail and Raven or publicly available information, and portions of the information herein may be based upon certain statements, estimates and forecasts provided Vail and Raven with respect to the anticipated future performance of Raven, and provided Vail with respect to the anticipated future performance of Vail. We have relied upon the accuracy and completeness of the foregoing information, and have not assumed any responsibility for any independent verification of such information or any independent valuation or appraisal of any of the assets or liabilities of Vail, Raven or any other entity, or concerning solvency or fair value of Vail, Raven or any other entity. With respect to financial forecasts, we have assumed that they have been reasonably prepared in good faith on bases reflecting the best currently available estimates and judgments of management of Vail and Raven as to the future financial performance of Vail or Raven, as applicable. We assume no responsibility for and express no view as to such forecasts or the assumptions on which they are based. The information set forth herein is based upon economic, monetary, market and other conditions as in effect on, and the information made available to us as of, the date hereof, unless indicated otherwise. These materials and the information contained herein are confidential and may not be disclosed publicly or made available to third parties without the prior written consent of Lazard; provided, however, that you may disclose to any and all persons the U.S. federal income tax treatment and tax structure of the transaction described herein and the portions of these materials that relate to such tax treatment or structure. Lazard is acting as investment banker to the Special Committee of the Board of Directors of Vail, and will not be responsible for and will not provide any tax, accounting, actuarial, legal or other specialist advice.
DRAFT C O N F I D E N T I A L P R O J E C T R A V E N I Transaction Background

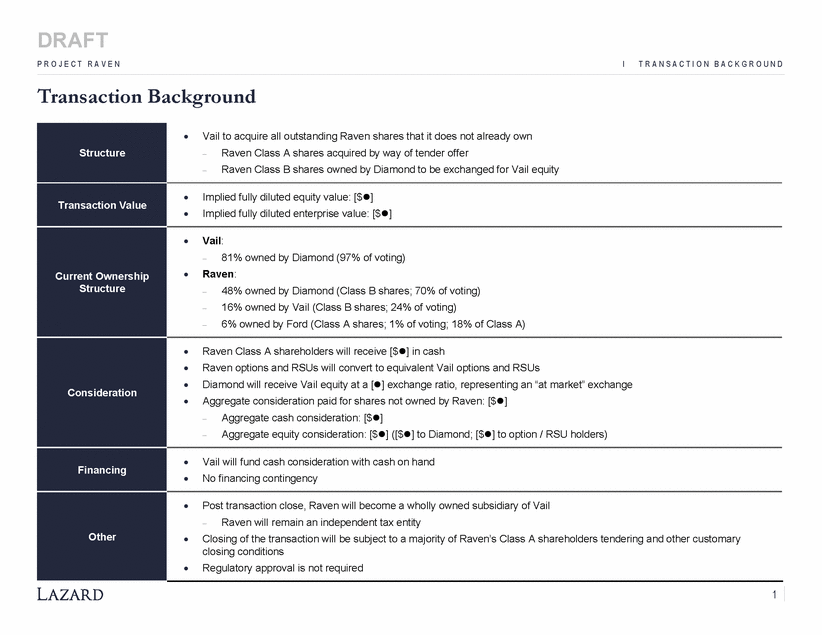
DRAFT P R O J E C T R A V E N I T R A N S A C T I O N B A C K G R O U N D Transaction Background 1 Structure Vail to acquire all outstanding Raven shares that it does not already own Raven Class A shares acquired by way of tender offer Raven Class B shares owned by Diamond to be exchanged for Vail equity Transaction Value Implied fully diluted equity value: [$] Implied fully diluted enterprise value: [$] Current Ownership Structure Vail: 81% owned by Diamond (97% of voting) Raven: 48% owned by Diamond (Class B shares; 70% of voting) 16% owned by Vail (Class B shares; 24% of voting) 6% owned by Ford (Class A shares; 1% of voting; 18% of Class A) Consideration Raven Class A shareholders will receive [$] in cash Raven options and RSUs will convert to equivalent Vail options and RSUs Diamond will receive Vail equity at a [] exchange ratio, representing an “at market” exchange Aggregate consideration paid for shares not owned by Raven: [$] Aggregate cash consideration: [$] Aggregate equity consideration: [$] ([$] to Diamond; [$] to option / RSU holders) Financing Vail will fund cash consideration with cash on hand No financing contingency Other Post transaction close, Raven will become a wholly owned subsidiary of Vail Raven will remain an independent tax entity Closing of the transaction will be subject to a majority of Raven’s Class A shareholders tendering and other customary closing conditions Regulatory approval is not required
DRAFT C O N F I D E N T I A L P R O J E C T R A V E N II Raven Background Overview
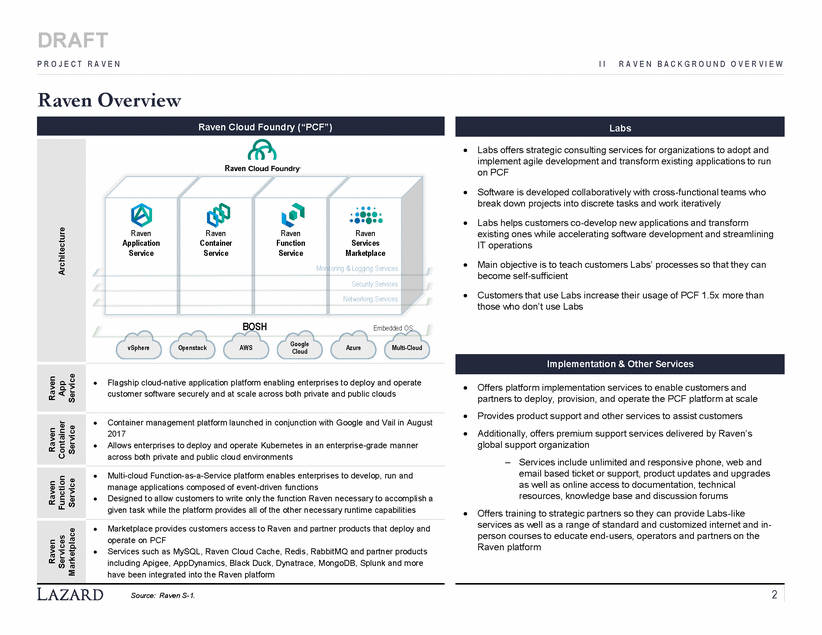
DRAFT P R O J E C T R A V E N I I R A V E N B A C K G R O U N D O V E R V I E W Raven Overview Labs offers strategic consulting services for organizations to adopt and implement agile development and transform existing applications to run on PCF Software is developed collaboratively with cross-functional teams who break down projects into discrete tasks and work iteratively Labs helps customers co-develop new applications and transform existing ones while accelerating software development and streamlining IT operations Main objective is to teach customers Labs’ processes so that they can become self-sufficient Customers that use Labs increase their usage of PCF 1.5x more than those who don’t use Labs Cloud Offers platform implementation services to enable customers and partners to deploy, provision, and operate the PCF platform at scale Provides product support and other services to assist customers Additionally, offers premium support services delivered by Raven’s global support organization – Services include unlimited and responsive phone, web and email based ticket or support, product updates and upgrades as well as online access to documentation, technical resources, knowledge base and discussion forums Offers training to strategic partners so they can provide Labs-like services as well as a range of standard and customized internet and in-person courses to educate end-users, operators and partners on the Raven platform 2 Source: Raven S-1. Implementation & Other Services Architecture Raven RavenRavenRavenRaven ApplicationContainerFunctionServices ServiceServiceServiceMarketplace Monitoring & Logging Services Security Services Networking Services BOSHEmbedded OS vSphereOpenstackAWSGoogleAzureMulti-Cloud Raven App Service Flagship cloud-native application platform enabling enterprises to deploy and operate customer software securely and at scale across both private and public clouds Raven Container Service Container management platform launched in conjunction with Google and Vail in August 2017 Allows enterprises to deploy and operate Kubernetes in an enterprise-grade manner across both private and public cloud environments Raven Function Service Multi-cloud Function-as-a-Service platform enables enterprises to develop, run and manage applications composed of event-driven functions Designed to allow customers to write only the function Raven necessary to accomplish a given task while the platform provides all of the other necessary runtime capabilities Raven Services Marketplace Marketplace provides customers access to Raven and partner products that deploy and operate on PCF Services such as MySQL, Raven Cloud Cache, Redis, RabbitMQ and partner products including Apigee, AppDynamics, Black Duck, Dynatrace, MongoDB, Splunk and more have been integrated into the Raven platform Labs Raven Cloud Foundry (“PCF”)
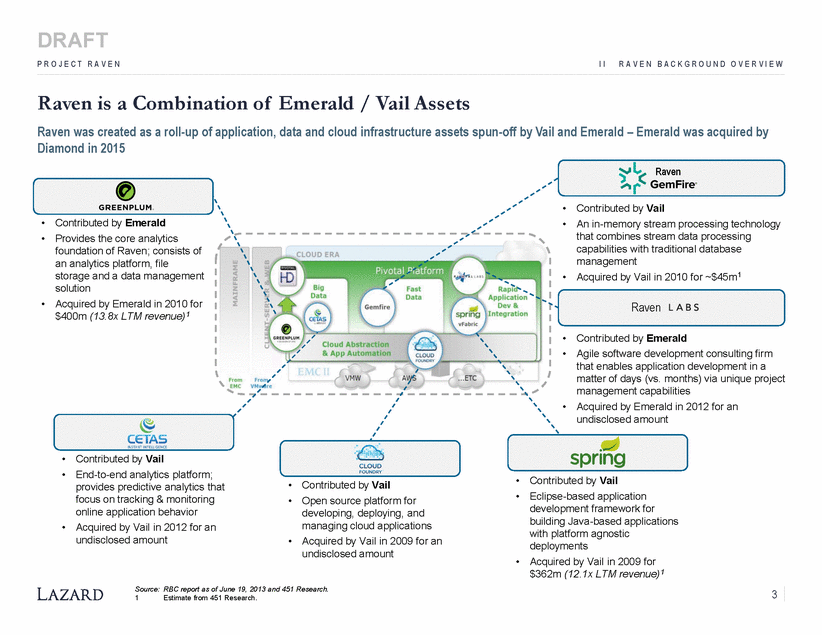
DRAFT P R O J E C T R A V E N I I R A V E N B A C K G R O U N D O V E R V I E W Raven is a Combination of Emerald / Vail Assets Raven was created as a roll-up of application, data and cloud infrastructure assets spun-off by Vail and Emerald – Emerald was acquired by Diamond in 2015 • • Contributed by Vail An in-memory stream processing technology that combines stream data processing capabilities with traditional database management Acquired by Vail in 2010 for ~$45m1 • • Contributed by Emerald Provides the core analytics foundation of Raven; consists of an analytics platform, file storage and a data management solution Acquired by Emerald in 2010 for $400m (13.8x LTM revenue)1 • • • • Contributed by Emerald Agile software development consulting firm that enables application development in a matter of days (vs. months) via unique project management capabilities Acquired by Emerald in 2012 for an undisclosed amount • • • Contributed by Vail End-to-end analytics platform; provides predictive analytics that focus on tracking & monitoring online application behavior Acquired by Vail in 2012 for an undisclosed amount • • Contributed by Vail Eclipse-based application development framework for building Java-based applications with platform agnostic deployments Acquired by Vail in 2009 for $362m (12.1x LTM revenue)1 • • Contributed by Vail Open source platform for developing, deploying, and managing cloud applications Acquired by Vail in 2009 for an undisclosed amount • • • Source: RBC report as of June 19, 2013 and 451 Research. 3 1 Estimate from 451 Research. Raven Raven
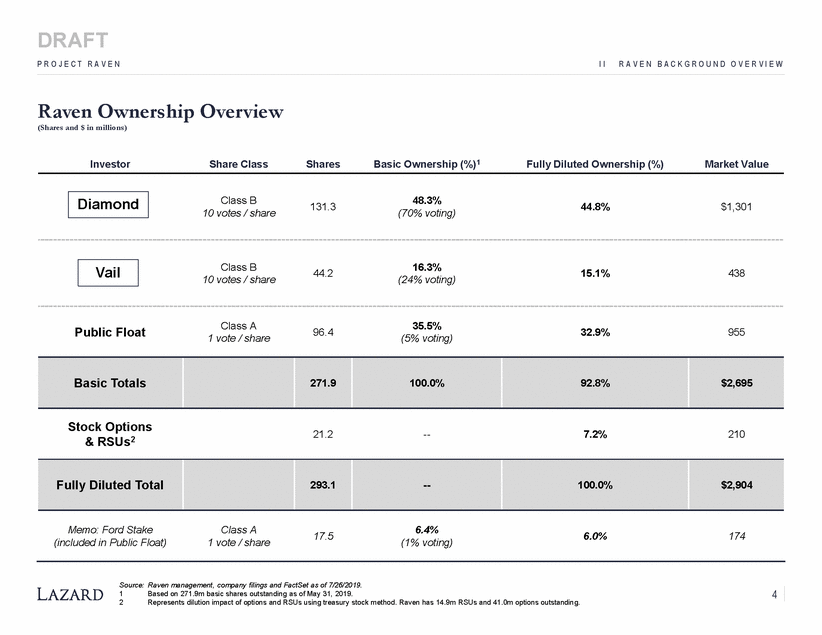
DRAFT P R O J E C T R A V E N I I R A V E N B A C K G R O U N D O V E R V I E W Raven Ownership Overview (Shares and $ in millions) Basic Ownership (%)1 Investor Share Class Shares Fully Diluted Ownership (%) Market Value 44.8% $1,301 (70% voting) 15.1% 438 (24% voting) Source: Raven management, company filings and FactSet as of 7/26/2019. 4 1 2 Based on 271.9m basic shares outstanding as of May 31, 2019. Represents dilution impact of options and RSUs using treasury stock method. Raven has 14.9m RSUs and 41.0m options outstanding. Class B 10 votes / share 131.3 48.3% Class B 10 votes / share 44.2 16.3% Public Float Class A 1 vote / share 96.4 35.5% (5% voting) 32.9% 955 Basic Totals 271.9 100.0% 92.8% $2,695 Stock Options & RSUs2 21.2 --7.2% 210 Fully Diluted Total 293.1 --100.0% $2,904 Memo: Ford Stake (included in Public Float) Class A 1 vote / share 17.5 6.4% (1% voting) 6.0% 174 Vail Diamond
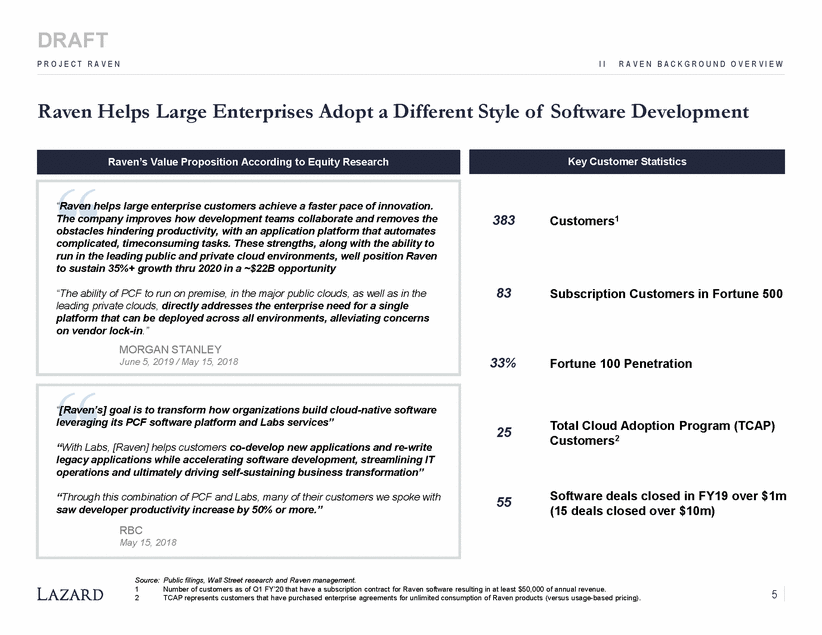
DRAFT P R O J E C T R A V E N I I R A V E N B A C K G R O U N D O V E R V I E W Raven Helps Large Enterprises Adopt a Different Style of Software Development 383 Customers1 83 Subscription Customers in Fortune 500 33% Fortune 100 Penetration Total Cloud Adoption Program (TCAP) Customers2 25 Software deals closed in FY19 over $1m (15 deals closed over $10m) 55 Source: Public filings, Wall Street research and Raven management. 1 2 Number of customers as of Q1 FY’20 that have a subscription contract for Raven software resulting in at least $50,000 of annual revenue. TCAP represents customers that have purchased enterprise agreements for unlimited consumption of Raven products (versus usage-based pricing). 5 “[Raven’s] goal is to transform how organizations build cloud-native software leveraging its PCF software platform and Labs services” “With Labs, [Raven] helps customers co-develop new applications and re-write legacy applications while accelerating software development, streamlining IT operations and ultimately driving self-sustaining business transformation” “Through this combination of PCF and Labs, many of their customers we spoke with saw developer productivity increase by 50% or more.” RBC May 15, 2018 “Raven helps large enterprise customers achieve a faster pace of innovation. The company improves how development teams collaborate and removes the obstacles hindering productivity, with an application platform that automates complicated, timeconsuming tasks. These strengths, along with the ability to run in the leading public and private cloud environments, well position Raven to sustain 35%+ growth thru 2020 in a ~$22B opportunity “The ability of PCF to run on premise, in the major public clouds, as well as in the leading private clouds, directly addresses the enterprise need for a single platform that can be deployed across all environments, alleviating concerns on vendor lock-in.” MORGAN STANLEY June 5, 2019 / May 15, 2018 Key Customer Statistics Raven’s Value Proposition According to Equity Research
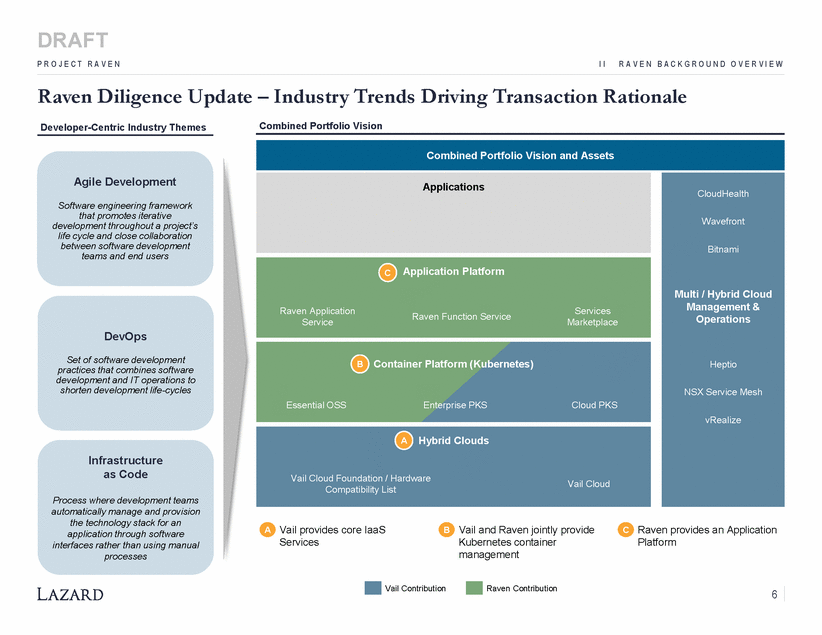
DRAFT P R O J E C T R A V E N I I R A V E N B A C K G R O U N D O V E R V I E W Raven Diligence Update Developer-Centric Industry Themes – Industry Trends Driving Transaction Rationale Combined Portfolio Vision Agile Development Software engineering framework that promotes iterative development throughout a project’s life cycle and close collaboration between software development teams and end users Operations DevOps Set of software development practices that combines software development and IT operations to shorten development life-cycles Infrastructure as Code Vail Cloud Compatibility List Process where development teams automatically manage and provision the technology stack for an application through software interfaces rather than using manual processes A Vail provides core IaaS Services Vail and Raven jointly provide Kubernetes container management C Raven provides an Application Platform B Vail Contribution Raven Contribution 6 AHybrid Clouds Vail Cloud Foundation / Hardware Combined Portfolio Vision and Assets Applications CloudHealth Wavefront Bitnami Multi / Hybrid Cloud Management & Heptio NSX Service Mesh vRealize BContainer Platform (Kubernetes) Essential OSSEnterprise PKSCloud PKS CApplication Platform Raven ApplicationServices ServiceRaven Function ServiceMarketplace
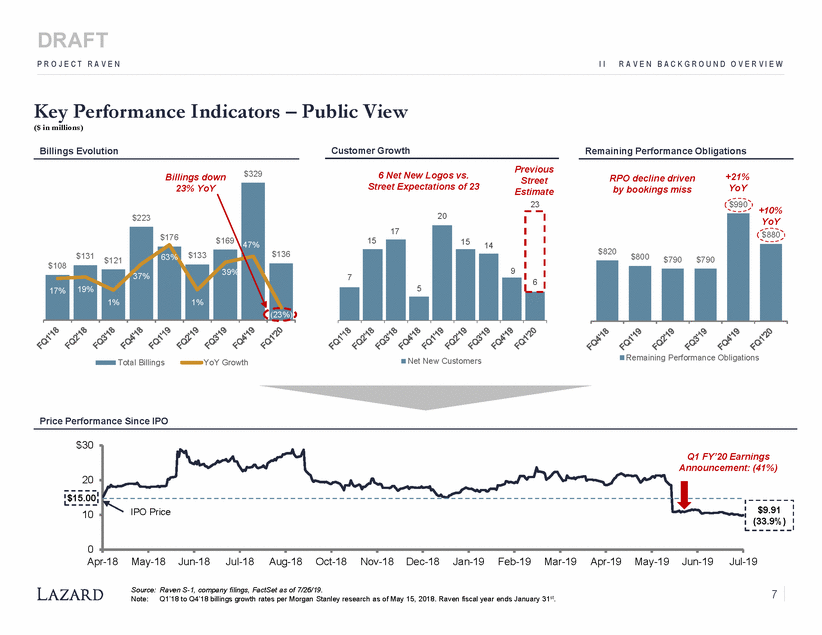
DRAFT P R O J E C T R A V E N I I R A V E N B A C K G R O U N D O V E R V I E W Key Performance Indicators – Public View ($ in millions) Billings Evolution Customer Growth Remaining Performance Obligations Previous Street Estimate 23 $329 6 Net New Logos vs. Street Expectations of 23 +21% YoY $990 Billings down RPO decline driven by bookings miss +10% $169 $121 $108 Remaining Performance Obligations Net New Customers Total Billings YoY Growth Price Performance Since IPO $30 20 10 0 Apr-18 May-18 Jun-18 Jul-18 Aug-18 Oct-18 Nov-18Dec-18 Jan-19 Feb-19 Mar-19 Apr-19 May-19 Jun-19 Jul-19 Source: Raven S-1, company filings, FactSet as of 7/26/19. Note:Q1’18 to Q4’18 billings growth rates per Morgan Stanley research as of May 15, 2018. Raven fiscal year ends January 31st. 7 $15.00 Q1 FY’20 Earnings Announcement: (41%) IPO Price $9.91 (33.9%) $820$800$790$790 YoY $880 20 6 17 1514 15 5 7 9 23% YoY $223 47% $136 $131 37% $176 63% $133 39% 1% (23%) 19% 1% 17%
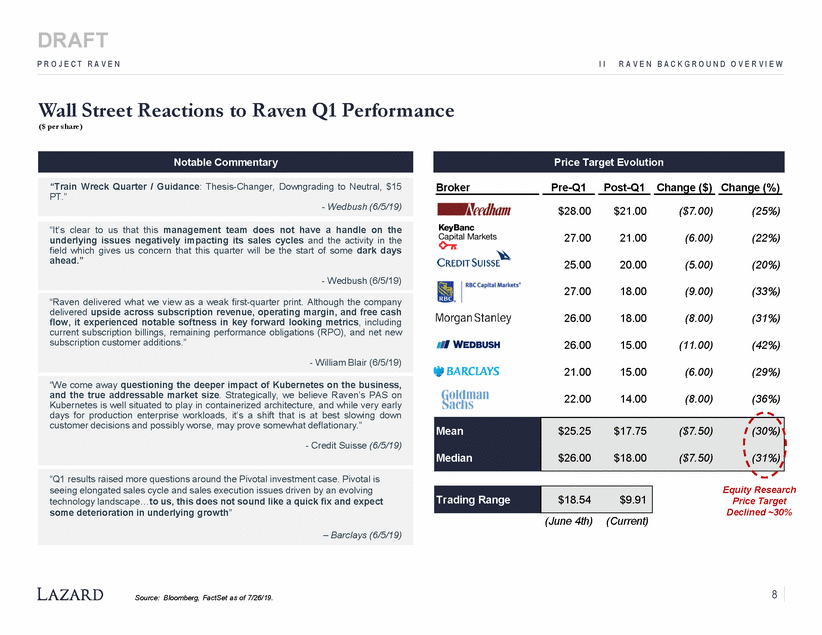
DRAFT P R O J E C T R A V E N I I R A V E N B A C K G R O U N D O V E R V I E W Wall Street ($ per share) Reactions to Raven Q1 Performance Broker Pre-Q1 Post-Q1 Change ($) Change (%) $28.00 $21.00 ($7.00) (25%) 27.00 21.00 (6.00) (22%) 25.00 20.00 (5.00) (20%) 27.00 18.00 (9.00) (33%) 26.00 18.00 (8.00) (31%) 26.00 15.00 (11.00) (42%) 21.00 15.00 (6.00) (29%) 22.00 14.00 (8.00) (36%) Equity Research Price Target Declined ~30% (June 4th) (Current) 8 Source: Bloomberg, FactSet as of 7/26/19. Trading Range $18.54 $9.91 “Q1 results raised more questions around the Pivotal investment case. Pivotal is seeing elongated sales cycle and sales execution issues driven by an evolving technology landscape…to us, this does not sound like a quick fix and expect some deterioration in underlying growth” – Barclays (6/5/19) Mean Median $25.25 $17.75 ($7.50) (30%) $26.00 $18.00 ($7.50) (31%) “We come away questioning the deeper impact of Kubernetes on the business, and the true addressable market size. Strategically, we believe Raven’s PAS on Kubernetes is well situated to play in containerized architecture, and while very early days for production enterprise workloads, it’s a shift that is at best slowing down customer decisions and possibly worse, may prove somewhat deflationary.” - Credit Suisse (6/5/19) “Raven delivered what we view as a weak first-quarter print. Although the company delivered upside across subscription revenue, operating margin, and free cash flow, it experienced notable softness in key forward looking metrics, including current subscription billings, remaining performance obligations (RPO), and net new subscription customer additions.” - William Blair (6/5/19) “It’s clear to us that this management team does not have a handle on the underlying issues negatively impacting its sales cycles and the activity in the field which gives us concern that this quarter will be the start of some dark days ahead.” - Wedbush (6/5/19) “Train Wreck Quarter / Guidance: Thesis-Changer, Downgrading to Neutral, $15 PT.” - Wedbush (6/5/19) Price Target Evolution Notable Commentary
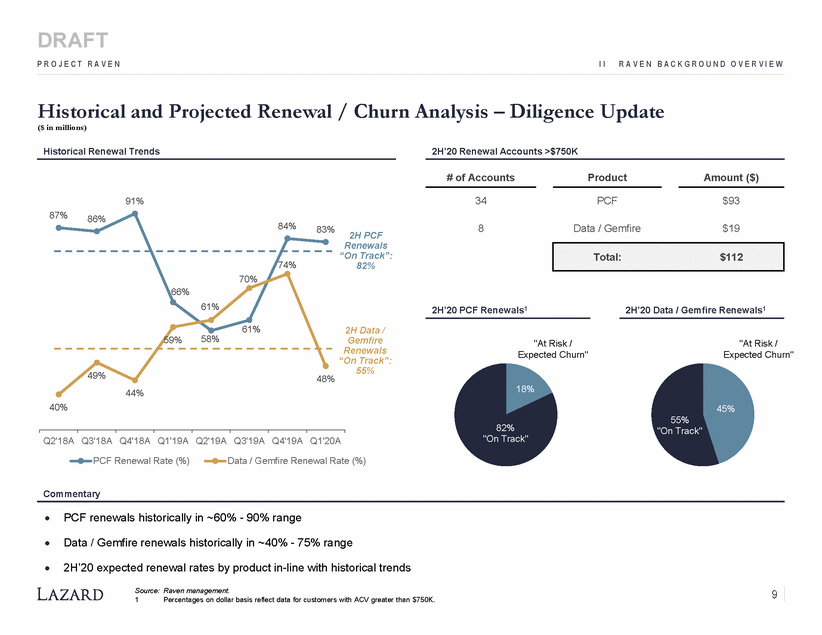
DRAFT P R O J E C T R A V E N I I R A V E N B A C K G R O U N D O V E R V I E W Historical and Projected Renewal / Churn Analysis – Diligence Update ($ in millions) Historical Renewal Trends 2H’20 Renewal Accounts >$750K # of Accounts Product Amount ($) 34 PCF $93 91% 87% 86% 84% 8 Data / Gemfire $19 83% 2H PCF Renewals “On Track”: 82% 74% 70% 66% 61% 2H’20 PCF Renewals1 2H’20 Data / Gemfire Renewals1 61% 2H Data / Gemfire Renewals “On Track”: 55% 58% 59% "At Risk / Expected Churn" "At Risk / Expected Churn" 49% 48% 18% 44% 40% 45% 55% "On Track" 82% "On Track" Q2'18A Q3'18A Q4'18A Q1'19A Q2'19A Q3'19A Q4'19A Q1'20A PCF Renewal Rate (%) Data / Gemfire Renewal Rate (%) Commentary PCF renewals historically in ~60% - 90% range Data / Gemfire renewals historically in ~40% - 75% range 2H’20 expected renewal rates by product in-line with historical trends Source: Raven management. 9 1 Percentages on dollar basis reflect data for customers with ACV greater than $750K. Total:$112
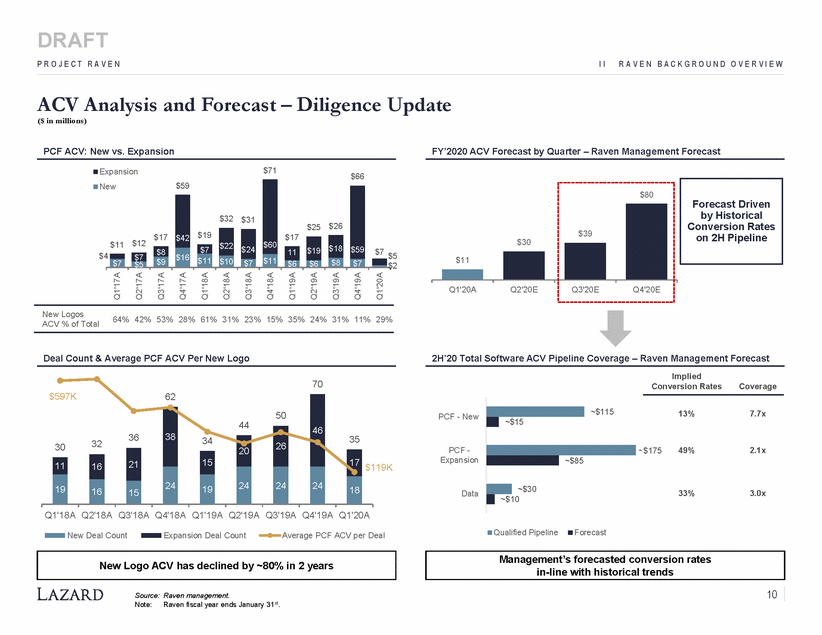
DRAFT P R O J E C T R A V E N I I R A V E N B A C K G R O U N D O V E R V I E W ACV Analysis and Forecast – Diligence Update ($ in millions) PCF ACV: New vs. Expansion FY’2020 ACV Forecast by Quarter – Raven Management Forecast $71 Expansion N $66 $7 $5 $4 $2 New Logos ACV % of Total 64% 42% 53% 28% 61% 31% 23% 15% 35% 24% 31% 11% 29% Deal Count & Average PCF ACV Per New Logo 2H’20 Total Software ACV Pipeline Coverage – Raven Management Forecast Implied 70 Conversion Rates Coverage PCF - New 44 32 30 PCF - Expansion ~$175 49% 2.1x 119K Data Q1'18A Q2'18A Q3'18A Q4'18A Q1'19A Q2'19A Q3'19A Q4'19A Q1'20A Qualified Pipeline Forecast New Deal Count Expansion Deal Count Average PCF ACV per Deal in-line with historical trends 10 Source: Raven management. Note:Raven fiscal year ends January 31st. Q1'17A Q2'17A Q3'17A Q4'17A Q1'18A Q2'18A Q3'18A Q4'18A Q1'19A Q2'19A Q3'19A Q4'19A Q1'20A Management’s forecasted conversion rates New Logo ACV has declined by ~80% in 2 years ~$115 ~$15 ~$85 ~$30 ~$10 $597K62 46 35 36 38 50 26 34 20 21 15 17 $ 16 11 24 24 24 24 19 18 19 16 15 13%7.7x 33%3.0x $30 $80 $39 $11 Q1'20AQ2'20E Q3'20EQ4'20E ew$59 $32 $31 $17 $42 $19 $11 $12$22 $7$5$9 $16 $11 $10 $7 $60 $25 $26 $17 $18 $11 $6$6$8 $59 $24 $19 $7 $8 11 $7 $7 Forecast Driven by Historical Conversion Rates on 2H Pipeline
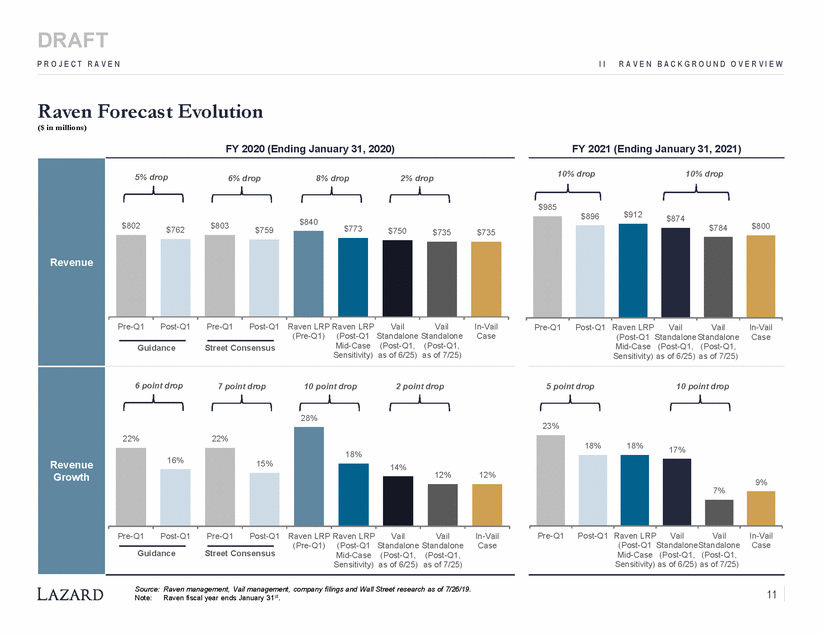
DRAFT P R O J E C T R A V E N I I R A V E N B A C K G R O U N D O V E R V I E W Raven Forecast Evolution ($ in millions) FY 2020 (Ending January 31, 2020) FY 2021 (Ending January 31, 2021) 10% drop 10% drop $985 $912 $896 $874 $800 $784 $750 $735 $735 Pre-Q1 Post-Q1 Raven LRP Vail Vail In-Vail Case (Post-Q1 Standalone Standalone Mid-Case (Post-Q1, (Post-Q1, Sensitivity) as of 6/25) as of 7/25) 5 point drop 10 point drop 23% 14% 7% Pre-Q1 Post-Q1 Raven LRP Vail Vail In-Vail Case (Post-Q1 StandaloneStandalone Mid-Case (Post-Q1, (Post-Q1, Sensitivity) as of 6/25) as of 7/25) Source: Raven management, Vail management, company filings and Wall Street research as of 7/26/19. Note:Raven fiscal year ends January 31st. 11 18%18%17% 9% Revenue 5% drop6% drop8% drop2% drop $802$762$803$759$840$773 Pre-Q1Post-Q1Pre-Q1Post-Q1 Raven LRP Raven LRPVailVailIn-Vail (Pre-Q1)(Post-Q1 Standalone StandaloneCase GuidanceStreet ConsensusMid-Case (Post-Q1, (Post-Q1, Sensitivity) as of 6/25) as of 7/25) Revenue Growth 6 point drop7 point drop10 point drop2 point drop 28% 18% 12%12% Pre-Q1Post-Q1Pre-Q1Post-Q1 Raven LRP Raven LRPVailVailIn-Vail (Pre-Q1)(Post-Q1 Standalone StandaloneCase GuidanceStreet ConsensusMid-Case (Post-Q1, (Post-Q1, Sensitivity) as of 6/25) as of 7/25) 22%22% 16%15%
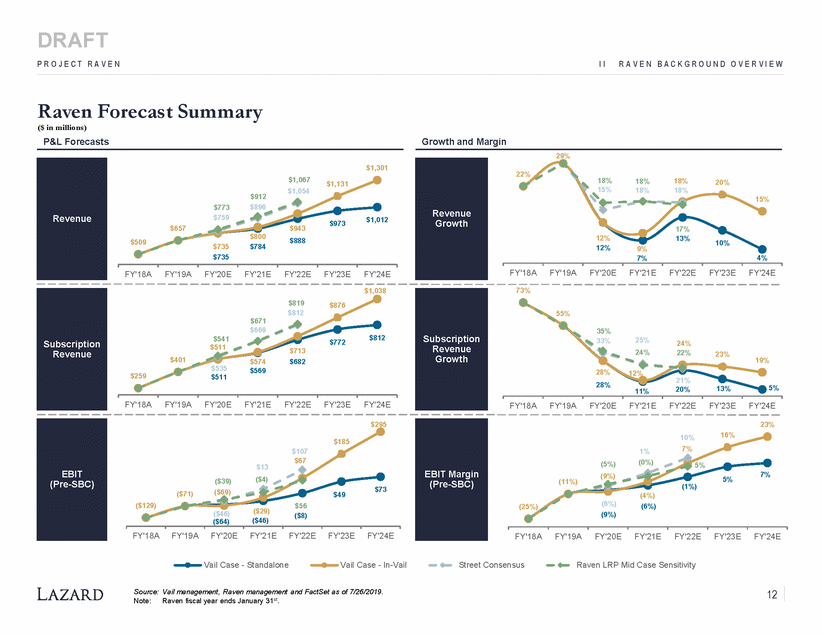
DRAFT P R O J E C T R A V E N I I R A V E N B A C K G R O U N D O V E R V I E W Raven Forecast Summary ($ in millions) P&L Forecasts Growth and Margin 29% $1,301 22% $1,067 $1,054 18% 15% 18% 18% 18% 18% 20% $1,131 $912 $896 15% $773 $759 $1,012 $973 $657 $943 $888 17% 13% $800 $784 12% 12% $509 10% $735 $735 9% 7% 4% FY'18A FY'19A FY'20E FY'21E FY'22E FY'23E FY'24E FY'18A FY'19A FY'20E FY'21E FY'22E FY'23E FY'24E $1,038 73% $819 $812 $876 55% $671 $669 35% 33% $812 $541 $511 25% 24% $772 24% 22% $713 $682 23% $401 19% $574 $569 $535 $511 28% 28% 12% $259 21% 20% 5% 13% 11% FY'18A FY'19A FY'20E FY'21E FY'22E FY'23E FY'24E FY'18A FY'19A FY'20E FY'21E FY'22E FY'23E FY'24E $295 23% 16% 10% 7% $185 $107 $67 1% (0%) (5%) (9%) 5% $13 ($4) 7% 5% ($39) ($69) (11%) (1%) $73 ($71) $49 (4%) (6%) (6%) (9%) ($129) $56 ($8) (25%) ($29) ($46) ($64) ($46) FY'18AFY'19AFY'20EFY'21E FY'22E FY'23E FY'24E FY'18A FY'19A FY'20E FY'21E FY'22E FY'23E FY'24E Vail Case - Standalone Vail Case - In-Vail Street Consensus Raven LRP Mid Case Sensitivity Source: Vail management, Raven management and FactSet as of 7/26/2019. Note:Raven fiscal year ends January 31st. 12 EBIT Margin (Pre-SBC) EBIT (Pre-SBC) Subscription Revenue Growth Subscription Revenue Revenue Growth Revenue
DRAFT C O N F I D E N T I A L P R O J E C T R A V E N III Raven Valuation Analysis
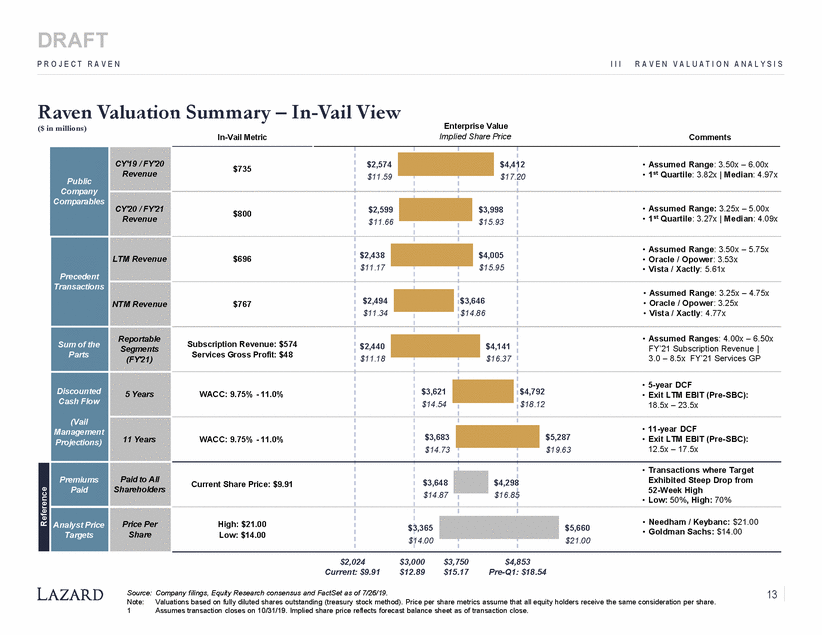
DRAFT P R O J E C T R A V E N I I I R A V E N V A L U A T I O N A N A L Y S I S Raven Valuation Summary – In-Vail View 12 • Assumed Range: 3.50x – 6.00x $11.59 $17. • 1st Quartile: 3.27x | Median: 4.09x $5,287 • Exit LTM EBIT (Pre-SBC): Exhibited Steep Drop from 5 • Low: 50%, High: 70% 3,365 • Goldman Sachs: $14.00 $2,024 Current: $9.91 $3,000 $12.89 $3,750 $15.17 $4,853 Pre-Q1: $18.54 Source: Company filings, Equity Research consensus and FactSet as of 7/26/19. Note:Valuations based on fully diluted shares outstanding (treasury stock method). Price per share metrics assume that all equity holders receive the same consideration per share. 13 1 Assumes transaction closes on 10/31/19. Implied share price reflects forecast balance sheet as of transaction close. Reference ($ in millions) In-Vail Metric Enterprise Value Implied Share Price Comments Public Company Comparables CY'19 / FY'20 Revenue $735 20 • 1st Quartile: 3.82x | Median: 4.97x $2,574 $4,4 CY'20 / FY'21 Revenue $800 • Assumed Range: 3.25x – 5.00x $2,599 $3,998 $11.66 $15.93 Precedent Transactions LTM Revenue $696 • Assumed Range: 3.50x – 5.75x • Oracle / Opower: 3.53x • Vista / Xactly: 5.61x $2,438 $4,005 $11.17 $15.95 NTM Revenue $767 $3,646 $14.86 • Assumed Range: 3.25x – 4.75x • Oracle / Opower: 3.25x • Vista / Xactly: 4.77x $2,494 $11.34 Sum of the Parts Reportable Segments (FY'21) Subscription Revenue: $574 Services Gross Profit: $48 • Assumed Ranges: 4.00x – 6.50x FY’21 Subscription Revenue | 3.0 – 8.5x FY’21 Services GP $2,440 $4,141 $11.18 $16.37 Discounted Cash Flow (Vail Management Projections) 5 Years WACC: 9.75% - 11.0% • 5-year DCF $4,792 • Exit LTM EBIT (Pre-SBC): $18.1218.5x – 23.5x $3,621 $14.54 11 Years WACC: 9.75% - 11.0% $3,683 • 11-year DCF $14.73 $19.63 12.5x – 17.5x Premiums Paid Paid to All Shareholders Current Share Price: $9.91 • Transactions where Target 52-Week High $3,648 $4,298 $14.87 $16.8 Analyst Price Targets Price Per Share High: $21.00 Low: $14.00 $ $ $5,660 • Needham / Keybanc: $21.00 14.00 $21.00
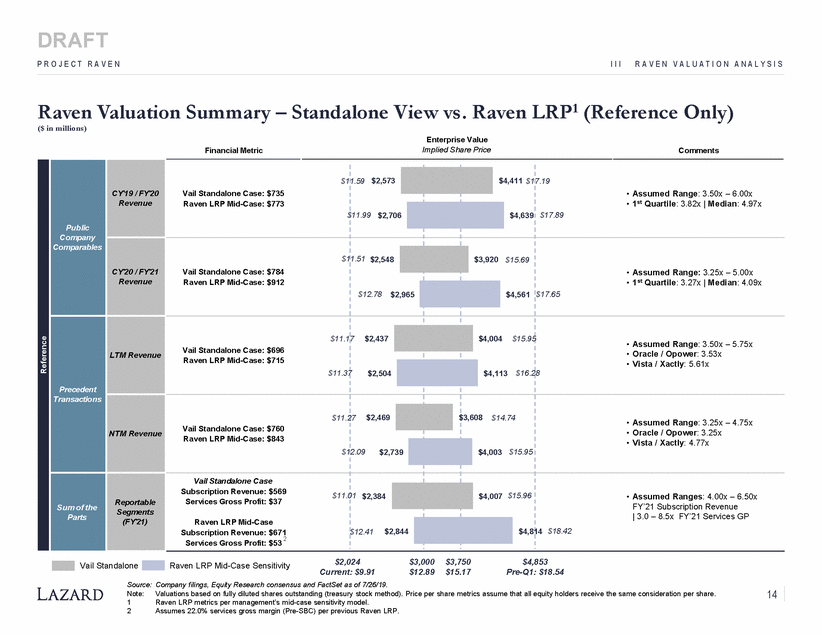
DRAFT P R O J E C T R A V E N I I I R A V E N V A L U A T I O N A N A L Y S I S – Standalone View vs. Raven LRP1 (Reference Only) Enterprise Value Raven Valuation ($ in millions) Summary Financial Metric Implied Share Price Comments • Assumed Range: 3.50x – 5.75x • Vista / Xactly: 5.61x 7$2,504 $3,608 $14.74 • Oracle / Opower: 3.25x 01 $2,384 Services Gross Profit: $37 | 3.0 – 8.5x FY’21 Services GP 14 $18.42 Services Gross Profit: $53 2 $2,024 Current: $9.91 $3,000$3,750 $12.89$15.17 $4,853 Pre-Q1: $18.54 Vail Standalone Raven LRP Mid-Case Sensitivity Source: Company filings, Equity Research consensus and FactSet as of 7/26/19. 14 Note: 1 2 Valuations based on fully diluted shares outstanding (treasury stock method). Price per share metrics assume that all equity holders receive the same consideration per share. Raven LRP metrics per management’s mid-case sensitivity model. Assumes 22.0% services gross margin (Pre-SBC) per previous Raven LRP. Reference Public Company Comparables CY'19 / FY'20 Revenue $1 Vail Standalone Case: $735 Raven LRP Mid-Case: $773 $ 7.19 • Assumed Range: 3.50x – 6.00x • 1st Quartile: 3.82x | Median: 4.97x $17.89 1.59 $2,573 $4,411 $1 11.99 $2,706 $4,639 CY'20 / FY'21 Revenue $1 Vail Standalone Case: $784 Raven LRP Mid-Case: $912 • Assumed Range: 3.25x – 5.00x • 1st Quartile: 3.27x | Median: 4.09x $17.65 1.51 $2,548 $3,920 $15.69 $12.78 $2,965 $4,561 Precedent Transactions LTM Revenue $11.1 Vail Standalone Case: $696 Raven LRP Mid-Case: $715 $11.3 • Oracle / Opower: 3.53x 8 7$2,437 $4,004 $15.95 $4,113 $16.2 NTM Revenue $11.2 Vail Standalone Case: $760 Raven LRP Mid-Case: $843 $1 • Assumed Range: 3.25x – 4.75x • Vista / Xactly: 4.77x 7$2,469 2.09$2,739 $4,003 $15.95 Sum of the Parts Reportable Segments (FY'21) Vail Standalone Case Subscription Revenue: $569$11. Raven LRP Mid-Case Subscription Revenue: $671 • Assumed Ranges: 4.00x – 6.50x FY’21 Subscription Revenue $4,007 $15.96 $12.41$2,844 $4,8
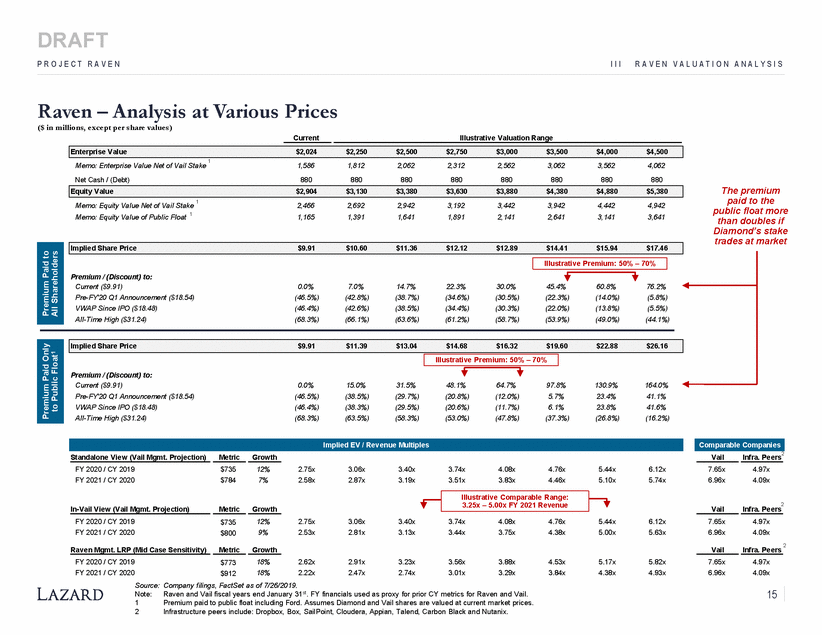
DRAFT P R O J E C T R A V E N I I I R A V E N V A L U A T I O N A N A L Y S I S Raven – Analysis at Various Prices ($ in millions, except per share values) Current Illustrative Valuation Range 1 Memo: Enterprise Value Net of Vail Stake Net Cash / (Debt) 1,586 880 1,812 880 2,062 880 2,312 880 2,562 880 3,062 880 3,562 880 4,062 880 The premium paid to the public float more than doubles if Diamond’s stake trades at market Memo: Equity Value Net of Vail Stake 1 2,466 1,165 2,692 1,391 2,942 1,641 3,192 1,891 3,442 2,141 3,942 2,641 4,442 3,141 4,942 3,641 1 Memo: Equity Value of Public Float Premium / (Discount) to: Current ($9.91) Pre-FY'20 Q1 Announcement ($18.54) VWAP Since IPO ($18.48) All-Time High ($31.24) 0.0% (46.5%) (46.4%) (68.3%) 7.0% (42.8%) (42.6%) (66.1%) 14.7% (38.7%) (38.5%) (63.6%) 22.3% (34.6%) (34.4%) (61.2%) 30.0% (30.5%) (30.3%) (58.7%) 45.4% (22.3%) (22.0%) (53.9%) 60.8% (14.0%) (13.8%) (49.0%) 76.2% (5.8%) (5.5%) (44.1%) Premium / (Discount) to: Current ($9.91) Pre-FY'20 Q1 Announcement ($18.54) VWAP Since IPO ($18.48) All-Time High ($31.24) 0.0% (46.5%) (46.4%) (68.3%) 15.0% (38.5%) (38.3%) (63.5%) 31.5% (29.7%) (29.5%) (58.3%) 48.1% (20.8%) (20.6%) (53.0%) 64.7% (12.0%) (11.7%) (47.8%) 97.8% 5.7% 6.1% (37.3%) 130.9% 23.4% 23.8% (26.8%) 164.0% 41.1% 41.6% (16.2%) 2 Standalone View (Vail Mgm t. Proje ction) Metric Growth Vail Infra. Peers FY 2020 / CY 2019 FY 2021 / CY 2020 $735 $784 12% 7% 2.75x 2.58x 3.06x 2.87x 3.40x 3.19x 3.74x 3.51x 4.08x 3.83x 4.76x 4.46x 5.44x 5.10x 6.12x 5.74x 7.65x 6.96x 4.97x 4.09x 2 Vail Infra. Peers In-Vail View (Vail Mgmt. Projection) Metric Growth FY 2020 / CY 2019 FY 2021 / CY 2020 $735 $800 12% 9% 2.75x 2.53x 3.06x 2.81x 3.40x 3.13x 3.74x 3.44x 4.08x 3.75x 4.76x 4.38x 5.44x 5.00x 6.12x 5.63x 7.65x 6.96x 4.97x 4.09x 2 Raven Mgmt. LRP (Mid Case Sensitivity) Metric Growth Vail Infra. Peers FY 2020 / CY 2019 FY 2021 / CY 2020 18% 18% 2.62x 2.22x 2.91x 2.47x 3.23x 2.74x 3.56x 3.01x 3.88x 3.29x 4.53x 3.84x 5.17x 4.38x 5.82x 4.93x 7.65x 6.96x 4.97x 4.09x $773 $912 Source: Company filings, FactSet as of 7/26/2019. 15 Note: 1 2 Raven and Vail fiscal years end January 31st. FY financials used as proxy for prior CY metrics for Raven and Vail. Premium paid to public float including Ford. Assumes Diamond and Vail shares are valued at current market prices. Infrastructure peers include: Dropbox, Box, SailPoint, Cloudera, Appian, Talend, Carbon Black and Nutanix. Premium Paid Only to Public Float1 Premium Paid to All Shareholders Illustrative Comparable Range: 3.25x – 5.00x FY 2021 Revenue Comparable Companies Implied EV / Revenue Multiples Implied Share Price $9.91 $11.39 $13.04 $14.68 $16.32 $19.60 $22.88 $26.16 Illustrative Premium: 50% – 70% Illustrative Premium: 50% – 70% Implied Share Price $9.91 $10.60 $11.36 $12.12 $12.89 $14.41 $15.94 $17.46 Equity Value $2,904 $3,130 $3,380 $3,630 $3,880 $4,380 $4,880 $5,380 Enterprise Value $2,024 $2,250 $2,500 $2,750 $3,000 $3,500 $4,000 $4,500
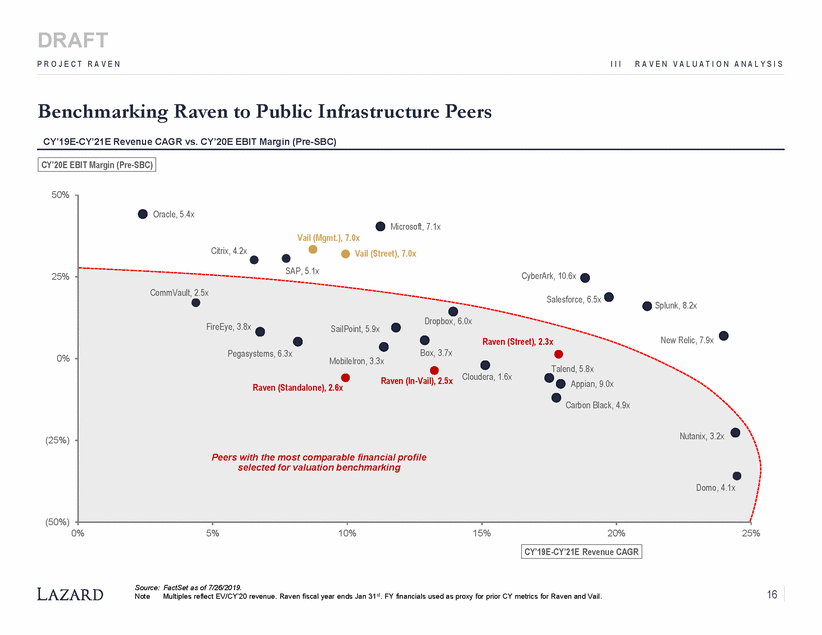
DRAFT P R O J E C T R A V E N I I I R A V E N V A L U A T I O N A N A L Y S I S Benchmarking Raven to Public Infrastructure Peers CY’19E-CY’21E Revenue CAGR vs. CY’20E EBIT Margin (Pre-SBC) 50% 25% Salesforce, 6.5x Splunk, 8.2x FireEye, 3.8x SailPoint, 5.9x 0% Talend, 5.8x Appian, 9.0x Raven (In-Vail), 2.5x Raven (Standalone), 2.6x (25%) (50%) 0% 5% 10% 15% 20% 25% Source: FactSet as of 7/26/2019. 16 Multiples reflect EV/CY’20 revenue. Raven fiscal year ends Jan 31st. FY financials used as proxy for prior CY metrics for Raven and Vail. Note CY’19E-CY’21E Revenue CAGR Oracle, 5.4x Microsoft, 7.1x Vail (Mgmt.), 7.0x Citrix, 4.2xVail (Street), 7.0x SAP, 5.1xCyberArk, 10.6x CommVault, 2.5x Dropbox, 6.0x Raven (Street), 2.3xNew Relic, 7.9x Pegasystems, 6.3xBox, 3.7x MobileIron, 3.3x Cloudera, 1.6x Carbon Black, 4.9x Nutanix, 3.2x Peers with the most comparable financial profile selected for valuation benchmarking Domo, 4.1x CY’20E EBIT Margin (Pre-SBC)
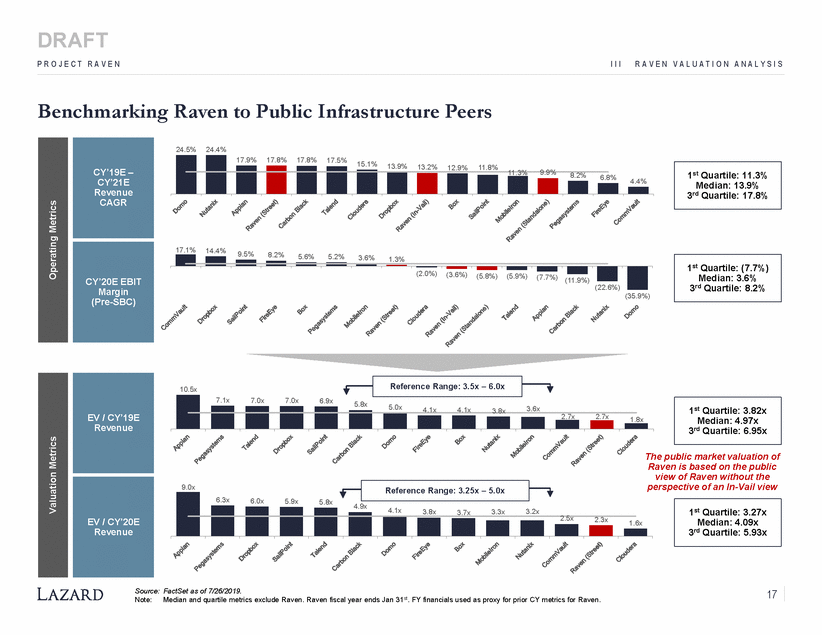
DRAFT P R O J E C T R A V E N I I I R A V E N V A L U A T I O N A N A L Y S I S Benchmarking Raven to Public Infrastructure Peers 24.5% 24.4% 11.3% 9.9% 8.2% 6.8% 4.4% 3rd Quartile: 17.8% 17.1% 14.4% 9.5% 8.2% 5.6% 5.2% 3.6% 1.3% (2.0%) (3.6%) (5.8%) (5.9%) (7.7%) (11.9%) (35.9%) 10.5x 3.6x 4.1x 4.1x 3.8x 2.7x 2.7x 1.8x 3rd Quartile: 6.95x The public market valuation of Raven is based on the public view of Raven without the perspective of an In-Vail view 9.0x 4.9x 4.1x 3.8x 3.3x 3.2x 3.7x 2.5x 2.3x 1.6x Source: FactSet as of 7/26/2019. Note:Median and quartile metrics exclude Raven. Raven fiscal year ends Jan 31st. FY financials used as proxy for prior CY metrics for Raven. 17 Valuation Metrics Operating Metrics 1st Quartile: 3.27x Median: 4.09x 3rd Quartile: 5.93x 6.3x6.0x5.9x5.8x Reference Range: 3.25x – 5.0x EV / CY’20E Revenue 7.1x7.0x7.0x6.9x5.8x5.0x 1st Quartile: 3.82x Median: 4.97x Reference Range: 3.5x – 6.0x EV / CY’19E Revenue (22.6%) 1st Quartile: (7.7%) Median: 3.6% 3rd Quartile: 8.2% CY’20E EBIT Margin (Pre-SBC) 1st Quartile: 11.3% Median: 13.9% 17.9% 17.8% 17.8% 17.5% 15.1% 13.9% 13.2% 12.9% 11.8% CY’19E – CY’21E Revenue CAGR
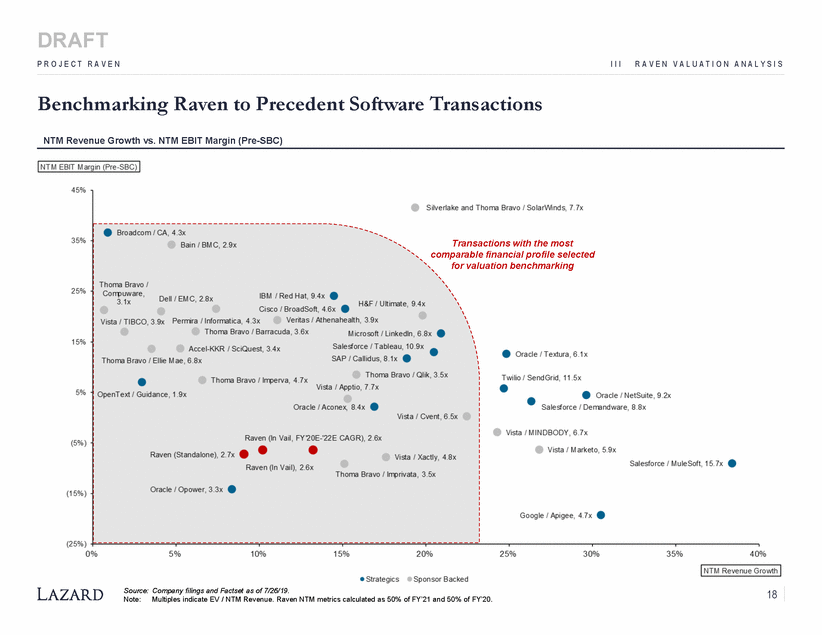
DRAFT P R O J E C T R A V E N I I I R A V E N V A L U A T I O N A N A L Y S I S Benchmarking Raven to Precedent Software NTM Revenue Growth vs. NTM EBIT Margin (Pre-SBC) Transactions Transactions with the most comparable financial profile selected for valuation benchmarking Source: Company filings and Factset as of 7/26/19. Note:Multiples indicate EV / NTM Revenue. Raven NTM metrics calculated as 50% of FY’21 and 50% of FY’20. 18
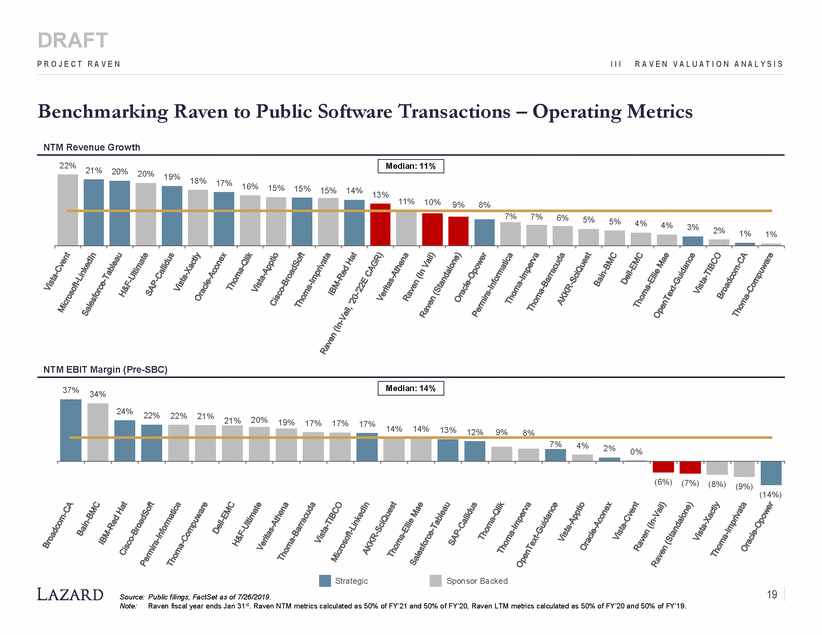
DRAFT P R O J E C T R A V E N I I I R A V E N V A L U A T I O N A N A L Y S I S Benchmarking Raven to Public Software Transactions – Operating Metrics NTM Revenue Growth 22% 21% 20% 20% 19% 18% 17% 16% 15% 15% 15% 14% 13% 11% 10% 9% 8% 7% 7% 6% 5% 5% 4% 4% 3% 2% 1% 1 NTM EBIT Margin (Pre-SBC) 37% 34% 20% 21% 19% 17% 17% 17% 14% 14% 13% 12% 9% 8% 7% 4% 2% 0% (9%) (14%) Strategic Sponsor Backed 19 Source: Public filings, FactSet as of 7/26/2019. Note:Raven fiscal year ends Jan 31st. Raven NTM metrics calculated as 50% of FY’21 and 50% of FY’20, Raven LTM metrics calculated as 50% of FY’20 and 50% of FY’19. 24% 22% 22% 21% (6%) (7%) (8%) Median: 14% % Median: 11%
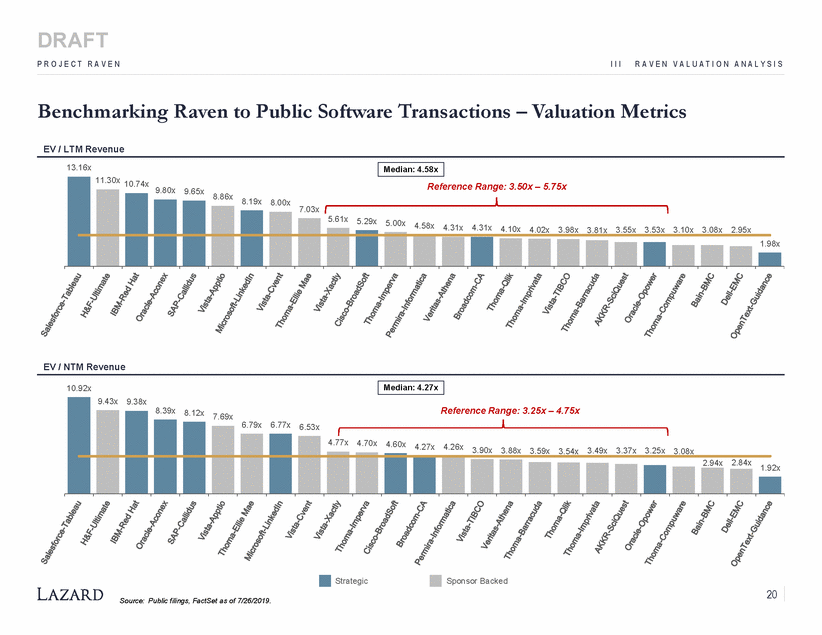
DRAFT P R O J E C T R A V E N I I I R A V E N V A L U A T I O N A N A L Y S I S Benchmarking Raven to Public Software Transactions – Valuation Metrics EV / LTM Revenue 13.16x 11.30x 10.74x Reference Range: 3.50x – 5.75x 9.80x 9.65x 8.86x 8.19x 8.00x 7.03x 5.61x 5.29x 5.00x 4.58x 4.31x 4.31x 4.10x 4.02x 3.98x 3.81x 3.55x 3.53x 3.10x 3.08x 2.95x 1.98x EV / NTM Revenue 10.92x 9.43x 9.38x 8.39x Reference Range: 3.25x – 4.75x 8.12x 7.69x 6.79x 6.77x 6.53x 4.77x 4.70x 4.60x 4.27x 4.26x 3.90x 3.88x 3.59x 3.54x 3.49x 3.37x 3.25x 3.08x 2.94x 2.84x 1.92x Strategic Sponsor Backed 20 Source: Public filings, FactSet as of 7/26/2019. Median: 4.27x Median: 4.58x
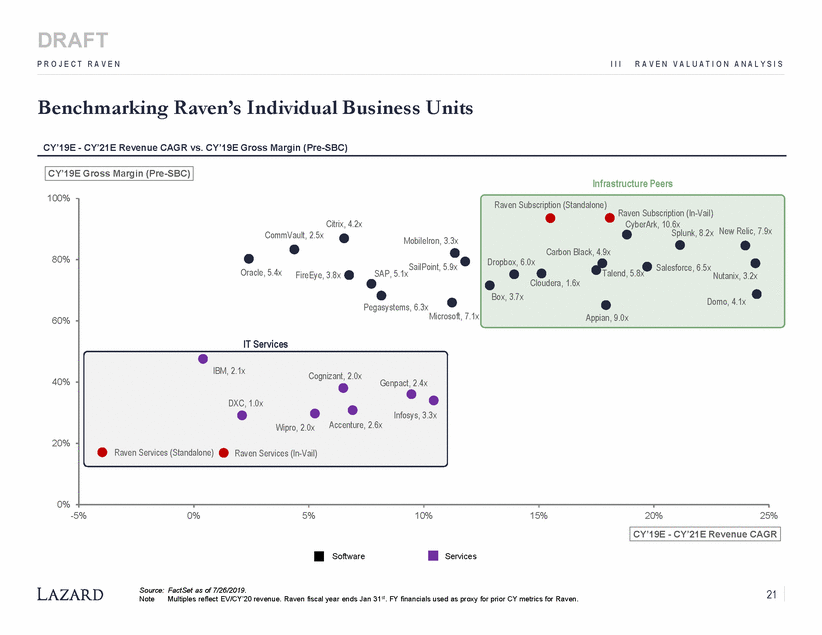
DRAFT P R O J E C T R A V E N I I I R A V E N V A L U A T I O N A N A L Y S I S Benchmarking Raven’s Individual Business Units CY’19E - CY’21E Revenue CAGR vs. CY’19E Gross Margin (Pre-SBC) Infrastructure Peers 100% Raven Subscription (In-Vail) x MobileIron, 3.3x 80% Oracle, 5.4x SAP, 5.1x Talend, 5.8x FireEye, 3.8x Nutanix, 3.2x Pegasystems, 6.3x 60% 40% 20% 0% -5% 0% 5% 10% 15% 20% 25% Software Services Source: FactSet as of 7/26/2019. 21 Note Multiples reflect EV/CY’20 revenue. Raven fiscal year ends Jan 31st. FY financials used as proxy for prior CY metrics for Raven. CY’19E - CY’21E Revenue CAGR Raven Subscription (Standalone) Citrix, 4.2xCyberArk, 10.6x CommVault, 2.5xSplunk, 8.2x New Relic, 7.9 Carbon Black, 4.9x SailPoint, 5.9xDropbox, 6.0xSalesforce, 6.5x Cloudera, 1.6x Box, 3.7xDomo, 4.1x Microsoft, 7.1xAppian, 9.0x IT Services IBM, 2.1xCognizant, 2.0x Genpact, 2.4x DXC, 1.0x Infosys, 3.3x Wipro, 2.0xAccenture, 2.6x Raven Services (Standalone)Raven Services (In-Vail) CY’19E Gross Margin (Pre-SBC)
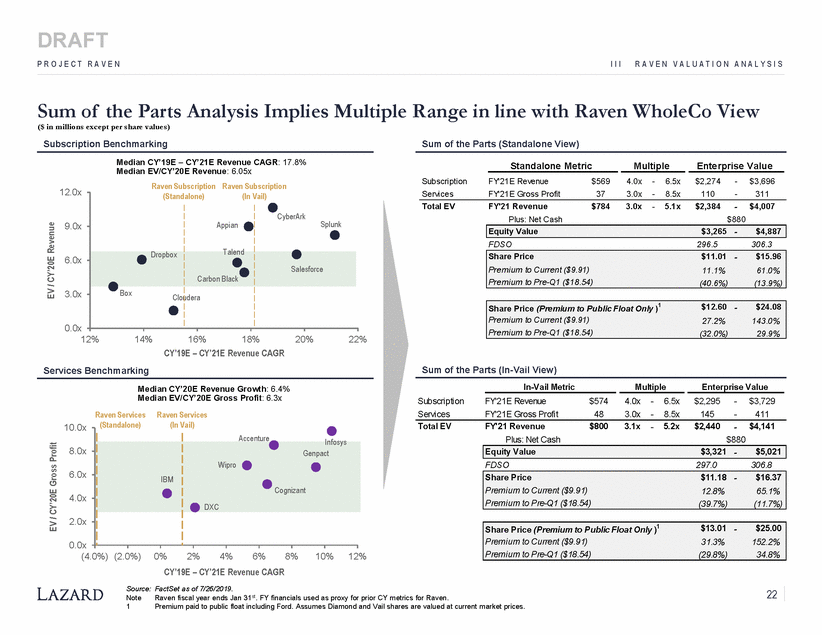
DRAFT P R O J E C T R A V E N I I I R A V E N V A L U A T I O N A N A L Y S I S Sum of the Parts Analysis Implies Multiple Range in line with Raven WholeCo View ($ in millions except per share values) Subscription Benchmarking Median CY’19E – CY’21E Revenue CAGR: 17.8% Median EV/CY’20E Revenue: 6.05x Sum of the Parts (Standalone View) Standalone Metric Multiple Enterprise Value Subscription Services FY'21E Revenue FY'21E Gross Profit $569 37 4.0x 3.0x - - 6.5x 8.5x $2,274 110 - - $3,696 311 Raven Subscription Raven Subscription 12.0x Total EV FY'21 Revenue Plus: Net Cash $784 3.0x - 5.1x $2,384 - $880 $4,007 9.0x FDSO 296.5 306.3 6.0x Premium to Pre-Q1 ($18.54) (40.6%) (13.9%) 3.0x 0.0x 12% 14% 16% 18% 20% 22% CY’19E – CY’21E Revenue CAGR Sum of the Parts (In-Vail View) In-Vail Metric Services Benchmarking Median CY’20E Revenue Growth: 6.4% Median EV/CY’20E Gross Profit: 6.3x Multiple Enterprise Value Subscription Services FY'21E Revenue FY'21E Gross Profit $574 48 4.0x 3.0x - - 6.5x 8.5x $2,295 145 - - $3,729 411 Raven Services Raven Services (In Vail) (Standalone) Total EV FY'21 Revenue Plus: Net Cash $800 3.1x 5.2x $2,440 $4,141 10.0x - - $880 Accenture Infosys 8.0x FDSO 297.0 306.8 6.0x 4.0x 2.0x 0.0x (4.0%) (2.0%) 0% 2% 4% 6% 8% 10% 12% CY’19E – CY’21E Revenue CAGR Source: FactSet as of 7/26/2019. 22 Raven fiscal year ends Jan 31st. FY financials used as proxy for prior CY metrics for Raven. Premium paid to public float including Ford. Assumes Diamond and Vail shares are valued at current market prices. Note 1 EV / CY’20E Revenue EV / CY’20E Gross Profit Share Price (Premium to Public Float Only )1 $13.01 - $25.00 Premium to Current ($9.91) 31.3% 152.2% Premium to Pre-Q1 ($18.54) (29.8%) 34.8% Share Price $11.18 - $16.37 Premium to Current ($9.91) 12.8% 65.1% Premium to Pre-Q1 ($18.54) (39.7%) (11.7%) Equity Value $3,321 - $5,021 IBM Genpact Wipro Cognizant DXC Share Price (Premium to Public Float Only )1 $12.60 - $24.08 Premium to Current ($9.91) 27.2% 143.0% Premium to Pre-Q1 ($18.54) (32.0%) 29.9% Share Price $11.01 - $15.96 Premium to Current ($9.91) 11.1% 61.0% Equity Value $3,265 - $4,887 (Standalone)(In Vail) Appian CyberArk Splunk Dropbox Talend Carbon Black Salesforce BoxClo udera
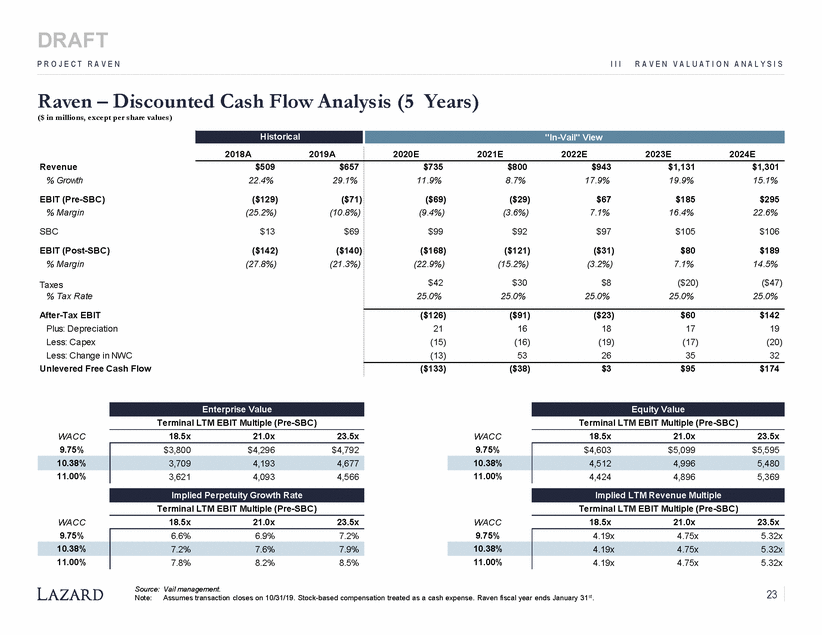
DRAFT P R O J E C T R A V E N I I I R A V E N V A L U A T I O N A N A L Y S I S Raven – Discounted Cash Flow Analysis (5Years) ($ in millions, except per share values) 2018A 2019A 2020E 2021E 2022E 2023E 2024E Revenue % Growth $509 22.4% $657 29.1% $735 11.9% $800 8.7% $943 17.9% $1,131 19.9% $1,301 15.1% EBIT (Pre-SBC) % Margin ($129) (25.2%) ($71) (10.8%) ($69) (9.4%) ($29) (3.6%) $67 7.1% $185 16.4% $295 22.6% SBC $13 $69 $99 $92 $97 $105 $106 EBIT (Post-SBC) % Margin ($142) (27.8%) ($140) (21.3%) ($168) (22.9%) ($121) (15.2%) ($31) (3.2%) $80 7.1% $189 14.5% $42 25.0% $30 25.0% $8 25.0% ($20) 25.0% ($47) 25.0% Taxes % Tax Rate After-Tax EBIT Plus: Depreciation Less: Capex Less: Change in NWC Unlevered Free Cash Flow ($126) 21 (15) (13) ($91) 16 (16) 53 ($23) 18 (19) 26 $60 17 (17) 35 $142 19 (20) 32 ($133) ($38) $3 $95 $174 Terminal LTM EBIT Multiple (Pre-SBC) Terminal LTM EBIT Multiple (Pre-SBC) 18.5x 21.0x 23.5x 18.5x 21.0x 23.5x WACC WACC Terminal LTM EBIT Multiple (Pre-SBC) Terminal LTM EBIT Multiple (Pre-SBC) 18.5x 21.0x 23.5x 18.5x 21.0x 23.5x WACC WACC Source: Vail management. Note:Assumes transaction closes on 10/31/19. Stock-based compensation treated as a cash expense. Raven fiscal year ends January 31st. 23 9.75% 4.19x4.75x5.32x 10.38% 4.19x4.75x5.32x 11.00% 4.19x4.75x5.32x 9.75% 6.6%6.9%7.2% 10.38% 7.2%7.6%7.9% 11.00% 7.8%8.2%8.5% Implied LTM Revenue Multiple Implied Perpetuity Growth Rate 9.75% $4,603$5,099$5,595 10.38% 4,5124,9965,480 11.00% 4,4244,8965,369 9.75% $3,800$4,296$4,792 10.38% 3,7094,1934,677 11.00% 3,6214,0934,566 Equity Value Enterprise Value Historical "In-Vail" View
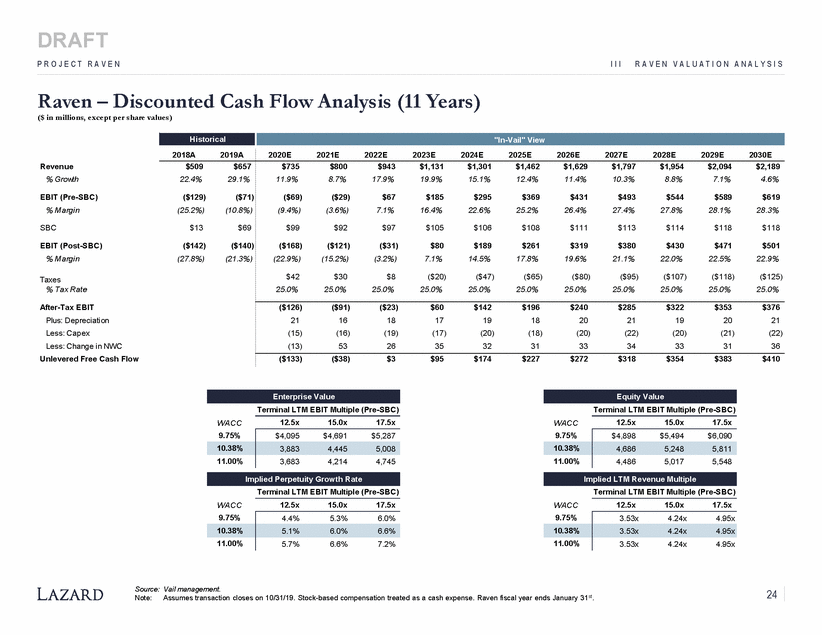
DRAFT P R O J E C T R A V E N I I IR A V E N V A L U A T I O N A N A L Y S I S Raven – Discounted Cash Flow Analysis (11 Years) ($ in millions, except per share values) 2018A 2019A 2020E 2021E 2022E 2023E 2024E 2025E 2026E 2027E 2028E 2029E 2030E Revenue % Growth $509 22.4% $657 29.1% $735 11.9% $800 8.7% $943 17.9% $1,131 19.9% $1,301 15.1% $1,462 12.4% $1,629 11.4% $1,797 10.3% $1,954 8.8% $2,094 7.1% $2,189 4.6% EBIT (Pre-SBC) % Margin ($129) (25.2%) ($71) (10.8%) ($69) (9.4%) ($29) (3.6%) $67 7.1% $185 16.4% $295 22.6% $369 25.2% $431 26.4% $493 27.4% $544 27.8% $589 28.1% $619 28.3% SBC $13 $69 $99 $92 $97 $105 $106 $108 $111 $113 $114 $118 $118 EBIT (Post-SBC) % Margin ($142) (27.8%) ($140) (21.3%) ($168) (22.9%) ($121) (15.2%) ($31) (3.2%) $80 7.1% $189 14.5% $261 17.8% $319 19.6% $380 21.1% $430 22.0% $471 22.5% $501 22.9% $42 25.0% $30 25.0% $8 25.0% ($20) 25.0% ($47) 25.0% ($65) 25.0% ($80) 25.0% ($95) 25.0% ($107) 25.0% ($118) 25.0% ($125) 25.0% Taxes % Tax Rate After-Tax EBIT Plus: Depreciation Less: Capex Less: Change in NWC Unlevered Free Cash Flow ($126) 21 (15) (13) ($91) 16 (16) 53 ($23) 18 (19) 26 $60 17 (17) 35 $142 19 (20) 32 $196 18 (18) 31 $240 20 (20) 33 $285 21 (22) 34 $322 19 (20) 33 $353 20 (21) 31 $376 21 (22) 36 ($133) ($38) $3 $95 $174 $227 $272 $318 $354 $383 $410 Terminal LTM EBIT Multiple (Pre-SBC) Terminal LTM EBIT Multiple (Pre-SBC) WACC 12.5x 15.0x 17.5x WACC 12.5x 15.0x 17.5x Terminal LTM EBIT Multiple (Pre-SBC) Terminal LTM EBIT Multiple (Pre-SBC) WACC 12.5x 15.0x 17.5x WACC 12.5x 15.0x 17.5x Source: Vail management. Note:Assumes transaction closes on 10/31/19. Stock-based compensation treated as a cash expense. Raven fiscal year ends January 31st. 24 9.75% 3.53x 4.24x 4.95x 10.38% 3.53x 4.24x 4.95x 11.00% 3.53x 4.24x 4.95x 9.75% 4.4% 5.3% 6.0% 10.38% 5.1% 6.0% 6.6% 11.00% 5.7% 6.6% 7.2% Implied LTM Revenue Multiple Implied Perpetuity Growth Rate 9.75% $4,898 $5,494 $6,090 10.38% 4,686 5,248 5,811 11.00% 4,486 5,017 5,548 9.75% $4,095 $4,691 $5,287 10.38% 3,883 4,445 5,008 11.00% 3,683 4,214 4,745 Equity Value Enterprise Value Historical "In-Vail" View
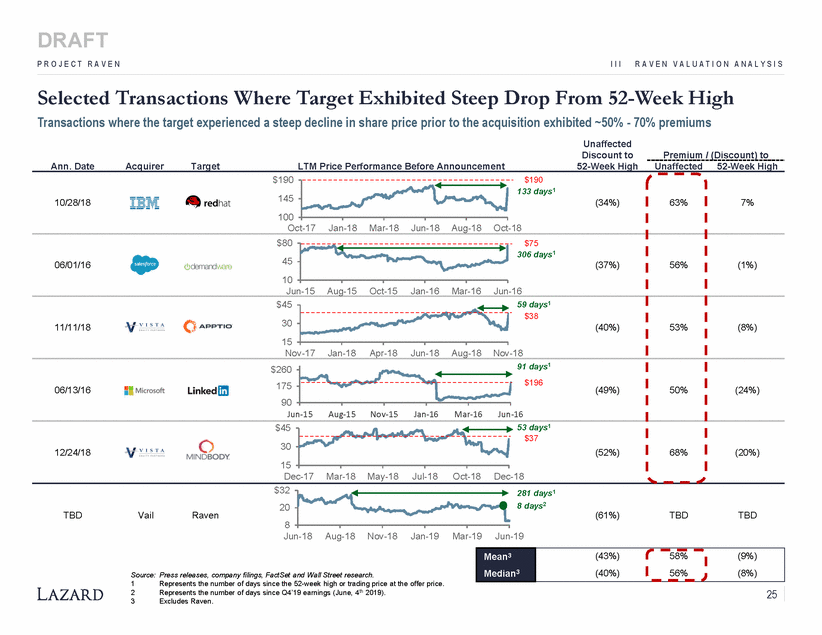
DRAFT P R O J E C T R A V E N I I I R A V E N V A L U A T I O N A N A L Y S I S Selected Transactions Where Target Exhibited Steep Drop From 52-Week High Transactions where the target experienced a steep decline in share price prior to the acquisition exhibited ~50% - 70% premiums Unaffected Discount to 52-Week High Premium / (Discount) to Ann. Date Acquirer Target LTM Price Performance Before Announcement Unaffected 52-Week High $190 145 100 $190 133 days1 10/28/18 (34%) 63% 7% Oct-17 Jan-18Mar-18Jun-18Aug-18Oct-18 $80 45 10 $75 306 days1 06/01/16 (37%) 56% (1%) Jun-15 Aug-15 Oct-15 Jan-16 Mar-16 Jun-16 $45 30 15 59 days1 $38 11/11/18 (40%) 53% (8%) Nov-17 Jan-18 Apr-18 Jun-18 Aug-18 Nov-18 91 days1 $196 $260 175 90 06/13/16 (49%) 50% (24%) Jun-15 Aug-15 Nov-15 Jan-16 Mar-16 Jun-16 $45 30 15 53 days1 $37 12/24/18 (52%) 68% (20%) Dec-17 Mar-18 May-18 Jul-18 Oct-18 Dec-18 $32 20 8 281 days1 8 days2 TBD Vail Raven (61%) TBD TBD Jun-18 Aug-18 Nov-18 Jan-19 Mar-19 Jun-19 Source: Press releases, company filings, FactSet and Wall Street research. 1 2 3 Represents the number of days since the 52-week high or trading price at the offer price. Represents the number of days since Q4’19 earnings (June, 4th 2019). Excludes Raven. 25 Mean3 Median3 (43%)58%(9%) (40%)56%(8%)
DRAFT C O N F I D E N T I A L P R O J E C T R A V E N IV Vail Valuation Analysis
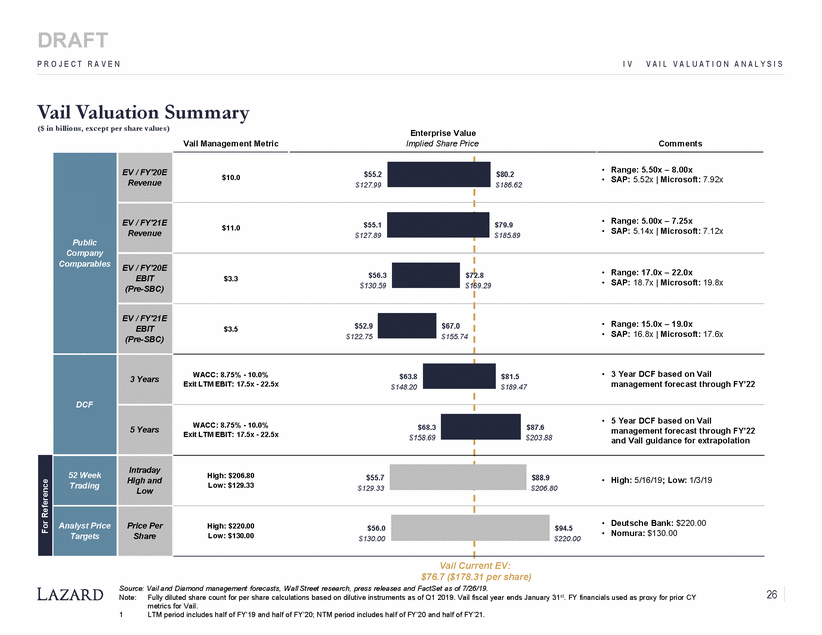
DRAFT P R O J E C T R A V E N I V V A I L V A L U A T I O N A N A L Y S I S Vail Valuation Summary ($ in billions, except per share values) Vail Management Metric Enterprise Value Implied Share Price Comments $10.0 $186.62 $11.0 • SAP: 5.14x | Microsoft: 7.12x $185.89 • SAP: 16.8x | Microsoft: 17.6x management forecast through FY’22 $189.47 $87.6 $203.88 management forecast through FY’22 and Vail guidance for extrapolation $206.80 • Nomura: $130.00 $220.00 Vail Current EV: $76.7 ($178.31 per share) Source: Vail and Diamond management forecasts, Wall Street research, press releases and FactSet as of 7/26/19. Note:Fully diluted share count for per share calculations based on dilutive instruments as of Q1 2019. Vail fiscal year ends January 31st. FY financials used as proxy for prior CY metrics for Vail. 26 1 LTM period includes half of FY’19 and half of FY’20; NTM period includes half of FY’20 and half of FY’21. For Reference Public Company Comparables EV / FY'20E Revenue $55.2 $127.99 $80.2• Range: 5.50x – 8.00x • SAP: 5.52x | Microsoft: 7.92x EV / FY'21E Revenue $55.1 $127.89 $79.9• Range: 5.00x – 7.25x EV / FY'20E EBIT (Pre-SBC) $3.3$56.3$7 $130.59$1 2.8• Range: 17.0x – 22.0x 69.29• SAP: 18.7x | Microsoft: 19.8x EV / FY'21E EBIT (Pre-SBC) $3.5$52.9$67.0 $122.75$155.74 • Range: 15.0x – 19.0x DCF 3 Years WACC: 8.75% - 10.0%$63.8 Exit LTM EBIT: 17.5x - 22.5x$148.20 $81.5• 3 Year DCF based on Vail 5 Years WACC: 8.75% - 10.0%$68.3 Exit LTM EBIT: 17.5x - 22.5x$158.69 • 5 Year DCF based on Vail 52 Week Trading Intraday High and Low High: $206.80$55.7 Low: $129.33$129.33 $88.9• High: 5/16/19; Low: 1/3/19 Analyst Price Targets Price Per Share High: $220.00$56.0 Low: $130.00$130.00 $94.5• Deutsche Bank: $220.00
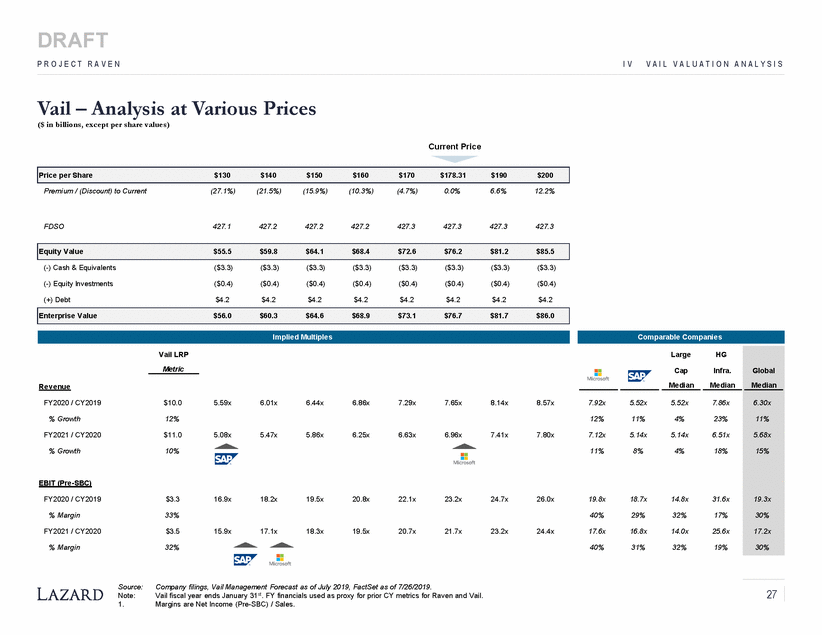
DRAFT P R O J E C T R A V E N I V V A I L V A L U A T I O N A N A L Y S I S Vail – Analysis at Various Prices ($ in billions, except per share values) Current Price Premium / (Discount) to Current (27.1%) (21.5%) (15.9%) (10.3%) (4.7%) 0.0% 6.6% 12.2% FDSO 427.1 427.2 427.2 427.2 427.3 427.3 427.3 427.3 (-) Cash & Equivalents ($3.3) ($3.3) ($3.3) ($3.3) ($3.3) ($3.3) ($3.3) ($3.3) (-) Equity Investments ($0.4) ($0.4) ($0.4) ($0.4) ($0.4) ($0.4) ($0.4) ($0.4) (+) Debt $4.2 $4.2 $4.2 $4.2 $4.2 $4.2 $4.2 $4.2 Vail LRP Large HG Metric Cap Infra. Global Median Median Median Revenue FY2020 / CY2019 $10.0 5.59x 6.01x 6.44x 6.86x 7.29x 7.65x 8.14x 8.57x 7.92x 5.52x 5.52x 7.86x 6.30x % Growth 12% 12% 11% 4% 23% 11% FY2021 / CY2020 $11.0 5.08x 5.47x 5.86x 6.25x 6.63x 6.96x 7.41x 7.80x 7.12x 5.14x 5.14x 6.51x 5.68x % Growth 10% 11% 8% 4% 18% 15% EBIT (Pre -SBC) FY2020 / CY2019 $3.3 16.9x 18.2x 19.5x 20.8x 22.1x 23.2x 24.7x 26.0x 19.8x 18.7x 14.8x 31.6x 19.3x % Margin 33% 40% 29% 32% 17% 30% FY2021 / CY2020 $3.5 15.9x 17.1x 18.3x 19.5x 20.7x 21.7x 23.2x 24.4x 17.6x 16.8x 14.0x 25.6x 17.2x % Margin 32% 40% 31% 32% 19% 30% Source: Note: 1. Company filings, Vail Management Forecast as of July 2019, FactSet as of 7/26/2019. Vail fiscal year ends January 31st. FY financials used as proxy for prior CY metrics for Raven and Vail. Margins are Net Income (Pre-SBC) / Sales. 27 Comparable Companies Implied Multiples Enterprise Value$56.0$60.3$64.6$68.9$73.1$76.7$81.7$86.0 Equity Value$55.5$59.8$64.1$68.4$72.6$76.2$81.2$85.5 Price per Share$130$140$150$160$170$178.31$190$200
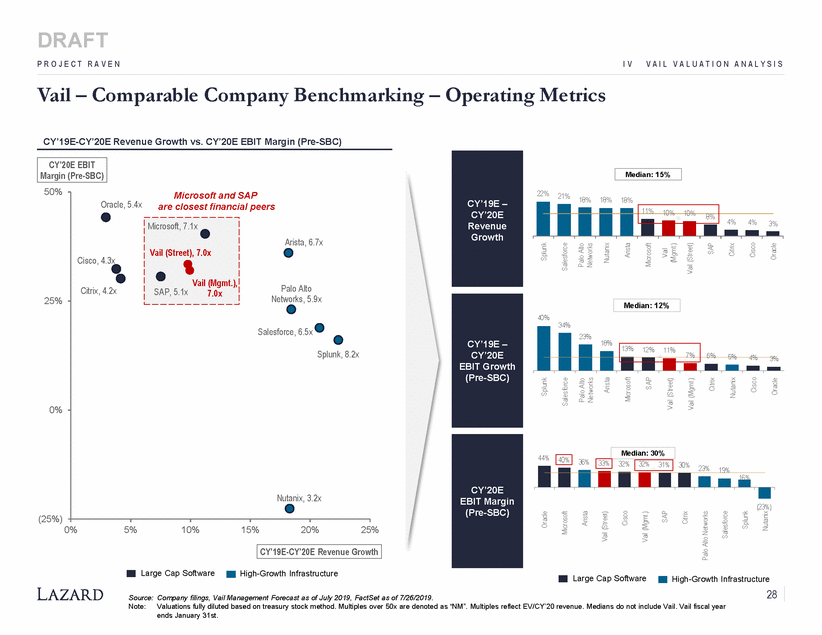
DRAFT P R O J E C T R A V E N I V V A I L V A L U A T I O N A N A L Y S I S Vail – Comparable Company Benchmarking – Operating Metrics CY’19E-CY’20E Revenue Growth vs. CY’20E EBIT Margin (Pre-SBC) 50% 22% 21% 18% 18% 18% Oracle, 5.4x are closest financial peers 11% 10% 10% 8% 3% 25% 40% 34% 18% 6% 5% 4% 3 0% 23% 19% 16% (23%) (25%) 0% 5% 10% 15% 20% 25% Large Cap Software High-Growth Infrastructure Large Cap Software High-Growth Infrastructure 28 Source: Company filings, Vail Management Forecast as of July 2019, FactSet as of 7/26/2019. Note:Valuations fully diluted based on treasury stock method. Multiples over 50x are denoted as “NM”. Multiples reflect EV/CY’20 revenue. Medians do not include Vail. Vail fiscal year ends January 31st. Splunk Splunk Oracle Microsoft Salesforce Salesforce Palo Alto Networks Palo Alto Networks Arista Vail (Street) Arista Nutanix Cisco Arista Microsoft Vail (Mgmt.) Microsoft SAP Vail (Mgmt.) SAP Vail (Street) Citrix Vail (Street) Vail (Mgmt.) Palo Alto Networks Citrix SAP Salesforce Citrix Nutanix Splunk Cisco Cisco Nutanix Oracle Oracle CY’19E-CY’20E Revenue Growth Median: 30% 30% 44% 40% 36% 33% 32% 32% 31% % 23% 13% 12% 11% 7% Median: 12% 4% 4% Microsoft and SAP Arista, 6.7x Cisco, 4.3x Citrix, 4.2xPalo Alto Networks, 5.9x Salesforce, 6.5x Splunk, 8.2x Nutanix, 3.2x Microsoft, 7.1x Vail (Street), 7.0x Vail (Mgmt.), SAP, 5.1x7.0x Median: 15% CY’20E EBIT Margin (Pre-SBC) CY’19E – CY’20E Revenue Growth CY’19E – CY’20E EBIT Growth (Pre-SBC) CY’20E EBIT Margin (Pre-SBC)
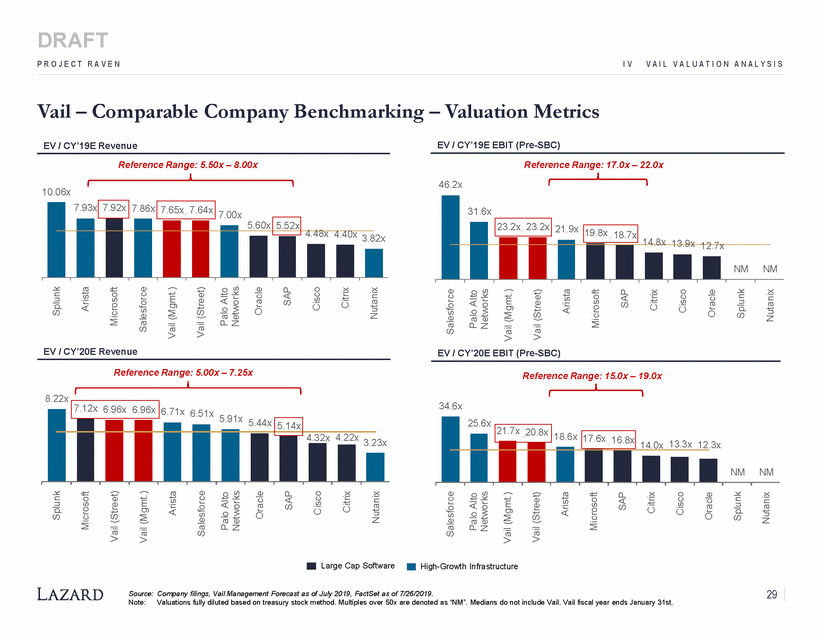
DRAFT P R O J E C T R A V E N I V V A I L V A L U A T I O N A N A L Y S I S Vail – Comparable Company Benchmarking – Valuation Metrics EV / CY’19E Revenue EV / CY’19E EBIT (Pre-SBC) Reference Range: 5.50x – 8.00x Reference Range: 17.0x – 22.0x 46.2x 10.06x 5.60x 19.8x 4.48x 4.40x 3.82x 13.9x 12.7x NM EV / CY’20E Revenue EV / CY’20E EBIT (Pre-SBC) Reference Range: 5.00x – 7.25x Reference Range: 15.0x – 19.0x 8.22x 34.6x 5.91x 5.44x 25.6x 3.23x Large Cap Software High-Growth Infrastructure 29 Source: Company filings, Vail Management Forecast as of July 2019, FactSet as of 7/26/2019. Note:Valuations fully diluted based on treasury stock method. Multiples over 50x are denoted as “NM”. Medians do not include Vail. Vail fiscal year ends January 31st. Splunk Splunk Microsoft Arista Vail (Street) Microsoft Salesforce Vail (Mgmt.) Vail (Mgmt.) Arista Vail (Street) Salesforce Palo Alto Networks Palo Alto Networks Oracle Oracle SAP SAP Cisco Cisco Citrix Citrix Nutanix Nutanix Salesforce Salesforce Palo Alto Networks Palo Alto Networks Vail (Mgmt.) Vail (Mgmt.) Vail (Street) Vail (Street) Arista Arista Microsoft Microsoft SAP SAP Citrix Citrix Cisco Cisco Oracle Oracle Splunk Splunk Nutanix Nutanix .3x 21.7x 20.8x 18.6x 17.6x 16.8x 14.0x 13.3x 12 NM NM 7.12x 6.96x 6.96x 6.71x 6.51x 5.14x 4.32x 4.22x 7.93x 7.92x 7.86x 7.65x 7.64x 7.00x 5.52x 31.6x 23.2x 23.2x 21.9x 18.7x 14.8x NM
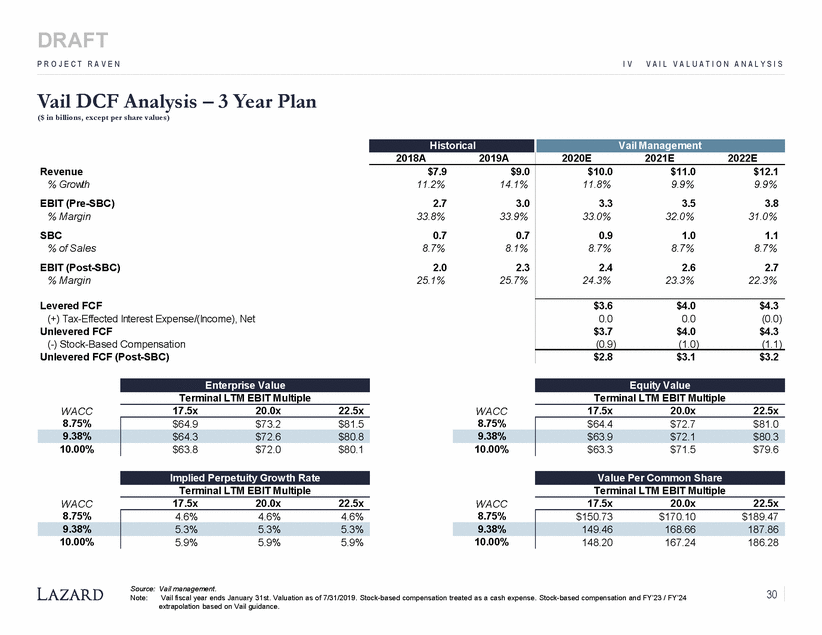
DRAFT P R O J E C T R A V E N I V V A I L V A L U A T I O N A N A L Y S I S Vail DCF Analysis – 3 ($ in billions, except per share values) Year Plan Revenue % Growth EBIT (Pre-SBC) % Margin SBC % of Sales EBIT (Post-SBC) % Margin Levered FCF (+) Tax-Effected Interest Expense/(Income), Net Unlevered FCF (-) Stock-Based Compensation Unlevered FCF (Post-SBC) Terminal LTM EBIT Multiple Terminal LTM EBIT Multiple 17.5x 20.0x 22.5x 17.5x 20.0x 22.5x WACC WACC Terminal LTM EBIT Multiple Terminal LTM EBIT Multiple WACC 17.5x 20.0x 22.5x WACC 17.5x 20.0x 22.5x Source: Vail management. Note:Vail fiscal year ends January 31st. Valuation as of 7/31/2019. Stock-based compensation treated as a cash expense. Stock-based compensation and FY’23 / FY’24 extrapolation based on Vail guidance. 30 8.75% $150.73 $170.10 $189.47 9.38% 149.46 168.66 187.86 10.00% 148.20 167.24 186.28 8.75% 4.6% 4.6% 4.6% 9.38% 5.3% 5.3% 5.3% 10.00% 5.9% 5.9% 5.9% Value Per Common Share Implied Perpetuity Growth Rate 8.75% $64.4 $72.7 $81.0 9.38% $63.9 $72.1 $80.3 10.00% $63.3 $71.5 $79.6 8.75% $64.9 $73.2 $81.5 9.38% $64.3 $72.6 $80.8 10.00% $63.8 $72.0 $80.1 Equity Value Enterprise Value Historical Vail Management 2018A 2019A 2020E 2021E 2022E $7.9 $9.0 11.2% 14.1% 2.7 3.0 33.8% 33.9% 0.7 0.7 8.7% 8.1% 2.0 2.3 25.1% 25.7% $10.0 $11.0 $12.1 11.8% 9.9% 9.9% 3.3 3.5 3.8 33.0% 32.0% 31.0% 0.9 1.0 1.1 8.7% 8.7% 8.7% 2.4 2.6 2.7 24.3% 23.3% 22.3% $3.6 $4.0 $4.3 0.0 0.0 (0.0) $3.7 $4.0 $4.3 (0.9) (1.0) (1.1) $2.8 $3.1 $3.2
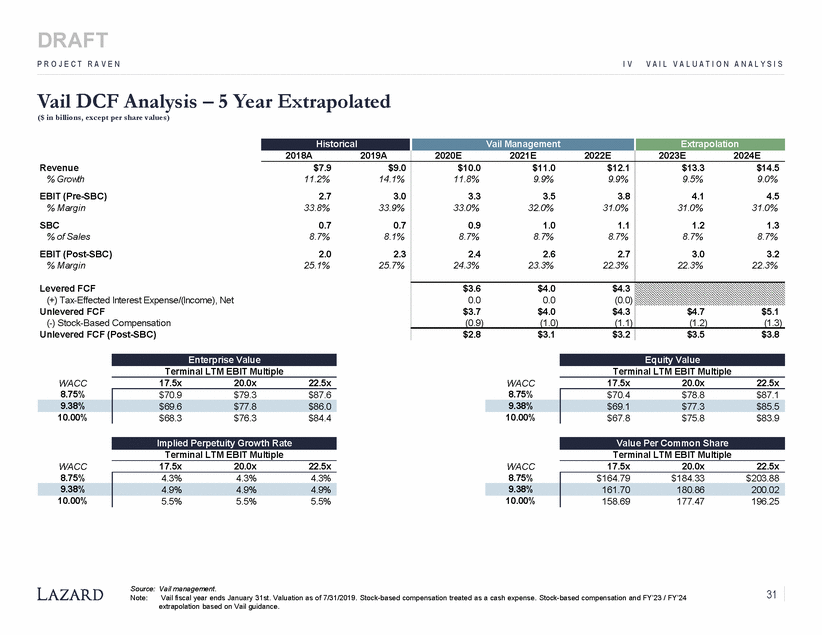
DRAFT P R O J E C T R A V E N I V V A I L V A L U A T I O N A N A L Y S I S Vail DCF Analysis – 5 ($ in billions, except per share values) Year Extrapolated Revenue % Growth EBIT (Pre-SBC) % Margin SBC % of Sales EBIT (Post-SBC) % Margin Levered FCF (+) Tax-Effected Interest Expense/(Income), Net Unlevered FCF (-) Stock-Based Compensation Unlevered FCF (Post-SBC) Terminal LTM EBIT Multiple Terminal LTM EBIT Multiple WACC 17.5x 20.0x 22.5x WACC 17.5x 20.0x 22.5x Terminal LTM EBIT Multiple Terminal LTM EBIT Multiple 17.5x 20.0x 22.5x 17.5x 20.0x 22.5x WACC WACC Source: Vail management. Note:Vail fiscal year ends January 31st. Valuation as of 7/31/2019. Stock-based compensation treated as a cash expense. Stock-based compensation and FY’23 / FY’24 extrapolation based on Vail guidance. 31 8.75% $164.79 $184.33 $203.88 9.38% 161.70 180.86 200.02 10.00% 158.69 177.47 196.25 8.75% 4.3% 4.3% 4.3% 9.38% 4.9% 4.9% 4.9% 10.00% 5.5% 5.5% 5.5% Value Per Common Share Implied Perpetuity Growth Rate 8.75% $70.4 $78.8 $87.1 9.38% $69.1 $77.3 $85.5 10.00% $67.8 $75.8 $83.9 8.75% $70.9 $79.3 $87.6 9.38% $69.6 $77.8 $86.0 10.00% $68.3 $76.3 $84.4 Equity Value Enterprise Value Historical Vail Management Extrapolation 2018A 2019A 2020E 2021E 2022E 2023E 2024E $7.9 $9.0 11.2% 14.1% 2.7 3.0 33.8% 33.9% 0.7 0.7 8.7% 8.1% 2.0 2.3 25.1% 25.7% $10.0 $11.0 $12.1 11.8% 9.9% 9.9% 3.3 3.5 3.8 33.0% 32.0% 31.0% 0.9 1.0 1.1 8.7% 8.7% 8.7% 2.4 2.6 2.7 24.3% 23.3% 22.3% $13.3 $14.5 9.5% 9.0% 4.1 4.5 31.0% 31.0% 1.2 1.3 8.7% 8.7% 3.0 3.2 22.3% 22.3% $3.6 $4.0 $4.3 0.0 0.0 (0.0) $3.7 $4.0 $4.3 (0.9) (1.0) (1.1) $4.7 $5.1 (1.2) (1.3) $2.8 $3.1 $3.2 $3.5 $3.8
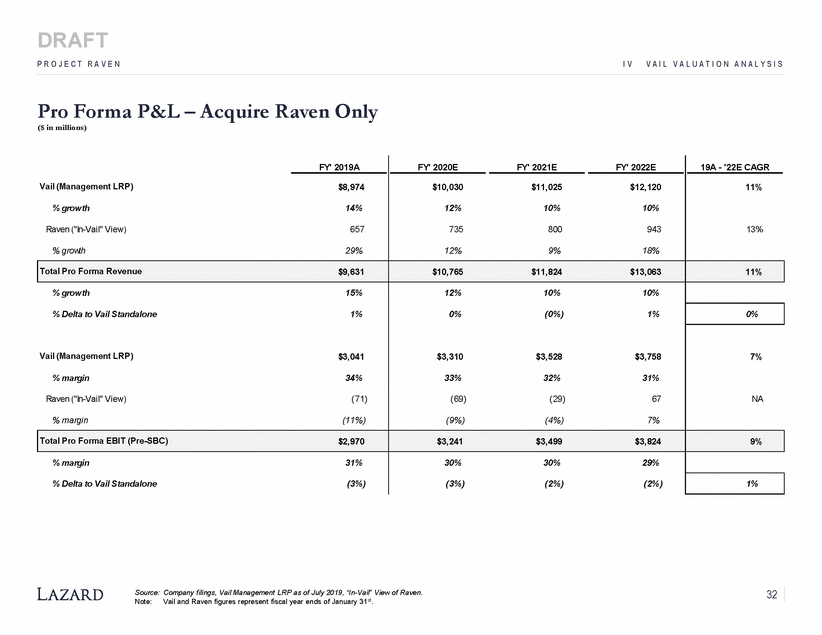
DRAFT P R O J E C T R A V E N I V V A I L V A L U A T I O N A N A L Y S I S Pro Forma P&L – Acquire Raven Only ($ in millions) Source: Company filings, Vail Management LRP as of July 2019, “In-Vail” View of Raven. Note:Vail and Raven figures represent fiscal year ends of January 31st. 32 Vail (Management LRP) % growth Raven ("In-Vail" View) % growth FY' 2019A FY' 2020E FY' 2021E FY' 2022E 19A - '22E CAGR $8,974 14% 657 29% $10,030 $11,025 $12,120 12% 10% 10% 735 800 943 12% 9% 18% 11% 13% Total Pro Forma Revenue $9,631 $10,765 $11,824 $13,063 11% % growth 15% % Delta to Vail Standalone 1% Vail (Management LRP) $3,041 % margin 34% Raven ("In-Vail" View) (71) % margin (11%) 12% 10% 10% 0% (0%) 1% $3,310 $3,528 $3,758 33% 32% 31% (69) (29) 67 (9%) (4%) 7% 0% 7% NA Total Pro Forma EBIT (Pre-SBC) $2,970 $3,241 $3,499 $3,824 9% % margin 31% % Delta to Vail Standalone (3%) 30% 30% 29% (3%) (2%) (2%) 1%
DRAFT P R O J E C T R A V E N I V V A I L V A L U A T I O N A N A L Y S I S Pro Forma P&L – Acquire Calistoga ($ in millions) Only 33 Source: Company filings, Vail Management LRP as of July 2019 and FactSet as of 7/26/2019. Note:Vail figures represent fiscal year ends of January 31st; Calistoga figures represent equity research consensus for CY’18A – CY’21E. Vail (Management LRP) % growth Raven ("In-Vail" View) % growth FY' 2019A FY' 2020E FY' 2021E FY' 2022E 19A - '22E CAGR $8,974 14% 657 29% $10,030 $11,025 $12,120 12% 10% 10% 735 800 943 12% 9% 18% 11% 13% Total Pro Forma Revenue $9,631 $10,765 $11,824 $13,063 11% % growth 15% % Delta to Vail Standalone 1% Vail (Management LRP) $3,041 % margin 34% Raven ("In-Vail" View) (71) % margin (11%) 12% 10% 10% 0% (0%) 1% $3,310 $3,528 $3,758 33% 32% 31% (69) (29) 67 (9%) (4%) 7% 0% 7% NA Total Pro Forma EBIT (Pre-SBC) $2,970 $3,241 $3,499 $3,824 9% % margin 31% % Delta to Vail Standalone (3%) 30% 30% 29% (3%) (2%) (2%) 1%
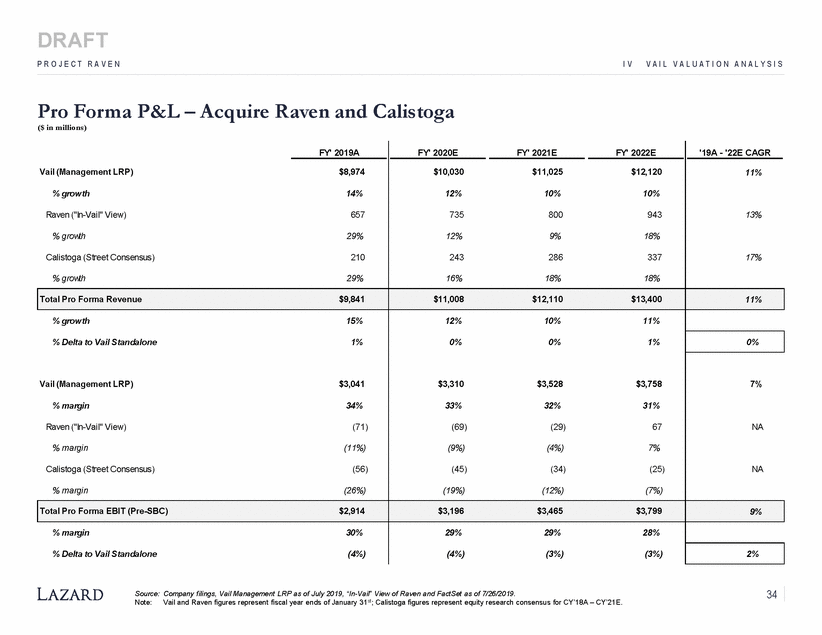
DRAFT P R O J E C T R A V E N I V V A I L V A L U A T I O N A N A L Y S I S Pro Forma P&L – Acquire Raven and Calistoga ($ in millions) 34 Source: Company filings, Vail Management LRP as of July 2019, “In-Vail” View of Raven and FactSet as of 7/26/2019. Note:Vail and Raven figures represent fiscal year ends of January 31st; Calistoga figures represent equity research consensus for CY’18A – CY’21E. Vail (Management LRP) % growth Raven ("In-Vail" View) % growth Calistoga (Street Consensus) % growth FY' 2019A FY' 2020E FY' 2021E FY' 2022E '19A - '22E CAGR $8,974 14% 657 29% 210 29% $10,030 $11,025 $12,120 12% 10% 10% 735 800 943 12% 9% 18% 243 286 337 16% 18% 18% 11% 13% 17% Total Pro Forma Revenue $9,841 $11,008 $12,110 $13,400 11% % growth 15% % Delta to Vail Standalone 1% Vail (Management LRP) $3,041 % margin 34% Raven ("In-Vail" View) (71) % margin (11%) Calistoga (Street Consensus) (56) % margin (26%) 12% 10% 11% 0% 0% 1% $3,310 $3,528 $3,758 33% 32% 31% (69) (29) 67 (9%) (4%) 7% (45) (34) (25) (19%) (12%) (7%) 0% 7% NA NA Total Pro Forma EBIT (Pre-SBC) $2,914 $3,196 $3,465 $3,799 9% % margin 30% % Delta to Vail Standalone (4%) 29% 29% 28% (4%) (3%) (3%) 2%
DRAFT C O N F I D E N T I A L P R O J E C T R A V E N Appendix
DRAFT C O N F I D E N T I A L P R O J E C T R A V E N A Raven
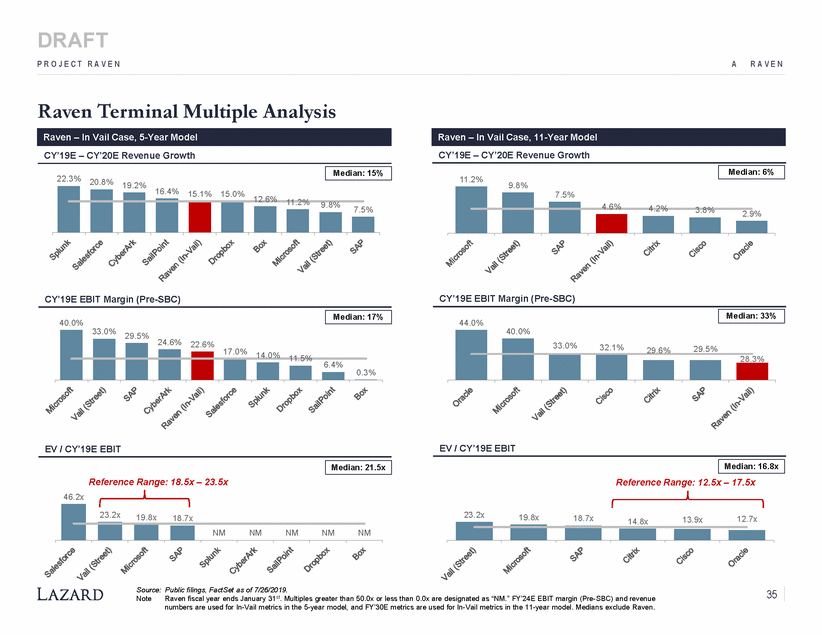
DRAFT P R O J E C T R A V E N A R A V E N Raven Terminal Multiple Analysis CY’19E – CY’20E Revenue Growth CY’19E – CY’20E Revenue Growth 22.3% 11.2% 20.8% 19.2% 9.8% 16.4% 15.1% 15.0% 12.6% 11.2% 9.8% 4.6% 4.2% 7.5% 3.8% 2.9% CY’19E EBIT Margin (Pre-SBC) CY’19E EBIT Margin (Pre-SBC) 40.0% 44.0% 24.6% 22.6% 17.0% 14.0% 11.5% 28.3% 6.4% 0.3% EV / CY’19E EBIT EV / CY’19E EBIT Reference Range: 18.5x – 23.5x Reference Range: 12.5x – 17.5x 46.2x 23.2x 19.8x 18.7x 12.7x 13.9x 14.8x NM Source: Public filings, FactSet as of 7/26/2019. 35 Raven fiscal year ends January 31st. Multiples greater than 50.0x or less than 0.0x are designated as “NM.” FY’24E EBIT margin (Pre-SBC) and revenue numbers are used for In-Vail metrics in the 5-year model, and FY’30E metrics are used for In-Vail metrics in the 11-year model. Medians exclude Raven. Note 23.2x19.8x18.7x NMNMNMNM Median: 16.8x Median: 21.5x 33.0% 29.5% 40.0% 33.0%32.1%29.6%29.5% Median: 33% Median: 17% 7.5% Median: 6% Median: 15% Raven – In Vail Case, 5-Year Model Raven – In Vail Case, 11-Year Model
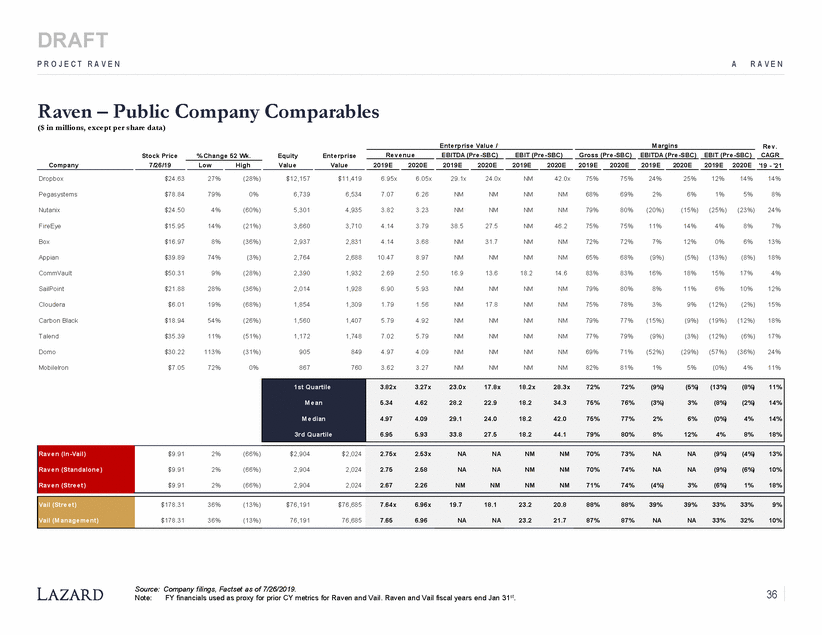
DRAFT P R O J E C T R A V E N A R A V E N Raven – Public Company Comparables ($ in millions, except per share data) Ente rprise Value / M argins Re v . Re v e nue EBITDA (Pre -SBC) EBIT (Pre -SBC) Gross (Pre -SBC) EBITDA (Pre -SBC) EBIT (Pre -SBC) CAGR Stock Price 7/26/19 % Change 52 Wk. Equity Value Ente rprise Value Company Low High 2019E 2020E 2019E 2020E 2019E 2020E 2019E 2020E 2019E 2020E 2019E 2020E '19 - '21 Dropbox $24.63 27% (28%) $12,157 $11,419 6.95x 6.05x 29.1x 24.0x NM 42.0x 75% 75% 24% 25% 12% 14% 14% Pegasystems $78.84 79% 0% 6,739 6,534 7.07 6.26 NM NM NM NM 68% 69% 2% 6% 1% 5% 8% Nutanix $24.50 4% (60%) 5,301 4,935 3.82 3.23 NM NM NM NM 79% 80% (20%) (15%) (25%) (23%) 24% FireEye $15.95 14% (21%) 3,660 3,710 4.14 3.79 38.5 27.5 NM 46.2 75% 75% 11% 14% 4% 8% 7% Box $16.97 8% (36%) 2,937 2,831 4.14 3.68 NM 31.7 NM NM 72% 72% 7% 12% 0% 6% 13% Appian $39.89 74% (3%) 2,764 2,688 10.47 8.97 NM NM NM NM 65% 68% (9%) (5%) (13%) (8%) 18% CommVault $50.31 9% (28%) 2,390 1,932 2.69 2.50 16.9 13.6 18.2 14.6 83% 83% 16% 18% 15% 17% 4% SailPoint $21.88 28% (36%) 2,014 1,928 6.90 5.93 NM NM NM NM 79% 80% 8% 11% 6% 10% 12% Cloudera $6.01 19% (68%) 1,854 1,309 1.79 1.56 NM 17.8 NM NM 75% 78% 3% 9% (12%) (2%) 15% Carbon Black $18.94 54% (26%) 1,560 1,407 5.79 4.92 NM NM NM NM 79% 77% (15%) (9%) (19%) (12%) 18% Talend $35.39 11% (51%) 1,172 1,748 7.02 5.79 NM NM NM NM 77% 79% (9%) (3%) (12%) (6%) 17% Domo $30.22 113% (31%) 905 849 4.97 4.09 NM NM NM NM 69% 71% (52%) (29%) (57%) (36%) 24% MobileIron $7.05 72% 0% 867 760 3.62 3.27 NM NM NM NM 82% 81% 1% 5% (0%) 4% 11% Source: Company filings, Factset as of 7/26/2019. 36 Note: FY financials used as proxy for prior CY metrics for Raven and Vail. Raven and Vail fiscal years end Jan 31st. 1st Quartile M e an M e dian 3rd Quartile 3.82x 3.27x 23.0x 17.8x 18.2x 28.3x 72% 72% (9%) (5%) (13%) (8%) 11% 5.34 4.62 28.2 22.9 18.2 34.3 75% 76% (3%) 3% (8%) (2%) 14% 4.97 4.09 29.1 24.0 18.2 42.0 75% 77% 2% 6% (0%) 4% 14% 6.95 5.93 33.8 27.5 18.2 44.1 79% 80% 8% 12% 4% 8% 18% Rav e n (In-Vail) Rav e n (Standalone ) Rav e n (Stre e t) $9.91 2% (66%) $2,904 $2,024 $9.91 2% (66%) 2,904 2,024 $9.91 2% (66%) 2,904 2,024 2.75x 2.53x NA NA NM NM 70% 73% NA NA (9%) (4%) 13% 2.75 2.58 NA NA NM NM 70% 74% NA NA (9%) (6%) 10% 2.67 2.26 NM NM NM NM 71% 74% (4%) 3% (6%) 1% 18% Vail (Stre e t) Vail (M anage me nt) $178.31 36% (13%) $76,191 $76,685 $178.31 36% (13%) 76,191 76,685 7.64x 6.96x 19.7 18.1 23.2 20.8 88% 88% 39% 39% 33% 33% 9% 7.65 6.96 NA NA 23.2 21.7 87% 87% NA NA 33% 32% 10%
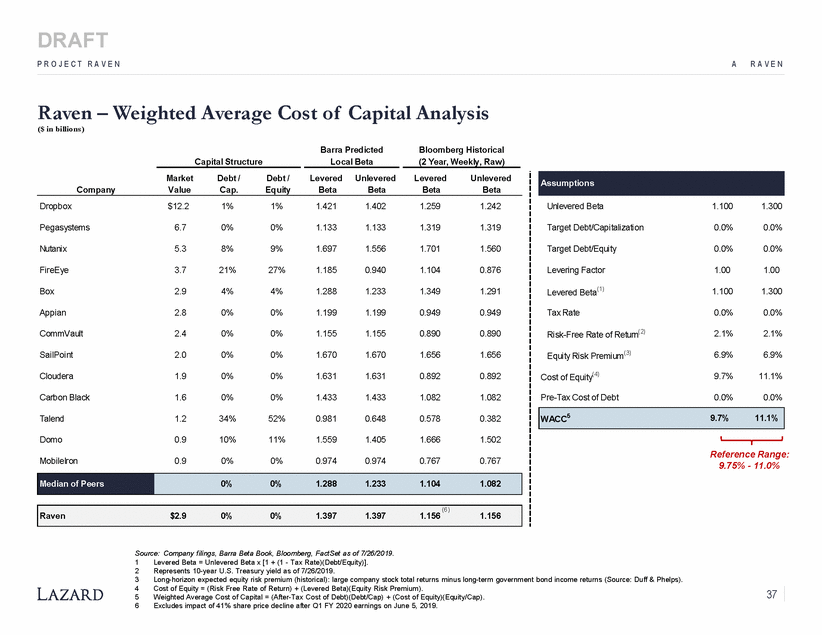
DRAFT P R O J E C T R A V E N A R A V E N Raven – Weighted Average Cost of Capital Analysis ($ in billions) Barra Predicted Local Beta Bloomberg Historical (2 Year, Weekly, Raw) Capital Structure Market Debt / Debt / Levered Unlevered Levered Unlevered Company Value Cap. Equity Beta Beta Beta Beta Dropbox $12.2 1% 1% 1.421 1.402 1.259 1.242 Unlevered Beta 1.100 1.300 Pegasystems 6.7 0% 0% 1.133 1.133 1.319 1.319 Target Debt/Capitalization 0.0% 0.0% Nutanix 5.3 8% 9% 1.697 1.556 1.701 1.560 Target Debt/Equity 0.0% 0.0% FireEye 3.7 21% 27% 1.185 0.940 1.104 0.876 Levering Factor 1.00 1.00 Levered Beta(1) Box 2.9 4% 4% 1.288 1.233 1.349 1.291 1.100 1.300 Appian 2.8 0% 0% 1.199 1.199 0.949 0.949 Tax Rate 0.0% 0.0% Risk-Free Rate of Return(2) Equity Risk Premium(3) Cost of Equity(4) CommVault 2.4 0% 0% 1.155 1.155 0.890 0.890 2.1% 2.1% SailPoint 2.0 0% 0% 1.670 1.670 1.656 1.656 6.9% 6.9% Cloudera 1.9 0% 0% 1.631 1.631 0.892 0.892 9.7% 11.1% Carbon Black 1.6 0% 0% 1.433 1.433 1.082 1.082 Pre-Tax Cost of Debt 0.0% 0.0% Talend 1.2 34% 52% 0.981 0.648 0.578 0.382 Domo 0.9 10% 11% 1.559 1.405 1.666 1.502 Reference Range: 9.75% - 11.0% MobileIron 0.9 0% 0% 0.974 0.974 0.767 0.767 Raven $2.9 0% 0% 1.397 1.397 1.156 1.156 Source: Company filings, Barra Beta Book, Bloomberg, FactSet as of 7/26/2019. 1 2 3 4 5 6 Levered Beta = Unlevered Beta x [1 + (1 - Tax Rate)(Debt/Equity)]. Represents 10-year U.S. Treasury yield as of 7/26/2019. Long-horizon expected equity risk premium (historical): large company stock total returns minus long-term government bond income returns (Source: Duff & Phelps). Cost of Equity = (Risk Free Rate of Return) + (Levered Beta)(Equity Risk Premium). Weighted Average Cost of Capital = (After-Tax Cost of Debt)(Debt/Cap) + (Cost of Equity)(Equity/Cap). Excludes impact of 41% share price decline after Q1 FY 2020 earnings on June 5, 2019. 37 (6) Median of Peers 0% 0% 1.288 1.233 1.104 1.082 WACC5 9.7% 11.1% Assumptions
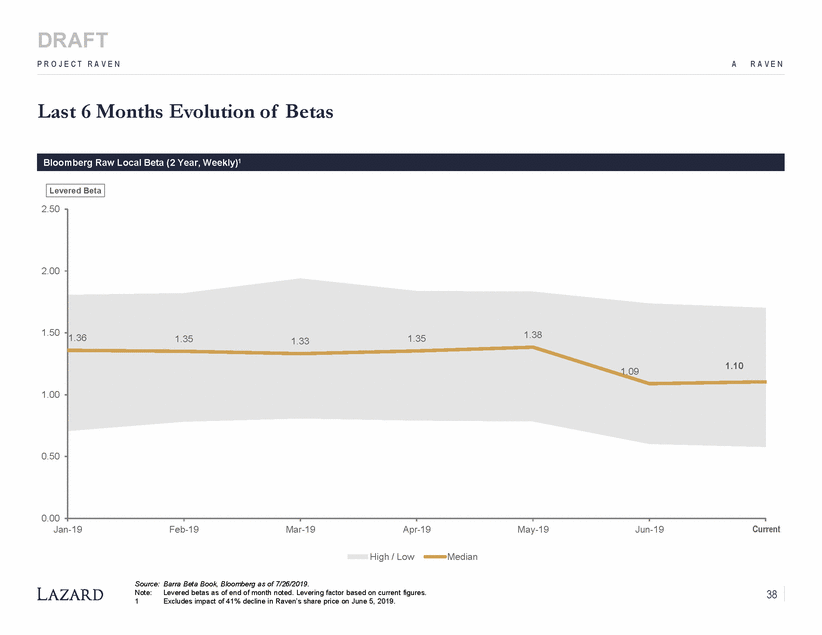
DRAFT P R O J E C T R A V E N A R A V E N Last 6 Months Evolution of Betas 2.50 2.00 1.50 1.00 0.50 0.00 Jan-19 Feb-19 Mar-19 Apr-19 May-19 Jun-19 CJurl-r1en9t High / Low Median Source: Barra Beta Book, Bloomberg as of 7/26/2019. Note:Levered betas as of end of month noted. Levering factor based on current figures. 38 1 Excludes impact of 41% decline in Raven’s share price on June 5, 2019. 1.361.351.331.351.38 1.091.10 Levered Beta Bloomberg Raw Local Beta (2 Year, Weekly)1
DRAFT C O N F I D E N T I A L P R O J E C T R A V E N B Vail & Pro Forma Impact
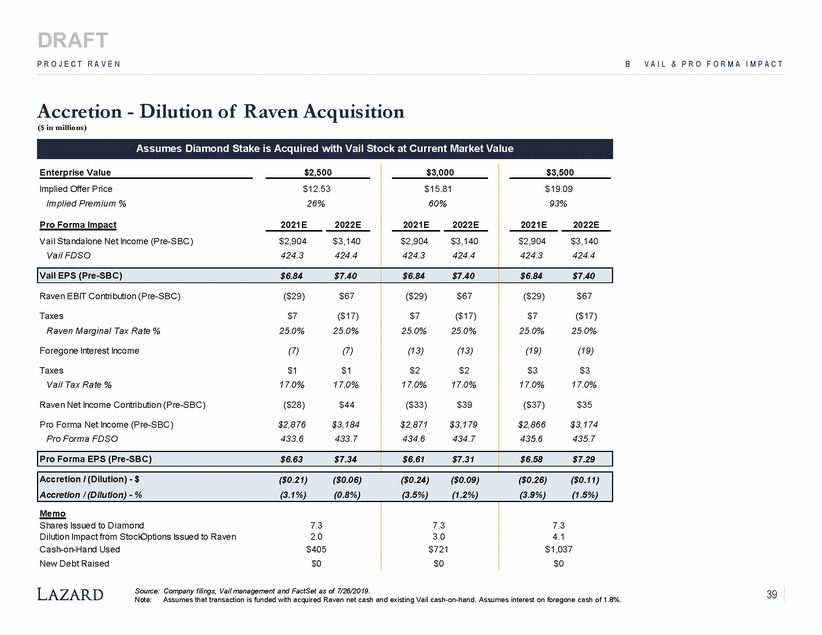
DRAFT P R O J E C T R A V E N B V A I L & P R O F O R M A I M P A C T Accretion - Dilution of ($ in millions) Raven Acquisition Enterprise Value $2,500 $3,000 $3,500 Implied Offer Price Implied Premium % $12.53 26% $15.81 60% $19.09 93% Pro Forma Impact 2021E 2022E 2021E 2022E 2021E 2022E Vail Standalone Net Income (Pre-SBC) Vail FDSO $2,904 424.3 $3,140 424.4 $2,904 424.3 $3,140 424.4 $2,904 424.3 $3,140 424.4 Raven EBIT Contribution (Pre-SBC) ($29) $67 ($29) $67 ($29) $67 Taxes Raven Marginal Tax Rate % $7 25.0% ($17) 25.0% $7 25.0% ($17) 25.0% $7 25.0% ($17) 25.0% Foregone Interest Income (7) (7) (13) (13) (19) (19) Taxes Vail Tax Rate % $1 17.0% $1 17.0% $2 17.0% $2 17.0% $3 17.0% $3 17.0% Raven Net Income Contribution (Pre-SBC) ($28) $44 ($33) $39 ($37) $35 Pro Forma Net Income (Pre-SBC) Pro Forma FDSO $2,876 433.6 $3,184 433.7 $2,871 434.6 $3,179 434.7 $2,866 435.6 $3,174 435.7 Memo Shares Issued to Diamond Dilution Impact from Stock DOptions Issued to Raven Cash-on-Hand Used New Debt Raised 7.3 2.0 $405 $0 7.3 3.0 $721 $0 7.3 4.1 $1,037 $0 Source: Company filings, Vail management and FactSet as of 7/26/2019. Note:Assumes that transaction is funded with acquired Raven net cash and existing Vail cash-on-hand. Assumes interest on foregone cash of 1.8%. 39 Accretion / (Dilution) - $ ($0.21) ($0.06) ($0.24) ($0.09) ($0.26) ($0.11) Accretion / (Dilution) - % (3.1%) (0.8%) (3.5%) (1.2%) (3.9%) (1.5%) Pro Forma EPS (Pre-SBC) $6.63 $7.34 $6.61 $7.31 $6.58 $7.29 Vail EPS (Pre-SBC) $6.84 $7.40 $6.84 $7.40 $6.84 $7.40 Assumes Diamond Stake is Acquired with Vail Stock at Current Market Value
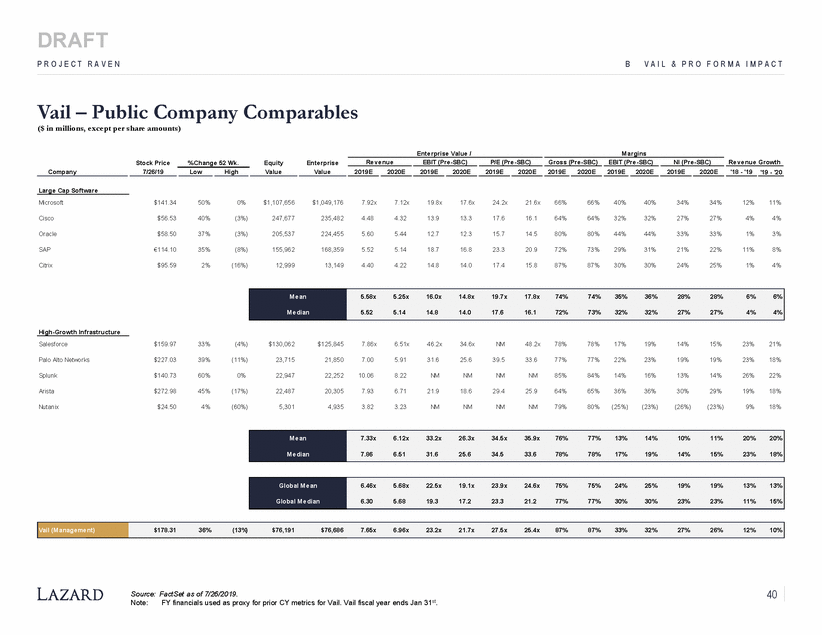
DRAFT P R O J E C T R A V E N B V A I L & P R O F O R M A I M P A C T Vail – Public Company Comparables ($ in millions, except per share amounts) Ente rprise Value / M argins Stock Price 7/26/19 % Change 52 Wk. Equity Value Ente rprise Value Re v e nue EBIT (Pre -SBC) P/E (Pre -SBC) Gross (Pre -SBC) EBIT (Pre -SBC) NI (Pre -SBC) Re v e nue Growth Company Low High 2019E 2020E 2019E 2020E 2019E 2020E 2019E 2020E 2019E 2020E 2019E 2020E '18 - '19 '19 - '20 Large Cap Software Microsoft $141.34 50% 0% $1,107,656 $1,049,176 7.92x 7.12x 19.8x 17.6x 24.2x 21.6x 66% 66% 40% 40% 34% 34% 12% 11% Cisco $56.53 40% (3%) 247,677 235,482 4.48 4.32 13.9 13.3 17.6 16.1 64% 64% 32% 32% 27% 27% 4% 4% Oracle $58.50 37% (3%) 205,537 224,455 5.60 5.44 12.7 12.3 15.7 14.5 80% 80% 44% 44% 33% 33% 1% 3% SAP €114.10 35% (8%) 155,962 168,359 5.52 5.14 18.7 16.8 23.3 20.9 72% 73% 29% 31% 21% 22% 11% 8% Citrix $95.59 2% (16%) 12,999 13,149 4.40 4.22 14.8 14.0 17.4 15.8 87% 87% 30% 30% 24% 25% 1% 4% High-Growth Infrastructure Salesforce $159.97 33% (4%) $130,062 $125,845 7.86x 6.51x 46.2x 34.6x NM 48.2x 78% 78% 17% 19% 14% 15% 23% 21% Palo Alto Networks $227.03 39% (11%) 23,715 21,850 7.00 5.91 31.6 25.6 39.5 33.6 77% 77% 22% 23% 19% 19% 23% 18% Splunk $140.73 60% 0% 22,947 22,252 10.06 8.22 NM NM NM NM 85% 84% 14% 16% 13% 14% 26% 22% Arista $272.98 45% (17%) 22,487 20,305 7.93 6.71 21.9 18.6 29.4 25.9 64% 65% 36% 36% 30% 29% 19% 18% Nutanix $24.50 4% (60%) 5,301 4,935 3.82 3.23 NM NM NM NM 79% 80% (25%) (23%) (26%) (23%) 9% 18% 40 Source: FactSet as of 7/26/2019. FY financials used as proxy for prior CY metrics for Vail. Vail fiscal year ends Jan 31st. Note: Vail (M anage me nt) $178.31 36% (13%) $76,191 $76,686 7.65x 6.96x 23.2x 21.7x 27.5x 25.4x 87% 87% 33% 32% 27% 26% 12% 10% Global M e an Global M e dian 6.46x 5.68x 22.5x 19.1x 23.9x 24.6x 75% 75% 24% 25% 19% 19% 13% 13% 6.30 5.68 19.3 17.2 23.3 21.2 77% 77% 30% 30% 23% 23% 11% 15% M e an M e dian 7.33x 6.12x 33.2x 26.3x 34.5x 35.9x 76% 77% 13% 14% 10% 11% 20% 20% 7.86 6.51 31.6 25.6 34.5 33.6 78% 78% 17% 19% 14% 15% 23% 18% M e an 5.58x 5.25x 16.0x 14.8x 19.7x 17.8x 74% 74% 35% 36% 28% 28% 6% 6% M e dian 5.52 5.14 14.8 14.0 17.6 16.1 72% 73% 32% 32% 27% 27% 4% 4%
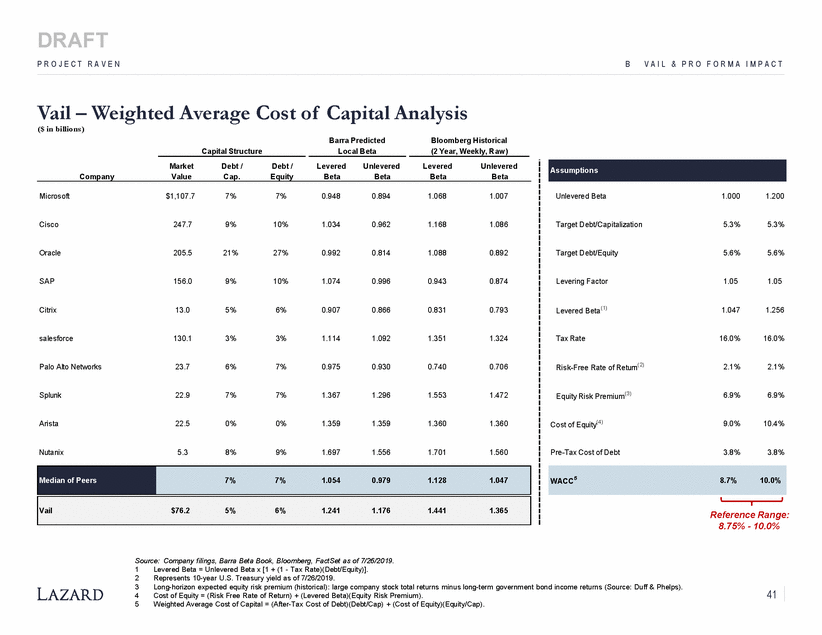
DRAFT P R O J E C T R A V E N B V A I L & P R O F O R M A I M P A C T Vail – Weighted Average Cost of Capital Analysis ($ in billions) Barra Predicted Local Beta Bloomberg Historical (2 Year, Weekly, Raw) Capital Structure Market Debt / Debt / Levered Unlevered Levered Unlevered Company Value Cap. Equity Beta Beta Beta Beta Microsoft $1,107.7 7% 7% 0.948 0.894 1.068 1.007 Unlevered Beta 1.000 1.200 Cisco 247.7 9% 10% 1.034 0.962 1.168 1.086 Target Debt/Capitalization 5.3% 5.3% Oracle 205.5 21% 27% 0.992 0.814 1.088 0.892 Target Debt/Equity 5.6% 5.6% SAP 156.0 9% 10% 1.074 0.996 0.943 0.874 Levering Factor 1.05 1.05 Levered Beta(1) Citrix 13.0 5% 6% 0.907 0.866 0.831 0.793 1.047 1.256 salesforce 130.1 3% 3% 1.114 1.092 1.351 1.324 Tax Rate 16.0% 16.0% Risk-Free Rate of Return(2) Palo Alto Networks 23.7 6% 7% 0.975 0.930 0.740 0.706 2.1% 2.1% Equity Risk Premium(3) Splunk 22.9 7% 7% 1.367 1.296 1.553 1.472 6.9% 6.9% Cost of Equity(4) Arista 22.5 0% 0% 1.359 1.359 1.360 1.360 9.0% 10.4% Nutanix 5.3 8% 9% 1.697 1.556 1.701 1.560 Pre-Tax Cost of Debt 3.8% 3.8% Reference Range: 8.75% - 10.0% Source: Company filings, Barra Beta Book, Bloomberg, FactSet as of 7/26/2019. 1 2 3 4 5 Levered Beta = Unlevered Beta x [1 + (1 - Tax Rate)(Debt/Equity)]. Represents 10-year U.S. Treasury yield as of 7/26/2019. Long-horizon expected equity risk premium (historical): large company stock total returns minus long-term government bond income returns (Source: Duff & Phelps). Cost of Equity = (Risk Free Rate of Return) + (Levered Beta)(Equity Risk Premium). Weighted Average Cost of Capital = (After-Tax Cost of Debt)(Debt/Cap) + (Cost of Equity)(Equity/Cap). 41 WACC5 8.7% 10.0% Median of Peers 7% 7% 1.054 0.979 1.128 1.047 Vail $76.2 5% 6% 1.241 1.176 1.441 1.365 Assumptions