UNITED STATES
SECURITIES AND EXCHANGE COMMISSION
Washington, D.C. 20549
FORM N-CSRS
CERTIFIED SHAREHOLDER REPORT OF REGISTERED
MANAGEMENT INVESTMENT COMPANIES
Investment Company Act file number: 811-22885
Broadview Funds Trust
(Exact name of registrant as specified in charter)
330 East Kilbourn Ave., Suite 1475
Milwaukee, Wisconsin 53202
(Address of principal executive offices) (Zip code)
The Corporation Trust Company
1209 Orange Street
Wilmington, Delaware 19801
(Name and address of agent for service)
Registrant’s telephone number, including area code: (414) 918-3900
Date of fiscal year end: September 30
Date of reporting period: November 26, 2013 – March 31, 2014
Item 1. Reports to Stockholders.

| TABLE OF CONTENTS
| | |
| Broadview Opportunity Fund | | Shareholder Letter |
| | March 31, 2014 (Unaudited) |
Dear Fellow Shareholders,
2013 proved to be a great year for equity market participants with almost every equity index appreciating nicely, in our opinion. Coming into 2014, investors started the year cautiously optimistic about the economic recovery in the US. We too believed that strength in employment, housing, and manufacturing all pointed to economic activity that would be more positive than expected. However, many of our portfolio companies that had performed well in 2013 corrected down following their earnings releases. Although in many cases, the earnings results were fine, they simply were not positive “enough” given the extended stock prices. For the quarter ended March 31, 2014, the Fund reported a gain of 1.05% against a gain of 1.12% by the Russell 2000 Index, a gain of 0.48% by the Russell 2000 Growth Index, and a gain of 2.30% by the Russell 2500 Index.
Despite the somewhat rocky start to the year, we believe that the economic up-cycle is still intact. The first quarter of 2014 results were somewhat impacted by weather disruptions, but economic data has improved with the warmer weather. Indeed it was the coldest winter in 25 years, so some disruption is to be expected. Although we also believe the Ukraine crisis will have repercussions on an already weak European economy, domestic equities are enjoying a strong tailwind of modest inflation and accelerating economic growth.
We must concede that we believe equity valuations are less attractive than they were last year and a more muted market return in 2014 would not be surprising. We will seek to exceed this return through our search for strong businesses that trade at attractive discounts to private market value. In any market, great companies can fall out of favor for one reason or another, and while these opportunities are less plentiful today, they still exist.
We have made some selective additions to the portfolio in the consumer and information technology sectors, as many attractive growth companies sold off during the first quarter volatility. We believe the consumer sector can continue to enjoy a strong tailwind of low energy prices and improving employment. We also have had some strong performance in healthcare driven by investments in companies that have new technologies and products with large addressable markets that are early in their adoption cycles. In our opinion, healthcare will be a contentious space to invest capital in over the implementation of the Affordable Care Act, but we believe there are many great opportunities to create wealth by investing in companies and technologies that save the healthcare system money. Our industrial positioning also remains overweight as we continue to see a renaissance in North American manufacturing and a recovery in commercial construction. We remain enthusiastic about our portfolio investments and look forward to opportunistically adding to positions we like over the next several years, while judiciously selling as companies reach our price targets.
Stock Building Supply Holdings, Inc. (STCK) – Richard J. Whiting
During the last quarter, we participated in the secondary offering of Stock Building Supply and were happy to grow our position despite limited liquidity. We have written in past shareholder letters of our enthusiasm for the nascent recovery in single family housing and the home repair and remodeling markets. Stock Building Supply is essentially the Home Depot or Lowes of the contracting community in the markets they serve and, as such, is front and center to potentially benefit from those tailwinds. What is different in the contractor markets versus the Do-It-Yourself retail market is the degree of fragmentation among wholesalers and the opportunity for a supplier to differentiate oneself and grow market share.
Stock Building Supply is differentiated from its competitors due to a strong balance sheet which allowed the company to maintain the inventory, staff, distribution footprint, and delivery equipment necessary to have top-of-class fulfillment service in our view. These are characteristics that many privately-held, family-owned, independent suppliers were not able to maintain through the downturn. Many competitors currently lack the credit available to deliver “now.”
Particularly attractive to us is the e-business platform offered by Stock Building Supply to its contractor partners. This portal allows a builder/remodeler to electronically send blueprints and specifications and then have materials estimated, quantified and delivered in proper synchronization to the job site. Often the company will prebuild components such as trusses and walls for the contractor and deliver completed modules to the job site. The contractor, mindful of his or her own profitability, sees a benefit of having the materials they need –no more and no less– on site, on time and in an order that corresponds to his subcontractor schedules. It further enhances the builder’s profitability to have his labor assemble components rather than build subsections in conditions far less ideal than the indoor facilities available to Stock Building Supply.
The economic back drop, as mentioned earlier, favors Stock Building Supply, and their business model is designed to augment that opportunity by a superior process and margin enhancing services. Still, we believe there is potential growth beyond those dynamics. The company’s footprint currently serves only 22% of the geography available. And while nearly 50% of the cost of a new single family home is comprised of products that Stock Building Supply can sell to the contractor, they currently only own 10% of the builder’s wallet. We believe it is reasonable that the supply
| | |
Semi-Annual Report | March 31, 2014 | | 1 |
| | |
Broadview Opportunity Fund | | Shareholder Letter |
| | March 31, 2014 (Unaudited) |
solutions they offer the builder will allow them to grow share. Stock Building Supply is also growing its capacity to sell contractors custom millwork and other higher margin componentry into the channel. In sum, we will invest in economic tailwinds where we can find them, but Stock Building Supply’s superior logistics, estimating and ordering solutions, increasing portfolio of higher margin services and untapped white space portend growth beyond industry norms in our view.
Lululemon Athletica Inc. (LULU) – Faraz Farzam, CFA
In our December 2013 shareholder letter, we briefly discussed a simmering slowdown in fundamentals across the consumer discretionary universe that began in the summer months that we believed would reach full boil in what turned out to be a disastrous fourth quarter for almost all retailers. We were well positioned for the fallout. Kate Spade & Co. (KATE) and Tumi Holdings, Inc. (TUMI) both delivered outstanding results and our investment discipline kept us out of the names that bore the biggest brunt of the selloff. However, as we also discussed, we were optimistic that the disappointing fourth quarter results would provide some opportunities to buy some great businesses.
The newest consumer sector addition to our portfolio is Lululemon Athletica. It was a difficult 2013 for the renowned yoga inspired athletic apparel vendor. In April, revelations of quality issues in their core yoga pants due to substandard Luon, the input fabric, led to a product recall and a hit to profitability. Subsequently, an internal investigation revealed that their manufacturing supply chain required investments to catch up with the company’s rapid growth.
In November 2013, unfortunate and inappropriate public comments made by Chairman and founder Chip Wilson led to his resignation as chairman and the resignation of longtime CEO, Christine Day. The stock price continued its downward slide in 2014 when management revealed that fourth quarter sales were coming in below projections mainly due to an overly conservative inventory position as the company grappled with a fluid supply chain situation. As negative sentiment and heavy selling pressure pushed the shares to the mid-$40s, we initiated our investment.
Our view is that despite the stumbles the brand is still strong and resonates on an emotional level with an attractive demographic. Furthermore, the opportunity to capitalize on the brand and grow the business is ample with only 175 U.S. stores and almost nothing in Europe. We believe the potential exists for Lululemon to more than double their retail presence. Despite the necessary investments that are needed, Lululemon still has enjoyed industry-leading profitability and returns. Finally, it is our opinion the new CEO, Laurent Potsdevin, is the perfect steward for the company as it navigates its turnaround. Prior to joining Lululemon, Laurent was CEO of Toms Shoes and Burton, the iconic snowboarding brand. The technical expertise required at Burton and the supply chain complexity of building the global shoe brand at Toms make Laurent an ideal fit for Lululemon. Although the company has its hands full and the near-term outlook is unclear, we believe we purchased one of the most desirable assets in global retailing at a reasonable valuation. In the long run, Lululemon’s issues are fixable and we are excited about the long-term potential of this investment.
Myriad Genetics, Inc. (MYGN) – Aaron J. Garcia, CFA
In January, we began buying shares of Myriad Genetics. Myriad Genetics is a genetic testing laboratory based out of Salt Lake City, Utah. The company specializes in lifetime risk testing of breast cancer, prostate cancer and colorectal cancer. Perhaps most famously, it is the market leader in BRAC1/2, BART test, which is a three gene panel or test for breast cancer risk. This is the test that Angelina Jolie made famous when she decided to receive a double mastectomy after evaluating her results.
The stock in Myriad Genetics came under pressure following Centers for Medicare & Medicaid Service’s (CMS) decision to cut reimbursement of the test from roughly $2,800 to $1,400. This news came as quite a shock to investors given that $1,400 was the original reimbursement for the older generation BRAC1 test which was only one genetic characterization as opposed to the newer three gene panel. Short interest in the stock grew as many negatively biased investors argued that this decision would affect pricing across managed care companies and that Myriad’s margins would decline.
While these concerns were a risk, the company’s equity was trading at $22, or 7x cash adjusted earnings, so that even a 50% cut of earnings estimates due to reimbursement pressure would imply a discount to a market multiple. Further, the company is transitioning its product offering away from the BRAC1/2 BART test to a multi-panel gene test called MyRisk. We believed the company’s first mover advantage in this industry had been overlooked by the street and that they would be able to grow earnings despite competitive pressures in its legacy business. We believed the franchise was fundamentally undervalued by investors and despite the high short interest and negative investor sentiment, Myriad was a solid investment.
| | |
| Broadview Opportunity Fund | | Shareholder Letter |
| | March 31, 2014 (Unaudited) |
In February, the company announced encouraging fourth quarter results and spoke to the lack of pricing pressure from the managed care companies. The stock quickly moved closer to fair value in the first quarter generating a surprisingly quick return for our investors. Despite the price move, we felt that Myriad was still fundamentally undervalued given the MyRisk opportunity. We have continued to hold the stock but have trimmed our position in response to the rapid price appreciation caused by short covering.
In conclusion, we thank you, our fellow shareholders, for your investment in the Broadview Opportunity Fund.
Best regards,
| | | | | | |

| | 
| | 
| |  ) )
|
| | | |
Richard J. Whiting | | Faraz Farzam, CFA | | Aaron J. Garcia, CFA | | Richard E. Lane, CFA |
The views and information discussed in this commentary are as of the date of publication, are subject to change, and may not reflect the writers’ current views. The views expressed represent an assessment of market conditions at a specific point in time, are opinions only and should not be relied upon as investment advice regarding a particular investment or markets in general. Such information does not constitute a recommendation to buy or sell specific securities or investment vehicles. It should not be assumed that any investment will be profitable or will equal the performance of the fund(s) or any securities or any sectors mentioned herein. The subject matter contained herein has been derived from several sources believed to be reliable and accurate at the time of compilation.
| | |
Semi-Annual Report | March 31, 2014 | | 3 |
| | |
Broadview Opportunity Fund | | Manager Commentary |
| | March 31, 2014 (Unaudited) |
GROWTH OF $10,000 INVESTMENT IN THE FUND
From its inception (12/16/96) to 3/31/14 as compared to the Russell 2500 TR(1), the Russell 2000 TR(2) and the Russell 2000 Growth TR(3)
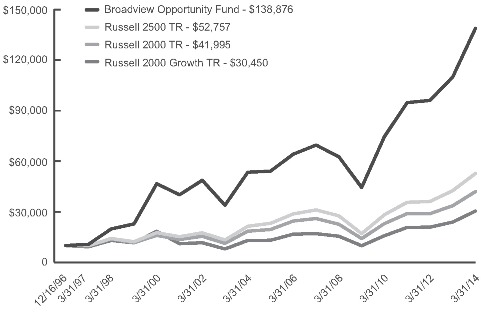
PERFORMANCE (For Periods Ended 3/31/14)
| | | | | | | | | | | | | | | | | | | | |
| | | Total Return* | | | | Annualized Total Return* |
| | | 3 Months | | YTD | | | | | | | 5 Year | | | 10 Year | | | Since Inception** |
Broadview Opportunity Fund | | 1.05% | | | 1.05% | | | | | | | | 25.58% | | �� | | 10.02% | | | 16.44% |
Russell 2500 TR | | 2.30% | | | 2.30% | | | | | | | | 25.33% | | | | 9.43% | | | 10.10% |
Russell 2000 TR | | 1.12% | | | 1.12% | | | | | | | | 24.31% | | | | 8.53% | | | 8.65% |
Russell 2000 Growth TR | | 0.48% | | | 0.48% | | | | | | | | 25.24% | | | | 8.87% | | | 6.65% |
Performance data quoted represents past performance. Past performance does not guarantee future results. Investment return and principal value of an investment will fluctuate so that an investor’s shares, when sold or redeemed, may be worth more or less than the original cost. Current performance data may be higher or lower than actual data quoted. For most recent month end performance please visit bvafunds.com or call 1-855-846-1463. As of the Fund’s Prospectus dated December 1, 2013, the Broadview Opportunity Fund’s annual operating expense ratio is 1.21%.
| (1) | Russell 2500 Total Return - A broad index featuring 2,500 stocks that cover the small- and mid-cap market capitalizations. The Russell 2500 is a market cap weighted index that includes the smallest 2,500 companies covered in the Russell 3000 universe of United States-based listed equities. |
| (2) | Russell 2000 Total Return - An index measuring the performance of approximately 2,000 small-cap companies in the Russell 3000 Index, which is made up of 3,000 of the biggest U.S. stocks. The Russell 2000 serves as a benchmark for small-cap stocks in the United States. |
| (3) | Russell 2000 Growth Total Return - An index measuring the performance of the 2,000 smallest companies in the Russell 3000 Index, which is made up of 3,000 of the biggest U.S. stocks. The Russell 2000 serves as a benchmark for small-cap stocks in the United States. |
| * | Total return includes change in share prices and in each case includes reinvestments of any dividends, interest and capital gain distributions. |
| ** | Fund Inception Date: December 16, 1996 |
| | |
Broadview Opportunity Fund | | Manager Commentary |
| | March 31, 2014 (Unaudited) |
SECTOR ALLOCATION (As a percentage of Net Assets)
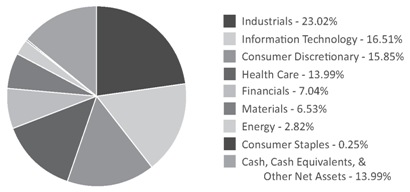
Holdings are subject to change.
These allocations may not reflect the current or future positions of the portfolio.
| | |
Semi-Annual Report | March 31, 2014 | | 5 |
| | |
Broadview Opportunity Fund | | Disclosure of Fund Expenses |
| | March 31, 2014 (Unaudited) |
As a shareholder of the Broadview Opportunity Fund (the “Fund”) you will incur two types of costs: (1) transaction costs; and (2) ongoing costs, including management fees and other Fund expenses. The following examples are intended to help you understand your ongoing costs (in dollars) of investing in the Fund and to compare these costs with the ongoing costs of investing in other mutual funds. The examples are based on an investment of $1,000 invested on October 1, 2013 and held until March 31, 2014.
Actual Expenses. The first line of the table below provides information about actual account values and actual expenses. You may use the information in this line, together with the amount you invested, to estimate the expenses that you paid over the period. Simply divide your account value by $1,000 (for example, an $8,600 account value divided by $1,000 = 8.6), then multiply the result by the number in the first line under the heading “Expenses Paid During Period” to estimate the expenses you paid on your account during this period.
Hypothetical Example for Comparison Purposes. The second line of the table below provides information about hypothetical account values and hypothetical expenses based on the Fund’s actual expense ratio and an assumed rate of return of 5% per year before expenses, which is not the Fund’s actual return. The hypothetical account values and expenses may not be used to estimate the actual ending account balance or expenses you paid for the period. You may use this information to compare the ongoing costs of investing in the Fund and other mutual funds. To do so, compare this 5% hypothetical example with the 5% hypothetical examples that appear in the shareholder reports of the other funds. The expenses shown in the table are meant to highlight ongoing Fund costs only and do not reflect transaction fees. Therefore, the second line of the table below is useful in comparing ongoing costs only, and may not help you determine the relative total costs of owning different funds. In addition, if these transactional costs were included, your costs would have been higher.
| | | | | | | | |
| | | Beginning Account Value 10/1/13 | | Ending Account Value 3/31/14 | | Expense Ratio(a) | | Expenses Paid During period 10/1/13 - 3/31/14(b) |
| | | | |
Actual | | $ 1,000.00 | | $ 1,099.50 | | 1.22% | | $ 6.39 |
Hypothetical (5% return before expenses) | | $ 1,000.00 | | $ 1,018.85 | | 1.22% | | $ 6.14 |
| (a) | The Fund’s expense ratios have been based on the Fund’s most recent fiscal half-year expenses. |
| (b) | Expenses are equal to the Fund’s annualized expense ratio multiplied by the average account value over the period, multiplied by the number of days in the most recent fiscal half-year (182)/365 (to reflect the half-year period). |
| | |
| Broadview Opportunity Fund | | Schedule of Investments |
| | March 31, 2014 (Unaudited) |
| | | | | | | | |
| | | Shares | | | Value | |
COMMON STOCKS (86.01%) | | | | | | | | |
CONSUMER DISCRETIONARY (15.85%) | | | | | | | | |
Consumer Durables & Apparel (4.55%) | | | | | | | | |
Black Diamond, Inc.(a) | | | 691,765 | | | $ | 8,460,286 | |
Callaway Golf Co. | | | 637,924 | | | | 6,519,583 | |
Tumi Holdings, Inc.(a) | | | 530,300 | | | | 12,000,689 | |
Vince Holding Corp.(a) | | | 318,600 | | | | 8,398,296 | |
Winnebago Industries, Inc.(a) | | | 390,736 | | | | 10,702,259 | |
| | | | | | | | |
| | | | | | | 46,081,113 | |
| | | | | | | | |
Consumer Services (0.90%) | | | | | | | | |
Royal Caribbean Cruises, Ltd. | | | 168,100 | | | | 9,171,536 | |
| | | | | | | | |
Media (5.16%) | | | | | | | | |
Interpublic Group of Cos., Inc. | | | 731,400 | | | | 12,536,196 | |
MDC Partners, Inc. - Class A | | | 1,300,683 | | | | 29,681,586 | |
National CineMedia, Inc. | | | 671,742 | | | | 10,076,130 | |
| | | | | | | | |
| | | | | | | 52,293,912 | |
| | | | | | | | |
Retailing (5.24%) | | | | | | | | |
Hibbett Sports, Inc.(a) | | | 178,750 | | | | 9,452,300 | |
Kate Spade & Co.(a) | | | 382,528 | | | | 14,187,964 | |
Lululemon Athletica, Inc.(a) | | | 212,400 | | | | 11,170,116 | |
Ulta Salon Cosmetics & Fragrance, Inc.(a) | | | 84,700 | | | | 8,256,556 | |
Urban Outfitters, Inc.(a) | | | 275,523 | | | | 10,048,324 | |
| | | | | | | | |
| | | | | | | 53,115,260 | |
| | | | | | | | |
CONSUMER STAPLES (0.25%) | | | | | | | | |
Food (0.25%) | | | | | | | | |
Annie’s, Inc.(a) | | | 64,100 | | | | 2,576,179 | |
| | | | | | | | |
ENERGY (2.82%) | | | | | | | | |
Capital Goods (1.19%) | | | | | | | | |
Chicago Bridge & Iron Co. N.V. | | | 138,000 | | | | 12,026,700 | |
| | | | | | | | |
| | |
Energy (1.63%) | | | | | | | | |
Rowan Cos. PLC - Class A(a) | | | 248,500 | | | | 8,369,480 | |
Whiting Petroleum Corp.(a) | | | 117,831 | | | | 8,176,293 | |
| | | | | | | | |
| | | | | | | 16,545,773 | |
| | | | | | | | |
FINANCIALS (7.04%) | | | | | | | | |
Banks (4.91%) | | | | | | | | |
Associated Banc-Corp. | | | 81,786 | | | | 1,477,055 | |
CoBiz Financial, Inc. | | | 799,657 | | | | 9,212,048 | |
Columbia Banking System, Inc. | | | 125,838 | | | | 3,588,900 | |
First Midwest Bancorp, Inc. | | | 418,400 | | | | 7,146,272 | |
Hancock Holding Co. | | | 270,100 | | | | 9,899,165 | |
Santander Consumer USA Holdings, Inc.(a) | | | 900 | | | | 21,672 | |
Zions Bancorporation | | | 593,900 | | | | 18,399,022 | |
| | | | | | | | |
| | | | | | | 49,744,134 | |
| | | | | | | | |
Insurance (2.13%) | | | | | | | | |
Arthur J. Gallagher & Co. | | | 46,775 | | | | 2,225,554 | |
Essent Group, Ltd.(a) | | | 111,075 | | | | 2,494,745 | |
MGIC Investment Corp.(a) | | | 1,667,075 | | | | 14,203,479 | |
Reinsurance Group of America, Inc. | | | 33,400 | | | | 2,659,642 | |
| | | | | | | | |
| | | | | | | 21,583,420 | |
| | | | | | | | |
HEALTH CARE (13.99%) | | | | | | | | |
Health Care Equipment & Services (11.70%) | | | | | | | | |
Align Technology, Inc.(a) | | | 148,750 | | | | 7,703,762 | |
Edwards Lifesciences Corp.(a) | | | 200,550 | | | | 14,874,793 | |
See Notes to Financial Statements.
| | |
Semi-Annual Report | March 31, 2014 | | 7 |
| | |
Broadview Opportunity Fund | | Schedule of Investments |
| | March 31, 2014 (Unaudited) |
| | | | | | | | |
| | | Shares | | | Value | |
COMMON STOCKS (86.01%) (continued) | | | | | | | | |
HEALTH CARE (13.99%) (continued) | | | | | | | | |
Health Care Equipment & Services (11.70%) (continued) | | | | | | | | |
HealthSouth Corp. | | | 520,002 | | | $ | 18,683,672 | |
MedAssets, Inc.(a) | | | 446,667 | | | | 11,037,142 | |
NxStage Medical, Inc.(a) | | | 1,466,525 | | | | 18,683,529 | |
Omnicare, Inc. | | | 197,600 | | | | 11,790,792 | |
PAREXEL International Corp.(a) | | | 158,106 | | | | 8,551,954 | |
Select Medical Holdings Corp. | | | 649,500 | | | | 8,086,275 | |
Universal Health Services, Inc. - Class B | | | 233,000 | | | | 19,122,310 | |
| | | | | | | | |
| | | | | | | 118,534,229 | |
| | | | | | | | |
Pharmaceuticals, Biotechnology & Life Sciences (2.29%) | | | | | | | | |
Meridian Bioscience, Inc. | | | 568,060 | | | | 12,378,027 | |
Myriad Genetics, Inc.(a) | | | 317,000 | | | | 10,838,230 | |
| | | | | | | | |
| | | | | | | 23,216,257 | |
| | | | | | | | |
INDUSTRIALS (23.02%) | | | | | | | | |
Automobiles & Components (2.64%) | | | | | | | | |
Gentex Corp. | | | 545,900 | | | | 17,212,227 | |
Modine Manufacturing Co.(a) | | | 651,842 | | | | 9,549,485 | |
| | | | | | | | |
| | | | | | | 26,761,712 | |
| | | | | | | | |
Capital Goods (14.64%) | | | | | | | | |
B/E Aerospace, Inc.(a) | | | 112,800 | | | | 9,789,912 | |
Crane Co. | | | 169,200 | | | | 12,038,580 | |
Douglas Dynamics, Inc. | | | 558,268 | | | | 9,725,028 | |
Dynamic Materials Corp. | | | 273,316 | | | | 5,203,937 | |
Hexcel Corp.(a) | | | 578,329 | | | | 25,180,445 | |
Kennametal, Inc. | | | 327,000 | | | | 14,486,100 | |
Masco Corp. | | | 904,500 | | | | 20,088,945 | |
MasTec, Inc.(a) | | | 79,000 | | | | 3,431,760 | |
Regal-Beloit Corp. | | | 174,100 | | | | 12,658,811 | |
Stock Building Supply Holdings, Inc.(a) | | | 538,101 | | | | 10,934,212 | |
Terex Corp. | | | 325,000 | | | | 14,397,500 | |
Triumph Group, Inc. | | | 65,600 | | | | 4,236,448 | |
Twin Disc, Inc. | | | 236,740 | | | | 6,235,732 | |
| | | | | | | | |
| | | | | | | 148,407,410 | |
| | | | | | | | |
Commercial Services & Supplies (1.81%) | | | | | | | | |
Kforce, Inc. | | | 411,200 | | | | 8,766,784 | |
Robert Half International, Inc. | | | 227,043 | | | | 9,524,454 | |
| | | | | | | | |
| | | | | | | 18,291,238 | |
| | | | | | | | |
Diversified Financials (2.47%) | | | | | | | | |
Mobile Mini, Inc. | | | 577,737 | | | | 25,050,676 | |
| | | | | | | | |
Transportation (1.46%) | | | | | | | | |
Swift Transportation Co.(a) | | | 281,300 | | | | 6,962,175 | |
UTi Worldwide, Inc. | | | 736,175 | | | | 7,796,093 | |
| | | | | | | | |
| | | | | | | 14,758,268 | |
| | | | | | | | |
INFORMATION TECHNOLOGY (16.51%) | | | | | | | | |
Retailing (1.52%) | | | | | | | | |
Arrow Electronics, Inc.(a) | | | 213,292 | | | | 12,661,013 | |
ScanSource, Inc.(a) | | | 67,336 | | | | 2,745,289 | |
| | | | | | | | |
| | | | | | | 15,406,302 | |
| | | | | | | | |
Semiconductors & Semiconductor Equipment (2.44%) | | | | | | | | |
MKS Instruments, Inc. | | | 400,600 | | | | 11,973,934 | |
Veeco Instruments, Inc.(a) | | | 304,100 | | | | 12,750,913 | |
| | | | | | | | |
| | | | | | | 24,724,847 | |
| | | | | | | | |
See Notes to Financial Statements.
| | |
| Broadview Opportunity Fund | | Schedule of Investments |
| | March 31, 2014 (Unaudited) |
| | | | | | | | |
| | | Shares | | | Value | |
COMMON STOCKS (86.01%) (continued) | | | | | | | | |
INFORMATION TECHNOLOGY (16.51%) (continued) | | | | | | | | |
Software & Services (8.35%) | | | | | | | | |
Infoblox, Inc.(a) | | | 246,700 | | | $ | 4,948,802 | |
Informatica Corp.(a) | | | 547,200 | | | | 20,673,216 | |
PTC, Inc.(a) | | | 604,019 | | | | 21,400,393 | |
Qlik Technologies, Inc.(a) | | | 347,700 | | | | 9,245,343 | |
Quality Systems, Inc. | | | 476,604 | | | | 8,045,076 | |
SciQuest, Inc.(a) | | | 241,250 | | | | 6,517,369 | |
TIBCO Software, Inc.(a) | | | 680,700 | | | | 13,831,824 | |
| | | | | | | | |
| | | | | | | 84,662,023 | |
| | | | | | | | |
Technology Hardware & Equipment (4.20%) | | | | | | | | |
Ciena Corp.(a) | | | 519,300 | | | | 11,808,882 | |
F5 Networks, Inc.(a) | | | 151,302 | | | | 16,133,332 | |
Fortinet, Inc.(a) | | | 321,800 | | | | 7,089,254 | |
Vocera Communications, Inc.(a) | | | 462,482 | | | | 7,552,331 | |
| | | | | | | | |
| | | | | | | 42,583,799 | |
| | | | | | | | |
MATERIALS (6.53%) | | | | | | | | |
Materials (6.53%) | | | | | | | | |
Allegheny Technologies, Inc. | | | 205,850 | | | | 7,756,428 | |
Celanese Corp. - Series A | | | 281,850 | | | | 15,645,494 | |
Rockwood Holdings, Inc. | | | 179,068 | | | | 13,322,659 | |
Sealed Air Corp. | | | 345,300 | | | | 11,350,011 | |
U.S. Silica Holdings, Inc. | | | 75,973 | | | | 2,899,889 | |
Vulcan Materials Co. | | | 229,300 | | | | 15,236,985 | |
| | | | | | | | |
| | | | | | | 66,211,466 | |
| | | | | | | | |
TOTAL COMMON STOCKS | | | | | | | | |
(COST $639,702,850) | | | | | | | 871,746,254 | |
| | | | | | | | |
SHORT-TERM SECURITY (14.41%) | | | | | | | | |
MONEY MARKET FUND (14.41%) | | | | | | | | |
Morgan Stanley Institutional Liquidity Funds - Government Portfolio, Institutional Class, 7 Day Yield 0.040% | | | 146,114,593 | | | | 146,114,593 | |
| | | | | | | | |
| | |
TOTAL SHORT-TERM SECURITY | | | | | | | | |
(COST $146,114,593) | | | | | | | 146,114,593 | |
| | | | | | | | |
| | |
TOTAL INVESTMENTS (100.42%) | | | | | | | | |
(COST $785,817,443) | | | | | | | 1,017,860,847 | |
| | | | | | | | |
| | |
TOTAL LIABILITIES IN EXCESS OF OTHER ASSETS (-0.42%) | | | | | | | (4,303,841) | |
| | | | | | | | |
| | |
NET ASSETS 100.00% | | | | | | $ | 1,013,557,006 | |
| | | | | | | | |
| (a) | Non-income producing security. |
Percentages are stated as a percent of net assets.
Common Abbreviations:
Ltd. - Limited.
N.V. - Naamloze Vennootschap is the Dutch term for a public limited liability corporation.
PLC - Public Limited Company.
See Notes to Financial Statements.
| | |
Semi-Annual Report | March 31, 2014 | | 9 |
| | |
Broadview Opportunity Fund | | Statement of Assets and Liabilities |
| | March 31, 2014 (Unaudited) |
| | | | |
ASSETS: | | | | |
Investments in securities, at value | | $ | 1,017,860,847 | |
Cash | | | 918,409 | |
Receivable for shareholder purchases | | | 2,636,561 | |
Dividends receivable | | | 267,854 | |
Prepaid expenses | | | 56,235 | |
| |
Total assets | | | 1,021,739,906 | |
| |
| |
LIABILITIES: | | | | |
Payable for management fees | | | 852,073 | |
Payable for investments purchased | | | 6,548,911 | |
Payable to shareholders for redemptions | | | 653,749 | |
Payable for Board of Directors fees | | | 5,403 | |
Payable for chief compliance officer fees | | | 2,531 | |
Accrued expenses and other liabilities | | | 120,233 | |
| |
Total liabilities | | | 8,182,900 | |
| |
NET ASSETS | | $ | 1,013,557,006 | |
| |
| |
NET ASSETS CONSIST OF: | | | | |
Paid-in capital ($0.0001 par value; 100,000,000 shares authorized) | | $ | 735,618,611 | |
Accumulated net investment loss | | | (1,715,585) | |
Accumulated net realized gain on investments | | | 47,610,576 | |
Net unrealized appreciation on investments | | | 232,043,404 | |
| |
NET ASSETS | | $ | 1,013,557,006 | |
| |
| |
INVESTMENTS IN SECURITIES, AT COST | | $ | 785,817,443 | |
| |
PRICING OF SHARES: | | | | |
Net Asset Value, offering and redemption price per share | | $ | 40.35 | |
Net Assets | | $ | 1,013,557,006 | |
Shares of beneficial interest outstanding | | | 25,119,849 | |
See Notes to Financial Statements.
| | |
| Broadview Opportunity Fund | | Statement of Operations |
| | For the Period Ended March 31, 2014 (Unaudited) |
| | | | |
| |
INVESTMENT INCOME: | | | | |
Dividends | | $ | 4,075,427 | |
Foreign taxes withheld | | | (99,376) | |
Interest | | | 19,028 | |
| |
Total Investment Income | | | 3,995,079 | |
| |
| |
EXPENSES: | | | | |
Management fees | | | 4,665,387 | |
Administration and accounting services | | | 193,717 | |
Transfer agent fees | | | 589,181 | |
Professional fees | | | 30,094 | |
Custodian fees | | | 33,053 | |
Board of Directors fees | | | 27,986 | |
Chief compliance officer fees | | | 10,031 | |
Printing and postage expenses | | | 75,369 | |
Registration fees | | | 67,191 | |
Other expenses | | | 18,655 | |
| |
Total Expenses | | | 5,710,664 | |
| |
NET INVESTMENT LOSS | | | (1,715,585) | |
| |
| |
REALIZED AND UNREALIZED GAIN FROM INVESTMENTS | | | | |
Net realized gain on investments | | | 69,931,880 | |
Net change in unrealized appreciation of investments | | | 18,085,963 | |
| |
NET REALIZED AND UNREALIZED GAIN FROM INVESTMENTS | | | 88,017,843 | |
| |
NET INCREASE IN NET ASSETS RESULTING FROM OPERATIONS | | $ | 86,302,258 | |
| |
See Notes to Financial Statements.
| | |
Semi-Annual Report | March 31, 2014 | | 11 |
| | |
Broadview Opportunity Fund | | Statements of Changes in Net Assets |
| | | | | | | | |
| | | For the Six | | | | |
| | | Months Ended | | | For the | |
| | | March 31, 2014 | | | Year Ended | |
| | | (Unaudited) | | | September 30, 2013 | |
OPERATIONS: | | | | | | | | |
Net investment loss | | $ | (1,715,585) | | | $ | (3,086,077) | |
Net realized gain on investments | | | 69,931,880 | | | | 85,160,769 | |
Net change in unrealized appreciation on investments | | | 18,085,963 | | | | 146,688,701 | |
Net increase in net assets resulting from operations | | | 86,302,258 | | | | 228,763,393 | |
| | |
DISTRIBUTIONS TO SHAREHOLDERS (Note 5): | | | | | | | | |
From net realized gains on investments | | | (93,415,501) | | | | (16,810,686) | |
Total distributions | | | (93,415,501) | | | | (16,810,686) | |
| | |
SHARE TRANSACTIONS (Note 5): | | | | | | | | |
Proceeds from sales of shares | | | 188,326,129 | | | | 223,348,986 | |
Distributions reinvested | | | 91,810,255 | | | | 16,262,495 | |
Cost of shares redeemed | | | (112,189,222) | | | | (217,381,818) | |
Net increase from share transactions | | | 167,947,162 | | | | 22,229,663 | |
| | |
Net increase in net assets | | | 160,833,919 | | | | 234,182,370 | |
| | |
NET ASSETS: | | | | | | | | |
Beginning of period | | | 852,723,087 | | | | 618,540,717 | |
End of period* | | $ | 1,013,557,006 | | | $ | 852,723,087 | |
| |
* Includes accumulated net investment income/(loss) of: | | $ | (1,715,585) | | | $ | 0 | |
| | |
Other Information: | | | | | | | | |
SHARE TRANSACTIONS: | | | | | | | | |
Sold | | | 4,700,840 | | | | 6,268,465 | |
Distributions reinvested | | | 2,355,046 | | | | 555,062 | |
Redeemed | | | (2,812,185) | | | | (6,388,918) | |
Net increase in shares outstanding | | | 4,243,701 | | | | 434,609 | |
| |
See Notes to Financial Statements.
| | |
| Broadview Opportunity Fund | | Financial Highlights |
| | For a Share Outstanding Throughout the Periods Presented |
| | | | | | | | | | | | | | | | | | | | | | | | |
| | | For the Six Months | | | For the | | | For the | | | For the | | | For the | | | For the | |
| | | Ended | | | Year Ended | | | Year Ended | | | Year Ended | | | Year Ended | | | Year Ended | |
| | | March 31, 2014(a) | | | September 30, | | | September 30, | | | September 30, | | | September 30, | | | September 30, | |
| | | (Unaudited) | | | 2013 | | | 2012 | | | 2011 | | | 2010 | | | 2009 | |
NET ASSET VALUE, BEGINNING OF PERIOD | | | $ 40.85 | | | | $ 30.26 | | | | $ 25.54 | | | | $ 26.37 | | | | $ 22.72 | | | | $ 28.34 | |
INCOME/(LOSS) FROM OPERATIONS: | | | | | | | | | | | | | | | | | | | | | | | | |
Net investment income/(loss) | | | (0.07) | | | | (0.15) | | | | (0.10) | | | | (0.15) | | | | (0.11) | | | | 0.02 | |
Net realized and unrealized gain/(loss) on investments | | | 3.91 | | | | 11.59 | | | | 6.02 | | | | (0.68) | | | | 3.79 | | | | (0.65) | |
Total from investment operations | | | 3.84 | | | | 11.44 | | | | 5.92 | | | | (0.83) | | | | 3.68 | | | | (0.63) | |
| | | | | | |
LESS DISTRIBUTIONS: | | | | | | | | | | | | | | | | | | | | | | | | |
From net investment income | | | – | | | | – | | | | – | | | | – | | | | (0.03) | | | | – | |
From net realized gains on investments | | | (4.34) | | | | (0.85) | | | | (1.20) | | | | – | | | | – | | | | (4.99) | |
Total distributions | | | (4.34) | | | | (0.85) | | | | (1.20) | | | | – | | | | (0.03) | | | | (4.99) | |
INCREASE/(DECREASE) IN NET ASSET VALUE | | | (0.50) | | | | 10.59 | | | | 4.72 | | | | (0.83) | | | | 3.65 | | | | (5.62) | |
NET ASSET VALUE, END OF PERIOD | | | $ 40.35 | | | | $ 40.85 | | | | $ 30.26 | | | | $ 25.54 | | | | $ 26.37 | | | | $ 22.72 | |
| |
| | | | | | |
TOTAL RETURN | | | 9.95% | (b) | | | 38.91% | | | | 23.48% | | | | (3.15%) | | | | 16.21% | | | | 3.52% | |
| | | | | | |
SUPPLEMENTAL DATA: | | | | | | | | | | | | | | | | | | | | | | | | |
Net assets, end of period (000’s) | | | $ 1,013,557 | | | | $ 852,723 | | | | $ 618,541 | | | | $ 434,932 | | | | $ 424,027 | | | | $ 403,999 | |
| | | | | | |
RATIOS TO AVERAGE NET ASSETS: | | | | | | | | | | | | | | | | | | | | | | | | |
Operating expenses | | | 1.22% | (c) | | | 1.26% | | | | 1.26% | | | | 1.26% | | | | 1.30% | | | | 1.40% | |
Net investment income/(loss) | | | (0.37%) | (c) | | | (0.44%) | | | | (0.34%) | | | | (0.48%) | | | | (0.47%) | | | | 0.12% | |
| | | | | | |
PORTFOLIO TURNOVER RATE | | | 29% | (b) | | | 70% | | | | 55% | | | | 78% | | | | 59% | | | | 58% | |
| (a) | On November 25, 2013, shareholders of the FMI Focus Fund, a series of FMI Funds, Inc. (the “Predecessor Fund”), approved a tax-free reorganization under which all assets and liabilities of the Predecessor Fund were transferred to the Broadway Opportunity Fund, a series of Broadview Funds Trust, at the close of business on November 29, 2013. |
See Notes to Financial Statements.
| | |
Semi-Annual Report | March 31, 2014 | | 13 |
| | |
Broadview Opportunity Fund | | Notes to Financial Statements |
| | March 31, 2014 (Unaudited) |
1. ORGANIZATION
Broadview Funds Trust (the “Trust”) is an open-end management investment company registered under the Investment Company Act of 1940, as amended (the “1940 Act”). The Trust was organized on September 9, 2013 as a Delaware statutory trust. The Trust currently offers one series, the Broadview Opportunity Fund (the “Fund”). The Fund is a diversified portfolio with an investment objective to seek capital appreciation.
On November 25, 2013, shareholders of the FMI Focus Fund, a series of FMI Funds, Inc (the “Predecessor Fund”), approved a tax-free reorganization under which all assets and liabilities of the Predecessor Fund were transferred to the Broadview Opportunity Fund, a series of Broadview Funds Trust, at the close of business on November 29, 2013. The Predecessor Fund commenced operations on December 16, 1996.
2. SIGNIFICANT ACCOUNTING POLICIES
The following is a summary of significant accounting policies consistently followed by the Fund. These policies are in conformity with U.S. generally accepted accounting principles (“GAAP”).
Use of Estimates — The preparation of financial statements in conformity with GAAP requires management to make estimates and assumptions that affect the amounts reported in financial statements. Actual results could differ from those estimates.
Investment Valuation — The Fund’s portfolio securities are valued as of the close of trading of the New York Stock Exchange (“NYSE”) (normally 4:00 p.m., Eastern Time). Each security, excluding short-term investments, is valued at the last sale price reported by the principal security exchange on which the issue is traded. Securities that are traded on the Nasdaq Stock Market, Inc. are valued at the Nasdaq Official Closing Price or if no sale is reported, the mean between the bid and the ask. Securities which are traded over-the-counter are valued at the mean between the bid and the ask. Securities sold short which are listed on a national securities exchange or the Nasdaq Stock Market but which were not traded on the valuation date are valued at the mean between the bid and the ask. Unlisted equity securities for which market quotations are readily available are valued at the last sale price or, if no sale price, the mean between the bid and the ask. Options purchased or written by the Fund are valued at the average of the current bid and asked prices. Securities for which quotations are not readily available are valued at fair value as determined by the investment adviser in accordance with procedures approved by the Board of Directors. The fair value of a security is the amount which the Fund might reasonably expect to receive upon a current sale. The fair value of a security may differ from the last quoted price and the Fund may not be able to sell a security at the fair value. Market quotations may not be available, for example, if trading in particular securities was halted during the day and not resumed prior to the close of trading on the New York Stock Exchange. As of March 31, 2014 there were no securities that were internally fair valued. Variable rate demand notes are recorded at par value which approximates market value. Short-term investments with maturities of 60 days or less are valued at amortized cost which approximates value. For financial reporting purposes, investment transactions are recorded on the trade date.
Securities Transactions and Related Investment Income — Securities transactions are accounted for on trade date. Dividend income is recorded on the ex-dividend date. Realized gains and losses from investment transactions are determined using the identified cost basis. Interest income which includes amortization of premium and accretion of discount, is recorded on the accrual basis.
Fair Value Measurements — A three-tier hierarchy has been established to classify fair value measurements for disclosure purposes. Inputs refer broadly to the assumptions that market participants would use in pricing the asset or liability, including assumptions about risk. Inputs may be observable or unobservable. Observable inputs are inputs that reflect the assumptions market participants would use in pricing the asset or liability that are developed based on market data obtained from sources independent of the reporting entity. Unobservable inputs are inputs that reflect the reporting entity’s own assumptions about the assumptions market participants would use in pricing the asset or liability that are developed based on the best information available. In accordance with the authoritative guidance on fair value measurements and disclosure under GAAP, the Fund discloses fair value of its investments in a hierarchy that prioritizes the inputs to valuation techniques used to measure the fair value.
Various inputs are used in determining the value of the Fund’s investments as of the reporting period end. These inputs are categorized in the following hierarchy under applicable financial accounting standards:
| | |
Level 1 — | | Unadjusted quoted prices in active markets for identical, unrestricted assets or liabilities that the Fund have the ability to access at the measurement date; |
| |
Level 2 — | | Quoted prices which are not active, quoted prices for similar assets or liabilities in active markets or inputs other than quoted prices that are observable (either directly or indirectly) for substantially the full term of the asset or liability; and |
| | |
| Broadview Opportunity Fund | | Notes to Financial Statements |
| | March 31, 2014 (Unaudited) |
| | |
Level 3 — | | Significant unobservable prices or inputs (including the Fund’s own assumptions in determining the fair value of investments) where there is little or no market activity for the asset or liability at the measurement date. |
The availability of observable inputs can vary from security to security and is affected by a wide variety of factors, including, for example, the type of security, whether the security is new and not yet established in the marketplace, the liquidity of markets, and other characteristics particular to the security. To the extent that valuation is based on models or inputs that are less observable or unobservable in the market, the determination of fair value requires more judgment. Accordingly, the degree of judgment exercised in determining fair value is greatest for instruments categorized in Level 3.
An investment level within the fair value hierarchy is based on the lowest level input, individually or in the aggregate, that is significant to fair value measurement. The valuation techniques used by the Fund to measure fair value during the six months ended March 31, 2014 maximized the use of observable inputs and minimized the use of unobservable inputs.
The inputs or methodologies used for valuing securities are not necessarily an indication of the risk or liquidity associated with investing in those securities. The following is a summary of the inputs used in valuing the Fund’s investments as of March 31, 2014:
Broadview Opportunity Fund
| | | | | | | | | | | | | | | | |
| | | Valuation Inputs | | | | |
| | | | | | | | |
| Investments in Securities at Value* | | Level 1 | | | Level 2 | | | Level 3 | | | Total | |
| |
Common Stocks | | $ | 871,746,254 | | | $ | – | | | $ | – | | | $ | 871,746,254 | |
Short-Term Security | | | 146,114,593 | | | | – | | | | – | | | | 146,114,593 | |
| | | | |
Total | | $ | 1,017,860,847 | | | $ | – | | | $ | – | | | $ | 1,017,860,847 | |
| | | | |
| * | See Schedule of Investments for industry classification. |
It is the Fund’s policy to recognize transfers between levels at the end of the reporting period. There were no transfers between Levels 1 and 2 during the six months ended March 31, 2014.
For the six months ended March 31, 2014, the Fund did not have any unobservable inputs (Level 3) used in determining fair value.
Distributions to Shareholders — Dividends from net investment income and distributions of net realized capital gains, if any, will be declared and paid at least annually. Income and capital gains distributions are determined in accordance with income tax regulations, which may differ from GAAP. Distributions to shareholders are recorded on the ex-dividend date.
Income Taxes — As of and during the six months ended March 31, 2014, the Fund did not have a liability for any unrecognized tax benefits. The Fund files U.S. federal, state, and local tax returns as required. The Fund’s tax returns are subject to examination by the relevant tax authorities until expiration of the applicable statute of limitations which is generally three years after the filing of the tax return for federal purposes and four years for most state returns. Tax returns for open years have incorporated no uncertain tax positions that require a provision for income taxes. The Fund intends to continue to qualify each year as a “regulated investment company” under Subchapter M of the Internal Revenue Code of 1986, as amended. By so qualifying, the Fund will not be subject to Federal income taxes to the extent that it distributes substantially all of its taxable or tax-exempt income, if any, for its tax year ending September 30. In addition, by distributing in each calendar year substantially all of its net investment income, capital gains and certain other amounts, if any, the Fund will not be subject to a Federal excise tax. Therefore, no provision is made by the Funds for Federal income or excise taxes.
3. ADVISORY FEES, ADMINISTRATION FEES AND OTHER AGREEMENTS
Investment Advisory
Effective the close of business on November 29, 2013, the Fund entered into an advisory agreement with Broadview Advisors, LLC (the “Adviser”). The Fund pays the Adviser a monthly fee based upon the average daily net assets of the Fund and calculated at an annual rate of 1.00%.
Prior to November 29, 2013, Fiduciary Management, Inc. (“FMI”) was the Predecessor Fund’s investment adviser. As full compensation for the investment advisory services provided to the Fund, FMI received monthly compensation based on the Fund’s average daily net assets at the annual rate of 1.00%.
Prior to November 29, 2013, FMI had a sub-advisory agreement with the Adviser, with whom a certain director of the Predecessor Fund was affiliated, to assist it in the day-to-day management of the Predecessor Fund. The Adviser determined which securities were purchased, retained or
| | |
Semi-Annual Report | March 31, 2014 | | 15 |
| | |
Broadview Opportunity Fund | | Notes to Financial Statements |
| | March 31, 2014 (Unaudited) |
sold for the Predecessor Fund. FMI paid the Adviser 0.85% of the first $500 million of the average daily net assets of the Predecessor Fund and 0.80% of the Predecessor Fund’s average daily net assets in excess of $500 million.
Fund Accounting Fees and Expenses
Effective December 2, 2013, ALPS Fund Services, Inc. (“ALPS” and the “Administrator”) provides administrative, fund accounting and other services to the Fund under the Administration, Bookkeeping and Pricing Services Agreement with the Trust. Under the Agreement, ALPS is paid fees, accrued on a daily basis and paid on a monthly basis following the end of the month, based on the greater of (a) an annual total fee of $175,000 from the first to the last, or projected last, day of the then current year of service under the Administration Agreement; or (b) the following basis point fee schedule:
| | |
| Average Total Net Assets | | Basis Points (annualized) |
Between $0-$500M | | 4.0 |
$500M-$1B | | 2.5 |
Above $1B | | 1.5 |
The Administrator is also reimbursed by the Fund for certain out of pocket expenses.
Prior to the close of business on December 2, 2013, U.S. Bancorp Financial Services, LLC (“USBFS”) served as administrator to the Predecessor Fund. In connection with its duties as administrator, USBFS prepared and maintained the books, accounts and other documents required by the 1940 Act, calculated the Predecessor Fund’s net asset value, responded to shareholder inquiries, prepared the Predecessor Fund’s financial statements, prepared reports and filings with the SEC and with state Blue Sky authorities, furnished statistical and research data, clerical, accounting and bookkeeping services and stationery and office supplies, kept and maintained the Predecessor Fund’s financial accounts and records and generally assists in all aspects of the Predecessor Fund’s operations.
The Fund has entered into a Distribution Plan (the “Plan”) pursuant to Rule 12b-1 under the Act. The Plan provides that the Fund may incur certain costs which may not exceed the lesser of a monthly amount equal to 0.25% of the Fund’s daily net assets or the actual distribution costs incurred during the year. Amounts payable under the Plan are paid monthly for any activities or expenses primarily intended to result in the sale of shares of the Fund. For the six months ended March 31, 2014, no such expenses were incurred. The Fund presently intends not to utilize the Plan or pay any 12b-1 fees during the fiscal year ending September 30, 2014.
Transfer Agent And Shareholder Services Agreement
Effective December 2, 2013, ALPS serves as transfer, dividend paying and shareholder servicing agent for the Fund (the “Transfer Agent”) under a Transfer Agency and Services Agreement with the Trust.
Prior to the close of business on December 2, 2013, under the terms of the prior Transfer Agent and Shareholder Services Agreement, USBFS maintained the records of each shareholder’s account, answered shareholders’ inquiries concerning their accounts, processed purchases and redemptions of the Predecessor Fund’s shares, acted as dividend and distribution disbursing agent and performed other shareholder service functions.
Compliance Services
Effective December 2, 2013, ALPS provides Chief Compliance Officer services to the Fund. Additionally, ALPS provides services in monitoring and testing the policies and procedures of the Trust in conjunction with requirements under Rule 38a-1 under the 1940 Act. ALPS is compensated under the Chief Compliance Officer Services Agreement.
Distributor
Effective December 2, 2013, the Fund has entered into a Distribution Agreement with ALPS Distributors, Inc (“the Distributor”) to provide distribution services to the Fund. The Distributor serves as underwriter/distributor of shares of the Fund.
Prior to December 2, 2013, Rafferty Capital Markets, LLC provided distribution services to the Predecessor Fund.
Officer and Trustee Compensation
Officers of the Trust and Trustees who are “interested persons” of the Trust or the Adviser will receive no salary or fees from the Trust. Each Trustee who is not an “interested person” receives an annual fee of $15,000 each year. The Trust reimburses each Trustee and Officer for his or her travel and other expenses relating to attendance at such meetings.
Certain Trustees and Officers of the Trust are also officers of the Adviser.
| | |
| Broadview Opportunity Fund | | Notes to Financial Statements |
| | March 31, 2014 (Unaudited) |
4. PURCHASES AND SALES OF INVESTMENT SECURITIES
The aggregate cost of purchases and proceeds from sales of investment securities, excluding short-term securities, are shown below for the six months ended March 31, 2014. Purchases and proceeds from sales of U.S. Government obligations are included in the totals of Purchases of Securities and Proceeds from Sales of Securities below and also broken out separately for your convenience:
| | | | |
| Broadview Opportunity Fund | | | |
Cost of Investments Purchased | | $ | 255,577,987 | |
Proceeds from Investments Sold | | $ | 232,051,495 | |
5. TAX BASIS INFORMATION
Distributions are determined in accordance with federal income tax regulations, which differ from GAAP, and, therefore, may differ significantly in amount or character from net investment income and realized gains for financial reporting purposes. Financial reporting records are adjusted for permanent book/tax differences to reflect tax character but are not adjusted for temporary differences. The amounts and characteristics of tax basis distributions and composition of distributable earnings/(accumulated losses) are finalized at fiscal year end. Accordingly, tax basis balances have not been determined as of March 31, 2014.
The tax character of distributions paid during the year ended September 30, 2013, were as follows:
| | | | |
| | | Long-Term Capital Gain | |
Broadview Opportunity Fund | | | $ 16,810,686 | |
As of March 31, 2014, net unrealized appreciation/(depreciation) of investments based on the federal tax cost were as follows:
| | | | | | | | | | | | | | | | |
| | | Cost of Investments | | | Gross Unrealized
Appreciation | | | Gross Unrealized
Depreciation | | | Net Appreciation on
Investments | |
Broadview Opportunity Fund | | $ | 788,414,501 | | | $ | 240,083,197 | | | $ | (10,636,851 | ) | | $ | 229,446,346 | |
The difference between book basis and tax basis is primarily attributable to wash sales.
6. COMMITMENTS AND CONTINGENCIES
Under the Trust’s organizational documents, its Officers and Trustees are indemnified against certain liabilities arising out of the performance of their duties to the Fund. In addition, in the normal course of business, the Trust entered into contracts with its service providers, on behalf of the Fund, and others that provide for general indemnifications. The Fund’s maximum exposure under these arrangements is unknown, as this would involve future claims that may be made against the Fund. The Fund expects the risk of loss to be remote.
| | |
Semi-Annual Report | March 31, 2014 | | 17 |
| | |
Broadview Opportunity Fund | | Additional Information |
| | March 31, 2014 (Unaudited) |
1. PROXY VOTING POLICIES AND VOTING RECORD
A description of the policies and procedures that the Fund uses to vote proxies relating to portfolio securities is available without charge upon request by calling toll-free 855-846-1463, or on the Securities and Exchange Commission’s (“SEC”) website at http://www.sec.gov. Information regarding how the Fund voted proxies relating to portfolio securities during the most recent 12-month period ended June 30th is available without charge upon request by calling toll-free 855-846-1463, or on the SEC’s website at http://www.sec.gov.
2. QUARTERLY PORTFOLIO HOLDINGS
The Trust files a complete listing of portfolio holdings for the Fund with the SEC four times each fiscal year at quarter-ends. The Fund files the schedule of portfolio holdings with the SEC on Form N-CSR (second and fourth quarters) and on Form N-Q (first and third quarters). The filings are available upon request by calling 855-846-1463. Furthermore, you may obtain a copy of the filing on the SEC’s website at http://www.sec.gov. The Fund’s Forms N-CSR and N-Q may also be reviewed and copied at the SEC’s Public Reference Room in Washington, D.C., and information on the operation of the Public Reference Room may be obtained by calling 1-800-SEC-0330.
3. BASIS FOR TRUSTEES’ APPROVAL OF THE INVESTMENT ADVISORY AGREEMENT
The Board of Trustees (the “Board” or the “Trustees”) of Broadview Funds Trust (the “Trust”) met on November 8, 2013 to consider the initial approval of the Investment Advisory Agreement (the “Agreement”) between the Trust, on behalf of the Broadview Opportunities Fund (the “Fund”), and Broadview Advisors, LLC (the “Adviser”). In advance of the meeting the Trustees requested and received materials to assist them in considering the approval of the Agreement, including a copy of the Agreement, a memorandum provided by the Fund’s legal counsel, that outlined the Trustees’ responsibilities in considering the Agreement, due diligence materials prepared by the Adviser (including select financial statements of the Adviser, the Adviser’s response to a specific request letter from Trust counsel, detailed comparative information relating to the Fund’s performance, management fees and other expenses and the Adviser’s Form ADV) and other pertinent information. Based on their evaluation of the information provided by the Adviser, in conjunction with the Fund’s other service providers, the Trustees, by a unanimous vote (including a separate vote of the Independent Trustees), approved the Advisory Agreement for an initial two-year term.
Discussion of Factors Considered
In considering the approval of the Agreement and reaching their conclusions, the Trustees reviewed and analyzed various factors they determined were relevant, including the factors enumerated below.
Nature, Extent and Quality of Services to be Provided to the Fund. The Trustees considered the nature, extent and quality of services to be provided by the Adviser to the Fund and the amount of time to be devoted to the Fund’s affairs by the Adviser’s staff. This included an evaluation of the services currently being provided by the Adviser to the FMI Focus Fund (the “Predecessor Fund”). The Trustees considered the Adviser’s specific responsibilities in all aspects of day-to-day management of the Fund, as well as the qualifications, experience and responsibilities of Richard E. Lane, Richard J. Whiting, Faraz Farzam and Aaron J. Garcia, the Fund’s portfolio managers, and other key personnel at the Adviser involved in the day-to-day activities of the Fund. The Trustees reviewed the structure of the Adviser’s compliance program and the Adviser’s marketing activity and goals and its continuing commitment to the growth of Fund assets. The Trustees also noted any services that extended beyond portfolio management, and they considered the trading capability of the Adviser, including information provided with respect to brokerage commissions paid by the Predecessor Fund. The Trustees concluded that the Adviser had sufficient quality and depth of personnel, resources, investment methods and compliance policies and procedures essential to performing its duties under the Investment Advisory Agreement and that the nature, overall quality and extent of the management services provided to the Predecessor Fund and to be provided to the Fund, as well as the Adviser’s compliance program, were satisfactory and reliable.
Investment Performance of the Fund and the Adviser. The Board reviewed the performance of the Predecessor Fund for the year-to-date, one-year, three-year, five-year, seven-year, ten-year, fifteen-year, and since inception periods as of September 30, 2013. In assessing the quality of the management services delivered by the Adviser, the Trustees also compared the short-term and long-term performance of the Predecessor Fund on both an absolute and relative basis and in comparison to a benchmark index (the Russell 2000 Growth Index) and a Lipper peer group universe of U.S. small-cap core funds (the “Lipper Peer Group”). The Trustees also reviewed information on the historical performance of other separately- managed accounts of the Adviser that were similar to the Fund in terms of investment strategy. The Trustees noted that the Predecessor Fund outperformed its benchmark for the one-year, five-year, seven-year, ten-year, fifteen-year and since inception periods ended September 30, 2013. The Predecessor Fund slightly underperformed its benchmark for the year-to-date and three-year periods ended September 30, 2013. The Trustees noted that the Predecessor Fund’s performance, in comparison to the Lipper Peer Group, was in or above the first quartile for the year-to-date, one-year, five-year, seven-year, fifteen-year and since inception periods ended September 30, 2013. The Predecessor Fund’s performance, in comparison to the Lipper Peer Group, fell in the second quartile for the three-year and ten-year periods ended September 30, 2013. The Trustees
| | |
| Broadview Opportunity Fund | | Additional Information |
| | March 31, 2014 (Unaudited) |
noted that the Predecessor Fund’s performance for all periods was generally in-line with the performance of the Adviser’s other separately-managed accounts of the Adviser that were similar to the Predecessor Fund in terms of investment strategy.
After considering all of the information, the Trustees concluded that the performance obtained by the Adviser for the Predecessor Fund was satisfactory under current market conditions. Although past performance is not a guarantee or indication of future results, the Trustees determined that the Fund and its shareholders were likely to benefit from the Adviser’s management.
Costs of Services Provided and Profits Realized by the Adviser. The Trustees considered the cost of services and the structure of the Adviser’s fees, including a review of the expense analyses and other pertinent material with respect to the Fund. The Trustees reviewed the related statistical information and other materials provided, including the comparative expenses, expense components and peer group selection. The Trustees considered the cost structure of the Fund relative to a peer group using data from Morningstar, Inc. based on a range of criteria including Morningstar classification (small blend, small growth, mid blend and mid growth fund classifications), load structure (no-load funds without 12b-1 fees) and asset size. This peer group (the “Morningstar Peer Group”) was compiled by the Adviser.
The Trustees also considered the overall profitability of the Adviser and reviewed the Adviser’s financial information. The Trustees also examined the level of profits that could be expected to accrue to the Adviser from the fees payable under the Investment Advisory Agreement, as well as the Fund’s brokerage commissions and use of soft dollars by the Adviser.
The Trustees noted that the Fund’s contractual management fee of 1.00% is slightly above but in line with the Morningstar Peer Group average of 0.96% and median of 0.90%. The Fund’s contractual management fee falls between the third and fourth quartiles among the Morningstar Peer Group funds. The Trustees observed that the Fund’s anticipated total annual fund operating expense ratio of 1.21% is below both the Morningstar Peer Group average of 1.28% and the median of 1.23% and places it in the second quartile among the Morningstar Peer Group funds.
The Trustees then compared the fees to be paid by the Fund to the fees paid by separately-managed accounts of the Adviser and noted that the Fund’s management fee was at the top of the range of fees paid by the separately-managed account clients. The Trustees concluded that the Fund’s anticipated expenses and the management fee to be paid to the Adviser were fair and reasonable in light of the comparative performance, expense and management fee information. The Trustees noted that the Adviser’s profit from sponsoring the Predecessor Fund was not excessive and the Adviser maintained adequate profit levels to support its services to the Fund from the revenues of its overall investment advisory activities.
Extent of Economies of Scale. The Trustees compared the Fund’s proposed expenses relative to the Morningstar Peer Group and discussed realized and potential economies of scale. The Trustees also reviewed the structure of the Fund’s management fee and whether the Fund was large enough to generate economies of scale for shareholders or whether economies of scale would be expected to be realized as Fund assets grow (and if so, how those economies of scale would be shared with shareholders). The Trustees noted that no expense limitation arrangement with respect to the Fund were being contemplated by the Adviser. The Trustees noted that the Fund’s management fee structure did not contain any breakpoint reductions as the Fund’s assets grow in size, but that the flexibility of incorporating breakpoints would continue to be reviewed on a regular basis. With respect to the Adviser’s fee structure, the Trustees concluded that the current fee structure was reasonable and reflected a sharing of economies of scale between the Adviser and the Fund.
Benefits Derived from the Relationship with the Fund. The Trustees considered the direct and indirect benefits that could be realized by the Adviser from its association with the Fund. The Trustees examined the brokerage commissions of the Adviser with respect to the Fund. The Trustees concluded that the benefits the Adviser may receive, such as greater name recognition, growth in separate account management services or greater exposure to press coverage appear to be reasonable, and in many cases may benefit the Fund through growth in assets.
Based on the Trustees’ deliberations and their evaluation of the information described above, the Trustees, including the Independent Trustees, unanimously: (a) concluded that the terms of the Agreement were fair and reasonable; (b) concluded that the Adviser’s fees are reasonable in light of the services that the Adviser will provide to the Fund; and (c) agreed to approve the Agreement for an initial term of two years.
4. SHAREHOLDER MEETING VOTING RESULTS
Matters Submitted to a Vote of Shareholders
A special meeting of the shareholders of the Predecessor Fund was held on November 25, 2013 at the offices of Fiduciary Management, Inc., 100 East Wisconsin Avenue, Milwaukee, Wisconsin at 10:00 a.m., Central Time. As of the close of business on October 2, 2013, the record date for the special meeting, the Predecessor Fund had outstanding and entitled to vote at the special meeting 20,883,065 shares. Of such shares, 10,748,778 shares, which represented 51.47% of the record date shares were present in person or represented by proxy at the special meeting, constituting a quorum.
| | |
Semi-Annual Report | March 31, 2014 | | 19 |
| | |
Broadview Opportunity Fund | | Additional Information |
| | March 31, 2014 (Unaudited) |
Predecessor Fund: Plan of Reorganization
Shareholders of the Predecessor Fund were asked to consider and vote on a proposal to approve an Agreement and Plan of Reorganization, which provided for: (a) the transfer of all the assets and liabilities of the Predecessor Fund to the Fund, in exchange for shares of the Fund; and (b) the distribution of the shares of the Fund pro rata by the Predecessor Fund to its shareholders in complete liquidation of the Predecessor Fund.
A total of 10,748,778 shares were voted, representing 51.47% of total shares. A total of 10,221,678 shares of the Predecessor Fund were cast in favor of the Proposal, representing 95.10% of shares voted. A total of 136,593 shares were cast against the proposal, representing 1.27% of shares voted. A total of 390,508 shares abstained, representing 3.63% of shares voted. There were no broker non-votes.

| | | | |
Item 2. | | | | Code of Ethics. |
| | |
| | | | Not applicable to semi-annual report. |
| | |
Item 3. | | | | Audit Committee Financial Expert. |
| | |
| | | | Not applicable to semi-annual report. |
| | |
Item 4. | | | | Principal Accountant Fees and Services. |
| | |
| | | | Not applicable to semi-annual report. |
| | |
Item 5. | | | | Audit Committee of Listed Registrants. |
| | |
| | | | Not applicable to the Registrant. |
| | |
Item 6. | | | | Schedule of Investments. |
| |
| | (a) The Registrant’s “Schedule I – Investments in securities of unaffiliated issuers” (as set forth in 17 CFR 210.12-12) is included in Item 1 of this Form N-CSR. |
| |
| | (b) Not applicable to the Registrant. |
| | |
Item 7. | | | | Disclosure of Proxy Voting Policies and Procedures for Closed-End Management Investment Companies. |
| | |
| | | | Not applicable to the Registrant. |
| | |
Item 8. | | | | Portfolio Managers of Closed-End Management Investment Companies. |
| | |
| | | | Not applicable to the Registrant. |
| | |
Item 9. | | | | Purchases of Equity Securities by Closed-End Management Investment Company and Affiliated Purchasers. |
| | |
| | | | Not applicable to the Registrant. |
| | |
Item 10. | | | | Submission of Matters to a Vote of Security Holders. |
| | |
| | | | None. |
| | | | |
| Item 11. Controls and Procedures. |
| | |
| | (a) | | The Registrant’s principal executive officer and principal financial officer have evaluated the Registrant’s disclosure controls and procedures (as defined in Rule 30a-3(c) under the Investment Company Act of 1940, as amended) within 90 days of this filing and have concluded that the Registrant’s disclosure controls and procedures were effective as of that date. |
| | |
| | (b) | | There was no change in the Registrant’s internal control over financial reporting (as defined in Rule 30a-3(d) under the Investment Company Act of 1940, as amended) during the second fiscal quarter of the period covered by this report that has materially affected, or is reasonably likely to materially affect, the Registrant’s internal control over financial reporting. |
|
| Item 12. Exhibits. |
| | |
| | (a)(1) | | Not applicable to semi-annual report. |
| | |
| | (a)(2) | | A separate certification for the Registrant’s Principal Executive Officer and Principal Financial Officer as required by Rule 30a-2(a) under the Investment Company Act of 1940, as amended (17 CFR 270.30a-2(a)), are attached hereto as Ex 99.Cert. |
| | |
| | (a)(3) | | None. |
| | |
| | (b) | | The certifications by the Registrant’s Principal Executive Officer and Principal Financial Officer, as required by Rule 30a-2(b) of the Investment Company Act of 1940, as amended, and Section 906 of the Sarbanes-Oxley Act of 2002 are attached hereto as Ex99.906Cert. |
SIGNATURES
Pursuant to the requirements of the Securities Exchange Act of 1934 and the Investment Company Act of 1940, the Registrant has duly caused this report to be signed on its behalf by the undersigned, thereunto duly authorized.
Broadview Funds Trust
| | |
| By: | | /s/ Richard E. Lane |
| | Richard E. Lane |
| | President |
| |
| Date: | | May 27, 2014 |
Pursuant to the requirements of the Securities Exchange Act of 1934 and the Investment Company Act of 1940, this report has been signed below by the following persons on behalf of the Registrant and in the capacities and on the dates indicated.
| | |
| By: | | /s/ Richard E. Lane |
| | Richard E. Lane |
| | President (Principal Executive Officer) |
| |
| Date: | | May 27, 2014 |
| |
| By: | | /s/ Aaron J. Garcia |
| | Aaron J. Garcia |
| | Chief Financial Officer (Principal Financial Officer) |
| |
| Date: | | May 27, 2014 |