UNITED STATES
SECURITIES AND EXCHANGE COMMISSION
Washington, D.C. 20549
FORM N-CSR
CERTIFIED SHAREHOLDER REPORT OF REGISTERED
MANAGEMENT INVESTMENT COMPANIES
Investment Company Act file number: 811-22885
Broadview Funds Trust
(Exact name of registrant as specified in charter)
330 East Kilbourn Ave., Suite 1475
Milwaukee, Wisconsin 53202
(Address of principal executive offices) (Zip code)
The Corporation Trust Company
1209 Orange Street
Wilmington, Delaware 19801
(Name and address of agent for service)
Registrant’s telephone number, including area code: (414) 918-3900
Date of fiscal year end: September 30
Date of reporting period: November 30, 2014 – March 31, 2015
| Item 1. | Reports to Stockholders. |


| | |
| Broadview Opportunity Fund | | Shareholder Letter |
| | March 31, 2015 (Unaudited) |
Dear Fellow Shareholders,
The New Year began rather ominously for small cap stocks. The Russell 2000 Index tumbled -4.15% in the first half of January. After a year of volatile but largely sideways moves, it looked like 2015 was going to be another difficult year for small caps. While the jury on the year is still way out, the Russell 2000 Index has rallied valiantly since the January 2015 lows, finishing the first quarter of 2015 up 4.32% and the Fund’s portfolio returning 3.94%. Our performance was largely driven by strength in our Consumer Discretionary names, the clearest direct beneficiary of the drastic decline in energy prices. Our lack of Biotechnology exposure led to our underperformance relative to the benchmark.
Headwinds & Tailwinds – Faraz Farzam, CFA
The broader macro environment is dominated by the pulling and pushing of both positive and negative forces, or as we title our commentary: Headwinds and Tailwinds. Entering the sixth year of the economic recovery, the market continues to weigh the various headwinds and tailwinds it faces in order to gauge which direction economic and market ships will sail. Although first quarter (Q1) consensus Gross Domestic Product (GDP) was revised down to 1.4% from 3% at the beginning of the year, this was driven mainly by the snowstorms on the East Coast and the port strikes on the West Coast. These are two factors which we believe are largely transitory and are trumped by the tangible signs that the labor market is tightening. Not only is the unemployment rate down to 5.5%, but we see evidence of sustained wage growth with large retailers such as Wal-Mart Stores, Inc. (WMT) publicly bumping wages. Combined with the aforementioned record low in energy prices and near record lows in financial obligations, consumer free cash flow has not been this strong in well over 20 years.
Food & Energy Expenditure %
Personal Consumption

Source: U.S Bureau of Economic Analysis (as of 12/31/14)
Financial Obligations Ratio
Source: Federal Reserve (as of 12/31/14)
The US Consumer should be further buoyed by the unprecedented strength in the U.S. dollar (USD). Year-over-year through March 2015, the dollar has strengthened 29% against the Euro and 18% versus the Yen. While the European Central Bank (ECB) and Japan continue to ramp their “late to the party” monetary stimulus, the U.S. is winding down quantitative easing. Expectations for the first Federal Reserve rate hike have been pulled forward from March 2016 to December 2015.
Although, as we write this piece, the clock is still ticking on the following data point, April is poised to mark the first time that the trade-weighted dollar (TWD) has risen for nine consecutive months. This consistency in dollar strength is only eclipsed by the fact that the dollar has appreciated against EVERY currency in the TWD Index. While this is good for the American consumer, the opposite is true for U.S. exporters, as U.S. manufactured goods become less price competitive.
An often overlooked danger in the rapidly appreciating greenback is the financial risk poised to emerging economies (consumers of U.S. exports) that have recently issued vast amounts of dollar-denominated debt. Many of these emerging economies are considered “commodity economies”, that is,
| | |
| | |
| Semi-Annual Report | March 31, 2015 | | 1 |
| | |
| Broadview Opportunity Fund | | Shareholder Letter |
| | March 31, 2015 (Unaudited) |
their economic growth is directly tied to commodities such as energy and minerals. As the dollar appreciates, their debt load increases and their income (through lower energy prices) declines. This is not a particularly positive combination. At this time, it is rather difficult for us to see the strength of the USD abating. The ECB maintains its €600 billion per month asset purchases and Japan maintains an ¥80 trillion annual stimulus pace.
This is the first time that so many major economies are functioning under zero interest rate policies. Record low yields are nothing new. In fact, they have become rather commonplace since 2009. However, Switzerland made the unprecedented move of actually issuing ten-year bonds at negative interest rates. Not to be outdone, Mexico issued 100-year Euro-denominated bonds to take advantage of record low yields.
These are unchartered waters, but what about inflation? Despite this ocean of stimulus from one side of the Pacific to the other side of the Atlantic, Japanese inflation is still forecast at 1% and European inflation at 0.3%. Although traditional inflation metrics are nowhere to be seen, there are significant areas of asset price inflation across the globe. As we write this, Asian equity markets, especially the Nikkei Index and the Hang Seng Index, are skyrocketing and making eight-to-ten year highs. Across the pond in Europe, the German Stock Index (DAX) is at a twenty year high and the remaining European bourses are all up and to the right. Additionally, if you have not noticed, the S&P 500 Index, the Dow Jones Industrial Average, and Russell 2000 Index are all making 20 year highs.
Disaggregating the Russell 2000 Index performance in Q1 2015 reveals that much of the strength lies in the Biotechnology industry, an area of the market we refer to at Broadview as ‘lottery tickets’. Not to be outdone by the public markets, arguably the most significant area of asset inflation might be in the private markets. There are now 82 pre-Initial Public Offering (IPO) companies that are valued at over $1 billion and, by our count, at least 7 valued at over $10 billion dollars. As we write this, Über is being valued at a staggering $41.2 billion dollars.
Up until the first quarter of 2015, mergers and acquisitions (M&A) were relatively dormant. Even that changed. According to Credit Suisse First Boston, in the first quarter, global M&A totaled $887.1 billion, up 23% year-over-year and up 21% in the US. This is the highest it has been since Q1 of 2007. In the Fund’s portfolio, Informatica Corp. (INFA) was acquired by a private equity group for just over $5 billion.
What is ironic is that it is happening when small cap valuations are above their ten year average, EBITDA margins are 2-3% over their ten year average and overall U.S. P/E ratios are 15% above their 10 year average. So much for smart money.
Our aim in this review is to illustrate that despite some very positive economic developments domestically, headwinds such as valuation and currency risk keep us cautious. In our last letter we discussed our positive outlook for the consumer and our new investments in that sector, such as ULTA Salon, Cosmetics & Fragrance, Inc. (ULTA), Urban Outfitters, Inc. (URBN), Lululemon Athletica, Inc. (LULU) and Hibbett Sports, Inc. (HIBB). Our positive thesis played out this quarter with Consumer Discretionary being our best performing sector. We continue to like our prospects for these names going forward.
Although the broad-based strength in equities is making it more difficult to find new investment opportunities, there continue to be overlooked areas that we are exploiting. In times like these, we find solace in our time-tested investment and valuation processes. In our opinion, buying great businesses that are durable and enduring, while maintaining a strict valuation discipline, is the only way to navigate through uncertain periods where headwinds and tailwinds make charting a path forward challenging.
Renasant Corp. (RNST) – Sam Koehler
During the first quarter, we built a position in bank holding company Renasant Corporation. Renasant is a $5.8 billion bank headquartered in Tupelo, Mississippi with branches in Mississippi, Alabama, Georgia and Tennessee. The 111 year-old bank has a deep history, loyal customer base, and an astute management team with a deep bench of talent behind CEO Robin McGraw and CFO Kevin Chapman. We believe the team has great banking expertise in mid-sized southern markets. The bank’s high market share in these geographies warrants considerable strategic value.
Renasant is able to consistently generate strong loan growth despite banking in many smaller markets. The company has developed material footholds in larger markets including Nashville, Atlanta, and Memphis that considerably contribute to loan growth. The bank has a high quality deposit base that is all the more important given the potential for interest rate hikes in the near future, as loan yields should rise faster than more sluggish deposits. Rising interest rates would certainly benefit Renasant, however, internal catalysts mean that Renasant should do well independent of interest rate changes. In 2014, the bank generated a return on assets of 1.02% and a return on average tangible equity of 16.25%. These metrics are well ahead of comparable regional banks and we expect these number to continue rising. Additionally, 2014 also saw diluted earnings per share increase 54% to $1.88 from $1.22.
| | |
| Broadview Opportunity Fund | | Shareholder Letter |
| | March 31, 2015 (Unaudited) |
Over the past several years, management has generated value through acquiring and integrating smaller community banks. The latest, First M&F Corporation, was completed in late 2013 and exceeded street expectations. Renasant recently gained regulatory approval to acquire Heritage Financial Group, Inc. (HBOS) an Albany, Georgia bank and anticipates closing on the deal within a few months. Heritage will introduce Renasant into new markets in Alabama, Georgia, and North Florida which present additional growth opportunities while sharing similar characteristics to the bank’s current markets. There is also notable branch overlap in the Atlanta and Birmingham markets. The map highlights the pro-forma footprint which generates above average population and economic growth. Given the execution during the First M&F merger, as well as the Heritage branch overlap, we believe management’s cost saving estimates will prove to be conservative. Additionally, with an increased footprint, Renasant will have even more opportunities to execute accretive small bank acquisitions given the fragmented nature of these southern markets.
| | |
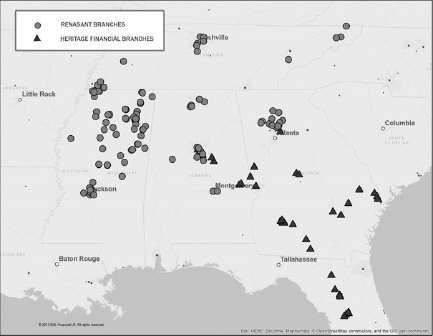
| | Source: SNL Financial (as of 3/31/15) |
In summary, Renasant’s peer leading returns and profitability enhancement opportunities cause us to believe that Renasant deserves a premium valuation over time. A high degree of insider holdings causes the stock to be relatively less liquid and trade at a discount. We view this as an alignment of interests which is reassuring and expect the discount to dissipate as Renasant grows into a larger, more well-known institution.
Allscripts Healthcare Solutions, Inc. (MDRX) – Aaron Garcia, CFA
We initiated a position in Allscripts in the first quarter of 2015. Allscripts is a healthcare IT company that specializes in clinical and financial systems for hospitals and physician practices. While the company grew revenue aggressively during the past 10 years during the build-out of electronic medical records (EMR), the previous management neglected to integrate its myriad acquisitions. As a result, the margins of the company suffered, and the product portfolio stagnated. Recently appointed CEO Paul Black has accelerated R&D spending, refocused the sales force, and simplified the product offering. Additionally, the company has moved into population health software, which has a massive greenfield opportunity as the healthcare system transitions to a pay for performance model.
Over time, we believe that Allscripts can regain its position in the marketplace and reaccelerate revenue growth. We think there is ample opportunity in population health and the core EMR market is stickier than investors appreciate. We forecast $1.00 in earnings power in 2017. Our private market value is $20 per share.
Stock Building Supply Holdings, Inc. (STCK) – Rick Whiting
We thought it would be timely, on a seasonal basis, to review the Fund’s holding in Stock Building Supply. Stock Building Supply is a building materials distributor to home builders and remodeling contractors. Their customers are almost entirely devoted to the residential housing market
| | |
| | |
| Semi-Annual Report | March 31, 2015 | | 3 |
| | |
| Broadview Opportunity Fund | | Shareholder Letter |
| | March 31, 2015 (Unaudited) |
and are in geographies ranging from the Atlantic states, through much of the south and west of the Rockies. In a generalized sense, these markets have enjoyed a more vibrant housing recovery than the Midwest and much of the plains states.
Our investment in Stock Building Supply dates back to the company’s IPO in August of 2013. It was, and remains our belief, that single family housing starts would have a gradual but sustained recovery off the lows of 2008 when the number of starts dropped to below 400,000 units after having peaked at 1.8 million in 2006. Indeed, the number of single family starts continued to bump along between 400,000 and 600,000 units through 2012. Clearly there were governors on the pace of recovery: underwater home owners, foreclosed inventory competing with new home construction, tighter lending standards and very uncertain economic and employment conditions.
Today, in 2015, it would appear that we will be on an annualized pace of somewhere between 900,000 and one-million single family housing starts. This is a far cry from the peak, but significantly off the bottom. We would caution investors to take monthly data with a large grain of salt. Monthly, even quarterly, data released by the Federal government can be quite volatile with weather and other factors playing outsized roles.
Our investment is based upon a cyclical recovery and no single month or quarter will prove or negate that thesis. We do not believe that we need to return to the halcyon days of easy credit for Stock Building Supply to continue to work as an investment. A methodical walk back to what many regard as a normalized level of construction, around the 1.2 million units annually, would do very nicely. Further, while the number of housing starts is a useful metric to monitor, the progress of the end market is only part of the story. Stock Building Supply’s customers, building contractors, are active in the repair and remodel markets. These markets, while quite large, are far more difficult to quantify through published economic data. It is clear to us that with returning consumer confidence and rising home valuations, home owners are unleashing pent up demand for both repair and remodeling projects that were untenable in the earlier years of the post-2008 recovery.
The building supply distribution business has historically been a very fragmented and regional business on the contractor level. It is, and should remain, an industry under consolidation, with Stock Building Supply being one of the consolidators. This accomplishes a multitude of benefits among which are greater pricing discipline in the industry and a larger share of individual contractor’s wallet. The majority of distributors are privately owned and still carry scar tissue from the downturn. They lack the balance sheets and banking relationships to carry the inventory and delivery mechanisms necessary to fully participate in the recovery. They are being further eclipsed by the innovation that a company like Stock Building Supply can bring to the business, with expanded product offerings and most interestingly sophisticated web-based connectivity to the contractor. This should prove to be a boon to the contractor and a widely adopted platform allowing the contractor to quote out materials and schedule on-time deliveries to coincide with the progress of construction and the availability of his subcontractors.
In summary, while we look to housing as an increasingly vibrant portion of GDP, we look to Stock Building Supply to enjoy a premium to that growth rate. Improving pricing discipline in the industry coupled with a consolidation of the players will help to grow market share. Furthermore, we think the company can compete for a larger share of the contractor’s wallet via web-based bidding and delivery solutions, and an increasing depth of higher margin product offerings. We believe there will be volatility as the economic data can be lumpy and Stock Building Supply is not a very liquid issue, but for those of the proper mindset, we like the investment.
In conclusion, we thank you, our fellow shareholders, for your continued investment in the Broadview Opportunity Fund.
Best regards,
| | | | | | |

| | 
| | 
| | 
|
| | | |
Richard E. Lane, CFA | | Faraz Farzam, CFA | | Aaron J. Garcia, CFA | | Richard J. Whiting |
| | |
| Broadview Opportunity Fund | | Shareholder Letter |
| | March 31, 2015 (Unaudited) |
The views and information discussed in this commentary are as of the date of publication, are subject to change, and may not reflect the writer’s current views. The views expressed represent an assessment of market conditions at a specific point in time, are opinions only and should not be relied upon as investment advice regarding a particular investment or markets in general. Such information does not constitute a recommendation to buy or sell specific securities or investment vehicles. It should not be assumed that any investment will be profitable or will equal the performance of the Fund or any securities or any sectors mentioned herein. The subject matter contained herein has been derived from several sources believed to be reliable and accurate at the time of compilation.
A NOTE ON FORWARD LOOKING STATEMENTS
Except for historical information contained in this report for the Fund, the matters discussed in this report may constitute forward-looking statements made pursuant to the safe-harbor provisions of the Private Securities Litigation Reform Act of 1995. These include any adviser or portfolio manager predictions, assessments, analyses or outlooks for individual securities, industries, market sectors and/or markets. These statements involve risks and uncertainties. In addition to the general risks described for the Fund in the current Prospectus, other factors bearing on this report include the accuracy of the adviser’s or portfolio managers’ forecasts and predictions, and the appropriateness of the investment programs designed by the adviser or portfolio managers to implement their strategies efficiently and effectively. Any one or more of these factors, as well as other risks affecting the securities markets and investment instruments generally, could cause the actual results of the Fund to differ materially as compared to benchmarks associated with the Fund.
DEFINITIONS:
TWD Index - A measurement of the foreign exchange value of the U.S. dollar compared against certain foreign currencies.
Nikkei Index - It is a price-weighted index comprised of Japan’s top 225 blue-chip companies on the Tokyo Stock Exchange.
Hang Seng Index - A market capitalization-weighted index of 40 of the largest companies that trade on the Hong Kong Exchange.
German Stock Index (Dax) - Germany’s benchmark stock market index, it is a total return index of the 30 largest German blue-chip companies traded on the Frankfurt Stock Exchange.
S&P 500 Index - An index of 500 stocks chosen for market size, liquidity and industry grouping, among other factors.
Dow Jones Industrial Average - is a price-weighted average of 30 significant stocks traded on the New York Stock Exchange and the Nasdaq.
P/E ratio - A valuation ratio of a company’s current share price compared to its per-share earnings.
The Russell 2000 Total Return Index - measures the performance of the 2,000 smallest companies in the Russell 3000 Index which comprises the 3,000 largest U.S. companies based on total market capitalization.
EBITDA - Earnings Before Interest, Taxes, Depreciation and Amortization. net income with interest, taxes, depreciation, and amortization added back to it, and can be used to analyze and compare profitability between companies and industries because it eliminates the effects of financing and accounting decisions.
| | |
| | |
| Semi-Annual Report | March 31, 2015 | | 5 |
| | |
| Broadview Opportunity Fund | | Manager Commentary |
| | March 31, 2015 (Unaudited) |
| | |
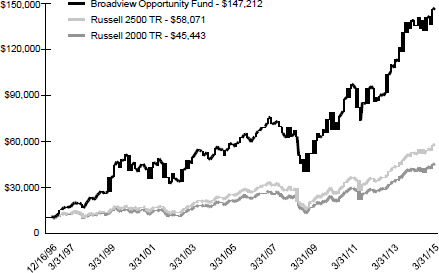
| GROWTH OF $10,000 INVESTMENT IN THE FUND |
From its inception (12/16/96) to 3/31/15 as compared to the Russell 2500 TR(1) and the Russell 2000 TR(2)
PERFORMANCE (For Periods Ended 3/31/15)
| | | | | | | | | | |
| | | Total Return* | | Annualized Total Return* |
| | | 3 Months | | 1 Year | | 5 Year | | 10 Year | | Since Inception** |
Broadview Opportunity Fund | | 3.94% | | 6.00% | | 14.56% | | 10.52% | | 15.84% |
Russell 2500 TR | | 5.17% | | 10.07% | | 15.48% | | 9.62% | | 10.10% |
Russell 2000 TR | | 4.32% | | 8.21% | | 14.57% | | 8.82% | | 8.63% |
Performance data quoted represents past performance. Past performance does not guarantee future results. Investment return and principal value of an investment will fluctuate so that an investor’s shares, when sold or redeemed, may be worth more or less than the original cost. Current performance data may be higher or lower than actual data quoted. For most recent month end performance please visit bvafunds.com or call 1-855-846-1463. As of the Fund’s Prospectus dated February 1, 2015, the Broadview Opportunity Fund’s annual operating expense ratio is 1.25%. One cannot invest directly in an index.
| (1) | Russell 2500 Total Return Index - A broad index featuring 2,500 stocks that cover the small- and mid-cap market capitalizations. The Russell 2500 is a market cap weighted index that includes the smallest 2,500 companies covered in the Russell 3000 universe of United States-based listed equities. | |
| (2) | The Russell 2000 Total Return Index measures the performance of the 2,000 smallest companies in the Russell 3000 Index which comprises the 3,000 largest U.S. companies based on total market capitalization. | |
| * | Total return includes changes in share prices and in each case includes reinvestments of any dividends, interest and capital gain distributions. | |
| ** | Fund Inception Date: December 16, 1996 |
| | |
| Broadview Opportunity Fund | | Manager Commentary |
| | March 31, 2015 (Unaudited) |
SECTOR ALLOCATION (as of March 31, 2015) (As a percentage of Net Assets)

Holdings are subject to change.
These allocations may not reflect the current or future positions of the portfolio.
| | |
| | |
| Semi-Annual Report | March 31, 2015 | | 7 |
| | |
| Broadview Opportunity Fund | | Disclosure of Fund Expenses |
| | March 31, 2015 (Unaudited) |
As a shareholder of the Broadview Opportunity Fund (the “Fund”) you will incur two types of costs: (1) transaction costs; and (2) ongoing costs, including management fees and other Fund expenses. The following examples are intended to help you understand your ongoing costs (in dollars) of investing in the Fund and to compare these costs with the ongoing costs of investing in other mutual funds. The examples are based on an investment of $1,000 invested on October 1, 2014 and held until March 31, 2015.
Actual Expenses. The first line of the table below provides information about actual account values and actual expenses. You may use the information in this line, together with the amount you invested, to estimate the expenses that you paid over the period. Simply divide your account value by $1,000 (for example, an $8,600 account value divided by $1,000 = 8.6), then multiply the result by the number in the first line under the heading “Expenses Paid During Period” to estimate the expenses you paid on your account during this period.
Hypothetical Example for Comparison Purposes. The second line of the table below provides information about hypothetical account values and hypothetical expenses based on the Fund’s actual expense ratio and an assumed rate of return of 5% per year before expenses, which is not the Fund’s actual return. The hypothetical account values and expenses may not be used to estimate the actual ending account balance or expenses you paid for the period. You may use this information to compare the ongoing costs of investing in the Fund and other mutual funds. To do so, compare this 5% hypothetical example with the 5% hypothetical examples that appear in the shareholder reports of the other funds. The expenses shown in the table are meant to highlight ongoing Fund costs only and do not reflect transaction fees. Therefore, the second line of the table below is useful in comparing ongoing costs only, and may not help you determine the relative total costs of owning different funds. In addition, if these transactional costs were included, your costs would have been higher.
| | | | | | | | | | | | | | | | | | | | |
| | | Beginning Account Value 10/1/14 | | Ending Account Value 3/31/15 | | Expense Ratio(a) | | Expenses Paid During Period 10/1/14 - 3/31/15(b) |
| | | | |
Actual | | $ 1,000.00 | | $ 1,111.50 | | 1.26% | | $ 6.63 |
Hypothetical (5% return before expenses) | | $ 1,000.00 | | $ 1,018.65 | | 1.26% | | $ 6.34 |
| (a) | The Fund’s expense ratios have been based on the Fund’s most recent fiscal half-year expenses. |
| (b) | Expenses are equal to the Fund’s annualized expense ratio multiplied by the average account value over the period, multiplied by the number of days in the most recent fiscal half-year (182)/365 (to reflect the half-year period). | |
| | |
| Broadview Opportunity Fund | | Schedule of Investments |
| | March 31, 2015 (Unaudited) |
| | | | | | | | |
| | | Shares | | | Value | |
COMMON STOCKS (90.04%) | | | | | | | | |
CONSUMER DISCRETIONARY (19.14%) | | | | | | | | |
Consumer Durables & Apparel (4.91%) | | | | | | | | |
Black Diamond, Inc.(a) | | | 317,989 | | | $ | 3,004,996 | |
Callaway Golf Co. | | | 1,045,573 | | | | 9,964,311 | |
Kate Spade & Co.(a) | | | 130,428 | | | | 4,354,991 | |
Tumi Holdings, Inc.(a) | | | 583,850 | | | | 14,280,971 | |
Vince Holding Corp.(a) | | | 392,600 | | | | 7,282,730 | |
Winnebago Industries, Inc. | | | 414,754 | | | | 8,817,670 | |
| | | | | | | | |
| | | | | | | 47,705,669 | |
| | | | | | | | |
| | |
Hotels Restaurants & Leisure (1.07%) | | | | | | | | |
Chuy’s Holdings, Inc.(a) | | | 463,700 | | | | 10,447,161 | |
| | | | | | | | |
| | |
Internet Software & Services (0.46%) | | | | | | | | |
HomeAway, Inc.(a) | | | 147,900 | | | | 4,462,143 | |
| | | | | | | | |
| | |
Media (6.64%) | | | | | | | | |
AMC Networks, Inc. - Class A(a) | | | 70,200 | | | | 5,380,128 | |
Interpublic Group of Cos., Inc. | | | 538,250 | | | | 11,906,090 | |
MDC Partners, Inc. - Class A | | | 1,493,383 | | | | 42,337,408 | |
National CineMedia, Inc. | | | 328,124 | | | | 4,954,672 | |
| | | | | | | | |
| | | | | | | 64,578,298 | |
| | | | | | | | |
| | |
Retailing (6.06%) | | | | | | | | |
Hibbett Sports, Inc.(a) | | | 289,950 | | | | 14,224,947 | |
Lululemon Athletica, Inc.(a) | | | 237,400 | | | | 15,198,348 | |
Ulta Salon Cosmetics & Fragrance, Inc.(a) | | | 72,600 | | | | 10,951,710 | |
Urban Outfitters, Inc.(a) | | | 407,123 | | | | 18,585,165 | |
| | | | | | | | |
| | | | | | | 58,960,170 | |
| | | | | | | | |
| | |
CONSUMER STAPLES (0.48%) | | | | | | | | |
Food Products (0.48%) | | | | | | | | |
Freshpet, Inc.(a) | | | 241,933 | | | | 4,700,758 | |
| | | | | | | | |
| | |
ENERGY (0.35%) | | | | | | | | |
Energy (0.35%) | | | | | | | | |
Whiting Petroleum Corp.(a) | | | 109,931 | | | | 3,396,868 | |
| | | | | | | | |
| | |
FINANCIALS (10.96%) | | | | | | | | |
Banks (8.66%) | | | | | | | | |
CoBiz Financial, Inc. | | | 1,071,496 | | | | 13,200,831 | |
Columbia Banking System, Inc. | | | 328,738 | | | | 9,523,540 | |
First Horizon National Corp. | | | 551,000 | | | | 7,873,790 | |
First Midwest Bancorp, Inc. | | | 418,400 | | | | 7,267,608 | |
Glacier Bancorp, Inc. | | | 122,600 | | | | 3,083,390 | |
Hancock Holding Co. | | | 270,100 | | | | 8,065,186 | |
Hilltop Holdings, Inc.(a) | | | 425,559 | | | | 8,272,867 | |
LegacyTexas Financial Group, Inc. | | | 104,100 | | | | 2,366,193 | |
Renasant Corp. | | | 323,444 | | | | 9,719,492 | |
Zions Bancorporation | | | 549,400 | | | | 14,833,800 | |
| | | | | | | | |
| | | | | | | 84,206,697 | |
| | | | | | | | |
Insurance (2.30%) | | | | | | | | |
MGIC Investment Corp.(a) | | | 2,327,875 | | | | 22,417,436 | |
| | | | | | | | |
| | |
HEALTH CARE (12.46%) | | | | | | | | |
Biotechnology (1.07%) | | | | | | | | |
Exact Sciences Corp.(a) | | | 473,425 | | | | 10,424,818 | |
| | | | | | | | |
| | |
| See Notes to Financial Statements. | | |
| Semi-Annual Report | March 31, 2015 | | 9 |
| | |
| Broadview Opportunity Fund | | Schedule of Investments |
| | March 31, 2015 (Unaudited) |
| | | | | | | | |
| | | Shares | | | Value | |
COMMON STOCKS (90.04%) (continued) | | | | | | | | |
HEALTH CARE (12.46%) (continued) | | | | | | | | |
Health Care Equipment & Services (9.46%) | | | | | | | | |
Envision Healthcare Holdings, Inc.(a) | | | 337,200 | | | $ | 12,931,620 | |
Hanger, Inc.(a) | | | 377,650 | | | | 8,568,878 | |
HealthSouth Corp. | | | 466,602 | | | | 20,698,465 | |
NxStage Medical, Inc.(a) | | | 1,093,225 | | | | 18,912,793 | |
PAREXEL International Corp.(a) | | | 239,506 | | | | 16,523,519 | |
Select Medical Holdings Corp. | | | 968,900 | | | | 14,368,787 | |
| | | | | | | | |
| | | | | | | 92,004,062 | |
| | | | | | | | |
Health Care Providers & Services (0.91%) | | | | | | | | |
Air Methods Corp.(a) | | | 190,605 | | | | 8,880,287 | |
| | | | | | | | |
| | |
Health Care Technology (1.02%) | | | | | | | | |
Allscripts Healthcare Solutions, Inc.(a) | | | 830,200 | | | | 9,929,192 | |
| | | | | | | | |
| | |
INDUSTRIALS (19.86%) | | | | | | | | |
Automobiles & Components (2.83%) | | | | | | | | |
Gentex Corp. | | | 1,323,600 | | | | 24,221,880 | |
Modine Manufacturing Co.(a) | | | 244,272 | | | | 3,290,344 | |
| | | | | | | | |
| | | | | | | 27,512,224 | |
| | | | | | | | |
Capital Goods (8.60%) | | | | | | | | |
Crane Co. | | | 111,750 | | | | 6,974,318 | |
Hexcel Corp. | | | 428,629 | | | | 22,040,103 | |
Kennametal, Inc. | | | 209,800 | | | | 7,068,162 | |
Masco Corp. | | | 553,800 | | | | 14,786,460 | |
MasTec, Inc.(a) | | | 256,300 | | | | 4,946,590 | |
Regal-Beloit Corp. | | | 145,500 | | | | 11,628,360 | |
Stock Building Supply Holdings, Inc.(a) | | | 507,601 | | | | 9,167,274 | |
Terex Corp. | | | 178,700 | | | | 4,751,633 | |
Twin Disc, Inc. | | | 130,200 | | | | 2,300,634 | |
| | | | | | | | |
| | | | | | | 83,663,534 | |
| | | | | | | | |
| | |
Commercial Services & Supplies (2.18%) | | | | | | | | |
Kforce, Inc. | | | 585,518 | | | | 13,062,907 | |
Robert Half International, Inc. | | | 133,943 | | | | 8,106,230 | |
| | | | | | | | |
| | | | | | | 21,169,137 | |
| | | | | | | | |
| | |
Diversified Financials (2.25%) | | | | | | | | |
Mobile Mini, Inc. | | | 512,937 | | | | 21,871,633 | |
| | | | | | | | |
| | |
Electrical Products (0.97%) | | | | | | | | |
Cree, Inc.(a) | | | 265,800 | | | | 9,433,242 | |
| | | | | | | | |
| | |
Machinery (1.96%) | | | | | | | | |
Astec Industries, Inc. | | | 278,400 | | | | 11,937,792 | |
Manitowoc Co., Inc. | | | 331,100 | | | | 7,138,516 | |
| | | | | | | | |
| | | | | | | 19,076,308 | |
| | | | | | | | |
| | |
Transportation (1.07%) | | | | | | | | |
UTi Worldwide, Inc.(a) | | | 845,667 | | | | 10,401,704 | |
| | | | | | | | |
| | |
INFORMATION TECHNOLOGY (20.82%) | | | | | | | | |
Electrical Equimpent (1.03%) | | | | | | | | |
Sensata Technologies Holding N.V.(a) | | | 175,100 | | | | 10,059,495 | |
| | | | | | | | |
| | |
Electronics (1.41%) | | | | | | | | |
FEI Co. | | | 179,184 | | | | 13,678,907 | |
| | | | | | | | |
| | |
| See Notes to Financial Statements. | | |
| 10 | | www.bvafunds.com |
| | |
| Broadview Opportunity Fund | | Schedule of Investments |
| | March 31, 2015 (Unaudited) |
| | | | | | | | |
| | | Shares | | | Value | |
COMMON STOCKS (90.04%) (continued) | | | | | | | | |
INFORMATION TECHNOLOGY (20.82%) (continued) | | | | | | | | |
Internet Software & Services (0.69%) | | | | | | | | |
Pandora Media, Inc.(a) | | | 413,900 | | | $ | 6,709,319 | |
| | | | | | | | |
Retailing (1.33%) | | | | | | | | |
Arrow Electronics, Inc.(a) | | | 169,092 | | | | 10,339,976 | |
ScanSource, Inc.(a) | | | 63,536 | | | | 2,582,738 | |
| | | | | | | | |
| | | | | | | 12,922,714 | |
| | | | | | | | |
Semiconductors & Semiconductor Equipment (3.32%) | | | | | | | | |
Intersil Corp. - Class A | | | 490,800 | | | | 7,028,256 | |
MKS Instruments, Inc. | | | 377,900 | | | | 12,776,799 | |
Veeco Instruments, Inc.(a) | | | 408,200 | | | | 12,470,510 | |
| | | | | | | | |
| | | | | | | 32,275,565 | |
| | | | | | | | |
Software (0.71%) | | | | | | | | |
CommVault Systems, Inc.(a) | | | 159,300 | | | | 6,961,410 | |
| | | | | | | | |
Software & Services (8.23%) | | | | | | | | |
Infoblox, Inc.(a) | | | 558,264 | | | | 13,325,762 | |
Informatica Corp.(a) | | | 542,000 | | | | 23,769,410 | |
PTC, Inc.(a) | | | 682,519 | | | | 24,686,712 | |
Qlik Technologies, Inc.(a) | | | 330,984 | | | | 10,303,532 | |
SciQuest, Inc.(a) | | | 470,750 | | | | 7,969,797 | |
| | | | | | | | |
| | | | | | | 80,055,213 | |
| | | | | | | | |
Technology Hardware & Equipment (4.10%) | | | | | | | | |
Ciena Corp.(a) | | | 636,400 | | | | 12,288,884 | |
F5 Networks, Inc.(a) | | | 117,102 | | | | 13,459,704 | |
Fortinet, Inc.(a) | | | 403,895 | | | | 14,116,130 | |
| | | | | | | | |
| | | | | | | 39,864,718 | |
| | | | | | | | |
MATERIALS (5.97%) | | | | | | | | |
Chemicals (0.77%) | | | | | | | | |
Flotek Industries, Inc.(a) | | | 507,100 | | | | 7,474,654 | |
| | | | | | | | |
Construction Materials (2.71%) | | | | | | | | |
Summit Materials, Inc. - Class A(a) | | | 17,600 | | | | 389,840 | |
Vulcan Materials Co. | | | 307,800 | | | | 25,947,540 | |
| | | | | | | | |
| | | | | | | 26,337,380 | |
| | | | | | | | |
Energy Equipment & Services (0.74%) | | | | | | | | |
U.S. Silica Holdings, Inc. | | | 202,936 | | | | 7,226,551 | |
| | | | | | | | |
Materials (1.75%) | | | | | | | | |
Allegheny Technologies, Inc. | | | 409,358 | | | | 12,284,834 | |
Celanese Corp. - Series A | | | 41,250 | | | | 2,304,225 | |
Sealed Air Corp. | | | 52,750 | | | | 2,403,290 | |
| | | | | | | | |
| | | | | | | 16,992,349 | |
| | | | | | | | |
| | |
TOTAL COMMON STOCKS
(COST $673,618,201) | | | | | | | 875,799,616 | |
| | | | | | | | |
| | |
| See Notes to Financial Statements. | | |
| Semi-Annual Report | March 31, 2015 | | 11 |
| | |
| Broadview Opportunity Fund | | Schedule of Investments |
| | March 31, 2015 (Unaudited) |
| | | | | | | | |
| | | Shares | | | Value | |
SHORT-TERM SECURITY (5.81%) | | | | | | | | |
MONEY MARKET FUND (5.81%) | | | | | | | | |
Morgan Stanley Institutional Liquidity Funds - Government Portfolio, Institutional Class, 7 Day
Yield 0.040% | | | 56,540,080 | | | $ | 56,540,080 | |
| | | | | | | | |
| | |
TOTAL SHORT-TERM SECURITY
(COST $56,540,080) | | | | | | | 56,540,080 | |
| | | | | | | | |
| | |
TOTAL INVESTMENTS (95.85%)
(COST $730,158,281) | | | | | | | 932,339,696 | |
| | | | | | | | |
| | |
TOTAL ASSETS IN EXCESS OF OTHER LIABILITIES (4.15%) | | | | | | | 40,397,460 | |
| | | | | | | | |
| | |
NET ASSETS 100.00% | | | | | | $ | 972,737,156 | |
| | | | | | | | |
| (a) | Non-income producing security. |
Percentages are stated as a percent of net assets.
Common Abbreviations:
N.V. - Naamloze Vennootschap is the Dutch term for a public limited liability corporation.
| | |
| See Notes to Financial Statements. | | |
| 12 | | www.bvafunds.com |
| | |
| Broadview Opportunity Fund | | Statement of Assets and Liabilities |
| | March 31, 2015 (Unaudited) |
| | | | | | |
ASSETS: | | | | | | |
Investments in securities, at value | | | | $ | 932,339,696 | |
Receivable for investments sold | | | | | 43,461,305 | |
Receivable for shareholder purchases | | | | | 902,677 | |
Dividends and interest receivable | | | | | 242,060 | |
Prepaid expenses | | | | | 52,347 | |
Total assets | | | | | 976,998,085 | |
| | |
LIABILITIES: | | | | | | |
Payable for management fees | | | | | 824,366 | |
Payable for investments purchased | | | | | 2,343,729 | |
Payable to shareholders for redemptions | | | | | 749,085 | |
Payable for transfer agency fees | | | | | 196,655 | |
Payable for Board of Trustees fees | | | | | 1,089 | |
Payable for chief compliance officer fees | | | | | 2,463 | |
Accrued expenses and other liabilities | | | | | 143,542 | |
Total liabilities | | | | | 4,260,929 | |
NET ASSETS | | | | $ | 972,737,156 | |
| | |
NET ASSETS CONSIST OF: | | | | | | |
Paid-in capital | | | | $ | 735,837,757 | |
Accumulated net investment loss | | | | | (2,087,482 | ) |
Accumulated net realized gain on investments | | | | | 36,805,466 | |
Net unrealized appreciation on investments | | | | | 202,181,415 | |
NET ASSETS | | | | $ | 972,737,156 | |
| | |
INVESTMENTS IN SECURITIES, AT COST | | | | $ | 730,158,281 | |
| | |
PRICING OF SHARES: | | | | | | |
Net Asset Value, offering and redemption price per share | | | | $ | 38.55 | |
Net Assets | | | | $ | 972,737,156 | |
Shares of beneficial interest outstanding | | | | | 25,233,651 | |
| | |
| See Notes to Financial Statements. | | |
| Semi-Annual Report | March 31, 2015 | | 13 |
| | |
| Broadview Opportunity Fund | | Statement of Operations |
| | For the Period Ended March 31, 2015 (Unaudited) |
| | | | |
INVESTMENT INCOME: | | | | |
Dividends | | $ | 3,873,587 | |
Foreign taxes withheld | | | (89,252 | ) |
Total Investment Income | | | 3,784,335 | |
| |
EXPENSES: | | | | |
Management fees | | | 4,676,851 | |
Administration and accounting services | | | 157,204 | |
Transfer agent fees | | | 747,993 | |
Professional fees | | | 60,976 | |
Custodian fees | | | 36,864 | |
Board of Trustees fees | | | 27,270 | |
Chief compliance officer fees | | | 14,963 | |
Printing and postage expenses | | | 69,019 | |
Registration fees | | | 28,559 | |
Other expenses | | | 52,118 | |
Total Expenses | | | 5,871,817 | |
NET INVESTMENT LOSS | | | (2,087,482 | ) |
| |
REALIZED AND UNREALIZED GAIN FROM INVESTMENTS | | | | |
Net realized gain on investments | | | 53,470,371 | |
Net change in unrealized appreciation of investments | | | 47,624,985 | |
NET REALIZED AND UNREALIZED GAIN FROM INVESTMENTS | | | 101,095,356 | |
NET INCREASE IN NET ASSETS RESULTING FROM OPERATIONS | | $ | 99,007,874 | |
| | |
| See Notes to Financial Statements. | | |
| 14 | | www.bvafunds.com |
| | |
| Broadview Opportunity Fund | | Statements of Changes in Net Assets |
| | |
| | | | | | | | | | |
| | | | | For the Six Months Ended March 31, 2015 (Unaudited) | | | For the Year Ended
September 30, 2014 | |
OPERATIONS: | | | | | | | | | | |
Net investment loss | | | | $ | (2,087,482) | | | $ | (4,863,589) | |
Net realized gain on investments | | | | | 53,470,371 | | | | 106,189,173 | |
Net change in unrealized appreciation/(depreciation) on investments | | | | | 47,624,985 | | | | (59,401,011) | |
Net increase in net assets resulting from operations | | | | | 99,007,874 | | | | 41,924,573 | |
| | | |
DISTRIBUTIONS TO SHAREHOLDERS (Note 5): | | | | | | | | | | |
From net realized gains on investments | | | | | (95,669,184) | | | | (93,415,501) | |
Total distributions | | | | | (95,669,184) | | | | (93,415,501) | |
| | | |
SHARE TRANSACTIONS (Note 5): | | | | | | | | | | |
Proceeds from sales of shares | | | | | 77,195,765 | | | | 292,037,410 | |
Distributions reinvested | | | | | 93,541,782 | | | | 91,810,255 | |
Cost of shares redeemed | | | | | (105,490,561) | | | | (280,928,344) | |
Net increase from share transactions | | | | | 65,246,986 | | | | 102,919,321 | |
| | | |
Net increase in net assets | | | | | 68,585,676 | | | | 51,428,393 | |
| | | |
NET ASSETS: | | | | | | | | | | |
Beginning of year | | | | | 904,151,480 | | | | 852,723,087 | |
End of year* | | | | $ | 972,737,156 | | | $ | 904,151,480 | |
*Includes accumulated net investment loss of: | | | | $ | (2,087,482) | | | $ | 0 | |
| | | |
Other Information: | | | | | | | | | | |
SHARE TRANSACTIONS: | | | | | | | | | | |
Sold | | | | | 2,013,340 | | | | 7,308,930 | |
Distributions reinvested | | | | | 2,490,463 | | | | 2,355,046 | |
Redeemed | | | | | (2,764,627) | | | | (7,045,649) | |
Net increase in shares outstanding | | | | | 1,739,176 | | | | 2,618,327 | |
| | |
| See Notes to Financial Statements. | | |
| Semi-Annual Report | March 31, 2015 | | 15 |
| | |
| Broadview Opportunity Fund | | Financial Highlights |
| | For a Share Outstanding Throughout the Periods Presented |
| | | | | | | | | | | | | | | | | | | | | | | | | | | | | | |
| | | For the Six Months Ended March 31, 2015 (Unaudited) | | For the Year Ended September 30, 2014(a) | | For the Year Ended September 30, 2013 | | For the Year Ended September 30, 2012 | | For the Year Ended September 30, 2011 | | For the Year Ended September 30, 2010 |
NET ASSET VALUE, BEGINNING OF YEAR | | | | $ 38.48 | | | | | $ 40.85 | | | | | $ 30.26 | | | | | $ 25.54 | | | | | $ 26.37 | | | | | $ 22.72 | |
INCOME/(LOSS) FROM OPERATIONS: | | | | | | | | | | | | | | | | | | | | | | | | | | | | | | |
Net investment loss | | | | (0.09) | | | | | (0.21) | | | | | (0.15) | | | | | (0.10) | | | | | (0.15) | | | | | (0.11) | |
Net realized and unrealized gain/(loss) on investments | | | | 4.27 | | | | | 2.18 | | | | | 11.59 | | | | | 6.02 | | | | | (0.68) | | | | | 3.79 | |
Total from investment operations | | | | 4.18 | | | | | 1.97 | | | | | 11.44 | | | | | 5.92 | | | | | (0.83) | | | | | 3.68 | |
| | | | | | |
LESS DISTRIBUTIONS: | | | | | | | | | | | | | | | | | | | | | | | | | | | | | | |
From net investment income | | | | – | | | | | – | | | | | – | | | | | – | | | | | – | | | | | (0.03) | |
From net realized gains on investments | | | | (4.11) | | | | | (4.34) | | | | | (0.85) | | | | | (1.20) | | | | | – | | | | | – | |
Total distributions | | | | (4.11) | | | | | (4.34) | | | | | (0.85) | | | | | (1.20) | | | | | – | | | | | (0.03) | |
INCREASE/(DECREASE) IN NET ASSET VALUE | | | | 0.07 | | | | | (2.37) | | | | | 10.59 | | | | | 4.72 | | | | | (0.83) | | | | | 3.65 | |
NET ASSET VALUE, END OF YEAR | | | | $ 38.55 | | | | | $ 38.48 | | | | | $ 40.85 | | | | | $ 30.26 | | | | | $ 25.54 | | | | | $ 26.37 | |
| | | | | | |
TOTAL RETURN | | | | 11.15% | (b) | | | | 4.86% | | | | | 38.91% | | | | | 23.48% | | | | | (3.15%) | | | | | 16.21% | |
| | | | | | |
SUPPLEMENTAL DATA: | | | | | | | | | | | | | | | | | | | | | | | | | | | | | | |
Net assets, end of year (000’s) | | | | $ 972,737 | | | | | $ 904,151 | | | | | $ 852,723 | | | | | $ 618,541 | | | | | $ 434,932 | | | | | $ 424,027 | |
| | | | | | |
RATIOS TO AVERAGE NET ASSETS: | | | | | | | | | | | | | | | | | | | | | | | | | | | | | | |
Operating expenses | | | | 1.26% | (c) | | | | 1.25% | | | | | 1.26% | | | | | 1.26% | | | | | 1.26% | | | | | 1.30% | |
Net investment loss | | | | (0.45%) | (c) | | | | (0.50%) | | | | | (0.44%) | | | | | (0.34%) | | | | | (0.48%) | | | | | (0.47%) | |
| | | | | | |
PORTFOLIO TURNOVER RATE | | | | 24% | (b) | | | | 56% | | | | | 70% | | | | | 55% | | | | | 78% | | | | | 59% | |
| (a) | On November 25, 2013, shareholders of the FMI Focus Fund, a series of FMI Funds, Inc. (the “Predecessor Fund”), approved a tax-free reorganization under which all assets and liabilities of the Predecessor Fund were transferred to the Broadway Opportunity Fund, a series of Broadview Funds Trust, at the close of business on November 29, 2013. |
| | |
| See Notes to Financial Statements. | | |
| 16 | | www.bvafunds.com |
| | |
| Broadview Opportunity Fund | | Notes to Financial Statements |
| | March 31, 2015 (Unaudited) |
1. ORGANIZATION
Broadview Funds Trust (the “Trust”) is an open-end management investment company registered under the Investment Company Act of 1940, as amended (the “1940 Act”). The Trust was organized on September 9, 2013 as a Delaware statutory trust. The Trust currently offers one series, the Broadview Opportunity Fund (the “Fund”). The Fund is a diversified portfolio with an investment objective to seek capital appreciation.
On November 25, 2013, shareholders of the FMI Focus Fund, a series of FMI Funds, Inc. (the “Predecessor Fund”), approved a tax-free reorganization under which all assets and liabilities of the Predecessor Fund were transferred to the Fund, a series of the Trust, at the close of business on November 29, 2013. The Predecessor Fund commenced operations on December 16, 1996.
2. SIGNIFICANT ACCOUNTING POLICIES
The following is a summary of significant accounting policies consistently followed by the Fund. These policies are in conformity with U.S. generally accepted accounting principles (“GAAP”). The Fund is considered an investment company for financial reporting purposes under GAAP.
Use of Estimates — The preparation of financial statements in conformity with GAAP requires management to make estimates and assumptions that affect the amounts reported in financial statements. Actual results could differ from those estimates.
Investment Valuation — The Fund’s portfolio securities are valued as of the close of trading of the New York Stock Exchange (“NYSE”) (normally 4:00 p.m., Eastern Time). Each security, excluding short-term investments, is valued at the last sale price reported by the principal security exchange on which the issue is traded. Securities that are traded on the Nasdaq Stock Market, Inc. are valued at the Nasdaq Official Closing Price or if no sale is reported, the mean between the bid and the ask. Securities which are traded over-the-counter are valued at the last sale price or, if no sale, at the mean between the bid and the ask. Securities sold short which are listed on a national securities exchange or the Nasdaq Stock Market but which were not traded on the valuation date are valued at the mean between the bid and the ask. Unlisted equity securities for which market quotations are readily available are valued at the last sale price or, if no sale price, the mean between the bid and the ask. Options purchased or written by the Fund are valued at the mean of the highest bid and lowest ask price of all the exchanges on which the option trades. Securities for which quotations are not readily available are valued at fair value as determined by the investment adviser in accordance with procedures approved by the Board of Trustees. The fair value of a security is the amount which the Fund might reasonably expect to receive upon a current sale. The fair value of a security may differ from the last quoted price and the Fund may not be able to sell a security at the fair value. Market quotations may not be available, for example, if trading in particular securities was halted during the day and not resumed prior to the close of trading on the New York Stock Exchange. As of March 31, 2015 there were no securities that were internally fair valued. Variable rate demand notes are recorded at par value which approximates market value. Short-term investments with maturities of 60 days or less are valued at amortized cost which approximates value. For financial reporting purposes, investment transactions are recorded on the trade date.
Securities Transactions and Related Investment Income — Securities transactions are accounted for on trade date. Dividend income is recorded on the ex-dividend date. Realized gains and losses from investment transactions are determined using the identified cost basis. Interest income which includes amortization of premium and accretion of discount, is recorded on the accrual basis.
Fair Value Measurements — A three-tier hierarchy has been established to classify fair value measurements for disclosure purposes. Inputs refer broadly to the assumptions that market participants would use in pricing the asset or liability, including assumptions about risk. Inputs may be observable or unobservable. Observable inputs are inputs that reflect the assumptions market participants would use in pricing the asset or liability that are developed based on market data obtained from sources independent of the reporting entity. Unobservable inputs are inputs that reflect the reporting entity’s own assumptions about the assumptions market participants would use in pricing the asset or liability that are developed based on the best information available. In accordance with the authoritative guidance on fair value measurements and disclosure under GAAP, the Fund discloses fair value of its investments in a hierarchy that prioritizes the inputs to valuation techniques used to measure the fair value.
Various inputs are used in determining the value of the Fund’s investments as of the reporting period end. These inputs are categorized in the following hierarchy under applicable financial accounting standards:
| | |
Level 1 — | | Unadjusted quoted prices in active markets for identical, unrestricted assets or liabilities that the Fund has the ability to access at the measurement date; |
| | |
| |
Level 2 — | | Quoted prices which are not active, quoted prices for similar assets or liabilities in active markets or inputs other than quoted prices that are observable (either directly or indirectly) for substantially the full term of the asset or liability; and |
| | |
| | |
| Semi-Annual Report | March 31, 2015 | | 17 |
| | |
| Broadview Opportunity Fund | | Notes to Financial Statements |
| | March 31, 2015 (Unaudited) |
| | |
Level 3 — | | Significant unobservable prices or inputs (including the Fund’s own assumptions in determining the fair value of investments) where there is little or no market activity for the asset or liability at the measurement date. |
The availability of observable inputs can vary from security to security and is affected by a wide variety of factors, including, for example, the type of security, whether the security is new and not yet established in the marketplace, the liquidity of markets, and other characteristics particular to the security. To the extent that valuation is based on models or inputs that are less observable or unobservable in the market, the determination of fair value requires more judgment. Accordingly, the degree of judgment exercised in determining fair value is greatest for instruments categorized in Level 3.
An investment level within the fair value hierarchy is based on the lowest level input, individually or in the aggregate, that is significant to fair value measurement. The valuation techniques used by the Fund to measure fair value during the period ended March 31, 2015 maximized the use of observable inputs and minimized the use of unobservable inputs.
The inputs or methodologies used for valuing securities are not necessarily an indication of the risk or liquidity associated with investing in those securities. The following is a summary of the inputs used in valuing the Fund’s investments as of March 31, 2015:
Broadview Opportunity Fund
| | | | | | | | | | | | | | | | | | |
| | | Valuation Inputs | | | |
| Investments in Securities at Value* | | Level 1 | | | Level 2 | | | Level 3 | | | | | Total | |
Common Stocks | | $ | 875,799,616 | | | $ | – | | | $ | – | | | | | $ | 875,799,616 | |
Short-Term Security | | | 56,540,080 | | | | – | | | | – | | | | | | 56,540,080 | |
Total | | $ | 932,339,696 | | | $ | – | | | $ | – | | | | | $ | 932,339,696 | |
| * | See Schedule of Investments for industry classification. |
It is the Fund’s policy to recognize transfers between levels at the end of the reporting period. There were no transfers between Levels 1 and 2 during the period ended March 31, 2015.
For the period ended March 31, 2015, the Fund did not have any unobservable inputs (Level 3) used in determining fair value.
Distributions to Shareholders — Dividends from net investment income and distributions of net realized capital gains, if any, will be declared and paid at least annually. Income and capital gains distributions are determined in accordance with income tax regulations, which may differ from GAAP. Distributions to shareholders are recorded on the ex-dividend date.
Income Taxes — As of and during the period ended March 31, 2015, the Fund did not have a liability for any unrecognized tax benefits. The Fund files U.S. federal, state, and local tax returns as required. The Fund’s tax returns are subject to examination by the relevant tax authorities until expiration of the applicable statute of limitations which is generally three years after the filing of the tax return for federal purposes and four years for most state returns. Tax returns for open years have incorporated no uncertain tax positions that require a provision for income taxes. The Fund intends to continue to qualify each year as a “regulated investment company” under Subchapter M of the Internal Revenue Code of 1986, as amended. By so qualifying, the Fund will not be subject to Federal income taxes to the extent that it distributes substantially all of its taxable or tax-exempt income, if any, for its tax year ending September 30. In addition, by distributing in each calendar year substantially all of its net investment income, capital gains and certain other amounts, if any, the Fund will not be subject to a Federal excise tax. Therefore, no provision is made by the Fund for Federal income or excise taxes.
3. ADVISORY FEES, ADMINISTRATION FEES AND OTHER AGREEMENTS
Investment Advisory
Effective the close of business on November 29, 2013, the Fund entered into an investment advisory agreement with Broadview Advisors, LLC (the “Adviser”). The Fund pays the Adviser a monthly fee based upon the average daily net assets of the Fund and calculated at an annual rate of 1.00%.
Prior to November 29, 2013, Fiduciary Management, Inc. (“FMI”) was the Predecessor Fund’s investment adviser. As full compensation for the investment advisory services provided to the Predecessor Fund, FMI received monthly compensation based on the Predecessor Fund’s average daily net assets at the annual rate of 1.00%.
| | |
| Broadview Opportunity Fund | | Notes to Financial Statements |
| | March 31, 2015 (Unaudited) |
Prior to November 29, 2013, FMI had an investment sub-advisory agreement with the Adviser, with whom a certain director of the Predecessor Fund was affiliated, to assist it in the day-to-day management of the Predecessor Fund. The Adviser determined which securities were purchased, retained or sold for the Predecessor Fund. FMI paid the Adviser 0.85% of the first $500 million of the average daily net assets of the Predecessor Fund and 0.80% of the Predecessor Fund’s average daily net assets in excess of $500 million.
Under the Trust’s organizational documents, each director, officer, employee or other agent of the Fund (including the Adviser) is indemnified, to the extent permitted by the Act, against certain liabilities that may arise out of performance of their duties to the Fund. Additionally, in the normal course of business, the Fund enters into contracts that contain a variety of indemnification clauses. The Fund’s maximum exposure under these arrangements is unknown as this would involve future claims that may be made against the Fund that have not yet occurred. However, the Fund has not had prior claims or losses pursuant to these contracts and believes the risk of loss to be remote.
Beneficial Ownership
At March 31, 2015, one financial intermediary is the record owner of approximately 34% of the Fund’s shares.
Fund Accounting Fees and Expenses
ALPS Fund Services, Inc. (“ALPS” or the “Administrator”) provides administrative, fund accounting and other services to the Fund under the Administration, Bookkeeping and Pricing Services Agreement (the “Administration Agreement”) with the Trust. Under the Agreement, ALPS is paid fees, accrued on a daily basis and paid on a monthly basis following the end of the month.
The Administrator is also reimbursed by the Fund for certain out of pocket expenses.
The Fund has entered into a Distribution Plan (the “Plan”) pursuant to Rule 12b-1 under the Act. The Plan provides that the Fund may incur certain costs which may not exceed the lesser of a monthly amount equal to 0.25% of the Fund’s daily net assets or the actual distribution costs incurred during the year. Amounts payable under the Plan are paid monthly for any activities or expenses primarily intended to result in the sale of shares of the Fund. For the period ended March 31, 2015, no such expenses were incurred. The Fund presently intends not to utilize the Plan or pay any 12b-1 fees during the fiscal year ending September 30, 2015.
Transfer Agent and Shareholder Services Agreement
ALPS serves as transfer, dividend paying and shareholder servicing agent for the Fund (the “Transfer Agent”) under a Transfer Agency and Services Agreement with the Trust.
Compliance Services
ALPS provides Chief Compliance Officer services to the Fund. Additionally, ALPS provides services in monitoring and testing the policies and procedures of the Trust in conjunction with requirements under Rule 38a-1 under the 1940 Act. ALPS is compensated under the Chief Compliance Officer Services Agreement.
Distributor
The Fund has entered into a Distribution Agreement with ALPS Distributors, Inc. (“the Distributor”) to provide distribution services to the Fund. The Distributor serves as underwriter/distributor of shares of the Fund.
Officer and Trustee Compensation
Officers of the Trust and Trustees who are “interested persons” of the Trust or the Adviser will receive no salary or fees from the Trust. Each Trustee who is not an “interested person” receives an annual fee of $20,000 each year. The Trust reimburses each Trustee and Officer for his or her travel and other expenses relating to attendance at such meetings.
Certain Trustees and Officers of the Trust are also officers of the Adviser.
| | |
| | |
| Semi-Annual Report | March 31, 2015 | | 19 |
| | |
| Broadview Opportunity Fund | | Notes to Financial Statements |
| | March 31, 2015 (Unaudited) |
4. PURCHASES AND SALES OF INVESTMENT SECURITIES
The aggregate cost of purchases and proceeds from sales of investment securities, excluding short-term securities, are shown below for the period ended March 31, 2015.
| | | | |
| Broadview Opportunity Fund | | | |
Cost of Investments Purchased | | $ | 207,950,515 | |
Proceeds from Investments Sold | | $ | 236,168,408 | |
5. TAX BASIS INFORMATION
Distributions are determined in accordance with federal income tax regulations, which differ from GAAP, and, therefore, may differ significantly in amount or character from net investment income and realized gains for financial reporting purposes. Financial reporting records are adjusted for permanent book/tax differences to reflect tax character but are not adjusted for temporary differences. The amounts and characteristics of tax basis distributions and composition of distributable earnings/(accumulated losses) are finalized at fiscal year-end.
The tax character of distributions paid during the year ended September 30, 2014, were as follows:
| | | | | | |
| | | Ordinary Income | | | Long-Term Capital Gain |
Broadview Opportunity Fund | | $ | 22,814,664 | | | $ 70,600,837 |
As of March 31, 2015, net unrealized appreciation/(depreciation) of investments based on the federal tax cost were as follows:
| | | | | | | | | | | | | | | | |
| | | Cost of Investments | | | Gross Unrealized
Appreciation | | | Gross Unrealized
Depreciation | | | Net Appreciation on
Investments | |
Broadview Opportunity Fund | | $ | 733,309,448 | | | $ | 227,057,242 | | | $ | (28,026,994 | ) | | $ | 199,030,248 | |
The difference between book basis and tax basis is primarily attributable to wash sales.
6. COMMITMENTS AND CONTINGENCIES
Under the Trust’s organizational documents, its Officers and Trustees are indemnified against certain liabilities arising out of the performance of their duties to the Fund. In addition, in the normal course of business, the Trust entered into contracts with its service providers, on behalf of the Fund, and others that provide for general indemnifications. The Fund’s maximum exposure under these arrangements is unknown, as this would involve future claims that may be made against the Fund. The Fund expects the risk of loss to be remote.
| | |
| Broadview Opportunity Fund | | Additional Information |
| | March 31, 2015 (Unaudited) |
1. PROXY VOTING POLICIES AND VOTING RECORD
A description of the policies and procedures that the Fund uses to vote proxies relating to portfolio securities is available without charge upon request by calling toll-free 855-846-1463, or on the Securities and Exchange Commission’s (“SEC”) website at http://www.sec.gov. Information regarding how the Fund voted proxies relating to portfolio securities during the most recent 12-month period ended June 30th is available without charge upon request by calling toll-free 855-846-1463, or on the SEC’s website at http://www.sec.gov.
2. QUARTERLY PORTFOLIO HOLDINGS
The Trust files a complete listing of portfolio holdings for the Fund with the SEC four times each fiscal year at quarter-ends. The Fund files the schedule of portfolio holdings with the SEC on Form N-CSR (second and fourth quarters) and on Form N-Q (first and third quarters). The filings are available upon request by calling 855-846-1463. Furthermore, you may obtain a copy of the filing on the SEC’s website at http://www.sec.gov. The Fund’s Forms N-CSR and N-Q may also be reviewed and copied at the SEC’s Public Reference Room in Washington, D.C., and information on the operation of the Public Reference Room may be obtained by calling 1-800-SEC-0330.
| | |
| | |
| Semi-Annual Report | March 31, 2015 | | 21 |

| | |
| Item 2. | | Code of Ethics. |
| |
| | Not applicable to semi-annual report. |
| |
| Item 3. | | Audit Committee Financial Expert. |
| |
| | Not applicable to semi-annual report. |
| |
| Item 4. | | Principal Accountant Fees and Services. |
| |
| | Not applicable to semi-annual report. |
| |
| Item 5. | | Audit Committee of Listed Registrants. |
| |
| | Not applicable to the Registrant. |
| |
| Item 6. | | Schedule of Investments. |
| |
| | (a) The Registrant’s “Schedule I – Investments in securities of unaffiliated issuers” (as set forth in 17 CFR 210.12-12) is included in Item 1 of this Form N-CSR. |
| |
| | (b) Not applicable to the Registrant. |
| |
| Item 7. | | Disclosure of Proxy Voting Policies and Procedures for Closed-End Management Investment Companies. |
| |
| | Not applicable to the Registrant. |
| |
| Item 8. | | Portfolio Managers of Closed-End Management Investment Companies. |
| |
| | Not applicable to the Registrant. |
| |
| Item 9. | | Purchases of Equity Securities by Closed-End Management Investment Company and Affiliated Purchasers. |
| |
| | Not applicable to the Registrant. |
| |
| Item 10. | | Submission of Matters to a Vote of Security Holders. |
| |
| | None. |
| | |
| Item 11. | | Controls and Procedures. |
| |
| (a) | | The Registrant’s principal executive officer and principal financial officer have evaluated the Registrant’s disclosure controls and procedures (as defined in Rule 30a-3(c) under the Investment Company Act of 1940, as amended) within 90 days of this filing and have concluded that the Registrant’s disclosure controls and procedures were effective as of that date. |
| |
| (b) | | There was no change in the Registrant’s internal control over financial reporting (as defined in
Rule 30a-3(d) under the Investment Company Act of 1940, as amended) during the second fiscal quarter of the period covered by this report that has materially affected, or is reasonably likely to materially affect, the Registrant’s internal control over financial reporting. |
| |
| Item 12. | | Exhibits. |
| |
| (a)(1) | | Not applicable to semi-annual report. |
| |
| (a)(2) | | A separate certification for the Registrant’s Principal Executive Officer and Principal Financial Officer as required by Rule 30a-2(a) under the Investment Company Act of 1940, as amended
(17 CFR 270.30a-2(a)), are attached hereto as Ex 99.Cert. |
| |
| (a)(3) | | None. |
| |
| (b) | | The certifications by the Registrant’s Principal Executive Officer and Principal Financial Officer, as required by Rule 30a-2(b) of the Investment Company Act of 1940, as amended, and Section 906 of the Sarbanes-Oxley Act of 2002 are attached hereto as Ex99.906Cert. |
SIGNATURES
Pursuant to the requirements of the Securities Exchange Act of 1934 and the Investment Company Act of 1940, the Registrant has duly caused this report to be signed on its behalf by the undersigned, thereunto duly authorized.
Broadview Funds Trust
| | |
| By: | | /s/ Richard E. Lane |
| | Richard E. Lane |
| | President |
| |
| Date: | | June 1, 2015 |
Pursuant to the requirements of the Securities Exchange Act of 1934 and the Investment Company Act of 1940, this report has been signed below by the following persons on behalf of the Registrant and in the capacities and on the dates indicated.
| | |
| By: | | /s/ Richard E. Lane |
| | Richard E. Lane |
| | President (Principal Executive Officer) |
| |
| Date: | | June 1, 2015 |
| | |
| By: | | /s/ Aaron J. Garcia |
| | Aaron J. Garcia |
| | Chief Financial Officer (Principal Financial Officer) |
| |
| Date: | | June 1, 2015 |