UNITED STATES
SECURITIES AND EXCHANGE COMMISSION
Washington, D.C. 20549
FORM N-CSRS
CERTIFIED SHAREHOLDER REPORT OF REGISTERED
MANAGEMENT INVESTMENT COMPANIES
Investment Company Act file number: 811-22885
Broadview Funds Trust
(Exact name of registrant as specified in charter)
330 East Kilbourn Ave., Suite 1475
Milwaukee, Wisconsin 53202
(Address of principal executive offices) (Zip code)
Angela L. Pingel
Broadview Advisors, LLC
330 East Kilbourn Ave., Suite 1475
Milwaukee, Wisconsin 53202
(Name and address of agent for service)
Registrant’s telephone number, including area code: (414) 918-3900
Date of fiscal year end: September 30, 2017
Date of reporting period: October 1, 2017 – March 31, 2018
Item 1. Reports to Stockholders.

| Shareholder Letter | 1 |
| Manager Commentary | 4 |
| Disclosure of Fund Expenses | 6 |
| Schedule of Investments | 7 |
| Statement of Assets and Liabilities | 11 |
| Statement of Operations | 12 |
| Statements of Changes in Net Assets | 13 |
| Financial Highlights | 14 |
| Notes to Financial Statements | 15 |
| Additional Information | 19 |
| Broadview Opportunity Fund | Shareholder Letter |
March 31, 2018 (Unaudited)
Dear Fellow Shareholders,
Softly, Softly Catchee Monkey – Rick Lane, CFA
The title to our review refers to an African proverb. Largely popularized by Lord Baden-Powell, the founder of the Boy Scouts, the saying means “patience gains the day.” We believe investors will have to be patient and cautious over the near to medium term as the equity markets absorb rising interest rates and the ongoing trade negotiations. These two recent developments come on the heels of thirteen straight months of extremely low volatility, rising valuations, and powerful equity returns. Indeed, the 29% advance in the S&P 500 Index (January 1, 2017-January 31, 2018) was dwarfed by the returns of the collectively known FANG stocks over the same period, led by Netflix, Inc. (NFLX) up 118%, Amazon.com, Inc. (AMZN) up 93%, Facebook, Inc. (FB) up 62% and Alphabet, Inc. (GOOGL), the parent company of Google, up 49%. Yet FANG was child’s play compared to the 940% increase in the crypto-currency Bitcoin.
The two factors cited above, rising interest rates and trade negotiations, quickly pricked this speculative market bubble in early February 2018. In our minds, this was a long time in coming. Super low interest rates since 2009 had set in motion a reach for yield and drove asset valuations to high levels while feeding speculation in sectors like technology. In our view, there has also been a flywheel effect caused by so much money flowing into passive investments, like index funds, that it essentially prevented normal corrections along the way. That abnormally low level of volatility only emboldened investors to put more money into equities. Against that backdrop, the market was overdue for a correction.
Jerome Powel, the new Chair of the Federal Reserve, recently outlined three to four quarter point Fed Funds increases this year which we believe caused investors to pause. However, in our opinion, it was President Trump’s strident approach to trade negotiations which really caused the sell- off in early February 2018.
So where does that leave the Broadview Opportunity Fund (the “Fund”)? Our base-case scenario is that rising interest rates will at some point negatively impact asset valuations through both the discounting mechanism as well as creating some competition for equities. Most studies we have seen suggest individual investors are over-weighted in equities. Given the length and magnitude of this bull market, combined with super low interest rates in fixed income, this is easy to understand. Our thinking is that if short-term rates approach three percent while intermediate-term corporate yields approach mid-five percent, investors will likely reallocate some equity exposure to fixed income.
On the other hand, earnings are likely to be very strong this year. Furthermore, we don’t think the benefit from a considerably lower corporate tax rate can be overlooked. The recent correction has brought valuations down some, and yet the “pain” has not been evenly distributed.
Several other nuances are very relevant to our thinking here as well. One, growth stocks have dramatically outperformed the rest of the market for a few years now, creating solid value in many overlooked industries. Secondly, the significant flow of money into S&P 500 Index-based funds has inflated many components of that index. Markets have a way of correcting these imbalances. We think this may be unfolding as we speak. Warren Buffet likes to say that in the short run the market is a popularity contest (today’s technology stocks) while in the long run the market is a weighing machine. We believe the market is likely to rebalance toward the solid growing, fairly-valued companies that comprise the Fund’s portfolio. Patience gains the day!
Ciena Corp. (CIEN) – Faraz Farzam, CFA
Our technology investments delivered solid gains on both an absolute and relative basis this quarter led by telecommunication equipment maker Ciena Corp. Following strong calendar fourth quarter 2017 results, we met with Ciena’s CEO Gary Smith. Based on our due diligence, we believe Ciena’s competitive position is stronger than ever due to favorable industry consolidation.
Ciena sells critical software and equipment to telecommunications providers. Their largest customers include AT&T Inc. (T) and Verizon Communications, Inc. (VZ). Both companies have initiatives to drive fiber closer to their customers. Once the fiber is laid, Ciena's equipment is required to “light” the fiber, enabling it to carry a signal.
Additionally, AT&T has been commissioned by the Federal government to build the FirstNet, a $6 billion project to build and manage America’s first nationwide public safety broadband network dedicated to first responders. Ciena is AT&T’s primary optical equipment supplier.
Their second largest customer, Verizon, is in the early stages of developing a 5G wireless broadband network. Their aim is to challenge cable companies’ dominance in providing residential broadband internet service. Ciena is also Verizon’s primary optical equipment supplier.
| Semi-Annual Report | March 31, 2018 | 1 |
| Broadview Opportunity Fund | Shareholder Letter |
March 31, 2018 (Unaudited)
Elsewhere, India is in the throes of building out their modern communication networks. Ciena is the optical supplier to all the major carriers including Reliance Communications Ltd. (532712-IN), Vodafone Group Plc (VOD-GB), and TATA Communications Ltd. (500483-IN).
Finally, the rise of large global content networks (GCN), like Spotify Technology (SPOT), Netflix, Facebook, and Google, has created a new and significant customer category for Ciena. These GCN’s are so large that they are building their own networks and buying gear from Ciena. The sum of all this is that we believe there are several tailwinds behind Ciena’s business. Ciena’s balance sheet is improving as they will generate $150 million of free cash flow this year while retiring $300 million of debt. We continue to like the prospects for Ciena and its stock price.
Boston Beer Company, Inc. (SAM) – Faraz Farzam, CFA
While our consumer discretionary investments broadly delivered positive performance this quarter, our more defensive consumer staples investments retreated. The net result was a neutral impact to the Fund’s performance relative to the Russell 2000 Index for the quarter. Our largest consumer position, Boston Beer Company, Inc., reported fourth quarter results that were largely as expected. The pullback in the shares came after a stellar run in the fourth quarter. Boston Beer continues to see improvement in its core lager and seasonal business while delivering solid gains in its Cider and Fermented Malt Beverage (FMB) brands. Boston Beer also announced it has completed its yearlong CEO search. Long- time board member Dave Burwick will replace Martin Roper who will be retiring in May. Mr. Burwick has two decades of experience in beverage and retail operations, including senior roles at PepsiCo, Inc. (PEP).
We believe the opportunity for Boston Beer is significant. They have a solid brand with only one percent market share in the beer category. They are category leaders in the growing Cider and FMB space. Finally, we believe Boston Beer may be an attractive acquisition target for larger beverage operators.
Energy Sector: Recent Developments in the Exploration & Production (E&P) Industry – Aaron Garcia, CFA
On March 28, 2018, Concho Resources Inc. (CXO) bought RSP Permian, Inc. (RSPP) for $9.5 billion in stock, a 29% premium to the day before close. RSP Permian is a Permian basin based pure-play with high quality acreage in the oil-rich Midland and Delaware basin. While we did not benefit from this specific transaction, we were encouraged to see a realization of private market values in the Permian basin.
We are believers in the upside of this basin and have investments in Permian operators Parsley Energy, Inc. (PE) and WPX Energy, Inc. (WPX). Like RSP, they have top tier quality acreage and capable management teams. We believe that 2018 may well be the start of the recovery of the E&P sector, and that Permian names will be among the largest beneficiaries. They offer the highest capital yields and have the lowest cost of extraction among all U.S. plays. Both these companies have recently digested large acreage acquisitions and are now implementing aggressive development programs. They are using pad drilling and enhanced completion techniques to drive superior economics by increasing total resource recovery and decreasing costs per well drilled. Pad drilling allows for lower cost drilling of longer laterals and tighter spacing of the wells.
We are also encouraged by the progress of Whiting Petroleum Corp. (WLL), an operator with most of its operations in the Bakken Formation. The new management team has done a solid job in refocusing the company’s drilling program. Results in the Bakken have continued to surprise to the upside, and Whiting’s new CEO has laid out a conservative plan for 2018 that should drive positive free cash flow. We had long suspected there was some slack in the previous regime’s capital budget, and that appears to be the case. Capital spending estimates continue to move down as the new management team executes against their plan. While the stock has been a standout performer in the beginning of 2018, we see continued upside as it de-levers and its multiple continues to move higher.
More generally, the E&P equities have been choppy in this volatile environment. The commodity has held above $60 per barrel of oil all year (except for a small dip) and is up 21% over the last year (WTI price). The equities have lagged this price performance. WPX is flat over this time frame and PE is slightly down. Concern over both weather volatility and service cost inflation have weighed on the stocks this quarter, but we think the equities have been over looked.
Not only have production economics continued to improve through new methods, but there are some signs that the industry is evolving into a more investible space. Historically, the smaller E&P companies have been looked at as equity plays on the commodity. They offered some differentiation based on location and management. However, the industry generated little excess return on capital and free cash flow. Management raised equity with impunity to speculate on new areas and rarely were held accountable for economic returns. We believe that is slowly changing.
| Broadview Opportunity Fund | Shareholder Letter |
March 31, 2018 (Unaudited)
Investors have begun to demand more accountability. Companies with a path to free cash flow generation are being rewarded with multiple expansion. Also, we believe the new manufacturing-like techniques that the industry is adopting have the potential to smooth out some of the volatility in quarterly results. Despite this, the industry still sells a commodity that trades around the world. A softening of global demand would be detrimental to the price of oil and could affect our outlook for these companies.
Best Regards,
 |  |  |  |
| | | | |
| Richard E. Lane, CFA | Faraz Farzam, CFA | Aaron J. Garcia, CFA | Richard J. Whiting |
The views and information discussed in this commentary are as of the date of publication, are subject to change, and may not reflect current views. The views expressed represent an assessment of market conditions at a specific point in time, are opinions only and should not be relied upon as investment advice regarding a particular investment or markets in general. Such information does not constitute a recommendation to buy or sell specific securities or investment vehicles. It should not be assumed that any investment will be profitable or will equal the performance of the Fund or any securities or any sectors mentioned herein. The subject matter contained herein has been derived from several sources believed to be reliable and accurate at the time of compilation.
A NOTE ON FORWARD LOOKING STATEMENTS
Except for historical information contained in this report for the Fund, the matters discussed in this report may constitute forward-looking statements made pursuant to the safe-harbor provisions of the Private Securities Litigation Reform Act of 1995. These include any adviser or portfolio manager predictions, assessments, analyses or outlooks for individual securities, industries, market sectors and/or markets. These statements involve risks and uncertainties. In addition to the general risks described for the Fund in the current Prospectus, other factors bearing on this report include the accuracy of the adviser’s or portfolio managers’ forecasts and predictions, and the appropriateness of the investment programs designed by the adviser or portfolio managers to implement their strategies efficiently and effectively. Any one or more of these factors, as well as other risks affecting the securities markets and investment instruments generally, could cause the actual results of the Fund to differ materially as compared to benchmarks associated with the Fund.
Standard & Poor’s 500 Index (S&P 500) - An index of 500 stocks chosen for market size, liquidity and industry grouping, among other factors. The S&P 500 is designed to be a leading indicator of U.S. equities and is meant to reflect the risk/return characteristics of the large cap universe.
Russell 2000® Index - An index measuring the performance of approximately 2,000 small-cap companies in the Russell 3000® Index, which is made up of 3,000 of the biggest U.S. stocks. The Russell 2000® serves as a benchmark for small-cap stocks in the United States.
| Semi-Annual Report | March 31, 2018 | 3 |
| Broadview Opportunity Fund | Manager Commentary |
March 31, 2018 (Unaudited)
MANAGEMENT’S DISCUSSION OF FUND PERFORMANCE
For the six months ended March 31, 2018, the Fund provided a return of 3.74%, outperforming the Russell 2000 Index with a return of 3.25% and underperforming the Russell 2500 Index with a return of 4.99%. The Fund’s cash position was a drag on performance. Additional negative impact on the Fund’s performance came from the Health Care sector. On the other hand, the Financials and Consumer Discretionary sectors positively affected the Fund’s performance. Bottom detractors to the Fund's performance included Veeco Instruments Inc. (VECO) and Acadia Healthcare Company, Inc. (ACHC). Top contributors to the Fund's performance included Westlake Chemical Corp. (WLK) and PTC Inc. (PTC).
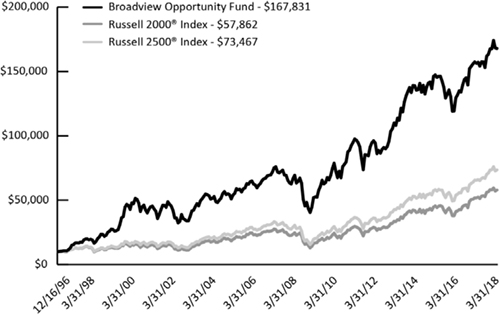
GROWTH OF $10,000 INVESTMENT IN THE FUND
From its inception (12/16/96) to 3/31/18 as compared to the Russell 2000 Index(1) and the Russell 2500 Index(2)
| Broadview Opportunity Fund | Manager Commentary |
March 31, 2018 (Unaudited)
PERFORMANCE* (For Periods Ended 3/31/18)
| | Total Return** | Annualized Total Return** |
| | 3 Months | 1 Year | 5 Year | 10 Year | 15 Year | Since Inception*** |
| Broadview Opportunity Fund | 0.09% | 7.32% | 8.82% | 10.36% | 11.25% | 14.17% |
| Russell 2000® Index | -0.08% | 11.79% | 11.47% | 9.84% | 11.50% | 8.60% |
| Russell 2500® Index | -0.24% | 12.31% | 11.55% | 10.28% | 12.05% | 9.82% |
Performance data quoted represents past performance. Past performance does not guarantee future results. Investment return and principal value of an investment will fluctuate so that an investor’s shares, when sold or redeemed, may be worth more or less than the original cost. Current performance data may be higher or lower than actual data quoted. For the most recent month-end performance please visit bvafunds.com or call 1-855-846-1463. As of the Fund’s Prospectus dated January 26, 2018, the Broadview Opportunity Fund’s annual operating expense ratio is 1.25%. One cannot invest directly in an index.
| (1) | The Russell 2000® Index measures the performance of the 2,000 smallest companies in the Russell 3000® Index. |
| (2) | The Russell 2500® Index is a market cap weighted index that includes the smallest 2,500 companies covered in the Russell 3000® Index, which comprises the 3,000 largest U.S. companies based on total market capitalization. |
| * | The Adviser believes that the Russell 2000® Index is the most appropriate benchmark for the Fund. As a result, the Russell 2000® Index has replaced the Russell 2500® Index as the primary benchmark for the Fund, and the Russell 2500® Index is now reflected as the secondary benchmark for the Fund. |
| ** | Total return includes changes in share prices and in each case includes reinvestments of any dividends, interest and capital gain distributions. The returns do not reflect the deduction of taxes that a shareholder would pay on Fund distributions or the redemption of Fund shares. |
| *** | Fund Inception Date: December 16, 1996. |
SECTOR ALLOCATION (as of March 31, 2018) (As a percentage of Net Assets)

Holdings are subject to change.
These allocations may not reflect the current or future positions of the portfolio.
| Semi-Annual Report | March 31, 2018 | 5 |
| Broadview Opportunity Fund | Disclosure of Fund Expenses |
March 31, 2018 (Unaudited)
As a shareholder of the Broadview Opportunity Fund (the “Fund”) you will incur ongoing costs, including management fees and other Fund expenses. The following examples are intended to help you understand your ongoing costs (in dollars) of investing in the Fund and to compare these costs with the ongoing costs of investing in other mutual funds. The examples are based on an investment of $1,000 invested on October 1, 2017 and held until March 31, 2018.
Actual Expenses. The first line of the table below provides information about actual account values and actual expenses. You may use the information in this line, together with the amount you invested, to estimate the expenses that you paid over the period. Simply divide your account value by $1,000 (for example, an $8,600 account value divided by $1,000 = 8.6), then multiply the result by the number in the first line under the heading “Expenses Paid During Period” to estimate the expenses you paid on your account during this period.
Hypothetical Example for Comparison Purposes. The second line of the table below provides information about hypothetical account values and hypothetical expenses based on the Fund’s actual expense ratio and an assumed rate of return of 5% per year before expenses, which is not the Fund’s actual return. The hypothetical account values and expenses may not be used to estimate the actual ending account balance or expenses you paid for the period. You may use this information to compare the ongoing costs of investing in the Fund and other mutual funds. To do so, compare this 5% hypothetical example with the 5% hypothetical examples that appear in the shareholder reports of the other funds. The expenses shown in the table are meant to highlight ongoing Fund costs only and do not reflect any transactional costs, such as sales charges (loads), redemption fees, or exchange fees that, although not charged by the Fund, may be charged by other funds. Therefore, the second line of the table below is useful in comparing ongoing costs only, and may not help you determine the relative total costs of owning different funds.
| | Beginning Account Value 10/1/17 | Ending Account Value 3/31/18 | Expense Ratio(a) | Expenses Paid During Period 10/1/17 - 3/31/18(b) |
| Broadview Opportunity Fund | | | | |
| Actual | $1,000.00 | $1,037.40 | 1.21% | $6.15 |
| Hypothetical (5% return before expenses) | $1,000.00 | $1,018.90 | 1.21% | $6.09 |
| (a) | The Fund's expense ratios have been based on the Fund's most recent fiscal half-year expenses. |
| (b) | Expenses are equal to the Fund's annualized expense ratio multiplied by the average account value over the period, multiplied by the number of days in the most recent fiscal half-year (182)/365 (to reflect the half-year period). |
| Broadview Opportunity Fund | Schedule of Investments |
March 31, 2018 (Unaudited)
| | | | Shares | | | Value |
| COMMON STOCKS (87.85%) | | | | | | | | |
| CONSUMER DISCRETIONARY (6.07%) | | | | | | | | |
| Hotels, Restaurants & Leisure (1.85%) | | | | | | | | |
| Chuy's Holdings, Inc.(a) | | | 393,807 | | | $ | 10,317,743 | |
| | | | | | | | | |
| Leisure Products (1.47%) | | | | | | | | |
| Brunswick Corp. | | | 137,710 | | | | 8,178,597 | |
| | | | | | | | | |
| Media (0.94%) | | | | | | | | |
| National CineMedia, Inc. | | | 1,015,331 | | | | 5,269,568 | |
| | | | | | | | | |
| Multiline Retail (1.05%) | | | | | | | | |
| Nordstrom, Inc. | | | 120,500 | | | | 5,833,405 | |
| | | | | | | | | |
| Specialty Retail (0.76%) | | | | | | | | |
| Hibbett Sports, Inc.(a) | | | 177,051 | | | | 4,240,372 | |
| | | | | | | | | |
| CONSUMER STAPLES (3.93%) | | | | | | | | |
| Beverages (1.76%) | | | | | | | | |
| Boston Beer Co., Inc. - Class A(a) | | | 52,000 | | | | 9,830,600 | |
| | | | | | | | | |
| Food Products (2.17%) | | | | | | | | |
| B&G Foods, Inc. | | | 204,200 | | | | 4,839,540 | |
| Freshpet, Inc.(a) | | | 439,950 | | | | 7,237,177 | |
| | | | | | | | 12,076,717 | |
| ENERGY (7.05%) | | | | | | | | |
| Energy Equipment & Services (2.57%) | | | | | | | | |
| Helmerich & Payne, Inc. | | | 44,800 | | | | 2,981,888 | |
| Keane Group, Inc.(a) | | | 157,000 | | | | 2,323,600 | |
| Superior Energy Services, Inc.(a) | | | 326,500 | | | | 2,752,395 | |
| U.S. Silica Holdings, Inc. | | | 157,886 | | | | 4,029,251 | |
| Unit Corp.(a) | | | 113,870 | | | | 2,250,071 | |
| | | | | | | | 14,337,205 | |
| Oil, Gas & Consumable Fuels (4.48%) | | | | | | | | |
| Oasis Petroleum, Inc.(a) | | | 635,400 | | | | 5,146,740 | |
| Parsley Energy, Inc. - Class A(a) | | | 133,550 | | | | 3,871,614 | |
| Range Resources Corp. | | | 343,500 | | | | 4,994,490 | |
| Whiting Petroleum Corp.(a) | | | 163,300 | | | | 5,526,072 | |
| WPX Energy, Inc.(a) | | | 369,300 | | | | 5,458,254 | |
| | | | | | | | 24,997,170 | |
| FINANCIALS (20.80%) | | | | | | | | |
| Banks (14.87%) | | | | | | | | |
| Bank of the Ozarks, Inc. | | | 147,391 | | | | 7,114,564 | |
| Chemical Financial Corp. | | | 161,787 | | | | 8,846,513 | |
| CoBiz Financial, Inc. | | | 667,067 | | | | 13,074,513 | |
| First Horizon National Corp. | | | 141,700 | | | | 2,668,211 | |
| Guaranty Bancorp | | | 230,567 | | | | 6,536,575 | |
| IBERIABANK Corp. | | | 62,900 | | | | 4,906,200 | |
| LegacyTexas Financial Group, Inc. | | | 297,481 | | | | 12,738,136 | |
| Western Alliance Bancorp.(a) | | | 255,800 | | | | 14,864,538 | |
| Zions Bancorp. | | | 230,800 | | | | 12,170,084 | |
| | | | | | | | 82,919,334 | |
| Consumer Finance (1.35%) | | | | | | | | |
| PRA Group, Inc.(a) | | | 197,250 | | | | 7,495,500 | |
See Notes to Financial Statements.
| Semi-Annual Report | March 31, 2018 | 7 |
| Broadview Opportunity Fund | Schedule of Investments |
March 31, 2018 (Unaudited)
| | | | Shares | | | Value |
| COMMON STOCKS (87.85%) (continued) | | | | | | | | |
| FINANCIALS (20.80%) (continued) | | | | | | | | |
| Insurance (3.67%) | | | | | | | | |
| MGIC Investment Corp.(a) | | | 1,574,975 | | | $ | 20,474,675 | |
| | | | | | | | | |
| Real Estate (0.91%) | | | | | | | | |
| Realogy Holdings Corp. | | | 186,000 | | | | 5,074,080 | |
| | | | | | | | | |
| HEALTH CARE (8.79%) | | | | | | | | |
| Biotechnology (0.78%) | | | | | | | | |
| Natera, Inc.(a) | | | 469,752 | | | | 4,354,601 | |
| | | | | | | | | |
| Health Care Equipment & Supplies (1.99%) | | | | | | | | |
| K2M Group Holdings, Inc.(a) | | | 429,815 | | | | 8,144,994 | |
| Varex Imaging Corp.(a) | | | 82,200 | | | | 2,941,116 | |
| | | | | | | | 11,086,110 | |
| Health Care Providers & Services (6.02%) | | | | | | | | |
| AMN Healthcare Services, Inc.(a) | | | 90,900 | | | | 5,158,575 | |
| Diplomat Pharmacy, Inc.(a) | | | 250,400 | | | | 5,045,560 | |
| Encompass Health Corp. | | | 106,432 | | | | 6,084,718 | |
| Envision Healthcare Corp.(a) | | | 145,800 | | | | 5,603,094 | |
| MEDNAX, Inc.(a) | | | 75,100 | | | | 4,177,813 | |
| Select Medical Holdings Corp.(a) | | | 435,280 | | | | 7,508,580 | |
| | | | | | | | 33,578,340 | |
| INDUSTRIALS (15.05%) | | | | | | | | |
| Aerospace & Defense (0.83%) | | | | | | | | |
| KLX, Inc.(a) | | | 65,500 | | | | 4,654,430 | |
| | | | | | | | | |
| Building Products (1.16%) | | | | | | | | |
| Masco Corp. | | | 159,613 | | | | 6,454,750 | |
| | | | | | | | | |
| Commercial Services & Supplies (1.29%) | | | | | | | | |
| Mobile Mini, Inc. | | | 102,439 | | | | 4,456,096 | |
| Stericycle, Inc.(a) | | | 46,700 | | | | 2,733,351 | |
| | | | | | | | 7,189,447 | |
| Electrical Equipment (1.66%) | | | | | | | | |
| Generac Holdings, Inc.(a) | | | 108,551 | | | | 4,983,576 | |
| Sensata Technologies Holding N.V.(a) | | | 82,400 | | | | 4,270,792 | |
| | | | | | | | 9,254,368 | |
| Industrial Conglomerates (1.40%) | | | | | | | | |
| Carlisle Cos., Inc. | | | 75,000 | | | | 7,830,750 | |
| | | | | | | | | |
| Machinery (6.38%) | | | | | | | | |
| Astec Industries, Inc. | | | 74,837 | | | | 4,129,506 | |
| Crane Co. | | | 53,800 | | | | 4,989,412 | |
| Gardner Denver Holdings, Inc.(a) | | | 180,900 | | | | 5,550,012 | |
| Kornit Digital, Ltd.(a) | | | 316,800 | | | | 4,086,720 | |
| Rexnord Corp.(a) | | | 390,400 | | | | 11,587,072 | |
| Welbilt, Inc.(a) | | | 268,852 | | | | 5,229,171 | |
| | | | | | | | 35,571,893 | |
| Trading Companies & Distributors (2.33%) | | | | | | | | |
| BMC Stock Holdings, Inc.(a) | | | 503,961 | | | | 9,852,438 | |
| MRC Global, Inc.(a) | | | 189,300 | | | | 3,112,092 | |
| | | | | | | | 12,964,530 | |
See Notes to Financial Statements.
| Broadview Opportunity Fund | Schedule of Investments |
March 31, 2018 (Unaudited)
| | | | Shares | | | Value |
| COMMON STOCKS (87.85%) (continued) | | | | | | | | |
| INFORMATION TECHNOLOGY (14.23%) | | | | | | | | |
| Communications Equipment (2.27%) | | | | | | | | |
| Ciena Corp.(a) | | | 488,400 | | | $ | 12,649,560 | |
| | | | | | | | | |
| Electronic Equipment, Instruments & Components (0.81%) | | | | | | | | |
| Keysight Technologies, Inc.(a) | | | 85,900 | | | | 4,500,301 | |
| | | | | | | | | |
| IT Services (2.60%) | | | | | | | | |
| Acxiom Corp.(a) | | | 217,841 | | | | 4,947,169 | |
| Imperva, Inc.(a) | | | 220,200 | | | | 9,534,660 | |
| | | | | | | | 14,481,829 | |
| Semiconductors & Semiconductor Equipment (1.19%) | | | | | | | | |
| Marvell Technology Group, Ltd. | | | 317,100 | | | | 6,659,100 | |
| | | | | | | | | |
| Software (7.36%) | | | | | | | | |
| CommVault Systems, Inc.(a) | | | 180,254 | | | | 10,310,529 | |
| CyberArk Software, Ltd.(a) | | | 98,245 | | | | 5,012,460 | |
| FireEye, Inc.(a) | | | 409,300 | | | | 6,929,449 | |
| PROS Holdings, Inc.(a) | | | 133,200 | | | | 4,396,932 | |
| PTC, Inc.(a) | | | 91,419 | | | | 7,131,596 | |
| Tableau Software, Inc. - Class A(a) | | | 89,950 | | | | 7,269,759 | |
| | | | | | | | 41,050,725 | |
| MATERIALS (11.93%) | | | | | | | | |
| Chemicals (5.08%) | | | | | | | | |
| Ferro Corp.(a) | | | 416,853 | | | | 9,679,326 | |
| Kraton Corp.(a) | | | 206,570 | | | | 9,855,455 | |
| Olin Corp. | | | 153,700 | | | | 4,670,943 | |
| Westlake Chemical Corp. | | | 37,300 | | | | 4,145,895 | |
| | | | | | | | 28,351,619 | |
| Construction Materials (4.04%) | | | | | | | | |
| Summit Materials, Inc. - Class A(a) | | | 362,834 | | | | 10,986,614 | |
| US Concrete, Inc.(a) | | | 41,500 | | | | 2,506,600 | |
| Vulcan Materials Co. | | | 78,950 | | | | 9,013,721 | |
| | | | | | | | 22,506,935 | |
| Containers & Packaging (1.28%) | | | | | | | | |
| Sealed Air Corp. | | | 166,600 | | | | 7,128,814 | |
| | | | | | | | | |
| Metals & Mining (1.53%) | | | | | | | | |
| Allegheny Technologies, Inc.(a) | | | 360,000 | | | | 8,524,800 | |
| | | | | | | | | |
| TOTAL COMMON STOCKS | | | | | | | | |
| (COST $377,492,524) | | | | | | | 489,837,868 | |
See Notes to Financial Statements.
| Semi-Annual Report | March 31, 2018 | 9 |
| Broadview Opportunity Fund | Schedule of Investments |
March 31, 2018 (Unaudited)
| | | | Shares | | | Value |
| SHORT-TERM SECURITY (11.99%) | | | | | | | | |
| MONEY MARKET FUND (11.99%) | | | | | | | | |
| Morgan Stanley Institutional Liquidity Funds - Government Portfolio, Institutional Class, 7 Day Yield 1.573% | | | 66,867,225 | | | $ | 66,867,225 | |
| | | | | | | | | |
| TOTAL SHORT-TERM SECURITY | | | | | | | | |
| (COST $66,867,225) | | | | | | | | |
| | | | | | | | 66,867,225 | |
| TOTAL INVESTMENTS (99.84%) | | | | | | | | |
| (COST $444,359,749) | | | | | | | 556,705,093 | |
| | | | | | | | | |
| TOTAL ASSETS IN EXCESS OF OTHER LIABILITIES (0.16%) | | | | | | | 911,926 | |
| | | | | | | | | |
| NET ASSETS 100.00% | | | | | | $ | 557,617,019 | |
| (a) | Non-income producing security. |
Percentages are stated as a percent of net assets.
See Notes to Financial Statements.
| Broadview Opportunity Fund | Statement of Assets and Liabilities |
March 31, 2018 (Unaudited)
| ASSETS: | |
| Investments in securities, at value | $ | 556,705,093 | |
| Cash | | 6,870 | |
| Receivable for investments sold | | 2,973,450 | |
| Receivable for shareholder purchases | | 203,860 | |
| Dividends and interest receivable | | 263,312 | |
| Prepaid expenses | | 59,225 | |
| Total assets | | 560,211,810 | |
| | | | |
| LIABILITIES: | | | |
| Payable for management fees | | 487,288 | |
| Payable for investments purchased | | 1,329,806 | |
| Payable to shareholders for redemptions | | 501,878 | |
| Payable for transfer agency fees | | 145,418 | |
| Payable for Board of Trustees fees | | 195 | |
| Payable for chief compliance officer fees | | 5,617 | |
| Accrued expenses and other liabilities | | 124,589 | |
| Total liabilities | | 2,594,791 | |
| NET ASSETS | $ | 557,617,019 | |
| | | | |
| NET ASSETS CONSIST OF: | | | |
| Paid-in capital | $ | 406,031,800 | |
| Accumulated net investment loss | | (4,424,887 | ) |
| Accumulated net realized gain on investments | | 43,664,762 | |
| Net unrealized appreciation on investments | | 112,345,344 | |
| NET ASSETS | $ | 557,617,019 | |
| | | | |
| INVESTMENTS IN SECURITIES, AT COST | $ | 444,359,749 | |
| | | | |
| PRICING OF SHARES: | | | |
| Net Asset Value, offering and redemption price per share | $ | 34.56 | |
| Net Assets | $ | 557,617,019 | |
| Shares of beneficial interest outstanding (unlimited number of shares authorized with no par value per share) | | 16,134,913 | |
See Notes to Financial Statements.
| Semi-Annual Report | March 31, 2018 | 11 |
| Broadview Opportunity Fund | Statement of Operations |
For the Period Ended March 31, 2018 (Unaudited)
| INVESTMENT INCOME: | |
| Dividends | $ | 2,250,165 | |
| Total Investment Income | | 2,250,165 | |
| | | | |
| EXPENSES: | | | |
| Management fees | | 2,974,033 | |
| Administration and accounting services | | 104,405 | |
| Transfer agent fees | | 332,116 | |
| Professional fees | | 42,375 | |
| Custodian fees | | 16,820 | |
| Board of Trustees fees | | 30,339 | |
| Chief compliance officer fees | | 16,808 | |
| Printing and postage expenses | | 36,843 | |
| Registration fees | | 21,295 | |
| Other expenses | | 24,137 | |
| Total Expenses | | 3,599,171 | |
| NET INVESTMENT LOSS | | (1,349,006 | ) |
| | | | |
| REALIZED AND UNREALIZED GAIN/(LOSS) FROM INVESTMENTS: | | | |
| Net realized gain on investments | | 48,126,789 | |
| Net change in unrealized depreciation of investments | | (23,129,339 | ) |
| NET REALIZED AND UNREALIZED GAIN FROM INVESTMENTS | | 24,997,450 | |
| NET INCREASE IN NET ASSETS RESULTING FROM OPERATIONS | $ | 23,648,444 | |
See Notes to Financial Statements.
| Broadview Opportunity Fund | Statements of Changes in Net Assets |
| | For the Six Months Ended March 31, 2018 (Unaudited) | | For the Year Ended September 30, 2017 |
| OPERATIONS: | | | |
| Net investment loss | $ | (1,349,006 | ) | | $ | (4,132,946 | ) |
| Net realized gain on investments | | 48,126,789 | | | | 67,963,720 | |
| Net change in unrealized appreciation/(depreciation) on investments | | (23,129,339 | ) | | | 6,020,754 | |
| Net increase in net assets resulting from operations | | 23,648,444 | | | | 69,851,528 | |
| | | | | | | | |
| DISTRIBUTIONS TO SHAREHOLDERS (Note 5): | | | | | | | |
| From net realized gains on investments | | (62,281,529 | ) | | | (30,306,302 | ) |
| Total distributions | | (62,281,529 | ) | | | (30,306,302 | ) |
| | | | | | | | |
| SHARE TRANSACTIONS: | | | | | | | |
| Proceeds from sales of shares | | 22,125,740 | | | | 69,718,699 | |
| Distributions reinvested | | 61,406,985 | | | | 29,553,564 | |
| Cost of shares redeemed | | (99,012,898 | ) | | | (180,925,285 | ) |
| Net decrease from share transactions | | (15,480,173 | ) | | | (81,653,022 | ) |
| | | | | | | | |
| Net decrease in net assets | | (54,113,258 | ) | | | (42,107,796 | ) |
| | | | | | | | |
| NET ASSETS: | | | | | | | |
| Beginning of period | | 611,730,277 | | | | 653,838,073 | |
| End of period* | $ | 557,617,019 | | | $ | 611,730,277 | |
| *Includes accumulated net investment loss of: | $ | (4,424,887 | ) | | $ | (3,075,881 | ) |
| | | | | | | | |
| Other Information: | | | | | | | |
| SHARE TRANSACTIONS: | | | | | | | |
| Sold | | 613,022 | | | | 1,948,981 | |
| Distributions reinvested | | 1,770,674 | | | | 824,597 | |
| Redeemed | | (2,737,651 | ) | | | (5,071,033 | ) |
| Net decrease in shares outstanding | | (353,955 | ) | | | (2,297,455 | ) |
See Notes to Financial Statements.
| Semi-Annual Report | March 31, 2018 | 13 |
| Broadview Opportunity Fund | Financial Highlights |
For a Share Outstanding Throughout the Periods Presented
| | | For the Six Months Ended March 31, 2018 (Unaudited) | | For the Year Ended September 30, 2017 | | For the Year Ended September 30, 2016 | | For the Year Ended September 30, 2015 | | For the Year Ended September 30, 2014(a) | | For the Year Ended September 30, 2013 |
| NET ASSET VALUE, BEGINNING OF PERIOD | | $ | 37.10 | | | $ | 34.80 | | | $ | 33.85 | | | $ | 38.48 | | | $ | 40.85 | | | $ | 30.26 | |
| INCOME/(LOSS) FROM OPERATIONS: | | | | | | | | | | | | | | | | | | | | | | | | |
| Net investment loss | | | (0.08 | )(b) | | | (0.23 | )(b) | | | (0.14 | )(b) | | | (0.19 | ) | | | (0.21 | ) | | | (0.15 | ) |
| Net realized and unrealized gain/(loss) on investments | | | 1.48 | | | | 4.20 | | | | 3.96 | | | | (0.33 | ) | | | 2.18 | | | | 11.59 | |
| Total from investment operations | | | 1.40 | | | | 3.97 | | | | 3.82 | | | | (0.52 | ) | | | 1.97 | | | | 11.44 | |
| | | | | | | | | | | | | | | | | | | | | | | | | |
| LESS DISTRIBUTIONS: | | | | | | | | | | | | | | | | | | | | | | | | |
| From net realized gains on investments | | | (3.94 | ) | | | (1.67 | ) | | | (2.87 | ) | | | (4.11 | ) | | | (4.34 | ) | | | (0.85 | ) |
| Total distributions | | | (3.94 | ) | | | (1.67 | ) | | | (2.87 | ) | | | (4.11 | ) | | | (4.34 | ) | | | (0.85 | ) |
| INCREASE/(DECREASE) IN NET ASSET VALUE | | | (2.54 | ) | | | 2.30 | | | | 0.95 | | | | (4.63 | ) | | | (2.37 | ) | | | 10.59 | |
| NET ASSET VALUE, END OF PERIOD | | $ | 34.56 | | | $ | 37.10 | | | $ | 34.80 | | | $ | 33.85 | | | $ | 38.48 | | | $ | 40.85 | |
| | | | | | | | | | | | | | | | | | | | | | | | | |
| TOTAL RETURN | | | 3.74 | %(c) | | | 11.58 | % | | | 12.17 | % | | | (2.40 | %) | | | 4.86 | % | | | 38.91 | % |
| | | | | | | | | | | | | | | | | | | | | | | | | |
| SUPPLEMENTAL DATA: | | | | | | | | | | | | | | | | | | | | | | | | |
| Net assets, end of period (000's) | | $ | 557,617 | | | $ | 611,730 | | | $ | 653,838 | | | $ | 742,230 | | | $ | 904,151 | | | $ | 852,723 | |
| | | | | | | | | | | | | | | | | | | | | | | | | |
| RATIOS TO AVERAGE NET ASSETS: | | | | | | | | | | | | | | | | | | | | | | | | |
| Operating expenses | | | 1.21 | %(d) | | | 1.23 | % | | | 1.25 | % | | | 1.23 | % | | | 1.25 | % | | | 1.26 | % |
| Net investment loss | | | (0.45 | %)(d) | | | (0.64 | %) | | | (0.42 | %) | | | (0.48 | %) | | | (0.50 | %) | | | (0.44 | %) |
| PORTFOLIO TURNOVER RATE | | | 25 | %(c) | | | 53 | % | | | 40 | % | | | 41 | % | | | 56 | % | | | 70 | % |
|
(a) | On November 25, 2013, shareholders of the FMI Focus Fund, a series of FMI Funds, Inc. (the "Predecessor Fund"), approved a tax-free reorganization under which all assets and liabilities of the Predecessor Fund were transferred to the Broadview Opportunity Fund, a series of Broadview Funds Trust, at the close of business on November 29, 2013. |
| (b) | Per share amounts are based upon average shares outstanding. |
See Notes to Financial Statements.
| Broadview Opportunity Fund | Notes to Financial Statements |
| | March 31, 2018 (Unaudited) |
Broadview Funds Trust (the “Trust”) is an open-end management investment company registered under the Investment Company Act of 1940, as amended (the “1940 Act”). The Trust was organized on September 9, 2013 as a Delaware statutory trust. The Trust currently offers one series, the Broadview Opportunity Fund (the “Fund”). The Fund is a diversified portfolio with an investment objective to seek capital appreciation.
On November 25, 2013, shareholders of the FMI Focus Fund, a series of FMI Funds, Inc. (the “Predecessor Fund”), approved a tax-free reorganization under which all assets and liabilities of the Predecessor Fund were transferred to the Fund, a series of the Trust, at the close of business on November 29, 2013. The Predecessor Fund commenced operations on December 16, 1996. On the date of the reorganization, the Predecessor Fund was deemed to be the accounting survivor for financial reporting purposes, and as a result, the financial statements and the financial highlights reflect the operations of the Predecessor Fund for periods prior to the reorganization date.
| 2. | SIGNIFICANT ACCOUNTING POLICIES |
The following is a summary of significant accounting policies consistently followed by the Fund. These policies are in conformity with U.S. generally accepted accounting principles (“GAAP”). The Fund is an investment company and accordingly follows the investment company accounting and reporting guidance of the Financial Accounting Standards Board (“FASB”) Accounting Standards Codification Topic 946 Financials Services- Investment Companies.
Use of Estimates — The preparation of financial statements in conformity with GAAP requires management to make estimates and assumptions that affect the reported amounts of assets and liabilities and disclosure of contingent assets and liabilities at the date of the financial statements and the reported amounts of increases and decreases in net assets from operations during the reporting period. Actual results could differ from those estimates.
Investment Valuation — The Fund’s portfolio securities are fair valued as of the close of trading of the New York Stock Exchange (“NYSE”) (normally 4:00 p.m., Eastern Time). Each security, excluding short-term investments, is valued at the last sale price reported by the principal security exchange on which the issue is traded. Securities that are traded on the Nasdaq Stock Market, Inc. are valued at the Nasdaq Official Closing Price or if no sale is reported, the mean between the bid and the ask. Securities which are traded over-the-counter are valued at the last sale price or, if no sale price, at the mean between the bid and the ask. Securities sold short which are listed on a national securities exchange or the Nasdaq Stock Market but which were not traded on the valuation date are valued at the mean between the bid and the ask. Unlisted equity securities for which market quotations are readily available are valued at the last sale price or, if no sale price, at the mean between the bid and the ask. Options purchased or written by the Fund are valued at the mean of the highest bid and lowest ask price of all the exchanges on which the option trades. Securities for which quotations are not readily available are valued at fair value as determined by the investment adviser in accordance with procedures approved by the Board of Trustees. The fair value of a security is the amount which the Fund might reasonably expect to receive upon a current sale. The fair value of a security may differ from the last quoted price and the Fund may not be able to sell a security at the fair value. Market quotations may not be available, for example, if trading in particular securities was halted during the day and not resumed prior to the close of trading on the NYSE. As of March 31, 2018, there were no securities that were internally fair valued by the investment adviser. Variable rate demand notes are recorded at par value which approximates market value. Variable rate demand notes are recorded at par value which approximates market value. Money market funds, representing short-term investments, are valued at their net asset value. Other short-term investments with maturities of 60 days or less are valued at fair value.
Securities Transactions and Related Investment Income — Dividend income is recorded on the ex-dividend date. Realized gains and losses from investment transactions are determined using the identified cost basis. Interest income which includes amortization of premium and accretion of discount, is recorded on the accrual basis. Withholding taxes on foreign dividends have been provided for in accordance with the Fund’s understanding of the applicable country’s tax rules and regulations. For financial reporting purposes, investment transactions are recorded on the trade date.
Fair Value Measurements — A three-tier hierarchy has been established to classify fair value measurements for disclosure purposes. Inputs refer broadly to the assumptions that market participants would use in pricing the asset or liability, including assumptions about risk. Inputs may be observable or unobservable. Observable inputs are inputs that reflect the assumptions market participants would use in pricing the asset or liability that are developed based on market data obtained from sources independent of the reporting entity. Unobservable inputs are inputs that reflect the reporting entity’s own assumptions about the assumptions market participants would use in pricing the asset or liability that are developed based on the best information available. In accordance with the authoritative guidance on fair value measurements and disclosure under GAAP, the Fund discloses fair value of its investments in a hierarchy that prioritizes the inputs to valuation techniques used to measure the fair value.
| Semi-Annual Report | March 31, 2018 | 15 |
| Broadview Opportunity Fund | Notes to Financial Statements |
| | March 31, 2018 (Unaudited) |
Various inputs are used in determining the value of the Fund’s investments as of the reporting period end. These inputs are categorized in the following hierarchy under GAAP:
| Level 1 — | Unadjusted quoted prices in active markets for identical, unrestricted assets or liabilities that the Fund has the ability to access at the measurement date; |
| Level 2 — | Quoted prices which are not active, quoted prices for similar assets or liabilities in active markets or inputs other than quoted prices that are observable (either directly or indirectly) for substantially the full term of the asset or liability; and |
| Level 3 — | Significant unobservable prices or inputs (including the Fund’s own assumptions in determining the fair value of investments) where there is little or no market activity for the asset or liability at the measurement date. |
The availability of observable inputs can vary from security to security and is affected by a wide variety of factors, including, for example, the type of security, whether the security is new and not yet established in the marketplace, the liquidity of markets, and other characteristics particular to the security. To the extent that valuation is based on models or inputs that are less observable or unobservable in the market, the determination of fair value requires more judgment. Accordingly, the degree of judgment exercised in determining fair value is greatest for instruments categorized in Level 3.
An investment level within the fair value hierarchy is based on the lowest level input, individually or in the aggregate, that is significant to fair value measurement. The valuation techniques used by the Fund to measure fair value during the period ended March 31, 2018, maximized the use of observable inputs and minimized the use of unobservable inputs.
The inputs or methodologies used for valuing securities are not necessarily an indication of the risk or liquidity associated with investing in those securities. The following is a summary of the inputs used in valuing the Fund’s investments as of March 31, 2018:
Broadview Opportunity Fund
| | | Valuation Inputs | | | | |
| Investments in Securities at Fair Value* | | Level 1 | | | Level 2 | | | Level 3 | | | Total | |
| Common Stocks | | $ | 489,837,868 | | | $ | — | | | $ | — | | | $ | 489,837,868 | |
| Short-Term Security | | | 66,867,225 | | | | — | | | | — | | | | 66,867,225 | |
| Total | | $ | 556,705,093 | | | $ | — | | | $ | — | | | $ | 556,705,093 | |
| * | See Schedule of Investments for industry classification. |
It is the Fund’s policy to recognize transfers between levels at the end of the reporting period. There were no transfers between Levels 1 and 2 during the period ended March 31, 2018.
For the period ended March 31, 2018, the Fund did not have any unobservable inputs (Level 3) used in determining fair value.
Distributions to Shareholders — Dividends from net investment income and distributions of net realized capital gains, if any, will be declared and paid at least annually. Income and capital gains distributions are determined in accordance with income tax regulations, which may differ from GAAP. Distributions to shareholders are recorded on the ex-dividend date.
Income Taxes — As of and during the period ended March 31, 2018, the Fund did not have a liability for any unrecognized tax benefits. The Fund files U.S. federal, state, and local tax returns as required. The Fund’s tax returns are subject to examination by the relevant tax authorities until expiration of the applicable statute of limitations which is generally three years after the filing of the tax return for federal purposes and four years for most state returns. Tax returns for open years have incorporated no uncertain tax positions that require a provision for income taxes. The Fund intends to continue to qualify each year as a “regulated investment company” under Subchapter M of the Internal Revenue Code of 1986, as amended. By so qualifying, the Fund will not be subject to Federal income taxes to the extent that it distributes substantially all of its taxable or tax-exempt income, if any, for its tax year ending September 30. In addition, by distributing in each calendar year substantially all of its net investment income, capital gains and certain other amounts, if any, the Fund will not be subject to a Federal excise tax. Therefore, no provision is made by the Fund for Federal income or excise taxes.
| Broadview Opportunity Fund | Notes to Financial Statements |
| | March 31, 2018 (Unaudited) |
| 3. | ADVISORY FEES, ADMINISTRATION FEES AND OTHER AGREEMENTS |
Investment Advisory Agreement
Effective as of the close of business on November 29, 2013, the Fund entered into an investment advisory agreement with Broadview Advisors, LLC (the “Adviser”). The Fund pays the Adviser a monthly fee based upon the average daily net assets of the Fund and calculated at an annual rate of 1.00%.
Beneficial Ownership
At March 31, 2018, Wells Fargo Advisors, LLC is a record owner of 27% of the Fund’s shares.
Fund Accounting Fees and Expenses
ALPS Fund Services, Inc. (“ALPS” or the “Administrator”) provides administrative, fund accounting and other services to the Fund under the Administration, Bookkeeping and Pricing Services Agreement (the “Administration Agreement”) with the Trust. Under the Agreement, ALPS is paid fees, accrued on a daily basis and paid on a monthly basis following the end of the month.
The Administrator is also reimbursed by the Fund for certain out of pocket expenses.
The Fund has entered into a Distribution Plan (the “Plan”) pursuant to Rule 12b-1 under the Act. The Plan provides that the Fund may incur certain costs which may not exceed the lesser of a monthly amount equal to 0.25% of the Fund’s daily net assets or the actual distribution costs incurred during the year. Amounts payable under the Plan are paid monthly for any activities or expenses primarily intended to result in the sale of shares of the Fund. For the period ended March 31, 2018, no such expenses were incurred. The Fund presently intends not to utilize the Plan or pay any 12b-1 fees during the fiscal year ending September 30, 2018.
Transfer Agent and Shareholder Services Agreement
ALPS serves as transfer, dividend paying and shareholder servicing agent for the Fund (the “Transfer Agent”) under a Transfer Agency and Services Agreement with the Trust.
Compliance Services
Through October 20, 2017, ALPS provided Chief Compliance Officer Services to the Fund under a Chief Compliance Officer Service Agreement. Effective October 20, 2017, the Trust, on behalf of the Fund, entered into a Chief Compliance Officer Support Services Agreement with ALPS. Under the Chief Compliance Officer Support Services Agreement, ALPS provides support services to the Trust’s Chief Compliance Officer with monitoring and testing the policies and procedures of the Trust in conjunction with requirements under Rule 38a-1 under the 1940 Act. ALPS is compensated under the Chief Compliance Officer Support Services Agreement.
Distributor
The Fund has entered into a Distribution Agreement with ALPS Distributors, Inc. (the “Distributor”) to provide distribution services to the Fund. The Distributor serves as underwriter/distributor of shares of the Fund.
Officer and Trustee Compensation
Officers of the Trust and Trustees who are “interested persons” of the Trust or the Adviser will receive no salary or fees from the Trust. Each Trustee who is not an ��interested person” receives an annual fee of $20,000 each year. The Trust reimburses each Trustee and Officer for his or her travel and other expenses relating to attendance at such meetings.
Certain Trustees and Officers of the Trust are also officers of the Adviser or ALPS.
| 4. | PURCHASES AND SALES OF INVESTMENT SECURITIES |
The aggregate cost of purchases and proceeds from sales of investment securities, excluding short-term securities, are shown below for the period ended March 31, 2018.
| Broadview Opportunity Fund | | | |
| Cost of Investments Purchased | | $ | 135,330,133 | |
| Proceeds from Investments Sold | | $ | 222,204,330 | |
| Semi-Annual Report | March 31, 2018 | 17 |
| Broadview Opportunity Fund | Notes to Financial Statements |
| | March 31, 2018 (Unaudited) |
Distributions are determined in accordance with federal income tax regulations, which differ from GAAP, and, therefore, may differ significantly in amount or character from net investment income and realized gains for financial reporting purposes. Financial reporting records are adjusted for permanent book/tax differences to reflect tax character but are not adjusted for temporary differences. The amounts and characteristics of tax basis distributions and composition of distributable earnings/(accumulated losses) are finalized at fiscal year-end.
The tax character of distributions paid during the year ended September 30, 2017, were as follows:
| | Ordinary
Income | | | Long-Term
Capital Gain |
| | $ | — | | | $ | 30,306,302 |
As of March 31, 2018, net unrealized appreciation/(depreciation) of investments based on the federal tax cost was as follows:
| | Cost of Investments | | | Gross Unrealized Appreciation | | | Gross Unrealized Depreciation | | | Net Appreciation
on Investments | |
| | $ | 446,844,107 | | | $ | 129,660,890 | | | $ | (19,799,904 | ) | | $ | 109,860,986 | |
The difference between book basis and tax basis is primarily attributable to wash sales.
| 6. | COMMITMENTS AND CONTINGENCIES |
Under the Trust’s organizational documents, each director, officer, employee or other agent of the Fund (including the Adviser) is indemnified, to the extent permitted by the Act, against certain liabilities that may arise out of performance of their duties to the Fund. Additionally, in the normal course of business, the Fund enters into contracts that contain a variety of indemnification clauses. The Fund’s maximum exposure under these arrangements is unknown as this would involve future claims that may be made against the Fund that have not yet occurred. However, the Fund has not had prior claims or losses pursuant to these contracts and believes the risk of loss to be remote.
| Broadview Opportunity Fund | Additional Information |
| | March 31, 2018 (Unaudited) |
| 1. | PROXY VOTING POLICIES AND VOTING RECORD |
A description of the policies and procedures that the Fund uses to vote proxies relating to portfolio securities is available without charge upon request by calling toll-free 855-846-1463, or on the Securities and Exchange Commission’s (“SEC”) website at http://www.sec.gov. Information regarding how the Fund voted proxies relating to portfolio securities during the most recent 12-month period ended June 30th is available without charge upon request by calling toll-free 855-846-1463, or on the SEC’s website at http://www.sec.gov.
| 2. | QUARTERLY PORTFOLIO HOLDINGS |
The Trust files a complete listing of portfolio holdings for the Fund with the SEC four times each fiscal year at quarter-ends. The Fund files the schedule of portfolio holdings with the SEC on Form N-CSR (second and fourth quarters) and on Form N-Q (first and third quarters). The filings are available upon request by calling 855-846-1463. Furthermore, you may obtain a copy of the filing on the SEC’s website at http://www.sec.gov. The Fund’s Forms N-CSR and N-Q may also be reviewed and copied at the SEC’s Public Reference Room in Washington, D.C., and information on the operation of the Public Reference Room may be obtained by calling 1-800-SEC-0330.
| 3. | BASIS FOR TRUSTEES’ APPROVAL OF THE INVESTMENT ADVISORY AGREEMENT |
The Board of Trustees (the “Board” or the “Trustees”) of Broadview Funds Trust (the “Trust”) met on November 20, 2017 to consider the renewal of the Investment Advisory Agreement (the “Agreement”) between the Trust, on behalf of the Broadview Opportunity Fund (the “Fund”), a series of the Trust, and Broadview Advisors, LLC, the Fund’s investment adviser (the “Adviser”). Prior to the meeting, the Trustees requested and received materials to assist them in considering the renewal of the Agreement. The materials provided contained information with respect to the factors enumerated below, including a copy of the Agreement, a memorandum prepared by the Trust’s outside legal counsel discussing in detail the Trustees’ fiduciary obligations and the factors they should assess in considering the renewal of the Agreement, the Adviser’s Form ADV, a due diligence questionnaire completed by the Adviser in response to a specific request letter from the Trust’s outside legal counsel, financial and insurance information for the Adviser, and detailed comparative information relating to the Fund’s performance, as well as the advisory fee and other expenses of the Fund. Based on their evaluation of the information provided by the Adviser, in conjunction with the Fund’s other service providers, the Trustees, by a unanimous vote (including a separate vote of the Trustees who are not “interested persons,” as that term is defined in the Investment Company Act of 1940, as amended (the “Independent Trustees”)), approved the continuation of the Agreement for an additional one-year term.
Discussion of Factors Considered
In considering the renewal of the Agreement and reaching their conclusions, the Trustees reviewed and analyzed various factors they determined were relevant, including the factors enumerated below.
Nature, Extent and Quality of Services Provided to the Fund. The Trustees considered the nature, extent and quality of services provided by the Adviser to the Fund and the amount of time devoted to the Fund’s affairs by the Adviser’s staff. The Trustees considered the Adviser’s specific responsibilities in all aspects of the day-to-day management of the Fund, as well as the qualifications, experience and responsibilities of Messrs. Richard E. Lane, Richard J. Whiting, Faraz Farzam and Aaron J. Garcia, the Fund’s portfolio managers, and other key personnel at the Adviser involved in the day-to-day activities of the Fund. The Trustees considered the stability of the key personnel, and that an employee of the Adviser is now serving as the Fund’s chief compliance officer, a role that has been recently assumed by Ms. Pingel. The Trustees reviewed the structure of the Adviser’s compliance program and discussed the Adviser’s marketing activity and its continuing commitment to the growth of Fund assets. The Trustees also noted any services that extended beyond portfolio management, and they considered the brokerage practices of the Adviser, including information provided with respect to brokerage commissions paid by the Fund. The Trustees concluded that the Adviser had sufficient quality and depth of personnel, resources, investment methods and compliance policies and procedures essential to performing its duties under the Investment Advisory Agreement and that the nature, overall quality and extent of the management services provided to the Fund were satisfactory and reliable.
Investment Performance of the Fund and the Adviser. The Board reviewed the performance of the Fund for the year-to-date, one-year, three- year, five-year, ten-year, and since inception periods ended September 30, 2017 in comparison to the Fund’s benchmark indexes (the Russell 2000 Index and the Russell 2500 Index). In assessing the quality of the management services delivered by the Adviser, the Trustees also compared the short-term and long-term performance of the Fund on both an absolute and relative basis in comparison to a peer group of small blend funds (the “Peer Group”) selected by FUSE Research Network, LLC (“FUSE”), an independent consulting firm, and a universe that consists of the Fund, the Peer Group, and other funds classified by Morningstar as small blend funds with similar characteristics as determined by FUSE (the “Universe”), for the quarter, one-year, three-year, five-year, ten-year and since inception periods ended September 30, 2017. The Trustees also reviewed information on the historical performance of a composite consisting of other separately-managed accounts of the Adviser that were similar to the Fund in terms of investment strategy.
| Semi-Annual Report | March 31, 2018 | 19 |
| Broadview Opportunity Fund | Additional Information |
| | March 31, 2018 (Unaudited) |
The Trustees noted that the Fund underperformed its benchmarks for the year-to-date, one-year, three-year and five-year periods ended September 30, 2017. The Fund outperformed its benchmarks for the ten-year and since inception periods ended September 30, 2017. The Trustees noted that the Fund’s performance, in comparison to the Universe, was in the 87th percentile for the year-to-date, 91st percentile for the one-year, the 80th percentile for the three-year, the 57th percentile for the five-year, the 18th percentile for the ten-year and the 1st percentile for the since inception periods ended September 30, 2017. The Trustees noted that the Fund’s performance for all periods was generally in-line with the performance of the composite consisting of the Adviser’s other separately-managed accounts with similar investment strategies to that of the Fund. The Trustees also considered the Adviser’s investment strategy for the Fund, noting that the strategy tends to underperform late in an economic cycle, which was a factor that contributed to the Fund’s disappointing short term results.
After considering all of the information, the Trustees concluded that the performance obtained by the Adviser for the Fund was satisfactory under current market conditions. Although past performance is not a guarantee or indication of future results, the Trustees determined that the Fund and its shareholders were likely to continue to benefit from the Adviser’s management.
Costs of Services Provided and Profits Realized by the Adviser. The Trustees considered the cost of services and the structure of the Adviser’s fees, including a review of the expense analyses and other pertinent material with respect to the Fund. The Trustees reviewed the related statistical information and other materials provided, including the comparative expenses and expense components of the Universe and Peer Group. The Trustees considered that many of the funds in the Peer Group were series of larger fund families which provide efficiencies that the Fund will not be able to achieve as a single-fund complex. In addition, the Trustees considered the load structure (no-load funds without Rule 12b-1 fees) in the Universe and Peer Group.
The Trustees also considered the overall profitability of the Adviser and reviewed the Adviser’s financial information. The Trustees also examined the profitability analysis prepared by the Adviser from the fees payable under the Investment Advisory Agreement, as well as the Fund’s brokerage commissions and use of soft dollars by the Adviser.
The Trustees noted that the Fund’s contractual management fee of 1.00% is above the Peer Group median of 0.83% and is above the Universe median of 0.85%. The Trustees observed that the Fund’s total annual fund operating expense ratio of 1.25% is above both the Peer Group median of 1.14% and above the Universe median of 1.16%.
The Trustees then compared the fees paid by the Fund to the fees paid by separately-managed accounts of the Adviser and noted that the Fund’s management fee was at the top of the range of fees paid by the separately-managed account clients but that the Adviser has additional responsibilities with respect to the Fund, including financial commitments and additional compliance and reporting obligations that support the reasonableness of the Fund’s management fee.
The Trustees concluded that the Fund’s expenses and the management fee to be paid to the Adviser were fair and reasonable in light of the comparative performance, expense and management fee information. The Trustees noted, based on the profitability analysis prepared by the Adviser, that the Adviser’s profit from sponsoring the Fund had not been, and was not, excessive and the Adviser maintained adequate profit levels to support its services to the Fund from the revenues of its overall investment advisory activities.
Extent of Economies of Scale. The Trustees compared the Fund’s expenses relative to the Peer Group and discussed realized and potential economies of scale. The Trustees also reviewed the structure of the Fund’s management fee and whether the Fund was large enough to generate economies of scale for shareholders or whether economies of scale would be expected to be realized as Fund assets grow (and if so, how those economies of scale would be shared with shareholders). The Trustees noted that no expense limitation arrangements with respect to the Fund were being contemplated by the Adviser at this time. The Trustees noted that the Fund’s management fee structure did not contain any breakpoint reductions as the Fund’s assets grow in size, but that the flexibility of incorporating breakpoints would continue to be reviewed on a regular basis. With respect to the Adviser’s fee structure, the Trustees concluded that the current fee structure was reasonable and reflected a sharing of economies of scale between the Adviser and the Fund.
Benefits Derived from the Relationship with the Fund. The Trustees considered the direct and indirect benefits that could be realized by the Adviser from its association with the Fund. The Trustees examined the brokerage commissions of the Adviser with respect to the Fund. The Trustees concluded that the benefits the Adviser may receive, such as greater name recognition, growth in separate account management services, increased ability to obtain research on brokerage services, or greater exposure to press coverage appear to be reasonable, and in many cases may benefit the Fund.
| Broadview Opportunity Fund | Additional Information |
| | March 31, 2018 (Unaudited) |
Based on the Trustees’ deliberations and their evaluation of the information described above, the Trustees, including the Independent Trustees, unanimously: (a) concluded that the terms of the Investment Advisory Agreement continue to be fair and reasonable; (b) concluded that the Adviser’s fees are reasonable in light of the services that the Adviser provides to the Fund; and (c) approved the Investment Advisory Agreement for another one year period.
| Semi-Annual Report | March 31, 2018 | 21 |

Item 2. Code of Ethics.
Not applicable to semi-annual report.
Item 3. Audit Committee Financial Expert.
Not applicable to semi-annual report.
Item 4. Principal Accountant Fees and Services.
Not applicable to semi-annual report.
Item 5. Audit Committee of Listed Registrants.
Not applicable to the Registrant.
Item 6. Schedule of Investments.
| (a) | The Registrant’s “Schedule I – Investments in securities of unaffiliated issuers” (as set forth in 17 CFR 210.12-12) is included in Item 1 of this Form N-CSR. |
| (b) | Not applicable to the Registrant. |
Item 7. Disclosure of Proxy Voting Policies and Procedures for Closed-End Management Investment Companies.
Not applicable to the Registrant.
Item 8. Portfolio Managers of Closed-End Management Investment Companies.
Not applicable to the Registrant.
Item 9. Purchases of Equity Securities by Closed-End Management Investment Company and Affiliated Purchasers.
Not applicable to the Registrant.
Item 10. Submission of Matters to a Vote of Security Holders.
None.
Item 11. Controls and Procedures.
| (a) | The Registrant’s principal executive officer and principal financial officer have evaluated the Registrant’s disclosure controls and procedures (as defined in Rule 30a-3(c) under the Investment Company Act of 1940, as amended (the “1940 Act”)) within 90 days of the filing of this report, as required by Rule 30a-3(b) under the Act and Rules 13a-15(b) or 15d-15(b) under the Securities Exchange Act of 1934, and have concluded that the Registrant’s disclosure controls and procedures were effective as of that date. |
| (b) | There was no change in the Registrant’s internal control over financial reporting (as defined in Rule 30a-3(d) under the 1940 Act) during the second fiscal quarter of the period covered by this report that has materially affected, or is reasonably likely to materially affect, the Registrant’s internal control over financial reporting. |
Item 12. Disclosure of Securities Lending Activities for Closed-End Management Investment Companies.
Not applicable to the Registrant.
Item 13. Exhibits.
| (a)(1) | Not applicable to semi-annual report. |
| (a)(2) | A separate certification for the Registrant’s Principal Executive Officer and Principal Financial Officer as required by Rule 30a-2(a) under the 1940 Act (17 CFR 270.30a-2(a)), are attached hereto as Ex99.Cert. |
| (b) | The certifications by the Registrant’s Principal Executive Officer and Principal Financial Officer, as required by Rule 30a-2(b) of the 1940 Act, and Section 906 of the Sarbanes-Oxley Act of 2002 are attached hereto as Ex99.906Cert. |
SIGNATURES
Pursuant to the requirements of the Securities Exchange Act of 1934 and the Investment Company Act of 1940, the Registrant has duly caused this report to be signed on its behalf by the undersigned, thereunto duly authorized.
Broadview Funds Trust
| By: | /s/ Richard E. Lane | |
| | Richard E. Lane | |
| | President | |
| | | |
| Date: | June 5, 2018 | |
Pursuant to the requirements of the Securities Exchange Act of 1934 and the Investment Company Act of 1940, this report has been signed below by the following persons on behalf of the Registrant and in the capacities and on the dates indicated.
| By: | /s/ Richard E. Lane | |
| | Richard E. Lane | |
| | President (Principal Executive Officer) | |
| | | |
| Date: | June 5, 2018 | |
| By: | /s/ Aaron J. Garcia | |
| | Aaron J. Garcia | |
| | Chief Financial Officer (Principal Financial Officer) |
| | | |
| Date: | June 5, 2018 | |