UNITED STATES
SECURITIES AND EXCHANGE COMMISSION
Washington, D.C. 20549
FORM N-CSRS
CERTIFIED SHAREHOLDER REPORT OF REGISTERED
MANAGEMENT INVESTMENT COMPANIES
Investment Company Act file number: 811-22885
Broadview Funds Trust
(Exact name of registrant as specified in charter)
330 East Kilbourn Ave., Suite 1475
Milwaukee, Wisconsin 53202
(Address of principal executive offices) (Zip code)
Angela L. Pingel
Broadview Advisors, LLC
330 East Kilbourn Ave., Suite 1475
Milwaukee, Wisconsin 53202
(Name and address of agent for service)
Registrant’s telephone number, including area code: (414) 918-3900
| Date of fiscal year end: | September 30, 2018 |
| Date of reporting period: | October 1, 2018 – March 31, 2019 |
| Item 1. | Reports to Stockholders. |

table of contents
| Shareholder Letter | 1 |
| Manager Commentary | 4 |
| Disclosure of Fund Expenses | 6 |
| Schedule of Investments | 7 |
| Statement of Assets and Liabilities | 10 |
| Statement of Operations | 11 |
| Statements of Changes in Net Assets | 12 |
| Financial Highlights | 13 |
| Notes to Financial Statements | 14 |
| Additional Information | 18 |
Beginning on January 1, 2021, as permitted by regulations adopted by the SEC, paper copies of the annual and semi-annual shareholder reports for the Broadview Opportunity Fund (the “Fund”) will no longer be sent by mail, unless you specifically request paper copies of the reports from the Fund or from your financial intermediary (such as a broker-dealer or bank). Instead, the reports will be made available on the Fund’s website (www.bvafunds.com), and you will be notified by mail each time a report is posted and provided with a website link to access the report.
Beginning on January 1, 2019, you may elect to receive all future reports in paper free of charge. If you invest through a financial intermediary, you can contact your financial intermediary to request that you continue to receive paper copies of your shareholder reports. If you invest directly with the Fund, you can call the Fund toll-free at (855) 846-1463. If you invest through a financial intermediary, your election to receive reports in paper will apply to all funds held in your account.
If you already elected to receive shareholder reports electronically, you will not be affected by this change and you need not take any action. You may elect to receive shareholder reports and other communications from the Fund electronically anytime by contacting your financial intermediary or, if you invest directly with the Fund, by calling (855) 846-1463.
| Broadview Opportunity Fund | Shareholder Letter |
March 31, 2019 (Unaudited)
Dear Fellow Shareholders,
Rebound from Chaos – Rick Lane, CFA
The December 2018 equity market reminded me of the character “Mayhem” from the Allstate Insurance commercials. Maybe worse! As highlighted in the December 2018 letter, on the heels of Federal Reserve (“Fed”) Chairman Jerome Powell’s march toward higher interest rates, the financial markets hit a tipping point last fall. Investors became convinced the Fed was on autopilot and would raise interest rates three to four times in 2019 alone. Along with many others, we believed this course of rate hikes would send the U.S. economy into recession. Financial and cyclical stocks were hit especially hard as investors prepared for a market downturn.
Things changed in a hurry as the Fed reacted to the market carnage. The Fed essentially signaled that further interest rate increases would be on hold for the foreseeable future. Furthermore, we believe weak economic data from Europe and China caused the European Central Bank to back off their tightening and the Chinese government to expand stimulative policies.
As fast as the markets declined, they quickly clawed back a significant portion of their year-end losses. While technology stocks took the lead in regaining ground, in many cases commanding premium multiples, other areas of the market were slower to move off the recent decline. Financial stocks, being interest rate sensitive, led the market selloff in December 2018. Relative to the broader markets, they have not recovered and sell at low multiples. Many of our bank and insurance holdings sell as low as seven to ten times earnings, while sporting three to four-and-a-half percent dividend yields.
The Fund’s financial investments all have some idiosyncratic aspects that are driving earnings. Warren Buffet has spoken extensively of the astonishingly low bank valuations, particularly in a low interest rate environment. Buffet used J.P. Morgan Chase & Co. (JPM) as an example in an extensive interview with CNBC’s Becky Quick on “Squawk Box” on February 25, 2019. He contended, “you can find a bank like [J.P. Morgan], maybe 15%, maybe 17%, even, on net tangible equity. A business that earns 15% or 16% or 17% on net tangible equity, that’s incredible in a world of 3% bonds… if you have an instrument that could compound at 15% for ten years and use the added capital, that’s worth way more than three times tangible equity at current interest rates, way more.” As of April 23, 2019, J.P. Morgan is trading at 2.0 times tangible book value.
Given the later stage of the economic cycle, for industrial companies, we want to see something unique and inexpensive. For example, we believe the aerospace industry is in the middle of a multi-year upcycle driven by a historically robust backlog of planes constructed of modern composite materials and super alloys. These materials allow for more fuel efficiency, less noise, and a better passenger experience. In our opinion, the currently advanced age of the airline fleets in developed economies and the growth in air fleets from emerging economies should drive demand for at least the next five years.
The volatility investors had to contend with in these past six months has been challenging. We believe this very volatility affords opportunity. Each portfolio manager maintains a “bench” of pre-vetted names, all awaiting price limits. We believe this patient and disciplined approach has served us well over time. Toward that end, Aaron Garcia reviews FLIR Systems, Inc. (FLIR) below. Then, Faraz Farzam discusses trends in the technology and consumer sectors.
FLIR Systems, Inc. (FLIR) – Aaron Garcia, CFA
FLIR Systems provides thermal imaging systems in a broad array of applications for the commercial, industrial, and government markets. We started looking at FLIR Systems in 2015. Although we liked the fundamentals of the business and the underlying technology, management was struggling to generate reliable results and develop new commercial market opportunities.
In February 2017, the CEO and CFO of FLIR Systems announced their resignations. James Cannon was appointed CEO effective June 2017. Since his start, the company has simplified its go-to-market strategy for its commercial division and made a renewed push into the defense markets with some key hires. Results in 2017 and 2018 were largely more positive. Additionally, the company has acquired several drone companies that provide another leg of growth for FLIR Systems.
In our opinion, the company now has the tools necessary to successfully gain access to larger defense programs. We also believe that, in a general sense, FLIR Systems is transitioning from a point provider of sensors to a solution provider of intelligent sensing. This includes artificial intelligence capability, Unmanned Aerial Systems (“UAS”) enclosures, and other exciting extensions to their product portfolio. We think this will open new commercial markets and be accretive to long-term revenue growth.
While investors have largely cheered the renewed focus on profitable growth at the company, the stock pulled back meaningfully in late 2018 due to the market selloff. We took this opportunity to initiate a position in the company. We feel that the current product portfolio is highly profitable with nice growth of 1.5x Gross Domestic Product. The opportunity in UAS and autonomous systems could drastically raise the growth profile of the company. While we believe this opportunity is difficult to quantify, we posit that the current valuation is attractive for FLIR System's legacy business on its own.
| Semi-Annual Report | March 31, 2019 | 1 |
| Broadview Opportunity Fund | Shareholder Letter |
March 31, 2019 (Unaudited)
Technology Sector Review – Faraz Farzam, CFA
Although the overall technology sector participated in the market rebound, the fundamental profiles of the technology industries have diverged. Fundamentals for semiconductor companies continue to be disappointing with companies reporting weak results and outlooks. However, this has not stopped the stocks from regaining ground as many investors believe the bottom is in the past and we may be poised for a second-half recovery. We believe there is little evidence to support a second-half recovery, built largely on the expectation of a natural reversion to the mean.
As of April 15, 2019, the Fund’s largest semiconductor investment, Marvell Technology Group Ltd. (MRVL), has reached a stock price not seen since June 2006. We are using the opportunity to realize gains and believe the bounce back has been too strong, too soon. Should we get a correction combined with evidence that the recovery is more than just hope, we will look to add to our names. We are rather cautious looking forward.
Beyond semiconductors, we generally believe technology company valuations are not attractive, especially in software where the fundamentals are strongest. However, we initiated a position in Cloudera, Inc. (CLDR), a software company we believe is attractively valued following a recent report which sent the shares crashing. Cloudera recently merged with its largest direct rival, Hortonworks, Inc. (HDP), a company we have previously held. The combined company is now a billion-dollar recurring revenue business, with a debt-free, cash-rich balance sheet generating nearly $100 million in free cash flow. We believe a great deal of the selloff was due to uncertainty regarding the forward expectations from the combination. Although there are competitive question marks surrounding the role of Cloud infrastructure providers, such as Amazon’s AWS, we believe the stock is simply too cheap to ignore.
Consumer Sector Review – Faraz Farzam, CFA
Our consumer investments delivered good results driven primarily by our consumer staples stocks, Scotts Miracle-Gro Company (SMG) and Freshpet Inc. (FRPT). Freshpet continues to deliver solid revenue growth while Scotts lawn care business is rebounding from 2018’s dismal spring weather. During the first quarter of 2019, we established a couple of new consumer staples positions, one being Edgewell Personal Care Co. (EPC).
Edgewell operates in three distinct categories: wet shave, sun and skin care and feminine care. Over the past three years, the wet shave category, made up of the Schick and Edge brands, has come under pressure mainly in North America. Industry giant Procter & Gamble Co. (PG) has cut prices in reaction to changing consumer behavior (men are opting for more facial hair these days), and online brands, like Dollar Shave Club, have added competition. However, over the past year Edgewell has been fighting back with innovation and counter-competitive price action. Point of sales data is encouraging as the numbers show the business may have stabilized after years of decline. On the other hand, the sun and skin care business built on the Hawaiian Tropic and Banana Boat brands is rather healthy and growing nicely. Although the feminine care business is also under pressure, new management has publicly expressed its intent to sell this asset and focus the business on the skin care brands (wet shave and sun). Although the stock as of April 15, 2019 is in the mid-$40s, we believe a conservative sum-of-the-parts analysis of the businesses values the company at $70 per share.
Best Regards,
 |  |  |  |
| Richard E. Lane, CFA | Faraz Farzam, CFA | Aaron J. Garcia, CFA | Richard J. Whiting |
| Broadview Opportunity Fund | Shareholder Letter |
March 31, 2019 (Unaudited)
The views and information discussed in this commentary are as of the date of publication, are subject to change, and may not reflect current views. The views expressed represent an assessment of market conditions at a specific point in time, are opinions only and should not be relied upon as investment advice regarding a particular investment or markets in general. Such information does not constitute a recommendation to buy or sell specific securities or investment vehicles. It should not be assumed that any investment will be profitable or will equal the performance of the Fund or any securities or any sectors mentioned herein. The subject matter contained herein has been derived from several sources believed to be reliable and accurate at the time of compilation.
A NOTE ON FORWARD-LOOKING STATEMENTS
Except for historical information contained in this report for the Fund, the matters discussed in this report may constitute forward-looking statements made pursuant to the safe-harbor provisions of the Private Securities Litigation Reform Act of 1995. These include any adviser or portfolio manager predictions, assessments, analyses or outlooks for individual securities, industries, market sectors and/or markets. These statements involve risks and uncertainties. In addition to the general risks described for the Fund in the current Prospectus, other factors bearing on this report include the accuracy of the adviser’s or portfolio managers’ forecasts and predictions, and the appropriateness of the investment programs designed by the adviser or portfolio managers to implement their strategies efficiently and effectively. Any one or more of these factors, as well as other risks affecting the securities markets and investment instruments generally, could cause the actual results of the Fund to differ materially as compared to benchmarks associated with the Fund.
| Semi-Annual Report | March 31, 2019 | 3 |
| Broadview Opportunity Fund | Manager Commentary |
March 31, 2019 (Unaudited)
MANAGEMENT’S DISCUSSION OF FUND PERFORMANCE
Over the past six months ended March 31, 2019, the Fund posted a loss of -8.50%, compared to a loss of -8.56% for the Russell 2000®Index and a loss of -5.59% for the Russell 2500® Index. Hidden behind these numbers is the volatility between the two quarters. For the quarter ended December 31, 2018, the Fund posted a loss of -20.97%, compared to a loss of -20.20% for the Russell 2000®Index and a loss of -18.49% for the Russell 2500® Index. In the first quarter of 2019, the markets reversed course and made up ground as the Fund returned 15.79%, the Russell 2000® Index returned 14.58%, and the Russell 2500® Index returned 15.82%.
Top contributors to Fund performance over the past six months include Ciena Corp. (CIEN), Marvell Technology Group Ltd. (MRVL), Imperva, Inc. (IMPV), Entegris, Inc. (ENTG), and LiveRamp Holdings, Inc. (RAMP). The most negative contributors to performance include Whiting Petroleum Corp. (WLL), Tivity Health, Inc. (TVTY), Western Alliance Bancorp (WAL), WillScot Corp. (WSC), and Kraton Corp. (KRA).
In the first fiscal quarter ended December 31, 2018, compared to the Russell 2000® Index, positive relative performance came from investments in the Information Technology sector along with cash holdings (which would be expected in a significantly negative quarter). Negatively impacting relative performance were holdings in the Financial, Energy and Materials sectors.
For the second fiscal quarter ended March 31, 2019, compared to the Russell 2000® Index, positive relative performance came from investments in the Industrials, Consumer Staples, and Financials sectors. Negatively impacting relative performance were investments in the Health Care sector and cash holdings (again, as would be expected in a significantly positive quarter).
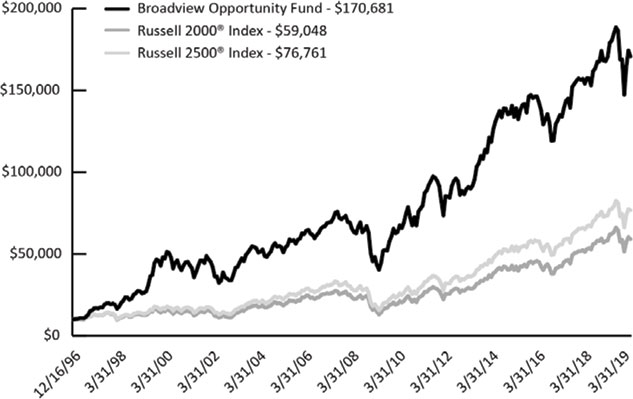
GROWTH OF $10,000 INVESTMENT IN THE FUND**
From its inception (12/16/96) to 3/31/19 as compared to the Russell 2000 Index(1) and the Russell 2500 Index(2)
| Broadview Opportunity Fund | Manager Commentary |
March 31, 2019 (Unaudited)
PERFORMANCE*(For Periods Ended 3/31/19)
| | Total Return** | Annualized Total Return** |
| | 3 Months | 1 Year | 5 Year | 10 Year | 15 Year | 20 Year | Since Inception*** |
| Broadview Opportunity Fund | 15.79% | 1.70% | 4.21% | 14.40% | 8.05% | 10.58% | 13.58% |
| Russell 2000®Index(1) | 14.58% | 2.05% | 7.05% | 15.36% | 8.04% | 8.44% | 8.29% |
| Russell 2500®Index(2) | 15.82% | 4.48% | 7.79% | 16.23% | 8.88% | 9.59% | 9.58% |
Performance data quoted represents past performance. Past performance does not guarantee future results. Investment return and principal value of an investment will fluctuate so that an investor’s shares, when sold or redeemed, may be worth more or less than the original cost. Current performance data may be higher or lower than actual data quoted. For the most recent month-end performance please visit bvafunds.com or call 1-855-846-1463. As of the Fund’s Prospectus dated January 28, 2019, the Broadview Opportunity Fund’s annual operating expense ratio is 1.23%. One cannot invest directly in an index.
| (1) | The Russell 2000® Index measures the performance of the 2,000 smallest companies in the Russell 3000® Index. The Russell 2000® Index serves as a benchmark for small-cap stocks in the United States. |
| (2) | The Russell 2500® Index is a market cap weighted index that includes the smallest 2,500 companies covered in the Russell 3000® Index, which comprises the 3,000 largest U.S. companies based on total market capitalization. |
| * | The Adviser believes that the Russell 2000®Index is the most appropriate benchmark for the Fund. As a result, the Russell 2000® Index is the primary benchmark for the Fund, and the Russell 2500® Index is the secondary benchmark for the Fund. |
| ** | Returns in the graph and table above reflect changes in share prices and the reinvestment of any dividends, interest and capital gain distributions. The returns do not reflect the deduction of taxes that a shareholder would pay on Fund distributions or the redemption of Fund shares. |
| *** | Fund Inception Date: December 16, 1996. |
SECTOR ALLOCATION(as of March 31, 2019) (As a percentage of net assets)
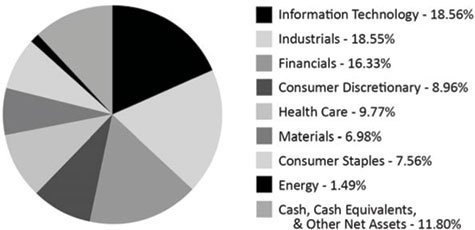
Holdings are subject to change.
These allocations may not reflect the current or future positions of the portfolio.
| Semi-Annual Report | March 31, 2019 | 5 |
| Broadview Opportunity Fund | Disclosure of Fund Expenses |
March 31, 2019 (Unaudited)
As a shareholder of the Broadview Opportunity Fund (the “Fund”) you will incur ongoing costs, including management fees and other Fund expenses. The following examples are intended to help you understand your ongoing costs (in dollars) of investing in the Fund and to compare these costs with the ongoing costs of investing in other mutual funds. The examples are based on an investment of $1,000 invested on October 1, 2018 and held until March 31, 2019.
Actual Expenses. The first line of the table below provides information about actual account values and actual expenses. You may use the information in this line, together with the amount you invested, to estimate the expenses that you paid over the period. Simply divide your account value by $1,000 (for example, an $8,600 account value divided by $1,000 = 8.6), then multiply the result by the number in the first line under the heading “Expenses Paid During Period” to estimate the expenses you paid on your account during this period.
Hypothetical Example for Comparison Purposes. The second line of the table below provides information about hypothetical account values and hypothetical expenses based on the Fund’s actual expense ratio and an assumed rate of return of 5% per year before expenses, which is not the Fund’s actual return. The hypothetical account values and expenses may not be used to estimate the actual ending account balance or expenses you paid for the period. You may use this information to compare the ongoing costs of investing in the Fund and other mutual funds. To do so, compare this 5% hypothetical example with the 5% hypothetical examples that appear in the shareholder reports of the other funds. The expenses shown in the table are meant to highlight ongoing Fund costs only and do not reflect any transactional costs, such as sales charges (loads), redemption fees, or exchange fees that, although not charged by the Fund, may be charged by other funds. Therefore, the second line of the table below is useful in comparing ongoing costs only, and may not help you determine the relative total costs of owning different funds.
| | Beginning Account Value 10/1/18 | Ending Account Value 3/31/19 | Expense Ratio(a) | Expenses Paid During Period 10/1/18 - 3/31/19(b) |
| Broadview Opportunity Fund | | | | |
| Actual | $1,000.00 | $915.40 | 1.30% | $6.21 |
| Hypothetical (5% return before expenses) | $1,000.00 | $1,018.45 | 1.30% | $6.54 |
| (a) | The Fund's expense ratios have been based on the Fund's most recent fiscal half-year expenses. |
| (b) | Expenses are equal to the Fund's annualized expense ratio multiplied by the average account value over the period, multiplied by the number of days in the most recent fiscal half-year (182)/365 (to reflect the half-year period). |
| Broadview Opportunity Fund | Schedule of Investments |
March 31, 2019 (Unaudited)
| | | Shares | | | Value | |
| COMMON STOCKS (88.20%) | | | | | | | | |
| CONSUMER DISCRETIONARY (8.96%) | | | | | | | | |
| Hotels, Restaurants & Leisure (1.52%) | | | | | | | | |
| Chuy’s Holdings, Inc.(a) | | | 200,883 | | | $ | 4,574,106 | |
| | | | | | | | | |
| Interactive Media & Services (1.99%) | | | | | | | | |
| TripAdvisor, Inc.(a) | | | 115,800 | | | | 5,957,910 | |
| | | | | | | | | |
| Leisure Products (1.31%) | | | | | | | | |
| Brunswick Corp. | | | 78,054 | | | | 3,928,458 | |
| | | | | | | | | |
| Media (1.11%) | | | | | | | | |
| National CineMedia, Inc. | | | 472,509 | | | | 3,331,188 | |
| | | | | | | | | |
| Multiline Retail (1.72%) | | | | | | | | |
| Nordstrom, Inc. | | | 116,200 | | | | 5,156,956 | |
| | | | | | | | | |
| Specialty Retail (1.31%) | | | | | | | | |
| Hibbett Sports, Inc.(a) | | | 172,951 | | | | 3,945,012 | |
| | | | | | | | | |
| CONSUMER STAPLES (7.56%) | | | | | | | | |
| Beverages (1.71%) | | | | | | | | |
| Boston Beer Co., Inc. - Class A(a) | | | 17,386 | | | | 5,124,176 | |
| | | | | | | | | |
| Chemicals (2.55%) | | | | | | | | |
| Scotts Miracle-Gro Co. | | | 97,572 | | | | 7,667,207 | |
| | | | | | | | | |
| Food Products (2.27%) | | | | | | | | |
| Freshpet, Inc.(a) | | | 89,900 | | | | 3,801,871 | |
| Hain Celestial Group, Inc.(a) | | | 131,000 | | | | 3,028,720 | |
| | | | | | | | 6,830,591 | |
| Personal Products (1.03%) | | | | | | | | |
| Edgewell Personal Care Co.(a) | | | 70,300 | | | | 3,085,467 | |
| | | | | | | | | |
| ENERGY (1.49%) | | | | | | | | |
| Oil, Gas & Consumable Fuels (1.49%) | | | | | | | | |
| Range Resources Corp. | | | 255,700 | | | | 2,874,068 | |
| Whiting Petroleum Corp.(a) | | | 61,220 | | | | 1,600,291 | |
| | | | | | | | 4,474,359 | |
| FINANCIALS (16.33%) | | | | | | | | |
| Banks (10.55%) | | | | | | | | |
| BOK Financial Corp. | | | 28,107 | | | | 2,292,126 | |
| Chemical Financial Corp. | | | 128,487 | | | | 5,288,525 | |
| IBERIABANK Corp. | | | 59,000 | | | | 4,230,890 | |
| LegacyTexas Financial Group, Inc. | | | 113,981 | | | | 4,261,750 | |
| PacWest Bancorp | | | 28,700 | | | | 1,079,407 | |
| Renasant Corp. | | | 44,600 | | | | 1,509,710 | |
| Veritex Holdings, Inc. | | | 145,298 | | | | 3,519,117 | |
| Western Alliance Bancorp(a) | | | 140,000 | | | | 5,745,600 | |
| Zions Bancorp | | | 82,400 | | | | 3,741,784 | |
| | | | | | | | 31,668,909 | |
| Consumer Finance (1.66%) | | | | | | | | |
| PRA Group, Inc.(a) | | | 186,400 | | | | 4,997,384 | |
| | | | | | | | | |
| Thrifts & Mortgage Finance (4.12%) | | | | | | | | |
| MGIC Investment Corp.(a) | | | 937,525 | | | | 12,365,955 | |
See Notes to Financial Statements.
| Semi-Annual Report | March 31, 2019 | 7 |
| Broadview Opportunity Fund | Schedule of Investments |
March 31, 2019 (Unaudited)
| | | Shares | | | Value | |
| COMMON STOCKS (88.20%) (continued) | | | | | | | | |
| HEALTH CARE (9.77%) | | | | | | | | |
| Biotechnology (0.93%) | | | | | | | | |
| Natera, Inc.(a) | | | 135,317 | | | $ | 2,790,237 | |
| | | | | | | | | |
| Commercial Services & Supplies (0.58%) | | | | | | | | |
| Stericycle, Inc.(a) | | | 32,100 | | | | 1,746,882 | |
| | | | | | | | | |
| Health Care Equipment & Supplies (3.45%) | | | | | | | | |
| Avanos Medical, Inc.(a) | | | 37,800 | | | | 1,613,304 | |
| Cardiovascular Systems, Inc.(a) | | | 31,500 | | | | 1,217,790 | |
| Globus Medical, Inc. - Class A(a) | | | 120,000 | | | | 5,929,200 | |
| Nevro Corp.(a) | | | 25,700 | | | | 1,606,507 | |
| | | | | | | | 10,366,801 | |
| Health Care Providers & Services (2.87%) | | | | | | | | |
| Encompass Health Corp. | | | 93,232 | | | | 5,444,749 | |
| Tivity Health, Inc.(a) | | | 179,565 | | | | 3,153,161 | |
| | | | | | | | 8,597,910 | |
| Health Care Technology (0.48%) | | | | | | | | |
| Vocera Communications, Inc.(a) | | | 45,800 | | | | 1,448,654 | |
| | | | | | | | | |
| Pharmaceuticals (1.46%) | | | | | | | | |
| Catalent, Inc.(a) | | | 107,700 | | | | 4,371,543 | |
| | | | | | | | | |
| INDUSTRIALS (18.55%) | | | | | | | | |
| Building Products (1.30%) | | | | | | | | |
| Masco Corp. | | | 98,713 | | | | 3,880,408 | |
| | | | | | | | | |
| Construction & Engineering (2.70%) | | | | | | | | |
| Construction Partners, Inc. - Class A(a) | | | 141,073 | | | | 1,801,502 | |
| WillScot Corp.(a) | | | 569,050 | | | | 6,310,765 | |
| | | | | | | | 8,112,267 | |
| Electrical Equipment (0.72%) | | | | | | | | |
| Thermon Group Holdings, Inc.(a) | | | 88,294 | | | | 2,164,086 | |
| | | | | | | | | |
| Electronic Equipment, Instruments & Components (1.00%) | | | | | | | | |
| FLIR Systems, Inc. | | | 63,200 | | | | 3,007,056 | |
| | | | | | | | | |
| Industrial Conglomerates (1.86%) | | | | | | | | |
| Carlisle Cos., Inc. | | | 45,600 | | | | 5,591,472 | |
| | | | | | | | | |
| Machinery (9.71%) | | | | | | | | |
| Crane Co. | | | 55,500 | | | | 4,696,410 | |
| Gardner Denver Holdings, Inc.(a) | | | 167,050 | | | | 4,645,660 | |
| Kennametal, Inc. | | | 21,027 | | | | 772,742 | |
| Kornit Digital, Ltd.(a) | | | 216,125 | | | | 5,143,775 | |
| Rexnord Corp.(a) | | | 238,956 | | | | 6,007,354 | |
| Twin Disc, Inc.(a) | | | 194,800 | | | | 3,243,420 | |
| Welbilt, Inc.(a) | | | 282,994 | | | | 4,635,442 | |
| | | | | | | | 29,144,803 | |
| Trading Companies & Distributors (1.26%) | | | | | | | | |
| Beacon Roofing Supply, Inc.(a) | | | 117,700 | | | | 3,785,232 | |
| | | | | | | | | |
| INFORMATION TECHNOLOGY (18.56%) | | | | | | | | |
| Communications Equipment (1.15%) | | | | | | | | |
| Ciena Corp.(a) | | | 92,300 | | | | 3,446,482 | |
See Notes to Financial Statements.
| Broadview Opportunity Fund | Schedule of Investments |
March 31, 2019 (Unaudited)
| | | Shares | | | Value | |
| COMMON STOCKS (88.20%) (continued) | | | | | | | | |
| INFORMATION TECHNOLOGY (18.56%) (continued) | | | | | | | | |
| Electronic Equipment, Instruments & Components (0.50%) | | | | | | | | |
| National Instruments Corp. | | | 34,000 | | | $ | 1,508,240 | |
| | | | | | | | | |
| IT Services (2.08%) | | | | | | | | |
| LiveRamp Holdings, Inc.(a) | | | 114,241 | | | | 6,234,131 | |
| | | | | | | | | |
| Semiconductors & Semiconductor Equipment (3.51%) | | | | | | | | |
| Entegris, Inc. | | | 119,600 | | | | 4,268,524 | |
| Marvell Technology Group, Ltd. | | | 315,400 | | | | 6,273,306 | |
| | | | | | | | 10,541,830 | |
| Software (9.93%) | | | | | | | | |
| Box, Inc. - Class A(a) | | | 157,600 | | | | 3,043,256 | |
| Cloudera, Inc.(a) | | | 250,600 | | | | 2,741,564 | |
| CommVault Systems, Inc.(a) | | | 180,354 | | | | 11,676,118 | |
| FireEye, Inc.(a) | | | 400,300 | | | | 6,721,037 | |
| PTC, Inc.(a) | | | 61,019 | | | | 5,624,732 | |
| | | | | | | | 29,806,707 | |
| Technology Hardware, Storage & Peripherals (1.39%) | | | | | | | | |
| Pure Storage, Inc. - Class A(a) | | | 191,700 | | | | 4,177,143 | |
| | | | | | | | | |
| MATERIALS (6.98%) | | | | | | | | |
| Chemicals (3.49%) | | | | | | | | |
| Ferro Corp.(a) | | | 396,475 | | | | 7,505,272 | |
| Olin Corp. | | | 129,300 | | | | 2,992,002 | |
| | | | | | | | 10,497,274 | |
| Construction Materials (1.36%) | | | | | | | | |
| Vulcan Materials Co. | | | 34,411 | | | | 4,074,262 | |
| | | | | | | | | |
| Metals & Mining (2.13%) | | | | | | | | |
| Allegheny Technologies, Inc.(a) | | | 249,800 | | | | 6,387,386 | |
| | | | | | | | | |
| TOTAL COMMON STOCKS | | | | | | | | |
| (COST $214,319,641) | | | | | | | 264,788,484 | |
| | | | | | | | | |
| SHORT TERM INVESTMENTS (12.46%) | | | | | | | | |
| MONEY MARKET FUND (12.46%) | | | | | | | | |
| Morgan Stanley Institutional Liquidity Funds - Government Portfolio, Institutional Class, 7 Day Yield 2.326% | | | 37,405,281 | | | | 37,405,281 | |
| | | | | | | | | |
| TOTAL SHORT TERM INVESTMENTS | | | | | | | | |
| (COST $37,405,281) | | | | | | | 37,405,281 | |
| | | | | | | | | |
| TOTAL INVESTMENTS (100.66%) | | | | | | | | |
| (COST $251,724,922) | | | | | | | 302,193,765 | |
| | | | | | | | | |
| TOTAL LIABILITIES IN EXCESS OF OTHER ASSETS (-0.66%) | | | | | | | (1,989,531 | ) |
| | | | | | | | | |
| NET ASSETS 100.00% | | | | | | $ | 300,204,234 | |
| (a) | Non-income producing security. |
Percentages are stated as a percent of net assets.
See Notes to Financial Statements.
| Semi-Annual Report | March 31, 2019 | 9 |
| Broadview Opportunity Fund | Statement of Assets and Liabilities |
March 31, 2019 (Unaudited)
| ASSETS: | | | |
| Investments in securities, at value | | $ | 302,193,765 | |
| Receivable for shareholder purchases | | | 72,866 | |
| Dividends and interest receivable | | | 120,238 | |
| Prepaid expenses | | | 42,207 | |
| Total assets | | | 302,429,076 | |
| | | | | |
| LIABILITIES: | | | | |
| Payable for management fees | | | 259,996 | |
| Payable for investments purchased | | | 1,695,310 | |
| Payable to shareholders for redemptions | | | 115,729 | |
| Payable for transfer agency fees | | | 87,862 | |
| Payable for Board of Trustees fees | | | 263 | |
| Payable for compliance service fees | | | 2,886 | |
| Accrued expenses and other liabilities | | | 62,796 | |
| Total liabilities | | | 2,224,842 | |
| NET ASSETS | | $ | 300,204,234 | |
| | | | | |
| NET ASSETS CONSIST OF: | | | | |
| Paid-in capital | | $ | 233,777,678 | |
| Total distributable earnings | | | 66,426,556 | |
| NET ASSETS | | $ | 300,204,234 | |
| | | | | |
| INVESTMENTS IN SECURITIES, AT COST | | $ | 251,724,922 | |
| | | | | |
| PRICING OF SHARES: | | | | |
| Net Asset Value, offering and redemption price per share | | $ | 28.83 | |
| Net Assets | | $ | 300,204,234 | |
| Shares of beneficial interest outstanding (unlimited number of shares authorized with no par value per share) | | | 10,414,369 | |
See Notes to Financial Statements.
| Broadview Opportunity Fund | Statement of Operations |
For the Period Ended March 31, 2019 (Unaudited)
| INVESTMENT INCOME: | | | |
| Dividends | | $ | 1,629,157 | |
| Total Investment Income | | | 1,629,157 | |
| | | | | |
| EXPENSES: | | | | |
| Management fees | | | 1,819,936 | |
| Administration and accounting services | | | 107,952 | |
| Transfer agent fees | | | 245,717 | |
| Professional fees | | | 47,551 | |
| Custodian fees | | | 14,797 | |
| Board of Trustees fees | | | 30,830 | |
| Compliance service fees | | | 17,052 | |
| Printing and postage expenses | | | 29,748 | |
| Registration fees | | | 23,497 | |
| Other expenses | | | 22,215 | |
| Total Expenses | | | 2,359,295 | |
| NET INVESTMENT LOSS | | | (730,138 | ) |
| | | | | |
| REALIZED AND UNREALIZED GAIN/(LOSS) FROM INVESTMENTS: | | | | |
| Net realized gain on investments | | | 31,976,958 | |
| Net change in unrealized depreciation of investments | | | (87,344,756 | ) |
| NET REALIZED AND UNREALIZED LOSS FROM INVESTMENTS | | | (55,367,798 | ) |
| NET DECREASE IN NET ASSETS RESULTING FROM OPERATIONS | | $ | (56,097,936 | ) |
See Notes to Financial Statements.
| Semi-Annual Report | March 31, 2019 | 11 |
| Broadview Opportunity Fund | Statements of Changes in Net Assets |
| | | For the Six Months Ended March 31, 2019 (Unaudited) | | | For the Year Ended September 30, 2018 | |
| OPERATIONS: | | | | | | | | |
| Net investment loss | | $ | (730,138 | ) | | $ | (3,304,833 | ) |
| Net realized gain on investments | | | 31,976,958 | | | | 83,867,641 | |
| Net change in unrealized appreciation/(depreciation) on investments | | | (87,344,756 | ) | | | 2,338,916 | |
| Net increase/(decrease) in net assets resulting from operations | | | (56,097,936 | ) | | | 82,901,724 | |
| | | | | | | | | |
| TOTAL DISTRIBUTIONS TO SHAREHOLDERS (Note 5) | | $ | (79,268,837 | ) | | $ | (62,281,529 | ) |
| | | | | | | | | |
| SHARE TRANSACTIONS: | | | | | | | | |
| Proceeds from sales of shares | | | 9,426,729 | | | | 38,272,723 | |
| Distributions reinvested | | | 78,081,956 | | | | 61,406,985 | |
| Cost of shares redeemed | | | (195,898,281 | ) | | | (188,069,577 | ) |
| Net decrease from share transactions | | | (108,389,596 | ) | | | (88,389,869 | ) |
| | | | | | | | | |
| Net decrease in net assets | | | (243,756,369 | ) | | | (67,769,674 | ) |
| | | | | | | | | |
| NET ASSETS: | | | | | | | | |
| Beginning of period | | | 543,960,603 | | | | 611,730,277 | |
| End of period | | $ | 300,204,234 | | | $ | 543,960,603 | |
| | | | | | | | | |
| Other Information: | | | | | | | | |
| SHARE TRANSACTIONS: | | | | | | | | |
| Sold | | | 320,174 | | | | 1,049,443 | |
| Distributions reinvested | | | 2,744,533 | | | | 1,770,674 | |
| Redeemed | | | (6,812,174 | ) | | | (5,147,149 | ) |
| Net decrease in shares outstanding | | | (3,747,467 | ) | | | (2,327,032 | ) |
See Notes to Financial Statements.
| Broadview Opportunity Fund | Financial Highlights |
For a Share Outstanding Throughout the Periods Presented
| | | For the Six
Months Ended
March 31, 2019
(Unaudited) | | | For the
Year Ended
September 30,
2018 | | | For the
Year Ended
September 30,
2017 | | | For the
Year Ended
September 30,
2016 | | | For the
Year Ended
September 30,
2015 | | | For the Year Ended September 30, 2014(a) | |
| NET ASSET VALUE, BEGINNING OF PERIOD | | $ | 38.41 | | | $ | 37.10 | | | $ | 34.80 | | | $ | 33.85 | | | $ | 38.48 | | | $ | 40.85 | |
| INCOME/(LOSS) FROM OPERATIONS: | | | | | | | | | | | | | | | | | | | | | | | | |
| Net investment loss | | | (0.06 | ) | | | (0.21 | )(b) | | (0.23 | )(b) | | (0.14 | )(b) | | (0.19 | ) | | | (0.21 | ) |
| Net realized and unrealized gain/(loss) on investments | | | (3.27 | ) | | | 5.46 | | | | 4.20 | | | | 3.96 | | | | (0.33 | ) | | | 2.18 | |
| Total from investment operations | | | (3.33 | ) | | | 5.25 | | | | 3.97 | | | | 3.82 | | | | (0.52 | ) | | | 1.97 | |
| | | | | | | | | | | | | | | | | | | | | | | | | |
| LESS DISTRIBUTIONS: | | | | | | | | | | | | | | | | | | | | | | | | |
| From net realized gains on investments | | | (6.25 | ) | | | (3.94 | ) | | | (1.67 | ) | | | (2.87 | ) | | | (4.11 | ) | | | (4.34 | ) |
| Total distributions | | | (6.25 | ) | | | (3.94 | ) | | | (1.67 | ) | | | (2.87 | ) | | | (4.11 | ) | | | (4.34 | ) |
| INCREASE/(DECREASE) IN NET ASSET VALUE | | | (9.58 | ) | | | 1.31 | | | | 2.30 | | | | 0.95 | | | | (4.63 | ) | | | (2.37 | ) |
| NET ASSET VALUE, END OF PERIOD | | $ | 28.83 | | | $ | 38.41 | | | $ | 37.10 | | | $ | 34.80 | | | $ | 33.85 | | | $ | 38.48 | |
| | | | | | | | | | | | | | | | | | | | | | | | | |
| TOTAL RETURN | | | (8.46 | %)(c) | | | 15.29 | % | | | 11.58 | % | | | 12.17 | % | | | (2.40 | %) | | | 4.86 | % |
| | | | | | | | | | | | | | | | | | | | | | | | | |
| SUPPLEMENTAL DATA: | | | | | | | | | | | | | | | | | | | | | | | | |
| Net assets, end of period (000’s) | | $ | 300,204 | | | $ | 543,961 | | | $ | 611,730 | | | $ | 653,838 | | | $ | 742,230 | | | $ | 904,151 | |
| | | | | | | | | | | | | | | | | | | | | | | | | |
| RATIOS TO AVERAGE NET ASSETS: | | | | | | | | | | | | | | | | | | | | | | | | |
| Operating expenses | | | 1.30 | %(d) | | | 1.21 | % | | | 1.23 | % | | | 1.25 | % | | | 1.23 | % | | | 1.25 | % |
| Net investment loss | | | (0.40 | %)(d) | | | (0.57 | %) | | (0.64 | %) | | (0.42 | %) | | (0.48 | %) | | | (0.50 | %) |
| | | | | | | | | | | | | | | | | | | | | | | | | |
| PORTFOLIO TURNOVER RATE | | | 37 | %(c) | | | 49 | % | | | 53 | % | | | 40 | % | | | 41 | % | | | 56 | % |
| (a) | On November 25, 2013, shareholders of the FMI Focus Fund, a series of FMI Funds, Inc. (the “Predecessor Fund”), approved a tax-free reorganization under which all assets and liabilities of the Predecessor Fund were transferred to the Broadview Opportunity Fund, a series of Broadview Funds Trust, at the close of business on November 29, 2013. |
| (b) | Per share amounts are based upon average shares outstanding. |
See Notes to Financial Statements.
| Semi-Annual Report | March 31, 2019 | 13 |
| Broadview Opportunity Fund | Notes to Financial Statements |
March 31, 2019 (Unaudited)
1. ORGANIZATION
Broadview Funds Trust (the “Trust”) is an open-end management investment company registered under the Investment Company Act of 1940, as amended (the “1940 Act”). The Trust was organized on September 9, 2013 as a Delaware statutory trust. The Trust currently offers one series, the Broadview Opportunity Fund (the “Fund”). The Fund is a diversified portfolio with an investment objective to seek capital appreciation.
On November 25, 2013, shareholders of the FMI Focus Fund, a series of FMI Funds, Inc. (the “Predecessor Fund”), approved a tax-free reorganization under which all assets and liabilities of the Predecessor Fund were transferred to the Fund, a series of the Trust, at the close of business on November 29, 2013. The Predecessor Fund commenced operations on December 16, 1996. On the date of the reorganization, the Predecessor Fund was deemed to be the accounting survivor for financial reporting purposes, and as a result, the financial statements and the financial highlights reflect the operations of the Predecessor Fund for periods prior to the reorganization date.
2. SIGNIFICANT ACCOUNTING POLICIES
The following is a summary of significant accounting policies consistently followed by the Fund. These policies are in conformity with U.S. generally accepted accounting principles (“GAAP”). The Fund is an investment company and accordingly follows the investment company accounting and reporting guidance of the Financial Accounting Standards Board (“FASB”) Accounting Standards Codification Topic 946 Financials Services Investment Companies.
Use of Estimates — The preparation of financial statements in conformity with GAAP requires management to make estimates and assumptions that affect the reported amounts of assets and liabilities and disclosure of contingent assets and liabilities at the date of the financial statements and the reported amounts of increases and decreases in net assets from operations during the reporting period. Actual results could differ from those estimates.
Investment Valuation — The Fund’s portfolio securities are fair valued as of the close of trading of the New York Stock Exchange (“NYSE”) (normally 4:00 p.m., Eastern Time). Each security, excluding short-term investments and securities listed on the NASDAQ Stock Market, LLC (“NASDAQ”), is valued at the last sale price reported by the principal security exchange on which the issue is traded. Securities that are traded on NASDAQ are valued at the Nasdaq Official Closing Price or if no sale is reported, the mean between the bid and the ask. Securities which are traded over-the-counter are valued at the last sale price or, if no sale price, at the mean between the bid and the ask. Securities for which quotations are not readily available are valued at fair value as determined by the investment adviser in accordance with procedures approved by the Board of Trustees. The fair value of a security is the amount which the Fund might reasonably expect to receive upon a current sale. The fair value of a security may differ from the last quoted price and the Fund may not be able to sell a security at the fair value. Market quotations may not be available, for example, if trading in particular securities was halted during the day and not resumed prior to the close of trading on the NYSE. As of March 31, 2019, there were no securities that were internally fair valued by the investment adviser. Money market funds, representing short-term investments, are valued at their net asset value. Other short-term investments with maturities of 60 days or less are valued at fair value.
Securities Transactions and Related Investment Income — Dividend income is recorded on the ex-dividend date. Realized gains and losses from investment transactions are determined using the identified cost basis. Interest income which includes amortization of premium and accretion of discount, is recorded on the accrual basis. Withholding taxes on foreign dividends have been provided for in accordance with the Fund’s understanding of the applicable country’s tax rules and regulations. For financial reporting purposes, investment transactions are recorded on the trade date.
Fair Value Measurements — A three-tier hierarchy has been established to classify fair value measurements for disclosure purposes. Inputs refer broadly to the assumptions that market participants would use in pricing the asset or liability, including assumptions about risk. Inputs may be observable or unobservable. Observable inputs are inputs that reflect the assumptions market participants would use in pricing the asset or liability that are developed based on market data obtained from sources independent of the reporting entity. Unobservable inputs are inputs that reflect the reporting entity’s own assumptions about the assumptions market participants would use in pricing the asset or liability that are developed based on the best information available. In accordance with the authoritative guidance on fair value measurements and disclosure under GAAP, the Fund discloses fair value of its investments in a hierarchy that prioritizes the inputs to valuation techniques used to measure the fair value.
| Broadview Opportunity Fund | Notes to Financial Statements |
March 31, 2019 (Unaudited)
Various inputs are used in determining the value of the Fund’s investments as of the reporting period end. These inputs are categorized in the following hierarchy under GAAP:
| Level 1 — | Unadjusted quoted prices in active markets for identical, unrestricted assets or liabilities that the Fund has the ability to access at the measurement date; |
| Level 2 — | Quoted prices which are not active, quoted prices for similar assets or liabilities in active markets or inputs other than quoted prices that are observable (either directly or indirectly) for substantially the full term of the asset or liability; and |
| Level 3 — | Significant unobservable prices or inputs (including the Fund’s own assumptions in determining the fair value of investments) where there is little or no market activity for the asset or liability at the measurement date. |
The availability of observable inputs can vary from security to security and is affected by a wide variety of factors, including, for example, the type of security, whether the security is new and not yet established in the marketplace, the liquidity of markets, and other characteristics particular to the security. To the extent that valuation is based on models or inputs that are less observable or unobservable in the market, the determination of fair value requires more judgment. Accordingly, the degree of judgment exercised in determining fair value is greatest for instruments categorized in Level 3.
An investment level within the fair value hierarchy is based on the lowest level input, individually or in the aggregate, that is significant to fair value measurement. The valuation techniques used by the Fund to measure fair value during the period ended March 31, 2019, maximized the use of observable inputs and minimized the use of unobservable inputs.
The inputs or methodologies used for valuing securities are not necessarily an indication of the risk or liquidity associated with investing in those securities. The following is a summary of the inputs used in valuing the Fund’s investments as of March 31, 2019:
Broadview Opportunity Fund
| | | Valuation Inputs | | |
| Investments in Securities at Fair Value* | | Level 1 | | Level 2 | | Level 3 | | Total |
| Common Stocks | | $ | 264,788,484 | | | $ | – | | | $ | – | | | $ | 264,788,484 | |
| Short Term Investment | | | 37,405,281 | | | | – | | | | – | | | | 37,405,281 | |
| Total | | $ | 302,193,765 | | | $ | – | | | $ | – | | | $ | 302,193,765 | |
| * | See Schedule of Investments for industry classification. |
For the period ended March 31, 2019, the Fund did not have any unobservable inputs (Level 3) used in determining fair value.
Distributions to Shareholders — Dividends from net investment income and distributions of net realized capital gains, if any, will be declared and paid at least annually. Income and capital gains distributions are determined in accordance with income tax regulations, which may differ from GAAP. Distributions to shareholders are recorded on the ex-dividend date.
Income Taxes — As of and during the period ended March 31, 2019, the Fund did not have a liability for any unrecognized tax benefits. The Fund files U.S. federal, state, and local tax returns as required. The Fund’s tax returns are subject to examination by the relevant tax authorities until expiration of the applicable statute of limitations which is generally three years after the filing of the tax return for federal purposes and four years for most state returns. Tax returns for open years have incorporated no uncertain tax positions that require a provision for income taxes. The Fund intends to continue to qualify each year as a “regulated investment company” under Subchapter M of the Internal Revenue Code of 1986, as amended. By so qualifying, the Fund will not be subject to Federal income taxes to the extent that it distributes substantially all of its taxable or tax-exempt income, if any, for its tax year ending September 30. In addition, by distributing in each calendar year substantially all of its net investment income, capital gains and certain other amounts, if any, the Fund will not be subject to a Federal excise tax. Therefore, no provision is made by the Fund for Federal income or excise taxes.
| Semi-Annual Report | March 31, 2019 | 15 |
| Broadview Opportunity Fund | Notes to Financial Statements |
March 31, 2019 (Unaudited)
3. ADVISORY FEES AND OTHER AGREEMENTS
Investment Advisory Agreement
Effective as of the close of business on November 29, 2013, the Fund entered into an investment advisory agreement with Broadview Advisors, LLC (the “Adviser”). The Fund pays the Adviser a monthly management fee based upon the average daily net assets of the Fund and calculated at an annual rate of 1.00%.
Distributor/Distribution Plan
The Fund has entered into a Distribution Agreement with ALPS Distributors, Inc. (the “Distributor”) to provide distribution services to the Fund. The Distributor serves as underwriter/distributor of shares of the Fund.
The Fund has entered into a Distribution Plan (the “Plan”) pursuant to Rule 12b-1 under the Act. The Plan provides that the Fund may incur certain costs which may not exceed the lesser of a monthly amount equal to 0.25% of the Fund’s daily net assets or the actual distribution costs incurred during the year. Amounts payable under the Plan are paid monthly for any activities or expenses primarily intended to result in the sale of shares of the Fund. For the period ended March 31, 2019, no such expenses were incurred. The Fund presently intends not to utilize the Plan or pay any 12b-1 fees during the period ended March 31, 2019.
Officer and Trustee Compensation
Officers of the Trust and Trustees who are “interested persons” of the Trust or the Adviser will receive no salary or fees from the Trust. Each Trustee who is not an “interested person” receives an annual fee of $20,000 each year. The Trust reimburses each Trustee and Officer for his or her travel and other expenses relating to attendance at such meetings.
Certain Trustees and Officers of the Trust are also officers of the Adviser.
4. PURCHASES AND SALES OF INVESTMENT SECURITIES
The aggregate cost of purchases and proceeds from sales of investment securities, excluding short-term securities, are shown below for the period ended March 31, 2019.
| Broadview Opportunity Fund | | |
| Cost of Investments Purchased | | $ | 121,459,623 | |
| Proceeds from Investments Sold | | $ | 272,119,748 | |
5. TAX BASIS INFORMATION
Distributions are determined in accordance with federal income tax regulations, which differ from GAAP, and, therefore, may differ significantly in amount or character from net investment income and realized gains for financial reporting purposes. Financial reporting records are adjusted for permanent book/tax differences to reflect tax character but are not adjusted for temporary differences. The amounts and characteristics of tax basis distributions and composition of distributable earnings/(accumulated losses) are finalized at fiscal year-end.
The tax character of distributions paid during the year ended September 30, 2018, were as follows:
| | | Ordinary Income | | Long-Term Capital Gain |
| | | $ | 1,936,655 | | | $ | 60,344,874 | |
As of March 31, 2019, net unrealized appreciation/(depreciation) of investments based on the federal tax cost was as follows:
| Cost of Investments | | Gross Unrealized
Appreciation | | Gross Unrealized
Depreciation | | Net Appreciation on Investments |
| $ | 255,854,899 | | | $ | 60,887,141 | | | $ | (14,548,275 | ) | | $ | 46,338,866 | |
The difference between book basis and tax basis is primarily attributable to wash sales.
| Broadview Opportunity Fund | Notes to Financial Statements |
March 31, 2019 (Unaudited)
6. COMMITMENTS AND CONTINGENCIES
Under the Trust’s organizational documents, each director, officer, employee or other agent of the Fund (including the Adviser) is indemnified, to the extent permitted by the Act, against certain liabilities that may arise out of performance of their duties to the Fund. Additionally, in the normal course of business, the Fund enters into contracts that contain a variety of indemnification clauses. The Fund’s maximum exposure under these arrangements is unknown as this would involve future claims that may be made against the Fund that have not yet occurred. However, the Fund has not had prior claims or losses pursuant to these contracts and believes the risk of loss to be remote.
7. SUBSEQUENT EVENT
On May 13, 2019, the Board of Trustees of the Trust approved the reorganization (the “Reorganization”) of the Fund, the sole series of the Trust, into the Madison Small Cap Fund (the “Madison Fund”), a series of Madison Funds. Under the terms of the Agreement and Plan of Reorganization and Liquidation approved by the Board of Trustees of each of the Trust and Madison Funds, shares held by Fund shareholders will be exchanged for shares of the Madison Fund at the closing of the Reorganization. At the same time, assets held by, and liabilities of, the Fund will be transferred to the Madison Fund. As a result of the Reorganization, each shareholder of the Fund will become a shareholder of the Madison Fund and will receive Class Y shares of the Madison Fund of equal value to their shares in the Fund. It is expected that the Reorganization will be treated as a tax-free reorganization for federal tax purposes. Shareholder approval is not required to effect the Reorganization, and shareholder approval is not being sought.
| Semi-Annual Report|March 31, 2019 | 17 |
| Broadview Opportunity Fund | Additional Information |
March 31, 2019 (Unaudited)
1. PROXY VOTING POLICIES AND VOTING RECORD
A description of the policies and procedures that the Fund uses to vote proxies relating to portfolio securities is available without charge upon request by calling toll-free 855-846-1463, or on the Securities and Exchange Commission’s (“SEC”) website at http://www.sec.gov. Information regarding how the Fund voted proxies relating to portfolio securities during the most recent 12-month period ended June 30th is available without charge upon request by calling toll-free 855-846-1463, or on the SEC’s website at http://www.sec.gov.
2. QUARTERLY PORTFOLIO HOLDINGS
The Trust files a complete listing of portfolio holdings for the Fund with the SEC for the first and third quarters of each fiscal year on Form N-Q. The Fund’s Forms N-Q are available upon request by calling 855-846-1463. Furthermore, you may obtain a copy of the filing on the SEC’s website at http://www.sec.gov.
3. BASIS FOR TRUSTEES’ APPROVAL OF THE INVESTMENT ADVISORY AGREEMENT
The Board of Trustees (the “Board” or the “Trustees”) of Broadview Funds Trust (the “Trust”) met on November 19, 2018 to consider the renewal of the Investment Advisory Agreement (the “Agreement”) between the Trust, on behalf of the Broadview Opportunity Fund (the “Fund”), a series of the Trust, and Broadview Advisors, LLC, the Fund’s investment adviser (the “Adviser”). Prior to the meeting, the Trustees requested and received materials to assist them in considering the renewal of the Agreement. The materials provided contained information with respect to the factors enumerated below, including a copy of the Agreement, a memorandum prepared by the Trust’s outside legal counsel discussing in detail the Trustees’ fiduciary obligations and the factors they should assess in considering the renewal of the Agreement, the Adviser’s Form ADV, a due diligence questionnaire completed by the Adviser in response to a specific request letter from the Trust’s outside legal counsel, financial and insurance information for the Adviser, and detailed comparative information relating to the Fund’s performance, as well as the advisory fee and other expenses of the Fund. Based on their evaluation of the information provided by the Adviser, in conjunction with the Fund’s other service providers, the Trustees, by a unanimous vote (including a separate vote of the Trustees who are not “interested persons,” as that term is defined in the Investment Company Act of 1940, as amended (the “Independent Trustees”)), approved the continuation of the Agreement for an additional one-year term.
Discussion of Factors Considered
In considering the renewal of the Agreement and reaching their conclusions, the Trustees reviewed and analyzed various factors they determined were relevant, including the factors enumerated below.
Nature, Extent and Quality of Services Provided to the Fund. The Trustees considered the nature, extent and quality of services provided by the Adviser to the Fund and the amount of time devoted to the Fund’s affairs by the Adviser’s staff. The Trustees considered the Adviser’s specific responsibilities in all aspects of the day-to-day management of the Fund, as well as the qualifications, experience and responsibilities of Messrs. Richard E. Lane, Richard J. Whiting, Faraz Farzam and Aaron J. Garcia, the Fund’s portfolio managers, and other key personnel at the Adviser involved in the day-to-day activities of the Fund. The Trustees considered the stability of the key personnel, and that Ms. Angela L. Pingel, an employee of the Adviser, serves as the Fund’s chief compliance officer. The Trustees reviewed the structure of the Adviser’s compliance program and discussed the Adviser’s marketing activity and its continuing commitment to the growth of Fund assets. The Trustees concluded that the Adviser had sufficient quality and depth of personnel, resources, investment methods and compliance policies and procedures essential to performing its duties under the Investment Advisory Agreement and that the nature, overall quality and extent of the management services provided to the Fund were satisfactory and reliable.
Investment Performance of the Fund and the Adviser. The Board reviewed the performance of the Fund for the quarter, year-to-date, one-year, three-year, five-year, ten-year, and since inception periods ended September 30, 2018 in comparison to the Fund’s primary and secondary benchmark indices, the Russell 2000 Index and the Russell 2500 Index, respectively. In assessing the quality of the management services delivered by the Adviser, the Trustees also compared the short-term and long-term performance of the Fund on both an absolute and relative basis in comparison to a peer group (the “Peer Group”) selected by FUSE Research Network, LLC (“FUSE”), an independent consulting firm, and a universe that consists of the Fund, the Peer Group, and other funds classified by Morningstar as small blend funds with similar characteristics as determined by FUSE (the “Universe”), for the quarter, one-year, three-year, five-year, ten-year and since inception periods ended September 30, 2018. Mr. Whiting noted the peer group is reviewed and updated annually by FUSE. The Trustees also reviewed information on the historical performance of a composite consisting of other separately-managed accounts of the Adviser that were similar to the Fund in terms of investment strategy.
The Trustees noted that the Fund underperformed one or both of its benchmarks for the quarter, year-to-date, one-year, three-year, five-year and ten-year periods ended September 30, 2018. The Fund outperformed both of its benchmarks for the since inception period ended September 30, 2018. The Trustees noted the Fund’s quarter, year-to-date, one-year and ten-year performance returns were generally consistent with the returns of the Russell 2000, the Fund’s primary benchmark. The Trustees noted that the Fund’s performance, in comparison to the Universe, was in the 40th percentile for the quarter, the 15th percentile for the one-year, the 75th percentile for the three-year, the 82nd percentile for the five-year, the 31st percentile for the ten-year and the 1st percentile for the since inception periods ended September 30, 2018. The Trustees noted that the Fund’s performance for all periods was generally in-line with the performance of the composite consisting of the Adviser’s other separately-managed accounts with similar investment strategies to that of the Fund. The Trustees also considered the Fund’s larger than typical cash position over the course of the year ended September 30, 2018 and the Adviser’s investment strategy for the Fund, noting that the strategy tends to underperform late in an economic cycle, both of which were factors that contributed to the Fund’s disappointing results.
| Broadview Opportunity Fund | Additional Information |
March 31, 2019 (Unaudited)
After considering all of the information, the Trustees concluded that the performance obtained by the Adviser for the Fund was satisfactory under current market conditions. Although past performance is not a guarantee or indication of future results, the Trustees determined that the Fund and its shareholders were likely to continue to benefit from the Adviser’s management.
Costs of Services Provided and Profits Realized by the Adviser. The Trustees considered the cost of services and the structure of the Adviser’s fees, including a review of the expense analyses and other pertinent material with respect to the Fund. The Trustees reviewed the related statistical information and other materials provided, including the comparative expenses and expense components of the Universe and Peer Group. The Trustees considered that many of the funds in the Peer Group were series of larger fund families which provides efficiencies that the Fund will not be able to achieve as a single-fund complex. In addition, the Trustees considered the load structure (no-load funds without Rule 12b-1 fees) in the Universe and Peer Groups.
The Trustees also considered the overall profitability of the Adviser and reviewed the Adviser’s financial information. The Trustees also examined the profitability analysis prepared by the Adviser from the fees payable under the Investment Advisory Agreement, as well as the Fund’s brokerage commissions and use of soft dollars by the Adviser.
The Trustees noted that the Fund’s contractual management fee of 1.00% is above the Peer Group median of 0.85%. The Trustees observed that the Fund’s total annual fund operating expense ratio of 1.23% is above both the Peer Group median of 1.12% and the Universe median of 1.16%.
The Trustees then compared the fees paid by the Fund to the fees paid by separately-managed accounts of the Adviser and noted that the Fund’s management fee was at the top of the range of fees paid by the separately-managed account clients but that the Adviser has additional responsibilities with respect to the Fund, including financial commitments and additional compliance and reporting obligations that support the reasonableness of the Fund’s management fee.
The Trustees concluded that the Fund’s expenses and the management fee to be paid to the Adviser were fair and reasonable in light of the comparative performance, expense and management fee information. The Trustees noted, based on the profitability analysis prepared by the Adviser, that the Adviser’s profit from sponsoring the Fund had not been, and was not, excessive and the Adviser maintained adequate profit levels to support its services to the Fund from the revenues of its overall investment advisory activities.
Extent of Economies of Scale. The Trustees compared the Fund’s expenses relative to the Peer Group and discussed realized and potential economies of scale. The Trustees also reviewed the structure of the Fund’s management fee and whether the Fund was large enough to generate economies of scale for shareholders or whether economies of scale would be expected to be realized as Fund assets grow (and if so, how those economies of scale would be shared with shareholders). The Trustees noted that no expense limitation arrangements with respect to the Fund were being contemplated by the Adviser at this time. The Trustees noted that the Fund’s management fee structure did not contain any breakpoint reductions as the Fund’s assets grow in size, but that the flexibility of incorporating breakpoints would continue to be reviewed on a regular basis. With respect to the Adviser’s fee structure, the Trustees concluded that the current fee structure was reasonable and reflected a sharing of economies of scale between the Adviser and the Fund.
Benefits Derived from the Relationship with the Fund. The Trustees considered the direct and indirect benefits that could be realized by the Adviser from its association with the Fund. The Trustees examined the brokerage commissions of the Adviser with respect to the Fund. The Trustees concluded that the benefits the Adviser may receive, such as greater name recognition, growth in separate account management services, increased ability to obtain research on brokerage services, or greater exposure to press coverage appear to be reasonable, and in many cases may benefit the Fund.
Based on the Trustees’ deliberations and their evaluation of the information described above, the Trustees, including the Independent Trustees, unanimously: (a) concluded that the terms of the Investment Advisory Agreement continue to be fair and reasonable; (b) concluded that the Adviser’s fees are reasonable in light of the services that the Adviser provides to the Fund; and (c) approved the Investment Advisory Agreement for another one year period.
| Semi-Annual Report | March 31, 2019 | 19 |

Not applicable to semi-annual report.
| Item 3. | Audit Committee Financial Expert. |
Not applicable to semi-annual report.
| Item 4. | Principal Accountant Fees and Services. |
Not applicable to semi-annual report.
| Item 5. | Audit Committee of Listed Registrants. |
Not applicable to the Registrant.
| Item 6. | Schedule of Investments. |
| (a) | The Registrant’s “Schedule I – Investments in securities of unaffiliated issuers” (as set forth in 17 CFR 210.12-12) is included in Item 1 of this Form N-CSR. |
| (b) | Not applicable to the Registrant. |
| Item 7. | Disclosure of Proxy Voting Policies and Procedures for Closed-End Management Investment Companies. |
Not applicable to the Registrant.
| Item 8. | Portfolio Managers of Closed-End Management Investment Companies. |
Not applicable to the Registrant.
| Item 9. | Purchases of Equity Securities by Closed-End Management Investment Company and Affiliated Purchasers. |
Not applicable to the Registrant.
| Item 10. | Submission of Matters to a Vote of Security Holders. |
None.
| Item 11. | Controls and Procedures. |
| (a) | The Registrant’s principal executive officer and principal financial officer have evaluated the Registrant’s disclosure controls and procedures (as defined in Rule 30a-3(c) under the Investment Company Act of 1940, as amended (the “1940 Act”)) within 90 days of the filing of this report, as required by Rule 30a-3(b) under the Act and Rules 13a-15(b) or 15d-15(b) under the Securities Exchange Act of 1934, and have concluded that the Registrant’s disclosure controls and procedures were effective as of that date. |
| (b) | There was no change in the Registrant’s internal control over financial reporting (as defined in Rule 30a-3(d) under the 1940 Act) during the second fiscal quarter of the period covered by this report that has materially affected, or is reasonably likely to materially affect, the Registrant’s internal control over financial reporting. |
Item 12. Disclosure of Securities Lending Activities for Closed-End Management Investment Companies.
Not applicable to the Registrant.
| (a)(1) | Not applicable to semi-annual report. |
| (a)(2) | A separate certification for the Registrant’s Principal Executive Officer and Principal Financial Officer as required by Rule 30a-2(a) under the 1940 Act (17 CFR 270.30a-2(a)), are attached hereto as Ex99.Cert. |
SIGNATURES
Pursuant to the requirements of the Securities Exchange Act of 1934 and the Investment Company Act of 1940, the Registrant has duly caused this report to be signed on its behalf by the undersigned, thereunto duly authorized.
Broadview Funds Trust
| By: | /s/ Richard E. Lane | |
| | Richard E. Lane | |
| | President | |
| | | |
| Date: | 5/31/2019 | |
Pursuant to the requirements of the Securities Exchange Act of 1934 and the Investment Company Act of 1940, this report has been signed below by the following persons on behalf of the Registrant and in the capacities and on the dates indicated.
| By: | /s/ Richard E. Lane | |
| | Richard E. Lane | |
| | President (Principal Executive Officer) | |
| | | |
| Date: | 5/31/2019 | |
| By: | /s/ Aaron J. Garcia | |
| | Aaron J. Garcia | |
| | Chief Financial Officer (Principal Financial Officer) |
| | | |
| Date: | 5/31/2019 | |