UNITED STATES
SECURITIES AND EXCHANGE COMMISSION
Washington, D.C. 20549
FORM N-CSRS
CERTIFIED SHAREHOLDER REPORT OF REGISTERED
MANAGEMENT INVESTMENT COMPANIES
Investment Company Act file number: 811-22885
Broadview Funds Trust
(Exact name of registrant as specified in charter)
330 East Kilbourn Ave., Suite 1475
Milwaukee, Wisconsin 53202
(Address of principal executive offices) (Zip code)
Angela L. Pingel
Broadview Advisors, LLC
330 East Kilbourn Ave., Suite 1475
Milwaukee, Wisconsin 53202
(Name and address of agent for service)
Registrant’s telephone number, including area code: (414) 918-3900
Date of fiscal year end: September 30, 2016
Date of reporting period: October 1, 2016 – March 31, 2017
Item 1. Reports to Stockholders.
table of contents |
Shareholder Letter | 1 |
Manager Commentary | 5 |
Disclosure of Fund Expenses | 7 |
Schedule of Investments | 8 |
Statement of Assets and Liabilities | 12 |
Statement of Operations | 13 |
Statements of Changes in Net Assets | 14 |
Financial Highlights | 15 |
Notes to Financial Statements | 16 |
Additional Information | 20 |
Broadview Opportunity Fund | Shareholder Letter |
March 31, 2017 (Unaudited)
Dear Fellow Shareholders,
Small cap stocks enjoyed strong gains in 2016 and dramatically outperformed their large cap brethren. The first quarter of 2017 witnessed precisely the opposite. Similarly, value and core strategies strongly outperformed growth in 2016 and reversed course in the first quarter. The Fund’s small core strategy performed in line with the above trends. Mean reversion is very much in play here and is not at all surprising.
“Trump bump” beneficiaries, such as financials and industrials, are in the process of trimming the significant post-election gains. We elected to monetize some of our winners in those two groups that we deemed to be ahead of fundamentals and that hit our price targets. Having said that, we do feel the fundamentals in these two industries are positive and believe we will have nice opportunities to reinvest subsequent to the ongoing correction. Our cash position should afford us some dry powder to deploy as this process unfolds.
As we write this, the three legs to the Trump economic policy – health reform, tax reform, and infrastructure build – are unsurprisingly bogged down in Congress. The sausage-making political process is never pretty to watch and always takes longer than originally hoped. We will monitor these important issues closely. Without them, we may not get the extended cycle we initially theorized immediately following the election. We have a long list of investment candidates for the portfolio pending lower prices and/or successful economic legislation. Stay tuned—this may get very interesting!
Reset Button for MGIC – Rick Lane, CFA
MGIC Investment Corporation (MTG) is our largest holding. The Milwaukee-based company provides mortgage insurance to lenders against default loss from low-down-payment borrowers (typically under 20%). Mortgage originations are tied to the strength of the economy and drive the company’s revenue. Credit losses are MGIC’s main expense and are typically hypersensitive to the state of the business cycle. The housing market has enjoyed a reasonably robust run over the past few years while credit losses have been extremely low (a point to which we will return shortly).
Given that backdrop, MGIC’s strong stock price performance over the past several years should hardly be a surprise. However, many investors, ourselves included, feared that political meddling could derail MGIC’s favorable operating environment. The election in November might have resulted in tighter financial regulation, higher taxes, and a general disposition to favor government programs over private market solutions. Indeed, in a post-election “Hail Mary,” the outgoing head of the Department of Housing and Urban Development, or HUD, lowered the insurance premium on Federal Housing Administration (FHA) insured low-down-payment home loans—its tenuous financial condition notwithstanding. The FHA is the government-backed insurer of low-down-payment mortgage loans, hence the principal competitor to MGIC and its private enterprise cohorts.
Donald Trump’s surprise win changed everything. His campaign promised regulatory reform/roll-back, tax reform, and an overall pro-business stance. The “Trump Era” likely extends the current economic cycle and should be positive for most industries and businesses. With respect to MGIC, very few industries are more levered to this dramatic change in events than the mortgage insurance industry. In his first official act, newly appointed HUD Secretary Dr. Ben Carson rescinded the FHA premium reduction, setting the stage for private mortgage insurers (PMIs) to claw back some market share. Having given the 20,000-foot view of the PMI investment case, the balance of the MGIC discussion delves into the investment case details.
The notion of an extended economic cycle is key to the MGIC investment case. This yields more time for the strong underlying fundamentals to play out. Based on this, there are three key drivers to our investment thesis.
The first is the new administration’s commitment to private market solutions. Since the start of this cycle (2008-2009 timeframe), the FHA has grown its book of insurance from roughly $500 billion to some $1.2 trillion. For perspective, the PMI industry collectively insures about $840 billion. The FHA was originally set up to insure low FICO, low down payment loans to homebuyers unable to qualify for conventional home financing. Prospective first time homebuyers qualifying for conventional financing were expected to avail themselves of private mortgage insurance.
In fact, encouraged by various government entities, the FHA encroached on PMI turf and wrestled away market share. Some 20% of the FHA’s book is now higher FICO score loans than could have been insured through the PMI industry. This FHA strategy has historically resulted in underpricing and severe losses. The Trump administration all but eliminates the FHA price reduction possibility. This is likely to further curb the FHA’s growth to the direct benefit of PMIs.
Another aspect to the private market focus of the new administration is the potential for government sponsored enterprise (GSE) reform. Recall that Fannie Mae (FNMA) and Freddie Mac (FMCC) purchase the majority of new mortgages from mortgage originators (banks and mortgage brokers). In turn, the GSEs securitize the newly created mortgages, essentially guaranteeing and pooling them into mortgage-backed securities sold to investors. Fannie Mae and Freddie Mac dictate “conventional” lending standards. Generally speaking, they require homebuyers to put at least 20% down or purchase mortgage insurance to cover the shortfall. Unique to the PMI industry, the lender is the beneficiary of the insurance even though the borrower pays the premium. In the event of a default, the PMIs are the first loss position, while the GSE absorbs any additional losses beyond the PMI coverage.
Semi-Annual Report | March 31, 2017 | 1 |
Broadview Opportunity Fund | Shareholder Letter |
March 31, 2017 (Unaudited)
Historically, investors and the PMIs themselves were justly paranoid that the GSEs would elbow out the PMIs by insuring 100% of the mortgage. This issue has ebbed and flowed over the years, a political tug-of-war. Given the magnitude of the 2008 mortgage debacle, the momentum has swung back in favor of the PMIs taking a larger role. The Trump administration would likely further that momentum, but given the volatile history of the GSEs, we are not holding our breath.
Several housing finance reform templates have been put forward, including the Royce bill and Johnson-Crapo bill. We believe Fannie Mae and Freddie Mac will eventually be recognized as an essential part of the mortgage origination industry. We believe they will be left in place with one important difference – the risk to tax payers will be reduced by private players who essentially take a greater piece of the risk. The increased risk sharing could take place up front by PMIs assuming a greater percent of the loan risk (known as deeper coverage), or on the back end through the securitization process/capital markets.
While the GSE reform opportunity represents significant upside to our base case, the odds are tough to call. Even without GSE reform, the absence of negative political risk is still significant. Historically, the risk to PMIs from government fiat put a ceiling on valuation no matter how strong the underlying business trends. We believe this risk is off the table for the next four years and should allow valuations to move up commensurate with the strong underlying fundamentals.
The second key driver to our investment case is our contention that the “old book” of business—mortgages guaranteed during the disastrous bubble years of 2004 through 2008—is over reserved. This “old book” has been in run-off mode for quite a while. Claims have stabilized and are starting to decline. Over the next several years, we believe MGIC could release up to several hundred million dollars in “excess reserves” in addition to reserves already released. Our analysis suggests the market is giving MGIC little-to-no credit on this front. Many investors will not even consider MGIC because of the perceived risk that the “old book” is in fact under reserved. The old book aspect sufficiently muddies and complicates the investment case, such that many investors just move on.
The third and final driver is the stunningly pristine and profitable “new book” of business – mortgages guaranteed after 2008. This new book is so conservatively underwritten that losses have been de minimis. As the old book burns off over the next few years, the new book “butterfly” should emerge and investors will have a much clearer understanding of just how outstanding the new book really is. As a check on MGIC’s combined new book and old book reserves, we reverse engineered competitor Essent Group Ltd.’s (ESNT) reserves. Essent went public after the 2008 mortgage bust, so it only has a “new book” of business. Its credit metrics are very similar to MGIC’s new book. We took Essent’s reserve metrics and applied those to MGIC’s new book, adjusted for MGIC’s larger book. We then assigned the balance of MGIC’s total reserves to MGIC’s old book of business. The result left a sufficiently large balance of reserves, which further assuaged our worry about insufficient reserves, bolstering our belief that substantial redundant reserves likely exist.
As an aside, Essent carries a large valuation premium to MGIC, which makes little sense. Again, investors have gravitated to the simplicity of the Essent story, uncomplicated by the old book. We believe the opposite is true – MGIC’s old book carries value in the form of excess reserves. Eventually, MGIC and Essent will approach each other in an asymptote fashion as MGIC’s old book of business runs off, with the excess old book reserves.
In summary, we believe MGIC is poised to deliver strong earnings growth for the next several years. The company’s excess capital, approximately $700 million vis a vis PMIERS (GSE capital requirements) and $1.7 billion at the State of Wisconsin level, only enhances the argument for higher valuation. Further, our research suggests that the tail risk long associated with the PMI industry will be mitigated by old book excess reserves and overly conservative underwriting of the new book.
With earnings power in the $1.25 to $1.35 range, assuming excess capital is deployed to shrink the outstanding shares, and return on equity is in the 13%-14% range longer term, we target a $15 price objective 18 months out. Upside could develop if investors embrace our higher valuation argument.
2 | www.bvafunds.com |
Broadview Opportunity Fund | Shareholder Letter |
March 31, 2017 (Unaudited)
Hilltop Holdings Inc. (HTH) and Chemical Financial Corp. (CHFC) – Sam Koehler
In the first quarter, we took an opportunity to swap part of our Hilltop Holdings position for stock in Chemical Financial. Hilltop is a financial company in which we still have a long term positive outlook, so the position reduction is a reflection of the relative attractiveness in Chemical Financial. Hilltop’s stock appreciated materially since an early-2016 low caused by fears of energy credit losses. We were confident in the loan quality at Hilltop due to a long history of conservative credit culture and a low concentration in energy loans.
As energy fears subsided, the stock strongly rebounded. Near-term acquisition opportunities may be harder to come by given a core competency is buying and fixing discounted banks. This extended bull market has not caused many bank credit issues or failures and therefore has reduced the potential pool of acquisitions for Hilltop. This is a name we still like over the long term and think highly of the future prospects. However, we believed that there was a strong relative opportunity in Chemical Financial.
Chemical Financial is the largest Michigan headquartered bank with a footprint extending into Indiana and Ohio. With a history as a strong community-oriented bank, the company was transformed by an early-2016 merger with Talmer Bancorp. We followed Talmer closely since the initial public offering in early-2014. We were impressed with the strong management team, success in buying troubled banks and the prospects for future growth. Talmer was led by an exceptionally strong management team including CEO David Provost, who has subsequently joined the Chemical board of directors, and CFO Dennis Klaeser, who serves in the same role at the combined organization.
The combined Chemical management team is impressive as well, with CEO David Ramaker leading the company since 2002. The merger between Chemical and Talmer created strong revenue growth and cost synergy opportunities and the organization is on track to meet targets, in our opinion. Chemical has been able to generate loan growth faster than the industry, while maintaining expense discipline and strong credit quality, which has resulted in above peer returns. Chemical faces its first stress test later this year because the combined assets will cross the $10 billion threshold. As the integration matures, we believe the company will be well positioned to consider more acquisitions to strengthen the franchise. Despite these attractive traits, Chemical trades at a discounted valuation compared to the regional bank index and moreover has a nice dividend yield.
K2M Group Holdings, Inc. (KTWO) – Aaron Garcia, CFA
Another recent addition to our portfolio is K2M, an orthopedic implant manufacturer specializing in complex spine technologies. We became aware of this company's product portfolio through our due diligence on LDR Spine USA, Inc., another orthopedic company we owned which was purchased by Zimmer Biomet Holdings, Inc. (ZBH) in 2016.
K2M has a differentiated product portfolio with a leading position in spinal deformity. This is a niche area of spinal implants which has limited innovation or competition from larger players. The company is also one of the leading innovators in 3D printed implants, which allow for easier manufacturing of structures that can promote bone growth and fusion.
We believe the lack of innovation by larger competitors provides K2M outsized revenue growth potential via market share gains and a large group of potential acquirers should the company seek a sale. We believe management is capable of continuing to grow the top line faster than the industry and the new product pipeline is robust. 2016 was a bit of a challenging year for the company due to international distributor issues and some delays in product registration, which caused revenue disappointment. In addition, private equity sponsors exited the stock, resulting in a surfeit of shares in a tough healthcare backdrop.
We think the company's financial performance is poised to bounce back in 2017 and the long-term growth opportunity is promising. We initiated the position in mid-2016, and have opportunistically added to the position in the first quarter of 2017.
Healthcare Reform – Brief Opinion – Aaron Garcia, CFA
We believe there is still a chance that the House Republicans will revive the American Health Care Act (AHCA). However, there remains a philosophical schism in the Republican Party as to the government's role in healthcare. We feel that any of the more austere solutions favored by the Freedom Caucus will face a tough road in the Senate.
Healthcare reform remains an incredibly difficult process. From an investment standpoint, we have avoided investing in hospitals, managed care, life sciences and pharmaceutical sectors. We think these areas offer the most reform risk and could be more volatile due to movement in Washington. We have focused our attention on low volatility distribution and supplier businesses, as well as small growth companies with significant product cycle opportunities. We think the likelihood of volatility from legislative headlines will provide further opportunities to buy strong franchises at cheap valuations.
Semi-Annual Report | March 31, 2017 | 3 |
Broadview Opportunity Fund | Shareholder Letter |
March 31, 2017 (Unaudited)
Best regards,
Richard E. Lane, CFA | Faraz Farzam, CFA | Aaron J. Garcia, CFA | Richard J. Whiting |
The views and information discussed in this commentary are as of the date of publication, are subject to change, and may not reflect the writer’s current views. The views expressed represent an assessment of market conditions at a specific point in time, are opinions only and should not be relied upon as investment advice regarding a particular investment or markets in general. Such information does not constitute a recommendation to buy or sell specific securities or investment vehicles. It should not be assumed that any investment will be profitable or will equal the performance of the Fund or any securities or any sectors mentioned herein. The subject matter contained herein has been derived from several sources believed to be reliable and accurate at the time of compilation.
A NOTE ON FORWARD LOOKING STATEMENTS
Except for historical information contained in this report for the Fund, the matters discussed in this report may constitute forward-looking statements made pursuant to the safe-harbor provisions of the Private Securities Litigation Reform Act of 1995. These include any adviser or portfolio manager predictions, assessments, analyses or outlooks for individual securities, industries, market sectors and/or markets. These statements involve risks and uncertainties. In addition to the general risks described for the Fund in the current Prospectus, other factors bearing on this report include the accuracy of the adviser’s or portfolio managers’ forecasts and predictions, and the appropriateness of the investment programs designed by the adviser or portfolio managers to implement their strategies efficiently and effectively. Any one or more of these factors, as well as other risks affecting the securities markets and investment instruments generally, could cause the actual results of the Fund to differ materially as compared to benchmarks associated with the Fund.
4 | www.bvafunds.com |
Broadview Opportunity Fund | Manager Commentary |
March 31, 2017 (Unaudited)
MANAGEMENT’S DISCUSSION OF FUND PERFORMANCE
For the six months ended March 31, 2017, the Fund provided a return of 7.85%. This underperformed the Russell 2500 Index by 2.26% and the Russell 2000 Index by 3.67%. As the market rallied post-election, the Fund’s cash position was a significant drag on performance. Additional negative impact came from Consumer Discretionary and Energy sector holdings. On the other hand, holdings in the Financials and Health Care sectors positively affected performance. Bottom detractors to the Fund’s return included Hibbett Sports, Inc. (HIBB), MDC Partners Inc. (MDCA), and Range Resources Corp. (RRC). Top contributors to the Fund’s return included Veeco Instruments Inc. (VECO), Zions Bancorporation (ZION), and MGIC Investment Corp. (MTG).
GROWTH OF $10,000 INVESTMENT IN THE FUND
From its inception (12/16/96) to 3/31/17 as compared to the Russell 2500 Index(1) and the Russell 2000 Index(2)
Semi-Annual Report | March 31, 2017 | 5 |
Broadview Opportunity Fund | Manager Commentary |
March 31, 2017 (Unaudited)
PERFORMANCE (For Periods Ended 3/31/17)
Total Return* | Annualized Total Return* | ||||||
3 Months | 1 Year | 5 Year | 10 Year | 15 Year | Since Inception** | ||
Broadview Opportunity Fund | 1.56% | 20.84% | 10.23% | 8.43% | 8.09% | 14.51% | |
Russell 2500 Index | 3.76% | 21.53% | 12.60% | 7.71% | 9.17% | 9.70% | |
Russell 2000 Index | 2.47% | 26.22% | 12.35% | 7.12% | 8.38% | 8.44% |
Performance data quoted represents past performance. Past performance does not guarantee future results. Investment return and principal value of an investment will fluctuate so that an investor’s shares, when sold or redeemed, may be worth more or less than the original cost. Current performance data may be higher or lower than actual data quoted. For the most recent month-end performance please visit bvafunds.com or call 1-855-846-1463. As of the Fund’s Prospectus dated January 27, 2017, the Broadview Opportunity Fund’s annual operating expense ratio is 1.27%. One cannot invest directly in an index.
(1) | The Russell 2500 Index is a market cap weighted index that includes the smallest 2,500 companies covered in the Russell 3000 Index, which comprises the 3,000 largest U.S. companies based on total market capitalization. |
(2) | The Russell 2000 Index measures the performance of the 2,000 smallest companies in the Russell 3000 Index. |
* | Total return includes changes in share prices and in each case includes reinvestments of any dividends, interest and capital gain distributions. The returns do not reflect the deduction of taxes that a shareholder would pay on Fund distributions or the redemption of Fund shares. |
** | Fund Inception Date: December 16, 1996. |
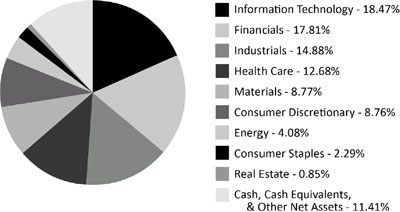
SECTOR ALLOCATION (as of March 31, 2017) (As a percentage of Net Assets)
Holdings are subject to change.
These allocations may not reflect the current or future positions of the portfolio.
6 | www.bvafunds.com |
Broadview Opportunity Fund | Disclosure of Fund Expenses |
March 31, 2017 (Unaudited)
As a shareholder of the Broadview Opportunity Fund (the “Fund”) you will incur ongoing costs, including management fees and other Fund expenses. The following examples are intended to help you understand your ongoing costs (in dollars) of investing in the Fund and to compare these costs with the ongoing costs of investing in other mutual funds. The examples are based on an investment of $1,000 invested on October 1, 2016 and held until March 31, 2017.
Actual Expenses. The first line of the table below provides information about actual account values and actual expenses. You may use the information in this line, together with the amount you invested, to estimate the expenses that you paid over the period. Simply divide your account value by $1,000 (for example, an $8,600 account value divided by $1,000 = 8.6), then multiply the result by the number in the first line under the heading “Expenses Paid During Period” to estimate the expenses you paid on your account during this period.
Hypothetical Example for Comparison Purposes. The second line of the table below provides information about hypothetical account values and hypothetical expenses based on the Fund’s actual expense ratio and an assumed rate of return of 5% per year before expenses, which is not the Fund’s actual return. The hypothetical account values and expenses may not be used to estimate the actual ending account balance or expenses you paid for the period. You may use this information to compare the ongoing costs of investing in the Fund and other mutual funds. To do so, compare this 5% hypothetical example with the 5% hypothetical examples that appear in the shareholder reports of the other funds. The expenses shown in the table are meant to highlight ongoing Fund costs only and do not reflect any transactional costs, such as sales charges (loads), redemption fees, or exchange fees that, although not charged by the Fund, may be charged by other funds. Therefore, the second line of the table below is useful in comparing ongoing costs only, and may not help you determine the relative total costs of owning different funds.
Beginning Account Value 10/1/16 | Ending Account Value 3/31/17 | Expense Ratio(a) | Expenses Paid During Period 10/1/16 - 3/31/17(b) | |
Broadview Opportunity Fund | ||||
Actual | $1,000.00 | $1,078.50 | 1.24% | $6.43 |
Hypothetical (5% return before expenses) | $1,000.00 | $1,018.75 | 1.24% | $6.24 |
(a) | The Fund’s expense ratios have been based on the Fund’s most recent fiscal half-year expenses. |
(b) | Expenses are equal to the Fund’s annualized expense ratio multiplied by the average account value over the period, multiplied by the number of days in the most recent fiscal half-year (182)/365 (to reflect the half-year period). |
Semi-Annual Report | March 31, 2017 | 7 |
Broadview Opportunity Fund | Schedule of Investments |
March 31, 2017 (Unaudited)
Shares | Value | |||||||
COMMON STOCKS (88.59%) | ||||||||
CONSUMER DISCRETIONARY (8.76%) | ||||||||
Hotels Restaurants & Leisure (1.25%) | ||||||||
Chuy's Holdings, Inc.(a) | 273,250 | $ | 8,142,850 | |||||
Leisure Products (3.07%) | ||||||||
Brunswick Corp. | 195,300 | 11,952,360 | ||||||
Callaway Golf Co. | 245,023 | 2,712,405 | ||||||
Polaris Industries, Inc. | 64,500 | 5,405,100 | ||||||
20,069,865 | ||||||||
Media (1.00%) | ||||||||
National CineMedia, Inc. | 518,731 | 6,551,573 | ||||||
Specialty Retail (3.44%) | ||||||||
Dick's Sporting Goods, Inc. | 96,400 | 4,690,824 | ||||||
Hibbett Sports, Inc.(a) | 497,650 | 14,680,675 | ||||||
Urban Outfitters, Inc.(a) | 129,223 | 3,070,338 | ||||||
22,441,837 | ||||||||
CONSUMER STAPLES (2.29%) | ||||||||
Beverages (0.99%) | ||||||||
The Boston Beer Co., Inc. - Class A(a) | 44,400 | 6,422,460 | ||||||
Food Products (1.30%) | ||||||||
Freshpet, Inc.(a) | 773,417 | 8,507,587 | ||||||
ENERGY (4.08%) | ||||||||
Energy Equipment & Services (1.43%) | ||||||||
Superior Energy Services, Inc.(a) | 210,849 | 3,006,707 | ||||||
Whiting Petroleum Corp.(a) | 667,481 | 6,314,370 | ||||||
9,321,077 | ||||||||
Oil, Gas & Consumable Fuels (2.65%) | ||||||||
Gulfport Energy Corp.(a) | 92,178 | 1,584,540 | ||||||
Range Resources Corp. | 369,700 | 10,758,270 | ||||||
WPX Energy, Inc.(a) | 372,400 | 4,986,436 | ||||||
17,329,246 | ||||||||
FINANCIALS (17.81%) | ||||||||
Banks (13.24%) | ||||||||
Bank of the Ozarks, Inc. | 59,541 | 3,096,727 | ||||||
Chemical Financial Corp. | 63,445 | 3,245,212 | ||||||
CoBiz Financial, Inc. | 846,367 | 14,218,966 | ||||||
First Horizon National Corp. | 351,300 | 6,499,050 | ||||||
Guaranty Bancorp | 257,267 | 6,264,451 | ||||||
LegacyTexas Financial Group, Inc. | 310,781 | 12,400,162 | ||||||
Renasant Corp. | 139,194 | 5,524,610 | ||||||
Western Alliance Bancorp(a) | 316,800 | 15,551,712 | ||||||
Zions Bancorporation | 468,700 | 19,685,400 | ||||||
86,486,290 | ||||||||
Consumer Finance (0.42%) | ||||||||
PRA Group, Inc.(a) | 81,650 | 2,706,697 | ||||||
Thrifts & Mortgage Finance (4.15%) | ||||||||
MGIC Investment Corp.(a) | 2,675,175 | 27,099,523 | ||||||
HEALTH CARE (12.68%) | ||||||||
Biotechnology (1.68%) | ||||||||
Exact Sciences Corp.(a) | 463,974 | 10,959,066 |
See Notes to Financial Statements.
8 | www.bvafunds.com |
Broadview Opportunity Fund | Schedule of Investments |
March 31, 2017 (Unaudited)
Shares | Value | |||||||
COMMON STOCKS (88.59%) (continued) | ||||||||
HEALTH CARE (12.68%) (continued) | ||||||||
Health Care Equipment & Supplies (2.34%) | ||||||||
K2M Group Holdings, Inc.(a) | 295,800 | $ | 6,066,858 | |||||
NxStage Medical, Inc.(a) | 344,681 | 9,247,791 | ||||||
15,314,649 | ||||||||
Health Care Providers & Services (4.68%) | ||||||||
Acadia Healthcare Co., Inc.(a) | 120,300 | 5,245,080 | ||||||
Diplomat Pharmacy, Inc.(a) | 321,600 | 5,129,520 | ||||||
Envision Healthcare Corp.(a) | 24,550 | 1,505,406 | ||||||
HealthSouth Corp. | 324,402 | 13,887,649 | ||||||
Select Medical Holdings Corp.(a) | 359,580 | 4,800,393 | ||||||
30,568,048 | ||||||||
Health Care Technology (1.71%) | ||||||||
Allscripts Healthcare Solutions, Inc.(a) | 880,600 | 11,166,008 | ||||||
Life Sciences Tools & Services (1.07%) | ||||||||
VWR Corp.(a) | 247,850 | 6,989,370 | ||||||
Pharmaceuticals (1.20%) | ||||||||
Catalent, Inc.(a) | 276,418 | 7,828,158 | ||||||
INDUSTRIALS (14.88%) | ||||||||
Aerospace & Defense (1.54%) | ||||||||
Hexcel Corp. | 129,879 | 7,084,899 | ||||||
KLX, Inc.(a) | 67,100 | 2,999,370 | ||||||
10,084,269 | ||||||||
Building Products (2.27%) | ||||||||
Masco Corp. | 437,100 | 14,857,029 | ||||||
Commercial Services & Supplies (1.69%) | ||||||||
Mobile Mini, Inc. | 361,919 | 11,038,530 | ||||||
Electrical Equipment (0.43%) | ||||||||
Regal-Beloit Corp. | 36,859 | 2,788,383 | ||||||
Electrical Equipment & Services (0.47%) | ||||||||
Generac Holdings, Inc.(a) | 82,200 | 3,064,416 | ||||||
Machinery (3.26%) | ||||||||
Astec Industries, Inc. | 145,937 | 8,974,396 | ||||||
Crane Co. | 38,100 | 2,851,023 | ||||||
Kennametal, Inc. | 64,600 | 2,534,258 | ||||||
Rexnord Corp.(a) | 300,000 | 6,924,000 | ||||||
21,283,677 | ||||||||
Professional Services (1.61%) | ||||||||
Kforce, Inc. | 285,938 | 6,791,027 | ||||||
Robert Half International, Inc. | 76,343 | 3,727,829 | ||||||
10,518,856 | ||||||||
Road & Rail (0.35%) | ||||||||
Genesee & Wyoming, Inc. - Class A(a) | 33,950 | 2,303,847 | ||||||
Trading Companies & Distribution (3.26%) | ||||||||
BMC Stock Holdings, Inc.(a) | 472,644 | 10,681,755 | ||||||
HD Supply Holdings, Inc.(a) | 219,131 | 9,011,762 | ||||||
MRC Global, Inc.(a) | 85,600 | 1,569,048 | ||||||
21,262,565 |
See Notes to Financial Statements.
Semi-Annual Report | March 31, 2017 | 9 |
Broadview Opportunity Fund | Schedule of Investments |
March 31, 2017 (Unaudited)
Shares | Value | |||||||
COMMON STOCKS (88.59%) (continued) | ||||||||
INFORMATION TECHNOLOGY (18.47%) | ||||||||
Communication Equipment (1.84%) | ||||||||
Ciena Corp.(a) | 508,400 | $ | 12,003,324 | |||||
Electrical Equipment & Instruments (0.27%) | ||||||||
Sensata Technologies Holding N.V.(a) | 40,300 | 1,759,901 | ||||||
Electrical Equipment & Services (0.53%) | ||||||||
Arrow Electronics, Inc.(a) | 46,692 | 3,427,660 | ||||||
Electronic Equipment & Instruments (0.89%) | ||||||||
Zebra Technologies Corp. - Class A(a) | 63,600 | 5,803,500 | ||||||
Internet Software & Services (1.24%) | ||||||||
Pandora Media, Inc.(a) | 683,400 | 8,070,954 | ||||||
IT Services (0.57%) | ||||||||
Acxiom Corp.(a) | 131,141 | 3,733,584 | ||||||
Semiconductors & Semiconductor Equipment (4.10%) | ||||||||
MKS Instruments, Inc. | 114,647 | 7,881,981 | ||||||
Veeco Instruments, Inc.(a) | 633,600 | 18,912,960 | ||||||
26,794,941 | ||||||||
Software (9.03%) | ||||||||
CommVault Systems, Inc.(a) | 298,300 | 15,153,640 | ||||||
CyberArk Software Ltd.(a) | 125,445 | 6,381,387 | ||||||
Fortinet, Inc.(a) | 158,795 | 6,089,788 | ||||||
Imperva, Inc.(a) | 127,900 | 5,250,295 | ||||||
Mobileye NV(a) | 90,000 | 5,526,000 | ||||||
PROS Holdings, Inc.(a) | 282,300 | 6,828,837 | ||||||
PTC, Inc.(a) | 156,219 | 8,209,308 | ||||||
Tableau Software, Inc. - Class A(a) | 111,950 | 5,547,123 | ||||||
58,986,378 | ||||||||
MATERIALS (8.77%) | ||||||||
Chemicals (4.89%) | ||||||||
Celanese Corp. - Series A | 60,800 | 5,462,880 | ||||||
Ferro Corp.(a) | 480,803 | 7,303,398 | ||||||
Kraton Corp.(a) | 183,200 | 5,664,544 | ||||||
U.S. Silica Holdings, Inc. | 100,586 | 4,827,122 | ||||||
Westlake Chemical Corp. | 131,600 | 8,692,180 | ||||||
31,950,124 | ||||||||
Construction Materials (2.91%) | ||||||||
Summit Materials, Inc. - Class A(a) | 363,252 | 8,975,957 | ||||||
Vulcan Materials Co. | 83,100 | 10,011,888 | ||||||
18,987,845 | ||||||||
Containers & Packaging (0.97%) | ||||||||
Sealed Air Corp. | 146,000 | 6,362,680 |
See Notes to Financial Statements.
10 | www.bvafunds.com |
Broadview Opportunity Fund | Schedule of Investments |
March 31, 2017 (Unaudited)
Shares | Value | |||||||
COMMON STOCKS (88.59%) (continued) | ||||||||
REAL ESTATE (0.85%) | ||||||||
Real Estate Management & Development (0.85%) | ||||||||
Realogy Holdings Corp. | 186,000 | $ | 5,540,940 | |||||
TOTAL COMMON STOCKS (COST $449,086,018) | 578,527,707 | |||||||
SHORT-TERM SECURITY (11.89%) | ||||||||
MONEY MARKET FUND (11.89%) | ||||||||
Morgan Stanley Institutional Liquidity Funds - Government Portfolio, Institutional Class, 7 Day Yield 0.601% | 77,623,089 | 77,623,089 | ||||||
TOTAL SHORT-TERM SECURITY (COST $77,623,089) | 77,623,089 | |||||||
TOTAL INVESTMENTS (100.48%) (COST $526,709,107) | 656,150,796 | |||||||
TOTAL LIABILITIES IN EXCESS OF OTHER ASSETS (-0.48%) | (3,117,963 | ) | ||||||
NET ASSETS 100.00% | $ | 653,032,833 |
(a) | Non-income producing security. |
Percentages are stated as a percent of net assets.
See Notes to Financial Statements.
Semi-Annual Report | March 31, 2017 | 11 |
Broadview Opportunity Fund | Statement of Assets and Liabilities |
March 31, 2017 (Unaudited)
ASSETS: | ||||
Investments in securities, at value | $ | 656,150,796 | ||
Receivable for investments sold | 2,927,962 | |||
Receivable for shareholder purchases | 516,075 | |||
Dividends and interest receivable | 152,873 | |||
Prepaid expenses | 51,822 | |||
Total assets | 659,799,528 | |||
LIABILITIES: | ||||
Payable for management fees | 555,698 | |||
Payable for investments purchased | 5,409,550 | |||
Payable to shareholders for redemptions | 591,193 | |||
Payable for transfer agency fees | 118,114 | |||
Payable for Board of Trustees fees | 214 | |||
Payable for chief compliance officer fees | 2,556 | |||
Accrued expenses and other liabilities | 89,370 | |||
Total liabilities | 6,766,695 | |||
NET ASSETS | $ | 653,032,833 | ||
NET ASSETS CONSIST OF: | ||||
Paid-in capital | $ | 482,705,701 | ||
Accumulated net investment loss | (3,906,492 | ) | ||
Accumulated net realized gain on investments | 44,791,935 | |||
Net unrealized appreciation on investments | 129,441,689 | |||
NET ASSETS | $ | 653,032,833 | ||
INVESTMENTS IN SECURITIES, AT COST | $ | 526,709,107 | ||
PRICING OF SHARES: | ||||
Net Asset Value, offering and redemption price per share | $ | 35.86 | ||
Net Assets | $ | 653,032,833 | ||
Shares of beneficial interest outstanding (unlimited number of shares authorized with no par value per share) | 18,208,102 |
See Notes to Financial Statements.
12 | www.bvafunds.com |
Broadview Opportunity Fund | Statement of Operations |
For the Period Ended March 31, 2017 (Unaudited)
INVESTMENT INCOME: | ||||
Dividends and Interest | $ | 2,159,113 | ||
Total Investment Income | 2,159,113 | |||
EXPENSES: | ||||
Management fees | 3,294,614 | |||
Administration and accounting services | 113,685 | |||
Transfer agent fees | 481,202 | |||
Professional fees | 39,393 | |||
Custodian fees | 21,803 | |||
Board of Trustees fees | 30,389 | |||
Chief compliance officer fees | 15,562 | |||
Printing and postage expenses | 42,101 | |||
Registration fees | 22,813 | |||
Other expenses | 26,586 | |||
Total Expenses | 4,088,148 | |||
NET INVESTMENT LOSS | (1,929,035 | ) | ||
REALIZED AND UNREALIZED GAIN/(LOSS) FROM INVESTMENTS: | ||||
Net realized gain on investments | 51,901,631 | |||
Net change in unrealized depreciation of investments | (12,240 | ) | ||
NET REALIZED AND UNREALIZED GAIN FROM INVESTMENTS | 51,889,391 | |||
NET INCREASE IN NET ASSETS RESULTING FROM OPERATIONS | $ | 49,960,356 |
See Notes to Financial Statements.
Semi-Annual Report | March 31, 2017 | 13 |
Broadview Opportunity Fund | Statements of Changes in Net Assets |
For the Six Months Ended March 31, 2017 (Unaudited) | For the Year Ended September 30, 2016 | |||||||
OPERATIONS: | ||||||||
Net investment loss | $ | (1,929,035 | ) | $ | (2,848,353 | ) | ||
Net realized gain on investments | 51,901,631 | 29,120,359 | ||||||
Net change in unrealized appreciation/(depreciation) on investments | (12,240 | ) | 49,176,293 | |||||
Net increase in net assets resulting from operations | 49,960,356 | 75,448,299 | ||||||
DISTRIBUTIONS TO SHAREHOLDERS (Note 5): | ||||||||
From net realized gains on investments | (30,306,302 | ) | (59,156,314 | ) | ||||
Total distributions | (30,306,302 | ) | (59,156,314 | ) | ||||
SHARE TRANSACTIONS: | ||||||||
Proceeds from sales of shares | 37,017,314 | 78,741,917 | ||||||
Distributions reinvested | 29,553,564 | 57,589,371 | ||||||
Cost of shares redeemed | (87,030,172 | ) | (241,014,827 | ) | ||||
Net decrease from share transactions | (20,459,294 | ) | (104,683,539 | ) | ||||
Net decrease in net assets | (805,240 | ) | (88,391,554 | ) | ||||
NET ASSETS: | ||||||||
Beginning of year | 653,838,073 | 742,229,627 | ||||||
End of year* | $ | 653,032,833 | $ | 653,838,073 | ||||
*Includes accumulated net investment loss of: | $ | (3,906,492 | ) | $ | (1,977,457 | ) | ||
Other Information: | ||||||||
SHARE TRANSACTIONS: | ||||||||
Sold | 1,034,617 | 2,496,244 | ||||||
Distributions reinvested | 824,597 | 1,824,758 | ||||||
Redeemed | (2,437,435 | ) | (7,464,570 | ) | ||||
Net decrease in shares outstanding | (578,221 | ) | (3,143,568 | ) |
See Notes to Financial Statements.
14 | www.bvafunds.com |
Broadview Opportunity Fund | Financial Highlights |
For a Share Outstanding Throughout the Periods Presented
For the Six Months Ended March 31, 2017 (Unaudited) | For the Year Ended September 30, 2016 | For the Year Ended September 30, 2015 | For the Year Ended September 30, 2014(a) | For the Year Ended September 30, 2013 | For the Year Ended September 30, 2012 | |||||||||||||||||||
NET ASSET VALUE, BEGINNING OF YEAR | $ | 34.80 | $ | 33.85 | $ | 38.48 | $ | 40.85 | $ | 30.26 | $ | 25.54 | ||||||||||||
INCOME/(LOSS) FROM OPERATIONS: | ||||||||||||||||||||||||
Net investment loss | (0.10 | )(b) | (0.14 | )(b) | (0.19 | ) | (0.21 | ) | (0.15 | ) | (0.10 | ) | ||||||||||||
Net realized and unrealized gain/(loss) on investments | 2.83 | 3.96 | (0.33 | ) | 2.18 | 11.59 | 6.02 | |||||||||||||||||
Total from investment operations | 2.73 | 3.82 | (0.52 | ) | 1.97 | 11.44 | 5.92 | |||||||||||||||||
LESS DISTRIBUTIONS: | ||||||||||||||||||||||||
From net realized gains on investments | (1.67 | ) | (2.87 | ) | (4.11 | ) | (4.34 | ) | (0.85 | ) | (1.20 | ) | ||||||||||||
Total distributions | (1.67 | ) | (2.87 | ) | (4.11 | ) | (4.34 | ) | (0.85 | ) | (1.20 | ) | ||||||||||||
INCREASE/(DECREASE) IN NET ASSET VALUE | 1.06 | 0.95 | (4.63 | ) | (2.37 | ) | 10.59 | 4.72 | ||||||||||||||||
NET ASSET VALUE, END OF YEAR | $ | 35.86 | $ | 34.80 | $ | 33.85 | $ | 38.48 | $ | 40.85 | $ | 30.26 | ||||||||||||
TOTAL RETURN | 7.85 | %(c) | 12.17 | % | (2.40 | %) | 4.86 | % | 38.91 | % | 23.48 | % | ||||||||||||
SUPPLEMENTAL DATA: | ||||||||||||||||||||||||
Net assets, end of year (000's) | $ | 653,033 | $ | 653,838 | $ | 742,230 | $ | 904,151 | $ | 852,723 | $ | 618,541 | ||||||||||||
RATIOS TO AVERAGE NET ASSETS: | ||||||||||||||||||||||||
Operating expenses | 1.24 | %(d) | 1.25 | % | 1.23 | % | 1.25 | % | 1.26 | % | 1.26 | % | ||||||||||||
Net investment loss | (0.59 | %)(d) | (0.42 | %) | (0.48 | %) | (0.50 | %) | (0.44 | %) | (0.34 | %) | ||||||||||||
PORTFOLIO TURNOVER RATE | 23 | %(c) | 40 | % | 41 | % | 56 | % | 70 | % | 55 | % |
(a) | On November 25, 2013, shareholders of the FMI Focus Fund, a series of FMI Funds, Inc. (the "Predecessor Fund"), approved a tax-free reorganization under which all assets and liabilities of the Predecessor Fund were transferred to the Broadview Opportunity Fund, a series of Broadview Funds Trust, at the close of business on November 29, 2013. |
(b) | Per share amounts are based upon average shares outstanding. |
(c) | Not annualized. |
(d) | Annualized. |
See Notes to Financial Statements.
Semi-Annual Report | March 31, 2017 | 15 |
Broadview Opportunity Fund | Notes to Financial Statements |
March 31, 2017 (Unaudited)
1. ORGANIZATION
Broadview Funds Trust (the “Trust”) is an open-end management investment company registered under the Investment Company Act of 1940, as amended (the “1940 Act”). The Trust was organized on September 9, 2013 as a Delaware statutory trust. The Trust currently offers one series, the Broadview Opportunity Fund (the “Fund”). The Fund is a diversified portfolio with an investment objective to seek capital appreciation.
On November 25, 2013, shareholders of the FMI Focus Fund, a series of FMI Funds, Inc. (the “Predecessor Fund”), approved a tax-free reorganization under which all assets and liabilities of the Predecessor Fund were transferred to the Fund, a series of the Trust, at the close of business on November 29, 2013. The Predecessor Fund commenced operations on December 16, 1996.
2. SIGNIFICANT ACCOUNTING POLICIES
The following is a summary of significant accounting policies consistently followed by the Fund. These policies are in conformity with U.S. generally accepted accounting principles (“GAAP”). The Fund is an investment company and accordingly follows the investment company accounting and reporting guidance of the Financial Accounting Standards Board (“FASB”) Accounting Standards Codification Topic 946 Financials Services-Investment Companies.
Use of Estimates — The preparation of financial statements in conformity with GAAP requires management to make estimates and assumptions that affect the reported amounts of assets and liabilities and disclosure of contingent assets and liabilities on the date of the financial statements and the reported amounts of increases and decreases in net assets from operations during the reporting period. Actual results could differ from those estimates.
Investment Valuation — The Fund’s portfolio securities are fair valued as of the close of trading of the New York Stock Exchange (“NYSE”) (normally 4:00 p.m., Eastern Time). Each security, excluding short-term investments, is valued at the last sale price reported by the principal security exchange on which the issue is traded. Securities that are traded on the Nasdaq Stock Market, Inc. are valued at the Nasdaq Official Closing Price or if no sale is reported, at the mean between the bid and the ask. Securities which are traded over-the-counter are valued at the last sale price or, if no sale is reported, at the mean between the bid and the ask. Securities sold short which are listed on a national securities exchange or the Nasdaq Stock Market but which were not traded on the valuation date are valued at the mean between the bid and the ask. Unlisted equity securities for which market quotations are readily available are valued at the last sale price or, if no sale price, the mean between the bid and the ask. Options purchased or written by the Fund are valued at the mean of the highest bid and lowest ask price of all the exchanges on which the option trades. Securities for which quotations are not readily available are valued at fair value as determined by the investment adviser in accordance with procedures approved by the Board of Trustees. The fair value of a security is the amount which the Fund might reasonably expect to receive upon a current sale. The fair value of a security may differ from the last quoted price and the Fund may not be able to sell a security at the fair value. Market quotations may not be available, for example, if trading in particular securities was halted during the day and not resumed prior to the close of trading on the New York Stock Exchange. As of March 31, 2017, there were no securities that were internally fair valued by the investment adviser. Variable rate demand notes are recorded at par value which approximates market value. Money market funds, representing short-term investments, are valued at their net asset value. Other short-term investments with maturities of 60 days or less are valued at fair value. For financial reporting purposes, investment transactions are recorded on the trade date.
Securities Transactions and Related Investment Income — Dividend income is recorded on the ex-dividend date. Realized gains and losses from investment transactions are determined using the identified cost basis. Interest income which includes amortization of premium and accretion of discount, is recorded on the accrual basis. Withholding taxes on foreign dividends have been provided for in accordance with the Fund’s understanding of the applicable country’s tax rules and regulations.
Fair Value Measurements — A three-tier hierarchy has been established to classify fair value measurements for disclosure purposes. Inputs refer broadly to the assumptions that market participants would use in pricing the asset or liability, including assumptions about risk. Inputs may be observable or unobservable. Observable inputs are inputs that reflect the assumptions market participants would use in pricing the asset or liability that are developed based on market data obtained from sources independent of the reporting entity. Unobservable inputs are inputs that reflect the reporting entity’s own assumptions about the assumptions market participants would use in pricing the asset or liability that are developed based on the best information available. In accordance with the authoritative guidance on fair value measurements and disclosure under GAAP, the Fund discloses fair value of its investments in a hierarchy that prioritizes the inputs to valuation techniques used to measure the fair value.
16 | www.bvafunds.com |
Broadview Opportunity Fund | Notes to Financial Statements |
March 31, 2017 (Unaudited)
Various inputs are used in determining the value of the Fund’s investments as of the reporting period end. These inputs are categorized in the following hierarchy under GAAP:
Level 1 | — | Unadjusted quoted prices in active markets for identical, unrestricted assets or liabilities that the Fund has the ability to access at the measurement date; |
Level 2 | — | Quoted prices which are not active, quoted prices for similar assets or liabilities in active markets or inputs other than quoted prices that are observable (either directly or indirectly) for substantially the full term of the asset or liability; and |
Level 3 | — | Significant unobservable prices or inputs (including the Fund’s own assumptions in determining the fair value of investments) where there is little or no market activity for the asset or liability at the measurement date. |
The availability of observable inputs can vary from security to security and is affected by a wide variety of factors, including, for example, the type of security, whether the security is new and not yet established in the marketplace, the liquidity of markets, and other characteristics particular to the security. To the extent that valuation is based on models or inputs that are less observable or unobservable in the market, the determination of fair value requires more judgment. Accordingly, the degree of judgment exercised in determining fair value is greatest for instruments categorized in Level 3.
An investment level within the fair value hierarchy is based on the lowest level input, individually or in the aggregate, that is significant to fair value measurement. The valuation techniques used by the Fund to measure fair value during the period ended March 31, 2017, maximized the use of observable inputs and minimized the use of unobservable inputs.
The inputs or methodologies used for valuing securities are not necessarily an indication of the risk or liquidity associated with investing in those securities. The following is a summary of the inputs used in valuing the Fund’s investments as of March 31, 2017:
Broadview Opportunity Fund
Valuation Inputs | ||||||||||||||||
Investments in Securities at Fair Value* | Level 1 | Level 2 | Level 3 | Total | ||||||||||||
Common Stocks | $ | 578,527,707 | $ | – | $ | – | $ | 578,527,707 | ||||||||
Short-Term Security | 77,623,089 | – | – | 77,623,089 | ||||||||||||
Total | $ | 656,150,796 | $ | – | $ | – | $ | 656,150,796 |
* | See Schedule of Investments for industry classification. |
It is the Fund’s policy to recognize transfers between levels at the end of the reporting period. There were no transfers between Levels 1 and 2 during the period ended March 31, 2017.
For the period ended March 31, 2017, the Fund did not have any unobservable inputs (Level 3) used in determining fair value.
Distributions to Shareholders — Dividends from net investment income and distributions of net realized capital gains, if any, will be declared and paid at least annually. Income and capital gains distributions are determined in accordance with income tax regulations, which may differ from GAAP. Distributions to shareholders are recorded on the ex-dividend date.
Income Taxes — As of and during the period ended March 31, 2017, the Fund did not have a liability for any unrecognized tax benefits. The Fund files U.S. federal, state, and local tax returns as required. The Fund’s tax returns are subject to examination by the relevant tax authorities until expiration of the applicable statute of limitations which is generally three years after the filing of the tax return for federal purposes and four years for most state returns. Tax returns for open years have incorporated no uncertain tax positions that require a provision for income taxes. The Fund intends to continue to qualify each year as a “regulated investment company” under Subchapter M of the Internal Revenue Code of 1986, as amended. By so qualifying, the Fund will not be subject to Federal income taxes to the extent that it distributes substantially all of its taxable or tax-exempt income, if any, for its tax year ending September 30. In addition, by distributing in each calendar year substantially all of its net investment income, capital gains and certain other amounts, if any, the Fund will not be subject to a Federal excise tax. Therefore, no provision is made by the Fund for Federal income or excise taxes.
Semi-Annual Report | March 31, 2017 | 17 |
Broadview Opportunity Fund | Notes to Financial Statements |
March 31, 2017 (Unaudited)
3. ADVISORY FEES, ADMINISTRATION FEES AND OTHER AGREEMENTS
Investment Advisory Agreement
Effective as of the close of business on November 29, 2013, the Fund entered into an investment advisory agreement with Broadview Advisors, LLC (the “Adviser”). The Fund pays the Adviser a monthly fee based upon the average daily net assets of the Fund and calculated at an annual rate of 1.00%.
Prior to November 29, 2013, Fiduciary Management, Inc. (“FMI”) was the Predecessor Fund’s investment adviser. As full compensation for the investment advisory services provided to the Predecessor Fund, FMI received monthly compensation based on the Predecessor Fund’s average daily net assets at the annual rate of 1.00%.
Prior to November 29, 2013, FMI had an investment sub-advisory agreement with the Adviser, with whom a certain director of the Predecessor Fund was affiliated, to assist it in the day-to-day management of the Predecessor Fund. The Adviser determined which securities were purchased, retained or sold for the Predecessor Fund. FMI paid the Adviser 0.85% of the first $500 million of the average daily net assets of the Predecessor Fund and 0.80% of the Predecessor Fund’s average daily net assets in excess of $500 million.
Beneficial Ownership
At March 31, 2017, Wells Fargo Advisors, LLC is a record owner of 26% of the Fund’s shares.
Fund Accounting Fees and Expenses
ALPS Fund Services, Inc. (“ALPS” or the “Administrator”) provides administrative, fund accounting and other services to the Fund under the Administration, Bookkeeping and Pricing Services Agreement (the “Administration Agreement”) with the Trust. Under the Agreement, ALPS is paid fees, accrued on a daily basis and paid on a monthly basis following the end of the month.
The Administrator is also reimbursed by the Fund for certain out of pocket expenses.
The Fund has entered into a Distribution Plan (the “Plan”) pursuant to Rule 12b-1 under the Act. The Plan provides that the Fund may incur certain costs which may not exceed the lesser of a monthly amount equal to 0.25% of the Fund’s daily net assets or the actual distribution costs incurred during the year. Amounts payable under the Plan are paid monthly for any activities or expenses primarily intended to result in the sale of shares of the Fund. For the period ended March 31, 2017, no such expenses were incurred. The Fund presently intends not to utilize the Plan or pay any 12b-1 fees during the fiscal year ending September 30, 2017.
Transfer Agent and Shareholder Services Agreement
ALPS serves as transfer, dividend paying and shareholder servicing agent for the Fund (the “Transfer Agent”) under a Transfer Agency and Services Agreement with the Trust.
Compliance Services
ALPS provides Chief Compliance Officer services to the Fund. Additionally, ALPS provides services in monitoring and testing the policies and procedures of the Trust in conjunction with requirements under Rule 38a-1 under the 1940 Act. ALPS is compensated under the Chief Compliance Officer Services Agreement.
Distributor
The Fund has entered into a Distribution Agreement with ALPS Distributors, Inc. (the “Distributor”) to provide distribution services to the Fund. The Distributor serves as underwriter/distributor of shares of the Fund.
Officer and Trustee Compensation
Officers of the Trust and Trustees who are “interested persons” of the Trust or the Adviser will receive no salary or fees from the Trust. Each Trustee who is not an “interested person” receives an annual fee of $20,000 each year. The Trust reimburses each Trustee and Officer for his or her travel and other expenses relating to attendance at such meetings.
Certain Trustees and Officers of the Trust are also officers of the Adviser or ALPS.
18 | www.bvafunds.com |
Broadview Opportunity Fund | Notes to Financial Statements |
March 31, 2017 (Unaudited)
4. PURCHASES AND SALES OF INVESTMENT SECURITIES
The aggregate cost of purchases and proceeds from sales of investment securities, excluding short-term securities, are shown below for the period ended March 31, 2017.
Broadview Opportunity Fund | ||||
Cost of Investments Purchased | $ | 134,518,312 | ||
Proceeds from Investments Sold | $ | 188,172,420 |
5. TAX BASIS INFORMATION
Distributions are determined in accordance with federal income tax regulations, which differ from GAAP, and, therefore, may differ significantly in amount or character from net investment income and realized gains for financial reporting purposes. Financial reporting records are adjusted for permanent book/tax differences to reflect tax character but are not adjusted for temporary differences. The amounts and characteristics of tax basis distributions and composition of distributable earnings/(accumulated losses) are finalized at fiscal year-end.
The tax character of distributions paid during the year ended September 30, 2016, were as follows:
Ordinary Income | Long-Term Capital Gain | |||||||
$ | – | $ | 59,156,314 |
As of March 31, 2017, net unrealized appreciation/(depreciation) of investments based on the federal tax cost was as follows:
Cost of Investments | Gross Unrealized Appreciation | Gross Unrealized Depreciation | Net Appreciation on Investments | ||||||||||||
$ | 527,774,327 | $ | 156,182,774 | $ | (27,806,305 | ) | $ | 128,376,469 |
The difference between book basis and tax basis is primarily attributable to wash sales.
6. COMMITMENTS AND CONTINGENCIES
Under the Trust’s organizational documents, each director, officer, employee or other agent of the Fund (including the Adviser) is indemnified, to the extent permitted by the Act, against certain liabilities that may arise out of performance of their duties to the Fund. Additionally, in the normal course of business, the Fund enters into contracts that contain a variety of indemnification clauses. The Fund’s maximum exposure under these arrangements is unknown as this would involve future claims that may be made against the Fund that have not yet occurred. However, the Fund has not had prior claims or losses pursuant to these contracts and believes the risk of loss to be remote.
Semi-Annual Report | March 31, 2017 | 19 |
Broadview Opportunity Fund | Additional Information |
March 31, 2017 (Unaudited)
1. PROXY VOTING POLICIES AND VOTING RECORD
A description of the policies and procedures that the Fund uses to vote proxies relating to portfolio securities is available without charge upon request by calling toll-free 855-846-1463, or on the Securities and Exchange Commission’s (“SEC”) website at http://www.sec.gov. Information regarding how the Fund voted proxies relating to portfolio securities during the most recent 12-month period ended June 30th is available without charge upon request by calling toll-free 855-846-1463, or on the SEC’s website at http://www.sec.gov.
2. QUARTERLY PORTFOLIO HOLDINGS
The Trust files a complete listing of portfolio holdings for the Fund with the SEC four times each fiscal year at quarter-ends. The Fund files the schedule of portfolio holdings with the SEC on Form N-CSR (second and fourth quarters) and on Form N-Q (first and third quarters). The filings are available upon request by calling 855-846-1463. Furthermore, you may obtain a copy of the filing on the SEC’s website at http://www.sec.gov. The Fund’s Forms N-CSR and N-Q may also be reviewed and copied at the SEC’s Public Reference Room in Washington, D.C., and information on the operation of the Public Reference Room may be obtained by calling 1-800-SEC-0330.
3. BASIS FOR TRUSTEES’ APPROVAL OF THE INVESTMENT ADVISORY AGREEMENT
The Board of Trustees (the “Board” or the “Trustees”) of Broadview Funds Trust (the “Trust”) met on November 21, 2016 to consider the renewal of the Investment Advisory Agreement (the “Agreement”) between the Trust, on behalf of the Broadview Opportunity Fund (the “Fund”), a series of the Trust, and Broadview Advisors, LLC, the Fund’s investment adviser (the “Adviser”). Prior to the meeting, the Trustees requested and received materials to assist them in considering the renewal of the Agreement. The materials provided contained information with respect to the factors enumerated below, including a copy of the Agreement, a memorandum prepared by the Trust’s outside legal counsel discussing in detail the Trustees’ fiduciary obligations and the factors they should assess in considering the renewal of the Agreement, the Adviser’s Form ADV, a due diligence questionnaire completed by the Adviser in response to a specific request letter from the Trust’s outside legal counsel, financial and insurance information for the Adviser, and detailed comparative information relating to the Fund’s performance, as well as the advisory fee and other expenses of the Fund. Based on their evaluation of the information provided by the Adviser, in conjunction with the Fund’s other service providers, the Trustees, by a unanimous vote (including a separate vote of the Trustees who are not “interested persons,” as that term is defined in the Investment Company Act of 1940, as amended (the “Independent Trustees”)), approved the continuation of the Agreement for an additional one-year term.
Discussion of Factors Considered
In considering the renewal of the Agreement and reaching their conclusions, the Trustees reviewed and analyzed various factors they determined were relevant, including the factors enumerated below.
Nature, Extent and Quality of Services Provided to the Fund. The Trustees considered the nature, extent and quality of services provided by the Adviser to the Fund and the amount of time devoted to the Fund’s affairs by the Adviser’s staff. The Trustees considered the Adviser’s specific responsibilities in all aspects of day-to-day management of the Fund, as well as the qualifications, experience and responsibilities of Richard E. Lane, Richard J. Whiting, Faraz Farzam and Aaron J. Garcia, the Fund’s portfolio managers, and other key personnel at the Adviser involved in the day-to-day activities of the Fund. The Trustees reviewed the structure of the Adviser’s compliance program and discussed the Adviser’s marketing activity and its continuing commitment to the growth of Fund assets. The Trustees also noted any services that extended beyond portfolio management, and they considered the brokerage practices of the Adviser, including information provided with respect to brokerage commissions paid by the Fund. The Trustees concluded that the Adviser had sufficient quality and depth of personnel, resources, investment methods and compliance policies and procedures essential to performing its duties under the Investment Advisory Agreement and that the nature, overall quality and extent of the management services provided to the Fund, as well as the Adviser’s compliance program, were satisfactory and reliable.
Investment Performance of the Fund and the Adviser. The Board reviewed the performance of the Fund for the one-year, three-year, five-year, ten-year and since inception periods ended September 30, 2016 in comparison to the Fund’s benchmark indexes (the Russell 2500 Index and the Russell 2000 Index). In assessing the quality of the management services delivered by the Adviser, the Trustees also compared the short-term and long-term performance of the Fund on both an absolute and relative basis in comparison to a peer group of small/mid cap blend funds (the “Peer Group”) selected by FUSE Research Network, LLC (“FUSE”), an independent consulting firm, and a universe that consists of the Fund, the Peer Group, and other funds classified by Morningstar as small blend funds with similar characteristics as determined by FUSE (the “Universe”), for the quarter, one-year, three-year, five-year, ten-year and since inception periods ended September 30, 2016. The Trustees also reviewed information on the historical performance of a composite consisting of other separately-managed accounts of the Adviser that were similar to the Fund in terms of investment strategy. The Trustees noted that the Fund underperformed its benchmarks for the one-year, three-year and five-year periods ended September 30, 2016. The Fund outperformed its benchmarks for the ten-year and since inception periods ended September 30, 2016. The Trustees noted that the Fund’s performance, in comparison to the Universe, was in the 30th percentile for the quarter, the 59th percentile for the one year, the 75th percentile for the three-year, the 60th percentile for the five-year, 14th percentile for the ten-year and 1st percentile for the since inception periods ended September 30, 2016. The Trustees noted that the Fund’s performance for all periods was generally in-line with the performance of the composite consisting of the Adviser’s other separately-managed accounts with similar investment strategies to that of the Fund. After considering all of the information, the Trustees concluded that the performance obtained by the Adviser for the Fund was satisfactory under current market conditions. Although past performance is not a guarantee or indication of future results, the Trustees determined that the Fund and its shareholders were likely to continue to benefit from the Adviser’s management.
20 | www.bvafunds.com |
Broadview Opportunity Fund | Additional Information |
March 31, 2017 (Unaudited)
Costs of Services Provided and Profits Realized by the Adviser. The Trustees considered the cost of services and the structure of the Adviser’s fees, including a review of the expense analyses and other pertinent material with respect to the Fund. The Trustees reviewed the related statistical information and other materials provided, including the comparative expenses and expense components of the Universe and Peer Group. The Trustees considered the load structure (no-load funds without Rule 12b-1 fees) in the Universe and Peer Group. The Trustees also considered the overall profitability of the Adviser and reviewed the Adviser’s financial information. The Trustees also examined the profitability analysis prepared by the Adviser from the fees payable under the Investment Advisory Agreement, as well as the Fund’s brokerage commissions and use of soft dollars by the Adviser. The Trustees noted that the Fund’s contractual management fee of 1.00% is equal to the Peer Group average and median of 1.00% and is above the Universe median of 0.90%. The Trustees observed that the Fund’s total annual fund operating expense ratio of 1.23% is above both the Peer Group average of 1.18% and the median of 1.20% and above the Universe median of 1.15%. The Trustees then compared the fees paid by the Fund to the fees paid by separately-managed accounts of the Adviser and noted that the Fund’s management fee was at the top of the range of fees paid by the separately-managed account clients but that the Adviser has additional responsibilities with respect to the Fund, including financial commitments and additional compliance and reporting obligations that support the reasonableness of the Fund’s management fee. The Trustees concluded that the Fund’s expenses and the management fee to be paid to the Adviser were fair and reasonable in light of the comparative performance, expense and management fee information. The Trustees noted, based on the profitability analysis prepared by the Adviser, that the Adviser’s profit from sponsoring the Fund had not been, and was not, excessive and the Adviser maintained adequate profit levels to support its services to the Fund from the revenues of its overall investment advisory activities.
Extent of Economies of Scale. The Trustees compared the Fund’s expenses relative to the Peer Group and discussed realized and potential economies of scale. The Trustees also reviewed the structure of the Fund’s management fee and whether the Fund was large enough to generate economies of scale for shareholders or whether economies of scale would be expected to be realized as Fund assets grow (and if so, how those economies of scale would be shared with shareholders). The Trustees noted that no expense limitation arrangements with respect to the Fund were being contemplated by the Adviser. The Trustees noted that the Fund’s management fee structure did not contain any breakpoint reductions as the Fund’s assets grow in size, but that the flexibility of incorporating breakpoints would continue to be reviewed on a regular basis. With respect to the Adviser’s fee structure, the Trustees concluded that the current fee structure was reasonable and reflected a sharing of economies of scale between the Adviser and the Fund.
Benefits Derived from the Relationship with the Fund. The Trustees considered the direct and indirect benefits that could be realized by the Adviser from its association with the Fund. The Trustees examined the brokerage commissions of the Adviser with respect to the Fund. The Trustees concluded that the benefits the Adviser may receive, such as greater name recognition, growth in separate account management services, increased ability to obtain research on brokerage services, or greater exposure to press coverage appear to be reasonable, and in many cases may benefit the Fund.
Based on the Trustees’ deliberations and their evaluation of the information described above, the Trustees, including the Independent Trustees, unanimously: (a) concluded that the terms of the Investment Advisory Agreement continue to be fair and reasonable; (b) concluded that the Adviser’s fees are reasonable in light of the services that the Adviser provides to the Fund; and (c) agreed to approve the Investment Advisory Agreement for another one year period.
Semi-Annual Report | March 31, 2017 | 21 |
Item 2. Code of Ethics.
Not applicable to semi-annual report.
Item 3. Audit Committee Financial Expert.
Not applicable to semi-annual report.
Item 4. Principal Accountant Fees and Services.
Not applicable to semi-annual report.
Item 5. Audit Committee of Listed Registrants.
Not applicable to the Registrant.
Item 6. Schedule of Investments.
(a) | The Registrant’s “Schedule I – Investments in securities of unaffiliated issuers” (as set forth in 17 CFR 210.12-12) is included in Item 1 of this Form N-CSR. |
(b) | Not applicable to the Registrant. |
Item 7. Disclosure of Proxy Voting Policies and Procedures for Closed-End Management Investment Companies.
Not applicable to the Registrant.
Item 8. Portfolio Managers of Closed-End Management Investment Companies.
Not applicable to the Registrant.
Item 9. Purchases of Equity Securities by Closed-End Management Investment Company and Affiliated Purchasers.
Not applicable to the Registrant.
Item 10. Submission of Matters to a Vote of Security Holders.
None.
Item 11. Controls and Procedures.
(a) | The Registrant’s principal executive officer and principal financial officer have evaluated the Registrant’s disclosure controls and procedures (as defined in Rule 30a-3(c) under the Investment Company Act of 1940, as amended (the “1940 Act”)) within 90 days of the filing of this report, as required by Rule 30a-3(b) under the Act and Rules 13a-15(b) or 15d-15(b) under the Securities Exchange Act of 1934, and have concluded that the Registrant’s disclosure controls and procedures were effective as of that date. |
(b) | There was no change in the Registrant’s internal control over financial reporting (as defined in Rule 30a-3(d) under the 1940 Act) during the second fiscal quarter of the period covered by this report that has materially affected, or is reasonably likely to materially affect, the Registrant’s internal control over financial reporting. |
Item 12. Exhibits.
(a)(1) | Not applicable to semi-annual report. |
(a)(2) | A separate certification for the Registrant’s Principal Executive Officer and Principal Financial Officer as required by Rule 30a-2(a) under the 1940 Act (17 CFR 270.30a-2(a)), are attached hereto as Ex99.Cert. |
(a)(3) | None. |
(b) | The certifications by the Registrant’s Principal Executive Officer and Principal Financial Officer, as required by Rule 30a-2(b) of the 1940 Act, and Section 906 of the Sarbanes-Oxley Act of 2002 are attached hereto as Ex99.906Cert. |
SIGNATURES
Pursuant to the requirements of the Securities Exchange Act of 1934 and the Investment Company Act of 1940, the Registrant has duly caused this report to be signed on its behalf by the undersigned, thereunto duly authorized.
Broadview Funds Trust
By: | /s/ Richard E. Lane | |
Richard E. Lane | ||
President | ||
Date: | June 2, 2017 |
Pursuant to the requirements of the Securities Exchange Act of 1934 and the Investment Company Act of 1940, this report has been signed below by the following persons on behalf of the Registrant and in the capacities and on the dates indicated.
By: | /s/ Richard E. Lane | |
Richard E. Lane | ||
President (Principal Executive Officer) | ||
Date: | June 2, 2017 |
By: | /s/ Aaron J. Garcia | |
Aaron J. Garcia | ||
Chief Financial Officer (Principal Financial Officer) | ||
Date: | June 2, 2017 |