UNITED STATES
SECURITIES AND EXCHANGE COMMISSION
Washington, D.C. 20549
FORM N-CSRS
CERTIFIED SHAREHOLDER REPORT OF REGISTERED
MANAGEMENT INVESTMENT COMPANIES
Investment Company Act file number: 811-22885
Broadview Funds Trust
(Exact name of registrant as specified in charter)
330 East Kilbourn Ave., Suite 1475
Milwaukee, Wisconsin 53202
(Address of principal executive offices) (Zip code)
Angela L. Pingel
Broadview Advisors, LLC
330 East Kilbourn Ave., Suite 1475
Milwaukee, Wisconsin 53202
(Name and address of agent for service)
Registrant’s telephone number, including area code: (414) 918-3900
Date of fiscal year end: September 30
Date of reporting period: October 1, 2015 – March 31, 2016
| Item 1. | Reports to Stockholders. |

table of contents
Shareholder Letter | 1 |
| Manager Commentary | 5 |
Disclosure of Fund Expenses | 7 |
| Schedule of Investments | 8 |
| Statement of Assets and Liabilities | 12 |
| Statement of Operations | 13 |
| Statements of Changes in Net Assets | 14 |
| Financial Highlights | 15 |
| Notes to Financial Statements | 16 |
| Additional Information | 20 |
| Broadview Opportunity Fund | Shareholder Letter |
March 31, 2016 (Unaudited)
Dear Fellow Shareholders,
Groundhog Day – Rick Lane, CFA
For small-cap core investors, the past fifteen months have felt about as fun and rewarding as Bill Murray’s role in the classic movie Groundhog Day. We have experienced several periods where economic growth appeared poised to snap out of its doldrums only to fall back into a funk. A similar pattern has played out with interest rates. Using the U.S. 10 Year Treasury Note as an example, yields have increased only to fall again. We believe mildly rising interest rates would be very good for the Fund’s financial sector holdings. Rising interest rates are also typically good for equity prices because they are associated with a strengthening economy and increasing corporate profits.
Why can’t the U.S. economy seem to gain a firmer footing? Before weighing in on that topic, we note that while overall growth certainly hasn’t been robust, it has not been nearly as bad as portrayed by journalists and politicians. Job growth has been averaging over 200,000 per month. Personal income grew 4.4% in 2015. Energy prices have been lower, providing consumers much needed relief. That said, there is still a fair amount of “slack” in the labor market. Uncertainty on the part of businesses and consumers is high and no one seems particularly happy.
In our opinion, this suboptimal economic growth is likely to continue for the foreseeable future. Not only is the U.S. in the latter stages of the economic cycle that began following the financial debacles of 2008, but it is also suffering from an unfriendly regulatory environment which acts as a drag on productivity. Furthermore, we believe U.S. exports are being negatively impacted by recessions in many of the emerging markets. Of course, the crushing decline in energy prices is taking a toll on the U.S. energy sector.
Interest rates in the U.S. fixed income market have been artificially suppressed by the increased demand from Japanese and European investors. Given the negative interest rate environments they face in their own countries, foreign investors are drawn to the “higher” interest rates in the U.S. even though in absolute terms our rates are also extremely low by historical standards.
Low rates are depressing the U.S. financial sector through compressed lending spreads. Compounding this misery has been the regulatory environment. Dodd Frank, the Consumer Financial Protection Bureau (CFPB), and a myriad of other regulations have squeezed earnings in a revenue-challenged environment. Higher capital standards have further magnified these challenges. U.S. financial institutions have had to reign in lending, particularly in certain arenas such as home mortgages. The overall effect is yet another retardant to overall economic growth.
Despite the aforementioned, the U.S. economy continues to advance. But the various impediments are not about to go away. While we are in the latter stage of this economic cycle, the Federal Reserve seems determined to extend this cycle indefinitely. So, until an exogenous event spoils the party or economic imbalances develop, the current economic condition could go on for a while.
Meanwhile, equity valuations are not cheap. This is particularly the case in the less cyclical sectors where investors, fearing the end of the cycle, have bid prices up to nosebleed levels. Therein lies the dilemma. Most “bargains” in the equity market tend to be in more cyclical sectors or the much maligned energy sector. Yet, given how deep into the current economic cycle we are, we believe one should be very careful about over-exposure to cyclically-sensitive businesses. The energy sector certainly intrigues the contrarian spirit in us, but trying to pick a bottom can be treacherous. Furthermore, much of the energy space is comprised of commodity businesses, lacking the barriers to entry we require of a portfolio company.
We have identified a few companies in the energy sector that meet our Five Pillar criteria. Two are Exploration and Production (E&P) companies, Gulfport Energy Corp. (GPOR) and Range Resources Corp. (RRC), and three are energy services companies, Patterson-UTI Energy, Inc. (PTEN), Superior Energy Services, Inc. (SPN), and U.S. Silica Holdings, Inc. (SLCA). Given the extreme volatility of this sector’s stock prices, the positions currently account for about 5% of the Fund’s total assets. We believe these companies are leaders in their respective fields, possess solid balance sheets to weather the storm, have capable and seasoned management teams who have successfully lead their companies through prior downturns, have strong competitive positions in the industry, and, in the case of the two E&P’s, have low-cost long-lived assets.
We believe there is a current inventory imbalance, which will work its way off over the next twelve months or so, allowing supply and demand to level off. Balance will likely stabilize prices for a period of time although the exact timing is impossible to predict. Worldwide demand for oil goes up roughly one million barrels a day on a base of about 95 million barrels per day. Especially important is the natural decline rate which measures the rate of decline of existing oil production without any additional capital spending (e.g. new oil rigs). Our work suggests the worldwide natural decline rate is somewhere around 2 to 4 million barrels per day. With industry capital spending plunging for a period of several years, a significant percent of the natural decline rate will not be offset.
Commodity market shortages and gluts are defined by small imbalances driving large price swings. It is hard to calculate how much oil and gas prices are currently being discounted in the valuation of energy stocks. The consensus is generally between $45 and $50 dollars. This is about $10 higher than what we are seeing as we write this. Equity prices never reflected $115/barrel oil at the peak, nor did they reflect the recent lows in the low to mid-twenties. This adds an element of complexity and imprecision to valuing companies in the energy sector. We do feel the intermediate-term opportunity is sufficiently large to warrant wading into high quality companies, but very carefully.
| Semi-Annual Report | March 31, 2016 | 1 |
| Broadview Opportunity Fund | Shareholder Letter |
March 31, 2016 (Unaudited)
When measuring the Fund’s overall energy holdings, it is important to note we own a handful of banks with exposure to energy companies, referred to as “energy banks,” including Hilltop Holdings, Inc. (HTH), IBERIABANK Corp. (IBKC), Legacy Texas Financial Group, Inc. (LTXB), and Zions Bancorporation (ZION). Collectively these banks comprise approximately 5.5% of the Fund’s portfolio. These energy banks generally have between 4% and 8% of their loan portfolios in energy-related loans and tend to have geographical concentrations in oil producing regions as well. Places like Houston will feel the pain of low energy prices in other economic sectors such as commercial real estate. Therefore, energy banks trade with energy prices, but with less volatility. These could be considered “safer ways to play” the recovery in oil and gas.
With respect to the rest of the portfolio, overall we believe we are positioned conservatively with respect to economic sensitivity. We believe we have been careful and disciplined about valuations in a market where many sectors are extremely overpriced (driven by the zero-interest-rate environment). We also have exposure to sectors of the economy that still have more of their respective cycles left to play out. Residential housing is a good example of where we think substantial upside is still possible, assuming no near-term recession. For this reason, we have invested in Vulcan Materials Co. (VMC), Summit Materials Inc. (SUM), and MGIC Investment Corp. (MTG). In our opinion, the recently enacted multi-year federal highway bill should benefit certain of our portfolio holdings, specifically Astec Industries, Inc. (ASTE), Vulcan Materials, and Summit Materials. We are all painfully aware of the sorry state of our roads and highways, so this is certainly good news for all Americans and for investors in the Fund.
Consumer Update – Faraz Farzam, CFA
After a difficult 2015, the Fund’s consumer investments rebounded sharply in the first quarter of 2016, driving the lion’s share of Fund outperformance. Our best performing stock was accessories and luggage retailer, Tumi Holdings, Inc. (TUMI), which was acquired by Samsonite International in a $1.8 billion deal valuing the company at $26.75 per share, a 35% premium to the stock price.
Our largest consumer position, Hibbett Sports, Inc. (HIBB), which we discussed in detail in our quarterly update for the period ended December 31, 2015, reported better than expected results driving a modest relief rally, although the market continues to keep the valuation in the penalty box. In a related development, industry peer TSA Stores, Inc. (Sports Authority) filed for Chapter 11 bankruptcy. They announced they are liquidating all 450 of their retail stores as the company failed to make interest payments on debt in excess of $1 billion.
In contrast, Hibbett is financially solid in our opinion. The company has no debt, significant cash on the balance sheet and, despite ongoing investments in its business, generates free cash flow. Although Hibbett and Sports Authority have little geographic overlap, the implications of Sports Authority’s filing are very positive for Hibbett. Sporting goods retailers depend on product availability from branded partners such as NIKE, Inc. (NKE) and Under Armour, Inc. (UA) which make up almost three-quarters of Hibbett purchases. With Sports Authority withering on the vine, well financed and well run partners like Hibbett become increasingly important channels of distribution for NIKE and Under Armour with their compelling product lines.
In our conversations with Hibbett management, we find that both NIKE and Under Armour are also investing in Hibbett. Last fall, NIKE opened an office near Hibbett headquarters in Birmingham, AL solely to service the company. Similarly in May, Under Armour plans to open an office near Hibbett headquarters solely to service the company. We continue to believe that Hibbett is one of the most compelling businesses in our portfolio trading at a rock bottom valuation.
Mobileye N.V. (MBLY) – Aaron Garcia, CFA
This quarter we initiated a position on Mobileye. This investment reflects an evolving investment theme regarding autonomous driving automobiles. While we are still many years away from stepping into a car that can drive you to work, automobile original equipment manufacturers (OEMs), tier 1 suppliers, and large technology companies are all feverishly pursuing solutions to enable this future technology. We believe Mobileye will be one of the key suppliers of image sensing and processing chipsets for the automobile industry during this transition.
In our opinion, the company is the current market leader in vision technology, specifically autonomous emergency braking (AEB). AEB is considered the next largest safety feature in global automobiles with a market adoption potential similar to airbags. Mobileye’s disruptive vision solution is more accurate, more functional and lower cost than other technologies. It has become the gold standard of AEB at this time.
While autonomous driving technology is certainly a future initiative for Mobileye, it is too nascent to confidently incorporate into the valuation. However, OEMs award technologies several years out and Mobileye’s recent wins (91% win rate in vision/radar based contracts over the past three years) position it well to grow both revenue and earnings, while continuing to develop more advanced applications.
| 2 | www.bvafunds.com |
| Broadview Opportunity Fund | Shareholder Letter |
March 31, 2016 (Unaudited)
Mobileye went public mid-2014. Analysts universally loved the name and forecast 80-100% market adoption of the Advanced Driver Assistance Systems (ADAS) market by 2020, which would imply many billions in revenue (potential for 100 million units at $100-200 average suggested price). According to a Deutsche Bank report issued in August 2015, Active Safety Technologies such as AEB is expected to gain fitment on the vast majority of Developed Market vehicles and a significant portion of developing market vehicles over the next 10 years. Unsurprisingly, the analysts continued forecasting eye popping numbers in more and more bombastic reports as the stock marched from its IPO price of $25 to a high of $64. While valuation is always an impediment to our investment discipline, we could not find fault with the company’s market leading technology and nearly 100% win rate. Fortuitously, the currently volatile equity markets presented an opportunity to initiate a position near the IPO price, even though we were a year-and-a-half closer to the revenue ramp and earnings growth from AEB. We anticipate $2.50 per share in earnings by 2019 driven by $1.1 billion in revenue, which represents contracts already in hand as of 2015. A 25x multiple implies $62.50/share which does not include an option value on future ADAS technology.
Allscripts Healthcare Solutions, Inc. (MDRX) – Aaron Garcia, CFA
Allscripts is a healthcare information technology company that specializes in clinical and financial systems that help healthcare organizations improve their clinical, financial, and operational results. The company provides these services to a diverse client base which includes physician practices, hospitals, post-acute care facilities, medical research hospitals, and life science companies. Key services include electronic health records (EHRs), hosted services, clinical decision support, financial reporting & billing, and population health management solutions.
The healthcare IT sector has enjoyed several years of strong revenue growth post the 2008 recession. During this period of economic distress, the government passed the Health Information Technology for Economic and Clinical Health (HITECH) Act, which spurred the adoption of information technology solutions by the healthcare industry. Allscripts benefited from this adoption curve and was able to grow revenue rapidly, both organically and through acquisition.
It is worth noting that Allscripts is perhaps the most acquisitive company in the industry. The company rolled up several large companies, Mysis and Eclipsys most notably. While this allowed the company to grow rapidly and establish a large software user base, integration of multiple software platforms was challenging and led to a sub-optimal user experience. These issues compounded into disappointing financial results at the company and the stock pulled back from a high of $30 per share to a low of $9 per share.
New management was hired to right the ship in late 2012. Since then, the company has accelerated R&D spending, refocused the sales force, and simplified the product offering by integrated its various software platforms. These investments have borne fruit. Bookings have accelerated. Client satisfaction and retention has improved. Additionally, the company has moved into population health software, which has a massive green-field opportunity as the healthcare system transitions to a pay-for-performance model. The company has also made strides in interoperability that has helped cross selling into its customer base.
The stock has recovered from its lows of 2012 and traded at $13.21 at March quarter-end. Despite this, we believe the stock price does not reflect all of the improvements that the management team has made. Going forward, we believe revenue growth will outperform based on the improvement in bookings and the growth of the company’s population health solution. In 2016, the company is forecasting revenue growth of 4%, which is somewhat affected by a 2-4% decline in non-recurring revenue. This piece of the business is getting smaller (23% of revenue in the fourth quarter of 2015) and will be less of a headwind to revenue growth in 2017. Given the improvement in the margin profile, we believe 2017 could demonstrate meaningful improvement over the 2016 numbers. In our opinion, $1.00 in earnings for the company is not unreasonable over the medium term. Our private market value is $20 per share.
Best regards,
 |  |  |  |
| Richard E. Lane, CFA | Faraz Farzam, CFA | Aaron J. Garcia, CFA | Richard J. Whiting |
| Semi-Annual Report | March 31, 2016 | 3 |
| Broadview Opportunity Fund | Shareholder Letter |
March 31, 2016 (Unaudited)
The views and information discussed in this commentary are as of the date of publication, are subject to change, and may not reflect the writer’s current views. The views expressed represent an assessment of market conditions at a specific point in time, are opinions only and should not be relied upon as investment advice regarding a particular investment or markets in general. Such information does not constitute a recommendation to buy or sell specific securities or investment vehicles. It should not be assumed that any investment will be profitable or will equal the performance of the Fund or any securities or any sectors mentioned herein. The subject matter contained herein has been derived from several sources believed to be reliable and accurate at the time of compilation.
A NOTE ON FORWARD LOOKING STATEMENTS
Except for historical information contained in this report for the Fund, the matters discussed in this report may constitute forward-looking statements made pursuant to the safe-harbor provisions of the Private Securities Litigation Reform Act of 1995. These include any adviser or portfolio manager predictions, assessments, analyses or outlooks for individual securities, industries, market sectors and/or markets. These statements involve risks and uncertainties. In addition to the general risks described for the Fund in the current Prospectus, other factors bearing on this report include the accuracy of the adviser’s or portfolio managers’ forecasts and predictions, and the appropriateness of the investment programs designed by the adviser or portfolio managers to implement their strategies efficiently and effectively. Any one or more of these factors, as well as other risks affecting the securities markets and investment instruments generally, could cause the actual results of the Fund to differ materially as compared to benchmarks associated with the Fund.
| 4 | www.bvafunds.com |
| Broadview Opportunity Fund | Manager Commentary |
March 31, 2016 (Unaudited)
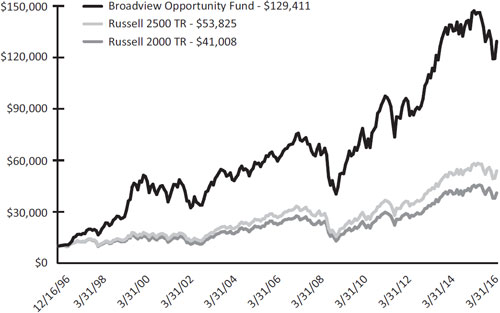
GROWTH OF $10,000 INVESTMENT IN THE FUND
From its inception (12/16/96) to 3/31/16 as compared to the Russell 2500 TR(1) and the Russell 2000 TR(2)
PERFORMANCE (For Periods Ended 3/31/16)
| Total Return* | Annualized Total Return* | |||||
| 3 Months | 1 Year | 5 Year | 10 Year | Since Inception** | ||
| Broadview Opportunity Fund | -0.80% | -12.09% | 6.42% | 7.26% | 14.20% | |
| Russell 2500 TR | 0.39% | -7.31% | 8.58% | 6.47% | 9.12% | |
| Russell 2000 TR | -1.52% | -9.76% | 7.20% | 5.26% | 7.59% | |
Performance data quoted represents past performance. Past performance does not guarantee future results. Investment return and principal value of an investment will fluctuate so that an investor’s shares, when sold or redeemed, may be worth more or less than the original cost. Current performance data may be higher or lower than actual data quoted. For the most recent month-end performance please visit bvafunds.com or call 1-855-846-1463. As of the Fund’s Prospectus dated January 28, 2016, the Broadview Opportunity Fund’s annual operating expense ratio is 1.23%. One cannot invest directly in an index.
| (1) | Russell 2500 Total Return Index - A broad index featuring 2,500 stocks that cover the small- and mid-cap market capitalizations. The Russell 2500 is a market cap weighted index that includes the smallest 2,500 companies covered in the Russell 3000 universe of United States-based listed equities. |
| (2) | The Russell 2000 Total Return Index measures the performance of the 2,000 smallest companies in the Russell 3000 Index which comprises the 3,000 largest U.S. companies based on total market capitalization. |
| * | Total return includes changes in share prices and in each case includes reinvestments of any dividends, interest and capital gain distributions. The returns do not reflect the deduction of taxes that a shareholder would pay on Fund distributions or the redemption of Fund shares. |
| ** | Fund Inception Date: December 16, 1996 |
| Semi-Annual Report | March 31, 2016 | 5 |
| Broadview Opportunity Fund | Manager Commentary |
March 31, 2016 (Unaudited)
SECTOR ALLOCATION (as of March 31, 2016) (As a percentage of Net Assets)
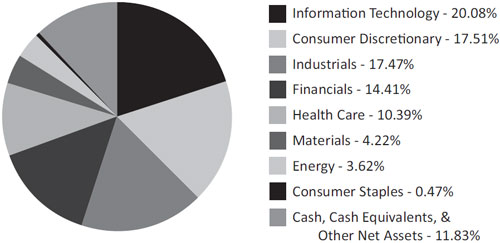
Holdings are subject to change.
These allocations may not reflect the current or future positions of the portfolio.
| 6 | www.bvafunds.com |
| Broadview Opportunity Fund | Disclosure of Fund Expenses |
March 31, 2016 (Unaudited)
As a shareholder of the Broadview Opportunity Fund (the “Fund”) you will incur two types of costs: (1) transaction costs; and (2) ongoing costs, including management fees and other Fund expenses. The following examples are intended to help you understand your ongoing costs (in dollars) of investing in the Fund and to compare these costs with the ongoing costs of investing in other mutual funds. The examples are based on an investment of $1,000 invested on October 1, 2015 and held until March 31, 2016.
Actual Expenses. The first line of the table below provides information about actual account values and actual expenses. You may use the information in this line, together with the amount you invested, to estimate the expenses that you paid over the period. Simply divide your account value by $1,000 (for example, an $8,600 account value divided by $1,000 = 8.6), then multiply the result by the number in the first line under the heading “Expenses Paid During Period” to estimate the expenses you paid on your account during this period.
Hypothetical Example for Comparison Purposes. The second line of the table below provides information about hypothetical account values and hypothetical expenses based on the Fund’s actual expense ratio and an assumed rate of return of 5% per year before expenses, which is not the Fund’s actual return. The hypothetical account values and expenses may not be used to estimate the actual ending account balance or expenses you paid for the period. You may use this information to compare the ongoing costs of investing in the Fund and other mutual funds. To do so, compare this 5% hypothetical example with the 5% hypothetical examples that appear in the shareholder reports of the other funds. The expenses shown in the table are meant to highlight ongoing Fund costs only and do not reflect transaction fees. Therefore, the second line of the table below is useful in comparing ongoing costs only, and may not help you determine the relative total costs of owning different funds. In addition, if these transactional costs were included, your costs would have been higher.
Beginning Account Value 10/1/15 | Ending Account Value 3/31/16 | Expense Ratio(a) | Expenses Paid During Period 10/1/15 - 3/31/16(b) | |
| Broadview Opportunity Fund | ||||
| Actual | $1,000.00 | $1,001.10 | 1.27% | $6.35 |
| Hypothetical (5% return before expenses) | $1,000.00 | $1,018.65 | 1.27% | $6.41 |
| (a) | The Fund's expense ratios have been based on the Fund's most recent fiscal half-year expenses. |
| (b) | Expenses are equal to the Fund's annualized expense ratio multiplied by the average account value over the period, multiplied by the number of days in the most recent fiscal half-year (183)/366 (to reflect the half-year period). |
| Semi-Annual Report | March 31, 2016 | 7 |
| Broadview Opportunity Fund | Schedule of Investments |
March 31, 2016 (Unaudited)
| Shares | Value | |||||||
| COMMON STOCKS (88.17%) | ||||||||
| CONSUMER DISCRETIONARY (17.51%) | ||||||||
| Automobiles & Components (0.98%) | ||||||||
| Gentex Corp. | 410,900 | $ | 6,447,021 | |||||
| Hotels Restaurants & Leisure (1.11%) | ||||||||
Chuy's Holdings, Inc.(a) | 235,450 | 7,315,431 | ||||||
| Leisure Products (2.22%) | ||||||||
| Brunswick Corp. | 162,550 | 7,799,149 | ||||||
| Callaway Golf Co. | 744,023 | 6,785,490 | ||||||
| 14,584,639 | ||||||||
| Media (6.54%) | ||||||||
AMC Networks, Inc. - Class A(a) | 63,680 | 4,135,379 | ||||||
| Interpublic Group of Cos., Inc. | 195,150 | 4,478,692 | ||||||
MDC Partners, Inc. - Class A | 1,187,883 | 28,034,039 | ||||||
| National CineMedia, Inc. | 416,931 | 6,341,521 | ||||||
| 42,989,631 | ||||||||
| Specality Retail (3.42%) | ||||||||
Hibbett Sports, Inc.(a) | 397,600 | 14,273,840 | ||||||
Urban Outfitters, Inc.(a) | 248,323 | 8,217,008 | ||||||
| 22,490,848 | ||||||||
| Textiles, Apparel & Luxury Goods (3.24%) | ||||||||
Lululemon Athletica, Inc.(a) | 113,300 | 7,671,543 | ||||||
Tumi Holdings, Inc.(a) | 508,650 | 13,641,993 | ||||||
| 21,313,536 | ||||||||
| CONSUMER STAPLES (0.47%) | ||||||||
| Food Products (0.47%) | ||||||||
Freshpet, Inc.(a) | 422,628 | 3,097,863 | ||||||
| ENERGY (3.62%) | ||||||||
| Energy Equipment & Services (1.90%) | ||||||||
Patterson-UTI Energy, Inc. | 96,600 | 1,702,092 | ||||||
| Superior Energy Services, Inc. | 364,998 | 4,887,323 | ||||||
| U.S. Silica Holdings, Inc. | 122,736 | 2,788,562 | ||||||
Whiting Petroleum Corp.(a) | 395,281 | 3,154,342 | ||||||
| 12,532,319 | ||||||||
| Oil, Gas & Consumable Fuels (1.72%) | ||||||||
Gulfport Energy Corp.(a) | 248,700 | 7,048,158 | ||||||
| Range Resources Corp. | 131,100 | 4,245,018 | ||||||
| 11,293,176 | ||||||||
| FINANCIALS (14.41%) | ||||||||
| Banks (12.02%) | ||||||||
Allegiance Bancshares, Inc.(a) | 83,169 | 1,527,815 | ||||||
| CoBiz Financial, Inc. | 957,571 | 11,318,489 | ||||||
| Columbia Banking System, Inc. | 240,238 | 7,187,921 | ||||||
| East West Bancorp, Inc. | 151,800 | 4,930,464 | ||||||
| First Horizon National Corp. | 531,600 | 6,963,960 | ||||||
Hilltop Holdings, Inc.(a) | 438,909 | 8,286,602 | ||||||
| IBERIABANK Corp. | 124,296 | 6,372,656 | ||||||
| LegacyTexas Financial Group, Inc. | 374,056 | 7,350,200 | ||||||
| Renasant Corp. | 192,194 | 6,325,105 | ||||||
Western Alliance Bancorp(a) | 153,100 | 5,110,478 | ||||||
| Zions Bancorporation | 566,500 | 13,714,965 | ||||||
| 79,088,655 | ||||||||
See Notes to Financial Statements.
| 8 | www.bvafunds.com |
| Broadview Opportunity Fund | Schedule of Investments |
March 31, 2016 (Unaudited)
| Shares | Value | |||||||
| COMMON STOCKS (88.17%) (continued) | ||||||||
| FINANCIALS (14.41%) (continued) | ||||||||
| Thrifts & Mortgage Finance (2.39%) | ||||||||
MGIC Investment Corp.(a) | 2,047,575 | $ | 15,704,900 | |||||
| HEALTH CARE (10.39%) | ||||||||
| Biotechnology (0.37%) | ||||||||
Exact Sciences Corp.(a) | 357,006 | 2,406,220 | ||||||
| Health Care Equipment & Supplies (2.00%) | ||||||||
LDR Holding Corp.(a) | 144,469 | 3,682,515 | ||||||
NxStage Medical, Inc.(a) | 634,181 | 9,506,373 | ||||||
| 13,188,888 | ||||||||
| Health Care Providers & Services (3.11%) | ||||||||
| HealthSouth Corp. | 367,602 | 13,832,863 | ||||||
Select Medical Holdings Corp.(a) | 560,380 | 6,618,088 | ||||||
| 20,450,951 | ||||||||
| Health Care Technology (1.94%) | ||||||||
Allscripts Healthcare Solutions, Inc.(a) | 965,400 | 12,752,934 | ||||||
| Life Sciences Tools & Services (2.17%) | ||||||||
PAREXEL International Corp.(a) | 121,206 | 7,603,252 | ||||||
VWR Corp.(a) | 247,850 | 6,706,821 | ||||||
| 14,310,073 | ||||||||
| Pharmaceuticals (0.80%) | ||||||||
Catalent, Inc.(a) | 196,886 | 5,250,950 | ||||||
| INDUSTRIALS (17.47%) | ||||||||
| Aerospace & Defense (2.33%) | ||||||||
| B/E Aerospace, Inc. | 121,500 | 5,603,580 | ||||||
| Hexcel Corp. | 221,779 | 9,693,960 | ||||||
| 15,297,540 | ||||||||
| Building Products (2.26%) | ||||||||
| Masco Corp. | 471,400 | 14,825,530 | ||||||
| Commercial Services & Supplies (2.40%) | ||||||||
| Mobile Mini, Inc. | 478,837 | 15,811,198 | ||||||
| Electrical Equipment (1.31%) | ||||||||
Regal-Beloit Corp. | 136,800 | 8,630,712 | ||||||
| Machinery (3.38%) | ||||||||
| Astec Industries, Inc. | 375,150 | 17,508,250 | ||||||
| Crane Co. | 38,100 | 2,052,066 | ||||||
Rexnord Corp.(a) | 133,300 | 2,695,326 | ||||||
| 22,255,642 | ||||||||
| Professional Services (3.10%) | ||||||||
| Kforce, Inc. | 711,938 | 13,939,746 | ||||||
| ManpowerGroup, Inc. | 44,618 | 3,632,798 | ||||||
| Robert Half International, Inc. | 60,443 | 2,815,435 | ||||||
| 20,387,979 | ||||||||
| Road & Rail (0.32%) | ||||||||
Genesee & Wyoming, Inc. - Class A(a) | 33,950 | 2,128,665 | ||||||
| Trading Companies & Distribution (2.37%) | ||||||||
BMC Stock Holdings, Inc.(a) | 357,880 | 5,947,966 | ||||||
See Notes to Financial Statements.
| Semi-Annual Report | March 31, 2016 | 9 |
| Broadview Opportunity Fund | Schedule of Investments |
March 31, 2016 (Unaudited)
| Shares | Value | |||||||
| COMMON STOCKS (88.17%) (continued) | ||||||||
| INDUSTRIALS (17.47%) (continued) | ||||||||
| Trading Companies & Distribution (2.37%) (continued) | ||||||||
HD Supply Holdings, Inc.(a) | 291,531 | $ | 9,640,930 | |||||
| 15,588,896 | ||||||||
| INFORMATION TECHNOLOGY (20.08%) | ||||||||
| Communication Equipment (2.92%) | ||||||||
Ciena Corp.(a) | 659,800 | 12,549,396 | ||||||
F5 Networks, Inc.(a) | 62,702 | 6,637,007 | ||||||
| 19,186,403 | ||||||||
| Electrical Equipment & Services (2.05%) | ||||||||
Arrow Electronics, Inc.(a) | 119,992 | 7,728,685 | ||||||
| FEI Co. | 64,800 | 5,767,848 | ||||||
| 13,496,533 | ||||||||
| Electronic Equipment & Instruments (1.15%) | ||||||||
Zebra Technologies Corp. - Class A(a) | 109,200 | 7,534,800 | ||||||
| Internet Software & Services (0.67%) | ||||||||
Pandora Media, Inc.(a) | 494,300 | 4,423,985 | ||||||
| Semiconductors & Semiconductor Equipment (4.94%) | ||||||||
Intersil Corp. - Class A | 908,000 | 12,139,960 | ||||||
| MKS Instruments, Inc. | 329,600 | 12,409,440 | ||||||
Veeco Instruments, Inc.(a) | 408,200 | 7,951,736 | ||||||
| 32,501,136 | ||||||||
| Software (8.35%) | ||||||||
CommVault Systems, Inc.(a) | 271,600 | 11,724,972 | ||||||
Fortinet, Inc.(a) | 237,095 | 7,262,220 | ||||||
Infoblox, Inc.(a) | 466,664 | 7,979,954 | ||||||
Mobileye NV(a) | 90,000 | 3,356,100 | ||||||
PROS Holdings, Inc.(a) | 197,700 | 2,330,883 | ||||||
PTC, Inc.(a) | 383,719 | 12,724,122 | ||||||
Qlik Technologies, Inc.(a) | 328,984 | 9,514,217 | ||||||
| 54,892,468 | ||||||||
| MATERIALS (4.22%) | ||||||||
| Chemicals (0.92%) | ||||||||
Ferro Corp.(a) | 321,800 | 3,819,766 | ||||||
Flotek Industries, Inc.(a) | 309,100 | 2,265,703 | ||||||
| 6,085,469 | ||||||||
| Construction Materials (3.30%) | ||||||||
Summit Materials, Inc. - Class A(a) | 157,073 | 3,055,070 | ||||||
| Vulcan Materials Co. | 176,500 | 18,633,105 | ||||||
| 21,688,175 | ||||||||
| TOTAL COMMON STOCKS (COST $493,289,638) | 579,953,166 | |||||||
See Notes to Financial Statements.
| 10 | www.bvafunds.com |
| Broadview Opportunity Fund | Schedule of Investments |
March 31, 2016 (Unaudited)
| Shares | Value | |||||||
SHORT-TERM SECURITY (12.29%) | ||||||||
| MONEY MARKET FUND (12.29%) | ||||||||
Morgan Stanley Institutional Liquidity Funds - Government Portfolio, Institutional Class, 7 Day Yield 0.257% | 80,878,599 | $ | 80,878,599 | |||||
TOTAL SHORT-TERM SECURITY (COST $80,878,599) | 80,878,599 | |||||||
| TOTAL INVESTMENTS (100.46%) (COST $574,168,237) | 660,831,765 | |||||||
TOTAL LIABILITIES IN EXCESS OF OTHER ASSETS (-0.46%) | (3,042,251 | ) | ||||||
| NET ASSETS 100.00% | $ | 657,789,514 | ||||||
| (a) | Non-income producing security. |
Percentages are stated as a percent of net assets.
See Notes to Financial Statements.
| Semi-Annual Report | March 31, 2016 | 11 |
| Broadview Opportunity Fund | Statement of Assets and Liabilities |
March 31, 2016 (Unaudited)
| ASSETS: | ||||
| Investments in securities, at value | $ | 660,831,765 | ||
| Receivable for investments sold | 1,464,012 | |||
| Receivable for shareholder purchases | 241,959 | |||
| Dividends and interest receivable | 223,749 | |||
| Prepaid expenses | 55,005 | |||
| Total assets | 662,816,490 | |||
| LIABILITIES: | ||||
| Payable for management fees | 548,416 | |||
| Payable for investments purchased | 3,633,078 | |||
| Payable to shareholders for redemptions | 470,591 | |||
| Payable for transfer agency fees | 210,547 | |||
| Payable for Board of Trustees fees | 223 | |||
| Payable for chief compliance officer fees | 5,142 | |||
| Accrued expenses and other liabilities | 158,979 | |||
| Total liabilities | 5,026,976 | |||
| NET ASSETS | $ | 657,789,514 | ||
| NET ASSETS CONSIST OF: | ||||
Paid-in capital | $ | 582,931,056 | ||
| Accumulated net investment loss | (1,219,862 | ) | ||
| Accumulated net realized loss on investments | (10,585,208 | ) | ||
| Net unrealized appreciation on investments | 86,663,528 | |||
| NET ASSETS | $ | 657,789,514 | ||
| INVESTMENTS IN SECURITIES, AT COST | $ | 574,168,237 | ||
| PRICING OF SHARES: | ||||
| Net Asset Value, offering and redemption price per share | $ | 31.06 | ||
| Net Assets | $ | 657,789,514 | ||
| Shares of beneficial interest outstanding | 21,180,396 | |||
| See Notes to Financial Statements. |
| 12 | www.bvafunds.com |
| Broadview Opportunity Fund | Statement of Operations |
| For the Period Ended March 31, 2016 (Unaudited) |
| INVESTMENT INCOME: | ||||
| Dividends | $ | 3,205,841 | ||
| Foreign taxes withheld | (74,837 | ) | ||
| Total Investment Income | 3,131,004 | |||
| EXPENSES: | ||||
| Management fees | 3,435,690 | |||
| Administration and accounting services | 126,617 | |||
| Transfer agent fees | 557,009 | |||
| Professional fees | 48,963 | |||
| Custodian fees | 30,780 | |||
| Board of Trustees fees | 30,357 | |||
| Chief compliance officer fees | 15,422 | |||
| Printing and postage expenses | 51,672 | |||
| Registration fees | 31,436 | |||
| Other expenses | 22,920 | |||
| Total Expenses | 4,350,866 | |||
| NET INVESTMENT LOSS | (1,219,862 | ) | ||
| REALIZED AND UNREALIZED GAIN/(LOSS) FROM INVESTMENTS: | ||||
| Net realized loss on investments | (4,661,455 | ) | ||
| Net change in unrealized appreciation of investments | 6,385,892 | |||
| NET REALIZED AND UNREALIZED GAIN FROM INVESTMENTS | 1,724,437 | |||
| NET INCREASE IN NET ASSETS RESULTING FROM OPERATIONS | $ | 504,575 | ||
| See Notes to Financial Statements. |
| Semi-Annual Report | March 31, 2016 | 13 |
| Broadview Opportunity Fund | Statements of Changes in Net Assets |
For the Six Months Ended March 31, 2016 (Unaudited) | For the Year Ended September 30, 2015 | |||||||
| OPERATIONS: | ||||||||
| Net investment loss | $ | (1,219,862 | ) | $ | (4,244,959 | ) | ||
| Net realized gain/(loss) on investments | (4,661,455 | ) | 74,142,425 | |||||
| Net change in unrealized appreciation/(depreciation) on investments | 6,385,892 | (74,278,794 | ) | |||||
| Net increase/(decrease) in net assets resulting from operations | 504,575 | (4,381,328 | ) | |||||
| DISTRIBUTIONS TO SHAREHOLDERS (Note 5): | ||||||||
| From net realized gains on investments | (59,156,314 | ) | (95,669,184 | ) | ||||
| Total distributions | (59,156,314 | ) | (95,669,184 | ) | ||||
| SHARE TRANSACTIONS (Note 5): | ||||||||
| Proceeds from sales of shares | 47,729,407 | 147,080,123 | ||||||
| Distributions reinvested | 57,589,371 | 93,541,782 | ||||||
| Cost of shares redeemed | (131,107,152 | ) | (302,493,246 | ) | ||||
| Net decrease from share transactions | (25,788,374 | ) | (61,871,341 | ) | ||||
| Net decrease in net assets | (84,440,113 | ) | (161,921,853 | ) | ||||
| NET ASSETS: | ||||||||
| Beginning of year | 742,229,627 | 904,151,480 | ||||||
| End of year* | $ | 657,789,514 | $ | 742,229,627 | ||||
| *Includes accumulated net investment income/(loss) of: | $ | (1,219,862 | ) | $ | 0 | |||
| Other Information: | ||||||||
| SHARE TRANSACTIONS: | ||||||||
| Sold | 1,553,091 | 3,865,177 | ||||||
| Distributions reinvested | 1,824,758 | 2,490,463 | ||||||
| Redeemed | (4,127,344 | ) | (7,920,224 | ) | ||||
| Net decrease in shares outstanding | (749,495 | ) | (1,564,584 | ) | ||||
| See Notes to Financial Statements. |
| 14 | www.bvafunds.com |
| Broadview Opportunity Fund | Financial Highlights |
| For a Share Outstanding Throughout the Periods Presented |
For the Six Months Ended March 31, 2016 (Unaudited) | For the Year Ended September 30, 2015 | For the Year Ended September 30, 2014(a) | For the Year Ended September 30, 2013 | For the Year Ended September 30, 2012 | For the Year Ended September 30, 2011 | |||||||||||||||||||
| NET ASSET VALUE, BEGINNING OF YEAR | $ | 33.85 | $ | 38.48 | $ | 40.85 | $ | 30.26 | $ | 25.54 | $ | 26.37 | ||||||||||||
| INCOME/(LOSS) FROM OPERATIONS: | ||||||||||||||||||||||||
| Net investment loss | (0.06 | ) | (0.19 | ) | (0.21 | ) | (0.15 | ) | (0.10 | ) | (0.15 | ) | ||||||||||||
| Net realized and unrealized gain/(loss) on investments | 0.14 | (0.33 | ) | 2.18 | 11.59 | 6.02 | (0.68 | ) | ||||||||||||||||
| Total from investment operations | 0.08 | (0.52 | ) | 1.97 | 11.44 | 5.92 | (0.83 | ) | ||||||||||||||||
| LESS DISTRIBUTIONS: | ||||||||||||||||||||||||
| From net realized gains on investments | (2.87 | ) | (4.11 | ) | (4.34 | ) | (0.85 | ) | (1.20 | ) | – | |||||||||||||
| Total distributions | (2.87 | ) | (4.11 | ) | (4.34 | ) | (0.85 | ) | (1.20 | ) | – | |||||||||||||
| INCREASE/(DECREASE) IN NET ASSET VALUE | (2.79 | ) | (4.63 | ) | (2.37 | ) | 10.59 | 4.72 | (0.83 | ) | ||||||||||||||
| NET ASSET VALUE, END OF YEAR | $ | 31.06 | $ | 33.85 | $ | 38.48 | $ | 40.85 | $ | 30.26 | $ | 25.54 | ||||||||||||
| TOTAL RETURN | 0.11 | %(b) | (2.40 | %) | 4.86 | % | 38.91 | % | 23.48 | % | (3.15 | %) | ||||||||||||
| SUPPLEMENTAL DATA: | ||||||||||||||||||||||||
| Net assets, end of year (000's) | $ | 657,790 | $ | 742,230 | $ | 904,151 | $ | 852,723 | $ | 618,541 | $ | 434,932 | ||||||||||||
| RATIOS TO AVERAGE NET ASSETS: | ||||||||||||||||||||||||
| Operating expenses | 1.27 | %(c) | 1.23 | % | 1.25 | % | 1.26 | % | 1.26 | % | 1.26 | % | ||||||||||||
| Net investment loss | (0.36 | %)(c) | (0.48 | %) | (0.50 | %) | (0.44 | %) | (0.34 | %) | (0.48 | %) | ||||||||||||
| PORTFOLIO TURNOVER RATE | 20 | %(b) | 41 | % | 56 | % | 70 | % | 55 | % | 78 | % | ||||||||||||
| (a) | On November 25, 2013, shareholders of the FMI Focus Fund, a series of FMI Funds, Inc. (the "Predecessor Fund"), approved a tax-free reorganization under which all assets and liabilities of the Predecessor Fund were transferred to the Broadview Opportunity Fund, a series of Broadview Funds Trust, at the close of business on November 29, 2013. |
| (b) | Not annualized. |
| (c) | Annualized. |
| See Notes to Financial Statements. |
| Semi-Annual Report | March 31, 2016 | 15 |
| Broadview Opportunity Fund | Notes to Financial Statements |
| March 31, 2016 (Unaudited) |
1. ORGANIZATION
Broadview Funds Trust (the “Trust”) is an open-end management investment company registered under the Investment Company Act of 1940, as amended (the “1940 Act”). The Trust was organized on September 9, 2013 as a Delaware statutory trust. The Trust currently offers one series, the Broadview Opportunity Fund (the “Fund”). The Fund is a diversified portfolio with an investment objective to seek capital appreciation.
On November 25, 2013, shareholders of the FMI Focus Fund, a series of FMI Funds, Inc. (the “Predecessor Fund”), approved a tax-free reorganization under which all assets and liabilities of the Predecessor Fund were transferred to the Fund, a series of the Trust, at the close of business on November 29, 2013. The Predecessor Fund commenced operations on December 16, 1996.
2. SIGNIFICANT ACCOUNTING POLICIES
The following is a summary of significant accounting policies consistently followed by the Fund. These policies are in conformity with U.S. generally accepted accounting principles (“GAAP”). The Fund is considered an investment company for financial reporting purposes under GAAP.
Use of Estimates — The preparation of financial statements in conformity with GAAP requires management to make estimates and assumptions that affect the amounts reported in financial statements. Actual results could differ from those estimates.
Investment Valuation — The Fund’s portfolio securities are valued as of the close of trading of the New York Stock Exchange (“NYSE”) (normally 4:00 p.m., Eastern Time). Each security, excluding short-term investments, is valued at the last sale price reported by the principal security exchange on which the issue is traded. Securities that are traded on the Nasdaq Stock Market, Inc. are valued at the Nasdaq Official Closing Price or if no sale is reported, the mean between the bid and the ask. Securities which are traded over-the-counter are valued at the last sale price or, if no sale, at the mean between the bid and the ask. Securities sold short which are listed on a national securities exchange or the Nasdaq Stock Market but which were not traded on the valuation date are valued at the mean between the bid and the ask. Unlisted equity securities for which market quotations are readily available are valued at the last sale price or, if no sale price, the mean between the bid and the ask. Options purchased or written by the Fund are valued at the mean of the highest bid and lowest ask price of all the exchanges on which the option trades. Securities for which quotations are not readily available are valued at fair value as determined by the investment adviser in accordance with procedures approved by the Board of Trustees. The fair value of a security is the amount which the Fund might reasonably expect to receive upon a current sale. The fair value of a security may differ from the last quoted price and the Fund may not be able to sell a security at the fair value. Market quotations may not be available, for example, if trading in particular securities was halted during the day and not resumed prior to the close of trading on the New York Stock Exchange. As of March 31, 2016, there were no securities that were internally fair valued. Variable rate demand notes are recorded at par value which approximates market value. Short-term investments with maturities of 60 days or less are valued at market value. For financial reporting purposes, investment transactions are recorded on the trade date.
Securities Transactions and Related Investment Income — Securities transactions are accounted for on trade date. Dividend income is recorded on the ex-dividend date. Realized gains and losses from investment transactions are determined using the identified cost basis. Interest income which includes amortization of premium and accretion of discount, is recorded on the accrual basis.
Fair Value Measurements — A three-tier hierarchy has been established to classify fair value measurements for disclosure purposes. Inputs refer broadly to the assumptions that market participants would use in pricing the asset or liability, including assumptions about risk. Inputs may be observable or unobservable. Observable inputs are inputs that reflect the assumptions market participants would use in pricing the asset or liability that are developed based on market data obtained from sources independent of the reporting entity. Unobservable inputs are inputs that reflect the reporting entity’s own assumptions about the assumptions market participants would use in pricing the asset or liability that are developed based on the best information available. In accordance with the authoritative guidance on fair value measurements and disclosure under GAAP, the Fund discloses fair value of its investments in a hierarchy that prioritizes the inputs to valuation techniques used to measure the fair value.
Various inputs are used in determining the value of the Fund’s investments as of the reporting period end. These inputs are categorized in the following hierarchy under applicable financial accounting standards:
| Level 1 — | Unadjusted quoted prices in active markets for identical, unrestricted assets or liabilities that the Fund has the ability to access at the measurement date; |
| Level 2 — | Quoted prices which are not active, quoted prices for similar assets or liabilities in active markets or inputs other than quoted prices that are observable (either directly or indirectly) for substantially the full term of the asset or liability; and |
| 16 | www.bvafunds.com |
| Broadview Opportunity Fund | Notes to Financial Statements |
| March 31, 2016 (Unaudited) |
| Level 3 — | Significant unobservable prices or inputs (including the Fund’s own assumptions in determining the fair value of investments) where there is little or no market activity for the asset or liability at the measurement date. |
The availability of observable inputs can vary from security to security and is affected by a wide variety of factors, including, for example, the type of security, whether the security is new and not yet established in the marketplace, the liquidity of markets, and other characteristics particular to the security. To the extent that valuation is based on models or inputs that are less observable or unobservable in the market, the determination of fair value requires more judgment. Accordingly, the degree of judgment exercised in determining fair value is greatest for instruments categorized in Level 3.
An investment level within the fair value hierarchy is based on the lowest level input, individually or in the aggregate, that is significant to fair value measurement. The valuation techniques used by the Fund to measure fair value during the six months ended March 31, 2016 maximized the use of observable inputs and minimized the use of unobservable inputs.
The inputs or methodologies used for valuing securities are not necessarily an indication of the risk or liquidity associated with investing in those securities. The following is a summary of the inputs used in valuing the Fund’s investments as of March 31, 2016:
| Broadview Opportunity Fund | ||||||||||||||||
| Valuation Inputs | ||||||||||||||||
| Investments in Securities at Value* | Level 1 | Level 2 | Level 3 | Total | ||||||||||||
| Common Stocks | $ | 579,953,166 | $ | – | $ | – | $ | 579,953,166 | ||||||||
Short-Term Security | 80,878,599 | – | – | 80,878,599 | ||||||||||||
| Total | $ | 660,831,765 | $ | – | $ | – | $ | 660,831,765 | ||||||||
| * | See Schedule of Investments for industry classification. |
It is the Fund’s policy to recognize transfers between levels at the end of the reporting period. There were no transfers between Levels 1 and 2 during the six months ended March 31, 2016.
For the six months ended March 31, 2016, the Fund did not have any unobservable inputs (Level 3) used in determining fair value.
Distributions to Shareholders — Dividends from net investment income and distributions of net realized capital gains, if any, will be declared and paid at least annually. Income and capital gains distributions are determined in accordance with income tax regulations, which may differ from GAAP. Distributions to shareholders are recorded on the ex-dividend date.
Income Taxes — As of and during the year ended September 30, 2015, the Fund did not have a liability for any unrecognized tax benefits. The Fund files U.S. federal, state, and local tax returns as required. The Fund’s tax returns are subject to examination by the relevant tax authorities until expiration of the applicable statute of limitations which is generally three years after the filing of the tax return for federal purposes and four years for most state returns. Tax returns for open years have incorporated no uncertain tax positions that require a provision for income taxes. The Fund intends to continue to qualify each year as a “regulated investment company” under Subchapter M of the Internal Revenue Code of 1986, as amended. By so qualifying, the Fund will not be subject to Federal income taxes to the extent that it distributes substantially all of its taxable or tax-exempt income, if any, for its tax year ending September 30. In addition, by distributing in each calendar year substantially all of its net investment income, capital gains and certain other amounts, if any, the Fund will not be subject to a Federal excise tax. Therefore, no provision is made by the Fund for Federal income or excise taxes.
3. ADVISORY FEES, ADMINISTRATION FEES AND OTHER AGREEMENTS
Investment Advisory
Effective as of the close of business on November 29, 2013, the Fund entered into an investment advisory agreement with Broadview Advisors, LLC (the “Adviser”). The Fund pays the Adviser a monthly fee based upon the average daily net assets of the Fund and calculated at an annual rate of 1.00%.
Prior to November 29, 2013, Fiduciary Management, Inc. (“FMI”) was the Predecessor Fund’s investment adviser. As full compensation for the investment advisory services provided to the Predecessor Fund, FMI received monthly compensation based on the Predecessor Fund’s average daily net assets at the annual rate of 1.00%.
| Semi-Annual Report | March 31, 2016 | 17 |
| Broadview Opportunity Fund | Notes to Financial Statements |
| March 31, 2016 (Unaudited) |
Prior to November 29, 2013, FMI had an investment sub-advisory agreement with the Adviser, with whom a certain director of the Predecessor Fund was affiliated, to assist it in the day-to-day management of the Predecessor Fund. The Adviser determined which securities were purchased, retained or sold for the Predecessor Fund. FMI paid the Adviser 0.85% of the first $500 million of the average daily net assets of the Predecessor Fund and 0.80% of the Predecessor Fund’s average daily net assets in excess of $500 million.
Beneficial Ownership
At March 31, 2016, two financial intermediaries are each a record owner of approximately 25% of the Fund’s shares.
Fund Accounting Fees and Expenses
ALPS Fund Services, Inc. (“ALPS” or the “Administrator”) provides administrative, fund accounting and other services to the Fund under the Administration, Bookkeeping and Pricing Services Agreement (the “Administration Agreement”) with the Trust. Under the Agreement, ALPS is paid fees, accrued on a daily basis and paid on a monthly basis following the end of the month.
The Administrator is also reimbursed by the Fund for certain out of pocket expenses.
The Fund has entered into a Distribution Plan (the “Plan”) pursuant to Rule 12b-1 under the Act. The Plan provides that the Fund may incur certain costs which may not exceed the lesser of a monthly amount equal to 0.25% of the Fund’s daily net assets or the actual distribution costs incurred during the year. Amounts payable under the Plan are paid monthly for any activities or expenses primarily intended to result in the sale of shares of the Fund. For the six months ended March 31, 2016, no such expenses were incurred. The Fund presently intends not to utilize the Plan or pay any 12b-1 fees during the fiscal year ending September 30, 2016.
Transfer Agent and Shareholder Services Agreement
ALPS serves as transfer, dividend paying and shareholder servicing agent for the Fund (the “Transfer Agent”) under a Transfer Agency and Services Agreement with the Trust.
Compliance Services
ALPS provides Chief Compliance Officer services to the Fund. Additionally, ALPS provides services in monitoring and testing the policies and procedures of the Trust in conjunction with requirements under Rule 38a-1 under the 1940 Act. ALPS is compensated under the Chief Compliance Officer Services Agreement.
Distributor
The Fund has entered into a Distribution Agreement with ALPS Distributors, Inc. (“the Distributor”) to provide distribution services to the Fund. The Distributor serves as underwriter/distributor of shares of the Fund.
Officer and Trustee Compensation
Officers of the Trust and Trustees who are “interested persons” of the Trust or the Adviser will receive no salary or fees from the Trust. Each Trustee who is not an “interested person” receives an annual fee of $20,000 each year. The Trust reimburses each Trustee and Officer for his or her travel and other expenses relating to attendance at such meetings.
Certain Trustees and Officers of the Trust are also officers of the Adviser.
4. PURCHASES AND SALES OF INVESTMENT SECURITIES
The aggregate cost of purchases and proceeds from sales of investment securities, excluding short-term securities, are shown below for the six months ended March 31, 2016.
| Broadview Opportunity Fund | ||||
| Cost of Investments Purchased | $ | 114,400,877 | ||
| Proceeds from Investments Sold | $ | 150,288,841 | ||
| 18 | www.bvafunds.com |
| Broadview Opportunity Fund | Notes to Financial Statements |
| March 31, 2016 (Unaudited) |
5. TAX BASIS INFORMATION
Distributions are determined in accordance with federal income tax regulations, which differ from GAAP, and, therefore, may differ significantly in amount or character from net investment income and realized gains for financial reporting purposes. Financial reporting records are adjusted for permanent book/tax differences to reflect tax character but are not adjusted for temporary differences. The amounts and characteristics of tax basis distributions and composition of distributable earnings/(accumulated losses) are finalized at fiscal year-end.
The tax character of distributions paid during the year ended September 30, 2015, were as follows:
Ordinary Income | Long-Term Capital Gain | ||||||
| $ | 5,030,412 | $ | 90,638,772 | ||||
As of March 31, 2016, net unrealized appreciation/(depreciation) of investments based on the federal tax cost were as follows:
| Cost of Investments | Gross Unrealized Appreciation | Gross Unrealized Depreciation | Net Appreciation on Investments | |||||||||||
| $ | 575,446,273 | $ | 122,419,858 | $ | (37,034,366 | ) | $ | 85,385,492 | ||||||
The difference between book basis and tax basis is primarily attributable to wash sales.
6. COMMITMENTS AND CONTINGENCIES
Under the Trust’s organizational documents, each director, officer, employee or other agent of the Fund (including the Adviser) is indemnified, to the extent permitted by the Act, against certain liabilities that may arise out of performance of their duties to the Fund. Additionally, in the normal course of business, the Fund enters into contracts that contain a variety of indemnification clauses. The Fund’s maximum exposure under these arrangements is unknown as this would involve future claims that may be made against the Fund that have not yet occurred. However, the Fund has not had prior claims or losses pursuant to these contracts and believes the risk of loss to be remote.
| Semi-Annual Report | March 31, 2016 | 19 |
| Broadview Opportunity Fund | Additional Information |
| March 31, 2016 (Unaudited) |
1. PROXY VOTING POLICIES AND VOTING RECORD
A description of the policies and procedures that the Fund uses to vote proxies relating to portfolio securities is available without charge upon request by calling toll-free 855-846-1463, or on the Securities and Exchange Commission’s (“SEC”) website at http://www.sec.gov. Information regarding how the Fund voted proxies relating to portfolio securities during the most recent 12-month period ended June 30th is available without charge upon request by calling toll-free 855-846-1463, or on the SEC’s website at http://www.sec.gov.
2. QUARTERLY PORTFOLIO HOLDINGS
The Trust files a complete listing of portfolio holdings for the Fund with the SEC four times each fiscal year at quarter-ends. The Fund files the schedule of portfolio holdings with the SEC on Form N-CSR (second and fourth quarters) and on Form N-Q (first and third quarters). The filings are available upon request by calling 855-846-1463. Furthermore, you may obtain a copy of the filing on the SEC’s website at http://www.sec.gov. The Fund’s Forms N-CSR and N-Q may also be reviewed and copied at the SEC’s Public Reference Room in Washington, D.C., and information on the operation of the Public Reference Room may be obtained by calling 1-800-SEC-0330.
3. BASIS FOR TRUSTEES’ APPROVAL OF THE INVESTMENT ADVISORY AGREEMENT
The Board of Trustees (the “Board” or the “Trustees”) of Broadview Funds Trust (the “Trust”) met on November 23, 2015 to consider the renewal of the Investment Advisory Agreement (the “Agreement”) between the Trust, on behalf of the Broadview Opportunity Fund (the “Fund”), a series of the Trust, and Broadview Advisors, LLC, the Fund’s investment adviser (the “Adviser”). Prior to the meeting, the Trustees requested and received materials to assist them in considering the renewal of the Agreement. The materials provided contained information with respect to the factors enumerated below, including a copy of the Agreement, a memorandum prepared by the Trust’s outside legal counsel discussing in detail the Trustees’ fiduciary obligations and the factors they should assess in considering the renewal of the Agreement, the Adviser’s Form ADV, a due diligence questionnaire completed by the Adviser in response to a specific request letter from the Trust’s outside legal counsel, financial and insurance information for the Adviser, and detailed comparative information relating to the Fund’s performance, as well as the advisory fee and other expenses of the Fund. Based on their evaluation of the information provided by the Adviser, in conjunction with the Fund’s other service providers, the Trustees, by a unanimous vote (including a separate vote of the Trustees who are not “interested persons,” as that term is defined in the Investment Company Act of 1940, as amended (the “Independent Trustees”)), approved the continuation of the Agreement for an additional one-year term.
Discussion of Factors Considered
In considering the renewal of the Agreement and reaching their conclusions, the Trustees reviewed and analyzed various factors they determined were relevant, including the factors enumerated below.
Nature, Extent and Quality of Services Provided to the Fund. The Trustees considered the nature, extent and quality of services provided by the Adviser to the Fund and the amount of time devoted to the Fund’s affairs by the Adviser’s staff. The Trustees considered the Adviser’s specific responsibilities in all aspects of day-to-day management of the Fund, as well as the qualifications, experience and responsibilities of Richard E. Lane, Richard J. Whiting, Faraz Farzam and Aaron J. Garcia, the Fund’s portfolio managers, and other key personnel at the Adviser involved in the day-to-day activities of the Fund. The Trustees reviewed the structure of the Adviser’s compliance program and discussed the Adviser’s marketing activity and its continuing commitment to the growth of Fund assets. The Trustees also noted any services that extended beyond portfolio management, and they considered the brokerage practices of the Adviser, including information provided with respect to brokerage commissions paid by the Fund. The Trustees concluded that the Adviser had sufficient quality and depth of personnel, resources, investment methods and compliance policies and procedures essential to performing its duties under the Investment Advisory Agreement and that the nature, overall quality and extent of the management services provided to the Fund, as well as the Adviser’s compliance program, were satisfactory and reliable.
Investment Performance of the Fund and the Adviser. The Board reviewed the performance of the Fund for the one-year, three-year, five-year, ten-year, and since inception periods ended September 30, 2015 in comparison to the Fund’s benchmark indexes (the Russell 2500 Index and the Russell 2000 Index). In assessing the quality of the management services delivered by the Adviser, the Trustees also compared the short-term and longer-term performance of the Fund on both an absolute and relative basis in comparison to a Morningstar peer group universe of U.S. small blend funds as constructed by data presented by FUSE Research Network LLC, an independent consulting firm (the “Morningstar Peer Group”), for the quarter, one-year, three-year and five-year periods ended September 30, 2015. The Trustees also reviewed information on the historical performance of a composite consisting of other separately-managed accounts of the Adviser that were similar to the Fund in terms of investment strategy.
| 20 | www.bvafunds.com |
| Broadview Opportunity Fund | Additional Information |
| March 31, 2016 (Unaudited) |
The Trustees noted that the Fund underperformed its benchmarks for the one-year and five-year periods ended September 30, 2015. The Fund outperformed its benchmarks for the three-year, ten-year and since inception periods ended September 30, 2015. The Trustees noted that the Fund’s performance, in comparison to the Morningstar Peer Group, was in the 59th percentile for the quarter, the 62th percentile for the one-year, the 30th percentile for the three-year and the 55th percentile for the five-year periods ended September 30, 2015. The Trustees noted that the Fund’s performance for all periods was generally in-line with the performance of the composite consisting of the Adviser’s other separately-managed accounts with similar investment strategies to that of the Fund.
After considering all of the information, the Trustees concluded that the performance obtained by the Adviser for the Fund was satisfactory under current market conditions. Although past performance is not a guarantee or indication of future results, the Trustees determined that the Fund and its shareholders were likely to continue to benefit from the Adviser’s management.
Costs of Services Provided and Profits Realized by the Adviser. The Trustees considered the cost of services and the structure of the Adviser’s fees, including a review of the expense analyses and other pertinent material with respect to the Fund. The Trustees reviewed the related statistical information and other materials provided, including the comparative expenses and expense components of the Morningstar Peer Group. The Trustees considered the load structure (no-load funds without Rule 12b-1 fees) and asset size of the Fund and the funds in the Morningstar Peer Group.
The Trustees also considered the overall profitability of the Adviser and reviewed the Adviser’s financial information. The Trustees also examined the profitability analysis prepared by the Adviser from the fees payable under the Investment Advisory Agreement, as well as the Fund’s brokerage commissions and use of soft dollars by the Adviser.
The Trustees noted that the Fund’s contractual management fee of 1.00% is above the Morningstar Peer Group average of 0.89% and median of 0.88%. The Fund’s contractual management fee falls in the third quartile, above the Morningstar Peer Group average and median, which also fall in the third quartile. The Trustees observed that the Fund’s total annual fund operating expense ratio of 1.25%, which falls in the third quartile, is above both the Morningstar Peer Group average of 1.15% and the median of 1.13%, which also fall in the third quartile.
The Trustees then compared the fees paid by the Fund to the fees paid by separately-managed accounts of the Adviser and noted that the Fund’s management fee was at the top of the range of fees paid by the separately-managed account clients but that the Adviser has additional responsibilities with respect to the Fund, including financial commitments and additional compliance and reporting obligations that support the reasonableness of the Fund’s management fee.
The Trustees concluded that the Fund’s expenses and the management fee to be paid to the Adviser were fair and reasonable in light of the comparative performance, expense and management fee information. The Trustees noted, based on the profitability analysis prepared by the Adviser, that the Adviser’s profit from sponsoring the Fund had not been, and was not, excessive and the Adviser maintained adequate profit levels to support its services to the Fund from the revenues of its overall investment advisory activities.
Extent of Economies of Scale. The Trustees compared the Fund’s expenses relative to the Morningstar Peer Group and discussed realized and potential economies of scale. The Trustees also reviewed the structure of the Fund’s management fee and whether the Fund was large enough to generate economies of scale for shareholders or whether economies of scale would be expected to be realized as Fund assets grow (and if so, how those economies of scale would be shared with shareholders). The Trustees noted that no expense limitation arrangements with respect to the Fund were being contemplated by the Adviser. The Trustees noted that the Fund’s management fee structure did not contain any breakpoint reductions as the Fund’s assets grow in size, but that the flexibility of incorporating breakpoints would continue to be reviewed on a regular basis. With respect to the Adviser’s fee structure, the Trustees concluded that the current fee structure was reasonable and reflected a sharing of economies of scale between the Adviser and the Fund.
Benefits Derived from the Relationship with the Fund. The Trustees considered the direct and indirect benefits that could be realized by the Adviser from its association with the Fund. The Trustees examined the brokerage commissions of the Adviser with respect to the Fund. The Trustees concluded that the benefits the Adviser may receive, such as greater name recognition, growth in separate account management services, increased ability to obtain research on brokerage services, or greater exposure to press coverage appear to be reasonable, and in many cases may benefit the Fund.
Based on the Trustees’ deliberations and their evaluation of the information described above, the Trustees, including the Independent Trustees, unanimously: (a) concluded that the terms of the Investment Advisory Agreement continue to be fair and reasonable; (b) concluded that the Adviser’s fees are reasonable in light of the services that the Adviser provides to the Fund; and (c) agreed to approve the Investment Advisory Agreement for another one year period.
| Semi-Annual Report | March 31, 2016 | 21 |
| Broadview Opportunity Fund | Additional Information |
| March 31, 2016 (Unaudited) |
4. CHANGE OF INDEPENDENT REGISTERED PUBLIC ACCOUNTING FIRM
On January 25, 2016, the Trust dismissed PricewaterhouseCoopers LLP (“PwC”) as the independent registered public accounting firm for the Fund, a series of the Trust. The Trust engaged Cohen Fund Audit Services Ltd. (“Cohen”) as the new independent registered public accounting firm for the Fund as of February 20, 2016 for the Fund’s fiscal year ending September 30, 2016. The Board and Audit Committee of the Board participated in and approved the decision to change the independent registered public accounting firm for the Fund.
The reports of PwC on the Fund’s financial statements as of and for the two most recent fiscal years ended September 30, 2015 and 2014 contained no adverse opinion or disclaimer of opinion nor were they qualified or modified as to uncertainty, audit scope or accounting principles.
During the Fund’s two most recent fiscal years ended September 30, 2015 and 2014 and during the period from the end of the most recent fiscal year through January 25, 2016: (i) there were no disagreements between the Trust and PwC on any matter of accounting principles or practices, financial statement disclosure or auditing scope or procedure, which disagreements, if not resolved to the satisfaction of PwC, would have caused PwC to make reference to the subject matter of the disagreements in connection with its reports on the Fund’s financial statements for such years; and (ii) there were no “reportable events” of the kind described in Item 304(a)(1)(v) of Regulation S-K under the Securities Exchange Act of 1934, as amended.
During the Fund’s two most recent fiscal years ended September 30, 2015 and 2014 and during the period from the end of the most recent fiscal year through January 25, 2016, neither the Trust nor the Fund nor anyone on their behalf consulted with Cohen regarding any of the matters described in S-K 304(a)(2)(i) or S-K 304(a)(2)(ii).
| 22 | www.bvafunds.com |
Intentionally Left Blank

| Item 2. | Code of Ethics. |
Not applicable to semi-annual report.
| Item 3. | Audit Committee Financial Expert. |
Not applicable to semi-annual report.
| Item 4. | Principal Accountant Fees and Services. |
Not applicable to semi-annual report.
| Item 5. | Audit Committee of Listed Registrants. |
Not applicable to the Registrant.
| Item 6. | Schedule of Investments. |
| (a) | The Registrant’s “Schedule I – Investments in securities of unaffiliated issuers” (as set forth in 17 CFR 210.12-12) is included in Item 1 of this Form N-CSR. |
| (b) | Not applicable to the Registrant. |
| Item 7. | Disclosure of Proxy Voting Policies and Procedures for Closed-End Management Investment Companies. |
Not applicable to the Registrant.
| Item 8. | Portfolio Managers of Closed-End Management Investment Companies. |
Not applicable to the Registrant.
| Item 9. | Purchases of Equity Securities by Closed-End Management Investment Company and Affiliated Purchasers. |
Not applicable to the Registrant.
| Item 10. | Submission of Matters to a Vote of Security Holders. |
None.
| Item 11. | Controls and Procedures. |
| (a) | The Registrant’s principal executive officer and principal financial officer have evaluated the Registrant’s disclosure controls and procedures (as defined in Rule 30a-3(c) under the Investment Company Act of 1940, as amended) within 90 days of this filing and have concluded that the Registrant’s disclosure controls and procedures were effective as of that date. |
| (b) | There was no change in the Registrant’s internal control over financial reporting (as defined in Rule 30a-3(d) under the Investment Company Act of 1940, as amended) during the second fiscal quarter of the period covered by this report that has materially affected, or is reasonably likely to materially affect, the Registrant’s internal control over financial reporting. |
| Item 12. | Exhibits. |
| (a)(1) | Not applicable to semi-annual report. |
| (a)(2) | A separate certification for the Registrant’s Principal Executive Officer and Principal Financial Officer as required by Rule 30a-2(a) under the Investment Company Act of 1940, as amended (17 CFR 270.30a-2(a)), are attached hereto as Ex 99.Cert. |
| (a)(3) | None. |
| (b) | The certifications by the Registrant’s Principal Executive Officer and Principal Financial Officer, as required by Rule 30a-2(b) of the Investment Company Act of 1940, as amended, and Section 906 of the Sarbanes-Oxley Act of 2002 are attached hereto as Ex99.906Cert. |
SIGNATURES
Pursuant to the requirements of the Securities Exchange Act of 1934 and the Investment Company Act of 1940, the Registrant has duly caused this report to be signed on its behalf by the undersigned, thereunto duly authorized.
Broadview Funds Trust
| By: | /s/ Richard E. Lane | |
| Richard E. Lane | ||
| President | ||
| Date: | June 3, 2016 |
Pursuant to the requirements of the Securities Exchange Act of 1934 and the Investment Company Act of 1940, this report has been signed below by the following persons on behalf of the Registrant and in the capacities and on the dates indicated.
| By: | /s/ Richard E. Lane | |
| Richard E. Lane | ||
| President (Principal Executive Officer) | ||
| Date: | June 3, 2016 |
| By: | /s/ Aaron J. Garcia | |
| Aaron J. Garcia | ||
| Chief Financial Officer (Principal Financial Officer) | ||
| Date: | June 3, 2016 |