UNITED STATES
SECURITIES AND EXCHANGE COMMISSION
Washington, D.C. 20549
FORM N-CSR
CERTIFIED SHAREHOLDER REPORT OF REGISTERED
MANAGEMENT INVESTMENT COMPANIES
Investment Company Act file number 811-22894
INVESTMENT MANAGERS SERIES TRUST II
(Exact name of registrant as specified in charter)
235 W. Galena Street
Milwaukee, WI 53212
(Address of principal executive offices) (Zip code)
Diane J. Drake
Mutual Fund Administration, LLC
2220 E. Route 66, Suite 226
Glendora, CA 91740
(Name and address of agent for service)
(626) 385-5777
Registrant's telephone number, including area code
Date of fiscal year end: June 30
Date of reporting period: June 30, 2021
Item 1. Report to Stockholders.
The registrant’s annual report transmitted to shareholders pursuant to Rule 30e-1 under the Investment Company Act of 1940, as amended (the “Investment Company Act”), is as follows:

AXS Alternative Value Fund
(Investor Class: COGLX)
(Class I: COGVX)
AXS Market Neutral Fund
(Investor Class: COGMX)
(Class I: COGIX)
ANNUAL REPORT
June 30, 2021
AXS Funds
Each a series of Investment Managers Series Trust II
Table of Contents
| Shareholder Letters | 1 |
| Fund Performance | 5 |
| Schedule of Investments | 9 |
| Statements of Assets and Liabilities | 26 |
| Statements of Operations | 28 |
| Statements of Changes in Net Assets | 29 |
| Statement of Cash Flows | 31 |
| Financial Highlights | 32 |
| Notes to Financial Statements | 36 |
| Report of Independent Registered Public Accounting Firm | 48 |
| Supplemental Information | 50 |
| Expense Examples | 57 |
This report and the financial statements contained herein are provided for the general information of the shareholders of the AXS Funds. This report is not authorized for distribution to prospective investors in the Fund unless preceded or accompanied by an effective prospectus.
www.axsinvestments.com
Dear Shareholder,
This Annual Report covers the AXS Alternative Value Fund (“the Value Fund”) and the AXS Market Neutral Fund (“the Market Neutral Fund”) for the fiscal year ending June 30, 2021. We appreciate this opportunity to offer insight into the funds’ investment strategies and to offer commentary on performance and evolving global market conditions.
The Value Fund
Market Commentary
| Total Return Performance |
| July 1, 2020 – June 30, 2021 |
| S&P 500 | Russell 1000 Value |
| 40.79% | 43.68% |
The trailing twelve months ended June 30, 2021 was a strong period of return in the equity market, as the rally from the pandemic-inspired March lows continued in earnest. Value stocks that had underperformed the growth stocks in the previous twelve month period had a robust recovery from a lower market low. This explains the outperformance of the Russell 1000 Value Index1 over the S&P 5002.
While value stocks outperformed growth stocks over the past twelve months, the wide valuation dispersion between growth and value stocks that was mentioned in last year’s remains prominent. The overall valuation of the market appears elevated, most likely as a result of the very low rates on U.S. Treasuries. Growth stocks are even more expensive than value stocks today. As of June 30, 2021, the quoted price to earnings ratio3 for the iShares Russell 1000 Growth ETF, an index fund that designed to replicate the performance of the Russell 1000 Growth Index, was 46.26x and the price to book ratio4 was 14.29x, both high relative to historical norms. The price to earnings ratio for the iShares Russell 1000 Value ETF, an index fund Russell 1000 Value Index was 24.50x and the price to book ratio was 2.63x. The spread between the ratios at 21.76x has been wider in the past, but it is higher than the approximate 10.0x average spread over the past 20 years.
The macroeconomic view upon which our value strategies are based is what we consider to be a straightforward model of market behavior over time. This model is based on the belief that corporate profits, market multiples, and interest rates drive stock price returns over very long periods of time. However, this is not to say that a market correction or crash will occur in the near future. Should an adverse market event occur, we believe the Value and Market Neutral Funds are well positioned to mitigate volatility relative to their respective benchmarks.
| 1 | Russell 1000 Value Index: Measures the performance of the broad value segment of U.S. equity value universe. It includes those Russell 1000 companies with lower price-to-book ratios and lower forecasted growth values. |
| 2 | S&P 500® Index: is an unmanaged index of 500 common stocks primarily traded on the New York Stock Exchange, weighted by market capitalization. Index performance includes the reinvestment of dividends and capital gains. |
| 3 | Price-to-Earnings Ratio (“P/E Ratio”): Current share price of a stock divided by its earnings per share. |
| 4 | Price-to-Book Ratio (“P/B Ratio”): A ratio used to compare a stock's market value to its book value. It is calculated by dividing the current price of the stock by the latest quarter's book value per share. Also known as the price-equity ratio. |
3965 West 83rd Street • #348 • Prairie Village, KS 66208
913.214.5001
www.cognios.com
Performance Commentary
The Value Fund invests in high quality companies that trade at attractive valuations relative to the broader market. We utilize our proprietary ROTA/ROME® investment selection and portfolio construction methodology to execute this strategy. ROTA/ROME® focuses on a company’s Return on Total Assets (“ROTA”) and Return on Market Value of Equity (“ROME”) in order to identify companies whose per share intrinsic value has diverged significantly from the current market price of its stock. We believe that companies that exhibit sustainable long-term high ROTA are higher quality companies that most likely have a competitive advantage within the marketplace. ROME is a measure of profit yield, and like a yield on a bond, the higher the ROME, the more likely that shares in the company can be purchased at a better valuation compared to a company with a lower ROME.
During the fiscal year ended June 30, 2021, the total return for the Class I Shares (COGVX) was 45.36% and the total return for the Investor Class Shares (COGLX) was 44.75%, both ahead of the Russell 1000 Value Index. Over the course of the last fiscal year, the Value Fund maintained investment positions in one hundred forty-six positions. Of those investment positions, one hundred thirty-two were profitable resulting in a .904 batting average. The tables below display the top five positions that contributed to gross profit:
| Top 5 Investment Positions by Contribution to Gross Profit |
| Ticker | Company | Contribution to Gross Profit |
| L | L Brands, Inc. (Pre-transaction with BBWI) | 5.2% |
| ABMD | Abiomed, Inc. | 3.2% |
| CHD | Church & Dwight, Inc | 3.1% |
| TTWO | Take Two Interactive Software, Inc. | 3.0% |
| CHRW | C.H. Robinson Worldwide, Inc. | 2.8% |
| Total | | 17.3% |
The Market Neutral Fund
The AXS Market Neutral Fund employs a Beta -adjusted5 market neutral investment strategy that seeks to provide investors with returns that are non-correlated to, or independent of, the returns of the global equity and fixed income markets. By attempting to hedge out all of the market Beta, the Fund’s returns over time should be essentially “pure Alpha” (i.e., Alpha is the excess return of a portfolio after considering its Beta exposure.) Additionally, by hedging out the general market movements in this Beta-adjusted market neutral fashion, we believe that the total returns of the Fund will be independent of those broad “systemic” risk factors and macro events that move the entire stock market either positively or negatively over time.
Performance Commentary
The Market Neutral Fund invests long in high quality companies that trade at attractive valuations relative to the broader market. We utilize our proprietary ROTA/ROME® investment selection and portfolio construction methodology, very similar to the Value Fund. Conversely, The Market Neutral Fund sells short shares in companies that demonstrate poor qualities based on our proprietary ROTA/ROME® investment selection and portfolio construction methodology.
For the twelve months ended June 30, 2021, the total return for the Class I Shares (COGIX) was -0.68% and the total return for the Investor Class Shares (COGMX) was -0.89%, underperforming the Morningstar Market Neutral Category return by 1.83% (COGIX). Over the course of the last fiscal year, the Market Neutral Fund held one hundred nine long positions, of which seventy-one were profitable resulting in a .651 batting average. The table below displays the top five positions that contributed to gross profit for the long positions:
| 5 | Beta: Beta measures the sensitivity of an investment to the movement of its benchmark. A beta higher than 1.0 indicates the investment has been more volatile than the benchmark and a beta of less than 1.0 indicates that the investment has been less volatile than the benchmark. |
| Top 5 Long Positions by Contribution to Long Gross Profit of the Market Neutral Fund |
| Ticker | Company | Contribution to Gross Profit* |
| UPS | United Parcel Service, Inc. | 23.8% |
| PSA | Public Storage | 14.6% |
| TGT | Target Corp. | 13.7% |
| MCD | McDonald’s Corp. | 12.3% |
| MSI | Motorola Solutions, Inc. | 12.0% |
| Total | | 76.4% |
| * | Percentages are shown as positive return to the Fund. |
Over the course of the last fiscal year, the Market Neutral Fund held two hundred eleven short positions, of which sixty-two were profitable resulting in a .294 batting average. The table below displays the top five positions that contributed to gross profit for the short positions:
| Top 5 Short Positions by Contribution to Short Gross Profit of the Market Neutral Fund |
| Ticker | Company | Contribution to Gross Profit* |
| COTY | Coty, Inc. | 6.2% |
| PRGO | Perrigo Companies, Inc. | 4.3% |
| INCY | Incyte Corp. | 4.1% |
| XOM | Exxon Mobil Corp. | 3.3% |
| CVX | Chevron Corp. | 2.9% |
| Total | | 20.8% |
| * | Percentages are shown as positive return to the Fund. |
We look forward to future opportunities to connect with our shareholders. We strive to continuously add value to your investment experience by providing access to fund information, portfolio updates and straightforward commentary.
We thank you for investing with us and for the trust you have placed in us.
Sincerely,
 |  |
| Jonathan Angrist | Brian Machtley |
Portfolio Managers,
Cognios Capital
Disclosures
The information provided herein represents the opinion of the Funds’ manager, is subject to change at any time, is not guaranteed and should not be considered investment advice.
Performance data quoted represents past performance; past performance does not guarantee future results.
The Funds’ holdings and sector allocations are subject to change at any time and should not be considered recommendations to buy and sell any security. Please refer to the Schedule of Investments in this report for a complete list of Fund holdings.
Mutual funds involve risk including possible loss of principal. There is no assurance that the Fund will achieve its investment objective.
The value of the Fund’s assets will fluctuate as the equity market fluctuates, although the beta-adjusted market neutral focus of the Fund should reduce the effect of general market fluctuations on the valuation of the Fund as a whole. Utilization of leverage, such as borrowings and shorting positions, involves certain risks to the Fund’s shareholders, including potential for higher volatility of the net asset value (“NAV”) of the Fund’s shares and the relatively greater effect of portfolio holdings on the NAV of the shares. The Fund may not always be able to close out a short position on favorable terms. Short sales involve the risk that the Fund will incur a loss by subsequently buying a security at a higher price than the price at which it sold the security short. Value investing is subject to the risk that the market will not recognize a security’s inherent value for a long time or at all, or that a stock judged to be undervalued may actually be appropriately priced or overvalued. The prices of foreign securities may be more volatile than the prices of securities of U.S. issuers because of economic and social conditions abroad, political developments and changes in the regulatory environments of foreign countries.
You cannot invest directly in an index.
Index performance is not indicative of a fund’s performance.
Must be preceded or accompanied by a prospectus.
Distributed by IMST Distributors, LLC, which is not affiliated with AXS.
AXS Alternative Value Fund
FUND PERFORMANCE at June 30, 2021 (Unaudited)

This graph compares a hypothetical $10,000 investment in the Fund’s Class I shares, made at its inception, with a similar investment in the S&P 500 Total Return Index. The performance graph above is shown for the Fund Class I shares. Class A shares performance may vary. Results include the reinvestment of all dividends and capital gains.
The S&P 500 Total Return Index is a broad unmanaged index of 500 stocks, which is widely recognized as representative of the equity market in general. The index does not reflect expenses, fees or sales charge, which would lower performance. The index is unmanaged and is not available for investment.
| Average Annual Total Returns as of June 30, 2021 | 1 Year | Since Inception | Inception Date |
| Class I | 45.36% | 14.24% | 10/03/16 |
| Investor Class | 44.75% | 14.06% | 10/03/16 |
| S&P 500 Total Return Index | 40.79% | 17.84% | 10/03/16 |
The performance data quoted here represents past performance and past performance is not a guarantee of future results. Investment return and principal value will fluctuate so that an investor’s shares, when redeemed, may be worth more or less than their original cost. Current performance may be lower or higher than the performance information quoted. The most recent month end performance may be obtained by calling (833) 297-2587.
The Fund acquired the assets and liabilities of the AXS Alternative Value Fund (formerly, Cognios Large Cap Value Fund), a series of the M3Sixty Funds Trust (the “Predecessor Fund”) on March 5, 2021. As a result of the reorganization, the Fund is the accounting successor of the Predecessor Fund. Performance results shown in the graph and the performance table above for the periods prior to March 5, 2021, reflect the performance of the Predecessor Fund.
Gross and net expense ratios for the Investor Class shares were 2.65% and 2.02%, respectively, and the Class I shares were 2.40% and 1.77%, respectively, which were stated in the current prospectus dated January 25, 2021, as amended April 9, 2021. For the Fund’s current one year expense ratios, please refer to the Financial Highlights section of this report. The Fund’s Advisor has contractually agreed to waive its fees and/or pay for operating expenses of the Fund to ensure that total annual fund operating expenses (excluding any taxes, leverage interest, brokerage commissions, dividend and interest expenses on short sales, acquired fund fees and expenses as determined in accordance with Form N-1A, expenses incurred in connection with any merger or reorganization, or extraordinary expenses such as litigation expenses) do not exceed 1.10% and 0.85% of the average daily net assets of the Fund’s Investor Class and Class I shares, respectively. This agreement is in effect until March 5, 2023, and it may be terminated before that date only by the Trust’s Board of Trustees. In the absence of such waivers, the Fund’s returns would be lower.
AXS Alternative Value Fund
FUND PERFORMANCE at June 30, 2021 (Unaudited) – Continued
Returns reflect the reinvestment of distributions made by the Fund, if any. The graph and the performance table above do not reflect the deduction of taxes that a shareholder would pay on Fund distributions or the redemption of the Fund shares. Shares redeemed within 30 days of purchase will be charged 1.00% redemption fee.
AXS Market Neutral Fund
FUND PERFORMANCE at June 30, 2021 (Unaudited)
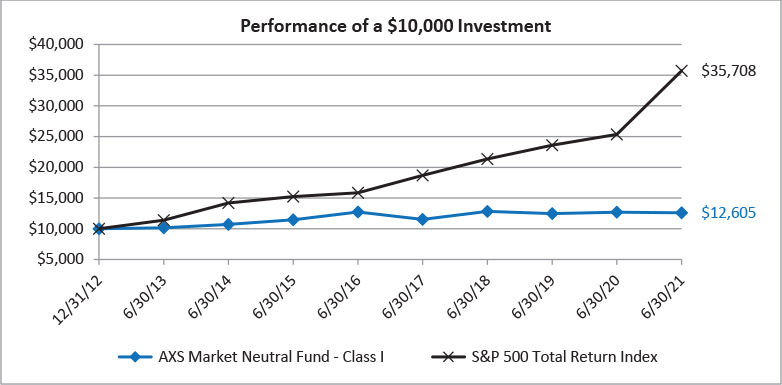
This graph compares a hypothetical $10,000 investment in the Fund’s Class I shares, made at its inception, with a similar investment in the S&P 500 Total Return Index. The performance graph above is shown for the Fund Class I shares. Class A shares performance may vary. Results include the reinvestment of all dividends and capital gains.
The S&P 500 Total Return Index is a broad unmanaged index of 500 stocks, which is widely recognized as representative of the equity market in general. The index does not reflect expenses, fees or sales charge, which would lower performance. The index is unmanaged and is not available for investment.
| Average Annual Total Returns as of June 30, 2021 | 1 Year | 5 Years | Since Inception | Inception Date |
| Class I | -0.68% | -0.21% | 2.76% | 12/31/12 |
| Investor Class | -0.89% | -0.44% | 2.51% | 12/31/12 |
| S&P 500 Total Return Index | 40.79% | 17.65% | 16.16% | 12/31/12 |
The performance data quoted here represents past performance and past performance is not a guarantee of future results. Investment return and principal value will fluctuate so that an investor’s shares, when redeemed, may be worth more or less than their original cost. Current performance may be lower or higher than the performance information quoted. The most recent month end performance may be obtained by calling (833) 297-2587.
The Fund acquired the assets and liabilities of the AXS Market Neutral Fund (formerly, Cognios Market Neutral Large Cap Fund), a series of the M3Sixty Funds Trust (the “Predecessor Fund”) on March 5, 2021. As a result of the reorganization, the Fund is the accounting successor of the Predecessor Fund. Performance results shown in the graph and the performance table above for the periods prior to March 5, 2021, reflect the performance of the Predecessor Fund.
Gross and net expense ratios for the Investor Class shares were 4.69% and 4.35%, respectively, and the Class I shares were 4.44% and 4.10%, respectively, which were stated in the current prospectus dated January 25, 2021, as amended April 9, 2021. For the Fund’s current one year expense ratios, please refer to the Financial Highlights section of this report. The Fund’s Advisor has contractually agreed to waive its fees and/or pay for operating expenses of the Fund to ensure that total annual fund operating expenses (excluding any taxes, leverage interest, brokerage commissions, dividend and interest expenses on short sales, acquired fund fees and expenses as determined in accordance with Form N-1A, expenses incurred in connection with any merger or reorganization, or extraordinary expenses such as litigation expenses) do not exceed 1.70% and 1.45% of the average daily net assets of the Fund’s Investor Class and Class I shares, respectively. This agreement is in effect until March 5, 2023, and it may be terminated before that date only by the Trust’s Board of Trustees. In the absence of such waivers, the Fund’s returns would be lower.
AXS Market Neutral Fund
FUND PERFORMANCE at June 30, 2021 (Unaudited) – Continued
Returns reflect the reinvestment of distributions made by the Fund, if any. The graph and the performance table above do not reflect the deduction of taxes that a shareholder would pay on Fund distributions or the redemption of the Fund shares. Shares redeemed within 30 days of purchase will be charged 1.00% redemption fee.
AXS Alternative Value Fund
SCHEDULE OF INVESTMENTS
As of June 30, 2021
| Number of Shares | | | | | Value | |
| | | | | COMMON STOCKS — 139.1% | | | | |
| | | | | ADVERTISING — 1.5% | | | | |
| | 235 | | | Omnicom Group, Inc.1 | | $ | 18,798 | |
| | | | | AEROSPACE/DEFENSE — 2.3% | | | | |
| | 51 | | | L3Harris Technologies, Inc.1 | | | 11,024 | |
| | 51 | | | Northrop Grumman Corp.1 | | | 18,535 | |
| | | | | | | | 29,559 | |
| | | | | AGRICULTURE — 3.1% | | | | |
| | 486 | | | Altria Group, Inc.1 | | | 23,172 | |
| | 162 | | | Philip Morris International, Inc.1 | | | 16,056 | |
| | | | | | | | 39,228 | |
| | | | | BEVERAGES — 2.5% | | | | |
| | 78 | | | Coca-Cola Co.1 | | | 4,221 | |
| | 21 | | | Constellation Brands, Inc. - Class A1 | | | 4,912 | |
| | 149 | | | PepsiCo, Inc.1 | | | 22,077 | |
| | | | | | | | 31,210 | |
| | | | | BIOTECHNOLOGY — 8.2% | | | | |
| | 68 | | | Amgen, Inc.1 | | | 16,575 | |
| | 74 | | | Biogen, Inc.1 | | | 25,624 | |
| | 309 | | | Gilead Sciences, Inc.1 | | | 21,278 | |
| | 38 | | | Incyte Corp.*,1 | | | 3,197 | |
| | 38 | | | Regeneron Pharmaceuticals, Inc.1 | | | 21,225 | |
| | 77 | | | Vertex Pharmaceuticals, Inc.1 | | | 15,525 | |
| | | | | | | | 103,424 | |
| | | | | COMMERCIAL SERVICES — 1.7% | | | | |
| | 250 | | | H&R Block, Inc.1 | | | 5,870 | |
| | 126 | | | Rollins, Inc.1 | | | 4,309 | |
| | 67 | | | Verisk Analytics, Inc.1 | | | 11,706 | |
| | | | | | | | 21,885 | |
| | | | | COSMETICS/PERSONAL CARE — 4.0% | | | | |
| | 264 | | | Colgate-Palmolive Co.1 | | | 21,477 | |
| | 25 | | | Estee Lauder Cos., Inc. - Class A1 | | | 7,952 | |
| | 155 | | | Procter & Gamble Co.1 | | | 20,914 | |
| | | | | | | | 50,343 | |
| | | | | DISTRIBUTION/WHOLESALE — 0.8% | | | | |
| | 22 | | | Pool Corp.1 | | | 10,090 | |
| | | | | DIVERSIFIED FINANCIAL SERVICES — 6.6% | | | | |
| | 221 | | | Cboe Global Markets, Inc.1 | | | 26,310 | |
| | 97 | | | CME Group, Inc.1 | | | 20,630 | |
AXS Alternative Value Fund
SCHEDULE OF INVESTMENTS - Continued
As of June 30, 2021
| Number of Shares | | | | | Value | |
| | | | | COMMON STOCKS (Continued) | | | | |
| | | | | DIVERSIFIED FINANCIAL SERVICES (Continued) | | | | |
| | 205 | | | Intercontinental Exchange, Inc.1 | | $ | 24,334 | |
| | 69 | | | Nasdaq, Inc.1 | | | 12,130 | |
| | | | | | | | 83,404 | |
| | | | | ELECTRIC — 2.8% | | | | |
| | 169 | | | AES Corp.1 | | | 4,406 | |
| | 138 | | | DTE Energy Co.1 | | | 17,885 | |
| | 45 | | | Entergy Corp.1 | | | 4,487 | |
| | 77 | | | Evergy, Inc.1 | | | 4,653 | |
| | 151 | | | PPL Corp.1 | | | 4,223 | |
| | | | | | | | 35,654 | |
| | | | | ELECTRONICS — 0.4% | | | | |
| | 13 | | | Waters Corp.1 | | | 4,493 | |
| | | | | ENVIRONMENTAL CONTROL — 4.0% | | | | |
| | 229 | | | Republic Services, Inc.1 | | | 25,192 | |
| | 182 | | | Waste Management, Inc.1 | | | 25,500 | |
| | | | | | | | 50,692 | |
| | | | | FOOD — 15.8% | | | | |
| | 424 | | | Campbell Soup Co.1 | | | 19,330 | |
| | 336 | | | Conagra Brands, Inc.1 | | | 12,224 | |
| | 338 | | | General Mills, Inc.1 | | | 20,594 | |
| | 137 | | | Hershey Co.1 | | | 23,863 | |
| | 349 | | | Hormel Foods Corp.1 | | | 16,665 | |
| | 102 | | | J M Smucker Co.1 | | | 13,216 | |
| | 267 | | | Kellogg Co.1 | | | 17,176 | |
| | 498 | | | Kroger Co.1 | | | 19,078 | |
| | 304 | | | Lamb Weston Holdings, Inc.1 | | | 24,521 | |
| | 163 | | | McCormick & Co., Inc.1 | | | 14,396 | |
| | 265 | | | Tyson Foods, Inc. - Class A1 | | | 19,546 | |
| | | | | | | | 200,609 | |
| | | | | GAS — 0.8% | | | | |
| | 392 | | | NiSource, Inc.1 | | | 9,604 | |
| | | | | HEALTHCARE-PRODUCTS — 4.3% | | | | |
| | 21 | | | ABIOMED, Inc.*,1 | | | 6,554 | |
| | 34 | | | Danaher Corp.1 | | | 9,124 | |
| | 42 | | | ResMed, Inc.1 | | | 10,354 | |
| | 97 | | | STERIS PLC1,2 | | | 20,011 | |
| | 18 | | | Thermo Fisher Scientific, Inc.1 | | | 9,081 | |
| | | | | | | | 55,124 | |
AXS Alternative Value Fund
SCHEDULE OF INVESTMENTS - Continued
As of June 30, 2021
| Number of Shares | | | | | Value | |
| | | | | COMMON STOCKS (Continued) | | | | |
| | | | | HEALTHCARE-SERVICES — 3.5% | | | | |
| | 130 | | | Centene Corp.1 | | $ | 9,481 | |
| | 21 | | | Humana, Inc.1 | | | 9,297 | |
| | 63 | | | UnitedHealth Group, Inc.1 | | | 25,228 | |
| | | | | | | | 44,006 | |
| | | | | HOME BUILDERS — 0.4% | | | | |
| | 1 | | | NVR, Inc.*,1 | | | 4,973 | |
| | | | | HOUSEHOLD PRODUCTS/WARES — 4.7% | | | | |
| | 241 | | | Church & Dwight Co., Inc.1 | | | 20,538 | |
| | 103 | | | Clorox Co.1 | | | 18,531 | |
| | 149 | | | Kimberly-Clark Corp.1 | | | 19,933 | |
| | | | | | | | 59,002 | |
| | | | | INSURANCE — 13.8% | | | | |
| | 244 | | | Aflac, Inc.1 | | | 13,093 | |
| | 169 | | | Allstate Corp.1 | | | 22,044 | |
| | 44 | | | Aon PLC - Class A1,2 | | | 10,506 | |
| | 188 | | | Arthur J. Gallagher & Co.1 | | | 26,335 | |
| | 61 | | | Berkshire Hathaway, Inc. - Class B*,1 | | | 16,953 | |
| | 26 | | | Chubb Ltd.1,2 | | | 4,132 | |
| | 123 | | | Cincinnati Financial Corp.1 | | | 14,344 | |
| | 34 | | | Everest Re Group Ltd.1,2 | | | 8,568 | |
| | 69 | | | Marsh & McLennan Cos., Inc.1 | | | 9,707 | |
| | 231 | | | Progressive Corp.1 | | | 22,687 | |
| | 56 | | | Travelers Cos., Inc.1 | | | 8,384 | |
| | 80 | | | Willis Towers Watson PLC1,2 | | | 18,402 | |
| | | | | | | | 175,155 | |
| | | | | INTERNET — 1.6% | | | | |
| | 28 | | | F5 Networks, Inc.*,1 | | | 5,227 | |
| | 64 | | | VeriSign, Inc.1 | | | 14,572 | |
| | | | | | | | 19,799 | |
| | | | | OIL & GAS — 1.5% | | | | |
| | 1,116 | | | Cabot Oil & Gas Corp.1 | | | 19,485 | |
| | | | | PACKAGING & CONTAINERS — 0.6% | | | | |
| | 722 | | | Amcor PLC1,2 | | | 8,274 | |
| | | | | PHARMACEUTICALS — 12.5% | | | | |
| | 219 | | | AbbVie, Inc.1 | | | 24,668 | |
| | 40 | | | AmerisourceBergen Corp.1 | | | 4,579 | |
| | 336 | | | Bristol-Myers Squibb Co.1 | | | 22,451 | |
| | 68 | | | Cigna Corp.1 | | | 16,121 | |
AXS Alternative Value Fund
SCHEDULE OF INVESTMENTS - Continued
As of June 30, 2021
| Number of Shares | | | | | Value | |
| | | | | COMMON STOCKS (Continued) | | | | |
| | | | | PHARMACEUTICALS (Continued) | | | | |
| | 307 | | | CVS Health Corp.1 | | $ | 25,616 | |
| | 102 | | | Eli Lilly & Co.1 | | | 23,411 | |
| | 134 | | | Johnson & Johnson1 | | | 22,075 | |
| | 82 | | | McKesson Corp.1 | | | 15,682 | |
| | 24 | | | Zoetis, Inc.1 | | | 4,473 | |
| | | | | | | | 159,076 | |
| | | | | REITS — 2.2% | | | | |
| | 92 | | | Public Storage - REIT1 | | | 27,663 | |
| | | | | RETAIL — 15.6% | | | | |
| | 3 | | | AutoZone, Inc.*,1 | | | 4,477 | |
| | 58 | | | Costco Wholesale Corp.1 | | | 22,949 | |
| | 105 | | | Dollar General Corp.1 | | | 22,721 | |
| | 92 | | | Dollar Tree, Inc.*,1 | | | 9,154 | |
| | 32 | | | Domino's Pizza, Inc.1 | | | 14,928 | |
| | 81 | | | McDonald's Corp.1 | | | 18,710 | |
| | 10 | | | O'Reilly Automotive, Inc.*,1 | | | 5,662 | |
| | 80 | | | Ross Stores, Inc.1 | | | 9,920 | |
| | 47 | | | Starbucks Corp.1 | | | 5,255 | |
| | 70 | | | Target Corp.1 | | | 16,922 | |
| | 141 | | | TJX Cos., Inc.1 | | | 9,506 | |
| | 37 | | | Tractor Supply Co.1 | | | 6,884 | |
| | 472 | | | Walgreens Boots Alliance, Inc.1 | | | 24,832 | |
| | 150 | | | Walmart, Inc.1 | | | 21,153 | |
| | 43 | | | Yum! Brands, Inc.1 | | | 4,946 | |
| | | | | | | | 198,019 | |
| | | | | SEMICONDUCTORS — 2.2% | | | | |
| | 13 | | | Broadcom, Inc.1 | | | 6,199 | |
| | 385 | | | Intel Corp.1 | | | 21,614 | |
| | | | | | | | 27,813 | |
| | | | | SOFTWARE — 12.3% | | | | |
| | 187 | | | Activision Blizzard, Inc.1 | | | 17,847 | |
| | 197 | | | Akamai Technologies, Inc.1 | | | 22,970 | |
| | 283 | | | Cerner Corp.1 | | | 22,119 | |
| | 158 | | | Citrix Systems, Inc.1 | | | 18,529 | |
| | 30 | | | Electronic Arts, Inc.1 | | | 4,315 | |
| | 109 | | | Jack Henry & Associates, Inc.1 | | | 17,823 | |
| | 17 | | | Microsoft Corp.1 | | | 4,605 | |
| | 340 | | | Oracle Corp.1 | | | 26,466 | |
| | 122 | | | Take-Two Interactive Software, Inc.1 | | | 21,596 | |
| | | | | | | | 156,270 | |
AXS Alternative Value Fund
SCHEDULE OF INVESTMENTS - Continued
As of June 30, 2021
| Number of Shares | | | | | Value | |
| | | | | COMMON STOCKS (Continued) | | | | |
| | | | | TELECOMMUNICATIONS — 5.4% | | | | |
| | 707 | | | AT&T, Inc.1 | | $ | 20,348 | |
| | 173 | | | Juniper Networks, Inc.1 | | | 4,732 | |
| | 124 | | | Motorola Solutions, Inc.1 | | | 26,889 | |
| | 305 | | | Verizon Communications, Inc.1 | | | 17,089 | |
| | | | | | | | 69,058 | |
| | | | | TRANSPORTATION — 4.0% | | | | |
| | 232 | | | C.H. Robinson Worldwide, Inc.1 | | | 21,731 | |
| | 228 | | | Expeditors International of Washington, Inc.1 | | | 28,865 | |
| | | | | | | | 50,596 | |
| | | | | TOTAL COMMON STOCKS | | | | |
| | | | | (Cost $1,516,117) | | | 1,763,306 | |
| Principal Amount | | | | | | |
| | | | | SHORT-TERM INVESTMENTS — 1.6% | | | | |
| $ | 21,067 | | | UMB Money Market Fiduciary, 0.01%3 | | | 21,067 | |
| | | | | TOTAL SHORT-TERM INVESTMENTS | | | | |
| | | | | (Cost $21,067) | | | 21,067 | |
| | | | | TOTAL INVESTMENTS — 140.7% | | | | |
| | | | | (Cost $1,537,184) | | | 1,784,373 | |
| | | | | Liabilities in Excess of Other Assets — (40.7)% | | | (516,574 | ) |
| | | | | TOTAL NET ASSETS — 100.0% | | $ | 1,267,799 | |
PLC – Public Limited Company
REIT – Real Estate Investment Trusts
| * | Non-income producing security. |
| 1 | All or a portion of the security is segregated as collateral for line of credit borrowings. As of June 30, 2021, the aggregate value of those securities was $1,763,306, representing 139.1% of net assets. |
| 2 | Foreign security denominated in U.S. Dollars. |
| 3 | The rate is the annualized seven-day yield at period end. |
See accompanying Notes to Financial Statements.
AXS Alternative Value Fund
SUMMARY OF INVESTMENTS
As of June 30, 2021
| Security Type/Industry | Percent of Total
Net Assets |
| Common Stocks | |
| Food | 15.8% |
| Retail | 15.6% |
| Insurance | 13.8% |
| Pharmaceuticals | 12.5% |
| Software | 12.3% |
| Biotechnology | 8.2% |
| Diversified Financial Services | 6.6% |
| Telecommunications | 5.4% |
| Household Products/Wares | 4.7% |
| Healthcare-Products | 4.3% |
| Cosmetics/Personal Care | 4.0% |
| Environmental Control | 4.0% |
| Transportation | 4.0% |
| Healthcare-Services | 3.5% |
| Agriculture | 3.1% |
| Electric | 2.8% |
| Beverages | 2.5% |
| Aerospace/Defense | 2.3% |
| Semiconductors | 2.2% |
| REITS | 2.2% |
| Commercial Services | 1.7% |
| Internet | 1.6% |
| Oil & Gas | 1.5% |
| Advertising | 1.5% |
| Distribution/Wholesale | 0.8% |
| Gas | 0.8% |
| Packaging & Containers | 0.6% |
| Electronics | 0.4% |
| Home Builders | 0.4% |
| Total Common Stocks | 139.1% |
| Short-Term Investments | 1.6% |
| Total Investments | 140.7% |
| Liabilities in Excess of Other Assets | (40.7)% |
| Total Net Assets | 100.0% |
See accompanying Notes to Financial Statements.
AXS Market Neutral Fund
SCHEDULE OF INVESTMENTS
As of June 30, 2021
| Number of Shares | | | | | Value | |
| | | | | COMMON STOCKS — 143.9% | | | | |
| | | | | AGRICULTURE — 1.8% | | | | |
| | 4,464 | | | Altria Group, Inc.1 | | $ | 212,844 | |
| | | | | BEVERAGES — 3.8% | | | | |
| | 4,069 | | | Coca-Cola Co.1 | | | 220,173 | |
| | 1,510 | | | PepsiCo, Inc.1 | | | 223,737 | |
| | | | | | | | 443,910 | |
| | | | | BIOTECHNOLOGY — 9.9% | | | | |
| | 884 | | | Amgen, Inc.1 | | | 215,475 | |
| | 790 | | | Biogen, Inc.1 | | | 273,553 | |
| | 3,220 | | | Gilead Sciences, Inc.1 | | | 221,729 | |
| | 435 | | | Regeneron Pharmaceuticals, Inc.1 | | | 242,965 | |
| | 1,030 | | | Vertex Pharmaceuticals, Inc.1 | | | 207,679 | |
| | | | | | | | 1,161,401 | |
| | | | | COMMERCIAL SERVICES — 3.8% | | | | |
| | 6,330 | | | Rollins, Inc.1 | | | 216,486 | |
| | 1,287 | | | Verisk Analytics, Inc.1 | | | 224,865 | |
| | | | | | | | 441,351 | |
| | | | | COSMETICS/PERSONAL CARE — 3.7% | | | | |
| | 2,646 | | | Colgate-Palmolive Co.1 | | | 215,252 | |
| | 1,609 | | | Procter & Gamble Co.1 | | | 217,102 | |
| | | | | | | | 432,354 | |
| | | | | DISTRIBUTION/WHOLESALE — 2.0% | | | | |
| | 516 | | | Pool Corp.1 | | | 236,669 | |
| | | | | DIVERSIFIED FINANCIAL SERVICES — 5.9% | | | | |
| | 1,996 | | | Cboe Global Markets, Inc.1 | | | 237,624 | |
| | 1,034 | | | CME Group, Inc.1 | | | 219,911 | |
| | 1,981 | | | Intercontinental Exchange, Inc.1 | | | 235,145 | |
| | | | | | | | 692,680 | |
| | | | | ELECTRIC — 5.5% | | | | |
| | 8,872 | | | AES Corp.1 | | | 231,293 | |
| | 1,603 | | | DTE Energy Co.1 | | | 207,749 | |
| | 7,551 | | | PPL Corp.1 | | | 211,201 | |
| | | | | | | | 650,243 | |
| | | | | ELECTRONICS — 2.1% | | | | |
| | 725 | | | Waters Corp.1 | | | 250,567 | |
| | | | | ENVIRONMENTAL CONTROL — 3.8% | | | | |
| | 2,038 | | | Republic Services, Inc.1 | | | 224,201 | |
AXS Market Neutral Fund
SCHEDULE OF INVESTMENTS - Continued
As of June 30, 2021
| Number of Shares | | | | | Value | |
| | | | | COMMON STOCKS (Continued) | | | | |
| | | | | ENVIRONMENTAL CONTROL (Continued) | | | | |
| | 1,585 | | | Waste Management, Inc.1 | | $ | 222,074 | |
| | | | | | | | 446,275 | |
| | | | | FOOD — 16.8% | | | | |
| | 4,516 | | | Campbell Soup Co.1 | | | 205,884 | |
| | 3,505 | | | General Mills, Inc.1 | | | 213,560 | |
| | 1,271 | | | Hershey Co.1 | | | 221,383 | |
| | 4,783 | | | Hormel Foods Corp.1 | | | 228,388 | |
| | 1,647 | | | J M Smucker Co.1 | | | 213,402 | |
| | 3,334 | | | Kellogg Co.1 | | | 214,476 | |
| | 6,001 | | | Kroger Co.1 | | | 229,898 | |
| | 2,869 | | | Lamb Weston Holdings, Inc.1 | | | 231,414 | |
| | 2,445 | | | McCormick & Co., Inc.1 | | | 215,942 | |
| | | | | | | | 1,974,347 | |
| | | | | HEALTHCARE-PRODUCTS — 8.5% | | | | |
| | 886 | | | Danaher Corp.1 | | | 237,767 | |
| | 1,151 | | | ResMed, Inc.1 | | | 283,745 | |
| | 1,146 | | | STERIS PLC1 | | | 236,420 | |
| | 485 | | | Thermo Fisher Scientific, Inc.1 | | | 244,668 | |
| | | | | | | | 1,002,600 | |
| | | | | HEALTHCARE-SERVICES — 3.8% | | | | |
| | 3,096 | | | Centene Corp.1 | | | 225,791 | |
| | 540 | | | UnitedHealth Group, Inc.1 | | | 216,238 | |
| | | | | | | | 442,029 | |
| | | | | HOUSEHOLD PRODUCTS/WARES — 5.6% | | | | |
| | 2,516 | | | Church & Dwight Co., Inc.1 | | | 214,413 | |
| | 1,216 | | | Clorox Co.1 | | | 218,771 | |
| | 1,665 | | | Kimberly-Clark Corp.1 | | | 222,744 | |
| | | | | | | | 655,928 | |
| | | | | INSURANCE — 10.8% | | | | |
| | 1,511 | | | Arthur J. Gallagher & Co.1 | | | 211,661 | |
| | 1,335 | | | Chubb Ltd.1 | | | 212,185 | |
| | 1,857 | | | Cincinnati Financial Corp.1 | | | 216,563 | |
| | 814 | | | Everest Re Group Ltd.1 | | | 205,136 | |
| | 2,168 | | | Progressive Corp.1 | | | 212,919 | |
| | 1,411 | | | Travelers Cos., Inc.1 | | | 211,241 | |
| | | | | | | | 1,269,705 | |
| | | | | INTERNET — 2.0% | | | | |
| | 1,008 | | | VeriSign, Inc.1 | | | 229,511 | |
AXS Market Neutral Fund
SCHEDULE OF INVESTMENTS - Continued
As of June 30, 2021
| Number of Shares | | | | | Value | |
| | | | | COMMON STOCKS (Continued) | | | | |
| | | | | OIL & GAS — 1.9% | | | | |
| | 12,431 | | | Cabot Oil & Gas Corp.1 | | $ | 217,045 | |
| | | | | PACKAGING & CONTAINERS — 1.8% | | | | |
| | 18,161 | | | Amcor PLC1 | | | 208,125 | |
| | | | | PHARMACEUTICALS — 11.6% | | | | |
| | 1,908 | | | AbbVie, Inc.1 | | | 214,917 | |
| | 3,382 | | | Bristol-Myers Squibb Co.1 | | | 225,985 | |
| | 2,488 | | | CVS Health Corp.1 | | | 207,599 | |
| | 1,127 | | | Eli Lilly & Co.1 | | | 258,669 | |
| | 1,301 | | | Johnson & Johnson1 | | | 214,327 | |
| | 1,302 | | | Zoetis, Inc.1 | | | 242,641 | |
| | | | | | | | 1,364,138 | |
| | | | | REITS — 2.1% | | | | |
| | 806 | | | Public Storage - REIT1 | | | 242,356 | |
| | | | | RETAIL — 9.7% | | | | |
| | 578 | | | Costco Wholesale Corp.1 | | | 228,697 | |
| | 1,077 | | | Dollar General Corp.1 | | | 233,052 | |
| | 508 | | | Domino's Pizza, Inc.1 | | | 236,977 | |
| | 955 | | | McDonald's Corp.1 | | | 220,596 | |
| | 4,038 | | | Walgreens Boots Alliance, Inc.1 | | | 212,439 | |
| | | | | | | | 1,131,761 | |
| | | | | SEMICONDUCTORS — 1.9% | | | | |
| | 4,032 | | | Intel Corp.1 | | | 226,356 | |
| | | | | SOFTWARE — 15.5% | | | | |
| | 2,340 | | | Activision Blizzard, Inc.1 | | | 223,330 | |
| | 1,947 | | | Akamai Technologies, Inc.1 | | | 227,020 | |
| | 2,822 | | | Cerner Corp.1 | | | 220,568 | |
| | 1,905 | | | Citrix Systems, Inc.1 | | | 223,399 | |
| | 1,438 | | | Jack Henry & Associates, Inc.1 | | | 235,127 | |
| | 909 | | | Microsoft Corp.1 | | | 246,248 | |
| | 2,814 | | | Oracle Corp.1 | | | 219,042 | |
| | 1,258 | | | Take-Two Interactive Software, Inc.1 | | | 222,691 | |
| | | | | | | | 1,817,425 | |
| | | | | TELECOMMUNICATIONS — 5.8% | | | | |
| | 7,575 | | | AT&T, Inc.1 | | | 218,009 | |
| | 1,112 | | | Motorola Solutions, Inc.1 | | | 241,137 | |
| | 3,873 | | | Verizon Communications, Inc.1 | | | 217,004 | |
| | | | | | | | 676,150 | |
AXS Market Neutral Fund
SCHEDULE OF INVESTMENTS - Continued
As of June 30, 2021
| Number of Shares | | | | | Value | |
| | | | COMMON STOCKS (Continued) | | | | |
| | | | | TRANSPORTATION — 3.8% | | | | |
| | 2,279 | | | C.H. Robinson Worldwide, Inc.1 | | $ | 213,474 | |
| | 1,873 | | | Expeditors International of Washington, Inc.1 | | | 237,122 | |
| | | | | | | | 450,596 | |
| | | | | TOTAL COMMON STOCKS | | | | |
| | | | | (Cost $14,355,964) | | | 16,876,366 | |
| Principal Amount | | | | | | |
| | | | | SHORT-TERM INVESTMENTS — 0.2% | | | | |
| $ | 21,928 | | | UMB Money Market Fiduciary, 0.01%2 | | | 21,928 | |
| | | | | TOTAL SHORT-TERM INVESTMENTS | | | | |
| | | | | (Cost $21,928) | | | 21,928 | |
| | | | | TOTAL INVESTMENTS — 144.1% | | | | |
| | | | | (Cost $14,377,892) | | | 16,898,294 | |
| | | | | Liabilities in Excess of Other Assets — (44.1)% | | | (5,173,508 | ) |
| | | | | TOTAL NET ASSETS — 100.0% | | $ | 11,724,786 | |
| Number of Shares | | | | | | |
| | | | | SECURITIES SOLD SHORT — (91.1)% | | | | |
| | | | | COMMON STOCKS — (91.1)% | | | | |
| | | | | AEROSPACE/DEFENSE — (0.6)% | | | | |
| | (831 | ) | | Raytheon Technologies Corp. | | | (70,893 | ) |
| | | | | AGRICULTURE — (0.5)% | | | | |
| | (1,064 | ) | | Archer-Daniels-Midland Co. | | | (64,478 | ) |
| | | | | AIRLINES — (1.1)% | | | | |
| | (1,528 | ) | | Delta Air Lines, Inc.* | | | (66,101 | ) |
| | (1,157 | ) | | Southwest Airlines Co.* | | | (61,425 | ) |
| | | | | | | | (127,526 | ) |
| | | | | APPAREL — (2.4)% | | | | |
| | (524 | ) | | NIKE, Inc. - Class B | | | (80,953 | ) |
| | (528 | ) | | Ralph Lauren Corp. | | | (62,203 | ) |
| | (3,173 | ) | | Under Armour, Inc. - Class A* | | | (67,109 | ) |
| | (824 | ) | | VF Corp. | | | (67,601 | ) |
| | | | | | | | (277,866 | ) |
| | | | | BANKS — (1.8)% | | | | |
| | (378 | ) | | First Republic Bank | | | (70,750 | ) |
| | (1 | ) | | Morgan Stanley | | | (64 | ) |
AXS Market Neutral Fund
SCHEDULE OF INVESTMENTS - Continued
As of June 30, 2021
| Number of Shares | | | | | Value | |
| | | | | SECURITIES SOLD SHORT (Continued) | | | | |
| | | | | COMMON STOCKS (Continued) | | | | |
| | | | | BANKS (Continued) | | | | |
| | (600 | ) | | Northern Trust Corp. | | $ | (69,372 | ) |
| | (1,519 | ) | | Wells Fargo & Co. | | | (68,795 | ) |
| | | | | | | | (208,981 | ) |
| | | | | BEVERAGES — (0.6)% | | | | |
| | (897 | ) | | Brown-Forman Corp. - Class B | | | (67,221 | ) |
| | | | | BIOTECHNOLOGY — (2.6)% | | | | |
| | (119 | ) | | Bio-Rad Laboratories, Inc. - Class A* | | | (76,671 | ) |
| | (1,557 | ) | | Corteva, Inc. | | | (69,053 | ) |
| | (182 | ) | | Illumina, Inc.* | | | (86,124 | ) |
| | (864 | ) | | Incyte Corp.* | | | (72,688 | ) |
| | | | | | | | (304,536 | ) |
| | | | | BUILDING MATERIALS — (1.8)% | | | | |
| | (1,114 | ) | | Johnson Controls International plc | | | (76,454 | ) |
| | (194 | ) | | Martin Marietta Materials, Inc. | | | (68,251 | ) |
| | (380 | ) | | Vulcan Materials Co. | | | (66,147 | ) |
| | | | | | | | (210,852 | ) |
| | | | | CHEMICALS — (5.2)% | | | | |
| | (235 | ) | | Air Products and Chemicals, Inc. | | | (67,605 | ) |
| | (426 | ) | | Celanese Corp. | | | (64,581 | ) |
| | (1,324 | ) | | CF Industries Holdings, Inc. | | | (68,120 | ) |
| | (831 | ) | | DuPont de Nemours, Inc. | | | (64,328 | ) |
| | (326 | ) | | Ecolab, Inc. | | | (67,146 | ) |
| | (601 | ) | | FMC Corp. | | | (65,028 | ) |
| | (495 | ) | | International Flavors & Fragrances, Inc. | | | (73,953 | ) |
| | (238 | ) | | Linde PLC | | | (68,806 | ) |
| | (399 | ) | | PPG Industries, Inc. | | | (67,738 | ) |
| | | | | | | | (607,305 | ) |
| | | | | COMMERCIAL SERVICES — (3.2)% | | | | |
| | (370 | ) | | Automatic Data Processing, Inc. | | | (73,489 | ) |
| | (360 | ) | | Global Payments, Inc. | | | (67,514 | ) |
| | (687 | ) | | IHS Markit Ltd. | | | (77,398 | ) |
| | (289 | ) | | PayPal Holdings, Inc.* | | | (84,238 | ) |
| | (767 | ) | | Quanta Services, Inc. | | | (69,467 | ) |
| | | | | | | | (372,106 | ) |
| | | | | COMPUTERS — (0.5)% | | | | |
| | (4,387 | ) | | Hewlett Packard Enterprise Co. | | | (63,963 | ) |
AXS Market Neutral Fund
SCHEDULE OF INVESTMENTS - Continued
As of June 30, 2021
| Number of Shares | | | | | Value | |
| | | | | SECURITIES SOLD SHORT (Continued) | | | | |
| | | | | COMMON STOCKS (Continued) | | | | |
| | | | | DIVERSIFIED FINANCIAL SERVICES — (1.9)% | | | | |
| | (456 | ) | | American Express Co. | | $ | (75,345 | ) |
| | (996 | ) | | Charles Schwab Corp. | | | (72,519 | ) |
| | (537 | ) | | Raymond James Financial, Inc. | | | (69,756 | ) |
| | | | | | | | (217,620 | ) |
| | | | | ELECTRIC — (12.8)% | | | | |
| | (1,210 | ) | | Alliant Energy Corp. | | | (67,470 | ) |
| | (834 | ) | | Ameren Corp. | | | (66,753 | ) |
| | (816 | ) | | American Electric Power Co., Inc. | | | (69,025 | ) |
| | (2,881 | ) | | CenterPoint Energy, Inc. | | | (70,642 | ) |
| | (1,103 | ) | | CMS Energy Corp. | | | (65,165 | ) |
| | (896 | ) | | Consolidated Edison, Inc. | | | (64,261 | ) |
| | (907 | ) | | Dominion Energy, Inc. | | | (66,728 | ) |
| | (689 | ) | | Duke Energy Corp. | | | (68,018 | ) |
| | (1,218 | ) | | Edison International | | | (70,425 | ) |
| | (666 | ) | | Entergy Corp. | | | (66,400 | ) |
| | (1,118 | ) | | Evergy, Inc. | | | (67,561 | ) |
| | (838 | ) | | Eversource Energy | | | (67,241 | ) |
| | (1,538 | ) | | Exelon Corp. | | | (68,149 | ) |
| | (1,874 | ) | | FirstEnergy Corp. | | | (69,732 | ) |
| | (973 | ) | | NextEra Energy, Inc. | | | (71,302 | ) |
| | (2,045 | ) | | NRG Energy, Inc. | | | (82,414 | ) |
| | (821 | ) | | Pinnacle West Capital Corp. | | | (67,297 | ) |
| | (1,133 | ) | | Public Service Enterprise Group, Inc. | | | (67,685 | ) |
| | (513 | ) | | Sempra Energy | | | (67,962 | ) |
| | (1,098 | ) | | Southern Co. | | | (66,440 | ) |
| | (734 | ) | | WEC Energy Group, Inc. | | | (65,289 | ) |
| | (993 | ) | | Xcel Energy, Inc. | | | (65,419 | ) |
| | | | | | | | (1,501,378 | ) |
| | | | | ENERGY-ALTERNATE SOURCES — (0.9)% | | | | |
| | (554 | ) | | Enphase Energy, Inc.* | | | (101,731 | ) |
| | | | | ENGINEERING & CONSTRUCTION — (0.6)% | | | | |
| | (521 | ) | | Jacobs Engineering Group, Inc. | | | (69,512 | ) |
| | | | | ENTERTAINMENT — (0.6)% | | | | |
| | (816 | ) | | Live Nation Entertainment, Inc.* | | | (71,473 | ) |
| | | | | FOOD — (0.6)% | | | | |
| | (1,119 | ) | | Mondelez International, Inc. - Class A | | | (69,870 | ) |
AXS Market Neutral Fund
SCHEDULE OF INVESTMENTS - Continued
As of June 30, 2021
| Number of Shares | | | | | Value | |
| | | | | SECURITIES SOLD SHORT (Continued) | | | | |
| | | | | COMMON STOCKS (Continued) | | | | |
| | | | | GAS — (1.2)% | | | | |
| | (709 | ) | | Atmos Energy Corp. | | $ | (68,142 | ) |
| | (2,785 | ) | | NiSource, Inc. | | | (68,233 | ) |
| | | | | | | | (136,375 | ) |
| | | | | HEALTHCARE-PRODUCTS — (7.3)% | | | | |
| | (604 | ) | | Abbott Laboratories | | | (70,022 | ) |
| | (845 | ) | | Baxter International, Inc. | | | (68,022 | ) |
| | (1,685 | ) | | Boston Scientific Corp.* | | | (72,051 | ) |
| | (183 | ) | | Cooper Cos., Inc. | | | (72,517 | ) |
| | (1,042 | ) | | DENTSPLY SIRONA, Inc. | | | (65,917 | ) |
| | (887 | ) | | Henry Schein, Inc.* | | | (65,806 | ) |
| | (87 | ) | | Intuitive Surgical, Inc.* | | | (80,009 | ) |
| | (558 | ) | | Medtronic PLC | | | (69,265 | ) |
| | (279 | ) | | Stryker Corp. | | | (72,465 | ) |
| | (179 | ) | | Teleflex, Inc. | | | (71,920 | ) |
| | (214 | ) | | West Pharmaceutical Services, Inc. | | | (76,847 | ) |
| | (423 | ) | | Zimmer Biomet Holdings, Inc. | | | (68,027 | ) |
| | | | | | | | (852,868 | ) |
| | | | | HEALTHCARE-SERVICES — (1.3)% | | | | |
| | (697 | ) | | Catalent, Inc.* | | | (75,360 | ) |
| | (305 | ) | | IQVIA Holdings, Inc.* | | | (73,907 | ) |
| | | | | | | | (149,267 | ) |
| | | | | INSURANCE — (2.8)% | | | | |
| | (1,392 | ) | | American International Group, Inc. | | | (66,259 | ) |
| | (445 | ) | | Assurant, Inc. | | | (69,500 | ) |
| | (1,217 | ) | | Loews Corp. | | | (66,509 | ) |
| | (1,091 | ) | | MetLife, Inc. | | | (65,297 | ) |
| | (898 | ) | | W R Berkley Corp. | | | (66,838 | ) |
| | | | | | | | (334,403 | ) |
| | | | | INTERNET — (2.0)% | | | | |
| | (144 | ) | | Netflix, Inc.* | | | (76,062 | ) |
| | (2,645 | ) | | NortonLifeLock, Inc. | | | (71,997 | ) |
| | (1,314 | ) | | Twitter, Inc.* | | | (90,417 | ) |
| | | | | | | | (238,476 | ) |
| | | | | LODGING — (1.2)% | | | | |
| | (583 | ) | | Hilton Worldwide Holdings, Inc.* | | | (70,322 | ) |
| | (1,245 | ) | | Las Vegas Sands Corp.* | | | (65,599 | ) |
| | | | | | | | (135,921 | ) |
AXS Market Neutral Fund
SCHEDULE OF INVESTMENTS - Continued
As of June 30, 2021
| Number of Shares | | | | | Value | |
| | | | | SECURITIES SOLD SHORT (Continued) | | | | |
| | | | | COMMON STOCKS (Continued) | | | | |
| | | | | MACHINERY-CONSTRUCTION & MINING — (0.6)% | | | | |
| | (299 | ) | | Caterpillar, Inc. | | $ | (65,071 | ) |
| | | | | MACHINERY-DIVERSIFIED — (1.2)% | | | | |
| | (196 | ) | | Deere & Co. | | | (69,131 | ) |
| | (1,484 | ) | | Ingersoll Rand, Inc.* | | | (72,434 | ) |
| | | | | | | | (141,565 | ) |
| | | | | MEDIA — (1.9)% | | | | |
| | (103 | ) | | Charter Communications, Inc. - Class A* | | | (74,309 | ) |
| | (1,292 | ) | | Comcast Corp. - Class A | | | (73,670 | ) |
| | (413 | ) | | Walt Disney Co.* | | | (72,593 | ) |
| | | | | | | | (220,572 | ) |
| | | | | MINING — (0.5)% | | | | |
| | (942 | ) | | Newmont Corp. | | | (59,704 | ) |
| | | | | MISCELLANEOUS MANUFACTURING — (0.6)% | | | | |
| | (5,419 | ) | | General Electric Co. | | | (72,940 | ) |
| | | | | OIL & GAS — (1.2)% | | | | |
| | (677 | ) | | Chevron Corp. | | | (70,909 | ) |
| | (1,184 | ) | | Exxon Mobil Corp. | | | (74,687 | ) |
| | | | | | | | (145,596 | ) |
| | | | | PACKAGING & CONTAINERS — (1.1)% | | | | |
| | (812 | ) | | Ball Corp. | | | (65,788 | ) |
| | (1,197 | ) | | Westrock Co. | | | (63,705 | ) |
| | | | | | | | (129,493 | ) |
| | | | | PHARMACEUTICALS — (4.3)% | | | | |
| | (598 | ) | | AmerisourceBergen Corp. | | | (68,465 | ) |
| | (289 | ) | | Becton, Dickinson and Co. | | | (70,282 | ) |
| | (212 | ) | | Dexcom, Inc.* | | | (90,524 | ) |
| | (891 | ) | | Merck & Co., Inc. | | | (69,293 | ) |
| | (89 | ) | | Organon & Co.* | | | (2,693 | ) |
| | (1,554 | ) | | Perrigo Co. PLC | | | (71,251 | ) |
| | (1,762 | ) | | Pfizer, Inc. | | | (69,000 | ) |
| | (4,453 | ) | | Viatris, Inc. | | | (63,633 | ) |
| | | | | | | | (505,141 | ) |
| | | | | REAL ESTATE — (0.6)% | | | | |
| | (832 | ) | | CBRE Group, Inc. - Class A* | | | (71,327 | ) |
AXS Market Neutral Fund
SCHEDULE OF INVESTMENTS - Continued
As of June 30, 2021
| Number of Shares | | | | | Value | |
| | | | | SECURITIES SOLD SHORT (Continued) | | | | |
| | | | | COMMON STOCKS (Continued) | | | | |
| | | | | REITS — (15.8)% | | | | |
| | (404 | ) | | Alexandria Real Estate Equities, Inc. - REIT | | $ | (73,504 | ) |
| | (285 | ) | | American Tower Corp. - REIT | | | (76,990 | ) |
| | (355 | ) | | AvalonBay Communities, Inc. - REIT | | | (74,085 | ) |
| | (634 | ) | | Boston Properties, Inc. - REIT | | | (72,650 | ) |
| | (383 | ) | | Crown Castle International Corp. - REIT | | | (74,723 | ) |
| | (468 | ) | | Digital Realty Trust, Inc. - REIT | | | (70,415 | ) |
| | (1,557 | ) | | Duke Realty Corp. - REIT | | | (73,724 | ) |
| | (98 | ) | | Equinix, Inc. - REIT | | | (78,655 | ) |
| | (949 | ) | | Equity Residential - REIT | | | (73,073 | ) |
| | (244 | ) | | Essex Property Trust, Inc. - REIT | | | (73,203 | ) |
| | (486 | ) | | Extra Space Storage, Inc. - REIT | | | (79,617 | ) |
| | (628 | ) | | Federal Realty Investment Trust - REIT | | | (73,583 | ) |
| | (2,121 | ) | | Healthpeak Properties, Inc. - REIT | | | (70,608 | ) |
| | (4,125 | ) | | Host Hotels & Resorts, Inc. - REIT* | | | (70,496 | ) |
| | (1,655 | ) | | Iron Mountain, Inc. - REIT | | | (70,040 | ) |
| | (3,438 | ) | | Kimco Realty Corp. - REIT | | | (71,682 | ) |
| | (448 | ) | | Mid-America Apartment Communities, Inc. - REIT | | | (75,452 | ) |
| | (608 | ) | | Prologis, Inc. - REIT | | | (72,674 | ) |
| | (1,073 | ) | | Realty Income Corp. - REIT | | | (71,612 | ) |
| | (1,119 | ) | | Regency Centers Corp. - REIT | | | (71,694 | ) |
| | (240 | ) | | SBA Communications Corp. - REIT | | | (76,488 | ) |
| | (1,529 | ) | | UDR, Inc. - REIT | | | (74,890 | ) |
| | (1,310 | ) | | Ventas, Inc. - REIT | | | (74,801 | ) |
| | (1,537 | ) | | Vornado Realty Trust - REIT | | | (71,732 | ) |
| | (970 | ) | | Welltower, Inc. - REIT | | | (80,607 | ) |
| | | | | | | | (1,846,998 | ) |
| | | | | RETAIL — (1.9)% | | | | |
| | (357 | ) | | Advance Auto Parts, Inc. | | | (73,235 | ) |
| | (53 | ) | | Chipotle Mexican Grill, Inc.* | | | (82,168 | ) |
| | (489 | ) | | Walmart, Inc. | | | (68,959 | ) |
| | | | | | | | (224,362 | ) |
| | | | | SAVINGS & LOANS — (0.5)% | | | | |
| | (3,722 | ) | | People's United Financial, Inc. | | | (63,795 | ) |
| | | | | SEMICONDUCTORS — (1.3)% | | | | |
| | (370 | ) | | NXP Semiconductors N.V. | | | (76,116 | ) |
| | (412 | ) | | Qorvo, Inc.* | | | (80,608 | ) |
| | | | | | | | (156,724 | ) |
| | | | | SOFTWARE — (2.6)% | | | | |
| | (477 | ) | | Fidelity National Information Services, Inc. | | | (67,577 | ) |
AXS Market Neutral Fund
SCHEDULE OF INVESTMENTS - Continued
As of June 30, 2021
| Number of Shares | | | | | Value | |
| | | | | SECURITIES SOLD SHORT (Continued) | | | | |
| | | | | COMMON STOCKS (Continued) | | | | |
| | | | | SOFTWARE (Continued) | | | | |
| | (220 | ) | | Paycom Software, Inc.* | | $ | (79,963 | ) |
| | (555 | ) | | PTC, Inc.* | | | (78,399 | ) |
| | (319 | ) | | salesforce.com, Inc.* | | | (77,922 | ) |
| | | | | | | | (303,861 | ) |
| | | | | TELECOMMUNICATIONS — (1.2)% | | | | |
| | (1,638 | ) | | Corning, Inc. | | | (66,994 | ) |
| | (522 | ) | | T-Mobile US, Inc.* | | | (75,602 | ) |
| | | | | | | | (142,596 | ) |
| | | | | TRANSPORTATION — (1.7)% | | | | |
| | (2,145 | ) | | CSX Corp. | | | (68,812 | ) |
| | (236 | ) | | Kansas City Southern | | | (66,875 | ) |
| | (253 | ) | | Norfolk Southern Corp. | | | (67,149 | ) |
| | | | | | | | (202,836 | ) |
| | | | | WATER — (0.6)% | | | | |
| | (460 | ) | | American Water Works Co., Inc. | | | (70,900 | ) |
| | | | | TOTAL COMMON STOCKS | | | | |
| | | | | (Proceeds $9,402,566) | | | (10,678,102 | ) |
| | | | | TOTAL SECURITIES SOLD SHORT | | | | |
| | | | | (Proceeds $9,402,566) | | $ | (10,678,102 | ) |
PLC – Public Limited Company
REIT – Real Estate Investment Trusts
| * | Non-income producing security. |
| 1 | All or a portion of the security is segregated as collateral for securities sold short. As of June 30, 2021, the aggregate value of those securities was $16,876,366, representing 143.9% of net assets. |
| 2 | The rate is the annualized seven-day yield at period end. |
See accompanying Notes to Financial Statements.
AXS Market Neutral Fund
SUMMARY OF INVESTMENTS
As of June 30, 2021
| Security Type/Industry | Percent of Total
Net Assets |
| Common Stocks | |
| Food | 16.8% |
| Software | 15.5% |
| Pharmaceuticals | 11.6% |
| Insurance | 10.8% |
| Biotechnology | 9.9% |
| Retail | 9.7% |
| Healthcare-Products | 8.5% |
| Diversified Financial Services | 5.9% |
| Telecommunications | 5.8% |
| Household Products/Wares | 5.6% |
| Electric | 5.5% |
| Beverages | 3.8% |
| Environmental Control | 3.8% |
| Healthcare-Services | 3.8% |
| Commercial Services | 3.8% |
| Transportation | 3.8% |
| Cosmetics/Personal Care | 3.7% |
| Electronics | 2.1% |
| REITS | 2.1% |
| Distribution/Wholesale | 2.0% |
| Internet | 2.0% |
| Semiconductors | 1.9% |
| Oil & Gas | 1.9% |
| Agriculture | 1.8% |
| Packaging & Containers | 1.8% |
| Total Common Stocks | 143.9% |
| Short-Term Investments | 0.2% |
| Total Investments | 144.1% |
| Liabilities in Excess of Other Assets | (44.1)% |
| Total Net Assets | 100.0% |
See accompanying Notes to Financial Statements.
STATEMENTS OF ASSETS AND LIABILITIES
As of June 30, 2021
| | | AXS Alternative Value Fund | | | AXS Market Neutral Fund | |
| Assets: | | | | | | |
| Investments, at cost | | $ | 1,537,184 | | | $ | 14,377,892 | |
| Investments, at value | | $ | 1,784,373 | | | $ | 16,898,294 | |
| Cash | | | 7,207 | | | | 39,959 | |
| Cash deposited with brokers for securities sold short | | | - | | | | 5,560,156 | |
| Receivables: | | | | | | | | |
| Due from Advisor | | | 11,192 | | | | 7,086 | |
| Dividends and interest | | | 1,923 | | | | 18,319 | |
| Prepaid expenses | | | 5,693 | | | | 5,840 | |
| Total assets | | | 1,810,388 | | | | 22,529,654 | |
| | | | | | | | | |
| Liabilities: | | | | | | | | |
| Securities sold short, proceeds | | $ | - | | | $ | 9,402,566 | |
| Securities sold short, at value | | $ | - | | | $ | 10,678,102 | |
| Due to broker | | | 450,321 | | | | - | |
| Payables: | | | | | | | | |
| Fund shares redeemed | | | - | | | | 246 | |
| Distribution fees (Note 7) | | | 118 | | | | 446 | |
| Fund accounting and administration fees | | | 34,907 | | | | 37,669 | |
| Auditing fees | | | 23,707 | | | | 24,726 | |
| Transfer agent fees and expenses | | | 13,334 | | | | 9,719 | |
| Custody fees | | | 6,740 | | | | 8,657 | |
| Trustees' fees and expenses | | | 3,503 | | | | 3,396 | |
| Legal fees | | | 3,008 | | | | 10,313 | |
| Shareholder reporting fees | | | 1,970 | | | | 1,854 | |
| Chief Compliance Officer fees | | | 1,352 | | | | 1,830 | |
| Dividends on securities sold short and interest expense | | | 474 | | | | 21,452 | |
| Sub-transfer agent fees and expenses | | | 330 | | | | 628 | |
| Trustees' deferred compensation (Note 3) | | | 23 | | | | 290 | |
| Accrued other expenses | | | 2,802 | | | | 5,540 | |
| Total liabilities | | | 542,589 | | | | 10,804,868 | |
| | | | | | | | | |
| Net Assets | | $ | 1,267,799 | | | $ | 11,724,786 | |
| | | | | | | | | |
| Components of Net Assets: | | | | | | | | |
| Paid-in capital (par value of $0.01 per share with an unlimited number of shares authorized) | | $ | 1,029,836 | | | $ | 17,115,092 | |
| Total distributable earnings (accumulated deficit) | | | 237,963 | | | | (5,390,306 | ) |
| Net Assets | | $ | 1,267,799 | | | $ | 11,724,786 | |
See accompanying Notes to Financial Statements.
STATEMENTS OF ASSETS AND LIABILITIES - Continued
As of June 30, 2021
| | | AXS Alternative Value Fund | | | AXS Market Neutral Fund | |
| Maximum Offering Price per Share: | | | | | | | | |
| Investor Class Shares: | | | | | | | | |
| Net assets applicable to shares outstanding | | $ | 584,098 | | | $ | 2,188,284 | |
| Shares of beneficial interest issued and outstanding | | | 55,194 | | | | 217,516 | |
| Redemption price per share | | | 10.58 | | | | 10.06 | |
| | | | | | | | | |
| Class I Shares: | | | | | | | | |
| Net assets applicable to shares outstanding | | $ | 683,701 | | | $ | 9,536,502 | |
| Shares of beneficial interest issued and outstanding | | | 64,603 | | | | 928,075 | |
| Redemption price per share | | $ | 10.58 | | | $ | 10.28 | |
See accompanying Notes to Financial Statements.
STATEMENTS OF OPERATIONS
For the Year Ended June 30, 2021
| | | AXS Alternative Value Fund | | | AXS Market Neutral Fund | |
| Investment Income: | | | | | | | | |
| Dividends | | $ | 57,990 | | | $ | 607,777 | |
| Interest | | | 13 | | | | 768 | |
| Total investment income | | | 58,003 | | | | 608,545 | |
| | | | | | | | | |
| Expenses: | | | | | | | | |
| Fund accounting and administration fees | | | 103,819 | | | | 150,223 | |
| Registration fees | | | 43,510 | | | | 75,782 | |
| Custody fees | | | 24,628 | | | | 22,487 | |
| Auditing fees | | | 23,707 | | | | 24,726 | |
| Shareholder reporting fees | | | 20,116 | | | | 20,712 | |
| Legal fees | | | 18,125 | | | | 29,321 | |
| Miscellaneous | | | 16,687 | | | | 20,355 | |
| Advisory fees | | | 16,231 | | | | 309,366 | |
| Chief Compliance Officer fees | | | 14,622 | | | | 15,296 | |
| Transfer agent fees and expenses | | | 14,493 | | | | 11,921 | |
| Trustees' fees and expenses | | | 13,762 | | | | 14,441 | |
| Interest expense | | | 13,352 | | | | 126,261 | |
| Distribution fees - Investor Class (Note 7) | | | 1,195 | | | | 11,020 | |
| Insurance fees | | | 1,058 | | | | 7,168 | |
| Sub-transfer agent fees and expenses | | | 805 | | | | 4,876 | |
| Dividends on securities sold short | | | - | | | | 428,184 | |
| Total expenses | | | 326,110 | | | | 1,272,139 | |
| Advisory fees waived | | | (16,231 | ) | | | (309,366 | ) |
| Other expenses absorbed | | | (274,087 | ) | | | (76,636 | ) |
| Fees paid indirectly (Note 3) | | | (21 | ) | | | (259 | ) |
| Net expenses | | | 35,771 | | | | 885,878 | |
| Net investment income (loss) | | | 22,232 | | | | (277,333 | ) |
| | | | | | | | | |
| Realized and Unrealized Gain (Loss): | | | | | | | | |
| Net realized gain (loss) on: | | | | | | | | |
| Investments | | | 663,466 | | | | 6,220,135 | |
| Securities sold short | | | - | | | | (6,415,488 | ) |
| Net realized gain (loss) | | | 663,466 | | | | (195,353 | ) |
| Net change in unrealized appreciation/depreciation on: | | | | | | | | |
| Investments | | | 850,401 | | | | (153,543 | ) |
| Securities sold short | | | - | | | | (18,848 | ) |
| Net change in unrealized appreciation/depreciation | | | 850,401 | | | | (172,391 | ) |
| Net realized and unrealized gain (loss) | | | 1,513,867 | | | | (367,744 | ) |
| | | | | | | | | |
| Net Increase (Decrease) in Net Assets from Operations | | $ | 1,536,099 | | | $ | (645,077 | ) |
See accompanying Notes to Financial Statements.
AXS Alternative Value Fund
STATEMENTS OF CHANGES IN NET ASSETS
| | | For the Year Ended June 30, 20211 | | | For the Year Ended June 30, 2020 | |
| Increase (Decrease) in Net Assets From: | | | | | | | | |
| Operations: | | | | | | | | |
| Net investment income | | $ | 22,232 | | | $ | 335,609 | |
| Net realized gain on investments | | | 663,466 | | | | 625,973 | |
| Net change in unrealized appreciation/depreciation on investments | | | 850,401 | | | | (2,580,661 | ) |
| Net increase (decrease) in net assets resulting from operations | | | 1,536,099 | | | | (1,619,079 | ) |
| | | | | | | | | |
| Distributions to shareholders: | | | | | | | | |
| Distributions: | | | | | | | | |
| Investor Class | | | (47,914 | ) | | | (78,029 | ) |
| Class I | | | (89,850 | ) | | | (1,903,561 | ) |
| Total distributions to shareholders | | | (137,764 | ) | | | (1,981,590 | ) |
| | | | | | | | | |
| Capital Transactions: | | | | | | | | |
| Net proceeds from shares sold: | | | | | | | | |
| Investor Class | | | 285,324 | | | | 1,146,545 | |
| Class I | | | 168,778 | | | | 4,860,219 | |
| Reinvestment of distributions: | | | | | | | | |
| Investor Class | | | 47,914 | | | | 78,029 | |
| Class I | | | 89,850 | | | | 1,903,562 | |
| Cost of shares redeemed: | | | | | | | | |
| Investor Class | | | (428,995 | ) | | | (959,662 | ) |
| Class I2 | | | (11,599,747 | ) | | | (12,613,624 | ) |
| Net decrease in net assets from capital transactions | | | (11,436,876 | ) | | | (5,584,931 | ) |
| | | | | | | | | |
| Total decrease in net assets | | | (10,038,541 | ) | | | (9,185,600 | ) |
| | | | | | | | | |
| Net Assets: | | | | | | | | |
| Beginning of year | | | 11,306,340 | | | | 20,491,940 | |
| End of year | | $ | 1,267,799 | | | $ | 11,306,340 | |
| | | | | | | | | |
| Capital Share Transactions: | | | | | | | | |
| Shares sold: | | | | | | | | |
| Investor Class | | | 30,434 | | | | 121,063 | |
| Class I | | | 16,895 | | | | 515,604 | |
| Shares reinvested: | | | | | | | | |
| Investor Class | | | 5,342 | | | | 8,301 | |
| Class I | | | 10,039 | | | | 202,722 | |
| Shares redeemed: | | | | | | | | |
| Investor Class | | | (46,740 | ) | | | (120,916 | ) |
| Class I | | | (1,281,710 | ) | | | (1,513,379 | ) |
| Net decrease in capital share transactions | | | (1,265,740 | ) | | | (786,605 | ) |
| 1 | With the Plan of Reorganization with respect to the AXS Alternative Value Fund (formerly, Cognios Large Cap Value Fund), Investor Class and Institutional Class shareholders received Investor Class and Class I shares of the AXS Alternative Value Fund, respectively, effective as of the close of business on March 5, 2021. See Note 1 in the accompanying Notes to Financial Statements. |
| 2 | Net of redemption fees of $382 and $0, respectively. |
See accompanying Notes to Financial Statements.
AXS Market Neutral Fund
STATEMENTS OF CHANGES IN NET ASSETS
| | | For the Year Ended June 30, 20211 | | | For the Year Ended June 30, 2020 | |
| Increase (Decrease) in Net Assets From: | | | | | | | | |
| Operations: | | | | | | | | |
| Net investment loss | | $ | (277,333 | ) | | $ | (576,863 | ) |
| Net realized loss | | | (195,353 | ) | | | (4,315,752 | ) |
| Net change in unrealized appreciation/depreciation on investments and securities sold short | | | (172,391 | ) | | | 6,315,285 | |
| Net increase (decrease) in net assets resulting from operations | | | (645,077 | ) | | | 1,422,670 | |
| | | | | | | | | |
| Capital Transactions: | | | | | | | | |
| Net proceeds from shares sold: | | | | | | | | |
| Investor Class | | | 1,461,001 | | | | 2,203,175 | |
| Class I | | | 1,537,662 | | | | 8,659,564 | |
| Cost of shares redeemed: | | | | | | | | |
| Investor Class2 | | | (6,188,254 | ) | | | (13,188,820 | ) |
| Class I3 | | | (23,029,121 | ) | | | (52,963,742 | ) |
| Net decrease in net assets from capital transactions | | | (26,218,712 | ) | | | (55,289,823 | ) |
| | | | | | | | | |
| Total decrease in net assets | | | (26,863,789 | ) | | | (53,867,153 | ) |
| | | | | | | | | |
| Net Assets: | | | | | | | | |
| Beginning of period | | | 38,588,575 | | | | 92,455,728 | |
| End of period | | $ | 11,724,786 | | | $ | 38,588,575 | |
| | | | | | | | | |
| Capital Share Transactions: | | | | | | | | |
| Shares sold: | | | | | | | | |
| Investor Class | | | 144,466 | | | | 216,567 | |
| Class I | | | 151,780 | | | | 845,563 | |
| Shares redeemed: | | | | | | | | |
| Investor Class | | | (631,680 | ) | | | (1,304,274 | ) |
| Class I | | | (2,261,339 | ) | | | (5,136,106 | ) |
| Net decrease in capital share transactions | | | (2,596,773 | ) | | | (5,378,250 | ) |
| 1 | With the Plan of Reorganization with respect to the AXS Market Neutral Fund (formerly, Cognios Market Neutral Large Cap Fund), Investor Class and Institutional Class shareholders received Investor Class and Class I shares of the AXS Market Neutral Fund, respectively, effective as of the close of business on March 5, 2021. See Note 1 in the accompanying Notes to Financial Statements. |
| 2 | Net of redemption fees of $1,032 and $0, respectively. |
| 3 | Net of redemption fees of $1,374 and $0, respectively. |
See accompanying Notes to Financial Statements.
AXS Market Neutral Fund
STATEMENT OF CASH FLOWS
For the Year Ended June 30, 2021
| Increase (Decrease) in Cash: | | | |
| Cash flows provided by (used for) operating activities: | | | |
| Net decrease in net assets resulting from operations | | $ | (645,077 | ) |
| Adjustments to reconcile net increase in net assets from operations to net cash provided by (used for) operating activities: | | | | |
| Purchases of long-term investments | | | (23,295,723 | ) |
| Sales of long-term investments | | | 60,747,591 | |
| Proceeds from securities sold short | | | 18,346,964 | |
| Cover short securities | | | (49,328,519 | ) |
| Sale of short-term investments, net | | | 18,740 | |
| Increase in Due from Advisor | | | (7,086 | ) |
| Decrease in dividends and interest receivables | | | 39,724 | |
| Decrease in other assets | | | 17,935 | |
| Decrease in payables for dividends on securities sold short and interest expense | | | (66,319 | ) |
| Decrease in advisory fees payable | | | (17,119 | ) |
| Increase in accrued expenses | | | 66,129 | |
| Net realized loss | | | 287,166 | |
| Net change in unrealized appreciation/depreciation | | | 172,391 | |
| Net cash provided by operating activities | | | 6,336,797 | |
| | | | | |
| Cash flows provided by (used for) financing activities: | | | | |
| Proceeds from shares sold | | | 2,999,269 | |
| Cost of shares redeemed | | | (29,288,156 | ) |
| Net cash used for financing activities | | | (26,288,887 | ) |
| | | | | |
| Net Decrease in cash | | | (19,952,090 | ) |
| | | | | |
| Cash and cash equivalents | | | | |
| Beginning cash held at broker | | | 3,128,075 | |
| Beginning segregated cash held by custodian | | | 22,424,130 | |
| Total beginning cash and cash equivalents | | | 25,552,205 | |
| | | | | |
| Ending cash balance | | | 39,959 | |
| Ending cash held at broker | | | 5,560,156 | |
| Total ending cash and cash equivalents | | $ | 5,600,115 | |
See accompanying Notes to Financial Statements.
AXS Alternative Value Fund
FINANCIAL HIGHLIGHTS
Investor Class*
Per share operating performance.
For a capital share outstanding throughout each period.
| | | For the Year Ended June 30, | | | For the Period October 3, 2016** through | |
| | | 2021 | | | 2020 | | | 2019 | | | 2018 | | | June 30, 2017 | |
| Net asset value, beginning of period | | $ | 8.16 | | | $ | 9.44 | | | $ | 10.23 | | | $ | 10.79 | | | $ | 10.00 | |
| Income from Investment Operations: | | | | | | | | | | | | | | | | | | | | |
| Net investment income1 | | | 0.07 | | | | 0.10 | | | | 0.11 | | | | 0.12 | | | | 0.04 | |
| Net realized and unrealized gain (loss) | | | 3.39 | | | | (0.65 | ) | | | 0.92 | | | | 1.29 | | | | 0.75 | |
| Total from investment operations | | | 3.46 | | | | (0.55 | ) | | | 1.03 | | | | 1.41 | | | | 0.79 | |
| | | | | | | | | | | | | | | | | | | | | |
| Less Distributions: | | | | | | | | | | | | | | | | | | | | |
| From net investment income | | | (1.04 | ) | | | (0.08 | ) | | | (0.19 | ) | | | (0.18 | ) | | | - | 2 |
| From net realized gain | | | - | | | | (0.65 | ) | | | (1.63 | ) | | | (1.79 | ) | | | - | |
| Total distributions | | | (1.04 | ) | | | (0.73 | ) | | | (1.82 | ) | | | (1.97 | ) | | | - | |
| | | | | | | | | | | | | | | | | | | | | |
| Net asset value, end of period | | $ | 10.58 | | | $ | 8.16 | | | $ | 9.44 | | | $ | 10.23 | | | $ | 10.79 | |
| | | | | | | | | | | | | | | | | | | | | |
| Total return3 | | | 44.75 | % | | | (6.89 | )% | | | 12.90 | % | | | 13.58 | % | | | 7.92 | %5 |
| | | | | | | | | | | | | | | | | | | | | |
| Ratios and Supplemental Data: | | | | | | | | | | | | | | | | | | | | |
| Net assets, end of period (in thousands) | | $ | 584 | | | $ | 540 | | | $ | 545 | | | $ | 25 | | | $ | 11 | |
| | | | | | | | | | | | | | | | | | | | | |
| Ratio of expenses to average net assets (including interest expense): | | | | | | | | | | | | | | | | | | | | |
| Before fees waived and expenses absorbed4 | | | 13.41 | % | | | 2.87 | % | | | 2.96 | % | | | 1.62 | % | | | 1.52 | %6 |
| After fees waived and expenses absorbed4 | | | 1.65 | % | | | 2.02 | % | | | 2.07 | % | | | 1.10 | % | | | 1.10 | %6 |
| Ratio of net investment income (loss) to average net assets (including interest expense): | | | | | | | | | | | | | | | | | | | | |
| Before fees waived and expenses absorbed | | | (11.06 | )% | | | 2.01 | % | | | 2.28 | % | | | 1.37 | % | | | 1.21 | %6 |
| After fees waived and expenses absorbed | | | 0.70 | % | | | 1.16 | % | | | 1.39 | % | | | 0.85 | % | | | 0.79 | %6 |
| | | | | | | | | | | | | | | | | | | | | |
| Portfolio turnover rate | | | 50 | % | | | 74 | % | | | 64 | % | | | 84 | % | | | 24 | %5 |
| * | Financial information from October 3, 2016 through March 5, 2021 is for the AXS Alternative Value Fund (formerly, Cognios Large Cap Value Fund), which was reorganized into the AXS Alternative Value Fund as of the close of business on March 5, 2021. See Note 1 in the accompanying Notes to Financial Statements. |
| ** | Commencement of operations. |
| 1 | Calculated based on average shares outstanding for the period. |
| 2 | Amount represents less than $0.01 per share. |
| 3 | Total returns would have been lower had expenses not been waived or absorbed by the Advisor. Returns shown include 12b-1 fees of up to 0.25% and do not reflect the deduction of taxes that a shareholder would pay on Fund distributions or the redemption of Fund shares. |
| 4 | If interest expense had been excluded, the expense ratios would have been lowered by 0.55% for the year ended June 30, 2021. For the periods ended June 30, 2020, 2019, 2018 and 2017, the ratios would have been lowered by 0.92%, 0.97%, 0.00% and 0.00%, respectively. |
See accompanying Notes to Financial Statements.
AXS Alternative Value Fund
FINANCIAL HIGHLIGHTS
Class I*
Per share operating performance.
For a capital share outstanding throughout each period.
| | | For the Year Ended June 30, | | | For the Period October 3, 2016** through | |
| | | 2021 | | | 2020 | | | 2019 | | | 2018 | | | June 30, 2017 | |
| Net asset value, beginning of period | | $ | 8.16 | | | $ | 9.43 | | | $ | 10.25 | | | $ | 10.80 | | | $ | 10.00 | |
| Income from Investment Operations: | | | | | | | | | | | | | | | | | | | | |
| Net investment income 1 | | | 0.08 | | | | 0.13 | | | | 0.18 | | | | 0.20 | | | | 0.06 | |
| Net realized and unrealized gain (loss) | | | 3.42 | | | | (0.66 | ) | | | 0.82 | | | | 1.23 | | | | 0.75 | |
| Total from investment operations | | | 3.50 | | | | (0.53 | ) | | | 1.00 | | | | 1.43 | | | | 0.81 | |
| | | | | | | | | | | | | | | | | | | | | |
| Less Distributions: | | | | | | | | | | | | | | | | | | | | |
| From net investment income | | | (1.08 | ) | | | (0.09 | ) | | | (0.19 | ) | | | (0.19 | ) | | | (0.01 | ) |
| From net realized gain | | | - | | | | (0.65 | ) | | | (1.63 | ) | | | (1.79 | ) | | | - | |
| Total distributions | | | (1.08 | ) | | | (0.74 | ) | | | (1.82 | ) | | | (1.98 | ) | | | (0.01 | ) |
| | | | | | | | | | | | | | | | | | | | | |
| Redemption fee proceeds | | | - | 2 | | | - | | | | - | | | | - | | | | - | |
| | | | | | | | | | | | | | | | | | | | | |
| Net asset value, end of period | | $ | 10.58 | | | $ | 8.16 | | | $ | 9.43 | | | $ | 10.25 | | | $ | 10.80 | |
| | | | | | | | | | | | | | | | | | | | | |
| Total return3 | | | 45.36 | % | | | (6.67 | )% | | | 12.56 | % | | | 13.87 | % | | | 8.09 | %5 |
| | | | | | | | | | | | | | | | | | | | | |
| Ratios and Supplemental Data: | | | | | | | | | | | | | | | | | | | | |
| Net assets, end of period (in thousands) | | $ | 684 | | | $ | 10,766 | | | $ | 19,947 | | | $ | 25,014 | | | $ | 40,514 | |
| | | | | | | | | | | | | | | | | | | | | |
| Ratio of expenses to average net assets (including interest expense): | | | | | | | | | | | | | | | | | | | | |
| Before fees waived and expenses absorbed4 | | | 13.16 | % | | | 2.62 | % | | | 2.71 | % | | | 1.37 | % | | | 1.27 | %6 |
| After fees waived and expenses absorbed4 | | | 1.40 | % | | | 1.77 | % | | | 1.82 | % | | | 0.85 | % | | | 0.85 | %6 |
| Ratio of net investment income (loss) to average net assets (including interest expense): | | | | | | | | | | | | | | | | | | | | |
| Before fees waived and expenses absorbed | | | (10.81 | )% | | | 2.26 | % | | | 2.53 | % | | | 1.62 | % | | | 1.46 | %6 |
| After fees waived and expenses absorbed | | | 0.95 | % | | | 1.41 | % | | | 1.64 | % | | | 1.10 | % | | | 1.04 | %6 |
| | | | | | | | | | | | | | | | | | | | | |
| Portfolio turnover rate | | | 50 | % | | | 74 | % | | | 64 | % | | | 84 | % | | | 24 | %5 |
| * | Financial information from October 3, 2016 through March 5, 2021 is for the AXS Alternative Value Fund (formerly, Cognios Large Cap Value Fund), which was reorganized into the AXS Alternative Value Fund as of the close of business on March 5, 2021. See Note 1 in the accompanying Notes to Financial Statements. |
| ** | Commencement of operations. |
| 1 | Calculated based on average shares outstanding for the period. |
| 2 | Amount represents less than $0.01 per share. |
| 3 | Total returns would have been lower had fees not been waived or absorbed by the Advisor. These returns do not reflect the deduction of taxes that a shareholder would pay on the Fund distributions or redemption of Fund shares. |
| 4 | If interest expense had been excluded, the expense ratios would have been lowered by 0.55% for the year ended June 30, 2021. For the periods ended June 30, 2020, 2019, 2018 and 2017, the ratios would have been lowered by 0.92%, 0.97%, 0.00% and 0.00%, respectively. |
See accompanying Notes to Financial Statements.
AXS Market Neutral Fund
FINANCIAL HIGHLIGHTS
Investor Class*
Per share operating performance.
For a capital share outstanding throughout each period.
| | | For the Year Ended June 30, | | | For the Period October 1, 2017 through June 30, | | | For the Year Ended September 30, | |
| | | 2021 | | | 2020 | | | 2019 | | | 2018 | | | 2017 | | | 2016 | |
| Net asset value, beginning of period | | $ | 10.15 | | | $ | 10.00 | | | $ | 10.31 | | | $ | 9.32 | | | $ | 9.93 | | | $ | 9.68 | |
| Income from Investment Operations: | | | | | | | | | | | | | | | | | | | | | | | | |
| Net investment loss1 | | | (0.15 | ) | | | (0.11 | ) | | | (0.05 | ) | | | (0.08 | ) | | | (0.13 | ) | | | (0.15 | ) |
| Net realized and unrealized gain (loss) | | | 0.06 | | | | 0.26 | | | | (0.26 | ) | | | 1.07 | | | | (0.33 | ) | | | 0.45 | |
| Total from investment operations | | | (0.09 | ) | | | 0.15 | | | | (0.31 | ) | | | 0.99 | | | | (0.46 | ) | | | 0.30 | |
| | | | | | | | | | | | | | | | | | | | | | | | | |
| Less Distributions: | | | | | | | | | | | | | | | | | | | | | | | | |
| From net realized gain | | | - | | | | - | | | | - | | | | - | | | | (0.15 | ) | | | (0.05 | ) |
| Total distributions | | | - | | | | - | | | | - | | | | - | | | | (0.15 | ) | | | (0.05 | ) |
| | | | | | | | | | | | | | | | | | | | | | | | | |
| Redemption fee proceeds1 | | | - | 2 | | | - | | | | - | | | | - | | | | - | | | | - | |
| | | | | | | | | | | | | | | | | | | | | | | | | |
| Net asset value, end of period | | $ | 10.06 | | | $ | 10.15 | | | $ | 10.00 | | | $ | 10.31 | | | $ | 9.32 | | | $ | 9.93 | |
| | | | | | | | | | | | | | | | | | | | | | | | | |
| Total return3 | | | (0.89 | )% | | | 1.50 | % | | | (3.01 | )% | | | 10.62 | %5 | | | (4.65 | )% | | | 3.15 | % |
| | | | | | | | | | | | | | | | | | | | | | | | | |
| Ratios and Supplemental Data: | | | | | | | | | | | | | | | | | | | | | | | | |
| Net assets, end of period (in thousands) | | $ | 2,188 | | | $ | 7,155 | | | $ | 17,931 | | | $ | 19,771 | | | $ | 22,997 | | | $ | 43,779 | |
| | | | | | | | | | | | | | | | | | | | | | | | | |
| Ratio of expenses to average net assets (including dividends on securities sold short and interest expense): | | | | | | | | | | | | | | | | | | | | | | | | |
| Before fees waived and expenses absorbed4 | | | 5.97 | % | | | 4.86 | % | | | 4.27 | % | | | 4.09 | %6 | | | 3.87 | % | | | 4.07 | % |
| After fees waived and expenses absorbed4 | | | 4.22 | % | | | 4.34 | % | | | 3.88 | % | | | 3.66 | %6,7 | | | 3.72 | % | | | 3.80 | % |
| Ratio of net investment loss to average net assets (including dividends on securities sold short and interest expense): | | | | | | | | | | | | | | | | | | | | | | | | |
| Before fees waived and expenses absorbed | | | (3.21 | )% | | | (1.61 | )% | | | (0.65 | )% | | | (1.41 | )%6 | | | (1.57 | )% | | | (1.80 | )% |
| After fees waived and expenses absorbed | | | (1.46 | )% | | | (1.09 | )% | | | (0.26 | )% | | | (0.98 | )%6 | | | (1.42 | )% | | | (1.53 | )% |
| | | | | | | | | | | | | | | | | | | | | | | | | |
| Portfolio turnover rate | | | 91 | % | | | 137 | % | | | 159 | % | | | 104 | %5 | | | 277 | % | | | 250 | % |
| * | Financial information for the year ended September 30, 2016 through March 5, 2021 is for the AXS Market Neutral Fund (formerly, Cognios Market Neutral Large Cap Fund), which was reorganized into the AXS Market Neutral Fund as of the close of business on March 5, 2021. See Note 1 in the accompanying Notes to Financial Statements. |
| 1 | Calculated based on average shares outstanding for the period. |
| 2 | Amount represents less than $0.01 per share. |
| 3 | Total returns would have been lower had expenses not been waived or absorbed by the Advisor. Returns shown include 12b-1 fees of up to 0.25% and do not reflect the deduction of taxes that a shareholder would pay on Fund distributions or the redemption of Fund shares. |
| 4 | If interest expense and dividends on securities sold short had been excluded, the expense ratios would have been lowered by 2.52% for the year ended June 30, 2021. For the periods ended June 30, 2020, 2019, 2018 and the periods ended September 30, 2017 and 2016, the ratios would have been lowered by 2.64%, 2.19%, 1.79%, 1.77% and 1.85%, respectively. |
| 7 | Contractual expense limitation changed from 1.95% to 1.70% effective May 5, 2018. |
See accompanying Notes to Financial Statements.
AXS Market Neutral Fund
FINANCIAL HIGHLIGHTS
Class I*
Per share operating performance.
For a capital share outstanding throughout each period.
| | | For the Year Ended June 30, | | | For the Period October 1, 2017 through June 30, | | | For the Year Ended September 30, | |
| | | 2021 | | | 2020 | | | 2019 | | | 2018 | | | 2017 | | | 2016 | |
| Net asset value, beginning of period | | $ | 10.35 | | | $ | 10.17 | | | $ | 10.46 | | | $ | 9.44 | | | $ | 10.02 | | | $ | 9.76 | |
| Income from Investment Operations: | | | | | | | | | | | | | | | | | | | | | | | | |
| Net investment income (loss)1 | | | (0.12 | ) | | | (0.08 | ) | | | 0.01 | | | | (0.05 | ) | | | (0.11 | ) | | | (0.13 | ) |
| Net realized and unrealized gain (loss) | | | 0.05 | | | | 0.26 | | | | (0.30 | ) | | | 1.07 | | | | (0.32 | ) | | | 0.44 | |
| Total from investment operations | | | (0.07 | ) | | | 0.18 | | | | (0.29 | ) | | | 1.02 | | | | (0.43 | ) | | | 0.31 | |
| | | | | | | | | | | | | | | | | | | | | | | | | |
| Less Distributions: | | | | | | | | | | | | | | | | | | | | | | | | |
| From net realized gain | | | - | | | | - | | | | - | | | | - | | | | (0.15 | ) | | | (0.05 | ) |
| Total distributions | | | - | | | | - | | | | - | | | | - | | | | (0.15 | ) | | | (0.05 | ) |
| | | | | | | | | | | | | | | | | | | | | | | | | |
| Redemption fee proceeds | | | - | 2 | | | - | | | | - | | | | - | | | | - | | | | - | |
| | | | | | | | | | | | | | | | | | | | | | | | | |
| Net asset value, end of period | | $ | 10.28 | | | $ | 10.35 | | | $ | 10.17 | | | $ | 10.46 | | | $ | 9.44 | | | $ | 10.02 | |
| | | | | | | | | | | | | | | | | | | | | | | | | |
| Total return3 | | | (0.68 | )% | | | 1.77 | % | | | (2.77 | )% | | | 10.81 | %5 | | | (4.31 | )% | | | 3.23 | % |
| | | | | | | | | | | | | | | | | | | | | | | | | |
| Ratios and Supplemental Data: | | | | | | | | | | | | | | | | | | | | | | | | |
| Net assets, end of period (in thousands) | | $ | 9,537 | | | $ | 31,433 | | | $ | 74,525 | | | $ | 44,363 | | | $ | 38,856 | | | $ | 113,499 | |
| | | | | | | | | | | | | | | | | | | | | | | | | |
| Ratio of expenses to average net assets (including dividends on securities sold short and interest expense): | | | | | | | | | | | | | | | | | | | | | | | | |
| Before fees waived and expenses absorbed4 | | | 5.72 | % | | | 4.61 | % | | | 4.02 | % | | | 3.84 | %6 | | | 3.62 | % | | | 3.83 | % |
| After fees waived and expenses absorbed4 | | | 3.97 | % | | | 4.09 | % | | | 3.63 | % | | | 3.41 | %6,7 | | | 3.47 | % | | | 3.55 | % |
| Ratio of net investment loss to average net assets (including dividends on securities sold short and interest expense): | | | | | | | | | | | | | | | | | | | | | | | | |
| Before fees waived and expenses absorbed | | | (2.96 | )% | | | (1.36 | )% | | | (0.40 | )% | | | (1.16 | )%6 | | | (1.29 | )% | | | (1.58 | )% |
| After fees waived and expenses absorbed | | | (1.21 | )% | | | (0.84 | )% | | | (0.01 | )% | | | (0.73 | )%6 | | | (1.14 | )% | | | (1.30 | )% |
| | | | | | | | | | | | | | | | | | | | | | | | | |
| Portfolio turnover rate | | | 91 | % | | | 137 | % | | | 159 | % | | | 104 | %5 | | | 277 | % | | | 250 | % |
| * | Financial information for the year ended September 30, 2016 through March 5, 2021 is for the AXS Market Neutral Fund (formerly, Cognios Market Neutral Large Cap Fund), which was reorganized into the AXS Market Neutral Fund as of the close of business on March 5, 2021. See Note 1 in the accompanying Notes to Financial Statements. |
| 1 | Calculated based on average shares outstanding for the period. |
| 2 | Amount represents less than $0.01 per share. |
| 3 | Total returns would have been lower had fees not been waived or absorbed by the Advisor. These returns do not reflect the deduction of taxes that a shareholder would pay on the Fund distributions or redemption of Fund shares. |
| 4 | If interest expense and dividends on securities sold short had been excluded, the expense ratios would have been lowered by2.52% for the year ended June 30, 2021. For the periods ended June 30, 2020, 2019, 2018 and the periods ended September 30, 2017 and 2016, the ratios would have been lowered by 2.64%, 2.19%, 1.79%, 1.77% and 1.85%, respectively. |
| 7 | Contractual expense limitation changed from 1.75% to 1.45% effective May 5, 2018. |
See accompanying Notes to Financial Statements.
AXS Funds
NOTES TO FINANCIAL STATEMENTS
June 30, 2021
Note 1 – Organization
AXS Alternative Value Fund (the ‘‘Alternative Value Fund’’) and AXS Market Neutral Fund (the “Market Neutral Fund”) (each a “Fund” and collectively the ‘‘Funds’’) are organized as a diversified series of Investment Managers Series Trust II, a Delaware statutory trust (the “Trust”) which is registered as an open-end management investment company under the Investment Company Act of 1940, as amended (the “1940 Act”).
The Alternative Value Fund’s investment objective is to seek long-term growth of capital.
The Alternative Value Fund commenced investment operations on March 8, 2021 with Class I shares and Investor Class shares. Prior to that date, the Alternative Value Fund acquired the assets and assumed the liabilities of the AXS Alternative Value Fund (formerly, Cognios Large Cap Value Fund) (the "Alternative Value Predecessor Fund"), a series of M3Sixty Funds Trust, which offered two classes of shares, Investor Class shares and Institutional Class shares, in a tax-free reorganization as set out in the Agreement and Plan of Reorganization. The proposed Plan of Reorganization was approved by the Trust’s Board on October 20, 2020, by the Board of M3Sixty Funds Trust on October 20, 2020, and by beneficial owners of the Alternative Value Predecessor Fund on February 26, 2021. The tax-free reorganization was accomplished on March 5, 2021. As a result of the reorganization, the Alternative Value Fund assumed the performance and accounting history of the Alternative Value Predecessor Fund. Financial information included for the dates prior to the reorganization is that of the Alternative Value Predecessor Fund.
The reorganization was accomplished by the following tax-free exchange in which each shareholder of the Alternative Value Predecessor Fund received the same aggregate share net asset value in the corresponding classes as noted below:
| | | Shares Issued | | | Net Assets | |
| Investor Class | | | 53,742 | | | $ | 497,821 | |
| Institutional Class | | | 65,608 | | | $ | 606,912 | |
The net unrealized appreciation of investments transferred was $143,049 as of the date of the acquisition.
The Market Neutral Fund Fund’s investment objective is to seek long-term growth of capital independent of stock market direction.
The Market Neutral Fund commenced investment operations on March 8, 2021 with Class I shares and Investor Class shares. Prior to that date, the Market Neutral Fund acquired the assets and assumed the liabilities of the AXS Market Neutral Fund (formerly, Cognios Market Neutral Large Cap Fund) (the “Market Neutral Predecessor Fund”), a series of M3Sixty Funds Trust, which offered two class of shares, Investor Class shares and Institutional Class shares in a tax-free reorganization as set out in the Agreement and Plan of Reorganization. The proposed Plan of Reorganization was approved by the Trust’s Board on October 20, 2020, by the Board of M3Sixty Funds Trust on October 20, 2020, and by beneficial owners of the Market Neutral Predecessor Fund on March 3, 2021. The tax-free reorganization was accomplished on March 5, 2021. As a result of the reorganization, the Market Neutral Fund assumed the performance and accounting history of the Market Neutral Predecessor Fund. Financial information included for the dates prior to the reorganization is that of the Market Neutral Predecessor Fund.
AXS Funds
NOTES TO FINANCIAL STATEMENTS - Continued
June 30, 2021
The reorganization was accomplished by the following tax-free exchange in which each shareholder of the Market Neutral Predecessor Fund received the same aggregate share net asset value in the corresponding classes as noted below:
| | | Shares Issued | | | Net Assets | |
| Investor Class | | | 246,342 | | | $ | 2,334,398 | |
| Institutional Class | | | 1,189,884 | | | $ | 11,511,835 | |
The net unrealized appreciation of investments transferred was $735,813 as of the date of the acquisition.
The shares of each class of each Fund represent an interest in the same portfolio of investments of each particular Fund and have equal rights as to voting, redemptions, dividends and liquidation, subject to the approval of the Trustees. Income, expenses (other than expenses attributable to a specific class) and realized and unrealized gains and losses on investments are allocated to each class of shares in proportion to their relative net assets. Shareholders of a class that bears distribution and service expenses under the terms of a distribution plan have exclusive voting rights to that distribution plan.
Each Fund is an investment company and accordingly follows the investment company accounting and reporting guidance of the Financial Accounting Standards Board (FASB) Accounting Standard Codification Topic 946 “Financial Services—Investment Companies.”
Note 2 – Accounting Policies
The following is a summary of the significant accounting policies consistently followed by the Funds in the preparation of their financial statements. The preparation of financial statements in conformity with accounting principles generally accepted in the United States of America (“GAAP”) requires management to make estimates and assumptions that affect the reported amounts and disclosures in the financial statements. Actual results could differ from these estimates.
(a) Valuation of Investments
The Funds value equity securities at the last reported sale price on the principal exchange or in the principal over the counter (“OTC”) market in which such securities are traded, as of the close of regular trading on the NYSE on the day the securities are being valued or, if the last-quoted sales price is not readily available, the securities will be valued at the last bid or the mean between the last available bid and ask price. Securities traded on the NASDAQ are valued at the NASDAQ Official Closing Price (“NOCP”). Investments in open-end investment companies are valued at the daily closing net asset value of the respective investment company. Debt securities are valued by utilizing a price supplied by independent pricing service providers. The independent pricing service providers may use various valuation methodologies including matrix pricing and other analytical pricing models as well as market transactions and dealer quotations. These models generally consider such factors as yields or prices of bonds of comparable quality, type of issue, coupon, maturity, ratings and general market conditions. If a price is not readily available for a portfolio security, the security will be valued at fair value (the amount which the Funds might reasonably expect to receive for the security upon its current sale) as determined in good faith by the Funds’ advisor, subject to review and approval by the Valuation Committee, pursuant to procedures adopted by the Board of Trustees. The actions of the Valuation Committee are subsequently reviewed by the Board at its next regularly scheduled board meeting. The Valuation Committee meets as needed. The Valuation Committee is comprised of all the Trustees, but action may be taken by any one of the Trustees.
AXS Funds
NOTES TO FINANCIAL STATEMENTS - Continued
June 30, 2021
(b) Foreign Currency Translation
The Funds’ records are maintained in U.S. dollars. The value of securities, currencies and other assets and liabilities denominated in currencies other than U.S. dollars are translated into U.S. dollars based upon foreign exchange rates prevailing at the end of the reporting period. The currencies are translated into U.S. dollars by using the exchange rates quoted as of 4:00 PM Eastern Standard Time. Purchases and sales of investment securities, income and expenses are translated on the respective dates of such transactions.
The Funds do not isolate that portion of their net realized and unrealized gains and losses on investments resulting from changes in foreign exchange rates from the impact arising from changes in market prices. Such fluctuations are included with net realized and unrealized gain or loss from investments and foreign currency.
Net realized foreign currency transaction gains and losses arise from sales of foreign currencies, currency gains or losses realized between the trade and settlement dates on securities transactions, and the differences between the amounts of dividends, interest, and foreign withholding taxes recorded on the Funds’ books and the U.S. dollar equivalent of the amounts actually received or paid. Net unrealized foreign currency translation gains and losses arise from changes in the value of assets and liabilities, other than investments in securities, resulting from changes in the exchange rates.
(c) Short Sales
Short sales are transactions in which the Funds sell a security they do not own in anticipation of a decline in the value of that security. To complete such a transaction, the Funds must borrow the security to make delivery to the buyer. The Funds then are obligated to replace the security borrowed by purchasing the security at market price at the time of replacement. The price at such time may be more or less than the price at which the security was sold by the Funds. When a security is sold short, a decrease in the value of the security will be recognized as a gain and an increase in the value of the security will be recognized as a loss, which is potentially limitless. Until the security is replaced, the Funds are required to pay the lender amounts equal to dividend or interest that accrue during the period of the loan which is recorded as an expense. To borrow the security, the Funds also may be required to pay a premium or an interest fee, which are recorded as interest expense. Cash or securities are segregated for the broker to meet the necessary margin requirements. The Funds are subject to the risk that they may not always be able to close out a short position at a particular time or at an acceptable price.
(d) Investment Transactions, Investment Income and Expenses
Investment transactions are accounted for on the trade date. Realized gains and losses on investments are determined on the identified cost basis. Dividend income is recorded net of applicable withholding taxes on the ex-dividend date and interest income is recorded on an accrual basis. Withholding taxes on foreign dividends, if applicable, are paid (a portion of which may be reclaimable) or provided for in accordance with the applicable country’s tax rules and rates and are disclosed in the Statement of Operations. Withholding tax reclaims are filed in certain countries to recover a portion of the amounts previously withheld. The Funds record a reclaim receivable based on a number of factors, including a jurisdiction’s legal obligation to pay reclaims as well as payment history and market convention. Income and expenses of the Funds are allocated on a pro rata basis to each class of shares net relative assets, except for distribution and service fees which are unique to each class of shares. Expenses incurred by the Trust with respect to more than one fund are allocated in proportion to the net assets of each fund except where allocation of direct expenses to each fund or an alternative allocation method can be more appropriately made.
(e) Federal Income Tax
The Funds intend to comply with the requirements of Subchapter M of the Internal Revenue Code applicable to regulated investment companies and to distribute substantially all of their net investment income and any net realized gains to their shareholders. Therefore, no provision is made for federal income or excise taxes. Due to the timing of dividend distributions and the differences in accounting for income and realized gains and losses for financial statement and federal income tax purposes, the fiscal year in which amounts are distributed may differ from the year in which the income and realized gains and losses are recorded by the Funds.
AXS Funds
NOTES TO FINANCIAL STATEMENTS - Continued
June 30, 2021
Accounting for Uncertainty in Income Taxes (the “Income Tax Statement”) requires an evaluation of tax positions taken (or expected to be taken) in the course of preparing a Fund’s tax returns to determine whether these positions meet a “more-likely-than-not” standard that, based on the technical merits, have a more than fifty percent likelihood of being sustained by a taxing authority upon examination. A tax position that meets the “more-likely-than-not” recognition threshold is measured to determine the amount of benefit to recognize in the financial statements. The Funds recognize interest and penalties, if any, related to unrecognized tax benefits as income tax expense in the Statements of Operations.
The Income Tax Statement requires management of the Funds to analyze tax positions taken in the prior three open tax years, if any, and tax positions expected to be taken in the Funds’ current tax year, as defined by the IRS statute of limitations for all major jurisdictions, including federal tax authorities and certain state tax authorities. As of June 30, 2021, and during the prior three open tax years, the Funds did not have a liability for any unrecognized tax benefits. The Funds have no examinations in progress and are not aware of any tax positions for which it is reasonably possible that the total amounts of unrecognized tax benefits will significantly change in the next twelve months.
(f) Distributions to Shareholders
The Funds will make distributions of net investment income and net capital gains, if any, at least annually. Distributions to shareholders are recorded on the ex-dividend date. The amount and timing of distributions are determined in accordance with federal income tax regulations, which may differ from GAAP.
The character of distributions made during the year from net investment income or net realized gains may differ from the characterization for federal income tax purposes due to differences in the recognition of income, expense and gain (loss) items for financial statement and tax purposes.
(g) Illiquid Securities
Pursuant to Rule 22e-4 under the 1940 Act, the Funds have adopted a Liquidity Risk Management Program (“LRMP”) that requires, among other things, that the Funds limit their illiquid investments that are assets to no more than 15% of net assets. An illiquid investment is any security which may not reasonably be expected to be sold or disposed of in current market conditions in seven calendar days or less without the sale or disposition significantly changing the market value of the investment. If the Advisor, at any time, determines that the value of illiquid securities held by the Fund exceed 15% of its net asset value, the Advisor will take such steps as it considers appropriate to reduce them as soon as reasonably practicable in accordance with the Funds’ written LRMP.
AXS Funds
NOTES TO FINANCIAL STATEMENTS - Continued
June 30, 2021
Note 3 – Investment Advisory and Other Agreements
The Trust, on behalf of the Funds, entered into an Investment Advisory Agreement (the “Agreement”) with AXS Investments LLC (the “Advisor”). Under the terms of the Agreement, the Funds pay twice a month investment advisory fee to the Advisor. The annual rates are listed by Fund in the table below.
| Fund | Investment Advisory Fees |
| Alternative Value Fund | 0.65% |
| Market Neutral Fund | 1.40% |
The Advisor has contractually agreed to waive its fee and, if necessary, to absorb other operating expenses to ensure that total annual operating expenses (excluding any taxes, leverage interest, brokerage commissions, dividend and interest expenses on short sales, acquired fund fees and expenses as determined in accordance with Form N-1A, expenses incurred in connection with any merger or reorganization, and extraordinary expenses such as litigation expenses) in order to limit total annual operating expenses of each fund. This agreement is in effect until March 5, 2023, and it may be terminated before that date only by the Trust’s Board of Trustees. The table below contains the expense cap by Fund and by Class.
| | Total Limit on Annual |
| | Operating Expenses |
| | Investor Class Shares | Class I Shares |
| Alternative Value Fund | 1.10% | 0.85% |
| Market Neutral Fund | 1.70% | 1.45% |
The Advisor has engaged Quantitative Value Technologies, LLC d/b/a Cognios Capital (the “Cognios”), a Sub-Advisor, to manage the Alternative Value Fund and Market Neutral Fund and pays Cognios from its advisory fees.
Prior to the close of business on March 5, 2021, investment advisory services were provided to the Alternative Value Predecessor Fund and Market Neutral Predecessor Fund by Cognios for the period July 1, 2020 through November 30, 2020, and by AXS Investments LLC for the period December 1, 2020 through March 5, 2021, which received investment management fees for their services pursuant to the terms of the investment advisory agreements for the Alternative Value Predecessor Fund and the Market Neutral Predecessor Fund. The investment advisory fees were computed and accrued daily and paid monthly at an annual rate of 0.65% of the Alternative Value Predecessor Fund’s average daily net assets and 1.40% of the Market Neutral Predecessor Fund’s average daily net assets. Cognios and AXS Investments LLC had contractually agreed to waive its fee and, if necessary, to absorb other operating expenses to ensure that total annual operating expenses (excluding any taxes, leverage interest, brokerage commissions, dividend and interest expenses on short sales, acquired fund fees and expenses as determined in accordance with Form N-1A, expenses incurred in connection with any merger or reorganization, and extraordinary expenses such as litigation expenses) do not exceed 1.10% and 0.85% of the average daily net assets of Investor Class and Institutional Class shares, respectively, of the Alternative Value Predecessor Fund and do not exceed 1.70% and 1.45% of the average daily net assets of Investor Class and Institutional Class shares, respectively, of the Market Neutral Predecessor Fund.
The Advisor may recover from the Funds’ fees and/or expenses previously waived and/or absorbed if the Funds’ expense ratio, including the recovered expenses, falls below the expense limit at which it was waived. The Funds’ advisor is permitted to seek reimbursement from each Fund, subject to certain limitations, of fees waived or payments made to the Fund for a period ending three years after the date of the waiver or payment. This reimbursement may be requested from the Funds if the reimbursement will not cause the Funds’ annual expense ratio to exceed the lesser of (a) the expense limitation amount in effect at the time such fees were waived or payments made, or (b) the expense limitation amount in effect at the time of the reimbursement. The Advisor may recapture all or a portion of this amount no later than the date stated below:
AXS Funds
NOTES TO FINANCIAL STATEMENTS - Continued
June 30, 2021
| | | Alternative Value Fund | | | Market Neutral Fund | |
| June 30, 2024 | | $ | 204,502 | | | $ | 255,480 | |
| Total | | $ | 204,502 | | | $ | 255,480 | |
Cognios is permitted to seek reimbursement, subject to certain limitations, of fees waived or payments made by Cognios to the Alternative Value Predecessor Fund and the Market Neutral Predecessor Fund reorganization on March 5, 2021, for a period ending three years after the date of the waiver of payment Such reimbursement may be requested from each Fund if the reimbursement will not cause the Fund’s annual expense ratios to exceed the lesser of (a) the expense limitation amount in effect at the time such fees were waived or payments made, or (b) the expense limitation amount in effect at the time of the reimbursements. Reimbursements of fees waived or payments made will be made on a “first in, first out” basis so that the oldest fees waived or payments are satisfied first. Any reimbursements of fees waived or payments made by Cognios to the Alternative Value Predecessor Fund and Market Neutral Predecessor Fund prior to the reorganization must be approved by the Trust’s Board of Trustees. Cognios may recapture all or a portion of this amount no later than June 30 of the years of the dates stated below:
| | | Alternative Value Fund | | | Market Neutral Fund | |
| 2022 | | $ | 175,817 | | | $ | 322,356 | |
| 2023 | | | 203,862 | | | | 336,109 | |
| 2024 | | | 85,816 | | | | 130,522 | |
| Total | | $ | 465,495 | | | $ | 788,987 | |
UMB Fund Services, Inc. (“UMBFS”) serves as the Funds’ fund accountant, transfer agent and co-administrator; and Mutual Fund Administration, LLC (“MFAC”) serves as the Funds’ other co-administrator. UMB Bank, N.A., an affiliate of UMBFS, serves as the Funds’ custodian. For the period March 6, 2021 to June 30, 2021, the Alternative Value Fund and Market Neutral Fund paid UMBFS $30,626 and $36,336, respectively, and UMB Bank, N.A. $9,420 and $10,907, respectively.
Prior to the close of business on March 5, 2021, M3Sixty Administration, LLC (“M3Sixty”) served as administrator, fund accountant, and transfer agent to the Predecessor Funds’ and MUFG Union Bank, N.A. (“MUFG”) served as these Predecessor Funds’ Custodian. For the period July 1, 2020 to March 5, 2021, the Alternative Value Predecessor Fund and Market Neutral Predecessor Fund paid M3Sixty $73,193 and $113,887, respectively, and MUFG $15,208 and $11,580, respectively.
These Funds’ allocated fees incurred for fund accounting, fund administration, transfer agency and custody services for the year ended June 30, 2021, are reported on the Statements of Operations.
IMST Distributors, LLC serves as the Funds’ distributor (the “Distributor”). The Distributor does not receive compensation from the Funds for its distribution services; the Advisor pays the Distributor a fee for its distribution related services.
AXS Funds
NOTES TO FINANCIAL STATEMENTS - Continued
June 30, 2021
Prior to the close of business on March 5, 2021, ALPS Distributors, Inc. (“ALPS”) served as distributor to the Predecessor Funds.
Certain trustees and officers of the Trust are employees of UMBFS or MFAC. The Funds do not compensate trustees and officers affiliated with the Funds’ co-administrators. For the year ended June 30, 2021, the Funds’ allocated fees incurred to Trustees who are not affiliated with the Funds’ co-administrators are reported on the Statements of Operations. A portion of the fees were paid by the Trust’s Co-Administrators. Such amount is shown as a reduction of expenses, “Fees paid indirectly”, on the Statements of Operations.
For the period March 6, 2021 to June 30, 2021, the Alternative Value Fund and Market Neutral Fund paid its Trustees who are not affiliated with the Funds $2,345 and $3,024, respectively.
For the period July 1, 2020 to March 5, 2021, the Alternative Value Predecessor Fund and Market Neutral Predecessor Fund paid its Trustees who are not affiliated with the Funds $11,417 and $11,417, respectively.
The Funds’ Board of Trustees has adopted a Deferred Compensation Plan (the “Plan”) for the Independent Trustees that enables Trustees to elect to receive payment in cash or the option to select various fund(s) in the Trust in which their deferred accounts shall be deemed to be invested. If a trustee elects to defer payment, the Plan provides for the creation of a deferred payment account. The Funds’ liability for these amounts is adjusted for market value changes in the invested fund and remains a liability to the Funds until distributed in accordance with the Plan. The Trustees’ Deferred compensation liability under the Plan constitutes a general unsecured obligation of the Funds and is disclosed in the Statements of Assets and Liabilities. Contributions made under the plan and the change in unrealized appreciation/depreciation and income are included in the Trustees’ fees and expenses in the Statements of Operations.
Dziura Compliance Consulting, LLC provides Chief Compliance Officer (“CCO”) services to the Trust. For the period March 6, 2021 to June 30, 2021, the Alternative Value Fund and Market Neutral Fund paid the CCO $2,380 and $3,054, respectively. Prior to the close of business on March 5, 2021, M3Sixty served as the CCO to the Predecessor Funds. For the period July 1, 2020 to March 5, 2021, the Alternative Value Predecessor Fund and Market Neutral Predecessor Fund paid the CCO $12,242 and $12,242, respectively. The Funds’ allocated fees incurred for CCO services for the year ended June 30, 2021, are reported on the Statements of Operations.
Note 4 – Federal Income Taxes
At June 30, 2021, gross unrealized appreciation (depreciation) of investments based on cost for federal income tax purposes were as follows:
| | | Alternative Value Fund | | | Market Neutral Fund | |
| Cost of investments | | $ | 1,563,776 | | | $ | 6,470,902 | |
| | | | | | | | | |
| Gross unrealized appreciation | | $ | 249,433 | | | $ | 2,650,899 | |
| Gross unrealized depreciation | | | (28,836 | ) | | | (2,901,609 | ) |
| Net unrealized appreciation (depreciation) on investments | | $ | 220,597 | | | $ | (250,710 | ) |
The difference between cost amounts for financial statement and federal income tax purposes is due primarily to timing differences in recognizing certain gains and losses in security transactions.
AXS Funds
NOTES TO FINANCIAL STATEMENTS - Continued
June 30, 2021
GAAP requires that certain components of net assets be reclassified between financial and tax reporting. These reclassifications have no effect on net assets or net asset value per share. For the year ended June 30, 2021, permanent differences in book and tax accounting have been reclassified to paid-in capital and total distributable earnings (loss) as follows:
| | | Increase (Decrease) | |
| | | Paid-in Capital | | | Total Distributable Earnings (Loss) | |
| Alternative Value Fund | | $ | 55,789 | | | $ | (55,789 | ) |
| Market Neutral Fund | | | (610,483 | ) | | | 610,483 | |
As of June 30, 2021, the components of accumulated earnings (deficit) on a tax basis were as follows:
| | | Alternative Value Fund | | | Market Neutral Fund | |
| Undistributed ordinary income | | $ | 22,218 | | | $ | - | |
| Undistributed long-term capital gains | | | - | | | | - | |
| Tax accumulated earnings | | | 22,218 | | | | - | |
| | | | | | | | | |
| Accumulated capital and other losses | | | (4,829 | ) | | | (5,139,306 | ) |
| Unrealized appreciation (depreciation) on investments | | | 220,597 | | | | (250,710 | ) |
| Unrealized Trustees’ deferred compensation | | | (23 | ) | | | (290 | ) |
| Total accumulated earnings (deficit) | | $ | 237,963 | | | $ | (5,390,306 | ) |
The tax character of the distributions paid during the years ended June 30, 2021 and June 30, 2020 were as follows:
| | | Alternative Value Fund | |
| | | June 30, 2021 | | | June 30, 2020 | |
| Distributions paid from: | | | | | | | | |
| Ordinary income | | $ | 137,764 | | | $ | 771,689 | |
| Net long-term capital gains | | | - | | | | 1,209,901 | |
| Total distributions paid | | $ | 137,764 | | | $ | 1,981,590 | |
| | | Market Neutral Fund | |
| Distributions paid from: | | June 30, 2021 | | | June 30, 2020 | |
| Ordinary income | | $ | - | | | $ | - | |
| Net long-term capital gains | | | - | | | | - | |
| Total distributions paid | | $ | - | | | $ | - | |
AXS Funds
NOTES TO FINANCIAL STATEMENTS - Continued
June 30, 2021
As of June 30, 2021, the Funds had net capital loss carryovers as follows:
| | | Alternative Value Fund | | | Market Neutral Fund | |
| Not subject to expiration: | | | | | | | | |
| Short-term | | $ | 4,829 | | | $ | 5,139,306 | |
| Long-term | | | - | | | | - | |
| Total | | $ | 4,829 | | | $ | 5,139,306 | |
Note 5 – Redemption Fee
The Alternative Value Fund and Market Neutral Fund may impose a redemption fee of 1.00% of the total redemption amount on all shares redeemed within 30 days of purchase. These Funds received redemption fees as follows:
| | | Year Ended
June 30, 2021 | | | Year Ended
June 30, 2020 | |
| Alternative Value Fund | | $ | 382 | | | $ | - | |
| Market Neutral Fund | | | 2,406 | | | | - | |
Note 6 – Investment Transactions
For the year ended June 30, 2021, cost of purchases and proceeds from sales of portfolio securities, other than short-term investments and short-term U.S. Government securities were as follows:
| | | Purchases | | | Sales | | | Proceeds from Securities Sold Short | | | Cover Short Securities | |
| Alternative Value Fund | | $ | 1,839,269 | | | $ | 16,533,672 | | | $ | - | | | $ | - | |
| Market Neutral Fund | | | 23,295,723 | | | | 60,747,591 | | | | 18,346,964 | | | | 49,328,519 | |
Note 7 – Distribution Plan
The Trust, on behalf of each Fund, has adopted a Distribution Plan (the “Plan”) pursuant to Rule 12b-1 under the 1940 Act that allows each Fund to pay distribution fees for the sale and distribution of its shares. With respect to Investor Class shares, the Plan provides for the payment of distribution fees at the annual rate of up to 0.25% of average daily net assets. Class I Shares are not subject to any distribution or service fees under the Plan.
Prior to the close of business on March 5, 2021, the Alternative Value Predecessor Fund and Market Neutral Predecessor Fund adopted a distribution plan pursuant to Rule 12b-1 with respect to Investor Class shares. Institutional Class shares did not pay any distribution fees. For the period July 1, 2020 to March 5, 2021, the Alternative Value Predecessor Fund and Market Neutral Predecessor Fund paid ALPS $758 and $9,272, respectively, with respect to Investor Class shares under the Predecessor Funds’ distribution plan. For the year ended June 30, 2021, distribution fees incurred are disclosed on the Statements of Operations.
AXS Funds
NOTES TO FINANCIAL STATEMENTS - Continued
June 30, 2021
Note 8 – Indemnifications
In the normal course of business, the Funds enter into contracts that contain a variety of representations, which provide general indemnifications. The Funds’ maximum exposure under these arrangements is unknown, as this would involve future claims that may be made against the Funds that have not yet occurred. However, the Funds expect the risk of loss to be remote.
Note 9 – Fair Value Measurements and Disclosure
Fair Value Measurements and Disclosures defines fair value, establishes a framework for measuring fair value in accordance with GAAP, and expands disclosure about fair value measurements. It also provides guidance on determining when there has been a significant decrease in the volume and level of activity for an asset or a liability, when a transaction is not orderly, and how that information must be incorporated into a fair value measurement.
Under Fair Value Measurements and Disclosures, various inputs are used in determining the value of the Funds’ investments. These inputs are summarized into three broad Levels as described below:
| · | Level 1 – Unadjusted quoted prices in active markets for identical assets or liabilities that the Funds have the ability to access. |
| · | Level 2 – Observable inputs other than quoted prices included in level 1 that are observable for the asset or liability, either directly or indirectly. These inputs may include quoted prices for the identical instrument on an inactive market, prices for similar instruments, interest rates, prepayment speeds, credit risk, yield curves, default rates and similar data. |
| · | Level 3 – Unobservable inputs for the asset or liability, to the extent relevant observable inputs are not available; representing the Funds’ own assumptions about the assumptions a market participant would use in valuing the asset or liability and would be based on the best information available. |
The availability of observable inputs can vary from security to security and is affected by a wide variety of factors, including, for example, the type of security, whether the security is new and not yet established in the marketplace, the liquidity of markets, and other characteristics particular to the security. To the extent that valuation is based on models or inputs that are less observable or unobservable in the market, the determination of fair value requires more judgment. Accordingly, the degree of judgment exercised in determining fair value is greatest for instruments categorized in Level 3.
The inputs used to measure fair value may fall into different Levels of the fair value hierarchy. In such cases, for disclosure purposes, the Level in the fair value hierarchy within which the fair value measurement falls in its entirety, is determined based on the lowest Level input that is significant to the fair value measurement in its entirety.
AXS Funds
NOTES TO FINANCIAL STATEMENTS - Continued
June 30, 2021
The inputs or methodology used for valuing securities are not an indication of the risk associated with investing in those securities. The following is a summary of the inputs used, as of June 30, 2021, in valuing the Funds’ assets carried at fair value:
| Alternative Value Fund | | Level 1 | | | Level 2* | | | Level 3* | | | Total | |
| Assets | | | | | | | | | | | | | | | | |
| Common Stock1 | | $ | 1,763,306 | | | $ | - | | | $ | - | | | $ | 1,763,306 | |
| Short-Term Investments | | | 21,067 | | | | - | | | | - | | | | 21,067 | |
| Total Assets | | $ | 1,784,373 | | | $ | - | | | $ | - | | | $ | 1,784,373 | |
| Market Neutral Fund | | Level 1 | | | Level 2* | | | Level 3* | | | Total | |
| Assets | | | | | | | | | | | | | | | | |
| Common Stock1 | | $ | 16,876,366 | | | $ | - | | | $ | - | | | $ | 16,876,366 | |
| Short-Term Investments | | | 21,928 | | | | - | | | | - | | | | 21,928 | |
| Total Assets | | $ | 16,898,294 | | | $ | - | | | $ | - | | | $ | 16,898,294 | |
| | | | | | | | | | | | | | | | | |
| Liabilities | | | | | | | | | | | | | | | | |
| Securities Sold Short1 | | $ | 10,678,102 | | | $ | - | | | $ | - | | | $ | 10,678,102 | |
| Total Liabilities | | $ | 10,678,102 | | | $ | - | | | $ | - | | | $ | 10,678,102 | |
| 1 | For a detailed break-out of common stocks and securities sold short by major industry classification, please refer to the Schedules of Investments. |
| * | The Funds did not hold any Level 2 or 3 securities at period end. |
Note 10 – Borrowing
The Alternative Value Fund and Market Neutral Fund have entered into a borrowing agreement with BNP Paribas (acting through its New York Branch). The Funds may borrow amounts up to one-third of the value of its assets. The Alternative Value Fund and Market Neutral Fund are charged interest of the bank’s prime rate plus 1.25% and 1.00%, respectively, for borrowing under this agreement. Interest expense for the year ended June 30, 2021, is disclosed on the Statements of Operations, if applicable. Credit facility activity for the year ended June 30, 2021, was as follows:
| | | Alternative Value Fund | | | Market Neutral Fund | |
| Maximum available credit | | $ | 895,435 | | | $ | 10,791,815 | |
| Largest amount outstanding on an individual day | | | 4,061,053 | | | | - | |
| Average daily loan outstanding | | | 935,508 | | | | - | |
| Credit facility outstanding as of June 30, 2021 | | | 450,241 | | | | - | |
| Average interest rate when in use | | | 1.324 | % | | | - | |
Note 11 – COVID-19 Risks
In early 2020, an outbreak of a novel strain of coronavirus (COVID-19) emerged globally. This coronavirus has resulted in closing international borders, enhanced health screenings, healthcare service preparation and delivery, quarantines, cancellations, disruptions to supply chains and customer activity, as well as general public concern and uncertainty. The impact of this outbreak has negatively affected the worldwide economy, as well as the economies of individual countries, the financial health of individual companies and the market in general in significant and unforeseen ways. The future impact of COVID-19 is currently unknown, and it may exacerbate other risks that apply to the Funds, including political, social and economic risks. Any such impact could adversely affect the Funds’ performance, the performance of the securities in which the Funds invest and may lead to losses on your investment in the Funds. The ultimate impact of COVID-19 on the financial performance of the Funds’ investments is not reasonably estimable at this time.
AXS Funds
NOTES TO FINANCIAL STATEMENTS - Continued
June 30, 2021
Note 12 – Events Subsequent to the Fiscal Period End
The Funds have adopted financial reporting rules regarding subsequent events which require an entity to recognize in the financial statements the effects of all subsequent events that provide additional evidence about conditions that existed at the date of the balance sheet. Management has evaluated the Funds’ related events and transactions that occurred through the date of issuance of the Funds’ financial statements.
Effective July 1, 2021, the Funds have changed the fiscal year end to September 30.
There were no other events or transactions that occurred during this period that materially impacted the amounts or disclosures in the Funds’ financial statements.
REPORT OF INDEPENDENT REGISTERED PUBLIC ACCOUNTING FIRM
To the Board of Trustees of Investment Managers Series Trust II and
Shareholders of AXS Funds
Opinion on the Financial Statements
We have audited the accompanying statements of assets and liabilities of AXS Alternative Value Fund and AXS Market Neutral Fund (the “Funds”), each a series of Investment Managers Series Trust II (the “Trust”), including the schedules of investments, as of June 30, 2021, the related statements of operations, the statement of cash flows, the statements of changes in net assets and the financial highlights for the periods indicated in the table below, and the related notes (collectively referred to as the “financial statements”). In our opinion, the financial statements present fairly, in all material respects, the financial position of the Funds as of June 30, 2021, the results of their operations and their cash flows for the year then ended, the changes in their net assets and their financial highlights for each of the periods indicated in the table below, in conformity with accounting principles generally accepted in the United States of America.
| | | | | | | | | |
| Fund | | Statement of Operations | | Statement of Cash Flows | | Statements of Changes in Net Assets | | Financial Highlights |
AXS Alternative Value Fund | | For the year ended June 30, 2021 | | NA | | For the year ended June 30, 2021 | | For the year ended June 30, 2021 |
| AXS Market Neutral Fund | | For the year ended June 30, 2021 | | For the year ended June 30, 2021 | | For the year ended June 30, 2021 | | For the year ended June 30, 2021 |
| | | | | | | | | |
With respect to the AXS Alternative Value Fund, the statement of changes in net assets for the year ended June 30, 2020 and the financial highlights for each of the three years in the period ended June 30, 2020 and for the period October 3, 2016 through June 30, 2017 were audited by other auditors, and in their opinions dated August 31, 2020 and August 29, 2017, they expressed unqualified opinions on said financial statements and financial highlights. With respect to the AXS Market Neutral Fund, the statement of changes in net assets for the year ended June 30, 2020 and the financial highlights for each of the two years in the period ended June 30, 2020, for the period October 1, 2017 through June 30, 2018 and for the two years in the period ended September 30, 2017 were audited by other auditors, and in their opinions dated August 31, 2020 and November 29, 2017, they expressed unqualified opinions on said financial statements and financial highlights.
Basis for Opinion
These financial statements are the responsibility of the Funds’ management. Our responsibility is to express an opinion on the Funds’ financial statements based on our audits. We are a public accounting firm registered with the Public Company Accounting Oversight Board (United States) (“PCAOB”) and are required to be independent with respect to the Funds in accordance with the U.S. federal securities laws and the applicable rules and regulations of the Securities and Exchange Commission and the PCAOB. We have served as the auditor of one or more of the funds in the Trust since 2013.
We conducted our audits in accordance with the standards of the PCAOB. Those standards require that we plan and perform the audits to obtain reasonable assurance about whether the financial statements are free of material misstatement, whether due to error or fraud. The Funds are not required to have, nor were we engaged to perform, an audit of the Funds’ internal control over financial reporting. As part of our audits we are required to obtain an understanding of internal control over financial reporting, but not for the purpose of expressing an opinion on the effectiveness of the Funds’ internal control over financial reporting. Accordingly, we express no such opinion.
Our audits included performing procedures to assess the risks of material misstatement of the financial statements, whether due to error or fraud, and performing procedures that respond to those risks. Such procedures included examining, on a test basis, evidence regarding the amounts and disclosures in the financial statements. Our audits also included evaluating the accounting principles used and significant estimates made by management, as well as evaluating the overall presentation of the financial statements. Our procedures included confirmation of securities owned as of June 30, 2021 by correspondence with the custodian and broker. We believe that our audits provide a reasonable basis for our opinion.
| |  |
| | TAIT, WELLER & BAKER LLP |
Philadelphia, Pennsylvania
August 30, 2021
AXS Funds
SUPPLEMENTAL INFORMATION (Unaudited)
Corporate Dividends Received Deduction
For the year ended June 30, 2021, the Alternative Value Fund, respectively, had 100% of the dividends paid from net investment income qualifies for the 70% dividends received deduction available to corporate shareholders.
Qualified Dividend Income
For the year ended June 30, 2021, the Alternative Value Fund, respectively, had 100% of dividends paid from net investment income, designated as qualified dividend income.
Trustees and Officers Information
Additional information about the Trustees is included in the Funds’ Statement of Additional Information which is available, without charge, upon request by calling (833) 297-2587. The Trustees and officers of the Funds and their principal occupations during the past five years are as follows:
| Name, Address, Year of Birth and Position(s) held with Trust | Term of Officec and Length of Time Served | Principal Occupation During the Past Five Years and Other Affiliations | Number of Portfolios in the Fund Complex Overseen by Trusteed | Other Directorships Held by Trustee During the Past Five Yearse |
| Independent Trustees: | | |
Thomas Knipper, CPA a (Born 1957) Trustee | Since September 2013 | Vice President and Chief Compliance Officer, Ameritas Investment Partners, a registered investment advisor (1995 – present). | 12 | None. |
Kathleen K. Shkuda a (born 1951) Trustee | Since September 2013 | Zigzag Consulting, a financial services consulting firm (2008 – present). Director, Managed Accounts, Merrill Lynch (2007-2008). | 12 | None. |
Larry D. Tashjian a (born 1953) Trustee and Chairman of the Board | Since September 2013 | Principal, CAM Capital Advisors, a family office (2001 – present). | 12 | General Finance Corporation. |
John P. Zader a (born 1961) Trustee | Since September 2013 | Retired (June 2014 – present); CEO, UMB Fund Services, Inc., a mutual fund and hedge fund service provider, and the transfer agent, fund accountant, and co-administrator for the Fund (December 2006 – June 2014); President, Investment Managers Series Trust (December 2007 - June 2014). | 12 | Investment Managers Series Trust, a registered investment company (includes 53 portfolios), and 361 Social Infrastructure Fund, a closed-end investment company. |
AXS Funds
SUPPLEMENTAL INFORMATION (Unaudited) – Continued
| Interested Trustees: | | |
Eric M. Banhazl b† (born 1957) Trustee | Since September 2013 | Chairman (2016 – present), and President (2006 – 2015), Mutual Fund Administration, LLC, co-administrator for the Fund. Chairman (2018 – present), Foothill Capital Management, LLC, a registered investment advisor. | 12 | Investment Managers Series Trust, a registered investment company (includes 53 portfolios), and 361 Social Infrastructure Fund, a closed-end investment company. |
Terrance P. Gallagher a* (born 1958) Trustee and President | Since July 2019 | President, Investment Managers Series Trust II (September 2013 – present); Executive Vice President, UMB Fund Services, Inc. (2007 – present). Director of Compliance, Unified Fund Services Inc. (now Huntington Fund Services), a mutual fund service provider (2004 – 2007). | 12 | Cliffwater Corporate Lending Fund, a registered investment company; GAI Corbin Multi Strategy Fund, a closed-end investment company; and GAI Agility Income Fund, a closed-end investment company. |
| Officers of the Trust: | | | | |
Rita Dam b (born 1966) Treasurer and Assistant Secretary | Since September 2013 | Co-President, Foothill Capital Management, LLC, a registered investment advisor (2018 – present); Co-Chief Executive Officer (2016 – present), and Vice President (2006 – 2015), Mutual Fund Administration, LLC. | N/A | N/A |
Joy Ausili b (born 1966) Vice President and Assistant Secretary | Since January 2016 | Co-President, Foothill Capital Management, LLC, a registered investment advisor (2018 – present); Co-Chief Executive Officer (2016 – present), and Vice President (2006 – 2015), Mutual Fund Administration, LLC; Secretary and Assistant Treasurer, Investment Managers Series Trust (September 2013 – January 2016). | N/A | N/A |
Diane Drake b (born 1967) Secretary | Since January 2016 | Senior Counsel, Mutual Fund Administration, LLC (October 2015 – present). Chief Compliance Officer (2018 – 2019), Foothill Capital Management, LLC, a registered investment advisor. | N/A | N/A |
AXS Funds
SUPPLEMENTAL INFORMATION (Unaudited) – Continued
| Officer of the Trust: | | | | |
Martin Dziura b (born 1959) Chief Compliance Officer | Since September 2013 | Principal, Dziura Compliance Consulting, LLC (October 2014 - present). Managing Director, Cipperman Compliance Services (2010 – September 2014). Chief Compliance Officer, Hanlon Investment Management (2009 - 2010). Vice President − Compliance, Morgan Stanley Investment Management (2000 − 2009). | N/A | N/A |
| a | Address for certain Trustees and certain officers: 235 West Galena Street, Milwaukee, Wisconsin 53212. |
| b | Address for Mr. Banhazl, Ms. Ausili, Ms. Dam and Ms. Drake: 2220 E. Route 66, Suite 226, Glendora, California 91740. Address for Mr. Dziura: 309 Woodridge Lane, Media, Pennsylvania 19063. |
| c | Trustees and officers serve until their successors have been duly elected. |
| d | The Trust is comprised of 20 series managed by unaffiliated investment advisors. The term “Fund Complex” applies only to the Funds managed by the same investment advisor. The Funds’ investment advisor also serves as the investment advisor to the AXS All Terrain Opportunity Fund, AXS Alternative Growth Fund, AXS Multi-Strategy Alternatives Fund, AXS Chesapeake Strategy Fund, AXS Aspect Core Diversified Strategy Fund, AXS Managed Futures Strategy Fund, AXS Sustainable Fund, AXS Merger Fund, AXS Thomson Reuters Venture Capital Return Tracker and AXS Thomson Reuters Private Equity Return Tracker Fund which are offered in separate prospectus. The Funds do not hold themselves out as related to any other series within the Trust, for purposes of investment and investor services. |
| e | “Other Directorships Held” includes only directorship of companies required to register or file reports with the SEC under the Securities Exchange Act of 1934, as amended (that is, “public companies”) or other investment companies registered under the 1940 Act. |
| † | Mr. Banhazl is an “interested person” of the Trust by virtue of his position with Mutual Fund Administration, LLC and Foothill Capital Management, LLC. |
| * | Mr. Gallagher is an “interested person” of the Trust by virtue of his position with UMB Fund Services, Inc. |
AXS Funds
SUPPLEMENTAL INFORMATION (Unaudited) - Continued
Board Consideration of Investment Advisory and Sub-Advisory Agreements
At a meeting held on January 20, 2021, the Board of Trustees (the “Board”) of Investment Managers Series Trust II (the “Trust”), including the trustees who are not “interested persons” of the Trust (the “Independent Trustees”) as defined in the Investment Company Act of 1940, as amended (the “1940 Act”), reviewed and unanimously approved the investment advisory agreement (the “Advisory Agreement”) between the Trust and AXS Investments LLC (the “Investment Advisor”) with respect to the AXS Market Neutral Fund (the “Market Neutral Fund”) and the AXS Alternative Value Fund (the “Alternative Value Fund” and together with the Market Neutral Fund, the “Funds”) series of the Trust for an initial two-year term.
At the same meeting, the Board and the Independent Trustees also reviewed and unanimously approved the sub-advisory agreement (the “Sub-Advisory Agreement”) between the Investment Advisor and Quantitative Value Technologies, LLC d/b/a Cognios Capital, LLC (the “Sub-Advisor”) with respect to each Fund for an initial two-year term.
The Advisory Agreement and the Sub-Advisory Agreement are collectively referred to below as the “Fund Advisory Agreements.” In approving each Fund Advisory Agreement, the Board, including the Independent Trustees, determined that such approval was in the best interests of each Fund and its shareholders. The Board acknowledged that in accordance with exemptive relief granted by the U.S. Securities and Exchange Commission, due to unforeseen emergency circumstances related to the COVID-19 pandemic, the meeting was being held by videoconference, and that as required by the relief, the Board would ratify the approval of the Fund Advisory Agreements at its next in-person meeting.
Background
In advance of the meeting, the Board received information about the Funds and the Fund Advisory Agreements from the Investment Advisor, the Sub-Advisor, and Mutual Fund Administration, LLC and UMB Fund Services, Inc., the Trust’s co-administrators, certain portions of which are discussed below. The materials, among other things, included information about the organization and financial condition of the Investment Advisor and the Sub-Advisor; information regarding the background, experience, and compensation structure of relevant personnel who would be providing services to the Funds; information about the Investment Advisor’s and the Sub-Advisor’s compliance policies and procedures, disaster recovery and contingency planning, and policies with respect to portfolio execution and trading; information regarding the estimated profitability of the Investment Advisor’s overall relationship with the Funds; information regarding the performance of the predecessor funds of the Market Neutral Fund (the “Market Neutral Predecessor Fund”) and Alternative Value Fund (the “Alternative Value Predecessor Fund” and together with the Market Neutral Predecessor Fund, the “Predecessor Funds”), each of which were managed by the Sub-Advisor and would be reorganized into a new series of the Trust, for various periods ended October 31, 2020; and reports prepared by Broadridge Financial Solutions, Inc. (“Broadridge”) comparing the proposed advisory fee and estimated total expenses of each Fund with those of a group of comparable funds selected by Broadridge (each a “Peer Group”) from Morningstar, Inc.’s relevant fund universe (each a “Fund Universe”). The Board also received a memorandum from legal counsel to the Trust discussing the legal standards under the 1940 Act and other applicable law for their consideration of the proposed approval of the Fund Advisory Agreements. In addition, the Board considered information reviewed by the Board regarding other series of the Trust managed by the Investment Advisor during the year at other Board and Board committee meetings. No representatives of the Investment Advisor or the Sub-Advisor were present during the Board’s consideration of the Fund Advisory Agreements, and the Independent Trustees were represented by their legal counsel with respect to the matters considered.
In approving the Fund Advisory Agreements, the Board and the Independent Trustees considered a variety of factors, including those discussed below. In their deliberations, the Board and the Independent Trustees did not identify any particular factor that was controlling, and each Trustee may have attributed different weights to the various factors.
AXS Funds
SUPPLEMENTAL INFORMATION (Unaudited) - Continued
AXS Investments LLC
Nature, Extent and Quality of Services
With respect to the relevant performance information, the meeting materials indicated the following with respect to the Predecessor Funds, each of which was managed by the Sub-Advisor:
| · | The Market Neutral Predecessor Fund’s annualized total returns were above the Peer Group median returns for the one- and three-year periods, and were the same as the Peer Group median return for the five-year period. The Market Neutral Predecessor Fund’s annualized total returns for the one-, three-, and five-year periods were below the Market Neutral Fund Universe median returns (by 1.83%, 0.28%, and 1.57%, respectively) and the S&P 500 Index returns (by 11.88%, 8.79%, and 11.19%, respectively). The Trustees noted that the Sub-Advisor had reported that its Market Neutral Equity strategy had outperformed the median returns of the Fund Universe for the three- and five-year and since inception periods, through November 17, 2020, and that it had underperformed for the one-year period likely because value-oriented strategies were out of favor compared to growth-oriented strategies. |
| · | The Alternative Value Predecessor Fund’s annualized total returns for the one- and three- year periods were above the Peer Group and Large Value Fund Universe median returns, but below the S&P 500 Index returns (by 11.57% and 2.94%, respectively). |
The Board noted its familiarity with the Investment Advisor as the investment advisor for several other series of the Trust, and considered the services to be provided by the Investment Advisor and the Sub-Advisor to each Fund. In doing so, the Board considered the Investment Advisor’s role as the Funds’ investment advisor, noting that the Investment Advisor would provide overall supervision of the general investment management and investment operations of each Fund, and oversee the Sub-Advisor with respect to each Fund’s operations, including monitoring the Sub-Advisor’s investment and trading activities with respect to each Fund, monitoring each Fund’s compliance with its investment policies, and providing general administrative services related to the Investment Advisor’s overall supervision of each Fund; and that the Sub-Advisor’s responsibilities would include day-to-day portfolio management for each Fund. The Board also considered the qualifications, experience, and responsibilities of the personnel of the Investment Advisor who would be involved in the activities of the Funds. In addition, the Board considered the overall quality of the organization and operations of the Investment Advisor, as well as its compliance structure and compliance procedures.
The Board and the Independent Trustees concluded that based on the various factors they had reviewed, the Investment Advisor would have the capabilities, resources, and personnel necessary to manage each Fund, and that the Investment Advisor would provide each Fund with a reasonable potential for good investment results.
Advisory Fees and Expense Ratios
The Board reviewed information regarding each Fund’s proposed advisory fee and estimated total expenses. The meeting materials indicated the following:
| · | The Market Neutral Fund’s proposed annual investment advisory fee (gross of fee waivers) was higher than the Peer Group and Market Neutral Fund Universe medians by 0.05% and 0.30%, respectively. The Trustees considered that the Investment Advisor did not expect to receive the gross advisory fee with respect to the Fund for a significant period of time. |
The estimated annual total expenses (net of fee waivers) of the Fund were the same as the Peer Group median, but higher than the Fund Universe median by 0.10%. The Trustees noted, however, that the average net assets of the Fund’s class considered by Broadridge were significantly lower than the average net assets of corresponding classes of funds in the Fund Universe, and that certain of those other funds also had significant assets in other classes.
AXS Funds
SUPPLEMENTAL INFORMATION (Unaudited) - Continued
| · | The Alternative Value Fund’s proposed annual investment advisory fee (gross of fee waivers) was the same as the Large Value Fund Universe median, but slightly higher than the Peer Group median by 0.025%. |
The estimated annual total expenses (net of fee waivers) of the Fund were higher than the Peer Group and Fund Universe medians by 0.10% and 0.12%, respectively. The Trustees noted, however, that the average net assets of the Fund’s class considered by Broadridge were significantly lower than the average net assets of corresponding classes of funds in the Peer Group and Fund Universe, and that certain of those other funds also had significant assets in other classes.
In reviewing the proposed advisory fee for each Fund, the Trustees noted that the proposed advisory fee was the same as the advisory fee for the Predecessor Fund that was reorganizing into the Fund. The Trustees also noted that the Investment Advisor does not manage any other accounts with the same objectives and policies as either Fund, and therefore they did not have a good basis for comparing each Fund’s proposed advisory fee with those of other similar client accounts of the Investment Advisor. The Trustee also considered that each Fund’s proposed advisory fee was within the range of advisory fees paid by other series of the Trust managed by the Investment Advisor.
The Board and the Independent Trustees concluded that the proposed compensation payable to the Investment Advisor under the Advisory Agreement would be fair and reasonable in light of the nature and quality of the services proposed to be provided by the Investment Advisor to each Fund.
Profitability and Economies of Scale
The Board next reviewed the estimated profitability to the Investment Advisor of its relationship with each Fund in the Fund’s first year of operations, taking into account each Predecessor Fund’s current assets. The Board observed that the Investment Advisor anticipated waiving almost its entire advisory fee for the Alternative Value Fund, and waiving a portion of its advisory fee for the Market Neutral Fund, and that the Investment Advisor did not anticipate that it would realize a profit with respect to the Alternative Value Fund in its first year of operations. The Board determined that the Investment Advisor’s anticipated profit level with respect to the Market Neutral Fund was reasonable.
The Board noted that the potential benefits received by the Investment Advisor as a result of its relationships with the Funds, other than the receipt of its advisory fees, would include the usual types of “fall out” benefits received by advisors to the Trust, including the beneficial effects from the review by the Trust’s Chief Compliance Officer of the Investment Advisor’s compliance program, the intangible benefits of its association with the Funds generally and any favorable publicity arising in connection with the Funds’ performance. The Board also noted that although the Advisory Agreement does not provide for any advisory fee breakpoints, the Funds’ asset levels would likely be too low to achieve significant economies of scale following the reorganizations, and that any such economies would be considered in the future as the assets of the Funds grow.
Quantitative Value Technologies, LLC d/b/a Cognios Capital, LLC
Nature, Extent and Quality of Services
The Board considered the overall quality of services to be provided by the Sub-Advisor to the Funds. In doing so, the Board noted that as the sole sub-advisor to each Fund, the Sub-Advisor would be primarily responsible for the day-to-day management of each Fund and its investment results. The Board also considered the services to be provided by the Sub-Advisor to each Fund, and the qualifications, experience, and responsibilities of the personnel of the Sub-Advisor who would be involved in the activities of the Fund. In addition, the Board considered the overall quality of the organization and operations of the Sub-Advisor, as well as its compliance structure and compliance procedures. Information regarding the performance of each Predecessor Fund, which was managed by the Sub-Advisor, is described above.
AXS Funds
SUPPLEMENTAL INFORMATION (Unaudited) - Continued
The Board and the Independent Trustees concluded that based on the various factors they had reviewed, the Sub-Advisor would have the capabilities, resources, and personnel necessary to manage each Fund, and that the Sub-Advisor would provide each Fund with a reasonable potential for good investment results.
Sub-Advisory Fee
The Board reviewed information regarding the annual sub-advisory fee proposed to be charged by the Sub-Advisor with respect to each Fund. The Trustees noted that the sub-advisory fee proposed to be charged to the Alternative Value Fund was lower than the fee that the Sub-Advisor charges to manage separate accounts with similar objectives and policies as the Alternative Value Fund. The Trustees also considered that the sub-advisory fee proposed to be charged to the Market Neutral Fund was lower than the fee, which includes a management fee and an incentive fee, that the Sub-Advisor charges to manage a private fund with similar objectives and policies as the Market Neutral Fund. The Board also noted that the Investment Advisor would pay the Sub-Advisor’s sub-advisory fees from the Investment Advisor’s advisory fees.
The Board and the Independent Trustees concluded that the proposed compensation payable to the Sub-Advisor under the Sub-Advisory Agreement would be fair and reasonable in light of the nature and quality of the services proposed to be provided by the Sub-Advisor to each Fund.
Benefits to the Sub-Advisor
The Board also considered that the potential benefits to be received by the Sub-Advisor as a result of its relationships with the Funds, other than the receipt of its sub-advisory fees, would include the usual types of “fall out” benefits received by sub-advisors to the Trust, including any research received from broker-dealers providing execution services to the Funds, the beneficial effects from the review by the Trust’s Chief Compliance Officer of the Sub-Advisor’s compliance program, and the intangible benefits of the Sub-Advisor’s association with the Funds generally and any favorable publicity arising in connection with the Funds’ performance.
Conclusion
Based on these and other factors, the Board and the Independent Trustees concluded that approval of each Fund Advisory Agreement was in the best interests of each Fund and its shareholders and, accordingly, approved the Fund Advisory Agreements with respect to each Fund.
AXS Funds
EXPENSE EXAMPLES
For the Six Months Ended June 30, 2021 (Unaudited)
Expense Examples
As a shareholder of the Funds, you incur two types of costs: (1) transaction costs; and (2) ongoing costs, including management fees; distribution and/or 12b-1 fees (Investor Class shares only) and other Fund expenses. The examples below are intended to help you understand your ongoing costs (in dollars) of investing in the Funds and to compare these costs with the ongoing costs of investing in other mutual funds.
These examples are based on an investment of $1,000 invested at the beginning of the period and held for the entire period from January 1, 2021 to June 30, 2021.
Actual Expenses
The information in the row titled “Actual Performance” of the table below provides actual account values and actual expenses. You may use the information in these columns, together with the amount you invested, to estimate the expenses that you paid over the period. Simply divide your account value by $1,000 (for example, an $8,600 account value divided by $1,000 = 8.6), then multiply the result by the number in the appropriate row for your share class, under the column titled “Expenses Paid During Period” to estimate the expenses you paid on your account during this period.
Hypothetical Example for Comparison Purposes
The information in the row titled “Hypothetical (5% annual return before expenses)” of the table below provides hypothetical account values and hypothetical expenses based on the Fund’s actual expense ratios and an assumed rate of return of 5% per year before expenses, which is not the Fund’s actual return. The hypothetical account values and expenses may not be used to estimate the actual ending account balance or expenses you paid for the period. You may use this information to compare the ongoing costs of investing in the Fund and other funds. To do so, compare these 5% hypothetical examples with the 5% hypothetical examples that appear in the shareholder reports of the other funds.
Please note that the expenses shown in the table are meant to highlight your ongoing costs only and do not reflect any transaction costs, such as sales charges (load) or contingent deferred sales charges. Therefore, the information in the row titled “Hypothetical (5% annual return before expenses)” is useful in comparing ongoing costs only and will not help you determine the relative total costs of owning different funds. In addition, if these transactional costs were included, your costs would have been higher.
| Alternative Value Fund | Beginning Account Value | Ending Account Value | Expenses Paid During Period* |
| | | 1/1/21 | 6/30/21 | 1/1/21 – 6/30/21 |
| Investor Class | Actual Performance | $ 1,000.00 | $1,166.50 | $8.31 |
| | Hypothetical (5% annual return before expenses) | 1,000.00 | 1,017.13 | 7.74 |
| Class I | Actual Performance | 1,000.00 | 1,169.10 | 7.21 |
| | Hypothetical (5% annual return before expenses) | 1,000.00 | 1,018.14 | 6.71 |
| * | Expenses are equal to the Fund’s annualized expense ratios of 1.55% and 1.34% for Investor Class shares and Class I shares, respectively, multiplied by the average account values over the period, multiplied by 181/365 (to reflect the six-month period). The expense ratios reflect an expense waiver. Assumes all dividends and distributions were reinvested. |
AXS Funds
EXPENSE EXAMPLES - Continued
For the Six Months Ended June 30, 2021 (Unaudited)
| Market Neutral Fund | Beginning Account Value | Ending Account Value | Expenses Paid During Period* |
| | | 1/1/21 | 6/30/21 | 1/1/21 – 6/30/21 |
| Investor Class | Actual Performance | $1,000.00 | $1,030.70 | $19.93 |
| | Hypothetical (5% annual return before expenses) | 1,000.00 | 1,005.17 | 19.68 |
| Class I | Actual Performance | 1,000.00 | 1,032.10 | 19.92 |
| | Hypothetical (5% annual return before expenses) | 1,000.00 | 1,005.19 | 19.66 |
| * | Expenses are equal to the Fund’s annualized expense ratios of 3.96% and 3.95% for Investor Class shares and Class I shares, respectively, multiplied by the average account values over the period, multiplied by 181/365 (to reflect the six-month period). The expense ratios reflect an expense waiver. Assumes all dividends and distributions were reinvested. |
This page is intentionally left blank
This page is intentionally left blank
AXS Funds
Each a series of Investment Managers Series Trust II
Investment Advisor
AXS Investments LLC
181 Westchester Avenue, Unit 402
Port Chester, New York 10573
Sub-Advisor
Quantitative Value Technologies, LLC dba Cognios Capital
3965 West 83rd Street, Suite 348
Prairie Village, Kansas 66208
Independent Registered Public Accounting Firm
Tait, Weller & Baker LLP
Two Liberty Place
50 South 16th Street, Suite 2900
Philadelphia, Pennsylvania 19102
Custodian
UMB Bank, n.a.
928 Grand Boulevard, 5th Floor
Kansas City, Missouri 64106
Fund Co-Administrator
Mutual Fund Administration, LLC
2220 E. Route 66, Suite 226
Glendora, California 91740
Fund Co-Administrator, Transfer Agent and Fund Accountant
UMB Fund Services, Inc.
235 W. Galena Street
Milwaukee, Wisconsin 53212
Distributor
IMST Distributors, LLC
Three Canal Plaza, Suite 100
Portland, Maine 04101
www.foreside.com
FUND INFORMATION
| | TICKER | CUSIP |
| AXS Alternative Value Fund – Investor Class | COGLX | 46141T 240 |
| AXS Alternative Value Fund – Class I | COGVX | 46141T 257 |
| AXS Market Neutral Fund – Investor Class | COGMX | 46141T 224 |
| AXS Market Neutral Fund – Class I | COGIX | 46141T 232 |
Privacy Principles of the AXS Funds for Shareholders
The Funds are committed to maintaining the privacy of its shareholders and to safeguarding its non-public personal information. The following information is provided to help you understand what personal information the Funds collect, how we protect that information and why, in certain cases, we may share information with select other parties.
Generally, the Funds do not receive any non-public personal information relating to its shareholders, although certain non-public personal information of its shareholders may become available to the Funds. The Funds do not disclose any non-public personal information about its shareholders or former shareholders to anyone, except as permitted by law or as is necessary in order to service shareholder accounts (for example, to a transfer agent or third party administrator).
This report is sent to shareholders of the AXS Funds for their information. It is not a Prospectus, circular or representation intended for use in the purchase or sale of shares of the Funds or of any securities mentioned in this report.
Proxy Voting
The Funds’ proxy voting policies and procedures, as well as information regarding how the Funds voted proxies for portfolio securities, if applicable, during the most recent 12-month period ended June 30, are available, without charge and upon request by calling (833) 297-2587 or on the SEC’s website at www.sec.gov.
Fund Portfolio Holdings
The Funds file a complete schedule of their portfolio holdings with the SEC for the first and third quarters of each fiscal year on Form N-PORT within 60 days of the end of such fiscal quarter. Shareholders may obtain the Funds’ Form N-PORT on the SEC’s website at www.sec.gov.
Prior to their use of Form N-PORT, the Funds filed their complete schedule of portfolio holdings with the SEC on Form N-Q, which is available online at www.sec.gov.
Householding
The Funds will mail only one copy of shareholder documents, including prospectuses and notice of annual and semi-annual reports availability and proxy statements, to shareholders with multiple accounts at the same address. This practice is commonly called “householding” and is intended to reduce expenses and eliminate duplicate mailings of shareholder documents. Mailings of your shareholder documents may be householded indefinitely unless you instruct us otherwise. If you do not want the mailing of these documents to be combined with those for other members of your household, please call the Funds at (833) 297-2587.
AXS Funds
P.O. Box 2175
Milwaukee, WI 53201
Toll Free: (833) 297-2587
Item 1. Report to Stockholders (Continued).
(b) Not applicable.
Item 2. Code of Ethics.
The registrant has adopted a code of ethics that applies to the registrant's principal executive officer and principal financial officer. The registrant has not made any amendments to its code of ethics during the period covered by this report. The registrant has not granted any waivers from any provisions of the code of ethics during the period covered by this report.
The registrant undertakes to provide to any person without charge, upon request, a copy of its code of ethics by mail when they call the registrant at 1-833-297-2587.
Item 3. Audit Committee Financial Expert.
The Board of Trustees of the Registrant has determined that the Registrant has the following “audit committee financial experts” as defined in Item 3(b) of Form N-CSR serving on its Audit Committee: Messrs. Thomas Knipper and John P. Zader. The audit committee financial experts are “independent” as that term is defined in Item 3(a)(2) of Form N-CSR.
Item 4. Principal Accountant Fees and Services.
The registrant has engaged its principal accountant to perform audit services, audit-related services, tax services and other services during the past two fiscal years. "Audit services" refer to performing an audit of the registrant's annual financial statements or services that are normally provided by the accountant in connection with statutory and regulatory filings or engagements for those fiscal years. "Audit-related services" refer to the assurance and related services by the principal accountant that are reasonably related to the performance of the audit. "Tax services" refer to professional services rendered by the principal accountant for tax compliance, tax advice, and tax planning. There were no "other services" provided by the principal accountant. The following table details the aggregate fees billed or expected to be billed for each of the last two fiscal years for audit fees, audit-related fees, tax fees and other fees by the principal accountant.
| AXS Alternative Value Fund | FYE 6/30/2020* | FYE 6/30/2021 |
| Audit Fees | $11,000 | $12,500 |
| Audit-Related Fees | N/A | N/A |
| Tax Fees | $2,000 | $2,500 |
| All Other Fees | N/A | N/A |
| AXS Market Neutral Fund | FYE 6/30/2020* | FYE 6/30/2021 |
| Audit Fees | $12,000 | $12,500 |
| Audit-Related Fees | N/A | N/A |
| Tax Fees | $2,500 | $2,500 |
| All Other Fees | N/A | N/A |
| * | For the year ended June 30, 2020, fees were paid to BBD, LLP. |
The audit committee has adopted pre-approval policies and procedures that require the audit committee to pre-approve all audit and non-audit services of the registrant, including services provided to any entity affiliated with the registrant.
The percentage of fees billed by Tait, Weller, & Weller LLP applicable to non-audit services pursuant to waiver of pre-approval requirement were as follows:
| AXS Alternative Value Fund | FYE 6/30/2020* | FYE 6/30/2021 |
| Audit-Related Fees | 0% | N/A |
| Tax Fees | 0% | N/A |
| All Other Fees | 0% | N/A |
| AXS Market Neutral Fund | FYE 6/30/2020* | FYE 6/30/2021 |
| Audit-Related Fees | 0% | N/A |
| Tax Fees | 0% | N/A |
| All Other Fees | 0% | N/A |
| * | Fees billed by BBD, LLP. |
All of the principal accountant's hours spent on auditing the registrant's financial statements were attributed to work performed by full-time permanent employees of the principal accountant.
The following table indicates the non-audit fees billed or expected to be billed by the registrant's accountant for services to the registrant and to the registrant's investment advisor (and any other controlling entity, etc.—not sub-advisor) for the last two years. The audit committee of the Board of Trustees has considered whether the provision of non-audit services that were rendered to the registrant's investment advisor is compatible with maintaining the principal accountant's independence and has concluded that the provision of such non-audit services by the accountant has not compromised the accountant's independence.
| AXS Alternative Value Fund | | |
| Non-Audit Related Fees | FYE 6/30/2020* | FYE 6/30/2021 |
| Registrant | N/A | N/A |
| Registrant’s Investment Advisor | N/A | N/A |
| AXS Market Neutral Fund | | |
| Non-Audit Related Fees | FYE 6/30/2020* | FYE 6/30/2021 |
| Registrant | N/A | N/A |
| Registrant’s Investment Advisor | N/A | N/A |
*Fees billed by BBD, LLP.
Item 5. Audit Committee of Listed Registrants.
| (a) | Not applicable to registrants who are not listed issuers (as defined in Rule 10A-3 under the Securities Exchange Act of 1934). |
Item 6. Schedule of Investments.
| (a) | Schedule of Investments is included as part of the report to shareholders filed under Item 1 of this Form. |
(b) Not Applicable.
Item 7. Disclosure of Proxy Voting Policies and Procedures for Closed-End Management Investment Companies.
Not applicable to open-end investment companies.
Item 8. Portfolio Managers of Closed-End Management Investment Companies.
Not applicable to open-end investment companies.
Item 9. Purchases of Equity Securities by Closed-End Management Investment Company and Affiliated Purchasers.
Not applicable.
Item 10. Submission of Matters to a Vote of Security Holders.
The registrant has not made any material changes to the procedures by which shareholders may recommend nominees to the registrant’s Board of Trustees.
Item 11. Controls and Procedures.
| (a) | The Registrant’s President/Chief Executive Officer and Treasurer/Chief Financial Officer have reviewed the Registrant's disclosure controls and procedures (as defined in Rule 30a-3(c) under the Investment Company Act of 1940 (the “Act”)) as of a date within 90 days of the filing of this report, as required by Rule 30a-3(b) under the Act and Rules 13a-15(b) or 15d-15(b) under the Securities Exchange Act of 1934. Based on their review, such officers have concluded that the disclosure controls and procedures are effective in ensuring that information required to be disclosed in this report is appropriately recorded, processed, summarized and reported and made known to them by others within the Registrant and by the Registrant’s service provider. |
| (b) | There were no changes in the Registrant's internal control over financial reporting (as defined in Rule 30a-3(d) under the Act) that occurred during the period covered by this report that has materially affected, or is reasonably likely to materially affect, the Registrant's internal control over financial reporting. |
Item 12. Disclosure of Securities Lending Activities for Closed-End Management Investment Companies.
Not applicable to open-end investment companies.
Item 13. Exhibits.
(2) Certifications pursuant to Section 302 of the Sarbanes-Oxley Act of 2002. Filed herewith.
(3) Any written solicitation to purchase securities under Rule 23c-1 under the Act sent or given during the period covered by the report by or on behalf of the registrant to 10 or more persons. Not applicable to open-end investment companies.
(4) Change in the registrant’s independent public accountant. There was no change in the registrant’s independent public accountant for the period covered by this report.
SIGNATURES
Pursuant to the requirements of the Securities Exchange Act of 1934 and the Investment Company Act of 1940, the registrant has duly caused this report to be signed on its behalf by the undersigned, thereunto duly authorized.
| (Registrant) | Investment Managers Series Trust II | |
| | | |
| By (Signature and Title) | /s/ Terrance Gallagher | |
| | Terrance Gallagher, President/Chief Executive Officer | |
| | | |
| Date | 9/8/2021 | |
Pursuant to the requirements of the Securities Exchange Act of 1934 and the Investment Company Act of 1940, this report has been signed below by the following persons on behalf of the registrant and in the capacities and on the dates indicated.
| By (Signature and Title) | /s/ Terrance Gallagher | |
| | Terrance Gallagher, President/Chief Executive Officer | |
| | | |
| Date | 9/8/2021 | |
| | | |
| By (Signature and Title) | /s/ Rita Dam | |
| | Rita Dam, Treasurer/Chief Financial Officer | |
| | | |
| Date | 9/8/2021 | |