UNITED STATES
SECURITIES AND EXCHANGE COMMISSION
Washington, D.C. 20549
FORM N-CSR
CERTIFIED SHAREHOLDER REPORT OF REGISTERED
MANAGEMENT INVESTMENT COMPANIES
Investment Company Act file number 811-22894
INVESTMENT MANAGERS SERIES TRUST II
(Exact name of registrant as specified in charter)
235 W. Galena Street
Milwaukee, WI 53212
(Address of principal executive offices) (Zip code)
Diane J. Drake
Mutual Fund Administration, LLC
2220 E. Route 66, Suite 226
Glendora, CA 91740
(Name and address of agent for service)
(626) 385-5777
Registrant's telephone number, including area code
Date of fiscal year end: September 30
Date of reporting period: September 30, 2021
Item 1. Report to Stockholders.
The registrant’s annual report transmitted to shareholders pursuant to Rule 30e-1 under the Investment Company Act of 1940, as amended (the “Investment Company Act”), is as follows:
The First Trust Funds
Each a series of Investment Managers Series Trust II
Table of Contents
| Shareholder Letter | 1 |
| Fund Performance | 6 |
| Schedule of Investments | 10 |
| Statements of Assets and Liabilities | 36 |
| Statements of Operations | 37 |
| Statements of Changes in Net Assets | 38 |
| Statements of Cash Flows | 40 |
| Financial Highlights | 42 |
| Notes to Financial Statements | 46 |
| Report of Independent Registered Public Accounting Firm | 61 |
| Supplemental Information | 62 |
| Expense Examples | 76 |
This report and the financial statements contained herein are provided for the general information of the shareholders of the First Trust Funds. This report is not authorized for distribution to prospective investors in the Funds unless preceded or accompanied by an effective prospectus.
www.firsttrustcapital.com

FIRST TRUST CAPITAL MANAGEMENT FUNDS
ANNUAL SHAREHOLDER LETTER
Contents
| |
| Executive-Level Overview | Market Perspective |
| First Trust Merger Arbitrage Fund | VARAX | VARBX |
| First Trust Multi-Strategy Fund | OMOAX | OMOIX |
Executive-Level Overview
First and foremost, we are thrilled to be writing our first Annual Shareholder Letter as First Trust Capital Management L.P. As many of you are aware, the past few months Vivaldi Holdings, LLC has been diligently working on a joint venture with First Trust Capital Partners, LLC. As part of this transaction, we are happy to re-introduce Vivaldi Asset Management, LLC as First Trust Capital Management L.P. and are excited for what the future holds as we begin our new journey together. We believe that together with our partners, we will be a position to provide wider access to the opportunities we see in the alternative investment marketplace and capitalize on our shared vision of bringing innovative solutions to the financial marketplace for all types of investors. It is important to know that the key personnel will remain in place and continue to be responsible for the management of the funds, and there will be no changes to the underlying strategies and investment processes as a result. We will continue to strive to provide our clients with the same service that you’ve come to expect from us and hope you will stay connected as we work to bring better opportunities and solutions to our clients.
We would also like to preface our Annual Shareholder Letter with an Executive-level overview to reinforce our investment process and current mindset in present market conditions. As financial markets have returned almost back to pre-Covid normalcy, there still is a continued impact felt from the pandemic on most areas of the economy. Overall, we continue to be cognizant of the current “top-down” headline risks that have kept many investors cautious as the overall market environment remains relatively volatile. While we actively consider and monitor many of those macro-level risks and the effects on global capital markets, we remain steadfast in our effort to build durable portfolios that provide a high probability of generating positive absolute performance regardless of the broader market environment and throughout various market cycles. While this approach can, at times, limit our participation in attractive markets over the short-term, it also alleviates the responsibility of timing shifts in market sentiment that may unwind successful trades rapidly. Over the long term, we remain confident in our ability to identify strategies and construct portfolios that adhere to those investment guidelines. As is customary in our Annual Shareholder Letter, we will review what we believe to be the important drivers of performance and opportunity set across each of the Funds for the past fiscal year period.
First Trust Merger Arbitrage Fund
The First Trust Merger Arbitrage Fund (the “Fund”, formerly the Vivaldi Merger Arbitrage Fund) A and I share classes returned +8.95% and +9.30%, respectively, for the one-year fiscal period ending 9/30/2021. Comparatively, the Bloomberg Barclays Aggregate Bond Index1 (the “AGG”) returned -0.90% over that same lookback period. The team is pleased with this positive outperformance from the Fund compared to the broader capital markets performance over the lookback period, as the Fund has been able to rebound nicely following the significant COVID-19 market correction. While markets have largely continued their upward trajectory in 2021, the underlying currents driving that performance have remained more nuanced. Whether one looks at the significant factor rotations in equity markets, the increase and subsequent decline in interest rates, or the massive fiscal stimulus and ensuing Fed actions, the overall volatility and activity across most asset classes and markets has remained elevated. We are pleased with the Fund’s ability to navigate such a rapidly evolving environment while generating returns that are in-line with expectations.
| 1 | The AGG broadly tracks $15 trillion of fixed income securities, nearly the entire U.S. investment-grade bond market, and includes government securities, mortgage-backed securities, asset-backed securities and corporate securities. |
First Trust Capital Management | 225 W. Wacker Drive | Suite 2100 | Chicago, IL 60606 | P: 872.260.4182 | F: 847.386.2910
We were also satisfied with the Fund’s consistency in generating those returns over the trailing one-year period. More specifically, the Fund generated positive returns in 9 of the last 12 months, having returned an average of +1.22% in each of those positive months. Comparatively, the AGG generated positive returns in 6 of the last 12 months. In the six months when the AGG saw a negative return, the Fund generated an average monthly return of +0.54% compared to the AGG’s average return over those same months of -0.79%. Perhaps most importantly, the Fund continues to generate those returns with relatively muted risk levels, with realized volatility over the trailing one-year period of only 2.99%. Comparatively, the AGG demonstrated a realized volatility of 3.2% over that same timeframe. Additionally, correlation between the Fund and both the AGG and the S&P 500 index remains low at 0.03 and 0.3, respectively. We remain confident in the Fund’s potential to generate a strong risk-adjusted and absolute return stream, isolated from broader market factors and developments over full market cycles.
The top five deals in the Fund as of 9/30/2021 were PRA Health Sciences (PRAH)/Icon (Private) at 7.4%, Alexion (ALXN)/AstraZeneca (AZN) at 6.8%, Proofpoint (PFPT)/Thoma Bravo (Private) at 6.8%, Brookfield Property (BPY)/Brookfield Asset Management (BAM) at 5.6%, and At Home Group (HOME)/Hellman & Friedman (Private) at 5.4%.
The Fund’s more recent and notable addition to its investable mandate has been the addition of Special Purpose Acquisition Companies (SPACs), which have provided strong opportunities and attribution since their inclusion in the portfolio. Q4 2020 marked one of the strongest issuance periods in the history of the SPAC market, with over $271bn in new transactions, representing the sixth best quarter since 1998 and 80% above the historical average. This activity continued into the first quarter of 2021 but has since come down to more normalized levels. The elevated level of issuance has created an oversupply in the market that is expected to alleviate as SPAC mergers close. Currently, there are 424 SPACs seeking a target acquisition, with 152 of those SPACs having announced a deal that has yet to formally close. More recently, the most significant opportunity has been active trading in the secondary market in SPACs that have been trading below cash-and-trust level, effectively providing a free upside call option. Overall, we are excited about the SPAC environment and the more recent opportunity to employ a more nuanced strategy in the secondary market.
The merger arbitrage market has been an extremely attractive area of opportunity as global M&A set a historical record in the first six months of 2021 with deals totaling $2.6tr. Deal flow is up from $926bn year-over-year and is surging past the pre-pandemic five-year average of $1.6tr, as every sector is experiencing a significant number of announced mergers and acquisitions. This elevated level of deal flow is expected to continue through year end given the combination of historic low interest rates, equity valuations near all-time highs, and the overall continued recovery from COVID-19. Business leaders remain optimistic in continued global economic growth even in the face of some macroeconomic concerns around inflation and geopolitical factors such as tax policy and increased regulatory scrutiny. Based on that backdrop, we are expecting companies to maintain their sharp focus on M&A strategies as an avenue to accelerate growth and increase scale and are expecting that dynamic to result in a positive M&A landscape well into 2022.
First Trust Capital Management | 225 W. Wacker Drive | Suite 2100 | Chicago, IL 60606 | P: 872.260.4182 | F: 847.386.2910
First Trust Multi-Strategy Fund
The First Trust Multi-Strategy Fund (the “Fund”, formerly the Vivaldi Multi-Strategy Fund) A and I Share Classes returned +13.53% and +13.84%, respectively, for the 1-year fiscal period ending 9/30/2021. The Fund’s benchmark, the ICE BofAML 3-Month U.S. Treasury Bill Index, finished the fiscal year period ending 9/30/2021 with a +0.07% return. The Fund’s positive performance, and outperformance relative to the benchmark, is attributable to the Fund’s Relative Value: Closed-end-fund (“CEF”) strategy, which contributed +27.36% over the trailing one-year lookback period, largely driven by the strong performance across the broader closed-end-fund market and the strategy’s relative positioning in the market over that timeframe. Additionally, the two remaining underlying strategies generated positive performance over the fiscal year with the structured credit sleeve returning +9.03% and the event driven sleeve adding +3.74%. We are pleased to see the underlying strategies continue to participate in the strong market environment following the initial COVID-19 market correction.
Over a longer-term lookback, the overall correlation benefit across the three strategies remained robust, as the Fund’s volatility has remained very low at 4.26%, compared to a 6.69% annualized volatility if we assumed no correlation benefit across strategies. The diversification benefit within the portfolio is also evident in the fact that the 1.1 Sharpe Ratio2 of the strategy was higher than the return-to-risk ratio of some of the underlying strategies on a stand-alone basis. Additionally, we remain pleased with the asymmetry of the Fund’s return profile over the trailing one-year period as the Fund generated positive returns in 11 of the 12 months over the trailing one-year period, having generated an average return of +1.25% in those months. Comparatively, the S&P 500 and the Barclays Aggregate Bond Index generated positive returns in nine and six months, respectively, over the lookback period. In the three periods the S&P 500 was negative, the Fund returned an average of +0.35%. Similarly, in the six periods where the Barclays Aggregate Bond Index had a negative return, the Fund generated an average return of +0.60 in those months. We remain pleased with all aspects of Fund’s return and risk profiles over the trailing one-year period.
| 2 | The Sharpe Ratio measures the Fund’s return earned in excess of the risk-free rate over a specified time period per unit of total risk, as measured by the Fund’s standard deviation of returns over that same time period. |
First Trust Capital Management | 225 W. Wacker Drive | Suite 2100 | Chicago, IL 60606 | P: 872.260.4182 | F: 847.386.2910
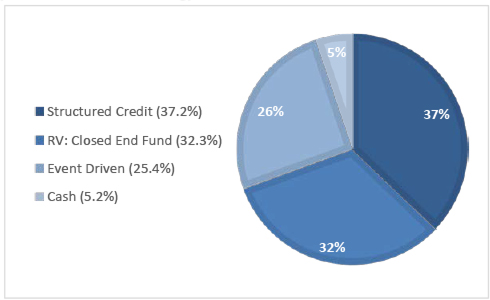
We continue to believe in the power of conviction-weighted portfolios and think that one of the main challenges to multi-alternative mutual funds historically has been overly diversified portfolios that largely net themselves out to minimal returns. In that vein, we currently allocate to three sub-strategies within the overall Fund. One of our key responsibilities is to remain constantly vigilant with respect to balancing the portfolio across the best mix of underlying strategies, attempting to provide the best chance to meet or exceed our absolute return mandate with a stable risk profile. The underlying strategies in the portfolio were largely selected for their attractive correlation benefits when viewed alongside one another, so the portfolio tends to run relatively balanced from a strategy exposure perspective. Importantly, shifts between strategy allocations have tended to be incremental in nature, in which one strategy may see a decrease in allocation across the course of a quarter or two while that harvested capital has been pushed to another underlying team with a more active opportunity set. As of the end of the fiscal year, the sub-strategy allocations were as follows: Structured Credit (37.2%), Relative Value: Closed End Fund (32.3%), and Event Driven (25.4%).
As always, we thank you for your continued support and intend to work hard to maintain it.
Kind Regards,
 |  |
Michael Peck, CFA President, Co-Chief Investment Officer mpeck@FirstTrustCapital.com | Brian R. Murphy Co-Chief Investment Officer bmurphy@FirstTrustCapital.com |
The views were those of the Portfolio Fund Managers as of September 30, 2021 and may not reflect their views on the date this material is first published or anytime thereafter. These views are intended to assist the shareholders of the Funds in understanding their investments and do not constitute investment advice. This material may contain discussions about investments that may or may not be held by the Funds as of the date of this material. All current and future holdings are subject to risk and to change.
Mutual fund investing involves risk. Principal loss is possible. Investments in companies that are the subject of a publicly announced transaction carry the risk that the proposed or expected transaction may not be completed or may be completed on less favorable terms than originally expected, which may lower the Funds’ performance. Investments in foreign securities involve greater volatility and political, economic, and currency risks and difference in accounting methods. These risks are greater for emerging markets. Investments in small and medium sized companies involve additional risks such as limited liquidity or greater volatility. Derivatives involve special risks including correlation, counterparty, liquidity, operational, accounting and tax risks. These risks, in certain cases, may be greater than the risks presented by more traditional investments. The Funds may make short sales of securities, which involves the risk that losses may exceed the original amount invested. The Funds may use leverage which may exaggerate the effect of any securities or the Net Asset Value of the Funds, and money borrowed will be subjected to interest costs. In the case of an investment in a potential acquisition target, if the proposed merger, exchange offer or cash tender offer appears likely not to be consummated, in fact is not consummated, or is delayed, the market price of the security to be tendered or exchanged will usually decline sharply, resulting in a loss to the Funds. If a put or call option purchased by one of the Funds expires without being sold or exercised, the Fund will lose the premium it paid for the option. The risk involved in writing a covered call option is the lack of liquidity for the option. The First Trust Merger Fund is non-diversified, meaning it may concentrate its assets in fewer individual holdings than a diversified fund. Therefore, the Fund is more exposed to individual stock volatility than a diversified fund. The Funds may invest in mortgage-backed securities that include additional risks that investors should be aware of such as credit risk, prepayment risk, possible illiquidity and default, as well as increased susceptibility to adverse economic developments. Multi-investment management styles may lead to higher transaction expenses compared to a single investment management style. Outcomes depend on the skill of the sub-advisers and funds (ETFs), which may trade at a discount to the aggregate value of the underlying securities, and, although expense ratios for ETFs are generally low, frequent trading of ETFs by the Funds can generate brokerage expenses. For a complete description of risks, please read the prospectus.
First Trust Capital Management | 225 W. Wacker Drive | Suite 2100 | Chicago, IL 60606 | P: 872.260.4182 | F: 847.386.2910
First Trust Capital Management L.P. is the Adviser to the First Trust Merger Arbitrage Fund and the First Trust Multi-Strategy Fund (collectively, the “Funds”). First Trust Portfolios L.P., member FINRA, is the distributor for the Funds.
First Trust Capital Management | 225 W. Wacker Drive | Suite 2100 | Chicago, IL 60606 | P: 872.260.4182 | F: 847.386.2910
First Trust Merger Arbitrage Fund
FUND PERFORMANCE at September 30, 2021 (Unaudited)
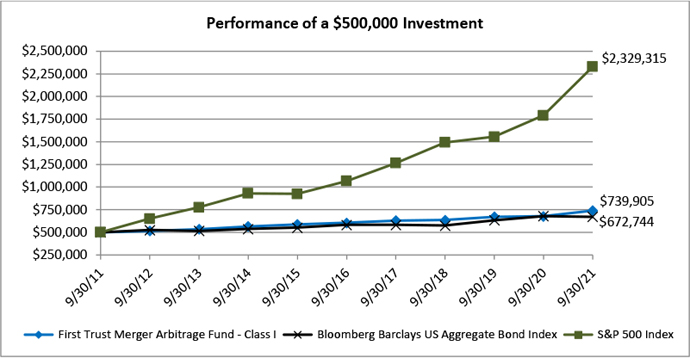
This graph compares a hypothetical $500,000 investment in the Fund’s Class I shares with a similar investment in the Bloomberg Barclays US Aggregate Bond Index and the S&P 500 Index during the periods shown. The performance graph above is shown for the Fund’s Class I shares. Class A shares performance may vary. Results include the reinvestment of all dividends and capital gains.
| Average Annual Total Returns as of September 30, 2021 | 1 Year | 5 Years | 10 Years |
| Before deducting maximum sales charge | | | |
| Class A¹ | 8.95% | 3.74% | 3.69% |
| Class I² | 9.30% | 4.06% | 4.00% |
| After deducting maximum sales charge | | | |
| Class A¹ | 2.68% | 2.51% | 3.08% |
| Bloomberg Barclays US Aggregate Bond Index | -0.90% | 2.94% | 3.01% |
| S&P 500 Index | 30.00% | 16.90% | 16.63% |
| 1 | Maximum sales charge for Class A shares is 5.75%. |
| 2 | Class I shares do not have any initial or deferred sales charge. |
The performance data quoted here represents past performance and past performance is not a guarantee of future results. Investment return and principal value will fluctuate so that an investor’s shares, when redeemed, may be worth more or less than their original cost. Current performance may be lower or higher than the performance information quoted. The most recent month end performance may be obtained by calling (877) 779-1999.
The expense ratios for Class A and Class I shares were 2.49% and 2.16%, respectively, which were the amounts stated in the current prospectus dated February 1, 2021, as amended November 5, 2021. For the Fund’s current one year expense ratios, please refer to the Financial Highlights section of this report. While the Fund’s advisor has contractually agreed to waive its fees and/or pay for operating expenses of the Fund to ensure that total annual fund operating expenses do not exceed 1.85% and 1.55% of the average daily net assets of the Fund’s Class A and Class I shares, respectively. This agreement is in effect until November 1, 2023, and it may be terminated before that date only by the Trust’s Board of Trustees. In the absence of such waivers, the Fund’s returns for periods other than the year ended September 30, 2021 would be lower.
First Trust Merger Arbitrage Fund
FUND PERFORMANCE at September 30, 2021 (Unaudited) – Continued
The Fund commenced investment operations on October 1, 2015, after the reorganization of Highland Capital Management Institutional Fund, LLC, a Delaware limited liability company which commenced operations on April 1, 2000 (the “Predecessor Fund”), into the Fund, pursuant to which the Predecessor Fund transferred substantially all of its assets into the Fund. As a result of the reorganization, the Fund is the accounting successor of the Predecessor Fund. The Predecessor Fund was not registered under the 1940 Act and, therefore, was not subject to certain restrictions imposed by the 1940 Act on registered investment companies and by the Internal Revenue Code of 1986, as amended, on regulated investment companies such as the Fund. Performance results shown in the graph and the performance table above for the period prior to October 1, 2015 reflect the performance of the Predecessor Fund.
Returns reflect the reinvestment of distributions made by the Fund, if any. The graph and the performance table shown do not reflect the deduction of taxes that a shareholder would pay on Fund distributions or the redemption of Fund shares. Shares redeemed within 30 days of purchase will be charged a redemption fee of 1.00%.
The Bloomberg Barclays US Aggregate Bond Index is market capitalization weighted and includes treasury securities, government agency bonds, mortgage backed bonds and corporate bonds. It excludes municipal bonds and treasury inflation-protected securities because of tax treatment. The S&P 500 Index includes a representative sample of 500 leading companies in leading industries of the U.S. economy and assumes any dividends are reinvested back into the index. These indices do not reflect expenses, fees or sales charge, which would lower performance. The indices are unmanaged and they are not available for investment.
First Trust Multi-Strategy Fund
FUND PERFORMANCE at September 30, 2021 (Unaudited)
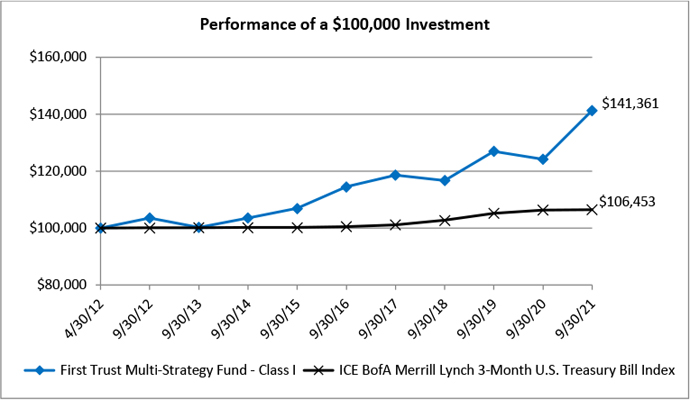
This graph compares a hypothetical $100,000 investment in the Fund’s Class I shares, made at its inception, with a similar investment in the ICE BofA Merrill Lynch 3-Month U.S. Treasury Bill Index. The performance graph above is shown for the Fund’s Class I shares. Class A shares performance may vary. Results include the reinvestment of all dividends and capital gains.
| Average Annual Total Returns as of September 30, 2021 | 1 Year | 5 Years | Since Inception | Inception Date |
| Before deducting maximum sales charge | | | | |
| Class A¹ | 13.53% | 4.00% | 3.44% | 04/30/12 |
| Class I² | 13.84% | 4.30% | 3.74% | 04/30/12 |
| After deducting maximum sales charge | | | | |
| Class A¹ | 7.85% | 2.94% | 2.87% | 04/30/12 |
| ICE BofA Merrill Lynch 3-Month U.S. Treasury Bill Index | 0.07% | 1.16% | 0.67% | 04/30/12 |
| 1 | Maximum sales charge for Class A shares is 5.00%. |
| 2 | Class I shares do not have any initial or deferred sales charge. |
The performance data quoted here represents past performance and past performance is not a guarantee of future results. Investment return and principal value will fluctuate so that an investor’s shares, when redeemed, may be worth more or less than their original cost. Current performance may be lower or higher than the performance information quoted. The most recent month end performance may be obtained by calling (877) 779-1999.
Gross and net expense ratios for Class A and Class I shares were 2.65% and 2.38%, respectively, and for Class A and Class I shares were 2.56% and 2.29%, respectively, which were the amounts stated in the current prospectus dated February 1, 2021, as amended November 5, 2021. For the Fund’s current one year expense ratios, please refer to the Financial Highlights section of this report. The Fund’s advisor has contractually agreed to waive its fees and/or pay for operating expenses of the Fund to ensure that total annual fund operating expenses do not exceed 1.85% and 1.55% of the average daily net assets of the Fund’s Class A and Class I shares, respectively. This agreement is in effect until November 1, 2023, and it may be terminated before that date only by the Trust’s Board of Trustees. In the absence of such waivers, the Fund’s returns would be lower.
First Trust Multi-Strategy Fund
FUND PERFORMANCE at September 30, 2021 (Unaudited) – Continued
The Fund commenced investment operations on December 16, 2016, after the reorganization of Vivaldi Orinda Macro Opportunities Fund, which commenced operations on April 30, 2012 (the “Predecessor Fund”), into the Fund, pursuant to which the Predecessor Fund transferred substantially all of its assets into the Fund. As a result of the reorganization, the Fund is the accounting successor of the Predecessor Fund. Performance results shown in the graph and the performance table above for the period prior to December 16, 2016 reflect the performance of the Predecessor Fund.
Returns reflect the reinvestment of distributions made by the Fund, if any. The graph and the performance table shown do not reflect the deduction of taxes that a shareholder would pay on Fund distributions or the redemption of Fund shares.
The ICE BofA Merrill Lynch 3-Month U.S. Treasury Bill Index tracks the performance of the U.S. Dollar denominated U.S. Treasury Bills publicly issued in the U.S. Domestic Market with a remaining term to final maturity of less than 3 months. This index does not reflect expenses, fees or sales charges, which would lower performance. The index is unmanaged and it is not available for investment.
First Trust Merger Arbitrage Fund
SCHEDULE OF INVESTMENTS
As of September 30, 2021
Number
of Shares | | | | | Value | |
| | | | COMMON STOCKS — 88.6% | | | |
| | | | CHEMICALS-SPECIALTY — 1.5% | | | |
| | 437,262 | | | Atotech Ltd.*,1 | | $ | 10,559,877 | |
| | | | | COMMERCIAL BANKS-CENTRAL US — 6.6% | | | | |
| | 480,577 | | | Cadence BanCorp - Class A | | | 10,553,471 | |
| | 676,840 | | | Flagstar Bancorp, Inc.1 | | | 34,369,935 | |
| | | | | | | | 44,923,406 | |
| | | | | COMMERCIAL BANKS-EASTERN US — 1.2% | | | | |
| | 413,730 | | | Howard Bancorp, Inc.*,1 | | | 8,390,444 | |
| | | | | COMMERCIAL BANKS-WESTERN US — 2.3% | | | | |
| | 350,248 | | | Altabancorp1 | | | 15,466,952 | |
| | | | | COMPUTER SOFTWARE — 8.7% | | | | |
| | 1,721,742 | | | Cloudera, Inc.*,1 | | | 27,496,220 | |
| | 558,789 | | | Cornerstone OnDemand, Inc.*,1 | | | 31,996,258 | |
| | | | | | | | 59,492,478 | |
| | | | | DIAGNOSTIC EQUIPMENT — 1.9% | | | | |
| | 420,704 | | | Itamar Medical Ltd.* | | | 12,713,675 | |
| | | | | E-COMMERCE/SERVICE — 3.8% | | | | |
| | 78,945 | | | Stamps.com, Inc.*,1 | | | 26,035,272 | |
| | | | | INTERNET CONTENT-INFO — 1.7% | | | | |
| | 338,334 | | | Score Media and Gaming, Inc. - Class A* | | | 11,581,173 | |
| | | | | MEDICAL PRODUCTS — 1.1% | | | | |
| | 369,460 | | | Soliton, Inc.*,1 | | | 7,522,206 | |
| | | | | MEDICAL-BIOMEDICAL/GENERICS — 1.2% | | | | |
| | 33,877 | | | Acceleron Pharma, Inc.* | | | 5,830,231 | |
| | 136,180 | | | Trillium Therapeutics, Inc.* | | | 2,391,321 | |
| | | | | | | | 8,221,552 | |
| | | | | MEDICAL-HM — 2.3% | | | | |
| | 165,375 | | | Magellan Health, Inc.*,1 | | | 15,636,206 | |
| | | | | OIL COMP-EXPLORATION & PRODUCTION — 3.6% | | | | |
| | 284,719 | | | Cimarex Energy Co. | | | 24,827,497 | |
| | | | | REITS-OFFICE PROPERTY — 0.3% | | | | |
| | 96,791 | | | Columbia Property Trust, Inc. | | | 1,840,965 | |
First Trust Merger Arbitrage Fund
SCHEDULE OF INVESTMENTS - Continued
As of September 30, 2021
Number
of Shares | | | | | Value | |
| | | | COMMON STOCKS (Continued) | | | |
| | | | RENTAL AUTO/EQUIPMENT — 0.2% | | | |
| | 20,175 | | | CAI International, Inc.1 | | $ | 1,127,984 | |
| | | | | S & L/THRIFTS-EASTERN US — 4.6% | | | | |
| | 1,270,826 | | | Sterling Bancorp1 | | | 31,719,817 | |
| | | | | SPECIFIED PURPOSE ACQUISITIONS — 41.5% | | | | |
| | 140,000 | | | 26 Capital Acquisition Corp.* | | | 1,360,800 | |
| | 35,042 | | | 5:01 Acquisition Corp. - Class A* | | | 343,412 | |
| | 169,910 | | | 7GC & Co. Holdings, Inc. - Class A* | | | 1,651,525 | |
| | 664,284 | | | 890 5th Avenue Partners, Inc. - Class A* | | | 6,583,054 | |
| | 289,418 | | | ACON S2 Acquisition Corp.* | | | 2,894,180 | |
| | 20,000 | | | Adit EdTech Acquisition Corp.* | | | 194,800 | |
| | 273,028 | | | Alkuri Global Acquisition Corp. - Class A* | | | 2,722,089 | |
| | 113,400 | | | Altimeter Growth Corp. 2 - Class A* | | | 1,121,526 | |
| | 95,000 | | | Altitude Acquisition Corp. - Class A* | | | 934,800 | |
| | 294,700 | | | Apollo Strategic Growth Capital - Class A* | | | 2,876,272 | |
| | 158,000 | | | ARYA Sciences Acquisition Corp. V - Class A* | | | 1,561,040 | |
| | 244,359 | | | Athena Technology Acquisition Corp.* | | | 2,425,361 | |
| | 164,872 | | | Athlon Acquisition Corp. - Class A* | | | 1,612,448 | |
| | 26,200 | | | Atlantic Avenue Acquisition Corp. - Class A* | | | 256,760 | |
| | 1,987 | | | Aurora Acquisition Corp. - Class A* | | | 19,771 | |
| | 260,292 | | | Avanti Acquisition Corp. - Class A* | | | 2,548,259 | |
| | 191,272 | | | BCLS Acquisition Corp. - Class A* | | | 1,912,720 | |
| | 128,440 | | | Benessere Capital Acquisition Corp. - Class A* | | | 1,294,675 | |
| | 25,000 | | | Better World Acquisition Corp.* | | | 251,875 | |
| | 337,429 | | | Big Cypress Acquisition Corp.* | | | 3,401,284 | |
| | 90,000 | | | Biotech Acquisition Co. - Class A* | | | 876,600 | |
| | 18,811 | | | Breeze Holdings Acquisition Corp.* | | | 189,991 | |
| | 84,207 | | | Bridgetown 2 Holdings Ltd. - Class A* | | | 834,491 | |
| | 177,983 | | | Bridgetown Holdings Ltd. - Class A* | | | 1,746,013 | |
| | 268,763 | | | Burgundy Technology Acquisition Corp. - Class A* | | | 2,674,192 | |
| | 78,008 | | | Capstar Special Purpose Acquisition Corp. - Class A* | | | 773,839 | |
| | 102,258 | | | Cartesian Growth Corp. - Class A* | | | 1,009,286 | |
| | 69,819 | | | CC Neuberger Principal Holdings II - Class A* | | | 685,623 | |
| | 187,642 | | | CF Acquisition Corp. IV - Class A* | | | 1,825,757 | |
| | 185,025 | | | CF Acquisition Corp. V - Class A* | | | 1,831,748 | |
| | 257,886 | | | CHP Merger Corp. - Class A* | | | 2,584,018 | |
| | 206,700 | | | Churchill Capital Corp. V - Class A* | | | 2,021,526 | |
| | 138,370 | | | Churchill Capital Corp. VII - Class A* | | | 1,344,956 | |
| | 411,135 | | | CM Life Sciences III, Inc. - Class A* | | | 4,078,459 | |
| | 237,525 | | | Cohn Robbins Holdings Corp. - Class A* | | | 2,332,496 | |
| | 254,819 | | | Corner Growth Acquisition Corp. - Class A* | | | 2,487,033 | |
First Trust Merger Arbitrage Fund
SCHEDULE OF INVESTMENTS - Continued
As of September 30, 2021
Number
of Shares | | | | | Value | |
| | | | COMMON STOCKS (Continued) | | | |
| | | | SPECIFIED PURPOSE ACQUISITIONS (Continued) | | | |
| | 32,089 | | | DD3 Acquisition Corp. II* | | $ | 318,323 | |
| | 36,546 | | | Decarbonization Plus Acquisition Corp. II - Class A* | | | 361,440 | |
| | 145,344 | | | DFP Healthcare Acquisitions Corp. - Class A* | | | 1,441,813 | |
| | 299,335 | | | dMY Technology Group, Inc. IV - Class A* | | | 2,966,410 | |
| | 279,770 | | | DPCM Capital, Inc. - Class A* | | | 2,733,353 | |
| | 268,320 | | | Dragoneer Growth Opportunities Corp. II - Class A* | | | 2,669,784 | |
| | 338,835 | | | E.Merge Technology Acquisition Corp. - Class A* | | | 3,327,360 | |
| | 176,283 | | | East Resources Acquisition Co. - Class A* | | | 1,734,625 | |
| | 336,404 | | | ECP Environmental Growth Opportunities Corp. - Class A* | | | 3,323,672 | |
| | 15,000 | | | EdtechX Holdings Acquisition Corp. II* | | | 149,700 | |
| | 579,997 | | | Environmental Impact Acquisition Corp.* | | | 5,736,170 | |
| | 101,973 | | | Epiphany Technology Acquisition Corp. - Class A* | | | 996,276 | |
| | 294,975 | | | EQ Health Acquisition Corp. - Class A* | | | 2,881,906 | |
| | 276,959 | | | Equity Distribution Acquisition Corp. - Class A* | | | 2,719,737 | |
| | 167,525 | | | Eucrates Biomedical Acquisition Corp.* | | | 1,638,395 | |
| | 286,268 | | | European Sustainable Growth Acquisition Corp. - Class A* | | | 2,839,779 | |
| | 394,328 | | | Far Peak Acquisition Corp. - Class A* | | | 3,923,564 | |
| | 113,661 | | | Foresight Acquisition Corp. - Class A* | | | 1,120,697 | |
| | 306,400 | | | Fortress Capital Acquisition Corp. - Class A* | | | 2,996,592 | |
| | 123,744 | | | Frazier Lifesciences Acquisition Corp. - Class A* | | | 1,206,504 | |
| | 126,348 | | | Frontier Acquisition Corp. - Class A* | | | 1,224,312 | |
| | 181 | | | FS Development Corp. II* | | | 1,801 | |
| | 434,613 | | | FTAC Athena Acquisition Corp. - Class A* | | | 4,293,976 | |
| | 144,007 | | | FTAC Hera Acquisition Corp. - Class A* | | | 1,402,628 | |
| | 90,000 | | | Fusion Acquisition Corp. II - Class A* | | | 873,900 | |
| | 465,269 | | | GigCapital4, Inc.* | | | 4,587,552 | |
| | 156,172 | | | GO Acquisition Corp.* | | | 1,532,047 | |
| | 45,000 | | | Golden Falcon Acquisition Corp. - Class A* | | | 438,750 | |
| | 417,100 | | | Gores Guggenheim, Inc. - Class A* | | | 4,262,762 | |
| | 311,571 | | | Gores Metropoulos II, Inc. - Class A* | | | 3,078,322 | |
| | 153,827 | | | Greenrose Acquisition Corp.* | | | 1,550,576 | |
| | 125,201 | | | Growth Capital Acquisition Corp. - Class A* | | | 1,236,986 | |
| | 188,630 | | | Healthcare Capital Corp. - Class A* | | | 1,859,892 | |
| | 275,971 | | | HealthCor Catalio Acquisition Corp. - Class A* | | | 2,732,113 | |
| | 203,838 | | | Hennessy Capital Investment Corp. V - Class A* | | | 2,011,881 | |
| | 224,465 | | | HIG Acquisition Corp. - Class A* | | | 2,193,023 | |
| | 137,054 | | | Highland Transcend Partners I Corp. - Class A* | | | 1,359,576 | |
| | 624,540 | | | Horizon Acquisition Corp. - Class A* | | | 6,232,909 | |
| | 203,186 | | | Horizon Acquisition Corp. II - Class A* | | | 1,991,223 | |
| | 81,539 | | | HumanCo Acquisition Corp. - Class A* | | | 806,421 | |
| | 323,512 | | | IG Acquisition Corp. - Class A* | | | 3,167,183 | |
First Trust Merger Arbitrage Fund
SCHEDULE OF INVESTMENTS - Continued
As of September 30, 2021
Number
of Shares | | | | | Value | |
| | | | COMMON STOCKS (Continued) | | | |
| | | | SPECIFIED PURPOSE ACQUISITIONS (Continued) | | | |
| | 164,026 | | | InterPrivate III Financial Partners, Inc. - Class A* | | $ | 1,624,678 | |
| | 129,630 | | | Ivanhoe Capital Acquisition Corp. - Class A* | | | 1,283,337 | |
| | 232,506 | | | Khosla Ventures Acquisition Co. - Class A* | | | 2,294,834 | |
| | 125,645 | | | Khosla Ventures Acquisition Co. III - Class A* | | | 1,231,321 | |
| | 200,814 | | | Kingswood Acquisition Corp. - Class A* | | | 2,026,213 | |
| | 280,000 | | | KINS Technology Group, Inc. - Class A* | | | 2,783,200 | |
| | 159,340 | | | Lazard Growth Acquisition Corp. I* | | | 1,550,378 | |
| | 121,996 | | | Leo Holdings III Corp. - Class A* | | | 1,212,640 | |
| | 565,848 | | | Lionheart Acquisition Corp. II - Class A* | | | 5,610,383 | |
| | 269,031 | | | Live Oak Acquisition Corp. II - Class A* | | | 2,684,929 | |
| | 15,419 | | | LMF Acquisition Opportunities, Inc. - Class A* | | | 154,807 | |
| | 320,000 | | | Longview Acquisition Corp. II - Class A* | | | 3,164,800 | |
| | 128,473 | | | Lux Health Tech Acquisition Corp. - Class A* | | | 1,260,320 | |
| | 255,125 | | | M3-Brigade Acquisition II Corp. - Class A* | | | 2,528,289 | |
| | 97,686 | | | Magnum Opus Acquisition Ltd. - Class A* | | | 966,115 | |
| | 184,134 | | | Malacca Straits Acquisition Co., Ltd. - Class A* | | | 1,830,292 | |
| | 21,361 | | | Marquee Raine Acquisition Corp. - Class A* | | | 213,396 | |
| | 515,824 | | | MCAP Acquisition Corp. - Class A* | | | 5,091,183 | |
| | 7,245 | | | MDH Acquisition Corp. - Class A* | | | 71,363 | |
| | 143,281 | | | Montes Archimedes Acquisition Corp. - Class A* | | | 1,432,810 | |
| | 230,794 | | | Motive Capital Corp. - Class A* | | | 2,284,861 | |
| | 224,791 | | | Mountain Crest Acquisition Corp. II* | | | 2,241,166 | |
| | 125,946 | | | North Mountain Merger Corp. - Class A* | | | 1,233,011 | |
| | 92,100 | | | Northern Genesis Acquisition Corp. II* | | | 914,553 | |
| | 203,522 | | | Northern Star Investment Corp. II - Class A* | | | 2,020,973 | |
| | 121,500 | | | Novus Capital Corp. II - Class A* | | | 1,202,850 | |
| | 206,564 | | | Oaktree Acquisition Corp. II - Class A* | | | 2,024,327 | |
| | 45,900 | | | Omega Alpha SPAC - Class A* | | | 446,607 | |
| | 226,359 | | | Pine Island Acquisition Corp. - Class A* | | | 2,209,264 | |
| | 70,787 | | | Plum Acquisition Corp. I - Class A* | | | 684,510 | |
| | 210,167 | | | PMV Consumer Acquisition Corp.* | | | 2,061,738 | |
| | 80,170 | | | Poema Global Holdings Corp. - Class A* | | | 790,476 | |
| | 221,953 | | | Population Health Investment Co., Inc. - Class A* | | | 2,170,700 | |
| | 300,000 | | | Prime Impact Acquisition I - Class A* | | | 2,946,000 | |
| | 94,500 | | | Prospector Capital Corp. - Class A* | | | 922,320 | |
| | 264,201 | | | Queen's Gambit Growth Capital - Class A* | | | 2,607,664 | |
| | 194,510 | | | RedBall Acquisition Corp. - Class A* | | | 1,913,978 | |
| | 165,471 | | | Reinvent Technology Partners Y - Class A* | | | 1,643,127 | |
| | 168,936 | | | Research Alliance Corp. II - Class A* | | | 1,631,922 | |
| | 202,631 | | | Roman DBDR Tech Acquisition Corp. - Class A* | | | 2,048,599 | |
| | 40,297 | | | Roth Ch Acquisition III Co.* | | | 400,552 | |
First Trust Merger Arbitrage Fund
SCHEDULE OF INVESTMENTS - Continued
As of September 30, 2021
Number
of Shares | | | | | Value | |
| | | | COMMON STOCKS (Continued) | | | |
| | | | SPECIFIED PURPOSE ACQUISITIONS (Continued) | | | |
| | 13,214 | | | Sarissa Capital Acquisition Corp. - Class A* | | $ | 130,290 | |
| | 876 | | | Science 37 Holidings, Inc.* | | | 8,760 | |
| | 134,158 | | | ScION Tech Growth I - Class A* | | | 1,305,357 | |
| | 221,539 | | | Seaport Global Acquisition Corp. - Class A* | | | 2,230,898 | |
| | 207,478 | | | Seven Oaks Acquisition Corp. - Class A* | | | 2,060,257 | |
| | 31,590 | | | Social Capital Hedosophia Holdings Corp. IV - Class A* | | | 319,691 | |
| | 325,800 | | | Social Capital Hedosophia Holdings Corp. VI - Class A* | | | 3,306,870 | |
| | 204,287 | | | Social Leverage Acquisition Corp. I - Class A* | | | 1,997,927 | |
| | 5,334 | | | Spartacus Acquisition Corp. - Class A* | | | 54,033 | |
| | 514,111 | | | Spartan Acquisition Corp. III - Class A* | | | 5,079,417 | |
| | 27,492 | | | Sports Entertainment Acquisition Corp. - Class A* | | | 275,470 | |
| | 408,670 | | | Spring Valley Acquisition Corp. | | | 4,127,567 | |
| | 446,327 | | | Switchback II Corp. - Class A* | | | 4,445,417 | |
| | 434,213 | | | Tailwind Acquisition Corp. - Class A* | | | 4,246,603 | |
| | 20,200 | | | Tailwind Two Acquisition Corp. - Class A* | | | 196,546 | |
| | 25,442 | | | Tech and Energy Transition Corp. - Class A* | | | 248,568 | |
| | 332,416 | | | Tekkorp Digital Acquisition Corp. - Class A* | | | 3,264,325 | |
| | 296,510 | | | Thayer Ventures Acquisition Corp. - Class A* | | | 2,997,716 | |
| | 80,206 | | | Thimble Point Acquisition Corp. - Class A* | | | 797,248 | |
| | 139,110 | | | Tiga Acquisition Corp. - Class A* | | | 1,409,184 | |
| | 566,288 | | | Trebia Acquisition Corp. - Class A* | | | 5,611,914 | |
| | 131,940 | | | Trepont Acquisition Corp. I - Class A* | | | 1,315,442 | |
| | 25,000 | | | Turmeric Acquisition Corp. - Class A* | | | 244,750 | |
| | 25,000 | | | VectoIQ Acquisition Corp. II - Class A* | | | 242,750 | |
| | 77,164 | | | Ventoux CCM Acquisition Corp.* | | | 770,868 | |
| | 90,000 | | | Virtuoso Acquisition Corp. - Class A* | | | 891,900 | |
| | 32,793 | | | VPC Impact Acquisition Holdings - Class A* | | | 331,537 | |
| | 129,815 | | | VPC Impact Acquisition Holdings III, Inc. - Class A* | | | 1,286,467 | |
| | 169,971 | | | Vy Global Growth - Class A* | | | 1,667,416 | |
| | 232,999 | | | Yucaipa Acquisition Corp.* | | | 2,302,030 | |
| | 132,997 | | | Zanite Acquisition Corp. - Class A* | | | 1,344,600 | |
| | | | | | | | 283,112,916 | |
| | | | | TRANSPORT-RAIL — 6.1% | | | | |
| | 153,681 | | | Kansas City Southern1 | | | 41,592,226 | |
| | | | | TOTAL COMMON STOCKS | | | | |
| | | | | (Cost $603,946,810) | | | 604,764,646 | |
| | | | | UNITS — 11.0% | | | | |
| | | | | REAL ESTATE OPERATIONS/DEVELOPMENTS — 1.9% | | | | |
| | 789,898 | | | Landmark Infrastructure Partners LP1 | | | 12,914,832 | |
First Trust Merger Arbitrage Fund
SCHEDULE OF INVESTMENTS - Continued
As of September 30, 2021
Number
of Shares | | | | | Value | |
| | | | UNITS (Continued) | | | |
| | | | SPECIFIED PURPOSE ACQUISITIONS — 9.1% | | | |
| | 117,323 | | | 7GC & Co. Holdings, Inc.* | | $ | 1,162,671 | |
| | 45,000 | | | Ackrell Spac Partners I Co.* | | | 459,900 | |
| | 135,000 | | | Adit EdTech Acquisition Corp.* | | | 1,347,300 | |
| | 33,120 | | | Agile Growth Corp.* | | | 327,888 | |
| | 251,333 | | | Americas Technology Acquisition Corp.* | | | 2,576,163 | |
| | 67,500 | | | Archimedes Tech SPAC Partners Co.* | | | 671,625 | |
| | 60,000 | | | Atlas Crest Investment Corp. II* | | | 599,400 | |
| | 90,000 | | | Authentic Equity Acquisition Corp.* | | | 902,700 | |
| | 161,875 | | | BlueRiver Acquisition Corp.* | | | 1,610,656 | |
| | 57,957 | | | BOA Acquisition Corp.* | | | 572,615 | |
| | 126,000 | | | Bright Lights Acquisition Corp.* | | | 1,265,040 | |
| | 126,000 | | | Broadscale Acquisition Corp.* | | | 1,246,140 | |
| | 250,000 | | | Carney Technology Acquisition Corp. II* | | | 2,492,500 | |
| | 90,000 | | | CF Acquisition Corp. VI* | | | 886,500 | |
| | 138,750 | | | Clarim Acquisition Corp.* | | | 1,365,300 | |
| | 9,127 | | | Climate Real Impact Solutions II Acquisition Corp.* | | | 90,814 | |
| | 258,555 | | | Colicity, Inc.* | | | 2,564,866 | |
| | 22,500 | | | COVA Acquisition Corp.* | | | 223,650 | |
| | 135,000 | | | Delwinds Insurance Acquisition Corp.* | | | 1,335,150 | |
| | 139,500 | | | DiamondHead Holdings Corp.* | | | 1,381,050 | |
| | 150,000 | | | Direct Selling Acquisition Corp.* | | | 1,512,000 | |
| | 45,000 | | | Dune Acquisition Corp.* | | | 456,750 | |
| | 67,500 | | | EdtechX Holdings Acquisition Corp. II* | | | 691,200 | |
| | 180,000 | | | Empowerment & Inclusion Capital I Corp.* | | | 1,800,000 | |
| | 63,432 | | | EQ Health Acquisition Corp.* | | | 634,320 | |
| | 210,000 | | | European Biotech Acquisition Corp.* | | | 2,087,400 | |
| | 9,000 | | | Fortress Value Acquisition Corp. III* | | | 89,415 | |
| | 200,000 | | | Forum Merger IV Corp.* | | | 1,970,000 | |
| | 200,000 | | | GigCapital5, Inc.* | | | 2,056,000 | |
| | 75,000 | | | Golden Arrow Merger Corp.* | | | 742,500 | |
| | 45,000 | | | HH&L Acquisition Co.* | | | 446,850 | |
| | 15,000 | | | Hudson Executive Investment Corp. II* | | | 149,100 | |
| | 45,000 | | | ITHAX Acquisition Corp.* | | | 445,500 | |
| | 111,779 | | | Jaws Juggernaut Acquisition Corp.* | | | 1,117,790 | |
| | 36,000 | | | KL Acquisition Corp.* | | | 354,600 | |
| | 67,500 | | | LightJump Acquisition Corp.* | | | 674,325 | |
| | 30,000 | | | LMF Acquisition Opportunities, Inc.* | | | 315,000 | |
| | 112,600 | | | Monument Circle Acquisition Corp.* | | | 1,135,008 | |
| | 48,600 | | | Moringa Acquisition Corp.* | | | 485,514 | |
| | 173,000 | | | North Atlantic Acquisition Corp.* | | | 1,730,000 | |
| | 156,849 | | | North Mountain Merger Corp.* | | | 1,582,606 | |
First Trust Merger Arbitrage Fund
SCHEDULE OF INVESTMENTS - Continued
As of September 30, 2021
Number
of Shares | | | | | Value | |
| | | | UNITS (Continued) | | | |
| | | | SPECIFIED PURPOSE ACQUISITIONS (Continued) | | | |
| | 175,000 | | | Orion Biotech Opportunities Corp.* | | $ | 1,732,500 | |
| | 45,000 | | | Peridot Acquisition Corp. II* | | | 443,700 | |
| | 158,400 | | | Pivotal Investment Corp. III* | | | 1,564,992 | |
| | 50,000 | | | Plum Acquisition Corp. I* | | | 490,500 | |
| | 58,500 | | | Progress Acquisition Corp.* | | | 585,000 | |
| | 154,854 | | | RMG Acquisition Corp. III* | | | 1,529,958 | |
| | 180,000 | | | Sarissa Capital Acquisition Corp.* | | | 1,800,000 | |
| | 172,000 | | | ScION Tech Growth I* | | | 1,714,840 | |
| | 340,000 | | | Software Acquisition Group, Inc. III* | | | 3,434,000 | |
| | 13,500 | | | Stratim Cloud Acquisition Corp.* | | | 134,190 | |
| | 185,000 | | | Tailwind International Acquisition Corp.* | | | 1,833,350 | |
| | 100,000 | | | Thunder Bridge Capital Partners IV Inc.* | | | 985,000 | |
| | 54,000 | | | TLG Acquisition One Corp.* | | | 535,950 | |
| | 185,000 | | | Z-Work Acquisition Corp.* | | | 1,829,650 | |
| | | | | | | | 62,171,436 | |
| | | | | TOTAL UNITS | | | | |
| | | | | (Cost $76,489,605) | | | 75,086,268 | |
| | | | | WARRANTS — 0.0% | | | | |
| | 82,436 | | | Athlon Acquisition Corp., Expiration Date: March 5, 2026* | | | 57,705 | |
| | 45,000 | | | Biotech Acquisition Co., Expiration Date: November 30, 2027* | | | 29,686 | |
| | 29,981 | | | Fusion Acquisition Corp. II, Expiration Date: December 31, 2027* | | | 19,494 | |
| | | | | TOTAL WARRANTS | | | | |
| | | | | (Cost $0) | | | 106,885 | |
| | | | | SHORT-TERM INVESTMENTS — 1.1% | | | | |
| | 7,538,110 | | | Morgan Stanley Institutional Liquidity Fund - Government Portfolio - Institutional Class, 0.03%2 | | | 7,538,110 | |
| | | | | TOTAL SHORT-TERM INVESTMENTS | | | | |
| | | | | (Cost $7,538,110) | | | 7,538,110 | |
| | | | | TOTAL INVESTMENTS — 100.7% | | | | |
| | | | | (Cost $687,974,525) | | | 687,495,909 | |
| | | | | Liabilities in Excess of Other Assets — (0.7)% | | | (4,489,099 | ) |
| | | | | TOTAL NET ASSETS — 100.0% | | $ | 683,006,810 | |
| | | | | SECURITIES SOLD SHORT — (24.1)% | | | | |
| | | | | COMMON STOCKS — (24.1)% | | | | |
| | | | | COMMERCIAL BANKS-EASTERN US — (6.0)% | | | | |
| | (744,713 | ) | | FNB Corp. | | | (8,653,565 | ) |
First Trust Merger Arbitrage Fund
SCHEDULE OF INVESTMENTS - Continued
As of September 30, 2021
Number
of Shares | | | | | Value | |
| | | | SECURITIES SOLD SHORT (Continued) | | | |
| | | | COMMON STOCKS (Continued) | | | |
| | | | | COMMERCIAL BANKS-EASTERN US (Continued) | | | | |
| | (588,392 | ) | | Webster Financial Corp. | | $ | (32,043,828 | ) |
| | | | | | | | (40,697,393 | ) |
| | | | | COMMERCIAL BANKS-SOUTHERN US — (1.5)% | | | | |
| | (336,406 | ) | | BancorpSouth Bank | | | (10,018,171 | ) |
| | | | | COMMERCIAL BANKS-WESTERN US — (2.3)% | | | | |
| | (279,184 | ) | | Glacier Bancorp, Inc. | | | (15,452,834 | ) |
| | | | | OIL COMP-EXPLORATION & PRODUCTION — (3.6)% | | | | |
| | (1,143,033 | ) | | Cabot Oil & Gas Corp. | | | (24,872,398 | ) |
| | | | | RACETRACKS — (0.9)% | | | | |
| | (81,133 | ) | | Penn National Gaming, Inc.* | | | (5,878,897 | ) |
| | | | | S & L/THRIFTS-EASTERN US — (5.1)% | | | | |
| | (2,717,580 | ) | | New York Community Bancorp, Inc. | | | (34,975,255 | ) |
| | | | | SEMICONDUCTOR EQUIPMENT — (0.5)% | | | | |
| | (24,137 | ) | | MKS Instruments, Inc. | | | (3,642,515 | ) |
| | | | | TRANSPORT-RAIL — (4.2)% | | | | |
| | (443,216 | ) | | Canadian Pacific Railway Ltd. | | | (28,840,065 | ) |
| | | | | TOTAL COMMON STOCKS | | | | |
| | | | | (Proceeds $160,417,514) | | | (164,377,528 | ) |
| | | | | TOTAL SECURITIES SOLD SHORT | | | | |
| | | | | (Proceeds $160,417,514) | | $ | (164,377,528 | ) |
Number
of Contracts | | | | | | |
| | | | WRITTEN OPTIONS CONTRACTS — (0.0)% | | | |
| | | | CALL OPTIONS — (0.0)% | | | |
| | | | | Altimeter Growth Corp. 2 | | | | |
| | (1,134 | ) | | Exercise Price: $10.00, Notional Amount: $(1,134,000),
Expiration Date: October 15, 2021* | | | (5,670 | ) |
| | | | | Altitude Acquisition, Corp. | | | | |
| | (650 | ) | | Exercise Price: $10.00, Notional Amount: $(650,000),
Expiration Date: October 15, 2021* | | | (1,625 | ) |
| | | | | Bridgetown Holdings Ltd. | | | | |
| | (314 | ) | | Exercise Price: $10.00, Notional Amount: $(314,000),
Expiration Date: October 15, 2021* | | | (1,570 | ) |
First Trust Merger Arbitrage Fund
SCHEDULE OF INVESTMENTS - Continued
As of September 30, 2021
Number
of Contracts | | | | | Value | |
| | | | WRITTEN OPTIONS CONTRACTS (Continued) | | | |
| | | | CALL OPTIONS (Continued) | | | |
| | (1,150 | ) | | Exercise Price: $10.00, Notional Amount: $(1,150,000),
Expiration Date: December 17, 2021* | | $ | (11,500 | ) |
| | | | | CAI International, Inc. | | | | |
| | (4 | ) | | Exercise Price: $55.00, Notional Amount: $(22,000),
Expiration Date: October 15, 2021* | | | (240 | ) |
| | (30 | ) | | Exercise Price: $55.00, Notional Amount: $(165,000),
Expiration Date: January 21, 2022* | | | (3,000 | ) |
| | | | | Cloudera, Inc. | | | | |
| | (3 | ) | | Exercise Price: $16.00, Notional Amount: $(4,800),
Expiration Date: November 19, 2021* | | | (9 | ) |
| | (603 | ) | | Exercise Price: $16.00, Notional Amount: $(964,800),
Expiration Date: January 21, 2022* | | | (1,809 | ) |
| | | | | Far Peak Acquisition, Corp. | | | | |
| | (256 | ) | | Exercise Price: $10.00, Notional Amount: $(256,000),
Expiration Date: October 15, 2021* | | | (1,280 | ) |
| | | | | Gores Guggenheim, Inc. | | | | |
| | (124 | ) | | Exercise Price: $10.00, Notional Amount: $(124,000),
Expiration Date: October 15, 2021* | | | (3,720 | ) |
| | (4 | ) | | Exercise Price: $10.00, Notional Amount: $(4,000),
Expiration Date: November 19, 2021* | | | (120 | ) |
| | (361 | ) | | Exercise Price: $12.50, Notional Amount: $(451,250),
Expiration Date: November 19, 2021* | | | (2,166 | ) |
| | (3,682 | ) | | Exercise Price: $10.00, Notional Amount: $(3,682,000),
Expiration Date: January 21, 2022* | | | (184,100 | ) |
| | | | | Horizon Acquisition II Corp. | | | | |
| | (119 | ) | | Exercise Price: $10.00, Notional Amount: $(119,000),
Expiration Date: October 15, 2021* | | | (298 | ) |
| | | | | Lux Health Tech Acquisition Corp. | | | | |
| | (1,285 | ) | | Exercise Price: $10.00, Notional Amount: $(1,285,000),
Expiration Date: October 15, 2021* | | | (6,425 | ) |
| | | | | Merida Merger Corp. I | | | | |
| | (183 | ) | | Exercise Price: $10.00, Notional Amount: $(183,000),
Expiration Date: October 15, 2021* | | | (915 | ) |
| | | | | Pine Island Acquisition Corp. | | | | |
| | (1,396 | ) | | Exercise Price: $10.00, Notional Amount: $(1,396,000),
Expiration Date: October 15, 2021* | | | (5,584 | ) |
| | | | | Social Capital Hedosophia Holdings Corp. IV | | | | |
| | (316 | ) | | Exercise Price: $10.00, Notional Amount: $(316,000),
Expiration Date: October 15, 2021* | | | (3,160 | ) |
| | | | | Social Capital Hedosophia Holdings Corp. VI | | | | |
| | (602 | ) | | Exercise Price: $10.00, Notional Amount: $(602,000),
Expiration Date: November 19, 2021* | | | (15,050 | ) |
First Trust Merger Arbitrage Fund
SCHEDULE OF INVESTMENTS - Continued
As of September 30, 2021
Number
of Contracts | | | | | Value | |
| | | | WRITTEN OPTIONS CONTRACTS (Continued) | | | |
| | | | CALL OPTIONS (Continued) | | | |
| | (2,607 | ) | | Exercise Price: $10.00, Notional Amount: $(2,607,000),
Expiration Date: December 17, 2021* | | $ | (78,210 | ) |
| | (49 | ) | | Exercise Price: $11.00, Notional Amount: $(53,900),
Expiration Date: December 17, 2021* | | | (882 | ) |
| | | | | Trillium Therapeutics, Inc. | | | | |
| | (100 | ) | | Exercise Price: $17.50, Notional Amount: $(175,000),
Expiration Date: October 15, 2021* | | | (2,500 | ) |
| | (169 | ) | | Exercise Price: $20.00, Notional Amount: $(338,000),
Expiration Date: November 19, 2021* | | | (422 | ) |
| | (494 | ) | | Exercise Price: $20.00, Notional Amount: $(988,000),
Expiration Date: December 17, 2021* | | | (2,470 | ) |
| | | | | TOTAL CALL OPTIONS | | | | |
| | | | | (Proceeds $405,886) | | | (332,725 | ) |
| | | | | TOTAL WRITTEN OPTIONS CONTRACTS | | | | |
| | | | | (Proceeds $405,886) | | $ | (332,725 | ) |
LP — Limited Partnership
| * | Non-income producing security. |
| 1 | All or a portion of this security is segregated as collateral for securities sold short and written options contracts. The market value of the securities pledged as collateral was $209,682,807, which represents 30.70% of total net assets of the Fund. |
| 2 | The rate is the annualized seven-day yield at period end. |
See accompanying Notes to Financial Statements.
First Trust Merger Arbitrage Fund
SUMMARY OF INVESTMENTS
As of September 30, 2021
| Security Type/Sector | | Percent of Total
Net Assets | |
| Common Stocks | | | |
| Specified Purpose Acquisitions | | | 41.5 | % |
| Computer Software | | | 8.7 | % |
| Commercial Banks-Central US | | | 6.6 | % |
| Transport-Rail | | | 6.1 | % |
| S & L/Thrifts-Eastern US | | | 4.6 | % |
| E-Commerce/Service | | | 3.8 | % |
| Oil Comp-Exploration & Production | | | 3.6 | % |
| Medical-HM | | | 2.3 | % |
| Commercial Banks-Western US | | | 2.3 | % |
| Diagnostic Equipment | | | 1.9 | % |
| Internet Content-Info | | | 1.7 | % |
| Chemicals-Specialty | | | 1.5 | % |
| Commercial Banks-Eastern US | | | 1.2 | % |
| Medical-Biomedical/Generics | | | 1.2 | % |
| Medical Products | | | 1.1 | % |
| REITS-Office Property | | | 0.3 | % |
| Rental Auto/Equipment | | | 0.2 | % |
| Total Common Stocks | | | 88.6 | % |
| Units | | | 11.0 | % |
| Warrants | | | 0.0 | % |
| Short-Term Investments | | | 1.1 | % |
| Total Investments | | | 100.7 | % |
| Liabilities in Excess of Other Assets | | | (0.7 | )% |
| Total Net Assets | | | 100.0 | % |
Please refer to the Schedule of Investments for information on securities sold short and written options contracts.
See accompanying Notes to Financial Statements.
First Trust Multi-Strategy Fund
SCHEDULE OF INVESTMENTS
As of September 30, 2021
Principal
Amount | | | | | Value | |
| | | | ASSET-BACKED SECURITIES — 14.6% | | | |
| $ | 500,000 | | | Affirm Asset Securitization Trust
Series 2020-A, Class C, 6.230%, 2/18/20251,2 | | $ | 512,361 | |
| | 500,000 | | | Anchorage Credit Funding 12 Ltd.
Series 2020-12A, Class D, 5.927%, 10/25/20381,2 | | | 503,350 | |
| | | | | Aqua Finance Trust | | | | |
| | 150,000 | | | Series 2020-AA, Class B, 2.790%, 7/17/20461,2 | | | 152,949 | |
| | 150,000 | | | Series 2020-AA, Class C, 3.970%, 7/17/20461,2 | | | 157,948 | |
| | 100,000 | | | Carvana Auto Receivables Trust
Series 2021-N1, Class E, 2.880%, 1/10/20281,2 | | | 99,987 | |
| | 500,000 | | | CPS Auto Receivables Trust
Series 2019-C, Class E, 4.300%, 7/15/20251,2 | | | 519,628 | |
| | 250,000 | | | Home RE Ltd.
Series 2019-1, Class M2, 3.336% (1-Month USD Libor+325 basis points), 5/25/20291,2,3 | | | 253,731 | |
| | 250,000 | | | Mello Warehouse Securitization Trust
Series 2019-2, Class G, 4.086% (1-Month USD Libor+400 basis points), 11/25/20521,2,3 | | | 249,906 | |
| | 504,329 | | | Merrill Lynch Mortgage Investors Trust
Series 2006-WMC2, Class A1, 0.566% (1-Month USD Libor+48 basis points), 3/25/20372,3 | | | 179,602 | |
| | 1,000,000 | | | Monroe Capital Mml Clo X Ltd.
Series 2020-1A, Class D, 7.030% (3-Month USD Libor+690 basis points), 8/20/20311,2,3 | | | 1,001,766 | |
| | 250,000 | | | Oaktown Re III Ltd.
Series 2019-1A, Class M2, 2.636% (1-Month USD Libor+255 basis points), 7/25/20291,2,3,4 | | | 251,897 | |
| | 500,000 | | | Palmer Square Loan Funding Ltd.
Series 2020-1A, Class SUB, 0.000%, 2/19/20281,2,4 | | | 450,671 | |
| | 500,000 | | | Traingle Re Ltd.
Series 2021-1, Class M1B, 3.086% (1-Month USD Libor+300 basis points), 8/25/20331,2,3 | | | 501,801 | |
| | 550,000 | | | Upstart Securitization Trust
Series 2019-3, Class C, 5.381%, 1/21/20301,2 | | | 570,645 | |
| | 150,000 | | | Veros Automobile Receivables Trust
Series 2020-1, Class D, 5.640%, 2/16/20271,2 | | | 151,431 | |
| | | | | TOTAL ASSET-BACKED SECURITIES | | | | |
| | | | | (Cost $5,288,764) | | | 5,557,673 | |
Number
of Shares | | | | | | |
| | | | CLOSED-END FUNDS — 18.8% | | | |
| | 24,853 | | | Aberdeen Emerging Markets Equity Income Fund, Inc.5 | | | 206,777 | |
| | 5,478 | | | Blackrock Science & Technology Trust | | | 285,732 | |
| | 1,507 | | | BrandywineGLOBAL Global Income Opportunities Fund, Inc. | | | 18,868 | |
First Trust Multi-Strategy Fund
SCHEDULE OF INVESTMENTS - Continued
As of September 30, 2021
Number
of Shares | | | | | Value | |
| | | | CLOSED-END FUNDS (Continued) | | | |
| | 10,840 | | | Calamos Long/Short Equity & Dynamic Income Trust | | $ | 220,594 | |
| | 12,989 | | | DTF Tax-Free Income, Inc. | | | 187,691 | |
| | 41,919 | | | Eaton Vance Floating-Rate Income Plus Fund6 | | | 34,548 | |
| | 48,058 | | | First Trust Senior Floating Rate 2022 Target Term Fund5 | | | 463,279 | |
| | 26,495 | | | GDL Fund | | | 237,925 | |
| | 54,442 | | | Guggenheim Enhanced Equity Income Fund5 | | | 505,222 | |
| | 33,262 | | | Invesco Dynamic Credit Opportunities Fund | | | 389,165 | |
| | 26,997 | | | Invesco Senior Income Trust5 | | | 120,137 | |
| | 15,469 | | | Kayne Anderson NextGen Energy & Infrastructure, Inc.5 | | | 112,614 | |
| | 51,085 | | | Miller/Howard High Dividend Fund5 | | | 502,676 | |
| | 59,192 | | | Morgan Stanley Emerging Markets Domestic Debt Fund, Inc.5 | | | 346,273 | |
| | 15,810 | | | NexPoint Strategic Opportunities Fund | | | 219,917 | |
| | 51,916 | | | Nuveen Corporate Income November 2021 Target Term Fund5 | | | 486,972 | |
| | 16,265 | | | Pershing Square Holdings Ltd.7 | | | 579,847 | |
| | 34,298 | | | PIMCO Energy & Tactical Credit Opportunities Fund5 | | | 418,779 | |
| | 6,453 | | | Pioneer Municipal High Income Fund, Inc. | | | 78,275 | |
| | 157,300 | | | Saba Capital Income & Opportunities Fund5 | | | 715,715 | |
| | 36,018 | | | Special Opportunities Fund, Inc.5 | | | 553,597 | |
| | 13,327 | | | Sprott Physical Gold and Silver Trust*,7 | | | 228,291 | |
| | 3,033 | | | Tortoise Midstream Energy Fund, Inc. | | | 87,563 | |
| | 20,905 | | | Virtus AllianzGI Convertible & Income Fund II | | | 108,497 | |
| | 4,674 | | | Voya Emerging Markets High Income Dividend Equity Fund | | | 34,541 | |
| | | | | TOTAL CLOSED-END FUNDS | | | | |
| | | | | (Cost $7,356,828) | | | 7,143,495 | |
Principal
Amount | | | | | | |
| | | | COLLATERALIZED MORTGAGE OBLIGATIONS — 17.4% | | | |
| | | | Alternative Loan Trust | | | |
| $ | 37,757 | | | Series 2005-3CB, Class 1A4, 5.250%, 3/25/20352 | | | 37,438 | |
| | 6,286,242 | | | Series 2006-HY10, Class 1X, 0.476%, 5/25/20362,4 | | | 79,622 | |
| | 237,007 | | | Series 2006-6CB, Class 2A3, 5.750%, 5/25/20362 | | | 137,099 | |
| | 47,337 | | | Banc of America Funding Trust
Series 2007-A, Class 2A1, 0.407% (1-Month USD Libor+32 basis points), 2/20/20472,3 | | | 45,870 | |
| | 154,018 | | | Bear Stearns Trust
Series 2005-7, Class 22A1, 2.910%, 9/25/20352,4 | | | 119,623 | |
| | 250,000 | | | Bellemeade Re Ltd.
Series 2019-2A, Class M2, 3.186% (1-Month USD Libor+310 basis points), 4/25/20291,2,3,4 | | | 253,425 | |
| | 413,071 | | | CSMC Mortgage-Backed Trust
Series 2006-6, Class 1A4, 6.000%, 7/25/20362 | | | 308,061 | |
First Trust Multi-Strategy Fund
SCHEDULE OF INVESTMENTS - Continued
As of September 30, 2021
Principal
Amount | | | | | Value | |
| | | | COLLATERALIZED MORTGAGE OBLIGATIONS (Continued) | | | |
| $ | 909,052 | | | CSMC Trust
Series 2017-RPL3, Class B5, 4.408%, 8/1/20571,2,4 | | $ | 951,151 | |
| | 163,158 | | | Deutsche Alt-A Securities Mortgage Loan Trust
Series 2006-AR3, Class A6, 0.646% (1-Month USD Libor+56 basis points), 8/25/20362,3 | | | 162,286 | |
| | 250,000 | | | Foursight Capital Automobile Receivables Trust
Series 2020-1, Class F, 4.620%, 6/15/20271,2 | | | 257,027 | |
| | 100,000 | | | Freddie Mac Multifamily Structured Credit Risk
Series 2021-MN1, Class M2, 3.800% (SOFR30A+375 basis points), 1/25/20511,2,3,4 | | | 105,699 | |
| | 221,779 | | | Freddie Mac Structured Agency Credit Risk Debt Notes
Series 2018-SPI3, Class B, 4.148%, 8/25/20481,2,4 | | | 218,336 | |
| | 234,052 | | | GreenPoint Mortgage Funding Trust
Series 2006-OH1, Class A1, 0.266% (1-Month USD Libor+18 basis points), 1/25/20372,3 | | | 228,843 | |
| | | | | HarborView Mortgage Loan Trust | | | | |
| | 130,598 | | | Series 2006-13, Class A, 0.267% (1-Month USD Libor+18 basis points), 11/19/20462,3 | | | 111,705 | |
| | 78,937 | | | Series 2006-14, Class 2A1A, 0.237% (1-Month USD Libor+15 basis points), 1/25/20472,3 | | | 75,352 | |
| | 198,246 | | | Impac CMB Trust
Series 2004-10, Class 3A1, 0.786% (1-Month USD Libor+70 basis points), 3/25/20352,3 | | | 192,908 | |
| | 1,601 | | | IndyMac INDA Mortgage Loan Trust
Series 2007-AR2, Class A1, 3.255%, 6/25/20372,4 | | | 1,413 | |
| | 466,429 | | | IndyMac INDX Mortgage Loan Trust
Series 2006-AR2, Class 1A1A, 0.526% (1-Month USD Libor+44 basis points), 4/25/20462,3 | | | 450,860 | |
| | 115,022 | | | JP Morgan Alternative Loan Trust
Series 2007-A2, Class 11A1, 0.446% (1-Month USD Libor+36 basis points), 6/25/20372,3 | | | 80,754 | |
| | 600,472 | | | JP Morgan Mortgage Trust
Series 2005-A8, Class 3A1, 2.713%, 11/25/20352,4 | | | 579,176 | |
| | | | | MASTR Alternative Loan Trust | | | | |
| | 530,492 | | | Series 2007-HF1, Class 4A1, 7.000%, 10/25/20472 | | | 338,133 | |
| | 244,619 | | | Series 2005-5, Class 3A1, 5.750%, 8/25/20352 | | | 171,116 | |
| | 464,530 | | | Morgan Stanley Mortgage Loan Trust
Series 2006-13AX, Class A2, 0.426% (1-Month USD Libor+34 basis points), 10/25/20362,3,4 | | | 197,848 | |
| | | | | RALI Trust | | | | |
| | 124,847 | | | Series 2006-QS6, Class 1A2, 6.000%, 6/25/20362 | | | 119,863 | |
| | 259,171 | | | Series 2007-QS5, Class A1, 5.500%, 3/25/20372 | | | 251,395 | |
| | 273,324 | | | Series 2006-QO9, Class 1A3A, 0.486% (1-Month USD Libor+40 basis points), 12/25/20462,3 | | | 259,920 | |
| | 165,995 | | | Series 2006-QS15, Class A1, 6.500%, 10/25/20362 | | | 166,023 | |
First Trust Multi-Strategy Fund
SCHEDULE OF INVESTMENTS - Continued
As of September 30, 2021
Principal
Amount | | | | | Value | |
| | | | COLLATERALIZED MORTGAGE OBLIGATIONS (Continued) | | | |
| $ | 203,005 | | | Series 2007-QO4, Class A1A, 0.466% (1-Month USD Libor+38 basis points), 5/25/20472,3 | | $ | 197,429 | |
| | 241,162 | | | STACR Trust
Series 2018-HRP1, Class B2, 11.836% (1-Month USD Libor+1,175 basis points), 5/25/20431,2,3 | | | 279,723 | |
| | 234,000 | | | Verus Securitization Trust
Series 2019-INV2, Class B1, 4.452%, 7/25/20591,2,4 | | | 238,372 | |
| | | | | TOTAL COLLATERALIZED MORTGAGE OBLIGATIONS | | | | |
| | | | | (Cost $6,824,691) | | | 6,616,470 | |
Number
of Shares | | | | | | |
| | | | COMMON STOCKS — 24.6% | | | |
| | | | CHEMICALS-SPECIALTY — 0.3% | | | |
| | 4,851 | | | Atotech Ltd.*,7 | | | 117,152 | |
| | | | | COMMERCIAL BANKS-CENTRAL US — 1.7% | | | | |
| | 6,748 | | | Cadence BanCorp - Class A | | | 148,186 | |
| | 9,576 | | | Flagstar Bancorp, Inc.5 | | | 486,269 | |
| | | | | | | | 634,455 | |
| | | | | COMMERCIAL BANKS-EASTERN US — 0.3% | | | | |
| | 6,053 | | | Howard Bancorp, Inc.* | | | 122,755 | |
| | | | | COMMERCIAL BANKS-WESTERN US — 2.0% | | | | |
| | 17,516 | | | Altabancorp5 | | | 773,507 | |
| | | | | COMPUTER SOFTWARE — 2.2% | | | | |
| | 24,503 | | | Cloudera, Inc.*,5 | | | 391,313 | |
| | 7,823 | | | Cornerstone OnDemand, Inc.* | | | 447,945 | |
| | | | | | | | 839,258 | |
| | | | | DIAGNOSTIC EQUIPMENT — 0.5% | | | | |
| | 5,931 | | | Itamar Medical Ltd.*,7 | | | 179,235 | |
| | | | | E-COMMERCE/SERVICE — 1.0% | | | | |
| | 1,082 | | | Stamps.com, Inc.* | | | 356,833 | |
| | | | | INTERNET CONTENT-INFO — 0.4% | | | | |
| | 4,760 | | | Score Media and Gaming, Inc. - Class A*,7 | | | 162,935 | |
| | | | | INVESTMENT COMPANIES — 0.7% | | | | |
| | 1,847 | | | Barings BDC, Inc. | | | 20,354 | |
First Trust Multi-Strategy Fund
SCHEDULE OF INVESTMENTS - Continued
As of September 30, 2021
Number
of Shares | | | | | Value | |
| | | | COMMON STOCKS (Continued) | | | |
| | | | INVESTMENT COMPANIES (Continued) | | | |
| | 53,508 | | | First Eagle Alternative Capital BDC, Inc. | | $ | 235,970 | |
| | | | | | | | 256,324 | |
| | | | | MEDICAL PRODUCTS — 0.2% | | | | |
| | 3,544 | | | Soliton, Inc.* | | | 72,156 | |
| | | | | MEDICAL-BIOMEDICAL/GENERICS — 0.3% | | | | |
| | 473 | | | Acceleron Pharma, Inc.* | | | 81,403 | |
| | 2,007 | | | Trillium Therapeutics, Inc.*,7 | | | 35,243 | |
| | | | | | | | 116,646 | |
| | | | | MEDICAL-HM — 0.8% | | | | |
| | 3,254 | | | Magellan Health, Inc.* | | | 307,666 | |
| | | | | OIL COMP-EXPLORATION & PRODUCTION — 0.9% | | | | |
| | 3,989 | | | Cimarex Energy Co. | | | 347,841 | |
| | | | | REAL ESTATE OPERATIONS/DEVELOPMENTS — 0.5% | | | | |
| | 11,737 | | | Landmark Infrastructure Partners LP | | | 191,900 | |
| | | | | REITS-OFFICE PROPERTY — 0.1% | | | | |
| | 1,369 | | | Columbia Property Trust, Inc. | | | 26,038 | |
| | | | | RENTAL AUTO/EQUIPMENT — 0.1% | | | | |
| | 641 | | | CAI International, Inc. | | | 35,838 | |
| | | | | S & L/THRIFTS-EASTERN US — 1.5% | | | | |
| | 21,937 | | | Sterling Bancorp5 | | | 547,547 | |
| | | | | SPECIFIED PURPOSE ACQUISITIONS — 9.5% | | | | |
| | 258 | | | 7GC & Co. Holdings, Inc. - Class A* | | | 2,508 | |
| | 4,500 | | | 890 5th Avenue Partners, Inc. - Class A* | | | 44,595 | |
| | 1,900 | | | Ace Global Business Acquisition Ltd.*,7 | | | 19,304 | |
| | 4,230 | | | ACON S2 Acquisition Corp.*,7 | | | 42,300 | |
| | 3,452 | | | Agba Acquisition Ltd.*,5,7 | | | 37,523 | |
| | 4,239 | | | Alkuri Global Acquisition Corp. - Class A* | | | 42,263 | |
| | 1,940 | | | Americas Technology Acquisition Corp.*,7 | | | 19,478 | |
| | 2,116 | | | Aries I Acquisition Corp. - Class A*,7 | | | 21,118 | |
| | 1,686 | | | Artisan Acquisition Corp. - Class A*,7 | | | 16,725 | |
| | 4,079 | | | Athena Technology Acquisition Corp.* | | | 40,486 | |
| | 3,356 | | | Athlon Acquisition Corp. - Class A* | | | 32,822 | |
| | 4,948 | | | Aurora Acquisition Corp. - Class A*,7 | | | 49,233 | |
| | 4,016 | | | Benessere Capital Acquisition Corp. - Class A* | | | 40,481 | |
First Trust Multi-Strategy Fund
SCHEDULE OF INVESTMENTS - Continued
As of September 30, 2021
Number
of Shares | | | | | Value | |
| | | | COMMON STOCKS (Continued) | | | |
| | | | SPECIFIED PURPOSE ACQUISITIONS (Continued) | | | |
| | 4,500 | | | Big Cypress Acquisition Corp.* | | $ | 45,360 | |
| | 1,708 | | | Big Sky Growth Partners, Inc. - Class A* | | | 16,704 | |
| | 3,324 | | | Biotech Acquisition Co. - Class A*,7 | | | 32,376 | |
| | 3,370 | | | Blue Safari Group Acquisition Corp. - Class A*,7 | | | 33,363 | |
| | 4,500 | | | Bridgetown 2 Holdings Ltd. - Class A*,7 | | | 44,595 | |
| | 100 | | | Bridgetown Holdings Ltd. - Class A*,7 | | | 981 | |
| | 1,186 | | | Bright Lights Acquisition Corp. - Class A* | | | 11,552 | |
| | 1,635 | | | Brilliant Acquisition Corp.*,7 | | | 16,579 | |
| | 3,776 | | | Burgundy Technology Acquisition Corp. - Class A*,7 | | | 37,571 | |
| | 4,588 | | | Capstar Special Purpose Acquisition Corp. - Class A* | | | 45,513 | |
| | 258 | | | CF Acquisition Corp. IV - Class A* | | | 2,510 | |
| | 3,445 | | | Churchill Capital Corp. VI - Class A* | | | 33,658 | |
| | 4,516 | | | CM Life Sciences III, Inc. - Class A* | | | 44,799 | |
| | 2,868 | | | Colombier Acquisition Corp. - Class A* | | | 27,734 | |
| | 663 | | | Corner Growth Acquisition Corp. - Class A*,7 | | | 6,471 | |
| | 4,000 | | | DD3 Acquisition Corp. II* | | | 39,680 | |
| | 2,880 | | | Delwinds Insurance Acquisition Corp. - Class A* | | | 28,397 | |
| | 4,000 | | | DFP Healthcare Acquisitions Corp. - Class A* | | | 39,680 | |
| | 4,000 | | | dMY Technology Group, Inc. IV - Class A* | | | 39,640 | |
| | 4,500 | | | Dragoneer Growth Opportunities Corp. II - Class A*,7 | | | 44,775 | |
| | 2,024 | | | Dune Acquisition Corp. - Class A* | | | 20,038 | |
| | 4,001 | | | East Stone Acquisition Corp.*,5,7 | | | 40,810 | |
| | 4,500 | | | ECP Environmental Growth Opportunities Corp. - Class A* | | | 44,460 | |
| | 2,878 | | | Empowerment & Inclusion Capital I Corp. - Class A* | | | 28,147 | |
| | 4,050 | | | Environmental Impact Acquisition Corp.* | | | 40,054 | |
| | 5,391 | | | European Sustainable Growth Acquisition Corp. - Class A*,7 | | | 53,479 | |
| | 9,201 | | | Far Peak Acquisition Corp. - Class A*,7 | | | 91,550 | |
| | 4,000 | | | FTAC Athena Acquisition Corp. - Class A*,7 | | | 39,520 | |
| | 3,386 | | | GigInternational1, Inc.* | | | 33,420 | |
| | 1,686 | | | Global Consumer Acquisition Corp.* | | | 16,658 | |
| | 3,300 | | | Global SPAC Partners Co.*,7 | | | 32,967 | |
| | 268 | | | Golden Falcon Acquisition Corp. - Class A* | | | 2,613 | |
| | 775 | | | Gores Holdings VII, Inc. - Class A* | | | 7,579 | |
| | 4,500 | | | Gores Metropoulos II, Inc. - Class A* | | | 44,460 | |
| | 3,385 | | | Graf Acquisition Corp. IV* | | | 32,801 | |
| | 7,640 | | | Greenrose Acquisition Corp.*,5 | | | 77,011 | |
| | 4,143 | | | Growth Capital Acquisition Corp. - Class A* | | | 40,933 | |
| | 194 | | | Healthcare Services Acquisition Corp. - Class A* | | | 1,888 | |
| | 4,559 | | | HealthCor Catalio Acquisition Corp. - Class A*,7 | | | 45,134 | |
| | 4,500 | | | Horizon Acquisition Corp. - Class A*,7 | | | 44,910 | |
| | 4,500 | | | InterPrivate III Financial Partners, Inc. - Class A* | | | 44,572 | |
First Trust Multi-Strategy Fund
SCHEDULE OF INVESTMENTS - Continued
As of September 30, 2021
Number
of Shares | | | | | Value | |
| | | | COMMON STOCKS (Continued) | | | |
| | | | SPECIFIED PURPOSE ACQUISITIONS (Continued) | | | |
| | 4,414 | | | Ivanhoe Capital Acquisition Corp. - Class A*,7 | | $ | 43,699 | |
| | 694 | | | Jack Creek Investment Corp. - Class A*,7 | | | 6,766 | |
| | 1,060 | | | Kairos Acquisition Corp. - Class A*,7 | | | 10,250 | |
| | 1,292 | | | KINS Technology Group, Inc. - Class A* | | | 12,842 | |
| | 147 | | | KL Acquisition Corp. - Class A* | | | 1,436 | |
| | 4,500 | | | Leo Holdings III Corp. - Class A*,7 | | | 44,730 | |
| | 2,964 | | | LightJump Acquisition Corp.* | | | 29,195 | |
| | 9,626 | | | Lionheart Acquisition Corp. II - Class A* | | | 95,442 | |
| | 1,563 | | | Live Oak Acquisition Corp. II - Class A* | | | 15,599 | |
| | 4,000 | | | Lux Health Tech Acquisition Corp. - Class A* | | | 39,240 | |
| | 4,406 | | | M3-Brigade Acquisition II Corp. - Class A* | | | 43,663 | |
| | 4,129 | | | Magnum Opus Acquisition Ltd. - Class A*,7 | | | 40,836 | |
| | 3,354 | | | Maquia Capital Acquisition Corp. - Class A* | | | 33,540 | |
| | 4,000 | | | MCAP Acquisition Corp. - Class A* | | | 39,480 | |
| | 6,824 | | | Merida Merger Corp. I*,5 | | | 68,172 | |
| | 3,296 | | | Model Performance Acquisition Corp. - Class A*,7 | | | 32,894 | |
| | 4,227 | | | Motive Capital Corp. - Class A*,7 | | | 41,847 | |
| | 3,748 | | | Mountain Crest Acquisition Corp. II* | | | 37,367 | |
| | 3,384 | | | Mountain Crest Acquisition Corp. III* | | | 33,197 | |
| | 4,500 | | | Northern Star Investment Corp. II - Class A* | | | 44,685 | |
| | 3,383 | | | OceanTech Acquisitions I Corp. - Class A* | | | 33,424 | |
| | 29 | | | Omega Alpha SPAC - Class A*,7 | | | 282 | |
| | 2,935 | | | Orion Biotech Opportunities Corp. - Class A*,7 | | | 28,352 | |
| | 3,374 | | | Osiris Acquisition Corp. - Class A* | | | 33,133 | |
| | 4,581 | | | Pine Island Acquisition Corp. - Class A* | | | 44,710 | |
| | 846 | | | Post Holdings Partnering Corp. - Class A* | | | 8,155 | |
| | 1,551 | | | PropTech Investment Corp. II - Class A* | | | 15,200 | |
| | 147 | | | Prospector Capital Corp. - Class A*,7 | | | 1,435 | |
| | 4,016 | | | Queen's Gambit Growth Capital - Class A*,7 | | | 39,638 | |
| | 2,979 | | | RedBall Acquisition Corp. - Class A*,7 | | | 29,313 | |
| | 4,000 | | | Reinvent Technology Partners Y - Class A*,7 | | | 39,720 | |
| | 4,500 | | | Roman DBDR Tech Acquisition Corp. - Class A* | | | 45,495 | |
| | 663 | | | ScION Tech Growth I - Class A*,7 | | | 6,451 | |
| | 2,841 | | | ScION Tech Growth II - Class A*,7 | | | 27,700 | |
| | 4,500 | | | Seaport Global Acquisition Corp. - Class A* | | | 45,315 | |
| | 3,382 | | | Senior Connect Acquisition Corp. I - Class A* | | | 33,042 | |
| | 8,440 | | | Seven Oaks Acquisition Corp. - Class A* | | | 83,809 | |
| | 6,071 | | | Spartan Acquisition Corp. III - Class A* | | | 59,981 | |
| | 25 | | | SVF Investment Corp. - Class A*,7 | | | 244 | |
| | 2,557 | | | SVF Investment Corp. 3 - Class A*,7 | | | 25,135 | |
| | 4,000 | | | Switchback II Corp. - Class A*,7 | | | 39,840 | |
First Trust Multi-Strategy Fund
SCHEDULE OF INVESTMENTS - Continued
As of September 30, 2021
Number
of Shares | | | | | Value | |
| | | | COMMON STOCKS (Continued) | | | |
| | | | SPECIFIED PURPOSE ACQUISITIONS (Continued) | | | |
| | 3,572 | | | Tastemaker Acquisition Corp. - Class A* | | $ | 35,220 | |
| | 6,615 | | | Trebia Acquisition Corp. - Class A*,7 | | | 65,555 | |
| | 2,464 | | | Tuscan Holdings Corp. II*,5 | | | 24,911 | |
| | 145 | | | VectoIQ Acquisition Corp. II - Class A* | | | 1,408 | |
| | 3,768 | | | Ventoux CCM Acquisition Corp.* | | | 37,642 | |
| | 7,416 | | | Vickers Vantage Corp. I*,7 | | | 74,012 | |
| | 3,895 | | | Vistas Media Acquisition Co., Inc. - Class A* | | | 39,262 | |
| | 3,405 | | | Viveon Health Acquisition Corp.* | | | 34,016 | |
| | 4,443 | | | VPC Impact Acquisition Holdings III, Inc. - Class A* | | | 44,030 | |
| | 4,702 | | | Yunhong International - Class A*,5,7 | | | 48,289 | |
| | | | | | | | 3,543,377 | |
| | | | | TRANSPORT-RAIL — 1.6% | | | | |
| | 2,267 | | | Kansas City Southern5 | | | 613,541 | |
| | | | | TOTAL COMMON STOCKS | | | | |
| | | | | (Cost $9,113,853) | | | 9,245,004 | |
Principal
Amount | | | | | | |
| | | | CORPORATE BONDS — 4.3% | | | |
| | | | FINANCIALS — 4.3% | | | |
| $ | 300,000 | | | Allegiance Bank
5.250% (3-Month USD Libor+303 basis points), 12/15/20271,2,4 | | | 306,120 | |
| | 205,570 | | | BlackRock Capital Investment Corp.
5.000%, 6/15/20225,8 | | | 208,393 | |
| | 300,000 | | | ConnectOne Bancorp, Inc.
5.200% (3-Month USD Libor+284 basis points), 2/1/20282,4 | | | 307,207 | |
| | 300,000 | | | Independent Bank Group, Inc.
5.000% (3-Month USD Libor+283 basis points), 12/31/20272,4 | | | 305,788 | |
| | 250,000 | | | Nationstar Mortgage Holdings, Inc.
5.500%, 8/15/20281,2 | | | 257,839 | |
| | 230,000 | | | PennantPark Floating Rate Capital Ltd.
4.250%, 4/1/20262 | | | 232,172 | |
| | | | | | | | 1,617,519 | |
| | | | | TOTAL CORPORATE BONDS | | | | |
| | | | | (Cost $1,572,027) | | | 1,617,519 | |
Number
of Shares | | | | | | |
| | | | EXCHANGE-TRADED DEBT SECURITIES — 1.8% | | | |
| | | | FINANCIALS — 1.8% | | | |
| | | | | First Eagle Alternative Capital BDC, Inc. | | | | |
| | 6,599 | | | 6.125%, 10/30/20232,5 | | | 165,899 | |
First Trust Multi-Strategy Fund
SCHEDULE OF INVESTMENTS - Continued
As of September 30, 2021
Number
of Shares | | | | | Value | |
| | | | EXCHANGE-TRADED DEBT SECURITIES (Continued) | | | |
| | | | FINANCIALS (Continued) | | | |
| | 4,092 | | | 5.000%, 5/25/20262 | | $ | 103,323 | |
| | | | | Oxford Square Capital Corp. | | | | |
| | 13,092 | | | 6.500%, 3/30/20242,5 | | | 331,359 | |
| | 2,042 | | | 6.250%, 4/30/20262,5 | | | 51,948 | |
| | 1,800 | | | WhiteHorse Finance, Inc.
6.500%, 11/30/20252,5 | | | 45,414 | |
| | | | | | | | 697,943 | |
| | | | | TOTAL EXCHANGE-TRADED DEBT SECURITIES | | | | |
| | | | | (Cost $683,713) | | | 697,943 | |
| | | | | RIGHTS — 0.0% | | | | |
| | 3,452 | | | Agba Acquisition Ltd., Expiration Date: November 16, 2021*,5,7 | | | 870 | |
| | 3 | | | Angel Oak Financial Strategies Income Term Trust - Class R, Expiration Date: October 14, 2021* | | | 1 | |
| | 4,016 | | | Benessere Capital Acquisition Corp., Expiration Date: January 4, 2022* | | | 1,253 | |
| | 3,370 | | | Blue Safari Group Acquisition Corp., Expiration Date: December 8, 2023*,7 | | | 1,180 | |
| | 1,635 | | | Brilliant Acquisition Corp., Expiration Date: March 20, 2022*,7 | | | 605 | |
| | 4,001 | | | East Stone Acquisition Corp., Expiration Date: November 3, 2021*,5,7 | | | 1,680 | |
| | 100 | | | High Income Securities Fund, Expiration Date: October 22, 2021*,6 | | | — | |
| | 1 | | | Mexico Equity and Income Fund, Inc., Expiration Date: October 1, 2021*,6 | | | — | |
| | 3,296 | | | Model Performance Acquisition Corp., Expiration Date: October 6, 2022*,7 | | | 1,384 | |
| | 3,648 | | | Mountain Crest Acquisition Corp. II, Expiration Date: April 6, 2022* | | | 2,735 | |
| | 3,384 | | | Mountain Crest Acquisition Corp. III, Expiration Date: November 26, 2021* | | | 1,524 | |
| | 3,768 | | | Ventoux CCM Acquisition Corp., Expiration Date: June 23, 2022* | | | 659 | |
| | 3,405 | | | Viveon Health Acquisition Corp., Expiration Date: February 17, 2022* | | | 613 | |
| | 4,702 | | | Yunhong International, Expiration Date: November 3, 2021*,5,7 | | | 940 | |
| | | | | TOTAL RIGHTS | | | | |
| | | | | (Cost $0) | | | 13,444 | |
| | | | | UNITS — 0.2% | | | | |
| | | | | SPECIFIED PURPOSE ACQUISITIONS — 0.2% | | | | |
| | 1 | | | 7GC & Co. Holdings, Inc.* | | | 10 | |
| | 168 | | | B Riley Principal 250 Merger Corp.* | | | 1,660 | |
| | 1 | | | Big Sky Growth Partners, Inc.* | | | 10 | |
| | 3 | | | Churchill Capital Corp. VI* | | | 30 | |
| | 2,521 | | | Data Knights Acquisition Corp.* | | | 26,193 | |
| | 1 | | | Empowerment & Inclusion Capital I Corp.* | | | 10 | |
| | 1 | | | KL Acquisition Corp.* | | | 10 | |
| | 1 | | | Orion Biotech Opportunities Corp.*,7 | | | 10 | |
| | 1 | | | PropTech Investment Corp. II* | | | 10 | |
| | 1 | | | Prospector Capital Corp.*,7 | | | 10 | |
| | 2 | | | ScION Tech Growth I*,7 | | | 20 | |
First Trust Multi-Strategy Fund
SCHEDULE OF INVESTMENTS - Continued
As of September 30, 2021
Number
of Shares | | | | | Value | |
| | | | UNITS (Continued) | | | |
| | | | SPECIFIED PURPOSE ACQUISITIONS (Continued) | | | |
| | 1 | | | ScION Tech Growth II*,7 | | $ | 10 | |
| | 3,211 | | | SPK Acquisition Corp.* | | | 32,110 | |
| | 4 | | | SVF Investment Corp.*,7 | | | 40 | |
| | 3 | | | VectoIQ Acquisition Corp. II* | | | 29 | |
| | | | | | | | 60,162 | |
| | | | | TOTAL UNITS | | | | |
| | | | | (Cost $59,199) | | | 60,162 | |
| | | | | WARRANTS — 0.2% | | | | |
| | 129 | | | 7GC & Co. Holdings, Inc., Expiration Date: December 31, 2026* | | | 71 | |
| | 1,900 | | | Ace Global Business Acquisition Ltd., Expiration Date: December 31, 2027*,7 | | | 931 | |
| | 3,452 | | | Agba Acquisition Ltd., Expiration Date: May 10, 2024*,5,7 | | | 690 | |
| | 6,857 | | | AgileThought, Inc., Expiration Date: August 23, 2026*,5 | | | 7,063 | |
| | 970 | | | Americas Technology Acquisition Corp., Expiration Date: December 31, 2027*,7 | | | 478 | |
| | 1,058 | | | Aries I Acquisition Corp., Expiration Date: May 7, 2023*,7 | | | 583 | |
| | 562 | | | Artisan Acquisition Corp., Expiration Date: December 31, 2028*,7 | | | 641 | |
| | 1,678 | | | Athlon Acquisition Corp., Expiration Date: March 5, 2026* | | | 1,175 | |
| | 3,012 | | | Benessere Capital Acquisition Corp., Expiration Date: December 31, 2027* | | | 1,325 | |
| | 427 | | | Big Sky Growth Partners, Inc., Expiration Date: February 26, 2023* | | | 342 | |
| | 1,662 | | | Biotech Acquisition Co., Expiration Date: November 30, 2027*,7 | | | 1,096 | |
| | 593 | | | Bright Lights Acquisition Corp., Expiration Date: December 31, 2027* | | | 569 | |
| | 999 | | | Brilliant Acquisition Corp., Expiration Date: December 31, 2025*,7 | | | 400 | |
| | 1,888 | | | Burgundy Technology Acquisition Corp., Expiration Date: October 5, 2025*,7 | | | 1,284 | |
| | 287 | | | Capstar Special Purpose Acquisition Corp., Expiration Date: July 9, 2027* | | | 250 | |
| | 86 | | | CF Acquisition Corp. IV, Expiration Date: December 14, 2025* | | | 74 | |
| | 689 | | | Churchill Capital Corp. VI, Expiration Date: November 30, 2028* | | | 827 | |
| | 972 | | | Clarus Therapeutics Holdings, Inc., Expiration Date: August 31, 2027* | | | 729 | |
| | 956 | | | Colombier Acquisition Corp., Expiration Date: December 31, 2028* | | | 535 | |
| | 221 | | | Corner Growth Acquisition Corp., Expiration Date: December 31, 2027*,7 | | | 188 | |
| | 1,440 | | | Delwinds Insurance Acquisition Corp., Expiration Date: August 1, 2027* | | | 936 | |
| | 1,012 | | | Dune Acquisition Corp., Expiration Date: October 29, 2027* | | | 657 | |
| | 1,439 | | | Empowerment & Inclusion Capital I Corp., Expiration Date: December 31, 2027* | | | 1,079 | |
| | 5,749 | | | Ensysce Biosciences, Inc., Expiration Date: December 28, 2022*,5 | | | 1,955 | |
| | 1,567 | | | Far Peak Acquisition Corp., Expiration Date: May 31, 2025*,7 | | | 2,711 | |
| | 1,693 | | | GigInternational1, Inc., Expiration Date: December 31, 2028* | | | 1,422 | |
| | 843 | | | Global Consumer Acquisition Corp., Expiration Date: December 31, 2027* | | | 396 | |
| | 1,650 | | | Global SPAC Partners Co., Expiration Date: November 30, 2027*,7 | | | 759 | |
| | 134 | | | Golden Falcon Acquisition Corp., Expiration Date: November 4, 2026* | | | 82 | |
| | 677 | | | Graf Acquisition Corp. IV, Expiration Date: May 31, 2028* | | | 785 | |
| | 7,084 | | | Greenrose Acquisition Corp., Expiration Date: May 11, 2024*,5 | | | 4,180 | |
| | 97 | | | Healthcare Services Acquisition Corp., Expiration Date: December 31, 2027* | | | 64 | |
First Trust Multi-Strategy Fund
SCHEDULE OF INVESTMENTS - Continued
As of September 30, 2021
Number
of Shares | | | | | Value | |
| | | | WARRANTS (Continued) | | | |
| | 347 | | | Jack Creek Investment Corp., Expiration Date: December 31, 2027*,7 | | $ | 212 | |
| | 2,074 | | | Jasper Therapeutics, Inc., Expiration Date: December 1, 2026*,5 | | | 3,070 | |
| | 530 | | | Kairos Acquisition Corp., Expiration Date: December 31, 2027*,7 | | | 313 | |
| | 646 | | | KINS Technology Group, Inc., Expiration Date: December 31, 2025* | | | 420 | |
| | 49 | | | KL Acquisition Corp., Expiration Date: January 12, 2028* | | | 35 | |
| | 1,482 | | | LightJump Acquisition Corp., Expiration Date: December 30, 2027* | | | 812 | |
| | 2,518 | | | Lionheart Acquisition Corp. II, Expiration Date: February 14, 2026* | | | 2,340 | |
| | 521 | | | Live Oak Acquisition Corp. II, Expiration Date: December 7, 2025* | | | 990 | |
| | 1,677 | | | Maquia Capital Acquisition Corp., Expiration Date: December 31, 2027* | | | 922 | |
| | 3,412 | | | Merida Merger Corp. I, Expiration Date: November 7, 2026*,5 | | | 4,026 | |
| | 1,648 | | | Model Performance Acquisition Corp., Expiration Date: April 29, 2026*,7 | | | 770 | |
| | 3,383 | | | OceanTech Acquisitions I Corp., Expiration Date: May 10, 2026* | | | 1,489 | |
| | 587 | | | Orion Biotech Opportunities Corp., Expiration Date: December 31, 2027*,7 | | | 499 | |
| | 1,687 | | | Osiris Acquisition Corp., Expiration Date: May 1, 2028* | | | 828 | |
| | 282 | | | Post Holdings Partnering Corp., Expiration Date: February 9, 2023* | | | 254 | |
| | 517 | | | PropTech Investment Corp. II, Expiration Date: December 31, 2027* | | | 439 | |
| | 49 | | | Prospector Capital Corp., Expiration Date: January 1, 2025*,7 | | | 34 | |
| | 993 | | | RedBall Acquisition Corp., Expiration Date: August 17, 2022*,7 | | | 799 | |
| | 3,962 | | | Renovacor, Inc., Expiration Date: March 5, 2025* | | | 2,233 | |
| | 221 | | | ScION Tech Growth I, Expiration Date: November 1, 2025*,7 | | | 170 | |
| | 947 | | | ScION Tech Growth II, Expiration Date: January 28, 2026*,7 | | | 616 | |
| | 1,691 | | | Senior Connect Acquisition Corp. I, Expiration Date: December 31, 2027* | | | 1,201 | |
| | 1,970 | | | Seven Oaks Acquisition Corp., Expiration Date: December 22, 2025* | | | 1,556 | |
| | 5 | | | SVF Investment Corp., Expiration Date: December 31, 2027*,7 | | | 5 | |
| | 1,786 | | | Tastemaker Acquisition Corp., Expiration Date: December 31, 2025* | | | 1,161 | |
| | 832 | | | TMC the metals Co., Inc., Expiration Date: June 26, 2025*,7 | | | 799 | |
| | 1,232 | | | Tuscan Holdings Corp. II, Expiration Date: July 16, 2025*,5 | | | 825 | |
| | 29 | | | VectoIQ Acquisition Corp. II, Expiration Date: December 31, 2027* | | | 23 | |
| | 3,768 | | | Ventoux CCM Acquisition Corp., Expiration Date: September 30, 2025* | | | 904 | |
| | 3,708 | | | Vickers Vantage Corp. I, Expiration Date: December 31, 2027*,7 | | | 1,854 | |
| | 3,895 | | | Vistas Media Acquisition Co., Inc., Expiration Date: August 1, 2026* | | | 2,723 | |
| | 3,405 | | | Viveon Health Acquisition Corp., Expiration Date: December 31, 2027* | | | 851 | |
| | 2,351 | | | Yunhong International, Expiration Date: January 31, 2027*,5,7 | | | 370 | |
| | | | | TOTAL WARRANTS | | | | |
| | | | | (Cost $0) | | | 67,820 | |
First Trust Multi-Strategy Fund
SCHEDULE OF INVESTMENTS - Continued
As of September 30, 2021
Number
of Shares | | | | | Value | |
| | | | SHORT-TERM INVESTMENTS — 16.2% | | | |
| | 6,136,781 | | | Morgan Stanley Institutional Liquidity Fund - Government Portfolio - Institutional Class 0.026%5,9 | | $ | 6,136,781 | |
| | | | | TOTAL SHORT-TERM INVESTMENTS | | | | |
| | | | | (Cost $6,136,781) | | | 6,136,781 | |
| | | | | TOTAL INVESTMENTS — 97.9% | | | | |
| | | | | (Cost $37,035,856) | | | 37,156,311 | |
| | | | | Assets in Excess of Other Liabilities — 2.1% | | | 779,673 | |
| | | | | TOTAL NET ASSETS — 100.0% | | $ | 37,935,984 | |
| | | | | SECURITIES SOLD SHORT — (11.1)% | | | | |
| | | | | COMMON STOCKS — (7.9)% | | | | |
| | | | | COMMERCIAL BANKS-EASTERN US — (1.8)% | | | | |
| | (10,895 | ) | | FNB Corp. | | | (126,600 | ) |
| | (10,157 | ) | | Webster Financial Corp. | | | (553,150 | ) |
| | | | | | | | (679,750 | ) |
| | | | | COMMERCIAL BANKS-SOUTHERN US — (0.4)% | | | | |
| | (4,724 | ) | | BancorpSouth Bank | | | (140,681 | ) |
| | | | | COMMERCIAL BANKS-WESTERN US — (2.1)% | | | | |
| | (13,962 | ) | | Glacier Bancorp, Inc. | | | (772,796 | ) |
| | | | | OIL COMP-EXPLORATION & PRODUCTION — (0.9)% | | | | |
| | (16,017 | ) | | Cabot Oil & Gas Corp. | | | (348,530 | ) |
| | | | | RACETRACKS — (0.2)% | | | | |
| | (1,141 | ) | | Penn National Gaming, Inc.* | | | (82,677 | ) |
| | | | | S & L/THRIFTS-EASTERN US — (1.3)% | | | | |
| | (38,452 | ) | | New York Community Bancorp, Inc. | | | (494,877 | ) |
| | | | | SEMICONDUCTOR EQUIPMENT — (0.1)% | | | | |
| | (268 | ) | | MKS Instruments, Inc. | | | (40,444 | ) |
| | | | | TRANSPORT-RAIL — (1.1)% | | | | |
| | (6,539 | ) | | Canadian Pacific Railway Ltd.7 | | | (425,493 | ) |
| | | | | TOTAL COMMON STOCKS | | | | |
| | | | | (Proceeds $2,885,326) | | | (2,985,248 | ) |
| | | | | EXCHANGE-TRADED FUNDS — (3.2)% | | | | |
| | (1,000 | ) | | iShares Russell 1000 Growth ETF - ETF | | | (274,040 | ) |
| | (2,032 | ) | | SPDR S&P 500 ETF Trust - ETF | | | (872,013 | ) |
First Trust Multi-Strategy Fund
SCHEDULE OF INVESTMENTS - Continued
As of September 30, 2021
Number
of Shares | | | | | Value | |
| | | | EXCHANGE-TRADED FUNDS (Continued) | | | |
| | (682 | ) | | SPDR S&P Oil & Gas Exploration & Production ETF - ETF | | $ | (65,963 | ) |
| | | | | TOTAL EXCHANGE-TRADED FUNDS | | | | |
| | | | | (Proceeds $1,190,528) | | | (1,212,016 | ) |
| | | | | TOTAL SECURITIES SOLD SHORT | | | | |
| | | | | (Proceeds $4,075,854) | | $ | (4,197,264 | ) |
Number
of Contracts | | | | | | |
| | | | WRITTEN OPTIONS CONTRACTS — (0.0)% | | | |
| | | | CALL OPTIONS — (0.0)% | | | |
| | | | Bridgetown Holdings Ltd. | | | |
| | (1 | ) | | Exercise Price: $10.00, Notional Amount: $(1,000),
Expiration Date: October 15, 2021* | | | (5 | ) |
| | | | | CAI International, Inc. | | | | |
| | (1 | ) | | Exercise Price: $55.00, Notional Amount: $(5,500),
Expiration Date: January 21, 2022* | | | (100 | ) |
| | | | | Cloudera, Inc. | | | | |
| | (6 | ) | | Exercise Price: $16.00, Notional Amount: $(9,600),
Expiration Date: January 21, 2022* | | | (18 | ) |
| | | | | Lux Health Tech Acquisition Corp. | | | | |
| | (40 | ) | | Exercise Price: $10.00, Notional Amount: $(40,000),
Expiration Date: October 15, 2021* | | | (200 | ) |
| | | | | Pine Island Acquisition Corp. | | | | |
| | (46 | ) | | Exercise Price: $10.00, Notional Amount: $(46,000),
Expiration Date: October 15, 2021* | | | (184 | ) |
| | | | | Trillium Therapeutics, Inc. | | | | |
| | (1 | ) | | Exercise Price: $17.50, Notional Amount: $(1,750),
Expiration Date: October 15, 2021* | | | (25 | ) |
| | (2 | ) | | Exercise Price: $20.00, Notional Amount: $(4,000),
Expiration Date: November 19, 2021* | | | (5 | ) |
| | (5 | ) | | Exercise Price: $20.00, Notional Amount: $(10,000),
Expiration Date: December 17, 2021* | | | (25 | ) |
| | | | | TOTAL CALL OPTIONS | | | | |
| | | | | (Proceeds $757) | | | (562 | ) |
| | | | | TOTAL WRITTEN OPTIONS CONTRACTS | | | | |
| | | | | (Proceeds $757) | | $ | (562 | ) |
ETF — Exchange-Traded Fund
LP — Limited Partnership
| * | Non-income producing security. |
| 1 | Security exempt from registration under Rule 144A of the Securities Act of 1933. These securities are restricted and may be resold in transactions exempt from registration normally to qualified institutional buyers. The total value of these securities is $8,245,763, which represents 21.74% of total net assets of the Fund. |
| 3 | Variable or floating rate security, which interest rate adjusts periodically based on changes in current interest rates and prepayments on the underlying pool of assets. Rate shown is the rate in effect as of period end. |
First Trust Multi-Strategy Fund
SCHEDULE OF INVESTMENTS - Continued
As of September 30, 2021
| 5 | All or a portion of this security is segregated as collateral for securities sold short and written options contracts. The market value of the securities pledged as collateral was $5,342,956, which represent 14.08% of total net assets of the Fund. |
| 6 | Level 3 securities fair valued under procedures established by the Board of Trustees, represents 0.09% of Net Assets. The total value of these securities is $34,548. |
| 7 | Foreign security denominated in U.S. Dollars. |
| 9 | The rate is the annualized seven-day yield at period end. |
See accompanying Notes to Financial Statements.
First Trust Multi-Strategy Fund
SUMMARY OF INVESTMENTS
As of September 30, 2021
| Security Type/Sector | | Percent of Total
Net Assets |
| Asset-Backed Securities | | | 14.6 | % |
| Closed-End Funds | | | 18.8 | % |
| Collateralized Mortgage Obligations | | | 17.4 | % |
| Common Stocks | | | | |
| Financials | | | 15.4 | % |
| Technology | | | 2.3 | % |
| Health Care | | | 1.8 | % |
| Industrials | | | 1.7 | % |
| Communications | | | 1.4 | % |
| Energy | | | 0.9 | % |
| Real Estate | | | 0.6 | % |
| Materials | | | 0.3 | % |
| Total Common Stocks | | | 24.4 | % |
| Corporate Bonds | | | 4.3 | % |
| Exchange-Traded Debt Securities | | | | |
| Financials | | | 1.8 | % |
| Rights | | | 0.0 | % |
| Units | | | | |
| Specified Purpose Acquisitions | | | 0.2 | % |
| Warrants | | | 0.2 | % |
| Short-Term Investments | | | 16.2 | % |
| Total Investments | | | 97.9 | % |
| Other Assets in Excess of Liabilities | | | 2.1 | % |
| Total Net Assets | | | 100.0 | % |
Please refer to Schedule of Investments for information on securities sold short and written options contracts.
See accompanying Notes to Financial Statements.
STATEMENTS OF ASSETS AND LIABILITIES
As of September 30, 2021
| | | First Trust Merger Arbitrage Fund | | | First Trust Multi-Strategy Fund | |
| Assets: | | | | | | |
| Investments, at cost | | $ | 687,974,525 | | | $ | 37,035,856 | |
| Investments, at value | | $ | 687,495,909 | | | $ | 37,156,311 | |
| Cash | | | 1,620,103 | | | | 146,872 | |
| Cash deposited with brokers for securities sold short and written options contracts | | | 163,746,436 | | | | 4,911,000 | |
| Receivables: | | | | | | | | |
| Investment securities sold | | | 5,864,409 | | | | 131,707 | |
| Fund shares sold | | | 649,226 | | | | 185 | |
| Dividends and interest | | | 50,161 | | | | 65,464 | |
| Prepaid expenses | | | 42,222 | | | | 11,060 | |
| Total assets | | | 859,468,466 | | | | 42,422,599 | |
| Liabilities: | | | | | | | | |
| Securities sold short, proceeds | | $ | 160,417,514 | | | $ | 4,075,854 | |
| Written options contracts, proceeds | | | 405,886 | | | | 757 | |
| Securities sold short, at value | | $ | 164,377,528 | | | $ | 4,197,264 | |
| Written options contracts, at value | | | 332,725 | | | | 562 | |
| Payables: | | | | | | | | |
| Investment securities purchased | | | 10,139,011 | | | | 170,612 | |
| Fund shares redeemed | | | 331,554 | | | | 36,510 | |
| Advisory fees | | | 705,672 | | | | 36,349 | |
| Shareholder servicing fees (Note 8) | | | 71,018 | | | | 4,283 | |
| Distribution fees (Note 7) | | | 11,235 | | | | 427 | |
| Fund services fees | | | 160,148 | | | | - | |
| Dividends and interest on securities sold short | | | 239,137 | | | | 4,843 | |
| Trustees' deferred compensation (Note 3) | | | 40,837 | | | | 9,556 | |
| Shareholder reporting fees | | | 15,910 | | | | 3,077 | |
| Auditing fees | | | 15,001 | | | | 14,981 | |
| Trustees' fees and expenses | | | 7,719 | | | | 832 | |
| Legal fees | | | 4,390 | | | | 833 | |
| Chief Compliance Officer fees | | | 1,845 | | | | 5,026 | |
| Accrued other expenses | | | 7,926 | | | | 1,460 | |
| Total liabilities | | | 176,461,656 | | | | 4,486,615 | |
| Net Assets | | $ | 683,006,810 | | | $ | 37,935,984 | |
| Components of Net Assets: | | | | | | | | |
| Paid-in capital (par value of $0.01 per share with an unlimited number of shares authorized) | | $ | 639,678,174 | | | $ | 38,435,040 | |
| Total distributable earnings (accumulated deficit) | | | 43,328,636 | | | | (499,056 | ) |
| Net Assets | | $ | 683,006,810 | | | $ | 37,935,984 | |
| Maximum Offering Price per Share: | | | | | | | | |
| Class A Shares: | | | | | | | | |
| Net assets applicable to shares outstanding | | $ | 56,251,768 | | | $ | 1,900,016 | |
| Number of shares issued and outstanding | | | 5,040,932 | | | | 73,518 | |
| Redemption price per share | | $ | 11.16 | | | $ | 25.84 | |
| Maximum sales charge (5.75%, 5.00%, respectively, of offering price)* | | | 0.68 | | | | 1.36 | |
| Maximum offering price to public | | $ | 11.84 | | | $ | 27.20 | |
| Class I Shares: | | | | | | | | |
| Net assets applicable to shares outstanding | | $ | 626,755,042 | | | $ | 36,035,968 | |
| Number of shares issued and outstanding | | | 55,196,241 | | | | 1,366,972 | |
| Redemption price per share | | $ | 11.36 | | | $ | 26.36 | |
| * | No sales charge applies on investments of $1 million or more. On sales of $25,000 or more, the sales charge will be reduced for the Vivaldi Merger Arbitrage Fund. On sales of $50,000 or more, the sales charge will be reduced for the Vivaldi Multi-Strategy Fund. |
See accompanying Notes to Financial Statements.
STATEMENTS OF OPERATIONS
For the Year Ended September 30, 2021
| | | First Trust Merger Arbitrage Fund | | | First Trust Multi-Strategy Fund | |
| Investment income: | | | | | | |
| Dividends | | $ | 9,981,311 | | | $ | 1,103,055 | |
| Interest | | | 28,362 | | | | 987,503 | |
| Total investment income | | | 10,009,673 | | | | 2,090,558 | |
| Expenses: | | | | | | | | |
| Advisory fees | | | 7,350,046 | | | | 463,844 | |
| Shareholder servicing fees Class A (Note 8) | | | 74,193 | | | | 1,776 | |
| Shareholder servicing fees Class I (Note 8) | | | 466,043 | | | | 36,596 | |
| Distribution fees - (Note 7) | | | 123,803 | | | | 5,269 | |
| Dividends on securities sold short | | | 1,072,284 | | | | 76,060 | |
| Fund services fees | | | 891,483 | | | | 59,256 | |
| Interest expense | | | 291,578 | | | | 25,785 | |
| Registration fees | | | 91,858 | | | | 68,383 | |
| Shareholder reporting fees | | | 69,858 | | | | 10,769 | |
| Trustees' fees and expenses | | | 46,076 | | | | 3,867 | |
| Legal fees | | | 39,335 | | | | 1,639 | |
| Chief Compliance Officer fees | | | 16,502 | | | | 25,039 | |
| Miscellaneous | | | 15,001 | | | | 5,147 | |
| Auditing fees | | | 15,001 | | | | 14,982 | |
| Insurance fees | | | 13,786 | | | | 1,736 | |
| Total expenses | | | 10,576,847 | | | | 800,148 | |
| Advisory fees waived | | | (8,524 | ) | | | - | |
| Fees paid indirectly (Note 3) | | | (14,366 | ) | | | (93,066 | ) |
| Net expenses | | | 10,553,957 | | | | 707,082 | |
| Net investment income (loss) | | | (544,284 | ) | | | 1,383,476 | |
| Realized and Unrealized Gain (Loss) | | | | | | | | |
| Net realized gain (loss) on: | | | | | | | | |
| Investments | | | 52,959,262 | | | | 3,503,028 | |
| Purchased options contracts | | | (126,451 | ) | | | 414 | |
| Securities sold short | | | (101,460 | ) | | | (105,864 | ) |
| Written options contracts | | | 1,455,328 | | | | 10,107 | |
| Net realized gain | | | 54,186,679 | | | | 3,407,685 | |
| Net change in unrealized appreciation/depreciation on: | | | | | | | | |
| Investments | | | (6,359,918 | ) | | | 546,424 | |
| Securities sold short | | | (746,639 | ) | | | (77,777 | ) |
| Written options contracts | | | (41,750 | ) | | | (1,311 | ) |
| Net change in unrealized appreciation/depreciation | | | (7,148,307 | ) | | | 467,336 | |
| Net increase from payments by affiliates (Note 3) | | | - | | | | 440 | |
| Net realized and unrealized gain | | | 47,038,372 | | | | 3,875,461 | |
| Net Increase in Net Assets from Operations | | $ | 46,494,088 | | | $ | 5,258,937 | |
See accompanying Notes to Financial Statements.
First Trust Merger Arbitrage Fund
STATEMENTS OF CHANGES IN NET ASSETS
| | | For the
Year Ended
September 30, 2021 | | | For the
Year Ended
September 30, 2020 | |
| Increase (Decrease) in Net Assets from: | | | | | | | | |
| Operations: | | | | | | | | |
| Net investment loss | | $ | (544,284 | ) | | $ | (6,324,936 | ) |
| Net realized gain | | | 54,186,679 | | | | 7,219,199 | |
Net change in unrealized appreciation/depreciation on
investments, securities sold short, written options contracts and swap contracts | | | (7,148,307 | ) | | | 2,504,088 | |
| Net increase in net assets resulting from operations | | | 46,494,088 | | | | 3,398,351 | |
| Distributions to Shareholders: | | | | | | | | |
| Distributions: | | | | | | | | |
| Class A | | | (384,641 | ) | | | (2,663,911 | ) |
| Class I | | | (3,779,861 | ) | | | (30,677,263 | ) |
| Total distributions to shareholders | | | (4,164,502 | ) | | | (33,341,174 | ) |
| Capital Transactions: | | | | | | | | |
| Net proceeds from shares sold: | | | | | | | | |
| Class A | | | 24,040,095 | | | | 18,114,907 | |
| Class I | | | 239,222,041 | | | | 236,806,046 | |
| Reinvestment of distributions: | | | | | | | | |
| Class A | | | 374,347 | | | | 2,596,722 | |
| Class I | | | 3,145,463 | | | | 25,742,679 | |
| Cost of shares redeemed: | | | | | | | | |
| Class A1 | | | (15,605,297 | ) | | | (33,206,520 | ) |
| Class I2 | | | (140,232,886 | ) | | | (326,207,463 | ) |
| Net increase (decrease) in net assets from capital transactions | | | 110,943,763 | | | | (76,153,629 | ) |
| Total increase (decrease) in net assets | | | 153,273,349 | | | | (106,096,452 | ) |
| Net Assets: | | | | | | | | |
| Beginning of period | | | 529,733,461 | | | | 635,829,913 | |
| End of period | | $ | 683,006,810 | | | $ | 529,733,461 | |
| Capital Share Transactions: | | | | | | | | |
| Shares sold: | | | | | | | | |
| Class A | | | 2,192,987 | | | | 1,754,129 | |
| Class I | | | 21,368,580 | | | | 22,558,438 | |
| Shares reinvested: | | | | | | | | |
| Class A | | | 35,961 | | | | 250,891 | |
| Class I | | | 297,584 | | | | 2,458,709 | |
| Shares redeemed: | | | | | | | | |
| Class A | | | (1,434,678 | ) | | | (3,180,340 | ) |
| Class I | | | (12,841,642 | ) | | | (31,231,207 | ) |
| Net increase (decrease) in capital share transactions | | | 9,618,792 | | | | (7,389,380 | ) |
| 1 | Net of redemption fee proceeds of $2,160 and $1,039, respectively. |
| 2 | Net of redemption fee proceeds of $6,164 and $11,012, respectively. |
See accompanying Notes to Financial Statements.
First Trust Multi-Strategy Fund
STATEMENTS OF CHANGES IN NET ASSETS
| | | For the
Year Ended
September 30, 2021 | | | For the
Year Ended
September 30, 2020 | |
| Increase (Decrease) in Net Assets from: | | | | | | | | |
| Operations: | | | | | | | | |
| Net investment income | | $ | 1,383,476 | | | $ | 859,568 | |
| Net realized gain (loss) | | | 3,407,685 | | | | (2,025,096 | ) |
Net change in unrealized appreciation/depreciation on
investments, purchased options contracts, securities sold short, written options contracts, swap contracts and foreign currency translations | | | 467,336 | | | | (1,295,544 | ) |
| Net increase from payment by affiliates (Note 3) | | | 440 | | | | - | |
| Net increase (decrease) in net assets resulting from operations | | | 5,258,937 | | | | (2,461,072 | ) |
| Distributions to Shareholders: | | | | | | | | |
| Distributions: | | | | | | | | |
| Class A | | | (68,636 | ) | | | (380,980 | ) |
| Class I | | | (1,268,427 | ) | | | (3,889,997 | ) |
| From return of capital: | | | | | | | | |
| Class A | | | (29,877 | ) | | | (38,519 | ) |
| Class I | | | (500,024 | ) | | | (752,217 | ) |
| Total distributions to shareholders | | | (1,866,964 | ) | | | (5,061,713 | ) |
| Capital Transactions: | | | | | | | | |
| Net proceeds from shares sold: | | | | | | | | |
| Class A | | | 887,343 | | | | 1,082,483 | |
| Class I | | | 14,899,646 | | | | 38,478,341 | |
| Reinvestment of distributions: | | | | | | | | |
| Class A | | | 89,314 | | | | 402,535 | |
| Class I | | | 1,603,738 | | | | 3,740,095 | |
| Cost of shares redeemed: | | | | | | | | |
| Class A | | | (1,689,077 | ) | | | (3,871,894 | ) |
| Class I | | | (29,412,486 | ) | | | (37,251,286 | ) |
| Net increase (decrease) in net assets from capital transactions | | | (13,621,522 | ) | | | 2,580,274 | |
| Total decrease in net assets | | | (10,229,549 | ) | | | (4,942,511 | ) |
| Net Assets: | | | | | | | | |
| Beginning of period | | | 48,165,533 | | | | 53,108,044 | |
| End of period | | $ | 37,935,984 | | | $ | 48,165,533 | |
| Capital Share Transactions: | | | | | | | | |
| Shares sold: | | | | | | | | |
| Class A | | | 34,353 | | | | 43,872 | |
| Class I | | | 571,647 | | | | 1,531,827 | |
| Shares reinvested: | | | | | | | | |
| Class A | | | 3,475 | | | | 15,970 | |
| Class I | | | 61,264 | | | | 149,225 | |
| Shares redeemed: | | | | | | | | |
| Class A | | | (67,244 | ) | | | (162,003 | ) |
| Class I | | | (1,142,814 | ) | | | (1,529,165 | ) |
| Net increase (decrease) in capital share transactions | | | (539,319 | ) | | | 49,726 | |
See accompanying Notes to Financial Statements.
First Trust Merger Arbitrage Fund
STATEMENT OF CASH FLOWS
For the Year Ended September 30, 2021
| Increase (Decrease) in Cash: | | | |
| Cash flows provided by (used for) operating activities: | | | |
| Net increase in net assets resulting from operations | | $ | 46,494,088 | |
| Adjustments to reconcile net increase (decrease) in net assets from operations to net cash provided by (used for) operating activities: | | | | |
| Purchases of long-term investments | | | (2,446,063,004 | ) |
| Sales of long-term investments | | | 2,181,564,633 | |
| Return of capital dividends received | | | 3,145,932 | |
| Proceeds from securities sold short | | | 542,373,748 | |
| Cover short securities | | | (450,250,563 | ) |
| Proceeds from written options | | | 2,558,662 | |
| Closed written options | | | (433,971 | ) |
| Sales of short-term investments, net | | | 168,015,611 | |
| Increase in investment securities sold receivable | | | (4,917,929 | ) |
| Decrease in dividends and interest receivables | | | 68,748 | |
| Increase in prepaid expenses | | | (9,371 | ) |
| Decrease in investment securities purchased payable | | | (7,995,483 | ) |
| Increase in advisory fees payable | | | 156,709 | |
| Increase in interest and dividends on securities sold short | | | 221,150 | |
| Increase in accrued expenses | | | 69,319 | |
| Net realized gain | | | (54,116,769 | ) |
| Net change in unrealized appreciation/depreciation | | | 7,148,307 | |
| Net cash used for operating activities | | | (11,970,183 | ) |
| Cash flows provided by (used for) financing activities: | | | | |
| Proceeds from shares sold | | | 262,945,164 | |
| Cost of shares redeemed | | | (155,839,899 | ) |
| Dividends paid to shareholders, net of reinvestments | | | (644,692 | ) |
| Net cash provided by financing activities | | | 106,460,573 | |
| Net increase in cash | | | 94,490,390 | |
| Cash and cash equivalents | | | | |
| Beginning cash balance | | | - | |
| Begining cash held at brokers | | | 70,876,149 | |
| Total beginning cash and cash equivalents | | | 70,876,149 | |
| Ending cash balance | | | 1,620,103 | |
| Ending cash held at brokers | | | 163,746,436 | |
| Total ending cash and cash equivalents | | $ | 165,366,539 | |
| Supplemental disclosure of interest expense paid | | $ | 284,865 | |
| Non cash financing activities not included herein consist of $3,519,810 of reinvested dividends. | | | | |
See accompanying Notes to Financial Statements.
First Trust Multi-Strategy Fund
STATEMENT OF CASH FLOWS
For the Year Ended September 30, 2021
| Increase (Decrease) in Cash: | | | |
| Cash flows provided by (used for) operating activities: | | | | |
| Net increase in net assets resulting from operations | | $ | 5,258,937 | |
| Adjustments to reconcile net increase (decrease) in net assets from operations to net cash provided by (used for) operating activities: | | | | |
| Purchases of long-term investments | | | (49,143,736 | ) |
| Sales of long-term investments | | | 63,572,945 | |
| Return of capital dividends received | | | 425,627 | |
| Proceeds from securities sold short | | | 9,898,232 | |
| Cover short securities | | | (9,085,684 | ) |
| Proceeds from written options | | | 11,762 | |
| Closed written options | | | (221 | ) |
| Purchases of short-term investments, net | | | (382,257 | ) |
| Decrease in investment securities sold receivable | | | 18,457 | |
| Decrease in dividends and interest receivables | | | 64,356 | |
| Decrease in prepaid expenses | | | 30,171 | |
| Decrease in investment securities purchased payable | | | (384,548 | ) |
| Decrease in advisory fees payable | | | (11,419 | ) |
| Increase in interest and dividends on securities sold short | | | 1,958 | |
| Decrease in accrued expenses | | | (3,376 | ) |
| Net amortization on investments | | | (59,826 | ) |
| Net realized gain | | | (3,553,422 | ) |
| Net change in unrealized appreciation/depreciation | | | (467,336 | ) |
| Net cash provided by operating activities | | | 16,190,620 | |
| Cash flows provided by (used for) financing activities: | | | | |
| Proceeds from shares sold | | | 15,789,187 | |
| Cost of shares redeemed | | | (31,076,410 | ) |
| Dividends paid to shareholders, net of reinvestments | | | (173,912 | ) |
| Net cash used for financing activities | | | (15,461,135 | ) |
| Net increase in cash | | | 729,485 | |
| Cash and cash equivalents | | | | |
| Beginning cash balance | | | 458,302 | |
| Begining cash held at brokers | | | 3,870,085 | |
| Total beginning cash and cash equivalents | | | 4,328,387 | |
| Ending cash balance | | | 146,872 | |
| Ending cash held at brokers | | | 4,911,000 | |
| Total ending cash and cash equivalents | | $ | 5,057,872 | |
| Supplemental disclosure of interest expense paid | | $ | 27,916 | |
| Non cash financing activities not included herein consist of $1,693,052 of reinvested dividends. | | | | |
See accompanying Notes to Financial Statements.
First Trust Merger Arbitrage Fund
FINANCIAL HIGHLIGHTS
Class A
Per share operating performance.
For a capital share outstanding throughout each period.
| | | For the Year Ended September 30, | |
| | | 2021 | | | 2020 | | | 2019 | | | 2018 | | | 2017 | |
| Net asset value, beginning of period | | $ | 10.33 | | | $ | 10.86 | | | $ | 10.51 | | | $ | 10.63 | | | $ | 10.26 | |
| Income from Investment Operations: | | | | | | | | | | | | | | | | | | | | |
| Net investment income (loss)1 | | | (0.04 | ) | | | (0.14 | ) | | | - | | | | 0.18 | | | | (0.06 | ) |
| Net realized and unrealized gain (loss) | | | 0.96 | | | | 0.19 | | | | 0.55 | | | | (0.12 | ) | | | 0.44 | |
| Net increase from payments by affiliates | | | - | | | | - | | | | - | | | | - | 2,3 | | | - | 3,4 |
| Total from investment operations | | | 0.92 | | | | 0.05 | | | | 0.55 | | | | 0.06 | | | | 0.38 | |
| Less Distributions: | | | | | | | | | | | | | | | | | | | | |
| From net investment income | | | - | | | | - | | | | (0.10 | ) | | | - | | | | - | |
| From net realized gain | | | (0.09 | ) | | | (0.58 | ) | | | (0.10 | ) | | | (0.18 | ) | | | (0.01 | ) |
| Total distributions | | | (0.09 | ) | | | (0.58 | ) | | | (0.20 | ) | | | (0.18 | ) | | | (0.01 | ) |
| Redemption Fee Proceeds1 | | | - | 3 | | | - | 3 | | | - | 3 | | | - | 3 | | | - | 3 |
| Net asset value, end of period | | $ | 11.16 | | | $ | 10.33 | | | $ | 10.86 | | | $ | 10.51 | | | $ | 10.63 | |
| Total return5 | | | 8.95 | % | | | 0.47 | % | | | 5.26 | % | | | 0.57 | % | | | 3.67 | % |
| Ratios and Supplemental Data: | | | | | | | | | | | | | | | | | | | | |
| Net assets, end of period (in thousands) | | $ | 56,252 | | | $ | 43,870 | | | $ | 58,887 | | | $ | 78,053 | | | $ | 86,740 | |
| Ratio of expenses to average net assets (including dividends and interest on securities sold short and interest expense): | | | | | | | | | | | | | | | | | | | | |
| Before fees waived and expenses absorbed | | | 2.08 | %6 | | | 2.40 | %6 | | | 2.78 | %6 | | | 2.43 | %6 | | | 3.03 | %6 |
| After fees waived and expenses absorbed | | | 2.08 | %6 | | | 2.40 | %6 | | | 2.78 | %6 | | | 2.46 | %6 | | | 3.04 | %6 |
| Ratio of net investment income (loss) to average net assets (including dividends and interest on securities sold short and interest expense): | | | | | | | | | | | | | | | | | | | | |
| Before fees waived and expenses absorbed | | | (0.38 | )% | | | (1.34 | )% | | | 0.03 | % | | | 1.77 | % | | | (0.54 | )% |
| After fees waived and expenses absorbed | | | (0.38 | )% | | | (1.34 | )% | | | 0.03 | % | | | 1.74 | % | | | (0.55 | )% |
| Portfolio turnover rate | | | 459 | % | | | 644 | % | | | 716 | % | | | 670 | % | | | 478 | % |
| 1 | Based on average daily shares outstanding for the period. |
| 2 | Affiliate reimbursed the Fund $2,674 for errors during processing. The reimbursement had no impact to the Fund's performance. |
| 3 | Amount represents less than $0.01 per share. |
| 4 | Affiliate reimbursed the Fund $11,641 for errors during processing. The reimbursement had no impact to the Fund's performance. |
| 5 | Total returns would have been higher/lower had expenses not been recovered/waived and absorbed by the Advisor. Returns shown include Rule 12b-1 fees of up to 0.25% and do not reflect the deduction of taxes that a shareholder would pay on Fund distributions or the redemption of Fund shares. Returns shown do not include payment of sales load of 5.75% of offering price which is reduced on sales of $25,000 or more. If the sales charge was included total returns would be lower. |
| 6 | If dividends and interest on securities sold short and interest expense had been excluded, the expense ratios would have been lowered by 0.23% for the year ended September 30, 2021. For the years ended September 30, 2020, 2019, 2018, and 2017, the ratios would have been lowered by 0.55%, 0.95%, 0.64%, and 1.22%, respectively. |
See accompanying Notes to Financial Statements.
First Trust Merger Arbitrage Fund
FINANCIAL HIGHLIGHTS
Class I
Per share operating performance.
For a capital share outstanding throughout each period.
| | | For the Year Ended September 30, | |
| | 2021 | | | 2020 | | | 2019 | | | 2018 | | | 2017 | |
| Net asset value, beginning of period | | $ | 10.48 | | | $ | 10.97 | | | $ | 10.62 | | | $ | 10.70 | | | $ | 10.30 | |
| Income from Investment Operations: | | | | | | | | | | | | | | | | | | | | |
| Net investment income (loss)1 | | | (0.01 | ) | | | (0.11 | ) | | | 0.04 | | | | 0.21 | | | | (0.03 | ) |
| Net realized and unrealized gain (loss) | | | 0.98 | | | | 0.20 | | | | 0.54 | | | | (0.11 | ) | | | 0.44 | |
| Net increase from payments by affiliates | | | - | | | | - | | | | - | | | | - | 2,3 | | | - | 3,4 |
| Total from investment operations | | | 0.97 | | | | 0.09 | | | | 0.58 | | | | 0.10 | | | | 0.41 | |
| Less Distributions: | | | | | | | | | | | | | | | | | | | | |
| From net investment income | | | - | | | | - | | | | (0.13 | ) | | | - | | | | - | |
| From net realized gain | | | (0.09 | ) | | | (0.58 | ) | | | (0.10 | ) | | | (0.18 | ) | | | (0.01 | ) |
| Total distributions | | | (0.09 | ) | | | (0.58 | ) | | | (0.23 | ) | | | (0.18 | ) | | | (0.01 | ) |
| Redemption Fee Proceeds1 | | | - | 3 | | | - | 3 | | | - | 3 | | | - | 3 | | | - | 3 |
| Net asset value, end of period | | $ | 11.36 | | | $ | 10.48 | | | $ | 10.97 | | | $ | 10.62 | | | $ | 10.70 | |
| Total return5 | | | 9.30 | % | | | 0.85 | % | | | 5.52 | % | | | 0.94 | % | | | 3.95 | % |
| Ratios and Supplemental Data: | | | | | | | | | | | | | | | | | | | | |
| Net assets, end of period (in thousands) | | $ | 626,755 | | | $ | 485,864 | | | $ | 576,943 | | | $ | 473,711 | | | $ | 445,110 | |
| Ratio of expenses to average net assets (including dividends and interest on securities sold short and interest expense): | | | | | | | | | | | | | | | | | | | | |
| Before fees waived and expenses absorbed | | | 1.77 | %6 | | | 2.07 | %6 | | | 2.47 | %6 | | | 2.14 | %6 | | | 2.74 | %6 |
| After fees waived and expenses absorbed | | | 1.77 | %6 | | | 2.07 | %6 | | | 2.47 | %6 | | | 2.17 | %6 | | | 2.75 | %6 |
| Ratio of net investment income (loss) to average net assets (including dividends and interest on securities sold short and interest expense): | | | | | | | | | | | | | | | | | | | | |
| Before fees waived and expenses absorbed | | | (0.07 | )% | | | (1.01 | )% | | | 0.34 | % | | | 2.06 | % | | | (0.25 | )% |
| After fees waived and expenses absorbed | | | (0.07 | )% | | | (1.01 | )% | | | 0.34 | % | | | 2.03 | % | | | (0.26 | )% |
| Portfolio turnover rate | | | 459 | % | | | 644 | % | | | 716 | % | | | 670 | % | | | 478 | % |
| 1 | Based on average daily shares outstanding for the period. |
| 2 | Affiliate reimbursed the Fund $2,674 for errors during processing. The reimbursement had no impact to the Fund's performance. |
| 3 | Amount represents less than $0.01 per share. |
| 4 | Affiliate reimbursed the Fund $11,641 for errors during processing. The reimbursement had no impact to the Fund's performance. |
| 5 | Total returns would have been higher/lower had expenses not been recovered/waived and absorbed by the Advisor. Returns shown do not reflect the deduction of taxes that a shareholder would pay on Fund distributions or the redemption of Fund shares. |
| 6 | If dividends and interest on securities sold short and interest expense had been excluded, the expense ratios would have been lowered by 0.23% for the year ended September 30, 2021. For the years ended September 30, 2020, 2019, 2018, and 2017, the ratios would have been lowered by 0.55%, 0.95%, 0.64%, and 1.22%, respectively. |
See accompanying Notes to Financial Statements.
First Trust Multi-Strategy Fund
FINANCIAL HIGHLIGHTS
Class A*
Per share operating performance.
For a capital share outstanding throughout each period.
| | | For the Year Ended September 30, | | | For the Period March 1, 2017 through September 30, | | | For the Year Ended February 28, | |
| | | 2021 | | | 2020 | | | 2019 | | | 2018 | | | 2017** | | | 2017 | |
| Net asset value, beginning of period | | $ | 23.90 | | | $ | 27.08 | | | $ | 25.62 | | | $ | 26.92 | | | $ | 26.28 | | | $ | 25.88 | |
| Income from Investment Operations: | | | | | | | | | | | | | | | | | | | | | | | | |
| Net investment income (loss)1 | | | 0.86 | | | | 0.35 | | | | 0.41 | | | | 0.24 | | | | (0.08 | ) | | | (0.54 | ) |
| Net realized and unrealized gain (loss) | | | 2.34 | | | | (0.98 | ) | | | 1.72 | | | | (0.73 | ) | | | 0.72 | | | | 1.38 | |
| Net increase from payments by affiliates (Note 3) | | | - | 2 | | | - | | | | - | | | | - | | | | - | | | | - | |
| Total from investment operations | | | 3.20 | | | | (0.63 | ) | | | 2.13 | | | | (0.49 | ) | | | 0.64 | | | | 0.84 | |
| | | | | | | | | | | | | | | | | | | | | | | | | |
| Less Distributions: | | | | | | | | | | | | | | | | | | | | | | | | |
| From net investment income | | | (0.89 | ) | | | (0.58 | ) | | | (0.67 | ) | | | - | | | | - | | | | - | |
| From net realized gain | | | - | | | | (1.62 | ) | | | - | | | | (0.81 | ) | | | - | | | | (0.44 | ) |
| From return of capital | | | (0.37 | ) | | | (0.35 | ) | | | - | | | | - | | | | - | | | | - | |
| Total distributions | | | (1.26 | ) | | | (2.55 | ) | | | (0.67 | ) | | | (0.81 | ) | | | - | | | | (0.44 | ) |
| | | | | | | | | | | | | | | | | | | | | | | | | |
| Redemption Fee Proceeds1 | | | - | | | | - | | | | - | | | | - | | | | - | | | | - | |
| | | | | | | | | | | | | | | | | | | | | | | | | |
| Net asset value, end of period | | $ | 25.84 | | | $ | 23.90 | | | $ | 27.08 | | | $ | 25.62 | | | $ | 26.92 | | | $ | 26.28 | |
| | | | | | | | | | | | | | | | | | | | | | | | | |
| Total return3 | | | 13.53 | % | | | (2.45 | )% | | | 8.44 | % | | | (1.89 | )% | | | 2.40 | %4 | | | 3.22 | % |
| Ratios and Supplemental Data: | | | | | | | | | | | | | | | | | | | | | | | | |
| Net assets, end of period (in thousands) | | $ | 1,900 | | | $ | 2,460 | | | $ | 5,554 | | | $ | 7,767 | | | $ | 27,016 | | | $ | 30,800 | |
| | | | | | | | | | | | | | | | | | | | | | | | | |
| Ratio of expenses to average net assets (including dividends and interest on securities sold short and interest expense): | | | | | | | | | | | | | | | | | | | | | | | | |
| Before fees waived and expenses absorbed | | | 2.29 | %5 | | | 2.19 | %5 | | | 2.49 | %5 | | | 3.12 | %5,6 | | | 3.67 | %5,7 | | | 3.71 | %5 |
| After fees waived and expenses absorbed | | | 2.05 | %5 | | | 2.10 | %5 | | | 2.33 | %5 | | | 2.98 | %5,6 | | | 3.67 | %5,7 | | | 3.66 | %5 |
| Ratio of net investment income (loss) to average net assets (including dividends and interest on securities sold short and interest expense): | | | | | | | | | | | | | | | | | | | | | | | | |
| Before fees waived and expenses absorbed | | | 3.12 | % | | | 1.30 | % | | | 1.42 | % | | | 0.80 | % | | | (0.49 | )%7 | | | (2.08 | )% |
| After fees waived and expenses absorbed | | | 3.36 | % | | | 1.39 | % | | | 1.58 | % | | | 0.94 | % | | | (0.49 | )%7 | | | (2.03 | )% |
| Portfolio turnover rate | | | 170 | % | | | 223 | % | | | 286 | % | | | 275 | % | | | 198 | %4 | | | 323 | % |
| * | Financial information from April 30, 2012 through December 18, 2016 is for the Vivaldi Orinda Macro Opportunities Fund, which was reorganized into the Vivaldi Multi-Strategy Fund as of the close of business December 18, 2016. |
| ** | Fiscal year end changed to September 30, effective July 20, 2017. |
| 1 | Based on average shares outstanding for the period. |
| 2 | Amount represents less than $0.01 per share. |
| 3 | Total returns would have been lower had expenses not been waived and absorbed by the Advisor. Returns shown include Rule 12b-1 fees of up to 0.25% and do not reflect the deduction of taxes that a shareholder would pay on Fund distributions or the redemption of Fund shares. Returns shown do not include payment of sales load of 5.00% of offering price which is reduced on sales of $50,000 or more. If the sales charge was included total returns would be lower. |
| 5 | If dividends and interest on securities sold short and interest expense had been excluded, the expense ratios would have been lowered by 0.27% for year ended September 30, 2021. For the periods ended 2020, 2019, 2018 and 2017, the ratios would have been lowered by 0.31%, 0.50%, 0.78%, 1.42%, and 1.20%, respectively. |
| 6 | Effective August 1, 2018, the Fund's advisor had contractually agreed to waive its fees and/or pay for operating expenses of the Fund to ensure that the total annual fund operating expenses (excluding taxes, leverage interest, brokerage commissions, dividend and interest expenses on short sales, acquired fund fees and expenses as determined in accordance with SEC Form N-1A, expenses incurred in connection with any merger or reorganization, or extraordinary expenses such as litigation) do not exceed 1.85% of average daily net assets of the Fund. Prior to August 1, 2018, the annual operating expense limitation was 2.25%. |
See accompanying Notes to Financial Statements.
First Trust Multi-Strategy Fund
FINANCIAL HIGHLIGHTS
Class I*
Per share operating performance.
For a capital share outstanding throughout each period.
| | | For the Year Ended September 30, | | | For the Period March 1, 2017 through September 30, | | | For the Year Ended February 28, | |
| | | 2021 | | | 2020 | | | 2019 | | | 2018 | | | 2017** | | | 2017 | |
| Net asset value, beginning of period | | $ | 24.35 | | | $ | 27.57 | | | $ | 26.17 | | | $ | 27.40 | | | $ | 26.71 | | | $ | 26.21 | |
| Income from Investment Operations: | | | | | | | | | | | | | | | | | | | | | | | | |
| Net investment income (loss)1 | | | 0.93 | | | | 0.42 | | | | 0.50 | | | | 0.33 | | | | (0.03 | ) | | | (0.47 | ) |
| Net realized and unrealized gain (loss) | | | 2.41 | | | | (1.01 | ) | | | 1.74 | | | | (0.75 | ) | | | 0.72 | | | | 1.41 | |
| Net increase from payments by affiliates (Note 3) | | | - | 2 | | | - | | | | - | | | | - | | | | - | | | | - | |
| Total from investment operations | | | 3.34 | | | | (0.59 | ) | | | 2.24 | | | | (0.42 | ) | | | 0.69 | | | | 0.94 | |
| | | | | | | | | | | | | | | | | | | | | | | | | |
| Less Distributions: | | | | | | | | | | | | | | | | | | | | | | | | |
| From net investment income | | | (0.94 | ) | | | (0.64 | ) | | | (0.84 | ) | | | - | | | | - | | | | - | |
| From net realized gain | | | - | | | | (1.62 | ) | | | - | | | | (0.81 | ) | | | - | | | | (0.44 | ) |
| From return of capital | | | (0.39 | ) | | | (0.37 | ) | | | - | | | | - | | | | - | | | | - | |
| Total distributions | | | (1.33 | ) | | | (2.63 | ) | | | (0.84 | ) | | | (0.81 | ) | | | - | | | | (0.44 | ) |
| | | | | | | | | | | | | | | | | | | | | | | | | |
| Redemption Fee Proceeds1 | | | - | | | | - | | | | - | | | | - | | | | - | | | | - | |
| | | | | | | | | | | | | | | | | | | | | | | | | |
| Net asset value, end of period | | $ | 26.36 | | | $ | 24.35 | | | $ | 27.57 | | | $ | 26.17 | | | $ | 27.40 | | | $ | 26.71 | |
| | | | | | | | | | | | | | | | | | | | | | | | | |
| Total return3 | | | 13.84 | % | | | (2.23 | )% | | | 8.80 | % | | | (1.60 | )% | | | 2.58 | %4 | | | 3.56 | % |
| Ratios and Supplemental Data: | | | | | | | | | | | | | | | | | | | | | | | | |
| Net assets, end of period (in thousands) | | $ | 36,036 | | | $ | 45,706 | | | $ | 47,554 | | | $ | 57,368 | | | $ | 128,676 | | | $ | 111,728 | |
| | | | | | | | | | | | | | | | | | | | | | | | | |
| Ratio of expenses to average net assets (including dividends and interest on securities sold short and interest expense): | | | | | | | | | | | | | | | | | | | | | | | | |
| Before fees waived and expenses absorbed | | | 2.06 | %5 | | | 1.92 | %5 | | | 2.17 | %5 | | | 2.82 | %5,6 | | | 3.37 | %5,7 | | | 3.41 | %5 |
| After fees waived and expenses absorbed | | | 1.82 | %5 | | | 1.83 | %5 | | | 2.01 | %5 | | | 2.68 | %5,6 | | | 3.37 | %5,7 | | | 3.36 | %5 |
| Ratio of net investment income (loss) to average net assets (including dividends and interest on securities sold short and interest expense): | | | | | | | | | | | | | | | | | | | | | | | | |
| Before fees waived and expenses absorbed | | | 3.35 | % | | | 1.57 | % | | | 1.74 | % | | | 1.10 | % | | | (0.19 | )%7 | | | (1.78 | )% |
| After fees waived and expenses absorbed | | | 3.59 | % | | | 1.66 | % | | | 1.90 | % | | | 1.24 | % | | | (0.19 | )%7 | | | (1.73 | )% |
| Portfolio turnover rate | | | 170 | % | | | 223 | % | | | 286 | % | | | 275 | % | | | 198 | %4 | | | 323 | % |
| * | Financial information from April 30, 2012 through December 18, 2016 is for the Vivaldi Orinda Macro Opportunities Fund, which was reorganized into the Vivaldi Multi-Strategy Fund as of the close of business December 18, 2016. |
| ** | Fiscal year end changed to September 30, effective July 20, 2017. |
| 1 | Based on average shares outstanding for the period. |
| 2 | Amount represents less than $0.01 per share. |
| 3 | Total returns would have been lower had expenses not been waived and absorbed by the Advisor. Returns shown do not reflect the deduction of taxes that a shareholder would pay on Fund distributions or the redemption of Fund shares. |
| 5 | If dividends and interest on securities sold short and interest expense had been excluded, the expense ratios would have been lowered by 0.27% for the year ended September 30, 2021. For the periods ended 2020, 2019, 2018 and 2017, the ratios would have been lowered by 0.31%, 0.50%, 0.78%, 1.42%, and 1.20%, respectively. |
| 6 | Effective August 1, 2018, the Fund's advisor had contractually agreed to waive its fees and/or pay for operating expenses of the Fund to ensure that the total annual fund operating expenses (excluding taxes, leverage interest, brokerage commissions, dividend and interest expenses on short sales, acquired fund fees and expenses as determined in accordance with SEC Form N-1A, expenses incurred in connection with any merger or reorganization, or extraordinary expenses such as litigation) do not exceed 1.55% of average daily net assets of the Fund. Prior to August 1, 2018, the annual operating expense limitation was 1.95%. |
See accompanying Notes to Financial Statements.
First Trust Funds
NOTES TO FINANCIAL STATEMENTS
September 30, 2021
Note 1 – Organization
First Trust Merger Arbitrage Fund (formerly, Vivaldi Merger Arbitrage Fund) (the ‘‘Merger Arbitrage Fund’’) and First Trust Multi-Strategy Fund (formerly, Vivaldi Multi-Strategy Fund) (the “Multi-Strategy Fund”) (each a “Fund” and collectively the ‘‘Funds’’) are organized as a series of Investment Managers Series Trust II, a Delaware statutory trust (the “Trust”) which is registered as an open-end management investment company under the Investment Company Act of 1940, as amended (the “1940 Act”). The Multi-Strategy Fund is a diversified fund. The Merger Arbitrage Fund is a non-diversified fund.
The Merger Arbitrage Fund seeks returns that are largely uncorrelated with the returns of the general stock market and capital appreciation. The Fund commenced investment operations on October 1, 2015 with Class A and Class I shares. Prior to that date, its only activity was the receipt of a $1,000 investment from principals of the Fund’s advisor and a transfer of 307,251 newly issued shares of the Fund’s Class I in exchange for the net assets of the Highland Capital Management Institutional Fund, LLC, a Delaware limited liability company (the “Company”) valued at $3,073,511. This exchange was nontaxable. The primary assets received by the Fund were cash, interest receivable and securities of the Company with a fair value of $2,249,946 (identified cost of investments transferred were $2,271,450), totaling $3,073,511. For financial reporting purposes, assets received and shares issued by the Fund were recorded at fair value; however, the cost basis of the investments received from the Company was carried forward to align ongoing reporting of the Fund’s realized and unrealized gains and losses with amounts distributable to shareholders for tax purposes.
The Multi-Strategy Fund seeks to achieve long-term capital appreciation by pursuing positive absolute returns across market cycles. In pursuing its objective, the Fund seeks to generate attractive long-term returns with low sensitivity to traditional equity and fixed-income indices. The Fund commenced investment operations on December 16, 2016 with Class A and Class I shares. Prior to that date, the Fund acquired the assets and assumed the liabilities of the Vivaldi Orinda Macro Opportunities Fund (the “Predecessor Fund”), a series of Advisors Series Trust. The reorganization was accomplished by the following tax-free exchange in which each shareholder of the Predecessor Fund received the same aggregate share net asset value in the corresponding classes as noted below:
| | | Shares Issued | | | Net Assets | |
| Class A | | | 1,058,074 | | | $ | 28,004,864 | |
| Class I | | | 3,174,754 | | | $ | 85,334,375 | |
The net unrealized appreciation of investments transferred was $3,090,238 as of the date of the acquisition.
The shares of each class of each Fund represent an interest in the same portfolio of investments of each particular Fund and have equal rights as to voting, redemptions, dividends and liquidation, subject to the approval of the Trustees. Income, expenses (other than expenses attributable to a specific class) and realized and unrealized gains and losses on investments are allocated to each class of shares in proportion to their relative net assets. Shareholders of a class that bears distribution and service expenses under the terms of a distribution plan have exclusive voting rights to that distribution plan.
Each Fund is an investment company and accordingly follows the investment company accounting and reporting guidance of the Financial Accounting Standards Board (FASB) Accounting Standard Codification Topic 946 “Financial Services—Investment Companies.”
Note 2 – Accounting Policies
The following is a summary of the significant accounting policies consistently followed by the Funds in the preparation of their financial statements. The preparation of financial statements in conformity with accounting principles generally accepted in the United States of America (“GAAP”) requires management to make estimates and assumptions that affect the reported amounts and disclosures in the financial statements. Actual results could differ from these estimates.
First Trust Funds
NOTES TO FINANCIAL STATEMENTS - Continued
September 30, 2021
(a) Valuation of Investments
The Funds value equity securities at the last reported sale price on the principal exchange or in the principal over the counter (“OTC”) market in which such securities are traded, as of the close of regular trading on the NYSE on the day the securities are being valued or, if the last-quoted sales price is not readily available, the securities will be valued at the last bid or the mean between the last available bid and ask price. Securities traded on the NASDAQ are valued at the NASDAQ Official Closing Price (“NOCP”). Investments in open-end investment companies are valued at the daily closing net asset value of the respective investment company. Options are valued at the mean between the last available bid and asked prices used. Debt securities are valued by utilizing a price supplied by independent pricing service providers. The independent pricing service providers may use various valuation methodologies including matrix pricing and other analytical pricing models as well as market transactions and dealer quotations. These models generally consider such factors as yields or prices of bonds of comparable quality, type of issue, coupon, maturity, ratings and general market conditions. If a price is not readily available for a portfolio security, the security will be valued at fair value (the amount which the Funds might reasonably expect to receive for the security upon its current sale) as determined in good faith by the Funds’ advisor, subject to review and approval by the Valuation Committee, pursuant to procedures adopted by the Board of Trustees. The actions of the Valuation Committee are subsequently reviewed by the Board at its next regularly scheduled board meeting. The Valuation Committee meets as needed. The Valuation Committee is comprised of all the Trustees, but action may be taken by any one of the Trustees.
(b) Foreign Currency Translation
The Funds’ records are maintained in U.S. dollars. The value of securities, currencies and other assets and liabilities denominated in currencies other than U.S. dollars are translated into U.S. dollars based upon foreign exchange rates prevailing at the end of the reporting period. The currencies are translated into U.S. dollars by using the exchange rates quoted as of 4:00 PM Eastern Standard Time. Purchases and sales of investment securities, income and expenses are translated on the respective dates of such transactions.
The Funds do not isolate that portion of their net realized and unrealized gains and losses on investments resulting from changes in foreign exchange rates from the impact arising from changes in market prices. Such fluctuations are included with net realized and unrealized gain or loss from investments and foreign currency.
Net realized foreign currency transaction gains and losses arise from sales of foreign currencies, currency gains or losses realized between the trade and settlement dates on securities transactions, and the differences between the amounts of dividends, interest, and foreign withholding taxes recorded on the Funds’ books and the U.S. dollar equivalent of the amounts actually received or paid. Net unrealized foreign currency translation gains and losses arise from changes in the value of assets and liabilities, other than investments in securities, resulting from changes in the exchange rates.
(c) Short Sales
Short sales are transactions in which the Funds sell a security they do not own in anticipation of a decline in the value of that security. To complete such a transaction, the Funds must borrow the security to make delivery to the buyer. The Funds then are obligated to replace the security borrowed by purchasing the security at market price at the time of replacement. The price at such time may be more or less than the price at which the security was sold by the Funds. When a security is sold short, a decrease in the value of the security will be recognized as a gain and an increase in the value of the security will be recognized as a loss, which is potentially limitless. Until the security is replaced, the Funds are required to pay the lender amounts equal to dividend or interest that accrue during the period of the loan which is recorded as an expense. To borrow the security, the Funds also may be required to pay a premium or an interest fee, which are recorded as interest expense. Cash or securities are segregated for the broker to meet the necessary margin requirements. The Funds are subject to the risk that they may not always be able to close out a short position at a particular time or at an acceptable price.
First Trust Funds
NOTES TO FINANCIAL STATEMENTS - Continued
September 30, 2021
(d) Options
The Funds may write or purchase options contracts primarily to enhance the Funds’ returns or reduce volatility. In addition, the Funds may utilize options in an attempt to generate gains from option premiums or to reduce overall portfolio risk. When a Fund writes or purchases an option, an amount equal to the premium received or paid by a Fund is recorded as a liability or an asset and is subsequently adjusted to the current market value of the option written or purchased. Premiums received or paid from writing or purchasing options which expire unexercised are treated by a Fund on the expiration date as realized gains or losses. The difference between the premium and the amount paid or received on effecting a closing purchase or sale transaction, including brokerage commissions, is also treated as a realized gain or loss. If an option is exercised, the premium paid or received is added to the cost of the purchase or proceeds from the sale in determining whether a Fund has realized a gain or a loss on investment transactions. A Fund, as a writer of an option, may have no control over whether the underlying securities may be sold (call) or purchased (put) and as a result bears the market risk of an unfavorable change in the price of the security underlying the written option.
(e) Exchange Traded Funds (“ETFs”)
ETFs typically trade on securities exchanges and their shares may, at times, trade at a premium or discount to their net asset values. In addition, an ETF may not replicate exactly the performance of the benchmark index it seeks to track for a number of reasons, including transaction costs incurred by the ETF, the temporary unavailability of certain index securities in the secondary market or discrepancies between the ETF and the index with respect to the weighting of securities or the number of securities held. Investing in ETFs, which are investment companies, may involve duplication of advisory fees and certain other expenses. As a result, Fund shareholders indirectly bear their proportionate share of these incurred expenses. Therefore, the cost of investing in the Fund will be higher than the cost of investing directly in ETFs and may be higher than other mutual funds that invest directly in securities.
Each ETF in which each Fund invests is subject to specific risks, depending on the nature of the ETF. Each ETF is subject to the risks associated with direct ownership of the securities comprising the index on which the ETF is based. These risks could include liquidity risk, sector risk, and risks associated with fixed-income securities.
(f) Closed-end Funds (“CEFs”)
The Multi-Strategy Fund may invest in shares of CEFs. A CEF is a pooled investment vehicle that is registered under the Investment Company Act of 1940 and whose shares are listed and traded on U.S. national securities exchanges. Investments in CEFs are subject to various risks, including reliance on management’s ability to meet a CEF’s investment objective and to manage a CEF’s portfolio, and fluctuation in the market value of a CEF’s shares compared to the changes in the value of the underlying securities that the CEF owns. In addition, the Fund bears a pro rata share of the management fees and expenses of each underlying CEF, which results in the Fund’s shareholders being subject to higher expenses than if they invested directly in the CEFs.
(g) Investment Transactions, Investment Income and Expenses
Investment transactions are accounted for on the trade date. Realized gains and losses on investments are determined on the identified cost basis. Dividend income is recorded net of applicable withholding taxes on the ex-dividend date and interest income is recorded on an accrual basis. Withholding taxes on foreign dividends, if applicable, are paid (a portion of which may be reclaimable) or provided for in accordance with the applicable country’s tax rules and rates and are disclosed in the Statements of Operations. Withholding tax reclaims are filed in certain countries to recover a portion of the amounts previously withheld. The Fund records a reclaim receivable based on a number of factors, including a jurisdiction’s legal obligation to pay reclaims as well as payment history and market convention. Discounts or premiums on debt securities are accreted or amortized to interest income over the lives of the respective securities using the effective interest method. Income and expenses of the Funds are allocated on a pro rata basis to each class of shares, except for distribution and service fees which are unique to each class of shares relative net assets. Expenses incurred by the Trust with respect to more than one Fund are allocated in proportion to the net assets of each Fund except where allocation of direct expenses to each Fund or an alternative allocation method can be more appropriately made.
First Trust Funds
NOTES TO FINANCIAL STATEMENTS - Continued
September 30, 2021
(h) Federal Income Taxes
Each Fund intends to comply with the requirements of Subchapter M of the Internal Revenue Code applicable to regulated investment companies and to distribute substantially all of its net investment income and any net realized gains to its shareholders. Therefore, no provision is made for federal income or excise taxes. Due to the timing of dividend distributions and the differences in accounting for income and realized gains and losses for financial statement and federal income tax purposes, the fiscal year in which amounts are distributed may differ from the year in which the income and realized gains and losses are recorded by the Funds.
Accounting for Uncertainty in Income Taxes (the “Income Tax Statement”) requires an evaluation of tax positions taken (or expected to be taken) in the course of preparing a Fund’s tax returns to determine whether these positions meet a “more-likely-than-not” standard that, based on the technical merits, have a more than fifty percent likelihood of being sustained by a taxing authority upon examination. A tax position that meets the “more-likely-than-not” recognition threshold is measured to determine the amount of benefit to recognize in the financial statements. The Funds recognize interest and penalties, if any, related to unrecognized tax benefits as income tax expense in the Statements of Operations.
The Income Tax Statement requires management of the Funds to analyze tax positions taken in the prior three open tax years, if any, and tax positions expected to be taken in the Funds’ current tax year, as defined by the IRS statute of limitations for all major jurisdictions, including federal tax authorities and certain state tax authorities. As of September 30, 2021 and during the prior three open tax years, the Funds did not have a liability for any unrecognized tax benefits. The Funds have no examination in progress and are not aware of any tax positions for which it is reasonably possible that the total amounts of unrecognized tax benefits will significantly change in the next twelve months.
(i) Distributions to Shareholders
The Funds will make distributions of net investment income per the table below and net capital gains, if any, at least annually. The Multi-Strategy Fund seeks to make distributions once per quarter based on a pre-determined rate. A portion of the distributions made by the Multi-Strategy Fund may be treated as return of capital for tax purposes. Shareholders who receive a payment of a distribution consisting of a return of capital may be under the impression that they are receiving net profits when, in fact, they are not. Shareholders should not assume that the source of a distribution from the Multi-Strategy Fund is net profit. The Multi-Strategy Fund may make additional payments of dividends or distributions if it deems it desirable at any other time during the year. Distributions to shareholders are recorded on the ex-dividend date. The amount and timing of distributions are determined in accordance with federal income tax regulations, which may differ from GAAP.
First Trust Funds
NOTES TO FINANCIAL STATEMENTS - Continued
September 30, 2021
| | Distribution Frequency of Net Investment Income |
| Merger Arbitrage Fund | Annually |
| Multi-Strategy Fund | Quarterly |
The character of distributions made during the year from net investment income or net realized gains may differ from the characterization for federal income tax purposes due to differences in the recognition of income, expense and gain (loss) items for financial statement and tax purposes.
(j) Illiquid Securities
Pursuant to Rule 22e-4 under the 1940 Act, the Funds have adopted a Liquidity Risk Management Program (“LRMP”) that requires, among other things, that the Funds limit their illiquid investments that are assets to no more than 15% of net assets. An illiquid investment is any security which may not reasonably be expected to be sold or disposed of in current market conditions in seven calendar days or less without the sale or disposition significantly changing the market value of the investment. If the Advisor, at any time, determines that the value of illiquid securities held by a Fund exceeds 15% of its net asset value, the Advisor will take such steps as it considers appropriate to reduce them as soon as reasonably practicable in accordance with the Funds’ written LRMP.
Note 3 – Investment Advisory and Other Agreements
The Trust, on behalf of the Funds, entered into an Investment Advisory Agreement (the “Agreement”) with Vivaldi Asset Management, LLC (the “Advisor”). Under the terms of the Agreement, the Funds pay a monthly investment advisory fee to the Advisor at the following annual rates based on the average daily net assets of the Funds:
| Merger Arbitrage Fund | 1.25% |
| Multi-Strategy Fund | 1.20% |
The Advisor has engaged RiverNorth Capital Management, LLC and Angel Oak Capital Advisors, LLC, (each, a "Sub-Advisor" and together, the “Sub-Advisors”) to manage certain assets of the Multi-Strategy Fund and pays the Sub-Advisors from its advisory fees.
The Funds’ Advisor has contractually agreed to waive its fee and/or pay for expenses of the Funds to ensure that the annual Funds’ operating expenses (excluding any taxes, leverage interest, acquired fund fees and expenses (as determined in accordance with Form N-1A), dividend and interest expense on short sales, brokerage commissions, expenses incurred in connection with any merger or reorganization and extraordinary expenses such as litigation expenses) do not exceed the following levels:
| | Annual Expense Limit Class A Shares† | Annual Expense Limit Class I Shares† |
| Merger Arbitrage Fund | 1.85% | 1.55% |
| Multi-Strategy Fund | 1.85% | 1.55% |
| † | The limit on annual operating expenses is calculated based on each Fund’s average daily net assets. |
This agreement is in effect until November 1, 2023 for each Fund. These agreements may be terminated before that date only by the Trust’s Board of Trustees.
First Trust Funds
NOTES TO FINANCIAL STATEMENTS - Continued
September 30, 2021
For the year ended September 30, 2021, the Advisor waived fees as follows:
| | | Advisory fees waived | |
| Merger Arbitrage Fund | | $ | 8,524 | |
The Advisor is permitted to seek reimbursement from the Funds, subject to certain limitations, of fees waived or payments made to the Funds for a period ending three full fiscal years after the date of the waiver or payment. This reimbursement may be requested from the Funds if the reimbursement will not cause the Funds’ annual expense ratio to exceed the lesser of (a) the expense limitation amount in effect at the time such fees were waived or payments made, or (b) the expense limitation amount in effect at the time of the reimbursement. At September 30, 2021, the amount of these potentially recoverable expenses was $8,524 for the Merger Arbitrage Fund. The Advisor may recapture all or a portion of this amount no later than September 30, 2024.
UMB Fund Services, Inc. (“UMBFS”) serves as the Funds’ fund accountant, transfer agent and co-administrator; and Mutual Fund Administration, LLC (“MFAC”) serves as the Funds’ other co-administrator. UMB Bank, n.a., an affiliate of UMBFS, serves as the Funds’ custodian. The Funds’ allocated fees incurred for fund accounting, fund administration, transfer agency and custody services for the year ended September 30, 2021, are reported as “Fund services fees” on the Statements of Operations. UMBFS, UMB Bank, n.a., and MFAC have voluntarily waived their fees that they would otherwise be paid, and/or to assume expenses in the amount of $0 for the Merger Arbitrage Fund and $92,010 for the Multi-Strategy Fund for the year ended September 30, 2021. This amount is shown as a reduction of expenses, “Fees paid indirectly”, on the Statements of Operations.
IMST Distributors, LLC serves as the Funds’ distributor (the “Distributor”). The Distributor does not receive compensation from the Funds for its distribution services; the Advisor pays the Distributor a fee for its distribution-related services.
The Funds have a fee arrangement with their custodian, UMB Bank, n.a., which provides for custody fees to be reduced by earning credits based on cash balances left on deposit with the custodian. For the year ended September 30, 2021, there were no fees reduced by earning credits.
Certain trustees and officers of the Trust are employees of UMBFS or MFAC. The Funds do not compensate trustees and officers affiliated with the Funds’ co-administrators. For the year ended September 30, 2021, the Funds’ allocated fees incurred to Trustees who are not affiliated with the Funds’ co-administrators are reported on the Statements of Operations. A portion of the fees were paid by the Trust’s Co-Administrators. Such amount is shown as a reduction of expenses, “Fees paid indirectly”, on the Statements of Operations as follows:
| | | Fees Paid Indirectly | |
| Merger Arbitrage Fund | | $ | 14,366 | |
| Multi-Strategy Fund | | | 1,056 | |
The Funds’ Board of Trustees has adopted a Deferred Compensation Plan (the “Plan”) for the Independent Trustees that enables Trustees to elect to receive payment in cash or the option to select various fund(s) in the Trust in which their deferred accounts shall be deemed to be invested. If a trustee elects to defer payment, the Plan provides for the creation of a deferred payment account. The Funds’ liability for these amounts is adjusted for market value changes in the invested fund(s) and remains a liability of the Funds until distributed in accordance with the Plan. The Trustees Deferred compensation liability under the Plan constitutes a general unsecured obligation of each Fund and is disclosed in the Statements of Assets and Liabilities. Contributions made under the plan and the change in unrealized appreciation/depreciation and income are included in the Trustees’ fees and expenses in the Statements of Operations.
First Trust Funds
NOTES TO FINANCIAL STATEMENTS - Continued
September 30, 2021
Dziura Compliance Consulting, LLC provides Chief Compliance Officer (“CCO”) services to the Trust. The Funds’ allocated fees incurred for CCO services for the year ended September 30, 2021, are reported on the Statements of Operations.
During the period ended September 30, 2021, UMBFS reimbursed the Multi-Strategy Fund $440 for an error during processing. This amount is reported on the Fund’s Statements of Operations and Statements of Changes in Net Assets under the caption “Reimbursement by affiliate.” These reimbursements had no impact on the Fund’s performance.
The Funds are permitted to purchase or sell securities from or to certain affiliated funds under specified conditions outlined in procedures adopted by the Board. The procedures have been designed to ensure that any purchase or sale of securities by a Fund from or to another fund or portfolio that is or could be considered an affiliate by virtue of having a common investment adviser (or affiliated investment advisers), common trustees and/or common officers complies with Rule 17a-7 of the 1940 Act. Further, as defined under these procedures, each transaction is affected at the current market price to minimize trading costs, where permissible. For the year ended September 30, 2021, the Multi-Strategy Fund engaged in purchases and sales of securities, pursuant to Rule 17a-7 of the 1940 Act, as follows:
| Fund | | Purchases | | | Sales | | | Net Realized Gain (Loss) | |
| Multi-Strategy Fund | | $ | - | | | $ | 1,194,847 | | | $ | (63,967 | ) |
Note 4 – Federal Income Taxes
At September 30, 2021, the cost of investments on a tax basis and gross unrealized appreciation (depreciation) on investments for federal income tax purposes were as follows:
| | | Merger Arbitrage Fund | | | Multi-Strategy Fund | |
| Cost of investments | | $ | 528,342,521 | | | $ | 33,034,272 | |
| | | | | | | | | |
| Gross unrealized appreciation | | $ | 11,416,925 | | | $ | 1,141,864 | |
| Gross unrealized depreciation | | | (16,973,790 | ) | | | (1,217,651 | ) |
| Net unrealized depreciation on investments | | $ | (5,556,865 | ) | | $ | (75,787 | ) |
The difference between cost amounts for financial statement and federal income tax purposes is due primarily to timing differences in recognizing certain gains and losses in security transactions.
GAAP requires that certain components of net assets be reclassified between financial and tax reporting. These reclassifications have no effect on net assets or net asset value per share. For the year ended September 30, 2021, permanent differences in book and tax accounting have been reclassified to paid-in capital and total distributable earnings (loss) as follows:
First Trust Funds
NOTES TO FINANCIAL STATEMENTS - Continued
September 30, 2021
| | | Increase (Decrease) | |
| Fund | | Paid-in Capital | | | Total Distributable Earnings (Accumulated Deficit) | |
| Merger Arbitrage Fund | | $ | 425 | | | $ | (425 | ) |
| Multi-Strategy Fund | | | (10,074 | ) | | | 10,074 | |
As of September 30, 2021, the components of accumulated earnings (deficit) on a tax basis were as follows:
| | | Merger Arbitrage Fund | | | Multi-Strategy Fund | |
| Undistributed ordinary income | | $ | 48,613,230 | | | $ | - | |
| Undistributed long-term capital gains | | | 313,108 | | | | - | |
| Accumulated earnings | | | 48,926,338 | | | | - | |
| | | | | | | | | |
| Accumulated capital and other losses | | | - | | | | (413,713 | ) |
| Unrealized depreciation on investments | | | (5,556,865 | ) | | | (75,787 | ) |
| Unrealized deferred compensation | | | (40,837 | ) | | | (9,556 | ) |
| Total accumulated earnings (loss) | | $ | 43,328,636 | | | $ | (499,056 | ) |
The tax character of distributions paid during the years ended September 30, 2021 and 2020 was as follows:
| | | Merger Arbitrage Fund | | | Multi-Strategy Fund | |
| Distribution paid from: | | 2021 | | | 2020 | | | 2021 | | | 2020 | |
| Ordinary income | | $ | 4,101,016 | | | $ | 33,341,174 | | | $ | 1,337,063 | | | $ | 4,022,509 | |
| Net long-term capital gains | | | 63,486 | | | | - | | | | - | | | | 248,468 | |
| Return of Capital | | | - | | | | - | | | | 529,901 | | | | 790,736 | |
| Total taxable distributions | | $ | 4,164,502 | | | $ | 33,341,174 | | | $ | 1,866,964 | | | $ | 5,061,713 | |
As of September 30, 2021, the Multi-Strategy Fund had net capital loss carryovers as follows:
| | | Multi-Strategy Fund | |
| Not subject to expiration: | | | | |
| Short-term | | $ | 344,936 | |
| Long-Term | | | 68,776 | |
| Total | | $ | 413,712 | |
Note 5 – Redemption Fee
The Merger Arbitrage Fund may impose a redemption fee of 1.00% of the total redemption amount on all shares redeemed within 30 days of purchase. For the years ended September 30, 2021 and 2020, the Fund received $8,324 and $12,051, respectively, in redemption fees.
First Trust Funds
NOTES TO FINANCIAL STATEMENTS - Continued
September 30, 2021
Note 6 – Investment Transactions
For the year ended September 30, 2021, purchases and sales of investments, excluding short-term investments, were as follows:
| | | Purchases | | | Sales | | | Proceeds from Securities Sold Short | | | Cover Short Securities | |
| Merger Arbitrage Fund | | $ | 2,445,493,915 | | | $ | 2,181,121,994 | | | $ | 542,373,748 | | | $ | 450,250,563 | |
| Multi-Strategy Fund | | | 49,143,701 | | | | 63,572,496 | | | | 9,898,232 | | | | 9,085,684 | |
Note 7 – Distribution Plan
The Trust, on behalf of the Funds, has adopted a Distribution Plan (the “Plan”) pursuant to Rule 12b-1 under the 1940 Act that allows the Funds to pay distribution fees for the sale and distribution of its shares. With respect to Class A, the Plan provides for the payment of distribution fees at the annual rate of up to 0.25% of average daily net assets. Class I does not pay any distribution fees.
For the year ended September 30, 2021, distribution fees incurred are disclosed on the Statements of Operations.
Note 8 – Shareholder Servicing Plan
The Trust, on behalf of the Merger Arbitrage Fund and Multi-Strategy Fund, has adopted a Shareholder Servicing Plan to pay a fee at an annual rate of up to 0.15% of average daily net assets of Class A shares and 0.10% of average daily net assets of Class I shares serviced by shareholder servicing agents who provide administrative and support services to their customers.
For the year ended September 30, 2021, shareholder servicing fees incurred are disclosed on the Statements of Operations.
Note 9 – Indemnifications
In the normal course of business, the Funds enter into contracts that contain a variety of representations which provide general indemnifications. The Funds’ maximum exposure under these arrangements is unknown, as this would involve future claims that may be made against the Funds that have not yet occurred. However, the Funds expect the risk of loss to be remote.
Note 10 – Fair Value Measurements and Disclosure
Fair Value Measurements and Disclosures defines fair value, establishes a framework for measuring fair value in accordance with GAAP, and expands disclosure about fair value measurements. It also provides guidance on determining when there has been a significant decrease in the volume and level of activity for an asset or a liability, when a transaction is not orderly, and how that information must be incorporated into a fair value measurement.
Under Fair Value Measurements and Disclosures, various inputs are used in determining the value of the Funds’ investments. These inputs are summarized into three broad Levels as described below:
| · | Level 1 – Unadjusted quoted prices in active markets for identical assets or liabilities that the Funds have the ability to access. |
| · | Level 2 – Observable inputs other than quoted prices included in Level 1 that are observable for the asset or liability, either directly or indirectly. These inputs may include quoted prices for the identical instrument on an inactive market, prices for similar instruments, interest rates, prepayment speeds, credit risk, yield curves, default rates and similar data. |
First Trust Funds
NOTES TO FINANCIAL STATEMENTS - Continued
September 30, 2021
| · | Level 3 – Unobservable inputs for the asset or liability, to the extent relevant observable inputs are not available, representing the Funds’ own assumptions about the assumptions a market participant would use in valuing the asset or liability, and would be based on the best information available. |
The availability of observable inputs can vary from security to security and is affected by a wide variety of factors, including for example, the type of security, whether the security is new and not yet established in the marketplace, the liquidity of markets, and other characteristics particular to the security. To the extent that valuation is based on models or inputs that are less observable or unobservable in the market, the determination of fair value requires more judgment. Accordingly, the degree of judgment exercised in determining fair value is greatest for instruments categorized in Level 3.
The inputs to measure fair value may fall into different Levels of the fair value hierarchy. In such cases, for disclosure purposes, the Level in the fair value hierarchy within which the fair value measurement falls in its entirety is determined based on the lowest Level input that is significant to the fair value measurement in its entirety.
The inputs or methodology used for valuing securities are not an indication of the risk associated with investing in those securities. The following is a summary of the inputs used, as of September 30, 2021, in valuing the Funds’ assets carried at fair value:
| Merger Arbitrage Fund | | Level 1 | | | Level 2 | | | Level 3** | | | Total | |
| Assets | | | | | | | | | | | | | | | | |
| Investments | | | | | | | | | | | | | | | | |
| Common Stocks* | | $ | 596,301,329 | | | $ | 8,463,317 | | | $ | - | | | $ | 604,764,646 | |
| Short-Term Investments | | | 7,538,110 | | | | - | | | | - | | | | 7,538,110 | |
| Units | | | 75,086,268 | | | | - | | | | - | | | | 75,086,268 | |
| Warrants | | | 106,885 | | | | - | | | | - | | | | 106,885 | |
| Total Investments | | $ | 679,032,592 | | | $ | 8,463,317 | | | $ | - | | | $ | 687,495,909 | |
| | | | | | | | | | | | | | | | | |
| Liabilities | | | | | | | | | | | | | | | | |
| Securities Sold Short | | | | | | | | | | | | | | | | |
| Common Stocks* | | $ | 164,377,528 | | | $ | - | | | $ | - | | | $ | 164,377,528 | |
| Total Securities Sold Short | | | 164,377,528 | | | | - | | | | - | | | | 164,377,528 | |
| Written Options Contracts | | | 315,045 | | | | 17,680 | | | | - | | | | 332,725 | |
| Total Securities Sold Short and Options | | $ | 164,692,573 | | | $ | 17,680 | | | $ | - | | | $ | 164,710,253 | |
First Trust Funds
NOTES TO FINANCIAL STATEMENTS - Continued
September 30, 2021
| Multi-Strategy Fund | | Level 1 | | | Level 2 | | | Level 3 | | | Total | |
| Assets | | | | | | | | | | | | | | | | |
| Investments | | | | | | | | | | | | | | | | |
| Asset-Backed Securities | | $ | - | | | $ | 5,557,673 | | | $ | - | | | $ | 5,557,673 | |
| Closed-End Funds | | | 7,108,947 | | | | - | | | | 34,548 | | | | 7,143,495 | |
| Collateralized Mortgage Obligations | | | - | | | | 6,616,470 | | | | - | | | | 6,616,470 | |
| Common Stocks* | | | 9,202,704 | | | | 42,300 | | | | - | | | | 9,245,004 | |
| Corporate Bonds | | | - | | | | 1,617,519 | | | | - | | | | 1,617,519 | |
| Exchange-Traded Debt Securities | | | 697,943 | | | | - | | | | - | | | | 697,943 | |
| Rights | | | 13,444 | | | | - | | | | - | | | | 13,444 | |
| Units | | | 60,162 | | | | - | | | | - | | | | 60,162 | |
| Warrants | | | 67,820 | | | | - | | | | - | | | | 67,820 | |
| Short-Term Investments | | | 6,136,781 | | | | - | | | | - | | | | 6,136,781 | |
| Total Investments | | $ | 23,287,801 | | | $ | 13,833,962 | | | $ | 34,548 | | | $ | 37,156,311 | |
| | | | | | | | | | | | | | | | | |
| Liabilities | | | | | | | | | | | | | | | | |
| Securities Sold Short | | | | | | | | | | | | | | | | |
| Common Stocks* | | $ | 2,985,248 | | | $ | - | | | $ | - | | | $ | 2,985,248 | |
| Exchange-Traded Funds | | | 1,212,016 | | | | - | | | | - | | | | 1,212,016 | |
| Total Securities Sold Short | | | 4,197,264 | | | | - | | | | - | | | | 4,197,264 | |
| Written Options Contracts | | | 257 | | | | 305 | | | | - | | | | 562 | |
| Total Securities Sold Short and Options | | $ | 4,197,521 | | | $ | 305 | | | $ | - | | | $ | 4,197,826 | |
| * | All common stocks held in the Fund are Level 1 and Level 2 securities. For a detailed break-out of common stocks by major industry classification, please refer to the Schedule of Investments. |
| ** | The Fund did not hold any Level 3 securities at period end. |
The following is a reconciliation of assets in which significant unobservable inputs (Level 3) were used in determining value:
| Merger Arbitrage Fund |
| | | Rights | |
| Balance as of September 30, 2020 | | $ | 164,888 | |
| Transfers into Level 3 during the period | | | - | |
| Transfers out of Level 3 during the period | | | - | |
| Total gains or losses for the period | | | | |
| Included in earnings (or changes in net assets) | | | 334,772 | |
| Included in other comprehensive income | | | - | |
| Purchases, sales, and principal paydowns | | | | |
| Net purchases | | | - | |
| Net sales | | | (499,660 | ) |
| Principal paydown | | | - | |
| Balance as of September 30, 2021 | | $ | - | |
| Change in unrealized gains or losses for the period included in earnings (or changes in net assets) for assets held at the end of the reporting period | | $ | - | |
First Trust Funds
NOTES TO FINANCIAL STATEMENTS - Continued
September 30, 2021
| Multi-Strategy Fund |
| | | Asset-Backed Securities | | | Closed-End Funds | | | Rights | |
| Balance as of September 30, 2020 | | $ | 500,000 | | | $ | - | | | $ | 2,726 | |
| Transfers into Level 3 during the period | | | - | | | | 34,548 | | | | - | |
| Transfers out of Level 3 during the period | | | (500,000 | ) | | | - | | | | - | |
| Total gains or losses for the period | | | | | | | | | | | | |
| Included in earnings (or changes in net assets) | | | - | | | | - | | | | 5,534 | |
| Included in other comprehensive income | | | - | | | | - | | | | | |
| Purchases, sales, and principal paydowns | | | | | | | | | | | | |
| Net purchases | | | - | | | | - | | | | - | |
| Net sales | | | - | | | | - | | | | (8,260 | ) |
| Principal paydown | | | - | | | | - | | | | - | |
| Balance as of September 30, 2021 | | $ | - | | | $ | 34,548 | | | $ | - | |
| Change in unrealized gains or losses for the period included in earnings (or changes in net assets) for assets held at the end of the reporting period | | $ | - | | | $ | - | | | $ | - | |
The following tables present additional quantitative information about valuation methodologies and inputs used for investments that are measured at fair value and categorized within Level 3 as of September 30, 2021:
| Multi-Strategy Fund |
| Asset Class | | Fair Value at 9/30/2021 | | | Valuation Technique(s) | | Unobservable Input(1) | | Range of Input | | | Weighted Average of Input | | Impact to Valuation from an Increase in Input(2) |
| Closed-End Funds | | $ | 34,548 | | | Asset Approach | | Expected Remaining Distributions | | $ | 0.8242 | | | N/A | | Increase |
| (1) | The investment advisor/sub-advisor considers relevant indications of value that are reasonably and timely available to it in determining the fair value to be assigned to a particular security, such as the type and cost of the security; contractual or legal restrictions on resale of the security; relevant financial or business developments of the issuer; actively traded related securities; conversion or exchange rights on the security; related corporate actions; significant events occurring after the close of trading in the security; and changes in overall market conditions. The Fund’s use of fair value pricing may cause the net asset value of Fund shares to differ from the net asset value that would be calculated using market quotations. Fair value pricing involves subjective judgments and it is possible that the fair value determined for a security may be materially different than the value that could be realized upon the sale of that security. |
| (2) | This column represents the directional change in the fair value of the Level 3 investments that would result from an increase to the corresponding unobservable input. A decrease to the unobservable input would have the opposite effect. |
First Trust Funds
NOTES TO FINANCIAL STATEMENTS - Continued
September 30, 2021
Note 11 – Derivative and Hedging Disclosure
Derivatives and Hedging requires enhanced disclosures about the Funds’ derivative and hedging activities, including how such activities are accounted for and their effects on the Funds’ financial position, performance and cash flows. The Funds invested in options contracts during the year ended September 30, 2021.
The effects of these derivative instruments on the Funds’ financial position and financial performance as reflected in the Statements of Assets and Liabilities and Statements of Operations are presented in the tables below. The fair values of derivative instruments as of September 30, 2021, by risk category are as follows:
| | | Merger Arbitrage Fund |
| | | Liability Derivatives |
| Derivatives not designated as hedging instruments | | Statement of Asset and Liabilities Location | | Value | |
| Equity contracts | | Written options contracts, at value | | $ | 332,725 | |
| Total | | | | $ | 332,725 | |
| �� | | Multi-Strategy Fund |
| | | Liability Derivatives |
| Derivatives not designated as hedging instruments | | Statement of Asset and Liabilities Location | | Value | |
| Equity contracts | | Written options contracts, at value | | $ | 562 | |
| Total | | | | $ | 562 | |
The effects of derivative instruments on the Statements of Operations for the year ended September 30, 2021, are as follows:
| Merger Arbitrage Fund |
| Amount of Realized Gain or (Loss) on Derivatives Recognized in Income |
| Derivatives not designated as hedging instruments | | Purchased Options Contracts | | | Written Options Contracts | |
| Equity contracts | | $ | (126,451 | ) | | $ | 1,455,328 | |
| Total | | $ | (126,451 | ) | | $ | 1,455,328 | |
First Trust Funds
NOTES TO FINANCIAL STATEMENTS - Continued
September 30, 2021
| Multi-Strategy Fund |
| Amount of Realized Gain or (Loss) on Derivatives Recognized in Income |
| Derivatives not designated as hedging instruments | | Purchased Options Contracts | | | Written Options Contracts | |
| Equity contracts | | $ | 414 | | | $ | 10,107 | |
| Total | | $ | 414 | | | $ | 10,107 | |
| Merger Arbitrage Fund |
Change in Unrealized Appreciation/Depreciation on Derivatives Recognized in Income |
| Derivatives not designated as hedging instruments | | Written Options Contracts | |
| Equity contracts | | $ | (41,750 | ) |
| Total | | $ | (41,750 | ) |
| Multi-Strategy Fund |
Change in Unrealized Appreciation/Depreciation on Derivatives Recognized in Income |
| Derivatives not designated as hedging instruments | | Written Options Contracts | |
| Equity contracts | | $ | (1,311 | ) |
| Total | | $ | (1,311 | ) |
The number of contracts is included on the Schedule of Investments. The quarterly average volumes of derivative instruments as of September 30, 2021, are as follows:
| Merger Arbitrage Fund |
| Derivative | | Quarterly Average | | Amount | |
| Options Contracts - Written | | Average Notional Value | | $ | (31,668,982 | ) |
| Multi-Strategy Fund |
| Derivative | | Quarterly Average | | Amount | |
| Options Contracts - Written | | Average Notional Value | | $ | (284,835 | ) |
Note 12 – Borrowing
The Funds have entered into a borrowing agreement with BNP Paribas (acting through its New York Branch). The Funds may borrow amounts up to one-third of the value of its assets. The Funds are charged interest of one-month Libor plus 1.10% for borrowing under this agreement. The Funds did not borrow under the line of credit agreement during the year ended September 30, 2021.
Note 13 – COVID-19 Risks
In early 2020, an outbreak of a novel strain of coronavirus (COVID-19) emerged globally. This coronavirus has resulted in closing international borders, enhanced health screenings, healthcare service preparation and delivery, quarantines, cancellations, disruptions to supply chains and customer activity, as well as general public concern and uncertainty. The impact of this outbreak has negatively affected the worldwide economy, as well as the economies of individual countries, the financial health of individual companies and the market in general in significant and unforeseen ways. The future impact of COVID-19 is currently unknown, and it may exacerbate other risks that apply to the Funds, including political, social and economic risks. Any such impact could adversely affect the Funds’ performance, the performance of the securities in which the Funds invest and may lead to losses on your investment in the Funds. The ultimate impact of COVID-19 on the financial performance of the Funds’ investments is not reasonably estimable at this time.
First Trust Funds
NOTES TO FINANCIAL STATEMENTS - Continued
September 30, 2021
Note 14 – Recently Issued Accounting Pronouncements
In March 2020, the FASB issued ASU No. 2020-04 (“ASU 2020-04”), Reference Rate Reform (Topic 848) - Facilitation of the Effects of Reference Rate Reform on Financial Reporting. The amendments in ASU 2020-04 provide optional temporary financial reporting relief from the effect of certain types of contract modifications due to the planned discontinuation of LIBOR and other interbank-offered based reference rates as of the end of 2021. ASU 2020-04 is effective for certain reference rate-related contract modifications that occur during the period March 12, 2020 through December 31, 2022. Management is currently evaluating the impact of the guidance.
Note 15 – Events Subsequent to the Fiscal Period End
The Funds have adopted financial reporting rules regarding subsequent events which require an entity to recognize in the financial statements the effects of all subsequent events that provide additional evidence about conditions that existed at the date of the balance sheet. Management has evaluated the Funds’ related events and transactions that occurred through the date of issuance of the Funds’ financial statements.
Vivaldi Asset Management, LLC (“VAM”) has served as the Merger Arbitrage Fund’s investment advisor since the Fund’s inception, and also has served as the Multi-Strategy Fund’s investment advisor since it commenced operations and acquired the assets and liabilities of the Vivaldi Orinda Macro Opportunities Fund, a series of Advisors Series Trust, on December 16, 2016. Effective November 1, 2021, Vivaldi Holdings, LLC (“Vivaldi Holdings”), the parent company of VAM, entered into a joint venture with First Trust Capital Partners, LLC to create a new entity called First Trust Capital Solutions L.P. (the “Transaction”). As a result of the Transaction, VAM became a wholly owned subsidiary of First Trust Capital Solutions L.P., which, under the 1940 Act, resulted in an assignment and termination of the existing investment advisory agreement between VAM and the Trust, on behalf of the Funds. There were no changes in the management or day-to-day advisory services provided to the Funds as a result of the Transaction. As part of the Transaction, VAM changed its name to FTCM and Vivaldi Holdings changed its name to VFT Holdings LP. FTCM is controlled by First Trust Capital Solutions L.P. First Trust Capital Solutions L.P. is a Delaware limited partnership owned 50% by First Trust Capital Partners, LLC and 50% by VFT Holdings LP and its affiliates. In anticipation of the Transaction and these related events, the Board of Trustees of the Trust approved the Advisory Agreement between the Trust, on behalf of the Funds, and VAM, to allow VAM to continue to serve as the investment advisor to the Funds. At a special meeting of the Multi-Strategy Fund’s shareholders held on September 28, 2021 and a special meeting of the Merger Arbitrage Fund held on October 22, 2021, shareholders of each Fund voted to approve the Advisory Agreement between VAM and the Trust, on behalf of the Funds.
Effective November 1, 2021, the names of the Vivaldi Merger Arbitrage Fund and the Vivaldi Multi-Strategy Fund changed to the First Trust Merger Arbitrage Fund and the First Trust Multi-Strategy Fund, respectively, and the Funds’ distributor changed to First Trust Portfolios L.P.
There were no other events or transactions that occurred during this period that materially impacted the amounts or disclosures in the Funds’ financial statements.
REPORT OF INDEPENDENT REGISTERED PUBLIC ACCOUNTING FIRM
To the Board of Trustees of Investment Managers Series Trust II and
Shareholders of First Trust (formerly Vivaldi) Funds
Opinion on the Financial Statements
We have audited the accompanying statements of assets and liabilities of First Trust Merger Arbitrage Fund (formerly, Vivaldi Merger Arbitrage Fund) and First Trust Multi-Strategy Fund (formerly, Vivaldi Multi-Strategy Fund) (the “Funds”), each a series of Investment Managers Series Trust II (the “Trust”), including the schedules of investments, as of September 30, 2021, the related statements of operations and cash flows for the year then ended, the statements of changes in net assets for each of the two years in the period then ended and the financial highlights for the periods indicated thereon, and the related notes (collectively referred to as the “financial statements”). In our opinion, the financial statements present fairly, in all material respects, the financial position of the Funds as of September 30, 2021, the results of their operations and their cash flows for the year then ended, the changes in their net assets for each of the two years in the period then ended and their financial highlights for the periods indicated thereon, in conformity with accounting principles generally accepted in the United States of America.
Basis for Opinion
These financial statements are the responsibility of the Funds’ management. Our responsibility is to express an opinion on the Funds’ financial statements based on our audits. We are a public accounting firm registered with the Public Company Accounting Oversight Board (United States) (“PCAOB”) and are required to be independent with respect to the Funds in accordance with the U.S. federal securities laws and the applicable rules and regulations of the Securities and Exchange Commission and the PCAOB. We have served as the auditor of one or more of the funds in the Trust since 2013.
We conducted our audits in accordance with the standards of the PCAOB. Those standards require that we plan and perform the audits to obtain reasonable assurance about whether the financial statements are free of material misstatement, whether due to error or fraud. The Funds are not required to have, nor were we engaged to perform, an audit of the Funds’ internal control over financial reporting. As part of our audits we are required to obtain an understanding of internal control over financial reporting, but not for the purpose of expressing an opinion on the effectiveness of the Funds’ internal control over financial reporting. Accordingly, we express no such opinion.
Our audits included performing procedures to assess the risks of material misstatement of the financial statements, whether due to error or fraud, and performing procedures that respond to those risks. Such procedures included examining, on a test basis, evidence regarding the amounts and disclosures in the financial statements. Our audits also included evaluating the accounting principles used and significant estimates made by management, as well as evaluating the overall presentation of the financial statements. Our procedures included confirmation of securities owned as of September 30, 2021 by correspondence with the custodian and brokers or by other appropriate auditing procedures where replies were not received. We believe that our audits provide a reasonable basis for our opinion.
| |  |
| | TAIT, WELLER & BAKER LLP |
Philadelphia, Pennsylvania
November 29, 2021
First Trust Funds
SUPPLEMENTAL INFORMATION (Unaudited)
Qualified Dividend Income
For the year ended September 30, 2021, 22.34% and 33.73% of dividends to be paid from net investment income, including short-term capital gains (if any) from the Merger Arbitrage Fund and Multi-Strategy Fund, respectively, are designated as qualified dividend income.
Corporate Dividends Received Deduction
For the year ended September 30, 2021, 17.72% and 29.90% of the dividends to be paid from net investment income, including short-term capital gains (if any) from the Merger Arbitrage Fund and Multi-Strategy Fund, respectively, are designated as dividends received deduction available to corporate shareholders.
Capital Gain Designation
For Federal income tax purposes, the Merger Arbitrage Fund designates long-term capital gain dividends of $63,486 for the year ended September 30, 2021.
Results of Shareholder Meeting
At a special meeting held on October 22, 2021, shareholders of the Vivaldi Merger Arbitrage Fund approved the New Advisory Agreement between the Trust and Vivaldi Asset Management, LLC. The percentage of share outstanding and entitled to vote that were present by proxy for Vivaldi Merger Arbitrage Fund was 50.47%. The number of shares voted were as follows:
New Advisory Agreement:
| For | Against | Abstain | Total |
| 27,833,817 | 311,030 | 1,307,039 | 29,451,886 |
At a special meeting held on September 28, 2021, shareholders of the Vivaldi Multi-Strategy Fund approved the New Advisory Agreement between the Trust and Vivaldi Asset Management, LLC. The percentage of share outstanding and entitled to vote that were present by proxy for Vivaldi Multi-Strategy Fund was 52.54%. The number of shares voted were as follows:
New Advisory Agreement:
| For | Against | Abstain | Total |
| 701,616 | 498 | 23,254 | 725,368 |
Trustees and Officers Information
Additional information about the Trustees is included in the Funds’ Statement of Additional Information which is available, without charge, upon request by calling (877) 779-1999. The Trustees and officers of the Funds and their principal occupations during the past five years are as follows:
First Trust Funds
SUPPLEMENTAL INFORMATION (Unaudited) – Continued
| Name, Address, Year of Birth and Position(s) held with Trust | Term of Officec and Length of Time Served | Principal Occupation During the Past Five Years and Other Affiliations | Number of Portfolios in the Fund Complex Overseen by Trusteed | Other Directorships Held by Trustee During the Past Five Yearse |
| Independent Trustees: | | |
Thomas Knipper, CPA a (Born 1957) Trustee | Since September 2013 | Vice President and Chief Compliance Officer, Ameritas Investment Partners, a registered investment advisor (1995 – present). | 2 | None. |
Kathleen K. Shkuda a (born 1951) Trustee | Since September 2013 | Zigzag Consulting, a financial services consulting firm (2008 – present). Director, Managed Accounts, Merrill Lynch (2007-2008). | 2 | None. |
Larry D. Tashjian a (born 1953) Trustee and Chairman of the Board | Since September 2013 | Principal, CAM Capital Advisors, a family office (2001 – present). | 2 | General Finance Corporation. |
John P. Zader a (born 1961) Trustee | Since September 2013 | Retired (June 2014 – present); CEO, UMB Fund Services, Inc., a mutual fund and hedge fund service provider, and the transfer agent, fund accountant, and co-administrator for the Fund (December 2006 – June 2014); President, Investment Managers Series Trust (December 2007 - June 2014). | 2 | Investment Managers Series Trust, a registered investment company (includes 53 portfolios); 361 Social Infrastructure Fund, a closed-end investment company. |
| Interested Trustees: | | |
Eric M. Banhazl b† (born 1957) Trustee | Since September 2013 | Chairman, Foothill Capital Management, LLC, a registered investment advisor (2018 – present); Chairman (2016 – present), and President (2006 – 2015), Mutual Fund Administration, LLC, co-administrator for the Fund. | 2 | Investment Managers Series Trust, a registered investment company (includes 53 portfolios); 361 Social Infrastructure Fund, a closed-end investment company. |
First Trust Funds
SUPPLEMENTAL INFORMATION (Unaudited) – Continued
| Name, Address, Year of Birth and Position(s) held with Trust | Term of Officec and Length of Time Served | Principal Occupation During the Past Five Years and Other Affiliations | Number of Portfolios in the Fund Complex Overseen by Trusteed | Other Directorships Held by Trustee During the Past Five Yearse |
Terrance P. Gallagher a* (born 1958) Trustee and President | Since July 2019 | President, Investment Managers Series Trust II (September 2013 – present); Executive Vice President, UMB Fund Services, Inc. (2007 – present). Director of Compliance, Unified Fund Services Inc. (now Huntington Fund Services), a mutual fund service provider (2004 – 2007). | 2 | Cliffwater Corporate Lending Fund, Agility Multi-Asset Income Fund, Corbin Multi-Strategy Fund, Aspiriant Risk-Managed Real Asset Fund, Aspiriant Risk-Managed Capital Appreciation Fund, Infinity Core Alternative Fund, Infinity Long/Short Equity Fund, LLC, Keystone Private Income Fund, First Trust Alternative Opportunities Fund, and Variant Alternative Income Fund, each a closed-end investment company. |
| Officers of the Trust: | | | | |
Rita Dam b (born 1966) Treasurer and Assistant Secretary | Since September 2013 | Treasurer, 361 Social Infrastructure Fund (December 2019 – present); Co-President, Foothill Capital Management, LLC, a registered investment advisor (2018 – present); Co-Chief Executive Officer (2016 – present), and Vice President (2006 – 2015), Mutual Fund Administration, LLC. | N/A | N/A |
Joy Ausili b (born 1966) Vice President and Assistant Secretary | Since January 2016 | Vice President and Assistant Secretary, 361 Social Infrastructure Fund (December 2019 – present); Co-President, Foothill Capital Management, LLC, a registered investment advisor (2018 – present); Co-Chief Executive Officer (2016 – present), and Vice President (2006 – 2015), Mutual Fund Administration, LLC; Secretary and Assistant Treasurer, Investment Managers Series Trust (September 2013 – January 2016). | N/A | N/A |
First Trust Funds
SUPPLEMENTAL INFORMATION (Unaudited) – Continued
| Name, Address, Year of Birth and Position(s) held with Trust | Term of Officec and Length of Time Served | Principal Occupation During the Past Five Years and Other Affiliations | Number of Portfolios in the Fund Complex Overseen by Trusteed | Other Directorships Held by Trustee During the Past Five Yearse |
Diane Drake b (born 1967) Secretary | Since January 2016 | Secretary, 361 Social Infrastructure Fund (December 2019 – present); Senior Counsel, Mutual Fund Administration, LLC (October 2015 – present); Chief Compliance Officer, Foothill Capital Management, LLC, a registered investment advisor (2018 – 2019). | N/A | N/A |
Martin Dziura b (born 1959) Chief Compliance Officer | Since September 2013 | Principal, Dziura Compliance Consulting, LLC (October 2014 - present). Managing Director, Cipperman Compliance Services (2010 – September 2014). Chief Compliance Officer, Hanlon Investment Management (2009 - 2010). Vice President − Compliance, Morgan Stanley Investment Management (2000 − 2009). | N/A | N/A |
| a | Address for certain Trustees and certain officers: 235 West Galena Street, Milwaukee, Wisconsin 53212. |
| b | Address for Mr. Banhazl, Ms. Ausili, Ms. Dam and Ms. Drake: 2220 E. Route 66, Suite 226, Glendora, California 91740. Address for Mr. Dziura: 309 Woodridge Lane, Media, Pennsylvania 19063. |
| c | Trustees and officers serve until their successors have been duly elected. |
| d | The Trust is comprised of 21 series managed by unaffiliated investment advisors. Each Trustee serves as Trustee of each series of the Trust. The term “Fund Complex” applies only to the Funds managed by the same investment advisor. The Funds do not hold themselves out as related to any other series within the Trust, for purposes of investment and investor services, nor do they share the same investment advisor with any other series. |
| e | “Other Directorships Held” includes only directorship of companies required to register or file reports with the SEC under the Securities Exchange Act of 1934, as amended (that is, “public companies”) or other investment companies registered under the 1940 Act. |
| † | Mr. Banhazl is an “interested person” of the Trust by virtue of his position with Mutual Fund Administration, LLC and Foothill Capital Management, LLC. |
| * | Mr. Gallagher is an “interested person” of the Trust by virtue of his position with UMB Fund Services, Inc. |
First Trust Funds
SUPPLEMENTAL INFORMATION (Unaudited) - Continued
Board Consideration of Investment Advisory and Sub-Advisory Agreements
At a meeting held on April 22, 2021, the Board of Trustees (the “Board”) of Investment Managers Series Trust II (the “Trust”), including the trustees who are not “interested persons” of the Trust (the “Independent Trustees”) as defined in the Investment Company Act of 1940, as amended (the “1940 Act”), reviewed and unanimously approved the renewal of the investment advisory agreement (the “Advisory Agreement”) between the Trust and Vivaldi Asset Management, LLC (the “Investment Advisor”) for an additional one-year term from when it otherwise would expire, with respect to the following series of the Trust (each a “Fund” and together, the “Funds”):
| · | the Vivaldi Merger Arbitrage Fund (the “Merger Arbitrage Fund”), and |
| · | the Vivaldi Multi-Strategy Fund (the “Multi-Strategy Fund”). |
At the same meeting, the Board and the Independent Trustees also reviewed and unanimously approved the renewal of the following sub-advisory agreements (together, the “Sub-Advisory Agreements”), each for additional one-year terms from when they otherwise would expire:
| · | the sub-advisory agreement between the Investment Advisor and RiverNorth Capital Management, LLC (“RiverNorth”) with respect to the Multi-Strategy Fund (the “RiverNorth Sub-Advisory Agreement”), and |
| · | the sub-advisory agreement between the Investment Advisor and Angel Oak Capital Advisors, LLC (“Angel Oak” and together with RiverNorth, the “Sub-Advisors”) with respect to the Multi-Strategy Fund (the “Angel Oak Sub-Advisory Agreement”). |
The Advisory Agreement and the Sub-Advisory Agreements are collectively referred to below as the “Fund Advisory Agreements.”
In addition, at a meeting held on June 30, 2021, the Board, including the Independent Trustees, unanimously approved (1) a new investment advisory agreement between the Trust, on behalf of the Funds, and the Investment Advisor (the “New Advisory Agreement”); (2) a new sub-advisory agreement between the Investment Advisor and RiverNorth with respect to the Multi-Strategy Fund (the “New RiverNorth Agreement”); and (3) a new sub-advisory agreement between the Investment Advisor and Angel Oak with respect to the Multi-Strategy Fund (the “New Angel Oak Agreement” and together with the New Advisory Agreement and the New RiverNorth Agreement, the “New Agreements”), in connection with a pending change of control of the Investment Advisor. Effective November 1, 2021, VFT Holdings LP, formerly Vivaldi Holdings, LLC, the parent company of the Investment Advisor, entered into a joint venture with First Trust Capital Partners, LLC (“First Trust”) and created a new entity called First Trust Capital Solutions L.P., which is equally owned by First Trust and VFT Holdings (the “Transaction”). As a result of the Transaction, the Investment Advisor became a wholly owned subsidiary of First Trust Capital Solutions L.P., which, under the 1940 Act, resulted in an assignment and termination of the then-existing Fund Advisory Agreements. The New Advisory Agreement was substantially the same as the Advisory Agreement, except that the New Advisory Agreement would be effective for 150 days from the date of the closing of the Transaction, unless approved by the shareholders of each Fund, in which case the New Advisory Agreement would remain in effect for a two-year period. The New RiverNorth Agreement and the New Angel Oak Agreement are substantially the same as the respective Sub-Advisory Agreements. The Multi-Strategy Fund’s shareholders approved the New Advisory Agreement at a meeting held on September 28, 2021, the Merger Arbitrage Fund’s shareholders approved the New Advisory Agreement at a meeting held on October 22, 2021, and the Investment Advisor, RiverNorth, and Angel Oak began providing services to each Fund, as applicable, under the New Agreements on November 1, 2021, upon the closing of the Transaction.1
| 1 | Effective November 1, 2021, upon the closing of the Transaction, (1) the Investment Advisor changed its name from Vivaldi Asset Management, LLC to First Trust Capital Management L.P.; (2) the Vivaldi Merger Arbitrage Fund changed its name to the First Trust Merger Arbitrage Fund; and (3) the Vivaldi Multi-Strategy Fund changed its name to the First Trust Multi-Strategy Fund. |
First Trust Funds
SUPPLEMENTAL INFORMATION (Unaudited) - Continued
In approving renewal of each Fund Advisory Agreement and approving each New Agreement, the Board, including the Independent Trustees, determined that such renewal and approval, as applicable, was in the best interests of each Fund and its shareholders. With respect to each meeting, the Board acknowledged that in accordance with exemptive relief granted by the U.S. Securities and Exchange Commission, due to unforeseen emergency circumstances related to the COVID-19 pandemic, the meeting was being held by videoconference, and that as required by the relief, the Board would ratify the renewal of the Fund Advisory Agreements and the approval of the New Agreements at its next in-person meeting.
Fund Advisory Agreements
Background
In advance of the April meeting, the Board received information about the Funds and the Fund Advisory Agreements from the Investment Advisor, the Sub-Advisors, and Mutual Fund Administration, LLC and UMB Fund Services, Inc., the Trust’s co-administrators, certain portions of which are discussed below. The materials, among other things, included information about the organization and financial condition of the Investment Advisor and the Sub-Advisors; information regarding the background, experience, and compensation structure of relevant personnel providing services to the Funds; information about the Investment Advisor’s and the Sub-Advisors’ compliance policies and procedures, disaster recovery and contingency planning, and policies with respect to portfolio execution and trading; information regarding the profitability of the Investment Advisor’s overall relationship with each Fund; reports comparing the performance of each Fund with returns of its benchmark index and a group of comparable funds (each, a “Peer Group”) selected by Broadridge Financial Solutions, Inc. (“Broadridge”) from Morningstar, Inc.’s relevant fund universe (each, a “Fund Universe”) for various periods ended January 31, 2021; reports comparing the investment advisory fee and total expenses of each Fund with those of its Peer Group and Fund Universe; and the advisory and sub-advisory fees paid pursuant to the Advisory Agreement and Sub-Advisory Agreements, respectively. The Board also received a memorandum from legal counsel to the Trust discussing the legal standards under the 1940 Act and other applicable law for their consideration of the proposed renewal of the Fund Advisory Agreements. In addition, the Board considered information reviewed by the Board during the year at other Board and Board committee meetings. No representatives of the Investment Advisor or the Sub-Advisors were present during the Board’s consideration of the Fund Advisory Agreements, and the Independent Trustees were represented by their legal counsel with respect to the matters considered.
In renewing each Fund Advisory Agreement, the Board and the Independent Trustees considered a variety of factors, including those discussed below. In their deliberations, the Board and the Independent Trustees did not identify any particular factor that was controlling, and each Trustee may have attributed different weights to the various factors.
Vivaldi Asset Management, LLC
Nature, Extent and Quality of Services
With respect to the performance results of each Fund, the meeting materials indicated the following:
| · | The Merger Arbitrage Fund’s total return for the one-year period was above the Peer Group and Market Neutral Fund Universe median returns and the Bloomberg U.S. Aggregate Bond Index return, but below the S&P 500 Index return by 11.30%. The Fund’s annualized total return for the three-year period was higher than the median return of the Fund Universe, but below the Peer Group median return, the Bloomberg Index return, and the S&P 500 Index return by 0.45%, 0.68%, and 7.01%, respectively. The Fund’s annualized total return for the five-year period was above the Fund Universe median return, but below the Bloomberg Index return, the Peer Group median return, and the S&P 500 Index return by 0.20%, 1.58%, and 12.45%, respectively. The Trustees observed that the Fund’s volatility of returns, as measured by its standard deviation, and its downside volatility, as measured by its Morningstar risk score, ranked it in the first quartile of the funds (which is the most favorable) in the Peer Group and Fund Universe for the one-, three-, and five-year periods. The Trustees also considered the Investment Advisor’s assertion that the Fund’s modest underperformance of the Bloomberg Index over the three- and five-year periods was due to significant outperformance by traditional bonds during those periods. |
First Trust Funds
SUPPLEMENTAL INFORMATION (Unaudited) - Continued
| · | The Multi-Strategy Fund’s annualized total returns for the three- and five-year periods were above the Peer Group and Multialternative Fund Universe median returns and the ICE BofA 3-Month U.S. Treasury Bill Index returns. The Fund’s total return for the one-year period was above the Fund Universe median return and the ICE BofA Index return, but below the Peer Group median return by 0.22%. The Trustees considered that for the three- and five-year periods, the Fund’s performance ranked it in the top quartile and the second quartile, respectively, of the funds in the Peer Group and Fund Universe. |
The Board also considered the overall quality of services provided by the Investment Advisor to the Funds. In doing so, the Board considered the Investment Advisor’s specific responsibilities in day-to-day management and oversight of the Funds, as well as the qualifications, experience, and responsibilities of the personnel involved in the activities of the Funds. The Board also considered the overall quality of the organization and operations of the Investment Advisor, as well as its compliance structure. In addition, the Board considered the respective roles of the Investment Advisor and the Sub-Advisors with respect to the Multi-Strategy Fund, noting that the Investment Advisor provides overall supervision of the general investment management and investment operations of the Fund and oversees each Sub-Advisor with respect to the Fund’s operations, including monitoring the investment and trading activities of each Sub-Advisor, monitoring the Fund’s compliance with its investment policies, and providing general administrative services related to the Investment Advisor’s overall supervision of the Fund; and that each Sub-Advisor’s responsibilities include day-to-day management of a portion of the Fund’s assets utilizing its designated strategy. The Board and the Independent Trustees concluded that based on the various factors they had reviewed, the nature, overall quality, and extent of the management and oversight services provided by the Investment Advisor to each Fund were satisfactory.
Advisory Fees and Expense Ratios
With respect to the advisory fees and expenses paid by the Funds, the meeting materials indicated the following:
| · | The Merger Arbitrage Fund’s annual investment advisory fee (gross of fee waivers) was above the Peer Group median and the Market Neutral Fund Universe median by 0.10% and 0.15%, respectively. The Trustees noted that the Fund’s advisory fee was not in the highest quartile of funds in the Peer Group. The Trustees also considered the complexity of the Fund’s investment strategy and noted that the Fund Universe does not represent only dedicated merger arbitrage strategy funds but rather the entire market neutral universe. The Trustees also considered that the Investment Advisor manages assets for a private fund and an exchange-traded fund with similar investment strategies as those used by the Fund, but that those accounts have different restrictions than the Fund regarding position sizing, restricted securities/sectors and leverage, and as a result, those accounts have differing fee structures. The Trustees observed, however, that management of mutual fund assets requires compliance with certain requirements under the 1940 Act that do not apply to a private fund. The Trustees also noted that the Fund’s advisory fee was within the range of the advisory fee paid by the other series of the Trust managed by the Investment Advisor. |
First Trust Funds
SUPPLEMENTAL INFORMATION (Unaudited) - Continued
The annual total expenses paid by the Fund (net of fee waivers) for the Fund’s most recent fiscal year were above the Peer Group and Fund Universe medians by 0.09% and 0.26%, respectively. The Trustees considered the Investment Advisor’s assertion that as a smaller firm, it could not cap expenses at levels comparable to peer funds that were part of much larger fund complexes, the advisors of which could support lower expense caps due to their size.
| · | The Multi-Strategy Fund’s annual investment advisory fee (gross of fee waivers) was the same as the Peer Group median, but higher than the Multialternative Fund Universe median by 0.10%. The Trustees considered that the Investment Advisor manages one other registered fund using a multialternative strategy for a lower fee than it charged the Fund, but noted the Investment Advisor’s assertion that the fee for that fund is lower due to its fund-of-funds structure. The Trustees also considered that the Fund’s advisory fee was lower than the advisory fee paid by the other series of the Trust managed by the Investment Advisor. |
The annual total expenses paid by the Fund (net of fee waivers) for the Fund’s most recent fiscal year were slightly higher than the Peer Group median by 0.02%, and higher than the Fund Universe median by 0.26%. The Trustees noted, however, that the average net assets of the Fund’s class considered by Broadridge were lower than the average net assets of corresponding classes of funds in the Peer Group, and significantly lower than the average net assets of corresponding classes of funds in the Fund Universe, and that certain of those other funds also had significant assets in other classes.
The Board and the Independent Trustees concluded that based on the factors they had reviewed, the compensation payable to the Investment Advisor by each Fund under the Advisory Agreement was fair and reasonable in light of the nature and quality of the services the Investment Advisor provides to the Fund.
Profitability and Economies of Scale
The Board next considered information prepared by the Investment Advisor relating to its costs and profits with respect to each Fund for the year ended January 31, 2021, noting that the Investment Advisor had waived a portion of its advisory fee with respect to the Merger Arbitrage Fund. Recognizing the difficulty in evaluating an investment advisor’s profitability with respect to the funds it manages in the context of an advisor with multiple lines of business, and noting that other profitability methodologies might also be reasonable, the Board and the Independent Trustees concluded that the profits of the Investment Advisor from its relationships with the Merger Arbitrage Fund and Multi-Strategy Fund were reasonable.
The Board also considered the benefits received by the Investment Advisor as a result of its relationship with the Funds, other than the receipt of its investment advisory fees, including any research received from broker-dealers providing execution services to the Merger Arbitrage Fund, the beneficial effects from the review by the Trust’s Chief Compliance Officer of the Investment Advisor’s compliance program, and the intangible benefits of the Investment Advisor’s association with the Funds generally and any favorable publicity arising in connection with the Funds’ performance. With respect to the Merger Arbitrage Fund, the Trustees noted that although there were no advisory fee breakpoints, the Fund’s capacity is likely to be constrained and therefore, the Investment Advisor does not expect to realize economies of scale with respect to the Fund. With respect to the Multi-Strategy Fund, the Trustees noted that the asset level of the Fund was not currently likely to lead to significant economies of scale, and that any such economies would be considered in the future as the assets of the Fund grow.
First Trust Funds
SUPPLEMENTAL INFORMATION (Unaudited) - Continued
RiverNorth Capital Management, LLC
Nature, Extent and Quality of Services
The Board considered the overall quality of services provided by RiverNorth to the Multi-Strategy Fund. In doing so, the Board considered RiverNorth’s specific responsibilities in day-to-day management of a portion of the Fund’s assets utilizing a closed-end fund arbitrage strategy, as well as the qualifications, experience, and responsibilities of the personnel involved in the activities of the Fund. The Board also considered the overall quality of the organization and operations of RiverNorth, as well as its compliance structure. The meeting materials indicated that RiverNorth generated positive returns for the Fund for the one-year period ended January 31, 2021, and the Trustees observed the Investment Advisor’s satisfaction with this performance. The Board and the Independent Trustees concluded that based on the various factors they had reviewed, the nature, overall quality, and extent of the management services provided by RiverNorth to the Multi-Strategy Fund were satisfactory.
Sub-Advisory Fee
The Board reviewed information regarding the sub-advisory fee charged by RiverNorth with respect to the Multi-Strategy Fund, and noted that RiverNorth serves as advisor or sub-advisor to other registered investment companies, private funds, and separately managed accounts with similar objectives and policies as RiverNorth’s portion of the Multi-Strategy Fund. The Trustees also noted that, except for one registered fund sub-advisory relationship, one registered fund advisory relationship, and one separately managed account, the sub-advisory fee charged by RiverNorth to the Multi-Strategy Fund is the same as or lower than the fees RiverNorth charges to manage the registered investment companies, private funds and separate accounts with similar strategies as RiverNorth’s portion of the Fund. The Trustees observed that the Investment Advisor pays RiverNorth’s sub-advisory fee out of the Investment Advisor’s advisory fee.
The Board and the Independent Trustees concluded that based on the factors they had reviewed, the compensation payable to RiverNorth under the RiverNorth Sub-Advisory Agreement was fair and reasonable in light of the nature and quality of the services RiverNorth provides to the Multi-Strategy Fund.
Benefits to the Sub-Advisor
The Board also considered the benefits received by RiverNorth as a result of its relationship with the Multi-Strategy Fund, other than the receipt of its sub-advisory fee, including any research received from broker-dealers providing execution services to the Fund, the beneficial effects from the review by the Trust’s Chief Compliance Officer of RiverNorth’s compliance program, and the intangible benefits of RiverNorth’s association with the Fund generally and any favorable publicity arising in connection with the Fund’s performance.
Angel Oak Capital Advisors, LLC
Nature, Extent and Quality of Services
The Board considered the overall quality of services provided by Angel Oak to the Multi-Strategy Fund. In doing so, the Board considered Angel Oak’s specific responsibilities in day-to-day management of a portion of the Fund’s assets utilizing an asset-backed fixed income market strategy, as well as the qualifications, experience, and responsibilities of the personnel involved in the activities of the Fund. The Board also considered the overall quality of the organization and operations of Angel Oak, as well as its compliance structure. The meeting materials indicated that Angel Oak generated positive returns for the Fund for the one-year period ended January 31, 2021, and the Trustees observed the Investment Advisor’s satisfaction with this performance. The Board and the Independent Trustees concluded that based on the various factors they had reviewed, the nature, overall quality, and extent of the management services provided by Angel Oak to the Multi-Strategy Fund were satisfactory.
First Trust Funds
SUPPLEMENTAL INFORMATION (Unaudited) - Continued
Sub-Advisory Fee
The Board reviewed information regarding the sub-advisory fee charged by Angel Oak with respect to the Multi-Strategy Fund, and noted that Angel Oak serves as advisor to a registered fund and a UCITS fund, each of which has the same investment objective and investment strategies as Angel Oak’s portion of the Multi-Strategy Fund. The Trustees also noted that the sub-advisory fee that Angel Oak charges to manage its portion of the Fund is lower than the advisory fee that Angel Oak receives from the registered fund, and that Angel Oak provides more services as advisor to the registered fund than it does as sub-advisor to the Multi-Strategy Fund. The Trustees also observed that the Investment Advisor pays Angel Oak’s sub-advisory fee out of the Investment Advisor’s advisory fee.
The Board and the Independent Trustees concluded that based on the factors they had reviewed, the compensation payable to Angel Oak under the Angel Oak Sub-Advisory Agreement was fair and reasonable in light of the nature and quality of the services Angel Oak provides to the Multi-Strategy Fund.
Benefits to the Sub-Advisor
The Board also considered the benefits received by Angel Oak as a result of its relationship with the Multi-Strategy Fund, other than the receipt of its sub-advisory fee, including any research received from broker-dealers providing execution services to the Fund, the beneficial effects from the review by the Trust’s Chief Compliance Officer of Angel Oak’s compliance program, and the intangible benefits of Angel Oak’s association with the Fund generally and any favorable publicity arising in connection with the Fund’s performance.
Conclusion
Based on these and other factors, the Board and the Independent Trustees concluded that renewal of each Fund Advisory Agreement was in the best interests of each Fund and its shareholders and, accordingly, renewed each Fund Advisory Agreement with respect to the Funds, as applicable.
New Agreements
Background
In advance of the June meeting, the Board received information about the Funds and the New Agreements from the Investment Advisor, the Sub-Advisors, and Mutual Fund Administration, LLC and UMB Fund Services, Inc., the Trust’s co-administrators, certain portions of which are discussed below. The materials, among other things, included information about the organization and financial condition of the Investment Advisor and the Sub-Advisors; information regarding the background, experience, and compensation structure of relevant personnel who would be providing services to the Funds; information about the Investment Advisor’s and the Sub-Advisors’ compliance policies and procedures, disaster recovery and contingency planning, and policies with respect to portfolio execution and trading; information regarding the estimated profitability of the Investment Advisor’s overall relationship with each Fund; reports comparing the performance of each Fund with returns of its benchmark index and Peer Group selected by Broadridge from Morningstar, Inc.’s relevant Fund Universe for various periods ended January 31, 2021, and May 31, 2021; and reports comparing the proposed investment advisory fee and estimated total expenses of each Fund with those of its Peer Group and Fund Universe. The Board also received a memorandum from legal counsel to the Trust discussing the legal standards under the 1940 Act and other applicable law for their consideration of the proposed approval of the New Agreements. In addition, the Board considered information reviewed by the Board during the year at other Board and Board committee meetings. No representatives of the Investment Advisor or the Sub-Advisors were present during the Board’s consideration of the New Agreements, and the Independent Trustees were represented by their legal counsel with respect to the matters considered.
In approving the New Agreements, the Board and the Independent Trustees considered a variety of factors, including those discussed below. In their deliberations, the Board and the Independent Trustees did not identify any particular factor that was controlling, and each Trustee may have attributed different weights to the various factors.
First Trust Funds
SUPPLEMENTAL INFORMATION (Unaudited) - Continued
Vivaldi Asset Management, LLC
Nature, Extent and Quality of Services
The Board’s observations regarding the performance of each Fund for various periods ended January 31, 2021, are described above under “Fund Advisory Agreements.” With respect to the performance results of each Fund for various periods ended May 31, 2021, the meeting materials indicated the following:
| · | The Merger Arbitrage Fund’s annualized total returns for the one-, three-, and five-year periods were ranked in the third quartile of funds in the Peer Group and above the returns of the Bloomberg U.S. Aggregate Bond Index, but below the returns of the S&P 500 Index by at least 12.26%. |
| · | The Multi-Strategy Fund’s total return for the one-year period was ranked in the highest quartile of funds in the Peer Group and above the returns of the ICE BofA 3-Month U.S. Treasury Bill Index. The Fund’s annualized total returns for the three- and five-year periods were ranked in the second quartile of funds in the Peer Group and above the returns of the ICE BofA Index. |
The Board also considered the overall quality of services to be provided by the Investment Advisor to the Funds. In doing so, the Board considered the Investment Advisor’s role as the investment advisor to the Funds, noting that the Investment Advisor would provide overall supervision of the general investment management and investment operations of each Fund, and oversee each Sub-Advisor with respect to the Multi-Strategy Fund’s operations, including monitoring the investment and trading activities of each Sub-Advisor, monitoring the Fund’s compliance with its investment policies, and providing general administrative services related to the Investment Advisor’s overall supervision of the Fund; and that each Sub-Advisor’s responsibilities include day-to-day management of a portion of the Fund’s assets. The Board also considered the qualifications, experience, and responsibilities of the personnel of the Investment Advisor who would be involved in the activities of the Funds, noting that key personnel of the Investment Advisor would continue to be involved in overall supervision of the general investment management and investment operations of each Fund. The Board also noted that there would be no changes in the Funds’ investment objectives or principal investment strategies as a result of the completion of the Transaction or the approval of the New Advisory Agreement. In addition, the Board considered the overall quality of the organization and operations of the Investment Advisor, as well as its compliance structure and compliance procedures.
The Board and the Independent Trustees concluded that based on the various factors they had reviewed, the Investment Advisor would have the capabilities, resources, and personnel necessary to manage each Fund, and that the Investment Advisor would provide each Fund with a reasonable potential for good investment results.
Advisory Fees and Expense Ratios
The Board considered that under the New Advisory Agreement, the Investment Advisor would be entitled to the same advisory fees as the Investment Advisor is entitled under the Advisory Agreement, and that in addition, the Investment Advisor had contractually agreed to maintain the same expense limitation arrangement for the Funds currently in effect for a period of two years from the closing of the Transaction. The Board’s observations regarding the advisory fees and annual total expenses paid by the Funds are described above under “Fund Advisory Agreements.”
The Board and the Independent Trustees concluded that the proposed compensation payable to the Investment Advisor under the New Advisory Agreement would be fair and reasonable in light of the nature and quality of the services proposed to be provided by the Investment Advisor to each Fund.
First Trust Funds
SUPPLEMENTAL INFORMATION (Unaudited) - Continued
Profitability and Economies of Scale
The Board next considered information prepared by the Investment Advisor relating to its expected costs and profits with respect to each Fund, noting that the Investment Advisor had agreed to maintain the current expense limitation arrangement for a period of two years from the closing of the Transaction. Recognizing the difficulty in evaluating an investment advisor’s profitability with respect to the funds it manages in the context of an advisor with multiple lines of business, and noting that other profitability methodologies might also be reasonable, the Board and the Independent Trustees concluded that the expected profits of the Investment Advisor from its relationships with the Merger Arbitrage Fund and Multi-Strategy Fund were reasonable.
The Board also noted that the potential benefits to be received by the Investment Advisor as a result of its relationship with the Funds, other than the receipt of its advisory fees, would include the usual types of “fall out” benefits received by advisors to the Trust, including any research received from broker-dealers providing execution services to the Merger Arbitrage Fund, the beneficial effects from the review by the Trust’s Chief Compliance Officer of the Investment Advisor’s compliance program, and the intangible benefits of the Investment Advisor’s association with the Funds generally and any favorable publicity arising in connection with the Funds’ performance. With respect to the Merger Arbitrage Fund, the Trustees noted that although there were no advisory fee breakpoints, the Fund’s capacity is likely to be constrained and therefore, the Investment Advisor does not expect to realize economies of scale with respect to the Fund. With respect to the Multi-Strategy Fund, the Trustees noted that the asset level of the Fund was not currently likely to lead to significant economies of scale, and that any such economies would be considered in the future as the assets of the Fund grow.
RiverNorth Capital Management, LLC
Nature, Extent and Quality of Services
The Board considered the overall quality of services to be provided by RiverNorth to the Multi-Strategy Fund. In doing so, the Board noted that as a sub-advisor to the Fund, RiverNorth is responsible for the day-to-day management of a portion of the Fund’s assets utilizing a closed-end fund arbitrage strategy. The meeting materials indicated that RiverNorth’s portion of the Fund outperformed the Bloomberg U.S. Aggregate Bond Index for the one- and three-year periods ended May 31, 2021, and outperformed the Morningstar All Closed-End Fund Total Return Index for the three-year period, but underperformed the S&P 500 Index for the one- and three-year periods by 7.97% and 7.05%, respectively. The Trustees noted RiverNorth’s observation that its portion of the Fund had outperformed the S&P 500 Index adjusted to reflect the portfolio’s beta (i.e., volatility against the benchmark) to the S&P 500 Index for both periods. The Trustees also noted that the Investment Advisor recommended approval of the New RiverNorth Agreement.
The Board and the Independent Trustees concluded that based on the various factors they had reviewed, RiverNorth would have the capabilities, resources, and personnel necessary to manage its portion of the Multi-Strategy Fund, and that RiverNorth would provide the Fund with a reasonable potential for good investment results.
Sub-Advisory Fee
The Board reviewed information regarding the annual sub-advisory fee proposed to be charged by RiverNorth with respect to the Multi-Strategy Fund. The Trustees noted that under the New RiverNorth Agreement, RiverNorth would be entitled to the same sub-advisory fee as under the RiverNorth Sub-Advisory Agreement with respect to the Fund. The Board’s observations regarding RiverNorth’s current sub-advisory fee are described above under “Fund Advisory Agreements.”
The Board and the Independent Trustees concluded that the proposed compensation payable to RiverNorth under the New RiverNorth Agreement would be fair and reasonable in light of the nature and quality of the services proposed to be provided by RiverNorth to the Multi-Strategy Fund.
First Trust Funds
SUPPLEMENTAL INFORMATION (Unaudited) - Continued
Benefits to the Sub-Advisor
The Board also considered that the potential benefits to be received by RiverNorth as a result of its relationship with the Multi-Strategy Fund, other than the receipt of its sub-advisory fee, would include the usual types of “fall out” benefits received by sub-advisors to the Trust, including any research received from broker-dealers providing execution services to the Fund, the beneficial effects from the review by the Trust’s Chief Compliance Officer of RiverNorth’s compliance program, and the intangible benefits of RiverNorth’s association with the Fund generally and any favorable publicity arising in connection with the Fund’s performance.
Angel Oak Capital Advisors, LLC
Nature, Extent and Quality of Services
The Board considered the overall quality of services to be provided by Angel Oak to the Multi-Strategy Fund. In doing so, the Board noted that as a sub-advisor to the Fund, Angel Oak is responsible for the day-to-day management of a portion of the Fund’s assets utilizing an asset-backed fixed income market strategy. The meeting materials indicated that Angel Oak’s portion of the Fund outperformed the Bloomberg U.S. Aggregate Bond Index for the one-, three-, and five-year periods ended May 31, 2021. The Trustees also noted that the Investment Advisor recommended approval of the New Angel Oak Agreement.
The Board and the Independent Trustees concluded that based on the various factors they had reviewed, Angel Oak would have the capabilities, resources, and personnel necessary to manage its portion of the Multi-Strategy Fund, and that Angel Oak would provide the Fund with a reasonable potential for good investment results.
Sub-Advisory Fee
The Board reviewed information regarding the annual sub-advisory fee proposed to be charged by Angel Oak with respect to the Multi-Strategy Fund. The Trustees noted that under the New Angel Oak Agreement, Angel Oak would be entitled to the same sub-advisory fee as under the Angel Oak Sub-Advisory Agreement with respect to the Fund. The Board’s observations regarding Angel Oak’s current sub-advisory fee are described above under “Fund Advisory Agreements.”
The Board and the Independent Trustees concluded that the proposed compensation payable to Angel Oak under the New Angel Oak Agreement would be fair and reasonable in light of the nature and quality of the services proposed to be provided by Angel Oak to the Multi-Strategy Fund.
Benefits to the Sub-Advisor
The Board also considered that the potential benefits to be received by Angel Oak as a result of its relationship with the Multi-Strategy Fund, other than the receipt of its sub-advisory fee, would include the usual types of “fall out” benefits received by sub-advisors to the Trust, including any research received from broker-dealers providing execution services to the Fund, the beneficial effects from the review by the Trust’s Chief Compliance Officer of Angel Oak’s compliance program, and the intangible benefits of Angel Oak’s association with the Fund generally and any favorable publicity arising in connection with the Fund’s performance.
Conclusion
Based on these and other factors, the Board and the Independent Trustees concluded that approval of each New Agreement was in the best interests of each Fund and its shareholders and, accordingly, approved each New Agreement with respect to the Funds, as applicable.
First Trust Funds
SUPPLEMENTAL INFORMATION (Unaudited) - Continued
Statement Regarding Liquidity Risk Management Program
The Securities and Exchange Commission adopted Rule 22e-4 under the Investment Company Act of 1940, as amended (the “Liquidity Rule”), to promote effective liquidity risk management throughout the open-end investment company industry, thereby reducing the risk that funds will be unable to meet their redemption obligations and mitigating dilution of the interests of fund shareholders.
The Board of Trustees (the “Board”) of Investment Managers Series Trust II (the “Trust”) met on April 22, 2021 (the “Meeting”), to review the liquidity risk management program (the “Fund Program”) applicable to the following series of the Trust (each, a “Fund” and together, the “Funds”) pursuant to the Liquidity Rule:
Vivaldi Merger Arbitrage Fund
Vivaldi Multi-Strategy Fund
The Board has appointed Vivaldi Asset Management, LLC, the investment adviser to the Funds, as the program administrator (“Program Administrator”) for the Fund Program. Under the Trust’s liquidity risk management program (the “Trust Program”), the Board has delegated oversight of the Trust Program to the Liquidity Oversight Committee (the “Oversight Committee”). At the Meeting, the Oversight Committee, on behalf of Program Administrator and the Funds, provided the Board with a written report (the “Report”) that addressed the operation, adequacy, and effectiveness of implementation of the Fund Program, and any material changes to it for the period from August 1, 2020 through January 31, 2021 (the “Program Reporting Period”).
In assessing the adequacy and effectiveness of implementation of the Fund Program, the Report discussed the following, among other things:
| · | The Fund Program’s liquidity classification methodology for categorizing each Fund’s investments (including derivative transactions); |
| · | An overview of market liquidity for each Fund during the Program Reporting Period; |
| · | Each Fund’s ability to meet redemption requests; |
| · | Each Fund’s cash management; |
| · | Each Fund’s borrowing activity, if any, in order to meet redemption requests; |
| · | Each Fund’s compliance with the 15% limit of illiquid investments; and |
| · | Each Fund’s status as a primarily highly liquid fund (“PHLF”), the effectiveness of the implementation of the PHLF standard, and whether it would be appropriate for each Fund to adopt a highly liquid investment minimum (“HLIM”). |
The Report stated that the Funds primarily hold assets that are defined under the Liquidity Rule as "highly liquid investments," and therefore each Fund is not required to establish an HLIM. Highly liquid investments are defined as cash and any investment reasonably expected to be convertible to cash in current market conditions in three business days or less without the conversion to cash significantly changing the market value of the investment. The Report also stated that there were no material changes made to the Fund Program during the Program Reporting Period.
In the Report, the Program Administrator concluded that (i) the Fund Program, as adopted and implemented, remains reasonably designed to assess and manage each Fund’s liquidity risk; (ii) each Fund continues to qualify as a PHLF and therefore is not required to adopt an HLIM; (iii) during the Program Reporting Period, each Fund was able to meet redemption requests without significant dilution of remaining investors’ interests; and (iv) there were no weaknesses in the design or implementation of the Fund Program during the Program Reporting Period.
There can be no assurance that the Fund Program will achieve its objectives in the future. Please refer to the Funds’ prospectus for more information regarding each Fund’s exposure to liquidity risk and other principal risks to which an investment in the Funds may be subject.
First Trust Funds
EXPENSE EXAMPLES
For the Six Months Ended September 30, 2021 (Unaudited)
Expense Examples
As a shareholder of the Funds, you incur two types of costs: (1) transaction costs including sales charges (loads) on purchases within certain classes; and (2) ongoing costs, including management fees, distribution and/or service (12b-1) fees (Class A only) and other Fund expenses. The examples below are intended to help you understand your ongoing costs (in dollars) of investing in the Funds and to compare these costs with the ongoing costs of investing in other mutual funds.
These examples are based on an investment of $1,000 invested at the beginning of the period and held for the entire period from April 1, 2021 to September 30, 2021.
Actual Expenses
The information in the row titled “Actual Performance” of the table below provides actual account values and actual expenses. You may use the information in these columns, together with the amount you invested, to estimate the expenses that you paid over the period. Simply divide your account value by $1,000 (for example, an $8,600 account value divided by $1,000 = 8.6), then multiply the result by the number in the appropriate row under the column titled “Expenses Paid During Period” to estimate the expenses you paid on your account during this period.
Hypothetical Example for Comparison Purposes
The information in the row titled “Hypothetical (5% annual return before expenses)” of the table below provides hypothetical account values and hypothetical expenses based on the Fund’s actual expense ratios and an assumed rate of return of 5% per year before expenses, which is not the Fund’s actual return. The hypothetical account values and expenses may not be used to estimate the actual ending account balance or expenses you paid for the period. You may use this information to compare the ongoing costs of investing in the Funds and other funds. To do so, compare these 5% hypothetical examples with the 5% hypothetical examples that appear in the shareholder reports of the other funds.
Please note that the expenses shown in the table are meant to highlight your ongoing costs only and do not reflect any transaction costs, such as sales charges (load) or contingent deferred sales charges. Therefore, the information in the row titled “Hypothetical (5% annual return before expenses)” is useful in comparing ongoing costs only, and will not help you determine the relative total costs of owning different funds. In addition, if these transactional costs were included, your costs would have been higher.
| Merger Arbitrage Fund | Beginning Account Value | Ending Account Value | Expenses Paid During Period* |
| 4/1/21 | 9/30/21 | 4/1/21 – 9/30/21 |
| Class A | Actual Performance | $ 1,000.00 | $ 1,015.50 | $ 11.19 |
| | Hypothetical (5% annual return before expenses) | 1,000.00 | 1,013.97 | 11.18 |
| Class I | Actual Performance | 1,000.00 | 1,017.00 | 9.61 |
| | Hypothetical (5% annual return before expenses) | 1,000.00 | 1,015.53 | 9.61 |
| * | Expenses are equal to the Fund’s annualized expense ratios of 2.21% and 1.90% for the Class A and Class I shares, respectively, multiplied by the average account values over the period, multiplied by 183/365 (to reflect the six month period) for Class A shares and Class I shares. Assumes all dividends and distributions were reinvested. |
First Trust Funds
EXPENSE EXAMPLES - Continued
For the Six Months Ended September 30, 2021 (Unaudited)
| Multi-Strategy Fund | Beginning Account Value | Ending Account Value | Expenses Paid During Period* |
| 4/1/21 | 9/30/21 | 4/1/21 – 9/30/21 |
| Class A | Actual Performance | $ 1,000.00 | $ 1,027.20 | $ 10.29 |
| | Hypothetical (5% annual return before expenses) | 1,000.00 | 1,014.92 | 10.23 |
| Class I | Actual Performance | 1,000.00 | 1,028.20 | 9.10 |
| | Hypothetical (5% annual return before expenses) | 1,000.00 | 1,016.09 | 9.05 |
| * | Expenses are equal to the Fund’s annualized expense ratios of 2.02% and 1.79% for the Class A and Class I shares, respectively, multiplied by the average account values over the period, multiplied by 183/365 (to reflect the six month period) for Class A shares and Class I shares. The expense ratios reflect an expense waiver. Assumes all dividends and distributions were reinvested. |
This page is intentionally left blank
This page is intentionally left blank
This page is intentionally left blank
The First Trust Funds
Each a series of Investment Managers Series Trust II
Investment Advisor
First Trust Capital Management L.P.
225 West Wacker Drive, Suite 2100
Chicago, Illinois 60606
Sub-Advisor
Angel Oak Capital Advisors, LLC
3344 Peachtree Road Northeast, Suite 1725
Atlanta, Georgia 30326
Sub-Advisor
RiverNorth Capital Management, LLC
433 West Van Buren Street, 1150-E
Chicago, Illinois 60607
Independent Registered Public Accounting Firm
Tait, Weller & Baker LLP
Two Liberty Place
50 South 16th Street, Suite 2900
Philadelphia, Pennsylvania 19102
Custodian
UMB Bank, n.a.
928 Grand Boulevard, 5th Floor
Kansas City, Missouri 64106
Fund Co-Administrator
Mutual Fund Administration, LLC
2220 East Route 66, Suite 226
Glendora, California 91740
Fund Co-Administrator, Transfer Agent and Fund Accountant
UMB Fund Services, Inc.
235 West Galena Street
Milwaukee, Wisconsin 53212
Distributor
First Trust Portfolios L.P.
120 E. Liberty Drive, Suite 400
Wheaton, Illinois 60187
FUND INFORMATION
| | TICKER | CUSIP |
| First Trust Arbitrage Fund – Class A | VARAX | 46141T 877 |
| First Trust Arbitrage Fund – Class I | VARBX | 46141T 869 |
| First Trust Multi-Strategy Fund – Class A | OMOAX | 46141T 687 |
| First Trust Multi-Strategy Fund – Class I | OMOIX | 46141T 679 |
Privacy Principles of the First Trust Funds for Shareholders
The Funds are committed to maintaining the privacy of their shareholders and to safeguarding their non-public personal information. The following information is provided to help you understand what personal information the Funds collect, how we protect that information and why, in certain cases, we may share information with select other parties.
Generally, the Funds do not receive any non-public personal information relating to their shareholders, although certain non-public personal information of their shareholders may become available to the Funds. The Funds do not disclose any non-public personal information about their shareholders or former shareholders to anyone, except as permitted by law or as is necessary in order to service shareholder accounts (for example, to a transfer agent or third party administrator).
This report is sent to shareholders of the First Trust Funds for their information. It is not a Prospectus, circular or representation intended for use in the purchase or sale of shares of the Funds or of any securities mentioned in this report.
Proxy Voting
The Funds’ proxy voting policies and procedures, as well as information regarding how the Funds voted proxies for portfolio securities, if applicable, during the most recent 12-month period ended June 30, are available, without charge and upon request by calling (877) 779-1999 or on the SEC’s website at www.sec.gov.
Fund Portfolio Holdings
The Funds file a complete schedule of their portfolio holdings with the SEC for the first and third quarters of each fiscal year on Form N-PORT within 60 days of the end of such fiscal quarter. Shareholders may obtain the Funds’ Form N-PORT on the SEC’s website at www.sec.gov.
Prior to the use of Form N-PORT, the Funds filed their complete schedule of portfolio holdings with the SEC on Form N-Q, which is available online at www.sec.gov.
Householding
The Funds will mail only one copy of shareholder documents, including prospectuses, notice of annual and semi-annual reports availability and proxy statements, to shareholders with multiple accounts at the same address. This practice is commonly called “householding” and is intended to reduce expenses and eliminate duplicate mailings of shareholder documents. Mailings of your shareholder documents may be householded indefinitely unless you instruct us otherwise. If you do not want the mailing of these documents to be combined with those for other members of your household, please call the Funds at (877) 779-1999.
First Trust Funds
P.O. Box 2175
Milwaukee, WI 53201
Toll Free: (877) 779-1999
Item 1. Report to Stockholders (Continued).
Item 2. Code of Ethics.
The registrant has adopted a code of ethics that applies to the registrant's principal executive officer and principal financial officer. The registrant has not made any amendments to its code of ethics during the period covered by this report. The registrant has not granted any waivers from any provisions of the code of ethics during the period covered by this report.
The registrant undertakes to provide to any person without charge, upon request, a copy of its code of ethics by mail when they call the registrant at 1-877-779-1999.
Item 3. Audit Committee Financial Expert.
The Board of Trustees of the Registrant has determined that the Registrant has the following “audit committee financial experts” as defined in Item 3(b) of Form N-CSR serving on its Audit Committee: Messrs. Thomas Knipper and John P. Zader. The audit committee financial experts are “independent” as that term is defined in Item 3(a)(2) of Form N-CSR.
Item 4. Principal Accountant Fees and Services.
The registrant has engaged its principal accountant to perform audit services, audit-related services, tax services and other services during the past two fiscal years. "Audit services" refer to performing an audit of the registrant's annual financial statements or services that are normally provided by the accountant in connection with statutory and regulatory filings or engagements for those fiscal years. "Audit-related services" refer to the assurance and related services by the principal accountant that are reasonably related to the performance of the audit. "Tax services" refer to professional services rendered by the principal accountant for tax compliance, tax advice, and tax planning. There were no "other services" provided by the principal accountant. The following table details the aggregate fees billed or expected to be billed for each of the last two fiscal years for audit fees, audit-related fees, tax fees and other fees by the principal accountant.
| First Trust Merger Arbitrage Fund | FYE 9/30/2021 | FYE 9/31/2020 |
| Audit Fees | $12,500 | $12,500 |
| Audit-Related Fees | N/A | N/A |
| Tax Fees | $2,500 | $2,500 |
| All Other Fees | N/A | N/A |
| First Trust Multi-Strategy Fund | FYE 9/30/2021 | FYE 9/30/2020 |
| Audit Fees | $12,500 | $12,500 |
| Audit-Related Fees | N/A | N/A |
| Tax Fees | $2,500 | $2,500 |
| All Other Fees | N/A | N/A |
The audit committee has adopted pre-approval policies and procedures that require the audit committee to pre-approve all audit and non-audit services of the registrant, including services provided to any entity affiliated with the registrant.
The percentage of fees billed by Tait, Weller, & Weller LLP applicable to non-audit services pursuant to waiver of pre-approval requirement were as follows:
| First Trust Merger Arbitrage Fund | FYE 9/30/2021 | FYE 9/30/2020 |
| Audit-Related Fees | 0% | 0% |
| Tax Fees | 0% | 0% |
| All Other Fees | 0% | 0% |
| A First Trust Multi-Strategy Fund | FYE 9/30/2021 | FYE 9/30/2020 |
| Audit-Related Fees | 0% | 0% |
| Tax Fees | 0% | 0% |
| All Other Fees | 0% | 0% |
All of the principal accountant's hours spent on auditing the registrant's financial statements were attributed to work performed by full-time permanent employees of the principal accountant.
The following table indicates the non-audit fees billed or expected to be billed by the registrant's accountant for services to the registrant and to the registrant's investment advisor (and any other controlling entity, etc.—not sub-advisor) for the last two years. The audit committee of the Board of Trustees has considered whether the provision of non-audit services that were rendered to the registrant's investment advisor is compatible with maintaining the principal accountant's independence and has concluded that the provision of such non-audit services by the accountant has not compromised the accountant's independence.
| First Trust Merger Arbitrage Fund | | |
| Non-Audit Related Fees | FYE 9/30/2021 | FYE 9/30/2020 |
| Registrant | N/A | N/A |
| Registrant’s Investment Advisor | N/A | N/A |
| First Trust Multi-Strategy Fund | | |
| Non-Audit Related Fees | FYE 9/30/2021 | FYE 9/30/2020 |
| Registrant | N/A | N/A |
| Registrant’s Investment Advisor | N/A | N/A |
Item 5. Audit Committee of Listed Registrants.
| (a) | Not applicable to registrants who are not listed issuers (as defined in Rule 10A-3 under the Securities Exchange Act of 1934). |
Item 6. Schedule of Investments.
| (a) | Schedule of Investments is included as part of the report to shareholders filed under Item 1 of this Form. |
Item 7. Disclosure of Proxy Voting Policies and Procedures for Closed-End Management Investment Companies.
Not applicable to open-end investment companies.
Item 8. Portfolio Managers of Closed-End Management Investment Companies.
Not applicable to open-end investment companies.
Item 9. Purchases of Equity Securities by Closed-End Management Investment Company and Affiliated Purchasers.
Not applicable.
Item 10. Submission of Matters to a Vote of Security Holders.
The registrant has not made any material changes to the procedures by which shareholders may recommend nominees to the registrant’s Board of Trustees.
Item 11. Controls and Procedures.
| (a) | The Registrant’s President/Chief Executive Officer and Treasurer/Chief Financial Officer have reviewed the Registrant's disclosure controls and procedures (as defined in Rule 30a-3(c) under the Investment Company Act of 1940 (the “Act”)) as of a date within 90 days of the filing of this report, as required by Rule 30a-3(b) under the Act and Rules 13a-15(b) or 15d-15(b) under the Securities Exchange Act of 1934. Based on their review, such officers have concluded that the disclosure controls and procedures are effective in ensuring that information required to be disclosed in this report is appropriately recorded, processed, summarized and reported and made known to them by others within the Registrant and by the Registrant’s service provider. |
| (b) | There were no changes in the Registrant's internal control over financial reporting (as defined in Rule 30a-3(d) under the Act) that occurred during the period covered by this report that has materially affected, or is reasonably likely to materially affect, the Registrant's internal control over financial reporting. |
Item 12. Disclosure of Securities Lending Activities for Closed-End Management Investment Companies.
Not applicable to open-end investment companies.
Item 13. Exhibits.
(2) Certifications pursuant to Section 302 of the Sarbanes-Oxley Act of 2002. Filed herewith.
(3) Any written solicitation to purchase securities under Rule 23c-1 under the Act sent or given during the period covered by the report by or on behalf of the registrant to 10 or more persons. Not applicable to open-end investment companies.
(4) Change in the registrant’s independent public accountant. There was no change in the registrant’s independent public accountant for the period covered by this report.
SIGNATURES
Pursuant to the requirements of the Securities Exchange Act of 1934 and the Investment Company Act of 1940, the registrant has duly caused this report to be signed on its behalf by the undersigned, thereunto duly authorized.
| (Registrant) | Investment Managers Series Trust II | |
| | | |
| By (Signature and Title) | /s/ Terrance Gallagher | |
| | Terrance Gallagher, President/Chief Executive Officer | |
| | | |
| Date | 12/8/2021 | |
Pursuant to the requirements of the Securities Exchange Act of 1934 and the Investment Company Act of 1940, this report has been signed below by the following persons on behalf of the registrant and in the capacities and on the dates indicated.
| By (Signature and Title) | /s/ Terrance Gallagher | |
| | Terrance Gallagher, President/Chief Executive Officer | |
| | | |
| Date | 12/8/2021 | |
| | | |
| By (Signature and Title) | /s/ Rita Dam | |
| | Rita Dam, Treasurer/Chief Financial Officer | |
| | | |
| Date | 12/8/2021 | |