UNITED STATES
SECURITIES AND EXCHANGE COMMISSION
Washington, D.C. 20549
FORM N-CSR
CERTIFIED SHAREHOLDER REPORT OF REGISTERED
MANAGEMENT INVESTMENT COMPANIES
Investment Company Act file number 811-22894
INVESTMENT MANAGERS SERIES TRUST II
(Exact name of registrant as specified in charter)
235 W. Galena Street
Milwaukee, WI 53212
(Address of principal executive offices) (Zip code)
Diane J. Drake
Mutual Fund Administration, LLC
2220 E. Route 66, Suite 226
Glendora, CA 91740
(Name and address of agent for service)
(626) 385-5777
Registrant's telephone number, including area code
Date of fiscal year end: November 30
Date of reporting period: November 30, 2021
Item 1. Report to Stockholders.
| (a) | The registrant’s annual report transmitted to shareholders pursuant to Rule 30e-1 under the Investment Company Act of 1940, as amended (the “Investment Company Act”), is as follows: |
ACR Multi-Strategy Quality Return (MQR) Fund
Class I Shares
(Ticker Symbol: MQRIX)
ACR International Quality Return (IQR) Fund
Class I Shares
(Ticker Symbol: IQRIX)
ANNUAL REPORT
November 30, 2021
ACR Funds
Each a series of Investment Managers Series Trust II
Table of Contents
| Shareholder Letters | 1 |
| Fund Performance | 33 |
| Schedule of Investments | 37 |
| Statements of Assets and Liabilities | 44 |
| Statements of Operations | 45 |
| Statements of Changes in Net Assets | 46 |
| Financial Highlights | 50 |
| Notes to Financial Statements | 52 |
| Report of Independent Registered Public Accounting Firm | 64 |
| Supplemental Information | 66 |
| Expense Examples | 74 |
This report and the financial statements contained herein are provided for the general information of the shareholders of the ACR Funds. This report is not authorized for distribution to prospective investors in the Funds unless preceded or accompanied by an effective prospectus.
www.acr-investfunds.com
November 30, 2021
Dear Shareholders:
The ACR Alpine Capital Research investment team is pleased to present its seventh annual investment letter for the ACR Multi-Strategy Quality Return (MQR) Fund (“MQR” or “MQR Fund,” or “the Fund”).
Our aim with this annual report is to provide a summary and discussion of the MQR Fund’s performance and positioning, plus its audited financial statements. ACR’s fund website, www.acr-investfunds.com, also provides information about the Fund and connects you to ACR’s firm website, which includes quarterly firm commentaries that explain our investment philosophy, view of market conditions, and investment strategies.
ACR understands that the trust and confidence of MQR Fund shareholders is contingent upon integrity between ACR’s words and actions and, ultimately, the MQR Fund’s investment results. The ACR investment team strives to earn and keep that trust and confidence, and we look forward to partnering with shareholders for many years of prosperity and intelligent decision-making.
Sincerely,
Tim Piechowski, CFA®
Portfolio Manager
8000 Maryland Avenue, Suite 700 | St. Louis, MO 63105
t 314.932.7600 | f 314.932.1111 | 877.849.7733 | acr-invest.com
Management’s Discussion of Fund Performance
The MQR Fund Class I generated a 28.65% net return in Fiscal 2021 versus a return of 19.78% for the MSCI ACWI (Gross) Index and 16.13% for the HFRI Equity Hedge (Total) Index.
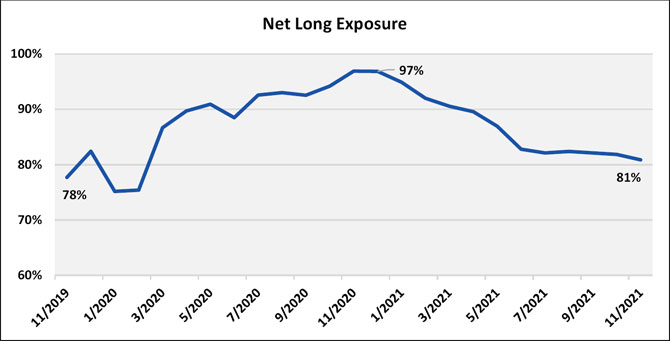
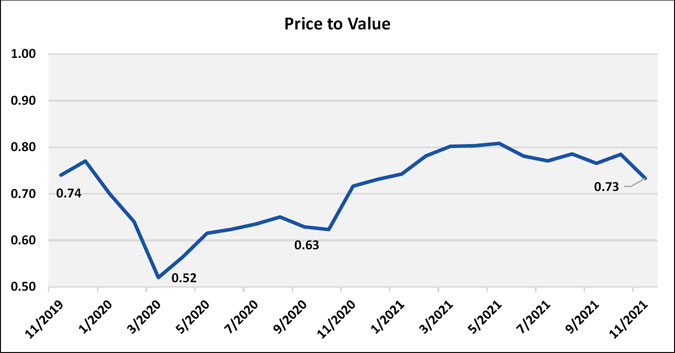
MQR had an excellent year as not only did the Fund outperform from a market price perspective, but the intrinsic value development in the Fund’s investee companies was such that the price to value ratio of the Fund stayed approximately flat at 0.73x versus 0.72x in the prior year. The Fund’s net long exposure declined from approximately 97% at the prior fiscal year end to 81%, reflecting a lack of qualifying new investment ideas in the second half of the fiscal year after market prices had appreciated. One benefit of this lower net long exposure is that the Fund has ample “dry powder” if idiosyncratic ideas come to the fore or if market volatility picks up in 2022.
The remainder of this letter will provide an overview of the Fund’s objectives and a discussion of the Fund’s Fiscal 2021 performance, the market conditions under which the Fund has operated since inception, and why these past conditions and the Fund’s current positioning give the team confidence that the Fund is well positioned going forward.
MQR Objectives
The investment objectives of the MQR Fund are to preserve capital during periods of economic decline and provide above-average absolute and relative returns in the long run. “Long run” is defined as an investment performance period that includes a full economic cycle of expansion and contraction in output and equity market prices.
“Above-average absolute returns” means higher than a “fair” equity-like return (i.e., stock market returns over a full market cycle) commensurate with the risk of investing in equities in the long run. The term “absolute return” in no way implies there will be positive returns in any period other than in the “long run” as defined above. Market value fluctuations are expected to produce significant negative returns in certain short-term periods. Annual market returns are expected to be both positive and negative.
“Above-average relative returns” means returns higher than returns of an equity market benchmark in the long run. The equity market benchmark is the MSCI ACWI Index because it is a broad proxy for the world equity market.
ACR achieves each of these objectives by seeking securities that (a) have reliable cash flows and (b) are priced at a discount to a conservative estimate of the present value of these cash flows. The investment team refrains from putting capital to work in a security unless the investment, at fundamental value, is expected to generate at least a 5-7% annualized return over inflation. We believe the discipline to purchase the security at a discount to our estimate of fundamental value should allow us to earn an excess return over this minimum hurdle. More importantly, the discount to fundamental value helps protect capital against permanent impairment, thereby increasing the likelihood that the Fund meets its return hurdles.
Overview of Fiscal 2021 Performance
The MQR Fund Class I generated a 28.65% net return in Fiscal 2021 versus a return of 19.78% for the MSCI ACWI (Gross) Index and 16.13% for the HFRI Equity Hedge (Total) Index.
MQR had an exceptional year driven by substantial excess return in both its U.S. and ex-U.S. positions. On a weighted average basis, the Fund’s U.S. holdings were up 41.25% versus 27.92% for the S&P 500 Index1, while its ex-U.S. holdings were up 28.06% versus 9.14% for the MSCI All Country World Index ex-US (“ACWX”).
These investment returns were solid, especially because growth stocks again outperformed value stocks during the fiscal year. One example of this is that the S&P 500 Value Index2 was up 20.76% in the period while the S&P 500 Growth Index3 was up 34.08% in the period.
As we mentioned last year, ACR’s fundamental investment approach relies upon deep research in industries and companies which helps us to understand future margin structures, opportunities to redeploy capital at attractive returns, and ultimately the terminal economics of each business.
In general, our investments hue closer to the types of companies found in value indices versus those of growth indices, as companies in growth indices tend to have embedded pricing expectations that force one to speculate on the long-term structure of each of the items above rather than establish a high-quality understanding of those items. Given this value bent, and growth’s continued outperformance, we were pleased to see that the Fund significantly outperformed its benchmark in the period through strong stock selection. The investment team believes that the Fund’s outperformance during the year is a strong indicator that our research process is finding idiosyncratic opportunities with unique valuation, quality and potential return characteristics.
The Fund started Fiscal 2021 with a 97% net long exposure, the highest on record since inception. ACR’s investment team positioned the Fund this way as there were several unique opportunities and intra-market discrepancies to start the year as the market was still digesting what the reopening from COVID lockdowns would look like in 2021. As the market recovered, ACR’s positions generated excess returns, and some intra-market discrepancies declined in size. Thus, as the year progressed, ACR reduced the Fund’s net long exposure to 81%. If, and when, market volatility or our research uncover new opportunities, we have substantial excess dry powder to deploy.
| 1 | The S&P 500 Index® is made up of large capitalization U.S. Equities, with the index making up approximately 500 of the largest companies in the United States that make up some 80% of the country’s available market capitalization. |
| 2 | The S&P 500 Value Index® measures the performance of the large cap value segment of the US equity universe. It includes those S&P 500 Index companies with lower price-to-book ratios, lower forecasted growth values and lower momentum than those excluded from the index. |
| 3 | The S&P 500® Growth Index measures the performance of the large cap growth segment of the US equity universe. It includes those S&P 500 Index® companies with higher price-to-book ratios, higher forecasted growth values and higher momentum than those excluded from the index. |
Despite reducing the Fund’s net long exposure during the year, the investment team continues to believe that its current holdings are materially undervalued. One measure for this is the Fund’s Price to Value which increased only modestly to 0.73x from 0.72x during the fiscal year. Note that the price to value statistic measures the discount at which the Fund’s holdings (ex-cash) trade to intrinsic value, and its reciprocal, 1/0.73x or 37%, is the amount by which the Fund’s holdings would appreciate in total if they were to each reach intrinsic value immediately. In the below chart, one can see the significant volatility in the Fund’s price to value ratio caused by COVID last year and then the recovery by the end of last year. Too, this year’s lack of movement in the price to value ratio despite the market moving up materially indicates that the Fund’s underlying holdings saw significant intrinsic value growth during the year.
Detractors and Contributors Fiscal 2021
The three largest detractors for the Fund in FY 2021 were Plastic Omnium, Five Point Holdings, and a short on the iShares Russell 2000 ETF.
Plastic Omnium (“POM”, 142 basis points negative contribution, 26.9% decline)
Our largest detractor was POM. POM is a French auto parts manufacturer with #1 global share in intelligent exterior systems (15% market share), clean energy systems (22% market share) and plastic modules (18% market share). The business has grown faster than global auto production by approximately 5% per year and we expect this trend to continue due to increased product content on new car models, and potential contribution from its nascent hydrogen business (in storage vessel, fuel cell stacks and integrated hydrogen systems).
Global auto production has been negatively impacted by 2021’s global supply chain constraints (the automotive sector is particularly impacted by the global semiconductor shortage), and POM was not immune to these industry problems. The company’s performance for 2021 will be significantly below our prior expectations. The market appears to have taken a myopic view of this performance, and the company’s share price has significantly underperformed. Our investment philosophy revolves around longer term corporate performance, and while we would have preferred a better environment in 2021, the year’s lost production is not lost forever. There continues to be pent up demand for new cars, and we continue to expect a longer-term sustainable level of global auto production well above the number of units to be produced in 2021. Our estimate of value for POM has come down slightly to reflect the slower ramp of expected profit, but we added to our position as POM’s share price declined during the year.
Five Point Holdings (“FPH”, 58 basis point negative contribution, 4.4% decline)
FPH, our second largest detractor, is a land development company that is in various stages of entitlement and land sales at its three largest assets. These assets include Valencia, Candlestick and The San Francisco Shipyard, and an approximately 37.5% interest in the Great Park Neighborhoods. Valencia is a master-planned community in northern Los Angeles County spanning 15,000 acres that is designed to include approximately 21,500 homesites and 11.5 million square feet of commercial space as well as various amenities. Candlestick and The San Francisco Shipyard are located on approximately 800 acres of bayfront property in the City of San Francisco and is designed to have approximately 12,000 homesites and 6.3 million square feet of commercial space. Finally, the Great Parks Neighborhood is located in Irvine, California and is designed for some 10,500 homesites, having sold 6,196 of these.
FPH declined modestly during the year as there has been significant cost capitalized at Valencia and the San Francisco site that have yet to be recovered given the long time frames in developing these sites. ACR’s performance in the stock was worse than the stock’s twelve month returns as FPH was undervalued throughout the year relative to other holdings and ACR added to it at prices higher than where it started and ended the year. Investors have been concerned about the level of overhead expense at FPH. The homebuilder Lennar, FPH’s largest investor with a 40% stake, recently made leadership changes at the company that appear to be focused on right sizing the company’s expense base over time. FPH owns land in three of the most land constrained areas in the United States, and ACR’s research shows that over time FPH’s real estate will likely be monetized at prices well in excess of ACR’s purchase price.
iShares Russell 2000 ETF Short (“IWM”, 34 basis points negative contribution, 22% increase)
ACR maintained a small short position in IWM entering the fiscal year given ACR’s research showing the small cap equity indices remain overvalued. ACR expects that it will have an opportunity to close its position at better prices given continued market volatility.
The three largest contributors to the Fund in FY 2021 were Protector Forsikring, Jefferies Financial Group, and General Motors.
Protector Forsikring (“PROT”, 586 basis point contribution, 121% return)
Our largest contributor during the year was PROT. PROT is a Norwegian insurance company with a low cost and high customer service business model (typically very difficult to pull off) that has grown organically by double digits for many years. We invested in the company in the middle of 2018 after its performance hit a speed bump as it had expanded too rapidly and subsequently found out that it mispriced certain insurance policies. The company’s share price had already come down 30% before we invested. Our research indicated that the poorly underwritten policies were most likely to be an infrequently repeating event, we trusted that management would right the ship and we estimated that the company’s cost advantage would be maintained in the future. The market told us that our investment thesis was wrong by delivering a negative return on our investment from our initial purchase in mid-2018 through the end of fiscal year 2020.
However, since 2017 the company has grown its gross written premium by approximately 70%, repurchased approximately 5% of shares outstanding, paid out a significant special dividend, generated solid investment returns on its float and returned to a mid-90s net combined ratio. Fiscal 2021 was the year that the market decided to reward PROT shareholders for the growth and improvement in profitability of the last several years. We never know what route an investment might take, but ultimately if our estimates of corporate performance are approximately right (they have been, so far, in PROT’s case) we should be rewarded over time. Fiscal 2021’s return has now brought our investment in PROT to a strong annualized return since our initial purchase in mid-2018.
Jefferies Financial Group (“JEF”, 286 basis point contribution, 70% return)
JEF, our second largest contributor, is a holding company made up of the investment bank Jefferies Group, LLC and a number of non-core assets that are being slowly monetized. As non-core assets are sold, JEF’s management is either reinvesting proceeds into its investment banking franchise or returning capital to shareholders. JEF appreciated materially in the fiscal year as investment banking revenues were up over 100% year over year in the trailing twelve months ended 8/31/2021. Firmwide profit was up 153% in the period and earnings per share were up an incredible 177% due to significant share retirements. This revenue and profit boom is due in significant part to strong market conditions, but also reflects the reality that JEF has increased its investment banking staff from 734 in 2016 to over 1,200 today with an increase in managing directors from 188 to 237. In the relatively lean investment banking years of 2016-2019, this investment was a hindrance on JEF’s returns, but today it is paying off in spades. Too, JEF’s non-core assets, which include ownership stakes in Linkem, a fixed wireless provider in Italy, Vitesse, an owner of non-working interests in the Bakken oil field, and Idaho Timber, a lumber manufacturer and distributor, amongst others, saw strong business fundamentals during the period. Over time we continue to expect exceptional results from JEF given its significant share gains in investment banking in the U.S., a recently announced partnership with Sumitomo Mitsui Banking Corporation in Japan, and the likelihood that it will be able to monetize its non-core assets at prices well in excess of book value.
General Motors (“GM”, 221 basis points contribution, 32% return)
GM was our third largest contributor in the period. General Motors has approximately 17% market share in the United States, 15% in Latin America, and has a 50% stake in joint ventures in China that have approximately 11.5% share in that country. Too, GM owns a captive financing arm, GM Financial, as well as Cruise Automotive which is attempting to bring driverless taxis to streets in the United States. Shares in GM appreciated in the fiscal year as pricing for new vehicles surged due to global automotive production constraints driven by supply chain issues for low priced semiconductors. Despite not being able to produce as many cars as it planned, GM saw near record margins from its automotive operations and high used car prices drove significant profitability in the company’s financing arm. In October 2021 GM laid out its battery electric and autonomous vehicle ambitions out to 2030 which were well received by Wall Street. ACR’s research continues to show that GM’s breakeven profitability levels are well below those of its predecessor entity and that it is well positioned to be a market leader as new technologies are brought to market in the automotive space. These factors combined with GM’s low valuation give us confidence that GM will produce meaningful returns for its shareholders.
The Market Conditions Under Which the Fund has Operated Since Inception
The Fund had an excellent year as discussed above and as demonstrated by the Fund’s 887 basis points of outperformance. This result was achieved despite a continuation of the Value Depression that we outlined in last year’s letter. In this section we will provide an update on the Value Depression that has formed over the last several years. In the next section we will discuss the opportunity that this Value Depression has provided the investment team to build a portfolio that its research shows is well positioned to generate strong relative performance and satisfactory total returns over the next several years.
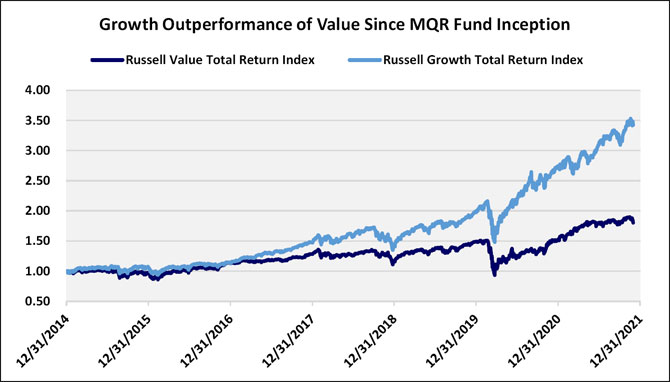
There are two related phenomena that make up the Value Depression. First, “growth” stocks have significantly outperformed “value” stocks since inception of the Fund. Second, U.S. stocks have materially outperformed ex-U.S. stocks. There is some correlation to these items, as ex-U.S. indices are materially underweight technology stocks which generally are in the “growth” camp.
One can see in the chart below that value stocks, or those companies that generally have established business models, are likely to grow at rates at or slightly below GDP, and that generally have lower multiples have underperformed, while those in nascent industries have seen their share prices rise exponentially. One example of this is in the United States where the Russell 1000 Growth Index4 is up 242% since the inception of the Fund, while the Russell 1000 Value index is up just 80%.5
| 4 | The Russell 1000 Growth Index® measures the performance of the large cap growth segment of the US equity universe. It includes those Russell 1000 Index® companies with higher price-to-book ratios and higher forecasted growth values. |
| 5 | Please reference the appendix for the full MQR Fund performance disclosures. The Russell 1000 Value Index® measures the performance of the large cap value segment of the US equity universe. It includes those Russell 1000 Index companies with lower price-to-book ratios and lower forecasted growth values. |
Secondarily, the S&P 500 is up 154% since inception of the Fund versus a 50% return for the MSCI ACWI Ex- US (“ACWI”).
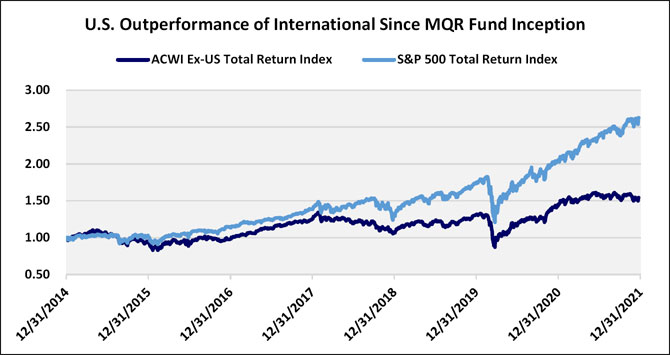
Each of these factors has held back the Fund’s performance as ACR’s analysis generally has a “value” tilt to it (as discussed above) and value stocks have been exceptionally out of favor. Too, perhaps doubling down on this value tilt, the investment team has found a number of opportunities outside of the United States and has operated with less than 40% of its holdings on average in the U.S. since inception versus a U.S. weighting in the MSCI of over 50%.
The question for ACR’s investment team (and indeed Fund shareholders): have we missed the proverbial boat by not riding along as “growth” outperformed value, or, does the significant outperformance of growth reflect a cyclical willingness of the market to buy growth at speculative prices while ignoring fundamentals?
As we discuss below, our research indicates the markets of the last several years have provided patient investors the opportunity to build portfolios that are made up of well capitalized business of quality companies trading at inexpensive prices that have the potential to perform exceptionally well in the years to come. Though no one can divine the future, history suggests that building portfolios in this way and not speculating on significantly outsized growth rates or unproven business models is an intelligent and reliable way to protect capital and maximize returns.
Current Positioning of the MQR Fund
ACR’s investment team believes that the Value Depression has allowed it to create a portfolio that is concentrated in a select number of opportunities with characteristics that are substantially different than that of the market.
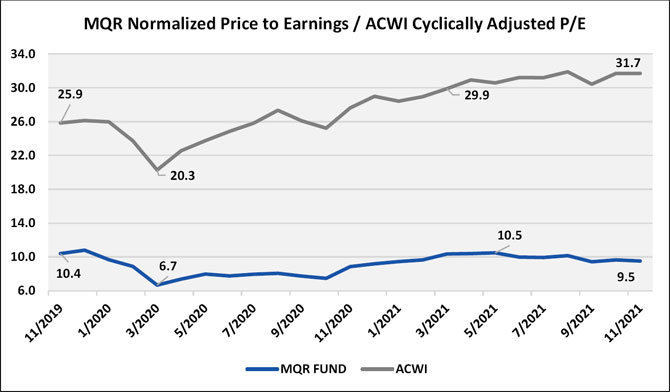
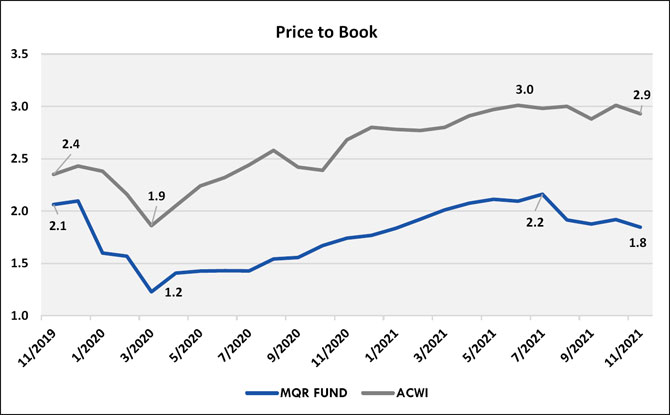
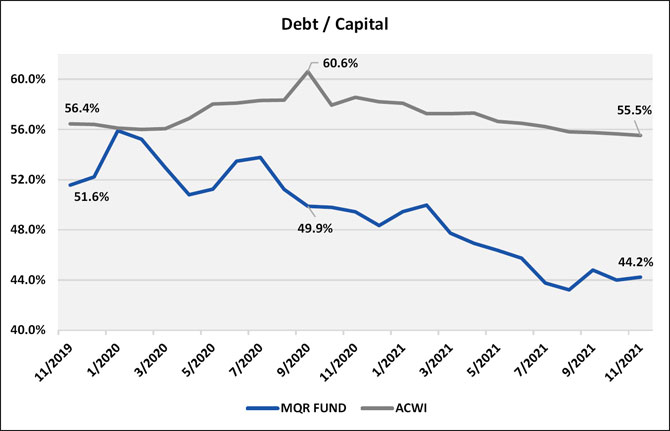
Today, as is shown graphically in the charts below, MQR is structured with a portfolio that has a weighted average P/E6 that is well below that of the ACWI with returns on equity7 that are above and price to book (P/B) values8 that are well below those of the index. Too, the Fund’s companies maintain debt to capital ratios9 that are below that of the average company in the index, suggesting that the Fund’s holdings have better balances sheets and greater financial flexibility than the average index constituent.
| 6 | Price to Earnings compares the market capitalization of a company to the net income available to common equity. |
| 7 | Return on Equity compares the net income available to common equity to common equity. |
| 8 | Price to Book compares the market capitalization of a company to its common shareholders’ equity. |
| 9 | Debt to Capital compares the debt of a company to the total of its debt plus its shareholders’ equity. |
As of November 30, 2021, Source: ACR Analysis, Barclays, DataStream

As of November 30, 2021 Source: ACR Analysis, Bloomberg, S&P Capital IQ
As of November 30, 2021, Source: ACR Analysis, Bloomberg, S&P Capital IQ
As of November 30, 2021, Source: ACR Analysis, Bloomberg, S&P Capital IQ
Though we don’t know when the market will appreciate the characteristics of our portfolio companies, we believe that the substantial discrepancy between each of the figures above bodes very well for future relative and absolute returns in the MQR Fund.
Conclusion
MQR’s Fiscal Year 2021 performance was excellent from an intrinsic value and market price growth perspective. Despite this, the Value Depression, characterized by growth outperforming value and U.S. stocks outperforming ex-U.S. stocks, has continued and restrained the Fund’s longer term performance. Given MQR’s holdings’ low P/E, low P/B, high ROE and low debt to capital statistics in both absolute terms and relative to that of its benchmark, ACR’s investment team is confident that the MQR Fund is well positioned to generate attractive returns in future periods.
Thank you for your continued trust,
Tim Piechowski, CFA®
Portfolio Manager
Appendix: MQR Fund’s Performance Disclosures
| Total Fund Market Return | Fiscal Year
Ended
11/30/2021 | 5 Years Ended
11/30/2021 | Inception To Date Return1 |
| MQRIX at NAV | 28.65% | 9.84% | 7.53% |
| MSCI ACWI (Gross) Index | 19.78% | 14.57% | 10.99% |
| HFRI Equity Hedge (Total) Index | 16.13% | 9.32% | 7.20% |
| 1 | Reflects 83 months of performance, annualized, as fund was launched 12/31/2014. |
Per the current prospectus, gross and net expense ratios for the Class I Shares were 2.03% and 1.31% respectively. The Fund’s Advisor has contractually agreed to waive its fees and/or pay for operating expenses to ensure that total annual fund operating expenses do not exceed and 1.25% of the average daily net assets of Class I shares of the Fund. This agreement is in effect until March 31, 2022, and it may be terminated before that date only by the Trust’s Board of Trustees. The Fund’s advisor is permitted to seek reimbursement from the Fund, subject to certain limitations, of fees waived or payments made to the Fund for a period of three years from the date of the waiver or payment.
The performance data quoted here represents past performance, which is not a guarantee of future results. Investment return and principal value will fluctuate so that an investor’s shares when redeemed may be worth more or less than their original cost. Current performance may be lower or higher than the performance information quoted. The most recent month end performance may be obtained by calling (855) 955-9552.
Appendix: ACR’s Investment Principles
Investment Principles
Intrinsic value and risk are our focus when evaluating investments
Intrinsic (or fundamental) value is the cash generated by an enterprise or asset over its useful life. Intrinsic value is earned in the future as dividends, interest, and principal are paid or as retained earnings are successfully reinvested.
Risk is the likelihood and potential magnitude of a permanent decline in the earning power or asset value of an enterprise, or the payment of a market price at purchase which is higher than intrinsic value. Our objective is to mitigate risk through integrity with our investment principles and investment process excellence.
When buying, we never confuse intrinsic value with market price. Market price is what we pay. Intrinsic value is what we get. Market price may be found quoted daily from news services or ascertained from past transaction records. Intrinsic value is determined by enterprise cash flows.
Market price, it follows, is not a barometer we would use to evaluate corporate performance. Our evaluation of corporate performance is based on items such as income, assets, and return on capital. We view the price of a security simply as a record of what others – well informed or not – were willing to pay for it at various times in the past.
Intrinsic value is such a critical concept because it is the only reference point for what an investment is actually worth, and therefore, whether or not the market price is fair, high, or low. Two facts support this view. First, the theoretical point that an investment is worth the present value of its future cash flows is self-evident and undisputed. Second, new era theories that have driven market prices to speculative levels in the short run have always succumbed to intrinsic value in the long run.
We insist on quality with a “margin of safety”
The quality of a security is defined by the reliability of the cash flows or assets which comprise its intrinsic value. The quality of an investment is defined by the price paid for the intrinsic value received.
A quantifiable “margin of safety” is the hallmark of a quality investment. For higher rated fixed income investments, an issuer’s available resources must be significantly greater than the interest and principal due the investor. For lower rated fixed income investments selling below their principal value, the assets backing an issue must be significantly greater than its price. For equity investments, the intrinsic value of a company must be significantly greater than its price. For other types of investments and as a general rule, the probability of achieving a return commensurate with the risk taken must be very high.
We only invest in what we understand
True understanding is built upon high probability statements about security values. It requires a dogged determination to get to the bottom of things and an equally dogged honesty about whether or not we did.
Understanding is also relative. Achieving better-than-average returns requires understanding security values better-than-average. The problem is most investment managers believe they are better-than-average.
Competence and honesty are the keys to assuring that we are not fooling ourselves. Competence means that we are capable of estimating security values and returns for both our portfolios and the markets in which we participate. Honesty means that we are candid about our relative return advantage or lack thereof, and only commit capital when we have an advantage.
Diversification and concentration are balanced with knowledge
Proper diversification is paramount to quality at the portfolio level. Proper diversification is achieved when the overall portfolio return is protected from unexpected adverse results in individual holdings, industries, countries, or other risk factors.
Proper concentration can be risk reducing as well as value enhancing. Concentration refers to making greater commitments to more attractive investments. The greater the difference between intrinsic value and market price, the more robust our knowledge of an investment’s value, and the lower the risk of the investment, the more capital we are willing to concentrate in that investment.
Successfully executed, concentration has three benefits: (a) returns are enhanced by selecting investments with the highest probability of success, (b) risk is reduced by avoiding mediocre and poor commitments, and (c) knowledge is improved by concentrating the analytical effort.
A concentrated portfolio with fewer holdings is desirable when value-to-price, understanding, and quality are high. A low-cost, more widely diversified approach to a market is appropriate when there are no clear advantages in understanding, and therefore, in our ability to evaluate quality or estimate value-to-price.
Communication is essential for intelligent investor decision-making
One of the greatest risks investors face is selling low in a panic. Education and communication can greatly reduce this risk. We explain to investors the difference between intrinsic and market value and openly share the rationale behind our investment decision-making. We believe this significantly reduces the risk of investors selling at market bottoms or buying at market tops.
Communication is also important for evaluating an investment manager’s abilities. Luck, risk, and a bull market can make an incompetent manager look brilliant. Conversely, every brilliant manager will under-perform at some time, and usually this is the best time to invest with them. Investors must look beyond performance to evaluate manager competence. To aid current and prospective investors in this endeavor, we regularly discuss the strategy and holdings behind our performance, and candidly address both our successes and mistakes.
The views in this letter were as of November 30th 2021 and may not necessarily reflect the same views on the date this letter is first published or any time thereafter. These views are intended to help shareholders in understanding the fund’s investment methodology and do not constitute investment advice.
The Fund is non-diversified and may invest a greater percentage of its assets in a particular issue and may own fewer securities than other mutual funds. All investments involve risk and principal loss is possible.
November 30, 2021
Dear Shareholders:
The ACR Alpine Capital Research investment team is pleased to present our fifth annual investment report for the ACR International Quality Return (IQR) Fund (“IQR” or “IQR Fund” or “the Fund”) covering the period November 30, 2020 through November 30, 2021.
Communication is one of ACR’s core principles, and we firmly believe that clear communication is essential for intelligent shareholder decision-making. Without clear communication and an understanding of the Fund’s investment process, shareholders risk making suboptimal financial decisions. ACR seeks a shareholder base who remains committed to a long-term investment holding horizon and makes investment decisions based on logic and relevant facts rather than impulse or fear. A more stable shareholder base with a longer holding horizon allows the ACR investment team to appropriately execute the IQR Fund investment process.
Our aim with this annual report is to provide you the information you need to understand the performance and positioning of the IQR Fund. This report includes a summary and discussion of the Fund’s performance and its audited financial statements. In addition, our website, www.acr-investfunds.com, provides a wealth of information about the Fund and ACR. We would also encourage you to read ACR’s investment principles (attached as an appendix to this letter) as these underpin the IQR investment process.
We understand that your trust and confidence in ACR, and the IQR Fund, is contingent upon the integrity between ACR’s words and actions, and ultimately the IQR Fund’s investment results. The ACR investment team will strive to earn and keep that trust and confidence, and we look forward to partnering with shareholders for many years of prosperity and intelligent decision- making.
Sincerely,
Willem Schilpzand, CFA®
Portfolio Manager
8000 Maryland Avenue, Suite 700 | St. Louis, MO 63105
t 314.932.7600 | f 314.932.1111 | 877.849.7733 | acr-invest.com
Management’s Discussion of Fund’s Performance
The net performance of the Fund’s I Class shares for fiscal year 2021, from November 30, 2020 to November 30, 2021 was 14.24% vs. 9.14% for the Fund’s benchmark, the MSCI All Country World Index Ex-U.S. This letter will provide an overview of the Fund’s 2021 performance, provide the longer-term performance of the Fund, provide clarity into the Fund’s positioning entering fiscal 2022 and discuss how macro events might impact the IQR Fund portfolio. We will start the shareholder letter by recapping the Fund’s investment objective and will end it with our conclusions.
| I. | IQR Fund Investment Objective |
| II. | Fiscal Year 2021 in Review |
| V. | Macro Impacts on the IQR Fund |
| I. | IQR Fund Investment Objective |
“The investment objective of the ACR International Quality Return (IQR) Fund (the “Fund” or “IQR Fund”) is to protect capital from permanent impairment while providing a return above both the Fund’s cost of capital and the Fund’s benchmark over a full market cycle.”
Please reference the Appendix for a discussion of the Fund’s investment objective.
| II. | Fiscal Year 2021 in Review |
The net performance of the Fund’s I Class shares for fiscal year 2021 was 14.24% vs. 9.14% for the Fund’s benchmark. While the fiscal 2021 performance was satisfactory from both an absolute and relative return perspective, we believe the fiscal 2021 performance was even more positive than highlighted here. We will discuss our guarded optimism for the Fund’s future performance later in this letter.
Fiscal 2021 looks very similar to fiscal 2020. The IQR Fund returns of 14.24% and 20.23% and the benchmark’s returns of 9.14% and 9.52% for fiscal 2021 and 2020 respectively look similar*. More interesting is that the approximate IQR Fund position returns for fiscal 2021 and 2020 also look similar. In both years the IQR Fund had several significant outperformers and underperformers.
| * | Please reference the appendix for the full IQR Fund performance disclosures. |

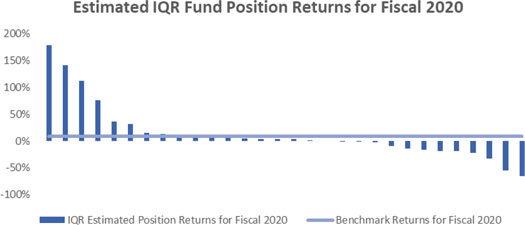
Source: ACR and Bloomberg
Fiscal 2020 included the start of the Covid pandemic, and hence position dispersion is to be expected as the pandemic created winners and losers. Fiscal 2021 did not include such an event and therefore it is easy to draw the conclusion that the IQR Fund is inherently volatile. This, however, would be an incorrect conclusion. Five out of the top six best performers for fiscal 2021 were below benchmark performers in fiscal 2020. This implies that market prices might move up and down in a volatile fashion in the short term but over a multi-year period corporate performance may be rewarded.
Detractors:
The largest detractor for the Fund in fiscal 2021 was our investment in Kits Eyecare. Kits Eyecare is a Canadian-based, vertically integrated online eyewear company that sells contact lenses, prescription eyeglasses and sunglasses (both prescription and non-prescription) direct to consumer (DTC). The global eyecare market serves customers relatively poorly with expensive eye exams, expensive eyeglasses and long lead times between eyeglass order and delivery. Our research indicates that the industry’s poor customer proposition is due to a large percentage of sales still completed through brick-and-mortar stores. Physical retail space and the vision specialists that work in it are expensive, hence vision care prices are high. Further, prices are kept artificially high due to the domination of $90 billion market cap company EssilorLuxottica who controls approximately 40% of the industry lens manufacturing.
Kits solves the industry’s problems through controlling production and fulfillment through its own partially automated lens lab and selling DTC online. Kits can price its eyeglasses at a 50% or greater discount to retail stores and can get a new order to customers within days. Kits’ high value for money, convenient online ordering and speedy delivery are already generating positive consumer reviews and repeat customer purchases. We believe Kits’ disruptive business model has an opportunity to take meaningful market share with their DTC proposition and/or their B2B focused ‘fulfillment by Kits’ (where Kits becomes the back-end eyeglass provider for health plans that provide a vision service to its members).
Our investment in Kits, however, has gotten off to a rocky start. We first invested in Kits in May 2021, and the share price has come under significant pressure since then. Kits’ recent fundamental performance has been mixed, but we believe this is partly due to transitory market trends created by Covid and its impact on consumer purchasing behavior. Our research continues to indicate that Kits’ value proposition remains intact, and that there is a tremendous opportunity ahead for the company. Due to Kits’ very small market cap, its illiquid shares and wide range of potential business outcomes we have kept the position to a small size in our portfolio, but we see the risk/reward in this investment as highly attractive.
Our second largest detractor was Plastic Omnium. Plastic Omnium is a French auto parts manufacturer with #1 global share in intelligent exterior systems (15% market share), clean energy systems (22% market share) and plastic modules (18% market share). The business has grown faster than global auto production by approximately 5% per year and we expect this trend to continue due to increased product content on new car models, and potential contribution from its nascent hydrogen business (in storage vessel, fuel cell stacks and integrated hydrogen systems).
Global auto production has been negatively impacted by the 2021 global supply chain constraints (the automotive sector is particularly impacted by the global chip shortage), and Plastic Omnium was not immune to these industry problems. The company’s performance for 2021 will be significantly below our prior expectations. The market appears to take the myopic view of this performance, and the company’s share price has significantly underperformed. Our investment philosophy revolves around longer term corporate performance, and while we would have preferred a better 2021 environment, the lost production in 2021 is not lost forever. There continues to be pent up demand for new cars, and we continue to expect a longer-term sustainable level of global auto production well above the number to be produced in 2021. Our estimate of value for Plastic Omnium has come down slightly to reflect the slower ramp of expected profit, but we have added to our position as the share price came down.
Contributors:
Our largest contributor during the year was Protector Forsikring. Protector is a Norwegian insurance company with a low cost and high customer service business model (typically very difficult to pull off) that has grown organically by double digits for many years. We invested in the company in the middle of 2018 after its performance hit a speed bump as it had expanded too rapidly and subsequently found out that it mispriced certain insurance policies. The company’s share price had already come down 30% before we invested. Our research indicated that the poorly underwritten policies were most likely to be an infrequently repeating event, we trusted that management would right the ship and we estimated that the company’s cost advantage would be maintained in the future. The market told us that our investment thesis was wrong by delivering a negative return on our investment since our initial purchase in mid-2018 through end of fiscal year 2020.
However, since 2017 the company has grown its gross written premium by approximately 70%, repurchased approximately 5% of shares outstanding, paid out a significant special dividend, generated solid investment returns on its float and returned to a mid-90s net combined ratio. Fiscal 2021 appears to be the year that the market decided to reward shareholders for the growth and improvement in profitability over the last several years. We never know what route an investment might take, but ultimately if our estimates of corporate performance are approximately right (they have been, so far, in Protector’s case) we should be rewarded over time. The fiscal 2021 return has now brought our investment in Protector to a strong annualized return since our initial purchase in mid-2018.
Our second largest contributor was Ashtead. Ashtead was also our 4th largest contributor in fiscal 2020 (the year we initiated our investment in the business), and the company has gone from strength to strength. Ashtead is a UK-based tools and equipment rental company most well-known for its U.S. brand, Sunbelt Rentals. Economic theory is founded on beliefs about equilibrium, competitive markets, and reversion to the mean. This belief system works well for many industries, but it fails in others. Tool rental is one industry where future corporate performance appears more related to prior performance and hence leads to increasing returns for industry winners. Ashtead is now at a scale where it can purchase equipment at more favorable prices than competitors, procure equipment that competitors might not have access to, offer better equipment availability through its denser rental location network, invest more capital in leading edge technology (app design and usage) and provide a larger tool and equipment inventory. In other words, why go elsewhere?
The market has realized Ashtead’s advantaged position in its industry and has priced its share price commensurately. We are invested in several other businesses in various industries with a similar return to scale dynamic as Ashtead. We are uncertain if those companies will have the corporate performance and the investment return of Ashtead, but we are cautiously optimistic. We have reduced our position size in Ashtead as the company’s share price has continued to appreciate towards our estimate of value.
New Investments and Divestments:
During fiscal 2021 we invested in two new businesses, divested one business, and received one new business in a spin-off. We started fiscal 2021 with investments in 20 companies and ended the fiscal year with investments in 22 companies. One of our new investments, Kits Eyecare, was discussed previously and the other new investment was Countryside Properties Plc.
Countryside is a UK-based homebuilder in the process of running down its traditional home building business and focusing 100% on its partnership business. This strategic refocus caught our attention. Our research indicates the company is set to release significant capital from winding down its more capital-intensive traditional home building business and use the proceeds to repurchase shares and reinvest in the partnership business with lower capital intensity, higher returns on invested capital (ROIC) and with a higher and longer-term growth opportunity.
It is no secret that England is short on housing, particularly affordable housing. Our estimate is that approximately 250,000 homes need to be completed per year in England to satisfy the demand from new household formations and rebuild homes that need to be replaced (England has a very old housing stock). The English government even issued targets for annual home completions to move to 300,000 by 2025. Unfortunately, England has not managed to complete more than 200,000 houses in a single year since the late 1980s, and the housing shortage was accentuated by the home building crash after the Great Financial Crisis in 2009. The market demand is there. The obstacles to building more homes appear to be scarcity of land and misaligned incentives. We believe Countryside’s partnership model could solve both problems and could unlock an acceleration of affordable home building that the country sorely needs.
The partnership model, as developed by Countryside (this operating model is still unique but is creating imitator companies), builds mixed tenure housing with typically 40% of homes built as affordable homes, 40% as private for sale at higher prices and higher specs and 20% of homes built for the private for rent market (more affordable than private for sale). The mix satisfies government and local governing bodies’ demands to stem inequality and create mixed and integrated communities. The mix itself is important, but easily replicated. The novelty is the funding of the mix that makes the model attractive for Countryside, local communities, and industrial partners. Local housing authorities might have land (e.g., open land, brownfield land, land occupied by affordable housing units that need to be replaced), industrial partners (e.g., private equity funds, pensions) might have capital, and Countryside has the expertise. The partnership between these parties allows Countryside to build housing that is in demand (affordable + private for rent), accept lower margins on the projects (makes it feasible for partners to pay for it) but at still attractive ROICs as the capital intensity is reduced significantly from discounted land provided by local authorities and capital provided by industrial partners. Lower capital intensity allows Countryside to build homes quicker (don’t have to wait to sell a private for sale home to start the next lot of private for sale homes) and satisfy more demand.
The result of the model for the local authority is that it can better meet housing demand, the old affordable housing stock is replaced by new stock, brownfield sites are regenerated, and prior dilapidated communities have an opportunity to thrive again. The benefit for industrial partners is access to high-quality homes it can rent to private individuals who lack the resources to qualify for a mortgage. With interest rates low, this model can potentially provide a steady stream of income for large industrial players and pension funds. Countryside wins as it accepts lower margins and lower profit per house built, but due to lower capital intensity it can generate very attractive returns on invested capital. In fiscal 2021, Countryside built 4,393 partnership houses. Could this number be 10,000 or more in a decade? Our research indicates that the market opportunity is there, and that Countryside is best positioned in the industry. Time will tell, but we believe Countryside represents a very interesting risk/reward opportunity and have sized the position appropriately in the portfolio.
In January 2021, we sold our investment in SPX Flow for approximately $63 per share. SPX Flow manufactures and services flow control products like pumps and valves for food & beverage and industrial application. We invested in SPX Flow at IQR Fund’s inception for approximately $32 per share. Over our holding period, we also got the opportunity to double down on our position during the March 2020 selloff in the high teens price per share. At $63 per share, SPX Flow hit our conservative estimate of value and we sold. Over our holding period, the investment in SPX Flow was a big success, however, news came out in June 2021 that Ingersoll Rand had offered to acquire SPX Flow for $85 per share. The IQR Fund missed out on 35% further appreciation. We, however, do not consider selling SPX Flow in January a mistake. We debated the situation internally, but we kept coming back to the same conclusion. With the information we had at the time, we would sell again.
The portfolio also added Medmix AG in fiscal 2021. Medmix was the applicator business (applicators are high-precision devices that mix and inject liquids into the industrial, dental and health care end markets) that was spun out of Sulzer (an IQR Fund investment) during the fiscal year. At the price that Medmix shares got spun off to the Fund, we were neither excited about buying more or selling. Therefore, we maintained a small position in the company.
Fiscal year 2021 was a satisfactory year for the Fund, but we believe a much longer time horizon is needed to validate whether we have added value to investors. We believe the Fund’s five-year historical track record is insufficient to validate a conclusion on this, but since this is all we have, we provide the below information*.
| * | Please reference the appendix for the full IQR Fund performance disclosures. |
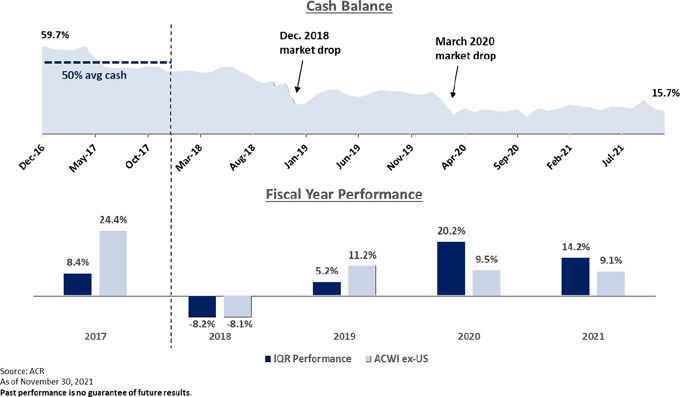
The IQR Fund is unique in its strategy (discussed in more detail in our fiscal 2020 letter – fundamental investment philosophy, long term investment horizon, balancing concentration with diversification, willing to hold cash in the absence of satisfactory investment opportunities, all-cap mandate) and therefore divergence from the benchmark in any given year is to be expected. The IQR Fund got off to a slow start with capital deployment in 2017 (average cash balance of 50%) and hence got left behind when the market rallied strongly in fiscal 2017. After the start-up phase in 2017, we believe the IQR Fund performance versus its benchmark is more illustrative*.
| * | Please reference the appendix for the full IQR Fund performance disclosures. |
Source: ACR
Past performance is no guarantee of future results.
| IV. | IQR Fund’s Positioning |
Fiscal 2021 was a good year for the IQR Fund as we were able to generate a satisfactory return (+14.24%) and still end the fiscal year with a more fully invested and more attractively priced portfolio. The portfolio’s cash balance was reduced to 15.7% and the portfolio’s Price to Value (P/V) was reduced to 0.71. As a reminder, we calculate the value of each individual company in the portfolio based on our estimates of their future corporate performance (this is the output of all our research). In turn, these individual estimates of company value sum up to the value for the whole IQR Fund portfolio. A lower P/V implies that there is more estimated client value in the portfolio per unit of price paid. Over time equity prices gravitate toward value, and if our estimates of value prove to be approximately correct, we can be cautiously optimistic about satisfactory forward-going returns.
% Invested vs Liquid Reserve
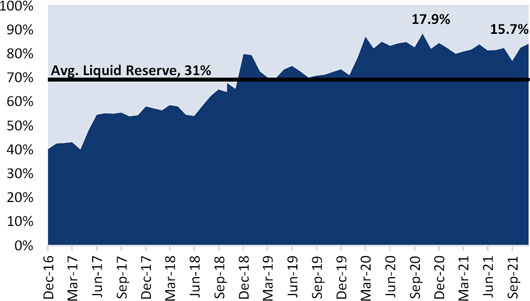
Source: ACR
IQR Price to Value
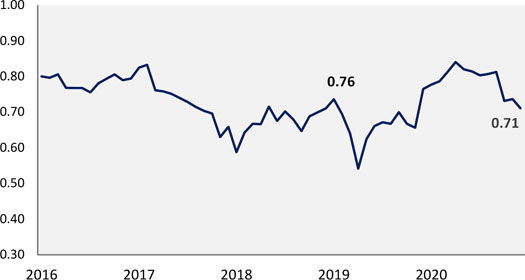
Source: ACR
The above statements are likely to be confusing. Most clients and investors solely focus on the actual annualized returns (14.24% in IQR Fund’s case) and ignore the more important piece of information (often not provided) about how the portfolio changed over the year and what the estimated value of the portfolio at the end of the measurement period is. The problem in the investment industry is that most investment funds do not calculate the estimated value of client portfolios (e.g., momentum strategies, index funds, algorithmic trading, growth funds focused solely on growth), and if they do, they don’t report it to clients. Ultimately, forward-going returns are determined by the attractiveness of the portfolio at the end of the measurement period, and we believe every client should be interested in how the portfolio is positioned to perform in the future. We strive to be transparent and provide the information on our Fund’s performance and positioning that we would want to see as outsiders.
The IQR Fund continues to find more opportunities in the small cap space. The common assumption from U.S. investors is that smaller cap companies are lower quality. While a broad statement, we don’t necessarily disagree with this sentiment for the U.S. market. The U.S. market is large, and size is often needed to get economies of scale and/or product/customer diversification. We, however, strongly disagree with the statement as it relates to international markets.
Over the five years since the IQR Fund has been in existence, we have found a large group of high-quality smaller cap international companies. Most of these companies dominate a small niche in their geographical market. To gain scale in the local Norwegian insurance market (Protector) or engineering & architecture market (Multiconsult), you still won’t be a large company by U.S. standards. This in no way diminishes the quality of the businesses. The same can be said for the local UK-based PVC window frame market (Eurocell), the local partnership home building market in England (Countryside) and the local food-to-go market in the UK (Greencore). The IQR Fund is an all-cap strategy, and we own, and will continue to own, large market capitalization companies, but we are excited about finding great businesses with solid market positions that are at market capitalization levels small enough to be uninteresting to larger institutional players and investors.
The quality of the IQR Fund is also supported by the data below. While the reported numbers for the IQR companies look like the benchmark, our estimates for our companies’ normalized corporate performance highlights attractive return on equity and low net leverage at an attractive price.

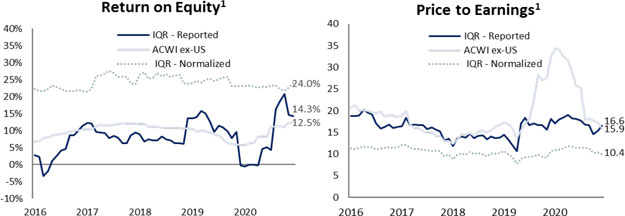

As of November 30, 2021
| 1 | Portfolio characteristics, are based on the equity investment portion of the strategy and are subject to change. Normalized PE for the Fund is based on Normalized Earnings, which is a cyclically-adjusted (or smoothing out) of earnings. Normalized Earnings for the Fund is based on portfolio manager estimates of the sustainable cash earning power of the individual companies in the portfolio. Normalized Earnings for the MSCIACWI ex US is calculated byACR using country level cyclically-adjusted price to earnings (CAPE) ratios published by Barclays Research and using the corresponding country weights in the Index to determine an overall CAPE ratio for the Index at the end of the period. ROE (return on equity) is the amount of net income returned as a percentage of shareholders' equity. Net debt to Earnings Before Interest Taxes Depreciation and Amortization (EBITDA) ratio is a measurement of leverage, calculated as a company's interest-bearing liabilities minus cash or cash equivalents, divided by its EBITDA. The Price/Value (P/V) is ACR's estimate of under valuation based on market prices and fundamental value. Fundamental value is ACR's estimate of what a company is worth based upon our estimate of its future cash flows and their riskiness. Ultimately, fundamental value represents the portfolio manager's subjective estimate of business value. |
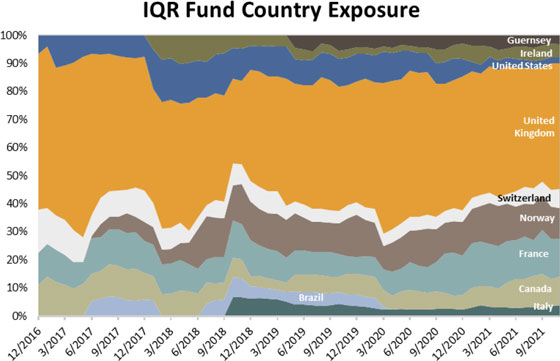
The IQR Fund also remains appropriately diversified across countries and industries. We continuously attempt to optimize the balance between concentration and diversification.

| V. | Macro Impacts on the IQR Fund |
The IQR Fund is a bottom-up fundamental strategy. This means that we evaluate each investment as a standalone investment (quality, profits, sustainability, competition, management, future opportunities/risks) and create a portfolio with the highest odds of meeting our investment objective (certain amount of concentration) at the lowest risk of shortfalls to this goal (sufficient risk diversification). This also implies we do not make sweeping macro bets or invest behind macro themes. We just don’t know which macro events will come to pass and how market prices might react to these outcomes. However, we do not stick our heads in the sand as it relates to macro events as we are cognizant that such events impact our individual portfolio companies. We think about many more risks and opportunities related to our investments than we will ever get asked about (e.g., inequality, climate change, populism, demographics, debt sustainability, global imbalances, zero bound interest rates, entitlement programs, China, automation, AI, the metaverse). This doesn’t mean we have answers, often the questions we pose don’t have answers. Simply acknowledging them and thinking through possible outcomes helps inform our decisions on specific companies and portfolio composition. This is how we address macro risk/opportunities into our process. Below, we highlight this thought process with the topic we have been asked about most in fiscal 2021, inflation.
Inflation:
We have no opinion on where inflation might go, we just don’t know. We believe that each flare up of inflation is different. Looking at the historical market outcomes of prior bouts of inflation, to us, risks making the wrong investment decisions. Inflation brought on by an oil price shock, supply constraints, excess demand, increased labor bargaining power and government intervention could all have different impacts on a group of different companies during different moments in time.
For instance, consider our holding in Greencore Group. This is a UK-based company that manufactures and supplies food-to-go products (e.g., sandwiches, salads, sushi) to grocery stores and convenience stores. Greencore is what you could consider a price taker company, not the type of business that has pricing power. However, per contractual agreements, in normal circumstances, it can pass through to customers the inflationary cost increases in its raw materials. Distribution cost and labor cost, however, are often excluded from these contractual agreements. An oil or raw material cost increase should not have much impact on Greencore, but the current shortages of labor and the distribution cost increases could negatively impact the company.
The analysis doesn’t end here, as nothing happens in a vacuum. The demand for food-to-go items remains reasonably solid from both a customer (grocery stores) and end client (consumers of the food) perspective, and the Covid pandemic bankrupted a large competitor and weakened several others. This has severely curtailed industry capacity for food-to-go items and has allowed Greencore to take market share. In this environment, the company is pushing through price increases that compensate it for all aspects of inflation it is currently facing. Additionally, the environment has the potential to weaken competitors further and strengthen Greencore’s future competitive position. Normally, Greencore is a price taker and inflation would be a negative impact. In this environment, it might not be and could potentially be a competitive tailwind.
Another example is our investment in Ashtead. Ashtead is a very capital-intensive business, as it buys equipment and then attempts to rent it. Inflationary environments for capital intensive businesses are often considered negative. However, Ashtead is facing inflationary pressures from supply shortages due to supplier capacity constraints. Since Ashtead is the 2nd largest rental company in the U.S. with approximately 11% market share, it has much better access to a supply constrained equipment market than its competitors. Competitors are left with older equipment and risk losing out to Ashtead who has access to better, newer, and greener equipment. Ashtead has continued to take market share. Further, supply constraints on equipment have increased equipment prices and this in turn has made the outright purchase of equipment less desirable and steers the incremental customer towards rental. Hence, the rental penetration rate of tools and equipment is increasing further, which is beneficial for Ashtead. Ashtead is currently experiencing very high levels of equipment utilization.
A last example is related to our investment in Danone. Strong brands are often associated with pricing power, particularly in the consumer-packaged goods space. However, we are more concerned about substitution or trade down effects (to regular yogurt from Greek yoghurt or from brand to house label). Danone will be less impacted by labor cost increases than most companies but could well be under pressure from higher distribution expense and adverse product mix effects. However, we believe that Danone continues to have a bloated and expensive infrastructure and should be able to offset a large part of the potential negative inflationary impacts with cost saves.
We don’t make explicit forecasts for macro risks/opportunities but attempt to invest in companies with quality characteristics that allow them to weather periods of uncertainty (of which increasing inflation would be one) and perhaps even use these periods of uncertainty to improve their competitive position versus peers. Ultimately, this is what matters in the long run. The IQR Fund is not immune to unforeseen events, and we will make mistakes, but as the Covid pandemic has shown, the IQR Fund portfolio weathered that storm and came out better on the other side.
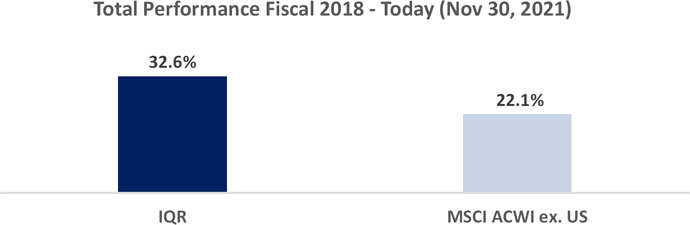
Fiscal 2021 was a satisfactory year from a return perspective (+14.24%), and we have put more distance between the Fund and the benchmark over our measurement period from fiscal 2018 to fiscal 2021 that purposefully omits the startup year in 2017 when the IQR Fund held approximately 50% cash on average*. Fiscal 2021, however, was even better than the annual return indicates as the portfolio at the end of fiscal 2021 was more attractive than the one we started the fiscal year with. Caution, however, is necessary as the market can humble any investor. We will make mistakes and unforeseen surprises will invariably pop up. Still, our disciplined process, the Fund’s advantages (as explained in the fiscal 2020 letter), our current portfolio composition, and the international opportunity set allow us to look toward the future with confidence.
Thank you for your continued trust,
The ACR Investment Team

Willem Schilpzand, CFA®
Portfolio Manager
| * | Please reference the appendix for the full IQR Fund performance disclosures. |
Appendix: Notes on the IQR Fund Investment Objectives
IQR Fund Investment Objective
“The investment objective of the ACR International Quality Return (IQR) Fund (the “Fund” or “IQR Fund”) is to protect capital from permanent impairment while providing a return above both the Fund’s cost of capital and the Fund’s benchmark over a full market cycle.”
It is important to note that “providing a return above the Fund’s cost of capital and the Fund’s benchmark” are performance objectives the Fund expects to meet. We consider the “cost of capital” of the Fund to be approximately 6% real + inflation (the opportunity cost for our Fund shareholders). The Fund’s benchmark is the MSCI All Country World Index Ex-U.S. The timeframe of “over a full market cycle” remains purposefully undefined as market prices can vary widely from fundamental value over the short to medium term. The IQR Fund has no control over when prices start to converge towards underlying fundamental value (as determined by actual cash flows of companies), but history and corporate financial theory give us significant confidence that prices will eventually converge with value. This is the Fund’s advantage. We make the trade-off for short to medium term uncertainty for the opportunity to outperform over the longer term (i.e., “a full market cycle”). “Protect capital from permanent impairment” is a philosophical objective that signals to Fund shareholders that the IQR Fund is resolutely focused on risk and will not allocate capital (i.e., will build a cash balance) in the absence of satisfactory risk/reward investment opportunities. This is a similar methodology to what private equity firms deploy, but IQR executes this strategy in the public markets. “Risk” does not mean volatility as the IQR Fund portfolio is expected to move around similarly to markets, but “risk” means taking equity risk and not getting an equity like return over a sufficiently long investment period.
Appendix: IQR Fund’s Performance Disclosures
| | Fiscal Year Ended
11/30/2020 | Fiscal Year Ended
11/30/2021 | Since
Inception |
| IQR Fund | 20.23% | 14.24% | 7.66% |
| MSCI ACWI ex USA Index | 9.52% | 9.14% | 8.88% |
Inception date of the Fund is December 30, 2016.
Per the most recent prospectus, gross and net expense ratios were 2.24% and 1.14% respectively.
The Fund’s advisor has contractually agreed to waive its fees and/or pay for operating expenses of the Fund to ensure that total annual fund operating expenses (excluding any taxes, leverage interest, brokerage commissions, dividend and interest expenses on short sales, acquired fund fees and expenses as determined in accordance with SEC Form N-1A), expenses incurred in connection with any merger or reorganization, and extraordinary expenses (such as litigation expenses) do not exceed 1.10% of the average daily net assets of Class I shares of the Fund. This agreement is in effect until March 31, 2022, and it may be terminated before that date only by the Trust’s Board of Trustees.
Past performance is no guarantee of future results and current performance may be higher or lower than the performance shown. This data represents past performance and investors should understand that investment returns and principal values fluctuate, so that when you redeem your investment it may be worth more or less than its original cost. Current month-end performance data may be obtained by calling toll-free, 1-855-955-9552.
Appendix: ACR’s Investment Principles
Investment Principles
Intrinsic value and risk is our focus when evaluating investments
Intrinsic (or fundamental) value is the cash generated by an enterprise or asset over its useful life. Intrinsic value is earned in the future as dividends, interest, and principal are paid or as retained earnings are successfully reinvested.
Risk is the likelihood and potential magnitude of a permanent decline in the earning power or asset value of an enterprise, or the payment of a market price at purchase which is higher than intrinsic value. Our objective is to mitigate risk through integrity with our investment principles and investment process excellence.
When buying, we never confuse intrinsic value with market price. Market price is what we pay. Intrinsic value is what we get. Market price may be found quoted daily from news services or ascertained from past transaction records. Intrinsic value is determined by enterprise cash flows.
Market price, it follows, is not a barometer we would use to evaluate corporate performance. Our evaluation of corporate performance is based on items such as income, assets, and return on capital. We view the price of a security simply as a record of what others – well informed or not – were willing to pay for it at various times in the past.
Intrinsic value is such a critical concept because it is the only reference point for what an investment is actually worth, and therefore, whether or not the market price is fair, high, or low. Two facts support this view. First, the theoretical point that an investment is worth the present value of its future cash flows is self-evident and undisputed. Second, new era theories that have driven market prices to speculative levels in the short run have always succumbed to intrinsic value in the long run.
We insist on quality with a “margin of safety”
The quality of a security is defined by the reliability of the cash flows or assets which comprise its intrinsic value. The quality of an investment is defined by the price paid for the intrinsic value received.
A quantifiable “margin of safety” is the hallmark of a quality investment. For higher rated fixed income investments, an issuer’s available resources must be significantly greater than the interest and principal due the investor. For lower rated fixed income investments selling below their principal value, the assets backing an issue must be significantly greater than its price. For equity investments, the intrinsic value of a company must be significantly greater than its price. For other types of investments and as a general rule, the probability of achieving a return commensurate with the risk taken must be very high.
We only invest in what we understand
True understanding is built upon high probability statements about security values. It requires a dogged determination to get to the bottom of things and an equally dogged honesty about whether or not we did.
Understanding is also relative. Achieving better-than-average returns requires understanding security values better-than-average. The problem is most investment managers believe they are better-than-average.
Competence and honesty are the keys to assuring that we are not fooling ourselves. Competence means that we believe we are capable of estimating security values and returns for both our portfolios and the markets in which we participate. Honesty means that we are candid about our relative return advantage or lack thereof, and only commit capital when we have an advantage.
Diversification and concentration are balanced with knowledge
Proper diversification is paramount to quality at the portfolio level. Proper diversification is achieved when the overall portfolio return is protected from unexpected adverse results in individual holdings, industries, countries, or other risk factors.
Proper concentration can be risk reducing as well as value enhancing. Concentration refers to making greater commitments to more attractive investments. The greater the difference between intrinsic value and market price, the more robust our knowledge of an investment’s value, and the lower the risk of the investment, the more capital we are willing to concentrate in that investment.
Successfully executed, concentration has three benefits: (a) returns are enhanced by selecting investments with the highest probability of success, (b) risk is reduced by avoiding mediocre and poor commitments, and (c) knowledge is improved by concentrating the analytical effort.
A concentrated portfolio with fewer holdings is desirable when value-to-price, understanding, and quality are high. A low-cost, more widely diversified approach to a market is appropriate when there are no clear advantages in understanding, and therefore, in our ability to evaluate quality or estimate value-to-price. Diversification does not assure a profit or protect against a loss in a declining market.
Communication is essential for intelligent investor decision-making
One of the greatest risks investors face is selling low in a panic. Education and communication can greatly reduce this risk. We explain to investors the difference between intrinsic and market value and openly share the rationale behind our investment decision-making. We believe this significantly reduces the risk of investors selling at market bottoms or buying at market tops.
Communication is also important for evaluating an investment manager’s abilities. Luck, risk, and a bull market can make an incompetent manager look brilliant. Conversely, every brilliant manager will under-perform at some time, and this could be the best time to invest with them. Investors must look beyond performance to evaluate manager competence. To aid current and prospective investors in this endeavor, we regularly discuss the strategy and holdings behind our performance, and candidly address both our successes and mistakes.
The views in this letter were as of November 30th, 2021 and may not necessarily reflect the same views on the date this letter is first published or any time thereafter. These views are intended to help shareholders in understanding the fund’s investment methodology and do not constitute investment advice.
The Fund is non-diversified and may invest a greater percentage of its assets in a particular issue and may own fewer securities than other mutual funds. All investments involve risk and principal loss is possible.
ACR Multi-Strategy Quality Return (MQR) Fund
FUND PERFORMANCE at November 30, 2021 (Unaudited)

This graph compares a hypothetical $10,000 investment in the Fund’s Class I shares, made at its inception, with a similar investment in the HFRI Equity Hedge (Total) Index and the MSCI ACWI Index. Results include the reinvestment of all dividends and capital gains.
HFRI Equity Hedge Index consists of Investment Managers who maintain positions both long and short in primarily equity and equity derivative securities.
MSCI ACWI Index captures large and mid cap representation across 23 Developed Markets (DM) and 23 Emerging Markets (EM) countries. With 2,469 constituents, the index covers approximately 85% of the global investable equity opportunity set.
These indices do not reflect expenses, fees or sales charge, which would lower performance. The indices are unmanaged and they are not available for investment.
| Average Annual Total Returns as of November 30, 2021 | 1 Year | 5 Years | Since
Inception | Inception
Date |
| Class I | 28.65% | 9.84% | 7.53% | 12/31/14 |
| HFRI Equity Hedge (Total) Index | 16.13% | 9.32% | 7.20% | 12/31/14 |
| MSCI ACWI Index | 19.78% | 14.57% | 10.99% | 12/31/14 |
The performance data quoted here represents past performance and past performance is not a guarantee of future results. Investment return and principal value will fluctuate so that an investor's shares, when redeemed, may be worth more or less than their original cost. Current performance may be lower or higher than the performance information quoted. The most recent month end performance may be obtained by calling (855) 955-9552.
Gross and net expense ratios for Class I shares were 2.03% and 1.31%, respectively, which were the amounts stated in the current prospectus dated April 1, 2021. For the Fund’s current one-year expense ratios, please refer to the Financial Highlights. The Fund’s advisor has contractually agreed to waive its fees and/or pay for operating expenses of the Fund to ensure that total annual fund operating expenses do not exceed 1.25% of the average daily net assets of Class I shares of the Fund. This agreement is in effect until March 31, 2022, and it may be terminated before that date only by the Trust’s Board of Trustees. In the absence of such waivers, the Fund’s returns would be lower.
ACR Multi-Strategy Quality Return (MQR) Fund
FUND PERFORMANCE at November 30, 2021 (Unaudited) - Continued
Returns reflect the reinvestment of distributions made by the Fund, if any. The graph and the performance table above do not reflect the deduction of taxes that a shareholder would pay on Fund distributions or the redemption of Fund shares. Shares redeemed within 90 days of purchase will be charged 2.00% redemption fee.
ACR International Quality Return (IQR) Fund
FUND PERFORMANCE at November 30, 2021 (Unaudited)
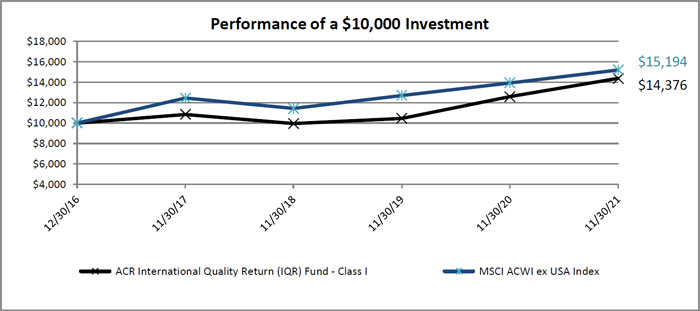
This graph compares a hypothetical $10,000 investment in the Fund’s Class I shares, made at its inception, with a similar investment in the MSCI ACWI ex USA Index. Results include the reinvestment of all dividends and capital gains.
The MSCI ACWI ex USA Index captures large and mid cap representation across 22 of 23 Developed Markets (DM) countries (excluding the US) and 24 Emerging Markets (EM) countries. With 1,866 constituents, the index covers approximately 85% of the global equity opportunity set outside the US.
This index does not reflect expenses, fees or sales charge, which would lower performance. The index is unmanaged and it is not available for investment.
| Average Annual Total Returns as of November 30, 2021 | 1 Year | 3 Years | Since
Inception | Inception
Date |
| Class I | 14.24% | 13.05% | 7.66% | 12/30/16 |
| MSCI ACWI ex USA Index | 9.14% | 9.95% | 8.88% | 12/30/16 |
The performance data quoted here represents past performance and past performance is not a guarantee of future results. Investment return and principal value will fluctuate so that an investor's shares, when redeemed, may be worth more or less than their original cost. Current performance may be lower or higher than the performance information quoted. The most recent month end performance may be obtained by calling (855) 955-9552.
Gross and net expense ratios for Class I shares were 2.24% and 1.14%, respectively, which were the amounts restated on May 28, 2021 in the current prospectus dated April 1, 2021. For the Fund’s current one-year expense ratios, please refer to the Financial Highlights. The Fund’s advisor has contractually agreed to waive its fees and/or pay for operating expenses of the Fund to ensure that total annual fund operating expenses do not exceed 1.10% of the average daily net assets of Class I shares of the Fund. This agreement is in effect until March 31, 2022, and it may be terminated before that date only by the Trust’s Board of Trustees. In the absence of such waivers, the Fund’s returns would be lower.
ACR International Quality Return (IQR) Fund
FUND PERFORMANCE at November 30, 2021 (Unaudited) - Continued
Returns reflect the reinvestment of distributions made by the Fund, if any. The graph and the performance table above do not reflect the deduction of taxes that a shareholder would pay on Fund distributions or the redemption of Fund shares. Shares redeemed within 90 days of purchase will be charged 2.00% redemption fee.
ACR Multi-Strategy Quality Return (MQR) Fund
SCHEDULE OF INVESTMENTS
As of November 30, 2021
Number
of Shares | | | | Value |
| | | | | COMMON STOCKS — 81.4% | | | | |
| | | | | COMMUNICATIONS — 12.2% | | | | |
| | 75,000 | | | Liberty Global PLC - Class C*1,2 | | $ | 1,998,000 | |
| | 61,000 | | | Liberty Latin America Ltd. - Class C*2 | | | 685,640 | |
| | 112,000 | | | Lumen Technologies, Inc.1 | | | 1,382,080 | |
| | 130,000 | | | Vodafone Group PLC - ADR1 | | | 1,908,400 | |
| | | | | | | | 5,974,120 | |
| | | | | CONSUMER DISCRETIONARY — 18.1% | | | | |
| | 97,000 | | | Cie Plastic Omnium S.A. | | | 2,423,262 | |
| | 35,000 | | | General Motors Co.*1 | | | 2,025,450 | |
| | 211,000 | | | Haier Smart Home Co., Ltd. - Class D | | | 344,568 | |
| | 40,000 | | | Howden Joinery Group PLC | | | 460,843 | |
| | 34,100 | | | Lennar Corp. | | | 2,925,098 | |
| | 9,750 | | | Magna International, Inc.2 | | | 733,590 | |
| | | | | | | | 8,912,811 | |
| | | | | CONSUMER STAPLES — 4.4% | | | | |
| | 300,000 | | | Greencore Group PLC* | | | 498,736 | |
| | 195,000 | | | Naked Wines PLC* | | | 1,657,202 | |
| | | | | | | | 2,155,938 | |
| | | | | ENERGY — 6.6% | | | | |
| | 13,454 | | | Chevron Corp. | | | 1,518,553 | |
| | 214,480 | | | Comstock Resources, Inc.* | | | 1,735,143 | |
| | | | | | | | 3,253,696 | |
| | | | | FINANCIALS — 28.2% | | | | |
| | 196,000 | | | Barclays PLC - ADR1 | | | 1,940,400 | |
| | 100,753 | | | Burford Capital Ltd. | | | 1,022,404 | |
| | 26,980 | | | Citigroup, Inc.1 | | | 1,718,626 | |
| | 5,200 | | | Fairfax Financial Holdings Ltd.1,2 | | | 2,309,320 | |
| | 60,000 | | | Jefferies Financial Group, Inc.1 | | | 2,254,800 | |
| | 77,766 | | | Kingstone Cos., Inc. | | | 382,609 | |
| | 40,000 | | | Power Corp. of Canada | | | 1,290,332 | |
| | 262,000 | | | Protector Forsikring A.S.A. | | | 2,966,278 | |
| | | | | | | | 13,884,769 | |
| | | | | INDUSTRIALS — 4.7% | | | | |
| | 6,700 | | | Ashtead Group PLC | | | 539,008 | |
| | 42,000 | | | ISS A/S* | | | 754,895 | |
| | 10,500 | | | Sulzer A.G. | | | 995,546 | |
| | | | | | | | 2,289,449 | |
| | | | | MATERIALS — 4.6% | | | | |
| | 510,000 | | | Eurocell PLC | | | 1,716,053 | |
ACR Multi-Strategy Quality Return (MQR) Fund
SCHEDULE OF INVESTMENTS - Continued
As of November 30, 2021
Number
of Shares | | | | Value |
| | | COMMON STOCKS (Continued) | | |
| | | MATERIALS (Continued) | | |
| | 48,000 | | | Resolute Forest Products, Inc.1 | | $ | 542,880 | |
| | | | | | | | 2,258,933 | |
| | | | | REAL ESTATE — 2.6% | | | | |
| | 127,733 | | | Five Point Holdings LLC - Class A* | | | 688,481 | |
| | 7,000 | | | Howard Hughes Corp.* | | | 573,930 | |
| | | | | | | | 1,262,411 | |
| | | | | TOTAL COMMON STOCKS | | | | |
| | | | | (Cost $33,917,781) | | | 39,992,127 | |
| | | | | PREFERRED STOCKS — 0.6% | | | | |
| | | | | ENERGY — 0.6% | | | | |
| | 3,357 | | | Elk Liquidating Trust *3,4,5 | | | 136,560 | |
| | 3,073 | | | EPI Preferred Holdings, Inc.3,4,5 | | | 161,363 | |
| | | | | | | | 297,923 | |
| | | | | TOTAL PREFERRED STOCKS | | | | |
| | | | | (Cost $356,450) | | | 297,923 | |
Principal
Amount | | | | |
| | | SHORT-TERM INVESTMENTS — 17.9% | | |
| $ | 8,805,195 | | | UMB Bank Demand Deposit, 0.01%6 | | | 8,805,195 | |
| | | | | TOTAL SHORT-TERM INVESTMENTS | | | | |
| | | | | (Cost $8,805,195) | | | 8,805,195 | |
| | | | | | | | | |
| | | | | TOTAL INVESTMENTS — 99.9% | | | | |
| | | | | (Cost $43,079,426) | | | 49,095,245 | |
| | | | | Other Assets in Excess of Liabilities — 0.1% | | | 69,436 | |
| | | | | TOTAL NET ASSETS — 100.0% | | $ | 49,164,681 | |
Number
of Shares | | | | |
| | | SECURITIES SOLD SHORT — (1.1)% | | |
| | | EXCHANGE-TRADED FUNDS — (1.1)% | | |
| | (2,500 | ) | | iShares Russell 2000 ETF | | | (545,425 | ) |
| | | | | TOTAL EXCHANGE-TRADED FUNDS | | | | |
| | | | | (Proceeds $382,871) | | | (545,425 | ) |
| | | | | TOTAL SECURITIES SOLD SHORT | | | | |
| | | | | (Proceeds $382,871) | | $ | (545,425 | ) |
| ADR – American Depository Receipt |
| ETF – Exchange-Traded Fund |
| LLC – Limited Liability Company |
| PLC – Public Limited Company |
| * | Non-income producing security. |
ACR Multi-Strategy Quality Return (MQR) Fund
SCHEDULE OF INVESTMENTS - Continued
As of November 30, 2021
| 1 | All or a portion of this security is segregated as collateral for securities sold short. The market value of the securities pledged as collateral was $10,552,278, which represents 21.5% of total net assets of the Fund. |
| 2 | Foreign security denominated in U.S. Dollars. |
| 3 | Level 3 securities fair valued under procedures established by the Board of Trustees, represent 0.6% of Net Assets. The aggregate value of these securities is $297,923. |
| 4 | Post-reorganization assets. |
| 5 | Security in a privately owned company. |
| 6 | The rate is the annualized seven-day yield at period end. |
See accompanying Notes to Financial Statements.
ACR Multi-Strategy Quality Return (MQR) Fund
SUMMARY OF INVESTMENTS
As of November 30, 2021
| Security Type/Industry | | Percent of Total
Net Assets |
| Common Stocks | | | | |
| Financials | | | 28.2 | % |
| Consumer Discretionary | | | 18.1 | % |
| Communications | | | 12.2 | % |
| Energy | | | 6.6 | % |
| Industrials | | | 4.7 | % |
| Materials | | | 4.6 | % |
| Consumer Staples | | | 4.4 | % |
| Real Estate | | | 2.6 | % |
| Total Common Stocks | | | 81.4 | % |
| Preferred Stocks | | | 0.6 | % |
| Short-Term Investments | | | 17.9 | % |
| Total Investments | | | 99.9 | % |
| Other Assets in Excess of Liabilities | | | 0.1 | % |
| Total Net Assets | | | 100.0 | % |
See accompanying Notes to Financial Statements.
ACR International Quality Return (IQR) Fund
SCHEDULE OF INVESTMENTS
As of November 30, 2021
Number
of Shares | | | | Value |
| | | | | COMMON STOCKS — 84.2% | | | | |
| | | | | CANADA — 8.1% | | | | |
| | 9,360 | | | Fairfax Financial Holdings Ltd. | | $ | 4,153,935 | |
| | 804,710 | | | KITS Eyecare Ltd.* | | | 1,549,579 | |
| | | | | | | | 5,703,514 | |
| | | | | DENMARK — 4.6% | | | | |
| | 180,886 | | | ISS A/S* | | | 3,251,190 | |
| | | | | | | | | |
| | | | | FRANCE — 10.8% | | | | |
| | 146,672 | | | Cie Plastic Omnium S.A. | | | 3,664,172 | |
| | 20,210 | | | Danone S.A. | | | 1,188,563 | |
| | 33,952 | | | Thales S.A. | | | 2,785,492 | |
| | | | | | | | 7,638,227 | |
| | | | | IRELAND — 3.8% | | | | |
| | 1,617,958 | | | Greencore Group PLC* | | | 2,689,782 | |
| | | | | | | | | |
| | | | | ITALY — 3.1% | | | | |
| | 161,490 | | | Brembo S.p.A. | | | 2,137,078 | |
| | | | | | | | | |
| | | | | NORWAY — 8.6% | | | | |
| | 103,891 | | | Multiconsult A.S.A.1 | | | 1,763,181 | |
| | 379,963 | | | Protector Forsikring A.S.A. | | | 4,301,817 | |
| | | | | | | | 6,064,998 | |
| | | | | SWITZERLAND — 5.4% | | | | |
| | 10,545 | | | Medmix A.G.*1 | | | 503,073 | |
| | 35,045 | | | Sulzer A.G. | | | 3,322,751 | |
| | | | | | | | 3,825,824 | |
| | | | | UNITED KINGDOM — 37.3% | | | | |
| | 34,991 | | | Ashtead Group PLC | | | 2,814,991 | |
| | 213,426 | | | Barclays PLC - ADR | | | 2,112,917 | |
| | 522,200 | | | Countryside Properties PLC*1 | | | 2,869,912 | |
| | 1,382,518 | | | Eurocell PLC | | | 4,651,909 | |
| | 96,277 | | | Howden Joinery Group PLC | | | 1,109,215 | |
| | 135,218 | | | Liberty Global PLC - Class C*2 | | | 3,602,207 | |
| | 98,848 | | | Liberty Latin America Ltd. - Class C*2 | | | 1,111,052 | |
| | 497,545 | | | Naked Wines PLC* | | | 4,228,372 | |
| | 259,695 | | | Vodafone Group PLC - ADR | | | 3,812,323 | |
| | | | | | | | 26,312,898 | |
ACR International Quality Return (IQR) Fund
SCHEDULE OF INVESTMENTS - Continued
As of November 30, 2021
Number
of Shares | | | | Value |
| | | COMMON STOCKS (Continued) | | |
| | | UNITED STATES — 2.5% | | |
| | 174,122 | | | Burford Capital Ltd. | | $ | 1,766,925 | |
| | | | | TOTAL COMMON STOCKS | | | | |
| | | | | (Cost $55,664,673) | | | 59,390,436 | |
Principal
Amount | | | | |
| | | SHORT-TERM INVESTMENTS — 15.5% | | |
| $ | 10,969,299 | | | UMB Bank Demand Deposit, 0.01%3 | | | 10,969,299 | |
| | | | | TOTAL SHORT-TERM INVESTMENTS | | | | |
| | | | | (Cost $10,969,299) | | | 10,969,299 | |
| | | | | | | | | |
| | | | | TOTAL INVESTMENTS — 99.7% | | | | |
| | | | | (Cost $66,633,972) | | | 70,359,735 | |
| | | | | Other Assets in Excess of Liabilities — 0.3% | | | 212,817 | |
| | | | | TOTAL NET ASSETS — 100.0% | | $ | 70,572,552 | |
| ADR – American Depository Receipt |
| PLC – Public Limited Company |
| * | Non-income producing security. |
| 1 | Security exempt from registration under Rule 144A of the Securities Act of 1933. These securities are restricted and may be resold in transactions exempt from registration normally to qualified institutional buyers. The total value of these securities is $5,136,166 which represents 7.3% of Net Assets. |
| 2 | Foreign security denominated in U.S. Dollars. |
| 3 | The rate is the annualized seven-day yield at period end. |
See accompanying Notes to Financial Statements.
ACR International Quality Return (IQR) Fund
SUMMARY OF INVESTMENTS
As of November 30, 2021
| Security Type/Industry | | Percent of Total
Net Assets |
| Common Stocks | | | | |
| Industrials | | | 19.7 | % |
| Financials | | | 17.5 | % |
| Consumer Discretionary | | | 13.9 | % |
| Communications | | | 12.1 | % |
| Consumer Staples | | | 11.5 | % |
| Materials | | | 6.6 | % |
| Health Care | | | 2.9 | % |
| Total Common Stocks | | | 84.2 | % |
| Short-Term Investments | | | 15.5 | % |
| Total Investments | | | 99.7 | % |
| Other Assets in Excess of Liabilities | | | 0.3 | % |
| Total Net Assets | | | 100.0 | % |
See accompanying Notes to Financial Statements.
STATEMENTS OF ASSETS AND LIABILITIES
As of November 30, 2021
| | | ACR Multi-Strategy Quality Return (MQR) Fund | | | ACR International Quality Return (IQR) Fund | |
| Assets: | | | | | | | | |
| Investments, at value (cost $43,079,426 and $66,633,972, respectively) | | $ | 49,095,245 | | | $ | 70,359,735 | |
| Foreign currency, at value (cost $0 and $254,170, respectively) | | | - | | | | 254,170 | |
| Cash | | | - | | | | 23,719 | |
| Cash deposited with broker for securities sold short | | | 633,136 | | | | - | |
| Receivables: | | | | | | | | |
| Fund shares sold | | | 4,625 | | | | 26,989 | |
| Dividends and interest | | | 152,839 | | | | 233,839 | |
| Prepaid expenses | | | 14,284 | | | | 20,546 | |
| Total assets | | | 49,900,129 | | | | 70,918,998 | |
| | | | | | | | | |
| Liabilities: | | | | | | | | |
| Securities sold short, at value (proceeds $382,871 and $0, respectively) | | | 545,425 | | | | - | |
| Payables: | | | | | | | | |
| Investment securities purchased | | | 71,924 | | | | 254,170 | |
| Fund shares redeemed | | | 147 | | | | 7 | |
| Advisory fees | | | 30,757 | | | | 33,295 | |
| Shareholder servicing fees (Note 8) | | | 10,300 | | | | 2,399 | |
| Fund administration and accounting fees | | | 12,442 | | | | 5,120 | |
| Transfer agent fees and expenses | | | 7,379 | | | | 4,557 | |
| Custody fees | | | 3,381 | | | | 2,280 | |
| Trustees' deferred compensation (Note 3) | | | 22,094 | | | | 21,177 | |
| Auditing fees | | | 14,980 | | | | 14,959 | |
| Legal fees | | | 3,624 | | | | 1,165 | |
| Trustees' fees and expenses | | | 2,864 | | | | 938 | |
| Chief Compliance Officer fees | | | 1,945 | | | | 1,310 | |
| Interest expense | | | 478 | | | | - | |
| Due to broker | | | - | | | | 22 | |
| Accrued other expenses | | | 7,708 | | | | 5,047 | |
| Total Liabilities | | | 735,448 | | | | 346,446 | |
| Net Assets | | $ | 49,164,681 | | | $ | 70,572,552 | |
| | | | | | | | | |
| Components of Net Assets: | | | | | | | | |
| Paid-in capital (par value of $0.01 per share with an unlimited number of shares authorized) | | $ | 43,540,412 | | | $ | 64,127,159 | |
| Total distributable earnings | | | 5,624,269 | | | | 6,445,393 | |
| Net Assets | | $ | 49,164,681 | | | $ | 70,572,552 | |
| | | | | | | | | |
| Maximum Offering Price per Share: | | | | | | | | |
| Class I Shares: | | | | | | | | |
| Net assets applicable to shares outstanding | | $ | 49,164,681 | | | $ | 70,572,552 | |
| Shares of beneficial interest issued and outstanding | | | 3,381,276 | | | | 5,111,827 | |
| Redemption price per share | | $ | 14.54 | | | $ | 13.81 | |
See accompanying Notes to Financial Statements.
STATEMENTS OF OPERATIONS
For the Year Ended November 30, 2021
| | | ACR Multi-Strategy Quality Return (MQR) Fund | | | ACR International Quality Return (IQR) Fund | |
| Investment income: | | | | | | | | |
| Dividends (net of foreign withholdings taxes of $58,728 and $124,453, respectively) | | $ | 1,008,631 | | | $ | 1,045,237 | |
| Interest | | | 524 | | | | 988 | |
| Total investment income | | | 1,009,155 | | | | 1,046,225 | |
| | | | | | | | | |
| Expenses: | | | | | | | | |
| Advisory fees | | | 447,211 | | | | 547,114 | |
| Shareholder servicing fees (Note 8) | | | 34,284 | | | | 46,909 | |
| Distribution fees - Class A (Note 7) | | | 6,775 | | | | 14 | |
| Fund administration and accounting fees | | | 87,973 | | | | 88,397 | |
| Trustees' fees and expenses | | | 15,867 | | | | 15,468 | |
| Transfer agent fees and expenses | | | 42,591 | | | | 35,868 | |
| Registration fees | | | 35,979 | | | | 29,007 | |
| Legal fees | | | 15,502 | | | | 16,451 | |
| Auditing fees | | | 14,958 | | | | 14,958 | |
| Custody fees | | | 14,947 | | | | 24,876 | |
| Chief Compliance Officer fees | | | 8,599 | | | | 9,226 | |
| Interest expense | | | 6,621 | | | | - | |
| Dividends on securities sold short | | | 5,042 | | | | - | |
| Miscellaneous | | | 4,734 | | | | 7,077 | |
| Insurance fees | | | 3,621 | | | | 3,344 | |
| Shareholder reporting fees | | | 2,315 | | | | 6,406 | |
| Total expenses | | | 747,019 | | | | 845,115 | |
| Advisory fees waived | | | (182,624 | ) | | | (222,146 | ) |
| Fees paid indirectly (Note 3) | | | (4,056 | ) | | | (4,186 | ) |
| Net expenses | | | 560,339 | | | | 618,783 | |
| Net investment income | | | 448,816 | | | | 427,442 | |
| | | | | | | | | |
| Realized and Unrealized Gain (Loss): | | | | | | | | |
| Net realized gain (loss) on: | | | | | | | | |
| Investments | | | (351,458 | ) | | | 2,804,357 | |
| Foreign currency transactions | | | (270 | ) | | | (3,568 | ) |
| Net realized gain (loss) | | | (351,728 | ) | | | 2,800,789 | |
| Net change in unrealized appreciation/depreciation on: | | | | | | | | |
| Investments | | | 8,879,799 | | | | (574,915 | ) |
| Securities sold short | | | (92,875 | ) | | | - | |
| Foreign currency translations | | | (1,707 | ) | | | (4,309 | ) |
| Net change in unrealized appreciation/depreciation | | | 8,785,217 | | | | (579,224 | ) |
| Net realized and unrealized gain | | | 8,433,489 | | | | 2,221,565 | |
| | | | | | | | | |
| Net Increase in Net Assets from Operations | | $ | 8,882,305 | | | $ | 2,649,007 | |
See accompanying Notes to Financial Statements.
ACR Multi-Strategy Quality Return (MQR) Fund
STATEMENTS OF CHANGES IN NET ASSETS
| | | For the
Year Ended
November 30, 2021 | | | For the
Year Ended
November 30, 2020 | |
| Increase (Decrease) in Net Assets from: | | | | | | | | |
| Operations: | | | | | | | | |
| Net investment income | | $ | 448,816 | | | $ | 180,478 | |
| Net realized loss | | | (351,728 | ) | | | (75,709 | ) |
| Net change in unrealized appreciation/depreciation on investments, securities sold short and foreign currency translations | | | 8,785,217 | | | | 565,552 | |
| Net increase in net assets resulting from operations | | | 8,882,305 | | | | 670,321 | |
| | | | | | | | | |
| Distributions to Shareholders: | | | | | | | | |
| Distributions: | | | | | | | | |
| Class A1 | | | (22,638 | ) | | | (163,031 | ) |
| Class I | | | (205,542 | ) | | | (1,465,816 | ) |
| Total distributions to shareholders | | | (228,180 | ) | | | (1,628,847 | ) |
| | | | | | | | | |
| Capital Transactions: | | | | | | | | |
| Net proceeds from shares sold: | | | | | | | | |
| Class A1 | | | 11,520 | | | | 5,681 | |
| Class I | | | 18,562,598 | 2 | | | 2,903,377 | |
| Reinvestment of distributions: | | | | | | | | |
| Class A1 | | | 19,554 | | | | 146,750 | |
| Class I | | | 198,645 | | | | 1,404,966 | |
| Cost of shares redeemed: | | | | | | | | |
| Class A1,3 | | | (5,859,978 | )4 | | | (2,426,130 | ) |
| Class I5 | | | (5,492,440 | ) | | | (32,728,848 | ) |
Net increase (decrease) in net assets from capital transactions | | | 7,439,899 | | | | (30,694,204 | ) |
| | | | | | | | | |
| Total increase (decrease) in net assets | | | 16,094,024 | | | | (31,652,730 | ) |
| | | | | | | | | |
| Net Assets: | | | | | | | | |
| Beginning of period | | | 33,070,657 | | | | 64,723,387 | |
| End of period | | $ | 49,164,681 | | | $ | 33,070,657 | |
| Capital Share Transactions: | | | | | | | | |
| Shares sold: | | | | | | | | |
| Class A1 | | | 796 | | | | 592 | |
| Class I | | | 1,236,324 | 6 | | | 296,194 | |
| Shares reinvested: | | | | | | | | |
| Class A1 | | | 1,653 | | | | 14,401 | |
| Class I | | | 16,707 | | | | 137,204 | |
| Shares redeemed: | | | | | | | | |
| Class A1 | | | (387,733 | )7 | | | (257,054 | ) |
| Class I | | | (394,310 | ) | | | (3,592,249 | ) |
| Net increase (decrease) in capital share transactions | | | 473,437 | | | | (3,400,912 | ) |
| 1 | Class A shares were converted into Class I shares effective as of the close of business on June 11, 2021. |
| 2 | Proceeds from shares sold include $5,414,446 converted from Class A to Class I. |
See accompanying Notes to Financial Statements.
ACR Multi-Strategy Quality Return (MQR) Fund
STATEMENTS OF CHANGES IN NET ASSETS - Continued
| 3 | Net redemption fee proceeds of $0 and $22, respectively. |
| 4 | Cost of shares redeemed include $5,414,446 converted from Class A to Class I. |
| 5 | Net redemption fee proceeds of $2,862 and $2,082, respectively. |
| 6 | Shares sold include 354,330 converted from Class A to Class I. |
| 7 | Shares redeemed include 356,446 converted from Class A to Class I. |
See accompanying Notes to Financial Statements.
ACR International Quality Return (IQR) Fund
STATEMENTS OF CHANGES IN NET ASSETS
| | | For the
Year Ended
November 30, 2021 | | | For the
Year Ended
November 30, 2020 | |
| Increase (Decrease) in Net Assets from: | | | | | | | | |
| Operations: | | | | | | | | |
| Net investment income (loss) | | $ | 427,442 | | | $ | (42,379 | ) |
| Net realized gain | | | 2,800,789 | | | | 43,254 | |
| Net change in unrealized appreciation/depreciation on investments and foreign currency translations | | | (579,224 | ) | | | 4,877,315 | |
| Net increase from reimbursement by affiliates (Note 3) | | | - | | | | 4,202 | |
| Net increase in net assets resulting from operations | | | 2,649,007 | | | | 4,882,392 | |
| Distributions to Shareholders: | | | | | | | | |
| Distributions: | | | | | | | | |
| Class A1 | | | (28 | ) | | | (32 | ) |
| Class I | | | (137,793 | ) | | | (204,998 | ) |
| Total distributions to shareholders | | | (137,821 | ) | | | (205,030 | ) |
| | | | | | | | | |
| Capital Transactions: | | | | | | | | |
| Net proceeds from shares sold: | | | | | | | | |
| Class A1 | | | 5,000 | | | | - | |
| Class I | | | 38,782,564 | 2 | | | 5,008,074 | |
| Reinvestment of distributions: | | | | | | | | |
| Class A1 | | | 28 | | | | 32 | |
| Class I | | | 137,793 | | | | 204,998 | |
| Cost of shares redeemed: | | | | | | | | |
| Class A1 | | | (13,492 | )3 | | | - | |
| Class I4 | | | (1,185,720 | ) | | | (1,442,217 | ) |
| Net increase in net assets from capital transactions | | | 37,726,173 | | | | 3,770,887 | |
| | | | | | | | | |
| Total increase in net assets | | | 40,237,359 | | | | 8,448,249 | |
| | | | | | | | | |
| Net Assets: | | | | | | | | |
| Beginning of period | | | 30,335,193 | | | | 21,886,944 | |
| End of period | | $ | 70,572,552 | | | $ | 30,335,193 | |
| Capital Share Transactions: | | | | | | | | |
| Shares sold: | | | | | | | | |
| Class A1 | | | 363 | | | | - | |
| Class I | | | 2,680,559 | 5 | | | 485,258 | |
| Shares reinvested: | | | | | | | | |
| Class A1 | | | 2 | | | | 3 | |
| Class I | | | 10,841 | | | | 19,807 | |
| Shares redeemed: | | | | | | | | |
| Class A1 | | | (880 | )6 | | | - | |
| Class I | | | (78,439 | ) | | | (153,359 | ) |
| Net increase in capital share transactions | | | 2,612,446 | | | | 351,709 | |
| 1 | Class A shares were converted into Class I shares effective as of the close of business on June 11, 2021. |
| 2 | Proceeds from shares sold include $13,492 converted from Class A to Class I. |
See accompanying Notes to Financial Statements.
ACR International Quality Return (IQR) Fund
STATEMENTS OF CHANGES IN NET ASSETS - Continued
| 3 | Cost of shares redeemed includes $13,492 converted from Class A to Class I. |
| 4 | Net redemption fee proceeds of $134 and $41, respectively. |
| 5 | Shares sold include 878 converted from Class A to Class I. |
| 6 | Shares redeemed include 880 converted from Class A to Class I. |
See accompanying Notes to Financial Statements.
ACR Multi-Strategy Quality Return (MQR) Fund
FINANCIAL HIGHLIGHTS
Class I
Per share operating performance.
For a capital share outstanding throughout each period.
| | | For the Year Ended November 30, | |
| | | 2021 | | | 2020 | | | 2019 | | | 2018 | | | 2017 | |
| Net asset value, beginning of period | | $ | 11.38 | | | $ | 10.27 | | | $ | 11.12 | | | $ | 11.32 | | | $ | 10.33 | |
| Income from Investment Operations: | | | | | | | | | | | | | | | | | | | | |
| Net investment income1 | | | 0.15 | | | | 0.04 | | | | 0.20 | | | | 0.22 | | | | 0.01 | |
| Net realized and unrealized gain (loss) | | | 3.09 | | | | 1.36 | | | | (0.40 | ) | | | (0.27 | ) | | | 1.14 | |
| Net increase from reimbursement by affiliates | | | - | | | | - | | | | - | | | | - | 2,3 | | | - | |
| Total from investment operations | | | 3.24 | | | | 1.40 | | | | (0.20 | ) | | | (0.05 | ) | | | 1.15 | |
| | | | | | | | | | | | | | | | | | | | | |
| Less Distributions: | | | | | | | | | | | | | | | | | | | | |
| From net investment income | | | (0.08 | ) | | | (0.22 | ) | | | (0.26 | ) | | | (0.01 | ) | | | - | |
| From net realized gain | | | - | | | | (0.07 | ) | | | (0.39 | ) | | | (0.14 | ) | | | (0.16 | ) |
| Total distributions | | | (0.08 | ) | | | (0.29 | ) | | | (0.65 | ) | | | (0.15 | ) | | | (0.16 | ) |
| | | | | | | | | | | | | | | | | | | | | |
| Redemption fee proceeds1 | | | - | 2 | | | - | 2 | | | - | 2 | | | - | 2 | | | - | 2 |
| Net asset value, end of period | | $ | 14.54 | | | $ | 11.38 | | | $ | 10.27 | | | $ | 11.12 | | | $ | 11.32 | |
| | | | | | | | | | | | | | | | | | | | | |
| Total return4 | | | 28.65 | % | | | 13.91 | % | | | (1.44 | )% | | | (0.50 | )% | | | 11.27 | % |
| | | | | | | | | | | | | | | | | | | | | |
| Ratios and Supplemental Data: | | | | | | | | | | | | | | | | | | | | |
| Net assets, end of period (in thousands) | | $ | 49,165 | | | $ | 28,715 | | | $ | 58,326 | | | $ | 106,789 | | | $ | 90,046 | |
| | | | | | | | | | | | | | | | | | | | | |
| Ratios of expenses to average net assets (including dividends on securities sold short and interest expense): | | | | | | | | | | | | | | | | | | | | |
| Before fees waived, expenses absorbed and fees paid indirectly | | | 1.65 | %5 | | | 2.03 | %5 | | | 1.69 | %5 | | | 1.67 | %5 | | | 1.86 | %5 |
| After fees waived, expenses absorbed and fees paid indirectly | | | 1.24 | %5 | | | 1.31 | %5 | | | 1.30 | %5 | | | 1.40 | %5 | | | 1.45 | %5 |
| Ratio of net investment income (loss) to average net assets (including dividends on securities sold short and interest expense): | | | | | | | | | | | | | | | | | | | | |
| Before fees waived, expenses absorbed and fees paid indirectly | | | 0.61 | % | | | (0.26 | )% | | | 1.58 | % | | | 1.65 | % | | | (0.28 | )% |
| After fees waived, expenses absorbed and fees paid indirectly | | | 1.02 | % | | | 0.46 | % | | | 1.97 | % | | | 1.92 | % | | | 0.13 | % |
| | | | | | | | | | | | | | | | | | | | | |
| Portfolio turnover rate | | | 17 | % | | | 33 | % | | | 18 | % | | | 48 | % | | | 33 | % |
| 1 | Based on average daily shares outstanding for the period. |
| 2 | Amount represents less than $0.01 per share. |
| 3 | During the year ended November 30, 2018, the Advisor reimbursed the Fund $3,826 for errors during processing. The reimbursement had no impact to the Fund's performance. |
| 4 | Total returns would have been lower had expenses not been waived or absorbed by the Advisor. Returns shown do not reflect the deduction of taxes that a shareholder would pay on Fund distributions or the redemption of Fund shares. |
| 5 | If interest expense and dividends on securities sold short had been excluded, the expense ratios would have been lowered by 0.03% for the year ended November 30, 2021. For the years ended November 30, 2020, 2019, 2018, and 2017, the ratios would have been lowered by 0.14%, 0.13%, 0.24%, and 0.29%, respectively. |
See accompanying Notes to Financial Statements.
ACR International Quality Return (IQR) Fund
FINANCIAL HIGHLIGHTS
Class I
Per share operating performance.
For a capital share outstanding throughout each period.
| | | For the Year Ended November 30, | | | For the Period
December 30,
2016*
through
November 30, | |
| | | 2021 | | | 2020 | | | 2019 | | | 2018 | | | 2017 | |
| Net asset value, beginning of period | | $ | 12.14 | | | $ | 10.19 | | | $ | 9.86 | | | $ | 10.84 | | | $ | 10.00 | |
| Income from Investment Operations: | | | | | | | | | | | | | | | | | | | | |
| Net investment income (loss) 1 | | | 0.11 | | | | (0.02 | ) | | | 0.10 | | | | 0.08 | | | | 0.02 | |
| Net realized and unrealized gain (loss) | | | 1.61 | | | | 2.07 | | | | 0.40 | | | | (0.96 | ) | | | 0.82 | |
| Net increase from reimbursement by affiliates (Note 3) | | | - | | | | - | 2,3 | | | - | 2,4 | | | - | 2,5 | | | - | |
| Total from investment operations | | | 1.72 | | | | 2.05 | | | | 0.50 | | | | (0.88 | ) | | | 0.84 | |
| | | | | | | | | | | | | | | | | | | | | |
| Less Distributions: | | | | | | | | | | | | | | | | | | | | |
| From net investment income | | | - | | | | (0.10 | ) | | | (0.07 | ) | | | (0.03 | ) | | | - | |
| From net realized gain | | | (0.05 | ) | | | - | | | | (0.10 | ) | | | (0.07 | ) | | | - | |
| Total distributions | | | (0.05 | ) | | | (0.10 | ) | | | (0.17 | ) | | | (0.10 | ) | | | - | |
| | | | | | | | | | | | | | | | | | | | | |
| Redemption fee proceeds1 | | | - | 2 | | | - | 2 | | | - | 2 | | | - | 2 | | | - | 2 |
| Net asset value, end of period | | $ | 13.81 | | | $ | 12.14 | | | $ | 10.19 | | | $ | 9.86 | | | $ | 10.84 | |
| | | | | | | | | | | | | | | | | | | | | |
| Total return6 | | | 14.24 | % | | | 20.23 | % | | | 5.18 | % | | | (8.20 | )% | | | 8.40 | %7 |
| | | | | | | | | | | | | | | | | | | | | |
| Ratios and Supplemental Data: | | | | | | | | | | | | | | | | | | | | |
| Net assets, end of period (in thousands) | | $ | 70,573 | | | $ | 30,329 | | | $ | 21,882 | | | $ | 18,575 | | | $ | 14,316 | |
| | | | | | | | | | | | | | | | | | | | | |
| Ratio of expenses to average net assets (including interest expense): | | | | | | | | | | | | | | | | | | | | |
| Before fees waived, expenses absorbed and fees paid indirectly | | | 1.54 | % | | | 2.20 | % | | | 2.24 | % | | | 2.59 | % | | | 4.06 | %8 |
| After fees waived, expenses absorbed and fees paid indirectly | | | 1.13 | %9 | | | 1.19 | % | | | 1.20 | % | | | 1.20 | % | | | 1.19 | %8 |
| Ratio of net investment income (loss) to average net assets (including interest expense): | | | | | | | | | | | | | | | | | | | | |
| Before fees waived, expenses absorbed and fees paid indirectly | | | 0.37 | % | | | (1.20 | )% | | | (0.07 | )% | | | (0.69 | )% | | | (2.62 | )%8 |
| After fees waived, expenses absorbed and fees paid indirectly | | | 0.78 | % | | | (0.19 | )% | | | 0.97 | % | | | 0.70 | % | | | 0.25 | %8 |
| | | | | | | | | | | | | | | | | | | | | |
| Portfolio turnover rate | | | 14 | % | | | 44 | % | | | 32 | % | | | 52 | % | | | 9 | %7 |
| * | Commencement of operations. |
| 1 | Based on average daily shares outstanding for the period. |
| 2 | Amount represents less than $0.01 per share. |
| 3 | Reimbursement had no impact to the Fund's performance (Note 3). |
| 4 | During the year ended November 30, 2019, the Advisor reimbursed the Fund $1,272 for errors during processing. The reimbursement had no impact to the Fund's performance. |
| 5 | During the year ended November 30, 2018, the Advisor reimbursed the Fund $1,010 for errors during processing. The reimbursement had no impact to the Fund's performance. |
| 6 | Total returns would have been lower had expenses not been waived or absorbed by the Advisor. Returns shown do not reflect the deduction of taxes that a shareholder would pay on Fund distributions or the redemption of Fund shares. |
| 7 | Not annualized. |
| 8 | Annualized. |
| 9 | Effective as of the close of business on June 11, 2021, the Advisor has contractually agreed to limit the annual fund operating expenses to 1.10%. Prior to the close of business on June 11, 2021, the annual fund operating expense limitation was 1.25%. |
See accompanying Notes to Financial Statements.
ACR Funds
NOTES TO FINANCIAL STATEMENTS
November 30, 2021
Note 1 – Organization
ACR Multi-Strategy Quality Return (MQR) Fund and ACR International Quality Return (IQR) Fund (each a “Fund” and collectively the ‘‘Funds’’) are organized as a non-diversified series of Investment Managers Series Trust II, a Delaware statutory trust (the “Trust”) which is registered as an open-end management investment company under the Investment Company Act of 1940, as amended (the “1940 Act”).
The ACR Multi-Strategy Quality Return (MQR) Fund seeks to preserve capital from permanent loss during periods of economic decline, and to provide above average absolute and relative returns in the long run. The Fund commenced investment operations on December 31, 2014, with two classes of shares, Class A and Class I. Effective as of the close of business on June 11, 2021, Class A shares were converted into Class I shares. Class A shares were subsequently terminated.
The ACR International Quality Return (IQR) Fund seeks to protect capital from permanent impairment while providing a return above both the Fund’s cost of capital and above the Fund’s benchmark over a full market cycle. The Fund commenced investment operations on December 30, 2016, with two classes of shares, Class A and Class I. Effective as of the close of business on June 11, 2021, Class A shares were converted into Class I shares. Class A shares were subsequently terminated.
The shares of each class represent an interest in the same portfolio of investments of the Funds and have equal rights as to voting, redemptions, dividends and liquidation, subject to the approval of the Trustees. Income, expenses (other than expenses attributable to a specific class) and realized and unrealized gains and losses on investments are allocated to each class of shares in proportion to their relative net assets. Shareholders of a class that bears distribution and service expenses under the terms of a distribution plan have exclusive voting rights to that distribution plan.
Each Fund is an investment company and accordingly follows the investment company accounting and reporting guidance of the Financial Accounting Standards Board (FASB) Accounting Standard Codification Topic 946 “Financial Services—Investment Companies.”
Note 2 – Accounting Policies
The following is a summary of the significant accounting policies consistently followed by the Funds in the preparation of their financial statements. The preparation of financial statements in conformity with accounting principles generally accepted in the United States of America (“GAAP”) requires management to make estimates and assumptions that affect the reported amounts and disclosures in the financial statements. Actual results could differ from these estimates.
(a) Valuation of Investments
The Funds value equity securities at the last reported sale price on the principal exchange or in the principal over the counter (“OTC”) market in which such securities are traded, as of the close of regular trading on the NYSE on the day the securities are being valued or, if the last-quoted sales price is not readily available, the securities will be valued at the last bid or the mean between the last available bid and ask price. Securities traded on the NASDAQ are valued at the NASDAQ Official Closing Price (“NOCP”). Investments in open-end investment companies are valued at the daily closing net asset value of the respective investment company. Options are valued at the mean between the last available bid and asked prices used. Debt securities are valued by utilizing a price supplied by independent pricing service providers. The independent pricing service providers may use various valuation methodologies including matrix pricing and other analytical pricing models as well as market transactions and dealer quotations. These models generally consider such factors as yields or prices of bonds of comparable quality, type of issue, coupon, maturity, ratings and general market conditions. If a price is not readily available for a portfolio security, the security will be valued at fair value (the amount which the Funds might reasonably expect to receive for the security upon its current sale) as determined in good faith by the Funds’ advisor, subject to review and approval by the Valuation Committee, pursuant to procedures adopted by the Board of Trustees. The actions of the Valuation Committee are subsequently reviewed by the Board at its next regularly scheduled board meeting. The Valuation Committee meets as needed. The Valuation Committee is comprised of all the Trustees, but action may be taken by any one of the Trustees.
ACR Funds
NOTES TO FINANCIAL STATEMENTS - Continued
November 30, 2021
(b) Short Sales
Short sales are transactions under which the Funds sell a security it does not own in anticipation of a decline in the value of that security. To complete such a transaction, the Funds must borrow the security to make delivery to the buyer. The Funds then are obligated to replace the security borrowed by purchasing the security at market price at the time of replacement. The price at such time may be more or less than the price at which the security was sold by the Funds. When a security is sold short a decrease in the value of the security will be recognized as a gain and an increase in the value of the security will be recognized as a loss, which is potentially limitless. Until the security is replaced, the Funds are required to pay the lender amounts equal to dividend or interest that accrue during the period of the loan which is recorded as an expense. To borrow the security, the Funds also may be required to pay a premium or an interest fee, which are recorded as interest expense. Cash or securities are segregated for the broker to meet the necessary margin requirements. The Funds are subject to the risk that it may not always be able to close out a short position at a particular time or at an acceptable price.
(c) Options
The Funds may write or purchase options contracts primarily to enhance the Funds’ returns or reduce volatility. In addition, the Funds may utilize options in an attempt to generate gains from option premiums or to reduce overall portfolio risk. When a Fund writes or purchases an option, an amount equal to the premium received or paid by a Fund is recorded as a liability or an asset and is subsequently adjusted to the current market value of the option written or purchased. Premiums received or paid from writing or purchasing options which expire unexercised are treated by a Fund on the expiration date as realized gains or losses. The difference between the premium and the amount paid or received on effecting a closing purchase or sale transaction, including brokerage commissions, is also treated as a realized gain or loss. If an option is exercised, the premium paid or received is added to the cost of the purchase or proceeds from the sale in determining whether a Fund has realized a gain or a loss on investment transactions. A Fund, as a writer of an option, may have no control over whether the underlying securities may be sold (call) or purchased (put) and as a result bears the market risk of an unfavorable change in the price of the security underlying the written option.
(d) Investment Transactions, Investment Income and Expenses
Investment transactions are accounted for on the trade date. Realized gains and losses on investments are determined on the identified cost basis. Dividend income is recorded net of applicable withholding taxes on the ex-dividend date and interest income is recorded on an accrual basis. Withholding taxes on foreign dividends, if applicable, are paid (a portion of which may be reclaimable) or provided for in accordance with the applicable country’s tax rules and rates and are disclosed in the Statements of Operations. Withholding tax reclaims are filed in certain countries to recover a portion of the amounts previously withheld. The Funds record a reclaim receivable based on a number of factors, including a jurisdiction’s legal obligation to pay reclaims as well as payment history and market convention. Discounts or premiums on debt securities are accreted or amortized to interest income over the lives of the respective securities using the effective interest method. Income and expenses of the Funds are allocated on a pro rata basis to each class of shares relative net assets, except for distribution and service fees which are unique to each class of shares. Expenses incurred by the Trust with respect to more than one Fund are allocated in proportion to the net assets of each Fund except where allocation of direct expenses to each Fund or an alternative allocation method can be more appropriately made.
ACR Funds
NOTES TO FINANCIAL STATEMENTS - Continued
November 30, 2021
(e) Federal Income Taxes
Each Fund intends to comply with the requirements of Subchapter M of the Internal Revenue Code applicable to regulated investment companies and to distribute substantially all of its net investment income and any net realized gains to its shareholders. Therefore, no provision is made for federal income or excise taxes. Due to the timing of dividend distributions and the differences in accounting for income and realized gains and losses for financial statement and federal income tax purposes, the fiscal year in which amounts are distributed may differ from the year in which the income and realized gains and losses are recorded by the Funds.
Accounting for Uncertainty in Income Taxes (the “Income Tax Statement”) requires an evaluation of tax positions taken (or expected to be taken) in the course of preparing a Fund’s tax returns to determine whether these positions meet a “more-likely-than-not” standard that, based on the technical merits, have a more than fifty percent likelihood of being sustained by a taxing authority upon examination. A tax position that meets the “more-likely-than-not” recognition threshold is measured to determine the amount of benefit to recognize in the financial statements. The Funds recognize interest and penalties, if any, related to unrecognized tax benefits as income tax expense in the Statements of Operations.
The Income Tax Statement requires management of the Funds to analyze tax positions taken in the prior three open tax years, if any, and tax positions expected to be taken in the Funds’ current tax year, as defined by the IRS statute of limitations for all major jurisdictions, including federal tax authorities and certain state tax authorities. As of November 30, 2021 and during the prior three tax years, the Funds did not have a liability for any unrecognized tax benefits. The Funds have no examination in progress and are not aware of any tax positions for which it is reasonably possible that the total amounts of unrecognized tax benefits will significantly change in the next twelve months.
(f) Distributions to Shareholders
The Funds will make distributions of net investment income and net capital gains, if any, at least annually. Distributions to shareholders are recorded on the ex-dividend date. The amount and timing of distributions are determined in accordance with federal income tax regulations, which may differ from GAAP.
The character of distributions made during the year from net investment income or net realized gains may differ from the characterization for federal income tax purposes due to differences in the recognition of income expense and gain (loss) items for financial statement and tax purposes.
(g) Illiquid Securities
Pursuant to Rule 22e-4 under the 1940 Act, the Funds have adopted a Liquidity Risk Management Program (“LRMP”) that requires, among other things, that the Funds limit their illiquid investments that are assets to no more than 15% of net assets. An illiquid investment is any security which may not reasonably be expected to be sold or disposed of in current market conditions in seven calendar days or less without the sale or disposition significantly changing the market value of the investment. If the Advisor, at any time, determines that the value of illiquid securities held by a Fund exceeds 15% of its net asset value, the Advisor will take such steps as it considers appropriate to reduce them as soon as reasonably practicable in accordance with the Funds’ written LRMP.
(h) Use of Estimates
The presentation of financial statements in conformity with GAAP requires management to make estimates and assumptions that affect the reported amounts of assets and liabilities at the date of the financial statements and the reported amounts of income and expenses during the reporting period. Actual results could differ from those estimates.
ACR Funds
NOTES TO FINANCIAL STATEMENTS - Continued
November 30, 2021
Note 3 – Investment Advisory and Other Agreements
The Trust, on behalf of the Funds, entered into an Investment Advisory Agreement (the “Agreement”) with ACR Alpine Capital Research, LLC (the “Advisor”). Under the terms of the Agreement, the Funds pay a monthly investment advisory fee to the Advisor based on each Fund’s average daily net assets. The annual rates are listed by Fund in the table below. The Advisor has contractually agreed to waive its fee and/or pay for operating expenses (excluding any taxes, leverage interest, acquired fund fees and expenses (as determined in accordance with Form N-1A), dividend and interest expense on short sales, brokerage commissions, expenses incurred in connection with any merger or reorganization and extraordinary expenses such as litigation expenses) in order to limit total annual operating expenses of each fund. This agreement is in effect until March 31, 2022 for the Funds, and it may be terminated before that date only by the Trust’s Board of Trustees. The table below contains the annual investment advisory fees and expense cap by Fund and by Class.
| | Investment
Advisory Fees | Total Limit on Annual
Operating Expenses
Class I Shares† |
| ACR Multi-Strategy Quality Return (MQR) Fund | 1.00% | 1.25% |
| ACR International Quality Return (IQR) Fund | 1.00% | 1.10%* |
| † | The total limit on annual operating expenses is calculated based on each Fund’s average daily net assets. |
| * | Effective as of the close of business on June 11, 2021, the Advisor has agreed to reduce the expense limitation from 1.25% to 1.10% of the Class I Shares’ average daily net assets. |
For the year ended November 30, 2021, the Advisor waived a portion of its advisory fees totaling $182,624 for the ACR Multi-Strategy Quality Return (MQR) Fund and $222,146 for the ACR International Quality Return (IQR) Fund, respectively. The Advisor is permitted to seek reimbursement from the Funds, subject to certain limitations, of fees waived or payments made to the Funds for a period ending three full fiscal years after the date of the waiver or payment. This reimbursement may be requested from the Funds if the reimbursement will not cause the Funds’ annual expense ratio to exceed the lesser of (a) the expense limitation amount in effect at the time such fees were waived or payments made, or (b) the expense limitation amount in effect at the time of the reimbursement. At November 30, 2021, the amount of these potentially recoverable expenses was $762,335 and $640,318 for the ACR Multi-Strategy Quality Return (MQR) Fund and the ACR International Quality Return (IQR) Fund, respectively. The Advisor may recapture all or a portion of this amount no later than November 30 of the years stated below:
| | | ACR Multi-Strategy
Quality Return (MQR)
Fund | | | ACR International
Quality Return (IQR)
Fund | |
| 2022 | | | 289,828 | | | | 196,129 | |
| 2023 | | | 289,883 | | | | 222,043 | |
| 2024 | | | 182,624 | | | | 222,146 | |
| Total | | $ | 762,335 | | | $ | 640,318 | |
UMB Fund Services, Inc. (“UMBFS”) serves as the Funds’ fund accountant, transfer agent and co-administrator; and Mutual Fund Administration, LLC (“MFAC”) serves as the Funds’ other co-administrator. UMB Bank, n.a., an affiliate of UMBFS, serves as the Funds’ custodian. The Funds’ allocated fees incurred for fund accounting, fund administration, transfer agency and custody services for the year ended November 30, 2021, are reported on the Statements of Operations.
ACR Funds
NOTES TO FINANCIAL STATEMENTS - Continued
November 30, 2021
IMST Distributors, LLC serves as the Funds’ distributor (the “Distributor”). The Distributor does not receive compensation from the Funds for its distribution services; the Advisor pays the Distributor a fee for its distribution-related services.
Certain trustees and officers of the Trust are employees of UMBFS or MFAC. The Funds do not compensate trustees and officers affiliated with the Funds’ co-administrators. For the year ended November 30, 2021, the Funds’ allocated fees incurred to Trustees who are not affiliated with the Funds’ co-administrators are reported on the Statements of Operations. A portion of the fees were paid by the Trust's Co-Administrators. Such amount is shown as a reduction of expenses, "Fees paid indirectly", on the Statements of Operations.
The Funds’ Board of Trustees has adopted a Deferred Compensation Plan (the “Plan”) for the Independent Trustees that enables Trustees to elect to receive payment in cash or the option to select various fund(s) in the Trust in which their deferred accounts shall be deemed to be invested. If a trustee elects to defer payment, the Plan provides for the creation of a deferred payment account. The Funds’ liability for these amounts is adjusted for market value changes in the invested fund(s) and remains a liability to the Funds until distributed in accordance with the Plan. The Trustees Deferred compensation liability under the Plan constitutes a general unsecured obligation of each Fund and is disclosed in the Statements of Assets and Liabilities. Contributions made under the plan and the change in unrealized appreciation/depreciation and income are included in the Trustees’ fees and expenses in the Statements of Operations.
Dziura Compliance Consulting, LLC provides Chief Compliance Officer (“CCO”) services to the Trust. The Funds’ allocated fees incurred for CCO services for the year ended November 30, 2021, are reported on the Statements of Operations.
During the year ended November 30, 2020, UMB Bank reimbursed the ACR International Quality Return (IQR) Fund $4,202 for FX loss. This amount is reported on the Fund’s Statements of Changes in Net Assets under the caption “Net increase from reimbursement by affiliates.” This reimbursement had no impact on the Fund’s performance.
Note 4 – Federal Income Taxes
At November 30, 2021, the cost of securities and the proceeds from securities sold short, on a tax basis and gross unrealized appreciation and depreciation of investments and securities sold short for federal income tax purposes were as follows:
| | | ACR Multi-Strategy Quality Return (MQR) Fund | | | ACR International Quality Return (IQR) Fund | |
| Cost of investments | | $ | 42,831,748 | | | $ | 66,975,707 | |
| | | | | | | | | |
| Gross unrealized appreciation | | $ | 8,856,306 | | | $ | 9,037,093 | |
| Gross unrealized depreciation | | | (3,138,234 | ) | | | (5,653,065 | ) |
| | | | | | | | | |
| Net unrealized appreciation (depreciation) on investments and securities sold short | | $ | 5,718,072 | | | $ | 3,384,028 | |
The difference between cost amounts for financial statement and federal income tax purposes is due primarily to timing differences in recognizing certain gains and losses in security transactions.
ACR Funds
NOTES TO FINANCIAL STATEMENTS - Continued
November 30, 2021
GAAP requires that certain components of net assets be reclassified between financial and tax reporting. These reclassifications have no effect on net assets or net asset value per share. For the year ended November 30, 2021, permanent differences in book and tax accounting have been reclassified to paid-in capital and total distributable earnings (accumulated deficit) as follows:
| | | Increase (Decrease) | |
| Fund | | | Paid-in Capital | | | | Total Distributable Earnings (Accumulated Deficit) | |
| ACR Multi-Strategy Quality Return (MQR) Fund | | $ | 701 | | | $ | (701 | ) |
| ACR International Quality Return (IQR) Fund | | | 542 | | | | (542 | ) |
As of November 30, 2021, the components of accumulated earnings (deficit) on a tax basis were as follows:
| | | ACR Multi-Strategy Quality Return (MQR) Fund | | | ACR International Quality Return (IQR) Fund | |
| Undistributed ordinary income | | $ | 399,454 | | | $ | 1,141,281 | |
| Undistributed long-term capital gains | | | - | | | | 1,944,028 | |
| Accumulated earnings | | | 399,454 | | | | 3,085,309 | |
| | | | | | | | | |
| Accumulated capital and other losses | | | (469,456 | ) | | | - | |
| Unrealized appreciation (depreciation) on investments and securities sold short | | | 5,718,072 | | | | 3,384,028 | |
| Unrealized appreciation on foreign currency translations | | | (1,707 | ) | | | (2,767 | ) |
| Unrealized deferred compensation | | | (22,094 | ) | | | (21,177 | ) |
| Total accumulated earnings (deficit) | | $ | 5,624,269 | | | $ | 6,445,393 | |
At November 30, 2021, the Funds had non-expiring capital loss carryforwards as follows:
| | | Not Subject to Expiration: | |
| Fund | | | Short-Term | | | | Long-Term | |
| ACR Multi-Strategy Quality Return (MQR) Fund | | $ | - | | | $ | 469,456 | |
| ACR International Quality Return (IQR) Fund | | | - | | | | - | |
The tax character of distributions paid during the periods ended November 30, 2021 and November 30, 2020, respectively, was as follows:
| | | | ACR Multi-Strategy Quality Return (MQR) Fund | | | | ACR International Quality Return (IQR) Fund | |
| Distribution paid from: | | | 2021 | | | | 2020 | | | | 2021 | | | | 2020 | |
| Ordinary income | | $ | 228,180 | | | $ | 1,251,781 | | | $ | 137,821 | | | $ | 205,030 | |
| Net long-term capital gains | | | - | | | | 377,066 | | | | - | | | | - | |
| Total taxable distributions | | $ | 228,180 | | | $ | 1,628,847 | | | $ | 137,821 | | | $ | 205,030 | |
ACR Funds
NOTES TO FINANCIAL STATEMENTS - Continued
November 30, 2021
Note 5 – Redemption Fee
The Funds may impose a redemption fee of 2.00% of the total redemption amount on all shares redeemed within 90 days of purchase. For the year ended November 30, 2021 and the year ended November 30, 2020, respectively, the ACR Multi-Strategy Quality Return (MQR) Fund received $2,862 and $2,104 in redemption fees, and the ACR International Quality Return (IQR) Fund received $134 and $41 in redemption fees.
Note 6 – Investment Transactions
For the year ended November 30, 2021, purchases and sales of investments, excluding short-term investments, were as follows:
| | | Purchases | | | Sales | | | Proceeds from
Securities Sold
Short | | | Cover Short
Securities | |
| ACR Multi-Strategy Quality Return (MQR) Fund | | $ | 6,488,892 | | | $ | 7,384,436 | | | $ | - | | | $ | - | |
| ACR International Quality Return (IQR) Fund | | | 38,282,837 | | | | 6,068,464 | | | | - | | | | - | |
Note 7 – Distribution Plan
The Trust, on behalf of the Funds, had adopted a Distribution Plan (the “Plan”) pursuant to Rule 12b-1 under the 1940 Act that allowed the Funds to pay distribution fees for the sale and distribution of their Class A shares. With respect to Class A shares, the Plan provided for the payment of distribution fees at the annual rate of up to 0.25% of average daily net assets. Effective as of the close of business on June 11, 2021, the Funds’ Class A Shares were converted into Class I Shares. Class A shares were subsequently terminated. Class I shares do not pay any distribution fees.
For the year ended November 30, 2021, distribution fees incurred are disclosed on the Statements of Operations.
Note 8 – Shareholder Servicing Plan
The Trust, on behalf of the Funds, has adopted a Shareholder Servicing Plan to pay a fee at an annual rate of up to 0.15% of average daily net assets of Class I shares serviced by shareholder servicing agents who provide administrative and support services to their customers. A portion of the shareholder servicing fees in the Funds were paid for Class A shares. Effective as of the close of business on June 11, 2021, the Funds' Class A Shares were converted to Class I Shares. Class A shares were subsequently terminated.
For the year ended November 30, 2021, shareholder servicing fees incurred are disclosed on the Statements of Operations.
Note 9 – Indemnifications
In the normal course of business, the Funds enter into contracts that contain a variety of representations which provide general indemnifications. The Funds’ maximum exposure under these arrangements is unknown, as this would involve future claims that may be made against the Funds that have not yet occurred. However, the Funds expect the risk of loss to be remote.
Note 10 – Fair Value Measurements and Disclosure
Fair Value Measurements and Disclosures defines fair value, establishes a framework for measuring fair value in accordance with GAAP, and expands disclosure about fair value measurements. It also provides guidance on determining when there has been a significant decrease in the volume and level of activity for an asset or a liability, when a transaction is not orderly, and how that information must be incorporated into a fair value measurement.
ACR Funds
NOTES TO FINANCIAL STATEMENTS - Continued
November 30, 2021
Under Fair Value Measurements and Disclosures, various inputs are used in determining the value of the Funds’ investments. These inputs are summarized into three broad Levels as described below:
| ● | Level 1 – Unadjusted quoted prices in active markets for identical assets or liabilities that the Funds have the ability to access. |
| ● | Level 2 – Observable inputs other than quoted prices included in Level 1 that are observable for the asset or liability, either directly or indirectly. These inputs may include quoted prices for the identical instrument on an inactive market, prices for similar instruments, interest rates, prepayment speeds, credit risk, yield curves, default rates and similar data. |
| ● | Level 3 – Unobservable inputs for the asset or liability, to the extent relevant observable inputs are not available, representing the Funds’ own assumptions about the assumptions a market participant would use in valuing the asset or liability, and would be based on the best information available. |
The availability of observable inputs can vary from security to security and is affected by a wide variety of factors, including for example, the type of security, whether the security is new and not yet established in the marketplace, the liquidity of markets, and other characteristics particular to the security. To the extent that valuation is based on models or inputs that are less observable or unobservable in the market, the determination of fair value requires more judgment. Accordingly, the degree of judgment exercised in determining fair value is greatest for instruments categorized in Level 3.
The inputs to measure fair value may fall into different Levels of the fair value hierarchy. In such cases, for disclosure purposes, the Level in the fair value hierarchy within which the fair value measurement falls in its entirety, is determined based on the lowest Level input that is significant to the fair value measurement in its entirety.
The inputs or methodology used for valuing securities are not an indication of the risk associated with investing in those securities. The following is a summary of the inputs used, as of November 30, 2021, in valuing the Funds’ assets carried at fair value:
ACR Funds
NOTES TO FINANCIAL STATEMENTS - Continued
November 30, 2021
| ACR Multi-Strategy Return (MQR) Fund | | Level 1 | | | Level 2 | | | Level 3 | | | Total | |
| Assets | | | | | | | | | | | | | | | | |
| Common Stock | | | | | | | | | | | | | | | | |
| Communications | | $ | 5,974,120 | | | $ | - | | | $ | - | | | $ | 5,974,120 | |
| Consumer Discretionary | | | 6,028,706 | | | | 2,884,105 | | | | - | | | | 8,912,811 | |
| Consumer Staples | | | 2,155,938 | | | | - | | | | - | | | | 2,155,938 | |
| Energy | | | 3,253,696 | | | | - | | | | - | | | | 3,253,696 | |
| Financials | | | 13,884,769 | | | | - | | | | - | | | | 13,884,769 | |
| Industrials | | | - | | | | 2,289,449 | | | | - | | | | 2,289,449 | |
| Materials | | | 2,258,933 | | | | - | | | | - | | | | 2,258,933 | |
| Real Estate | | | 1,262,411 | | | | - | | | | - | | | | 1,262,411 | |
| Preferred Stocks | | | - | | | | - | | | | 297,923 | | | | 297,923 | |
| Short-Term Investments | | | 8,805,195 | | | | - | | | | - | | | | 8,805,195 | |
| Total Assets | | $ | 43,623,768 | | | $ | 5,173,554 | | | $ | 297,923 | | | $ | 49,095,245 | |
| | | | | | | | | | | | | | | | | |
| Liabilities | | | | | | | | | | | | |
| Securities Sold Short | | | | | | | | | | | | | | | | |
| Exchange-Traded Funds | | | 545,425 | | | | - | | | | - | | | | 545,425 | |
| Total Liabilities | | $ | 545,425 | | | $ | - | | | $ | - | | | $ | 545,425 | |
| ACR International Quality Return (IQR) Fund | | Level 1 | | | Level 2 | | | Level 3* | | | Total | |
| Assets | | | | | | | | | | | | | | | | |
| Common Stock | | | | | | | | | | | | | | | | |
| Canada | | $ | 5,703,514 | | | $ | - | | | $ | - | | | $ | 5,703,514 | |
| Denmark | | | - | | | | 3,251,190 | | | | - | | | | 3,251,190 | |
| France | | | - | | | | 7,638,227 | | | | - | | | | 7,638,227 | |
| Ireland | | | 2,689,782 | | | | - | | | | - | | | | 2,689,782 | |
| Italy | | | - | | | | 2,137,078 | | | | - | | | | 2,137,078 | |
| Norway | | | 6,064,998 | | | | - | | | | - | | | | 6,064,998 | |
| Switzerland | | | 503,073 | | | | 3,322,751 | | | | - | | | | 3,825,824 | |
| United Kingdom | | | 19,518,780 | | | | 6,794,118 | | | | - | | | | 26,312,898 | |
| United States | | | 1,766,925 | | | | - | | | | - | | | | 1,766,925 | |
| Short-Term Investments | | | 10,969,299 | | | | - | | | | - | | | | 10,969,299 | |
| Total Assets | | $ | 47,216,371 | | | $ | 23,143,364 | | | $ | - | | | $ | 70,359,735 | |
| * | The Fund did not hold any Level 3 securities at period end. |
ACR Funds
NOTES TO FINANCIAL STATEMENTS - Continued
November 30, 2021
The following is a reconciliation of assets in which significant unobservable inputs (Level 3) were used in determining value:
| | | ACR Multi-Strategy Quality Return (MQR) Fund | |
| Beginning balance November 30, 2020 | | $ | 429,189 | |
| Transfers into Level 3 during the period | | | - | |
| Transfers out of Level 3 during the period | | | - | |
| Total realized gain/(loss) | | | (2,869,709 | ) |
| Change in unrealized appreciation/(depreciation) | | | 2,869,710 | |
| Net purchases | | | - | |
| Return of Capital | | | (131,267 | ) |
| Net sales | | | - | |
| Balance as of November 30, 2021 | | $ | 297,923 | |
The following table presents additional quantitative information about valuation methodologies and inputs used for investments that are measured at fair value and categorized within Level 3 as of November 30, 2021:
ACR Multi-Strategy Quality Return (MQR) Fund
| Asset Class | Fair Value at
11/30/2021 | Valuation
Technique(s) | Unobservable
Input(1) | Range of Input | Weighted
Average of
Input | Impact to
Valuation
from an
Increase in
Input(2) |
| Preferred Stocks | $297,923 | Asset Approach | Estimated Recovery Proceeds | $40.674 | $52.510 | $47.08 | Increase |
| (1) | The investment advisor considers relevant indications of value that are reasonably and timely available to it in determining the fair value to be assigned to a particular security, such as the type and cost of the security; contractual or legal restrictions on resale of the security; relevant financial or business developments of the issuer; actively traded related securities; conversion or exchange rights on the security; related corporate actions; significant events occurring after the close of trading in the security; and changes in overall market conditions. The Fund’s use of fair value pricing may cause the net asset value of Fund shares to differ from the net asset value that would be calculated using market quotations. Fair value pricing involves subjective judgments and it is possible that the fair value determined for a security may be materially different than the value that could be realized upon the sale of that security. |
| (2) | This column represents the directional change in the fair value of the Level 3 investments that would result from an increase to the corresponding unobservable input. A decrease to the unobservable input would have the opposite effect. |
Note 11 – Covid-19 Risks
In early 2020, an outbreak of a novel strain of coronavirus (COVID-19) emerged globally. This coronavirus has resulted in closing international borders, enhanced health screenings, healthcare service preparation and delivery, quarantines, cancellations, disruptions to supply chains and customer activity, as well as general public concern and uncertainty. The impact of this outbreak has negatively affected the worldwide economy, as well as the economies of individual countries, the financial health of individual companies and the market in general in significant and unforeseen ways. The future impact of COVID-19 is currently unknown, and it may exacerbate other risks that apply to the Funds, including political, social and economic risks. Any such impact could adversely affect the Funds’ performance, the performance of the securities in which the Funds invest and may lead to losses on your investment in the Funds. The ultimate impact of COVID-19 on the financial performance of the Funds’ investments is not reasonably estimable at this time.
ACR Funds
NOTES TO FINANCIAL STATEMENTS - Continued
November 30, 2021
Note 12 – New Accounting Pronouncements
In October 2020, the SEC adopted new regulations governing the use of derivatives by registered investment companies (“Rule 18f-4”). Rule 18f-4 will impose limits on the amount of derivatives a Fund can enter into, eliminate the asset segregation framework currently used by funds to comply with Section 18 of the 1940 Act, and require funds whose use of derivatives is greater than a limited specified amount to establish and maintain a comprehensive derivatives risk management program and appoint a derivatives risk manager. Funds will be required to comply with Rule 18f-4 by August 19, 2022. It is not currently clear what impact, if any, Rule 18f-4 will have on the availability, liquidity or performance of derivatives. Management is currently evaluating the potential impact of Rule 18f-4 on the Fund(s). When fully implemented, Rule 18f-4 may require changes in how a Fund uses derivatives, adversely affect the Fund’s performance and increase costs related to the Fund’s use of derivatives.
In December 2020, the SEC adopted a new rule providing a framework for fund valuation practices (“Rule 2a-5”). Rule 2a-5 establishes requirements for determining fair value in good faith for purposes of the 1940 Act. Rule 2a-5 will permit fund boards to designate certain parties to perform fair value determinations, subject to board oversight and certain other conditions. Rule 2a-5 also defines when market quotations are “readily available” for purposes of the 1940 Act and the threshold for determining whether a fund must fair value a security. In connection with Rule 2a-5, the SEC also adopted related recordkeeping requirements and is rescinding previously issued guidance, including with respect to the role of a board in determining fair value and the accounting and auditing of fund investments. The Funds will be required to comply with the rules by September 8, 2022. Management is currently assessing the potential impact of the new rules on the Funds’ financial statements.
The SEC adopted new Rule 12d1-4, which will allow registered investment companies (including business development companies (“BDCs”), unit investment trusts (“UITs”), closed-end funds, exchange-traded funds (“ETFs”), and exchange-traded managed funds (“ETMFs”) (an “acquiring” fund), to invest in other investment companies (an “acquired fund”), including private funds under a specific exception, beyond the limits of Section 12(d)(1), subject to the conditions of the rule. Rule 12d1-4 became effective January 19, 2021.
In March 2020, FASB issued ASU 2020-04, Reference Rate Reform: Facilitation of the Effects of Reference Rate Reform on Financial Reporting. The main objective of the new guidance is to provide relief to companies that will be impacted by the expected change in benchmark interest rates at the end of 2021, when participating banks will no longer be required to submit London Interbank Offered Rate (“LIBOR”) quotes by the UK Financial Conduct Authority. The new guidance allows companies to, provided the only change to existing contracts are a change to an approved benchmark interest rate, account for modifications as a continuance of the existing contract without additional analysis. In addition, derivative contracts that qualified for hedge accounting prior to modification, will be allowed to continue to receive such treatment, even if critical terms change due to a change in the benchmark interest rate. For new and existing contracts, the Funds may elect to apply the amendments as of March 12, 2020 through December 31, 2022. Management is currently assessing the impact of the ASU’s adoption to the Funds’ financial statements and various filings.
Note 13 – Events Subsequent to the Fiscal Period End
The Funds have adopted financial reporting rules regarding subsequent events which require an entity to recognize in the financial statements the effects of all subsequent events that provide additional evidence about conditions that existed at the date of the balance sheet. Management has evaluated the Funds’ related events and transactions that occurred through the date of issuance of the Funds’ financial statements.
ACR Funds
NOTES TO FINANCIAL STATEMENTS - Continued
November 30, 2021
The Funds each declared the payment of distributions to be paid, on December 16, 2021, to shareholders of record on December 15, 2021 as follows:
| | | Short Term
Capital Gain | Long Term
Capital Gain | Income |
| ACR Multi-Strategy Quality Return (MQR) Fund | Class I Shares | None | None | $ 0.11814 |
| ACR International Quality Return (IQR) Fund | Class I Shares | $ 0.13852 | $ 0.37784 | $ 0.08331 |
There were no other events or transactions that occurred during this period that materially impacted the amounts or disclosures in the Funds’ financial statements.
REPORT OF INDEPENDENT REGISTERED PUBLIC ACCOUNTING FIRM
To the Shareholders of the ACR Funds and
the Board of Trustees of
Investment Managers Series Trust II
Opinion on the Financial Statements
We have audited the accompanying statements of assets and liabilities of ACR Multi-Strategy Quality Return Fund (MQR) Fund and ACR International Quality Return Fund (IQR) (the “Funds”), each a series of Investment Managers Series Trust II, including the schedules of investments, as of November 30, 2021, the related statements of operations, the statements of changes, and the financial highlights for the periods stated in the table below, and the related notes (collectively referred to as the “financial statements”). In our opinion, the financial statements present fairly, in all material respects, the financial position of the Funds as of November 30, 2021, the results of their operations, the changes in their net assets, and the financial highlights for the periods stated in the table below, in conformity with accounting principles generally accepted in the United States of America.
Individual Funds Constituting
Investment Managers Series
Trust II | Statement Of
Operations | Statements Of Changes In Net Assets | Financial Highlights |
| MQR | For the year ended November 30, 2021 | For each of the two years in period ended November 30, 2021 | For each of the five years in the period ended November 30, 2021 |
| IQR | For the year ended November 30, 2021 | For each of the two years in period ended November 30, 2021 | For each of the four years in the period ended November 30, 2021 and for the period December 30, 2016 (commencement of operations) to November 30, 2017 |
Basis for Opinion
These financial statements are the responsibility of the Funds’ management. Our responsibility is to express an opinion on the Funds financial statements based on our audits. We are a public accounting firm registered with the Public Company Accounting Oversight Board (United States) (“PCAOB”) and are required to be independent with respect to the Funds in accordance with the U.S. federal securities laws and the applicable rules and regulations of the Securities and Exchange Commission and the PCAOB. We have served as the auditor of one or more of the funds in the Trust since 2013.
We conducted our audits in accordance with the standards of the PCAOB. Those standards require that we plan and perform the audits to obtain reasonable assurance about whether the financial statements are free of material misstatement, whether due to error or fraud. The Funds are not required to have, nor were we engaged to perform, an audit of their internal control over financial reporting. As part of our audits we are required to obtain an understanding of internal control over financial reporting, but not for the purpose of expressing an opinion on the effectiveness of the Funds internal control over financial reporting. Accordingly, we express no such opinion.
Our audits included performing procedures to assess the risks of material misstatement of the financial statements, whether due to error or fraud, and performing procedures that respond to those risks. Such procedures included examining, on a test basis, evidence regarding the amounts and disclosures in the financial statements. Our audits also included evaluating the accounting principles used and significant estimates made by management, as well as evaluating the overall presentation of the financial statements. Our procedures included confirmation of securities owned as of November 30, 2021 by correspondence with the custodian, counter party, and brokers or by other appropriate auditing procedures where replies from broker were not received. We believe that our audits provide a reasonable basis for our opinion.
| |  |
| TAIT, WELLER & BAKER LLP |
Philadelphia, Pennsylvania
January 25, 2022
ACR Funds
SUPPLEMENTAL INFORMATION (Unaudited)
Qualified Dividend Income
For the year ended November 30, 2021, 100% and 100%, respectively, of dividends to be paid from net investment income, including short-term capital gains (if any), for the Multi-Strategy Quality Return (MQR) Fund and the International Quality Return (IQR) Fund, is designated as qualified dividend income.
Corporate Dividends Received Deduction
For the year ended November 30, 2021, 83.99% of dividends to be paid from net investment income, including short-term capital gains, (if any), for the Multi-Strategy Quality Return (MQR) Fund, is designated as a dividends received deduction available to corporate shareholders.
Trustees and Officers Information
Additional information about the Trustees is included in the Funds’ Statement of Additional Information which is available, without charge, upon request by calling (855) 955-9552. The Trustees and officers of the Funds and their principal occupations during the past five years are as follows:
Name, Address, Year of Birth and Position(s) held with Trust | Term of Officec and Length of Time Served | Principal Occupation During the Past Five Years and Other Affiliations | Number of Portfolios in the Fund Complex Overseen by Trusteed | Other Directorships Held by Trustee During the Past Five Years |
| “Independent” Trustees: | | | |
Thomas Knipper, CPA a
(Born 1957)
Trustee | Since September 2013 | Independent Consulting, financial services organizations (March 2021 – present); Vice President and Chief Compliance Officer, Ameritas Investment Partners, a registered investment advisor (1995 – March 2021). | 2 | None. |
Kathleen K. Shkuda a
(born 1951)
Trustee | Since September 2013 | Zigzag Consulting, a financial services consulting firm (2008 – present); Director, Managed Accounts, Merrill Lynch (2007 – 2008). | 2 | None. |
Larry D. Tashjian a
(born 1953)
Trustee and Chairman of the Board | Since September 2013 | Principal, CAM Capital Advisors, a family office (2001 – present). | 2 | General Finance Corporation. |
John P. Zader a
(born 1961)
Trustee | Since September 2013 | Retired (June 2014 – present); CEO, UMB Fund Services, Inc., a mutual fund and hedge fund service provider, and the transfer agent, fund accountant, and co-administrator for the Fund (December 2006 – June 2014); President, Investment Managers Series Trust (December 2007 – June 2014). | 2 | Investment Managers Series Trust, a registered investment company (includes 53 portfolios); 361 Social Infrastructure Fund, a closed-end investment company. |
ACR Funds
SUPPLEMENTAL INFORMATION (Unaudited) - Continued
Name, Address, Year of
Birth and Position(s) held
with Trust | Term of Officec and Length of Time Served | Principal Occupation During the Past Five Years and Other Affiliations | Number of Portfolios in the Fund Complex Overseen by Trusteed | Other
Directorships Held
by Trustee During
the Past Five Years |
| Interested Trustee: | | | |
Eric M. Banhazl b†
(born 1957)
Trustee | Since September 2013 | Chairman, Foothill Capital Management, LLC, a registered investment advisor (2018 – present); Chairman (2016 – present), and President (2006 – 2015), Mutual Fund Administration, LLC, co-administrator for the Fund. | 2 | Investment Managers Series Trust, a registered investment company (includes 53 portfolios); 361 Social Infrastructure Fund, a closed-end investment company. |
Terrance P. Gallagher a*
(born 1958)
Trustee and President
| Since July 2019 | President, Investment Managers Series Trust II (September 2013 – present); Executive Vice President, UMB Fund Services, Inc. (2007 – present); and Director of Compliance, Unified Fund Services Inc. (now Huntington Fund Services), a mutual fund service provider (2004 – 2007). | 2 | Cliffwater Corporate Lending Fund, Agility Multi-Asset Income Fund, Corbin Multi-Strategy Fund, Aspiriant Risk-Managed Real Asset Fund, Aspiriant Risk-Managed Capital Appreciation Fund, Infinity Core Alternative Fund, Infinity Long/Short Equity Fund, LLC, Keystone Private Income Fund, First Trust Alternative Opportunities Fund, and Variant Alternative Income Fund, each a closed-end investment company. |
| Officers of the Trust: | | |
Rita Dam b (born 1966) Treasurer and Assistant Secretary | Since September 2013 | Co-Chief Executive Officer (2016 – present), and Vice President (2006 – 2015), Mutual Fund Administration, LLC; Co-President, Foothill Capital Management, LLC, a registered investment advisor (2018 – present); Treasurer, 361 Social Infrastructure Fund (December 2019 – January 2022). | N/A | N/A |
ACR Funds
SUPPLEMENTAL INFORMATION (Unaudited) - Continued
Name, Address, Year of
Birth and Position(s) held
with Trust | Term of
Officec and
Length of
Time Served | Principal Occupation During the Past Five Years
and Other Affiliations | Number of
Portfolios in
the Fund Complex Overseen by
Trusteed | Other
Directorships Held
by Trustee During
the Past Five Years |
Joy Ausili b
(born 1966)
Vice President and Assistant Secretary | Since January 2016 | Co-Chief Executive Officer (2016 – present), and Vice President (2006 – 2015), Mutual Fund Administration, LLC; Co-President, Foothill Capital Management, LLC, a registered investment advisor (2018 – present); Vice President and Assistant Secretary, 361 Social Infrastructure Fund (December 2019 – January 2022); Secretary and Assistant Treasurer, Investment Managers Series Trust (September 2013 – January 2016). | N/A | N/A |
Diane Drake b
(born 1967)
Secretary | Since January 2016 | Senior Counsel, Mutual Fund Administration, LLC (October 2015 – present); Secretary, 361 Social Infrastructure Fund (December 2019 – January 2022); Chief Compliance Officer, Foothill Capital Management, LLC, a registered investment advisor (2018 – 2019). | N/A | N/A |
Martin Dziura b
(born 1959)
Chief Compliance Officer | Since September 2013 | Principal, Dziura Compliance Consulting, LLC (October 2014 - present); Managing Director, Cipperman Compliance Services (2010 – September 2014); Chief Compliance Officer, Hanlon Investment Management (2009 - 2010); Vice President − Compliance, Morgan Stanley Investment Management (2000 − 2009). | N/A | N/A |
| a | Address for certain Trustees and certain officers: 235 West Galena Street, Milwaukee, Wisconsin 53212. |
| b | Address for Mr. Banhazl, Ms. Ausili, Ms. Dam and Ms. Drake: 2220 E. Route 66, Suite 226, Glendora, California 91740. |
| | Address for Mr. Dziura: 309 Woodridge Lane, Media, Pennsylvania 19063. |
| c | Trustees and officers serve until their successors have been duly elected. |
| d | The Trust is comprised of 24 series managed by unaffiliated investment advisors. Each Trustee serves as Trustee of each series of the Trust. The term “Fund Complex” applies only to the Fund(s) managed by the same investment advisor. The Funds do not hold themselves out as related to any other series within the Trust, for purposes of investment and investor services, nor do they share the same investment advisor with any other series. |
| † | Mr. Banhazl is an “interested person” of the Trust by virtue of his position with Mutual Fund Administration, LLC and Foothill Capital Management, LLC. |
| * | Mr. Gallagher is an “interested person” of the Trust by virtue of his position with UMB Fund Services, Inc. |
ACR Funds
SUPPLEMENTAL INFORMATION (Unaudited) - Continued
Board Consideration of Investment Advisory Agreement
At a meeting held on October 27, 2021, the Board of Trustees (the “Board”) of Investment Managers Series Trust II (the “Trust”), including the trustees who are not “interested persons” of the Trust (the “Independent Trustees”) as defined in the Investment Company Act of 1940, as amended (the “1940 Act”), reviewed and unanimously approved the renewal of the investment advisory agreement (the “Advisory Agreement”) between the Trust and ACR Alpine Capital Research, LLC (the “Investment Advisor”) with respect to the ACR Multi-Strategy Quality Return (MQR) Fund (the “MQR Fund”) and the ACR International Quality Return (IQR) Fund (the “IQR Fund” and together with the MQR Fund, the “Funds”) series of the Trust for an additional one-year term from when it otherwise would expire. In approving renewal of the Advisory Agreement, the Board, including the Independent Trustees, determined that such renewal was in the best interests of each Fund and its shareholders. The Board acknowledged that in accordance with exemptive relief granted by the U.S. Securities and Exchange Commission, due to unforeseen emergency circumstances related to the COVID-19 pandemic, the meeting was being held by videoconference, and that as required by the relief, the Board would ratify the renewal of the Advisory Agreement at its next in-person meeting.
Background
In advance of the meeting, the Board received information about the Funds and the Advisory Agreement from the Investment Advisor and from Mutual Fund Administration, LLC and UMB Fund Services, Inc., the Trust’s co-administrators, certain portions of which are discussed below. The materials, among other things, included information about the Investment Advisor’s organization and financial condition; information regarding the background, experience, and compensation structure of relevant personnel providing services to the Funds; information about the Investment Advisor’s compliance policies and procedures, disaster recovery and contingency planning, and policies with respect to portfolio execution and trading; information regarding the profitability of the Investment Advisor’s overall relationship with the Funds; reports comparing the performance of each Fund with returns of its benchmark index and a group of comparable funds (each a “Peer Group”) selected by Broadridge Financial Solutions, Inc. (“Broadridge”) from Morningstar, Inc.’s relevant fund universe (each a “Fund Universe”) for various periods ended July 31, 2021; and reports comparing the investment advisory fee and total expenses of each Fund with those of its Peer Group and Fund Universe. The Board also received a memorandum from legal counsel to the Trust and the Independent Trustees discussing the legal standards under the 1940 Act and other applicable law for their consideration of the proposed renewal of the Advisory Agreement. In addition, the Board considered information reviewed by the Board during the year at other Board and Board committee meetings. No representatives of the Investment Advisor were present during the Board’s consideration of the Advisory Agreement, and the Independent Trustees were represented by their legal counsel with respect to the matters considered.
In renewing the Advisory Agreement, the Board and the Independent Trustees considered a variety of factors, including those discussed below. In their deliberations, the Board and the Independent Trustees did not identify any particular factor that was controlling, and each Trustee may have attributed different weights to the various factors.
Nature, Extent and Quality of Services
The Board considered information included in the meeting materials regarding the performance of each Fund. The materials they reviewed indicated the following:
| • | The MQR Fund’s annualized total returns for the one-, three-, and five-year periods were higher than the HFRI Equity Hedge (Total) Index returns and the Peer Group and Tactical Allocation Fund Universe median returns. The MQR Fund’s total return for the one-year period was higher than the MSCI All Country World Index return, but the Fund’s annualized total returns for the three- and five-year periods were below the MSCI Index returns by 1.97% and 3.57%, respectively. The Trustees considered the Investment Advisor’s explanation that the Fund’s underperformance relative to the MSCI Index was due in part to the fact that the Fund’s style tilts more toward value than growth, and that growth stocks generally outperformed value stocks over the three- and five-year periods. |
ACR Funds
SUPPLEMENTAL INFORMATION (Unaudited) - Continued
| • | The IQR Fund’s annualized total returns for the one- and three-year periods were above the Peer Group and Foreign Small/Mid Blend Fund Universe median returns and the MSCI All Country World Ex-USA Index returns. |
The Board also considered the overall quality of services provided by the Investment Advisor to the Funds. In doing so, the Board considered the Investment Advisor’s specific responsibilities in day-to-day management and oversight of the Funds, as well as the qualifications, experience, and responsibilities of the personnel involved in the activities of the Funds. The Board also considered the overall quality of the organization and operations of the Investment Advisor, as well as its compliance structure. The Board and the Independent Trustees concluded that based on the various factors they had reviewed, the nature, overall quality, and extent of the management and oversight services provided by the Investment Advisor to each Fund were satisfactory.
Advisory Fees and Expense Ratios
With respect to the advisory fees and expenses paid by the Funds, the meeting materials indicated the following:
| • | The MQR Fund’s annual investment advisory fee (gross of fee waivers) was higher than both the Peer Group and Tactical Allocation Fund Universe medians by 0.25%. The Trustees noted, however, that the Fund’s advisory fee was not in the top quartile of funds in the Fund Universe, and that the Investment Advisor has waived a portion of its advisory fee since the Fund’s inception. The Trustees considered that the Investment Advisor does not manage any other accounts with the same objectives and policies as the Fund, and therefore they did not have a good basis for comparing the Fund’s advisory fee to those of other similar accounts of the Investment Advisor. The Trustees also noted that the Fund’s advisory fee was the same as that of the other series of the Trust managed by the Investment Advisor. |
The annual total expenses paid by the Fund (net of fee waivers) for the Fund’s most recent fiscal year were higher than the Peer Group and Fund Universe medians by 0.17% and 0.32%, respectively. The Trustees noted, however, that the average net assets of the Fund’s class considered by Broadridge were significantly lower than the average net assets of corresponding classes of funds in the Peer Group and Fund Universe, and that certain of those other funds also had significant assets in other classes.
| • | The IQR Fund’s annual investment advisory fee (gross of fee waivers) was higher than the Foreign Small/Mid Blend Fund Universe and Peer Group medians by 0.05% and 0.10%, respectively. The Trustees noted, however, that the Fund’s advisory fee was not in the top quartile of funds in the Fund Universe. The Trustees considered that the Investment Advisor does not manage any other client accounts with the same objectives and policies as the Fund, and therefore they did not have a good basis for comparing the Fund’s advisory fee with those of other similar accounts of the Investment Advisor. The Trustees also noted that the Fund’s advisory fee was the same as that of the other series of the Trust managed by the Investment Advisor. |
The annual total expenses paid by the Fund (net of fee waivers) for the Fund’s most recent fiscal year were higher than both the Peer Group and Fund Universe medians by 0.05%. The Trustees noted, however, that the average net assets of the Fund’s class considered by Broadridge were significantly lower than the average net assets of corresponding classes of funds in the Peer Group and Fund Universe, and that certain of those other funds also had significant assets in other classes.
ACR Funds
SUPPLEMENTAL INFORMATION (Unaudited) - Continued
The Board and the Independent Trustees concluded that based on the factors they had reviewed, the compensation payable to the Investment Advisor under the Advisory Agreement was fair and reasonable in light of the nature and quality of the services the Investment Advisor provides to the Funds.
Profitability and Economies of Scale
The Board next considered information prepared by the Investment Advisor relating to its costs and profits with respect to each Fund for the year ended July 31, 2021, noting that the Investment Advisor had waived a significant portion of its advisory fee for each of the MQR Fund and IQR Fund. Recognizing the difficulty in evaluating an investment advisor’s profitability with respect to the funds it manages in the context of an advisor with multiple lines of business, and noting that other profitability methodologies might also be reasonable, the Board and the Independent Trustees concluded that the profits of the Investment Advisor from its relationships with the MQR Fund and the IQR Fund were reasonable.
The Board also considered the benefits received by the Investment Advisor as a result of the Investment Advisor’s relationship with the Funds, other than the receipt of its investment advisory fees, including any research received from broker-dealers providing execution services to the Funds, the beneficial effects from the review by the Trust’s Chief Compliance Officer of the Investment Advisor’s compliance program, and the intangible benefits of the Investment Advisor’s association with the Funds generally and any favorable publicity arising in connection with the Funds’ performance. The Board noted that although there were no advisory fee breakpoints, the asset levels of the Funds were not currently likely to lead to significant economies of scale, and that any such economies would be considered in the future as the Funds’ assets grow.
Conclusion
Based on these and other factors, the Board and the Independent Trustees concluded that renewal of the Advisory Agreement was in the best interests of each Fund and its shareholders and, accordingly, approved the renewal of the Advisory Agreement with respect to each Fund.
ACR Funds
SUPPLEMENTAL INFORMATION (Unaudited) - Continued
Statement Regarding Liquidity Risk Management Program
The Securities and Exchange Commission adopted Rule 22e-4 under the Investment Company Act of 1940, as amended (the “Liquidity Rule”), to promote effective liquidity risk management throughout the open-end investment company industry, thereby reducing the risk that funds will be unable to meet their redemption obligations and mitigating dilution of the interests of fund shareholders.
The Board of Trustees (the “Board”) of Investment Managers Series Trust II (the “Trust”) met on October 27, 2021 (the “Meeting”), to review the liquidity risk management program (the “Fund Program”) applicable to the following series of the Trust (each, a “Fund” and together, the “Funds”) pursuant to the Liquidity Rule:
ACR International Quality Return (IQR) Fund
ACR Multi-Strategy Quality Return (MQR) Fund
The Board has appointed ACR Alpine Capital Research, LLC, the investment adviser to the Funds, as the program administrator (“Program Administrator”) for the Fund Program. Under the Trust’s liquidity risk management program (the “Trust Program”), the Board has delegated oversight of the Trust Program to the Liquidity Oversight Committee (the “Oversight Committee”). At the Meeting, the Oversight Committee, on behalf of Program Administrator and the Funds, provided the Board with a written report (the “Report”) that addressed the operation, adequacy, and effectiveness of implementation of the Fund Program, and any material changes to it for the period from August 1, 2020 through July 31, 2021 (the “Program Reporting Period”).
In assessing the adequacy and effectiveness of implementation of the Fund Program, the Report discussed the following, among other things:
| • | The Fund Program’s liquidity classification methodology for categorizing each Fund’s investments (including derivative transactions); |
| • | An overview of market liquidity for each Fund during the Program Reporting Period; |
| • | Each Fund’s ability to meet redemption requests; |
| • | Each Fund’s cash management; |
| • | Each Fund’s borrowing activity, if any, in order to meet redemption requests; |
| • | Each Fund’s compliance with the 15% limit of illiquid investments; and |
| • | Each Fund’s status as a primarily highly liquid fund (“PHLF”), the effectiveness of the implementation of the PHLF standard, and whether it would be appropriate for each Fund to adopt a highly liquid investment minimum (“HLIM”). |
The Report stated that the Funds primarily hold assets that are defined under the Liquidity Rule as “highly liquid investments,” and therefore each Fund is not required to establish an HLIM. Highly liquid investments are defined as cash and any investment reasonably expected to be convertible to cash in current market conditions in three business days or less without the conversion to cash significantly changing the market value of the investment. The Report also stated that there were no material changes made to the Fund Program during the Program Reporting Period.
In the Report, the Program Administrator concluded that (i) the Fund Program, as adopted and implemented, remains reasonably designed to assess and manage each Fund’s liquidity risk; (ii) each Fund continues to qualify as a PHLF and therefore is not required to adopt an HLIM; (iii) during the Program Reporting Period, each Fund was able to meet redemption requests without significant dilution of remaining investors’ interests; and (iv) there were no weaknesses in the design or implementation of the Fund Program during the Program Reporting Period.
ACR Funds
SUPPLEMENTAL INFORMATION (Unaudited) - Continued
There can be no assurance that the Fund Program will achieve its objectives in the future. Please refer to the Funds’ prospectus for more information regarding each Fund’s exposure to liquidity risk and other principal risks to which an investment in the Funds may be subject.
ACR Funds
EXPENSE EXAMPLES
For the Six Months Ended November 30, 2021 (Unaudited)
Expense Examples
As a shareholder of the Funds, you incur two types of costs: (1) transaction costs; and (2) ongoing costs, including management fees; and other Fund expenses. The examples below are intended to help you understand your ongoing costs (in dollars) of investing in the Funds and to compare these costs with the ongoing costs of investing in other mutual funds.
These examples are based on an investment of $1,000 invested at the beginning of the period and held for the entire period from June 1, 2021 to November 30, 2021.
Actual Expenses
The information in the row titled “Actual Performance” of the table below provides actual account values and actual expenses. You may use the information in these columns, together with the amount you invested, to estimate the expenses that you paid over the period. Simply divide your account value by $1,000 (for example, an $8,600 account value divided by $1,000 = 8.6), then multiply the result by the number in the appropriate row, under the column titled “Expenses Paid During Period” to estimate the expenses you paid on your account during this period.
Hypothetical Example for Comparison Purposes
The information in the row titled “Hypothetical (5% annual return before expenses)” of the table below provides hypothetical account values and hypothetical expenses based on the Funds’ actual expense ratios and an assumed rate of return of 5% per year before expenses, which is not the Funds’ actual return. The hypothetical account values and expenses may not be used to estimate the actual ending account balance or expenses you paid for the period. You may use this information to compare the ongoing costs of investing in the Funds and other funds. To do so, compare these 5% hypothetical examples with the 5% hypothetical examples that appear in the shareholder reports of the other funds.
Please note that the expenses shown in the table are meant to highlight your ongoing costs only and do not reflect any transaction costs, such as redemption fees. Therefore, the information in the row titled “Hypothetical (5% annual return before expenses)” is useful in comparing ongoing costs only, and will not help you determine the relative total costs of owning different funds. In addition, if these transactional costs were included, your costs would have been higher.
| ACR Multi-Strategy Quality Return (MQR) Fund | Beginning Account Value | Ending Account Value | Expenses Paid During Period* |
| 6/1/21 | 11/30/21 | 6/1/21 – 11/30/21 |
| Class I | Actual Performance | $ | 1,000.00 | $ | 944.20 | $ | 6.21 |
| | Hypothetical (5% annual return before expenses) | | 1,000.00 | | 1,018.69 | | 6.44 |
| * | Expenses are equal to the Fund’s annualized expense ratios of 1.27% for the Class I shares, multiplied by the average account values over the period, multiplied by 183/365. The expense ratios reflect an expense waiver. Assume all dividends and distributions were reinvested. |
| ACR International Quality Return (IQR) Fund | Beginning Account Value | Ending Account Value | Expenses Paid During Period* |
| 6/1/21 | 11/30/21 | 6/1/21 – 11/30/21 |
| Class I | Actual Performance | $ | 1,000.00 | $ | 887.00 | $ | 5.23 |
| | Hypothetical (5% annual return before expenses) | | 1,000.00 | | 1,019.53 | | 5.59 |
| * | Expenses are equal to the Fund’s annualized expense ratios of 1.10% for the Class I shares, multiplied by the average account values over the period, multiplied by 183/365. The expense ratios reflect an expense waiver. Assume all dividends and distributions were reinvested. |
This page is intentionally left blank
This page is intentionally left blank
ACR Funds
Each a series of Investment Managers Series Trust II
Investment Advisor
ACR Alpine Capital Research, LLC
8000 Maryland Avenue, Suite 700
Saint Louis, Missouri 63105
Independent Registered Public Accounting Firm
Tait, Weller & Baker LLP
Two Liberty Place
50 South 16th Street, Suite 2900
Philadelphia, Pennsylvania 19102
Custodian
UMB Bank, n.a.
928 Grand Boulevard, 5th Floor
Kansas City, Missouri 64106
Fund Co-Administrator
Mutual Fund Administration, LLC
2220 East Route 66, Suite 226
Glendora, California 91740
Fund Co-Administrator, Transfer Agent and Fund Accountant
UMB Fund Services, Inc.
235 West Galena Street
Milwaukee, Wisconsin 53212
Distributor
IMST Distributors, LLC
Three Canal Plaza, Suite 100
Portland, Maine 04101
www.foreside.com
FUND INFORMATION
| | TICKER | CUSIP |
| ACR Multi-Strategy Quality Return (MQR) Fund – Class I | MQRIX | 46141T 802 |
| ACR International Quality Return (IQR) Fund – Class I | IQRIX | 46141T 653 |
Privacy Principles of the ACR Funds for Shareholders
The Funds are committed to maintaining the privacy of their shareholders and to safeguarding their non-public personal information. The following information is provided to help you understand what personal information the Funds collect, how we protect that information and why, in certain cases, we may share information with select other parties.
Generally, the Funds do not receive any non-public personal information relating to their shareholders, although certain non-public personal information of their shareholders may become available to the Funds. The Funds do not disclose any non-public personal information about their shareholders or former shareholders to anyone, except as permitted by law or as is necessary in order to service shareholder accounts (for example, to a transfer agent or third party administrator).
This report is sent to shareholders of the ACR Funds for their information. It is not a Prospectus, circular or representation intended for use in the purchase or sale of shares of the Funds or of any securities mentioned in this report.
Proxy Voting Policies and Procedures
A description of the Funds’ proxy voting policies and procedures related to portfolio securities are available without charge, upon request, by calling the Funds at (855) 955-9552 or on the U.S. Securities and Exchange Commission’s (“SEC”) website at www.sec.gov.
Proxy Voting Record
Information regarding how the Funds voted proxies for portfolio securities, if applicable, during the most recent 12-month period ended June 30, is also available, without charge and upon request by calling (855) 955-9552 or by accessing the Funds’ Form N-PX on the SEC’s website at www.sec.gov.
Fund Portfolio Holdings
The Funds file a complete schedule of their portfolio holdings with the SEC for the first and third quarters of each fiscal year on Form N-PORT within 60 days of the end of such fiscal quarter. Shareholders may obtain the Funds’ Form N-PORT on the SEC’s website at www.sec.gov.
Prior to the use of Form N-PORT, the Funds filed their complete schedule of portfolio holdings with the SEC on Form N-Q, which is available online at www.sec.gov.
Householding Mailings
The Funds will mail only one copy of shareholder documents, including prospectuses, and notice of annual and semi-annual reports availability and proxy statements, to shareholders with multiple accounts at the same address. This practice is commonly called “householding” and is intended to reduce expenses and eliminate duplicate mailings of shareholder documents. Mailings of your shareholder documents may be householded indefinitely unless you instruct us otherwise. If you do not want the mailing of these documents to be combined with those for other members of your household, please call the Funds at (855) 955-9552.
ACR Funds
P.O. Box 2175
Milwaukee, WI 53201
Toll Free: (855) 955-9552
Item 1. Report to Stockholders (Continued).
Item 2. Code of Ethics.
The registrant has adopted a code of ethics that applies to the registrant's principal executive officer and principal financial officer. The registrant has not made any amendments to its code of ethics during the period covered by this report. The registrant has not granted any waivers from any provisions of the code of ethics during the period covered by this report.
The registrant undertakes to provide to any person without charge, upon request, a copy of its code of ethics by mail when they call the registrant at 1-855-955-9552.
Item 3. Audit Committee Financial Expert.
The Board of Trustees of the Registrant has determined that the Registrant has the following “audit committee financial experts” as defined in Item 3(b) of Form N-CSR serving on its Audit Committee: Messrs. Thomas Knipper and John P. Zader. The audit committee financial experts are “independent” as that term is defined in Item 3(a)(2) of Form N-CSR.
Item 4. Principal Accountant Fees and Services.
The registrant has engaged its principal accountant to perform audit services, audit-related services, tax services and other services during the past two fiscal years. "Audit services" refer to performing an audit of the registrant's annual financial statements or services that are normally provided by the accountant in connection with statutory and regulatory filings or engagements for those fiscal years. "Audit-related services" refer to the assurance and related services by the principal accountant that are reasonably related to the performance of the audit. "Tax services" refer to professional services rendered by the principal accountant for tax compliance, tax advice, and tax planning. There were no "other services" provided by the principal accountant. The following table details the aggregate fees billed or expected to be billed for each of the last two fiscal years for audit fees, audit-related fees, tax fees and other fees by the principal accountant.
| | FYE 11/30/2021 | FYE 11/30/2020 |
| Audit Fees | $25,000 | $25,000 |
| Audit-Related Fees | N/A | N/A |
| Tax Fees | $5,000 | $5,000 |
| All Other Fees | N/A | N/A |
The audit committee has adopted pre-approval policies and procedures that require the audit committee to pre-approve all audit and non-audit services of the registrant, including services provided to any entity affiliated with the registrant.
The percentage of fees billed by Tait Weller applicable to non-audit services pursuant to waiver of pre-approval requirement were as follows:
| | FYE 11/30/2021 | FYE 11/30/2020 |
| Audit-Related Fees | 0% | 0% |
| Tax Fees | 0% | 0% |
| All Other Fees | 0% | 0% |
All of the principal accountant's hours spent on auditing the registrant's financial statements were attributed to work performed by full-time permanent employees of the principal accountant.
The following table indicates the non-audit fees billed or expected to be billed by the registrant's accountant for services to the registrant and to the registrant's investment advisor (and any other controlling entity, etc.—not sub-advisor) for the last two years. The audit committee of the Board of Trustees has considered whether the provision of non-audit services that were rendered to the registrant's investment advisor is compatible with maintaining the principal accountant's independence and has concluded that the provision of such non-audit services by the accountant has not compromised the accountant's independence.
| Non-Audit Related Fees | FYE 11/30/2021 | FYE 11/30/2020 |
| Registrant | N/A | N/A |
| Registrant’s Investment Advisor | N/A | N/A |
Item 5. Audit Committee of Listed Registrants.
| (a) | Not applicable to registrants who are not listed issuers (as defined in Rule 10A-3 under the Securities Exchange Act of 1934). |
Item 6. Schedule of Investments.
| (a) | Schedule of Investments is included as part of the report to shareholders filed under Item 1 of this Form. |
Item 7. Disclosure of Proxy Voting Policies and Procedures for Closed-End Management Investment Companies.
Not applicable to open-end investment companies.
Item 8. Portfolio Managers of Closed-End Management Investment Companies.
Not applicable to open-end investment companies.
Item 9. Purchases of Equity Securities by Closed-End Management Investment Company and Affiliated Purchasers.
Not applicable.
Item 10. Submission of Matters to a Vote of Security Holders.
The registrant has not made any material changes to the procedures by which shareholders may recommend nominees to the registrant’s Board of Trustees.
Item 11. Controls and Procedures.
| (a) | The Registrant’s President/Chief Executive Officer and Treasurer/Chief Financial Officer have reviewed the Registrant's disclosure controls and procedures (as defined in Rule 30a-3(c) under the Investment Company Act of 1940 (the “Act”)) as of a date within 90 days of the filing of this report, as required by Rule 30a-3(b) under the Act and Rules 13a-15(b) or 15d-15(b) under the Securities Exchange Act of 1934. Based on their review, such officers have concluded that the disclosure controls and procedures are effective in ensuring that information required to be disclosed in this report is appropriately recorded, processed, summarized and reported and made known to them by others within the Registrant and by the Registrant’s service provider. |
| (b) | There were no changes in the Registrant's internal control over financial reporting (as defined in Rule 30a-3(d) under the Act) that occurred during the period covered by this report that has materially affected, or is reasonably likely to materially affect, the Registrant's internal control over financial reporting. |
Item 12. Disclosure of Securities Lending Activities for Closed-End Management Investment Companies.
Not applicable to open-end investment companies.
Item 13. Exhibits.
(2) Certifications pursuant to Section 302 of the Sarbanes-Oxley Act of 2002. Filed herewith.
(3) Any written solicitation to purchase securities under Rule 23c-1 under the Act sent or given during the period covered by the report by or on behalf of the registrant to 10 or more persons. Not applicable to open-end investment companies.
(4) Change in the registrant’s independent public accountant. There was no change in the registrant’s independent public accountant for the period covered by this report.
| (b) | Certification pursuant to Section 906 of the Sarbanes-Oxley Act of 2002. Filed herewith. |
SIGNATURES
Pursuant to the requirements of the Securities Exchange Act of 1934 and the Investment Company Act of 1940, the registrant has duly caused this report to be signed on its behalf by the undersigned, thereunto duly authorized.
| (Registrant) | Investment Managers Series Trust II | |
| | | |
| By (Signature and Title) | /s/ Terrance Gallagher | |
| | Terrance Gallagher, President/Chief Executive Officer | |
| | | |
| Date | 02/04/2022 | |
Pursuant to the requirements of the Securities Exchange Act of 1934 and the Investment Company Act of 1940, this report has been signed below by the following persons on behalf of the registrant and in the capacities and on the dates indicated.
| By (Signature and Title) | /s/ Terrance Gallagher | |
| | Terrance Gallagher, President/Chief Executive Officer | |
| | | |
| Date | 02/04/2022 | |
| | | |
| By (Signature and Title) | /s/ Rita Dam | |
| | Rita Dam, Treasurer/Chief Financial Officer | |
| | | |
| Date | 02/04/2022 | |