UNITED STATES
SECURITIES AND EXCHANGE COMMISSION
Washington, D.C. 20549
FORM N-CSR
CERTIFIED SHAREHOLDER REPORT OF REGISTERED
MANAGEMENT INVESTMENT COMPANIES
Investment Company Act file number 811-22894
INVESTMENT MANAGERS SERIES TRUST II
(Exact name of registrant as specified in charter)
235 W. Galena Street
Milwaukee, WI 53212
(Address of principal executive offices) (Zip code)
Diane J. Drake
Mutual Fund Administration, LLC
2220 E. Route 66, Suite 226
Glendora, CA 91740
(Name and address of agent for service)
(626) 385-5777
Registrant's telephone number, including area code
Date of fiscal year end: September 30
Date of reporting period: September 30, 2021
Item 1. Report to Stockholders.
The registrant’s annual report transmitted to shareholders pursuant to Rule 30e-1 under the Investment Company Act of 1940, as amended (the “Investment Company Act”), is as follows:

AXS Alternative Growth Fund
(Class A: EEHAX)
(Class I: EEHIX)
AXS Aspect Core Diversified Strategy Fund
(Class A: EQAAX)
(Class C: EQACX)
(Class I: EQAIX)
AXS Chesapeake Strategy Fund
(Class A: ECHAX)
(Class C: ECHCX)
(Class I: EQCHX)
AXS Managed Futures Strategy Fund
(Class A: MHFAX)
(Class C: MHFCX)
(Class I: MHFIX)
AXS Multi-Strategy Alternatives Fund
(Class I: KCMIX)
(Class R-1: KCMTX)
AXS Sustainable Income Fund
(Class I: AXSKX)
AXS Thomson Reuters Private Equity Return Tracker Fund
(Class A: LDPAX)
(Class C: LDPCX)
(Class I: LDPIX)
AXS Thomson Reuters Venture Capital Return Tracker Fund
(Class A: LDVAX)
(Class C: LDVCX)
(Class I: LDVIX)
ANNUAL REPORT
SEPTEMBER 30, 2021
AXS Funds
Each a series of Investment Managers Series Trust II
Table of Contents
| Shareholder Letters | 1 |
| Fund Performance | 42 |
| Consolidated Schedule of Investments | 58 |
| Consolidated Statements of Assets and Liabilities | 124 |
| Consolidated Statements of Operations | 130 |
| Consolidated Statements of Changes in Net Assets | 133 |
| Consolidated Financial Highlights | 141 |
| Notes to Consolidated Financial Statements | 161 |
| Report of Independent Registered Public Accounting Firm | 205 |
| Supplemental Information | 210 |
| Expense Examples | 213 |
This report and the financial statements contained herein are provided for the general information of the shareholders of the AXS Funds. This report is not authorized for distribution to prospective investors in the Fund unless preceded or accompanied by an effective prospectus.
www.axsinvestments.com

AXS Alternative Growth Fund
Annual Letter to Shareholders for the year ended September 30, 2021
For the fiscal year ending September 30, 2021, the AXS Alternative Growth Fund’s Class I and Class A shares were up +25.04% and +24.82%, respectively, underperforming the S&P 500 Total Return Index® (“S&P 500®”), which was up +30.00%.
| Return 12-Mo | Annualized Rate of Return (AROR) Since Inception (9/9/2013 to 9/30/2021) | Annualized Standard Deviation Since Inception (9/9/2013 to 9/30/2021) |
| AXS Alternative Growth – Class I | 25.04% | 10.56% | 15.61% |
| AXS Alternative Growth – Class A | 24.82% | 10.27% | 15.47% |
| AXS Alternative Growth – Class A (w/ 5.75% max sales charge) | 17.60% | 9.46% | -- |
| S&P 500® | 30.00% | 14.70% | 13.68% |
Past performance does not guarantee future results. Investors cannot directly invest in an index.
RATIONALE
Over the years, we have observed that many investor portfolios are inadequately diversified because of the perceived opportunity cost of selling equities to gain exposure to diversifying alternative assets. We believe an overlay strategy offers the potential for superior and meaningful diversification without the need to reduce exposure to core holdings. This is the concept implemented in the Alternative Growth Fund. The Fund provides futures-based exposure to the broad US equity market, while simultaneously seeking to diversify equity factor risk through strategic and meaningful exposure to a futures-based portfolio of (i) uncorrelated diversifiers and (ii) negatively correlated dynamic equity-hedging strategies.
ANALYSIS OF PERFORMANCE
The Fund’s underperformance can be attributed mainly to the hedge strategy, as shown in the Table below. Further, most of the hedge strategy’s underperformance can be attributed to the Quadriga Smart Gold options and futures trading program. This absolute return strategy aims to generate negatively correlated returns (“crisis alpha”) during adverse and hostile equity markets, while seeking to earn neutral to positive returns during benign markets. Thus, the strategy seeks to earn, in the long run, higher risk-adjusted overall returns, particularly on the downside, through the combination of potentially higher compounded returns, lower realized volatility, and shallower drawdowns. Unfortunately, during a very strong year for equity markets (+30% for the Equities Index), a volatile and down year for gold (spot gold depreciated by about −8%), and a losing year for US Treasury securities (the 10-year bond returned about −4.5%), the Quadriga program lost about −50%, representing a contribution of −706 bps to the Fund’s performance. The allocation to the Quadriga program was reduced progressively during the year, and the program was removed from the Fund’s portfolio in October 2021, shortly after the end of the fiscal year.
ampersandinvestments.com • 609.454.5200
TABLE 1: FUND CONTRIBUTION BY STRATEGY
| Strategy | Oct-2020 to Sep-2021 |
| Long Only | 34.19% |
| Diversifier | 4.70% |
| Hedge | -14.04% |
| Fixed Income | 0.19% |
| Fund Total | 25.04% |
Eight of our diversifying trading programs contributed positively, totaling 927 bps, while seven programs combined to yield negative performance of −457 bps. The best performer was a discretionary global macro trading program, followed by a trend-following program and an adaptive machine-learning program. Negative contributions came from across the board, including both currency trading programs.
As mentioned earlier, the Quadriga Smart Gold strategy was the worst performer for the year, although the QDRA strategy and the Quest Hedging Strategy were also significant negative contributors. While negative performance by hedging strategies is not entirely unexpected during a strong year for equity markets, its magnitude was disappointing.
TABLE 2: PERFORMANCE ATTRIBUTION BY CTAS:
| Commodity Trading Advisor | Program | Oct-2020 to Sep-2021 |
| Diversifiers | | |
| Arctic Blue Capital | Arctic Blue Inuvik | 0.00% |
| Crabel Capital Management | Crabel Multi-Product | 0.48% |
| Emil van Essen | Emil Van Essen | -0.42% |
| FORT, L.P. | Fort Global Contrarian | -0.57% |
| H20 Asset Management | H2O Asset Management | 4.58% |
| IPM Informed Portfolio Mgmt. | IPM Systematic Macro | -0.71% |
| J E Moody | JEM CRV Program | 0.99% |
| KeyQuant | Key Trends Financials Program | -0.53% |
| LCJ Investments | LCJ | -0.63% |
| Mesirow Financial (Currency Management) | Cambridge Strategy Emerging Markets Alpha | -1.00% |
| QMS Capital Management | QMS Financials Only Global Macro | -0.71% |
| Quantica Capital | Quantica | 1.45% |
| Quantitative Investment Management | QIM | 0.15% |
| Quest Partners | Quest QTI | 0.35% |
| SCT Capital Management | SCT Capital - AQT Program | 1.27% |
| Total Diversifier | | 4.70% |
| Hedges | | |
| QDRA Pty. Ltd | QDRA Dynamic Macro | -4.63% |
| Quadriga Asset Managers | Quadriga | -7.06% |
| Quest Partners | Quest Hedging Program | -2.35% |
| Total Hedge | | -14.04% |
ampersandinvestments.com • 609.454.5200
Performance attribution is estimated by Ampersand Investment Management and is net of fees. Past performance does not guarantee future results.
At the sector level, equity indices were, not surprisingly, the biggest positive contributors to performance, followed by energy. Interest rates were the largest negative contributors, followed by metals and currencies, while agricultural commodities were negative but close to flat.
TABLE 3: FUND PERFORMANCE ATTRIBUTION BY SECTOR (10/1/2020 to 9/30/2021)
| Sector | Contribution |
| Currencies | -3.18% |
| Equity Indices | 4.95% |
| Interest Rates | -8.71% |
| Agricultural Commodities | -0.35% |
| Metals | -3.21% |
| Energy | 1.16% |
| Total | -9.34% |
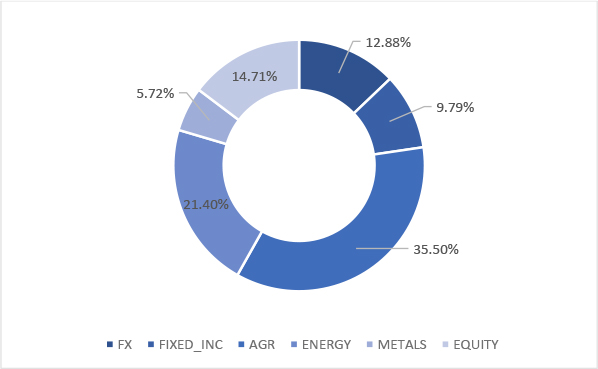
The overlay’s largest gross exposure as of fiscal year-end was to energy (about 48%), followed by agricultural commodities (about 23%), equity indices (about 12%), currencies (about 10%), fixed income (about 4%), and metals (about 3%). Together, the physical commodity sectors represent about 74% of the Fund’s exposure, higher than at the previous year-end.
At the end of September, the dynamic hedging strategies had a negative beta of about −0.08 with respect to the S&P 500 Index®. It is expected that this beta will be negative, on average and over time. Currencies and equity indices had the largest negative betas (−0.17 and −0.07, respectively) and energy had the largest positive beta (+0.17), while the betas for all other sectors were relatively close to zero.
FUND SECTOR DIVERSIFICATION
GROSS SECTOR EXPOSURE AS OF 9/30/2020
ampersandinvestments.com • 609.454.5200
GROSS SECTOR EXPOSURE AS OF 9/30/2021
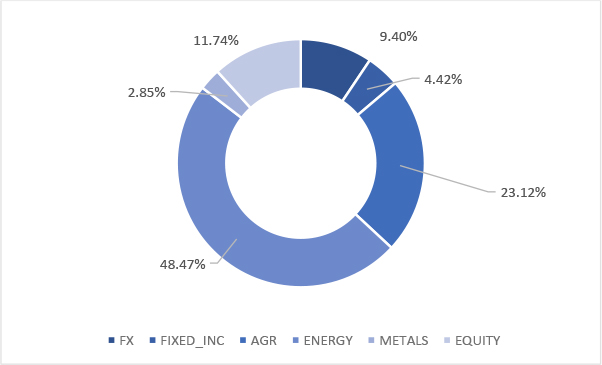
Source: Ampersand Investment Management and Bloomberg, LP. Reflects aggregate sector gross risk exposures. Sector exposures and positions held may vary depending on market conditions and may not be representative of the Fund’s current or future exposures. Portfolio positions are subject to change and should not be considered investment advice. Attribution numbers have been rounded for ease of use.
MARKET COMMENTARY
Q4 2020
For Q4 2020, the Ampersand Fund’s Class I shares earned a return of +11.41%. The Fund slightly underperformed the S&P 500 Total Return Index, which was up +12.15% for the same period.
It was another very good quarter for global equity markets. Equity market volatility as measured by the VIX Index started the quarter at about 27% and continued to climb, peaking at about 40% towards month-end. By the second week of November, it declined to about 25%, and it remained in a fairly narrow band between 20% and 25% for the rest of the quarter, still higher than its long-term historical average but significantly below the levels seen earlier during 2020.
ampersandinvestments.com • 609.454.5200
OCTOBER 2020
The Fund’s Class I shares were down significantly during October (−6.51%), driven mainly by the long strategy (−2.78%). The hedge strategy (−1.97%) and the diversifier strategy (−1.83%) were also down for the month.
Financial and commodity markets remained anxious in a month where global coronavirus cases rose by a single-day record of half a million. Renewed national lockdowns were imposed across Europe, leading to a crash in oil prices. Investor appetite for risk assets was also dampened by upcoming US election uncertainty and a breakdown in US fiscal stimulus talks. Brexit negotiations continued, with focus on a few sticking points, although markets were relieved when the UK did not walk away from a self-imposed deadline. On the data front, the US posted a muted labor market picture, signaling a slowdown in recovery while most data out of Europe also indicated a worsening outlook as the virus continued to spread.
Long fixed income positions were hurt as key Asian and North American bond yields rose, with the latter partly attributable to expectations of additional US stimulus. Fears of an economic slowdown amid increased coronavirus cases led to major stock market selloffs, which detracted from long positions. In currencies, the Chinese Yuan benefited from a positive economic backdrop in China.
Short energy positions gained as the outlook for global consumption weakened with new pandemic-driven mobility restrictions. In metals, improving Chinese demand boosted aluminum prices. Weather concerns in the Americas helped boost key agricultural markets such as soybean, cotton, and wheat.
NOVEMBER 2020
The Fund performed handsomely in November (up +12.96%), driven by both the long strategy (+12.55%) and the diversifier strategy (+5.57%). The hedge strategy (−5.21%) detracted from performance.
Not surprisingly, November was dominated by COVID-19 developments. There were several significant announcements, notable among which was the news that three strong vaccine candidates, claiming up to 95% efficacy, had completed Phase 3 testing and were filing for emergency use. This prompted a strong rally in risk assets and led to one of the biggest stock market spikes in history. Investors rotated out of growth and momentum stocks into value stocks as the prospects of a vaccine accelerated the outlook for a global recovery. Risk assets were also bolstered by the US election results which pointed to a Joe Biden victory, although the Trump campaign was still trying to overturn the election outcomes in courts. Despite this positive news, the fact that much of the world was still battling an increase in COVID-19 cases and hospitalizations with varying degrees of lockdowns continued to cast a pall on markets.
Many government bond yields surged on the vaccine news, causing losses for net long fixed income exposure. Long stock index positions benefited, as a vaccine-induced, broad-based rally in equities ensued. Gains were generated by the currencies sector where net short US Dollar exposure yielded profits, particularly against the New Zealand Dollar, after data on China’s PMI (Purchasing Managers’ Index) surprised on the upside.
Net long metals exposure also generated gains. Industrial metals rallied, especially copper, on the optimistic vaccine announcement, growing demand, and signs that China's manufacturing PMIs were accelerating at the fastest rate in a decade. Net long agricultural commodity exposure was also profitable as dry weather and strong demand from China for products such as soybeans boosted prices. Long positions in crude oil also profited as prices rallied on vaccine hopes, while natural gas prices fell on forecasts of a warmer winter.
ampersandinvestments.com • 609.454.5200
DECEMBER 2020
December was another positive month for the Fund (+5.49%), driven again by both the long strategy (+4.57%) and the diversifier strategy (+1.10%), while the hedge strategy (−0.20%) detracted slightly.
Risk assets rallied strongly, bolstered by the deployment of several COVID-19 vaccines. After months of negotiations, the US signed into law the second largest relief bill in its history ($900bn) while the EU was able to secure its $2.2 trillion budget and stimulus plan. The UK and EU agreed to a post-Brexit trade agreement. All these agreements helped to boost market sentiment further while a global surge in coronavirus cases and hospitalizations counteracted some of these positive developments.
Equity markets appreciated strongly throughout the month, as the near-term optimism surrounding vaccinations, additional stimulus measures and strong IPO activity drove positive sentiment throughout the month. Core government bond yields were more mixed.
One of the main themes generating positive performance this month was continued US dollar weakness. Among the best performing currency positions were long exposures to commodity-sensitive regions such as Australia, Chile and South Africa. Long metals exposure also generated gains, with the sector overall appreciating in price as the US dollar weakened. Soybeans reached a six-year high on export optimism and supply concerns as dry weather conditions continued in key growing areas in South America.
In energy, short natural gas positions made strong gains as forecasters projected warmer trends and reduced heating demand. Crude oil prices soared as major oil producers agreed to persist with production cuts.
Q1 2021
For Q1 2021, the Ampersand Fund’s Class I shares earned a return of +1.68%. The Fund underperformed the S&P 500 Total Return Index, which was up +6.17% for the same period.
It was another positive albeit volatile quarter for global equity markets. Equity market volatility as measured by the VIX® Index started the quarter north of 25% and stayed in the 20-25% range, before spiking up to about 37% towards month-end. By the second week of February, it dropped and then remained in a fairly narrow band around 20% for most of the month before another brief spike up to about 28% at month-end. By the second week of March, it subsided to a range from 18% to 20%, still higher than its long-term historical average but significantly below the levels seen during early 2020.
January 2021
The Fund’s Class I shares were down significantly during January (−5.60%). The long strategy (−1.28%), the hedge strategy (−1.84%) and the diversifier strategy (−2.51%) were all down for the month.
The overall positive sentiment that had lifted markets towards the end of 2020 carried over into 2021. Global equities continued their march upwards, spurred by optimism around the inauguration of President Biden and the expected effect of the new administration on both domestic stimulus plans and foreign policy. However, the month ended on a more cautious tone as the market experienced jitters on valuation concerns and disappointing economic data.
ampersandinvestments.com • 609.454.5200
Early gains from net long stock indices were eroded from bouts of uncertainty in the final trading days of the month. The early investor optimism went against long fixed income positions as yields rose.
Higher US yields also supported a stronger US dollar, which moved against its multi-month downward trend, generating losses on short positions, mainly versus emerging market currencies.
Long positions in agricultural commodities benefited from strong Chinese export demand and supply concerns. The growing risk appetite played out as expected in the energy sector, with net positive performance from long positions. Industrial metals were helped by the improved global manufacturing outlook, while precious metal prices were weighed down by the stronger US dollar.
February 2021
The Fund had a positive February (up +1.78%), driven by both the long strategy (+3.38%) and the diversifier strategy (+2.45%). The hedge strategy (−4.07%) detracted from performance.
Global bond markets experienced a rout, as investors were more spooked by inflation threats than encouraged by the possible positive impact of fiscal stimulus on economic growth. Cyclical assets such as value stocks and oil were boosted by accelerating vaccine rollouts, while growth stocks and gold suffered from rising yields. Major price moves occurred towards the end of the month as global policymakers sought to quell the panic through dovish rhetoric.
Developed market bond yields had some of their biggest monthly jumps in more than a decade, reflecting fears that central banks may need to tighten policy earlier than expected to suppress inflation. Long bond positions suffered. Net long exposure to stock indices made gains despite investors dumping highly valued stock market segments in the face of spiking bond yields. Initially, long positions in emerging market and commodity currencies benefited from the improving growth outlook. However, these gains were largely erased during the final days as the dollar rose, while risk appetite waned amid inflation concerns.
Long energy market positions produced gains as frigid weather in the US boosted fuel demand, while supply was hampered by a winter storm in Texas. China's strong economic story helped long positions in agricultural markets such as cotton, where demand from China's textile industry grew while inventories fell. Sturdy Chinese manufacturing activity and supply issues also drove gains in industrial metals such as copper and aluminum.
MARCH 2021
March was a good month for the Fund (+5.83%), driven again by both the long strategy (+5.18%) and the diversifier strategy (+1.19%), while the hedge strategy (−0.54%) detracted slightly.
Major government bonds, particularly longer-dated US treasuries, continued to sell off and yields surged as the Federal Reserve pledged to stay accommodative for at least another two years and reiterated its position to allow inflation to rise above 2%. This amplified growing concerns that vast government spending and monetary stimulus would fuel inflation.
Equities rose on strong economic growth signals as President Joe Biden signed a $1.9tn spending bill into law and accelerated vaccination efforts. Meanwhile, details began to emerge of a further multi-trillion-dollar infrastructure plan. Yields climbed in response to the Federal Reserve's dovish tones and rising growth expectations. The rise in yields and increasing expectation of a strong US recovery helped drive further US Dollar appreciation against major currencies, leading to losses, while the Euro lost value against its peers amidst a third wave of COVID-19 infections. Losses came from net long metals exposure as metal prices fell with the strengthening US Dollar. Oil markets were increasingly volatile as a container ship accidentally blocked up the Suez Canal. Long positions in lean hogs contributed to profits in the agricultural sector on news of another outbreak of African swine fever in China; however, these were offset by other losses.
ampersandinvestments.com • 609.454.5200
Q2 2021
For Q2 2021, the Ampersand Fund’s Class I shares earned a return of +12.27%. The Fund outperformed the S&P 500 Total Return Index, which was up +8.55% for the same period.
It was a much less volatile quarter for global equity markets. Equity market volatility as measured by the VIX® Index started the quarter well below 20% and stayed in the 16-20% range, except for a brief spike into 20%-27% territory during the middle third of May. Towards the end of June, it had subsided to just above 15%, close to its long-term historical average and significantly below the pandemic highs seen during 2020.
APRIL 2021
The Fund’s Class I shares were up nicely during April (+4.96%). This was mainly attributable to the long strategy (+6.13%) and the diversifier strategy (+0.49%), while the hedge strategy (−1.66%) was down for the month.
Risk assets, mainly equities and commodities, thrived on upbeat economic data that pointed to strong signs of an accelerating recovery in the US. While the Federal Reserve reaffirmed its accommodative policies, President Biden came out in support of aggressive new tax hikes, causing investors to look past inflationary fears and send US treasury yields lower. Risk-off assets were also supported by a sharp increase in COVID cases, particularly in India, which struggled to contain a new coronavirus variant.
Long stock index positions gained as US stock markets reached record highs and European equities erased all their pandemic losses. Short positions in longer-dated US treasuries were large detractors as recent trends reversed. Gains from long positions in commodity-sensitive currencies were offset by losses on short positions in the Swiss Franc, the Japanese Yen and, especially, the Euro, with that currency strengthening as the vaccination rollout in the Eurozone picked up speed.
Long exposures across commodity markets generated gains as adverse weather conditions in key growing regions caused grain prices (corn, soy and wheat) to rally. Long positions in industrial metals were profitable as prices surged on the back of a weakening US dollar and accelerating demand. An optimistic OPEC report for global oil demand coupled with generally strengthening risk appetite resulted in gains on long energy positions.
MaY 2021
The Fund had an even better May (+5.17%). The long strategy (+0.81%), the diversifier strategy (+1.50%), and the hedge strategy (+2.86%) all contributed to performance.
The “reflation trade” (a bet on assets that benefit from a strengthening economy and a pickup in inflation) contributed most of May’s returns. Risk assets continued their year-long rise, although mixed economic data releases from the US caused markets to fluctuate throughout the month. The specter of inflation continued to worry investors, although Federal Reserve officials attempted to reassure markets via dovish signals. This accommodative messaging caused the US Dollar to weaken against major peers, continuing its recent slide.
Net short US Dollar positions benefited from the currency’s ongoing weakness, mainly against commodity currencies and the British Pound. The US Dollar erased virtually all the gains it had made at the start of the year. A mid-month wobble, caused by the highest monthly core Consumer Price Index (CPI) rise in years and associated inflation fears, did not deter stock markets from rising by month-end. Prices were pushed higher by the continued easing of lockdown restrictions and strong Purchasing Managers' Index (PMI) data releases out of Europe. Fixed income positions finished the month down, as small gains in long positions in shorter-dated bonds were offset by losses on short exposures.
ampersandinvestments.com • 609.454.5200
Long commodity exposures continue to be profitable. Lean hogs were one of the best performers, as the reopening of restaurants across the US stimulated pork demand. Gas oil and gasoline prices rose on fears of supply shortages due to a cyberattack on a major US fuel pipeline operator, benefiting long exposures. Metal markets joined other commodities, with prices rising as the reopening of economies continued to drive up demand.
JUNE 2021
June was another positive month for the Fund (+1.71%), capping off an excellent quarter. Performance was driven by the long strategy (+2.54%), while the diversifier strategy (−0.61%) and the hedge strategy (−0.22%) detracted slightly.
The Federal Reserve surprised markets with its hawkish rate projections, causing the yield curve to flatten. Investors also temporarily pulled out of the hitherto popular “reflation trade.” US stock markets subsequently rallied to all-time highs on hopes for President Biden's new infrastructure deal. By the end of the month, however, investors had begun to weigh economic growth prospects against rising inflationary pressures and the spread of the highly infectious Delta coronavirus variant.
Q3 2021
After a very good Q2, the Alternative Growth Fund’s Class I shares returned -1.68% for Q3. The Fund underperformed the S&P 500 Total Return Index, which was up +0.58% for the same period.
July and August were relatively quiet months for global equity markets. Equity market volatility as measured by the VIX® Index started the quarter at about 15% and stayed in the 15-20% range for the most part. Hurricane Ida contributed to a turbulent September, with the VIX® moving into the 20-25% range for most of the month, and ending the quarter at about 23%.
July 2021
The Fund’s Class I shares were up nicely during July (+5.33%). This was mainly attributable to the long strategy (+2.85%), while both the diversifier strategy (+1.14%) and the hedge strategy (+1.34%) were also up for the month.
Risk assets started the month strong, with US stocks reaching record highs. However, concerns about the coronavirus Delta variant and indications that inflation in the US may be picking up stoked uncertainty about global growth. Investors flocked out of the “reflation trade” (a bet on assets that benefit from a strengthening economy) and into safe-haven assets. Longer-dated US treasury yields experienced sharp declines. Many longer-term trends within commodities, fixed income and FX continued their reversal, while the US Dollar showed further strength.
Long commodities exposure generated profits, particularly in the energy sector. Natural gas prices rallied on the prospect of higher weather-related demand. Long industrial metals positions were profitable; nickel prices neared a seven-year high on robust demand and constrained supply.
In financial markets, fixed income rallied strongly, leading to gains in long positions. Long stock index exposures suffered losses on fears of a slowdown in the economic recovery. In currencies, gains from long US Dollar positions against emerging market currencies were more than offset by Euro losses, as the Euro also appreciated on the European Central Bank’s announcement that it would allow inflation to overshoot its target.
AUGUST 2021
The Fund had a positive August (+2.26%). The long strategy (+3.50%) was the main contributor, while the diversifier strategy (-0.18%) and the hedge strategy (-1.06%) both detracted from performance.
ampersandinvestments.com • 609.454.5200
Robust economic data and earning releases helped European and US stocks reach record highs despite the spread of the coronavirus Delta variant. Asian stocks suffered, however, spooked by the Chinese regulatory clampdown and fears of consequent growth deceleration. The Federal Reserve sent strong signals that it would soon start to unwind its accommodative policies. As other central banks followed suit, investors fled into the safe-haven US dollar and away from government bonds, as prospects for tighter monetary policy appeared more likely. This sharp reversal led to losses on long fixed income exposures.
As economies continued to gradually reopen, hopes of an improving recovery sent most stock indices higher. The US dollar strengthened due to increasing talk of tapering, political tensions, and disappointing economic data from China, before weakening again towards the end of the month.
US natural gas continued to rally on reports of inventory levels well below expectations, while other energy positions suffered losses. In agricultural commodities, sugar and coffee prices rose due to adverse weather conditions and prospects of lower output in key regions. Metal prices fell as the US dollar strengthened, causing losses from long exposures.
SEPTEMBER 2021
September was a disappointing month for the Fund (-8.72%), ending a streak of positive months that began in February. Negative performance was driven mainly by the long strategy (-5.61%), but the diversifier strategy (−2.28%) and the hedge strategy (−0.83%) also detracted from performance.
The villain behind this stormy month was Hurricane Ida, which forced oil production shutdowns in the Gulf of Mexico. Oil prices surged further on the decision by OPEC+ to increase output only modestly. Energy prices continued to march upwards in the second half of the month, spurred by low European gas inventories and fears of potential supply shortages during winter. Stocks reversed their near-relentless climb, as central banks, including the Federal Reserve, signaled less accommodative policy stances. The impending halt to supportive monetary policy also helped the US Dollar and Treasury yields to rise.
CONCLUSION
We believe that concerns about the global economy and geopolitics have been exacerbated by the coronavirus crisis. Historically, futures trading programs have tended to perform well in a variety of market conditions, perhaps particularly so during periods of market turbulence and volatility expansion. A period of a few weeks or months is far too short to judge the long-term potential of any strategy or asset class.
The Fund seeks to provide returns that, in the long run, are comparable to the S&P 500® Total Return Index with comparable volatility, while seeking to mitigate downside risk. We continue to believe that a significant and strategic allocation to the Fund as a substitute for core equity exposure in a portfolio may provide “smarter” equity exposure: equity exposure that is dynamically hedged, coupled with the potential for uncorrelated alpha in the long run.
Definition of Terms
Alpha is a measure of performance on a risk-adjusted basis. Alpha takes the volatility (price risk) of a fund and compares its risk-adjusted performance to a benchmark index. The excess return of the fund relative to the return of the benchmark index is a fund’s alpha.
Annualized rate of return (AROR) is the geometric average return for a period greater than or equal to one year, expressed on an annual basis or as a return per year.
ampersandinvestments.com • 609.454.5200
Beta is a measure of the volatility, or systematic risk, of a security or a portfolio in comparison to the market as a whole. A beta of 1 indicates that the security's return will move with the market. A beta of less than 1 means that the security’s return will be less volatile than the market. A beta of greater than 1 indicates that the security's return will be more volatile than the market. For example, if a stock's beta is 1.2, it's return is theoretically 20% more volatile than the market’s return.
Basis Points (bps) is a unit of measure used in quoting yields, changes in yields or differences between yields. One basis point is equal to 0.01%, or one one-hundredth of a percent of yield and 100 basis points equals 1%.
Brexit is an abbreviation of “British exit,” which refers to the June 23, 2016 referendum by British voters to exit the European Union. The referendum roiled global markets, including currencies, causing the British pound to fall to its lowest level in decades. Prime Minister David Cameron, who supported the UK remaining in the EU announced he would step down in October.
Call options are financial contracts that give the option buyer the right, but not the obligation, to buy a stock, bond, commodity or other asset or instrument at a specified price within a specific time period.
Commodity Trading Advisors (CTA) provide advice and services related to trading in futures contracts. They are responsible for the trading within managed futures accounts.
Correlation is a statistical measure of how two securities move in relation to each other.
Crisis alpha: Refers to profits or gains that can be made by exploiting certain market trends during times of market turmoil.
Hedge is making an investment to reduce the risk of adverse price movements in an asset. Normally, a hedge consists of taking an offsetting position in a related security, such as a futures contract.
Long position refers to buying a security such as a stock, commodity, or currency, with the expectation that the asset will rise in value.
The Purchasing Managers' Index (PMI) is an index of the prevailing direction of economic trends in the manufacturing and service sectors. The PMI is based on a monthly survey sent to senior executives at more than 400 companies in 19 primary industries, which are weighted by their contribution to U.S. GDP.
The S&P 500 Total Return Index® is widely regarded as the best single gauge of the U.S. equities market. This world-renowned Index includes 500 leading companies in leading industries of the U.S. economy.
Short position is a position whereby an investor sells borrowed securities in anticipation of a price decline and is required to return an equal number of shares at some point in the future.
Standard Deviation (Volatility) is a measure of fluctuation in the value of an asset or investment. Lower volatility improves the stability and lowers the risk of an investment portfolio.
The VIX® Index (VIX) is a forward-looking measure of equity market volatility. Since its introduction, the VIX is considered by many to be the world’s premier barometer of investor sentiment and market volatility.
Yield is the income return on an investment. This refers to the interest or dividends received from a security and is usually expressed annually as a percentage based on the investment’s cost, its current market value or its face value.
ampersandinvestments.com • 609.454.5200
Investors cannot directly invest in an index and unmanaged index returns do not reflect any fees, expenses or sales charges. The views in this letter were as of September 30, 2021 and may not necessarily reflect the same views on the date this letter is first published or any time thereafter. These views are intended to help shareholders in understanding the fund’s investment methodology and do not constitute investment advice.
ampersandinvestments.com • 609.454.5200
Annual Commentary – AXS Aspect Core Diversified Strategy Fund
| 30 September 2021 | Private and Confidential |
Q4 2020 Commentary
In October, markets appeared anxious in a month where global coronavirus cases rose by a single-day record of half a million. To curb the spread, renewed national lockdowns were imposed, particularly across Europe which led to a crash in global oil prices. Investor appetite for riskier assets was also dented by upcoming US election uncertainty and a breakdown in US fiscal stimulus talks. Like other months this year, November was also dominated by COVID-19 developments. Several significant vaccine announcements, some boasting up to 95% efficacy, prompted a strong rally in risk assets and led to one of the biggest stock market factor upheavals in history. Investors rotated out of growth and momentum stocks into value stocks, as the prospect of a vaccine accelerated the outlook for a global recovery. Risk assets were also bolstered by the US election results which increasingly pointed to a Joe Biden victory. However, concerns over soaring rates of COVID-19 infections helped to temper the market’s buoyancy somewhat. Risk assets continued to rally strongly in December, bolstered by the deployment of several COVID-19 vaccines which fuelled global growth optimism. After months of negotiations, the US signed into law the second largest relief bill in its history and the UK and EU agreed to a post-Brexit trade agreement. Both agreements helped to boost market sentiment further. However, like in November, a global surge in coronavirus cases and hospitalisations counteracted some of these positive developments.
The main themes generating positive performance in Q4 were continued US Dollar weakness as well as rallying commodity markets, particularly in metals and agriculturals. Unsurprisingly, some of the Fund’s best performing currency positions were longs* in commodity sensitive regions such as Australia and New Zealand. The Fund’s long metals exposure generated gains, with the sector overall appreciating in price as the US Dollar weakened. Notable strong positive performance was seen in both copper markets, as price rises were supported by strong industry optimism globally and robust demand from China, the largest consumer of the metal. The Fund’s net long agriculturals exposure was steadily profitable throughout the quarter. Poor weather conditions in key grain growing areas coupled with strong export demand caused prices to rise. Sizeable profits were seen in long soybean positions as the market reached a six-year high by the end of the quarter. In energies, large gains from the short** natural gas position were offset by smaller losses in short positions in other energy markets. Similar to other commodity markets, prices were lifted by hope of renewed demand.
The positive sentiment surrounding news of several COVID-19 vaccines induced a broad-based rally in equity markets in November. The Fund was positioned net short stock indices for the first half of the month resulting in losses. These were partially offset by positive performance from the net long sector exposure in December, as markets continued to be buoyed by positive sentiment. The Fund produced broadly muted returns in fixed income over the quarter. The near-term optimism surrounding vaccinations and additional stimulus measures was hampered by the resurgent pandemic wave throughout the quarter leading to mixed movements across core government bond yields.
Portfolio Positioning – Q4 2020
Long positioning in fixed income has remained stable throughout the quarter. Stock indices exposure changed from net short to net long. In commodities, both the metals and agriculturals sectors extended net long exposures driven by strong trends seen in the sectors. Energies continue to hold a net short position. However, this was reduced during the latter months of Q4. In currencies, largest positioning changes were seen in the US Dollar and the Euro, with the Dollar extending its net short whereas the net long exposure in the Euro was reduced.
Q1 2021 Commentary
Positive sentiment that had buoyed markets in the closing months of 2020 spilled over into the start of 2021. Global equities initially continued their march upwards fuelled by optimism around the inauguration of President Biden and the expected effect a Biden government could have on both domestic stimulus plans and foreign policy. However, January ended on a more cautious tone caused by market jitters surrounding valuation concerns, retail investment turbulence and disappointing economic data announcements. In February, global bond markets experienced a rout as investors weighed inflation threats against the possible impact of fiscal stimulus on economic growth. Cyclical assets such as value stocks and oil were boosted by accelerating vaccine rollouts whilst growth stocks and gold suffered from rising yields. Major price moves occurred towards the end of February as global policymakers sought to quell panic through dovish rhetoric. In the final month of the quarter, government bonds - particularly longer-dated US treasuries - continued to sell off and yields surged as the Federal Reserve pledged to stay accommodative for at least another two years and reiterated its position to allow inflation to rise above 2%. This amplified growing concerns that vast government spending and monetary stimulus would fuel inflation. Equities rose and the US Dollar strengthened as President Joe Biden signed a USD1.9tn spending bill into law and accelerated vaccination efforts, meanwhile details emerged of a further multi-trillion dollar infrastructure plan.
 | Private and Confidential |
Annual Commentary – AXS Aspect Core Diversified Strategy Fund
Over the course of Q1, the Fund maintained a net long exposure to risk assets such as commodity markets and stock indices which resulted in gains. Within commodities, markets generally rallied on the improved global outlook, strong Chinese export demand and weather-driven supply issues. The Fund’s profitable long positions in the sector were spread across agricultural, metal and energy markets. Net long agriculturals exposure remained stable over the quarter whilst energy exposure grew, however net long exposure to metals declined as the US Dollar strengthened, weighing on metals prices. In stock indices, the Fund’s small net long exposure steadily grew and successfully captured the general upward trend in prices. Initial gains from long positions during January were eroded by bouts of uncertainty in the final trading days of the month. However losses were recouped and the Fund continued to make gains from nearly every market in the sector for the rest of the quarter as positive sentiment increased.
Currencies proved to be more challenging. The US Dollar generally strengthened, moving against its multi-month downward trend, resulting in losses for the Fund’s net short position. Over the course of Q1, the Fund’s net short USD position more than halved in response to the currency’s trend. Losses in the sector were widespread, with only a limited number of gains from the Fund’s variable positions in safe-haven currencies such as the Japanese Yen and Swiss Franc. Overall, returns from fixed income were muted. In January, investor optimism went against the Fund’s long fixed income positions as yields rose. The Fund switched to a net short exposure mid-way through February and earlier losses were recouped as developed market bond yields had some of their biggest monthly jumps in over a decade, reflecting fears that central banks may tighten policy earlier than expected in order to suppress inflation.
Portfolio Positioning – Q1 2021
Long positioning in agriculturals remained stable over the quarter whilst the Fund’s fixed income and metals net long exposure more than halved. Energies switched from a small net short to net long mid-way through January and continued to grow for most of the quarter. The Fund’s small net long stock indices exposure steadily grew and had nearly doubled by the end of March. In currencies, the Fund’s net short US Dollar position was significantly reduced and remains the largest net short currency exposure. The Fund’s next largest currency positions are a net long in Pound Sterling and net short in Japanese Yen.
Q2 2021 Commentary
The start of the quarter saw risk assets such as equities and commodities thrive amidst upbeat economic data from the US, with the region showing strong signs of an accelerating recovery. The Federal Reserve reaffirmed their accommodative policies and President Joe Biden announced aggressive new tax hikes, allowing investors to look past inflationary fears and send US treasury yields lower. Safe haven assets were also supported by a record rise in coronavirus cases, particularly from India as it struggled to contain a new variant.
Risk assets continued their year-long rise in May. However, mixed economic data releases from the US caused markets to waver throughout the month. Inflation worries continued to prevail amongst investors, yet Federal Reserve officials attempted to calm markets by sending reassuring dovish tones. This accommodative messaging caused the US Dollar to weaken against major peers as it struggled to abate its recent slide.
| Private and Confidential |
Annual Commentary – AXS Aspect Core Diversified Strategy Fund
In June, the Federal Reserve surprised markets with hawkish rate projections which caused major yield curves to flatten. Investors also temporarily pulled out of the popular reflation trade. Markets subsequently steadied and US stock markets rallied to all-time highs amid President Biden’s new infrastructure deal. Towards the end of the month, investors balanced economic growth prospects against rising inflationary pressures and the spread of the highly infectious Delta coronavirus variant.
Portfolio Positioning – Q2 2021
Long positioning in agriculturals remained stable over the quarter whilst the Fund’s fixed income exposure remained short. Metals, energies, and stock indices remained relatively consistently long. In currencies, the Fund’s net short US Dollar position increased and then decreased significantly but still remains the largest net short currency exposure. The Fund’s next largest currency positions are a net short in the Euro and a net long in Pound Sterling.
Q3 2021 Commentary
Safe-haven assets found support at the start of the quarter from the rapid spread of the coronavirus Delta variant, hot inflation data and disappointing US economic data. All of which added to the uncertainty around global growth and caused some investors to reconsider the ‘reflation trade’. Longer-dated US treasury yields experienced sharp declines as investors flocked to the perceived safety of government bonds. Risk assets also started July strong and US stocks reached record highs as US jobs data surprised on the upside. Robust economic data and earning releases helped European and US stocks reach record highs despite the spread of the Delta variant in August. Asian stock indices suffered however, weighed down by Chinese regulatory clampdown and associated growth deceleration concerns. The Federal Reserve then sent their strongest signal yet that their accommodative policies would start to unwind by the end of this year. As other central banks followed suit, investors fled into the safe-haven US dollar and away from government bonds as tighter monetary policy became more likely. In September, it was energy markets which dominated headlines. Hurricane Ida forced oil production shutdowns off the Gulf of Mexico in the opening weeks of the month. Energies continued to be propelled upwards in the second half of September by low European gas inventories and fears of potential supply shortages during the coming winter months. Stocks also fell as central banks, including the Federal Reserve, again pointed towards less accommodative policy stances. The potential end to ultra-supportive monetary policy also helped strengthen the US Dollar and caused Treasury yields to rise.
The Fund successfully navigated the surge in energy prices. With particularly strong trends, and resulting performance, being seen in natural gas during September. Its net long exposure in the other commodities sectors also provided profits. Stock indices finished the quarter flat. Gains made in August were given back in September as equities went against their recent trends and fell due to increasing rhetoric from central banks that interest rate hikes may be on the horizon. The changing environment throughout the quarter between delta variant fears and the associated need for safe-haven assets and then inflationary concerns proved challenging in both the fixed income and currencies sectors. Losses were gradual throughout the quarter; the long British Pound position and variable German bond exposures were amongst the worst performing markets for the Fund.
Portfolio Positioning – Q3 2021
The Fund’s net long commodities exposure remained in place over the quarter. Positioning in agriculturals and metals remained relatively stable, whilst energies increased. In financials, the Fund’s net short bond exposure flipped to a net long at the end of July before then returning to a net short by the end of September. The net long stock indices positioning remained consistently long. The Fund’s US Dollar exposure changed from a net short at the start of the quarter to a net long by the end of the period. However, there was some variability during August caused by the oscillating market demand for safe-haven assets. The Fund’s largest net long position is in the US Dollar, whereas it’s largest net short is in the Euro. The 12 months net return for the Fund to 30 September 2021 were 5.98% for Class A, 5.17% for Class C and 6.21% for Class I.
| Private and Confidential |
Annual Commentary – AXS Aspect Core Diversified Strategy Fund
The views in this letter were as of September 30, 2021 and may not necessarily reflect the same views on the date this letter is first published or any time thereafter. These views are intended to help shareholders in understanding the fund’s investment methodology and do not constitute investment advice
| * | A long position refers to getting economic exposure to a reference asset, and this position will increase in value if the reference asset’s price increases. |
| ** | A short position refers to getting economic exposure to a reference asset, and this position will increase in value if the reference asset’s price decreases. |
| Private and Confidential |
 | Annual Commentary 2021 |
AXS Chesapeake Strategy Fund
The fiscal year for the fund was profitable as the portfolio was able to take advantage of trends that developed and/ or continued over the period. Performance for the fiscal year for the Class I shares1 was 29.89%. The portfolio was able to capitalize on higher price trends in the commodity sector and continues to hold net long positions in the commodity sector; including long positions in the Energy, Agricultural and industrial metals complexes. Short positions in the US dollar also posted positive results. However, as the trend has reversed and the fund is positioned long US dollars vs some G7 counterparts. Positions remain intact on long US and global equity markets. The fixed income sector also saw a reversal in trend during the period and the fund is now positioned for an increasing global rate environment. Below is the monthly breakdown for the year where the monthly performance reflects the Class I shares.
OCTOBER 2020
The AXS Chesapeake Strategy Fund posted a loss of -0.95% for October. Losses were recorded for the Fund in the fixed income, equity, and currency complexes, while the commodity sector was positive.
| · | The commodity sector posted positive results for the month. The grain complex produced gains on long soybean and canola positions and more than losses from being long corn. In the energy and meat complex, short positions posted minor gains and losses, respectively. |
| · | The fixed income sector was negative as long positions in the global rate markets produced gains that were offset from losses in the US rate market. |
| · | The equity sector produced negative results as long positions in the Nasdaq and S&P 500 incurred losses that exceeded gains from positions in the London FTSE market. |
| · | The currency sector also produced slight losses for the month. Gains were recorded on short US Dollar positions against the Japanese Yen, Swiss Franc and Swedish Krona, and were offset by losses in the Australian and Canadian dollar as well as the Euro. Gains were incurred on long dollar positions versus the Brazilian Real. |
NOVEMBER 2020
The Fund posted a gain of 7.97% for November. Gains were recorded in three sectors: equities, currencies and commodities. The fixed income sector was basically flat.
| · | The currency sector was the best performing sector for the month. Gains were recorded on short US Dollar positions with the biggest contributors to gains being the British Pound, Euro, Canadian Dollar, New Zealand and the Australian Dollar. |
| · | The commodity sector posted positive results for the month. Gains on long positions in the agricultural complex, led by long positions in canola, soybeans and corn were the best performing sub sectors. Gains on long positions in the industrial metals complex, led by aluminum, copper and zinc also contributed positive results. Losses were recorded in the energy and softs complex. |
| · | The equity sector posted positive results for the month. Gains were led by long positions in the broad indices, the Nasdaq and S&P 500. |
| · | The fixed income sector was basically flat for the month. |
DECEMBER 2020
The Fund posted a gain 8.86% for December. The month saw a continuation of established trends and the Fund posted positive results in all four sectors in which it trades: currencies, equities, fixed income, and commodities.
| · | The currency sector contributed the most to the positive results for the Fund for the month as most currency positions were profitable. Gains were recorded on short US Dollar positions against the Swiss Franc, Swedish Krona and Euro Dollar, as well as the British Pound, Canadian Dollar and the Australian Dollar. |
| 1 | Class A and Class C shares returned 29.62% and 28.66%, respectively, for the fiscal year. |
308 Long Lane ¨ Richmond, Virginia 23221
Tel: 804.836.1617 ¨ Fax: 804.836.1610 ¨ E-mail: clientservices@chesapeakecapital.com
| Annual Commentary 2021 |
| · | In fixed income, interest rate performance was positive for the month. Global bond markets contributed the most to the positive performance led by Italian, German and British interest rate positions. |
| · | The equity sector produced gains on long positions on Us indexes, as well as some global indices including those in China and Japan. |
| · | The commodity sector posted strong positive results for the month. The grain complex produced gains on long soybean, corn, wheat and canola positions. The gain from the metals complex was led by long positions in the precious metals, namely, gold and silver. Long positions in cotton and sugar added gains for the month as well. |
January 2021
The AXS Chesapeake Strategy Fund posted a gain of 0.54% for the month. Gains came from the commodity complex, while the currency and fixed income sectors were negative. Equities were quiet.
| · | The commodity sector posted positive results for the month. The grain complex produced gains on long soybean, corn and canola positions. Gains were also registered in the soft complex on long positions in sugar and cotton. The energy sector produced gains on long crude oil and gasoline positions. Losses were incurred on various long positions in the metals complex. |
| · | The fixed income sector was negative as long positions in the global rate markets produced losses as interest rates trended lower during the month. |
| · | The equity sector was basically flat for the month. |
| · | The currency sector produced losses for the month. Losses were recorded on short US Dollar positions against the Canadian and Australian dollars. Long US dollar positions versus the Brazilian Real produced gains. |
February 2021
The AXS Chesapeake Strategy Fund posted a gain of 7.19% for the month as market trends continued to be favorable for the portfolio. Gains were recorded for the Fund in the fixed income, commodity and equity complexes, while the currency sector produced negative results.
| · | The commodity sector posted positive results for the month. The grain complex produced gains on long soybean, soybean oil, corn and canola positions. Gains were also registered in the soft complex on long positions in sugar and cotton. The energy sector produced strong gains on long crude oil, heating oil and gasoline positions. Gains were also posted on long positions in the metals complex, led by the base metals which included copper and aluminum. |
| · | The fixed income sector was positive as long positions in the global rate markets produced gains particularly on the long end of the yield curve during the month. |
| · | The equity sector produced positive results as long positions in Global stock indices led the gains. The Japanese and French stock indices were the best performers in this sector. |
| · | The currency sector produced losses for the month. Losses were recorded on short US Dollar positions against the Swiss franc. Long US dollar positions versus the Brazilian Real produced gains. |
March 2021
The AXS Chesapeake Strategy Fund posted a loss of -0.08% for the month as losses incurred in the currency and commodity sectors offset gains in the fixed income and equity complexes.
| · | The commodity sector posted negative results for the month. The grain complex produced gains on long soybean, soybean oil, corn and canola positions, and losses on long wheat positions. Losses were also registered in the soft complex on long positions in sugar, coffee, and cotton. The energy sector produced losses on long crude oil and heating oil positions. Losses were also posted on long positions in the metals complex, led by nickel and silver. The meat complex produced gains on long lean hog and live cattle positions. |
| · | The fixed income sector was positive as long positions in the global rate markets produced gains as global interest rates continued their recent trend of higher yields during the month. |
| · | The equity sector produced positive results on long positions in Global stock indices. Gains were recorded on long positions in European and US indices. |
| · | The currency sector produced losses as the US dollar strengthened during the month. Losses were recorded on short US Dollar positions against the Euro, New Zealand dollar, Swiss Franc and British Pound. |
308 Long Lane ¨ Richmond, Virginia 23221
Tel: 804.836.1617 ¨ Fax: 804.836.1610 ¨ E-mail: clientservices@chesapeakecapital.com
| Annual Commentary 2021 |
APRIL 2021
The AXS Chesapeake Strategy Fund posted a gain of 6.05% for the month as market trends continued to be favorable for the portfolio. Gains were recorded in the commodity, currency, and equity sectors while the fixed income sectors produced negative results.
| · | The commodity sector posted positive results for the month. The grain complex produced gains on long soybean, soybean oil, corn, and canola positions. Gains were also registered in the soft complex on long positions in coffee, sugar, and cotton. The energy sector produced gains on long crude oil, heating oil and gasoline positions. The metals complex produced gains on long industrial metal positions, including copper, aluminum, lead, nickel, and zinc. |
| · | The equity sector produced gains on both foreign and domestic stock indices. Long positions in the CAC40 and DAX led the gains. |
| · | The currency sector produced gains for the month. Gains were recorded on short dollar positions versus the Australian and New Zealand dollars and the Euro. Long dollar positions against the Japanese yen produced losses for the month. |
| · | The fixed income sector was negative as long positions in the interest rate markets produced losses as interest rates trended lower during the month. Losses were incurred on short positions in the US 10-year note and 30-year bond. |
MAY 2021
The Fund posted a gain of 2.06% for the month. Gains were recorded for the Fund in the commodity, currency, and equity complexes, while the fixed income sector produced negative results.
| · | The commodity sector posted positive results for the month. Gains were posted on long positions in the metals complex, led by the base metals, namely, copper, zinc and aluminum. Losses were posted on short gold positions. Gains in the softs complex were from long positions in sugar and coffee. Long positions in cotton were negative. The grain complex produced slight gains on long soybean oil and canola positions. Losses were incurred on long positions in wheat, corn, and soybeans. The energy sector produced gains on long crude oil, heating oil and gasoline positions. |
| · | The equity sector produced positive results as long positions in global stock indices led the way. The best performers were the Chinese and French stock indices. |
| · | The currency sector produced gains for the month. Gains were recorded on short dollar positions versus the Indian rupee, British pound, and the Euro. Long US dollar positions versus the Brazilian Real produced losses. |
JUNE 2021
The AXS Chesapeake Strategy Fund posted a loss of -4.03% for the month as losses were incurred in three of the four sectors traded. The currency, commodity and fixed income sectors produced losses while the equity sector produced gains.
| · | The equity sector produced positive results on long positions in global stock indices. Gains were recorded on long positions in European and US indices. |
| · | The commodity sector posted negative results for the month. Only the energy sector produced gains in the sector as the upwards price trend continued in the complex. Gains were recorded on long crude oil, heating oil and gasoline positions. The grain complex produced losses as long soybean and soybean oil results more than negated the gains on long positions in wheat, corn, and canola. Losses were also posted on long positions in metals complex, led by copper, platinum, nickel, and silver. The meat and soft complexes were relatively flat for the month. |
| · | The currency sector produced losses for the month as the US dollar strengthened, reversing its trend against most world currencies. Losses were recorded on short US Dollar positions against the Euro, British pound, Russian ruble as well as the New Zealand, Australian and Canadian dollars. |
| · | The fixed income sector was negative as short positions in the domestic and global rate markets produced losses during the month. |
308 Long Lane ¨ Richmond, Virginia 23221
Tel: 804.836.1617 ¨ Fax: 804.836.1610 ¨ E-mail: clientservices@chesapeakecapital.com
| Annual Commentary 2021 |
JULY 2021
The AXS Chesapeake Strategy Fund posted a loss of -2.34% for the month, as three of the four sectors traded incurred losses, led by fixed income, while the commodity sector produced gains.
| · | The fixed income sector was negative as short positions in the interest rate markets produced losses as interest rates moved substantially lower during the month. Losses were incurred on short positions in the US 10-year note and 30-year bond as well as European fixed income positions. |
| · | The equity sector produced losses as long positions in the emerging market index and the Asian indices more than offset gains from US and European positions. |
| · | The currency sector produced losses for the month. Losses were recorded on short dollar positions versus the Australian and Canadian dollars as well as the Brazilian Real. |
| · | The commodity sector posted positive results for the month. Losses from the grain sector were more than offset from gains in the metals, energy, and soft complexes. RBOB gas, heating oil, coffee, sugar, and cotton continued their upward trends and produced gains for the month. |
AUGUST 2021
The Fund posted a gain of 0.17% for the month, with gains in the fixed income and equity complexes. The currency sector produced negative results, and the commodity sector was flat.
| · | The equity sector produced positive results as long positions in global stock indices led the gains. |
| · | The fixed income sector was positive as short positions in the global rate markets produced gains as interest rates rose during the month. |
| · | The currency sector produced losses for the month. Losses were recorded on short dollar positions versus the Australian and Canadian Dollars and the British pound. |
| · | The commodity sector was basically flat. Losses were posted on long positions in metals complex led by copper, silver, and palladium. Gains were posted on long aluminum positions. Gains in the Softs complex came from long positions in sugar, coffee and cotton. The grain complex was basically flat as gains from canola were mostly offset by losses from long positions in corn and soybean oil. The energy sector produced losses due to price declines from being long crude oil, heating oil and gasoline. |
September 2021
The AXS Chesapeake Strategy Fund posted a gain of 1.98% for the month as gains in the fixed income and commodity sectors more than offset losses in the equity and currency complexes.
| · | The fixed income sector was positive as short positions in the domestic and global rate markets produced gains during the month. The Long Gilt produced the greatest gain. Profits were also recorded across the yield curve of US notes and bonds. |
| · | The commodity sector posted positive results for the month. The energy sector produced gains as the upward price trend continued in the complex. Gains were recorded on long crude oil, heating oil and gasoline positions. The Softs complex produced gains due to being long cotton. Losses were posted on long positions in the metals complex. The meat and grain complexes were relatively flat for the month. |
| · | The currency sector produced a small loss for the month as the US dollar strengthened versus the Euro, producing gains that were more than offset by US dollar positions in several emerging market currencies. |
| · | The equity sector produced negative results on long positions in global stock indices. Losses were recorded on long positions in European and US indices with some of these losses being offset by gains from being long the Japan’s stock index. |
The views in this letter were as of September 30, 2021 and may not necessarily reflect the same views on the date this letter is first published or any time thereafter. These views are intended to help shareholders in understanding the fund’s investment methodology and do not constitute investment advice.
308 Long Lane ¨ Richmond, Virginia 23221
Tel: 804.836.1617 ¨ Fax: 804.836.1610 ¨ E-mail: clientservices@chesapeakecapital.com
| Annual Commentary 2021 |
Past performance is not necessarily indicative of future results. Futures trading is speculative and involves substantial risk of loss. This report is for use by current clients, authorized selling agents and prospective clients who have received a current Chesapeake disclosure document.
Actual Performance for Individual Capital Accounts may vary from the rate of return for the Company overall depending on the timing of the initial investment and subsequent additions and/or withdrawals.
308 Long Lane ¨ Richmond, Virginia 23221
Tel: 804.836.1617 ¨ Fax: 804.836.1610 ¨ E-mail: clientservices@chesapeakecapital.com
AXS Managed Futures Strategy Fund
Annual Letter to Shareholders for the year ended September 30, 2021
For the fiscal year ending September 30, 2021, the Fund’s Class A Shares (with No Load) returned −4.78%, Class A Shares (with Maximum Load) returned −10.25%, Class C Shares returned −5.58%, and Class I Shares returned −4.55%. During the period, the Fund’s Class I Shares underperformed both the Barclay BTOP50 Index® (the “Managed Futures Index”), which returned +16.08%, and US equities as represented by S&P 500® Total Return Index (the “Equities Index”), which returned +30.00%.
Much of the Fund’s underperformance can be attributed to a single trading program, the Quadriga Smart Gold options and futures trading program. This absolute return strategy aims to protect capital and generate negatively correlated returns (“crisis alpha”) during adverse and hostile equity markets, while seeking to earn neutral to positive returns during benign markets. Thus, the strategy seeks to earn, in the long run, higher risk-adjusted overall returns, particularly on the downside, through the combination of potentially higher compounded returns, lower realized volatility, and shallower drawdowns. Unfortunately, during a very strong year for equity markets (+30% for the Equities Index), a volatile and down year for gold (spot gold depreciated by about −8%), and a losing year for US Treasury securities (the 10-year bond returned about −4.5%), the Quadriga program lost about −50%, representing a contribution of −969 bps to the Fund’s performance, which eclipsed the combined positive contribution (+514 bps) made by all the other trading programs. The allocation to the Quadriga program was reduced progressively during the year, and the program was removed from the Fund’s portfolio in October 2021, shortly after the end of the fiscal year.
The Fund’s return has remained virtually uncorrelated to equities since inception, with a 0.19 correlation to the Equities Index. Like the managed futures asset class, to which it has had a correlation of 0.76 since inception, the Fund offers the potential for diversification benefits when added to traditional investment portfolios that have equities as their core holding.
FUND STRATEGY
The Fund’s investment objective is to seek capital appreciation in both rising and falling equity markets, with an annualized long-run volatility that is generally lower than the historical level of volatility experienced by the Equities Index.1 The Fund’s realized volatility since inception has been about 10.7%.
The Sub-Advisor pursues the Fund’s investment objectives mainly by investing in (i) fixed-income securities, and (ii) global derivatives markets, through the proprietary programs of one or more commodity trading advisors (“CTAs”), which are often labeled “managed futures” programs.
| 1 | The Fund’s sub-advisor seeks to manage the long-term volatility of the Fund’s returns within a target band of 8%-12%. This is only a voluntarily imposed internal target, and short-term volatility may fall outside this range. |
ampersandinvestments.com • 609.454.5200
The Sub-Advisor draws on its experience in the managed futures space to select futures trading programs and, by analyzing the interrelationships among them, to combine them in a portfolio that seeks to offer more consistent performance potential with lower volatility than individual programs. The portfolio is designed to be diversified across (i) trading methodologies (e.g., trend-following, global macro trading, relative value trading); (ii) trading time horizons (short-term, medium-term, long-term); (iii) sectors (energy, metals, agricultural commodities, equity indices, interest rates, currencies); and (iv) geography (US, Europe, Far East). The Sub-Advisor seeks to manage the risk of the portfolio by monitoring key parameters such as returns, volatility, drawdowns, value at risk (VaR), and sector exposures. While the portfolio is actively managed, it does not express or incorporate tactical views on markets or trading programs; rather, the Sub-Advisor emphasizes strategic allocation and long-term risk-adjusted returns.
PORTFOLIO
As of September 30, 2021, the Fund’s portfolio consisted of 17 futures trading programs. Four machine-learning/short-term trading programs (Crabel, Katonah, QIM and SCT) had a 20% allocation, as did two currency trading programs (LCJ and Mesirow). Two global macro programs (H2O and QMS) represented about 17% of the Fund’s portfolio, while four diversified intermediate-term to long-term (primarily) trend-following programs (Winton, KeyQuant, Quantica, and Quest) represented approximately 17% of the Fund’s portfolio. Two relative-value/commodity trading programs (EVE and J E Moody) represented approximately 15%, while the remaining 11% was allocated to other strategies (FORT Contrarian, QDRA and Quadriga).2 The Sub-Advisor believes that this diversification across trading styles and horizons has the potential, over time, to earn positive returns under a wide range of market conditions while keeping the volatility of the Fund’s returns within the desired range.
Table 1 displays the Fund’s quarter-by-quarter allocations to futures trading programs. This year, there were two deletions. In February, we discontinued our allocation to the Arctic Blue Inuvik commodity trading program. We increased our allocations to the other commodity programs in the portfolio. During April, we discontinued our allocation to the IPM Systematic Macro trading program. Both programs were wound down by their managers.
| 2 | It is worth mentioning that the above allocations are based on “notional trading,” whereas the Sub-Advisor employs a modified “risk-parity” allocation approach to determine allocations. |
ampersandinvestments.com • 609.454.5200
TABLE 1: QUARTER-END PORTFOLIO ALLOCATIONS
| Advisor | 9/30/2020 | 12/31/2020 | 3/31/2021 | 6/30/2021 | 9/30/2021 |
| Arctic Blue | 5.0% | 5.0% | | | |
| Crabel | 7.0% | 6.0% | 7.0% | 7.0% | 7.0% |
| Emil van Essen | 5.0% | 5.0% | 5.0% | 5.0% | 5.0% |
| Fort Contrarian | 5.0% | 5.0% | 5.0% | 5.0% | 4.0% |
| H2O Asset Management | 9.0% | 9.0% | 8.0% | 9.0% | 10.0% |
| IPM | 7.0% | 7.0% | 8.0% | | |
| J E Moody | 5.0% | 6.0% | 10.0% | 10.0% | 10.0% |
| Katonah | 4.0% | 6.0% | 5.0% | 6.0% | 5.0% |
| Key Trends | 5.0% | 5.0% | 5.0% | 6.0% | 6.0% |
| LCJ | 5.0% | 6.0% | 7.0% | 8.0% | 8.0% |
| Mesirow Financial | 4.0% | 6.0% | 9.0% | 10.0% | 12.0% |
| QDRA | 6.0% | 5.0% | 5.0% | 6.0% | 6.0% |
| QIM | 6.0% | 4.0% | 4.0% | 4.0% | 4.0% |
| QMS | 5.0% | 4.0% | 6.0% | 7.0% | 7.0% |
| Quadriga | 4.0% | 5.0% | 2.0% | 2.0% | 1.0% |
| Quantica | 6.0% | 4.0% | 3.0% | 3.0% | 3.0% |
| Quest | 3.0% | 3.0% | 3.0% | 3.0% | 3.0% |
| SCT | 4.0% | 4.0% | 4.0% | 4.0% | 4.0% |
| Winton | 5.0% | 5.0% | 4.0% | 5.0% | 5.0% |
ANALYSIS OF FUND PERFORMANCE
As shown in Table 2, the Fund underperformed both the Managed Futures Index and the Equities Index. The Fund’s volatility since inception is lower than that of the Equities Index.
TABLE 2: PERFORMANCE STATISTICS OF THE FUND
| | RETURN (Fiscal Year) | VOLATILITY (5/24/2011-9/30/2021) | CORRELATION (5/24/2011 – 9/30/2021) |
| Fund (Class I shares) | -4.55% | 10.67% | 1.00 |
| Barclay BTOP50 Index® | 16.08% | 6.43% | 0.76 |
| S&P 500 Total Return Index® | 30.00% | 13.48% | 0.19 |
FUND PERFORMANCE ATTRIBUTION BY TRADING PROGRAM AND SECTOR
As we have mentioned in earlier years, the Fund’s diversified portfolio of trading allocations generally results in the number of positive and negative performers being roughly balanced, even in a bad year: there were ten positive contributors to performance (including fixed-income securities), adding up to +22.71%. There were also ten negative contributions, which totaled −27.26%. In addition to the Quadriga program highlighted previously, negative contributions came from a wide range of trading strategies, notably global macro and currencies. The largest positive contribution was from a discretionary global macro trading program, with smaller contributions coming from across the board.
ampersandinvestments.com • 609.454.5200
TABLE 3: TRADING PROGRAM CONTRIBUTIONS TO PERFORMANCE (10/1/2020 to 9/30/2021)
| Trading Program | Contribution |
| Arctic Blue | 0.02% |
| Crabel | 0.71% |
| Emil van Essen | -0.84% |
| Fort Contrarian | -0.88% |
| H2O Asset Management | 11.00% |
| IPM | -0.98% |
| J E Moody | 2.14% |
| Katonah | -2.15% |
| Key Trends | -2.09% |
| LCJ | -1.23% |
| Mesirow Financial | -3.24% |
| QDRA | -4.21% |
| QIM | 0.18% |
| QMS | -1.95% |
| Quadriga | -9.69% |
| Quantica | 2.88% |
| Quest | 1.42% |
| SCT | 2.05% |
| Winton | 2.14% |
| Fixed Income Securities | 0.17% |
| TOTAL | -4.55% |
At the sector level, as shown in Table 4, equity indices were, not surprisingly, the biggest positive contributors to performance, followed by agricultural commodities and energy. Interest rates were the largest negative contributors, followed by currencies and metals.
TABLE 4: FUND PERFORMANCE ATTRIBUTION BY SECTOR (10/1/2020 to 9/30/2021)
| Sector | Contribution |
| Currencies | -7.58% |
| Equity Indices | 15.39% |
| Interest Rates | -14.10% |
| Agricultural Commodities | 3.43% |
| Energy | 2.48% |
| Metals | -4.34% |
| Fixed Income Securities | 0.17% |
| Total | -4.55% |
ampersandinvestments.com • 609.454.5200
Performance contribution is estimated by Ampersand Investment Management and is net of fees. Past performance does not guarantee future results.
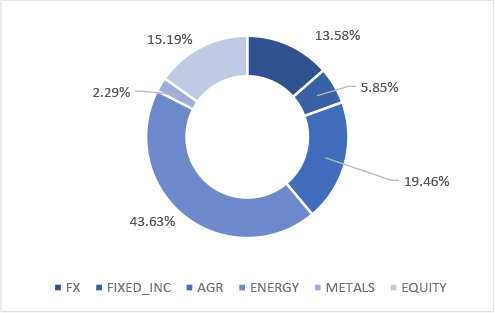
FUND SECTOR DIVERSIFICATION
RISK EXPOSURE AS OF 9/30/2021
RISK EXPOSURE AS OF 9/30/2020
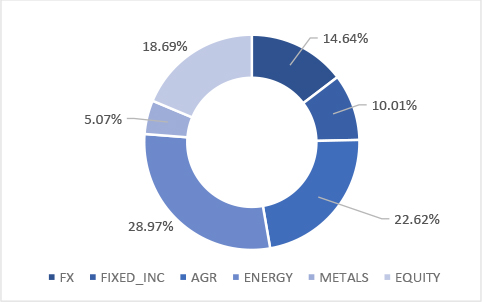
Source: Ampersand Investment Management and Bloomberg, LP. Reflects aggregate sector gross risk exposures
The Fund’s largest gross exposure was to energy (about 44%), followed by agricultural commodities (about 19%), equities (15%), currencies (about 14%), fixed income (about 6%), and metals (about 2%). Together, the financial sectors represent about 35% of the Fund’s exposure, much lower than the previous year’s 44%.
ampersandinvestments.com • 609.454.5200
MARKET COMMENTARY
Q4 2020
The Fund’s Class I shares kicked off the fiscal year with an excellent quarter (+6.98%).
OCTOBER 2020
The Fund started off the quarter with a negative month in October (−4.06%). Financial and commodity markets remained anxious in a month where global coronavirus cases rose by a single-day record of half a million. Renewed national lockdowns were imposed across Europe, leading to a crash in oil prices. Investor appetite for risk assets was also dampened by upcoming US election uncertainty and a breakdown in US fiscal stimulus talks. Brexit negotiations continued with focus on a few sticking points, although markets were relieved when the UK did not walk away from a self-imposed deadline. On the data front, the US posted a muted labor market picture, signaling a slowdown in recovery while most data out of Europe also indicated a worsening outlook as the virus continued to spread.
Long fixed income positions were hurt as key Asian and North American bond yields rose, with the latter partly attributable to expectations of additional US stimulus. Fears of an economic slowdown amid increased coronavirus cases led to major stock market selloffs, which detracted from long positions. In currencies, the Chinese Yuan benefited from a positive economic backdrop in China.
Short energy positions gained as the outlook for global consumption weakened with new pandemic-driven mobility restrictions. In metals, improving Chinese demand boosted aluminum prices. Weather concerns in the Americas helped boost key agricultural markets such as soybean, cotton, and wheat.
NOVEMBER 2020
The Fund had an excellent month in November (+6.09%). Not surprisingly, November was dominated by COVID-19 developments. There were several significant announcements, notable among which was the news that three strong vaccine candidates, claiming up to 95% efficacy, had completed Phase 3 testing and were filing for emergency use. This prompted a strong rally in risk assets and led to one of the biggest stock market spikes in history. Investors rotated out of growth and momentum stocks into value stocks as the prospects of a vaccine accelerated the outlook for a global recovery. Risk assets were also bolstered by the US election results, which pointed to a Joe Biden victory, although the Trump campaign was still trying to overturn the election outcomes in courts. Despite this positive news, the fact that much of the world was still battling an increase in COVID-19 cases and hospitalizations with varying degrees of lockdowns continued to cast a pall on markets.
Many government bond yields surged on the vaccine news, causing losses for net long fixed income exposure. Long stock index positions benefited, as a vaccine-induced, broad-based rally in equities ensued. Gains were generated by the currencies sector, where net short US Dollar exposure yielded profits, particularly against the New Zealand Dollar, after data on China’s PMI (Purchasing Managers’ Index) surprised on the upside.
Net long metals exposure also generated gains. Industrial metals rallied, especially copper, on the optimistic vaccine announcement, growing demand, and signs that China's manufacturing PMIs were accelerating at the fastest rate in a decade. Net long agricultural commodity exposure was also profitable as dry weather and strong demand from China for products such as soybeans boosted prices. Long positions in crude oil also profited as prices rallied on vaccine hopes, while natural gas prices fell on forecasts of a warmer winter.
ampersandinvestments.com • 609.454.5200
DECEMBER 2020
A good month of December (+5.10%) helped the Fund claw back even more of the year’s losses. Risk assets rallied strongly, bolstered by the deployment of several COVID-19 vaccines. After months of negotiations, the US signed into law the second largest relief bill in its history ($900bn) while the EU was able to secure its $2.2 trillion budget and stimulus plan. The UK and EU agreed to a post-Brexit trade agreement. All these agreements helped to boost market sentiment further while a global surge in coronavirus cases and hospitalizations counteracted some of these positive developments.
Equity markets appreciated strongly throughout the month, as the near-term optimism surrounding vaccinations, additional stimulus measures and strong IPO activity drove positive sentiment throughout the month. Core government bond yields were more mixed.
One of the main themes generating positive performance this month was continued US dollar weakness. Among the best performing currency positions were long exposures to commodity-sensitive regions such as Australia, Chile and South Africa. Long metals exposure also generated gains, with the sector overall appreciating in price as the US dollar weakened. Soybeans reached a six-year high on export optimism and supply concerns as dry weather conditions continued in key growing areas in South America.
In energy, short natural gas positions made strong gains as forecasters projected warmer trends and reduced heating demand. Crude oil prices soared as major oil producers agreed to persist with production cuts.
It was another very good quarter for global equity markets. Equity market volatility as measured by the VIX Index started the quarter at about 27% and continued to climb, peaking at about 40% towards month-end. By the second week of November, it declined to about 25%, and it remained in a fairly narrow band between 20% and 25% for the rest of the quarter, still higher than its long-term historical average but significantly below the levels seen earlier during 2020.
Q1 2021
The Fund’s Class I shares had a difficult first quarter of 2021 (-7.44%).
January 2021
The Fund began the quarter and the new year with a poor month of January (−6.53%).
The overall positive sentiment that had lifted markets towards the end of 2020 carried over into 2021. Global equities continued their march upwards, spurred by optimism around the inauguration of President Biden and the expected effect of the new administration on both domestic stimulus plans and foreign policy. However, the month ended on a more cautious tone as the market experienced jitters on valuation concerns and disappointing economic data.
Early gains from net long stock indices were eroded from bouts of uncertainty in the final trading days of the month. The early investor optimism went against long fixed income positions as yields rose. Higher US yields also supported a stronger US dollar, which moved against its multi-month downward trend, generating losses on short positions, mainly versus emerging market currencies.
Long positions in agricultural commodities benefited from strong Chinese export demand and supply concerns. The growing risk appetite played out as expected in the energy sector, with net positive performance from long positions. Industrial metals were helped by the improved global manufacturing outlook, while precious metal prices were weighed down by the stronger US dollar.
ampersandinvestments.com • 609.454.5200
February 2021
The Fund was flat during February (+0.00%).
Global bond markets experienced a rout, as investors were more spooked by inflation threats than encouraged by the possible positive impact of fiscal stimulus on economic growth. Cyclical assets such as value stocks and oil were boosted by accelerating vaccine rollouts, while growth stocks and gold suffered from rising yields. Major price moves occurred towards the end of the month as global policymakers sought to quell the panic through dovish rhetoric.
Developed market bond yields had some of their biggest monthly jumps in more than a decade, reflecting fears that central banks may need to tighten policy earlier than expected to suppress inflation. Long bond positions suffered. Net long exposure to stock indices made gains despite investors dumping highly-valued stock market segments in the face of spiking bond yields. Initially, long positions in emerging market and commodity currencies benefited from the improving growth outlook. However, these gains were largely erased during the final days as the dollar rose, whilst risk appetite waned amid inflation concerns.
Long energy market positions produced gains as frigid weather in the US boosted fuel demand, while supply was hampered by a winter storm in Texas. China's strong economic story helped long positions in agricultural markets such as cotton, where demand from China's textile industry grew while inventories fell. Sturdy Chinese manufacturing activity and supply issues also drove gains in industrial metals such as copper and aluminum.
MARCH 2021
The quarter ended on a disappointing note with a slightly negative month of March (-0.97%).
Major government bonds, particularly longer-dated US treasuries, continued to sell off and yields surged as the Federal Reserve pledged to stay accommodative for at least another two years and reiterated its position to allow inflation to rise above 2%. This amplified growing concerns that vast government spending and monetary stimulus would fuel inflation.
Equities rose on strong economic growth signals as President Joe Biden signed a USD1.9tn spending bill into law and accelerated vaccination efforts. Meanwhile, details began to emerge of a further multi-trillion-dollar infrastructure plan. Yields climbed in response to the Federal Reserve's dovish tones and rising growth expectations. The rise in yields and increasing expectation of a strong US recovery helped drive further US Dollar appreciation against major currencies, leading to losses, while the Euro lost value against its peers amidst a third wave of Covid-19 infections.
Losses came from net long metals exposure as metal prices fell with the strengthening US Dollar. Oil markets were increasingly volatile as a container ship accidentally blocked up the Suez Canal. Long positions in lean hogs contributed to profits in the agricultural sector on news of another outbreak of African swine fever in China; however, these were offset by other losses.
It was another positive albeit volatile quarter for global equity markets. Equity market volatility as measured by the VIX® Index started the quarter north of 25% and stayed in the 20-25% range, before spiking up to about 37% towards month-end. By the second week of February, it dropped and then remained in a fairly narrow band around 20% for most of the month before another brief spike up to about 28% at month-end. By the second week of March, it subsided to a range from 18% to 20%, still higher than its long-term historical average but significantly below the levels seen during early 2020.
ampersandinvestments.com • 609.454.5200
Q2 2021
The Fund’s Class I shares had a good quarter (+2.79%).
APRIL 2021
The Fund began the quarter with a virtually flat month of April (−0.16%).
Risk assets, mainly equities and commodities, thrived on upbeat economic data that pointed to strong signs of an accelerating recovery in the US. While the Federal Reserve reaffirmed its accommodative policies, President Biden came out in support of aggressive new tax hikes, causing investors to look past inflationary fears and send US treasury yields lower. Risk-off assets were also supported by a sharp increase in COVID cases, particularly in India, which struggled to contain a new coronavirus variant.
Long stock index positions gained as US stock markets reached record highs and European equities erased all their pandemic losses. Short positions in longer-dated US treasuries were large detractors as recent trends reversed. Gains from long positions in commodity-sensitive currencies were offset by losses on short positions in the Swiss Franc, the Japanese Yen and, especially, the Euro, with that currency strengthening as the vaccination rollout in the Eurozone picked up speed.
Long exposures across commodity markets generated gains as adverse weather conditions in key growing regions caused grain prices (corn, soy and wheat) to rally. Long positions in industrial metals were profitable as prices surged on the back of a weakening US dollar and accelerating demand. An optimistic OPEC report for global oil demand coupled with generally strengthening risk appetite resulted in gains on long energy positions.
MaY 2021
The Fund had a very strong month of May (+6.40%).
The “reflation trade” (a bet on assets that benefit from a strengthening economy and a pickup in inflation) contributed most of May’s returns. Risk assets continued their year-long rise, although mixed economic data releases from the US caused markets to fluctuate throughout the month. The specter of inflation continued to worry investors, although Federal Reserve officials attempted to reassure markets via dovish signals. This accommodative messaging caused the US Dollar to weaken against major peers, continuing its recent slide.
Net short US Dollar positions benefited from the currency’s ongoing weakness, mainly against commodity currencies and the British Pound. The US Dollar erased virtually all the gains it had made at the start of the year. A mid-month wobble, caused by the highest monthly core Consumer Price Index (CPI) rise in years and associated inflation fears, did not deter stock markets from rising by month-end. Prices were pushed higher by the continued easing of lockdown restrictions and strong Purchasing Managers' Index (PMI) data releases out of Europe. Fixed income positions finished the month down, as small gains in long positions in shorter-dated bonds were offset by losses on short exposures.
Long commodity exposures continue to be profitable. Lean hogs were one of the best performers, as the reopening of restaurants across the US stimulated pork demand. Gas oil and gasoline prices rose on fears of supply shortages due to a cyberattack on a major US fuel pipeline operator, benefiting long exposures. Metal markets joined other commodities, with prices rising as the reopening of economies continued to drive up demand.
ampersandinvestments.com • 609.454.5200
JUNE 2021
The Fund gave back some of May’s return during June (-3.24%).
The Federal Reserve surprised markets with its hawkish rate projections, causing the yield curve to flatten. Investors also temporarily pulled out of the hitherto popular “reflation trade.” US stock markets subsequently rallied to all-time highs on hopes for President Biden's new infrastructure deal. By the end of the month, however, investors had begun to weigh economic growth prospects against rising inflationary pressures and the spread of the highly infectious Delta coronavirus variant.
Yield curve flattening hurt the Fund, with short positions in longer-dated US, European and Canadian bonds detracting from performance. The potential for higher interest rates boosted the US Dollar versus major peers, leading to losses on net short positions. Fiscal stimulus and central bank assurances outweighed the impact of strong inflation data to calm the major stock markets, with the VIX index dropping to pre-pandemic levels.
Oil prices neared three-year highs on stronger demand and increasing concerns about supply deficits caused by reduced investment in the sector. In commodities, lean hog prices retreated on news of rapidly rising hog numbers in China. Gold and other major metals declined on the back of the robust US dollar and expectations for a faster pace of tightening by central banks.
It was a much less volatile quarter for global equity markets. Equity market volatility as measured by the VIX® Index started the quarter well below 20% and stayed in the 16-20% range, except for a brief spike into 20%-27% territory during the middle third of May. Towards the end of June, it had subsided to just above 15%, close to its long-term historical average and significantly below the pandemic highs seen during 2020.
Q3 2021
The Fund’s Class I shares ended the fiscal year with a disappointing quarter (-6.22%).
July 2021
The Fund began the quarter with very good performance for July (+2.55%).
Risk assets started the month strong, with US stocks reaching record highs. However, concerns about the coronavirus Delta variant and indications that inflation in the US may be picking up stoked uncertainty about global growth. Investors flocked out of the “reflation trade” (a bet on assets that benefit from a strengthening economy) and into safe-haven assets. Longer-dated US treasury yields experienced sharp declines. Many longer-term trends within commodities, fixed income and FX continued their reversal, while the US Dollar showed further strength.
Long commodities exposure generated profits, particularly in the energy sector. Natural gas prices rallied on the prospect of higher weather-related demand. Long industrial metals positions were profitable; nickel prices neared a seven-year high on robust demand and constrained supply.
In financial markets, fixed income rallied strongly, leading to gains in long positions. Long stock index exposures suffered losses on fears of a slowdown in the economic recovery. In currencies, gains from long US Dollar positions against emerging market currencies were more than offset by Euro losses, as the Euro also appreciated on the European Central Bank’s announcement that it would allow inflation to overshoot its target.
ampersandinvestments.com • 609.454.5200
AUGUST 2021
The Fund had a difficult month during August (-2.80%).
Robust economic data and earning releases helped European and US stocks reach record highs despite the spread of the coronavirus Delta variant. Asian stocks suffered, however, spooked by the Chinese regulatory clampdown and fears of consequent growth deceleration. The Federal Reserve sent strong signals that it would soon start to unwind its accommodative policies. As other central banks followed suit, investors fled into the safe-haven US dollar and away from government bonds, as prospects for tighter monetary policy appeared more likely. This sharp reversal led to losses on long fixed income exposures.
As economies continued to gradually reopen, hopes of an improving recovery sent most stock indices higher. The US dollar strengthened due to increasing talk of tapering, political tensions and disappointing economic data from China, before weakening again towards the end of the month.
US natural gas continued to rally on reports of inventory levels well below expectations, while other energy positions suffered losses. In agricultural commodities, sugar and coffee prices rose due to adverse weather conditions and prospects of lower output in key regions. Metal prices fell as the US dollar strengthened, causing losses from long exposures.
SEPTEMBER 2021
The Fund performed poorly during September (-5.92%).
The villain of this stormy month was Hurricane Ida, which forced oil production shutdowns in the Gulf of Mexico. Oil prices surged further on the decision by OPEC+ to increase output only modestly. Energy prices continued to march upwards in the second half of the month, spurred by low European gas inventories and fears of potential supply shortages during winter. Stocks reversed their near-relentless climb, as central banks, including the Federal Reserve, signaled less accommodative policy stances. The impending halt to supportive monetary policy also helped the US Dollar and Treasury yields to rise.
Net long energy exposure was the sole bright spot this month, but its positive contribution was eclipsed by all the other sectors. Rising yields led to fixed income exposures being the biggest detractors from performance. Stock indices added to the woes, as markets declined on fears that one of the world’s largest property developers, Evergrande, could default and set off global financial contagion. Signals of potential interest rate hikes helped the US Dollar to appreciate.
July and August were relatively quiet months for global equity markets. Equity market volatility as measured by the VIX® Index started the quarter at about 15% and stayed in the 15-20% range for the most part. Hurricane Ida contributed to a turbulent September, with the VIX® moving into the 20-25% range for most of the month, and ending the quarter at about 23%.
Conclusion
We believe that concerns about the global economy and geopolitics have been exacerbated by the coronavirus crisis. Historically, futures trading programs have tended to perform well in a variety of market conditions, perhaps particularly so during periods of market turbulence and volatility expansion. A period of a few weeks or months is far too short to judge the long-term potential of any strategy or asset class.
ampersandinvestments.com • 609.454.5200
The Fund seeks to provide returns that, in the long run, are comparable to the S&P 500® Total Return Index with comparable volatility, while seeking to mitigate downside risk. We continue to believe that a significant and strategic allocation to the Fund as a substitute for core equity exposure in a portfolio may provide “smarter” equity exposure: equity exposure that is dynamically hedged, coupled with the potential for uncorrelated alpha in the long run.
Definition of Terms
Alpha is a measure of performance on a risk-adjusted basis. Alpha takes the volatility (price risk) of a fund and compares its risk-adjusted performance to a benchmark index. The excess return of the fund relative to the return of the benchmark index is a fund’s alpha.
Annualized rate of return (AROR) is the geometric average return for a period greater than or equal to one year, expressed on an annual basis or as a return per year.
Basis Points (bps) is a unit of measure used in quoting yields, changes in yields or differences between yields. One basis point is equal to 0.01%, or one one-hundredth of a percent of yield and 100 basis points equals 1%.
Brexit is an abbreviation of “British exit,” which refers to the June 23, 2016 referendum by British voters to exit the European Union. The referendum roiled global markets, including currencies, causing the British pound to fall to its lowest level in decades. Prime Minister David Cameron, who supported the UK remaining in the EU announced he would step down in October.
Commodity Trading Advisors (CTA) provide advice and services related to trading in futures contracts. They are responsible for the trading within managed futures accounts.
Correlation is a statistical measure of how two securities move in relation to each other.
Crisis alpha: Refers to profits or gains that can be made by exploiting certain market trends during times of market turmoil.
Hedge is making an investment to reduce the risk of adverse price movements in an asset. Normally, a hedge consists of taking an offsetting position in a related security, such as a futures contract.
Long position refers to buying a security such as a stock, commodity, or currency, with the expectation that the asset will rise in value.
The Purchasing Managers' Index (PMI) is an index of the prevailing direction of economic trends in the manufacturing and service sectors. The PMI is based on a monthly survey sent to senior executives at more than 400 companies in 19 primary industries, which are weighted by their contribution to U.S. GDP.
The S&P 500 Total Return Index® is widely regarded as the best single gauge of the U.S. equities market. This world-renowned Index includes 500 leading companies in leading industries of the U.S. economy.
Short position is a position whereby an investor sells borrowed securities in anticipation of a price decline and is required to return an equal number of shares at some point in the future.
Standard Deviation (Volatility) is a measure of fluctuation in the value of an asset or investment. Lower volatility improves the stability and lowers the risk of an investment portfolio.
ampersandinvestments.com • 609.454.5200
The VIX® Index (VIX) is a forward-looking measure of equity market volatility. Since its introduction, the VIX is considered by many to be the world’s premier barometer of investor sentiment and market volatility.
Yield is the income return on an investment. This refers to the interest or dividends received from a security and is usually expressed annually as a percentage based on the investment’s cost, its current market value or its face value.
Investors cannot directly invest in an index and unmanaged index returns do not reflect any fees, expenses or sales charges. The views in this letter were as of September 30, 2021 and may not necessarily reflect the same views on the date this letter is first published or any time thereafter. These views are intended to help shareholders in understanding the fund’s investment methodology and do not constitute investment advice.
ampersandinvestments.com • 609.454.5200

Dear Fellow Shareholders,
We write this annual shareholder letter for the AXS Multi-Strategy Alternatives Fund (“the Fund”) as of fiscal year end on September 30, 2021.
OVERVIEW
The period began with Kerns Capital Management, Inc. (“KCM”) serving as the Fund’s sub-advisor for AXS Investments LLC (“AXS”). AXS and KCM terminated their relationship in January 2021. For continuity, AXS in turn hired KCM Chief Investment Officer Parker Binion in January to continue managing the Fund. Previously, Mr. Binion had managed the Fund for KCM since January 2016. The strategy remains the same. AXS Head of Investments Mark Lacuesta now assists Mr. Binion in Fund operations.
Effective May 2021, Morningstar recategorized the Fund from Long-Short Equity to Multistrategy where the Fund enjoyed a 5-star rank at fiscal year-end.1 The Fund remains in Lipper’s Alternative Global Macro category.
The fiscal year saw the equity market continue its Covid rally without a significant pullback of 10% or more. Meanwhile the bond market was flat to slightly negative as interest rates rose in conjunction with the reopening of the economy. The Fund remained net 100% long equities2 throughout the period aside from a few days around the presidential election in November 2020 when the Fund hedged its equity exposure.
INVESTMENT STRATEGY
The AXS Multi-Strategy Alternatives Fund is a liquid, equity-focused macro fund with the flexibility to invest globally and tactically, including long/short, across all asset classes. The Fund's flexible mandate gives it the ability to invest globally in a wide variety of asset classes, company sizes, industries and equity styles (e.g., growth vs. value). It can also employ leverage to accentuate market moves and hedge in an effort to control risk and manage volatility. Quantitative, top-down hedging and bottoms-up stock picking tools are used, which help reduce emotion and behavioral biases in investment decision-making.
INVESTMENT PHILOSOPHY
The AXS Multi-Strategy Alternatives Fund employs a risk-averse investment strategy predicated on the belief that strong long-term investment results are best achieved through the compounding of reasonable gains and the avoidance of major losses. The Fund strives to be nimble and responsive to significant market cycle changes by moving out of “harm’s way” during recessions and capitalizing on opportunistic equity strategies during stronger markets. Said another way, the Fund strives to both “manage and participate” by “de-risking” the portfolio in dangerous markets and “re-risking” or “re-engaging” the portfolio to return generating assets when markets are stronger. As a recent example, the Fund was hedged during the March 2020 Covid decline.
| 1 | In the Morningstar Multistrategy category, KCMTX and KCMIX received an overall rating of 5 stars (127 funds) and a 3-year rating of 5 stars (127 funds). KCMTX received a 5-year rating of 5 stars (101 funds), and a 10-year rating of 5 stars (35 funds), all based on risk-adjusted returns as of 9/30/2021. See disclosure at the end of this letter. |
| 2 | Net long percentage is the Fund’s gross long exposure less its gross short exposure. When fully invested in equities, the Fund allocates 120% of its AUM to stock purchases (long) and 20% to stock sales (short selling). |
INVESTMENT PROCESS
| 1. | Long-term growth of capital |
The Fund’s mandate gives it the flexibility to invest globally in any asset class, long or short. The Fund is equity-focused, as historically owning common stocks and certain ETFs offer the greatest opportunity to grow capital over time. The Fund determines whether to be invested in stocks via equity exposure rules. The Fund uses a "Risk On/Risk Off" hedging process. If Risk is On, the Fund employs several quantitative equity strategies (algorithms) to make buy/sell decisions. These algorithms are based on a variety of inputs and are designed to exploit opportunities in the marketplace. Each strategy may focus on fundamental factors (such as earnings, debt, free cash flow, dividends and industry leadership) and technical factors (including price, momentum, volume, volatility and breadth). Each algorithm has its own ranking system and buy/sell rules. Most of the strategies set sector-based exposure ceilings, with individual stocks limited to about 3% of AUM at the Fund level. This diversification helps reduce sector and stock-specific risk. International allocations are made in the same manner and held in American Depositary Receipts (ADRs).
| 2. | Preservation of capital |
If Risk is Off, the Fund will hedge using three approaches: (a) buying index ETFs that act inversely to the stock market to create a market neutral or net short posture, (b) shorting index ETFs via total return swap trades, and (3) by investing in noncorrelated asset classes such as bonds, precious metals or currencies through the use of ETFs. The Fund can also use cash as a defensive position.
Although not the primary focus, the Fund uses stock strategies built with portfolio turnover in mind in order to maximize the chance for long-term capital gains. The Fund prefers stocks it can own for several months to several years. The Fund also seek to reduce turnover with the hedging process. First, by using leveraged inverse ETFs and swaps to hedge, the Fund is able to stay partially invested. This allows for a market neutral position without having to raise more cash than necessary and realize excess gains.
PERFORMANCE
Institutional shares3 of the Fund (KCMIX) returned 29.30% for the period, outpacing the benchmark HFRX Equity Hedge Index which gained 17.74% and the Morningstar Multistrategy category which advanced 9.66%.
Stock selections of Moderna, Alphabet, Tesla and the Energy and Financial sector ETFs drove upside performance. The largest detractors were Baidu, Amgen, Paypal and the Palladium ETF. From a factor perspective, size, volatility and beta contributed to performance while momentum and earnings hurt performance.
| 3 | R-1 shares (KCMTX) returned 29.23% for the fiscal year. |
OUTLOOK
Going forward, staying power of the market rally will be challenged as the nation enters a midterm election year facing supply chain disruptions, inflationary pressures and a tapering Fed. Should the market stumble and our hedge rules become triggered, we will take defensive action again.
The views in this letter were as of September 30, 2021, and may not necessarily reflect the same views on the date this letter is first published or any time thereafter. These views are intended to help shareholders in understanding the Fund’s investment methodology and do not constitute investment advice.
Faithfully yours,
| Parker B. Binion | Mark M. Lacuesta |
| Portfolio Manager, AXS Investments LLC | Head of Investments, AXS Investments LLC |
The Morningstar Rating™ for funds, or "star rating," is calculated for managed products (including mutual funds, variable annuity and variable life subaccounts, exchange-traded funds, closed-end funds, and separate accounts) with at least a three-year history. Exchange-traded funds and open-ended mutual funds are considered a single population for comparative purposes. It is calculated based on a Morningstar Risk-Adjusted Return measure that accounts for variation in a managed product's monthly excess performance, placing more emphasis on downward variations and rewarding consistent performance. The Morningstar Rating does not include any adjustment for sales loads. The top 10% of products in each product category receive 5 stars, the next 22.5% receive 4 stars, the next 35% receive 3 stars, the next 22.5% receive 2 stars, and the bottom 10% receive 1 star. The Overall Morningstar Rating for a managed product is derived from a weighted average of the performance figures associated with its three-, five- and 10-year (if applicable) Morningstar Rating metrics.
The weights are: 100% three-year rating for 36-59 months of total returns, 60% five-year rating/40% three-year rating for 60-119 months of total returns, and 50% 10-year rating/30% five-year rating/20% three-year rating for 120 or more months of total returns. While the 10-year overall star rating formula seems to give the most weight to the 10-year period, the most recent three-year period actually has the greatest impact because it is included in all three rating periods. Morningstar Rating is for the I share classes; other classes may have different performance characteristics.
© 2021 Morningstar. All Rights Reserved. The information contained herein: (1) is proprietary to Morningstar and/or its content providers; (2) may not be copied or distributed; and (3) is not warranted to be accurate, complete or timely. Neither Morningstar nor its content providers are responsible for any damages or losses arising from any use of this information.

The AXS Sustainable Income Fund is fixed income focused seeking to deliver a consistent high-income stream with limited volatility. The Fund invests primarily in corporate credit and given the environment over the last twelve months has principally invested in the US high yield market. The Investment Manager utilizes a deep fundamental process that incorporates top down, bottom up and sustainability analysis at the issuer level to select investments for the Fund. Over the last twelve months, the Fund has delivered a strong total return of 9.52% (the return was 8.42% for the period October 17, 2020 through September 30, 2021), net of fees with dividends reinvested, which dramatically outperformed its general fixed income benchmark and most other fixed income asset classes. The Fund’s holdings have benefited from monetary and fiscal stimulus, a general re-opening of the economy post COVID lock downs, a higher relative yield, improving credit fundamentals marked by more upgrades than downgrades and a falling default rate, and importantly, a resistance to increasing risk free rates that have caused negative total returns for most traditional fixed income asset classes1.
In concert with the high yield market, the Fund saw 12 straight months of positive returns for the one-year period ended September 30, 2021 driven by positive geopolitical and fundamental developments. Some of the highlights include markets reacting positively to the US election results as well as US lawmakers agreeing on the terms of a second relief package to help ease economic strains as the much anticipated second wave of Covid-19 gripped the world early during this time period; Enthusiasm for a strong economic recovery was supported by declining Covid related deaths as effective vaccines began to be administered across the globe; Earnings beats and relaxation of pandemic restrictions boosted sentiment in the later part of the time period and eased concerns associated with the Delta Variant. Commodity prices soared foreshadowing higher inflation and compounding logistical and shipping constraints. Perhaps most influential to fixed income, Treasuries ended the period with the 2-year up 15 basis points (bps) to 0.28% and the 10-year higher by 80 bps to 1.49% as the yield curve steepened. That was most dramatic in the first quarter of 2021, which the Bloomberg Barclays Aggregate Index returned -4.46% while the Fund remained well insulated returning +2.08% comparatively.
In total, the AXS Sustainable Income Fund (“the Fund”) posted a strong absolute return over the one-year period ended September 30, 2021, returning 9.52% and substantially outperforming short dated fixed income alternatives, like the ICE BofA 1-3 year US Corporate and Government Index which returned 0.35% for the period. By allocation, the Fund benefitted from its holdings in higher yielding securities that saw spread compression from improved fundamentals and holdings in the 2-4 year part of the credit curve, which outperformed the rest of the high yield market for the period. The 2-4 year part of the credit curve was enough duration and convexity to benefit from tightening spreads, but not so much that it was dragged down by negative returns associated with rising rates (i.e. duration) particularly in Q1 2021. By sector, the primary driver of performance was strong security selection within those sectors most tied to reopening risk such as Media and Transportation while sectors like Utility and Insurance lagged though they represent a combined less than 1% of the Fund. By rating, the portfolio benefited from the down in credit quality exposure as government and investment grade returns were much lower on a relative basis. The performance of the Fund also benefited from strong returns concentrated in high conviction positions as 7 of the Fund’s top 10 holdings and 13 of the top 20 holdings had total returns which exceeded the Fund return for the period.
As it relates to Sustainability, the Fund continues to emphasize companies the investment manager believes to be further along the continuum integrating sustainability principles in their business and those that have less transition risk associated with the changing environment. The Fund does not invest in fossil fuels, which was not beneficial during the period, as energy rallied in concert with the rise in Oil during the period; however, the investment manager was able to replace that risk with other sectors and industries that benefited from the same drivers as those that would cause energy bonds to perform well. In addition, the manager continues to believe that energy will face longer term secular challenges, as COP 26 recently highlights an accelerating commitment, which could be more difficult for lower rated energy companies to transition and address. Overall, the Fund’s sustainability focus remains more targeted at risk mitigation, which helps to further insult against the asymmetric nature of credit risk.
| 1 | Includes but is not limited to the ICE BofA US Corporate and Government Index -1.38%, Bloomberg Barclays Global Aggregate Index -0.91%, ICE BofA US Mortgage Backed Securities Index -0.46% |
SKY Harbor Capital Management, LLC 20 Horseneck Lane, Greenwich, CT 06830
As we look forward, we believe investors in credit assets remain torn between a focus on the generally improving fundamentals of corporate issuers as the economy pushes through various headwinds and the threat associated with rising interest rates. Fortunately, the Fund and the high yield market have done well historically in periods of rising rates. In our view, current valuations are broadly supported by fundamentals which have benefited from a strong recovery in earnings and generally strong aggregate economic data, though supply chain difficulties and inflationary pressures are reducing forward outlooks. Default risk is rapidly normalizing, and the credit ratings cycle has swung to the positive after a pandemic-induced downgrade cycle.
We continue to believe that there remains an opportunity around spread compression based upon a reduction in the excess spread component of overall high yield market spreads. Unlike last year where picking bonds with recovering results and attractive valuations was a key driver of returns, this year we expect returns will be a function of missing companies that stumble and are rerated to higher yields. Our valuation work suggests a to continue our bias towards lower rated credit that typically is lower duration and shorter duration assets in general.
The views in this letter were as of September 30, 2021 and may not necessarily reflect the same views on the date this letter is first published or any time thereafter. These views are intended to help shareholders in understanding the fund’s investment methodology and do not constitute investment advice.
SKY Harbor Capital Management, LLC 20 Horseneck Lane, Greenwich, CT 06830
Dear Shareholders,
Thank you for your continued investment and interest in the AXS Thomson Reuters Venture Capital Return Tracker Fund and the AXS Thomson Reuters Private Equity Return Tracker Fund.
On November 20, 2020, AXS Investments LLC concluded the conversion of these funds to begin its stewardship of their underlying portfolios. Since this date, the S&P 500 Index has returned 22.60% on a total return basis compared to -1.38% for aggregate fixed income as represented by the Bloomberg Barclays U.S. Aggregate Total Return Index. The Bloomberg Commodity Index, a broad measure of the commodity markets, returned 35.91% while the performance of the USD vs a broad basket of currencies returned 1.55% as measured by the Bloomberg Dollar Spot Index.
This performance occurred with the backdrop of the global pandemic exerting its influence on the markets in general with financial market participants providing their various interpretations of how the monetary and fiscal response to the pandemic have supported asset prices. Themes centered on the timing and extent of the reopening of the economy, the possible resurgence of lock-downs due to COVID-19 variants, the growing concern around supply-chain constraints, geopolitical developments, and the increasing concerns from inflation emerged during the fiscal year of these funds.
As indexed-based strategies, the Funds are designed to track the performance of their underlying indices, both of which seek to replicate the aggregate risk and performance profile of the Venture Capital and Private Equity Buyout space, respectively.
AXS Thomson Reuters Venture Capital Return Tracker Fund (LDVAX, LDVIX, LDVCX)
The AXS Thomson Reuters Venture Capital Return Tracker Fund is available in class A, I, and C shares. For the fiscal year ended September 30, 2021, performance for the A share was 33.23% (25.57% with load), the I share returned 33.54%, and the C share returned 32.26%. Fund performance was in line with the Thomson Reuters Venture Capital Index gross performance of 35.23%. The Fund’s prospectus benchmark NASDAQ Composite Total Return Index returned 30.26%.
The Fund replicates the exposures of its underlying index using U.S. listed equities and total return swaps to create economic leverage and to implement a relative-value overlay. U.S. listed equities provide exposures to the economic sectors represented by the universe of venture capital backed private companies.
The index is constructed using the Thomson Reuters Business Classification (TRBC) to classify and measure the direct economic exposures of the universe of venture capital backed companies. In certain instances, the economic sectors are more specific, as is the case for Software and Technology Equipment, rather than that more general Technology. During the period, Software, Heath Care Services, Industrials, Technology Equipment, and Non-Cyclical Consumer Goods & Services consistently ranked as the top 5 sectors of the underlying index to represent the primary exposures of the index. The aggregate sector weights are determined by the index and implemented by the fund.
The index selects U.S. listed large cap equities among the respective sectors and weights the membership according to their market value subject to a 4.5% (ex-cash) weight constraint. Each sector is diversified in the number of securities within each sector and through use of the weight constraint. In this manner, the intent is to reduce idiosyncratic risks and to isolate the systemic risks of each sector. The Fund implements the index membership in both the security and relative target weights.
AXS Thomson Reuters Private Equity Return Tracker Fund (LDPAX, LDPIX, LDPCX)
The AXS Thomson Reuters Private Equity Return Tracker Fund is available in class A, I, and C shares. For the fiscal year ended September 30, 2021, performance for the A share was 29.35% (21.89% with load), the I share returned 29.68%, and the C share returned 28.36%. Fund performance was in line with the Thomson Reuters Private Equity Index gross performance of 31.31%. The Fund’s prospectus benchmark S&P 500 Total Return Index returned 30.00%.
The Fund replicates the exposures of its underlying index using U.S. listed equities and total return swaps to create economic leverage and to implement a relative-value overlay. U.S. listed equities provide exposures to the economic sectors represented by the universe of private equity buyout companies.
The index is constructed using the Thomson Reuters Business Classification (TRBC) to classify and measure the direct economic exposures of the universe of private equity buyout companies. During the period, the relative weights among the 10 sectors remained consistent with the largest sectors being Technology, Cyclical Consumer Goods & Services, and Industrials, and Non-Cyclical Consumer Goods & Services.
The index selects U.S. listed large cap equities among the respective sectors and weights the membership according to their market value subject to a 4.5% (ex-cash) weight constraint. Each sector is diversified in the number of securities within each sector and through use of the weight constraint. In this manner, the intent is to reduce idiosyncratic risks and to isolate the systemic risks of each sector. The Fund implements the index membership in both the security and relative target weights.
Outlook
As index-based strategies, the Funds are designed to track their underlying indexes and are passively managed. The indexes replicate the average returns of the venture capital and private equity space. Direct investment in these strategies have required large capital commitments and long lock-up periods in private LP structures resulting in the need for long-term investment horizons. Replication strategies using an open-end mutual fund structure address these hurdles by allowing lower investment minimums and offering daily liquidity.
Institutions have utilized these strategies as long-term strategic investments and we suggest the outlook for these strategies should undertake a similar approach. These strategies serve as tools to achieve a strategic allocation to the venture capital and private equity space. The passive, rules-based investment process is consistently applied throughout various market environments.
We thank you for your continued support and confidence in our implementation of these strategies.
The views in this letter were as of September 30, 2021, and may not necessarily reflect the same views on the date this letter is first published or any time thereafter. These views are intended to help shareholders in understanding the Fund’s investment methodology and do not constitute investment advice.
AXS Alternative Growth Fund
FUND PERFORMANCE at September 30, 2021 (Unaudited)
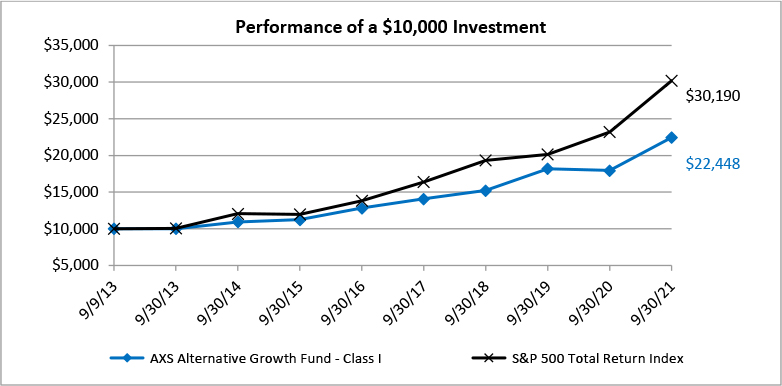
This graph compares a hypothetical $10,000 investment in the Fund’s Class I shares, made at its inception, with a similar investment in the S&P 500 Total Return Index. The performance graph above is shown for the Fund’s Class I shares. Class A shares performance may vary. Results include the reinvestment of all dividends and capital gains.
The S&P 500 Total Return Index is widely regarded as the best single gauge of the U.S. equities market. This world-renowned Index includes 500 leading companies in leading industries of the U.S. economy. The index does not reflect expenses, fees or sales charge, which would lower performance. The index is unmanaged and is not available for investment.
| Average Annual Total Returns as of September 30, 2021 | 1 Year | 5 Years | Since Inception | Inception Date |
| Before deducting maximum sales charge | | | | |
| Class A1 | 24.82% | 11.52% | 10.27% | 09/09/13 |
| Class I | 25.04% | 11.83% | 10.56% | 09/09/13 |
| After deducting maximum sales charge | | | | |
| Class A1 | 17.60% | 10.20% | 9.46% | 09/09/13 |
| S&P 500 Total Return Index | 30.00% | 16.90% | 14.70% | 09/09/13 |
| 1 | Maximum sales charge for Class A shares is 5.75%. |
The performance data quoted here represents past performance and past performance is not a guarantee of future results. Investment return and principal value will fluctuate so that an investor’s shares, when redeemed, may be worth more or less than their original cost. Current performance may be lower or higher than the performance information quoted. The most recent month end performance may be obtained by calling (833) 297-2587.
The Fund acquired the assets and liabilities of the Equinox Ampersand Strategy Fund, a series of the Equinox Funds Trust (the “Predecessor Fund”) on November 8, 2019. As a result of the reorganization, the Fund is the accounting successor of the Predecessor Fund. Performance results shown in the graph and the performance table above for the periods prior to November 8, 2019, reflect the performance of the Predecessor Fund.
AXS Alternative Growth Fund
FUND PERFORMANCE at September 30, 2021 (Unaudited) – Continued
Gross and net expense ratios for the Class A shares were 4.83% and 1.24%, respectively, and the Class I shares were 4.58% and 0.99%, respectively, which were stated in the current prospectus dated February 1, 2021, as amended February 16, 2021. For the Fund’s current one year expense ratios, please refer to the Consolidated Financial Highlights section of this report. The Fund’s Advisor has contractually agreed to waive its fees and/or pay for operating expenses of the Fund to ensure that total annual fund operating expenses (excluding, as applicable, taxes, leverage interest, brokerage commissions, dividend and interest expenses on short sales, acquired fund fees and expenses as determined in accordance with Form N-1A, expenses incurred in connection with any merger or reorganization, or extraordinary expenses such as litigation expenses) do not exceed 1.24% and 0.99% of the average daily net assets of the Fund’s Class A and Class I shares, respectively. This agreement is in effect until January 31, 2022, and it may be terminated before that date only by the Trust’s Board of Trustees. In the absence of such waivers, the Fund’s returns would be lower.
Returns reflect the reinvestment of distributions made by the Fund, if any. The graph and the performance table above do not reflect the deduction of taxes that a shareholder would pay on Fund distributions or the redemption of the Fund shares. Shares redeemed within 30 days of purchase will be charged 1.00% redemption fee.
AXS Aspect Core Diversified Strategy Fund
FUND PERFORMANCE at September 30, 2021 (Unaudited)
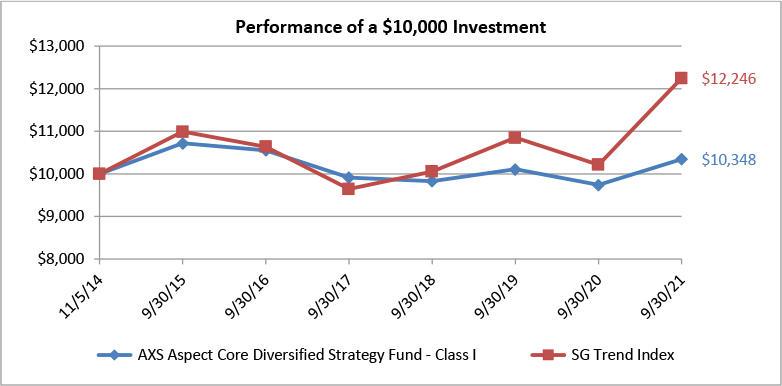
This graph compares a hypothetical $10,000 investment in the Fund’s Class I shares, made at its inception, with a similar investment in the SG Trend Index. The performance graph above is shown for the Fund’s Class I shares. Class A shares and Class C shares performance may vary. Results include the reinvestment of all dividends and capital gains.
The SG Trend Index is designed to track the 10 largest (by AUM) trend following CTAs and be representative of the trend followers in the managed futures space. The SG Trend index is equally weighted, and rebalanced and reconstituted annually. The index does not reflect expenses, fees or sales charge, which would lower performance. The index is unmanaged and is not available for investment.
| Average Annual Total Returns as of September 30, 2021 | 1 Year | 5 Years | Since Inception | Inception Date |
| Before deducting maximum sales charge | | | | |
| Class A1 | 5.98% | -0.61% | -0.82% | 08/21/15 |
| Class C2 | 5.17% | -1.39% | -1.59% | 08/21/15 |
| Class I3 | 6.21% | -0.40% | 0.50% | 11/05/14 |
| After deducting maximum sales charge | | | | |
| Class A1 | -0.12% | -1.78% | -1.78% | 08/21/15 |
| Class C2 | 4.17% | -1.39% | -1.59% | 08/21/15 |
| SG Trend Index | 19.59% | 2.80% | 2.94% | 11/05/14 |
| 1 | Maximum sales charge for Class A shares is 5.75%. No initial sales charge applies to purchase of $1 million or more. |
| 2 | Class C Shares are subject to a contingent deferred sales charge (“CDSC”) of 1.00% on any shares sold within 12 months of the date of purchase. |
| 3 | Class I shares do not have any initial or contingent deferred sales charge. |
The performance data quoted here represents past performance and past performance is not a guarantee of future results. Investment return and principal value will fluctuate so that an investor’s shares, when redeemed, may be worth more or less than their original cost. Current performance may be lower or higher than the performance information quoted. The most recent month end performance may be obtained by calling (833) 297-2587.
The Fund acquired the assets and liabilities of the Equinox Aspect Core Diversified Strategy Fund, a series of the Equinox Funds Trust (the “Predecessor Fund”) on November 8, 2019. As a result of the reorganization, the Fund is the accounting successor of the Predecessor Fund. Performance results shown in the graph and the performance table above for the period prior to November 8, 2019, reflect the performance of the Predecessor Fund.
AXS Aspect Core Diversified Strategy Fund
FUND PERFORMANCE at September 30, 2021 (Unaudited) – Continued
Gross and net expense ratios for the Class A were 2.63% and 1.74%, respectively, for the Class C shares were 3.38% and 2.49%, respectively, and for the Class I shares were 2.38% and 1.49%, respectively, which were stated in the current prospectus dated February 1, 2021, as amended February 16, 2021. For the Fund’s current one year expense ratios, please refer to the Consolidated Financial Highlights section of this report. The Fund’s Advisor has contractually agreed to waive its fees and/or pay for operating expenses of the Fund to ensure that total annual fund operating expenses (excluding, as applicable, taxes, leverage interest, brokerage commissions, dividend and interest expenses on short sales, acquired fund fees and expenses as determined in accordance with Form N-1A, expenses incurred in connection with any merger or reorganization, or extraordinary expenses such as litigation expenses) do not exceed 1.70%, 2.45%, and 1.45% of the average daily net assets of the Fund’s Class A, Class C, and Class I shares, respectively. This agreement is in effect until January 31, 2022, and it may be terminated before that date only by the Trust’s Board of Trustees. In the absence of such waivers, the Fund’s returns would be lower.
Returns reflect the reinvestment of distributions made by the Fund, if any. The graph and the performance table above do not reflect the deduction of taxes that a shareholder would pay on Fund distributions or the redemption of the Fund shares.
AXS Chesapeake Strategy Fund
FUND PERFORMANCE at September 30, 2021 (Unaudited)

This graph compares a hypothetical $10,000 investment in the Fund’s Class I shares, made at its inception, with a similar investment in the SG Trend Index. The performance graph above is shown for the Fund’s Class I shares. Class A shares and Class C shares performance may vary. Results include the reinvestment of all dividends and capital gains.
The SG Trend Index is designed to track the 10 largest (by AUM) trend following CTAs and be representative of the trend followers in the managed futures space. The SG Trend index is equally weighted, and rebalanced and reconstituted annually. The index does not reflect expenses, fees or sales charge, which would lower performance. The index is unmanaged and is not available for investment.
| Average Annual Total Returns as of September 30, 2021 | 1 Year | 5 Years | Since Inception | Inception Date |
| Before deducting maximum sales charge | | | | |
| Class A1 | 29.62% | 1.42% | 0.54% | 08/21/15 |
| Class C2 | 28.66% | 0.67% | -0.19% | 08/21/15 |
| Class I3 | 29.89% | 1.68% | 5.14% | 09/10/12 |
| After deducting maximum sales charge | | | | |
| Class A1 | 22.22% | 0.22% | -0.42% | 08/21/15 |
| Class C2 | 27.66% | 0.67% | -0.19% | 08/21/15 |
| SG Trend Index | 19.59% | 2.80% | 3.16% | 09/10/12 |
| 1 | Maximum sales charge for Class A shares is 5.75%. No initial sales charge applies to purchase of $1 million or more. |
| 2 | Class C Shares are subject to a contingent deferred sales charge (“CDSC”) of 1.00% on any shares sold within 12 months of the date of purchase. |
| 3 | Class I shares do not have any initial or contingent deferred sales charge. |
The performance data quoted here represents past performance and past performance is not a guarantee of future results. Investment return and principal value will fluctuate so that an investor’s shares, when redeemed, may be worth more or less than their original cost. Current performance may be lower or higher than the performance information quoted. The most recent month end performance may be obtained by calling (833) 297-2587.
The Fund acquired the assets and liabilities of the Equinox Chesapeake Strategy Fund, a series of the Equinox Funds Trust (the “Predecessor Fund”) on November 8, 2019. As a result of the reorganization, the Fund is the accounting successor of the Predecessor Fund. Performance results shown in the graph and the performance table above for the period prior to November 8, 2019, reflect the performance of the Predecessor Fund.
AXS Chesapeake Strategy Fund
FUND PERFORMANCE at September 30, 2021 (Unaudited) – Continued
Gross and net expense ratios for the Class A were 2.35% and 2.12%, respectively, for the Class C shares were 3.10% and 2.87%, respectively, and for the Class I shares were 2.10% and 1.87%, respectively, which were stated in the current prospectus dated February 1, 2021, as amended February 16, 2021. For the Fund’s current one year expense ratios, please refer to the Consolidated Financial Highlights section of this report. The Fund’s Advisor has contractually agreed to waive its fees and/or pay for operating expenses of the Fund to ensure that total annual fund operating expenses (excluding, as applicable, taxes, leverage interest, brokerage commissions, dividend and interest expenses on short sales, acquired fund fees and expenses as determined in accordance with Form N-1A, expenses incurred in connection with any merger or reorganization, or extraordinary expenses such as litigation expenses) do not exceed 2.10%, 2.85%, and 1.85% of the average daily net assets of the Fund’s Class A, Class C, and Class I shares, respectively. This agreement is in effect until January 31, 2022, and it may be terminated before that date only by the Trust’s Board of Trustees. In the absence of such waivers, the Fund’s returns would be lower.
Returns reflect the reinvestment of distributions made by the Fund, if any. The graph and the performance table above do not reflect the deduction of taxes that a shareholder would pay on Fund distributions or the redemption of the Fund shares.
AXS Managed Futures Strategy Fund
FUND PERFORMANCE at September 30, 2021 (Unaudited)
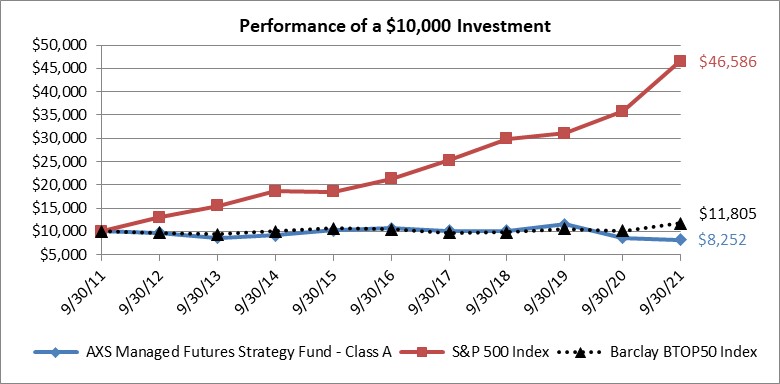
This graph compares a hypothetical $10,000 investment in the Fund’s Class A shares with a similar investment in the Barclay BTOP50 Index and S&P 500 Index. The performance graph above is shown for the Fund’s Class A shares. Class C shares and Class I shares performance may vary. Results include the reinvestment of all dividends and capital gains.
The Fund's benchmark changed from the S&P 500 Index to the Barclay BTOP50 Index. The Barclay BTOP50 Index is comprised of a diversified group of CTA strategies which the Advisor believes more closely represents the Fund's investment strategy and objectives.
The Barclays BTOP50 index seeks to replicate the overall composition of the managed futures industry with regard to trading style and overall market exposure. The S&P 500 Index includes a representative sample of 500 leading companies in leading industries of the U.S. economy and assumes any dividends are reinvested back into the index. The indexes do not reflect expenses, fees or sales charge, which would lower performance. The indexes are unmanaged and are not available for investment.
| Average Annual Total Returns as of September 30, 2021 | 1 Year | 5 Years | 10 Years |
| Before deducting maximum sales charge | | | |
| Class A1 | -4.78% | -5.07% | -1.90% |
| Class C2 | -5.58% | -5.79% | -2.64% |
| Class I3 | -4.55% | -4.83% | -1.66% |
| After deducting maximum sales charge | | | |
| Class A1 | -10.25% | -6.19% | -2.48% |
| Class C2 | -6.53% | -5.79% | -2.64% |
| Barclay BTOP50 Index | 16.08% | 2.40% | 1.68% |
| S&P 500 Index | 30.00% | 16.90% | 16.63% |
| 1 | Maximum sales charge for Class A shares is 5.75%. No initial sales charge applies to purchase of $1 million or more. |
| 2 | Class C Shares are subject to a contingent deferred sales charge (“CDSC”) of 1.00% on any shares sold within 12 months of the date of purchase. |
| 3 | Class I shares do not have any initial or contingent deferred sales charge. |
The performance data quoted here represents past performance and past performance is not a guarantee of future results. Investment return and principal value will fluctuate so that an investor’s shares, when redeemed, may be worth more or less than their original cost. Current performance may be lower or higher than the performance information quoted. The most recent month end performance may be obtained by calling (833) 297-2587.
AXS Managed Futures Strategy Fund
FUND PERFORMANCE at September 30, 2021 (Unaudited) – Continued
The Fund acquired the assets and liabilities of the Equinox MutualHedge Futures Strategy Fund, a series of the Northern Lights Fund Trust (the “Predecessor Fund”) on January 24, 2020. As a result of the reorganization, the Fund is the accounting successor of the Predecessor Fund. Performance results shown in the graph and the performance table above for the period prior to January 24, 2020, reflect the performance of the Predecessor Fund.
Gross and net expense ratios for the Class A were 2.03% and 1.96%, respectively, for the Class C shares were 2.78% and 2.71%, respectively, and for the Class I shares were 1.78% and 1.71%, respectively, which were stated in the current prospectus dated February 1, 2021, as amended February 16, 2021. For the Fund’s current one year expense ratios, please refer to the Consolidated Financial Highlights section of this report. The Fund’s Advisor has contractually agreed to waive its fees and/or pay for operating expenses of the Fund to ensure that total annual fund operating expenses (excluding, as applicable, taxes, leverage interest, brokerage commissions, dividend and interest expenses on short sales, acquired fund fees and expenses as determined in accordance with Form N-1A, expenses incurred in connection with any merger or reorganization, or extraordinary expenses such as litigation expenses) do not exceed 1.95%, 2.70%, and 1.70% of the average daily net assets of the Fund’s Class A, Class C, and Class I shares, respectively. This agreement is in effect until January 31, 2022, and it may be terminated before that date only by the Trust’s Board of Trustees. In the absence of such waivers, the Fund’s returns would be lower.
Returns reflect the reinvestment of distributions made by the Fund, if any. The graph and the performance table above do not reflect the deduction of taxes that a shareholder would pay on Fund distributions or the redemption of the Fund shares. Shares redeemed within 30 days of purchase will be charged a redemption fee of 1.00%.
AXS Multi-Strategy Alternatives Fund
FUND PERFORMANCE at September 30, 2021 (Unaudited)
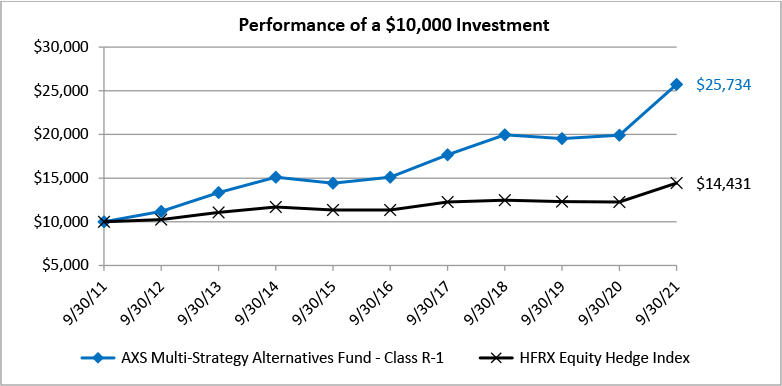
This graph compares a hypothetical $10,000 investment in the Fund’s Class R-1 shares with a similar investment in the HFRX Equity Hedge Index during the periods shown. The performance graph above is shown for the Fund’s Class R-1 shares. Class I shares performance may vary. Results include the reinvestment of all dividends and capital gains.
The HFRX Equity Hedge Index is an unmanaged index designed to measure daily performance representative of long-short equity hedge funds. The index does not reflect expenses, fees or sales charge, which would lower performance. The index is unmanaged and is not available for investment.
| Average Annual Total Returns as of September 30, 2021 | 1 Year | 5 Years | 10 Years |
| Class R-1 | 29.23% | 11.23% | 9.91% |
| Class I | 29.30% | N/A | N/A |
| HFRX Equity Hedge Index | 17.74% | 4.90% | 3.74% |
The performance data quoted here represents past performance and past performance is not a guarantee of future results. Investment return and principal value will fluctuate so that an investor’s shares, when redeemed, may be worth more or less than their original cost. Current performance may be lower or higher than the performance information quoted. The most recent month end performance may be obtained by calling (833) 297-2587.
The Fund acquired the assets and liabilities of the KCM Macro Trends Fund, a series of Northern Lights Fund Trust (the “Predecessor Fund”) on October 18, 2019. As a result of the reorganization, the Fund is the accounting successor of the Predecessor Fund. Performance results shown in the graph and the performance table above for the period prior to October 18, 2019, reflect the performance of the Predecessor Fund.
Expense ratios for Class R-1 and Class I shares were 1.77% and 1.52%, respectively, which were the amounts stated in the current prospectus dated February 1, 2021, as amended February 16, 2021. For the Fund’s current one year expense ratios, please refer to the Financial Highlights section of this report. The Fund’s Advisor has contractually agreed to waive its fees and/or pay for operating expenses of the Fund to ensure that total annual fund operating expenses (excluding, as applicable, taxes, leverage interest, brokerage commissions, dividend and interest expenses on short sales, acquired fund fees and expenses as determined in accordance with Form N-1A, expenses incurred in connection with any merger or reorganization, or extraordinary expenses such as litigation expenses) do not exceed 1.51% and 1.68% of the average daily net assets of the Fund’s Class I and Class R-1 shares, respectively. This agreement is in effect until January 31, 2022, and it may be terminated before that date only by the Trust’s Board of Trustees. In the absence of such waivers, the Fund’s returns would be lower.
AXS Multi-Strategy Alternatives Fund
FUND PERFORMANCE at September 30, 2021 (Unaudited) – Continued
Returns reflect the reinvestment of distributions made by the Fund, if any. The graph and the performance table shown do not reflect the deduction of taxes that a shareholder would pay on Fund distributions or the redemption of Fund shares.
AXS Sustainable Income Fund
FUND PERFORMANCE at September 30, 2021 (Unaudited)

This graph compares a hypothetical $10,000 investment in the Fund’s Class I shares, made at its inception, with a similar investment in the ICE BofA Merrill Lynch 1-3 Year US Corporate & Government Index. The performance graph above is shown for the Fund Class I shares. Results include the reinvestment of all dividends and capital gains.
The ICE BofA Merrill Lynch 1-3 Year US Corporate & Government Index is the performance of U.S. dollar denominated investment grade debt publicly issued in the U.S. domestic market, including U.S. Treasury, U.S. agency, foreign government, supranational and corporate securities. The index does not reflect expenses, fees or sales charge, which would lower performance. The index is unmanaged and is not available for investment.
| Average Annual Total Returns as of September 30, 2021 | 1 Year | 5 Years | Since Inception | Inception Date |
| Class I | 9.52% | 4.19% | 3.16% | 02/01/13 |
| ICE BofA Merrill Lynch 1-3 Year US Corporate & Government Index | 0.35% | 1.92% | 1.54% | 02/01/13 |
The performance data quoted here represents past performance and past performance is not a guarantee of future results. Investment return and principal value will fluctuate so that an investor’s shares, when redeemed, may be worth more or less than their original cost. Current performance may be lower or higher than the performance information quoted. The most recent month end performance may be obtained by calling (833) 297-2587.
The Fund acquired the assets and liabilities of the Sky Harbor Short Duration High Yield Partners, LP, a Delaware limited partnership which commenced operations on February 1, 2013 (the “Predecessor Fund”) on October 16, 2020. As a result of the reorganization, the Fund is the accounting successor of the Predecessor Fund. The Predecessor Fund was not registered under the Investment Company Act of 1940, as amended (the "1940 Act") and therefore was not subject to certain restrictions imposed by the 1940 Act on registered investment companies and by the Internal Revenue Code of 1986 on regulated investment companies. If the Predecessor Fund had been registered under the 1940 Act, the Predecessor Fund's performance may have been adversely affected. Performance results shown in the graph and the performance table above for the period prior to October 16, 2020, reflect the performance of the Predecessor Fund. The return was 8.42% for the period October 17, 2020 (commencement of operations) through September 30, 2021.
Gross and net expense ratios for the Class I shares were 1.01% and 0.99%, respectively, which were stated in the current prospectus dated October 15, 2020. For the Fund’s current one year expense ratios, please refer to the Financial Highlights section of this report. The Fund’s Advisor has contractually agreed to waive its fees and/or pay for operating expenses of the Fund to ensure that total annual fund operating expenses (excluding, as applicable, taxes, leverage interest, brokerage commissions, dividend and interest expenses on short sales, acquired fund fees and expenses as determined in accordance with Form N-1A, expenses incurred in connection with any merger or reorganization, or extraordinary expenses such as litigation expenses) do not exceed 0.99% of the average daily net assets of the Fund’s Class I shares. This agreement is in effect until January 31, 2022, and it may be terminated before that date only by the Trust’s Board of Trustees. In the absence of such waivers, the Fund’s returns would be lower.
AXS Sustainable Income Fund
FUND PERFORMANCE at September 30, 2021 (Unaudited) – Continued
Returns reflect the reinvestment of distributions made by the Fund, if any. The graph and the performance table above do not reflect the deduction of taxes that a shareholder would pay on Fund distributions or the redemption of the Fund shares. Shares redeemed within 30 days of purchase will be charged 1.00% redemption fee.
AXS Thomson Reuters Private Equity Return Tracker Fund
FUND PERFORMANCE at September 30, 2021 (Unaudited)
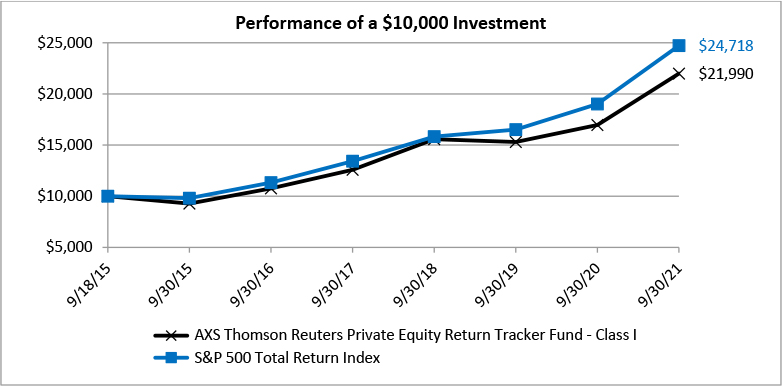
This graph compares a hypothetical $10,000 investment in the Fund’s Class I shares, made at its inception, with a similar investment in the S&P 500 Total Return Index. The performance graph above is shown for the Fund Class I shares. Class A shares and Class C shares performance may vary. Results include the reinvestment of all dividends and capital gains.
The S&P 500 Total Return Index is a broad unmanaged index of 500 stocks, which is widely recognized as representative of the equity market in general. The index does not reflect expenses, fees or sales charge, which would lower performance. The index is unmanaged and is not available for investment.
| Average Annual Total Returns as of September 30, 2021 | 1 Year | 5 Years | Since Inception | Inception Date |
| Before deducting maximum sales charge | | | | |
| Class A1 | 29.35% | 15.10% | 13.70% | 09/18/15 |
| Class C2 | 28.36% | 14.21% | 12.93% | 09/18/15 |
| Class I3 | 29.68% | 15.37% | 13.95% | 09/18/15 |
| After deducting maximum sales charge | | | | |
| Class A1 | 21.89% | 13.74% | 12.59% | 09/18/15 |
| Class C2 | 27.36% | 14.21% | 12.93% | 09/18/15 |
| S&P 500 Total Return Index | 30.00% | 16.90% | 16.18% | 09/18/15 |
| 1 | Maximum sales charge for Class A shares is 5.75%. No initial sales charge applies to purchase of $1 million or more. |
| 2 | Class C Shares are subject to a contingent deferred sales charge (“CDSC”) of 1.00% on any shares sold within 12 months of the date of purchase. |
| 3 | Class I shares do not have any initial or contingent deferred sales charge. |
The performance data quoted here represents past performance and past performance is not a guarantee of future results. Investment return and principal value will fluctuate so that an investor’s shares, when redeemed, may be worth more or less than their original cost. Current performance may be lower or higher than the performance information quoted. The most recent month end performance may be obtained by calling (833) 297-2587.
The Fund acquired the assets and liabilities of the Leland Thomson Reuters Private Equity Buyout Index Fund, a series of the Northern Lights Fund Trust III (the “Predecessor Fund”) on November 20, 2020. As a result of the reorganization, the Fund is the accounting successor of the Predecessor Fund. Performance results shown in the graph and the performance table above for the period prior to November 20, 2020, reflect the performance of the Predecessor Fund.
AXS Thomson Reuters Private Equity Return Tracker Fund
FUND PERFORMANCE at September 30, 2021 (Unaudited) – Continued
Gross and net expense ratios for the Class A were 2.03% and 1.76%, respectively, for the Class C shares were 2.78% and 2.51%, respectively, and for the Class I shares were 1.78% and 1.51%, respectively, which were stated in the current prospectus dated February 1, 2021, as amended February 16, 2021. For the Fund’s current one year expense ratios, please refer to the Financial Highlights section of this report. The Fund’s Advisor has contractually agreed to waive its fees and/or pay for operating expenses of the Fund to ensure that total annual fund operating expenses (excluding, as applicable, taxes, leverage interest, brokerage commissions, dividend and interest expenses on short sales, acquired fund fees and expenses as determined in accordance with Form N-1A, expenses incurred in connection with any merger or reorganization, or extraordinary expenses such as litigation expenses) do not exceed 1.75%, 2.50%, and 1.50% of the average daily net assets of the Fund’s Class A, Class C, and Class I shares, respectively. This agreement is in effect until November 21, 2022, and it may be terminated before that date only by the Trust’s Board of Trustees. In the absence of such waivers, the Fund’s returns would be lower.
Returns reflect the reinvestment of distributions made by the Fund, if any. The graph and the performance table above do not reflect the deduction of taxes that a shareholder would pay on Fund distributions or the redemption of the Fund shares. Shares redeemed within 30 days of purchase will be charged 1.00% redemption fee.
AXS Thomson Reuters Venture Capital Return Tracker Fund
FUND PERFORMANCE at September 30, 2021 (Unaudited)
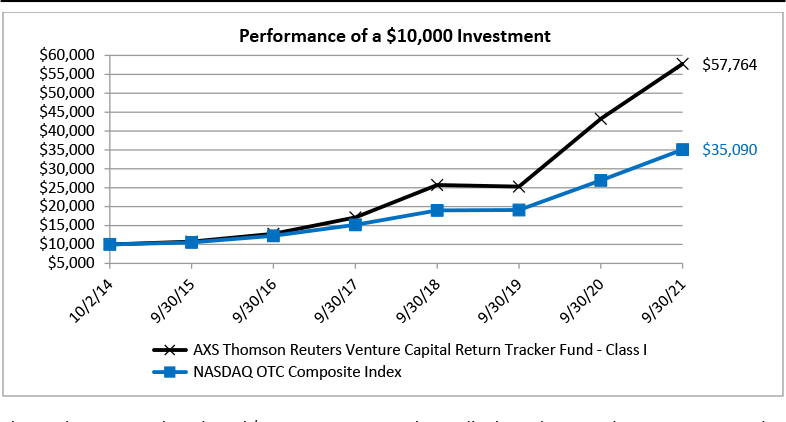
This graph compares a hypothetical $10,000 investment in the Fund’s Class I shares, made at its inception, with a similar investment in the NASDAQ OTC Composite Index. The performance graph above is shown for the Fund Class I shares. Class A shares and Class C shares performance may vary. Results include the reinvestment of all dividends and capital gains.
The NASDAQ OTC Composite Index is the market capitalization-weighted index of over 2,500 common equities listed on the Nasdaq stock exchange. The index does not reflect expenses, fees or sales charge, which would lower performance. The index is unmanaged and is not available for investment.
| Average Annual Total Returns as of September 30, 2021 | 1 Year | 5 Years | Since Inception | Inception Date |
| Before deducting maximum sales charge | | | | |
| Class A1 | 33.23% | 34.77% | 28.25% | 10/02/14 |
| Class C2 | 32.26% | 33.77% | 30.21% | 09/23/15 |
| Class I3 | 33.54% | 35.07% | 28.50% | 10/02/14 |
| After deducting maximum sales charge | | | | |
| Class A1 | 25.57% | 33.19% | 27.28% | 10/02/14 |
| Class C2 | 31.26% | 33.77% | 30.21% | 09/23/15 |
| NASDAQ OTC Composite Index | 30.26% | 23.37% | 19.66% | 10/02/14 |
| 1 | Maximum sales charge for Class A shares is 5.75%. No initial sales charge applies to purchase of $1 million or more. |
| 2 | Class C Shares are subject to a contingent deferred sales charge (“CDSC”) of 1.00% on any shares sold within 12 months of the date of purchase. |
| 3 | Class I shares do not have any initial or contingent deferred sales charge. |
The performance data quoted here represents past performance and past performance is not a guarantee of future results. Investment return and principal value will fluctuate so that an investor’s shares, when redeemed, may be worth more or less than their original cost. Current performance may be lower or higher than the performance information quoted. The most recent month end performance may be obtained by calling (833) 297-2587.
The Fund acquired the assets and liabilities of the Leland Thomson Reuters Venture Capital Index Fund, a series of the Northern Lights Fund Trust III (the “Predecessor Fund”) on November 20, 2020. As a result of the reorganization, the Fund is the accounting successor of the Predecessor Fund. Performance results shown in the graph and the performance table above for the period prior to November 20, 2020, reflect the performance of the Predecessor Fund.
AXS Thomson Reuters Venture Capital Return Tracker Fund
FUND PERFORMANCE at September 30, 2021 (Unaudited) – Continued
The expense ratios for the Class A, Class C and Class I shares were 1.76%, 2.51% and 1.51%, respectively, which were stated in the current prospectus dated February 1, 2021, as amended February 16, 2021. For the Fund’s current one year expense ratios, please refer to the Financial Highlights section of this report. The Fund’s Advisor has contractually agreed to waive its fees and/or pay for operating expenses of the Fund to ensure that total annual fund operating expenses (excluding, as applicable, taxes, leverage interest, brokerage commissions, dividend and interest expenses on short sales, acquired fund fees and expenses as determined in accordance with Form N-1A, expenses incurred in connection with any merger or reorganization, or extraordinary expenses such as litigation expenses) do not exceed 1.75%, 2.50%, and 1.50% of the average daily net assets of the Fund’s Class A, Class C, and Class I shares, respectively. This agreement is in effect until November 21, 2022, and it may be terminated before that date only by the Trust’s Board of Trustees. In the absence of such waivers, the Fund’s returns would be lower.
Returns reflect the reinvestment of distributions made by the Fund, if any. The graph and the performance table above do not reflect the deduction of taxes that a shareholder would pay on Fund distributions or the redemption of the Fund shares. Shares redeemed within 30 days of purchase will be charged 1.00% redemption fee.
AXS Alternative Growth Fund
CONSOLIDATED SCHEDULE OF INVESTMENTS
As of September 30, 2021
Number
of Shares | | | | | Value | |
| | | | SHORT-TERM INVESTMENTS — 67.1% | | | |
| | 2,292,922 | | | Fidelity Investments Money Market Government Portfolio - Class I, 0.01%1 | | $ | 2,292,922 | |
| | | | | TOTAL SHORT-TERM INVESTMENTS | | | | |
| | | | | (Cost $2,292,922) | | | 2,292,922 | |
| | | | | TOTAL INVESTMENTS — 67.1% | | | | |
| | | | | (Cost $2,292,922) | | | 2,292,922 | |
| | | | | Other Assets in Excess of Liabilities — 32.9% | | | 1,122,571 | |
| | | | | TOTAL NET ASSETS — 100.0% | | $ | 3,415,493 | |
| 1 | The rate is the annualized seven-day yield at period end. |
See accompanying Notes to Consolidated Financial Statements.
AXS Alternative Growth Fund
CONSOLIDATED SCHEDULE OF INVESTMENTS - Continued
As of September 30, 2021
FUTURES CONTRACTS
| Number of Contracts | | | Description | | Expiration Date | | Notional Value | | | Value at September 30, 2021 | | | Unrealized Appreciation (Depreciation) | |
| | | | | | | | | | | | | | | |
| | 18 | | | S&P 500 E-Mini | | December 2021 | | $ | 4,001,045 | | | $ | 3,867,975 | | | $ | (133,070 | ) |
| | | | | | | | | | | | | | | | | | | |
| TOTAL FUTURES CONTRACTS | | $ | 4,001,045 | | | $ | 3,867,975 | | | $ | (133,070 | ) |
See accompanying Notes to Consolidated Financial Statements.
AXS Alternative Growth Fund
CONSOLIDATED SCHEDULE OF INVESTMENTS - Continued
As of September 30, 2021
SWAP CONTRACT
TOTAL RETURN SWAP
| Counterparty | | Reference Entity | | Pay/Receive Total Return on Reference Entity | | Financing Rate1 | | | Termination Date | | Notional Value | | | Unrealized Appreciation (Depreciation) | |
| | | | | | | | | | | | | | | | |
| Deutsche Bank | | AXS Alternative Growth Fund Custom Basket2 | | Receive | | | 0.50% of Notional Value | | | June 1, 2023 | | $ | 7,326,538 | | | $ | (635,360 | ) |
| TOTAL SWAP CONTRACT | | | | | | | | | | | | $ | (635,360 | ) |
| 1 | Financing rate is based upon predetermined notional amounts. |
| 2 | This investment is a holding of the AXS Alternative Growth Fund Limited. |
See accompanying Notes to Consolidated Financial Statements.
AXS Alternative Growth Fund
CONSOLIDATED SCHEDULE OF INVESTMENTS - Continued
As of September 30, 2021
Total Return Swap Top 50 Holdings^
FUTURES CONTRACTS
| Number of Long Contracts | | | Description | | Expiration Date | | Notional Value | | | Unrealized Appreciation (Depreciation) | |
| | 24 | | | Three Month Canadian Bankers Acceptance Future | | Mar-23 | | $ | 4,611,378 | | | $ | (10,884 | ) |
| | 12 | | | Eurodollar | | Jun-22 | | | 2,957,941 | | | | (427 | ) |
| | 11 | | | Eurodollar | | Dec-22 | | | 2,762,966 | | | | (2,176 | ) |
| | 29 | | | Light Sweet Crude Oil (WTI) Future | | Nov-21 | | | 2,139,576 | | | | 196,965 | |
| | 7 | | | 3 month Euro (EURIBOR) | | Oct-21 | | | 1,931,506 | | | | (347 | ) |
| | 9 | | | Three Month Canadian Bankers Acceptance Future | | Dec-22 | | | 1,750,714 | | | | (2,782 | ) |
| | 9 | | | 3 month Sterling | | Mar-22 | | | 1,467,520 | | | | (3,388 | ) |
| | 5 | | | Eurodollar | | Sep-22 | | | 1,340,108 | | | | (736 | ) |
| | 9 | | | 10 year US Treasury Notes | | Dec-21 | | | 1,239,706 | | | | (14,271 | ) |
| | 6 | | | 90 Day Bank Accepted Bill Future | | Mar-23 | | | 1,086,411 | | | | (431 | ) |
| | 5 | | | Three Month Canadian Bankers Acceptance Future | | Sep-22 | | | 1,075,846 | | | | (1,412 | ) |
| | 3 | | | 3 month Euro (EURIBOR) | | Sep-22 | | | 981,959 | | | | (289 | ) |
| | 6 | | | 3 month Sterling | | Jun-22 | | | 931,323 | | | | (2,626 | ) |
| | 4 | | | Eurodollar | | Sep-23 | | | 890,254 | | | | (1,487 | ) |
| | 3 | | | Eurodollar | | Mar-22 | | | 863,006 | | | | 108 | |
| | 3 | | | 3 month Euro (EURIBOR) | | Dec-21 | | | 794,175 | | | | (9 | ) |
| | 3 | | | Eurodollar | | Dec-23 | | | 682,047 | | | | 118 | |
| | 2 | | | 3 month Euro (EURIBOR) | | Dec-23 | | | 647,450 | | | | (10 | ) |
| | 3 | | | E-Mini S&P 500 | | Dec-21 | | | 634,790 | | | | (9,175 | ) |
| Number of Short Contracts | | Description | | Expiration Date | | Notional Value | | | Unrealized Appreciation (Depreciation) | |
| (18) | | 3 month Euro (EURIBOR) | | Jun-23 | | $ | (5,155,157 | ) | | $ | 2,819 | |
| (13) | | Eurodollar | | Jun-24 | | | (3,215,140 | ) | | | 5,917 | |
| (12) | | Three Month Canadian Bankers Acceptance Future | | Dec-21 | | | (2,415,926 | ) | | | (10 | ) |
| (29) | | Light Sweet Crude Oil (WTI) Future | | Oct-21 | | | (2,199,434 | ) | | | (160,296 | ) |
| (6) | | 3 month Sterling | | Dec-21 | | | (1,082,507 | ) | | | 1,115 | |
| (8) | | 5 year US Treasury Notes | | Dec-21 | | | (1,034,381 | ) | | | 3,806 | |
| (9) | | JPY/USD | | Dec-21 | | | (1,017,771 | ) | | | 6,725 | |
| (6) | | 3 month Sterling | | Jun-23 | | | (985,164 | ) | | | 2,785 | |
| (6) | | 2 year Euro-Schatz | | Dec-21 | | | (833,468 | ) | | | 189 | |
| (14) | | Henry Hub Natural Gas Future | | Oct-21 | | | (803,576 | ) | | | (121,104 | ) |
| (4) | | Euro-BUND | | Dec-21 | | | (799,083 | ) | | | 1,748 | |
| (3) | | Eurodollar | | Jun-23 | | | (742,500 | ) | | | 1,004 | |
| (5) | | EUR/USD | | Dec-21 | | | (733,010 | ) | | | 12,923 | |
| (3) | | Three Month Canadian Bankers Acceptance Future | | Jun-22 | | | (686,134 | ) | | | 341 | |
| (4) | | 3 month Sterling | | Sep-22 | | | (662,696 | ) | | | 764 | |
OPTIONS ON CURRENCY
| | | | Put/Call | | | Description | | | Expiration Date | | Strike Price | | | Notional Value | | | Unrealized Appreciation (Depreciation) | |
| Purchased | | | | | | | | | | | | | | | | | | |
| | | | | | Put | | | | JPY/CAD | | | Mar-22 | | $ | 78.00 | | | $ | 911,563 | | $ | 298 | |
| | | | | | Put | | | | JPY/AUD | | | Mar-22 | | | 70.00 | | | | 871,167 | | | (24 | ) |
| | | | | | Call | | | | ZAR/USD | | | Mar-22 | | | 17.50 | | | | 751,330 | | | 2,131 | |
| | | | | | Call | | | | XAU/USD | | | Dec-22 | | | 1,900.00 | | | | 738,734 | | | 1,287 | |
| | | | | | Put | | | | JPY/GBP | | | Mar-22 | | | 138.50 | | | | 676,498 | | | 3,047 | |
| | | | | | Call | | | | XAU/USD | | | Aug-22 | | | 2,009.00 | | | | 671,782 | | | 660 | |
| | | | | | | | | | | | | | | | | | | | | | | | |
| Written | | | | | | | | | | | | | | | | | | | | | | |
| | | | | | Put | | | | JPY/CAD | | | Mar-22 | | $ | 78.00 | | | $ | (911,563 | ) | $ | (2,249 | ) |
| | | | | | Put | | | | JPY/AUD | | | Mar-22 | | | 70.00 | | | | (871,167 | ) | | (2,759 | ) |
| | | | | | Call | | | | ZAR/USD | | | Mar-22 | | | 17.50 | | | | (751,330 | ) | | (8,460 | ) |
| | | | | | Put | | | | JPY/GBP | | | Mar-22 | | | 138.50 | | | | (676,498 | ) | | (3,047 | ) |
FORWARD FOREIGN CURRENCY CONTRACTS
| Settlement Date | | Counterparty | | Currency Units to Deliver/(Receive) | | | | | | In Exchange For | | | | | | Unrealized Appreciation (Depreciation) | |
| Dec-21 | | Deutsche Bank | | $ | 21,186,161 | | | | TWD | | | $ | 767,777 | | | | USD | | | $ | 3,986 | |
| Dec-21 | | Deutsche Bank | | | (117,367,809 | ) | | | JPY | | | | (1,061,680 | ) | | | USD | | | | (8,777 | ) |
| Dec-21 | | Deutsche Bank | | | (20,023,313 | ) | | | TWD | | | | (726,025 | ) | | | USD | | | | (4,156 | ) |
OPTIONS ON FUTURES CONTRACTS
| | | | Put/Call | | | Description | | | Expiration Date | | Strike Price | | | Notional Value | | | Unrealized Appreciation (Depreciation) | |
| Purchased | | | | | | | | | | | | | | | | | | | | | | |
| | | | | | Call | | | | Eurodollar | | | Jun-22 | | $ | 99.25 | | | $ | 2,110,088 | | $ | 159 | |
| | | | | | Call | | | | Eurodollar | | | Dec-21 | | | 100.00 | | | | 1,018,258 | | | 25 | |
| Written | | | | | | | | | | | | | | | | | | | | | | |
| | | | | | Call | | | | Eurodollar | | | Jun-22 | | $ | 99.00 | | | $ | 1,063,464 | | $ | (81 | ) |
AUD - Australian Dollar
CAD - Canadian Dollar
GBP - Pound Sterling
JPY - Japanese Yen
NOK - Norwegian Krone
NZD - New Zealand Dollar
TWD - Taiwan Dollar
USD - U.S. Dollar
XAG - Silver
ZAR - South African Rand
| ^ | These investments are not direct holdings of the Fund. The holdings were determined based on the absolute notional values of the positions within the underlying swap basket. |
See accompanying Notes to Consolidated Financial Statements.
AXS Alternative Growth Fund
CONSOLIDATED SUMMARY OF INVESTMENTS
As of September 30, 2021
| Security Type | | Percent of Total
Net Assets | |
| Short-Term Investments | | | 67.1 | % |
| Total Investments | | | 67.1 | % |
| Other Assets in Excess of Liabilities | | | 32.9 | % |
| Total Net Assets | | | 100.0 | % |
See accompanying Notes to Consolidated Financial Statements.
AXS Aspect Core Diversified Strategy Fund
CONSOLIDATED SCHEDULE OF INVESTMENTS
As of September 30, 2021
Number
of Shares | | | | | Value | |
| | | | SHORT-TERM INVESTMENTS — 83.4% | | | |
| | 7,889,584 | | | Fidelity Investments Money Market Treasury Portfolio - Institutional Class, 0.01%1 | | $ | 7,889,584 | |
| | | | | | | | | |
Principal
Amount | | | | | | |
| $ | 9,400,551 | | | UMB Bank demand deposit, 0.01%1 | | | 9,400,551 | |
| | | | | TOTAL SHORT-TERM INVESTMENTS | | | | |
| | | | | (Cost $17,290,135) | | | 17,290,135 | |
| | | | | TOTAL INVESTMENTS — 83.4% | | | | |
| | | | | (Cost $17,290,135) | | | 17,290,135 | |
| | | | | Other Assets in Excess of Liabilities — 16.6% | | | 3,453,044 | |
| | | | | TOTAL NET ASSETS — 100.0% | | $ | 20,743,179 | |
| 1 | The rate is the annualized seven-day yield at period end. |
See accompanying Notes to Consolidated Financial Statements.
AXS Aspect Core Diversified Strategy Fund
CONSOLIDATED SCHEDULE OF INVESTMENTS - Continued
As of September 30, 2021
FUTURES CONTRACTS
| Long Contracts | | Expiration Date | | Number of Contracts | | | Notional Value* | | | Value at September 30, 2021* | | | Unrealized Appreciation (Depreciation) | |
| Commodity Futures | | | | | | | | | | | | | | |
| CBOT Corn1 | | December 2021 | | | 2 | | | | 54,205 | | | | 53,675 | | | $ | (530 | ) |
| CBOT Corn1 | | March 2022 | | | 2 | | | | 55,092 | | | | 54,450 | | | | (642 | ) |
| CBOT Soybean1 | | November 2021 | | | 2 | | | | 142,030 | | | | 125,600 | | | | (16,430 | ) |
| CBOT Soybean Oil1 | | December 2021 | | | 3 | | | | 114,349 | | | | 105,642 | | | | (8,707 | ) |
| CBOT Wheat1 | | December 2021 | | | 1 | | | | 37,515 | | | | 36,275 | | | | (1,240 | ) |
| CBOT Wheat1 | | March 2022 | | | 2 | | | | 73,242 | | | | 73,650 | | | | 408 | |
| CME Lean Hogs1 | | December 2021 | | | 3 | | | | 95,938 | | | | 102,480 | | | | 6,542 | |
| CME Lean Hogs1 | | February 2022 | | | 3 | | | | 101,218 | | | | 104,670 | | | | 3,452 | |
| CME Live Cattle1 | | April 2022 | | | 1 | | | | 55,753 | | | | 53,560 | | | | (2,193 | ) |
| CME Live Cattle1 | | February 2022 | | | 1 | | | | 55,393 | | | | 52,260 | | | | (3,133 | ) |
| CMX Copper1 | | December 2021 | | | 2 | | | | 218,442 | | | | 204,450 | | | | (13,992 | ) |
| ICE Brent Crude Oil1 | | December 2021 | | | 4 | | | | 285,105 | | | | 313,240 | | | | 28,135 | |
| ICE Brent Crude Oil1 | | January 2022 | | | 2 | | | | 144,273 | | | | 155,060 | | | | 10,787 | |
| ICE Cocoa1 | | December 2021 | | | 1 | | | | 18,191 | | | | 18,931 | | | | 740 | |
| ICE Cocoa1 | | March 2022 | | | 2 | | | | 36,712 | | | | 37,100 | | | | 388 | |
| ICE ECX Emission1 | | December 2021 | | | 2 | | | | 124,628 | | | | 123,298 | | | | (1,330 | ) |
| ICE Low Sulphur Gas1 | | December 2021 | | | 3 | | | | 184,605 | | | | 201,300 | | | | 16,695 | |
| ICE Low Sulphur Gas1 | | November 2021 | | | 6 | | | | 360,809 | | | | 405,300 | | | | 44,491 | |
| KCBT Hard Red Winter Wheat1 | | December 2021 | | | 4 | | | | 143,360 | | | | 146,350 | | | | 2,990 | |
| LME Copper1 | | December 2021 | | | 1 | | | | 239,281 | | | | 223,406 | | | | (15,875 | ) |
| LME Lead1 | | December 2021 | | | 1 | | | | 56,719 | | | | 52,400 | | | | (4,319 | ) |
| LME Primary Aluminum1 | | December 2021 | | | 6 | | | | 396,443 | | | | 428,587 | | | | 32,144 | |
| LME Primary Nickel1 | | December 2021 | | | 1 | | | | 117,123 | | | | 107,619 | | | | (9,504 | ) |
| LME Zinc1 | | December 2021 | | | 3 | | | | 228,477 | | | | 224,025 | | | | (4,452 | ) |
| NYBOT Coffee 'C'1 | | December 2021 | | | 2 | | | | 121,374 | | | | 145,500 | | | | 24,126 | |
| NYBOT Coffee 'C'1 | | March 2022 | | | 1 | | | | 63,321 | | | | 73,800 | | | | 10,479 | |
| NYBOT Coffee 'C'1 | | May 2022 | | | 1 | | | | 74,215 | | | | 74,213 | | | | (2 | ) |
| NYBOT Cotton #21 | | December 2021 | | | 4 | | | | 188,571 | | | | 211,600 | | | | 23,029 | |
| NYBOT Sugar #111 | | March 2022 | | | 7 | | | | 154,948 | | | | 159,465 | | | | 4,517 | |
| NYBOT Sugar #111 | | May 2022 | | | 8 | | | | 177,452 | | | | 177,050 | | | | (402 | ) |
| NYMEX Natural Gas1 | | December 2021 | | | 4 | | | | 203,298 | | | | 239,640 | | | | 36,342 | |
| NYMEX Natural Gas1 | | November 2021 | | | 10 | | | | 498,910 | | | | 586,700 | | | | 87,790 | |
| NYMEX NY Harbor ULSD1 | | December 2021 | | | 4 | | | | 374,281 | | | | 391,759 | | | | 17,478 | |
| NYMEX NY Harbor ULSD1 | | January 2022 | | | 2 | | | | 195,856 | | | | 195,048 | | | | (808 | ) |
| NYMEX RBOB Gasoline1 | | December 2021 | | | 4 | | | | 356,713 | | | | 362,225 | | | | 5,512 | |
| NYMEX WTI Crude Oil1 | | December 2021 | | | 1 | | | | 68,702 | | | | 74,700 | | | | 5,998 | |
| NYMEX WTI Crude Oil1 | | November 2021 | | | 3 | | | | 209,187 | | | | 225,090 | | | | 15,903 | |
| | | | | | | | | | | | | | | | | | | |
| Foreign Exchange Futures | | | | | | | | | | | | | | | | | | |
| CME British Pound | | December 2021 | | | 12 | | | | 1,035,515 | | | | 1,010,625 | | | | (24,890 | ) |
| CME Mexican Peso | | December 2021 | | | 24 | | | | 595,254 | | | | 575,880 | | | | (19,374 | ) |
| CME New Zealand Dollar | | December 2021 | | | 1 | | | | 71,076 | | | | 69,045 | | | | (2,031 | ) |
| | | | | | | | | | | | | | | | | | | |
| Index Futures | | | | | | | | | | | | | | | | | | |
| CBOT DJIA Index E-Mini | | December 2021 | | | 2 | | | | 344,923 | | | | 337,220 | | | | (7,703 | ) |
| CME E-mini Russell 2000 Index | | December 2021 | | | 3 | | | | 337,189 | | | | 330,120 | | | | (7,069 | ) |
| CME E-mini S&P 500 | | December 2021 | | | 2 | | | | 444,898 | | | | 429,775 | | | | (15,123 | ) |
| CME E-mini S&P MidCap 400 | | December 2021 | | | 1 | | | | 267,906 | | | | 263,320 | | | | (4,586 | ) |
| CME NASDAQ 100 E-Mini | | December 2021 | | | 1 | | | | 308,147 | | | | 293,650 | | | | (14,497 | ) |
| CME Nikkei 225 | | December 2021 | | | 1 | | | | 150,128 | | | | 146,750 | | | | (3,378 | ) |
| EOE AEX Index (Amsterdam) | | October 2021 | | | 2 | | | | 316,856 | | | | 306,751 | | | | (10,105 | ) |
| EOP CAC 40 10 Euro | | October 2021 | | | 6 | | | | 398,139 | | | | 389,962 | | | | (8,177 | ) |
| EUX DAX Index | | December 2021 | | | 1 | | | | 392,426 | | | | 380,581 | | | | (11,845 | ) |
| EUX Euro STOXX 50 | | December 2021 | | | 9 | | | | 373,610 | | | | 362,849 | | | | (10,761 | ) |
| ICF FTSE 100 Index | | December 2021 | | | 5 | | | | 351,033 | | | | 354,593 | | | | 3,560 | |
| MIL FTSE/MIB Index | | December 2021 | | | 4 | | | | 514,257 | | | | 506,383 | | | | (7,874 | ) |
| MSE S&P/TSE 60 Index | | December 2021 | | | 2 | | | | 486,204 | | | | 480,074 | | | | (6,130 | ) |
| NYF MSCI EAFE Index | | December 2021 | | | 2 | | | | 234,838 | | | | 226,700 | | | | (8,138 | ) |
| OSE TOPIX Index | | December 2021 | | | 4 | | | | 81,583,171 | | | | 81,579,908 | | | | (3,263 | ) |
| SFE SPI 200 Index | | December 2021 | | | 3 | | | | 548,531 | | | | 547,406 | | | | (1,125 | ) |
AXS Aspect Core Diversified Strategy Fund
CONSOLIDATED SCHEDULE OF INVESTMENTS - Continued
As of September 30, 2021
FUTURES CONTRACTS (Continued)
| Long Contracts (Continued) | | Expiration Date | | Number of Contracts | | | Notional Value* | | | Value at September 30, 2021* | | | Unrealized Appreciation (Depreciation) | |
| Index Futures (Continued) | | | | | | | | | | | | | | |
| SGX Nifty 50 Index | | October 2021 | | | 8 | | | | 284,442 | | | | 281,632 | | | $ | (2,810 | ) |
| SGX Nikkei 225 | | December 2021 | | | 2 | | | | 29,797,224 | | | | 29,796,081 | | | | (1,143 | ) |
| SGX Taiwan Index | | October 2021 | | | 3 | | | | 181,705 | | | | 177,480 | | | | (4,225 | ) |
| SSE OMXS30 Index | | October 2021 | | | 18 | | | | 4,190,868 | | | | 4,175,445 | | | | (15,423 | ) |
| | | | | | | | | | | | | | | | | | | |
| Interest Rate Futures | | | | | | | | | | | | | | | | | | |
| EUX Euro-BTP Italian Government Bond | | December 2021 | | | 5 | | | | 771,743 | | | | 757,851 | | | | (13,892 | ) |
| EUX Euro-Schatz | | December 2021 | | | 1 | | | | 112,266 | | | | 112,196 | | | | (70 | ) |
| EUX Short-term Euro-BTP Italian Government Bond | | December 2021 | | | 8 | | | | 910,984 | | | | 909,473 | | | | (1,511 | ) |
| OSE Japanese 10-Year Bond | | December 2021 | | | 1 | | | | 151,855,695 | | | | 151,851,331 | | | | (4,364 | ) |
| SFE Australian 3 Year Bond | | December 2021 | | | 107 | | | | 12,487,382 | | | | 12,466,773 | | | | (20,609 | ) |
| Total Long Contracts | | | | | | | | | 295,372,141 | | | | 295,439,972 | | | | 67,831 | |
| Short Contracts | | Expiration Date | | Number of Contracts | | | Notional Value* | | | Value at September 30, 2021* | | | Unrealized Appreciation (Depreciation) | |
| Commodity Futures | | | | | | | | | | | | | | |
| CBOT Soybean Meal1 | | December 2021 | | | (3 | ) | | | (101,953 | ) | | | (98,610 | ) | | | 3,343 | |
| CME Live Cattle1 | | December 2021 | | | (1 | ) | | | (50,558 | ) | | | (50,290 | ) | | | 268 | |
| CMX Gold1 | | December 2021 | | | (1 | ) | | | (175,148 | ) | | | (175,700 | ) | | | (552 | ) |
| CMX Silver1 | | December 2021 | | | (2 | ) | | | (231,921 | ) | | | (220,470 | ) | | | 11,451 | |
| NYMEX Platinum1 | | January 2022 | | | (2 | ) | | | (92,069 | ) | | | (96,240 | ) | | | (4,171 | ) |
| | | | | | | | | | | | | | | | | | | |
| Foreign Exchange Futures | | | | | | | | | | | | | | | | | | |
| CME Australian Dollar | | December 2021 | | | (18 | ) | | | (1,316,923 | ) | | | (1,302,120 | ) | | | 14,803 | |
| CME Euro | | December 2021 | | | (24 | ) | | | (3,545,726 | ) | | | (3,480,000 | ) | | | 65,726 | |
| CME Japanese Yen | | December 2021 | | | (25 | ) | | | (2,833,882 | ) | | | (2,806,563 | ) | | | 27,319 | |
| CME Swiss Franc | | December 2021 | | | (7 | ) | | | (948,641 | ) | | | (939,925 | ) | | | 8,716 | |
| | | | | | | | | | | | | | | | | | | |
| Index Futures | | | | | | | | | | | | | | | | | | |
| FTSE China A50 | | October 2021 | | | (22 | ) | | | (339,260 | ) | | | (340,846 | ) | | | (1,586 | ) |
| HKG Hang Seng Index | | October 2021 | | | (2 | ) | | | (2,450,911 | ) | | | (2,451,103 | ) | | | (192 | ) |
| HKG HSCEI | | October 2021 | | | (8 | ) | | | (3,460,098 | ) | | | (3,463,733 | ) | | | (3,635 | ) |
| NYF MSCI Emerging Markets Index | | December 2021 | | | (1 | ) | | | (62,263 | ) | | | (62,280 | ) | | | (17 | ) |
| SAF FTSE/JSE Top 40 | | December 2021 | | | (1 | ) | | | (577,067 | ) | | | (577,382 | ) | | | (315 | ) |
| | | | | | | | | | | | | | | | | | | |
| Interest Rate Futures | | | | | | | | | | | | | | | | | | |
| CBOT 10-Year U.S. Treasury Note | | December 2021 | | | (18 | ) | | | (2,380,119 | ) | | | (2,368,969 | ) | | | 11,150 | |
| CBOT 5-Year U.S. Treasury Note | | December 2021 | | | (38 | ) | | | (4,676,545 | ) | | | (4,664,203 | ) | | | 12,342 | |
| CBOT U.S. Long Bond | | December 2021 | | | (1 | ) | | | (159,468 | ) | | | (159,219 | ) | | | 249 | |
| CME Eurodollar | | March 2024 | | | (4 | ) | | | (988,031 | ) | | | (987,250 | ) | | | 781 | |
| EUX Euro-BOBL | | December 2021 | | | (1 | ) | | | (134,970 | ) | | | (134,924 | ) | | | 46 | |
| EUX Euro-Bund | | December 2021 | | | (3 | ) | | | (510,219 | ) | | | (509,340 | ) | | | 879 | |
| EUX Euro-Buxl 30 Year Bond | | December 2021 | | | (2 | ) | | | (412,539 | ) | | | (405,752 | ) | | | 6,787 | |
| EUX Euro-OAT | | December 2021 | | | (4 | ) | | | (664,807 | ) | | | (663,640 | ) | | | 1,167 | |
| ICF 90 Day Sterling | | December 2023 | | | (40 | ) | | | (4,962,008 | ) | | | (4,946,503 | ) | | | 15,505 | |
| ICF 90 Day Sterling | | June 2023 | | | (40 | ) | | | (4,966,988 | ) | | | (4,950,162 | ) | | | 16,826 | |
| ICF 90 Day Sterling | | March 2024 | | | (33 | ) | | | (4,090,101 | ) | | | (4,080,710 | ) | | | 9,391 | |
| ICF 90 Day Sterling | | September 2023 | | | (50 | ) | | | (6,205,527 | ) | | | (6,185,028 | ) | | | 20,499 | |
| ICF Long Gilt | | December 2021 | | | (25 | ) | | | (3,183,588 | ) | | | (3,109,703 | ) | | | 73,885 | |
| MSE Canadian 10 Year Bond | | December 2021 | | | (15 | ) | | | (2,164,463 | ) | | | (2,150,873 | ) | | | 13,590 | |
| SFE Australian 10 Year Bond | | December 2021 | | | (3 | ) | | | (424,752 | ) | | | (424,510 | ) | | | 242 | |
| Total Short Contracts | | | | | | | | | (52,110,545 | ) | | | (51,806,048 | ) | | | 304,497 | |
| | | | | | | | | | | | | | | | | | | |
| TOTAL FUTURES CONTRACTS | | | | | | | | | 243,261,596 | | | | 243,633,924 | | | $ | 372,328 | |
| 1 | This investment is a holding of AXS Aspect Core Diversified Strategy Fund Limited. |
See accompanying Notes to Consolidated Financial Statements.
AXS Aspect Core Diversified Strategy Fund
CONSOLIDATED SCHEDULE OF INVESTMENTS - Continued
As of September 30, 2021
FORWARD FOREIGN CURRENCY CONTRACTS
| Settlement Date | | Counterparty | | Currency Units to Receive/(Deliver) | | In Exchange For | | Unrealized Appreciation (Depreciation) | |
| 12/15/2021 | | Morgan Stanley | | | 1,310,475 | | | BRL | | | 250,000 | | | USD | | $ | (12,623 | ) |
| 12/15/2021 | | Morgan Stanley | | | (134,758 | ) | | BRL | | | (25,000 | ) | | USD | | | 590 | |
| 12/15/2021 | | Morgan Stanley | | | (134,764 | ) | | BRL | | | (25,000 | ) | | USD | | | 589 | |
| 12/15/2021 | | Morgan Stanley | | | (137,369 | ) | | BRL | | | (25,000 | ) | | USD | | | 117 | |
| 12/15/2021 | | Morgan Stanley | | | (137,510 | ) | | BRL | | | (25,000 | ) | | USD | | | 92 | |
| 12/15/2021 | | Morgan Stanley | | | (19,686,878 | ) | | CLP | | | (25,000 | ) | | USD | | | 890 | |
| 12/15/2021 | | Morgan Stanley | | | (19,689,400 | ) | | CLP | | | (25,000 | ) | | USD | | | 887 | |
| 12/15/2021 | | Morgan Stanley | | | (19,717,663 | ) | | CLP | | | (25,000 | ) | | USD | | | 853 | |
| 12/15/2021 | | Morgan Stanley | | | (19,730,750 | ) | | CLP | | | (25,000 | ) | | USD | | | 837 | |
| 12/15/2021 | | Morgan Stanley | | | (20,383,133 | ) | | CLP | | | (25,000 | ) | | USD | | | 38 | |
| 12/15/2021 | | Morgan Stanley | | | (20,383,738 | ) | | CLP | | | (25,000 | ) | | USD | | | 37 | |
| 12/15/2021 | | Morgan Stanley | | | (39,778,000 | ) | | CLP | | | (50,000 | ) | | USD | | | 1,286 | |
| 12/15/2021 | | Morgan Stanley | | | (40,080,160 | ) | | CLP | | | (50,000 | ) | | USD | | | 916 | |
| 12/15/2021 | | Morgan Stanley | | | (115,683,975 | ) | | CLP | | | (150,000 | ) | | USD | | | 8,327 | |
| 12/15/2021 | | Morgan Stanley | | | 1,626,412 | | | CNH | | | 250,000 | | | USD | | | 682 | |
| 12/15/2021 | | Morgan Stanley | | | 1,137,886 | | | CNH | | | 175,000 | | | USD | | | 385 | |
| 12/15/2021 | | Morgan Stanley | | | 813,263 | | | CNH | | | 125,000 | | | USD | | | 350 | |
| 12/15/2021 | | Morgan Stanley | | | 813,233 | | | CNH | | | 125,000 | | | USD | | | 345 | |
| 12/15/2021 | | Morgan Stanley | | | 813,171 | | | CNH | | | 125,000 | | | USD | | | 336 | |
| 12/15/2021 | | Morgan Stanley | | | 813,107 | | | CNH | | | 125,000 | | | USD | | | 326 | |
| 12/15/2021 | | Morgan Stanley | | | 813,082 | | | CNH | | | 125,000 | | | USD | | | 322 | |
| 12/15/2021 | | Morgan Stanley | | | 650,657 | | | CNH | | | 100,000 | | | USD | | | 287 | |
| 12/15/2021 | | Morgan Stanley | | | 325,684 | | | CNH | | | 50,000 | | | USD | | | 198 | |
| 12/15/2021 | | Morgan Stanley | | | 324,359 | | | CNH | | | 50,000 | | | USD | | | (6 | ) |
| 12/15/2021 | | Morgan Stanley | | | 162,491 | | | CNH | | | 25,000 | | | USD | | | 45 | |
| 12/15/2021 | | Morgan Stanley | | | 162,479 | | | CNH | | | 25,000 | | | USD | | | 43 | |
| 12/15/2021 | | Morgan Stanley | | | 162,210 | | | CNH | | | 25,000 | | | USD | | | 2 | |
| 12/15/2021 | | Morgan Stanley | | | 162,191 | | | CNH | | | 25,000 | | | USD | | | (1 | ) |
| 12/15/2021 | | Morgan Stanley | | | (162,258 | ) | | CNH | | | (25,000 | ) | | USD | | | (9 | ) |
| 12/15/2021 | | Morgan Stanley | | | (162,269 | ) | | CNH | | | (25,000 | ) | | USD | | | (11 | ) |
| 12/15/2021 | | Morgan Stanley | | | (324,877 | ) | | CNH | | | (50,000 | ) | | USD | | | (74 | ) |
| 12/15/2021 | | Morgan Stanley | | | (326,450 | ) | | CNH | | | (50,000 | ) | | USD | | | (316 | ) |
| 12/15/2021 | | Morgan Stanley | | | (96,143,713 | ) | | COP | | | (25,000 | ) | | USD | | | (118 | ) |
| 12/15/2021 | | Morgan Stanley | | | (96,181,213 | ) | | COP | | | (25,000 | ) | | USD | | | (127 | ) |
| 12/15/2021 | | Morgan Stanley | | | (189,946,425 | ) | | COP | | | (50,000 | ) | | USD | | | 376 | |
| 12/15/2021 | | Morgan Stanley | | | (192,744,425 | ) | | COP | | | (50,000 | ) | | USD | | | (355 | ) |
| 12/15/2021 | | Morgan Stanley | | | (380,627,850 | ) | | COP | | | (100,000 | ) | | USD | | | 561 | |
| 12/15/2021 | | Morgan Stanley | | | 2,547,493 | | | CZK | | | 100,000 | | | EUR | | | 165 | |
| 12/15/2021 | | Morgan Stanley | | | 1,274,490 | | | CZK | | | 50,000 | | | EUR | | | 116 | |
| 12/15/2021 | | Morgan Stanley | | | 1,274,445 | | | CZK | | | 50,000 | | | EUR | | | 114 | |
| 12/15/2021 | | Morgan Stanley | | | 1,274,083 | | | CZK | | | 50,000 | | | EUR | | | 98 | |
| 12/15/2021 | | Morgan Stanley | | | 1,273,896 | | | CZK | | | 50,000 | | | EUR | | | 89 | |
| 12/15/2021 | | Morgan Stanley | | | 1,273,578 | | | CZK | | | 50,000 | | | EUR | | | 75 | |
| 12/15/2021 | | Morgan Stanley | | | 637,727 | | | CZK | | | 25,000 | | | EUR | | | 81 | |
| 12/15/2021 | | Morgan Stanley | | | 637,284 | | | CZK | | | 25,000 | | | EUR | | | 60 | |
| 12/15/2021 | | Morgan Stanley | | | 637,221 | | | CZK | | | 25,000 | | | EUR | | | 57 | |
See accompanying Notes to Consolidated Financial Statements.
AXS Aspect Core Diversified Strategy Fund
CONSOLIDATED SCHEDULE OF INVESTMENTS - Continued
As of September 30, 2021
FORWARD FOREIGN CURRENCY CONTRACTS - Continued
| Settlement Date | | Counterparty | | Currency Units to Receive/(Deliver) | | In Exchange For | | Unrealized Appreciation (Depreciation) | |
| 12/15/2021 | | Morgan Stanley | | | 637,107 | | | CZK | | | 25,000 | | | EUR | | $ | 52 | |
| 12/15/2021 | | Morgan Stanley | | | 636,921 | | | CZK | | | 25,000 | | | EUR | | | 44 | |
| 12/15/2021 | | Morgan Stanley | | | 636,774 | | | CZK | | | 25,000 | | | EUR | | | 37 | |
| 12/15/2021 | | Morgan Stanley | | | 636,637 | | | CZK | | | 25,000 | | | EUR | | | 30 | |
| 12/15/2021 | | Morgan Stanley | | | 636,093 | | | CZK | | | 25,000 | | | EUR | | | 6 | |
| 12/15/2021 | | Morgan Stanley | | | 50,000 | | | EUR | | | 1,275,321 | | | CZK | | | (154 | ) |
| 12/15/2021 | | Morgan Stanley | | | 25,000 | | | EUR | | | 639,989 | | | CZK | | | (183 | ) |
| 12/15/2021 | | Morgan Stanley | | | 25,000 | | | EUR | | | 640,209 | | | CZK | | | (193 | ) |
| 12/15/2021 | | Morgan Stanley | | | 75,000 | | | EUR | | | 27,047,156 | | | HUF | | | 76 | |
| 12/15/2021 | | Morgan Stanley | | | 75,000 | | | EUR | | | 26,144,255 | | | HUF | | | 2,979 | |
| 12/15/2021 | | Morgan Stanley | | | 50,000 | | | EUR | | | 18,057,203 | | | HUF | | | (32 | ) |
| 12/15/2021 | | Morgan Stanley | | | 50,000 | | | EUR | | | 17,932,268 | | | HUF | | | 308 | |
| 12/15/2021 | | Morgan Stanley | | | 50,000 | | | EUR | | | 17,766,688 | | | HUF | | | 902 | |
| 12/15/2021 | | Morgan Stanley | | | 50,000 | | | EUR | | | 17,753,228 | | | HUF | | | 1,007 | |
| 12/15/2021 | | Morgan Stanley | | | 25,000 | | | EUR | | | 9,029,534 | | | HUF | | | (20 | ) |
| 12/15/2021 | | Morgan Stanley | | | 25,000 | | | EUR | | | 9,027,227 | | | HUF | | | (12 | ) |
| 12/15/2021 | | Morgan Stanley | | | 25,000 | | | EUR | | | 9,011,146 | | | HUF | | | 40 | |
| 12/15/2021 | | Morgan Stanley | | | 25,000 | | | EUR | | | 8,993,847 | | | HUF | | | 96 | |
| 12/15/2021 | | Morgan Stanley | | | 25,000 | | | EUR | | | 8,994,569 | | | HUF | | | 93 | |
| 12/15/2021 | | Morgan Stanley | | | 25,000 | | | EUR | | | 8,994,144 | | | HUF | | | 95 | |
| 12/15/2021 | | Morgan Stanley | | | 25,000 | | | EUR | | | 8,994,377 | | | HUF | | | 94 | |
| 12/15/2021 | | Morgan Stanley | | | 25,000 | | | EUR | | | 8,968,075 | | | HUF | | | 178 | |
| 12/15/2021 | | Morgan Stanley | | | 25,000 | | | EUR | | | 8,955,872 | | | HUF | | | 217 | |
| 12/15/2021 | | Morgan Stanley | | | 25,000 | | | EUR | | | 8,718,072 | | | HUF | | | 983 | |
| 12/15/2021 | | Morgan Stanley | | | 50,000 | | | EUR | | | 511,152 | | | NOK | | | (412 | ) |
| 12/15/2021 | | Morgan Stanley | | | 50,000 | | | EUR | | | 230,429 | | | PLN | | | 97 | |
| 12/15/2021 | | Morgan Stanley | | | 50,000 | | | EUR | | | 232,698 | | | PLN | | | (473 | ) |
| 12/15/2021 | | Morgan Stanley | | | 25,000 | | | EUR | | | 114,022 | | | PLN | | | 349 | |
| 12/15/2021 | | Morgan Stanley | | | 25,000 | | | EUR | | | 113,955 | | | PLN | | | 365 | |
| 12/15/2021 | | Morgan Stanley | | | 25,000 | | | EUR | | | 114,349 | | | PLN | | | 266 | |
| 12/15/2021 | | Morgan Stanley | | | 25,000 | | | EUR | | | 114,242 | | | PLN | | | 293 | |
| 12/15/2021 | | Morgan Stanley | | | 25,000 | | | EUR | | | 115,658 | | | PLN | | | (63 | ) |
| 12/15/2021 | | Morgan Stanley | | | 25,000 | | | EUR | | | 115,595 | | | PLN | | | (47 | ) |
| 12/15/2021 | | Morgan Stanley | | | 25,000 | | | EUR | | | 115,278 | | | PLN | | | 33 | |
| 12/15/2021 | | Morgan Stanley | | | 25,000 | | | EUR | | | 115,277 | | | PLN | | | 33 | |
| 12/15/2021 | | Morgan Stanley | | | 25,000 | | | EUR | | | 114,650 | | | PLN | | | 191 | |
| 12/15/2021 | | Morgan Stanley | | | 25,000 | | | EUR | | | 114,639 | | | PLN | | | 194 | |
| 12/15/2021 | | Morgan Stanley | | | 25,000 | | | EUR | | | 115,027 | | | PLN | | | 96 | |
| 12/15/2021 | | Morgan Stanley | | | 25,000 | | | EUR | | | 114,905 | | | PLN | | | 127 | |
| 12/15/2021 | | Morgan Stanley | | | 25,000 | | | EUR | | | 115,880 | | | PLN | | | (118 | ) |
| 12/15/2021 | | Morgan Stanley | | | 25,000 | | | EUR | | | 115,800 | | | PLN | | | (98 | ) |
| 12/15/2021 | | Morgan Stanley | | | 25,000 | | | EUR | | | 115,594 | | | PLN | | | (46 | ) |
| 12/15/2021 | | Morgan Stanley | | | 25,000 | | | EUR | | | 115,529 | | | PLN | | | (30 | ) |
| 12/15/2021 | | Morgan Stanley | | | 25,000 | | | EUR | | | 115,598 | | | PLN | | | (48 | ) |
| 12/15/2021 | | Morgan Stanley | | | 25,000 | | | EUR | | | 115,470 | | | PLN | | | (16 | ) |
| 12/15/2021 | | Morgan Stanley | | | 25,000 | | | EUR | | | 116,017 | | | PLN | | | (153 | ) |
| 12/15/2021 | | Morgan Stanley | | | 25,000 | | | EUR | | | 115,968 | | | PLN | | | (140 | ) |
See accompanying Notes to Consolidated Financial Statements.
AXS Aspect Core Diversified Strategy Fund
CONSOLIDATED SCHEDULE OF INVESTMENTS - Continued
As of September 30, 2021
FORWARD FOREIGN CURRENCY CONTRACTS - Continued
| Settlement Date | | Counterparty | | Currency Units to Receive/(Deliver) | | In Exchange For | | Unrealized Appreciation (Depreciation) | |
| 12/15/2021 | | Morgan Stanley | | | 25,000 | | | EUR | | | 115,943 | | | PLN | | $ | (134 | ) |
| 12/15/2021 | | Morgan Stanley | | | 25,000 | | | EUR | | | 115,918 | | | PLN | | | (128 | ) |
| 12/15/2021 | | Morgan Stanley | | | 25,000 | | | EUR | | | 115,914 | | | PLN | | | (127 | ) |
| 12/15/2021 | | Morgan Stanley | | | 25,000 | | | EUR | | | 115,836 | | | PLN | | | (107 | ) |
| 12/15/2021 | | Morgan Stanley | | | 50,000 | | | EUR | | | 510,583 | | | SEK | | | (358 | ) |
| 12/15/2021 | | Morgan Stanley | | | 25,000 | | | EUR | | | 254,946 | | | SEK | | | (139 | ) |
| 12/15/2021 | | Morgan Stanley | | | 25,000 | | | EUR | | | 255,047 | | | SEK | | | (151 | ) |
| 12/15/2021 | | Morgan Stanley | | | 25,000 | | | EUR | | | 255,145 | | | SEK | | | (162 | ) |
| 12/15/2021 | | Morgan Stanley | | | 25,000 | | | EUR | | | 255,207 | | | SEK | | | (169 | ) |
| 12/15/2021 | | Morgan Stanley | | | 25,000 | | | EUR | | | 255,269 | | | SEK | | | (176 | ) |
| 12/15/2021 | | Morgan Stanley | | | 25,000 | | | EUR | | | 255,189 | | | SEK | | | (168 | ) |
| 12/15/2021 | | Morgan Stanley | | | 17,502,642 | | | HUF | | | 50,000 | | | EUR | | | (1,751 | ) |
| 12/15/2021 | | Morgan Stanley | | | 17,501,832 | | | HUF | | | 50,000 | | | EUR | | | (1,754 | ) |
| 12/15/2021 | | Morgan Stanley | | | 17,501,437 | | | HUF | | | 50,000 | | | EUR | | | (1,754 | ) |
| 12/15/2021 | | Morgan Stanley | | | 17,498,502 | | | HUF | | | 50,000 | | | EUR | | | (1,765 | ) |
| 12/15/2021 | | Morgan Stanley | | | 17,494,447 | | | HUF | | | 50,000 | | | EUR | | | (1,778 | ) |
| 12/15/2021 | | Morgan Stanley | | | 17,490,317 | | | HUF | | | 50,000 | | | EUR | | | (1,791 | ) |
| 12/15/2021 | | Morgan Stanley | | | 17,483,072 | | | HUF | | | 50,000 | | | EUR | | | (1,814 | ) |
| 12/15/2021 | | Morgan Stanley | | | 17,476,022 | | | HUF | | | 50,000 | | | EUR | | | (1,837 | ) |
| 12/15/2021 | | Morgan Stanley | | | 17,472,027 | | | HUF | | | 50,000 | | | EUR | | | (1,850 | ) |
| 12/15/2021 | | Morgan Stanley | | | 17,467,442 | | | HUF | | | 50,000 | | | EUR | | | (1,864 | ) |
| 12/15/2021 | | Morgan Stanley | | | 17,467,042 | | | HUF | | | 50,000 | | | EUR | | | (1,865 | ) |
| 12/15/2021 | | Morgan Stanley | | | 17,461,557 | | | HUF | | | 50,000 | | | EUR | | | (1,883 | ) |
| 12/15/2021 | | Morgan Stanley | | | 17,447,257 | | | HUF | | | 50,000 | | | EUR | | | (1,929 | ) |
| 12/15/2021 | | Morgan Stanley | | | 17,446,312 | | | HUF | | | 50,000 | | | EUR | | | (1,932 | ) |
| 12/15/2021 | | Morgan Stanley | | | 8,749,288 | | | HUF | | | 25,000 | | | EUR | | | (882 | ) |
| 12/15/2021 | | Morgan Stanley | | | 8,748,343 | | | HUF | | | 25,000 | | | EUR | | | (885 | ) |
| 12/15/2021 | | Morgan Stanley | | | 8,745,436 | | | HUF | | | 25,000 | | | EUR | | | (895 | ) |
| 12/15/2021 | | Morgan Stanley | | | 8,744,251 | | | HUF | | | 25,000 | | | EUR | | | (898 | ) |
| 12/15/2021 | | Morgan Stanley | | | 8,743,223 | | | HUF | | | 25,000 | | | EUR | | | (902 | ) |
| 12/15/2021 | | Morgan Stanley | | | 8,735,341 | | | HUF | | | 25,000 | | | EUR | | | (926 | ) |
| 12/15/2021 | | Morgan Stanley | | | 8,734,493 | | | HUF | | | 25,000 | | | EUR | | | (929 | ) |
| 12/15/2021 | | Morgan Stanley | | | 8,730,091 | | | HUF | | | 25,000 | | | EUR | | | (943 | ) |
| 12/15/2021 | | Morgan Stanley | | | 320,296 | | | ILS | | | 100,000 | | | USD | | | (573 | ) |
| 12/15/2021 | | Morgan Stanley | | | 240,219 | | | ILS | | | 75,000 | | | USD | | | (430 | ) |
| 12/15/2021 | | Morgan Stanley | | | 160,146 | | | ILS | | | 50,000 | | | USD | | | (287 | ) |
| 12/15/2021 | | Morgan Stanley | | | 160,138 | | | ILS | | | 50,000 | | | USD | | | (290 | ) |
| 12/15/2021 | | Morgan Stanley | | | 160,119 | | | ILS | | | 50,000 | | | USD | | | (296 | ) |
| 12/15/2021 | | Morgan Stanley | | | 160,114 | | | ILS | | | 50,000 | | | USD | | | (297 | ) |
| 12/15/2021 | | Morgan Stanley | | | 80,081 | | | ILS | | | 25,000 | | | USD | | | (141 | ) |
| 12/15/2021 | | Morgan Stanley | | | 66,412,800 | | | INR | | | 900,000 | | | USD | | | (12,424 | ) |
| 12/15/2021 | | Morgan Stanley | | | 1,863,641 | | | INR | | | 25,000 | | | USD | | | (93 | ) |
| 12/15/2021 | | Morgan Stanley | | | 1,862,786 | | | INR | | | 25,000 | | | USD | | | (105 | ) |
| 12/15/2021 | | Morgan Stanley | | | 1,857,887 | | | INR | | | 25,000 | | | USD | | | (170 | ) |
| 12/15/2021 | | Morgan Stanley | | | 1,856,962 | | | INR | | | 25,000 | | | USD | | | (183 | ) |
| 12/15/2021 | | Morgan Stanley | | | 1,854,632 | | | INR | | | 25,000 | | | USD | | | (214 | ) |
| 12/15/2021 | | Morgan Stanley | | | 1,853,582 | | | INR | | | 25,000 | | | USD | | | (228 | ) |
See accompanying Notes to Consolidated Financial Statements.
AXS Aspect Core Diversified Strategy Fund
CONSOLIDATED SCHEDULE OF INVESTMENTS - Continued
As of September 30, 2021
FORWARD FOREIGN CURRENCY CONTRACTS - Continued
| Settlement Date | | Counterparty | | Currency Units to Receive/(Deliver) | | In Exchange For | | Unrealized Appreciation (Depreciation) | |
| 12/15/2021 | | Morgan Stanley | | | 1,845,666 | | | INR | | | 25,000 | | | USD | | $ | (334 | ) |
| 12/15/2021 | | Morgan Stanley | | | 1,845,316 | | | INR | | | 25,000 | | | USD | | | (338 | ) |
| 12/15/2021 | | Morgan Stanley | | | (1,858,209 | ) | | INR | | | (25,000 | ) | | USD | | | 166 | |
| 12/15/2021 | | Morgan Stanley | | | (1,859,499 | ) | | INR | | | (25,000 | ) | | USD | | | 149 | |
| 12/15/2021 | | Morgan Stanley | | | (1,866,984 | ) | | INR | | | (25,000 | ) | | USD | | | 49 | |
| 12/15/2021 | | Morgan Stanley | | | (1,867,459 | ) | | INR | | | (25,000 | ) | | USD | | | 42 | |
| 12/15/2021 | | Morgan Stanley | | | (1,868,271 | ) | | INR | | | (25,000 | ) | | USD | | | 31 | |
| 12/15/2021 | | Morgan Stanley | | | (1,869,194 | ) | | INR | | | (25,000 | ) | | USD | | | 19 | |
| 12/15/2021 | | Morgan Stanley | | | (1,869,409 | ) | | INR | | | (25,000 | ) | | USD | | | 16 | |
| 12/15/2021 | | Morgan Stanley | | | (1,870,809 | ) | | INR | | | (25,000 | ) | | USD | | | (2 | ) |
| 12/15/2021 | | Morgan Stanley | | | 29,016,603 | | | KRW | | | 25,000 | | | USD | | | (517 | ) |
| 12/15/2021 | | Morgan Stanley | | | 28,981,468 | | | KRW | | | 25,000 | | | USD | | | (547 | ) |
| 12/15/2021 | | Morgan Stanley | | | (29,310,438 | ) | | KRW | | | (25,000 | ) | | USD | | | 269 | |
| 12/15/2021 | | Morgan Stanley | | | (29,314,783 | ) | | KRW | | | (25,000 | ) | | USD | | | 266 | |
| 12/15/2021 | | Morgan Stanley | | | (29,343,228 | ) | | KRW | | | (25,000 | ) | | USD | | | 241 | |
| 12/15/2021 | | Morgan Stanley | | | (29,350,613 | ) | | KRW | | | (25,000 | ) | | USD | | | 235 | |
| 12/15/2021 | | Morgan Stanley | | | (29,358,533 | ) | | KRW | | | (25,000 | ) | | USD | | | 229 | |
| 12/15/2021 | | Morgan Stanley | | | (29,368,825 | ) | | KRW | | | (25,000 | ) | | USD | | | 220 | |
| 12/15/2021 | | Morgan Stanley | | | (29,398,533 | ) | | KRW | | | (25,000 | ) | | USD | | | 195 | |
| 12/15/2021 | | Morgan Stanley | | | (29,401,683 | ) | | KRW | | | (25,000 | ) | | USD | | | 192 | |
| 12/15/2021 | | Morgan Stanley | | | (29,474,783 | ) | | KRW | | | (25,000 | ) | | USD | | | 131 | |
| 12/15/2021 | | Morgan Stanley | | | (29,482,618 | ) | | KRW | | | (25,000 | ) | | USD | | | 124 | |
| 12/15/2021 | | Morgan Stanley | | | (29,594,033 | ) | | KRW | | | (25,000 | ) | | USD | | | 30 | |
| 12/15/2021 | | Morgan Stanley | | | (29,600,354 | ) | | KRW | | | (25,000 | ) | | USD | | | 25 | |
| 12/15/2021 | | Morgan Stanley | | | (29,602,783 | ) | | KRW | | | (25,000 | ) | | USD | | | 22 | |
| 12/15/2021 | | Morgan Stanley | | | (29,603,108 | ) | | KRW | | | (25,000 | ) | | USD | | | 22 | |
| 12/15/2021 | | Morgan Stanley | | | (29,670,354 | ) | | KRW | | | (25,000 | ) | | USD | | | (34 | ) |
| 12/15/2021 | | Morgan Stanley | | | (29,675,354 | ) | | KRW | | | (25,000 | ) | | USD | | | (39 | ) |
| 12/15/2021 | | Morgan Stanley | | | (29,677,685 | ) | | KRW | | | (25,000 | ) | | USD | | | (41 | ) |
| 12/15/2021 | | Morgan Stanley | | | (29,681,988 | ) | | KRW | | | (25,000 | ) | | USD | | | (44 | ) |
AXS Aspect Core Diversified Strategy Fund
CONSOLIDATED SCHEDULE OF INVESTMENTS - Continued
As of September 30, 2021
FORWARD FOREIGN CURRENCY CONTRACTS - Continued
| Settlement Date | | Counterparty | | Currency Units to Receive/(Deliver) | | In Exchange For | | Unrealized Appreciation (Depreciation) | |
| 12/15/2021 | | Morgan Stanley | | | (173,613,195 | ) | | KRW | | | (150,000 | ) | | USD | | | 3,514 | |
| 12/15/2021 | | Morgan Stanley | | | (405,079,955 | ) | | KRW | | | (350,000 | ) | | USD | | | 8,213 | |
| 12/15/2021 | | Morgan Stanley | | | 774,255 | | | NOK | | | 75,000 | | | EUR | | | 1,480 | |
| 12/15/2021 | | Morgan Stanley | | | 516,242 | | | NOK | | | 50,000 | | | EUR | | | 994 | |
| 12/15/2021 | | Morgan Stanley | | | 516,093 | | | NOK | | | 50,000 | | | EUR | | | 977 | |
| 12/15/2021 | | Morgan Stanley | | | 515,882 | | | NOK | | | 50,000 | | | EUR | | | 953 | |
| 12/15/2021 | | Morgan Stanley | | | 515,594 | | | NOK | | | 50,000 | | | EUR | | | 920 | |
| 12/15/2021 | | Morgan Stanley | | | 515,344 | | | NOK | | | 50,000 | | | EUR | | | 891 | |
| 12/15/2021 | | Morgan Stanley | | | 257,984 | | | NOK | | | 25,000 | | | EUR | | | 482 | |
| 12/15/2021 | | Morgan Stanley | | | 257,965 | | | NOK | | | 25,000 | | | EUR | | | 480 | |
| 12/15/2021 | | Morgan Stanley | | | 257,860 | | | NOK | | | 25,000 | | | EUR | | | 468 | |
| 12/15/2021 | | Morgan Stanley | | | 257,420 | | | NOK | | | 25,000 | | | EUR | | | 417 | |
| 12/15/2021 | | Morgan Stanley | | | 257,266 | | | NOK | | | 25,000 | | | EUR | | | 399 | |
| 12/15/2021 | | Morgan Stanley | | | 256,156 | | | NOK | | | 25,000 | | | EUR | | | 273 | |
| 12/15/2021 | | Morgan Stanley | | | 256,072 | | | NOK | | | 25,000 | | | EUR | | | 263 | |
| 12/15/2021 | | Morgan Stanley | | | 255,271 | | | NOK | | | 25,000 | | | EUR | | | 172 | |
| 12/15/2021 | | Morgan Stanley | | | 255,262 | | | NOK | | | 25,000 | | | EUR | | | 170 | |
See accompanying Notes to Consolidated Financial Statements.
AXS Aspect Core Diversified Strategy Fund
CONSOLIDATED SCHEDULE OF INVESTMENTS - Continued
As of September 30, 2021
FORWARD FOREIGN CURRENCY CONTRACTS – Continued
| Settlement Date | | Counterparty | | Currency Units to Receive/(Deliver) | | In Exchange For | | Unrealized Appreciation (Depreciation) | |
| 12/15/2021 | | Morgan Stanley | | | 255,236 | | | NOK | | | 25,000 | | | EUR | | $ | 167 | |
| 12/15/2021 | | Morgan Stanley | | | 255,231 | | | NOK | | | 25,000 | | | EUR | | | 166 | |
| 12/15/2021 | | Morgan Stanley | | | 255,192 | | | NOK | | | 25,000 | | | EUR | | | 163 | |
| 12/15/2021 | | Morgan Stanley | | | 254,791 | | | NOK | | | 25,000 | | | EUR | | | 116 | |
| 12/15/2021 | | Morgan Stanley | | | 254,720 | | | NOK | | | 25,000 | | | EUR | | | 109 | |
| 12/15/2021 | | Morgan Stanley | | | 254,681 | | | NOK | | | 25,000 | | | EUR | | | 104 | |
| 12/15/2021 | | Morgan Stanley | | | 254,598 | | | NOK | | | 25,000 | | | EUR | | | 95 | |
| 12/15/2021 | | Morgan Stanley | | | 254,552 | | | NOK | | | 25,000 | | | EUR | | | 89 | |
| 12/15/2021 | | Morgan Stanley | | | 254,515 | | | NOK | | | 25,000 | | | EUR | | | 85 | |
| 12/15/2021 | | Morgan Stanley | | | 254,393 | | | NOK | | | 25,000 | | | EUR | | | 71 | |
| 12/15/2021 | | Morgan Stanley | | | 254,357 | | | NOK | | | 25,000 | | | EUR | | | 67 | |
| 12/15/2021 | | Morgan Stanley | | | 254,004 | | | NOK | | | 25,000 | | | EUR | | | 26 | |
| 12/15/2021 | | Morgan Stanley | | | 253,936 | | | NOK | | | 25,000 | | | EUR | | | 19 | |
| 12/15/2021 | | Morgan Stanley | | | 253,850 | | | NOK | | | 25,000 | | | EUR | | | 9 | |
| 12/15/2021 | | Morgan Stanley | | | 253,848 | | | NOK | | | 25,000 | | | EUR | | | 8 | |
| 12/15/2021 | | Morgan Stanley | | | 253,839 | | | NOK | | | 25,000 | | | EUR | | | 7 | |
| 12/15/2021 | | Morgan Stanley | | | 253,783 | | | NOK | | | 25,000 | | | EUR | | | 2 | |
| 12/15/2021 | | Morgan Stanley | | | 253,534 | | | NOK | | | 25,000 | | | EUR | | | (27 | ) |
| 12/15/2021 | | Morgan Stanley | | | 252,852 | | | NOK | | | 25,000 | | | EUR | | | (105 | ) |
| 12/15/2021 | | Morgan Stanley | | | 252,630 | | | NOK | | | 25,000 | | | EUR | | | (130 | ) |
| 12/15/2021 | | Morgan Stanley | | | 252,609 | | | NOK | | | 25,000 | | | EUR | | | (133 | ) |
| 12/15/2021 | | Morgan Stanley | | | 252,575 | | | NOK | | | 25,000 | | | EUR | | | (137 | ) |
| 12/15/2021 | | Morgan Stanley | | | 252,491 | | | NOK | | | 25,000 | | | EUR | | | (147 | ) |
| 12/15/2021 | | Morgan Stanley | | | 252,478 | | | NOK | | | 25,000 | | | EUR | | | (148 | ) |
AXS Aspect Core Diversified Strategy Fund
CONSOLIDATED SCHEDULE OF INVESTMENTS - Continued
As of September 30, 2021
FORWARD FOREIGN CURRENCY CONTRACTS - Continued
| Settlement Date | | Counterparty | | Currency Units to Receive/(Deliver) | | In Exchange For | | Unrealized Appreciation (Depreciation) | |
| 12/15/2021 | | Morgan Stanley | | | 252,392 | | | NOK | | | 25,000 | | | EUR | | | (158 | ) |
| 12/15/2021 | | Morgan Stanley | | | 252,324 | | | NOK | | | 25,000 | | | EUR | | | (165 | ) |
| 12/15/2021 | | Morgan Stanley | | | 251,804 | | | NOK | | | 25,000 | | | EUR | | | (225 | ) |
| 12/15/2021 | | Morgan Stanley | | | 251,579 | | | NOK | | | 25,000 | | | EUR | | | (251 | ) |
| 12/15/2021 | | Morgan Stanley | | | (2,518,100 | ) | | PHP | | | (50,000 | ) | | USD | | | 772 | |
| 12/15/2021 | | Morgan Stanley | | | (2,521,363 | ) | | PHP | | | (50,000 | ) | | USD | | | 708 | |
| 12/15/2021 | | Morgan Stanley | | | (2,580,563 | ) | | PHP | | | (50,000 | ) | | USD | | | (450 | ) |
| 12/15/2021 | | Morgan Stanley | | | 113,537 | | | PLN | | | 25,000 | | | EUR | | | (471 | ) |
| 12/15/2021 | | Morgan Stanley | | | 113,481 | | | PLN | | | 25,000 | | | EUR | | | (485 | ) |
| 12/15/2021 | | Morgan Stanley | | | 112,986 | | | PLN | | | 25,000 | | | EUR | | | (609 | ) |
| 12/15/2021 | | Morgan Stanley | | | 112,970 | | | PLN | | | 25,000 | | | EUR | | | (613 | ) |
| 12/15/2021 | | Morgan Stanley | | | 33,358,356 | | | RUB | | | 450,000 | | | USD | | | 1,171 | |
| 12/15/2021 | | Morgan Stanley | | | 29,703,840 | | | RUB | | | 400,000 | | | USD | | | 1,744 | |
| 12/15/2021 | | Morgan Stanley | | | 3,716,759 | | | RUB | | | 50,000 | | | USD | | | 269 | |
| 12/15/2021 | | Morgan Stanley | | | 1,858,145 | | | RUB | | | 25,000 | | | USD | | | 131 | |
| 12/15/2021 | | Morgan Stanley | | | 1,857,739 | | | RUB | | | 25,000 | | | USD | | | 126 | |
| 12/15/2021 | | Morgan Stanley | | | 1,852,946 | | | RUB | | | 25,000 | | | USD | | | 61 | |
| 12/15/2021 | | Morgan Stanley | | | 1,851,402 | | | RUB | | | 25,000 | | | USD | | | 40 | |
| 12/15/2021 | | Morgan Stanley | | | 1,848,728 | | | RUB | | | 25,000 | | | USD | | | 4 | |
| 12/15/2021 | | Morgan Stanley | | | 1,847,543 | | | RUB | | | 25,000 | | | USD | | | (12 | ) |
| 12/15/2021 | | Morgan Stanley | | | 1,839,290 | | | RUB | | | 25,000 | | | USD | | | (124 | ) |
| 12/15/2021 | | Morgan Stanley | | | 1,838,379 | | | RUB | | | 25,000 | | | USD | | | (136 | ) |
| 12/15/2021 | | Morgan Stanley | | | 4,067,343 | | | SEK | | | 400,000 | | | EUR | | | 885 | |
See accompanying Notes to Consolidated Financial Statements.
AXS Aspect Core Diversified Strategy Fund
CONSOLIDATED SCHEDULE OF INVESTMENTS - Continued
As of September 30, 2021
FORWARD FOREIGN CURRENCY CONTRACTS - Continued
| Settlement Date | | Counterparty | | Currency Units to Receive/(Deliver) | | In Exchange For | | Unrealized Appreciation (Depreciation) | |
| 12/15/2021 | | Morgan Stanley | | | 508,810 | | | SEK | | | 50,000 | | | EUR | | $ | 155 | |
| 12/15/2021 | | Morgan Stanley | | | 508,553 | | | SEK | | | 50,000 | | | EUR | | | 126 | |
| 12/15/2021 | | Morgan Stanley | | | 507,114 | | | SEK | | | 50,000 | | | EUR | | | (39 | ) |
| 12/15/2021 | | Morgan Stanley | | | 254,511 | | | SEK | | | 25,000 | | | EUR | | | 90 | |
| 12/15/2021 | | Morgan Stanley | | | 254,181 | | | SEK | | | 25,000 | | | EUR | | | 52 | |
| 12/15/2021 | | Morgan Stanley | | | 254,177 | | | SEK | | | 25,000 | | | EUR | | | 51 | |
| 12/15/2021 | | Morgan Stanley | | | 254,130 | | | SEK | | | 25,000 | | | EUR | | | 46 | |
| 12/15/2021 | | Morgan Stanley | | | 253,587 | | | SEK | | | 25,000 | | | EUR | | | (15 | ) |
| 12/15/2021 | | Morgan Stanley | | | 253,557 | | | SEK | | | 25,000 | | | EUR | | | (19 | ) |
| 12/15/2021 | | Morgan Stanley | | | 67,055 | | | SGD | | | 50,000 | | | USD | | | (623 | ) |
| 12/15/2021 | | Morgan Stanley | | | 33,561 | | | SGD | | | 25,000 | | | USD | | | (287 | ) |
| 12/15/2021 | | Morgan Stanley | | | 33,554 | | | SGD | | | 25,000 | | | USD | | | (292 | ) |
| 12/15/2021 | | Morgan Stanley | | | (33,581 | ) | | SGD | | | (25,000 | ) | | USD | | | 272 | |
| 12/15/2021 | | Morgan Stanley | | | (33,591 | ) | | SGD | | | (25,000 | ) | | USD | | | 265 | |
| 12/15/2021 | | Morgan Stanley | | | (33,783 | ) | | SGD | | | (25,000 | ) | | USD | | | 124 | |
| 12/15/2021 | | Morgan Stanley | | | (33,783 | ) | | SGD | | | (25,000 | ) | | USD | | | 123 | |
| 12/15/2021 | | Morgan Stanley | | | (33,785 | ) | | SGD | | | (25,000 | ) | | USD | | | 122 | |
| 12/15/2021 | | Morgan Stanley | | | (33,790 | ) | | SGD | | | (25,000 | ) | | USD | | | 118 | |
| 12/15/2021 | | Morgan Stanley | | | (33,793 | ) | | SGD | | | (25,000 | ) | | USD | | | 116 | |
| 12/15/2021 | | Morgan Stanley | | | (33,849 | ) | | SGD | | | (25,000 | ) | | USD | | | 75 | |
| 12/15/2021 | | Morgan Stanley | | | (33,878 | ) | | SGD | | | (25,000 | ) | | USD | | | 54 | |
| 12/15/2021 | | Morgan Stanley | | | (33,880 | ) | | SGD | | | (25,000 | ) | | USD | | | 52 | |
AXS Aspect Core Diversified Strategy Fund
CONSOLIDATED SCHEDULE OF INVESTMENTS - Continued
As of September 30, 2021
FORWARD FOREIGN CURRENCY CONTRACTS - Continued
| Settlement Date | | Counterparty | | Currency Units to Receive/(Deliver) | | In Exchange For | | Unrealized Appreciation (Depreciation) | |
| 12/15/2021 | | Morgan Stanley | | | (34,019 | ) | | SGD | | | (25,000 | ) | | USD | | | (50 | ) |
| 12/15/2021 | | Morgan Stanley | | | (34,025 | ) | | SGD | | | (25,000 | ) | | USD | | | (55 | ) |
| 12/15/2021 | | Morgan Stanley | | | (67,131 | ) | | SGD | | | (50,000 | ) | | USD | | | 567 | |
| 12/15/2021 | | Morgan Stanley | | | (67,918 | ) | | SGD | | | (50,000 | ) | | USD | | | (12 | ) |
| 12/15/2021 | | Morgan Stanley | | | 845,141 | | | THB | | | 25,000 | | | USD | | | (31 | ) |
| 12/15/2021 | | Morgan Stanley | | | 844,636 | | | THB | | | 25,000 | | | USD | | | (46 | ) |
| 12/15/2021 | | Morgan Stanley | | | (813,879 | ) | | THB | | | (25,000 | ) | | USD | | | 955 | |
| 12/15/2021 | | Morgan Stanley | | | (814,336 | ) | | THB | | | (25,000 | ) | | USD | | | 941 | |
| 12/15/2021 | | Morgan Stanley | | | (814,459 | ) | | THB | | | (25,000 | ) | | USD | | | 938 | |
| 12/15/2021 | | Morgan Stanley | | | (814,484 | ) | | THB | | | (25,000 | ) | | USD | | | 937 | |
| 12/15/2021 | | Morgan Stanley | | | (815,471 | ) | | THB | | | (25,000 | ) | | USD | | | 908 | |
| 12/15/2021 | | Morgan Stanley | | | (815,496 | ) | | THB | | | (25,000 | ) | | USD | | | 907 | |
| 12/15/2021 | | Morgan Stanley | | | (816,079 | ) | | THB | | | (25,000 | ) | | USD | | | 890 | |
| 12/15/2021 | | Morgan Stanley | | | (817,091 | ) | | THB | | | (25,000 | ) | | USD | | | 860 | |
| 12/15/2021 | | Morgan Stanley | | | (817,856 | ) | | THB | | | (25,000 | ) | | USD | | | 837 | |
| 12/15/2021 | | Morgan Stanley | | | (818,356 | ) | | THB | | | (25,000 | ) | | USD | | | 822 | |
| 12/15/2021 | | Morgan Stanley | | | (824,664 | ) | | THB | | | (25,000 | ) | | USD | | | 636 | |
| 12/15/2021 | | Morgan Stanley | | | (824,814 | ) | | THB | | | (25,000 | ) | | USD | | | 632 | |
| 12/15/2021 | | Morgan Stanley | | | (825,406 | ) | | THB | | | (25,000 | ) | | USD | | | 614 | |
| 12/15/2021 | | Morgan Stanley | | | (825,556 | ) | | THB | | | (25,000 | ) | | USD | | | 610 | |
| 12/15/2021 | | Morgan Stanley | | | (831,551 | ) | | THB | | | (25,000 | ) | | USD | | | 432 | |
| 12/15/2021 | | Morgan Stanley | | | (831,661 | ) | | THB | | | (25,000 | ) | | USD | | | 429 | |
| 12/15/2021 | | Morgan Stanley | | | (836,024 | ) | | THB | | | (25,000 | ) | | USD | | | 300 | |
| 12/15/2021 | | Morgan Stanley | | | (836,374 | ) | | THB | | | (25,000 | ) | | USD | | | 290 | |
| 12/15/2021 | | Morgan Stanley | | | (836,951 | ) | | THB | | | (25,000 | ) | | USD | | | 273 | |
See accompanying Notes to Consolidated Financial Statements.
AXS Aspect Core Diversified Strategy Fund
CONSOLIDATED SCHEDULE OF INVESTMENTS - Continued
As of September 30, 2021
FORWARD FOREIGN CURRENCY CONTRACTS - Continued
| Settlement Date | | Counterparty | | Currency Units to Receive/(Deliver) | | In Exchange For | | Unrealized Appreciation (Depreciation) | |
| 12/15/2021 | | Morgan Stanley | | | (836,971 | ) | | THB | | | (25,000 | ) | | USD | | $ | 272 | |
| 12/15/2021 | | Morgan Stanley | | | (837,754 | ) | | THB | | | (25,000 | ) | | USD | | | 249 | |
| 12/15/2021 | | Morgan Stanley | | | (837,839 | ) | | THB | | | (25,000 | ) | | USD | | | 247 | |
| 12/15/2021 | | Morgan Stanley | | | (838,056 | ) | | THB | | | (25,000 | ) | | USD | | | 240 | |
| 12/15/2021 | | Morgan Stanley | | | (838,406 | ) | | THB | | | (25,000 | ) | | USD | | | 230 | |
| 12/15/2021 | | Morgan Stanley | | | 2,751,385 | | | TWD | | | 100,000 | | | USD | | | (1,238 | ) |
| 12/15/2021 | | Morgan Stanley | | | 685,871 | | | TWD | | | 25,000 | | | USD | | | (380 | ) |
| 12/15/2021 | | Morgan Stanley | | | 685,810 | | | TWD | | | 25,000 | | | USD | | | (383 | ) |
| 12/15/2021 | | Morgan Stanley | | | (689,779 | ) | | TWD | | | (25,000 | ) | | USD | | | 240 | |
| 12/15/2021 | | Morgan Stanley | | | (690,029 | ) | | TWD | | | (25,000 | ) | | USD | | | 231 | |
| 12/15/2021 | | Morgan Stanley | | | (691,154 | ) | | TWD | | | (25,000 | ) | | USD | | | 191 | |
| 12/15/2021 | | Morgan Stanley | | | (691,529 | ) | | TWD | | | (25,000 | ) | | USD | | | 177 | |
| 12/15/2021 | | Morgan Stanley | | | (1,384,778 | ) | | TWD | | | (50,000 | ) | | USD | | | 293 | |
| 12/15/2021 | | Morgan Stanley | | | 1,454,198 | | | ZAR | | | 100,000 | | | USD | | | (4,463 | ) |
| 12/15/2021 | | Morgan Stanley | | | 1,453,069 | | | ZAR | | | 100,000 | | | USD | | | (4,537 | ) |
| 12/15/2021 | | Morgan Stanley | | | 728,874 | | | ZAR | | | 50,000 | | | USD | | | (2,115 | ) |
| 12/15/2021 | | Morgan Stanley | | | 362,475 | | | ZAR | | | 25,000 | | | USD | | | (1,186 | ) |
| 12/15/2021 | | Morgan Stanley | | | 362,342 | | | ZAR | | | 25,000 | | | USD | | | (1,195 | ) |
| 12/15/2021 | | Morgan Stanley | | | 358,753 | | | ZAR | | | 25,000 | | | USD | | | (1,431 | ) |
| 12/15/2021 | | Morgan Stanley | | | 358,559 | | | ZAR | | | 25,000 | | | USD | | | (1,443 | ) |
| 12/15/2021 | | Morgan Stanley | | | (369,068 | ) | | ZAR | | | (25,000 | ) | | USD | | | 753 | |
| 12/15/2021 | | Morgan Stanley | | | (370,058 | ) | | ZAR | | | (25,000 | ) | | USD | | | 688 | |
| 12/15/2021 | | Morgan Stanley | | | (380,177 | ) | | ZAR | | | (25,000 | ) | | USD | | | 23 | |
| 12/15/2021 | | Morgan Stanley | | | (380,818 | ) | | ZAR | | | (25,000 | ) | | USD | | | (19 | ) |
| 12/15/2021 | | Morgan Stanley | | | (380,822 | ) | | ZAR | | | (25,000 | ) | | USD | | | (19 | ) |
| 12/15/2021 | | Morgan Stanley | | | (381,022 | ) | | ZAR | | | (25,000 | ) | | USD | | | (32 | ) |
| 12/15/2021 | | Morgan Stanley | | | (750,086 | ) | | ZAR | | | (50,000 | ) | | USD | | | 721 | |
| TOTAL FORWARD FOREIGN CURRENCY CONTRACTS | | | | | | | | $ | (11,607 | ) |
BRL - Brazilian Real
CLP - Chilean Peso
CNH - Chinese Yuan Renminbi
COP - Colombian Peso
CZK - Czech Koruna
EUR - Euro
HUF - Hungarian Forint
ILS - New Israeli Sheqel
INR - Indian Rupee
KRW - South Korean Won
NOK - Norwegian Krone
PHP - Philippine Peso
PLN - Polish Zloty
RUB - Russian Ruble
SEK - Swedish Krona
SGD - Singapore Dollar
See accompanying Notes to Consolidated Financial Statements.
AXS Aspect Core Diversified Strategy Fund
CONSOLIDATED SCHEDULE OF INVESTMENTS - Continued
As of September 30, 2021
THB - Baht
TWD - New Taiwan Dollar
USD - United States Dollar
ZAR - South African Rand
See accompanying Notes to Consolidated Financial Statements.
AXS Aspect Core Diversified Strategy Fund
CONSOLIDATED SUMMARY OF INVESTMENTS
As of September 30, 2021
| Security Type | | Percent of Total
Net Assets | |
| Short-Term Investments | | | 83.4 | % |
| Total Investments | | | 83.4 | % |
| Other Assets in Excess of Liabilities | | | 16.6 | % |
| Total Net Assets | | | 100.0 | % |
See accompanying Notes to Consolidated Financial Statements.
AXS Chesapeake Strategy Fund
CONSOLIDATED SCHEDULE OF INVESTMENTS
As of September 30, 2021
| Number of Shares | | | SHORT-TERM INVESTMENTS — 91.0% | | Value | |
| | 9,306,008 | | | Fidelity Investments Money Market Government Portfolio - Institutional Class, 0.01%1 | | $ | 9,306,008 | |
| | Principal | | | | | | | |
| | Amount | | | | | | | |
| $ | 7,800,454 | | | UMB Bank Demand Deposit, 0.01%1 | | | 7,800,454 | |
| | | | | TOTAL SHORT-TERM INVESTMENTS | | | | |
| | | | | (Cost $17,106,462) | | | 17,106,462 | |
| | | | | | | | | |
| | | | | TOTAL INVESTMENTS — 91.0% | | | | |
| | | | | (Cost $17,106,462) | | | 17,106,462 | |
| | | | | Other Assets in Excess of Liabilities — 9.0% | | | 1,686,305 | |
| | | | | TOTAL NET ASSETS — 100.0% | | $ | 18,792,767 | |
| 1 | The rate is the annualized seven-day yield at period end. |
See accompanying Notes to Consolidated Financial Statements.
AXS Chesapeake Strategy Fund
CONSOLIDATED SCHEDULE OF INVESTMENTS - Continued
As of September 30, 2021
FUTURES CONTRACTS
| Long Contracts | | Expiration Date | | Number of Contracts | | | Notional Value* | | | Value at September 30, 2021* | | | Unrealized Appreciation (Depreciation) | |
| Commodity Futures | | | | | | | | | | | | | | |
| CBOT Corn1 | | December 2021 | | | 11 | | | | 296,175 | | | | 295,212 | | | $ | (963 | ) |
| CBOT Soybean Oil1 | | December 2021 | | | 5 | | | | 179,430 | | | | 176,070 | | | | (3,360 | ) |
| CBOT Wheat1 | | December 2021 | | | 10 | | | | 365,250 | | | | 362,750 | | | | (2,500 | ) |
| CME Lean Hogs1 | | December 2021 | | | 7 | | | | 210,996 | | | | 239,120 | | | | 28,124 | |
| CMX Copper1 | | December 2021 | | | 5 | | | | 535,300 | | | | 511,125 | | | | (24,175 | ) |
| ICE Canola1 | | November 2021 | | | 30 | | | | 431,136 | | | | 514,007 | | | | 82,871 | |
| LME Lead1 | | December 2021 | | | 7 | | | | 398,125 | | | | 366,800 | | | | (31,325 | ) |
| LME Primary Aluminum1 | | December 2021 | | | 8 | | | | 559,000 | | | | 571,450 | | | | 12,450 | |
| LME Primary Nickel1 | | December 2021 | | | 2 | | | | 235,740 | | | | 215,238 | | | | (20,502 | ) |
| LME Zinc1 | | December 2021 | | | 5 | | | | 384,125 | | | | 373,375 | | | | (10,750 | ) |
| NYBOT Coffee 'C'1 | | December 2021 | | | 10 | | | | 700,687 | | | | 727,500 | | | | 26,813 | |
| NYBOT Cotton #21 | | December 2021 | | | 16 | | | | 704,215 | | | | 846,400 | | | | 142,185 | |
| NYBOT Sugar #111 | | March 2022 | | | 31 | | | | 699,608 | | | | 706,205 | | | | 6,597 | |
| NYMEX NY Harbor ULSD1 | | November 2021 | | | 9 | | | | 835,954 | | | | 883,953 | | | | 47,999 | |
| NYMEX RBOB Gasoline1 | | November 2021 | | | 6 | | | | 524,912 | | | | 552,888 | | | | 27,976 | |
| NYMEX WTI Crude Oil1 | | November 2021 | | | 7 | | | | 493,920 | | | | 525,210 | | | | 31,290 | |
| | | | | | | | | | | | | | | | | | | |
| Currency Futures | | | | | | | | | | | | | | | | | | |
| Brazil Real | | November 2021 | | | 30 | | | | 564,900 | | | | 548,400 | | | | (16,500 | ) |
| Canadian Dollar | | December 2021 | | | 9 | | | | 706,460 | | | | 710,910 | | | | 4,450 | |
| CME British Pound | | December 2021 | | | 8 | | | | 687,550 | | | | 673,750 | | | | (13,800 | ) |
| CME Mexican Peso | | December 2021 | | | 23 | | | | 571,065 | | | | 551,885 | | | | (19,180 | ) |
| Indian Rupee | | October 2021 | | | 36 | | | | 2,434,680 | | | | 2,417,940 | | | | (16,740 | ) |
| New Zealand Dollar | | December 2021 | | | 8 | | | | 566,080 | | | | 552,360 | | | | (13,720 | ) |
| Russian Ruble | | December 2021 | | | 26 | | | | 870,675 | | | | 881,400 | | | | 10,725 | |
| Swedish Krona | | December 2021 | | | 3 | | | | 2,574,780 | | | | 2,580,558 | | | | 5,778 | |
| | | | | | | | | | | | | | | | | | | |
| Index Futures | | | | | | | | | | | | | | | | | | |
| CAC 40 10 Euro | | October 2021 | | | 9 | | | | 597,735 | | | | 584,860 | | | | (12,875 | ) |
| CME E-mini S&P 500 | | December 2021 | | | 3 | | | | 672,480 | | | | 644,662 | | | | (27,818 | ) |
| CME NASDAQ 100 E-Mini | | December 2021 | | | 2 | | | | 622,058 | | | | 587,300 | | | | (34,758 | ) |
| EUX DAX Index | | December 2021 | | | 1 | | | | 389,638 | | | | 381,023 | | | | (8,615 | ) |
| ICF FTSE 100 Index | | December 2021 | | | 3 | | | | 209,805 | | | | 213,039 | | | | 3,234 | |
| MSCI Emerging Markets | | December 2021 | | | 3 | | | | 195,180 | | | | 186,840 | | | | (8,340 | ) |
| SGX Nikkei 225 | | December 2021 | | | 7 | | | | 102,445,000 | | | | 102,457,579 | | | | 12,579 | |
| Total Long Contracts | | | | | | | | | 121,662,659 | | | | 121,839,809 | | | | 177,150 | |
| Short Contracts | | | | | | | | | | | | | | | |
| Commodity Futures | | | | | | | | | | | | | | | |
| CME Live Cattle1 | | | December 2021 | | | | (1 | ) | | | (50,570 | ) | | | (50,290 | ) | | | 280 | |
| NYMEX Platinum1 | | | January 2022 | | | | (2 | ) | | | (99,130 | ) | | | (96,240 | ) | | | 2,890 | |
| | | | | | | | | | | | | | | | | | | | | |
| Currency Futures | | | | | | | | | | | | | | | | | | | | |
| CME Australian Dollar | | | December 2021 | | | | (8 | ) | | | (588,784 | ) | | | (578,720 | ) | | | 10,064 | |
| CME Euro | | | December 2021 | | | | (16 | ) | | | (2,355,135 | ) | | | (2,320,000 | ) | | | 35,135 | |
| CME Japanese Yen | | | December 2021 | | | | (15 | ) | | | (1,700,251 | ) | | | (1,683,938 | ) | | | 16,313 | |
| CME Swiss Franc | | | December 2021 | | | | (9 | ) | | | (1,213,350 | ) | | | (1,208,475 | ) | | | 4,875 | |
| | | | | | | | | | | | | | | | | | | | | |
| Interest Rate Futures | | | | | | | | | | | | | | | | | | | | |
| CBOT 5-Year U.S. Treasury Note | | | December 2021 | | | | (26 | ) | | | (3,212,828 | ) | | | (3,191,297 | ) | | | 21,531 | |
| CBOT 10-Year U.S. Treasury Note | | | December 2021 | | | | (47 | ) | | | (6,274,867 | ) | | | (6,185,640 | ) | | | 89,227 | |
| CBOT U.S. Long Bond | | | December 2021 | | | | (16 | ) | | | (2,618,500 | ) | | | (2,547,500 | ) | | | 71,000 | |
| CBOT Ultra Long-Term U.S. Treasury Bond | | | December 2021 | | | | (7 | ) | | | (1,391,609 | ) | | | (1,337,438 | ) | | | 54,171 | |
| ICF Long Gilt | | | December 2021 | | | | (29 | ) | | | (3,744,480 | ) | | | (3,589,360 | ) | | | 155,120 | |
| Total Short Contracts | | | | | | | | | | | (23,249,504 | ) | | | (22,788,898 | ) | | | 460,606 | |
| | | | | | | | | | | | | | | | | | | | | |
| TOTAL FUTURES CONTRACTS | | | | | | | | | | | 98,413,155 | | | | 99,050,911 | | | $ | 637,756 | |
| 1 | This investment is a holding of AXS Chesapeake Strategy Fund Limited. |
See accompanying Notes to Consolidated Financial Statements.
AXS Chesapeake Strategy Fund
CONSOLIDATED SUMMARY OF INVESTMENTS
As of September 30, 2021
| Security Type | | Percent of Total Net Assets | |
| Short-Term Investments | | | 91.0 | % |
| Total Investments | | | 91.0 | % |
| Other Assets in Excess of Liabilities | | | 9.0 | % |
| Total Net Assets | | | 100.0 | % |
See accompanying Notes to Consolidated Financial Statements.
AXS Managed Futures Strategy Fund
CONSOLIDATED SCHEDULE OF INVESTMENTS
As of September 30, 2021
Number
of Shares | | | | | Value | |
| | | | SHORT-TERM INVESTMENTS — 41.6% | | | |
| | 14,161,493 | | | Fidelity Investments Money Market Government Portfolio - Institutional Class, 0.01%1 | | $ | 14,161,493 | |
| | 1,722,241 | | | Goldman Sachs Funds PLC - US Liquid Reserves Fund - Administrative Share Class, 0.01%1,2,3 | | | 1,722,241 | |
| | 1,722,654 | | | JPMorgan Liquidity Funds - US Dollar Liquidity Fund - Premier Share Class, 0.01%1,2,3 | | | 1,722,654 | |
| | | | | TOTAL SHORT-TERM INVESTMENTS | | | | |
| | | | | (Cost $17,606,388) | | | 17,606,388 | |
| | | | | TOTAL INVESTMENTS — 41.6% | | | | |
| | | | | (Cost $17,606,388) | | | 17,606,388 | |
| | | | | Other Assets in Excess of Liabilities — 58.4% | | | 24,733,407 | |
| | | | | TOTAL NET ASSETS — 100.0% | | $ | 42,339,795 | |
PLC – Public Limited Company
| 1 | The rate is the annualized seven-day yield at period end. |
| 2 | All or a portion of this security is segregated as collateral for swap agreement. As of September 30, 2021, the aggregate value of those securities was $3,444,895, representing 8.1% of net assets. |
| 3 | All or a portion of this investment is a holding of AXS Managed Futures Strategy Fund Limited. |
See accompanying Notes to Consolidated Financial Statements.
AXS Managed Futures Strategy Fund
CONSOLIDATED SCHEDULE OF INVESTMENTS - Continued
As of September 30, 2021
SWAP CONTRACTS
TOTAL RETURN SWAPS
| Counterparty | | Reference Entity | | Pay/Receive Total Return on Reference Entity | | Financing Rate1 | | Termination Date | | Notional Value | | | Unrealized Appreciation (Depreciation) | |
| | | | | | | | | | | | | | | |
| Deutsche Bank | | AXS Financial Futures Index | | Receive | | 0.50% of Notional Value | | 1/31/22 | | $ | 72,346,358 | | | $ | (5,518,910 | ) |
| Deutsche Bank | | AXS Physical Futures Index2 | | Receive | | 0.50% of Notional Value | | 9/30/26 | | | 81,684,017 | | | | (2,137,559 | ) |
| Morgan Stanley | | Single CTA Program Total Return Swap2 | | Receive | | One month USD Libor plus 0.27% of the notional value | | 3/9/22 | | | 8,666,157 | | | | 28,861 | |
| Morgan Stanley | | Alphas Managed Accounts Platform XV Limited Portfolio2 | | Receive | | 0.45% of Notional Value | | 3/9/22 | | | 9,455,691 | | | | 9,011 | |
| TOTAL SWAP CONTRACTS | | | | | | | | | | | | $ | (7,618,597 | ) |
| 1 | Financing rate is based upon predetermined notional amounts. |
| 2 | This investment is a holding of the AXS Managed Futures Strategy Fund Limited. |
See accompanying Notes to Consolidated Financial Statements.
AXS Managed Futures Strategy Fund
CONSOLIDATED SCHEDULE OF INVESTMENTS - Continued
As of September 30, 2021
AXS Financial Futures Index Top 50 Holdings1
FUTURES CONTRACTS
| Number of Long Contracts | | Description | | Counterparty | | Expiration Date | | Notional Value | | | Unrealized Appreciation (Depreciation) | |
| 303 | | 3 month Euro (EURIBOR) | | Deutsche Bank | | Mar-22 | | $ | 88,394,115 | | | $ | (15,972 | ) |
| 158 | | Eurodollar | | Deutsche Bank | | Mar-22 | | | 39,333,719 | | | | 4,966 | |
| 156 | | Eurodollar | | Deutsche Bank | | Dec-22 | | | 38,726,647 | | | | (15,086 | ) |
| 125 | | 3 month Euro (EURIBOR) | | Deutsche Bank | | Dec-21 | | | 36,506,562 | | | | (397 | ) |
| 116 | | 3 month Euro (EURIBOR) | | Deutsche Bank | | Sep-22 | | | 33,664,082 | | | | (9,899 | ) |
| 126 | | Eurodollar | | Deutsche Bank | | Sep-22 | | | 31,462,149 | | | | (14,531 | ) |
| 94 | | Eurodollar | | Deutsche Bank | | Jun-22 | | | 23,439,773 | | | | (3,777 | ) |
| 64 | | 3 month Euro (EURIBOR) | | Deutsche Bank | | Dec-23 | | | 18,566,272 | | | | (978 | ) |
| 81 | | 2 year US Treasury Notes | | Deutsche Bank | | Dec-21 | | | 17,875,032 | | | | (16,257 | ) |
| 130 | | 2 year Euro-Schatz | | Deutsche Bank | | Dec-21 | | | 16,940,966 | | | | (8,139 | ) |
| Number of Short Contracts | | Description | | Counterparty | | Expiration Date | | Notional Value | | | Unrealized Appreciation (Depreciation) | |
| (164) | | 3 month Euro (EURIBOR) | | Deutsche Bank | | Jun-23 | | $ | (47,822,862 | ) | | $ | 15,365 | |
| (262) | | 2 year Euro-Schatz | | Deutsche Bank | | Dec-21 | | | (34,120,427 | ) | | | 5,520 | |
| (181) | | 3 month Sterling | | Deutsche Bank | | Sep-22 | | | (30,339,533 | ) | | | 34,879 | |
| (90) | | 3 month Euro (EURIBOR) | | Deutsche Bank | | Dec-22 | | | (26,286,531 | ) | | | 1,031 | |
| (88) | | Eurodollar | | Deutsche Bank | | Dec-22 | | | (21,929,210 | ) | | | 2,252 | |
| (163) | | 5 year US Treasury Notes | | Deutsche Bank | | Dec-21 | | | (19,946,599 | ) | | | 73,094 | |
OPTIONS ON CURRENCY
| | | Put/Call | | | Description | | | Expiration Date | | Strike Price | | | Notional Value | | | Unrealized Appreciation (Depreciation) | |
| Purchased | | | | | | | | | | | | | | | | | |
| | | | Put | | | | JPY/CAD | | | Mar-22 | | $ | 78.00 | | | $ | 26,873,511 | | $ | 8,799 | |
| | | | Put | | | | JPY/AUD | | | Mar-22 | | | 70.00 | | | | 25,682,600 | | | (712 | ) |
| | | | Call | | | | ZAR/USD | | | Mar-22 | | | 17.50 | | | | 22,149,730 | | | 62,833 | |
| | | | Put | | | | JPY/GBP | | | Mar-22 | | | 138.50 | | | | 19,943,616 | | | 89,823 | |
| | | | Put | | | | NOK/USD | | | Jan-22 | | | 7.85 | | | | 18,458,108 | | | 5,417 | |
| | | | Put | | | | JPY/CAD | | | Nov-21 | | | 80.50 | | | | 17,526,203 | | | 5,490 | |
| | | | | | | | | | | | | | | | | | | | | | |
| Written | | | | | | | | | | | | | | | | | | | | | |
| | | | Put | | | | JPY/CAD | | | Mar-22 | | $ | 78.00 | | | $ | (26,873,511 | ) | $ | (66,313 | ) |
| | | | Put | | | | JPY/AUD | | | Mar-22 | | | 70.00 | | | | (25,682,600 | ) | | (81,350 | ) |
| | | | Call | | | | ZAR/USD | | | Mar-22 | | | 17.50 | | | | (22,149,730 | ) | | (249,420 | ) |
| | | | Put | | | | JPY/GBP | | | Mar-22 | | | 138.50 | | | | (19,943,616 | ) | | (89,823 | ) |
| | | | Put | | | | NOK/USD | | | Jan-22 | | | 7.85 | | | | (18,458,108 | ) | | (5,417 | ) |
| | | | Put | | | | JPY/CAD | | | Nov-21 | | | 80.50 | | | | (17,526,203 | ) | | (5,490 | ) |
See accompanying Notes to Consolidated Financial Statements.
AXS Managed Futures Strategy Fund
CONSOLIDATED SCHEDULE OF INVESTMENTS - Continued
As of September 30, 2021
AXS Financial Futures Index Top 50 Holdings1 - Continued
OPTIONS ON FUTURES
| | | | Put/Call | | | Description | | Number of Contracts | | Expiration Date | | Strike Price | | | Notional Value | | | Unrealized Appreciation (Depreciation) | |
| Purchased | | | | | | | | | | | | | | | | | | | |
| | | | | Call | | | Eurodollar | | 405 | | Jun-22 | | $ | 99.25 | | | $ | 100,393,685 | | $ | 7,587 | |
| | | | | Call | | | Eurodollar | | 194 | | Dec-21 | | | 100.00 | | | | 48,446,641 | | | 1,211 | |
| | | | | Put | | | 5 year US Treasury Note Week 1 Option - Friday | | 142 | | Oct-21 | | | 122.00 | | | | 17,354,758 | | | 1,111 | |
| | | | | Call | | | 2 Year Eurodollar Midcurve Option | | 69 | | Mar-22 | | | 99.63 | | | | 17,184,449 | | | 1,294 | |
| | | | | | | | | | | | | | | | | | | | | | | |
| Written | | | | | | | | | | | | | | | | | | | | | | |
| | | | | Call | | | Eurodollar | | (204) | | Jun-22 | | $ | 99.00 | | | $ | (50,597,459 | ) | $ | (3,833 | ) |
FORWARD FOREIGN CURRENCY CONTRACTS
| | | Settlement Date | | Counterparty | | Currency Units to Receive/Deliver | | | In Exchange For | | | Unrealized Appreciation (Depreciation) | |
| Long Contracts | | | | | | | | | | | | | | | | | |
| | | Dec-21 | | Deutsche Bank | | $ | 1,042,900,568 | | | | TWO | | | $ | 37,794,267 | | | | USD | | $ | 196,235 | |
| | | Dec-21 | | Deutsche Bank | | | 1,996,269,127 | | | | INO | | | | 26,884,582 | | | | USD | | | 185,183 | |
| | | Dec-21 | | Deutsche Bank | | | 70,340,622 | | | | ILS | | | | 21,916,779 | | | | USD | | | 89,748 | |
| | | Dec-21 | | Deutsche Bank | | | 1,568,445,673 | | | | RUB | | | | 21,137,515 | | | | USD | | | (146,642 | ) |
| | | Dec-21 | | Deutsche Bank | | | 287,396,217,268 | | | | IDO | | | | 19,968,621 | | | | USD | | | 59,877 | |
| | | Dec-21 | | Deutsche Bank | | | 18,963,266,248 | | | | KRO | | | | 16,257,379 | | | | USD | | | 259,271 | |
| | | Dec-21 | | Deutsche Bank | | | 1,768,479,496 | | | | JPY | | | | 16,067,388 | | | | USD | | | 202,402 | |
| | | Dec-21 | | Deutsche Bank | | | 21,873,578 | | | | SGO | | | | 16,169,712 | | | | USD | | | 96,526 | |
| | | Dec-21 | | Deutsche Bank | | | 20,585,726 | | | | CAD | | | | 16,248,657 | | | | USD | | | (39,404 | ) |
| | | | | | | | | | | | | | | | | | | | | | | | |
| Short Contracts | | | | | | | | | | | | | | | | | | | | | |
| | | Dec-21 | | Deutsche Bank | | $ | (4,514,816,450 | ) | | | JPY | | | $ | (40,862,109 | ) | | | USD | | $ | (359,810 | ) |
| | | Dec-21 | | Deutsche Bank | | | (985,658,739 | ) | | | TWO | | | | (35,738,960 | ) | | | USD | | | (204,575 | ) |
| | | Dec-21 | | Deutsche Bank | | | (15,252,135 | ) | | | USD | | | | (21,470,298 | ) | | | NZD | | | 414,270 | |
| | | Dec-21 | | Deutsche Bank | | | (1,597,547,236 | ) | | | INO | | | | (21,527,147 | ) | | | USD | | | (160,513 | ) |
| | | Dec-21 | | Deutsche Bank | | | (16,846,819 | ) | | | CHF | | | | (18,312,686 | ) | | | USD | | | (219,414 | ) |
| | | Dec-21 | | Deutsche Bank | | | (252,037,956,763 | ) | | | IDO | | | | (17,513,941 | ) | | | USD | | | (54,564 | ) |
| | | Dec-21 | | Deutsche Bank | | | (19,919,746 | ) | | | USD | | | | (16,904,902 | ) | | | EUR | | | 291,843 | |
| | | Dec-21 | | Deutsche Bank | | | (54,492,617 | ) | | | ILS | | | | (17,036,643 | ) | | | USD | | | (127,321 | ) |
AUD - Australian Dollar
CAD - Canadian Dollar
EUR - Euro
GBP - British Pound
IDO - Indonesian Rupiah Offshore
ILS - Israeli Shekel
INO - Indian Rupee Offshore
JPY - Japanese Yen
KRO - South Korean Won Offshore
NOK - Norwegian Krone
NZD - New Zealand Dollar
RUB - Russian Ruble
SGO - Signapore Dollar Offshore
TWO - New Taiwan Dollar Offshore
USD - U.S. Dollar
ZAR - South African Rand
| 1 | These investments are not direct holdings of the Fund. The holdings were determined based on the absolute notional values of the positions within the underlying swap basket. |
See accompanying Notes to Consolidated Financial Statements.
AXS Managed Futures Strategy Fund
CONSOLIDATED SCHEDULE OF INVESTMENTS - Continued
As of September 30, 2021
AXS Physical Futures Index Top 50 Holdings1
FUTURES CONTRACTS
| Number of Long Contracts | | Description | | Counterparty | | Expiration Date | | Notional Value | | | Unrealized Appreciation (Depreciation) | |
| 303 | | Three Month Canadian Bankers Acceptance Future | | Deutsche Bank | | Mar-23 | | $ | 59,057,541 | | | $ | (139,389 | ) |
| 563 | | Light Sweet Crude Oil (WTI) Future | | Deutsche Bank | | Nov-21 | | | 42,024,900 | | | | 3,866,500 | |
| 151 | | Eurodollar | | Deutsche Bank | | Jun-22 | | | 37,588,674 | | | | (5,299 | ) |
| 101 | | Eurodollar | | Deutsche Bank | | Dec-22 | | | 25,104,969 | | | | (23,805 | ) |
| 116 | | Three Month Canadian Bankers Acceptance Future | | Deutsche Bank | | Dec-22 | | | 22,711,385 | | | | (35,919 | ) |
| 112 | | 3 month Sterling | | Deutsche Bank | | Mar-22 | | | 18,855,112 | | | | (43,442 | ) |
| 126 | | 10 year US Treasury Notes | | Deutsche Bank | | Dec-21 | | | 16,556,810 | | | | (187,250 | ) |
| 80 | | 90 Day Bank Accepted Bill Future | | Deutsche Bank | | Mar-23 | | | 14,168,555 | | | | (5,564 | ) |
| 70 | | Three Month Canadian Bankers Acceptance Future | | Deutsche Bank | | Sep-22 | | | 13,804,234 | | | | (18,110 | ) |
| 72 | | 3 month Sterling | | Deutsche Bank | | Jun-22 | | | 12,028,408 | | | | (33,741 | ) |
| 53 | | E-Mini S&P 500 | | Deutsche Bank | | Dec-21 | | | 11,442,756 | | | | (138,190 | ) |
| 46 | | Eurodollar | | Deutsche Bank | | Sep-23 | | | 11,434,219 | | | | (19,074 | ) |
| 7 | | 10 year Japanese Government Bond | | Deutsche Bank | | Dec-21 | | | 9,409,426 | | | | (10,639 | ) |
| 37 | | Eurodollar | | Deutsche Bank | | Dec-23 | | | 9,223,322 | | | | 1,851 | |
| 72 | | 5 year US Treasury Notes | | Deutsche Bank | | Dec-21 | | | 8,851,573 | | | | (44,061 | ) |
| 35 | | Eurodollar | | Deutsche Bank | | Sep-22 | | | 8,607,207 | | | | (5,422 | ) |
| 44 | | Gold | | Deutsche Bank | | Dec-21 | | | 7,816,707 | | | | (85,458 | ) |
| 44 | | 90 Day Bank Accepted Bill Future | | Deutsche Bank | | Dec-22 | | | 7,804,236 | | | | (2,898 | ) |
| 34 | | Copper Grade A Future | | Deutsche Bank | | Oct-21 | | | 7,584,284 | | | | (487,222 | ) |
| 37 | | Euro-BUND | | Deutsche Bank | | Dec-21 | | | 7,216,365 | | | | (60,166 | ) |
| 119 | | Henry Hub Natural Gas Future | | Deutsche Bank | | Jan-22 | | | 6,854,862 | | | | 995,674 | |
| 100 | | Light Sweet Crude Oil (WTI) Future | | Deutsche Bank | | Nov-22 | | | 6,761,279 | | | | 161,515 | |
| 31 | | Three Month Canadian Bankers Acceptance Future | | Deutsche Bank | | Jun-23 | | | 6,040,581 | | | | (15,054 | ) |
| 27 | | Copper Grade A Future | | Deutsche Bank | | Dec-21 | | | 6,007,219 | | | | (294,013 | ) |
| 108 | | Live Cattle Future | | Deutsche Bank | | Dec-21 | | | 5,425,850 | | | | (83,684 | ) |
| 104 | | Cotton #2 Future | | Deutsche Bank | | Mar-22 | | | 5,310,778 | | | | 587,182 | |
| Number of Short Contracts | | Description | | Counterparty | | Expiration Date | | Notional Value | | | Unrealized Appreciation (Depreciation) | |
| (576) | | Light Sweet Crude Oil (WTI) Future | | Deutsche Bank | | Oct-21 | | $ | (43,211,301 | ) | | $ | (3,147,571 | ) |
| (157) | | Three Month Canadian Bankers Acceptance Future | | Deutsche Bank | | Dec-21 | | | (30,940,563 | ) | | | (129 | ) |
| (65) | | 3 month Euro (EURIBOR) | | Deutsche Bank | | Jun-23 | | | (18,936,774 | ) | | | 6,870 | |
| (248) | | Henry Hub Natural Gas Future | | Deutsche Bank | | Oct-21 | | | (14,148,668 | ) | | | (2,015,794 | ) |
| (57) | | Eurodollar | | Deutsche Bank | | Jun-24 | | | (13,970,230 | ) | | | 18,512 | |
| (82) | | 3 month Sterling | | Deutsche Bank | | Dec-21 | | | (13,863,575 | ) | | | 14,279 | |
| (39) | | Eurodollar | | Deutsche Bank | | Jun-23 | | | (9,598,744 | ) | | | 12,883 | |
| (172) | | Cotton #2 Future | | Deutsche Bank | | Dec-21 | | | (8,871,508 | ) | | | (1,156,682 | ) |
| (43) | | Euro-BUND | | Deutsche Bank | | Dec-21 | | | (8,384,389 | ) | | | 7,989 | |
| (34) | | Copper Grade A Future | | Deutsche Bank | | Oct-21 | | | (7,584,284 | ) | | | 483,347 | |
| (94) | | Light Sweet Crude Oil (WTI) Future | | Deutsche Bank | | May-22 | | | (6,666,514 | ) | | | (114,633 | ) |
| (39) | | 3 month Sterling | | Deutsche Bank | | Jun-23 | | | (6,467,619 | ) | | | 19,550 | |
| (57) | | JPY/USD Currency Future | | Deutsche Bank | | Dec-21 | | | (6,413,019 | ) | | | 46,244 | |
| (28) | | Copper Grade A Future | | Deutsche Bank | | Dec-21 | | | (6,307,579 | ) | | | 304,409 | |
| (21) | | E-Mini Nasdaq-100 | | Deutsche Bank | | Dec-21 | | | (6,175,685 | ) | | | 56,772 | |
| (41) | | EUR/USD Currency Future | | Deutsche Bank | | Dec-21 | | | (5,894,757 | ) | | | 89,618 | |
| (80) | | Coffee C Future | | Deutsche Bank | | Dec-21 | | | (5,822,597 | ) | | | (386,629 | ) |
| (26) | | E-Mini S&P 500 | | Deutsche Bank | | Dec-21 | | | (5,760,979 | ) | | | 50,730 | |
| (109) | | Live Cattle Future | | Deutsche Bank | | Feb-22 | | | (5,677,014 | ) | | | 166,192 | |
| (46) | | CME E-Mini Russell 2000 Index | | Deutsche Bank | | Dec-21 | | | (5,148,264 | ) | | | 38,510 | |
| (4) | | 10 year Japanese Government Bond | | Deutsche Bank | | Dec-21 | | | (5,128,984 | ) | | | (596 | ) |
| (22) | | Copper Grade A Future | | Deutsche Bank | | Nov-21 | | | (4,979,452 | ) | | | 197,573 | |
OPTIONS ON CURRENCY AND COMMODITY
| | | | Put/Call | | | Description | | | Expiration Date | | Strike Price | | | Notional Value | | | Unrealized Appreciation (Depreciation) |
| | Purchased | | | | | | | | | | | | | | | | | | | |
| | | | | | Call | | | | XAU/USD | | | Dec-22 | | $ | 1,900.00 | | | $ | 9,932,642 | | $ | 17,303 |
| | | | | | Call | | | | XAU/USD | | | Aug-22 | | | 2,009.00 | | | | 9,032,441 | | | 8,872 |
EUR - Euro
JPY - Japanese Yen
USD - U.S. Dollar
XAU - Gold
| 1 | These investments are not direct holdings of the Fund. The holdings were determined based on the absolute notional values of the positions within the underlying swap basket. |
See accompanying Notes to Consolidated Financial Statements.
AXS Managed Futures Strategy Fund
CONSOLIDATED SCHEDULE OF INVESTMENTS - Continued
As of September 30, 2021
Single CTA Program Total Return Swap Top 50 Holdings1
FUTURES CONTRACTS
| Number of Long Contracts | | Description | | Counterparty | | Expiration Date | | Notional Value | | | Unrealized Appreciation (Depreciation) | |
| 4 | | 90-Day Bank Bill | | Morgan Stanley | | Mar-22 | | $ | 2,665,860 | | | $ | (118 | ) |
| 35 | | Australian 3Yr Bond Future | | Morgan Stanley | | Dec-21 | | | 2,492,317 | | | | (5,315 | ) |
| 3 | | 90-Day Bank Bill | | Morgan Stanley | | Dec-21 | | | 2,132,096 | | | | 177 | |
| 3 | | 90-Day Bank Bill | | Morgan Stanley | | Sep-22 | | | 1,861,136 | | | | (92 | ) |
| 2 | | 90-Day Bank Bill | | Morgan Stanley | | Jun-22 | | | 1,595,827 | | | | 85 | |
| 6 | | 90-Day Euro Future | | Morgan Stanley | | Sep-22 | | | 1,562,641 | | | | (544 | ) |
| 6 | | 90-Day Euro Future | | Morgan Stanley | | Dec-22 | | | 1,375,726 | | | | (1,244 | ) |
| 5 | | 90-Day Euro Future | | Morgan Stanley | | Mar-23 | | | 1,281,873 | | | | (1,884 | ) |
| 4 | | 90-Day Euro Future | | Morgan Stanley | | Jun-22 | | | 1,102,790 | | | | 14 | |
| 12 | | BP Currency Future | | Morgan Stanley | | Dec-21 | | | 1,024,100 | | | | (26,372 | ) |
| 4 | | 90-Day Euro Future | | Morgan Stanley | | Jun-23 | | | 1,004,603 | | | | (1,672 | ) |
| 4 | | 90-Day Euro Future | | Morgan Stanley | | Sep-23 | | | 913,183 | | | | (1,562 | ) |
| 3 | | 90-Day Euro Future | | Morgan Stanley | | Dec-23 | | | 729,093 | | | | (1,645 | ) |
| 6 | | US 5Yr Note | | Morgan Stanley | | Dec-21 | | | 724,166 | | | | (3,507 | ) |
| 4 | | Short Euro-British Pound Future | | Morgan Stanley | | Dec-21 | | | 533,448 | | | | (593 | ) |
| 1 | | Japanese 10Yr Bond Future | | Morgan Stanley | | Dec-21 | | | 503,229 | | | | (1,556 | ) |
| 4 | | US 10Yr Note | | Morgan Stanley | | Dec-21 | | | 485,641 | | | | (5,724 | ) |
| 2 | | 90-Day Euro Future | | Morgan Stanley | | Mar-24 | | | 454,158 | | | | (1,041 | ) |
| 1 | | 90-Day Euro Future | | Morgan Stanley | | Jun-24 | | | 362,392 | | | | (1,046 | ) |
| 1 | | 90-Day Euro Future | | Morgan Stanley | | Sep-24 | | | 361,988 | | | | (944 | ) |
| 2 | | 90-Day Euro Future | | Morgan Stanley | | Mar-22 | | | 354,533 | | | | (6,580 | ) |
| 5 | | Australian 10Yr Bond Future | | Morgan Stanley | | Dec-21 | | | 341,035 | | | | (8,737 | ) |
| 1 | | 3 month Euro (EURIBOR) | | Morgan Stanley | | Sep-24 | | | 321,859 | | | | (672 | ) |
| 1 | | S&P500 Emini Future | | Morgan Stanley | | Dec-21 | | | 315,885 | | | | (10,405 | ) |
| 4 | | C $ Currency Future | | Morgan Stanley | | Dec-21 | | | 291,473 | | | | 601 | |
| 1 | | Euro-Brittish Pound Future | | Morgan Stanley | | Dec-21 | | | 258,736 | | | | (3,253 | ) |
| 1 | | 90 Day Sterling Future | | Morgan Stanley | | Jun-22 | | | 246,007 | | | | (655 | ) |
| 1 | | Nasdaq 100 E-Mini | | Morgan Stanley | | Dec-21 | | | 217,301 | | | | (10,277 | ) |
| 2 | | Canadian 10Yr Bond Future | | Morgan Stanley | | Dec-21 | | | 207,955 | | | | (4,624 | ) |
| 3 | | Natural Gas Future | | Morgan Stanley | | Dec-21 | | | 198,868 | | | | 20,775 | |
| 8 | | Mexican Peso Future | | Morgan Stanley | | Dec-21 | | | 194,640 | | | | (5,681 | ) |
| 3 | | LME Pri Aluminum Future | | Morgan Stanley | | Nov -21 | | | 184,260 | | | | 16,214 | |
| 3 | | Natural Gas Future | | Morgan Stanley | | Nov-21 | | | 173,165 | | | | 32,145 | |
| 1 | | Bank Acceptance Future | | Morgan Stanley | | Dec-21 | | | 143,198 | | | | (2,143 | ) |
| Number of Short Contracts | | Description | | Counterparty | | Expiration Date | | Notional Value | | | Unrealized Appreciation (Depreciation) | |
| (12) | | Euro Fx Currency Future | | Morgan Stanley | | Dec-21 | | $ | (1,709,550 | ) | | $ | 28,131 | |
| (11) | | JPN Yen Currency Future | | Morgan Stanley | | Dec-21 | | | (1,200,086 | ) | | | 11,318 | |
| (9) | | AUD/USD Currency Future | | Morgan Stanley | | Dec-21 | | | (666,251 | ) | | | 5,397 | |
| (3) | | 90 Day Sterling Future | | Morgan Stanley | | Jun-23 | | | (492,296 | ) | | | 782 | |
| (3) | | 90 Day Sterling Future | | Morgan Stanley | | Sep-23 | | | (492,097 | ) | | | 714 | |
| (3) | | 90 Day Sterling Future | | Morgan Stanley | | Mar-23 | | | (430,724 | ) | | | 643 | |
| (3) | | 90 Day Sterling Future | | Morgan Stanley | | Dec-23 | | | (430,203 | ) | | | 571 | |
| (3) | | 90 Day Sterling Future | | Morgan Stanley | | Mar-24 | | | (430,116 | ) | | | 618 | |
| (2) | | 90 Day Sterling Future | | Morgan Stanley | | Dec-22 | | | (369,177 | ) | | | 419 | |
| (2) | | 90 Day Sterling Future | | Morgan Stanley | | Jun-24 | | | (368,321 | ) | | | 667 | |
| (2) | | CHF Currency Future | | Morgan Stanley | | Dec-21 | | | (296,748 | ) | | | 3,543 | |
| (1) | | 3 month Euro (EURIBOR) | | Morgan Stanley | | Sep-22 | | | (215,258 | ) | | | (5 | ) |
| (1) | | 3 month Euro (EURIBOR) | | Morgan Stanley | | Dec-22 | | | (215,194 | ) | | | (5 | ) |
| (1) | | 3 month Euro (EURIBOR) | | Morgan Stanley | | Mar-23 | | | (215,108 | ) | | | - | |
| (1) | | 3 month Euro (EURIBOR) | | Morgan Stanley | | Jun-23 | | | (215,044 | ) | | | (5 | ) |
| (1) | | 90 Day Sterling Future | | Morgan Stanley | | Sept-24 | | | (184,956 | ) | | | (5,681 | ) |
AUD - Australian Dollar
BP - British Pound
CHF - Swiss Franc
JPN - Japanese Yen
USD - United States Dollar
| 1 | These investments are not direct holdings of the Fund. The holdings were determined based on the absolute notional values of the positions within the underlying swap basket. |
See accompanying Notes to Consolidated Financial Statements.
AXS Managed Futures Strategy Fund
CONSOLIDATED SCHEDULE OF INVESTMENTS - Continued
As of September 30, 2021
Alphas Managed Accounts Platform XV Limited Portfolio Top 50 Holdings1
FUTURES CONTRACTS
| Number of Long Contracts | | Description | | Counterparty | | Expiration Date | | Notional Value | | | Unrealized Appreciation (Depreciation) | |
| 9 | | E-Mini Russ 2000 | | Morgan Stanley | | Dec-21 | | $ | 999,257 | | | $ | (8,897 | ) |
| 5 | | BP Currency Future | | Morgan Stanley | | Dec-21 | | | 425,150 | | | | (4,054 | ) |
| 4 | | C $ Currency Future | | Morgan Stanley | | Dec-21 | | | 314,570 | | | | 1,400 | |
| 3 | | Coffee C Future | | Morgan Stanley | | Dec-21 | | | 218,651 | | | | (402 | ) |
| 1 | | CAC 40 10 Euro Future | | Morgan Stanley | | Oct-21 | | | 77,041 | | | | (1,430 | ) |
| 1 | | AUD/USD Currency Future | | Morgan Stanley | | Dec-21 | | | 72,040 | | | | 301 | |
| 1 | | Cotton #2 Future | | Morgan Stanley | | Dec-21 | | | 46,955 | | | | 5,945 | |
| 1 | | Cocoa Future | | Morgan Stanley | | Dec-21 | | | 25,513 | | | | 1,008 | |
| Number of Short Contracts | | Description | | Counterparty | | Expiration Date | | Notional Value | | | Unrealized Appreciation (Depreciation) | |
| (8) | | Euro-Bund Future | | Morgan Stanley | | Dec-21 | | $ | (1,586,138 | ) | | $ | 10,190 | |
| (11) | | Us 10Yr Note | | Morgan Stanley | | Dec-21 | | | (1,457,160 | ) | | | 11,895 | |
| (7) | | Long Gilt Future | | Morgan Stanley | | Dec-21 | | | (1,195,466 | ) | | | 12,782 | |
| (7) | | Canadian 10Yr Bond Future | | Morgan Stanley | | Dec-21 | | | (802,174 | ) | | | 10,534 | |
| (9) | | Australian 10Yr Bond Future | | Morgan Stanley | | Dec-21 | | | (639,065 | ) | | | 9,896 | |
| (4) | | Euro Fx Currency Future | | Morgan Stanley | | Dec-21 | | | (590,763 | ) | | | 10,770 | |
| (4) | | CHF Currency Future | | Morgan Stanley | | Dec-21 | | | (539,225 | ) | | | 2,139 | |
| (5) | | FTSE 100 Index Future | | Morgan Stanley | | Dec-21 | | | (473,603 | ) | | | (3,851 | ) |
| (2) | | S&P 500 E-Mini Future | | Morgan Stanley | | Dec-21 | | | (443,567 | ) | | | 13,792 | |
| (1) | | Dax Index Future | | Morgan Stanley | | Dec-21 | | | (442,801 | ) | | | (550 | ) |
| (6) | | Natural Gas Future | | Morgan Stanley | | Nov-21 | | | (329,000 | ) | | | (22,985 | ) |
| (1) | | NASDAQ 100 E-Mini Future | | Morgan Stanley | | Dec-21 | | | (305,340 | ) | | | 11,690 | |
| (6) | | Soybean Oil Future | | Morgan Stanley | | Dec-21 | | | (205,452 | ) | | | (5,832 | ) |
| (9) | | Sugar #11 | | Morgan Stanley | | Mar-22 | | | (201,835 | ) | | | (3,160 | ) |
| (4) | | Wheat Future | | Morgan Stanley | | Dec-21 | | | (139,550 | ) | | | (5,576 | ) |
| (1) | | New York Harbor ULSD Future | | Morgan Stanley | | Dec-21 | | | (95,735 | ) | | | (2,205 | ) |
| (1) | | Gasoline RBOB Future | | Morgan Stanley | | Dec-21 | | | (89,435 | ) | | | (1,121 | ) |
| (3) | | Corn Future | | Morgan Stanley | | Dec-21 | | | (78,900 | ) | | | (1,585 | ) |
| (1) | | WTI Crude Future | | Morgan Stanley | | Dec-21 | | | (71,780 | ) | | | (2,916 | ) |
| (1) | | Soybean Future | | Morgan Stanley | | Nov-21 | | | (63,750 | ) | | | 927 | |
AUD - Australian Dollar
BP - Brittish Pounds
CHF - Swiss Franc
USD - United States Dollar
| 1 | These investments are not direct holdings of the Fund. The holdings were determined based on the absolute notional values of the positions within the underlying swap basket. This basket contains only 28 investments. |
See accompanying Notes to Consolidated Financial Statements.
AXS Managed Futures Strategy Fund
CONSOLIDATED SUMMARY OF INVESTMENTS
As of September 30, 2021
| Security Type | | Percent of Total
Net Assets | |
| Short-Term Investments | | | 41.6 | % |
| Total Investments | | | 41.6 | % |
| Other Assets in Excess of Liabilities | | | 58.4 | % |
| Total Net Assets | | | 100.0 | % |
See accompanying Notes to Consolidated Financial Statements.
AXS Multi-Strategy Alternatives Fund
SCHEDULE OF INVESTMENTS
As of September 30, 2021
Number
of Shares | | | | | Value | |
| | | | COMMON STOCKS — 60.3% | | | |
| | | | AUTO MANUFACTURERS — 4.3% | | | |
| | 905 | | | Cummins, Inc. | | $ | 203,227 | |
| | 855 | | | Tesla, Inc.* | | | 663,035 | |
| | | | | | | | 866,262 | |
| | | | | | | | | |
| | | | | AUTO PARTS & EQUIPMENT — 1.4% | | | | |
| | 6,255 | | | BorgWarner, Inc. | | | 270,278 | |
| | | | | | | | | |
| | | | | BANKS — 5.5% | | | | |
| | 1,345 | | | First Republic Bank | | | 259,424 | |
| | 820 | | | Goldman Sachs Group, Inc. | | | 309,985 | |
| | 2,540 | | | State Street Corp. | | | 215,189 | |
| | 5,415 | | | U.S. Bancorp | | | 321,867 | |
| | | | | | | | 1,106,465 | |
| | | | | | | | | |
| | | | | BEVERAGES — 2.3% | | | | |
| | 635 | | | Constellation Brands, Inc. - Class A | | | 133,788 | |
| | 2,110 | | | PepsiCo, Inc. | | | 317,365 | |
| | | | | | | | 451,153 | |
| | | | | | | | | |
| | | | | BIOTECHNOLOGY — 4.0% | | | | |
| | 5,200 | | | Corteva, Inc. | | | 218,816 | |
| | 2,650 | | | Gilead Sciences, Inc. | | | 185,103 | |
| | 1,025 | | | Moderna, Inc.* | | | 394,481 | |
| | | | | | | | 798,400 | |
| | | | | | | | | |
| | | | | CHEMICALS — 0.8% | | | | |
| | 1,835 | | | FMC Corp. | | | 168,013 | |
| | | | | | | | | |
| | | | | COMMERCIAL SERVICES — 2.1% | | | | |
| | 495 | | | Cintas Corp. | | | 188,427 | |
| | 895 | | | PayPal Holdings, Inc.* | | | 232,888 | |
| | | | | | | | 421,315 | |
| | | | | | | | | |
| | | | | COMPUTERS — 3.4% | | | | |
| | 2,505 | | | Apple, Inc. | | | 354,458 | |
| | 5,635 | | | Western Digital Corp.* | | | 318,039 | |
| | | | | | | | 672,497 | |
| | | | | | | | | |
| | | | | ELECTRONICS — 1.0% | | | | |
| | 1,350 | | | Garmin Ltd.1 | | | 209,871 | |
| | | | | | | | | |
| | | | | HEALTHCARE-PRODUCTS — 2.6% | | | | |
| | 525 | | | Intuitive Surgical, Inc.* | | | 521,929 | |
AXS Multi-Strategy Alternatives Fund
SCHEDULE OF INVESTMENTS - Continued
As of September 30, 2021
Number
of Shares | | | | | Value | |
| | | | COMMON STOCKS (Continued) | | | |
| | | | HEALTHCARE-SERVICES — 1.6% | | | |
| | 820 | | | UnitedHealth Group, Inc. | | $ | 320,407 | |
| | | | | | | | | |
| | | | | INTERNET — 13.9% | | | | |
| | 195 | | | Alphabet, Inc. - Class A* | | | 521,336 | |
| | 180 | | | Amazon.com, Inc.* | | | 591,307 | |
| | 1,755 | | | Baidu, Inc. - ADR*,1 | | | 269,831 | |
| | 110 | | | Booking Holdings, Inc.* | | | 261,126 | |
| | 1,075 | | | Facebook, Inc. - Class A* | | | 364,844 | |
| | 955 | | | Netflix, Inc.* | | | 582,875 | |
| | 5,740 | | | TripAdvisor, Inc.* | | | 194,299 | |
| | | | | | | | 2,785,618 | |
| | | | | | | | | |
| | | | | LEISURE TIME — 1.9% | | | | |
| | 7,305 | | | Carnival Corp.*,1 | | | 182,698 | |
| | 2,110 | | | Royal Caribbean Cruises Ltd.*,1 | | | 187,684 | |
| | | | | | | | 370,382 | |
| | | | | | | | | |
| | | | | LODGING — 1.7% | | | | |
| | 4,290 | | | MGM Resorts International | | | 185,114 | |
| | 1,755 | | | Wynn Resorts Ltd.* | | | 148,736 | |
| | | | | | | | 333,850 | |
| | | | | | | | | |
| | | | | PHARMACEUTICALS — 2.1% | | | | |
| | 990 | | | Eli Lilly & Co. | | | 228,739 | |
| | 4,650 | | | Pfizer, Inc. | | | 199,997 | |
| | | | | | | | 428,736 | |
| | | | | | | | | |
| | | | | REITS — 1.8% | | | | |
| | 9,405 | | | Park Hotels & Resorts, Inc. - REIT* | | | 180,012 | |
| | 8,245 | | | Pebblebrook Hotel Trust - REIT | | | 184,770 | |
| | | | | | | | 364,782 | |
| | | | | | | | | |
| | | | | SEMICONDUCTORS — 3.8% | | | | |
| | 3,920 | | | Micron Technology, Inc. | | | 278,242 | |
| | 1,140 | | | NVIDIA Corp. | | | 236,162 | |
| | 1,300 | | | Texas Instruments, Inc. | | | 249,873 | |
| | | | | | | | 764,277 | |
| | | | | | | | | |
| | | | | SOFTWARE — 4.3% | | | | |
| | 390 | | | Adobe, Inc.* | | | 224,531 | |
| | 465 | | | Intuit, Inc. | | | 250,872 | |
| | 1,370 | | | Microsoft Corp. | | | 386,230 | |
| | | | | | | | 861,633 | |
AXS Multi-Strategy Alternatives Fund
SCHEDULE OF INVESTMENTS - Continued
As of September 30, 2021
Number
of Shares | | | | | Value | |
| | | | COMMON STOCKS (Continued) | | | |
| | | | TELECOMMUNICATIONS — 1.8% | | | |
| | 12,980 | | | Juniper Networks, Inc. | | $ | 357,210 | |
| | | | | TOTAL COMMON STOCKS | | | | |
| | | | | (Cost $10,571,752) | | | 12,073,078 | |
| | | | | EXCHANGE-TRADED FUNDS — 20.8% | | | | |
| | 1,225 | | | Aberdeen Standard Physical Palladium Shares ETF* | | | 218,479 | |
| | 4,985 | | | Direxion Daily S&P 500 Bull 3X - ETF | | | 533,295 | |
| | 13,835 | | | Energy Select Sector SPDR Fund - ETF | | | 720,665 | |
| | 16,860 | | | Financial Select Sector SPDR Fund - ETF | | | 632,756 | |
| | 2,630 | | | Global X MSCI Norway ETF | | | 38,082 | |
| | 1,815 | | | iShares China Large-Cap ETF | | | 70,658 | |
| | 4,870 | | | iShares Core MSCI Emerging Markets ETF | | | 300,771 | |
| | 3,305 | | | iShares MSCI Australia ETF | | | 82,030 | |
| | 1,630 | | | iShares MSCI Austria ETF | | | 40,538 | |
| | 2,165 | | | iShares MSCI Brazil ETF | | | 69,562 | |
| | 2,540 | | | iShares MSCI Canada ETF | | | 92,202 | |
| | 950 | | | iShares MSCI Peru ETF | | | 25,046 | |
| | 990 | | | iShares MSCI Thailand ETF | | | 73,864 | |
| | 4,695 | | | ProShares UltraPro S&P 500 - ETF | | | 533,869 | |
| | 27,185 | | | U.S. Global Jets ETF | | | 642,382 | |
| | 3,210 | | | VanEck Russia ETF | | | 97,327 | |
| | | | | TOTAL EXCHANGE-TRADED FUNDS | | | | |
| | | | | (Cost $3,426,189) | | | 4,171,526 | |
| | | | | SHORT-TERM INVESTMENTS — 18.9% | | | | |
| | 3,789,056 | | | Fidelity Investments Money Market Government Portfolio - Institutional Class, 0.01%2,3 | | | 3,789,056 | |
| | | | | TOTAL SHORT-TERM INVESTMENTS | | | | |
| | | | | (Cost $3,789,056) | | | 3,789,056 | |
| | | | | TOTAL INVESTMENTS — 100.0% | | | | |
| | | | | (Cost $17,786,997) | | | 20,033,660 | |
| | | | | Other Assets in Excess of Liabilities — 0.0% | | | 2,780 | |
| | | | | TOTAL NET ASSETS — 100.0% | | $ | 20,036,440 | |
ADR – American Depository Receipt
REIT – Real Estate Investment Trusts
ETF – Exchange-Traded Fund
| * | Non-income producing security. |
| 1 | Foreign security denominated in U.S. Dollars. |
| 2 | All or a portion of this security is segregated as collateral for swap agreement. As of September 30, 2021, the aggregate value of those securities was $2,422,489, representing 12.1% of net assets. |
| 3 | The rate is the annualized seven-day yield at period end. |
See accompanying Notes to Consolidated Financial Statements.
AXS Multi-Strategy Alternatives Fund
SCHEDULE OF INVESTMENTS - Continued
As of September 30, 2021
SWAP CONTRACTS
EQUITY SWAP CONTRACTS
| Counterparty | | Reference Entity | | Pay/Receive Equity on Reference Entity | | Financing Rate | | Pay/Receive Frequency | | Termination Date | | Notional Amount | | | Premium Paid (Received) | | | Unrealized Appreciation (Depreciation) | |
| | | | | | | | | | | | | | | | | | | | |
| Cowen | | Cowen Financial Product - AXS Multi-Strat Long | | Receive | | OBRF01* | | Monthly | | 8/31/2022 | | $ | 3,463,663 | | | $ | - | | | $ | (150,597 | ) |
| Cowen | | Cowen Financial Product - AXS Multi-Strat Short | | Pay | | OBRF01* | | Monthly | | 8/31/2022 | | | (3,503,816 | ) | | | - | | | | 170,937 | |
| TOTAL EQUITY SWAP CONTRACTS | | | | | | | | | | | | | | $ | 20,340 | |
| * | OBFR01 - Overnight Bank Funding Rate, 0.06% as of September 30, 2021. |
Equity Swap Top 50 Holdings^
| Cowen Financial Product - AXS Multi-Strat Long | | EQUITIES | | | | |
| | | | | | | | | | |
| Number of Shares | | | Description | | Notional Value | | | Percentage of Equity Swap's Notional Amount | |
| | 6,370 | | | Invesco S&P 500 Pure Growth ETF | | $ | 1,226,607 | | | | 35.41 | % |
| | 7,675 | | | Invesco S&P Pure Equal Weight ETF | | | 1,149,868 | | | | 33.20 | % |
| | 4,970 | | | iShares Russell 2000 ETF | | | 1,087,188 | | | | 31.39 | % |
| Cowen Financial Product - AXS Multi-Strat Short | | EQUITIES | | | | |
| | | | | | | | | | |
| Number of Shares | | | Description | | Notional Value | | | Percentage of Equity Swap's Notional Amount | |
| | (8,900 | ) | | iShares S&P 100 ETF | | $ | (1,757,216 | ) | | | 50.15 | % |
| | (4,070 | ) | | SPDR S&P 500 ETF | | | (1,746,600 | ) | | | 49.85 | % |
| | | | | | | | | | | | | |
| ^ | These investments are not direct holdings of the Fund. The holdings were determined based on the absolute notional values of the positions within the underlying swap basket. This basket contains only 5 investments. |
See accompanying Notes to Consolidated Financial Statements.
AXS Multi-Strategy Alternatives Fund
SUMMARY OF INVESTMENTS
As of September 30, 2021
| Security Type/Industry | | Percent of Total
Net Assets | |
| Common Stocks | | | |
| Internet | | | 13.9 | % |
| Banks | | | 5.5 | % |
| Software | | | 4.3 | % |
| Auto Manufacturers | | | 4.3 | % |
| Biotechnology | | | 4.0 | % |
| Semiconductors | | | 3.8 | % |
| Computers | | | 3.4 | % |
| Healthcare-Products | | | 2.6 | % |
| Beverages | | | 2.3 | % |
| Pharmaceuticals | | | 2.1 | % |
| Commercial Services | | | 2.1 | % |
| Leisure Time | | | 1.9 | % |
| REITS | | | 1.8 | % |
| Telecommunications | | | 1.8 | % |
| Lodging | | | 1.7 | % |
| Healthcare-Services | | | 1.6 | % |
| Auto Parts & Equipment | | | 1.4 | % |
| Electronics | | | 1.0 | % |
| Chemicals | | | 0.8 | % |
| Total Common Stocks | | | 60.3 | % |
| Exchange-Traded Funds | | | 20.8 | % |
| Short-Term Investments | | | 18.9 | % |
| Total Investments | | | 100.0 | % |
| Other Assets in Excess of Liabilities | | | 0.0 | % |
| Total Net Assets | | | 100.0 | % |
See accompanying Notes to Consolidated Financial Statements.
AXS Sustainable Income Fund
SCHEDULE OF INVESTMENTS
As of September 30, 2021
| Principal Amount | | | | | Value | |
| | | | | CORPORATE BONDS — 98.1% | | | | |
| | | | | ADVERTISING — 2.5% | | | | |
| | | | | Clear Channel Outdoor Holdings, Inc. | | | | |
| $ | 700,000 | | | 7.750%, 4/15/20281,2 | | $ | 736,750 | |
| | 80,000 | | | 7.500%, 6/1/20291,2 | | | 83,200 | |
| | | | | Outfront Media Capital LLC / Outfront Media Capital Corp. | | | | |
| | 475,000 | | | 6.250%, 6/15/20251,2 | | | 501,719 | |
| | | | | | | | 1,321,669 | |
| | | | | AEROSPACE/DEFENSE — 0.5% | | | | |
| | | | | Triumph Group, Inc. | | | | |
| | 209,000 | | | 8.875%, 6/1/20241,2 | | | 229,900 | |
| | 45,000 | | | 6.250%, 9/15/20241,2 | | | 44,976 | |
| | | | | | | | 274,876 | |
| | | | | AIRLINES — 3.8% | | | | |
| | | | | American Airlines, Inc. | | | | |
| | 880,000 | | | 11.750%, 7/15/20252 | | | 1,089,000 | |
| | | | | Delta Air Lines, Inc. | | | | |
| | 512,000 | | | 7.000%, 5/1/20252 | | | 597,088 | |
| | | | | Hawaiian Brand Intellectual Property Ltd. / HawaiianMiles Loyalty Ltd. | | | | |
| | 320,000 | | | 5.750%, 1/20/20261,2,3 | | | 334,800 | |
| | | | | | | | 2,020,888 | |
| | | | | AUTO MANUFACTURERS — 0.6% | | | | |
| | | | | Ford Motor Co. | | | | |
| | 180,000 | | | 9.000%, 4/22/20251 | | | 216,319 | |
| | | | | JB Poindexter & Co., Inc. | | | | |
| | 5,000 | | | 7.125%, 4/15/20261,2 | | | 5,263 | |
| | | | | Wabash National Corp. | | | | |
| | 78,000 | | | 4.500%, 10/15/20281,2 | | | 77,902 | |
| | | | | | | | 299,484 | |
| | | | | AUTO PARTS & EQUIPMENT — 4.2% | | | | |
| | | | | Adient Global Holdings Ltd. | | | | |
| | 310,000 | | | 4.875%, 8/15/20261,2,3 | | | 317,502 | |
| | | | | American Axle & Manufacturing, Inc. | | | | |
| | 325,000 | | | 6.875%, 7/1/20281 | | | 346,531 | |
| | | | | Clarios Global LP | | | | |
| | 305,000 | | | 6.750%, 5/15/20251,2,3 | | | 321,775 | |
| | | | | Tenneco, Inc. | | | | |
| | 525,000 | | | 5.375%, 12/15/20241 | | | 524,585 | |
| | 150,000 | | | 5.000%, 7/15/20261 | | | 147,734 | |
| | | | | Titan International, Inc. | | | | |
| | 530,000 | | | 7.000%, 4/30/20281,2 | | | 558,488 | |
| | | | | | | | 2,216,615 | |
AXS Sustainable Income Fund
SCHEDULE OF INVESTMENTS - Continued
As of September 30, 2021
| Principal Amount | | | | | Value | |
| | | | | CORPORATE BONDS (Continued) | | | | |
| | | | | BUILDING MATERIALS — 1.5% | | | | |
| | | | | CP Atlas Buyer, Inc. | | | | |
| $ | 480,000 | | | 7.000%, 12/1/20281,2 | | $ | 481,200 | |
| | | | | Koppers, Inc. | | | | |
| | 295,000 | | | 6.000%, 2/15/20251,2 | | | 301,638 | |
| | | | | | | | 782,838 | |
| | | | | CHEMICALS — 7.6% | | | | |
| | | | | CVR Partners LP / CVR Nitrogen Finance Corp. | | | | |
| | 200,000 | | | 6.125%, 6/15/20281,2 | | | 209,750 | |
| | | | | GPD Cos., Inc. | | | | |
| | 465,000 | | | 10.125%, 4/1/20261,2 | | | 503,362 | |
| | | | | Herens Holdco Sarl | | | | |
| | 200,000 | | | 4.750%, 5/15/20281,2,3 | | | 201,000 | |
| | | | | Innophos Holdings, Inc. | | | | |
| | 390,000 | | | 9.375%, 2/15/20281,2 | | | 420,225 | |
| | | | | Iris Holdings, Inc. | | | | |
| | 135,000 | | | 8.750%, 2/15/20261,2 | | | 137,025 | |
| | | | | LSF11 A5 HoldCo LLC | | | | |
| | 275,000 | | | 6.625%, 10/15/20291,2 | | | 279,813 | |
| | | | | NOVA Chemicals Corp. | | | | |
| | 250,000 | | | 5.250%, 6/1/20271,2,3 | | | 263,133 | |
| | | | | OCI N.V. | | | | |
| | 170,000 | | | 4.625%, 10/15/20251,2,3 | | | 178,619 | |
| | | | | Polar U.S. Borrower LLC /Schenectady International Group, Inc. | | | | |
| | 500,000 | | | 6.750%, 5/15/20261,2 | | | 503,125 | |
| | | | | Rayonier AM Products, Inc. | | | | |
| | 750,000 | | | 7.625%, 1/15/20261,2 | | | 792,656 | |
| | | | | Unifrax Escrow Issuer Corp. | | | | |
| | 45,000 | | | 5.250%, 9/30/20281,2 | | | 45,676 | |
| | | | | Venator Finance Sarl / Venator Materials LLC | | | | |
| | 450,000 | | | 9.500%, 7/1/20251,2,3 | | | 497,812 | |
| | | | | | | | 4,032,196 | |
| | | | | COAL — 0.8% | | | | |
| | | | | SunCoke Energy, Inc. | | | | |
| | 400,000 | | | 4.875%, 6/30/20291,2 | | | 398,500 | |
| | | | | | | | | |
| | | | | COMMERCIAL SERVICES — 6.7% | | | | |
| | | | | Allied Universal Holdco LLC /Allied Universal Finance Corp. | | | | |
| | 415,000 | | | 6.625%, 7/15/20261,2 | | | 438,771 | |
| | | | | Alta Equipment Group, Inc. | | | | |
| | 240,000 | | | 5.625%, 4/15/20261,2 | | | 246,600 | |
| | | | | Avis Budget Car Rental LLC /Avis Budget Finance, Inc. | | | | |
| | 40,000 | | | 5.750%, 7/15/20271,2 | | | 41,692 | |
AXS Sustainable Income Fund
SCHEDULE OF INVESTMENTS - Continued
As of September 30, 2021
| Principal Amount | | | | | Value | |
| | | | | CORPORATE BONDS (Continued) | | | | |
| | | | | COMMERCIAL SERVICES (Continued) | | | | |
| | | | | GEMS MENASA Cayman Ltd./GEMS Education Delaware LLC | | | | |
| $ | 375,000 | | | 7.125%, 7/31/20261,2,3 | | $ | 384,375 | |
| | | | | Metis Merger Sub LLC | | | | |
| | 560,000 | | | 6.500%, 5/15/20291,2 | | | 544,600 | |
| | | | | Modulaire Global Finance Plc | | | | |
| | 205,000 | | | 8.000%, 2/15/20231,2,3 | | | 209,305 | |
| | | | | MoneyGram International, Inc. | | | | |
| | 290,000 | | | 5.375%, 8/1/20261,2 | | | 294,350 | |
| | | | | Prime Security Services Borrower LLC / Prime Finance, Inc. | | | | |
| | 215,000 | | | 5.250%, 4/15/20242 | | | 229,308 | |
| | | | | Quad/Graphics, Inc. | | | | |
| | 1,038,000 | | | 7.000%, 5/1/2022 | | | 1,052,273 | |
| | | | | WASH Multifamily Acquisition, Inc. | | | | |
| | 120,000 | | | 5.750%, 4/15/20261,2 | | | 124,950 | |
| | | | | | | | 3,566,224 | |
| | | | | COMPUTERS — 2.4% | | | | |
| | | | | Austin BidCo, Inc. | | | | |
| | 500,000 | | | 7.125%, 12/15/20281,2 | | | 503,750 | |
| | | | | NCR Corp. | | | | |
| | 170,000 | | | 5.750%, 9/1/20271,2 | | | 179,350 | |
| | | | | Presidio Holdings, Inc. | | | | |
| | 240,000 | | | 4.875%, 2/1/20271,2 | | | 247,800 | |
| | | | | Unisys Corp. | | | | |
| | 305,000 | | | 6.875%, 11/1/20271,2 | | | 333,212 | |
| | | | | | | | 1,264,112 | |
| | | | | COSMETICS/PERSONAL CARE — 0.7% | | | | |
| | | | | Coty, Inc. | | | | |
| | 340,000 | | | 5.000%, 4/15/20261,2 | | | 347,320 | |
| | | | | | | | | |
| | | | | DISTRIBUTION/WHOLESALE — 1.0% | | | | |
| | | | | BCPE Empire Holdings, Inc. | | | | |
| | 525,000 | | | 7.625%, 5/1/20271,2 | | | 522,375 | |
| | | | | | | | | |
| | | | | DIVERSIFIED FINANCIAL SERVICES — 5.9% | | | | |
| | | | | Jefferies Finance LLC/JFIN Co.-Issuer Corp. | | | | |
| | 200,000 | | | 5.000%, 8/15/20281,2 | | | 203,000 | |
| | | | | LFS Topco LLC | | | | |
| | 45,000 | | | 5.875%, 10/15/20261,2 | | | 46,350 | |
| | | | | Midcap Financial Issuer Trust | | | | |
| | 375,000 | | | 6.500%, 5/1/20281,2 | | | 390,825 | |
| | 575,000 | | | 5.625%, 1/15/20301,2 | | | 569,250 | |
| | | | | Navient Corp. | | | | |
| | 120,000 | | | 5.500%, 1/25/2023 | | | 125,428 | |
AXS Sustainable Income Fund
SCHEDULE OF INVESTMENTS - Continued
As of September 30, 2021
| Principal Amount | | | | | Value | |
| | | | | CORPORATE BONDS (Continued) | | | | |
| | | | | DIVERSIFIED FINANCIAL SERVICES (Continued) | | | | |
| | | | | NFP Corp. | | | | |
| $ | 276,000 | | | 4.875%, 8/15/20281,2 | | $ | 279,450 | |
| | | | | OneMain Finance Corp. | | | | |
| | 205,000 | | | 5.625%, 3/15/2023 | | | 215,628 | |
| | 320,000 | | | 6.125%, 3/15/20241 | | | 341,920 | |
| | 105,000 | | | 3.500%, 1/15/20271 | | | 104,750 | |
| | | | | VistaJet Malta Finance PLC /XO Management Holding, Inc. | | | | |
| | 750,000 | | | 10.500%, 6/1/20241,2,3 | | | 814,687 | |
| | | | | | | | 3,091,288 | |
| | | | | ENGINEERING & CONSTRUCTION — 1.1% | | | | |
| | | | | Artera Services LLC | | | | |
| | 515,000 | | | 9.033%, 12/4/20251,2 | | | 558,775 | |
| | | | | | | | | |
| | | | | ENTERTAINMENT — 2.3% | | | | |
| | | | | Cinemark USA, Inc. | | | | |
| | 185,000 | | | 5.875%, 3/15/20261,2 | | | 186,850 | |
| | 435,000 | | | 5.250%, 7/15/20281,2 | | | 428,475 | |
| | | | | Motion Bondco DAC | | | | |
| | 485,000 | | | 6.625%, 11/15/20271,2,3 | | | 487,425 | |
| | | | | Powdr Corp. | | | | |
| | 125,000 | | | 6.000%, 8/1/20251,2 | | | 131,250 | |
| | | | | | | | 1,234,000 | |
| | | | | ENVIRONMENTAL CONTROL — 0.3% | | | | |
| | | | | GFL Environmental, Inc. | | | | |
| | 170,000 | | | 4.250%, 6/1/20251,2,3 | | | 175,313 | |
| | | | | | | | | |
| | | | | FOOD — 1.0% | | | | |
| | | | | H-Food Holdings LLC / Hearthside Finance Co., Inc. | | | | |
| | 500,000 | | | 8.500%, 6/1/20261,2 | | | 518,125 | |
| | | | | | | | | |
| | | | | FOREST PRODUCTS & PAPER — 0.5% | | | | |
| | | | | Mercer International, Inc. | | | | |
| | 255,000 | | | 5.125%, 2/1/20291 | | | 260,419 | |
| | | | | | | | | |
| | | | | HEALTHCARE-SERVICES — 2.7% | | | | |
| | | | | Cano Health LLC | | | | |
| | 100,000 | | | 6.250%, 10/1/20281,2 | | | 101,000 | |
| | | | | ModivCare Escrow Issuer, Inc. | | | | |
| | 85,000 | | | 5.000%, 10/1/20291,2 | | | 88,107 | |
| | | | | ModivCare, Inc. | | | | |
| | 420,000 | | | 5.875%, 11/15/20251,2 | | | 444,150 | |
| | | | | Select Medical Corp. | | | | |
| | 260,000 | | | 6.250%, 8/15/20261,2 | | | 273,416 | |
AXS Sustainable Income Fund
SCHEDULE OF INVESTMENTS - Continued
As of September 30, 2021
| Principal Amount | | | | | Value | |
| | | | | CORPORATE BONDS (Continued) | | | | |
| | | | | HEALTHCARE-SERVICES (Continued) | | | | |
| | | | | Tenet Healthcare Corp. | | | | |
| $ | 105,000 | | | 4.625%, 7/15/20241 | | $ | 106,575 | |
| | | | | U.S. Acute Care Solutions LLC | | | | |
| | 370,000 | | | 6.375%, 3/1/20261,2 | | | 391,737 | |
| | | | | | | | 1,404,985 | |
| | | | | HOME BUILDERS — 2.7% | | | | |
| | | | | New Home Co., Inc. | | | | |
| | 1,090,000 | | | 7.250%, 10/15/20251,2 | | | 1,146,974 | |
| | | | | Winnebago Industries, Inc. | | | | |
| | 265,000 | | | 6.250%, 7/15/20281,2 | | | 284,875 | |
| | | | | | | | 1,431,849 | |
| | | | | INSURANCE — 0.5% | | | | |
| | | | | AmWINS Group, Inc. | | | | |
| | 275,000 | | | 4.875%, 6/30/20291,2 | | | 279,125 | |
| | | | | | | | | |
| | | | | INTERNET — 1.9% | | | | |
| | | | | Cablevision Lightpath LLC | | | | |
| | 260,000 | | | 5.625%, 9/15/20281,2 | | | 260,943 | |
| | | | | Photo Holdings Merger Sub, Inc. | | | | |
| | 250,000 | | | 8.500%, 10/1/20261,2 | | | 270,312 | |
| | | | | Uber Technologies, Inc. | | | | |
| | 465,000 | | | 8.000%, 11/1/20261,2 | | | 491,447 | |
| | | | | | | | 1,022,702 | |
| | | | | INVESTMENT COMPANIES — 0.5% | | | | |
| | | | | Compass Group Diversified Holdings LLC | | | | |
| | 245,000 | | | 5.250%, 4/15/20291,2 | | | 256,331 | |
| | | | | | | | | |
| | | | | IRON/STEEL — 1.9% | | | | |
| | | | | Allegheny Technologies, Inc. | | | | |
| | 40,000 | | | 4.875%, 10/1/20291 | | | 40,150 | |
| | | | | TMS International Corp. | | | | |
| | 585,000 | | | 6.250%, 4/15/20291,2 | | | 611,325 | |
| | | | | United States Steel Corp. | | | | |
| | 126,000 | | | 6.250%, 3/15/20261 | | | 130,057 | |
| | 225,000 | | | 6.875%, 3/1/20291 | | | 239,899 | |
| | | | | | | | 1,021,431 | |
| | | | | LEISURE TIME — 1.8% | | | | |
| | | | | Carnival Corp. | | | | |
| | 470,000 | | | 7.625%, 3/1/20261,2,3 | | | 501,725 | |
| | | | | Royal Caribbean Cruises Ltd. | | | | |
| | 140,000 | | | 5.500%, 8/31/20261,2,3 | | | 143,912 | |
AXS Sustainable Income Fund
SCHEDULE OF INVESTMENTS - Continued
As of September 30, 2021
| Principal Amount | | | | | Value | |
| | | | | CORPORATE BONDS (Continued) | | | | |
| | | | | LEISURE TIME (Continued) | | | | |
| | | | | Viking Ocean Cruises Ship VII Ltd. | | | | |
| $ | 280,000 | | | 5.625%, 2/15/20291,2,3 | | $ | 278,950 | |
| | | | | | | | 924,587 | |
| | | | | LODGING — 0.2% | | | | |
| | | | | Marriott Ownership Resorts, Inc. | | | | |
| | 115,000 | | | 6.125%, 9/15/20251,2 | | | 121,469 | |
| | | | | | | | | |
| | | | | MACHINERY-CONSTRUCTION & MINING — 0.5% | | | | |
| | | | | Manitowoc Co., Inc. | | | | |
| | 250,000 | | | 9.000%, 4/1/20261,2 | | | 267,768 | |
| | | | | | | | | |
| | | | | MACHINERY-DIVERSIFIED — 0.6% | | | | |
| | | | | Titan Acquisition Ltd. / Titan Co.-Borrower LLC | | | | |
| | 300,000 | | | 7.750%, 4/15/20261,2,3 | | | 306,429 | |
| | | | | | | | | |
| | | | | MEDIA — 12.4% | | | | |
| | | | | Audacy Capital Corp. | | | | |
| | 380,000 | | | 6.500%, 5/1/20271,2 | | | 388,550 | |
| | 905,000 | | | 6.750%, 3/31/20291,2 | | | 912,168 | |
| | | | | Cengage Learning, Inc. | | | | |
| | 765,000 | | | 9.500%, 6/15/20241,2 | | | 782,855 | |
| | | | | DIRECTV Holdings LLC / DIRECTV Financing Co., Inc. | | | | |
| | 325,000 | | | 5.875%, 8/15/20271,2 | | | 339,219 | |
| | | | | DISH DBS Corp. | | | | |
| | 255,000 | | | 7.375%, 7/1/20281 | | | 271,533 | |
| | | | | iHeartCommunications, Inc. | | | | |
| | 480,000 | | | 8.375%, 5/1/20271 | | | 513,000 | |
| | | | | Mav Acquisition Corp. | | | | |
| | 260,000 | | | 5.750%, 8/1/20281,2 | | | 255,450 | |
| | | | | Meredith Corp. | | | | |
| | 1,246,000 | | | 6.875%, 2/1/20261 | | | 1,286,495 | |
| | | | | Townsquare Media, Inc. | | | | |
| | 1,045,000 | | | 6.875%, 2/1/20261,2 | | | 1,099,862 | |
| | | | | Videotron Ltd. | | | | |
| | 500,000 | | | 3.625%, 6/15/20291,2,3 | | | 506,875 | |
| | | | | Ziggo Bond Co. B.V. | | | | |
| | 185,000 | | | 6.000%, 1/15/20271,2,3 | | | 191,255 | |
| | | | | | | | 6,547,262 | |
| | | | | METAL FABRICATE/HARDWARE — 1.0% | | | | |
| | | | | Park-Ohio Industries, Inc. | | | | |
| | 515,000 | | | 6.625%, 4/15/20271 | | | 514,356 | |
AXS Sustainable Income Fund
SCHEDULE OF INVESTMENTS - Continued
As of September 30, 2021
| Principal Amount | | | | | Value | |
| | | | | CORPORATE BONDS (Continued) | | | | |
| | | | | MINING — 2.6% | | | | |
| | | | | Century Aluminum Co. | | | | |
| $ | 395,000 | | | 7.500%, 4/1/20281,2 | | $ | 418,700 | |
| | | | | First Quantum Minerals Ltd. | | | | |
| | 350,000 | | | 6.500%, 3/1/20241,2,3 | | | 354,375 | |
| | 200,000 | | | 7.500%, 4/1/20251,2,3 | | | 205,166 | |
| | | | | Taseko Mines Ltd. | | | | |
| | 395,000 | | | 7.000%, 2/15/20261,2,3 | | | 400,431 | |
| | | | | | | | 1,378,672 | |
| | | | | MISCELLANEOUS MANUFACTURING — 2.1% | | | | |
| | | | | FXI Holdings, Inc. | | | | |
| | 230,000 | | | 7.875%, 11/1/20241,2 | | | 234,600 | |
| | 700,000 | | | 12.250%, 11/15/20261,2 | | | 794,500 | |
| | | | | LSB Industries, Inc. | | | | |
| | 105,000 | | | 6.250%, 10/15/20281,2 | | | 105,919 | |
| | | | | | | | 1,135,019 | |
| | | | | OFFICE FURNISHINGS — 0.5% | | | | |
| | | | | Interface, Inc. | | | | |
| | 250,000 | | | 5.500%, 12/1/20281,2 | | | 262,500 | |
| | | | | | | | | |
| | | | | PACKAGING & CONTAINERS — 4.9% | | | | |
| | | | | Ardagh Packaging Finance PLC / Ardagh Holdings USA, Inc. | | | | |
| | 510,000 | | | 5.250%, 8/15/20271,2,3 | | | 519,183 | |
| | | | | Intelligent Packaging Ltd. Finco, Inc. / Intelligent Packaging Ltd. | | | | |
| | | | | Co.-Issuer LLC | | | | |
| | 250,000 | | | 6.000%, 9/15/20281,2,3 | | | 261,925 | |
| | | | | Intertape Polymer Group, Inc. | | | | |
| | 240,000 | | | 4.375%, 6/15/20291,2,3 | | | 243,986 | |
| | | | | LABL, Inc. | | | | |
| | 275,000 | | | 6.750%, 7/15/20261,2 | | | 288,750 | |
| | | | | Mauser Packaging Solutions Holding Co. | | | | |
| | 485,000 | | | 8.500%, 4/15/20241,2 | | | 501,975 | |
| | 365,000 | | | 7.250%, 4/15/20251,2 | | | 362,775 | |
| | | | | Plastipak Holdings, Inc. | | | | |
| | 400,000 | | | 6.250%, 10/15/20251,2 | | | 407,120 | |
| | | | | | | | 2,585,714 | |
| | | | | PHARMACEUTICALS — 0.8% | | | | |
| | | | | AdaptHealth LLC | | | | |
| | 250,000 | | | 6.125%, 8/1/20281,2 | | | 265,937 | |
| | | | | Bausch Health Americas, Inc. | | | | |
| | 135,000 | | | 8.500%, 1/31/20271,2 | | | 144,788 | |
| | | | | | | | 410,725 | |
AXS Sustainable Income Fund
SCHEDULE OF INVESTMENTS - Continued
As of September 30, 2021
| Principal Amount | | | | | Value | |
| | | | | CORPORATE BONDS (Continued) | | | | |
| | | | | REAL ESTATE — 1.6% | | | | |
| | | | | Realogy Group LLC / Realogy Co.-Issuer Corp. | | | | |
| $ | 195,000 | | | 7.625%, 6/15/20251,2 | | $ | 207,919 | |
| | 330,000 | | | 9.375%, 4/1/20271,2 | | | 362,587 | |
| | 250,000 | | | 5.750%, 1/15/20291,2 | | | 259,315 | |
| | | | | | | | 829,821 | |
| | | | | REITS — 1.2% | | | | |
| | | | | iStar, Inc. | | | | |
| | 360,000 | | | 4.750%, 10/1/20241 | | | 380,700 | |
| | | | | Park Intermediate Holdings LLC / PK Domestic Property LLC / PK Finance | | | | |
| | | | | Co.-Issuer | | | | |
| | 165,000 | | | 5.875%, 10/1/20281,2 | | | 174,461 | |
| | | | | Starwood Property Trust, Inc. | | | | |
| | 100,000 | | | 3.625%, 7/15/20261,2 | | | 100,375 | |
| | | | | | | | 655,536 | |
| | | | | RETAIL — 6.0% | | | | |
| | | | | Bloomin' Brands, Inc. / OSI Restaurant Partners LLC | | | | |
| | 260,000 | | | 5.125%, 4/15/20291,2 | | | 270,494 | |
| | | | | Dave & Buster's, Inc. | | | | |
| | 375,000 | | | 7.625%, 11/1/20251,2 | | | 401,235 | |
| | | | | Foundation Building Materials, Inc. | | | | |
| | 275,000 | | | 6.000%, 3/1/20291,2 | | | 269,500 | |
| | | | | Guitar Center, Inc. | | | | |
| | 305,000 | | | 8.500%, 1/15/20261,2 | | | 327,112 | |
| | | | | LCM Investments Holdings II LLC | | | | |
| | 400,000 | | | 4.875%, 5/1/20291,2 | | | 410,428 | |
| | | | | LSF9 Atlantis Holdings LLC / Victra Finance Corp. | | | | |
| | 415,000 | | | 7.750%, 2/15/20261,2 | | | 429,701 | |
| | | | | Macy's Retail Holdings LLC | | | | |
| | 520,000 | | | 5.875%, 4/1/20291,2 | | | 564,200 | |
| | | | | Michaels Cos., Inc. | | | | |
| | 250,000 | | | 7.875%, 5/1/20291,2 | | | 259,063 | |
| | | | | NMG Holding Co., Inc. / Neiman Marcus Group LLC | | | | |
| | 245,000 | | | 7.125%, 4/1/20261,2 | | | 260,006 | |
| | | | | | | | 3,191,739 | |
| | | | | SEMICONDUCTORS — 0.5% | | | | |
| | | | | Amkor Technology, Inc. | | | | |
| | 255,000 | | | 6.625%, 9/15/20271,2 | | | 273,169 | |
| | | | | | | | | |
| | | | | SOFTWARE — 4.0% | | | | |
| | | | | Boxer Parent Co., Inc. | | | | |
| | 265,000 | | | 7.125%, 10/2/20251,2 | | | 282,887 | |
AXS Sustainable Income Fund
SCHEDULE OF INVESTMENTS - Continued
As of September 30, 2021
| Principal Amount | | | | | Value | |
| | | | | CORPORATE BONDS (Continued) | | | | |
| | | | | SOFTWARE (Continued) | | | | |
| | | | | Dun & Bradstreet Corp. | | | | |
| $ | 155,000 | | | 6.875%, 8/15/20261,2 | | $ | 162,556 | |
| | | | | Rocket Software, Inc. | | | | |
| | 1,045,000 | | | 6.500%, 2/15/20291,2 | | | 1,034,550 | |
| | | | | SS&C Technologies, Inc. | | | | |
| | 185,000 | | | 5.500%, 9/30/20271,2 | | | 195,477 | |
| | | | | Veritas US, Inc. / Veritas Bermuda Ltd. | | | | |
| | 405,000 | | | 7.500%, 9/1/20251,2 | | | 421,200 | |
| | | | | | | | 2,096,670 | |
| | | | | TELECOMMUNICATIONS — 2.5% | | | | |
| | | | | Altice France S.A./France | | | | |
| | 145,000 | | | 7.375%, 5/1/20261,2,3 | | | 150,468 | |
| | | | | Avaya, Inc. | | | | |
| | 610,000 | | | 6.125%, 9/15/20281,2 | | | 641,397 | |
| | | | | Connect Finco SARL/ Connect U.S. Finco LLC | | | | |
| | 250,000 | | | 6.750%, 10/1/20261,2,3 | | | 261,562 | |
| | | | | Viasat, Inc. | | | | |
| | 240,000 | | | 5.625%, 4/15/20271,2 | | | 250,200 | |
| | | | | | | | 1,303,627 | |
| | | | | TRANSPORTATION — 1.3% | | | | |
| | | | | Danaos Corp. | | | | |
| | 645,000 | | | 8.500%, 3/1/20281,2,3 | | | 712,725 | |
| | | | | | | | | |
| | | | | TOTAL CORPORATE BONDS | | | | |
| | | | | (Cost $50,954,836) | | | 51,819,228 | |
AXS Sustainable Income Fund
SCHEDULE OF INVESTMENTS - Continued
As of September 30, 2021
| Principal Amount | | | | | Value | |
| | | | | SHORT-TERM INVESTMENTS — 2.2% | | | | |
| $ | 1,160,117 | | | UMB Bank demand deposit, 0.01%4 | | $ | 1,160,117 | |
| | | | | TOTAL SHORT-TERM INVESTMENTS | | | | |
| | | | | (Cost $1,160,117) | | | 1,160,117 | |
| | | | | TOTAL INVESTMENTS — 100.3% | | | | |
| | | | | (Cost $52,114,953) | | | 52,979,345 | |
| | | | | Liabilities in Excess of Other Assets — (0.3)% | | | (139,082 | ) |
| | | | | TOTAL NET ASSETS — 100.0% | | $ | 52,840,263 | |
LLC - Limited Liability Company
LP - Limited Partnership
PLC - Public Limited Company
| 2 | Security exempt from registration under Rule 144A of the Securities Act of 1933. These securities are restricted and may be resold in transactions exempt from registration normally to qualified institutional buyers. The total value of these securities is $45,000,877, which represents 85.2% of total net assets of the Fund. |
| 3 | Foreign security denominated in U.S. Dollars. |
| 4 | The rate is the annualized seven-day yield at period end. |
See accompanying Notes to Consolidated Financial Statements.
AXS Sustainable Income Fund
SUMMARY OF INVESTMENTS
As of September 30, 2021
| Security Type/Industry | | Percent of Total Net Assets | |
| Corporate Bonds | | | | |
| Media | | | 12.4 | % |
| Chemicals | | | 7.6 | % |
| Commercial Services | | | 6.7 | % |
| Retail | | | 6.0 | % |
| Diversified Financial Services | | | 5.9 | % |
| Packaging & Containers | | | 4.9 | % |
| Auto Parts & Equipment | | | 4.2 | % |
| Software | | | 4.0 | % |
| Airlines | | | 3.8 | % |
| Healthcare-Services | | | 2.7 | % |
| Home Builders | | | 2.7 | % |
| Mining | | | 2.6 | % |
| Telecommunications | | | 2.5 | % |
| Advertising | | | 2.5 | % |
| Computers | | | 2.4 | % |
| Entertainment | | | 2.3 | % |
| Miscellaneous Manufacturing | | | 2.1 | % |
| Internet | | | 1.9 | % |
| Iron/Steel | | | 1.9 | % |
| Leisure Time | | | 1.8 | % |
| Real Estate | | | 1.6 | % |
| Building Materials | | | 1.5 | % |
| Transportation | | | 1.3 | % |
| REITS | | | 1.2 | % |
| Engineering & Construction | | | 1.1 | % |
| Metal Fabricate/Hardware | | | 1.0 | % |
| Food | | | 1.0 | % |
| Distribution/Wholesale | | | 1.0 | % |
| Pharmaceuticals | | | 0.8 | % |
| Coal | | | 0.8 | % |
| Cosmetics/Personal Care | | | 0.7 | % |
| Auto Manufacturers | | | 0.6 | % |
| Machinery-Diversified | | | 0.6 | % |
| Machinery-Construction & Mining | | | 0.5 | % |
| Aerospace/Defense | | | 0.5 | % |
| Semiconductors | | | 0.5 | % |
| Office Furnishings | | | 0.5 | % |
| Investment Companies | | | 0.5 | % |
| Insurance | | | 0.5 | % |
| Forest Products & Paper | | | 0.5 | % |
| Environmental Control | | | 0.3 | % |
| Lodging | | | 0.2 | % |
| Total Corporate Bonds | | | 98.1 | % |
| Short-Term Investments | | | 2.2 | % |
AXS Sustainable Income Fund
SUMMARY OF INVESTMENTS - Continued
As of September 30, 2021
| Security Type/Industry | | Percent of Total Net Assets | |
| Total Investments | | | 100.3 | % |
| Liabilities in Excess of Other Assets | | | (0.3 | )% |
| Total Net Assets | | | 100.0 | % |
See accompanying Notes to Consolidated Financial Statements.
AXS Thomson Reuters Private Equity Return Tracker Fund
SCHEDULE OF INVESTMENTS
As of September 30, 2021
| Number of Shares | | | | | Value | |
| | | | COMMON STOCKS — 100.9% | | | |
| | | | AEROSPACE/DEFENSE — 2.0% | | | |
| | 790 | | | Boeing Co.* | | $ | 173,753 | |
| | 462 | | | Lockheed Martin Corp. | | | 159,436 | |
| | 2,047 | | | Raytheon Technologies Corp. | | | 175,960 | |
| | | | | | | | 509,149 | |
| | | | | AGRICULTURE — 1.3% | | | | |
| | 2,196 | | | Altria Group, Inc. | | | 99,962 | |
| | 833 | | | Archer-Daniels-Midland Co. | | | 49,988 | |
| | 1,864 | | | Philip Morris International, Inc. | | | 176,689 | |
| | | | | | | | 326,639 | |
| | | | | APPAREL — 0.6% | | | | |
| | 1,126 | | | NIKE, Inc. - Class B | | | 163,529 | |
| | | | | AUTO MANUFACTURERS — 2.6% | | | | |
| | 4,521 | | | Ford Motor Co.* | | | 64,017 | |
| | 1,383 | | | General Motors Co.* | | | 72,898 | |
| | 695 | | | Tesla, Inc.*,1,2 | | | 538,959 | |
| | | | | | | | 675,874 | |
| | | | | AUTO PARTS & EQUIPMENT — 0.2% | | | | |
| | 287 | | | Aptiv PLC* | | | 42,754 | |
| | | | | BANKS — 5.4% | | | | |
| | 6,148 | | | Bank of America Corp. | | | 260,983 | |
| | 1,691 | | | Citigroup, Inc. | | | 118,674 | |
| | 277 | | | Goldman Sachs Group, Inc. | | | 104,714 | |
| | 2,472 | | | JPMorgan Chase & Co. | | | 404,642 | |
| | 1,141 | | | Morgan Stanley | | | 111,031 | |
| | 421 | | | PNC Financial Services Group, Inc. | | | 82,365 | |
| | 1,336 | | | Truist Financial Corp. | | | 78,356 | |
| | 1,446 | | | U.S. Bancorp | | | 85,950 | |
| | 3,337 | | | Wells Fargo & Co. | | | 154,870 | |
| | | | | | | | 1,401,585 | |
| | | | | BEVERAGES — 2.6% | | | | |
| | 4,929 | | | Coca-Cola Co.1,2 | | | 258,625 | |
| | 278 | | | Constellation Brands, Inc. - Class A | | | 58,572 | |
| | 1,339 | | | Keurig Dr Pepper, Inc. | | | 45,740 | |
| | 571 | | | Monster Beverage Corp.* | | | 50,722 | |
| | 1,734 | | | PepsiCo, Inc.1,2 | | | 260,811 | |
| | | | | | | | 674,470 | |
| | | | | BIOTECHNOLOGY — 0.9% | | | | |
| | 399 | | | Amgen, Inc. | | | 84,847 | |
AXS Thomson Reuters Private Equity Return Tracker Fund
SCHEDULE OF INVESTMENTS - Continued
As of September 30, 2021
| Number of Shares | | | | | Value | |
| | | | COMMON STOCKS (Continued) | | | |
| | | | BIOTECHNOLOGY (Continued) | | | |
| | 1,215 | | | Corteva, Inc. | | $ | 51,127 | |
| | 258 | | | Moderna, Inc.* | | | 99,294 | |
| | | | | | | | 235,268 | |
| | | | | BUILDING MATERIALS — 0.3% | | | | |
| | 122 | | | Martin Marietta Materials, Inc. | | | 41,685 | |
| | 253 | | | Vulcan Materials Co. | | | 42,797 | |
| | | | | | | | 84,482 | |
| | | | | CHEMICALS — 3.3% | | | | |
| | 331 | | | Air Products and Chemicals, Inc. | | | 84,772 | |
| | 242 | | | Albemarle Corp. | | | 52,991 | |
| | 1,107 | | | Dow, Inc. | | | 63,719 | |
| | 801 | | | DuPont de Nemours, Inc. | | | 54,460 | |
| | 407 | | | Ecolab, Inc. | | | 84,908 | |
| | 367 | | | International Flavors & Fragrances, Inc. | | | 49,075 | |
| | 834 | | | Linde PLC | | | 244,679 | |
| | 408 | | | LyondellBasell Industries N.V. - Class A | | | 38,291 | |
| | 466 | | | PPG Industries, Inc. | | | 66,643 | |
| | 395 | | | Sherwin-Williams Co. | | | 110,493 | |
| | | | | | | | 850,031 | |
| | | | | COMMERCIAL SERVICES — 3.3% | | | | |
| | 625 | | | Automatic Data Processing, Inc. | | | 124,950 | |
| | 286 | | | Moody's Corp. | | | 101,561 | |
| | 1,225 | | | PayPal Holdings, Inc.*,1,2 | | | 318,757 | |
| | 323 | | | S&P Global, Inc. | | | 137,240 | |
| | 684 | | | Square, Inc. - Class A* | | | 164,051 | |
| | | | | | | | 846,559 | |
| | | | | COMPUTERS — 6.0% | | | | |
| | 971 | | | Accenture PLC | | | 310,642 | |
| | 7,556 | | | Apple, Inc. | | | 1,069,174 | |
| | 1,305 | | | International Business Machines Corp. | | | 181,304 | |
| | | | | | | | 1,561,120 | |
| | | | | COSMETICS/PERSONAL CARE — 2.5% | | | | |
| | 1,392 | | | Colgate-Palmolive Co. | | | 105,207 | |
| | 358 | | | Estee Lauder Cos., Inc. - Class A | | | 107,375 | |
| | 3,095 | | | Procter & Gamble Co.1,2 | | | 432,681 | |
| | | | | | | | 645,263 | |
| | | | | DIVERSIFIED FINANCIAL SERVICES — 4.4% | | | | |
| | 528 | | | American Express Co. | | | 88,456 | |
| | 118 | | | BlackRock, Inc. | | | 98,962 | |
AXS Thomson Reuters Private Equity Return Tracker Fund
SCHEDULE OF INVESTMENTS - Continued
As of September 30, 2021
| Number of Shares | | | | | Value | |
| | | | COMMON STOCKS (Continued) | | | |
| | | | DIVERSIFIED FINANCIAL SERVICES (Continued) | | | |
| | 456 | | | Capital One Financial Corp. | | $ | 73,858 | |
| | 1,358 | | | Charles Schwab Corp. | | | 98,917 | |
| | 345 | | | CME Group, Inc. | | | 66,716 | |
| | 915 | | | Mastercard, Inc. - Class A1,2 | | | 318,127 | |
| | 1,772 | | | Visa, Inc. - Class A1,2 | | | 394,713 | |
| | | | | | | | 1,139,749 | |
| | | | | ELECTRIC — 1.0% | | | | |
| | 260 | | | American Electric Power Co., Inc. | | | 21,107 | |
| | 370 | | | Dominion Energy, Inc. | | | 27,017 | |
| | 358 | | | Duke Energy Corp. | | | 34,937 | |
| | 427 | | | Exelon Corp. | | | 20,641 | |
| | 868 | | | NextEra Energy, Inc. | | | 68,155 | |
| | 265 | | | Public Service Enterprise Group, Inc. | | | 16,139 | |
| | 153 | | | Sempra Energy | | | 19,355 | |
| | 471 | | | Southern Co. | | | 29,188 | |
| | 260 | | | Xcel Energy, Inc. | | | 16,250 | |
| | | | | | | | 252,789 | |
| | | | | ELECTRONICS — 0.8% | | | | |
| | 941 | | | Honeywell International, Inc. | | | 199,756 | |
| | | | | ENERGY-ALTERNATE SOURCES — 0.1% | | | | |
| | 181 | | | Enphase Energy, Inc.* | | | 27,145 | |
| | | | | FOOD — 0.9% | | | | |
| | 1,000 | | | General Mills, Inc. | | | 59,820 | |
| | 1,776 | | | Mondelez International, Inc. | | | 103,328 | |
| | 837 | | | Sysco Corp. | | | 65,704 | |
| | | | | | | | 228,852 | |
| | | | | HEALTHCARE-PRODUCTS — 2.2% | | | | |
| | 1,051 | | | Abbott Laboratories | | | 124,155 | |
| | 373 | | | Danaher Corp. | | | 113,556 | |
| | 84 | | | Intuitive Surgical, Inc.* | | | 83,509 | |
| | 995 | | | Medtronic PLC | | | 124,723 | |
| | 220 | | | Thermo Fisher Scientific, Inc. | | | 125,692 | |
| | | | | | | | 571,635 | |
| | | | | HEALTHCARE-SERVICES — 0.8% | | | | |
| | 532 | | | UnitedHealth Group, Inc. | | | 207,874 | |
| | | | | HOUSEHOLD PRODUCTS/WARES — 0.3% | | | | |
| | 521 | | | Kimberly-Clark Corp. | | | 69,001 | |
AXS Thomson Reuters Private Equity Return Tracker Fund
SCHEDULE OF INVESTMENTS - Continued
As of September 30, 2021
| Number of Shares | | | | | Value | |
| | | | | COMMON STOCKS (Continued) | | | | |
| | | | | INSURANCE — 2.9% | | | | |
| | 2,493 | | | Berkshire Hathaway, Inc.* | | $ | 680,439 | |
| | 452 | | | Chubb Ltd. | | | 78,413 | |
| | | | | | | | 758,852 | |
| | | | | INTERNET — 13.6% | | | | |
| | 411 | | | Alphabet, Inc. - Class A* | | | 1,098,817 | |
| | 330 | | | Amazon.com, Inc.* | | | 1,084,063 | |
| | 47 | | | Booking Holdings, Inc.* | | | 111,572 | |
| | 2,392 | | | Facebook, Inc. - Class A* | | | 811,821 | |
| | 601 | | | Netflix, Inc.*,1,2 | | | 366,814 | |
| | 115 | | | Roku, Inc. - Class A* | | | 36,035 | |
| | | | | | | | 3,509,122 | |
| | | | | IRON/STEEL — 0.2% | | | | |
| | 526 | | | Nucor Corp. | | | 51,806 | |
| | | | | LODGING — 0.2% | | | | |
| | 334 | | | Marriott International, Inc. - Class A* | | | 49,462 | |
| | | | | MACHINERY-CONSTRUCTION & MINING — 0.5% | | | | |
| | 737 | | | Caterpillar, Inc. | | | 141,482 | |
| | | | | MACHINERY-DIVERSIFIED — 0.5% | | | | |
| | 380 | | | Deere & Co. | | | 127,327 | |
| | | | | MEDIA — 2.1% | | | | |
| | 58 | | | Charter Communications, Inc. - Class A* | | | 42,198 | |
| | 4,054 | | | Comcast Corp. - Class A | | | 226,740 | |
| | 1,610 | | | Walt Disney Co.*,1,2 | | | 272,364 | |
| | | | | | | | 541,302 | |
| | | | | MINING — 0.5% | | | | |
| | 2,334 | | | Freeport-McMoRan, Inc. | | | 75,925 | |
| | 1,204 | | | Newmont Corp. | | | 65,377 | |
| | | | | | | | 141,302 | |
| | | | | MISCELLANEOUS MANUFACTURING — 1.9% | | | | |
| | 782 | | | 3M Co. | | | 137,178 | |
| | 699 | | | Eaton Corp. PLC | | | 104,368 | |
| | 1,364 | | | General Electric Co. | | | 140,533 | |
| | 472 | | | Illinois Tool Works, Inc. | | | 97,529 | |
| | | | | | | | 479,608 | |
| | | | | OIL & GAS — 3.7% | | | | |
| | 2,184 | | | Chevron Corp. | | | 221,567 | |
AXS Thomson Reuters Private Equity Return Tracker Fund
SCHEDULE OF INVESTMENTS - Continued
As of September 30, 2021
| Number of Shares | | | | | Value | |
| | | | COMMON STOCKS (Continued) | | | |
| | | | OIL & GAS (Continued) | | | |
| | 1,533 | | | ConocoPhillips | | $ | 103,891 | |
| | 977 | | | Devon Energy Corp. | | | 34,693 | |
| | 517 | | | EOG Resources, Inc. | | | 41,500 | |
| | 4,802 | | | Exxon Mobil Corp. | | | 282,454 | |
| | 379 | | | Hess Corp. | | | 29,604 | |
| | 696 | | | Marathon Petroleum Corp. | | | 43,020 | |
| | 1,441 | | | Occidental Petroleum Corp. | | | 42,625 | |
| | 494 | | | Phillips 66 | | | 34,595 | |
| | 334 | | | Pioneer Natural Resources Co. | | | 55,614 | |
| | 11 | | | Texas Pacific Land Corp. | | | 13,303 | |
| | 599 | | | Valero Energy Corp. | | | 42,271 | |
| | | | | | | | 945,137 | |
| | | | | OIL & GAS SERVICES — 0.4% | | | | |
| | 863 | | | Baker Hughes Co. | | | 21,342 | |
| | 1,276 | | | Halliburton Co. | | | 27,587 | |
| | 1,589 | | | Schlumberger N.V. | | | 47,098 | |
| | | | | | | | 96,027 | |
| | | | | PACKAGING & CONTAINERS — 0.2% | | | | |
| | 598 | | | Ball Corp. | | | 53,802 | |
| | | | | PHARMACEUTICALS — 3.7% | | | | |
| | 1,041 | | | AbbVie, Inc. | | | 112,293 | |
| | 1,735 | | | Bristol-Myers Squibb Co. | | | 102,660 | |
| | 1,018 | | | CVS Health Corp. | | | 86,387 | |
| | 473 | | | Eli Lilly & Co. | | | 109,287 | |
| | 1,565 | | | Johnson & Johnson | | | 252,748 | |
| | 248 | | | McKesson Corp. | | | 49,446 | |
| | 1,427 | | | Merck & Co., Inc. | | | 107,182 | |
| | 3,308 | | | Pfizer, Inc. | | | 142,277 | |
| | | | | | | | 962,280 | |
| | | | | PIPELINES — 0.6% | | | | |
| | 371 | | | Cheniere Energy, Inc.* | | | 36,236 | |
| | 2,285 | | | Kinder Morgan, Inc. | | | 38,228 | |
| | 645 | | | ONEOK, Inc. | | | 37,403 | |
| | 1,782 | | | Williams Cos., Inc. | | | 46,225 | |
| | | | | | | | 158,092 | |
| | | | | REITS — 1.2% | | | | |
| | 341 | | | American Tower Corp. - REIT | | | 90,505 | |
| | 457 | | | Crown Castle International Corp. - REIT | | | 79,207 | |
| | 89 | | | Equinix, Inc. - REIT | | | 70,322 | |
AXS Thomson Reuters Private Equity Return Tracker Fund
SCHEDULE OF INVESTMENTS - Continued
As of September 30, 2021
| Number of Shares | | | | | Value | |
| | | | COMMON STOCKS (Continued) | | | |
| | | | REITS (Continued) | | | |
| | 565 | | | Prologis, Inc. - REIT | | $ | 70,868 | |
| | | | | | | | 310,902 | |
| | | | | RETAIL — 6.6% | | | | |
| | 29 | | | Chipotle Mexican Grill, Inc.* | | | 52,708 | |
| | 512 | | | Costco Wholesale Corp. | | | 230,067 | |
| | 238 | | | Dollar General Corp. | | | 50,490 | |
| | 951 | | | Home Depot, Inc.1,2 | | | 312,175 | |
| | 829 | | | Lowe's Cos., Inc. | | | 168,171 | |
| | 862 | | | McDonald's Corp. | | | 207,837 | |
| | 1,362 | | | Starbucks Corp. | | | 150,242 | |
| | 548 | | | Target Corp. | | | 125,366 | |
| | 1,389 | | | TJX Cos., Inc. | | | 91,646 | |
| | 1,176 | | | Walgreens Boots Alliance, Inc. | | | 55,331 | |
| | 1,807 | | | Walmart, Inc. | | | 251,860 | |
| | | | | | | | 1,695,893 | |
| | | | | SEMICONDUCTORS — 7.0% | | | | |
| | 1,769 | | | Advanced Micro Devices, Inc.* | | | 182,030 | |
| | 1,206 | | | Applied Materials, Inc. | | | 155,248 | |
| | 441 | | | Broadcom, Inc. | | | 213,854 | |
| | 5,650 | | | Intel Corp.1,2 | | | 301,032 | |
| | 2,413 | | | NVIDIA Corp. | | | 499,877 | |
| | 1,659 | | | QUALCOMM, Inc. | | | 213,978 | |
| | 1,280 | | | Texas Instruments, Inc. | | | 246,029 | |
| | | | | | | | 1,812,048 | |
| | | | | SOFTWARE — 9.2% | | | | |
| | 448 | | | Adobe, Inc.*,1,2 | | | 257,923 | |
| | 861 | | | Fidelity National Information Services, Inc. | | | 104,766 | |
| | 928 | | | Fiserv, Inc.* | | | 100,688 | |
| | 367 | | | Intuit, Inc. | | | 198,000 | |
| | 3,869 | | | Microsoft Corp. | | | 1,090,748 | |
| | 2,569 | | | Oracle Corp. | | | 223,837 | |
| | 926 | | | salesforce.com, Inc.* | | | 251,150 | |
| | 263 | | | ServiceNow, Inc.* | | | 163,657 | |
| | | | | | | | 2,390,769 | |
| | | | | TELECOMMUNICATIONS — 1.5% | | | | |
| | 1,872 | | | AT&T, Inc. | | | 50,562 | |
| | 4,416 | | | Cisco Systems, Inc./Delaware | | | 240,363 | |
| | 346 | | | Lumen Technologies, Inc. | | | 4,287 | |
| | 221 | | | T-Mobile US, Inc.* | | | 28,235 | |
AXS Thomson Reuters Private Equity Return Tracker Fund
SCHEDULE OF INVESTMENTS - Continued
As of September 30, 2021
| Number of Shares | | | | | Value | |
| | | | COMMON STOCKS (Continued) | | | |
| | | | TELECOMMUNICATIONS (Continued) | | | |
| | 1,084 | | | Verizon Communications, Inc. | | $ | 58,547 | |
| | | | | | | | 381,994 | |
| | | | | TRANSPORTATION — 2.5% | | | | |
| | 3,361 | | | CSX Corp. | | | 99,956 | |
| | 405 | | | FedEx Corp. | | | 88,812 | |
| | 442 | | | Norfolk Southern Corp. | | | 105,749 | |
| | 906 | | | Union Pacific Corp. | | | 177,585 | |
| | 977 | | | United Parcel Service, Inc. - Class B | | | 177,912 | |
| | | | | | | | 650,014 | |
| | | | | VENTURE CAPITAL — 0.3% | | | | |
| | 723 | | | Blackstone, Inc. | | | 84,114 | |
| | | | | WATER — 0.1% | | | | |
| | 101 | | | American Water Works Co., Inc. | | | 17,073 | |
| | | | | TOTAL COMMON STOCKS | | | | |
| | | | | (Cost $21,419,841) | | | 26,071,932 | |
| Principal Amount | | | | | | |
| | | | SHORT-TERM INVESTMENTS — 1.6% | | | |
| $ | 424,393 | | | UMB Bank demand deposit, 0.01%3 | | | 424,393 | |
| | | | | TOTAL SHORT-TERM INVESTMENTS | | | | |
| | | | | (Cost $424,393) | | | 424,393 | |
| | | | | TOTAL INVESTMENTS — 102.5% | | | | |
| | | | | (Cost $21,844,234) | | | 26,496,325 | |
| | | | | Liabilities in Excess of Other Assets — (2.5)% | | | (653,499 | ) |
| | | | | TOTAL NET ASSETS — 100.0% | | $ | 25,842,826 | |
| PLC – Public Limited Company |
| REIT – Real Estate Investment Trusts |
| * | Non-income producing security. |
| 1 | All or a portion of this security is segregated as collateral for swap agreement. As of September 30, 2021, the aggregate value of those securities was $1,165,237, representing 4.5% of net assets. |
| 2 | Foreign security denominated in U.S. Dollars. |
| 3 | The rate is the annualized seven-day yield at period end. |
See accompanying Notes to Consolidated Financial Statements.
AXS Thomson Reuters Private Equity Return Tracker Fund
SCHEDULE OF INVESTMENTS - Continued
As of September 30, 2021
SWAP CONTRACTS
EQUITY SWAP CONTRACTS
| Counterparty | | Reference Entity | | Fund Pays | | Fund Receives | | Pay/Receive Frequency | | Termination Date | | Notional Amount | | | Premium Paid (Received) | | | Unrealized Appreciation (Depreciation) | |
| | | | | | | | | | | | | | | | | | | | |
| BNP Paribas | | BNP Paribas Index Swap1 | | 1-Month LIBOR + 0.50% | | Index Return | | Monthly | | 10/1/21 | | $ | 27,412,734 | | | $ | 624 | | | $ | (651,326 | ) |
| BNP Paribas | | BNP Paribas Equity Basket Swap2 | | 1-Month LIBOR + 0.50% | | Basket Return | | Monthly | | 10/1/21 | | | 5,607,116 | | | | 2,949 | | | | (293,263 | ) |
| TOTAL EQUITY SWAP CONTRACTS | | | | | | | | | | | | | | $ | (944,589 | ) |
| 1 | The BNP Paribas Index Swap is made up of the Nasdaq 100 Total Return Index, Dow Jones Industrial Average Total Return Index, and S&P 500 Total Return Index and exposure to each index was 46.84%, (46.84)%, and 74.1%, respectively. |
| | |
| 2 | BNP Paribas Equity Basket Swap Top 50 Holdings^ |
| Number of Shares | | | Description | | Value | | | Percentage of Equity Swap's Notional Amount | |
| | 100 | | | Amazon.com, Inc. | | $ | 328,504 | | | | 5.86 | % |
| | 2,295 | | | Apple, Inc. | | | 324,743 | | | | 5.79 | % |
| | 945 | | | Facebook, Inc. - Class A | | | 320,724 | | | | 5.72 | % |
| | 1,085 | | | Microsoft Corp. | | | 305,883 | | | | 5.46 | % |
| | 105 | | | Alphabet, Inc. - Class A | | | 280,720 | | | | 5.01 | % |
| | 745 | | | Berkshire Hathaway, Inc. | | | 203,340 | | | | 3.63 | % |
| | 955 | | | NVIDIA Corp. | | | 197,838 | | | | 3.53 | % |
| | 215 | | | Tesla, Inc. | | | 166,728 | | | | 2.97 | % |
| | 705 | | | Visa, Inc. - Class A | | | 157,039 | | | | 2.80 | % |
| | 945 | | | Procter & Gamble Co. | | | 132,111 | | | | 2.36 | % |
| | 365 | | | Mastercard, Inc. - Class | | | 126,903 | | | | 2.26 | % |
| | 485 | | | PayPal Holdings, Inc. | | | 126,202 | | | | 2.25 | % |
| | 755 | | | JPMorgan Chase & Co. | | | 123,586 | | | | 2.20 | % |
| | 1,735 | | | Exxon Mobil Corp. | | | 102,053 | | | | 1.82 | % |
| | 175 | | | Adobe, Inc. | | | 100,751 | | | | 1.80 | % |
| | 365 | | | salesforce.com, Inc. | | | 98,995 | | | | 1.77 | % |
| | 295 | | | Home Depot, Inc. | | | 96,837 | | | | 1.73 | % |
| | 1,755 | | | Cisco Systems, Inc./Delaware | | | 95,525 | | | | 1.70 | % |
| | 490 | | | Walt Disney Co. | | | 82,893 | | | | 1.48 | % |
| | 790 | | | Chevron Corp. | | | 80,146 | | | | 1.43 | % |
| | 1,880 | | | Bank of America Corp. | | | 79,806 | | | | 1.42 | % |
| | 530 | | | PepsiCo, Inc. | | | 79,717 | | | | 1.42 | % |
| | 1,505 | | | Coca-Cola Co. | | | 78,967 | | | | 1.41 | % |
| | 480 | | | Johnson & Johnson | | | 77,520 | | | | 1.38 | % |
| | 550 | | | Walmart, Inc. | | | 76,659 | | | | 1.37 | % |
| | 250 | | | Linde PLC | | | 73,345 | | | | 1.31 | % |
| | 1,235 | | | Comcast Corp. - Class A | | | 69,074 | | | | 1.23 | % |
| | 165 | | | UnitedHealth Group, Inc. | | | 64,472 | | | | 1.15 | % |
| | 280 | | | Honeywell International, Inc. | | | 59,438 | | | | 1.06 | % |
| | 565 | | | Philip Morris International, Inc. | | | 53,556 | | | | 0.96 | % |
| | 270 | | | Union Pacific Corp. | | | 52,923 | | | | 0.94 | % |
| | 615 | | | Raytheon Technologies Corp. | | | 52,865 | | | | 0.94 | % |
| | 290 | | | United Parcel Service, Inc. - Class B | | | 52,809 | | | | 0.94 | % |
| | 235 | | | Boeing Co. | | | 51,686 | | | | 0.92 | % |
| | 345 | | | NIKE, Inc. - Class B | | | 50,104 | | | | 0.89 | % |
| | 1,035 | | | Wells Fargo & Co. | | | 48,034 | | | | 0.86 | % |
| | 1,025 | | | Pfizer, Inc. | | | 44,085 | | | | 0.79 | % |
| | 100 | | | S&P Global, Inc. | | | 42,489 | | | | 0.76 | % |
| | 410 | | | General Electric Co. | | | 42,242 | | | | 0.75 | % |
| | 220 | | | Caterpillar, Inc. | | | 42,233 | | | | 0.75 | % |
| | 235 | | | 3M Co. | | | 41,224 | | | | 0.74 | % |
| | 70 | | | Thermo Fisher Scientific, Inc. | | | 39,993 | | | | 0.71 | % |
| | 115 | | | Deere & Co. | | | 38,533 | | | | 0.69 | % |
| | 325 | | | Abbott Laboratories | | | 38,392 | | | | 0.68 | % |
| | 555 | | | ConocoPhillips | | | 37,612 | | | | 0.67 | % |
| | 120 | | | Danaher Corp. | | | 36,533 | | | | 0.65 | % |
| | 515 | | | Citigroup, Inc. | | | 36,143 | | | | 0.64 | % |
| | 330 | | | AbbVie, Inc. | | | 35,597 | | | | 0.63 | % |
| | 350 | | | Morgan Stanley | | | 34,061 | | | | 0.61 | % |
| | 145 | | | Eli Lilly & Co. | | | 33,502 | | | | 0.60 | % |
| ^ | These investments are not direct holdings of the Fund. The holdings were determined based on the absolute notional values of the positions within the underlying swap basket. |
See accompanying Notes to Consolidated Financial Statements.
AXS Thomson Reuters Private Equity Return Tracker Fund
SUMMARY OF INVESTMENTS
As of September 30, 2021
| Security Type/Industry | | Percent of Total
Net Assets | |
| Common Stocks | | | |
| Internet | | | 13.6 | % |
| Software | | | 9.2 | % |
| Semiconductors | | | 7.0 | % |
| Retail | | | 6.6 | % |
| Computers | | | 6.0 | % |
| Banks | | | 5.4 | % |
| Diversified Financial Services | | | 4.4 | % |
| Pharmaceuticals | | | 3.7 | % |
| Oil & Gas | | | 3.7 | % |
| Chemicals | | | 3.3 | % |
| Commercial Services | | | 3.3 | % |
| Insurance | | | 2.9 | % |
| Beverages | | | 2.6 | % |
| Auto Manufacturers | | | 2.6 | % |
| Cosmetics/Personal Care | | | 2.5 | % |
| Transportation | | | 2.5 | % |
| Healthcare-Products | | | 2.2 | % |
| Media | | | 2.1 | % |
| Aerospace/Defense | | | 2.0 | % |
| Miscellaneous Manufacturing | | | 1.9 | % |
| Telecommunications | | | 1.5 | % |
| Agriculture | | | 1.3 | % |
| REITS | | | 1.2 | % |
| Electric | | | 1.0 | % |
| Food | | | 0.9 | % |
| Biotechnology | | | 0.9 | % |
| Healthcare-Services | | | 0.8 | % |
| Electronics | | | 0.8 | % |
| Pipelines | | | 0.6 | % |
| Apparel | | | 0.6 | % |
| Machinery-Diversified | | | 0.5 | % |
| Machinery-Construction & Mining | | | 0.5 | % |
| Mining | | | 0.5 | % |
| Oil & Gas Services | | | 0.4 | % |
| Building Materials | | | 0.3 | % |
| Venture Capital | | | 0.3 | % |
| Household Products/Wares | | | 0.3 | % |
| Iron/Steel | | | 0.2 | % |
| Packaging & Containers | | | 0.2 | % |
| Lodging | | | 0.2 | % |
| Auto Parts & Equipment | | | 0.2 | % |
AXS Thomson Reuters Private Equity Return Tracker Fund
SUMMARY OF INVESTMENTS - Continued
As of September 30, 2021
| Security Type/Industry | | Percent of Total Net Assets | |
| Water | | | 0.1 | % |
| Energy-Alternate Sources | | | 0.1 | % |
| Total Common Stocks | | | 100.9 | % |
| Short-Term Investments | | | 1.6 | % |
| Total Investments | | | 102.5 | % |
| Liabilities in Excess of Other Assets | | | (2.5 | )% |
| Total Net Assets | | | 100.0 | % |
See accompanying Notes to Consolidated Financial Statements.
AXS Thomson Reuters Venture Capital Return Tracker Fund
SCHEDULE OF INVESTMENTS
As of September 30, 2021
| Number of Shares | | | | | Value | |
| | | | COMMON STOCKS — 102.2% | | | |
| | | | ADVERTISING — 0.5% | | | |
| | 25,821 | | | Trade Desk, Inc. - Class A* | | $ | 1,815,216 | |
| | | | | AEROSPACE/DEFENSE — 0.9% | | | | |
| | 7,358 | | | Boeing Co.* | | | 1,618,319 | |
| | 19,069 | | | Raytheon Technologies Corp. | | | 1,639,171 | |
| | | | | | | | 3,257,490 | |
| | | | | AGRICULTURE — 0.7% | | | | |
| | 19,518 | | | Altria Group, Inc. | | | 888,459 | |
| | 16,543 | | | Philip Morris International, Inc. | | | 1,568,111 | |
| | | | | | | | 2,456,570 | |
| | | | | AUTO MANUFACTURERS — 0.2% | | | | |
| | 1,206 | | | Tesla, Inc.* | | | 935,229 | |
| | | | | BANKS — 1.4% | | | | |
| | 27,955 | | | Bank of America Corp. | | | 1,186,690 | |
| | 7,685 | | | Citigroup, Inc. | | | 539,333 | |
| | 1,262 | | | Goldman Sachs Group, Inc. | | | 477,074 | |
| | 11,237 | | | JPMorgan Chase & Co. | | | 1,839,384 | |
| | 5,189 | | | Morgan Stanley | | | 504,942 | |
| | 15,223 | | | Wells Fargo & Co. | | | 706,499 | |
| | | | | | | | 5,253,922 | |
| | | | | BEVERAGES — 0.6% | | | | |
| | 21,490 | | | Coca-Cola Co. | | | 1,127,580 | |
| | 7,548 | | | PepsiCo, Inc. | | | 1,135,295 | |
| | | | | | | | 2,262,875 | |
| | | | | BIOTECHNOLOGY — 0.3% | | | | |
| | 2,758 | | | Illumina, Inc.* | | | 1,118,672 | |
| | | | | CHEMICALS — 1.0% | | | | |
| | 1,712 | | | Air Products and Chemicals, Inc. | | | 438,460 | |
| | 5,711 | | | Dow, Inc. | | | 328,725 | |
| | 4,139 | | | DuPont de Nemours, Inc. | | | 281,411 | |
| | 2,098 | | | Ecolab, Inc. | | | 437,685 | |
| | 4,309 | | | Linde PLC1 | | | 1,264,174 | |
| | 1,857 | | | PPG Industries, Inc. | | | 265,570 | |
| | 2,033 | | | Sherwin-Williams Co. | | | 568,691 | |
| | | | | | | | 3,584,716 | |
| | | | | COMMERCIAL SERVICES — 5.8% | | | | |
| | 27,994 | | | Automatic Data Processing, Inc.2 | | | 5,596,560 | |
| | 57,679 | | | PayPal Holdings, Inc.* | | | 15,008,653 | |
AXS Thomson Reuters Venture Capital Return Tracker Fund
SCHEDULE OF INVESTMENTS - Continued
As of September 30, 2021
| Number of Shares | | | | | Value | |
| | | | COMMON STOCKS (Continued) | | | |
| | | | COMMERCIAL SERVICES (Continued) | | | |
| | 3,001 | | | S&P Global, Inc. | | $ | 1,275,095 | |
| | | | | | | | 21,880,308 | |
| | | | | COMPUTERS — 9.5% | | | | |
| | 43,378 | | | Accenture PLC1 | | | 13,877,490 | |
| | 37,944 | | | Apple, Inc.2 | | | 5,369,076 | |
| | 34,629 | | | Cognizant Technology Solutions Corp. - Class A | | | 2,569,818 | |
| | 12,462 | | | Crowdstrike Holdings, Inc. - Class A* | | | 3,062,910 | |
| | 8,694 | | | Fortinet, Inc.* | | | 2,538,996 | |
| | 60,401 | | | International Business Machines Corp.2 | | | 8,391,511 | |
| | | | | | | | 35,809,801 | |
| | | | | COSMETICS/PERSONAL CARE — 0.9% | | | | |
| | 9,480 | | | Colgate-Palmolive Co. | | | 716,498 | |
| | 2,436 | | | Estee Lauder Cos., Inc. - Class A | | | 730,630 | |
| | 13,421 | | | Procter & Gamble Co. | | | 1,876,256 | |
| | | | | | | | 3,323,384 | |
| | | | | DIVERSIFIED FINANCIAL SERVICES — 9.0% | | | | |
| | 533 | | | BlackRock, Inc. | | | 447,006 | |
| | 48,524 | | | Mastercard, Inc. - Class A | | | 16,870,824 | |
| | 73,152 | | | Visa, Inc. - Class A2 | | | 16,294,608 | |
| | | | | | | | 33,612,438 | |
| | | | | ELECTRIC — 0.0% | | | | |
| | 76 | | | Duke Energy Corp. | | | 7,417 | |
| | 196 | | | NextEra Energy, Inc. | | | 15,390 | |
| | 100 | | | Southern Co. | | | 6,197 | |
| | | | | | | | 29,004 | |
| | | | | ELECTRONICS — 0.8% | | | | |
| | 6,191 | | | Agilent Technologies, Inc. | | | 975,268 | |
| | 8,742 | | | Honeywell International, Inc. | | | 1,855,752 | |
| | | | | | | | 2,831,020 | |
| | | | | FOOD — 0.2% | | | | |
| | 15,774 | | | Mondelez International, Inc. | | | 917,731 | |
| | | | | HEALTHCARE-PRODUCTS — 5.3% | | | | |
| | 20,752 | | | Abbott Laboratories | | | 2,451,434 | |
| | 1,734 | | | Align Technology, Inc.* | | | 1,153,856 | |
| | 11,228 | | | Baxter International, Inc. | | | 903,068 | |
| | 33,183 | | | Boston Scientific Corp.* | | | 1,439,810 | |
| | 7,412 | | | Danaher Corp. | | | 2,256,509 | |
| | 13,862 | | | Edwards Lifesciences Corp.* | | | 1,569,317 | |
AXS Thomson Reuters Venture Capital Return Tracker Fund
SCHEDULE OF INVESTMENTS - Continued
As of September 30, 2021
| Number of Shares | | | | | Value | |
| | | | COMMON STOCKS (Continued) | | | |
| | | | HEALTHCARE-PRODUCTS (Continued) | | | |
| | 1,876 | | | IDEXX Laboratories, Inc.* | | $ | 1,166,685 | |
| | 1,272 | | | Intuitive Surgical, Inc.* | | | 1,264,559 | |
| | 15,008 | | | Medtronic PLC1 | | | 1,881,253 | |
| | 2,993 | | | ResMed, Inc. | | | 788,805 | |
| | 7,647 | | | Stryker Corp. | | | 2,016,667 | |
| | 4,341 | | | Thermo Fisher Scientific, Inc. | | | 2,480,144 | |
| | 4,612 | | | Zimmer Biomet Holdings, Inc. | | | 675,012 | |
| | | | | | | | 20,047,119 | |
| | | | | HEALTHCARE-SERVICES — 2.5% | | | | |
| | 5,722 | | | Anthem, Inc. | | | 2,133,162 | |
| | 11,004 | | | Centene Corp.* | | | 685,659 | |
| | 5,666 | | | HCA Healthcare, Inc. | | | 1,375,252 | |
| | 2,593 | | | Humana, Inc. | | | 1,009,066 | |
| | 10,556 | | | UnitedHealth Group, Inc.2 | | | 4,124,651 | |
| | | | | | | | 9,327,790 | |
| | | | | HOUSEHOLD PRODUCTS/WARES — 0.1% | | | | |
| | 3,549 | | | Kimberly-Clark Corp. | | | 470,030 | |
| | | | | INSURANCE — 1.7% | | | | |
| | 23,090 | | | Berkshire Hathaway, Inc.* | | | 6,302,185 | |
| | | | | INTERNET — 20.1% | | | | |
| | 5,883 | | | Alphabet, Inc. - Class A* | | | 15,728,318 | |
| | 663 | | | Amazon.com, Inc.* | | | 2,177,981 | |
| | 101 | | | Cogent Communications Holdings, Inc. | | | 7,155 | |
| | 44,316 | | | eBay, Inc. | | | 3,087,496 | |
| | 44,612 | | | Facebook, Inc. - Class A* | | | 15,140,867 | |
| | 14,996 | | | Match Group, Inc.* | | | 2,354,222 | |
| | 2,487 | | | MercadoLibre, Inc.* | | | 4,176,668 | |
| | 26,692 | | | Netflix, Inc.* | | | 16,291,195 | |
| | 6,319 | | | Palo Alto Networks, Inc.* | | | 3,026,801 | |
| | 70,154 | | | Snap, Inc. - Class A* | | | 5,182,276 | |
| | 53,336 | | | Twitter, Inc.*,2 | | | 3,220,961 | |
| | 111,055 | | | Uber Technologies, Inc.*,2 | | | 4,975,264 | |
| | | | | | | | 75,369,204 | |
| | | | | IRON/STEEL — 0.1% | | | | |
| | 2,093 | | | Nucor Corp. | | | 206,140 | |
| | | | | MACHINERY-CONSTRUCTION & MINING — 0.4% | | | | |
| | 6,871 | | | Caterpillar, Inc. | | | 1,319,026 | |
AXS Thomson Reuters Venture Capital Return Tracker Fund
SCHEDULE OF INVESTMENTS - Continued
As of September 30, 2021
| Number of Shares | | | | | Value | |
| | | | COMMON STOCKS (Continued) | | | |
| | | | MEDIA — 0.2% | | | |
| | 657 | | | Altice USA, Inc. - Class A* | | $ | 13,613 | |
| | 11 | | | Cable One, Inc. | | | 19,944 | |
| | 493 | | | Charter Communications, Inc. - Class A* | | | 358,687 | |
| | 2,785 | | | Walt Disney Co.* | | | 471,139 | |
| | | | | | | | 863,383 | |
| | | | | MINING — 0.2% | | | | |
| | 12,025 | | | Freeport-McMoRan, Inc. | | | 391,173 | |
| | 6,201 | | | Newmont Corp. | | | 336,715 | |
| | | | | | | | 727,888 | |
| | | | | MISCELLANEOUS MANUFACTURING — 1.0% | | | | |
| | 7,245 | | | 3M Co. | | | 1,270,918 | |
| | 23,152 | | | General Electric Co. | | | 2,385,350 | |
| | | | | | | | 3,656,268 | |
| | | | | OIL & GAS — 0.4% | | | | |
| | 4,577 | | | Chevron Corp. | | | 464,337 | |
| | 3,213 | | | ConocoPhillips | | | 217,745 | |
| | 1,079 | | | EOG Resources, Inc. | | | 86,611 | |
| | 10,056 | | | Exxon Mobil Corp. | | | 591,494 | |
| | 1,456 | | | Marathon Petroleum Corp. | | | 89,995 | |
| | 1,038 | | | Phillips 66 | | | 72,691 | |
| | 514 | | | Pioneer Natural Resources Co. | | | 85,586 | |
| | | | | | | | 1,608,459 | |
| | | | | OIL & GAS SERVICES — 0.0% | | | | |
| | 3,317 | | | Schlumberger N.V.1 | | | 98,316 | |
| | | | | PHARMACEUTICALS — 2.9% | | | | |
| | 8,091 | | | AbbVie, Inc. | | | 872,776 | |
| | 6,788 | | | Becton, Dickinson and Co. | | | 1,668,626 | |
| | 6,980 | | | Cigna Corp. | | | 1,397,117 | |
| | 15,385 | | | CVS Health Corp. | | | 1,305,571 | |
| | 1,844 | | | Dexcom, Inc.* | | | 1,008,410 | |
| | 3,650 | | | Eli Lilly & Co. | | | 843,332 | |
| | 12,076 | | | Johnson & Johnson | | | 1,950,274 | |
| | 11,027 | | | Merck & Co., Inc. | | | 828,238 | |
| | 25,584 | | | Pfizer, Inc. | | | 1,100,368 | |
| | | | | | | | 10,974,712 | |
| | | | | PIPELINES — 0.0% | | | | |
| | 4,786 | | | Kinder Morgan, Inc. | | | 80,070 | |
| | 2,740 | | | Williams Cos., Inc. | | | 71,075 | |
| | | | | | | | 151,145 | |
AXS Thomson Reuters Venture Capital Return Tracker Fund
SCHEDULE OF INVESTMENTS - Continued
As of September 30, 2021
| Number of Shares | | | | | Value | |
| | | | COMMON STOCKS (Continued) | | | |
| | | | RETAIL — 0.7% | | | |
| | 1,655 | | | Home Depot, Inc. | | $ | 543,270 | |
| | 16,051 | | | Walmart, Inc. | | | 2,237,189 | |
| | | | | | | | 2,780,459 | |
| | | | | SEMICONDUCTORS — 1.8% | | | | |
| | 5,646 | | | Advanced Micro Devices, Inc.* | | | 580,973 | |
| | 3,848 | | | Applied Materials, Inc. | | | 495,353 | |
| | 1,405 | | | Broadcom, Inc. | | | 681,327 | |
| | 18,028 | | | Intel Corp. | | | 960,532 | |
| | 5,212 | | | Micron Technology, Inc. | | | 369,948 | |
| | 10,747 | | | NVIDIA Corp. | | | 2,226,348 | |
| | 5,294 | | | QUALCOMM, Inc. | | | 682,820 | |
| | 4,085 | | | Texas Instruments, Inc. | | | 785,178 | |
| | | | | | | | 6,782,479 | |
| | | | | SOFTWARE — 31.4% | | | | |
| | 44,791 | | | Activision Blizzard, Inc.2 | | | 3,466,376 | |
| | 25,463 | | | Adobe, Inc.* | | | 14,659,558 | |
| | 7,128 | | | Atlassian Corp. PLC - Class A*,1 | | | 2,790,042 | |
| | 14,326 | | | Autodesk, Inc.* | | | 4,085,345 | |
| | 16,988 | | | Cadence Design Systems, Inc.* | | | 2,572,663 | |
| | 11,215 | | | DocuSign, Inc.* | | | 2,887,077 | |
| | 17,729 | | | Electronic Arts, Inc. | | | 2,521,950 | |
| | 38,117 | | | Fidelity National Information Services, Inc. | | | 4,638,077 | |
| | 16,350 | | | Intuit, Inc. | | | 8,820,989 | |
| | 55,853 | | | Microsoft Corp. | | | 15,746,078 | |
| | 118,345 | | | Oracle Corp.2 | | | 10,311,400 | |
| | 111,776 | | | Palantir Technologies, Inc. - Class A* | | | 2,687,095 | |
| | 6,024 | | | Roper Technologies, Inc. | | | 2,687,487 | |
| | 58,660 | | | salesforce.com, Inc.*,2 | | | 15,909,765 | |
| | 11,701 | | | ServiceNow, Inc.* | | | 7,281,181 | |
| | 11,794 | | | Snowflake, Inc. * | | | 3,566,859 | |
| | 8,743 | | | Synopsys, Inc.* | | | 2,617,742 | |
| | 10,386 | | | Twilio, Inc. - Class A*,2 | | | 3,313,653 | |
| | 2,983 | | | Veeva Systems, Inc. - Class A* | | | 859,611 | |
| | 11,938 | | | Workday, Inc. - Class A* | | | 2,983,187 | |
| | 13,284 | | | Zoom Video Communications, Inc. - Class A*,2 | | | 3,473,766 | |
| | | | | | | | 117,879,901 | |
| | | | | TELECOMMUNICATIONS — 0.7% | | | | |
| | 22,351 | | | AT&T, Inc. | | | 603,700 | |
| | 19,685 | | | Cisco Systems, Inc. | | | 1,071,455 | |
| | 268 | | | Iridium Communications, Inc.* | | | 10,680 | |
| | 2,898 | | | Lumen Technologies, Inc. | | | 35,906 | |
| | 1,870 | | | T-Mobile US, Inc.* | | | 238,911 | |
AXS Thomson Reuters Venture Capital Return Tracker Fund
SCHEDULE OF INVESTMENTS - Continued
As of September 30, 2021
| Number of Shares | | | | | Value | |
| | | | COMMON STOCKS (Continued) | | | |
| | | | TELECOMMUNICATIONS (Continued) | | | |
| | 12,968 | | | Verizon Communications, Inc. | | $ | 700,402 | |
| | 654 | | | Vonage Holdings Corp.* | | | 10,542 | |
| | | | | | | | 2,671,596 | |
| | | | | TRANSPORTATION — 0.9% | | | | |
| | 8,339 | | | Union Pacific Corp. | | | 1,634,527 | |
| | 9,005 | | | United Parcel Service, Inc. - Class B | | | 1,639,811 | |
| | | | | | | | 3,274,338 | |
| | | | | TOTAL COMMON STOCKS | | | | |
| | | | | (Cost $323,997,249) | | | 383,598,814 | |
| Principal Amount | | | | | | |
| | | | SHORT-TERM INVESTMENTS — 2.3% | | | |
| $ | 8,643,204 | | | UMB Bank demand deposit, 0.01%3 | | | 8,643,204 | |
| | | | | TOTAL SHORT-TERM INVESTMENTS | | | | |
| | | | | (Cost $8,643,204) | | | 8,643,204 | |
| | | | | TOTAL INVESTMENTS — 104.5% | | | | |
| | | | | (Cost $332,640,453) | | | 392,242,018 | |
| | | | | Liabilities in Excess of Other Assets — (4.5)% | | | (17,066,500 | ) |
| | | | | TOTAL NET ASSETS — 100.0% | | $ | 375,175,518 | |
PLC – Public Limited Company
| * | Non-income producing security. |
| 1 | Foreign security denominated in U.S. Dollars. |
| 2 | All or a portion of this security is segregated as collateral for swap agreement. As of September 30, 2021, the aggregate value of those securities was $33,143,418, representing 8.8% of net assets. |
| 3 | The rate is the annualized seven-day yield at period end. |
See accompanying Notes to Consolidated Financial Statements.
AXS Thomson Reuters Venture Capital Return Tracker Fund
SCHEDULE OF INVESTMENTS - Continued
As of September 30, 2021
SWAP CONTRACTS
EQUITY SWAP CONTRACTS
| Counterparty | | Reference Entity | | Fund Pays | | Fund Receives | | Pay/Receive Frequency | | Termination Date | | Notional Amount | | | Premium Paid (Received) | | | Unrealized Appreciation (Depreciation) | |
| | | | | | | | | | | | | | | | | | | | |
| BNP Paribas | | BNP Paribas Index Swap1 | | 0.50% | | Index Return | | Monthly | | 10/1/21 | | $ | 407,626,360 | | | $ | 36,613 | | | $ | (4,002,880 | ) |
| BNP Paribas | | BNP Paribas Equity Basket Swap2 | | 1-Month LIBOR + 0.50% | | Basket Return | | Monthly | | 10/1/21 | | | 313,099,804 | | | | 9,268 | | | | (16,202,685 | ) |
| TOTAL EQUITY SWAP CONTRACTS | | | | | | | | | | | | | | $ | (20,205,565 | ) |
| 1 | The BNP Paribas Index Swap is made up of the Nasdaq 100 Total Return Index and the S&P 500 Total Return Index and exposure to each index was 134.84% and (134.84)%, respectively. |
| | |
| 2 | BNP Paribas Equity Basket Swap Top 50 Holdings^ |
| Number of Shares | | | Description | | Value | | | Percentage of Equity Swap's Notional Amount | |
| | 27,130 | | | Netflix, Inc. | | $ | 16,558,524 | | | | 5.29 | % |
| | 46,450 | | | Mastercard, Inc. - Class A | | | 16,149,736 | | | | 5.16 | % |
| | 70,385 | | | Visa, Inc. - Class A | | | 15,678,259 | | | | 5.01 | % |
| | 56,860 | | | salesforce.com, Inc. | | | 15,421,569 | | | | 4.93 | % |
| | 53,075 | | | Microsoft Corp. | | | 14,962,904 | | | | 4.78 | % |
| | 5,480 | | | Alphabet, Inc. - Class A | | | 14,650,890 | | | | 4.68 | % |
| | 56,240 | | | PayPal Holdings, Inc. | | | 14,634,210 | | | | 4.67 | % |
| | 42,065 | | | Facebook, Inc. - Class A | | | 14,276,440 | | | | 4.56 | % |
| | 43,535 | | | Accenture PLC | | | 13,927,717 | | | | 4.45 | % |
| | 24,080 | | | Adobe, Inc. | | | 13,863,338 | | | | 4.43 | % |
| | 111,510 | | | Oracle Corp. | | | 9,715,866 | | | | 3.10 | % |
| | 16,570 | | | Intuit, Inc. | | | 8,939,681 | | | | 2.86 | % |
| | 56,370 | | | International Business Machines Corp. | | | 7,831,484 | | | | 2.50 | % |
| | 11,875 | | | ServiceNow, Inc. | | | 7,389,456 | | | | 2.36 | % |
| | 21,975 | | | Berkshire Hathaway, Inc. | | | 5,997,857 | | | | 1.92 | % |
| | 27,930 | | | Automatic Data Processing, Inc. | | | 5,583,766 | | | | 1.78 | % |
| | 36,365 | | | Apple, Inc. | | | 5,145,648 | | | | 1.64 | % |
| | 65,750 | | | Snap, Inc. - Class A | | | 4,856,953 | | | | 1.55 | % |
| | 38,995 | | | Fidelity National Information Services, Inc. | | | 4,744,912 | | | | 1.52 | % |
| | 102,945 | | | Uber Technologies, Inc. | | | 4,611,936 | | | | 1.47 | % |
| | 2,530 | | | MercadoLibre, Inc. | | | 4,248,882 | | | | 1.36 | % |
| | 14,370 | | | Autodesk, Inc. | | | 4,097,893 | | | | 1.31 | % |
| | 10,425 | | | UnitedHealth Group, Inc. | | | 4,073,465 | | | | 1.30 | % |
| | 14,260 | | | Zoom Video Communications, Inc. - Class A | | | 3,728,990 | | | | 1.19 | % |
| | 11,970 | | | Snowflake, Inc. | | | 3,620,087 | | | | 1.16 | % |
| | 45,315 | | | Activision Blizzard, Inc. | | | 3,506,928 | | | | 1.12 | % |
| | 10,525 | | | Twilio, Inc. - Class A | | | 3,358,001 | | | | 1.07 | % |
| | 13,050 | | | Crowdstrike Holdings, Inc. - Class A | | | 3,207,429 | | | | 1.02 | % |
| | 44,605 | | | eBay, Inc. | | | 3,107,630 | | | | 0.99 | % |
| | 50,965 | | | Twitter, Inc. | | | 3,077,776 | | | | 0.98 | % |
| | 11,945 | | | DocuSign, Inc. | | | 3,075,001 | | | | 0.98 | % |
| | 6,385 | | | Palo Alto Networks, Inc. | | | 3,058,415 | | | | 0.98 | % |
| | 12,105 | | | Workday, Inc. - Class A | | | 3,024,918 | | | | 0.97 | % |
| | 7,650 | | | Atlassian Corp. PLC - Class A | | | 2,994,363 | | | | 0.96 | % |
| | 6,045 | | | Roper Technologies, Inc. | | | 2,696,856 | | | | 0.86 | % |
| | 8,780 | | | Synopsys, Inc. | | | 2,628,820 | | | | 0.84 | % |
| | 17,295 | | | Cadence Design Systems, Inc. | | | 2,619,155 | | | | 0.84 | % |
| | 34,710 | | | Cognizant Technology Solutions Corp. - Class A | | | 2,575,829 | | | | 0.82 | % |
| | 8,790 | | | Fortinet, Inc. | | | 2,567,032 | | | | 0.82 | % |
| | 4,400 | | | Thermo Fisher Scientific, Inc. | | | 2,513,852 | | | | 0.80 | % |
| | 17,600 | | | Electronic Arts, Inc. | | | 2,503,600 | | | | 0.80 | % |
| | 103,440 | | | Palantir Technologies, Inc. - Class A | | | 2,486,698 | | | | 0.79 | % |
| | 20,635 | | | Abbott Laboratories | | | 2,437,613 | | | | 0.78 | % |
| | 15,240 | | | Match Group, Inc. | | | 2,392,528 | | | | 0.76 | % |
| | 7,415 | | | Danaher Corp. | | | 2,257,423 | | | | 0.72 | % |
| | 14,085 | | | Procter & Gamble Co. | | | 1,969,083 | | | | 0.63 | % |
| | 14,910 | | | Medtronic PLC | | | 1,868,969 | | | | 0.60 | % |
| | 25,950 | | | Trade Desk, Inc. - Class A | | | 1,824,285 | | | | 0.58 | % |
| | 8,260 | | | Honeywell International, Inc. | | | 1,753,433 | | | | 0.56 | % |
| | 8,035 | | | Union Pacific Corp. | | | 1,574,940 | | | | 0.50 | % |
| ^ | These investments are not direct holdings of the Fund. The holdings were determined based on the absolute notional values of the positions within the underlying swap basket. |
See accompanying Notes to Consolidated Financial Statements.
AXS Thomson Reuters Venture Capital Return Tracker Fund
SUMMARY OF INVESTMENTS
As of September 30, 2021
| Security Type/Industry | | Percent of Total Net Assets | |
| Common Stocks | | | |
| Software | | | 31.4 | % |
| Internet | | | 20.1 | % |
| Computers | | | 9.5 | % |
| Diversified Financial Services | | | 9.0 | % |
| Commercial Services | | | 5.8 | % |
| Healthcare-Products | | | 5.3 | % |
| Pharmaceuticals | | | 2.9 | % |
| Healthcare-Services | | | 2.5 | % |
| Semiconductors | | | 1.8 | % |
| Insurance | | | 1.7 | % |
| Banks | | | 1.4 | % |
| Chemicals | | | 1.0 | % |
| Miscellaneous Manufacturing | | | 1.0 | % |
| Cosmetics/Personal Care | | | 0.9 | % |
| Transportation | | | 0.9 | % |
| Aerospace/Defense | | | 0.9 | % |
| Electronics | | | 0.8 | % |
| Telecommunications | | | 0.7 | % |
| Retail | | | 0.7 | % |
| Agriculture | | | 0.7 | % |
| Beverages | | | 0.6 | % |
| Advertising | | | 0.5 | % |
| Oil & Gas | | | 0.4 | % |
| Machinery-Construction & Mining | | | 0.4 | % |
| Biotechnology | | | 0.3 | % |
| Media | | | 0.2 | % |
| Mining | | | 0.2 | % |
| Food | | | 0.2 | % |
| Auto Manufacturers | | | 0.2 | % |
| Iron/Steel | | | 0.1 | % |
| Household Products/Wares | | | 0.1 | % |
| Electric | | | 0.0 | % |
| Pipelines | | | 0.0 | % |
| Oil & Gas Services | | | 0.0 | % |
| Total Common Stocks | | | 102.2 | % |
| Short-Term Investments | | | 2.3 | % |
| Total Investments | | | 104.5 | % |
| Liabilities in Excess of Other Assets | | | (4.5 | )% |
| Total Net Assets | | | 100.0 | % |
See accompanying Notes to Consolidated Financial Statements.
AXS Funds
CONSOLIDATED STATEMENTS OF ASSETS AND LIABILITIES
As of September 30, 2021
| | | Alternative Growth Fund | | | Aspect Core Diversified Strategy Fund | | | Chesapeake Strategy Fund | |
| Assets: | | | | | | | | | |
| Investments, at value (cost $2,292,922, $17,290,135, and $17,106,462, respectively) | | $ | 2,292,922 | | | $ | 17,290,135 | | | $ | 17,106,462 | |
| Cash | | | - | | | | 1,520,000 | | | | - | |
| Cash deposited with brokers for open futures contracts | | | 377,973 | | | | 1,615,199 | | | | 1,067,556 | |
| Cash deposited with brokers for open swap contract | | | 2,373,018 | | | | - | | | | - | |
| Variation margin on futures contracts | | | - | | | | 372,328 | | | | 637,756 | |
| Unrealized appreciation on open swap contracts | | | - | | | | - | | | | - | |
| Receivables: | | | | | | | | | | | | |
| Investment securities sold | | | - | | | | 4 | | | �� | - | |
| Fund shares sold | | | - | | | | - | | | | 25,000 | |
| Due from Advisor | | | 14,281 | | | | - | | | | - | |
| Dividends and interest | | | 20 | | | | 142 | | | | 135 | |
| Prepaid expenses and other assets | | | 31,433 | | | | 24,511 | | | | 30,145 | |
| Total assets | | | 5,089,647 | | | | 20,822,319 | | | | 18,867,054 | |
| | | | | | | | | | | | | |
| Liabilities: | | | | | | | | | | | | |
| Unrealized depreciation on open swap contract | | | 635,360 | | | | - | | | | - | |
| Unrealized depreciation on forward foreign currency exchange contracts | | | - | | | | 11,607 | | | | - | |
| Variation margin on futures contracts | | | 133,070 | | | | - | | | | - | |
| Payables: | | | | | | | | | | | | |
| Investment securities purchased | | | - | | | | - | | | | - | |
| Fund shares redeemed | | | 64 | | | | - | | | | 62 | |
| Due to Broker - Swap contract | | | 858,664 | | | | - | | | | - | |
| Advisory fees | | | - | | | | 485 | | | | 2,536 | |
| Distribution fees - Class A & Class C (Note 7) | | | 161 | | | | 1,978 | | | | 993 | |
| Auditing fees | | | 25,500 | | | | 22,611 | | | | 22,702 | |
| Fund administration and accounting fees | | | 12,215 | | | | 22,512 | | | | 20,783 | |
| Transfer agent fees and expenses | | | 1,990 | | | | 2,366 | | | | 4,803 | |
| Shareholder reporting fees | | | 1,818 | | | | - | | | | 4,497 | |
| Chief Compliance Officer fees | | | 1,160 | | | | 1,404 | | | | 1,341 | |
| Trustees' deferred compensation (Note 3) | | | 1,050 | | | | 2,521 | | | | - | |
| Trustees' fees and expenses | | | 663 | | | | 1,115 | | | | 6,844 | |
| Custody fees | | | 612 | | | | 2,290 | | | | 3,368 | |
| Legal fees | | | 525 | | | | 3,084 | | | | 1,341 | |
| Sub-transfer agent fees and expenses | | | 12 | | | | 3,254 | | | | 3,182 | |
| Accrued other expenses | | | 1,290 | | | | 3,913 | | | | 1,835 | |
| Total liabilities | | | 1,674,154 | | | | 79,140 | | | | 74,287 | |
| | | | | | | | | | | | | |
| Net Assets | | $ | 3,415,493 | | | $ | 20,743,179 | | | $ | 18,792,767 | |
See accompanying Notes to Consolidated Financial Statements.
AXS Funds
CONSOLIDATED STATEMENTS OF ASSETS AND LIABILITIES - Continued
As of September 30, 2021
| | | Alternative Growth Fund | | | Aspect Core Diversified Strategy Fund | | | Chesapeake Strategy Fund | |
| Components of Net Assets: | | | | | | | | | |
| Paid-in capital (par value of $0.01 per share with an unlimited number of shares authorized) | | $ | 5,547,846 | | | $ | 23,962,365 | | | $ | 45,224,573 | |
| Total distributable earnings (accumulated deficit) | | | (2,132,353 | ) | | | (3,219,186 | ) | | | (26,431,806 | ) |
| Net Assets | | $ | 3,415,493 | | | $ | 20,743,179 | | | $ | 18,792,767 | |
| | | | | | | | | | | | | |
| Maximum Offering Price per Share: | | | | | | | | | | | | |
| Class A Shares: | | | | | | | | | | | | |
| Net assets applicable to shares outstanding | | $ | 676,897 | | | $ | 884,830 | | | $ | 3,798,626 | |
| Shares of beneficial interest issued and outstanding | | | 48,930 | | | | 103,994 | | | | 311,109 | |
| Redemption price per share1 | | $ | 13.83 | | | $ | 8.51 | | | $ | 12.21 | |
| Maximum sales charge (5.75% of offering price)2 | | | 0.84 | | | | 0.52 | | | | 0.74 | |
| Maximum offering price to public | | $ | 14.67 | | | $ | 9.03 | | | $ | 12.95 | |
| | | | | | | | | | | | | |
| Class C Shares: | | | | | | | | | | | | |
| Net assets applicable to shares outstanding | | | | | | $ | 2,137,426 | | | $ | 270,773 | |
| Shares of beneficial interest issued and outstanding | | | | | | | 262,775 | | | | 22,857 | |
| Redemption price per share3 | | | | | | $ | 8.13 | | | $ | 11.85 | |
| | | | | | | | | | | | | |
| Class I Shares: | | | | | | | | | | | | |
| Net assets applicable to shares outstanding | | $ | 2,738,596 | | | $ | 17,720,923 | | | $ | 14,723,368 | |
| Shares of beneficial interest issued and outstanding | | | 195,135 | | | | 2,071,710 | | | | 1,192,772 | |
| Redemption price per share1 | | $ | 14.03 | | | $ | 8.55 | | | $ | 12.34 | |
| 1 | Redemptions made within 30 days of purchase may be assessed a redemption fee of 1.00%. |
| 2 | No sales charge applies on investments of $1 million or more. |
| 3 | A contingent deferred sales charge ("CDSC") of 1.00% may be charged on purchases that are redeemed within 12 months of purchase. |
See accompanying Notes to Consolidated Financial Statements.AXS Funds
CONSOLIDATED STATEMENTS OF ASSETS AND LIABILITIES - Continued
As of September 30, 2021
| | | Managed Futures Strategy Fund | | | Multi-Strategy Alternatives Fund4 | | | Sustainable Income Fund4 | |
| Assets: | | | | | | | | | |
| Investments, at value (cost $17,606,388, $17,786,997, and $52,114,953, respectively) | | $ | 17,606,388 | | | $ | 20,033,660 | | | $ | 52,979,345 | |
| Cash | | | 2,870,000 | | | | - | | | | - | |
| Cash deposited with brokers for open futures contracts | | | - | | | | - | | | | - | |
| Cash deposited with brokers for open swap contracts | | | 37,536,347 | | | | - | | | | - | |
| Variation margin on futures contracts | | | - | | | | - | | | | - | |
| Unrealized appreciation on open swap contracts | | | 37,872 | | | | 20,340 | | | | - | |
| Receivables: | | | | | | | | | | | | |
| Investment securities sold | | | - | | | | - | | | | - | |
| Fund shares sold | | | 684 | | | | 11,971 | | | | - | |
| Due from Advisor | | | - | | | | - | | | | - | |
| Dividends and interest | | | 150 | | | | 10,038 | | | | 1,003,628 | |
| Prepaid expenses and other assets | | | 15,255 | | | | 19,037 | | | | 19,608 | |
| Total assets | | | 58,066,696 | | | | 20,095,046 | | | | 54,002,581 | |
| | | | | | | | | | | | | |
| Liabilities: | | | | | | | | | | | | |
| Unrealized depreciation on open swap contracts | | | 7,656,469 | | | | - | | | | - | |
| Unrealized depreciation on forward foreign currency exchange contracts | | | - | | | | - | | | | - | |
| Variation margin on futures contracts | | | - | | | | - | | | | - | |
| Payables: | | | | | | | | | | | | |
| Investment securities purchased | | | - | | | | - | | | | 1,082,994 | |
| Fund shares redeemed | | | 1,854,401 | | | | 691 | | | | - | |
| Due to Broker - Swap contracts | | | 6,102,600 | | | | - | | | | - | |
| Advisory fees | | | 2,407 | | | | 3,364 | | | | 13,088 | |
| Distribution fees - Class A, Class C, & Class R-1 (Note 7) | | | 7,175 | | | | 2,159 | | | | - | |
| Auditing fees | | | 36,500 | | | | 18,000 | | | | 18,500 | |
| Fund administration and accounting fees | | | 24,835 | | | | 10,784 | | | | 20,344 | |
| Transfer agent fees and expenses | | | 10,053 | | | | 4,320 | | | | 5,465 | |
| Shareholder reporting fees | | | 5,750 | | | | 2,215 | | | | 1,971 | |
| Chief Compliance Officer fees | | | 3,113 | | | | 1,511 | | | | 1,930 | |
| Trustees' deferred compensation (Note 3) | | | 10,809 | | | | 5,196 | | | | 3,171 | |
| Trustees' fees and expenses | | | 3,609 | | | | 1,626 | | | | 1,989 | |
| Custody fees | | | 1,246 | | | | 2,158 | | | | 3,732 | |
| Legal fees | | | 2,443 | | | | 1,047 | | | | 2,960 | |
| Sub-transfer agent fees and expenses | | | 5,026 | | | | 3,352 | | | | 2,448 | |
| Accrued other expenses | | | 465 | | | | 2,183 | | | | 3,726 | |
| Total liabilities | | | 15,726,901 | | | | 58,606 | | | | 1,162,318 | |
| | | | | | | | | | | | | |
| Net Assets | | $ | 42,339,795 | | | $ | 20,036,440 | | | $ | 52,840,263 | |
See accompanying Notes to Consolidated Financial Statements.
AXS Funds
CONSOLIDATED STATEMENTS OF ASSETS AND LIABILITIES - Continued
As of September 30, 2021
| | | Managed Futures Strategy Fund | | | Multi-Strategy Alternatives Fund4 | | | Sustainable Income Fund4 | |
| Components of Net Assets: | | | | | | | | | |
| Paid-in capital (par value of $0.01 per share with an unlimited number of shares authorized) | | $ | 175,426,110 | | | $ | 14,049,855 | | | $ | 51,026,785 | |
| Total distributable earnings (accumulated deficit) | | | (133,086,315 | ) | | | 5,986,585 | | | | 1,813,478 | |
| Net Assets | | $ | 42,339,795 | | | $ | 20,036,440 | | | $ | 52,840,263 | |
| | | | | | | | | | | | | |
| Maximum Offering Price per Share: | | | | | | | | | | | | |
| Class A Shares: | | | | | | | | | | | | |
| Net assets applicable to shares outstanding | | $ | 7,220,099 | | | | | | | | | |
| Shares of beneficial interest issued and outstanding | | | 1,249,279 | | | | | | | | | |
| Redemption price per share5 | | $ | 5.78 | | | | | | | | | |
| Maximum sales charge (5.75% of offering price)6 | | | 0.35 | | | | | | | | | |
| Maximum offering price to public | | $ | 6.13 | | | | | | | | | |
| | | | | | | | | | | | | |
| Class C Shares: | | | | | | | | | | | | |
| Net assets applicable to shares outstanding | | $ | 6,442,851 | | | | | | | | | |
| Shares of beneficial interest issued and outstanding | | | 1,191,033 | | | | | | | | | |
| Redemption price per share7 | | $ | 5.41 | | | | | | | | | |
| | | | | | | | | | | | | |
| Class R-1 Shares: | | | | | | | | | | | | |
| Net assets applicable to shares outstanding | | | | | | $ | 10,546,158 | | | | | |
| Shares of beneficial interest issued and outstanding | | | | | | | 733,934 | | | | | |
| Redemption price per share | | | | | | $ | 14.37 | | | | | |
| | | | | | | | | | | | | |
| Class I Shares: | | | | | | | | | | | | |
| Net assets applicable to shares outstanding | | $ | 28,676,846 | | | $ | 9,490,282 | | | $ | 52,840,263 | |
| Shares of beneficial interest issued and outstanding | | | 4,879,505 | | | | 657,864 | | | | 5,094,809 | |
| Redemption price per share | | $ | 5.88 | | | $ | 14.43 | | | $ | 10.37 | |
| 4 | Financial statements are not consolidated. |
| 5 | Redemptions made within 30 days of purchase may be assessed a redemption fee of 1.00%. |
| 6 | No sales charge applies on investments of $1 million or more. |
| 7 | A contingent deferred sales charge ("CDSC") of 1.00% may be charged on purchases that are redeemed within 12 months of purchase. |
See accompanying Notes to Consolidated Financial Statements.
AXS Funds
CONSOLIDATED STATEMENTS OF ASSETS AND LIABILITIES - Continued
As of September 30, 2021
| | | Thomson Reuters Private Equity Return Tracker Fund8 | | | Thomson Reuters Venture Capital Return Tracker Fund8 | |
| Assets: | | | | | | |
| Investments, at value (cost $21,844,234 and $332,640,453, respectively) | | $ | 26,496,325 | | | $ | 392,242,018 | |
| Cash | | | - | | | | - | |
| Cash deposited with brokers for open futures contracts | | | - | | | | - | |
| Cash deposited with brokers for open swap contracts | | | 260,000 | | | | 3,314,088 | |
| Variation margin on futures contracts | | | - | | | | - | |
| Unrealized appreciation on open swap contracts | | | - | | | | - | |
| Receivables: | | | | | | | | |
| Investment securities sold | | | - | | | | - | |
| Fund shares sold | | | 4,572 | | | | 411,725 | |
| Due from Advisor | | | - | | | | - | |
| Dividends and interest | | | 16,641 | | | | 116,865 | |
| Prepaid expenses | | | 54,072 | | | | 67,566 | |
| Total assets | | | 26,831,610 | | | | 396,152,262 | |
| | | | | | | | | |
| Liabilities: | | | | | | | | |
| Unrealized depreciation on open swap contracts | | | 944,589 | | | | 20,205,565 | |
| Unrealized depreciation on forward foreign currency exchange contracts | | | - | | | | - | |
| Variation margin on futures contracts | | | - | | | | - | |
| Payables: | | | | | | | | |
| Investment securities purchased | | | - | | | | - | |
| Fund shares redeemed | | | 10,609 | | | | 396,555 | |
| Due to Broker - Swap contracts | | | - | | | | - | |
| Advisory fees | | | 472 | | | | 202,267 | |
| Distribution fees - Class A & Class C (Note 7) | | | 304 | | | | 35,729 | |
| Auditing fees | | | 22,000 | | | | 22,500 | |
| Fund administration and accounting fees | | | 6,087 | | | | 51,852 | |
| Transfer agent fees and expenses | | | 1,745 | | | | 13,518 | |
| Shareholder reporting fees | | | 29 | | | | 179 | |
| Chief Compliance Officer fees | | | 162 | | | | 3,114 | |
| Trustees' deferred compensation (Note 3) | | | 1,470 | | | | 16,384 | |
| Trustees' fees and expenses | | | 570 | | | | 3,505 | |
| Custody fees | | | 213 | | | | 314 | |
| Legal fees | | | 361 | | | | 2,856 | |
| Sub-transfer agent fees and expenses | | | 58 | | | | 20,236 | |
| Accrued other expenses | | | 115 | | | | 2,170 | |
| Total liabilities | | | 988,784 | | | | 20,976,744 | |
| | | | | | | | | |
| Net Assets | | $ | 25,842,826 | | | $ | 375,175,518 | |
See accompanying Notes to Consolidated Financial Statements.
AXS Funds
CONSOLIDATED STATEMENTS OF ASSETS AND LIABILITIES - Continued
As of September 30, 2021
| | | Thomson Reuters Private Equity Return Tracker Fund8 | | | Thomson Reuters Venture Capital Return Tracker Fund8 | |
| Components of Net Assets: | | | | | | |
| Paid-in capital (par value of $0.01 per share with an unlimited number of shares authorized) | | $ | 15,291,068 | | | $ | 264,266,822 | |
| Total distributable earnings (accumulated deficit) | | | 10,551,758 | | | | 110,908,696 | |
| Net Assets | | $ | 25,842,826 | | | $ | 375,175,518 | |
| | | | | | | | | |
| Maximum Offering Price per Share: | | | | | | | | |
| Class A Shares: | | | | | | | | |
| Net assets applicable to shares outstanding | | $ | 579,282 | | | $ | 103,229,138 | |
| Shares of beneficial interest issued and outstanding | | | 33,240 | | | | 2,938,208 | |
| Redemption price per share9 | | $ | 17.43 | | | $ | 35.13 | |
| Maximum sales charge (5.75% of offering price)10 | | | 1.06 | | | | 2.14 | |
| Maximum offering price to public | | $ | 18.49 | | | $ | 37.27 | |
| | | | | | | | | |
| Class C Shares: | | | | | | | | |
| Net assets applicable to shares outstanding | | $ | 206,331 | | | $ | 14,776,413 | |
| Shares of beneficial interest issued and outstanding | | | 12,269 | | | | 443,385 | |
| Redemption price per share9,11 | | $ | 16.82 | | | $ | 33.33 | |
| | | | | | | | | |
| Class I Shares: | | | | | | | | |
| Net assets applicable to shares outstanding | | $ | 25,057,213 | | | $ | 257,169,967 | |
| Shares of beneficial interest issued and outstanding | | | 1,418,344 | | | | 7,217,001 | |
| Redemption price per share9 | | $ | 17.67 | | | $ | 35.63 | |
| 8 | Financial statements are not consolidated. |
| 9 | Redemptions made within 30 days of purchase may be assessed a redemption fee of 1.00%. |
| 10 | No sales charge applies on investments of $1 million or more. |
| 11 | A contingent deferred sales charge ("CDSC") of 1.00% may be charged on purchases that are redeemed within 12 months of purchase. |
See accompanying Notes to Consolidated Financial Statements.
AXS Funds
CONSOLIDATED STATEMENTS OF OPERATIONS
For the Periods Ended September 30, 2021
| | | Alternative Growth Fund | | | Aspect Core Diversified Strategy Fund | | | Chesapeake Strategy Fund | |
| Investment Income: | | | | | | | | | |
| Dividends | | $ | - | | | $ | - | | | $ | - | |
| Interest | | | 12,258 | | | | 61,463 | | | | 68,848 | |
| Total investment income | | | 12,258 | | | | 61,463 | | | | 68,848 | |
| | | | | | | | | | | | | |
| Expenses: | | | | | | | | | | | | |
| Registration fees | | | 72,483 | | | | 67,993 | | | | 74,790 | |
| Fund administration and accounting fees | | | 43,371 | | | | 71,145 | | | | 61,588 | |
| Advisory fees | | | 36,862 | | | | 260,465 | | | | 260,763 | |
| Auditing fees | | | 31,579 | | | | 28,546 | | | | 24,373 | |
| Custody fees | | | 19,331 | | | | 21,371 | | | | 17,640 | |
| Shareholder reporting fees | | | 16,459 | | | | 7,889 | | | | 15,193 | |
| Miscellaneous | | | 10,012 | | | | 11,012 | | | | 10,932 | |
| Transfer agent fees and expenses | | | 9,741 | | | | 10,091 | | | | 13,346 | |
| Legal fees | | | 9,022 | | | | 17,341 | | | | 13,882 | |
| Sub-transfer agent fees and expenses | | | 6,213 | | | | 10,471 | | | | 20,685 | |
| Chief Compliance Officer fees | | | 3,851 | | | | 8,848 | | | | 8,308 | |
| Distribution fees - Class A (Note 7) | | | 1,931 | | | | 2,059 | | | | 9,507 | |
| Trustees' fees and expenses | | | 1,412 | | | | 6,075 | | | | 5,345 | |
| Insurance fees | | | 1,409 | | | | 4,502 | | | | 13,469 | |
| Interest expense | | | 95 | | | | 1,099 | | | | - | |
| Distribution fees - Class C (Note 7) | | | - | | | | 22,257 | | | | 3,393 | |
| Distribution fees - Class R-1 (Note 7) | | | - | | | | - | | | | - | |
| Total expenses | | | 263,771 | | | | 551,164 | | | | 553,214 | |
| Advisory fees waived | | | (36,862 | ) | | | (233,124 | ) | | | (217,024 | ) |
| Other expenses absorbed | | | (175,619 | ) | | | - | | | | - | |
| Fees paid indirectly (Note 3) | | | (609 | ) | | | (2,105 | ) | | | (1,682 | ) |
| Net expenses | | | 50,681 | | | | 315,935 | | | | 334,508 | |
| Net investment income (loss) | | | (38,423 | ) | | | (254,472 | ) | | | (265,660 | ) |
| | | | | | | | | | | | | |
| Realized and Unrealized Gain (Loss): | | | | | | | | | | | | |
| Net realized gain (loss) on: | | | | | | | | | | | | |
| Investments | | | 187 | | | | - | | | | - | |
| Futures contracts | | | 1,702,768 | | | | 1,341,162 | | | | 3,746,660 | |
| Forward foreign currency exchange contracts | | | - | | | | (92,929 | ) | | | - | |
| Foreign currency transactions | | | - | | | | 2,219 | | | | 24,230 | |
| Swap contract | | | (568,393 | ) | | | - | | | | - | |
| Net realized gain (loss) | | | 1,134,562 | | | | 1,250,452 | | | | 3,770,890 | |
| Net change in unrealized appreciation/depreciation on: | | | | | | | | | | | | |
| Investments | | | (10,985 | ) | | | (57,543 | ) | | | (73,475 | ) |
| Futures contracts | | | (59,955 | ) | | | 278,749 | | | | 773,550 | |
| Forward foreign currency exchange contracts | | | - | | | | (90,301 | ) | | | - | |
| Foreign currency translations | | | - | | | | (1,901 | ) | | | (13,804 | ) |
| Swap contract | | | 175,274 | | | | - | | | | - | |
| Net change in unrealized appreciation/depreciation | | | 104,334 | | | | 129,004 | | | | 686,271 | |
| Net increase from payment by affiliates (Note 3) | | | - | | | | - | | | | - | |
| Net realized and unrealized gain | | | 1,238,896 | | | | 1,379,456 | | | | 4,457,161 | |
| Net Increase (Decrease) in Net Assets from Operations | | $ | 1,200,473 | | | $ | 1,124,984 | | | $ | 4,191,501 | |
See accompanying Notes to Consolidated Financial Statements.
AXS Funds
CONSOLIDATED STATEMENTS OF OPERATIONS - Continued
For the Periods Ended September 30, 2021
| | | Managed Futures Strategy Fund | | | Multi-Strategy Alternatives Fund1 | | | Sustainable Income Fund1,2 | |
| Investment Income: | | | | | | | | | |
| Dividends | | $ | - | | | $ | 209,420 | | | $ | - | |
| Interest | | | 151,113 | | | | 416 | | | | 2,831,626 | |
| Total investment income | | | 151,113 | | | | 209,836 | | | | 2,831,626 | |
| | | | | | | | | | | | | |
| Expenses: | | | | | | | | | | | | |
| Registration fees | | | 84,583 | | | | 80,017 | | | | 30,371 | |
| Fund administration and accounting fees | | | 49,715 | | | | 47,828 | | | | 68,221 | |
| Advisory fees | | | 1,032,118 | | | | 260,987 | | | | 345,865 | |
| Auditing fees | | | 50,562 | | | | 13,179 | | | | 18,500 | |
| Custody fees | | | 30,071 | | | | 14,478 | | | | 9,472 | |
| Shareholder reporting fees | | | 37,123 | | | | 9,193 | | | | 7,143 | |
| Miscellaneous | | | 7,846 | | | | 3,574 | | | | 8,348 | |
| Transfer agent fees and expenses | | | 8,298 | | | | 15,677 | | | | 14,277 | |
| Legal fees | | | 43,460 | | | | 12,222 | | | | 16,092 | |
| Sub-transfer agent fees and expenses | | | 112,342 | | | | 20,526 | | | | 2,691 | |
| Chief Compliance Officer fees | | | 10,052 | | | | 6,583 | | | | 10,701 | |
| Distribution fees - Class A (Note 7) | | | 23,092 | | | | - | | | | - | |
| Trustees' fees and expenses | | | 21,571 | | | | 7,597 | | | | 11,767 | |
| Insurance fees | | | 11,009 | | | | 2,196 | | | | 2,760 | |
| Interest expense | | | - | | | | - | | | | - | |
| Distribution fees - Class C (Note 7) | | | 85,691 | | | | - | | | | - | |
| Distribution fees - Class R-1 (Note 7) | | | - | | | | 28,253 | | | | - | |
| Total expenses | | | 1,607,533 | | | | 522,310 | | | | 546,208 | |
| Advisory fees waived | | | (280,243 | ) | | | (105,332 | ) | | | (53,753 | ) |
| Other expenses absorbed | | | - | | | | - | | | | - | |
| Fees paid indirectly (Note 3) | | | (8,483 | ) | | | (3,673 | ) | | | (3,302 | ) |
| Net expenses | | | 1,318,807 | | | | 413,305 | | | | 489,153 | |
| Net investment income (loss) | | | (1,167,694 | ) | | | (203,469 | ) | | | 2,342,473 | |
| | | | | | | | | | | | | |
| Realized and Unrealized Gain (Loss): | | | | | | | | | | | | |
| Net realized gain (loss) on: | | | | | | | | | | | | |
| Investments | | | 39,898 | | | | 9,172,329 | | | | 951,695 | |
| Futures contracts | | | - | | | | - | | | | - | |
| Forward foreign currency exchange contracts | | | - | | | | - | | | | - | |
| Foreign currency transactions | | | - | | | | - | | | | - | |
| Swap contracts | | | (5,058,654 | ) | | | (1,322,259 | ) | | | - | |
| Net realized gain (loss) | | | (5,018,756 | ) | | | 7,850,070 | | | | 951,695 | |
| Net change in unrealized appreciation/depreciation on: | | | | | | | | | | | | |
| Investments | | | (181,738 | ) | | | (2,548,516 | ) | | | 864,392 | |
| Futures contracts | | | - | | | | - | | | | - | |
| Forward foreign currency exchange contracts | | | - | | | | - | | | | - | |
| Foreign currency translations | | | - | | | | - | | | | - | |
| Swap contracts | | | 5,682,944 | | | | 227,500 | | | | - | |
| Net change in unrealized appreciation/depreciation | | | 5,501,206 | | | | (2,321,016 | ) | | | 864,392 | |
| Net increase from payment by affiliates (Note 3) | | | - | | | | - | | | | - | |
| Net realized and unrealized gain | | | 482,450 | | | | 5,529,054 | | | | 1,816,087 | |
| Net Increase (Decrease) in Net Assets from Operations | | $ | (685,244 | ) | | $ | 5,325,585 | | | $ | 4,158,560 | |
| 1 | Financial statements are not consolidated. |
| 2 | For the period October 17, 2020 (Commencement of Operations) through September 30, 2021. |
See accompanying Notes to Consolidated Financial Statements.
AXS Funds
CONSOLIDATED STATEMENTS OF OPERATIONS - Continued
For the Periods Ended September 30, 2021
| | | Thomson Reuters Private Equity Return Tracker Fund3 | | | Thomson Reuters Venture Capital Return Tracker Fund3 | |
| Investment Income: | | | | | | |
| Dividends | | $ | 347,717 | | | $ | 2,080,677 | |
| Interest | | | 176 | | | | 839 | |
| Total investment income | | | 347,893 | | | | 2,081,516 | |
| | | | | | | | | |
| Expenses: | | | | | | | | |
| Registration fees | | | 30,540 | | | | 62,834 | |
| Fund administration and accounting fees | | | 56,133 | | | | 382,375 | |
| Advisory fees | | | 308,174 | | | | 3,532,005 | |
| Auditing fees | | | 22,000 | | | | 22,500 | |
| Custody fees | | | 23,443 | | | | 29,409 | |
| Shareholder reporting fees | | | 7,165 | | | | 24,548 | |
| Miscellaneous | | | 8,848 | | | | 18,930 | |
| Transfer agent fees and expenses | | | 8,344 | | | | 60,571 | |
| Legal fees | | | 6,161 | | | | 66,731 | |
| Sub-transfer agent fees and expenses | | | 23,358 | | | | 240,657 | |
| Chief Compliance Officer fees | | | 1,783 | | | | 20,270 | |
| Distribution fees - Class A (Note 7) | | | 919 | | | | 222,389 | |
| Trustees' fees and expenses | | | 5,126 | | | | 54,120 | |
| Insurance fees | | | 1,180 | | | | 13,062 | |
| Interest expense | | | - | | | | - | |
| Distribution fees - Class C (Note 7) | | | 7,487 | | | | 115,865 | |
| Distribution fees - Class I (Note 7) | | | | | | | - | |
| Total expenses | | | 510,661 | | | | 4,866,266 | |
| Advisory fees waived | | | (124,648 | ) | | | (246,853 | ) |
| Other expenses absorbed | | | - | | | | - | |
| Fees paid indirectly (Note 3) | | | (1,538 | ) | | | (17,055 | ) |
| Net expenses | | | 384,475 | | | | 4,602,358 | |
| Net investment income (loss) | | | (36,582 | ) | | | (2,520,842 | ) |
| | | | | | | | | |
| Realized and Unrealized Gain (Loss): | | | | | | | | |
| Net realized gain (loss) on: | | | | | | | | |
| Investments | | | 5,607,838 | | | | 51,009,967 | |
| Futures contracts | | | - | | | | - | |
| Forward foreign currency exchange contracts | | | - | | | | - | |
| Foreign currency transactions | | | - | | | | - | |
| Swap contracts | | | 7,907 | | | | 12,167,818 | |
| Net realized gain (loss) | | | 5,615,745 | | | | 63,177,785 | |
| Net change in unrealized appreciation/depreciation on: | | | | | | | | |
| Investments | | | (770,814 | ) | | | 5,882,338 | |
| Futures contracts | | | - | | | | - | |
| Forward foreign currency exchange contracts | | | - | | | | - | |
| Foreign currency translations | | | - | | | | - | |
| Swap contracts | | | 816,267 | | | | 2,211,751 | |
| Net change in unrealized appreciation/depreciation | | | 45,453 | | | | 8,094,089 | |
| Net increase from payment by affiliates (Note 3) | | | - | | | | 3,927 | |
| Net realized and unrealized gain | | | 5,661,198 | | | | 71,275,801 | |
| Net Increase (Decrease) in Net Assets from Operations | | $ | 5,624,616 | | | $ | 68,754,959 | |
| 3 | Financial statements are not consolidated. |
See accompanying Notes to Consolidated Financial Statements.
AXS Alternative Growth Fund
CONSOLIDATED STATEMENTS OF CHANGES IN NET ASSETS
| | | For the Year Ended September 30, 2021 | | | For the Period July 1, 2020 through September 30, 2020* | | | For the Year Ended June 30, 20201 | |
| Increase (Decrease) in Net Assets from: | | | | | | | | | |
| Operations: | | | | | | | | | |
| Net investment income (loss) | | $ | (38,423 | ) | | $ | (4,898 | ) | | $ | 53,395 | |
| Net realized gain (loss) on investments, futures contracts and swap contract | | | 1,134,562 | | | | 815,897 | | | | (2,518,130 | ) |
| Net change in unrealized appreciation/depreciation on investments, futures contracts and swap contract | | | 104,334 | | | | (279,492 | ) | | | (1,096,488 | ) |
| Net increase (decrease) in net assets resulting from operations | | | 1,200,473 | | | | 531,507 | | | | (3,561,223 | ) |
| | | | | | | | | | | | | |
| Distributions to Shareholders: | | | | | | | | | | | | |
| Distributions: | | | | | | | | | | | | |
| Class A | | | - | | | | - | | | | (131,196 | ) |
| Class I | | | - | | | | - | | | | (1,394,208 | ) |
| Total distributions to shareholders | | | - | | | | - | | | | (1,525,404 | ) |
| | | | | | | | | | | | | |
| Capital Transactions: | | | | | | | | | | | | |
| Net proceeds from shares sold: | | | | | | | | | | | | |
| Class A | | | 162,430 | | | | 12,725 | | | | 3,929,092 | |
| Class I | | | 1,225,609 | | | | 1,667,805 | | | | 20,297,244 | |
| Reinvestment of distributions: | | | | | | | | | | | | |
| Class A | | | - | | | | - | | | | 122,272 | |
| Class I | | | - | | | | - | | | | 1,022,008 | |
| Cost of shares redeemed: | | | | | | | | | | | | |
| Class A2 | | | (605,943 | ) | | | (439,701 | ) | | | (3,267,260 | ) |
| Class I3 | | | (6,539,009 | ) | | | (852,881 | ) | | | (16,630,753 | ) |
| Net increase (decrease) in net assets from capital transactions | | | (5,756,913 | ) | | | 387,948 | | | | 5,472,603 | |
| | | | | | | | | | | | | |
| Total increase (decrease) in net assets | | | (4,556,440 | ) | | | 919,455 | | | | 385,976 | |
| | | | | | | | | | | | | |
| Net Assets: | | | | | | | | | | | | |
| Beginning of period | | | 7,971,933 | | | | 7,052,478 | | | | 6,666,502 | |
| End of period | | $ | 3,415,493 | | | $ | 7,971,933 | | | $ | 7,052,478 | |
| | | | | | | | | | | | | |
| Capital Share Transactions: | | | | | | | | | | | | |
| Shares sold: | | | | | | | | | | | | |
| Class A | | | 11,852 | | | | 1,112 | | | | 334,813 | |
| Class I | | | 95,457 | | | | 149,160 | | | | 1,719,381 | |
| Shares reinvested: | | | | | | | | | | | | |
| Class A | | | - | | | | - | | | | 10,605 | |
| Class I | | | - | | | | - | | | | 87,576 | |
| Shares redeemed: | | | | | | | | | | | | |
| Class A | | | (48,304 | ) | | | (39,836 | ) | | | (322,742 | ) |
| Class I | | | (526,727 | ) | | | (75,335 | ) | | | (1,728,137 | ) |
| Net increase (decrease) in capital share transactions | | | (467,722 | ) | | | 35,101 | | | | 101,496 | |
| * | Fiscal year end changed to September 30, effective July 1, 2020. |
| 1 | With the Plan of Reorganization with respect to the Equinox Ampersand Strategy Fund, Class A and Class I shareholders received Class A and Class I shares of the AXS Alternative Growth Fund, respectively, effective as of the close of business on November 8, 2019. See Note 1 in the accompanying Notes to Consolidated Financial Statements. |
| 2 | Net of redemption fee proceeds of $69, $0 and $7,399, respectively. |
| 3 | Net of redemption fee proceeds of $1,738, $119 and $5,614, respectively. |
See accompanying Notes to Consolidated Financial Statements.
AXS Aspect Core Diversified Strategy Fund
CONSOLIDATED STATEMENTS OF CHANGES IN NET ASSETS
| | | For the Year Ended September 30, 2021 | | | For the Year Ended September 30, 20201 | |
| Increase (Decrease) in Net Assets from: | | | | | | |
| Operations: | | | | | | |
| Net investment income (loss) | | $ | (254,472 | ) | | $ | 30,598 | |
| Net realized gain (loss) on investments, futures contracts, forward foreign currency contracts and foreign currency transactions | | | 1,250,452 | | | | (1,182,642 | ) |
| Net change in unrealized appreciation/depreciation on investments, futures contracts, forward foreign currency contracts and foreign currency transactions | | | 129,004 | | | | 109,952 | |
| Net increase (decrease) in net assets resulting from operations | | | 1,124,984 | | | | (1,042,092 | ) |
| | | | | | | | | |
| Distributions to Shareholders: | | | | | | | | |
| Distributions: | | | | | | | | |
| Class A | | | - | | | | (57,109 | ) |
| Class C | | | - | | | | (239,407 | ) |
| Class I | | | - | | | | (1,278,806 | ) |
| From return of capital: | | | | | | | | |
| Class A | | | - | | | | (25,536 | ) |
| Class C | | | - | | | | (117,329 | ) |
| Class I | | | - | | | | (553,854 | ) |
| Total distributions to shareholders | | | - | | | | (2,272,041 | ) |
| | | | | | | | | |
| Capital Transactions: | | | | | | | | |
| Net proceeds from shares sold: | | | | | | | | |
| Class A | | | 261,262 | | | | 125,766 | |
| Class C | | | 577,709 | | | | 450,353 | |
| Class I | | | 3,067,711 | | | | 9,259,885 | |
| Reinvestment of distributions: | | | | | | | | |
| Class A | | | - | | | | 82,645 | |
| Class C | | | - | | | | 299,326 | |
| Class I | | | - | | | | 1,356,208 | |
| Cost of shares redeemed: | | | | | | | | |
| Class A | | | (52,537 | ) | | | (188,441 | ) |
| Class C | | | (663,603 | ) | | | (1,605,417 | ) |
| Class I | | | (5,954,343 | ) | | | (7,524,674 | ) |
| Net increase (decrease) in net assets from capital transactions | | | (2,763,801 | ) | | | 2,255,651 | |
| | | | | | | | | |
| Total decrease in net assets | | | (1,638,817 | ) | | | (1,058,482 | ) |
| | | | | | | | | |
| Net Assets: | | | | | | | | |
| Beginning of period | | | 22,381,996 | | | | 23,440,478 | |
| End of period | | $ | 20,743,179 | | | $ | 22,381,996 | |
| | | | | | | | | |
| Capital Share Transactions: | | | | | | | | |
| Shares sold: | | | | | | | | |
| Class A | | | 31,770 | | | | 14,402 | |
| Class C | | | 73,816 | | | | 57,206 | |
| Class I | | | 367,481 | | | | 1,085,986 | |
| Shares reinvested: | | | | | | | | |
| Class A | | | - | | | | 10,153 | |
| Class C | | | - | | | | 37,938 | |
| Class I | | | - | | | | 166,406 | |
| Shares redeemed: | | | | | | | | |
| Class A | | | (6,356 | ) | | | (22,146 | ) |
| Class C | | | (84,315 | ) | | | (195,843 | ) |
| Class I | | | (734,455 | ) | | | (858,339 | ) |
| Net increase (decrease) in capital share transactions | | | (352,059 | ) | | | 295,763 | |
| 1 | With the Plan of Reorganization with respect to the Equinox Aspect Core Diversified Strategy Fund, Class A, Class C, and Class I shareholders received Class A, Class C, and Class I shares of the AXS Aspect Core Diversified Strategy Fund, respectively, effective as of the close of business on November 8, 2019. See Note 1 in the accompanying Notes to Consolidated Financial Statements. |
See accompanying Notes to Consolidated Financial Statements.
AXS Chesapeake Strategy Fund
CONSOLIDATED STATEMENTS OF CHANGES IN NET ASSETS
| | | For the Year Ended September 30, 2021 | | | For the Year Ended September 30, 20201 | |
| Increase (Decrease) in Net Assets from: | | | | | | |
| Operations: | | | | | | |
| Net investment income (loss) | | $ | (265,660 | ) | | $ | 7,758 | |
| Net realized gain (loss) on investments, futures contracts and foreign currency transactions | | | 3,770,890 | | | | (9,138,740 | ) |
| Net change in unrealized appreciation/depreciation on investments, futures contracts and foreign currency translations | | | 686,271 | | | | (1,631,917 | ) |
| Net increase from payment by affiliates (Note 3) | | | - | | | | 457 | |
| Net increase (decrease) in net assets resulting from operations | | | 4,191,501 | | | | (10,762,442 | ) |
| | | | | | | | | |
| Distributions to Shareholders: | | | | | | | | |
| Distributions: | | | | | | | | |
| Class A | | | - | | | | (170,310 | ) |
| Class C | | | - | | | | (12,387 | ) |
| Class I | | | - | | | | (2,963,494 | ) |
| Total distributions to shareholders | | | - | | | | (3,146,191 | ) |
| | | | | | | | | |
| Capital Transactions: | | | | | | | | |
| Net proceeds from shares sold: | | | | | | | | |
| Class A | | | 630,452 | | | | 1,573,610 | |
| Class C | | | 39,312 | | | | 30,000 | |
| Class I | | | 4,336,958 | | | | 15,250,896 | |
| Reinvestment of distributions: | | | | | | | | |
| Class A | | | - | | | | 162,508 | |
| Class C | | | - | | | | 10,898 | |
| Class I | | | - | | | | 2,777,102 | |
| Cost of shares redeemed: | | | | | | | | |
| Class A | | | (1,136,715 | ) | | | (2,570,995 | ) |
| Class C | | | (159,981 | ) | | | (249,436 | ) |
| Class I | | | (4,748,821 | ) | | | (83,180,693 | ) |
| Net decrease in net assets from capital transactions | | | (1,038,795 | ) | | | (66,196,110 | ) |
| | | | | | | | | |
| Total increase (decrease) in net assets | | | 3,152,706 | | | | (80,104,743 | ) |
| | | | | | | | | |
| Net Assets: | | | | | | | | |
| Beginning of period | | | 15,640,061 | | | | 95,744,804 | |
| End of period | | $ | 18,792,767 | | | $ | 15,640,061 | |
| | | | | | | | | |
| Capital Share Transactions: | | | | | | | | |
| Shares sold: | | | | | | | | |
| Class A | | | 54,343 | | | | 151,250 | |
| Class C | | | 3,316 | | | | 3,015 | |
| Class I | | | 362,604 | | | | 1,476,667 | |
| Shares reinvested: | | | | | | | | |
| Class A | | | - | | | | 15,824 | |
| Class C | | | - | | | | 1,079 | |
| Class I | | | - | | | | 268,578 | |
| Shares redeemed: | | | | | | | | |
| Class A | | | (101,613 | ) | | | (257,101 | ) |
| Class C | | | (14,039 | ) | | | (24,462 | ) |
| Class I | | | (428,122 | ) | | | (8,423,115 | ) |
| Net decrease in capital share transactions | | | (123,511 | ) | | | (6,788,265 | ) |
| 1 | With the Plan of Reorganization with respect to the Equinox Chesapeake Strategy Fund, Class A, Class C and Class I shareholders received Class A, Class C and Class I shares of the AXS Chesapeake Strategy Fund, respectively, effective as of the close of business on November 8, 2019. See Note 1 in the accompanying Notes to Consolidated Financial Statements. |
See accompanying Notes to Consolidated Financial Statements.
AXS Managed Futures Strategy Fund
CONSOLIDATED STATEMENTS OF CHANGES IN NET ASSETS
| | | For the Year Ended September 30, 2021 | | | For the Year Ended September 30, 20201 | |
| Increase (Decrease) in Net Assets from: | | | | | | |
| Operations: | | | | | | |
| Net investment loss | | $ | (1,167,694 | ) | | $ | (793,511 | ) |
| Net realized loss on investments and swap contracts | | | (5,018,756 | ) | | | (12,226,677 | ) |
| Net change in unrealized appreciation/depreciation on investments and swap contracts | | | 5,501,206 | | | | (44,246,370 | ) |
| Net increase (decrease) in net assets resulting from operations | | | (685,244 | ) | | | (57,266,558 | ) |
| | | | | | | | | |
| Distributions to Shareholders: | | | | | | | | |
| Distributions: | | | | | | | | |
| Class A | | | - | | | | (3,604,474 | ) |
| Class C | | | - | | | | (2,160,419 | ) |
| Class I | | | - | | | | (21,960,143 | ) |
| From return of capital | | | | | | | | |
| Class A | | | - | | | | (215,848 | ) |
| Class C | | | - | | | | (129,373 | ) |
| Class I | | | - | | | | (1,315,044 | ) |
| Total distributions to shareholders | | | - | | | | (29,385,301 | ) |
| | | | | | | | | |
| Capital Transactions: | | | | | | | | |
| Net proceeds from shares sold: | | | | | | | | |
| Class A | | | 1,260,390 | | | | 5,692,683 | |
| Class C | | | 310,232 | | | | 902,004 | |
| Class I | | | 10,225,081 | | | | 56,712,284 | |
| Reinvestment of distributions: | | | | | | | | |
| Class A | | | - | | | | 3,679,350 | |
| Class C | | | - | | | | 2,204,352 | |
| Class I | | | - | | | | 21,976,827 | |
| Cost of shares redeemed: | | | | | | | | |
| Class A2 | | | (7,382,334 | ) | | | (18,179,968 | ) |
| Class C3 | | | (4,490,423 | ) | | | (6,132,701 | ) |
| Class I4 | | | (73,113,135 | ) | | | (118,977,271 | ) |
| Net decrease in net assets from capital transactions | | | (73,190,189 | ) | | | (52,122,440 | ) |
| | | | | | | | | |
| Total decrease in net assets | | | (73,875,433 | ) | | | (138,774,299 | ) |
| | | | | | | | | |
| Net Assets: | | | | | | | | |
| Beginning of period | | | 116,215,228 | | | | 254,989,527 | |
| End of period | | $ | 42,339,795 | | | $ | 116,215,228 | |
| | | | | | | | | |
| Capital Share Transactions: | | | | | | | | |
| Shares sold: | | | | | | | | |
| Class A | | | 204,277 | | | | 740,840 | |
| Class C | | | 53,530 | | | | 122,591 | |
| Class I | | | 1,628,082 | | | | 7,441,210 | |
| Shares reinvested: | | | | | | | | |
| Class A | | | - | | | | 472,317 | |
| Class C | | | - | | | | 298,288 | |
| Class I | | | - | | | | 2,785,403 | |
| Shares redeemed: | | | | | | | | |
| Class A | | | (1,199,090 | ) | | | (2,554,978 | ) |
| Class C | | | (772,571 | ) | | | (894,179 | ) |
| Class I | | | (11,618,454 | ) | | | (16,817,971 | ) |
| Net decrease in capital share transactions | | | (11,704,226 | ) | | | (8,406,479 | ) |
| | | | | | | | |
| 1 | With the Plan of Reorganization with respect to the Equinox MutualHedge Futures Strategy Fund, Class A, Class C, and Class I shareholders received Class A, Class C, and Class I shares of the AXS Managed Futures Strategy Fund, respectively, effective as of the close of business on January 24, 2020. See Note 1 in the accompanying Notes to Consolidated Financial Statements. |
| 2 | Net of redemption fee proceeds of $387 and $8,566, respectively. |
| 3 | Net of redemption fee proceeds of $11 and $61, respectively. |
| 4 | Net of redemption fee proceeds of $3,979 and $19,340 respectively. |
See accompanying Notes to Consolidated Financial Statements.
AXS Multi-Strategy Alternatives Fund
STATEMENTS OF CHANGES IN NET ASSETS
| | | For the Year Ended September 30, 2021 | | | For the Period May 1, 2020 through September 30, 2020* | | | For the Year Ended April 30, 20201 | |
| Increase (Decrease) in Net Assets from: | | | | | | | | | |
| Operations: | | | | | | | | | |
| Net investment loss | | $ | (203,469 | ) | | $ | (140,351 | ) | | $ | (182,356 | ) |
| Net realized gain (loss) on investments and swap contracts | | | 7,850,070 | | | | 1,736,581 | | | | (5,129,397 | ) |
| Net change in unrealized appreciation/depreciation on investments and swap contracts | | | (2,321,016 | ) | | | 5,224,685 | | | | (4,525,259 | ) |
| Net increase (decrease) in net assets resulting from operations | | | 5,325,585 | | | | 6,820,915 | | | | (9,837,012 | ) |
| | | | | | | | | | | | | |
| Distributions to Shareholders: | | | | | | | | | | | | |
| Distributions: | | | | | | | | | | | | |
| Class R-1 | | | - | | | | - | | | | (239,097 | ) |
| Class I | | | - | | | | - | | | | (579,979 | ) |
| Total distributions to shareholders | | | - | | | | - | | | | (819,076 | ) |
| | | | | | | | | | | | | |
| Capital Transactions: | | | | | | | | | | | | |
| Net proceeds from shares sold: | | | | | | | | | | | | |
| Class R-1 | | | 4,296,537 | | | | 866,530 | | | | 4,838,789 | |
| Class I | | | 3,478,805 | | | | 3,042,521 | | | | 70,226,126 | |
| Reinvestment of distributions: | | | | | | | | | | | | |
| Class R-1 | | | - | | | | - | | | | 237,859 | |
| Class I | | | - | | | | - | | | | 579,979 | |
| Cost of shares redeemed: | | | | | | | | | | | | |
| Class R-1 | | | (9,622,259 | ) | | | (3,975,549 | ) | | | (83,269,760 | ) |
| Class I | | | (46,307,874 | ) | | | (2,351,039 | ) | | | (21,287,319 | ) |
| Capital contribution from a predecessor affiliate (Note 3) | | | - | | | | - | | | | 43,948 | |
| Net decrease in net assets from capital transactions | | | (48,154,791 | ) | | | (2,417,537 | ) | | | (28,630,378 | ) |
| | | | | | | | | | | | | |
| Total increase (decrease) in net assets | | | (42,829,206 | ) | | | 4,403,378 | | | | (39,286,466 | ) |
| | | | | | | | | | | | | |
| Net Assets: | | | | | | | | | | | | |
| Beginning of period | | | 62,865,646 | | | | 58,462,268 | | | | 97,748,734 | |
| End of period | | $ | 20,036,440 | | | $ | 62,865,646 | | | $ | 58,462,268 | |
| | | | | | | | | | | | | |
| Capital Share Transactions: | | | | | | | | | | | | |
| Shares sold: | | | | | | | | | | | | |
| Class R-1 | | | 314,196 | | | | 79,979 | | | | 436,570 | |
| Class I | | | 255,045 | | | | 289,476 | | | | 6,299,413 | |
| Shares reinvested: | | | | | | | | | | | | |
| Class R-1 | | | - | | | | - | | | | 21,256 | |
| Class I | | | - | | | | - | | | | 51,784 | |
| Shares redeemed: | | | | | | | | | | | | |
| Class R-1 | | | (743,673 | ) | | | (382,487 | ) | | | (7,461,647 | ) |
| Class I | | | (4,069,561 | ) | | | (216,039 | ) | | | (1,992,795 | ) |
| Net decrease in capital share transactions | | | (4,243,993 | ) | | | (229,071 | ) | | | (2,645,419 | ) |
| * | Fiscal year end changed to September 30, effective May 1, 2020. |
| 1 | With the Plan of Reorganization with respect to the KCM Macro Trends Fund, Class R-1 and Institutional Class shareholders received Class R-1 and Class I shares of the AXS Multi-Strategy Alternatives Fund, respectively, effective as of the close of business on October 18, 2019. See Note 1 in the accompanying Notes to Consolidated Financial Statements. |
See accompanying Notes to Consolidated Financial Statements.
AXS Sustainable Income Fund
STATEMENT OF CHANGES IN NET ASSETS
| | | For the Period October 17, 2020* through September 30, 2021 | |
| Increase in Net Assets from: | | | |
| Operations: | | | |
| Net investment income | | $ | 2,342,473 | |
| Net realized gain on investments | | | 951,695 | |
| Net change in unrealized appreciation/depreciation on investments | | | 864,392 | |
| Net increase in net assets resulting from operations | | | 4,158,560 | |
| | | | | |
| Distributions to Shareholders: | | | | |
| Distributions: | | | | |
| Class I | | | (2,357,551 | ) |
| Total distributions to shareholders | | | (2,357,551 | ) |
| | | | | |
| Capital Transactions: | | | | |
| Net proceeds from shares sold: | | | | |
| Class I | | | 52,140,340 | |
| Reinvestment of distributions: | | | | |
| Class I | | | 67,580 | |
| Cost of shares redeemed: | | | | |
| Class I | | | (1,168,666 | ) |
| Net increase in net assets from capital transactions | | | 51,039,254 | |
| | | | | |
| Total increase in net assets | | | 52,840,263 | |
| | | | | |
| Net Assets: | | | | |
| Beginning of period | | | - | |
| End of period | | $ | 52,840,263 | |
| | | | | |
| Capital Share Transactions: | | | | |
| Shares sold: | | | | |
| Class I | | | 5,199,789 | |
| Shares reinvested: | | | | |
| Class I | | | 6,576 | |
| Shares redeemed: | | | | |
| Class I | | | (111,556 | ) |
| Net increase in capital share transactions | | | 5,094,809 | |
| * | Commencement of operations. |
See accompanying Notes to Consolidated Financial Statements.
AXS Thomson Reuters Private Equity Return Tracker Fund
STATEMENTS OF CHANGES IN NET ASSETS
| | | For the Year Ended September 30, 20211 | | | For the Year Ended September 30, 2020 | |
| Increase (Decrease) in Net Assets from: | | | | | | |
| Operations: | | | | | | |
| Net investment income (loss) | | $ | (36,582 | ) | | $ | 89,988 | |
| Net realized gain on investments and swap contracts | | | 5,615,745 | | | | 3,709,235 | |
| Net change in unrealized appreciation/depreciation on investments and swap contracts | | | 45,453 | | | | (838,753 | ) |
| Net increase in net assets resulting from operations | | | 5,624,616 | | | | 2,960,470 | |
| | | | | | | | | |
| Distributions to Shareholders: | | | | | | | | |
| Distributions: | | | | | | | | |
| Class A | | | (11,023 | ) | | | - | |
| Class C | | | (53,502 | ) | | | - | |
| Class I | | | (890,391 | ) | | | - | |
| Total distributions to shareholders | | | (954,916 | ) | | | - | |
| | | | | | | | | |
| Capital Transactions: | | | | | | | | |
| Net proceeds from shares sold: | | | | | | | | |
| Class A | | | 365,919 | | | | 2,050 | |
| Class C | | | 23,000 | | | | 592,850 | |
| Class I | | | 11,879,384 | | | | 6,165,834 | |
| Reinvestment of distributions: | | | | | | | | |
| Class A | | | 11,023 | | | | - | |
| Class C | | | 53,502 | | | | - | |
| Class I | | | 844,151 | | | | - | |
| Cost of shares redeemed: | | | | | | | | |
| Class A2 | | | (84,414 | ) | | | (1,443,389 | ) |
| Class C3 | | | (1,201,610 | ) | | | (250,969 | ) |
| Class I4 | | | (13,112,031 | ) | | | (5,191,994 | ) |
| Net decrease in net assets from capital transactions | | | (1,221,076 | ) | | | (125,618 | ) |
| | | | | | | | | |
| Total increase in net assets | | | 3,448,624 | | | | 2,834,852 | |
| | | | | | | | | |
| Net Assets: | | | | | | | | |
| Beginning of period | | | 22,394,202 | | | | 19,559,350 | |
| End of period | | $ | 25,842,826 | | | $ | 22,394,202 | |
| | | | | | | | | |
| Capital Share Transactions: | | | | | | | | |
| Shares sold: | | | | | | | | |
| Class A | | | 20,524 | | | | 157 | |
| Class C | | | 1,317 | | | | 69,009 | |
| Class I | | | 682,158 | | | | 549,169 | |
| Shares reinvested: | | | | | | | | |
| Class A | | | 697 | | | | - | |
| Class C | | | 3,485 | | | | - | |
| Class I | | | 52,726 | | | | - | |
| Shares redeemed: | | | | | | | | |
| Class A | | | (4,850 | ) | | | (118,881 | ) |
| Class C | | | (71,834 | ) | | | (29,892 | ) |
| Class I | | | (800,862 | ) | | | (418,088 | ) |
| Net increase (decrease) in capital share transactions | | | (116,639 | ) | | | 51,474 | |
| 1 | With the Plan of Reorganization with respect to the Leland Thomson Reuters Private Equity Buyout Index Fund, Class A, Class C, and Class I shareholders received Class A, Class C, and Class I shares of the AXS Thomson Reuters Private Equity Return Tracker Fund, respectively, effective as of the close of business on November 20, 2020. See Note 1 in the accompanying Notes to Consolidated Financial Statements. |
| 2 | Net of redemption fee proceeds of $3 and $1, respectively. |
| 3 | Net of redemption fee proceeds of $0 and $28, respectively. |
| 4 | Net of redemption fee proceeds of $3,470 and $600, respectively. |
See accompanying Notes to Consolidated Financial Statements.
AXS Thomson Reuters Venture Capital Return Tracker Fund
STATEMENTS OF CHANGES IN NET ASSETS
| | | For the Year Ended September 30, 20211 | | | For the Year Ended September 30, 2020 | |
| Increase (Decrease) in Net Assets from: | | | | | | |
| Operations: | | | | | | |
| Net investment loss | | $ | (2,520,842 | ) | | $ | (1,080,633 | ) |
| Net realized gain on investments and swap contracts | | | 63,177,785 | | | | 75,458,519 | |
| Net change in unrealized appreciation/depreciation on investments and swap contracts | | | 8,094,089 | | | | 16,423,099 | |
| Net increase from payment by affiliates (Note 3) | | | 3,927 | | | | - | |
| Net increase in net assets resulting from operations | | | 68,754,959 | | | | 90,800,985 | |
| | | | | | | | | |
| Distributions to Shareholders: | | | | | | | | |
| Distributions: | | | | | | | | |
| Class A | | | (13,240,552 | ) | | | - | |
| Class C | | | (1,962,054 | ) | | | - | |
| Class I | | | (23,679,428 | ) | | | - | |
| Total distributions to shareholders | | | (38,882,034 | ) | | | - | |
| | | | | | | | | |
| Capital Transactions: | | | | | | | | |
| Net proceeds from shares sold: | | | | | | | | |
| Class A | | | 37,247,911 | | | | 70,517,661 | |
| Class C | | | 7,619,615 | | | | 6,717,075 | |
| Class I | | | 153,482,443 | | | | 102,204,469 | |
| Reinvestment of distributions: | | | | | | | | |
| Class A | | | 13,091,280 | | | | - | |
| Class C | | | 1,886,193 | | | | - | |
| Class I | | | 22,996,333 | | | | - | |
| Cost of shares redeemed: | | | | | | | | |
| Class A2 | | | (39,974,916 | ) | | | (56,872,556 | ) |
| Class C3 | | | (6,828,995 | ) | | | (4,774,420 | ) |
| Class I4 | | | (86,311,291 | ) | | | (69,473,783 | ) |
| Net increase in net assets from capital transactions | | | 103,208,573 | | | | 48,318,446 | |
| | | | | | | | | |
| Total increase in net assets | | | 133,081,498 | | | | 139,119,431 | |
| | | | | | | | | |
| Net Assets: | | | | | | | | |
| Beginning of period | | | 242,094,020 | | | | 102,974,589 | |
| End of period | | $ | 375,175,518 | | | $ | 242,094,020 | |
| | | | | | | | | |
| Capital Share Transactions: | | | | | | | | |
| Shares sold: | | | | | | | | |
| Class A | | | 1,095,729 | | | | 3,067,904 | |
| Class C | | | 229,902 | | | | 300,304 | |
| Class I | | | 4,378,995 | | | | 4,458,369 | |
| Shares reinvested: | | | | | | | | |
| Class A | | | 438,275 | | | | - | |
| Class C | | | 66,182 | | | | - | |
| Class I | | | 760,461 | | | | - | |
| Shares redeemed: | | | | | | | | |
| Class A | | | (1,250,854 | ) | | | (2,481,949 | ) |
| Class C | | | (226,413 | ) | | | (226,632 | ) |
| Class I | | | (2,634,485 | ) | | | (3,000,938 | ) |
| Net increase in capital share transactions | | | 2,857,792 | | | | 2,117,058 | |
| 1 | With the Plan of Reorganization with respect to the Leland Thomson Reuters Venture Capital Index Fund, Class A, Class C, and Class I shareholders received Class A, Class C, and Class I shares of the AXS Thomson Reuters Venture Capital Return Tracker Fund, respectively, effective as of the close of business on November 20, 2020. See Note 1 in the accompanying Notes to Consolidated Financial Statements. |
| 2 | Net of redemption fee proceeds of $25,603 and $40,836, respectively. |
| 3 | Net of redemption fee proceeds of $4,547 and $3,592, respectively. |
| 4 | Net of redemption fee proceeds of $36,967 and $36,998, respectively. |
See accompanying Notes to Consolidated Financial Statements.
AXS Alternative Growth Fund
CONSOLIDATED FINANCIAL HIGHLIGHTS
Class A*
Per share operating performance.
For a capital share outstanding throughout each period.
| | | For the Year Ended September 30, | | | For the Period July 1, 2020 through | | | For the Year Ended June 30, | |
| | | 2021 | | | September 30, 2020** | | | 2020 | | | 2019 | | | 2018 | | | 2017 | |
| Net asset value, beginning of period | | $ | 11.08 | | | $ | 10.33 | | | $ | 11.47 | | | $ | 10.42 | | | $ | 10.36 | | | $ | 10.21 | |
| Income from Investment Operations: | | | | | | | | | | | | | | | | | | | | | | | | |
| Net investment income (loss)1 | | | (0.13 | ) | | | (0.01 | ) | | | 0.01 | | | | 0.09 | | | | (0.07 | ) | | | (0.11 | ) |
| Net realized and unrealized gain (loss) | | | 2.88 | | | | 0.76 | | | | (0.44 | ) | | | 1.41 | | | | 1.05 | | | | 0.78 | |
| Total from investment operations | | | 2.75 | | | | 0.75 | | | | (0.43 | ) | | | 1.50 | | | | 0.98 | | | | 0.67 | |
| | | | | | | | | | | | | | | | | | | | | | | | | |
| Less Distributions: | | | | | | | | | | | | | | | | | | | | | | | | |
| From net investment income | | | - | | | | - | | | | (0.34 | ) | | | - | 2 | | | - | | | | (0.26 | ) |
| From net realized gain | | | - | | | | - | | | | (0.41 | ) | | | (0.45 | ) | | | (0.92 | ) | | | (0.26 | ) |
| Total distributions | | | - | | | | - | | | | (0.75 | ) | | | (0.45 | ) | | | (0.92 | ) | | | (0.52 | ) |
| | | | | | | | | | | | | | | | | | | | | | | | | |
| Redemption fee proceeds1 | | | - | 2 | | | - | | | | 0.04 | | | | - | 2 | | | - | 2 | | | - | 2 |
| | | | | | | | | | | | | | | | | | | | | | | | | |
| Net asset value, end of period | | $ | 13.83 | | | $ | 11.08 | | | $ | 10.33 | | | $ | 11.47 | | | $ | 10.42 | | | $ | 10.36 | |
| | | | | | | | | | | | | | | | | | | | | | | | | |
| Total return3 | | | 24.82 | % | | | 7.26 | %7 | | | (4.05 | )% | | | 15.75 | % | | | 9.50 | % | | | 6.79 | % |
| | | | | | | | | | | | | | | | | | | | | | | | | |
| Ratios and Supplemental Data: | | | | | | | | | | | | | | | | | | | | | | | | |
| Net assets, end of period (in thousands) | | $ | 677 | | | $ | 946 | | | $ | 1,282 | | | $ | 1,163 | | | $ | 4,029 | | | $ | 4,098 | |
| | | | | | | | | | | | | | | | | | | | | | | | | |
| Ratio of expenses to average net assets (including interest expense): | | | | | | | | | | | | | | | | | | | | | | | | |
| Before fees waived and expenses absorbed | | | 5.58 | %9 | | | 4.83 | %8 | | | 2.33 | %4 | | | 3.98 | %5 | | | 3.36 | % | | | 3.37 | % |
| After fees waived and expenses absorbed | | | 1.24 | %9 | | | 1.24 | %8 | | | 1.25 | %4 | | | 1.24 | %5 | | | 1.45 | % | | | 1.45 | % |
| Ratio of net investment income (loss) to average net assets (including interest expense): | | | | | | | | | | | | | | | | | | | | | | | | |
| Before fees waived and expenses absorbed | | | (5.33 | )% | | | (4.05 | )%8 | | | (0.95 | )% | | | (1.86 | )%5,6 | | | (2.61 | )% | | | (3.00 | )% |
| After fees waived and expenses absorbed | | | (0.99 | )% | | | (0.46 | )%8 | | | 0.13 | % | | | 0.88 | %5,6 | | | (0.70 | )% | | | (1.08 | )% |
| | | | | | | | | | | | | | | | | | | | | | | | | |
| Portfolio turnover rate | | | 0 | % | | | 0 | %7 | | | 99 | % | | | 80 | % | | | 69 | % | | | 0 | % |
| * | Financial information from June 30, 2015 through November 8, 2019 is for the Equinox Ampersand Strategy Fund, which was reorganized into the AXS Alternative Growth Fund as of the close of business on November 8, 2019. See Note 1 in the accompanying Notes to Consolidated Financial Statements. |
| ** | Fiscal year end changed to September 30, effective July 1, 2020. |
| 1 | Based on average shares outstanding for the period. |
| 2 | Amount represents less than $0.005 per share. |
| 3 | Total returns would have been lower had expenses not been waived and absorbed by the Advisor. Returns shown include Rule 12b-1 fees of up to 0.25% and do not reflect the deduction of taxes that a shareholder would pay on Fund distributions or the redemption of Fund shares. Returns shown do not include payment of sales load of 5.75% of offering price which will not apply on sales of $1 million or more. If the sales charge was included total returns would be lower. |
| 4 | If expenses not included in the expense cap had been excluded, the expense ratios would have been lower by 0.01% for the year ended June 30, 2020. |
| 5 | Does not include the expenses of other investment companies in which the Fund invests. |
| 6 | Recognition of net investment income by the Fund is affected by the timing of the declaration of dividends by the underlying exchange traded funds in which the Fund invests. |
| 7 | Not annualized. |
| 8 | Annualized. |
| 9 | If interest expense had been excluded, the expense ratios would have remained unchanged for the year ended September 30, 2021. |
See accompanying Notes to Consolidated Financial Statements.
AXS Alternative Growth Fund
CONSOLIDATED FINANCIAL HIGHLIGHTS
Class I*
Per share operating performance.
For a capital share outstanding throughout each period.
| | | For the Year Ended September 30, | | | For the Period July 1, 2020 through | | | For the Year Ended June 30, | |
| | | 2021 | | | September 30, 2020** | | | 2020 | | | 2019 | | | 2018 | | | 2017 | |
| Net asset value, beginning of period | | $ | 11.22 | | | $ | 10.44 | | | $ | 11.62 | | | $ | 10.56 | | | $ | 10.43 | | | $ | 10.28 | |
| Income from Investment Operations: | | | | | | | | | | | | | | | | | | | | | | | | |
| Net investment income (loss)1 | | | (0.09 | ) | | | (0.01 | ) | | | 0.04 | | | | 0.11 | | | | (0.04 | ) | | | (0.09 | ) |
| Net realized and unrealized gain (loss) | | | 2.89 | | | | 0.79 | | | | (0.44 | ) | | | 1.45 | | | | 1.05 | | | | 0.79 | |
| Total from investment operations | | | 2.80 | | | | 0.78 | | | | (0.40 | ) | | | 1.56 | | | | 1.01 | | | | 0.70 | |
| | | | | | | | | | | | | | | | | | | | | | | | | |
| Less Distributions: | | | | | | | | | | | | | | | | | | | | | | | | |
| From net investment income | | | - | | | | - | | | | (0.37 | ) | | | (0.05 | ) | | | - | | | | (0.29 | ) |
| From net realized gain | | | - | | | | - | | | | (0.41 | ) | | | (0.45 | ) | | | (0.92 | ) | | | (0.26 | ) |
| Total distributions | | | - | | | | - | | | | (0.78 | ) | | | (0.50 | ) | | | (0.92 | ) | | | (0.55 | ) |
| | | | | | | | | | | | | | | | | | | | | | | | | |
| Redemption fee proceeds1 | | | 0.01 | | | | - | 2 | | | - | 2 | | | - | 2 | | | 0.04 | | | | - | |
| | | | | | | | | | | | | | | | | | | | | | | | | |
| Net asset value, end of period | | $ | 14.03 | | | $ | 11.22 | | | $ | 10.44 | | | $ | 11.62 | | | $ | 10.56 | | | $ | 10.43 | |
| | | | | | | | | | | | | | | | | | | | | | | | | |
| Total return3 | | | 25.04 | % | | | 7.47 | %7 | | | (4.13 | )% | | | 16.19 | % | | | 10.15 | % | | | 7.00 | % |
| | | | | | | | | | | | | | | | | | | | | | | | | |
| Ratios and Supplemental Data: | | | | | | | | | | | | | | | | | | | | | | | | |
| Net assets, end of period (in thousands) | | $ | 2,739 | | | $ | 7,026 | | | $ | 5,770 | | | $ | 5,503 | | | $ | 7,758 | | | $ | 2,458 | |
| | | | | | | | | | | | | | | | | | | | | | | | | |
| Ratio of expenses to average net assets (including interest expense): | | | | | | | | | | | | | | | | | | | | | | | | |
| Before fees waived and expenses absorbed | | | 5.33 | %9 | | | 4.58 | %8 | | | 2.08 | %4 | | | 3.57 | %5 | | | 3.32 | % | | | 3.11 | % |
| After fees waived and expenses absorbed | | | 0.99 | %9 | | | 0.99 | %8 | | | 1.00 | %4 | | | 0.99 | %5 | | | 1.20 | % | | | 1.20 | % |
| Ratio of net investment income (loss) to average net assets (including interest expense): | | | | | | | | | | | | | | | | | | | | | | | | |
| Before fees waived and expenses absorbed | | | (5.08 | )% | | | (3.80 | )%8 | | | (0.70 | )% | | | (1.50 | )%5,6 | | | (2.53 | )% | | | (2.74 | )% |
| After fees waived and expenses absorbed | | | (0.74 | )% | | | (0.21 | )%8 | | | 0.38 | % | | | 1.08 | %5,6 | | | (0.41 | )% | | | (0.83 | )% |
| | | | | | | | | | | | | | | | | | | | | | | | | |
| Portfolio turnover rate | | | 0 | % | | | 0 | %7 | | | 99 | % | | | 80 | % | | | 69 | % | | | 0 | % |
| * | Financial information from June 30, 2015 through November 8, 2019 is for the Equinox Ampersand Strategy Fund, which was reorganized into the AXS Alternative Growth Fund as of the close of business on November 8, 2019. See Note 1 in the accompanying Notes to Consolidated Financial Statements. |
| ** | Fiscal year end changed to September 30, effective July 1, 2020. |
| 1 | Based on average shares outstanding for the period. |
| 2 | Amount represents less than $0.005 per share. |
| 3 | Total returns would have been lower had expenses not been waived and absorbed by the Advisor. Returns shown do not reflect the deduction of taxes that a shareholder would pay on Fund distributions or the redemption of Fund shares. |
| 4 | If expenses not included in the expense cap had been excluded, the expense ratios would have been lower by 0.01% for the year ended June 30, 2020. |
| 5 | Does not include the expenses of other investment companies in which the Fund invests. |
| 6 | Recognition of net investment income by the Fund is affected by the timing of the declaration of dividends by the underlying exchange traded funds in which the Fund invests. |
| 7 | Not annualized. |
| 8 | Annualized. |
| 9 | If interest expense had been excluded, the expense ratios would have remained unchanged for the year ended September 30, 2021. |
See accompanying Notes to Consolidated Financial Statements.
AXS Aspect Core Diversified Strategy Fund
CONSOLIDATED FINANCIAL HIGHLIGHTS
Class A*
Per share operating performance.
For a capital share outstanding throughout each period.
| | | For the Year Ended September 30, | |
| | | 2021 | | | 2020 | | | 2019 | | | 2018 | | | 2017 | |
| Net asset value, beginning of period | | $ | 8.03 | | | $ | 9.42 | | | $ | 9.19 | | | $ | 9.29 | | | $ | 9.98 | |
| Income from Investment Operations: | | | | | | | | | | | | | | | | | | | | |
| Net investment income (loss)1 | | | (0.12 | ) | | | - | 2 | | | 0.06 | | | | (0.04 | ) | | | (0.12 | ) |
| Net realized and unrealized gain (loss) | | | 0.60 | | | | (0.34 | ) | | | 0.17 | | | | (0.06 | ) | | | (0.49 | ) |
| Total from investment operations | | | 0.48 | | | | (0.34 | ) | | | 0.23 | | | | (0.10 | ) | | | (0.61 | ) |
| | | | | | | | | | | | | | | | | | | | | |
| Less Distributions: | | | | | | | | | | | | | | | | | | | | |
| From net investment income | | | - | | | | (0.73 | ) | | | - | | | | - | | | | (0.08 | ) |
| From net realized gain | | | - | | | | - | | | | - | | | | - | | | | - | |
| From return of capital | | | - | | | | (0.32 | ) | | | - | | | | - | | | | - | |
| Total distributions | | | - | | | | (1.05 | ) | | | - | | | | - | | | | (0.08 | ) |
| | | | | | | | | | | | | | | | | | | | | |
| Net asset value, end of period | | $ | 8.51 | | | $ | 8.03 | | | $ | 9.42 | | | $ | 9.19 | | | $ | 9.29 | |
| | | | | | | | | | | | | | | | | | | | | |
| Total return3 | | | 5.98 | % | | | (3.79 | )% | | | 2.50 | % | | | (1.08 | )% | | | (6.18 | )% |
| | | | | | | | | | | | | | | | | | | | | |
| Ratios and Supplemental Data: | | | | | | | | | | | | | | | | | | | | |
| Net assets, end of period (in thousands) | | $ | 885 | | | $ | 631 | | | $ | 717 | | | $ | 614 | | | $ | 131 | |
| | | | | | | | | | | | | | | | | | | | | |
| Ratio of expenses to average net assets (including interest expense): | | | | | | | | | | | | | | | | | | | | |
| Before fees waived and expenses absorbed5 | | | 2.88 | % | | | 2.61 | %4 | | | 2.42 | % | | | 2.14 | % | | | 2.47 | % |
| After fees waived and expenses absorbed5 | | | 1.71 | % | | | 1.72 | %4 | | | 1.70 | % | | | 1.70 | % | | | 1.70 | % |
| Ratio of net investment income (loss) to average net assets (including interest expense): | | | | | | | | | | | | | | | | | | | | |
| Before fees waived and expenses absorbed | | | (2.57 | )% | | | (0.87 | )% | | | (0.09 | )% | | | (0.88 | )% | | | (2.00 | )% |
| After fees waived and expenses absorbed | | | (1.40 | )% | | | 0.02 | % | | | 0.63 | % | | | (0.44 | )% | | | (1.23 | )% |
| | | | | | | | | | | | | | | | | | | | | |
| Portfolio turnover rate | | | 0 | % | | | 0 | % | | | 59 | % | | | 20 | % | | | 0 | % |
| * | Financial information from September 30, 2015 through November 8, 2019 is for the Equinox Aspect Core Diversified Strategy Fund, which was reorganized into the AXS Aspect Core Diversified Strategy Fund as of the close of business on November 8, 2019. See Note 1 in the accompanying Notes to Consolidated Financial Statements. |
| 1 | Based on average shares outstanding for the period. |
| 2 | Amount represents less than $0.005 per share. |
| 3 | Total returns would have been higher/lower had expenses not been recovered/waived and absorbed by the Advisor. Returns shown include Rule 12b-1 fees of up to 0.25% and do not reflect the deduction of taxes that a shareholder would pay on Fund distributions or the redemption of Fund shares. Returns shown do not include payment of sales load of 5.75% of offering price which will not apply on sales of $1 million or more. If the sales charge was included total returns would be lower. |
| 4 | If expenses not included in the expense cap had been excluded, the expense ratios would have been lower by 0.02% for the year ended September 30, 2020. |
| 5 | If interest expense had been excluded, the expense ratios would have been lower by 0.01%, 0.02%, 0%, 0%, and 0% for the years ended September 30, 2021, 2020, 2019, 2018, and 2017, respectively. |
See accompanying Notes to Consolidated Financial Statements.
AXS Aspect Core Diversified Strategy Fund
CONSOLIDATED FINANCIAL HIGHLIGHTS
Class C*
Per share operating performance.
For a capital share outstanding throughout each period.
| | | For the Year Ended September 30, | |
| | | 2021 | | | 2020 | | | 2019 | | | 2018 | | | 2017 | |
| Net asset value, beginning of period | | $ | 7.73 | | | $ | 9.11 | | | $ | 8.96 | | | $ | 9.12 | | | $ | 9.89 | |
| Income from Investment Operations: | | | | | | | | | | | | | | | | | | | | |
| Net investment loss1 | | | (0.17 | ) | | | (0.06 | ) | | | (0.01 | ) | | | (0.11 | ) | | | (0.18 | ) |
| Net realized and unrealized gain (loss) | | | 0.57 | | | | (0.34 | ) | | | 0.16 | | | | (0.05 | ) | | | (0.51 | ) |
| Total from investment operations | | | 0.40 | | | | (0.40 | ) | | | 0.15 | | | | (0.16 | ) | | | (0.69 | ) |
| | | | | | | | | | | | | | | | | | | | | |
| Less Distributions: | | | | | | | | | | | | | | | | | | | | |
| From net investment income | | | - | | | | (0.66 | ) | | | - | | | | - | | | | (0.08 | ) |
| From net realized gain | | | - | | | | - | | | | - | | | | - | | | | - | |
| From return of capital | | | - | | | | (0.32 | ) | | | - | | | | - | | | | - | |
| Total distributions | | | - | | | | (0.98 | ) | | | - | | | | - | | | | (0.08 | ) |
| | | | | | | | | | | | | | | | | | | | | |
| Net asset value, end of period | | $ | 8.13 | | | $ | 7.73 | | | $ | 9.11 | | | $ | 8.96 | | | $ | 9.12 | |
| | | | | | | | | | | | | | | | | | | | | |
| Total return2 | | | 5.17 | % | | | (4.57 | )% | | | 1.67 | % | | | (1.75 | )% | | | (6.99 | )% |
| | | | | | | | | | | | | | | | | | | | | |
| Ratios and Supplemental Data: | | | | | | | | | | | | | | | | | | | | |
| Net assets, end of period (in thousands) | | $ | 2,137 | | | $ | 2,113 | | | $ | 3,406 | | | $ | 2,963 | | | $ | 479 | |
| | | | | | | | | | | | | | | | | | | | | |
| Ratio of expenses to average net assets (including interest expense): | | | | | | | | | | | | | | | | | | | | |
| Before fees waived and expenses absorbed4 | | | 3.63 | % | | | 3.36 | %3 | | | 3.18 | % | | | 2.89 | % | | | 3.17 | % |
| After fees waived and expenses absorbed4 | | | 2.46 | % | | | 2.47 | %3 | | | 2.45 | % | | | 2.45 | % | | | 2.45 | % |
| Ratio of net investment income (loss) to average net assets (including interest expense): | | | | | | | | | | | | | | | | | | | | |
| Before fees waived and expenses absorbed | | | (3.32 | )% | | | (1.62 | )% | | | (0.85 | )% | | | (1.68 | )% | | | (2.68 | )% |
| After fees waived and expenses absorbed | | | (2.15 | )% | | | (0.73 | )% | | | (0.12 | )% | | | (1.24 | )% | | | (1.96 | )% |
| | | | | | | | | | | | | | | | | | | | | |
| Portfolio turnover rate | | | 0 | % | | | 0 | % | | | 59 | % | | | 20 | % | | | 0 | % |
| * | Financial information from September 30, 2015 through November 8, 2019 is for the Equinox Aspect Core Diversified Strategy Fund, which was reorganized into the AXS Aspect Core Diversified Strategy Fund as of the close of business on November 8, 2019. See Note 1 in the accompanying Notes to Consolidated Financial Statements. |
| 1 | Based on average shares outstanding for the period. |
| 2 | Total returns would have been higher/lower had expenses not been recovered/waived and absorbed by the Advisor. Returns shown include Rule 12b-1 fees of up to 0.25% and do not reflect the deduction of taxes that a shareholder would pay on Fund distributions or the redemption of Fund shares. Returns shown do not include payment of sales load of 5.75% of offering price which will not apply on sales of $1 million or more. If the sales charge was included total returns would be lower. |
| 3 | If expenses not included in the expense cap had been excluded, the expense ratios would have been lower by 0.02% for the year ended September 30, 2020. |
| 4 | If interest expense had been excluded, the expense ratios would have been lower by 0.01%, 0.02%, 0%, 0%, and 0% for the years ended September 30, 2021, 2020, 2019, 2018, and 2017, respectively. |
See accompanying Notes to Consolidated Financial Statements.
AXS Aspect Core Diversified Strategy Fund
CONSOLIDATED FINANCIAL HIGHLIGHTS
Class I*
Per share operating performance.
For a capital share outstanding throughout each period.
| | | For the Year Ended September 30, | |
| | | 2021 | | | 2020 | | | 2019 | | | 2018 | | | 2017 | |
| Net asset value, beginning of period | | $ | 8.05 | | | $ | 9.45 | | | $ | 9.20 | | | $ | 9.27 | | | $ | 9.99 | |
| Income from Investment Operations: | | | | | | | | | | | | | | | | | | | | |
| Net investment income (loss)1 | | | (0.10 | ) | | | 0.02 | | | | 0.07 | | | | (0.03 | ) | | | (0.09 | ) |
| Net realized and unrealized gain (loss) | | | 0.60 | | | | (0.35 | ) | | | 0.18 | | | | (0.04 | ) | | | (0.51 | ) |
| Total from investment operations | | | 0.50 | | | | (0.33 | ) | | | 0.25 | | | | (0.07 | ) | | | (0.60 | ) |
| | | | | | | | | | | | | | | | | | | | | |
| Less Distributions: | | | | | | | | | | | | | | | | | | | | |
| From net investment income | | | - | | | | (0.75 | ) | | | - | | | | - | | | | (0.12 | ) |
| From net realized gain | | | - | | | | - | | | | - | | | | - | | | | - | |
| From return of capital | | | - | | | | (0.32 | ) | | | - | | | | - | | | | - | |
| Total distributions | | | - | | | | (1.07 | ) | | | - | | | | - | | | | (0.12 | ) |
| | | | | | | | | | | | | | | | | | | | | |
| Net asset value, end of period | | $ | 8.55 | | | $ | 8.05 | | | $ | 9.45 | | | $ | 9.20 | | | $ | 9.27 | |
| | | | | | | | | | | | | | | | | | | | | |
| Total return2 | | | 6.21 | % | | | (3.62 | )% | | | 2.72 | % | | | (0.76 | )% | | | (6.05 | )% |
| | | | | | | | | | | | | | | | | | | | | |
| Ratios and Supplemental Data: | | | | | | | | | | | | | | | | | | | | |
| Net assets, end of period (in thousands) | | $ | 17,721 | | | $ | 19,638 | | | $ | 19,317 | | | $ | 33,838 | | | $ | 31,991 | |
| | | | | | | | | | | | | | | | | | | | | |
| Ratio of expenses to average net assets (including interest expense): | | | | | | | | | | | | | | | | | | | | |
| Before fees waived and expenses absorbed4 | | | 2.63 | % | | | 2.36 | %3 | | | 2.10 | % | | | 1.89 | % | | | 2.18 | % |
| After fees waived and expenses absorbed4 | | | 1.46 | % | | | 1.47 | %3 | | | 1.45 | % | | | 1.45 | % | | | 1.45 | % |
| Ratio of net investment income (loss) to average net assets (including interest expense): | | | | | | | | | | | | | | | | | | | | |
| Before fees waived and expenses absorbed | | | (2.32 | )% | | | (0.62 | )% | | | 0.19 | % | | | (0.77 | )% | | | (1.69 | )% |
| After fees waived and expenses absorbed | | | (1.15 | )% | | | 0.27 | % | | | 0.84 | % | | | (0.33 | )% | | | (0.96 | )% |
| | | | | | | | | | | | | | | | | | | | | |
| Portfolio turnover rate | | | 0 | % | | | 0 | % | | | 59 | % | | | 20 | % | | | 0 | % |
| * | Financial information from September 30, 2015 through November 8, 2019 is for the Equinox Aspect Core Diversified Strategy Fund, which was reorganized into the AXS Aspect Core Diversified Strategy Fund as of the close of business on November 8, 2019. See Note 1 in the accompanying Notes to Consolidated Financial Statements. |
| 1 | Based on average shares outstanding for the period. |
| 2 | Total returns would have been higher/lower had expenses not been recovered/waived and absorbed by the Advisor. Returns shown do not reflect the deduction of taxes that a shareholder would pay on Fund distributions or the redemption of Fund shares. |
| 3 | If expenses not included in the expense cap had been excluded, the expense ratios would have been lower by 0.02% for the year ended September 30, 2020. |
| 4 | If interest expense had been excluded, the expense ratios would have been lower by 0.01%, 0.02%, 0%, 0%, and 0% for the years ended September 30, 2021, 2020, 2019, 2018, and 2017, respectively. |
See accompanying Notes to Consolidated Financial Statements.
AXS Chesapeake Strategy Fund
CONSOLIDATED FINANCIAL HIGHLIGHTS
Class A*
Per share operating performance.
For a capital share outstanding throughout each period.
| | | For the Year Ended September 30, | |
| | | 2021 | | | 2020 | | | 2019 | | | 2018 | | | 2017 | |
| Net asset value, beginning of period | | $ | 9.42 | | | $ | 11.26 | | | $ | 12.54 | | | $ | 11.77 | | | $ | 11.90 | |
| Income from Investment Operations: | | | | | | | | | | | | | | | | | | | | |
| Net investment income (loss)1 | | | (0.20 | ) | | | (0.02 | ) | | | 0.03 | | | | (0.11 | ) | | | (0.10 | ) |
| Net realized and unrealized gain (loss) | | | 2.99 | | | | (1.45 | ) | | | (1.21 | ) | | | 0.88 | | | | (0.03 | ) |
| Total from investment operations | | | 2.79 | | | | (1.47 | ) | | | (1.18 | ) | | | 0.77 | | | | (0.13 | ) |
| | | | | | | | | | | | | | | | | | | | | |
| Less Distributions: | | | | | | | | | | | | | | | | | | | | |
| From net investment income | | | - | | | | (0.37 | ) | | | (0.05 | ) | | | - | | | | - | |
| From net realized gain | | | - | | | | - | | | | (0.05 | ) | | | - | | | | - | |
| Total distributions | | | - | | | | (0.37 | ) | | | (0.10 | ) | | | - | | | | - | |
| | | | | | | | | | | | | | | | | | | | | |
| Net increase from payment by affiliates (Note 3) | | | - | | | | 0.00 | 2 | | | - | | | | - | | | | - | |
| | | | | | | | | | | | | | | | | | | | | |
| Net asset value, end of period | | $ | 12.21 | | | $ | 9.42 | | | $ | 11.26 | | | $ | 12.54 | | | $ | 11.77 | |
| | | | | | | | | | | | | | | | | | | | | |
| Total return3 | | | 29.62 | % | | | (13.31 | )% | | | (9.40 | )% | | | 6.54 | % | | | (1.09 | )% |
| | | | | | | | | | | | | | | | | | | | | |
| Ratios and Supplemental Data: | | | | | | | | | | | | | | | | | | | | |
| Net assets, end of period (in thousands) | | $ | 3,799 | | | $ | 3,376 | | | $ | 5,048 | | | $ | 5,799 | | | $ | 1,181 | |
| | | | | | | | | | | | | | | | | | | | | |
| Ratio of expenses to average net assets: | | | | | | | | | | | | | | | | | | | | |
| Before fees waived and expenses absorbed4 | | | 3.36 | % | | | 2.35 | % | | | 2.24 | % | | | 2.04 | % | | | 1.86 | % |
| After fees waived and expenses absorbed4 | | | 2.10 | % | | | 2.12 | % | | | 2.10 | % | | | 2.10 | % | | | 1.42 | % |
| Ratio of net investment income (loss) to average net assets: | | | | | | | | | | | | | | | | | | | | |
| Before fees waived and expenses absorbed | | | (2.96 | )% | | | (0.44 | )% | | | 0.11 | % | | | (0.84 | )% | | | (1.32 | )% |
| After fees waived and expenses absorbed | | | (1.70 | )% | | | (0.21 | )% | | | 0.25 | % | | | (0.90 | )% | | | (0.88 | )% |
| | | | | | | | | | | | | | | | | | | | | |
| Portfolio turnover rate | | | 0 | % | | | 0 | % | | | 36 | % | | | 13 | % | | | 0 | % |
| * | Financial information from September 30, 2015 through November 8, 2019 is for the Equinox Chesapeake Strategy Fund, which was reorganized into the AXS Chesapeake Strategy Fund as of the close of business on November 8, 2019. See Note 1 in the accompanying Notes to Consolidated Financial Statements. |
| 1 | Based on average shares outstanding for the period. |
| 2 | Amount represents less than $0.005 per share. |
| 3 | Total returns would have been higher/lower had expenses not been recovered/waived and absorbed by the Advisor. Returns shown include Rule 12b-1 fees of up to 0.25% and do not reflect the deduction of taxes that a shareholder would pay on Fund distributions or the redemption of Fund shares. Returns shown do not include payment of sales load of 5.75% of offering price which will not apply on sales of $1 million or more. If the sales charge was included total returns would be lower. |
| 4 | If reorganizational costs and interest expense had been excluded, the expense ratios would have been lower by 0%, 0.02%, 0%, 0%, and 0% for the years ended September 30, 2021, 2020, 2019, 2018, and 2017, respectively. |
See accompanying Notes to Consolidated Financial Statements.
AXS Chesapeake Strategy Fund
CONSOLIDATED FINANCIAL HIGHLIGHTS
Class C*
Per share operating performance.
For a capital share outstanding throughout each period.
| | | For the Year Ended September 30, | |
| | | 2021 | | | 2020 | | | 2019 | | | 2018 | | | 2017 | |
| Net asset value, beginning of period | | $ | 9.21 | | | $ | 10.98 | | | $ | 12.26 | | | $ | 11.59 | | | $ | 11.81 | |
| Income from Investment Operations: | | | | | | | | | | | | | | | | | | | | |
| Net investment loss1 | | | (0.27 | ) | | | (0.10 | ) | | | (0.05 | ) | | | (0.20 | ) | | | (0.19 | ) |
| Net realized and unrealized gain (loss) | | | 2.91 | | | | (1.41 | ) | | | (1.18 | ) | | | 0.87 | | | | (0.03 | ) |
| Total from investment operations | | | 2.64 | | | | (1.51 | ) | | | (1.23 | ) | | | 0.67 | | | | (0.22 | ) |
| | | | | | | | | | | | | | | | | | | | | |
| Less Distributions: | | | | | | | | | | | | | | | | | | | | |
| From net investment income | | | - | | | | (0.26 | ) | | | - | | | | - | | | | - | |
| From net realized gain | | | - | | | | - | | | | (0.05 | ) | | | - | | | | - | |
| Total distributions | | | - | | | | (0.26 | ) | | | (0.05 | ) | | | - | | | | - | |
| | | | | | | | | | | | | | | | | | | | | |
| Net increase from payment by affiliates (Note 3) | | | - | | | | 0.00 | 2 | | | - | | | | - | | | | - | |
| | | | | | | | | | | | | | | | | | | | | |
| Net asset value, end of period | | $ | 11.85 | | | $ | 9.21 | | | $ | 10.98 | | | $ | 12.26 | | | $ | 11.59 | |
| | | | | | | | | | | | | | | | | | | | | |
| Total return3 | | | 28.66 | % | | | (13.96 | )% | | | (10.04 | )% | | | 5.78 | % | | | (1.86 | )% |
| | | | | | | | | | | | | | | | | | | | | |
| Ratios and Supplemental Data: | | | | | | | | | | | | | | | | | | | | |
| Net assets, end of period (in thousands) | | $ | 271 | | | $ | 309 | | | $ | 592 | | | $ | 931 | | | $ | 514 | |
| | | | | | | | | | | | | | | | | | | | | |
| Ratio of expenses to average net assets: | | | | | | | | | | | | | | | | | | | | |
| Before fees waived and expenses absorbed4 | | | 4.11 | % | | | 3.10 | % | | | 2.99 | % | | | 2.81 | % | | | 2.90 | % |
| After fees waived and expenses absorbed4 | | | 2.85 | % | | | 2.87 | % | | | 2.85 | % | | | 2.85 | % | | | 2.24 | % |
| Ratio of net investment loss to average net assets: | | | | | | | | | | | | | | | | | | | | |
| Before fees waived and expenses absorbed | | | (3.71 | )% | | | (1.19 | )% | | | (0.63 | )% | | | (1.61 | )% | | | (2.34 | )% |
| After fees waived and expenses absorbed | | | (2.45 | )% | | | (0.96 | )% | | | (0.49 | )% | | | (1.65 | )% | | | (1.68 | )% |
| | | | | | | | | | | | | | | | | | | | | |
| Portfolio turnover rate | | | 0 | % | | | 0 | % | | | 36 | % | | | 13 | % | | | 0 | % |
| * | Financial information from September 30, 2015 through November 8, 2019 is for the Equinox Chesapeake Strategy Fund, which was reorganized into the AXS Chesapeake Strategy Fund as of the close of business on November 8, 2019. See Note 1 in the accompanying Notes to Consolidated Financial Statements. |
| 1 | Based on average shares outstanding for the period. |
| 2 | Amount represents less than $0.005 per share. |
| 3 | Total returns would have been higher/lower had expenses not been recovered/waived and absorbed by the Advisor. Returns shown do not reflect the deduction of taxes that a shareholder would pay on Fund distributions or the redemption of Fund shares. |
| 4 | If reorganizational costs and interest expense had been excluded, the expense ratios would have been lower by 0%, 0.02%, 0%, 0% and 0% for the years ended September 30, 2021, 2020, 2019, 2018 and 2017, respectively. |
See accompanying Notes to Consolidated Financial Statements.
AXS Chesapeake Strategy Fund
CONSOLIDATED FINANCIAL HIGHLIGHTS
Class I*
Per share operating performance.
For a capital share outstanding throughout each period.
| | | For the Year Ended September 30, | |
| | | 2021 | | | 2020 | | | 2019 | | | 2018 | | | 2017 | |
| Net asset value, beginning of period | | $ | 9.50 | | | $ | 11.35 | | | $ | 12.65 | | | $ | 11.83 | | | $ | 11.93 | |
| Income from Investment Operations: | | | | | | | | | | | | | | | | | | | | |
| Net investment income (loss)1 | | | (0.17 | ) | | | - | 2 | | | 0.05 | | | | (0.08 | ) | | | (0.08 | ) |
| Net realized and unrealized gain (loss) | | | 3.01 | | | | (1.45 | ) | | | (1.22 | ) | | | 0.90 | | | | (0.02 | ) |
| Total from investment operations | | | 2.84 | | | | (1.45 | ) | | | (1.17 | ) | | | 0.82 | | | | (0.10 | ) |
| | | | | | | | | | | | | | | | | | | | | |
| Less Distributions: | | | | | | | | | | | | | | | | | | | | |
| From net investment income | | | - | | | | (0.40 | ) | | | (0.08 | ) | | | - | | | | - | |
| From net realized gain | | | - | | | | - | | | | (0.05 | ) | | | - | | | | - | |
| Total distributions | | | - | | | | (0.40 | ) | | | (0.13 | ) | | | - | | | | - | |
| | | | | | | | | | | | | | | | | | | | | |
| Net increase from payment by affiliates (Note 3) | | | - | | | | - | 2 | | | - | | | | - | | | | - | |
| | | | | | | | | | | | | | | | | | | | | |
| Net asset value, end of period | | $ | 12.34 | | | $ | 9.50 | | | $ | 11.35 | | | $ | 12.65 | | | $ | 11.83 | |
| | | | | | | | | | | | | | | | | | | | | |
| Total return3 | | | 29.89 | % | | | (13.07 | )% | | | (9.23 | )% | | | 6.93 | % | | | (0.84 | )% |
| | | | | | | | | | | | | | | | | | | | | |
| Ratios and Supplemental Data: | | | | | | | | | | | | | | | | | | | | |
| Net assets, end of period (in thousands) | | $ | 14,723 | | | $ | 11,955 | | | $ | 90,105 | | | $ | 158,876 | | | $ | 51,427 | |
| | | | | | | | | | | | | | | | | | | | | |
| Ratio of expenses to average net assets: | | | | | | | | | | | | | | | | | | | | |
| Before fees waived and expenses absorbed4 | | | 3.11 | % | | | 2.10 | % | | | 1.98 | % | | | 1.81 | % | | | 1.87 | % |
| After fees waived and expenses absorbed4 | | | 1.85 | % | | | 1.87 | % | | | 1.85 | % | | | 1.85 | % | | | 1.24 | % |
| Ratio of net investment income (loss) to average net assets: | | | | | | | | | | | | | | | | | | | | |
| Before fees waived and expenses absorbed | | | (2.71 | )% | | | (0.19 | )% | | | 0.36 | % | | | (0.56 | )% | | | (1.31 | )% |
| After fees waived and expenses absorbed | | | (1.45 | )% | | | 0.04 | % | | | 0.49 | % | | | (0.60 | )% | | | (0.68 | )% |
| | | | | | | | | | | | | | | | | | | | | |
| Portfolio turnover rate | | | 0 | % | | | 0 | % | | | 36 | % | | | 13 | % | | | 0 | % |
| * | Financial information from September 30, 2015 through November 8, 2019 is for the Equinox Chesapeake Strategy Fund, which was reorganized into the AXS Chesapeake Strategy Fund as of the close of business on November 8, 2019. See Note 1 in the accompanying Notes to Consolidated Financial Statements. |
| 1 | Based on average shares outstanding for the period. |
| 2 | Amount represents less than $0.005 per share. |
| 3 | Total returns would have been higher/lower had expenses not been recovered/waived and absorbed by the Advisor. Returns shown do not reflect the deduction of taxes that a shareholder would pay on Fund distributions or the redemption of Fund shares. |
| 4 | If reorganizational costs and interest expense had been excluded, the expense ratios would have been lower by 0%, 0.02%, 0%, 0% and 0% for the years ended September 30, 2021, 2020, 2019, 2018 and 2017, respectively. |
See accompanying Notes to Consolidated Financial Statements.
AXS Managed Futures Strategy Fund
CONSOLIDATED FINANCIAL HIGHLIGHTS
Class A*
Per share operating performance.
For a capital share outstanding throughout each period.
| | | For the Year Ended September 30, | |
| | | | | | | | | | | | | | | | |
| | | 2021 | | | 2020 | | | 2019 | | | 2018 | | | 2017 | |
| Net asset value, beginning of period | | $ | 6.07 | | | $ | 9.24 | | | $ | 8.08 | | | $ | 8.05 | | | $ | 8.82 | |
| Income from Investment Operations: | | | | | | | | | | | | | | | | | | | | |
| Net investment income (loss)1 | | | (0.11 | ) | | | (0.04 | ) | | | 0.02 | | | | (0.08 | ) | | | (0.12 | ) |
| Net realized and unrealized gain (loss) | | | (0.18 | )4 | | | (2.05 | ) | | | 1.14 | | | | 0.11 | | | | (0.36 | ) |
| Total from investment operations | | | (0.29 | ) | | | (2.09 | ) | | | 1.16 | | | | 0.03 | | | | (0.48 | ) |
| | | | | | | | | | | | | | | | | | | | | |
| Less Distributions: | | | | | | | | | | | | | | | | | | | | |
| From net investment income | | | - | | | | (1.02 | ) | | | - | | | | - | | | | (0.11 | ) |
| From net realized gain | | | - | | | | - | | | | - | | | | - | | | | (0.04 | ) |
| From return of capital | | | - | | | | (0.06 | ) | | | - | | | | - | | | | (0.14 | ) |
| Total distributions | | | - | | | | (1.08 | ) | | | - | | | | - | | | | (0.29 | ) |
| | | | | | | | | | | | | | | | | | | | | |
| Redemption fee proceeds1 | | | - | 2 | | | - | 2 | | | - | 2 | | | - | 2 | | | - | 2 |
| | | | | | | | | | | | | | | | | | | | | |
| Net asset value, end of period | | $ | 5.78 | | | $ | 6.07 | | | $ | 9.24 | | | $ | 8.08 | | | $ | 8.05 | |
| | | | | | | | | | | | | | | | | | | | | |
| Total return3 | | | (4.78 | )% | | | (25.22 | )% | | | 14.36 | % | | | 0.37 | % | | | (5.67 | )% |
| | | | | | | | | | | | | | | | | | | | | |
| Ratios and Supplemental Data: | | | | | | | | | | | | | | | | | | | | |
| Net assets, end of period (in thousands) | | $ | 7,220 | | | $ | 13,632 | | | $ | 33,150 | | | $ | 31,434 | | | $ | 72,169 | |
| | | | | | | | | | | | | | | | | | | | | |
| Ratio of expenses to average net assets: | | | | | | | | | | | | | | | | | | | | |
| Before fees waived and expenses absorbed | | | 2.36 | % | | | 2.02 | % | | | 1.91 | % | | | 1.93 | % | | | 1.97 | % |
| After fees waived and expenses absorbed | | | 1.95 | % | | | 1.94 | % | | | 1.94 | % | | | 1.95 | % | | | 1.95 | % |
| | | | | | | | | | | | | | | | | | | | | |
| Ratio of net investment income (loss) to average net assets: | | | | | | | | | | | | | | | | | | | | |
| Before fees waived and expenses absorbed | | | (2.14 | )% | | | (0.62 | )% | | | 0.24 | % | | | (0.99 | )% | | | (1.48 | )% |
| After fees waived and expenses absorbed | | | (1.73 | )% | | | (0.54 | )% | | | 0.21 | % | | | (1.01 | )% | | | (1.46 | )% |
| | | | | | | | | | | | | | | | | | | | | |
| Portfolio turnover rate | | | 0 | % | | | 15 | % | | | 11 | % | | | 75 | % | | | 78 | % |
| * | Financial information from September 30, 2015 through January 24, 2020 is for the Equinox MutualHedge Futures Strategy Fund, which was reorganized into the AXS Managed Futures Strategy Fund as of the close of business on January 24, 2020. See Note 1 in the accompanying Notes to Consolidated Financial Statements. |
| 1 | Based on average shares outstanding for the period. |
| 2 | Amount represents less than $0.005 per share. |
| 3 | Total returns would have been higher/lower had expenses not been recovered/waived and absorbed by the Advisor. Returns shown include Rule 12b-1 fees of up to 0.25% and do not reflect the deduction of taxes that a shareholder would pay on Fund distributions or the redemption of Fund shares. Returns shown do not include payment of sales load of 5.75% of offering price which will not apply on sales of $1 million or more. If the sales charge was included total returns would be lower. |
| 4 | Realized and unrealized gains and losses per share in this caption are balancing amounts necessary to reconcile the change in net asset value per share for the period, and may not reconcile with the aggregate gains and losses in the Statement of Operations due to share transactions for the period. |
See accompanying Notes to Consolidated Financial Statements.
AXS Managed Futures Strategy Fund
CONSOLIDATED FINANCIAL HIGHLIGHTS
Class C*
Per share operating performance.
For a capital share outstanding throughout each period.
| | | For the Year Ended September 30, | |
| | | | | | | | | | | | | | | | |
| | | 2021 | | | 2020 | | | 2019 | | | 2018 | | | 2017 | |
| Net asset value, beginning of period | | $ | 5.73 | | | $ | 8.77 | | | $ | 7.72 | | | $ | 7.75 | | | $ | 8.50 | |
| Income from Investment Operations: | | | | | | | | | | | | | | | | | | | | |
| Net investment loss1 | | | (0.14 | ) | | | (0.09 | ) | | | (0.04 | ) | | | (0.13 | ) | | | (0.18 | ) |
| Net realized and unrealized gain (loss) | | | (0.18 | )4 | | | (1.95 | ) | | | 1.09 | | | | 0.10 | | | | (0.35 | ) |
| Total from investment operations | | | (0.32 | ) | | | (2.04 | ) | | | 1.05 | | | | (0.03 | ) | | | (0.53 | ) |
| | | | | | | | | | | | | | | | | | | | | |
| Less Distributions: | | | | | | | | | | | | | | | | | | | | |
| From net investment income | | | - | | | | (0.94 | ) | | | - | | | | - | | | | (0.04 | ) |
| From net realized gain | | | - | | | | - | | | | - | | | | - | | | | (0.04 | ) |
| From return of capital | | | - | | | | (0.06 | ) | | | - | | | | - | | | | (0.14 | ) |
| Total distributions | | | - | | | | (1.00 | ) | | | - | | | | - | | | | (0.22 | ) |
| | | | | | | | | | | | | | | | | | | | | |
| Redemption fee proceeds1 | | | - | 2 | | | - | 2 | | | - | 2 | | | - | 2 | | | - | 2 |
| | | | | | | | | | | | | | | | | | | | | |
| Net asset value, end of period | | $ | 5.41 | | | $ | 5.73 | | | $ | 8.77 | | | $ | 7.72 | | | $ | 7.75 | |
| | | | | | | | | | | | | | | | | | | | | |
| Total return3 | | | (5.58 | )% | | | (25.80 | )% | | | 13.60 | % | | | (0.39 | )% | | | (6.41 | )% |
| | | | | | | | | | | | | | | | | | | | | |
| Ratios and Supplemental Data: | | | | | | | | | | | | | | | | | | | | |
| Net assets, end of period (in thousands) | | $ | 6,443 | | | $ | 10,945 | | | $ | 20,892 | | | $ | 27,921 | | | $ | 32,203 | |
| | | | | | | | | | | | | | | | | | | | | |
| Ratio of expenses to average net assets: | | | | | | | | | | | | | | | | | | | | |
| Before fees waived and expenses absorbed | | | 3.11 | % | | | 2.77 | % | | | 2.66 | % | | | 2.68 | % | | | 2.73 | % |
| After fees waived and expenses absorbed | | | 2.70 | % | | | 2.69 | % | | | 2.69 | % | | | 2.70 | % | | | 2.70 | % |
| Ratio of net investment loss to average net assets: | | | | | | | | | | | | | | | | | | | | |
| Before fees waived and expenses absorbed | | | (2.89 | )% | | | (1.37 | )% | | | (0.51 | )% | | | (1.67 | )% | | | (2.24 | )% |
| After fees waived and expenses absorbed | | | (2.48 | )% | | | (1.29 | )% | | | (0.54 | )% | | | (1.69 | )% | | | (2.21 | )% |
| | | | | | | | | | | | | | | | | | | | | |
| Portfolio turnover rate | | | 0 | % | | | 15 | % | | | 11 | % | | | 75 | % | | | 78 | % |
| * | Financial information from June 30, 2015 through January 24, 2020 is for the Equinox MutualHege Strategy Fund, which was reorganized into the AXS Managed Futures Strategy Fund as of the close of business on January 24, 2020. See Note 1 in the accompanying Notes to Consolidated Financial Statements. |
| 1 | Based on average shares outstanding for the period. |
| 2 | Amount represents less than $0.005 per share. |
| 3 | Total returns would have been higher/lower had expenses not been recovered/waived and absorbed by the Advisor. Returns shown include Rule 12b-1 fees of up to 1.00% and do not reflect the deduction of taxes that a shareholder would pay on Fund distributions or the redemption of Fund shares. Returns do not include payment of Contingent Deferred Sales Charge "(CDSC)" of 1.00% on certain redemptions of Class C shares made within 12 months of purchase. If the Sales charge was included, total returns would be lower. |
| 4 | Realized and unrealized gains and losses per share in this caption are balancing amounts necessary to reconcile the change in net asset value per share for the period, and may not reconcile with the aggregate gains and losses in the Statement of Operations due to share transactions for the period. |
See accompanying Notes to Consolidated Financial Statements.
AXS Managed Futures Strategy Fund
CONSOLIDATED FINANCIAL HIGHLIGHTS
Class I*
Per share operating performance.
For a capital share outstanding throughout each period.
| | | For the Year Ended September 30, | |
| | | | | | | | | | | | | | | | |
| | | 2021 | | | 2020 | | | 2019 | | | 2018 | | | 2017 | |
| Net asset value, beginning of period | | $ | 6.16 | | | $ | 9.36 | | | $ | 8.16 | | | $ | 8.12 | | | $ | 8.89 | |
| Income from Investment Operations: | | | | | | | | | | | | | | | | | | | | |
| Net investment income (loss)1 | | | (0.09 | ) | | | (0.02 | ) | | | 0.04 | | | | (0.05 | ) | | | (0.10 | ) |
| Net realized and unrealized gain (loss) | | | (0.19 | )4 | | | (2.08 | ) | | | 1.16 | | | | 0.09 | | | | (0.36 | ) |
| Total from investment operations | | | (0.28 | ) | | | (2.10 | ) | | | 1.20 | | | | 0.04 | | | | (0.46 | ) |
| | | | | | | | | | | | | | | | | | | | | |
| Less Distributions: | | | | | | | | | | | | | | | | | | | | |
| From net investment income | | | - | | | | (1.04 | ) | | | - | | | | - | | | | (0.13 | ) |
| From net realized gain | | | - | | | | - | | | | - | | | | - | | | | (0.04 | ) |
| From return of capital | | | - | | | | (0.06 | ) | | | - | | | | - | | | | (0.14 | ) |
| Total distributions | | | - | | | | (1.10 | ) | | | - | | | | - | | | | (0.31 | ) |
| | | | | | | | | | | | | | | | | | | | | |
| Redemption fee proceeds1 | | | - | 2 | | | - | 2 | | | - | 2 | | | - | 2 | | | - | 2 |
| | | | | | | | | | | | | | | | | | | | | |
| Net asset value, end of period | | $ | 5.88 | | | $ | 6.16 | | | $ | 9.36 | | | $ | 8.16 | | | $ | 8.12 | |
| | | | | | | | | | | | | | | | | | | | | |
| Total return3 | | | (4.55 | )% | | | (25.01 | )% | | | 14.71 | % | | | 0.49 | % | | | (5.37 | )% |
| | | | | | | | | | | | | | | | | | | | | |
| Ratios and Supplemental Data: | | | | | | | | | | | | | | | | | | | | |
| Net assets, end of period (in thousands) | | $ | 28,677 | | | $ | 91,638 | | | $ | 200,948 | | | $ | 202,274 | | | $ | 152,690 | |
| | | | | | | | | | | | | | | | | | | | | |
| Ratio of expenses to average net assets: | | | | | | | | | | | | | | | | | | | | |
| Before fees waived and expenses absorbed | | | 2.11 | % | | | 1.77 | % | | | 1.66 | % | | | 1.67 | % | | | 1.74 | % |
| After fees waived and expenses absorbed | | | 1.70 | % | | | 1.69 | % | | | 1.69 | % | | | 1.70 | % | | | 1.70 | % |
| Ratio of net investment income (loss) to average net assets: | | | | | | | | | | | | | | | | | | | | |
| Before fees waived and expenses absorbed | | | (1.89 | )% | | | (0.37 | )% | | | 0.49 | % | | | (0.59 | )% | | | (1.26 | )% |
| After fees waived and expenses absorbed | | | (1.48 | )% | | | (0.29 | )% | | | 0.46 | % | | | (0.62 | )% | | | (1.22 | )% |
| | | | | | | | | | | | | | | | | | | | | |
| Portfolio turnover rate | | | 0 | % | | | 15 | % | | | 11 | % | | | 75 | % | | | 78 | % |
| * | Financial information from September 30, 2015 through January 24, 2020 is for the Equinox MutualHedge Futures Strategy Fund, which was reorganized into the AXS Managed Futures Strategy Fund as of the close of business on January 24, 2020. See Note 1 in the accompanying Notes to Consolidated Financial Statements. |
| 1 | Based on average shares outstanding for the period. |
| 2 | Amount represents less than $0.005 per share. |
| 3 | Total returns would have been higher/lower had expenses not been recovered/waived and absorbed by the Advisor. Returns shown do not reflect the deduction of taxes that a shareholder would pay on Fund distributions or the redemption of Fund shares. |
| 4 | Realized and unrealized gains and losses per share in this caption are balancing amounts necessary to reconcile the change in net asset value per share for the period, and may not reconcile with the aggregate gains and losses in the Statement of Operations due to share transactions for the period. |
See accompanying Notes to Consolidated Financial Statements.
AXS Multi-Strategy Alternatives Fund
FINANCIAL HIGHLIGHTS
Class R-1*
Per share operating performance.
For a capital share outstanding throughout each period.
| | | | | | | | | For the Year Ended April 30, | |
| | | For the Year Ended September 30, 2021 | | | For the Period May 1, 2020 through September 30, 2020** | | | 2020 | | | 2019 | | | 2018 | | | 2017 | |
| Net asset value, beginning of period | | $ | 11.12 | | | $ | 9.95 | | | $ | 11.49 | | | $ | 13.28 | | | $ | 12.80 | | | $ | 11.56 | |
| Income from Investment Operations: | | | | | | | | | | | | | | | | | | | | | | | | |
| Net investment income (loss)1 | | | (0.11 | ) | | | (0.03 | ) | | | (0.03 | ) | | | - | 2 | | | 0.03 | | | | 0.04 | |
| Net realized and unrealized gain (loss) | | | 3.36 | | | | 1.20 | | | | (1.41 | ) | | | 0.61 | | | | 2.15 | | | | 1.64 | |
| Total from investment operations | | | 3.25 | | | | 1.17 | | | | (1.44 | ) | | | 0.61 | | | | 2.18 | | | | 1.68 | |
| | | | | | | | | | | | | | | | | | | | | | | | | |
| Less Distributions: | | | | | | | | | | | | | | | | | | | | | | | | |
| From net investment income | | | - | | | | - | | | | - | | | | - | | | | (0.05 | ) | | | - | |
| From net realized gain | | | - | | | | - | | | | (0.10 | ) | | | (2.40 | ) | | | (1.65 | ) | | | (0.44 | ) |
| Total distributions | | | - | | | | - | | | | (0.10 | ) | | | (2.40 | ) | | | (1.70 | ) | | | (0.44 | ) |
| | | | | | | | | | | | | | | | | | | | | | | | | |
| Net asset value, end of period | | $ | 14.37 | | | $ | 11.12 | | | $ | 9.95 | | | $ | 11.49 | | | $ | 13.28 | | | $ | 12.80 | |
| | | | | | | | | | | | | | | | | | | | | | | | | |
| Total return3 | | | 29.23 | % | | | 11.76 | %5 | | | (12.66 | )%4 | | | 5.34 | % | | | 17.25 | % | | | 14.70 | % |
| | | | | | | | | | | | | | | | | | | | | | | | | |
| Ratios and Supplemental Data: | | | | | | | | | | | | | | | | | | | | | | | | |
| Net assets, end of period (in thousands) | | $ | 10,546 | | | $ | 12,941 | | | $ | 14,586 | | | $ | 97,281 | | | $ | 84,790 | | | $ | 81,999 | |
| | | | | | | | | | | | | | | | | | | | | | | | | |
| Ratio of expenses to average net assets: | | | | | | | | | | | | | | | | | | | | | | | | |
| Before fees waived and expenses absorbed | | | 2.14 | % | | | 1.66 | %6 | | | 1.58 | % | | | 1.68 | % | | | 1.64 | % | | | 1.62 | % |
| After fees waived and expenses absorbed | | | 1.68 | % | | | 1.66 | %6 | | | 1.58 | % | | | 1.68 | % | | | 1.64 | % | | | 1.62 | % |
| | | | | | | | | | | | | | | | | | | | | | | | | |
| Ratio of net investment income (loss) to average net assets: | | | | | | | | | | | | | | | | | | | | | | | | |
| Before fees waived and expenses absorbed | | | (1.34 | )% | | | (0.75 | )%6 | | | (0.30 | )% | | | (0.02 | )% | | | 0.24 | % | | | 0.31 | % |
| After fees waived and expenses absorbed | | | (0.88 | )% | | | (0.75 | )%6 | | | (0.30 | )% | | | (0.02 | )% | | | 0.24 | % | | | 0.31 | % |
| | | | | | | | | | | | | | | | | | | | | | | | | |
| Portfolio turnover rate | | | 419 | % | | | 193 | %5 | | | 727 | % | | | 838 | % | | | 534 | % | | | 318 | % |
| * | Financial information from April 30, 2016 through October 18, 2019 is for the KCM Macro Trends Fund, which was reorganized into the AXS Multi-Strategy Alternatives Fund as of the close of business on October 18, 2019. See Note 1 in the accompanying Notes to Consolidated Financial Statements. |
| ** | Fiscal year end changed to September 30, effective May 1, 2020. |
| 1 | Based on average daily shares outstanding for the period. |
| 2 | Amount represents less than $0.005 per share. |
| 3 | Total returns would have been higher/lower had expenses not been recovered/waived and absorbed by the Advisor. Returns shown do not reflect the deduction of taxes that a shareholder would pay on Fund distributions or the redemption of Fund shares. |
| 4 | A predecessor affiliate reimbursed the Fund $43,948 for losses on pricing error (Note 3). The payment had a positive 0.09% impact to the total return. |
See accompanying Notes to Consolidated Financial Statements.
AXS Multi-Strategy Alternatives Fund
FINANCIAL HIGHLIGHTS
Class I*
Per share operating performance.
For a capital share outstanding throughout each period.
| | | | | | | | | For the Year Ended April 30, | | | | |
| | | For the Year Ended September 30, 2021 | | | For the Period May 1, 2020 through September 30, 2020*** | | | 2020 | | | 2019 | | | 2018 | | | For the Period March 20, 2017** through April 30, 2017 | |
| Net asset value, beginning of period | | $ | 11.16 | | | $ | 9.97 | | | $ | 11.53 | | | $ | 13.28 | | | $ | 12.80 | | | $ | 12.77 | |
| Income from Investment Operations: | | | | | | | | | | | | | | | | | | | | | | | | |
| Net investment income (loss)1 | | | (0.09 | ) | | | (0.02 | ) | | | - | 2 | | | 0.02 | | | | 0.04 | | | | - | 2 |
| Net realized and unrealized gain (loss) | | | 3.36 | | | | 1.21 | | | | (1.41 | ) | | | 0.63 | | | | 2.18 | | | | 0.03 | |
| Total from investment operations | | | 3.27 | | | | 1.19 | | | | (1.41 | ) | | | 0.65 | | | | 2.22 | | | | 0.03 | |
| | | | | | | | | | | | | | | | | | | | | | | | | |
| Less Distributions: | | | | | | | | | | | | | | | | | | | | | | | | |
| From net investment income | | | - | | | | - | | | | (0.05 | ) | | | - | | | | (0.09 | ) | | | - | |
| From net realized gain | | | - | | | | - | | | | (0.10 | ) | | | (2.40 | ) | | | (1.65 | ) | | | - | |
| Total distributions | | | - | | | | - | | | | (0.15 | ) | | | (2.40 | ) | | | (1.74 | ) | | | - | |
| | | | | | | | | | | | | | | | | | | | | | | | | |
| Net asset value, end of period | | $ | 14.43 | | | $ | 11.16 | | | $ | 9.97 | | | $ | 11.53 | | | $ | 13.28 | | | $ | 12.80 | |
| | | | | | | | | | | | | | | | | | | | | | | | | |
| Total return3 | | | 29.30 | % | | | 11.94 | %4 | | | (12.43 | )%7 | | | 5.65 | % | | | 17.49 | % | | | 0.23 | %4 |
| | | | | | | | | | | | | | | | | | | | | | | | | |
| Ratios and Supplemental Data: | | | | | | | | | | | | | | | | | | | | | | | | |
| Net assets, end of period6 | | $ | 9,490,282 | | | $ | 49,924,822 | | | $ | 43,876,547 | | | $ | 467,278 | | | $ | 563,187 | | | $ | 15 | |
| | | | | | | | | | | | | | | | | | | | | | | | | |
| Ratio of expenses to average net assets: | | | | | | | | | | | | | | | | | | | | | | | | |
| Before fees waived and expenses absorbed | | | 1.89 | % | | | 1.41 | %5 | | | 1.31 | % | | | 1.51 | % | | | 1.63 | % | | | 1.37 | %5 |
| After fees waived and expenses absorbed | | | 1.51 | % | | | 1.41 | %5 | | | 1.31 | % | | | 1.51 | % | | | 1.63 | % | | | 1.37 | %5 |
| Ratio of net investment income (loss) to average net assets: | | | | | | | | | | | | | | | | | | | | | | | | |
| Before fees waived and expenses absorbed | | | (1.09 | )% | | | (0.50 | )%5 | | | (0.03 | )% | | | 0.18 | % | | | 0.31 | % | | | 0.00 | %5 |
| After fees waived and expenses absorbed | | | (0.71 | )% | | | (0.50 | )%5 | | | (0.03 | )% | | | 0.18 | % | | | 0.31 | % | | | 0.00 | %5 |
| | | | | | | | | | | | | | | | | | | | | | | | | |
| Portfolio turnover rate | | | 419 | % | | | 193 | %4 | | | 727 | % | | | 838 | % | | | 534 | % | | | 318 | %4 |
| * | Financial information from March 20, 2017 through October 18, 2019 is for the KCM Macro Trends Fund, which was reorganized into the AXS Multi-Strategy Alternatives Fund as of the close of business on October 18, 2019. On October 21, 2019, Institutional Class shares were re-designated into Class I Shares. See Note 1 in the accompanying Notes to Consolidated Financial Statements. |
| ** | Commencement of operations. |
| *** | Fiscal year end changed to September 30, effective May 1, 2020. |
| 1 | Based on average daily shares outstanding for the period. |
| 2 | Amount represents less than $0.005 per share. |
| 3 | Total returns would have been higher/lower had expenses not been recovered/waived and absorbed by the Advisor. Returns shown do not reflect the deduction of taxes that a shareholder would pay on Fund distributions or the redemption of Fund shares. |
| 6 | Amount is actual; not presented in thousands. |
| 7 | Payment by a predecessor affiliate had no impact to the total return (Note 3). |
See accompanying Notes to Consolidated Financial Statements.
AXS Sustainable Income Fund
FINANCIAL HIGHLIGHTS
Class I
Per share operating performance.
For a capital share outstanding throughout each period.
| | | For the Period October 17, 2020* through September 30, 2021 | |
| Net asset value, beginning of period | | $ | 10.00 | |
| Income from Investment Operations: | | | | |
| Net investment income 1 | | | 0.47 | |
| Net realized and unrealized gain | | | 0.36 | |
| Total from investment operations | | | 0.83 | |
| | | | | |
| Less Distributions: | | | | |
| From net investment income | | | (0.46 | ) |
| Total distributions | | | (0.46 | ) |
| | | | | |
| Net asset value, end of period | | $ | 10.37 | |
| | | | | |
| Total return 2 | | | 8.42 | %3 |
| | | | | |
| Ratios and Supplemental Data: | | | | |
| Net assets, end of period (in thousands) | | $ | 52,840 | |
| | | | | |
| Ratio of expenses to average net assets: | | | | |
| Before fees waived and expenses absorbed | | | 1.11 | %4 |
| After fees waived and expenses absorbed | | | 0.99 | %4 |
| Ratio of net investment income to average net assets: | | | | |
| Before fees waived and expenses absorbed | | | 4.62 | %4 |
| After fees waived and expenses absorbed | | | 4.74 | %4 |
| | | | | |
| Portfolio turnover rate | | | 114 | %3 |
| * | Commencement of operations. |
| 1 | Based on average shares outstanding for the period. |
| 2 | Total returns would have been lower had expenses not been waived and absorbed by the Advisor. Returns shown do not reflect the deduction of taxes that a shareholder would pay on Fund distributions or the redemption of Fund shares. |
See accompanying Notes to Consolidated Financial Statements.
AXS Thomson Reuters Private Equity Return Tracker Fund
FINANCIAL HIGHLIGHTS
Class A*
Per share operating performance.
For a capital share outstanding throughout each period.
| | | For the Year Ended September 30, | |
| | | 2021 | | | 2020 | | | 2019 | | | 2018 | | | 2017 | |
| Net asset value, beginning of period | | $ | 14.05 | | | $ | 12.70 | | | $ | 13.97 | | | $ | 11.83 | | | $ | 10.28 | |
| Income from Investment Operations: | | | | | | | | | | | | | | | | | | | | |
| Net investment income (loss)1 | | | (0.06 | ) | | | 0.03 | | | | 0.06 | | | | 0.04 | | | | 0.06 | |
| Net realized and unrealized gain (loss) | | | 4.11 | | | | 1.32 | | | | (0.46 | ) | | | 2.66 | | | | 1.64 | |
| Total from investment operations | | | 4.05 | | | | 1.35 | | | | (0.40 | ) | | | 2.70 | | | | 1.70 | |
| | | | | | | | | | | | | | | | | | | | | |
| Less Distributions: | | | | | | | | | | | | | | | | | | | | |
| Return of capital | | | - | | | | - | | | | (0.02 | ) | | | - | | | | - | |
| From net investment income | | | - | | | | - | | | | - | | | | (0.22 | ) | | | - | |
| From net realized gain | | | (0.67 | ) | | | - | | | | (0.85 | ) | | | (0.35 | ) | | | (0.15 | ) |
| Total distributions | | | (0.67 | ) | | | - | | | | (0.87 | ) | | | (0.57 | ) | | | (0.15 | ) |
| | | | | | | | | | | | | | | | | | | | | |
| Redemption fee proceeds1 | | | - | 2 | | | - | 2 | | | - | 2 | | | 0.01 | | | | - | |
| | | | | | | | | | | | | | | | | | | | | |
| Net asset value, end of period | | $ | 17.43 | | | $ | 14.05 | | | $ | 12.70 | | | $ | 13.96 | | | $ | 11.83 | |
| | | | | | | | | | | | | | | | | | | | | |
| Total return3 | | | 29.35 | % | | | 10.63 | % | | | (1.99 | )% | | | 23.41 | % | | | 16.71 | % |
| | | | | | | | | | | | | | | | | | | | | |
| Ratios and Supplemental Data: | | | | | | | | | | | | | | | | | | | | |
| Net assets, end of period4 | | $ | 579,282 | | | $ | 237,027 | | | $ | 1,722,198 | | | $ | 1,123,625 | | | $ | 727,863 | |
| | | | | | | | | | | | | | | | | | | | | |
| Ratio of expenses to average net assets: | | | | | | | | | | | | | | | | | | | | |
| Before fees waived and expenses absorbed | | | 2.29 | % | | | 1.94 | % | | | 2.05 | % | | | 2.05 | % | | | 2.06 | % |
| After fees waived and expenses absorbed | | | 1.78 | % | | | 1.75 | % | | | 1.75 | % | | | 1.75 | % | | | 1.75 | % |
| Ratio of net investment income (loss) to average net assets: | | | | | | | | | | | | | | | | | | | | |
| Before fees waived and expenses absorbed | | | (0.87 | )% | | | 0.04 | % | | | 0.23 | % | | | 0.03 | % | | | 0.19 | % |
| After fees waived and expenses absorbed | | | (0.36 | )% | | | 0.23 | % | | | 0.53 | % | | | 0.33 | % | | | 0.50 | % |
| | | | | | | | | | | | | | | | | | | | | |
| Portfolio turnover rate | | | 100 | % | | | 78 | % | | | 72 | % | | | 38 | % | | | 48 | % |
| * | Financial information from October 1, 2015 through November 20, 2020 is for the Leland Thomson Reuters Private Equity Buyout Index Fund, which was reorganized into the AXS Thomson Reuters Private Equity Return Tracker Fund as of the close of business on November 20, 2020. See Note 1 in the accompanying Notes to Consolidated Financial Statements. |
| 1 | Based on average daily shares outstanding for the period. |
| 2 | Amount represents less than $0.005 per share. |
| 3 | Total returns would have been lower had expenses not been waived and absorbed by the Advisor. Returns shown include Rule 12b-1 fees of up to 0.25% and do not reflect the deduction of taxes that a shareholder would pay on Fund distributions or the redemption of Fund shares. Returns shown do not include payment of sales load of 5.75% of offering price which will not apply on sales of $1 million or more. If the sales charge was included total returns would be lower. |
| 4 | Amount is actual; not presented in thousands. |
See accompanying Notes to Consolidated Financial Statements.
AXS Thomson Reuters Private Equity Return Tracker Fund
FINANCIAL HIGHLIGHTS
Class C*
Per share operating performance.
For a capital share outstanding throughout each period.
| | | For the Year Ended September 30, | |
| | | 2021 | | | 2020 | | | 2019 | | | 2018 | | | 2017 | |
| Net asset value, beginning of period | | $ | 13.67 | | | $ | 12.46 | | | $ | 13.82 | | | $ | 11.71 | | | $ | 10.26 | |
| Income from Investment Operations: | | | | | | | | | | | | | | | | | | | | |
| Net investment loss1 | | | (0.18 | ) | | | (0.07 | ) | | | (0.03 | ) | | | (0.05 | ) | | | (0.04 | ) |
| Net realized and unrealized gain (loss) | | | 4.00 | | | | 1.28 | | | | (0.46 | ) | | | 2.63 | | | | 1.64 | |
| Total from investment operations | | | 3.82 | | | | 1.21 | | | | (0.49 | ) | | | 2.58 | | | | 1.60 | |
| | | | | | | | | | | | | | | | | | | | | |
| Less Distributions: | | | | | | | | | | | | | | | | | | | | |
| Return of capital | | | - | | | | - | | | | (0.02 | ) | | | - | | | | - | |
| From net investment income | | | - | | | | - | | | | - | | | | (0.12 | ) | | | - | |
| From net realized gain | | | (0.67 | ) | | | - | | | | (0.85 | ) | | | (0.35 | ) | | | (0.15 | ) |
| Total distributions | | | (0.67 | ) | | | - | | | | (0.87 | ) | | | (0.47 | ) | | | (0.15 | ) |
| | | | | | | | | | | | | | | | | | | | | |
| Redemption fee proceeds1 | | | - | | | | - | 2 | | | - | 2 | | | - | | | | - | |
| | | | | | | | | | | | | | | | | | | | | |
| Net asset value, end of period | | $ | 16.82 | | | $ | 13.67 | | | $ | 12.46 | | | $ | 13.82 | | | $ | 11.71 | |
| | | | | | | | | | | | | | | | | | | | | |
| Total return3 | | | 28.36 | % | | | 9.71 | % | | | (2.70 | )% | | | 22.42 | % | | | 15.76 | % |
| | | | | | | | | | | | | | | | | | | | | |
| Ratios and Supplemental Data: | | | | | | | | | | | | | | | | | | | | |
| Net assets, end of period4 | | $ | 206,331 | | | $ | 1,084,258 | | | $ | 500,680 | | | $ | 664,524 | | | $ | 109,775 | |
| | | | | | | | | | | | | | | | | | | | | |
| Ratio of expenses to average net assets: | | | | | | | | | | | | | | | | | | | | |
| Before fees waived and expenses absorbed | | | 3.04 | % | | | 2.69 | % | | | 2.80 | % | | | 2.80 | % | | | 2.81 | % |
| After fees waived and expenses absorbed | | | 2.53 | % | | | 2.50 | % | | | 2.50 | % | | | 2.50 | % | | | 2.50 | % |
| Ratio of net investment loss to average net assets: | | | | | | | | | | | | | | | | | | | | |
| Before fees waived and expenses absorbed | | | (1.62 | )% | | | (0.71 | )% | | | (0.52 | )% | | | (0.70 | )% | | | (0.67 | )% |
| After fees waived and expenses absorbed | | | (1.11 | )% | | | (0.52 | )% | | | (0.22 | )% | | | (0.40 | )% | | | (0.36 | )% |
| | | | | | | | | | | | | | | | | | | | | |
| Portfolio turnover rate | | | 100 | % | | | 78 | % | | | 72 | % | | | 38 | % | | | 48 | % |
| * | Financial information from October 1, 2015 through November 20, 2020 is for the Leland Thomson Reuters Private Equity Buyout Index Fund, which was reorganized into the AXS Thomson Reuters Private Equity Return Tracker Fund as of the close of business on November 20, 2020. See Note 1 in the accompanying Notes to Consolidated Financial Statements. |
| 1 | Based on average daily shares outstanding for the period. |
| 2 | Amount represents less than $0.005 per share. |
| 3 | Total returns would have been lower had expenses not been waived and absorbed by the Advisor. Returns shown include Rule 12b-1 fees of up to 1.00% and do not reflect the deduction of taxes that a shareholder would pay on Fund distributions or the redemption of Fund shares. Returns do not include payment of Contingent Deferred Sales Charge ("CDSC") of 1.00% on certain redemptions of Class C shares made within 12 months of purchase. If the Sales charge was included, total returns would be lower. |
| 4 | Amount is actual; not presented in thousands. |
See accompanying Notes to Consolidated Financial Statements.
AXS Thomson Reuters Private Equity Return Tracker Fund
FINANCIAL HIGHLIGHTS
Class I*
Per share operating performance.
For a capital share outstanding throughout each period.
| | | For the Year Ended September 30, | |
| | | 2021 | | | 2020 | | | 2019 | | | 2018 | | | 2017 | |
| Net asset value, beginning of period | | $ | 14.20 | | | $ | 12.81 | | | $ | 14.05 | | | $ | 11.88 | | | $ | 10.30 | |
| Income from Investment Operations: | | | | | | | | | | | | | | | | | | | | |
| Net investment income (loss)1 | | | (0.02 | ) | | | 0.06 | | | | 0.09 | | | | 0.08 | | | | 0.08 | |
| Net realized and unrealized gain (loss) | | | 4.16 | | | | 1.33 | | | | (0.46 | ) | | | 2.68 | | | | 1.65 | |
| Total from investment operations | | | 4.14 | | | | 1.39 | | | | (0.37 | ) | | | 2.76 | | | | 1.73 | |
| | | | | | | | | | | | | | | | | | | | | |
| Less Distributions: | | | | | | | | | | | | | | | | | | | | |
| Return of capital | | | - | | | | - | | | | (0.02 | ) | | | - | | | | - | |
| From net investment income | | | - | | | | - | | | | - | | | | (0.24 | ) | | | - | |
| From net realized gain | | | (0.67 | ) | | | - | | | | (0.85 | ) | | | (0.35 | ) | | | (0.15 | ) |
| Total distributions | | | (0.67 | ) | | | - | | | | (0.87 | ) | | | (0.59 | ) | | | (0.15 | ) |
| | | | | | | | | | | | | | | | | | | | | |
| Redemption fee proceeds1 | | | - | 2 | | | - | 2 | | | - | 2 | | | - | 2 | | | - | 2 |
| | | | | | | | | | | | | | | | | | | | | |
| Net asset value, end of period | | $ | 17.67 | | | $ | 14.20 | | | $ | 12.81 | | | $ | 14.05 | | | $ | 11.88 | |
| | | | | | | | | | | | | | | | | | | | | |
| Total return3 | | | 29.68 | % | | | 10.85 | % | | | (1.75 | )% | | | 23.71 | % | | | 16.98 | % |
| | | | | | | | | | | | | | | | | | | | | |
| Ratios and Supplemental Data: | | | | | | | | | | | | | | | | | | | | |
| Net assets, end of period (in thousands) | | $ | 25,057 | | | $ | 21,073 | | | $ | 17,336 | | | $ | 18,108 | | | $ | 9,884 | |
| | | | | | | | | | | | | | | | | | | | | |
| Ratio of expenses to average net assets: | | | | | | | | | | | | | | | | | | | | |
| Before fees waived and expenses absorbed | | | 2.04 | % | | | 1.69 | % | | | 1.80 | % | | | 1.80 | % | | | 1.81 | % |
| After fees waived and expenses absorbed | | | 1.53 | % | | | 1.50 | % | | | 1.50 | % | | | 1.50 | % | | | 1.50 | % |
| Ratio of net investment income (loss) to average net assets: | | | | | | | | | | | | | | | | | | | | |
| Before fees waived and expenses absorbed | | | (0.62 | )% | | | 0.29 | % | | | 0.48 | % | | | 0.29 | % | | | 0.39 | % |
| After fees waived and expenses absorbed | | | (0.11 | )% | | | 0.48 | % | | | 0.78 | % | | | 0.59 | % | | | 0.70 | % |
| | | | | | | | | | | | | | | | | | | | | |
| Portfolio turnover rate | | | 100 | % | | | 78 | % | | | 72 | % | | | 38 | % | | | 48 | % |
| * | Financial information from October 1, 2015 through November 20, 2020 is for the Leland Thomson Reuters Private Equity Buyout Index Fund, which was reorganized into the AXS Thomson Reuters Private Equity Return Tracker Fund as of the close of business on November 20, 2020. See Note 1 in the accompanying Notes to Consolidated Financial Statements. |
| 1 | Based on average daily shares outstanding for the period. |
| 2 | Amount represents less than $0.005 per share. |
| 3 | Total returns would have been lower had expenses not been waived and absorbed by the Advisor. Returns shown do not reflect the deduction of taxes that a shareholder would pay on Fund distributions or the redemption of Fund shares. |
See accompanying Notes to Consolidated Financial Statements.
AXS Thomson Reuters Venture Capital Return Tracker Fund
FINANCIAL HIGHLIGHTS
Class A*
Per share operating performance.
For a capital share outstanding throughout each period.
| | | For the Year Ended September 30, | |
| | | 2021 | | | 2020 | | | 2019 | | | 2018 | | | 2017 | |
| Net asset value, beginning of period | | $ | 31.14 | | | $ | 18.26 | | | $ | 19.88 | | | $ | 14.73 | | | $ | 11.50 | |
| Income from Investment Operations: | | | | | | | | | | | | | | | | | | | | |
| Net investment loss1 | | | (0.34 | ) | | | (0.18 | ) | | | (0.09 | ) | | | (0.15 | ) | | | (0.10 | ) |
| Net realized and unrealized gain (loss) | | | 9.73 | | | | 13.04 | | | | (0.45 | ) | | | 6.87 | | | | 3.77 | |
| Net increase from payment by affiliates (Note 3) | | | - | 2 | | | - | | | | - | | | | - | | | | - | |
| Total from investment operations | | | 9.39 | | | | 12.86 | | | | (0.54 | ) | | | 6.72 | | | | 3.67 | |
| | | | | | | | | | | | | | | | | | | | | |
| Less Distributions: | | | | | | | | | | | | | | | | | | | | |
| From net investment income | | | - | | | | - | | | | - | | | | (0.36 | ) | | | - | |
| From net realized gain | | | (5.41 | ) | | | - | | | | (1.08 | ) | | | (1.23 | ) | | | (0.44 | ) |
| Total distributions | | | (5.41 | ) | | | - | | | | (1.08 | ) | | | (1.59 | ) | | | (0.44 | ) |
| | | | | | | | | | | | | | | | | | | | | |
| Redemption fee proceeds1 | | | 0.01 | | | | 0.02 | | | | - | 2 | | | 0.02 | | | | - | |
| | | | | | | | | | | | | | | | | | | | | |
| Net asset value, end of period | | $ | 35.13 | | | $ | 31.14 | | | $ | 18.26 | | | $ | 19.88 | | | $ | 14.73 | |
| | | | | | | | | | | | | | | | | | | | | |
| Total return3 | | | 33.23 | % | | | 70.54 | % | | | (1.84 | )% | | | 49.63 | % | | | 33.24 | % |
| | | | | | | | | | | | | | | | | | | | | |
| Ratios and Supplemental Data: | | | | | | | | | | | | | | | | | | | | |
| Net assets, end of period (in thousands) | | $ | 103,229 | | | $ | 82,691 | | | $ | 37,779 | | | $ | 41,820 | | | $ | 1,519 | |
| | | | | | | | | | | | | | | | | | | | | |
| Ratio of expenses to average net assets: | | | | | | | | | | | | | | | | | | | | |
| Before fees waived and expenses absorbed | | | 1.85 | % | | | 1.89 | % | | | 2.06 | % | | | 1.99 | % | | | 1.99 | % |
| After fees waived and expenses absorbed | | | 1.76 | % | | | 1.75 | % | | | 1.75 | % | | | 1.75 | % | | | 1.75 | % |
| Ratio of net investment loss to average net assets: | | | | | | | | | | | | | | | | | | | | |
| Before fees waived and expenses absorbed | | | (1.11 | )% | | | (0.90 | )% | | | (0.83 | )% | | | (1.06 | )% | | | (0.96 | )% |
| After fees waived and expenses absorbed | | | (1.02 | )% | | | (0.76 | )% | | | (0.52 | )% | | | (0.82 | )% | | | (0.72 | )% |
| | | | | | | | | | | | | | | | | | | | | |
| Portfolio turnover rate | | | 100 | % | | | 115 | % | | | 115 | % | | | 47 | % | | | 88 | % |
| * | Financial information from October 1, 2016 through November 20, 2020 is for the Leland Thomson Reuters Venture Capital Index Fund, which was reorganized into the AXS Thomson Reuters Venture Capital Return Tracker Fund as of the close of business on November 20, 2020. See Note 1 in the accompanying Notes to Consolidated Financial Statements. |
| 1 | Based on average daily shares outstanding for the period. |
| 2 | Amount represents less than $0.005 per share. |
| 3 | Total returns would have been lower had expenses not been waived and absorbed by the Advisor. Returns shown include Rule 12b-1 fees of up to 0.25% and do not reflect the deduction of taxes that a shareholder would pay on Fund distributions or the redemption of Fund shares. Returns shown do not include payment of sales load of 5.75% of offering price which will not apply on sales of $1 million or more. If the sales charge was included total returns would be lower. |
See accompanying Notes to Consolidated Financial Statements.
AXS Thomson Reuters Venture Capital Return Tracker Fund
FINANCIAL HIGHLIGHTS
Class C*
Per share operating performance.
For a capital share outstanding throughout each period.
| | | For the Year Ended September 30, | |
| | | 2021 | | | 2020 | | | 2019 | | | 2018 | | | 2017 | |
| Net asset value, beginning of period | | $ | 29.98 | | | $ | 17.71 | | | $ | 19.46 | | | $ | 14.52 | | | $ | 11.43 | |
| Income from Investment Operations: | | | | | | | | | | | | | | | | | | | | |
| Net investment loss1 | | | (0.57 | ) | | | (0.34 | ) | | | (0.22 | ) | | | (0.28 | ) | | | (0.20 | ) |
| Net realized and unrealized gain (loss) | | | 9.32 | | | | 12.60 | | | | (0.45 | ) | | | 6.78 | | | | 3.73 | |
| Net increase from payment by affiliates (Note 3) | | | - | 2 | | | - | | | | - | | | | - | | | | - | |
| Total from investment operations | | | 8.75 | | | | 12.26 | | | | (0.67 | ) | | | 6.50 | | | | 3.53 | |
| | | | | | | | | | | | | | | | | | | | | |
| Less Distributions: | | | | | | | | | | | | | | | | | | | | |
| From net investment income | | | - | | | | - | | | | - | | | | (0.34 | ) | | | - | |
| From net realized gain | | | (5.41 | ) | | | - | | | | (1.08 | ) | | | (1.23 | ) | | | (0.44 | ) |
| Total distributions | | | (5.41 | ) | | | - | | | | (1.08 | ) | | | (1.57 | ) | | | (0.44 | ) |
| | | | | | | | | | | | | | | | | | | | | |
| Redemption fee proceeds1 | | | 0.01 | | | | 0.01 | | | | - | 2 | | | 0.01 | | | | - | |
| | | | | | | | | | | | | | | | | | | | | |
| Net asset value, end of period | | $ | 33.33 | | | $ | 29.98 | | | $ | 17.71 | | | $ | 19.46 | | | $ | 14.52 | |
| | | | | | | | | | | | | | | | | | | | | |
| Total return3 | | | 32.26 | % | | | 69.28 | % | | | (2.59 | )% | | | 48.59 | % | | | 32.19 | % |
| | | | | | | | | | | | | | | | | | | | | |
| Ratios and Supplemental Data: | | | | | | | | | | | | | | | | | | | | |
| Net assets, end of period (in thousands) | | $ | 14,776 | | | $ | 11,205 | | | $ | 5,315 | | | $ | 6,198 | | | $ | 98 | |
| | | | | | | | | | | | | | | | | | | | | |
| Ratio of expenses to average net assets: | | | | | | | | | | | | | | | | | | | | |
| Before fees waived and expenses absorbed | | | 2.60 | % | | | 2.64 | % | | | 2.81 | % | | | 2.74 | % | | | 2.74 | % |
| After fees waived and expenses absorbed | | | 2.51 | % | | | 2.50 | % | | | 2.50 | % | | | 2.50 | % | | | 2.50 | % |
| Ratio of net investment loss to average net assets: | | | | | | | | | | | | | | | | | | | | |
| Before fees waived and expenses absorbed | | | (1.86 | )% | | | (1.64 | )% | | | (1.58 | )% | | | (1.81 | )% | | | (1.74 | )% |
| After fees waived and expenses absorbed | | | (1.77 | )% | | | (1.50 | )% | | | (1.27 | )% | | | (1.57 | )% | | | (1.50 | )% |
| | | | | | | | | | | | | | | | | | | | | |
| Portfolio turnover rate | | | 100 | % | | | 115 | % | | | 115 | % | | | 47 | % | | | 88 | % |
| * | Financial information from October 1, 2016 through November 20, 2020 is for the Leland Thomson Reuters Venture Capital Index Fund, which was reorganized into the AXS Thomson Reuters Venture Capital Return Tracker Fund as of the close of business on November 20, 2020. See Note 1 in the accompanying Notes to Consolidated Financial Statements. |
| 1 | Based on average daily shares outstanding for the period. |
| 2 | Amount represents less than $0.005 per share. |
| 3 | Total returns would have been lower had expenses not been waived and absorbed by the Advisor. Returns shown include Rule 12b-1 fees of up to 1.00% and do not reflect the deduction of taxes that a shareholder would pay on Fund distributions or the redemption of Fund shares. Returns do not include payment of Contingent Deferred Sales Charge ("CDSC") of 1.00% on certain redemptions of Class C shares made within 12 months of purchase. If the Sales charge was included, total returns would be lower. |
See accompanying Notes to Consolidated Financial Statements.
AXS Thomson Reuters Venture Capital Return Tracker Fund
FINANCIAL HIGHLIGHTS
Class I*
Per share operating performance.
For a capital share outstanding throughout each period.
| | | For the Year Ended September 30, | |
| | | 2021 | | | 2020 | | | 2019 | | | 2018 | | | 2017 | |
| Net asset value, beginning of period | | $ | 31.45 | | | $ | 18.40 | | | $ | 19.97 | | | $ | 14.79 | | | $ | 11.51 | |
| Income from Investment Operations: | | | | | | | | | | | | | | | | | | | | |
| Net investment loss1 | | | (0.26 | ) | | | (0.12 | ) | | | (0.05 | ) | | | (0.10 | ) | | | (0.06 | ) |
| Net realized and unrealized gain (loss) | | | 9.84 | | | | 13.16 | | | | (0.44 | ) | | | 6.88 | | | | 3.78 | |
| Net increase from payment by affiliates (Note 3) | | | - | 2 | | | - | | | | - | | | | - | | | | - | |
| Total from investment operations | | | 9.58 | | | | 13.04 | | | | (0.49 | ) | | | 6.78 | | | | 3.72 | |
| | | | | | | | | | | | | | | | | | | | | |
| Less Distributions: | | | | | | | | | | | | | | | | | | | | |
| From net investment income | | | - | | | | - | | | | - | | | | (0.37 | ) | | | - | |
| From net realized gain | | | (5.41 | ) | | | - | | | | (1.08 | ) | | | (1.23 | ) | | | (0.44 | ) |
| Total distributions | | | (5.41 | ) | | | - | | | | (1.08 | ) | | | (1.60 | ) | | | (0.44 | ) |
| | | | | | | | | | | | | | | | | | | | | |
| Redemption fee proceeds1 | | | 0.01 | | | | 0.01 | | | | - | 2 | | | - | 2 | | | - | |
| | | | | | | | | | | | | | | | | | | | | |
| Net asset value, end of period | | $ | 35.63 | | | $ | 31.45 | | | $ | 18.40 | | | $ | 19.97 | | | $ | 14.79 | |
| | | | | | | | | | | | | | | | | | | | | |
| Total return3 | | | 33.54 | % | | | 70.92 | % | | | (1.57 | )% | | | 49.75 | % | | | 33.66 | % |
| | | | | | | | | | | | | | | | | | | | | |
| Ratios and Supplemental Data: | | | | | | | | | | | | | | | | | | | | |
| Net assets, end of period (in thousands) | | $ | 257,170 | | | $ | 148,199 | | | $ | 59,881 | | | $ | 54,377 | | | $ | 12,191 | |
| | | | | | | | | | | | | | | | | | | | | |
| Ratio of expenses to average net assets: | | | | | | | | | | | | | | | | | | | | |
| Before fees waived and expenses absorbed | | | 1.60 | % | | | 1.64 | % | | | 1.81 | % | | | 1.74 | % | | | 1.74 | % |
| After fees waived and expenses absorbed | | | 1.51 | % | | | 1.50 | % | | | 1.50 | % | | | 1.50 | % | | | 1.50 | % |
| Ratio of net investment loss to average net assets: | | | | | | | | | | | | | | | | | | | | |
| Before fees waived and expenses absorbed | | | (0.86 | )% | | | (0.66 | )% | | | (0.59 | )% | | | (0.78 | )% | | | (0.72 | )% |
| After fees waived and expenses absorbed | | | (0.77 | )% | | | (0.52 | )% | | | (0.28 | )% | | | (0.54 | )% | | | (0.48 | )% |
| | | | | | | | | | | | | | | | | | | | | |
| Portfolio turnover rate | | | 100 | % | | | 115 | % | | | 115 | % | | | 47 | % | | | 88 | % |
| * | Financial information from October 1, 2016 through November 20, 2020 is for the Leland Thomson Reuters Venture Capital Index Fund, which was reorganized into the AXS Thomson Reuters Venture Capital Return Tracker Fund as of the close of business on November 20, 2020. See Note 1 in the accompanying Notes to Consolidated Financial Statements. |
| 1 | Based on average daily shares outstanding for the period. |
| 2 | Amount represents less than $0.005 per share. |
| 3 | Total returns would have been lower had expenses not been waived and absorbed by the Advisor. Returns shown do not reflect the deduction of taxes that a shareholder would pay on Fund distributions or the redemption of Fund shares. |
See accompanying Notes to Consolidated Financial Statements.
AXS Funds
NOTES TO CONSOLIDATED FINANCIAL STATEMENTS
September 30, 2021
Note 1 – Organization
AXS Alternative Growth Fund (the ‘‘Alternative Growth Fund’’), AXS Aspect Core Diversified Strategy Fund (the “Aspect Core Diversified Strategy Fund”), AXS Chesapeake Strategy Fund (the “Chesapeake Strategy Fund”), AXS Managed Futures Strategy Fund (the “Managed Futures Strategy Fund”), AXS Multi-Strategy Alternatives Fund (the “Multi-Strategy Alternatives Fund”), AXS Sustainable Income Fund (the “Sustainable Income Fund”), AXS Thomson Reuters Private Equity Return Tracker Fund (the “Thomson Reuters Private Equity Return Tracker Fund”) and AXS Thomson Reuters Venture Capital Return Tracker Fund (the “Thomson Reuters Venture Capital Return Tracker Fund”) (each a “Fund” and collectively the ‘‘Funds’’) are organized as a diversified series of Investment Managers Series Trust II, a Delaware statutory trust (the “Trust”) which is registered as an open-end management investment company under the Investment Company Act of 1940, as amended (the “1940 Act”).
Each Fund, other than the Alternative Growth Fund, the Multi-Strategy Alternatives Fund, and the Sustainable Income Fund, is authorized to, and currently offers three classes of shares, Class A, Class C, and Class I. The Alternative Growth Fund currently offers two classes of shares, Class A and Class I. The Multi-Strategy Alternatives Fund currently offers two classes of shares, Class R-1 and Class I. The Sustainable Income Fund currently offers one class of shares, Class I. Class A Shares of the Sustainable Income Fund are not currently available.
The Alternative Growth Fund’s investment objective is to seek to achieve returns and volatility comparable to the S&P 500® Total Return Index, while seeking to avoid the full impact of downside risk. Effective July 1, 2020, the Alternative Growth Fund changed fiscal year end from June 30th to September 30th.
The Alternative Growth Fund commenced investment operations on November 11, 2019 with Class A shares and Class I shares. Prior to that date, the Alternative Growth Fund acquired the assets and assumed the liabilities of the Equinox Ampersand Strategy Fund (the "Alternative Growth Predecessor Fund"), a series of Equinox Funds Trust, which offered two classes of shares, Class A shares and Class I shares, in a tax-free reorganization as set out in the Agreement and Plan of Reorganization. The proposed Plan of Reorganization was approved by the Trust’s Board on June 14, 2019, by the Board of Equinox Funds Trust on July 1, 2019, and by beneficial owners of the Alternative Growth Predecessor Fund on October 17, 2019. The tax-free reorganization was accomplished on November 8, 2019. As a result of the reorganization, the Alternative Growth Fund assumed the performance and accounting history of the Alternative Growth Predecessor Fund. Financial information included for the dates prior to the reorganization is that of the Alternative Growth Predecessor Fund.
The reorganization was accomplished by the following tax-free exchange in which each shareholder of the Alternative Growth Predecessor Fund received the same aggregate share net asset value in the corresponding classes as noted below:
| | | Shares Issued | | | Net Assets | |
| Class A | | | 146,943 | | | $ | 1,754,296 | |
| Class I | | | 1,488,202 | | | $ | 18,014,396 | |
The net unrealized appreciation of investments transferred was $653,641 as of the date of the acquisition.
The Aspect Core Diversified Strategy Fund’s investment objective is to achieve long term capital appreciation.
The Aspect Core Diversified Strategy Fund commenced investment operations on November 11, 2019 with Class A shares, Class C Shares and Class I shares. Prior to that date, the Aspect Core Diversified Strategy Fund acquired the assets and assumed the liabilities of the Equinox Aspect Core Diversified Strategy Fund (the “Aspect Core Diversified Strategy Predecessor Fund”), a series of Equinox Funds Trust, which offered three class of shares, Class A, Class C, and Class I shares. On October 15, 2019, beneficial owners of the Aspect Core Diversified Strategy Predecessor Fund approved a proposed Agreement and Plan of Reorganization that provided for the reorganization into the AXS Aspect Core Diversified Strategy Fund. The Plan of Reorganization was approved by the Trust’s Board on June 14, 2019 and by the Equinox Funds Trust Board on July 1, 2019. The tax-free reorganization was accomplished on November 8, 2019. As a result of the reorganization, the Aspect Core Diversified Strategy Fund assumed the performance and accounting history of the Aspect Core Diversified Strategy Predecessor Fund. Financial information included for the dates prior to the reorganization is that of the Aspect Core Diversified Strategy Predecessor Fund Predecessor Fund.
AXS Funds
NOTES TO CONSOLIDATED FINANCIAL STATEMENTS - Continued
September 30, 2021
The reorganization was accomplished by the following tax-free exchange in which each shareholder of the Aspect Core Diversified Strategy Predecessor Fund received the same aggregate share net asset value in the corresponding classes as noted below:
| | | Shares Issued | | | Net Assets | |
| Class A | | | 78,751 | | | $ | 722,915 | |
| Class C | | | 365,100 | | | $ | 3,238,610 | |
| Class I | | | 2,041,750 | | | $ | 18,804,907 | |
The net unrealized appreciation of investments transferred was $27,284 as of the date of the acquisition.
The Chesapeake Strategy Fund’s investment objective is to achieve long-term capital appreciation.
The Chesapeake Strategy Fund commenced investment operations on November 11, 2019 with Class A shares, Class C Shares and Class I shares. Prior to that date, the Chesapeake Strategy Fund acquired the assets and assumed the liabilities of the Equinox Chesapeake Strategy Fund (the “Chesapeake Strategy Predecessor Fund”), a series of Equinox Funds Trust, which offered three class of shares, Class A, Class C, and Class I shares. On November 6, 2019, beneficial owners of the Chesapeake Strategy Predecessor Fund approved a proposed Agreement and Plan of Reorganization that provided for the reorganization into the AXS Chesapeake Strategy Fund. The Plan of Reorganization was approved by the Trust’s Board on June 14, 2019 and by the Equinox Funds Trust Board on July 1, 2019. The tax-free reorganization was accomplished on November 8, 2019. As a result of the reorganization, the Chesapeake Strategy Fund assumed the performance and accounting history of the Chesapeake Strategy Predecessor Fund. Financial information included for the dates prior to the reorganization is that of the Chesapeake Strategy Predecessor Fund.
The reorganization was accomplished by the following tax-free exchange in which each shareholder of the Chesapeake Strategy Predecessor Fund received the same aggregate share net asset value in the corresponding classes as noted below:
| | | Shares Issued | | | Net Assets | |
| Class A | | | 455,380 | | | $ | 4,835,786 | |
| Class C | | | 52,298 | | | $ | 541,044 | |
| Class I | | | 7,369,196 | | | $ | 78,929,398 | |
The net unrealized depreciation of investments transferred was $2,540,824 as of the date of the acquisition.
The Managed Futures Strategy Fund’s investment objective is to seek capital appreciation in both rising and falling (bull and bear) equity markets with an annualized level of volatility that is generally lower than the historic level of volatility experienced by the S&P 500 Index.
AXS Funds
NOTES TO CONSOLIDATED FINANCIAL STATEMENTS - Continued
September 30, 2021
The Managed Futures Strategy Fund commenced investment operations on January 27, 2020 with Class A shares, Class C shares, and Class I shares. Prior to that date, the Managed Futures Strategy Fund acquired the assets and assumed the liabilities of the Equinox MutualHedge Futures Strategy Fund (the "Managed Futures Strategy Predecessor Fund"), a series of Northern Lights Fund Trust, which offered three classes of shares, Class A shares, Class C shares, and Class I shares, in a tax-free reorganization as set out in the Agreement and Plan of Reorganization. The proposed Plan of Reorganization was approved by the Trust’s Board on June 14, 2019, by the Board of Equinox Funds Trust on June 17, 2019, and by beneficial owners of the Managed Futures Strategy Predecessor Fund on December 20, 2019. The tax-free reorganization was accomplished on January 24, 2020. As a result of the reorganization, the Managed Futures Strategy Fund assumed the performance and accounting history of the Managed Futures Strategy Predecessor Fund. Financial information included for the dates prior to the reorganization is that of the Managed Futures Strategy Predecessor Fund.
The reorganization was accomplished by the following tax-free exchange in which each shareholder of the Managed Futures Strategy Predecessor Fund received the same aggregate share net asset value in the corresponding classes as noted below:
| | | Shares Issued | | | Net Assets | |
| Class A | | | 3,732,844 | | | $ | 29,812,110 | |
| Class C | | | 2,500,224 | | | | 18,932,788 | |
| Class I | | | 24,003,504 | | | | 194,134,986 | |
The net unrealized appreciation of investments transferred was $27,079,696 as of the date of the acquisition.
The Multi-Strategy Alternatives Fund’s investment objective is long-term growth of capital. As a secondary goal, the Fund seeks to manage volatility and market risk. Effective May 1, 2020, the Multi-Strategy Alternatives Fund changed fiscal year end from April 30th to September 30th.
The Multi-Strategy Alternatives Fund commenced investment operations on October 21, 2019 with Class R-1 and Class I shares. Prior to that date, the Multi-Strategy Alternatives Fund acquired the assets and assumed the liabilities of the KCM Macro Trends Fund (the "Multi-Strategy Alternatives Predecessor Fund"), a series of Northern Lights Fund Trust, which offered two classes of shares, Class R-1 and Institutional Class, in a tax-free reorganization as set out in the Agreement and Plan of Reorganization. The proposed Plan of Reorganization was approved by the Trusts Board on June 14, 2019, by the Board of Northern Lights Fund Trust on June 17, 2019, and by beneficial owners of the Multi-Strategy Alternatives Predecessor Fund on October 17, 2019. The tax-free reorganization was accomplished on October 18, 2019. Upon closing of the Plan of Reorganization, Institutional Class shares were designated to Class I shares. As a result of the reorganization, the Multi-Strategy Alternatives Fund assumed the performance and accounting history of the Multi-Strategy Alternatives Predecessor Fund. Financial information included for the dates prior to the reorganization is that of the Multi-Strategy Alternatives Predecessor Fund.
The reorganization was accomplished by the following tax-free exchange in which each shareholder of the Multi-Strategy Alternatives Predecessor Fund received the same aggregate share net asset value in the corresponding classes as noted below:
| | | Shares Issued | | | Net Assets | |
| Class R-1 | | | 7,643,433 | | | $ | 84,119,077 | |
| Class I | | | 67,002 | | | $ | 740,865 | |
AXS Funds
NOTES TO CONSOLIDATED FINANCIAL STATEMENTS - Continued
September 30, 2021
The net unrealized appreciation of investments transferred was $2,594,449 as of the date of the acquisition.
The Sustainable Income Fund’s investment objective is to seek to generate current income.
The Sustainable Income Fund commenced investment operations on October 19, 2020 with Class I shares. Prior to that date, its only activity was a transfer of 101,960 newly issued shares of the Fund’s Class I in exchange for the net assets of the SKY Harbor Short Duration High Yield Partners, LP, a Delaware limited liability company (the “Company”) valued at $1,019,596. This exchange was nontaxable. The primary assets received by the Fund were cash, interest receivable and securities of the Company with a fair value of $946,696 (identified cost of investments transferred were $951,387), totaling $1,019,596. For financial reporting purposes, assets received and shares issued by the Fund were recorded at fair value; however, the cost basis of the investments received from the Company was carried forward to align ongoing reporting of the Fund’s realized and unrealized gains and losses with amounts distributable to shareholders for tax purposes.
The Thomson Reuters Private Equity Return Tracker Fund’s investment objective is to provide investment results that, before fees and expenses, correspond generally to the price performance of a specific benchmark designed to track the aggregate performance of U.S. private equity-backed companies. The Fund’s current benchmark is the Thomson Reuters Private Equity Buyout Index.
The Thomson Reuters Private Equity Return Tracker Fund commenced investment operations on November 23, 2020 with Class A shares, Class C shares, and Class I shares. Prior to that date, the Thomson Reuters Private Equity Return Tracker Fund acquired the assets and assumed the liabilities of the Leland Thomson Reuters Private Equity Buyout Index Fund (the "Thomson Reuters Private Equity Return Tracker Predecessor Fund"), a series of Northern Lights Fund Trust III, which offered three classes of shares, Class A shares, Class C shares, and Class I shares, in a tax-free reorganization as set out in the Agreement and Plan of Reorganization. The proposed Plan of Reorganization was approved by the Trust’s Board on August 6, 2020, by the Board of Northern Lights Fund Trust III on August 5, 2020, and by beneficial owners of the Thomson Reuters Private Equity Return Tracker Predecessor Fund on November 18, 2020. The tax-free reorganization was accomplished on November 20, 2020. As a result of the reorganization, the Thomson Reuters Private Equity Return Tracker Fund assumed the performance and accounting history of the Thomson Reuters Private Equity Return Tracker Predecessor Fund. Financial information included for the dates prior to the reorganization is that of the Thomson Reuters Private Equity Return Tracker Predecessor Fund.
The reorganization was accomplished by the following tax-free exchange in which each shareholder of the Thomson Reuters Private Equity Return Tracker Predecessor Fund received the same aggregate share net asset value in the corresponding classes as noted below:
| | | Shares Issued | | | Net Assets | |
| Class A | | | 16,123 | | | $ | 248,292 | |
| Class C | | | 79,301 | | | | 1,187,114 | |
| Class I | | | 1,342,937 | | | | 20,904,719 | |
The net unrealized appreciation of investments transferred was $7,553,217 as of the date of the acquisition.
The Thomson Reuters Venture Capital Return Tracker Fund’s investment objective is to provide investment results that, before fees and expenses, correspond generally to the price performance of a specific benchmark designed to track the aggregate performance of U.S. venture capital-backed companies. The Fund’s current benchmark is the Thomson Reuters Venture Capital Index.
AXS Funds
NOTES TO CONSOLIDATED FINANCIAL STATEMENTS - Continued
September 30, 2021
The Thomson Reuters Venture Capital Return Tracker Fund commenced investment operations on November 23, 2020 with Class A shares, Class C shares, and Class I shares. Prior to that date, the Thomson Reuters Venture Capital Return Tracker Fund acquired the assets and assumed the liabilities of the Leland Thomson Reuters Venture Capital Index Fund (the " Thomson Reuters Venture Capital Return Tracker Predecessor Fund"), a series of Northern Lights Fund Trust III, which offered three classes of shares, Class A shares, Class C shares, and Class I shares, in a tax-free reorganization as set out in the Agreement and Plan of Reorganization. The proposed Plan of Reorganization was approved by the Trust’s Board on August 6, 2020, by the Board of Northern Lights Fund Trust III on August 5, 2020, and by beneficial owners of the Thomson Reuters Venture Capital Return Tracker Predecessor Fund on November 18, 2020. The tax-free reorganization was accomplished on November 20, 2020. As a result of the reorganization, the Thomson Reuters Venture Capital Return Tracker Fund assumed the performance and accounting history of the Thomson Reuters Venture Capital Return Tracker Predecessor Fund. Financial information included for the dates prior to the reorganization is that of the Thomson Reuters Venture Capital Return Tracker Predecessor Fund.
The reorganization was accomplished by the following tax-free exchange in which each shareholder of the Thomson Reuters Venture Capital Return Tracker Predecessor Fund received the same aggregate share net asset value in the corresponding classes as noted below:
| | | Shares Issued | | | Net Assets | |
| Class A | | | 2,543,961 | | | $ | 81,237,729 | |
| Class C | | | 382,538 | | | | 11,745,929 | |
| Class I | | | 4,326,594 | | | | 139,556,985 | |
The net unrealized appreciation of investments transferred was $64,795,988 as of the date of the acquisition.
The shares of each class of each Fund (other than the Sustainable Income Fund which currently only offers one class of shares) represent an interest in the same portfolio of investments of each particular Fund and have equal rights as to voting, redemptions, dividends and liquidation, subject to the approval of the Trustees. Income, expenses (other than expenses attributable to a specific class) and realized and unrealized gains and losses on investments are allocated to each class of shares in proportion to their relative net assets. Shareholders of a class that bears distribution and service expenses under the terms of a distribution plan have exclusive voting rights to that distribution plan.
Each Fund is an investment company and accordingly follows the investment company accounting and reporting guidance of the Financial Accounting Standards Board (FASB) Accounting Standard Codification Topic 946 “Financial Services—Investment Companies.”
(a) Consolidation of Subsidiary
The Alternative Growth Fund may invest up to 25% of its total assets in its subsidiary, AXS Alternative Growth Fund Limited, a wholly-owned and controlled subsidiary formed under the laws of the Cayman Islands. The Consolidated Schedule of Investments, Statement of Assets and Liabilities, Statement of Operations, Statements of Changes in Net Assets and Financial Highlights of the Fund include the accounts of the AXS Alternative Growth Fund Limited. All inter-company accounts and transactions have been eliminated in the consolidation for the Alternative Growth Fund. The AXS Alternative Growth Fund Limited is advised by Ampersand Investment Management LLC (“Ampersand” or the “Sub-Advisor”) and acts as an investment vehicle in order to effect certain investments consistent with the Alternative Growth Fund’s investment objectives and policies specified in the Alternative Growth Fund’s prospectus and statement of additional information. The AXS Alternative Growth Fund Limited will generally invest in derivatives, including swaps, and other investments intended to serve as margin or collateral for swap positions. The inception date of the AXS Alternative Growth Fund Limited was June 27, 2018. As of September 30, 2021, total assets of the Alternative Growth Fund were $5,089,647, of which $878,994, or approximately 17.3%, represented the Alternative Growth Fund’s ownership of the shares of the AXS Alternative Growth Fund Limited.
AXS Funds
NOTES TO CONSOLIDATED FINANCIAL STATEMENTS - Continued
September 30, 2021
The Aspect Core Diversified Strategy Fund may invest up to 25% of its total assets in its subsidiary, Aspect Core Diversified Strategy Fund Limited, a wholly-owned and controlled subsidiary formed under the laws of the Cayman Islands. The Consolidated Schedule of Investments, Statement of Assets and Liabilities, Statement of Operations, Statements of Changes in Net Assets and Financial Highlights of the Aspect Core Diversified Strategy Fund include the accounts of the Aspect Core Diversified Strategy Fund Limited. All inter-company accounts and transactions have been eliminated in the consolidation for the Aspect Core Diversified Strategy Fund. The Aspect Core Diversified Strategy Fund Limited is advised by Aspect Capital Limited (“Aspect” or the “Sub-Advisor”) and acts as an investment vehicle in order to effect certain investments consistent with the Aspect Core Diversified Strategy Fund’s investment objectives and policies specified in the Aspect Core Diversified Strategy Fund’s prospectus and statement of additional information. The Aspect Core Diversified Strategy Fund Limited will generally invest in derivatives, including commodity futures, and other investments intended to serve as margin or collateral for derivative positions. The inception date of the Aspect Core Diversified Strategy Fund Limited was November 6, 2014. As of September 30, 2021, total assets of the Aspect Core Diversified Strategy Fund were $20,822,319, of which $657,660, or approximately 3.2%, represented the Aspect Core Diversified Strategy Fund’s ownership of the shares of the Aspect Core Diversified Strategy Fund Limited.
The Chesapeake Strategy Fund may invest up to 25% of its total assets in its subsidiary, AXS Chesapeake Strategy Fund Limited, a wholly-owned and controlled subsidiary formed under the laws of the Cayman Islands. The Consolidated Schedule of Investments, Statement of Assets and Liabilities, Statement of Operations, Statements of Changes in Net Assets and Financial Highlights of the Chesapeake Strategy Fund include the accounts of the AXS Chesapeake Strategy Fund Limited. All inter-company accounts and transactions have been eliminated in the consolidation for the Chesapeake Strategy Fund. The AXS Chesapeake Strategy Fund Limited is advised by Chesapeake Investment Management LLC (“Chesapeake” or the “Sub-Advisor”) and acts as an investment vehicle in order to effect certain investments consistent with the Chesapeake Strategy Fund’s investment objectives and policies specified in the Chesapeake Strategy Fund’s prospectus and statement of additional information. The AXS Chesapeake Strategy Fund Limited will generally invest in derivatives, including commodity futures, and other investments intended to serve as margin or collateral for derivative positions. The inception date of the AXS Chesapeake Strategy Fund Limited was April 19, 2012. As of September 30, 2021, total assets of the Chesapeake Strategy Fund were $18,867,054 of which $719,715, or approximately 3.8%, represented the Chesapeake Strategy Fund’s ownership of the shares of the AXS Chesapeake Strategy Fund Limited.
The Managed Futures Strategy Fund may invest up to 25% of its total assets in its subsidiary, AXS Managed Futures Fund Limited, a wholly-owned and controlled subsidiary formed under the laws of the Cayman Islands. The Consolidated Schedule of Investments, Statement of Assets and Liabilities, Statement of Operations, Statements of Changes in Net Assets and Financial Highlights of the Managed Futures Strategy Fund include the accounts of the AXS Managed Futures Fund Limited. All inter-company accounts and transactions have been eliminated in the consolidation for the Managed Futures Strategy Fund. The AXS Managed Futures Fund Limited is advised by Ampersand Investment Management LLC (“Ampersand” or the “Sub-Advisor”) and acts as an investment vehicle in order to effect certain investments consistent with the Managed Futures Strategy Fund’s investment objectives and policies specified in the Managed Futures Strategy Fund’s prospectus and statement of additional information. The AXS Managed Futures Fund Limited will generally invest in derivatives, including swaps, and other investments intended to serve as margin or collateral for swap positions. The inception date of the AXS Managed Futures Fund Limited was January 12, 2010. As of September 30, 2021, total assets of the Managed Futures Strategy Fund were $58,028,824, of which $11,226,843 or approximately 19.3%, represented the Managed Futures Strategy Fund’s ownership of the shares of the AXS Managed Futures Fund Limited.
AXS Funds
NOTES TO CONSOLIDATED FINANCIAL STATEMENTS - Continued
September 30, 2021
For tax purposes, the AXS Alternative Growth Fund Limited, Aspect Core Diversified Strategy Fund Limited, AXS Chesapeake Strategy Fund Limited and AXS Managed Futures Fund Limited are each an exempted Cayman investment company. Each subsidiary has received an undertaking from the Government of the Cayman Islands exempting it from all local income, profits and capital gains taxes. No such taxes are levied in the Cayman Islands at the present time. For U.S. income tax purposes, each subsidiary is a Controlled Foreign Corporation (“CFC”) and as such is not subject to U.S. income tax. However, as a wholly-owned CFC, each subsidiary’s net income and capital gains, to the extent of its earnings and profits, will be included each year in the Funds’ investment company taxable income.
Note 2 – Accounting Policies
The following is a summary of the significant accounting policies consistently followed by the Funds in the preparation of their financial statements. The preparation of financial statements in conformity with accounting principles generally accepted in the United States of America (“GAAP”) requires management to make estimates and assumptions that affect the reported amounts and disclosures in the financial statements. Actual results could differ from these estimates.
(a) Valuation of Investments
The Funds value equity securities at the last reported sale price on the principal exchange or in the principal over the counter (“OTC”) market in which such securities are traded, as of the close of regular trading on the NYSE on the day the securities are being valued or, if the last-quoted sales price is not readily available, the securities will be valued at the last bid or the mean between the last available bid and ask price. Securities traded on the NASDAQ are valued at the NASDAQ Official Closing Price (“NOCP”). Investments in open-end investment companies are valued at the daily closing net asset value of the respective investment company. Debt securities are valued by utilizing a price supplied by independent pricing service providers. The independent pricing service providers may use various valuation methodologies including matrix pricing and other analytical pricing models as well as market transactions and dealer quotations. These models generally consider such factors as yields or prices of bonds of comparable quality, type of issue, coupon, maturity, ratings and general market conditions. If a price is not readily available for a portfolio security, the security will be valued at fair value (the amount which the Funds might reasonably expect to receive for the security upon its current sale) as determined in good faith by the Funds’ advisor, subject to review and approval by the Valuation Committee, pursuant to procedures adopted by the Board of Trustees. The actions of the Valuation Committee are subsequently reviewed by the Board at its next regularly scheduled board meeting. The Valuation Committee meets as needed. The Valuation Committee is comprised of all the Trustees, but action may be taken by any one of the Trustees.
(b) Foreign Currency Translation
The Funds’ records are maintained in U.S. dollars. The value of securities, currencies and other assets and liabilities denominated in currencies other than U.S. dollars are translated into U.S. dollars based upon foreign exchange rates prevailing at the end of the reporting period. The currencies are translated into U.S. dollars by using the exchange rates quoted as of 4:00 PM Eastern Standard Time. Purchases and sales of investment securities, income and expenses are translated on the respective dates of such transactions.
The Funds do not isolate that portion of their net realized and unrealized gains and losses on investments resulting from changes in foreign exchange rates from the impact arising from changes in market prices. Such fluctuations are included with net realized and unrealized gain or loss from investments and foreign currency.
Net realized foreign currency transaction gains and losses arise from sales of foreign currencies, currency gains or losses realized between the trade and settlement dates on securities transactions, and the differences between the amounts of dividends, interest, and foreign withholding taxes recorded on the Funds’ books and the U.S. dollar equivalent of the amounts actually received or paid. Net unrealized foreign currency translation gains and losses arise from changes in the value of assets and liabilities, other than investments in securities, resulting from changes in the exchange rates.
AXS Funds
NOTES TO CONSOLIDATED FINANCIAL STATEMENTS - Continued
September 30, 2021
(c) Exchange Traded Funds (“ETFs”)
ETFs typically trade on securities exchanges and their shares may, at times, trade at a premium or discount to their net asset values. In addition, an ETF may not replicate exactly the performance of the benchmark index it seeks to track for a number of reasons, including transaction costs incurred by the ETF, the temporary unavailability of certain index securities in the secondary market or discrepancies between the ETF and the index with respect to the weighting of securities or the number of securities held. Investing in ETFs, which are investment companies, may involve duplication of advisory fees and certain other expenses. As a result, Fund shareholders indirectly bear their proportionate share of these incurred expenses. Therefore, the cost of investing in the Funds will be higher than the cost of investing directly in ETFs and may be higher than other mutual funds that invest directly in securities.
Each ETF in which the Funds invest is subject to specific risks, depending on the nature of the ETF. Each ETF is subject to the risks associated with direct ownership of the securities comprising the index on which the ETF is based. These risks could include liquidity risk, sector risk, and risks associated with fixed-income securities.
(d) Total Return Swaps
The Alternative Growth Fund and Managed Futures Strategy Fund are subject to equity price risk, interest rate risk and/or commodity risk in the normal course of pursuing its investment objective. The Funds enter into various swap transactions for investment purposes and to manage interest rate, equity, foreign exchange (currency), or credit risk. These two-party contracts are entered into primarily to exchange the returns (or differentials in rates of returns) earned or realized on particular pre-determined investments or instruments.
To help to reduce counterparty risk on the Alternative Growth Fund, the Advisor has the right to reduce the Alternative Growth Fund’s exposure and remove cash from the Alternative Growth Fund’s total return swap with Deutsche Bank AG. This cash holding shall be in excess of $250,000 and may not exceed 40% of the Index exposure in total. The Alternative Growth Fund is charged interest on this cash holding and any amount removed will be offset against the final settlement value of the swap. As of September 30, 2021, the Alternative Growth Fund did not have such cash advance.
To help to reduce counterparty risk on the Managed Futures Strategy Fund, the Advisor has the right to reduce the Managed Futures Strategy Fund’s exposure and remove cash from the Managed Futures Strategy Fund’s total return swap with Deutsche Bank AG. This cash holding shall be in excess of $250,000 and may not exceed 40% of the Index exposure in total. The Managed Futures Strategy Fund is charged interest on this cash holding and any amount removed will be offset against the final settlement value of the swap. As of September 30, 2021, the Managed Futures Strategy Fund did not have such cash advance.
The gross returns exchanged or “swapped” between parties are calculated with respect to a notional amount, i.e., the return on or increase in value of a particular dollar amount invested at a particular interest rate, in a particular foreign currency, or in a “basket” of securities representing a particular index or market segment. Changes in the value of swap agreements are recognized as net change in unrealized appreciation or depreciation in the Consolidated Statements of Operations by “marking to market” on a daily basis to reflect the value of the swap agreement at the end of each trading day. A liquidation payment received or made at the termination of the swap agreement is recorded as a realized gain or loss on the Consolidated Statements of Operations. Realized gains and losses from a decrease in the notional value swap are recognized on trade date. Swap agreements may also involve fees, commissions and other costs that may reduce the value of the swap agreement. These costs are not reflected in the Consolidated Statements of Operations, are deducted from the return of any such derivative instrument and, therefore, represent an indirect cost of investment in the Funds.
AXS Funds
NOTES TO CONSOLIDATED FINANCIAL STATEMENTS - Continued
September 30, 2021
(e) Equity Swaps (Total Return Swaps)
The Multi-Strategy Alternatives Fund, Thomson Reuters Private Equity Return Tracker Fund and Thomson Reuters Venture Capital Return Tracker Fund may enter into equity swap contracts for hedging or investment purposes. Equity swap contracts may be structured in different ways. The counterparty may agree to pay the Funds the amount, if any, by which the notional amount of the equity swap contract would have increased in value had it been invested in particular stocks (or an index of stocks), plus the dividends that would have been received on those stocks. In these cases, the Funds may agree to pay to the counterparty a floating-rate of interest on the notional amount of the equity swap contract plus the amount, if any, by which that notional amount would have decreased in value had it been invested in such stocks. In these cases, the return to the Funds on any equity swap contract should be the gain or loss on the notional amount plus dividends on the stocks less the interest paid by the Funds on the notional amount. In other cases, the counterparty and the Fund may agree to pay the other the difference between the relative investment performance that would have been achieved if the notional amount of the equity swap contract had been invested in different stocks (or indices of stocks).
Total return swap contracts are agreements between counterparties to exchange cash flow, one based on a market-linked return of an individual asset or group of assets (such as an index), and the other on a fixed or floating rate. As a total return swap, an equity swap may be structured in different ways. When the Funds enter into a “long” equity swap, the counterparty may agree to pay the Funds the amount, if any, by which the notional amount of the equity swap would have increased in value had it been invested in a particular referenced security or securities, plus the dividends that would have been received on those securities. In return, the Funds will generally agree to pay the counterparty interest on the notional amount of the equity swap plus the amount, if any, by which that notional amount would have decreased in value had it been invested in such referenced security or securities, plus, in certain instances, commissions or trading spreads on the notional amounts. Therefore, the Funds’ return on the equity swap generally should equal the gain or loss on the notional amount, plus dividends on the referenced security or securities less the interest paid by the Funds on the notional amount. Alternatively, when the Funds enter into a “short” equity swap, the counterparty will generally agree to pay the Funds the amount, if any, by which the notional amount of the equity swap would have decreased in value had the Funds sold a particular referenced security or securities short, less the dividend expense that the Funds would have incurred on the referenced security or securities, as adjusted for interest payments or other economic factors. In this situation, the Funds will generally be obligated to pay the amount, if any, by which the notional amount of the swap would have increased in value had they been invested directly in the referenced security or securities.
Equity swaps generally do not involve the delivery of securities or other referenced assets. Accordingly, the risk of loss with respect to equity swaps is normally limited to the net amount of payments that the Funds are contractually obligated to make. If the other party to an equity swap defaults, the Funds’ risk of loss consists of the net amount of payments that the Funds are contractually entitled to receive, if any. The Funds will segregate cash or liquid assets, enter into offsetting transactions or use other measures permitted by applicable law to “cover” the Funds’ current obligations.
Equity swaps are derivatives and their value can be very volatile. The Funds may engage in total return swaps to gain exposure to securities, along with offsetting long total return swap positions to maintain appropriate currency balances and risk exposures across all swap positions. To the extent that the Advisor does not accurately analyze and predict future market trends, the values or assets or economic factors, the Funds may suffer a loss, which may be substantial. As of September 30, 2021, open swap agreements are shown in the Schedules of Investments.
AXS Funds
NOTES TO CONSOLIDATED FINANCIAL STATEMENTS - Continued
September 30, 2021
(f) Futures Contracts
The Funds purchase and sell futures contracts to pursue their investment objective and to gain exposure to, or hedge against, change in the value of equities, interest rates, foreign currency, or commodities. Initial margin deposits required upon entering into futures contracts are satisfied by the segregation of specific securities or cash as collateral for the account of the broker (the Portfolio’s agent in acquiring the futures position). During the period the futures contracts are open, changes in the value of the contracts are recognized as unrealized gains or losses by “marking to market” on a daily basis to reflect the market value of the contracts at the end of each day’s trading. Variation margin payments are received or made depending upon whether unrealized gains or losses are incurred. When the contracts are closed, the Fund recognizes a realized gain or loss equal to the difference between the proceeds from, or cost of, the closing transaction and the Fund’s basis in the contract. If a Fund was unable to liquidate a futures contract and/or enter into an offsetting closing transaction, the Fund would continue to be subject to market risk with respect to the value of the contracts and continue to be required to maintain the margin deposits on the futures contracts. The Funds segregate liquid securities having a value at least equal to the amount of the current obligation under any open futures contract. Risks may exceed amounts recognized in the Consolidated Statements of Assets and Liabilities. With futures, there is minimal counterparty credit risk to a Fund since futures are exchange traded and the exchange’s clearinghouse, as counterparty to all exchange traded futures, guarantees the futures against default.
(g) Forward Foreign Currency Contracts
The Aspect Core Diversified Strategy Fund and the Chesapeake Strategy Fund may enter into forward currency exchange contracts in order to hedge against foreign currency exchange rate risks. A forward involves an obligation to purchase or sell a specific currency at a future date, which may be any fixed number of days from the date of the contract agreed upon by the parties, at a price set at the time of the contract. The market value of the contract fluctuates with changes in currency exchange rates. The contract is marked-to-market daily and the change in market value is recorded by the Fund as an unrealized gain or loss. As foreign securities are sold, a portion of the contract is generally closed and the Funds record a realized gain or loss equal to the difference between the value of the contract at the time it was opened and the value at the time it was closed. Realized gains and losses from contract transactions are included as a component of net realized gains/(losses) from forward foreign currency contracts in the Consolidated Statements of Operations.
(h) Short-Term Investments
The Alternative Growth Fund and the Managed Futures Strategy Fund invest a significant amount (67.1% and 33.4%, respectively, as of September 30, 2021) in the Fidelity Investments Money Market Government Portfolio (“FIGXX”). FIGXX Invests in U.S. Government securities and/or repurchase agreements that are collateralized fully, U.S. Government securities issued by entities that are chartered by Congress but whose securities are neither issued nor guaranteed by the U.S. Treasury and investing in compliance with industry-standard regulatory requirements for money market funds for the quality, maturity, liquidity and diversification of investments. FIGXX may invest at least 80% of its assets in U.S. Treasury securities and repurchase agreements for those securities.
The Aspect Core Diversified Strategy Fund invests a significant amount (38.1% as of September 30, 2021) in the Fidelity Investments Money Market Treasury Portfolio (“FISXX”). FISXX Invests in U.S. Treasury securities and/or repurchase agreements that are collateralized fully, U.S. Government securities issued by entities that are chartered or sponsored by Congress but whose securities are neither issued nor guaranteed by the U.S. Treasury, and investing in compliance with industry-standard regulatory requirements for money market funds for the quality, maturity, liquidity and diversification of investments. FISXX may invest at least 80% of its assets in U.S. Treasury securities and repurchase agreements for those securities.
The Aspect Core Diversified Strategy Fund invests a significant amount (45.3% as of September 30, 2021) in the UMB Bank demand deposit. The UMB Bank demand deposit acts as a bank deposit for the Fund, providing an interest bearing account for short-term investment purposes. This investment vehicle is not publicly traded on open markets. Accounting Standards Codification Topic 825, Financial Instruments identifies this situation as a concentration of credit risk requiring disclosure, regardless of degree of risk. The risk is managed by monitoring the financial institution in which the deposits are made.
AXS Funds
NOTES TO CONSOLIDATED FINANCIAL STATEMENTS - Continued
September 30, 2021
(i) Investment Transactions, Investment Income and Expenses
Investment transactions are accounted for on the trade date. Realized gains and losses on investments are determined on the identified cost basis. Dividend income is recorded net of applicable withholding taxes on the ex-dividend date and interest income is recorded on an accrual basis. Withholding taxes on foreign dividends, if applicable, are paid (a portion of which may be reclaimable) or provided for in accordance with the applicable country’s tax rules and rates and are disclosed in the Consolidated Statement of Operations. Withholding tax reclaims are filed in certain countries to recover a portion of the amounts previously withheld. The Funds record a reclaim receivable based on a number of factors, including a jurisdiction’s legal obligation to pay reclaims as well as payment history and market convention. Income and expenses of the Funds (other than the Sustainable Income Fund which currently only offers one class of shares) are allocated on a pro rata basis to each class of shares relative net assets, except for distribution and service fees which are unique to each class of shares. Expenses incurred by the Trust with respect to more than one fund are allocated in proportion to the net assets of the fund except where allocation of direct expenses to the fund or an alternative allocation method can be more appropriately made.
(j) Federal Income Tax
The Funds intend to comply with the requirements of Subchapter M of the Internal Revenue Code applicable to regulated investment companies and to distribute substantially all of their net investment income and any net realized gains to their shareholders. Therefore, no provision is made for federal income or excise taxes. Due to the timing of dividend distributions and the differences in accounting for income and realized gains and losses for financial statement and federal income tax purposes, the fiscal year in which amounts are distributed may differ from the year in which the income and realized gains and losses are recorded by the Funds.
Accounting for Uncertainty in Income Taxes (the “Income Tax Statement”) requires an evaluation of tax positions taken (or expected to be taken) in the course of preparing a Fund’s tax returns to determine whether these positions meet a “more-likely-than-not” standard that, based on the technical merits, have a more than fifty percent likelihood of being sustained by a taxing authority upon examination. A tax position that meets the “more-likely-than-not” recognition threshold is measured to determine the amount of benefit to recognize in the financial statements. The Funds recognize interest and penalties, if any, related to unrecognized tax benefits as income tax expense in the Consolidated Statements of Operations.
The Income Tax Statement requires management of the Funds to analyze tax positions taken in the prior three open tax years, if any, and tax positions expected to be taken in the Funds’ current tax year, as defined by the IRS statute of limitations for all major jurisdictions, including federal tax authorities and certain state tax authorities. As of September 30, 2021, and during the prior three open tax years, the Funds did not have a liability for any unrecognized tax benefits. The Funds have no examinations in progress and are not aware of any tax positions for which it is reasonably possible that the total amounts of unrecognized tax benefits will significantly change in the next twelve months.
(k) Distributions to Shareholders
Dividends from net investment income, if any, are declared and paid at least annually, except for the Sustainable Income Fund which will distribute net investment income, if any, quarterly. Distributable net realized capital gains, if any, are declared and distributed annually. Distributions to shareholders are recorded on the ex-dividend date. The amount and timing of distributions are determined in accordance with federal income tax regulations, which may differ from GAAP.
AXS Funds
NOTES TO CONSOLIDATED FINANCIAL STATEMENTS - Continued
September 30, 2021
The character of distributions made during the year from net investment income or net realized gains may differ from the characterization for federal income tax purposes due to differences in the recognition of income, expense and gain (loss) items for financial statement and tax purposes.
(l) Illiquid Securities
Pursuant to Rule 22e-4 under the 1940 Act, the Funds have adopted a Liquidity Risk Management Program (“LRMP”) that requires, among other things, that the Funds limit their illiquid investments that are assets to no more than 15% of net assets. An illiquid investment is any security which may not reasonably be expected to be sold or disposed of in current market conditions in seven calendar days or less without the sale or disposition significantly changing the market value of the investment. If the Advisor, at any time, determines that the value of illiquid securities held by the Fund exceed 15% of its net asset value, the Advisor will take such steps as it considers appropriate to reduce them as soon as reasonably practicable in accordance with the Funds’ written LRMP.
Note 3 – Investment Advisory and Other Agreements
The Trust, on behalf of the Funds, entered into an Investment Advisory Agreement (the “Agreement”) with AXS Investments LLC (the “Advisor”). Under the terms of the Agreement, the Funds pay twice a month investment advisory fee to the Advisor. The annual rates are listed by Fund in the table below.
| Fund | Investment
Advisory Fees | Subsidiary | Investment Advisory Fees |
| Alternative Growth Fund | 0.75% | Alternative Growth Fund Limited | 0.75% |
| Aspect Core Diversified Strategy Fund | 1.30% | Aspect Core Diversified Strategy Fund Limited | 1.30% |
| Chesapeake Strategy Fund | 1.50% | Chesapeake Strategy Fund Limited | 1.50% |
| Managed Futures Strategy Fund | 1.45% | Managed Futures Strategy Fund Limited | 1.45% |
| Multi-Strategy Alternatives Fund | 1.00% | | |
| Sustainable Income Fund | 0.70% | | |
Thomson Reuters Private Equity
Return Tracker Fund | 1.25% | | |
Thomson Reuters Venture Capital
Return Tracker Fund | 1.25% | | |
The investment management fees included a management fee paid to the Advisor by each Fund’s subsidiary at an annual rate listed above of the subsidiary’s average daily net assets. The Advisor had contractually agreed, for so long as each Fund invests in each subsidiary, to waive the management fee it received from the Fund in an amount equal to the management fee paid to the Advisor by each subsidiary. This undertaking may not be terminated by the advisor as long as the investment advisory agreement between the Subsidiary and the Advisor is in place unless the Advisor obtains the prior approval of the Fund’s Board of Trustees. The Advisor has contractually agreed to waive its fee and, if necessary, to absorb other operating expenses to ensure that total annual operating expenses (excluding any taxes, leverage interest, brokerage commissions, dividend and interest expenses on short sales, acquired fund fees and expenses as determined in accordance with Form N-1A, expenses incurred in connection with any merger or reorganization, and extraordinary expenses such as litigation expenses) in order to limit total annual operating expenses of each fund. For the Alternative Growth Fund, the Aspect Core Diversified Strategy Fund, the Chesapeake Strategy Fund, the Managed Futures Strategy Fund, the Multi-Strategy Alternatives Fund and the Sustainable Income Fund, this agreement is effective until January 31, 2022. For the Thomson Reuters Private Equity Return Tracker Fund and the Thomson Reuters Venture Capital Return Tracker Fund, this agreement is effective until November 21, 2022. These agreements may be terminated before that date only by the Trust’s Board of Trustees. The table below contains the expense cap by Fund and by Class.
AXS Funds
NOTES TO CONSOLIDATED FINANCIAL STATEMENTS - Continued
September 30, 2021
| | Total Limit on Annual |
| | Operating Expenses |
| | Class A Shares | Class C Shares | Class I Shares | Class R-1 Shares |
| Alternative Growth Fund | 1.24% | - | 0.99% | - |
| Aspect Core Diversified Strategy Fund | 1.70% | 2.45% | 1.45% | - |
| Chesapeake Strategy Fund | 2.10% | 2.85% | 1.85% | - |
| Managed Futures Strategy Fund | 1.95% | 2.70% | 1.70% | - |
| Multi-Strategy Alternatives Fund | - | - | 1.51% | 1.68% |
| Sustainable Income Fund | - | - | 0.99% | - |
| Thomson Reuters Private Equity Return Tracker Fund | 1.75% | 2.50% | 1.50% | - |
| Thomson Reuters Venture Capital Return Tracker Fund | 1.75% | 2.50% | 1.50% | - |
The Advisor has engaged Ampersand Investment Management LLC (the “Ampersand”), a Sub-Advisor, to manage the Alternative Growth Fund and Managed Futures Strategy Fund and pays Ampersand from its advisory fees.
The Advisor has engaged Aspect Capital Limited (“Aspect”), a Sub-Advisor, to manage the Aspect Core Diversified Strategy Fund and pays Aspect from its advisory fees.
The Advisor has engaged Chesapeake Capital Corporation (“Chesapeake”), a Sub-Advisor, to manage the Chesapeake Strategy Fund’s overall investment program, and pays Chesapeake from its advisory fees.
The Advisor has engaged SKY Harbor Capital Management, LLC (“SKY Harbor”), a Sub-Advisor, to manage the Sustainable Income Fund’s overall investment program, and pays SKY Harbor from its advisory fees.
Effective January 19, 2021, Kerns Capital Management, Inc. ("KCM") no longer serves as Sub-Advisor to the Multi-Strategy Alternatives Fund. As of January 19, 2021, the Advisor is responsible for the day-to-day management of the Fund's portfolio.
Prior to the close of business on November 8, 2019, investment advisory services were provided to the Alternative Growth Predecessor Fund, the Aspect Core Diversified Strategy Predecessor Fund, and the Chesapeake Strategy Predecessor Fund by Equinox Institutional Asset Management, LP (“Equinox”), which received investment management fees for its services pursuant to the terms of the investment advisory agreements for the Alternative Growth Predecessor Fund, the Aspect Core Diversified Strategy Predecessor Fund, and the Chesapeake Strategy Predecessor Fund. The investment advisory fees were computed and accrued daily and paid monthly at an annual rate of 0.75% of the Alternative Growth Predecessor Fund’s average daily net assets, 1.30% of the Aspect Core Diversified Strategy Predecessor Fund’s average daily net assets, and 1.50% of the Chesapeake Strategy Predecessor Fund’s, average daily net assets. Equinox had contractually agreed to waive its fee and, if necessary, to absorb other operating expenses to ensure that total annual operating expenses (excluding any taxes, leverage interest, brokerage commissions, dividend and interest expenses on short sales, acquired fund fees and expenses as determined in accordance with Form N-1A, expenses incurred in connection with any merger or reorganization, and extraordinary expenses such as litigation expenses) do not exceed 1.24% and 0.99% of the average daily net assets of Class A and Class I shares, respectively, of the Alternative Growth Predecessor Fund. Equinox had contractually agreed to waive its fee and, if necessary, to absorb other operating expenses to ensure that total annual operating expenses (excluding any taxes, leverage interest, brokerage commissions, dividend and interest expenses on short sales, acquired fund fees and expenses as determined in accordance with Form N-1A, expenses incurred in connection with any merger or reorganization, and extraordinary expenses such as litigation expenses) do not exceed 1.70%, 2.45% and 1.45% of the average daily net assets of Class A, Class C and Class I shares, respectively, of the Aspect Core Diversified Strategy Predecessor Fund. Equinox had contractually agreed to waive its fee and, if necessary, to absorb other operating expenses to ensure that total annual operating expenses (excluding any taxes, leverage interest, brokerage commissions, dividend and interest expenses on short sales, acquired fund fees and expenses as determined in accordance with Form N-1A, expenses incurred in connection with any merger or reorganization, and extraordinary expenses such as litigation expenses) do not exceed 2.10%, 2.85% and 1.85% of the average daily net assets of Class A, Class C and Class I shares, respectively, of the Chesapeake Strategy Predecessor Fund.
AXS Funds
NOTES TO CONSOLIDATED FINANCIAL STATEMENTS - Continued
September 30, 2021
Prior to the close of business on January 24, 2020, investment advisory services were provided to the Managed Futures Strategy Predecessor Fund by Equinox, which received investment management fees for its services pursuant to the terms of the investment advisory agreements for the Managed Futures Strategy Predecessor Fund. The investment advisory fees were computed and accrued daily and paid monthly at an annual rate of 1.45% of the Managed Futures Strategy Predecessor Fund’s average daily net assets. Equinox had contractually agreed to waive its fee and, if necessary, to absorb other operating expenses to ensure that total annual operating expenses (excluding any taxes, leverage interest, brokerage commissions, dividend and interest expenses on short sales, acquired fund fees and expenses as determined in accordance with Form N-1A, expenses incurred in connection with any merger or reorganization, and extraordinary expenses such as litigation expenses) do not exceed 1.95%, 2.70%, and 1.70% of the average daily net assets of Class A, Class C, and Class I shares, respectively, of the Managed Futures Strategy Predecessor Fund.
Prior to the close of business on October 18, 2019, investment advisory services were provided to the Multi-Strategy Alternatives Predecessor Fund by Kerns Capital Management, Inc., which received investment management fees for its services pursuant to the terms of the investment advisory agreements for the Multi-Strategy Alternatives Predecessor Fund. The investment advisory fees, which were computed and accrued daily and paid monthly, at an annual rate of 1.00% of the Fund’s average daily net assets.
Prior to the close of business on November 20, 2020, investment advisory services were provided to the Thomson Reuters Private Equity Return Tracker Predecessor Fund and the Thomson Reuters Venture Capital Return Tracker Predecessor Fund by Good Harbor Financial, LLC (“Good Harbor”) which received investment management fees for its services pursuant to the terms of the investment advisory agreements for the Thomson Reuters Private Equity Return Tracker Predecessor Fund and the Thomson Reuters Venture Capital Return Tracker Predecessor Fund. The investment advisory fees were computed and accrued daily and paid monthly at an annual rate of 1.25% of the Thomson Reuters Private Equity Return Tracker Predecessor Fund's average daily net assets and 1.25% of the Thomson Reuters Venture Capital Return Tracker Predecessor Fund's average daily net assets. Good Harbor had contractually agreed to waive its fee and, if necessary, to absorb other operating expenses to ensure that total annual operating expenses (excluding any taxes, leverage interest, brokerage commissions, dividend and interest expenses on short sales, acquired fund fees and expenses as determined in accordance with Form N-1A, expenses incurred in connection with any merger or reorganization, and extraordinary expenses such as litigation expenses) do not exceed 1.75%, 2.50%, and 1.50% of the average daily net assets of Class A, Class C, and Class I shares, respectively, of the Thomson Reuters Private Equity Return Tracker Predecessor Fund and the Thomson Reuters Venture Capital Return Tracker Predecessor Fund.
AXS Funds
NOTES TO CONSOLIDATED FINANCIAL STATEMENTS - Continued
September 30, 2021
The Funds’ Advisor may recover from the Fund’s fees and/or expenses previously waived and/or absorbed if the Funds’ expense ratio, including the recovered expenses, falls below the expense limit at which it was waived. The Funds’ advisor is permitted to seek reimbursement from the Fund, subject to certain limitations, of fees waived or payments made to the Fund for a period ending three full years after the date of the waiver or payment. This reimbursement may be requested from the Funds if the reimbursement will not cause the Funds’ annual expense ratio to exceed the lesser of (a) the expense limitation amount in effect at the time such fees were waived or payments made, or (b) the expense limitation amount in effect at the time of the reimbursement. The Advisor may recapture all or a portion of this amount no later than the dates stated below:
| | | | Alternative Growth Fund | | | Aspect Core Diversified Strategy Fund | | | Chesapeake Strategy Fund | | | Managed Futures Strategy Fund | | | Multi-Strategy Alternatives fund | |
| June 30, 2023 | | | $ | 121,818 | | | $ | - | | | $ | - | | | $ | - | | | $ | - | |
| September 30, 2023 | | | | 69,919 | | | | 164,898 | | | | 120,589 | | | | 120,251 | | | | - | |
| September 30, 2024 | | | | 212,481 | | | | 233,124 | | | | 217,024 | | | | 280,243 | | | | 105,332 | |
| Total | | | $ | 404,218 | | | $ | 398,022 | | | $ | 337,613 | | | $ | 400,494 | | | $ | 105,332 | |
| | | | Sustainable Income Fund | | | Thomson Reuters Private Equity Return Tracker Fund | | | Thomson Reuters Venture Capital Return Tracker Fund | |
| September 30, 2024 | | | $ | 53,753 | | | $ | 114,282 | | | $ | 148,438 | |
| Total | | | $ | 53,753 | | | $ | 114,282 | | | $ | 148,438 | |
Equinox is permitted to seek reimbursement, subject to certain limitations, of fees waived or payments made by Equinox to the Alternative Growth Predecessor Fund prior to the Alternative Growth Predecessor Fund’s reorganization on November 8, 2019, for a period ending three years after the date of the waiver of payment for the Alternative Growth Fund. This reimbursement may be requested from the Alternative Growth Fund if the reimbursement will not cause the Alternative Growth Fund’s annual expense ratio to exceed the lesser of (a) the expense limitation amount in effect at the time such fees were waived or payments made, or (b) the expense limitation amount in effect at the time of the reimbursement. Reimbursements of fees waived or payments made will be made on a “first in, first out” basis so that the oldest fees waived or payments are satisfied first. Any reimbursement of fees waived or payments made by Equinox to the Alternative Growth Predecessor Fund prior to the reorganization must be approved by the Trust’s Board of Trustees. Equinox may recapture all or a portion of this amount no later than June 30 of the years of the dates stated below for the Alternative Growth Fund:
| 2022 | | | $ | 231,363 | |
| 2023 | | | | 45,463 | |
| Total | | | $ | 276,826 | |
AXS Funds
NOTES TO CONSOLIDATED FINANCIAL STATEMENTS - Continued
September 30, 2021
Equinox is permitted to seek reimbursement, subject to certain limitations, of fees waived or payments made by Equinox to the Aspect Core Diversified Strategy Predecessor Fund prior to the Aspect Core Diversified Strategy Predecessor Fund’s reorganization on November 8, 2019, for a period ending three years after the date of the waiver of payment. This reimbursement may be requested from the Aspect Core Diversified Strategy Fund if the reimbursement will not cause the Aspect Core Diversified Strategy Fund’s annual expense ratio to exceed the lesser of (a) the expense limitation amount in effect at the time such fees were waived or payments made, or (b) the expense limitation amount in effect at the time of the reimbursement. Reimbursements of fees waived or payments made will be made on a “first in, first out” basis so that the oldest fees waived or payments are satisfied first. Any reimbursement of fees waived or payments made by Equinox to the Aspect Core Diversified Strategy Predecessor Fund prior to the reorganization must be approved by the Trust’s Board of Trustees. Equinox may recapture all or a portion of this amount no later than September 30 of the years stated below for the Aspect Core Diversified Strategy Fund:
| 2022 | | | $ | 179,344 | |
| 2023 | | | | 22,266 | |
| Total | | | $ | 201,610 | |
Equinox is permitted to seek reimbursement, subject to certain limitations, of fees waived or payments made by Equinox to the Chesapeake Strategy Predecessor Fund prior to the Chesapeake Strategy Predecessor Fund’s reorganization on November 8, 2019, for a period ending three years after the date of the waiver of payment. This reimbursement may be requested from the Chesapeake Strategy Fund if the reimbursement will not cause the Chesapeake Strategy Fund’s annual expense ratio to exceed the lesser of (a) the expense limitation amount in effect at the time such fees were waived or payments made, or (b) the expense limitation amount in effect at the time of the reimbursement. Reimbursements of fees waived or payments made will be made on a “first in, first out” basis so that the oldest fees waived or payments are satisfied first. Any reimbursement of fees waived or payments made by Equinox to the Chesapeake Strategy Predecessor Fund prior to the reorganization must be approved by the Trust’s Board of Trustees. Equinox may recapture all or a portion of this amount no later than September 30 of the years stated below for the Chesapeake Strategy Fund:
| 2022 | | | $ | 148,881 | |
| 2023 | | | | 9,685 | |
| Total | | | $ | 158,566 | |
Good Harbor is permitted to seek reimbursement, subject to certain limitations, of fees waived or payments made by Good Harbor to the Thomson Reuters Private Equity Return Tracker Predecessor Fund and Thomson Reuters Venture Capital Return Tracker Predecessor Fund prior to reorganization on November 20, 2020, for a period ending three years after the date of the waiver of payment. This reimbursement may be requested from the Thomson Reuters Private Equity Return Tracker Fund and Thomson Reuters Venture Capital Return Tracker Fund if the reimbursement will not cause the Thomson Reuters Private Equity Return Tracker’s annual expense ratio to exceed the lesser of (a) the expense limitation amount in effect at the time such fees were waived or payments made, or (b) the expense limitation amount in effect at the time of the reimbursement. Reimbursements of fees waived or payments made will be made on a “first in, first out” basis so that the oldest fees waived or payments are satisfied first. Any reimbursement of fees waived or payments made by Good Harbor to the Thomson Reuters Private Equity Return Tracker Predecessor Fund prior to the reorganization must be approved by the Trust’s Board of Trustees. Good Harbor may recapture all or a portion of this amount no later than September 30 of the years stated below for the Thomson Reuters Private Equity Return Tracker Fund and Thomson Reuters Venture Capital Return Tracker Fund:
| | | | Thomson Reuters Private Equity Return Tracker Fund |
| 2022 | | $ | 56,758 |
| 2023 | | | 38,717 |
| 2024 | | | 10,366 |
| Total | | $ | 105,841 |
AXS Funds
NOTES TO CONSOLIDATED FINANCIAL STATEMENTS - Continued
September 30, 2021
| | | | Thomson Reuters Venture Capital Return Tracker Fund |
| 2022 | | $ | 307,693 |
| 2023 | | | 231,346 |
| 2024 | | | 98,415 |
| Total | | $ | 637,454 |
During the periods ended September 30, 2021, a service provider reimbursed the Thomson Reuters Venture Capital Return Tracker Fund $3,927 for losses from a pricing error. This amount is reported on the Thomson Reuters Venture Capital Return Tracker Fund’s Statements of Operations and Statements of Changes under the caption “Net increase from payment by affiliates.” This reimbursement had no impact to the total return.
The Multi-Strategy Alternatives Predecessor’s Fund administrator reimbursed the Fund $43,948 for losses incurred by the Fund related to an operational error during the year ended April 30, 2020. This amount is reported on the Fund’s Statements of Changes under the caption “Capital contribution from a predecessor affiliate".
During the year ended September 30, 2020, the Advisor reimbursed the Chesapeake Strategy Fund $457 for losses from a trade error. This amount is reported on the Chesapeake Strategy Fund’s Statements of Changes under the caption “Net increase from payment by affiliates.” This reimbursement had no impact to the total return.
UMB Fund Services, Inc. (“UMBFS”) serves as the Funds’ fund accountant, transfer agent and co-administrator; and Mutual Fund Administration, LLC (“MFAC”) serves as the Funds’ other co-administrator. UMB Bank, N.A., an affiliate of UMBFS, serves as the Funds’ custodian. Deutsche Bank Trust Company America (“DBTCA”) acts as the custodian with respect to certain collateral arrangements between the Alternative Growth Fund and Managed Futures Strategy Fund and counter-parties. DBTCA also acts as the custodian for the Alternative Growth Fund’s and Managed Futures Strategy Fund’s subsidiaries, Alternative Growth Fund Limited and Managed Futures Strategy Fund Limited, respectively, including certain collateral arrangements between the Subsidiaries and counter-parties.
Prior to the close of business on November 20, 2020, Gemini Fund Services, LLC (“GFS”), an affiliate of Northern Lights Distributors, LLC (“NLD”), served as administrator, fund accountant, and transfer agent to the Thomson Reuters Private Equity Return Tracker Predecessor Fund’s and Thomson Reuters Venture Capital Return Tracker Predecessor Fund and U.S. Bank N.A. served as these Predecessor Funds’ Custodian. These Funds’ allocated fees incurred for fund accounting, fund administration, transfer agency and custody services for the periods ended September 30, 2021, are reported on the Consolidated Statements of Operations.
AXS Funds
NOTES TO CONSOLIDATED FINANCIAL STATEMENTS - Continued
September 30, 2021
IMST Distributors, LLC serves as the Funds’ distributor (the “Distributor”).
Prior to the close of business on November 20, 2020, NLD served as distributor to the Thomson Reuters Private Equity Return Tracker Predecessor Fund and Thomson Reuters Venture Capital Return Tracker Predecessor Fund.
Certain trustees and officers of the Trust are employees of UMBFS or MFAC. The Funds do not compensate trustees and officers affiliated with the Funds’ co-administrators. For the periods ended September 30, 2021, the Funds’ allocated fees incurred to Trustees who are not affiliated with the Funds’ co-administrators are reported on the Consolidated Statements of Operations. A portion of the fees were paid by the Trust’s Co-Administrators. Such amount is shown as a reduction of expenses, “Fees paid indirectly”, on the Consolidated Statements of Operations.
The Funds’ Board of Trustees has adopted a Deferred Compensation Plan (the “Plan”) for the Independent Trustees that enables Trustees to elect to receive payment in cash or the option to select various fund(s) in the Trust in which their deferred accounts shall be deemed to be invested. If a trustee elects to defer payment, the Plan provides for the creation of a deferred payment account. The Funds’ liability for these amounts is adjusted for market value changes in the invested fund and remains a liability to the Funds until distributed in accordance with the Plan. The Trustees’ Deferred compensation liability under the Plan constitutes a general unsecured obligation of the Funds and is disclosed in the Consolidated Statements of Assets and Liabilities. Contributions made under the plan and the change in unrealized appreciation/depreciation and income are included in the Trustees’ fees and expenses in the Consolidated Statements of Operations.
Dziura Compliance Consulting, LLC provides Chief Compliance Officer (“CCO”) services to the Trust. Prior to the close of business on November 20, 2020, Northern Lights Compliance Services, LLC (“NLCS”), an affiliate of GFS and NLD, served as the CCO to the Thomson Reuters Private Equity Return Tracker Predecessor Fund and Thomson Reuters Venture Capital Return Tracker Predecessor Fund. The Funds’ allocated fees incurred for CCO services for the periods ended September 30, 2021, are reported on the Consolidated Statements of Operations.
AXS Funds
NOTES TO CONSOLIDATED FINANCIAL STATEMENTS - Continued
September 30, 2021
Note 4 – Federal Income Taxes
At September 30, 2021, the cost of securities on a tax basis and gross unrealized appreciation and (depreciation) on investments for federal income tax purposes were as follows:
| | | Alternative Growth Fund | | | Aspect Core Diversified Strategy Fund | | | Chesapeake Strategy Fund | | | Managed Futures Strategy Fund | |
| Cost of investments | | $ | 2,571,895 | | | $ | 19,068,529 | | | $ | 26,875,555 | | | $ | 142,824,149 | |
| | | | | | | | | | | | | | | | | |
| Gross unrealized appreciation | | $ | - | | | $ | - | | | $ | - | | | $ | - | |
| Gross unrealized depreciation | | | (845,792 | ) | | | (1,778,394 | ) | | | (9,769,093 | ) | | | (125,217,761 | ) |
| Net unrealized depreciation on investments | | $ | (845,792 | ) | | $ | (1,778,394 | ) | | $ | (9,769,093 | ) | | $ | (125,217,761 | ) |
| | | Multi-Strategy Alternatives Fund | | | Sustainable Income Fund | | | Thomson Reuters Private Equity Return Tracker Fund | | | Thomson Reuters Venture Capital Return Tracker Fund | |
| Cost of investments | | $ | 17,803,153 | | | $ | 52,114,953 | | | $ | 20,941,607 | | | $ | 314,224,643 | |
| | | | | | | | | | | | | | | | | |
| Gross unrealized appreciation | | $ | 2,921,381 | | | $ | 1,050,145 | | | $ | 6,005,148 | | | $ | 86,551,756 | |
| Gross unrealized depreciation | | | (690,874 | ) | | | (185,753 | ) | | | (450,430 | ) | | | (8,534,381 | ) |
| Net unrealized appreciation on investments | | $ | 2,230,507 | | | $ | 864,392 | | | $ | 5,554,718 | | | $ | 78,017,375 | |
The difference between cost amounts for financial statement and federal income tax purposes is due primarily to timing differences in recognizing certain gains and losses in security transactions.
AXS Funds
NOTES TO CONSOLIDATED FINANCIAL STATEMENTS - Continued
September 30, 2021
GAAP requires that certain components of net assets be reclassified between financial and tax reporting. These reclassifications have no effect on net assets or net asset value per share. For the periods ended September 30, 2021, permanent differences in book and tax accounting have been reclassified to paid-in capital and total distributable earnings (loss) as follows:
| | | Increase (Decrease) | |
| | | Paid-in Capital | | | Total Distributable Earnings (Loss) | |
| Alternative Growth Fund | | $ | (9,925 | ) | | $ | 9,925 | |
| Aspect Core Diversified Strategy Fund | | | (1,629,518 | ) | | | 1,629,518 | |
| Chesapeake Strategy Fund | | | (3,607,539 | ) | | | 3,607,539 | |
| Managed Futures Strategy Fund | | | (33,338,821 | ) | | | 33,338,821 | |
| Multi-Strategy Alternatives Fund | | | (1,178 | ) | | | 1,178 | |
| Sustainable Income Fund | | | (12,469 | ) | | | 12,469 | |
| Thomson Reuters Private Equity Return Tracker Fund | | | (2 | ) | | | 2 | |
| Thomson Reuters Venture Capital Return Tracker Fund | | | 1 | | | | (1 | ) |
The tax basis of the components of distributable net earnings (deficit) at September 30, 2021 were as follows:
| | | Alternative Growth Fund | | | Aspect Core Diversified Strategy Fund | | | Chesapeake Strategy Fund | |
| Undistributed ordinary income | | $ | - | | | $ | 1,135,848 | | | $ | 3,152,347 | |
| Undistributed long-term capital gains | | | - | | | | - | | | | - | |
| Tax accumulated earnings | | | - | | | | 1,135,848 | | | | 3,152,347 | |
| | | | | | | | | | | | | |
| Accumulated capital and other losses | | | (650,151 | ) | | | (2,933,934 | ) | | | (17,070,529 | ) |
| Unrealized depreciation on investments | | | (845,792 | ) | | | (1,784,089 | ) | | | (9,769,093 | ) |
| Unrealized depreciation on open swap contracts | | | (768,430 | ) | | | - | | | | - | |
| Unrealized appreciation on futures contracts | | | 133,070 | | | | 372,328 | | | | 637,756 | |
| Unrealized depreciation on forward foreign currency exchange contracts | | | - | | | | (11,607 | ) | | | - | |
| Unrealized appreciation (depreciation) on foreign currency translations | | | - | | | | (906 | ) | | | 5,118 | |
| Unrealized Trustees’ deferred compensation | | | (1,050 | ) | | | (2,521 | ) | | | (3,612 | ) |
| Total accumulated deficit | | $ | (2,132,353 | ) | | $ | (3,219,186 | ) | | $ | (23,048,013 | ) |
AXS Funds
NOTES TO CONSOLIDATED FINANCIAL STATEMENTS - Continued
September 30, 2021
| | | Managed Futures Strategy Fund | | | Multi-Strategy Alternatives Fund | | | Sustainable Income Fund | |
| Undistributed ordinary income | | $ | - | | | $ | 3,443,735 | | | $ | 939,331 | |
| Undistributed long-term capital gains | | | - | | | | 317,539 | | | | 12,926 | |
| Tax accumulated earnings | | | - | | | | 3,761,274 | | | | 952,257 | |
| | | | | | | | | | | | | |
| Accumulated capital and other losses | | | (239,147 | ) | | | - | | | | - | |
| Unrealized appreciation (depreciation) on investments | | | (125,217,761 | ) | | | 2,230,507 | | | | 864,392 | |
| Unrealized depreciation on open swap contracts | | | (7,618,598 | ) | | | - | | | | - | |
| Unrealized appreciation (depreciation) on futures contracts | | | - | | | | - | | | | - | |
| Unrealized appreciation on forward foreign currency exchange contracts | | | - | | | | - | | | | - | |
| Unrealized appreciation on foreign currency translations | | | - | | | | - | | | | - | |
| Unrealized Trustees’ deferred compensation | | | (10,809 | ) | | | (5,196 | ) | | | (3,171 | ) |
| Total accumulated earnings (deficit) | | $ | (133,086,315 | ) | | $ | 5,986,585 | | | $ | 1,813,478 | |
AXS Funds
NOTES TO CONSOLIDATED FINANCIAL STATEMENTS - Continued
September 30, 2021
| | | | Thomson Reuters Private Equity Return Tracker Fund | | | | Thomson Reuters Venture Capital Return Tracker Fund | |
| Undistributed ordinary income | | $ | 853,191 | | | $ | 11,871,918 | |
| Undistributed long-term capital gains | | | 5,089,908 | | | | 41,241,352 | |
| Tax accumulated earnings | | | 5,943,099 | | | | 53,113,270 | |
| | | | | | | | | |
| Accumulated capital and other losses | | | - | | | | - | |
| Unrealized appreciation on investments | | | 5,554,718 | | | | 78,017,375 | |
| Unrealized depreciation on open swap contracts | | | (944,589 | ) | | | (20,205,565 | ) |
| Unrealized appreciation (depreciation) on futures contracts | | | - | | | | - | |
| Unrealized appreciation on forward foreign currency exchange contracts | | | - | | | | - | |
| Unrealized appreciation on foreign currency translations | | | - | | | | - | |
| Unrealized Trustees’ deferred compensation | | | (1,470 | ) | | | (16,384 | ) |
| Total accumulated earnings | | $ | 10,551,758 | | | $ | 110,908,696 | |
The tax character of the distributions paid during the periods ended September 30, 2021 and September 30, 2020 were as follows:
| | | Alternative Growth Fund |
| Distributions paid from: | | | September 30, 2021 | | | | September 30, 2020 | |
| Ordinary income | | $ | - | | | $ | - | |
| Net long-term capital gains | | | - | | | | - | |
| Return of capital | | | - | | | | - | |
| Total distributions paid | | $ | - | | | $ | - | |
| | | | Aspect Core Diversified Strategy Fund | |
| Distributions paid from: | | | September 30, 2021 | | | | September 30, 2020 | |
| Ordinary income | | $ | - | | | $ | 1,575,322 | |
| Net long-term capital gains | | | - | | | | - | |
| Return of capital | | | - | | | | 696,719 | |
| Total distributions paid | | $ | - | | | $ | 2,272,041 | |
AXS Funds
NOTES TO CONSOLIDATED FINANCIAL STATEMENTS - Continued
September 30, 2021
| | | Chesapeake Strategy Fund | |
| Distributions paid from: | | September
30, 2021 | | | September 30, 2020 | |
| Ordinary income | | $ | - | | | $ | 3,146,191 | |
| Net long-term capital gains | | | - | | | | - | |
| Return of capital | | | - | | | | - | |
| Total distributions paid | | $ | - | | | $ | 3,146,191 | |
| | | Managed Futures Strategy Fund | |
| Distributions paid from: | | September 30, 2021 | | | September 30, 2020 | |
| Ordinary income | | $ | - | | | $ | 27,725,036 | |
| Net long-term capital gains | | | - | | | | - | |
| Return of capital | | | - | | | | 1,660,265 | |
| Total distributions paid | | $ | - | | | $ | 29,385,301 | |
| | | | Multi-Strategy Alternatives Fund | |
| | | | September 30, 2021 | | | | September 30, 2020 | |
| Distributions paid from: | | | | | | | | |
| Ordinary income | | $ | - | | | $ | - | |
| Net long-term capital gains | | | - | | | | - | |
| Return of capital | | | - | | | | - | |
| Total distributions paid | | $ | - | | | $ | - | |
| | | Sustainable Income Fund | |
| | | September 30, 2021 | | | September 30, 2020 | |
| Distributions paid from: | | | | | | |
| Ordinary income | | $ | 2,357,551 | | | $ | - | |
| Net long-term capital gains | | | - | | | | - | |
| Return of capital | | | - | | | | - | |
| Total distributions paid | | $ | 2,357,551 | | | $ | - | |
| | | Thomson Reuters Private Equity Return Tracker Fund | |
| | | September 30, 2021 | | | September 30, 2020 | |
| Distributions paid from: | | | | | | |
| Ordinary income | | $ | 954,916 | | | $ | 126,901 | |
| Net long-term capital gains | | | - | | | | 126,587 | |
| Return of capital | | | - | | | | - | |
| Total distributions paid | | $ | 954,916 | | | $ | 253,488 | |
AXS Funds
NOTES TO CONSOLIDATED FINANCIAL STATEMENTS - Continued
September 30, 2021
| | | Thomson Reuters Venture Capital Return Tracker Fund | |
| | | September 30, 2021 | | | September 30, 2020 | |
| Distributions paid from: | | | | | | |
| Ordinary income | | $ | 38,882,034 | | | $ | 13,498,495 | |
| Net long-term capital gains | | | - | | | | 3,955,152 | |
| Return of capital | | | - | | | | - | |
| Total distributions paid | | $ | 38,882,034 | | | $ | 17,453,647 | |
Tax equalization allows a Fund to treat as distribution that portion of redemption proceeds representing a redeeming shareholder’s portion of undistributed taxable and net capital gains. The Thomson Reuters Private Equity Return Tracker Fund and Thomson Reuters Venture Capital Return Tracker Fund utilized equalization in the amount of $253,488 and $17,453,647, respectively, which resulted in a difference between tax distributions and book distributions as disclosed on the Statement of Changes for the year ended September 30, 2020. Net investment income and net realized gains(losses), as disclosed on the Statements of Operations and net assets were not affected by these reclassifications.
As of September 30, 2021, the Alternative Growth Fund had $30,210 of qualified late-year ordinary losses, which are deferred until fiscal year 2021 for tax purposes. Net late-year ordinary losses incurred after December 31, and within the taxable year, are deemed to arise on the first day of each Fund’s next taxable year.
As of September 30, 2021, the Funds had net capital loss carryovers as follows:
| | | Alternative Growth Fund | | | Aspect Core Diversified Strategy Fund | | | Chesapeake Strategy Fund | | | Managed Futures Strategy Fund | |
| Not subject to expiration: | | | | | | | | | | | | |
| Short-term | | $ | 212,610 | | | $ | 1,916,453 | | | $ | 15,436,522 | | | $ | 135,836 | |
| Long-Term | | | 407,331 | | | | 1,017,481 | | | | 1,634,007 | | | | 103,311 | |
| Total | | $ | 619,941 | | | $ | 2,933,934 | | | $ | 17,070,529 | | | $ | 239,147 | |
| | | | Multi-Strategy Alternatives Fund | | | | Sustainable Income Fund | | | | Thomson Reuters Private Equity Return Tracker Fund | | | | Thomson Reuters Venture Capital Return Tracker Fund | |
| Not subject to expiration: | | | | | | | | | | | | | | | | |
| Short-term | | $ | - | | | $ | - | | | $ | - | | | $ | - | |
| Long-Term | | | - | | | | - | | | | - | | | | - | |
| Total | | $ | - | | | $ | - | | | $ | - | | | $ | - | |
AXS Funds
NOTES TO CONSOLIDATED FINANCIAL STATEMENTS - Continued
September 30, 2021
The Alternative Growth Fund, Aspect Core Diversified Strategy Fund, Chesapeake Strategy Fund, and Multi-Strategy Alternatives Fund had utilized non-expiring capital loss carry overs totaling $2,261,400, $3,197,345, $960,028, and $3,731,893, respectively.
Note 5 – Redemption Fee
The Alternative Growth Fund, Managed Futures Strategy Fund, Sustainable Income Fund, Thomson Reuters Private Equity Return Tracker Fund and Thomson Reuters Venture Capital Return Tracker Fund may impose a redemption fee of 1.00% of the total redemption amount on all shares redeemed within 30 days of purchase. These Funds received redemption fees as follows:
| | | Periods Ended September 30, 2021 | | | Periods Ended September 30, 2020 | |
| Alternative Growth Fund | | $ | 1,807 | | | $ | 119 | |
| Managed Futures Strategy Fund | | | 4,377 | | | | 27,967 | |
| Sustainable Income Fund | | | - | | | | - | |
| Thomson Reuters Private Equity Return Tracker Fund | | | 3,473 | | | | 629 | |
| Thomson Reuters Venture Capital Return Tracker Fund | | | 67,117 | | | | 81,426 | |
Note 6 – Investment Transactions
For the periods ended September 30, 2021, cost of purchases and proceeds from sales of portfolio securities, other than short-term investments and short-term U.S. Government securities were as follows:
| | | Purchases | | Sales |
| Alternative Growth Fund | $ | - | $ | 3,368,048 |
| Aspect Core Diversified Strategy Fund | | - | | 8,400,000 |
| Chesapeake Strategy Fund | | - | | 12,000,000 |
| Managed Futures Strategy Fund | | - | | 30,480,493 |
| Multi-Strategy Alternatives Fund | | 95,675,999 | | 140,204,243 |
| Sustainable Income Fund | | 107,428,575 | | 58,004,860 |
| Thomson Reuters Private Equity Return Tracker Fund | | 22,250,780 | | 23,011,801 |
| Thomson Reuters Venture Capital Return Tracker Fund | | 366,700,875 | | 271,686,057 |
Note 7 – Distribution Plan
The Trust, on behalf of each Fund, has adopted a Distribution Plan (the “Plan”) pursuant to Rule 12b-1 under the 1940 Act that allows each Fund to pay distribution fees for the sale and distribution of its shares. With respect to Class A shares and Class R-1 shares, the Plan provides for the payment of distribution fees at the annual rate of up to 0.25% of average daily net assets. For Class C shares, the maximum annual fees payable to the Distributor for distribution services and administrative services are 0.75% and 0.25%, respectively, of the average daily net assets of such shares. Class I Shares are not subject to any distribution or service fees under the Plan.
Prior to the close of business on November 20, 2020, the Thomson Reuters Private Equity Return Tracker Predecessor Fund and Thomson Reuters Venture Capital Return Tracker Predecessor Fund adopted a distribution plan pursuant to Rule 12b-1 with respect to Class A shares and C shares. Pursuant to the Plan, the Thomson Reuters Private Equity Return Tracker Predecessor Fund and Thomson Reuters Venture Capital Return Tracker Predecessor Fund paid NLD at the annual rate of up to 0.25% and 1.00% of average daily net assets attributable to Class A shares and C shares, respectively. Class I shares did not pay any distribution fees. For the period October 1, 2020 through November 20, 2020, the Thomson Reuters Private Equity Return Tracker Predecessor Fund and Thomson Reuters Venture Capital Return Tracker Predecessor Fund paid NLD $1,668 and $45,346, respectively, with respect to Class A and Class C shares under the Predecessor Funds’ distribution plan. For the periods ended September 30, 2021, distribution fees incurred are disclosed on the Consolidated Statements of Operations.
AXS Funds
NOTES TO CONSOLIDATED FINANCIAL STATEMENTS - Continued
September 30, 2021
Note 8 – Indemnifications
In the normal course of business, the Funds enter into contracts that contain a variety of representations, which provide general indemnifications. The Funds’ maximum exposure under these arrangements is unknown, as this would involve future claims that may be made against the Funds that have not yet occurred. However, the Funds expect the risk of loss to be remote.
Note 9 – Fair Value Measurements and Disclosure
Fair Value Measurements and Disclosures defines fair value, establishes a framework for measuring fair value in accordance with GAAP, and expands disclosure about fair value measurements. It also provides guidance on determining when there has been a significant decrease in the volume and level of activity for an asset or a liability, when a transaction is not orderly, and how that information must be incorporated into a fair value measurement.
Under Fair Value Measurements and Disclosures, various inputs are used in determining the value of the Funds’ investments. These inputs are summarized into three broad Levels as described below:
| · | Level 1 – Unadjusted quoted prices in active markets for identical assets or liabilities that the Funds have the ability to access. |
| · | Level 2 – Observable inputs other than quoted prices included in level 1 that are observable for the asset or liability, either directly or indirectly. These inputs may include quoted prices for the identical instrument on an inactive market, prices for similar instruments, interest rates, prepayment speeds, credit risk, yield curves, default rates and similar data. |
| · | Level 3 – Unobservable inputs for the asset or liability, to the extent relevant observable inputs are not available; representing the Funds’ own assumptions about the assumptions a market participant would use in valuing the asset or liability and would be based on the best information available. |
The availability of observable inputs can vary from security to security and is affected by a wide variety of factors, including, for example, the type of security, whether the security is new and not yet established in the marketplace, the liquidity of markets, and other characteristics particular to the security. To the extent that valuation is based on models or inputs that are less observable or unobservable in the market, the determination of fair value requires more judgment. Accordingly, the degree of judgment exercised in determining fair value is greatest for instruments categorized in Level 3.
The inputs used to measure fair value may fall into different Levels of the fair value hierarchy. In such cases, for disclosure purposes, the Level in the fair value hierarchy within which the fair value measurement falls in its entirety, is determined based on the lowest Level input that is significant to the fair value measurement in its entirety.
The inputs or methodology used for valuing securities are not an indication of the risk associated with investing in those securities. The following is a summary of the inputs used, as of September 30, 2021, in valuing the Funds’ assets and liabilities carried at fair value:
AXS Funds
NOTES TO CONSOLIDATED FINANCIAL STATEMENTS - Continued
September 30, 2021
| Alternative Growth Fund | | Level 1 | | | Level 2 | | | Level 3* | | | Total | |
| Assets | | | | | | | | | | | | |
| Investments | | | | | | | | | | | | |
| Short-Term Investments | | $ | 2,292,922 | | | $ | - | | | $ | - | | | $ | 2,292,922 | |
| Total Assets | | $ | 2,292,922 | | | $ | - | | | $ | - | | | $ | 2,292,922 | |
| Liabilities | | | | | | | | | | | | | | | | |
| Other Financial Instruments** | | | | | | | | | | | | | | | | |
| Futures Contracts | | $ | 133,070 | | | $ | - | | | $ | - | | | $ | 133,070 | |
| Swap Contract | | | - | | | | 635,360 | | | | - | | | | 635,360 | |
| Total Liabilities | | $ | 133,070 | | | $ | 635,360 | | | $ | - | | | $ | 768,430 | |
| Aspect Core Diversified Strategy Fund | | Level 1 | | | Level 2 | | | Level 3* | | | Total | |
| Assets | | | | | | | | | | | | |
| Investments | | | | | | | | | | | | |
| Short-Term Investments | | $ | 17,290,135 | | | $ | - | | | $ | - | | | $ | 17,290,135 | |
| Total Investments | | | 17,290,135 | | | | - | | | | - | | | | 17,290,135 | |
| Other Financial Instruments** | | | | | | | | | | | | | | | | |
| Futures Contracts | | | 696,471 | | | | - | | | | - | | | | 696,471 | |
| Forward Foreign Currency Contracts | | | - | | | | 80,980 | | | | - | | | | 80,980 | |
| Total Assets | | $ | 17,986,606 | | | $ | 80,980 | | | $ | - | | | $ | 18,067,586 | |
| | | | | | | | | | | | | | | | | |
| Liabilities | | | | | | | | | | | | | | | | |
| Other Financial Instruments** | | | | | | | | | | | | | | | | |
| Futures Contracts | | $ | 324,143 | | | $ | - | | | $ | - | | | $ | 324,143 | |
| Forward Foreign Currency Contracts | | | - | | | | 92,587 | | | | - | | | | 92,587 | |
| Total Liabilities | | $ | 324,143 | | | $ | 92,587 | | | $ | - | | | $ | 416,730 | |
AXS Funds
NOTES TO CONSOLIDATED FINANCIAL STATEMENTS - Continued
September 30, 2021
| Chesapeake Strategy Fund | | Level 1 | | | Level 2* | | | Level 3* | | | Total | |
| Assets | | | | | | | | | | | | |
| Investments | | | | | | | | | | | | |
| Short-Term Investments | | $ | 17,106,462 | | | $ | - | | | $ | - | | | $ | 17,106,462 | |
| Total Investments | | | 17,106,462 | | | | - | | | | - | | | | 17,106,462 | |
| Other Financial Instruments** | | | | | | | | | | | | | | | | |
| Futures Contracts | | | 903,677 | | | | - | | | | - | | | | 903,677 | |
| Total Assets | | $ | 18,010,139 | | | $ | - | | | $ | - | | | $ | 18,010,139 | |
| | | | | | | | | | | | | | | | | |
| Liabilities | | | | | | | | | | | | | | | | |
| Other Financial Instruments** | | | | | | | | | | | | | | | | |
| Futures Contracts | | $ | 265,921 | | | $ | - | | | $ | - | | | $ | 265,921 | |
| Total Liabilities | | $ | 265,921 | | | $ | - | | | $ | - | | | $ | 265,921 | |
| Managed Futures Strategy Fund | | Level 1 | | | Level 2 | | | Level 3* | | | Total | |
| Assets | | | | | | | | | | | | |
| Investments | | | | | | | | | | | | |
| Short-Term Investments | | $ | 17,606,388 | | | $ | - | | | $ | - | | | $ | 17,606,388 | |
| Total Investments | | | 17,606,388 | | | | - | | | | - | | | | 17,606,388 | |
| Other Financial Instruments** | | | | | | | | | | | | | | | | |
| Swap Contracts | | | - | | | | 37,872 | | | | - | | | | 37,872 | |
| Total Assets | | $ | 17,606,388 | | | $ | 37,872 | | | $ | - | | | $ | 17,644,260 | |
| | | | | | | | | | | | | | | | | |
| Liabilities | | | | | | | | | | | | | | | | |
| Other Financial Instruments** | | | | | | | | | | | | | | | | |
| Swap Contracts | | $ | - | | | $ | 7,656,469 | | | $ | - | | | $ | 7,656,469 | |
| Total Liabilities | | $ | - | | | $ | 7,656,469 | | | $ | - | | | $ | 7,656,469 | |
AXS Funds
NOTES TO CONSOLIDATED FINANCIAL STATEMENTS - Continued
September 30, 2021
| Multi-Strategy Alternatives Fund | | Level 1 | | | Level 2 | | | Level 3* | | | Total | |
| Assets | | | | | | | | | | | | |
| Investments | | | | | | | | | | | | |
| Common Stocks1 | | $ | 12,073,078 | | | $ | - | | | $ | - | | | $ | 12,073,078 | |
| Exchange-Traded Funds | | | 4,171,526 | | | | - | | | | - | | | | 4,171,526 | |
| Short-Term Investments | | | 3,789,056 | | | | - | | | | - | | | | 3,789,056 | |
| Total Investments | | $ | 20,033,660 | | | $ | - | | | $ | - | | | $ | 20,033,660 | |
| Other Financial Instruments** | | | | | | | | | | | | | | | | |
| Swap Contracts | | $ | - | | | $ | 170,937 | | | $ | - | | | $ | 170,937 | |
| Total Assets | | $ | 20,033,660 | | | $ | 170,937 | | | $ | - | | | $ | 20,204,597 | |
| | | | | | | | | | | | | | | | | |
| Liabilities | | | | | | | | | | | | | | | | |
| Other Financial Instruments** | | | | | | | | | | | | | | | | |
| Swap Contracts | | $ | - | | | $ | 150,597 | | | $ | - | | | $ | 150,597 | |
| Total Liabilities | | $ | - | | | $ | 150,597 | | | $ | - | | | $ | 150,597 | |
| Sustainable Income Fund | | Level 1 | | | Level 2 | | | Level 3* | | | Total | |
| Investments | | | | | | | | | | | | |
| Corporate Bonds1 | | $ | - | | | $ | 51,819,228 | | | $ | - | | | $ | 51,819,228 | |
| Short-Term Investments | | | 1,160,117 | | | | - | | | | - | | | | 1,160,117 | |
| Total Investments | | $ | 1,160,117 | | | $ | 51,819,228 | | | $ | - | | | $ | 52,979,345 | |
| Thomson Reuters Private Equity Return Tracker Fund | | Level 1 | | | Level 2 | | | Level 3* | | | Total | |
| Assets | | | | | | | | | | | | |
| Investments | | | | | | | | | | | | |
| Common Stocks1 | | $ | 26,071,932 | | | $ | - | | | $ | - | | | $ | 26,071,932 | |
| Short-Term Investments | | | 424,393 | | | | - | | | | - | | | | 424,393 | |
| Total Assets | | $ | 26,496,325 | | | $ | - | | | $ | - | | | $ | 26,496,325 | |
| | | | | | | | | | | | | | | | | |
| Liabilities | | | | | | | | | | | | | | | | |
| Other Financial Instruments** | | | | | | | | | | | | | | | | |
| Swap Contracts | | $ | - | | | $ | 944,589 | | | $ | - | | | $ | 944,589 | |
| Total Liabilities | | $ | - | | | $ | 944,589 | | | $ | - | | | $ | 944,589 | |
AXS Funds
NOTES TO CONSOLIDATED FINANCIAL STATEMENTS - Continued
September 30, 2021
| Thomson Reuters Venture Capital Return Tracker Fund | | Level 1 | | | Level 2 | | | Level 3* | | | Total | |
| Assets | | | | | | | | | | | | |
| Investments | | | | | | | | | | | | |
| Common Stocks1 | | $ | 383,598,814 | | | $ | - | | | $ | - | | | $ | 383,598,814 | |
| Short-Term Investments | | | 8,643,204 | | | | - | | | | - | | | | 8,643,204 | |
| Total Assets | | $ | 392,242,018 | | | $ | - | | | $ | - | | | $ | 392,242,018 | |
| | | | | | | | | | | | | | | | | |
| Liabilities | | | | | | | | | | | | | | | | |
| Other Financial Instruments** | | | | | | | | | | | | | | | | |
| Swap Contracts | | $ | - | | | $ | 20,205,565 | | | $ | - | | | $ | 20,205,565 | |
| Total Liabilities | | $ | - | | | $ | 20,205,565 | | | $ | - | | | $ | 20,205,565 | |
| 1 | For a detailed break-out of common stocks and corporate bonds by major industry classification, please refer to the Schedules of Investments. |
| * | The Funds did not hold any Level 3 securities at period end. |
| ** | Other financial instruments are derivative instruments such as swap contracts, futures contracts and forward foreign currency contracts. Swap contracts, futures contracts and forward foreign currency contracts are valued at the unrealized appreciation (depreciation) on the instrument. |
Note 10 – Derivative and Hedging Disclosure
Derivatives and Hedging requires enhanced disclosures about the Funds’ derivative and hedging activities, including how such activities are accounted for and their effects on the Funds’ financial position and performance. The Funds invested in futures contracts, swap contracts and forward foreign currency contracts during the periods ended September 30, 2021.
The effects of these derivative instruments on the Funds’ financial position and financial performance as reflected in the Consolidated Statements of Assets and Liabilities and Consolidated Statements of Operations are presented in the tables below. The fair values of derivative instruments, as of September 30, 2021, by risk category are as follows:
AXS Funds
NOTES TO CONSOLIDATED FINANCIAL STATEMENTS - Continued
September 30, 2021
| Alternative Growth Fund |
| | | Liability Derivatives |
| Derivatives not designated as hedging instruments | | Consolidated Statements of Assets and
Liabilities | | Value | |
| Equity contracts | | Unrealized depreciation on open futures contracts* | | $ | 133,070 | |
| Mixed: Interest rate, equity and foreign exchange contracts | | Unrealized depreciation on open swap contract | | | 635,360 | |
| Total | | | | $ | 768,430 | |
| * | Includes cumulative appreciation/depreciation on futures contracts as reported on the Schedule of Investments. Net unrealized appreciation/depreciation is shown as variation margin on futures contracts on the Consolidated Statements of Assets and Liabilities. |
| Aspect Core Diversified Strategy Fund |
| | | Asset Derivatives | | | | | | Liability Derivatives | | | | |
| Derivatives not designated as hedging instruments | | Consolidated Statements of Assets and
Liabilities | | | Value | | | Consolidated Statements of Assets and
Liabilities | | | Value | |
| Commodity contracts | | Unrealized appreciation on open futures contracts | | $ | 393,008 | | | Unrealized depreciation on open futures contracts | | $ | 88,282 | |
| Currency contracts | | Unrealized appreciation on open futures contracts | | | 116,564 | | | Unrealized depreciation on open futures contracts | | | 46,295 | |
| Currency contracts | | Unrealized appreciation on forward foreign currency exchange contracts | | | 80,980 | | | Unrealized depreciation on forward foreign currency exchange contracts | | | 92,587 | |
| Interest rate contracts | | Unrealized appreciation on open futures contracts | | | 183,339 | | | Unrealized depreciation on open futures contracts | | | 40,446 | |
| Index contracts | | Unrealized appreciation on open futures contracts | | | 3,560 | | | Unrealized depreciation on open futures contracts | | | 149,120 | |
| Total | | | | $ | 777,451 | | | | | $ | 416,730 | |
| Chesapeake Strategy Fund |
| | | Asset Derivatives | | Liability Derivatives |
| Derivatives not designated as hedging instruments | | Consolidated Statements of Assets and Liabilities | | | Value | | | Consolidated Statements of Assets and Liabilities | | | Value | |
| Commodity contracts | | Unrealized appreciation on open futures contracts | | $ | 409,475 | | | Unrealized depreciation on open futures contracts | | $ | 93,575 | |
| Currency contracts | | Unrealized appreciation on open futures contracts | | | 87,340 | | | Unrealized depreciation on open futures contracts | | | 79,940 | |
| Interest rate contracts | | Unrealized appreciation on open futures contracts | | | 391,049 | | | Unrealized depreciation on open futures contracts | | | - | |
| Index contracts | | Unrealized appreciation on open futures contracts | | | 15,813 | | | Unrealized depreciation on open futures contracts | | | 92,406 | |
| Total | | | | $ | 903,677 | | | | | $ | 265,921 | |
AXS Funds
NOTES TO CONSOLIDATED FINANCIAL STATEMENTS - Continued
September 30, 2021
| Managed Futures Strategy Fund |
| | | Asset Derivatives | | Liability Derivatives |
| Derivatives not designated as hedging instruments | | Consolidated Statements of Assets and Liabilities | | | Value | | | Consolidated Statements of Assets and Liabilities | | | Value | |
| Mixed: Interest rate, equity and foreign exchange contracts | | Unrealized appreciation on open swap contracts | | $ | 37,872 | | | Unrealized depreciation on open swap contracts | | $ | 7,656,469 | |
| Total | | | | $ | 37,872 | | | | | $ | 7,656,469 | |
| Multi-Strategy Alternatives Fund |
| | | Asset Derivatives | | Liability Derivatives |
| Derivatives not designated as hedging instruments | | Consolidated Statements of Assets and Liabilities | | | Value | | | Consolidated Statements of Assets and Liabilities | | | Value | |
| Equity contracts | | Unrealized appreciation on open swap contracts | | $ | 170,937 | | | Unrealized depreciation on open swap contracts | | $ | 150,597 | |
| Total | | | | $ | 170,937 | | | | | $ | 150,597 | |
| Thomson Reuters Private Equity Return Tracker Fund |
| | | Liability Derivatives |
| Derivatives not designated as hedging instruments | | Consolidated Statements of Assets and Liabilities | | Value | |
| Equity contracts | | Unrealized depreciation on open swap contracts | | $ | 944,589 | |
| Total | | | | $ | 944,589 | |
| Thomson Reuters Venture Capital Return Tracker Fund |
| | | Liability Derivatives |
| Derivatives not designated as hedging instruments | | Consolidated Statements of Assets and Liabilities | | Value | |
| Equity contracts | | Unrealized depreciation on open swap contracts | | $ | 20,205,565 | |
| Total | | | | $ | 20,205,565 | |
AXS Funds
NOTES TO CONSOLIDATED FINANCIAL STATEMENTS - Continued
September 30, 2021
The effects of derivative instruments on the Consolidated Statements of Operations for the periods ended September 30, 2021, are as follows:
| Alternative Growth Fund |
| Amount of Realized Gain or (Loss) on Derivatives Recognized in the Consolidated Statements of Operations |
| Derivatives not designated as hedging instruments | | Futures Contracts | | | Open Swap Contract | |
| Equity contracts | | $ | 1,702,768 | | | $ | - | |
| Mixed: Interest rate, equity and foreign exchange contracts | | | - | | | | (568,393 | ) |
| Total | | $ | 1,702,768 | | | $ | (568,393 | ) |
| Aspect Core Diversified Strategy Fund |
| Amount of Realized Gain or (Loss) on Derivatives Recognized in the Consolidated Statements of Operations |
| Derivatives not designated as hedging instruments | | Futures Contracts | | | Forward Foreign Currency Exchange Contracts | | | Total | |
| Commodity contracts | | $ | 1,355,298 | | | $ | - | | | $ | 1,355,298 | |
| Currency | | | (53,810 | ) | | | (92,929 | ) | | | (146,739 | ) |
| Index contracts | | | 628,435 | | | | - | | | | 628,435 | |
| Interest rate contracts | | | (588,761 | ) | | | - | | | | (588,761 | ) |
| Total | | $ | 1,341,162 | | | $ | (92,929 | ) | | $ | 1,248,233 | |
| Chesapeake Strategy Fund |
| Amount of Realized Gain or (Loss) on Derivatives Recognized in the Consolidated Statements of Operations |
| Derivatives not designated as hedging instruments | | Futures Contracts | |
| Commodity contracts | | $ | 3,182,670 | |
| Currency contracts | | | 335,937 | |
| Index contracts | | | 860,156 | |
| Interest rate contracts | | | (632,103 | ) |
| Total | | $ | 3,746,660 | |
| Managed Futures Strategy Fund |
| Amount of Realized Gain or (Loss) on Derivatives Recognized in the Consolidated Statements of Operations |
| Derivatives not designated as hedging instruments | | Open Swap Contracts | |
| Mixed: Interest rate, equity and foreign exchange contracts | | $ | (5,058,654 | ) |
AXS Funds
NOTES TO CONSOLIDATED FINANCIAL STATEMENTS - Continued
September 30, 2021
| Multi-Strategy Alternatives Fund |
| Amount of Realized Gain or (Loss) on Derivatives Recognized in the Consolidated Statements of Operations |
| Derivatives not designated as hedging instruments | | Open Swap Contracts | |
| Equity contracts | | $ | (1,322,259 | ) |
| Thomson Reuters Private Equity Return Tracker Fund |
| Amount of Realized Gain or (Loss) on Derivatives Recognized in the Consolidated Statements of Operations |
| Derivatives not designated as hedging instruments | | Open Swap Contracts | |
| Equity contracts | | $ | 7,907 | |
| Thomson Reuters Venture Capital Return Tracker Fund |
| Amount of Realized Gain or (Loss) on Derivatives Recognized in the Consolidated Statements of Operations |
| Derivatives not designated as hedging instruments | | Open Swap Contracts | |
| Equity contracts | | $ | 12,167,818 | |
| Alternative Growth Fund |
| Change in Unrealized Appreciation/Depreciation on Derivatives Recognized in the Consolidated Statements of Operations |
| Derivatives not designated as hedging instruments | | Futures Contracts | | | Open Swap Contract | | | Total | |
| Equity contracts | | $ | (59,955 | ) | | $ | - | | | $ | (59,955 | ) |
| Mixed: Interest rate, equity and foreign exchange contracts | | | - | | | | 175,274 | | | | 175,274 | |
| Total | | $ | (59,955 | ) | | $ | 175,274 | | | $ | 115,319 | |
| Aspect Core Diversified Strategy Fund |
| Change in Unrealized Appreciation/Depreciation on Derivatives Recognized in the Consolidated Statements of Operations |
| Derivatives not designated as hedging instruments | | Futures Contracts | | | Forward Foreign Currency Exchange Contracts | | | Total | |
| Commodity contracts | | $ | 272,540 | | | $ | - | | | $ | 272,540 | |
| Foreign exchange contracts | | | 157,164 | | | | (90,301 | ) | | | 66,863 | |
| Index contracts | | | (187,609 | ) | | | - | | | | (187,609 | ) |
| Interest rate contracts | | | 36,654 | | | | - | | | | 36,654 | |
| Total | | $ | 278,749 | | | $ | (90,301 | ) | | $ | 188,448 | |
AXS Funds
NOTES TO CONSOLIDATED FINANCIAL STATEMENTS - Continued
September 30, 2021
| Chesapeake Strategy Fund |
| Change in Unrealized Appreciation/Depreciation on Derivatives Recognized in the Consolidated Statements of Operations |
| Derivatives not designated as hedging instruments | | Futures Contracts | |
| Commodity contracts | | $ | 356,237 | |
| Currency contracts | | | 221,574 | |
| Index contracts | | | (149,683 | ) |
| Interest rate contracts | | | 345,422 | |
| Total | | $ | 773,550 | |
| Managed Futures Strategy Fund |
| Change in Unrealized Appreciation/Depreciation on Derivatives Recognized in the Consolidated Statements of Operations |
| Derivatives not designated as hedging instruments | | Open Swap Contracts | |
| Mixed: Interest rate, equity and foreign exchange contracts | | $ | 5,682,944 | |
| Multi-Strategy Alternatives Fund |
| Change in Unrealized Appreciation/Depreciation on Derivatives Recognized in the Consolidated Statements of Operations |
| Derivatives not designated as hedging instruments | | Open Swap Contracts | |
| Equity contracts | | $ | 227,500 | |
| Thomson Reuters Private Equity Return Tracker Fund |
| Change in Unrealized Appreciation/Depreciation on Derivatives Recognized in the Consolidated Statements of Operations |
| Derivatives not designated as hedging instruments | | Open Swap Contracts | |
| Equity contracts | | $ | 816,267 | |
| Thomson Reuters Venture Capital Return Tracker Fund |
| Change in Unrealized Appreciation/Depreciation on Derivatives Recognized in the Consolidated Statements of Operations |
| Derivatives not designated as hedging instruments | | Open Swap Contracts | |
| Equity contracts | | $ | 2,211,751 | |
AXS Funds
NOTES TO CONSOLIDATED FINANCIAL STATEMENTS - Continued
September 30, 2021
The average quarterly volume of derivative instruments held by the Funds during the periods ended September 30, 2021 are as follows:
| Alternative Growth Fund |
| | | | | Futures Contracts | | | Open Swap Contract | |
| Equity contracts | | Notional Value | | $ | 6,085,062 | | | $ | - | |
| Mixed: Interest Rate, Equity and Foreign Exchange Contracts | | Notional Value | | | - | | | | 10,148,174 | |
| Aspect Core Diversified Strategy Fund |
| | | | | Long Futures Contracts* | | | Short Futures Contracts* | |
| Commodity contracts | | Notional Value | | 4,070,118 | | | 814,891 | |
| Currency contracts | | Notional Value | | | 5,839,918 | | | | 3,349,691 | |
| Index contracts | | Notional Value | | | 60,732,845 | | | | 2,777,244 | |
| Interest rate contracts | | Notional Value | | | 116,924,042 | | | | 78,761,885 | |
| Chesapeake Strategy Fund |
| | | | | Long Futures Contracts* | | | Short Futures Contracts* | |
| Commodity contracts | | Notional Value | | | 8,519,949 | | | | 301,736 | |
| Currency contracts | | Notional Value | | | 13,351,114 | | | | 15,026,773 | |
| Index contracts | | Notional Value | | | 82,546,852 | | | | 119,470 | |
| Interest rate contracts | | Notional Value | | | 10,690,073 | | | | 11,785,668 | |
| Managed Futures Strategy Fund |
| | | | | Open Swap Contract | |
| Mixed: Interest Rate, Equity and Foreign Exchange Contracts | | Notional Value | | $ | 267,543,952 | |
| Multi-Strategy Alternatives Fund |
| | | | | Open Swap Contracts - Long | | | Open Swap Contracts - Short | |
| Equity contracts | | Notional Value | | $ | 5,454,553 | | | $ | 5,488,863 | |
AXS Funds
NOTES TO CONSOLIDATED FINANCIAL STATEMENTS - Continued
September 30, 2021
| Thomson Reuters Private Equity Return Tracker Fund |
| | | | | Open Swap Contracts - Long | |
| Equity contracts | | Notional Value | | $ | 28,626,859 | |
| Thomson Reuters Venture Capital Return Tracker Fund |
| | | | | Open Swap Contracts - Long | |
| Equity contracts | | Notional Value | | $ | 469,938,907 | |
The value of the forward foreign currency contracts outstanding as of September 30, 2021 as disclosed in the Consolidated Schedule of Investments and the amounts of realized gains and losses and changes in unrealized appreciation/(depreciation) on derivative instruments during the period as disclosed above and within the Consolidated Statement of Operations serve as indicators of the volume of derivative activity for the Aspect Core Diversified Strategy Fund.
Note 11 - Disclosures about Offsetting Assets and Liabilities
Disclosures about Offsetting Assets and Liabilities requires an entity to disclose information about offsetting and related arrangements to enable users of its financial statements to understand the effect of those arrangements on its financial position. The guidance requires retrospective application for all comparative periods presented.
A Fund mitigates credit risk with respect to OTC derivative counterparties through credit support annexes included with International Swaps and Derivative Association (“ISDA”) Master Agreements or other Master Netting Agreements which are the standard contracts governing most derivative transactions between the Funds and each of its counterparties. These agreements allow the Funds and each counterparty to offset certain derivative financial instruments’ payables and/or receivables against each other and/or with collateral, which is generally held by the Funds’ custodian. The amount of collateral moved to/from applicable counterparties is based upon minimum transfer amounts specified in the agreement. To the extent amounts due to the Funds from its counterparties are not fully collateralized contractually or otherwise, the Funds bear the risk of loss from counterparty non-performance.
AXS Funds
NOTES TO CONSOLIDATED FINANCIAL STATEMENTS - Continued
September 30, 2021
It is the Funds’ policy to recognize a net asset or liability equal to the unrealized appreciation (depreciation) of futures, forward foreign currency exchange and swap contracts. As of September 30, 2021, the Funds are subject to a master netting arrangement for the futures, foreign forward currency exchange and swap contracts. The following table shows additional information regarding the offsetting of assets and liabilities as of September 30, 2021:
| Alternative Growth Fund |
| | | | | | | | | | | | | | Amounts Not Offset in Statement of Assets and Liabilities | | | | |
| Description | | Counterparty | | Gross Amounts of Recognized Assets & Liabilities | | | Gross Amounts Offset in the Statement of Assets and Liabilities | | | Net Amounts of Liabilities Presented in the Statement of Assets and Liabilities | | | Financial Instruments** | | | Cash Collateral** | | | Net Amount | |
| Unrealized depreciation on open futures contracts* | | Morgan Stanley | | $ | (133,070 | ) | | $ | - | | | $ | (133,070 | ) | | $ | - | | | $ | 133,070 | | | $ | - | |
| Unrealized depreciation on open swap contract | | Deutsche Bank | | | (635,360 | ) | | | - | | | | (635,360 | ) | | | - | | | | 635,360 | | | | - | |
| Aspect Core Diversified Strategy Fund |
| | | | | | | | | | | | | | Amounts Not Offset in Statement of Assets and Liabilities | | | | |
| Description | | Counterparty | | Gross Amounts of Recognized Assets & Liabilities | | | Gross Amounts Offset in the Statement of Assets and Liabilities | | | Net Amounts of Assets Presented in the Statement of Assets and Liabilities | | | Financial Instruments** | | | Cash Collateral** | | | Net Amount | |
| Unrealized appreciation on open futures contracts* | | Morgan Stanley | | $ | 696,471 | | | $ | (324,143 | ) | | $ | 372,328 | | | $ | - | | | $ | - | | | $ | - | |
| Unrealized depreciation on forward foreign currency exchange contracts | | Morgan Stanley | | | (92,587 | ) | | | 80,980 | | | | (11,607 | ) | | | - | | | | 11,607 | | | | - | |
AXS Funds
NOTES TO CONSOLIDATED FINANCIAL STATEMENTS - Continued
September 30, 2021
| Chesapeake Strategy Fund |
| | | | | | | | | | | | | | Amounts Not Offset in Statement of Assets and Liabilities | | | | |
| Description | | Counterparty | | Gross Amounts of Recognized Assets & Liabilities | | | Gross Amounts Offset in the Statement of Assets and Liabilities | | | Net Amounts of Assets Presented in the Statement of Assets and Liabilities | | | Financial Instruments** | | | Cash Collateral** | | | Net Amount | |
| Unrealized appreciation on open futures contracts* | | Morgan Stanley | | $ | 903,677 | | | $ | (265,921 | ) | | $ | 637,756 | | | $ | - | | | $ | - | | | $ | - | |
| Managed Futures Strategy Fund |
| | | | | | | | | | | | | | Amounts Not Offset in Statement of Assets and Liabilities | | | | |
| Description | | Counterparty | | Gross Amounts of Recognized Assets/(Liabilities) | | | Gross Amounts Offset in the Statement of Assets and Liabilities | | | Net Amounts of Liabilities Presented in the Statement of Assets and Liabilities | | | Financial Instruments** | | | Cash Collateral** | | | Net Amount | |
| Unrealized depreciation on open swap contracts | | Deutsche Bank | | $ | (7,656,469 | ) | | $ | - | | | $ | (7,656,469 | ) | | $ | - | | | $ | 7,656,469 | | | $ | - | |
| Unrealized appreciation on open swap contracts | | Morgan Stanley | | | 37,872 | | | | - | | | | 37,872 | | | | - | | | | - | | | | - | |
AXS Funds
NOTES TO CONSOLIDATED FINANCIAL STATEMENTS - Continued
September 30, 2021
| Multi-Strategy Alternatives Fund |
| | | | | | | | | | | | | | Amounts Not Offset in Statement of Assets and Liabilities | | | | |
| Description | | Counterparty | | Gross Amounts of Recognized Assets & Liabilities | | | Gross Amounts Offset in the Statement of Assets and Liabilities | | | Net Amounts of Assets Presented in the Statement of Assets and Liabilities | | | Financial Instruments** | | | Cash Collateral** | | | Net Amount | |
| Unrealized appreciation on open swap contracts | | Cowen | | $ | 170,937 | | | $ | (150,597 | ) | | $ | 20,340 | | | $ | - | | | $ | - | | | $ | - | |
| Thomson Reuters Private Equity Return Tracker Fund |
| | | | | | | | | | | | | | Amounts Not Offset in Statement of Assets and Liabilities | | | | |
| Description | | Counterparty | | Gross Amounts of Recognized Liabilities | | | Gross Amounts Offset in the Statement of Assets and Liabilities | | | Net Amounts of Liabilities Presented in the Statement of Assets and Liabilities | | | Financial Instruments** | | | Cash Collateral** | | | Net Amount | |
| Unrealized depreciation on open swap contracts | | BNP Paribas | | $ | (944,589 | ) | | $ | - | | | $ | (944,589 | ) | | $ | 944,589 | | | $ | - | | | $ | - | |
AXS Funds
NOTES TO CONSOLIDATED FINANCIAL STATEMENTS - Continued
September 30, 2021
| Thomson Reuters Venture Capital Return Tracker Fund |
| | | | | | | | | | | | | | Amounts Not Offset in Statement of Assets and Liabilities | | | | |
| Description | | Counterparty | | Gross Amounts of Recognized Liabilities | | | Gross Amounts Offset in the Statement of Assets and Liabilities | | | Net Amounts of Assets Presented in the Statement of Assets and Liabilities | | | Financial Instruments** | | | Cash Collateral** | | | Net Amount | |
| Unrealized depreciation on open swap contracts | | BNP Paribas | | $ | (20,205,565 | ) | | $ | - | | | $ | (20,205,565 | ) | | $ | 20,205,565 | | | $ | - | | | $ | - | |
| * | Includes cumulative appreciation/depreciation on futures contracts as reported on the Schedule of Investments. Net unrealized appreciation/depreciation is shown as variation margin on futures contracts on the Consolidated Statements of Assets and Liabilities. |
| ** | Amounts relate to master netting agreements and collateral agreements which have been determined by the Advisor to be legally enforceable in the event of default but where certain other criteria are not met in accordance with applicable offsetting accounting guidance. The collateral amounts may exceed the related net amounts of financial assets and liabilities presented in the Consolidated Statements of Assets and Liabilities. Where this is the case, the total amount reported is limited to the net amounts of financial assets and liabilities with that counterparty. |
Note 12 – Control Ownership
The beneficial ownership, either directly or indirectly, of more than 25% of the voting securities of a Fund creates presumption of control of the Fund, under Section 2(a) 9 of the Act. As of September 30, 2021, beneficial ownership in excess of 25% is as follows:
| Fund | Beneficial Owner | % of Outstanding Shares |
| Alternative Growth Fund | National Financial Services, LLC | 54% |
| Alternative Growth Fund | TD Ameritrade, Inc. | 32% |
| Aspect Core Diversified Strategy Fund | Alyssum Investments Limited | 47% |
| Aspect Core Diversified Strategy Fund | Raymond James Financial | 29% |
| Chesapeake Strategy Fund | National Financial Services, LLC | 33% |
| Managed Futures Strategy Fund | Raymond James Financial | 60% |
| Multi-Strategy Alternatives Fund | National Financial Services, LLC | 62% |
| Sustainable Income Fund | AXIS Reinsurance Company | 97% |
| Thomson Reuters Private Equity Return Tracker Fund | National Financial Services, LLC | 66% |
| Thomson Reuters Venture Capital Return Tracker Fund | National Financial Services, LLC | 26% |
| Thomson Reuters Venture Capital Return Tracker Fund | LPL Financial Holdings, Inc. | 26% |
AXS Funds
NOTES TO CONSOLIDATED FINANCIAL STATEMENTS - Continued
September 30, 2021
The Trust has no knowledge as to whether all or any portion of the shares owned of record are also owned beneficially.
Note 13 – COVID-19 Risks
In early 2020, an outbreak of a novel strain of coronavirus (COVID-19) emerged globally. This coronavirus has resulted in closing international borders, enhanced health screenings, healthcare service preparation and delivery, quarantines, cancellations, disruptions to supply chains and customer activity, as well as general public concern and uncertainty. The impact of this outbreak has negatively affected the worldwide economy, as well as the economies of individual countries, the financial health of individual companies and the market in general in significant and unforeseen ways. The future impact of COVID-19 is currently unknown, and it may exacerbate other risks that apply to the Funds, including political, social and economic risks. Any such impact could adversely affect the Funds’ performance, the performance of the securities in which the Funds invest and may lead to losses on your investment in the Funds. The ultimate impact of COVID-19 on the financial performance of the Funds’ investments is not reasonably estimable at this time.
Note 14 – Recently Issued Accounting Pronouncements
In March 2020, the FASB issued ASU No. 2020-04 (“ASU 2020-04”), Reference Rate Reform (Topic 848) - Facilitation of the Effects of Reference Rate Reform on Financial Reporting. The amendments in ASU 2020-04 provide optional temporary financial reporting relief from the effect of certain types of contract modifications due to the planned discontinuation of LIBOR and other interbank-offered based reference rates as of the end of 2021. ASU 2020-04 is effective for certain reference rate-related contract modifications that occur during the period March 12, 2020 through December 31, 2022. Management is currently evaluating the impact of the guidance.
AXS Funds
NOTES TO CONSOLIDATED FINANCIAL STATEMENTS - Continued
September 30, 2021
Note 15 – Change in Auditor
On August 6, 2020, the Board of Trustees appointed RSM US LLP (“RSM”) as the Thomson Reuters Private Equity Return Tracker Fund and Thomson Reuters Venture Capital Return Tracker Funds’ independent registered public accounting firm upon the reorganization of the Predecessor Funds for the fiscal period ended September 30, 2021.
Cohen & Company, LTD (“Cohen”) reports on the Predecessor Funds’ financial statements for the periods prior to September 30, 2021 did not contain an adverse opinion or a disclaimer of opinion, nor were such reports qualified or modified as to uncertainty, audit scope or accounting principles.
During the periods ended prior to September 30, 2021, neither the Funds nor anyone on its behalf has consulted with Cohen regarding; (i) the application of accounting principles to a specified transaction, either completed or proposed; or the type of audit opinion that might be rendered on the Funds’ financial statements, and neither a written report was provided to the Funds nor oral advice was provided that Cohen concluded was an important factor considered by the Funds in reaching a decision as to any accounting, auditing or financial reporting issue; or (ii) any matter that was the subject of a disagreement (as that term is defined in Item 304 (a)(1)(iv) of Regulation S-K and the related instructions to Item 304 of Regulation S-K) or a reportable event (as that term is defined in Item 304 (a)(1)(v) of Regulation S-K).
Note 16 – Events Subsequent to the Fiscal Period End
The Funds have adopted financial reporting rules regarding subsequent events which require an entity to recognize in the financial statements the effects of all subsequent events that provide additional evidence about conditions that existed at the date of the balance sheet. Management has evaluated the Funds’ related events and transactions that occurred through the date of issuance of the Funds’ consolidated financial statements.
On November 3, 2021, based on the recommendation of the Advisor, the Board of Trustees of the Trust (the “Board”) has approved the proposed reorganization (the “Reorganization”) of the AXS Aspect Core Diversified Strategy Fund (the “Target Fund”) into the AXS Chesapeake Strategy Fund (the “Acquiring Fund” and together with the Target Fund, the “Funds”), subject to approval by the shareholders of the Target Fund.
In order to accomplish the Reorganization, the Board approved an Agreement and Plan of Reorganization (the “Plan”). The Plan provides for an exchange of shares of each class of the Target Fund for shares of the same class of the Acquiring Fund, which would be distributed pro rata by the Target Fund to the holders of the shares of such class in complete liquidation of the Target Fund, and the Acquiring Fund’s assumption of all of the liabilities of the Target Fund. Shareholders of each class of the Target Fund will receive shares of the Acquiring Fund equal in value to the shares of the Target Fund held by the shareholders prior to the Reorganization. The effect of the Reorganization will be that the Target Fund’s shareholders will become shareholders of the Acquiring Fund. Target Fund shareholders are generally not expected to recognize gain or loss for U.S. federal income tax purposes as a direct result of the Reorganization.
The Advisor will continue to serve as investment advisor to the Acquiring Fund following the Reorganization. The Target Fund and Acquiring Fund have the same investment objective and similar, but not identical, investment strategies. The primary difference is that the Funds are managed by different sub-advisors, each of which uses its own proprietary investment program to invest its Fund’s assets. Both Funds utilize trend following strategies, which generally seek to identify the general direction of one or more global market segments (either up or down) using indicators such as current market prices and moving average prices, and buy or sell investments based on the assessment of these trade signals as determined before a trade is made. However, the Acquiring Fund applies a long-term trend following strategy (which typically seeks capital growth over five or more years), while the Target Fund employs a medium-term trend following strategy (which typically seeks capital growth over three to five years).
AXS Funds
NOTES TO CONSOLIDATED FINANCIAL STATEMENTS - Continued
September 30, 2021
The Board will call a meeting of the shareholders of the Target Fund to vote on the Plan. Management of the Trust expects the shareholder meeting to be held on or about December 15, 2021. If the Reorganization is approved by Target Fund shareholders, the Reorganization is expected to take effect in the fourth quarter of 2021.
There were no other events or transactions that occurred during this period that materially impacted the amounts or disclosures in the Funds’ consolidated financial statements.
Report of Independent Registered Public Accounting Firm
To the Board of Trustees of Investment Managers Series Trust II
and the Shareholders of AXS Alternative Growth Fund
Opinion on the Financial Statements
We have audited the accompanying consolidated statements of assets and liabilities of AXS Alternative Growth Fund (the Fund), including the consolidated schedule of investments, as of September 30, 2021, the related consolidated statement of operations for the year then ended, the consolidated statements of changes in net assets for the year then ended, for the period from July 1, 2020 through September 30, 2020 and for the year ended June 30, 2020, the financial highlights for the year then ended, for the period from July 1, 2020 through September 30, 2020 and for each of the four years ended June 30, 2020, 2019, 2018 and 2017 and the related notes to the consolidated financial statements (collectively, the financial statements). In our opinion, the financial statements present fairly, in all material respects, the financial position of the Fund as of September 30, 2021, the results of its operations for the year then ended, the changes in net assets for the year then ended, for the period from July 1, 2020 through September 30, 2020 and for the year ended June 30, 2020, and the financial highlights for the year then ended, for the period from July 1, 2020 through September 30, 2020 and for each of the four years ended June 30, 2020, 2019, 2018 and 2017, in conformity with accounting principles generally accepted in the United States of America.
Basis for Opinion
These financial statements are the responsibility of the Fund’s management. Our responsibility is to express an opinion on the Fund’s financial statements and financial highlights based on our audits. We are a public accounting firm registered with the Public Company Accounting Oversight Board (United States) (PCAOB) and are required to be independent with respect to the Fund in accordance with U.S. federal securities laws and the applicable rules and regulations of the Securities and Exchange Commission and the PCAOB.
We conducted our audits in accordance with the standards of the PCAOB. Those standards require that we plan and perform the audit to obtain reasonable assurance about whether the financial statements are free of material misstatement, whether due to error or fraud. The Fund is not required to have, nor were we engaged to perform, an audit of its internal control over financial reporting. As part of our audits, we are required to obtain an understanding of internal control over financial reporting but not for the purpose of expressing an opinion on the effectiveness of the Fund’s internal control over financial reporting. Accordingly, we express no such opinion.
Our audits included performing procedures to assess the risks of material misstatement of the financial statements, whether due to error or fraud, and performing procedures that respond to those risks. Such procedures included examining, on a test basis, evidence regarding the amounts and disclosures in the financial statements. Our procedures included confirmation of investments owned as of September 30, 2021, by correspondence with the custodian, broker and swap counterparty. Our audits also included evaluating the accounting principles used and significant estimates made by management, as well as evaluating the overall presentation of the financial statements. We believe that our audits provide a reasonable basis for our opinion.
/s/ RSM US LLP
We have served as the auditor of one or more AXS Investments LLC advised investment companies since 2010.
Denver, Colorado
November 29, 2021
Report of Independent Registered Public Accounting Firm
To the Board of Trustees of Investment Managers Series Trust II
and the Shareholders of AXS Aspect Core Diversified Strategy Fund, AXS Chesapeake Strategy Fund, and AXS Managed Futures Strategy Fund
Opinion on the Financial Statements
We have audited the accompanying consolidated statements of assets and liabilities of AXS Aspect Core Diversified Strategy Fund, AXS Chesapeake Strategy Fund and AXS Managed Futures Strategy Fund (collectively, the Funds), including the consolidated schedules of investments, as of September 30, 2021, the related consolidated statements of operations for the year then ended, the consolidated statements of changes in net assets for each of the two years in the period then ended, the financial highlights for each of the five years in the period then ended and the related notes to the consolidated financial statements (collectively, the financial statements). In our opinion, the financial statements and financial highlights present fairly, in all material respects, the financial position of the Funds as of September 30, 2021, the results of their operations for the year then ended, the changes in net assets for each of the two years in the period then ended, and the financial highlights for each of the five years in the period then ended, in conformity with accounting principles generally accepted in the United States of America.
Basis for Opinion
These financial statements are the responsibility of the Funds’ management. Our responsibility is to express an opinion on the Funds’ financial statements and financial highlights based on our audits. We are a public accounting firm registered with the Public Company Accounting Oversight Board (United States) (PCAOB) and are required to be independent with respect to the Funds in accordance with U.S. federal securities laws and the applicable rules and regulations of the Securities and Exchange Commission and the PCAOB.
We conducted our audits in accordance with the standards of the PCAOB. Those standards require that we plan and perform the audit to obtain reasonable assurance about whether the financial statements are free of material misstatement, whether due to error or fraud. The Funds are not required to have, nor were we engaged to perform, audits of their internal control over financial reporting. As part of our audits, we are required to obtain an understanding of internal control over financial reporting but not for the purpose of expressing an opinion on the effectiveness of the Funds’ internal control over financial reporting. Accordingly, we express no such opinion.
Our audits included performing procedures to assess the risks of material misstatement of the financial statements, whether due to error or fraud, and performing procedures that respond to those risks. Such procedures included examining, on a test basis, evidence regarding the amounts and disclosures in the financial statements. Our procedures included confirmation of investments owned as of September 30, 2021, by correspondence with the custodian, broker and swap counterparties. Our audits also included evaluating the accounting principles used and significant estimates made by management, as well as evaluating the overall presentation of the financial statements. We believe that our audits provide a reasonable basis for our opinion.
/s/ RSM US LLP
We have served as the auditor of one or more AXS Investments LLC advised investment companies since 2010.
Denver, Colorado
November 29, 2021
Report of Independent Registered Public Accounting Firm
To the Board of Trustees of Investment Managers Series Trust II
and the Shareholders of AXS Multi-Strategy Alternatives Fund
Opinion on the Financial Statements
We have audited the accompanying statement of assets and liabilities of AXS Multi-Strategy Alternatives Fund (the Fund), including the schedule of investments, as of September 30, 2021, the related statement of operations for the year then ended, the statements of changes in net assets for the year then ended, for the period from May 1, 2020 through September 30, 2020 and for the year ended April 30, 2020, the financial highlights for the year then ended, for the period from May 1, 2020 through September 30, 2020 and the years ended April 30, 2020 and April 30, 2019 and the related notes to the financial statements (collectively, the financial statements). In our opinion, the financial statements and financial highlights present fairly, in all material respects, the financial position of the Fund as of September 30, 2021, the results of its operations for the year then ended, the changes in net assets for the year then ended, for the period from May 1, 2020 through September 30, 2020 and the year ended April 30, 2020, and the financial highlights for the year then ended, for the period from May 1, 2020 through September 30, 2020 and for the years ended April 30, 2020 and April 30, 2019, in conformity with accounting principles generally accepted in the United States of America.
The financial highlights for the years ended April 30, 2018 and April 30, 2017, for the Fund were audited by other auditors. Those auditors expressed an unqualified opinion on those financial statements and financial highlights in their report dated June 27, 2018.
Basis for Opinion
These financial statements are the responsibility of the Fund’s management. Our responsibility is to express an opinion on the Fund’s financial statements and financial highlights based on our audits. We are a public accounting firm registered with the Public Company Accounting Oversight Board (United States) (PCAOB) and are required to be independent with respect to the Fund in accordance with U.S. federal securities laws and the applicable rules and regulations of the Securities and Exchange Commission and the PCAOB.
We conducted our audits in accordance with the standards of the PCAOB. Those standards require that we plan and perform the audit to obtain reasonable assurance about whether the financial statements are free of material misstatement, whether due to error or fraud. The Fund is not required to have, nor were we engaged to perform, an audit of its internal control over financial reporting. As part of our audits, we are required to obtain an understanding of internal control over financial reporting but not for the purpose of expressing an opinion on the effectiveness of the Fund’s internal control over financial reporting. Accordingly, we express no such opinion.
Our audits included performing procedures to assess the risks of material misstatement of the financial statements, whether due to error or fraud, and performing procedures that respond to those risks. Such procedures included examining, on a test basis, evidence regarding the amounts and disclosures in the financial statements. Our procedures included confirmation of investments owned as of September 30, 2021, by correspondence with the custodian, broker and swap counterparty. Our audits also included evaluating the accounting principles used and significant estimates made by management, as well as evaluating the overall presentation of the financial statements. We believe that our audits provide a reasonable basis for our opinion.
/s/ RSM US LLP
We have served as the auditor of one or more AXS Investments LLC advised investment companies since 2010.
Denver, Colorado
November 29, 2021
Report of Independent Registered Public Accounting Firm
To the Board of Trustees of Investment Managers Series Trust II
and the Shareholders of AXS Sustainable Income Fund
Opinion on the Financial Statements
We have audited the accompanying statement of assets and liabilities of AXS Sustainable Income Fund (the Fund), including the schedule of investments, as of September 30, 2021, the related statements of operations, changes in net assets and financial highlights for the period from October 17, 2020 (commencement of operations) through September 30, 2021, and the related notes to the financial statements (collectively, the financial statements). In our opinion, the financial statements and financial highlights present fairly, in all material respects, the financial position of the Fund as of September 30, 2021, the results of its operations, changes in net assets and the financial highlights for the period from October 17, 2020 (commencement of operations) through September 30, 2021, in conformity with accounting principles generally accepted in the United States of America.
Basis for Opinion
These financial statements are the responsibility of the Fund’s management. Our responsibility is to express an opinion on the Fund’s financial statements and financial highlights based on our audits. We are a public accounting firm registered with the Public Company Accounting Oversight Board (United States) (PCAOB) and are required to be independent with respect to the Fund in accordance with U.S. federal securities laws and the applicable rules and regulations of the Securities and Exchange Commission and the PCAOB.
We conducted our audits in accordance with the standards of the PCAOB. Those standards require that we plan and perform the audit to obtain reasonable assurance about whether the financial statements are free of material misstatement, whether due to error or fraud. The Fund is not required to have, nor were we engaged to perform, an audit of its internal control over financial reporting. As part of our audits, we are required to obtain an understanding of internal control over financial reporting but not for the purpose of expressing an opinion on the effectiveness of the Fund’s internal control over financial reporting. Accordingly, we express no such opinion.
Our audits included performing procedures to assess the risks of material misstatement of the financial statements, whether due to error or fraud, and performing procedures that respond to those risks. Such procedures included examining, on a test basis, evidence regarding the amounts and disclosures in the financial statements. Our procedures included confirmation of investments owned as of September 30, 2021, by correspondence with the custodian. Our audits also included evaluating the accounting principles used and significant estimates made by management, as well as evaluating the overall presentation of the financial statements. We believe that our audits provide a reasonable basis for our opinion.
/s/ RSM US LLP
We have served as the auditor of one or more AXS Investments LLC advised investment companies since 2010.
Denver, Colorado
November 29, 2021
Report of Independent Registered Public Accounting Firm
To the Board of Trustees of Investment Managers Series Trust II and
the Shareholders of AXS Thomson Reuters Private Equity Return Tracker Fund and
AXS Thomson Reuters Venture Capital Return Tracker Fund
Opinion on the Financial Statements
We have audited the accompanying statement of assets and liabilities of AXS Thomson Reuters Private Equity Return Tracker Fund and AXS Thomson Reuters Venture Capital Return Tracker Fund (collectively, the Funds), including the schedules of investments, as of September 30, 2021, the related statements of operations, changes in net assets and the financial highlights for the year then ended and the related notes to the financial statements (collectively, the financial statements). In our opinion, the financial statements and financial highlights present fairly, in all material respects, the financial position of the Funds as of September 30, 2021, the results of their operations, changes in net assets and the financial highlights for the year then ended, in conformity with accounting principles generally accepted in the United States of America.
The statements of changes in net assets for the year ended September 30, 2020 and the financial highlights for the years ended September 30, 2020, September 30, 2019, September 30, 2018 and September 30, 2017, for the Funds were audited by other auditors. Those auditors expressed unqualified opinions on those financial statements and financial highlights in their report dated November 30, 2020.
Basis for Opinion
These financial statements are the responsibility of the Funds’ management. Our responsibility is to express an opinion on the Funds’ financial statements and financial highlights based on our audits. We are a public accounting firm registered with the Public Company Accounting Oversight Board (United States) (PCAOB) and are required to be independent with respect to the Fund in accordance with U.S. federal securities laws and the applicable rules and regulations of the Securities and Exchange Commission and the PCAOB.
We conducted our audits in accordance with the standards of the PCAOB. Those standards require that we plan and perform the audit to obtain reasonable assurance about whether the financial statements are free of material misstatement, whether due to error or fraud. The Funds are not required to have, nor were we engaged to perform, an audit of their internal control over financial reporting. As part of our audits, we are required to obtain an understanding of internal control over financial reporting but not for the purpose of expressing an opinion on the effectiveness of the Funds’ internal control over financial reporting. Accordingly, we express no such opinion.
Our audits included performing procedures to assess the risks of material misstatement of the financial statements, whether due to error or fraud, and performing procedures that respond to those risks. Such procedures included examining, on a test basis, evidence regarding the amounts and disclosures in the financial statements. Our procedures included confirmation of investments owned as of September 30, 2021, by correspondence with the custodian and swap counterparty. Our audits also included evaluating the accounting principles used and significant estimates made by management, as well as evaluating the overall presentation of the financial statements. We believe that our audits provide a reasonable basis for our opinion.
/s/ RSM US LLP
We have served as the auditor of one or more AXS Investments LLC advised investment companies since 2010.
Denver, Colorado
November 29, 2021
AXS Funds
SUPPLEMENTAL INFORMATION (Unaudited)
For the year ended September 30, 2021, 38.00% and 16.24% of the dividends paid from net investment income, including short-term capital gains from the Thomson Reuters Private Equity Return Tracker Fund and Thomson Reuters Venture Capital Return Tracker Fund, respectively, is designated as dividends received deduction available to corporate shareholders.
For the year ended September 30, 2021, 39.07%, and 17.28% of dividends paid from net investment income, including short-term capital gains from the Thomson Reuters Private Equity Return Tracker Fund and Thomson Reuters Venture Capital Return Tracker Fund, respectively, are designated as qualified dividend income.
Trustees and Officers Information
Additional information about the Trustees is included in the Funds’ Statement of Additional Information which is available, without charge, upon request by calling (833) 297-2587. The Trustees and officers of the Fund and their principal occupations during the past five years are as follows:
| Name, Address, Year of Birth and Position(s) held with Trust | Term of Officec and Length of Time Served | Principal Occupation During the Past Five Years and Other Affiliations | Number of Portfolios in the Fund Complex Overseen by Trusteed | Other Directorships Held by Trustee During the Past Five Yearse |
| Independent Trustees: | | |
Thomas Knipper, CPA a (Born 1957) Trustee | Since September 2013 | Vice President and Chief Compliance Officer, Ameritas Investment Partners, a registered investment advisor (1995 – present). | 12 | None. |
Kathleen K. Shkuda a (born 1951) Trustee | Since September 2013 | Zigzag Consulting, a financial services consulting firm (2008 – present). Director, Managed Accounts, Merrill Lynch (2007-2008). | 12 | None. |
Larry D. Tashjian a (born 1953) Trustee and Chairman of the Board | Since September 2013 | Principal, CAM Capital Advisors, a family office (2001 – present). | 12 | General Finance Corporation. |
John P. Zader a (born 1961) Trustee | Since September 2013 | Retired (June 2014 – present); CEO, UMB Fund Services, Inc., a mutual fund and hedge fund service provider, and the transfer agent, fund accountant, and co-administrator for the Fund (December 2006 – June 2014); President, Investment Managers Series Trust (December 2007 - June 2014). | 12 | Investment Managers Series Trust, a registered investment company (includes 53 portfolios), and 361 Social Infrastructure Fund, a closed-end investment company. |
AXS Funds
SUPPLEMENTAL INFORMATION (Unaudited) – Continued
| Interested Trustees: | | |
Eric M. Banhazl b† (born 1957) Trustee | Since September 2013 | Chairman (2016 – present), and President (2006 – 2015), Mutual Fund Administration, LLC, co-administrator for the Fund. Trustee and Vice President, Investment Managers Series Trust (September 2013 – January 2016). Chairman (2018 – present), Foothill Capital Management, LLC, a registered investment advisor. | 12 | Investment Managers Series Trust, a registered investment company (includes 53 portfolios), and 361 Social Infrastructure Fund, a closed-end investment company. |
Terrance P. Gallagher a* (born 1958) Trustee and President | Since July 2019 | President, Investment Managers Series Trust II (September 2013 – present); Executive Vice President, UMB Fund Services, Inc. (2007 – present). Director of Compliance, Unified Fund Services Inc. (now Huntington Fund Services), a mutual fund service provider (2004 – 2007). | 5 | Cliffwater Corporate Lending Fund, Agility Multi-Asset Income Fund, Corbin Multi-Strategy Fund, Aspiriant Risk-Managed Real Asset Fund, Aspiriant Risk-Managed Capital Appreciation Fund, Infinity Core Alternative Fund, Infinity Long/Short Equity Fund, LLC, Keystone Private Income Fund, First Trust Alternative Opportunities Fund, and Variant Alternative Income Fund, each a closed-end investment company. |
| Officer of the Trust: | | | | |
Rita Dam b (born 1966) Treasurer and Assistant Secretary | Since September 2013 | Treasurer, 361 Social Infrastructure Fund (December 2019 – present); Co-President, Foothill Capital Management, LLC, a registered investment advisor (2018 – present); Co-Chief Executive Officer (2016 – present), and Vice President (2006 – 2015), Mutual Fund Administration, LLC. | N/A | N/A |
AXS Funds
SUPPLEMENTAL INFORMATION (Unaudited) – Continued
| Officers of the Trust: | | | | |
Joy Ausili b (born 1966) Vice President and Assistant Secretary | Since January 2016 | Vice President and Assistant Secretary, 361 Social Infrastructure Fund (December 2019 – present); Co-President, Foothill Capital Management, LLC, a registered investment advisor (2018 – present); Co-Chief Executive Officer (2016 – present), and Vice President (2006 – 2015), Mutual Fund Administration, LLC; Secretary and Assistant Treasurer, Investment Managers Series Trust (September 2013 – January 2016). | N/A | N/A |
Diane Drake b (born 1967) Secretary | Since January 2016 | Secretary, 361 Social Infrastructure Fund (December 2019 – present); Senior Counsel, Mutual Fund Administration, LLC (October 2015 – present); Chief Compliance Officer, Foothill Capital Management, LLC, a registered investment advisor (2018 – 2019). | N/A | N/A |
Martin Dziura b (born 1959) Chief Compliance Officer | Since September 2013 | Principal, Dziura Compliance Consulting, LLC (October 2014 - present). Managing Director, Cipperman Compliance Services (2010 – September 2014). Chief Compliance Officer, Hanlon Investment Management (2009 - 2010). Vice President − Compliance, Morgan Stanley Investment Management (2000 − 2009). | N/A | N/A |
| a | Address for certain Trustees and certain officers: 235 West Galena Street, Milwaukee, Wisconsin 53212. |
| b | Address for Mr. Banhazl, Ms. Ausili, Ms. Dam and Ms. Drake: 2220 E. Route 66, Suite 226, Glendora, California 91740. Address for Mr. Dziura: 309 Woodridge Lane, Media, Pennsylvania 19063. |
| c | Trustees and officers serve until their successors have been duly elected. |
| d | The Trust is comprised of 21 series managed by unaffiliated investment advisors. The term “Fund Complex” applies only to the Fund managed by the same investment advisor. The Funds’ investment advisor also serves as the investment advisor to the AXS All Terrain Opportunity Fund, AXS Alternative Value Fund, AXS Market Neutral Fund and AXS Merger Fund which are offered in separate prospectus. The Funds do not hold themselves out as related to any other series within the Trust, for purposes of investment and investor services. |
| e | “Other Directorships Held” includes only directorship of companies required to register or file reports with the SEC under the Securities Exchange Act of 1934, as amended (that is, “public companies”) or other investment companies registered under the 1940 Act. |
| † | Mr. Banhazl is an “interested person” of the Trust by virtue of his position with Mutual Fund Administration, LLC and Foothill Capital Management, LLC. |
| * | Mr. Gallagher is an “interested person” of the Trust by virtue of his position with UMB Fund Services, Inc. |
AXS Funds
EXPENSE EXAMPLES
For the Six Months Ended September 30, 2021 (Unaudited)
Expense Examples
As a shareholder of the Funds, you incur two types of costs: (1) transaction costs; and (2) ongoing costs, including management fees; distribution and/or 12b-1 fees (Class A, Class C, and Class R-1 shares only) and other Fund expenses. The examples below are intended to help you understand your ongoing costs (in dollars) of investing in the Funds and to compare these costs with the ongoing costs of investing in other mutual funds.
These examples are based on an investment of $1,000 invested at the beginning of the period and held for the entire period from April 1, 2021 to September 30, 2021.
Actual Expenses
The information in the row titled “Actual Performance” of the table below provides actual account values and actual expenses. You may use the information in these columns, together with the amount you invested, to estimate the expenses that you paid over the period. Simply divide your account value by $1,000 (for example, an $8,600 account value divided by $1,000 = 8.6), then multiply the result by the number in the appropriate row for your share class, under the column titled “Expenses Paid During Period” to estimate the expenses you paid on your account during this period.
Hypothetical Example for Comparison Purposes
The information in the row titled “Hypothetical (5% annual return before expenses)” of the table below provides hypothetical account values and hypothetical expenses based on the Fund’s actual expense ratios and an assumed rate of return of 5% per year before expenses, which is not the Fund’s actual return. The hypothetical account values and expenses may not be used to estimate the actual ending account balance or expenses you paid for the period. You may use this information to compare the ongoing costs of investing in the Fund and other funds. To do so, compare these 5% hypothetical examples with the 5% hypothetical examples that appear in the shareholder reports of the other funds.
Please note that the expenses shown in the table are meant to highlight your ongoing costs only and do not reflect any transaction costs, such as sales charges (load) or contingent deferred sales charges. Therefore, the information in the row titled “Hypothetical (5% annual return before expenses)” is useful in comparing ongoing costs only, and will not help you determine the relative total costs of owning different funds. In addition, if these transactional costs were included, your costs would have been higher.
| Alternative Growth Fund | Beginning Account Value | Ending Account Value | Expenses Paid During Period* |
| | | 4/1/21 | 9/30/21 | 4/1/21 – 9/30/21 |
| Class A | Actual Performance | $ 1,000.00 | $1,102.00 | $ 6.54 |
| | Hypothetical (5% annual return before expenses) | 1,000.00 | 1,018.85 | 6.28 |
| Class I | Actual Performance | 1,000.00 | 1,103.90 | 5.22 |
| | Hypothetical (5% annual return before expenses) | 1,000.00 | 1,020.10 | 5.02 |
| * | Expenses are equal to the Fund’s annualized expense ratios of 1.24% and 0.99% for Class A shares and Class I shares, respectively, multiplied by the average account values over the period, multiplied by 183/365 (to reflect the six-month period). The expense ratios reflect an expense waiver and other expenses absorbed. Assumes all dividends and distributions were reinvested. |
AXS Funds
EXPENSE EXAMPLES - Continued
For the Six Months Ended September 30, 2021 (Unaudited)
| Aspect Core Diversified Strategy Fund | Beginning Account Value | Ending Account Value | Expenses Paid During Period* |
| | | 4/1/21 | 9/30/21 | 4/1/21 – 9/30/21 |
| Class A | Actual Performance | $ 1,000.00 | $ 1,020.40 | $ 8.64 |
| | Hypothetical (5% annual return before expenses) | 1,000.00 | 1,016.52 | 8.62 |
| Class C | Actual Performance | 1,000.00 | 1,016.30 | 12.41 |
| | Hypothetical (5% annual return before expenses) | 1,000.00 | 1,012.75 | 12.39 |
| Class I | Actual Performance | 1,000.00 | 1,021.50 | 7.38 |
| | Hypothetical (5% annual return before expenses) | 1,000.00 | 1,017.77 | 7.37 |
| * | Expenses are equal to the Fund’s annualized expense ratios of 1.71%, 2.46%, and 1.46% for Class A shares, Class C share, and Class I shares, respectively, multiplied by the average account values over the period, multiplied by 183/365 (to reflect the six-month period). The expense ratios reflect an expense waiver. Assumes all dividends and distributions were reinvested. |
| Chesapeake Strategy Fund | Beginning Account Value | Ending Account Value | Expenses Paid During Period* |
| | | 4/1/21 | 9/30/21 | 4/1/21 – 9/30/21 |
| Class A | Actual Performance | $ 1,000.00 | $ 1,034.70 | $ 10.71 |
| | Hypothetical (5% annual return before expenses) | 1,000.00 | 1,014.54 | 10.60 |
| Class C | Actual Performance | 1,000.00 | 1,031.30 | 14.52 |
| | Hypothetical (5% annual return before expenses) | 1,000.00 | 1,010.78 | 14.37 |
| Class I | Actual Performance | 1,000.00 | 1,036.10 | 9.44 |
| | Hypothetical (5% annual return before expenses) | 1,000.00 | 1,015.80 | 9.34 |
| * | Expenses are equal to the Fund’s annualized expense ratios of 2.10%, 2.85% and 1.85% for Class A shares, Class C shares and Class I shares, respectively, multiplied by the average account values over the period, multiplied by 183/365 (to reflect the six-month period). The expense ratios reflect an expense waiver. Assumes all dividends and distributions were reinvested. |
| Managed Futures Strategy Fund | Beginning Account Value | Ending Account Value | Expenses Paid During Period* |
| | | 4/1/21 | 9/30/21 | 4/1/21 – 9/30/21 |
| Class A | Actual Performance | $ 1,000.00 | $ 906.00 | $ 9.32 |
| | Hypothetical (5% annual return before expenses) | 1,000.00 | 1,015.29 | 9.85 |
| Class C | Actual Performance | 1,000.00 | 949.60 | 13.20 |
| | Hypothetical (5% annual return before expenses) | 1,000.00 | 1,011.53 | 13.62 |
| Class I | Actual Performance | 1,000.00 | 963.90 | 8.37 |
| | Hypothetical (5% annual return before expenses) | 1,000.00 | 1,016.55 | 8.59 |
AXS Funds
EXPENSE EXAMPLES - Continued
For the Six Months Ended September 30, 2021 (Unaudited)
| * | Expenses are equal to the Fund’s annualized expense ratios of 1.95%, 2.70%, and 1.70% for Class A shares, Class C share, and Class I shares, respectively, multiplied by the average account values over the period, multiplied by 183/365 (to reflect the six-month period). The expense ratios reflect an expense waiver. Assumes all dividends and distributions were reinvested. |
| Multi-Strategy Alternatives Fund | Beginning Account Value | Ending Account Value | Expenses Paid During Period* |
| | | 4/1/21 | 9/30/21 | 4/1/21 – 9/30/21 |
| Class R-1 | Actual Performance | $ 1,000.00 | $ 1,105.40 | $ 8.85 |
| | Hypothetical (5% annual return before expenses) | 1,000.00 | 1,016.66 | 8.48 |
| Class I | Actual Performance | 1,000.00 | 1,105.70 | 7.99 |
| | Hypothetical (5% annual return before expenses) | 1,000.00 | 1,017.48 | 7.65 |
| * | Expenses are equal to the Fund’s annualized expense ratios of 1.68% and 1.51% for Class R-1 shares and Class I shares, respectively, multiplied by the average account values over the period, multiplied by 183/365 (to reflect the six-month period). The expense ratios reflect an expense waiver. Assumes all dividends and distributions were reinvested. |
| Sustainable Income Fund | Beginning Account Value | Ending Account Value | Expenses Paid During Period* |
| | | 4/1/21 | 9/30/21 | 4/1/21 – 9/30/21 |
| Class I | Actual Performance | $ 1,000.00 | $ 1,028.00 | $ 5.03 |
| | Hypothetical (5% annual return before expenses) | 1,000.00 | 1,020.10 | 5.01 |
| * | Expenses are equal to the Fund’s annualized expense ratio of 0.99% for Class I shares, multiplied by the average account values over the period, multiplied by 183/365 (to reflect the six-month period). The expense ratios reflect an expense waiver. Assumes all dividends and distributions were reinvested. |
| Thomson Reuters Private Equity Return Tracker Fund | Beginning Account Value | Ending Account Value | Expenses Paid During Period* |
| | | 4/1/21 | 9/30/21 | 4/1/21 – 9/30/21 |
| Class A | Actual Performance | $ 1,000.00 | $ 1,036.90 | $ 8.98 |
| | Hypothetical (5% annual return before expenses) | 1,000.00 | 1,016.25 | 8.89 |
| Class C | Actual Performance | 1,000.00 | 1,033.80 | 12.12 |
| | Hypothetical (5% annual return before expenses) | 1,000.00 | 1,013.15 | 11.99 |
| Class I | Actual Performance | 1,000.00 | 1,038.20 | 7.67 |
| | Hypothetical (5% annual return before expenses) | 1,000.00 | 1,017.54 | 7.59 |
| * | Expenses are equal to the Fund’s annualized expense ratios of 1.76%, 2.38% and 1.50% for Class A shares, Class C shares and Class I shares, respectively, multiplied by the average account values over the period, multiplied by 183/365 (to reflect the six-month period). The expense ratio reflects an expense waiver. Assumes all dividends and distributions were reinvested. |
AXS Funds
EXPENSE EXAMPLES - Continued
For the Six Months Ended September 30, 2021 (Unaudited)
| Thomson Reuters Venture Capital Return Tracker Fund | Beginning Account Value | Ending Account Value | Expenses Paid During Period* |
| | | 4/1/21 | 9/30/21 | 4/1/21 – 9/30/21 |
| Class A | Actual Performance | $ 1,000.00 | $ 1,127.40 | $ 9.33 |
| | Hypothetical (5% annual return before expenses) | 1,000.00 | 1,016.30 | 8.84 |
| Class C | Actual Performance | 1,000.00 | 1,123.40 | 13.30 |
| | Hypothetical (5% annual return before expenses) | 1,000.00 | 1,012.54 | 12.61 |
| Class I | Actual Performance | 1,000.00 | 1,128.60 | 8.01 |
| | Hypothetical (5% annual return before expenses) | 1,000.00 | 1,017.54 | 7.59 |
| * | Expenses are equal to the Fund’s annualized expense ratios of 1.75%, 2.50% and 1.50% for Class A shares, Class C shares and Class I shares, respectively, multiplied by the average account values over the period, multiplied by 183/365 (to reflect the six-month period). The expense ratio reflects an expense waiver. Assumes all dividends and distributions were reinvested. |
This page is intentionally left blank
AXS Funds
Each a series of Investment Managers Series Trust II
Investment Advisor
AXS Investments LLC
181 Westchester Avenue, Unit 402
Port Chester, New York 10573
Sub-Advisor
Ampersand Investment Management, LLC
10 Canal Street, Suite 336
Bristol, Pennsylvania 19007
Sub-Advisor
Aspect Capital Limited
10 Portman Square
London W1H 6AZ United Kingdom
Sub-Advisor
Chesapeake Capital Corporation
1721 Summit Avenue
Richmond, Virginia 23220
Sub-Advisor
SKY Harbor Capital Management, LLC
20 Horseneck Lane, 1st Floor
Greenwich, Connecticut 06830
Independent Registered Public Accounting Firm
RSM US LLP
555 17th Street, Suite 1200
Denver, Colorado 80202
Custodian
UMB Bank, n.a.
928 Grand Boulevard, 5th Floor
Kansas City, Missouri 64106
Fund Co-Administrator
Mutual Fund Administration, LLC
2220 E. Route 66, Suite 226
Glendora, California 91740
Fund Co-Administrator, Transfer Agent and Fund Accountant
UMB Fund Services, Inc.
235 W. Galena Street
Milwaukee, Wisconsin 53212
Distributor
IMST Distributors, LLC
Three Canal Plaza, Suite 100
Portland, Maine 04101
www.foreside.com
FUND INFORMATION
| | TICKER | CUSIP |
| AXS Alternative Growth Fund – Class A | EEHAX | 46141T 430 |
| AXS Alternative Growth Fund – Class I | EEHIX | 46141T 380 |
| AXS Aspect Core Diversified Strategy Fund – Class A | EQAAX | 46141T 422 |
| AXS Aspect Core Diversified Strategy Fund – Class C | EQACX | 46141T 414 |
| AXS Aspect Core Diversified Strategy Fund – Class I | EQAIX | 46141T 398 |
| AXS Chesapeake Strategy Fund – Class A | ECHAX | 46141T 471 |
| AXS Chesapeake Strategy Fund – Class C | ECHCX | 46141T 463 |
| AXS Chesapeake Strategy Fund – Class I | EQCHX | 46141T 372 |
| AXS Managed Futures Strategy Fund – Class A | MHFAX | 46141T 521 |
| AXS Managed Futures Strategy Fund – Class C | MHFCX | 46141T 513 |
| AXS Managed Futures Strategy Fund – Class I | MHFIX | 46141T 489 |
| AXS Multi-Strategy Alternatives Fund – Class I | KCMIX | 46141T 455 |
| AXS Multi-Strategy Alternatives Fund – Class R-1 | KCMTX | 46141T 448 |
| AXS Sustainable Income Fund – Class I | AXSKX | 46141T 349 |
| AXS Thomson Reuters Private Equity Return Tracker Fund – Class A | LDPAX | 46141T 323 |
| AXS Thomson Reuters Private Equity Return Tracker Fund – Class C | LDPCX | 46141T 315 |
| AXS Thomson Reuters Private Equity Return Tracker Fund – Class I | LDPIX | 46141T 299 |
| AXS Thomson Reuters Venture Capital Return Tracker Fund – Class A | LDVAX | 46141T 281 |
| AXS Thomson Reuters Venture Capital Return Tracker Fund – Class C | LDVCX | 46141T 273 |
| AXS Thomson Reuters Venture Capital Return Tracker Fund – Class I | LDVIX | 46141T 265 |
Privacy Principles of the AXS Funds for Shareholders
The Funds are committed to maintaining the privacy of their shareholders and to safeguarding their non-public personal information. The following information is provided to help you understand what personal information the Funds collect, how we protect that information and why, in certain cases, we may share information with select other parties.
Generally, the Funds do not receive any non-public personal information relating to their shareholders, although certain non-public personal information of their shareholders may become available to the Funds. The Funds do not disclose any non-public personal information about their shareholders or former shareholders to anyone, except as permitted by law or as is necessary in order to service shareholder accounts (for example, to a transfer agent or third party administrator).
This report is sent to shareholders of the AXS Funds for their information. It is not a Prospectus, circular or representation intended for use in the purchase or sale of shares of the Funds or of any securities mentioned in this report.
Proxy Voting
The Funds’ proxy voting policies and procedures, as well as information regarding how the Funds voted proxies for portfolio securities, if applicable, during the most recent 12-month period ended June 30, are available, without charge and upon request by calling (833) 297-2587 or on the SEC’s website at www.sec.gov.
Fund Portfolio Holdings
The Funds file a complete schedule of their portfolio holdings with the SEC for the first and third quarters of each fiscal year on Form N-PORT within 60 days of the end of such fiscal quarter. Shareholders may obtain the Funds’ Form N-PORT on the SEC’s website at www.sec.gov.
Prior to the use of Form N-PORT, the Funds file their complete schedule of portfolio holdings with the SEC on Form N-Q, which is available online at www.sec.gov.
Householding
The Funds will mail only one copy of shareholder documents, including prospectuses notice of annual and semi-annual reports availability and proxy statements, to shareholders with multiple accounts at the same address. This practice is commonly called “householding” and is intended to reduce expenses and eliminate duplicate mailings of shareholder documents. Mailings of your shareholder documents may be householded indefinitely unless you instruct us otherwise. If you do not want the mailing of these documents to be combined with those for other members of your household, please call the Funds at (833) 297-2587.
AXS Funds
P.O. Box 2175
Milwaukee, WI 53201
Toll Free: (833) 297-2587
Item 2. Code of Ethics.
The registrant has adopted a code of ethics that applies to the registrant's principal executive officer and principal financial officer. The registrant has not made any amendments to its code of ethics during the period covered by this report. The registrant has not granted any waivers from any provisions of the code of ethics during the period covered by this report.
The registrant undertakes to provide to any person without charge, upon request, a copy of its code of ethics by mail when they call the registrant at 1-833-297-2587.
Item 3. Audit Committee Financial Expert.
The Board of Trustees of the Registrant has determined that the Registrant has the following “audit committee financial experts” as defined in Item 3(b) of Form N-CSR serving on its Audit Committee: Messrs. Thomas Knipper and John P. Zader. The audit committee financial experts are “independent” as that term is defined in Item 3(a)(2) of Form N-CSR.
Item 4. Principal Accountant Fees and Services.
The registrant has engaged its principal accountant to perform audit services, audit-related services, tax services and other services during the past two fiscal years. "Audit services" refer to performing an audit of the registrant's annual financial statements or services that are normally provided by the accountant in connection with statutory and regulatory filings or engagements for those fiscal years. "Audit-related services" refer to the assurance and related services by the principal accountant that are reasonably related to the performance of the audit. "Tax services" refer to professional services rendered by the principal accountant for tax compliance, tax advice, and tax planning. There were no "other services" provided by the principal accountant. The following table details the aggregate fees billed or expected to be billed for each of the last two fiscal years for audit fees, audit-related fees, tax fees and other fees by the principal accountant.
| AXS Funds | FYE 9/30/2021 | FYE 9/30/2020 |
| Audit Fees | $156,000 | $103,000 |
| Audit-Related Fees | N/A | N/A |
| Tax Fees | $28,000 | $21,000 |
| All Other Fees | N/A | N/A |
The audit committee has adopted pre-approval policies and procedures that require the audit committee to pre-approve all audit and non-audit services of the registrant, including services provided to any entity affiliated with the registrant.
The percentage of fees billed by RSM US LLP applicable to non-audit services pursuant to waiver of pre-approval requirement were as follows:
| AXS Funds | FYE 9/30/2021 | FYE 9/30/2020 |
| Audit-Related Fees | 0% | 0% |
| Tax Fees | 0% | 0% |
| All Other Fees | 0% | 0% |
All of the principal accountant's hours spent on auditing the registrant's financial statements were attributed to work performed by full-time permanent employees of the principal accountant.
The following table indicates the non-audit fees billed or expected to be billed by the registrant's accountant for services to the registrant and to the registrant's investment advisor (and any other controlling entity, etc.—not sub-advisor) for the last two years. The audit committee of the Board of Trustees has considered whether the provision of non-audit services that were rendered to the registrant's investment advisor is compatible with maintaining the principal accountant's independence and has concluded that the provision of such non-audit services by the accountant has not compromised the accountant's independence.
| AXS Funds | | |
| Non-Audit Related Fees | FYE 9/30/2021 | FYE 9/30/2020 |
| Registrant | N/A | N/A |
| Registrant’s Investment Advisor | N/A | N/A |
Item 5. Audit Committee of Listed Registrants.
| (a) | Not applicable to registrants who are not listed issuers (as defined in Rule 10A-3 under the Securities Exchange Act of 1934). |
Item 6. Schedule of Investments.
| (a) | Schedule of Investments is included as part of the report to shareholders filed under Item 1 of this Form. |
(b) Not Applicable.
Item 7. Disclosure of Proxy Voting Policies and Procedures for Closed-End Management Investment Companies.
Not applicable to open-end investment companies.
Item 8. Portfolio Managers of Closed-End Management Investment Companies.
Not applicable to open-end investment companies.
Item 9. Purchases of Equity Securities by Closed-End Management Investment Company and Affiliated Purchasers.
Not applicable.
Item 10. Submission of Matters to a Vote of Security Holders.
The registrant has not made any material changes to the procedures by which shareholders may recommend nominees to the registrant’s Board of Trustees.
Item 11. Controls and Procedures.
| (a) | The Registrant’s President/Chief Executive Officer and Treasurer/Chief Financial Officer have reviewed the Registrant's disclosure controls and procedures (as defined in Rule 30a-3(c) under the Investment Company Act of 1940 (the “Act”)) as of a date within 90 days of the filing of this report, as required by Rule 30a-3(b) under the Act and Rules 13a-15(b) or 15d-15(b) under the Securities Exchange Act of 1934. Based on their review, such officers have concluded that the disclosure controls and procedures are effective in ensuring that information required to be disclosed in this report is appropriately recorded, processed, summarized and reported and made known to them by others within the Registrant and by the Registrant’s service provider. |
| (b) | There were no changes in the Registrant's internal control over financial reporting (as defined in Rule 30a-3(d) under the Act) that occurred during the period covered by this report that has materially affected, or is reasonably likely to materially affect, the Registrant's internal control over financial reporting. |
Item 12. Disclosure of Securities Lending Activities for Closed-End Management Investment Companies.
Not applicable to open-end investment companies.
Item 13. Exhibits.
(2) Certifications pursuant to Section 302 of the Sarbanes-Oxley Act of 2002. Filed herewith.
(3) Any written solicitation to purchase securities under Rule 23c-1 under the Act sent or given during the period covered by the report by or on behalf of the registrant to 10 or more persons. Not applicable to open-end investment companies.
(4) Change in the registrant’s independent public accountant. There was no change in the registrant’s independent public accountant for the period covered by this report.
SIGNATURES
Pursuant to the requirements of the Securities Exchange Act of 1934 and the Investment Company Act of 1940, the registrant has duly caused this report to be signed on its behalf by the undersigned, thereunto duly authorized.
| (Registrant) | Investment Managers Series Trust II | |
| | | |
| By (Signature and Title) | /s/ Terrance Gallagher | |
| | Terrance Gallagher, President/Chief Executive Officer | |
| | | |
| Date | 12/1/2021 | |
Pursuant to the requirements of the Securities Exchange Act of 1934 and the Investment Company Act of 1940, this report has been signed below by the following persons on behalf of the registrant and in the capacities and on the dates indicated.
| By (Signature and Title) | /s/ Terrance Gallagher | |
| | Terrance Gallagher, President/Chief Executive Officer | |
| | | |
| Date | 12/1/2021 | |
| | | |
| By (Signature and Title) | /s/ Rita Dam | |
| | Rita Dam, Treasurer/Chief Financial Officer | |
| | | |
| Date | 12/1/2021 | |