UNITED STATES
SECURITIES AND EXCHANGE COMMISSION
Washington, D.C. 20549
FORM N-CSR
CERTIFIED SHAREHOLDER REPORT OF REGISTERED
MANAGEMENT INVESTMENT COMPANIES
Investment Company Act file number 811-22894
INVESTMENT MANAGERS SERIES TRUST II
(Exact name of registrant as specified in charter)
235 W. Galena Street
Milwaukee, WI 53212
(Address of principal executive offices) (Zip code)
Diane J. Drake
Mutual Fund Administration, LLC
2220 E. Route 66, Suite 226
Glendora, CA 91740
(Name and address of agent for service)
(626) 385-5777
Registrant's telephone number, including area code
Date of fiscal year end: January 31
Date of reporting period: January 31, 2022
Item 1. Report to Stockholders.
| (a) | The registrant’s annual report transmitted to shareholders pursuant to Rule 30e-1 under the Investment Company Act of 1940, as amended (the “Investment Company Act”), is as follows: |

Cannabis Growth ETF
(BUDX)
ANNUAL REPORT
JANUARY 31, 2022
Cannabis Growth ETF
A series of Investment Managers Series Trust II
Table of Contents
| Letter to Shareholders | 1 |
| Fund Performance | 4 |
| Schedule of Investments | 6 |
| Statement of Assets and Liabilities | 9 |
| Statement of Operations | 10 |
| Statements of Changes in Net Assets | 11 |
| Financial Highlights | 12 |
| Notes to Financial Statements | 13 |
| Report of Independent Registered Public Accounting Firm | 23 |
| Supplemental Information | 24 |
| Expense Example | 31 |
This report and the financial statements contained herein are provided for the general information of the shareholders of the Cannabis Growth ETF. This report is not authorized for distribution to prospective investors in the Fund unless preceded or accompanied by an effective prospectus.
www.cannabisgrowthfunds.com

Dear Fellow Shareholders,
Thank you again for your investment in the Fund. We greatly appreciate the trust you have placed in us to help you navigate this new and emerging industry.
For the period January 31, 2021, through January 31, 2022, the Cannabis Growth ETF (BUDX) was down -49.05% compared to the Fund’s benchmark, the Cannabis World Index, which was down -55.63%. The Cannabis World Index measures the performance of exchange traded equity securities of companies that are engaged exclusively in legal cannabis activities under applicable national and local laws, including U.S. federal and state laws. The Cannabis Growth ETF outperformed the index by a sizable margin over the course of the last year. The Fund also considers the S&P 500 Index as another benchmark which returned 23.29% during the period.
Performance Review
2021 turned out to be a fantastic year for most risk assets other than cannabis stocks. Cannabis stocks had a historic rally off the lows back in late 2020 which carried though to February of 2021 when Democrats won the Georgia Senate race. Shortly after that, valuations and expectations got ahead of themselves, and the sector performed very poorly for the rest of 2021. It continues to underperform the overall market.
For the review period, the majority of the Fund’s holdings were down. What made it even more challenging was the overall equity markets were going up while cannabis stocks continued to drop. It has been extremely challenging dealing with a headline driven sector that is relying on legislation to turn investor sentiment and flows in a positive direction.
The Fund outperformed the Cannabis World Index by 15.5% in 2021. Our active approach has delivered significant outperformance not only last year but since inception as well. While performance suffered in 2021, we continue to build on our efforts to deliver strong relative performance vs our peers and benchmarks during these difficult times for the sector.
In 2021, one of our top picks, Innovative Industrial Properties continued to deliver stronger than expected results. Innovative Industrial Properties (IIPR) is a leading provider of real estate capital to the cannabis market. They are focused on sale-leasebacks with cannabis producers who need capital. The properties are owned by IIPR, and they sign tenants to long-term, triple net leases. Over the years they have invested over $1.7 billion in projects with over 73 properties in 18 states. At the current time, 100% of their properties are occupied. The company has strong market returns vs. the overall cannabis sector and we believe this trend should continue if banking laws take longer than expected in the United States.
Power REIT (PW), another real estate cannabis company, also delivered a stellar year in 2021. The stock was up over 100+% in 2021 and was one of the best performing cannabis companies. They also operate as a triple net lease REIT that provides stable operating income. The company also mentioned they have a very deep pipeline of potential acquisitions and will continue to build the company by utilizing non-dilutive financing which is beneficial to the shareholders in the long run. As mentioned above, we remain very positive on the outlook for our cannabis REITs if banking laws don’t change. If we start to see some motion on the banking front, we will adjust our portfolio accordingly to hopefully be ahead of potential risks to the prospects of these companies.
Our strategy is to be tactical while managing risk for our clients as best as possible which has been extremely difficult in the current cannabis environment. Price swings in both directions have been volatile, but we continue to take advantage for the long-term on selloffs in the sector.
For the most part, most of our holdings were down in 2021. I will highlight some of our largest positions and the reasons they underperformed.
Our largest holding MSOS (Advisorshares Pure Cannabis ETF) which made up roughly 19% of portfolio at the end of 1/31/22. MSOS was down 49% over the course of the review period and suffered with the overall cannabis market. By the Fund owning MSOS, we are utilizing the tools that we have available to us to gain exposure to the biggest cannabis market in the world, the United States. We still have a major portion of our portfolio invested in the MSOS ETF as we believe the U.S. cannabis market will drive the majority share of growth in the cannabis sector in the coming years.
Canopy Growth was another detractor to the Fund’s overall performance in 2021. In our view, the company failed to execute on many of their goals. Cost cutting and reducing overall expenses at the business level have not happened as fast as we would have liked. We still hold shares on the prospect of federal legalization where Canopy Growth is uniquely positioned when federal permissibility occurs. Canopy Growth owns a good portion of Terrascend who, is a multi-state operator currently operating in many states across the United States.
Why did global cannabis stocks collapse over the last year?
I think we can attribute the collapse first and foremost to the massive run up in companies share prices right after the elections. Expectations were very high and as soon as the market realized federal legalization was not coming anytime soon, we saw a major correction in the overall sector. We can also attribute price declines of many of the Canadian LPs to weaker than expected earnings results in 2021. Many of the top companies in Canada saw their market share cut down significantly causing major share price declines. We also had a few false starts in 2021 on the legislative front. Late in the year, cannabis banking legislation was added to the National Defense Authorization Act. Unfortunately, the SAFE Banking Act was removed from the bill after having been included and passed as part of the House version of the bill. Also, companies that are plant touching companies operating in the United States are not allowed to list on the major U.S. exchanges. This has had a major impact on these companies because large institutions won’t invest unless they are traded on major exchanges.
Fund Positioning for 2022
As of January 31st, 2022, the Fund had 18 holdings. This is a very concentrated portfolio as we are focusing on a core group of companies, we believe possess the key criteria for success in this ever-changing environment. The Fund maintained a large position in the MSOS (Advisorshares Pure US Cannabis ETF) which allows the Fund to gain access to the U.S. market. We believe the U.S. market has the largest opportunity for our investors over the long term. MJBiz Daily projected that U.S. recreational and medical cannabis market could reach $45.9 billion in annual sales by 2025.
As we discussed above, we are very bullish on the United States cannabis market. What was interesting to us was the breakdown of correlations in U.S. cannabis stocks and Canadian cannabis stocks. Back in 2020, there was almost no correlation between the U.S. and Canadian LPs. But in 2021, that correlation became very high which doesn’t make much sense as companies in the U.S. are not having the same issues as their Canadian counterparts. We think that valuations at the current time are super attractive, and this could be a “generational” buying opportunity for investors who are willing to ride this wave over the coming years. The overall fundamentals of U.S. cannabis companies remain very strong as they continue to deliver excellent operational performance. We monitor the sales volume of many U.S. companies and demand was very robust throughout 2021.
Another topic that comes up a lot with investors is the idea that cannabis stocks won’t rally until federal legalization. We are in the camp that federal legalization does not need to happen for U.S. Multi-State Operators to succeed for the long-term. If anything, the longer Washington waits to pass banking reforms or legalizing cannabis at the federal level, this will only enhance the moat of these companies. It’s going to make it very difficult for smaller players to enter the cannabis space and compete when large companies are already at massive scale.

We also believe that cannabis M&A will remain strong after having a record year in 2021. In 2021 we saw a record $10.1 billion in deals in the cannabis space which is greater than 2019 and 2020 combined. Something else that’s driving deals is the cost of capital in the cannabis sector continues to drop for many of these companies.
Lastly, we are very bullish on the science of cannabis as there is still a lot to learn. We have exposure to biotechnology companies using cannabis medicinally to combat specific diseases and ailments. This remains a very exciting segment of the cannabis industry. We think we are still in the early innings in the global cannabis boom. As more states legalize here in the United States and more countries open, we think there is a significant pathway for growth for the next decade.
Sincerely,

Past performance does not guarantee future results. The performance data quoted represents past performance and current returns may be lower or higher. The investment and principal will fluctuate so that investors shares, when redeemed, may be worth more or less than the original cost. To obtain performance information current to the most recent month end, please call 1-888-885-0588.
The views in this letter were as of 1/31/2022 and may not necessarily reflect the same views on the date this letter was first published or any time thereafter. These views are intended to help a shareholder in understanding the Fund’s investment methodology and do not constitute investment advice.
Cannabis Growth ETF
ETF PERFORMANCE at January 31, 2022 (Unaudited)
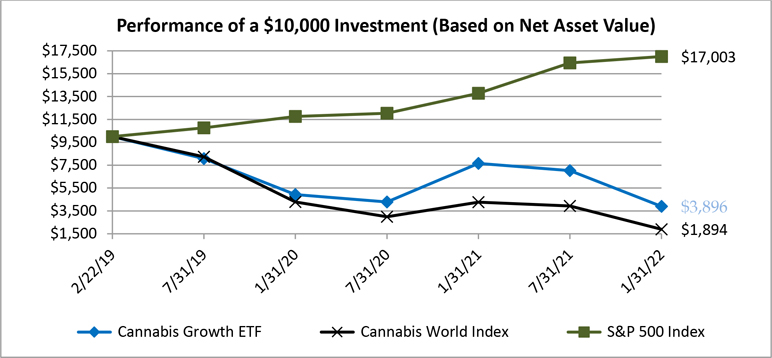
This graph compares a hypothetical $10,000 investment in the ETF with a similar investment in the Cannabis World Index and the S&P 500 Index during the periods shown. Results include the reinvestment of all dividends and capital gains.
The Cannabis World Index measures the performance of exchange traded equity securities of companies that are engaged exclusively in legal cannabis activities under applicable national and local laws, including U.S. federal and state laws. The S&P 500 Index includes a representative sample of 500 leading companies in leading industries of the U.S. economy and assumes any dividends are reinvested back into the index. These indices do not reflect expenses, fees or sales charge, which would lower performance. The indices are unmanaged and they are not available for investment.
| Average Annual Total Returns as of January 31, 2022 | 1 Year | Since Inception | Inception Date |
| Cannabis Growth ETF *(Net Asset Value) | -49.05% | -27.43% | 02/22/19 |
| Cannabis Growth ETF *(Market Price)1 | - | -46.11% | 09/24/21 |
| Cannabis World Index | -55.63% | -43.22% | 02/22/19 |
| S&P 500 Index | 23.29% | 19.79% | 02/22/19 |
| * | The ETF acquired the assets and liabilities of the Cannabis Growth Fund, also a series of the Investment Managers Series Trust II (the “Predecessor Fund”) on September 24, 2021. As a result of the acquisition, the ETF is the accounting successor of the Predecessor Fund. Performance results shown in the graph and the performance table above for the period prior to September 24, 2021 reflect the performance of the Predecessor Fund. |
| 1 | Performance is presented for the period since the conversion from open-ended mutual fund to an ETF after the close of business on September 24, 2021. Because the Cannabis Growth ETF has less than a full year track record, the return figures are actual, not annualized. |
The performance data quoted here represents past performance and past performance is not a guarantee of future results. Investment return and principal value will fluctuate so that an investor’s shares, when redeemed, may be worth more or less than their original cost. Current performance may be lower or higher than the performance information quoted. The most recent month end performance may be obtained by calling (888) 885-0588.
Cannabis Growth ETF
ETF PERFORMANCE at January 31, 2022 (Unaudited) – Continued
The ETF’s shares are listed on an exchange. The price of the ETF’s shares is based on market price, and because exchange-traded fund shares trade at market prices rather than net asset value, shares may be traded at a price greater than net asset value (premium) or less than net asset value (discount).
Gross and net expense ratios were 11.95% and 0.79%, respectively, which were the amounts stated in the current prospectus dated July 28, 2021. For the ETF’s current one-year expense ratios, please refer to the Financial Highlights section of this report. The ETF’s Advisor has contractually agreed to waive its fees and/or pay for operating expenses of the ETF to ensure that total annual fund operating expenses do not exceed 0.65% of the ETF’s average daily net assets. This agreement is in effect until May 31, 2031, and it may be terminated before that date only by the Trust’s Board of Trustees. In the absence of such waivers, the ETF’s returns would be lower.
Cannabis Growth ETF
SCHEDULE OF INVESTMENTS
As of January 31, 2022
| Number of Shares | | | | | Value | |
| | | | | COMMON STOCKS — 75.2% | | | | |
| | | | | AGRICULTURAL CHEMICALS — 7.4% | | | | |
| | 1,700 | | | Scotts Miracle-Gro Co. | | $ | 257,040 | |
| | | | | AGRICULTURAL PRODUCER — 8.3% | | | | |
| | 56,002 | | | Village Farms International, Inc.* | | | 290,650 | |
| | | | | BIOTECHNOLOGY — 3.6% | | | | |
| | 24,134 | | | Cardiol Therapeutics, Inc. - Class A* | | | 44,427 | |
| | 600 | | | Jazz Pharmaceuticals PLC* | | | 83,346 | |
| | | | | | | | 127,773 | |
| | | | | EXTRACTION — 2.3% | | | | |
| | 41,223 | | | Valens Co., Inc.* | | | 79,453 | |
| | | | | INDUSTRIALS — 2.1% | | | | |
| | 3,675 | | | Hydrofarm Holdings Group, Inc.* | | | 72,067 | |
| | | | | PHARMACEUTICAL — 20.0% | | | | |
| | 17,000 | | | Canopy Growth Corp.* | | | 136,680 | |
| | 22,623 | | | Charlottes Web Holdings, Inc.* | | | 23,315 | |
| | 38,735 | | | Cronos Group, Inc.* | | | 142,932 | |
| | 82,073 | | | Organigram Holdings, Inc.* | | | 122,289 | |
| | 45,742 | | | Tilray, Inc.* | | | 272,622 | |
| | | | | | | | 697,838 | |
| | | | | REIT — 18.1% | | | | |
| | 15,008 | | | AFC Gamma, Inc. | | | 295,507 | |
| | 1,693 | | | Innovative Industrial Properties, Inc. - REIT | | | 335,536 | |
| | | | | | | | 631,043 | |
| | | | | RETAIL — 10.9% | | | | |
| | 36,950 | | | Fire & Flower Holdings Corp.* | | | 139,237 | |
| | 11,146 | | | GrowGeneration Corp.* | | | 94,072 | |
| | 35,013 | | | High Tide, Inc.* | | | 145,654 | |
| | | | | | | | 378,963 | |
| | | | | SOFTWARE — 2.5% | | | | |
| | 17,494 | | | WM Technology, Inc.* | | | 88,694 | |
| | | | | TOTAL COMMON STOCKS | | | | |
| | | | | (Cost $4,198,050) | | | 2,623,521 | |
| | | | | | | | | |
| | | | | INVESTMENT COMPANIES / ETFS — 19.8% | | | | |
| | | | | HEALTHCARE — 19.8% | | | | |
| | 32,812 | | | AdvisorShares Pure U.S. Cannabis ETF* | | | 690,693 | |
| | | | | TOTAL INVESTMENT COMPANIES / ETFS | | | | |
| | | | | (Cost $928,793) | | | 690,693 | |
Cannabis Growth ETF
SCHEDULE OF INVESTMENTS - Continued
As of January 31, 2022
| Number of Contracts | | | | | Value | |
| | | | PURCHASED OPTIONS CONTRACTS — 4.8% | | | |
| | | | | CALL OPTIONS — 4.8% | | | | |
| | | | | AdvisorShares Pure U.S. Cannabis ETF* | | | | |
| | | | | Exercise Price: $45.00, Notional Amount: $2,137,500 | | | | |
| | 475 | | | Expiration Date: January 19, 2024 | | $ | 166,250 | |
| | | | | TOTAL PURCHASED OPTIONS CONTRACTS | | | | |
| | | | | (Cost $292,477) | | | 166,250 | |
| | | | | TOTAL INVESTMENTS — 99.8% | | | | |
| | | | | (Cost $5,419,320) | | | 3,480,464 | |
| | | | | Other Assets in Excess of Liabilities — 0.2% | | | 5,866 | |
| | | | | TOTAL NET ASSETS — 100.0% | | $ | 3,486,330 | |
ETF – Exchange-Traded Fund
PLC – Public Limited Company
REIT – Real Estate Investment Trusts
| * | Non-income producing security. |
See accompanying Notes to Financial Statements.
Cannabis Growth ETF
SUMMARY OF INVESTMENTS
As of January 31, 2022
| Security Type/Sector | | Percent of Total Net Assets | |
| Common Stocks | | | | |
| Pharmaceutical | | | 20.0 | % |
| REIT | | | 18.1 | % |
| Retail | | | 10.9 | % |
| Agricultural Producer | | | 8.3 | % |
| Agricultural Chemicals | | | 7.4 | % |
| Biotechnology | | | 3.6 | % |
| Software | | | 2.5 | % |
| Extraction | | | 2.3 | % |
| Industrials | | | 2.1 | % |
| Total Common Stocks | | | 75.2 | % |
| Investment Companies / ETFs | | | | |
| Healthcare | | | 19.8 | % |
| Purchased Options Contracts | | | 4.8 | % |
| Total Investments | | | 99.8 | % |
| Other Assets in Excess of Liabilities | | | 0.2 | % |
| Total Net Assets | | | 100.0 | % |
See accompanying Notes to Financial Statements.
Cannabis Growth ETF
STATEMENT OF ASSETS AND LIABILITIES
As of January 31, 2022
| Assets: | | | |
| Investments, at value (cost $5,126,843) | | $ | 3,314,214 | |
| Purchased options contracts, at value (cost $292,477) | | | 166,250 | |
| Cash | | | 58,316 | |
| Investment securities sold | | | 43,411 | |
| Fund reimbursement receivable | | | 16,739 | |
| Dividends receivable | | | 392 | |
| Prepaid expenses | | | 95 | |
| Total assets | | $ | 3,599,417 | |
| | | | | |
| Liabilities: | | | | |
| Payables: | | | | |
| Investment securities purchased | | | 45,244 | |
| Distribution fees (Note 8) | | | 7 | |
| Fund administration and accounting fees | | | 12,792 | |
| Transfer agent fees and expenses | | | 10,511 | |
| Custody fees | | | 6,822 | |
| Auditing fees | | | 15,838 | |
| Deferred trustees' compensation (Note 3) | | | 10,357 | |
| Legal fees | | | 4,370 | |
| Chief compliance officer fees | | | 1,913 | |
| Trustees' fees and expenses | | | 380 | |
| Accrued other expenses | | | 4,853 | |
| Total liabilities | | | 113,087 | |
| | | | | |
| Net Assets | | $ | 3,486,330 | |
| | | | | |
| Components of Net Assets: | | | | |
| Paid-in capital (par value of $0.01 per share with an unlimited number of shares authorized) | | $ | 6,577,036 | |
| Total accumulated deficit | | | (3,090,706 | ) |
| Net Assets | | $ | 3,486,330 | |
| | | | | |
| Maximum Offering Price per Share: | | | | |
| Net assets applicable to shares outstanding | | $ | 3,486,330 | |
| Shares of beneficial interest issued and outstanding | | | 311,622 | |
| Redemption price | | $ | 11.19 | |
See accompanying Notes to Financial Statements.
Cannabis Growth ETF
STATEMENT OF OPERATIONS
For the Year Ended January 31, 2022
| Investment Income: | | | |
| Dividend | | $ | 31,614 | |
| Interest | | | 8 | |
| Securities lending income | | | 7,991 | |
| Total investment income | | | 39,613 | |
| | | | | |
| Expenses: | | | | |
| Advisory fees | | | 39,620 | |
| Distribution fees (Note 8) | | | 2,388 | |
| Fund administration and accounting fees | | | 55,441 | |
| Transfer agent fees and expenses | | | 32,058 | |
| Custody fees | | | 10,687 | |
| Legal fees | | | 62,071 | |
| Registration fees | | | 42,864 | |
| Auditing fees | | | 15,884 | |
| Shareholder reporting fees | | | 15,533 | |
| Chief Compliance Officer fees | | | 13,749 | |
| Trustees' fees and expenses | | | 11,729 | |
| Listing Fees | | | 8,881 | |
| Insurance fees | | | 2,914 | |
| Miscellaneous | | | 5,752 | |
| Total expenses | | | 319,571 | |
| Advisory fees waived | | | (39,620 | ) |
| Other expenses absorbed | | | (226,192 | ) |
| Fees paid indirectly (Note 3) | | | (3,028 | ) |
| Net expenses | | | 50,731 | |
| Net investment loss | | | (11,118 | ) |
| | | | | |
| Realized and Unrealized Gain (Loss): | | | | |
| Net realized gain (loss) on: | | | | |
| Investments | | | 265,098 | |
| Purchased options contracts | | | (310,738 | ) |
| Foreign currency transactions | | | (858 | ) |
| Net realized loss | | | (46,498 | ) |
| Net change in unrealized appreciation/depreciation on: | | | | |
| Investments | | | (3,207,570 | ) |
| Purchased options contracts | | | (126,227 | ) |
| Foreign currency translations | | | (6,826 | ) |
| Net change in unrealized appreciation/depreciation | | | (3,340,623 | ) |
| Net realized and unrealized loss | | | (3,387,121 | ) |
| | | | | |
| Net Decrease in Net Assets from Operations | | $ | (3,398,239 | ) |
See accompanying Notes to Financial Statements.
Cannabis Growth ETF
STATEMENTS OF CHANGES IN NET ASSETS
| | For the Year Ended January 31, 2022* | | | For the Year Ended January 31, 2021 | |
| Increase (Decrease) in Net Assets from: | | | | | | |
| Operations: | | | | | | | | |
| Net investment income (loss) | | $ | (11,118 | ) | | $ | 29,386 | |
| Net realized loss on investments, purchased options contracts, and foreign currency transactions | | | (46,498 | ) | | | (544,949 | ) |
| Net change in unrealized appreciation/depreciation on investments, and purchased options contracts, and foreign currency transactions | | | (3,340,623 | ) | | | 1,894,112 | |
| Net increase (decrease) in net assets resulting from operations | | $ | (3,398,239 | ) | | | 1,378,549 | |
| | | | | | | | | |
| Distributions to Shareholders: | | | | | | | | |
| Distributions: | | | | | | | | |
| Investor Class1 | | | - | | | | (19,852 | ) |
| Class I | | | (52,010 | ) | | | (26,099 | ) |
| Total distributions to shareholders | | | (52,010 | ) | | | (45,951 | ) |
| | | | | | | | | |
| Capital Transactions: | | | | | | | | |
| Net proceeds from shares sold: | | | | | | | | |
| Investor Class1 | | | 3,063,166 | | | | 2,676,081 | |
| Class I | | | 3,623,780 | | | | 1,086,530 | |
| Conversion of shares: | | | | | | | | |
| Class I1 | | | 2,418,032 | | | | | |
| Reinvestment of distributions: | | | | | | | | |
| Investor Class1 | | | - | | | | 19,814 | |
| Class I | | | - | | | | 25,215 | |
| Cost of shares redeemed: | | | | | | | | |
| Investor Class1,2 | | | (4,768,209 | ) | | | (1,794,368 | ) |
| Class I3 | | | (1,493,269 | ) | | | (591,651 | ) |
| Net increase in net assets from capital transactions | | | 2,843,500 | | | | 1,421,621 | |
| | | | | | | | | |
| Total increase (decrease) in net assets | | $ | (606,749 | ) | | | 2,754,219 | |
| | | | | | | | | |
| Net Assets: | | | | | | | | |
| Beginning of period | | | 4,093,079 | | | | 1,338,860 | |
| End of period | | $ | 3,486,330 | | | $ | 4,093,079 | |
| | | | | | | | | |
| Capital Share Transactions: | | | | | | | | |
| Shares sold: | | | | | | | | |
| Investor Class1 | | | 329,342 | | | | 470,409 | |
| Class I | | | 305,269 | | | | 245,036 | |
| Shares converted: | | | | | | | | |
| Class I1 | | | 330,560 | | | | | |
| Shares reinvested: | | | | | | | | |
| Investor Class1 | | | - | | | | 3,375 | |
| Class I | | | - | | | | 4,333 | |
| Shares redeemed: | | | | | | | | |
| Investor Class1 | | | (604,056 | ) | | | (315,390 | ) |
| Class I | | | (159,939 | ) | | | (134,279 | ) |
| Reverse stock split | | | | | | | | |
| Class I4 | | | (439,038 | ) | | | - | |
| Net increase (decrease) from capital share transactions | | | (237,862 | ) | | | 273,484 | |
| * | The Cannabis Growth Fund reorganized as an ETF as of the close of business on September 24, 2021. |
| 1 | The Investor Class shares converted into Class I shares at the close of business on May 14, 2021. The converted amounts were 325,880 shares and $2,418,032. |
| 2 | Net of redemption fee proceeds of $24,188 and $6,770, respectively. |
| 3 | Net of redemption fee proceeds of $7,882 and $274, respectively. |
| 4 | The Cannabis Growth Fund had a 1-3 stock split with ex and payable dates of August 5, 2021. See Notes to Financial Statements. |
See accompanying Notes to Financial Statements.
Cannabis Growth ETF6,7
FINANCIAL HIGHLIGHTS
Per share operating performance.
For a capital share outstanding throughout each period.
| | | For the Year Ended January 31, | | For the Period May 24, 2019* through | |
| | | | 2022** | | | | 2021*** | | | | 1/31/2020*** | |
| Net asset value, beginning of period | | $ | 22.23 | | | $ | 14.55 | | | $ | 28.98 | |
| Income from Investment Operations: | | | | | | | | | | | | |
| Net investment income (loss)1 | | | - | | | | 0.24 | | | | 0.24 | |
| Net realized and unrealized income (loss) | | | (10.89 | ) | | | 7.71 | | | | (14.46 | ) |
| Total from investment operations | | | (10.89 | ) | | | 7.95 | | | | (14.22 | ) |
| | | | | | | | | | | | | |
| Less Distributions: | | | | | | | | | | | | |
| From net investment income | | | (0.17 | ) | | | (0.27 | ) | | | (0.21 | ) |
| From net realized gain | | | - | | | | - | | | | - | |
| Total distributions | | | (0.17 | ) | | | (0.27 | ) | | | (0.21 | ) |
| | | | | | | | | | | | | |
| Redemption fee proceeds | | | 0.02 | | | | - | 2 | | | - | 2 |
| | | | | | | | | | | | | |
| Net asset value, end of period | | $ | 11.19 | | | $ | 22.23 | | | $ | 14.55 | |
| | | | | | | | | | | | | |
| Total return 3 | | | (49.05 | )% | | | 55.25 | % | | | (49.00) | %4 |
| | | | | | | | | | | | | |
| Ratios and Supplemental Data: | | | | | | | | | | | | |
| Net assets, end of period (in thousands) | | $ | 3,486 | | | $ | 2,037 | | | $ | 774 | |
| | | | | | | | | | | | | |
| Ratio of expenses to average net assets: | | | | | | | | | | | | |
| Before fees waived and expenses absorbed | | | 6.75 | % | | | 13.99 | % | | | 28.80 | %5 |
| After fees waived and expenses absorbed | | | 0.93 | % | | | 1.07 | % | | | 1.10 | %5 |
| Ratio of net investment income (loss) to average net assets: | | | | | | | | | | | | |
| Before fees waived and expenses absorbed | | | (5.85 | )% | | | (11.26 | )% | | | (25.91) | %5 |
| After fees waived and expenses absorbed | | | (0.03 | )% | | | 1.66 | % | | | 1.79 | %5 |
| | | | | | | | | | | | | |
| Portfolio turnover rate | | | 210 | % | | | 177 | % | | | 54 | %4 |
| * | Commencement of operations. |
| ** | The Cannabis Growth Fund reorganized as an ETF as of the close of business on September 24, 2021. |
| *** | The Cannabis Growth Fund had a 1-3 stock split with ex and payable dates of August 5, 2021, prior periods reflect stock split. See Notes to Financial Statements. |
| 1 | Based on average shares outstanding for the period. |
| 2 | Amount represents less than $0.01 per share. |
| 3 | Total returns would have been lower had expenses not been waived and absorbed by the Advisor. Returns shown do not reflect the deduction of taxes that a shareholder would pay on Fund distributions or the redemption of Fund shares. |
| 6 | Effective August 25, 2020, Institutional Class Shares were re-designated as Class I Shares. |
| 7 | The Investor Class shares converted into Class I shares at the close of business on May 14, 2021. |
See accompanying Notes to Financial Statements.
Cannabis Growth ETF
NOTES TO FINANCIAL STATEMENTS
January 31, 2022
Note 1 – Organization
The Cannabis Growth ETF (the “Fund”) was organized as a non-diversified series of Investment Managers Series Trust II, a Delaware statutory trust (the “Trust”) which is registered as an open-end management investment company under the Investment Company Act of 1940, as amended (the “1940 Act”). The Fund is an actively managed exchange-traded fund ("ETF").
The Fund’s primary investment objective is to seek long-term capital appreciation. The Cannabis Growth Fund, (the "Predecessor Fund") commenced investment operations on February 22, 2019, with Investor Class. Institutional Class commenced investment operations at a later date, May 24, 2019. Effective August 25, 2020, Institutional Class Shares were re-designated as Class I Shares. At the close of business on May 14, 2021 Investor Class Shares were converted into Class I Shares.
The shares of each class represent an interest in the same portfolio of investments of the Fund and have equal rights as to voting, redemptions, dividends, liquidation, income and expenses, except class specific expenses, subject to the approval of the Trustees. Shareholders of a class that bears distribution and service expenses under the terms of a distribution plan have exclusive voting rights to that distribution plan.
On July 21, 2021, the Board also approved a one-for-three reverse share split for shares of the Cannabis Growth Fund, effective after the close of business on August 5, 2021. On August 6, 2021, shareholders will be deemed to hold one Fund share for every three Fund shares previously held as of the close of business on August 5, 2021. The reverse share split did not change the total value of the shareholders’ investments in the Fund.
The Fund commenced investment operations on September 27, 2021 following the tax-free reorganization of the Cannabis Growth Fund, into the Fund. The Agreement and Plan of Reorganization was approved by the Board of the Trust on June 4, 2021. The tax-free reorganization was accomplished as of the close of business on September 24, 2021. As a result of the reorganization, the Fund assumed the performance and accounting history of the Predecessor Fund. Financial information included for the dates prior to the reorganization is that of the Predecessor Fund.
The reorganization was accomplished by the following tax-free exchange in which each shareholder of the Predecessor Fund received the same aggregate share net asset value (“NAV”) in the corresponding classes as noted below:
| | | Shares Issued | | | Net Assets | |
| | | 206,657 | | | $ | 3,845,112 | |
The net unrealized depreciation of investments transferred was $348,037 as of the date of the acquisition.
The Fund is an investment company and accordingly follows the investment company accounting and reporting guidance of the Financial Accounting Standards Board (FASB) Accounting Standard Codification Topic 946 “Financial Services—Investment Companies.”
Note 2 – Accounting Policies
The following is a summary of the significant accounting policies consistently followed by the Fund in the preparation of their financial statements. The preparation of financial statements in conformity with accounting principles generally accepted in the United States of America (“GAAP”) requires management to make estimates and assumptions that affect the reported amounts and disclosures in the financial statements. Actual results could differ from these estimates.
Cannabis Growth ETF
NOTES TO FINANCIAL STATEMENTS - Continued
January 31, 2022
(a) Valuation of Investments
The Fund values equity securities at the last reported sale price on the principal exchange or in the principal over the counter (“OTC”) market in which such securities are traded, as of the close of regular trading on the NYSE on the day the securities are being valued or, if the last-quoted sales price is not readily available, the securities will be valued at the last bid or the mean between the last available bid and ask price. Securities traded on the NASDAQ are valued at the NASDAQ Official Closing Price (“NOCP”). Investments in open-end investment companies are valued at the daily closing net asset value of the respective investment company. Debt securities are valued by utilizing a price supplied by independent pricing service providers. The independent pricing service providers may use various valuation methodologies including matrix pricing and other analytical pricing models as well as market transactions and dealer quotations. These models generally consider such factors as yields or prices of bonds of comparable quality, type of issue, coupon, maturity, ratings and general market conditions. If a price is not readily available for a portfolio security, the security will be valued at fair value (the amount which the Fund might reasonably expect to receive for the security upon its current sale) as determined in good faith by the Fund’s advisor, subject to review and approval by the Valuation Committee, pursuant to procedures adopted by the Board of Trustees. The actions of the Valuation Committee are subsequently reviewed by the Board at its next regularly scheduled board meeting. The Valuation Committee meets as needed. The Valuation Committee is comprised of all the Trustees, but action may be taken by any one of the Trustees.
Foreign securities traded in countries outside the U.S. are fair valued by utilizing the quotations of an independent pricing service. The pricing service uses statistical analyses and quantitative models to adjust local prices using factors such as subsequent movement and changes in the prices of indexes, securities and exchange rates in other markets in determining fair value as of the time the Fund calculates the NAVs. The Board reviews the independent third party fair valuation analysis report quarterly.
(b) Foreign Currency Translation
The Funds’ records are maintained in U.S. dollars. The value of securities, currencies and other assets and liabilities denominated in currencies other than U.S. dollars are translated into U.S. dollars based upon foreign exchange rates prevailing at the end of the reporting period. The currencies are translated into U.S. dollars by using the exchange rates quoted as of 4:00 PM Eastern Standard Time. Purchases and sales of investment securities, income and expenses are translated on the respective dates of such transactions.
The Funds do not isolate that portion of their net realized and unrealized gains and losses on investments resulting from changes in foreign exchange rates from the impact arising from changes in market prices. Such fluctuations are included with net realized and unrealized gain or loss from investments and foreign currency.
Net realized foreign currency transaction gains and losses arise from sales of foreign currencies, currency gains or losses realized between the trade and settlement dates on securities transactions, and the differences between the amounts of dividends, interest, and foreign withholding taxes recorded on the Funds’ books and the U.S. dollar equivalent of the amounts actually received or paid. Net unrealized foreign currency translation gains and losses arise from changes in the value of assets and liabilities, other than investments in securities, resulting from changes in the exchange rates.
(c) Investment Transactions, Investment Income and Expenses
Investment transactions are accounted for on the trade date. Realized gains and losses on investments are determined on the identified cost basis. Dividend income is recorded net of applicable withholding taxes on the ex-dividend date and interest income is recorded on an accrual basis. Discounts on debt securities are accreted or amortized to interest income over the lives of the respective securities using the effective interest method. Premiums for callable debt securities are amortized to the earliest call date, if the call price was less than the purchase price. If the call price was not at par and the security was not called, the security is amortized to the next call price and date. Income and expenses of the Fund are allocated on a pro rata basis to each class of shares relative net assets, except for distribution and service fees which are unique to each class of shares. Expenses incurred by the Trust with respect to more than one fund are allocated in proportion to the net assets of each fund except where allocation of direct expenses to each Fund or an alternative allocation method can be more appropriately made.
Cannabis Growth ETF
NOTES TO FINANCIAL STATEMENTS - Continued
January 31, 2022
(d) Options
The Fund may write or purchase options contracts primarily to enhance the Fund’s returns or reduce volatility. In addition, the Fund may utilize options in an attempt to generate gains from option premiums or to reduce overall portfolio risk. When the Fund writes or purchases an option, an amount equal to the premium received or paid by the Fund is recorded as a liability or an asset and is subsequently adjusted to the current market value of the option written or purchased. Premiums received or paid from writing or purchasing options which expire unexercised are treated by a Fund on the expiration date as realized gains or losses. The difference between the premium and the amount paid or received on effecting a closing purchase or sale transaction, including brokerage commissions, is also treated as a realized gain or loss. If an option is exercised, the premium paid or received is added to the cost of the purchase or proceeds from the sale in determining whether the Fund has realized a gain or a loss on investment transactions. The Fund, as a writer of an option, may have no control over whether the underlying securities may be sold (call) or purchased (put) and as a result bears the market risk of an unfavorable change in the price of the security underlying the written option.
(e) Securities Lending
The Fund has entered into a securities lending agreement with BMO Harris Bank N.A. (“BMO”). The Fund may lend up to 33 1/3% of its total assets requiring that the loan be continuously collateralized by cash or other securities issued or guaranteed by the U.S. Government or its agencies or instrumentalities (“Government Securities”) at all times equal to at least 102% (105% for foreign securities) of the market value on the securities loaned. Daily market fluctuations could cause the value of loaned securities to be more or less than the value of the collateral received. When this occurs, the collateral is adjusted so that the market value of the collateral is not less than the initial margin requirement. Although risk is mitigated by the collateral, the Fund could experience a delay in recovering its securities and possible loss of income or value if the borrower fails to return them. During the term of the loan, the Fund will continue to receive any dividends, interest or amounts equivalent thereto, on the securities loaned while receiving a fee from the borrower and/or earning interest on the investments of the cash collateral. Such fees and interest are shared with the securities lending agent under the terms of the securities lending agreement. Securities lending income is disclosed as such in the Statement of Operations.
Effective August 10, 2021, the Fund no longer engages in securities lending activities.
(f) Distributions to Shareholders
The Fund will make distributions of net investment income and net capital gains, if any, at least annually, typically in December. Distributions to shareholders are recorded on the ex-dividend date. The amount and timing of distributions are determined in accordance with federal income tax regulations, which may differ from GAAP.
The character of distributions made during the year from net investment income or net realized gains may differ from the characterization for federal income tax purposes due to differences in the recognition of income, expense and gain (loss) items for financial statement and tax purposes.
Cannabis Growth ETF
NOTES TO FINANCIAL STATEMENTS - Continued
January 31, 2022
(g) Illiquid Securities
Pursuant to Rule 22e-4 under the 1940 Act, the Fund has adopted a Liquidity Risk Management Program (“LRMP”) that requires, among other things, that the Fund limits its illiquid investments that are assets to no more than 15% of net assets. An illiquid investment is any security which may not reasonably be expected to be sold or disposed of in current market conditions in seven calendar days or less without the sale or disposition significantly changing the market value of the investment. If the Advisor, at any time, determines that the value of illiquid securities held by the Fund exceeds 15% of its net asset value, the Advisor will take such steps as it considers appropriate to reduce them as soon as reasonably practicable in accordance with the Fund’s written LRMP.
Note 3 – Investment Advisory and Other Agreements
The Trust, on behalf of the Fund, entered into an Investment Advisory Agreement (the “Agreement”) with Foothill Capital Management, LLC (the “Advisor”). Under the terms of the Agreement, the Fund pays a monthly investment advisory fee to the Advisory at an annual rate of 0.65% of the Fund's average daily net assets. The Fund is responsible for its own operating expenses (all of which will be borne directly or indirectly by the Fund’s shareholders), including among others, legal fees and expenses of counsel to the Fund and the Fund’s independent trustees; insurance (including trustees’ and officers’ errors and omissions insurance); auditing and accounting expenses; taxes and governmental fees; listing fees; fees and expenses of the Fund’s custodians, administrators, transfer agents, registrars and other service providers; expenses for portfolio pricing services by a pricing agent, if any; expenses in connection with the issuance and offering of shares; brokerage commissions and other costs of acquiring or disposing of any portfolio holding of the Fund; and any litigation expenses.
The Advisor has contractually agreed to waive its fees and/or pay for operating expenses of the Fund to ensure that the total annual fund operating expenses (excluding any taxes, leverage interest, brokerage commissions, dividend and interest expenses on short sales, acquired fund fees and expenses (as determined in accordance with Form N-1A), expenses incurred in connection with any merger or reorganization, and extraordinary expenses such as litigation expenses) do not exceed 0.65% of the Fund’s average daily net assets. This agreement is in effect until May 31, 2031, and it may be terminated before that date only by the Trust’s Board of Trustees.
Prior to September 25, 2021, the Predecessor Fund paid a monthly investment advisory fee to the Advisor at the annual rate of 0.85% of the Fund’s average daily net assets. The Advisor has contractually agreed to waive its fees and/or pay for operating expenses of the Predecessor Fund to ensure that total annual fund operating expenses (excluding any taxes, leverage interest, brokerage commissions, dividend and interest expenses on short sales, acquired fund fees and expenses (as determined in accordance with SEC Form N-1A), expenses incurred in connection with any merger or reorganization, and extraordinary expenses such as litigation expenses) do not exceed 1.10% of the average daily net assets of Class I shares of the Predecessor Fund.
Brown Brothers Harriman & Co. serves as the Fund’s fund accountant, transfer agent and custodian. UMB Fund Services (“UMBFS”) and Mutual Fund Administration, LLC (“MFAC”) serve as the Fund’s co-administrators. Prior to September 25, 2021, IMST Distributors, LLC served as the Predecessor Fund’s distributor (the “Distributor”). The Distributor does not receive compensation from the Predecessor Fund for its distribution services; the Advisor paid the Distributor a fee for its distribution related services.
Certain trustees and officers of the Trust are employees of UMBFS or MFAC. The Fund does not compensate trustees and officers affiliated with the Fund’s co-administrators. For the year ended January 31, 2022, the Fund’s allocated fees incurred to Trustees who are not affiliated with the Fund’s co-administrators are reported on the Statement of Operations. A portion of the fees were paid by the Trust’s Co-Administrators. Such amount is shown as a reduction of expenses, “Fees paid indirectly”, on the Statement of Operations.
Cannabis Growth ETF
NOTES TO FINANCIAL STATEMENTS - Continued
January 31, 2022
The Fund’s Board of Trustees has adopted a Deferred Compensation Plan (the “Plan”) for the Independent Trustees that enables Trustees to elect to receive payment in cash or the option to select various Fund(s) in the Trust in which their deferred accounts shall be deemed to be invested. If a trustee elects to defer payment, the Plan provides for the creation of a deferred payment account. The Fund’s liability for these amounts is adjusted for market value changes in the invested fund(s) and remains a liability to the Fund until distributed in accordance with the Plan. The Trustees Deferred compensation liability under the Plan constitutes a general unsecured obligation of the Fund and is disclosed in the Statement of Assets and Liabilities. Contributions made under the plan and the change in unrealized appreciation/depreciation and income are included in the Trustees’ fees and expenses in the Statement of Operations.
Dziura Compliance Consulting, LLC provides Chief Compliance Officer (“CCO”) services to the Trust. The Fund’s allocated fees incurred for CCO services for the year ended January 31, 2022, are reported on the Statement of Operations.
Note 4 – Federal Income Taxes
At January 31, 2022, the cost of investments on a tax basis and gross unrealized appreciation (depreciation) on investments for federal income tax purposes were as follows:
| Cost of investments | | $ | 5,651,763 | |
| Gross unrealized appreciation | | | 53,514 | |
| Gross unrealized depreciation | | | (2,224,813 | ) |
| Net unrealized depreciation on investments | | $ | (2,171,299 | ) |
The difference between cost amounts for financial statement and federal income tax purposes is due primarily to timing differences in recognizing certain gains and losses in security transactions.
As of January 31, 2022, the components of accumulated earnings/(deficit) on a tax basis were as follows:
| Undistributed ordinary income | | $ | - | |
| Undistributed long-term capital gains | | | - | |
| Accumulated earnings | | | - | |
| | | | | |
| Accumulated capital and other losses | | | (909,050 | ) |
| Unrealized appreciation (depreciation) on investments | | | (2,171,299 | ) |
| Unrealized deferred compensation | | | (10,357 | ) |
| Total accumulated earnings (deficit) | | $ | (3,090,706 | ) |
As of January 31, 2022, the Fund had $9,270 of qualified late-year ordinary losses, which are deferred until fiscal year 2023 for tax purposes. Net late-year losses incurred after December 31, and within the taxable year are deemed to arise on the first day of the funds next taxable year.
Cannabis Growth ETF
NOTES TO FINANCIAL STATEMENTS - Continued
January 31, 2022
The tax character of distributions paid for the fiscal years ended January 31, 2022, and January 31, 2021 were as follows:
| | | For the Year Ended January 31, 2022 | | | For the Year Ended January 31, 2021 | |
| Distributions paid from: | | | | | | | | |
| Ordinary income | | $ | 52,010 | | | $ | 45,951 | |
| Net long-term capital gains | | | - | | | | - | |
| Total taxable distributions | | $ | 52,010 | | | $ | 45,951 | |
As of January 31, 2022, the Fund had a short-term capital loss carryover of $899,780, and a long-term capital loss carryover of $0, which reduces the Fund’s taxable income arising from future net realized gains on investments, if any, to the extent permitted by the Code, and thus will reduce the amount of distributions to shareholders which would otherwise be necessary to relieve the Fund of any liability for federal tax.
During the period ended January 31, 2022, the Fund utilized $33,019 of short-term and long-term capital loss carryforwards, respectively.
Note 5 – Redemption Fee
Prior to September 25, 2021, the Predecessor Fund imposed a redemption fee of 1.00% of the total redemption amount on all shares redeemed within 60 days of purchase. For the years ended January 31, 2022 and 2021, the Predecessor Fund received $32,070 and $7,044, respectively.
Note 6 - Investment Transactions
For the year ended January 31, 2022, purchases and sales of investments, excluding short-term investments were $11,296,069 and $9,055,843, respectively.
Note 7 – Shareholder Servicing Plan
Prior to September 25, 2021, the Trust, on behalf of the Predecessor Fund, has adopted a Shareholder Servicing Plan to pay a fee at an annual rate of up to 0.10% of average daily net assets to shareholder servicing agents who provide administrative and support services to their customers.
Note 8 – Distribution Plan
Prior to September 25, 2021, the Trust, on behalf of the Predecessor Fund, has adopted a Distribution Plan (the “Plan”) pursuant to Rule 12b-1 under the 1940 Act, that allows the Predecessor Fund to pay distribution fees for the sale and distribution of its shares. For Investor Class shares, the maximum annual fee payable to the Distributor for such distribution and/or shareholder liaison services is 0.25% of the average daily net assets of such shares. The Class I does not pay any distribution fees.
For the year ended January 31, 2022, distribution fees incurred are disclosed on the Statement of Operations.
Note 9 – Indemnifications
In the normal course of business, the Fund enters into contracts that contain a variety of representations which provide general indemnifications. The Fund’s maximum exposure under these arrangements is unknown, as this would involve future claims that may be made against the Fund that have not yet occurred. However, the Fund expects the risk of loss to be remote.
Cannabis Growth ETF
NOTES TO FINANCIAL STATEMENTS - Continued
January 31, 2022
Note 10 – Fair Value Measurements and Disclosure
Fair Value Measurements and Disclosures defines fair value, establishes a framework for measuring fair value in accordance with GAAP, and expands disclosure about fair value measurements. It also provides guidance on determining when there has been a significant decrease in the volume and level of activity for an asset or a liability, when a transaction is not orderly, and how that information must be incorporated into a fair value measurement.
Under Fair Value Measurements and Disclosures, various inputs are used in determining the value of the Fund’s investments. These inputs are summarized into three broad Levels as described below:
| | · | Level 1 – Unadjusted quoted prices in active markets for identical assets or liabilities that the Fund has the ability to access. |
| | · | Level 2 – Observable inputs other than quoted prices included in Level 1 that are observable for the asset or liability, either directly or indirectly. These inputs may include quoted prices for the identical instrument on an inactive market, prices for similar instruments, interest rates, prepayment speeds, credit risk, yield curves, default rates and similar data. |
| | · | Level 3 – Unobservable inputs for the asset or liability, to the extent relevant observable inputs are not available, representing the Fund’s own assumptions about the assumptions a market participant would use in valuing the asset or liability, and would be based on the best information available. |
The availability of observable inputs can vary from security to security and is affected by a wide variety of factors, including for example, the type of security, whether the security is new and not yet established in the marketplace, the liquidity of markets, and other characteristics particular to the security. To the extent that valuation is based on models or inputs that are less observable or unobservable in the market, the determination of fair value requires more judgment. Accordingly, the degree of judgment exercised in determining fair value is greatest for instruments categorized in Level 3.
The inputs used to measure fair value may fall into different Levels of the fair value hierarchy. In such cases, for disclosure purposes, the Level in the fair value hierarchy within which the fair value measurement falls in its entirety, is determined based on the lowest Level input that is significant to the fair value measurement in its entirety.
The inputs or methodology used for valuing securities are not an indication of the risk associated with investing in those securities. The following is a summary of the inputs used, as of January 31, 2022, in valuing the Fund’s assets carried at fair value:
| | | Level 1 | | | Level 2* | | | Level 3* | | | Total | |
| Investments | | | | | | | | | | | | |
| Common Stock1 | | $ | 2,623,521 | | | $ | - | | | $ | - | | | $ | 2,623,521 | |
| Investment Companies / ETFs | | | 690,693 | | | | - | | | | - | | | | 690,693 | |
| Total Investments | | | 3,314,214 | | | | - | | | | - | | | | 3,314,214 | |
| Purchased Options Contracts | | | 166,250 | | | | - | | | | - | | | | 166,250 | |
| Total Investments and Options | | $ | 3,480,464 | | | $ | - | | | $ | - | | | $ | 3,480,464 | |
| 1 | For a detailed break-out of common stocks by major industry classification, please refer to the Schedule of Investments. |
| * | The Fund did not hold any Level 2 or 3 securities at period end. |
Cannabis Growth ETF
NOTES TO FINANCIAL STATEMENTS - Continued
January 31, 2022
Note 11 – Derivative and Hedging Disclosure
Derivatives and Hedging requires enhanced disclosures about the Fund’s derivative and hedging activities, including how such activities are accounted for and their effects on the Fund’s financial position, performance and cash flows. The Fund invested in options contracts for the year ended January 31, 2022.
The effects of these derivative instruments on the Fund’s financial position and financial performance as reflected in the Statement of Assets and Liabilities and Statement of Operations are presented in the tables below. The fair values of derivative instruments as of January 31, 2022, by risk category are as follows:
| | | Asset Derivatives |
| Derivatives not designated as hedging instruments | | Statements of Assets, Liabilities and Shareholders’ Equity Location | | Value | |
| Equity contracts | | Purchased options contracts, at value | | $ | 166,250 | |
| Total | | | | $ | 166,250 | |
The effects of derivative instruments on the Statement of Operations for the year ended January 31, 2022, are as follows:
| Amount of Realized Gain or (Loss) on Derivatives Recognized in Income |
| Derivatives not designated as hedging instruments | | Purchased Options Contracts | |
| Equity contracts | | $ | (310,738 | ) |
| Total | | $ | (310,738 | ) |
| Change in Unrealized Appreciation (Depreciation) on Derivatives Recognized in Income |
| Derivatives not designated as hedging instruments | | Purchased Options Contracts | | | Total | |
| Equity contracts | | $ | (126,227 | ) | | $ | (126,227 | ) |
| Total | | $ | (126,227 | ) | | $ | (126,227 | ) |
The quarterly average volumes of derivative instruments as of January 31, 2022, are as follows:
| Derivative | | Quarterly Average | | | Amount | |
| Options Contracts - Purchased | | | Average Notional Value | | | $ | 1,144,000 | |
Note 12 – COVID-19 Risks
In early 2020, an outbreak of a novel strain of coronavirus (COVID-19) emerged globally. This coronavirus has resulted in closing international borders, enhanced health screenings, healthcare service preparation and delivery, quarantines, cancellations, disruptions to supply chains and customer activity, as well as general public concern and uncertainty. The impact of this outbreak has negatively affected the worldwide economy, as well as the economies of individual countries, the financial health of individual companies and the market in general in significant and unforeseen ways. The future impact of COVID-19 is currently unknown, and it may exacerbate other risks that apply to the Fund, including political, social and economic risks. Any such impact could adversely affect the Fund’s performance, the performance of the securities in which the Fund invests and may lead to losses on your investment in the Fund. The ultimate impact of COVID-19 on the financial performance of the Fund’s investments is not reasonably estimable at this time.
Cannabis Growth ETF
NOTES TO FINANCIAL STATEMENTS - Continued
January 31, 2022
Note 13 – New Accounting Pronouncements
In October 2020, the SEC adopted new regulations governing the use of derivatives by registered investment companies (“Rule 18f-4”). Rule 18f-4 will impose limits on the amount of derivatives a Fund can enter into, eliminate the asset segregation framework currently used by funds to comply with Section 18 of the 1940 Act, and require funds whose use of derivatives is greater than a limited specified amount to establish and maintain a comprehensive derivatives risk management program and appoint a derivatives risk manager. Funds will be required to comply with Rule 18f-4 by August 19, 2022. It is not currently clear what impact, if any, Rule 18f-4 will have on the availability, liquidity or performance of derivatives. Management is currently evaluating the potential impact of Rule 18f-4 on the Fund. When fully implemented, Rule 18f-4 may require changes in how a Fund uses derivatives, adversely affect the Fund’s performance and increase costs related to the Fund’s use of derivatives.
In December 2020, the SEC adopted a new rule providing a framework for fund valuation practices (“Rule 2a-5”). Rule 2a-5 establishes requirements for determining fair value in good faith for purposes of the 1940 Act. Rule 2a-5 will permit fund boards to designate certain parties to perform fair value determinations, subject to board oversight and certain other conditions. Rule 2a-5 also defines when market quotations are “readily available” for purposes of the 1940 Act and the threshold for determining whether a fund must fair value a security. In connection with Rule 2a-5, the SEC also adopted related recordkeeping requirements and is rescinding previously issued guidance, including with respect to the role of a board in determining fair value and the accounting and auditing of fund investments. The Fund will be required to comply with the rules by September 8, 2022. Management is currently assessing the potential impact of the new rules on the Fund’s financial statements.
The SEC adopted new Rule 12d1-4, which will allow registered investment companies (including business development companies (“BDCs”), unit investment trusts (“UITs”), closed-end funds, exchange-traded funds (“ETFs”), and exchange-traded managed funds (“ETMFs”) (an “acquiring” fund), to invest in other investment companies (an “acquired fund”), including private funds under a specific exception, beyond the limits of Section 12(d)(1), subject to the conditions of the rule. Rule 12d1-4 became effective January 19, 2021. Funds electing to rely on Rule 12d1-4 will have to comply with the rules by January 19, 2022.
In March 2020, FASB issued ASU 2020-04, Reference Rate Reform: Facilitation of the Effects of Reference Rate Reform on Financial Reporting. The main objective of the new guidance is to provide relief to companies that will be impacted by the expected change in benchmark interest rates at the end of 2021, when participating banks will no longer be required to submit London Interbank Offered Rate (“LIBOR”) quotes by the UK Financial Conduct Authority. The new guidance allows companies to, provided the only change to existing contracts are a change to an approved benchmark interest rate, account for modifications as a continuance of the existing contract without additional analysis. In addition, derivative contracts that qualified for hedge accounting prior to modification, will be allowed to continue to receive such treatment, even if critical terms change due to a change in the benchmark interest rate. For new and existing contracts, the Fund may elect to apply the amendments as of March 12, 2020 through December 31, 2022. Management is currently assessing the impact of the ASU’s adoption to the Fund’s financial statements and various filings.
Cannabis Growth ETF
NOTES TO FINANCIAL STATEMENTS - Continued
January 31, 2022
Note 14 – Events Subsequent to the Fiscal Period End
The Fund has adopted financial reporting rules regarding subsequent events which require an entity to recognize in the financial statements the effects of all subsequent events that provide additional evidence about conditions that existed at the date of the balance sheet. Management has evaluated the Fund’s related events and transactions that occurred through the date of issuance of the Fund’s financial statements.
On March 28, 2022, the Board of Trustees of the Trust has approved a Plan of Liquidation for the Fund. The Plan of Liquidation authorizes the termination, liquidation and dissolution of the Fund.
The Fund will create and redeem creation units through April 25, 2022 (the “Closing Date”), which will also be the last day of trading of the Fund’s shares on the NYSE Arca, Inc., the Fund’s principal U.S. listing exchange. On or about April 29, 2022 (the “Liquidation Date”), the Fund will cease operations, liquidate its assets, and prepare to distribute proceeds to shareholders of record as of the Liquidation Date.
As a result, during this time, all or a portion of the Fund may not be invested in a manner consistent with its stated investment strategies, which may prevent the Fund from achieving its investment objective.
There were no other events or transactions that occurred during this period that materially impacted the amounts or disclosures in the Fund’s financial statements.
REPORT OF INDEPENDENT REGISTERED PUBLIC ACCOUNTING FIRM
To the Shareholders of Cannabis Growth ETF and
the Board of Trustees of
Investment Managers Series Trust II
Opinion on the Financial Statements
We have audited the accompanying statement of assets and liabilities of Cannabis Growth ETF (the “Fund”), a series of Investment Managers Series Trust II, including the schedule of investments, as of January 31, 2022, the related statement of operations for the year then ended, the statements of changes in net assets for each of the two years in the period then ended, and financial highlights for each of the two years in the period then ended and for the period May 24, 2019 (commencement of operations) through January 31, 2020, and the related notes (collectively referred to as the “financial statements”). In our opinion, the financial statements present fairly, in all material respects, the financial position of the Fund as of January 31, 2022, the results of its operations for the year then ended, the changes in its net assets for each of the two years in the period then ended, and the financial highlights for each of the two years in the period then ended and for the period May 24, 2019 through January 31, 2020, in conformity with accounting principles generally accepted in the United States of America.
Basis for Opinion
These financial statements are the responsibility of the Fund’s management. Our responsibility is to express an opinion on the Fund’s financial statements based on our audits. We are a public accounting firm registered with the Public Company Accounting Oversight Board (United States) (“PCAOB”) and are required to be independent with respect to the Fund in accordance with the U.S. federal securities laws and the applicable rules and regulations of the Securities and Exchange Commission and the PCAOB. We have served as the auditor of one or more of the funds in the Trust since 2013.
We conducted our audits in accordance with the standards of the PCAOB. Those standards require that we plan and perform the audits to obtain reasonable assurance about whether the financial statements are free of material misstatement, whether due to error or fraud. The Fund is not required to have, nor were we engaged to perform, an audit of its internal control over financial reporting. As part of our audits, we are required to obtain an understanding of internal control over financial reporting, but not for the purpose of expressing an opinion on the effectiveness of the Fund’s internal control over financial reporting. Accordingly, we express no such opinion.
Our audits included performing procedures to assess the risks of material misstatement of the financial statements, whether due to error or fraud, and performing procedures that respond to those risks. Such procedures included examining, on a test basis, evidence regarding the amounts and disclosures in the financial statements. Our audits also included evaluating the accounting principles used and significant estimates made by management, as well as evaluating the overall presentation of the financial statements. Our procedures included confirmation of securities owned as of January 31, 2022 by correspondence with the custodian, brokers or by other appropriate auditing procedures where replies from broker were not received. We believe that our audits provide a reasonable basis for our opinion.
| |  |
| | TAIT, WELLER & BAKER LLP |
| Philadelphia, Pennsylvania | |
| April 1, 2022 | |
Cannabis Growth ETF
SUPPLEMENTAL INFORMATION (Unaudited)
Corporates Dividends Received Deduction
For the year ended January 31, 2022, 100% of the dividends paid from net investment income, including short-term capital gains (if any), for the Fund, qualifies for the dividends received deduction available to corporate shareholders.
Qualified Dividend Income
For the year ended January 31, 2022, 100% of the dividends paid from net investment income, including short-term capital gains (if any,) for the Fund, is designated as qualified dividend income.
Trustees and Officers Information
Additional information about the Trustees is included in the Fund’s Statement of Additional Information which is available, without charge, upon request by calling (888) 885-0588. The Trustees and officers of the Fund and their principal occupations during the past five years are as follows:
Name, Address, Year of Birth and Position(s) held with Trust | Term of Officec and Length of Time Served | Principal Occupation During the Past Five Years and Other Affiliations | Number of Portfolios in the Fund Complex Overseen by Trusteed | Other Directorships Held by Trustee During the Past Five Yearse |
| “Independent” Trustees: | | | |
Thomas Knipper, CPA a (Born 1957) Trustee | Since September 2013 | Independent Consulting, financial services organizations (March 2021 – present); Vice President and Chief Compliance Officer, Ameritas Investment Partners, a registered investment advisor (1995 – March 2021). | 1 | None. |
Kathleen K. Shkuda a (born 1951) Trustee | Since September 2013 | Zigzag Consulting, a financial services consulting firm (2008 – present); Director, Managed Accounts, Merrill Lynch (2007 – 2008). | 1 | None. |
Larry D. Tashjian a (born 1953) Trustee and Chairman of the Board | Since September 2013 | Principal, CAM Capital Advisors, a family office (2001 – present). | 1 | General Finance Corporation. |
Cannabis Growth ETF
SUPPLEMENTAL INFORMATION (Unaudited) - Continued
Name, Address, Year of Birth and Position(s) held with Trust | Term of Officec and Length of Time Served | Principal Occupation During the Past Five Years and Other Affiliations | Number of Portfolios in the Fund Complex Overseen by Trusteed | Other Directorships Held by Trustee During the Past Five Yearse |
| “Independent” Trustee: | | | | |
John P. Zader a (born 1961) Trustee | Since September 2013 | Retired (June 2014 – present); CEO, UMB Fund Services, Inc., a mutual fund and hedge fund service provider, and the transfer agent, fund accountant, and co-administrator for the Fund (December 2006 – June 2014); President, Investment Managers Series Trust (December 2007 – June 2014). | 1 | Investment Managers Series Trust, a registered investment company (includes 53 portfolios); 361 Social Infrastructure Fund, a closed-end investment company. |
| Interested Trustees: | | | |
Eric M. Banhazl b† (born 1957) Trustee | Since September 2013 | Chairman, Foothill Capital Management, LLC, a registered investment advisor (2018 – present); Chairman (2016 – present), and President (2006 – 2015), Mutual Fund Administration, LLC, co-administrator for the Fund. | 1 | Investment Managers Series Trust, a registered investment company (includes 53 portfolios); 361 Social Infrastructure Fund, a closed-end investment company. |
Cannabis Growth ETF
SUPPLEMENTAL INFORMATION (Unaudited) - Continued
Name, Address, Year of Birth and Position(s) held with Trust | Term of Officec and Length of Time Served | Principal Occupation During the Past Five Years and Other Affiliations | Number of Portfolios in the Fund Complex Overseen by Trusteed | Other Directorships Held by Trustee During the Past Five Yearse |
Terrance P. Gallagher a* (born 1958) Trustee and President | Since July 2019 | President, Investment Managers Series Trust II (September 2013 – present); Executive Vice President, UMB Fund Services, Inc. (2007 – present); Director of Compliance, Unified Fund Services Inc. (now Huntington Fund Services), a mutual fund service provider (2004 – 2007). | 1 | Cliffwater Corporate Lending Fund, a registered investment company; Agility Multi-Asset Income Fund, a closed-end investment company; Corbin Multi-Strategy Fund, a closed-end investment company; Aspiriant Risk-Managed Real Asset Fund, a closed-end investment company; Aspiriant Risk-Managed Capital Appreciation Fund, a closed-end investment company; Infinity Core Alternative Fund, a closed-end investment company; Infinity Long/Short Equity Fund, LLC, a closed-end investment company; Keystone Private Income Fund, a closed-end investment company; Relative Value Fund, a closed-end investment company; Variant Alternative Income Fund, a closed-end investment company. |
Cannabis Growth ETF
SUPPLEMENTAL INFORMATION (Unaudited) - Continued
Name, Address, Year of Birth and Position(s) held with Trust | Term of Officec and Length of Time Served | Principal Occupation During the Past Five Years and Other Affiliations | Number of Portfolios in the Fund Complex Overseen by Trusteed | Other Directorships Held by Trustee During the Past Five Yearse |
| Officers of the Trust: | | |
Rita Dam b (born 1966) Treasurer and Assistant Secretary | Since September 2013 | Co-Chief Executive Officer (2016 – present), and Vice President (2006 – 2015), Mutual Fund Administration, LLC; Co-President, Foothill Capital Management, LLC, a registered investment advisor (2018 – present); Treasurer, 361 Social Infrastructure Fund (December 2019 – January 2022). | N/A | N/A |
Joy Ausili b (born 1966) Vice President and Assistant Secretary | Since January 2016 | Co-Chief Executive Officer (2016 – present), and Vice President (2006 – 2015), Mutual Fund Administration, LLC; Co-President, Foothill Capital Management, LLC, a registered investment advisor (2018 – present); Vice President and Assistant Secretary, 361 Social Infrastructure Fund (December 2019 – January 2022); Secretary and Assistant Treasurer, Investment Managers Series Trust (September 2013 – January 2016). | N/A | N/A |
Diane Drake b (born 1967) Secretary | Since January 2016 | Senior Counsel, Mutual Fund Administration, LLC (October 2015 – present); Secretary, 361 Social Infrastructure Fund (December 2019 – January 2022); Chief Compliance Officer, Foothill Capital Management, LLC, a registered investment advisor (2018 – 2019). | N/A | N/A |
Cannabis Growth ETF
SUPPLEMENTAL INFORMATION (Unaudited) - Continued
Name, Address, Year of Birth and Position(s) held with Trust | Term of Officec and Length of Time Served | Principal Occupation During the Past Five Years and Other Affiliations | Number of Portfolios in the Fund Complex Overseen by Trusteed | Other Directorships Held by Trustee During the Past Five Yearse |
| Officer of the Trust: | | | | |
Martin Dziura b (born 1959) Chief Compliance Officer | Since September 2013 | Principal, Dziura Compliance Consulting, LLC (October 2014 – present); Managing Director, Cipperman Compliance Services (2010 – September 2014); Chief Compliance Officer, Hanlon Investment Management (2009 – 2010); Vice President − Compliance, Morgan Stanley Investment Management (2000 − 2009). | N/A | N/A |
| a | Address for certain Trustees and certain officers: 235 West Galena Street, Milwaukee, Wisconsin 53212. |
| b | Address for Mr. Banhazl, Ms. Ausili, Ms. Dam and Ms. Drake: 2220 E. Route 66, Suite 226, Glendora, California 91740. |
Address for Mr. Dziura: 309 Woodridge Lane, Media, Pennsylvania 19063.
| c | Trustees and officers serve until their successors have been duly elected. |
| d | The Trust is comprised of 27 series managed by unaffiliated investment advisors. Each Trustee serves as Trustee of each series of the Trust. The term “Fund Complex” applies only to the Fund(s) managed by the same investment advisor. The Fund does not hold itself out as related to any other series within the Trust, for purposes of investment and investor services, nor does it share the same investment advisor with any other series. |
| e | “Other Directorships Held” includes only directorship of companies required to register or file reports with the SEC under the Securities Exchange Act of 1934, as amended (that is, “public companies”) or other investment companies registered under the 1940 Act. |
| † | Mr. Banhazl is an “interested person” of the Trust by virtue of his position with Mutual Fund Administration, LLC and Foothill Capital Management, LLC. |
| * | Mr. Gallagher is an “interested person” of the Trust by virtue of his position with UMB Fund Services, Inc. |
Cannabis Growth ETF
SUPPLEMENTAL INFORMATION (Unaudited) - Continued
Board Consideration of Investment Advisory Agreement
At a meeting held on April 22, 2021, the Board of Trustees (the “Board”) of Investment Managers Series Trust II (the “Trust”), including the trustees who are not “interested persons” of the Trust (the “Independent Trustees”) as defined in the Investment Company Act of 1940, as amended (the “1940 Act”), reviewed and unanimously approved the investment advisory agreement (the “Advisory Agreement”) between the Trust and Foothill Capital Management, LLC (the “Investment Advisor”) with respect to the Cannabis Growth ETF series of the Trust (the “Fund”) for an initial two-year term. The Board, including the Independent Trustees, approved the Advisory Agreement in anticipation of the conversion of the Cannabis Growth Fund, a series of the Trust (the “Predecessor Fund”), into the Fund, which occurred on September 24, 2021 (the “Reorganization”). In approving the Advisory Agreement, the Board, including the Independent Trustees, determined that such approval was in the best interests of the Fund and its shareholders. The Board acknowledged that in accordance with exemptive relief granted by the U.S. Securities and Exchange Commission, due to unforeseen emergency circumstances related to the COVID-19 pandemic, the meeting was being held by videoconference, and that as required by the relief, the Board would ratify the approval of the Advisory Agreement at its next in-person meeting.
Background
In advance of the meeting, the Board received information about the Fund and the Advisory Agreement from the Investment Advisor and from Mutual Fund Administration, LLC (“MFAC”) and UMB Fund Services, Inc., the Trust’s co-administrators, certain portions of which are discussed below. The materials, among other things, included information about the organization and financial condition of the Investment Advisor; information regarding the background, experience, and compensation structure of relevant personnel who would be providing services to the Fund; information about the Investment Advisor’s compliance policies and procedures, disaster recovery and contingency planning, and policies with respect to portfolio execution and trading; information regarding the estimated profitability of the Investment Advisor’s overall relationship with the Fund; information regarding the performance of the Predecessor Fund for the one-year period ended January 31, 2021; and a report prepared by Broadridge Financial Solutions, Inc. (“Broadridge”) comparing the proposed advisory fee and estimated total expenses of the Fund with those of a group of comparable funds selected by Broadridge (the “Peer Group”). The Board also received a memorandum from legal counsel to the Trust and the Independent Trustees discussing the legal standards under the 1940 Act and other applicable law for their consideration of the proposed approval of the Advisory Agreement. In addition, the Board considered information reviewed by the Board during the year at other Board and Board committee meetings. No representatives of the Investment Advisor were present during the Independent Trustees’ consideration of the Advisory Agreement, and the Independent Trustees were represented by their legal counsel with respect to the matters considered.
In approving the Advisory Agreement, the Board and the Independent Trustees considered a variety of factors, including those discussed below. In their deliberations, the Board and the Independent Trustees did not identify any particular factor that was controlling, and each Trustee may have attributed different weights to the various factors.
Nature, Extent and Quality of Services
With respect to the relevant performance information, the meeting materials indicated that the Predecessor Fund’s total return for the one-year period was higher than the Peer Group median return, the Cannabis World Index return and the S&P 500 Index return, but below the median return of Morningstar, Inc.’s Miscellaneous Sector fund universe (the “Fund Universe”) by 0.06%. The Trustees considered Broadridge’s observation that the Fund Universe, which includes funds with a variety of strategies, is arguably less relevant than the Peer Group for purposes of comparing the Predecessor Fund’s performance.
The Board noted its familiarity with the Investment Advisor as the investment advisor of the Predecessor Fund, and considered the services to be provided by the Investment Advisor to the Fund. In doing so, the Board considered the Investment Advisor’s specific responsibilities in day-to-day management and oversight of the Fund, as well as the qualifications, experience, and responsibilities of the personnel who would be involved in the activities of the Fund. The Board also considered the overall quality of the organization and operations, and the compliance structure and compliance procedures, of the Investment Advisor. The Board also acknowledged that the Fund would pay co-administration fees to MFAC, and that certain officers of MFAC also serve as officers of the Investment Advisor.
Cannabis Growth ETF
SUPPLEMENTAL INFORMATION (Unaudited) - Continued
The Board and the Independent Trustees concluded that based on the various factors they had reviewed, the Investment Advisor would have the capabilities, resources, and personnel necessary to manage the Fund, and that the Investment Advisor would provide the Fund with a reasonable potential for good investment results.
Advisory Fee and Expense Ratio
The Board reviewed information regarding the Fund’s proposed advisory fee and estimated total expenses. The meeting materials indicated that the Fund’s proposed annual investment advisory fee (gross of fee waivers) was lower than the advisory fee of the Predecessor Fund, but slightly higher than the Peer Group median by 0.02%.
The meeting materials indicated that the estimated annual total expenses (net of fee waivers) of the Fund were lower than the annual total expenses of the Predecessor Fund as well as the Peer Group median. The Trustees considered that by capping the Fund’s expenses at the same level as the Fund’s proposed advisory fee, the Investment Advisor was, in effect, implementing a unitary fee for the Fund.
The Board and the Independent Trustees concluded that the proposed compensation payable to the Investment Advisor under the Advisory Agreement would be fair and reasonable in light of the nature and quality of the services proposed to be provided by the Investment Advisor to the Fund.
Profitability and Economies of Scale
The Board next reviewed the estimated profitability to the Investment Advisor of its relationship with the Fund in the Fund’s next year of operations, taking into account estimated assets of $5 million. The Board observed that the Investment Advisor anticipated waiving its entire advisory fee and subsidizing certain of the operating expenses for the Fund, and that the Investment Advisor did not expect to realize a profit with respect to the Fund in its first year of operations following the Reorganization. The Board noted that the potential benefits received by the Investment Advisor as a result of its relationship with the Fund, other than the receipt of its advisory fee, would include the usual types of “fall out” benefits received by advisors to the Trust, including any research received from broker-dealers providing execution services to the Fund, the beneficial effects from the review by the Trust’s Chief Compliance Officer of the Investment Advisor’s compliance program, and the intangible benefits of its association with the Fund generally and any favorable publicity arising in connection with the Fund’s performance. The Board also noted that although the Advisory Agreement does not provide for any advisory fee breakpoints, the Fund’s asset level would likely be too low to achieve significant economies of scale following the Reorganization, and that any such economies would be considered in the future as the Fund’s assets grow.
Conclusion
Based on these and other factors, the Board and the Independent Trustees concluded that approval of the Advisory Agreement was in the best interests of the Fund and its shareholders and, accordingly, approved the Advisory Agreement.
Cannabis Growth ETF
EXPENSE EXAMPLE
For the Six Months Ended January 31, 2022 (Unaudited)
Expense Example
As a shareholder of the Fund, you incur two types of costs: (1) transaction costs, and (2) ongoing costs, including management fees; distribution and/or service (12b-1) fees (Investor Class only); and other Fund expenses. The examples below are intended to help you understand your ongoing costs (in dollars) of investing in the Fund and to compare these costs with the ongoing costs of investing in other mutual funds.
These examples are based on an investment of $1,000 invested at the beginning of the period and held for the entire period from August 1, 2021 to January 31, 2022.
Actual Expenses
The information in the row titled “Actual Performance” of the table below provides actual account values and actual expenses. You may use the information in these columns, together with the amount you invested, to estimate the expenses that you paid over the period. Simply divide your account value by $1,000 (for example, an $8,600 account value divided by $1,000 = 8.6), then multiply the result by the number in the appropriate row for your share class, in the column titled “Expenses Paid During Period” to estimate the expenses you paid on your account during this period.
Hypothetical Example for Comparison Purposes
The information in the row titled “Hypothetical (5% annual return before expenses)” of the table below provides hypothetical account values and hypothetical expenses based on the Fund’s actual expense ratios and an assumed rate of return of 5% per year before expenses, which is not the Fund’s actual return. The hypothetical account values and expenses may not be used to estimate the actual ending account balance or expenses you paid for the period. You may use this information to compare the ongoing costs of investing in the Fund and other funds. To do so, compare these 5% hypothetical examples with the 5% hypothetical examples that appear in the shareholder reports of the other funds.
Please note that the expenses shown in the table are meant to highlight your ongoing costs only and do not reflect any transaction costs, such as sales charges (load) or contingent deferred sales charges. Therefore, the information in the row titled “Hypothetical (5% annual return before expenses)” is useful in comparing ongoing costs only, and will not help you determine the relative total costs of owning different funds. In addition, if these transactional costs were included, your costs would have been higher.
| | Beginning Account Value 8/1/21 | Ending Account Value 1/31/22 | Expenses Paid During Period 8/1/21-1/31/22* |
| Class I | | | |
| Actual Performance | $ 1,000.00 | $ 554.30 | $ 3.06 |
| Hypothetical (5% annual return before expenses) | 1,000.00 | 1,021.26 | 3.98 |
| * | Expenses are equal to the Fund’s blended annualized expense ratio of 0.78%, multiplied by the average account value over the period, multiplied by 184/365 (to reflect the six month period). The expense ratios reflect an expense waiver. Assumes all dividends and distributions were reinvested. |
This page is intentionally left blank
Cannabis Growth ETF
A series of Investment Managers Series Trust II
Investment Advisor
Foothill Capital Management, LLC
740 River Road, Suite 208
Fair Haven, New Jersey 07704
Independent Registered Public Accounting Firm
Tait, Weller & Baker LLP
Two Liberty Place
50 South 16th Street, Suite 2900
Philadelphia, Pennsylvania 19102
Custodian, Transfer Agent and Fund Accountant
Brown Brothers Harriman & Co.,
50 Post Office Square
Boston, Massachusetts 02110
Fund Co-Administrator
Mutual Fund Administration, LLC
2220 East Route 66, Suite 226
Glendora, California 91740
Fund Co-Administrator
UMB Fund Services, Inc.
235 West Galena Street
Milwaukee, Wisconsin 53212
Distributor
IMST Distributors, LLC
Three Canal Plaza, Suite 100
Portland, Maine 04101
www.foreside.com
FUND INFORMATION
| | TICKER | CUSIP |
| Cannabis Growth ETF | BUDX | 46141T 125 |
Privacy Principles of the Cannabis Growth ETF for Shareholders
The Fund is committed to maintaining the privacy of its shareholders and to safeguarding its non-public personal information. The following information is provided to help you understand what personal information the Fund collects, how we protect that information and why, in certain cases, we may share information with select other parties.
Generally, the Fund does not receive any non-public personal information relating to its shareholders, although certain non-public personal information of its shareholders may become available to the Fund. The Fund does not disclose any non-public personal information about its shareholders or former shareholders to anyone, except as permitted by law or as is necessary in order to service shareholder accounts (for example, to a transfer agent or third party administrator).
This report is sent to shareholders of the Cannabis Growth ETF for their information. It is not a Prospectus, circular or representation intended for use in the purchase or sale of shares of the Fund or of any securities mentioned in this report.
Proxy Voting Policies and Procedures
A description of the Fund’s proxy voting policies and procedures related to portfolio securities is available without charge, upon request, by calling the Fund at (888) 885-0588 or on the U.S. Securities and Exchange Commission’s (“SEC”) website at www.sec.gov.
Proxy Voting Record
Information regarding how the Fund voted proxies for portfolio securities, if applicable, during the most recent 12-month period ended June 30, is also available, without charge and upon request by calling the Fund at (888) 885-0588 or by accessing the Fund’s Form N-PX on the SEC’s website at www.sec.gov.
Fund Portfolio Holdings
The Fund files a complete schedule of its portfolio holdings with the SEC for the first and third quarters of each fiscal year on Form N-PORT within 60 days of the end of such fiscal quarter. Shareholders may obtain the Fund’s Form N-PORT on the SEC’s website at www.sec.gov.
Prior to the use of Form N-PORT, the Fund filed its complete schedule of portfolio holdings with the SEC on Form N-Q, which is available online at www.sec.gov.
Householding
The Fund will mail only one copy of shareholder documents, including prospectuses, and notice of annual and semi-annual reports availability and proxy statements, to shareholders with multiple accounts at the same address. This practice is commonly called “householding” and is intended to reduce expenses and eliminate duplicate mailings of shareholder documents. Mailings of your shareholder documents may be householded indefinitely unless you instruct us otherwise. If you do not want the mailing of these documents to be combined with those for other members of your household, please call the Fund at (888) 885-0588.
Cannabis Growth ETF
P.O. Box 2175
Milwaukee, WI 53201
Toll Free: (888) 885-0588
Item 1. Report to Stockholders (Continued).
Item 2. Code of Ethics.
The registrant has adopted a code of ethics that applies to the registrant's principal executive officer and principal financial officer. The registrant has not made any amendments to its code of ethics during the period covered by this report. The registrant has not granted any waivers from any provisions of the code of ethics during the period covered by this report.
The registrant undertakes to provide to any person without charge, upon request, a copy of its code of ethics by mail when they call the registrant at (888) 885-0588.
Item 3. Audit Committee Financial Expert.
The Board of Trustees of the Registrant has determined that the Registrant has the following “audit committee financial experts” as defined in Item 3(b) of Form N-CSR serving on its Audit Committee: Messrs. Thomas Knipper and John P. Zader. The audit committee financial experts are “independent” as that term is defined in Item 3(a)(2) of Form N-CSR.
Item 4. Principal Accountant Fees and Services.
The registrant has engaged its principal accountant to perform audit services, audit-related services, tax services and other services during the past two fiscal years. "Audit services" refer to performing an audit of the registrant's annual financial statements or services that are normally provided by the accountant in connection with statutory and regulatory filings or engagements for those fiscal years. "Audit-related services" refer to the assurance and related services by the principal accountant that are reasonably related to the performance of the audit. "Tax services" refer to professional services rendered by the principal accountant for tax compliance, tax advice, and tax planning. There were no "other services" provided by the principal accountant. The following table details the aggregate fees billed or expected to be billed for each of the last two fiscal years for audit fees, audit-related fees, tax fees and other fees by the principal accountant.
| | FYE 1/31/2022 | FYE 1/31/2021 |
| Audit Fees | $12,500 | $12,500 |
| Audit-Related Fees | N/A | N/A |
| Tax Fees | $2,500 | $2,500 |
| All Other Fees | N/A | N/A |
The audit committee has adopted pre-approval policies and procedures that require the audit committee to pre-approve all audit and non-audit services of the registrant, including services provided to any entity affiliated with the registrant.
The percentage of fees billed by Tait Weller applicable to non-audit services pursuant to waiver of pre-approval requirement were as follows:
| | FYE 1/31/2022 | FYE 1/31/2021 |
| Audit-Related Fees | 0% | N/A |
| Tax Fees | 0% | N/A |
| All Other Fees | 0% | N/A |
All of the principal accountant's hours spent on auditing the registrant's financial statements were attributed to work performed by full-time permanent employees of the principal accountant.
The following table indicates the non-audit fees billed or expected to be billed by the registrant's accountant for services to the registrant and to the registrant's investment advisor (and any other controlling entity, etc.—not sub-advisor) for the last two years. The audit committee of the Board of Trustees has considered whether the provision of non-audit services that were rendered to the registrant's investment advisor is compatible with maintaining the principal accountant's independence and has concluded that the provision of such non-audit services by the accountant has not compromised the accountant's independence.
| Non-Audit Related Fees | FYE 1/31/2022 | FYE 1/31/2021 |
| Registrant | N/A | N/A |
| Registrant’s Investment Advisor | N/A | N/A |
Item 5. Audit Committee of Listed Registrants.
| (a) | Not applicable to registrants who are not listed issuers (as defined in Rule 10A-3 under the Securities Exchange Act of 1934). |
Item 6. Schedule of Investments.
| (a) | Schedule of Investments is included as part of the report to shareholders filed under Item 1 of this Form. |
Item 7. Disclosure of Proxy Voting Policies and Procedures for Closed-End Management Investment Companies.
Not applicable to open-end investment companies.
Item 8. Portfolio Managers of Closed-End Management Investment Companies.
Not applicable to open-end investment companies.
Item 9. Purchases of Equity Securities by Closed-End Management Investment Company and Affiliated Purchasers.
Not applicable.
Item 10. Submission of Matters to a Vote of Security Holders.
The registrant has not made any material changes to the procedures by which shareholders may recommend nominees to the registrant’s Board of Trustees.
Item 11. Controls and Procedures.
| (a) | The Registrant’s President/Chief Executive Officer and Treasurer/Chief Financial Officer have reviewed the Registrant's disclosure controls and procedures (as defined in Rule 30a-3(c) under the Investment Company Act of 1940 (the “Act”)) as of a date within 90 days of the filing of this report, as required by Rule 30a-3(b) under the Act and Rules 13a-15(b) or 15d-15(b) under the Securities Exchange Act of 1934. Based on their review, such officers have concluded that the disclosure controls and procedures are effective in ensuring that information required to be disclosed in this report is appropriately recorded, processed, summarized and reported and made known to them by others within the Registrant and by the Registrant’s service provider. |
| (b) | There were no changes in the Registrant's internal control over financial reporting (as defined in Rule 30a-3(d) under the Act) that occurred during the period covered by this report that has materially affected, or is reasonably likely to materially affect, the Registrant's internal control over financial reporting. |
Item 12. Disclosure of Securities Lending Activities for Closed-End Management Investment Companies.
Not applicable to open-end investment companies.
Item 13. Exhibits.
| | (3) Any written solicitation to purchase securities under Rule 23c-1 under the Act sent or given during the period covered by the report by or on behalf of the registrant to 10 or more persons. Not applicable to open-end investment companies. |
| | (4) Change in the registrant’s independent public accountant. There was no change in the registrant’s independent public accountant for the period covered by this report. |
SIGNATURES
Pursuant to the requirements of the Securities Exchange Act of 1934 and the Investment Company Act of 1940, the registrant has duly caused this report to be signed on its behalf by the undersigned, thereunto duly authorized.
| (Registrant) | Investment Managers Series Trust II | |
| | | |
| By (Signature and Title) | /s/ Terrance Gallagher | |
| | Terrance Gallagher, President/Chief Executive Officer | |
| | | |
| Date | 4/11/2022 | |
Pursuant to the requirements of the Securities Exchange Act of 1934 and the Investment Company Act of 1940, this report has been signed below by the following persons on behalf of the registrant and in the capacities and on the dates indicated.
| By (Signature and Title) | /s/ Terrance Gallagher | |
| | Terrance Gallagher, President/Chief Executive Officer | |
| | | |
| Date | 4/11/2022 | |
| | | |
| By (Signature and Title) | /s/ Rita Dam | |
| | Rita Dam, Treasurer/Chief Financial Officer | |
| | | |
| Date | 4/11/2022 | |