Exhibit C9
Preliminary Draft and Highly Confidential
DISCUSSION MATERIALS
Project Amsterdam
February 2017
J.P.Morgan
Preliminary Draft and Highly Confidential
This presentation was prepared exclusively for the benefit and internal use of the J.P. Morgan client to whom it is directly addressed and delivered (including such client’s subsidiaries, the “Company”) in order to assist the Company in evaluating, on a preliminary basis, the feasibility of a possible transaction or transactions and does not carry any right of publication or disclosure, in whole or in part, to any other party. This presentation is for discussion purposes only and is incomplete without reference to, and should be viewed solely in conjunction with, the oral briefing provided by J.P. Morgan. Neither this presentation nor any of its contents may be disclosed or used for any other purpose without the prior written consent of J.P. Morgan.
The information in this presentation is based upon any forecasts supplied to us and reflects prevailing conditions and our views as of this date, all of which are accordingly subject to change. J.P. Morgan’s opinions and estimates constitute J.P. Morgan’s judgment and should be regarded as indicative, preliminary and for illustrative purposes only. In preparing this presentation, we have relied upon and assumed, without independent verification, the accuracy and completeness of all information available from public sources or which was provided to us by or on behalf of the Company or which was otherwise reviewed by us. In addition, our analyses are not and do not purport to be appraisals of the assets, stock, or business of the Company or any other entity. J.P. Morgan makes no representations as to the actual value which may be received in connection with a transaction nor the legal, tax or accounting effects of consummating a transaction. Unless expressly contemplated hereby, the information in this presentation does not take into account the effects of a possible transaction or transactions involving an actual or potential change of control, which may have significant valuation and other effects.
Notwithstanding anything herein to the contrary, the Company and each of its employees, representatives or other agents may disclose to any and all persons, without limitation of any kind, the U.S. federal and state income tax treatment and the U.S. federal and state income tax structure of the transactions contemplated hereby and all materials of any kind (including opinions or other tax analyses) that are provided to the Company relating to such tax treatment and tax structure insofar as such treatment and/or structure relates to a U.S. federal or state income tax strategy provided to the Company by J.P. Morgan.
J.P. Morgan’s policies prohibit employees from offering, directly or indirectly, a favorable research rating or specific price target, or offering to change a rating or price target, to a subject company as consideration or inducement for the receipt of business or for compensation.
J.P. Morgan also prohibits its research analysts from being compensated for involvement in investment banking transactions except to the extent that such participation is intended to benefit investors.
IRS Circular 230 Disclosure: JPMorgan Chase & Co. and its affiliates do not provide tax advice. Accordingly, any discussion of U.S. tax matters included herein (including any attachments) is not intended or written to be used, and cannot be used, in connection with the promotion, marketing or recommendation by anyone not affiliated with JPMorgan Chase & Co. of any of the matters addressed herein or for the purpose of avoiding U.S.tax-related penalties.
J.P. Morgan is the marketing name for the Corporate and Investment Banking activities of JPMorgan Chase Bank, N.A., JPMS (member, NYSE), J.P. Morgan PLC authorized by the Prudential Regulation Authority and regulated by the Financial Conduct Authority and the Prudential Regulation Authority) and their investment banking affiliates.
PROJECT AMSTERDAM
DISCUSSION MATERIALS
J.P.Morgan
Preliminary Draft and Highly Confidential
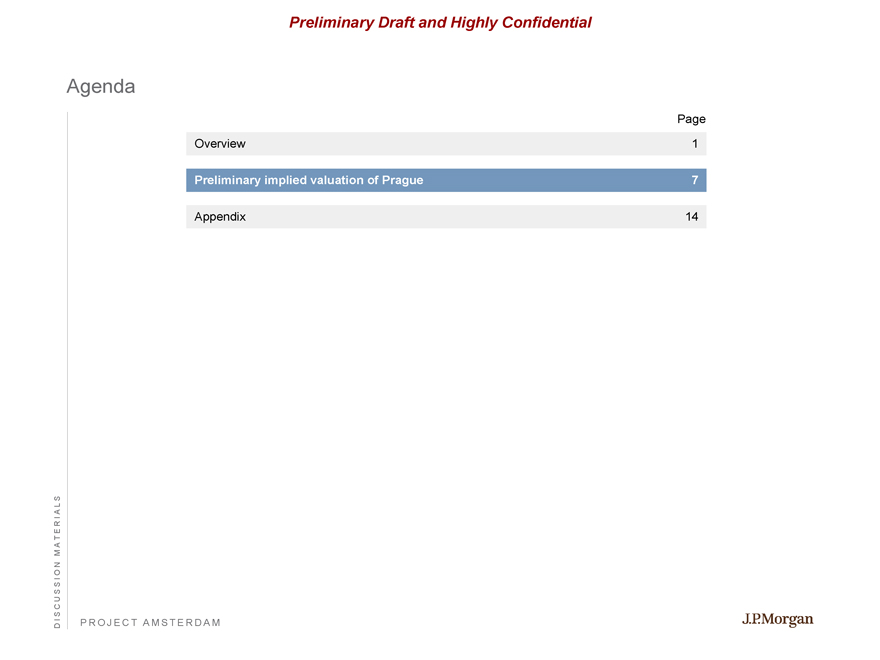
Agenda
Page
Overview 1
Preliminary implied valuation of Prague 7
Appendix 14
PROJECT AMSTERDAM
DISCUSSION MATERIALS
J.P.Morgan

Preliminary Draft and Highly Confidential
Situation overview
VTTI BV (“Brussels”) has requested J.P. Morgan to provide a preliminary valuation analysis with regards to its potential acquisition of the remaining outstanding LP units of VTTI Energy Partners
(“Prague”)
J.P. Morgan has relied on5-year financial projections provided by Brussels equity holders in order to perform its valuation
The materials herein provide a valuation analysis taking into consideration the following approaches:
Public trading multiples
Intrinsic valuation
Accordingly, in addition to valuation, Brussels must evaluation key qualitative aspects that will educate their proposed offer including:
Future strategy with respect to drop downs into Prague
Return on capital to key stakeholder policy
Cost of capital considerations as a public company
Future strategic flexibility
Tax impacts (if applicable) to entity and equity holders
PROJECT AMSTERDAM
1
J.P.Morgan
OVERVIEW
Preliminary Draft and Highly Confidential
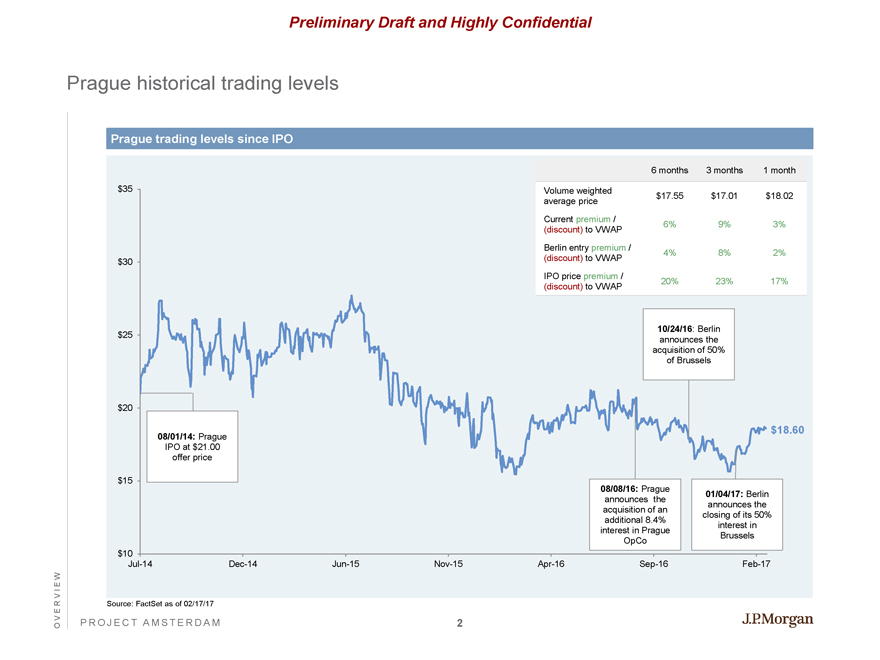
Prague historical trading levels
Prague trading levels since IPO
6 months 3 months 1 month
Volume weighted $17.55 $17.01 $18.02
average price
Current premium / 6% 9% 3%
(discount) to VWAP
Berlin entry premium / 4% 8% 2%
(discount) to VWAP
IPO price premium / 20% 23% 17%
(discount) to VWAP
$35 $30 $25 $20 $15 $10
08/01/14: Prague
IPO at $21.00 offer price
10/24/16: Berlin announces the acquisition of 50% of Brussels
08/08/16: Prague announces the acquisition of an additional 8.4% interest in Prague OpCo
01/04/17: Berlin announces the closing of its 50% interest in Brussels
Jul-14Dec-14Jun-15Nov-15Apr-16Sep-16Feb-17
Source: FactSet as of 02/17/17
PROJECT AMSTERDAM
2
J.P.Morgan
OVERVIEW
Preliminary Draft and Highly Confidential
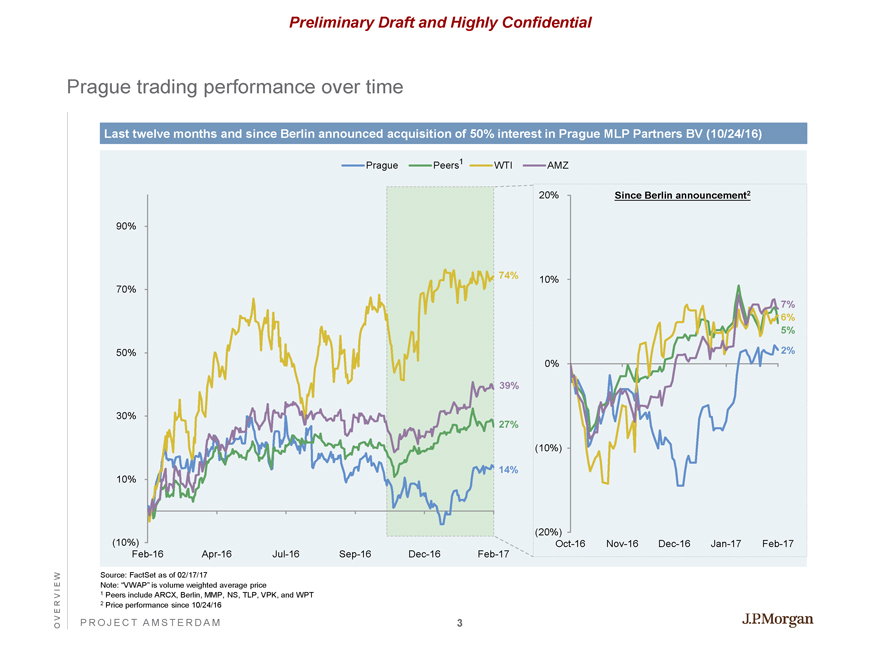
Prague trading performance over time
Last twelve months and since Berlin announced acquisition of 50% interest in Prague MLP Partners BV (10/24/16)
Prague Peers1 WTI AMZ
90%
70%
50%
30%
10%
(10%)
74%
39%
27%
14%
Feb-16Apr-16Jul-16Sep-16Dec-16Feb-17
Since Berlin announcement2
20%
10%
0%
(10%)
(20%)
7%
6%
5%
2%
Oct-16Nov-16Dec-16Jan-17Feb-17
Source: FactSet as of 02/17/17
Note: “VWAP” is volume weighted average price
1 Peers include ARCX, Berlin, MMP, NS, TLP, VPK, and WPT
2 Price performance since 10/24/16
PROJECT AMSTERDAM
3
J.P.Morgan
OVERVIEW
Preliminary Draft and Highly Confidential
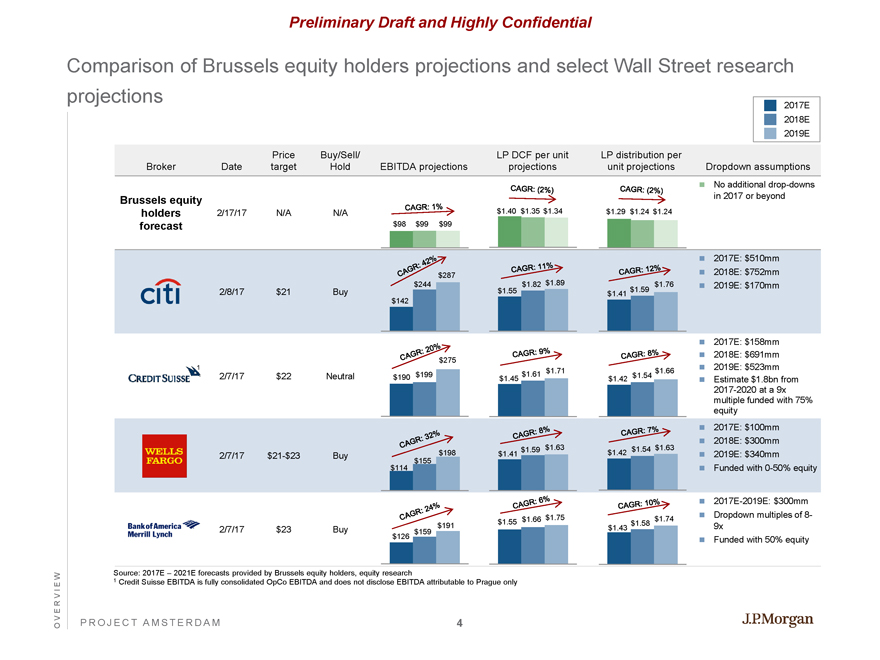
Comparison of Brussels equity holders projections and select Wall Street research projections
2017E
2018E
2019E
Broker Date Price target Buy/Sell/Hold EBITDA projections LP DCF per unit projections LP distribution per unit projections
Dropdown assumptions
Brussels equity holders forecast 2/17/17 N/A N/A CAGR: 1% $98 $99 $99 CAGR: (2%) $1.40 $1.35 $1.34 CAGR: (2%) $1.29 $1.24 $1.24 No additional drop-downs in 2017 or beyond
citi 2/8/17 $21 Buy CAGR: 42% $287 $244 $142 CAGR: 11% $1.82 $1.55 $1.89 CAGR: 12% $1.76 $1.41 $1.59
2017E: $510mm 2018E: $752mm 2019E: $170mm
1 CREDIT SUISSE 2/7/17 $22 Neutral
CAGR:20% $275 $190 $199
CAGR:9% $1.45 $1.61 $1.71
CAGR:8% $1.42 $1.54 $1.66
2017E: $158mm 2018E: $691mm 2019E: $523mm Estimate $1.8bn from 2017-2020 at a 9x multiple funded with 75% equity
WELLS FARGO 2/7/17$21-$23 Buy
CAGR:32% $198 $155 $114
CAGR:8% $1.59 $1.41
CAGR: 7%$1.63 $1.54 $1.63 $1.42
2017E: $100mm 2018E: $300mm 2019E: $340mm Funded with0-50% equity
Bank of America Merrill Lynch 2/7/17 $23 Buy
CAGR:24% $191 $159 $126
CAGR:6% $1.66 $1.55 $1.75
CAGR: 10% $1.74 $1.58 $1.43
2017E-2019E: $300mm Dropdown multiples of 8-9x Funded with 50% equity
Source: 2017E – 2021E forecasts provided by Brussels equity holders, equity research
1 Credit Suisse EBITDA is fully consolidated OpCo EBITDA and does not disclose EBITDA attributable to Prague only
PROJECT AMSTERDAM
4
J.P.Morgan
OVERVIEW
Preliminary Draft and Highly Confidential
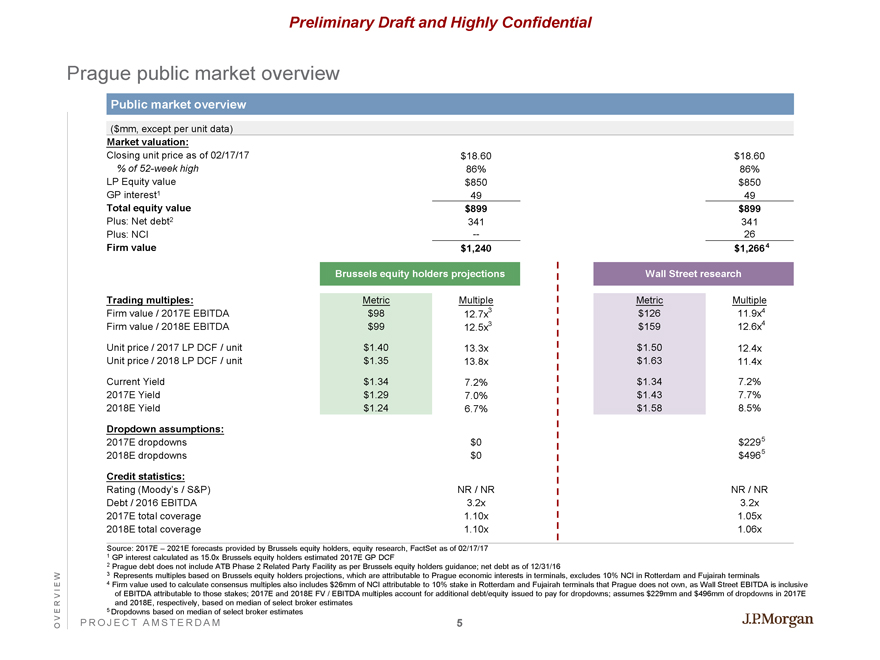
Prague public market overview
Public market overview
($mm, except per unit data)
Market valuation:
Closing unit price as of 02/17/17
$18.60 $18.60
% of52-week high
86% 86%
LP Equity value
$850 $850
GP interest1
49 49
Total equity value
$899 $899
Plus: Net debt2
341 341
Plus: NCI
—26
Firm value
$1,240 $1,266 4
Brussels equity holders projections
Trading multiples:
Firm value / 2017E EBITDA
Firm value / 2018E EBITDA
Unit price / 2017 LP DCF / unit
Unit price / 2018 LP DCF / unit
Current Yield
2017E Yield
2018E Yield
Dropdown assumptions:
2017E dropdowns
2018E dropdowns
Credit statistics:
Rating (Moody’s / S&P)
Debt / 2016 EBITDA
2017E total coverage
2018E total coverage
Metric
$98 $99 $1.40 $1.35 $1.34 $1.29 $1.24
Multiple
12.7x3 12.5x3 13.3x 13.8x 7.2% 7.0% 6.7% $0 $0
NR / NR
3.2x 1.10x 1.10x
Wall Street research
Metric
$126 $159 $1.50 $1.63 $1.34 $1.43 $1.58
Multiple
11.9x4 12.6x4 12.4x 11.4x 7.2% 7.7% 8.5% $229 5 $496 5
NR / NR
3.2x 1.05x 1.06x
Source: 2017E – 2021E forecasts provided by Brussels equity holders, equity research, FactSet as of 02/17/17
1 GP interest calculated as 15.0x Brussels equity holders estimated 2017E GP DCF
2 Prague debt does not include ATB Phase 2 Related Party Facility as per Brussels equity holders guidance; net debt as of 12/31/16
3 Represents multiples based on Brussels equity holders projections, which are attributable to Prague economic interests in terminals, excludes 10% NCI in Rotterdam and Fujairah terminals
4 Firm value used to calculate consensus multiples also includes $26mm of NCI attributable to 10% stake in Rotterdam and Fujairah terminals that Prague does not own, as Wall Street EBITDA is inclusive of EBITDA attributable to those stakes; 2017E and 2018E FV / EBITDA multiples account for additional debt/equity issued to pay for dropdowns; assumes $229mm and $496mm of dropdowns in 2017E and 2018E, respectively, based on median of select broker estimates
5 Dropdowns based on median of select broker estimates
PROJECT AMSTERDAM
5
J.P.Morgan
OVERVIEW
Preliminary Draft and Highly Confidential
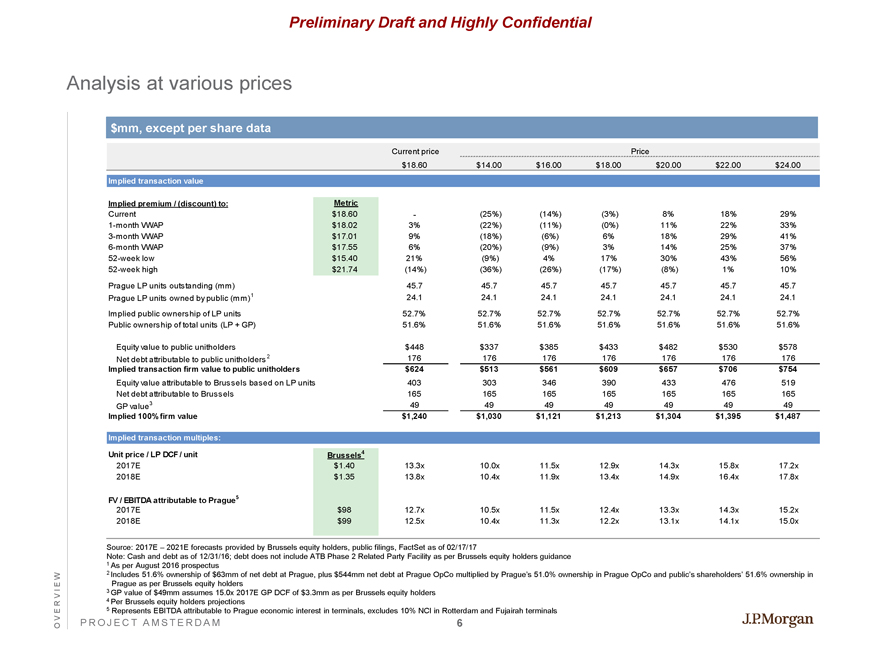
Analysis at various prices
$mm, except per share data
Current price Price
$18.60 $14.00 $16.00 $18.00 $20.00 $22.00 $24.00
Implied transaction value
Implied premium / (discount) to: Metric
Current $18.60 - (25%) (14%) (3%) 8% 18% 29%
1-month VWAP $18.02 3% (22%) (11%) (0%) 11% 22% 33%
3-month VWAP $17.01 9% (18%) (6%) 6% 18% 29% 41%
6-month VWAP $17.55 6% (20%) (9%) 3% 14% 25% 37%
52-week low $15.40 21% (9%) 4% 17% 30% 43% 56%
52-week high $21.74 (14%) (36%) (26%) (17%) (8%) 1% 10%
Prague LP units outstanding (mm) 45.7 45.7 45.7 45.7 45.7 45.7 45.7
Prague LP units owned by public (mm)1 24.1 24.1 24.1 24.1 24.1 24.1 24.1
Implied public ownership of LP units 52.7% 52.7% 52.7% 52.7% 52.7% 52.7% 52.7%
Public ownership of total units (LP + GP) 51.6% 51.6% 51.6% 51.6% 51.6% 51.6% 51.6%
Equity value to public unitholders $448 $337 $385 $433 $482 $530 $578
Net debt attributable to public unitholders 2 176 176 176 176 176 176 176
Implied transaction firm value to public unitholders $624 $513 $561 $609 $657 $706 $754
Equity value attributable to Brussels based on LP units 403 303 346 390 433 476 519
Net debt attributable to Brussels 165 165 165 165 165 165 165
GP value3 49 49 49 49 49 49 49
Implied 100% firm value $1,240 $1,030 $1,121 $1,213 $1,304 $1,395 $1,487
Implied transaction multiples:
Unit price / LP DCF / unit Brussels4
2017E $1.40 13.3x 10.0x 11.5x 12.9x 14.3x 15.8x 17.2x
2018E $1.35 13.8x 10.4x 11.9x 13.4x 14.9x 16.4x 17.8x FV / EBITDA attributable to Prague5
2017E $98 12.7x 10.5x 11.5x 12.4x 13.3x 14.3x 15.2x
2018E $99 12.5x 10.4x 11.3x 12.2x 13.1x 14.1x 15.0x
Source: 2017E – 2021E forecasts provided by Brussels equity holders, public filings, FactSet as of 02/17/17
Note: Cash and debt as of 12/31/16; debt does not include ATB Phase 2 Related Party Facility as per Brussels equity holders guidance
1 As per August 2016 prospectus
2 Includes 51.6% ownership of $63mm of net debt at Prague, plus $544mm net debt at Prague OpCo multiplied by Prague’s 51.0% ownership in Prague OpCo and public’s shareholders’ 51.6% ownership in Prague as per Brussels equity holders
3 GP value of $49mm assumes 15.0x 2017E GP DCF of $3.3mm as per Brussels equity holders
4 Per Brussels equity holders projections
5 Represents EBITDA attributable to Prague economic interest in terminals, excludes 10% NCI in Rotterdam and Fujairah terminals
PROJECT AMSTERDAM
6
J.P.Morgan
OVERVIEW
Preliminary Draft and Highly Confidential
Agenda
Page
Overview 1
Preliminary implied valuation of Prague 7
Appendix 14
PROJECT AMSTERDAM
J.P.Morgan
DISCUSSION MATERIALS
PRELIMINARY IMPLIED VALUATION OF PRAGUE
Preliminary Draft and Highly Confidential
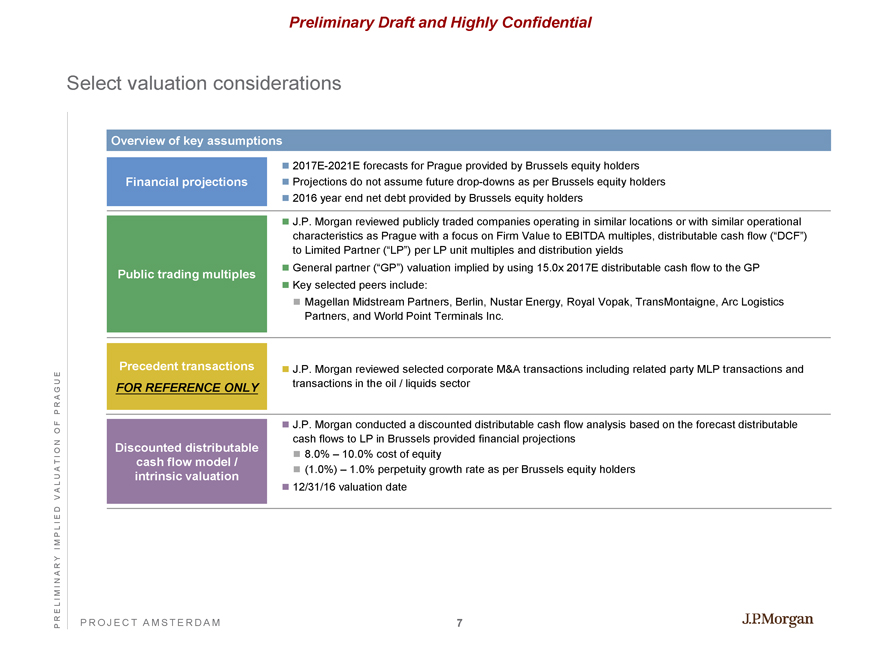
Select valuation considerations
Overview of key assumptions
Financial projections
2017E-2021E forecasts for Prague provided by Brussels equity holders Projections do not assume future drop-downs as per Brussels equity holders 2016 year end net debt provided by Brussels equity holders
Public trading multiples
J.P. Morgan reviewed publicly traded companies operating in similar locations or with similar operational characteristics as Prague with a focus on Firm Value to EBITDA multiples, distributable cash flow (“DCF”) to Limited Partner (“LP”) per LP unit multiples and distribution yields
General partner (“GP”) valuation implied by using 15.0x 2017E distributable cash flow to the GP
Key selected peers include:
Magellan Midstream Partners, Berlin, Nustar Energy, Royal Vopak, TransMontaigne, Arc Logistics Partners, and World Point Terminals Inc.
Precedent transactions
FOR REFERENCE ONLY
J.P. Morgan reviewed selected corporate M&A transactions including related party MLP transactions and transactions in the oil / liquids sector
Discounted distributable cash flow model / intrinsic valuation
J.P. Morgan conducted a discounted distributable cash flow analysis based on the forecast distributable cash flows to LP in Brussels provided financial projections
8.0% – 10.0% cost of equity
(1.0%) – 1.0% perpetuity growth rate as per Brussels equity holders
12/31/16 valuation date
PROJECT AMSTERDAM
7
J.P.Morgan
PRELIMINARY IMPLIED VALUATION OF PRAGUE
Preliminary Draft and Highly Confidential
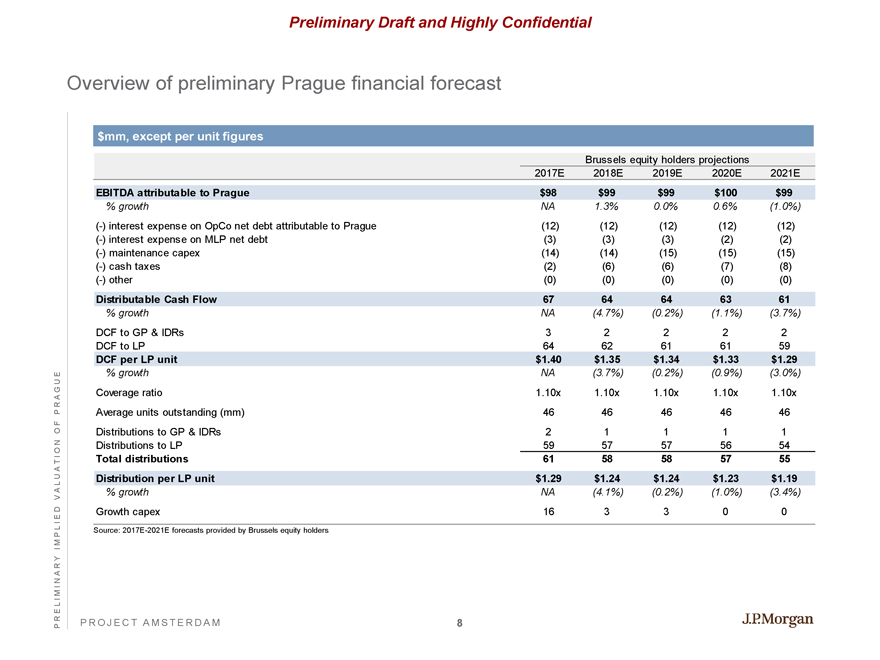
Overview of preliminary Prague financial forecast
$mm, except per unit figures
Brussels equity holders projections
2017E 2018E 2019E 2020E 2021E
EBITDA attributable to Prague $98 $99 $99 $100 $99
% growth NA 1.3% 0.0% 0.6% (1.0%)
(-) interest expense on OpCo net debt attributable to Prague (12) (12) (12) (12) (12)
(-) interest expense on MLP net debt (3) (3) (3) (2) (2)
(-) maintenance capex (14) (14) (15) (15) (15)
(-) cash taxes (2) (6) (6) (7) (8)
(-) other (0) (0) (0) (0) (0)
Distributable Cash Flow 67 64 64 63 61
% growth NA (4.7%) (0.2%) (1.1%) (3.7%)
DCF to GP & IDRs 3 2 2 2 2
DCF to LP 64 62 61 61 59
DCF per LP unit $1.40 $1.35 $1.34 $1.33 $1.29
% growth NA (3.7%) (0.2%) (0.9%) (3.0%)
Coverage ratio 1.10x 1.10x 1.10x 1.10x 1.10x
Average units outstanding (mm) 46 46 46 46 46
Distributions to GP & IDRs 2 1 1 1 1
Distributions to LP 59 57 57 56 54
Total distributions 61 58 58 57 55
Distribution per LP unit $1.29 $1.24 $1.24 $1.23 $1.19
% growth NA (4.1%) (0.2%) (1.0%) (3.4%)
Growth capex 16 3 3 0 0
Source: 2017E-2021E forecasts provided by Brussels equity holders
PROJECT AMSTERDAM
8
J.P.Morgan
PRELIMINARY IMPLIED VALUATION OF PRAGUE
Preliminary Draft and Highly Confidential
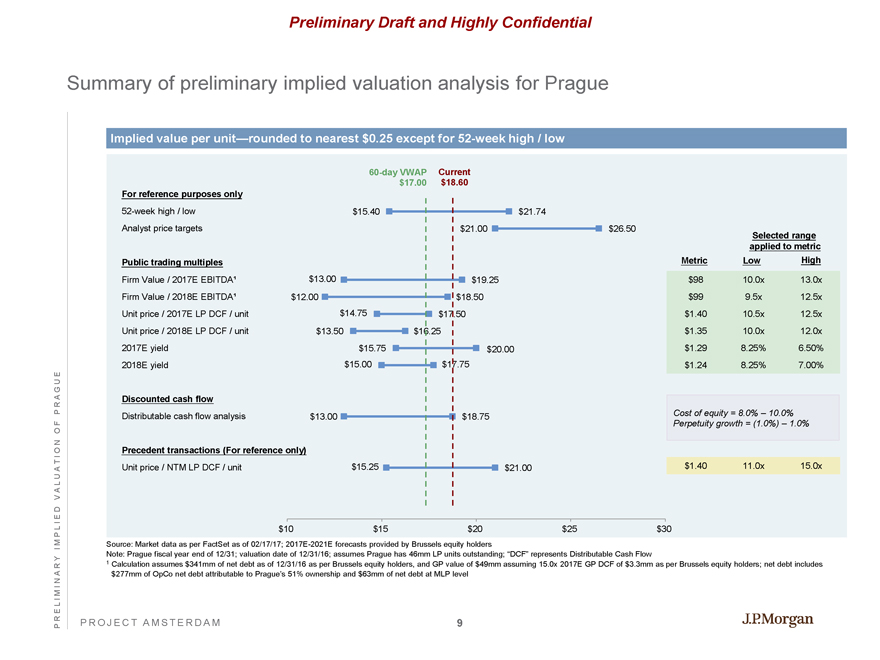
Summary of preliminary implied valuation analysis for Prague
Implied value per unit—rounded to nearest $0.25 except for52-week high / low
60-day VWAP Current
$17.00 $18.60
For reference purposes only
52-week high / low Analyst price targets
Public trading multiples
Firm Value / 2017E EBITDA¹ Firm Value / 2018E EBITDA¹ Unit price / 2017E LP DCF / unit Unit price / 2018E LP DCF / unit 2017E yield 2018E yield
Discounted cash flow
Distributable cash flow analysis
Precedent transactions (For reference only)
Unit price / NTM LP DCF / unit
$15.40 $21.74
$21.00 $26.50
$13.00 $19.25
$12.00 $18.50
$14.75 $17.50
$13.50 $16.25
$15.75 $20.00
$15.00 $17.75
$13.00 $18.75
$15.25 $21.00
Selected range applied to metric
Metric Low High
$98 10.0x 13.0x $99 9.5x 12.5x
$1.40
10.5x
12.5x
$1.35
10.0x
12.0x
$1.29
8.25%
6.50%
$1.24
8.25%
7.00%
Cost of equity = 8.0% – 10.0% Perpetuity growth = (1.0%) – 1.0%
$1.40 11.0x 15.0x
$10 $15 $20 $25 $30
Source: Market data as per FactSet as of 02/17/17; 2017E-2021E forecasts provided by Brussels equity holders
Note: Prague fiscal year end of 12/31; valuation date of 12/31/16; assumes Prague has 46mm LP units outstanding; “DCF” represents Distributable Cash Flow
1 Calculation assumes $341mm of net debt as of 12/31/16 as per Brussels equity holders, and GP value of $49mm assuming 15.0x 2017E GP DCF of $3.3mm as per Brussels equity holders; net debt includes $277mm of OpCo net debt attributable to Prague’s 51% ownership and $63mm of net debt at MLP level
PROJECT AMSTERDAM
9
J.P.Morgan
PRELIMINARY IMPLIED VALUATION OF PRAGUE
Preliminary Draft and Highly Confidential
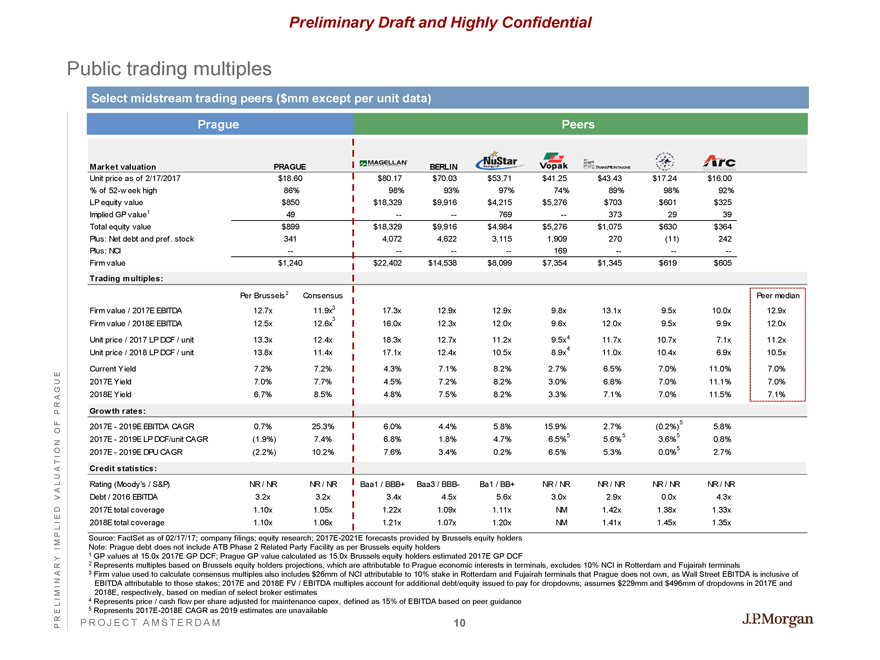
Public trading multiples
Select midstream trading peers ($mm except per unit data)
Prague Peers
Market valuation PRAGUE BERLIN
Unit price as of 2/17/2017 $18.60 $80.17 $70.03 $53.71 $41.25 $43.43 $17.24 $16.00
% of52-week high 86% 98% 93% 97% 74% 89% 98% 92%
LP equity value $850 $18,329 $9,916 $4,215 $5,276 $703 $601 $325
Implied GP value1 49 — — 769 — 373 29 39
Total equity value $899 $18,329 $9,916 $4,984 $5,276 $1,075 $630 $364
Plus: Net debt and pref. stock 341 4,072 4,622 3,115 1,909 270 (11) 242
Plus: NCI — — — — 169 — — —
Firm value $1,240 $22,402 $14,538 $8,099 $7,354 $1,345 $619 $605
Trading multiples:
Per Brussels2 Consensus Peer median
Firm value / 2017E EBITDA 12.7x 11.9x3 17.3x 12.9x 12.9x 9.8x 13.1x 9.5x 10.0x 12.9x
Firm value / 2018E EBITDA 12.5x 12.6x3 16.0x 12.3x 12.0x 9.6x 12.0x 9.5x 9.9x 12.0x
Unit price / 2017 LP DCF / unit 13.3x 12.4x 18.3x 12.7x 11.2x 9.5x4 11.7x 10.7x 7.1x 11.2x
Unit price / 2018 LP DCF / unit 13.8x 11.4x 17.1x 12.4x 10.5x 8.9x4 11.0x 10.4x 6.9x 10.5x
Current Yield 7.2% 7.2% 4.3% 7.1% 8.2% 2.7% 6.5% 7.0% 11.0% 7.0%
2017E Yield 7.0% 7.7% 4.5% 7.2% 8.2% 3.0% 6.8% 7.0% 11.1% 7.0%
2018E Yield 6.7% 8.5% 4.8% 7.5% 8.2% 3.3% 7.1% 7.0% 11.5% 7.1%
Growth rates:
2017E - 2019E EBITDA CAGR 0.7% 25.3% 6.0% 4.4% 5.8% 15.9% 2.7% (0.2%)5 5.8%
2017E - 2019E LP DCF/unit CAGR (1.9%) 7.4% 6.8% 1.8% 4.7% 6.5%5 5.6% 5 3.6%5 0.8%
2017E - 2019E DPU CAGR (2.2%) 10.2% 7.6% 3.4% 0.2% 6.5% 5.3% 0.0%5 2.7%
Credit statistics:
Rating (Moody’s / S&P) NR / NR NR / NR Baa1 / BBB+ Baa3 / BBB- Ba1 / BB+ NR / NR NR / NR NR / NR NR / NR
Debt / 2016 EBITDA 3.2x 3.2x 3.4x 4.5x 5.6x 3.0x 2.9x 0.0x 4.3x
2017E total coverage 1.10x 1.05x 1.22x 1.09x 1.11x NM 1.42x 1.38x 1.33x
2018E total coverage 1.10x 1.06x 1.21x 1.07x 1.20x NM 1.41x 1.45x 1.35x
Source: FactSet as of 02/17/17; company filings; equity research; 2017E-2021E forecasts provided by Brussels equity holders
Note: Prague debt does not include ATB Phase 2 Related Party Facility as per Brussels equity holders
1 GP values at 15.0x 2017E GP DCF; Prague GP value calculated as 15.0x Brussels equity holders estimated 2017E GP DCF
2 Represents multiples based on Brussels equity holders projections, which are attributable to Prague economic interests in terminals, excludes 10% NCI in Rotterdam and Fujairah terminals
3 Firm value used to calculate consensus multiples also includes $26mm of NCI attributable to 10% stake in Rotterdam and Fujairah terminals that Prague does not own, as Wall Street EBITDA is inclusive of EBITDA attributable to those stakes; 2017E and 2018E FV / EBITDA multiples account for additional debt/equity issued to pay for dropdowns; assumes $229mm and $496mm of dropdowns in 2017E and 2018E, respectively, based on median of select broker estimates
4 Represents price / cash flow per share adjusted for maintenance capex, defined as 15% of EBITDA based on peer guidance
5 Represents 2017E-2018E CAGR as 2019 estimates are unavailable
PROJECT AMSTERDAM
10
J.P.Morgan
PRELIMINARY IMPLIED VALUATION OF PRAGUE
Preliminary Draft and Highly Confidential
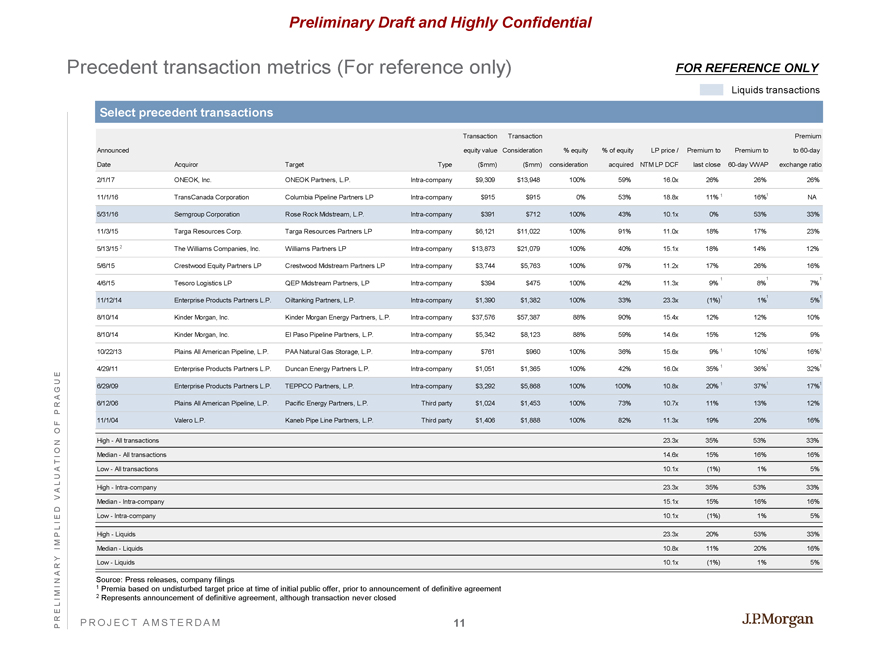
Precedent transaction metrics (For reference only)
FOR REFERENCE ONLY
Liquids transactions
Select precedent transactions
Transaction Transaction Premium
Announced equity value Consideration % equity % of equity LP price / Premium to Premium to to60-day
Date Acquiror Target Type ($mm) ($mm) consideration acquired NTM LP DCF last close60-day VWAP exchange ratio
2/1/17 ONEOK, Inc. ONEOK Partners, L.P. Intra-company $9,309 $13,948 100% 59% 16.0x 26% 26% 26%
11/1/16 TransCanada Corporation Columbia Pipeline Partners LP Intra-company $915 $915 0% 53% 18.8x 11%1 16%1 NA
5/31/16 Semgroup Corporation Rose Rock Midstream, L.P. Intra-company $391 $712 100% 43% 10.1x 0% 53% 33%
11/3/15 Targa Resources Corp. Targa Resources Partners LP Intra-company $6,121 $11,022 100% 91% 11.0x 18% 17% 23%
5/13/15 2 The Williams Companies, Inc. Williams Partners LP Intra-company $13,873 $21,079 100% 40% 15.1x 18% 14% 12%
5/6/15 Crestwood Equity Partners LP Crestwood Midstream Partners LP Intra-company $3,744 $5,763 100% 97% 11.2x 17% 26% 16%
4/6/15 Tesoro Logistics LP QEP Midstream Partners, LP Intra-company $394 $475 100% 42% 11.3x 9% 1 8%1 7%1
11/12/14 Enterprise Products Partners L.P. Oiltanking Partners, L.P. Intra-company $1,390 $1,382 100% 33% 23.3x (1%)1 1%1 5%1
8/10/14 Kinder Morgan, Inc. Kinder Morgan Energy Partners, L.P. Intra-company $37,576 $57,387 88% 90% 15.4x 12% 12% 10%
8/10/14 Kinder Morgan, Inc. El Paso Pipeline Partners, L.P. Intra-company $5,342 $8,123 88% 59% 14.6x 15% 12% 9%
10/22/13 Plains All American Pipeline, L.P. PAA Natural Gas Storage, L.P. Intra-company $761 $960 100% 36% 15.6x 9%1 10%1 16%1
4/29/11 Enterprise Products Partners L.P. Duncan Energy Partners L.P. Intra-company $1,051 $1,365 100% 42% 16.0x 35%1 36%1 32%1
6/29/09 Enterprise Products Partners L.P. TEPPCO Partners, L.P. Intra-company $3,292 $5,868 100% 100% 10.8x 20%1 37%1 17%1
6/12/06 Plains All American Pipeline, L.P. Pacific Energy Partners, L.P. Third party $1,024 $1,453 100% 73% 10.7x 11% 13% 12%
11/1/04 Valero L.P. Kaneb Pipe Line Partners, L.P. Third party $1,406 $1,888 100% 82% 11.3x 19% 20% 16%
High - All transactions 23.3x 35% 53% 33%
Median - All transactions 14.6x 15% 16% 16%
Low - All transactions 10.1x (1%) 1% 5%
High - Intra-company 23.3x 35% 53% 33%
Median - Intra-company 15.1x 15% 16% 16%
Low - Intra-company 10.1x (1%) 1% 5%
High - Liquids 23.3x 20% 53% 33%
Median - Liquids 10.8x 11% 20% 16%
Low - Liquids 10.1x (1%) 1% 5%
Source: Press releases, company filings
1 Premia based on undisturbed target price at time of initial public offer, prior to announcement of definitive agreement
2 Represents announcement of definitive agreement, although transaction never closed
PROJECT AMSTERDAM
11
J.P.Morgan
PRELIMINARY IMPLIED VALUATION OF PRAGUE
Preliminary Draft and Highly Confidential
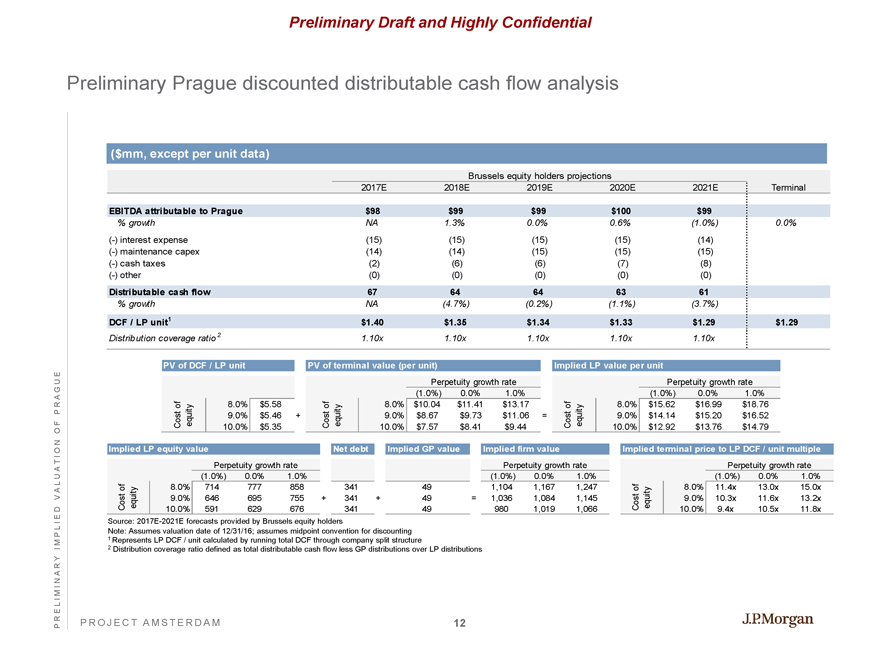
Preliminary Prague discounted distributable cash flow analysis
($mm, except per unit data)
Brussels equity holders projections
2017E 2018E 2019E 2020E 2021E Terminal
EBITDA attributable to Prague $98 $99 $99 $100 $99
% growth NA 1.3% 0.0% 0.6% (1.0%) 0.0%
(-) interest expense (15) (15) (15) (15) (14)
(-) maintenance capex (14) (14) (15) (15) (15)
(-) cash taxes (2) (6) (6) (7) (8)
(-) other (0) (0) (0) (0) (0)
Distributable cash flow 67 64 64 63 61
% growth NA (4.7%) (0.2%) (1.1%) (3.7%)
DCF / LP unit1 $1.40 $1.35 $1.34 $1.33 $1.29 $1.29
Distribution coverage ratio2 1.10x 1.10x 1.10x 1.10x 1.10x
PV of DCF / LP unit
Cost of equity
8.0% $5.58
9.0% $5.46
10.0% $5.35
+
Cost of equity
PV of terminal value (per unit)
Perpetuity growth rate
(1.0%) 0.0% 1.0%
8.0% $10.04 $11.41 $13.17
9.0% $8.67 $9.73 $11.06
10.0% $7.57 $8.41 $9.44
=
Implied LP value per unit
Cost of equity
Perpetuity growth rate
(1.0%) 0.0% 1.0%
8.0% $15.62 $16.99 $18.76
9.0% $14.14 $15.20 $16.52
10.0% $12.92 $13.76 $14.79
Implied LP equity value
Cost of equity
Perpetuity growth rate
(1.0%) 0.0% 1.0%
8.0% 714 777 858
9.0% 646 695 755
10.0% 591 629 676
+
Net debt
341 49
+ 341 + 49 =
341 49
Implied GP value
Implied firm value
Perpetuity growth rate
(1.0%) 0.0% 1.0%
1,104 1,167 1,247
1,036 1,084 1,145
980 1,019 1,066
Implied terminal price to LP DCF / unit multiple
Perpetuity growth rate
Cost of equity
(1.0%) 0.0% 1.0%
8.0% 11.4x 13.0x 15.0x
9.0% 10.3x 11.6x 13.2x
10.0% 9.4x 10.5x 11.8x
Source: 2017E-2021E forecasts provided by Brussels equity holders
Note: Assumes valuation date of 12/31/16; assumes midpoint convention for discounting
1 Represents LP DCF / unit calculated by running total DCF through company split structure
2 Distribution coverage ratio defined as total distributable cash flow less GP distributions over LP distributions
PROJECT AMSTERDAM
12
J.P.Morgan
PRELIMINARY IMPLIED VALUATION OF PRAGUE
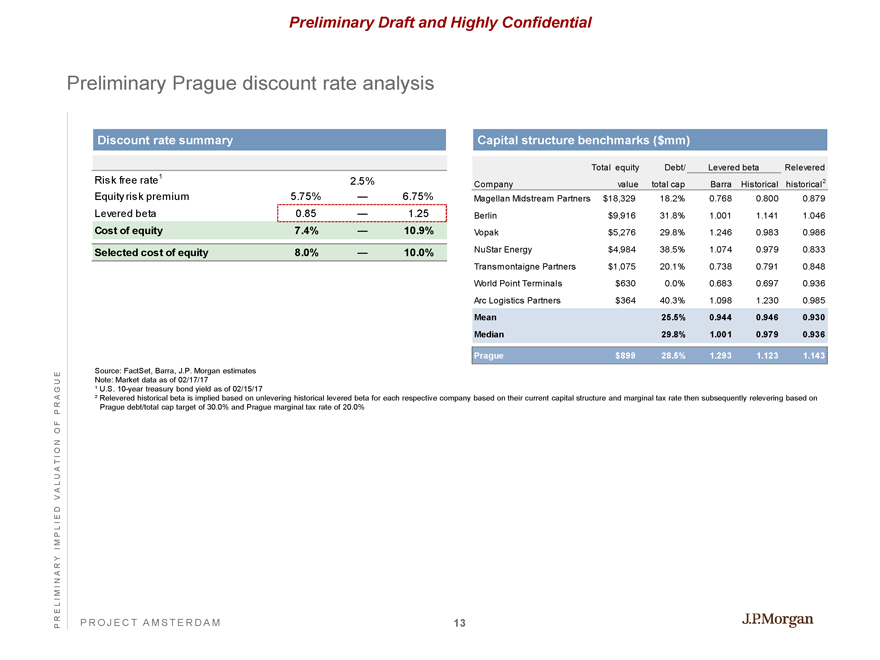
Preliminary Draft and Highly Confidential Preliminary Prague discount rate analysis Discount rate summary Risk free rate1 2.5%
Equity risk premium 5.75% — 6.75% Levered beta 0.85 — 1.25 Cost of equity 7.4% — 10.9%
Selected cost of equity 8.0% — 10.0%
Capital structure benchmarks ($mm)
Company Total equity value Debt/ total cap Levered beta Barra Historical Relevered historical2
Magellan Midstream Partners $18,329 18.2% 0.768 0.800 0.879 Berlin $9,916 31.8% 1.001 1.141 1.046 Vopak $5,276 29.8% 1.246 0.983 0.986 NuStar Energy $4,984 38.5% 1.074 0.979 0.833
Transmontaigne Partners $1,075 20.1% 0.738 0.791 0.848
World Point Terminals $630 0.0% 0.683 0.697 0.936 Arc Logistics Partners $364 40.3% 1.098 1.230 0.985
Mean 25.5% 0.944 0.946 0.930 Median 29.8% 1.001 0.979 0.936
Prague $899 28.5% 1.293 1.123 1.143 Source: FactSet, Barra, J.P. Morgan estimates
Note: Market data as of 02/17/17 1 U.S.10-year treasury bond yield as of 02/15/17
2 Relevered historical beta is implied based on unlevering historical levered beta for each respective company based on their current capital structure and marginal tax rate then subsequently relevering based on Prague debt/total cap target of 30.0% and Prague marginal tax rate of 20.0% PROJECT AMSTERDAM 13 J.P.Morgan
DISCUSSION MATERIALS
Preliminary Draft and Highly Confidential
Agenda
Page
Overview 1
Preliminary implied valuation of Prague 7
Appendix 14
PROJECT AMSTERDAM
J.P.Morgan
APPENDIX
Preliminary Draft and Highly Confidential
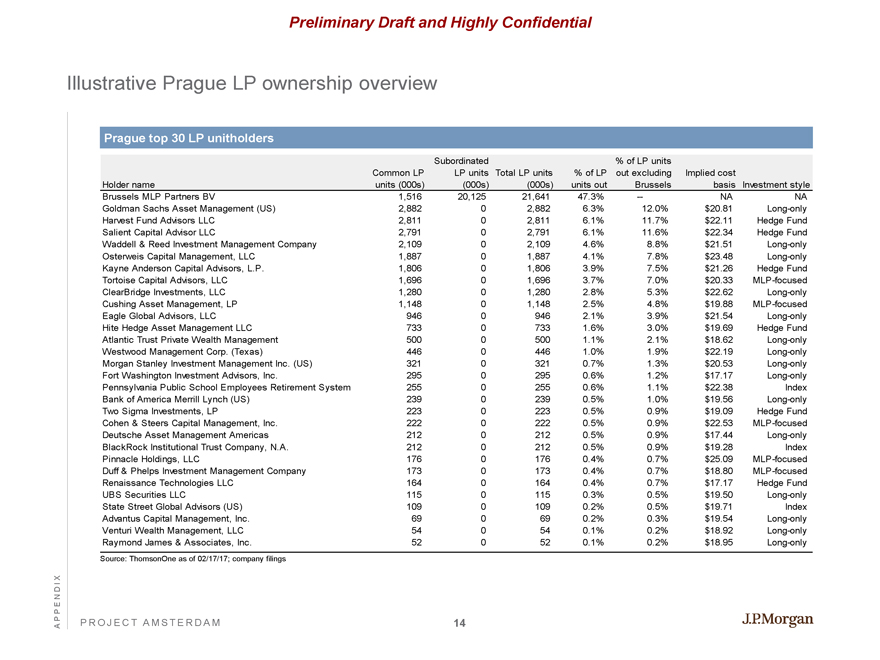
Illustrative Prague LP ownership overview
Prague top 30 LP unitholders
Holder name Common LP units (000s) Subordinated LP units (000s) Total LP units (000s) % of LP units out % of LP units out excluding Brussels Implied cost basis Investment style
Brussels MLP Partners BV 1,516 20,125 21,641 47.3% — NA NA
Goldman Sachs Asset Management (US) 2,882 0 2,882 6.3% 12.0% $20.81 Long-only
Harvest Fund Advisors LLC 2,811 0 2,811 6.1% 11.7% $22.11 Hedge Fund
Salient Capital Advisor LLC 2,791 0 2,791 6.1% 11.6% $22.34 Hedge Fund
Waddell & Reed Investment Management Company 2,109 0 2,109 4.6% 8.8% $21.51 Long-only
Osterweis Capital Management, LLC 1,887 0 1,887 4.1% 7.8% $23.48 Long-only
Kayne Anderson Capital Advisors, L.P. 1,806 0 1,806 3.9% 7.5% $21.26 Hedge Fund
Tortoise Capital Advisors, LLC 1,696 0 1,696 3.7% 7.0% $20.33MLP-focused
ClearBridge Investments, LLC 1,280 0 1,280 2.8% 5.3% $22.62 Long-only
Cushing Asset Management, LP 1,148 0 1,148 2.5% 4.8% $19.88MLP-focused
Eagle Global Advisors, LLC 946 0 946 2.1% 3.9% $21.54 Long-only
Hite Hedge Asset Management LLC 733 0 733 1.6% 3.0% $19.69 Hedge Fund
Atlantic Trust Private Wealth Management 500 0 500 1.1% 2.1% $18.62 Long-only
Westwood Management Corp. (Texas) 446 0 446 1.0% 1.9% $22.19 Long-only
Morgan Stanley Investment Management Inc. (US) 321 0 321 0.7% 1.3% $20.53 Long-only
Fort Washington Investment Advisors, Inc. 295 0 295 0.6% 1.2% $17.17 Long-only
Pennsylvania Public School Employees Retirement System 255 0 255 0.6% 1.1% $22.38 Index
Bank of America Merrill Lynch (US) 239 0 239 0.5% 1.0% $19.56 Long-only
Two Sigma Investments, LP 223 0 223 0.5% 0.9% $19.09 Hedge Fund
Cohen & Steers Capital Management, Inc. 222 0 222 0.5% 0.9% $22.53MLP-focused
Deutsche Asset Management Americas 212 0 212 0.5% 0.9% $17.44 Long-only
BlackRock Institutional Trust Company, N.A. 212 0 212 0.5% 0.9% $19.28 Index
Pinnacle Holdings, LLC 176 0 176 0.4% 0.7% $25.09MLP-focused
Duff & Phelps Investment Management Company 173 0 173 0.4% 0.7% $18.80MLP-focused
Renaissance Technologies LLC 164 0 164 0.4% 0.7% $17.17 Hedge Fund
UBS Securities LLC 115 0 115 0.3% 0.5% $19.50 Long-only
State Street Global Advisors (US) 109 0 109 0.2% 0.5% $19.71 Index
Advantus Capital Management, Inc. 69 0 69 0.2% 0.3% $19.54 Long-only
Venturi Wealth Management, LLC 54 0 54 0.1% 0.2% $18.92 Long-only
Raymond James & Associates, Inc. 52 0 52 0.1% 0.2% $18.95 Long-only
Source: ThomsonOne as of 02/17/17; company filings
PROJECT AMSTERDAM
14
J.P.Morgan