Exhibit (c)(5)
Preliminary Draft – Confidential
The Conflicts Committee of the Board of Directors of VTTI Energy Partners GP LLC
Discussion Materials Regarding Project Terminal Velocity April 24, 2017
Evercore
vtti
energy partners
Preliminary Draft – Confidential
These materials have been prepared by Evercore Group L.L.C. (“Evercore”) for the Conflicts Committee of the Board of Directors of VTTI Energy Partners GP LLC (“VTGP”) to whom such materials are directly addressed and delivered and may not be used or relied upon for any purpose other than as specifically contemplated by a written agreement with Evercore. These materials are based on information provided by or on behalf of the Board and/or other potential transaction participants, from public sources or otherwise reviewed by Evercore. Evercore assumes no responsibility for independent investigation or verification of such information and has relied on such information being complete and accurate in all material respects. To the extent such information includes estimates and forecasts of future financial performance prepared by or reviewed with the management of the Board and/or other potential transaction participants or obtained from public sources, Evercore has assumed that such estimates and forecasts have been reasonably prepared on bases reflecting the best currently available estimates and judgments of such management (or, with respect to estimates and forecasts obtained from public sources, represent reasonable estimates). No representation or warranty, express or implied, is made as to the accuracy or completeness of such information and nothing contained herein is, or shall be relied upon as, a representation, whether as to the past, the present or the future. These materials were designed for use by specific persons familiar with the business and affairs of the Board. These materials are not intended to provide the sole basis for evaluating, and should not be considered a recommendation with respect to, any transaction or other matter. These materials have been developed by and are proprietary to Evercore and were prepared exclusively for the benefit and internal use of the Board.
These materials were compiled on a confidential basis for use by the Board in evaluating the potential transaction described herein and not with a view to public disclosure or filing thereof under state or federal securities laws, and may not be reproduced, disseminated, quoted or referred to, in whole or in part, without the prior written consent of Evercore.
These materials do not constitute an offer or solicitation to sell or purchase any securities and are not a commitment by Evercore (or any affiliate) to provide or arrange any financing for any transaction or to purchase any security in connection therewith. Evercore assumes no obligation to update or otherwise revise these materials. These materials may not reflect information known to other professionals in other business areas of Evercore and its affiliates.
Evercore and its affiliates do not provide legal, accounting or tax advice. Accordingly, any statements contained herein as to tax matters were neither written nor intended by Evercore or its affiliates to be used and cannot be used by any taxpayer for the purpose of avoiding tax penalties that may be imposed on such taxpayer. Each person should seek legal, accounting and tax advice based on his, her or its particular circumstances from independent advisors regarding the impact of the transactions or matters described herein.
Evercore vtti energy partners
Preliminary Draft – Confidential
Executive Summary
Introduction
Evercore Group L.L.C. (“Evercore”) is pleased to provide the materials herein to the Conflicts Committee of the Board of Directors of VTTI Energy Partners GP LLC (“VTGP”) (the “Conflicts Committee”), the general partner of VTTI Energy Partners LP (“VTTI” or the “Partnership”), regarding the proposed acquisition of all publicly-held common units representing limited partner interests in VTTI from the current holders of such units (the “Unaffiliated Unitholders”) by VTTI MLP Partners B.V. (the “Sponsor”) (the “Proposed Transaction” or the “Merger”)
On March 2, 2017, the Sponsor proposed to acquire each publicly-owned VTTI common unit for cash consideration of $18.75 per unit as part of the Proposed Transaction (the “Initial Offer”)
On March 30, 2017, the Conflicts Committee made a counterproposal to the Sponsor for cash consideration of $21.00 per unit (the “First Counterproposal”)
On April 13, 2017, the Sponsor responded to the Conflicts Committee with a revised offer of $19.10 per unit (the “First Sponsor Counterproposal”)
On April 14, 2017, the Conflicts Committee made a second counterproposal to the Sponsor for cash consideration of $ 20.30 per unit (the “Second Counterproposal”) and requested that quarterly distributions continue to be paid up to the closing date of the Proposed Transaction
On April 20, 2017, the Sponsor responded to the Conflicts Committee with a final offer of $19.30 per unit (the “Second Sponsor Counterproposal” or the “Proposed Consideration”) and agreed to pay quarterly distributions up to the closing date of the Proposed Transaction
The Proposed Consideration represents a 4.9% premium to VTTI’s closing unit price of 18.40 as of March 2, 2017 1
The Proposed Consideration represents a 5.7% premium to VTTI’s30-day (trading) volume-weighted average unit price (“VWAP”) of $18.26 as of March 2, 2017
Pro forma for the Proposed Transaction, VTTI will cease to be a publicly-traded partnership and will be a wholly-owned
subsidiary of the Sponsor
The Proposed Transaction is subject to the negotiation and execution of an agreement and plan of merger among VTTI B.V., VTTI MLP Partners B.V., VTTI Merger Sub LLC, VTTI Energy Partners LP, and VTTI Energy Partners GP LLC (the “Merger Agreement”), including approval of the Merger Agreement and the transactions contemplated thereunder by the Sponsor’s Board of Directors, VTGP’s Board of Directors, VTTI’s Board of Directors, the Conflicts Committee, and a majority vote of the Unaffiliated Unitholders
Source: FactSet
1. Announcement date of the Proposed Transaction
Evercore 1 vtti energy partners
Preliminary Draft – Confidential
Executive Summary
Right of First Offer
Pursuant to the Omnibus Agreement between VTTI B.V. and the Partnership entered into upon completion of the Partnership’s initial public offering, VTTI B.V. granted the Partnership a right of first offer (“ROFO”) on any proposed Transfer of any Sale Asset (other than Sale Assets Transferred to an Affiliate of VTTI B.V. who agrees in writing that such Sale Asset remains subject to the provisions of the ROFO and assumes the obligations under the ROFO with respect to such Sale Asset)
“Sale Assets” means any right, title or interests in the VTTI Entities’ existing assets and any terminaling and other energy infrastructure assets that any of them may acquire or construct in the future, which assets shall include the terminal facilities, pipelines, storage tanks, equipment, machinery, docks and the real property appurtenant thereto
“VTTI Entities” means VTTI B.V. and each of its Affiliates, other than the Partnership and its Subsidiaries
“Affiliate” means, with respect to any Person, any other Person that directly or indirectly through one or more intermediaries controls, is controlled by or is under common control with, the Person in question
The term “control” means the possession, direct or indirect, of the power to direct or cause the direction of the management and policies of a Person, whether through ownership of voting securities, by contract or otherwise
Source: Partnership filings
EVERCORE 2 vtti energy partners
Preliminary Draft – Confidential
Executive Summary
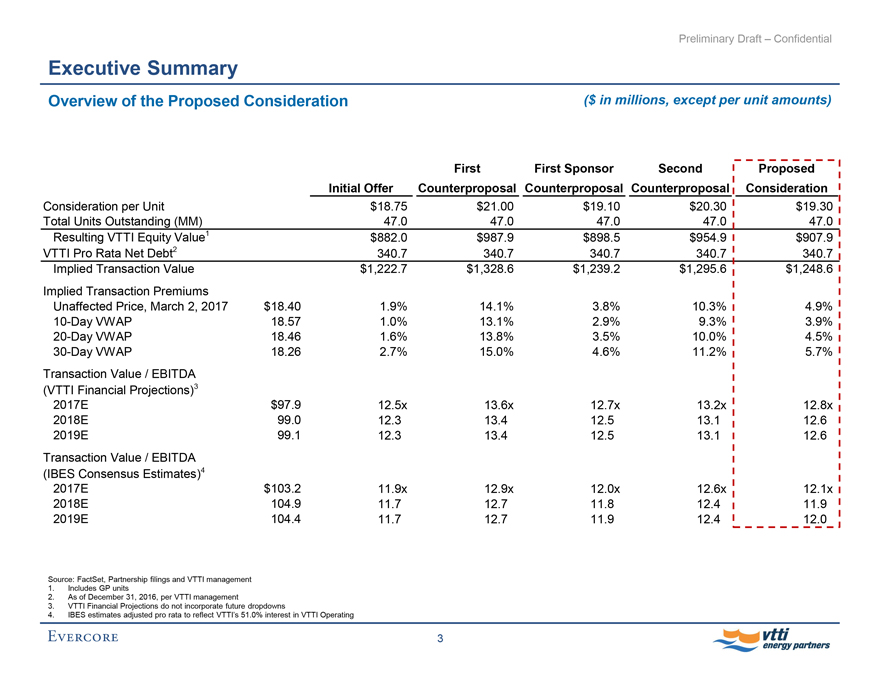
Overview of the Proposed Consideration ($ in millions, except per unit amounts)
Initial Offer
First Counterproposal
First Sponsor Counterproposal
Second Counterproposal
Proposed
Consideration
Consideration per Unit $18.75 $21.00 $19.10 $20.30 $19.30
Total Units Outstanding (MM) 47.0 47.0 47.0 47.0 47.0
Resulting VTTI Equity Value1 $882.0 $987.9 $898.5 $954.9 $907.9
VTTI Pro Rata Net Debt2 340.7 340.7 340.7 340.7 340.7
Implied Transaction Value $1,222.7 $1,328.6 $1,239.2 $1,295.6 $1,248.6
Implied Transaction Premiums
Unaffected Price, March 2, 2017 $18.40 1.9% 14.1% 3.8% 10.3% 4.9%
10-Day VWAP 18.57 1.0% 13.1% 2.9% 9.3% 3.9%
20-Day VWAP 18.46 1.6% 13.8% 3.5% 10.0% 4.5%
30-Day VWAP 18.26 2.7% 15.0% 4.6% 11.2% 5.7%
Transaction Value / EBITDA
(VTTI Financial Projections)3
2017E $97.9 12.5x 13.6x 12.7x 13.2x 12.8x
2018E 99.0 12.3 13.4 12.5 13.1 12.6
2019E 99.1 12.3 13.4 12.5 13.1 12.6
Transaction Value / EBITDA
(IBES Consensus Estimates)4
2017E $103.2 11.9x 12.9x 12.0x 12.6x 12.1x
2018E 104.9 11.7 12.7 11.8 12.4 11.9
2019E 104.4 11.7 12.7 11.9 12.4 12.0
Source: FactSet, Partnership filings and VTTI management
1. Includes GP units
2. As of December 31, 2016, per VTTI management
3. VTTI Financial Projections do not incorporate future dropdowns
4. IBES estimates adjusted pro rata to reflect VTTI’s 51.0% interest in VTTI Operating
EVERCORE 3 vtti energy partners
Preliminary Draft – Confidential
Executive Summary
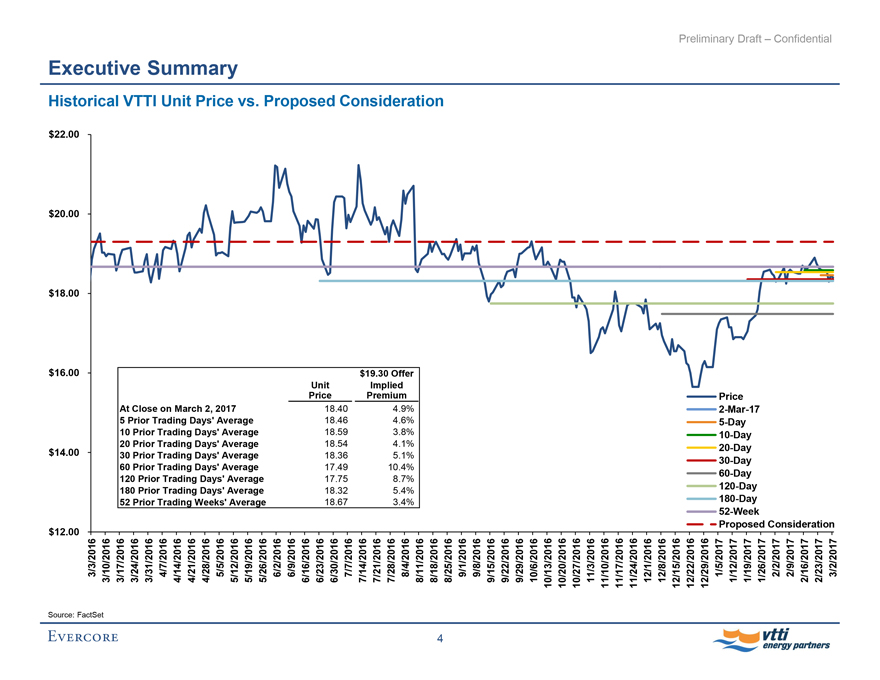
Historical VTTI Unit Price vs. Proposed Consideration
$22.00 $20.00 $18.00 $16.00 $14.00 $12.00
$19.30 Offer Implied Premium Unit Price At Close on March 2, 2017 18.40 4.9% 5 Prior Trading Days’ Average 18.46 4.6% 10 Prior Trading Days’ Average 18.59 3.8% 20 Prior Trading Days’ Average 18.54 4.1% 30 Prior Trading Days’ Average 18.36 5.1% 60 Prior Trading Days’ Average 17.49 10.4% 120 Prior Trading Days’ Average 17.75 8.7% 180 Prior Trading Days’ Average 18.32 5.4% 52 Prior Trading Weeks’ Average 18.67 3.4%
Price2-Mar-175-Day10-Day20-Day30-Day60-Day120-Day180-Day52-Week Proposed Consideration
3/3/2016 3/10/2016 3/17/2016 3/24/2016 3/31/2016 4/7/2016 4/14/2016 4/21/2016 4/28/2016 5/5/2016 5/12/2016 5/19/2016 5/26/2016 6/2/2016 6/9/2016 6/16/2016 6/23/2016 6/30/2016 7/7/2016 7/14/2016 7/21/2016 7/28/2016 8/4/2016 8/11/2016 8/18/2016 8/25/2016 9/1/2016 9/8/2016 9/15/2016 9/22/2016 9/29/2016 10/6/2016 10/13/2016 10/20/2016 10/27/2016 11/3/2016 11/10/2016 11/17/2016 11/24/2016 12/1/2016 12/8/2016 12/15/2016 12/22/2016 12/29/2016 1/5/2017 1/12/2017 1/19/2017 1/26/2017 2/2/2017 2/9/2017 2/16/2017 2/23/2017 3/2/2017
Source: FactSet
EVERCORE 4 vtti energy partners
Preliminary Draft – Confidential
Preliminary VTTI Valuation Analysis
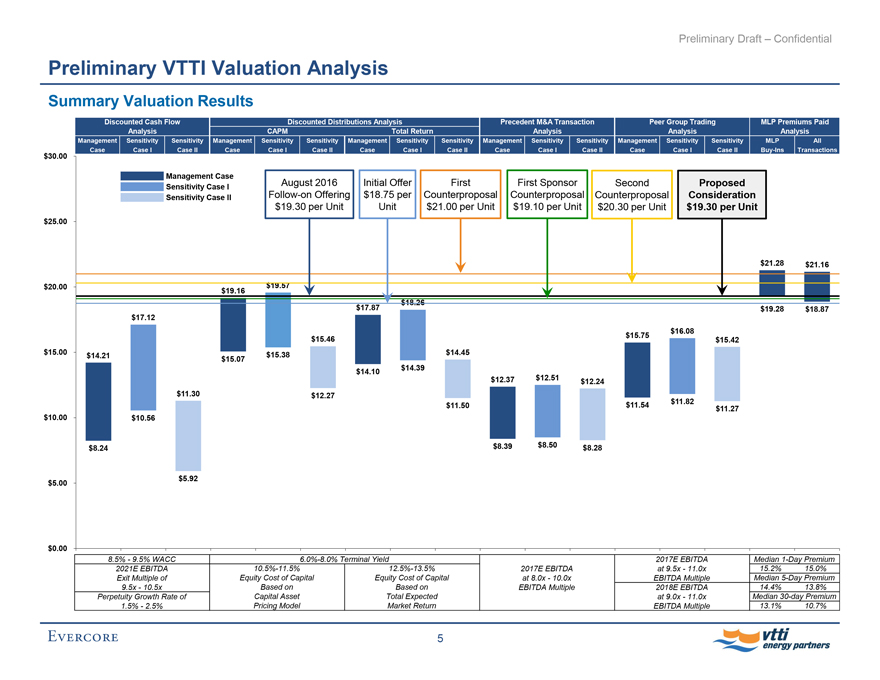
Summary Valuation Results
$30.00 $25.00 $20.00 $15.00 $10.00 $5.00 $0.00
Discounted Cash Flow Analysis
Discounted Distributions Analysis
Precedent M&A Transaction Analysis
Peer Group Trading Analysis
MLP Premiums Paid Analysis
CAPM Total Return
Management Case Sensitivity Case I Sensitivity Case II Management Case Sensitivity Case I Sensitivity Case II Management Case Sensitivity Case I Sensitivity Case II Management Case Sensitivity Case I Sensitivity Case II Management Case Sensitivity Case I Sensitivity Case II MLPBuy-Ins All Transactions Management Case Sensitivity Case I Sensitivity Case II
August 2016Follow-on Offering $19.30 per Unit Initial Offer $18.75 per Unit First Counterproposal $21.00 per Unit First Sponsor Counterproposal $19.10 per Unit Second Counterproposal $20.30 per Unit Proposed Consideration $19.30 per Unit
$21.28 $21.16 $19.57 $19.16 $18.26 $17.87 $19.28 $18.87 $17.12 $15.75 $16.08 $15.46 $15.42 $14.21 $15.38 $14.45 $15.07 $14.10 $14.39 $12.37 $12.51 $12.24 $11.30 $12.27 $11.82 $11.50 $11.54 $11.27 $10.56 $8.24 $8.39 $8.50 $8.28 $5.92
8.5% - 9.5% WACC 2021E EBITDA Exit Multiple of 9.5x - 10.5x Perpetuity Growth Rate of 1.5% - 2.5%
6.0%-8.0% Terminal Yield10.5%-11.5% Equity Cost of Capital Based on Capital Asset Pricing Model
12.5%-13.5% Equity Cost of Capital Based on Total Expected Market Return
2017E EBITDA at 8.0x - 10.0x EBITDA Multiple
2017E EBITDA at 9.5x - 11.0x EBITDA Multiple 2018E EBITDA at 9.0x - 11.0x EBITDA Multiple
Median1-Day Premium 15.2% Median5-Day Premium 14.4% Median30-day Premium 13.1%
15.0% 13.8% 10.7%
EVERCORE 5 vtti energy partners
Preliminary Draft – Confidential
Preliminary VTTI Valuation Analysis
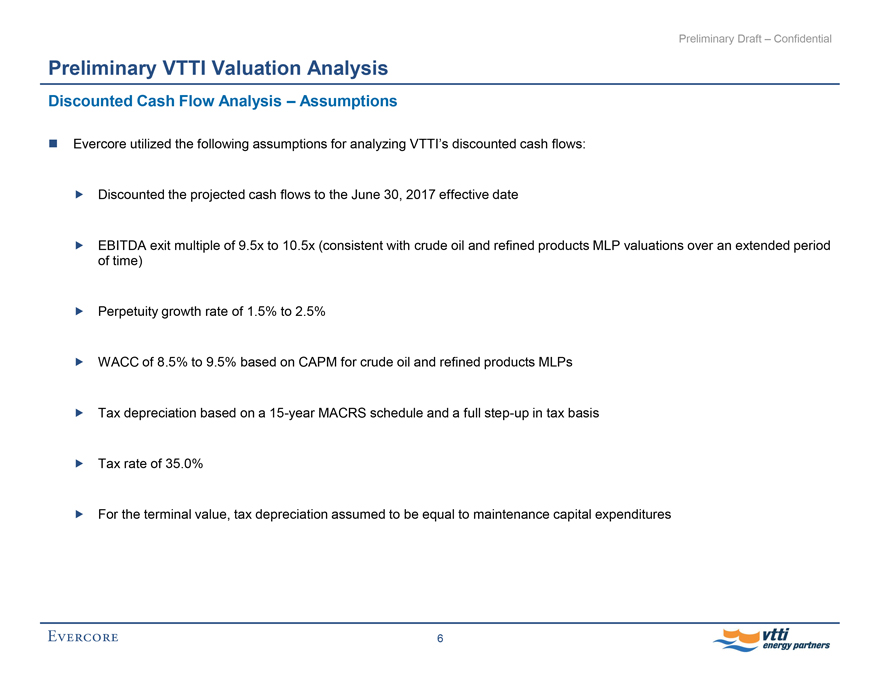
Discounted Cash Flow Analysis – Assumptions
Evercore utilized the following assumptions for analyzing VTTI’s discounted cash flows:
Discounted the projected cash flows to the June 30, 2017 effective date
EBITDA exit multiple of 9.5x to 10.5x (consistent with crude oil and refined products MLP valuations over an extended period of time)
Perpetuity growth rate of 1.5% to 2.5%
WACC of 8.5% to 9.5% based on CAPM for crude oil and refined products MLPs
Tax depreciation based on a15-year MACRS schedule and a fullstep-up in tax basis
Tax rate of 35.0%
For the terminal value, tax depreciation assumed to be equal to maintenance capital expenditures
EVERCORE 6 vtti energy partners

Preliminary Draft – Confidential Preliminary VTTI Valuation Analysis
Discounted Cash Flow Analysis – Management Case ($ in millions, except per unit amounts)
For the Six Months Ending December 31, For the Years Ending December 31, EBITDA Exit Multiple Perpetuity Growth Rate Terminal Value 2017E 2018E 2019E 2020E 2021E
Adjusted EBITDA $48.9 $99.0 $99.1 $99.7 $100.2 $100.2 $100.2
Less: Tax Depreciation and Amortization (45.3) (86.9) (79.9) (73.5) (67.7) (15.2)
EBIT $3.6 $12.1 $19.2 $26.2 $32.5 $85.0
Less: Cash Taxes @ 35.0% (1.3) (4.2) (6.7) (9.2) (11.4) (29.8)
EBIAT $2.4 $7.9 $12.5 $17.0 $21.1 $55.3
Plus: Tax Depreciation and Amortization 45.3 86.9 79.9 73.5 67.7 15.2
Less: Maintenance Capital Expenditures (6.8) (13.9) (14.3) (14.7) (15.2) (15.2)
Less: Growth Capital Expenditures (7.4) (2.8) (2.9) — — —
Unlevered Free Cash Flow $33.5 $78.1 $75.3 $75.9 $73.7 $55.3
EBITDA Multiple / Perpetuity Growth Rate 10.0x 2.0%
Terminal Value $1,001.9 — $805.4
PV of Terminal Value @ 9.0% $679.8 — $546.5
Plus: PV of Unlevered Free Cash Flow @ 9.0% 278.5
Implied Enterprise Value $958.3 — $825.0
Less: Estimated Pro Rata Net Debt on June 30, 2017 (348.2)
Implied Equity Value $610.1 — $476.8
Projected Units Outstanding (LP+GP) as of June 30, 2017 47.0
Implied Unit Price $12.97 — $10.14
EBITDA Exit Multiple Sensitivities EBITDA Multiple 9.0x 9.5x 10.0x 10.5x 11.0x WACC
8.0% $12.31 $13.11 $13.91 $14.71 $15.51
8.5% 11.86 12.64 13.43 14.21 15.00
9.0% 11.43 12.20 12.97 13.74 14.50
9.5% 11.03 11.78 12.53 13.28 14.03
10.0% 10.64 11.38 12.11 12.85 13.58
Perpetuity Growth Rate Sensitivities Perpetuity Growth Rate 1.0% 1.5% 2.0% 2.5% 3.0% WACC
8.0% $10.70 $11.75 $12.98 $14.42 $16.15
8.5% 9.52 10.42 11.45 12.65 14.07
9.0% 8.49 9.26 10.14 11.15 12.33
9.5% 7.57 8.24 9.00 9.86 10.86
10.0% 6.76 7.34 8.00 8.74 9.59
Evercore 7 vtti energy partners

Preliminary Draft – Confidential Preliminary VTTI Valuation Analysis
Discounted Cash Flow Analysis – Sensitivity Case I ($ in millions, except per unit amounts)
For the Six Months Ending December 31, For the Years Ending December 31, EBITDA Exit Multiple Perpetuity Growth Rate Terminal Value 2017E 2018E 2019E 2020E 2021E
Adjusted EBITDA $49.3 $100.4 $106.8 $113.5 $114.3 $114.3 $114.3
Less: Tax Depreciation and Amortization (51.6) (98.9) (90.7) (83.2) (76.4) (15.2)
EBIT ($2.3) $1.6 $16.2 $30.3 $37.9 $99.2
Less: Cash Taxes @ 35.0% — — (5.4) (10.6) (13.3) (34.7)
EBIAT ($2.3) $1.6 $10.8 $19.7 $24.6 $64.5
Plus: Tax Depreciation and Amortization 51.6 98.9 90.7 83.2 76.4 15.2
Less: Maintenance Capital Expenditures (6.8) (13.9) (14.3) (14.7) (15.2) (15.2)
Less: Growth Capital Expenditures (7.4) (2.8) (2.9) — — —
Unlevered Free Cash Flow $35.1 $83.7 $84.3 $88.2 $85.9 $64.5
EBITDA Multiple / Perpetuity Growth Rate 10.0x 2.0%
Terminal Value $1,143.3 — $939.3
PV of Terminal Value @ 9.0% $775.8 — $637.4
Plus: PV of Unlevered Free Cash Flow @ 9.0% 311.1
Implied Enterprise Value $1,086.8 — $948.5
Less: Estimated Pro Rata Net Debt on June 30, 2017 (348.0)
Implied Equity Value $738.9 — $600.5
Projected Units Outstanding (LP+GP) as of June 30, 2017 47.0
Implied Unit Price $15.71 — $12.76
EBITDA Exit Multiple Sensitivities EBITDA Multiple 9.0x 9.5x 10.0x 10.5x 11.0x WACC
8.0% $14.95 $15.86 $16.77 $17.68 $18.59
8.5% 14.44 15.34 16.23 17.12 18.01
9.0% 13.96 14.83 15.71 16.58 17.45
9.5% 13.49 14.35 15.21 16.06 16.92
10.0% 13.05 13.89 14.73 15.57 16.41
Perpetuity Growth Rate Sensitivities Perpetuity Growth Rate 1.0% 1.5% 2.0% 2.5% 3.0% WACC
8.0% $13.42 $14.64 $16.06 $17.74 $19.74
8.5% 12.05 13.09 14.29 15.69 17.33
9.0% 10.84 11.74 12.76 13.94 15.32
9.5% 9.78 10.56 11.44 12.45 13.61
10.0% 8.83 9.51 10.28 11.15 12.14
Evercore 8 vtti energy partners
Preliminary Draft – Confidential Preliminary VTTI Valuation Analysis
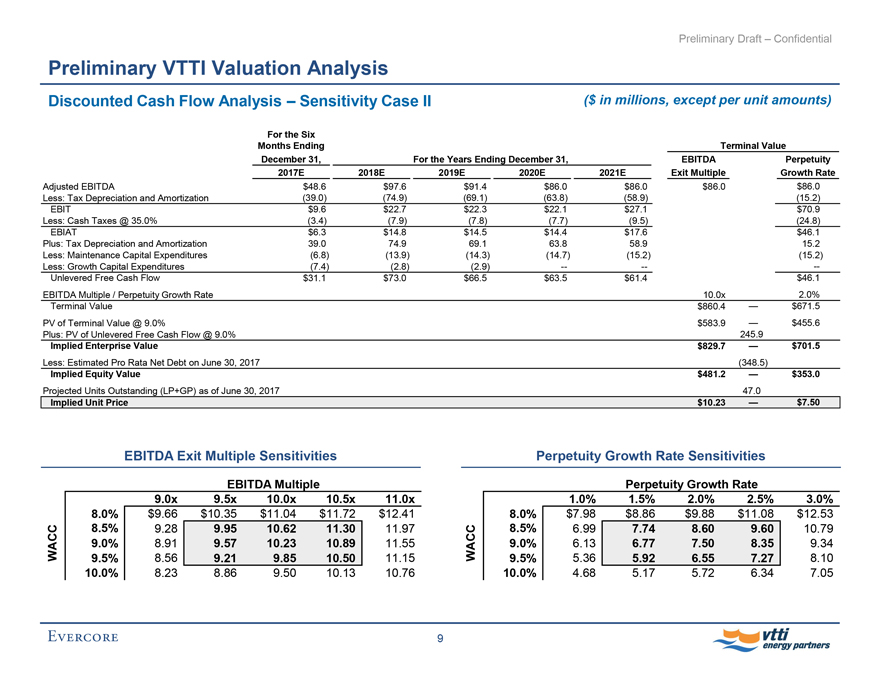
Discounted Cash Flow Analysis – Sensitivity Case II ($ in millions, except per unit amounts)
For the Six Months Ending December 31, For the Years Ending December 31,
EBITDA Exit Multiple Perpetuity Growth Rate Terminal Value
2017E 2018E 2019E 2020E 2021E
Adjusted EBITDA $48.6 $97.6 $91.4 $86.0 $86.0 $86.0 $86.0
Less: Tax Depreciation and Amortization (39.0) (74.9) (69.1) (63.8) (58.9) (15.2)
EBIT $9.6 $22.7 $22.3 $22.1 $27.1 $70.9
Less: Cash Taxes @ 35.0% (3.4) (7.9) (7.8) (7.7) (9.5) (24.8)
EBIAT $6.3 $14.8 $14.5 $14.4 $17.6 $46.1
Plus: Tax Depreciation and Amortization 39.0 74.9 69.1 63.8 58.9 15.2
Less: Maintenance Capital Expenditures (6.8) (13.9) (14.3) (14.7) (15.2) (15.2)
Less: Growth Capital Expenditures (7.4) (2.8) (2.9) — — —
Unlevered Free Cash Flow $31.1 $73.0 $66.5 $63.5 $61.4 $46.1
EBITDA Multiple / Perpetuity Growth Rate 10.0x 2.0%
Terminal Value $860.4 — $671.5
PV of Terminal Value @ 9.0% $583.9 — $455.6
Plus: PV of Unlevered Free Cash Flow @ 9.0% 245.9
Implied Enterprise Value $829.7 — $701.5
Less: Estimated Pro Rata Net Debt on June 30, 2017 (348.5)
Implied Equity Value $481.2 — $353.0
Projected Units Outstanding (LP+GP) as of June 30, 2017 47.0
Implied Unit Price $10.23 — $7.50
EBITDA Exit Multiple Sensitivities EBITDA Multiple WACC
9.0x 9.5x 10.0x 10.5x 11.0x
8.0% $9.66 $10.35 $11.04 $11.72 $12.41
8.5% 9.28 9.95 10.62 11.30 11.97
9.0% 8.91 9.57 10.23 10.89 11.55
9.5% 8.56 9.21 9.85 10.50 11.15
10.0% 8.23 8.86 9.50 10.13 10.76
Perpetuity Growth Rate Sensitivities Perpetuity Growth Rate WACC
1.0% 1.5% 2.0% 2.5% 3.0%
8.0% $7.98 $8.86 $9.88 $11.08 $12.53
8.5% 6.99 7.74 8.60 9.60 10.79
9.0% 6.13 6.77 7.50 8.35 9.34
9.5% 5.36 5.92 6.55 7.27 8.10
10.0% 4.68 5.17 5.72 6.34 7.05
Evercore 9 vtti energy partners

Preliminary Draft – Confidential Preliminary VTTI Valuation Analysis
Discounted Distribution Analysis – Management Case For the Six Months Ending December 31, For the Years Ending December 31, Terminal Value 2017E 2018E 2019E 2020E 2021E Low High
VTTI Distribution per LP Unit $0.67 $1.34 $1.34 $1.34 $1.34 $1.34 — $1.34
Terminal Yield1 8.0% — 6.0%
Terminal Value $16.80 — $22.40
Equity Cost of Capital Based on CAPM
Present Value @ 10.0% of Equity Value $15.85 — $19.50
Present Value @ 10.5% of Equity Value 15.58 — 19.16
Present Value @ 11.0% of Equity Value 15.32 — 18.82
Present Value @ 11.5% of Equity Value 15.07 — 18.50
Present Value @ 12.0% of Equity Value 14.82 — 18.18
Implied Equity Value Range—Based on CAPM $15.07 — $19.16
Equity Cost of Capital Based on Total Expected Market Return
Present Value @ 12.0% of Equity Value $14.82 — $18.18
Present Value @ 12.5% of Equity Value 14.57 — 17.87
Present Value @ 13.0% of Equity Value 14.34 — 17.57
Present Value @ 13.5% of Equity Value 14.10 — 17.27
Present Value @ 14.0% of Equity Value 13.88 — 16.98
Implied Common Unit Value Range—Based on Total Expected Market Return $14.10 — $17.87
1. VTTI52-week yield range of 5.9% to 8.4% with a median of 7.0% and mean of 7.0%; Current yield is 7.1% as of April 21, 2017
Evercore 10 vtti energy partners
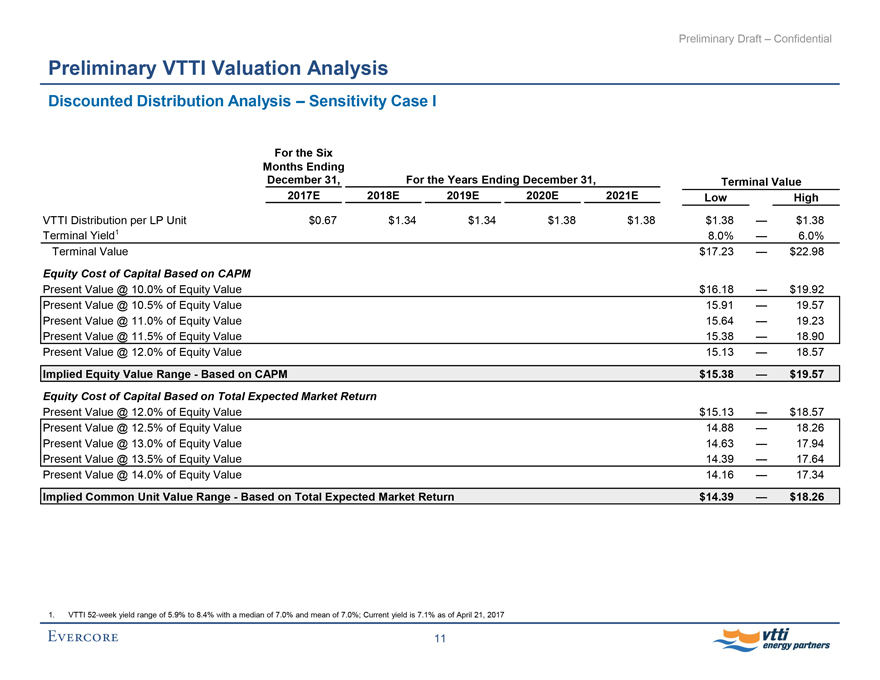
Preliminary Draft – Confidential Preliminary VTTI Valuation Analysis
Discounted Distribution Analysis – Sensitivity Case I
For the Six Months Ending December 31, For the Years Ending December 31, Terminal Value
2017E 2018E 2019E 2020E 2021E
Low High VTTI Distribution per LP Unit
$0.67 $1.34 $1.34 $1.38 $1.38 $1.38 — $1.38
Terminal Yield1 8.0% — 6.0%
Terminal Value $17.23 — $22.98
Equity Cost of Capital Based on CAPM
Present Value @ 10.0% of Equity Value $16.18 — $19.92
Present Value @ 10.5% of Equity Value 15.91 — 19.57
Present Value @ 11.0% of Equity Value 15.64 — 19.23
Present Value @ 11.5% of Equity Value 15.38 — 18.90
Present Value @ 12.0% of Equity Value 15.13 — 18.57
Implied Equity Value Range—Based on CAPM $15.38 — $19.57
Equity Cost of Capital Based on Total Expected Market Return
Present Value @ 12.0% of Equity Value $15.13 — $18.57
Present Value @ 12.5% of Equity Value 14.88 — 18.26
Present Value @ 13.0% of Equity Value 14.63 — 17.94
Present Value @ 13.5% of Equity Value 14.39 — 17.64
Present Value @ 14.0% of Equity Value 14.16 — 17.34
Implied Common Unit Value Range—Based on Total Expected Market Return $14.39 — $18.26
1. VTTI52-week yield range of 5.9% to 8.4% with a median of 7.0% and mean of 7.0%; Current yield is 7.1% as of April 21, 2017
Evercore 11 vtti energy partners
Preliminary Draft – Confidential
Preliminary VTTI Valuation Analysis
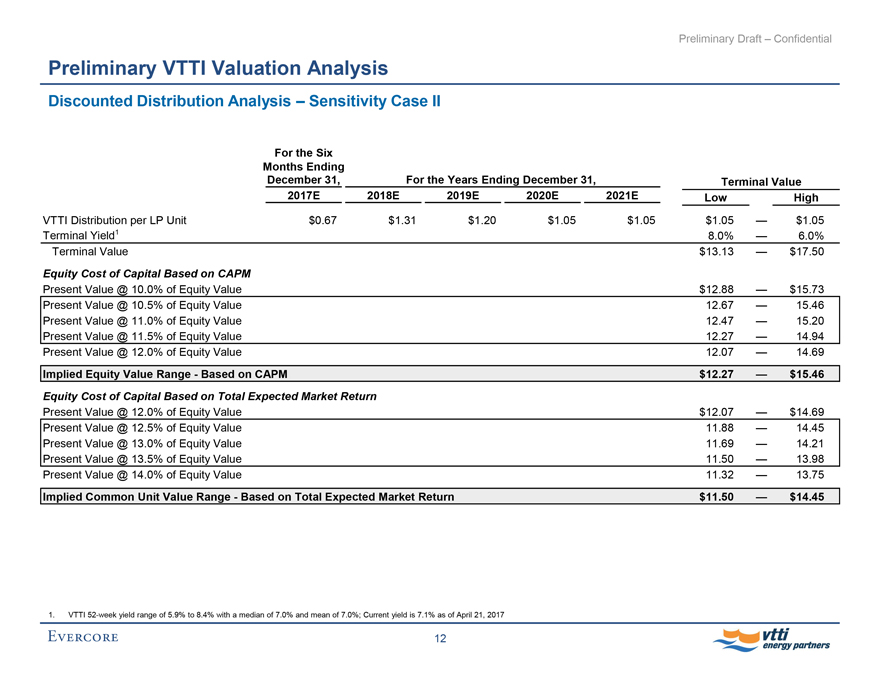
Discounted Distribution Analysis – Sensitivity Case II
For the Six
Months Ending
December 31, For the Years Ending December 31, Terminal Value
2017E 2018E 2019E 2020E 2021E Low High
VTTI Distribution per LP Unit $0.67 $1.31 $1.20 $1.05 $1.05 $1.05 -$1.05
Terminal Yield1 8.0% -6.0%
Terminal Value $13.13 -$17.50
Equity Cost of Capital Based on CAPM
Present Value @ 10.0% of Equity Value $12.88 -$15.73
Present Value @ 10.5% of Equity Value 12.67 -15.46
Present Value @ 11.0% of Equity Value 12.47 -15.20
Present Value @ 11.5% of Equity Value 12.27 -14.94
Present Value @ 12.0% of Equity Value 12.07 -14.69
Implied Equity Value Range - Based on CAPM $12.27 -$15.46
Equity Cost of Capital Based on Total Expected Market Return
Present Value @ 12.0% of Equity Value $12.07 -$14.69
Present Value @ 12.5% of Equity Value 11.88 -14.45
Present Value @ 13.0% of Equity Value 11.69 -14.21
Present Value @ 13.5% of Equity Value 11.50 -13.98
Present Value @ 14.0% of Equity Value 11.32 -13.75
Implied Common Unit Value Range - Based on Total Expected Market Return $11.50 - $14.45
1. VTTI52-week yield range of 5.9% to 8.4% with a median of 7.0% and mean of 7.0%; Current yield is 7.1% as of April 21, 2017
EVERCORE 12 vtti energy partners
Preliminary Draft – Confidential
Preliminary VTTI Valuation Analysis
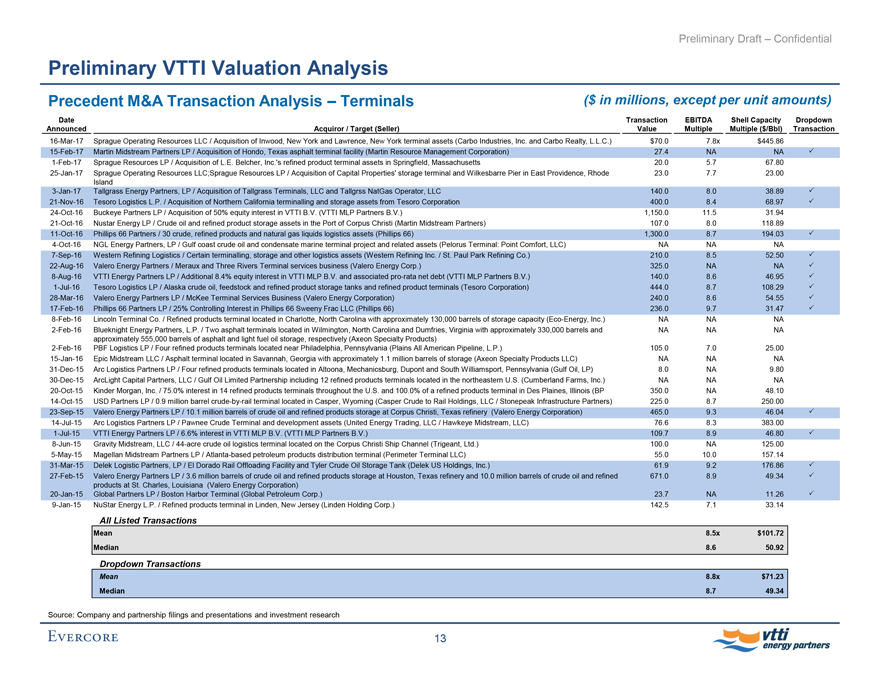
Precedent M&A Transaction Analysis – Terminals ($ in millions, except per unit amounts)
Date Transaction EBITDA Shell Capacity Dropdown
Announced Acquiror / Target (Seller) Value Multiple Multiple ($/Bbl) Transaction
16-Mar-17 Sprague Operating Resources LLC / Acquisition of Inwood, New York and Lawrence, New York terminal assets (Carbo Industries, Inc. and Carbo Realty, L.L.C.) $70.0 7.8x $445.86
15-Feb-17 Martin Midstream Partners LP / Acquisition of Hondo, Texas asphalt terminal facility (Martin Resource Management Corporation) 27.4 NA NA
1-Feb-17 Sprague Resources LP / Acquisition of L.E. Belcher, Inc.’s refined product terminal assets in Springfield, Massachusetts 20.0 5.7 67.80
25-Jan-17 Sprague Operating Resources LLC;Sprague Resources LP / Acquisition of Capital Properties’ storage terminal and Wilkesbarre Pier in East Providence, Rhode 23.0 7.7 23.00
Island
3-Jan-17 Tallgrass Energy Partners, LP / Acquisition of Tallgrass Terminals, LLC and Tallgrss NatGas Operator, LLC 140.0 8.0 38.89
21-Nov-16 Tesoro Logistics L.P. / Acquisition of Northern California terminalling and storage assets from Tesoro Corporation 400.0 8.4 68.97
24-Oct-16 Buckeye Partners LP / Acquisition of 50% equity interest in VTTI B.V. (VTTI MLP Partners B.V.) 1,150.0 11.5 31.94
21-Oct-16 Nustar Energy LP / Crude oil and refined product storage assets in the Port of Corpus Christi (Martin Midstream Partners) 107.0 8.0 118.89
11-Oct-16 Phillips 66 Partners / 30 crude, refined products and natural gas liquids logistics assets (Phillips 66) 1,300.0 8.7 194.03
4-Oct-16 NGL Energy Partners, LP / Gulf coast crude oil and condensate marine terminal project and related assets (Pelorus Terminal: Point Comfort, LLC) NA NA NA
7-Sep-16 Western Refining Logistics / Certain terminalling, storage and other logistics assets (Western Refining Inc. / St. Paul Park Refining Co.) 210.0 8.5 52.50
22-Aug-16 Valero Energy Partners / Meraux and Three Rivers Terminal services business (Valero Energy Corp.) 325.0 NA NA
8-Aug-16 VTTI Energy Partners LP / Additional 8.4% equity interest in VTTI MLP B.V. and associatedpro-rata net debt (VTTI MLP Partners B.V.) 140.0 8.6 46.95
1-Jul-16 Tesoro Logistics LP / Alaska crude oil, feedstock and refined product storage tanks and refined product terminals (Tesoro Corporation) 444.0 8.7 108.29
28-Mar-16 Valero Energy Partners LP / McKee Terminal Services Business (Valero Energy Corporation) 240.0 8.6 54.55
17-Feb-16 Phillips 66 Partners LP / 25% Controlling Interest in Phillips 66 Sweeny Frac LLC (Phillips 66) 236.0 9.7 31.47
8-Feb-16 Lincoln Terminal Co. / Refined products terminal located in Charlotte, North Carolina with approximately 130,000 barrels of storage capacity(Eco-Energy, Inc.) NA NA NA
2-Feb-16 Blueknight Energy Partners, L.P. / Two asphalt terminals located in Wilmington, North Carolina and Dumfries, Virginia with approximately 330,000 barrels and NA NA NA
approximately 555,000 barrels of asphalt and light fuel oil storage, respectively (Axeon Specialty Products)
2-Feb-16 PBF Logistics LP / Four refined products terminals located near Philadelphia, Pennsylvania (Plains All American Pipeline, L.P.) 105.0 7.0 25.00
15-Jan-16 Epic Midstream LLC / Asphalt terminal located in Savannah, Georgia with approximately 1.1 million barrels of storage (Axeon Specialty Products LLC) NA NA NA
31-Dec-15 Arc Logistics Partners LP / Four refined products terminals located in Altoona, Mechanicsburg, Dupont and South Williamsport, Pennsylvania (Gulf Oil, LP) 8.0 NA 9.80
30-Dec-15 ArcLight Capital Partners, LLC / Gulf Oil Limited Partnership including 12 refined products terminals located in the northeastern U.S. (Cumberland Farms, Inc.) NA NA NA
20-Oct-15 Kinder Morgan, Inc. / 75.0% interest in 14 refined products terminals throughout the U.S. and 100.0% of a refined products terminal in Des Plaines, Illinois (BP 350.0 NA 48.10
14-Oct-15 USD Partners LP / 0.9 million barrelcrude-by-rail terminal located in Casper, Wyoming (Casper Crude to Rail Holdings, LLC / Stonepeak Infrastructure Partners) 225.0 8.7 250.00
23-Sep-15 Valero Energy Partners LP / 10.1 million barrels of crude oil and refined products storage at Corpus Christi, Texas refinery (Valero Energy Corporation) 465.0 9.3 46.04
14-Jul-15 Arc Logistics Partners LP / Pawnee Crude Terminal and development assets (United Energy Trading, LLC / Hawkeye Midstream, LLC) 76.6 8.3 383.00
1-Jul-15 VTTI Energy Partners LP / 6.6% interest in VTTI MLP B.V. (VTTI MLP Partners B.V.) 109.7 8.9 46.80
8-Jun-15 Gravity Midstream, LLC /44-acre crude oil logistics terminal located on the Corpus Christi Ship Channel (Trigeant, Ltd.) 100.0 NA 125.00
5-May-15 Magellan Midstream Partners LP / Atlanta-based petroleum products distribution terminal (Perimeter Terminal LLC) 55.0 10.0 157.14
31-Mar-15 Delek Logistic Partners, LP / El Dorado Rail Offloading Facility and Tyler Crude Oil Storage Tank (Delek US Holdings, Inc.) 61.9 9.2 176.86
27-Feb-15 Valero Energy Partners LP / 3.6 million barrels of crude oil and refined products storage at Houston, Texas refinery and 10.0 million barrels of crude oil and refined 671.0 8.9 49.34
products at St. Charles, Louisiana (Valero Energy Corporation)
20-Jan-15 Global Partners LP / Boston Harbor Terminal (Global Petroleum Corp.) 23.7 NA 11.26
9-Jan-15 NuStar Energy L.P. / Refined products terminal in Linden, New Jersey (Linden Holding Corp.) 142.5 7.1 33.14
All Listed Transactions
Mean 8.5x $101.72
Median 8.6 50.92
Dropdown Transactions
Mean 8.8x $71.23
Median 8.7 49.34
Source: Company and partnership filings and presentations and investment research
EVERCORE 13 vtti energy partners

Preliminary Draft – Confidential
Preliminary VTTI Valuation Analysis
Precedent M&A Transaction Analysis – Terminals (cont’d) ($ in millions, except per unit amounts)
VTTI Financial Projections – Management Case
2017E Adjusted EBITDA $97.9
Relevant EBITDA Multiple 8.0x -10.0x
Implied Enterprise Value Range on December 31, 2017 $783.0 -$978.8
Implied Enterprise Value Range on June 30, 2017 @ 9.0% Discount Rate $750.0 -$937.5
Less: Present Value of Growth Capital Expenditures from June 30, 2017 to December 31, 2017 @ 9.0% Discount Rate (7.2)
Implied Enterprise Value Range $742.8 -$930.3
Less: Estimated Net Debt on June 30, 2017 (348.2)
Implied Equity Value Range $394.5 -$582.0
Projected Units Outstanding (LP+GP) as of June 30, 2017 47.0
Implied VTTI Unit Price $8.39 -$12.37
Memo
Capacity Multiple Approach
Capacity (MMBbls) 35.7
Relevant Multiple ($/Bbl) $45.00 $55.00
Implied Enterprise Value Range $1,606.5 -$1,963.5
Implied Enterprise Value Range Net to VTTI (51.0%) $819.3 $1,001.4
Less: Estimated Net Debt on June 30, 2017 (348.2)
Implied Equity Value Range $471.1 -$653.1
Projected Units Outstanding (LP+GP) as of June 30, 2017 47.0
Implied VTTI Unit Price $10.01 -$13.88
Source: VTTI management
EVERCORE 14 vtti energy partners
Preliminary Draft – Confidential
Preliminary VTTI Valuation Analysis
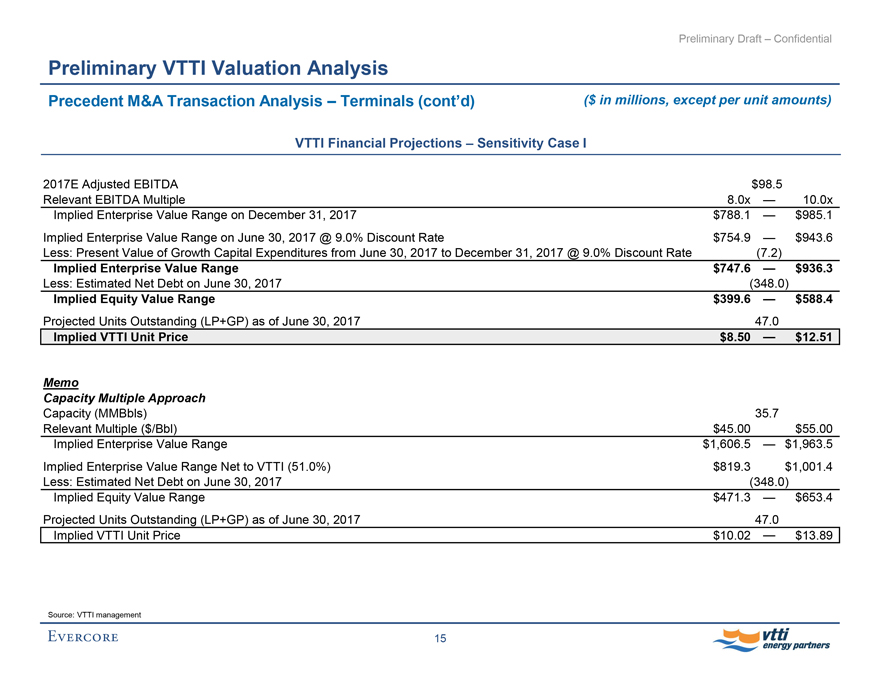
Precedent M&A Transaction Analysis – Terminals (cont’d) ($ in millions, except per unit amounts)
VTTI Financial Projections – Sensitivity Case I
2017E Adjusted EBITDA $98.5
Relevant EBITDA Multiple 8.0x -10.0x
Implied Enterprise Value Range on December 31, 2017 $788.1 -$985.1
Implied Enterprise Value Range on June 30, 2017 @ 9.0% Discount Rate $754.9 -$943.6
Less: Present Value of Growth Capital Expenditures from June 30, 2017 to December 31, 2017 @ 9.0% Discount Rate (7.2)
Implied Enterprise Value Range $747.6 -$936.3
Less: Estimated Net Debt on June 30, 2017 (348.0)
Implied Equity Value Range $399.6 -$588.4
Projected Units Outstanding (LP+GP) as of June 30, 2017 47.0
Implied VTTI Unit Price $8.50 -$12.51
Memo
Capacity Multiple Approach
Capacity (MMBbls) 35.7
Relevant Multiple ($/Bbl) $45.00 $55.00
Implied Enterprise Value Range $1,606.5 -$1,963.5
Implied Enterprise Value Range Net to VTTI (51.0%) $819.3 $1,001.4
Less: Estimated Net Debt on June 30, 2017 (348.0)
Implied Equity Value Range $471.3 -$653.4
Projected Units Outstanding (LP+GP) as of June 30, 2017 47.0
Implied VTTI Unit Price $10.02 -$13.89
Source: VTTI management
EVERCORE 15 vtti energy partners

Preliminary Draft – Confidential
Preliminary VTTI Valuation Analysis
Precedent M&A Transaction Analysis – Terminals (cont’d) ($ in millions, except per unit amounts)
VTTI Financial Projections – Sensitivity Case II
2017E Adjusted EBITDA $97.2
Relevant EBITDA Multiple 8.0x -10.0x
Implied Enterprise Value Range on December 31, 2017 $778.0 -$972.5
Implied Enterprise Value Range on June 30, 2017 @ 9.0% Discount Rate $745.2 -$931.4
Less: Present Value of Growth Capital Expenditures from June 30, 2017 to December 31, 2017 @ 9.0% Discount Rate (7.2)
Implied Enterprise Value Range $737.9 -$924.2
Less: Estimated Net Debt on June 30, 2017 (348.5)
Implied Equity Value Range $389.4 -$575.7
Projected Units Outstanding (LP+GP) as of June 30, 2017 47.0
Implied VTTI Unit Price $8.28 -$12.24
Memo
Capacity Multiple Approach
Capacity (MMBbls) 35.7
Relevant Multiple ($/Bbl) $45.00 $55.00
Implied Enterprise Value Range $1,606.5 -$1,963.5
Implied Enterprise Value Range Net to VTTI (51.0%) $819.3 $1,001.4
Less: Estimated Net Debt on June 30, 2017 (348.5)
Implied Equity Value Range $470.8 -$652.9
Projected Units Outstanding (LP+GP) as of June 30, 2017 47.0
Implied VTTI Unit Price $10.01 -$13.88
Source: VTTI management
EVERCORE 16 vtti energy partners
Preliminary Draft – Confidential
Preliminary VTTI Valuation Analysis
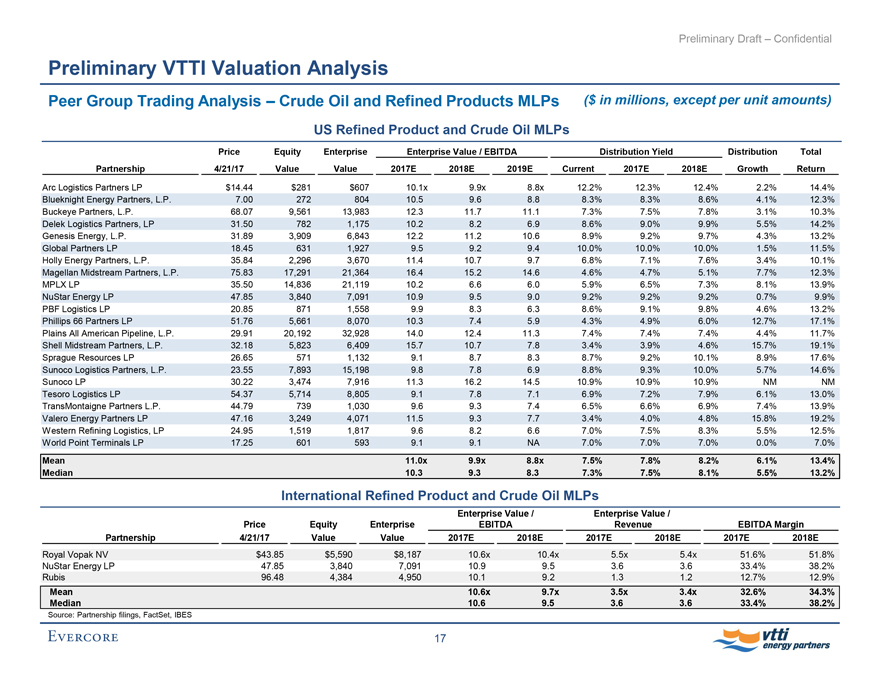
Peer Group Trading Analysis – Crude Oil and Refined Products MLPs ($ in millions, except per unit amounts)
US Refined Product and Crude Oil MLPs
Price Equity Enterprise Enterprise Value / EBITDA Distribution Yield Distribution Total
Partnership 4/21/17 Value Value 2017E 2018E 2019E Current 2017E 2018E Growth Return
Arc Logistics Partners LP $14.44 $281 $607 10.1x 9.9x 8.8x 12.2% 12.3% 12.4% 2.2% 14.4%
Blueknight Energy Partners, L.P. 7.00 272 804 10.5 9.6 8.8 8.3% 8.3% 8.6% 4.1% 12.3%
Buckeye Partners, L.P. 68.07 9,561 13,983 12.3 11.7 11.1 7.3% 7.5% 7.8% 3.1% 10.3%
Delek Logistics Partners, LP 31.50 782 1,175 10.2 8.2 6.9 8.6% 9.0% 9.9% 5.5% 14.2%
Genesis Energy, L.P. 31.89 3,909 6,843 12.2 11.2 10.6 8.9% 9.2% 9.7% 4.3% 13.2%
Global Partners LP 18.45 631 1,927 9.5 9.2 9.4 10.0% 10.0% 10.0% 1.5% 11.5%
Holly Energy Partners, L.P. 35.84 2,296 3,670 11.4 10.7 9.7 6.8% 7.1% 7.6% 3.4% 10.1%
Magellan Midstream Partners, L.P. 75.83 17,291 21,364 16.4 15.2 14.6 4.6% 4.7% 5.1% 7.7% 12.3%
MPLX LP 35.50 14,836 21,119 10.2 6.6 6.0 5.9% 6.5% 7.3% 8.1% 13.9%
NuStar Energy LP 47.85 3,840 7,091 10.9 9.5 9.0 9.2% 9.2% 9.2% 0.7% 9.9%
PBF Logistics LP 20.85 871 1,558 9.9 8.3 6.3 8.6% 9.1% 9.8% 4.6% 13.2%
Phillips 66 Partners LP 51.76 5,661 8,070 10.3 7.4 5.9 4.3% 4.9% 6.0% 12.7% 17.1%
Plains All American Pipeline, L.P. 29.91 20,192 32,928 14.0 12.4 11.3 7.4% 7.4% 7.4% 4.4% 11.7%
Shell Midstream Partners, L.P. 32.18 5,823 6,409 15.7 10.7 7.8 3.4% 3.9% 4.6% 15.7% 19.1%
Sprague Resources LP 26.65 571 1,132 9.1 8.7 8.3 8.7% 9.2% 10.1% 8.9% 17.6%
Sunoco Logistics Partners, L.P. 23.55 7,893 15,198 9.8 7.8 6.9 8.8% 9.3% 10.0% 5.7% 14.6%
Sunoco LP 30.22 3,474 7,916 11.3 16.2 14.5 10.9% 10.9% 10.9% NM NM
Tesoro Logistics LP 54.37 5,714 8,805 9.1 7.8 7.1 6.9% 7.2% 7.9% 6.1% 13.0%
TransMontaigne Partners L.P. 44.79 739 1,030 9.6 9.3 7.4 6.5% 6.6% 6.9% 7.4% 13.9%
Valero Energy Partners LP 47.16 3,249 4,071 11.5 9.3 7.7 3.4% 4.0% 4.8% 15.8% 19.2%
Western Refining Logistics, LP 24.95 1,519 1,817 9.6 8.2 6.6 7.0% 7.5% 8.3% 5.5% 12.5%
World Point Terminals LP 17.25 601 593 9.1 9.1 NA 7.0% 7.0% 7.0% 0.0% 7.0%
Mean 11.0x 9.9x 8.8x 7.5% 7.8% 8.2% 6.1% 13.4%
Median 10.3 9.3 8.3 7.3% 7.5% 8.1% 5.5% 13.2%
International Refined Product and Crude Oil MLPs
Enterprise Value / Enterprise Value /
Price Equity Enterprise EBITDA Revenue EBITDA Margin
Partnership 4/21/17 Value Value 2017E 2018E 2017E 2018E 2017E 2018E
Royal Vopak NV $43.85 $5,590 $8,187 10.6x 10.4x 5.5x 5.4x 51.6% 51.8%
NuStar Energy LP 47.85 3,840 7,091 10.9 9.5 3.6 3.6 33.4% 38.2%
Rubis 96.48 4,384 4,950 10.1 9.2 1.3 1.2 12.7% 12.9%
Mean 10.6x 9.7x 3.5x 3.4x 32.6% 34.3%
Median 10.6 9.5 3.6 3.6 33.4% 38.2%
Source: Partnership filings, FactSet, IBES
EVERCORE 17 vtti energy partners
Preliminary Draft – Confidential
Preliminary VTTI Valuation Analysis
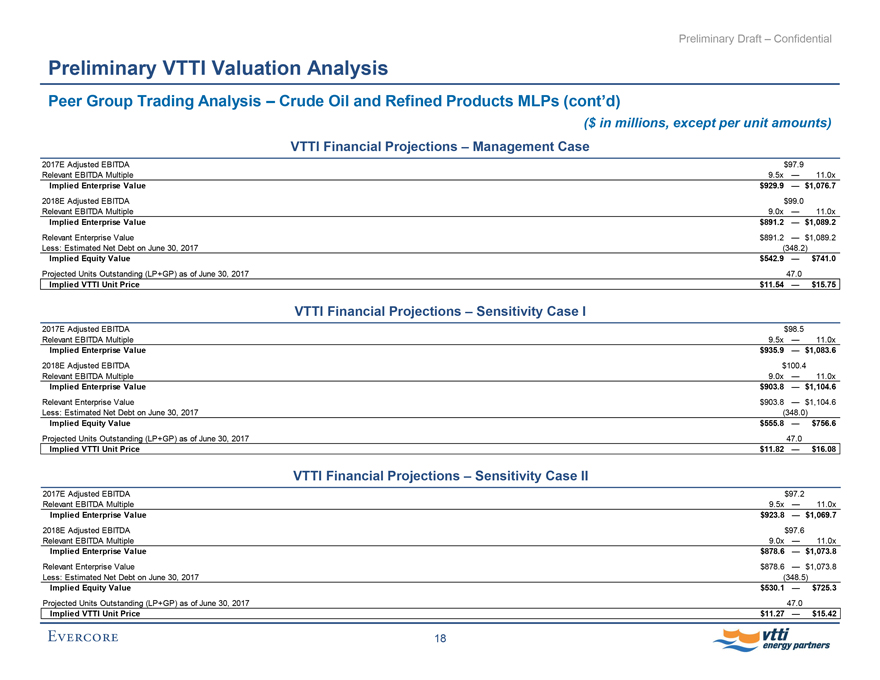
Peer Group Trading Analysis – Crude Oil and Refined Products MLPs (cont’d)
($ in millions, except per unit amounts)
VTTI Financial Projections – Management Case
2017E Adjusted EBITDA $97.9
Relevant EBITDA Multiple 9.5x - 11.0x
Implied Enterprise Value $929.9 -$1,076.7
2018E Adjusted EBITDA $99.0
Relevant EBITDA Multiple 9.0x - 11.0x
Implied Enterprise Value $891.2 -$1,089.2
Relevant Enterprise Value $891.2 - $1,089.2
Less: Estimated Net Debt on June 30, 2017 (348.2)
Implied Equity Value $542.9 -$741.0
Projected Units Outstanding (LP+GP) as of June 30, 2017 47.0
Implied VTTI Unit Price $11.54 -$15.75
VTTI Financial Projections – Sensitivity Case I
2017E Adjusted EBITDA $98.5
Relevant EBITDA Multiple 9.5x - 11.0x
Implied Enterprise Value $935.9 -$1,083.6
2018E Adjusted EBITDA $100.4
Relevant EBITDA Multiple 9.0x - 11.0x
Implied Enterprise Value $903.8 -$1,104.6
Relevant Enterprise Value $903.8 - $1,104.6
Less: Estimated Net Debt on June 30, 2017 (348.0)
Implied Equity Value $555.8 -$756.6
Projected Units Outstanding (LP+GP) as of June 30, 2017 47.0
Implied VTTI Unit Price $11.82 -$16.08
VTTI Financial Projections – Sensitivity Case II
2017E Adjusted EBITDA $97.2
Relevant EBITDA Multiple 9.5x - 11.0x
Implied Enterprise Value $923.8 -$1,069.7
2018E Adjusted EBITDA $97.6
Relevant EBITDA Multiple 9.0x - 11.0x
Implied Enterprise Value $878.6 -$1,073.8
Relevant Enterprise Value $878.6 - $1,073.8
Less: Estimated Net Debt on June 30, 2017 (348.5)
Implied Equity Value $530.1 -$725.3
Projected Units Outstanding (LP+GP) as of June 30, 2017 47.0
Implied VTTI Unit Price $11.27 -$15.42
EVERCORE 18 vtti energy partners
Preliminary Draft – Confidential
Preliminary VTTI Valuation Analysis
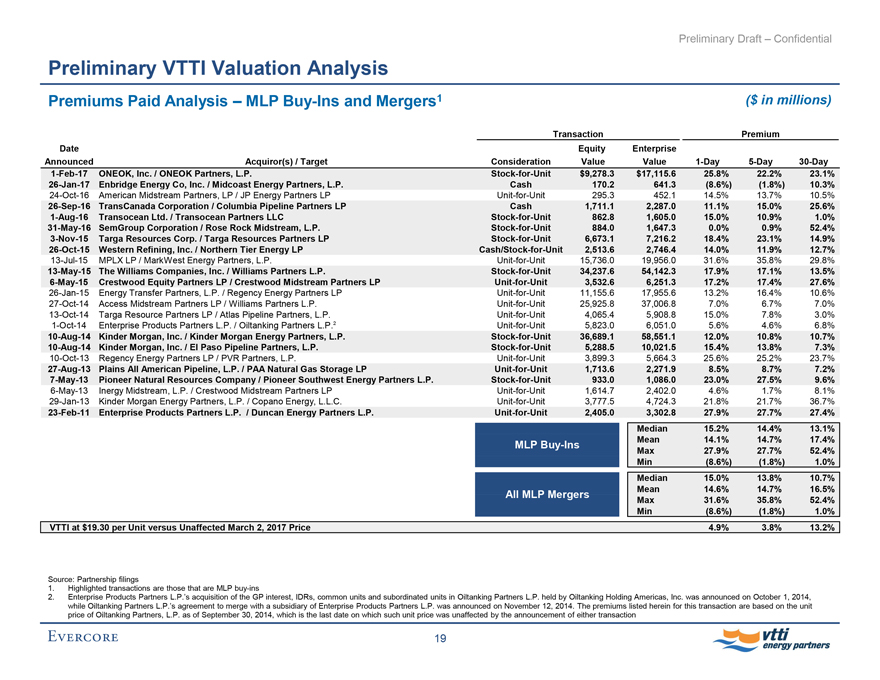
Premiums Paid Analysis – MLPBuy-Ins and Mergers1 ($ in millions)
Transaction Premium
Date Equity Enterprise
Announced Acquiror(s) / Target Consideration Value Value1-Day5-Day30-Day
1-Feb-17 ONEOK, Inc. / ONEOK Partners, L.P.Stock-for-Unit $9,278.3 $17,115.6 25.8% 22.2% 23.1%
26-Jan-17 Enbridge Energy Co, Inc. / Midcoast Energy Partners, L.P. Cash 170.2 641.3 (8.6%) (1.8%) 10.3%
24-Oct-16 American Midstream Partners, LP / JP Energy Partners LPUnit-for-Unit 295.3 452.1 14.5% 13.7% 10.5%
26-Sep-16 TransCanada Corporation / Columbia Pipeline Partners LP Cash 1,711.1 2,287.0 11.1% 15.0% 25.6%
1-Aug-16 Transocean Ltd. / Transocean Partners LLCStock-for-Unit 862.8 1,605.0 15.0% 10.9% 1.0%
31-May-16 SemGroup Corporation / Rose Rock Midstream, L.P.Stock-for-Unit 884.0 1,647.3 0.0% 0.9% 52.4%
3-Nov-15 Targa Resources Corp. / Targa Resources Partners LPStock-for-Unit 6,673.1 7,216.2 18.4% 23.1% 14.9%
26-Oct-15 Western Refining, Inc. / Northern Tier Energy LPCash/Stock-for-Unit 2,513.6 2,746.4 14.0% 11.9% 12.7%
13-Jul-15 MPLX LP / MarkWest Energy Partners, L.P.Unit-for-Unit 15,736.0 19,956.0 31.6% 35.8% 29.8%
13-May-15 The Williams Companies, Inc. / Williams Partners L.P.Stock-for-Unit 34,237.6 54,142.3 17.9% 17.1% 13.5%
6-May-15 Crestwood Equity Partners LP / Crestwood Midstream Partners LPUnit-for-Unit 3,532.6 6,251.3 17.2% 17.4% 27.6%
26-Jan-15 Energy Transfer Partners, L.P. / Regency Energy Partners LPUnit-for-Unit 11,155.6 17,955.6 13.2% 16.4% 10.6%
27-Oct-14 Access Midstream Partners LP / Williams Partners L.P.Unit-for-Unit 25,925.8 37,006.8 7.0% 6.7% 7.0%
13-Oct-14 Targa Resource Partners LP / Atlas Pipeline Partners, L.P.Unit-for-Unit 4,065.4 5,908.8 15.0% 7.8% 3.0%
1-Oct-14 Enterprise Products Partners L.P. / Oiltanking Partners L.P.2Unit-for-Unit 5,823.0 6,051.0 5.6% 4.6% 6.8%
10-Aug-14 Kinder Morgan, Inc. / Kinder Morgan Energy Partners, L.P.Stock-for-Unit 36,689.1 58,551.1 12.0% 10.8% 10.7%
10-Aug-14 Kinder Morgan, Inc. / El Paso Pipeline Partners, L.P.Stock-for-Unit 5,288.5 10,021.5 15.4% 13.8% 7.3%
10-Oct-13 Regency Energy Partners LP / PVR Partners, L.P.Unit-for-Unit 3,899.3 5,664.3 25.6% 25.2% 23.7%
27-Aug-13 Plains All American Pipeline, L.P. / PAA Natural Gas Storage LPUnit-for-Unit 1,713.6 2,271.9 8.5% 8.7% 7.2%
7-May-13 Pioneer Natural Resources Company / Pioneer Southwest Energy Partners L.P.Stock-for-Unit 933.0 1,086.0 23.0% 27.5% 9.6%
6-May-13 Inergy Midstream, L.P. / Crestwood Midstream Partners LPUnit-for-Unit 1,614.7 2,402.0 4.6% 1.7% 8.1%
29-Jan-13 Kinder Morgan Energy Partners, L.P. / Copano Energy, L.L.C.Unit-for-Unit 3,777.5 4,724.3 21.8% 21.7% 36.7%
23-Feb-11 Enterprise Products Partners L.P. / Duncan Energy Partners L.P.Unit-for-Unit 2,405.0 3,302.8 27.9% 27.7% 27.4%
Median 15.2% 14.4% 13.1%
MLPBuy-Ins Mean 14.1% 14.7% 17.4%
Max 27.9% 27.7% 52.4%
Min (8.6%) (1.8%) 1.0%
Median 15.0% 13.8% 10.7%
All MLP Mergers Mean 14.6% 14.7% 16.5%
Max 31.6% 35.8% 52.4%
Min (8.6%) (1.8%) 1.0%
VTTI at $19.30 per Unit versus Unaffected March 2, 2017 Price 4.9% 3.8% 13.2%
Source: Partnership filings
1. Highlighted transactions are those that are MLPbuy-ins
2. Enterprise Products Partners L.P.’s acquisition of the GP interest, IDRs, common units and subordinated units in Oiltanking Partners L.P. held by Oiltanking Holding Americas, Inc. was announced on October 1, 2014, while Oiltanking Partners L.P.’s agreement to merge with a subsidiary of Enterprise Products Partners L.P. was announced on November 12, 2014. The premiums listed herein for this transaction are based on the unit price of Oiltanking Partners, L.P. as of September 30, 2014, which is the last date on which such unit price was unaffected by the announcement of either transaction
EVERCORE 19 vtti energy partners
Preliminary Draft – Confidential
Preliminary VTTI Valuation Analysis
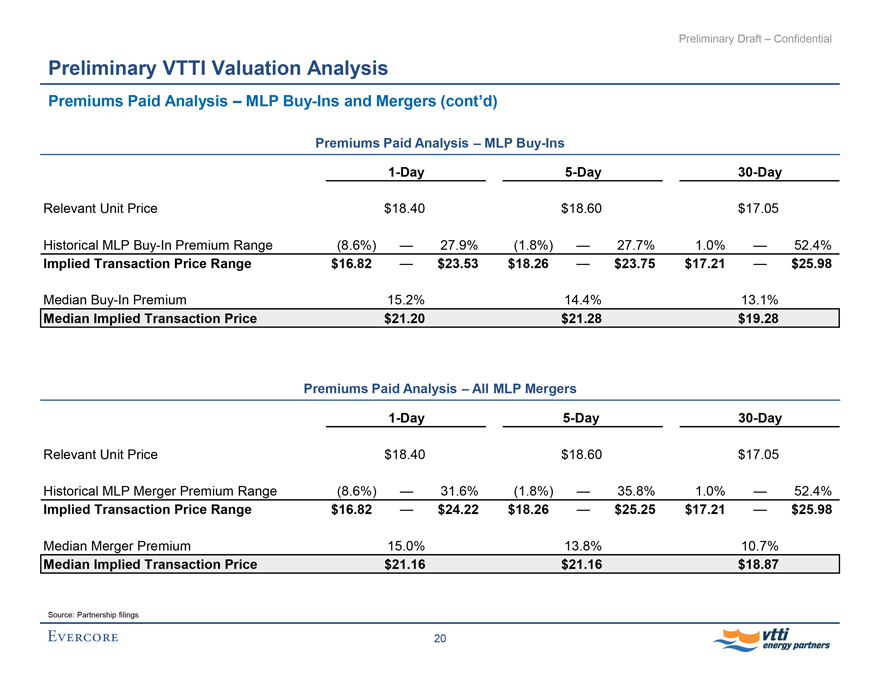
Premiums Paid Analysis – MLPBuy-Ins and Mergers (cont’d)
Premiums Paid Analysis – MLPBuy-Ins
1-Day5-Day30-Day
Relevant Unit Price $18.40 $18.60 $17.05
Historical MLPBuy-In Premium Range (8.6%) -27.9% (1.8%) -27.7% 1.0% -52.4%
Implied Transaction Price Range $16.82 -$23.53 $18.26 -$23.75 $17.21 -$25.98
MedianBuy-In Premium 15.2% 14.4% 13.1%
Median Implied Transaction Price $21.20 $21.28 $19.28
Premiums Paid Analysis – All MLP Mergers
1-Day5-Day30-Day
Relevant Unit Price $18.40 $18.60 $17.05
Historical MLP Merger Premium Range (8.6%) -31.6% (1.8%) -35.8% 1.0% -52.4%
Implied Transaction Price Range $16.82 -$24.22 $18.26 -$25.25 $17.21 -$25.98
Median Merger Premium 15.0% 13.8% 10.7%
Median Implied Transaction Price $21.16 $21.16 $18.87
Source: Partnership filings
EVERCORE 20 vtti energy partners