Exhibit (c)(8)
Confidential
The Conflicts Committee of the Board of Directors of VTTI Energy Partners GP LLC
Discussion Materials Regarding Project Terminal Velocity May 5, 2017
Evercore vtti energy partners
Confidential
These materials have been prepared by Evercore Group L.L.C. (“Evercore”) for the Conflicts Committee of the Board of Directors of VTTI Energy Partners GP LLC (“VTGP”) to whom such materials are directly addressed and delivered and may not be used or relied upon for any purpose other than as specifically contemplated by a written agreement with Evercore. These materials are based on information provided by or on behalf of the Board and/or other potential transaction participants, from public sources or otherwise reviewed by Evercore. Evercore assumes no responsibility for independent investigation or verification of such information and has relied on such information being complete and accurate in all material respects. To the extent such information includes estimates and forecasts of future financial performance prepared by or reviewed with the management of the Board and/or other potential transaction participants or obtained from public sources, Evercore has assumed that such estimates and forecasts have been reasonably prepared on bases reflecting the best currently available estimates and judgments of such management (or, with respect to estimates and forecasts obtained from public sources, represent reasonable estimates). No representation or warranty, express or implied, is made as to the accuracy or completeness of such information and nothing contained herein is, or shall be relied upon as, a representation, whether as to the past, the present or the future. These materials were designed for use by specific persons familiar with the business and affairs of the Board. These materials are not intended to provide the sole basis for evaluating, and should not be considered a recommendation with respect to, any transaction or other matter. These materials have been developed by and are proprietary to Evercore and were prepared exclusively for the benefit and internal use of the Board.
These materials were compiled on a confidential basis for use by the Board in evaluating the potential transaction described herein and not with a view to public disclosure or filing thereof under state or federal securities laws, and may not be reproduced, disseminated, quoted or referred to, in whole or in part, without the prior written consent of Evercore.
These materials do not constitute an offer or solicitation to sell or purchase any securities and are not a commitment by Evercore (or any affiliate) to provide or arrange any financing for any transaction or to purchase any security in connection therewith. Evercore assumes no obligation to update or otherwise revise these materials. These materials may not reflect information known to other professionals in other business areas of Evercore and its affiliates.
Evercore and its affiliates do not provide legal, accounting or tax advice. Accordingly, any statements contained herein as to tax matters were neither written nor intended by Evercore or its affiliates to be used and cannot be used by any taxpayer for the purpose of avoiding tax penalties that may be imposed on such taxpayer. Each person should seek legal, accounting and tax advice based on his, her or its particular circumstances from independent advisors regarding the impact of the transactions or matters described herein.
Evercore vtti energy partners
Confidential
Table of Contents
Section
Executive Summary
I
VTTI Situation Analysis
II
VTTI Operating Asset Overview and Projections
III
VTTI Financial Projections
IV
Preliminary VTTI Valuation Analysis
V
Appendix
A. Weighted Average Cost of Capital Analysis
B. Selected Historical Market Data
Evercore vtti energy partners
Confidential
I. Executive Summary
Evercore
Confidential
Executive Summary
Introduction
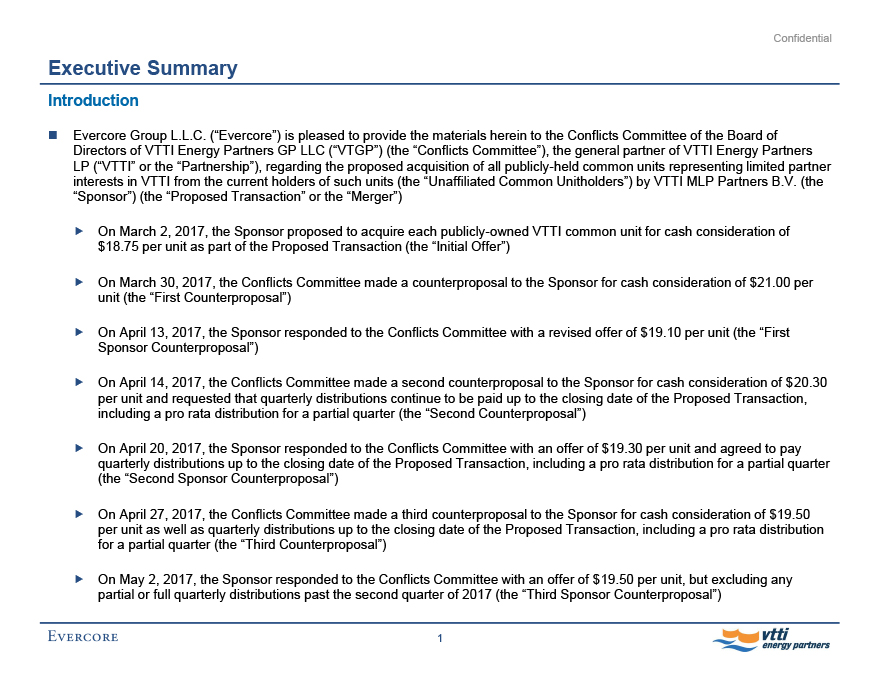
Evercore Group L.L.C. (“Evercore”) is pleased to provide the materials herein to the Conflicts Committee of the Board of Directors of VTTI Energy Partners GP LLC (“VTGP”) (the “Conflicts Committee”), the general partner of VTTI Energy Partners LP (“VTTI” or the “Partnership”), regarding the proposed acquisition of all publicly-held common units representing limited partner interests in VTTI from the current holders of such units (the “Unaffiliated Common Unitholders”) by VTTI MLP Partners B.V. (the “Sponsor”) (the “Proposed Transaction” or the “Merger”)
On March 2, 2017, the Sponsor proposed to acquire each publicly-owned VTTI common unit for cash consideration of
$18.75 per unit as part of the Proposed Transaction (the “Initial Offer”)
On March 30, 2017, the Conflicts Committee made a counterproposal to the Sponsor for cash consideration of $21.00 per unit (the “First Counterproposal”)
On April 13, 2017, the Sponsor responded to the Conflicts Committee with a revised offer of $19.10 per unit (the “First Sponsor Counterproposal”)
On April 14, 2017, the Conflicts Committee made a second counterproposal to the Sponsor for cash consideration of $20.30 per unit and requested that quarterly distributions continue to be paid up to the closing date of the Proposed Transaction, including a pro rata distribution for a partial quarter (the “Second Counterproposal”)
On April 20, 2017, the Sponsor responded to the Conflicts Committee with an offer of $19.30 per unit and agreed to pay quarterly distributions up to the closing date of the Proposed Transaction, including a pro rata distribution for a partial quarter
(the “Second Sponsor Counterproposal”)
On April 27, 2017, the Conflicts Committee made a third counterproposal to the Sponsor for cash consideration of $19.50 per unit as well as quarterly distributions up to the closing date of the Proposed Transaction, including a pro rata distribution for a partial quarter (the “Third Counterproposal”)
On May 2, 2017, the Sponsor responded to the Conflicts Committee with an offer of $19.50 per unit, but excluding any partial or full quarterly distributions past the second quarter of 2017 (the “Third Sponsor Counterproposal”)
1
Evercore vtti energy partners
Confidential
Executive Summary
Introduction (cont’d)
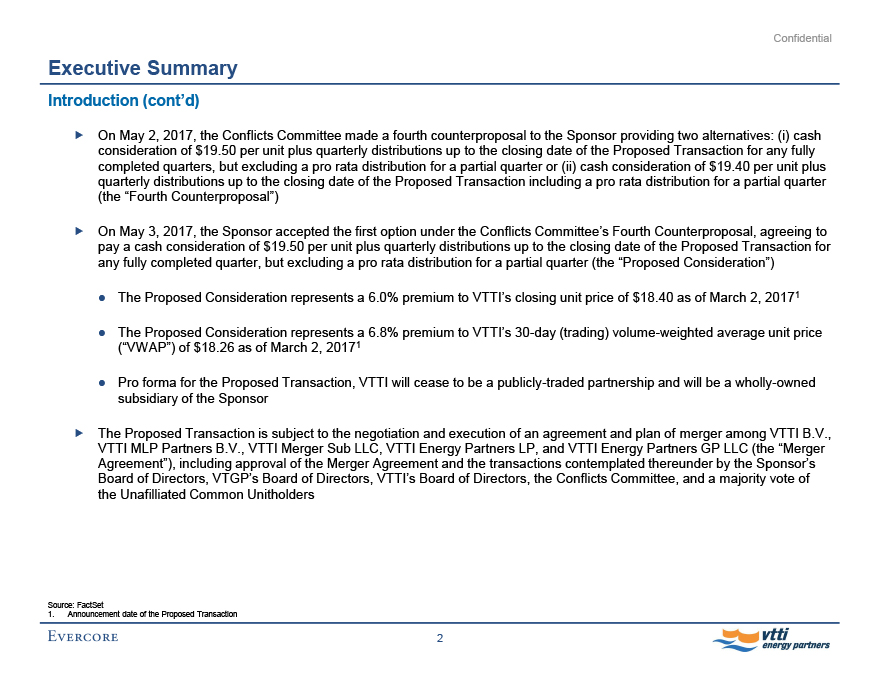
On May 2, 2017, the Conflicts Committee made a fourth counterproposal to the Sponsor providing two alternatives: (i) cash consideration of $19.50 per unit plus quarterly distributions up to the closing date of the Proposed Transaction for any fully completed quarters, but excluding a pro rata distribution for a partial quarter or (ii) cash consideration of $19.40 per unit plus quarterly distributions up to the closing date of the Proposed Transaction including a pro rata distribution for a partial quarter
(the “Fourth Counterproposal”)
On May 3, 2017, the Sponsor accepted the first option under the Conflicts Committee’s Fourth Counterproposal, agreeing to pay a cash consideration of $19.50 per unit plus quarterly distributions up to the closing date of the Proposed Transaction for any fully completed quarter, but excluding a pro rata distribution for a partial quarter (the “Proposed Consideration”)
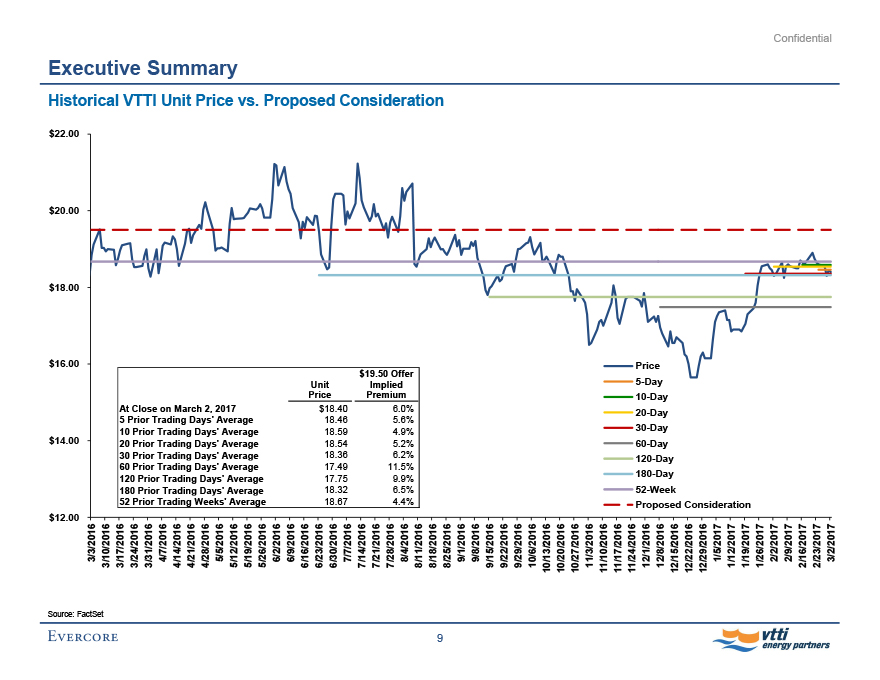
The Proposed Consideration represents a 6.0% premium to VTTI’s closing unit price of $18.40 as of March 2, 20171
The Proposed Consideration represents a 6.8% premium to VTTI’s 30-day (trading) volume-weighted average unit price
(“VWAP”) of $18.26 as of March 2, 20171
Pro forma for the Proposed Transaction, VTTI will cease to be a publicly-traded partnership and will be a wholly-owned subsidiary of the Sponsor
The Proposed Transaction is subject to the negotiation and execution of an agreement and plan of merger among VTTI B.V.,
VTTI MLP Partners B.V., VTTI Merger Sub LLC, VTTI Energy Partners LP, and VTTI Energy Partners GP LLC (the “Merger Agreement”), including approval of the Merger Agreement and the transactions contemplated thereunder by the Sponsor’s Board of Directors, VTGP’s Board of Directors, VTTI’s Board of Directors, the Conflicts Committee, and a majority vote of the Unafilliated Common Unitholders
Source: FactSet
1. Announcement date of the Proposed Transaction
2
Evercore vtti energy partners
Confidential
Executive Summary
Overview of Materials
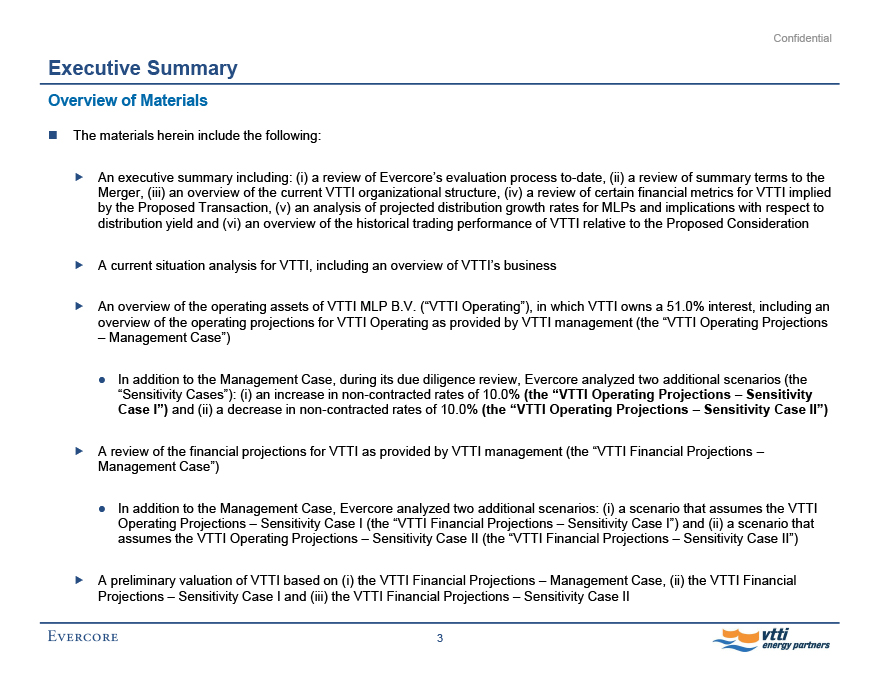
The materials herein include the following:
An executive summary including: (i) a review of Evercore’s evaluation process to-date, (ii) a review of summary terms to the Merger, (iii) an overview of the current VTTI organizational structure, (iv) a review of certain financial metrics for VTTI implied by the Proposed Transaction, (v) an analysis of projected distribution growth rates for MLPs and implications with respect to distribution yield and (vi) an overview of the historical trading performance of VTTI relative to the Proposed Consideration
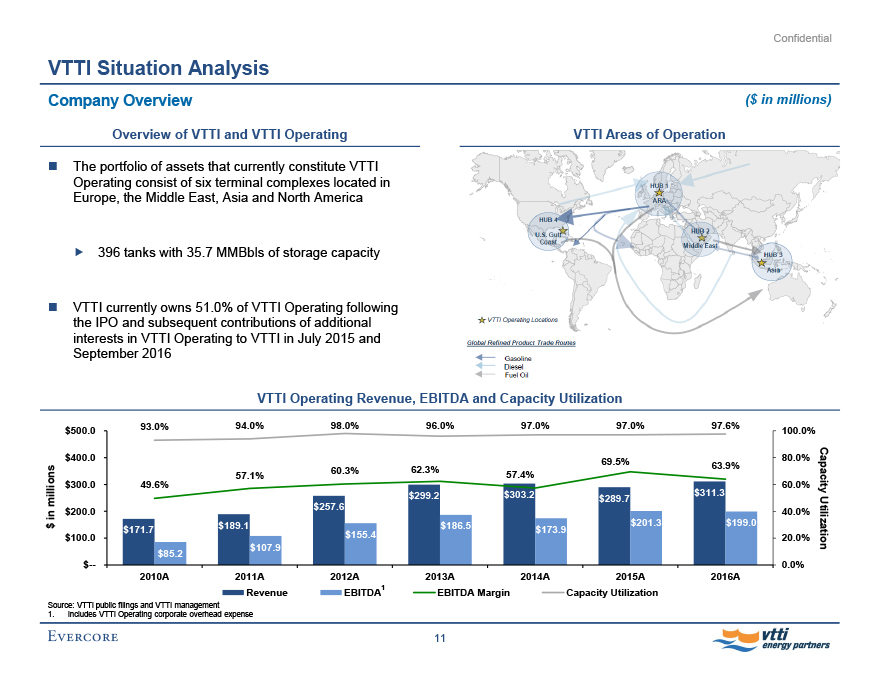
A current situation analysis for VTTI, including an overview of VTTI’s business
An overview of the operating assets of VTTI MLP B.V. (“VTTI Operating”), in which VTTI owns a 51.0% interest, including an overview of the operating projections for VTTI Operating as provided by VTTI management (the “VTTI Operating Projections
– Management Case”)
• In addition to the Management Case, during its due diligence review, Evercore analyzed two additional scenarios (the “Sensitivity Cases”): (i) an increase in non-contracted rates of 10.0% (the “VTTI Operating Projections – Sensitivity Case I”) and (ii) a decrease in non-contracted rates of 10.0% (the “VTTI Operating Projections – Sensitivity Case II”)
A review of the financial projections for VTTI as provided by VTTI management (the “VTTI Financial Projections – Management Case”)
In addition to the Management Case, Evercore analyzed two additional scenarios: (i) a scenario that assumes the VTTI Operating Projections – Sensitivity Case I (the “VTTI Financial Projections – Sensitivity Case I”) and (ii) a scenario that assumes the VTTI Operating Projections – Sensitivity Case II (the “VTTI Financial Projections – Sensitivity Case II”)
A preliminary valuation of VTTI based on (i) the VTTI Financial Projections – Management Case, (ii) the VTTI Financial Projections – Sensitivity Case I and (iii) the VTTI Financial Projections – Sensitivity Case II
3
Evercore vtti energy partners
Confidential
Executive Summary
Evercore Evaluation Process
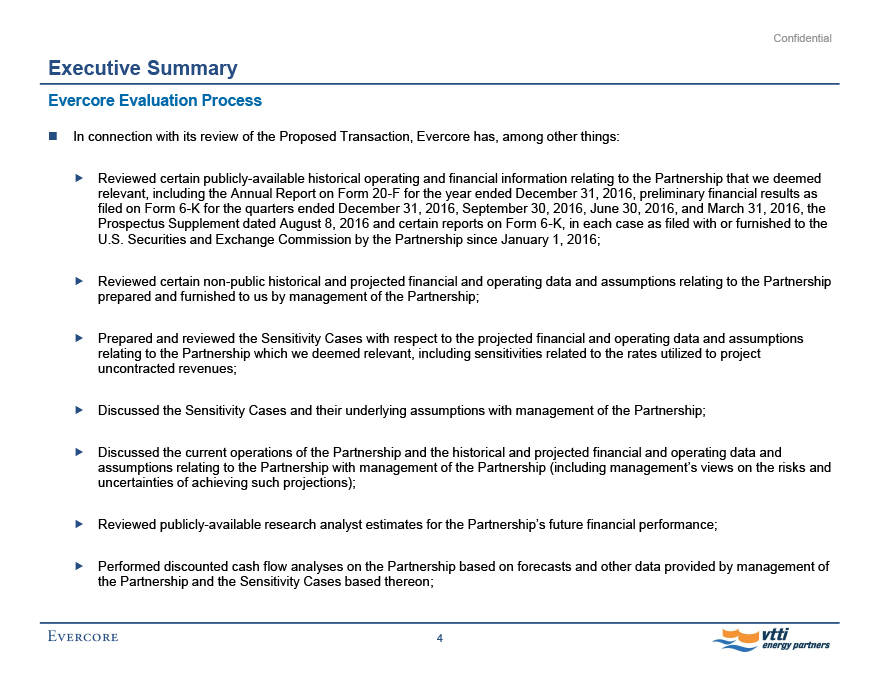
In connection with its review of the Proposed Transaction, Evercore has, among other things:
Reviewed certain publicly-available historical operating and financial information relating to the Partnership that we deemed relevant, including the Annual Report on Form 20-F for the year ended December 31, 2016, preliminary financial results as filed on Form 6-K for the quarters ended December 31, 2016, September 30, 2016, June 30, 2016, and March 31, 2016, the Prospectus Supplement dated August 8, 2016 and certain reports on Form 6-K, in each case as filed with or furnished to the U.S. Securities and Exchange Commission by the Partnership since January 1, 2016;
Reviewed certain non-public historical and projected financial and operating data and assumptions relating to the Partnership prepared and furnished to us by management of the Partnership;
Prepared and reviewed the Sensitivity Cases with respect to the projected financial and operating data and assumptions relating to the Partnership which we deemed relevant, including sensitivities related to the rates utilized to project uncontracted revenues;
Discussed the Sensitivity Cases and their underlying assumptions with management of the Partnership;
Discussed the current operations of the Partnership and the historical and projected financial and operating data and assumptions relating to the Partnership with management of the Partnership (including management’s views on the risks and uncertainties of achieving such projections);
Reviewed publicly-available research analyst estimates for the Partnership’s future financial performance;
Performed discounted cash flow analyses on the Partnership based on forecasts and other data provided by management of the Partnership and the Sensitivity Cases based thereon;
4
Evercore vtti energy partners
Confidential
Executive Summary
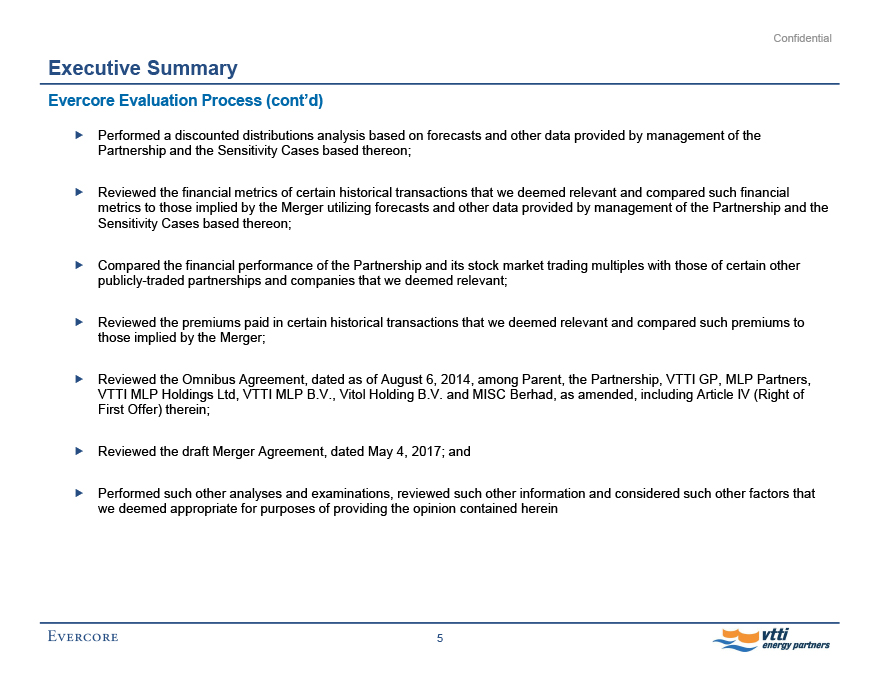
Evercore Evaluation Process (cont’d)
Performed a discounted distributions analysis based on forecasts and other data provided by management of the Partnership and the Sensitivity Cases based thereon;
Reviewed the financial metrics of certain historical transactions that we deemed relevant and compared such financial metrics to those implied by the Merger utilizing forecasts and other data provided by management of the Partnership and the Sensitivity Cases based thereon;
Compared the financial performance of the Partnership and its stock market trading multiples with those of certain other publicly-traded partnerships and companies that we deemed relevant;
Reviewed the premiums paid in certain historical transactions that we deemed relevant and compared such premiums to those implied by the Merger;
Reviewed the Omnibus Agreement, dated as of August 6, 2014, among Parent, the Partnership, VTTI GP, MLP Partners, VTTI MLP Holdings Ltd, VTTI MLP B.V., Vitol Holding B.V. and MISC Berhad, as amended, including Article IV (Right of First Offer) therein;
Reviewed the draft Merger Agreement, dated May 4, 2017; and
Performed such other analyses and examinations, reviewed such other information and considered such other factors that we deemed appropriate for purposes of providing the opinion contained herein
5
Evercore vtti energy partners
Confidential
Executive Summary
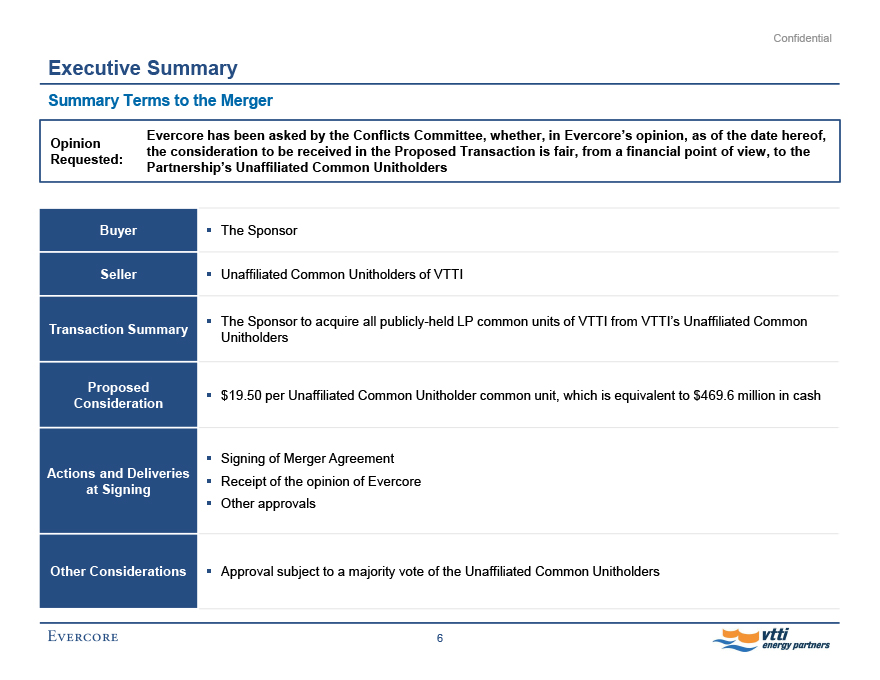
Summary Terms to the Merger
Opinion Requested:
Evercore has been asked by the Conflicts Committee, whether, in Evercore’s opinion, as of the date hereof, the consideration to be received in the Proposed Transaction is fair, from a financial point of view, to the Partnership’s Unaffiliated Common Unitholders
Buyer
The Sponsor
Seller
Unaffiliated Common Unitholders of VTTI
Transaction Summary
The Sponsor to acquire all publicly-held LP common units of VTTI from VTTI’s Unaffiliated Common
Unitholders
Proposed
$19.50 per Unaffiliated Common Unitholder common unit, which is equivalent to $469.6 million in cash
Consideration
Signing of Merger Agreement
Actions and Deliveries
Receipt of the opinion of Evercore
at Signing
Other approvals
Other Considerations
Approval subject to a majority vote of the Unaffiliated Common Unitholders
6
Evercore vtti energy partners
Confidential
Executive Summary
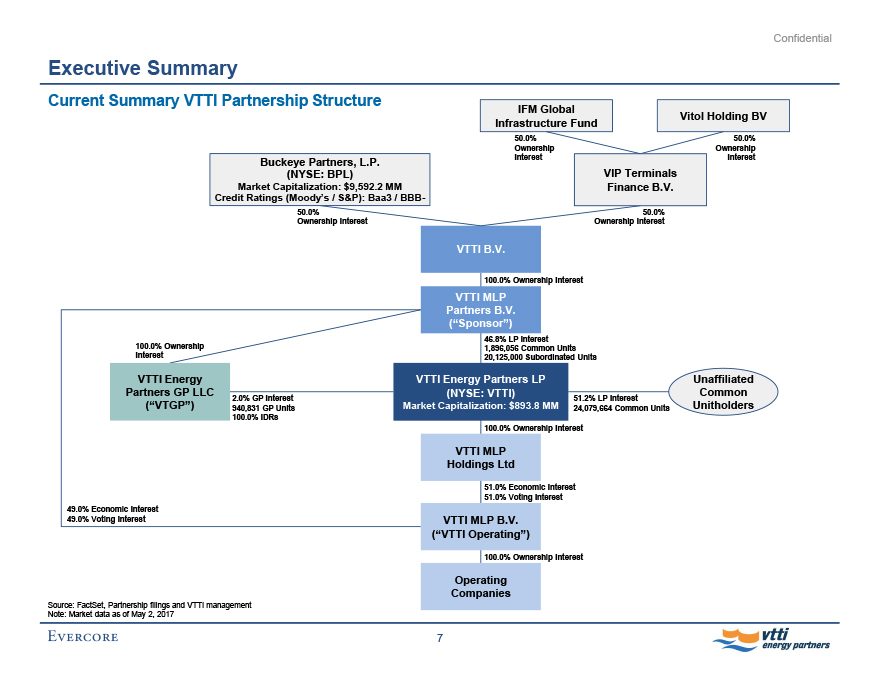
Current Summary VTTI Partnership Structure
Buckeye Partners, L.P.
(NYSE: BPL)
Market Capitalization: $9,592.2 MM
Credit Ratings (Moody’s / S&P): Baa3 / BBB-
50.0%
Ownership Interest
IFM Global
Infrastructure Fund
50.0%
Ownership
Interest
Vitol Holding BV
50.0%
Ownership
Interest
VIP Terminals
Finance B.V.
50.0%
Ownership Interest
100.0% Ownership Interest
VTTI Energy Partners GP LLC
(“VTGP”)
2.0% GP Interest
940,831 GP Units
100.0% IDRs
49.0% Economic Interest
49.0% Voting Interest
VTTI B.V.
100.0% Ownership Interest
VTTI MLP
Partners B.V.
(“Sponsor”)
46.8% LP Interest
1,896,056 Common Units
20,125,000 Subordinated Units
VTTI Energy Partners LP (NYSE: VTTI)
Market Capitalization: $893.8 MM
51.2% LP Interest
24,079,664 Common Units
Unaffiliated Common Unitholders
100.0% Ownership Interest
VTTI MLP
Holdings Ltd
51.0% Economic Interest
51.0% Voting Interest
VTTI MLP B.V.
(“VTTI Operating”)
100.0% Ownership Interest
Operating
Companies
Source: FactSet, Partnership filings and VTTI management Note: Market data as of May 2, 2017
7
Evercore vtti energy partners
Confidential
Executive Summary
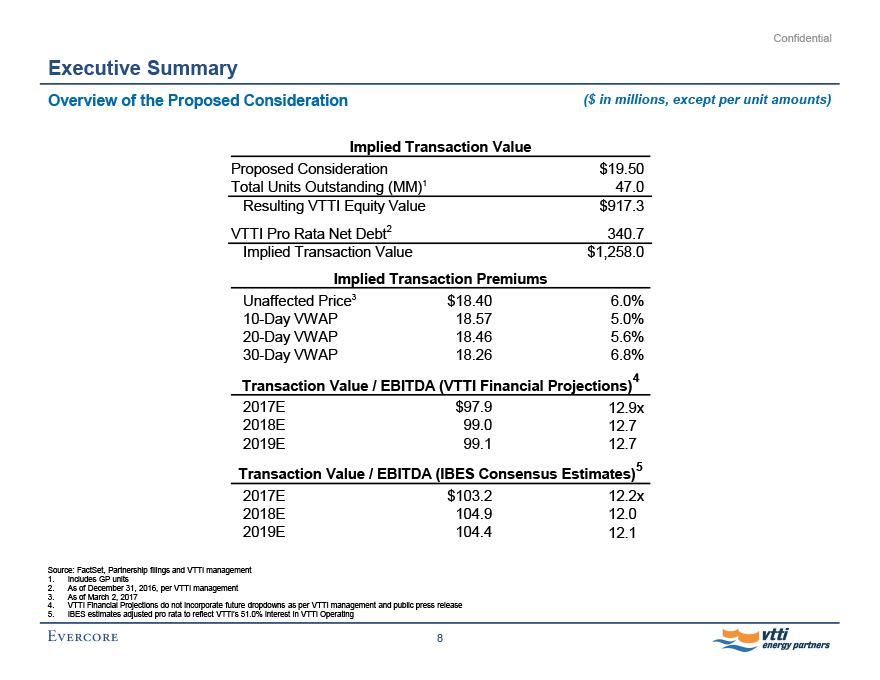
Overview of the Proposed Consideration ($ in millions, except per unit amounts)
Implied Transaction Value
Proposed Consideration
$19.50
Total Units Outstanding (MM)1
47.0
Resulting VTTI Equity Value
$917.3
VTTI Pro Rata Net Debt2
340.7
Implied Transaction Value
$1,258.0
Implied Transaction Premiums
Unaffected Price3
$18.40
6.0%
10-Day VWAP
18.57
5.0%
20-Day VWAP
18.46
5.6%
30-Day VWAP
18.26
6.8%
Transaction Value / EBITDA (VTTI Financial Projections)4
2017E
$97.9
12.9x
2018E
99.0
12.7
2019E
99.1
12.7
Transaction Value / EBITDA (IBES Consensus Estimates)5
2017E
$103.2
12.2x
2018E
104.9
12.0
2019E
104.4
12.1
Source: FactSet, Partnership filings and VTTI management
1. Includes GP units
2. As of December 31, 2016, per VTTI management
3. As of March 2, 2017
4. VTTI Financial Projections do not incorporate future dropdowns as per VTTI management and public press release
5. IBES estimates adjusted pro rata to reflect VTTI’s 51.0% interest in VTTI Operating
8
Evercore vtti energy partners
Confidential
Executive Summary Historical VTTI Unit Price vs. Proposed Consideration $22.00 $20.00 $18.00 $16.00 $14.00 $12.00 $19.50 Offer Unit Implied Price Premium At Close on March 2, 2017 $18.40 6.0% 5 Prior Trading Days’ Average 18.46 5.6% 10 Prior Trading Days’ Average 18.59 4.9% 20 Prior Trading Days’ Average 18.54 5.2% 30 Prior Trading Days’ Average 18.36 6.2% 60 Prior Trading Days’ Average 17.49 11.5% 120 Prior Trading Days’ Average 17.75 9.9% 180 Prior Trading Days’ Average 18.32 6.5% 52 Prior Trading Weeks’ Average 18.67 4.4% Price 5-Day 10-Day 20-Day 30-Day 60-Day 120-Day 180-Day 52-Week Proposed Consideration 3/3/2016 3/10/2016 3/17/2016 3/24/2016 3/31/2016 4/7/2016 4/14/2016 4/21/2016 4/28/2016 5/5/2016 5/12/2016 5/19/2016 5/26/2016 6/2/2016 6/9/2016 6/16/2016 6/23/2016 6/30/2016 7/7/2016 7/14/2016 7/21/2016 7/28/2016 8/4/2016 8/11/2016 8/18/2016 8/25/2016 9/1/2016 9/8/2016 9/15/2016 9/22/2016 9/29/2016 10/6/2016 10/13/2016 10/20/2016 10/27/2016 11/3/2016 11/10/2016 11/17/2016 11/24/2016 12/1/2016 12/8/2016 12/15/2016 12/22/2016 12/29/2016 1/5/2017 1/12/2017 1/19/2017 1/26/2017 2/2/2017 2/9/2017 2/16/2017 2/23/2017 3/2/2017 Source: FactSet 9
Evercore vtti energy partners
Confidential
Executive Summary
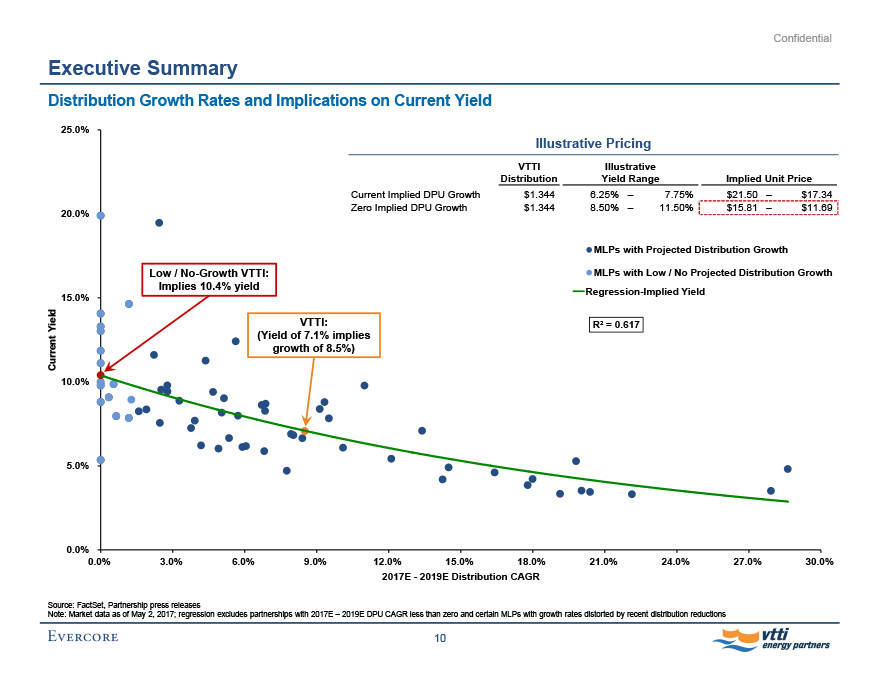
Distribution Growth Rates and Implications on Current Yield
Current Yield
25.0%
20.0%
15.0%
10.0%
5.0%
0.0%
Illustrative Pricing
VTTI
Illustrative
Distribution
Yield Range
Implied Unit Price
Current Implied DPU Growth
$1.344
6.25%
–
7.75%
$21.50
–
$17.34
Zero Implied DPU Growth
$1.344
8.50%
–
11.50%
$15.81
–
$11.69
Low / No-Growth VTTI: Implies 10.4% yield
VTTI:
(Yield of 7.1% implies growth of 8.5%)
MLPs with Projected Distribution Growth
MLPs with Low / No Projected Distribution Growth Regression-Implied Yield
R² = 0.617
0.0%
3.0%
6.0%
9.0%
12.0%
15.0%
18.0%
21.0%
24.0%
27.0%
30.0%
2017E - 2019E Distribution CAGR
Source: FactSet, Partnership press releases
Note: Market data as of May 2, 2017; regression excludes partnerships with 2017E – 2019E DPU CAGR less than zero and certain MLPs with growth rates distorted by recent distribution reductions
10
Evercore vtti energy partners
Confidential
II. VTTI Situation Analysis
Evercore vtti energy partners
Confidential
HUB 4 U.S. Gulf Coast HUB 1 ARA HUB 2 Middle East HUB 3 Asia VTTI Operating Locations Global Refined Product Trade Routes Gasoline Diesel Fuel Oil VTTI Situation Analysis Company Overview ($ in millions) Overview of VTTI and VTTI Operating The portfolio of assets that currently constitute VTTI Operating consist of six terminal complexes located in Europe, the Middle East, Asia and North America 396 tanks with 35.7 MMBbls of storage capacity VTTI currently owns 51.0% of VTTI Operating following the IPO and subsequent contributions of additional interests in VTTI Operating to VTTI in July 2015 and September 2016 VTTI Areas of Operation VTTI Operating Revenue, EBITDA and Capacity Utilization $ in millions $500.0 $400.0 $300.0 $200.0 $100.0 $-- 93.0% 94.0% 98.0% 96.0% 97.0% 97.0% 97.6% 69.5% 57.1% 60.3% 62.3% 57.4% 63.9% 49.6% $299.2 $303.2 $289.7 $311.3 $257.6 $189.1 $186.5 $201.3 $199.0 $171.7 $155.4 $173.9 $85.2 $107.9 2010A 2011A 2012A 2013A 2014A 2015A 2016A 100.0% 80.0% 60.0% 40.0% 20.0% 0.0% Capacity Utilization 1 Revenue EBITDA EBITDA Margin Capacity Utilization Source: VTTI public filings and VTTI management 1. Includes VTTI Operating corporate overhead expense 11
Evercore vtti energy partners
Confidential
VTTI Situation Analysis
Buckeye Energy Partners, L.P. Acquisition of 50.0% Interest in VTTI B.V.
Transaction Overview
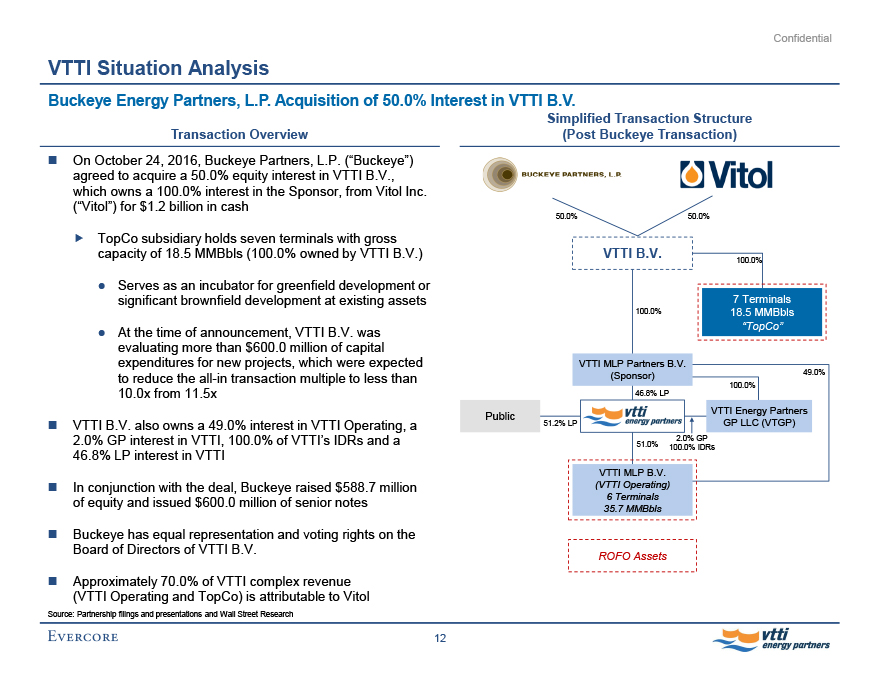
On October 24, 2016, Buckeye Partners, L.P. (“Buckeye”) agreed to acquire a 50.0% equity interest in VTTI B.V., which owns a 100.0% interest in the Sponsor, from Vitol Inc.
(“Vitol”) for $1.2 billion in cash
TopCo subsidiary holds seven terminals with gross capacity of 18.5 MMBbls (100.0% owned by VTTI B.V.)
Serves as an incubator for greenfield development or significant brownfield development at existing assets
At the time of announcement, VTTI B.V. was evaluating more than $600.0 million of capital expenditures for new projects, which were expected to reduce the all-in transaction multiple to less than
10.0x from 11.5x
VTTI B.V. also owns a 49.0% interest in VTTI Operating, a
2.0% GP interest in VTTI, 100.0% of VTTI���s IDRs and a
46.8% LP interest in VTTI
In conjunction with the deal, Buckeye raised $588.7 million of equity and issued $600.0 million of senior notes
Buckeye has equal representation and voting rights on the Board of Directors of VTTI B.V.
Approximately 70.0% of VTTI complex revenue (VTTI Operating and TopCo) is attributable to Vitol
Simplified Transaction Structure (Post Buckeye Transaction)
BUCKEYE PARTNERS, L.P.
Vitol
50.0% 50.0%
VTTI B.V.
100.0%
100.0%
7 Terminals
18.5 MMBbls
“TopCo”
VTTI MLP Partners B.V. (Sponsor)
46.8% LP
100.0%
49.0%
Public
51.2% LP
vtti energy partners
VTTI Energy Partners
GP LLC (VTGP)
51.0%
2.0% GP
100.0% IDRs
VTTI MLP B.V.
(VTTI Operating)
6 Terminals
35.7 MMBbls
ROFO Assets
Source: Partnership filings and presentations and Wall Street Research
12
Evercore vtti energy partners
Confidential
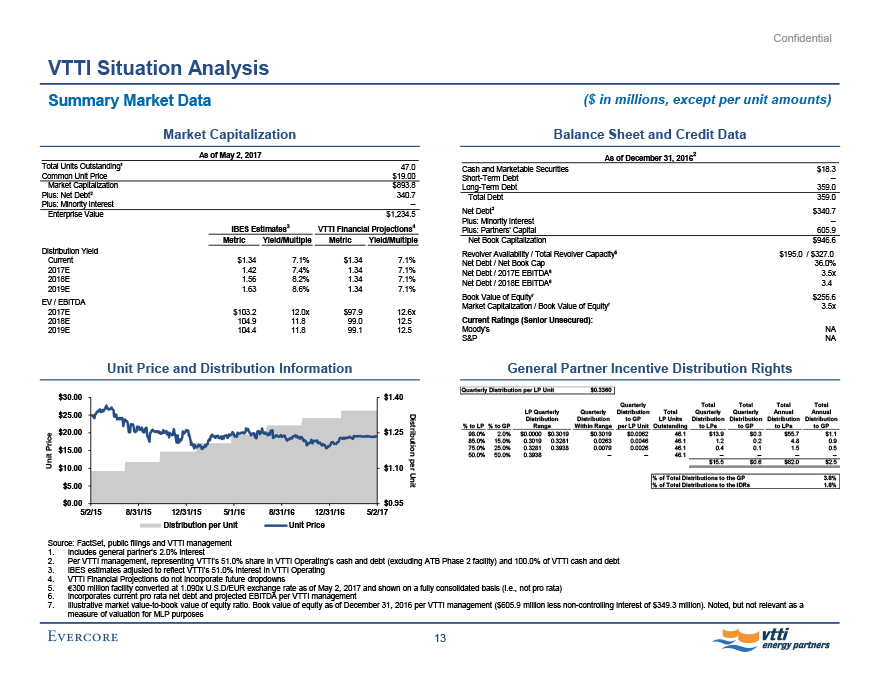
VTTI Situation Analysis Summary Market Data ($ in millions, except per unit amounts) Market Capitalization As of May 2, 2017 Total Units Outstanding1 47.0 Common Unit Price $19.00 Market Capitalization $893.8 Plus: Net Debt2 340.7 Plus: Minority Interest -- Enterprise Value $1,234.5 IBES Estimates3 VTTI Financial Projections4 Metric Yield/Multiple Metric Yield/Multiple Distribution Yield Current $1.34 7.1% $1.34 7.1% 2017E 1.42 7.4% 1.34 7.1% 2018E 1.56 8.2% 1.34 7.1% 2019E 1.63 8.6% 1.34 7.1% EV / EBITDA 2017E $103.2 12.0x $97.9 12.6x 2018E 104.9 11.8 99.0 12.5 2019E 104.4 11.8 99.1 12.5 Balance Sheet and Credit Data 2 As of December 31, 2016 Cash and Marketable Securities $18.3 Short-Term Debt -- Long-Term Debt 359.0 Total Debt 359.0 Net Debt2 $340.7 Plus: Minority Interest -- Plus: Partners’ Capital 605.9 Net Book Capitalization $946.6 Revolver Availability / Total Revolver Capacity5 $195.0 / $327.0 Net Debt / Net Book Cap 36.0% Net Debt / 2017E EBITDA6 3.5x Net Debt / 2018E EBITDA6 3.4 Book Value of Equity7 $256.6 Market Capitalization / Book Value of Equity7 3.5x Current Ratings (Senior Unsecured): Moody’s NA S&P NA Unit Price and Distribution Information Unit Price $30.00 $25.00 $20.00 $15.00 $10.00 $5.00 $0.00 $1.40 $1.25 $1.10 $0.95 Distribution per Unit 5/2/15 8/31/15 12/31/15 5/1/16 8/31/16 12/31/16 5/2/17 Distribution per Unit Unit Price General Partner Incentive Distribution Rights Quarterly Distribution per LP Unit $0.3360 Quarterly Total Total Total Total LP Quarterly Quarterly Distribution Total Quarterly Quarterly Annual Annual Distribution Distribution to GP LP Units Distribution Distribution Distribution Distribution % to LP % to GP Range Within Range per LP Unit Outstanding to LPs to GP to LPs to GP 98.0% 2.0% $0.0000 $0.3019 $0.3019 $0.0062 46.1 $13.9 $0.3 $55.7 $1.1 85.0% 15.0% 0.3019 0.3281 0.0263 0.0046 46.1 1.2 0.2 4.8 0.9 75.0% 25.0% 0.3281 0.3938 0.0079 0.0026 46.1 0.4 0.1 1.5 0.5 50.0% 50.0% 0.3938 -- -- 46.1 -- -- -- -- $15.5 $0.6 $62.0 $2.5 % of Total Distributions to the GP 3.8% % of Total Distributions to the IDRs
1.8% Source: FactSet, public filings and VTTI management
1. Includes general partner’s 2.0% interest 2. Per VTTI management, representing VTTI’s 51.0% share in VTTI Operating’s cash and debt (excluding ATB Phase 2 facility) and 100.0% of VTTI cash and debt
3. IBES estimates adjusted to reflect VTTI’s 51.0% interest in VTTI Operating 4. VTTI Financial Projections do not incorporate future dropdowns 5. €300 million facility converted at 1.090x U.S.D/EUR exchange rate as of May 2, 2017 and shown on a fully consolidated basis (i.e., not pro rata) 6. Incorporates current pro rata net debt and projected EBITDA per VTTI management 7. Illustrative market value-to-book value of equity ratio. Book value of equity as of December 31, 2016 per VTTI management ($605.9 million less non-controlling interest of $349.3 million). Noted, but not relevant as a measure of valuation for MLP purposes 13
Evercore vtti energy partners
Confidential
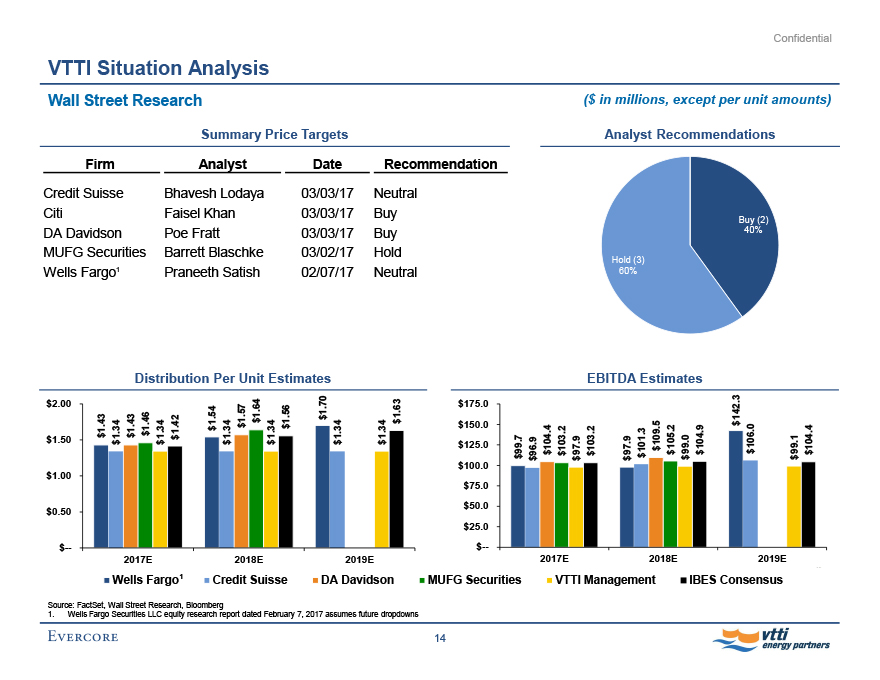
VTTI Situation Analysis Wall Street Research ($ in millions, except per unit amounts) Summary Price Targets Firm Analyst Date Recommendation Credit Suisse Bhavesh Lodaya 03/03/17 Neutral Citi Faisel Khan 03/03/17 Buy DA Davidson Poe Fratt 03/03/17 Buy MUFG Securities Barrett Blaschke 03/02/17 Hold Wells Fargo1 Praneeth Satish 02/07/17 Neutral Analyst Recommendations Hold (3) 60% Buy (2) 40% Distribution Per Unit Estimates $2.00 $1.50 $1.00 $0.50 $-- $1.43 $1.34 $1.43 $1.46 $1.34 $1.42 $1.54 $1.34 $1.57 $1.64 $1.34 $1.56 $1.70 $1.34 $1.34 $1.63 2017E 2018E 2019E EBITDA Estimates $175.0 $150.0 $125.0 $100.0 $75.0 $50.0 $25.0 $-- $99.7 $96.9 $104.4 $103.2 $97.9 $103.2 $97.9 $101.3 $109.5 $105.2 $99.0 $104.9 $142.3 $106.0 $99.1 $104.4 2017E 2018E 2019E Wells Fargo1 Credit Suisse DA Davidson MUFG Securities VTTI Management IBES Consensus Source: FactSet, Wall Street Research, Bloomberg 1. Wells Fargo Securities LLC equity research report dated February 7, 2017 assumes future dropdowns 14
Evercore vtti energy partners
Confidential
VTTI Situation Analysis
Historical Trading Performance
Unit Price
$40.00
$35.00
$30.00
$25.00
$20.00
$15.00
$10.00
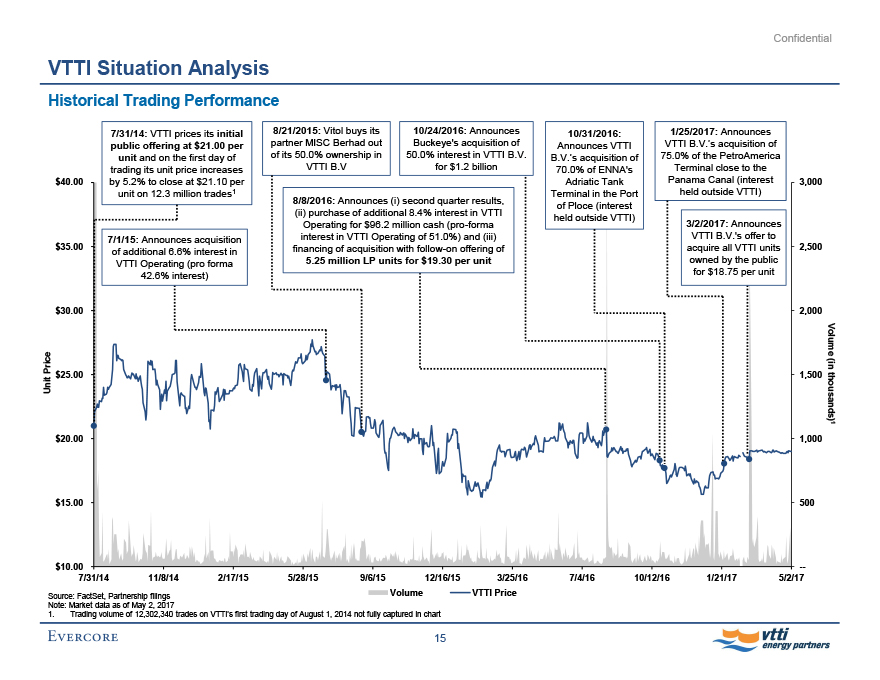
7/31/14: VTTI prices its initial public offering at $21.00 per unit and on the first day of trading its unit price increases by 5.2% to close at $21.10 per unit on 12.3 million trades1
7/1/15: Announces acquisition of additional 6.6% interest in VTTI Operating (pro forma 42.6% interest)
8/21/2015: Vitol buys its partner MISC Berhad out of its 50.0% ownership in VTTI B.V
10/24/2016: Announces
Buckeye’s acquisition of
50.0% interest in VTTI B.V. for $1.2 billion
8/8/2016: Announces (i) second quarter results, (ii) purchase of additional 8.4% interest in VTTI
Operating for $96.2 million cash (pro-forma interest in VTTI Operating of 51.0%) and (iii) financing of acquisition with follow-on offering of 5.25 million LP units for $19.30 per unit
10/31/2016:
Announces VTTI
B.V.’s acquisition of
70.0% of ENNA’s Adriatic Tank Terminal in the Port of Ploce (interest held outside VTTI)
1/25/2017: Announces
VTTI B.V.’s acquisition of
75.0% of the PetroAmerica Terminal close to the Panama Canal (interest held outside VTTI)
3/2/2017: Announces
VTTI B.V.‘s offer to acquire all VTTI units owned by the public for $18.75 per unit
3,000
2,500
2,000
1,500
1,000
500
Volume (in thousands)1
7/31/14 11/8/14 2/17/15 5/28/15 9/6/15 12/16/15 3/25/16 7/4/16 10/12/16 1/21/17 5/2/17
Volume VTTI Price
Source: FactSet, Partnership filings Note: Market data as of May 2, 2017
1. Trading volume of 12,302,340 trades on VTTI’s first trading day of August 1, 2014 not fully captured in chart
15
Evercore vtti energy partners
Confidential
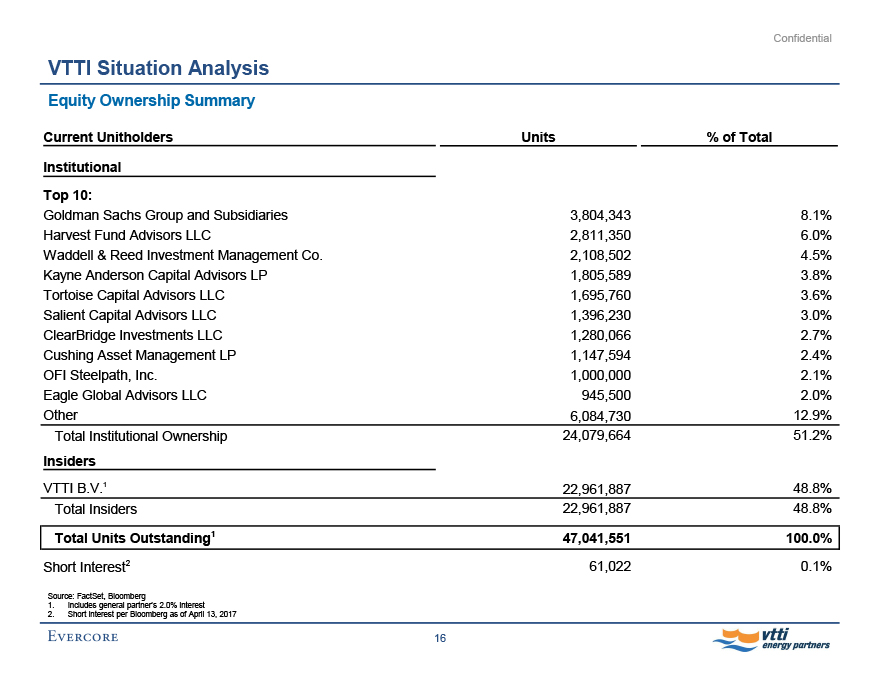
VTTI Situation Analysis Equity Ownership Summary Current Unitholders Units % of Total Institutional Top 10: Goldman Sachs Group and Subsidiaries 3,804,343 8.1% Harvest Fund Advisors LLC 2,811,350 6.0% Waddell & Reed Investment Management Co. 2,108,502 4.5% Kayne Anderson Capital Advisors LP 1,805,589 3.8% Tortoise Capital Advisors LLC 1,695,760 3.6% Salient Capital Advisors LLC 1,396,230 3.0% ClearBridge Investments LLC 1,280,066 2.7% Cushing Asset Management LP 1,147,594 2.4% OFI Steelpath, Inc. 1,000,000 2.1% Eagle Global Advisors LLC 945,500 2.0% Other 6,084,730 12.9% Total Institutional Ownership 24,079,664 51.2% Insiders VTTI B.V.1 22,961,887 48.8% Total Insiders 22,961,887 48.8% Total Units Outstanding1 47,041,551 100.0% Short Interest2 61,022 0.1% Source: FactSet, Bloomberg 1. Includes general partner’s 2.0% interest 2. Short interest per Bloomberg as of April 13, 2017 16
Evercore vtti energy partners
Confidential
VTTI Situation Analysis
Right of First Offer
Pursuant to the Omnibus Agreement between VTTI B.V. and the Partnership entered into upon completion of the Partnership’s initial public offering, VTTI B.V. granted the Partnership a right of first offer (“ROFO”) on any proposed Transfer of any Sale Asset (other than Sale Assets Transferred to an Affiliate of VTTI B.V. who agrees in writing that such Sale Asset remains subject to the provisions of the ROFO and assumes the obligations under the ROFO with respect to such Sale Asset)
“Sale Assets” means any right, title or interests in the VTTI Entities’ existing assets and any terminaling and other energy infrastructure assets that any of them may acquire or construct in the future, which assets shall include the terminal facilities, pipelines, storage tanks, equipment, machinery, docks and the real property appurtenant thereto
“VTTI Entities” means VTTI B.V. and each of its Affiliates, other than the Partnership and its Subsidiaries
“Affiliate” means, with respect to any Person, any other Person that directly or indirectly through one or more intermediaries controls, is controlled by or is under common control with, the Person in question
The term “control” means the possession, direct or indirect, of the power to direct or cause the direction of the management and policies of a Person, whether through ownership of voting securities, by contract or otherwise
Source: Partnership filings
17
Evercore vtti energy partners
Confidential
III. VTTI Operating Asset Overview and Projections
Evercore
Confidential
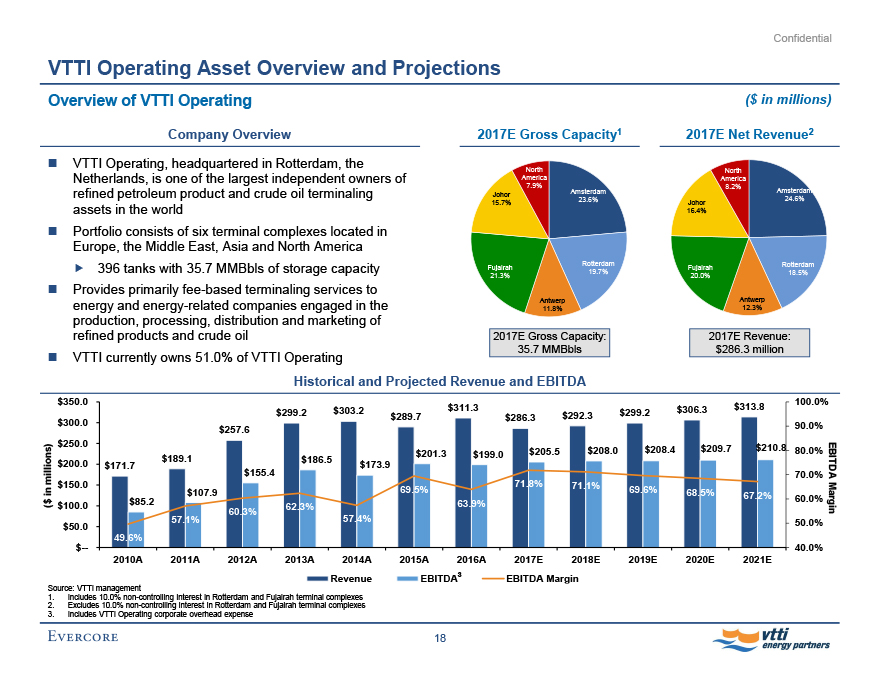
VTTI Operating Asset Overview and Projections Overview of VTTI Operating ($ in millions) Company Overview VTTI Operating, headquartered in Rotterdam, the Netherlands, is one of the largest independent owners of refined petroleum product and crude oil terminaling assets in the world Portfolio consists of six terminal complexes located in Europe, the Middle East, Asia and North America 396 tanks with 35.7 MMBbls of storage capacity Provides primarily fee-based terminaling services to energy and energy-related companies engaged in the production, processing, distribution and marketing of refined products and crude oil VTTI currently owns 51.0% of VTTI Operating 2017E Gross Capacity1 Johor 15.7% North America 7.9% Amsterdam 23.6% Fujairah 21.3% Antwerp 11.8% Rotterdam 19.7% 2017E Net Revenue2 North America 8.2% Johor 16.4% Amsterdam 24.6% Fujairah 20.0% Rotterdam 18.5% Antwerp 12.3% 2017E Gross Capacity: 35.7 MMBbls 2017E Revenue: $286.3 million Historical and Projected Revenue and EBITDA ($ in millions) $350.0 $300.0 $250.0 $200.0 $150.0 $100.0 $50.0 $-- $299.2 $303.2 $311.3 $292.3 $299.2 $306.3 $313.8 $289.7 $286.3 $257.6 $189.1 $186.5 $201.3 $199.0 $205.5 $208.0 $208.4 $209.7 $210.8 $171.7 $173.9 $155.4 71.8% 71.1% $107.9 69.5% 69.6% 68.5% 67.2% $85.2 62.3% 63.9% 60.3% 57.1% 57.4% 49.6% 100.0% 90.0% 80.0% 70.0% 60.0% 50.0% 40.0% EBITDA Margin 2010A 2011A 2012A 2013A 2014A 2015A 2016A 2017E 2018E 2019E 2020E 2021E Revenue EBITDA3 EBITDA Margin Source: VTTI management 1. Includes 10.0% non-controlling interest in Rotterdam and Fujairah terminal complexes 2. Excludes 10.0% non-controlling interest in Rotterdam and Fujairah terminal complexes 3. Includes VTTI Operating corporate overhead expense 18
Evercore vtti energy partners
Confidential
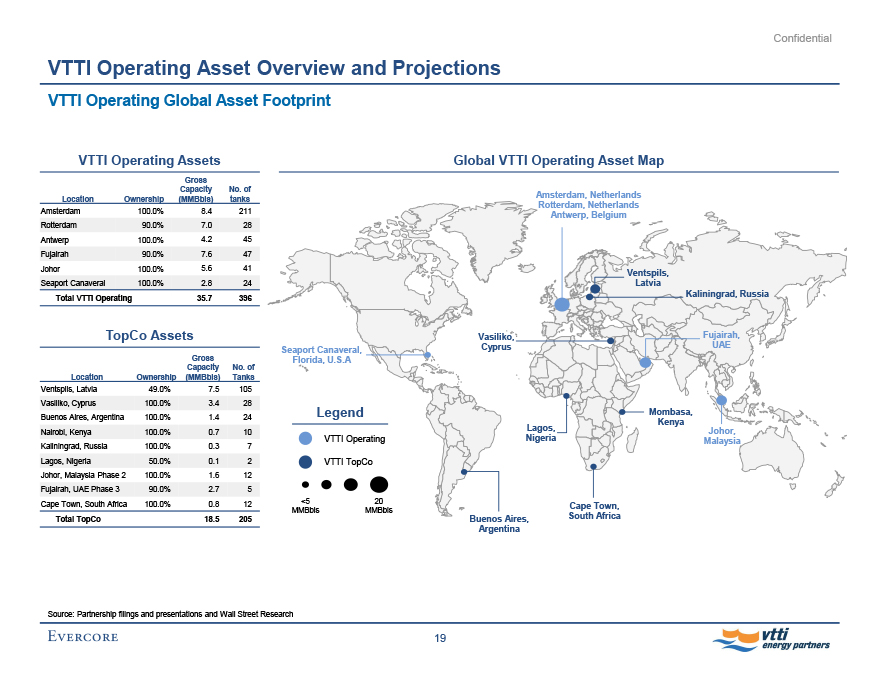
VTTI Operating Asset Overview and Projections VTTI Operating Global Asset Footprint VTTI Operating Assets Gross Capacity No. of Location Ownership (MMBbls) tanks Amsterdam 100.0% 8.4 211 Rotterdam 90.0% 7.0 28 Antwerp 100.0% 4.2 45 Fujairah 90.0% 7.6 47 Johor 100.0% 5.6 41 Seaport Canaveral 100.0% 2.8 24 Total VTTI Operating 35.7 396 TopCo Assets Gross Capacity No. of Location Ownership (MMBbls) Tanks Ventspils, Latvia 49.0% 7.5 105 Vasiliko, Cyprus 100.0% 3.4 28 Buenos Aires, Argentina 100.0% 1.4 24 Nairobi, Kenya 100.0% 0.7 10 Kaliningrad, Russia 100.0% 0.3 7 Lagos, Nigeria 50.0% 0.1 2 Johor, Malaysia Phase 2 100.0% 1.6 12 Fujairah, UAE Phase 3 90.0% 2.7 5 Cape Town, South Africa 100.0% 0.8 12 Total TopCo 18.5 205 Global VTTI Operating Asset Map Seaport Canaveral, Florida, U.S.A Legend VTTI Operating VTTI TopCo <5 20 MMBbls MMBbls Amsterdam, Netherlands Rotterdam, Netherlands Antwerp, Belgium Ventspils, Latvia Kaliningrad, Russia Vasiliko, Fujairah, Cyprus UAE Mombasa, Kenya Lagos, Johor, Nigeria Malaysia Cape Town, Buenos Aires, South Africa Argentina Source: Partnership filings and presentations and Wall Street Research 19
Evercore vtti energy partners
Confidential
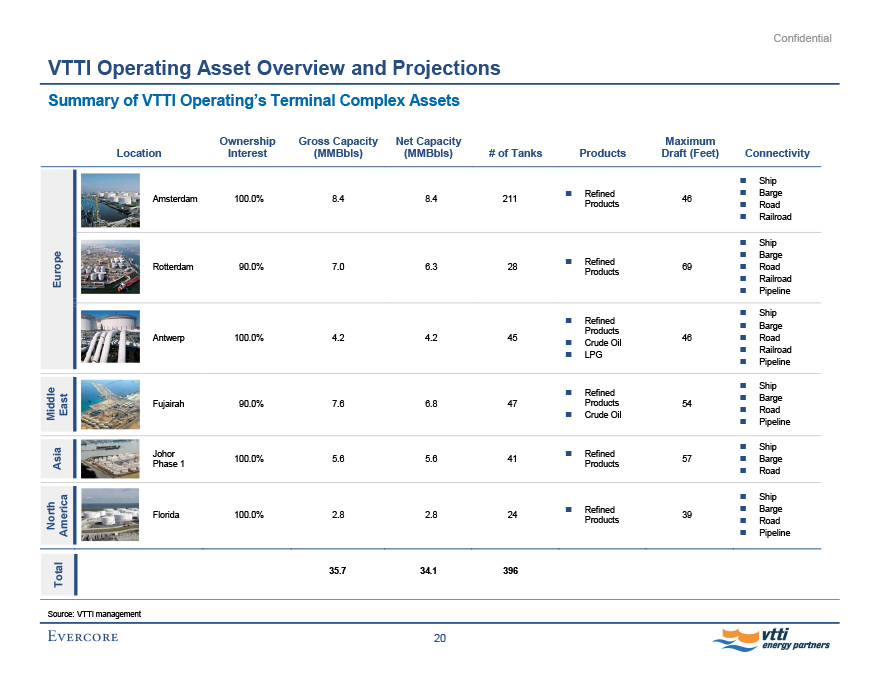
VTTI Operating Asset Overview and Projections Summary of VTTI Operating’s Terminal Complex Assets Europe Middle East Asia North America Total Ownership Gross Capacity Net Capacity Maximum Location Interest (MMBbls) (MMBbls) # of Tanks Products Draft (Feet) Connectivity Ship Refined Barge Amsterdam 100.0% 8.4 8.4 211 46 Products Road Railroad Ship Barge Refined Rotterdam 90.0% 7.0 6.3 28 69 Road Products Railroad Pipeline Ship Refined Barge Products Antwerp 100.0% 4.2 4.2 45 46 Road Crude Oil LPG Railroad Pipeline Ship Refined Barge Fujairah 90.0% 7.6 6.8 47 Products 54 Crude Oil Road Pipeline Ship Johor Refined 100.0% 5.6 5.6 41 57 Barge Phase 1 Products Road Ship Refined Barge Florida 100.0% 2.8 2.8 24 39 Products Road Pipeline 35.7 34.1 396 Source: VTTI management 20
Evercore vtti energy partners
Confidential
VTTI Operating Asset Overview and Projections
Summary of VTTI Operating Customer Contracts
VTTI Operating’s terminal complexes generate revenue primarily under multi-year, fee-based, take-or-pay arrangements with creditworthy counterparties VTTI Operating’s contracts typically have a duration of generally two to four years In addition to Vitol, VTTI Operating’s counterparties include major oil traders and other significant oil and gas industry participants, including subsidiaries of A- to AAA-rated global corporations such as Shell and Exxon Relationships with many of the trading companies date back to the early years of VTTI B.V.’s existence, while relationships with oil majors have been developed over the last four years Since July 2016, VTTI has entered into the following new storage contracts: Petronas has contracted 137,686 m3 of fuel oil storage capacity in Johor from August 17, 2016 through July 31, 2018 at a rate of $4.40/m3/month Koch Industries has contracted 125,011 m3 of fuel oil storage capacity in Johor from September 1, 2016 through August 31, 2017 at a rate of $4.14/m3/month Exxon has contracted 36,000 m3 of gasoil storage capacity in Antwerp from January 1, 2017 through December 31, 2020 at a rate of 3.30/m3/month Prax has contracted 82,500 m3 of gasoline storage capacity in Antwerp from January 1, 2017 through June 30, 2017 at a rate of 3.93/m3/month Vitol has contracted 27,890 m3 of gasoline storage capacity in Johor from January 1, 2017 through December 31, 2017 at a rate of $4.20/m3/month Vitol has contracted 27,925 m3 of distillate storage capacity in Johor from January 1, 2017 through December 31, 2017 at a rate of $4.20/m3/month Gunvor has contracted 55,816 m3 of gasoline storage capacity in Johor from January 4, 2017 through July 3, 2017 at a rate of $4.35/m3/month Source: VTTI management and public filings 21 Evercore vtti energy partners
Confidential
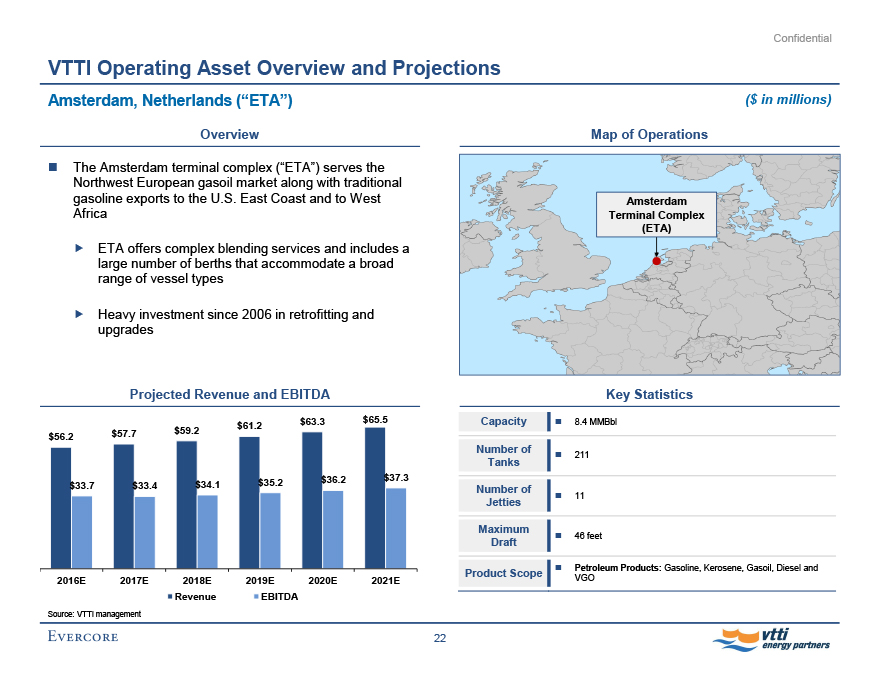
VTTI Operating Asset Overview and Projections Amsterdam, Netherlands (“ETA”) ($ in millions) Overview The Amsterdam terminal complex (“ETA”) serves the Northwest European gasoil market along with traditional gasoline exports to the U.S. East Coast and to West Africa ETA offers complex blending services and includes a large number of berths that accommodate a broad range of vessel types Heavy investment since 2006 in retrofitting and upgrades Projected Revenue and EBITDA Map of Operations
$63.3 $65.5 $56.2 $57.7 $59.2 $61.2 $33.7 $33.4 $34.1 $35.2 $36.2 $37.3 2016E 2017E 2018E 2019E 2020E 2021E Revenue EBITDA Source: VTTI management Amsterdam Terminal Complex (ETA) Key Statistics Capacity 8.4 MMBbl Number of Tanks 211 Number of Jetties 11 Maximum Draft 46 feet Product Scope Petroleum Products: Gasoline, Kerosene, Gasoil, Diesel and VGO 22 Evercore vtti energy partners
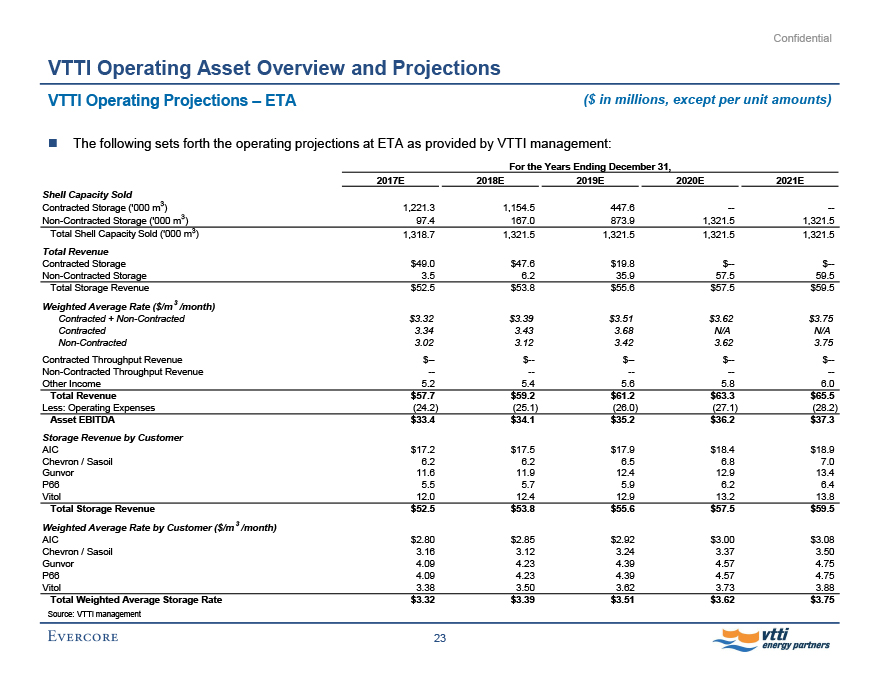
Confidential VTTI Operating Asset Overview and Projections VTTI Operating Projections – ETA ($ in millions, except per unit amounts) The following sets forth the operating projections at ETA as provided by VTTI management: For the Years Ending December 31, 2017E 2018E 2019E 2020E 2021E Shell Capacity Sold Contracted Storage (‘000 m3 ) 1,221.3 1,154.5 447.6 -- -- Non-Contracted Storage (‘000 m3 ) 97.4 167.0 873.9 1,321.5 1,321.5 Total Shell Capacity Sold (‘000 m3 ) 1,318.7 1,321.5 1,321.5 1,321.5 1,321.5 Total Revenue Contracted Storage $49.0 $47.6 $19.8 $-- $-- Non-Contracted Storage 3.5 6.2 35.9 57.5 59.5 Total Storage Revenue $52.5 $53.8 $55.6 $57.5 $59.5 Weighted Average Rate ($/m 3 /month) Contracted + Non-Contracted $3.32 $3.39 $3.51 $3.62 $3.75 Contracted 3.34 3.43 3.68 N/A N/A Non-Contracted 3.02 3.12 3.42 3.62 3.75 Contracted Throughput Revenue $-- $-- $-- $-- $-- Non-Contracted Throughput Revenue -- -- -- -- -- Other Income 5.2 5.4 5.6 5.8 6.0 Total Revenue $57.7 $59.2 $61.2 $63.3 $65.5 Less: Operating Expenses (24.2) (25.1) (26.0) (27.1) (28.2) Asset EBITDA $33.4 $34.1 $35.2 $36.2 $37.3 Storage Revenue by Customer AIC $17.2 $17.5 $17.9 $18.4 $18.9 Chevron / Sasoil 6.2 6.2 6.5 6.8 7.0 Gunvor 11.6 11.9 12.4 12.9 13.4 P66 5.5 5.7 5.9 6.2 6.4 Vitol 12.0 12.4 12.9 13.2 13.8 Total Storage Revenue $52.5 $53.8 $55.6 $57.5 $59.5 Weighted Average Rate by Customer ($/m 3 /month) AIC $2.80 $2.85 $2.92 $3.00 $3.08 Chevron / Sasoil 3.16 3.12 3.24 3.37 3.50 Gunvor 4.09 4.23 4.39 4.57 4.75 P66 4.09 4.23 4.39 4.57 4.75 Vitol 3.38 3.50 3.62 3.73 3.88 Total Weighted Average Storage Rate $3.32 $3.39 $3.51 $3.62 $3.75 Source: VTTI management 23 Evercore vtti energy partners
Confidential
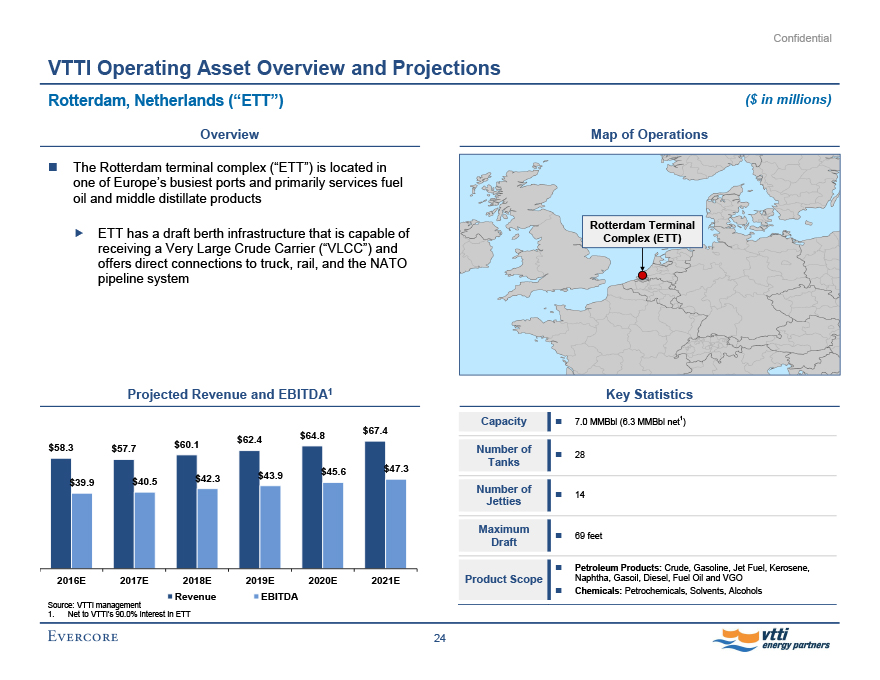
VTTI Operating Asset Overview and Projections Rotterdam, Netherlands (“ETT”)
($ in millions) Overview The Rotterdam terminal complex (“ETT”) is located in one of Europe’s busiest ports and primarily services fuel oil and middle distillate products ETT has a draft berth infrastructure that is capable of receiving a Very Large Crude Carrier (“VLCC”) and offers direct connections to truck, rail, and the NATO pipeline system Projected Revenue and EBITDA1 $67.4
$62.4 $64.8 $58.3 $57.7 $60.1 $47.3 $39.9 $40.5 $42.3 $43.9 $45.6 2016E 2017E 2018E 2019E 2020E 2021E Revenue EBITDA Source: VTTI management 1. Net to VTTI’s 90.0% interest in ETT Map of Operations Rotterdam Terminal Complex (ETT) Key Statistics Capacity 7.0 MMBbl (6.3 MMBbl net1 ) Number of Tanks 28 Number of Jetties 14 Maximum Draft 69 feet Petroleum Products: Crude, Gasoline, Jet Fuel, Kerosene, Product Scope Naphtha, Gasoil, Diesel, Fuel Oil and VGO Chemicals: Petrochemicals, Solvents, Alcohols 24 Evercore vtti energy partners
Confidential
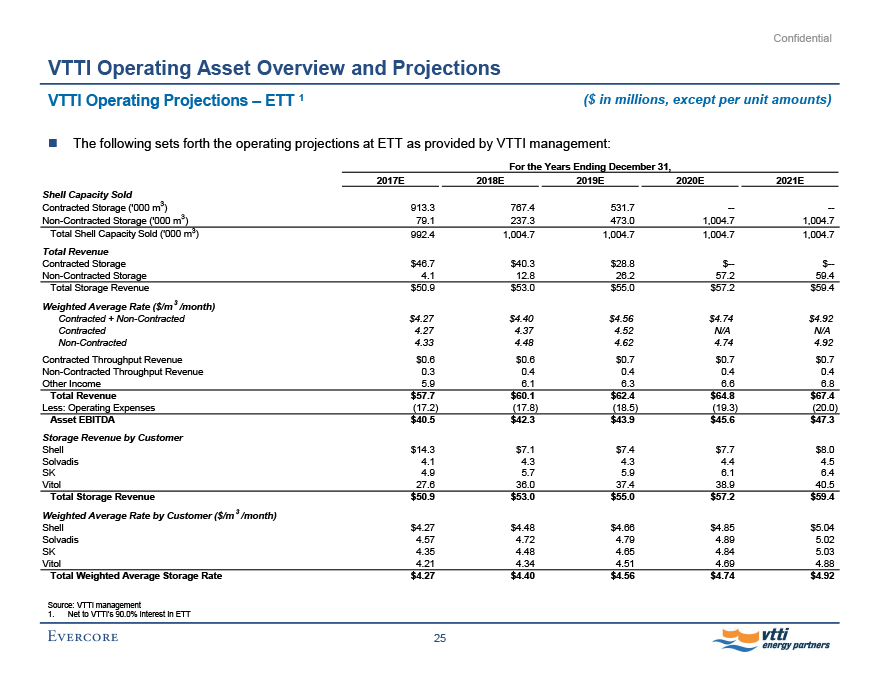
VTTI Operating Asset Overview and Projections
VTTI Operating Projections – ETT 1 ($ in millions, except per unit amounts) The following sets forth the operating projections at ETT as provided by VTTI management: For the Years Ending December 31, 2017E 2018E 2019E 2020E 2021E Shell Capacity Sold Contracted Storage (‘000 m3 ) 913.3 767.4 531.7 -- -- Non-Contracted Storage (‘000 m3 ) 79.1 237.3 473.0 1,004.7 1,004.7 Total Shell Capacity Sold (‘000 m3 ) 992.4 1,004.7 1,004.7 1,004.7 1,004.7 Total Revenue Contracted Storage $46.7 $40.3 $28.8 $-- $-- Non-Contracted Storage 4.1 12.8 26.2 57.2 59.4 Total Storage Revenue $50.9 $53.0 $55.0 $57.2 $59.4 Weighted Average Rate ($/m 3 /month) Contracted + Non-Contracted $4.27 $4.40 $4.56 $4.74 $4.92 Contracted 4.27 4.37 4.52 N/A N/A Non-Contracted 4.33 4.48 4.62 4.74 4.92 Contracted Throughput Revenue $0.6 $0.6 $0.7 $0.7 $0.7 Non-Contracted Throughput Revenue 0.3 0.4 0.4 0.4 0.4 Other Income 5.9 6.1 6.3 6.6 6.8 Total Revenue $57.7 $60.1 $62.4 $64.8 $67.4 Less: Operating Expenses (17.2) (17.8) (18.5) (19.3) (20.0) Asset EBITDA $40.5 $42.3 $43.9 $45.6 $47.3 Storage Revenue by Customer Shell $14.3 $7.1 $7.4 $7.7 $8.0 Solvadis 4.1 4.3 4.3 4.4 4.5 SK 4.9 5.7 5.9 6.1 6.4 Vitol 27.6 36.0 37.4 38.9 40.5 Total Storage Revenue $50.9 $53.0 $55.0 $57.2 $59.4 Weighted Average Rate by Customer ($/m 3 /month) Shell $4.27 $4.48 $4.66 $4.85 $5.04 Solvadis 4.57 4.72 4.79 4.89 5.02 SK 4.35 4.48 4.65 4.84 5.03 Vitol 4.21 4.34 4.51 4.69 4.88 Total Weighted Average Storage Rate $4.27 $4.40 $4.56 $4.74 $4.92 Source: VTTI management 1. Net to VTTI’s 90.0% interest in ETT 25 Evercore vtti energy partners
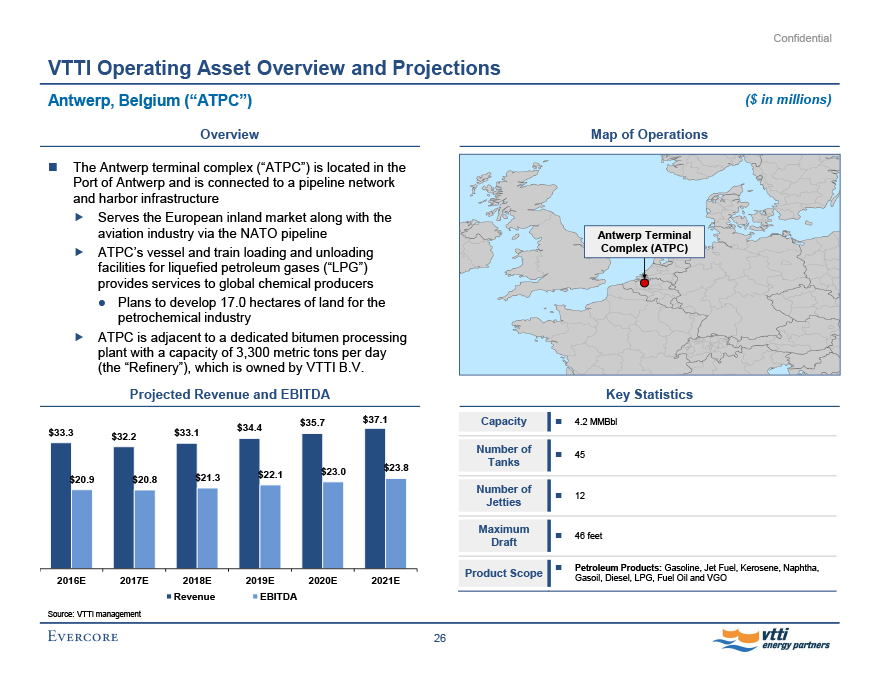
Confidential VTTI Operating Asset Overview and Projections Antwerp, Belgium (“ATPC”) ($ in millions) Overview The Antwerp terminal complex (“ATPC”) is located in the Port of Antwerp and is connected to a pipeline network and harbor infrastructure Serves the European inland market along with the aviation industry via the NATO pipeline ATPC’s vessel and train loading and unloading facilities for liquefied petroleum gases (“LPG”) provides services to global chemical producers Plans to develop 17.0 hectares of land for the petrochemical industry ATPC is adjacent to a dedicated bitumen processing plant with a capacity of 3,300 metric tons per day (the “Refinery”), which is owned by VTTI B.V. Projected Revenue and EBITDA $35.7 $37.1 $33.3 $33.1 $34.4 $32.2 $23.8 $20.9 $20.8 $21.3 $22.1 $23.0 2016E 2017E 2018E 2019E 2020E 2021E Revenue EBITDA Source: VTTI management Map of Operations Antwerp Terminal Complex (ATPC) Key Statistics Capacity 4.2 MMBbl Number of Tanks 45 Number of Jetties 12 Maximum Draft 46 feet Product Scope Petroleum Products: Gasoline, Jet Fuel, Kerosene, Naphtha, Gasoil, Diesel, LPG, Fuel Oil and VGO 26 Evercore vtti energy partners
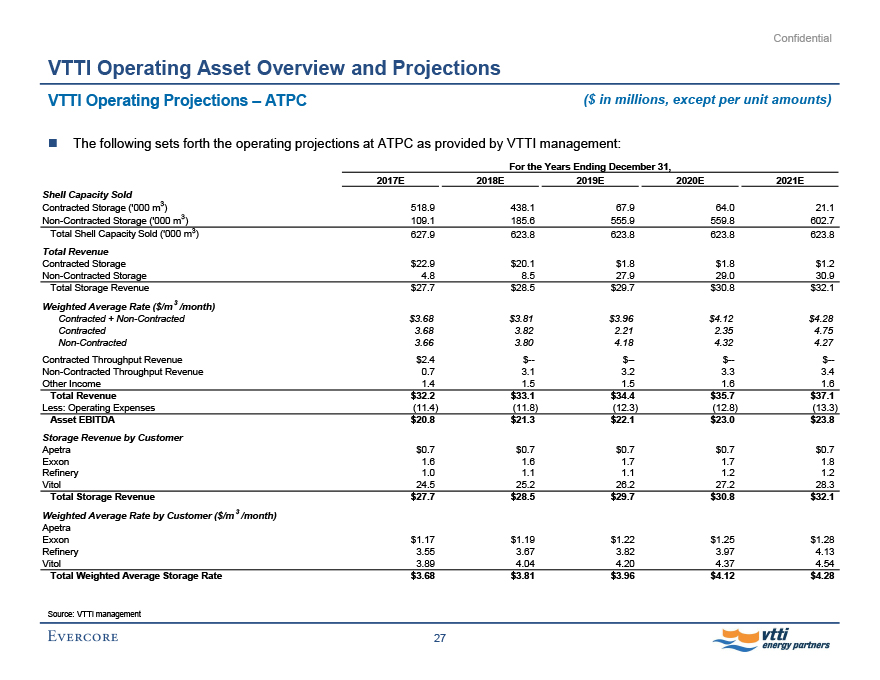
Confidential VTTI Operating Asset Overview and Projections VTTI Operating Projections – ATPC ($ in millions, except per unit amounts) The following sets forth the operating projections at ATPC as provided by VTTI management: For the Years Ending December 31, 2017E 2018E 2019E 2020E 2021E Shell Capacity Sold Contracted Storage (‘000 m3) 518.9 438.1 67.9 64.0 21.1
Non-Contracted Storage (‘000 m3) 109.1 185.6 555.9 559.8 602.7 Total Shell Capacity Sold (‘000 m3) 627.9 623.8 623.8 623.8 623.8 Total Revenue Contracted Storage $22.9 $20.1 $1.8 $1.8 $1.2 Non-Contracted Storage 4.8 8.5 27.9 29.0 30.9 Total Storage Revenue $27.7 $28.5 $29.7 $30.8 $32.1 Weighted Average Rate ($/m 3 /month) Contracted + Non-Contracted $3.68 $3.81 $3.96 $4.12 $4.28 Contracted 3.68 3.82 2.21 2.35 4.75 Non-Contracted 3.66 3.80 4.18 4.32 4.27 Contracted Throughput Revenue $2.4 $-- $-- $-- $-- Non-Contracted Throughput Revenue 0.7 3.1 3.2 3.3 3.4 Other Income 1.4 1.5 1.5 1.6 1.6 Total Revenue $32.2 $33.1 $34.4 $35.7 $37.1 Less: Operating Expenses (11.4) (11.8) (12.3) (12.8) (13.3) Asset EBITDA $20.8 $21.3 $22.1 $23.0 $23.8 Storage Revenue by Customer Apetra $0.7 $0.7 $0.7 $0.7 $0.7 Exxon 1.6 1.6 1.7 1.7 1.8 Refinery 1.0 1.1 1.1 1.2 1.2 Vitol 24.5 25.2 26.2 27.2 28.3 Total Storage Revenue $27.7 $28.5 $29.7 $30.8 $32.1 Weighted Average Rate by Customer ($/m 3 /month) Apetra Exxon $1.17 $1.19 $1.22 $1.25 $1.28 Refinery 3.55 3.67 3.82 3.97 4.13 Vitol 3.89 4.04 4.20 4.37 4.54 Total Weighted Average Storage Rate $3.68 $3.81 $3.96 $4.12 $4.28 Source: VTTI management 27 Evercore vtti energy partners
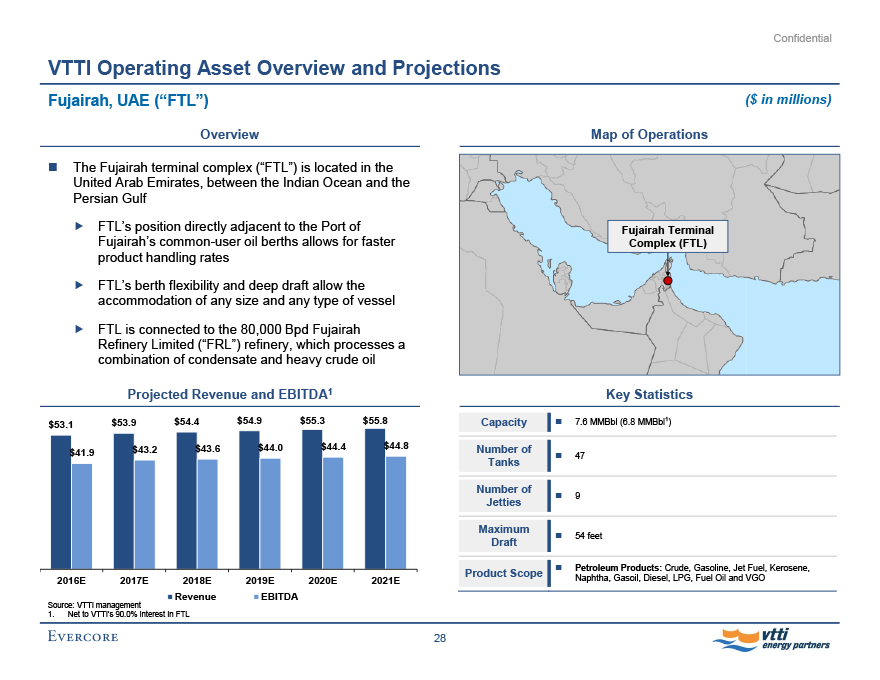
Confidential VTTI Operating Asset Overview and Projections Fujairah, UAE (“FTL”) ($ in millions) Overview The Fujairah terminal complex (“FTL”) is located in the United Arab Emirates, between the Indian Ocean and the Persian Gulf FTL’s position directly adjacent to the Port of Fujairah’s common-user oil berths allows for faster product handling rates FTL’s berth flexibility and deep draft allow the accommodation of any size and any type of vessel FTL is connected to the 80,000 Bpd Fujairah Refinery Limited (“FRL”) refinery, which processes a combination of condensate and heavy crude oil Projected Revenue and EBITDA1 $53.1 $53.9 $54.4 $54.9 $55.3 $55.8 $41.9 $43.2 $43.6 $44.0 $44.4 $44.8 2016E 2017E 2018E 2019E 2020E 2021E Revenue EBITDA Source: VTTI management 1. Net to VTTI’s 90.0% interest in FTL Map of Operations Fujairah Terminal Complex (FTL) Key Statistics Capacity 7.6 MMBbl (6.8 MMBbl1 ) Number of Tanks 47 Number of Jetties 9 Maximum Draft 54 feet Product Scope Petroleum Products: Crude, Gasoline, Jet Fuel, Kerosene, Naphtha, Gasoil, Diesel, LPG, Fuel Oil and VGO 28 Evercore vtti energy partners
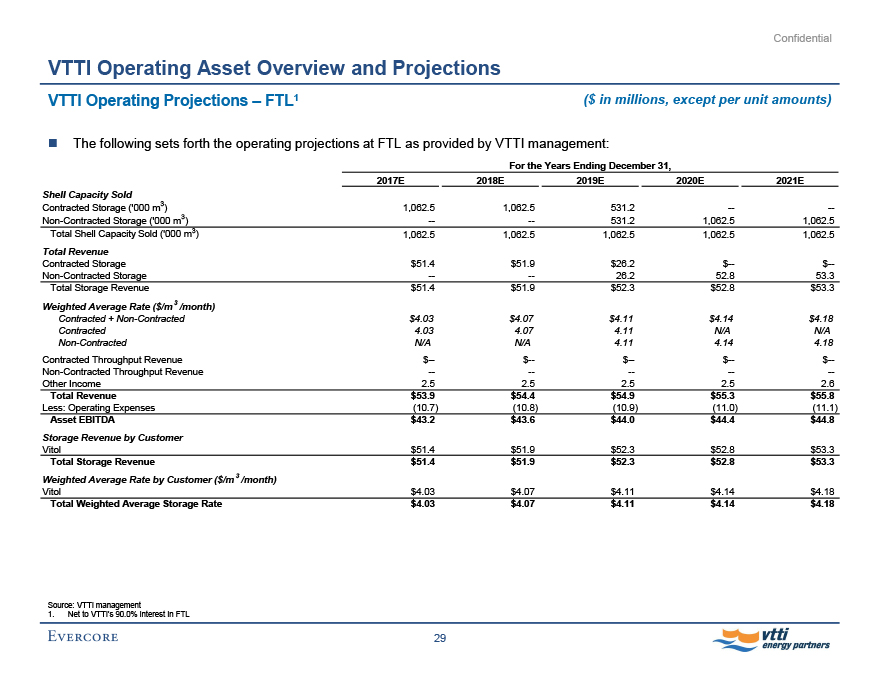
Confidential VTTI Operating Asset Overview and Projections VTTI Operating Projections – FTL1 ($ in millions, except per unit amounts) The following sets forth the operating projections at FTL as provided by VTTI management: For the Years Ending December 31, 2017E 2018E 2019E 2020E 2021E Shell Capacity Sold Contracted Storage (‘000 m3) 1,062.5 1,062.5 531.2 -- -- Non-Contracted Storage (‘000 m3) -- -- 531.2 1,062.5 1,062.5 Total Shell Capacity Sold (‘000 m3) 1,062.5 1,062.5 1,062.5 1,062.5 1,062.5 Total Revenue Contracted Storage $51.4 $51.9 $26.2 $-- $-- Non-Contracted Storage -- -- 26.2 52.8 53.3 Total Storage Revenue $51.4 $51.9 $52.3 $52.8 $53.3 Weighted Average Rate ($/m 3 /month) Contracted + Non-Contracted $4.03 $4.07 $4.11 $4.14 $4.18 Contracted 4.03 4.07 4.11 N/A N/A Non-Contracted N/A N/A 4.11 4.14 4.18 Contracted Throughput Revenue $-- $-- $-- $-- $-- Non-Contracted Throughput Revenue -- -- -- -- -- Other Income 2.5 2.5 2.5 2.5 2.6 Total Revenue $53.9 $54.4 $54.9 $55.3 $55.8 Less: Operating Expenses (10.7) (10.8) (10.9) (11.0) (11.1) Asset EBITDA $43.2 $43.6 $44.0 $44.4 $44.8 Storage Revenue by Customer Vitol $51.4 $51.9 $52.3 $52.8 $53.3 Total Storage Revenue $51.4 $51.9 $52.3 $52.8 $53.3 Weighted Average Rate by Customer ($/m 3 /month) Vitol $4.03 $4.07 $4.11 $4.14 $4.18 Total Weighted Average Storage Rate $4.03 $4.07 $4.11 $4.14 $4.18 Source: VTTI management 1. Net to VTTI’s 90.0% interest in FTL 29 Evercore vtti energy partners
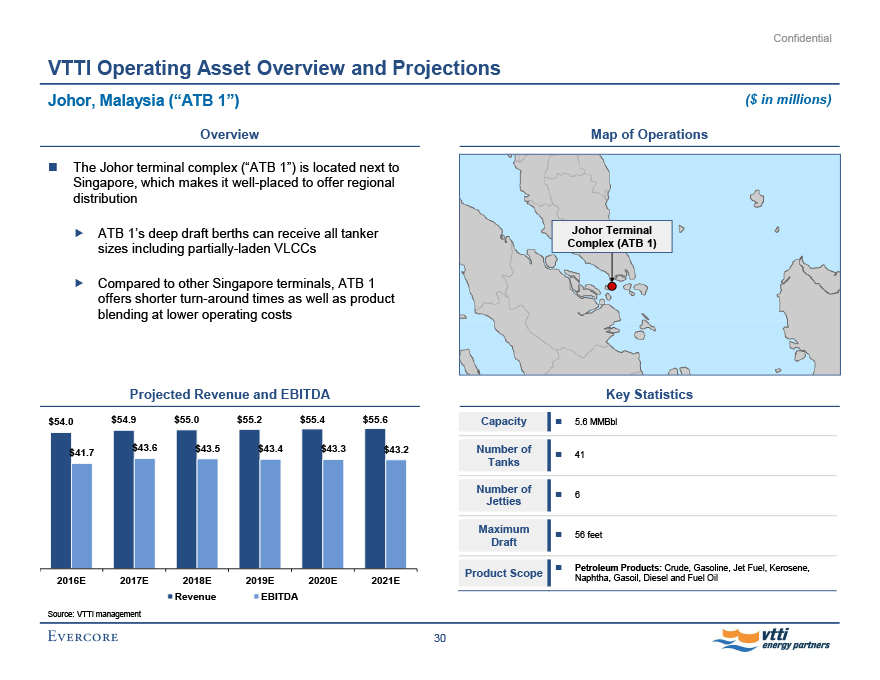
Confidential VTTI Operating Asset Overview and Projections Johor, Malaysia (“ATB 1”) ($ in millions) Overview The Johor terminal complex (“ATB 1”) is located next to Singapore, which makes it well-placed to offer regional distribution ATB 1’s deep draft berths can receive all tanker sizes including partially-laden VLCCs Compared to other Singapore terminals, ATB 1 offers shorter turn-around times as well as product blending at lower operating costs Projected Revenue and EBITDA $54.0 $54.9 $55.0 $55.2 $55.4 $55.6 $41.7 $43.6 $43.5 $43.4 $43.3 $43.2 2016E 2017E 2018E 2019E 2020E 2021E Revenue EBITDA Source: VTTI management Map of Operations Johor Terminal Complex (ATB 1) Key Statistics Capacity 5.6 MMBbl Number of Tanks 41 Number of Jetties 6 Maximum Draft 56 feet Product Scope Petroleum Products: Crude, Gasoline, Jet Fuel, Kerosene, Naphtha, Gasoil, Diesel and Fuel Oil 30 Evercore vtti energy partners
Confidential
VTTI Operating Asset Overview and Projections
VTTI Operating Projections – ATB 1 ($ in millions, except per unit amounts)
The following sets forth the operating projections at ATB 1 as provided by VTTI management:
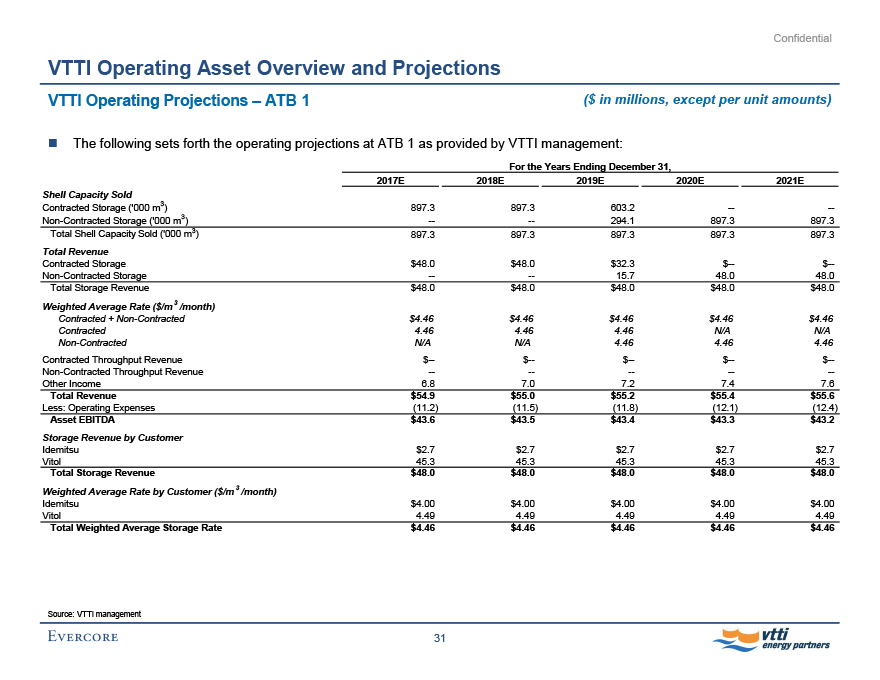
For the Years Ending December 31, 2017E 2018E 2019E 2020E 2021E Shell Capacity Sold Contracted Storage (‘000 m3) 897.3 897.3 603.2 -- -- Non-Contracted Storage (‘000 m3) -- -- 294.1 897.3 897.3 Total Shell Capacity Sold (‘000 m3) 897.3 897.3 897.3 897.3 897.3 Total Revenue Contracted Storage $48.0 $48.0 $32.3 $-- $-- Non-Contracted Storage -- -- 15.7 48.0 48.0 Total Storage Revenue $48.0 $48.0 $48.0 $48.0 $48.0 Weighted Average Rate ($/m 3 /month) Contracted + Non-Contracted $4.46 $4.46 $4.46 $4.46 $4.46 Contracted 4.46 4.46 4.46 N/A N/A Non-Contracted N/A N/A 4.46 4.46 4.46 Contracted Throughput Revenue $-- $-- $-- $-- $-- Non-Contracted Throughput Revenue -- -- -- -- -- Other Income 6.8 7.0 7.2 7.4 7.6 Total Revenue $54.9 $55.0 $55.2 $55.4 $55.6 Less: Operating Expenses (11.2) (11.5) (11.8) (12.1) (12.4) Asset EBITDA $43.6 $43.5 $43.4 $43.3 $43.2 Storage Revenue by Customer Idemitsu $2.7 $2.7 $2.7 $2.7 $2.7 Vitol 45.3 45.3 45.3 45.3 45.3 Total Storage Revenue $48.0 $48.0 $48.0 $48.0 $48.0 Weighted Average Rate by Customer ($/m 3 /month) Idemitsu $4.00 $4.00 $4.00 $4.00 $4.00 Vitol 4.49 4.49 4.49 4.49 4.49 Total Weighted Average Storage Rate $4.46 $4.46 $4.46 $4.46 $4.46 Source: VTTI management 31 Evercore vtti energy partners
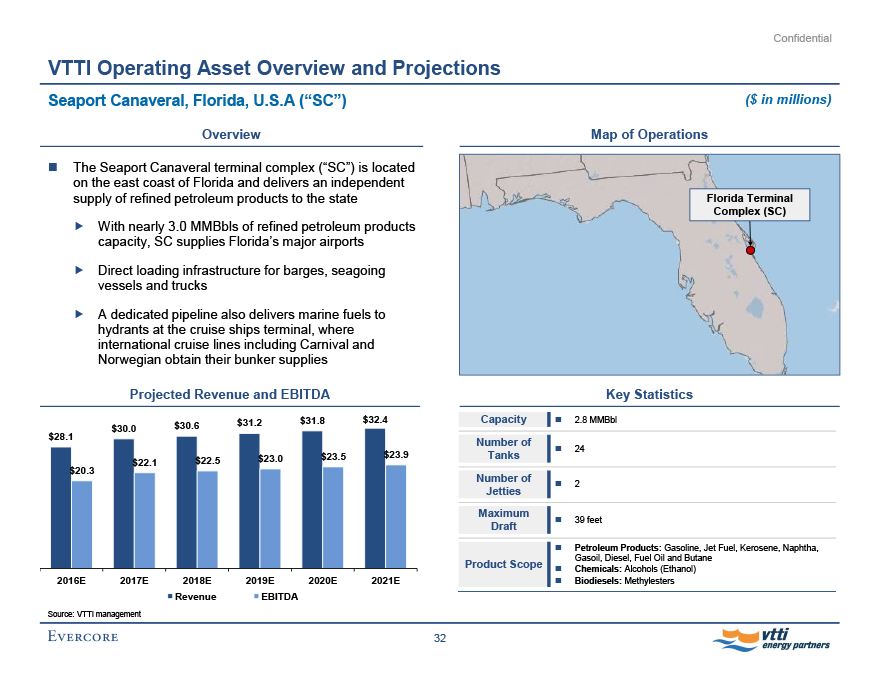
Confidential VTTI Operating Asset Overview and Projections Seaport Canaveral, Florida, U.S.A (“SC”) ($ in millions) Overview The Seaport Canaveral terminal complex (“SC”) is located on the east coast of Florida and delivers an independent supply of refined petroleum products to the state With nearly 3.0 MMBbls of refined petroleum products capacity, SC supplies Florida’s major airports Direct loading infrastructure for barges, seagoing vessels and trucks A dedicated pipeline also delivers marine fuels to hydrants at the cruise ships terminal, where international cruise lines including Carnival and Norwegian obtain their bunker supplies Projected Revenue and EBITDA $30.0 $30.6 $31.2 $31.8 $32.4 $28.1 $22.1 $22.5 $23.0 $23.5 $23.9 $20.3 2016E 2017E 2018E 2019E 2020E 2021E Revenue EBITDA Source: VTTI management Map of Operations Florida Terminal Complex (SC) Key Statistics Capacity 2.8 MMBbl Number of Tanks 24 Number of Jetties 2 Maximum Draft 39 feet Petroleum Products: Gasoline, Jet Fuel, Kerosene, Naphtha, Gasoil, Diesel, Fuel Oil and Butane Product Scope Chemicals: Alcohols (Ethanol) Biodiesels: Methylesters 32 Evercore vtti energy partners
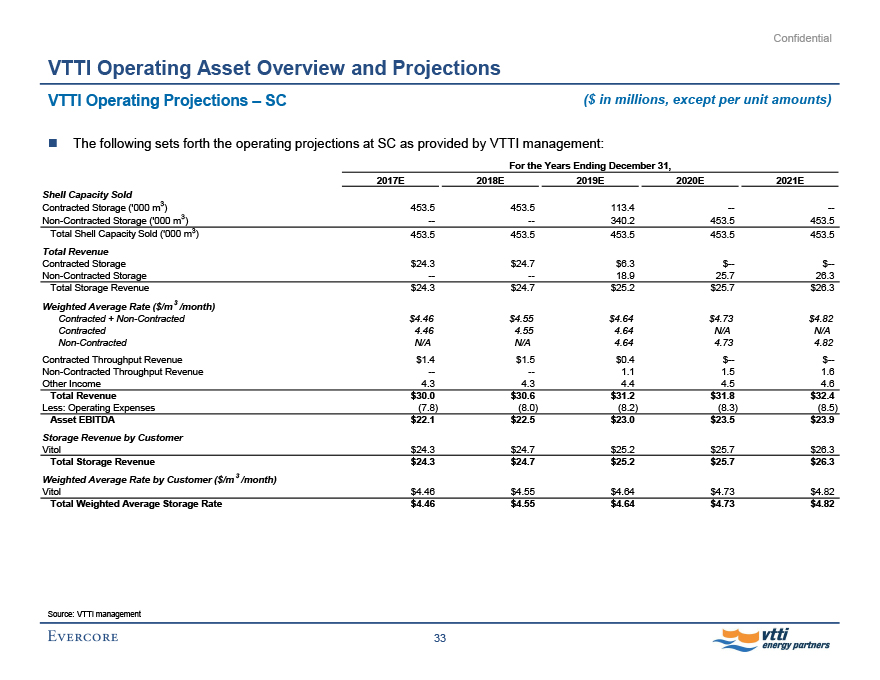
Confidential VTTI Operating Asset Overview and Projections VTTI Operating Projections – SC ($ in millions, except per unit amounts) The following sets forth the operating projections at SC as provided by VTTI management: For the Years Ending December 31, 2017E 2018E 2019E 2020E 2021E Shell Capacity Sold Contracted Storage (‘000 m3) 453.5 453.5 113.4 -- -- Non-Contracted Storage (‘000 m3) -- -- 340.2 453.5 453.5 Total Shell Capacity Sold (‘000 m3) 453.5 453.5 453.5 453.5 453.5 Total Revenue Contracted Storage $24.3 $24.7 $6.3 $-- $-- Non-Contracted Storage -- -- 18.9 25.7 26.3 Total Storage Revenue $24.3 $24.7 $25.2 $25.7 $26.3 Weighted Average Rate ($/m 3 /month) Contracted + Non-Contracted $4.46 $4.55 $4.64 $4.73 $4.82 Contracted 4.46 4.55 4.64 N/A N/A Non-Contracted N/A N/A 4.64 4.73 4.82 Contracted Throughput Revenue $1.4 $1.5 $0.4 $-- $-- Non-Contracted Throughput Revenue -- -- 1.1 1.5 1.6 Other Income 4.3 4.3 4.4 4.5 4.6 Total Revenue $30.0 $30.6 $31.2 $31.8 $32.4 Less: Operating Expenses (7.8) (8.0) (8.2) (8.3) (8.5) Asset EBITDA $22.1 $22.5 $23.0 $23.5 $23.9 Storage Revenue by Customer Vitol $24.3 $24.7 $25.2 $25.7 $26.3 Total Storage Revenue $24.3 $24.7 $25.2 $25.7 $26.3 Weighted Average Rate by Customer ($/m 3 /month) Vitol $4.46 $4.55 $4.64 $4.73 $4.82 Total Weighted Average Storage Rate $4.46 $4.55 $4.64 $4.73 $4.82 Source: VTTI management 33 Evercore vtti energy partners
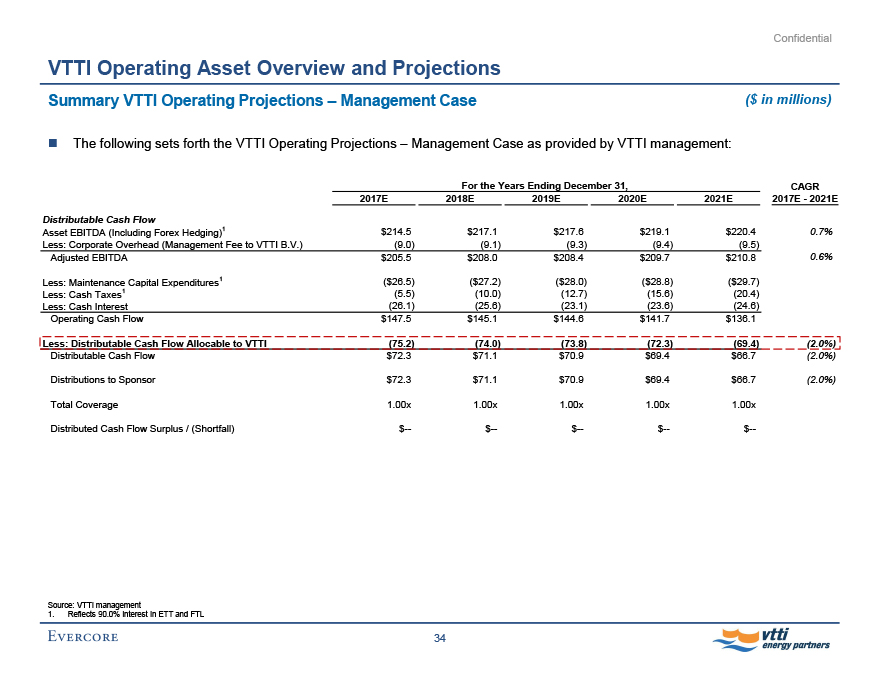
Confidential VTTI Operating Asset Overview and Projections Summary VTTI Operating Projections - Management Case ($ in millions) The following sets forth the VTTI Operating Projections - Management Case as provided by VTTI management: For the Years Ending December 31, CAGR 2017E 2018E 2019E 2020E 2021E 2017E - 2021E Distributable Cash Flow Asset EBITDA (Including Forex Hedging)1 $214.5 $217.1 $217.6 $219.1 $220.4 0.7% Less: Corporate Overhead (Management Fee to VTTI B.V.) (9.0) (9.1) (9.3) (9.4) (9.5) Adjusted EBITDA $205.5 $208.0 $208.4 $209.7 $210.8 0.6% Less: Maintenance Capital Expenditures1 ($26.5) ($27.2) ($28.0) ($28.8) ($29.7) Less: Cash Taxes1 (5.5) (10.0) (12.7) (15.6) (20.4) Less: Cash Interest (26.1) (25.6) (23.1) (23.6) (24.6) Operating Cash Flow $147.5 $145.1 $144.6 $141.7 $136.1 Less: Distributable Cash Flow Allocable to VTTI (75.2) (74.0) (73.8) (72.3) (69.4) (2.0%) Distributable Cash Flow $72.3 $71.1 $70.9 $69.4 $66.7 (2.0%) Distributions to Sponsor $72.3 $71.1 $70.9 $69.4 $66.7 (2.0%) Total Coverage 1.00x 1.00x 1.00x 1.00x 1.00x Distributed Cash Flow Surplus / (Shortfall) $-- $-- $-- $-- $-- Source: VTTI management 1. Reflects 90.0% interest in ETT and FTL 34 Evercore vtti energy partners
Confidential
VTTI Operating Asset Overview and Projections
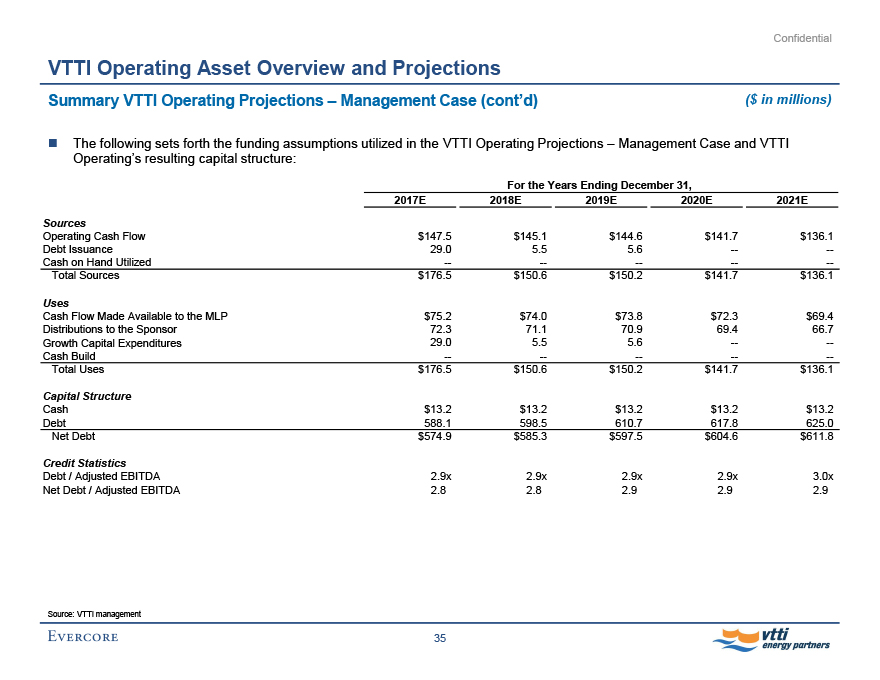
Summary VTTI Operating Projections - Management Case (cont’d) ($ in millions)
The following sets forth the funding assumptions utilized in the VTTI Operating Projections - Management Case and VTTI Operating’s resulting capital structure:
For the Years Ending December 31,
2017E 2018E 2019E 2020E 2021E
Sources
Operating Cash Flow $147.5 $145.1 $144.6 $141.7 $136.1
Debt Issuance 29.0 5.5 5.6 -- --
Cash on Hand Utilized -- -- -- -- --
Total Sources $176.5 $150.6 $150.2 $141.7 $136.1
Uses
Cash Flow Made Available to the MLP $75.2 $74.0 $73.8 $72.3 $69.4
Distributions to the Sponsor 72.3 71.1 70.9 69.4 66.7
Growth Capital Expenditures 29.0 5.5 5.6 -- --
Cash Build -- -- -- -- --
Total Uses $176.5 $150.6 $150.2 $141.7 $136.1
Capital Structure
Cash $13.2 $13.2 $13.2 $13.2 $13.2
Debt 588.1 598.5 610.7 617.8 625.0
Net Debt $574.9 $585.3 $597.5 $604.6 $611.8
Credit Statistics
Debt / Adjusted EBITDA 2.9x 2.9x 2.9x 2.9x 3.0x
Net Debt / Adjusted EBITDA 2.8 2.8 2.9 2.9 2.9
Source: VTTI management
35
Evercore vtti energy partners
Confidential
VTTI Operating Asset Overview and Projections
Assumptions for the VTTI Operating Projections - Sensitivity Case I and Sensitivity Case II
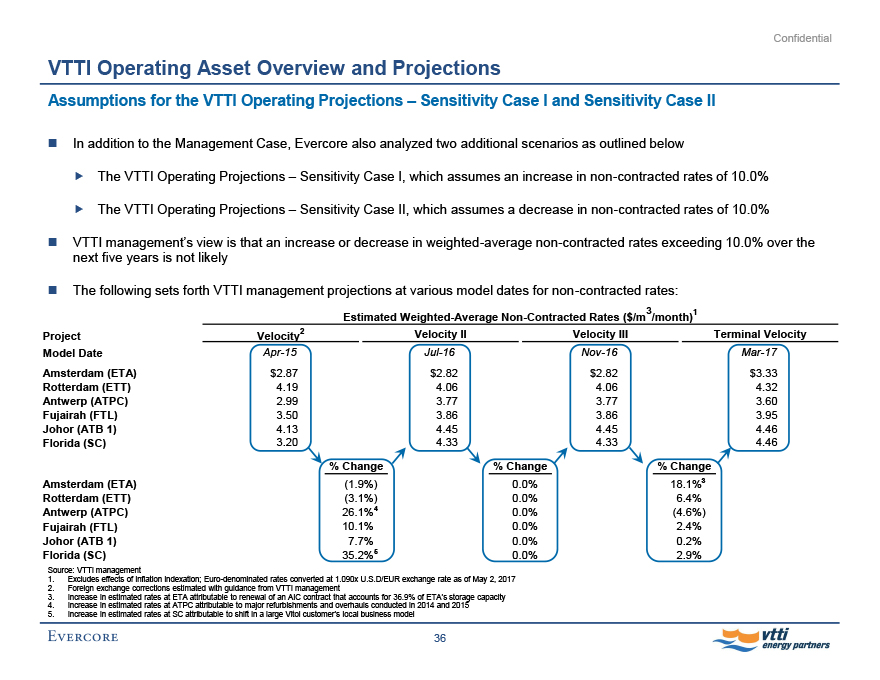
In addition to the Management Case, Evercore also analyzed two additional scenarios as outlined below
The VTTI Operating Projections - Sensitivity Case I, which assumes an increase in non-contracted rates of 10.0%
The VTTI Operating Projections - Sensitivity Case II, which assumes a decrease in non-contracted rates of 10.0%
VTTI management’s view is that an increase or decrease in weighted-average non-contracted rates exceeding 10.0% over the next five years is not likely
The following sets forth VTTI management projections at various model dates for non-contracted rates:
Estimated Weighted-Average Non-Contracted Rates ($/m3 /month)1
Project Velocity2 Velocity II Velocity III Terminal Velocity
Model Date Apr-15 Jul-16 Nov-16 Mar-17
Amsterdam (ETA) $2.87 $2.82 $2.82 $3.33
Rotterdam (ETT) 4.19 4.06 4.06 4.32
Antwerp (ATPC) 2.99 3.77 3.77 3.60
Fujairah (FTL) 3.50 3.86 3.86 3.95
Johor (ATB 1) 4.13 4.45 4.45 4.46
Florida (SC) 3.20 4.33 4.33 4.46
% Change % Change % Change
Amsterdam (ETA) (1.9%) 0.0% 18.1%3
Rotterdam (ETT) (3.1%) 0.0% 6.4%
Antwerp (ATPC) 26.1%4 0.0% (4.6%)
Fujairah (FTL) 10.1% 0.0% 2.4%
Johor (ATB 1) 7.7% 0.0% 0.2%
Florida (SC) 35.2%5 0.0% 2.9%
Source: VTTI management
1. Excludes effects of inflation indexation; Euro-denominated rates converted at 1.090x U.S.D/EUR exchange rate as of May 2, 2017
2. Foreign exchange corrections estimated with guidance from VTTI management
3. Increase in estimated rates at ETA attributable to renewal of an AIC contract that accounts for 36.9% of ETA’s storage capacity
4. Increase in estimated rates at ATPC attributable to major refurbishments and overhauls conducted in 2014 and 2015
5. Increase in estimated rates at SC attributable to shift in a large Vitol customer’s local business model
36
Evercore vtti energy partners
Confidential
VTTI Operating Asset Overview and Projections
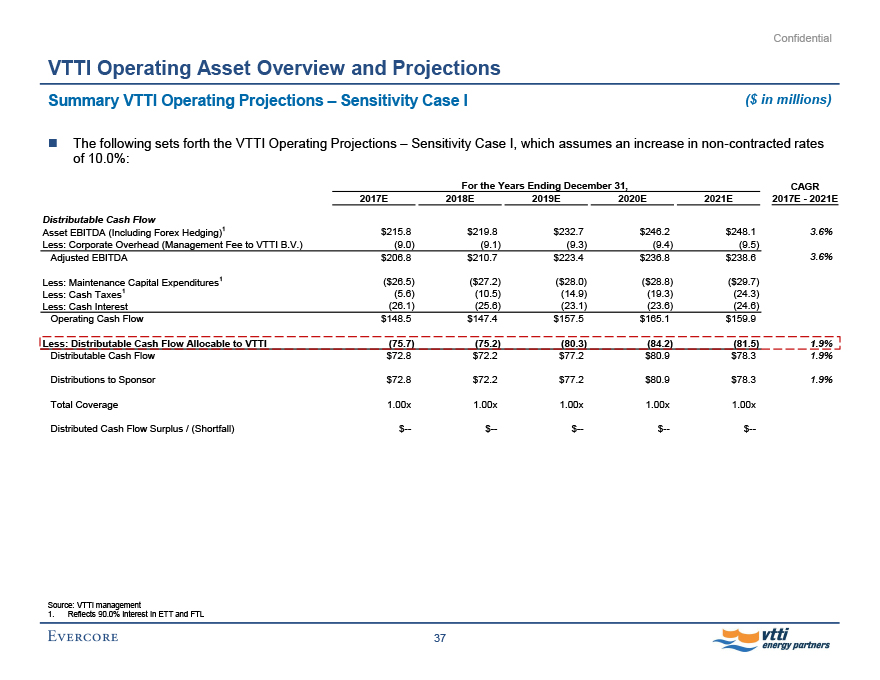
Summary VTTI Operating Projections - Sensitivity Case I ($ in millions)
The following sets forth the VTTI Operating Projections - Sensitivity Case I, which assumes an increase in non-contracted rates of 10.0%:
For the Years Ending December 31,
2017E 2018E 2019E 2020E 2021E CAGR 2017E - 2021E
Distributable Cash Flow
Asset EBITDA (Including Forex Hedging)1 $215.8 $219.8 $232.7 $246.2 $248.1 3.6%
Less: Corporate Overhead (Management Fee to VTTI B.V.) (9.0) (9.1) (9.3) (9.4) (9.5)
Adjusted EBITDA $206.8 $210.7 $223.4 $236.8 $238.6 3.6%
Less: Maintenance Capital Expenditures1 ($26.5) ($27.2) ($28.0) ($28.8) ($29.7)
Less: Cash Taxes1 (5.6) (10.5) (14.9) (19.3) (24.3)
Less: Cash Interest (26.1) (25.6) (23.1) (23.6) (24.6)
Operating Cash Flow $148.5 $147.4 $157.5 $165.1 $159.9
Less: Distributable Cash Flow Allocable to VTTI (75.7) (75.2) (80.3) (84.2) (81.5) 1.9%
Distributable Cash Flow $72.8 $72.2 $77.2 $80.9 $78.3 1.9%
Distributions to Sponsor $72.8 $72.2 $77.2 $80.9 $78.3 1.9%
Total Coverage 1.00x 1.00x 1.00x 1.00x 1.00x
Distributed Cash Flow Surplus / (Shortfall) $-- $-- $-- $-- $--
Source: VTTI management
1. Reflects 90.0% interest in ETT and FTL
37
Evercore vtti energy partners

Confidential
VTTI Operating Asset Overview and Projections
Summary VTTI Operating Projections - Sensitivity Case I (cont’d) ($ in millions)
The following sets forth the funding assumptions utilized in the VTTI Operating Projections - Sensitivity Case I and VTTI Operating’s resulting capital structure:
For the Years Ending December 31,
2017E 2018E 2019E 2020E 2021E
Sources
Operating Cash Flow $148.5 $147.4 $157.5 $165.1 $159.9
Debt Issuance 29.0 5.5 5.6 -- --
Cash on Hand Utilized -- -- -- -- --
Total Sources $177.5 $152.9 $163.1 $165.1 $159.9
Uses
Cash Flow Made Available to the MLP $75.7 $75.2 $80.3 $84.2 $81.5
Distributions to the Sponsor 72.8 72.2 77.2 80.9 78.3
Growth Capital Expenditures 29.0 5.5 5.6 -- --
Cash Build -- -- -- -- --
Total Uses $177.5 $152.9 $163.1 $165.1 $159.9
Capital Structure
Cash $13.2 $13.2 $13.2 $13.2 $13.2
Debt 588.1 598.5 610.7 617.8 625.0
Net Debt $574.9 $585.3 $597.5 $604.6 $611.8
Credit Statistics
Debt / Adjusted EBITDA 2.8x 2.8x 2.7x 2.6x 2.6x
Net Debt / Adjusted EBITDA 2.8 2.8 2.7 2.6 2.6
Source: VTTI management
38
Evercore vtti energy partners

Confidential
VTTI Operating Asset Overview and Projections
Summary VTTI Operating Projections - Sensitivity Case II ($ in millions)
The following sets forth the VTTI Operating Projections - Sensitivity Case II, which assumes a decrease in non-contracted rates of 10.0%:
For the Years Ending December 31,
2017E 2018E 2019E 2020E 2021E CAGR 2017E - 2021E
Distributable Cash Flow
Asset EBITDA (Including Forex Hedging)1 $213.3 $214.3 $202.5 $192.1 $192.6 (2.5%)
Less: Corporate Overhead (Management Fee to VTTI B.V.) (9.0) (9.1) (9.3) (9.4) (9.5)
Adjusted EBITDA $204.3 $205.2 $193.3 $182.7 $183.1 (2.7%)
Less: Maintenance Capital Expenditures1 ($26.5) ($27.2) ($28.0) ($28.8) ($29.7)
Less: Cash Taxes1 (5.3) (9.6) (10.5) (11.8) (16.5)
Less: Cash Interest (26.1) (25.7) (23.2) (24.1) (25.2)
Operating Cash Flow $146.4 $142.7 $131.6 $118.0 $111.7
Less: Distributable Cash Flow Allocable to VTTI (74.7) (72.8) (67.1) (60.2) (56.9) (6.5%)
Distributable Cash Flow $71.7 $69.9 $64.5 $57.8 $54.7 (6.5%)
Distributions to Sponsor $71.7 $69.9 $64.5 $57.8 $54.7 (6.5%)
Total Coverage 1.00x 1.00x 1.00x 1.00x 1.00x
Distributed Cash Flow Surplus / (Shortfall) $-- $-- $-- $-- $--
Source: VTTI management
1. Reflects 90.0% interest in ETT and FTL
39
Evercore vtti energy partners

Confidential
VTTI Operating Asset Overview and Projections
Summary VTTI Operating Projections - Sensitivity Case II (cont’d) ($ in millions)
The following sets forth the funding assumptions utilized in the VTTI Operating Projections - Sensitivity Case II and VTTI Operating’s resulting capital structure:
For the Years Ending December 31,
2017E 2018E 2019E 2020E 2021E
Sources
Operating Cash Flow $146.4 $142.7 $131.6 $118.0 $111.7
Debt Issuance 29.0 5.5 5.6 -- --
Cash on Hand Utilized -- -- -- -- --
Total Sources $175.4 $148.2 $137.2 $118.0 $111.7
Uses
Cash Flow Made Available to the MLP $74.7 $72.8 $67.1 $60.2 $56.9
Distributions to the Sponsor 71.7 69.9 64.5 57.8 54.7
Growth Capital Expenditures 29.0 5.5 5.6 -- --
Cash Build -- -- -- -- --
Total Uses $175.4 $148.2 $137.2 $118.0 $111.7
Capital Structure
Cash $13.2 $13.2 $13.2 $13.2 $13.2
Debt 588.1 598.5 610.7 617.8 624.9
Net Debt $574.9 $585.3 $597.5 $604.6 $611.7
Credit Statistics
Debt / Adjusted EBITDA 2.9x 2.9x 3.2x 3.4x 3.4x
Net Debt / Adjusted EBITDA 2.8 2.9 3.1 3.3 3.3
Source: VTTI management
40
Evercore vtti energy partners
Confidential
IV. VTTI Financial Projections
Evercore
Confidential
VTTI Financial Projections
Assumptions for the VTTI Financial Projections - Management Case ($ in millions)
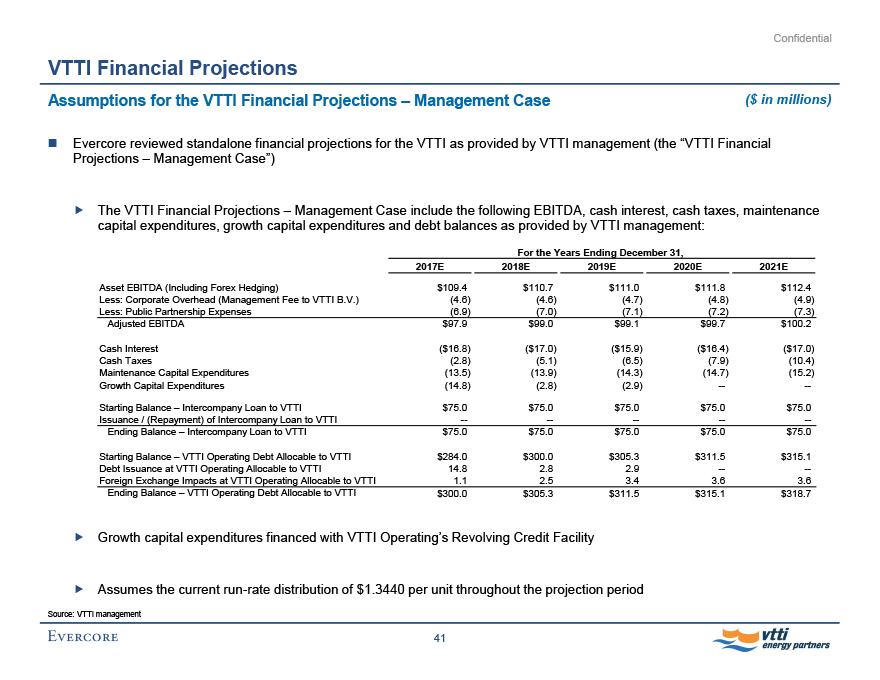
Evercore reviewed standalone financial projections for the VTTI as provided by VTTI management (the “VTTI Financial Projections - Management Case”)
The VTTI Financial Projections - Management Case include the following EBITDA, cash interest, cash taxes, maintenance capital expenditures, growth capital expenditures and debt balances as provided by VTTI management:
For the Years Ending December 31,
2017E 2018E 2019E 2020E 2021E
Asset EBITDA (Including Forex Hedging) $109.4 $110.7 $111.0 $111.8 $112.4
Less: Corporate Overhead (Management Fee to VTTI B.V.) (4.6) (4.6) (4.7) (4.8) (4.9)
Less: Public Partnership Expenses (6.9) (7.0) (7.1) (7.2) (7.3)
Adjusted EBITDA $97.9 $99.0 $99.1 $99.7 $100.2
Cash Interest ($16.8) ($17.0) ($15.9) ($16.4) ($17.0)
Cash Taxes (2.8) (5.1) (6.5) (7.9) (10.4)
Maintenance Capital Expenditures (13.5) (13.9) (14.3) (14.7) (15.2)
Growth Capital Expenditures (14.8) (2.8) (2.9) -- --
Starting Balance - Intercompany Loan to VTTI $75.0 $75.0 $75.0 $75.0 $75.0
Issuance / (Repayment) of Intercompany Loan to VTTI -- -- -- -- --
Ending Balance - Intercompany Loan to VTTI $75.0 $75.0 $75.0 $75.0 $75.0
Starting Balance - VTTI Operating Debt Allocable to VTTI $284.0 $300.0 $305.3 $311.5 $315.1
Debt Issuance at VTTI Operating Allocable to VTTI 14.8 2.8 2.9 -- --
Foreign Exchange Impacts at VTTI Operating Allocable to VTTI 1.1 2.5 3.4 3.6 3.6
Ending Balance - VTTI Operating Debt Allocable to VTTI $300.0 $305.3 $311.5 $315.1 $318.7
Growth capital expenditures financed with VTTI Operating’s Revolving Credit Facility
Assumes the current run-rate distribution of $1.3440 per unit throughout the projection period
Source: VTTI management
41
Evercore vtti energy partners
Confidential
VTTI Financial Projections
VTTI Financial Projections - Management Case ($ in millions, except per unit amounts)
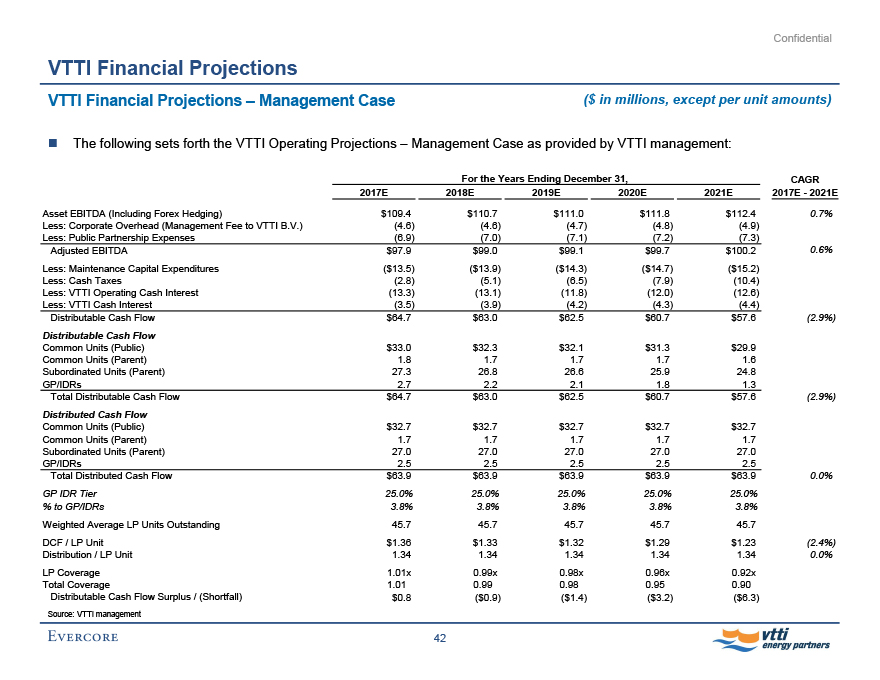
The following sets forth the VTTI Operating Projections - Management Case as provided by VTTI management:
For the Years Ending December 31,
2017E 2018E 2019E 2020E 2021E CAGR 2017E - 2021E
Asset EBITDA (Including Forex Hedging) $109.4 $110.7 $111.0 $111.8 $112.4 0.7%
Less: Corporate Overhead (Management Fee to VTTI B.V.) (4.6) (4.6) (4.7) (4.8) (4.9)
Less: Public Partnership Expenses (6.9) (7.0) (7.1) (7.2) (7.3)
Adjusted EBITDA $97.9 $99.0 $99.1 $99.7 $100.2 0.6%
Less: Maintenance Capital Expenditures ($13.5) ($13.9) ($14.3) ($14.7) ($15.2)
Less: Cash Taxes (2.8) (5.1) (6.5) (7.9) (10.4)
Less: VTTI Operating Cash Interest (13.3) (13.1) (11.8) (12.0) (12.6)
Less: VTTI Cash Interest (3.5) (3.9) (4.2) (4.3) (4.4)
Distributable Cash Flow $64.7 $63.0 $62.5 $60.7 $57.6 (2.9%)
Distributable Cash Flow
Common Units (Public) $33.0 $32.3 $32.1 $31.3 $29.9
Common Units (Parent) 1.8 1.7 1.7 1.7 1.6
Subordinated Units (Parent) 27.3 26.8 26.6 25.9 24.8
GP/IDRs 2.7 2.2 2.1 1.8 1.3
Total Distributable Cash Flow $64.7 $63.0 $62.5 $60.7 $57.6 (2.9%)
Distributed Cash Flow
Common Units (Public) $32.7 $32.7 $32.7 $32.7 $32.7
Common Units (Parent) 1.7 1.7 1.7 1.7 1.7
Subordinated Units (Parent) 27.0 27.0 27.0 27.0 27.0
GP/IDRs 2.5 2.5 2.5 2.5 2.5
Total Distributed Cash Flow $63.9 $63.9 $63.9 $63.9 $63.9 0.0%
GP IDR Tier 25.0% 25.0% 25.0% 25.0% 25.0%
% to GP/IDRs 3.8% 3.8% 3.8% 3.8% 3.8%
Weighted Average LP Units Outstanding 45.7 45.7 45.7 45.7 45.7
DCF / LP Unit $1.36 $1.33 $1.32 $1.29 $1.23 (2.4%)
Distribution / LP Unit 1.34 1.34 1.34 1.34 1.34 0.0%
LP Coverage 1.01x 0.99x 0.98x 0.96x 0.92x
Total Coverage 1.01 0.99 0.98 0.95 0.90
Distributable Cash Flow Surplus / (Shortfall) $0.8 ($0.9) ($1.4) ($3.2) ($6.3)
Source: VTTI management
42
Evercore vtti energy partners

Confidential
VTTI Financial Projections
VTTI Financial Projections - Management Case (cont’d) ($ in millions)
The following sets forth the funding assumptions utilized in the VTTI Financial Projections - Management Case and VTTI’s resulting capital structure:
For the Years Ending December 31,
2017E 2018E 2019E 2020E 2021E
Sources
DCF Surplus $0.8 $-- $-- $-- $--
Debt Issuance 14.8 2.8 2.9 -- --
Cash on Hand Utilized -- 0.9 1.4 3.2 6.3
Total Sources $15.6 $3.7 $4.3 $3.2 $6.3
Uses
DCF Shortfall $0.0 $0.9 $1.4 $3.2 $6.3
Growth Capital Expenditures 14.8 2.8 2.9 -- --
Cash Build 0.8 -- -- -- --
Total Uses $15.6 $3.7 $4.3 $3.2 $6.3
Capital Structure
Cash - VTTI $12.4 $11.6 $10.1 $6.9 $0.6
Debt - VTTI 75.0 75.0 75.0 75.0 75.0
Net Debt - VTTI $62.6 $63.4 $64.9 $68.1 $74.4
Cash - Pro Rata $19.1 $18.3 $16.8 $13.7 $7.4
Debt - Pro Rata1 375.0 380.3 386.5 390.1 393.7
Net Debt - Pro Rata $355.8 $362.0 $369.6 $376.4 $386.4
Cash - Consolidated $24.8 $25.6 $24.8 $23.3 $20.1
Debt - Consolidated1 663.1 673.5 685.7 692.8 700.0
Net Debt - Consolidated $638.3 $647.9 $661.0 $669.5 $679.8
Credit Statistics
Debt / Adjusted EBITDA - Pro Rata 3.8x 3.8x 3.9x 3.9x 3.9x
Net Debt / Adjusted EBITDA - Pro Rata 3.6 3.7 3.7 3.8 3.9
Debt / Adjusted EBITDA - Consolidated 3.2x 3.2x 3.3x 3.3x 3.3x
Net Debt / Adjusted EBITDA - Consolidated 3.1 3.1 3.2 3.2 3.2
Source: VTTI management
1. Includes impact of foreign exchange on debt balances as provided by VTTI management
43
Evercore vtti energy partners
Confidential
VTTI Financial Projections
Assumptions for the VTTI Financial Projections - Sensitivity Case I and Sensitivity Case II
In addition to the Management Case, Evercore also analyzed two additional scenarios as outlined below
The VTTI Financial Projections - Sensitivity Case I assume the following:
The VTTI Operating Projections - Sensitivity Case I, which assumes an increase in non-contracted rates of 10.0%
Growth capital expenditures financed with VTTI Operating’s Revolving Credit Facility
Assumes increases to distributions to maintain total coverage of 1.10x and no decreases to distributions per unit
The VTTI Financial Projections - Sensitivity Case II assume the following:
The VTTI Operating Projections - Sensitivity Case II, which assumes a decrease in non-contracted rates of 10.0%
Growth capital expenditures financed with VTTI Operating’s Revolving Credit Facility
Allows distributions to decrease to maintain total coverage of 1.00x but does not decrease distributions below annualized minimum quarterly distribution of $1.05 per unit
44
Evercore vtti energy partners
Confidential
VTTI Financial Projections
VTTI Financial Projections - Sensitivity Case I ($ in millions, except per unit amounts)
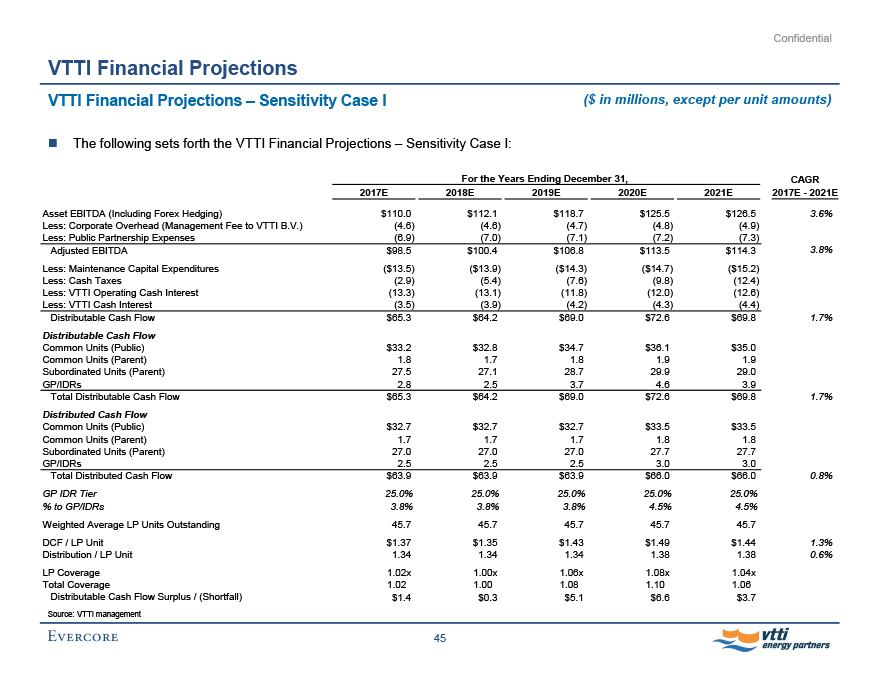
The following sets forth the VTTI Financial Projections - Sensitivity Case I:
For the Years Ending December 31,
2017E 2018E 2019E 2020E 2021E CAGR 2017E - 2021E
Asset EBITDA (Including Forex Hedging) $110.0 $112.1 $118.7 $125.5 $126.5 3.6%
Less: Corporate Overhead (Management Fee to VTTI B.V.) (4.6) (4.6) (4.7) (4.8) (4.9)
Less: Public Partnership Expenses (6.9) (7.0) (7.1) (7.2) (7.3)
Adjusted EBITDA $98.5 $100.4 $106.8 $113.5 $114.3 3.8%
Less: Maintenance Capital Expenditures ($13.5) ($13.9) ($14.3) ($14.7) ($15.2)
Less: Cash Taxes (2.9) (5.4) (7.6) (9.8) (12.4)
Less: VTTI Operating Cash Interest (13.3) (13.1) (11.8) (12.0) (12.6)
Less: VTTI Cash Interest (3.5) (3.9) (4.2) (4.3) (4.4)
Distributable Cash Flow $65.3 $64.2 $69.0 $72.6 $69.8 1.7%
Distributable Cash Flow
Common Units (Public) $33.2 $32.8 $34.7 $36.1 $35.0
Common Units (Parent) 1.8 1.7 1.8 1.9 1.9
Subordinated Units (Parent) 27.5 27.1 28.7 29.9 29.0
GP/IDRs 2.8 2.5 3.7 4.6 3.9
Total Distributable Cash Flow $65.3 $64.2 $69.0 $72.6 $69.8 1.7%
Distributed Cash Flow
Common Units (Public) $32.7 $32.7 $32.7 $33.5 $33.5
Common Units (Parent) 1.7 1.7 1.7 1.8 1.8
Subordinated Units (Parent) 27.0 27.0 27.0 27.7 27.7
GP/IDRs 2.5 2.5 2.5 3.0 3.0
Total Distributed Cash Flow $63.9 $63.9 $63.9 $66.0 $66.0 0.8%
GP IDR Tier 25.0% 25.0% 25.0% 25.0% 25.0%
% to GP/IDRs 3.8% 3.8% 3.8% 4.5% 4.5%
Weighted Average LP Units Outstanding 45.7 45.7 45.7 45.7 45.7
DCF / LP Unit $1.37 $1.35 $1.43 $1.49 $1.44 1.3%
Distribution / LP Unit 1.34 1.34 1.34 1.38 1.38 0.6%
LP Coverage 1.02x 1.00x 1.06x 1.08x 1.04x
Total Coverage 1.02 1.00 1.08 1.10 1.06
Distributable Cash Flow Surplus / (Shortfall) $1.4 $0.3 $5.1 $6.6 $3.7
Source: VTTI management
45
Evercore vtti energy partners

Confidential
VTTI Financial Projections
VTTI Financial Projections - Sensitivity Case I (cont’d) ($ in millions)
The following sets forth the funding assumptions utilized in the VTTI Financial Projections - Sensitivity Case I and VTTI’s resulting capital structure:
For the Years Ending December 31,
2017E 2018E 2019E 2020E 2021E
Sources
DCF Surplus $1.4 $0.3 $5.1 $6.6 $3.7
Debt Issuance 14.8 2.8 2.9 -- --
Cash on Hand Utilized -- -- -- -- --
Total Sources $16.1 $3.1 $8.0 $6.6 $3.7
Uses
DCF Shortfall $0.0 $0.0 $0.0 $0.0 $0.0
Growth Capital Expenditures 14.8 2.8 2.9 -- --
Cash Build 1.4 0.3 5.1 6.6 3.7
Total Uses $16.1 $3.1 $8.0 $6.6 $3.7
Capital Structure
Cash - VTTI $13.0 $13.3 $18.4 $25.0 $28.7
Debt - VTTI 75.0 75.0 75.0 75.0 75.0
Net Debt - VTTI $62.0 $61.7 $56.6 $50.0 $46.3
Cash - Pro Rata $19.7 $20.0 $25.1 $31.7 $35.5
Debt - Pro Rata1 375.0 380.3 386.5 390.1 393.7
Net Debt - Pro Rata $355.3 $360.3 $361.3 $358.4 $358.3
Cash - Consolidated $24.8 $26.2 $26.5 $31.6 $38.2
Debt - Consolidated1 663.1 673.5 685.7 692.8 700.0
Net Debt - Consolidated $638.3 $647.4 $659.3 $661.2 $661.8
Credit Statistics
Debt / Adjusted EBITDA - Pro Rata 3.8x 3.8x 3.6x 3.4x 3.4x
Net Debt / Adjusted EBITDA - Pro Rata 3.6 3.6 3.4 3.2 3.1
Debt / Adjusted EBITDA - Consolidated 3.2x 3.2x 3.1x 2.9x 2.9x
Net Debt / Adjusted EBITDA - Consolidated 3.1 3.1 3.0 2.8 2.8
Source: VTTI management
1. Includes impact of foreign exchange on debt balances as provided by VTTI management
46
Evercore vtti energy partners
Confidential
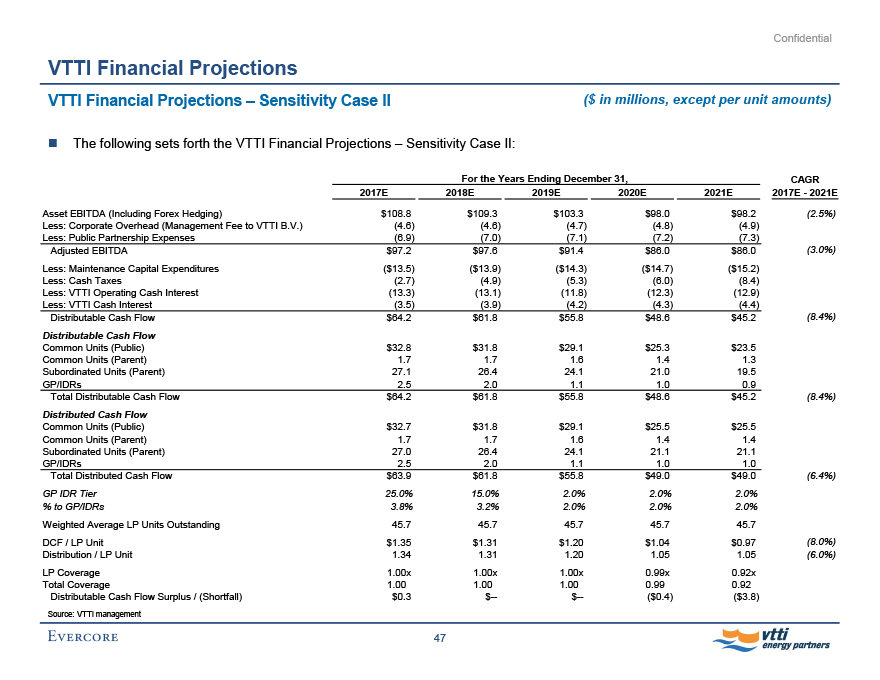
VTTI Financial Projections
VTTI Financial Projections - Sensitivity Case II ($ in millions, except per unit amounts)
The following sets forth the VTTI Financial Projections - Sensitivity Case II:
For the Years Ending December 31,
2017E 2018E 2019E 2020E 2021E CAGR 2017E - 2021E
Asset EBITDA (Including Forex Hedging) $108.8 $109.3 $103.3 $98.0 $98.2 (2.5%)
Less: Corporate Overhead (Management Fee to VTTI B.V.) (4.6) (4.6) (4.7) (4.8) (4.9)
Less: Public Partnership Expenses (6.9) (7.0) (7.1) (7.2) (7.3)
Adjusted EBITDA $97.2 $97.6 $91.4 $86.0 $86.0 (3.0%)
Less: Maintenance Capital Expenditures ($13.5) ($13.9) ($14.3) ($14.7) ($15.2)
Less: Cash Taxes (2.7) (4.9) (5.3) (6.0) (8.4)
Less: VTTI Operating Cash Interest (13.3) (13.1) (11.8) (12.3) (12.9)
Less: VTTI Cash Interest (3.5) (3.9) (4.2) (4.3) (4.4)
Distributable Cash Flow $64.2 $61.8 $55.8 $48.6 $45.2 (8.4%)
Distributable Cash Flow
Common Units (Public) $32.8 $31.8 $29.1 $25.3 $23.5
Common Units (Parent) 1.7 1.7 1.6 1.4 1.3
Subordinated Units (Parent) 27.1 26.4 24.1 21.0 19.5
GP/IDRs 2.5 2.0 1.1 1.0 0.9
Total Distributable Cash Flow $64.2 $61.8 $55.8 $48.6 $45.2 (8.4%)
Distributed Cash Flow
Common Units (Public) $32.7 $31.8 $29.1 $25.5 $25.5
Common Units (Parent) 1.7 1.7 1.6 1.4 1.4
Subordinated Units (Parent) 27.0 26.4 24.1 21.1 21.1
GP/IDRs 2.5 2.0 1.1 1.0 1.0
Total Distributed Cash Flow $63.9 $61.8 $55.8 $49.0 $49.0 (6.4%)
GP IDR Tier 25.0% 15.0% 2.0% 2.0% 2.0%
% to GP/IDRs 3.8% 3.2% 2.0% 2.0% 2.0%
Weighted Average LP Units Outstanding 45.7 45.7 45.7 45.7 45.7
DCF / LP Unit $1.35 $1.31 $1.20 $1.04 $0.97 (8.0%)
Distribution / LP Unit 1.34 1.31 1.20 1.05 1.05 (6.0%)
LP Coverage 1.00x 1.00x 1.00x 0.99x 0.92x
Total Coverage 1.00 1.00 1.00 0.99 0.92
Distributable Cash Flow Surplus / (Shortfall) $0.3 $-- $-- ($0.4) ($3.8)
Source: VTTI management
47
Evercore vtti energy partners
Confidential
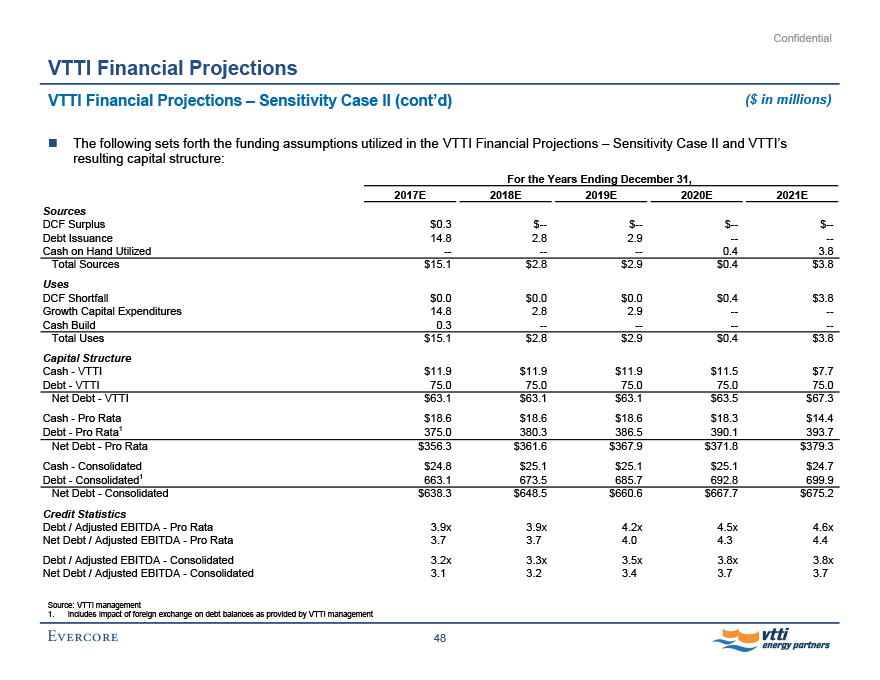
VTTI Financial Projections
VTTI Financial Projections - Sensitivity Case II (cont’d) ($ in millions)
The following sets forth the funding assumptions utilized in the VTTI Financial Projections - Sensitivity Case II and VTTI’s resulting capital structure:
For the Years Ending December 31,
2017E 2018E 2019E 2020E 2021E
Sources
DCF Surplus $0.3 $-- $-- $-- $--
Debt Issuance 14.8 2.8 2.9 -- --
Cash on Hand Utilized -- -- -- 0.4 3.8
Total Sources $15.1 $2.8 $2.9 $0.4 $3.8
Uses
DCF Shortfall $0.0 $0.0 $0.0 $0.4 $3.8
Growth Capital Expenditures 14.8 2.8 2.9 -- --
Cash Build 0.3 -- -- -- --
Total Uses $15.1 $2.8 $2.9 $0.4 $3.8
Capital Structure
Cash - VTTI $11.9 $11.9 $11.9 $11.5 $7.7
Debt - VTTI 75.0 75.0 75.0 75.0 75.0
Net Debt - VTTI $63.1 $63.1 $63.1 $63.5 $67.3
Cash - Pro Rata $18.6 $18.6 $18.6 $18.3 $14.4
Debt - Pro Rata1 375.0 380.3 386.5 390.1 393.7
Net Debt - Pro Rata $356.3 $361.6 $367.9 $371.8 $379.3
Cash - Consolidated $24.8 $25.1 $25.1 $25.1 $24.7
Debt - Consolidated1 663.1 673.5 685.7 692.8 699.9
Net Debt - Consolidated $638.3 $648.5 $660.6 $667.7 $675.2
Credit Statistics
Debt / Adjusted EBITDA - Pro Rata 3.9x 3.9x 4.2x 4.5x 4.6x
Net Debt / Adjusted EBITDA - Pro Rata 3.7 3.7 4.0 4.3 4.4
Debt / Adjusted EBITDA - Consolidated 3.2x 3.3x 3.5x 3.8x 3.8x
Net Debt / Adjusted EBITDA - Consolidated 3.1 3.2 3.4 3.7 3.7
Source: VTTI management
1. Includes impact of foreign exchange on debt balances as provided by VTTI management
48
Evercore vtti energy partners
Confidential
V. Preliminary VTTI Valuation Analysis
Evercore
Confidential
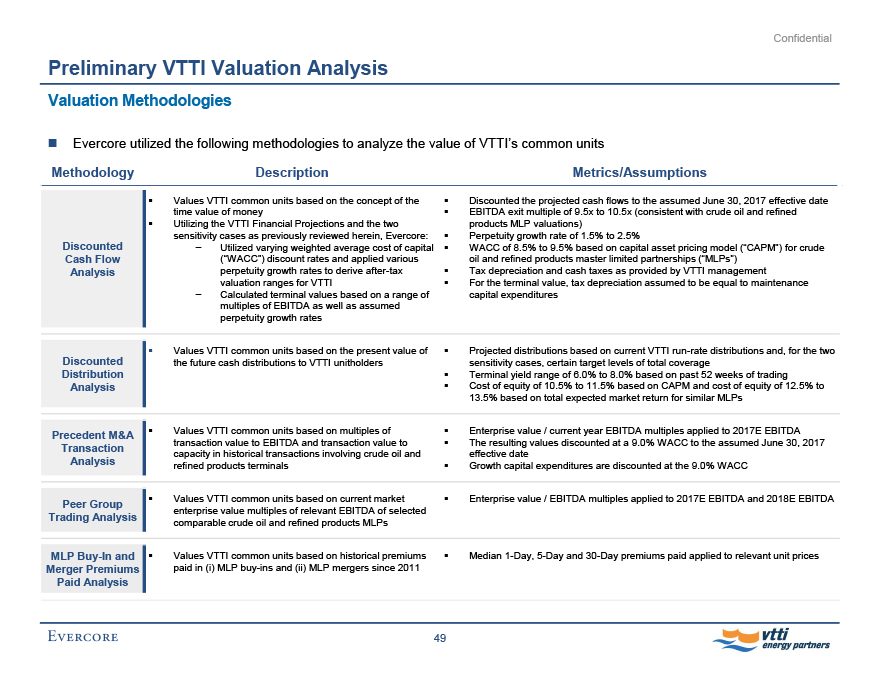
Preliminary VTTI Valuation Analysis
Valuation Methodologies
Evercore utilized the following methodologies to analyze the value of VTTI’s common units
Methodology Description Metrics/Assumptions
Discounted Cash Flow Analysis
Values VTTI common units based on the concept of the time value of money
Utilizing the VTTI Financial Projections and the two sensitivity cases as previously reviewed herein, Evercore:
- Utilized varying weighted average cost of capital (“WACC”) discount rates and applied various perpetuity growth rates to derive after-tax valuation ranges for VTTI
- Calculated terminal values based on a range of multiples of EBITDA as well as assumed perpetuity growth rates
Discounted the projected cash flows to the assumed June 30, 2017 effective date
EBITDA exit multiple of 9.5x to 10.5x (consistent with crude oil and refined products MLP valuations)
Perpetuity growth rate of 1.5% to 2.5%
WACC of 8.5% to 9.5% based on capital asset pricing model (“CAPM”) for crude oil and refined products master limited partnerships (“MLPs”)
Tax depreciation and cash taxes as provided by VTTI management
For the terminal value, tax depreciation assumed to be equal to maintenance capital expenditures
Discounted Distribution Analysis
Values VTTI common units based on the present value of the future cash distributions to VTTI unitholders
Projected distributions based on current VTTI run-rate distributions and, for the two sensitivity cases, certain target levels of total coverage
Terminal yield range of 6.0% to 8.0% based on past 52 weeks of trading
Cost of equity of 10.5% to 11.5% based on CAPM and cost of equity of 12.5% to 13.5% based on total expected market return for similar MLPs
Precedent M&A Transaction Analysis
Values VTTI common units based on multiples of transaction value to EBITDA and transaction value to capacity in historical transactions involving crude oil and refined products terminals
Enterprise value / current year EBITDA multiples applied to 2017E EBITDA
The resulting values discounted at a 9.0% WACC to the assumed June 30, 2017 effective date
Growth capital expenditures are discounted at the 9.0% WACC
Peer Group Trading Analysis
Values VTTI common units based on current market enterprise value multiples of relevant EBITDA of selected comparable crude oil and refined products MLPs
Enterprise value / EBITDA multiples applied to 2017E EBITDA and 2018E EBITDA
MLP Buy-In and Merger Premiums Paid Analysis
Values VTTI common units based on historical premiums paid in (i) MLP buy-ins and (ii) MLP mergers since 2011
Median 1-Day, 5-Day and 30-Day premiums paid applied to relevant unit prices
49
Evercore vtti energy partners
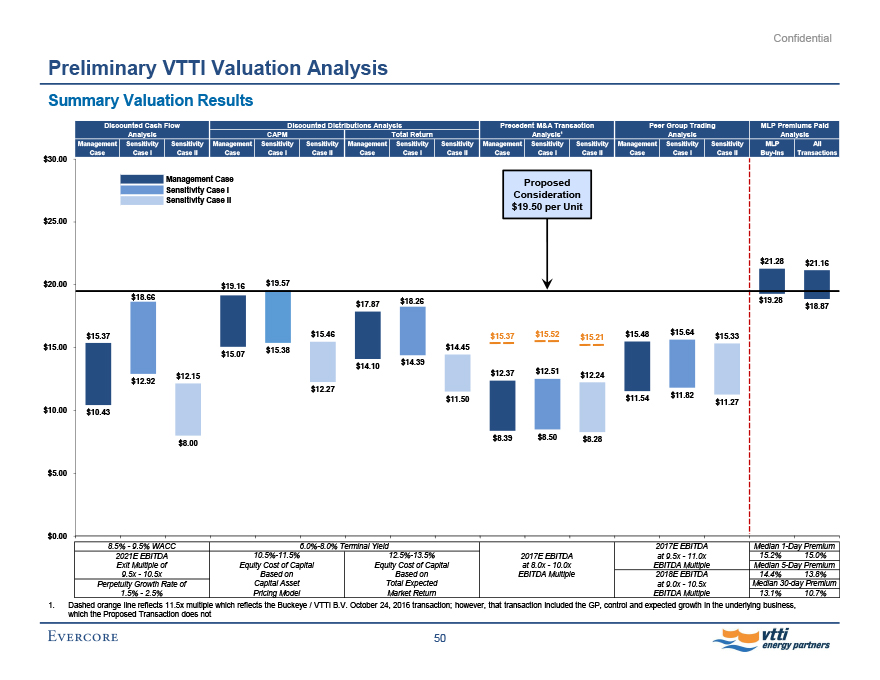
Confidential
Preliminary VTTI Valuation Analysis
Summary Valuation Results
$30.00
$25.00
$20.00
$15.00
$10.00
$5.00
$0.00
Discounted Cash Flow
Analysis Discounted Distributions Analysis CAPM Total Return Precedent M&A Transaction Analysis1 Peer Group Trading Analysis MLP Premiums Paid Analysis
Management Case Sensitivity Case I Sensitivity Case II Management Case Sensitivity Case I Sensitivity Case II Management Case Sensitivity Case I Sensitivity Case II Management Case Sensitivity Case I Sensitivity Case II Management Case Sensitivity Case I Sensitivity Case II MLP Buy-Ins All Transactions
Management Case
Sensitivity Case I
Sensitivity Case II
Proposed Consideration $19.50 per Unit
$21.28 $21.16
$19.16 $19.57
$18.66 $18.26 $19.28
$17.87 $18.87
$15.37 $15.46 $15.37 $15.52 $15.21 $15.48 $15.64 $15.33
$15.38 $ 14.45
$15.07
$14.10 $14.39
$12.15 $12.37 $12.51 $12.24
$12.92
$12.27
$11.82
$11.50 $11.54 $11.27
$10.43
$8.00 $8.39 $8.50 $8.28
8.5% - 9.5% WACC
2021E EBITDA
Exit Multiple of 9.5x - 10.5x
Perpetuity Growth Rate of 1.5% - 2.5%
6.0%-8.0% Terminal Yield
10.5%-11.5%
Equity Cost of Capital Based on Capital Asset Pricing Model
12.5%-13.5%
Equity Cost of Capital Based on Total Expected Market Return
2017E EBITDA at 8.0x - 10.0x EBITDA Multiple
2017E EBITDA at 9.5x - 11.0x EBITDA Multiple
2018E EBITDA at 9.0x - 10.5x EBITDA Multiple
Median 1-Day Premium 15.2% 15.0%
Median 5-Day Premium
14.4% 13.8%
Median 30-day Premium
13.1% 10.7%
1. Dashed orange line reflects 11.5x multiple which reflects the Buckeye / VTTI B.V. October 24, 2016 transaction; however, that transaction included the GP, control and expected growth in the underlying business, which the Proposed Transaction does not
50
Evercore vtti energy partners
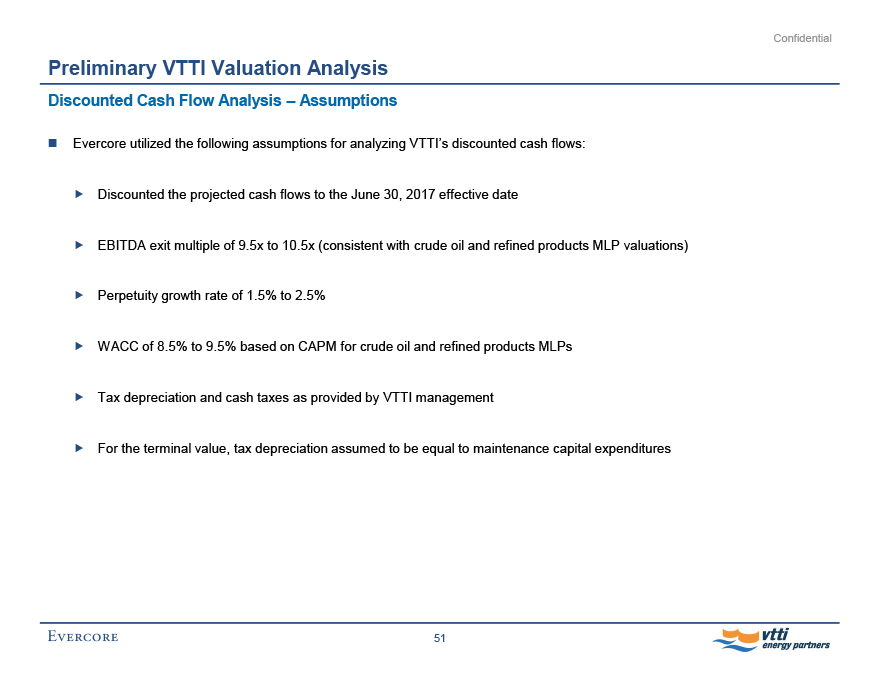
Confidential
Preliminary VTTI Valuation Analysis
Discounted Cash Flow Analysis - Assumptions
Evercore utilized the following assumptions for analyzing VTTI’s discounted cash flows:
Discounted the projected cash flows to the June 30, 2017 effective date
EBITDA exit multiple of 9.5x to 10.5x (consistent with crude oil and refined products MLP valuations)
Perpetuity growth rate of 1.5% to 2.5%
WACC of 8.5% to 9.5% based on CAPM for crude oil and refined products MLPs
Tax depreciation and cash taxes as provided by VTTI management
For the terminal value, tax depreciation assumed to be equal to maintenance capital expenditures
51
Evercore vtti energy partners
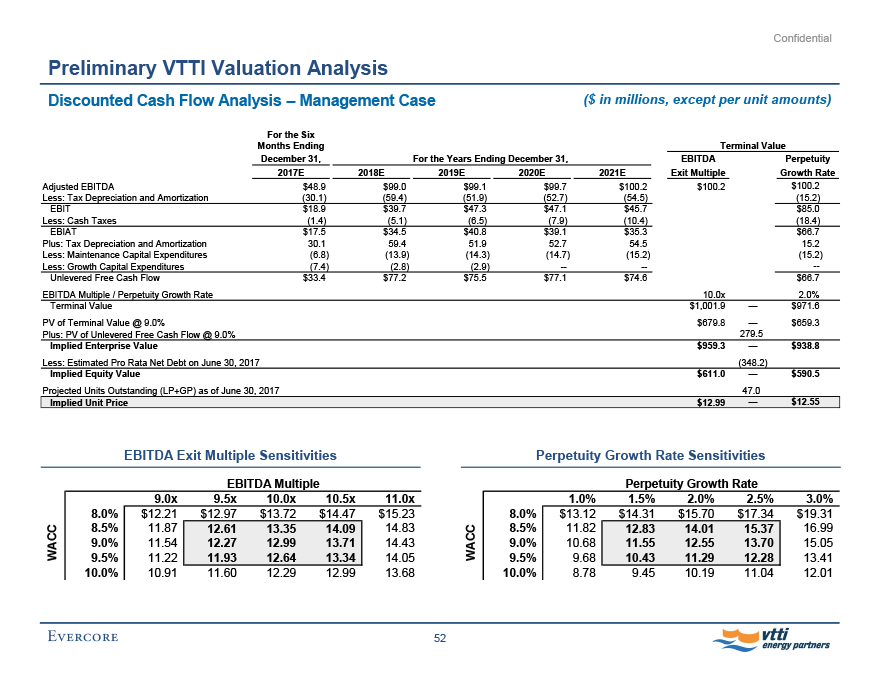
Confidential
Preliminary VTTI Valuation Analysis
Discounted Cash Flow Analysis - Management Case ($ in millions, except per unit amounts)
For the Six Months Ending December 31,
For the Years Ending December 31,
Terminal Value
2017E 2018E 2019E 2020E 2021E
EBITDA Exit Multiple
Perpetuity Growth Rate
Adjusted EBITDA $48.9 $99.0 $99.1 $99.7 $100.2 $100.2 $100.2
Less: Tax Depreciation and Amortization (30.1) (59.4) (51.9) (52.7) (54.5) (15.2)
EBIT $18.9 $39.7 $47.3 $47.1 $45.7 $85.0
Less: Cash Taxes (1.4) (5.1) (6.5) (7.9) (10.4) (18.4)
EBIAT $17.5 $34.5 $40.8 $39.1 $35.3 $66.7
Plus: Tax Depreciation and Amortization 30.1 59.4 51.9 52.7 54.5 15.2
Less: Maintenance Capital Expenditures (6.8) (13.9) (14.3) (14.7) (15.2) (15.2)
Less: Growth Capital Expenditures (7.4) (2.8) (2.9) -- -- --
Unlevered Free Cash Flow $33.4 $77.2 $75.5 $77.1 $74.6 $66.7
EBITDA Multiple / Perpetuity Growth Rate 10.0x 2.0%
Terminal Value $1,001.9 - $971.6
PV of Terminal Value @ 9.0% $679.8 - $659.3
Plus: PV of Unlevered Free Cash Flow @ 9.0% 279.5
Implied Enterprise Value $959.3 - $938.8
Less: Estimated Pro Rata Net Debt on June 30, 2017
(348.2)
Implied Equity Value $611.0 - $590.5
Projected Units Outstanding (LP+GP) as of June 30, 2017 47.0
Implied Unit Price $12.99 - $12.55
EBITDA Exit Multiple Sensitivities
EBITDA Multiple
WACC
9.0x 9.5x 10.0x 10.5x 11.0x
8.0% $12.21 $12.97 $13.72 $14.47 $15.23
8.5% 11.87 12.61 13.35 14.09 14.83
9.0% 11.54 12.27 12.99 13.71 14.43
9.5% 11.22 11.93 12.64 13.34 14.05
10.0% 10.91 11.60 12.29 12.99 13.68
Perpetuity Growth Rate Sensitivities
Perpetuity Growth Rate
WACC
1.0% 1.5% 2.0% 2.5% 3.0%
8.0% $13.12 $14.31 $15.70 $17.34 $19.31
8.5% 11.82 12.83 14.01 15.37 16.99
9.0% 10.68 11.55 12.55 13.70 15.05
9.5% 9.68 10.43 11.29 12.28 13.41
10.0% 8.78 9.45 10.19 11.04 12.01
52
Evercore vtti energy partners
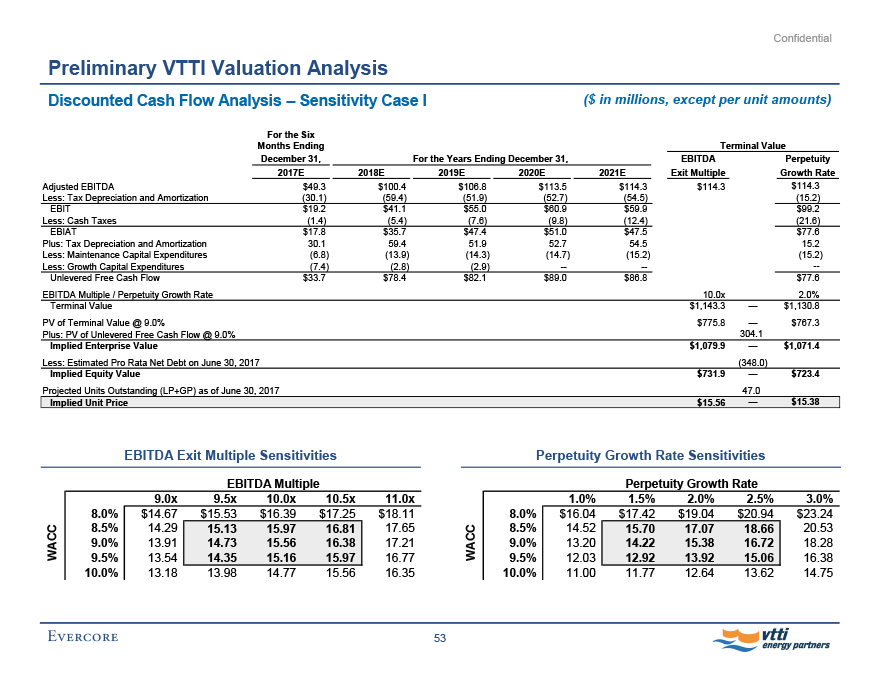
Confidential
Preliminary VTTI Valuation Analysis
Discounted Cash Flow Analysis - Sensitivity Case I ($ in millions, except per unit amounts)
For the Six Months Ending Terminal Value December 31, For the Years Ending December 31, EBITDA Perpetuity 2017E 2018E 2019E 2020E 2021E Exit Multiple Growth Rate Adjusted EBITDA $49.3 $100.4 $106.8 $113.5 $114.3 $114.3 $114.3 Less: Tax Depreciation and Amortization (30.1) (59.4) (51.9) (52.7) (54.5) (15.2) EBIT $19.2 $41.1 $55.0 $60.9 $59.9 $99.2 Less: Cash Taxes (1.4) (5.4) (7.6) (9.8) (12.4) (21.6) EBIAT $17.8 $35.7 $47.4 $51.0 $47.5 $77.6 Plus: Tax Depreciation and Amortization 30.1 59.4 51.9 52.7 54.5 15.2 Less: Maintenance Capital Expenditures (6.8) (13.9) (14.3) (14.7) (15.2) (15.2) Less: Growth Capital Expenditures (7.4) (2.8) (2.9) -- -- -- Unlevered Free Cash Flow $33.7 $78.4 $82.1 $89.0 $86.8 $77.6 EBITDA Multiple / Perpetuity Growth Rate 10.0x 2.0% Terminal Value $1,143.3 - $1,130.8 PV of Terminal Value @ 9.0% $775.8 - $767.3 Plus: PV of Unlevered Free Cash Flow @ 9.0% 304.1 Implied Enterprise Value $1,079.9 - $1,071.4 Less: Estimated Pro Rata Net Debt on June 30, 2017 (348.0) Implied Equity Value $731.9 - $723.4 Projected Units Outstanding (LP+GP) as of June 30, 2017 47.0 Implied Unit Price $15.56 - $15.38 EBITDA Exit Multiple Sensitivities EBITDA Multiple WACC 9.0x 9.5x 10.0x 10.5x 11.0x 8.0% $14.67 $15.53 $16.39 $17.25 $18.11 8.5% 14.29 15.13 15.97 16.81 17.65 9.0% 13.91 14.73 15.56 16.38 17.21 9.5% 13.54 14.35 15.16 15.97 16.77 10.0% 13.18 13.98 14.77 15.56 16.35 Perpetuity Growth Rate Sensitivities Perpetuity Growth Rate WACC 1.0% 1.5% 2.0% 2.5% 3.0% 8.0% $16.04 $17.42 $19.04 $20.94 $23.24 8.5% 14.52 15.70 17.07 18.66 20.53 9.0% 13.20 14.22 15.38 16.72 18.28 9.5% 12.03 12.92 13.92 15.06 16.38 10.0% 11.00 11.77 12.64 13.62 14.75 53
EVERCORE vtti energy partners

Confidential
Preliminary VTTI Valuation Analysis
Discounted Cash Flow Analysis - Sensitivity Case II ($ in millions, except per unit amounts) For the Six Months Ending Terminal Value December 31, For the Years Ending December 31, EBITDA Perpetuity 2017E 2018E 2019E 2020E 2021E Exit Multiple Growth Rate Adjusted EBITDA $48.6 $97.6 $91.4 $86.0 $86.0 $86.0 $86.0 Less: Tax Depreciation and Amortization (30.1) (59.4) (51.9) (52.7) (54.5) (15.2) EBIT $18.6 $38.3 $39.6 $33.3 $31.6 $70.9 Less: Cash Taxes (1.3) (4.9) (5.3) (6.0) (8.4) (14.9) EBIAT $17.2 $33.4 $34.3 $27.3 $23.1 $56.0 Plus: Tax Depreciation and Amortization 30.1 59.4 51.9 52.7 54.5 15.2 Less: Maintenance Capital Expenditures (6.8) (13.9) (14.3) (14.7) (15.2) (15.2) Less: Growth Capital Expenditures (7.4) (2.8) (2.9) -- -- -- Unlevered Free Cash Flow $33.1 $76.1 $69.0 $65.2 $62.5 $56.0 EBITDA Multiple / Perpetuity Growth Rate 10.0x 2.0% Terminal Value $860.4 - $816.0 PV of Terminal Value @ 9.0% $583.9 - $553.7 Plus: PV of Unlevered Free Cash Flow @ 9.0% 254.9 Implied Enterprise Value $838.7 - $808.6 Less: Estimated Pro Rata Net Debt on June 30, 2017 (348.5) Implied Equity Value $490.2 - $460.1 Projected Units Outstanding (LP+GP) as of June 30, 2017 47.0 Implied Unit Price $10.42 - $9.78 EBITDA Exit Multiple Sensitivities WACC EBITDA Multiple 9.0x 9.5x 10.0x 10.5x 11.0x 8.0% $9.76 $10.40 $11.05 $11.70 $12.34 8.5% 9.46 10.10 10.73 11.36 12.00 9.0% 9.18 9.80 10.42 11.04 11.66 9.5% 8.90 9.51 10.12 10.72 11.33 10.0% 8.63 9.23 9.82 10.42 11.01 Perpetuity Growth Rate Sensitivities Perpetuity Growth Rate WACC 1.0% 1.5% 2.0% 2.5% 3.0% 8.0% $10.26 $11.26 $12.43 $13.80 $15.46 8.5% 9.17 10.02 11.00 12.15 13.50 9.0% 8.21 8.94 9.78 10.75 11.88 9.5% 7.36 8.00 8.72 9.55 10.50 10.0% 6.61 7.17 7.79 8.50 9.32 54 EVERCORE vtti energy partners
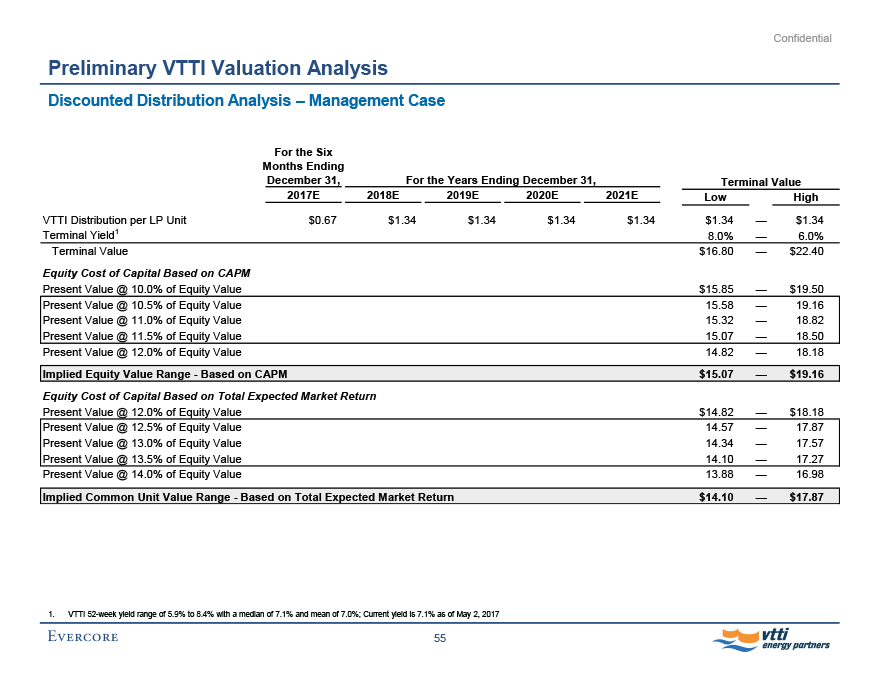
Confidential
Preliminary VTTI Valuation Analysis
Discounted Distribution Analysis - Management Case For the Six Months Ending December 31, For the Years Ending December 31, Terminal Value 2017E 2018E 2019E 2020E 2021E Low High VTTI Distribution per LP Unit $0.67 $1.34 $1.34 $1.34 $1.34 $1.34 - $1.34 Terminal Yield1 8.0% - 6.0% Terminal Value $16.80 - $22.40 Equity Cost of Capital Based on CAPM Present Value @ 10.0% of Equity Value $15.85 - $19.50 Present Value @ 10.5% of Equity Value 15.58 - 19.16 Present Value @ 11.0% of Equity Value 15.32 - 18.82 Present Value @ 11.5% of Equity Value 15.07 - 18.50 Present Value @ 12.0% of Equity Value 14.82 - 18.18 Implied Equity Value Range - Based on CAPM $15.07 - $19.16 Equity Cost of Capital Based on Total Expected Market Return Present Value @ 12.0% of Equity Value $14.82 - $18.18 Present Value @ 12.5% of Equity Value 14.57 - 17.87 Present Value @ 13.0% of Equity Value 14.34 - 17.57 Present Value @ 13.5% of Equity Value 14.10 - 17.27 Present Value @ 14.0% of Equity Value 13.88 - 16.98 Implied Common Unit Value Range - Based on Total Expected Market Return $14.10 - $17.87 1. VTTI 52-week yield range of 5.9% to 8.4% with a median of 7.1% and mean of 7.0%; Current yield is 7.1% as of May 2, 2017 55 EVERCORE vtti energy partners
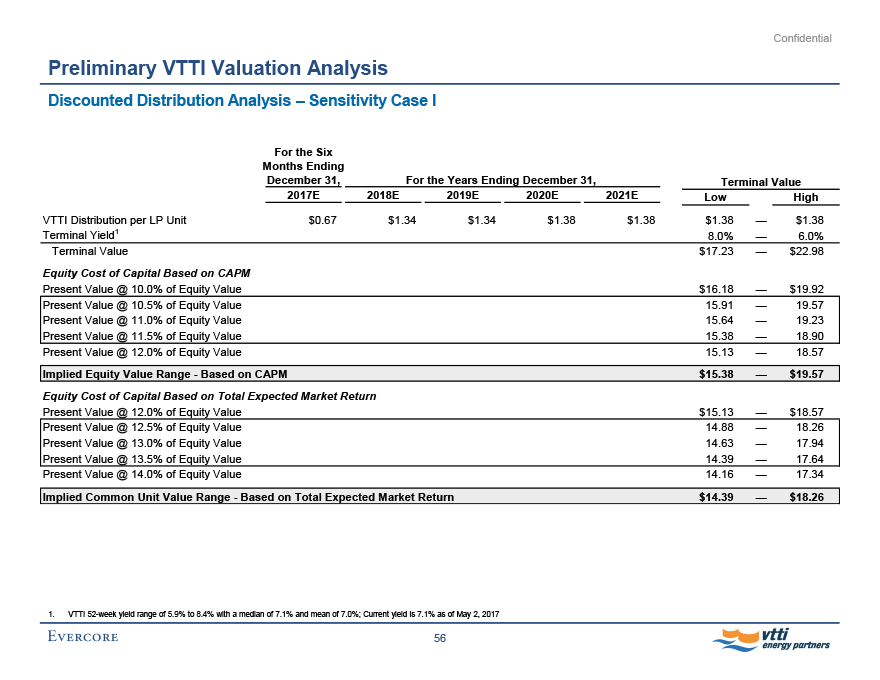
Confidential
Preliminary VTTI Valuation Analysis
Discounted Distribution Analysis - Sensitivity Case I For the Six Months Ending December 31, For the Years Ending December 31, Terminal Value 2017E 2018E 2019E 2020E 2021E Low High VTTI Distribution per LP Unit $0.67 $1.34 $1.34 $1.38 $1.38 $1.38 - $1.38 Terminal Yield1 8.0% - 6.0% Terminal Value $17.23 - $22.98 Equity Cost of Capital Based on CAPM Present Value @ 10.0% of Equity Value $16.18 - $19.92 Present Value @ 10.5% of Equity Value 15.91 - 19.57 Present Value @ 11.0% of Equity Value 15.64 - 19.23 Present Value @ 11.5% of Equity Value 15.38 - 18.90 Present Value @ 12.0% of Equity Value 15.13 - 18.57 Implied Equity Value Range - Based on CAPM $15.38 - $19.57 Equity Cost of Capital Based on Total Expected Market Return Present Value @ 12.0% of Equity Value $15.13 - $18.57 Present Value @ 12.5% of Equity Value 14.88 - 18.26 Present Value @ 13.0% of Equity Value 14.63 - 17.94 Present Value @ 13.5% of Equity Value 14.39 - 17.64 Present Value @ 14.0% of Equity Value 14.16 - 17.34 Implied Common Unit Value Range - Based on Total Expected Market Return $14.39 - $18.26 1. VTTI 52-week yield range of 5.9% to 8.4% with a median of 7.1% and mean of 7.0%; Current yield is 7.1% as of May 2, 2017 56 EVERCORE vtti energy partners

Confidential
Preliminary VTTI Valuation Analysis
Discounted Distribution Analysis - Sensitivity Case II For the Six Months Ending December 31, For the Years Ending December 31, Terminal Value 2017E 2018E 2019E 2020E 2021E Low High VTTI Distribution per LP Unit $0.67 $1.31 $1.20 $1.05 $1.05 $1.05 - $1.05 Terminal Yield1 8.0% - 6.0% Terminal Value $13.13 - $17.50 Equity Cost of Capital Based on CAPM Present Value @ 10.0% of Equity Value $12.88 - $15.73 Present Value @ 10.5% of Equity Value 12.67 - 15.46 Present Value @ 11.0% of Equity Value 12.47 - 15.20 Present Value @ 11.5% of Equity Value 12.27 - 14.94 Present Value @ 12.0% of Equity Value 12.07 - 14.69 Implied Equity Value Range - Based on CAPM $12.27 - $15.46 Equity Cost of Capital Based on Total Expected Market Return Present Value @ 12.0% of Equity Value $12.07 - $14.69 Present Value @ 12.5% of Equity Value 11.88 - 14.45 Present Value @ 13.0% of Equity Value 11.69 - 14.21 Present Value @ 13.5% of Equity Value 11.50 - 13.98 Present Value @ 14.0% of Equity Value 11.32 - 13.75 Implied Common Unit Value Range - Based on Total Expected Market Return $11.50 - $14.45 1. VTTI 52-week yield range of 5.9% to 8.4% with a median of 7.1% and mean of 7.0%; Current yield is 7.1% as of May 2, 2017 57 EVERCORE vtti energy partners
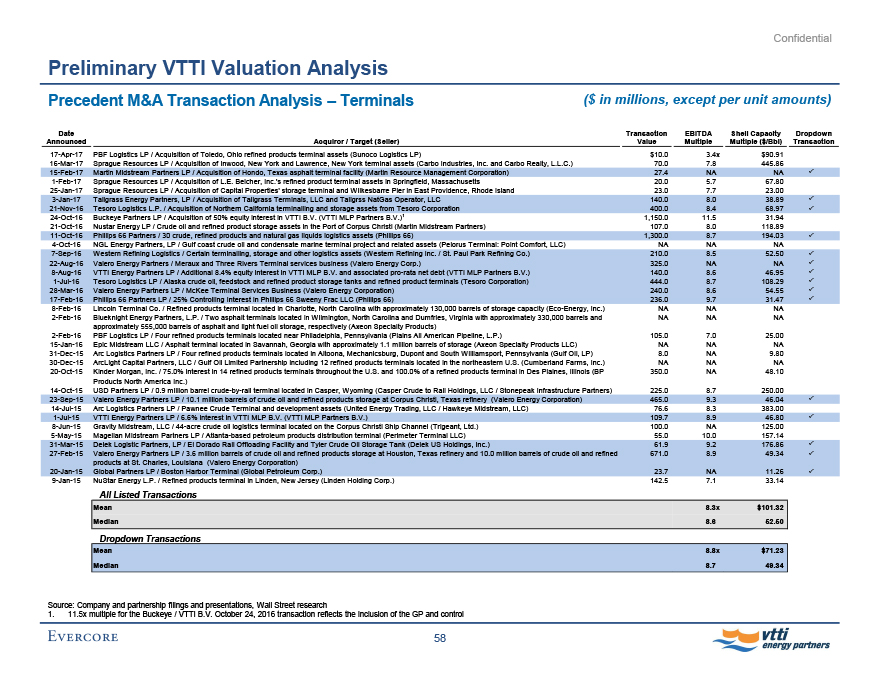
Confidential Preliminary VTTI Valuation Analysis Precedent M&A Transaction Analysis - Terminals ($ in millions, except per unit amounts) Date Transaction EBITDA Shell Capacity Dropdown Announced Acquiror / Target (Seller) Value Multiple Multiple ($/Bbl) Transaction 17-Apr-17 PBF Logistics LP / Acquisition of Toledo, Ohio refined products terminal assets (Sunoco Logistics LP) $10.0 3.4x $90.91 16-Mar-17 Sprague Resources LP / Acquisition of Inwood, New York and Lawrence, New York terminal assets (Carbo Industries, Inc. and Carbo Realty, L.L.C.) 70.0 7.8 445.86 15-Feb-17 Martin Midstream Partners LP / Acquisition of Hondo, Texas asphalt terminal facility (Martin Resource Management Corporation) 27.4 NA NA 1-Feb-17 Sprague Resources LP / Acquisition of L.E. Belcher, Inc.‘s refined product terminal assets in Springfield, Massachusetts 20.0 5.7 67.80 25-Jan-17 Sprague Resources LP / Acquisition of Capital Properties’ storage terminal and Wilkesbarre Pier in East Providence, Rhode Island 23.0 7.7 23.00 3-Jan-17 Tallgrass Energy Partners, LP / Acquisition of Tallgrass Terminals, LLC and Tallgrss NatGas Operator, LLC 140.0 8.0 38.89 21-Nov-16 Tesoro Logistics L.P. / Acquisition of Northern California terminalling and storage assets from Tesoro Corporation 400.0 8.4 68.97 24-Oct-16 Buckeye Partners LP / Acquisition of 50% equity interest in VTTI B.V. (VTTI MLP Partners B.V.)1 1,150.0 11.5 31.94 21-Oct-16 Nustar Energy LP / Crude oil and refined product storage assets in the Port of Corpus Christi (Martin Midstream Partners) 107.0 8.0 118.89 11-Oct-16 Phillips 66 Partners / 30 crude, refined products and natural gas liquids logistics assets (Phillips 66) 1,300.0 8.7 194.03 4-Oct-16 NGL Energy Partners, LP / Gulf coast crude oil and condensate marine terminal project and related assets (Pelorus Terminal: Point Comfort, LLC) NA NA NA 7-Sep-16 Western Refining Logistics / Certain terminalling, storage and other logistics assets (Western Refining Inc. / St. Paul Park Refining Co.) 210.0 8.5 52.50 22-Aug-16 Valero Energy Partners / Meraux and Three Rivers Terminal services business (Valero Energy Corp.) 325.0 NA NA 8-Aug-16 VTTI Energy Partners LP / Additional 8.4% equity interest in VTTI MLP B.V. and associated pro-rata net debt (VTTI MLP Partners B.V.) 140.0 8.6 46.95 1-Jul-16 Tesoro Logistics LP / Alaska crude oil, feedstock and refined product storage tanks and refined product terminals (Tesoro Corporation) 444.0 8.7 108.29 28-Mar-16 Valero Energy Partners LP / McKee Terminal Services Business (Valero Energy Corporation) 240.0 8.6 54.55 17-Feb-16 Phillips 66 Partners LP / 25% Controlling Interest in Phillips 66 Sweeny Frac LLC (Phillips 66) 236.0 9.7 31.47 8-Feb-16 Lincoln Terminal Co. / Refined products terminal located in Charlotte, North Carolina with approximately 130,000 barrels of storage capacity (Eco-Energy, Inc.) NA NA NA 2-Feb-16 Blueknight Energy Partners, L.P. / Two asphalt terminals located in Wilmington, North Carolina and Dumfries, Virginia with approximately 330,000 barrels and NA NA NA approximately 555,000 barrels of asphalt and light fuel oil storage, respectively (Axeon Specialty Products) 2-Feb-16 PBF Logistics LP / Four refined products terminals located near Philadelphia, Pennsylvania (Plains All American Pipeline, L.P.) 105.0 7.0 25.00 15-Jan-16 Epic Midstream LLC / Asphalt terminal located in Savannah, Georgia with approximately 1.1 million barrels of storage (Axeon Specialty Products LLC) NA NA NA 31-Dec-15 Arc Logistics Partners LP / Four refined products terminals located in Altoona, Mechanicsburg, Dupont and South Williamsport, Pennsylvania (Gulf Oil, LP) 8.0 NA 9.80 30-Dec-15 ArcLight Capital Partners, LLC / Gulf Oil Limited Partnership including 12 refined products terminals located in the northeastern U.S. (Cumberland Farms, Inc.) NA NA NA 20-Oct-15 Kinder Morgan, Inc. / 75.0% interest in 14 refined products terminals throughout the U.S. and 100.0% of a refined products terminal in Des Plaines, Illinois (BP 350.0 NA 48.10 Products North America Inc.) 14-Oct-15 USD Partners LP / 0.9 million barrel crude-by-rail terminal located in Casper, Wyoming (Casper Crude to Rail Holdings, LLC / Stonepeak Infrastructure Partners) 225.0 8.7 250.00 23-Sep-15 Valero Energy Partners LP / 10.1 million barrels of crude oil and refined products storage at Corpus Christi, Texas refinery (Valero Energy Corporation) 465.0 9.3 46.04 14-Jul-15 Arc Logistics Partners LP / Pawnee Crude Terminal and development assets (United Energy Trading, LLC / Hawkeye Midstream, LLC) 76.6 8.3 383.00 1-Jul-15 VTTI Energy Partners LP / 6.6% interest in VTTI MLP B.V. (VTTI MLP Partners B.V.) 109.7 8.9 46.80 8-Jun-15 Gravity Midstream, LLC / 44-acre crude oil logistics terminal located on the Corpus Christi Ship Channel (Trigeant, Ltd.) 100.0 NA 125.00 5-May-15 Magellan Midstream Partners LP / Atlanta-based petroleum products distribution terminal (Perimeter Terminal LLC) 55.0 10.0 157.14 31-Mar-15 Delek Logistic Partners, LP / El Dorado Rail Offloading Facility and Tyler Crude Oil Storage Tank (Delek US Holdings, Inc.) 61.9 9.2 176.86 27-Feb-15 Valero Energy Partners LP / 3.6 million barrels of crude oil and refined products storage at Houston, Texas refinery and 10.0 million barrels of crude oil and refined 671.0 8.9 49.34 products at St. Charles, Louisiana (Valero Energy Corporation) 20-Jan-15 Global Partners LP / Boston Harbor Terminal (Global Petroleum Corp.) 23.7 NA 11.26 9-Jan-15 NuStar Energy L.P. / Refined products terminal in Linden, New Jersey (Linden Holding Corp.) 142.5 7.1 33.14 All Listed Transactions Mean 8.3x $101.32 Median 8.6 52.50 Dropdown Transactions Mean 8.8x $71.23 Median 8.7 49.34 Source: Company and partnership filings and presentations, Wall Street research 1. 11.5x multiple for the Buckeye / VTTI B.V. October 24, 2016 transaction reflects the inclusion of the GP and control 58 EVERCORE vtti energy partners

Confidential
Preliminary VTTI Valuation Analysis
Precedent M&A Transaction Analysis - Terminals (cont’d) ($ in millions, except per unit amounts) VTTI Financial Projections - Management Case 2017E Adjusted EBITDA $97.9 Relevant EBITDA Multiple 8.0x - 10.0x Implied Enterprise Value Range on December 31, 2017 $783.0 - $978.8 Implied Enterprise Value Range on June 30, 2017 @ 9.0% Discount Rate $750.0 - $937.5 Less: Present Value of Growth Capital Expenditures from June 30, 2017 to December 31, 2017 @ 9.0% Discount Rate (7.2) Implied Enterprise Value Range $742.8 - $930.3 Less: Estimated Net Debt on June 30, 2017 (348.2) Implied Equity Value Range $394.5 - $582.0 Projected Units Outstanding (LP+GP) as of June 30, 2017 47.0 Implied VTTI Unit Price $8.39 - $12.37 Memo Capacity Multiple Approach Capacity (MMBbls) 35.7 Relevant Multiple ($/Bbl) $45.00 $55.00 Implied Enterprise Value Range $1,606.5 - $1,963.5 Implied Enterprise Value Range Net to VTTI (51.0%) $819.3 $1,001.4 Less: Estimated Net Debt on June 30, 2017 (348.2) Implied Equity Value Range $471.1 - $653.1 Projected Units Outstanding (LP+GP) as of June 30, 2017 47.0 Implied VTTI Unit Price $10.01 - $13.88 Source: VTTI management 59 EVERCORE vtti energy partners

Confidential
Preliminary VTTI Valuation Analysis
Precedent M&A Transaction Analysis - Terminals (cont’d) ($ in millions, except per unit amounts) VTTI Financial Projections - Sensitivity Case I 2017E Adjusted EBITDA $98.5 Relevant EBITDA Multiple 8.0x - 10.0x Implied Enterprise Value Range on December 31, 2017 $788.1 - $985.1 Implied Enterprise Value Range on June 30, 2017 @ 9.0% Discount Rate $754.9 - $943.6 Less: Present Value of Growth Capital Expenditures from June 30, 2017 to December 31, 2017 @ 9.0% Discount Rate (7.2) Implied Enterprise Value Range $747.6 - $936.3 Less: Estimated Net Debt on June 30, 2017 (348.0) Implied Equity Value Range $399.6 - $588.4 Projected Units Outstanding (LP+GP) as of June 30, 2017 47.0 Implied VTTI Unit Price $8.50 - $12.51 Memo Capacity Multiple Approach Capacity (MMBbls) 35.7 Relevant Multiple ($/Bbl) $45.00 $55.00 Implied Enterprise Value Range $1,606.5 - $1,963.5 Implied Enterprise Value Range Net to VTTI (51.0%) $819.3 $1,001.4 Less: Estimated Net Debt on June 30, 2017 (348.0) Implied Equity Value Range $471.3 - $653.4 Projected Units Outstanding (LP+GP) as of June 30, 2017 47.0 Implied VTTI Unit Price $10.02 - $13.89 Source: VTTI management 60 EVERCORE vtti energy partners
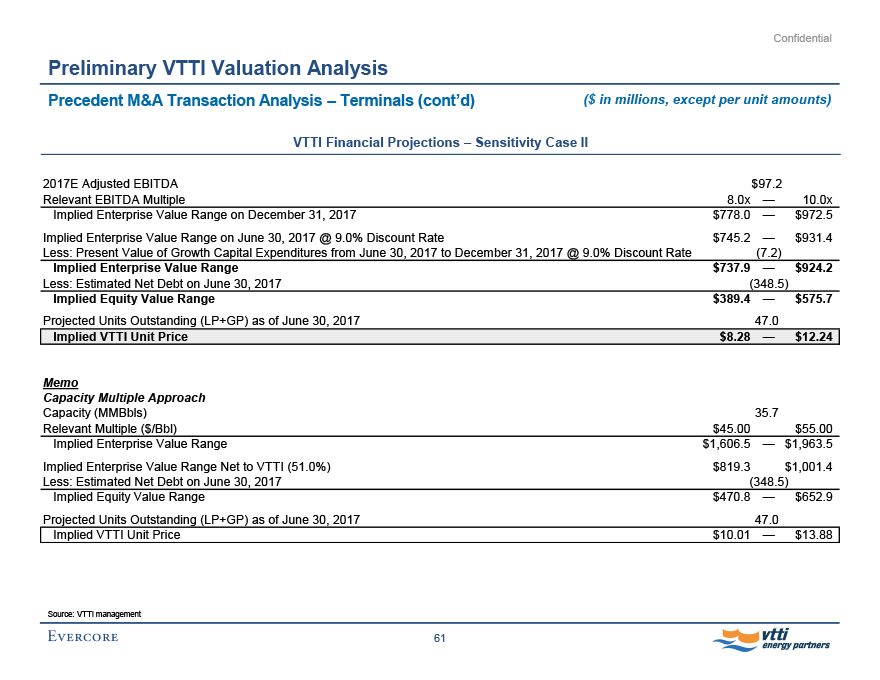
Confidential
Preliminary VTTI Valuation Analysis
Precedent M&A Transaction Analysis - Terminals (cont’d) ($ in millions, except per unit amounts)
VTTI Financial Projections - Sensitivity Case II
2017E Adjusted EBITDA $97.2 Relevant EBITDA Multiple 8.0x - 10.0x Implied Enterprise Value Range on December 31, 2017 $778.0 - $972.5 Implied Enterprise Value Range on June 30, 2017 @ 9.0% Discount Rate $745.2 - $931.4 Less: Present Value of Growth Capital Expenditures from June 30, 2017 to December 31, 2017 @ 9.0% Discount Rate
(7.2) Implied Enterprise Value Range $737.9 - $924.2 Less: Estimated Net Debt on June 30, 2017
(348.5) Implied Equity Value Range $389.4 - $575.7 Projected Units Outstanding (LP+GP) as of June 30, 2017 47.0 Implied VTTI Unit Price $8.28 - $12.24 Memo Capacity Multiple Approach Capacity (MMBbls) 35.7 Relevant Multiple ($/Bbl) $45.00 $55.00 Implied Enterprise Value Range $1,606.5 - $1,963.5 Implied Enterprise Value Range Net to VTTI (51.0%) $819.3 $1,001.4 Less: Estimated Net Debt on June 30, 2017 (348.5) Implied Equity Value Range $470.8 - $652.9 Projected Units Outstanding (LP+GP) as of June 30, 2017 47.0 Implied VTTI Unit Price $10.01 - $13.88 Source: VTTI management 61
EVERCORE vtti energy partners
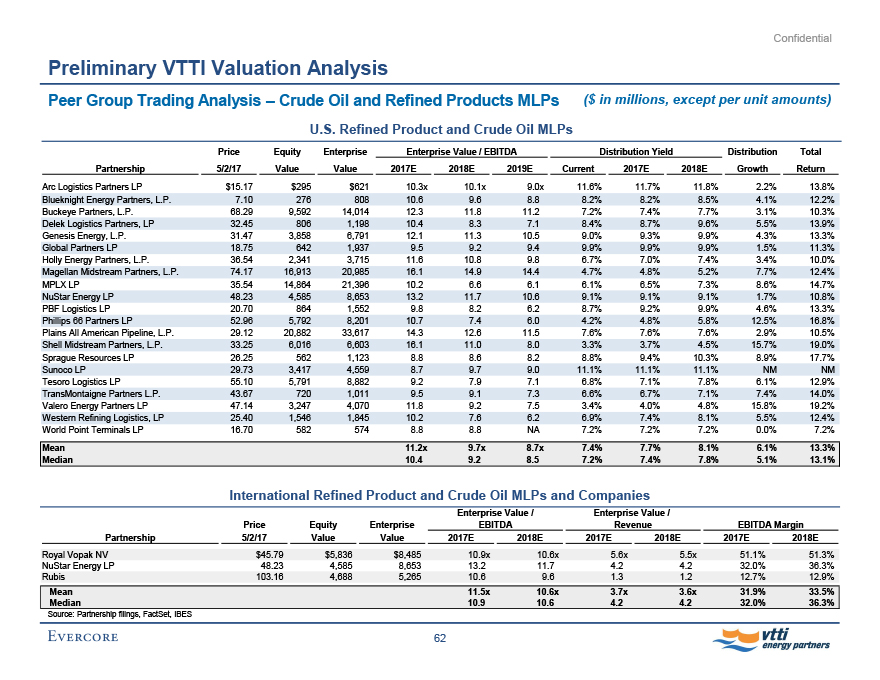
Confidential Preliminary VTTI Valuation Analysis Peer Group Trading Analysis - Crude Oil and Refined Products MLPs ($ in millions, except per unit amounts) U.S. Refined Product and Crude Oil MLPs Price Equity Enterprise Enterprise Value / EBITDA Distribution Yield Distribution Total Partnership 5/2/17 Value Value 2017E 2018E 2019E Current 2017E 2018E Growth Return Arc Logistics Partners LP $15.17 $295 $621 10.3x 10.1x 9.0x 11.6% 11.7% 11.8% 2.2% 13.8% Blueknight Energy Partners, L.P. 7.10 276 808 10.6 9.6 8.8 8.2% 8.2% 8.5% 4.1% 12.2% Buckeye Partners, L.P. 68.29 9,592 14,014 12.3 11.8 11.2 7.2% 7.4% 7.7% 3.1% 10.3% Delek Logistics Partners, LP 32.45 806 1,198 10.4 8.3 7.1 8.4% 8.7% 9.6% 5.5% 13.9% Genesis Energy, L.P. 31.47 3,858 6,791 12.1 11.3 10.5 9.0% 9.3% 9.9% 4.3% 13.3% Global Partners LP 18.75 642 1,937 9.5 9.2 9.4 9.9% 9.9% 9.9% 1.5% 11.3% Holly Energy Partners, L.P. 36.54 2,341 3,715 11.6 10.8 9.8 6.7% 7.0% 7.4% 3.4% 10.0% Magellan Midstream Partners, L.P. 74.17 16,913 20,985 16.1 14.9 14.4 4.7% 4.8% 5.2% 7.7% 12.4% MPLX LP 35.54 14,864 21,396 10.2 6.6 6.1 6.1% 6.5% 7.3% 8.6% 14.7% NuStar Energy LP 48.23 4,585 8,653 13.2 11.7 10.6 9.1% 9.1% 9.1% 1.7% 10.8% PBF Logistics LP 20.70 864 1,552 9.8 8.2 6.2 8.7% 9.2% 9.9% 4.6% 13.3% Phillips 66 Partners LP 52.96 5,792 8,201 10.7 7.4 6.0 4.2% 4.8% 5.8% 12.5% 16.8% Plains All American Pipeline, L.P. 29.12 20,882 33,617 14.3 12.6 11.5 7.6% 7.6% 7.6% 2.9% 10.5% Shell Midstream Partners, L.P. 33.25 6,016 6,603 16.1 11.0 8.0 3.3% 3.7% 4.5% 15.7% 19.0% Sprague Resources LP 26.25 562 1,123 8.8 8.6 8.2 8.8% 9.4% 10.3% 8.9% 17.7% Sunoco LP 29.73 3,417 4,559 8.7 9.7 9.0 11.1% 11.1% 11.1% NM NM Tesoro Logistics LP 55.10 5,791 8,882 9.2 7.9 7.1 6.8% 7.1% 7.8% 6.1% 12.9% TransMontaigne Partners L.P. 43.67 720 1,011 9.5 9.1 7.3 6.6% 6.7% 7.1% 7.4% 14.0% Valero Energy Partners LP 47.14 3,247 4,070 11.8 9.2 7.5 3.4% 4.0% 4.8% 15.8% 19.2% Western Refining Logistics, LP 25.40 1,546 1,845 10.2 7.6 6.2 6.9% 7.4% 8.1% 5.5% 12.4% World Point Terminals LP 16.70 582 574 8.8 8.8 NA 7.2% 7.2% 7.2% 0.0% 7.2% Mean 11.2x 9.7x 8.7x 7.4% 7.7% 8.1% 6.1% 13.3% Median 10.4 9.2 8.5 7.2% 7.4% 7.8% 5.1% 13.1% International Refined Product and Crude Oil MLPs and Companies Enterprise Value / Enterprise Value / Price Equity Enterprise EBITDA Revenue EBITDA Margin Partnership 5/2/17 Value Value 2017E 2018E 2017E 2018E 2017E 2018E Royal Vopak NV $45.79 $5,836 $8,485 10.9x 10.6x 5.6x 5.5x 51.1% 51.3% NuStar Energy LP 48.23 4,585 8,653 13.2 11.7 4.2 4.2 32.0% 36.3% Rubis 103.16 4,688 5,265 10.6 9.6 1.3 1.2 12.7% 12.9% Mean 11.5x 10.6x 3.7x 3.6x 31.9% 33.5% Median 10.9 10.6 4.2 4.2 32.0% 36.3% Source: Partnership filings, FactSet, IBES 62
EVERCORE vtti energy partners
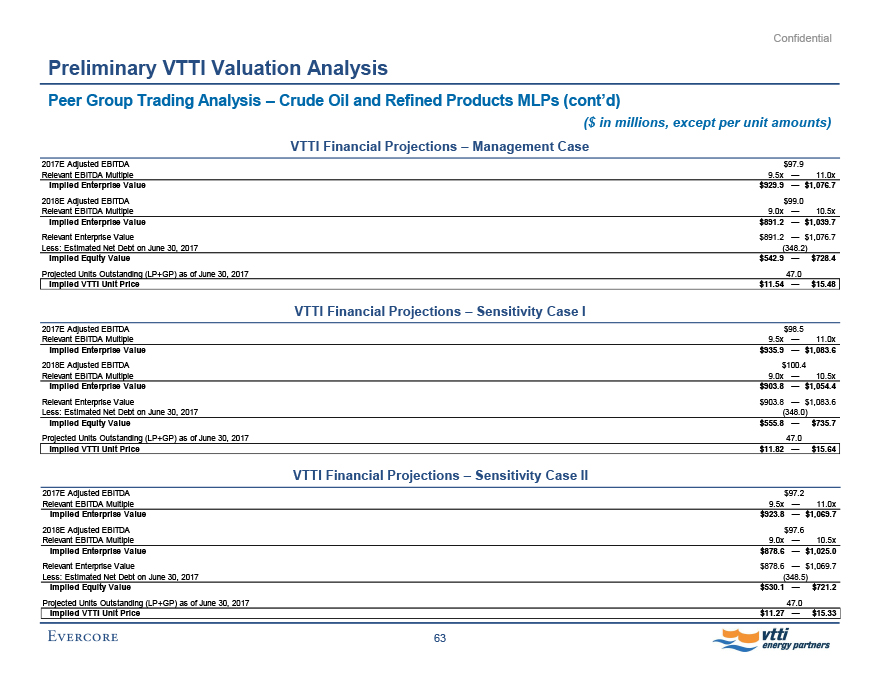
Confidential
Preliminary VTTI Valuation Analysis
Peer Group Trading Analysis - Crude Oil and Refined Products MLPs (cont’d)
($ in millions, except per unit amounts)
VTTI Financial Projections - Management Case
2017E Adjusted EBITDA
$97.9 Relevant EBITDA Multiple
9.5x - 11.0x Implied Enterprise Value
$929.9 -$1,076.7 2018E Adjusted EBITDA
$99.0 Relevant EBITDA Multiple
9.0x - 10.5x Implied Enterprise Value
$891.2 -$1,039.7
Relevant Enterprise Value $891.2 -$1,076.7
Less: Estimated Net Debt on June 30, 2017 (348.2)
Implied Equity Value $542.9 -$728.4
Projected Units Outstanding (LP+GP) as of June 30, 2017 47.0
Implied VTTI Unit Price $11.54 -$15.48
VTTI Financial Projections - Sensitivity Case I 2017E Adjusted EBITDA $98.5
Relevant EBITDA Multiple 9.5x - 11.0x
Implied Enterprise Value $935.9 -$1,083.6
2018E Adjusted EBITDA $100.4
Relevant EBITDA Multiple 9.0x - 10.5x
Implied Enterprise Value $903.8 -$1,054.4
Relevant Enterprise Value $903.8 -$1,083.6
Less: Estimated Net Debt on June 30, 2017 (348.0)
Implied Equity Value $555.8 -$735.7
Projected Units Outstanding (LP+GP) as of June 30, 2017 47.0
Implied VTTI Unit Price $11.82 -$15.64
VTTI Financial Projections - Sensitivity Case II 2017E Adjusted EBITDA $97.2
Relevant EBITDA Multiple 9.5x - 11.0x
Implied Enterprise Value $923.8 -$1,069.7
2018E Adjusted EBITDA $97.6
Relevant EBITDA Multiple 9.0x - 10.5x
Implied Enterprise Value $878.6 -$1,025.0
Relevant Enterprise Value $878.6 -$1,069.7
Less: Estimated Net Debt on June 30, 2017 (348.5)
Implied Equity Value $530.1 -$721.2
Projected Units Outstanding (LP+GP) as of June 30, 2017 47.0
Implied VTTI Unit Price $11.27 -$15.33 63 Evercore vtti energy partners
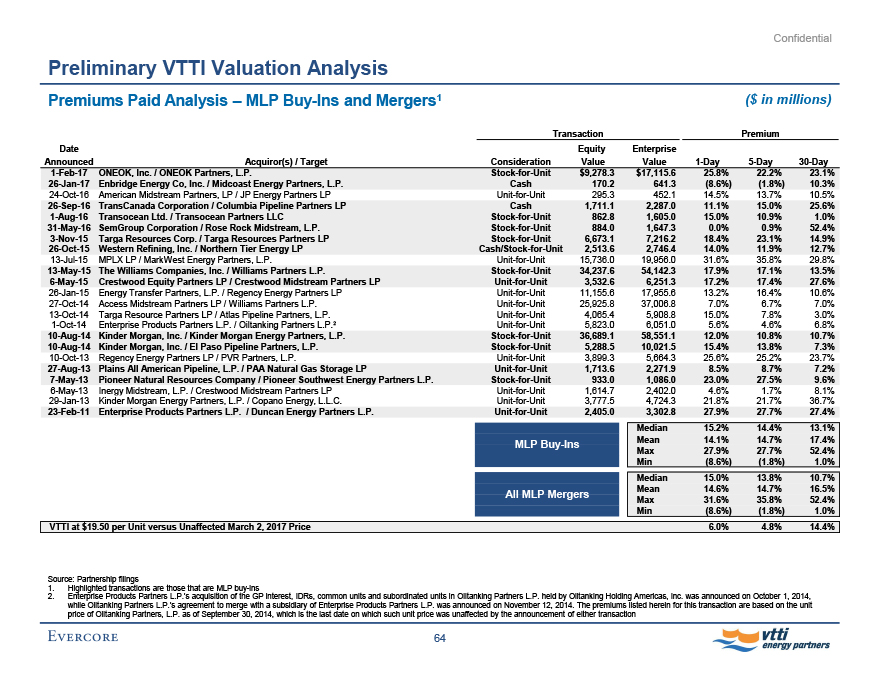
Confidential Preliminary VTTI Valuation Analysis Premiums Paid Analysis - MLP Buy-Ins and Mergers1 ($ in millions)
Transaction Premium Date Equity Enterprise Announced Acquiror(s) / Target Consideration Value Value 1-Day 5-Day 30-Day
1-Feb-17 ONEOK, Inc. / ONEOK Partners, L.P. Stock-for-Unit $9,278.3 $17,115.6 25.8% 22.2% 23.1%
26-Jan-17 Enbridge Energy Co, Inc. / Midcoast Energy Partners, L.P. Cash 170.2 641.3 (8.6%) (1.8%) 10.3%
24-Oct-16 American Midstream Partners, LP / JP Energy Partners LP Unit-for-Unit 295.3 452.1 14.5% 13.7% 10.5%
26-Sep-16 TransCanada Corporation / Columbia Pipeline Partners LP Cash 1,711.1 2,287.0 11.1% 15.0% 25.6%
1-Aug-16 Transocean Ltd. / Transocean Partners LLC Stock-for-Unit 862.8 1,605.0 15.0% 10.9% 1.0%
31-May-16 SemGroup Corporation / Rose Rock Midstream, L.P. Stock-for-Unit 884.0 1,647.3 0.0% 0.9% 52.4%
3-Nov-15 Targa Resources Corp. / Targa Resources Partners LP Stock-for-Unit 6,673.1 7,216.2 18.4% 23.1% 14.9%
26-Oct-15 Western Refining, Inc. / Northern Tier Energy LP Cash/Stock-for-Unit 2,513.6 2,746.4 14.0% 11.9% 12.7%
13-Jul-15 MPLX LP / MarkWest Energy Partners, L.P. Unit-for-Unit 15,736.0 19,956.0 31.6% 35.8% 29.8%
13-May-15 The Williams Companies, Inc. / Williams Partners L.P. Stock-for-Unit 34,237.6 54,142.3 17.9% 17.1% 13.5%
6-May-15 Crestwood Equity Partners LP / Crestwood Midstream Partners LP Unit-for-Unit 3,532.6 6,251.3 17.2% 17.4% 27.6%
26-Jan-15 Energy Transfer Partners, L.P. / Regency Energy Partners LP Unit-for-Unit 11,155.6 17,955.6 13.2% 16.4% 10.6%
27-Oct-14 Access Midstream Partners LP / Williams Partners L.P. Unit-for-Unit 25,925.8 37,006.8 7.0% 6.7% 7.0%
13-Oct-14 Targa Resource Partners LP / Atlas Pipeline Partners, L.P. Unit-for-Unit 4,065.4 5,908.8 15.0% 7.8% 3.0%
1-Oct-14 Enterprise Products Partners L.P. / Oiltanking Partners L.P.2 Unit-for-Unit 5,823.0 6,051.0 5.6% 4.6% 6.8%
10-Aug-14 Kinder Morgan, Inc. / Kinder Morgan Energy Partners, L.P. Stock-for-Unit 36,689.1 58,551.1 12.0% 10.8% 10.7%
10-Aug-14 Kinder Morgan, Inc. / El Paso Pipeline Partners, L.P. Stock-for-Unit 5,288.5 10,021.5 15.4% 13.8% 7.3%
10-Oct-13 Regency Energy Partners LP / PVR Partners, L.P. Unit-for-Unit 3,899.3 5,664.3 25.6% 25.2% 23.7%
27-Aug-13 Plains All American Pipeline, L.P. / PAA Natural Gas Storage LP Unit-for-Unit 1,713.6 2,271.9 8.5% 8.7% 7.2%
7-May-13 Pioneer Natural Resources Company / Pioneer Southwest Energy Partners L.P. Stock-for-Unit 933.0 1,086.0 23.0% 27.5%
9.6%
6-May-13 Inergy Midstream, L.P. / Crestwood Midstream Partners LP Unit-for-Unit 1,614.7 2,402.0 4.6% 1.7% 8.1%
29-Jan-13 Kinder Morgan Energy Partners, L.P. / Copano Energy, L.L.C. Unit-for-Unit 3,777.5 4,724.3 21.8% 21.7% 36.7%
23-Feb-11 Enterprise Products Partners L.P. / Duncan Energy Partners L.P. Unit-for-Unit 2,405.0 3,302.8 27.9% 27.7% 27.4%
Median 15.2% 14.4% 13.1% MLP Buy-Ins Mean 14.1% 14.7% 17.4% Max 27.9% 27.7% 52.4% Min (8.6%) (1.8%) 1.0%
Median 15.0% 13.8% 10.7% All MLP Mergers Mean 14.6% 14.7% 16.5% Max 31.6% 35.8% 52.4% Min (8.6%) (1.8%) 1.0%
VTTI at $19.50 per Unit versus Unaffected March 2, 2017 Price 6.0% 4.8% 14.4%
Source: Partnership filings 1. Highlighted transactions are those that are MLP buy-ins
2. Enterprise Products Partners L.P.’s acquisition of the GP interest, IDRs, common units and subordinated units in Oiltanking Partners L.P. held by Oiltanking Holding Americas, Inc. was announced on October 1, 2014, while Oiltanking Partners L.P.’s agreement to merge with a subsidiary of Enterprise Products Partners L.P. was announced on November 12, 2014. The premiums listed herein for this transaction are based on the unit price of Oiltanking Partners, L.P. as of September 30, 2014, which is the last date on which such unit price was unaffected by the announcement of either transaction 64 Evercore vtti energy partners
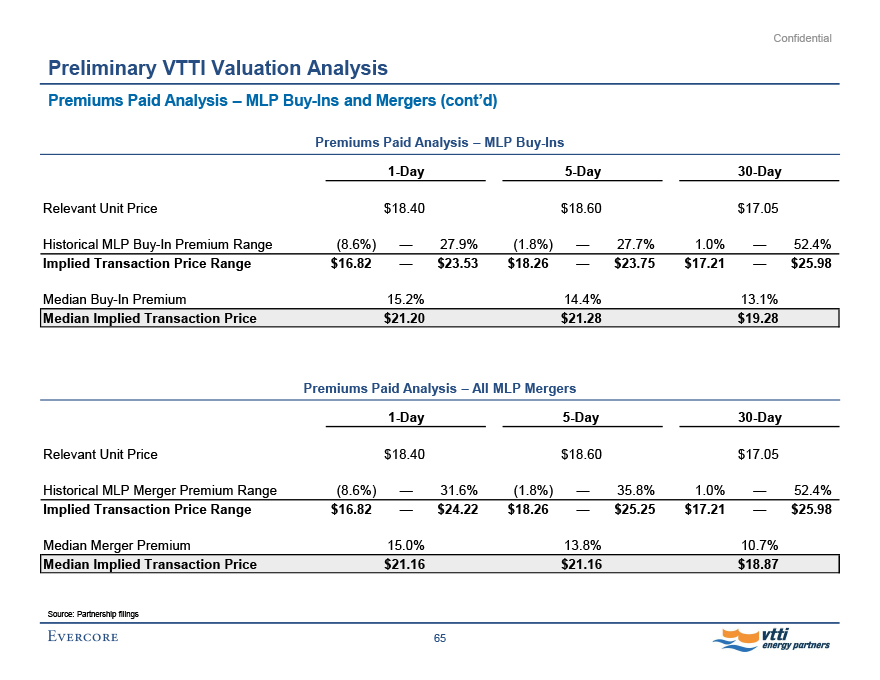
Confidential Preliminary VTTI Valuation Analysis Premiums Paid Analysis - MLP Buy-Ins and Mergers (cont’d) Premiums Paid Analysis - MLP Buy-Ins
1-Day 5-Day 30-Day Relevant Unit Price $18.40 $18.60 $17.05
Historical MLP Buy-In Premium Range (8.6%) - 27.9% (1.8%) - 27.7% 1.0% - 52.4%
Implied Transaction Price Range $16.82 - $23.53 $18.26 - $23.75 $17.21 - $25.98
Median Buy-In Premium 15.2% 14.4% 13.1%
Median Implied Transaction Price $21.20 $21.28 $19.28
Premiums Paid Analysis - All MLP Mergers 1-Day 5-Day 30-Day
Relevant Unit Price $18.40 $18.60 $17.05
Historical MLP Merger Premium Range (8.6%) - 31.6% (1.8%) - 35.8% 1.0% - 52.4%
Implied Transaction Price Range $16.82 - $24.22 $18.26 - $25.25 $17.21 - $25.98
Median Merger Premium 15.0% 13.8% 10.7%
Median Implied Transaction Price $21.16 $21.16 $18.87 Source: Partnership filings 65 Evercore vtti energy partners
Confidential
Appendix
Evercore
Confidential
A. Weighted Average Cost of Capital Analysis
Evercore
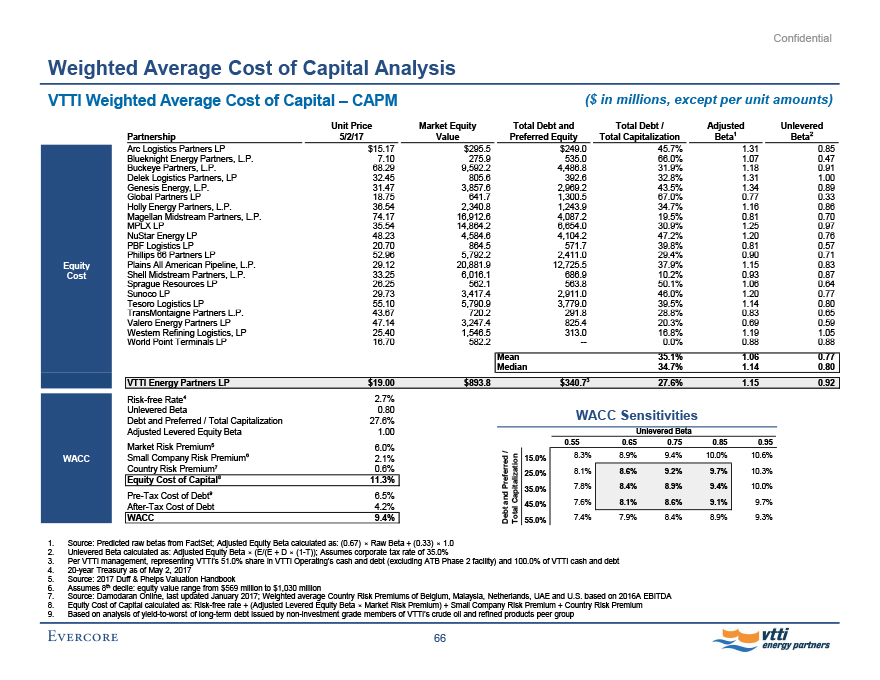
Confidential Weighted Average Cost of Capital Analysis
VTTI Weighted Average Cost of Capital - CAPM ($ in millions, except per unit amounts)
Equity Cost Unit Price Market Equity Total Debt and Total Debt / Adjusted Unlevered Partnership
5/2/17 Value Preferred Equity Total Capitalization Beta1 Beta2
Arc Logistics Partners LP $15.17 $295.5 $249.0 45.7% 1.31 0.85
Blueknight Energy Partners, L.P. 7.10 275.9 535.0 66.0% 1.07 0.47
Buckeye Partners, L.P. 68.29 9,592.2 4,486.8 31.9% 1.18 0.91
Delek Logistics Partners, LP 32.45 805.6 392.6 32.8% 1.31 1.00
Genesis Energy, L.P. 31.47 3,857.6 2,969.2 43.5% 1.34 0.89
Global Partners LP 18.75 641.7 1,300.5 67.0% 0.77 0.33
Holly Energy Partners, L.P. 36.54 2,340.8 1,243.9 34.7% 1.16 0.86
Magellan Midstream Partners, L.P. 74.17 16,912.6 4,087.2 19.5% 0.81 0.70
MPLX LP 35.54 14,864.2 6,654.0 30.9% 1.25 0.97
NuStar Energy LP 48.23 4,584.6 4,104.2 47.2% 1.20 0.76
PBF Logistics LP 20.70 864.5 571.7 39.8% 0.81 0.57
Phillips 66 Partners LP 52.96 5,792.2 2,411.0 29.4% 0.90 0.71
Plains All American Pipeline, L.P. 29.12 20,881.9 12,725.5 37.9% 1.15 0.83
Shell Midstream Partners, L.P. 33.25 6,016.1 686.9 10.2% 0.93 0.87
Sprague Resources LP 26.25 562.1 563.8 50.1% 1.06 0.64
Sunoco LP 29.73 3,417.4 2,911.0 46.0% 1.20 0.77
Tesoro Logistics LP 55.10 5,790.9 3,779.0 39.5% 1.14 0.80
TransMontaigne Partners L.P. 43.67 720.2 291.8 28.8% 0.83 0.65
Valero Energy Partners LP 47.14 3,247.4 825.4 20.3% 0.69 0.59
Western Refining Logistics, LP 25.40 1,546.5 313.0 16.8% 1.19 1.05
World Point Terminals LP 16.70 582.2 -- 0.0% 0.88 0.88 Mean 35.1% 1.06 0.77 Median 34.7% 1.14 0.80
VTTI Energy Partners LP $19.00 $893.8 $340.73 27.6% 1.15 0.92
WACC
Risk-free Rate4 2.7% Unlevered Beta 0.80 Debt and Preferred / Total Capitalization 27.6%
Adjusted Levered Equity Beta 1.00 Market Risk Premium5 6.0% Small Company Risk Premium6 2.1%
Country Risk Premium7 0.6% Equity Cost of Capital8 11.3% Pre-Tax Cost of Debt9 6.5% After-Tax Cost of Debt 4.2%
WACC 9.4%
WACC Sensitivities Unlevered Beta Debt and Preferred / Total Capitalization
0.55 0.65 0.75 0.85 0.95 15.0% 8.3% 8.9% 9.4% 10.0% 10.6% 25.0% 8.1% 8.6% 9.2% 9.7% 10.3% 35.0% 7.8% 8.4% 8.9% 9.4% 10.0% 45.0% 7.6% 8.1% 8.6% 9.1% 9.7% 55.0% 7.4% 7.9% 8.4% 8.9% 9.3%
1. Source: Predicted raw betas from FactSet; Adjusted Equity Beta calculated as: (0.67) × Raw Beta + (0.33) × 1.0
2. Unlevered Beta calculated as: Adjusted Equity Beta × (E/(E + D × (1-T)); Assumes corporate tax rate of 35.0%
3. Per VTTI management, representing VTTI’s 51.0% share in VTTI Operating’s cash and debt (excluding ATB Phase 2 facility) and 100.0% of VTTI cash and debt
4. 20-year Treasury as of May 2, 2017
5. Source: 2017 Duff & Phelps Valuation Handbook
6. Assumes 8th decile: equity value range from $569 million to $1,030 million
7. Source: Damodaran Online, last updated January 2017; Weighted average Country Risk Premiums of Belgium, Malaysia, Netherlands, UAE and U.S. based on 2016A EBITDA
8. Equity Cost of Capital calculated as: Risk-free rate + (Adjusted Levered Equity Beta × Market Risk Premium) + Small Company Risk Premium + Country Risk Premium
9. Based on analysis of yield-to-worst of long-term debt issued by non-investment grade members of VTTI’s crude oil and refined products peer group 66 Evercore vtti energy partners
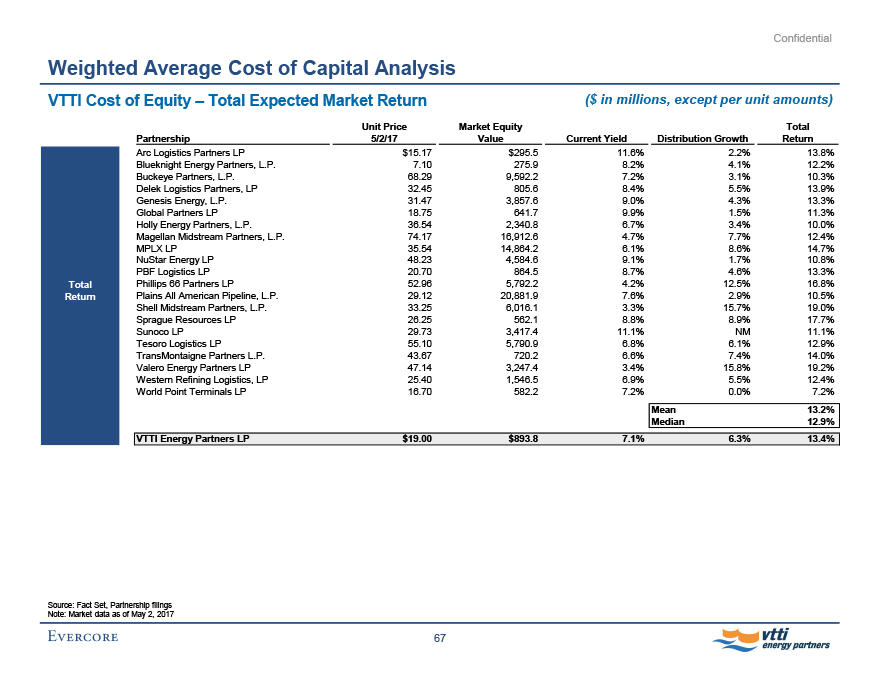
Confidential Weighted Average Cost of Capital Analysis
VTTI Cost of Equity - Total Expected Market Return ($ in millions, except per unit amounts)
Total Return Unit Price Market Equity Total Partnership
5/2/17 Value Current Yield Distribution Growth Return
Arc Logistics Partners LP $15.17 $295.5 11.6% 2.2% 13.8%
Blueknight Energy Partners, L.P. 7.10 275.9 8.2% 4.1% 12.2%
Buckeye Partners, L.P. 68.29 9,592.2 7.2% 3.1% 10.3%
Delek Logistics Partners, LP 32.45 805.6 8.4% 5.5% 13.9%
Genesis Energy, L.P. 31.47 3,857.6 9.0% 4.3% 13.3%
Global Partners LP 18.75 641.7 9.9% 1.5% 11.3%
Holly Energy Partners, L.P. 36.54 2,340.8 6.7% 3.4% 10.0%
Magellan Midstream Partners, L.P. 74.17 16,912.6 4.7% 7.7% 12.4%
MPLX LP 35.54 14,864.2 6.1% 8.6% 14.7%
NuStar Energy LP 48.23 4,584.6 9.1% 1.7% 10.8%
PBF Logistics LP 20.70 864.5 8.7% 4.6% 13.3%
Phillips 66 Partners LP 52.96 5,792.2 4.2% 12.5% 16.8%
Plains All American Pipeline, L.P. 29.12 20,881.9 7.6% 2.9% 10.5%
Shell Midstream Partners, L.P. 33.25 6,016.1 3.3% 15.7% 19.0%
Sprague Resources LP 26.25 562.1 8.8% 8.9% 17.7%
Sunoco LP 29.73 3,417.4 11.1% NM 11.1%
Tesoro Logistics LP 55.10 5,790.9 6.8% 6.1% 12.9%
TransMontaigne Partners L.P. 43.67 720.2 6.6% 7.4% 14.0%
Valero Energy Partners LP 47.14 3,247.4 3.4% 15.8% 19.2%
Western Refining Logistics, LP 25.40 1,546.5 6.9% 5.5% 12.4%
World Point Terminals LP 16.70 582.2 7.2% 0.0% 7.2%
Mean 13.2% Median 12.9%
VTTI Energy Partners LP $19.00 $893.8 7.1% 6.3% 13.4%
Source: Fact Set, Partnership filings Note: Market data as of May 2, 2017 67 Evercore vtti energy partners
Confidential
B. Selected Historical Market Data
Evercore
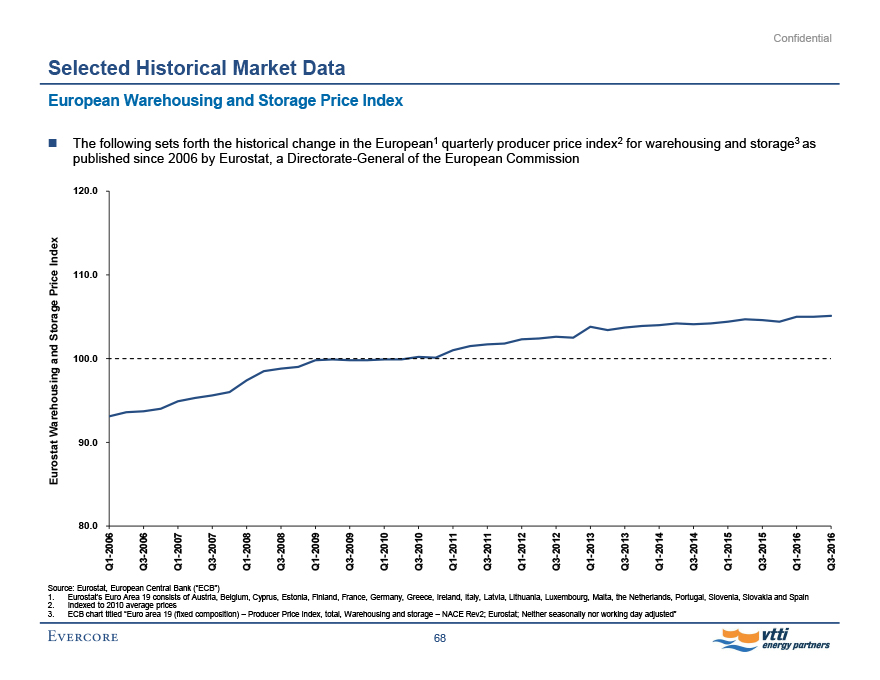
Confidential
Selected Historical Market Data
European Warehousing and Storage Price Index
The following sets forth the historical change in the European1 quarterly producer price index2 for warehousing and storage3 as published since 2006 by Eurostat, a Directorate-General of the European Commission
Eurostat Warehousing and Storage Price Index
120.0 110.0 100.0 90.0 80.0
Q1-2006 Q3-2006 Q1-2007 Q3-2007 Q1-2008 Q3-2008 Q1-2009 Q3-2009 Q1-2010 Q3-2010 Q1-2011 Q3-2011 Q1-2012 Q3-2012 Q1-2013 Q3-2013 Q1-2014 Q3-2014 Q1-2015 Q3-2015 Q1-2016 Q3-2016
Source: Eurostat, European Central Bank (“ECB”)
1. Eurostat’s Euro Area 19 consists of Austria, Belgium, Cyprus, Estonia, Finland, France, Germany, Greece, Ireland, Italy, Latvia, Lithuania, Luxembourg, Malta, the Netherlands, Portugal, Slovenia, Slovakia and Spain
2. Indexed to 2010 average prices
3. ECB chart titled “Euro area 19 (fixed composition) - Producer Price Index, total, Warehousing and storage - NACE Rev2; Eurostat; Neither seasonally nor working day adjusted” 68
Evercore vtti energy partners