Exhibit (c)(1)
Valuation analysis - For the attention of the Transaction Committee of Cnova N.V. 8 August 2016 Strictly Private and Confidential Transactions Restructuring Transformation Project Delphes - Final Report Fairness Opinion on the Merger
EIGHT ADVISORY 40, rue de Courcelles 75008 PARIS Tél : +33 (0)1 45 61 88 88 Fax : +33 (0)1 45 61 72 00 www.8advisory.com Cnova N.V. WTC Schiphol Airport Tower D, 7th Floor Schiphol Boulevard 273 1118 BH Schiphol The Netherlands 8 August 2016 For the attention of the Transaction Committee of Cnova N.V. in relation to the project Delphes Dear Sirs, In accordance with our engagement letter dated 14 March 2016 (the “Engagement letter”), we are pleased to provide the Transaction Committee of Cnova N.V. with the final report of our work on the Fairness Opinion related to the Merger contemplated by Via Varejo and Cnova Brazil and the combination of their businesses in the framework of the project Delphes. Context and Purpose of the Fairness Opinion In 2014, the following Group entities combined their e - commerce assets: - Casino Guichard Perrachon (“CGP”); - Almacenes Éxito S.A. (“Éxito”), a controlled subsidiary of Casino listed in Colombia; - Companhia Brasileira de Distribuiçao (“CBD” or “GPA”), a controlled subsidiary of CGP and Éxito, listed in Brazil and in the United States; and - Via Varejo S.A. (“Via Varejo” or “VV”), a controlled subsidiary of GPA listed in Brazil. These entities agreed on 4 June 2014 to transfer their respective e - commerce businesses in France, Latin America and Asia to Cnova N.V. (“Cnova” or the “Company”). As Cnova is a holding company, these e - commerce businesses are mainly operated through the following subsidiaries: - Cdiscount S.A. (“Cdiscount”) in France as well as in selected international countries; - Cnova Comércio Eletrônico S.A. (“Nova”, “Cnova Brazil”) in Brazil. In 2015, Cnova consolidated net sales reached € 3.42bn. Because of the global disturbed situation in Brazil and the commercial and financial difficulties encountered by Nova, the Casino group has announced a reorganization project on 12 May 2016 in which Cnova Comércio Eletrônico S.A., held by Cnova N.V., would be merged with Via Varejo S.A. through the creation of a new subsidiary(“VV Part Participações S.A.” or“VV Part”) wholly owned by Via Varejo(the “Transaction”). In connection with this contemplated transaction, Cnova Board of Directors has created a transaction committee (the "Transaction Committee") to assess the benefits of the Transaction for Cnova’s shareholders. This document (the “Final Report”, the “Final report of the Fairness Opinion” or the“Document”) was prepared by Eight Advisory France S.A.S.(“Eight Advisory”) for the benefit and use of the Transaction Committee, in connection with its analysis of the Transaction. The purpose of this Report is to provide the Transaction Committee of Cnova with our independent opinion on the financial fairness for Cnova’s shareholders of the contemplated Transaction(Merger of Via Varejo and Nova businesses). This Final Report is based on the terms and conditions presented in the Reorganization Agreement signed by the parties dated 8 August 2016. Valuation analysis - Project Delphes - Final Report - 8 August 2016 Transactions Restructuring Transformation 2
EIGHT ADVISORY 40, rue de Courcelles 75008 PARIS Tél : +33 (0)1 45 61 88 88 Fax : +33 (0)1 45 61 72 00 www.8advisory.com Eight Advisory and Declaration of Independence Founded in 2009 by several partners and directors from international audit and consulting firms and also from the business world, Eight Advisory is an independent financial and operational firm, gathering expert professionals in their respective fields. With 22 partners boasting an average of 22 years of experience in the business and over 220 employees, Eight Advisory performed more than 1,000 assignments in supporting large corporate groups, investment funds, financial institutions and family - owned groups in making decisions in the context of transactions, litigation, financial appraisal, restructuring and operational performance. With two offices in Paris and in London and about 15 international partners, Eight Advisory is a firm well - known for its trusted signature, on both national and international engagements. Eight Advisory France S.A.S. has neither legal nor financial relationships with entities involved in the Transaction or its advisors and holds neither financial interest in the success of the Transaction, nor receivables or debts to any companies involved in the Transaction or any individual or entity that it controls within the meaning of Article l.233 - 3 of the French commercial code. Eight Advisory confirms there is no past, present or future link with any entities involved in the Transaction or its advisors, which are likely to affect its independence or impartiality of its judgment in the context of this Transaction. For the realization of the Fairness Opinion related to the present Transaction, we inform the Transaction Committee and Cnova’s shareholders that our fees are not relying on the success of the Transaction. Scope of work and Diligences In the context of the Transaction, we were mandated by the Transaction Committee of Cnova N.V. in order to appraise the value of Cnova N.V., Nova and Cdiscount, and deliver our opinion on the fairness of the contemplated Transaction. Please note that this document is the third official report prepared with the latest information provided to us. It should be read in conjunction with our report dated 11 May 2016 and 30 July 2016. Our work consisted of the following steps: - Analyze the available historical financial data for Cnova N.V., Nova and Cdiscount; - Review and understand the Transaction context and process as well as the key drivers of the valuation of each entity; - Review the available business plans at the Transaction date; - Review BNPP valuation report dated 8 August 2016; - Interviews with the management of Cnova N.V., Nova, Cdiscount with regard to the historical performances and the business plans; - Implement a multi - criteria approach to appraise the equity values of Cnova N.V., Nova and Cdiscount; - Estimate the value of the potential synergies arising from the business combination of Nova and Via Varejo; - Review the projected terms of the Reorganization Agreement (“Agreement”) as of 8 August 2016; - Deliver our Fairness Opinion to the Transaction Committee on the financial Terms and Conditions as defined in the Agreement as of 8 August 2016. Valuation analysis - Project Delphes - Final Report - 8 August 2016 Transactions Restructuring Transformation 3
EIGHT ADVISORY 40, rue de Courcelles 75008 PARIS Tél : +33 (0)1 45 61 88 88 Fax : +33 (0)1 45 61 72 00 www.8advisory.com According to our quality risk management procedure, an independent review of this Document was performed by one of our Directors. Valuation approaches Our work relied on a multi - criteria approach, based on the generally accepted valuation methods: - The Income Approach indicates the Enterprise Value of a business based on the present value of the cash flows that the business can be expected to generate in the future. Such cash flows are discounted at a discount rate(the Weighted Average Cost of Capital) that reflects the time value of money and the risks associated with the cash flows. This approach relies on forecasts prepared by the management teams. - The Market approach indicates the value of a business based on a comparison with comparable firms in similar lines of business that are publicly traded or which are part of a public or private transaction. This approach can be estimated through the Trading Multiples Method and the Market Transaction Method. - The analysis of the historical evolution of the share price and its liquidity. - The analysis of recent transactions on the companies’ capital. - The Sum - of - the - Parts approach indicates the Equity Value of a company by adding the company assets and deducting its liabilities, estimated at their fair market values. The assets fair market values may be estimated according to the methods presented before. By nature, valuation is not an exact science. Therefore, conclusions from our work are inevitably subjective and rely on the appreciation and judgment of the appraiser. Source of information and limits For the purpose of our Fairness Opinion, we have relied upon financial and other information from various public, financial, and industry sources. This information has not be verified and accordingly, the accuracy of the information is not warranted. In addition to this information, our work was based on financial and other information and explanations provided to us by Cnova management team, which has confirmed to us that all information relevant to our work has been communicated to us during our engagement, and that it is not aware of any facts or circumstances that would make such information or data inaccurate or misleading in any material aspect. All forecasts are the sole responsibility of Cnova management team. We will accept no responsibility for the achievement of forecasts. We assume that they have been prepared on bases reflecting the best currently available estimates of the future financial performance and have performed analysis to assess whether the forecasts underlying assumptions were consistent with the information available. We relied on the assumption that the intragroup agreements conditions were at arm’s length. We note that they have been reviewed by an independent expert. Our work is based on market conditions prevailing as of 19 July 2016 and information on the Company as of 6 August 2016. Any evolution in the prospects of the Company or the market conditions (currencies, credit and stock markets conditions, macroeconomic and geopolitical risks, market and regulatory trends, etc.), or any change in operating conditions, and any information that is incorrect, incomplete or not communicated could have a significant impact on our conclusions and might require our analysis to be updated. Valuation analysis - Project Delphes - Final Report - 8 August 2016 Transactions Restructuring Transformation 4
EIGHT ADVISORY 40, rue de Courcelles 75008 PARIS Tél : +33 (0)1 45 61 88 88 Fax : +33 (0)1 45 61 72 00 www.8advisory.com We relied on information available as of 8 August 2016. In particular, our valuation work relies on the Reorganization Agreement as of 8 August 2016. This agreement presents over the global equation of the Transaction and some adjustments and guaranties that can not impact our valuation analysis at the date of our Report, such as: - Final price adjustment mechanism . The objective of this adjustment is to take into account in the final purchase price any deviation of the projected cash flows between the signing and the closing dates. Such deviation is not expected at the date of our work, and the adjustment was therefore not considered in our analysis; - Indemnity cap carve out on issues related to the Class action (settlement amount that could be paid by Cnova) and the amount of the potential SEC penalty . Our analyses rely on assumptions provided to us by Management and consistent with the Group’s position, i.e.$0m for the potential SEC penalty and $1m for the potential settlement amount in relation with the Class action. Any difference between these amounts and the final amounts to be paid by Cnova could significantly impact the conclusion of our analyses; - Indemnity cash collateral from Cnova (or alternatively Casino or banks guarantees) . By nature, this item can not impact the valuation at this stage, and was therefore not considered in our analysis. Our document was prepared for the benefit and use of the Transaction Committee, and is not rendered to, or for the benefit of, and shall not confer rights or remedies upon, any person other than the Transaction Committee. We express neither view nor opinion on the relative merits of the Transaction in comparison to other strategies available to Cnova, or on strategies Cnova’s shareholders should apply in this context. We understand that as part of the reorganization, a Tender Offer (the “Offer”) on Cnova free float is currently considered. We do not express any opinion on this Offer at this stage. Our work did not consist in performing audit procedures which would be necessary in order to express an opinion in respect of the Company’s financial statements. Date of our work This Report presents our conclusions based on the work performed and the information available as of 8 August 2016. We would like to thank you for providing us with this opportunity to work with you and remain at your disposal for any question. Yours Faithfully, Alexis Karklins - Marchay Partner For Eight Advisory SAS Valuation analysis - Project Delphes - Final Report - 8 August 2016 Transactions Restructuring Transformation 5

Table of contents Eight Advisory Team: Alexis Karklins - Marchay Partner Geoffroy Bizard Director Romain Le Theo Senior Manager David Benabou Manager Thomas Karcher Senior Alessio Carbe Analyst Quality review: Sophie Carles Director Section Page 1. Summary of our findings 8 2. Reconciliation with values presented on 11 May 2016 10 3. Context of our work 14 4. Valuation methodology and results 18 5. Valuation analysis 23 6. Synergies analysis 35 7. Valuation results including synergies 37 8. Review of BNP Paribas valuation analysis 40 9. Analysis of the Terms of the Agreement 44 10.Conclusions 49 11.Appendix 52 Valuation analysis - Project Delphes - Final Report - 8 August 2016 Contents © 2016 Owned by Eight Advisory - Confidential

General terms and abbreviations Glossary € m million of euros $m million of US Dollars R$m million of Brazilian reais 8A Eight Advisory A Actual Adj. Adjusted Agt See Agreement Agreement Reorganization Agreement as of 8 August 2016 AMF Autorité des Marchés Financiers B2C Business to Consumers BP Business plan BNPP BNP Paribas c. Circa CBD Companhia Brasileira de Distribuição CAGR Compound annual growth rate Capex Capital expenditure CEO Chief Executive Officer CFO Chief Financial Officer CF Cash flow CGP Casino Guichard - Perrachon CIT Corporate income tax CoGS Cost of Goods Sold D&A Depreciation of tangible fixed assets and amortization D&O Directors and Officers DCF Discounted cash flow EBIT Earnings before interest (and financial items), taxes(current deferred income taxes) and exceptional items EBITDA EBIT before depreciation & amortization of fixed assets Eq. V. Equity Value ERP Equity Risk Premium EV Enterprise Value e.g. For example FCF Free Cash Flows FY[XX]A Financial year ending 31 Dec 20[XX], actual FY[XX]B Financial year ending 31 Dec 20[XX], budget FY[XX]F Financial year ending 31 Dec 20[XX], forecast FX Foreign exchange GMV Gross Merchandise Value GPA Grupo Pao de Açucar HQ Headquarters I/C Intercompany i.e. Id est IPCA Índice Nacional de Preços ao Consumidor Amplo (Brazil consumer price index) IPO Initial Public Offering KPIs Key Performance Indicators LTG Long - Term Growth Rate Max. Maximum Min. Minimum n.a. Not applicable n.c. Not communicated n.m. Not meaningful NewCo VV Part Participações S.A., wholly owned subsidiary of Via Varejo S.A. NFD Net Financial Debt NOL Net Operating Losses Nova Cnova Comércio Eletrônico S.A. NPV Net Present Value NWC Net Working Capital Opex Operating expenses o/w Of which p.a. Per annum P&L Profit & loss account and PRC Provisions for risks and charges SELIC Sistema Especial de Liquidação eCustodia(Brazilbanks overnight rate) SG&A Selling General and Administrative vs. Versus WC Working capital WACC Weighted average cost of capital VWAP Volume weighted average price VV Via Varejo S.A. Y - o - Y Year on year YTD Year to date Valuation analysis - Project Delphes - Final Report - 8 August 2016 7 © 2016 Owned by Eight Advisory - Confidential

1. Summary of our findings
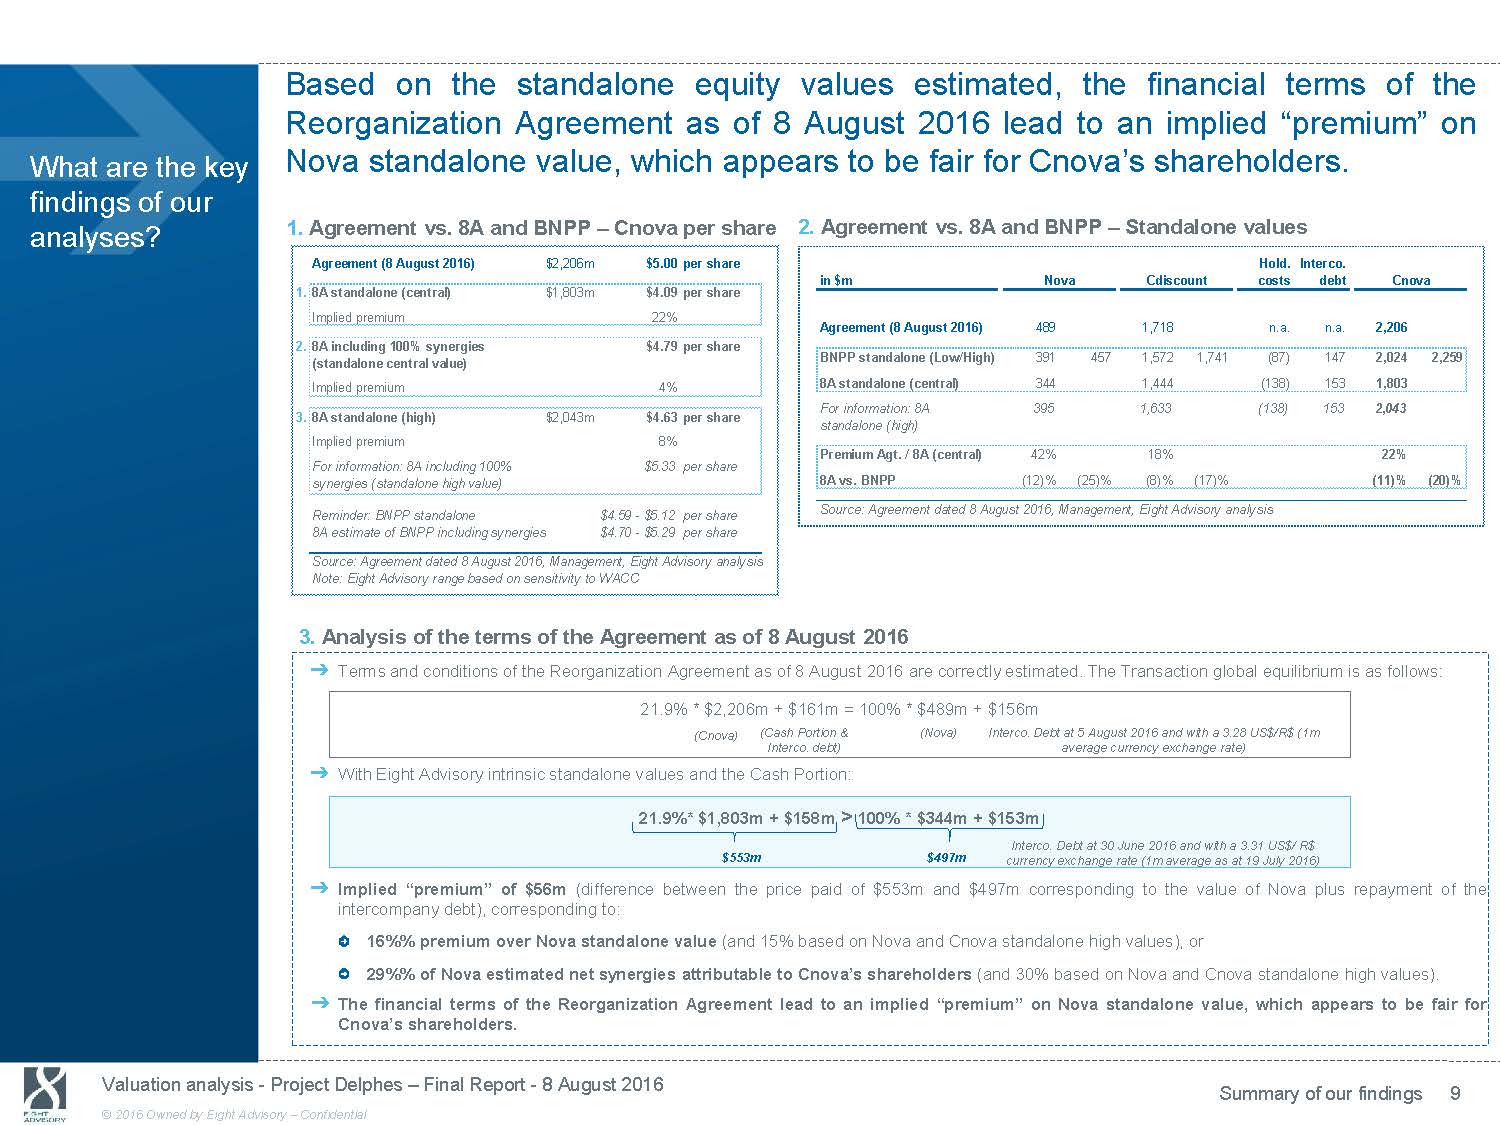
Based on the standalone equity values estimated, the financial terms of the Reorganization Agreement as of 8 August 2016 lead to an implied “premium” on What are the key findings of our Nova standalone value, which appears to be fair for Cnova’s shareholders. analyses? 1. Agreement vs. 8A and BNPP - Cnova per share Agreement (8 August 2016) $2,206m $5.00 per share 1. 8A standalone (central) $1,803m $4.09 per share Implied premium 22% 2. 8A including 100% synergies $4.79 per share (standalone central value) Implied premium 4% 3. 8A standalone (high) $2,043m $4.63 per share Implied premium 8% For information: 8A including 100% $5.33 per share synergies (standalone high value) Reminder: BNPP standalone $4.59 - $5.12 per share 8A estimate of BNPP including synergies $4.70 - $5.29 per share Source: Agreement dated 8 August 2016, Management, Eight Advisory analysis Note: Eight Advisory range based on sensitivity to WACC 2. Agreement vs. 8A and BNPP - Standalone values Hold. Interco. in $m Nova Cdiscount costs debt Cnova Agreement (8 August 2016) 489 1,718 n.a. n.a. 2,206 BNPP standalone (Low/High) 391 457 1,572 1,741 (87) 147 2,024 2,259 8A standalone (central) 344 1,444 (138) 153 1,803 For information: 8A 395 1,633 (138) 153 2,043 standalone (high) Premium Agt. / 8A (central) 42% 18% 22% 8A vs. BNPP (12)% (25)% (8)% (17)% (11)% (20)% Source: Agreement dated 8 August 2016, Management, Eight Advisory analysis 3. Analysis of the terms of the Agreement as of 8 August 2016 ᇄ Terms and conditions of the Reorganization Agreement as of 8 August 2016 are correctly estimated. The Transaction global equi li brium is as follows: 21.9% * $2,206m + $161m = 100% * $489m + $156m (Cnova) (Cash Portion & (Nova) Interco. Debt at 5 August 2016 and with a 3.28 US$/R$ (1m Interco. debt) average currency exchange rate) ᇄ With Eight Advisory intrinsic standalone values and the Cash Portion: 21.9%* $1,803m + $158m > 100% * $344m + $153m Interco. Debt at 30 June 2016 and with a 3.31 US$/ R$ $553m $497m currency exchange rate (1m average as at 19 July 2016) ᇄ Implied “premium” of $56m (difference between the price paid of $553m and $497m corresponding to the value of Nova plus repayment of the intercompany debt), corresponding to: 16%% premium over Nova standalone value (and 15% based on Nova and Cnova standalone high values), or 29%% of Nova estimated net synergies attributable to Cnova’s shareholders (and 30% based on Nova and Cnova standalone high values). ᇄ The financial terms of the Reorganization Agreement lead to an implied “premium” on Nova standalone value, which appears to b e fair for Cnova’s shareholders. Valuation analysis - Project Delphes - Final Report - 8 August 2016 Summary of our findings 9 © 2016 Owned by Eight Advisory - Confidential
2. Reconciliation with values presented on 11 May 2016
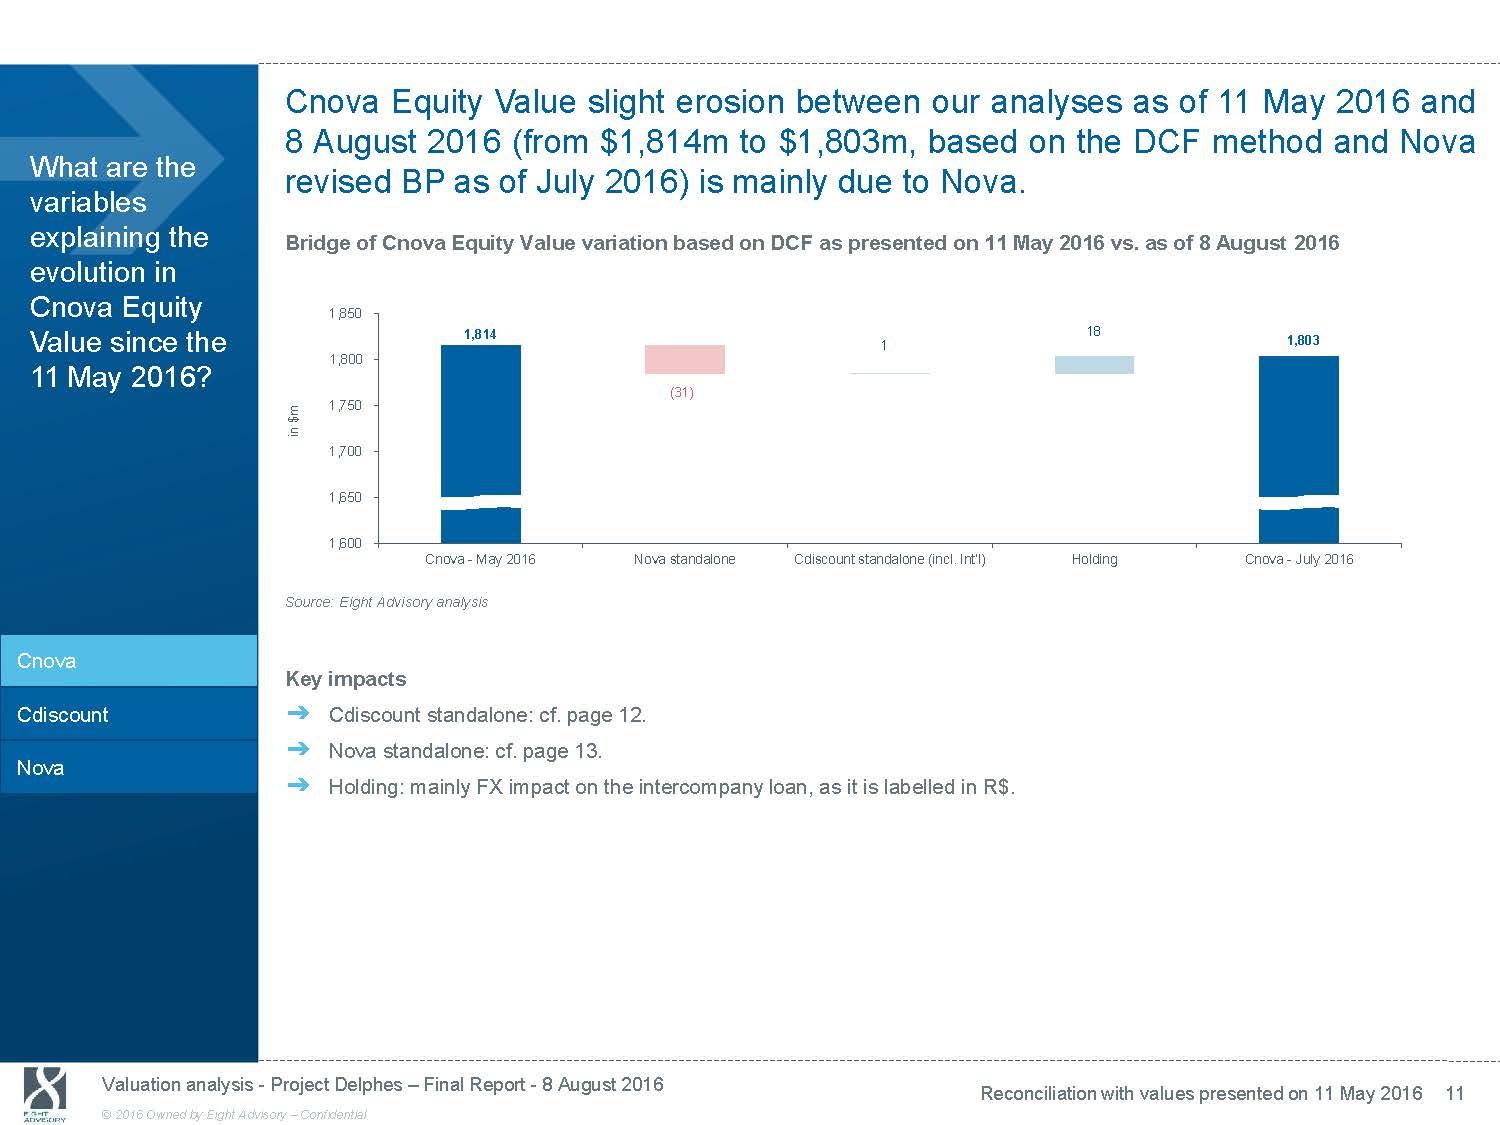
Cnova Equity Value slight erosion between our analyses as of 11 May 2016 and 8 August 2016 (from $1,814m to $1,803m, based on the DCF method and Nova What are the variables explaining the evolution in Cnova Equity revised BP as of July 2016) is mainly due to Nova. Bridge of Cnova Equity Value variation based on DCF as presented on 11 May 2016 vs. as of 8 August 2016 1,850 1,814 18 Value since the 11 May 2016? Cnova Cdiscount Nova 1 1,800 (31) 1,750 1,700 1,650 1,600 Cnova - May 2016 Nova standalone Cdiscount standalone (incl. Int'l) Source: Eight Advisory analysis Key impacts ᇄ Cdiscount standalone: cf. page 12. ᇄ Nova standalone: cf. page 13. ᇄ Holding: mainly FX impact on the intercompany loan, as it is labelled in R$. 1,803 Holding Cnova - July 2016 Valuation analysis - Project Delphes - Final Report - 8 August 2016 Reconciliation with values presented on 11 May 2016 11 © 2016 Owned by Eight Advisory - Confidential
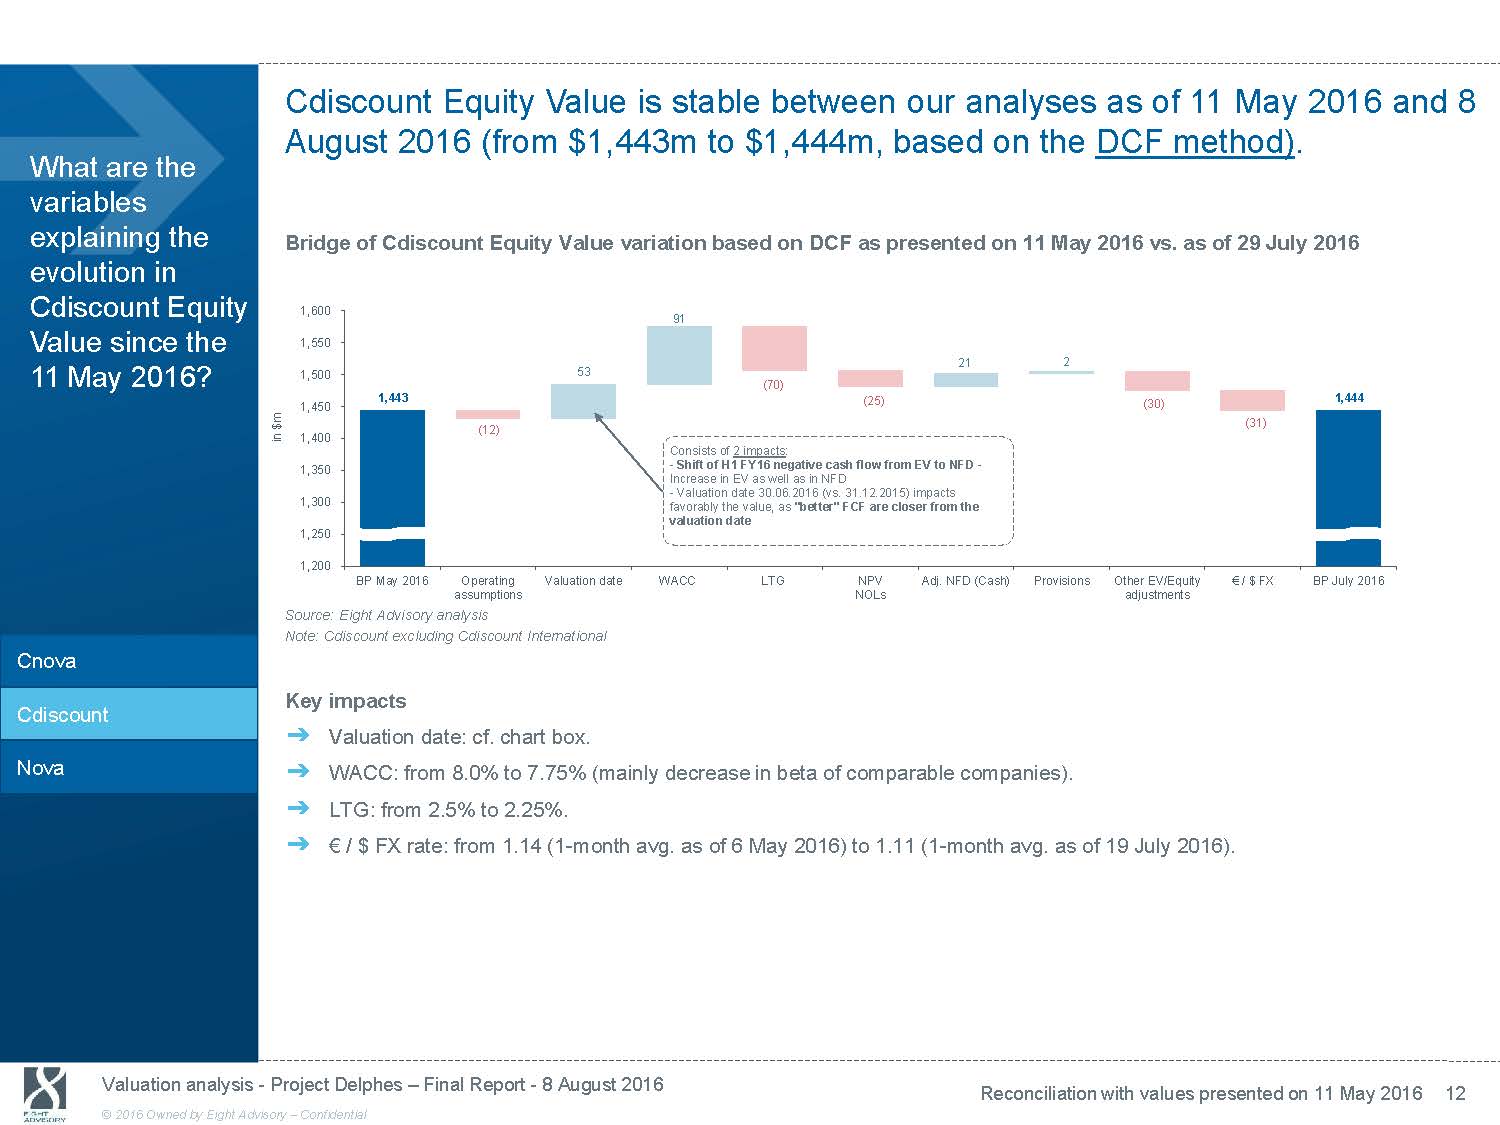
What are the variables explaining the evolution in Cdiscount Equity Cdiscount Equity Value is stable between our analyses as of 11 May 2016and8 August 2016 (from $1,443m to $1,444m, based on the DCF method). Bridge of Cdiscount Equity Value variation based on DCF as presented on11 May 2016 vs. as of 29 July 2016 1,600 91 Value since the 11 May 2016? 1,550 1,500 1,450 1,400 1,350 1,300 1,250 1,200 53 1,443 (12) BP May 2016 Operating Valuation date assumptions 21 (70) (25) Consists of 2 impacts: - Shift of H1 FY16 negative cash flow from EV to NFD - Increase in EV as well as in NFD - Valuation date 30.06.2016 (vs. 31.12.2015) impacts favorably the value, as "better" FCF are closer from the valuation date WACC LTG NPV Adj. NFD (Cash) NOLs 2 (30) (31) Provisions Other EV/Equity € / $ FX adjustments 1,444 BP July 2016 Source: Eight Advisory analysis Note: Cdiscount excluding Cdiscount International Cnova Cdiscount Nova Key impacts ᇄ Valuation date: cf. chart box. ᇄ WACC: from 8.0% to 7.75% (mainly decrease in beta of comparable companies). ᇄ LTG: from 2.5% to 2.25%. ᇄ € / $ FX rate: from 1.14 (1 - month avg. as of 6 May 2016) to 1.11 (1 - month avg. as of 19 July 2016). Valuation analysis - Project Delphes - Final Report - 8 August 2016 Reconciliation with values presented on 11 May 2016 12 © 2016 Owned by Eight Advisory - Confidential
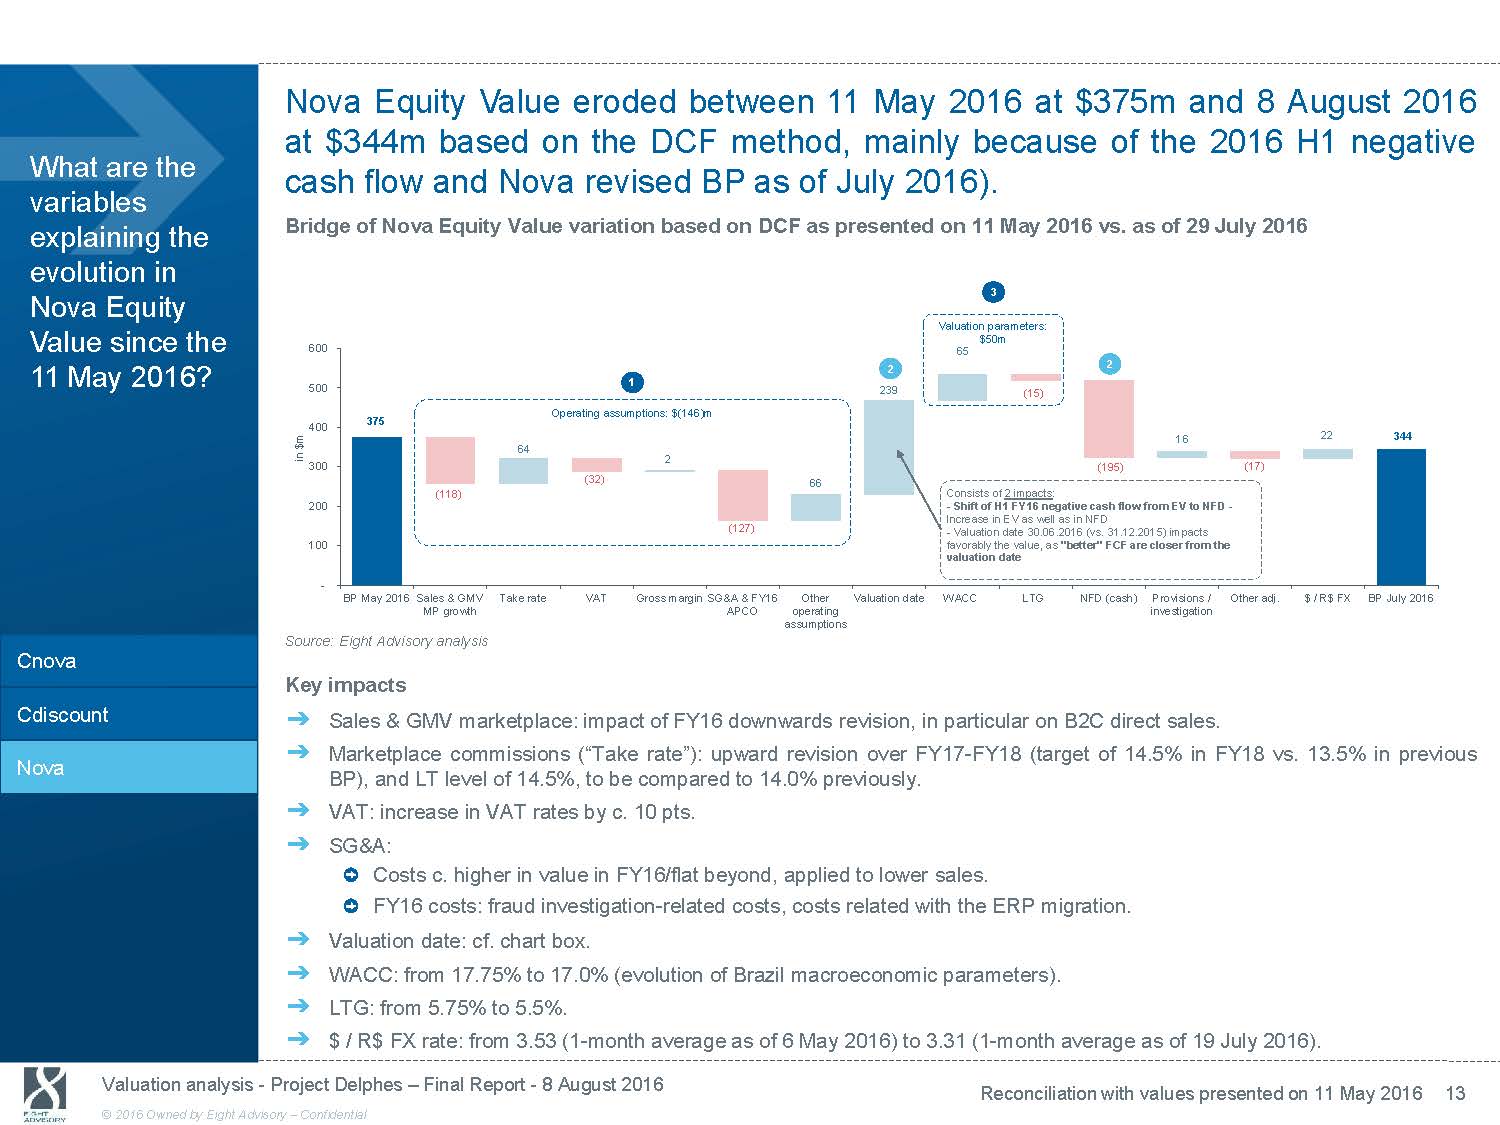
Nova Equity Value eroded between 11 May 2016 at $375m and 8 August 2016 at $344m based on the DCF method, mainly because of the 2016 H1 negative What are the variables explaining the evolution in Nova Equity Value since the 11 May 2016? cash flow and Nova revised BP as of July 2016). Bridge of Nova Equity Value variation based on DCF as presented on 11 May 2016 vs. as of 29 July 2016 3 Valuation parameters: $50m 600 65 2 2 500 1 400 300 200 100 - 375 64 (118) BP May 2016 Sales & GMV Take rate MP growth 239 Operating assumptions: $(146)m 2 (32) 66 (127) VAT Gross margin SG&A & FY16 Other Valuation date APCO operating assumptions (15) 16 22 344 (195) (17) Consists of 2 impacts: - Shift of H1 FY16 negative cash flow from EV to NFD - Increase in EV as well as in NFD - Valuation date 30.06.2016 (vs. 31.12.2015) impacts favorably the value, as "better" FCF are closer from the valuation date WACC LTG NFD (cash) Provisions / Other adj. $ / R$ FX BP July 2016 investigation Source: Eight Advisory analysis Cnova Key impacts Cdiscount Nova ᇄ Sales & GMV marketplace: impact of FY16 downwards revision, in particular on B2C direct sales. ᇄ Marketplace commissions (“Take rate”): upward revision over FY17 - FY18 (target of 14.5% in FY18 vs.13.5% in previous BP), and LT level of 14.5%, to be compared to 14.0% previously. ᇄ VAT: increase in VAT rates by c. 10 pts. ᇄ SG&A: Costs c. higher in value in FY16/flat beyond, applied to lower sales. FY16 costs: fraud investigation - related costs, costs related with the ERP migration. ᇄ Valuation date: cf. chart box. ᇄ WACC: from 17.75% to 17.0% (evolution of Brazil macroeconomic parameters). ᇄ LTG: from 5.75% to 5.5%. ᇄ $ / R$ FX rate: from 3.53 (1 - month average as of 6 May 2016) to 3.31 (1 - month average as of 19 July 2016). Valuation analysis - Project Delphes - Final Report - 8 August 2016 Reconciliation with values presented on 11 May 2016 13 © 2016 Owned by Eight Advisory - Confidential

3. Context of our work
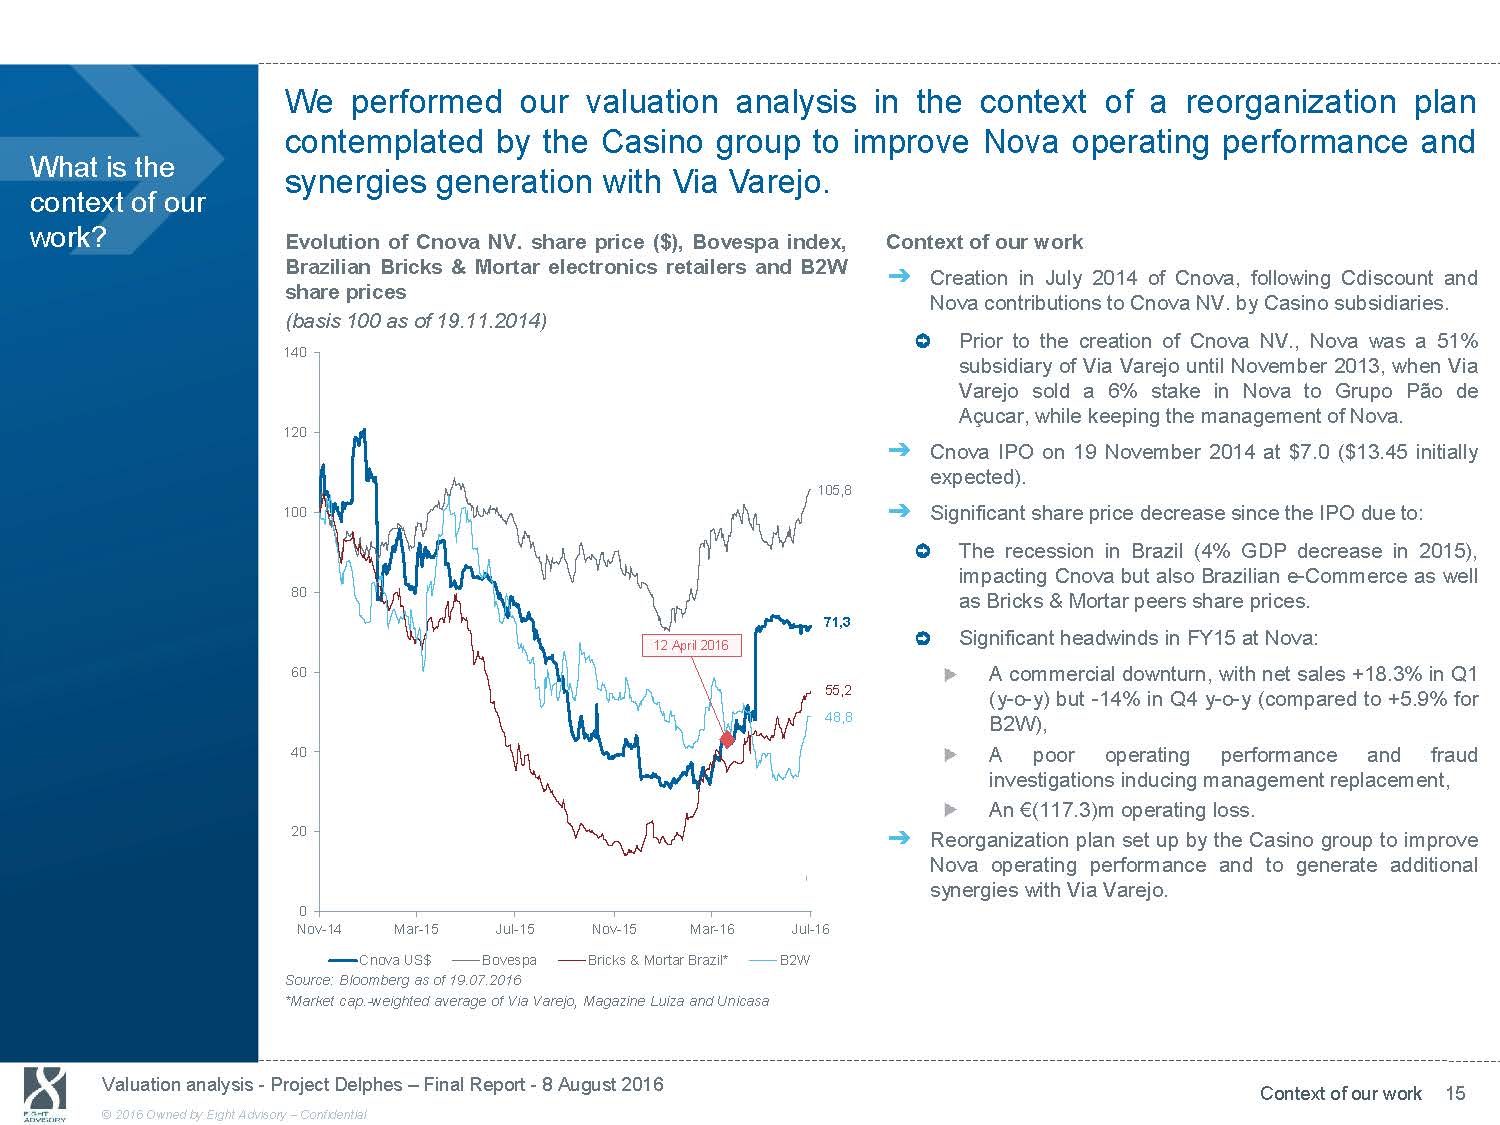
We performed our valuation analysis in the context of a reorganization plan contemplated by the Casino group to improve Nova operating performance and What is the context of our work? synergies generation with Via Varejo. Evolution of Cnova NV. share price ($), Bovespa index, Brazilian Bricks & Mortar electronics retailers and B2W share prices (basis100 as of 19.11.2014) 140 120 105,8 100 80 71,3 12 April 2016 60 55,2 48,8 40 20 0 Nov - 14 Mar - 15 Jul - 15 Nov - 15 Mar - 16 Jul - 16 Cnova US$ Bovespa Bricks & Mortar Brazil* B2W Source: Bloomberg as of 19.07.2016 *Market cap. - weighted average of Via Varejo, Magazine Luiza and Unicasa Context of our work ᇄ Creation in July 2014 of Cnova, following Cdiscount and Nova contributions to Cnova NV. by Casino subsidiaries. Prior to the creation of Cnova NV., Nova was a 51% subsidiary of Via Varejo until November 2013, when Via Varejo sold a6% stake in Nova to Grupo Pão de Açucar, while keeping the management of Nova. ᇄ Cnova IPO on 19 November 2014 at $7.0 ($13.45 initially expected). ᇄ Significant share price decrease since the IPO due to: The recession in Brazil (4% GDP decrease in 2015), impacting Cnova but also Brazilian e - Commerce as well as Bricks & Mortar peers share prices. Significant headwinds in FY15 at Nova: A commercial downturn, with net sales +18.3% in Q1 (y - o - y) but - 14% in Q4 y - o - y (compared to +5.9% for B2W), A poor operating performance and fraud investigations inducing management replacement, An € (117.3)m operating loss. ᇄ Reorganization plan set up by the Casino group to improve Nova operating performance and to generate additional synergies with Via Varejo. Valuation analysis - Project Delphes - Final Report - 8 August 2016 Context of our work 15 © 2016 Owned by Eight Advisory - Confidential
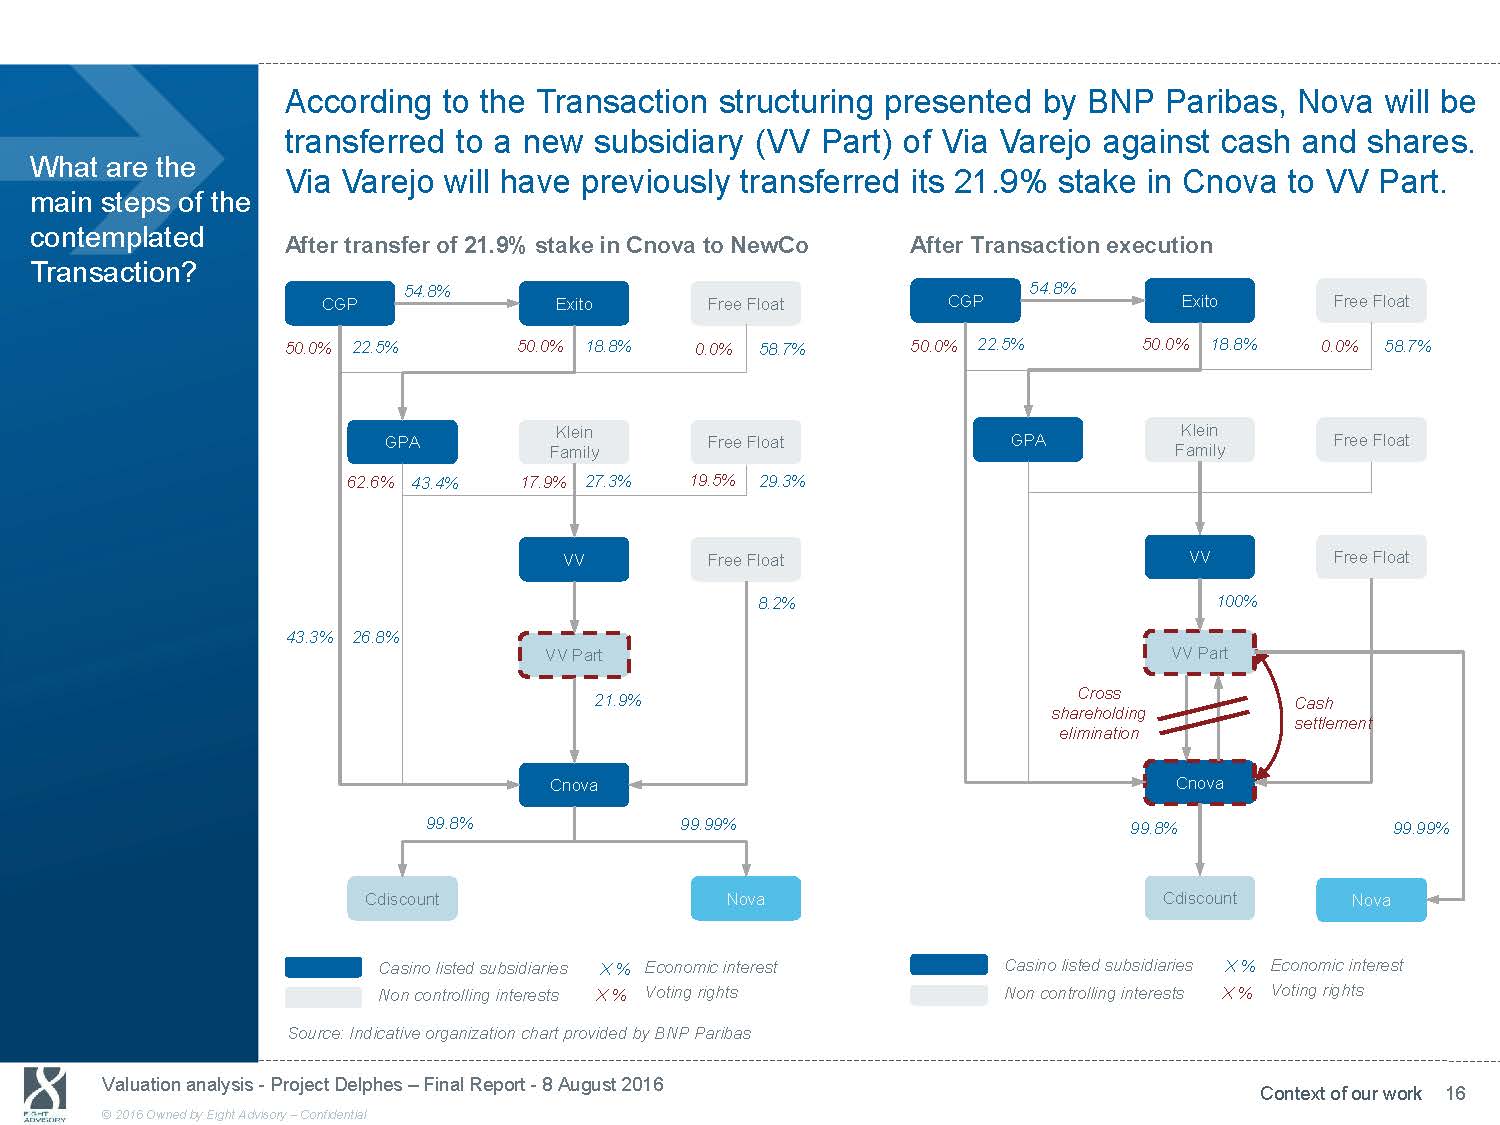
According to the Transaction structuring presented by BNP Paribas, Nova will be transferred to a new subsidiary (VV Part) of Via Varejo against cash and shares. What are the main steps of the contemplated Transaction? Via Varejo will have previously transferred its 21.9% stake in Cnova to VV Part. After transfer of 21.9% stake in Cnova to NewCo After Transaction execution 54.8% 54.8% CGP 50.0% 22.5% GPA 62.6% 43.4% 43.3% 26.8% 99.8% Cdiscount Exito 50.0% 18.8% Klein Family 17.9% 27.3% VV VV Part 21.9% Cnova Free Float CGP 0.0% 58.7% 50.0% 22.5% Free Float GPA 19.5% 29.3% Free Float 8.2% 99.99% Nova Exito 50.0% 18.8% Klein Family VV 100% VV Part Cross shareholding elimination Cnova 99.8% Cdiscount Free Float 0.0% 58.7% Free Float Free Float Cash settlement 99.99% Nova Casino listed subsidiaries X % Economic interest Casino listed subsidiaries X % Economic interest Non controlling interests X % Voting rights Non controlling interests X % Voting rights Source: Indicative organization chart provided by BNP Paribas Valuation analysis - Project Delphes - Final Report - 8 August 2016 Context of our work 16 © 2016 Owned by Eight Advisory - Confidential
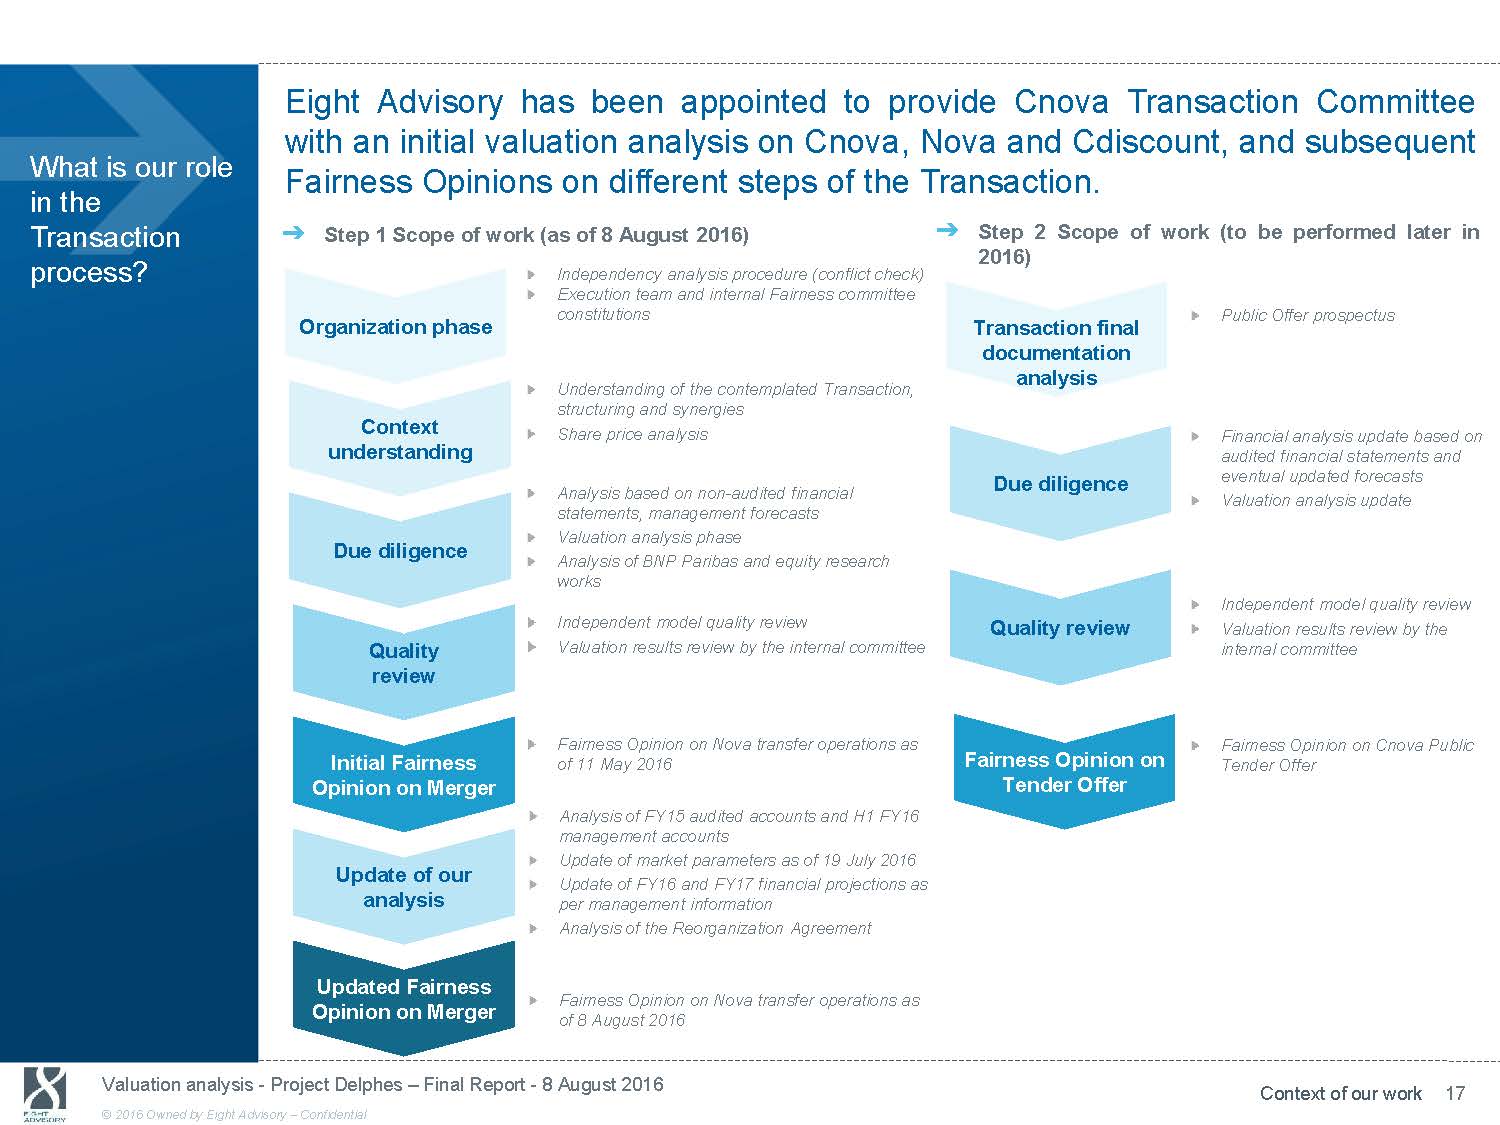
Eight Advisory has been appointed to provide Cnova Transaction Committee with an initial valuation analysis on Cnova, Nova and Cdiscount, and subsequent What is our role in the Transaction process? Fairness Opinions on different steps of the Transaction. ᇄ Step 1 Scope of work (as of 8 August 2016) ᇄ Step 2 Scope of work (to be performed later in 2016) Independency analysis procedure (conflict check) Execution team and internal Fairness committee constitutions Public Offer prospectus Organization phase Transaction final documentation Context understanding Due diligence Quality review Initial Fairness Opinion on Merger Update of our analysis Updated Fairness Opinion on Merger Understanding of the contemplated Transaction, structuring and synergies Share price analysis Analysis based on non - audited financial statements, management forecasts Valuation analysis phase Analysis of BNP Paribas and equity research works Independent model quality review Valuation results review by the internal committee Fairness Opinion on Nova transfer operations as of 11 May 2016 Analysis of FY15 audited accounts and H1 FY16 management accounts Update of market parameters as of 19 July 2016 Update of FY16 and FY17 financial projections as per management information Analysis of the Reorganization Agreement Fairness Opinion on Nova transfer operations as of 8 August 2016 analysis Due diligence Quality review Fairness Opinion on Tender Offer Financial analysis update based on audited financial statements and eventual updated forecasts Valuation analysis update Independent model quality review Valuation results review by the internal committee Fairness Opinion on Cnova Public Tender Offer Valuation analysis - Project Delphes - Final Report - 8 August 2016 Context of our work 17 © 2016 Owned by Eight Advisory - Confidential
4. Valuation methodology and results
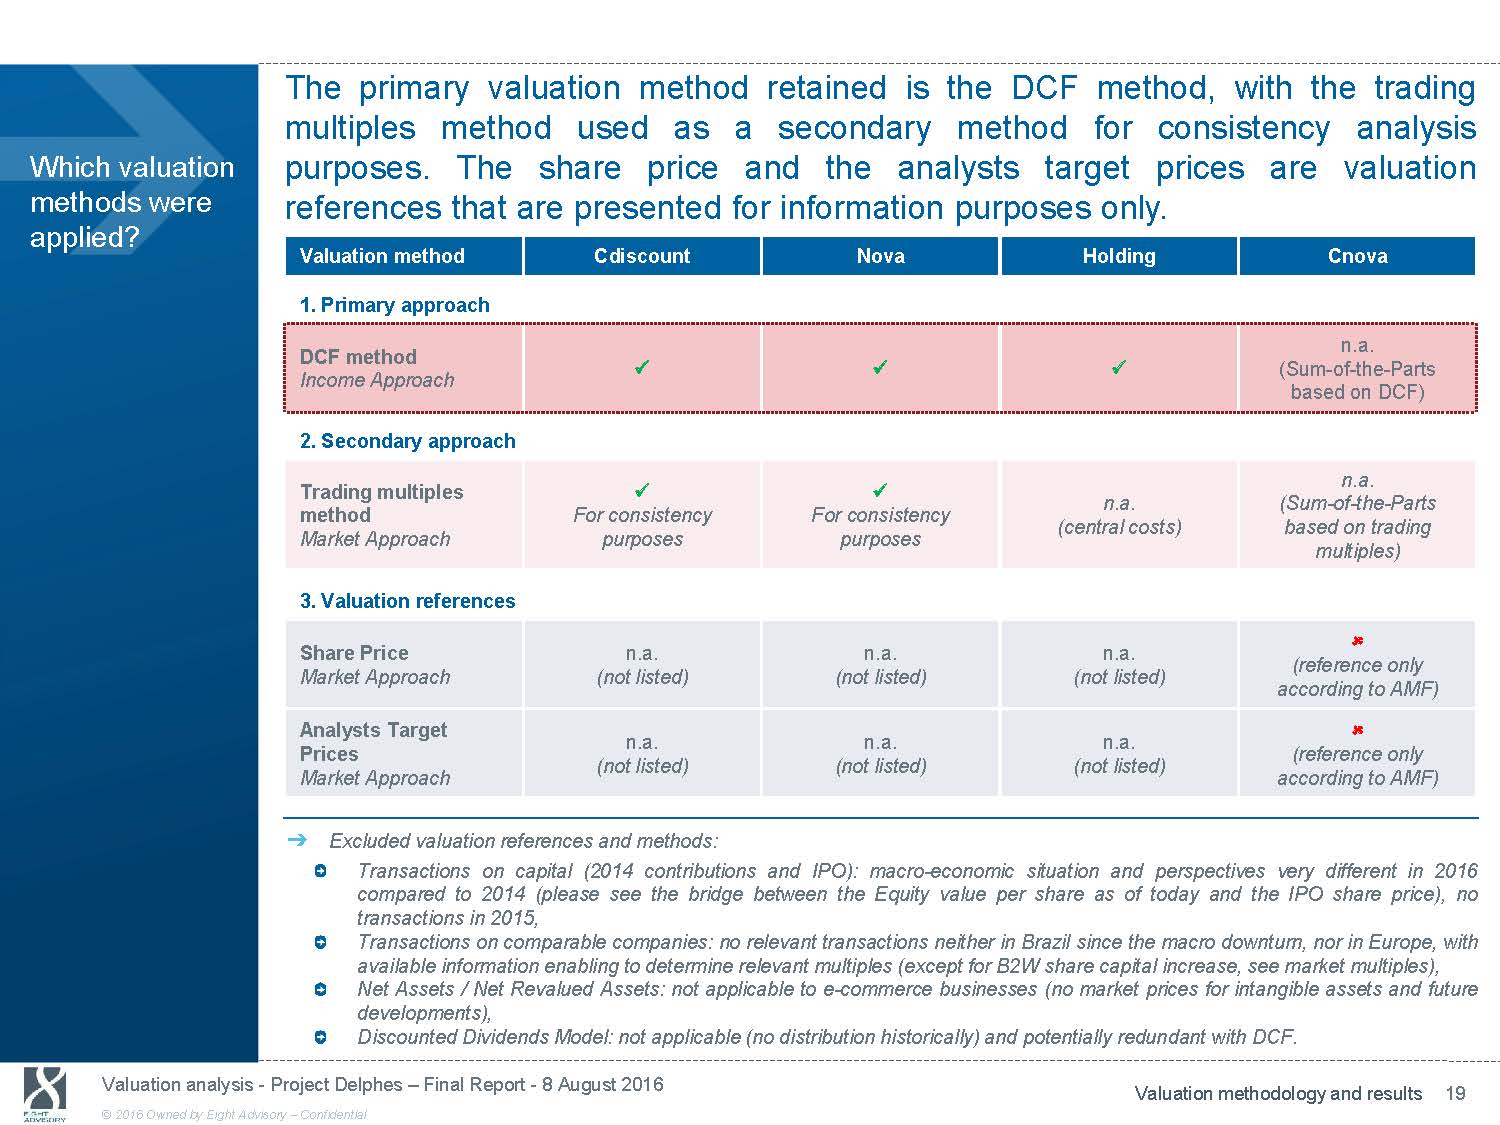
The primary valuation method retained is the DCF method, with the trading Which valuation methods were applied? multiples method used as a secondary method for consistency analysis purposes. The share price and the analysts target pricesare valuation references that are presented for information purposes only. Valuation method Cdiscount Nova Holding Cnova 1. Primary approach DCF method Income Approach x x n.a. x (Sum - of - the - Parts based on DCF) 2. Secondary approach Trading multiples x x method For consistency For consistency Market Approach purposes purposes n.a. n.a. (Sum - of - the - Parts (central costs) based on trading multiples) 3. Valuation references Share Price n.a. Market Approach (not listed) n.a. n.a. (not listed) (not listed) (reference only according to AMF) Analysts Target Prices Market Approach n.a. n.a. n.a. (not listed) (not listed) (not listed) (reference only according to AMF) ᇄ Excluded valuation references and methods: Transactions on capital (2014 contributions and IPO): macro - economic situation and perspectives very different in 201 6 compared to 2014 (please see the bridge between the Equity value per share as of today and the IPO share price), no transactions in 2015, Transactions on comparable companies: no relevant transactions neither in Brazil since the macro downturn, nor in Europe, wit h available information enabling to determine relevant multiples (except for B2W share capital increase, see market multiples), Net Assets / Net Revalued Assets: not applicable to e - commerce businesses (no market prices for intangible assets and future developments), Discounted Dividends Model: not applicable (no distribution historically) and potentially redundant with DCF. Valuation analysis - Project Delphes - Final Report - 8 August 2016 Valuation methodology and results 19 © 2016 Owned by Eight Advisory - Confidential
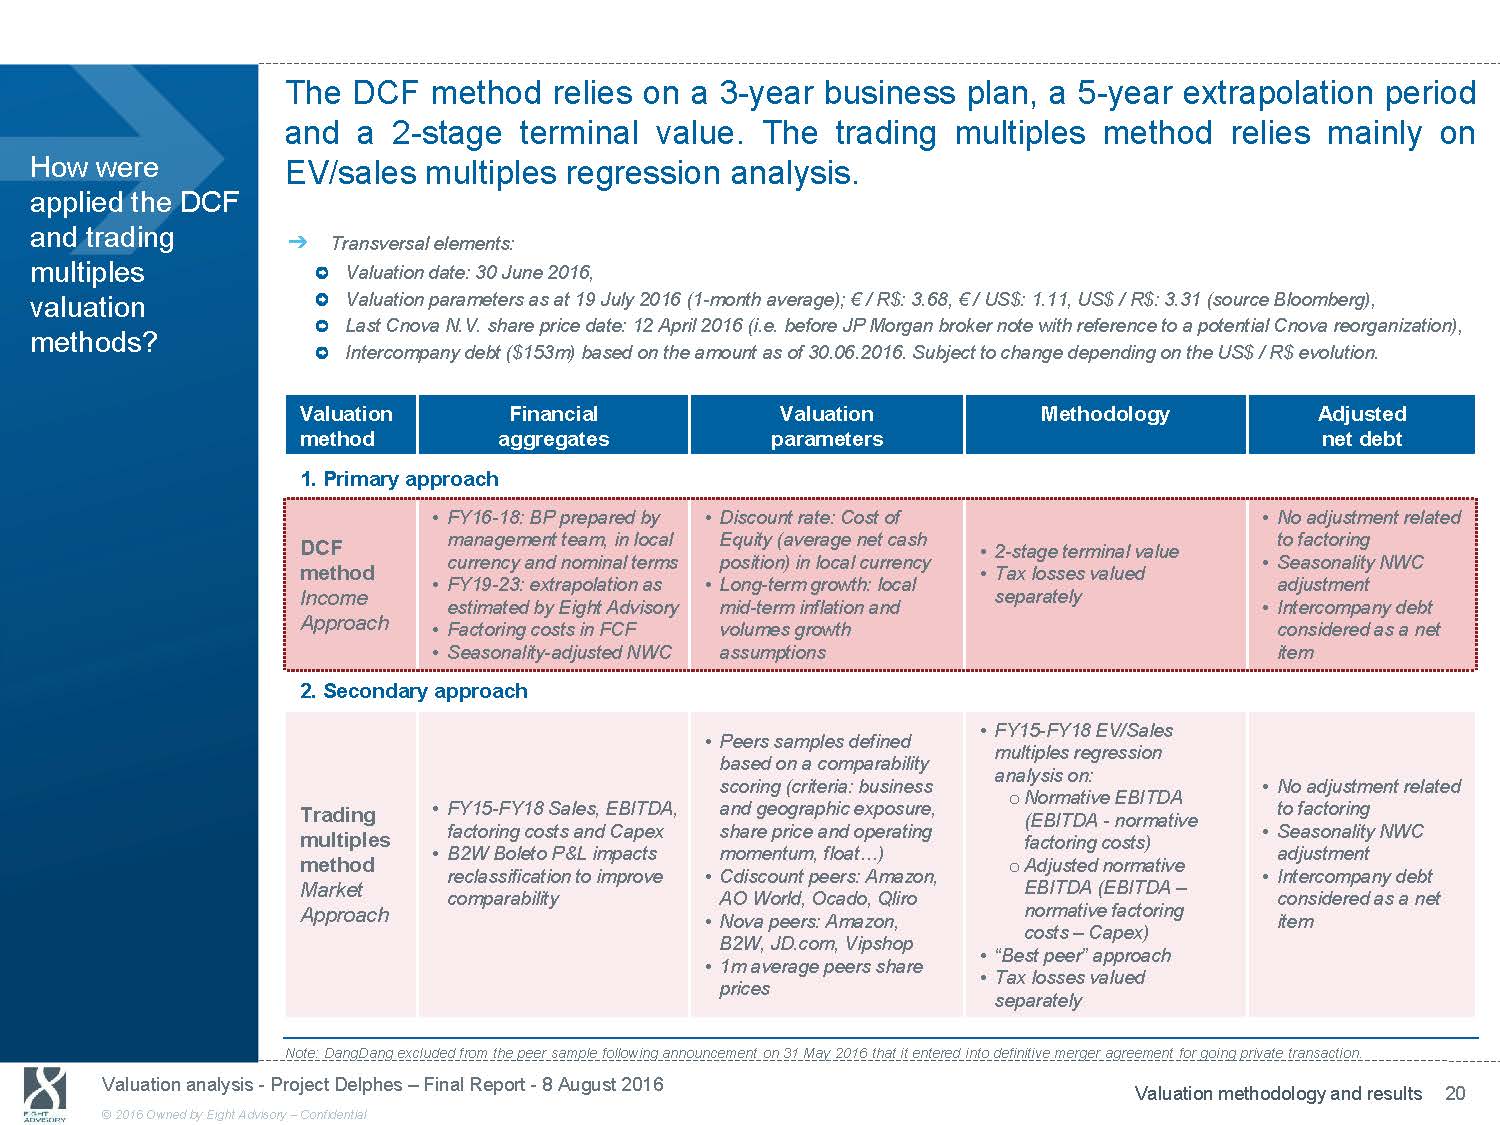
The DCF method relies on a 3 - year business plan, a 5 - year extrapolation period and a 2 - stage terminal value. The trading multiples method relies mainly on How were applied the DCF and trading multiples valuation methods? EV/sales multiples regression analysis. ᇄ Transversal elements: Valuation date: 30 June 2016, Valuation parameters as at 19 July 2016 (1 - month average); € / R$: 3.68, € / US$: 1.11, US$ / R$: 3.31 (source Bloomberg), Last Cnova N.V. share price date: 12 April 2016 (i.e. before JP Morgan broker note with reference to a potential Cnova reorga niz ation), Intercompany debt ($153m) based on the amount as of 30.06.2016. Subject to change depending on the US$ / R$ evolution. Valuation Financial Valuation Methodology Adjusted method aggregates parameters net debt 1. Primary approach • FY16 - 18: BP prepared by • Discount rate: Cost of • No adjustment related DCF management team, in local Equity (average net cash • 2 - stage terminal value to factoring method Income Approach currency and nominal terms • FY19 - 23: extrapolation as estimated by Eight Advisory • Factoring costs in FCF • Seasonality - adjusted NWC position) in local currency • Long - term growth: local mid - term inflation and volumes growth assumptions • Tax losses valued separately • Seasonality NWC adjustment • Intercompany debt considered as a net item 2. Secondary approach Trading multiples method Market Approach • FY15 - FY18 Sales, EBITDA, factoring costs and Capex • B2W Boleto P&L impacts reclassification to improve comparability • Peers samples defined based on a comparability scoring (criteria: business and geographic exposure, share price and operating momentum, float…) • Cdiscount peers: Amazon, AO World, Ocado, Qliro • Nova peers: Amazon, B2W, JD.com, Vipshop • 1m average peers share prices • FY15 - FY18 EV/Sales multiples regression analysis on: o Normative EBITDA (EBITDA - normative factoring costs) o Adjusted normative EBITDA (EBITDA - normative factoring costs - Capex) • “Best peer” approach • Tax losses valued separately • No adjustment related to factoring • Seasonality NWC adjustment • Intercompany debt considered as a net item Note: DangDang excluded from the peer sample following announcement on 31 May 2016 that it entered into definitive merger agr eem ent for going private transaction. Valuation analysis - Project Delphes - Final Report - 8 August 2016 Valuation methodology and results 20 © 2016 Owned by Eight Advisory - Confidential

Excluding synergies and with intercompany debt not capitalized , Cnova NV Equity Value defined with the DCF method ranges from $1,600m to $2,043m. What are the results of our valuation analysis? 1. Cnova Equity Value ($m) Cnova Equity Value Before Synergies 1,803 DCF method 1,600 2,043 Interco. debt not cap. Relative weights excl. Holding Cdiscount 81% - 81% Note: DCF method range is Nova 19% - 19% based on sensitivity to WACC Intercompany debt not Trading multiples - Current view 921 (regression) Trading multiples - Best view (Best peer) 1,741 1,245 2,160 Cdiscount 93% - 77% Nova 23% - 7% Cdiscount 87% - 83% Nova 17% - 13% capitalized Analysts target price Average 706 1,214 1,765 (1/2) Market capitalization (1 - month) Market capitalization (since IPO) 984 1,358 12 April 2016 (1) IPO market cap. 954 1,136 3,089 1 Mar. 2016 Source: Bloomberg, 3,732 13 Jan. 2015 Eight Advisory analysis 2. - 500 1,000 1,500 2,000 In $m Cdiscount and Nova Equity Values ($m) Cdiscount Equity Value Nova Equity Value Before Nova Synergies - Interco. 2,500 3,000 3,500 4,000 NPV Holding Costs Note (1): 1 - month average Intercompany debt Intercompany debt not capitalized DCF Method Trading multiples - Intercompany debt not capitalized 1,444 1,287 1,633 debt not capitalized 344 298 395 Before Holding Synergies (138) 153 (138) 153 Current view 840 1,338 67 388 (regression) (138) 153 Trading multiples - Best view 1,068 1,770 163 375 (Best peer) 750 950 1,150 1,350 1,550 1,750 1,950 - 200 400 600 800 (200) (150) (100) (50) - 100 120 140 160 180 200 In $m In $m In $m In $m Valuation analysis - Project Delphes - Final Report - 8 August 2016 Valuation methodology and results 21 © 2016 Owned by Eight Advisory - Confidential
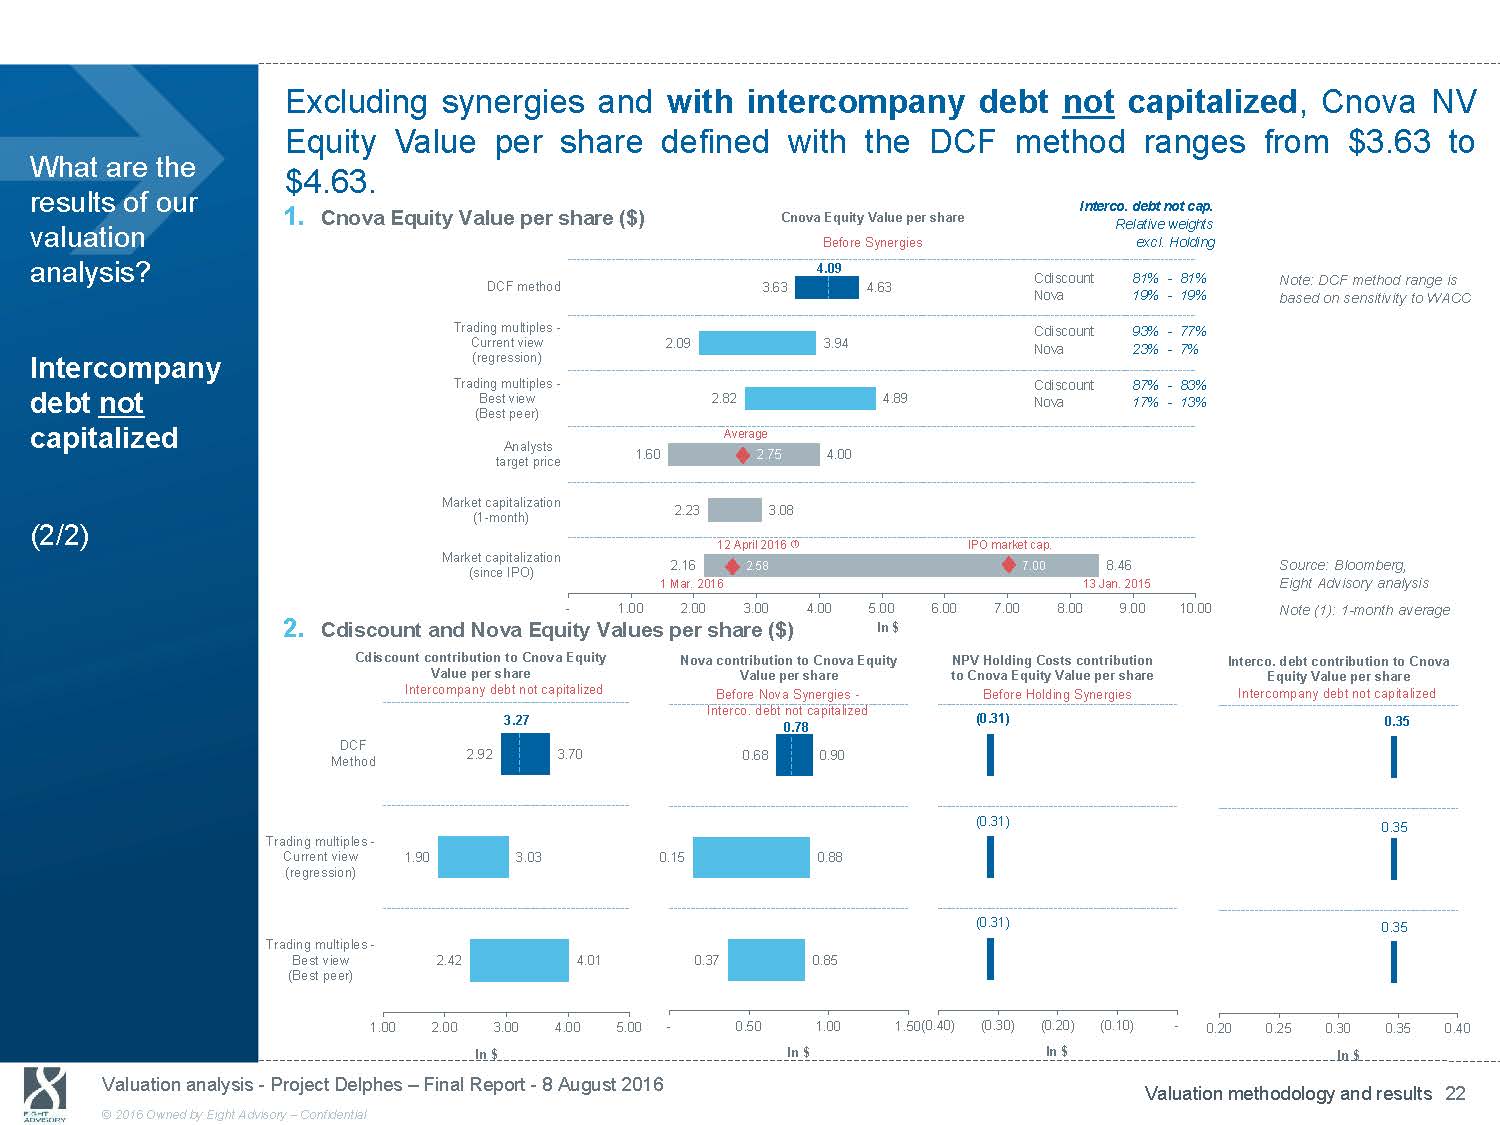
Excluding synergies and with intercompany debt not capitalized , Cnova NV What are the results of our Equity Value per share defined with the DCF method ranges $4.63. Interco. debt not cap. from $3.63 to 1. valuation analysis? Intercompany debt not Cnova Equity Value per share ($) Cnova Equity Value per share Before Synergies 4.09 DCF method 3.63 4.63 Trading multiples - Current view 2.09 3.94 (regression) Trading multiples - Best view 2.82 4.89 (Best peer) Relative weights excl. Holding Cdiscount 81% - 81% Note: DCF method range is Nova 19% - 19% based on sensitivity to WACC Cdiscount 93% - 77% Nova 23% - 7% Cdiscount 87% - 83% Nova 17% - 13% capitalized Analysts target price Average 1.60 2.75 4.00 (2/2) Market capitalization (1 - month) Market capitalization (since IPO) 2.23 3.08 12 April 2016 (1) IPO market cap. 2.16 2.58 7.00 1 Mar. 2016 8.46 Source: Bloomberg, 13 Jan. 2015 Eight Advisory analysis - 1.00 2.00 3.00 4.00 5.00 2. Cdiscount and Nova Equity Values per share ($) In $ Cdiscount contribution to Cnova Equity Nova contribution to Cnova Equity Value per share Value per share Intercompany debt not capitalized Before Nova Synergies - Interco. debt not capitalized 3.27 6.00 7.00 8.00 9.00 10.00 NPV Holding Costs contribution to Cnova Equity Value per share Before Holding Synergies (0.31) Note (1): 1 - month average Interco. debt contribution to Cnova Equity Value per share Intercompany debt not capitalized 0.35 0.78 DCF Method Trading multiples - Current view 1.90 (regression) Trading multiples - Best view 2.42 (Best peer) 1.00 2.00 2.92 3.70 3.03 0.15 4.01 3.00 4.00 5.00 - In $ 0.68 0.90 0.88 0.37 0.85 0.50 1.00 1.50(0.40) In $ (0.31) (0.31) (0.30) (0.20) (0.10) - In $ 0.35 0.35 0.20 0.25 0.30 0.35 0.40 In $ Valuation analysis - Project Delphes - Final Report - 8 August 2016 Valuation methodology and results 22 © 2016 Owned by Eight Advisory - Confidential
5. Valuation analysis
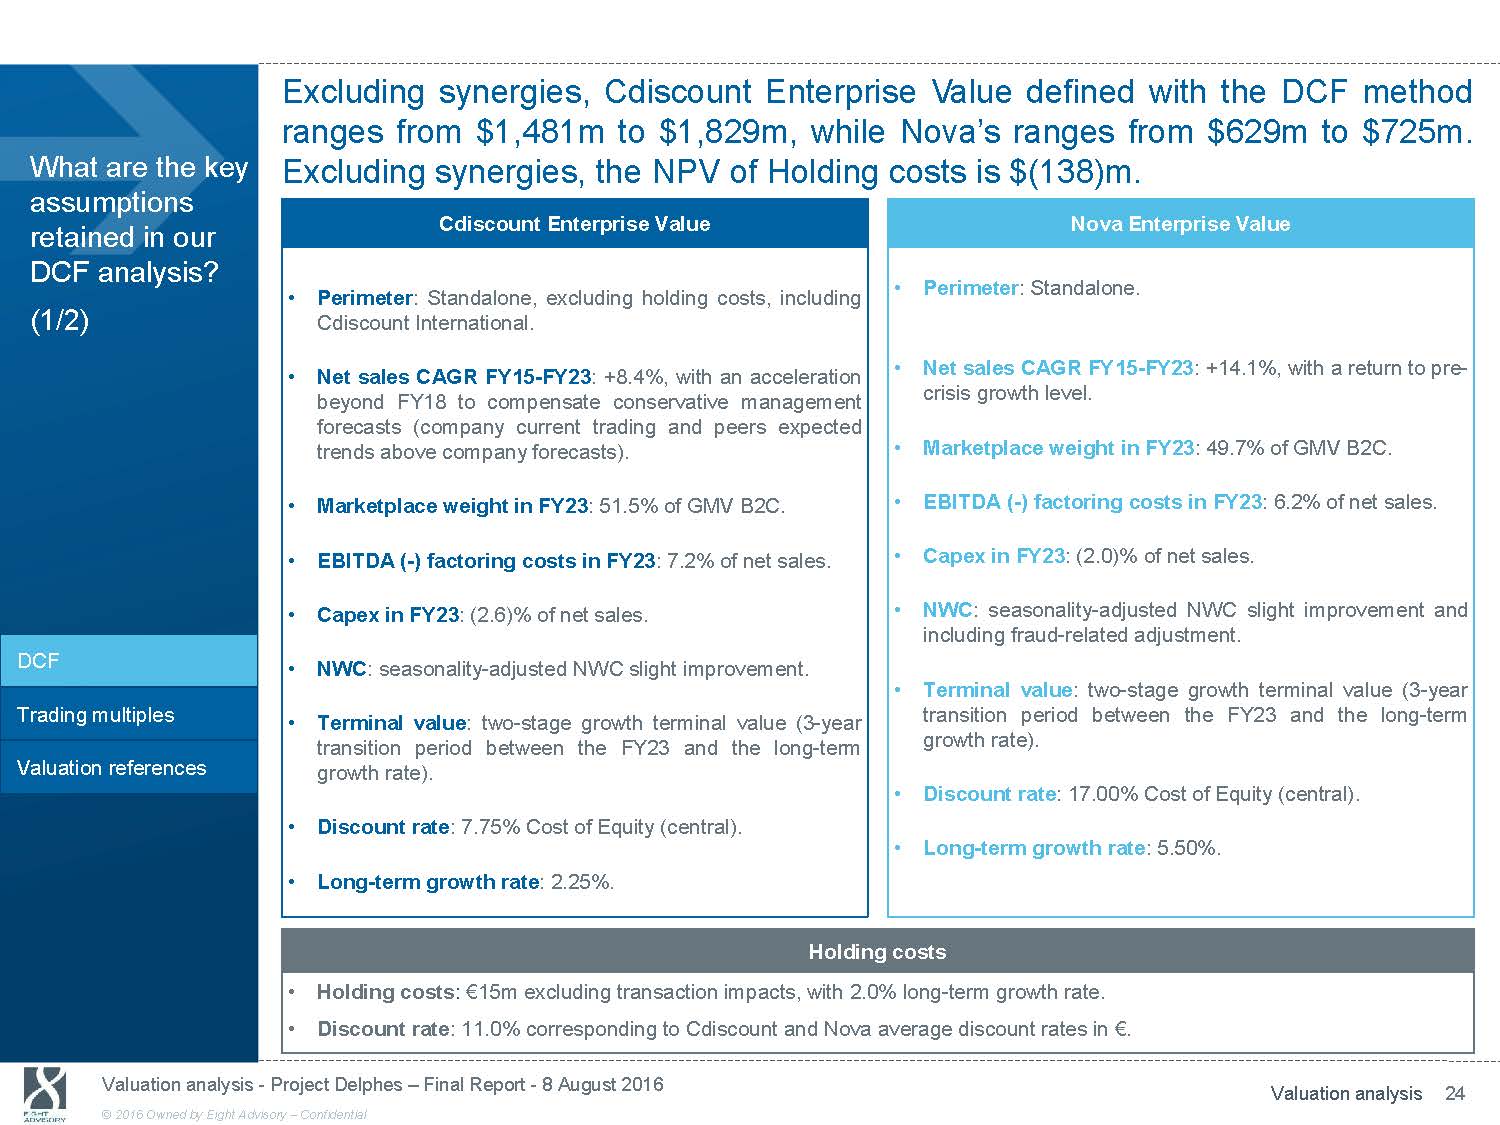
Excluding synergies, Cdiscount Enterprise Value defined with the DCF method ranges from $1,481m to $1,829m, while Nova’s ranges from $629m to $725m. What are the key assumptions retained in our DCF analysis? Excluding synergies, the NPV of Holding costs is $(138)m. Cdiscount Enterprise Value Nova Enterprise Value • Perimeter : Standalone. • (1/2) • • • • DCF • Trading multiples • Valuation references • • Perimeter : Standalone, excluding holding costs, including Cdiscount International. Net sales CAGR FY15 - FY23 : +8.4%, with an acceleration beyond FY18 to compensate conservative management forecasts(company current trading and peers expected trends above company forecasts). Marketplace weight in FY23 : 51.5% of GMV B2C. EBITDA ( - ) factoring costs in FY23 : 7.2% of net sales. Capex in FY23 : (2.6)% of net sales. NWC : seasonality - adjusted NWC slight improvement. Terminal value : two - stage growth terminal value (3 - year transition period between the FY23and the long - term growth rate). Discount rate : 7.75% Cost of Equity (central). Long - term growth rate : 2.25%. • Net sales CAGR FY15 - FY23 : +14.1%, with a return to pre - crisis growth level. • Marketplace weight in FY23 : 49.7% of GMV B2C. • EBITDA ( - ) factoring costs in FY23 : 6.2% of net sales. • Capex in FY23 : (2.0)% of net sales. • NWC : seasonality - adjusted NWC slight improvement and including fraud - related adjustment. • Terminal value : two - stage growth terminal value (3 - year transition period between the FY23 and the long - term growth rate). • Discount rate : 17.00% Cost of Equity (central). • Long - term growth rate : 5.50%. Holding costs • Holding costs : € 15m excluding transaction impacts, with 2.0% long - term growth rate. • Discount rate : 11.0% corresponding to Cdiscount and Nova average discount rates in € . Valuation analysis - Project Delphes - Final Report - 8 August 2016 Valuation analysis 24 © 2016 Owned by Eight Advisory - Confidential
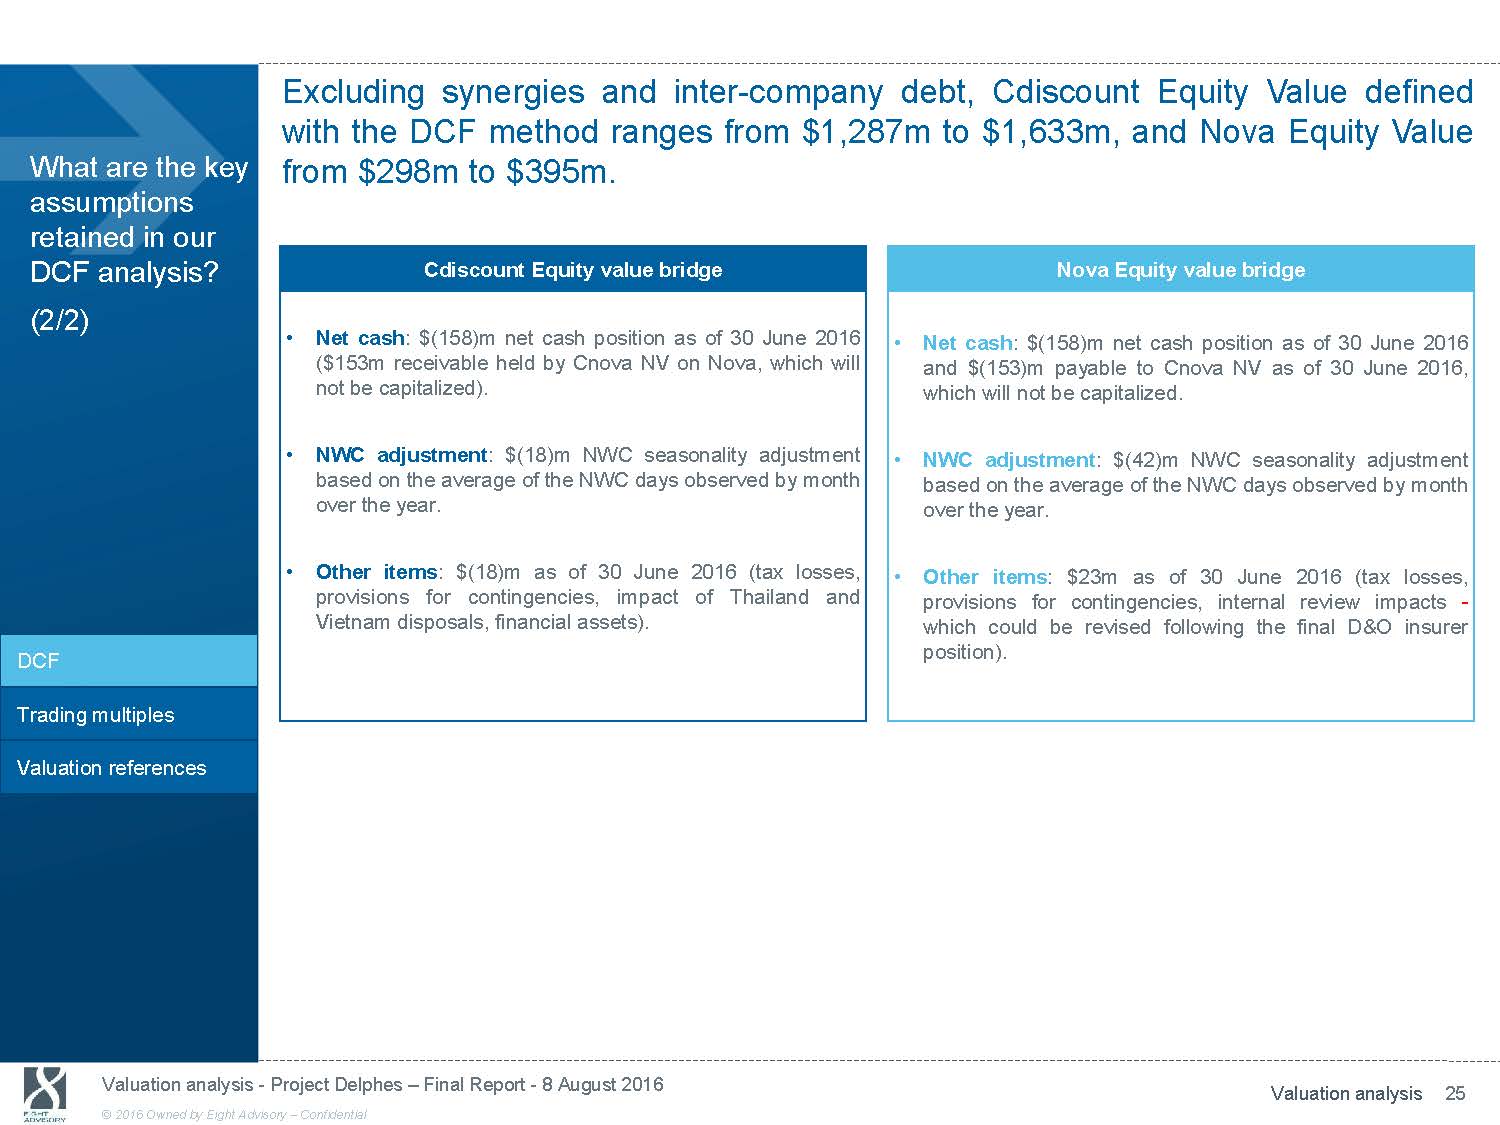
Excluding synergies and inter - company debt, Cdiscount Equity Value defined with the DCF method ranges from $1,287m to $1,633m, and Nova Equity Value What are the key from $298m to $395m. assumptions retained in our DCF analysis? (2/2) DCF Trading multiples Valuation references Cdiscount Equity value bridge • Net cash : $(158)m net cash position as of 30 June 2016 ($153m receivable held by Cnova NV on Nova, which will not be capitalized). • NWC adjustment : $(18)m NWC seasonality adjustment based on the average of the NWC days observed by month over the year. • Other items : $(18)m as of 30 June 2016 (tax losses, provisions for contingencies, impact of Thailand and Vietnam disposals, financial assets). Nova Equity value bridge • Net cash : $(158)m net cash position as of 30 June 2016 and $(153)m payable to Cnova NV as of 30 June 2016, which will not be capitalized. • NWC adjustment : $(42)m NWC seasonality adjustment based on the average of the NWC days observed by month over the year. • Other items : $23m as of 30 June 2016 (tax losses, provisions for contingencies, internal review impacts - which could be revised following the final D&O insurer position). Valuation analysis - Project Delphes - Final Report - 8 August 2016 Valuation analysis 25 © 2016 Owned by Eight Advisory - Confidential

Cdiscount and Nova DCF Equity Values mainly rely on a c.14% to 14.5% marketplace commissions to GMV ratio assumption, the reduction in Nova What are the key sensitivities on Cdiscount and Nova DCF Equity Values? factoring costs beyond 2018 and the top line growth beyond 2018. Cdiscount - Equity Value sensitivities (excl. synergies) Nova - Equity Value sensitivities (excl. synergies) 1. Marketplace commissions 1. Marketplace commissions In $m Cdiscount Equity Value in $m In $m Nova Equity Value in $m 1 600 400 (57)% 1 400 1 200 1 000 800 600 400 200 - 1 444 (27)% 300 1 049 200 100 - Business plan Com.% 10% lower than BP Marketplace commissions as % of GMV Marketplace 344 148 Business plan Com.% 10% lower than BP Marketplace commissions as % of GMV Marketplace DCF Trading multiples 2. Extrapolation period net sales growth In $m Cdiscount Equity Value in $m 1 600 2. Factoring costs In $m Nova Equity Value in $m Valuation references 1 400 1 200 1 000 800 600 400 200 - 1 444 (29)% 1 028 Extrapolation 75% only of the net sales growth beyond FY18 Sensitivity on net sales growth over the extrapolation period 400 (51)% 344 300 200 168 100 - Extrapolation Only 10% improvement (c. 30% improvement on # installments and % sales factored) Factoring costs based on installments (in months) and % sales factored Source: Eight Advisory analysis Valuation analysis - Project Delphes - Final Report - 8 August 2016 Valuation analysis 26 © 2016 Owned by Eight Advisory - Confidential
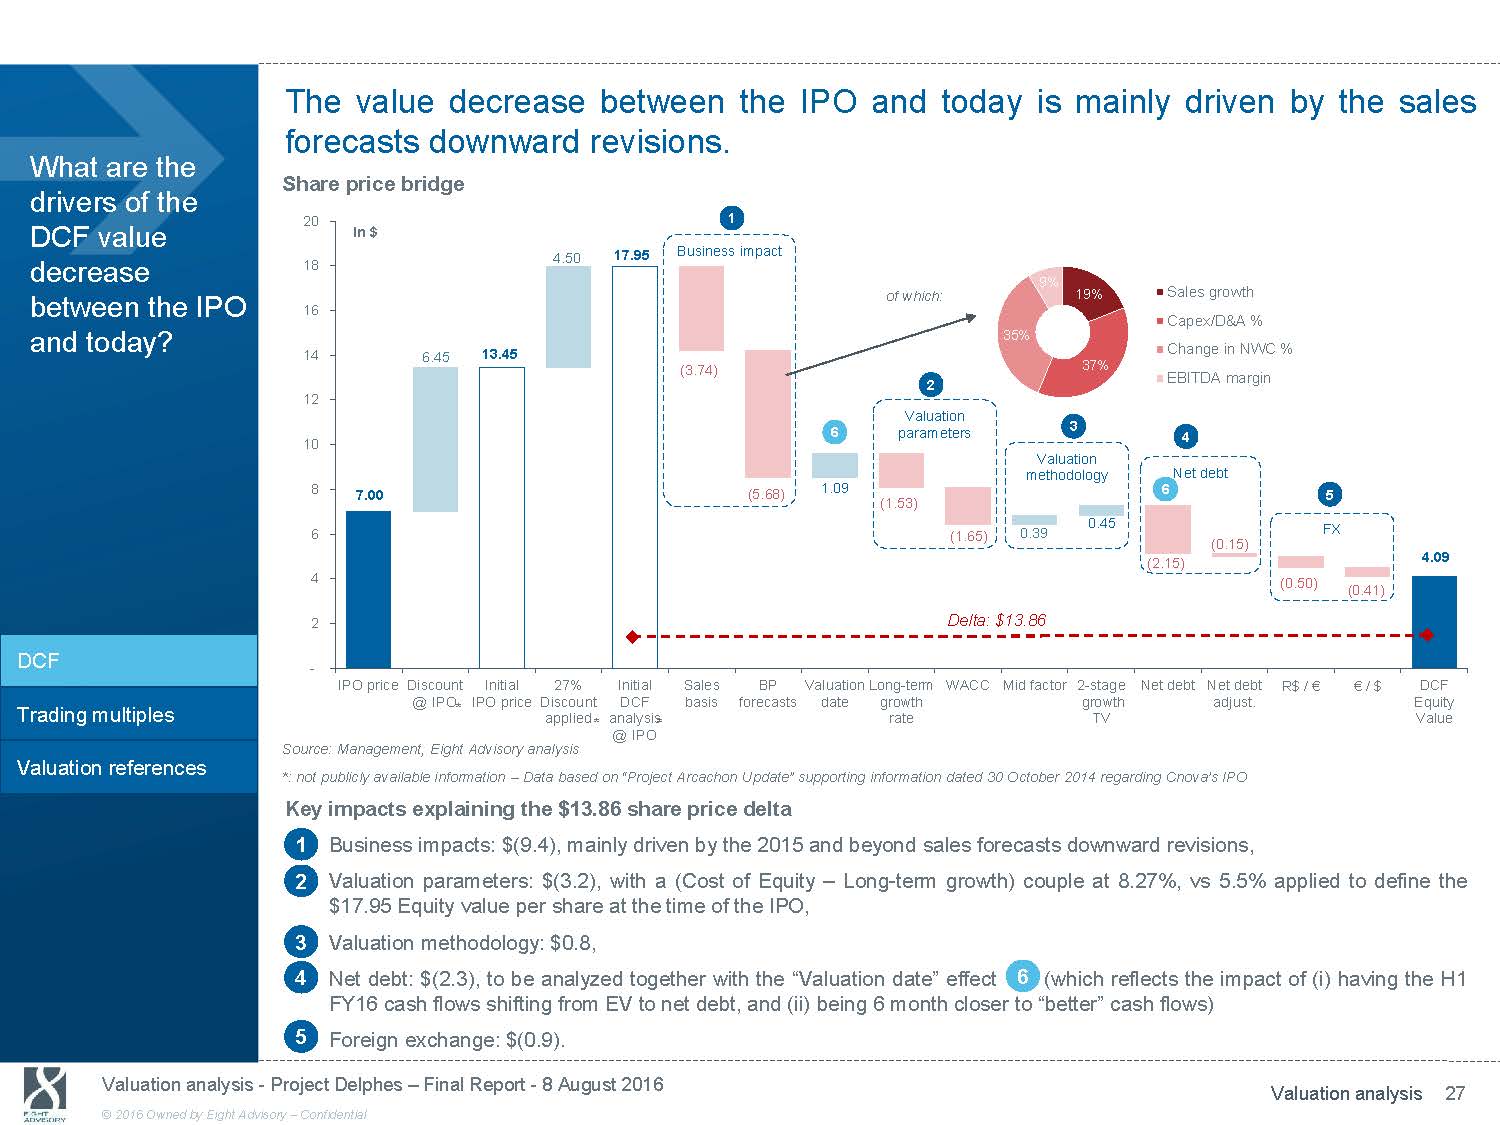
The value decrease between the IPO and today is mainly driven by the sales forecasts downward revisions. What are the drivers of the Share price bridge 20 1 20. DCF value decrease between the IPO and today? 18 16 14 12 10 8 In $ 4.50 6.45 13.45 7.00 17.95 Business impact (3.74) (5.68) of which: 2 Valuation 6 parameters 1.09 (1.53) 9% 19% 35% 37% 3 Valuation methodology 0.45 Sales growth Capex/D&A % Change in NWC % EBITDA margin 4 Net debt 6 15. 10. 5.0 5 - 6 4 2 DCF - IPO priceDiscount Initial 27% @ IPO IPO priceDiscount Initial Sales BP Valuation Long - term DCF basis forecasts date growth (1.65) 0.39 FX (0.15) (2.15) (0.50) Delta: $13.86 WACC Mid factor 2 - stage Net debt Net debt R$ / € growth adjust. 4.09 (0.41) (5.0 (10 € / $ DCF Equity * Trading multiples applied analysis rate @ IPO TV Value Source: Management, Eight Advisory analysis Valuation references * : not publicly available information - Data based on “Project Arcachon Update” supporting information dated 30 October 2014 rega rding Cnova’s IPO Key impacts explaining the $13.86 share price delta 1 Business impacts: $(9.4), mainly driven by the 2015 and beyond sales forecasts downward revisions, 2 Valuation parameters: $(3.2), with a (Cost of Equity - Long - term growth) couple at 8.27%, vs 5.5% applied to define the $17.95 Equity value per share at the time of the IPO, 3 Valuation methodology: $0.8, 4 Net debt: $(2.3), to be analyzed together with the “Valuation date” effect 6 (which reflects the impact of (i) having the H1 FY16 cash flows shifting from EV to net debt, and (ii) being 6 month closer to “better” cash flows) 5 Foreign exchange: $(0.9). Valuation analysis - Project Delphes - Final Report - 8 August 2016 Valuation analysis 27 © 2016 Owned by Eight Advisory - Confidential

Based on a standalone Equity value of $4.09 per share (central DCF excluding synergies), Cnova Equity value per share could range from $3.98 to $4.21 What would be Cnova standalone Equity value per share, assuming a change in € /$ and € /R$ assumptions? DCF Trading multiples Valuation references assuming a +/ - 10% variation on $/R$ FX rate. Sensitivity analysis of Cnova Equity value to a change in FX rates (in $) Cnova per share ($) $/R$ 2.98 3.14 3.31 3.47 3.64 4.21 4.15 4.09 4.03 3.98 Note : As of 19 July 2016 (1 - mo. average), € / R$ = 3.68; € / $ = 1.11 As of 6 May 2016 (1 - mo. average), € / R$ = 4.02; € / $ = 1.14 As of 25 July 2016 (spot), € / R$ = 3.57; € / $ = 1.10 Cdiscount - Central DCF ($) $/R$ 2.98 3.14 3.31 3.47 3.64 1,444 1,444 1,444 1,444 1,444 Nova - Central DCF ($) $/R$ 2.98 3.14 3.31 3.47 3.64 383 363 344 328 313 Cnova - Central DCF ($) $/R$ 2.98 3.14 3.31 3.47 3.64 1,859 1,830 1,803 1,780 1,758 Source: Eight Advisory analysis Sensitivity analysis of Cnova Equity value to a change in FX rates ᇄ Values presented opposite are based on standalone Equity Values derived from the DCF method. ᇄ Assuming a +/ - 10% change in $/R$ compared to FX rates as of 19 July 2016, would impact the values as follows: Cdiscount Equity Value would stand at $1,444m, Nova Equity Value would range from $313m to $383m, Cnova standalone Equity Value would range from $1,758m to $1,859m, Based on the above, Cnova Equity Value per share including synergies would range from $3.98 to $4.21 . Valuation analysis - Project Delphes - Final Report - 8 August 2016 Valuation analysis 28 © 2016 Owned by Eight Advisory - Confidential

The trading multiples method was implemented based on EV/sales multiples given the current profitability level. Excluding synergies, Cdiscount Enterprise Value What is the range of values derived from the derived from the trading multiples method ranges from $1,034 to $1,964m. Cdiscount - EV/Sales (regression) - Low range Cdiscount - EV/Sales (best peer) - High range trading multiples for Cdiscount? EV/Sales (Adj. norm. EBITDA** reg.) EV/Sales (Normative EBITDA* reg.) - 0.70x (FY17) 0.49x 1.10x (FY18) (FY15) 0.47x (FY17) 0.41x 0.67x (FY18) (FY15) 0.50x 1.00x 0.73x (FY17) EV/Sales (best peer - 0.53x 1.02x AO World) - 0.50x 1.00x 1.50x (FY18) (FY16) 1.50x ᇄ Peers’ Enterprise Value including NWC seasonality adjustment, and excluding financing of operations (discounting of receivables, securitization, etc.) from financial debt . ᇄ EV/sales multiples calculated on FY15 - FY18 aggregates. ᇄ Trading multiples method implemented as follows: Low - end of the range reflecting DCF * Normalized EBITDA = EBITDA ( - ) normalized factoring costs ** Adjusted Normalized EBITDA = EBITDA ( - ) normalized factoring costs ( - ) Capex Cdiscount - EV (regression) - Low range (in $m) 1,532 Cdiscount - EV summary (in $m) 1,283 Cdiscount’s situation in the foreseeable future compared to its peers, i.e. lower profitability, specific NWC financing (discounting of receivables) and lower capex intensity over the BP. In this respect, Peers’ EV (Adj. norm. Trading multiples EBITDA** reg.) Valuation references EV (Normative EBITDA* reg.) - 1,167 2,121 1,034 929 1,298 500 1,000 1,500 2,000 2,500 EV - "Current view" 1,034 (regression analysis) EV - "Best view" (Best peer 1,262 analysis) - 500 1,000 1,532 1,601 1,964 1,500 2,000 2,500 EV/sales multiples adjusted based on a regression analyses to: “Normative” EBITDA: EBITDA ( - ) Normative factoring, “Adjusted normative” EBITDA: EBITDA ( - ) Normative factoring ( - ) Capex. High - end of the range derived from the “Best peer” approach using AO Source: Bloomberg, Eight Advisory analysis World EV/Sales multiples. ᇄ Based on the above, Cdiscount Enterprise Value derived from the trading multiples method ranges from $1,034 to $1,964m . Valuation analysis - Project Delphes - Final Report - 8 August 2016 Valuation analysis 29 © 2016 Owned by Eight Advisory - Confidential

The trading multiples method was implemented based on EV/sales multiples given the current profitability level. Excluding synergies, Nova Enterprise Value What is the range of values derived from the trading multiples for Nova? derived from the trading multiples method ranges from $397m to $706m. Nova - EV/Sales (regression) - Low range ᇄ Peers’ Enterprise Value including NWC seasonality adjustment, and excluding financing of operations (discounting of receivables, 0.38x (FY17) 0.43x (FY17) (1/2) EV/Sales (Adj. norm. EBITDA** reg.) EV/Sales (Normative EBITDA* reg.) - 0.31x 0.45x "non - (FY17) normative" (FY18) factoring adjustment 0.21x (FY17) 0.27x (FY17) 0.15x 0.31x "non - (FY17) normative" (FY18) factoring adjustment 0.10x 0.20x 0.30x 0.40x 0.50x securitization, etc.) from financial debt. ᇄ EV/sales multiples calculated on FY15 - FY18 aggregates. ᇄ Trading multiples method implemented as follows: Low - end of the range reflecting Nova’s situation in the foreseeable future compared to its peers, i.e. lower profitability, specific NWC financing (discounting of receivables) and lower capex * Normalized EBITDA = EBITDA ( - ) normalized factoring costs ** Adjusted Normalized EBITDA = EBITDA ( - ) normalized factoring costs ( - ) Capex intensity over the BP. In this respect, Peers’ EV/sales multiples adjusted based on a Nova - EV/Sales (best peer) - High range DCF 0.38x (FY17) regression analyses to: “Normative” EBITDA: EBITDA ( - ) Normative factoring, EV/Sales Trading multiples Valuation references (best peer - B2W) - before FCF adj. EV/Sales (best peer - B2W) - after FCF adj. - FCF differential with B2W 0.34x 0.44x (FY18) (FY15) 0.33x (FY17) 0.30x 0.38x 0.20x 0.40x 0.60x For information, as per BNPP methodology for trading multiples (factoring debt in EV), B2W FY17 EV/sales “Adjusted normative” EBITDA: EBITDA ( - ) Normative factoring ( - ) Capex, Results derived from these approaches adjusted in order to take into account the fact that the normative factoring costs will not be reached before FY23. High - end of the range derived from the “Best peer” approach using B2W EV/Sales multiples. Results adjusted to capture the free cash flow Source: Bloomberg, Eight Advisory analysis multiple would stand at 0.53x differential over FY16 - FY18. ᇄ B2W multiples were adjusted from the impact of the R$823m capital increase which occurred on 5 July 2016. Valuation analysis - Project Delphes - Final Report - 8 August 2016 Valuation analysis 30 © 2016 Owned by Eight Advisory - Confidential
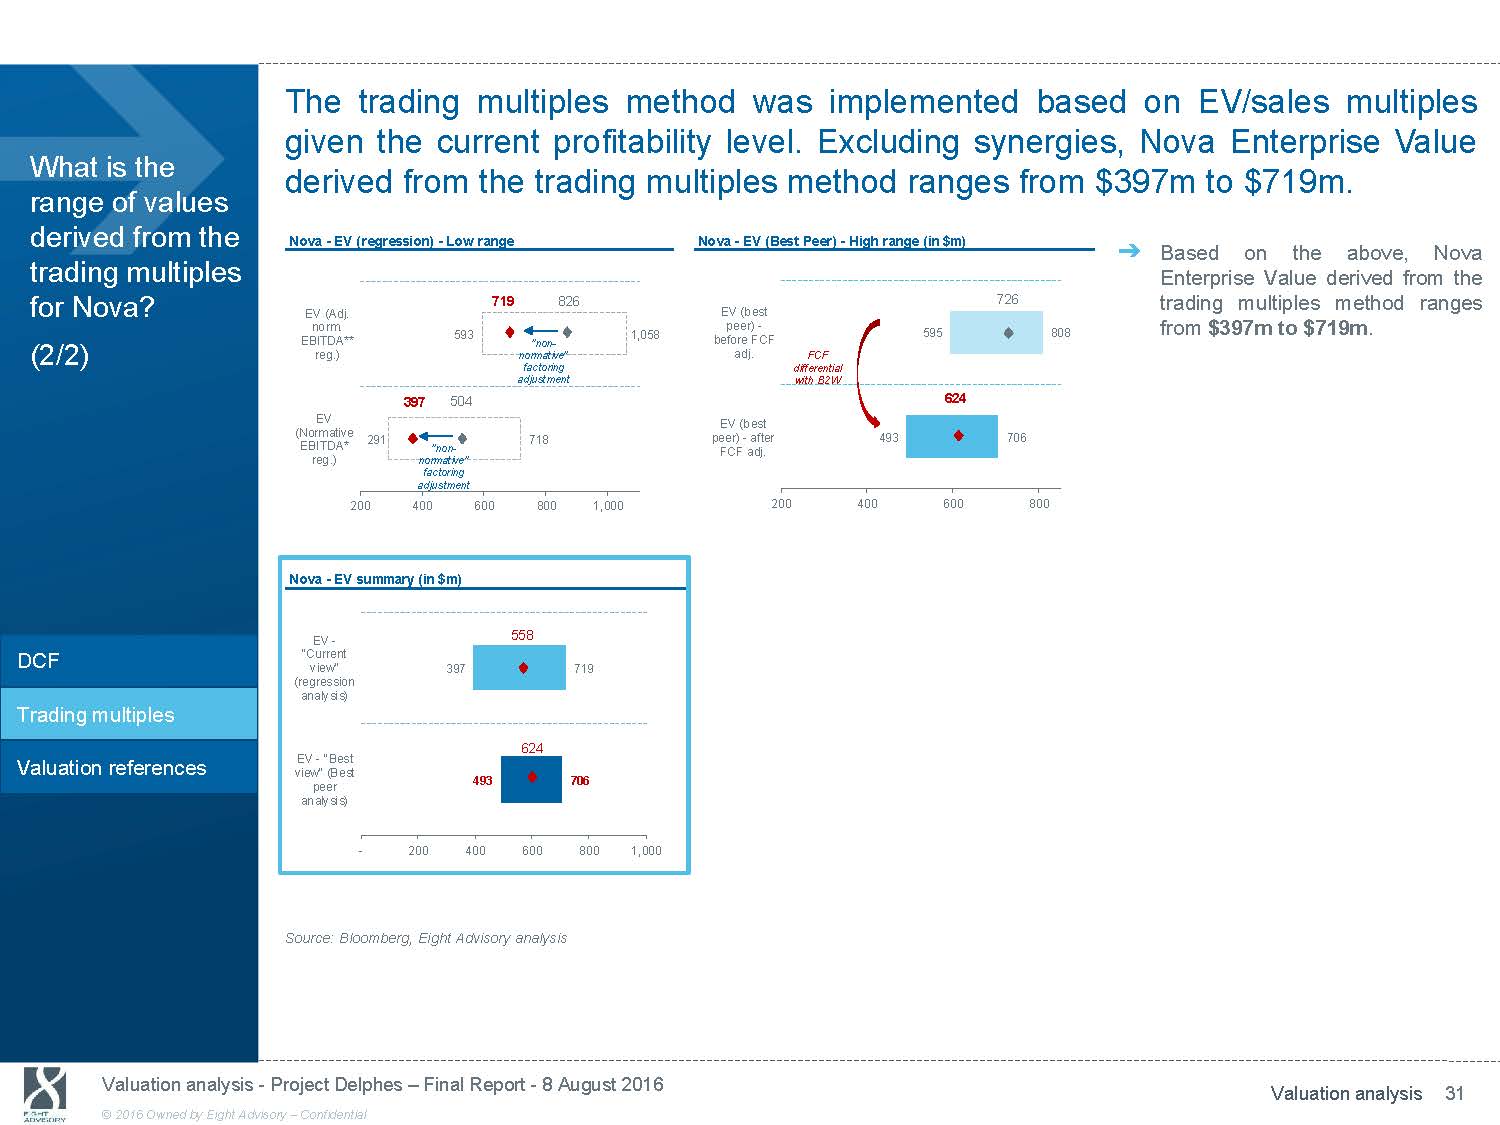
The trading multiples method was implemented based on EV/sales multiples given the current profitability level. Excluding synergies, Nova Enterprise Value What is the range of values derived from the derived from the trading multiples method ranges from $397m to $719m. Nova - EV (regression) - Low range Nova - EV (Best Peer) - High range (in $m) trading multiples for Nova? (2/2) EV (Adj. norm. EBITDA** reg.) EV (Normative EBITDA* reg.) 719 826 593 1,058 "non - normative" factoring adjustment 397 504 291 718 "non - normative" factoring adjustment EV (best peer) - before FCF adj. FCF differential with B2W EV (best peer) - after 493 FCF adj. 726 595 808 624 706 ᇄ Based on the above, Nova Enterprise Value derived from the trading multiples method ranges from $397m to $719m . DCF Trading multiples Valuation references 200 400 Nova - EV summary (in $m) EV - "Current view" 397 (regression analysis) EV - "Best view" (Best peer analysis) 600 800 1,000 200 400 600 800 558 719 624 493 706 - 200 400 600 800 1,000 Source: Bloomberg, Eight Advisory analysis Valuation analysis - Project Delphes - Final Report - 8 August 2016 Valuation analysis 31 © 2016 Owned by Eight Advisory - Confidential
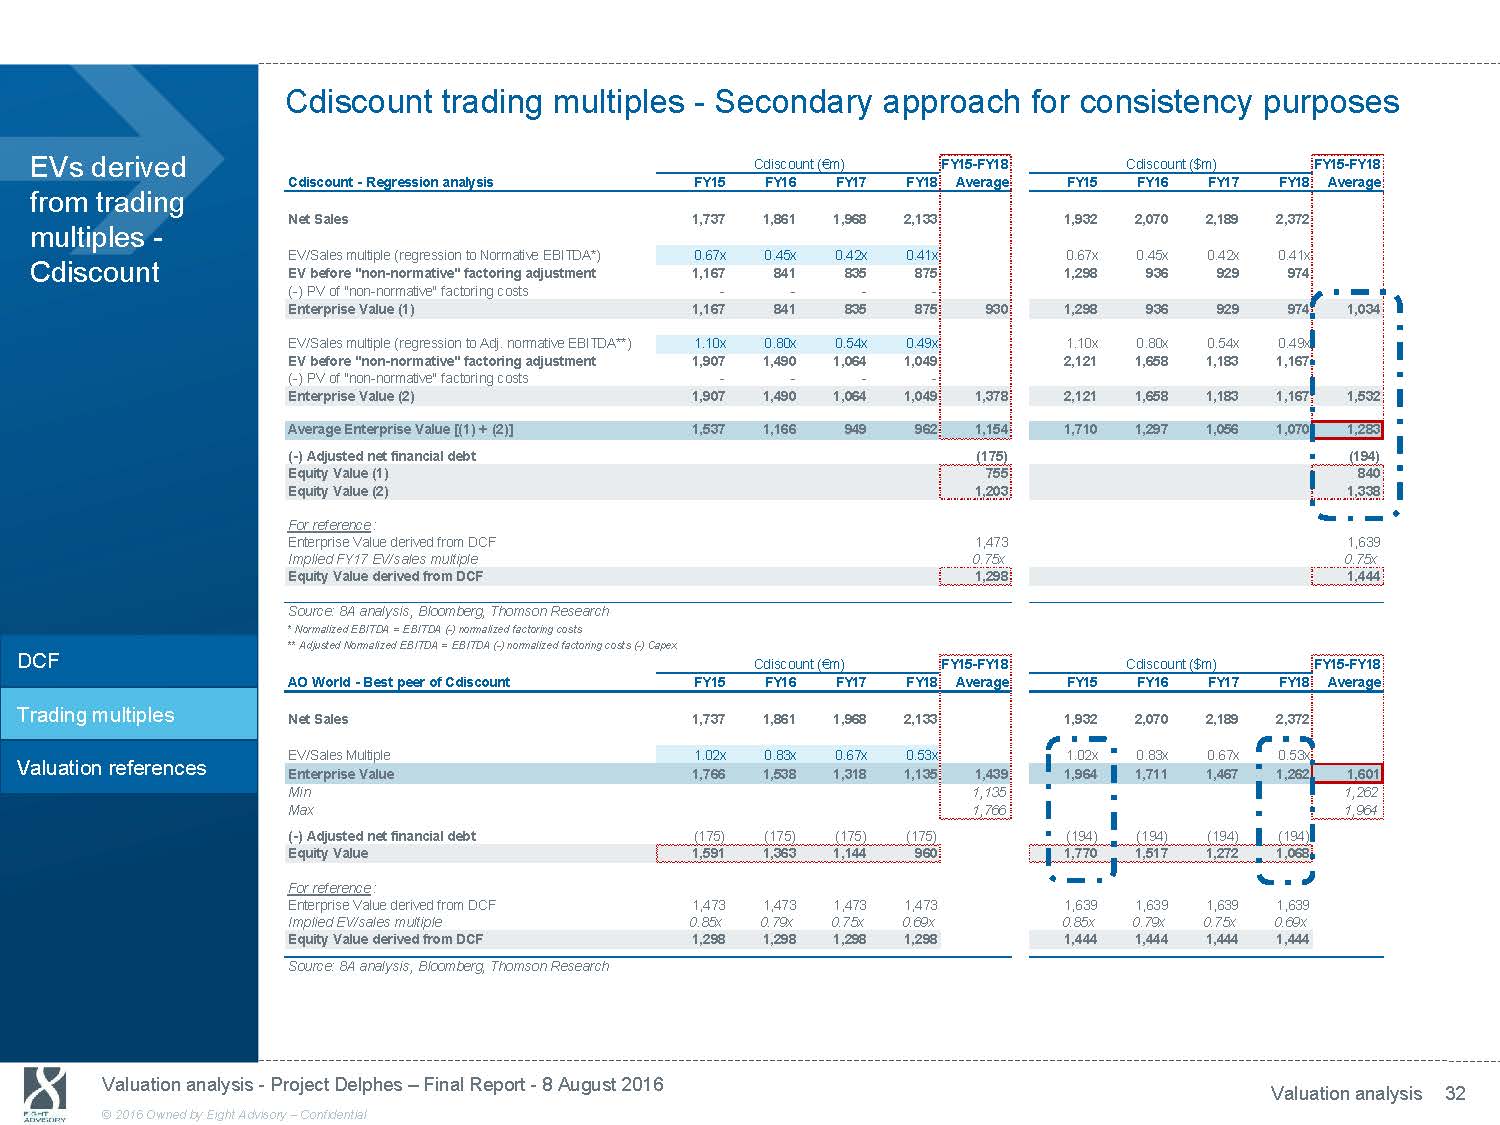
Cdiscount trading multiples - Secondary approach for consistency purposes EVs derived from trading multiples - Cdiscount Cdiscount - Regression analysis Net Sales EV/Sales multiple (regression to Normative EBITDA*) EV before "non - normative" factoring adjustment ( - ) PV of "non - normative" factoring costs Enterprise Value (1) EV/Sales multiple (regression to Adj. normative EBITDA**) EV before "non - normative" factoring adjustment ( - ) PV of "non - normative" factoring costs Enterprise Value (2) Average Enterprise Value [(1) + (2)] ( - ) Adjusted net financial debt Equity Value (1) Equity Value (2) For reference : Enterprise Value derived from DCF Implied FY17 EV/sales multiple Cdiscount ( € m) FY15 FY16 FY17 FY18 1,737 1,861 1,968 2,133 0.67x 0.45x 0.42x 0.41x 1,167 841 835 875 - - - - 1,167 841 835 875 1.10x 0.80x 0.54x 0.49x 1,907 1,490 1,064 1,049 - - - - 1,907 1,490 1,064 1,049 1,537 1,166 949 962 FY15 - FY18 Cdiscount ($m) FY15 - FY18 Average FY15 FY16 FY17 FY18 Average 1,932 2,070 2,189 2,372 0.67x 0.45x 0.42x 0.41x 1,298 936 929 974 930 1,298 936 929 974 1,034 1.10x 0.80x 0.54x 0.49x 2,121 1,658 1,183 1,167 1,378 2,121 1,658 1,183 1,167 1,532 1,154 1,710 1,297 1,056 1,070 1,283 (175) (194) 755 840 1,203 1,338 1,473 1,639 0.75x 0.75x Equity Value derived from DCF 1,298 1,444 Source: 8A analysis, Bloomberg, Thomson Research * Normalized EBITDA = EBITDA ( - ) normalized factoring costs ** Adjusted Normalized EBITDA = EBITDA ( - ) normalized factoring costs ( - ) Capex Cdiscount ( € m) FY15 - FY18 Cdiscount ($m) FY15 - FY18 AO World - Best peer of Cdiscount FY15 FY16 FY17 FY18 Average FY15 FY16 FY17 FY18 Average Net Sales 1,737 1,861 1,968 2,133 1,932 2,070 2,189 2,372 EV/Sales Multiple 1.02x 0.83x 0.67x 0.53x 1.02x 0.83x 0.67x 0.53x Enterprise Value 1,766 1,538 1,318 1,135 1,439 1,964 1,711 1,467 1,262 1,601 Min 1,135 1,262 Max 1,766 1,964 ( - ) Adjusted net financial debt (175) (175) (175) (175) (194) (194) (194) (194) Equity Value 1,591 1,363 1,144 960 1,770 1,517 1,272 1,068 For reference : Enterprise Value derived from DCF 1,473 1,473 1,473 1,473 1,639 1,639 1,639 1,639 Implied EV/sales multiple 0.85x 0.79x 0.75x 0.69x 0.85x 0.79x 0.75x 0.69x Equity Value derived from DCF 1,298 1,298 1,298 1,298 1,444 1,444 1,444 1,444 Source: 8A analysis, Bloomberg, Thomson Research Valuation analysis - Project Delphes - Final Report - 8 August 2016 Valuation analysis © 2016 Owned by Eight Advisory - Confidential

Nova trading multiples - Secondary approach for consistency purposes EVs derived from trading multiples - Nova Nova - Regression analysis Net Sales EV/Sales multiple (regression to Normative EBITDA*) EV before "non - normative" factoring adjustment ( - ) PV of "non - normative" factoring costs Enterprise Value (1) EV/Sales multiple (regression to Adj. normative EBITDA**) EV before "non - normative" factoring adjustment ( - ) PV of "non - normative" factoring costs Enterprise Value (2) Average Enterprise Value [(1) + (2)] ( - ) Adjusted net financial debt Equity Value (1) Equity Value (2) For reference : Enterprise Value derived from DCF Implied FY17 EV/sales multiple Nova (R$m) FY15 FY16 FY17 FY18 6,126 4,920 6,287 7,773 (0.65)x (1.52)x 0.15x 0.31x n.m. n.m. 961 2,375 (354) (354) (354) (354) n.m. n.m. 607 2,021 (0.38)x (1.31)x 0.31x 0.45x n.m. n.m. 1,961 3,500 (354) (354) (354) (354) n.m. n.m. 1,607 3,147 FY15 - FY18 Nova ($m) FY15 - FY18 Average FY15 FY16 FY17 FY18 Average 1,852 1,488 1,901 2,351 (0.65)x (1.52)x 0.15x 0.31x n.m. n.m. 291 718 (107) (107) (107) (107) 1,314 n.m. n.m. 184 611 397 (0.38)x (1.31)x 0.31x 0.45x n.m. n.m. 593 1,058 (107) (107) (107) (107) 2,377 n.m. n.m. 486 951 719 1,845 558 (1,092) (330) 222 67 1,285 388 2,231 675 0.35x 0.35x Equity Value derived from DCF 1,139 344 Source: 8A analysis, Bloomberg, Thomson Research * Normalized EBITDA = EBITDA ( - ) normalized factoring costs ** Adjusted Normalized EBITDA = EBITDA ( - ) normalized factoring costs ( - ) Capex B2W - Best peer of Nova Nova (R$m) FY15 FY16 FY17 FY18 FY15 - FY18 Nova ($m) FY15 - FY18 Average FY15 FY16 FY17 FY18 Average Net Sales 6,126 4,920 6,287 7,773 1,852 1,488 1,901 2,351 EV/Sales Multiple 0.44x 0.40x 0.37x 0.34x 0.44x 0.40x 0.37x 0.34x Enterprise Value before adjustment 2,665 1,969 2,298 2,673 2,401 806 595 695 808 726 ( - ) Nova "free cash flow" differential adjustment (339) (339) (339) (339) (103) (103) (103) (103) Enterprise Value 2,326 1,630 1,959 2,334 2,062 703 493 592 706 624 Min 1,630 493 Max 2,334 706 ( - ) Adjusted net financial debt (1,092) (1,092) (1,092) (1,092) (330) (330) (330) (330) Equity Value 1,234 538 867 1,241 373 163 262 375 For reference : Enterprise Value derived from DCF 2,231 2,231 2,231 2,231 675 675 675 675 Implied EV/sales multiple 0.36x 0.45x 0.35x 0.29x 0.36x 0.45x 0.35x 0.29x Equity Value derived from DCF 1,139 1,139 1,139 1,139 344 344 344 344 Source: 8A analysis, Bloomberg, Thomson Research Valuation analysis - Project Delphes - Final Report - 8 August 2016 Valuation analysis 33 © 2016 Owned by Eight Advisory - Confidential
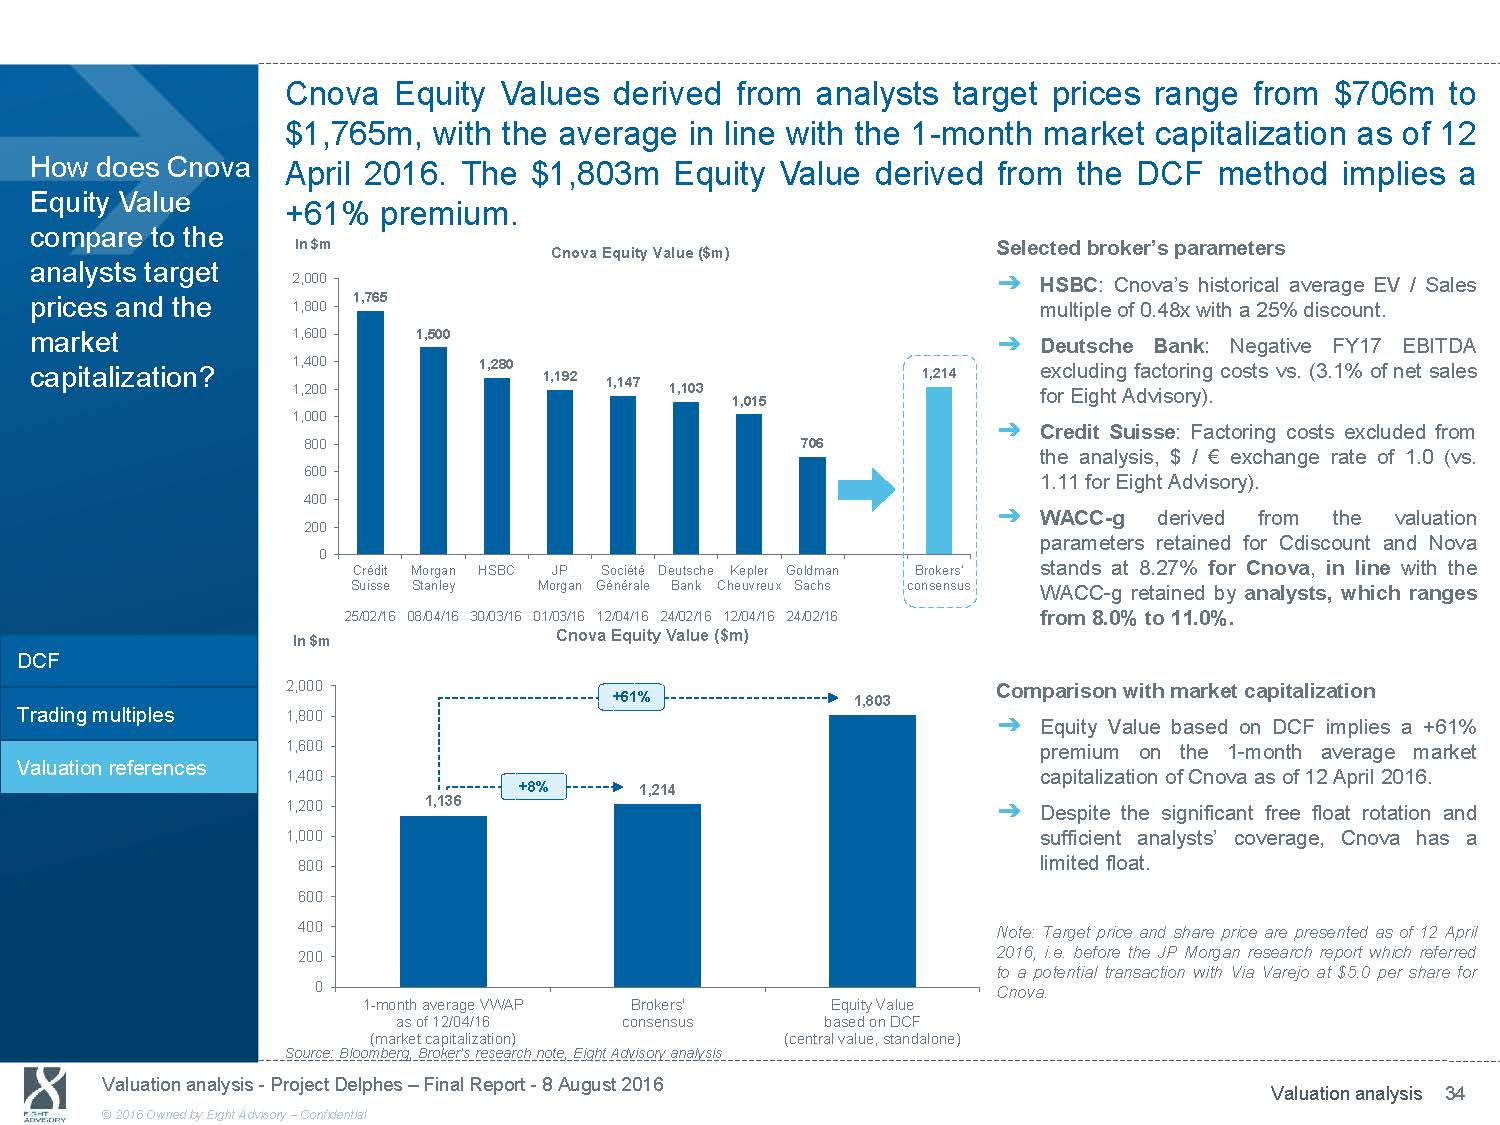
Cnova Equity Values derived from analysts target prices range from $706m to $1,765m, with the average in line with the 1 - month market capitalization as of 12 How does Cnova Equity Value compare to the April 2016. The $1,803m Equity Value derived from the DCF method implies a +61% premium. In $m analysts target prices and the market 2,000 1,800 1,600 1,400 Cnova Equity Value ($m) 1,765 1,500 1,280 1,192 1,214 Selected broker’s parameters ᇄ HSBC : Cnova’s historical average EV / Sales multiple of 0.48x with a 25% discount. ᇄ Deutsche Bank : Negative FY17 EBITDA excluding factoring costs vs. (3.1% of net sales capitalization? 1,200 1,000 800 600 400 200 0 Crédit Morgan HSBC Suisse Stanley 25/02/1608/04/1630/03/16 1,147 JP Société Morgan Générale 01/03/1612/04/16 1,103 1,015 706 Deutsche Kepler Goldman Brokers' Bank Cheuvreux Sachs consensus 24/02/1612/04/1624/02/16 for Eight Advisory). ᇄ Credit Suisse : Factoring costs excluded from the analysis, $ / € exchange rate of 1.0 (vs. 1.11 for Eight Advisory). ᇄ WACC - g derived from the valuation parameters retained for Cdiscount and Nova stands at 8.27% for Cnova , in line with the WACC - g retained by analysts, which ranges from 8.0% to 11.0%. DCF Trading multiples Valuation references In $m 2,000 1,800 1,600 1,400 1,200 1,000 800 600 400 200 0 +8% 1,136 1 - month average VWAP as of 12/04/16 (market capitalization) Cnova Equity Value ($m) +61% 1,803 1,214 Brokers' Equity Value consensus based on DCF (central value, standalone) Comparison with market capitalization ᇄ Equity Value based on DCF implies a +61% premium on the1 - month average market capitalization of Cnova as of 12 April 2016. ᇄ Despite the significant free float rotation and sufficient analysts’ coverage, Cnova has a limited float. Note: Target price and share price are presented as of 12 April 2016, i.e. before the JP Morgan research report which referred to a potential transaction with Via Varejo at $5.0 per share for Cnova. Source: Bloomberg, Broker’s research note, Eight Advisory analysis Valuation analysis - Project Delphes - Final Report - 8 August 2016 Valuation analysis 34 © 2016 Owned by Eight Advisory - Confidential

6. Synergies analysis
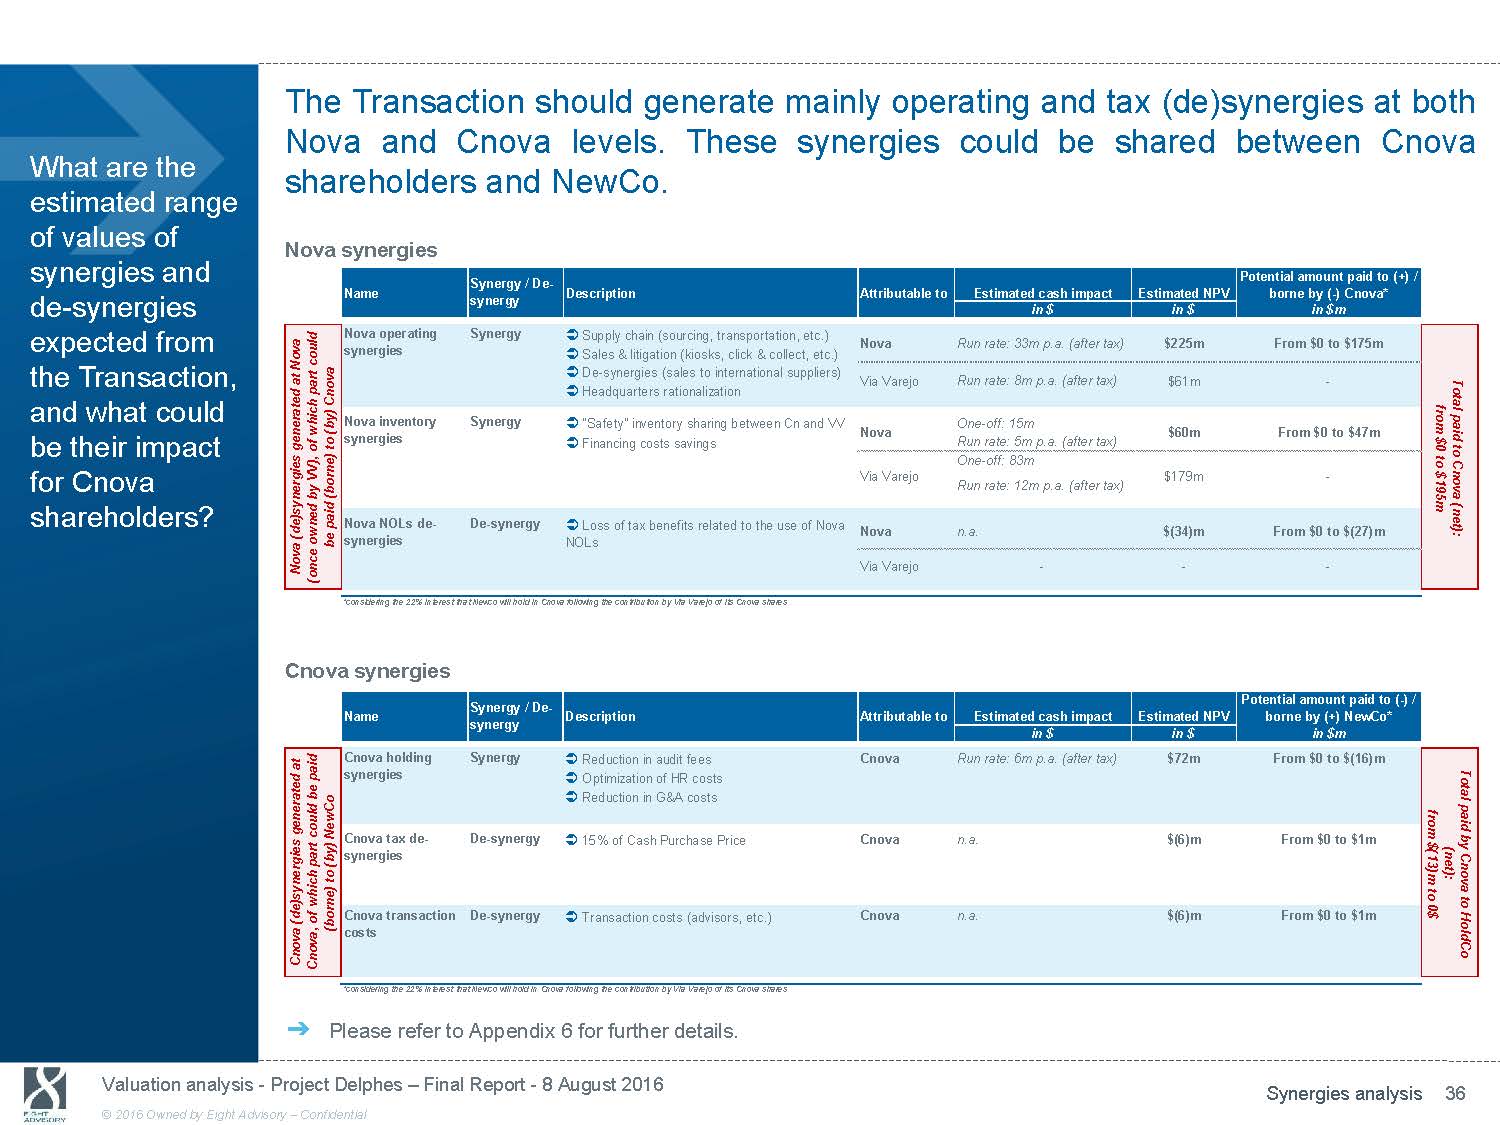
The Transaction should generate mainly operating and tax (de)synergies at both What are the estimated range of values of synergies and Nova and Cnova levels. These synergies shareholders and NewCo. Nova synergies Synergy / De - could be shared between Cnova Potential amount paid to (+) / Name de - synergies synergy Description Attributable to Estimated cash impact Estimated NPV borne by ( - ) Cnova* in $ in $ in $m expected from Nova operating Synergy Supply chain (sourcing, transportation, etc.) synergies Sales & litigation (kiosks, click & collect, etc.) Nova Run rate: 33m p.a. (after tax) $225m From $0 to $175m the Transaction, and what could be their impact for Cnova shareholders? De - synergies (sales to international suppliers) Headquarters rationalization Nova inventory Synergy "Safety" inventory sharing between Cn and VV synergies Financing costs savings Nova NOLs de - De - synergy Loss of tax benefits related to the use of Nova synergies NOLs Via Varejo Nova Via Varejo Nova Run rate: 8m p.a. (after tax) One - off: 15m Run rate: 5m p.a. (after tax) One - off: 83m Run rate: 12m p.a. (after tax) n.a. $61m - $60m From $0 to $47m $179m - $(34)m From $0 to $(27)m Via Varejo - - - *considering the 22% interest that Newco will hold in Cnova following the contribution by Via Varejo of its Cnova shares Cnova synergies Name Synergy / De - synergy Description Attributable to Potential amount paid to ( - ) / Estimated cash impact Estimated NPV borne by (+) NewCo* in $ in $ in $m Cnova holding Synergy Reduction in audit fees Cnova Run rate: 6m p.a. (after tax) $72m From $0 to $(16)m synergies Optimization of HR costs Reduction in G&A costs Cnova tax de - De - synergy 15% of Cash Purchase Price Cnova n.a. $(6)m From $0 to $1m synergies Cnova transaction De - synergy Transaction costs (advisors, etc.) Cnova n.a. $(6)m From $0 to $1m costs *considering the 22% interest that Newco will hold in Cnova following the contribution by Via Varejo of its Cnova shares ᇄ Please refer to Appendix 6 for further details. Valuation analysis - Project Delphes - Final Report - 8 August 2016 Synergies analysis 36 © 2016 Owned by Eight Advisory - Confidential
7. Valuation results including synergies

Including synergies (assuming 50% will be paid), Cnova Equity Value defined with the DCF method (central value) is estimated at $4.52 per share. What are the results of our valuation Cnova - From Enterprise Value (DCF central value) to analysis? Equity Value including synergies (50% assumption) 8A (central DCF / 50% synergies) # shares Cnova per in $ (million) Cnova ($m) share Cnova - From Enterprise Value to Equity Value including synergies ᇄ Cnova central Enterprise Value derived from DCF method was estimated at $2,175m. ᇄ Cnova central standalone Equity Value Enterprise Value (central) Equity Value standalone (central) Eq. V. standalone after cross shlding. elim. (78% Equity Value) Synergies @ 50% Equity Value including synergies 441.3 2,175 4.93 441.3 1,803 4.09 344.3 1,407 4.09 344.3 151 0.44 344.3 1,558 4.52 derived from DCF method was estimated at $1,803m. ᇄ Following Cnova cross shareholding elimination with NewCo(repurchase by Cnova of the 22% previously held by NewCo), Cnova central standalone Equity Value is estimated at $1,407m. Source: Eight Advisory analysis ᇄ Assuming 50% of the synergies and de - synergies expected from the transaction will in $ be shared between Cnova and NewCo’s shareholders, the impact of synergies on - 0.84 4.93 4.09 0.44 - 4.09 - 4.52 Cnova Equity Value was estimated at $151m. ᇄ Based on the above, including synergies (assuming 50% will be paid), Cnova Equity Value defined with the DCF method (central value) is estimated at $4.52 per share . Enterprise Value ( - ) Net debt items Equity value (DCF central) standalone Cross Eq. V. standalone Synergies (50% shareholding after cross shlding. assumption) elimination elim. Cnova Equity Value (incl. Synergies) Synergies @ 50% in $m Nova operating synergies 88 Nova inventory synergies 23 NOLs de - synergies (13) Tax de - synergies (indicative) (5) Holding synergies 64 Transaction costs (5) Total synergies 151 Source: Eight Advisory analysis Valuation analysis - Project Delphes - Final Report - 8 August 2016 Valuation results including synergies 38 © 2016 Owned by Eight Advisory - Confidential

Based on an Equity value of $4.52 per share (central DCF & including 50% synergies), Cnova Equity value per What would be share could range from $4.40 to $4.68 Cnova value per share, assuming a change in € /$ and € /R$ assumptions? assuming a +/ - 10% variation on $/R$ FX rate. Sensitivity analysis of Cnova Equity value to a change in FX rates (in $) Cnova including synergies per share ($) $/R$ 2.98 3.14 3.31 3.47 3.64 4.68 4.60 4.52 4.46 4.40 Note : As of 19 July 2016 (1 - mo. average), € / R$ = 3.68; € / $ = 1.11 As of 6 May 2016 (1 - mo. average), € / R$ = 4.02; € / $ = 1.14 As of 25 July 2016 (spot), € / R$ = 3.57; € / $ = 1.10 Cdiscount - Central DCF ($) $/R$ 2.98 3.14 3.31 3.47 3.64 1,444 1,444 1,444 1,444 1,444 Nova - Central DCF ($) $/R$ 2.98 3.14 3.31 3.47 3.64 383 363 344 328 313 Cnova - Central DCF ($) $/R$ 2.98 3.14 3.31 3.47 3.64 1,859 1,830 1,803 1,780 1,758 Synergies - 50% assumption ($) $/R$ 2.98 3.14 3.31 3.47 3.64 162 156 151 146 142 Source: Eight Advisory analysis Sensitivity analysis of Cnova Equity value to a change in FX rates ᇄ Values presented opposite are based on Equity Values derived from central DCF and assuming a 50% assumption of synergies paid in the Transaction. ᇄ Assuming a +/ - 10% change in $/R$ compared to FX rates as of 19 July 2016, would impact the values as follows: Cdiscount Equity Value would stand at $1,444m, Nova Equity Value would range from $313m to $383m, Cnova standalone Equity Value would range from $1,758m to $1,859m, Synergies (assuming 50% will be paid in the Transaction) value would range from $142m to $162m, Based on the above, Cnova Equity Value per share including synergies would range from $4.40 to $4.68 . Valuation analysis - Project Delphes - Final Report - 8 August 2016 Valuation results including synergies 39 © 2016 Owned by Eight Advisory - Confidential
8. Review of BNP Paribas valuation analysis
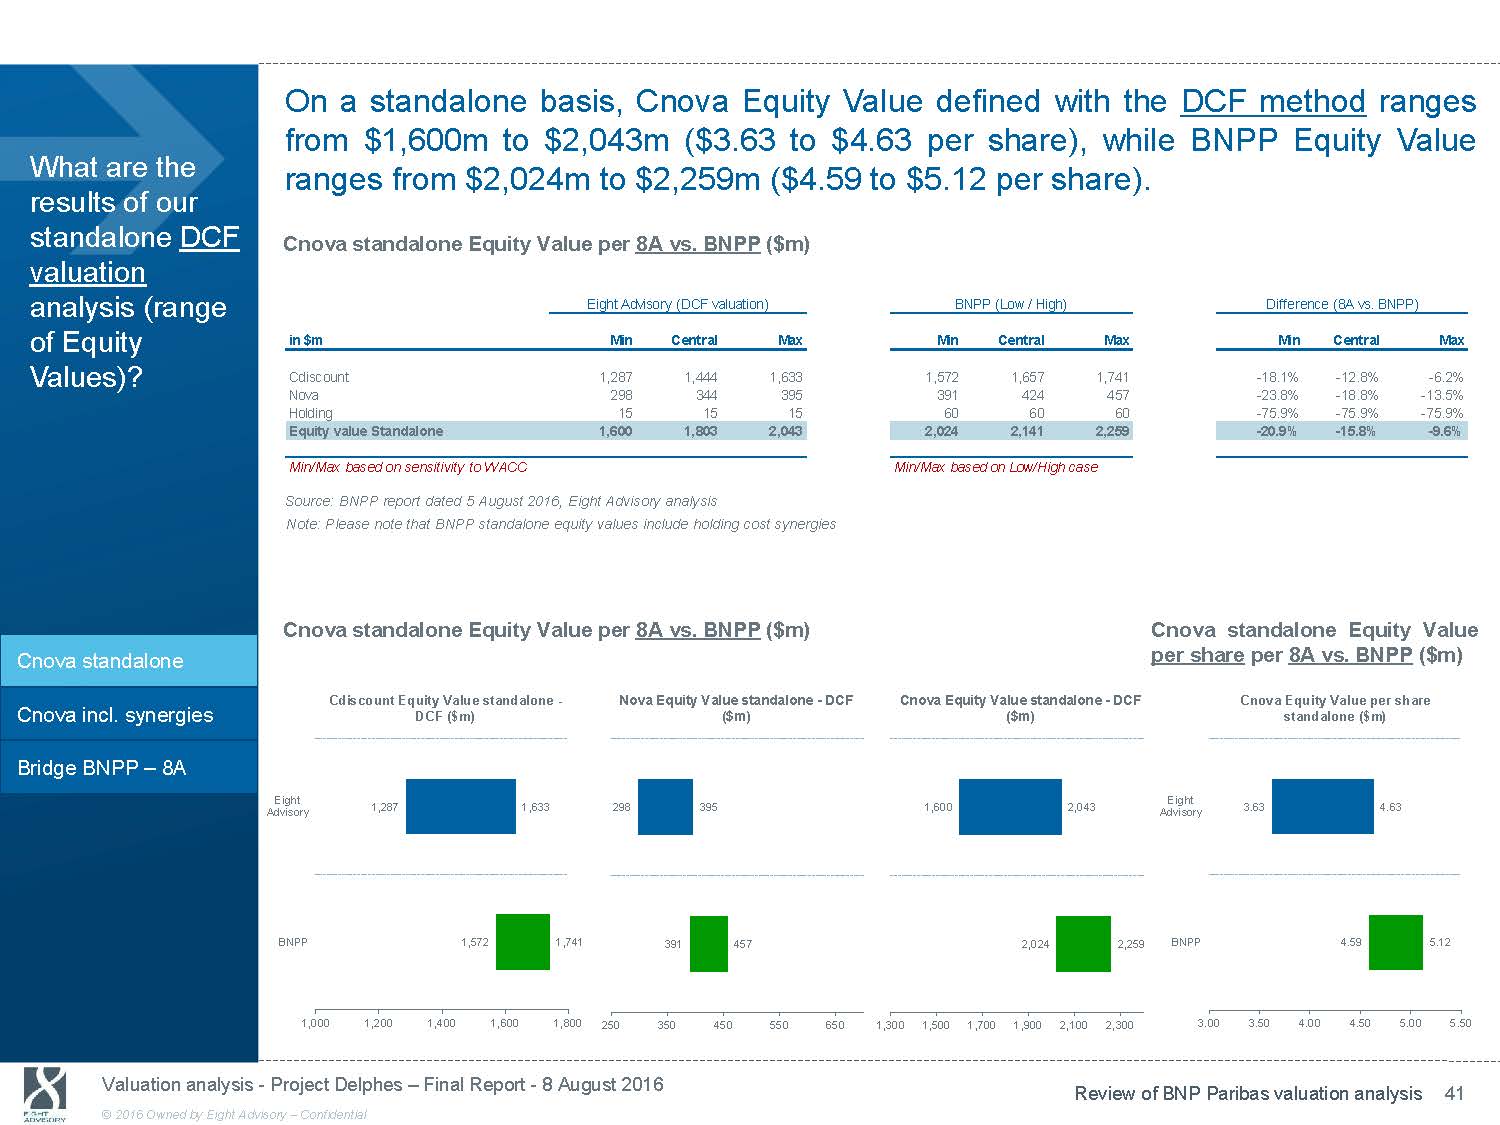
On a standalone basis, Cnova Equity Value defined with the DCF method ranges from $1,600m to $2,043m ($3.63 to $4.63 per share), while BNPP Equity Value What are the results of our standalone DCF valuation ranges from $2,024m to $2,259m ($4.59 to $5.12 per share). Cnova standalone Equity Value per 8A vs. BNPP ($m) analysis (range of Equity Values)? Eight Advisory (DCF valuation) in $m Min Central Cdiscount 1,287 1,444 Nova 298 344 Holding 15 15 Equity value Standalone 1,600 1,803 BNPP (Low / High) Max Min Central 1,633 1,572 1,657 395 391 424 15 60 60 2,043 2,024 2,141 Difference (8A vs. BNPP) Max Min Central Max 1,741 - 18.1% - 12.8% - 6.2% 457 - 23.8% - 18.8% - 13.5% 60 - 75.9% - 75.9% - 75.9% 2,259 - 20.9% - 15.8% - 9.6% Cnova standalone Cnova incl. synergies Bridge BNPP - 8A Min/Max based on sensitivity to WACC Source: BNPP report dated 5 August 2016, Eight Advisory analysis Note: Please note that BNPP standalone equity values include holding cost synergies Cnova standalone Equity Value per 8A vs. BNPP ($m) Cdiscount Equity Value standalone - Nova Equity Value standalone - DCF DCF ($m) ($m) Eight Min/Max based on Low/High case Cnova Equity Value standalone - DCF ($m) Cnova standalone Equity Value per share per 8A vs. BNPP ($m) Cnova Equity Value per share standalone ($m) Eight Advisory 1,287 BNPP 1,572 1,000 1,200 1,400 1,633 298 395 1,741 391 1,600 1,800 250 350 450 1,600 457 550 650 1,300 1,500 2,043 Advisory 2,024 2,259 BNPP 1,700 1,900 2,100 2,300 3.00 3.63 4.63 4.59 5.12 3.50 4.00 4.50 5.00 5.50 Valuation analysis - Project Delphes - Final Report - 8 August 2016 Review of BNP Paribas valuation analysis 41 © 2016 Owned by Eight Advisory - Confidential
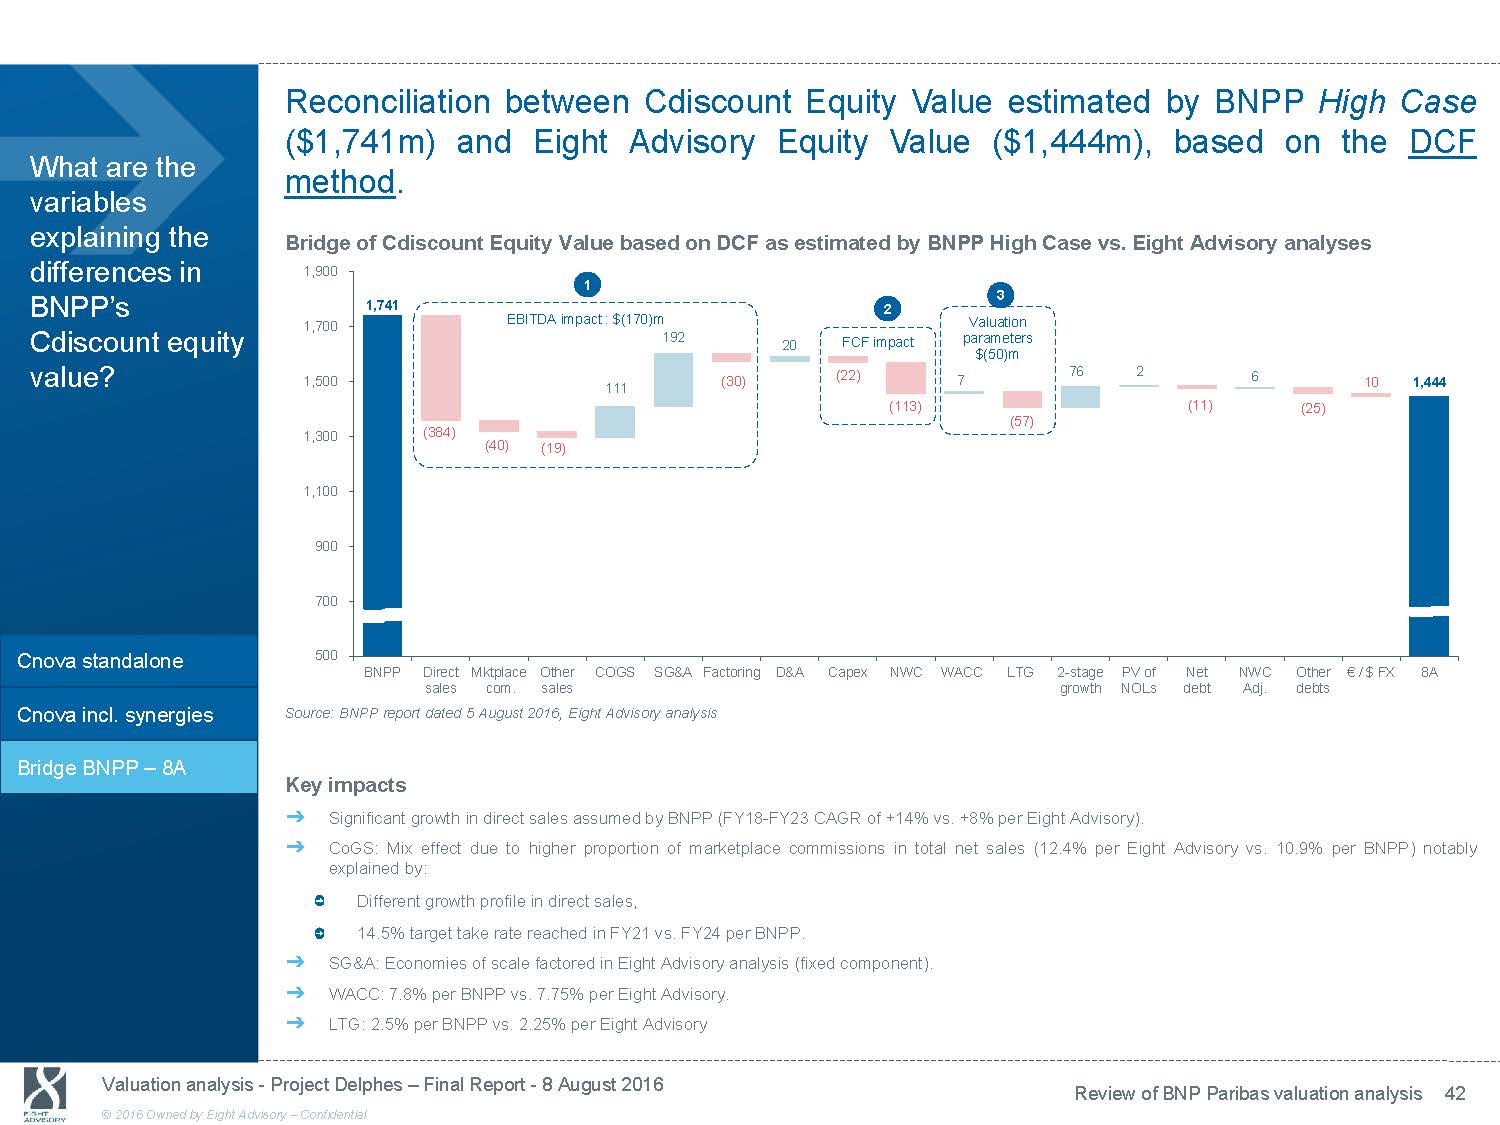
Reconciliation between Cdiscount Equity Value estimated by BNPP High Case What are the variables explaining the differences in ($1,741m) and Eight Advisory Equity Value ($1,444m), based on the DCF method. Bridge of Cdiscount Equity Value based on DCF as estimated by BNPP High Case vs. Eight Advisory analyses 1,900 2,000 1 BNPP’s Cdiscount equity value? Cnova standalone 1,741 1,700 1,500 1,300 (384) 1,100 900 700 500 EBITDA impact : $(170)m 192 111 (40) (19) 20 (30) 2 FCF impact (22) (113) 3 Valuation parameters $(50)m 7 (57) 76 2 6 (11) (25) 1,500 10 1,444 1,000 500 - (500) BNPP Direct Mktplace Other COGS SG&A Factoring D&A Capex NWC WACC LTG 2 - stage PV of Net NWC Other € / $ FX 8A sales com. sales growth NOLs debt Adj. debts Cnova incl. synergies Source: BNPP report dated 5 August 2016, Eight Advisory analysis Bridge BNPP - 8A Key impacts ᇄ Significant growth in direct sales assumed by BNPP (FY18 - FY23 CAGR of +14% vs. +8% per Eight Advisory). ᇄ CoGS: Mix effect due to higher proportion of marketplace commissions in total net sales (12.4% per Eight Advisory vs. 10.9% p e r BNPP) notably explained by: Different growth profile in direct sales, 14.5% target take rate reached in FY21 vs. FY24 per BNPP. ᇄ SG&A: Economies of scale factored in Eight Advisory analysis (fixed component). ᇄ WACC: 7.8% per BNPP vs. 7.75% per Eight Advisory. ᇄ LTG: 2.5% per BNPP vs. 2.25% per Eight Advisory Valuation analysis - Project Delphes - Final Report - 8 August 2016 Review of BNP Paribas valuation analysis 42 © 2016 Owned by Eight Advisory - Confidential
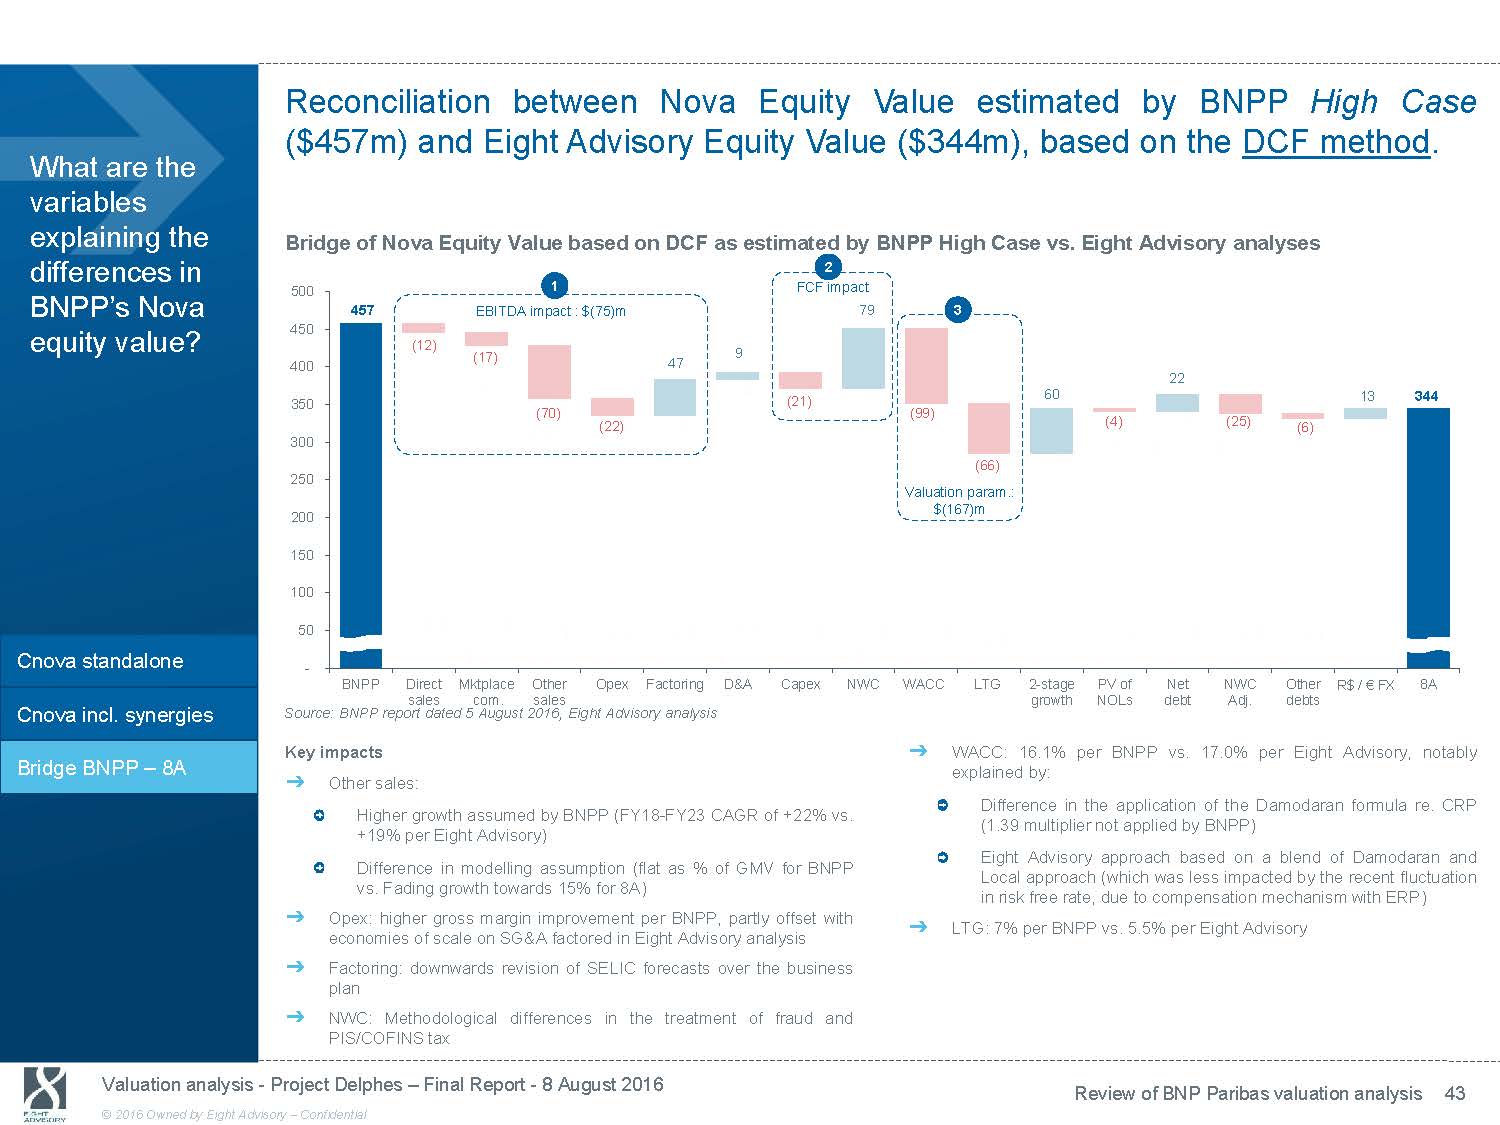
Reconciliation between Nova Equity Value estimated by BNPP High Case ($457m) and Eight Advisory Equity Value ($344m), based on the DCF method. What are the variables explaining the differences in Bridge of Nova Equity Value based on DCF as estimated by BNPP High Case vs. Eight Advisory analyses 2 1 FCF impact BNPP’s Nova equity value? Cnova standalone 500 450 400 350 300 250 200 150 100 50 - 457 EBITDA impact : $(75)m (12) (17) (70) (22) 47 79 3 9 (21) (99) (66) Valuation param.: $(167)m 22 60 (4) (25) 500 400 13 344 300 (6) 200 100 - (100 (200 Cnova incl. synergies Bridge BNPP - 8A BNPP Direct Mktplace Other Opex Factoring D&A Capex NWC sales com. sales Source: BNPP report dated 5 August 2016, Eight Advisory analysis Key impacts ᇄ Other sales: Higher growth assumed by BNPP (FY18 - FY23 CAGR of +22% vs. WACC LTG 2 - stage PV of Net growth NOLs debt ᇄ WACC: 16.1% per BNPP vs. explained by: Difference in the application NWC Other R$ / € FX 8A Adj. debts 17.0% per Eight Advisory, notably of the Damodaran formula re. CRP +19% per Eight Advisory) Difference in modelling assumption (flat as % of GMV for BNPP vs. Fading growth towards 15% for 8A) ᇄ Opex: higher gross margin improvement per BNPP, partly offset with economies of scale on SG&A factored in Eight Advisory analysis ᇄ Factoring: downwards revision of SELIC forecasts over the business plan ᇄ NWC: Methodological differences in the treatment of fraud and PIS/COFINS tax (1.39 multiplier not applied by BNPP) Eight Advisory approach based on a blend of Damodaran and Local approach (which was less impacted by the recent fluctuation in risk free rate, due to compensation mechanism with ERP) ᇄ LTG: 7% per BNPP vs. 5.5% per Eight Advisory Valuation analysis - Project Delphes - Final Report - 8 August 2016 Review of BNP Paribas valuation analysis 43 © 2016 Owned by Eight Advisory - Confidential
9. Analysis of the Terms of the Agreement
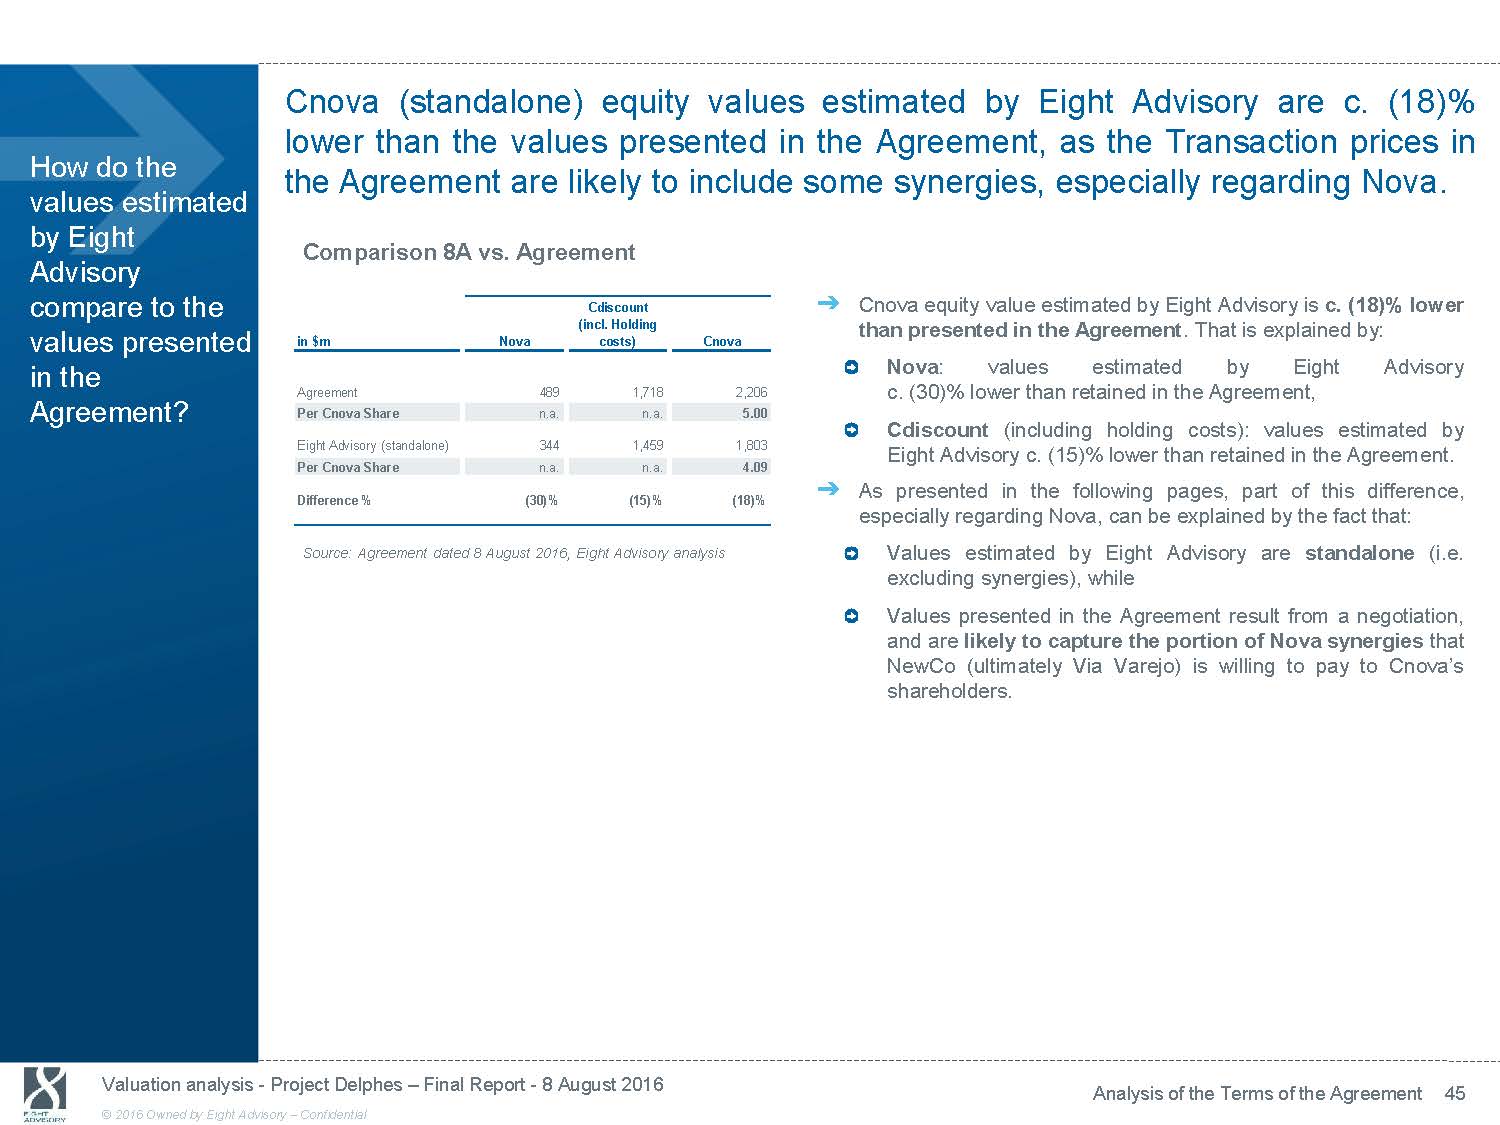
Cnova (standalone) equity values estimated by Eight Advisory are c. (18)% lower than the values presented in the Agreement, as the Transaction prices in How do the values estimated by Eight Advisory compare to the the Agreement are likely to include some synergies, especially regarding Nova. Comparison 8A vs. Agreement Cdiscount ᇄ Cnova equity value estimated by Eight Advisory is c. (18)% lower (incl. Holding values presented in the Agreement? in $m Nova costs) Cnova Agreement 489 1,718 2,206 Per Cnova Share n.a. n.a. 5.00 Eight Advisory (standalone) 344 1,459 1,803 Per Cnova Share n.a. n.a. 4.09 Difference % (30)% (15)% (18)% than presented in the Agreement . That is explained by: Nova : values estimated by Eight Advisory c. (30)% lower than retained in the Agreement, Cdiscount (including holding costs): values estimated by Eight Advisory c. (15)% lower than retained in the Agreement. ᇄ As presented in the following pages, part of this difference, especially regarding Nova, can be explained by the fact that: Source: Agreement dated 8 August 2016, Eight Advisory analysis Values estimated by Eight Advisory are standalone (i.e. excluding synergies), while Values presented in the Agreement result from a negotiation, and are likely to capture the portion of Nova synergies that NewCo (ultimately Via Varejo) is willing to pay to Cnova’s shareholders. Valuation analysis - Project Delphes - Final Report - 8 August 2016 Analysis of the Terms of the Agreement 45 © 2016 Owned by Eight Advisory - Confidential
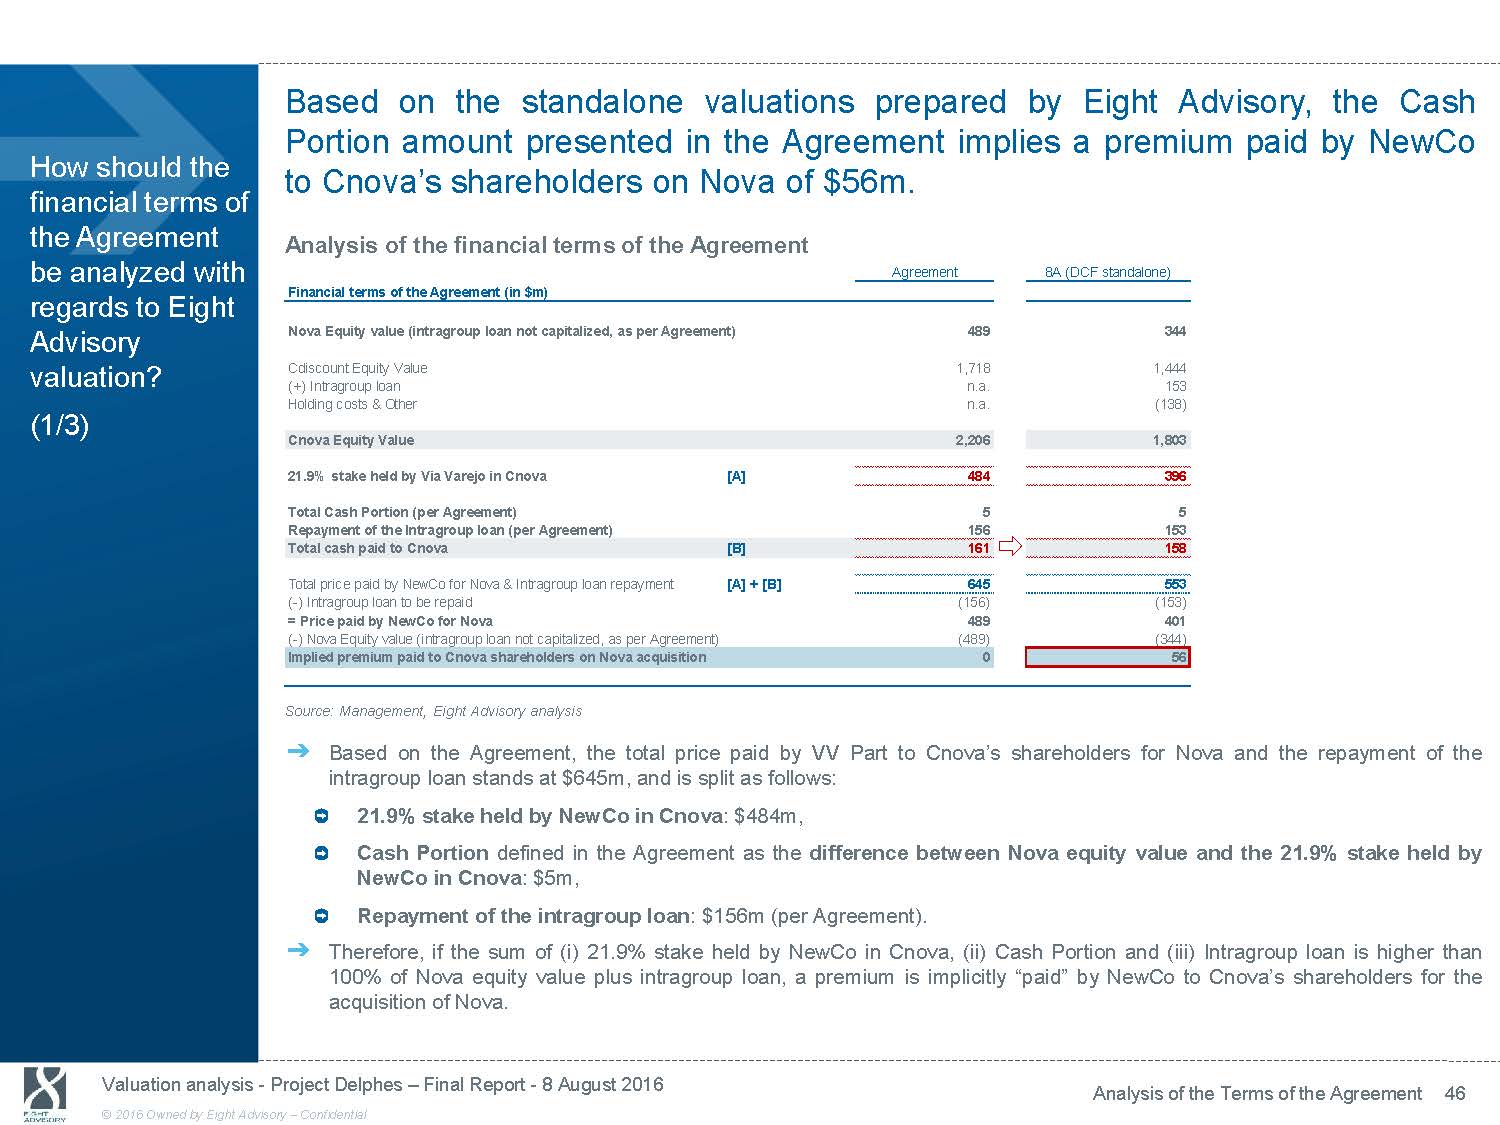
Based on the standalone valuations prepared by Eight Advisory, the Cash Portion amount presented in the Agreement implies a premium paid by NewCo How should the financial terms of the Agreement be analyzed with regards to Eight Advisory valuation? (1/3) to Cnova’s shareholders on Nova of $56m. Analysis of the financial terms of the Agreement Agreement 8A (DCF standalone) Financial terms of the Agreement (in $m) Nova Equity value (intragroup loan not capitalized, as per Agreement) 489 344 Cdiscount Equity Value 1,718 1,444 (+) Intragroup loan n.a. 153 Holding costs & Other n.a. (138) Cnova Equity Value 2,206 1,803 21.9% stake held by Via Varejo in Cnova [A] 484 396 Total Cash Portion (per Agreement) 5 5 Repayment of the Intragroup loan (per Agreement) 156 153 Total cash paid to Cnova [B] 161 158 Total price paid by NewCo for Nova & Intragroup loan repayment [A] + [B] 645 553 ( - ) Intragroup loan to be repaid (156) (153) = Price paid by NewCo for Nova 489 401 ( - ) Nova Equity value (intragroup loan not capitalized, as per Agreement) (489) (344) Implied premium paid to Cnova shareholders on Nova acquisition 0 56 Source: Management, Eight Advisory analysis ᇄ Based on the Agreement, the total price paid by VV Part to Cnova’s shareholders for Nova and the repayment of the intragroup loan stands at $645m, and is split as follows: 21.9% stake held by NewCo in Cnova : $484m, Cash Portion defined in the Agreement as the difference between Nova equity value and the 21.9% stake held by NewCo in Cnova : $5m, Repayment of the intragroup loan : $156m (per Agreement). ᇄ Therefore, if the sum of (i) 21.9% stake held by NewCo in Cnova, (ii) Cash Portion and (iii) Intragroup loan is higher than 100% of Nova equity value plus intragroup loan, a premium is implicitly “paid” by NewCo to Cnova’s shareholders for the acquisition of Nova. Valuation analysis - Project Delphes - Final Report - 8 August 2016 Analysis of the Terms of the Agreement 46 © 2016 Owned by Eight Advisory - Confidential
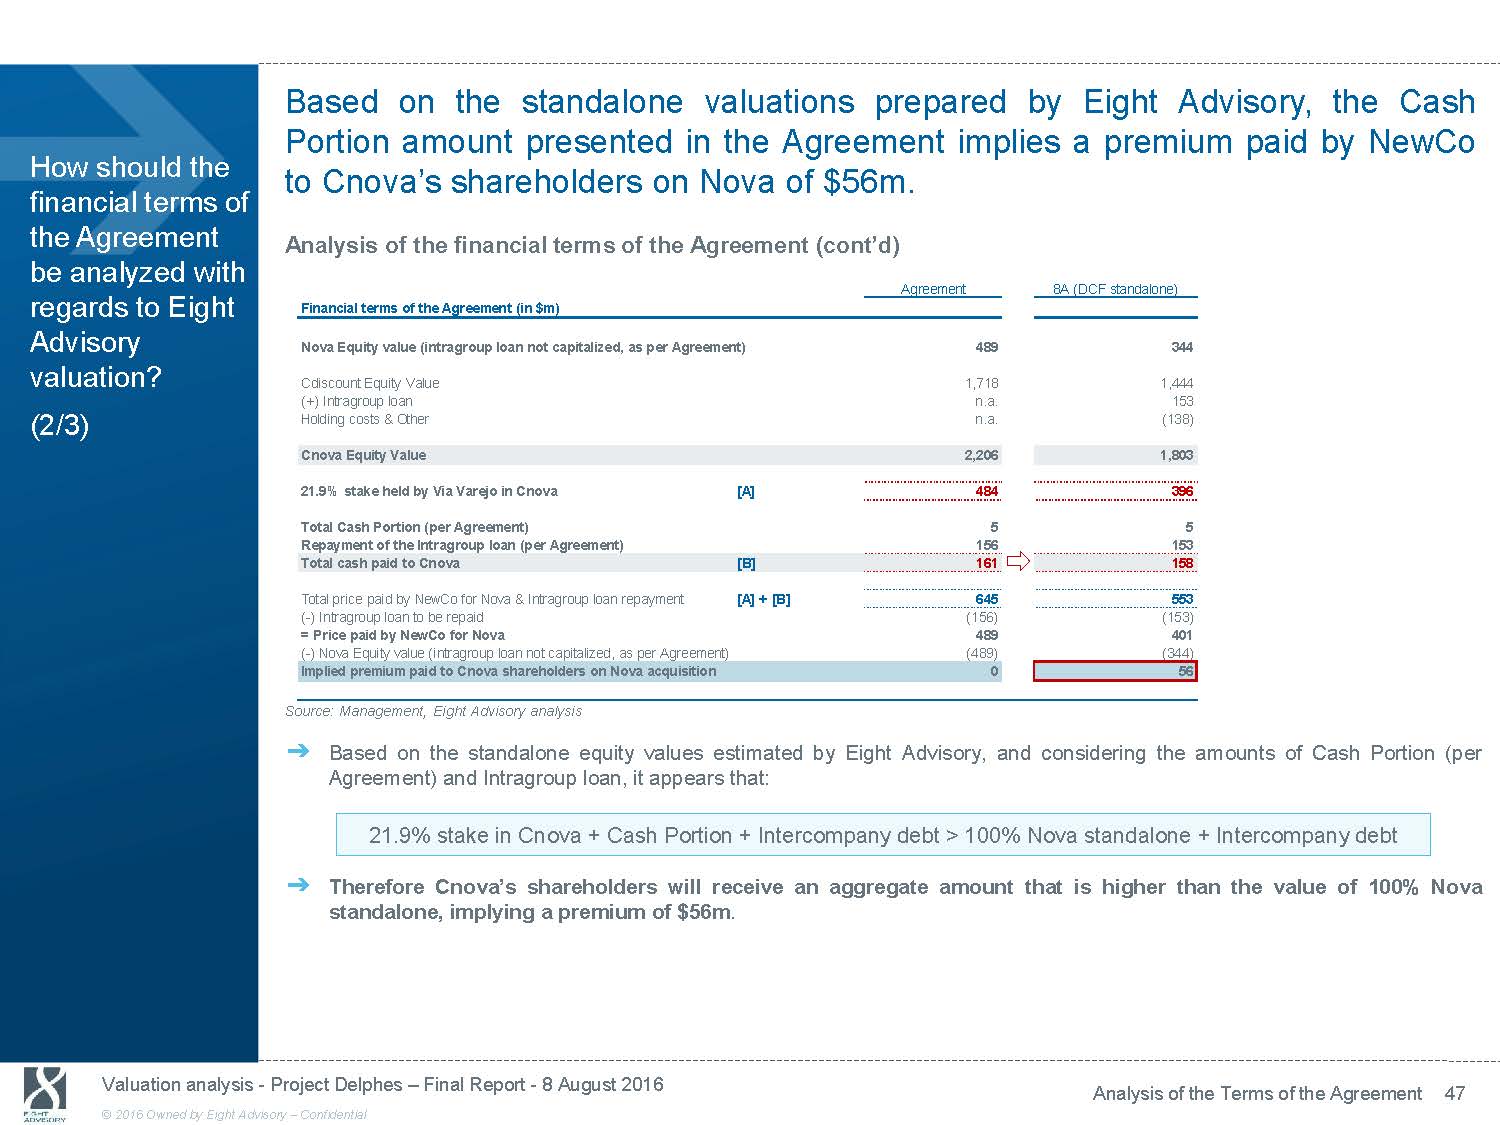
Based on the standalone valuations prepared by Eight Advisory, the Cash Portion amount presented in the Agreement implies a premium paid by NewCo How should the financial terms of the Agreement be analyzed with regards to Eight Advisory valuation? (2/3) to Cnova’s shareholders on Nova of $56m. Analysis of the financial terms of the Agreement (cont’d) Agreement 8A (DCF standalone) Financial terms of the Agreement (in $m) Nova Equity value (intragroup loan not capitalized, as per Agreement) 489 344 Cdiscount Equity Value 1,718 1,444 (+) Intragroup loan n.a. 153 Holding costs & Other n.a. (138) Cnova Equity Value 2,206 1,803 21.9% stake held by Via Varejo in Cnova [A] 484 396 Total Cash Portion (per Agreement) 5 5 Repayment of the Intragroup loan (per Agreement) 156 153 Total cash paid to Cnova [B] 161 158 Total price paid by NewCo for Nova & Intragroup loan repayment [A] + [B] 645 553 ( - ) Intragroup loan to be repaid (156) (153) = Price paid by NewCo for Nova 489 401 ( - ) Nova Equity value (intragroup loan not capitalized, as per Agreement) (489) (344) Implied premium paid to Cnova shareholders on Nova acquisition 0 56 Source: Management, Eight Advisory analysis ᇄ Based on the standalone equity values estimated by Eight Advisory, and considering the amounts of Cash Portion (per Agreement) and Intragroup loan, it appears that: 21.9% stake in Cnova + Cash Portion + Intercompany debt > 100% Nova standalone + Intercompany debt ᇄ Therefore Cnova’s shareholders will receive an aggregate amount that is higher than the value of 100% Nova standalone, implying a premium of $56m . Valuation analysis - Project Delphes - Final Report - 8 August 2016 Analysis of the Terms of the Agreement 47 © 2016 Owned by Eight Advisory - Confidential

The implied premium paid to Cnova’s shareholders corresponds to 31% of Nova’s net synergies. Based on Eight Advisory valuations, the Exchange ratio is How should the financial terms of the Agreement be analyzed with regards to Eight Advisory valuation? (3/3) c.86%, compared to c. 100% in the Agreement. Analysis of the financial terms of the Agreement (cont’d) Agreement 8A (DCF standalone) Focus on the implied premium paid to Cnova on Nova (in $m) Nova operating synergies n.a. 225 Nova inventory synergies n.a. 60 Nova NOLs de - synergies n.a. (34) Nova net synergies expected from the Transaction @ 100% n.a. 250 Nova net synergies @ Cnova max. share (78%) n.a. 195 Implied premium paid to Cnova shareholders on Nova acquisition 0 56 Implied portion of Nova synergies paid by Newco n.a. 29% Agreement 8A (DCF standalone) Exchange ratio per Agreement (in $m) Nova equity value [A] 489 344 21.9% stake held by Via Varejo in Cnova [B] 484 396 Cash Portion paid by NewCo (as per Agreement) [C] 5 5 Exchange ratio per Agreement [A] / ([B]+[C]) 100% 86% Source: Management, Eight Advisory analysis ᇄ Based on the estimation of the Nova net synergies (cf. page 36) expected to arise from the Transaction, the implied premium paid to Cnova’s shareholders on Nova captures 29% of the Nova synergies (net of NOLs de - synergies) attributable to Cnova’s shareholders (i.e. 78% of total Nova net synergies). ᇄ Based on the values estimated by Eight Advisory and the Cash Portion of the Agreement, the Exchange ratio would stand at c. 86% , compared to the c. 100% ratio derived from the values presented in the Agreement. This corroborates the fact that NewCo is paying an implied premium on Nova intrinsic value to acquire it. ᇄ Based on the above, the financial terms of the Agreement lead to an implied premium on Nova standalone value, which appears to be fair for Cnova’s shareholders. Valuation analysis - Project Delphes - Final Report - 8 August 2016 Analysis of the Terms of the Agreement 48 © 2016 Owned by Eight Advisory - Confidential
10. Conclusions
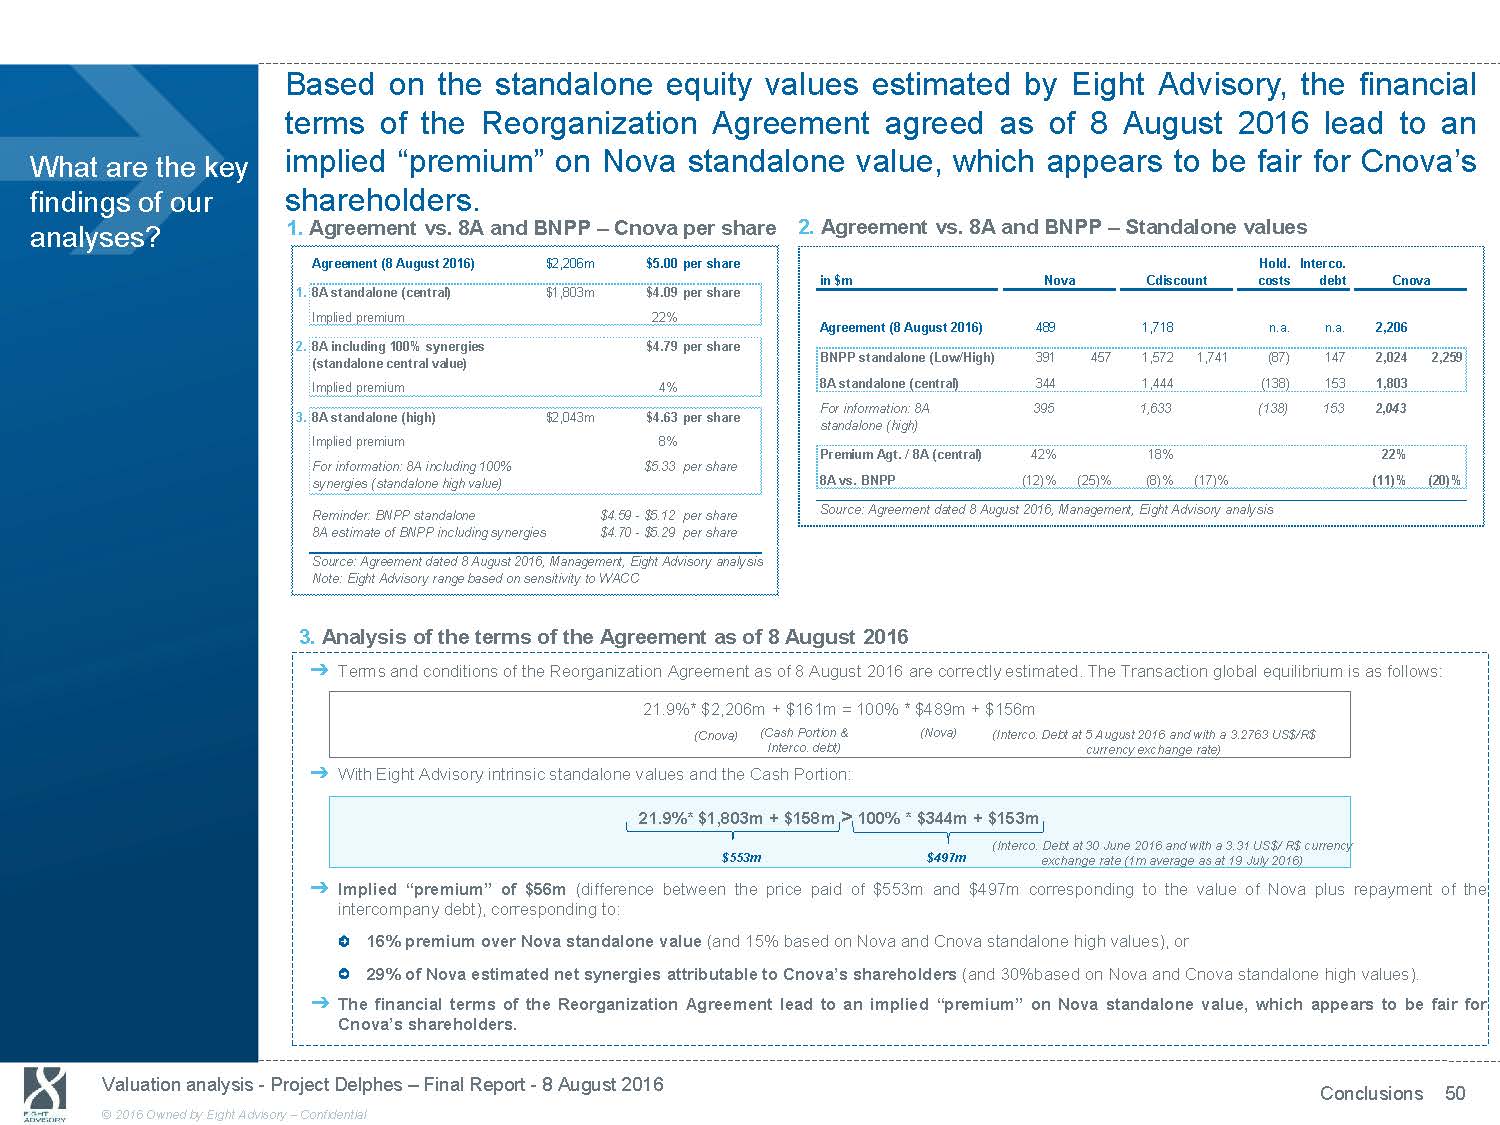
Based on the standalone equity values estimated by Eight Advisory, the financial terms of the Reorganization Agreement agreed as of 8 August 2016 lead to an What are the key findings of our implied “premium” on Nova standalone value, which appears to be fair for Cnova’s shareholders. analyses? 1. Agreement vs. 8A and BNPP - Cnova per share Agreement (8 August 2016) $2,206m $5.00 per share 1. 8A standalone (central) $1,803m $4.09 per share Implied premium 22% 2. 8A including 100% synergies $4.79 per share (standalone central value) Implied premium 4% 3. 8A standalone (high) $2,043m $4.63 per share Implied premium 8% For information: 8A including 100% $5.33 per share synergies (standalone high value) Reminder: BNPP standalone $4.59 - $5.12 per share 8A estimate of BNPP including synergies $4.70 - $5.29 per share Source: Agreement dated 8 August 2016, Management, Eight Advisory analysis Note: Eight Advisory range based on sensitivity to WACC 2. Agreement vs. 8A and BNPP - Standalone values Hold. Interco. in $m Nova Cdiscount costs debt Cnova Agreement (8 August 2016) 489 1,718 n.a. n.a. 2,206 BNPP standalone (Low/High) 391 457 1,572 1,741 (87) 147 2,024 2,259 8A standalone (central) 344 1,444 (138) 153 1,803 For information: 8A 395 1,633 (138) 153 2,043 standalone (high) Premium Agt. / 8A (central) 42% 18% 22% 8A vs. BNPP (12)% (25)% (8)% (17)% (11)% (20)% Source: Agreement dated 8 August 2016, Management, Eight Advisory analysis 3. Analysis of the terms of the Agreement as of 8 August 2016 ᇄ Terms and conditions of the Reorganization Agreement as of 8 August 2016 are correctly estimated. The Transaction global equi li brium is as follows: 21.9%* $2,206m + $161m = 100% * $489m + $156m (Cnova) (Cash Portion & (Nova) (Interco. Debt at 5 August 2016 and with a 3.2763 US$/R$ Interco. debt) currency exchange rate) ᇄ With Eight Advisory intrinsic standalone values and the Cash Portion: 21.9%* $1,803m + $158m > 100% * $344m + $153m (Interco. Debt at 30 June 2016 and with a 3.31 US$/ R$ currency $553m $497m exchange rate (1m average as at 19 July 2016) ᇄ Implied “premium” of $56m (difference between the price paid of $553m and $497m corresponding to the value of Nova plus repayment of the intercompany debt), corresponding to: 16% premium over Nova standalone value (and 15% based on Nova and Cnova standalone high values), or 29% of Nova estimated net synergies attributable to Cnova’s shareholders (and 30%based on Nova and Cnova standalone high values). ᇄ The financial terms of the Reorganization Agreement lead to an implied “premium” on Nova standalone value, which appears to b e fair for Cnova’s shareholders. Valuation analysis - Project Delphes - Final Report - 8 August 2016 Conclusions 50 © 2016 Owned by Eight Advisory - Confidential
Based on the standalone equity values estimated by Eight Advisory, the financial terms of the Reorganization Agreement agreed as of 8 August 2016 lead to an What are our conclusions about the Merger and its financial interest for Cnova’s shareholders? implied “premium” on Nova standalone value, which appears to be fair for Cnova’s shareholders. ᇄ Analysis of the financial Terms of the Agreement The amount of Cash Portion presented in the Agreement, stands at $5m is consistent with the compensation mechanism described in the Reorganization Agreement (i.e. Cash Portion equaling the difference between 100% of Nova value and 21.9% of Cnova value). Based on the standalone equity values estimated by Eight Advisory, and considering the amount of Cash Portion (per Agreement), the price paid by VV Part to Cnova’s shareholders for Nova implies a “premium” on Nova standalone value ranging stands at 16% . It could be considered that this implied “premium” captures 29% of the Nova synergies (net of NOLs de - synergies) attributable to Cnova’s shareholders. Based on the above, the financial terms of the Reorganization Agreement lead to an implied “premium” on Nova standalone value, which appears to be fair for Cnova’s shareholders. Valuation analysis - Project Delphes - Final Report - 8 August 2016 Conclusions 51 © 2016 Owned by Eight Advisory - Confidential