Exhibit (c)(4)
| Free English translation |
Project Delphes May 10, 2016 |
Context of the mandate:
In the context of its advisory mandate to the Board of Directors of Casino Guichard Perrachon (“Casino”), Messier Maris & Associés (“MMA”) has been requested to provide an opinion on the valuation of Cnova NV (“Cnova”) and Nova Brazil (“Nova”) made by the advisory banks of Casino, CA-CIB and Rothschild & Cie (the “advisory banks”), as part of the project to combine the non-food distribution activities of Casino in Brazil.
The present document provides a summary report of MMA analysis, detailed in the attached appendix document (“Appendix”).
I. Envisaged transaction
The envisaged transaction aims at reorganizing the non-food distribution activities of Casino in Brazil, through the combination of Nova Brazil activities (e-commerce) and Via Varejo (« VV ») (« brick & mortar » model).
Cnova, which currently comprises the companies Cdiscount (operating mainly in France) and Nova (Brazil), is expected to refocus on its historical markets, primarily France where it is a market leader.
The transaction will allow Via Varejo to become a reference player in the non-food distribution in Brazil, operating a “multi-channel” distribution model (“brick & mortar” and e-commerce). This integrated model will allow the new structure to better handle the recovery of the Brazilian economy. The current shareholding structure of the group’s activities in Latin America is as followed:
 | The Casino shares are listed in Paris on Euronext, Exito shares in Bogota (Columbia), GPA’s and Via Varejo’s in Sao Paulo (Brazil), Cnova’s on the Nasdaq (USA) and on Euronext (Paris).
Market capitalization as of April 29, 2016:
|
 | Document prepared exclusively for the governance bodies of Casino 10 May 2016 | 1 |
| Free English translation |
The envisaged reorganization will be implemented through the following steps:
| · | Step 1: VV will create aNewCo whose assets will comprise (i) the shares currently held by VV in Cnova (22%) and (ii) a cash amount to fund the cash balancing payment to be paid by VV to Cnova; |
| · | Step 2: Cnova will contribute its 100% stake in Nova Brazil toNewCo,in exchange for a c.50% stake inNewCo; |
| · | Step 3: Cnova will receive the 22% stake as well as the cash balancing payment in exchange for its shareholding inNewCo; |
| · | Step 4: Cancellation of treasury shares held in Cnova andNewCo; |
| · | Step 5: Following the transaction, Casino will launch a tender offer on Cnova shares. |
After the implementation of the transaction, and depending on the outcome of the tender offer, the shareholding structure should be as followed:
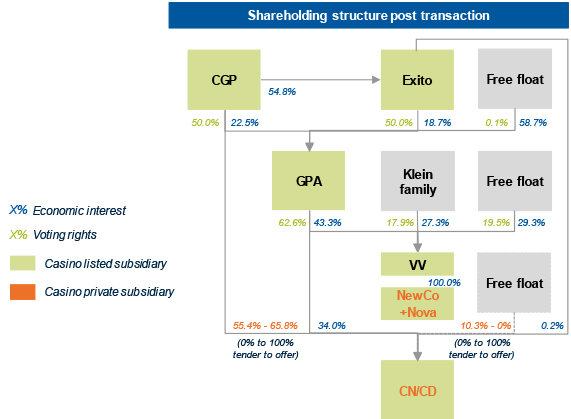
In the discussion of the economic terms of this transaction, the Cnova and Nova entities have been valued, in order to establish the amount of the cash balancing payment required to balance the valuation of Nova and the stake of VV in Cnova.
II. Work performed by MMA
MMA was able to attend the discussions between the various stakeholders since January 2016. MMA was granted access to the operational and financial information of the entities involved in the transaction as well as the management teams.
The discussions focused on:
| (i) | The economic and financial rationale of the envisaged transaction; |
| (ii) | The historical performances of the involved entities; |
| (iii) | The economic outlook of the same involved entities; |
| (iv) | The expected synergies; |
| (v) | The different options considered regarding the implementation of transaction; |
| (vi) | The financial and patrimonial impacts of the transaction on the Group Casino. |
| | Document prepared exclusively for the governance bodies of Casino 10 May 2016 | 2 |
| Free English translation |
MMA also had regular access to Casino’s advisory banks (CA-CIB and Rothschild) as part of a constructive dialogue in particular regarding the valuation approach of the involved entities.
III. Important clarifications regarding the context of MMA mandate
On December 18, 2015, the Board of Directors of Cnova announced that it had engaged advisors to assist in its investigations in connection with employee misconduct related to inventory management of its Brazilian entity in the distribution centers. During the investigation, Cnova also identified some discrepancies related to accounts payable due to suppliers and in accounts receivable/products in-transit with delivery companies. These discoveries had an impact on Cnova 2015 financial statements and will lead to accounting adjustments for the financial years 2013 and 2014. The final reports and financial statements regarding those accounting periods will be published in the coming weeks, as the internal investigation are still ongoing. At this stage, the 2015 financial statements (currently being audited by Ernst & Young) state a combined impact on the recurring operating outcome of -€48m.The final conclusions from the auditors will likely have an impact on the historical financial statements and might subsequently modify our assessment of (i) the historical performance and the balance sheet structure of Cnova, (ii) its economic outlook and (iii) the associated valuation.
AMemorandum of Understanding (« MoU ») is also currently being negotiated between Cnova and Via Varejo and must determine precisely the terms and conditions of the combination of VV and Nova. We understand that an agreement has been found at this stage regarding the economic aspects of the transaction. However, some conditions including representations and warranties are still under discussion. In this context, the final terms of the ultimate agreement may modify our assessment of Cnova valuation.
IV. Regarding the valuation approach chosen
| a. | Advisory banks’ approach |
In their valuation exercise, the advisory banks performed a multi-criteria approach including a discounted cash-flow analysis (« DCF »), this method being the main approach, as well as other valuation methods mentioned for illustrative purposes including the reference to listed comparable companies and comparable transactions, the historical share price and the analysts’ target prices.
The DCF method is presented by the advisory banks as the only one really relevant, given the current low profitability of Cnova (notably due to Nova’s performance) and the improvement of its profitability and cash generation over the next years.
The advisory banks underline that the other valuation approaches only have a limited significance in the current situation due to:
| - | The limited comparability of the set of listed companies of the sector (a total of 4 companies quite disparate in terms of business model, product-mix and geographies, as well in terms of growth and profitability profiles); |
| - | The very limited number of transactions really comparable in terms of geographies and activities; |
| - | The current Brazilian macroeconomic context, which makes the share price and the analysts’ target prices not sufficiently representative of the intrinsic valuation of the entities to be valued. |
| | Document prepared exclusively for the governance bodies of Casino 10 May 2016 | 3 |
| Free English translation |
The economic terms of the transaction have been approached sequentially:
| 1. | Valuation of Cnova by a sum of the parts approach allowing to assess separately the value of Cdiscount and Nova; |
| 2. | Valuation of the synergies associated with the envisaged transaction by DCF and attribution of 50% of their value to Nova; |
| 3. | Based on those elements, determination of the cash balancing payment; |
| 4. | Valuation of Cnova post transaction as the sum of Cdiscount and the cash balancing payment received after taking into account the tax impact. |
| b. | MMA’s approach |
The valuation approach of MMA also focuses on the DCF method for both Cnova and the synergies because:
| - | Only this method can approach the intrinsic value of Cnova; |
| - | The other usual methods have a limited significance in the present context because: |
| o | Cnova share price has been penalized by its operational performance and the Brazilian macroeconomic context. Therefore, the current valuation levels cannot be used as benchmarks in the context of a strategical transaction; |
| o | The analysts’ target prices show a wide disparity; |
| o | Cdiscount and Nova present a negative adjusted EBITDA making ineffective any approach which refers to comparable listed companies; |
| o | The analysis of comparable transactions in this sector did not result in the identification of transactions entirely comparable. |
Like Casino’s advisory banks, MMA opted for a « sum of the parts » approach, valuing Cnova as the addition of the values of Cdiscount and Nova. The holding costs have been allocated to each entity given their contribution to the turnover of Cnova, and they are thus included in Cnova’s valuation.
V. Regarding the valuation and its results
| a) | Business plans retained |
The advisory banks, as well as MMA, based their valuation analysis on the business plans of the different entities provided by Cnova’s management: (i) Cdiscount (France and international) in euros, (ii) Nova Brazil in Brazilian real, and (iii) the holding costs of Cnova in euros.
The assessment of the projected synergies resulting from the combination, used as a working assumption, was established by the teams of FHF (Friedrich, Heilbronn & Fiszer) in coordination with the management teams of the entities involved.
These business plans present detailed financial forecasts for the years 2016 to 2018. Beyond this horizon and for the need of the DCF valuation, the advisory banks created extrapolations over the 2019-2024 period, in order to have overall a 9-year projection period.
The forecasts for the 2019-2024 period rely on (i) a progressive deceleration of the growth towards a normative level, (ii) an increase of EBITDA margins towards a 8% target by the end of the plan for each company, reflecting notably the anticipated evolution of the business-mix and an improvement of the operational performance. The details of these assumptions are detailed in the appendix document to this report.
| | Document prepared exclusively for the governance bodies of Casino 10 May 2016 | 4 |
| Free English translation |
Cnova should publish its second quarter result in July 2016. Should the performance differ from the business plan forecasted for the year 2016, the impacts on the expected performance over the next years and the implications on the valuation would likely have to be analyzed.
| b) | DCF valuation parameters |
The weighted average cost of capital (WACC) has been determined for each entity: Cdiscount, Nova, as well as for the synergies, in particular by reference to the average beta of a set of companies from the sector.
The WACC retained for the valuation of the synergies is VV’s (the entity that will implement the synergies) inflated by a premium related to the execution risk, which is valued at 300bps.
Regarding the perpetual growth rates (PGR) used in the computation of the terminal value of the DCF (Gordon-Shapiro approach), MMA retained for each company long-term statistics of the relevant country, issued by the IMF. These levels are roughly in line with the assumptions retained by the advisory banks, which have determined their PGR by increasing the long-term inflation level by 100bps.
The list and the amount of the adjustments enabling the computation of the equity value from the enterprise value led to a constructive dialogue with the teams in charge of the project and the advisory banks. MMA retained FX rates as of December 31, 2015 for the conversion of elements in the balance sheet while the advisory banks retained a one-month average as of April 22, 2016.
| Comparison of the valuation parameters retained | |||||||
| Advisory banks | MMA | ||||||
| WACC(1) | PGR(1) | Adjustments | WACC(1) | PGR(1) | Adjustments | ||
| DCF assumptions | Cdiscount | 7.9% | 2.7% | $(46)m | 7.5% | 2.1% | $(51)m |
| Nova | 14.8% | 5.6% | $(164)m | 14.5% | 4.5% | $(149)m | |
| Synergies | 17.3% | 4.6% | n.a. | 17.9% | 4.5% | n.a. | |
Note 1: middle of the range
| c) | Comparisons of the results from the DCF method |
| MoU as of 9/05 | Advisory banks | MMA | ||||||||
| Equity value ($m) | Equity value ($m) | Price per share ($) | Equity value ($m) | Price per share ($) | ||||||
| min | max | min | max | min | max | min | max | min | max | |
| Cdiscount | 1,598 | 1,766 | 1,628 | 2,051 | $3.7 | $4.6 | 1,421 | 2,060 | $3.2 | $4.7 |
| Nova(1) | 492 | 557 | 507 | 669 | $1.1 | $1.5 | 469 | 623 | $1.1 | $1.4 |
| Cnova | 2,090 | 2,323 | 2,135 | 2,720 | $4.8 | $6.2 | 1,890 | 2,682 | $4.3 | $6.1 |
Note 1:includes the value of 50% of synergies (part attributed to Nova) for the valuation of the advisory banks and MMA
The valuation by MMA would entail a potential cash balancing payment comprised between $34m and $54m, which can be compared to a range of $32m to $49m mentioned in the MoU.
| | Document prepared exclusively for the governance bodies of Casino 10 May 2016 | 5 |
| Free English translation |
VI. Conclusion on the valuation presented by the advisory banks
As a conclusion, subjected to the context elements presented in paragraph III, the analysis and the results presented by the advisory banks in their valuation assignment are in line with the works performed by MMA and have been conducted according to methods upon which MMA has no further remark to bring forward other than the ones already noted in this report.
| | Document prepared exclusively for the governance bodies of Casino 10 May 2016 | 6 |

Confidential – Document prepared exclusively for the governance bodies of Casino Project Delphes Appendix to elements of the analysis of the valuation report performed by Casino’s advisory banks May 10, 2016 Free English translation
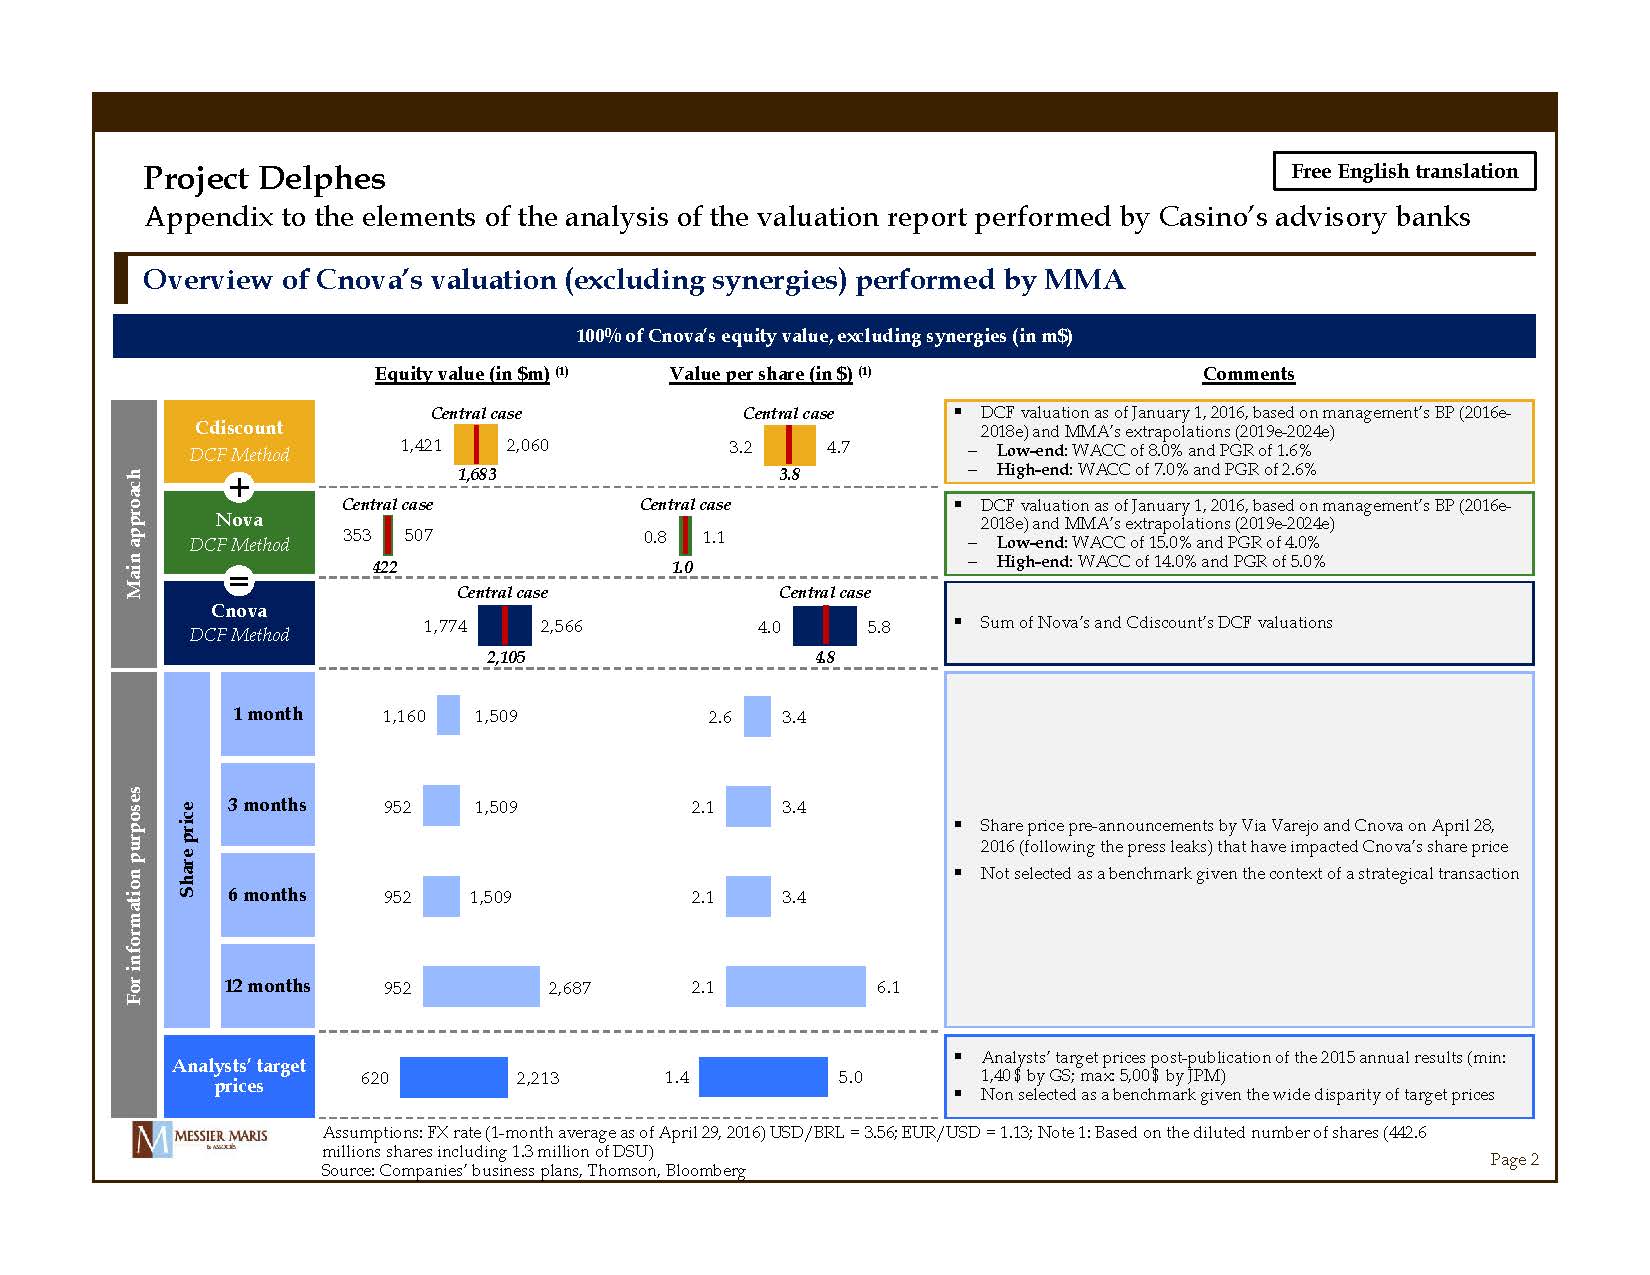
Free English translation Page 2 Assumptions: FX rate (1 - month average as of April 29, 2016) USD/BRL = 3.56; EUR/USD = 1.13; Note 1: Based on the diluted number of shares (442.6 millions shares including 1.3 million of DSU) Source: Companies’ business plans, Thomson, Bloomberg Overview of Cnova’s valuation (excluding synergies) performed by MMA 100% of Cnova’s equity value, excluding synergies (in m$) ▪ DCF valuation as of January 1, 2016, based on management’s BP (2016e - 2018e) and MMA’s extrapolations (2019e - 2024e) – Low - end : WACC of 8.0% and PGR of 1.6% – High - end : WACC of 7.0% and PGR of 2.6% Cdiscount DCF Method ▪ DCF valuation as of January 1, 2016, based on management’s BP (2016e - 2018e) and MMA’s extrapolations (2019e - 2024e) – Low - end : WACC of 15.0% and PGR of 4.0% – High - end : WACC of 14.0% and PGR of 5.0% Nova DCF Method Equity value (in $m) (1) Value per share ( i n $) (1) Comments 1,421 353 1,774 1,160 952 952 952 620 2,060 507 2,566 1,509 1,509 1,509 2,687 2,213 ▪ Sum of Nova’s and Cdiscount’s DCF valuations ▪ Share price pre - announcements by Via Varejo and Cnova on April 28, 2016 (following the press leaks) that have impacted Cnova’s share price ▪ Not selected as a benchmark given the context of a strategical transaction ▪ Analysts’ target prices post - publication of the 2015 annual results ( min: 1,40 $ by GS; max: 5,00 $ by JPM) ▪ Non selected as a benchmark given the wide disparity of target prices 1 month Share price 3 months 6 months 12 months Analysts’ target prices Project Delphes Appendix to the elements of the analysis of the valuation report performed by Casino’s advisory banks 3.2 0.8 4.0 2.6 2.1 2.1 2.1 1.4 4.7 1.1 5.8 3.4 3.4 3.4 6.1 5.0 M ain approach For information purposes Cnova DCF Method 2,105 Central case 4.8 1,683 Central case Central case 422 Central case + = 3.8 Central case Central case 1.0
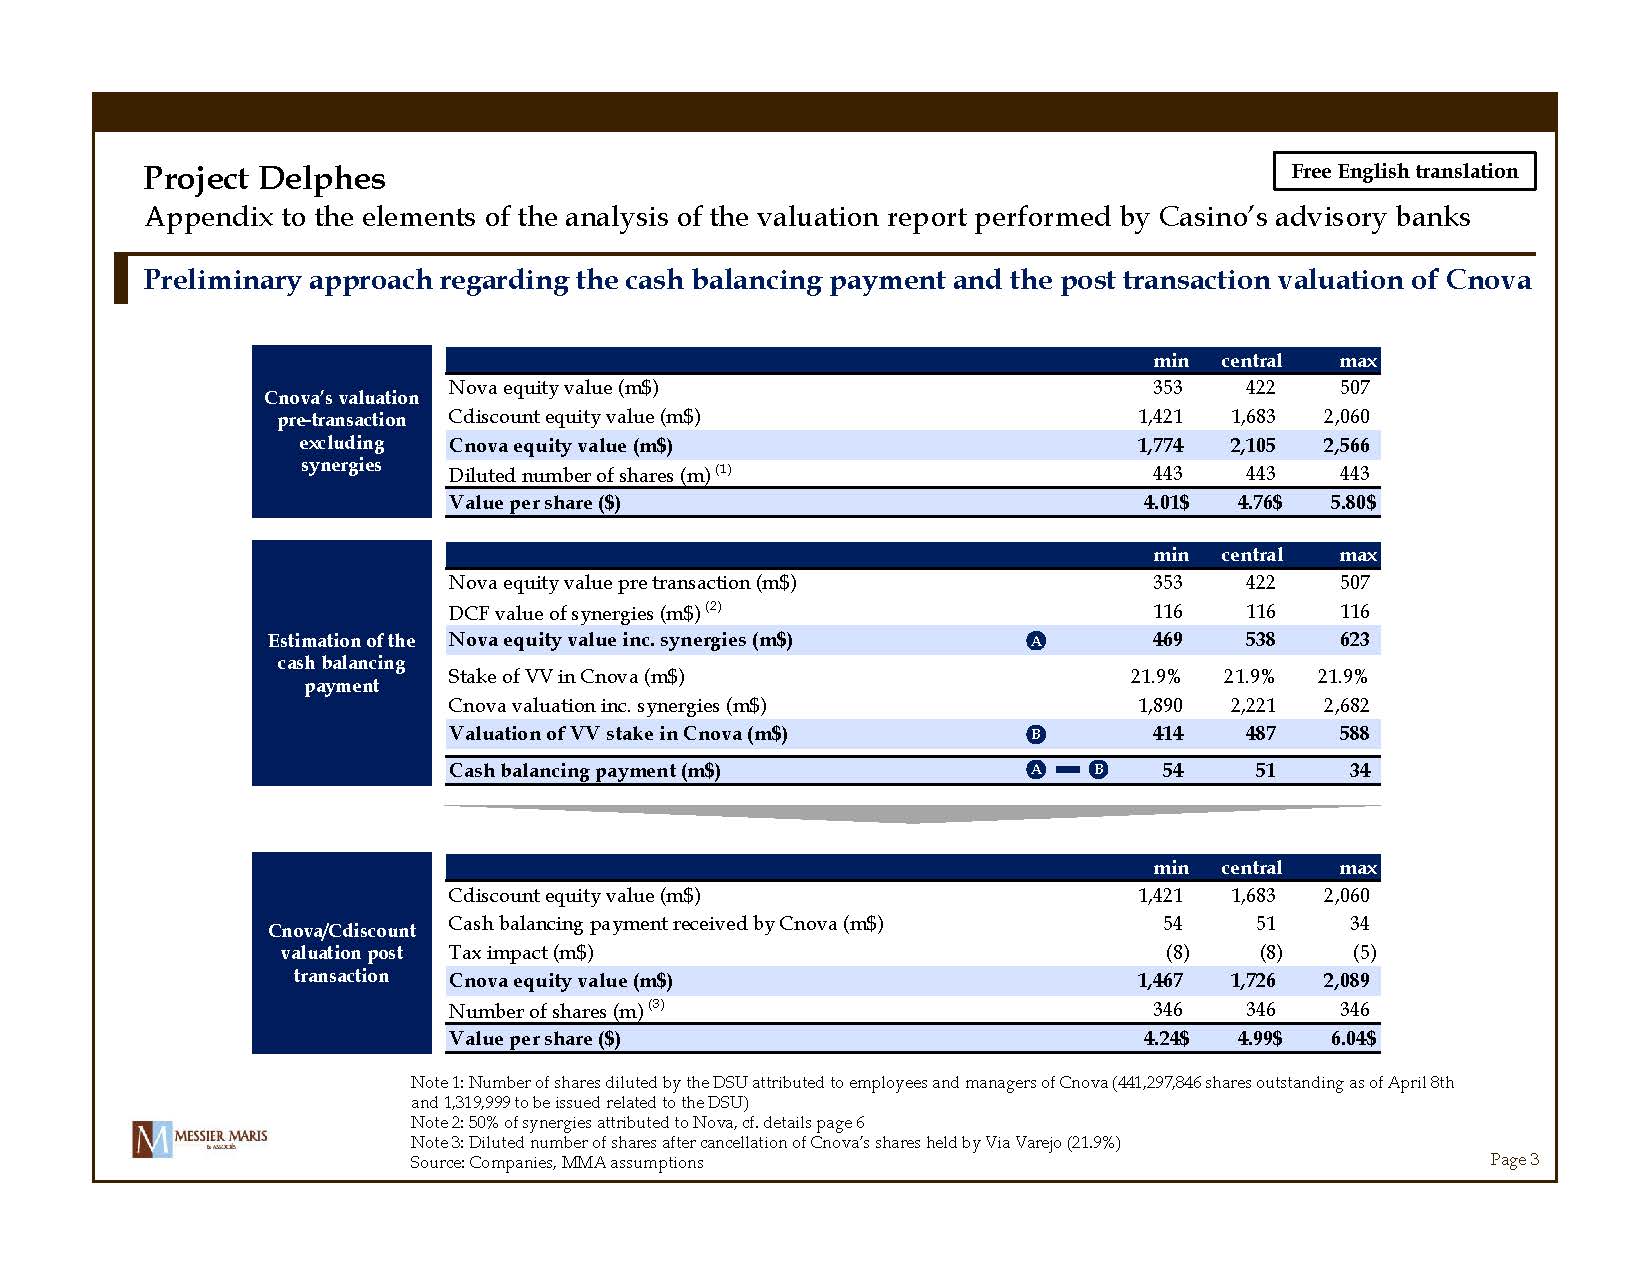
Free English translation Page 3 Note 1: Number of shares diluted by the DSU attributed to employees and managers of Cnova (441,297,846 shares outstanding as of April 8th and 1,319,999 to be issued related to the DSU) Note 2: 50% of synergies attributed to Nova, cf. details page 6 Note 3: Diluted number of shares after cancellation of Cnova’s shares held by Via Varejo (21.9%) Source: Companies, MMA assumptions Preliminary approach regarding the cash balancing payment and the post transaction valuation of Cnova min central max Nova equity value (m$) 353 422 507 Cdiscount equity value (m$) 1,421 1,683 2,060 Cnova equity value (m$) 1,774 2,105 2,566 Diluted number of shares (m) (1) 443 443 443 Value per share ($) 4.01$ 4.76$ 5.80$ Project Delphes Appendix to the elements of the analysis of the valuation report performed by Casino’s advisory banks Cnova’s valuation pre - transaction excluding synergies Estimation of the cash balancing payment Cnova/Cdiscount valuation post transaction min central max Nova equity value pre transaction (m$) 353 422 507 DCF value of synergies (m$) (2) 116 116 116 Nova equity value inc. synergies (m$) 469 538 623 Stake of VV in Cnova (m$) 21.9% 21.9% 21.9% Cnova valuation inc. synergies (m$) 1,890 2,221 2,682 Valuation of VV stake in Cnova (m$) 414 487 588 Cash balancing payment (m$) 54 51 34 min central max Cdiscount equity value (m$) 1,421 1,683 2,060 Cash balancing payment received by Cnova (m$) 54 51 34 Tax impact (m$) (8) (8) (5) Cnova equity value (m$) 1,467 1,726 2,089 Number of shares (m) (3) 346 346 346 Value per share ($) 4.24$ 4.99$ 6.04$ A B B A

Free English translation Page 4 Note: FX rate EUR/USD = 1.13 (1 - month average as of April 29, 2016) Source: Company business plan, MMA assumptions Cdiscount DCF analysis Business plan Extrapolations Normative In EURm 2015a 2016e 2017e 2018e 2019e 2020e 2021e 2022e 2023e 2024e Net sales 1,765 1,841 2,000 2,178 2,346 2,500 2,637 2,750 2,838 2,897 2,897 Growth (%) 0 4.3% 8.7% 8.9% 7.7% 6.6% 5.5% 4.3% 3.2% 2.1% EBITDA (9) 23 58 99 120 142 165 188 211 232 232 As % of net sales (0.5%) 1.3% 2.9% 4.5% 5.1% 5.7% 6.3% 6.8% 7.4% 8.0% 8.0% Factoring costs (13) (23) (23) (23) (25) (26) (28) (29) (30) (31) (31) As % of net sales (0.7%) (1.2%) (1.1%) (1.1%) (1.1%) (1.1%) (1.1%) (1.1%) (1.1%) (1.1%) (1.1%) Holding costs (10) (9) (9) (9) (9) (10) (10) (10) (10) (10) (10) Growth (%) - (9.8%) 2.1% 2.1% 2.1% 2.1% 2.1% 2.1% 2.1% 2.1% - As % of net sales (0.6%) (0.5%) (0.4%) (0.4%) (0.4%) (0.4%) (0.4%) (0.4%) (0.4%) (0.4%) (0.4%) Adjusted EBITDA (32) (8) 26 67 86 106 128 149 171 191 191 As % of net sales (1.8%) (0.5%) 1.3% 3.1% 3.7% 4.3% 4.8% 5.4% 6.0% 6.6% 6.6% D&A (22) (25) (30) (31) (32) (32) (32) (32) (30) (29) (29) As % of net sales (1.2%) (1.3%) (1.5%) (1.4%) (1.4%) (1.3%) (1.2%) (1.1%) (1.1%) (1.0%) (1.0%) Adjusted EBIT (54) (33) (3) 35 54 74 95 118 140 162 162 As % of net sales (3.0%) (1.8%) (0.2%) 1.6% 2.3% 3.0% 3.6% 4.3% 4.9% 5.6% 5.6% Tax - - - (12) (18) (25) (33) (41) (48) (56) (56) Normatif tax rate (%) 34.4% 34.4% 34.4% 34.4% 34.4% 34.4% 34.4% 34.4% 34.4% 34.4% 34.4% Change in NWC 18 55 36 42 39 36 31 26 20 13 13 As % of increase in net sales 0 71.9% 22.3% 23.7% 23.0% 23.0% 23.0% 23.0% 23.0% 23.0% Capex (47) (44) (48) (51) (49) (47) (44) (40) (35) (29) (29) As % of net sales (2.7%) (2.4%) (2.4%) (2.3%) (2.1%) (1.9%) (1.7%) (1.4%) (1.2%) (1.0%) (1.0%) Free cash flows 3 14 46 57 69 82 95 108 120 120 Discounted free cash flows 3 12 37 42 48 53 57 60 62 EURm USDm Discounted free cash flows 374 425 Terminal value 2,221 2,520 Discounted terminal value 1,154 1,309 Entreprise value 1,528 1,733 Adjustments (47) (51) Equity value 1,482 1,683 Main assumptions Equity value pre-transaction (in m$) PGR - 1.06% 1.56% 2.06% 2.56% 3.06% 6.55% 1,814 1,961 2,140 2,363 2,651 7.05% 1,630 1,747 1,888 2,060 2,275 WACC 7.55% 1,475 1,570 1,683 1,818 1,983 8.05% 1,342 1,421 1,513 1,621 1,751 8.55% 1,228 1,294 1,369 1,457 1,561 ▪ Valuation as of January 1, 2016 ▪ End - of - the - year cash flow conversion ▪ Central WACC of 7.55% and PGR of 2.06%(inflation rate in France estimated for 2021; source: IMF ) ▪ Valuation based on management’s BP (2016e - 2018e) and MMA’s extrapolations (2019e - 2024e) ▪ MMA’s extrapolations: - Sales growth rate to decelerate linearly towards a level in line with the long - term inflation rate in 2024 - EBITDA margin pre - holding costs converging towards a normative level of 8.0% - Holding costs growing at the inflation rate over the entire period (+2.1%) - Change in NWC as a % of increase in sales equals to 23.0% (average of 2017 - 2018) over the entire period - Capex converging towards 1.0% of sales - D&A converging towards 1.0% of sales (equal to capex at the end of the period) ▪ Normative year retained equal to 2024e ▪ Normative tax rate of 34.4% (French corporate tax) ▪ Adjustments to enterprise value amount to $(51)m Project Delphes Appendix to the elements of the analysis of the valuation report performed by Casino’s advisory banks
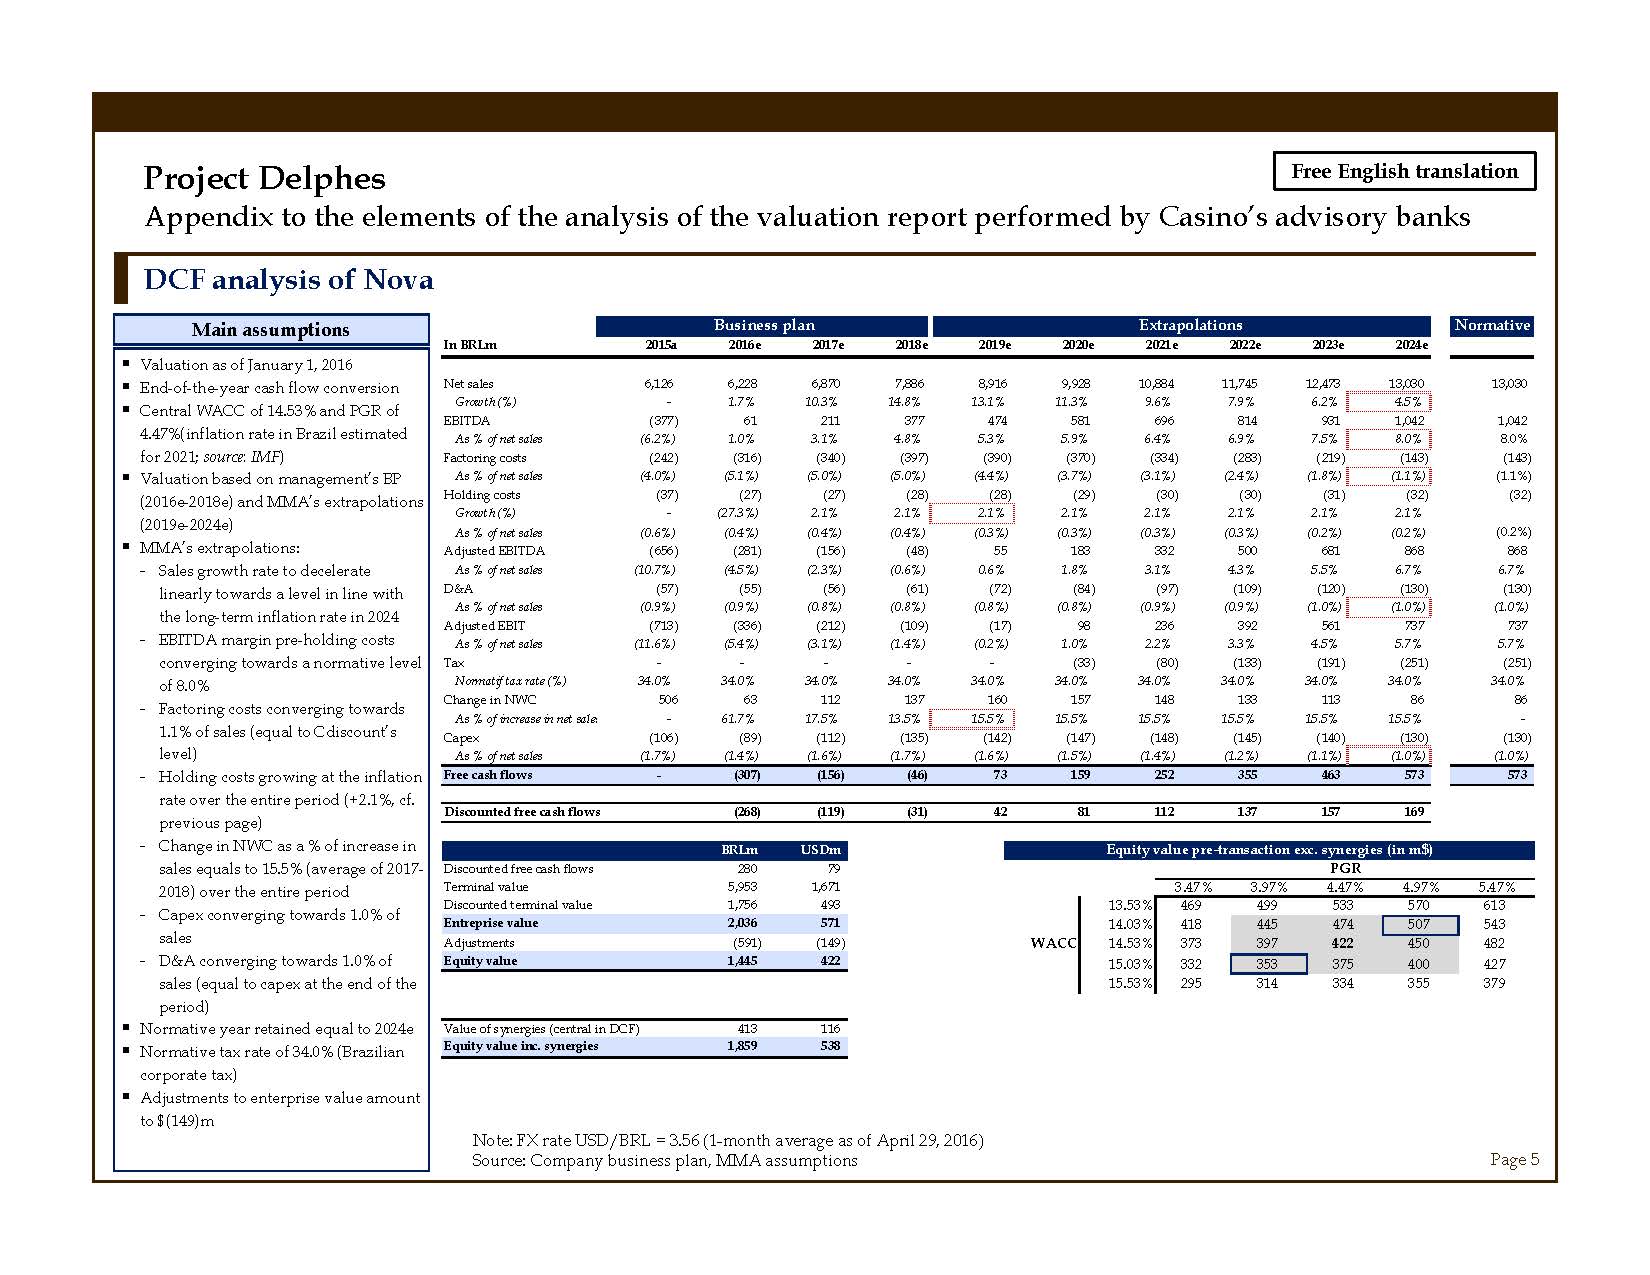
Free English translation Page 5 Note: FX rate USD/BRL = 3.56 (1 - month average as of April 29, 2016) Source: Company business plan, MMA assumptions DCF analysis of Nova Business plan Extrapolations Normative In BRLm 2015a 2016e 2017e 2018e 2019e 2020e 2021e 2022e 2023e 2024e Net sales 6,126 6,228 6,870 7,886 8,916 9,928 10,884 11,745 12,473 13,030 13,030 Growth (%) - 1.7% 10.3% 14.8% 13.1% 11.3% 9.6% 7.9% 6.2% 4.5% EBITDA (377) 61 211 377 474 581 696 814 931 1,042 1,042 As % of net sales (6.2%) 1.0% 3.1% 4.8% 5.3% 5.9% 6.4% 6.9% 7.5% 8.0% 8.0% Factoring costs (242) (316) (340) (397) (390) (370) (334) (283) (219) (143) (143) As % of net sales (4.0%) (5.1%) (5.0%) (5.0%) (4.4%) (3.7%) (3.1%) (2.4%) (1.8%) (1.1%) (1.1%) Holding costs (37) (27) (27) (28) (28) (29) (30) (30) (31) (32) (32) Growth (%) - (27.3%) 2.1% 2.1% 2.1% 2.1% 2.1% 2.1% 2.1% 2.1% As % of net sales (0.6%) (0.4%) (0.4%) (0.4%) (0.3%) (0.3%) (0.3%) (0.3%) (0.2%) (0.2%) (0.2%) Adjusted EBITDA (656) (281) (156) (48) 55 183 332 500 681 868 868 As % of net sales (10.7%) (4.5%) (2.3%) (0.6%) 0.6% 1.8% 3.1% 4.3% 5.5% 6.7% 6.7% D&A (57) (55) (56) (61) (72) (84) (97) (109) (120) (130) (130) As % of net sales (0.9%) (0.9%) (0.8%) (0.8%) (0.8%) (0.8%) (0.9%) (0.9%) (1.0%) (1.0%) (1.0%) Adjusted EBIT (713) (336) (212) (109) (17) 98 236 392 561 737 737 As % of net sales (11.6%) (5.4%) (3.1%) (1.4%) (0.2%) 1.0% 2.2% 3.3% 4.5% 5.7% 5.7% Tax - - - - - (33) (80) (133) (191) (251) (251) Normatif tax rate (%) 34.0% 34.0% 34.0% 34.0% 34.0% 34.0% 34.0% 34.0% 34.0% 34.0% 34.0% Change in NWC 506 63 112 137 160 157 148 133 113 86 86 As % of increase in net sales - 61.7% 17.5% 13.5% 15.5% 15.5% 15.5% 15.5% 15.5% 15.5% - Capex (106) (89) (112) (135) (142) (147) (148) (145) (140) (130) (130) As % of net sales (1.7%) (1.4%) (1.6%) (1.7%) (1.6%) (1.5%) (1.4%) (1.2%) (1.1%) (1.0%) (1.0%) Free cash flows - (307) (156) (46) 73 159 252 355 463 573 573 Discounted free cash flows (268) (119) (31) 42 81 112 137 157 169 BRLm USDm Discounted free cash flows 280 79 Terminal value 5,953 1,671 Discounted terminal value 1,756 493 Entreprise value 2,036 571 Adjustments (591) (149) Equity value 1,445 422 Value of synergies (central in DCF) 413 116 Equity value inc. synergies 1,859 538 Main assumptions Equity value pre-transaction exc. synergies (in m$) PGR 422 3.47% 3.97% 4.47% 4.97% 5.47% 13.53% 469 499 533 570 613 14.03% 418 445 474 507 543 WACC 14.53% 373 397 422 450 482 15.03% 332 353 375 400 427 15.53% 295 314 334 355 379 ▪ Valuation as of January 1, 2016 ▪ End - of - the - year cash flow conversion ▪ Central WACC of 14.53% and PGR of 4.47%(inflation rate in Brazil estimated for 2021; source: IMF ) ▪ Valuation based on management’s BP (2016e - 2018e) and MMA’s extrapolations (2019e - 2024e) ▪ MMA’s extrapolations: - Sales growth rate to decelerate linearly towards a level in line with the long - term inflation rate in 2024 - EBITDA m argin pre - holding costs converging towards a normative level of 8.0% - Factoring costs converging towards 1.1% of sales (equal to Cdiscount’s level) - Holding costs growing at the inflation rate over the entire period (+ 2.1%, cf. previous page) - Change in NWC as a % of increase in sales equals to 15.5% (average of 2017 - 2018) over the entire period - Capex converging towards 1.0% of sales - D&A converging towards 1.0% of sales (equal to capex at the end of the period) ▪ Normative year retained equal to 2024e ▪ Normative tax rate of 34.0% (Brazilian corporate tax) ▪ Adjustments to enterprise value amount to $(149)m Project Delphes Appendix to the elements of the analysis of the valuation report performed by Casino’s advisory banks
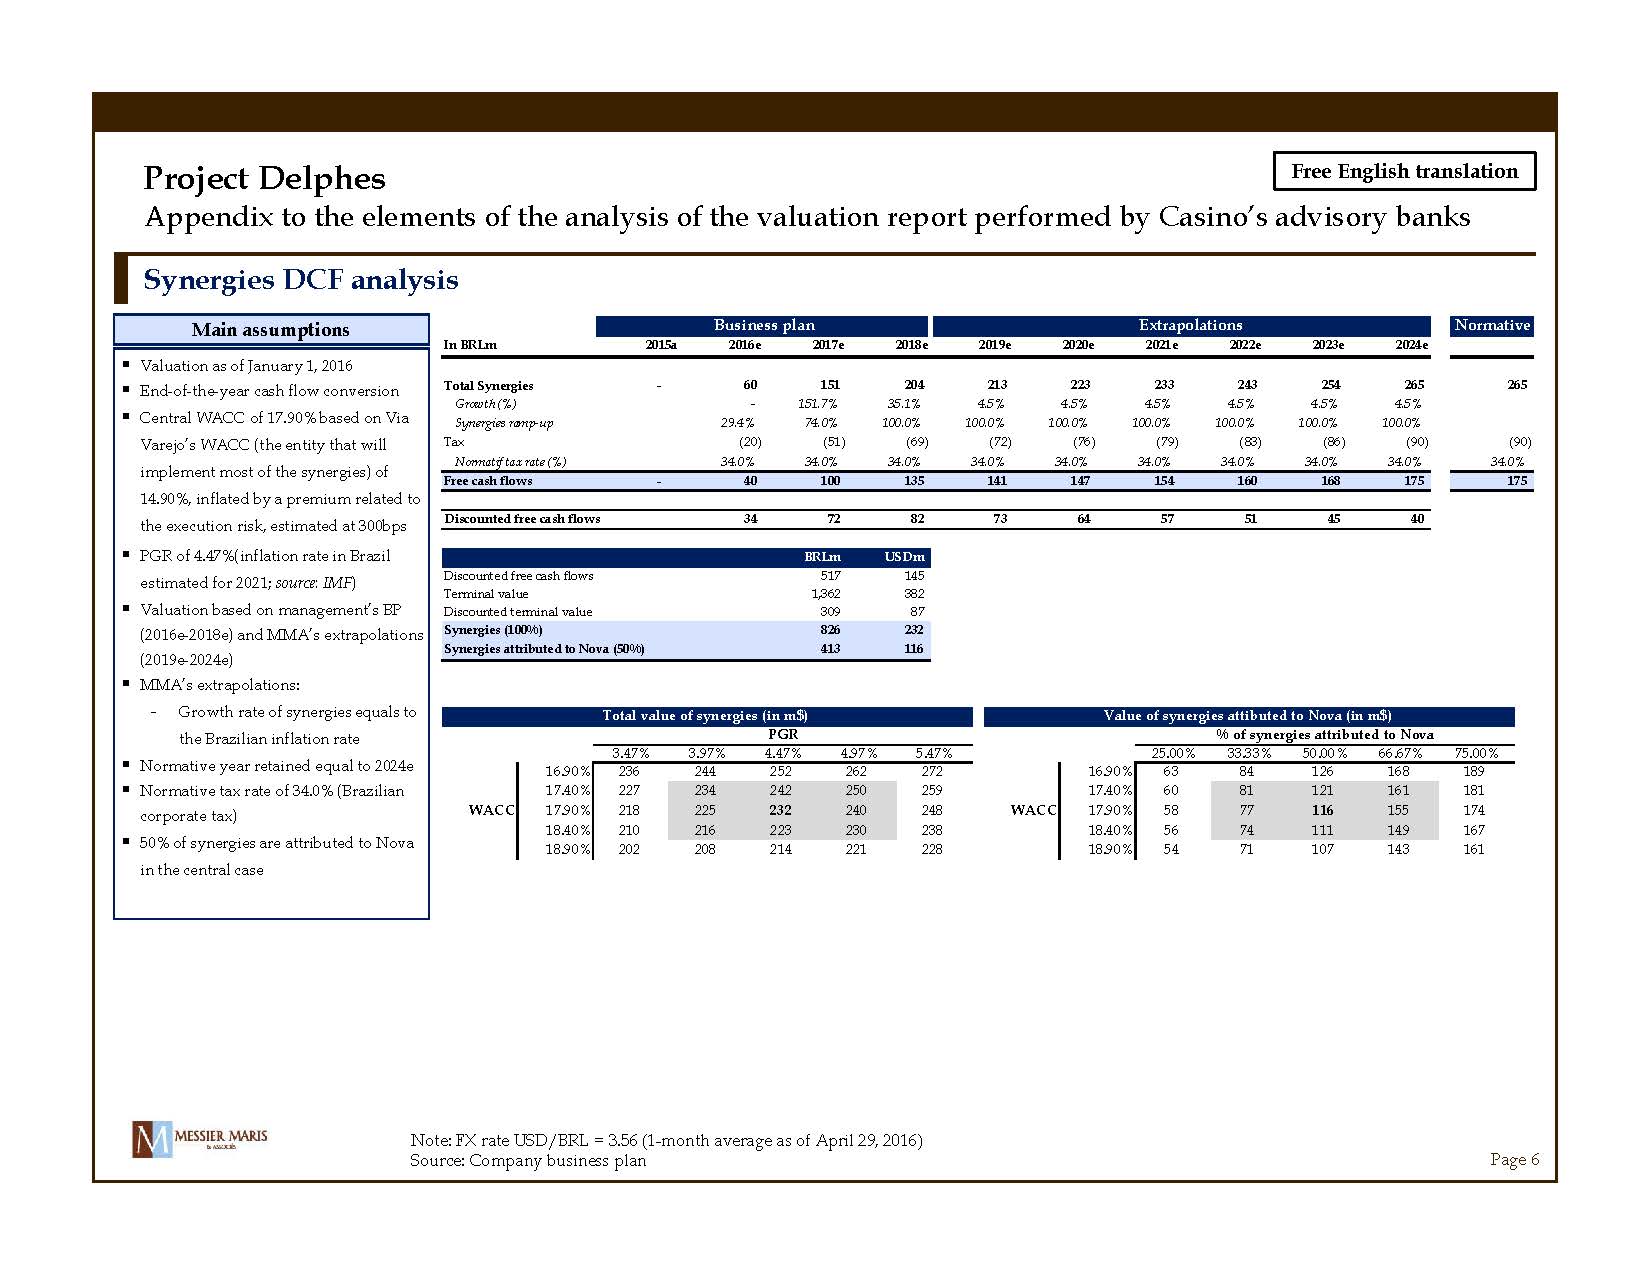
Free English translation Page 6 Note: FX rate USD/BRL = 3.56 (1 - month average as of April 29, 2016) Source: Company business plan Synergies DCF analysis Business plan Extrapolations Normative In BRLm 2015a 2016e 2017e 2018e 2019e 2020e 2021e 2022e 2023e 2024e Total Synergies - 60 151 204 213 223 233 243 254 265 265 Growth (%) - 151.7% 35.1% 4.5% 4.5% 4.5% 4.5% 4.5% 4.5% Synergies ramp-up 29.4% 74.0% 100.0% 100.0% 100.0% 100.0% 100.0% 100.0% 100.0% Tax (20) (51) (69) (72) (76) (79) (83) (86) (90) (90) Normatif tax rate (%) 34.0% 34.0% 34.0% 34.0% 34.0% 34.0% 34.0% 34.0% 34.0% 34.0% Free cash flows - 40 100 135 141 147 154 160 168 175 175 Discounted free cash flows 34 72 82 73 64 57 51 45 40 BRLm USDm Discounted free cash flows 517 145 Terminal value 1,362 382 Discounted terminal value 309 87 Synergies (100%) 826 232 Synergies attributed to Nova (50%) 413 116 Value of synergies attibuted to Nova (in m$) % of synergies attributed to Nova 116 25.00% 33.33% 50.00% 66.67% 75.00% 16.90% 63 84 126 168 189 17.40% 60 81 121 161 181 WACC 17.90% 58 77 116 155 174 18.40% 56 74 111 149 167 18.90% 54 71 107 143 161 Total value of synergies (in m$) PGR 232 3.47% 3.97% 4.47% 4.97% 5.47% 16.90% 236 244 252 262 272 17.40% 227 234 242 250 259 WACC 17.90% 218 225 232 240 248 18.40% 210 216 223 230 238 18.90% 202 208 214 221 228 Main assumptions ▪ Valuation as of January 1, 2016 ▪ End - of - the - year cash flow conversion ▪ Central WACC of 17.90% based on Via Varejo’s WACC (the entity that will implement most of the synergies) of 14.90%, inflated by a premium related to the execution risk, estimated at 300bps ▪ PGR of 4.47 %(inflation rate in Brazil estimated for 2021; source: IMF ) ▪ Valuation based on management’s BP (2016e - 2018e) and MMA’s extrapolations (2019e - 2024e) ▪ MMA’s extrapolations: - Growth rate of synergies equals to the Brazilian inflation rate ▪ Normative year retained equal to 2024e ▪ Normative tax rate of 34.0% (Brazilian corporate tax) ▪ 50% of synergies are attributed to Nova in the central case Project Delphes Appendix to the elements of the analysis of the valuation report performed by Casino’s advisory banks

Free English translation Page 7 Source: Thomson as of April 27, 2016; pre - announcements by Via Varejo and Cnova on April 28, 2016 (following the press leaks) that have impacted Cnova’s share price Cnova’s share price since IPO 0 2,000 4,000 6,000 8,000 10,000 12,000 14,000 16,000 18,000 - 1.0 2.0 3.0 4.0 5.0 6.0 7.0 8.0 9.0 Nov-14 Feb-15 May-15 Aug-15 Nov-15 Feb-16 Cnova volumes Cnova share price NASDAQ Composite index rebased Apr - 16 Price ($) Period VWAP ($) min ($) max ($) Performance 27-Apr-16 3.0$ 1 month 3.2$ 2.6$ 3.4$ 16% 3 months 2.6$ 2.1$ 3.4$ 38% 6 months 2.6$ 2.1$ 3.4$ (11)% 12 months 3.5$ 2.1$ 6.1$ (50)% Since IPO 5.7$ 2.1$ 8.5$ (58)% $3.03 ▪ Share price of Cnova between the IPO and April 27, 2016, last share price before the first rumors related to the project and the press releases of Via Varejo and Cnova on April 28, 2016, which have impacted the share price of Cnova Project Delphes Appendix to the elements of the analysis of the valuation report performed by Casino’s advisory banks volumes ’000

Free English translation Page 8 Source: Bloomberg as of April 29, 2016 Analysts’ target prices Analysts Date Recommandation Target price ($) Credit Suisse 27-Apr-16 Sell $4.00 Société Générale 26-Apr-16 Hold $2.60 Morgan Stanley 26-Apr-16 Hold $3.40 J.P. Morgan 26-Apr-16 Buy $5.00 Goldman Sachs 20-Apr-16 Sell $1.40 HSBC 12-Apr-16 Hold $2.90 Kepler Cheuvreux 12-Apr-16 Hold $2.30 Exane BNP Paribas 14-Mar-16 Hold $2.00 Average post publication of the 2015 annual results $2.95 Premium / (discount) vs. share price as of 27-Apr-16 (pre-rumors) -2.6% Minimum $1.40 Maximum $5.00 Average post publication of Q1 2016 results (26-Apr-16) $3.75 Premium / (discount) vs. share price as of 27-Apr-16 (pre-rumors) 23.8% Minimum $2.60 Maximum $5.00 Project Delphes Appendix to the elements of the analysis of the valuation report performed by Casino’s advisory banks
Complementary elements

Free English translation Page 10 Note: Spot market data as of April 29, 2016 Source: Companies, Thomson, Bloomberg, Damodaran, IMF WACC of Cdiscount Companies Levered NFD/ Unlevered Tax of the sector beta Mkt cap. beta rate Amazon USA 1.11 1,753 311,213 0.6% 1.11 40% Ao World UK 0.54 (30) 768 (3.9)% 0.55 21% Delticom Germany 0.58 4 201 1.8% 0.57 21% JD.com China 1.28 (2,203) 35,704 (6.2)% 1.34 25% Average 0.88 (1.9)% 0.89 Note: Adjusted beta calculated over 1 year on a daily basis (Bloomberg) Country Net fin. debt Mkt. cap. WACC computation Beta unlevered computation Elements Value Comments Risk free rate 1.87% 10-year US Treasury bonds yield (Bloomberg, spot) Unlevered beta 0.89 Average beta of companies of the sector (Bloomberg) Relevered beta 0.89 Relevered at the targeted leverage Equity risk premium 6.25% US equity risk premium (Damodaran, janvier 2016) Additional country risk premium 0.21% Country risk premium France vs. USA (Damodaran, janvier 2016) Cost of equity ($) 7.64% Targeted leverage - 100% equity WACC ($) 7.64% LT local inflation rate 2.06% Inflation rate in France in 2021 (IMF, April 2016) LT USA inflation rate 2.15% Inflation rate in the USA in 2021 (IMF, April 2016) WACC (EUR) 7.55% ▪ Amazon has been retained for the beta analysis, as the market leader in the e - commerce, however, it cannot be considered as a comparable company to Cdiscount given the significant differences in business - mix (weight of Amazon Web Services in the operating income), sizes and performances Project Delphes Appendix to the elements of the analysis of the valuation report performed by Casino’s advisory banks
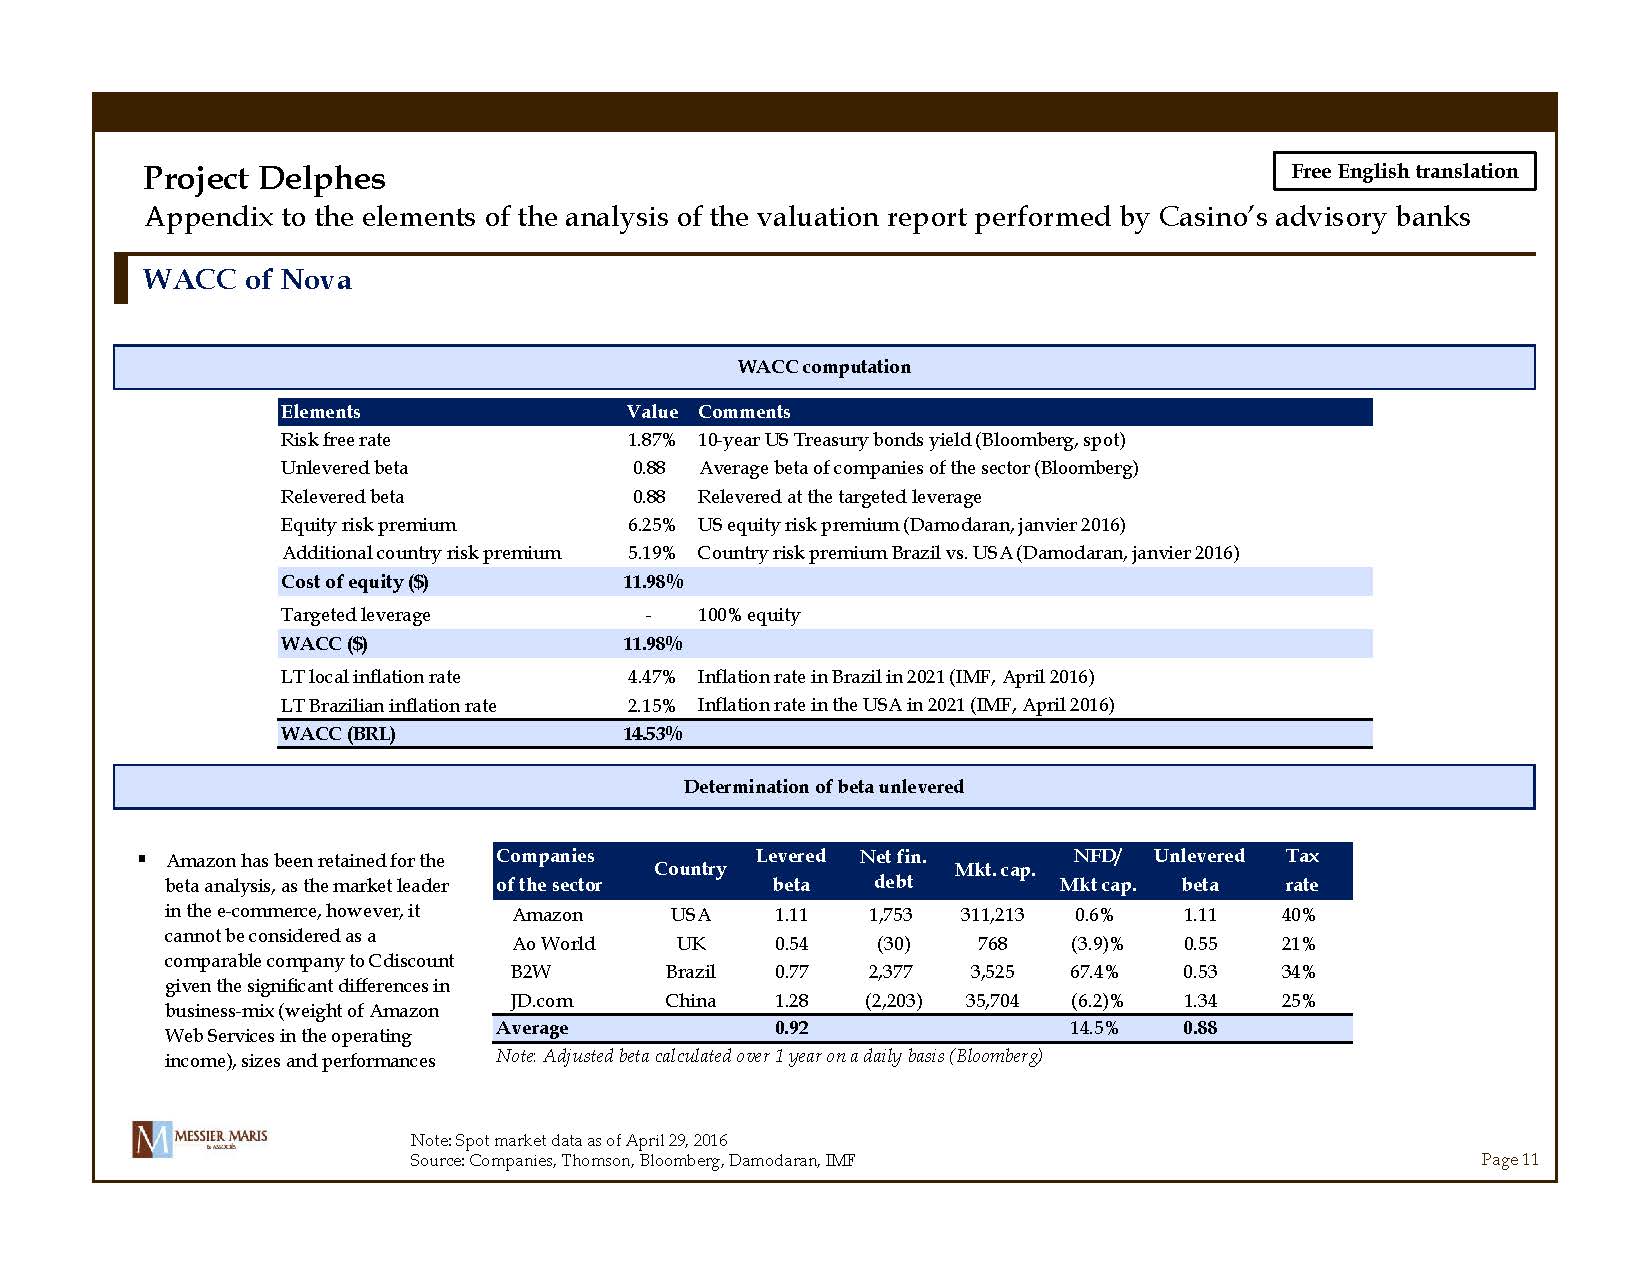
Free English translation Page 11 Note: Spot market data as of April 29, 2016 Source: Companies, Thomson, Bloomberg, Damodaran, IMF WACC of Nova Companies Levered NFD/ Unlevered Tax of the sector beta Mkt cap. beta rate Amazon USA 1.11 1,753 311,213 0.6% 1.11 40% Ao World UK 0.54 (30) 768 (3.9)% 0.55 21% B2W Brazil 0.77 2,377 3,525 67.4% 0.53 34% JD.com China 1.28 (2,203) 35,704 (6.2)% 1.34 25% Average 0.92 14.5% 0.88 Note: Adjusted beta calculated over 1 year on a daily basis (Bloomberg) Country Net fin. debt Mkt. cap. WACC computation Determination of beta unlevered Elements Value Comments Risk free rate 1.87% 10-year US Treasury bonds yield (Bloomberg, spot) Unlevered beta 0.88 Average beta of companies of the sector (Bloomberg) Relevered beta 0.88 Relevered at the targeted leverage Equity risk premium 6.25% US equity risk premium (Damodaran, janvier 2016) Additional country risk premium 5.19% Country risk premium Brazil vs. USA (Damodaran, janvier 2016) Cost of equity ($) 11.98% Targeted leverage - 100% equity WACC ($) 11.98% LT local inflation rate 4.47% Inflation rate in Brazil in 2021 (IMF, April 2016) LT Brazilian inflation rate 2.15% Inflation rate in the USA in 2021 (IMF, April 2016) WACC (BRL) 14.53% ▪ Amazon has been retained for the beta analysis, as the market leader in the e - commerce, however, it cannot be considered as a comparable company to Cdiscount given the significant differences in business - mix (weight of Amazon Web Services in the operating income), sizes and performances Project Delphes Appendix to the elements of the analysis of the valuation report performed by Casino’s advisory banks
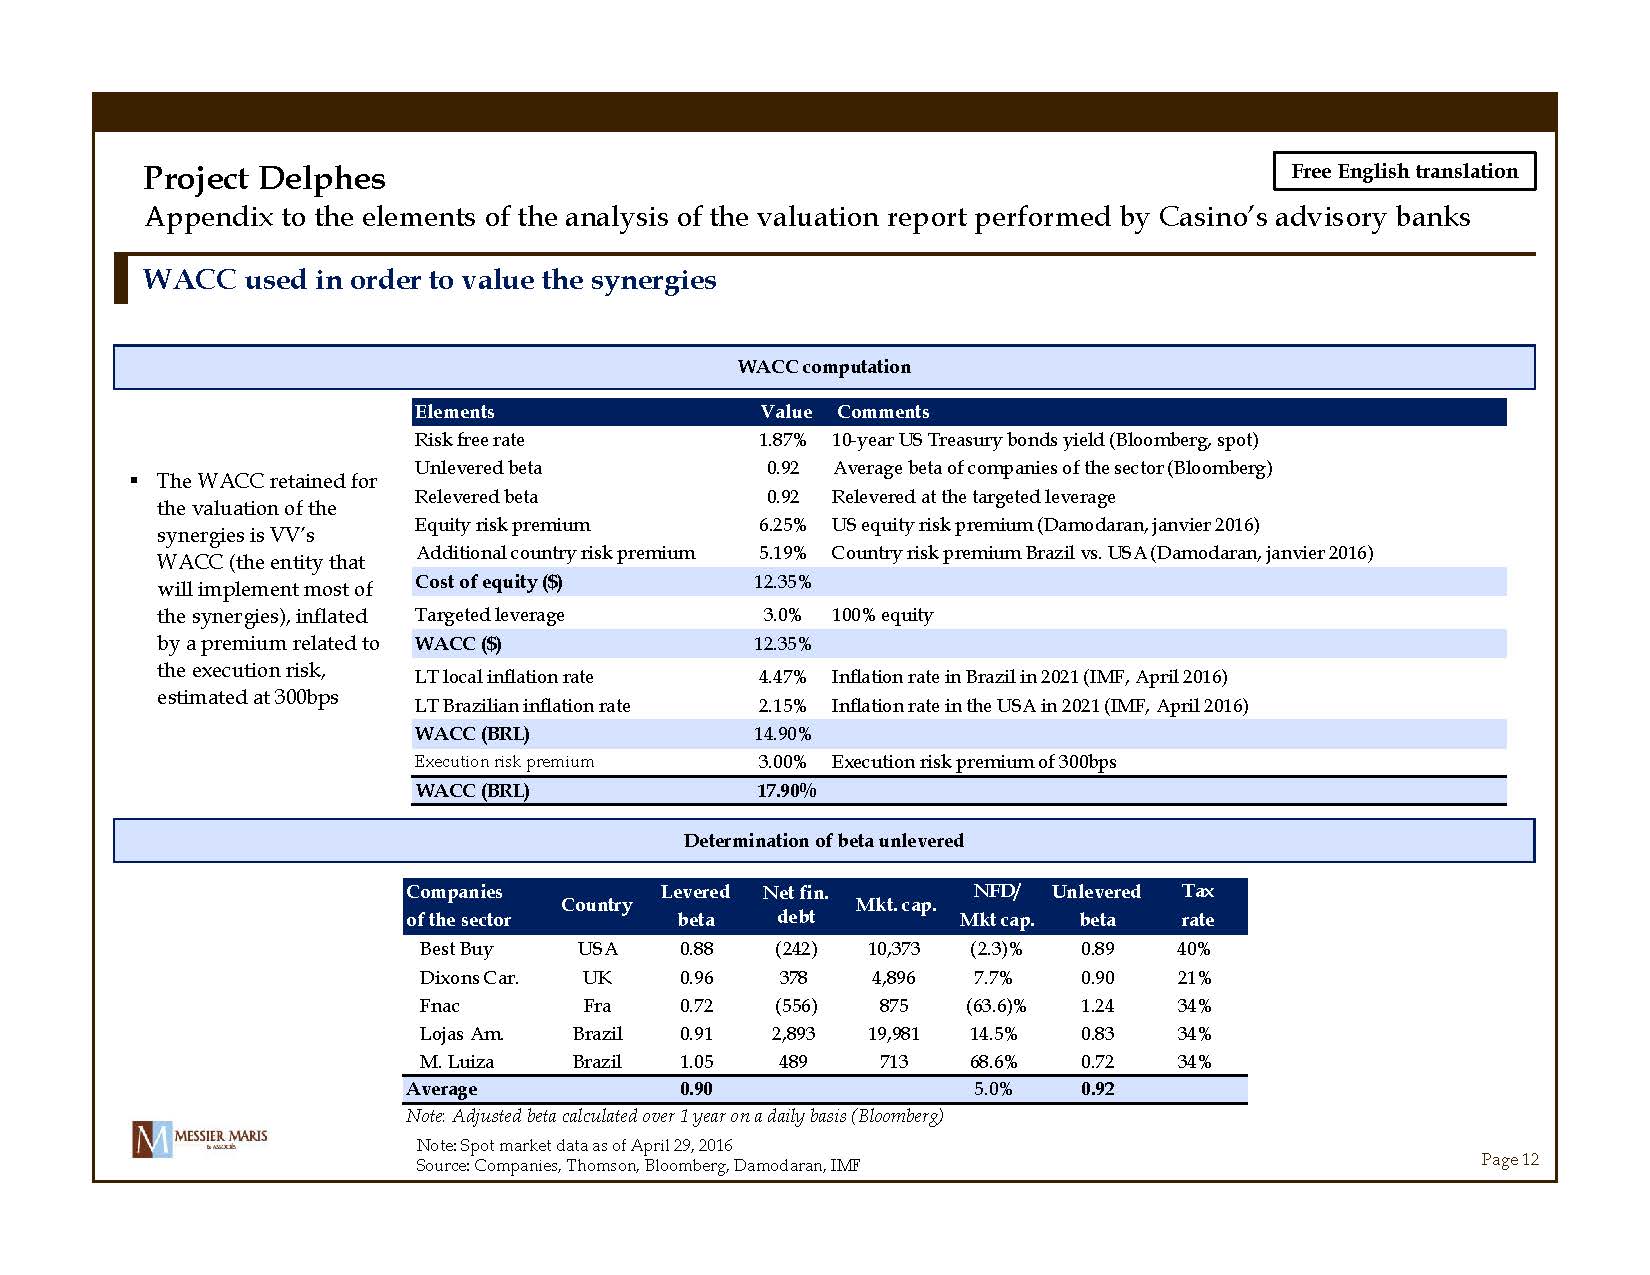
Free English translation Page 12 WACC used in order to value the synergies WACC computation Determination of beta unlevered Companies Levered NFD/ Unlevered Tax of the sector beta Mkt cap. beta rate Best Buy USA 0.88 (242) 10,373 (2.3)% 0.89 40% Dixons Car. UK 0.96 378 4,896 7.7% 0.90 21% Fnac Fra 0.72 (556) 875 (63.6)% 1.24 34% Lojas Am. Brazil 0.91 2,893 19,981 14.5% 0.83 34% M. Luiza Brazil 1.05 489 713 68.6% 0.72 34% Average 0.90 5.0% 0.92 Note: Adjusted beta calculated over 1 year on a daily basis (Bloomberg) Country Net fin. debt Mkt. cap. Elements Value Comments Risk free rate 1.87% 10-year US Treasury bonds yield (Bloomberg, spot) Unlevered beta 0.92 Average beta of companies of the sector (Bloomberg) Relevered beta 0.92 Relevered at the targeted leverage Equity risk premium 6.25% US equity risk premium (Damodaran, janvier 2016) Additional country risk premium 5.19% Country risk premium Brazil vs. USA (Damodaran, janvier 2016) Cost of equity ($) 12.35% Targeted leverage 3.0% 100% equity WACC ($) 12.35% LT local inflation rate 4.47% Inflation rate in Brazil in 2021 (IMF, April 2016) LT Brazilian inflation rate 2.15% Inflation rate in the USA in 2021 (IMF, April 2016) WACC (BRL) 14.90% Execution risk premium 3.00% Execution risk premium of 300bps WACC (BRL) 17.90% ▪ The WACC retained for the valuation of the synergies is VV’s WACC (the entity that will implement most of the synergies), inflated by a premium related to the execution risk, estimated at 300bps Project Delphes Appendix to the elements of the analysis of the valuation report performed by Casino’s advisory banks Note: Spot market data as of April 29, 2016 Source: Companies, Thomson, Bloomberg, Damodaran, IMF
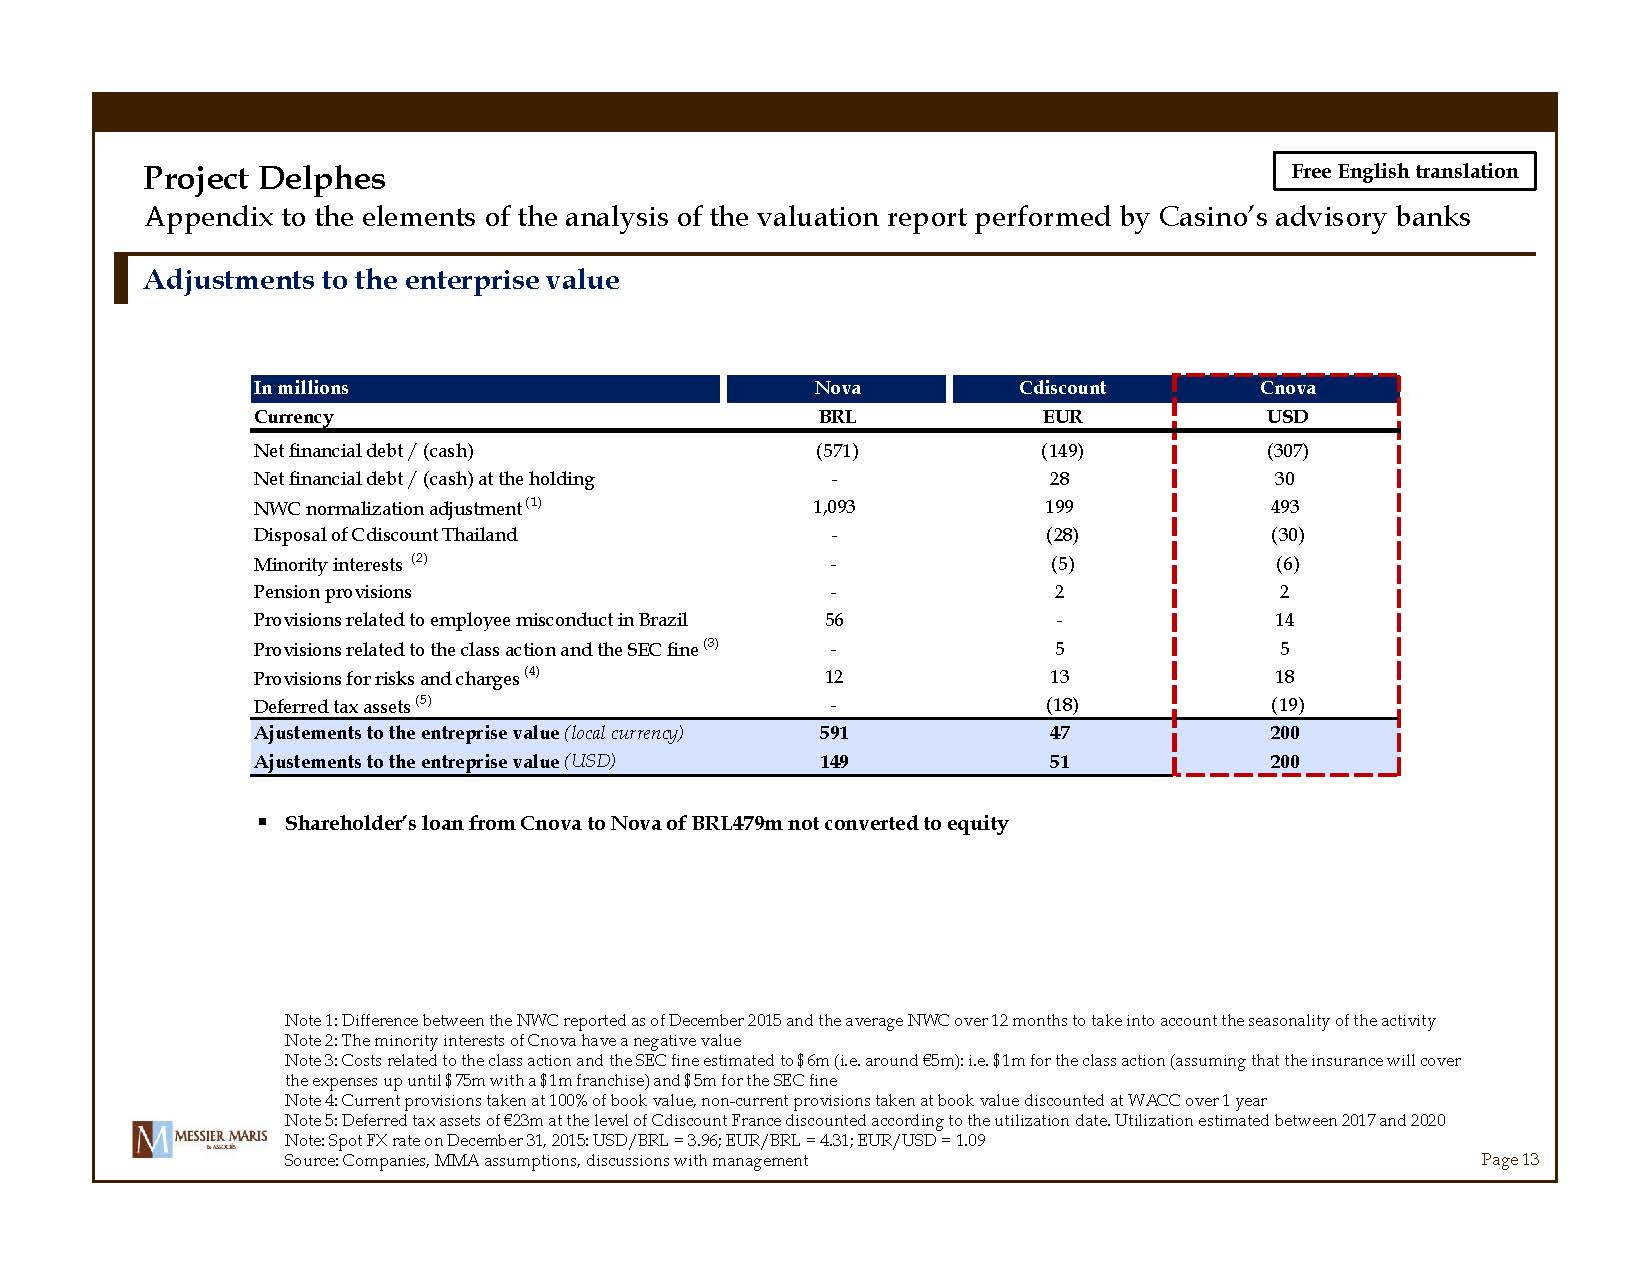
Free English translation Page 13 Note 1: Difference between the NWC reported as of December 2015 and the average NWC over 12 months to take into account the s eas onality of the activity Note 2: The minority interests of Cnova have a negative value Note 3: Costs related to the class action and the SEC fine estimated to $6m (i.e. around € 5m): i.e. $1m for the class action (assuming that the insurance will cover the expenses up until $75m with a $1m franchise) and $5m for the SEC fine Note 4: Current provisions taken at 100% of book value, non - current provisions taken at book value discounted at WACC over 1 year Note 5: Deferred tax assets of € 23m at the level of Cdiscount France discounted according to the utilization date. U tilization estimated between 2017 and 2020 Note: Spot FX rate on December 31, 2015: USD/BRL = 3.96; EUR/BRL = 4.31; EUR/USD = 1.09 Source: Companies, MMA assumptions, discussions with management Adjustments to the enterprise value In millions Nova Cdiscount Cnova Currency BRL EUR USD Net financial debt / (cash) (571) (149) (307) Net financial debt / (cash) at the holding - 28 30 NWC normalization adjustment (1) 1,093 199 493 Disposal of Cdiscount Thailand - (28) (30) Minority interests (2) - (5) (6) Pension provisions - 2 2 Provisions related to employee misconduct in Brazil 56 - 14 Provisions related to the class action and the SEC fine (3) - 5 5 Provisions for risks and charges (4) 12 13 18 Deferred tax assets (5) - (18) (19) Ajustements to the entreprise value (local currency) 591 47 200 Ajustements to the entreprise value (USD) 149 51 200 ▪ Shareholder’s loan from Cnova to Nova of BRL479m not converted to equity Project Delphes Appendix to the elements of the analysis of the valuation report performed by Casino’s advisory banks

Free English translation Page 14 Note: Spot market data as of April 29, 2016 Source: Companies, Thomson Listed companies from the sector – Operational metrics and valuation multiples Listed companies Mkt. Cap Entreprise Sales growth EBITDA margin EBIT margin from the sector (€m) value (€m) 2016 2017 2018 2016 2017 2018 2016 2017 2018 Sample for Nova Ao World 982 944 27.3% 24.3% 14.4% 0.2% 1.5% 3.2% (0.4%) 0.9% 2.3% B2W 892 1,493 13.6% 13.6% 12.1% 7.4% 8.4% 9.1% 4.2% 5.1% 6.0% JD.com 31,173 27,938 43.0% 34.1% 27.6% 1.2% 2.2% 3.4% (0.4%) 0.6% 2.1% Nova - Sample average 28.0% 24.0% 18.0% 2.9% 4.0% 5.2% 1.1% 2.2% 3.5% Nova - Sample median 27.3% 24.3% 14.4% 1.2% 2.2% 3.4% (0.4%) 0.9% 2.3% Sample for Cdiscount Ao World 982 944 27.3% 24.3% 14.4% 0.2% 1.5% 3.2% (0.4%) 0.9% 2.3% Delticom 201 205 7.9% 6.1% 6.2% 2.8% 3.3% 3.4% 1.7% 2.3% 2.5% JD.com 91,173 27,938 43.0% 34.1% 27.6% 1.2% 2.2% 3.4% (0.4%) 0.6% 2.1% Cdiscount - Sample average 26.1% 21.5% 16.0% 1.4% 2.3% 3.3% 0.3% 1.3% 2.3% Cdiscount - Sample median 27.3% 24.3% 14.4% 1.2% 2.2% 3.4% (0.4%) 0.9% 2.3% Average 27.0% 22.8% 17.0% 2.2% 3.2% 4.3% 0.7% 1.7% 2.9% Median 27.3% 24.3% 14.4% 1.2% 2.2% 3.4% (0.4%) 0.9% 2.3% Listed companies Mkt. Cap Entreprise EV / Sales EV / EBITDA EV / EBIT from the sector (€m) value (€m) 2016 2017 2018 2016 2017 2018 2016 2017 2018 Sample for Nova Ao World 982 944 1.02x 0.82x 0.72x ns ns 22.6x neg ns 31.1x B2W 892 1,493 0.58x 0.51x 0.45x 7.8x 6.1x 5.0x 13.8x 10.0x 7.6x JD.com 31,173 27,938 0.80x 0.60x 0.47x ns 26.8x 13.6x neg ns 22.4x Nova - Sample average 0.80x 0.64x 0.55x 7.8x 16.5x 13.7x 13.8x 10.0x 20.4x Nova - Sample median 0.80x 0.60x 0.47x 7.8x 16.5x 13.6x 13.8x 10.0x 22.4x Sample for Cdiscount Ao World 982 944 1.02x 0.82x 0.72x ns ns 22.6x neg ns 31.1x Delticom 201 205 0.34x 0.32x 0.30x 12.0x 9.8x 8.9x 19.7x 13.9x 12.3x JD.com 91,173 27,938 0.80x 0.60x 0.47x ns 26.8x 13.6x neg ns 22.4x Cdiscount - Sample average 0.72x 0.58x 0.50x 12.0x 18.3x 15.0x 19.7x 13.9x 21.9x Cdiscount - Sample median 0.80x 0.60x 0.47x 12.0x 18.3x 13.6x 19.7x 13.9x 22.4x Average 0.76x 0.61x 0.52x 9.9x 17.4x 14.4x 16.7x 12.0x 21.2x Median 0.80x 0.60x 0.47x 9.9x 18.3x 13.6x 16.7x 12.0x 22.4x Project Delphes Appendix to the elements of the analysis of the valuation report performed by Casino’s advisory banks

Free English translation Page 15 Listed company from the industry – Profiles Companies Key Figures Description Breakdown of sales by geography Shareholding Ao World ▪ Market cap.: € 982m ▪ EV: € 944m ▪ Sales 2015: € 610m ▪ EBITDA 2015: € 11m ▪ EBITDA margin: 1.8% ▪ Based in the United Kingdom, AO World is an online retailer of electronical household products, operating mainly via its website AO.com ▪ AO World has grown down the chain value by buying in 2009 the company Expert Logistics, a distribution company, allowing it to directly deliver the customers ▪ AO World is a listed company since February 2014 ▪ United Kingdom: 99% ▪ Rest of Europe: 1% ▪ Mr. Roberts (founder & CEO): 26% ▪ Mr. Caunce (COO): 12% ▪ Float: 62% B2W ▪ Market cap.: € 892m ▪ EV: € 1,493m ▪ Sales 2015: € 2,281m ▪ EBITDA 2015: € 154m ▪ EBITDA Margin: 6.8% ▪ Based in Brazil, B2W is the e - commerce leader in Brazil ▪ B2W offers 40 products categories ▪ Its main brands are: Americanas.com; Submari; Blockbuster Online et SouBarotos ▪ B2W is listed on the Sao Paulo stock exchange since 2005 ▪ Mainly Brazil ▪ Other: Mexico, Argentina ▪ Lojas Americanas (food and non - food Brazilian retailer): 56% ▪ APG AM: 11% ▪ Float: 33% Delticom ▪ Market cap.: € 201m ▪ EV: € 205m ▪ Sales 2015: € 560m ▪ EBITDA 2015: € 14m ▪ EBITDA Margin: 2.6% ▪ Based in Hanover, Delticom is the European leader of online sales of tires with 137 online stores within 42 countries ▪ The company sells any kind of tires for all sorts of vehicles in B2B and B2C ▪ The products are directly shipped either to the customers, or to one of the 35,000 replacement partner stations ▪ Delticom is listed on the German stock exchange since October, 2006 ▪ Europe: 78% ▪ USA and other regions: 22% ▪ Mr. Prüfer & Mr. Binder (founders): 50% ▪ Float: 50% JD.com ▪ Market cap.: € 31.2 bn ▪ EV: € 27.9bn ▪ CA 2015: € 24.4bn ▪ EBITDA 2015: € (147)m ▪ EBITDA Margin: neg. ▪ Based in China, JD.com is one of the e - commerce leaders in China with a market share of 57% ▪ The website operates with a business model based primarily on own sales (compared to Alibaba’s marketplace model) ▪ JD.com offers mainly electronical products ▪ JD.com is listed on the Nasdaq since 2014 ▪ China: 100% ▪ Hillhouse Capital: 11% ▪ DST Global: 10% ▪ Tiger Global: 5% ▪ Float: 75% Project Delphes Appendix to the elements of the analysis of the valuation report performed by Casino’s advisory banks Note: Spot market data as of April 29, 2016 Source: Companies, Thomson