EXHIBIT (c)(5) Project Delphes Financial Analysis Report CONFIDENTIAL | Sã+7o Paulo, August 5th 2016 This document is a free translation of the “Relatório de Análises Financeiras” (in Portuguese) furnished by Banco Santander (Brasil) S.A. on August 5, 2016. The document in Portuguese should always prevail over this version.
Important Note p.1 1. Banco Santander (Brasil) S.A. (“Santander”) has been engaged by Via Varejo S.A. (“Via Varejo” or “Company”), as requested by Via Varejo’s special committee (“Via Varejo Special Committee”), a committee established to comply with the guidelines of CVM Practice Bulletin (Parecer de Orientação da Comissão de Valores Mobiliários) n 35, dated as of September 1st, 2008 (“POCVM35”), exclusively in relation to the integration of the electronic commerce activities developed by Cnova Comércio Eletrônico S.A. (“Cnova Brasil”), a wholly-owned subsidiary of Cnova N.V. (“Cnova”), with Via Varejo’s business, pursuant to the Material Fact published by Via Varejo on May 11, 2016 (“Reorganization”). 2. Santander has been engaged by the Company with the sole purpose of assisting the Via Varejo Special Committee in its work and preparing a financial analysis report ("Financial Analysis Report") consolidating the analysis prepared within the scope of the services and, based on such analysis, indicating a valuation range of the Cnova’s shares and a valuation range for the capital stock of Cnova Brazil. 3. This Financial Analysis Report is an intellectual property of Santander and was prepared by Santander, exclusively to aid the Special Committee of Via Varejo in the context of the analysis of the Reorganization. The present Financial Analysis Report is provided on a confidential basis and shall not be used by the Company, by the Via Varejo Special Committee or any authorized third parties, for other purposes and shall not be disclosed, distributed, reproduced, summarized or made available to any third parties or applied for any other purposes without prior written authorization of Santander. This Financial Analysis Report may be disclosed to Via Varejo, its board of directors and shareholders, and/or, in order to fulfill legal and regulatory obligations related to the Reorganization, to CVM and the stock exchanges (bolsa de valores) in which securities issued by the Company are listed, pursuant to the respective applicable normative laws. 4. In case it is necessary to disclose the Financial Analysis Report in accordance with the law and/or the applicable regulation, this material shall only be disclosed in case its content is reproduced in its entirety, and any description or reference to Santander shall be made in a reasonable form and expressly approved by Santander and its consultants. Except by prior and express authorization, in writing, by Santander, no other person beyond the members of the Via Varejo Special Committee and the Company’s Board of Directors is authorized to use any representations, advices, opinions or conducts to third parties, except in the form required by the applicable law and the applicable regulation. 5. In case versions of the Financial Analysis Report are prepared in any language other than Portuguese, the Portuguese version of the Financial Analysis Report shall always prevail. 6. The Financial Analysis Report shall be read and interpreted in light of the assumptions, restrictions, qualifications and other conditions herein mentioned. Any person that uses this Financial Analysis Report, as long as duly authorized to do so, shall consider in its analyses the restrictions and characteristics of the sources of information used herein.
Important Note (cont’d) p.2 7. This Financial Analysis Report does not constitute judgment, opinion, proposal, request, suggestion or recommendation, express or implied, to the Via Varejo Special Committee, the Board of Directors or shareholders of the Company, or any third party regarding the convenience and opportunity, or regarding the terms and conditions of the Reorganization, included, but not limited to, its contractual terms, the definition of value or the exchange of shares issued by Cnova with shares issued by Cnova Brasil, regarding the Reorganization, or any other related values or the structure of the Reorganization. 8. This Financial Analysis Report does not intend to be the only base for the Via Varejo Special Committee, the Board of Directors and shareholders of the Company’s analysis of the Reorganization, as it does not include all necessary information for such analysis. Any decision undertaken by the Via Varejo Special Committee, by the Board of Directors of the Company and its shareholders will be at their exclusive and sole responsibility. The analysis of risk and benefits related to the implementation and approval of the Reorganization shall be exclusively and independently conducted by the Via Varejo Special Committee, the Board of Directors of the Company and its shareholders, as the case may be. 9. Cnova and Cnova Brasil, including their respective controlled and affiliated entities, have been evaluated independently (standalone) and the possible success or failure of any transaction regarding the Reorganization was not considered in the results of the valuation range of both companies. 10. Notwithstanding the above, Santander was requested by the Via Varejo Special Committee to analyze, strictly from an economic and financial perspective, the potential synergies that the Company could capture as a result of the Reorganization. The studies and analysis of the potential synergies, their financial impact and ramp-up curves ("Synergies’ Studies") were prepared by external consultants and reviewed and/or discussed with the teams of Via Varejo and Cnova Brasil. Additionally, it was prepared by Via Varejo a study on the financial impact of the potential reduction of the inventories of Via Varejo and Cnova Brasil after the Reorganization. The Synergies’ Studies were considered as a base for the analysis conducted by Santander. Santander has not conducted any investigation, independent verification or due diligence regarding the Synergies’ Studies and its viability. Therefore, Santander assumes that the Synergies’ Studies are complete and accurate and reflect the current best estimates of the companies. Santander does not express any opinion on potential effects that the Company might incur and assumes no liability with respect to the result of the Reorganization. 11. The results presented in this Financial Analysis Report, except regarding the potential synergies, refer exclusively to the companies (standalone) and do not apply to any other matter or transaction, present or future, related to the Company, Cnova Brasil, Cnova or to the economic groups of which they are part or to the sector in which they operate. Additionally, this Financial Analysis Report does not cover the strategic and commercial merits of the Reorganization, neither covers the possible strategic and commercial decision of the Company or its shareholders in participating, analyzing or executing the Reorganization, or any other strategies or other transactions that may be available to the Company. The use of values informed in the Financial Analysis Report for any other valuation related to Cnova and Cnova Brasil, or to any other purpose not covered by this Financial Analysis Report, is of the exclusive responsibility of the Board of Directors, the Company and /or its shareholders.
Important Note (cont’d) p.312. Santander does not express any opinion about the effects that eventually may be generated to the Company from the execution of the Reorganization or by any transaction involving the Company, or any of its controlled or affiliated entities. This Financial Analysis Report did not take into consideration any previous valuations of the Company, its subsidiaries, controlled or affiliated entities directly or indirectly or any securities issued by those companies, done by Santander or by any other institution, in the context of any transaction, offers or past negotiations involving the Company. In preparing this Financial Analysis Report, Santander prepared exclusively a financial-economic valuation of the companies. 13. Among the methodologies presented in the Financial Analysis Report for informative and reference purposes, Santander understands that the discounted cash flow (DCF) is the most appropriate methodology to evaluate the Company, since it considers the Cnova and Cnova Brasil’s operational cash flow discounted by its respective cost of capital, based in their respective operational aspects and specificities. In this sense, the risk profile and the cash generation potential of these companies are projected in more detail. Additionally, Santander prepared a valuation analysis based on trading and transaction implied multiples of comparable companies. In order to determine the economic-financial value per share of Cnova and Cnova Brasil, Santander considered the number of shares issued and outstanding as of June 30th, 2016. 14. The base date of the valuation contained in this Financial Analysis Report is June 30th, 2016. 15. The Financial Analysis Report was prepared by Santander based on the information prepared or supplied by the companies and/or discussed with the companies’ representatives, their external advisors and with the Company’s representatives appointed to Santander, as well as other publicly available information, in addition to the projections, estimates and analysis based on Santander’s expertise and experience. 16. The Financial Analysis Report prepared by Santander was based on, among others, the following information or documents that were made available by the Company to Santander until July 29th, 2016, which, jointly with the public information, estimates, projections, business plans, budgets, discussions and other information referred to in the items set forth herein below and utilized in the Financial Analysis Report, are hereinafter jointly referred to as “Information”: (i) audited and consolidated financial statements, republished on July 22nd, 2016, of the companies’ fiscal years ending on December 31st, 2013, December 31st, 2014 and December 31st, 2015 and the financial statements reviewed by an auditor related to the period ended on June 30th, 2016 (the “Reported Financial Statements”); (ii) public information regarding the business sectors in which the companies operate; (iii) Company’s business plan for the fiscal years of 2016 to 2018 prepared and reviewed by the management of the companies and approved by Cnova’s Board of Directors (“Business Plan”); (iv) discussions with the companies’ representatives and external advisors appointed to Santander regarding past performances and expectations for the future of the companies’ business; and (v) Synergies’ Studies, and mentioned above. 17. When preparing the Financial Analysis Report, Santander contemplated other financial and market studies and analyses and considered other aspects it deemed necessary, including the judgment of economic, monetary and market conditions; however, without making any independent verification.

Important Note (cont’d) p.418. The demographic, macroeconomic and regulatory Information of the stock markets and markets in which the companies, their controlled and affiliated entities mentioned in the Financial Analysis Report have activities, when not supplied by the companies, were based, among others, in publicly renowned sources, considered trustworthy (sector entities, governmental authorities and specialized publications), and, if applicable, such as the Brazilian Institute of Geography and Statistics (IBGE), Brazilian Central Bank, Brazilian Securities and Exchange Commission (Comissão de Valores Mobiliários – CVM), Bloomberg, Thomson Reuters, Economática, Ibbotson and Santander’s Economic Department. 19. Except when otherwise stated, the Financial Analysis Report takes into consideration the financial and accounting conditions of the companies, its controlled and affiliated entities, as reflected on the information received until July 29th, 2016, and therefore any modification in these conditions or in any Information after the present date may impact the results presented herein. Santander is not obliged to, at any time, update, review, correct or restate any information contained in the Financial Analysis Report, or to supply any additional information regarding the Financial Analysis Report. 20. Santander assumes and relies on the correctness, truthfulness, integrity, consistence, sufficiency and precision of all Information, whether disclosed in written form, or by means of discussions with the companies’ representatives and external advisors appointed to Santander, or publicly available, and does not undertake any liability for the correctness, truthfulness, integrity, consistence, sufficiency and precision of the Information, nor regarding the manner in which they were prepared. Santander assumes that all Information supplied to Santander or, in any form, made available by the companies or discussed with the companies’ representatives appointed to Santander are complete, correct and sufficient for the purposes of the Financial Analysis Report, and that, between the date the Information was supplied until the present date, to the best of Santander’s knowledge, there were no material modification in the business, corporate purpose, financial situation, assets, liabilities, business perspectives, commercial transactions or in the number of shares of the companies’ capital stock, as well as there were no other significant events that could potentially impact the Information, or caused the Information to become incorrect or imprecise in any material aspects or that could potentially have a material effect on the results of the Financial Analysis Report. 21. Santander does not assume and did not assume, with the Company’s authorization, responsibility for any independent investigation and did not independently verify, or was solicited to verify, any information that is publicly available or in any form disclosed to Santander, related to the companies, or in any form used in this Financial Analysis Report, including, without limitation, any operational or financial information, provisions, estimates or projections, considered in the companies’ financial valuation, including the Synergies’ Studies. Thus, when preparing this Financial Analysis Report, Santander, with the Company’s authorization, assumed and considered such information, true, precise and complete. Santander did not conduct (i) any valuation of the assets and liabilities (including any contingency, responsibility or off-balance sheet debt) of the companies, their controlled and affiliated entities; (ii) review or due diligence of the companies’ financial statements, their controlled and affiliated entities; (iii) technical due diligence of the companies’ operations, their controlled and affiliated entities; (iv) valuation of the companies, their controlled and affiliated entities’ solvency, according to any legislation related to bankruptcy, insolvency, judicial or extra-judicial recovery or similar issues; or (v) any physical inspection of the real estate properties, installations or assets of the Company, its controlled and affiliated entities.
Important Note (cont’d) p.522. Based on the Company’s and its representatives’ statement, Santander adopts the following assumptions: (i) the Company’s financial projections as per the Business Plan that were delivered to Santander by the Company reflects the best existing estimates on the date hereof, and reflects the best judgment of the companies’ management regarding the expectations of the companies’ future performance; and (ii) the estimates and projections that were delivered by the companies to Santander or discussed between Santander and companies’ representatives appointed to Santander, especially those of which the occurrence depend on future and uncertain events (including revenues, expenses, investments, operational profit or net profit projections) were based on the best judgment of the companies’ management. 23. Santander assumed, with your permission, that all governmental or regulatory authorizations, or any necessary and relevant consents regarding the execution of the business plan proposed in this Financial Analysis Report shall be obtained and, that regarding the obtainment of such authorizations and consents, or any alterations, modifications or waiver to any agreements, instruments or order in which the Company or Cnova is part or is subject to or is bound to, no limitation, restriction, term or condition, that would be relevant to our analysis, shall be imposed. 24. Neither Santander, nor any officers, members of the board of directors, employees, consultants, agents, representatives or any other person related to Santander makes nor shall make, expressly or implicitly, any representation, declaration or warranty regarding the completeness, accuracy, veracity, integrity, consistency, sufficiency, reasonableness and precision of the supplied information, including studies, projections or provisions of the companies, or assumptions and estimates in which such projections and predicaments are based on, used for the drafting of the Financial Analysis Report, nor assume any responsibility or obligation to indemnify regarding the content, accuracy, truthfulness, integrality, consistency, sufficiency and precision of such Information, which are of the Company’s full and exclusive responsibility. In this sense, regarding the liabilities and contingencies of Cnova, it is worth mentioning that Santander considered only the amounts duly provisioned for in the Reported Financial Statements as well as the informed balance based on the results of the diligences, provided that it did not consider the possibility of its eventual inaccuracy or insufficiency neither the effects of any judicial claims and/or administrative proceedings (civil, environmental, fiscal, labor, social security or of any other nature) in course involving such Company. 25. To the extent that, as publicly known, Cnova went through an investigation conducted by legal advisors and external accountants hired to ascertain possible irregularities potentially committed in inventory management in its distribution centers in Brazil, Santander made no verification about the potential contingencies arising from such facts and the Financial Analysis Report does not include any analysis in this regard. 26. Santander does not provide nor render services related to due diligence, accounting or legal (including tax, competition or regulatory) and the preparation of the Financial Analysis Report by Santander does not include any service or advice of such nature. 27. Santander is not and shall not be held liable for any direct or indirect losses or losses of profits eventually resulting from the use of the Financial Analysis Report.

Important Note (cont’d) p.628. The preparation of financial-economic valuation is a complex process that involves subjective judgments, and is not subject to partial analysis or summarized description. Santander does not attribute specific importance to certain factors contemplated in the Financial Analysis Report, on the contrary, it performed a qualitative analysis of the importance and relevance of the totality of the factors considered herein. Santander reached a final conclusion based on the results of all the analyses made, considered as a whole, and did not come to conclusions based on, or related to, any of the factors or methods individually taken into consideration in the analysis. In this sense, the Financial Analysis Report must be analyzed as a whole and the analysis of selected parts, summaries or specific aspects of the Financial Analysis Report, without the knowledge and analysis of the Financial Analysis Report in its entirety, may result in an incomplete and incorrect understanding of the analysis performed by Santander and the conclusions contained in the Financial Analysis Report. 29. The estimates and projections contemplated in the Financial Analysis Report are intrinsically subject to uncertainties and various events or factors that are beyond control of the Company, as well as of Santander, especially regarding those estimates and projections that depend on future and uncertain events. There is no assurance that the estimates and projections used in the Financial Analysis Report will be effectively achieved. The actual future results may differ significantly from those of the Financial Analysis Report. In this sense, Santander does not undertake any responsibility or obligation to indemnify in any case that the future results are different from the estimates and projections presented in the Financial Analysis Report and does not represent or warrant, in any manner, the above referred estimates and projections. Santander does not undertake any responsibility regarding the referred estimates and projections, including the manner in which these were prepared. 30. Nothing contained herein is, or can be considered as a promise, warranty or representation in relation to the past or future. 31. The role of Santander in preparing this Financial Analysis Report is of an independent advisor, and no statement contained in this document shall create or may be interpreted as establishing a fiduciary relationship between Santander, the Company, Cnova and any of their shareholders, interested third parties or holders of securities issued by the companies. 32. Other valuations of companies and sectors prepared by Santander may treat market assumptions differently from this Financial Analysis Report, and the research department and other departments of Santander and affiliated entities can use in their analyses, reports and publications, different estimates, projections and methodologies than the ones used in the Financial Analysis Report, and such analyses, reports and publications may contain different conclusions than the ones described in the Financial Analysis Report. 33. Santander has provided, directly or through affiliated entities, certain financial services and investment banking services to the Company, its controlled and affiliated entities, as well as to its controlling companies, for which it has received remuneration, continues to provide the aforementioned services and may, at any moment, provide them again. Santander, directly or through affiliated entities, is or may become a creditor of the Company, its controlled or affiliated entities, as well as of its controlling companies, in certain financial transactions, as well as may increase or reduce the volume of the financial transactions with these entities.
Important Note (cont’d) p.734. In the ordinary course of business, Santander may provide investment banking services and other financial services to the companies and their affiliates, as well as trade, directly or through affiliated entities, securities issued by the Company, its controlled and affiliate entities, as well as its controlling companies, on its behalf or on behalf of its clients and, consequently, may, at any time, hold equity positions, long or short, of the above mentioned securities. Furthermore, the professionals of its equity research department and other divisions may use in their analysis and publications different operational and market assumptions and different methodologies than then ones used in the preparation of this Financial Analysis Report, in such a way that the research reports and other publications prepared by them may contain different results and conclusions than the ones presented herein. Santander has policies and procedures to preserve the independency of its research analysts, who may have views different than the ones from the investment banking department. Santander also has policies and procedures to preserve the independency between the investment banking and other departments and areas of Santander, including, but not limited to, asset management, proprietary trading desk of securities, debt instruments, and other financial instruments. Other companies related to Santander may also hold, directly or indirectly, through vehicles managed by them, shares or other securities issued by the Company. 35. Santander is not aware of any conflicts of interest that may affect the preparation of the Financial Analysis Report. For the preparation of the Financial Analysis Report, Santander will be remunerated by the Company, regardless the completion of the Reorganization, considering that such remuneration is not based and it does not have any, direct or indirect relation, with the valuation contained herein. 36. Santander declares that the Via Varejo Special Committee, the Board of Directors of the Company, its shareholders and its managers did not lead, interfered, limit, difficult or performed any acts which compromised the access, use or knowledge of information, assets, documents or methodologies relevant for the quality of conclusions contained in this document, nor did it determine or restricted the ability of Santander to determine the methods used to reach the conclusions presented in the Financial Analysis Report or restrict the ability of Santander to determine the conclusions presented in the Financial Analysis Report. 37. Santander will be remunerated by the Company for the services rendered related to the preparation of this Financial Analysis Report. The Company has agreed to indemnify Santander for certain obligations and liabilities that may arise from the preparation of this Financial Analysis Report. 38. Santander declares that it is not a related party, as defined by CVM Resolution n° 642 of October 7th, 2010, to the Company or to its shareholders and managers. 39. Some calculations presented in this Financial Analysis Report may not result in an exact value, due to the rounding of figures.
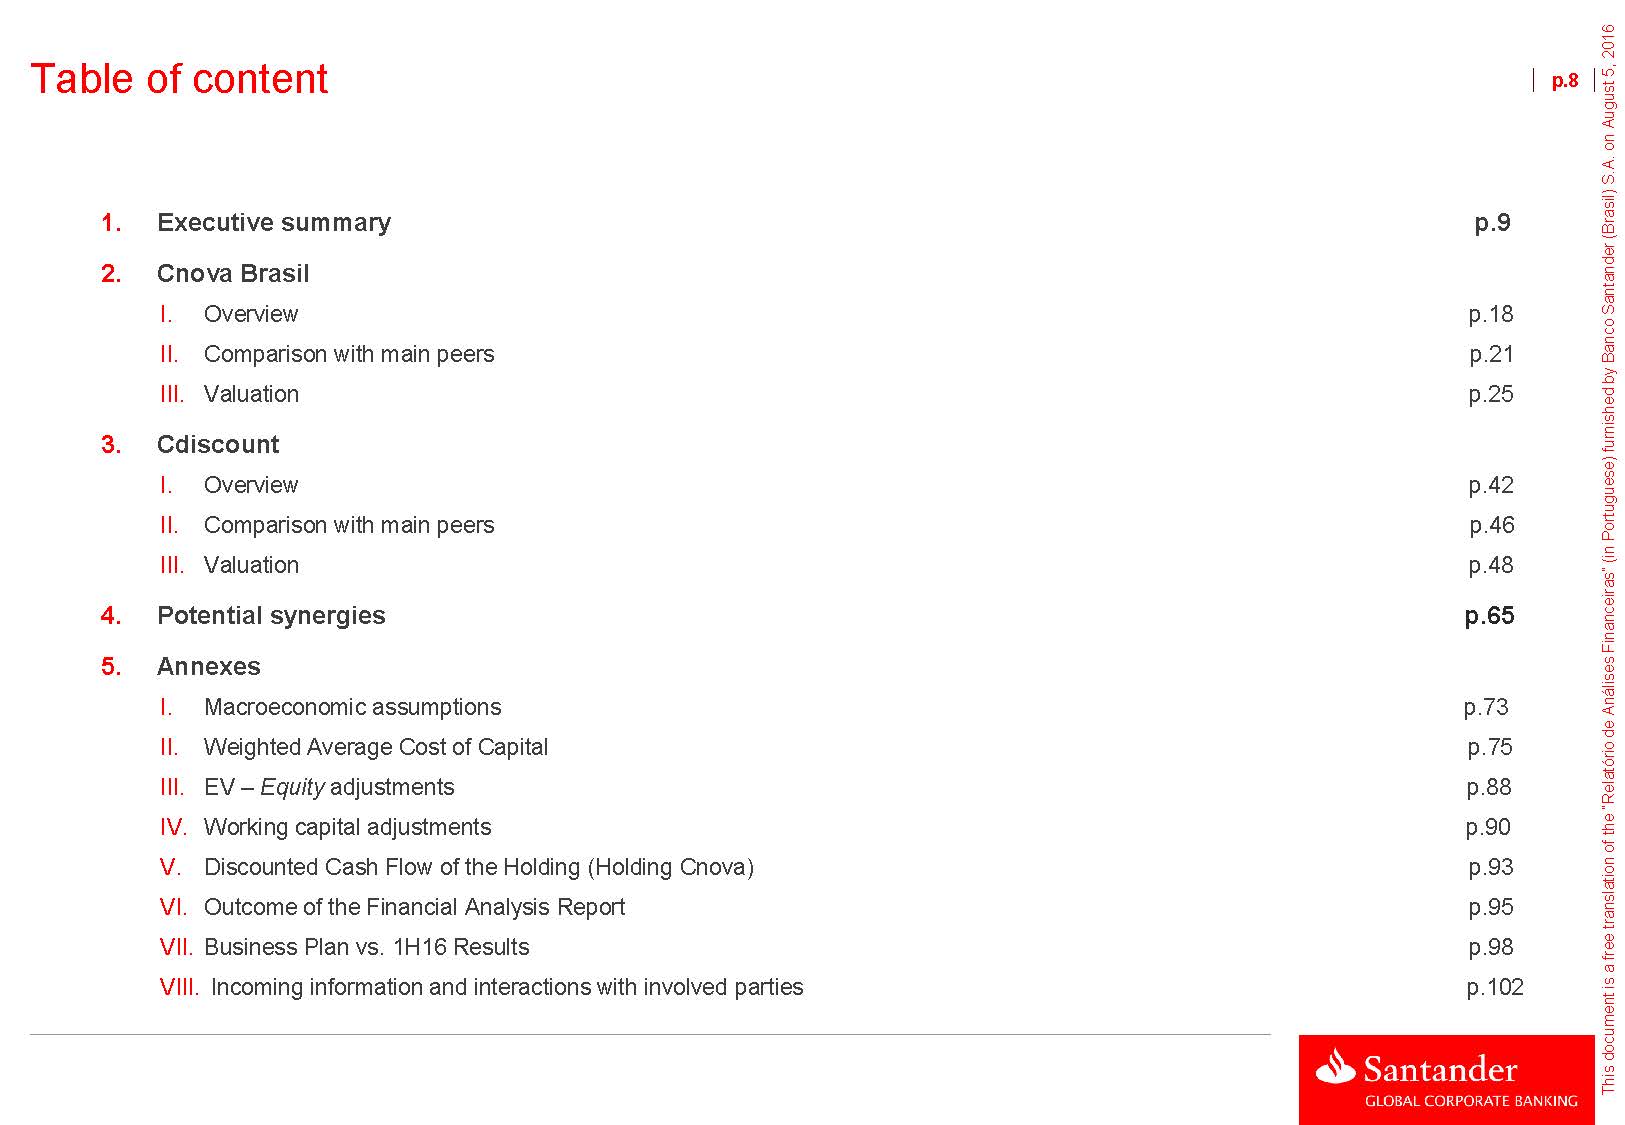
Table of content 1. Executive summary p.92. Cnova Brasilp.83.4. Potential synergies p.655. AnnexesI. Macroeconomic assumptions p.73 II. Weighted Average Cost of Capital p.75 III. EV –Equityadjustments p.88 IV. Working capital adjustments p.90 V. Discounted Cash Flow of the Holding (Holding Cnova) p.93 VI. Outcome of the Financial Analysis Report p.95 VII. Business Plan vs. 1H16 Results p.98 VIII. Incoming information and interactions with involved parties p.102 This document is a free translation of the “Relatório de Análises Financeiras” (in Portuguese) furnished by Banco Santander (Brasil) S.A. on August 5, 2016

Section 1 Executive summary P 9
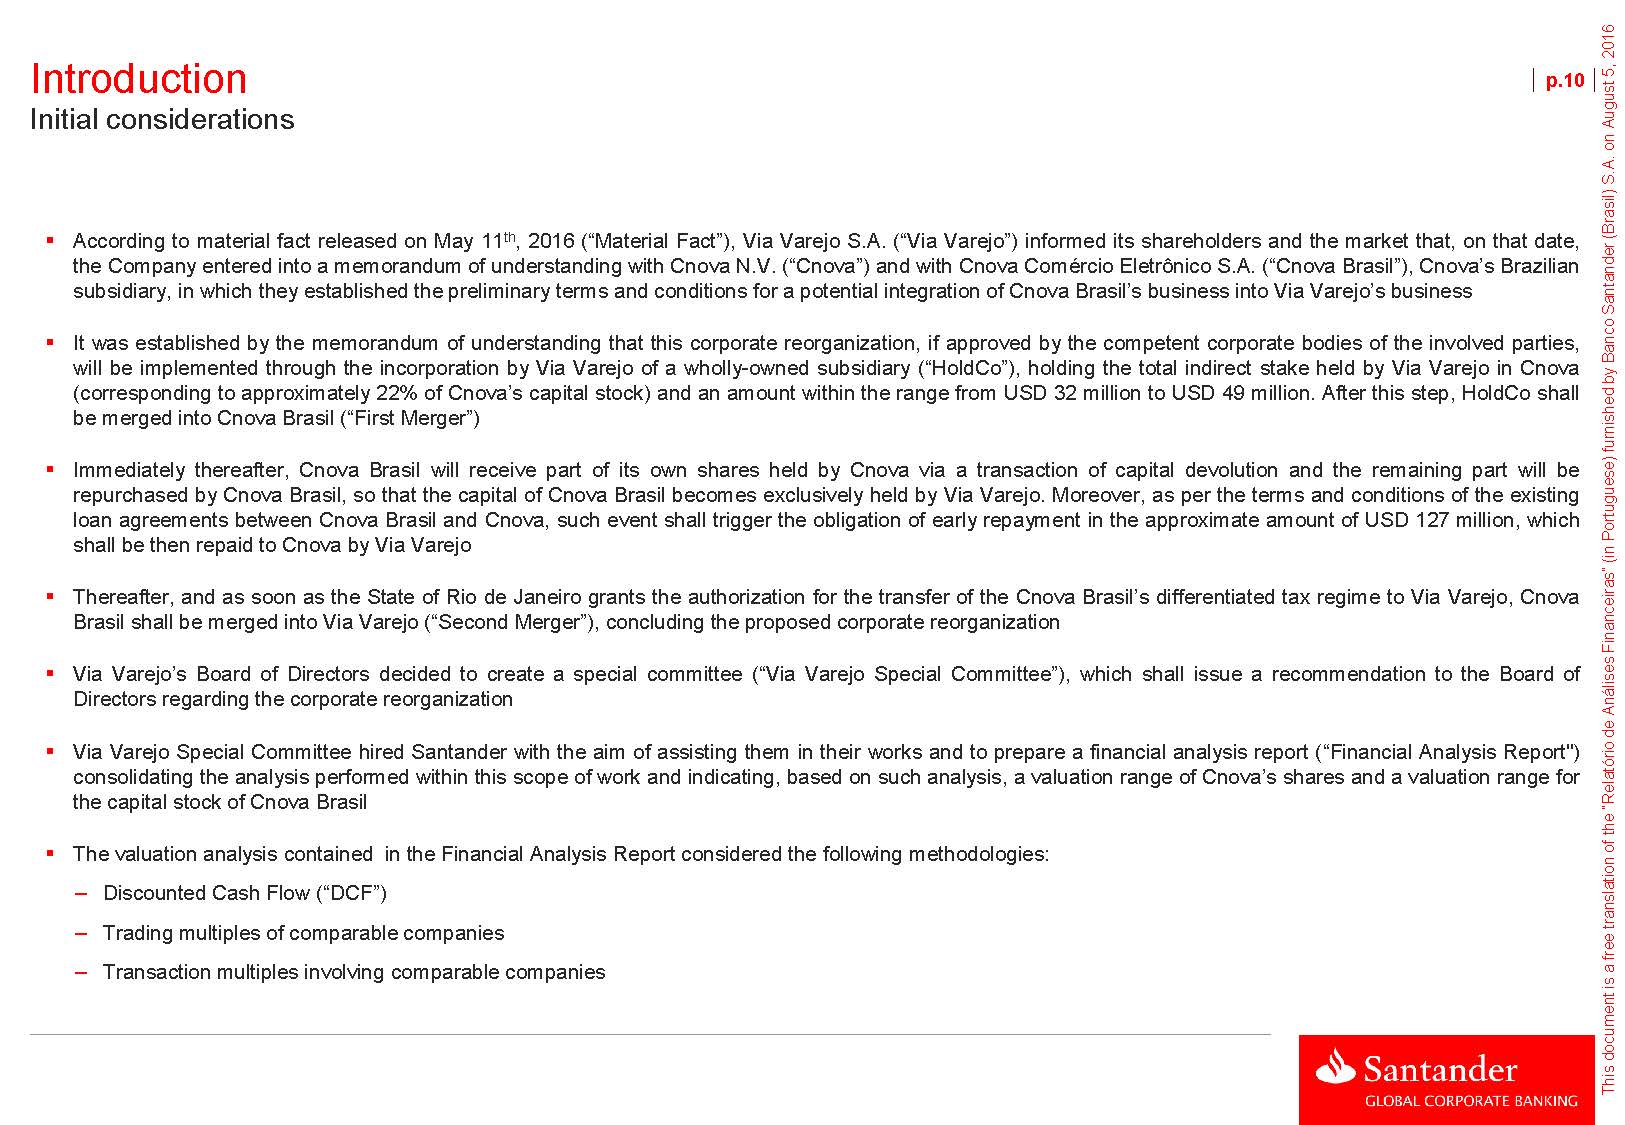
Introduction Initial considerations p.10According to material fact released on May 11th, 2016 (“Material Fact”), Via Varejo S.A. (“Via Varejo”) informed its shareholders and the market that, on that date, the Company entered into a memorandum of understanding with Cnova N.V. (“Cnova”) and with Cnova Comércio Eletrônico S.A. (“Cnova Brasil”), Cnova’s Brazilian subsidiary, in which they established the preliminary terms and conditions for a potential integration of Cnova Brasil’s business into Via Varejo’s businessIt was established by the memorandum of understanding that this corporate reorganization, if approved by the competent corporate bodies of the involved parties, will be implemented through the incorporation by Via Varejo of a wholly-owned subsidiary (“HoldCo”), holding the total indirect stake held by Via Varejo in Cnova (corresponding to approximately 22% of Cnova’s capital stock) and an amount within the range from USD 32 million to USD 49 million. After this step, HoldCo shall be merged into Cnova Brasil (“First Merger”)Immediately thereafter, Cnova Brasil will receive part of its own shares held by Cnova via a transaction of capital devolution and the remaining part will be repurchased by Cnova Brasil, so that the capital of Cnova Brasil becomes exclusively held by Via Varejo. Moreover, as per the terms and conditions of the existing loan agreements between Cnova Brasil and Cnova, such event shall trigger the obligation of early repayment in the approximate amount of USD 127 million, which shall be then repaid to Cnova by Via VarejoThereafter, and as soon as the State of Rio de Janeiro grants the authorization for the transfer of the Cnova Brasil’s differentiated tax regime to Via Varejo, Cnova Brasil shall be merged into Via Varejo (“Second Merger”), concluding the proposed corporate reorganizationVia Varejo’s Board of Directors decided to create a special committee (“Via Varejo Special Committee”), which shall issue a recommendation to the Board of Directors regarding the corporate reorganizationVia Varejo Special Committee hired Santander with the aim of assisting them in their works and to prepare a financial analysis report (“Financial Analysis Report") consolidating the analysis performed within this scope of work and indicating, based on such analysis, a valuation range of Cnova’s shares and a valuation range for the capital stock of Cnova BrasilThe valuation analysis contained in the Financial Analysis Report considered the following methodologies: Discounted Cash Flow (“DCF”) Trading multiples of comparable companies Transaction multiples involving comparable companies
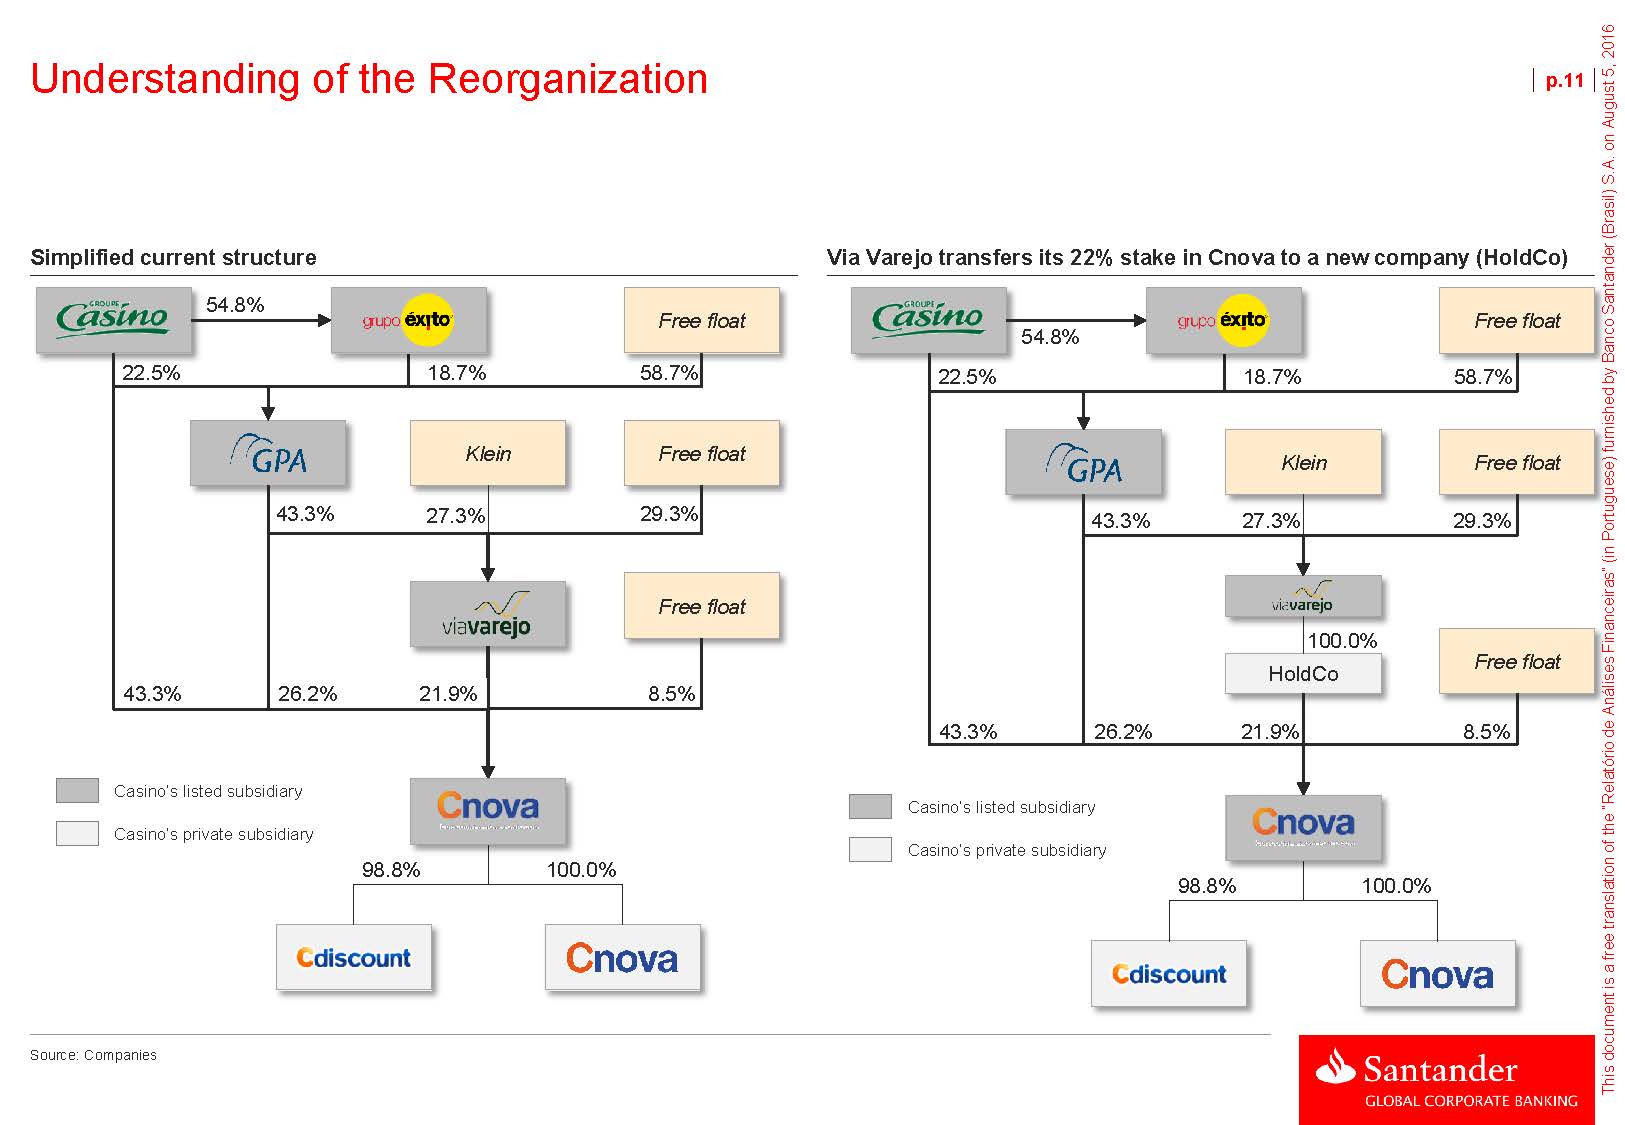
Understanding of the Reorganization p.11Simplified current structure Via Varejo transfers its 22% stake in Cnova to a new company (HoldCo) 22.5% 54.8% 18.7% Free float 58.7% 22.5% 54.8% 18.7% Free float 58.7% Klein Free float Klein Free float 43.3% 27.3% 29.3% 43.3% 27.3% 29.3% 43.3% 26.2% 21.9% Free float 8.5% 43.3% 26.2% 100.0% HoldCo 21.9% Free float 8.5% Casino’s listed subsidiary Casino’s private subsidiary 98.8% 100.0% Casino’s listed subsidiary Casino’s private subsidiary 98.8% 100.0% Source: Companies

Understanding of the Reorganization (cont’d) p.12HoldCo is incorporated by Cnova BrasilCnova NV’s capital devolution + repurchase of Cnova Brasil’s shares +prepayment of debt between related parties22.5% 54.8% 18.7% Free float 58.7% 22.5% 54.8% 18.7% Free float 58.7% Klein Free float Klein Free float 43.3% 27.3% 29.3% 43.3% 27.3% 29.3% HoldCo + Nova Free float + Cnova BrasilFree float 43.3% 26.2% 21.9% 8.5% 55.5% 33.6% 10.9% Casino’s listed subsidiary Casino’s private subsidiary 98.8% Casino’s listed subsidiary Casino’s private subsidiary 98.8% Source: Companies
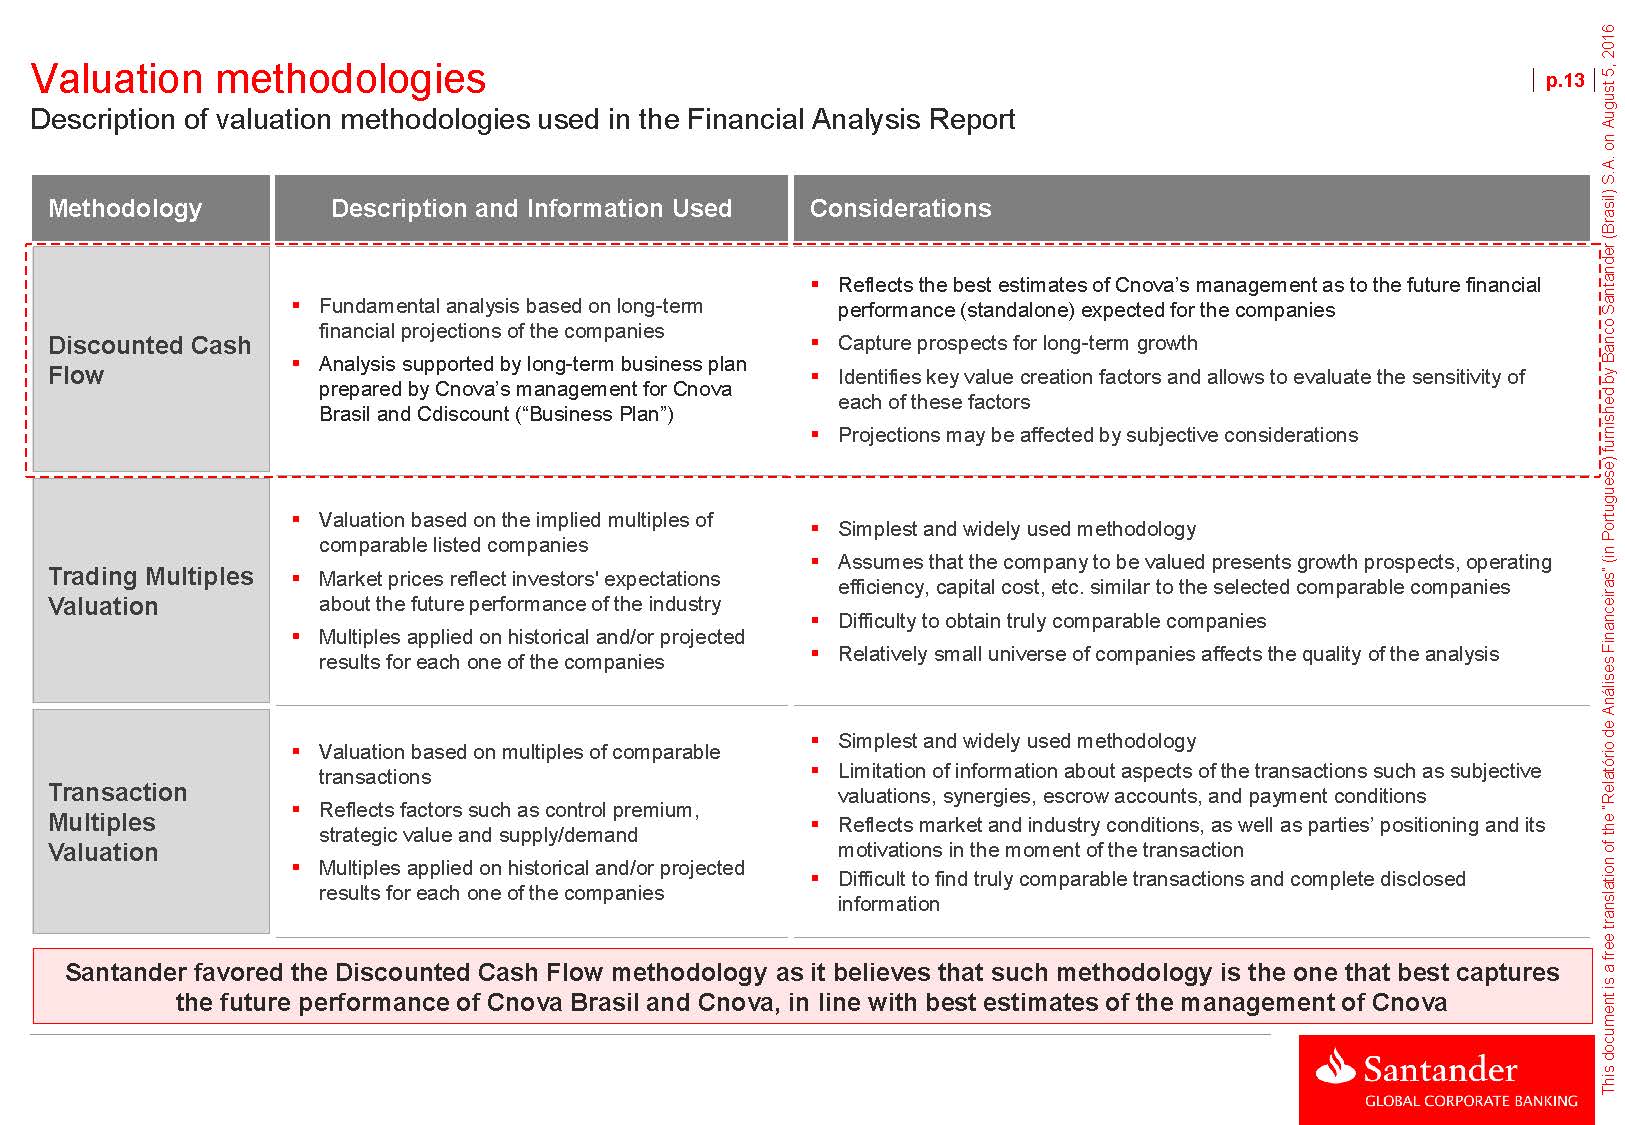
Valuation methodologies Description of valuation methodologies used in the Financial Analysis Report p.13Valuation based on the implied multiples of comparable listed companiesMarket prices reflect investors' expectations about the future performance of the industryMultiples applied on historical and/or projected results for each one of the companiesSimplest and widely used methodology Assumes that the company to be valued presents growth prospects, operating efficiency, capital cost, etc. similar to the selected comparable companiesDifficulty to obtain truly comparable companiesRelatively small universe of companies affects the quality of the analysisValuation based on multiples of comparable transactionsReflects factors such as control premium, strategic value and supply/demandMultiples applied on historical and/or projected results for each one of the companiesSimplest and widely used methodologyLimitation of information about aspects of the transactions such as subjective valuations, synergies, escrow accounts, and payment conditions Reflects market and industry conditions, as well as parties’ positioning and its motivations in the moment of the transactionDifficult to find truly comparable transactions and complete disclosed information Santander favored the Discounted Cash Flow methodology as it believes that such methodology is the one that best captures the future performance of Cnova Brasil and Cnova, in line with best estimates of the management of Cnova
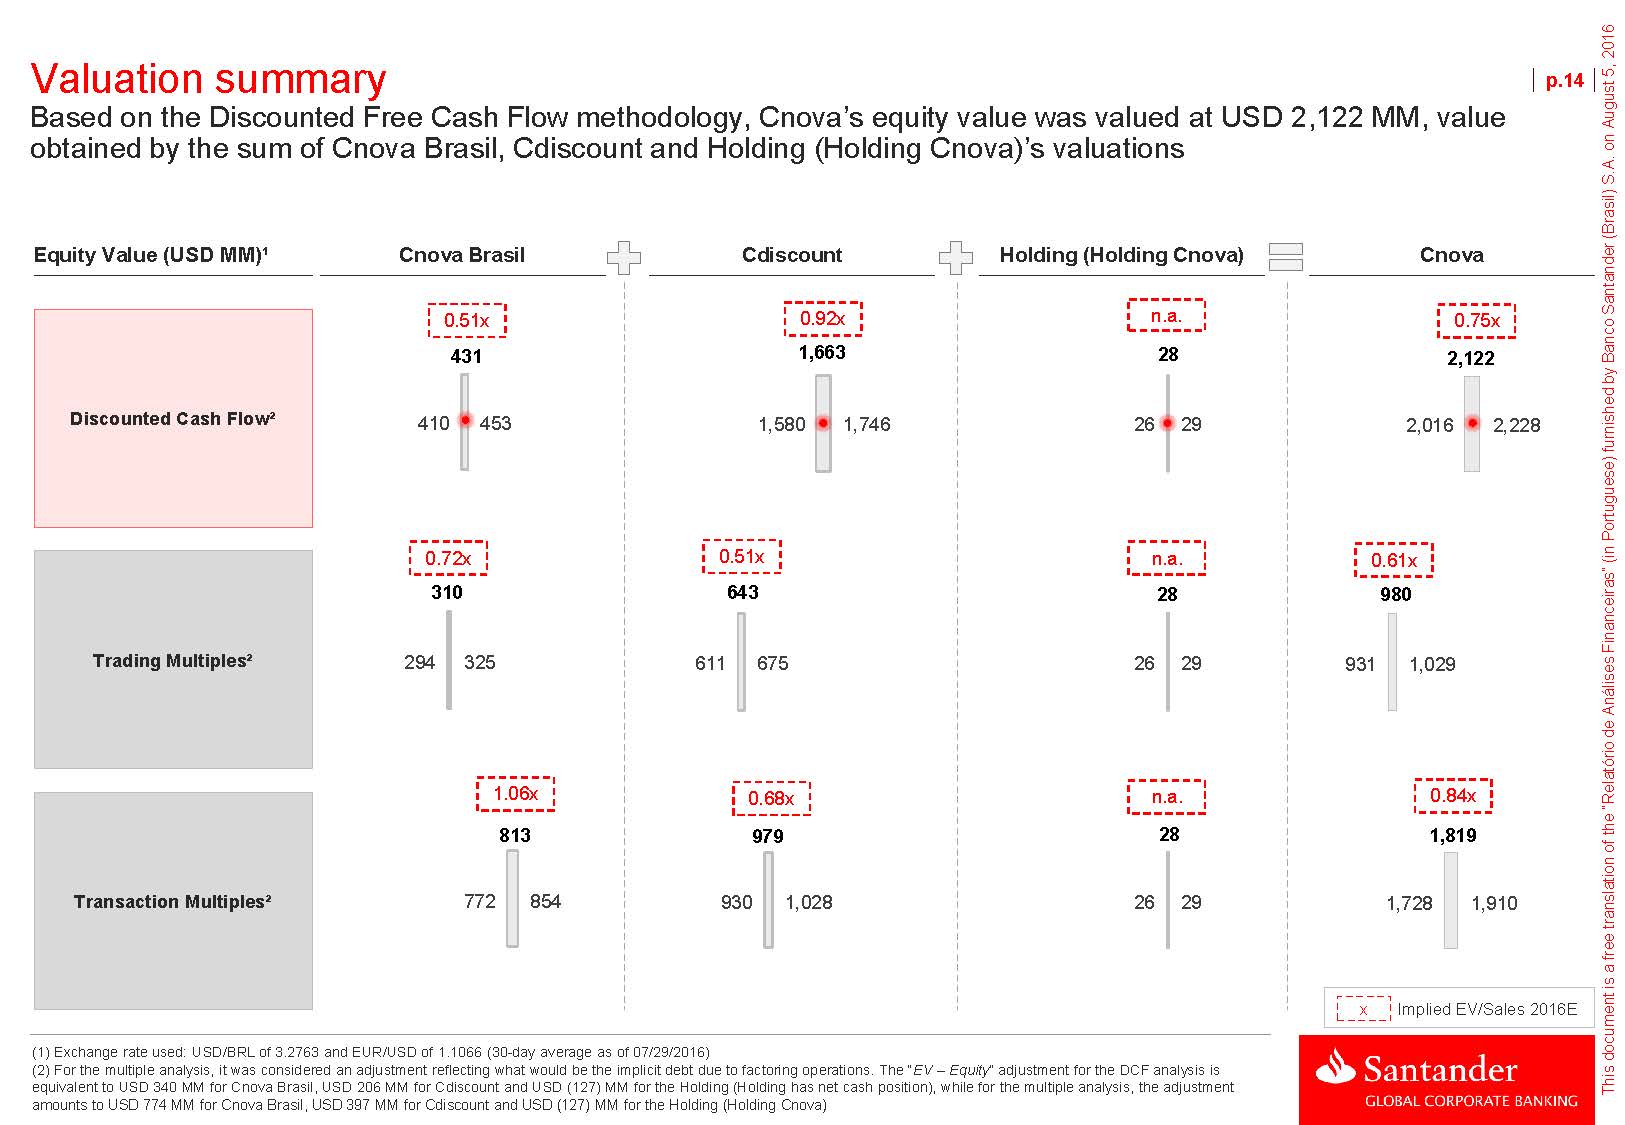
Valuation summary Based on the Discounted Free Cash Flow methodology, Cnova’s equity value was valued at USD 2,122 MM, value obtained by the sum of Cnova Brasil, Cdiscount and Holding (Holding Cnova)’s valuations p.14Equity Value (USD MM)¹Cnova BrasilCdiscount Holding (Holding Cnova) Cnova0.51x 4310.92x 1,663n.a. 280.75x 2,122Discounted Cash Flow²410 453 1,580 1,746 26 29 2,016 2,228 0.72x 3100.51x 643n.a. 280.61x 980Trading Multiples²294 325 611 675 26 29 931 1,029 1.06x 8130.68x 979n.a. 280.84x 1,819Transaction Multiples²772 854 930 1,028 26 29 1,728 1,910 (1) Exchange rate used: USD/BRL of 3.2763 and EUR/USD of 1.1066 (30-day average as of 07/29/2016) (2) For the multiple analysis, it was considered an adjustment reflecting what would be the implicit debt due to factoring operations. The “EV – Equity” adjustment for the DCF analysis is equivalent to USD 340 MM for Cnova Brasil, USD 206 MM for Cdiscount and USD (127) MM for the Holding (Holding has net cash position), while for the multiple analysis, the adjustment amounts to USD 774 MM for Cnova Brasil, USD 397 MM for Cdiscount and USD (127) MM for the Holding (Holding Cnova) x Implied EV/Sales 2016E
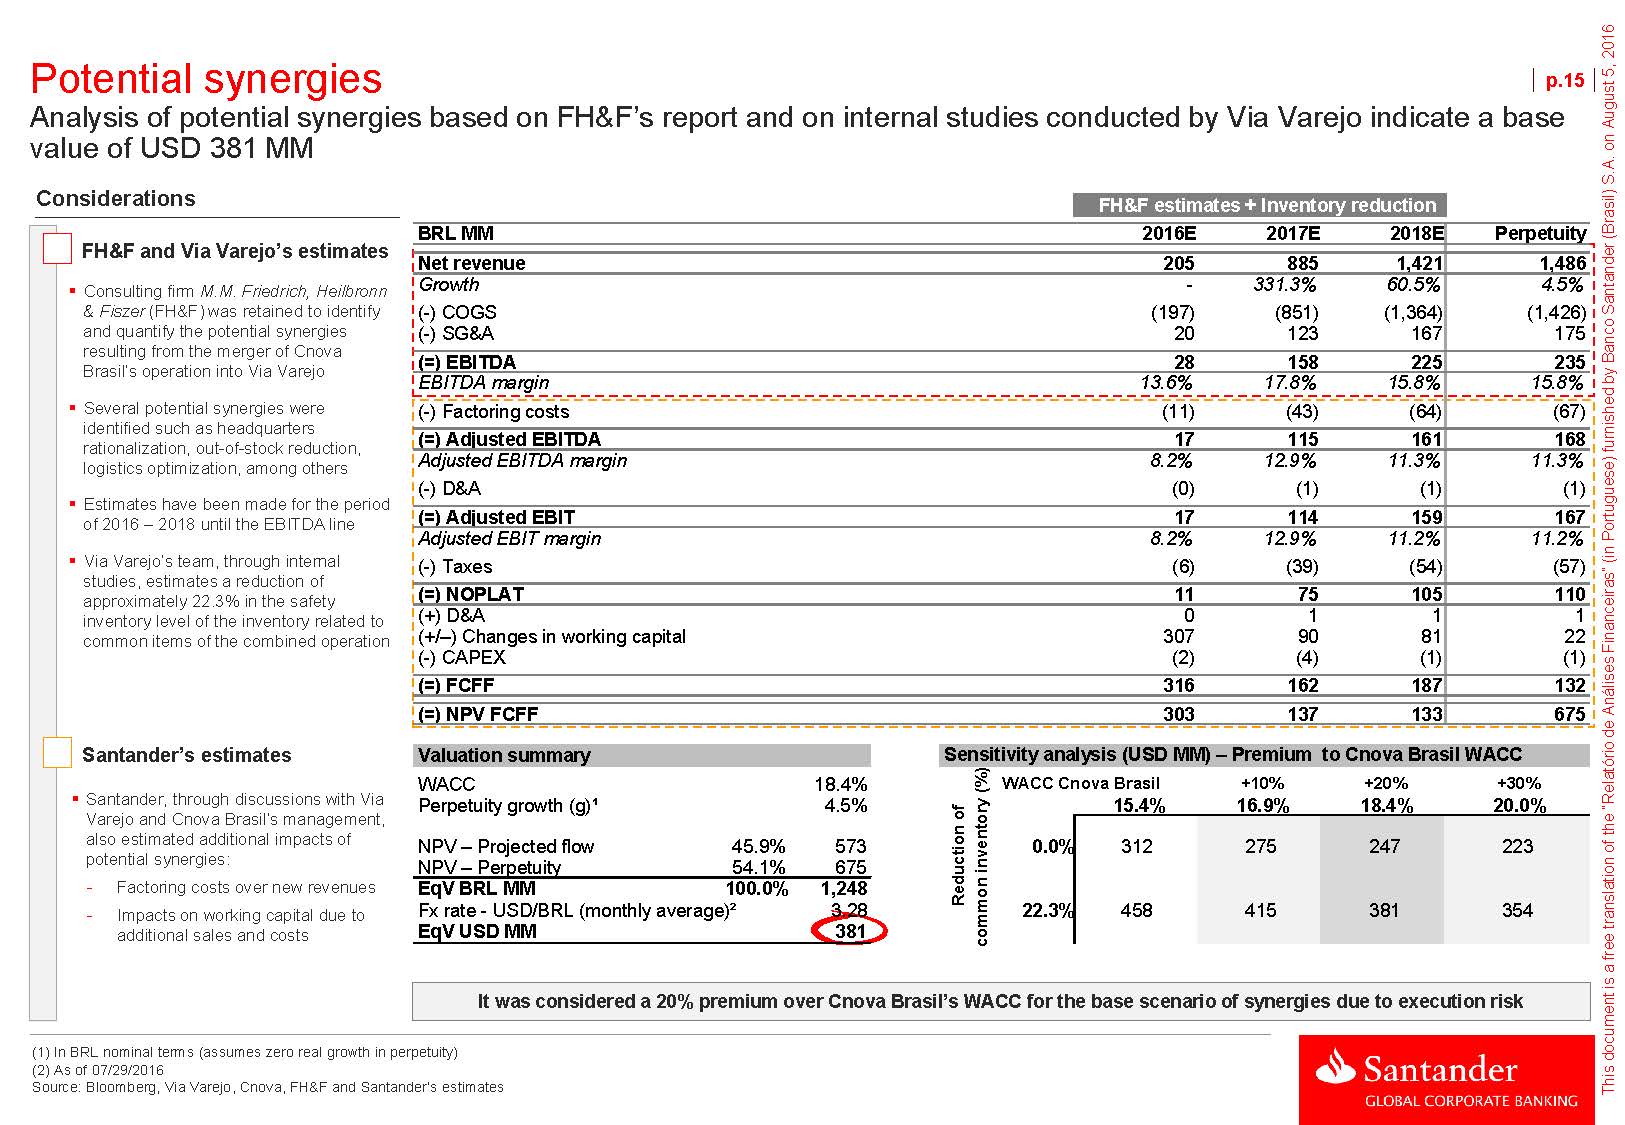
Potential synergies p.15Analysis of potential synergies based on FH&F’s report and on internal studies conducted by Via Varejo indicate a base value of USD 381 MM ConsiderationsFH&F and Via Varejo’s estimatesConsulting firmM.M. Friedrich, Heilbronn & Fiszer(FH&F) was retained to identify and quantify the potential synergies resulting from the merger of Cnova Brasil’s operation into Via VarejoSeveral potential synergies were identified such as headquarters rationalization, out-of-stock reduction, logistics optimization, among othersEstimates have been made for the period of 2016 – 2018 until the EBITDA lineVia Varejo’s team, through internal studies, estimates a reduction of approximately 22.3% in the safety inventory level of the inventory related to common items of the combined operation Santander’s estimatesSantander, through discussions with Via Varejo and Cnova Brasil’s management, also estimated additional impacts of potential synergies: Factoring costs over new revenues Impacts on working capital due to additional sales and costs FH&F estimates + Inventory reduction BRL MM 2016E 2017E 2018E Perpetuity Net revenue 205 885 1,421 1,486 Growth - 331.3% 60.5% (-) COGS (197) (851) (1,364) (-) SG&A 20 123 167 4.5% (1,426) 175 (=) EBITDA 28 158 225 235 EBITDA margin 13.6% 17.8% 15.8% 15.8% (-) Factoring costs (11) (43) (64) (67) (=) Adjusted EBITDA 17 115 161 168 Adjusted EBITDA margin 8.2% 12.9% 11.3% (-) D&A (0) (1) (1) 11.3% (1) (=) Adjusted EBIT 17 114 159 167 Adjusted EBIT margin 8.2% 12.9% 11.2% (-) Taxes (6) (39) (54) 11.2% (57) (=) NOPLAT 11 75 105 110 (+) D&A 0 1 1 (+/–) Changes in working capital 307 90 81 (-) CAPEX (2) (4) (1) 1 22 (1) (=) FCFF 316 162 187 132 (=) NPV FCFF 303 137 133 675 Valuation summary Sensitivity analysis (USD MM) – Premium to Cnova Brasil WACC WACC 18.4% WACC Cnova Brasil +10% +20% +30% Perpetuity growth (g)¹ 4.5% 15.4% 16.9% 18.4% 20.0% NPV – Projected flow 45.9% 573 0.0% 312 275 247 223 NPV – Perpetuity 54.1% 675 EqV BRL MM 100.0% 1,248 Fx rate - USD/BRL (monthly average)² 3.28 22.3% 458 415 381 354 EqV USD MM 381 It was considered a 20% premium over Cnova Brasil’s WACC for the base scenario of synergies due to execution risk (1) In BRL nominal terms (assumes zero real growth in perpetuity) (2) As of 07/29/2016 Source: Bloomberg, Via Varejo, Cnova, FH&F and Santander’s estimates
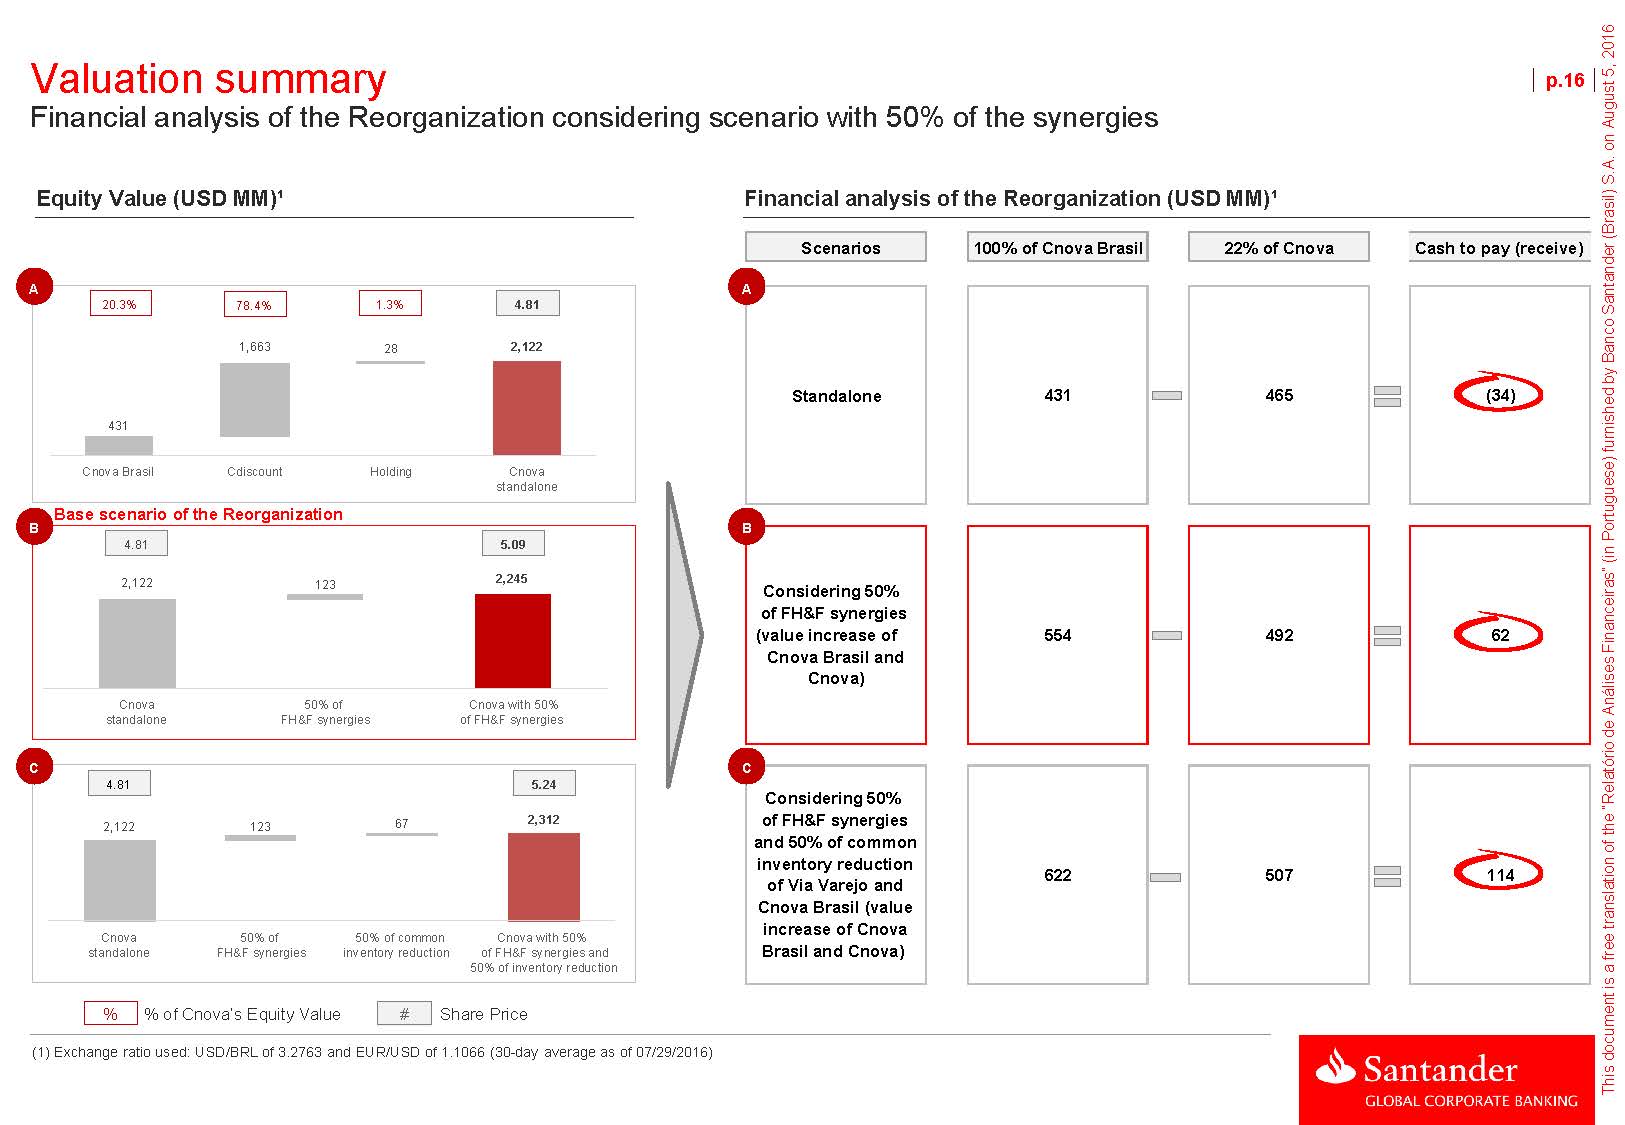
Valuation summary Financial analysis of the Reorganization considering scenario with 50% of the synergies p.16 Equity Value (USD MM)¹ Financial analysis of the Reorganization (USD MM)¹ Scenarios 100% of Cnova Brasil 22% of Cnova Cash to pay (receive) A A 20.3% 78.4% 1.3% 4.81 1,663 28 2,122 Standalone 431 465 (34) Cnova Brasil Cdiscount Holding Cnova standalone Base scenario of the Reorganization B 4.81 2,122 123 5.09 2,245 B Considering 50% of FH&F synergies (value increase of Cnova Brasil and Cnova) 554 492 62 Cnova standalone 50% of FH&F synergies Cnova with 50% of FH&F synergies C 4.81 2,122 123 67 5.24 2,312 C Considering 50% of FH&F synergies and 50% of common inventory reduction of Via Varejo and Cnova Brasil (value 622 507 114 Cnova standalone 50% of FH&F synergies 50% of common inventory reduction Cnova with 50% of FH&F synergies and 50% of inventory reduction increase of Cnova Brasil and Cnova) % % of Cnova’s Equity Value # Share Price (1) Exchange ratio used: USD/BRL of 3.2763 and EUR/USD of 1.1066 (30-day average as of 07/29/2016)
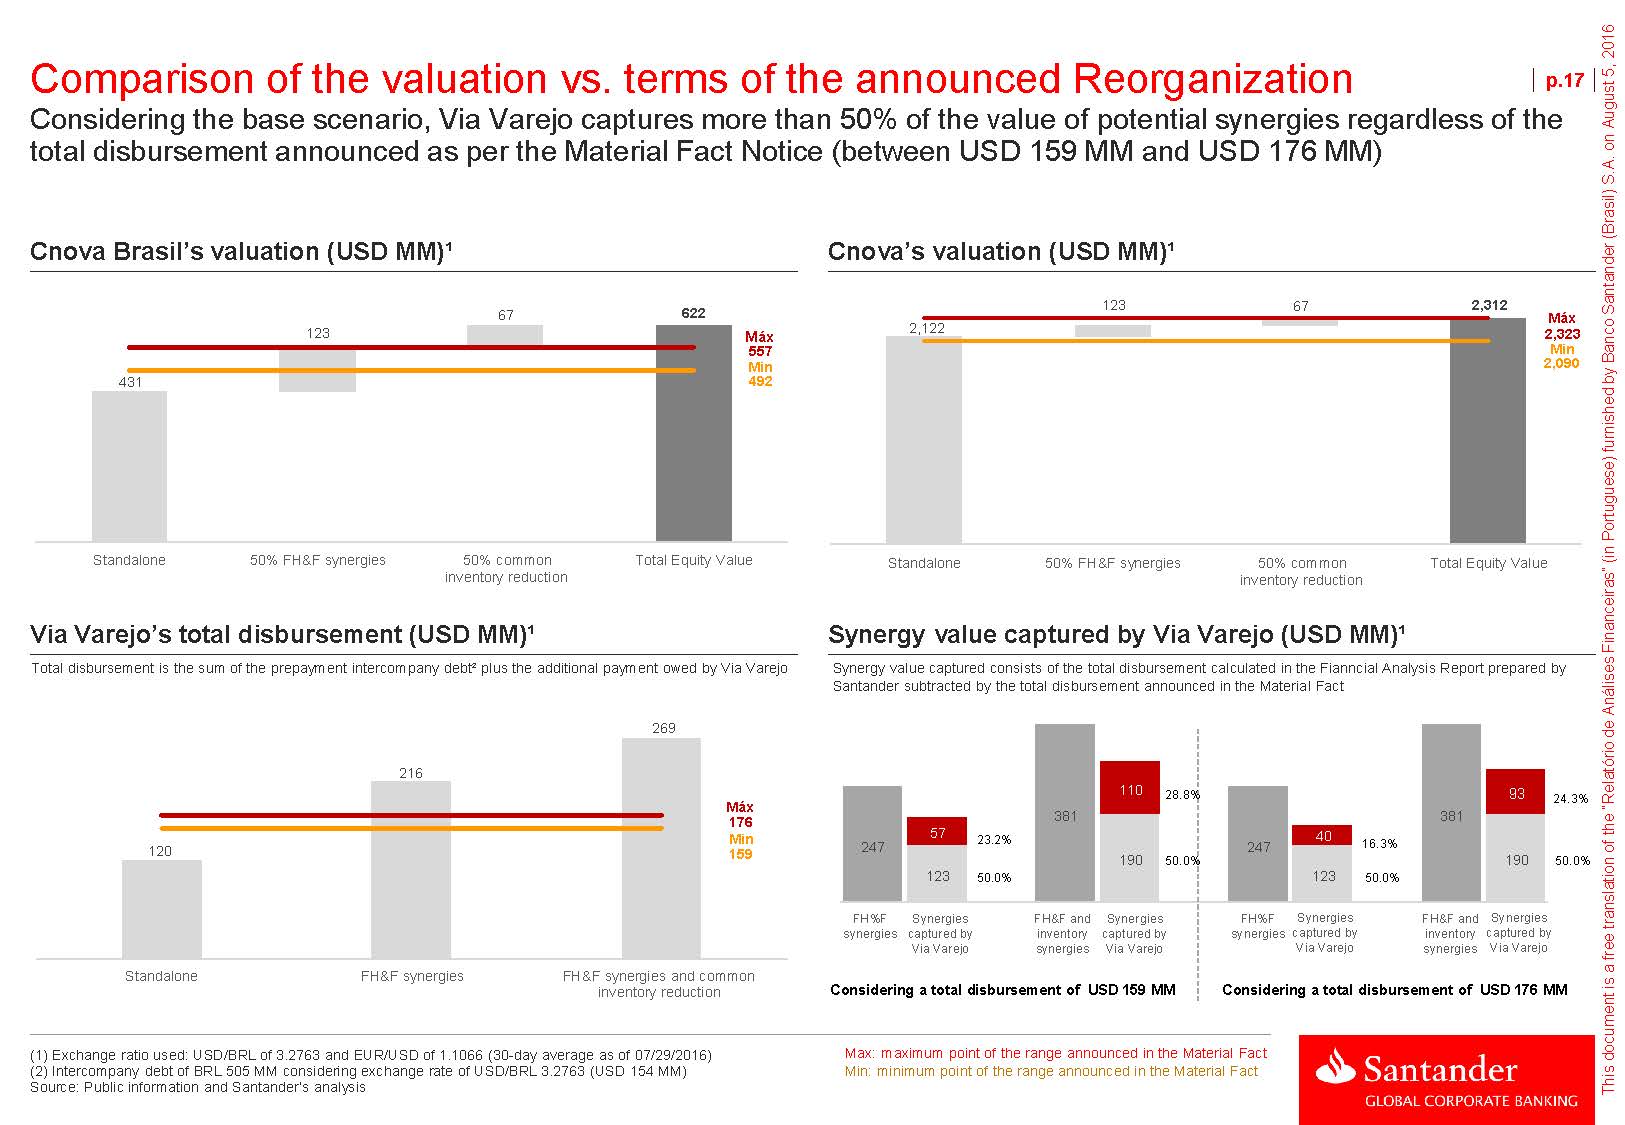
Comparison of the valuation vs. terms of the announced Reorganization p.17 Considering the base scenario, Via Varejo captures more than 50% of the value of potential synergies regardless of the total disbursement announced as per the Material Fact Notice (between USD 159 MM and USD 176 MM) Cnova Brasil’s valuation (USD MM)¹ Cnova’s valuation (USD MM)¹ 431 123 67 622 Máx 557 Min 492 2,122 123 67 2,312 Máx 2,323 Min 2,090 Standalone 50% FH&F synergies 50% common Total Equity Value Standalone 50% FH&F synergies 50% common Total Equity Value inventory reduction inventory reduction Via Varejo’s total disbursement (USD MM)¹ Synergy value captured by Via Varejo (USD MM)¹ Total disbursement is the sum of the prepayment intercompany debt² plus the additional payment owed by Via Varejo Synergy value captured consists of the total disbursement calculated in the Fianncial Analysis Report prepared by Santander subtracted by the total disbursement announced in the Material Fact 269 120 216 Máx 176 Min 159 247 57 123 23.2% 50.0% 381 110 190 28.8% 50.0% 247 40 123 16.3% 50.0% 381 93 190 24.3% 50.0% FH%F Synergies FH&F and Synergies FH%F Synergies FH&F and Synergies synergies captured by inventory captured by synergies captured by inventory captured by Standalone FH&F synergies FH&F synergies and common Via Varejo synergies Via Varejo Via Varejo synergies Via Varejo inventory reduction Considering a total disbursement of USD 159 MM Considering a total disbursement of USD 176 MM (1) Exchange ratio used: USD/BRL of 3.2763 and EUR/USD of 1.1066 (30-day average as of 07/29/2016) (2) Intercompany debt of BRL 505 MM considering exchange rate of USD/BRL 3.2763 (USD 154 MM) Source: Public information and Santander’s analysis Max: maximum point of the range announced in the Material Fact Min: minimum point of the range announced in the Material Fact
Section 2 Cnova Brasil I. Overview II. Comparison with main peers III. Valuation a) Discounted Cash Flow b) Trading multiples c) Transaction multiples p.18

Overview p.19 With retail operations and marketplace, Cnova Brazil stands out as one of the largest e-commerce companies in Brazil with 904 million hits in 2015 Overview Founded in 2008, Cnova Brasil started its operations with Pontofrio.com, online electronics retailer and the eHub, providing solutions in e-commerce to third parties Currently has 7 sites in its portfolio – out of which 4 operate as marketplace platform – totaling 904 million hits in 2015, representing a growth of 22.8% when compared to 2014 Shareholding structure Free float Click-&-Collect: 1,300 pickup points, with more than 4,000 employees Marketplace has 2,300 registered vendors, representing 10.8% of GMV¹ in 2015 43.3% 26.2% 21.9% 8.5% Accelerated growth 2008 2010 2012 2015 Beginning of Expansion of Extra.com.br Expansion of operations in the business inaugurates the Click-&- Brazil with the e-commerce Pontofrio.com and eHub with the introduction of 3 new brands Brazilian marketplace Beginning of Barateiro.com’s operation Collect services in Brazil, reaching more than 1,000 pickup points 99.8% 100.0% (1) GMV – Gross Merchandise Value Source:Company

Online stores in operation The company has a portfolio of websites operating in all online market segments. It provides first and second line items, and also operates in the B2B segment, via wholesale and solutions for e-commerce Cnova Brasil’s websites p.20 Traditional brand in the Brazilian market due to physical stores operated Focused on discounted sales of repackaged or minimal damaged Traditional brand in Brazil, launched its marketplace in 2012 Created as an extension of Pontofrio, operated by Via Varejo by Via Varejo Offers more than 30 categories of products online products All products are reviewed and guaranteed by the Also participates in the loyalty program Clube Extra Recognized for its electronic goods and the commercialization of newly launched products Incudes marketplace operations manufacturer Incudes marketplace operations It operates providing services to the online platforms of industries and Brazilian stores (fullcommerce) It offers logistics services, marketing, customer service, etc. Launched in 2014, it offers a line with discount quality products, as well as a marketplace platform It has more than 50,000 products on offer Operates in the online wholesale segment, offering products for small and medium enterprises in the electronics and mobile segments Source:Company

Section 2 Cnova Brasil I. Overview II. Comparison with main peers III. Valuation a) Discounted Cash Flow b) Trading multiples c) Transaction multiples p.21

Cnova Brasil vs. B2W B2W is the most comparable Brazilian company to Cnova Brasil in terms of geographic presence, business segments and marketplace exposure as a % of GMV p.22 2015 Figures Brasil E-commerce with 4 marketplaces and services for online sales platforms E-commerce with 3 marketplaces, services for online sales platforms and financial services BRL 7.7 bi BRL 11.2 bi 18% 26% 57% Cnova¹ BRL 837 mm B2W Others¹ 3.6% + 7.2 p.p. 10.8% 2014 2015 2,300 31% 69% Desktop Mobile device (1) Implicit values calculated from B2W’s market share Source:Companies and public information
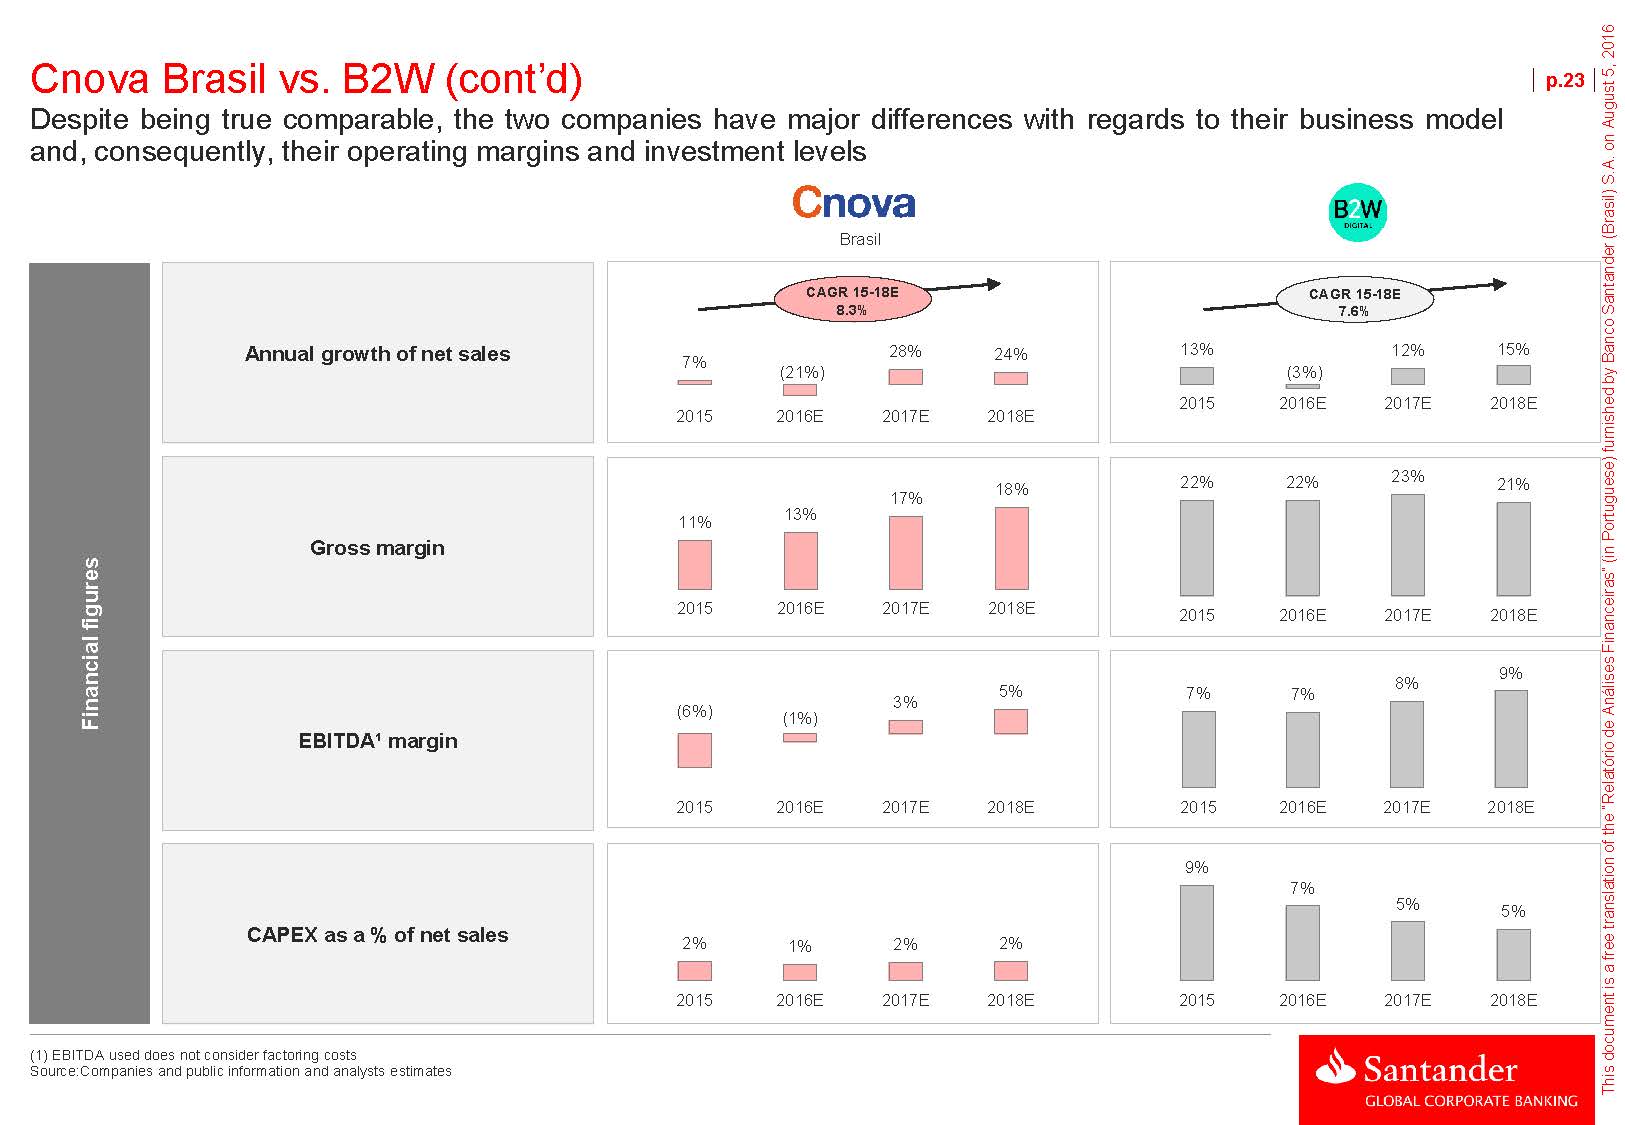
Cnova Brasil vs. B2W (cont’d) Despite being true comparable, the two companies have major differences with regards to their business model and, consequently, their operating margins and investment levels Brasil p.23 Annual growth of net sales CAGR 15-18E 8.3% 7% 28% 24% (21%) 13% CAGR 15-18E 7.6% 12% 15% (3%) 2015 2016E 2017E 2018E 2015 2016E 2017E 2018E Gross margin 11% 13% 17% 18% 22% 22% 23% 21% 2015 2016E 2017E 2018E 2015 2016E 2017E 2018E EBITDA¹ margin (6%) (1%) 3% 5% 7% 7% 8% 9% 2015 2016E 2017E 2018E 2015 2016E 2017E 2018E CAPEX as a % of net sales 2% 1% 2% 2% 9% 7% 5% 5% 2015 2016E 2017E 2018E 2015 2016E 2017E 2018E (1) EBITDA used does not consider factoring costs Source:Companies and public information and analysts estimates
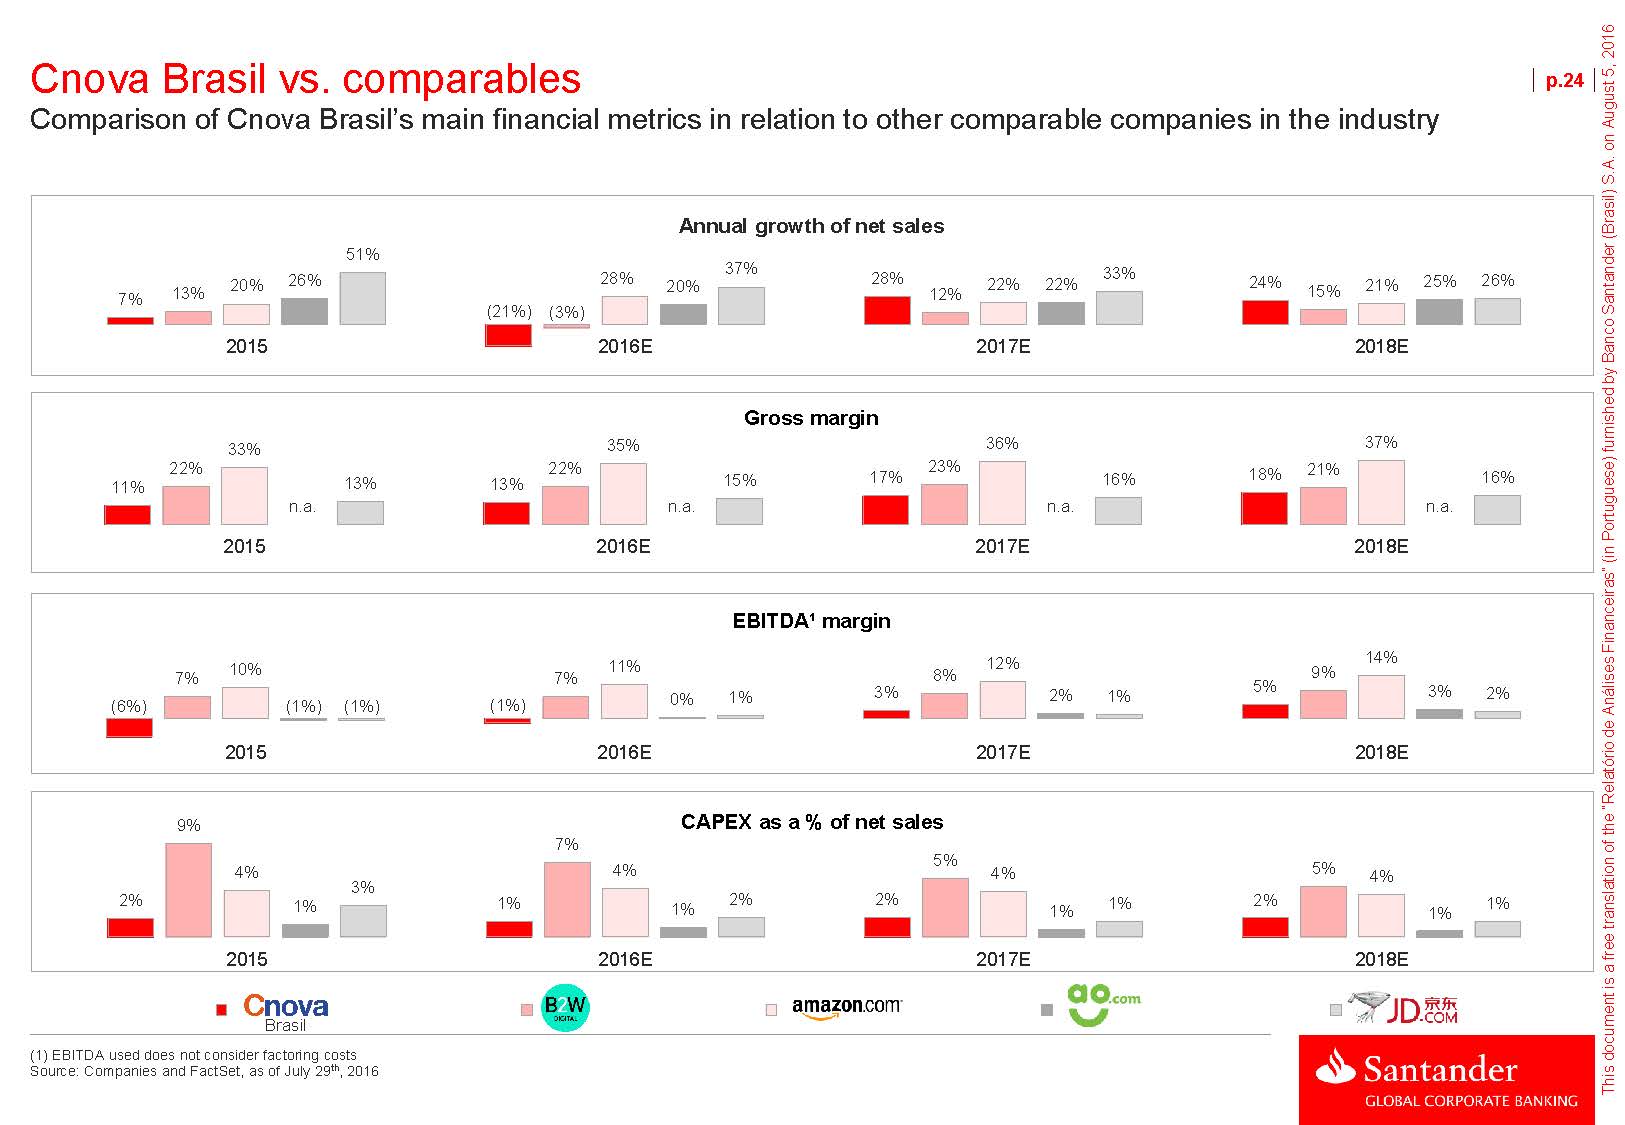
Cnova Brasil vs. comparables Comparison of Cnova Brasil’s main financial metrics in relation to other comparable companies in the industry p.24 51% Annual growth of net sales 7% 13% 20% 26% (21%) (3%) 28% 20% 37% 28% 12% 22% 22% 33% 24% 15% 21% 25% 26% 2015 2016E 2017E 2018E Gross margin 33% 35% 36% 37% 22% 22% 23% 21% 11% 13% 13% 15% 17% 16% 18% 16% n.a. n.a. n.a. n.a. 2015 2016E 2017E 2018E EBITDA¹ margin 10% 11% 12% 8% 14% 9% 7% 7% 3% 5% (6%) (1%) (1%) (1%) 0% 1% 2% 1% 3% 2% 2015 2016E 2017E 2018E 9% 7% 4% 4% 3% CAPEX as a % of net sales 5% 4% 5% 4% 2% 1% 1% 1% 2% 2% 1% 1% 2% 1% 1% 2015 2016E 2017E 2018E Brasil (1) EBITDA used does not consider factoring costs Source: Companies and FactSet, as of July 29th, 2016

Section 2 Cnova Brasil I. Overview II. Comparison with main peers III. Valuation a) Discounted Cash Flow b) Trading multiples c) Transaction multiples p.25
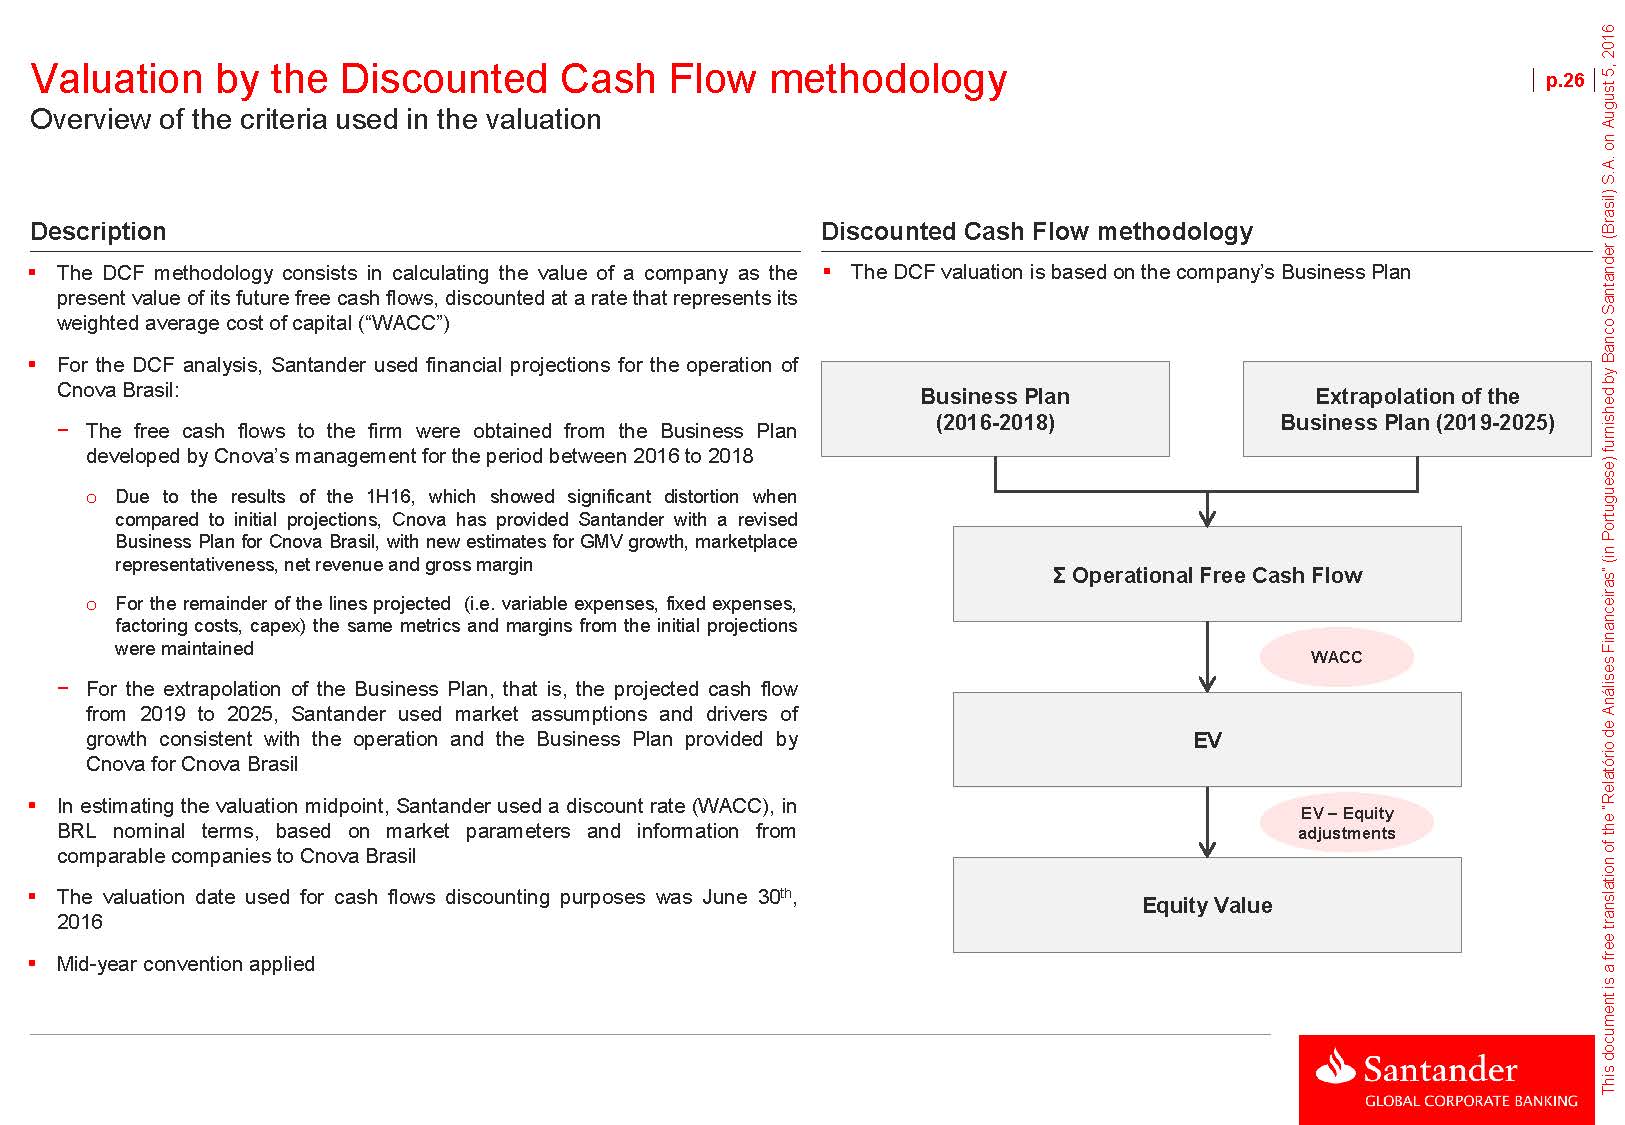
Valuation by the Discounted Cash Flow methodology Overview of the criteria used in the valuation p.26DescriptionThe DCF methodology consists in calculating the value of a company as the present value of its future free cash flows, discounted at a rate that represents its weighted average cost of capital (“WACC”) Discounted Cash Flow methodologyThe DCF valuation is based on the company’s Business PlanFor the DCF analysis, Santander used financial projections for the operation of Cnova Brasil: − The free cash flows to the firm were obtained from the Business Plan developed by Cnova’s management for the period between 2016 to 2018 Business Plan(2016-2018)Extrapolation of theBusiness Plan (2019-2025)oDue to the results of the 1H16, which showed significant distortion when compared to initial projections, Cnova has provided Santander with a revised Business Plan for Cnova Brasil, with new estimates for GMV growth, marketplace representativeness, net revenue and gross margin oFor the remainder of the lines projected (i.e. variable expenses, fixed expenses, factoring costs, capex) the same metrics and margins from the initial projections were maintained − For the extrapolation of the Business Plan, that is, the projected cash flow from 2019 to 2025, Santander used market assumptions and drivers of growth consistent with the operation and the Business Plan provided by Cnova for Cnova BrasilIn estimating the valuation midpoint, Santander used a discount rate (WACC), in BRL nominal terms, based on market parameters and information from comparable companies to Cnova Brasil The valuation date used for cash flows discounting purposes was June 30th, 2016Mid-year convention applied Σ Operational Free Cash FlowWACCEVEV – Equity adjustmentsEquity Value

Discount rate - WACC WACC in BRL nominal terms p.27Cost of equity (Ke)Risk free rate 1.9% - Average return of the 10-year U.S. Treasury Bond (last 12 months) Market risk premium 7.0% - Spread between the return of S&P-500 and the return of long-term US Treasury Bond from 1926 to 2014 (Ibbotson 2015) Unlevered Beta 0.97 - Average of the unlevered betas of comparable companies (5 years weekly) Income tax rate 34.0% - Applicable income tax rate in Brazil Target leverage - D/E 8.3% - Average leverage of comparable companies Levered Beta 1.03 - Average of the unlevered betas of comparable companies adjusted by target leverage Ke, USD Nominal 9.1%Country risk premium 4.2% - Brazilian country risk premium considering JPMorgan Brazil EMBI+ (last 12 months) Ke, USD Nominal Adjusted to Brazil 13.3%Long term inflation - Brazil 4.5% - Long-term inflation forecast for Brazil (IMF) Long term inflation - USA 2.1% - Long-term inflation forecast for USA (IIMF) Inflation differential 2.3% - Differential between long-term inflation forecasts for Brazil and USA Ke, BRL Nominal 15.9%Cost of debt (Kd)Kd, USD pre-tax 8.4% Kd, USD post-tax 5.5% Inflation differential (%) 2.3% Kd, BRL pre-tax 10.8% - Average anticipation cost projected for the period between 2016 and 2025 (108% of the average CDI of the period) Kd, BRL post-tax 7.1%WACCTarget leverage - E/(D+E) 93.8% Target leverage - D/(D+E) 6.2% WACC USD Nominal Adjusted Brazil 12.9% WACC BRL Nominal 15.4%Source: Bloomberg, Ibbotson 2015, IMF and Santander (macroeconomic projections as of 07/29/2016)

Discounted Cash Flow Main operating assumptions based on the Business Plan p.28AssumptionsFinancials – BRL MMBrazilian e-commerce marketProjection of the Brazilian e-commerce market for the Business Plan period was based on estimates from E-bit / Buscapé and CnovaFor the extrapolation period, by the nature and history of high growth rates in the internet segment in Brazil, projections assume a real growth curve starting in 2019 with a premium over the Brazilian GDP, until converging to the same in 2025 Business Plan Extrapolation8% 11% 10% 10% 9% 9% 8% 8% 7% 7% 83,541 89,796 96,079 59,811 65,463 71,328 77,369 41,300 44,600 49,506 54,457 2015 2016E 2017E 2018E 2019E 2020E 2021E 2022E 2023E 2024E 2025E Brazilian e-commerce market Growth CAGR 15 -25E 8.8% Cnova Brasil’s GMVGMV growth estimated by Cnova itself in the Business PlanFor the extrapolation period, GMV was projected based on the assumptions of maintenance of market share for Cnova Brasil’s own operations, and an Business Plan Extrapolation30% 32% 32% 32% 32% 19% 16% 20% 26,778 29,016 31,046 21,407 24,388 CAGR 15 -25E 14.7% 34.5% accelerated growth for the marketplace, 12,827 15,322 18,209 11,136 12,469 13,636 14,590 which explains the gain in market share presented in the projections 7,869 7,343 10,064 754 1,221 2,400 3,500 5,077 6,996 9,190 14,309 15,380 16,456 8.7% 7,115 6,122 7,664 9,327 10,244 11,212 12,217 13,252 2015 2016E 2017E 2018E 2019E 2020E 2021E 2022E 2023E 2024E 2025E Source: Via Varejo, Cnova, FH&F, E-bit / Buscapé and Santander estimates Own operation GMV Marketplace GMV Market share

Discounted Cash Flow (cont’d) Main operating assumptions based on the Business Plan p.29AssumptionsFinancials – BRL MMNet revenueNet revenue projection assumes Business Plan Extrapolation28% 24% maintenance of discounts in relation to the GMV for all segments, in accordance with the Business Plan -21% 12% 12% 11% 10% 8% 8% 7% 11,875 12,883 13,879 CAGR 15 -25E 9.1%Marketplace fees in line with the Business Plan of Cnova Brasil 6,231 4,920 6,287 7,773 8,704 9,721 473 685 945 10,803 1,241 1,503 1,683 1,841 1,970 37.4% 82 324 6,149 4,755 5,963 7,301 8,018 8,776 9,562 10,372 11,200 12,038 12,880 7.7% 2015 2016E 2017E 2018E 2019E 2020E 2021E 2022E 2023E 2024E 2025E Own operation revenue Marketplace revenue Growth Gross profitProjections assume the same margins contained in the Business Plan for all Business Plan Extrapolation20% 22% 23% 24% 25% 25% 25% CAGR 15 -25E lines of operating costsMargin improvement is explained by an accelerated growth of the marketplace, which presents a gross margin of 100% 11% 13% 17% 18% 1,438 1,746 2,105 2,505 2,875 3,164 3,433 3,673 18.3% 684 629 1,037 2015 2016E 2017E 2018E 2019E 2020E 2021E 2022E 2023E 2024E 2025E Source: Via Varejo, Cnova, FH&F, E-bit / Buscapé and Santander estimates Gross profit Gross margin

Discounted Cash Flow (cont’d) Main operating assumptions based on the Business Plan p.30AssumptionsFinancials – BRL MMOpexMost of the operating expenses, such as Payments, Marketing and IT, were projected as a percentage of GMVGeneral and administrative expenses indexed to inflation (IPCA) Business Plan Extrapolation25% 23% 14% 14% 14% 11% 9% 8% 7% -22% 1,949 2,102 2,246 CAGR 15 -25E 9.6% 1,082 1,239 1,415 1,607 1,790 107 111 122 127 393 426 456For fulfillment expenses, projectionsassume the same percentage of net 901 702 878 358 179 214 255 299 341 374 406 434 421 456 488 revenues of the segments B2C, 217159 286 336 383 344 420 461 505 550 597 644 692 741 wholesales and B2B, as per the Business Plan 2015 2016E 2017E 2018E 2019E 2020E 2021E 2022E 2023E 2024E 2025E Fulfillment Payment Marketing Technology G&A Growth Factoring costsFactoring costs projected considering a spread of 108% of CDIBusiness Plan assumes 100% discount of GMV from direct sales (B2C) and marketplace, 33% of GMV from wholesales and only 8.3% of GMV from sales B2BBusiness Plan assumes an average term of 6 installments – a reduction to 4 installments from 2019 onwards was considered in the projectionsBusiness Plan Extrapolation3.0% 3.6% 3.1% 2.7% 2.3% 1.9% 1.8% 1.7% 1.7% 1.7% 1.7% 487 521 408 449 350 359 354 239 265 308 2015 2016E 2017E 2018E 2019E 2020E 2021E 2022E 2023E 2024E 2025E CAGR 15 -25E 8.1% Source: Via Varejo, Cnova, FH&F, E-bit / Buscapé and Santander estimates Factoring costs % of GMV
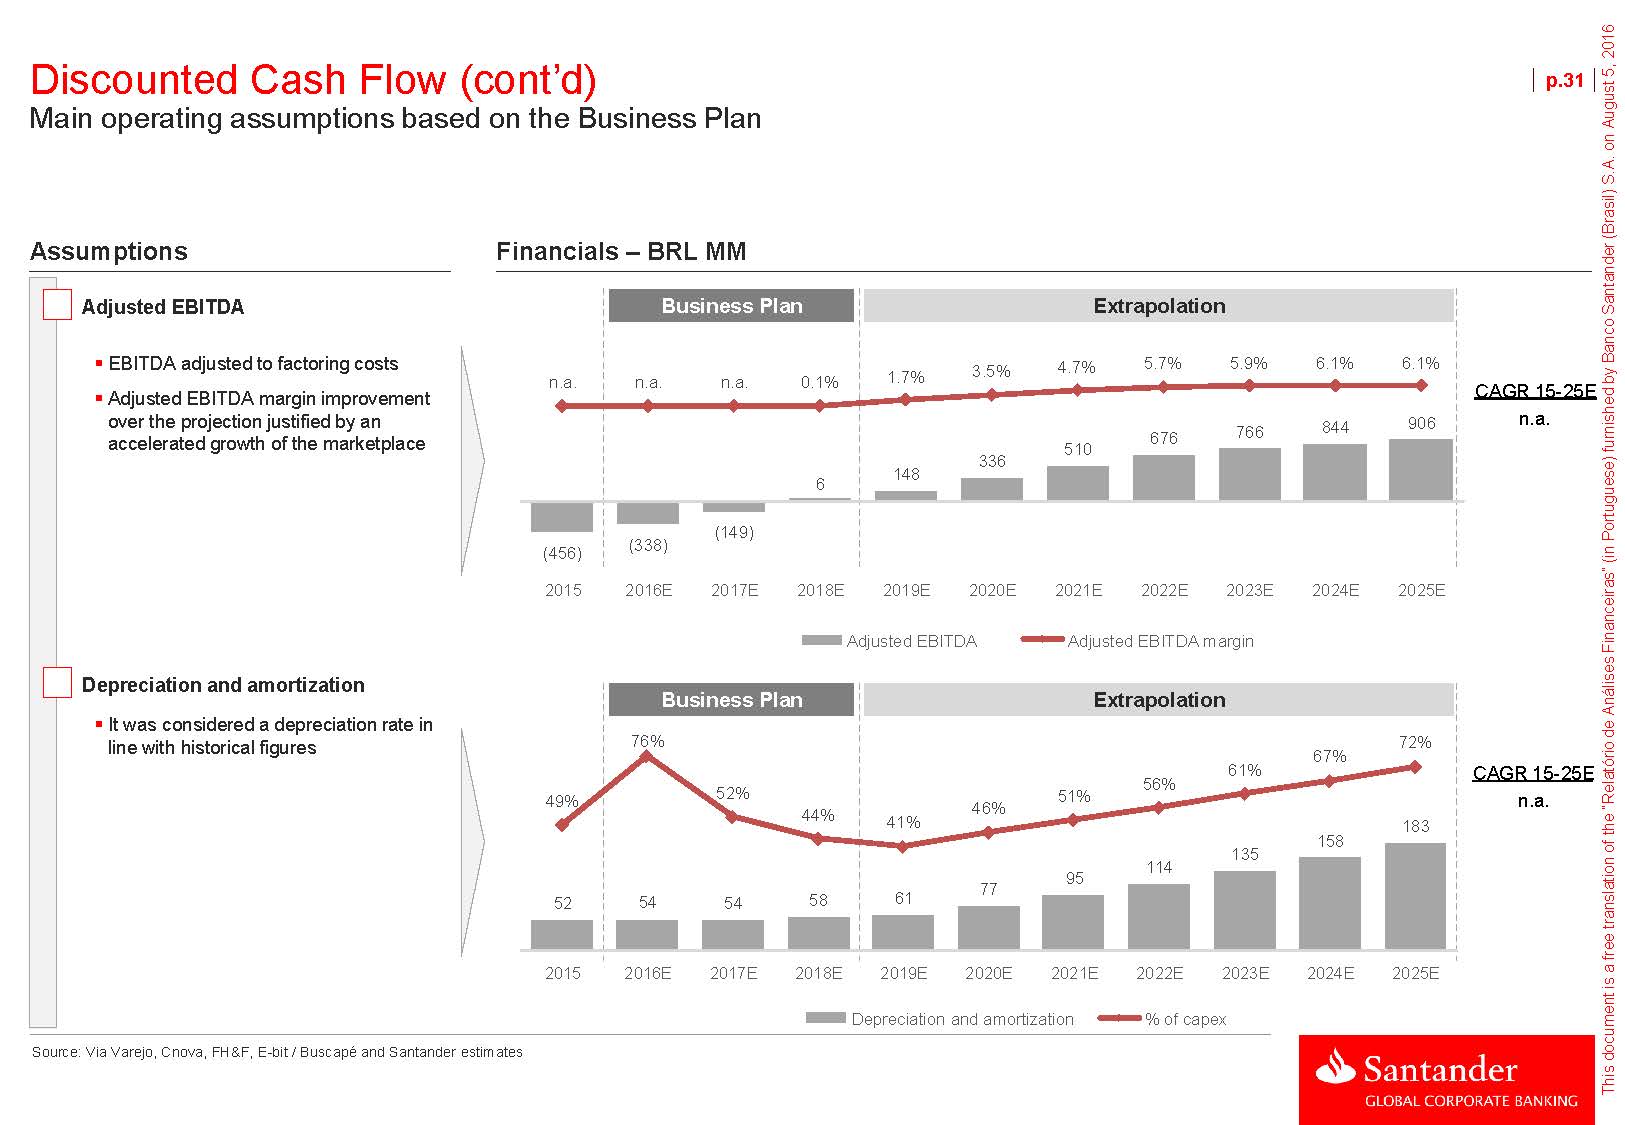
Discounted Cash Flow (cont’d) Main operating assumptions based on the Business Plan p.31AssumptionsFinancials – BRL MMAdjusted EBITDABusiness Plan ExtrapolationEBITDA adjusted to factoring costsAdjusted EBITDA margin improvement over the projection justified by an n.a. n.a. n.a. 0.1% 1.7% 3.5% 4.7% 5.7% 5.9% 6.1% 6.1% 766 844 906 CAGR 15-25E n.a. accelerated growth of the marketplace 6 148 336 676 510 (456) (338) (149) 2015 2016E 2017E 2018E 2019E 2020E 2021E 2022E 2023E 2024E 2025E Adjusted EBITDA Adjusted EBITDA margin Depreciation and amortizationIt was considered a depreciation rate in line with historical figures Business Plan Extrapolation76% 56% 61% 72% 67% CAGR 15 -25E 49% 52% 44% 41% 51% 46% 77 95 114 135 158 183 n.a. 52 54 54 58 61 2015 2016E 2017E 2018E 2019E 2020E 2021E 2022E 2023E 2024E 2025E Source: Via Varejo, Cnova, FH&F, E-bit / Buscapé and Santander estimates Depreciation and amortization % of capex
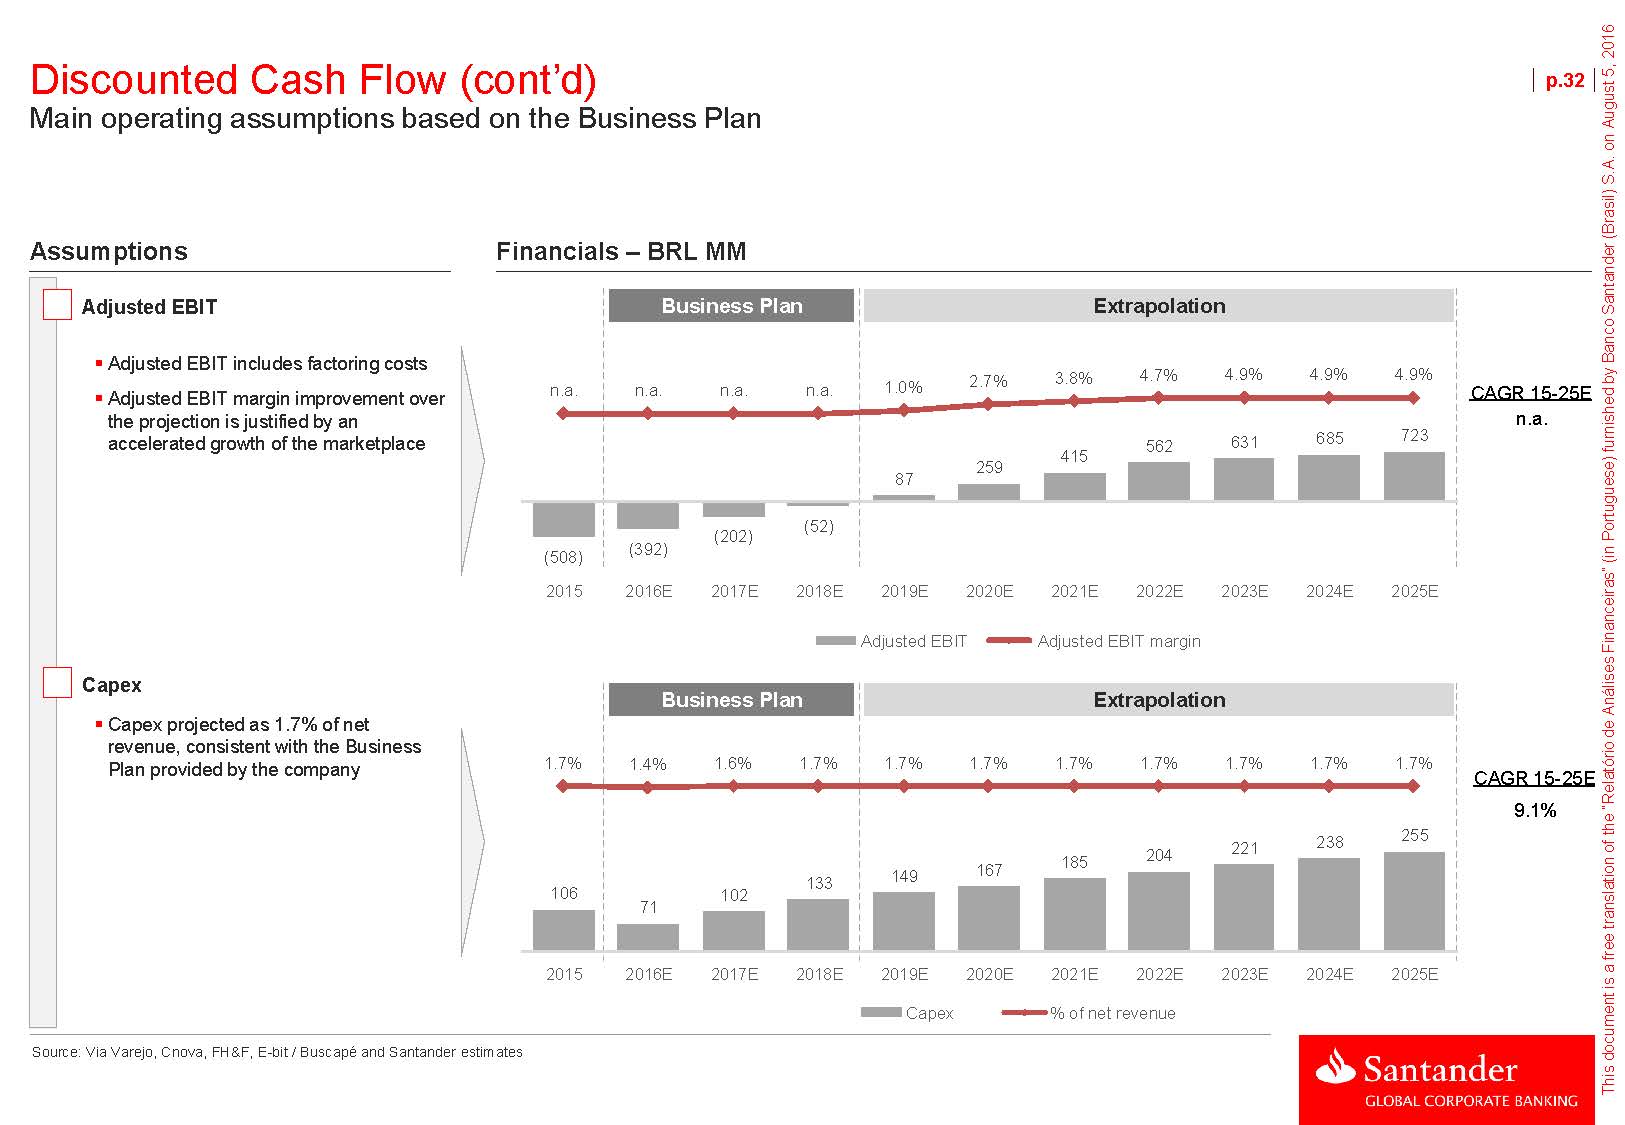
Discounted Cash Flow (cont’d) Main operating assumptions based on the Business Plan p.32AssumptionsFinancials – BRL MMAdjusted EBITBusiness Plan ExtrapolationAdjusted EBIT includes factoring costsAdjusted EBIT margin improvement over the projection is justified by an accelerated growth of the marketplace n.a. n.a. n.a. n.a. 1.0% 2.7% 3.8% 4.7% 4.9% 4.9% 4.9% 562 631 685 723 CAGR 15 -25E n.a. 259 415 87 (508) (392) (202) (52) 2015 2016E 2017E 2018E 2019E 2020E 2021E 2022E 2023E 2024E 2025E Adjusted EBIT Adjusted EBIT margin CapexCapex projected as 1.7% of net revenue, consistent with the Business Plan provided by the company Business Plan Extrapolation 1.7% 1.4% 1.6% 1.7% 1.7% 1.7% 1.7% 1.7% 1.7% 1.7% 1.7% 255 CAGR 15 -25E 9.1% 106 71 133 102 149 167 185 204 221 238 2015 2016E 2017E 2018E 2019E 2020E 2021E 2022E 2023E 2024E 2025E Source: Via Varejo, Cnova, FH&F, E-bit / Buscapé and Santander estimates Capex % of net revenue
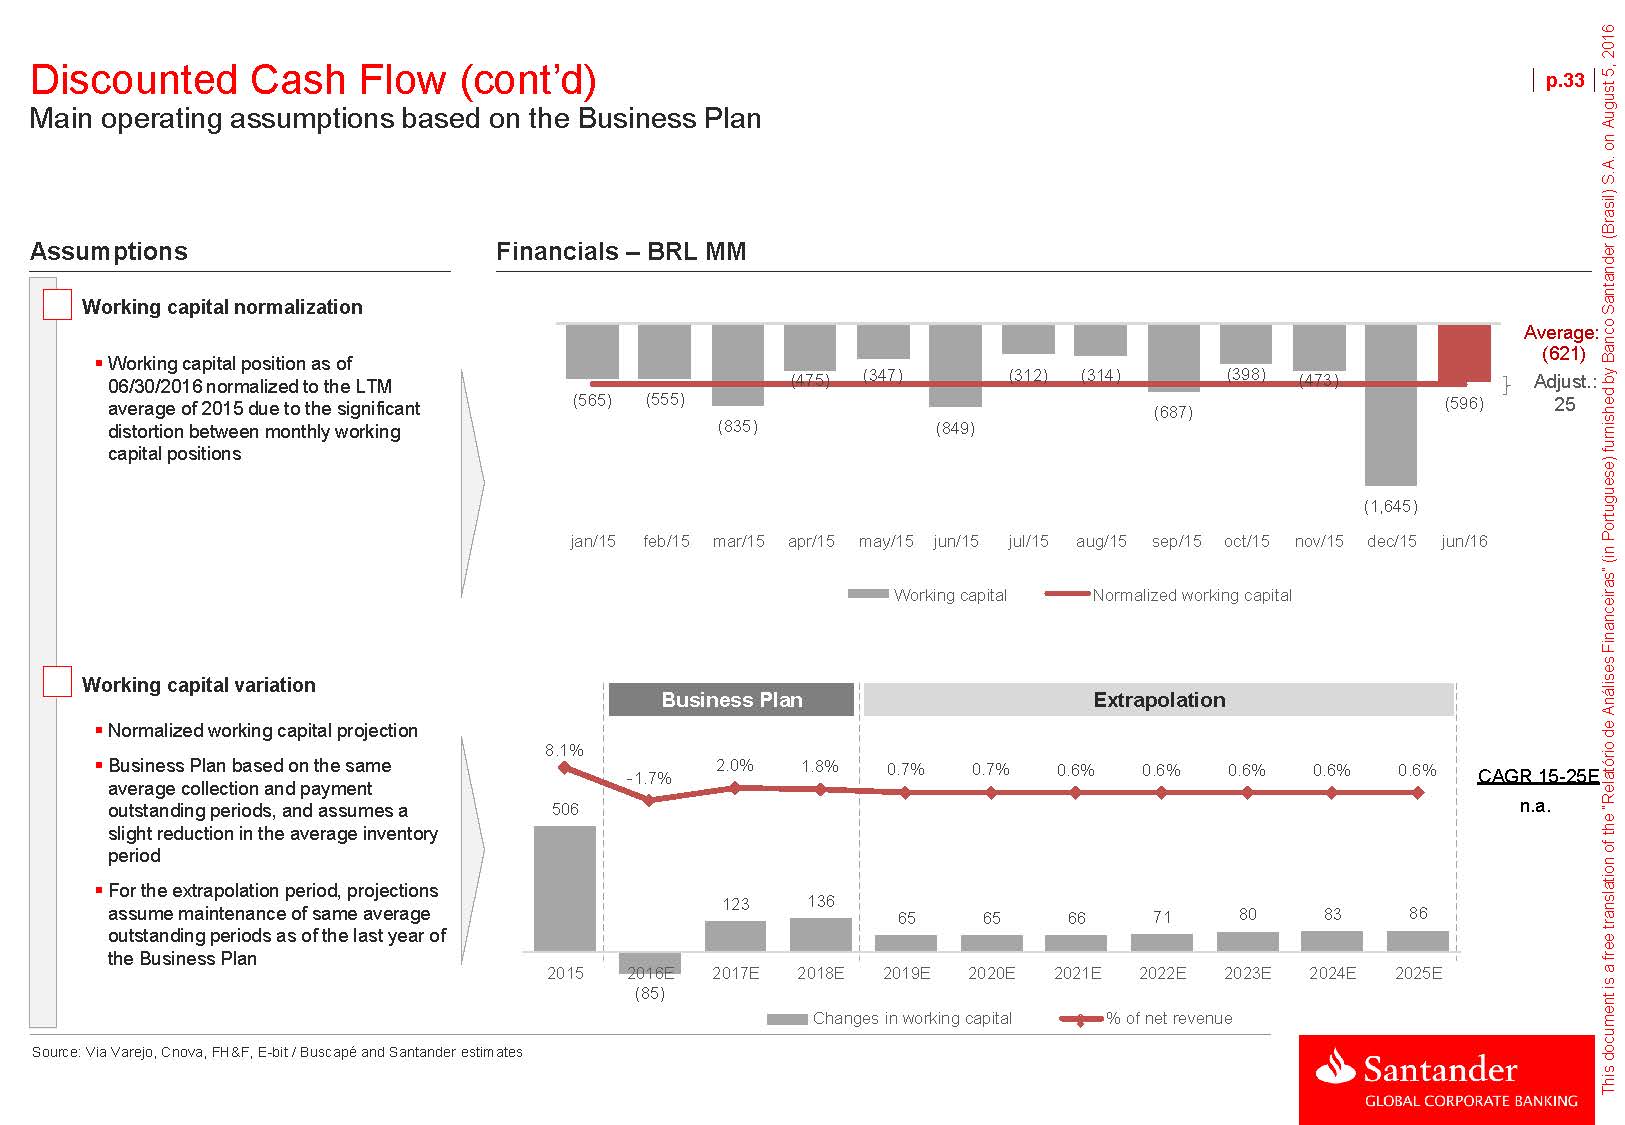
Discounted Cash Flow (cont’d) Main operating assumptions based on the Business Plan p.33AssumptionsFinancials – BRL MMWorking capital normalizationWorking capital position as of 06/30/2016 normalized to the LTM average of 2015 due to the significant distortion between monthly working capital positions (565) (555) (835) (475) (347) (849) (312) (314) (687) (398) (473) (596) Average: (621) Adjust.: 25 (1,645) jan/15 feb/15 mar/15 apr/15 may/15 jun/15 jul/15 aug/15 sep/15 oct/15 nov/15 dec/15 jun/16 Working capital Normalized working capital Working capital variationNormalized working capital projectionBusiness Plan based on the same average collection and payment outstanding periods, and assumes a slight reduction in the average inventory periodFor the extrapolation period, projections 8.1% 506 Business Plan Extrapolation -1.7% 2.0% 1.8% 0.7% 0.7% 0.6% 0.6% 0.6% 0.6% 0.6% CAGR 15-25E n.a. assume maintenance of same average outstanding periods as of the last year of the Business Plan 123 136 65 65 66 71 80 83 86 2015 2016E 2017E 2018E 2019E 2020E 2021E 2022E 2023E 2024E 2025E (85) Source: Via Varejo, Cnova, FH&F, E-bit / Buscapé and Santander estimates Changes in working capital % of net revenue

Discounted Cash Flow (cont’d) DCF valuation summary p.34RealizedBusiness PlanBusiness Plan extrapolationBRL MM Jan-Jun 16 Jul-Dec 16 2017E 2018E 2019E 2020E 2021E 2022E 2023E 2024E 2025E Perpetuity Net revenue 2,256 2,664 6,287 7,773 8,704 9,721 10,803 11,875 12,883 13,879 14,850 15,821 Growth (21.0%) 27.8% 23.6% 12.0% 11.7% 11.1% 9.9% 8.5% 7.7% 7.0% (-) COGS and SG&A (2,507) (2,486) (6,128) (7,417) (8,197) (9,030) (9,904) (10,791) (11,668) (12,548) (13,423)6.5% (14,301) (=) EBITDA (252) 178 159 356 507 690 899 1,085 1,215 1,331 1,427 1,520 EBITDA margin (11.2%) 6.7% 2.5% 4.6% 5.8% 7.1% 8.3% 9.1% 9.4% 9.6% 9.6% (-) Factoring costs (101) (163) (308) (350) (359) (354) (388) (408) (449) (487) (521)9.6% (555) (=) Adjusted EBITDA (353) 15 (149) 6 148 336 510 676 766 844 906 965 Adjusted EBITDA margin (15.6%) 0.6% (2.4%) 0.1% 1.7% 3.5% 4.7% 5.7% 5.9% 6.1% 6.1% (-) D&A (29) (25) (54) (58) (61) (77) (95) (114) (135) (158) (183)6.1% (195) (=) Adjusted EBIT (382) (10) (202) (52) 87 259 415 562 631 685 723 770 Adjusted EBIT margin (16.9%) (0.4%) (3.2%) (0.7%) 1.0% 2.7% 3.8% 4.7% 4.9% 4.9% 4.9% (-) Taxes - - - (29) (88) (141) (191) (214) (233) (246)4.9% (262) (=) NOPLAT (10) (202) (52) 57 171 274 371 416 452 477 508 (+) D&A 25 54 58 61 77 95 114 135 158 183 (+/–) Changes in working capital (85) 123 136 65 65 66 71 80 83 86 (-) CAPEX (25) (102) (133) (149) (167) (185) (204) (221) (238) (255) 195 86 (208) (=) FCFF (95) (128) 8 34 147 249 353 411 456 491 581 (=) NPV FCFF (92) (111) 6 22 83 122 150 151 145 136 1,816 (=) FCFF Fiscal credit - - - 9 26 42 57 64 36 - - (=) NPV FCFF Fiscal credit - - - 6 15 21 24 24 11 - - Valuation summary Implied multiples EV sensitivity analysis (USD MM) WACC 15.4% EV / Sales 16E 0.51x WACC Perpetuity growth (g)¹ 6.5% EV / Sales 17E 0.40x 14.4% 14.9% 15.4% 15.9% 16.4% 5.5% 816 756 702 653 609NPV – Projected flow 24.2% 611 6.0% 860 635 NPV – Fiscal credit 4.0% 101 g 6.5% 909663 NPV – Perpetuity 71.8% 1,816 Exit multiple (Perpetuity) 7.0% 965 694 EV BRL MM 100.0% 2,528 EV / Sales 0.44x 7.5% 1,029 938 859 790 729Fx rate - USD/BRL (monthly average)² 3.28 EV USD MM 772(1) In BRL nominal terms (considers 2.0% real growth in perpetuity) (2) As of 07/29/2016 Source: Bloomberg and Santander estimates

Discounted Cash Flow (cont’d) EV to Equity adjustments p.35EV – Equity adjustmentsTo arrive at Cnova Brasil’s equity value, the - Fraud provisions (fee of advisors) estimated by Brasil’s equity value was valued at BRL 1,413 MM (USD 431 MM) (1) Exchange rate used: USD/BRL of 3.2763 (30-day average as of 07/29/2016)

Section 2Cnova Brasil I. Overview II. Comparison with main peers III. Valuation a) Discounted Cash Flow b) Trading multiples c) Transaction multiples p.36
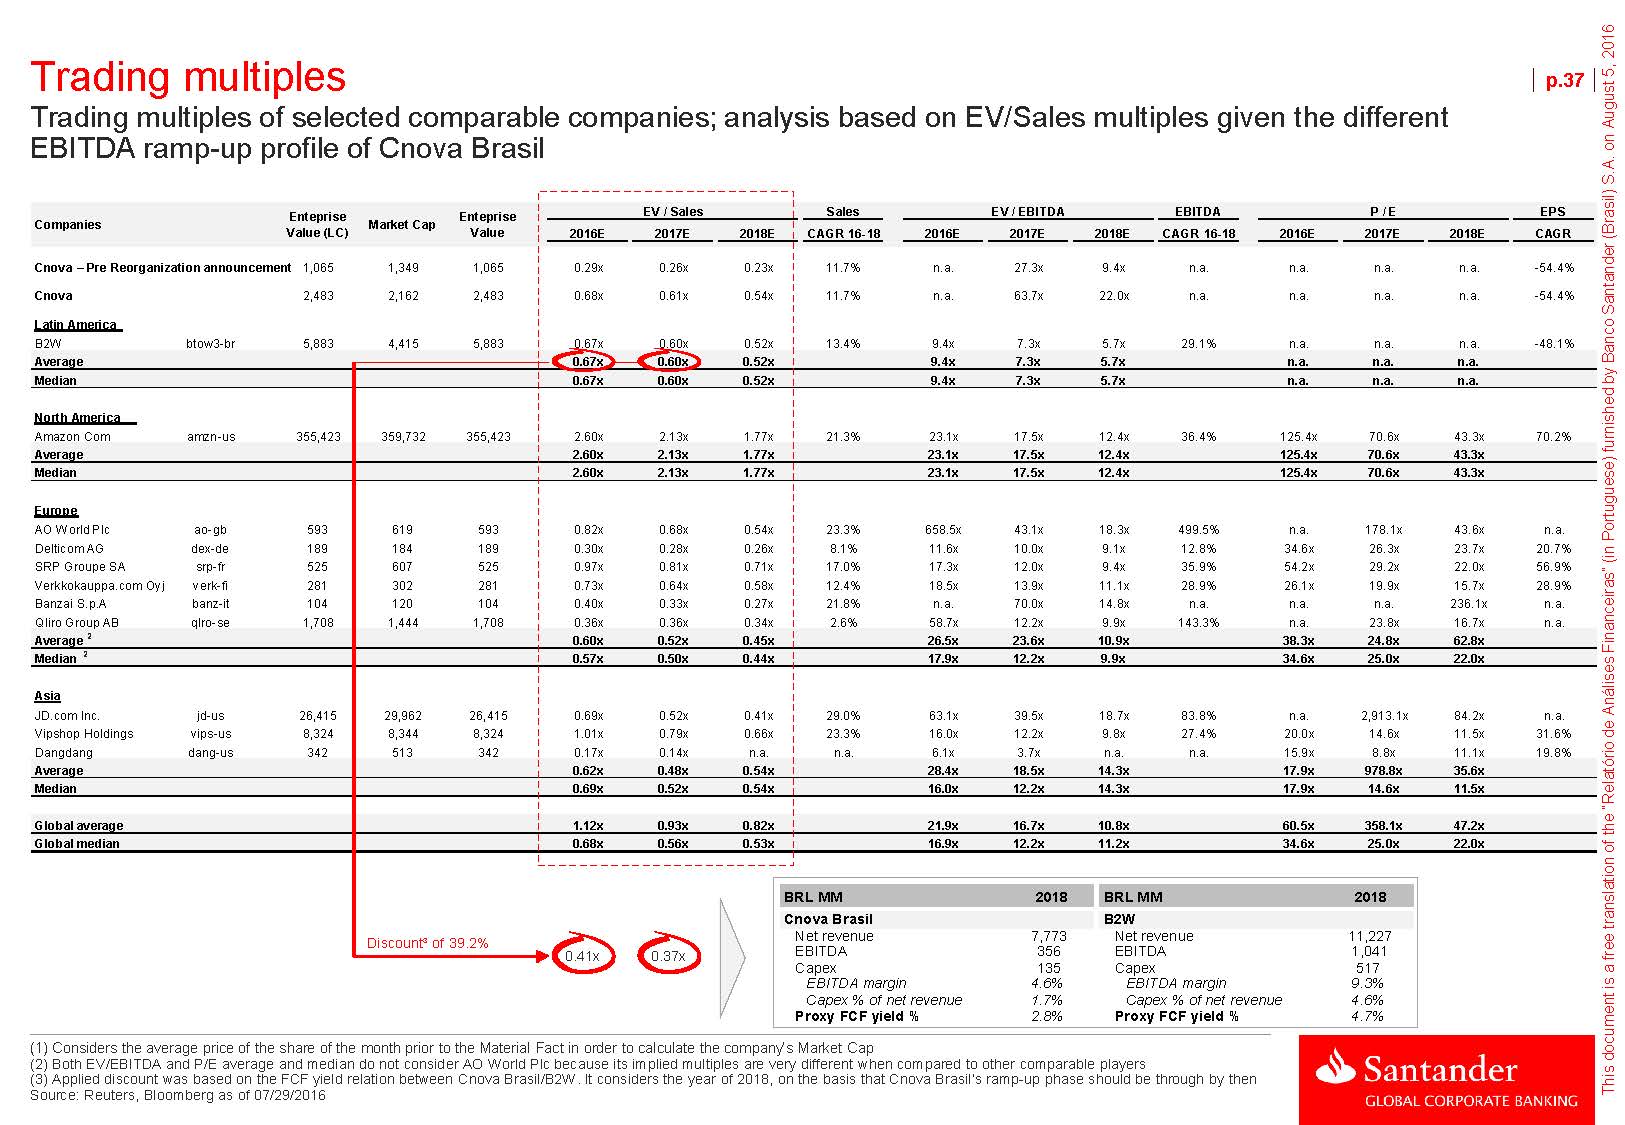
Trading multiples Trading multiples of selected comparable companies; analysis based on EV/Sales multiples given the different EBITDA ramp-up profile of Cnova Brasil p.37CompaniesEntepriseValue (LC)Market Cap EntepriseValue EV / Sales Sales EV / EBITDA EBITDA P / E EPS 2016E 2017E2018ECAGR 16-182016E 2017E 2018E CAGR 16-182016E 2017E 2018E CAGR Cnova – Pre Reorganization announcement1,065 1,349 1,065 0.29x 0.26x 0.23x 11.7% n.a. 27.3x 9.4x n.a. n.a. n.a. n.a. -54.4%CnovaLatin America 2,483 2,162 2,483 0.68x 0.61x 0.54x 11.7% n.a. 63.7x 22.0x n.a. n.a. n.a. n.a. -54.4% B2W btow3-br 5,883 4,415 5,883 0.67x 0.60x 0.52x 13.4% 9.4x 7.3x 5.7x 29.1% n.a. n.a. n.a. -48.1% Average 0.67x 0.60x 0.52x 9.4x 7.3x 5.7x n.a. n.a. n.a. Median 0.67x 0.60x 0.52x 9.4x 7.3x 5.7x n.a. n.a. n.a. North America Amazon Com amzn-us 355,423 359,732 355,423 2.60x 2.13x 1.77x 21.3% 23.1x 17.5x 12.4x 36.4% 125.4x 70.6x 43.3x 70.2% Average 2.60x 2.13x 1.77x 23.1x 17.5x 12.4x 125.4x 70.6x 43.3x Median 2.60x 2.13x 1.77x 23.1x 17.5x 12.4x 125.4x 70.6x 43.3x Europe AO World Plc ao-gb 593 619 593 0.82x 0.68x 0.54x 23.3% 658.5x 43.1x 18.3x 499.5% n.a. 178.1x 43.6x n.a. Delticom AG dex-de 189 184 189 0.30x 0.28x 0.26x 8.1% 11.6x 10.0x 9.1x 12.8% 34.6x 26.3x 23.7x 20.7% SRP Groupe SA srp-fr 525 607 525 0.97x 0.81x 0.71x 17.0% 17.3x 12.0x 9.4x 35.9% 54.2x 29.2x 22.0x 56.9% Verkkokauppa.com Oyj verk-fi 281 302 281 0.73x 0.64x 0.58x 12.4% 18.5x 13.9x 11.1x 28.9% 26.1x 19.9x 15.7x 28.9% Banzai S.p.A banz-it 104 120 104 0.40x 0.33x 0.27x 21.8% n.a. 70.0x 14.8x n.a. n.a. n.a. 236.1x n.a. Qliro Group AB qlro-se 1,708 1,444 1,708 0.36x 0.36x 0.34x 2.6% 58.7x 12.2x 9.9x 143.3% n.a. 23.8x 16.7x n.a. Average2 0.60x 0.52x 0.45x 26.5x 23.6x 10.9x 38.3x 24.8x 62.8x Median20.57x 0.50x 0.44x 17.9x 12.2x 9.9x 34.6x 25.0x 22.0x Asia JD.com Inc. jd-us 26,415 29,962 26,415 0.69x 0.52x 0.41x 29.0% 63.1x 39.5x 18.7x 83.8% n.a. 2,913.1x 84.2x n.a. Vipshop Holdings vips-us 8,324 8,344 8,324 1.01x 0.79x 0.66x 23.3% 16.0x 12.2x 9.8x 27.4% 20.0x 14.6x 11.5x 31.6% Dangdang dang-us 342 513 342 0.17x 0.14x n.a. n.a. 6.1x 3.7x n.a. n.a. 15.9x 8.8x 11.1x 19.8% Average 0.62x 0.48x 0.54x 28.4x 18.5x 14.3x 17.9x 978.8x 35.6x Median 0.69x 0.52x 0.54x 16.0x 12.2x 14.3x 17.9x 14.6x 11.5x Global average 1.12x 0.93x 0.82x 21.9x 16.7x 10.8x 60.5x 358.1x 47.2x Global median 0.68x 0.56x 0.53x 16.9x 12.2x 11.2x 34.6x 25.0x 22.0x Discount³ of 39.2% 0.41x 0.37x (1) Considers the average price of the share of the month prior to the Material Fact in order to calculate the company’s Market Cap (2) Both EV/EBITDA and P/E average and median do not consider AO World Plc because its implied multiples are very different when compared to other comparable players (3) Applied discount was based on the FCF yield relation between Cnova Brasil/B2W. It considers the year of 2018, on the basis that Cnova Brasil’s ramp-up phase should be through by then Source: Reuters, Bloomberg as of 07/29/2016

Trading multiples valuation p.38 Based on the trading multiples methodology, the Equity Value of Cnova Brasil was valued at c. BRL 1.0 bi (USD 0.3 bi) Enterprise Value (BRL MM) Equity Value (BRL MM)11Implied multiples at mid-point EV / Sales20162017CommentsMethodology based on comparable listed companies EV / SalesMultiples2016E2017E3,277 3,719 3,356 3,843 0.67x 0.77x 0.53x 0.60xEnterprise Value is calculated by applying the multiple EV/Sales from selected peers to Cnova Brasil’s projected net revenue in the Business Plan 2EV / SalesAdjusted² Multiples2016E2017E1,989 2,286 2,041 2,309 0.41x 0.47x 0.32x 0.37xEV/EBITDA multiples valuation was disregarded in this exercise given that Cnova Brasil has a negative EBITDA in 2016 and only reaches stable margins consistent with its operation from 2022 onwardsAverage range calculated from the average of the EV midpoints of the valuations using non- Average Range (BRL MM)Average Range (USD MM)³ 1,068 1,099 3,498 3,599 0.72x 0.56x adjusted EV/Sales multiplesAssumes a total adjustment from Enterprise Value to Equity Value for Cnova Brasil of BRL 2,534 million4 (1) Valuation range by applying a +/- 5% variation to the Equity Value (2) A 39.2% discount over B2W ‘s EV/Sales multiple was considered (3) Exchange rate used: USD/BRL of 3.2763 (30-day average as of 07/29/2016) (4) EV to Equity adjustment details in the Annex III Source: Santander, Reuters, Bloomberg

Section 2Cnova Brasil I. Overview II. Comparison with main peers III. Valuation a) Discounted Cash Flow b) Trading Multiples c) Transaction Multiples p.39
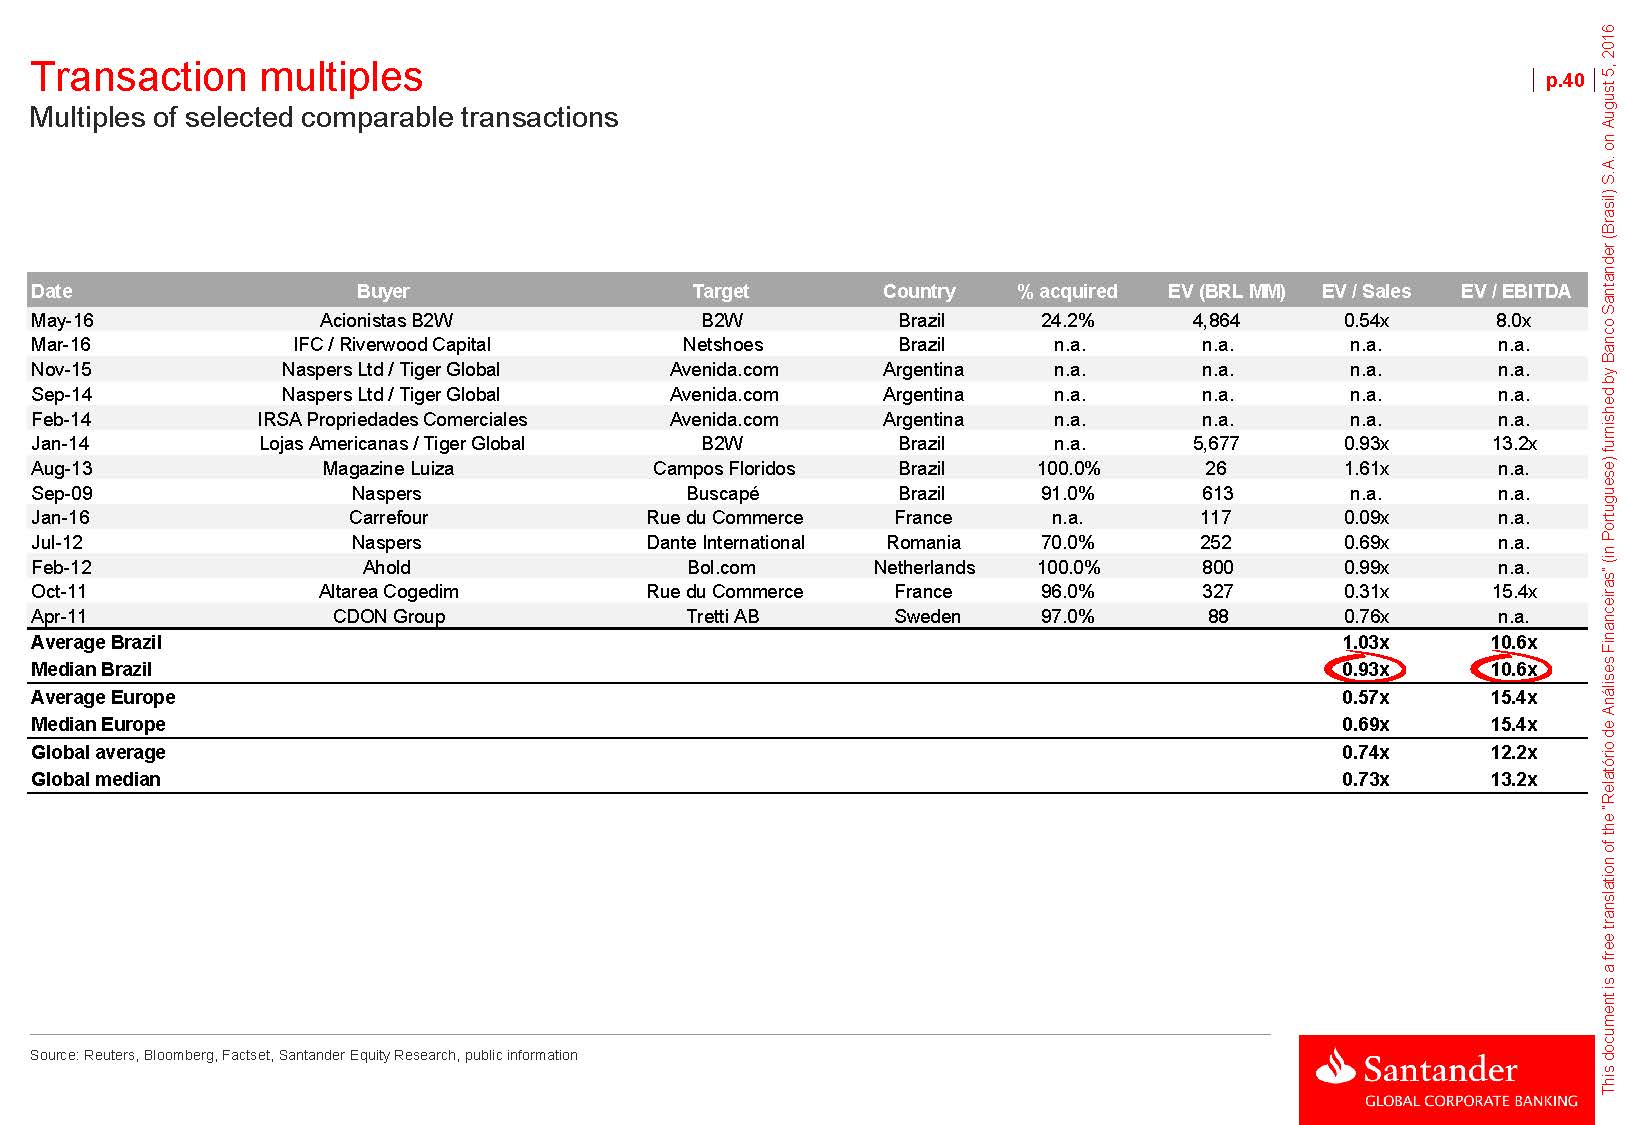
Transaction multiples Multiples of selected comparable transactions p.40Date Buyer Target Country % acquired EV (BRL MM) EV / Sales EV / EBITDA May-16 Acionistas B2W B2W Brazil 24.2% 4,864 0.54x 8.0x Mar-16 IFC / Riverwood Capital Netshoes Brazil n.a. n.a. n.a. n.a. Nov-15 Naspers Ltd / Tiger Global Avenida.com Argentina n.a. n.a. n.a. n.a. Sep-14 Naspers Ltd / Tiger Global Avenida.com Argentina n.a. n.a. n.a. n.a. Feb-14 IRSA Propriedades Comerciales Avenida.com Argentina n.a. n.a. n.a. n.a. Jan-14 Lojas Americanas / Tiger Global B2W Brazil n.a. 5,677 0.93x 13.2x Aug-13 Magazine Luiza Campos Floridos Brazil 100.0% 26 1.61x n.a. Sep-09 Naspers Buscapé Brazil 91.0% 613 n.a. n.a. Jan-16 Carrefour Rue du Commerce France n.a. 117 0.09x n.a. Jul-12 Naspers Dante International Romania 70.0% 252 0.69x n.a. Feb-12 Ahold Bol.com Netherlands 100.0% 800 0.99x n.a. Oct-11 Altarea Cogedim Rue du Commerce France 96.0% 327 0.31x 15.4x Apr-11 CDON Group Tretti AB Sweden 97.0% 88 0.76x n.a. Average Brazil 1.03x 10.6x Median Brazil 0.93x 10.6x Average Europe 0.57x 15.4x Median Europe 0.69x 15.4x Global average 0.74x 12.2xGlobal median 0.73x 13.2xSource: Reuters, Bloomberg, Factset, Santander Equity Research, public information

Transaction multiples valuation Based on the transaction multiples methodology, the Equity Value of Cnova Brasil was valued at c. BRL 2.7 bi (USD 0.8 bi) p.41 Enterprise Value (BRL MM) Equity Value (BRL MM)1Implied multiples at mid-point over ’16EV / SalesCommentsMethodology based on comparable transactionsEV / SalesMultiples20155,646 5,973 1.18xEnterprise Value is calculated by applying the multiple EV/Sales from selected comparable transactions to Cnova Brasil’s projected net revenue EV/EBITDA multiples valuation was disregarded 2016EAverage Range (BRL MM)Average Range (USD MM)²1,546 4,485 5,065 1,627 4,690 5,332 0.93x 1.06x in this exercise given that Cnova Brasil has a negative EBITDA in 2016 and only reaches stable margins consistent with its operation from 2022 onwardsAverage range calculated as the average of the EV midpointsAssumes a total adjustment from Enterprise Value to Equity Value for Cnova Brasil of BRL 2.534 milhões3 (1) Values range built by applying a +/- 5% variation to the Equity Value (2) Exchange rate used: USD/BRL of 3.2763 (30-day average as of 07/29/2016) (3) EV to Equity adjustment details in the Annex III Source: Santander, Reuters, Bloomberg, Factset, public information
Section 3Cdiscount I. Overview II. Comparison with main peers III. Valuation a) Discounted Cash Flow b) Trading multiples c) Transaction multiples p.42

Overview Cdiscount is the second largest e-commerce in France, with more than 760 hits in 2015 and over 16 million registered customers p.43Overview Shareholding structureFounded in 1999 and currently under Casino, Cdiscount has registered more than 16 million customers since its creationIt holds operations in France, Senegal, Cameroon, Ivory Coast and ColombiaThe company offers more than 100,000 products in about 40 different categories, in addition to its marketplace, which counts with another 10 million items offered by selected partners Cdiscount gives its customers the option of collecting purchased products directly at one of its 18,000 pickup points, which are distributed between its registered partners and hypermarkets from Casino’s chainThe company has a daily average of 900,000 visitors, reaching a peak of 2.5 million visitors in the first day of winter promotion It has 2 distribution centers in France, with 100,000 m² available and more than 1,200 employees 43.3% 26.2% 21.9% Free float 8.5% Geographic footprint99.8% 100.0% Source:Company
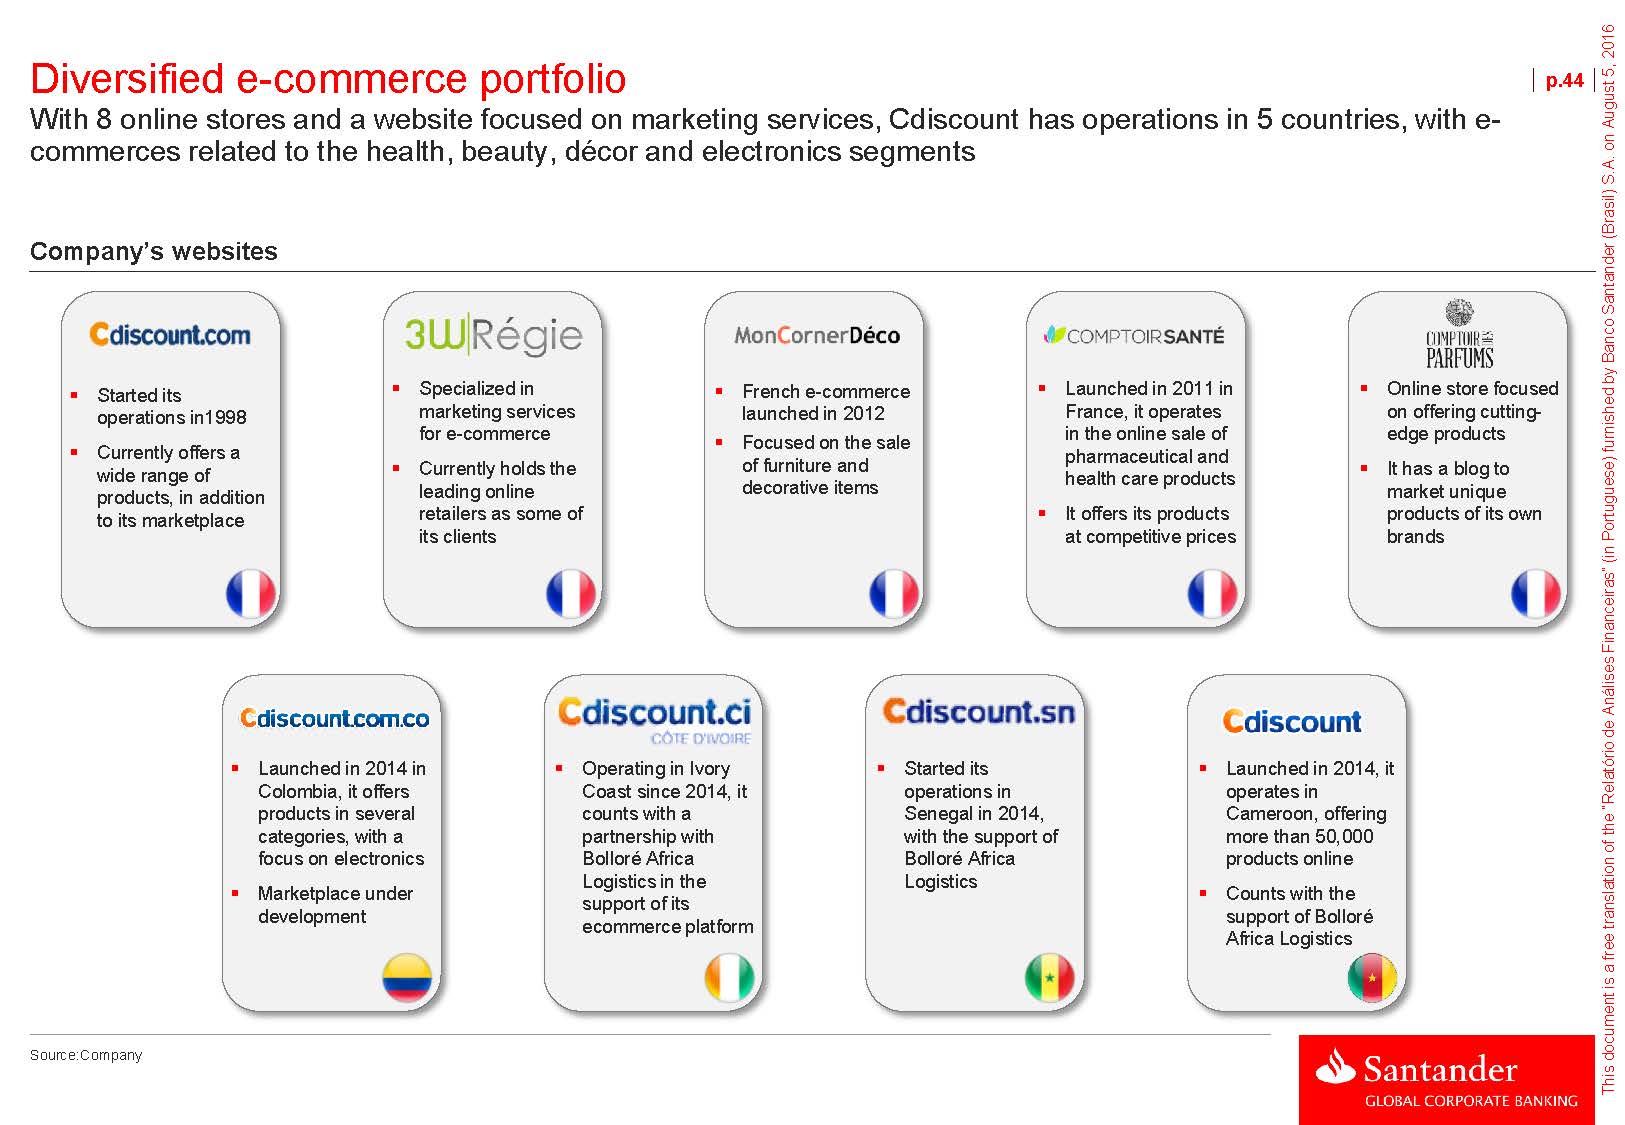
Diversified e-commerce portfolio With 8 online stores and a website focused on marketing services, Cdiscount has operations in 5 countries, with e- commerces related to the health, beauty, décor and electronics segments Company’s websitesp.44Started its operations in1998Currently offers a wide range of products, in addition to its marketplace Specialized in marketing services for e-commerceCurrently holds the leading online retailers as some of its clientsFrench e-commerce launched in 2012Focused on the sale of furniture and decorative itemsLaunched in 2011 in France, it operates in the online sale of pharmaceutical and health care productsIt offers its products at competitive pricesOnline store focused on offering cutting- edge productsIt has a blog to market unique products of its own brandsLaunched in 2014 in Colombia, it offers products in several categories, with a focus on electronicsMarketplace under developmentOperating in Ivory Coast since 2014, it counts with a partnership with Bolloré Africa Logistics in the support of its ecommerce platformStarted its operations in Senegal in 2014, with the support of Bolloré Africa LogisticsLaunched in 2014, it operates in Cameroon, offering more than 50,000 products onlineCounts with the support of Bolloré Africa Logistics Source:Company
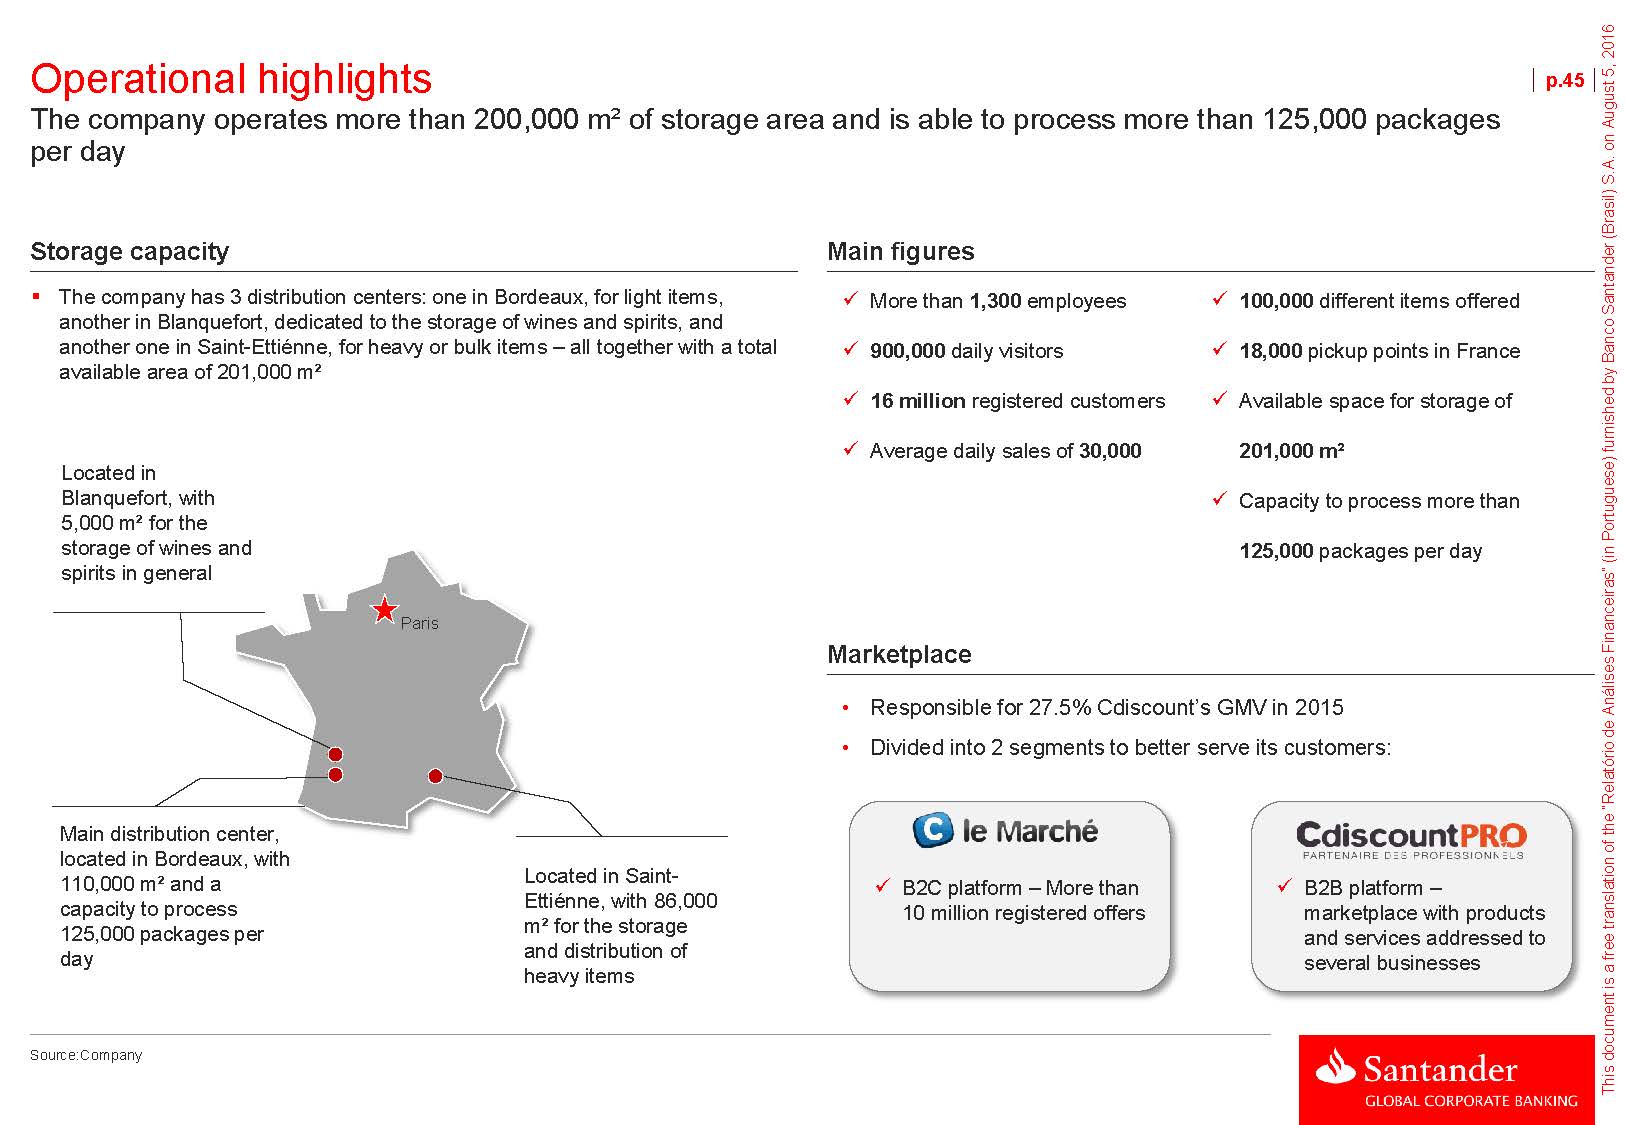
Operational highlights The company operates more than 200,000 m² of storage area and is able to process more than 125,000 packages per day p.45Storage capacityThe company has 3 distribution centers: one in Bordeaux, for light items, another in Blanquefort, dedicated to the storage of wines and spirits, and another one in Saint-Ettiénne, for heavy or bulk items – all together with a total available area of 201,000 m² Located in Blanquefort, with 5,000 m² for the storage of wines and spirits in general Main figuresüMore than 1,300 employeesü900,000 daily visitorsü 16 million registered customersüAverage daily sales of 30,000ü100,000 different items offeredü18,000 pickup points in Franceü Available space for storage of 201,000 m²üCapacity to process more than 125,000packages per dayParis Marketplace• Responsible for 27.5% Cdiscount’s GMV in 2015 • Divided into 2 segments to better serve its customers: Main distribution center, located in Bordeaux, with 110,000 m² and a capacity to process 125,000 packages per day Located in Saint- Ettiénne, with 86,000 m² for the storage and distribution of heavy itemsü B2C platform – More than 10 million registered offersüB2B platform – marketplace with products and services addressed to several businesses Source:Company

Section 3Cdiscount I. Overview II. Comparison with main peers III. Valuation a) Discounted Cash Flow b) Trading multiples c) Transaction multiples p.46
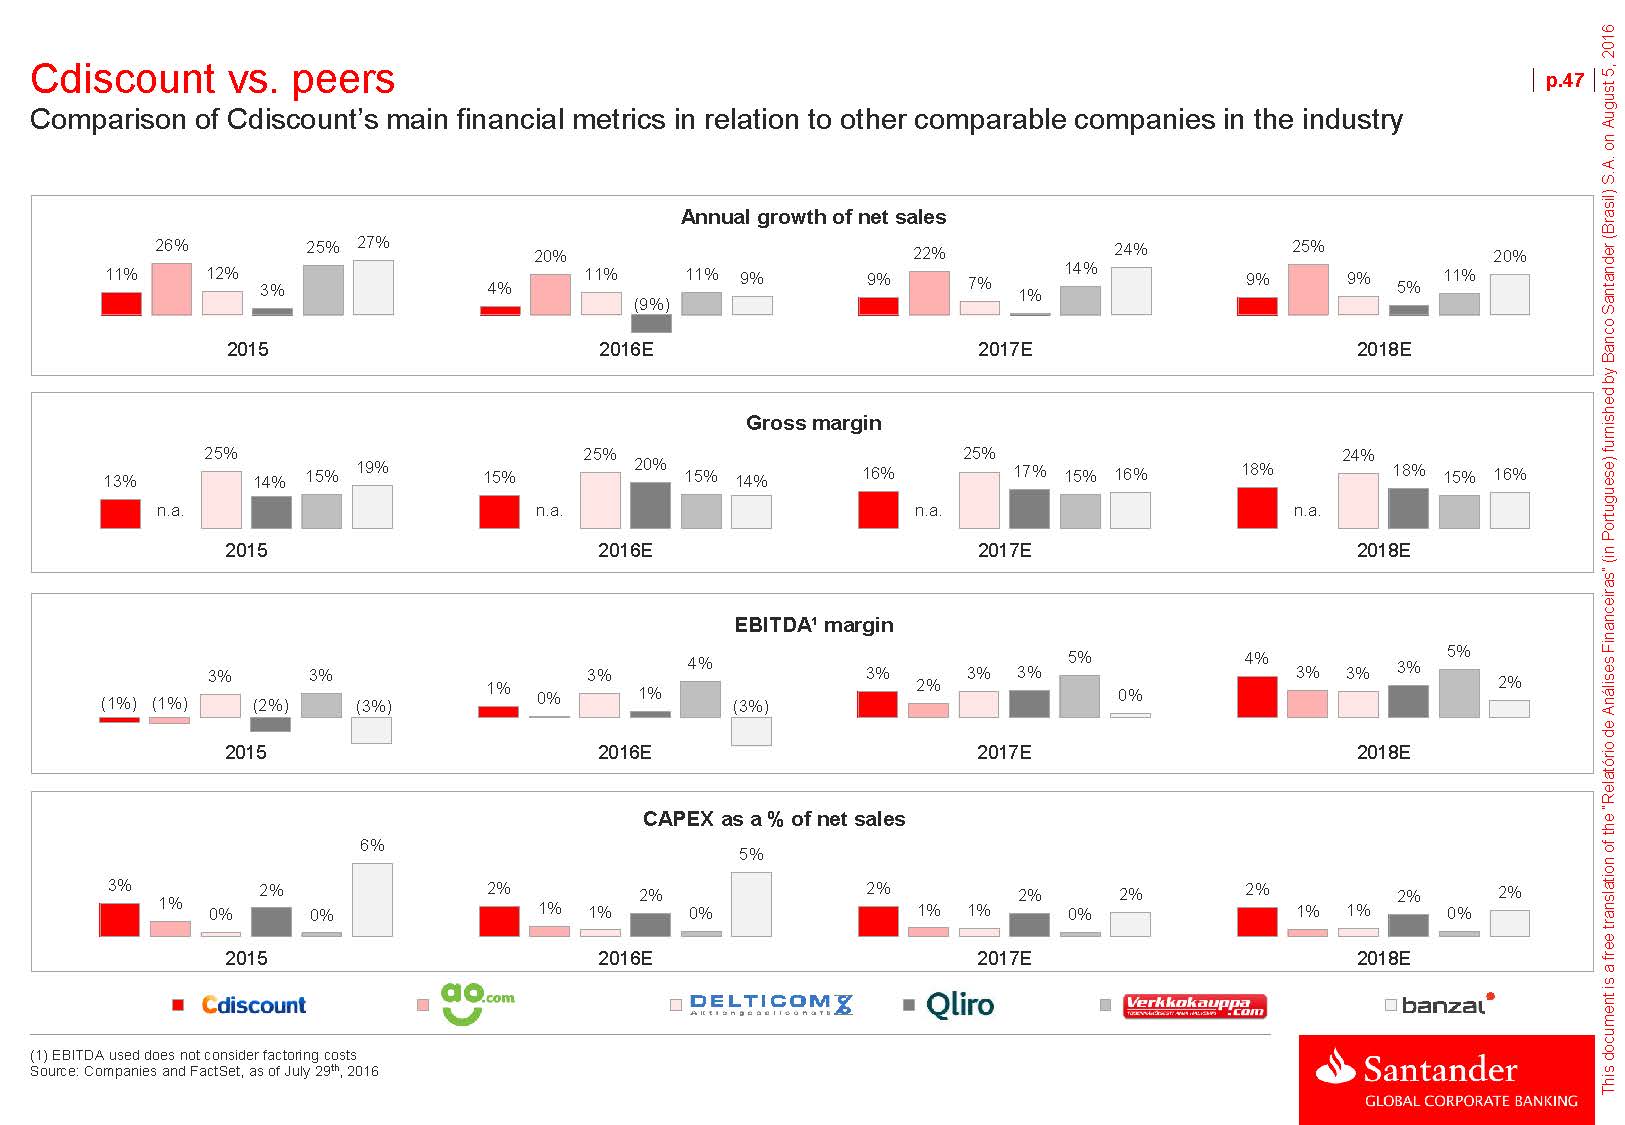
Cdiscount vs. peers Comparison of Cdiscount’s main financial metrics in relation to other comparable companies in the industry p.4726% 25% 27% Annual growth of net sales20% 22% 24% 25% 20% 11% 12% 11% 11% 7% 14% 11% 3% 4% 9% 9% 9% 9% (9%) 1% 5% 2015 2016E 2017E 2018E 25% 25% 20% Gross margin25% 24% 13% 14% 15% 19% 15% 15% 14% 16% 17% 15% 16% 18% 18% 15% 16% n.a. n.a. n.a. n.a. 2015 2016E 2017E 2018E 3% 3% EBITDA¹ margin3% 4% 3% 1% 2% 5% 3% 3% 4% 5% 3% 3% 3% 2% (1%) (1%) (2%) (3%) 0% 1% 0% (3%) 2015 2016E 2017E 2018E CAPEX as a % of net sales6% 5% 3% 2% 1% 0% 0% 2% 2% 1% 1% 0% 2% 1% 1% 2% 2% 0% 2% 1% 1% 2% 2% 0% 2015 2016E 2017E 2018E (1) EBITDA used does not consider factoring costs Source: Companies and FactSet, as of July 29th, 2016

Section 3Cdiscount I. Overview II. Comparison with main peers III. Valuation a) Discounted Cash Flow b) Trading multiples c) Transaction multiples p.48
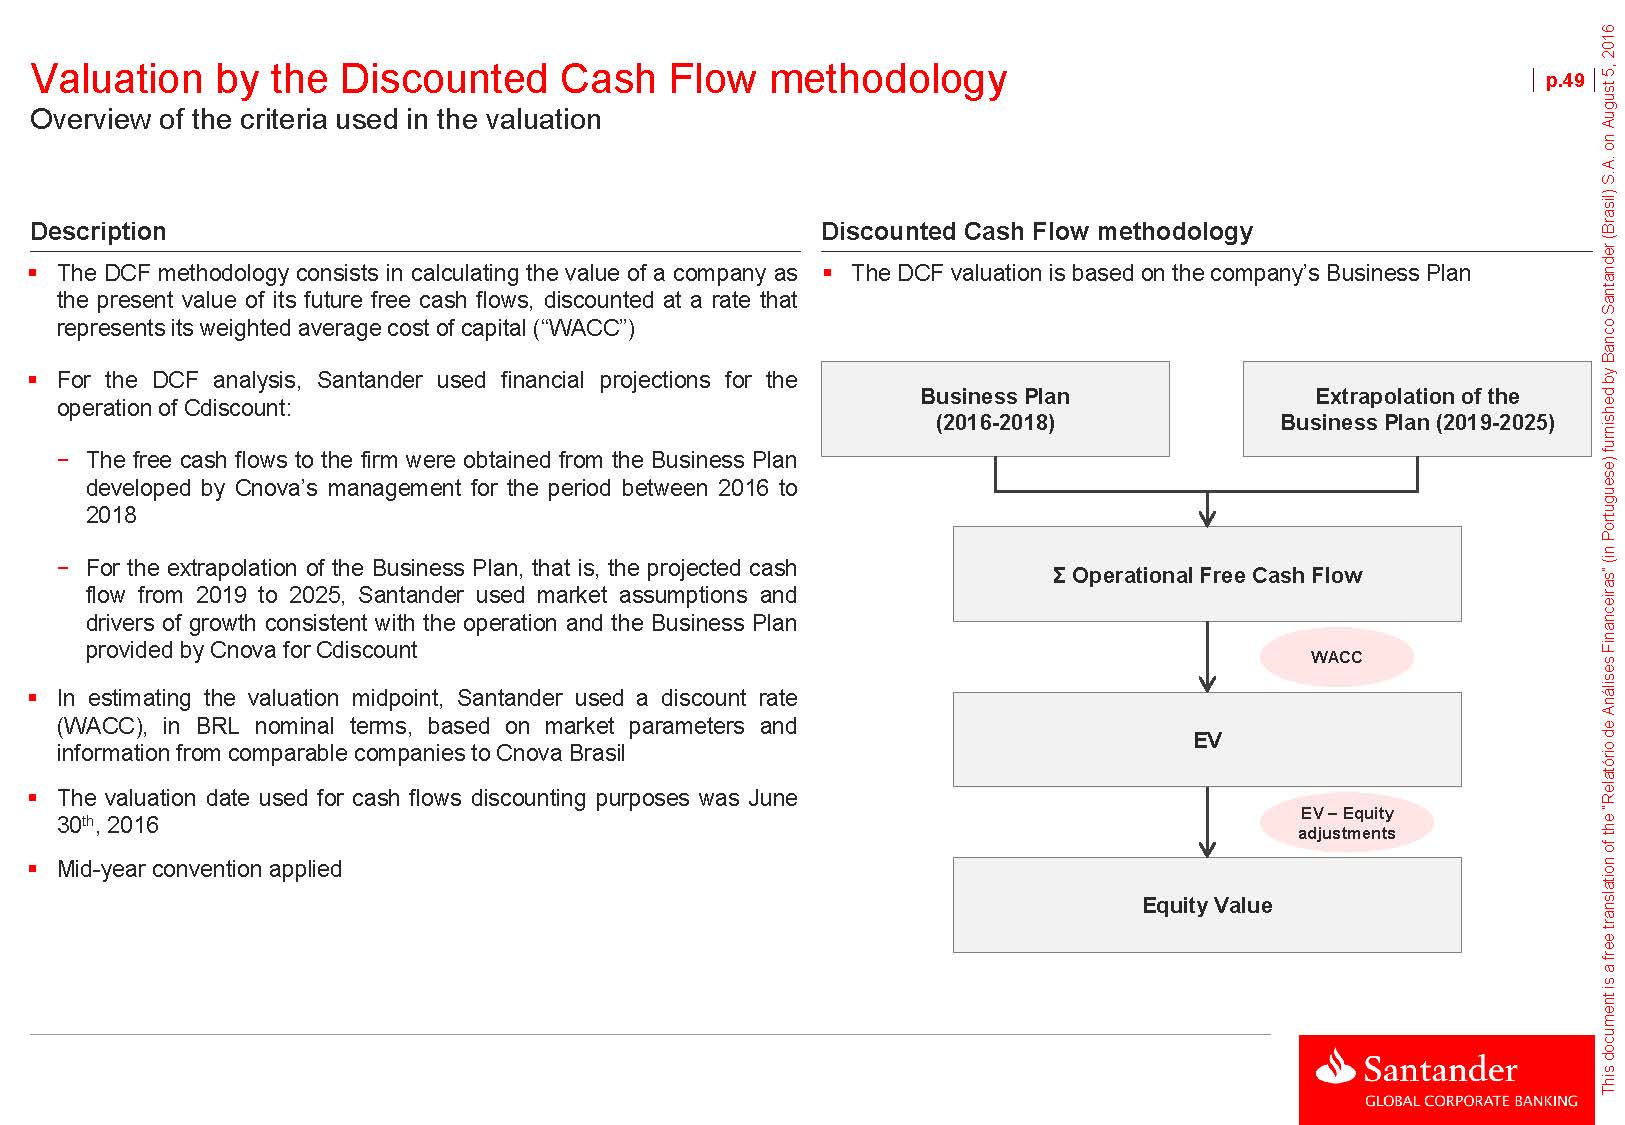
Valuation by the Discounted Cash Flow methodology Overview of the criteria used in the valuation p.49DescriptionThe DCF methodology consists in calculating the value of a company as the present value of its future free cash flows, discounted at a rate that represents its weighted average cost of capital (“WACC”) Discounted Cash Flow methodologyThe DCF valuation is based on the company’s Business PlanFor the DCF analysis, Santander used financial projections for the operation of Cdiscount: − The free cash flows to the firm were obtained from the Business Plan developed by Cnova’s management for the period between 2016 to 2018 Business Plan (2016-2018)Extrapolation of theBusiness Plan (2019-2025)− For the extrapolation of the Business Plan, that is, the projected cash flow from 2019 to 2025, Santander used market assumptions and drivers of growth consistent with the operation and the Business Plan provided by Cnova for CdiscountIn estimating the valuation midpoint, Santander used a discount rate (WACC), in BRL nominal terms, based on market parameters and information from comparable companies to Cnova BrasilThe valuation date used for cash flows discounting purposes was June 30th, 2016Mid-year convention appliedΣ Operational Free Cash FlowWACCEVEV – Equity adjustmentsEquity Value
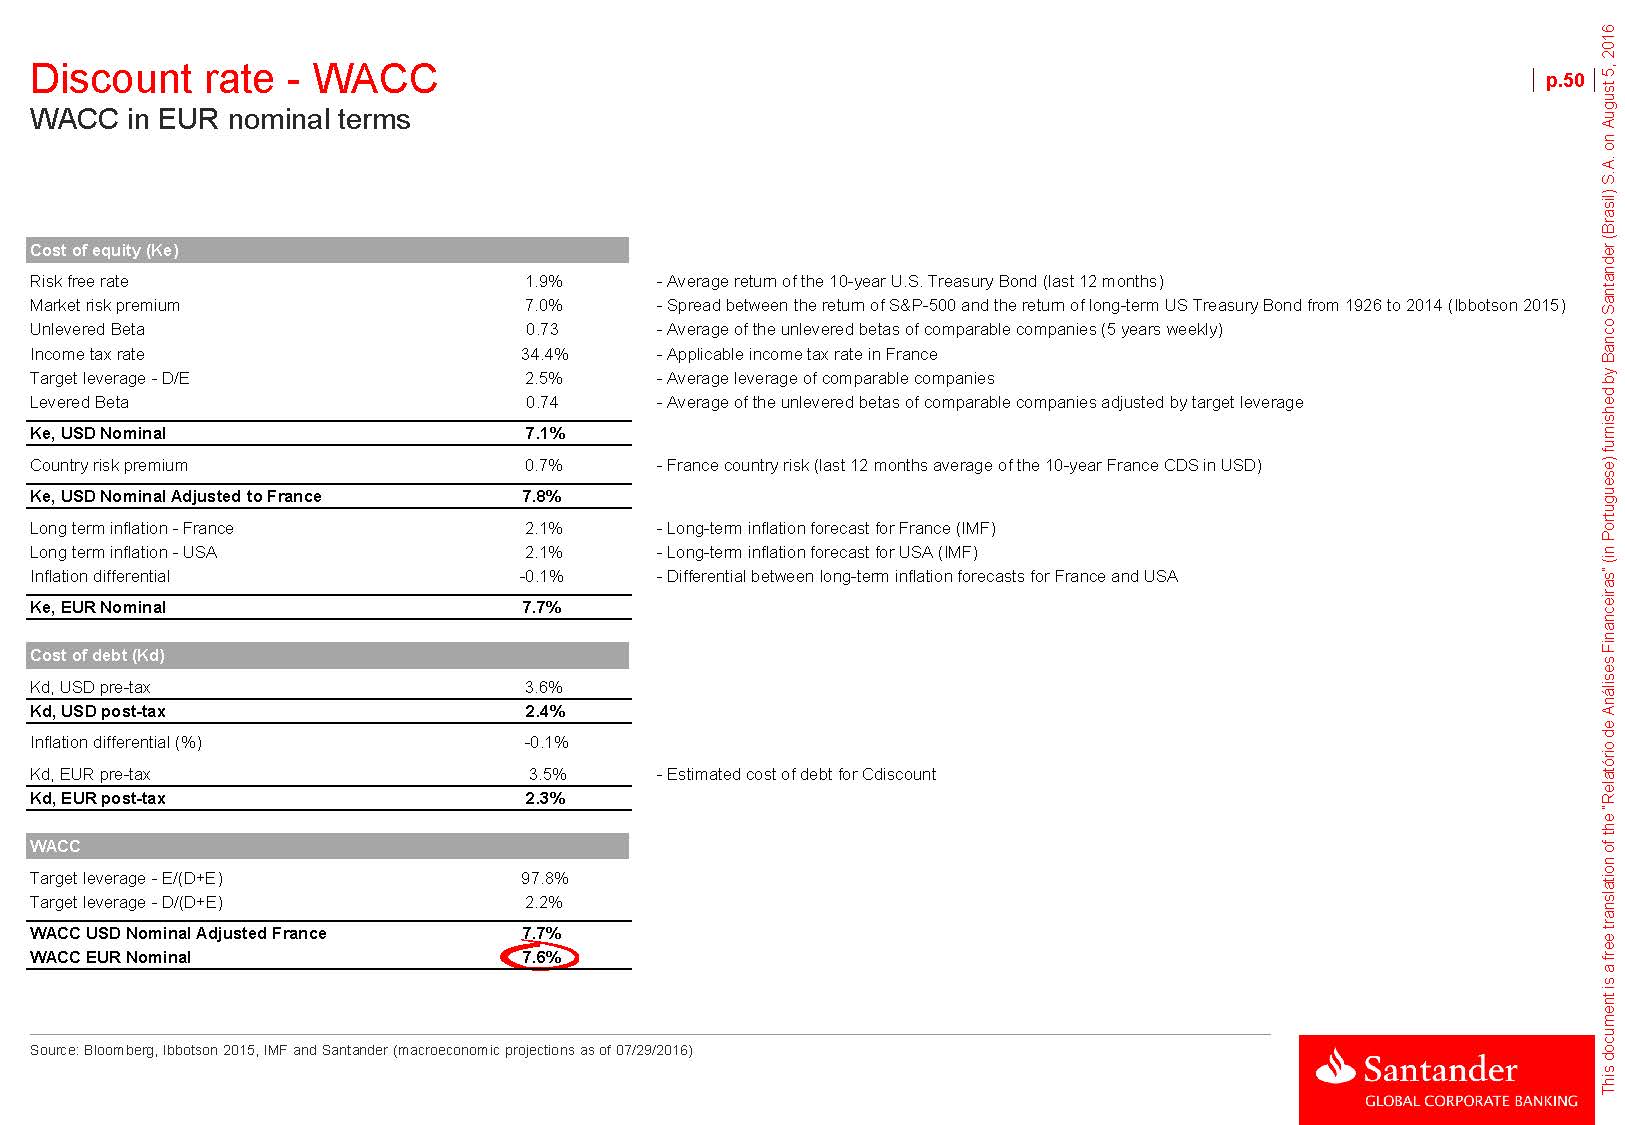
Discount rate - WACC WACC in EUR nominal terms p.50Cost of equity (Ke)Risk free rate 1.9% - Average return of the 10-year U.S. Treasury Bond (last 12 months) Market risk premium 7.0% - Spread between the return of S&P-500 and the return of long-term US Treasury Bond from 1926 to 2014 (Ibbotson 2015) Unlevered Beta 0.73 - Average of the unlevered betas of comparable companies (5 years weekly) Income tax rate 34.4% - Applicable income tax rate in France Target leverage - D/E 2.5% - Average leverage of comparable companies Levered Beta 0.74 - Average of the unlevered betas of comparable companies adjusted by target leverage Ke, USD Nominal 7.1%Country risk premium 0.7% - France country risk (last 12 months average of the 10-year France CDS in USD) Ke, USD Nominal Adjusted to France 7.8%Long term inflation - France 2.1% - Long-term inflation forecast for France (IMF) Long term inflation - USA 2.1% - Long-term inflation forecast for USA (IMF) Inflation differential -0.1% - Differential between long-term inflation forecasts for France and USA Ke, EUR Nominal 7.7%Cost of debt (Kd)Kd, USD pre-tax 3.6% Kd, USD post-tax 2.4%Inflation differential (%) -0.1% Kd, EUR pre-tax 3.5% - Estimated cost of debt for Cdiscount Kd, EUR post-tax 2.3%WACCTarget leverage - E/(D+E) 97.8% Target leverage - D/(D+E) 2.2% WACC USD Nominal Adjusted France 7.7% WACC EUR Nominal 7.6%Source: Bloomberg, Ibbotson 2015, IMF and Santander (macroeconomic projections as of 07/29/2016)
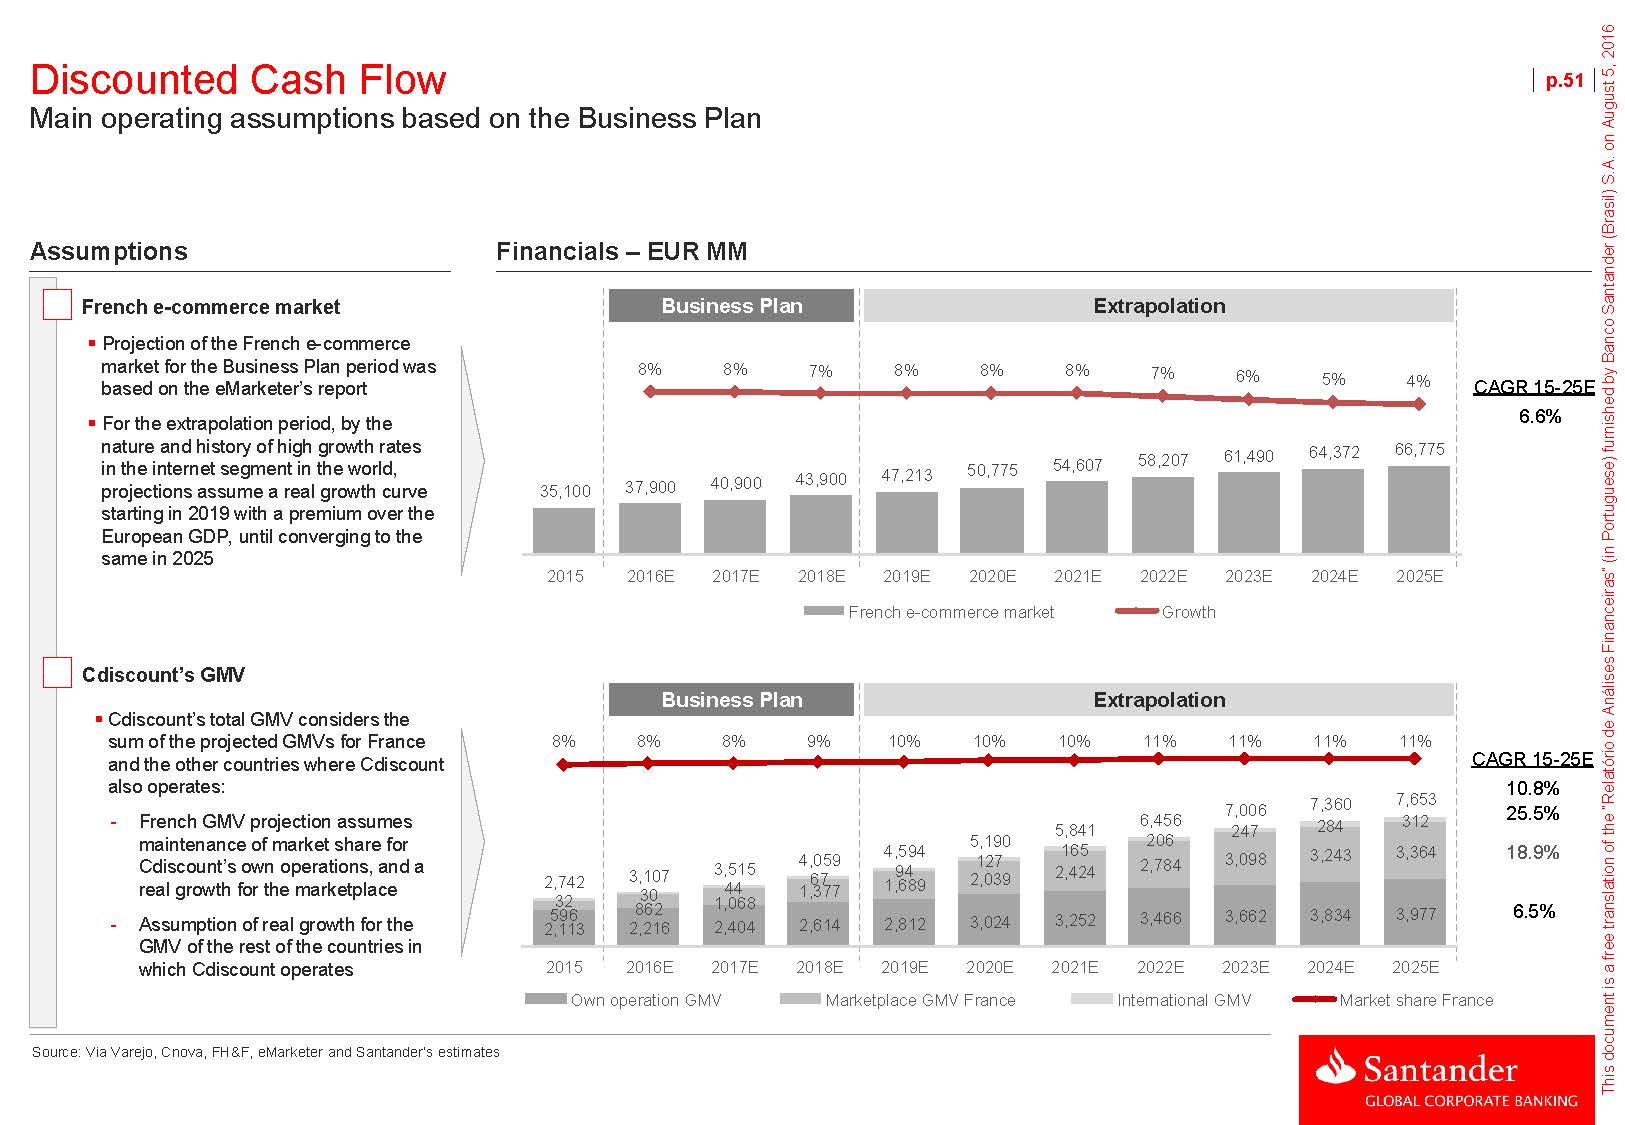
Discounted Cash Flow Main operating assumptions based on the Business Plan p.51AssumptionsFinancials – EUR MMFrench e-commerce marketProjection of the French e-commerce market for the Business Plan period was based on the eMarketer’s reportFor the extrapolation period, by the nature and history of high growth rates in the internet segment in the world, projections assume a real growth curve starting in 2019 with a premium over the European GDP, until converging to the same in 2025 Business Plan Extrapolation8% 8% 7% 8% 8% 8% 7% 6% 5% 4% 50,775 54,607 58,207 61,490 35,100 37,900 40,900 43,900 47,213 2015 2016E 2017E 2018E 2019E 2020E 2021E 2022E 2023E 2024E 2025E CAGR 15 -25E 6.6% French e-commerce market Growth Cdiscount’s GMVCdiscount’s total GMV considers the sum of the projected GMVs for France and the other countries where Cdiscount also operates: Business Plan Extrapolation 8% 8% 8% 9% 10% 10% 10% 11% 11% 11% 11% 7,006 7,360 7,653 CAGR 15 -25E 10.8% 25.5% - French GMV projection assumes maintenance of market share for 4,594 5,190 5,841 6,456 165 206 247 284 312 3,364 18.9% Cdiscount’s own operations, and a 3,515 4,059 67 94 127 2,424 2,784 3,098 3,243 real growth for the marketplace 2,742 3,107 596 862 1,068 1,377 1,689 2,039 6.5% - Assumption of real growth for the GMV of the rest of the countries in which Cdiscount operates Source: Via Varejo, Cnova, FH&F, eMarketer and Santander‘s estimates 2,113 2,216 2,404 2,614 2,812 3,024 3,252 3,466 3,662 3,834 3,977 2015 2016E 2017E 2018E 2019E 2020E 2021E 2022E 2023E 2024E 2025E Own operation GMV Marketplace GMV France International GMV Market share France
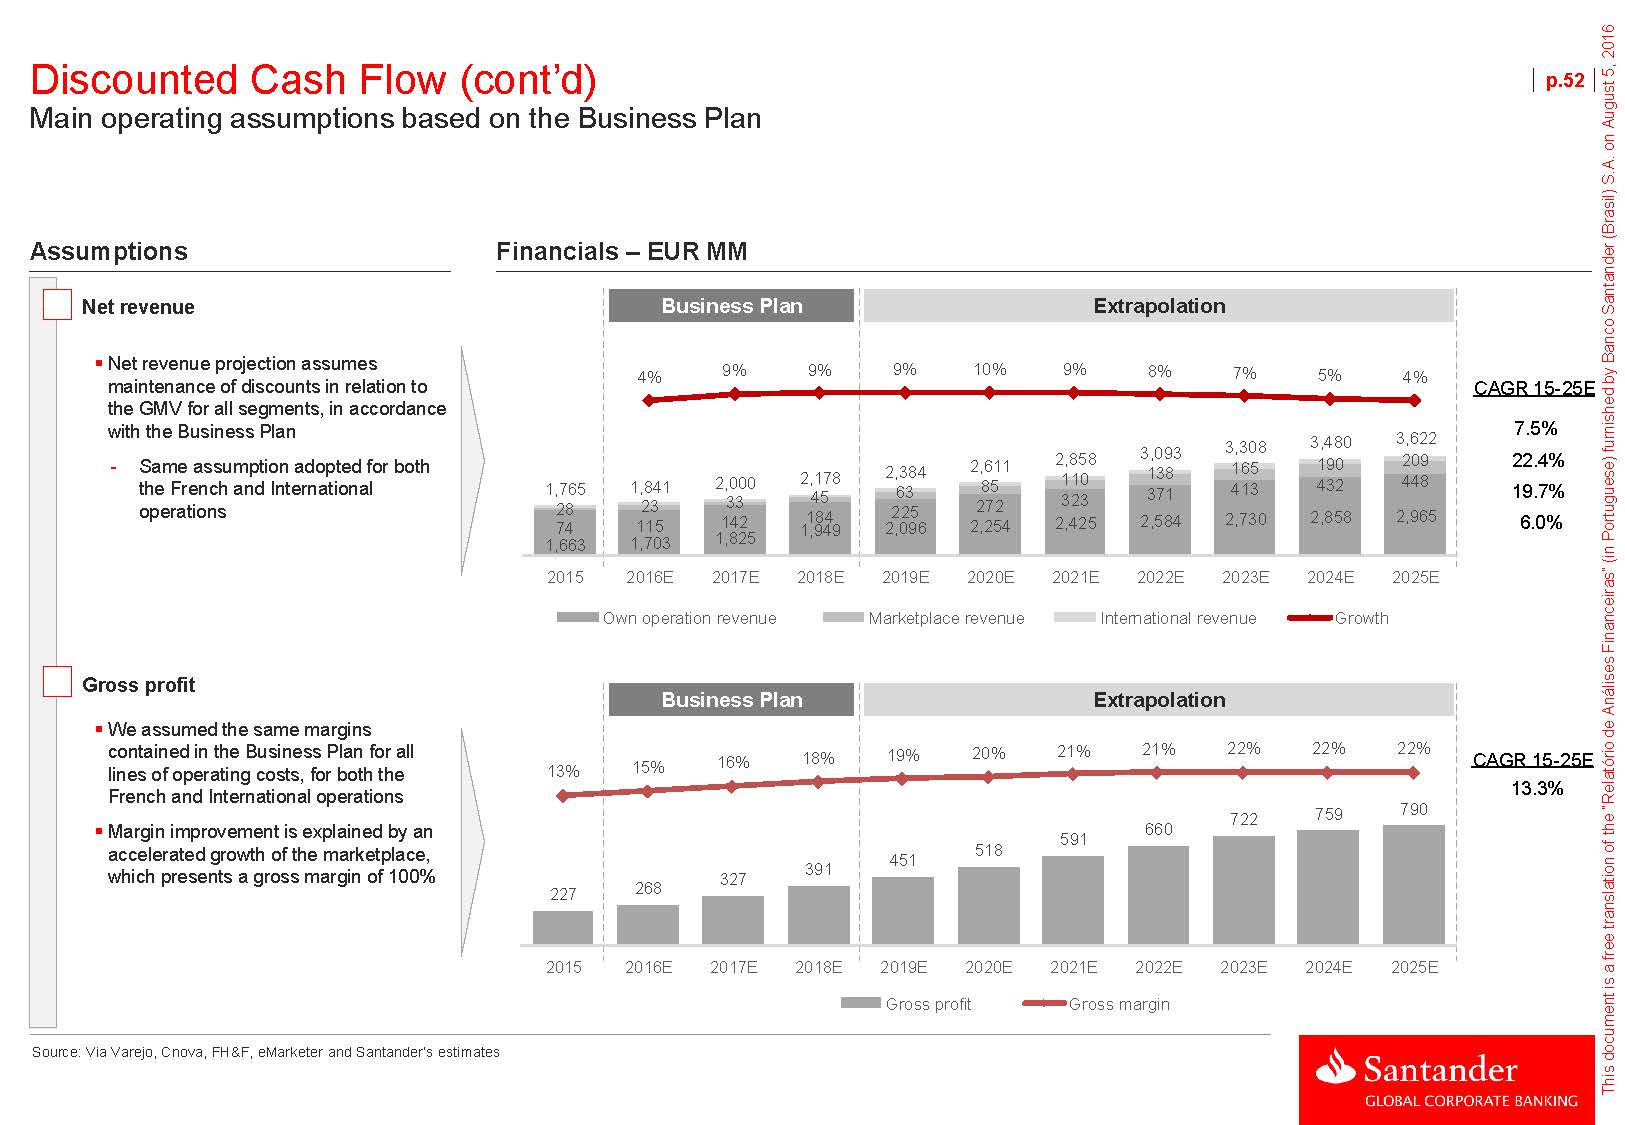
Discounted Cash Flow (cont’d) Main operating assumptions based on the Business Plan p.52AssumptionsFinancials – EUR MMNet revenue Business Plan ExtrapolationNet revenue projection assumes maintenance of discounts in relation to the GMV for all segments, in accordance with the Business Plan 4% 9% 9% 9% 10% 9% 8% 7% 5% 4% 3,093 3,308 3,480 3,622 CAGR 15-25E 7.5% - Same assumption adopted for both the French and International operations 1,765 1,841 2,000 2,178 28 23 33 45 2,384 2,611 2,858 63 85 110 225 272 323 138 165 190 209 371 413 432 448 22.4% 19.7% 142 184 1,663 1,703 1,825 1,949 2,096 2,254 2,425 2,584 2,730 2,858 2,965 6.0% 2015 2016E 2017E 2018E 2019E 2020E 2021E 2022E 2023E 2024E 2025E Own operation revenue Marketplace revenue International revenue Growth Gross profitWe assumed the same margins contained in the Business Plan for all lines of operating costs, for both the French and International operationsBusiness Plan Extrapolation19% 20% 21% 21% 22% 22% 22% 13% 15% 722 759 790 CAGR 15 -25E 13.3%Margin improvement is explained by an accelerated growth of the marketplace, which presents a gross margin of 100% 227 268 327 391 451 518 591 660 2015 2016E 2017E 2018E 2019E 2020E 2021E 2022E 2023E 2024E 2025E Source: Via Varejo, Cnova, FH&F, eMarketer and Santander‘s estimates Gross profit Gross margin

Discounted Cash Flow (cont’d) Main operating assumptions based on the Business Plan p.53AssumptionsFinancials – EUR MMOpexBusiness Plan ExtrapolationMost of the operating expenses, such as Payments, Marketing and IT, were projected as a percentage of GMVGeneral and administrative expenses 6% 10% 9% 10% 10% 10% 9% 7% 5% 4% 422 453 477 496 CAGR 15 -25E 7.9% indexed to inflation (CPI) 294 322 354 388 38 39 40 41 41 42 92 99 104For fulfillment expenses we assumed 231 245 270 56 65 74 84 64 68 71 the same percentage of net revenues of 52 58 20 23 26 30 34 38 41 45 47 49 direct sales 117 133 147 159 172 186 199 211 222 231 2015 2016E 2017E 2018E 2019E 2020E 2021E 2022E 2023E 2024E 2025E Fulfillment Payment Marketing Technology G&A Growth Factoring costsFor the Business Plan period we considered the factoring costs estimated by the companyFor the extrapolation period, factoring costs were projected as a percentage of the GMV of Cdiscount’s own operations in FranceInternational operation does not anticipate receivables Business Plan Extrapolation0.6% 1.0% 1.0% 0.9% 0.9% 0.9% 0.9% 0.9% 0.9% 0.9% 0.9% 30 32 34 35 23 23 23 25 27 29 13 2015 2016E 2017E 2018E 2019E 2020E 2021E 2022E 2023E 2024E 2025E CAGR 15 -25E 10.5% Source: Via Varejo, Cnova, FH&F, eMarketer and Santander‘s estimates Factoring costs % of own operation GMV
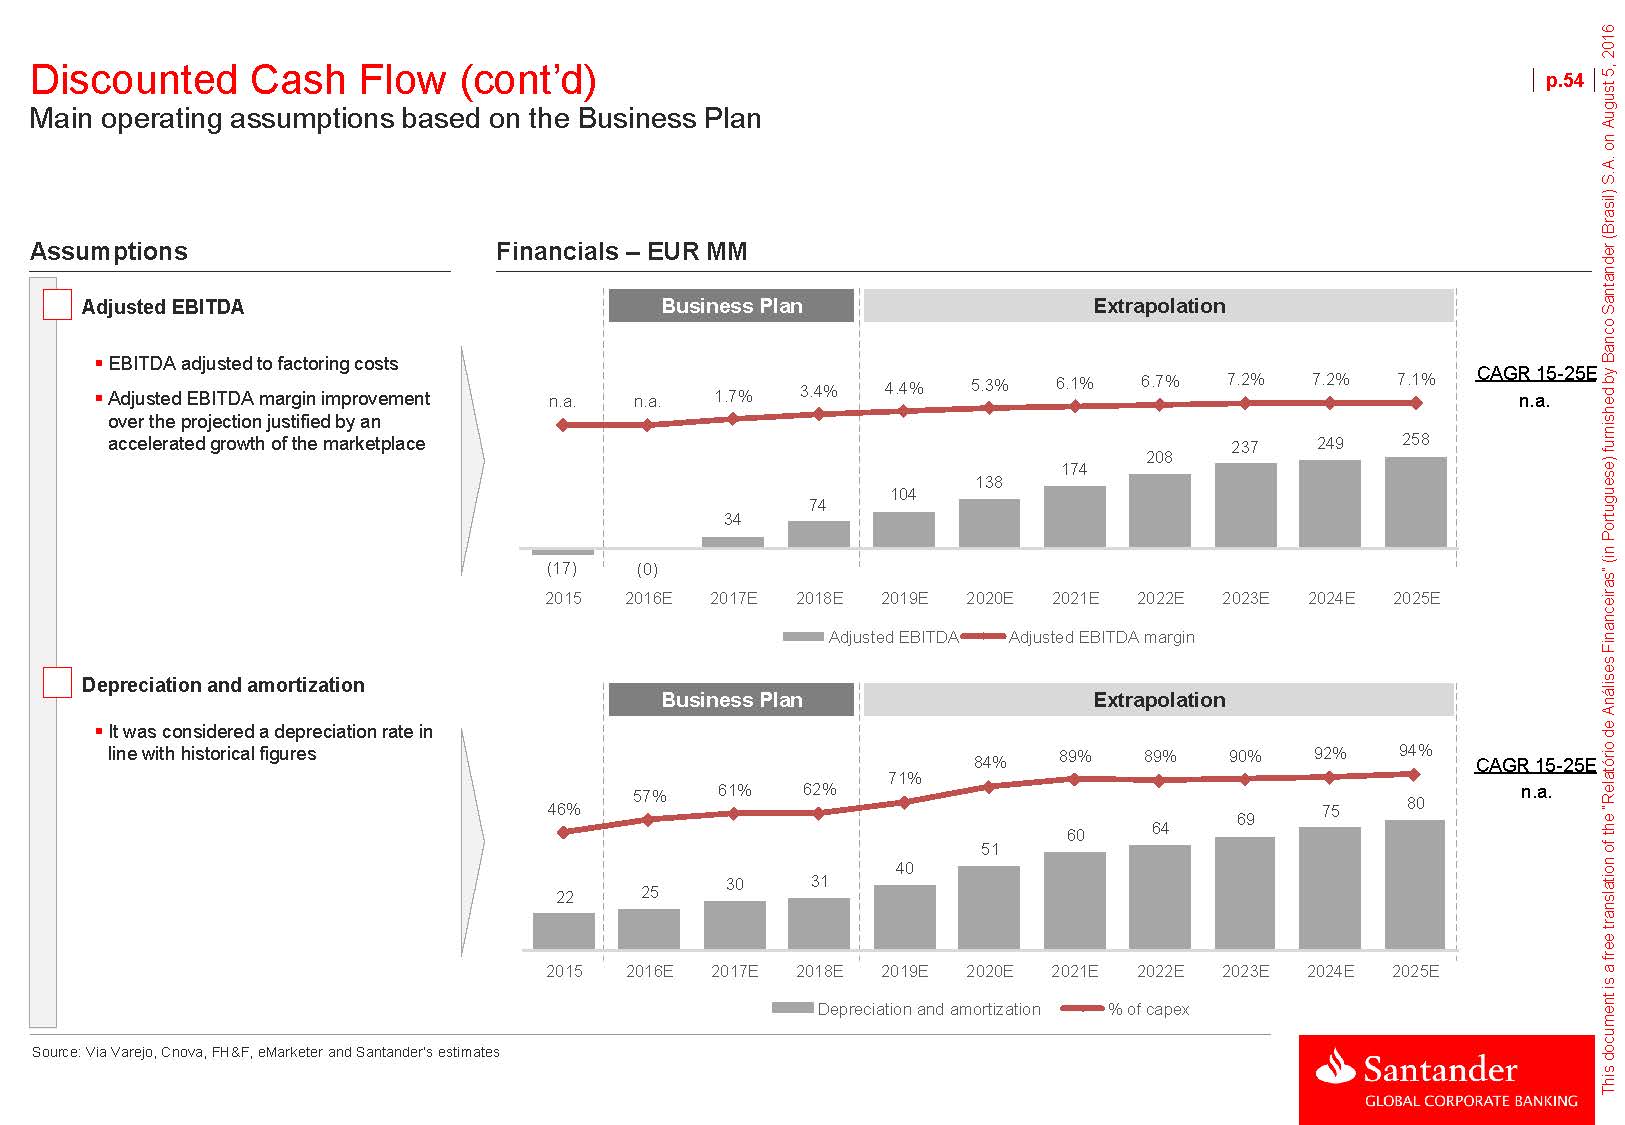
Discounted Cash Flow (cont’d) Main operating assumptions based on the Business Plan p.54AssumptionsFinancials – EUR MMAdjusted EBITDABusiness Plan ExtrapolationEBITDA adjusted to factoring costsAdjusted EBITDA margin improvement over the projection justified by an accelerated growth of the marketplace n.a. n.a. 1.7% 3.4% 4.4% 5.3% 6.1% 6.7% 7.2% 7.2% 7.1% 208 237 249 CAGR 15 -25E n.a. 74 104 34 138 174 (17) (0) 2015 2016E 2017E 2018E 2019E 2020E 2021E 2022E 2023E 2024E 2025E Adjusted EBITDA Adjusted EBITDA margin Depreciation and amortizationIt was considered a depreciation rate in line with historical figuresBusiness Plan Extrapolation84% 89% 89% 90% 92% 94% 71% 61% 62% CAGR 15 -25E n.a. 57% 46% 51 40 22 25 30 31 60 64 69 75 80 2015 2016E 2017E 2018E 2019E 2020E 2021E 2022E 2023E 2024E 2025E Source: Via Varejo, Cnova, FH&F, eMarketer and Santander‘s estimates Depreciation and amortization % of capex
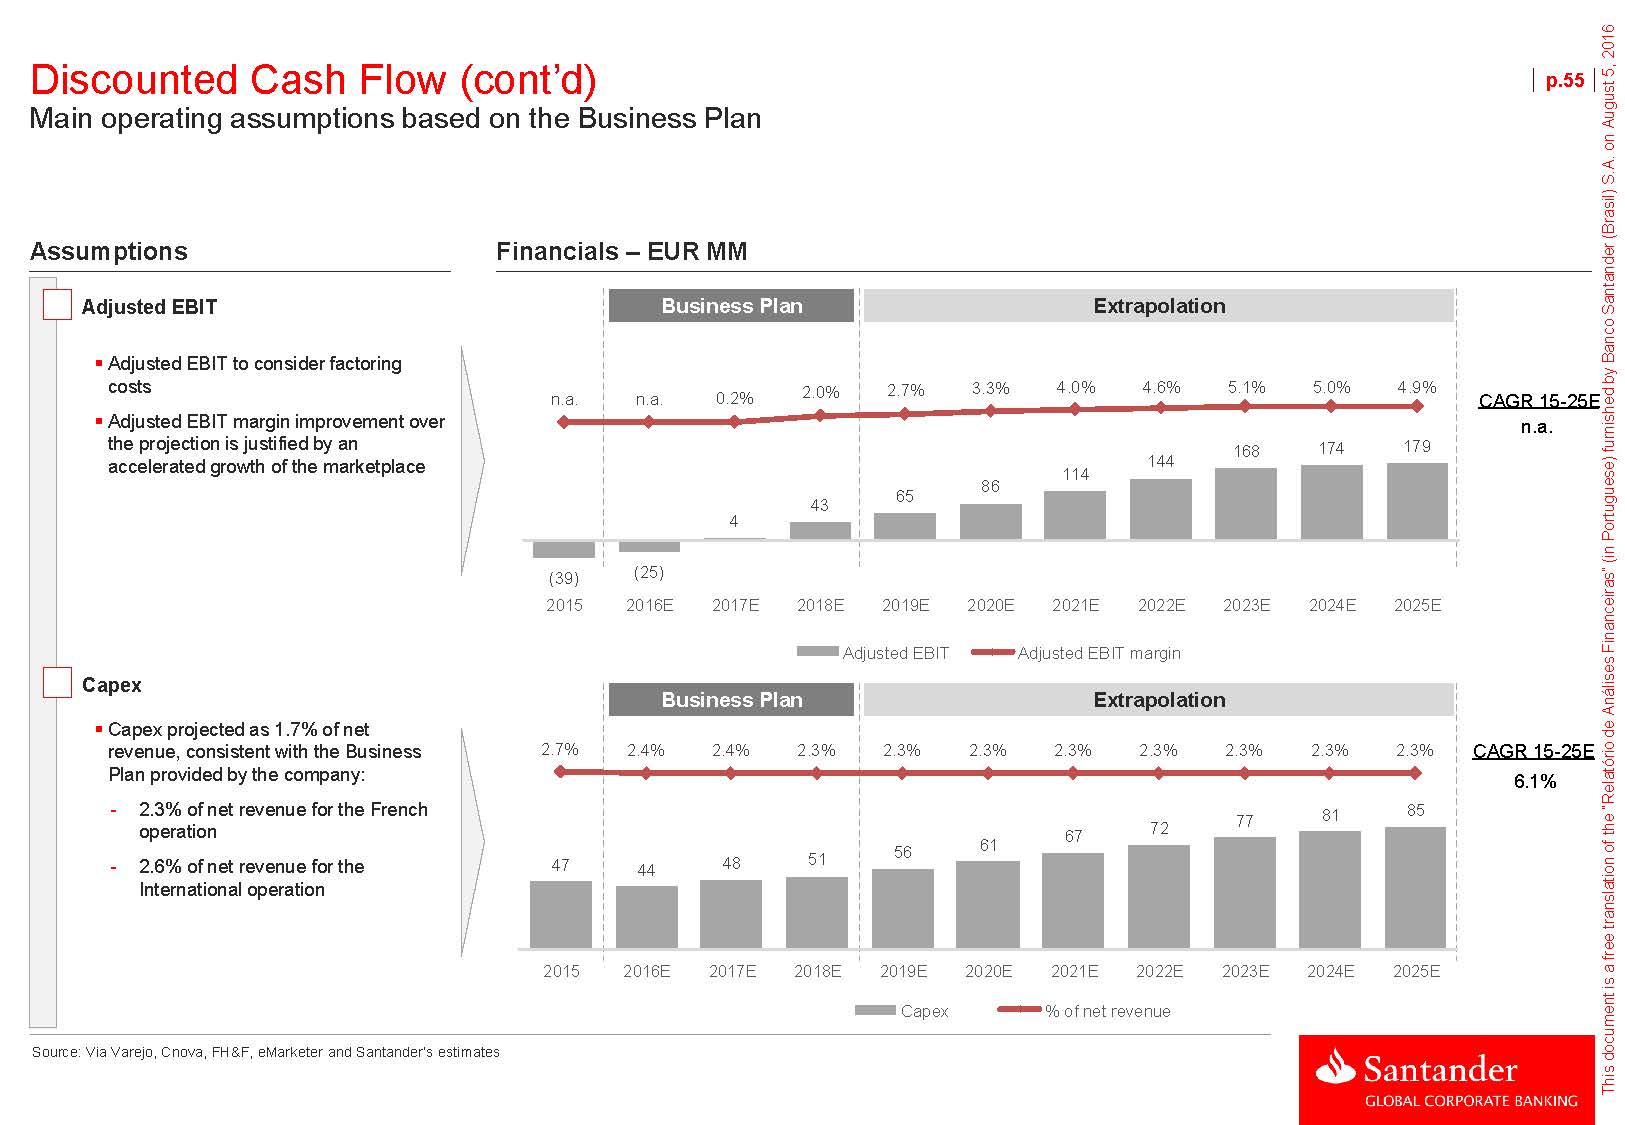
Discounted Cash Flow (cont’d) Main operating assumptions based on the Business Plan p.55AssumptionsFinancials – EUR MMAdjusted EBITBusiness Plan ExtrapolationAdjusted EBIT to consider factoring costsAdjusted EBIT margin improvement over the projection is justified by an accelerated growth of the marketplace n.a. n.a. 0.2% 2.0% 2.7% 43 65 3.3% 4.0% 4.6% 5.1% 5.0% 4.9% 168 174 179 144 114 86 CAGR 15 -25E n.a. 4 (39) (25) 2015 2016E 2017E 2018E 2019E 2020E 2021E 2022E 2023E 2024E 2025E CapexCapex projected as 1.7% of net revenue, consistent with the Business Plan provided by the company: - 2.3% of net revenue for the French operation Adjusted EBIT Adjusted EBIT margin Business Plan Extrapolation2.7% 2.4% 2.4% 2.3% 2.3% 2.3% 2.3% 2.3% 2.3% 2.3% 2.3% 72 77 81 56 61 67 CAGR 15 -25E 6.1% - 2.6% of net revenue for the International operation 47 44 48 51 2015 2016E 2017E 2018E 2019E 2020E 2021E 2022E 2023E 2024E 2025E Source: Via Varejo, Cnova, FH&F, eMarketer and Santander‘s estimates Capex % of net revenue
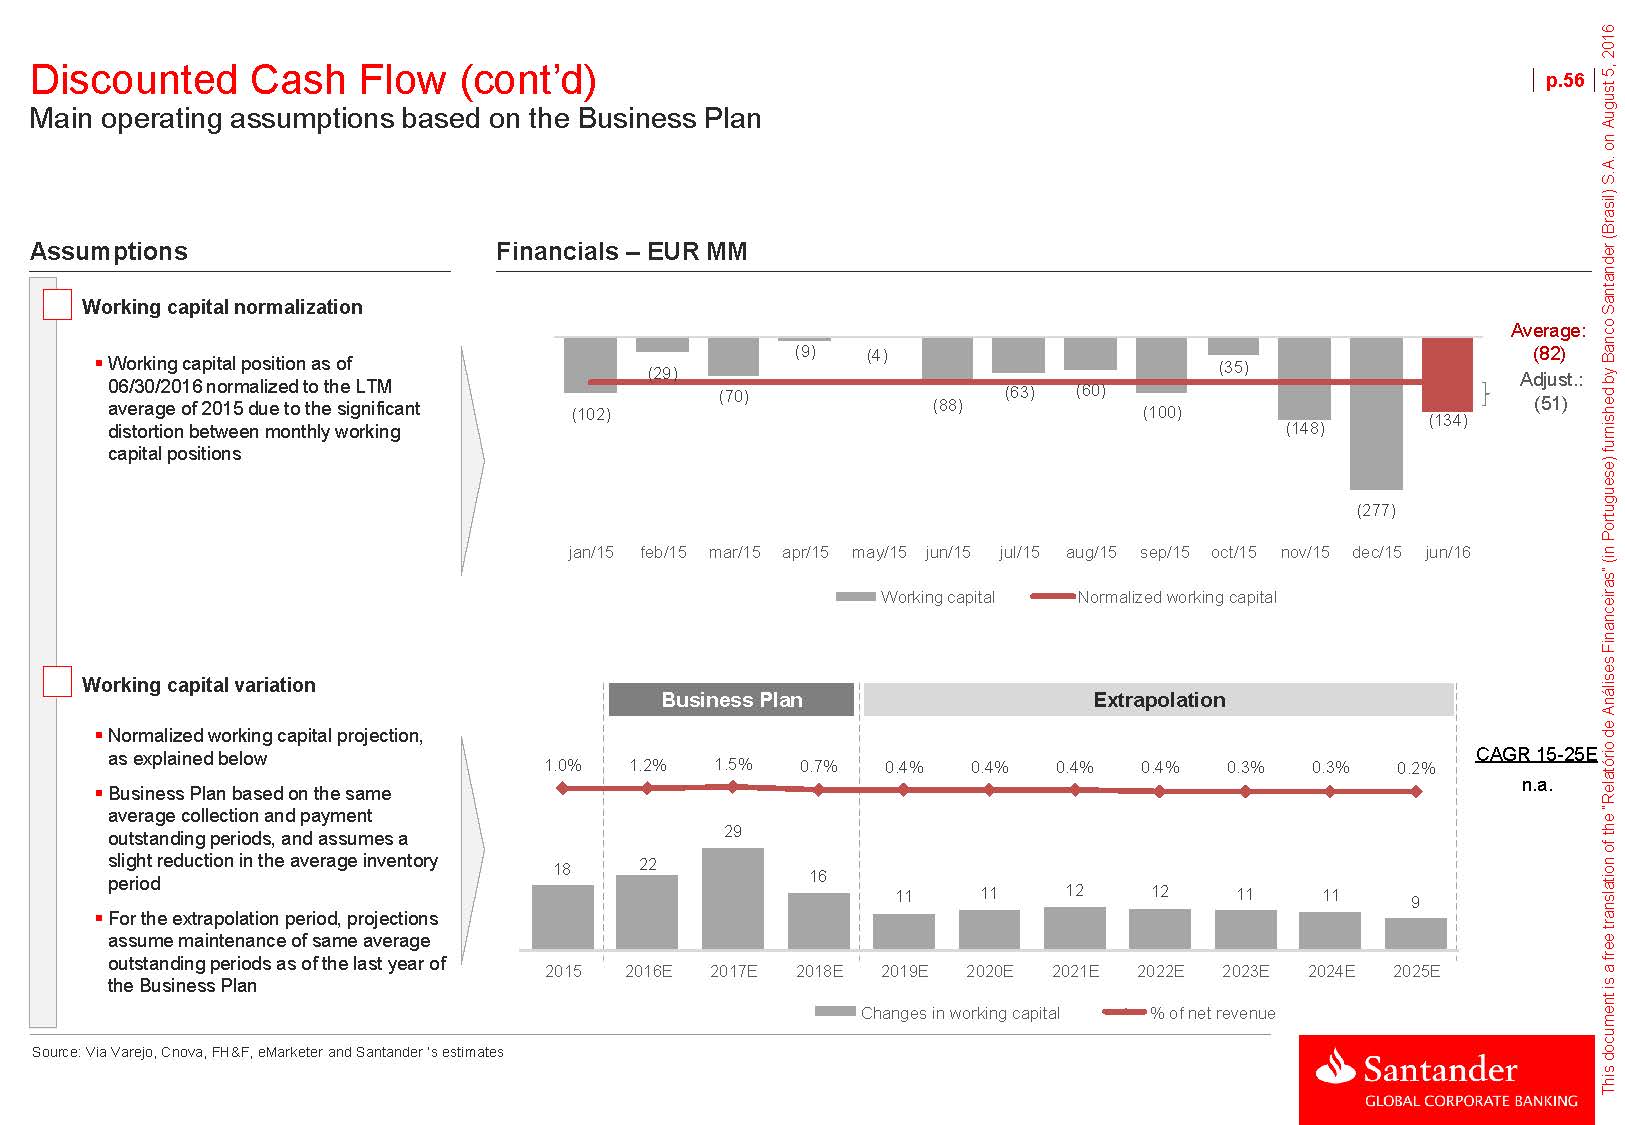
Discounted Cash Flow (cont’d) Main operating assumptions based on the Business Plan p.56AssumptionsFinancials – EUR MMWorking capital normalizationWorking capital position as of 06/30/2016 normalized to the LTM average of 2015 due to the significant distortion between monthly working capital positions (102) (29) (70) (9) (4) (88) (63) (60) (100) (35) (148) (134) Average: (82) Adjust.: (51) (277) jan/15 feb/15 mar/15 apr/15 may/15 jun/15 jul/15 aug/15 sep/15 oct/15 nov/15 dec/15 jun/16 Working capital Normalized working capital Working capital variationNormalized working capital projection, as explained belowBusiness Plan based on the same average collection and payment outstanding periods, and assumes a slight reduction in the average inventory period Business Plan Extrapolation1.0% 1.2% 1.5% 0.7% 0.4% 0.4% 0.4% 0.4% 0.3% 0.3% 0.2% 29 18 22 16 CAGR 15 -25E n.a.For the extrapolation period, projections assume maintenance of same average outstanding periods as of the last year of the Business Plan Source: Via Varejo, Cnova, FH&F, eMarketer and Santander ‘s estimates 11 11 12 12 11 11 9 2015 2016E 2017E 2018E 2019E 2020E 2021E 2022E 2023E 2024E 2025E Changes in working capital % of net revenue
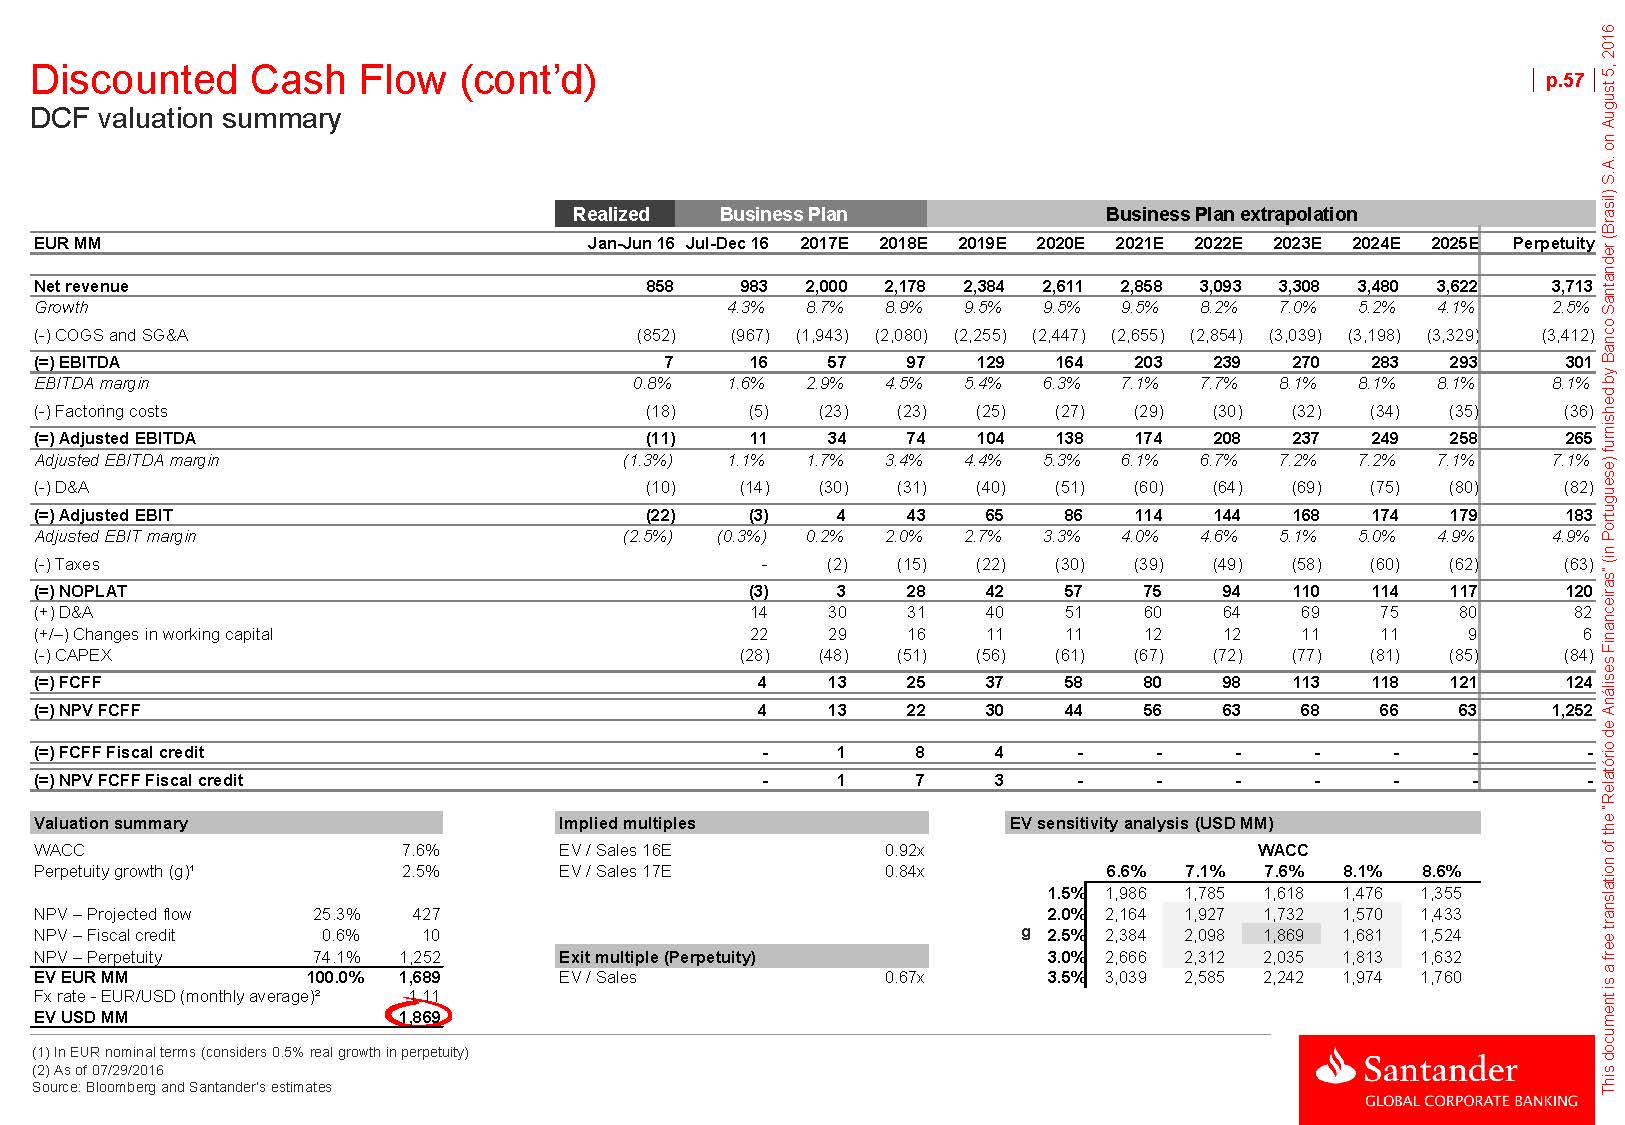
Discounted Cash Flow (cont’d) DCF valuation summary p.57RealizedBusiness PlanBusiness Plan extrapolationEUR MM Jan-Jun 16 Jul-Dec 16 2017E 2018E 2019E 2020E 2021E 2022E 2023E 2024E 2025E Perpetuity Net revenue 858 983 2,000 2,178 2,384 2,611 2,858 3,093 3,308 3,480 3,622 3,713 Growth 4.3% 8.7% 8.9% 9.5% 9.5% 9.5% 8.2% 7.0% 5.2% 4.1% (-) COGS and SG&A (852) (967) (1,943) (2,080) (2,255) (2,447) (2,655) (2,854) (3,039) (3,198) (3,329)2.5% (3,412) (=) EBITDA 7 16 57 97 129 164 203 239 270 283 293 301 EBITDA margin 0.8% 1.6% 2.9% 4.5% 5.4% 6.3% 7.1% 7.7% 8.1% 8.1% 8.1% (-) Factoring costs (18) (5) (23) (23) (25) (27) (29) (30) (32) (34) (35)8.1% (36) (=) Adjusted EBITDA (11) 11 34 74 104 138 174 208 237 249 258 265 Adjusted EBITDA margin (1.3%) 1.1% 1.7% 3.4% 4.4% 5.3% 6.1% 6.7% 7.2% 7.2% 7.1% (-) D&A (10) (14) (30) (31) (40) (51) (60) (64) (69) (75) (80)7.1% (82) (=) Adjusted EBIT (22) (3) 4 43 65 86 114 144 168 174 179 183 Adjusted EBIT margin (2.5%) (0.3%) 0.2% 2.0% 2.7% 3.3% 4.0% 4.6% 5.1% 5.0% 4.9% (-) Taxes - (2) (15) (22) (30) (39) (49) (58) (60) (62) 4.9% (63) (=) NOPLAT (3) 3 28 42 57 75 94 110 114 117 120 (+) D&A 14 30 31 40 51 60 64 69 75 80 (+/–) Changes in working capital 22 29 16 11 11 12 12 11 11 9 (-) CAPEX (28) (48) (51) (56) (61) (67) (72) (77) (81) (85) 82 6 (84) (=) FCFF 4 13 25 37 58 80 98 113 118 121 124 (=) NPV FCFF 4 13 22 30 44 56 63 68 66 63 1,252 (=) FCFF Fiscal credit - 1 8 4 - - - - - - - (=) NPV FCFF Fiscal credit - 1 7 3 - - - - - - - Valuation summary Implied multiples EV sensitivity analysis (USD MM) WACC 7.6% EV / Sales 16E 0.92x WACC Perpetuity growth (g)¹ 2.5% EV / Sales 17E 0.84x 6.6% 7.1% 7.6% 8.1% 8.6% 1.5%1,986 1,785 1,618 1,476 1,355NPV – Projected flow 25.3% 427 2.0% 2,164 1,433 NPV – Fiscal credit 0.6% 10 g 2.5% 2,3841,524NPV – Perpetuity 74.1% 1,252 Exit multiple (Perpetuity) 3.0% 2,6661,632EV EUR MM 100.0% 1,689 EV / Sales 0.67x 3.5% 3,039 2,585 2,242 1,974 1,760Fx rate - EUR/USD (monthly average)² 1.11EV USD MM 1,869(1) In EUR nominal terms (considers 0.5% real growth in perpetuity) (2) As of 07/29/2016 Source: Bloomberg and Santander’s estimates

Discounted Cash Flow (cont’d) EV to Equity adjustments p.58EV – Equity adjustmentsConsiderations:To arrive at Cdiscount’s equity value, the following adjustments were made: 06/30/2016 Value in EUR MM Value in USD MM¹Enterprise Value 1,689 1,869- Other provisions presented in Cdiscount’s MM (USD 1,663 MM) (1) Exchange rate used: EUR/USD of 1.1066 (30-day average as of 07/29/2016)

Section 3Cdiscount I. Overview II. Comparison with main peers III. Valuation a) Discounted Cash Flow b) Trading multiples c) Transaction multiples p.59
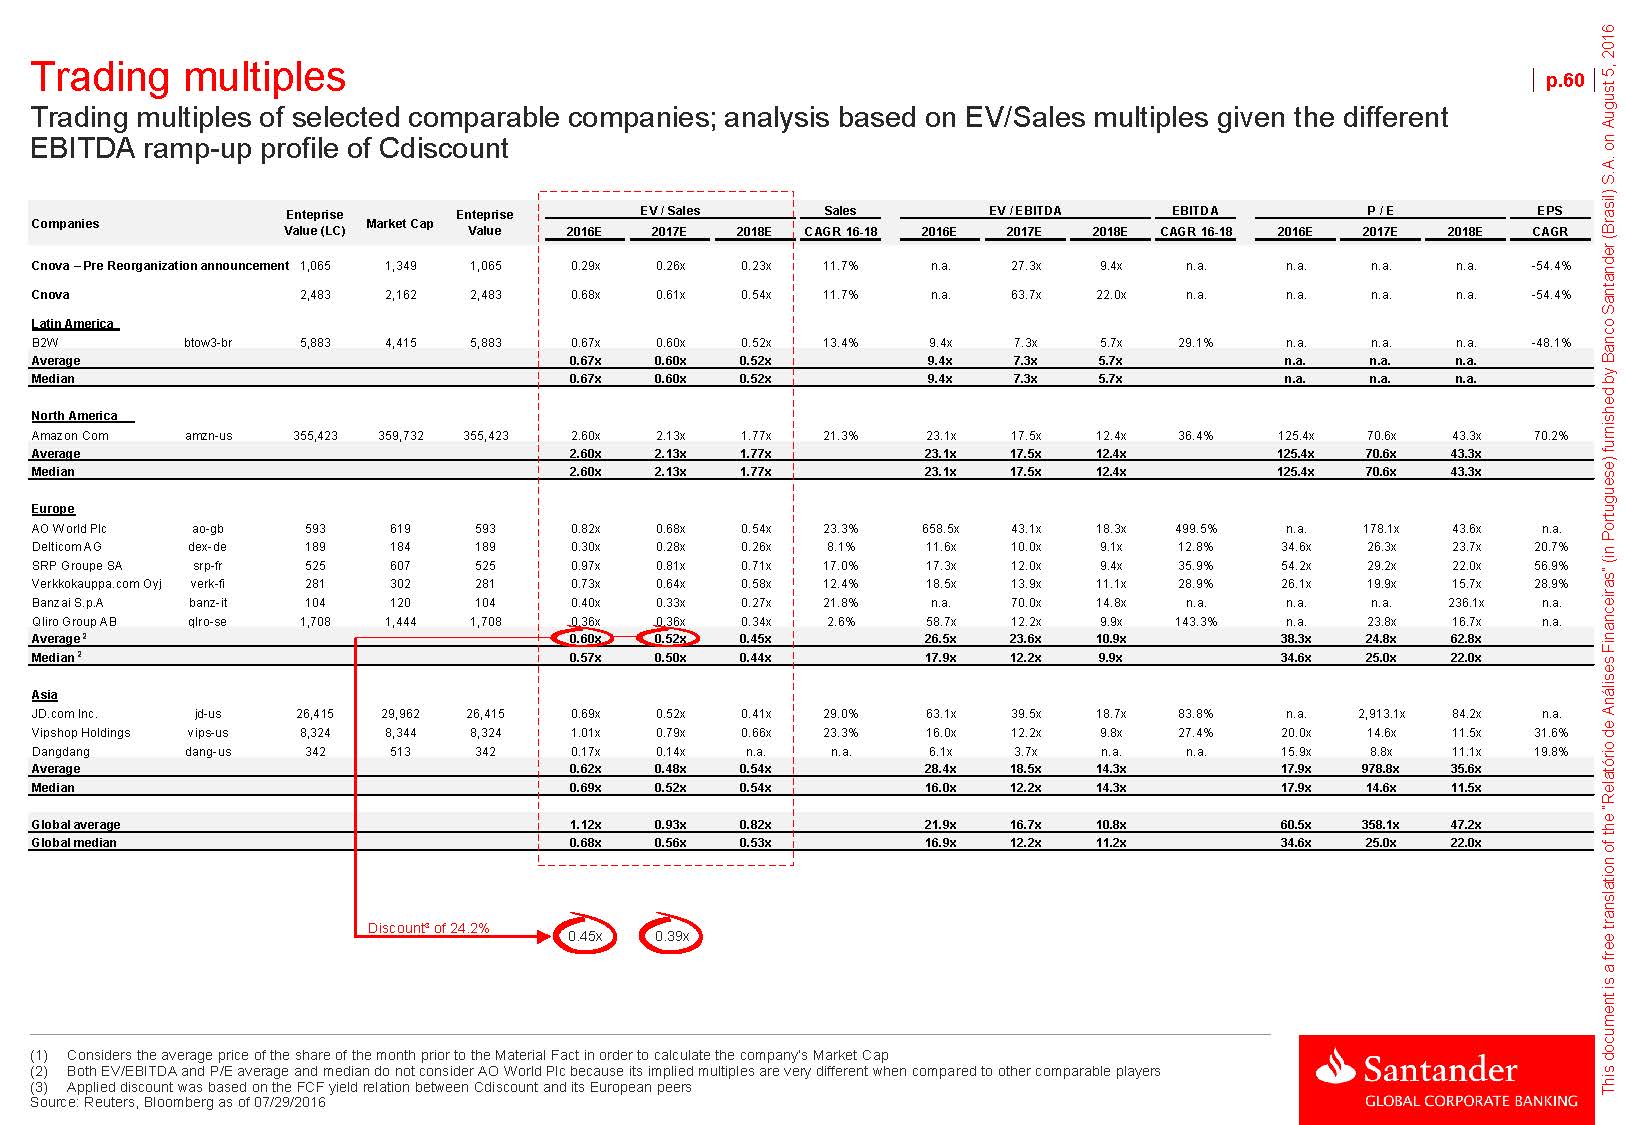
Trading multiples Trading multiples of selected comparable companies; analysis based on EV/Sales multiples given the different EBITDA ramp-up profile of Cdiscount p.60CompaniesEntepriseValue (LC)Market Cap EntepriseValue EV / Sales Sales EV / EBITDA EBITDA P / E EPS 2016E 2017E2018ECAGR 16-182016E 2017E 2018E CAGR 16-182016E 2017E 2018E CAGR Cnova – Pre Reorganization announcement1,065 1,349 1,065 0.29x 0.26x 0.23x 11.7% n.a. 27.3x 9.4x n.a. n.a. n.a. n.a. -54.4%CnovaLatin America 2,483 2,162 2,483 0.68x 0.61x 0.54x 11.7% n.a. 63.7x 22.0x n.a. n.a. n.a. n.a. -54.4% B2W btow3-br 5,883 4,415 5,883 0.67x 0.60x 0.52x 13.4% 9.4x 7.3x 5.7x 29.1% n.a. n.a. n.a. -48.1% Average 0.67x 0.60x 0.52x 9.4x 7.3x 5.7x n.a. n.a. n.a. Median 0.67x 0.60x 0.52x 9.4x 7.3x 5.7x n.a. n.a. n.a. North America Amazon Com amzn-us 355,423 359,732 355,423 2.60x 2.13x 1.77x 21.3% 23.1x 17.5x 12.4x 36.4% 125.4x 70.6x 43.3x 70.2% Average 2.60x 2.13x 1.77x 23.1x 17.5x 12.4x 125.4x 70.6x 43.3x Median 2.60x 2.13x 1.77x 23.1x 17.5x 12.4x 125.4x 70.6x 43.3x Europe AO World Plc ao-gb 593 619 593 0.82x 0.68x 0.54x 23.3% 658.5x 43.1x 18.3x 499.5% n.a. 178.1x 43.6x n.a. Delticom AG dex-de 189 184 189 0.30x 0.28x 0.26x 8.1% 11.6x 10.0x 9.1x 12.8% 34.6x 26.3x 23.7x 20.7% SRP Groupe SA srp-fr 525 607 525 0.97x 0.81x 0.71x 17.0% 17.3x 12.0x 9.4x 35.9% 54.2x 29.2x 22.0x 56.9% Verkkokauppa.com Oyj verk-fi 281 302 281 0.73x 0.64x 0.58x 12.4% 18.5x 13.9x 11.1x 28.9% 26.1x 19.9x 15.7x 28.9% Banzai S.p.A banz-it 104 120 104 0.40x 0.33x 0.27x 21.8% n.a. 70.0x 14.8x n.a. n.a. n.a. 236.1x n.a. Qliro Group AB qlro-se 1,708 1,444 1,708 0.36x 0.36x 0.34x 2.6% 58.7x 12.2x 9.9x 143.3% n.a. 23.8x 16.7x n.a. Average2 0.60x 0.52x 0.45x 26.5x 23.6x 10.9x 38.3x 24.8x 62.8x Median20.57x 0.50x 0.44x 17.9x 12.2x 9.9x 34.6x 25.0x 22.0x Asia JD.com Inc. jd-us 26,415 29,962 26,415 0.69x 0.52x 0.41x 29.0% 63.1x 39.5x 18.7x 83.8% n.a. 2,913.1x 84.2x n.a. Vipshop Holdings vips-us 8,324 8,344 8,324 1.01x 0.79x 0.66x 23.3% 16.0x 12.2x 9.8x 27.4% 20.0x 14.6x 11.5x 31.6% Dangdang dang-us 342 513 342 0.17x 0.14x n.a. n.a. 6.1x 3.7x n.a. n.a. 15.9x 8.8x 11.1x 19.8% Average 0.62x 0.48x 0.54x 28.4x 18.5x 14.3x 17.9x 978.8x 35.6x Median 0.69x 0.52x 0.54x 16.0x 12.2x 14.3x 17.9x 14.6x 11.5x Global average 1.12x 0.93x 0.82x 21.9x 16.7x 10.8x 60.5x 358.1x 47.2x Global median 0.68x 0.56x 0.53x 16.9x 12.2x 11.2x 34.6x 25.0x 22.0x Discount³ of 24.2% 0.45x 0.39x (1) Considers the average price of the share of the month prior to the Material Fact in order to calculate the company’s Market Cap (2) Both EV/EBITDA and P/E average and median do not consider AO World Plc because its implied multiples are very different when compared to other comparable players (3) Applied discount was based on the FCF yield relation between Cdiscount and its European peers Source: Reuters, Bloomberg as of 07/29/2016
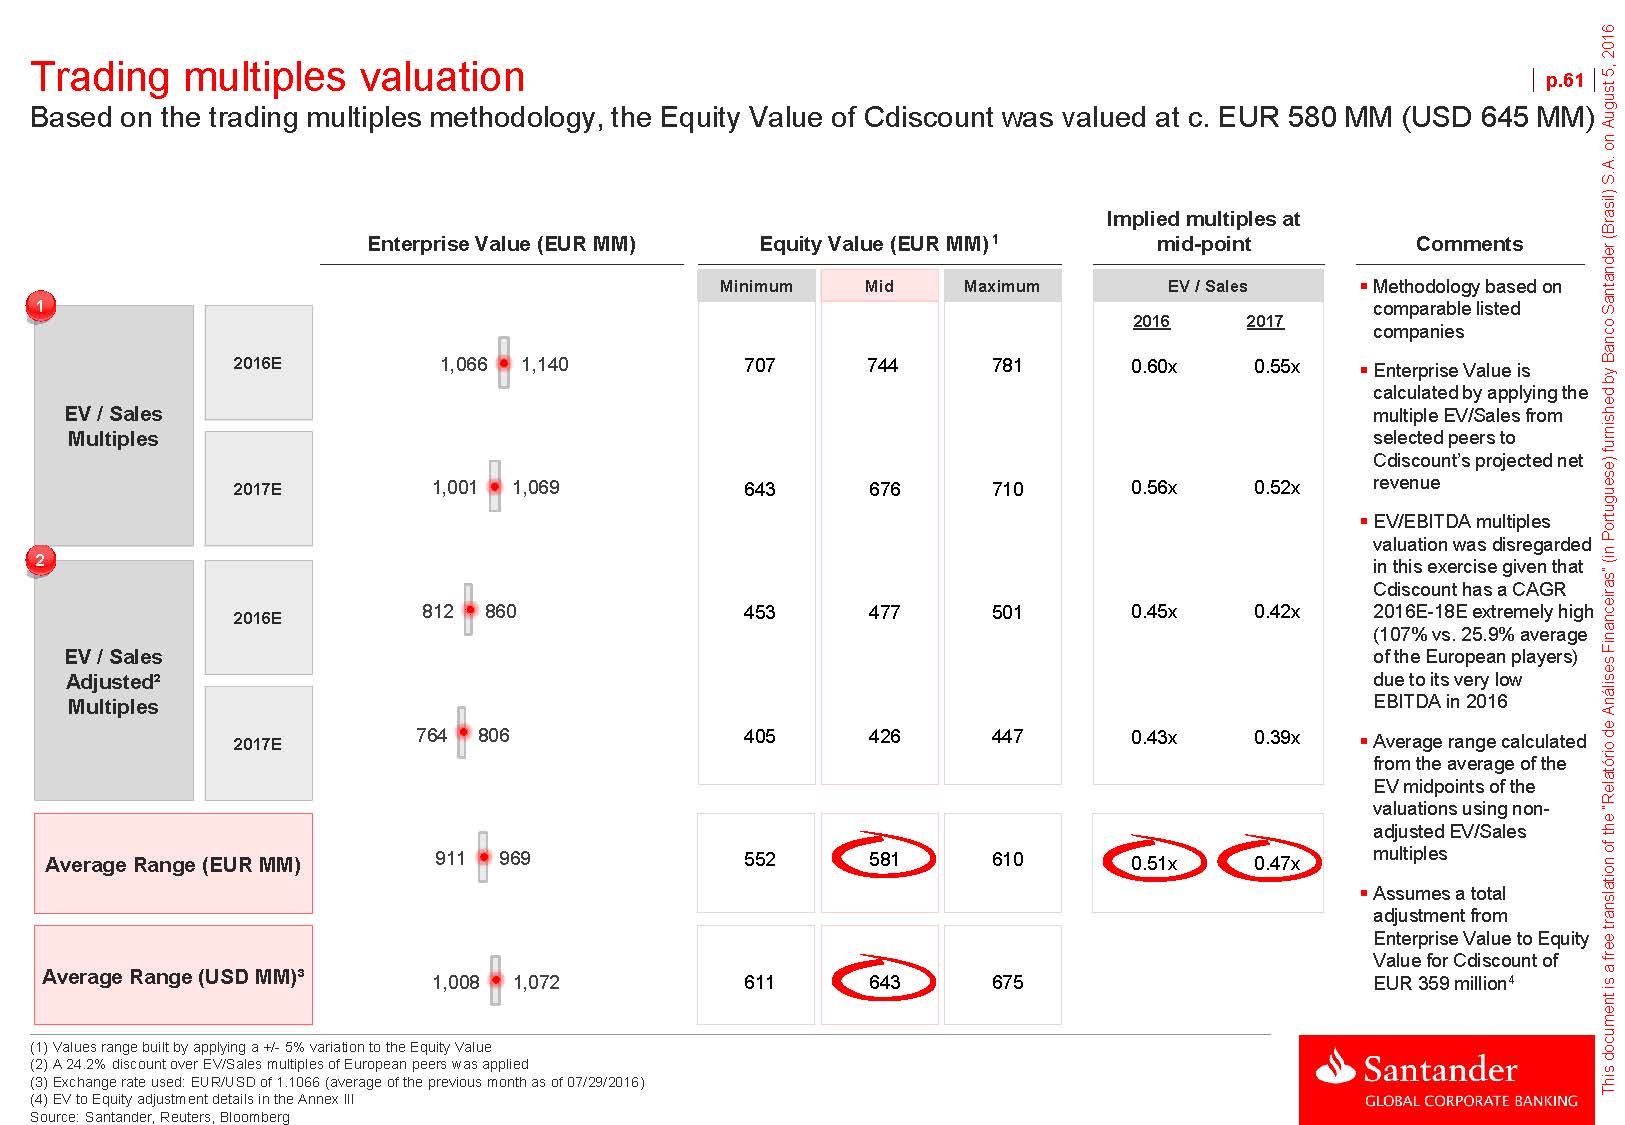
Trading multiples valuation p.61 Based on the trading multiples methodology, the Equity Value of Cdiscount was valued at c. EUR 580 MM (USD 645 MM) Enterprise Value (EUR MM) Equity Value (EUR MM)11Implied multiples at mid-point EV / Sales20162017CommentsMethodology based on comparable listed companies EV / SalesMultiples22016E2017E1,066 1,001 1,140 1,069 0.60x 0.56x 0.55x 0.52xEnterprise Value is calculated by applying the multiple EV/Sales from selected peers to Cdiscount’s projected net revenueEV/EBITDA multiples valuation was disregarded in this exercise given that Cdiscount has a CAGR EV / SalesAdjusted²Multiples 2016E2017E812 764 860 806 0.45x 0.43x 0.42x 0.39x 2016E-18E extremely high (107% vs. 25.9% average of the European players) due to its very low EBITDA in 2016Average range calculated from the average of the EV midpoints of the valuations using non- adjusted EV/Sales Average Range (EUR MM)Average Range (USD MM)³ 911 1,008 969 1,072 0.51x 0.47x multiplesAssumes a total adjustment from Enterprise Value to Equity Value for Cdiscount of EUR 359 million4 (1) Values range built by applying a +/- 5% variation to the Equity Value (2) A 24.2% discount over EV/Sales multiples of European peers was applied (3) Exchange rate used: EUR/USD of 1.1066 (average of the previous month as of 07/29/2016) (4) EV to Equity adjustment details in the Annex III Source: Santander, Reuters, Bloomberg
Section 3Cdiscount I. Overview II. Comparison with main peers III. Valuation a) Discounted Cash Flow b) Trading multiples c) Transaction multiples p.62

Transaction multiples Multiples of selected comparable transactions p.63Date Buyer Target Country % acquired EV (BRL MM) EV / Sales EV / EBITDA May-16 Acionistas B2W B2W Brazil 24.2% 4,864 0.54x 8.0x Mar-16 IFC / Riverwood Capital Netshoes Brazil n.a. n.a. n.a. n.a. Nov-15 Naspers Ltd / Tiger Global Avenida.com Argentina n.a. n.a. n.a. n.a. Sep-14 Naspers Ltd / Tiger Global Avenida.com Argentina n.a. n.a. n.a. n.a. Feb-14 IRSA Propriedades Comerciales Avenida.com Argentina n.a. n.a. n.a. n.a. Jan-14 Lojas Americanas / Tiger Global B2W Brazil n.a. 5,677 0.93x 13.2x Aug-13 Magazine Luiza Campos Floridos Brazil 100.0% 26 1.61x n.a. Sep-09 Naspers Buscapé Brazil 91.0% 613 n.a. n.a. Jan-16 Carrefour Rue du Commerce France n.a. 117 0.09x n.a. Jul-12 Naspers Dante International Romania 70.0% 252 0.69x n.a. Feb-12 Ahold Bol.com Netherlands 100.0% 800 0.99x n.a. Oct-11 Altarea Cogedim Rue du Commerce France 96.0% 327 0.31x 15.4x Apr-11 CDON Group Tretti AB Sweden 97.0% 88 0.76x n.a. Average Brazil 1.03x 10.6x Median Brazil 0.93x 10.6x Average Europe 0.57x 15.4x Median Europe 0.69x 15.4x Global average 0.74x 12.2xGlobal median 0.73x 13.2xSource: Reuters, Bloomberg, Factset, Santander Equity Research, public information

Transaction multiples valuation p.64Based on the transaction multiples methodology, the Equity Value of Cdiscount was valued at c. EUR 0.9 bi (USD 1.0 bi) Enterprise Value (EUR MM) Equity Value (EUR MM)1Implied multiples at mid-point over ’16EV / SalesCommentsMethodology based on comparable transactionsEV / SalesMultiples20152016E1,174 1,224 1,260 1,315 0.66x 0.69xEnterprise Value is calculated by applying the multiple EV/Sales from selected comparable transactions to Cdiscount’s projected net revenueAverage range calculated as the average of the EV midpoints Average Range (EUR MM)1,199 1,287 0.68xAssumes a total adjustment from Enterprise Value to Equity Value for Cdiscount of EUR 359 million³ Average Range (USD MM)²1,327 1,425 (1) Values range built by applying a +/- 5% variation to the Equity Value (2) Exchange rate used: EUR/USD of 1.1066 (average of the previous month as of 07/29/2016) (3) EV to Equity adjustment details in the Annex III Source: Santander, Reuters, Bloomberg, Factset, public information This document is a free translation of the “Relatório de Análises Financeiras” (in Portuguese) furnished by Banco Santander (Brasil) S.A. on August 5, 2016
p.65 Section 4 Potential synergies
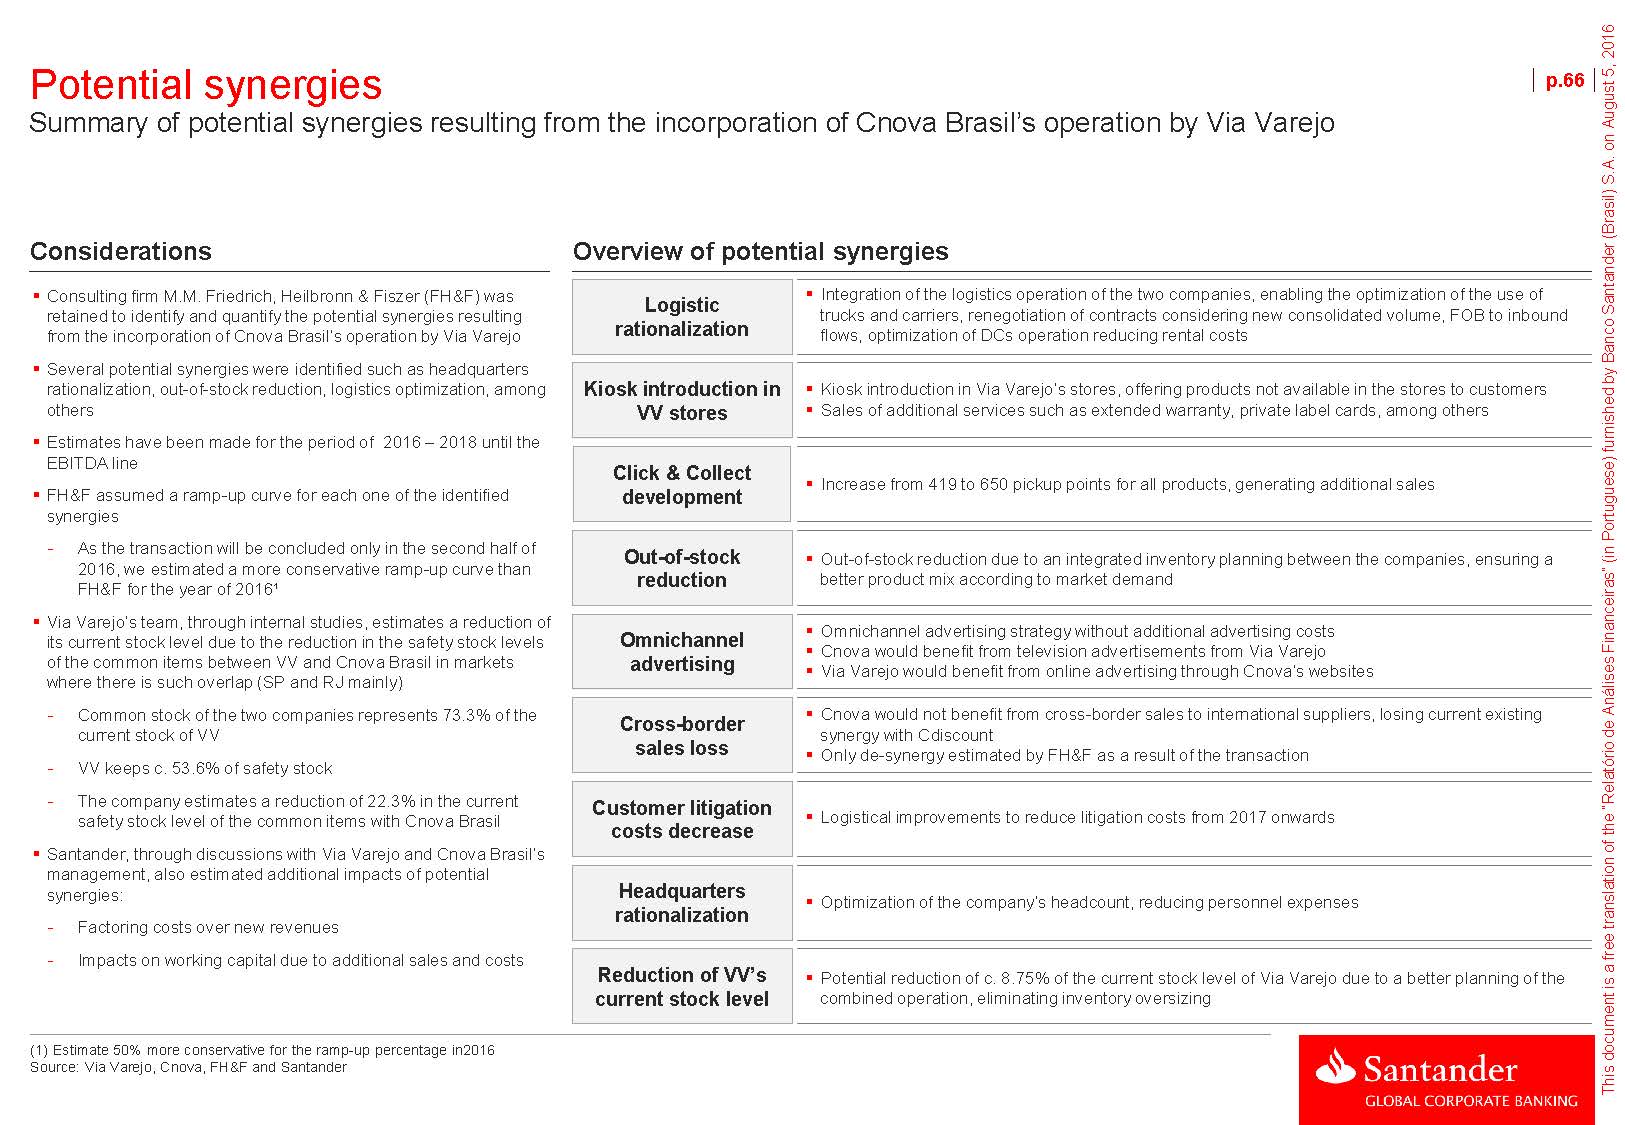
Potential synergies Summary of potential synergies resulting from the incorporation of Cnova Brasil’s operation by Via Varejo Considerations Overview of potential synergiesp.66Consulting firm M.M. Friedrich, Heilbronn & Fiszer (FH&F) was retained to identify and quantify the potential synergies resulting from the incorporation of Cnova Brasil’s operation by Via VarejoSeveral potential synergies were identified such as headquarters rationalization, out-of-stock reduction, logistics optimization, among othersEstimates have been made for the period of 2016 – 2018 until the EBITDA lineFH&F assumed a ramp-up curve for each one of the identified synergies - As the transaction will be concluded only in the second half of 2016, we estimated a more conservative ramp-up curve than FH&F for the year of 2016¹Via Varejo’s team, through internal studies, estimates a reduction of its current stock level due to the reduction in the safety stock levels of the common items between VV and Cnova Brasil in markets where there is such overlap (SP and RJ mainly) - Common stock of the two companies represents 73.3% of the current stock of VV - VV keeps c. 53.6% of safety stock - The company estimates a reduction of 22.3% in the current safety stock level of the common items with Cnova BrasilSantander, through discussions with Via Varejo and Cnova Brasil’s management, also estimated additional impacts of potential synergies:- Factoring costs over new revenues - Impacts on working capital due to additional sales and costs Logistic rationalization Kiosk introduction inVV storesClick & Collect developmentOut-of-stock reductionOmnichannel advertisingCross-border sales lossCustomer litigation costs decreaseHeadquarters rationalizationReduction of VV’scurrent stock levelIntegration of the logistics operation of the two companies, enabling the optimization of the use of trucks and carriers, renegotiation of contracts considering new consolidated volume, FOB to inbound flows, optimization of DCs operation reducing rental costsKiosk introduction in Via Varejo’s stores, offering products not available in the stores to customersSales of additional services such as extended warranty, private label cards, among othersIncrease from 419 to 650 pickup points for all products, generating additional salesOut-of-stock reduction due to an integrated inventory planning between the companies, ensuring a better product mix according to market demand Omnichannel advertising strategy without additional advertising costsCnova would benefit from television advertisements from Via VarejoVia Varejo would benefit from online advertising through Cnova’s websitesCnova would not benefit from cross-border sales to international suppliers, losing current existing synergy with CdiscountOnly de-synergy estimated by FH&F as a result of the transactionLogistical improvements to reduce litigation costs from 2017 onwardsOptimization of the company’s headcount, reducing personnel expensesPotential reduction of c. 8.75% of the current stock level of Via Varejo due to a better planning of the combined operation, eliminating inventory oversizing (1) Estimate 50% more conservative for the ramp-up percentage in2016 Source: Via Varejo, Cnova, FH&F and Santander
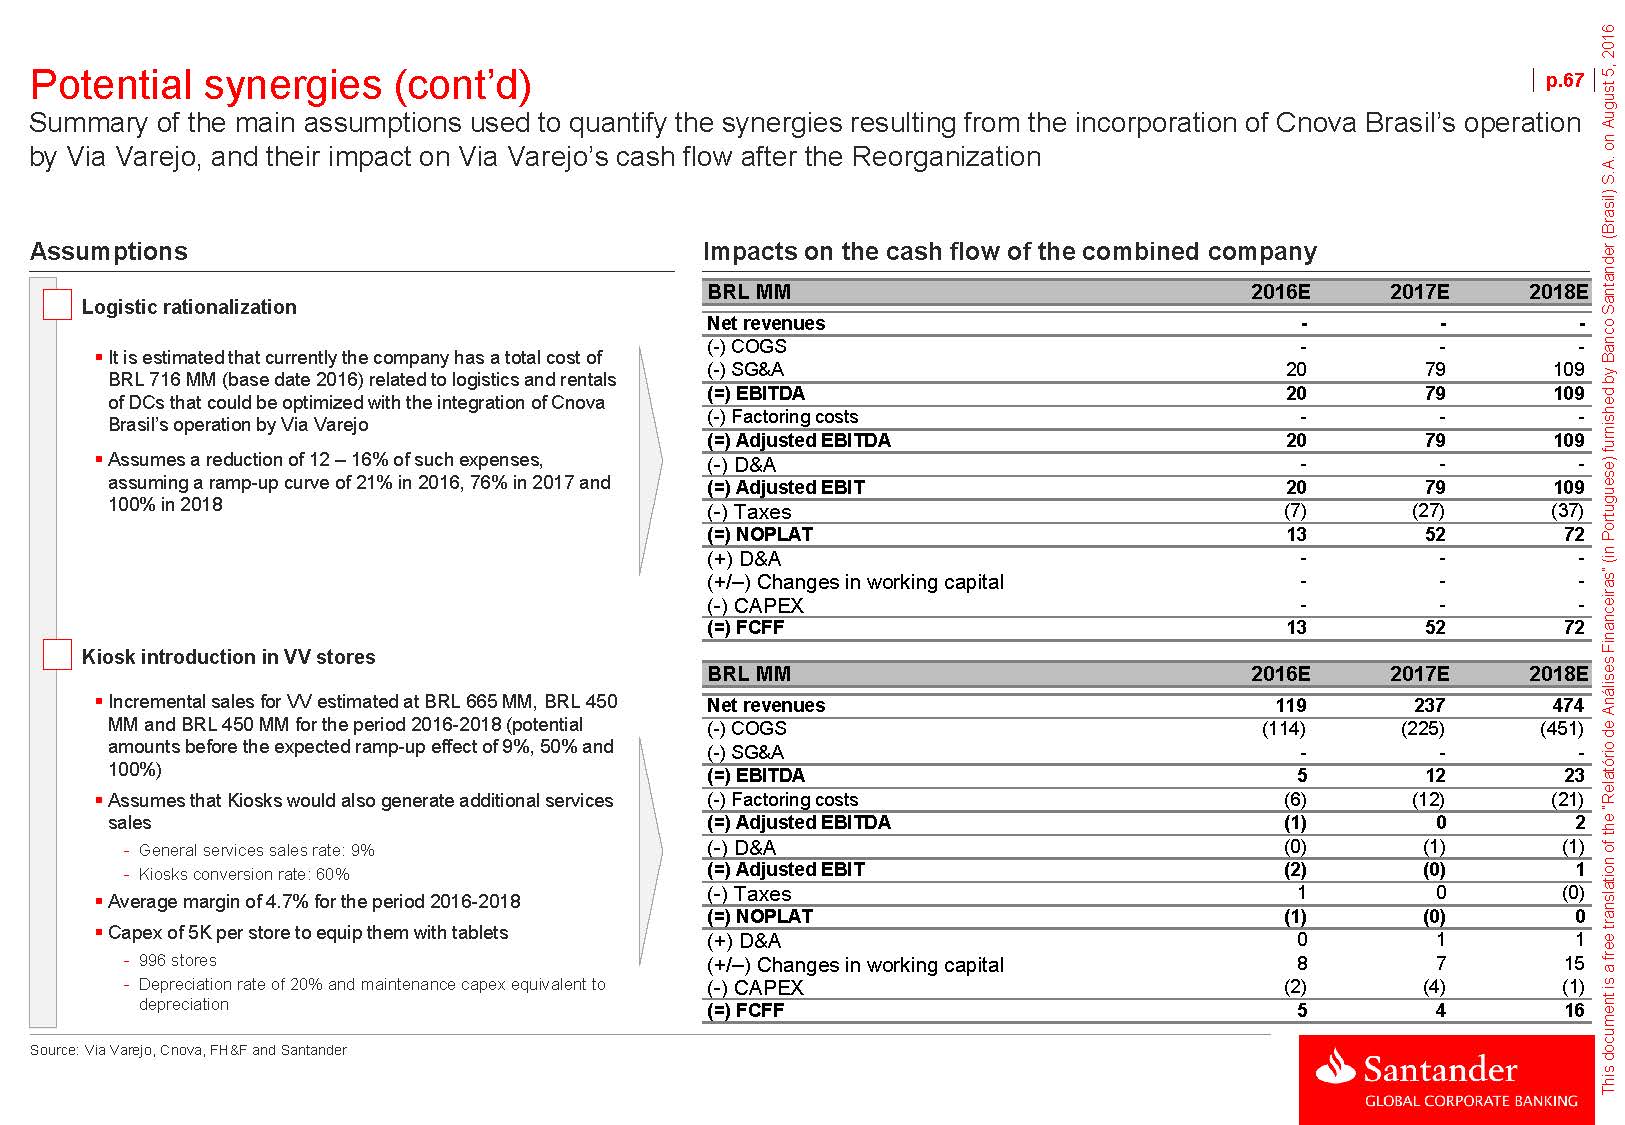
Potential synergies (cont’d) p.67Summary of the main assumptions used to quantify the synergies resulting from the incorporation of Cnova Brasil’s operation by Via Varejo, and their impact on Via Varejo’s cash flow after the Reorganization Assumptions Logistic rationalizationIt is estimated that currently the company has a total cost of BRL 716 MM (base date 2016) related to logistics and rentals of DCs that could be optimized with the integration of Cnova Brasil’s operation by Via VarejoAssumes a reduction of 12 – 16% of such expenses, assuming a ramp-up curve of 21% in 2016, 76% in 2017 and 100% in 2018 Kiosk introduction in VV storesIncremental sales for VV estimated at BRL 665 MM, BRL 450 MM and BRL 450 MM for the period 2016-2018 (potential amounts before the expected ramp-up effect of 9%, 50% and 100%)Assumes that Kiosks would also generate additional services sales - General services sales rate: 9% - Kiosks conversion rate: 60%Average margin of 4.7% for the period 2016-2018Capex of 5K per store to equip them with tablets- 996 stores - Depreciation rate of 20% and maintenance capex equivalent to depreciation Impacts on the cash flow of the combined companyBRL MM 2016E 2017E 2018ENet revenues - - - (-) COGS - - - (-) SG&A 20 79 109 (=) EBITDA 20 79 109 (-) Factoring costs - - - (=) Adjusted EBITDA 20 79 109(-) D&A- - - (=) Adjusted EBIT 20 79 109(-) Taxes(7) (27) (37) (=) NOPLAT 13 52 72(+) D&A- - -(+/–) Changes in working capital- - -(-) CAPEX- - - (=) FCFF 13 52 72 BRL MM 2016E 2017E 2018ENet revenues 119 237 474 (-) COGS (114) (225) (451) (-) SG&A - - - (=) EBITDA 5 12 23 (-) Factoring costs (6) (12) (21) (=) Adjusted EBITDA (1) 0 2(-) D&A(0) (1) (1) (=) Adjusted EBIT (2) (0) 1(-) Taxes1 0 (0) (=) NOPLAT (1) (0) 0(+) D&A0 1 1(+/–) Changes in working capital8 7 15(-) CAPEX(2) (4) (1) (=) FCFF 5 4 16 Source: Via Varejo, Cnova, FH&F and Santander
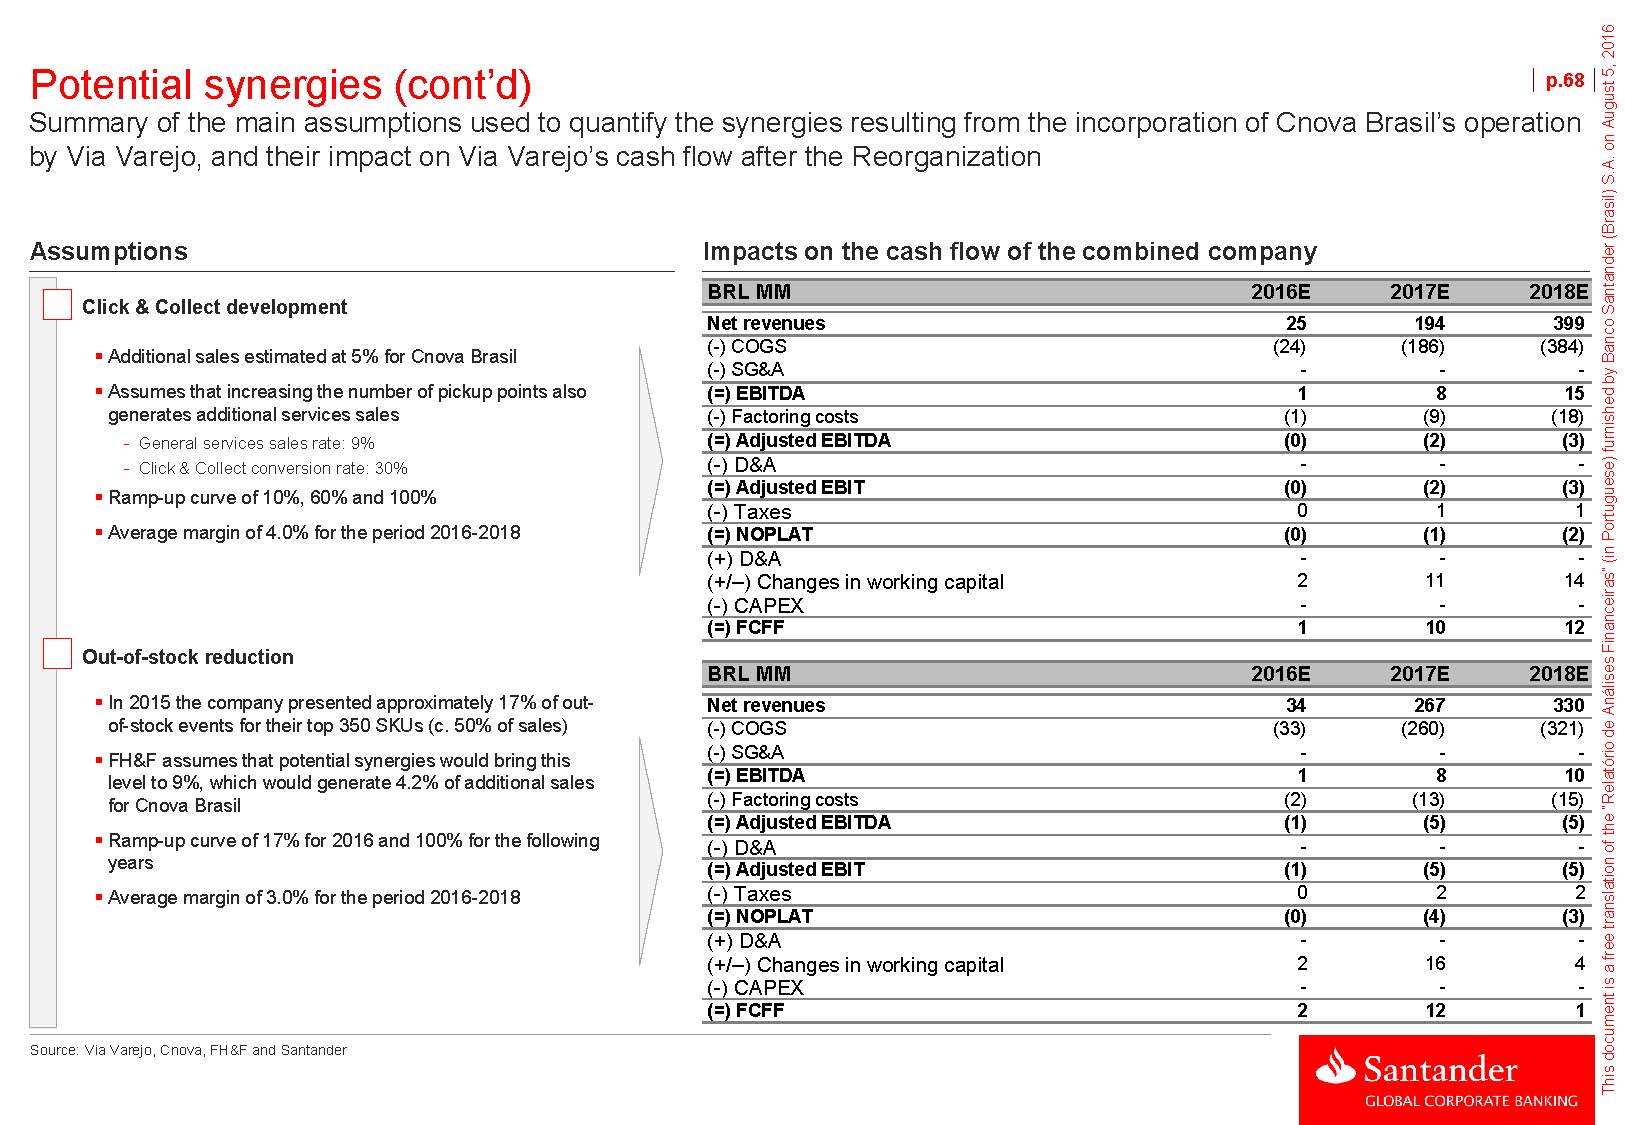
Potential synergies (cont’d) p.68Summary of the main assumptions used to quantify the synergies resulting from the incorporation of Cnova Brasil’s operation by Via Varejo, and their impact on Via Varejo’s cash flow after the Reorganization Assumptions Click & Collect developmentAdditional sales estimated at 5% for Cnova BrasilAssumes that increasing the number of pickup points also generates additional services sales- General services sales rate: 9% - Click & Collect conversion rate: 30%Ramp-up curve of 10%, 60% and 100%Average margin of 4.0% for the period 2016-2018 Out-of-stock reductionIn 2015 the company presented approximately 17% of out- of-stock events for their top 350 SKUs (c. 50% of sales)FH&F assumes that potential synergies would bring this level to 9%, which would generate 4.2% of additional sales for Cnova Brasil Ramp-up curve of 17% for 2016 and 100% for the following yearsAverage margin of 3.0% for the period 2016-2018 Source: Via Varejo, Cnova, FH&F and Santander Impacts on the cash flow of the combined company BRL MM 2016E 2017E 2018ENet revenues 25 194 399 (-) COGS (24) (186) (384) (-) SG&A - - - (=) EBITDA 1 8 15 (-) Factoring costs (1) (9) (18) (=) Adjusted EBITDA (0) (2) (3)(-) D&A- - - (=) Adjusted EBIT (0) (2) (3)(-) Taxes0 1 1 (=) NOPLAT (0) (1) (2)(+) D&A- - -(+/–) Changes in working capital2 11 14(-) CAPEX- - - (=) FCFF 1 10 12 BRL MM 2016E 2017E 2018ENet revenues 34 267 330 (-) COGS (33) (260) (321) (-) SG&A - - - (=) EBITDA 1 8 10 (-) Factoring costs (2) (13) (15) (=) Adjusted EBITDA (1) (5) (5)(-) D&A- - - (=) Adjusted EBIT (1) (5) (5)(-) Taxes0 2 2 (=) NOPLAT (0) (4) (3)(+) D&A- - -(+/–) Changes in working capital2 16 4(-) CAPEX- - - (=) FCFF 2 12 1
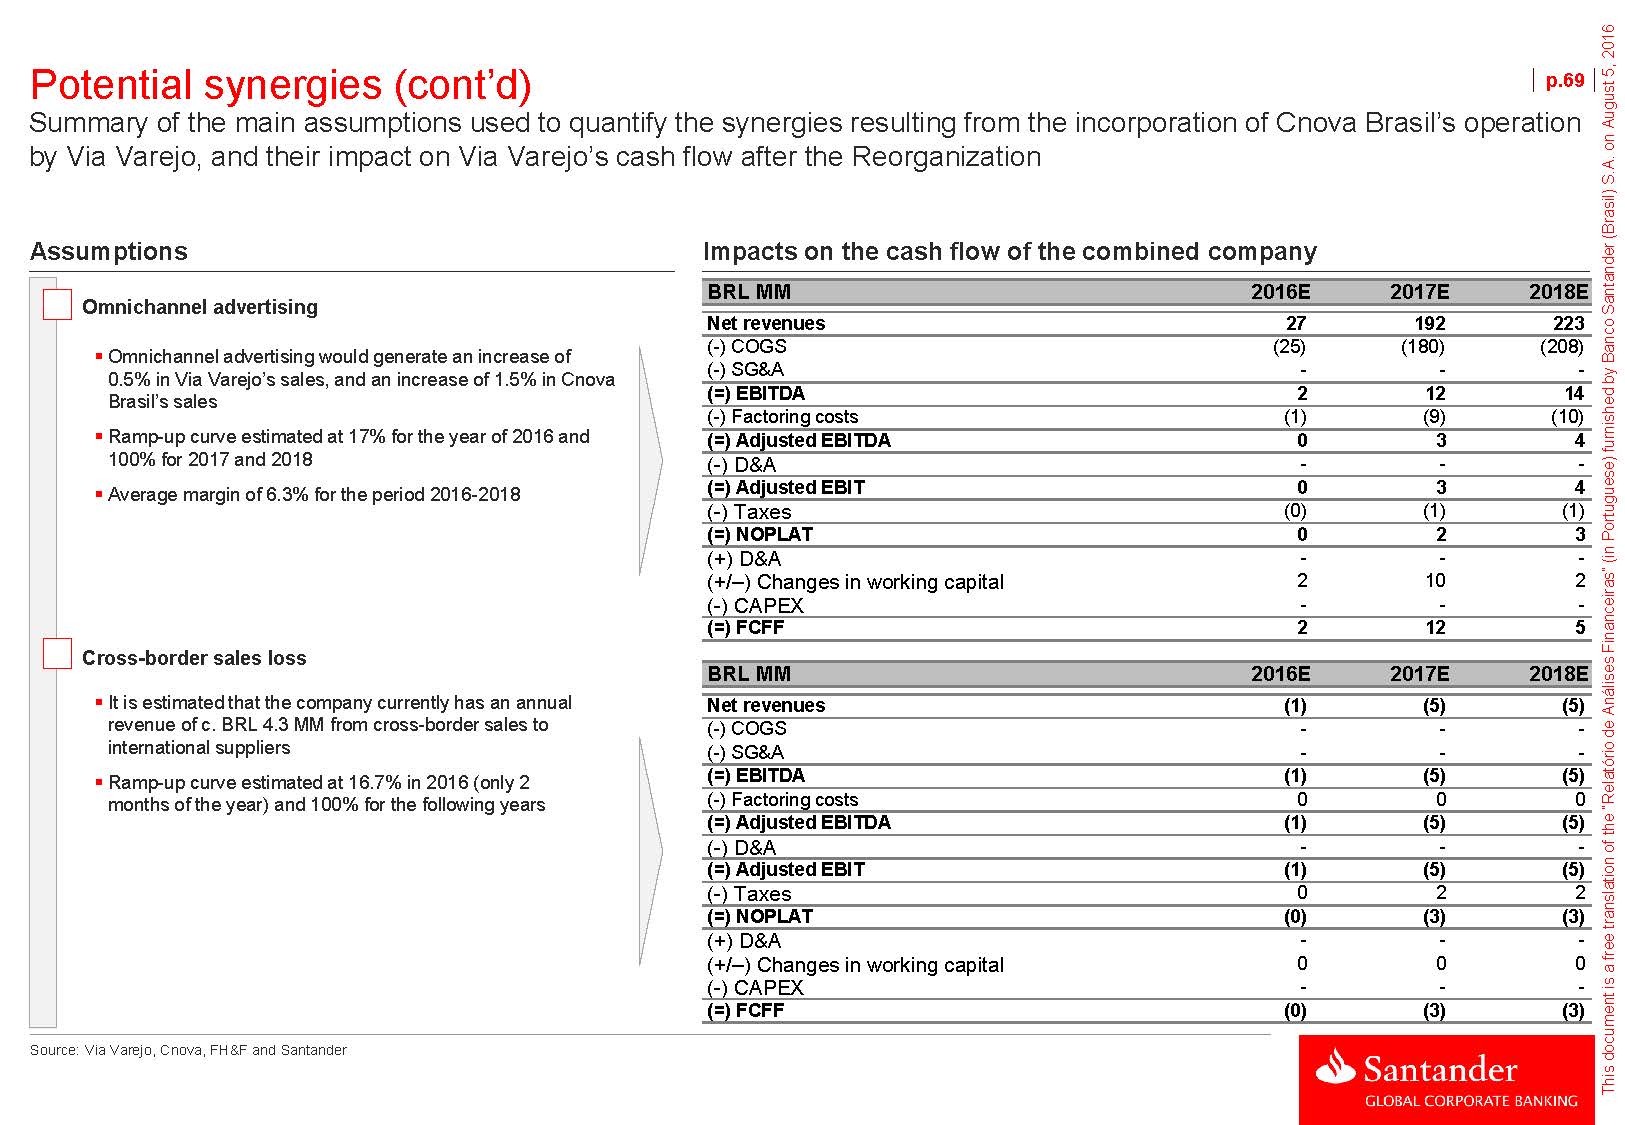
Potential synergies (cont’d) p.69Summary of the main assumptions used to quantify the synergies resulting from the incorporation of Cnova Brasil’s operation by Via Varejo, and their impact on Via Varejo’s cash flow after the Reorganization Assumptions Omnichannel advertisingOmnichannel advertising would generate an increase of 0.5% in Via Varejo’s sales, and an increase of 1.5% in Cnova Brasil’s salesRamp-up curve estimated at 17% for the year of 2016 and 100% for 2017 and 2018Average margin of 6.3% for the period 2016-2018 Cross-border sales lossIt is estimated that the company currently has an annual revenue of c. BRL 4.3 MM from cross-border sales to international suppliersRamp-up curve estimated at 16.7% in 2016 (only 2 months of the year) and 100% for the following years Source: Via Varejo, Cnova, FH&F and Santander Impacts on the cash flow of the combined companyBRL MM 2016E 2017E 2018ENet revenues 27 192 223 (-) COGS (25) (180) (208) (-) SG&A - - - (=) EBITDA 2 12 14 (-) Factoring costs (1) (9) (10) (=) Adjusted EBITDA 0 3 4(-) D&A- - - (=) Adjusted EBIT 0 3 4(-) Taxes(0) (1) (1) (=) NOPLAT 0 2 3(+) D&A- - -(+/–) Changes in working capital2 10 2(-) CAPEX- - - (=) FCFF 2 12 5 BRL MM 2016E 2017E 2018ENet revenues (1) (5) (5) (-) COGS - - - (-) SG&A - - - (=) EBITDA (1) (5) (5) (-) Factoring costs 0 0 0 (=) Adjusted EBITDA (1) (5) (5)(-) D&A- - - (=) Adjusted EBIT (1) (5) (5)(-) Taxes0 2 2 (=) NOPLAT (0) (3) (3)(+) D&A- - -(+/–) Changes in working capital0 0 0(-) CAPEX- - - (=) FCFF (0) (3) (3)

Potential synergies (cont’d) p.70Summary of the main assumptions used to quantify the synergies resulting from the incorporation of Cnova Brasil’s operation by Via Varejo, and their impact on Via Varejo’s cash flow after the Reorganization Assumptions Customer litigation costs decreaseIt is estimated that nowadays, the company incurs approximately BRL 50MM per year with litigation-related costsAssumes a reduction of 50% of such expenses from 2017 onwards Headquarters rationalizationIt is estimated that the company will save up to 20% in its personnel expensesLabor expenses were estimated at BRL 116MM for the year of 2015Ramp-up curve of 6% for 2016 an 100% for the following yearsAssumes restructuring costs of BRL 2MM for 2016 and BRL 7 MM for 2017 Source: Via Varejo, Cnova, FH&F and Santander Impacts on the cash flow of the combined companyBRL MM 2016E 2017E 2018ENet revenues - - - (-) COGS - - - (-) SG&A - 25 31 (=) EBITDA - 25 31 (-) Factoring costs - - - (=) Adjusted EBITDA - 25 31(-) D&A- - - (=) Adjusted EBIT - 25 31(-) Taxes- (9) (11) (=) NOPLAT - 17 21(+) D&A- - -(+/–) Changes in working capital- - -(-) CAPEX- - - (=) FCFF - 17 21 BRL MM 2016E 2017E 2018ENet revenues - - - (-) COGS - - - (-) SG&A (1) 19 27 (=) EBITDA (1) 19 27 (-) Factoring costs - - - (=) Adjusted EBITDA (1) 19 27(-) D&A- - - (=) Adjusted EBIT (1) 19 27(-) Taxes0 (7) (9) (=) NOPLAT (0) 13 18(+) D&A- - -(+/–) Changes in working capital- - -(-) CAPEX- - - (=) FCFF (0) 13 18
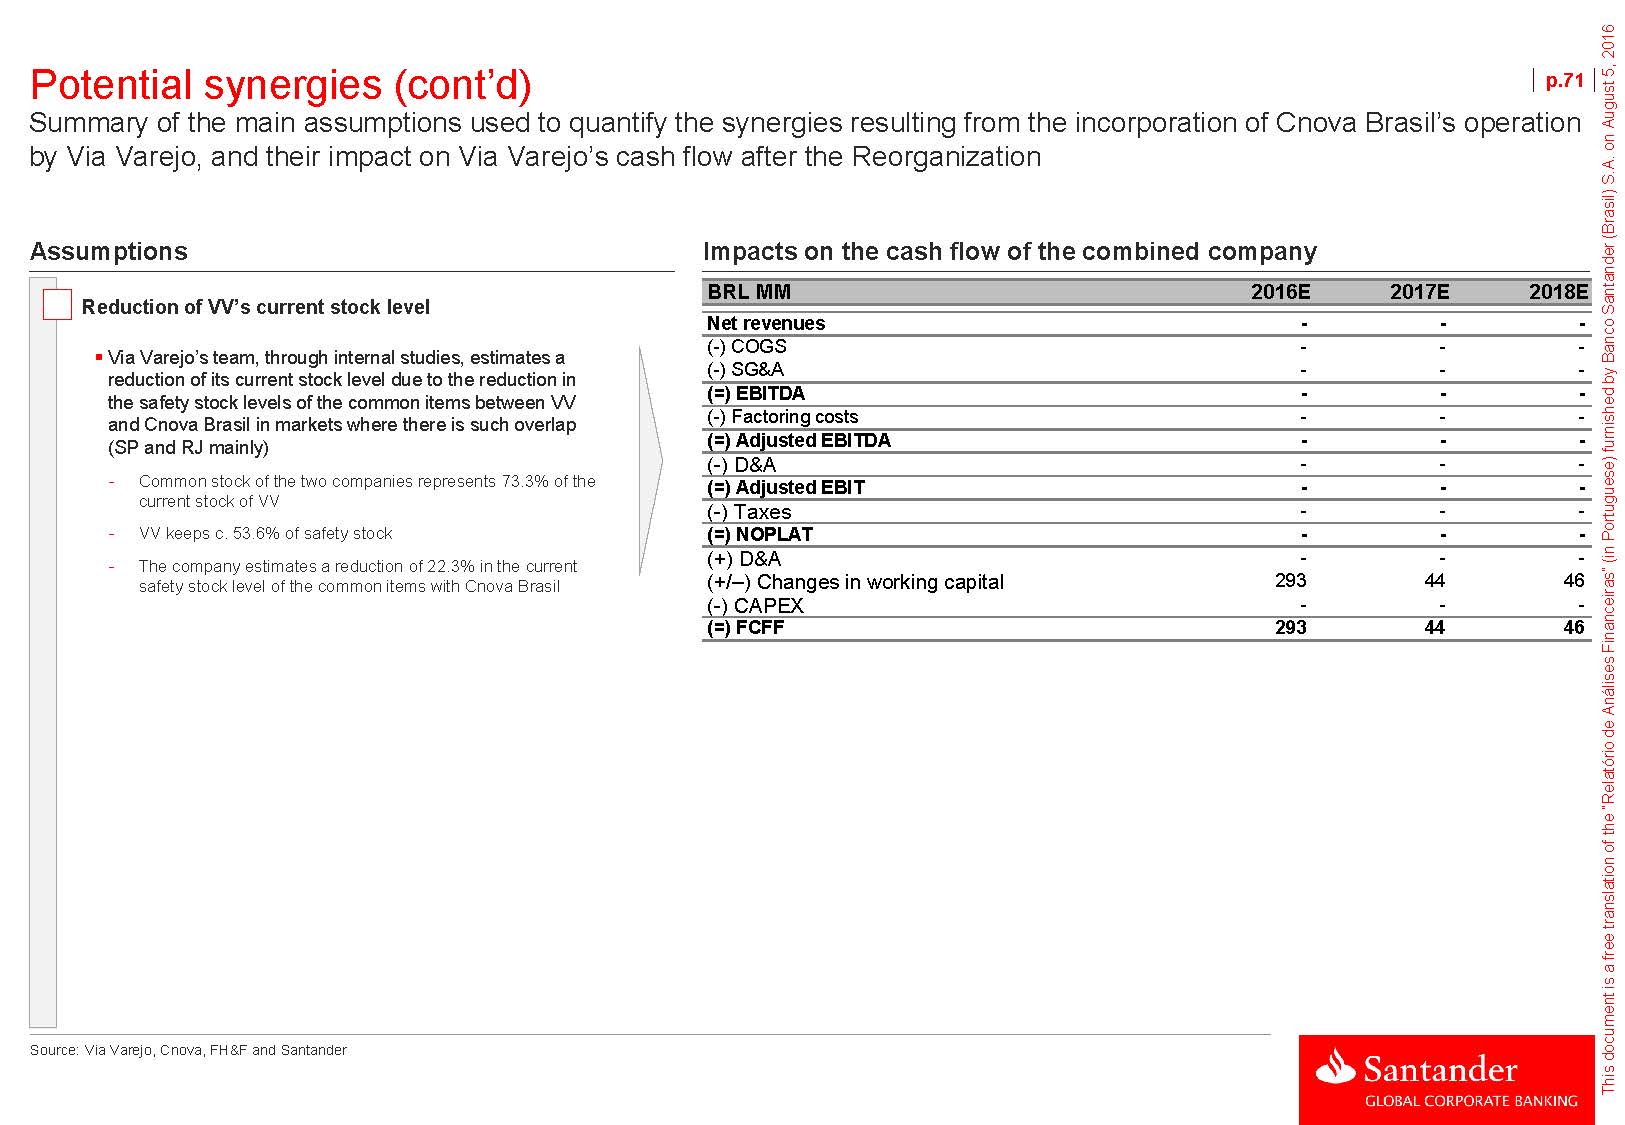
Potential synergies (cont’d) p.71Summary of the main assumptions used to quantify the synergies resulting from the incorporation of Cnova Brasil’s operation by Via Varejo, and their impact on Via Varejo’s cash flow after the Reorganization Assumptions Reduction of VV’s current stock levelVia Varejo’s team, through internal studies, estimates a reduction of its current stock level due to the reduction in the safety stock levels of the common items between VV and Cnova Brasil in markets where there is such overlap (SP and RJ mainly) - Common stock of the two companies represents 73.3% of the current stock of VV - VV keeps c. 53.6% of safety stock - The company estimates a reduction of 22.3% in the current safety stock level of the common items with Cnova Brasil Source: Via Varejo, Cnova, FH&F and Santander Impacts on the cash flow of the combined companyBRL MM 2016E 2017E 2018ENet revenues - - - (-) COGS - - - (-) SG&A - - - (=) EBITDA - - - (-) Factoring costs - - - (=) Adjusted EBITDA - - -(-) D&A- - - (=) Adjusted EBIT - - -(-) Taxes- - - (=) NOPLAT - - -(+) D&A- - -(+/–) Changes in working capital293 44 46(-) CAPEX- - - (=) FCFF 293 44 46

Potential synergies (cont’d) Net present value of the additional cash flows generated by the potential synergies estimated by FH&F, Via Varejo and Santander p.72FH&F estimates + Inventory reduction BRL MM 2016E 2017E 2018E Perpetuity Net revenues 205 885 1,421 1,486 Growth - 331.3% 60.5% (-) COGS (197) (851) (1,364) (-) SG&A 20 123 167 4.5% (1,426) 175 (=) EBITDA 28 158 225 235 EBITDA margin 13.6% 17.8% 15.8% (-) Factoring costs (11) (43) (64) 15.8% (67) (=) Adjusted EBITDA 17 115 161 168 Adjusted EBITDA margin 8.2% 12.9% 11.3% (-) D&A (0) (1) (1) 11.3% (1) (=) Adjusted EBIT 17 114 159 167 Adjusted EBIT margin 8.2% 12.9% 11.2% (-) Taxes (6) (39) (54) 11.2% (57) (=) NOPLAT 11 75 105 110 (+) D&A 0 1 1 (+/–) Changes in working capital 307 90 81 (-) CAPEX (2) (4) (1) 1 22 (1) (=) FCFF 316 162 187 132 (=) NPV FCFF 303 137 133 675 Valuation summary Sensitivity analysis (USD MM) - Premium WACC Cnova Brasil WACC¹ 18.4% WACC Cnova Brasil +10% +20% +30% Perpetuity growth (g)² 4.5% 15.4% 16.9% 18.4% 20.0% NPV – Projected flow 45.9% 573 0.0% 312 275 247 223 VPL – Perpetuity 54.1% 675 EqV BRL MM 100.0% 1,248 Fx rate - USD/BRL (m onthly average)³ 3.28 22.3% 458 415 381 354 EqV USD MM 381 (1) It was considered a 20% premium over Cnova Brasil’s WACC for the base scenario of synergies due to execution risk (2) In BRL nominal terms (assumes zero real growth in perpetuity) (3) As of 07/29/2016 Source: Bloomberg, Via Varejo, Cnova, FH&F and Santander’s estimates
AnnexesI. Macroeconomic assumptions II. Weighted Average Cost of Capital III. EV – Equity adjustments IV. Working capital adjustments V. Discounted Cash Flow of the Holding (Holding Cnova) VI. Outcome of the Financial Analysis Report VII. Business Plan vs. 1H16 Results VIII. Incoming information and interactions with involved parties p.73

Macroeconomic assumptions Main macroeconomic assumptions Macroeconomic assumptionsp.74Macroeconomic projections 2014 2015 2016E 2017E 2018E 2019E 2020E 2021E 2022E 2023E 2024E 2025E BrazilPIB 0.1% -3.8% -3.2% 1.1% 2.1% 2.3% 2.4% 2.4% 2.4% 2.4% 2.4% 2.4% IPCA 6.4% 10.7% 7.2% 5.3% 4.8% 4.6% 4.5% 4.5% 4.5% 4.5% 4.5% 4.5% IGP-M 3.7% 10.5% 8.6% 5.7% 5.2% 4.9% 4.7% 4.7% 4.7% 4.7% 4.7% 4.7% Selic (end of period)¹ 11.8% 14.3% 13.5% 11.1% 10.4% 10.0% 9.8% 9.2% 8.5% 8.5% 8.5% 8.5% Selic (average)¹ 10.9% 13.3% 14.1% 11.9% 10.6% 10.1% 9.9% 9.1% 8.4% 8.4% 8.4% 8.4% Europe Eurozone inflation -0.2% 0.2% 1.2% 1.6% 1.8% 2.0% 2.0% 2.0% 2.0% 2.0% 2.0% 2.0% Eurozone real growth 0.9% 1.6% 2.0% 2.0% 1.7% 1.7% 1.7% 1.7% 1.7% 1.7% 1.7% 1.7% USA inflation 1.6% 2.1% 1.9% 2.0% 2.0% 2.0% 2.0% 2.0% 2.0% 2.0% 2.0% 2.0% USA real growth 2.4% 2.4% 2.8% 3.0% 3.4% 3.4% 3.4% 3.4% 3.4% 3.4% 3.4% 3.4% (1) Selic projection assumes a normalization of the interest rate based on market reports (Focus only projects until 2020) Source: BACEN (Focus report as of July 29th, 2016), IMF, Santander’s macroeconomic team projections and analysts reports

AnnexesI. Macroeconomic assumptions II. Weighted Average Cost of Capital III. EV – Equity adjustments IV. Working capital adjustments V. Discounted Cash Flow of the Holding (Holding Cnova) VI. Outcome of the Financial Analysis Report VII. Business Plan vs. 1H16 Results VIII. Incoming information and interactions with involved parties p.75

Weighted Average Cost of Capital | Cnova Brasil Weighted Average Cost of Capital (WACC) p.76DescriptionThe WACC is determined as the weighted average of the company costs of equity and debtWe estimate the WACC of the company reflecting the country risk, the cost of debt, and borrowing capacity in order to determine an optimal capital structureSuch costs are weighted by the respective proportion of equity and debt of the company’s capital structure, according to the following formula:æEö æ DöD :Net Debt AmountWACC=ç ÷´ Ke+ç ÷´ Kd E :Equity AmountèD+Eø è D+EøKe :Cost of EquityKd :Cost of DebtOur calculations of cost of equity are derived from the CAPM formula: Ke= Rf+ β´(Rm - Rf)+ Z Ke :Cost of EquityRf :Risk Free RateRm – Rf :Market Risk Premiumß :Estimated beta for the non-diversifiable risk of a company measured by the correlation of its return versus market returnZ :Country RiskSource: Santander
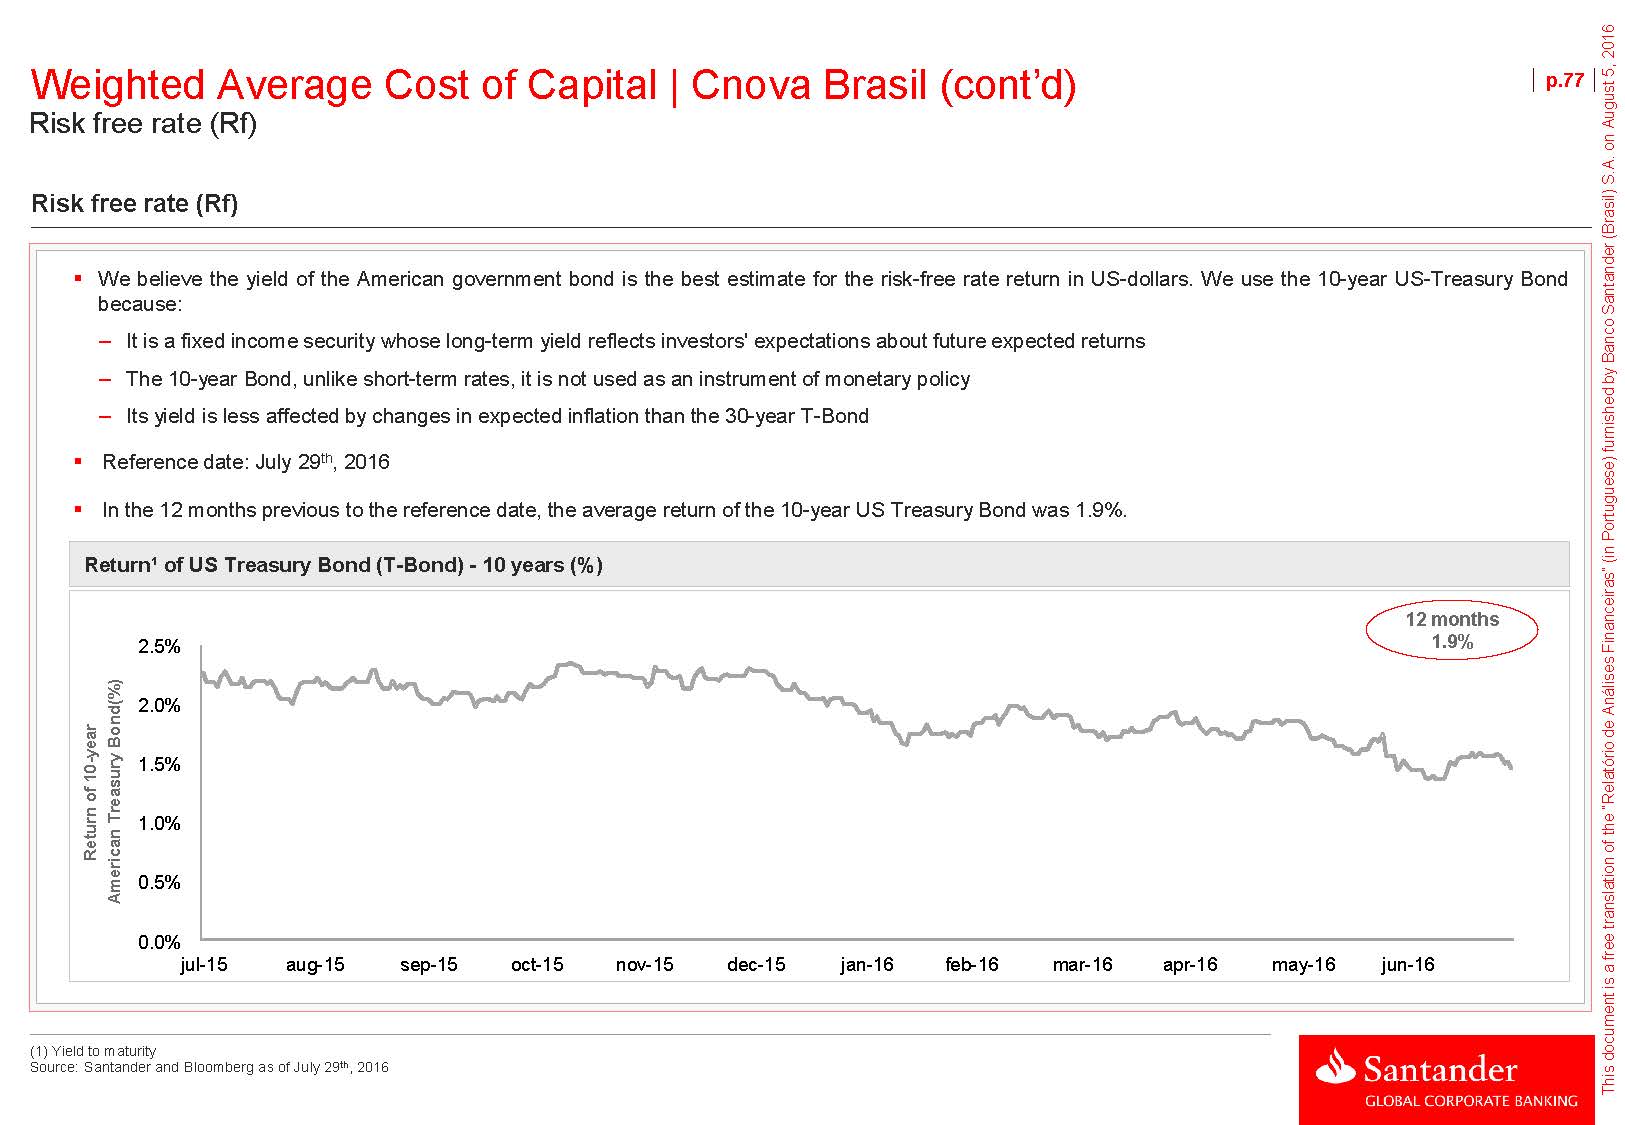
Weighted Average Cost of Capital | Cnova Brasil (cont’d) Risk free rate (Rf) Risk free rate (Rf)p.77We believe the yield of the American government bond is the best estimate for the risk-free rate return in US-dollars. We use the 10-year US-Treasury Bond because: – It is a fixed income security whose long-term yield reflects investors' expectations about future expected returns – The 10-year Bond, unlike short-term rates, it is not used as an instrument of monetary policy – Its yield is less affected by changes in expected inflation than the 30-year T-Bond Reference date: July 29th, 2016In the 12 months previous to the reference date, the average return of the 10-year US Treasury Bond was 1.9%. Return¹ of US Treasury Bond (T-Bond) - 10 years (%)2.5% 12 months1.9%2.0% 1.5% 1.0% 0.5% 0.0% jul-15 aug-15 sep-15 oct-15 nov-15 dec-15 jan-16 feb-16 mar-16 apr-16 may-16 jun-16 (1) Yield to maturity Source: Santander and Bloomberg as of July 29th, 2016
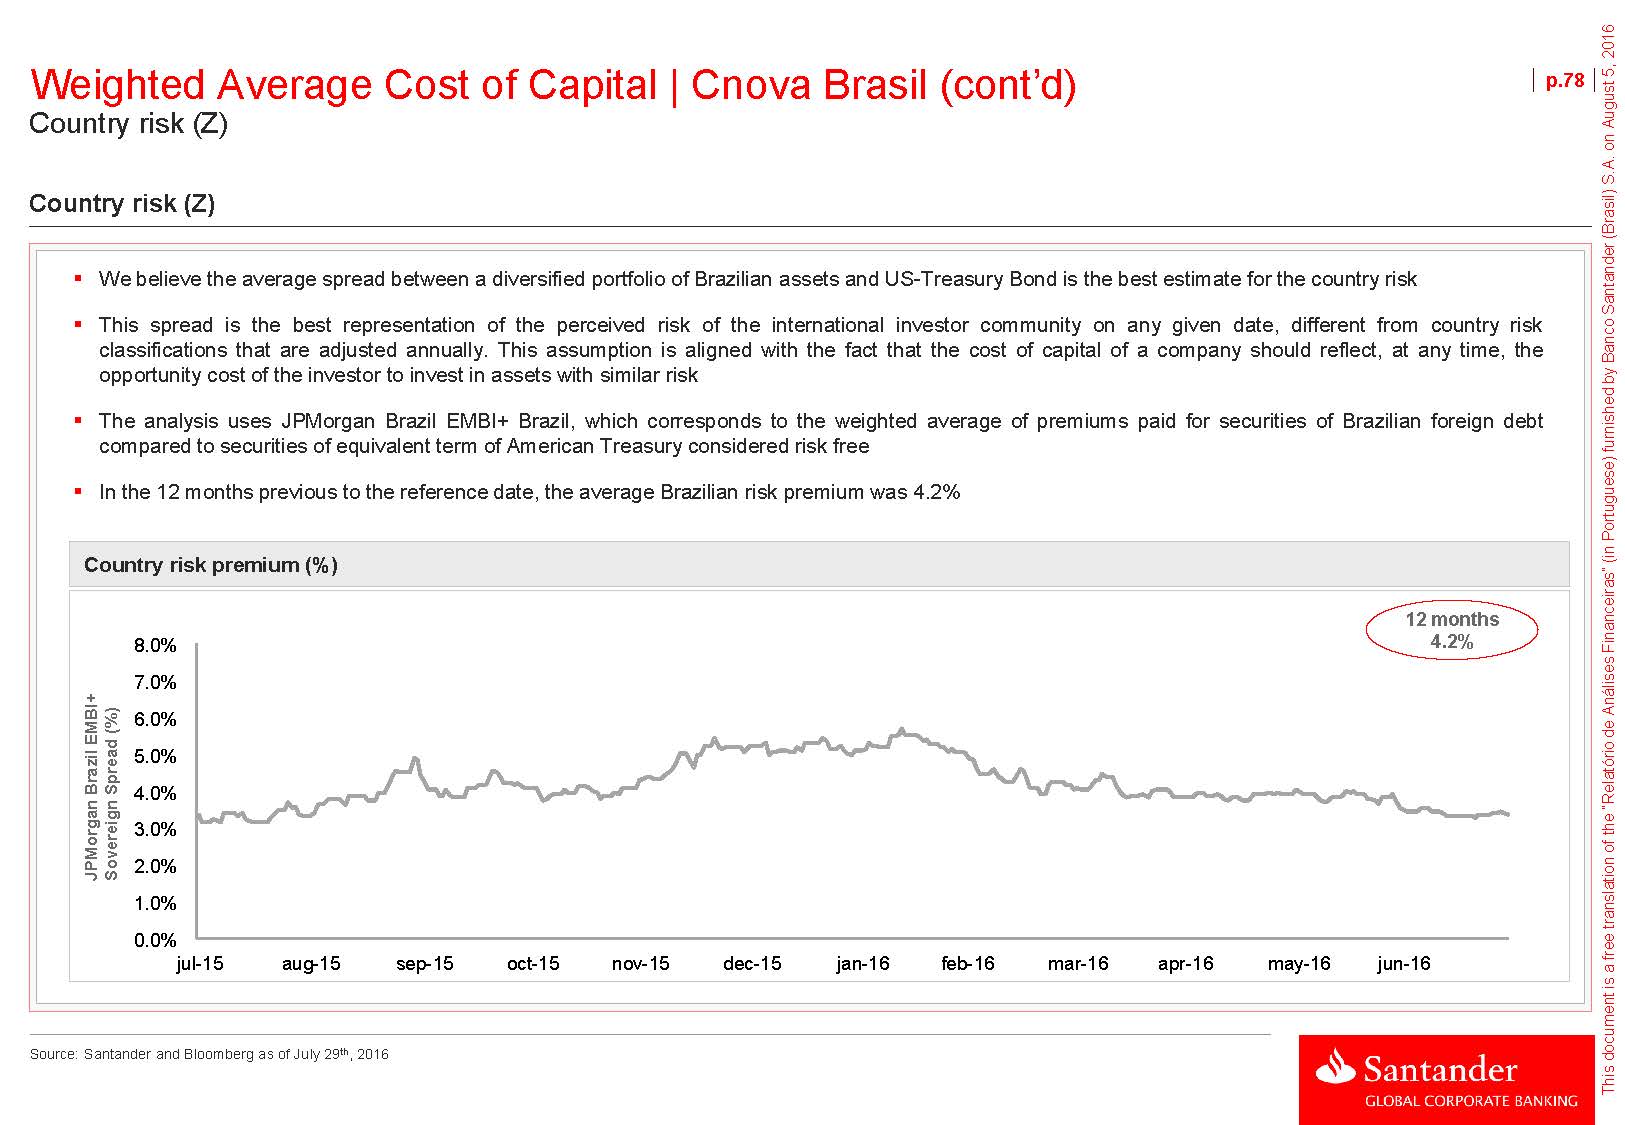
Weighted Average Cost of Capital | Cnova Brasil (cont’d) Country risk (Z) Country risk (Z)p.78We believe the average spread between a diversified portfolio of Brazilian assets and US-Treasury Bond is the best estimate for the country riskThis spread is the best representation of the perceived risk of the international investor community on any given date, different from country risk classifications that are adjusted annually. This assumption is aligned with the fact that the cost of capital of a company should reflect, at any time, the opportunity cost of the investor to invest in assets with similar riskThe analysis uses JPMorgan Brazil EMBI+ Brazil, which corresponds to the weighted average of premiums paid for securities of Brazilian foreign debt compared to securities of equivalent term of American Treasury considered risk freeIn the 12 months previous to the reference date, the average Brazilian risk premium was 4.2% Country risk premium (%)8.0% 7.0% 6.0% 5.0% 4.0% 3.0% 2.0% 1.0% 0.0% 12 months4.2%jul-15 aug-15 sep-15 oct-15 nov-15 dec-15 jan-16 feb-16 mar-16 apr-16 may-16 jun-16 Source: Santander and Bloomberg as of July 29th, 2016
Weighted Average Cost of Capital | Cnova Brasil (cont’d) Market risk premium (Rm - Rf) p.79Market risk premiumThe Market Risk Premium refers to the additional return required by investors to compensate for the higher risk involved in equities vis-à-vis investments in US Treasury bonds (risk free investment)An estimate of the Market Risk Premium is the historical average of the spread between the return of the Standard & Poors – 500 index (S&P-500) and the return on long-term bonds of the US government during the period between 1926 and 2012We prefer a historical approach rather than predictions of future behavior, since we do not believe that the Market Risk Premium is predictable beyond a period of three to four years. As the Market Risk Premium presents a random behavior, historical information are considered the best estimates of the futureWe use historical data since 1926 because:− This period reflects events that impacted the economic environment, such as wars, depressions and “booms”, which would not be reflected if we use shorter periods − Variations in the risk premium are random. Thus, using historical long-term data is considered the best way to estimate the future behavior We used a market risk premium of 7.0% (arithmetic average of the period)Source of data: Ibbotson 2015 Source: Ibbotson and Santander
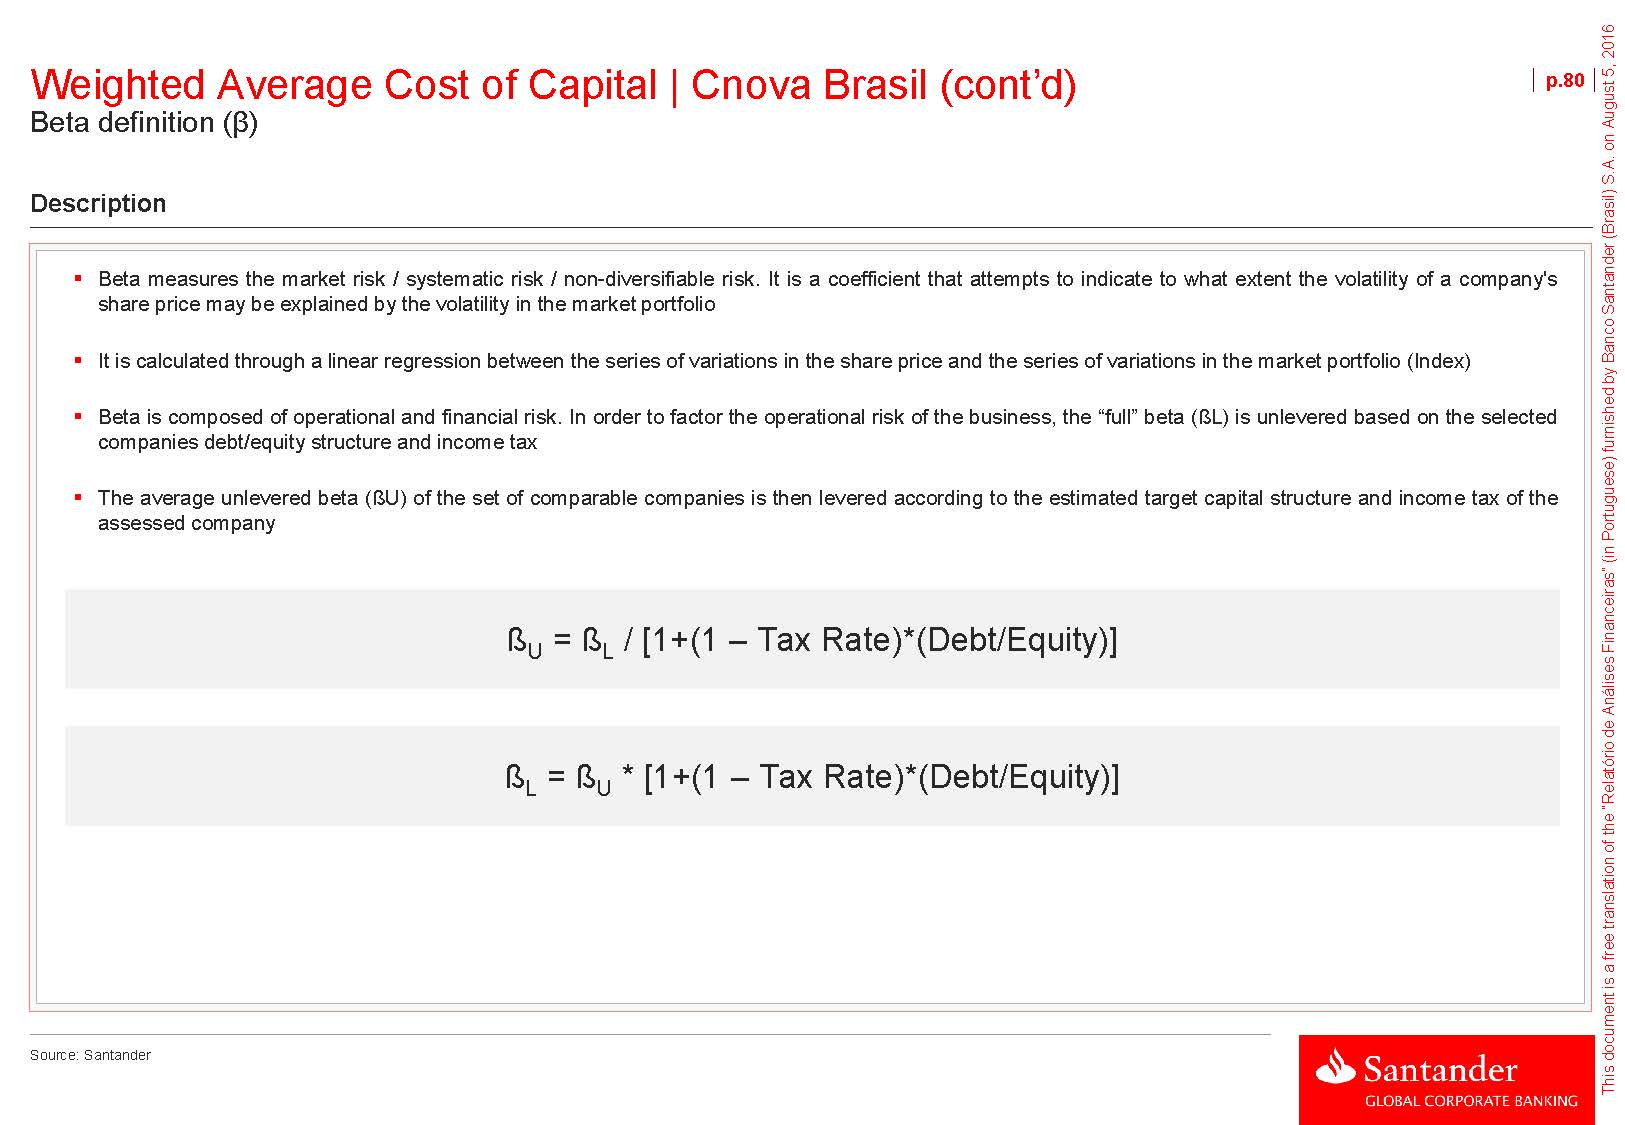
Weighted Average Cost of Capital | Cnova Brasil (cont’d) Beta definition (β) p.80DescriptionBeta measures the market risk / systematic risk / non-diversifiable risk. It is a coefficient that attempts to indicate to what extent the volatility of a company's share price may be explained by the volatility in the market portfolioIt is calculated through a linear regression between the series of variations in the share price and the series of variations in the market portfolio (Index)Beta is composed of operational and financial risk. In order to factor the operational risk of the business, the “full” beta (ßL) is unlevered based on the selected companies debt/equity structure and income taxThe average unlevered beta (ßU) of the set of comparable companies is then levered according to the estimated target capital structure and income tax of the assessed company ßU= ßL/ [1+(1 – Tax Rate)*(Debt/Equity)] ßL= ßU* [1+(1 – Tax Rate)*(Debt/Equity)] Source: Santander
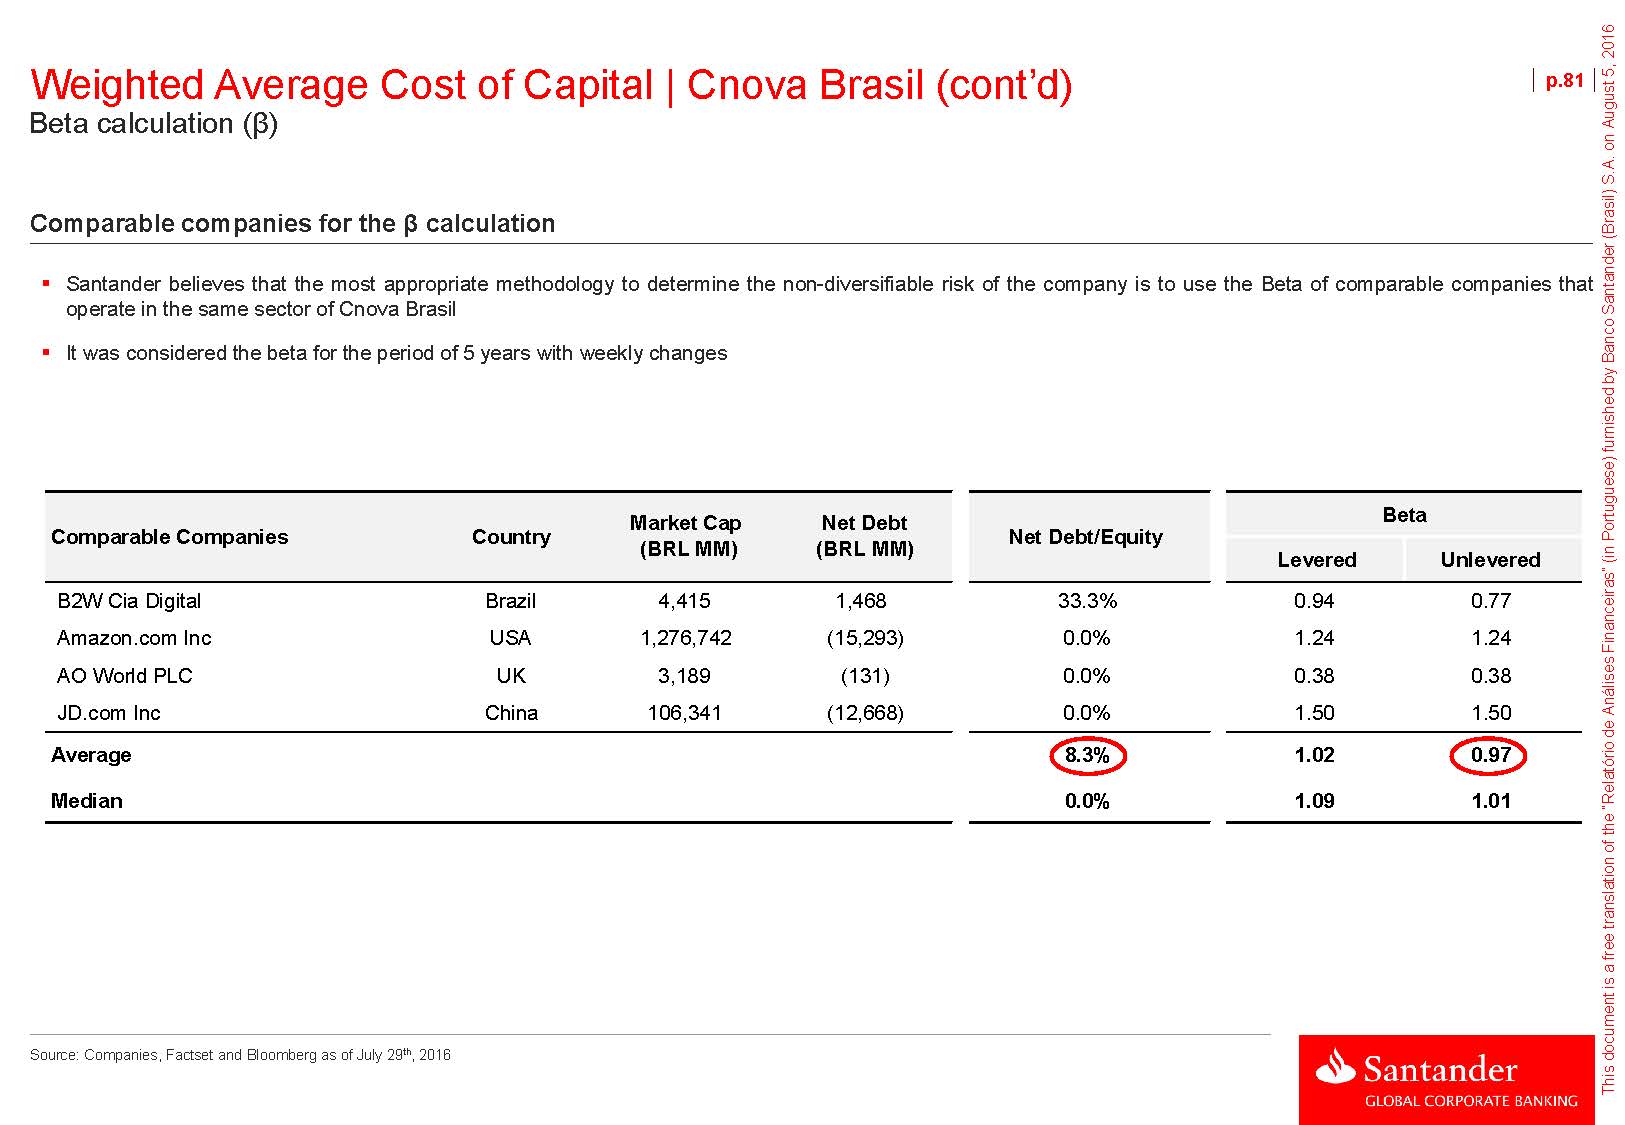
Weighted Average Cost of Capital | Cnova Brasil (cont’d) Beta calculation (β) p.81Comparable companies for the β calculationSantander believes that the most appropriate methodology to determine the non-diversifiable risk of the company is to use the Beta of comparable companies that operate in the same sector of Cnova BrasilIt was considered the beta for the period of 5 years with weekly changes Comparable Companies CountryMarket Cap(BRL MM)Net Debt(BRL MM)Net Debt/EquityBetaLevered UnleveredB2W Cia Digital Brazil 4,415 1,468 33.3% 0.94 0.77 Amazon.com Inc USA 1,276,742 (15,293) 0.0% 1.24 1.24 AO World PLC UK 3,189 (131) 0.0% 0.38 0.38 JD.com Inc China 106,341 (12,668) 0.0% 1.50 1.50 Average 8.3% 1.02 0.97Median 0.0% 1.09 1.01Source: Companies, Factset and Bloomberg as of July 29th, 2016
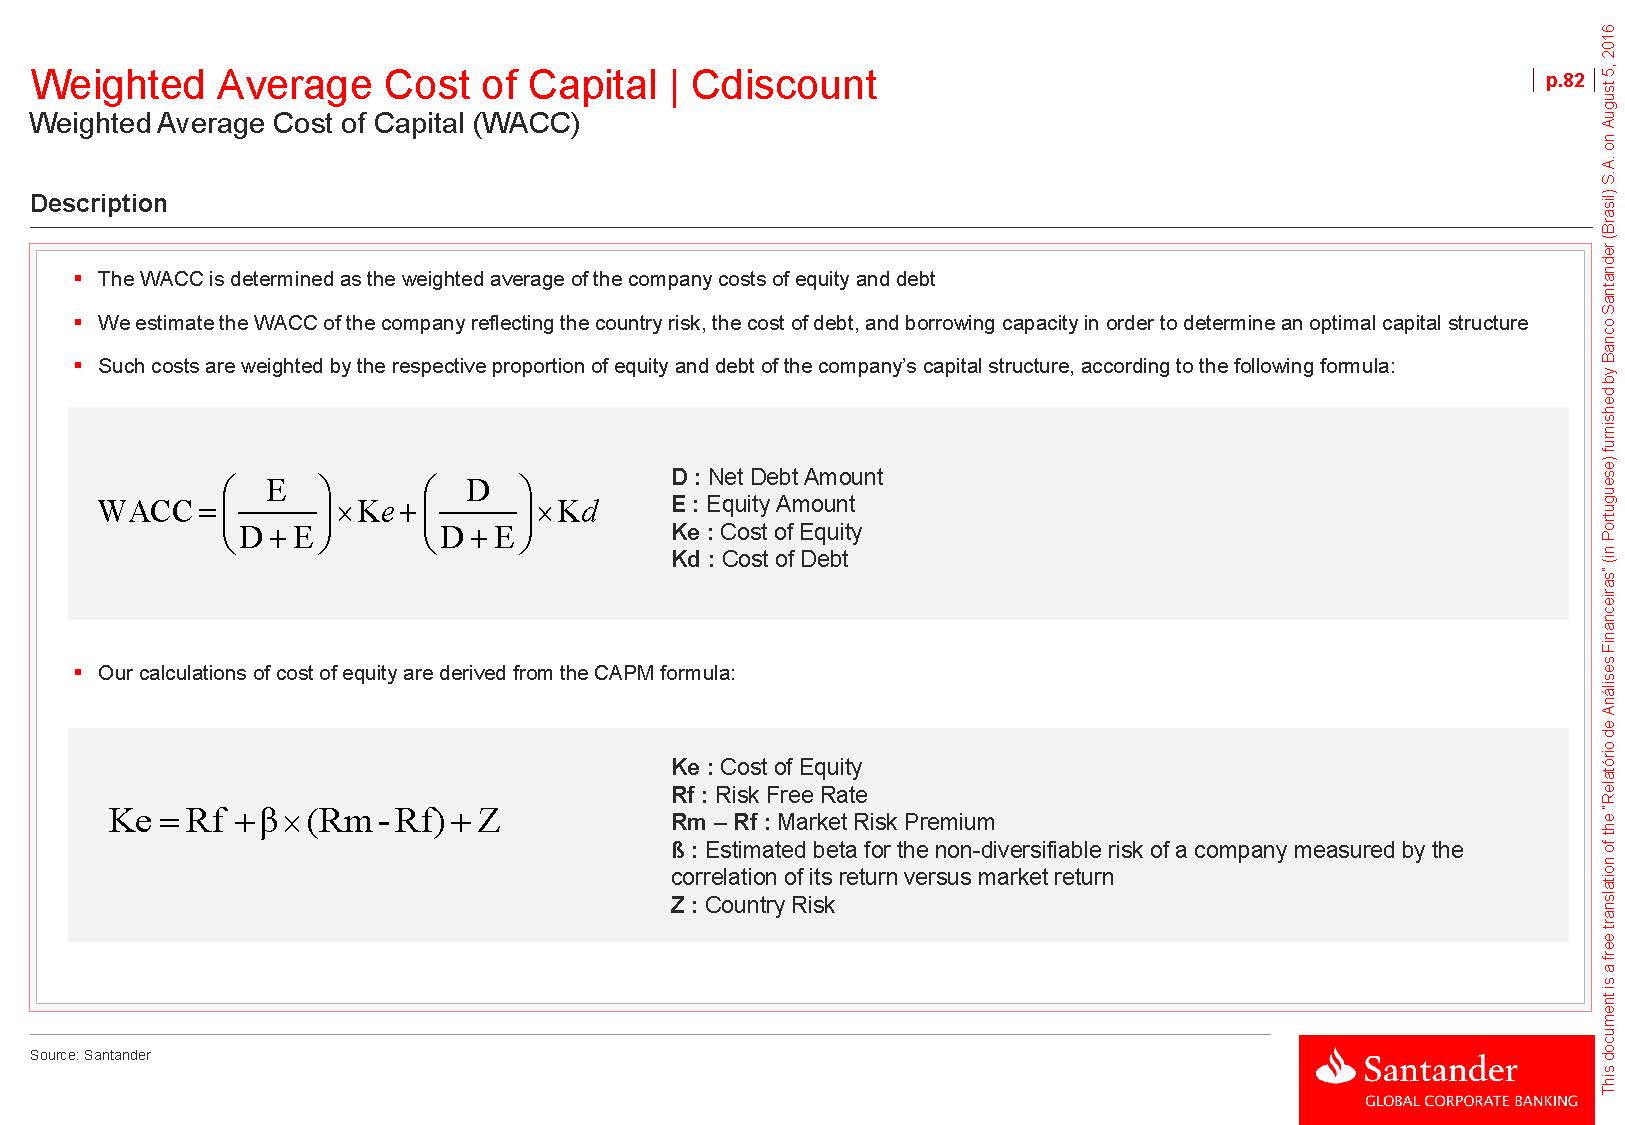
Weighted Average Cost of Capital | Cdiscount Weighted Average Cost of Capital (WACC) p.82DescriptionThe WACC is determined as the weighted average of the company costs of equity and debtWe estimate the WACC of the company reflecting the country risk, the cost of debt, and borrowing capacity in order to determine an optimal capital structureSuch costs are weighted by the respective proportion of equity and debt of the company’s capital structure, according to the following formula:æEö æ DöD :Net Debt AmountWACC=ç ÷´ Ke+ç ÷´ Kd E :Equity AmountèD+Eø è D+EøKe :Cost of EquityKd :Cost of DebtOur calculations of cost of equity are derived from the CAPM formula: Ke= Rf+ β´(Rm - Rf)+ Z Ke :Cost of EquityRf :Risk Free RateRm – Rf :Market Risk Premiumß :Estimated beta for the non-diversifiable risk of a company measured by the correlation of its return versus market returnZ :Country RiskSource: Santander

Weighted Average Cost of Capital | Cdiscount (cont’d) Risk free rate (Rf) Risk free rate (Rf)p.83We believe the yield of the American government bond is the best estimate for the risk-free rate of return in US-dollars. We use the 10-year US-Treasury Bond because: – It is a fixed income security whose long-term yield reflects investors' expectations about future expected returns – The 10-year Bond, unlike short-term rates, it is not used as an instrument of monetary policy – Its yield is less affected by changes in expected inflation than the 30-year T-Bond Reference date: July 29th, 2016In the 12 months previous to the reference date, the average return of the 10-year US Treasury Bond was 1.9%. Return¹ of US Treasury Bond (T-Bond) - 10 years (%)2.5% 12 months1.9%2.0% 1.5% 1.0% 0.5% 0.0% jul-15 aug-15 sep-15 oct-15 nov-15 dec-15 jan-16 feb-16 mar-16 apr-16 may-16 jun-16 (1) Yield to maturity Source: Santander and Bloomberg as oif July 29th, 2016

Weighted Average Cost of Capital | Cdiscount (cont’d) Country risk (Z) Country risk (Z)p.84We believe the average spread between a diversified portfolio of French assets and US-Treasury Bond is the best estimate for the country risk This spread is the best representation of the perceived risk of the international investor community on any given date, different from country risk classifications that are adjusted annually. This assumption is aligned with the fact that the cost of capital of a company should reflect, at any time, the opportunity cost of the investor to invest in assets with similar riskThe analysis uses the 10Y French CDS, which corresponds to the weighted average of premiums paid for securities of French foreign debt compared to securities of equivalent term of American Treasury considered risk freeIn the 12 months previous to the reference date, the average French risk premium was 0.7% Country risk premium (%)1.00% 0.90% 0.80% 0.70% 0.60% 0.50% 0.40% 0.30% 0.20% 12 months0.7%jul-15 aug-15 sep-15 oct-15 nov-15 dec-15 jan-16 feb-16 mar-16 apr-16 may-16 jun-16 jul-16 Source: Santander and Bloomberg as of July 29th, 2016
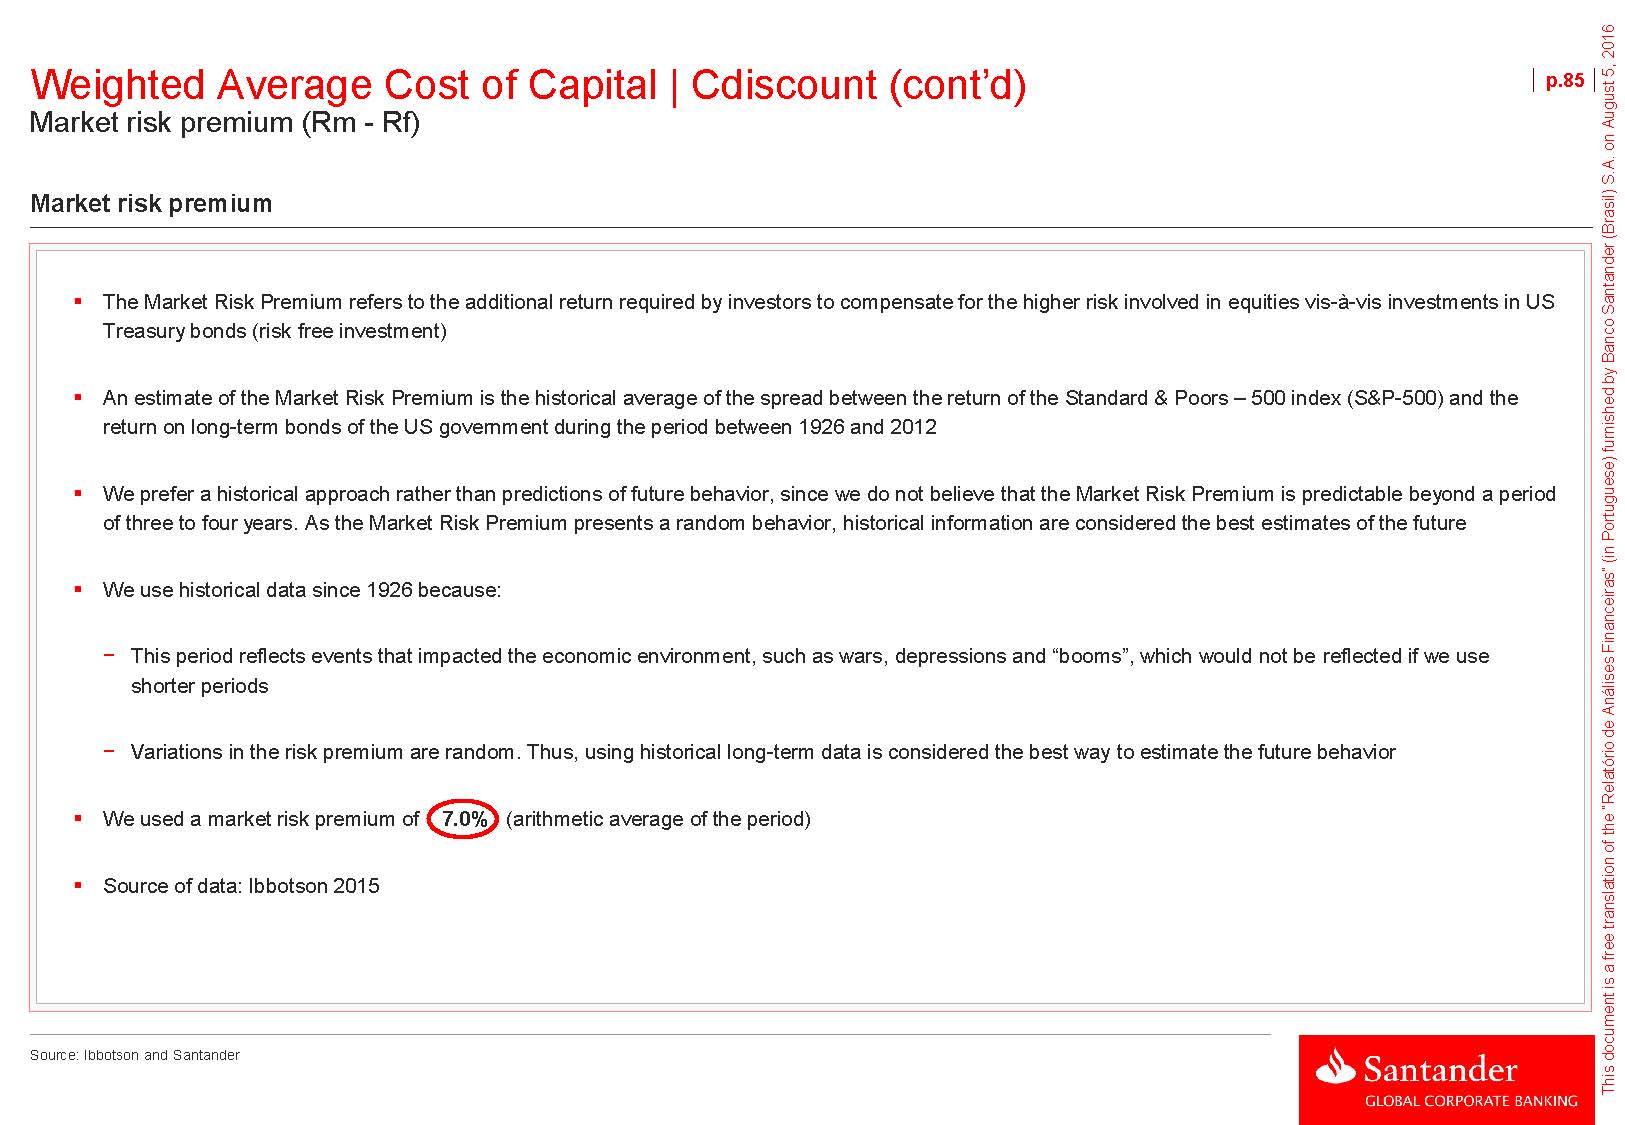
Weighted Average Cost of Capital | Cdiscount (cont’d) Market risk premium (Rm - Rf) p.85Market risk premiumThe Market Risk Premium refers to the additional return required by investors to compensate for the higher risk involved in equities vis-à-vis investments in US Treasury bonds (risk free investment)An estimate of the Market Risk Premium is the historical average of the spread between the return of the Standard & Poors – 500 index (S&P-500) and the return on long-term bonds of the US government during the period between 1926 and 2012We prefer a historical approach rather than predictions of future behavior, since we do not believe that the Market Risk Premium is predictable beyond a period of three to four years. As the Market Risk Premium presents a random behavior, historical information are considered the best estimates of the futureWe use historical data since 1926 because:− This period reflects events that impacted the economic environment, such as wars, depressions and “booms”, which would not be reflected if we use shorter periods − Variations in the risk premium are random. Thus, using historical long-term data is considered the best way to estimate the future behavior We used a market risk premium of 7.0% (arithmetic average of the period)Source of data: Ibbotson 2015 Source: Ibbotson and Santander

Weighted Average Cost of Capital | Cdiscount (cont’d) Beta definition (β) p.86DescriptionBeta measures the market risk / systematic risk / non-diversifiable risk. It is a coefficient that attempts to indicate to what extent the volatility of a company's share price may be explained by the volatility in the market portfolioIt is calculated through a linear regression between the series of variations in the share price and the series of variations in the market portfolio (Index)Beta is composed of operational and financial risk. In order to factor the operational risk of the business, the “full” beta (ßL) is unlevered based on the selected companies debt/equity structure and income taxThe average unlevered beta (ßU) of the set of comparable companies is then levered according to the estimated target capital structure and income tax of the assessed company ßU= ßL/ [1+(1 – Tax Rate)*(Debt/Equity)] ßL= ßU* [1+(1 – Tax Rate)*(Debt/Equity)] Source: Santander
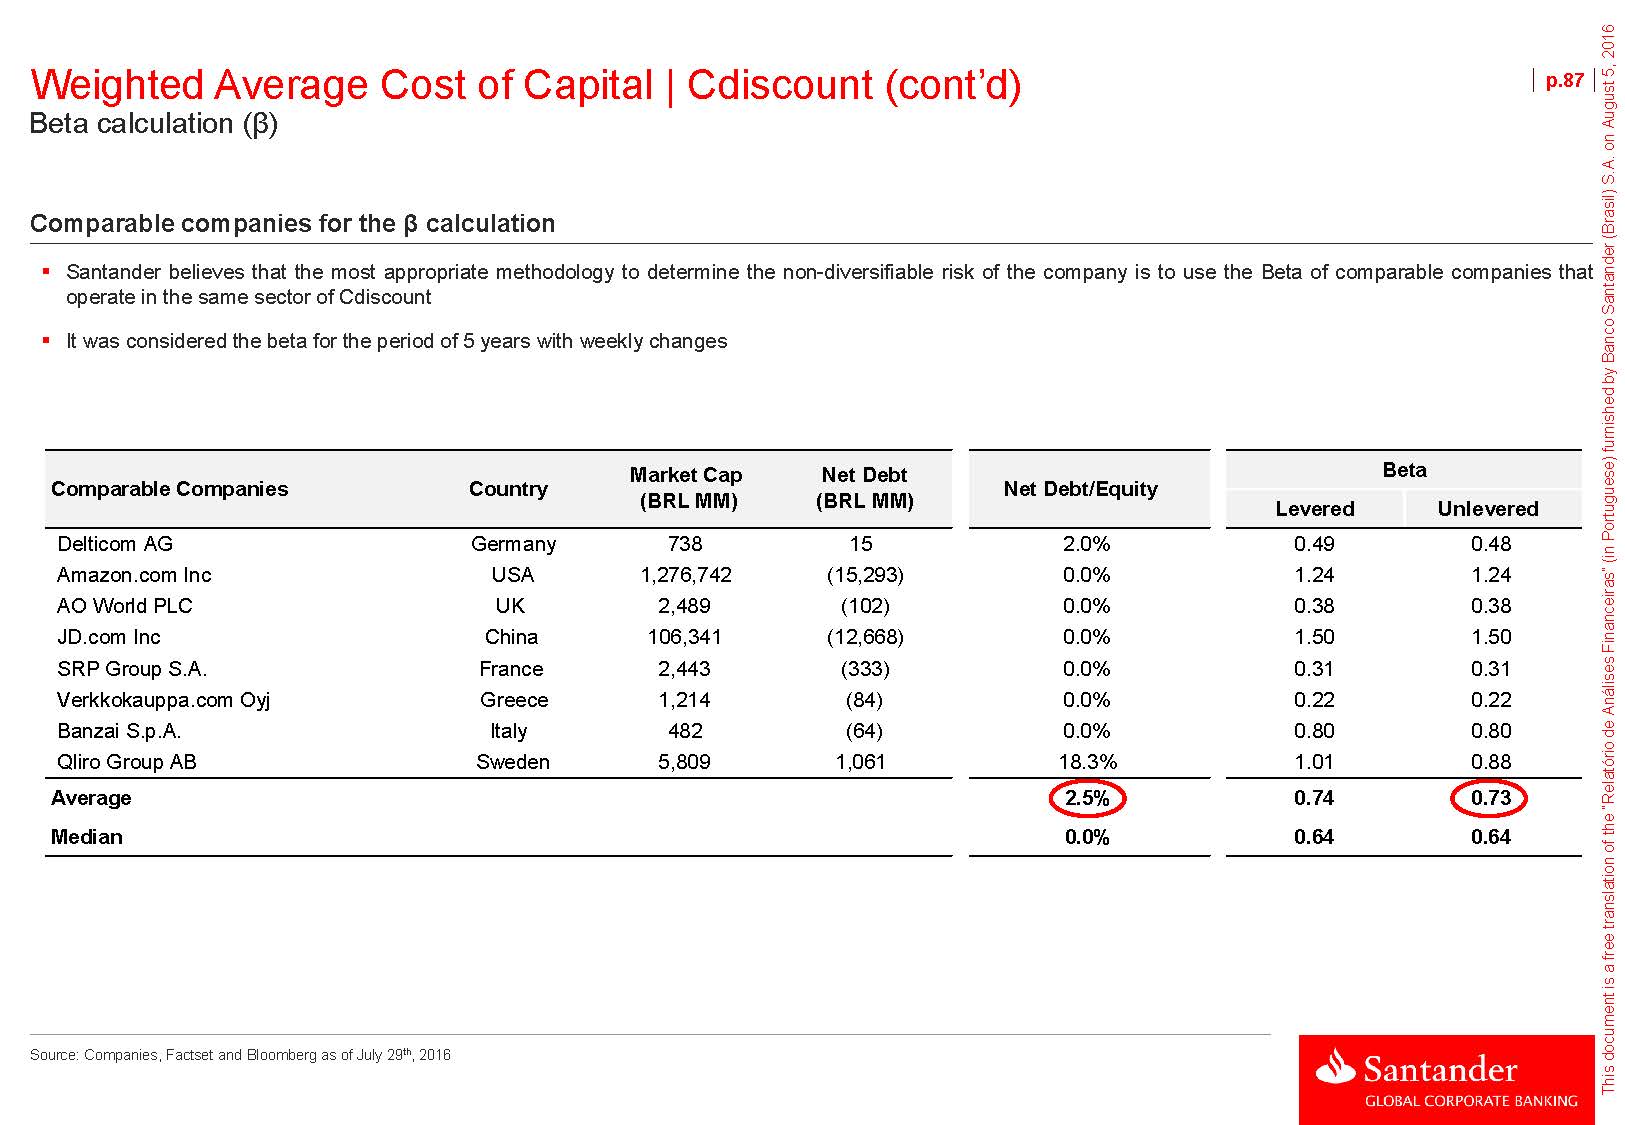
Weighted Average Cost of Capital | Cdiscount (cont’d) Beta calculation (β) p.87Comparable companies for the β calculationSantander believes that the most appropriate methodology to determine the non-diversifiable risk of the company is to use the Beta of comparable companies that operate in the same sector of CdiscountIt was considered the beta for the period of 5 years with weekly changes Comparable Companies CountryMarket Cap(BRL MM)Net Debt (BRL MM)Net Debt/EquityBetaLevered UnleveredDelticom AG Germany 738 15 2.0% 0.49 0.48 Amazon.com Inc USA 1,276,742 (15,293) 0.0% 1.24 1.24 AO World PLC UK 2,489 (102) 0.0% 0.38 0.38 JD.com Inc China 106,341 (12,668) 0.0% 1.50 1.50 SRP Group S.A. France 2,443 (333) 0.0% 0.31 0.31 Verkkokauppa.com Oyj Greece 1,214 (84) 0.0% 0.22 0.22 Banzai S.p.A. Italy 482 (64) 0.0% 0.80 0.80 Qliro Group AB Sweden 5,809 1,061 18.3% 1.01 0.88 Average 2.5% 0.74 0.73Median 0.0% 0.64 0.64 Source: Companies, Factset and Bloomberg as of July 29th, 2016
AnnexesI. Macroeconomic assumptions II. Weighted Average Cost of Capital III. EV – Equity adjustments IV. Working capital adjustments V. Discounted Cash Flow of the Holding (Holding Cnova) VI. Outcome of the Financial Analysis Report VII. Business Plan vs. 1H16 Results VIII. Incoming information and interactions with involved parties p.88
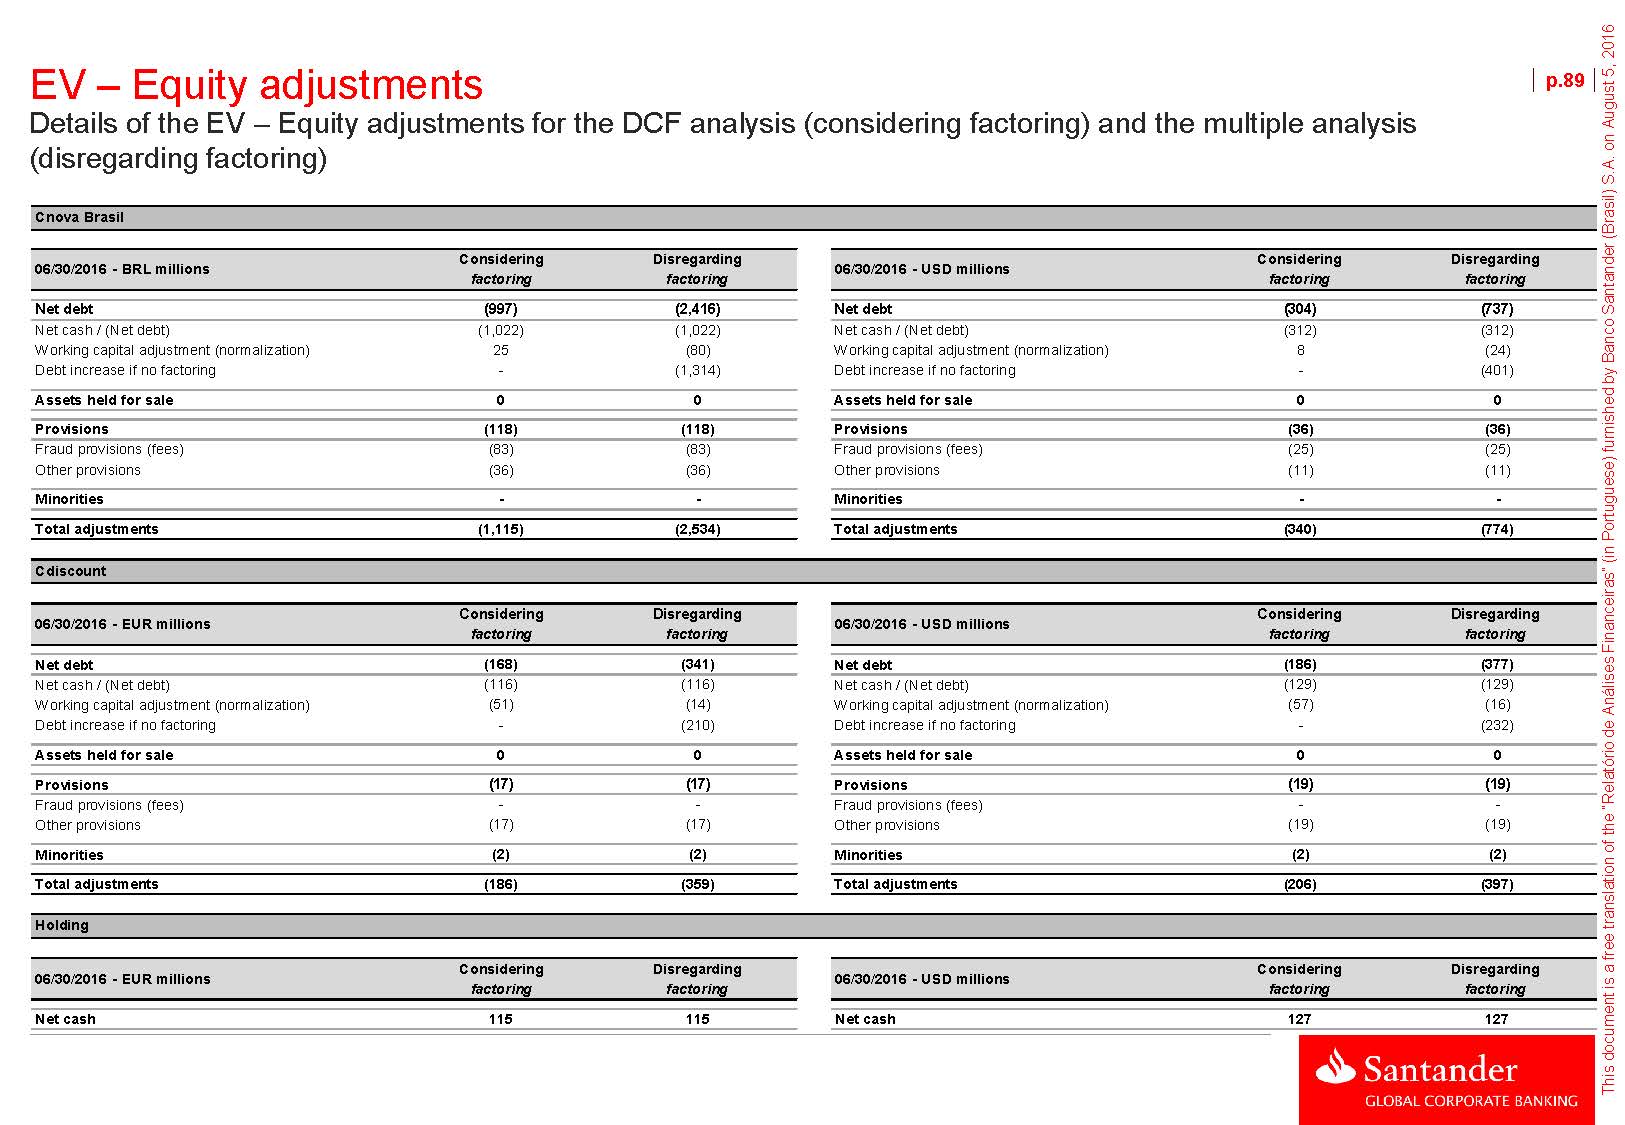
EV – Equity adjustments Details of the EV – Equity adjustments for the DCF analysis (considering factoring) and the multiple analysis (disregarding factoring) p.89Cnova Brasil06/30/2016 - BRL millionsConsideringfactoringDisregarding factoring06/30/2016 - USD millionsConsideringfactoringDisregarding factoringNet debt (997) (2,416)Net cash / (Net debt) (1,022) (1,022) Working capital adjustment (normalization) 25 (80) Debt increase if no factoring - (1,314)Assets held for sale 0 0Provisions (118) (118)Fraud provisions (fees) (83) (83) Other provisions (36) (36)Minorities - -Total adjustments (1,115) (2,534)Net debtNet cash / (Net debt) Working capital adjustment (normalization) Debt increase if no factoring Assets held for saleProvisionsFraud provisions (fees) Other provisions Minorities Total adjustments(304) (737)(312) (312) 8 (24) - (401) 0 0 (36) (36)(25) (25) (11) (11) - -(340) (774)CdiscountConsideringDisregardingConsideringDisregarding06/30/2016 - EUR millions 06/30/2016 - USD millionsfactoringfactoringfactoringfactoringNet debtNet cash / (Net debt) Working capital adjustment (normalization) Debt increase if no factoring Assets held for saleProvisionsFraud provisions (fees) Other provisions MinoritiesTotal adjustments(168) (341)(116) (116) (51) (14)- (210) 0 0(17) (17)- - (17) (17) (2) (2)(186) (359)Net debtNet cash / (Net debt) Working capital adjustment (normalization) Debt increase if no factoring Assets held for saleProvisions Fraud provisions (fees) Other provisions MinoritiesTotal adjustments(186) (377)(129) (129) (57) (16)- (232) 0 0(19) (19)- - (19) (19) (2) (2)(206) (397)Holding06/30/2016 - EUR millionsConsideringfactoringDisregardingfactoring06/30/2016 - USD millionsConsidering factoringDisregardingfactoringNet cash 115 115 Net cash 127 127

AnnexesI. Macroeconomic assumptions II. Weighted Average Cost of Capital III. EV – Equity adjustments IV. Working capital adjustments V. Discounted Cash Flow of the Holding (Holding Cnova) VI. Outcome of the Financial Analysis Report VII. Business Plan vs. 1H16 Results VIII. Incoming information and interactions with involved parties p.90
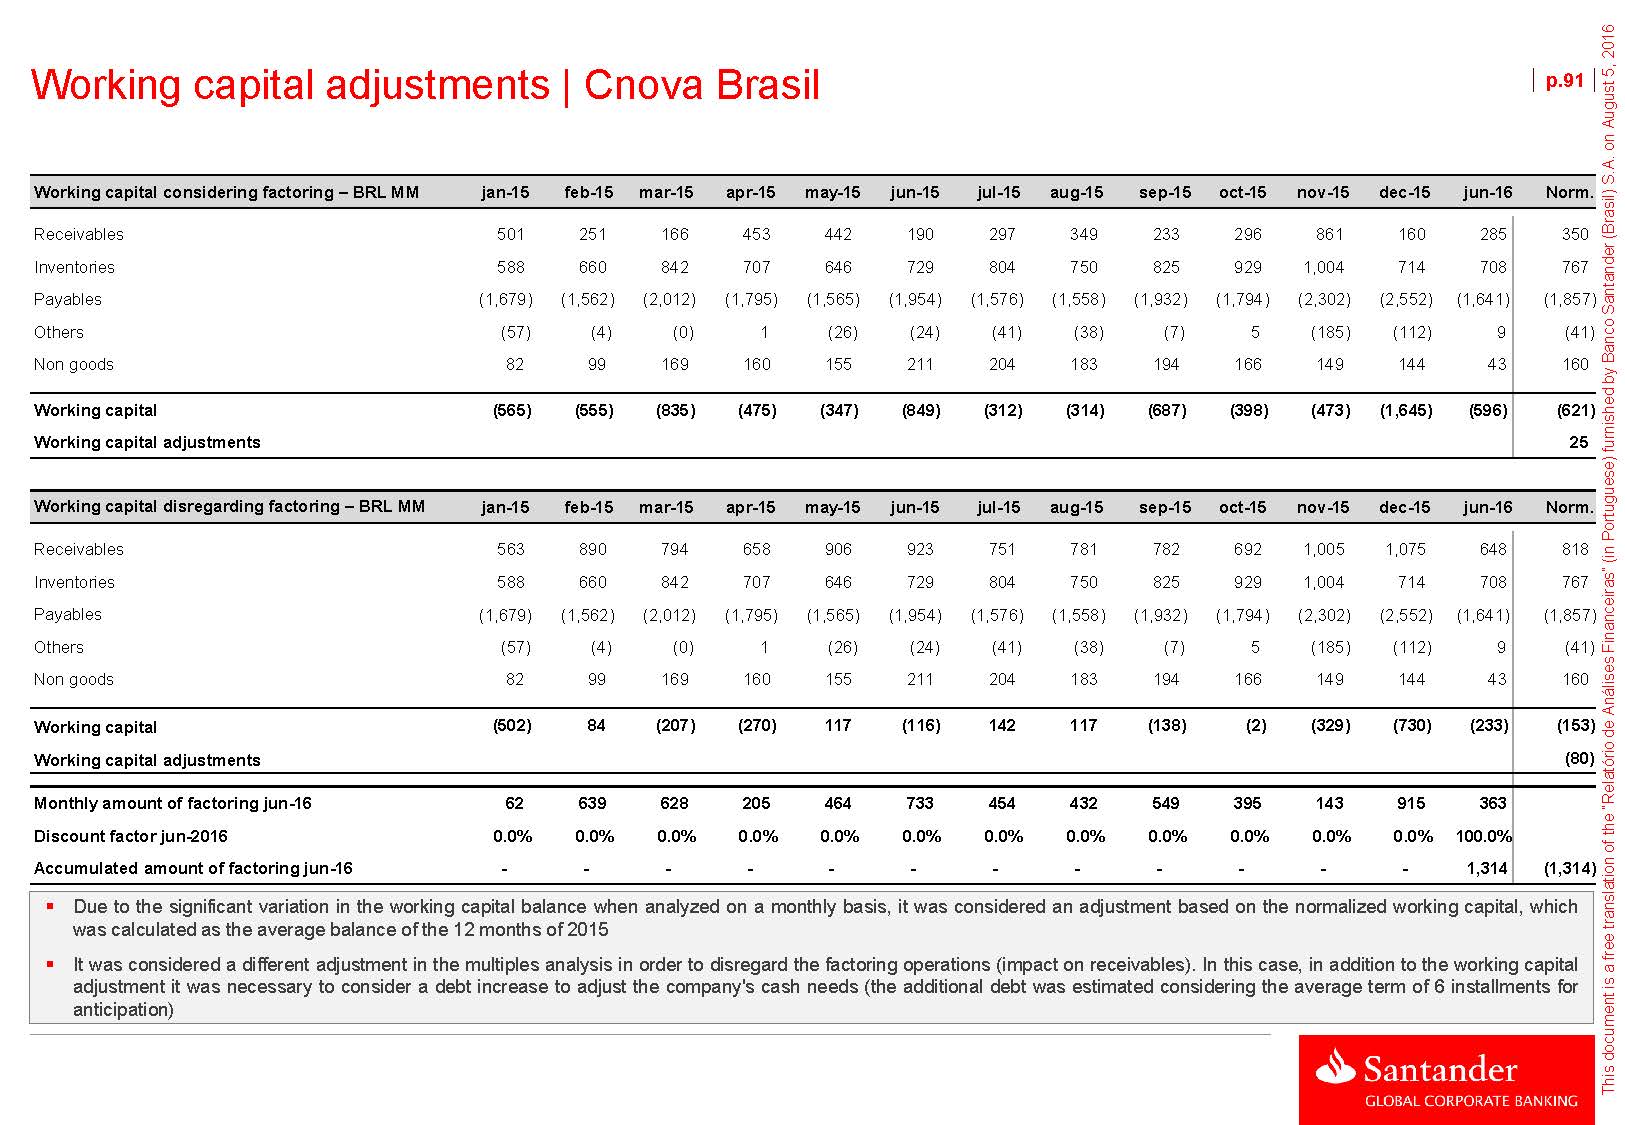
Working capital adjustments | Cnova Brasil p.91Working capital considering factoring – BRL MM jan-15 feb-15 mar-15 apr-15 may-15 jun-15 jul-15 aug-15 sep-15 oct-15 nov-15 dec-15 jun-16 Norm.Receivables 501 251 166 453 442 190 297 349 233 296 861 160 285 350 Inventories 588 660 842 707 646 729 804 750 825 929 1,004 714 708 767 Payables (1,679) (1,562) (2,012) (1,795) (1,565) (1,954) (1,576) (1,558) (1,932) (1,794) (2,302) (2,552) (1,641) (1,857) Others (57) (4) (0) 1 (26) (24) (41) (38) (7) 5 (185) (112) 9 (41) Non goods 82 99 169 160 155 211 204 183 194 166 149 144 43 160 Working capital (565) (555) (835) (475) (347) (849) (312) (314) (687) (398) (473) (1,645) (596) (621)Working capital adjustments 25Working capital disregarding factoring – BRL MM jan-15 feb-15 mar-15 apr-15 may-15 jun-15 jul-15 aug-15 sep-15 oct-15 nov-15 dec-15 jun-16Norm.Receivables 563 890 794 658 906 923 751 781 782 692 1,005 1,075 648 Inventories 588 660 842 707 646 729 804 750 825 929 1,004 714 708 Payables (1,679) (1,562) (2,012) (1,795) (1,565) (1,954) (1,576) (1,558) (1,932) (1,794) (2,302) (2,552) (1,641) Others (57) (4) (0) 1 (26) (24) (41) (38) (7) 5 (185) (112) 9 Non goods 82 99 169 160 155 211 204 183 194 166 149 144 43 818 767 (1,857) (41) 160 Working capital (502) 84 (207) (270) 117 (116) 142 117 (138) (2) (329) (730) (233)Working capital adjustments(153)(80) Monthly amount of factoring jun-16 62 639 628 205 464 733 454 432 549 395 143 915 363Discount factor jun-2016 0.0% 0.0% 0.0% 0.0% 0.0% 0.0% 0.0% 0.0% 0.0% 0.0% 0.0% 0.0% 100.0% Accumulated amount of factoring jun-16 - - - - - - - - - - - - 1,314 (1,314)Due to the significant variation in the working capital balance when analyzed on a monthly basis, it was considered an adjustment based on the normalized working capital, which was calculated as the average balance of the 12 months of 2015It was considered a different adjustment in the multiples analysis in order to disregard the factoring operations (impact on receivables). In this case, in addition to the working capital adjustment it was necessary to consider a debt increase to adjust the company's cash needs (the additional debt was estimated considering the average term of 6 installments for anticipation)

Working capital adjustments | Cdiscount p.92Working capital considering factoring – EUR MM jan-15 feb-15 mar-15 apr-15 may-15 jun-15 jul-15 aug-15 sep-15 oct-15 nov-15 dez-15 jun-16 Norm.Receivables 135 92 95 78 83 79 74 74 99 97 85 108 62 92 Inventories 217 209 208 225 212 219 217 208 224 257 294 241 231 228 Payables (474) (403) (422) (368) (336) (426) (388) (372) (426) (386) (518) (594) (404) (426) Others 8 70 55 54 38 41 37 42 37 33 39 53 24 42 Non goods 11 4 (5) 2 (1) (1) (4) (13) (35) (36) (48) (85) (47) (18) Working capital (102) (29) (70) (9) (4) (88) (63) (60) (100) (35) (148) (277) (134) (82)Working capital adjustments (51)Working capital disregarding factoring – EUR MMjan-15 feb-15 mar-15 apr-15 may-15 jun-15 jul-15 aug-15 sep-15 oct-15 nov-15 dez-15 jun-16Norm.Receivables 135 92 95 78 83 79 74 110 130 145 147 194 121 Inventories 217 209 208 225 212 219 217 208 224 257 294 241 231 Payables (474) (403) (422) (368) (336) (426) (388) (372) (426) (386) (518) (594) (404) Others 8 70 55 54 38 41 37 42 37 33 39 53 24 Non goods 11 4 (5) 2 (1) (1) (4) (13) (35) (36) (48) (85) (47) 114 228 (426) 42 (18) Working capital (102) (29) (70) (9) (4) (88) (63) (24) (69) 13 (86) (190) (75)Working capital adjustments(60) (14) Monthly amount of factoring jun-16 - - - - - - - 36 31 48 63 87 59Discount factor jun-2016 0.0% 0.0% 0.0% 0.0% 0.0% 0.0% 0.0% 0.0% 0.0% 0.0% 0.0% 0.0% 100.0% Accumulated amount of factoring jun-16 - - - - - - - - - - - - 210(210)Due to the significant variation in the working capital balance when analyzed on a monthly basis, it was considered an adjustment based on the normalized working capital, which was calculated as the average balance of the 12 months of 2015It was considered a different adjustment in the multiples analysis in order to disregard the factoring operations (impact on receivables). In this case, in addition to the working capital adjustment it was necessary to consider a debt increase to adjust the company's cash needs (the additional debt was estimated considering the average term of 6 installments for anticipation)

AnnexesI. Macroeconomic assumptions II. Weighted Average Cost of Capital III. EV – Equity adjustments IV. Working capital adjustments V. Discounted Cash Flow of the Holding (Holding Cnova) VI. Outcome of the Financial Analysis Report VII. Business Plan vs. 1H16 Results VIII. Incoming information and interactions with involved parties p.93

Discounted Cash Flow of the Holding (Holding Cnova) p.94Business PlanBusiness Plan extrapolationEUR MM 2016E 2017E 2018E 2019E 2020E 2021E 2022E 2023E 2024E 2025E Perpetuity Net revenues - - - - - - - - - - - Growth n.a. n.a. n.a. n.a. n.a. n.a. n.a. n.a. n.a. (-) COGS and SG&A (15) (7) (7) (7) (7) (7) (8) (8) (8) (8)n.a. (8) (=) EBITDA (15) (7) (7) (7) (7) (7) (8) (8) (8) (8) (8) EBITDA margin n.a. n.a. n.a. n.a. n.a. n.a. n.a. n.a. n.a. n.a. (-) Factoring costs - - - - - - - - - -n.a. - (=) Adjusted EBITDA (15) (7) (7) (7) (7) (7) (8) (8) (8) (8) (8) Adjusted EBITDA margin n.a. n.a. n.a. n.a. n.a. n.a. n.a. n.a. n.a. n.a. (-) D&A - - - - - - - - - -n.a. - (=) Adjusted EBIT (15) (7) (7) (7) (7) (7) (8) (8) (8) (8) (8) Adjusted EBIT margin n.a. n.a. n.a. n.a. n.a. n.a. n.a. n.a. n.a. n.a. (-) Taxes 5 2 2 2 3 3 3 3 3 3n.a. 3 (=) NOPLAT (10) (5) (5) (5) (5) (5) (5) (5) (5) (5) (5) (+) D&A - - - - - - - - - - (+/–) Working capital adjustments - - - - - - - - - - (-) CAPEX - - - - - - - - - - - - - (=) FCFF (10) (5) (5) (5) (5) (5) (5) (5) (5) (5) (5) (=) NPV FCFF (10) (4) (4) (4) (4) (3) (3) (3) (3) (3) (50) Valuation summary WACC 7.6% Perpetuity growth (g)¹ 2.0% NPV – Projected flow 45.0% (41) NPV – Perpetuity 55.0% (50) EV EUR MM 100.0% (90) Net cash 115 EqV EUR MM 25 Fx rate - EUR/USD (monthly average)² 1.11 EqV USD MM 28 (1) In EUR nominal (considering real growth equal to zero in the perpetuity) (2) Base date 07/29/2016 Source: Bloomberg and Santander estimates
Annexes I. Macroeconomic assumptions II. Weighted Average Cost of Capital III. EV – Equity adjustments IV. Working capital adjustments V. Discounted Cash Flow of the Holding (Holding Cnova) VI. Outcome of the Financial Analysis Report VII. Business Plan vs. 1H16 Results VIII. Incoming information and interactions with involved parties p.95
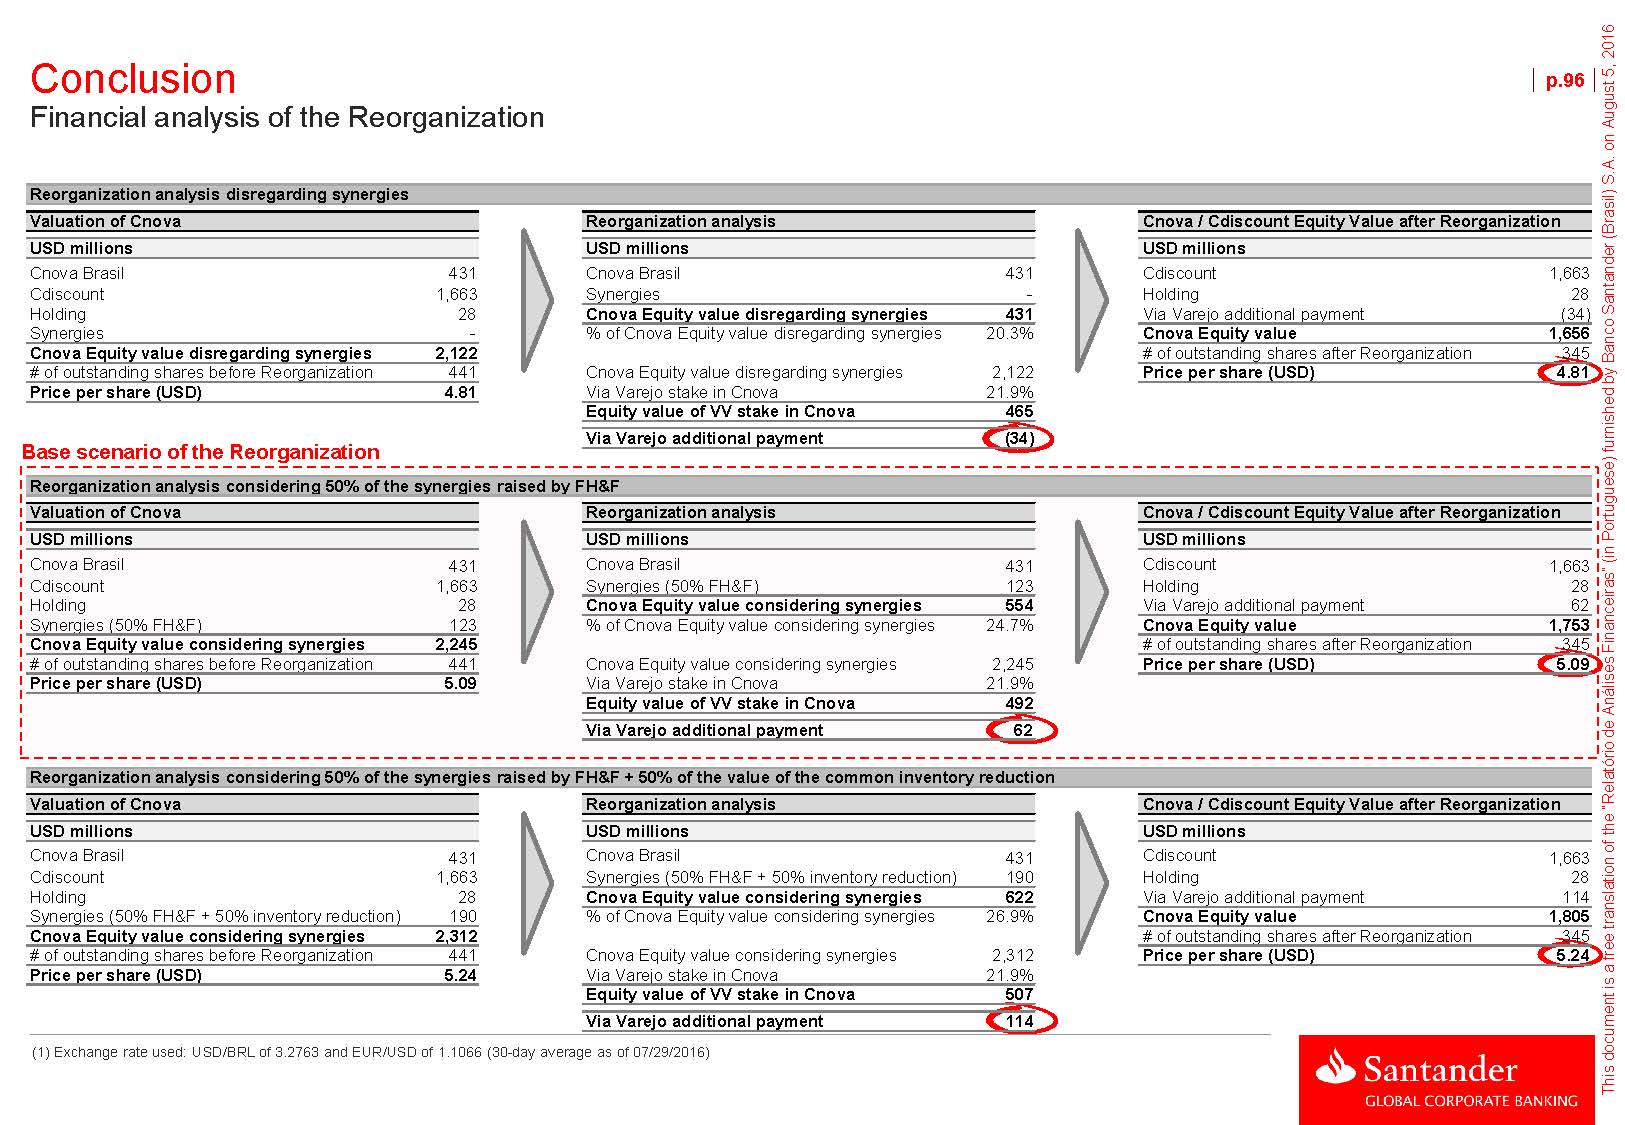
Conclusion Financial analysis of the Reorganization p.96 Reorganization analysis Cnova / Cdiscount Equity Value after Reorganization USD millions USD millions Cnova Brasil 431 Cnova Brasil 431 Cdiscount 1,663 Cdiscount 1,663 Synergies - Holding 28 Holding 28 Cnova Equity value disregarding synergies 431 Via Varejo additional payment (34) Synergies - % of Cnova Equity value disregarding synergies 20.3% Cnova Equity value 1,656 Cnova Equity value disregarding synergies 2,122# of outstanding shares after Reorganization 345# of outstanding shares before Reorganization 441 Cnova Equity value disregarding synergies 2,122 Price per share (USD) 4.81 Price per share (USD) 4.81Via Varejo stake in Cnova 21.9%Equity value of VV stake in Cnova 465Via Varejo additional payment (34)Base scenario of the ReorganizationReorganization analysis considering 50% of the synergies raised by FH&FValuation of CnovaReorganization analysisCnova / Cdiscount Equity Value after ReorganizationUSD millions USD millions USD millions Cnova Brasil 431 Cnova Brasil 431 Cdiscount 1,663 Cdiscount 1,663 Synergies (50% FH&F) 123 Holding 28 Holding 28 Cnova Equity value considering synergies 554 Via Varejo additional payment 62 Synergies (50% FH&F)123% of Cnova Equity value considering synergies24.7%Cnova Equity value1,753Cnova Equity value considering synergies 2,245 # of outstanding shares after Reorganization 345 # of outstanding shares before Reorganization441Cnova Equity value considering synergies2,245Price per share (USD)5.09Price per share (USD) 5.09 Via Varejo stake in Cnova 21.9% Equity value of VV stake in Cnova 492 Via Varejo additional payment 62 Reorganization analysis considering 50% of the synergies raised by FH&F + 50% of the value of the common inventory reductionValuation of CnovaUSD millionsReorganization analysisUSD millionsCnova / Cdiscount Equity Value after ReorganizationUSD millionsCnova Brasil Cdiscount Holding Synergies (50% FH&F + 50% inventory reduction) Cnova Equity value considering synergies# of outstanding shares before Reorganization Price per share (USD)431 1,663 28 190 2,312441 5.24Cnova Brasil Synergies (50% FH&F + 50% inventory reduction) Cnova Equity value considering synergies% of Cnova Equity value considering synergies Cnova Equity value considering synergies Via Varejo stake in Cnova Equity value of VV stake in CnovaVia Varejo additional payment 431 190 62226.9% 2,312 21.9% 507114Cdiscount Holding Via Varejo additional payment Cnova Equity value # of outstanding shares after Reorganization Price per share (USD)1,663 28 114 1,805345 5.24(1) Exchange rate used: USD/BRL of 3.2763 and EUR/USD of 1.1066 (30-day average as of 07/29/2016)
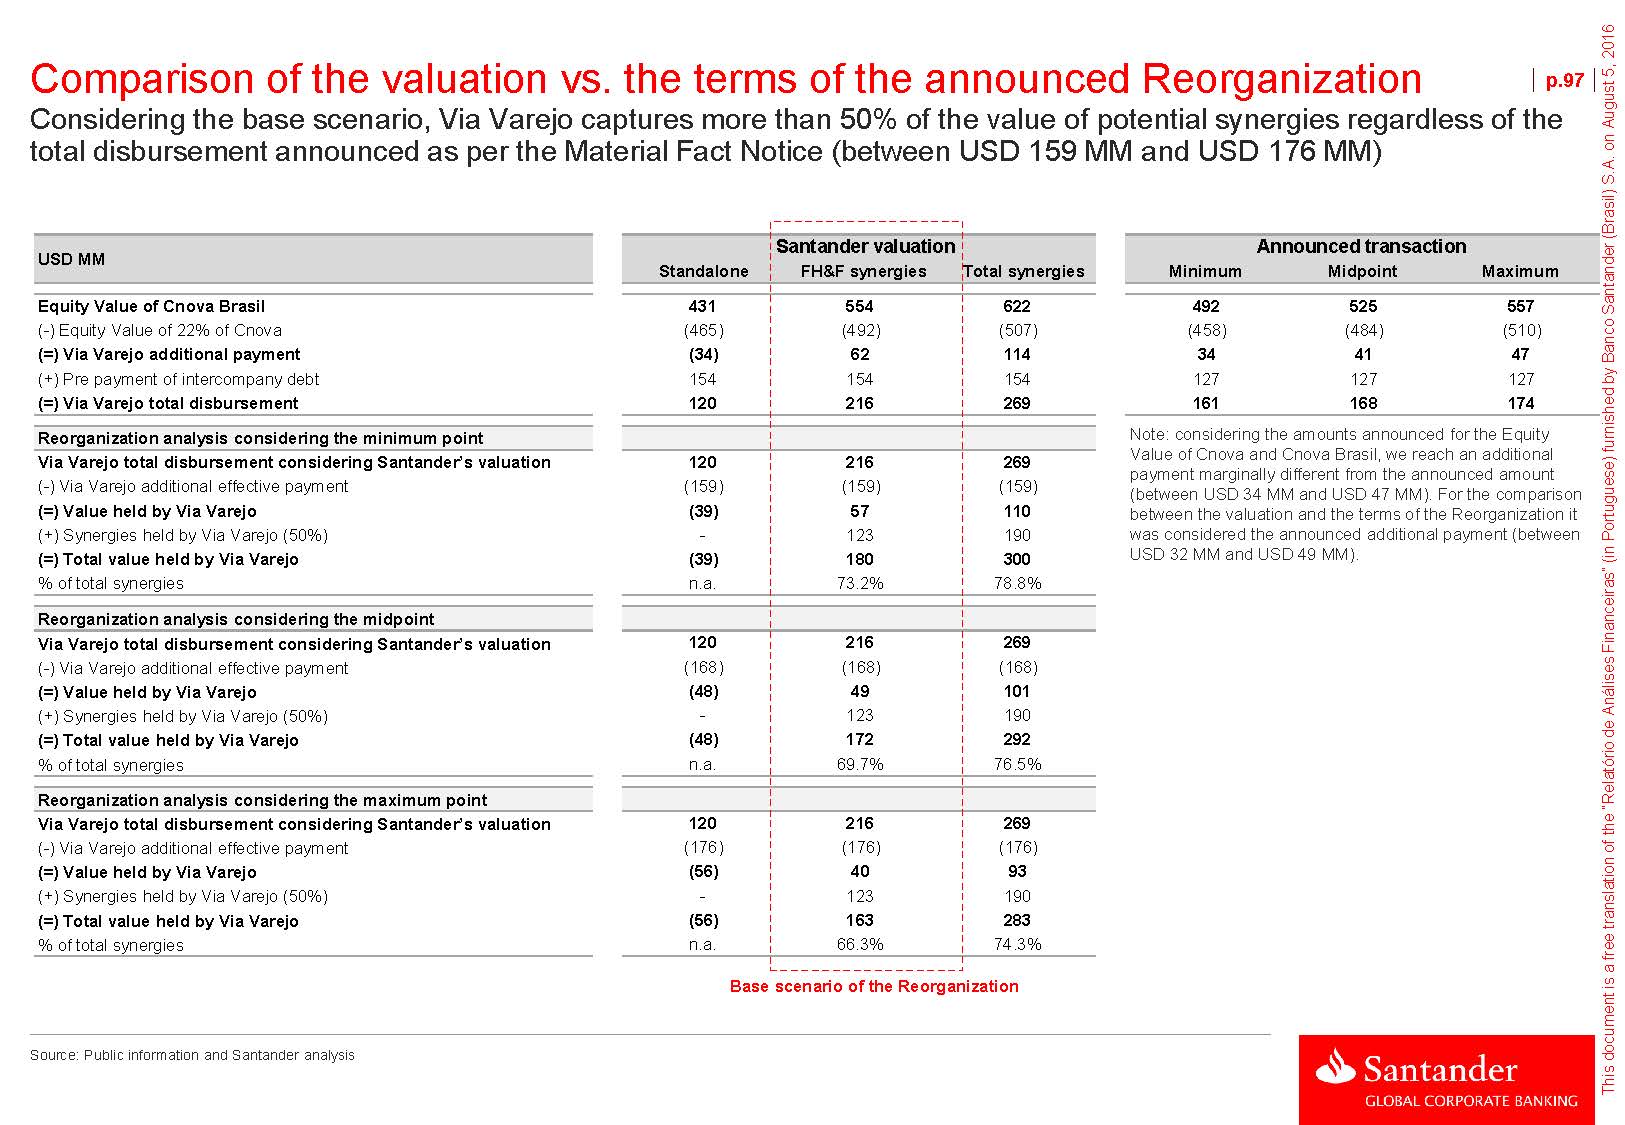
Comparison of the valuation vs. the terms of the announced Reorganization p.97Considering the base scenario, Via Varejo captures more than 50% of the value of potential synergies regardless of the total disbursement announced as per the Material Fact Notice (between USD 159 MM and USD 176 MM) USD MMEquity Value of Cnova Brasil(-) Equity Value of 22% of Cnova (=) Via Varejo additional payment (+) Pre payment of intercompany debt (=) Via Varejo total disbursementReorganization analysis considering the minimum pointVia Varejo total disbursement considering Santander’s valuation(-) Via Varejo additional effective payment (=) Value held by Via Varejo(+) Synergies held by Via Varejo (50%) (=) Total value held by Via Varejo% of total synergies Reorganization analysis considering the midpointVia Varejo total disbursement considering Santander’s valuation(-) Via Varejo additional effective payment (=) Value held by Via Varejo(+) Synergies held by Via Varejo (50%) (=) Total value held by Via Varejo% of total synergies Reorganization analysis considering the maximum pointVia Varejo total disbursement considering Santander’s valuation(-) Via Varejo additional effective payment (=) Value held by Via Varejo(+) Synergies held by Via Varejo (50%) (=) Total value held by Via Varejo% of total synergies Base scenario of the ReorganizationAnnounced transactionMinimum Midpoint Maximum492 525 557(458) (484) (510) 34 41 47127 127 127 161 168 174Note: considering the amounts announced for the Equity Value of Cnova and Cnova Brasil, we reach an additional payment marginally different from the announced amount (between USD 34 MM and USD 47 MM). For the comparison between the valuation and the terms of the Reorganization it was considered the announced additional payment (between USD 32 MM and USD 49 MM). Source: Public information and Santander analysis

AnnexesI. Macroeconomic assumptions II. Weighted Average Cost of Capital III. EV – Equity adjustments IV. Working capital adjustments V. Discounted Cash Flow of the Holding (Holding Cnova) VI. Outcome of the Financial Analysis Report VII. Business Plan vs. 1H16 Results VIII. Incoming information and interactions with involved parties p.98

Business Plan vs. 1H16 Results | Cnova Brasil Although 2016 is proving to be a challenging year in terms of results for Cnova Brasil, the company believes it is feasible to meet its revised Business Plan for this year p.99
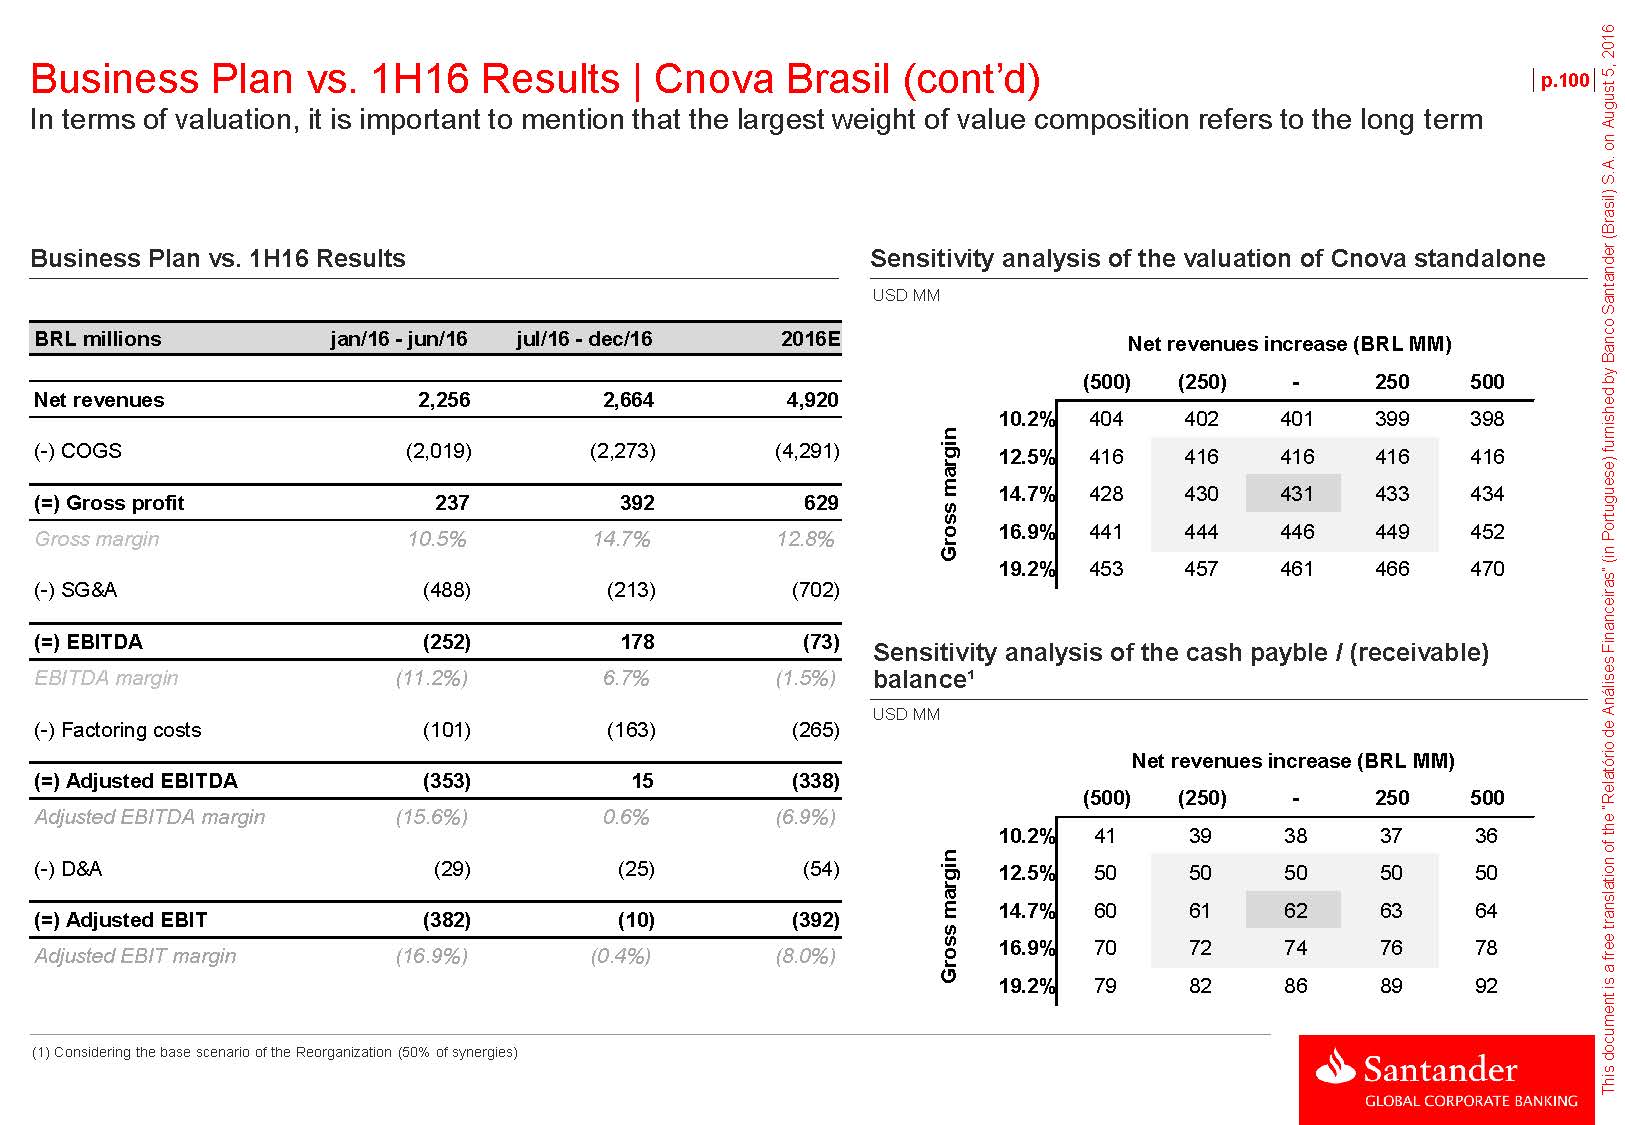
ConsiderationsExercise to compare 1H16 realized results vs. the one projected in the revised Business Plan for Cnova Brasil for the year of 2016When compared to 2015, the company will have to outperform meet the projected results of the Business PlanHowever, Cnova Brasil’s management believes that with the final implementation and stability of the ERP and the end of the investigation process, the company will be in better shape to present better results In addition, given the perspective of improvement in economic activity in the 2H16 (and the importance of it in terms of seasonality), and that, 2H15 was perhaps the worst point of the cycle, the comparison base tends to be negatively impactedIn terms of valuation, it is important to mention that the largest weight of the value composition refers to the long-term Overview of the company’s key metrics performance in the 1H16 vis a vis Business PlanSource: Company % % of the annual result Business Plan vs. 1H16 Results | Cnova Brasil (cont’d) In terms of valuation, it is important to mention that the largest weight of value composition refers to the long-term p.100
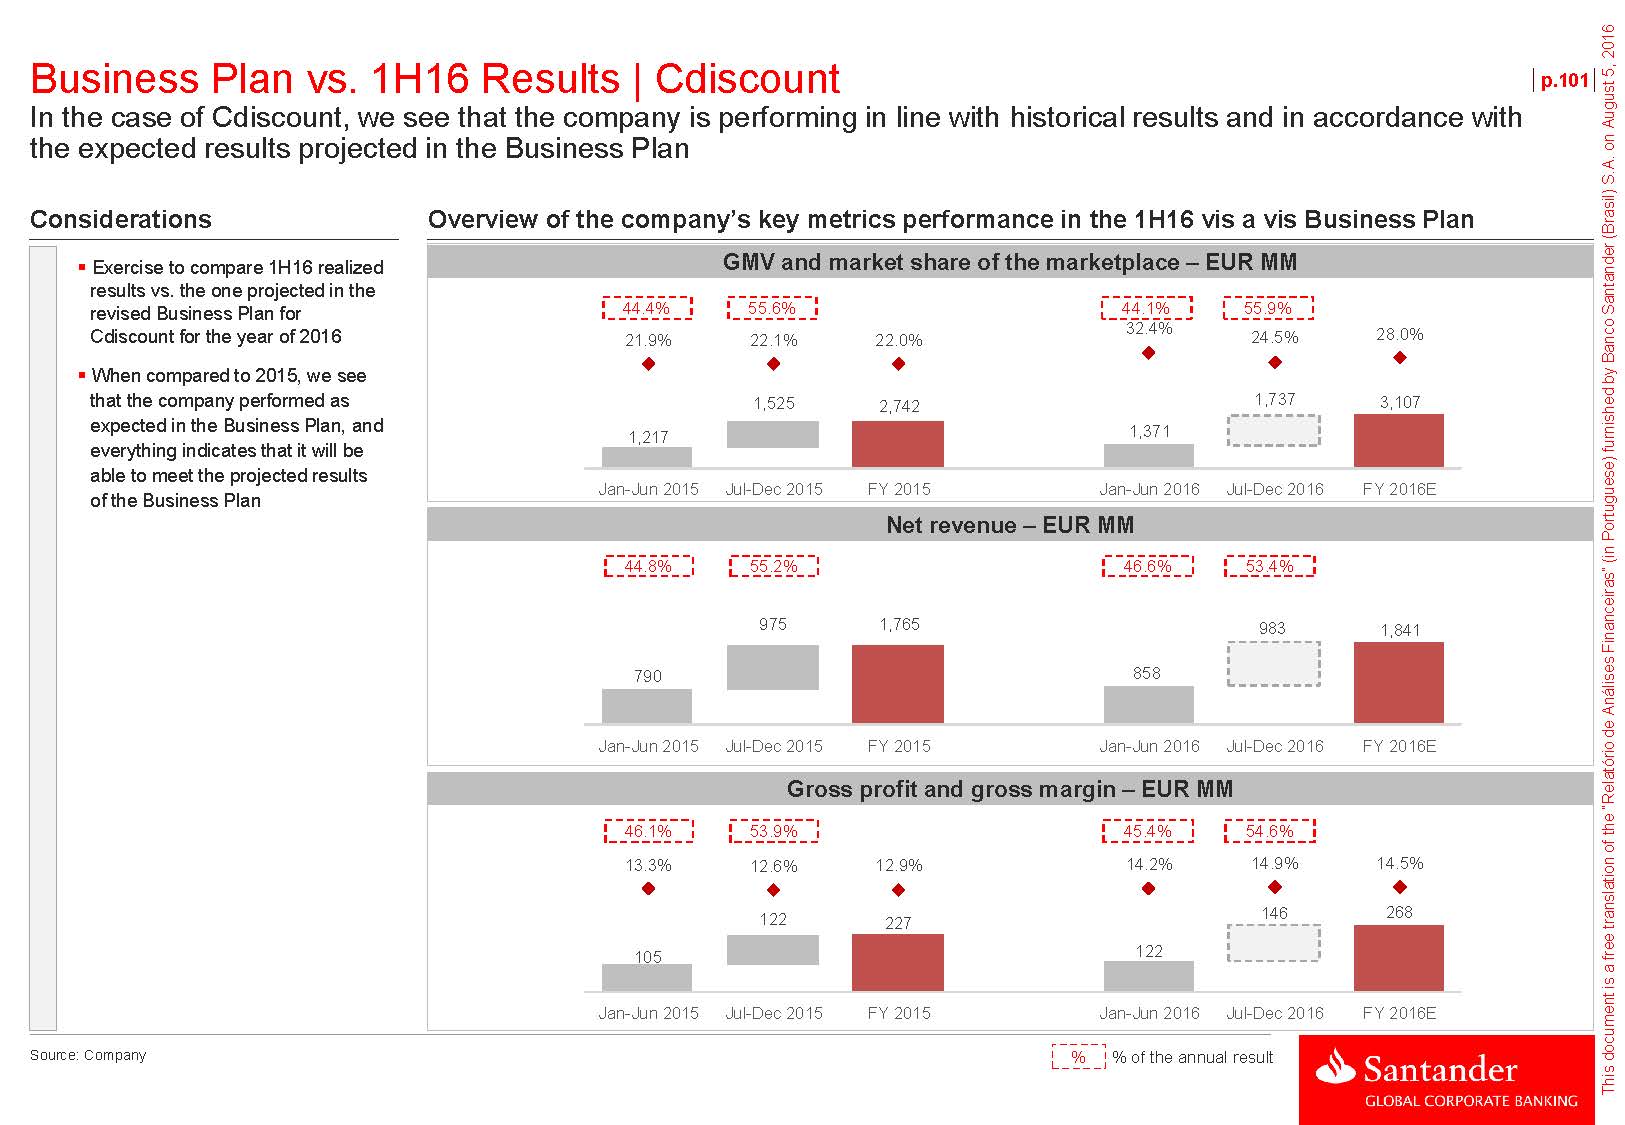
Business Plan vs. 1H16 Results Sensitivity analysis of the valuation of Cnova standaloneUSD MM BRL millions jan/16 - jun/16 jul/16 - dec/16 2016ENet revenues 2,256 2,664 4,920(-) COGS (2,019) (2,273) (4,291)(=) Gross profit 237 392 629Gross margin 10.5% 14.7% 12.8% (-) SG&A (488) (213) (702) (=) EBITDA (252) 178 (73)EBITDA margin (11.2%) 6.7% (1.5%) (-) Factoring costs (101) (163) (265) Net revenues increase (BRL MM)(500) (250) - 250 50010.2%404 402 401 399 39812.5%416 416 416 416 41614.7%428 430 431 433 43416.9%441 444 446 449 45219.2%453 457 461 466 470Sensitivity analysis of the cash payble / (receivable)balance¹USD MM (=) Adjusted EBITDA (353) 15 (338)Adjusted EBITDA margin (15.6%) 0.6% (6.9%) (-) D&A (29) (25) (54) (=) Adjusted EBIT (382) (10) (392)Adjusted EBIT margin (16.9%) (0.4%) (8.0%) Net revenues increase (BRL MM)(500) (250) - 250 50010.2%41 39 38 37 3612.5%50 50 50 50 5014.7%60 61 62 63 6416.9%70 72 74 76 7819.2%79 82 86 89 92(1) Considering the base scenario of the Reorganization (50% of synergies) Business Plan vs. 1H16 Results | Cdiscount In the case of Cdiscount, we see that the company is performing in line with historical results and in accordance with the expected results projected in the Business Plan p.101ConsiderationsExercise to compare 1H16 realized results vs. the one projected in the revised Business Plan for Cdiscount for the year of 2016When compared to 2015, we see that the company performed as expected in the Business Plan, and everything indicates that it will be able to meet the projected results of the Business Plan Overview of the company’s key metrics performance in the 1H16 vis a vis Business PlanSource: Company % % of the annual result
AnnexesI. Macroeconomic assumptions II. Weighted Average Cost of Capital III. EV – Equity adjustments IV. Working capital adjustments V. Discounted Cash Flow of the Holding (Holding Cnova) VI. Outcome of the Financial Analysis Report VII. Business Plan vs. 1H16 Results VIII. Incoming information and interactions with involved parties p.102

Incoming information and interactions with involved parties p.103Herein we list the interactions between Santander and Cnova, Via Varejo and Via Varejo Special Committee, as well as the main information received that served as support for the realization of the Financial Analysis Report Main information received from Cnova3-year Business Plan (2016 – 2018) provided by Cnova, which served as basis for the extrapolation of the financial projections of Cnova Brasil and Cdiscount Files containing the evolution of the working capital position of Interactions between Santander, Cnova, Via Varejo and Via Varejo SpecialCommitteeDate Event Considerations02-jun-16 Kick-off meeting Kick-off meeting of Project Delphes between Santander, Cnova and Special Committee Meeting between Santander, Cnova Brazil and Via Varejo to discuss FH&F’s report on the company for the year of 2015 and first four months of 2016, debt position / net cash, and other provisions to be considered in the calculation of the EV– Equity adjustment 14-jun-16 Synergies meeting potential synergies resulting from the incorporation of Cnova Brazil’s operation by Via Varejo. It was also discussed other potential impacts that were not considered by FH&F, which served as the basis for the analysis of SantanderFH&F’s report of potential synergies resulting from the 17-jun-16 Follow-up call about pending Conference call with Cnova to clarify which points were still pending response or incorporation of Cnova Brasil’s operation by Via Varejo information confirmation, and additional clarification questionsFile with the P&L of the Holding (Holding Cnova) to be considered in the projections 23-jun-16 Call to request YTD results Call with Cnova to request YTD April’s resultsFiles with 1H16 actual figuresFile with the potential estimated reductions in the combined stock of Via Retail and Cnova Brasil’s operations after the Reorganization File with the revised Business Plan (2016-2018) for Cnova Brasil, 24-jun-16 Santander and Special Committee’s meeting 04-jul-16 Call with Via Varejo’s management Call with Cnova Brasil’s Meeting between Santander and the Special Committee for the presentation of a preliminary version of the Financial Analysis Report Call for the better understanding of the potential stock reduction synergy, after receiving the internal studies conducted by Via Varejo’s team Call to discuss the preliminary results of 2016 and potential impacts on the company's strategy for Black Friday and Christmas, as well as impacts on the business plan. It was taking into account the results achieved in the first half of 2016 and the strategic decisions of the company's management 06-jul-16 management also discussed the company's strategic decision to reduce sales volume in order to increase marginsAudited financial statements for the year of 2015 and unaudited for the 1H16 26-jul-16 Call with Cnova’s management Call to discuss the impacts from the audited and unaudited financial statements of and June 2016, respectively, on the valuation exercise conducted by SantanderReport considering potential impacts of the audited financial statements for the year of 2015 in the valuation exercise conducted by Santander 28-jul-16 Call with VV’s CEO Call to discuss the viability of the synergies and potential impacts after the financial releases and revised Business PlanFiles containing the evolution of the working capital position of the company for the year of 2015 and first six months of 2016, 02-aug-16 Call with Cnova and BNP Paribas’ management Presentation of the Financial Call to discuss the EV – Equity adjustments considering the change of the base date from April to June debt position / net cash, and other provisions to be considered in the calculation of the EV– Equity adjustment 04-aug-16 Analysis Report Meeting with the Special Committee for the presentation of the Financial Analysis ReportReport with the price adjustment methodology and the projection of net debt and working capital positions at the closing date 05-aug-16 Santander’s Appraisal Reports Committee 05-aug-16 Delivery of the Financial Meeting with the Appraisal Reports Committee from Santander for the approval of the Financial Analysis Report (Investment Banking, Legal and Compliance) Analysis Report -