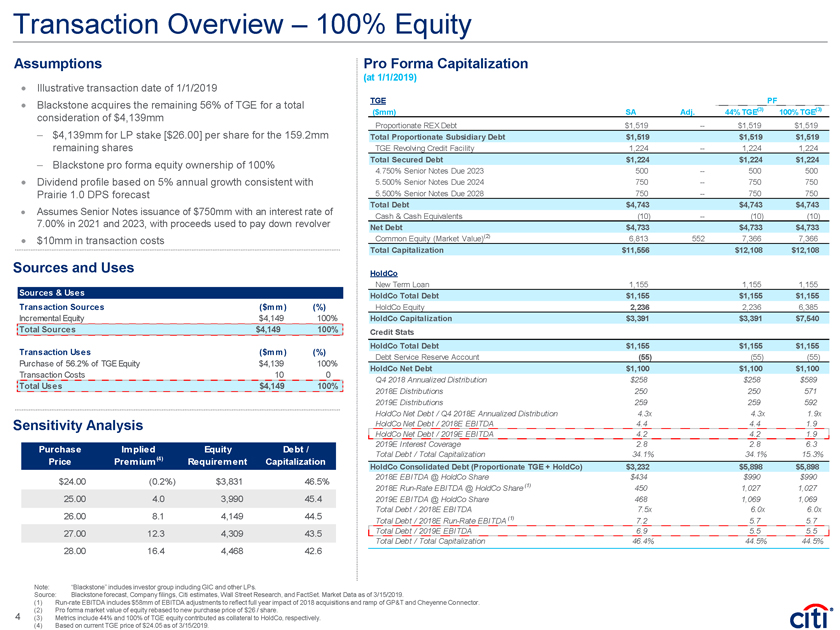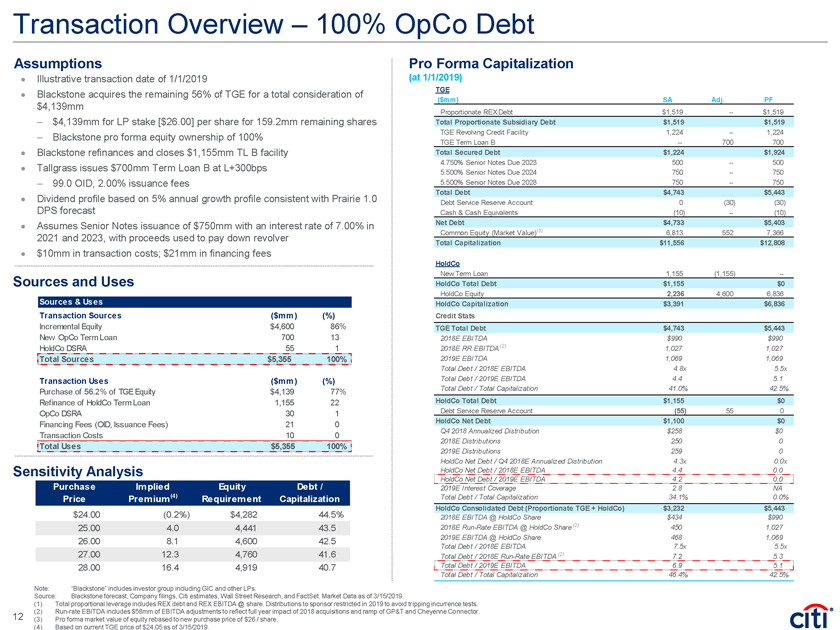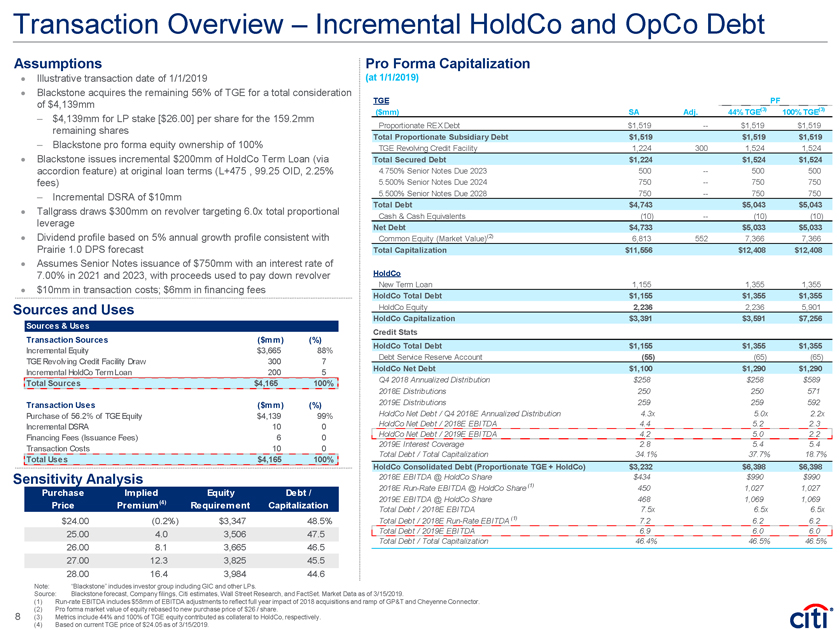
Transaction Overview – Incremental HoldCo and OpCo Debt Assumptions Pro Forma Capitalization Illustrative transaction date of 1/1/2019 (at 1/1/2019) Blackstone acquires the remaining 56% of TGE for a total consideration of $4,139mm TGE PF ($mm) SA Adj. 44% TGE(3) 100% TGE(3) – $4,139mm for LP stake [$26.00] per share for the 159.2mm Proportionate REX Debt $1,519 — $1,519 $1,519 remaining shares – Blackstone pro forma equity ownership of 100% Total Proportionate Subsidiary Debt $1,519 $1,519 $1,519 TGE Revolving Credit Facility 1,224 300 1,524 1,524 Blackstone issues incremental $200mm of HoldCo Term Loan (via Total Secured Debt $1,224 $1,524 $1,524 accordion feature) at original loan terms (L+475 , 99.25 OID, 2.25% 4.750% Senior Notes Due 2023 500 — 500 500 fees) 5.500% Senior Notes Due 2024 750 — 750 750 – Incremental DSRA of $10mm 5.500% Senior Notes Due 2028 750 — 750 750 Total Debt $4,743 $5,043 $5,043 Tallgrass draws $300mm on revolver targeting 6.0x total proportional Cash & Cash Equivalents (10) — (10) (10) leverage Net Debt $4,733 $5,033 $5,033 Dividend profile based on 5% annual growth profile consistent with Common Equity (Market Value)(2) 6,813 552 7,366 7,366 Prairie 1.0 DPS forecast Total Capitalization $11,556 $12,408 $12,408 Assumes Senior Notes issuance of $750mm with an interest rate of 7.00% in 2021 and 2023, with proceeds used to pay down revolver HoldCo New Term Loan 1,155 1,355 1,355 $10mm in transaction costs; $6mm in financing fees HoldCo Total Debt $1,155 $1,355 $1,355 Sources and Uses HoldCo Equity 2,236 2,236 5,901 HoldCo Capitalization $3,391 $3,591 $7,256 Sources & Uses Credit Stats Transaction Sources ($mm) (%) HoldCo Total Debt $1,155 $1,355 $1,355 Incremental Equity $3,665 88% Debt Service Reserve Account (55) (65) (65) TGE Revolving Credit Facility Draw 300 7 HoldCo Net Debt $1,100 $1,290 $1,290 Incremental HoldCo Term Loan 200 5 Q4 2018 Annualized Distribution $258 $258 $589 Total Sources $4,165 100% 2018E Distributions 250 250 571 Transaction Uses ($mm) (%) 2019E Distributions 259 259 592 Purchase of 56.2% of TGE Equity $4,139 99% HoldCo Net Debt / Q4 2018E Annualized Distribution 4.3x 5.0x 2.2x Incremental DSRA 10 0 HoldCo Net Debt / 2018E EBITDA 4.4 5.2 2.3 HoldCo Net Debt / 2019E EBITDA 4.2 5.0 2.2 Financing Fees (Issuance Fees) 6 0 2019E Interest Coverage 2.8 5.4 5.4 Transaction Costs 10 0 Total Debt / Total Capitalization 34.1% 37.7% 18.7% Total Uses $4,165 100% HoldCo Consolidated Debt (Proportionate TGE + HoldCo) $3,232 $6,398 $6,398 Sensitivity Analysis 2018E EBITDA @ HoldCo Share $434 $990 $990 2018ERun-Rate EBITDA @ HoldCo Share (1) 450 1,027 1,027 Purchase Implied Equity Debt / 2019E EBITDA @ HoldCo Share 468 1,069 1,069 Price Premium(4) Requirement Capitalization Total Debt / 2018E EBITDA 7.5x 6.5x 6.5x $24.00 (0.2%) $3,347 48.5% Total Debt / 2018ERun-Rate EBITDA (1) 7.2 6.2 6.2 25.00 4.0 3,506 47.5 Total Debt / 2019E EBITDA 6.9 6.0 6.0 Total Debt / Total Capitalization 46.4% 46.5% 46.5% 26.00 8.1 3,665 46.5 27.00 12.3 3,825 45.5 28.00 16.4 3,984 44.6 Note: “Blackstone” includes investor group including GIC and other LPs. Source: Blackstone forecast, Company filings, Citi estimates, Wall Street Research, and FactSet. Market Data as of 3/15/2019. (1)Run-rate EBITDA includes $58mm of EBITDA adjustments to reflect full year impact of 2018 acquisitions and ramp of GP&T and Cheyenne Connector. (2) Pro forma market value of equity rebased to new purchase price of $26 / share. 8 (3) Metrics include 44% and 100% of TGE equity contributed as collateral to HoldCo, respectively. (4) Based on current TGE price of $24.05 as of 3/15/2019.