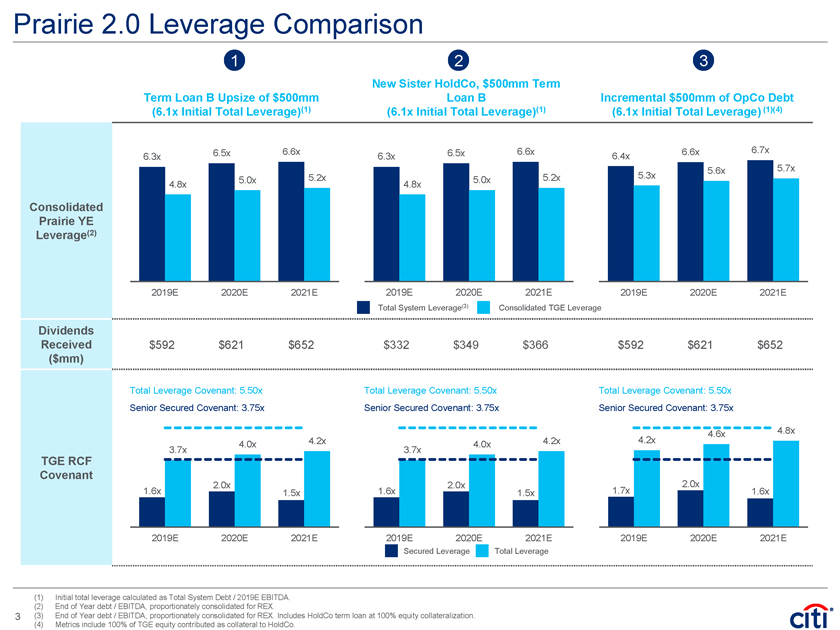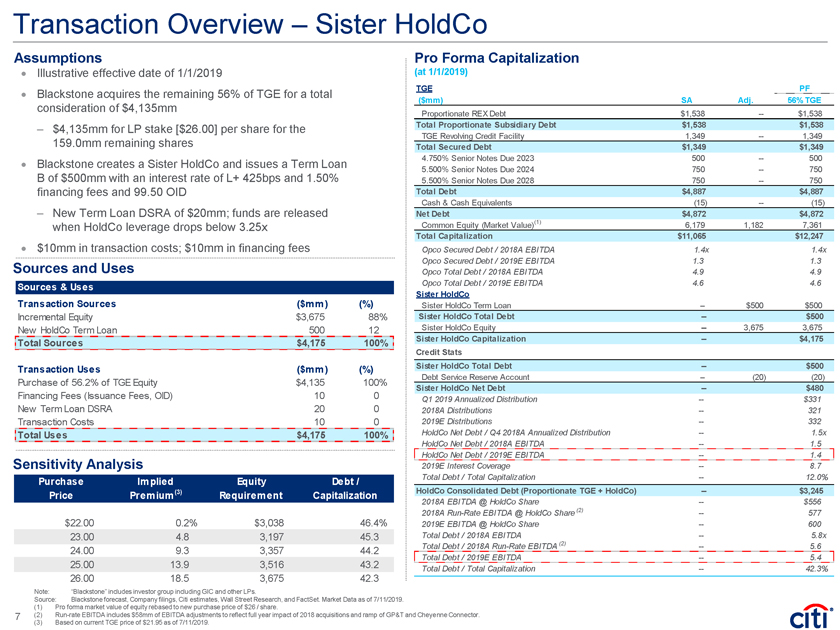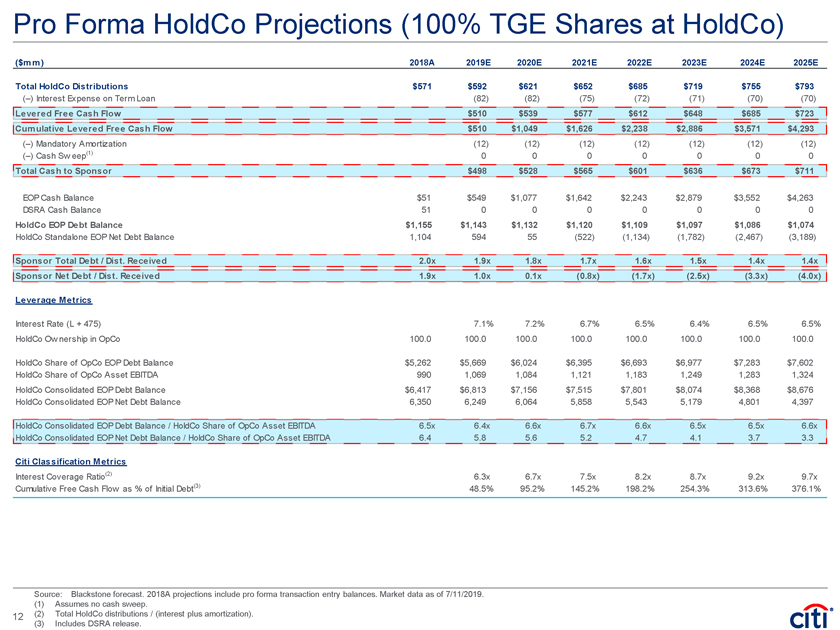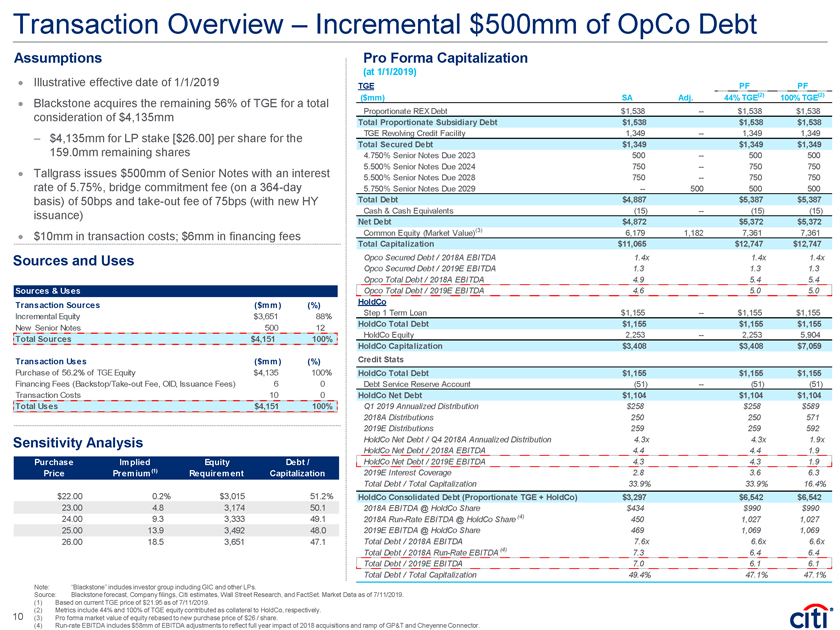
Transaction Overview – Incremental $500mm of OpCo Debt Assumptions Pro Forma Capitalization (at 1/1/2019) · Illustrative effective date of 1/1/2019 TGE PF PF TGE for ($mm) SA Adj. 44% TGE(2) 100% TGE(2) · Blackstone acquires the remaining 56% of a total Proportionate REX Debt $1,538 — $1,538 $1,538 consideration of $4,135mm Total Proportionate Subsidiary Debt $1,538 $1,538 $1,538 – $4,135mm for LP stake [$26.00] per share for the TGE Revolving Credit Facility 1,349 — 1,349 1,349 Total Secured Debt $1,349 $1,349 $1,349 159.0mm remaining shares 4.750% Senior Notes Due 2023 500 — 500 500 5.500% Senior Notes Due 2024 750 — 750 750 · Tallgrass issues $500mm of Senior Notes with an interest 5.500% Senior Notes Due 2028 750 — 750 750 rate of 5.75%, bridge commitment fee (on a364-day 5.750% Senior Notes Due 2029 — 500 500 500 basis) of 50bps andtake-out fee of 75bps (with new HY Total Debt $4,887 $5,387 $5,387 issuance) Cash & Cash Equivalents (15) — (15) (15) Net Debt $4,872 $5,372 $5,372 Common Equity (Market Value)(3) 6,179 1,182 7,361 7,361 · $10mm in transaction costs; $6mm in financing fees Total Capitalization $11,065 $12,747 $12,747 Sources and Uses Opco Secured Debt / 2018A EBITDA 1.4x 1.4x 1.4x Opco Secured Debt / 2019E EBITDA 1.3 1.3 1.3 Opco Total Debt / 2018A EBITDA 4.9 5.4 5.4 Sources & Uses Opco Total Debt / 2019E EBITDA 4.6 5.0 5.0 Transaction Sources ($mm) (%) HoldCo Incremental Equity $3,651 88% Step 1 Term Loan $1,155 — $1,155 $1,155 HoldCo Total Debt $1,155 $1,155 $1,155 New Senior Notes 500 12 HoldCo Equity 2,253 — 2,253 5,904 Total Sources $4,151 100% HoldCo Capitalization $3,408 $3,408 $7,059 Transaction Uses ($mm) (%) Credit Stats Purchase of 56.2% of TGE Equity $4,135 100% HoldCo Total Debt $1,155 $1,155 $1,155 Financing Fees(Backstop/Take-out Fee, OID, Issuance Fees) 6 0 Debt Service Reserve Account (51) — (51) (51) Transaction Costs 10 0 HoldCo Net Debt $1,104 $1,104 $1,104 Total Uses $4,151 100% Q1 2019 Annualized Distribution $258 $258 $589 2018A Distributions 250 250 571 2019E Distributions 259 259 592 Sensitivity Analysis HoldCo Net Debt / Q4 2018A Annualized Distribution 4.3x 4.3x 1.9x HoldCo Net Debt / 2018A EBITDA 4.4 4.4 1.9 Purchase Implied Equity Debt / HoldCo Net Debt / 2019E EBITDA 4.3 4.3 1.9 Price Premium(1) Requirement Capitalization 2019E Interest Coverage 2.8 3.6 6.3 Total Debt / Total Capitalization 33.9% 33.9% 16.4% $22.00 0.2% $3,015 51.2% HoldCo Consolidated Debt (Proportionate TGE + HoldCo) $3,297 $6,542 $6,542 23.00 4.8 3,174 50.1 2018A EBITDA @ HoldCo Share $434 $990 $990 24.00 9.3 3,333 49.1 2018ARun-Rate EBITDA @ HoldCo Share (4) 450 1,027 1,027 25.00 13.9 3,492 48.0 2019E EBITDA @ HoldCo Share 469 1,069 1,069 26.00 18.5 3,651 47.1 Total Debt / 2018A EBITDA 7.6x 6.6x 6.6x Total Debt / 2018ARun-Rate EBITDA (4) 7.3 6.4 6.4 Total Debt / 2019E EBITDA 7.0 6.1 6.1 Total Debt / Total Capitalization 49.4% 47.1% 47.1% Note: “Blackstone” includes investor group including GIC and other LPs. Source: Blackstone forecast, Company filings, Citi estimates, Wall Street Research, and FactSet. Market Data as of 7/11/2019. (1) Based on current TGE price of $21.95 as of 7/11/2019. (2) Metrics include 44% and 100% of TGE equity contributed as collateral to HoldCo, respectively. 10 (3) Pro forma market value of equity rebased to new purchase price of $26 / share.(4) Run-rate EBITDA includes $58mm of EBITDA adjustments to reflect full year impact of 2018 acquisitions and ramp of GP&T and Cheyenne Connector.