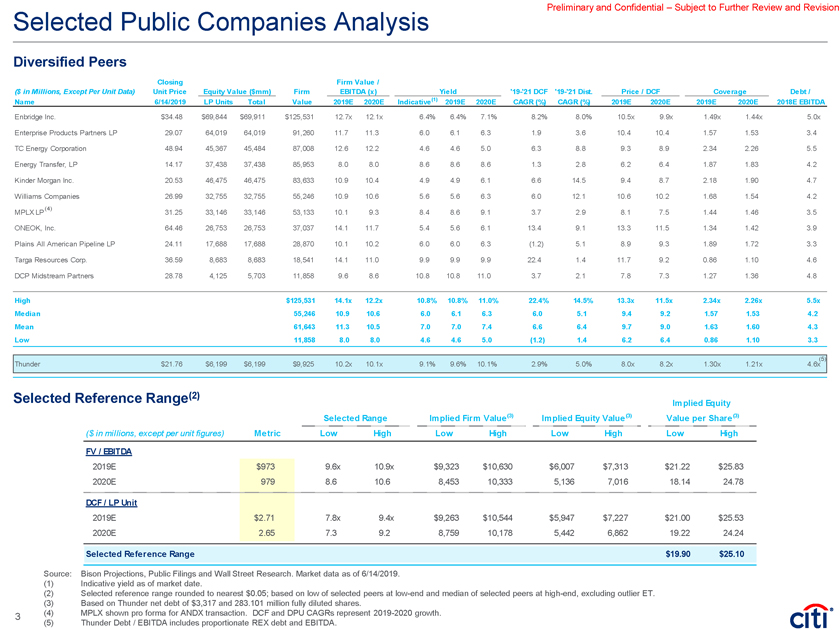
Preliminary and Confidential – Subject to Further Review and Revision Selected Public Companies Analysis Diversified Peers Closing Firm Value / ($ in Millions, Except Per Unit Data) Unit Price Equity Value ($mm) Firm EBITDA (x) Yield‘19-‘21 DCF‘19-‘21 Dist. Price / DCF Coverage Debt / Name 6/14/2019 LP Units Total Value 2019E 2020E Indicative(1) 2019E 2020E CAGR (%) CAGR (%) 2019E 2020E 2019E 2020E 2018E EBITDA Enbridge Inc. $34.48 $69,844 $69,911 $125,531 12.7x 12.1x 6.4% 6.4% 7.1% 8.2% 8.0% 10.5x 9.9x 1.49x 1.44x 5.0x Enterprise Products Partners LP 29.07 64,019 64,019 91,260 11.7 11.3 6.0 6.1 6.3 1.9 3.6 10.4 10.4 1.57 1.53 3.4 TC Energy Corporation 48.94 45,367 45,484 87,008 12.6 12.2 4.6 4.6 5.0 6.3 8.8 9.3 8.9 2.34 2.26 5.5 Energy Transfer, LP 14.17 37,438 37,438 85,953 8.0 8.0 8.6 8.6 8.6 1.3 2.8 6.2 6.4 1.87 1.83 4.2 Kinder Morgan Inc. 20.53 46,475 46,475 83,633 10.9 10.4 4.9 4.9 6.1 6.6 14.5 9.4 8.7 2.18 1.90 4.7 Williams Companies 26.99 32,755 32,755 55,246 10.9 10.6 5.6 5.6 6.3 6.0 12.1 10.6 10.2 1.68 1.54 4.2 (4) MPLX LP 31.25 33,146 33,146 53,133 10.1 9.3 8.4 8.6 9.1 3.7 2.9 8.1 7.5 1.44 1.46 3.5 ONEOK, Inc. 64.46 26,753 26,753 37,037 14.1 11.7 5.4 5.6 6.1 13.4 9.1 13.3 11.5 1.34 1.42 3.9 Plains All American Pipeline LP 24.11 17,688 17,688 28,870 10.1 10.2 6.0 6.0 6.3 (1.2) 5.1 8.9 9.3 1.89 1.72 3.3 Targa Resources Corp. 36.59 8,683 8,683 18,541 14.1 11.0 9.9 9.9 9.9 22.4 1.4 11.7 9.2 0.86 1.10 4.6 DCP Midstream Partners 28.78 4,125 5,703 11,858 9.6 8.6 10.8 10.8 11.0 3.7 2.1 7.8 7.3 1.27 1.36 4.8 High $125,531 14.1x 12.2x 10.8% 10.8% 11.0% 22.4% 14.5% 13.3x 11.5x 2.34x 2.26x 5.5x Median 55,246 10.9 10.6 6.0 6.1 6.3 6.0 5.1 9.4 9.2 1.57 1.53 4.2 Mean 61,643 11.3 10.5 7.0 7.0 7.4 6.6 6.4 9.7 9.0 1.63 1.60 4.3 Low 11,858 8.0 8.0 4.6 4.6 5.0 (1.2) 1.4 6.2 6.4 0.86 1.10 3.3 Thunder $21.76 $6,199 $6,199 $9,925 10.2x 10.1x 9.1% 9.6% 10.1% 2.9% 5.0% 8.0x 8.2x 1.30x 1.21x 4.6x (5) Selected Reference Range(2) Implied Equity Selected Range Implied Firm Value(3) Implied Equity Value(3) Value per Share(3) ($ in millions, except per unit figures) Metric Low High Low High Low High Low High FV / EBITDA 2019E $973 9.6x 10.9x $9,323 $10,630 $6,007 $7,313 $21.22 $25.83 2020E 979 8.6 10.6 8,453 10,333 5,136 7,016 18.14 24.78 DCF / LP Unit 2019E $2.71 7.8x 9.4x $9,263 $10,544 $5,947 $7,227 $21.00 $25.53 2020E 2.65 7.3 9.2 8,759 10,178 5,442 6,862 19.22 24.24 Selected Reference Range $19.90 $25.10 Source: Bison Projections, Public Filings and Wall Street Research. Market data as of 6/14/2019. (1) Indicative yield as of market date. (2) Selected reference range rounded to nearest $0.05; based on low of selected peers atlow-end and median of selected peers athigh-end, excluding outlier ET. (3) Based on Thunder net debt of $3,317 and 283.101 million fully diluted shares. 3 (4) MPLX shown pro forma for ANDX transaction. DCF and DPU CAGRs represent 2019-2020 growth. (5) Thunder Debt / EBITDA includes proportionate REX debt and EBITDA.