UNITED STATES
SECURITIES AND EXCHANGE COMMISSION
Washington, D.C. 20549
FORM N-CSR
CERTIFIED SHAREHOLDER REPORT OF REGISTERED
MANAGEMENT INVESTMENT COMPANIES
Investment Company Act file number: 811-23059
CLOUGH FUNDS TRUST
(Exact name of registrant as specified in charter)
1290 Broadway, Suite 1100, Denver, Colorado 80203
(Address of principal executive offices) (Zip code)
303.623.2577
(Registrant’s telephone number, including area code)
Karen S. Gilomen, Secretary
Clough Funds Trust
1290 Broadway, Suite 1100
Denver, CO 80203
(Name and address of agent for service)
Date of fiscal year end: October 31
Date of reporting period: November 1, 2017 – April 30, 2018
Item 1. Report to Stockholders.
| Clough Global Long/Short Fund | Table of Contents |
| Shareholder Letter | 2 |
| Portfolio Performance | 6 |
| Disclosure of Fund Expenses | 9 |
| Statement of Investments | 10 |
| Statement of Assets and Liabilities | 14 |
| Statement of Operations | 15 |
| Statement of Changes in Net Assets | 16 |
| Financial Highlights | 17 |
| Notes to Financial Statements | 20 |
| Additional Information | 30 |
| Investment Advisory Agreement Approval | 31 |
| Clough Global Long/Short Fund | Shareholder Letter |
April 30, 2018 (Unaudited)
Dear Shareholders:
For the semi-annual period ending April 30, 2018, the Clough Global Long/Short Fund (the “Fund”) had a total net return of 4.62% for Class I compared to 3.82% for the S&P 500 and 3.12% for the HFRI Equity Hedge Index. See total returns chart for performance for all other share classes.
During this period, the Fund outperformed its long/short benchmark, the HFRI Equity Hedge Index, by 150 basis points, and outperformed its long-only benchmark, the S&P 500 Index, by 81 basis points. The Fund carried an average long exposure of 87.2%, and an average short exposure of -20.9% for the period, which resulted in an average investment level for the Fund of approximately 65.8% on a net basis for the period. The Fund outperformed the Morningstar Long/Short Equity peer group average by 321 basis points during this same period.
With equity markets increasingly volatile during the period, the long book contributed 709 basis points to returns while the short book detracted 144 basis points. The short book played a role in reducing Fund volatility, as the S&P 500 experienced its first “correction” (defined as a drop of 10% or more from a peak) since October 2016. Within the period, the S&P 500 had a maximum drawdown of 10.1%, while the Fund experienced a maximum drawdown of 6.3%.
By region, the portfolio had meaningful gains from the United States, Europe, China, Japan and India. The countries which negatively impacted performance in the period were South Korea and Indonesia. By sector, the greatest contributions to returns were from Consumer Discretionary, Health Care, Information Technology, Industrials and Financials. Energy and Telecommunication Services were the sectors that most negatively impacted performance in the period.
The following is a summary of the key themes currently expressed in the Fund:
Consumer Dynamism in Asia
The Fund’s average exposure to China and India combined was approximately 21.8% for the period.
India’s Restructuring
We think the best signal for investing in emerging markets can be when a dysfunctional financial sector is being restructured. In India, that began in late 2016 when Prime Minister Modi’s demonetization policy drained the economy of most of its currency, effectively driving people to open bank accounts. This was transformational as it forced people into an electronic payment system, and put them in a position to more readily access credit. It should be no surprise in this capitalist economy that digital payment posts are emerging to ease the adjustment process, and citizens increased their usage of debit cards, credit cards, and e-wallets.
The stock of gold in India has historically been roughly equivalent to the stock of deposits, demonstrating its usefulness as both a means of tax avoidance and as a store of value. The migration of those gold holdings to bank deposits is likely to lead to a sharp rise in the volume of financial assets, since deposits can be mobilized to grow the economy, while gold cannot. Private institutions are at the heart of this revolution. Private banks and mortgage lenders have avoided most of the lending pitfalls in India, holding higher quality assets and enjoying lower funding costs. We think some of these private financial companies in India can sell at much higher price-to-book ratios than they do today.
Shifting attention to bankruptcy reform in India, the period marked the rapid escalation of a fraud case involving Punjab National Bank, a state-owned bank which lent to the promoter of Gitanjali Gems. Indian bank stocks suffered when details were first reported, but we think the incident provides evidence that the country’s new bankruptcy law, which establishes time limits for insolvencies to be resolved, is actually working. India’s public banks had been notorious for allowing defaulted loans to persist, which enabled asset-stripping and dragged down bank solvency in the process. Structural reforms like those being undertaken in India can create near-term volatility, but we think they are quite bullish in the long-term.
As we’ve noted previously, implementation of a national Goods and Services Tax (“GST”) in India removed a major productivity barrier for businesses looking to operate across state borders, and economies of scale are being realized for the first time. Before its implementation, trucks had to line up at each state’s border to calculate and pay taxes on cargo, forcing companies to focus on low-volume manufacturing and logistics facilities in each of India’s 29 states. Now, these businesses can deliver goods across state borders without stopping to pay hefty taxes. As a result, a larger and far more efficient capital stock is being built. These efficiency gains are beginning from a very low base, and the upside is meaningful.
China’s Emergence
China will remain in the news as various nations navigate their relationship with this emerging giant and its dissimilar political system. Amidst the noise over tariffs, debt, and corporate governance, the more positive long-term trends should be recalled.
| Clough Global Long/Short Fund | Shareholder Letter |
April 30, 2018 (Unaudited)
For one, financial regulations are moving in a market-friendly direction. The merger of separate banking and insurance regulatory bodies represents one step towards better governance, and helps clarify financial responsibilities. The crackdown on shadow-banking in China is deflationary, but we think it is ultimately bullish as asset quality improves. Bank asset growth is slowing and lending to financial institutions has virtually come to a halt. Many loans which were disguised as wealth management products are now transparent on bank balance sheets. This appears bullish to us, particularly as it relates to the outlook for bank profits. Consumer lending, which is far more profitable than lending to other financial institutions, rose from 24% of total commitments in 2014 to 45% of commitments in early 2018.
Chinese households are moving up the income scale and reaching income levels where demand for financial services begins to emerge. One estimate, by the Financial Times, is that China’s mutual fund industry could grow fivefold by 2025. Today, a mere 5% of China’s household assets are held in mutual funds.
Secondly, we believe China will ultimately compromise on trade issues for two simple reasons. First, it is in its best interest to do so, and second, because the U.S. has most of the leverage in these negotiations. China is already opening its economy in areas such as education, healthcare and financial services to non-Chinese investors. Beijing is also likely to agree to American demands on issues like market accessibility and the transfer of technology so that it can continue down its path of economic relevance on a global stage.
The Chinese economy is becoming more balanced. The campaign to replace excessive investment with consumption is gaining steam and this should improve China’s profit profile. China’s gross domestic product (“GDP”) is up eightfold since 2001, when it was admitted into the World Trade Organization (“WTO”). Much of that growth was capital investment driven, but today, China’s growth engines are more broad-based. Consumption represents 38% of China’s GDP, and provided 59% of annual growth largely due to a boom in services. Private savings rates remain high and increasingly private investment (which rose 9% in the first quarter of 2018) is picking up the slack from reduced government investment. The value of China’s modernized capital stock, particularly in technology, is unquestionably rising. The Chinese equity indices are ratifying this evolution by breaking out of ten-year trading ranges.
China still must restructure a good portion of its capital stock and that will be costly, though it is not building this capacity in the haphazard manner which it once did. By some estimates, China may have to write down amounts equal to as much of 20% of GDP. We think China’s economy has the flexibility to do so, boasting of a large current account surplus, high domestic savings, and a closed capital account and financial system. The U.S. made a similar adjustment from a manufacturing to a services economy in the 1980s with none of those advantages.
Biotechnology and Pharmaceuticals
The Fund’s exposure to the health care sector was one of the leading contributors to semi-annual performance on a sector basis, on an average net exposure of 13.0% for the period.
We think the repatriation of hundreds of billions of dollars in offshore cash back to U.S. based companies could form the foundation for a prolonged acquisition cycle. We have surmised that smaller companies could be snapped up for their late stage pipelines. In general, the markets agreed, lifting the shares of the mid-cap ($1 billion - $10 billion) drug and biotechnology sectors. Actual mergers and acquisitions (“M&A”) announcements in the first calendar quarter of 2018 totaled over $50 billion in deal value.
We continue to position a meaningful portion of the Fund’s capital in companies which we believe may be attractive targets for strategic buyers.
U.S. Household Formation
Our views regarding household formation trends in the U.S. have directed our research capabilities toward U.S. homebuilder stocks, as well as companies that we believe are likely to benefit from an increase in spending on home renovations, home improvement, household services, and even home furnishings & décor. During the period, exposure to this theme was over 10.0% on a net basis.
Millennials are entering the household formation stage of their lives at an older age than previous generations, but this largest cohort of the U.S. population (those born between 1982 and 2004) is finally on the move. Despite home prices climbing at a faster rate than wages, the rate of homeownership is picking up. The U.S. Census Bureau recently estimated that the homeownership rate increased to 64.2% in 2017, showing six consecutive quarters of gains in the count of homeowners, with notable growth among those under the age of 35.
Amid this demographic tailwind for housing starts, the country’s inventory of housing units is as low as it has been since before the financial crisis. Meanwhile, rental vacancy rates are back to multi-decade lows. Despite these supply/demand imbalances, overall affordability levels look like they can remain palatable for many actively evaluating their “rent vs. own” decision. In conjunction, these dynamics create a healthy fundamental backdrop for potential homebuilder profitability.
| Semi-Annual Report | April 30, 2018 | 3 |
| Clough Global Long/Short Fund | Shareholder Letter |
April 30, 2018 (Unaudited)
The home-buying tailwind and the commensurate lift in home equity values should carry over to home renovation, home improvement, and home furnishing companies as consumers increase their share of wallet towards all things home-related.
Information Technology
Technology is expected to continue to absorb the bulk of global capital spending and the engines of growth are artificial intelligence, social media and mobile technologies. We are using the current weakness in technology equities to build exposure to companies which provide information technology (“IT”) and business processing outsourcing services.
The demand curve for many technology providers is being shaped by the proliferation of mobile devices, cloud services, artificial intelligence, the “Internet of Things”, electric vehicles, and improving graphic processor capabilities.
Financials with Scale
In an area of increasing exposure for the Fund, we believe the potential investment upside in the U.S. money center banks goes beyond an analysis of yield curve dynamics and loan growth. We believe a major upgrade of franchise values for the larger U.S. financial firms may be underway, which could translate into meaningfully higher price-to-book ratios. It had been the case that smaller banks would tend to sell at higher multiples because they grew faster, were more profitable and were subject to less regulation than their larger brethren. This dynamic may be reversing as the benefits of incumbency and scale increasingly outweigh the benefits of a small-base effect and nimbleness.
As banking goes digital, the largest money centers may outgrow their smaller competitors. They have spent billions on digital infrastructure and payment ecosystems. The largest banks each have the scale and diversification to afford mobile banking and are expanding into new areas with capabilities that appeal to millennials. Their scale also enables them to price loans aggressively, spend on cyber and IT capabilities, and grow deposits more easily than smaller institutions.
Big banks have actually outgrown small banks since 2014, reflecting a better overall customer experience and lower expenses. Further, as they work off excess capital by returning it to shareholders, a virtual cycle emerges. Lower levels of excess capital translate to higher returns on equity and higher price-to-book ratios.
The Short Book
For the period, short positions carried an average weighting of -20.9% in the Fund, which helped to lower overall volatility but detracted 144 basis points from returns.
The degree to which the current bull market has moved asset prices higher amid ever-diminishing levels of volatility is almost unprecedented. This backdrop poses challenges for active managers broadly, and long/short strategies in particular, so we’ve had to depend on our long book for the bulk of our returns in recent years. Yet, if investors had been lulled into a sense of complacency on the heels of this steady move higher in asset prices during the era of quantitative easing, this first calendar quarter’s volatility may have been enough to reawaken cautionary senses.
In what seems like a base case scenario, volatility reverting back to even normal levels could help our strategy of constructing a portfolio with about 85-95% exposure on the long side, and 15-25% exposure on the short side. While that may be like a base case, some have noted that a more incendiary regime change could be underway, whereby higher levels of volatility and the commensurate drops in equity prices are no longer cushioned by the relative outperformance of treasury bonds, as the Federal Reserve orchestrates its transition to less accommodative borrowing rates.
In that scenario, the relative importance of alternative strategies in the hierarchy of ways to navigate the capital markets could be in an uptrend. Financial conditions are tightening and dispersions among equities are on the rise, so carrying a short book becomes an increasingly important way for us to try to reach our return objectives. The Fund’s short exposure is directed towards a subset of consumer companies, financials, health care companies, miners, and technology companies that we think are structurally disadvantaged. A potential decline in their prices is one way in which we seek to generate alpha for our investors, while lowering the Fund’s beta.
In Conclusion
During the semi-annual period of 2018, the Fund outperformed its long-only benchmark and its hedged benchmark. The long book averaged 87.2% exposure and the short book averaged -20.9% exposure. This is fairly typical of exposures the portfolio has exhibited across cycles.
| Clough Global Long/Short Fund | Shareholder Letter |
April 30, 2018 (Unaudited)
We believe the portfolio construction approach of our liquid alternative fund can serve investors well across market cycles, but we also think the current backdrop for active strategies, a global perspective, and long/short capabilities is becoming particularly compelling.
We appreciate your interest in our approach to investing as we endeavor to outperform the S&P 500 and HFRI Equity Hedge indices over full market cycles, with less volatility.
| Sincerely, | |
| | |
 |  |
| | |
| Charles I. Clough, Jr. | Vincent M. Lorusso, Jr. |
| Semi-Annual Report | April 30, 2018 | 5 |
| Clough Global Long/Short Fund | Portfolio Performance |
April 30, 2018 (Unaudited)
Performance (as of April 30, 2018)
| | 1 Month | Quarter | 6 Month | 1 Year | Since Inception† |
| Class C - NAV* | 0.44% | -1.31% | 4.15% | 13.24% | 3.22% |
| Class C - CDSC* | -0.56% | -2.30% | 3.15% | 12.24% | 3.22% |
| Class I - NAV* | 0.61% | -1.03% | 4.62% | 14.37% | 4.13% |
| Investor Class - NAV*(c) | 0.62% | -1.12% | 4.47% | 14.04% | 3.81% |
| S&P 500 Index(a) | 0.38% | -5.77% | 3.82% | 13.27% | 10.10% |
| HFRI Equity Hedge Index(b) | 0.43% | -1.98% | 3.12% | 9.14% | 5.44% |
The performance data quoted above represents past performance. Past performance is not a guarantee of future results. Investment return and value of the Fund shares will fluctuate so that an investor’s shares, when sold or redeemed, may be worth more or less than their original cost. Performance may be lower or higher than performance data quoted. Fund performance current to the most recent month-end is available by calling (855) 425-6844 or by visiting www.cloughglobal.com.
| † | Fund’s commencement date is September 30, 2015. The performance data quoted for the period prior to September 30, 2015 is that of an unregistered investment fund (the “Predecessor Fund”) that was managed by the Adviser since its inception and was reorganized into the Fund as of the date the Fund commenced investment operations. The Predecessor Fund was not a registered mutual fund and therefore was not subject to the same investment and tax restrictions as the Fund. Performance information reflects all fees and expenses incurred by the Predecessor Fund, and has not been adjusted to reflect Fund expenses. If it had been so adjusted, the Predecessor Fund’s performance would have been higher for that period. The Predecessor Fund commenced operations on January 2, 2015. |
| * | Returns shown prior to 9/30/2015 are based on the returns of the Predecessor Fund adjusted to reflect 12b-1 fees and shareholder services fees, as applicable. |
| ^ | Returns shown prior to 9/30/2015 are based on the returns of the Predecessor Fund. |
| (a) | The Standard & Poor’s composite index of 500 stocks, a widely recognized, unmanaged index of common stock prices. Index performance does not reflect fund performance. |
| (b) | An index designed by Hedge Fund Research, Inc. to represent the performance of investment managers who maintain positions both long and short in primarily equity and equity derivative securities. A wide variety of investment processes can be employed by such managers to arrive at an investment decision, including both quantitative and fundamental techniques; strategies can be broadly diversified or narrowly focused on specific sectors and can range broadly in terms of levels of net exposure, leverage employed, holding period, concentrations of market capitalizations and valuation ranges of typical portfolios. The HFRI family of indices reserves the right to revise historical performance data for a period of up to four months following the as of date. The performance shown was calculated using current, available data at the time of publication, but is subject to change outside of the control of the Fund and its affiliates |
| (c) | Prior to December 1, 2017, Investor Class was known as Class A. |
Returns of less than 1 year are cumulative.
An investor cannot invest directly in an index.
| Clough Global Long/Short Fund | Portfolio Performance & Allocation |
April 30, 2018 (Unaudited)
Performance of $10,000 Initial Investment (as of April 30, 2018)
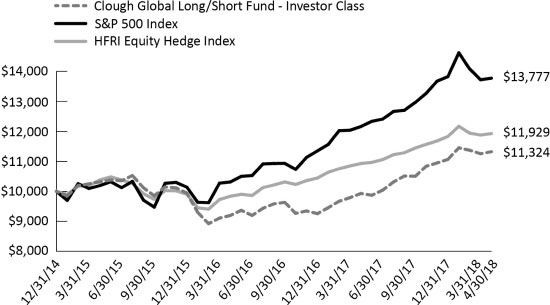
The graph shown above represents historical performance of a hypothetical investment of $10,000 in the Fund since inception. The historical performance prior to September 30, 2015 is that of the Predecessor Fund. Past performance does not guarantee future results. All returns reflect reinvested dividends, but do not reflect the deduction of taxes that a shareholder would pay on Fund distributions or the redemption of Fund shares.
| Top Ten Long Holdings (as a % of Net Assets)* | |
| Carvana Co. | 1.64% |
| The Home Depot, Inc. | 1.55% |
| Amazon.com, Inc. | 1.51% |
| CRISPR Therapeutics AG | 1.51% |
| Lennar Corp. | 1.49% |
| Facebook, Inc. | 1.49% |
| Align Technology, Inc. | 1.47% |
| Bank of America Corp. | 1.45% |
| Microsoft Corp. | 1.43% |
| JPMorgan Chase & Co. | 1.42% |
| Top Ten Holdings | 14.96% |
| * | Holdings are subject to change |
| Sector Allocation** | Long Exposure % TNA | Short Exposure % TNA | Gross Exposure % TNA | Net Exposure %
TNA |
| Consumer Discretionary | 22.2% | -2.0% | 24.3% | 20.2% |
| Health Care | 16.8% | -2.5% | 19.3% | 14.3% |
| Information Technology | 20.1% | -7.9% | 27.9% | 12.2% |
| Financials | 12.0% | -2.9% | 14.9% | 9.1% |
| Industrials | 6.7% | -0.8% | 7.5% | 5.9% |
| Real Estate | 2.2% | 0.0% | 2.2% | 2.2% |
| Telecommunication Services | 1.4% | 0.0% | 1.4% | 1.4% |
| Energy | 1.1% | 0.0% | 1.1% | 1.1% |
| Consumer Staples | 1.9% | -1.0% | 2.9% | 0.9% |
| Utilities | 0.4% | 0.0% | 0.4% | 0.4% |
| Materials | 0.0% | -2.9% | 2.9% | -2.9% |
| Total Investments | 84.8% | -20.0% | 104.8% | 64.8% |
| Semi-Annual Report | April 30, 2018 | 7 |
| Clough Global Long/Short Fund | Portfolio Allocation |
April 30, 2018 (Unaudited)
| Country Allocation ** | Long Exposure % TNA | Short Exposure % TNA | Gross Exposure % TNA | Net Exposure %
TNA |
| United States | 48.1% | -10.3% | 58.4% | 37.8% |
| China | 9.9% | 0.0% | 9.9% | 9.9% |
| India | 8.3% | 0.0% | 8.3% | 8.3% |
| Europe | 6.0% | -0.9% | 6.9% | 5.1% |
| Multinational | 6.8% | -4.2% | 11.0% | 2.6% |
| Japan | 3.1% | -1.0% | 4.1% | 2.1% |
| Other Developed Markets | 0.1% | 0.0% | 0.1% | 0.1% |
| Other Emerging Markets | 2.5% | -3.6% | 6.1% | -1.1% |
| Total Investments | 84.8% | -20.0% | 104.8% | 64.8% |
| ** | Allocation summaries and top ten long holdings calculated as percent of total net assets using market value of cash traded securities, notional value of derivative contracts and excluding short-term investments and futures. |
| Clough Global Long/Short Fund | Disclosure of Fund Expenses |
April 30, 2018 (Unaudited)
Examples. As a shareholder of the Clough Global Long/Short Fund (the “Fund”), you incur two types of costs: (1) transaction costs, including applicable redemption fees and sales charges (loads); and (2) ongoing costs, including management fees, distribution and service (12b-1) fees and other Fund expenses. The following examples are intended to help you understand your ongoing costs (in dollars) of investing in the Fund and to compare these costs with the ongoing costs of investing in other mutual funds. The examples are based on an investment of $1,000 invested on November 1, 2017 and held through April 30, 2018.
Actual Expenses. The first line of the table below provides information about actual account values and actual expenses. You may use the information in this line, together with the amount you invested, to estimate the expenses that you paid over the period. Simply divide your account value by $1,000 (for example, an $8,600 account value divided by $1,000 = 8.6), then multiply the result by the number in the first line under the heading “Expenses Paid During Period 11/01/17 - 4/30/18” to estimate the expenses you paid on your account during this period.
Hypothetical Example for Comparison Purposes. The second line of the table below provides information about hypothetical account values and hypothetical expenses based on the Fund’s actual expense ratio and an assumed rate of return of 5% per year before expenses, which is not the Fund’s actual return. The hypothetical account values and expenses may not be used to estimate the actual ending account balance or expenses you paid for the period. You may use this information to compare the ongoing costs of investing in the Fund and other mutual funds. To do so, compare this 5% hypothetical example with the 5% hypothetical examples that appear in the shareholder reports of the other mutual funds.
Please note that the expenses shown in the table are meant to highlight your ongoing Fund costs only and do not reflect any transactional costs, such as redemption fees. Therefore, the second line of the table below is useful in comparing ongoing costs only and may not help you determine the relative total costs of owning different funds. In addition, if these transactional costs were included, your costs would have been higher.
| | Beginning
Account Value
11/01/17 | Ending
Account Value
4/30/18 | Expense
Ratio(a)(b) | Expenses Paid During period 11/01/17 - 4/30/18(c) |
| Clough Global Long/Short Fund | | | | |
| Class I | | | | |
| Actual | $1,000.00 | $1,046.20 | 1.87% | $9.49 |
| Hypothetical (5% return before expenses) | $1,000.00 | $1,015.52 | 1.87% | $9.35 |
| Investor Class(d) | | | | |
| Actual | $1,000.00 | $1,044.70 | 2.15% | $10.90 |
| Hypothetical (5% return before expenses) | $1,000.00 | $1,014.13 | 2.15% | $10.74 |
| Class C | | | | |
| Actual | $1,000.00 | $1,041.50 | 2.87% | $14.53 |
| Hypothetical (5% return before expenses) | $1,000.00 | $1,010.56 | 2.87% | $14.31 |
| (a) | Expense ratio excluding interest expense and dividends paid on borrowed securities for the Clough Global Long/Short Fund is 1.60%, 1.90%, and 2.60% for Class I, Investor Class, and Class C respectively. |
| (b) | Annualized, based on the Fund's most recent fiscal half year expenses. |
| (c) | Expenses are equal to the Fund's annualized expense ratio multiplied by the average account value over the period, multiplied by the number of days in the most recent fiscal half-year (181)/365 (to reflect the half-year period). |
| (d) | Prior to December 1, 2017, Investor Class was known as Class A. |
| Semi-Annual Report | April 30, 2018 | 9 |
| Clough Global Long/Short Fund | Statement of Investments |
April 30, 2018 (Unaudited)
| | | Shares | | | Value | |
| COMMON STOCKS 81.45% | | | | | | | | |
| Consumer Discretionary 21.60% | | | | | | | | |
| Amazon.com, Inc.(a) | | | 495 | | | $ | 775,234 | |
| ANTA Sports Products, Ltd. | | | 44,000 | | | | 253,114 | |
| At Home Group, Inc.(a) | | | 10,000 | | | | 351,900 | |
| Carter's, Inc. | | | 4,250 | | | | 426,360 | |
| Carvana Co.(a)(b) | | | 32,100 | | | | 841,341 | |
| Children's Place, Inc. | | | 2,900 | | | | 369,895 | |
| DR Horton, Inc.(b) | | | 12,660 | | | | 558,812 | |
| Floor & Decor Holdings, Inc. - Class A(a) | | | 8,300 | | | | 461,397 | |
| Hero MotoCorp, Ltd. | | | 6,092 | | | | 340,678 | |
| The Home Depot, Inc.(b) | | | 4,300 | | | | 794,640 | |
| JD.com, Inc. - ADR(a) | | | 3,100 | | | | 113,181 | |
| Lennar Corp. - Class A(b) | | | 14,419 | | | | 762,621 | |
| Mahindra & Mahindra, Ltd. | | | 50,366 | | | | 659,045 | |
| Man Wah Holdings, Ltd. | | | 282,400 | | | | 210,127 | |
| Mohawk Industries, Inc.(a) | | | 1,400 | | | | 293,832 | |
| Panasonic Corp. | | | 23,400 | | | | 349,331 | |
| Pool Corp. | | | 3,000 | | | | 416,430 | |
| PulteGroup, Inc. | | | 18,673 | | | | 566,912 | |
| Service Corp. International | | | 10,736 | | | | 391,971 | |
| TAL Education Group - ADR | | | 9,800 | | | | 356,916 | |
| Toll Brothers, Inc.(b) | | | 11,400 | | | | 480,624 | |
| TRI Pointe Group, Inc.(a)(b) | | | 28,700 | | | | 491,057 | |
| Wayfair, Inc. - Class A(a) | | | 5,200 | | | | 323,960 | |
| zooplus AG(a) | | | 2,259 | | | | 469,211 | |
| | | | | | | | 11,058,589 | |
| | | | | | | | | |
| Consumer Staples 1.49% | | | | | | | | |
| ITC, Ltd. | | | 68,927 | | | | 290,673 | |
| Japan Tobacco, Inc. | | | 7,900 | | | | 212,206 | |
| Orion Corp. | | | 2,244 | | | | 261,577 | |
| | | | | | | | 764,456 | |
| | | | | | | | | |
| Energy 1.06% | | | | | | | | |
| Kinder Morgan, Inc.(b) | | | 34,200 | | | | 541,044 | |
| | | | | | | | | |
| Financials 10.76% | | | | | | | | |
| Bank of America Corp.(b) | | | 24,850 | | | | 743,512 | |
| China Life Insurance Co., Ltd. - Class H | | | 83,000 | | | | 237,939 | |
| Citigroup, Inc.(b) | | | 10,549 | | | | 720,180 | |
| Credit Acceptance Corp.(a) | | | 1,085 | | | | 358,961 | |
| Edelweiss Financial Services, Ltd. | | | 78,396 | | | | 336,889 | |
| First Republic Bank | | | 3,900 | | | | 362,193 | |
| Housing Development Finance Corp., Ltd. | | | 10,652 | | | | 300,575 | |
| Indiabulls Housing Finance, Ltd. | | | 21,096 | | | | 413,133 | |
| JPMorgan Chase & Co.(b) | | | 6,700 | | | | 728,826 | |
| Morgan Stanley(b) | | | 14,000 | | | | 722,680 | |
| Ping An Insurance Group Co. of China, Ltd. - Class H | | | 21,500 | | | | 212,435 | |
| Postal Savings Bank Of China Co., Ltd. - Class H | | | 382,000 | | | | 263,796 | |
| | | Shares | | | Value | |
| Financials (continued) | | | | | | | | |
| TPG Specialty Lending, Inc. | | | 5,900 | | | $ | 106,554 | |
| | | | | | | | 5,507,673 | |
| Health Care 16.78% | | | | | | | | |
| Align Technology, Inc.(a) | | | 3,015 | | | | 753,298 | |
| Amgen, Inc. | | | 2,400 | | | | 418,752 | |
| Apellis Pharmaceuticals, Inc.(a)(b) | | | 8,000 | | | | 192,880 | |
| ARMO Biosciences, Inc.(a) | | | 3,900 | | | | 103,818 | |
| Biogen, Inc.(a) | | | 1,318 | | | | 360,605 | |
| BioMarin Pharmaceutical, Inc.(a) | | | 1,436 | | | | 119,920 | |
| Bluebird Bio, Inc.(a) | | | 1,920 | | | | 326,688 | |
| Cardiome Pharma Corp.(a) | | | 26,970 | | | | 63,379 | |
| Celgene Corp.(a) | | | 5,047 | | | | 439,594 | |
| CRISPR Therapeutics AG(a) | | | 16,500 | | | | 773,190 | |
| Express Scripts Holding Co.(a) | | | 6,200 | | | | 469,340 | |
| Galapagos NV - Sponsored ADR(a) | | | 3,183 | | | | 283,701 | |
| GW Pharmaceuticals PLC - ADR(a) | | | 3,921 | | | | 521,140 | |
| Halyard Health, Inc.(a) | | | 6,300 | | | | 298,431 | |
| Illumina, Inc.(a) | | | 1,700 | | | | 409,581 | |
| Intra-Cellular Therapies, Inc.(a) | | | 11,100 | | | | 193,362 | |
| iRhythm Technologies, Inc.(a) | | | 7,400 | | | | 430,310 | |
| Jazz Pharmaceuticals PLC(a) | | | 1,000 | | | | 152,040 | |
| NxStage Medical, Inc.(a) | | | 12,200 | | | | 324,764 | |
| Perrigo Co., PLC | | | 2,600 | | | | 203,164 | |
| Sienna Biopharmaceuticals, Inc.(a)(b) | | | 15,600 | | | | 299,208 | |
| Teladoc, Inc.(a) | | | 11,700 | | | | 503,100 | |
| Vertex Pharmaceuticals, Inc.(a) | | | 2,642 | | | | 404,649 | |
| WAVE Life Sciences, Ltd.(a) | | | 12,300 | | | | 546,735 | |
| | | | | | | | 8,591,649 | |
| | | | | | | | | |
| Industrials 5.91% | | | | | | | | |
| Airbus SE | | | 4,663 | | | | 548,463 | |
| Armstrong World Industries, Inc.(a) | | | 5,300 | | | | 296,800 | |
| Ashtead Group PLC | | | 17,215 | | | | 481,819 | |
| Axon Enterprise, Inc.(a) | | | 4,900 | | | | 205,702 | |
| GS Yuasa Corp. | | | 72,000 | | | | 388,584 | |
| Larsen & Toubro, Ltd. | | | 14,582 | | | | 306,082 | |
| Masonite International Corp.(a) | | | 4,700 | | | | 285,290 | |
| TransDigm Group, Inc. | | | 1,600 | | | | 512,912 | |
| | | | | | | | 3,025,652 | |
| | | | | | | | | |
| Information Technology 19.87% | | | | | | | | |
| 58.com, Inc. - ADR(a) | | | 4,500 | | | | 393,255 | |
| Alibaba Group Holding, Ltd. - Sponsored ADR(a) | | | 750 | | | | 133,905 | |
| Alphabet, Inc. - Class C(a)(b) | | | 705 | | | | 717,218 | |
| Autohome, Inc. - ADR | | | 4,300 | | | | 419,465 | |
| Baidu, Inc. - Sponsored ADR(a) | | | 1,073 | | | | 269,216 | |
| Baozun, Inc. - Sponsored ADR(a) | | | 6,600 | | | | 303,534 | |
| Box, Inc. - Class A(a) | | | 17,400 | | | | 397,764 | |
| Catcher Technology Co., Ltd. | | | 10,000 | | | | 111,875 | |
| Cognizant Technology Solutions Corp. - Class A | | | 3,100 | | | | 253,642 | |
| Facebook, Inc. - Class A(a) | | | 4,430 | | | | 761,960 | |
| Clough Global Long/Short Fund | Statement of Investments |
April 30, 2018 (Unaudited)
| | | Shares | | | Value | |
| Information Technology (continued) | | | | | | | | |
| GTT Communications, Inc.(a) | | | 6,800 | | | $ | 326,740 | |
| Keyence Corp. | | | 300 | | | | 183,782 | |
| Lam Research Corp. | | | 1,290 | | | | 238,727 | |
| LogMeIn, Inc. | | | 2,080 | | | | 229,216 | |
| Microsoft Corp. | | | 7,850 | | | | 734,132 | |
| Mimecast, Ltd.(a) | | | 9,000 | | | | 342,450 | |
| Monolithic Power Systems, Inc. | | | 2,000 | | | | 234,200 | |
| Nanya Technology Corp. | | | 68,000 | | | | 213,746 | |
| NetEase, Inc. - ADR | | | 500 | | | | 128,535 | |
| Nintendo Co., Ltd. | | | 1,079 | | | | 455,703 | |
| NVIDIA Corp. | | | 1,100 | | | | 247,390 | |
| Pegatron Corp. | | | 54,000 | | | | 126,848 | |
| Qorvo, Inc.(a) | | | 1,700 | | | | 114,580 | |
| salesforce.com, Inc.(a) | | | 1,400 | | | | 169,386 | |
| ServiceNow, Inc.(a) | | | 3,060 | | | | 508,388 | |
| SK Hynix, Inc. | | | 3,244 | | | | 256,653 | |
| Sunny Optical Technology Group Co., Ltd. | | | 11,200 | | | | 185,652 | |
| Taiwan Semiconductor Manufacturing Co., Ltd. - Sponsored ADR | | | 5,900 | | | | 226,855 | |
| Tencent Holdings, Ltd. | | | 2,500 | | | | 124,544 | |
| ViaSat, Inc.(a)(b) | | | 6,300 | | | | 403,074 | |
| Virtusa Corp.(a) | | | 7,300 | | | | 351,422 | |
| Weibo Corp. - Sponsored ADR(a) | | | 3,000 | | | | 343,560 | |
| WNS Holdings, Ltd. - ADR(a) | | | 5,400 | | | | 264,222 | |
| | | | | | | | 10,171,639 | |
| | | | | | | | | |
| Real Estate 2.20% | | | | | | | | |
| Blackstone Mortgage Trust, Inc. - Class A | | | 11,800 | | | | 364,030 | |
| Country Garden Holdings Co., Ltd. | | | 136,000 | | | | 281,057 | |
| Longfor Properties Co., Ltd. | | | 76,000 | | | | 229,492 | |
| Starwood Property Trust, Inc. | | | 12,100 | | | | 253,616 | |
| | | | | | | | 1,128,195 | |
| | | | | | | | | |
| Telecommunication Services 1.36% | | | | | | | | |
| GCI Liberty, Inc. - Class A(a)(b) | | | 13,471 | | | | 600,807 | |
| Sarana Menara Nusantara PT | | | 423,600 | | | | 95,605 | |
| | | | | | | | 696,412 | |
| | | | | | | | | |
| Utilities 0.42% | | | | | | | | |
| Beijing Enterprises Water Group, Ltd. | | | 368,000 | | | | 215,680 | |
| | | | | | | | | |
| TOTAL COMMON STOCKS | | | | | | | | |
| (Cost $38,095,631) | | | | | | | 41,700,989 | |
| | | Shares | | | Value | |
| PARTICIPATION NOTES 0.49% | | | | | | | | |
| Consumer Discretionary 0.25% | | | | | | | | |
| Midea Group Co., Ltd. - Class A (Loan Participation Notes issued by Morgan Stanley Asia Products), expiring 05/13/2019(c) | | | 15,700 | | | $ | 127,866 | |
| | | | | | | | | |
| Information Technology 0.24% | | | | | | | | |
| Hangzhou Hikvision Digital Tec (Loan Participation Notes issued by Morgan Stanley Asia Product, expiring 01/18/2019(c) | | | 20,600 | | | | 124,982 | |
| | | | | | | | | |
| TOTAL PARTICIPATION NOTES | | | | | | | | |
| (Cost $202,378) | | | | | | | 252,848 | |
| | | | | | | | | |
| SHORT-TERM INVESTMENTS 13.55% | | | | | | | | |
| Money Market Fund 13.55% | | | | | | | | |
| BlackRock Liquidity Funds, T-Fund Portfolio - Institutional Class (1.556% 7-day yield) | | | 6,939,847 | | | | 6,939,847 | |
| | | | | | | | | |
| TOTAL SHORT-TERM INVESTMENTS | | | | | | | | |
| (Cost $6,939,847) | | | | | | | 6,939,847 | |
| | | | | | | | | |
| Total Investments - 95.49% | | | | | | | | |
| (Cost $45,237,856) | | | | | | | 48,893,684 | |
| | | | | | | | | |
| Other Assets in Excess of Liabilities - 4.51%(d) | | | | | | | 2,307,506 | |
| | | | | | | | | |
| NET ASSETS - 100.00% | | | | | | $ | 51,201,190 | |
| SCHEDULE OF SECURITIES SOLD SHORT(a) | | Shares | | | Value | |
| COMMON STOCKS (17.34%) | | | | | | | | |
| Consumer Discretionary (1.98%) | | | | | | | | |
| Dick's Sporting Goods, Inc. | | | (15,700 | ) | | | (519,513 | ) |
| Williams-Sonoma, Inc. | | | (10,300 | ) | | | (492,340 | ) |
| | | | | | | | (1,011,853 | ) |
| | | | | | | | | |
| Consumer Staples (1.01%) | | | | | | | | |
| Walgreens Boots Alliance, Inc. | | | (7,800 | ) | | | (518,310 | ) |
| | | | | | | | | |
| Financials (2.94%) | | | | | | | | |
| American Express Co. | | | (5,053 | ) | | | (498,984 | ) |
| Deutsche Bank AG | | | (34,600 | ) | | | (472,636 | ) |
| Semi-Annual Report | April 30, 2018 | 11 |
| Clough Global Long/Short Fund | Statement of Investments |
April 30, 2018 (Unaudited)
| SCHEDULE OF SECURITIES SOLD SHORT(a) | | | | | | |
| (continued) | | Shares | | | Value | |
| Financials (continued) | | | | | | | | |
| Santander Consumer USA Holdings, Inc. | | | (28,800 | ) | | $ | (531,360 | ) |
| | | | | | | | (1,502,980 | ) |
| | | | | | | | | |
| Health Care (2.52%) | | | | | | | | |
| Cardinal Health, Inc. | | | (7,800 | ) | | | (500,526 | ) |
| Editas Medicine, Inc. | | | (8,500 | ) | | | (266,900 | ) |
| McKesson Corp. | | | (3,351 | ) | | | (523,459 | ) |
| | | | | | | | (1,290,885 | ) |
| | | | | | | | | |
| Industrials (0.84%) | | | | | | | | |
| Triumph Group, Inc. | | | (18,300 | ) | | | (432,795 | ) |
| | | | | | | | | |
| Information Technology (6.10%) | | | | | | | | |
| AU Optronics Corp. - Sponsored ADR | | | (113,234 | ) | | | (450,671 | ) |
| Cirrus Logic, Inc. | | | (8,500 | ) | | | (309,995 | ) |
| F5 Networks, Inc. | | | (3,300 | ) | | | (538,197 | ) |
| International Business Machines Corp. | | | (3,360 | ) | | | (487,066 | ) |
| LINE Corp. - Sponsored ADR | | | (13,900 | ) | | | (501,512 | ) |
| Manhattan Associates, Inc. | | | (11,700 | ) | | | (503,802 | ) |
| Skyworks Solutions, Inc. | | | (3,800 | ) | | | (329,688 | ) |
| | | | | | | | (3,120,931 | ) |
| | | | | | | | | |
| Materials (1.95%) | | | | | | | | |
| Albemarle Corp. | | | (5,200 | ) | | | (504,192 | ) |
| FMC Corp. | | | (6,200 | ) | | | (494,326 | ) |
| | | | | | | | (998,518 | ) |
| | | | | | | | | |
| TOTAL COMMON STOCKS | | | | | | | | |
| (Proceeds $9,070,161) | | | | | | | (8,876,272 | ) |
| | | | | | | | | |
| TOTAL SECURITIES SOLD SHORT | | | | | | | | |
| (Proceeds $9,070,161) | | | | | | $ | (8,876,272 | ) |
| (a) | Non-income producing security. |
| (b) | Pledged security; a portion or all of the security is pledged as collateral for securities sold short. As of April 30, 2018, the aggregate market value of those securities was $2,665,303, representing 5.21% of net assets. (See Note 1) |
| (c) | Security exempt from registration of the Securities Act of 1933. These securities may be resold in transactions exempt from registration under Rule 144A, normally to qualified institutional buyers. As of April 30, 2018, the aggregate value of those securities was $252,848 or 0.49% of net assets. |
| (d) | Includes cash which is being held as collateral for total return swap contracts and securities sold short. |
| Clough Global Long/Short Fund | Statement of Investments |
April 30, 2018 (Unaudited)
TOTAL RETURN SWAP CONTRACTS
| Counter Party | | Reference Entity/Obligation | | Notional Amount | | | Floating Rate
Paid by the Fund | | Floating
Rate Index | | Termination Date | | Market
Value | | | Net Unrealized
Appreciation | |
| Morgan Stanley | | Edelweiss Financial Services, Ltd. | | $ | 89,075 | | | 225 bps + 1D FEDEF | | 1 D FEDEF | | 07/12/2018 | | $ | 210,283 | | | $ | 121,208 | |
| Morgan Stanley | | Hero MotoCorp, Ltd. | | | 166,308 | | | 225 bps + 1D FEDEF | | 1 D FEDEF | | 07/12/2018 | | | 206,577 | | | | 40,269 | |
| Morgan Stanley | | Housing Development Finance Corp. | | | 168,031 | | | 225 bps + 1D FEDEF | | 1 D FEDEF | | 07/12/2018 | | | 247,497 | | | | 79,466 | |
| Morgan Stanley | | Indiabulls Housing Finance, Ltd. | | | 123,630 | | | 225 bps + 1D FEDEF | | 1 D FEDEF | | 07/12/2018 | | | 193,230 | | | | 69,600 | |
| Morgan Stanley | | Innolux Corp. | | | (488,582 | ) | | 1D FEDEF -312.50 bps | | 1 D FEDEF | | 02/14/2019 | | | (410,062 | ) | | | 78,520 | |
| Morgan Stanley | | ITC, Ltd. | | | 194,848 | | | 225 bps + 1D FEDEF | | 1 D FEDEF | | 07/12/2018 | | | 230,878 | | | | 36,030 | |
| Morgan Stanley | | Larsen & Toubro, Ltd. | | | 111,878 | | | 225 bps + 1D FEDEF | | 1 D FEDEF | | 07/12/2018 | | | 256,482 | | | | 144,604 | |
| Morgan Stanley | | Shenzhen Inovance Technology Co., Ltd. | | | 104,838 | | | 250 bps + 1D FEDEF | | 1 D FEDEF | | 01/08/2020 | | | 129,317 | | | | 24,479 | |
| | | | | $ | 470,026 | | | | | | | | | $ | 1,064,202 | | | $ | 594,176 | |
| Counter Party | | Reference Entity/Obligation | | Notional Amount | | | Floating Rate Paid by the Fund | | Floating Rate Index | | Termination Date | | Market Value | | | Net Unrealized Depreciation | |
| Morgan Stanley | | Sociedad Quimica | | $ | (473,128 | ) | | 1D FEDEF - 325 bps | | 1 D FEDEF | | 02/03/2020 | | $ | (502,409 | ) | | $ | (29,281 | ) |
| Morgan Stanley | | United Microelectronics Corp. | | | (419,260 | ) | | 1D FEDEF - 50 bps | | 1 D FEDEF | | 07/25/2019 | | $ | (454,802 | ) | | | (35,542 | ) |
| | | | | $ | (892,388 | ) | | | | | | | | $ | (957,211 | ) | | $ | (64,823 | ) |
Investment Abbreviations:
1D FEDEF - Federal Funds Effective Rate (Daily)
For Fund compliance purposes, the Fund’s sector classifications refer to any one of the sector sub-classifications used by one or more widely recognized market indexes, and/or as defined by the Fund's management. This definition may not apply for purposes of this report, which may combine sector sub-classifications for reporting ease. Sectors are shown as a percent of net assets. These sector classifications are unaudited.
See Notes to the Financial Statements.
| Semi-Annual Report | April 30, 2018 | 13 |
| Clough Global Long/Short Fund | Statement of Assets and Liabilities |
April 30, 2018 (Unaudited)
| ASSETS: | | | |
| | | | |
| Investments, at value (Cost - see below) | | $ | 48,893,684 | |
| Cash | | | 88,919 | |
| Foreign currency, at value (Cost $340,626) | | | 338,345 | |
| Deposit with broker for securities sold short | | | 9,467,914 | |
| Deposit with broker for total return swap contracts | | | 1,095,787 | |
| Unrealized appreciation on total return swap contracts | | | 594,176 | |
| Interest receivable - margin account | | | 6,997 | |
| Dividends receivable | | | 25,152 | |
| Interest receivable | | | 7,970 | |
| Receivable for shares sold | | | 357,052 | |
| Prepaid expenses and other assets | | | 29,600 | |
| Total Assets | | | 60,905,596 | |
| | | | | |
| LIABILITIES: | | | | |
| | | | | |
| Securities sold short (Proceeds $9,070,161) | | | 8,876,272 | |
| Payable for investments purchased | | | 513,842 | |
| Payable for shares redeemed | | | 67,796 | |
| Payable for foreign capital gains tax | | | 42,415 | |
| Unrealized depreciation on total return swap contracts | | | 64,823 | |
| Dividends payable - short sales | | | 6,373 | |
| Accrued investment advisory fee | | | 18,320 | |
| Accrued distribution and service fees | | | 2,850 | |
| Accrued legal expense | | | 43,864 | |
| Accrued administration fee | | | 9,328 | |
| Accrued trustees fee | | | 5,464 | |
| Other payables and accrued expenses | | | 53,059 | |
| Total Liabilities | | | 9,704,406 | |
| Net Assets | | $ | 51,201,190 | |
| Cost of Investments | | $ | 45,237,856 | |
| | | | | |
| COMPOSITION OF NET ASSETS: | | | | |
| | | | | |
| Paid-in capital | | $ | 47,530,898 | |
| Accumulated net investment loss | | | (819,546 | ) |
| Accumulated net realized gain | | | 155,743 | |
| Net unrealized appreciation | | | 4,334,095 | |
| Net Assets | | $ | 51,201,190 | |
| PRICING OF CLASS I SHARES: | | | | |
| Net Assets | | $ | 46,074,445 | |
| Shares outstanding of no par value, unlimited shares authorized | | | 3,993,391 | |
| Net Asset Value, offering and redemption price per share | | $ | 11.54 | |
| PRICING OF INVESTOR CLASS SHARES: | | | | |
| Net Assets | | $ | 2,493,030 | |
| Shares outstanding of no par value, unlimited shares authorized | | | 217,783 | |
| Net Asset Value, offering and redemption price per share | | $ | 11.45 | |
| PRICING OF CLASS C SHARES: | | | | |
| Net Assets | | $ | 2,633,715 | |
| Shares outstanding of no par value, unlimited shares authorized | | | 233,236 | |
| Net Asset Value, offering and redemption price per share | | $ | 11.29 | |
See Notes to the Financial Statements.
| Clough Global Long/Short Fund | Statement of Operations |
For the six months ended April 30, 2018 (Unaudited)
| INVESTMENT INCOME: | | | | |
| | | | | |
| Dividends (net of foreign withholding taxes of $4,342) | | $ | 188,304 | |
| Interest income - margin account | | | 10,639 | |
| Total Income | | | 198,943 | |
| | | | | |
| EXPENSES: | | | | |
| | | | | |
| Investment advisory fees | | | 261,785 | |
| Distribution and shareholder service fees: | | | | |
| Investor Class(a) | | | 3,513 | |
| Class C | | | 5,703 | |
| Administration fees | | | 32,166 | |
| Trustees fees | | | 42,731 | |
| Registration fees | | | 24,197 | |
| Dividend expense - short sales | | | 52,524 | |
| Custodian fees | | | 22,611 | |
| Audit & Tax Services fees | | | 21,490 | |
| Legal fees | | | 75,718 | |
| Printing fees | | | 3,403 | |
| Insurance fees | | | 11,014 | |
| Transfer agent fees | | | 25,276 | |
| Delegated transfer agent fees: | | | | |
| Class I | | | 1,312 | |
| Investor Class(a) | | | 35 | |
| Class C | | | 5 | |
| Other expenses | | | 8,449 | |
| Total Expenses Before Waivers and/or Reimbursements | | | 591,932 | |
| Less fees waived and/or reimbursed by Adviser: | | | | |
| Class I | | | (202,565 | ) |
| Investor Class(a) | | | (11,047 | ) |
| Class C | | | (5,830 | ) |
| Net Expenses | | | 372,490 | |
| Net Investment Loss | | | (173,547 | ) |
| | | | | |
| NET REALIZED GAIN/(LOSS) ON: | | | | |
| Investment securities | | | 1,433,882 | |
| Securities sold short | | | (407,831 | ) |
| Total return swap contracts | | | 161,069 | |
| Foreign currency transactions | | | (19,080 | ) |
| Net realized gain | | | 1,168,040 | |
| NET CHANGE IN UNREALIZED APPRECIATION/DEPRECIATION ON: | | | | |
| Investment securities | | | 221,255 | |
| Securities sold short | | | 153,206 | |
| Total return swap contracts | | | 12,542 | |
| Foreign capital gains tax | | | (42,415 | ) |
| Translation of assets and liabilities denominated in foreign currencies | | | (2,646 | ) |
| Net change in unrealized appreciation | | | 341,942 | |
| Net realized and unrealized gain | | | 1,509,982 | |
| Net Increase in Net Assets from Operations | | $ | 1,336,435 | |
| (a) | Prior to December 1, 2017, Investor Class was known as Class A. |
See Notes to the Financial Statements.
| Semi-Annual Report | April 30, 2018 | 15 |
| Clough Global Long/Short Fund | Statement of Changes in Net Assets |
| | | For the
Six Months Ended April 30, 2018 (Unaudited) | | | For the
Year Ended
October 31,
2017 | |
| OPERATIONS: | | | | | | | | |
| | | | | | | | | |
| Net investment loss | | $ | (173,547 | ) | | $ | (332,237 | ) |
| Net realized gain | | | 1,168,040 | | | | 4,216,630 | |
| Net change in unrealized appreciation | | | 341,942 | | | | 1,427,824 | |
| Net Increase in Net Assets From Operations | | | 1,336,435 | | | | 5,312,217 | |
| | | | | | | | | |
| CAPITAL SHARE TRANSACTIONS: | | | | | | | | |
| Class I | | | | | | | | |
| Proceeds from shares sold | | | 15,944,452 | | | | 5,582,746 | |
| Payments for shares redeemed | | | (770,477 | ) | | | (25,241,907 | ) |
| Net Increase/(Decrease) in Net Assets From Class I Capital Share Transactions | | | 15,173,975 | | | | (19,659,161 | ) |
| | | | | | | | | |
| Investor Class(a) | | | | | | | | |
| Proceeds from shares sold | | | 2,340,687 | | | | 124,598 | |
| Payments for shares redeemed | | | (130,807 | ) | | | (6,586 | ) |
| Net Increase in Net Assets From Investor Class Capital Share Transactions | | | 2,209,880 | | | | 118,013 | |
| | | | | | | | | |
| Class C | | | | | | | | |
| Proceeds from shares sold | | | 2,547,282 | | | | 19,994 | |
| Payments for shares redeemed | | | – | | | | (8,916 | ) |
| Net Increase in Net Assets From Class C Capital Share Transactions | | | 2,547,282 | | | | 11,078 | |
| | | | | | | | | |
| Total Increase (Decrease) in Net Assets | | $ | 21,267,572 | | | $ | (14,217,854 | ) |
| | | | | | | | | |
| NET ASSETS: | | | | | | | | |
| Beginning of period | | | 29,933,618 | | | | 44,151,472 | |
| End of period* | | $ | 51,201,190 | | | $ | 29,933,618 | |
| *Includes accumulated net investment loss of: | | $ | (819,546 | ) | | $ | (645,999 | ) |
| (a) | Prior to December 1, 2017, Investor Class was known as Class A. |
See Notes to the Financial Statements.
| Clough Global Long/Short Fund – Class I | Financial Highlights |
For a share outstanding throughout the periods indicated
| | | For the Six Months Ended April 30, 2018 (Unaudited) | | | For the
Year Ended October 31,
2017 | | | For the
Year Ended October 31,
2016 | | | For the Period September 30, 2015 (commencement) to October 31, 2015 | |
| PER SHARE OPERATING PERFORMANCE: | | | | | | | | | | | | |
| NET ASSET VALUE, BEGINNING OF PERIOD | | $ | 11.03 | | | $ | 9.40 | | | $ | 10.30 | | | $ | 10.00 | |
| INCOME/(LOSS) FROM OPERATIONS: | | | | | | | | | | | | | | | | |
| Net investment loss(a) | | | (0.05 | ) | | | (0.10 | ) | | | (0.12 | ) | | | (0.01 | ) |
| Net realized and unrealized gain/(loss) on investments | | | 0.56 | | | | 1.73 | | | | (0.74 | ) | | | 0.31 | |
| Total from Investment Operations | | | 0.51 | | | | 1.63 | | | | (0.86 | ) | | | 0.30 | |
| | | | | | | | | | | | | | | | | |
| DISTRIBUTIONS TO COMMON SHAREHOLDERS FROM: | | | | | | | | | | | | | | | | |
| Net realized gains | | | – | | | | – | | | | (0.04 | ) | | | – | |
| Total Distributions to Common Shareholders | | | – | | | | – | | | | (0.04 | ) | | | – | |
| Net asset value - end of period | | $ | 11.54 | | | $ | 11.03 | | | $ | 9.40 | | | $ | 10.30 | |
| | | | | | | | | | | | | | | | | |
| Total Investment Return - Net Asset Value(b) | | | 4.62 | % | | | 17.34 | % | | | (8.39 | )% | | | 3.00 | % |
| | | | | | | | | | | | | | | | | |
| RATIOS AND SUPPLEMENTAL DATA: | | | | | | | | | | | | | | | | |
| Net assets attributable to common shares, end of period (in 000s) | | $ | 46,074 | | | $ | 29,629 | | | $ | 44,003 | | | $ | 35,760 | |
| | | | | | | | | | | | | | | | | |
| RATIOS TO AVERAGE NET ASSETS (including interest expense and dividend expense on securities sold short) | | | | | | | | | | | | | | | | |
| Operating expenses excluding fee waivers/reimbursements(c) | | | 3.01 | %(d) | | | 3.21 | % | | | 3.76 | % | | | 5.62 | %(d) |
| Operating expenses including fee waivers/reimbursements(c) | | | 1.87 | %(d) | | | 1.96 | % | | | 2.50 | % | | | 2.32 | %(d) |
| Net investment loss including fee waivers/reimbursements(c) | | | (0.85 | )%(d) | | | (0.96 | )% | | | (1.30 | )% | | | (1.66 | )%(d) |
| RATIOS TO AVERAGE NET ASSETS (excluding interest expense and dividend expense on securities sold short) | | | | | | | | | | | | | | | | |
| Operating expenses excluding fee waivers/reimbursements(c) | | | 2.74 | %(d) | | | 2.85 | % | | | 2.86 | % | | | 4.90 | %(d) |
| Operating expenses including fee waivers/reimbursements(c) | | | 1.60 | %(d) | | | 1.60 | % | | | 1.60 | % | | | 1.60 | %(d) |
| Net investment loss including fee waivers/reimbursements(c) | | | (0.58 | )%(d) | | | (0.60 | )% | | | (0.40 | )% | | | (0.94 | )%(d) |
| | | | | | | | | | | | | | | | | |
| PORTFOLIO TURNOVER RATE(e) | | | 80 | % | | | 237 | % | | | 261 | % | | | 22 | % |
| (a) | Per share amounts are based upon average shares outstanding. |
| (b) | Total investment return is for the period indicated and has not been annualized. The total investment return would have been lower had certain expenses not been waived / reimbursed during the period. The return shown does not reflect the deduction of taxes that a shareholder would pay on Fund distributions or the redemption of Fund shares. |
| (c) | Expense ratios before reductions for startup periods may not be representative of longer term operating periods. |
| (e) | Portfolio turnover rate for periods less than one full year have not been annualized and is calculated at the Fund level. |
See Notes to the Financial Statements.
| Semi-Annual Report | April 30, 2018 | 17 |
| Clough Global Long/Short Fund – Investor Class | Financial Highlights |
For a share outstanding throughout the periods indicated
| | | For the Six Months Ended April 30, 2018 (Unaudited)(a) | | | For the
Year Ended October 31,
2017 | | | For the
Year Ended October 31,
2016 | | | For the Period September 30, 2015 (commencement) to October 31, 2015 | |
| PER SHARE OPERATING PERFORMANCE: | | | | | | | | | | | | |
| NET ASSET VALUE, BEGINNING OF PERIOD | | $ | 10.96 | | | $ | 9.37 | | | $ | 10.30 | | | $ | 10.00 | |
| INCOME/(LOSS) FROM OPERATIONS: | | | | | | | | | | | | | | | | |
| Net investment loss(b) | | | (0.06 | ) | | | (0.14 | ) | | | (0.15 | ) | | | (0.02 | ) |
| Net realized and unrealized gain/(loss) on investments | | | 0.55 | | | | 1.73 | | | | (0.74 | ) | | | 0.32 | |
| Total from Investment Operations | | | 0.49 | | | | 1.59 | | | | (0.89 | ) | | | 0.30 | |
| | | | | | | | | | | | | | | | | |
| DISTRIBUTIONS TO COMMON SHAREHOLDERS FROM: | | | | | | | | | | | | | | | | |
| Net realized gains | | | – | | | | – | | | | (0.04 | ) | | | – | |
| Total Distributions to Common Shareholders | | | – | | | | – | | | | (0.04 | ) | | | – | |
| Net asset value - end of period | | $ | 11.45 | | | $ | 10.96 | | | $ | 9.37 | | | $ | 10.30 | |
| | | | | | | | | | | | | | | | | |
| Total Investment Return - Net Asset Value(c) | | | 4.47 | % | | | 16.97 | % | | | (8.68 | )% | | | 3.00 | % |
| | | | | | | | | | | | | | | | | |
| RATIOS AND SUPPLEMENTAL DATA: | | | | | | | | | | | | | | | | |
| Net assets attributable to common shares, end of period (in 000s) | | $ | 2,493 | | | $ | 210 | | | $ | 76 | | | $ | 27 | |
| | | | | | | | | | | | | | | | | |
| RATIOS TO AVERAGE NET ASSETS (including interest expense and dividend expense on securities sold short) | | | | | | | | | | | | | | | | |
| Operating expenses excluding fee waivers/reimbursements(d) | | | 3.24 | %(e) | | | 3.78 | % | | | 4.23 | % | | | 6.44 | %(e) |
| Operating expenses including fee waivers/reimbursements(d) | | | 2.15 | %(e) | | | 2.29 | % | | | 2.85 | % | | | 2.67 | %(e) |
| Net investment loss including fee waivers/reimbursements(d) | | | (1.10 | )%(e) | | | (1.36 | )% | | | (1.57 | )% | | | (2.00 | )%(e) |
| RATIOS TO AVERAGE NET ASSETS (excluding interest expense and dividend expense on securities sold short) | | | | | | | | | | | | | | | | |
| Operating expenses excluding fee waivers/reimbursements(d) | | | 2.99 | %(e) | | | 3.38 | % | | | 3.33 | % | | | 5.72 | %(e) |
| Operating expenses including fee waivers/reimbursements(d) | | | 1.90 | %(e)(f) | | | 1.89 | %(f) | | | 1.95 | % | | | 1.95 | %(e) |
| Net investment loss including fee waivers/reimbursements(d) | | | (0.85 | )%(e) | | | (0.96 | )% | | | (0.67 | )% | | | (1.28 | )%(e) |
| | | | | | | | | | | | | | | | | |
| PORTFOLIO TURNOVER RATE(g) | | | 80 | % | | | 237 | % | | | 261 | % | | | 22 | % |
| (a) | Prior to December 1, 2017, Investor Class was known as Class A. |
| (b) | Per share amounts are based upon average shares outstanding. |
| (c) | Total investment return is for the period indicated and has not been annualized. The total investment return would have been lower had certain expenses not been waived / reimbursed during the period. The return shown does not reflect the deduction of taxes that a shareholder would pay on Fund distributions or the redemption of Fund shares. Total investment return does not reflect the effect of sales charge. |
| (d) | Expense ratios before reductions for startup periods may not be representative of longer term operating periods. |
| (f) | According to the Fund's shareholder services plan with respect to the Fund's Class A shares, any amount of such payment not paid during the Fund's fiscal year for such services activities shall be reimbursed to the Fund as soon as practical after the end of the fiscal year. Fees were reimbursed to the Fund during the six months ended April 30, 2018 and the year ended October 31, 2017, in the amounts of 0.05% and 0.06%, respectively of average net assets of Class A shares. |
| (g) | Portfolio turnover rate for periods less than one full year have not been annualized and is calculated at the Fund level. |
See Notes to the Financial Statements.
| Clough Global Long/Short Fund – Class C | Financial Highlights |
For a share outstanding throughout the periods indicated
| | | For the Six Months Ended April 30, 2018 (Unaudited) | | | For the
Year Ended October 31,
2017 | | | For the
Year Ended October 31,
2016 | | | For the Period September 30, 2015 (commencement) to October 31, 2015 | |
| PER SHARE OPERATING PERFORMANCE: | | | | | | | | | | | | |
| NET ASSET VALUE, BEGINNING OF PERIOD | | $ | 10.84 | | | $ | 9.34 | | | $ | 10.30 | | | $ | 10.00 | |
| INCOME/(LOSS) FROM OPERATIONS: | | | | | | | | | | | | | | | | |
| Net investment loss(a) | | | (0.10 | ) | | | (0.20 | ) | | | (0.21 | ) | | | (0.02 | ) |
| Net realized and unrealized gain/(loss) on investments | | | 0.55 | | | | 1.70 | | | | (0.71 | ) | | | 0.32 | |
| Total from Investment Operations | | | 0.45 | | | | 1.50 | | | | (0.92 | ) | | | 0.30 | |
| | | | | | | | | | | | | | | | | |
| DISTRIBUTIONS TO COMMON SHAREHOLDERS FROM: | | | | | | | | | | | | | | | | |
| Net realized gains | | | – | | | | – | | | | (0.04 | ) | | | – | |
| Total Distributions to Common Shareholders | | | – | | | | – | | | | (0.04 | ) | | | – | |
| Net asset value - end of period | | $ | 11.29 | | | $ | 10.84 | | | $ | 9.34 | | | $ | 10.30 | |
| | | | | | | | | | | | | | | | | |
| Total Investment Return - Net Asset Value(b) | | | 4.15 | % | | | 16.06 | % | | | (8.97 | )% | | | 3.00 | % |
| | | | | | | | | | | | | | | | | |
| RATIOS AND SUPPLEMENTAL DATA: | | | | | | | | | | | | | | | | |
| Net assets attributable to common shares, end of period (in 000s) | | $ | 2,634 | | | $ | 95 | | | $ | 73 | | | $ | 26 | |
| | | | | | | | | | | | | | | | | |
| RATIOS TO AVERAGE NET ASSETS (including interest expense and dividend expense on securities sold short) | | | | | | | | | | | | | | | | |
| Operating expenses excluding fee waivers/reimbursements(c) | | | 3.88 | %(d) | | | 4.33 | % | | | 4.78 | % | | | 7.09 | %(d) |
| Operating expenses including fee waivers/reimbursements(c) | | | 2.87 | %(d) | | | 2.97 | % | | | 3.50 | % | | | 3.32 | %(d) |
| Net investment loss including fee waivers/reimbursements(c) | | | (1.79 | )%(d) | | | (2.03 | )% | | | (2.19 | )% | | | (2.66 | )%(d) |
| RATIOS TO AVERAGE NET ASSETS (excluding interest expense and dividend expense on securities sold short) | | | | | | | | | | | | | | | | |
| Operating expenses excluding fee waivers/reimbursements(c) | | | 3.61 | %(d) | | | 3.96 | % | | | 3.88 | % | | | 6.37 | %(d) |
| Operating expenses including fee waivers/reimbursements(c) | | | 2.60 | %(d) | | | 2.60 | % | | | 2.60 | % | | | 2.60 | %(d) |
| Net investment loss including fee waivers/reimbursements(c) | | | (1.52 | )%(d) | | | (1.66 | )% | | | (1.29 | )% | | | (1.94 | )%(d) |
| | | | | | | | | | | | | | | | | |
| PORTFOLIO TURNOVER RATE(e) | | | 80 | % | | | 237 | % | | | 261 | % | | | 22 | % |
| (a) | Per share amounts are based upon average shares outstanding. |
| (b) | Total investment return is for the period indicated and has not been annualized. The total investment return would have been lower had certain expenses not been waived / reimbursed during the period. The return shown does not reflect the deduction of taxes that a shareholder would pay on Fund distributions or the redemption of Fund shares. Total investment return does not reflect the effect of sales charge. |
| (c) | Expense ratios before reductions for startup periods may not be representative of longer term operating periods. |
| (e) | Portfolio turnover rate for periods less than one full year have not been annualized and is calculated at the Fund level. |
See Notes to the Financial Statements.
| Semi-Annual Report | April 30, 2018 | 19 |
| Clough Global Long/Short Fund | Notes to Financial Statements |
April 30, 2018 (Unaudited)
1. ORGANIZATION AND SIGNIFICANT ACCOUNTING AND OPERATING POLICIES
Clough Funds Trust (the “Trust”) is an open-end management investment company registered under the Investment Company Act of 1940, as amended (the “1940 Act”). The Trust was organized under the laws of the state of Delaware on March 17, 2015. The Trust currently offers shares of beneficial interest (“shares”) of the Clough Global Long/Short Fund (the “Fund”). The Fund’s commencement date is September 30, 2015. The Fund is a diversified investment company with an investment objective to seek to provide long-term capital appreciation. The Fund currently offers three Classes of shares: Class I, Investor Class and Class C. Prior to December 1, 2017, Investor Class shares were named Class A shares. Each share class of the Fund represents an investment in the same portfolio of securities, but each share class has its own expense structure. As of April 30, 2018, approximately 50% of the Fund is owned by affiliated parties. The Board of Trustees (the “Board”) may establish additional funds and classes of shares at any time in the future without shareholder approval.
The following is a summary of significant accounting policies followed by the Fund. These policies are in conformity with U.S. generally accepted accounting principles (“GAAP”). The preparation of financial statements in accordance with GAAP requires management to make estimates and assumptions that affect the reported amounts and disclosures in the financial statements during the reporting period. Management believes the estimates and security valuations are appropriate; however, actual results may differ from those estimates, and the security valuations reflected in the financial statements may differ from the value the Fund ultimately realizes upon sale of the securities. The Fund is considered an investment company for financial reporting purposes under GAAP and follows the accounting and reporting guidance applicable to investment companies as codified in Accounting Standards Codification (“ASC”) Topic 946 – Investment Companies.
The net asset value (“NAV”) per share of the Fund is determined no less frequently than daily, on each day that the New York Stock Exchange (“NYSE” or the “Exchange”) is open for trading, as of the close of regular trading on the Exchange (normally 4:00 p.m. New York time). Trading may take place in foreign issues held by the Fund at times when the Fund is not open for business. As a result, the Fund’s NAV may change at times when it is not possible to purchase or sell shares of the Fund.
Investment Valuation: Securities held by the Fund for which exchange quotations are readily available are valued at the last sale price, or if no sale price or if traded on the over-the-counter market, at the mean of the bid and asked prices on such day. Most securities listed on a foreign exchange are valued at the last sale price at the close of the exchange on which the security is primarily traded. In certain countries market maker prices are used since they are the most representative of the daily trading activity. Market maker prices are usually the mean between the bid and ask prices. Certain markets are not closed at the time that the Fund prices its portfolio securities. In these situations, snapshot prices are provided by the individual pricing services or other alternate sources at the close of the NYSE as appropriate. Securities not traded on a particular day are valued at the mean between the last reported bid and the asked quotes, or the last sale price when appropriate; otherwise fair value will be determined by the board-appointed fair valuation committee. Debt securities for which the over-the-counter market is the primary market are normally valued on the basis of prices furnished by one or more pricing services or dealers at the mean between the latest available bid and asked prices. As authorized by the Board, debt securities (including short-term obligations that will mature in 60 days or less) may be valued on the basis of valuations furnished by a pricing service which determines valuations based upon market transactions for normal, institutional-size trading units of securities or a matrix method which considers yield or price of comparable bonds provided by a pricing service. Total return swaps are priced based on valuations provided by a Board approved independent third party pricing agent. If a total return swap price cannot be obtained from an independent third party pricing agent the Fund shall seek to obtain a bid price from at least one independent and/or executing broker.
If the price of a security is unavailable in accordance with the aforementioned pricing procedures, or the price of a security is unreliable, e.g., due to the occurrence of a significant event, the security may be valued at its fair value determined by management pursuant to procedures adopted by the Board. For this purpose, fair value is the price that the Fund reasonably expects to receive on a current sale of the security. Due to the number of variables affecting the price of a security, however; it is possible that the fair value of a security may not accurately reflect the price that the Fund could actually receive on a sale of the security.
A three-tier hierarchy has been established to classify fair value measurements for disclosure purposes. Inputs refer broadly to the assumptions that market participants would use in pricing the asset or liability, including assumptions about risk. Inputs may be observable or unobservable. Observable inputs are inputs that reflect the assumptions market participants would use in pricing the asset or liability that are developed based on market data obtained from sources independent of the reporting entity. Unobservable inputs are inputs that reflect the reporting entity’s own assumptions about the assumptions market participants would use in pricing the asset or liability that are developed based on the best information available.
| Clough Global Long/Short Fund | Notes to Financial Statements |
April 30, 2018 (Unaudited)
Various inputs are used in determining the value of the Fund’s investments as of the reporting period end. These inputs are categorized in the following hierarchy under applicable financial accounting standards:
| Level 1 – | Unadjusted quoted prices in active markets for identical, unrestricted assets or liabilities that the Fund has the ability to access at the measurement date; |
| Level 2 – | Quoted prices which are not active, quoted prices for similar assets or liabilities in active markets or inputs other than quoted prices that are observable (either directly or indirectly) for substantially the full term of the asset or liability; and |
| Level 3 – | Significant unobservable prices or inputs (including the Fund’s own assumptions in determining the fair value of investments) where there is little or no market activity for the asset or liability at the measurement date. |
The following is a summary of the inputs used as of April 30, 2018, in valuing the Fund’s investments carried at value. The Fund recognizes transfers between the levels as of the end of the period in which the transfer occurred. There were no transfers between Levels during the six months ended April 30, 2018.
Clough Global Long/Short Fund
| Investments in Securities at Value* | | Level 1 | | | Level 2 | | | Level 3 | | | Total | |
| Common Stocks | | $ | 41,700,989 | | | $ | – | | | $ | – | | | $ | 41,700,989 | |
| Participation Notes | | | – | | | | 252,848 | | | | – | | | | 252,848 | |
| Short-Term Investments | | | | | | | | | | | | | | | | |
| Money Market Fund | | | 6,939,847 | | | | – | | | | – | | | | 6,939,847 | |
| TOTAL | | $ | 48,640,836 | | | $ | 252,848 | | | $ | – | | | $ | 48,893,684 | |
| | | | | | | | | | | | | | | | | |
| Other Financial Instruments Assets | | | | | | | | | | | | | | | | |
| Total Return Swap Contracts** | | $ | – | | | $ | 594,176 | | | $ | – | | | $ | 594,176 | |
| Liabilities | | | | | | | | | | | | | | | | |
| Securities Sold Short | | | | | | | | | | | | | | | | |
| Common Stocks | | | (8,876,272 | ) | | | – | | | | – | | | | (8,876,272 | ) |
| Total Return Swap Contracts** | | | – | | | | (64,823 | ) | | | – | | | | (64,823 | ) |
| TOTAL | | $ | (8,876,272 | ) | | $ | 529,353 | | | $ | – | | | $ | (8,346,919 | ) |
| * | For detailed sector descriptions, see the accompanying Statement of Investments. |
| ** | Swap contracts are reported at their unrealized appreciation/(depreciation) at measurement date, which represents the change in the contract's value from trade date. |
In the event a Board approved independent pricing service is unable to provide an evaluated price for a security or Clough Capital Partners L.P. (the “Adviser” or “Clough Capital”) believes the price provided is not reliable, securities of the Fund will be valued at fair value as described above. In these instances the Adviser may seek to find an alternative independent source, such as a broker/dealer to provide a price quote, or by using evaluated pricing models similar to the techniques and models used by the independent pricing service. These fair value measurement techniques may utilize unobservable inputs (Level 3).
On a monthly basis, the Fair Value Committee of the Fund meets and discusses securities that have been fair valued during the preceding month in accordance with the Fund’s Fair Value Procedures and reports quarterly to the Board on the results of those meetings.
For the six months ended April 30, 2018, the Fund did not have significant unobservable inputs (Level 3) used in determining fair value. Therefore, a reconciliation of assets in which significant unobservable inputs (Level 3) were used in determining fair value is not applicable.
Class Expenses: Expenses that are specific to a class of shares are charged directly to that share class. Fees provided under the distribution (Rule 12b-1) and/or shareholder service plans for a particular class of the Fund are charged to the operations of such class.
Income Taxes: The Fund’s policy is to comply with the provisions of the Internal Revenue Code applicable to regulated investment companies and to distribute all of its taxable income to its shareholders. Therefore, no federal income tax provision is required. As of and during the six months ended April 30, 2018, the Fund did not have a liability for any unrecognized tax benefits. The Fund plans to file U.S. Federal and various state and local tax returns as required. The Fund’s tax returns are subject to examination by the relevant tax authorities until expiration of the applicable statute of limitations, which is generally three years after the filing of the tax return but which can be extended to six years in certain circumstances. Tax returns for open years have incorporated no uncertain tax positions that require a provision for income taxes.
| Semi-Annual Report | April 30, 2018 | 21 |
| Clough Global Long/Short Fund | Notes to Financial Statements |
April 30, 2018 (Unaudited)
Certain foreign countries impose a capital gains tax which is accrued by the Fund based on the unrealized appreciation, if any, on affected securities. Any accrual would reduce the Fund's NAV. The tax is paid when the gain is realized and is included in capital gains tax in the Statement of Operations.
Distributions to Shareholders: The Fund normally pays dividends on an annual basis. Any net capital gains earned by the Fund are distributed annually. Distributions to shareholders are recorded by the Fund on the ex-dividend date.
Securities Transactions and Investment Income: Investment security transactions are accounted for on a trade date basis. Dividend income and dividend expense-short sales are recorded on the ex-dividend date. Certain dividend income from foreign securities will be recorded, in the exercise of reasonable diligence, as soon as a Fund is informed of the dividend if such information is obtained subsequent to the ex-dividend date and may be subject to withholding taxes in these jurisdictions. Interest income, which includes amortization of premium and accretion of discount, is recorded on the accrual basis. Realized gains and losses from securities transactions and unrealized appreciation and depreciation of securities are determined using the identified cost basis for both financial reporting and income tax purposes. All of the realized and unrealized gains and losses and net investment income, other than class specific expenses, are allocated daily to each class in proportion to its average daily net assets.
Foreign Securities: The Fund may invest a portion of its assets in foreign securities. In the event that the Fund executes a foreign security transaction, the Fund will generally enter into a foreign currency spot contract to settle the foreign security transaction. Foreign securities may carry more risk than U.S. securities, such as political, market and currency risks.
The accounting records of the Fund are maintained in U.S. dollars. Prices of securities denominated in foreign currencies are translated into U.S. dollars at the closing rates of exchange at period end. Amounts related to the purchase and sale of foreign securities and investment income are translated at the rates of exchange prevailing on the respective dates of such transactions.
The effect of changes in foreign currency exchange rates on investments is reported with investment securities realized and unrealized gains and losses in the Fund’s Statement of Operations.
A foreign currency spot contract is a commitment to purchase or sell a foreign currency at a future date, at a negotiated rate. The Fund may enter into foreign currency spot contracts to settle specific purchases or sales of securities denominated in a foreign currency and for protection from adverse exchange rate fluctuation. Risks to the Fund include the potential inability of the counterparty to meet the terms of the contract.
The net U.S. dollar value of foreign currency underlying all contractual commitments held by the Fund and the resulting unrealized appreciation or depreciation are determined using prevailing forward foreign currency exchange rates. Unrealized appreciation and depreciation on foreign currency spot contracts are reported in the Fund’s Statements of Assets and Liabilities as a receivable or a payable and in the Fund’s Statement of Operations with the change in unrealized appreciation or depreciation on translation of assets and liabilities denominated in foreign currencies. These spot contracts are used by the broker to settle investments denominated in foreign currencies.
The Fund may realize a gain or loss upon the closing or settlement of the foreign transaction, excluding investment securities. Such realized gains and losses are reported with all other foreign currency gains and losses in the Statement of Operations.
Exchange Traded Funds: The Fund may invest in exchange traded funds (“ETFs”), which are funds whose shares are traded on a national exchange. ETFs may be based on underlying equity or fixed income securities, as well as commodities or currencies. ETFs do not sell individual shares directly to investors and only issue their shares in large blocks known as “creation units.” The investor purchasing a creation unit then sells the individual shares on a secondary market. Although similar diversification benefits may be achieved through an investment in another investment company, ETFs generally offer greater liquidity and lower expenses. Because an ETF incurs its own fees and expenses, shareholders of a Fund investing in an ETF will indirectly bear those costs. Such Funds will also incur brokerage commissions and related charges when purchasing or selling shares of an ETF. Unlike typical investment company shares, which are valued once daily, shares in an ETF may be purchased or sold on a securities exchange throughout the trading day at market prices that are generally close to the NAV of the ETF.
Short Sales: The Fund may sell a security it does not own in anticipation of a decline in the fair value of that security. When the Fund sells a security short, it must borrow the security sold short and deliver it to the broker-dealer through which it made the short sale. A gain, limited to the price at which the Fund sold the security short, or a loss, unlimited in size, will be recognized upon the termination of the short sale.
The Fund's obligation to replace the borrowed security will be secured by collateral deposited with the broker-dealer, usually cash, U.S. government securities or other liquid securities. The Fund will also be required to designate on its books and records similar collateral with its custodian to the extent, if any, necessary so that the aggregate collateral value is at all times at least equal to the current value of the security sold short. The cash amount is reported on the Statement of Assets and Liabilities as Deposit with broker for securities sold short which is held with one counterparty. The Fund is obligated to pay interest to the broker for any debit balance of the margin account relating to short sales. The interest incurred by the Fund, if any, is reported on the Statement of Operations as Interest expense – margin account. Interest amounts payable, if any, are reported on the Statement of Assets and Liabilities as Interest payable – margin account.
| Clough Global Long/Short Fund | Notes to Financial Statements |
April 30, 2018 (Unaudited)
The Fund may also sell a security short if it owns at least an equal amount of the security sold short or another security convertible or exchangeable for an equal amount of the security sold short without payment of further compensation (a short sale against-the-box). In a short sale against-the-box, the short seller is exposed to the risk of being forced to deliver stock that it holds to close the position if the borrowed stock is called in by the lender, which would cause gain or loss to be recognized on the delivered stock. The Fund expects normally to close its short sales against-the-box by delivering newly acquired stock. Since the Fund intends to hold securities sold short for the short term, these securities are excluded from the purchases and sales of investment securities in Note 4 and the Fund’s Portfolio Turnover in the Financial Highlights.
Derivative Instruments and Hedging Activities: The following discloses the Fund’s use of derivative instruments and hedging activities.
The Fund’s investment objective not only permits the Fund to purchase investment securities, it also allows the Fund to enter into various types of derivative contracts, including, but not limited to, forward foreign currency contracts, futures, options and swaps. The Fund may use derivatives, among other reasons, as part of the Fund’s investment strategy, to attempt to employ its currency strategies, to seek to hedge against foreign exchange risk, and to gain access to foreign markets.
Risk of Investing in Derivatives: The Fund’s use of derivatives can result in losses due to unanticipated changes in the market risk factors and the overall market. In instances where the Fund is using derivatives to decrease or hedge exposures to market risk factors for securities held by the Fund, there are also risks that those derivatives may not perform as expected, resulting in losses for the combined or hedged positions.
Derivatives may have little or no initial cash investment relative to their market value exposure and therefore can produce significant gains or losses in excess of their cost. This use of embedded leverage allows the Fund to increase its market value exposure relative to its net assets and can substantially increase the volatility of the Fund’s performance.
Additional associated risks from investing in derivatives also exist and potentially could have significant effects on the valuation of the derivative and the Fund. Typically, the associated risks are not the risks that the Fund is attempting to increase or decrease exposure to its investment objective, but the additional risks from investing in derivatives. Associated risks can be different for each type of derivative and are discussed by each derivative type in the notes that follow.
Examples of these associated risks are liquidity risk, which is the risk that the Fund will not be able to sell the derivative in the open market in a timely manner, and counterparty credit risk, which is the risk that the counterparty will not fulfill its obligation to the Fund.
Market Risk Factors: In addition, in pursuit of its investment objectives, the Fund may seek to use derivatives, which may increase or decrease exposure to the following market risk factors:
Equity Risk: Equity risk relates to the change in value of equity securities as they relate to increases or decreases in the general market.
Foreign Exchange Rate Risk: Foreign exchange rate risk relates to the change in the U.S. dollar value of a security held that is denominated in a foreign currency. The value of a foreign currency denominated security will decrease as the dollar appreciates against the currency, while the value of the foreign currency denominated security will increase as the dollar depreciates against the currency.
Futures Contracts: The Fund may enter into futures contracts. A futures contract is an agreement to buy or sell a security or currency (or to deliver a final cash settlement price in the case of a contract relating to an index or otherwise not calling for physical delivery at the end of trading in the contract) for a set price at a future date. If the Fund buys a security futures contract, the Fund enters into a contract to purchase the underlying security and is said to be “long” under the contract. If the Fund sells a security futures contact, the Fund enters into a contract to sell the underlying security and is said to be “short” under the contract. The price at which the contract trades (the “contract price”) is determined by relative buying and selling interest on a regulated exchange. Futures contracts are marked to market daily and an appropriate payable or receivable for the change in value (“variation margin”) is recorded by the Fund. Such payables or receivables are recorded for financial statement purposes as variation margin payable or variation margin receivable by the Fund. The Fund pledges cash or liquid assets as collateral to satisfy the current obligations with respect to futures contracts. The cash amount is reported on the Statement of Assets and Liabilities as Deposit with broker for futures contracts.
The Fund enters into such transactions for hedging and other appropriate risk-management purposes or to increase return. While the Fund may enter into futures contracts for hedging purposes, the use of futures contracts might result in a poorer overall performance for the Fund than if it had not engaged in any such transactions. If, for example, the Fund had insufficient cash, it might have to sell a portion of its underlying portfolio of securities in order to meet daily variation margin requirements on its futures contracts or options on futures contracts at a time when it might be disadvantageous to do so. There may be an imperfect correlation between the Fund’s portfolio holdings and futures contracts entered into by the Fund, which may prevent the Fund from achieving the intended hedge or expose the Fund to risk of loss.
| Semi-Annual Report | April 30, 2018 | 23 |
| Clough Global Long/Short Fund | Notes to Financial Statements |
April 30, 2018 (Unaudited)
Futures contract transactions may result in losses substantially in excess of the variation margin. There can be no guarantee that there will be a correlation between price movements in the hedging vehicle and in the portfolio securities being hedged. An incorrect correlation could result in a loss on both the hedged securities in the Fund and the hedging vehicle so that the portfolio return might have been greater had hedging not been attempted. There can be no assurance that a liquid market will exist at a time when the Fund seeks to close out a futures contract. Lack of a liquid market for any reason may prevent the Fund from liquidating an unfavorable position, and the Fund would remain obligated to meet margin requirements until the position is closed. In addition, the Fund could be exposed to risk if the counterparties to the contracts are unable to meet the terms of their contracts. With exchange-traded futures contracts, there is minimal counterparty credit risk to the Fund since futures contracts are exchange-traded and the exchange’s clearinghouse, as counterparty to all exchange-traded futures contracts, guarantees the futures contracts against default.
During the six months ended April 30, 2018, the Fund did not invest in futures contracts.
Swaps: During the six months ended April 30, 2018, the Fund engaged in total return swaps. A swap is an agreement that obligates two parties to exchange a series of cash flows at specified intervals based upon or calculated by reference to changes in specified prices or rates for a specified amount of an underlying asset. The Fund may utilize swap agreements as a means to gain exposure to certain assets and/or to “hedge” or protect the Fund from adverse movements in securities prices or interest rates. The Fund is subject to equity risk and interest rate risk in the normal course of pursuing its investment objective through investments in swap contracts. Swap agreements entail the risk that a party will default on its payment obligation to the Fund. If the other party to a swap defaults, the Fund would risk the loss of the net amount of the payments that it contractually is entitled to receive. If the Fund utilizes a swap at the wrong time or judges market conditions incorrectly, the swap may result in a loss to the Fund and reduce the Fund’s total return.
Total return swaps involve an exchange by two parties in which one party makes payments based on a set rate, either fixed or variable, while the other party makes payments based on the return of an underlying asset, which includes both the income it generates and any capital gains over the payment period. A Fund’s maximum risk of loss from counterparty risk or credit risk is the discounted value of the payments to be received from/paid to the counterparty over the contract’s remaining life, to the extent that the amount is positive. The risk is mitigated by having a netting arrangement between a Fund and the counterparty and by the posting of collateral to a Fund to cover the Fund’s exposure to the counterparty. The Fund pledges cash or liquid assets as collateral to satisfy the current obligations with respect to swap contracts. The cash amount is reported on the Statement of Assets and Liabilities as Deposit with broker for total return swap contracts which is held with one counterparty.
During the six months ended April 30, 2018, the Fund invested in swap agreements consistent with the Fund’s investment strategies to seek to hedge against foreign exchange risk or to gain exposure to certain markets or indices.
The effect of derivatives instruments on the Fund’s Statement of Assets and Liabilities as of April 30, 2018:
| | | Asset Derivatives | | | |
| Risk Exposure | | Statements of Assets and Liabilities Location | | Fair Value | |
| Equity Contracts (Total Return Swap Contracts) | | Unrealized appreciation on total return swap contracts | | $ | 594,176 | |
| | | | | $ | 594,176 | |
| | | Liability Derivatives | | | |
| Risk Exposure | | Statements of Assets and Liabilities Location | | Fair Value | |
| Equity Contracts (Total Return Swap Contracts) | | Unrealized depreciation on total return swap contracts | | $ | 64,823 | |
| Total | | | | $ | 64,823 | |
| Clough Global Long/Short Fund | Notes to Financial Statements |
April 30, 2018 (Unaudited)
The effect of derivatives instruments on the Fund’s Statement of Operations for the six months ended April 30, 2018:
| Risk Exposure | | Statements of Operations Location | | Realized Gain/(Loss) on Derivatives Recognized in Income | | | Change in Unrealized Appreciation/ (Depreciation) on Derivatives Recognized in Income | |
Equity Contracts
(Total Return Swap Contracts) | | Net realized gain/(loss) on total return swap contracts/Net change in unrealized appreciation/(depreciation) on total return swap contracts | | | 161,069 | | | | 12,542 | |
| Total | | | | $ | 161,069 | | | $ | 12,542 | |
The average total return swap contracts notional amount during the six months ended April 30, 2018 is $(227,308).
Certain derivative contracts are executed under either standardized netting agreements or, for exchange-traded derivatives, the relevant contracts for a particular exchange which contain enforceable netting provisions. A derivative netting arrangement creates an enforceable right of set-off that becomes effective, and affects the realization of settlement on individual assets, liabilities and collateral amounts, only following a specified event of default or early termination. Default events may include the failure to make payments or deliver securities timely, material adverse changes in financial condition or insolvency, the breach of minimum regulatory capital requirements, or loss of license, charter or other legal authorization necessary to perform under the contract.
The following table presents derivative financial instruments that are subject to enforceable netting arrangements as of April 30, 2018.
| Offsetting of Derivatives Assets |
| | | | | | | | | | | | Gross Amounts Not
Offset in the
Statements of
Assets and
Liabilities | |
| | | Gross Amounts of Recognized Assets | | | Gross Amounts Offset in the Statements of Assets and Liabilities | | | Net Amounts Presented in the Statements of Assets and Liabilities | | | Financial Instruments(a) | | | Cash Collateral Received(a) | | | Net Amount | |
| Total Return Swap Contracts | | $ | 594,176 | | | $ | – | | | $ | 594,176 | | | $ | (64,823 | ) | | $ | – | | | $ | 529,353 | |
| Total | | $ | 594,176 | | | $ | – | | | $ | 594,176 | | | $ | (64,823 | ) | | $ | – | | | $ | 529,353 | |
| Offsetting of Derivatives Liabilities | | | | |
| | | | | | | | | | | | Gross Amounts Not
Offset in the
Statements of
Assets and
Liabilities | |
| | | Gross Amounts of Recognized Liabilities | | | Gross Amounts Offset in the Statements of Assets and Liabilities | | | Net Amounts Presented in the Statements of Assets and Liabilities | | | Financial Instruments(a) | | | Cash Collateral Pledged(a) | | | Net Amount | |
| Total Return Swap Contracts | | $ | 64,823 | | | $ | – | | | $ | 64,823 | | | $ | (64,823 | ) | | $ | – | | | $ | – | |
| Total | | $ | 64,823 | | | $ | – | | | $ | 64,823 | | | $ | (64,823 | ) | | $ | – | | | $ | – | |
| (a) | These amounts are limited to the derivative asset/liability balance and, accordingly, do not include excess collateral received/pledged which is disclosed in the Statement of Investments. |
| Semi-Annual Report | April 30, 2018 | 25 |
| Clough Global Long/Short Fund | Notes to Financial Statements |
April 30, 2018 (Unaudited)
Counterparty Risk: The Fund runs the risk that the issuer or guarantor of a fixed income security, the counterparty to an over-the-counter derivatives contract or the obligor of an obligation underlying an asset-backed security will be unable or unwilling to make timely principal, interest, or settlement payments or otherwise honor its obligations. In addition, to the extent that the Fund uses over-the-counter derivatives, and/or has significant exposure to a single counterparty, this risk will be particularly pronounced for the Fund.
Other Risk Factors: Investing in the Fund may involve certain risks including, but not limited to, the following:
Unforeseen developments in market conditions may result in the decline of prices of, and the income generated by, the securities held by the Fund. These events may have adverse effects on the Fund such as a decline in the value and liquidity of many securities held by the Fund, and a decrease in NAV. Such unforeseen developments may limit or preclude the Funds’ ability to achieve their investment objective.
Investing in stocks may involve larger price fluctuation and greater potential for loss than other types of investments. This may result in the securities held by the Fund being subject to larger short-term declines in value compared to other types of investments.
The Fund may have elements of risk due to concentrated investments in foreign issuers located in a specific country. Such concentrations may subject the Fund to additional risks resulting from future political or economic conditions and/or possible impositions of adverse foreign governmental laws or currency exchange restrictions. Investments in securities of non-U.S. issuers have unique risks not present in securities of U.S. issuers, such as greater price volatility and less liquidity.
2. TAXES
Classification of Distributions: Net investment income/(loss) and net realized gain/(loss) may differ for financial statement and tax purposes. The character of distributions made during the year from net investment income or net realized gains may differ from its ultimate characterization for federal income tax purposes. Also, due to the timing of dividend distributions, the fiscal year in which amounts are distributed may differ from the fiscal year in which the income or realized gain was recorded by the Fund.
There were no distributions paid by the Fund during the year ended October 31, 2017.
Tax Basis of Investments: Net unrealized appreciation/(depreciation) of investments based on federal tax costs as of April 30, 2018, was as follows:
| Gross appreciation (excess of value over tax cost) | | $ | 7,854,005 | |
| Gross depreciation (excess of tax cost over value) | | | (4,017,533 | ) |
| Net unrealized appreciation | | $ | 3,836,472 | |
| Cost of investments for income tax purposes | | $ | 45,780,454 | |
The difference between book and tax basis unrealized appreciation is primarily attributable to wash sales, passive foreign investment companies, and notional principal contracts.
| Clough Global Long/Short Fund | Notes to Financial Statements |
April 30, 2018 (Unaudited)
3. CAPITAL TRANSACTIONS
Common Shares: There is an unlimited number of shares of beneficial interest with no par value per share. Shares redeemed within 30 days of purchase may incur a 2.00% redemption fee deducted from the redemption amount.
| | | For the
Six Months
Ended
April 30, 2018 (Unaudited) | | | For the
Year Ended
October 31,
2017 | |
| Class I: | | | | | | | | |
| Beginning of period | | | 2,687,347 | | | | 4,681,053 | |
| Shares sold | | | 1,373,590 | | | | 546,132 | |
| Shares redeemed | | | (67,546 | ) | | | (2,539,838 | ) |
| Net increase (decrease) in shares outstanding | | | 1,306,044 | | | | (1,993,706 | ) |
| Shares outstanding, end of period | | | 3,993,391 | | | | 2,687,347 | |
| Investor Class:(a) | | | | | | | | |
| Beginning of period | | | 19,143 | | | | 8,059 | |
| Shares sold | | | 210,195 | | | | 11,740 | |
| Shares redeemed | | | (11,555 | ) | | | (656 | ) |
| Net increase in shares outstanding | | | 198,640 | | | | 11,084 | |
| Shares outstanding, end of period | | | 217,783 | | | | 19,143 | |
| Class C: | | | | | | | | |
| Beginning of period | | | 8,760 | | | | 7,843 | |
| Shares sold | | | 224,476 | | | | 1,855 | |
| Shares redeemed | | | – | | | | (938 | ) |
| Net increase in shares outstanding | | | 224,476 | | | | 917 | |
| Shares outstanding, end of period | | | 233,236 | | | | 8,760 | |
| (a) | Prior to December 1, 2017, Investor Class was known as Class A. |
4. PORTFOLIO SECURITIES
Purchases and sales of investment securities, excluding securities sold short intended to be held for less than one year, short-term securities, and Long Term U.S. Government obligations, for the six months ended April 30, 2018, are listed in the table below.
| Cost of Investments Purchased | | | Proceeds From Investments Sold | |
| $ | 41,274,465 | | | $ | 25,497,286 | |
5. INVESTMENT ADVISORY AND OTHER AGREEMENTS
Investment Advisory Agreement: Clough Capital will serve as the Fund’s investment adviser pursuant to an Investment Advisory Agreement with the Fund. As compensation for its services to the Fund, the Adviser receives an annual investment advisory fee of 1.35% based on the Fund’s average daily net assets, paid monthly. The Adviser has agreed contractually to limit the operating expenses of each class of the Fund (excluding Rule 12b-1 Distribution and Service Fees, Shareholder Services Fees, acquired fund fees and expenses, interest, taxes, brokerage costs and commissions, dividend and interest expense on short sales, and litigation, indemnification and extraordinary expenses as determined under generally accepted accounting principles) to an annual rate of 1.60% through February 28, 2020. The Adviser is permitted to recover, on a class-by-class basis, any fees waived and/or expenses reimbursed pursuant to the waiver agreement described above to the extent that such recovery does not cause total annual operating expenses to exceed the expense limitation in effect (i) at the time the fees and/or expenses to be recovered were waived and/or reimbursed and (ii) at the time of such recovery. The Adviser will not be entitled to recover any such waived or reimbursed fees and expenses more than three years after the end of the fiscal year in which the fees were waived or expenses were reimbursed. The Adviser may not terminate this waiver arrangement without the approval of the Fund’s Board.
| Semi-Annual Report | April 30, 2018 | 27 |
| Clough Global Long/Short Fund | Notes to Financial Statements |
April 30, 2018 (Unaudited)
As of October 31, 2017, the balances of future recoupable expenses were as follows:
| | | Expires in 2018 | | | Expires in 2019 | | | Expires in 2020 | | | Total | |
| Class I | | $ | (83,042 | ) | | $ | (537,227 | ) | | $ | (429,730 | ) | | $ | (1,049,999 | ) |
| Investor Class | | $ | (85 | ) | | $ | (470 | ) | | $ | (1,398 | ) | | $ | (1,953 | ) |
| Class C | | $ | (82 | ) | | $ | (734 | ) | | $ | (968 | ) | | $ | (1,784 | ) |
Administration Agreement: The Fund currently employs ALPS Fund Services, Inc. (“ALPS”) under an administration agreement to provide certain administrative services to the Fund. As compensation for its services to the Fund, ALPS receives an annual administration fee based on the Fund’s average daily net assets, paid monthly.
Transfer Agency and Service Agreement: ALPS, pursuant to a Transfer Agency and Service Agreement, serves as transfer agent for the Fund.
Distribution and Shareholder Services Plan: The Fund has adopted a separate plan of distribution for Investor Class and Class C shares, pursuant to Rule 12b-1 under the 1940 Act (each, a “Plan” and collectively, the “Plans”). ALPS Portfolio Solutions Distributor, Inc. (the “Distributor”) serves as the Fund’s distributor.
The Plans allow the Fund, as applicable, to use Investor Class and Class C assets to pay fees in connection with the distribution and marketing of Investor Class and Class C shares and/or the provision of ongoing servicing for the benefit of shareholders. Each Plan permits payment for services in connection with the administration of plans or programs that use Investor Class and/or Class C shares of the Fund as their funding medium and for related expenses.
The Plans permit the Fund to make total payments at an annual rate of up to 0.25% of the Fund’s average daily net assets attributable to its Investor Class shares, and 1.00% of the Fund’s average daily net assets attributable to its Class C shares. Because these fees are paid out of the Fund’s Investor Class and Class C shares, respectively, on an ongoing basis, over time they will increase the cost of an investment in Investor Class and Class C shares. For example, the Class C Plan fees may cost an investor more than the Investor Class Plan sales charges over time.
Under the terms of the Plans, the Trust is authorized to make payments to the Distributor for remittance to financial intermediaries, as compensation for distribution and/or the provision of on-going servicing for the benefit of shareholders performed by such financial intermediaries for their customers who are investors in the Fund. Financial intermediaries may from time to time be required to meet certain additional criteria in order to continue to receive 12b-1 fees. For Class C shares, the Distributor is entitled to retain all fees paid under the Plan for the first 12 months on any investment in Class C Shares to recoup the expenses with respect to the payment of commissions on sales of Class C Shares. Financial intermediaries will become eligible for Class C Plan compensation beginning in the 13th month following the purchase of Class C Shares, although the Distributor may, pursuant to a written agreement between the Distributor and a particular financial intermediary, pay such financial intermediary 12b-1 fees prior to the 13th month following the purchase of Class C Shares. The Distributor may retain some or all compensation payable pursuant to the Plans under certain circumstances, such as when a financial intermediary is removed as the broker of record or a financial intermediary fails to meet certain qualification standards to be eligible to continue to be the broker of record.
Shareholder Services Plan for Investor Class Shares: The Fund has adopted a non-12b-1 shareholder services plan (the “Services Plan”) with respect to the Fund’s Investor Class shares. Under the Services Plan, the Fund is authorized to pay financial intermediaries an aggregate fee in an amount not to exceed on an annual basis 0.10% of the average daily net asset value of the Investor Class shares of the Fund attributable to or held in the name of the financial intermediary for its clients as compensation for maintaining customer accounts that hold Fund shares. These activities may include, but are not limited to, establishing and maintaining Fund shareholder accounts on a transaction processing and record keeping system, providing Fund shareholders with the ability to access current Fund information, including without limitation, share balances, dividend information and transaction history, and permitting the Fund’s transfer agent to receive order instructions from or on behalf of Fund shareholders for the purchase or redemption of Shares. None of these activities include distribution services. Any amount of the Services Plan fees not paid during the Fund’s fiscal year for such servicing shall be reimbursed to the Fund.
6. AFFILIATED TRANSACTIONS
The Fund may engage in cross trades with an affiliate pursuant to Rule 17a-7 under the 1940 Act. Cross trading is the buying or selling of portfolio securities between funds to which the Adviser serves as the investment adviser. The Board of Trustees previously adopted procedures that apply to transactions from or to another registered investment company, or any account which is considered an affiliated account by reason of having a common investment adviser. At its regularly scheduled meetings, the Trustees review such transactions as of the most current calendar quarter for compliance with the requirements set forth by Rule 17a-7 and the Fund’s procedures. The procedures require that the transactions be a purchase or sale for no consideration other than cash payment or cash credit (to be used to purchase shares of the Fund involved) against prompt delivery of a security for which market quotations are readily available, and be consistent with the investment policies of the Fund. During the six months ended April 30, 2018 the Fund did not engage in cross trades.
| Clough Global Long/Short Fund | Notes to Financial Statements |
April 30, 2018 (Unaudited)
7. INDEMNIFICATION
Under the Trust’s organizational documents, its officers and Trustees are indemnified against certain liabilities arising out of the performance of their duties to the Trust. Additionally, in the normal course of business, the Trust enters into contracts with service providers that contain general indemnification clauses. The Trust’s maximum exposure under these arrangements is unknown, as this would involve future claims that may be made against the Trust that have not yet occurred. However, based on experience, the Trust believes the risk of loss to be remote.
| Semi-Annual Report | April 30, 2018 | 29 |
| Clough Global Long/Short Fund | Additional Information |
April 30, 2018 (Unaudited)
FUND PROXY VOTING POLICIES & PROCEDURES
The Fund’s policies and procedures used in determining how to vote proxies relating to portfolio securities are available on the Fund’s website at http://www.cloughglobal.com. Information regarding how the Fund voted proxies relating to portfolio securities held by the Fund for the period ended June 30, are available without charge, upon request, by contacting the Funds at 1-877-256-8445 and on the Commission’s website at http://www.sec.gov.
PORTFOLIO HOLDINGS
The Fund files its complete schedule of portfolio holdings with the Commission for the first and third quarters of each fiscal year on Form N–Q within 60 days after the end of the period. Copies of the Fund’s Form N–Q are available without a charge, upon request, by contacting the Fund at 1-877-256-8445 and on the Commission’s website at http://www.sec.gov. You may also review and copy Form N–Q at the Commission’s Public Reference Room in Washington, D.C. For more information about the operation of the Public Reference Room, please call the Commission at 1-800-SEC-0330.
| Clough Global Long/Short Fund | Investment Advisory Agreement Approval |
April 30, 2018 (Unaudited)
At an in-person meeting of the Board held on April 11, 2018, the Trustees of Clough Funds Trust (the “Trust”), including a majority of the Trustees who are not “interested persons” of the Trust (the “Independent Trustees”), voted to approve the continuation of the current Management Agreement (the “Management Agreement”) with Clough Capital Partners L.P. (the “Adviser”) with respect to the Clough Global Long/Short Fund (the “Fund”). In voting such approval, the Board took into account various sources of information, considerations and conclusions, as summarized below.
Management Agreement Approval Process
Section 15(c) of the Investment Company Act of 1940, as amended (the “1940 Act”), requires that each mutual fund’s board of directors or trustees, including a majority of those directors or trustees who are not “interested persons” of the mutual fund, as defined in the 1940 Act, initially approve, and after an initial term not exceeding two years, annually review and consider the continuation of, the mutual fund’s investment advisory agreement. The Board reviewed information relating to the Fund and the Adviser that was prepared in response to specific inquiries made on behalf of the Independent Trustees to assist them in their consideration of the continuation of the Management Agreement. This information included, among other things, information about: the Adviser’s organization, operations and personnel; the services provided to the Fund by the Adviser; the Adviser’s portfolio management, trading and compliance practices; and the level of the advisory fee and the total expense ratio of the Fund relative to a peer group of comparable alternative long-short equity funds, as detailed in a comparative analysis prepared by an independent data provider. As part of its consideration process, the Board received presentations from representatives of the Adviser regarding the Fund and its investment strategy, and reviewed the Fund’s investment performance in comparison to the performance of other similarly managed funds. The Independent Trustees of the Board also met in executive session separately from Fund management and the interested Trustees to consider the information provided and to confer with independent legal counsel regarding their responsibilities under relevant laws and regulations.
Nature, Quality and Extent of Services
In evaluating the nature, quality and extent of services provided by the Adviser to the Fund, the Board reviewed information relating to the Adviser’s operations and personnel, including: its organizational and management structure; the qualifications, education and experience of the individual investment professionals whose responsibilities include portfolio management and investment research for the Fund; the portfolio management and trading practices to be employed in managing the Fund; the Adviser’s financial condition and its ability to devote the resources necessary to provide the services required under the Management Agreement; and the Adviser’s dedication to maintaining appropriate compliance programs with respect to the Fund. In particular, the Board noted that the Adviser is a well-regarded organization with an appropriate level of financial and human resources, including personnel with experience managing global long-short portfolios. The Board also compared the Fund’s investment performance over various periods to benchmark indices and a peer group of comparable long-short equity funds selected by an independent data provider. The Board noted that the Fund had outperformed its peer group for the one-year period ended February 28, 2018, when the average annual net total return performance of the peer group was 8.17% and the Fund’s performance was 18.02%, placing it in the top decile.
Based upon these and other relevant factors, the Board concluded that the Adviser possesses the capability to effectively perform the duties required of it under the Management Agreement and that the Adviser’s personnel are qualified to manage the Fund’s assets in accordance with its stated investment objectives and policies.
Fees and Expenses
In considering the fee payable to the Adviser under the Management Agreement, the Board reviewed comparative information presented in the report of an independent data provider relating to the actual and contractual fee level and total expense ratio of the Fund relative to a peer group of comparable long-short equity funds. In this regard, the Board considered that the gross advisory fee payable by funds in the expense group ranged from 0.870% to 2.450%, with a median of 1.444%, and that the Fund’s gross advisory fee was 1.350%. The Board also considered that the net total expense ratio for the expense group, excluding investment related expenses, ranged from 1.230% to 2.900%, with a median of 1.600%, and the Fund’s net total expense ratio, excluding investment related expenses, was 1.600%.
The Board also requested and reviewed information regarding the fees charged by the Adviser to the other registered funds and institutional separate accounts it manages. In addition, the Board noted that during the one-year period ended February 28, 2018 the Adviser had waived a portion of its advisory fees for the purpose of maintaining a limit on total operating expenses, and that the Adviser had proposed to continue waiving advisory fees, if necessary, for each share class of the Fund for a period of at least one year from the date of the Fund’s prospectus, subject to potential recapture under certain conditions.
On the basis of the information provided, the Board concluded that the advisory fee was reasonable in light of the nature, quality and extent of services provided by the Adviser.
Profitability
In considering the fees payable under the Management Agreement, the Board reviewed information regarding the Adviser’s costs to provide investment management and related services to the Fund and the estimated profitability to the Adviser from all services provided to the Fund. In its evaluation, the Board considered the Adviser’s representation that the level of its estimated profitability was reasonable based on the nature and quality of the services provided and the Adviser’s costs in delivering such services. The Board also considered that the actual profitability of the Fund to the Adviser would depend on the growth of assets under management, after giving effect to the Adviser’s agreement to maintain a limit on total expenses for a period of at least one year from the date of the Fund’s prospectus. Based on these considerations, the Board concluded that the profits expected to be realized by the Adviser as a result of the continuation of the Management Agreement would not be excessive.
| Semi-Annual Report | April 30, 2018 | 31 |
| Clough Global Long/Short Fund | Investment Advisory Agreement Approval |
April 30, 2018 (Unaudited)
Economies of Scale
In reviewing the Fund’s advisory fee, the Board considered the extent to which the Adviser, on the one hand, and the Fund, on the other hand, can expect to benefit from economies of scale in the event the assets of the Fund increase over time. In considering the potential to realize benefits from economies of scale, the Board reviewed the Fund’s advisory fee in comparison to comparable peer funds as well as the Fund’s current and expected expense ratio after giving effect to the Adviser’s agreement to limit total expenses for a period of one year from the date of the Fund’s prospectus. On the basis of the foregoing, and in light of the Fund’s current and expected asset levels, the Board concluded that the structure of the advisory fee is appropriate and that fee breakpoints are not required at this time. The Board noted, however, that it would review future growth in Fund assets and the appropriateness of breakpoints as part of future annual reviews of the Management Agreement.
Other Benefits
The Board considered other potential benefits to be derived by the Adviser from its relationship with the Fund, as well as any additional benefits which may be derived by the Fund as a result of its association with the Adviser.
Conclusion
Based on its review of the information provided, and such other factors and conclusions as the Board deemed relevant, the Board, including a majority of the Independent Trustees, concluded that the approval of the Management Agreement is in the best interests of the Fund and voted to approve its continuation. In reaching this determination, the Board did not assign relative weights to any factors or conclusions taken into account nor did it deem any one or group of such factors or conclusions to be determinative in isolation.
Item 2. Code of Ethics.
Not applicable to this report.
Item 3. Audit Committee Financial Expert.
Not applicable to this report.
Item 4. Principal Accountant Fees and Services.
Not applicable to this report.
Item 5. Audit Committee of Listed Registrants.
Not applicable to registrant.
Item 6. Investments.
| (a) | Schedule of Investments is included as part of the Report to Stockholders filed under Item 1 of this Form N-CSR. |
Item 7. Disclosure of Proxy Voting Policies and Procedures for Closed-End Management Investment Companies.
Not applicable to the registrant.
Item 8. Portfolio Managers of Closed-End Management Investment Companies.
Not applicable to the registrant.
Item 9. Purchases of Equity Securities by Closed-End Management Investment Company and Affiliated Purchasers.
Not applicable to the registrant.
Item 10. Submission of Matters to Vote of Security Holders.
There have been no material changes to the procedures by which shareholders may recommend nominees to the Registrant’s Board of Trustees, where those changes were implemented after the Registrant last provided disclosure in response to the requirements of Item 407(c)(2)(iv) of Regulation S-K, or this Item.
Item 11. Controls and Procedures.
| (a) | The registrant’s principal executive officer and principal financial officer have evaluated the registrant’s disclosure controls and procedures (as defined in Rule 30a-3(c) under the Investment Company Act of 1940, as amended) within 90 days of this report and have concluded that the registrant’s disclosure controls and procedures were effective as of that date. |
| (b) | There was no change in the registrant’s internal control over financial reporting (as defined in Rule 30a-3(d) under the Investment Company Act of 1940, as amended) during the second fiscal quarter of the period covered by this report that has materially affected, or is reasonably likely to materially affect, the registrant’s internal control over financial reporting. |
Item 12. Disclosure of Securities Lending Activities for Closed-End Management Investment Companies.
Not applicable to registrant.
Item 13. Exhibits.
| (a)(1) | Not applicable to this report. |
| (a)(2) | The certifications required by Rule 30a-2(a) of the Investment Company Act of 1940, as amended, and Section 302 of the Sarbanes-Oxley Act of 2002 are attached hereto as Exhibit 99.Cert. |
| (b) | The certifications by the registrant’s principal executive officer and principal financial officer, as required by Rule 30a-2(b) of the Investment Company Act of 1940, as amended, and Section 906 of the Sarbanes-Oxley Act of 2002 are attached hereto as Exhibit 99.906Cert. |
SIGNATURES
Pursuant to the requirements of the Securities Exchange Act of 1934 and the Investment Company Act of 1940, the Registrant has duly caused this report to be signed on its behalf by the undersigned, thereunto duly authorized.
CLOUGH FUNDS TRUST
| By: | /s/ Edmund J. Burke | |
| | Edmund J. Burke | |
| | President/Principal Executive Officer | |
| | | |
| Date: | July 2, 2018 | |
Pursuant to the requirements of the Securities Exchange Act of 1934 and the Investment Company Act of 1940, this report has been signed below by the following persons on behalf of the Registrant and in the capacities and on the dates indicated.
CLOUGH FUNDS TRUST
| By: | /s/ Edmund J. Burke | |
| | Edmund J. Burke | |
| | President/Principal Executive Officer | |
| | | |
| Date: | July 2, 2018 | |
| | | |
| By: | /s/ Jill Kerschen | |
| | Jill Kerschen | |
| | Treasurer/Principal Financial Officer | |
| | | |
| Date: | July 2, 2018 | |