UNITED STATES
SECURITIES AND EXCHANGE COMMISSION
Washington, D.C. 20549
FORM N-CSR
CERTIFIED SHAREHOLDER REPORT OF REGISTERED
MANAGEMENT INVESTMENT COMPANIES
Investment Company Act file number: 811-23059
CLOUGH FUNDS TRUST
(Exact name of registrant as specified in charter)
1290 Broadway, Suite 1100, Denver, Colorado 80203
(Address of principal executive offices) (Zip code)
303.623.2577
(Registrant’s telephone number, including area code)
Sareena Khwaja-Dixon, Secretary
Clough Funds Trust
1290 Broadway, Suite 1100
Denver, CO 80203
(Name and address of agent for service)
Date of fiscal year end:October 31
Date of reporting period:November 1, 2018 - April 30, 2019
| Item 1. | Report to Stockholders. |
| Clough Global Long/Short Fund | Table of Contents |
| Shareholder Letter | 2 |
| Portfolio Performance | 5 |
| Disclosure of Fund Expenses | 8 |
| Statement of Investments | 9 |
| Statement of Assets and Liabilities | 12 |
| Statement of Operations | 13 |
| Statement of Changes in Net Assets | 14 |
| Financial Highlights | 15 |
| Notes to Financial Statements | 19 |
| Additional Information | 29 |
| Investment Advisory Agreement Approval | 30 |
Beginning on January 1, 2021, as permitted by regulations adopted by the U.S. Securities and Exchange Commission, paper copies of the Fund’s annual and semi-annual shareholder reports will no longer be sent by mail, unless you specifically request paper copies of the reports. Instead, the reports will be made available on the Fund’s website at www.cloughglobal.com, and you will be notified by mail each time a report is posted and provided with a website link to access the report.
Beginning on January 1, 2019, you may, notwithstanding the availability of shareholder reports online, elect to receive all future shareholder reports in paper free of charge. If you invest through a financial intermediary, you can contact your financial intermediary to request that you continue to receive paper copies of your shareholder reports. If you invest directly with the Fund, you can call 1-855-425-6844 to let the Fund know you wish to continue receiving paper copies of your shareholder reports.
If you already elected to receive shareholder reports electronically, you will not be affected by this change and you need not take any action. You may elect to receive shareholder reports and other communications from the Fund electronically anytime by contacting your financial intermediary (such as a broker-dealer or bank) or, if you are a direct investor, by enrolling at http://www.cloughglobal.com/open-end-funds/overview/cloax.
| Clough Global Long/Short Fund | Shareholder Letter |
April 30, 2019 (Unaudited)
To Our Investors:
For the semi-annual period ending April 30th, 2019, the Clough Global Long/Short Fund (the “Fund”) had a total return of 4.77% for Class I, compared to 9.70% for the MSCI ACWI and 5.12% for the HFRI Equity Hedge Index. See total returns chart for the performance of all other share classes. The Fund had an average net exposure of 65.4% during this period.
During the period, the long-book contributed 7.71% to returns with an average exposure of 84.3%, while the short book detracted 2.44% from returns with an average exposure of -18.9%. By geography, companies domiciled in the U.S. contributed 3.87% to returns while companies in Italy detracted 0.46%. By sector, the largest contributor was Consumer Discretionary which added 2.56% to returns while Health Care was the largest detractor from returns, with a negative 0.65% impact.
Following is a summary of the key themes expressed in the Fund during the fiscal year-to-date:
The Semiconductor Cycle
The semiconductor cycle is acting in a traditional fashion. Mid-decade, strong smartphone sales hyped demand for semiconductors and manufacturers responded with aggressive capacity additions.
The Bitcoin boom, which took place at the same time as Apple and Samsung introduced new phones with heavy component needs, only intensified demand. Double-ordering, which always occurs at the top of cycles, made demand appear even stronger than it was, and smartphone producers were left heavy with excess semiconductor inventory when sales disappointed and Bitcoin collapsed. Dynamic random-access memory (“DRAM”) pricing started to weaken in mid-2018. Furthermore, large internet companies stopped buying DRAM as pricing started to decline. Since inventories had to be marked down in a falling market, what began as double-digit year-on-year declines in prices turned into the monthly year-on-year decline in rates which are expected to reach 30-40% by Q2 2019 in the case of DRAM.
But the industry should adjust to this quickly. For one, the number of memory suppliers has declined from twelve to three, as European and Taiwanese producers left the industry. We expect that the profit cycle for DRAM and flash memory next time around will be strong. Once 5G-enabled devices and signal infrastructure needs emerge, demand for memory should pick up strongly. The sources of demand have also changed. DRAM is now used by a much broader spectrum of customers. Demand used to be limited by the needs of smartphones, gamers and laptops, but now data centers and industrial uses dominate. Data center investment, artificial intelligence networks and related demand for chips will likely reaccelerate later in 2019 just as memory chip inventory depletes. DRAM pricing should be particularly strong under that scenario.
Asian Consumer Growth
India
As developed economies enter a slowdown, it is important to keep in mind that India offers 7% growth while Japan and Germany offer 1% growth or less. In India, an aspirational millennial population is beginning to migrate from India’s poor and inefficient northern and eastern provinces, to the south and west where the wealth is. That is a similar dynamic to one that powered China’s growth in the 2000s.
Also, over the past twenty-five years the NIFTY 50 Index, which is the benchmark broad-based stock market index for the Indian equity market, has returned 11.09% on an annualized basis, which places it among the top global markets. Indian firms have higher returns on equity (“ROE”) than their global peers (the top 500 companies in India generate ROE of 15% versus the emerging market average of 11%). And India’s talent pool is strong.
To keep up with demographics, India must generate one million jobs each month, and it is moving away from agriculture as a dominant employer. The number of agricultural employees has declined from 700 million to 400 million over the past decade, which indicates that India is very early in a productivity boom which could potentially span the next two decades. The demonetization strategy Prime Minister Modi put in place a few years ago drove 30% of the Indian population from the cash economy into the banks where they can now access credit. The new bankruptcy law has forced many of the state-owned banks to clear the books of shady loans and the highly public insolvency of the Non-Bank Financial Institutions puts the quality, publicly-traded banks in a margin sweet spot. They control most of the deposits, enjoy the lowest deposit costs, can lend profitably to the highest quality credit and control most of the loan pricing power in the economy.
While the government has announced a “Housing for All” program to fund millions of homes by the mid-2020s, private investment is picking up as well. Affordability is rising as incomes rise and housing costs remain stable. Mortgages outstanding equal 10% of gross domestic product (“GDP”) versus 60% in the U.S. Housing costs are tax deductible and mortgages are subsidized. In addition, interest rates in India are high and bank spreads are strong. With the state banking institution in a state of decline, depositors are moving to the private institutions.
| Clough Global Long/Short Fund | Shareholder Letter |
April 30, 2019 (Unaudited)
We believe demand for credit will come from both the household and corporate sectors. A badly needed construction boom is underway in India. Real estate borrowing in India is 4-5% of total credit, 80% of which is residential and therefore highly stable. Unsold inventory is falling and a cut in the Goods and Services tax is lifting profits and sentiment.
China
While debt issues still dominate negative investor perceptions of China, the real question is where can a 45% savings rate go? The consumption cycle in China still seems largely misunderstood by the market and it is underestimated.
A government policy of corporate deleveraging amid tariff concerns led China stocks to a 24% decline in 2018. At the same time, China’s securities markets suffered from a tight monetary policy and a concerted effort by the authorities to force deleveraging. But we think the 2019 recovery has legs. China’s equity market sells at a low price to book level, speculation is muted, earnings revisions are beginning to move up, and the central bank is increasing liquidity. These are all promising indicators.
China is always undergoing tremendous change and much of the slowing in that economy can be attributed to the decline in industrial and export activity, a segment forever plagued by excess, inefficient capacity and low returns on investment. However, household consumption and certain market segments, such as health services and others, are undercounted and growing rapidly. Wages are increasing in China and financial service companies will face growing demand.
The China negatives, on the other hand, are well known. China’s GDP reportedly slowed to 6.4% in 2018 and perhaps less. Either way, it was the slowest real rate of growth for that country in 30 years. Exports and industrial activity are slowing. China’s population is peaking, and the working age population will soon be declining. The number of births was the lowest since 1961 and even though China’s long standing “one child” policy was recently cancelled, they will continue to decline. The cliché-based fear is that China will grow old, with accompanying social costs, before it becomes rich. Political reform has seemingly stopped, and government is moving back to the type of autocracy which sooner or later becomes sclerotic. That is the negative outlook.
So why even consider investing in China? For one, we believe that much of this is already priced into the market. Historically, price to earnings ratios in China have ranged from 9x to 16x (excluding the rapid growth phase when they traded up to 37x), and they are at 11x today. Stocks are down so much in China that even a little good news should rally the market to some extent.
While China’s industrial sector is coming under pressure and producers of industrial goods from iPhones and appliances to precision machines and automobiles are experiencing declining sales, China’s current account balance is positive, its currency is strong and China’s consumer economy is still vibrant. Many consumer and technology companies are experiencing growing sales as consumer incomes rise.
Secondly, we believe consumer company profits are about to benefit from the “accelerator effect” – that is, the tendency of consumers to accelerate spending on higher end goods and services as incomes rise, promising growth in the consumer economy well above the national average. Per capita incomes in China average about $9,500 U.S. dollars and the number of high-income consumers is accelerating. As more consumers enter the middle class, and the number of middle- class Chinese rises from 300 million to an estimated 500 million by 2026, consumer spending should grow by an amount that may equal the total dollar value of U.S. consumer spending by 2026.
For the moment, the market’s attention is focused on the tariff issue and while that issue may yet take time to unfold, we note in the interim, that after visiting and investing in China for the better part of three decades, we have learned that China never does anything that is not in its own best interest. The absence of a trade deal means further deterioration in employment, which is something we think China will try to avoid at all costs.
Healthcare – Positioning for The Election Cycle
During the period we added to healthcare companies with classic “cash pay” businesses within healthcare (i.e. companies whose revenues stem from direct customer payments rather than government or private insurance reimbursements). These include positions in the dental and the animal health markets, bolstering our existing “science-heavy” portfolio.
As we move into the 2020 election cycle, we are looking for investments that boast strong fundamentals and sustainable mid-single digit growth over the next several years, but have little reimbursement, generic threat or drug pricing political rhetoric risk. Our holdings include three companies that we believe are uniquely positioned within the animal health industry, including a market leader in animal therapeutics, a market leader in animal diagnostics, and a recent spinoff in animal therapeutics.
| Semi-Annual Report | April 30, 2019 | 3 |
| Clough Global Long/Short Fund | Shareholder Letter |
April 30, 2019 (Unaudited)
We continue to be bullish on merger and acquisition (“M&A”) activity in the biotechnology and mid-cap pharmaceutical sub-sector. The industry has seen significant M&A activity in 2019, and we expect continued deal activity for the foreseeable future. We continue to add strategic assets to the portfolio. We believe that currently, roughly half of our healthcare holdings make reasonable acquisition targets, offering innovative competitive products, long patent protection, and management teams that are aligned with shareholders.
Short Book
Our long-standing short position in a basket of Europe’s weakest banks has been maintained. As Europe depends on its banks to fund growth, little wonder its economies are so weak. And there is no easy fix. Mergers make little sense since there is no evidence larger institutions would be any stronger. A European recession would complicate things. What long term refinancing operation (“LTRO”) and quantitative easing in Europe accomplished was to saddle the banks with huge holdings of peripheral country debt.
In a long period of excess liquidity and credit availability, the opportunity for capital destruction is rife. We have seen once iconic companies like Sears, General Electric and IBM buy back stock at prices far higher than today’s and reduce financial flexibility and ROIs in the process. We have seen capital destroyed on wasteful acquisitions and poor expansion strategies. Our sense is the securities markets will be less tolerant of such strategies going forward and we have identified short positions which we think are likely to benefit as a result.
In Conclusion
The Fund’s recent results are encouraging to us, particularly following the market chaos of the late 2018 equity sell-off. Amid that turmoil, we kept our high conviction long positions intact, because we believed that attempts to trade around the steep equity sell-offs risked the portfolio being whipsawed. During this period, the Fund’s modest short book helped to reduce volatility, which made holding our high conviction long positions more palatable.
We do not base our investment strategies on economic forecasts, but we do follow investment and credit cycles and we draw three conclusions from what we see today: (1) the dominant price trends are deflationary; (2) the Fed is more likely to ease than tighten; and (3) the economy will likely slow rather than fall into recession. No serious inventory imbalances are present (beyond what we outlined above within the semiconductor complex), and no serious overbuild in the nation’s capital stock which would undermine pricing and profitability is visible, such as the technology boom in 2000 or housing in 2008. We believe that although temporary technical factors can knock the market down, the likelihood of a serious liquidity squeeze seems remote at this point.
Sincerely,
 |  |
| | |
| Charles I. Clough, Jr. | Vincent M. Lorusso, Jr. |
| Clough Global Long/Short Fund | Portfolio Performance |
April 30, 2019 (Unaudited)
Performance(as of April 30, 2019)
| | 1 Month | Quarter | 6 Month | 1 Year | 3 Year | Since Inception(a) |
| Class I - NAV(b)(c) | 1.17% | 3.70% | 4.77% | -2.86% | 6.39% | 2.47% |
| Investor Class - NAV(b)(g) | 1.09% | 3.64% | 4.62% | -3.14% | 6.04% | 2.16% |
| Class A - NAV(b)(h) | 1.09% | 3.64% | 4.62% | -3.14% | 6.04% | 3.04% |
| Class A - MOP(b)(h) | -4.48% | -2.03% | -1.16% | -8.50% | 4.07% | 1.43% |
| Class C - NAV(b) | 1.02% | 3.43% | 4.22% | -3.81% | 5.30% | 1.55% |
| Class C - CDSC(b) | 0.02% | 2.43% | 3.22% | -4.77% | 5.30% | 1.55% |
| MSCI All Country World Index(d) | 3.38% | 7.48% | 9.37% | 5.06% | 11.36% | 7.57% |
| HFRI Equity Hedge Index(e) | 1.63% | 4.09% | 5.05% | 0.98% | 6.92% | 4.35% |
| S&P 500 Index(f) | 4.05% | 9.48% | 9.76% | 13.49% | 14.87% | 10.88% |
The performance data quoted above represents past performance. Past performance is not a guarantee of future results. Investment return and value of the Fund shares will fluctuate so that an investor’s shares, when sold or redeemed, may be worth more or less than their original cost. Performance may be lower or higher than performance data quoted. Fund performance current to the most recent month-end is available by calling (855) 425-6844 or by visiting www.cloughglobal.com.
Maximum Offering Price (MOP) for Class A shares includes the Fund’s maximum sales charge of 5.50%. Performance shown at NAV does not include sales charges and would have been lower had it been taken into account. A Contingent Deferred Sales Charge (“CDSC”) of 1.00% may apply to Class C shares redeemed within the first 12 months after a purchase. The Fund imposes a 2.00% redemption fee on shares held for less than 30 days.
| (a) | Fund’s commencement date is September 30, 2015. The performance data quoted for the period prior to September 30, 2015 is that of an unregistered investment fund (the “Predecessor Fund”) that was managed by the Adviser since its inception and was reorganized into the Fund as of the date the Fund commenced investment operations. The Predecessor Fund was not a registered mutual fund and therefore was not subject to the same investment and tax restrictions as the Fund. Performance information reflects all fees and expenses incurred by the Predecessor Fund, and has not been adjusted to reflect Fund expenses. If it had been so adjusted, the Predecessor Fund’s performance would have been higher for that period. The Predecessor Fund commenced operations on January 2, 2015. |
| (b) | Returns shown prior to 9/30/2015 are based on the returns of the Predecessor Fund adjusted to reflect 12b-1 fees and shareholder services fees, as applicable. |
| (c) | Returns shown prior to 9/30/2015 are based on the returns of the Predecessor Fund. |
| (d) | The MSCI All Country World Index is a float-adjusted, capitalization weighted index that is designed to measure the equity market performance of the full opportunity set of large- and mid-cap stocks across 23 developed and 24 emerging markets. Both indices referenced herein reflect the reinvestment of dividends. The MSCI information may only be used for your internal use, may not be reproduced or re-disseminated in any form and may not be used as a basis for or a component of any financial instruments or products or indices. None of the MSCI information is intended to constitute investment advice or a recommendation to make (or refrain from making) any kind of investment decision and may not be relied on as such. Historical data and analysis should not be taken as an indication or guarantee of any future performance analysis, forecast or prediction. The MSCI information is provided on an “as is” basis and the user of this information assumes the entire risk of any use made of this information. MSCI, each of its affiliates and each other person involved in or related to compiling, computing or creating any MSCI information (collectively, the “MSCI Parties”) expressly disclaims all warranties (including, without limitation, any warranties of originality, accuracy, completeness, timeliness, non-infringement, merchantability and fitness for a particular purpose) with respect to this information. Without limiting any of the foregoing, in no event shall any MSCI Party have any liability for any direct, indirect, special, incidental, punitive, consequential (including, without limitation, lost profits) or any other damages (www.msci.com). |
| (e) | An index designed by Hedge Fund Research, Inc. to represent the performance of investment managers who maintain positions both long and short in primarily equity and equity derivative securities. A wide variety of investment processes can be employed by such managers to arrive at an investment decision, including both quantitative and fundamental techniques; strategies can be broadly diversified or narrowly focused on specific sectors and can range broadly in terms of levels of net exposure, leverage employed, holding period, concentrations of market capitalizations and valuation ranges of typical portfolios. The HFRI family of indices reserves the right to revise historical performance data for a period of up to four months following the as of date. The performance shown was calculated using current, available data at the time of publication, but is subject to change outside of the control of the Fund and its affiliates |
| (f) | The Standard & Poor’s composite index of 500 stocks, a widely recognized, unmanaged index of common stock prices. Index performance does not reflect fund performance. |
| (g) | On December 1, 2017, Class A was renamed Investor Class. |
| (h) | A new Class A commenced operations on June 29, 2018. |
Returns of less than 1 year are cumulative.
An investor cannot invest directly in an index.
| Semi-Annual Report | April 30, 2019 | 5 |
| Clough Global Long/Short Fund | Portfolio Performance & Allocation |
April 30, 2019 (Unaudited)
Performance of $10,000 Initial Investment(as of April 30, 2019)
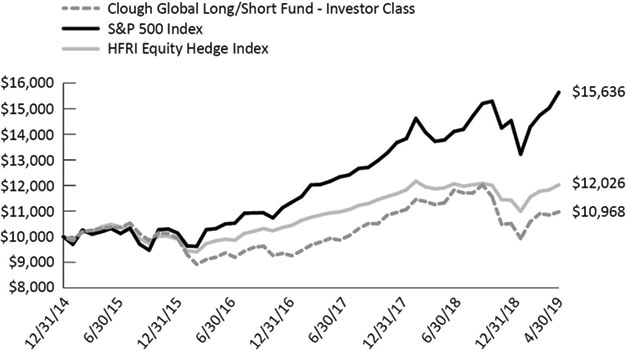
The graph shown above represents historical performance of a hypothetical investment of $10,000 in the Fund since inception. The historical performance prior to September 30, 2015 is that of the Predecessor Fund. Past performance does not guarantee future results. All returns reflect reinvested dividends, but do not reflect the deduction of taxes that a shareholder would pay on Fund distributions or the redemption of Fund shares.
| Top Ten Long Holdings(as a % of Net Assets)* | |
| Carvana Co. | 2.02% |
| CRISPR Therapeutics AG | 1.98% |
| Microsoft Corp. | 1.71% |
| TransDigm Group, Inc. | 1.70% |
| JPMorgan Chase & Co. | 1.67% |
| Citigroup, Inc. | 1.65% |
| Morgan Stanley | 1.65% |
| Bank of America Corp. | 1.62% |
| Analog Devices, Inc. | 1.52% |
| Home Depot, Inc. | 1.47% |
| Top Ten Holdings | 16.99% |
| * | Holdings are subject to change |
| Sector Allocation** | Long Exposure % TNA | Short Exposure % TNA | Gross Exposure % TNA | Net Exposure % TNA |
| Health Care | 18.2% | -2.2% | 20.4% | 16.0% |
| Consumer Discretionary | 18.2% | -3.5% | 21.7% | 14.7% |
| Financials | 16.8% | -4.7% | 21.5% | 12.1% |
| Information Technology | 16.3% | -4.0% | 20.3% | 12.3% |
| Communication Services | 6.9% | -1.1% | 8.0% | 5.8% |
| Industrials | 2.9% | -1.0% | 3.9% | 1.9% |
| Materials | 0.9% | 0.0% | 0.9% | 0.9% |
| Real Estate | 1.2% | -2.1% | 3.3% | -0.9% |
| Consumer Staples | 4.0% | -4.2% | 8.2% | -0.2% |
| Total Investments | 85.4% | -22.8% | 108.2% | 62.6% |
| Clough Global Long/Short Fund | Portfolio Allocation |
April 30, 2019 (Unaudited)
| Country Allocation ** | Long Exposure % TNA | Short Exposure % TNA | Gross Exposure % TNA | Net Exposure % TNA |
| United States | 43.9% | -9.8% | 53.7% | 34.1% |
| U.S. Multinationals† | 16.6% | -3.5% | 20.1% | 13.1% |
| China | 12.4% | 0.0% | 12.4% | 12.4% |
| India | 6.7% | 0.0% | 6.7% | 6.7% |
| Other - Developed Markets | 0.6% | 0.0% | 0.6% | 0.6% |
| Japan | 0.5% | 0.0% | 0.5% | 0.5% |
| Other - Emerging Markets | 0.0% | -1.0% | 1.0% | -1.0% |
| Europe | 4.7% | -8.5% | 13.2% | -3.8% |
| Total Investments | 85.4% | -22.8% | 108.2% | 62.6% |
| ** | Allocation summaries and top ten long holdings calculated as percent of total net assets using market value of cash traded securities, notional value of derivative contracts and excluding short-term investments. |
| † | US Multinational Corporations – has more than 50% of revenues derived outside of the U.S. |
Semi-Annual Report | April 30, 2019 | 7 |
| Clough Global Long/Short Fund | Disclosure of Fund Expenses |
April 30, 2019 (Unaudited)
Examples. As a shareholder of the Clough Global Long/Short Fund (the “Fund”), you incur two types of costs: (1) transaction costs, including applicable redemption fees and sales charges (loads); and (2) ongoing costs, including management fees, distribution and service (12b-1) fees and other Fund expenses. The following examples are intended to help you understand your ongoing costs (in dollars) of investing in the Fund and to compare these costs with the ongoing costs of investing in other mutual funds. The examples are based on an investment of $1,000 invested on November 1, 2018 and held through April 30, 2019.
Actual Expenses.The first line of the table below provides information about actual account values and actual expenses. You may use the information in this line, together with the amount you invested, to estimate the expenses that you paid over the period. Simply divide your account value by $1,000 (for example, an $8,600 account value divided by $1,000 = 8.6), then multiply the result by the number in the first line under the heading “Expenses Paid During Period November 1, 2018 – April 30, 2019” to estimate the expenses you paid on your account during this period.
Hypothetical Example for Comparison Purposes. The second line of the table below provides information about hypothetical account values and hypothetical expenses based on the Fund’s actual expense ratio and an assumed rate of return of 5% per year before expenses, which is not the Fund’s actual return. The hypothetical account values and expenses may not be used to estimate the actual ending account balance or expenses you paid for the period. You may use this information to compare the ongoing costs of investing in the Fund and other mutual funds. To do so, compare this 5% hypothetical example with the 5% hypothetical examples that appear in the shareholder reports of the other mutual funds.
Please note that the expenses shown in the table are meant to highlight your ongoing Fund costs only and do not reflect any transactional costs, such as redemption fees. Therefore, the second line of the table below is useful in comparing ongoing costs only and may not help you determine the relative total costs of owning different funds. In addition, if these transactional costs were included, your costs would have been higher.
| | Beginning
Account Value
11/01/18 | Ending
Account Value
4/30/19 | Expense Ratio(a)(b) | Expenses Paid During period 11/01/18 - 4/30/19(c) |
| Clough Global Long/Short Fund | | | | |
| Class I | | | | |
| Actual | $1,000.00 | $1,047.70 | 2.08% | $10.56 |
| Hypothetical (5% return before expenses) | $1,000.00 | $1,014.48 | 2.08% | $10.39 |
| Investor Class | | | | |
| Actual | $1,000.00 | $1,046.20 | 2.34% | $11.87 |
| Hypothetical (5% return before expenses) | $1,000.00 | $1,013.19 | 2.34% | $11.68 |
| Class A | | | | |
| Actual | $1,000.00 | $1,046.20 | 2.35% | $11.92 |
| Hypothetical (5% return before expenses) | $1,000.00 | $1,013.14 | 2.35% | $11.73 |
| Class C | | | | |
| Actual | $1,000.00 | $1,042.20 | 3.08% | $15.60 |
| Hypothetical (5% return before expenses) | $1,000.00 | $1,009.52 | 3.08% | $15.35 |
| (a) | Expense ratio excluding interest expense and dividends paid on borrowed securities for the Clough Global Long/Short Fund is 1.60%, 1.90%,1.85%, and 2.60% for Class I, Investor Class, Class A, and Class C respectively. |
| (b) | Annualized, based on the Fund's most recent fiscal half year expenses. |
| (c) | Expenses are equal to the Fund's annualized expense ratio multiplied by the average account value over the period, multiplied by the number of days in the most recent fiscal half-year (181)/365 (to reflect the half-year period). |
| Clough Global Long/Short Fund | Statement of Investments |
April 30, 2019 (Unaudited)
| | | | Shares | | | | Value | |
| COMMON STOCKS 82.69% | | | | | | | | |
| Communication Services 6.85% | | | | | | | | |
| Alphabet, Inc. - Class C(a) | | | 320 | | | $ | 380,314 | |
| China Tower Corp., Ltd. - Class H | | | 1,888,000 | | | | 510,218 | |
| GCI Liberty, Inc. - Class A(a)(b) | | | 12,671 | | | | 755,445 | |
| IMAX Corp.(a) | | | 27,300 | | | | 665,574 | |
| Momo, Inc. - Sponsored ADR | | | 7,700 | | | | 270,039 | |
| Netflix, Inc.(a) | | | 1,181 | | | | 437,608 | |
| Softbank Group Corp. | | | 2,700 | | | | 280,071 | |
| T-Mobile US, Inc.(a)(b) | | | 3,600 | | | | 262,764 | |
| | | | | | | | 3,562,033 | |
| | | | | | | | | |
| Consumer Discretionary 18.24% | | | | | | | | |
| Alibaba Group Holding, Ltd. - Sponsored ADR(a) | | | 2,760 | | | | 512,173 | |
| Amazon.com, Inc.(a)(b) | | | 275 | | | | 529,793 | |
| ANTA Sports Products, Ltd. | | | 57,300 | | | | 403,922 | |
| At Home Group, Inc.(a) | | | 23,000 | | | | 540,270 | |
| Carvana Co.(a)(b) | | | 14,700 | | | | 1,051,932 | |
| Eicher Motors, Ltd. | | | 2,000 | | | | 585,685 | |
| Floor & Decor Holdings, Inc. - Class A(a) | | | 12,200 | | | | 585,844 | |
| Galaxy Entertainment Group, Ltd. | | | 68,500 | | | | 512,126 | |
| Home Depot, Inc.(b) | | | 3,750 | | | | 763,875 | |
| Lifestyle International Holdings, Ltd. | | | 145,000 | | | | 252,486 | |
| Mahindra & Mahindra, Ltd. | | | 64,982 | | | | 602,885 | |
| Pool Corp. | | | 2,900 | | | | 532,846 | |
| RH(a)(b) | | | 5,600 | | | | 597,576 | |
| Service Corp. International | | | 17,436 | | | | 725,512 | |
| TAL Education Group - ADR(a) | | | 8,100 | | | | 311,607 | |
| Vail Resorts, Inc. | | | 2,550 | | | | 583,567 | |
| Wayfair, Inc. - Class A(a) | | | 2,460 | | | | 398,889 | |
| | | | | | | | 9,490,988 | |
| | | | | | | | | |
| Consumer Staples 1.77% | | | | | | | | |
| Estee Lauder Cos., Inc. - Class A | | | 3,800 | | | | 652,878 | |
| L'Oreal SA | | | 977 | | | | 268,581 | |
| | | | | | | | 921,459 | |
| | | | | | | | | |
| Financials 16.82% | | | | | | | | |
| AIA Group, Ltd. | | | 40,600 | | | | 413,773 | |
| American International Group, Inc. | | | 6,000 | | | | 285,420 | |
| Bank of America Corp. | | | 27,550 | | | | 842,479 | |
| Bank of China, Ltd. - Class H | | | 323,000 | | | | 153,990 | |
| China Construction Bank Corp. - Class H | | | 174,000 | | | | 153,710 | |
China International Capital Corp., Ltd. - Class H | | | 111,600 | | | | 239,566 | |
CITIC Securities Co., Ltd. - Class H | | | 107,000 | | | | 231,328 | |
| Citigroup, Inc. | | | 12,149 | | | | 858,934 | |
| Golub Capital BDC, Inc. | | | 30,000 | | | | 552,900 | |
| Granite Point Mortgage Trust, Inc. | | | 38,600 | | | | 742,278 | |
| HDFC Bank, Ltd. | | | 20,801 | | | | 693,065 | |
| | | Shares | | Value |
| Financials (continued) | | | | | | | | |
| ICICI Bank, Ltd. | | | 117,807 | | | $ | 690,205 | |
Industrial & Commercial Bank of China - Class H | | | 206,000 | | | | 154,668 | |
| JPMorgan Chase & Co.(b) | | | 7,500 | | | | 870,375 | |
| Morgan Stanley(b) | | | 17,800 | | | | 858,850 | |
| Ping An Insurance Group Co. of China, Ltd. - Class H | | | 21,500 | | | | 258,856 | |
| Starwood Property Trust, Inc.(b) | | | 32,700 | | | | 753,735 | |
| | | | | | | | 8,754,132 | |
| Health Care 17.64% | | | | | | | | |
| Align Technology, Inc.(a)(b) | | | 1,520 | | | | 493,514 | |
| Amgen, Inc. | | | 1,750 | | | | 313,810 | |
| Apellis Pharmaceuticals, Inc.(a)(b) | | | 35,600 | | | | 705,236 | |
| Baxter International, Inc. | | | 3,400 | | | | 259,420 | |
| BeiGene, Ltd. - ADR(a) | | | 3,700 | | | | 459,651 | |
| BioMarin Pharmaceutical, Inc.(a) | | | 8,236 | | | | 704,425 | |
| Boston Scientific Corp.(a) | | | 6,800 | | | | 252,416 | |
| Correvio Pharma Corp.(a) | | | 137,570 | | | | 330,168 | |
| CRISPR Therapeutics AG(a) | | | 25,600 | | | | 1,028,864 | |
| Elanco Animal Health, Inc.(a)(b) | | | 12,700 | | | | 400,050 | |
| Equillium, Inc.(a) | | | 19,200 | | | | 119,808 | |
| Galapagos NV - Sponsored ADR(a) | | | 1,833 | | | | 210,795 | |
| Gossamer Bio, Inc.(a)(b) | | | 30,400 | | | | 515,584 | |
| GW Pharmaceuticals PLC - ADR(a) | | | 1,891 | | | | 320,165 | |
| IDEXX Laboratories, Inc.(a) | | | 870 | | | | 201,840 | |
| Idorsia, Ltd.(a)(c) | | | 30,821 | | | | 609,191 | |
| Illumina, Inc.(a) | | | 825 | | | | 257,400 | |
| Intra-Cellular Therapies, Inc.(a) | | | 18,300 | | | | 241,011 | |
| Masimo Corp.(a) | | | 1,900 | | | | 247,285 | |
| Teladoc Health, Inc.(a)(b) | | | 4,500 | | | | 255,960 | |
| Thermo Fisher Scientific, Inc. | | | 950 | | | | 263,578 | |
| Veracyte, Inc.(a) | | | 13,800 | | | | 315,606 | |
| Vertex Pharmaceuticals, Inc.(a) | | | 1,452 | | | | 245,359 | |
| WAVE Life Sciences, Ltd.(a) | | | 9,200 | | | | 244,076 | |
| Zoetis, Inc. | | | 1,810 | | | | 184,330 | |
| | | | | | | | 9,179,542 | |
| | | | | | | | | |
| Industrials 2.92% | | | | | | | | |
| Larsen & Toubro, Ltd. | | | 32,880 | | | | 637,497 | |
| TransDigm Group, Inc.(a)(b) | | | 1,830 | | | | 883,012 | |
| | | | | | | | 1,520,509 | |
| | | | | | | | | |
| Information Technology 16.34% | | | | | | | | |
| Adobe Systems, Inc.(a) | | | 2,180 | | | | 630,565 | |
| Analog Devices, Inc. | | | 6,800 | | | | 790,432 | |
| Broadcom, Ltd.(b) | | | 1,391 | | | | 442,895 | |
| Coupa Software, Inc.(a) | | | 2,050 | | | | 211,827 | |
| Guidewire Software, Inc.(a) | | | 2,600 | | | | 276,900 | |
| Inphi Corp(a) | | | 3,500 | | | | 159,810 | |
| KLA-Tencor Corp. | | | 5,610 | | | | 715,163 | |
| Micron Technology, Inc.(a)(b) | | | 17,400 | | | | 731,844 | |
| Microsoft Corp.(b) | | | 6,800 | | | | 888,080 | |
| Pluralsight, Inc. - Class A(a) | | | 8,800 | | | | 312,312 | |
| Semi-Annual Report | April 30, 2019 | 9 |
| Clough Global Long/Short Fund | Statement of Investments |
April 30, 2019 (Unaudited)
| | | Shares | | Value |
| Information Technology (continued) | | | | | | | | |
| Proofpoint, Inc.(a) | | | 3,620 | | | $ | 454,020 | |
| RingCentral, Inc. - Class A(a) | | | 2,900 | | | | 337,473 | |
| salesforce.com, Inc.(a)(b) | | | 3,355 | | | | 554,749 | |
| ServiceNow, Inc.(a) | | | 2,140 | | | | 581,031 | |
| Twilio, Inc. - Class A(a) | | | 1,700 | | | | 233,138 | |
| Visa, Inc. - Class A | | | 3,250 | | | | 534,398 | |
| WNS Holdings, Ltd. - ADR(a) | | | 4,900 | | | | 280,035 | |
| Xilinx, Inc. | | | 3,060 | | | | 367,628 | |
| | | | | | | | 8,502,300 | |
| | | | | | | | | |
| Materials 0.92% | | | | | | | | |
| Anhui Conch Cement Co., Ltd. - Class H | | | 78,500 | | | | 478,817 | |
| | | | | | | | | |
| Real Estate 1.19% | | | | | | | | |
| SBA Communications Corp.(a)(b) | | | 3,050 | | | | 621,376 | |
| | | | | | | | | |
| TOTAL COMMON STOCKS | | | | | | | | |
| (Cost $37,776,685) | | | | | | | 43,031,156 | |
| | | | | | | | | |
| EXCHANGE TRADED FUNDS 0.51% | | | | | | | | |
| Health Care 0.51% | | | | | | | | |
| iShares U.S. Medical Devices ETF | | | 1,180 | | | | 265,252 | |
| | | | | | | | | |
| TOTAL EXCHANGE TRADED FUNDS | | | | | | | | |
| (Cost $260,165) | | | | | | | 265,252 | |
| | | | | | | | | |
| SHORT-TERM INVESTMENTS 15.70% | | | | | | | | |
| Money Market Funds 15.70% | | | | | | | | |
| BlackRock Liquidity Funds, T-Fund Portfolio - Institutional Class (2.306% 7-day yield) | | | 8,171,313 | | | | 8,171,313 | |
| | | | | | | | | |
| TOTAL SHORT-TERM INVESTMENTS | | | | | | | | |
| (Cost $8,171,313) | | | | | | | 8,171,313 | |
| | | | | | | | | |
| Total Investments - 98.90% | | | | | | | | |
| (Cost $46,208,163) | | | | | | | 51,467,721 | |
| | | | | | | | | |
| Other Assets in Excess of Liabilities - 1.10%(d) | | | | | | | 573,646 | |
| | | | | | | | | |
| NET ASSETS - 100.00% | | | | | | $ | 52,041,367 | |
| SCHEDULE OF SECURITIES SOLDSHORT(a) | | Shares | | Value |
| COMMON STOCKS (22.17%) | | | | | | | | |
| Communication Services (1.06%) | | | | | | | | |
| AT&T, Inc. | | | (17,800 | ) | | $ | (551,088 | ) |
| | | | | | | | | |
| Consumer Discretionary (3.46%) | | | | | | | | |
| Dick's Sporting Goods, Inc. | | | (15,680 | ) | | | (580,160 | ) |
| Next PLC | | | (8,210 | ) | | | (617,300 | ) |
| Williams-Sonoma, Inc. | | | (10,560 | ) | | | (603,715 | ) |
| | | | | | | | (1,801,175 | ) |
| | | | | | | | | |
| Consumer Staples (4.19%) | | | | | | | | |
| Nestle SA | | | (5,941 | ) | | | (571,682 | ) |
| Tesco PLC | | | (184,741 | ) | | | (601,774 | ) |
| Walgreens Boots Alliance, Inc. | | | (9,500 | ) | | | (508,915 | ) |
| Wm Morrison Supermarkets PLC | | | (177,609 | ) | | | (500,030 | ) |
| | | | | | | | (2,182,401 | ) |
| | | | | | | | | |
| Financials (4.18%) | | | | | | | | |
| American Express Co. | | | (3,053 | ) | | | (357,903 | ) |
| Deutsche Bank AG | | | (53,100 | ) | | | (439,668 | ) |
| Mediobanca Banca di Credito Finanziario SpA | | | (46,357 | ) | | | (491,343 | ) |
| Societe Generale S.A. | | | (12,680 | ) | | | (401,342 | ) |
| UniCredit SpA | | | (35,211 | ) | | | (486,945 | ) |
| | | | | | | | (2,177,201 | ) |
| | | | | | | | | |
| Health Care (2.23%) | | | | | | | | |
| Alexion Pharmaceuticals, Inc. | | | (4,500 | ) | | | (612,585 | ) |
| McKesson Corp. | | | (4,581 | ) | | | (546,284 | ) |
| | | | | | | | (1,158,869 | ) |
| | | | | | | | | |
| Industrials (1.01%) | | | | | | | | |
| Stericycle, Inc. | | | (9,000 | ) | | | (525,510 | ) |
| | | | | | | | | |
| Information Technology (3.96%) | | | | | | | | |
| Amkor Technology, Inc. | | | (14,300 | ) | | | (129,558 | ) |
| AU Optronics Corp. - Sponsored ADR | | | (153,434 | ) | | | (535,485 | ) |
| International Business Machines Corp. | | | (3,760 | ) | | | (527,415 | ) |
| Manhattan Associates, Inc. | | | (4,900 | ) | | | (330,505 | ) |
| NetApp, Inc. | | | (7,400 | ) | | | (539,090 | ) |
| | | | | | | | (2,062,053 | ) |
| | | | | | | | | |
| Real Estate (2.08%) | | | | | | | | |
| AvalonBay Communities, Inc. | | | (2,680 | ) | | | (538,492 | ) |
| Clough Global Long/Short Fund | Statement of Investments |
April 30, 2019 (Unaudited)
SCHEDULE OF SECURITIES SOLD SHORT(a)(continued) | | Shares | | Value |
| Real Estate (continued) | | | | | | | | |
| Equity Residential | | | (7,100 | ) | | $ | (542,582 | ) |
| | | | | | | | (1,081,074 | ) |
| | | | | | | | | |
| TOTAL COMMON STOCKS | | | | | | | | |
| (Proceeds $11,575,690) | | | | | | | (11,539,371 | ) |
| | | | | | | | | |
| TOTAL SECURITIES SOLD SHORT | | | | | | | | |
| (Proceeds $11,575,690) | | | | | | $ | (11,539,371 | ) |
| (a) | Non-income producing security. |
| (b) | Pledged security; a portion or all of the security is pledged as collateral for securities sold short or total return swap contracts. As of April 30, 2019, the aggregate market value of those securities was $4,164,483, representing 8.00% of net assets. (See Note 1) |
| (c) | Security exempt from registration of the Securities Act of 1933. These securities may be resold in transactions exempt from registration under Rule 144A, normally to qualified institutional buyers. As of April 30, 2019, the aggregate value of those securities was $609,191 or 1.17% of net assets. |
| (d) | Includes cash which is being held as collateral for total return swap contracts and securities sold short. |
TOTAL RETURN SWAP CONTRACTS
| Counter Party | | Reference
Entity/Obligation | | Notional
Amount | | Floating Rate
Paid by the Fund | | Floating
Rate Index | | Termination
Date | | Market
Value | | Net Unrealized
Appreciation |
| Morgan Stanley | | Kweichow Moutai Co., Ltd. | | $ | 514,281 | | | 1D FEDEF + 250 bps | | 1 D FEDEF | | 1/8/2020 | | $ | 701,209 | | | $ | 186,928 | |
| | | | | $ | 514,281 | | | | | | | | | $ | 701,209 | | | $ | 186,928 | |
| Counter Party | | Reference
Entity/Obligation | | Notional
Amount | | Floating Rate
Paid by the Fund | | Floating
Rate Index | | Termination
Date | | Market
Value | | Net Unrealized
Depreciation |
| Morgan Stanley | | Banco Santander SA | | $ | (282,071 | ) | | 1D FEDEF -50 bps | | 1 D FEDEF | | 05/20/2020 | | $ | (298,951 | ) | | $ | (16,880 | ) |
| Morgan Stanley | | Jiangsu Yanghe Brewery | | | 438,934 | | | 1D FEDEF + 255 bps | | 1 D FEDEF | | 10/01/2020 | | $ | 434,885 | | | | (4,049 | ) |
| | | | | $ | 156,863 | | | | | | | | | $ | 135,934 | | | $ | (20,929 | ) |
Investment Abbreviations:
1D FEDEF - Federal Funds Effective Rate (Daily)
For Fund compliance purposes, the Fund’s sector classifications refer to any one of the sector sub-classifications used by one or more widely recognized market indexes, and/or as defined by the Fund's management. This definition may not apply for purposes of this report, which may combine sector sub-classifications for reporting ease. Sectors are shown as a percent of net assets. These sector classifications are unaudited.
See Notes to the Financial Statements.
| Semi-Annual Report | April 30, 2019 | 11 |
| Clough Global Long/Short Fund | Statement of Assets and Liabilities |
April 30, 2019 (Unaudited)
| ASSETS: | | | |
| | | | |
| Investments, at value (Cost - see below) | | $ | 51,467,721 | |
| Cash | | | 525,965 | |
| Deposit with broker for securities sold short | | | 11,618,316 | |
| Deposit with broker for total return swap contracts | | | 529,409 | |
| Unrealized appreciation on total return swap contracts | | | 186,928 | |
| Interest receivable - margin account | | | 17,041 | |
| Dividends receivable | | | 13,115 | |
| Interest receivable | | | 10,283 | |
| Receivable for investments sold | | | 1,206,842 | |
| Receivable for shares sold | | | 12,018 | |
| Prepaid expenses and other assets | | | 37,413 | |
| Total Assets | | | 65,625,051 | |
| | | | | |
| LIABILITIES: | | | | |
| | | | | |
| Securities sold short (Proceeds $11,575,690) | | | 11,539,371 | |
| Payable for investments purchased | | | 1,667,682 | |
| Payable for shares redeemed | | | 208,855 | |
| Unrealized depreciation on total return swap contracts | | | 20,929 | |
| Payable for total return swap contracts payments | | | 21,287 | |
| Dividends payable - short sales | | | 16,546 | |
| Accrued investment advisory fee | | | 23,844 | |
| Accrued distribution and service fees | | | 4,294 | |
| Accrued legal expense | | | 30,041 | |
| Accrued administration fee | | | 18,039 | |
| Other payables and accrued expenses | | | 32,796 | |
| Total Liabilities | | | 13,583,684 | |
| Net Assets | | $ | 52,041,367 | |
| Cost of Investments | | $ | 46,208,163 | |
| | | | | |
| COMPOSITION OF NET ASSETS: | | | | |
| | | | | |
| Paid-in capital | | $ | 51,714,871 | |
| Distributable Earnings | | | 326,496 | |
| Net Assets | | $ | 52,041,367 | |
| PRICING OF CLASS I SHARES: | | | | |
| Net Assets | | $ | 45,684,624 | |
| Shares outstanding of no par value, unlimited shares authorized | | | 4,075,550 | |
| Net Asset Value, offering and redemption price per share | | $ | 11.21 | |
| PRICING OF INVESTOR CLASS SHARES: | | | | |
| Net Assets | | $ | 2,648,818 | |
| Shares outstanding of no par value, unlimited shares authorized | | | 238,827 | |
| Net Asset Value, offering and redemption price per share | | $ | 11.09 | |
| PRICING OF CLASS A SHARES: | | | | |
| Net Assets | | $ | 174,328 | |
| Shares outstanding of no par value, unlimited shares authorized | | | 15,718 | |
| Net Asset Value, offering and redemption price per share | | $ | 11.09 | |
| Maximum offering price per share (NAV/0.945), based on maximum sales charge of 5.50% of the offering price | | $ | 11.74 | |
| PRICING OF CLASS C SHARES: | | | | |
| Net Assets | | $ | 3,533,597 | |
| Shares outstanding of no par value, unlimited shares authorized | | | 325,290 | |
| Net Asset Value, offering and redemption price per share | | $ | 10.86 | |
See Notes to the Financial Statements.
| Clough Global Long/Short Fund | Statement of Operations |
For the six months ended April 30, 2019 (Unaudited)
| INVESTMENT INCOME: | | | | |
| | | | | |
| Dividends (net of foreign withholding taxes of $5,087) | | $ | 343,819 | |
| Interest income - margin account | | | 81,553 | |
| Total Income | | | 425,372 | |
| | | | | |
| EXPENSES: | | | | |
| | | | | |
| Investment advisory fees | | | 355,352 | |
| Distribution and shareholder service fees: | | | | |
| Investor Class | | | 4,587 | |
| Class A | | | 313 | |
| Class C | | | 17,317 | |
| Administration fees | | | 47,405 | |
| Trustees fees | | | 39,873 | |
| Registration fees | | | 34,380 | |
| Dividend expense - short sales | | | 126,540 | |
| Custodian fees | | | 28,671 | |
| Audit & Tax Services fees | | | 22,179 | |
| Legal fees | | | 49,638 | |
| Printing fees | | | 11,422 | |
| Insurance fees | | | 11,229 | |
| Transfer agent fees | | | 24,950 | |
| Delegated transfer agent fees: | | | | |
| Class I | | | 3,221 | |
| Investor Class | | | 27 | |
| Class C | | | 42 | |
| Other expenses | | | 8,606 | |
| Total Expenses Before Waivers and/or Reimbursements | | | 785,752 | |
| Less fees waived and/or reimbursed by Adviser: | | | | |
| Class I | | | (191,864 | ) |
| Investor Class | | | (10,699 | ) |
| Class A | | | (728 | ) |
| Class C | | | (14,147 | ) |
| Net Expenses | | | 568,314 | |
| Net Investment Loss | | | (142,942 | ) |
| | | | | |
| NET REALIZED GAIN/(LOSS) ON: | | | | |
| Investment securities | | | (2,395,469 | ) |
| Securities sold short | | | 37,316 | |
| Total return swap contracts | | | 143,046 | |
| Foreign currency transactions | | | (42,543 | ) |
| Net realized loss | | | (2,257,650 | ) |
| NET CHANGE IN UNREALIZED APPRECIATION/DEPRECIATION ON: | | | | |
| Investment securities | | | 5,586,942 | |
| Securities sold short | | | (1,034,462 | ) |
| Total return swap contracts | | | 77,508 | |
| Translation of assets and liabilities denominated in foreign currencies | | | (796 | ) |
| Net change in unrealized appreciation | | | 4,629,192 | |
| Net realized and unrealized gain | | | 2,371,542 | |
| Net Increase in Net Assets from Operations | | $ | 2,228,600 | |
See Notes to the Financial Statements.
| Semi-Annual Report | April 30, 2019 | 13 |
| Clough Global Long/Short Fund | Statement of Changes in Net Assets |
| | | For the Six Months Ended April 30, 2019 (Unaudited) | | | For the Year Ended October 31, 2018 | |
| OPERATIONS: | | | | | | |
| | | | | | | |
| Net investment loss | | $ | (142,942 | ) | | $ | (369,740 | ) |
| Net realized loss | | | (2,257,650 | ) | | | (1,325,090 | ) |
| Net change in unrealized appreciation/(depreciation) | | | 4,629,192 | | | | (3,159,490 | ) |
| Net Increase/(Decrease) in Net Assets From Operations | | | 2,228,600 | | | | (4,854,320 | ) |
| | | | | | | | | |
| CAPITAL SHARE TRANSACTIONS: | | | | | | | | |
| Class I | | | | | | | | |
| Proceeds from shares sold | | | 3,364,971 | | | | 40,880,632 | |
| Payments for shares redeemed | | | (12,335,345 | ) | | | (13,523,671 | ) |
| Net Increase/(Decrease) in Net Assets From Class I Capital Share Transactions | | | (8,970,374 | ) | | | 27,356,961 | |
| | | | | | | | | |
| Investor Class(a) | | | | | | | | |
| Proceeds from shares sold | | | 84,431 | | | | 3,164,441 | |
| Payments for shares redeemed | | | (324,721 | ) | | | (424,647 | ) |
| Net Increase/(Decrease) in Net Assets From Investor Class Capital Share Transactions | | | (240,290 | ) | | | 2,739,794 | |
| | | | | | | | | |
| Class A(b) | | | | | | | | |
| Proceeds from shares sold | | | – | | | | 268,606 | |
| Payments for shares redeemed, net of redemption fees | | | (38,728 | ) | | | (39,847 | ) |
| Net Increase/(Decrease) in Net Assets From Class A Capital Share Transactions | | | (38,728 | ) | | | 228,759 | |
| | | | | | | | | |
| Class C | | | | | | | | |
| Proceeds from shares sold | | | 64,976 | | | | 3,909,708 | |
| Payments for shares redeemed | | | (234,183 | ) | | | (83,154 | ) |
| Net Increase/(Decrease) in Net Assets From Class C Capital Share Transactions | | | (169,207 | ) | | | 3,826,554 | |
| | | | | | | | | |
| Total Increase/(Decrease) in Net Assets | | $ | (7,189,999 | ) | | $ | 29,297,748 | |
| | | | | | | | | |
| NET ASSETS: | | | | | | | | |
| Beginning of period | | | 59,231,366 | | | | 29,933,618 | |
| End of period | | $ | 52,041,367 | | | $ | 59,231,366 | |
| (a) | On December 1, 2017, Class A was renamed Investor Class. |
| (b) | A new Class A commenced operations on June 29, 2018. |
See Notes to the Financial Statements.
| Clough Global Long/Short Fund – Class I | Financial Highlights |
For a share outstanding throughout the periods indicated
| | | For the Six Months Ended April 30, 2019 (Unaudited) | | | For the Year Ended October 31, 2018 | | | For the Year Ended October 31, 2017 | | | For the Year Ended October 31, 2016 | | | For the Period September 30, 2015 (commencement) to October 31, 2015 | |
| PER SHARE OPERATING PERFORMANCE: | | | | | | | | | | | | | | | |
| NET ASSET VALUE, BEGINNING OF PERIOD | | $ | 10.70 | | | $ | 11.03 | | | $ | 9.40 | | | $ | 10.30 | | | $ | 10.00 | |
| INCOME/(LOSS) FROM OPERATIONS: | | | | | | | | | | | | | | | | | | | | |
| Net investment loss(a) | | | (0.02 | ) | | | (0.07 | ) | | | (0.10 | ) | | | (0.12 | ) | | | (0.01 | ) |
| Net realized and unrealized gain/(loss) on investments | | | 0.53 | | | | (0.26 | ) | | | 1.73 | | | | (0.74 | ) | | | 0.31 | |
| Total from Investment Operations | | | 0.51 | | | | (0.33 | ) | | | 1.63 | | | | (0.86 | ) | | | 0.30 | |
| | | | | | | | | | | | | | | | | | | | | |
| DISTRIBUTIONS TO COMMON SHAREHOLDERS FROM: | | | | | | | | | | | | | | | | | | | | |
| Net realized gains | | | – | | | | – | | | | – | | | | (0.04 | ) | | | – | |
| Total Distributions to Common Shareholders | | | – | | | | – | | | | – | | | | (0.04 | ) | | | – | |
| Net asset value - end of period | | $ | 11.21 | | | $ | 10.70 | | | $ | 11.03 | | | $ | 9.40 | | | $ | 10.30 | |
| | | | | | | | | | | | | | | | | | | | | |
| Total Investment Return - Net Asset Value(b) | | | 4.77 | % | | | (2.99 | )% | | | 17.34 | % | | | (8.39 | )% | | | 3.00 | % |
| | | | | | | | | | | | | | | | | | | | | |
| RATIOS AND SUPPLEMENTAL DATA: | | | | | | | | | | | | | | | | | | | | |
| Net assets attributable to common shares, end of period (in 000s) | | $ | 45,685 | | | $ | 52,684 | | | $ | 29,629 | | | $ | 44,003 | | | $ | 35,760 | |
| | | | | | | | | | | | | | | | | | | | | |
| RATIOS TO AVERAGE NET ASSETS (including interest expense and dividend expense on securities sold short) | | | | | | | | | | | | | | | | | | | | |
| Operating expenses excluding fee waivers/reimbursements | | | 2.91 | %(c) | | | 2.85 | % | | | 3.21 | % | | | 3.76 | %(d) | | | 5.62 | %(c)(d) |
| Operating expenses including fee waivers/reimbursements | | | 2.08 | %(c) | | | 2.03 | % | | | 1.96 | % | | | 2.50 | %(d) | | | 2.32 | %(c)(d) |
| Net investment loss including fee waivers/reimbursements | | | (0.46 | )%(c) | | | (0.64 | )% | | | (0.96 | )% | | | (1.30 | )%(d) | | | (1.66 | )%(c)(d) |
| RATIOS TO AVERAGE NET ASSETS (excluding interest expense and dividend expense on securities sold short) | | | | | | | | | | | | | | | | | | | | |
| Operating expenses excluding fee waivers/reimbursements | | | 2.43 | %(c) | | | 2.42 | % | | | 2.85 | % | | | 2.86 | %(d) | | | 4.90 | %(c)(d) |
| Operating expenses including fee waivers/reimbursements | | | 1.60 | %(c) | | | 1.60 | % | | | 1.60 | % | | | 1.60 | %(d) | | | 1.60 | %(c)(d) |
| Net investment loss including fee waivers/reimbursements | | | (0.94 | )%(c) | | | (0.21 | )% | | | (0.60 | )% | | | (0.40 | )%(d) | | | (0.94 | )%(c)(d) |
| | | | | | | | | | | | | | | | | | | | | |
| PORTFOLIO TURNOVER RATE(e) | | | 127 | % | | | 156 | % | | | 237 | % | | | 261 | % | | | 22 | % |
| (a) | Per share amounts are based upon average shares outstanding. |
| (b) | Total investment return is for the period indicated and has not been annualized. The total investment return would have been lower had certain expenses not been waived / reimbursed during the period. The return shown does not reflect the deduction of taxes that a shareholder would pay on Fund distributions or the redemption of Fund shares. |
| (d) | Expense ratios before reductions for startup periods may not be representative of longer term operating periods. |
| (e) | Portfolio turnover rate for periods less than one full year have not been annualized and is calculated at the Fund level. |
See Notes to the Financial Statements.
| Semi-Annual Report | April 30, 2019 | 15 |
| Clough Global Long/Short Fund – Investor Class | Financial Highlights |
For a share outstanding throughout the periods indicated
| | | For the Six Months Ended April 30, 2019 (Unaudited) | | | For the Year Ended October 31, 2018(a) | | | For the Year Ended October 31, 2017 | | | For the Year Ended October 31, 2016 | | | For the Period September 30, 2015 (commencement) to October 31, 2015 | |
| PER SHARE OPERATING PERFORMANCE: | | | | | | | | | | | | | | | |
| NET ASSET VALUE, BEGINNING OF PERIOD | | $ | 10.60 | | | $ | 10.96 | | | $ | 9.37 | | | $ | 10.30 | | | $ | 10.00 | |
| INCOME/(LOSS) FROM OPERATIONS: | | | | | | | | | | | | | | | | | | | | |
| Net investment loss(b) | | | (0.04 | ) | | | (0.11 | ) | | | (0.14 | ) | | | (0.15 | ) | | | (0.02 | ) |
| Net realized and unrealized gain/(loss) on investments | | | 0.53 | | | | (0.25 | ) | | | 1.73 | | | | (0.74 | ) | | | 0.32 | |
| Total from Investment Operations | | | 0.49 | | | | (0.36 | ) | | | 1.59 | | | | (0.89 | ) | | | 0.30 | |
| | | | | | | | | | | | | | | | | | | | | |
| DISTRIBUTIONS TO COMMON SHAREHOLDERS FROM: | | | | | | | | | | | | | | | | | | | | |
| Net realized gains | | | – | | | | – | | | | – | | | | (0.04 | ) | | | – | |
| Total Distributions to Common Shareholders | | | – | | | | – | | | | – | | | | (0.04 | ) | | | – | |
| Net asset value - end of period | | $ | 11.09 | | | $ | 10.60 | | | $ | 10.96 | | | $ | 9.37 | | | $ | 10.30 | |
| | | | | | | | | | | | | | | | | | | | | |
| Total Investment Return - Net Asset Value(c) | | | 4.62 | % | | | (3.28 | )% | | | 16.97 | %(d) | | | (8.68 | )%(d) | | | 3.00 | %(d) |
| | | | | | | | | | | | | | | | | | | | | |
| RATIOS AND SUPPLEMENTAL DATA: | | | | | | | | | | | | | | | | | | | | |
| Net assets attributable to common shares, end of period (in 000s) | | $ | 2,649 | | | $ | 2,776 | | | $ | 210 | | | $ | 76 | | | $ | 27 | |
| | | | | | | | | | | | | | | | | | | | | |
| RATIOS TO AVERAGE NET ASSETS (including interest expense and dividend expense on securities sold short) | | | | | | | | | | | | | | | | | | | | |
| Operating expenses excluding fee waivers/reimbursements | | | 3.16 | %(e) | | | 3.14 | % | | | 3.78 | % | | | 4.23 | %(f) | | | 6.44 | %(e)(f) |
| Operating expenses including fee waivers/reimbursements | | | 2.34 | %(e) | | | 2.33 | %(g) | | | 2.29 | %(g) | | | 2.85 | %(f) | | | 2.67 | %(e)(f) |
| Net investment loss including fee waivers/reimbursements | | | (0.72 | )%(e) | | | (0.93 | )% | | | (1.36 | )% | | | (1.57 | )%(f) | | | (2.00 | )%(e)(f) |
| RATIOS TO AVERAGE NET ASSETS (excluding interest expense and dividend expense on securities sold short) | | | | | | | | | | | | | | | | | | | | |
| Operating expenses excluding fee waivers/reimbursements | | | 2.68 | %(e) | | | 2.71 | % | | | 3.38 | % | | | 3.33 | %(f) | | | 5.72 | %(e)(f) |
| Operating expenses including fee waivers/reimbursements | | | 1.86 | %(e) | | | 1.90 | %(g) | | | 1.89 | %(g) | | | 1.95 | %(f) | | | 1.95 | %(e)(f) |
| Net investment loss including fee waivers/reimbursements | | | (1.20 | )%(e) | | | (0.50 | )% | | | (0.96 | )% | | | (0.67 | )%(f) | | | (1.28 | )%(e)(f) |
| | | | | | | | | | | | | | | | | | | | | |
| PORTFOLIO TURNOVER RATE(h) | | | 127 | % | | | 156 | % | | | 237 | % | | | 261 | % | | | 22 | % |
| (a) | On December 1, 2017, Class A was renamed Investor Class. |
| (b) | Per share amounts are based upon average shares outstanding. |
| (c) | Total investment return is for the period indicated and has not been annualized. The total investment return would have been lower had certain expenses not been waived / reimbursed during the period. The return shown does not reflect the deduction of taxes that a shareholder would pay on Fund distributions or the redemption of Fund shares. Total investment return does not reflect the effect of sales charge. |
| (d) | Total investment return does not reflect the effect of sales charge. |
| (f) | Expense ratios before reductions for startup periods may not be representative of longer term operating periods. |
| (g) | According to the Fund's shareholder services plan, any amount of such payment not paid during the Fund's fiscal year for such services activities shall be reimbursed to the Fund as soon as practical after the end of the fiscal year. Fees were reimbursed to the Fund during the year ended October 31, 2018 and the year ended October 31, 2017, in the amounts of 0.05% and 0.06%, respectively of average net assets of the share class. |
| (h) | Portfolio turnover rate for periods less than one full year have not been annualized and is calculated at the Fund level. |
See Notes to the Financial Statements.
| Clough Global Long/Short Fund – Class A | Financial Highlights |
For a share outstanding throughout the periods indicated
| | | For the Six Months Ended April 30, 2019 (Unaudited) | | | For the Period June 29, 2018 (commencement) to October 31, 2018 | |
| PER SHARE OPERATING PERFORMANCE: | | | | | | |
| NET ASSET VALUE, BEGINNING OF PERIOD | | $ | 10.60 | | | $ | 11.84 | |
| INCOME/(LOSS) FROM OPERATIONS: | | | | | | | | |
| Net investment loss(a) | | | (0.04 | ) | | | (0.02 | ) |
| Net realized and unrealized gain/(loss) on investments | | | 0.53 | | | | (1.22 | )(b) |
| Total from Investment Operations | | | 0.49 | | | | (1.24 | ) |
| Net asset value - end of period | | $ | 11.09 | | | $ | 10.60 | |
| | | | | | | | | |
| Total Investment Return - Net Asset Value(c) | | | 4.62 | % | | | (10.47 | )% |
| | | | | | | | | |
| RATIOS AND SUPPLEMENTAL DATA: | | | | | | | | |
| Net assets attributable to common shares, end of period (in 000s) | | $ | 174 | | | $ | 209 | |
| | | | | | | | | |
| RATIOS TO AVERAGE NET ASSETS (including interest expense and dividend expense on securities sold short) | | | | | | | | |
| Operating expenses excluding fee waivers/reimbursements | | | 3.17 | %(d) | | | 2.91 | %(d)(e) |
| Operating expenses including fee waivers/reimbursements | | | 2.35 | %(d) | | | 2.32 | %(d)(e) |
| Net investment loss including fee waivers/reimbursements | | | (0.75 | )%(d) | | | (0.61 | )%(d)(e) |
| RATIOS TO AVERAGE NET ASSETS (excluding interest expense and dividend expense on securities sold short) | | | | | | | | |
| Operating expenses excluding fee waivers/reimbursements | | | 2.69 | %(d) | | | 2.44 | %(d)(e) |
| Operating expenses including fee waivers/reimbursements | | | 1.87 | %(d) | | | 1.85 | %(d)(e)(f) |
| Net investment loss including fee waivers/reimbursements | | | (1.23 | )%(d) | | | (0.14 | )%(d)(e) |
| | | | | | | | | |
| PORTFOLIO TURNOVER RATE(g) | | | 127 | % | | | 156 | % |
| (a) | Per share amounts are based upon average shares outstanding. |
| (b) | The per share amount varies from the net realized and unrealized gain/loss for the whole period because of the timing of sales of fund shares and per share amount of realized and unrealized gains and losses at such time. |
| (c) | Total investment return is for the period indicated and has not been annualized. The total investment return would have been lower had certain expenses not been waived / reimbursed during the period. The return shown does not reflect the deduction of taxes that a shareholder would pay on Fund distributions or the redemption of Fund shares. Total investment return does not reflect the effect of sales charge. |
| (e) | Expense ratios before reductions for startup periods may not be representative of longer term operating periods. |
| (f) | According to the Fund's shareholder services plan, any amount of such payment not paid during the Fund's fiscal year for such services activities shall be reimbursed to the Fund as soon as practical after the end of the fiscal year. Fees were reimbursed to the Fund during the year ended October 31, 2018 in the amount of 0.10% of average net assets of the share class. |
| (g) | Portfolio turnover rate for periods less than one full year have not been annualized and is calculated at the Fund level. |
See Notes to the Financial Statements.
| Semi-Annual Report | April 30, 2019 | 17 |
| Clough Global Long/Short Fund – Class C | Financial Highlights |
For a share outstanding throughout the periods indicated
| | | For the Six Months Ended April 30, 2019 (Unaudited) | | | For the Year Ended October 31, 2018 | | | For the Year Ended October 31, 2017 | | | For the Year Ended October 31, 2016 | | | For the Period September 30, 2015 (commencement) to October 31, 2015 | |
| PER SHARE OPERATING PERFORMANCE: | | | | | | | | | | | | | | | |
| NET ASSET VALUE, BEGINNING OF PERIOD | | $ | 10.42 | | | $ | 10.84 | | | $ | 9.34 | | | $ | 10.30 | | | $ | 10.00 | |
| INCOME/(LOSS) FROM OPERATIONS: | | | | | | | | | | | | | | | | | | | | |
| Net investment loss(a) | | | (0.08 | ) | | | (0.18 | ) | | | (0.20 | ) | | | (0.21 | ) | | | (0.02 | ) |
| Net realized and unrealized gain/(loss) on investments | | | 0.52 | | | | (0.24 | ) | | | 1.70 | | | | (0.71 | ) | | | 0.32 | |
| Total from Investment Operations | | | 0.44 | | | | (0.42 | ) | | | 1.50 | | | | (0.92 | ) | | | 0.30 | |
| | | | | | | | | | | | | | | | | | | | | |
| DISTRIBUTIONS TO COMMON SHAREHOLDERS FROM: | | | | | | | | | | | | | | | | | | | | |
| Net realized gains | | | – | | | | – | | | | – | | | | (0.04 | ) | | | – | |
| Total Distributions to Common Shareholders | | | – | | | | – | | | | – | | | | (0.04 | ) | | | – | |
| Net asset value - end of period | | $ | 10.86 | | | $ | 10.42 | | | $ | 10.84 | | | $ | 9.34 | | | $ | 10.30 | |
| | | | | | | | | | | | | | | | | | | | | |
| Total Investment Return - Net Asset Value(b) | | | 4.22 | % | | | (3.87 | )% | | | 16.06 | % | | | (8.97 | )% | | | 3.00 | % |
| | | | | | | | | | | | | | | | | | | | | |
| RATIOS AND SUPPLEMENTAL DATA: | | | | | | | | | | | | | | | | | | | | |
| Net assets attributable to common shares, end of period (in 000s) | | $ | 3,534 | | | $ | 3,562 | | | $ | 95 | | | $ | 73 | | | $ | 26 | |
| | | | | | | | | | | | | | | | | | | | | |
| RATIOS TO AVERAGE NET ASSETS (including interest expense and dividend expense on securities sold short) | | | | | | | | | | | | | | | | | | | | |
| Operating expenses excluding fee waivers/reimbursements | | | 3.90 | %(c) | | | 3.79 | % | | | 4.33 | % | | | 4.78 | %(d) | | | 7.09 | %(c)(d) |
| Operating expenses including fee waivers/reimbursements | | | 3.08 | %(c) | | | 3.06 | % | | | 2.97 | % | | | 3.50 | %(d) | | | 3.32 | %(c)(d) |
| Net investment loss including fee waivers/reimbursements | | | (1.46 | )%(c) | | | (1.58 | )% | | | (2.03 | )% | | | (2.19 | )%(d) | | | (2.66 | )%(c)(d) |
| RATIOS TO AVERAGE NET ASSETS (excluding interest expense and dividend expense on securities sold short) | | | | | | | | | | | | | | | | | | | | |
| Operating expenses excluding fee waivers/reimbursements | | | 3.42 | %(c) | | | 3.32 | % | | | 3.96 | % | | | 3.88 | %(d) | | | 6.37 | %(c)(d) |
| Operating expenses including fee waivers/reimbursements | | | 2.60 | %(c) | | | 2.59 | % | | | 2.60 | % | | | 2.60 | %(d) | | | 2.60 | %(c)(d) |
| Net investment loss including fee waivers/reimbursements | | | (1.94 | )%(c) | | | (1.11 | )% | | | (1.66 | )% | | | (1.29 | )%(d) | | | (1.94 | )%(c)(d) |
| | | | | | | | | | | | | | | | | | | | | |
| PORTFOLIO TURNOVER RATE(e) | | | 127 | % | | | 156 | % | | | 237 | % | | | 261 | % | | | 22 | % |
| (a) | Per share amounts are based upon average shares outstanding. |
| (b) | Total investment return is for the period indicated and has not been annualized. The total investment return would have been lower had certain expenses not been waived / reimbursed during the period. The return shown does not reflect the deduction of taxes that a shareholder would pay on Fund distributions or the redemption of Fund shares. Total investment return does not reflect the effect of sales charge. |
| (d) | Expense ratios before reductions for startup periods may not be representative of longer term operating periods. |
| (e) | Portfolio turnover rate for periods less than one full year have not been annualized and is calculated at the Fund level. |
See Notes to the Financial Statements.
| Clough Global Long/Short Fund | Notes to Financial Statements |
April 30, 2019 (Unaudited)
1. ORGANIZATION AND SIGNIFICANT ACCOUNTING AND OPERATING POLICIES
Clough Funds Trust (the “Trust”) is an open-end management investment company registered under the Investment Company Act of 1940, as amended (the “1940 Act”). The Trust was organized under the laws of the state of Delaware on March 17, 2015. The Trust currently offers shares of beneficial interest (“shares”) of the Clough Global Long/Short Fund (the “Fund”). The Fund’s commencement date is September 30, 2015. The Fund is a diversified investment company with an investment objective to seek to provide long-term capital appreciation. The Fund currently offers four Classes of shares: Class I, Investor Class, Class A and Class C. Prior to December 1, 2017, Investor Class shares were named Class A shares. On June 29, 2018, a new Class A commenced operations. Each share class of the Fund represents an investment in the same portfolio of securities, but each share class has its own expense structure. As of April 30, 2019, approximately 48% of the Fund is owned by affiliated parties. The Board of Trustees (the “Board”) may establish additional funds and classes of shares at any time in the future without shareholder approval.
The following is a summary of significant accounting policies followed by the Fund. These policies are in conformity with U.S. generally accepted accounting principles (“GAAP”). The preparation of financial statements in accordance with GAAP requires management to make estimates and assumptions that affect the reported amounts and disclosures in the financial statements during the reporting period. Management believes the estimates and security valuations are appropriate; however, actual results may differ from those estimates, and the security valuations reflected in the financial statements may differ from the value the Fund ultimately realizes upon sale of the securities. The Fund is considered an investment company for financial reporting purposes under GAAP and follows the accounting and reporting guidance applicable to investment companies as codified in Accounting Standards Codification (“ASC”) Topic 946 – Investment Companies.
The net asset value (“NAV”) per share of the Fund is determined no less frequently than daily, on each day that the New York Stock Exchange (“NYSE” or the “Exchange”) is open for trading, as of the close of regular trading on the Exchange (normally 4:00 p.m. New York time). Trading may take place in foreign issues held by the Fund at times when the Fund is not open for business. As a result, the Fund’s NAV may change at times when it is not possible to purchase or sell shares of the Fund.
Investment Valuation: Securities held by the Fund for which exchange quotations are readily available are valued at the last sale price, or if no sale price or if traded on the over-the-counter market, at the mean of the bid and asked prices on such day. Most securities listed on a foreign exchange are valued at the last sale price at the close of the exchange on which the security is primarily traded. In certain countries market maker prices are used since they are the most representative of the daily trading activity. Market maker prices are usually the mean between the bid and ask prices. Certain markets are not closed at the time that the Fund prices its portfolio securities. In these situations, snapshot prices are provided by the individual pricing services or other alternate sources at the close of the NYSE as appropriate. Securities not traded on a particular day are valued at the mean between the last reported bid and the asked quotes, or the last sale price when appropriate; otherwise fair value will be determined by the board-appointed fair valuation committee. Debt securities for which the over-the-counter market is the primary market are normally valued on the basis of prices furnished by one or more pricing services or dealers at the mean between the latest available bid and asked prices. As authorized by the Board, debt securities (including short-term obligations that will mature in 60 days or less) may be valued on the basis of valuations furnished by a pricing service which determines valuations based upon market transactions for normal, institutional-size trading units of securities or a matrix method which considers yield or price of comparable bonds provided by a pricing service. Total return swaps are priced based on valuations provided by a Board approved independent third party pricing agent. If a total return swap price cannot be obtained from an independent third party pricing agent the Fund shall seek to obtain a bid price from at least one independent and/or executing broker.
If the price of a security is unavailable in accordance with the aforementioned pricing procedures, or the price of a security is unreliable, e.g., due to the occurrence of a significant event, the security may be valued at its fair value determined by management pursuant to procedures adopted by the Board. For this purpose, fair value is the price that the Fund reasonably expects to receive on a current sale of the security. Due to the number of variables affecting the price of a security, however; it is possible that the fair value of a security may not accurately reflect the price that the Fund could actually receive on a sale of the security.
A three-tier hierarchy has been established to classify fair value measurements for disclosure purposes. Inputs refer broadly to the assumptions that market participants would use in pricing the asset or liability, including assumptions about risk. Inputs may be observable or unobservable. Observable inputs are inputs that reflect the assumptions market participants would use in pricing the asset or liability that are developed based on market data obtained from sources independent of the reporting entity. Unobservable inputs are inputs that reflect the reporting entity’s own assumptions about the assumptions market participants would use in pricing the asset or liability that are developed based on the best information available.
| Semi-Annual Report | April 30, 2019 | 19 |
| Clough Global Long/Short Fund | Notes to Financial Statements |
April 30, 2019 (Unaudited)
Various inputs are used in determining the value of the Fund’s investments as of the reporting period end. These inputs are categorized in the following hierarchy under applicable financial accounting standards:
| Level 1 – | Unadjusted quoted prices in active markets for identical, unrestricted assets or liabilities that the Fund has the ability to access at the measurement date; |
| Level 2 – | Quoted prices which are not active, quoted prices for similar assets or liabilities in active markets or inputs other than quoted prices that are observable (either directly or indirectly) for substantially the full term of the asset or liability; and |
| Level 3 – | Significant unobservable prices or inputs (including the Fund’s own assumptions in determining the fair value of investments) where there is little or no market activity for the asset or liability at the measurement date. |
The following is a summary of the inputs used as of April 30, 2019, in valuing the Fund’s investments carried at value.
| Investments in Securities at Value* | | Level 1 | | | Level 2 | | | Level 3 | | | Total | |
| Common Stocks | | $ | 43,031,156 | | | $ | – | | | $ | – | | | $ | 43,031,156 | |
| Exchange Traded Funds | | | 265,252 | | | | – | | | | – | | | | 265,252 | |
| Short-Term Investments | | | 8,171,313 | | | | – | | | | – | | | | 8,171,313 | |
| TOTAL | | $ | 51,467,721 | | | $ | – | | | $ | – | | | $ | 51,467,721 | |
| | | | | | | | | | | | | | | | | |
| Other Financial Instruments | | | | | | | | | | | | | | | | |
| Assets | | | | | | | | | | | | | | | | |
| Total Return Swap Contracts** | | $ | – | | | $ | 186,928 | | | $ | – | | | $ | 186,928 | |
| Liabilities | | | | | | | | | | | | | | | | |
| Securities Sold Short | | | | | | | | | | | | | | | | |
| Common Stocks | | | (11,539,371 | ) | | | – | | | | – | | | | (11,539,371 | ) |
| Total Return Swap Contracts** | | | – | | | | (20,929 | ) | | | – | | | | (20,929 | ) |
| TOTAL | | $ | (11,539,371 | ) | | $ | 165,999 | | | $ | – | | | $ | (11,373,372 | ) |
| * | For detailed sector descriptions, see the accompanying Statement of Investments. |
| ** | Swap contracts are reported at their unrealized appreciation/(depreciation) at measurement date, which represents the change in the contract's value from trade date. |
Restricted Securities: Although the Fund will invest primarily in publicly traded securities, it may invest a portion of its assets (generally, 5% of its value) in restricted securities. Restricted securities are securities that may not be sold to the public without an effective registration statement under the Securities Act of 1933, as amended (the "Securities Act") or, if they are unregistered, may be sold only in a privately negotiated transaction or pursuant to an exemption from registration.
Restricted securities as of April 30, 2019 were as follows:
| Security | | % of Net Assets | | | Acquisition Dates | | Shares | | | Cost | | | Fair Value | |
| Idorsia, Ltd. | | 1.17% | | | 7/11/2018 - 2/7/2019 | | 30,821 | | | $ | 693,172 | | | $ | 609,191 | |
| | | 1.17% | | | | | | | | $ | 693,172 | | | $ | 609,191 | |
In the event a Board approved independent pricing service is unable to provide an evaluated price for a security or Clough Capital Partners L.P. (the “Adviser” or “Clough Capital”) believes the price provided is not reliable, securities of the Fund will be valued at fair value as described above. In these instances the Adviser may seek to find an alternative independent source, such as a broker/dealer to provide a price quote, or by using evaluated pricing models similar to the techniques and models used by the independent pricing service. These fair value measurement techniques may utilize unobservable inputs (Level 3).
On a monthly basis, the Fair Value Committee of the Fund meets and discusses securities that have been fair valued during the preceding month in accordance with the Fund’s Fair Value Procedures and reports quarterly to the Board on the results of those meetings.
For the six months ended April 30, 2019, the Fund did not have significant unobservable inputs (Level 3) used in determining fair value. Therefore, a reconciliation of assets in which significant unobservable inputs (Level 3) were used in determining fair value is not applicable.
| Clough Global Long/Short Fund | Notes to Financial Statements |
April 30, 2019 (Unaudited)
Class Expenses:Expenses that are specific to a class of shares are charged directly to that share class. Fees provided under the distribution (Rule 12b-1) and/or shareholder service plans for a particular class of the Fund are charged to the operations of such class.
Income Taxes: The Fund’s policy is to comply with the provisions of the Internal Revenue Code applicable to regulated investment companies and to distribute all of its taxable income to its shareholders. Therefore, no federal income tax provision is required. As of and during the six months ended April 30, 2019, the Fund did not have a liability for any unrecognized tax benefits. The Fund plans to file U.S. Federal and various state and local tax returns as required. The Fund’s tax returns are subject to examination by the relevant tax authorities until expiration of the applicable statute of limitations, which is generally three years after the filing of the tax return but which can be extended to six years in certain circumstances. Tax returns for open years have incorporated no uncertain tax positions that require a provision for income taxes.
Certain foreign countries impose a capital gains tax which is accrued by the Fund based on the unrealized appreciation, if any, on affected securities. Any accrual would reduce the Fund's NAV. The tax is paid when the gain is realized and is included in capital gains tax in the Statement of Operations.
Distributions to Shareholders: The Fund normally intends to pay dividends on an annual basis. Any net capital gains earned by the Fund are distributed annually. Distributions to shareholders are recorded by the Fund on the ex-dividend date.
Securities Transactions and Investment Income: Investment security transactions are accounted for on a trade date basis. Dividend income and dividend expense-short sales are recorded on the ex-dividend date. Certain dividend income from foreign securities will be recorded, in the exercise of reasonable diligence, as soon as a Fund is informed of the dividend if such information is obtained subsequent to the ex-dividend date and may be subject to withholding taxes in these jurisdictions. Interest income, which includes amortization of premium and accretion of discount, is recorded on the accrual basis. Realized gains and losses from securities transactions and unrealized appreciation and depreciation of securities are determined using the identified cost basis for both financial reporting and income tax purposes. All of the realized and unrealized gains and losses and net investment income, other than class specific expenses, are allocated daily to each class in proportion to its average daily net assets.
Foreign Securities: The Fund may invest a portion of its assets in foreign securities. In the event that the Fund executes a foreign security transaction, the Fund will generally enter into a foreign currency spot contract to settle the foreign security transaction. Foreign securities may carry more risk than U.S. securities, such as political, market and currency risks.
The accounting records of the Fund are maintained in U.S. dollars. Prices of securities denominated in foreign currencies are translated into U.S. dollars at the closing rates of exchange at period end. Amounts related to the purchase and sale of foreign securities and investment income are translated at the rates of exchange prevailing on the respective dates of such transactions.
The effect of changes in foreign currency exchange rates on investments is reported with investment securities realized and unrealized gains and losses in the Fund’s Statement of Operations.
A foreign currency spot contract is a commitment to purchase or sell a foreign currency at a future date, at a negotiated rate. The Fund may enter into foreign currency spot contracts to settle specific purchases or sales of securities denominated in a foreign currency and for protection from adverse exchange rate fluctuation. Risks to the Fund include the potential inability of the counterparty to meet the terms of the contract.
The net U.S. dollar value of foreign currency underlying all contractual commitments held by the Fund and the resulting unrealized appreciation or depreciation are determined using prevailing forward foreign currency exchange rates. Unrealized appreciation and depreciation on foreign currency spot contracts are reported in the Fund’s Statements of Assets and Liabilities as a receivable or a payable and in the Fund’s Statement of Operations with the change in unrealized appreciation or depreciation on translation of assets and liabilities denominated in foreign currencies. These spot contracts are used by the broker to settle investments denominated in foreign currencies.
The Fund may realize a gain or loss upon the closing or settlement of the foreign transaction, excluding investment securities. Such realized gains and losses are reported with all other foreign currency gains and losses in the Statement of Operations.
Exchange Traded Funds: The Fund may invest in exchange traded funds (“ETFs”), which are funds whose shares are traded on a national exchange. ETFs may be based on underlying equity or fixed income securities, as well as commodities or currencies. ETFs do not sell individual shares directly to investors and only issue their shares in large blocks known as “creation units.” The investor purchasing a creation unit then sells the individual shares on a secondary market. Although similar diversification benefits may be achieved through an investment in another investment company, ETFs generally offer greater liquidity and lower expenses. Because an ETF incurs its own fees and expenses, shareholders of a Fund investing in an ETF will indirectly bear those costs. Such funds will also incur brokerage commissions and related charges when purchasing or selling shares of an ETF. Unlike typical investment company shares, which are valued once daily, shares in an ETF may be purchased or sold on a securities exchange throughout the trading day at market prices that are generally close to the NAV of the ETF.
| Semi-Annual Report | April 30, 2019 | 21 |
| Clough Global Long/Short Fund | Notes to Financial Statements |
April 30, 2019 (Unaudited)
Short Sales: The Fund may sell a security it does not own in anticipation of a decline in the fair value of that security. When the Fund sells a security short, it must borrow the security sold short and deliver it to the broker-dealer through which it made the short sale. A gain, limited to the price at which the Fund sold the security short, or a loss, unlimited in size, will be recognized upon the termination of the short sale.
The Fund's obligation to replace the borrowed security will be secured by collateral deposited with the broker-dealer, usually cash, U.S. government securities or other liquid securities. The Fund will also be required to designate on its books and records similar collateral with its custodian to the extent, if any, necessary so that the aggregate collateral value is at all times at least equal to the current value of the security sold short. The cash amount is reported on the Statement of Assets and Liabilities as Deposit with broker for securities sold short which is held with one counterparty. The Fund is obligated to pay interest to the broker for any debit balance of the margin account relating to short sales. The interest incurred by the Fund, if any, is reported on the Statement of Operations as Interest expense – margin account. Interest amounts payable, if any, are reported on the Statement of Assets and Liabilities as Interest payable – margin account.
The Fund may also sell a security short if it owns at least an equal amount of the security sold short or another security convertible or exchangeable for an equal amount of the security sold short without payment of further compensation (a short sale against-the-box). In a short sale against-the-box, the short seller is exposed to the risk of being forced to deliver stock that it holds to close the position if the borrowed stock is called in by the lender, which would cause gain or loss to be recognized on the delivered stock. The Fund expects normally to close its short sales against-the-box by delivering newly acquired stock. Since the Fund intends to hold securities sold short for the short term, these securities are excluded from the purchases and sales of investment securities in Note 4 and the Fund’s Portfolio Turnover in the Financial Highlights.
Derivative Instruments and Hedging Activities: The following discloses the Fund’s use of derivative instruments and hedging activities.
The Fund’s investment objective not only permits the Fund to purchase investment securities, it also allows the Fund to enter into various types of derivative contracts, including, but not limited to, forward foreign currency contracts, futures, options and swaps. The Fund may use derivatives, among other reasons, as part of the Fund’s investment strategy, to attempt to employ its currency strategies, to seek to hedge against foreign exchange risk, and to gain access to foreign markets.
Risk of Investing in Derivatives: The Fund’s use of derivatives can result in losses due to unanticipated changes in the market risk factors and the overall market. In instances where the Fund is using derivatives to decrease or hedge exposures to market risk factors for securities held by the Fund, there are also risks that those derivatives may not perform as expected, resulting in losses for the combined or hedged positions.
Derivatives may have little or no initial cash investment relative to their market value exposure and therefore can produce significant gains or losses in excess of their cost. This use of embedded leverage allows the Fund to increase its market value exposure relative to its net assets and can substantially increase the volatility of the Fund’s performance.
Additional associated risks from investing in derivatives also exist and potentially could have significant effects on the valuation of the derivative and the Fund. Typically, the associated risks are not the risks that the Fund is attempting to increase or decrease exposure to its investment objective, but the additional risks from investing in derivatives. Associated risks can be different for each type of derivative and are discussed by each derivative type in the notes that follow.
Examples of these associated risks are liquidity risk, which is the risk that the Fund will not be able to sell the derivative in the open market in a timely manner, and counterparty credit risk, which is the risk that the counterparty will not fulfill its obligation to the Fund.
Market Risk Factors: In addition, in pursuit of its investment objectives, the Fund may seek to use derivatives, which may increase or decrease exposure to the following market risk factors:
Equity Risk: Equity risk relates to the change in value of equity securities as they relate to increases or decreases in the general market.
Foreign Exchange Rate Risk: Foreign exchange rate risk relates to the change in the U.S. dollar value of a security held that is denominated in a foreign currency. The value of a foreign currency denominated security will decrease as the dollar appreciates against the currency, while the value of the foreign currency denominated security will increase as the dollar depreciates against the currency.
Futures Contracts: The Fund may enter into futures contracts. A futures contract is an agreement to buy or sell a security or currency (or to deliver a final cash settlement price in the case of a contract relating to an index or otherwise not calling for physical delivery at the end of trading in the contract) for a set price at a future date. If the Fund buys a security futures contract, the Fund enters into a contract to purchase the underlying security and is said to be "long" under the contract. If the Fund sells a security futures contact, the Fund enters into a contract to sell the underlying security and is said to be "short" under the contract. The price at which the contract trades (the "contract price") is determined by relative buying and selling interest on a regulated exchange. Futures contracts are marked to market daily and an appropriate payable or receivable for the change in value (“variation margin”) is recorded by the Fund. Such payables or receivables are recorded for financial statement purposes as variation margin payable or variation margin receivable by the Fund. The Fund pledges cash or liquid assets as collateral to satisfy the current obligations with respect to futures contracts. The cash amount is reported on the Statement of Assets and Liabilities as Deposit with broker for futures contracts.
| Clough Global Long/Short Fund | Notes to Financial Statements |
April 30, 2019 (Unaudited)
The Fund enters into such transactions for hedging and other appropriate risk-management purposes or to increase return. While the Fund may enter into futures contracts for hedging purposes, the use of futures contracts might result in a poorer overall performance for the Fund than if it had not engaged in any such transactions. If, for example, the Fund had insufficient cash, it might have to sell a portion of its underlying portfolio of securities in order to meet daily variation margin requirements on its futures contracts or options on futures contracts at a time when it might be disadvantageous to do so. There may be an imperfect correlation between the Fund’s portfolio holdings and futures contracts entered into by the Fund, which may prevent the Fund from achieving the intended hedge or expose the Fund to risk of loss.
Futures contract transactions may result in losses substantially in excess of the variation margin. There can be no guarantee that there will be a correlation between price movements in the hedging vehicle and in the portfolio securities being hedged. An incorrect correlation could result in a loss on both the hedged securities in the Fund and the hedging vehicle so that the portfolio return might have been greater had hedging not been attempted. There can be no assurance that a liquid market will exist at a time when the Fund seeks to close out a futures contract. Lack of a liquid market for any reason may prevent the Fund from liquidating an unfavorable position, and the Fund would remain obligated to meet margin requirements until the position is closed. In addition, the Fund could be exposed to risk if the counterparties to the contracts are unable to meet the terms of their contracts. With exchange-traded futures contracts, there is minimal counterparty credit risk to the Fund since futures contracts are exchange-traded and the exchange’s clearinghouse, as counterparty to all exchange-traded futures contracts, guarantees the futures contracts against default. During the six months ended April 30, 2019, the Fund did not invest in futures contracts.
Swaps:During the six months ended April 30, 2019, the Fund engaged in total return swaps. A swap is an agreement that obligates two parties to exchange a series of cash flows at specified intervals based upon or calculated by reference to changes in specified prices or rates for a specified amount of an underlying asset. The Fund may utilize swap agreements as a means to gain exposure to certain assets and/or to “hedge” or protect the Fund from adverse movements in securities prices or interest rates. The Fund is subject to equity risk and interest rate risk in the normal course of pursuing its investment objective through investments in swap contracts. Swap agreements entail the risk that a party will default on its payment obligation to the Fund. If the other party to a swap defaults, the Fund would risk the loss of the net amount of the payments that it contractually is entitled to receive. If the Fund utilizes a swap at the wrong time or judges market conditions incorrectly, the swap may result in a loss to the Fund and reduce the Fund’s total return.
Total return swaps involve an exchange by two parties in which one party makes payments based on a set rate, either fixed or variable, while the other party makes payments based on the return of an underlying asset, which includes both the income it generates and any capital gains over the payment period. A Fund’s maximum risk of loss from counterparty risk or credit risk is the discounted value of the payments to be received from/paid to the counterparty over the contract’s remaining life, to the extent that the amount is positive. The risk is mitigated by having a netting arrangement between a Fund and the counterparty and by the posting of collateral to a Fund to cover the Fund’s exposure to the counterparty. The Fund pledges cash or liquid assets as collateral to satisfy the current obligations with respect to swap contracts. The cash amount is reported on the Statement of Assets and Liabilities as Deposit with broker for total return swap contracts which is held with one counterparty.
During the six months ended April 30, 2019, the Fund invested in swap agreements consistent with the Fund’s investment strategies to seek to hedge against foreign exchange risk or to gain exposure to certain markets or indices.
| Semi-Annual Report | April 30, 2019 | 23 |
| Clough Global Long/Short Fund | Notes to Financial Statements |
April 30, 2019 (Unaudited)
The effect of derivatives instruments on the Fund’s Statement of Assets and Liabilities as of April 30, 2019:
| | | Asset Derivatives | | | |
| Risk Exposure | | Statements of Assets and Liabilities Location | | Fair Value | |
| Equity Contracts (Total Return Swap Contracts) | | Unrealized appreciation on total return swap contracts | | $ | 186,928 | |
| | | | | $ | 186,928 | |
| | | Liability Derivatives | | | |
| Risk Exposure | | Statements of Assets and Liabilities Location | | Fair Value | |
| Equity Contracts (Total Return Swap Contracts) | | Unrealized depreciation on total return swap contracts | | $ | 20,929 | |
| Total | | | | $ | 20,929 | |
The effect of derivatives instruments on the Fund’s Statement of Operations for the six months ended April 30, 2019:
| Risk Exposure | | Statements of Operations Location | | Realized
Gain/(Loss)
on Derivatives
Recognized
in Income | | | Change in
Unrealized
Appreciation/
(Depreciation)
on Derivatives
Recognized
in Income | |
Equity Contracts
(Total Return Swap Contracts) | | Net realized gain/(loss) on total return swap contracts/Net change in unrealized appreciation/(depreciation) on total return swap contracts | | | 143,046 | | | | 77,508 | |
| Total | | | | $ | 143,046 | | | $ | 77,508 | |
The average total return swap contracts notional amount during the six months ended April 30, 2019 is $375,147.
Certain derivative contracts are executed under either standardized netting agreements or, for exchange-traded derivatives, the relevant contracts for a particular exchange which contain enforceable netting provisions. A derivative netting arrangement creates an enforceable right of set-off that becomes effective, and affects the realization of settlement on individual assets, liabilities and collateral amounts, only following a specified event of default or early termination. Default events may include the failure to make payments or deliver securities timely, material adverse changes in financial condition or insolvency, the breach of minimum regulatory capital requirements, or loss of license, charter or other legal authorization necessary to perform under the contract.
The following table presents derivative financial instruments that are subject to enforceable netting arrangements as of April 30, 2019.
| Offsetting of Derivatives Assets | |
| | | | | | | | | | | | Gross Amounts Not
Offset in the
Statements of
Assets and Liabilities | |
| | | Gross Amounts of Recognized Assets | | | Gross Amounts
Offset in the
Statements of
Assets and
Liabilities | | | Net Amounts
Presented in the
Statements of
Assets and
Liabilities | | | Financial
Instruments(a) | | | Cash Collateral
Received(a) | | | Net Amount | |
| Total Return Swap Contracts | | $ | 186,928 | | | $ | – | | | $ | 186,928 | | | $ | (20,929 | ) | | $ | – | | | $ | 165,999 | |
| Total | | $ | 186,928 | | | $ | – | | | $ | 186,928 | | | $ | (20,929 | ) | | $ | – | | | $ | 165,999 | |
| Clough Global Long/Short Fund | Notes to Financial Statements |
April 30, 2019 (Unaudited)
| Offsetting of Derivatives Liabilities |
| | | | | | | | | | | | Gross Amounts Not Offset in the Statements of Assets and Liabilities | |
| | | Gross Amounts of Recognized
Liabilities | | | Gross Amounts
Offset in the
Statements of
Assets and
Liabilities | | | Net Amounts
Presented in the
Statements of
Assets and
Liabilities | | | Financial
Instruments(a) | | | Cash Collateral
Pledged(a) | | | Net Amount | |
| Total Return Swap Contracts | | $ | 20,929 | | | $ | – | | | $ | 20,929 | | | $ | (20,929 | ) | | $ | – | | | $ | – | |
| Total | | $ | 20,929 | | | $ | – | | | $ | 20,929 | | | $ | (20,929 | ) | | $ | – | | | $ | – | |
| (a) | These amounts are limited to the derivative asset/liability balance and, accordingly, do not include excess collateral received/pledged which is disclosed in the Statement of Investments. |
Counterparty Risk: The Fund runs the risk that the issuer or guarantor of a fixed income security, the counterparty to an over-the-counter derivatives contract or the obligor of an obligation underlying an asset-backed security will be unable or unwilling to make timely principal, interest, or settlement payments or otherwise honor its obligations. In addition, to the extent that the Fund uses over-the-counter derivatives, and/or has significant exposure to a single counterparty, this risk will be particularly pronounced for the Fund.
Other Risk Factors: Investing in the Fund may involve certain risks including, but not limited to, the following:
Unforeseen developments in market conditions may result in the decline of prices of, and the income generated by, the securities held by the Fund. These events may have adverse effects on the Fund such as a decline in the value and liquidity of many securities held by the Fund, and a decrease in NAV. Such unforeseen developments may limit or preclude the Fund’s ability to achieve its investment objective.
Investing in stocks may involve larger price fluctuation and greater potential for loss than other types of investments. This may result in the securities held by the Fund being subject to larger short-term declines in value compared to other types of investments.
The Fund may have elements of risk due to the investments in foreign issuers located in various countries outside the U.S. Such investments may subject the Fund to additional risks resulting from future political or economic conditions and/or possible impositions of adverse foreign governmental laws or currency exchange restrictions. Investments in securities of non-U.S. issuers have unique risks not present in securities of U.S. issuers, such as greater price volatility and less liquidity.
2. TAXES
Classification of Distributions: Net investment income/(loss) and net realized gain/(loss) may differ for financial statement and tax purposes. The character of distributions made during the year from net investment income or net realized gains may differ from its ultimate characterization for federal income tax purposes. Also, due to the timing of dividend distributions, the fiscal year in which amounts are distributed may differ from the fiscal year in which the income or realized gain was recorded by the Fund.
There were no distributions paid by the Fund during the year ended October 31, 2018.
Tax Basis of Investments: Net unrealized appreciation/(depreciation) of investments based on federal tax costs as of April 30, 2019, was as follows:
| Gross appreciation (excess of value over tax cost) | | $ | 7,789,462 | |
| Gross depreciation (excess of tax cost over value) | | | (3,166,485 | ) |
| Net unrealized appreciation | | $ | 4,622,977 | |
| Cost of investments for income tax purposes | | $ | 47,047,062 | |
The difference between book and tax basis unrealized appreciation is primarily attributable to wash sales, passive foreign investment companies, and notional principal contracts.
| Semi-Annual Report | April 30, 2019 | 25 |
| Clough Global Long/Short Fund | Notes to Financial Statements |
| | April 30, 2019 (Unaudited) |
3. CAPITAL TRANSACTIONS
Common Shares: There is an unlimited number of shares of beneficial interest with no par value per share. Shares redeemed within 30 days of purchase may incur a 2.00% redemption fee deducted from the redemption amount.
| | | For the Six Months Ended April 30, 2019 (Unaudited) | | For the Year Ended October 31, 2018 |
| Class I: | | | | | | | | |
| Beginning of period | | | 4,924,544 | | | | 2,687,347 | |
| Shares sold | | | 311,614 | | | | 3,446,651 | |
| Shares redeemed | | | (1,160,608 | ) | | | (1,209,454 | ) |
| Net increase (decrease) in shares outstanding | | | (848,994 | ) | | | 2,237,197 | |
| Shares outstanding, end of period | | | 4,075,550 | | | | 4,924,544 | |
| Investor Class:(a) | | | | | | | | |
| Beginning of period | | | 261,884 | | | | 19,143 | |
| Shares sold | | | 8,140 | | | | 279,619 | |
| Shares redeemed | | | (31,197 | ) | | | (36,878 | ) |
| Net increase (decrease) in shares outstanding | | | (23,057 | ) | | | 242,741 | |
| Shares outstanding, end of period | | | 238,827 | | | | 261,884 | |
| Class A:(b) | | | | | | | | |
| Beginning of period | | | 19,727 | | | | – | |
| Shares sold | | | – | | | | 23,142 | |
| Shares redeemed | | | (4,009 | ) | | | (3,415 | ) |
| Net increase (decrease) in shares outstanding | | | (4,009 | ) | | | 19,727 | |
| Shares outstanding, end of period | | | 15,718 | | | | 19,727 | |
| Class C: | | | | | | | | |
| Beginning of period | | | 341,900 | | | | 8,760 | |
| Shares sold | | | 6,219 | | | | 340,278 | |
| Shares redeemed | | | (22,829 | ) | | | (7,138 | ) |
| Net increase (decrease) in shares outstanding | | | (16,610 | ) | | | 333,140 | |
| Shares outstanding, end of period | | | 325,290 | | | | 341,900 | |
| (a) | On December 1, 2017, Class A was renamed Investor Class. |
| (b) | A new Class A commenced operations on June 29, 2018. |
4. PORTFOLIO SECURITIES
Purchases and sales of investment securities, excluding securities sold short intended to be held for less than one year, short-term securities, and Long Term U.S. Government obligations, for the six months ended April 30, 2019, are listed in the table below.
| Cost of Investments Purchased | | Proceeds From Investments Sold |
| $ | 56,795,823 | | | $ | 66,203,733 | |
5. INVESTMENT ADVISORY AND OTHER AGREEMENTS
Investment Advisory Agreement: Clough Capital serves as the Fund’s investment adviser pursuant to an Investment Advisory Agreement with the Fund. As compensation for its services to the Fund, the Adviser receives an annual investment advisory fee of 1.35% based on the Fund’s average daily net assets, paid monthly. The Adviser has agreed contractually to limit the operating expenses of each class of the Fund (excluding Rule 12b-1 Distribution and Service Fees, Shareholder Services Fees, acquired fund fees and expenses, interest, taxes, brokerage costs and commissions, dividend and interest expense on short sales, and litigation, indemnification and extraordinary expenses as determined under generally accepted accounting principles) to an annual rate of 1.60% through February 28, 2020. The Adviser is permitted to recover, on a class-by-class basis, any fees waived and/or expenses reimbursed pursuant to the waiver agreement described above to the extent that such recovery does not cause total annual operating expenses to exceed the expense limitation in effect (i) at the time the fees and/or expenses to be recovered werewaived and/or reimbursed and (ii) at the time of such recovery. The Adviser will not be entitled to recover any such waived or reimbursed fees and expenses more than three years after the end of the fiscal year in which the fees were waived or expenses were reimbursed. The Adviser may not terminate this waiver arrangement without the approval of the Fund’s Board.
| Clough Global Long/Short Fund | Notes to Financial Statements |
| | April 30, 2019 (Unaudited) |
As of April 30, 2019, the balances of future recoupable expenses were as follows:
| | | Expires in
2019 | | Expires in
2020 | | Expires in
2021 | | Expires in
2022 | | Total |
| Class I | | $ | (537,227 | ) | | $ | (429,730 | ) | | $ | (397,552 | ) | | $ | (191,864 | ) | | $ | (1,556,373 | ) |
| Investor Class | | $ | (470 | ) | | $ | (1,398 | ) | | $ | (21,047 | ) | | | (10,699 | ) | | $ | (33,614 | ) |
| Class A | | $ | – | | | $ | – | | | $ | (366 | ) | | | (728 | ) | | $ | (1,094 | ) |
| Class C | | $ | (734 | ) | | $ | (968 | ) | | $ | (17,407 | ) | | | (14,147 | ) | | $ | (33,256 | ) |
Administration Agreement: The Fund currently employs ALPS Fund Services, Inc. (“ALPS”) under an administration agreement to provide certain administrative services to the Fund. As compensation for its services to the Fund, ALPS receives an annual administration fee accrued daily, paid monthly.
Transfer Agency and Service Agreement: ALPS, pursuant to a Transfer Agency and Service Agreement, serves as transfer agent for the Fund.
Distribution and Shareholder Services Plan: The Fund has adopted a separate plan of distribution for Investor Class, Class A and Class C shares, pursuant to Rule 12b-1 under the 1940 Act (each, a “Plan” and collectively, the “Plans”). ALPS Portfolio Solutions Distributor, Inc. (the “Distributor”) serves as the Fund’s distributor.
The Plans allow the Fund, as applicable, to use Investor Class, Class A and Class C assets to pay fees in connection with the distribution and marketing of Investor Class, Class A and Class C shares and/or the provision of ongoing servicing for the benefit of shareholders. Each Plan permits payment for services in connection with the administration of plans or programs that use Investor Class, Class A and/or Class C shares of the Fund as their funding medium and for related expenses.
The Plans permit the Fund to make total payments at an annual rate of up to 0.25% of the Fund’s average daily net assets attributable to its Investor Class and Class A shares, and 1.00% of the Fund’s average daily net assets attributable to its Class C shares. Because these fees are paid out of the Fund’s Investor Class, Class A and Class C shares, respectively, on an ongoing basis, over time they will increase the cost of an investment in Investor Class, Class A and Class C shares. For example, the Class C Plan fees may cost an investor more than the Investor Class and Class A Plan sales charges over time.
Under the terms of the Plans, the Trust is authorized to make payments to the Distributor for remittance to financial intermediaries, as compensation for distribution and/or the provision of on-going servicing for the benefit of shareholders performed by such financial intermediaries for their customers who are investors in the Fund. Financial intermediaries may from time to time be required to meet certain additional criteria in order to continue to receive 12b-1 fees. For Class C shares, the Distributor is entitled to retain all fees paid under the Plan for the first 12 months on any investment in Class C Shares to recoup the expenses with respect to the payment of commissions on sales of Class C Shares. Financial intermediaries will become eligible for Class C Plan compensation beginning in the 13th month following the purchase of Class C Shares, although the Distributor may, pursuant to a written agreement between the Distributor and a particular financial intermediary, pay such financial intermediary 12b-1 fees prior to the 13th month following the purchase of Class C Shares. The Distributor may retain some or all compensation payable pursuant to the Plans under certain circumstances, such as when a financial intermediary is removed as the broker of record or a financial intermediary fails to meet certain qualification standards to be eligible to continue to be the broker of record.
Shareholder Services Plan for Investor Class and Class A Shares: The Fund has adopted a non-12b-1 shareholder services plan (the “Services Plan”) with respect to the Fund’s Investor Class and Class A shares. Under the Services Plan, the Fund is authorized to pay financial intermediaries an aggregate fee in an amount not to exceed on an annual basis 0.10% of the average daily net asset value of the Investor Class and Class A shares of the Fund attributable to or held in the name of the financial intermediary for its clients as compensation for maintaining customer accounts that hold Fund shares. These activities may include, but are not limited to, establishing and maintaining Fund shareholder accounts on a transaction processing and record keeping system, providing Fund shareholders with the ability to access current Fund information, including without limitation, share balances, dividend information and transaction history, and permitting the Fund’s transfer agent to receive order instructions from or on behalf of Fund shareholders for the purchase or redemption of Shares. None of these activities include distribution services. Any amount of the Services Plan fees not paid during the Fund’s fiscal year for such servicing shall be reimbursed to the Fund.
| Semi-Annual Report | April 30, 2019 | 27 |
| Clough Global Long/Short Fund | Notes to Financial Statements |
| | April 30, 2019 (Unaudited) |
6. AFFILIATED TRANSACTIONS
The Fund may engage in cross trades with an affiliate pursuant to Rule 17a-7 under the 1940 Act. Cross trading is the buying or selling of portfolio securities between funds to which the Adviser serves as the investment adviser. The Board of Trustees previously adopted procedures that apply to transactions from or to another registered investment company, or any account which is considered an affiliated account by reason of having a common investment adviser. At its regularly scheduled meetings, the Trustees review such transactions as of the most current calendar quarter for compliance with the requirements set forth by Rule 17a-7 and the Fund’s procedures. The procedures require that the transactions be a purchase or sale for no consideration other than cash payment or cash credit (to be used to purchase shares of the Fund involved) against prompt delivery of a security for which market quotations are readily available, and be consistent with the investment policies of the Fund. During the six months ended April 30, 2019 the Fund did not engage in cross trades.
7. INDEMNIFICATION
Under the Trust’s organizational documents, its officers and Trustees are indemnified against certain liabilities arising out of the performance of their duties to the Trust. Additionally, in the normal course of business, the Trust enters into contracts with service providers that contain general indemnification clauses. The Trust’s maximum exposure under these arrangements is unknown, as this would involve future claims that may be made against the Trust that have not yet occurred. However, based on experience, the Trust believes the risk of loss to be remote.
8. RECENT ACCOUNTING PRONOUNCEMENT
In August 2018, the Financial Accounting Standards Board (“FASB”) issued Accounting Standards Update (“ASU”) 2018-13, which changes the fair value measurement disclosure requirements of FASB Accounting Standards Codification Topic 820, Fair Value Measurement. The update to Topic 820 includes new, eliminated, and modified disclosure requirements. ASU 2018-13 is effective for fiscal years beginning after December 15, 2019, including interim periods. Early adoption is permitted for any eliminated or modified disclosures. Eliminated and modified disclosures have been adopted, management is currently evaluating the impact of the new disclosures to the financial statements.
| Clough Global Long/Short Fund | Additional Information |
| | April 30, 2019 (Unaudited) |
FUND PROXY VOTING POLICIES & PROCEDURES
The Fund’s policies and procedures used in determining how to vote proxies relating to portfolio securities are available on the Fund’s website at http://www.cloughglobal.com. Information regarding how the Fund voted proxies relating to portfolio securities held by the Fund for the period ended June 30, are available without charge, upon request, by contacting the Fund at 1-877-256-8445 and on the Commission’s website at http://www.sec.gov.
PORTFOLIO HOLDINGS
The Fund files its complete schedule of portfolio holdings with the Commission for each fiscal quarter on Form N-PORT within 60 days after the end of the period. Copies of the Fund’s Form N-PORT are available without a charge, upon request, by contacting the Fund at 1-877-256-8445 and on the Commission’s website at http://www.sec.gov.
| Semi-Annual Report | April 30, 2019 | 29 |
| Clough Global Long/Short Fund | Investment Advisory Agreement Approval |
| | April 30, 2019 (Unaudited) |
At an in-person meeting of the Board held on April 10, 2019, the Trustees of Clough Funds Trust (the “Trust”), including a majority of the Trustees who are not “interested persons” of the Trust (the “Independent Trustees”), voted to approve the continuation of the current Management Agreement (the “Management Agreement”) with Clough Capital Partners L.P. (the “Adviser”) with respect to the Clough Global Long/Short Fund (the “Fund”). In voting such approval, the Board took into account various sources of information, considerations and conclusions, as summarized below.
Management Agreement Approval Process
Section 15(c) of the Investment Company Act of 1940, as amended (the “1940 Act”), requires that each mutual fund’s board of directors or trustees, including a majority of those directors or trustees who are not “interested persons” of the mutual fund, as defined in the 1940 Act, initially approve, and after an initial term not exceeding two years, annually review and consider the continuation of, the mutual fund’s investment advisory agreement. The Board reviewed information relating to the Fund and the Adviser that was prepared in response to specific inquiries made on behalf of the Independent Trustees to assist them in their consideration of the continuation of the Management Agreement. This information included, among other things, information about: the Adviser’s organization, operations and personnel; the services provided to the Fund by the Adviser; the Adviser’s portfolio management, trading and compliance practices; and the level of the advisory fee and the total expense ratio of the Fund relative to a peer group of comparable alternative long-short equity funds, as detailed in a comparative analysis prepared by an independent data provider. As part of its consideration process, the Board received presentations from representatives of the Adviser regarding the Fund and its investment strategy, and reviewed the Fund’s investment performance in comparison to the performance of benchmark indices and other similarly managed funds. The Independent Trustees of the Board also met in executive session separately from Fund management and the interested Trustees to consider the information provided and to confer with independent legal counsel regarding their responsibilities under relevant laws and regulations.
Nature, Quality and Extent of Services
In evaluating the nature, quality and extent of services provided by the Adviser to the Fund, the Board reviewed information relating to the Adviser’s operations and personnel, including: its organizational and management structure; the qualifications, education and experience of the individual investment professionals whose responsibilities include portfolio management and investment research for the Fund; the portfolio management and trading practices to be employed in managing the Fund; the Adviser’s financial condition and its ability to devote the resources necessary to provide the services required under the Management Agreement; and the Adviser’s dedication to maintaining appropriate compliance programs with respect to the Fund. In particular, the Board noted that the Adviser is a well-regarded organization with an appropriate level of financial and human resources, including personnel with experience managing global long-short portfolios. The Board also compared the Fund’s investment performance over various periods to benchmark indices and a peer group of comparable long-short equity funds selected by an independent data provider. The Board noted that the Fund had underperformed its peer group for the one-year period ended February 28, 2019, when the average annual net total return performance of the peer group was -1.99% and the Fund’s performance was -3.97%. The Board also noted that the Fund had outperformed its peer group for the three-year period ended February 28, 2019, when the average annual net total return performance of the peer group was 5.17% and the Fund’s performance was 7.26%.
Based upon these and other relevant factors, the Board concluded that the Adviser possesses the capability to effectively perform the duties required of it under the Management Agreement and that the Adviser’s personnel are qualified to manage the Fund’s assets in accordance with its stated investment objectives and policies.
Fees and Expenses
In considering the fee payable to the Adviser under the Management Agreement, the Board reviewed comparative information presented in the report of an independent data provider relating to the actual and contractual fee level and total expense ratio of the Fund relative to a peer group of comparable long-short equity funds. In this regard, the Board considered that the gross advisory fee payable by funds in the expense group ranged from 1.235% to 2.304%, with a median of 1.413%, and that the Fund’s gross advisory fee was 1.350%. The Board also considered that the net total expense ratio for the expense group, excluding investment related expenses, ranged from 1.382% to 2.760%, with a median of 1.603%, and the Fund’s net total expense ratio, excluding investment related expenses, was 1.599%.
The Board also requested and reviewed information regarding the fees charged by the Adviser to the other registered funds and institutional separate accounts it manages. In addition, the Board noted that during the one-year period ended February 28, 2019 the Adviser had waived a portion of its advisory fees for the purpose of maintaining a limit on total operating expenses, and that the Adviser had proposed to continue waiving advisory fees, if necessary, for each share class of the Fund for a period of at least one year from the date of the Fund’s prospectus, subject to potential recapture under certain conditions.
On the basis of the information provided, the Board concluded that the advisory fee was reasonable in light of the nature, quality and extent of services provided by the Adviser.
| Clough Global Long/Short Fund | Investment Advisory Agreement Approval |
| | April 30, 2019 (Unaudited) |
Profitability
In considering the fees payable under the Management Agreement, the Board reviewed information regarding the Adviser’s costs to provide investment management and related services to the Fund and the estimated profitability to the Adviser from all services provided to the Fund. In its evaluation, the Board considered the Adviser’s representation that the level of its estimated profitability was reasonable based on the nature and quality of the services provided and the Adviser’s costs in delivering such services. The Board also considered that the actual profitability of the Fund to the Adviser would depend on the growth of assets under management, after giving effect to the Adviser’s agreement to maintain a limit on total expenses for a period of at least one year from the date of the Fund’s prospectus. Based on these considerations, the Board concluded that the profits expected to be realized by the Adviser as a result of the continuation of the Management Agreement would not be excessive.
Economies of Scale
In reviewing the Fund’s advisory fee, the Board considered the extent to which the Adviser, on the one hand, and the Fund, on the other hand, can expect to benefit from economies of scale in the event the assets of the Fund increase over time. In considering the potential to realize benefits from economies of scale, the Board reviewed the Fund’s advisory fee in comparison to comparable peer funds as well as the Fund’s current and expected expense ratio after giving effect to the Adviser’s agreement to limit total expenses for a period of one year from the date of the Fund’s prospectus. On the basis of the foregoing, and in light of the Fund’s current and expected asset levels, the Board concluded that the structure of the advisory fee is appropriate and that fee breakpoints are not required at this time. The Board noted, however, that it would review future growth in Fund assets and the appropriateness of breakpoints as part of future annual reviews of the Management Agreement.
Other Benefits
The Board considered other potential benefits to be derived by the Adviser from its relationship with the Fund, as well as any additional benefits which may be derived by the Fund as a result of its association with the Adviser.
Conclusion
Based on its review of the information provided, and such other factors and conclusions as the Board deemed relevant, the Board, including a majority of the Independent Trustees, concluded that the approval of the Management Agreement is in the best interests of the Fund and voted to approve its continuation. In reaching this determination, the Board did not assign relative weights to any factors or conclusions taken into account nor did it deem any one or group of such factors or conclusions to be determinative in isolation.
| Semi-Annual Report | April 30, 2019 | 31 |

Item 2. Code of Ethics.
Not applicable to this report.
Item 3. Audit Committee Financial Expert.
Not applicable to this report.
Item 4. Principal Accountant Fees and Services.
Not applicable to this report.
Item 5. Audit Committee of Listed Registrants.
Not applicable to registrant.
Item 6. Investments.
| (a) | Schedule of Investments is included as part of the Report to Stockholders filed under Item 1 of this Form N-CSR. |
Item 7. Disclosure of Proxy Voting Policies and Procedures for Closed-End Management Investment Companies.
Not applicable to the registrant.
| Item 8. | Portfolio Managers of Closed-End Management Investment Companies. |
Not applicable to the registrant.
Item 9. Purchases of Equity Securities by Closed-End Management Investment Company and Affiliated Purchasers.
Not applicable to the registrant.
Item 10. Submission of Matters to Vote of Security Holders.
There have been no material changes to the procedures by which shareholders may recommend nominees to the Registrant’s Board of Trustees, where those changes were implemented after the Registrant last provided disclosure in response to the requirements of Item 407(c)(2)(iv) of Regulation S-K, or this Item.
Item 11. Controls and Procedures.
| (a) | The registrant’s principal executive officer and principal financial officer have evaluated the registrant’s disclosure controls and procedures (as defined in Rule 30a-3(c) under the Investment Company Act of 1940, as amended) within 90 days of this report and have concluded that the registrant’s disclosure controls and procedures were effective as of that date. |
| (b) | There was no change in the registrant’s internal control over financial reporting (as defined in Rule 30a-3(d) under the Investment Company Act of 1940, as amended) during the period covered by this report that has materially affected, or is reasonably likely to materially affect, the registrant’s internal control over financial reporting. |
Item 12.Disclosure of Securities Lending Activities for Closed-End Management Investment Companies.
Not applicable to registrant.
Item 13.Exhibits.
| (a)(1) | Not applicable to this report. |
| (a)(2) | The certifications required by Rule 30a-2(a) of the Investment Company Act of 1940, as amended, and Section 302 of the Sarbanes-Oxley Act of 2002 are attached hereto as Exhibit 99.Cert. |
| (b) | The certifications by the registrant’s principal executive officer and principal financial officer, as required by Rule 30a-2(b) of the Investment Company Act of 1940, as amended, and Section 906 of the Sarbanes-Oxley Act of 2002 are attached hereto as Exhibit 99.906Cert. |
SIGNATURES
Pursuant to the requirements of the Securities Exchange Act of 1934 and the Investment Company Act of 1940, the Registrant has duly caused this report to be signed on its behalf by the undersigned, thereunto duly authorized.
CLOUGH FUNDS TRUST
| By: | /s/ Brad Swenson | |
| | Brad Swenson | |
| | President/Principal Executive Officer | |
| | | |
| Date: | July 2, 2019 | |
Pursuant to the requirements of the Securities Exchange Act of 1934 and the Investment Company Act of 1940, this report has been signed below by the following persons on behalf of the Registrant and in the capacities and on the dates indicated.
CLOUGH FUNDS TRUST
| By: | /s/ Brad Swenson | |
| | Brad Swenson | |
| | President/Principal Executive Officer | |
| | | |
| Date: | July 2, 2019 | |
| By: | /s/ Jill Kerschen | |
| | Jill Kerschen | |
| | Treasurer/Principal Financial Officer | |
| | | |
| Date: | July 2, 2019 | |