united states
securities and exchange commission
washington, d.c. 20549
form n-csr
certified shareholder report of registered management
investment companies
Investment Company Act file number 811-23066
Northern Lights Fund Trust IV
(Exact name of registrant as specified in charter)
17605 Wright Street, Omaha, Nebraska 68130
(Address of principal executive offices) (Zip code)
Jen Farrell, Gemini Fund Services, LLC.
80 Arkay Drive, Hauppauge, NY 11788
(Name and address of agent for service)
Registrant's telephone number, including area code: 631-470-2600
Date of fiscal year end: 8/31
Date of reporting period: 8/31/18
Item 1. Reports to Stockholders.
 |
| Sage ESG Intermediate Credit ETF |
| GUDB |
| August 31, 2018 |
| Annual Report |
| Advised by: |
| Sage Advisory Services LTD Co. |
| 5900 Southwest Parkway |
| Building 1 |
| Austin, TX 78735-6202 |
| Distributed by Northern Lights Distributors, LLC |
| Member FINRA |
Annual Letter to Shareholders of the Sage Intermediate Credit ETF (GUDB)
One of our key initiatives at Sage is to provide clients with Environmental, Social, and Governance investing options. We are proud to have created the first intermediate duration credit ETF that optimizes for ESG factors. Launched in October 2017, GUDB stands for “good bonds,” and we at Sage strive to include the most sustainable investments in this asset class with the most attractive relative returns.
We would like to thank our supporters for making this advancement possible.
Because GUDB is a relatively new fund, we would like to review its investment objective, strategy, and purpose.
Investment Objective
The Sage ESG Intermediate Credit ETF (the “Fund”) seeks to provide investors access to a portfolio of investment grade credit bonds issued by companies with strong fundamentals and best-in-class ESG (Environmental, Social, Governance) characteristics. The Sage ESG Intermediate Credit ETF (the “Fund”) seeks to replicate investment results that generally correspond, before fees and expenses, to the performance of the Sage ESG Intermediate Credit Index. The Sage Intermediate Credit Index is created via a systematic, rules-based approach to identify securities from the Bloomberg Barclays US Intermediate Credit Index with optimal ESG ratings, while closely aligning duration and risk characteristics.
Principal Investment Strategy
The fund generally seeks to invest at least 80% of its total assets in the component securities of the SAGE ESG
Credit Bond Index (the “Index”). The Index consists of corporate bonds selected from the Barclays Capital U.S. Intermediate Credit Bond Index that meet Environmental, Social and Governance (ESG) criteria jointly developed by the Sage and Sustainalytics. Sustainalytics, based in London, England, is a global leader in ESG and Corporate Governance research and ratings. The index is maintained by using the Sage/Sustainalytics proprietary framework to assign each issuer of bonds in the Barclays Capital U.S. Intermediate Credit Bond Index an ESG score from 1 to 100. To be eligible for the inclusion in the index, an issuer must have
| ● | Minimum overall ESG Score of 50 |
| ● | Rank in the Top 1/3rd of its relevant peer group |
| ● | Have a controversy score of no higher than 3 (on a scale of 0-5) |
The Index using a rules-based methodology consists of investment grade domestic and U.S. dollar denominated foreign credit bonds that meet the criteria described above, representing each industry sector in proportion to the sectors that make up the Barclays Capital U.S. Intermediate Credit Bond Index. The bonds in the Index are also consistent with the duration, maturity and yield curve positioning in the Barclays Capital U.S. Intermediate Credit Bond Index.
Fund Performance
| Fund Name | 1M | 3M | 6M | Since Inception | Inception Date | |||||
| Sage ESG Intermediate Credit ETF | 0.50% | 0.72% | 0.84% | -0.78% | 10/31/2017 |
3880-NLD-9/22/2019
1
Purpose and Uses
| ● | The Sage ESG Intermediate Credit ETF could serve as an important core building block for a diversified ESG-focused asset allocation |
| ● | The Sage ESG Intermediate Credit ETF is an investment vehicle comprised of approximately 100 highly liquid corporate bonds diversified across industries and maturities. |
Market Outlook
This year has been challenging for fixed income investors, as it often is during a Federal Reserve monetary policy tightening cycle. The good news for investors, however, is that we see better return prospects for the remainder of 2018 and the first half of 2019. Fixed income returns are normally under pressure more in the early phase of a tightening cycle, but we believe we are now in the latter stages of this cycle and investors could reap the benefits of more stable yields and higher coupons as we exit this year.
On the surface, the fundamental outlook remains supportive for risk assets overall, with the global economy expected to grow 4% in 2018, inflation pressures contained, central banks giving investors more clarity on policy, and strong corporate earnings. Beneath the surface, the outlook has gotten a bit murkier. Growth appears solid, but has become more U.S. dependent, with both Japan and Europe failing to break out of the first quarter soft patch, and headwinds facing Emerging Markets have grown or at least are being paid heed by investors. On a more positive note, ESG investing continues its growth trend, with total global sustainable investment assets now at $22.89 trillion and growing. We expect that assets under management in sustainable investing will continue its upward trend due to increased investor awareness and its ability to deliver not only positive returns, but also better social and environmental outcomes.
Political and trade risks also increased over the last quarter. Trade is the most obvious near-term tail risk, and while current tariffs may not have a material impact on the growth picture, a retaliatory escalation could at some point cause a downgrade to growth expectations. Central bank policy remains a key market driver heading into the latter stages of 2018, but it is unlikely to be a major detractor to risk market sentiments in the next few months. Policymakers have added a high level of clarity to plans, and the recent European Central Bank monetary policy tapering announcement, along with assurances of no rate hikes for at least a year, was viewed as very dovish. On the negative side, after 2018 only one of the three major central banks will be engaged in asset purchases: The Bank of Japan. This switch from net QE (Quantitative Easing) to QT (Quantitative Tightening) is hard to ignore and the effects on financial conditions are unknown. From a rate perspective, current conditions and Fed commentary point to a couple more rate hikes by year-end, which will be felt mostly on the front end of the curve. We continue to hold our 3.0%-3.25% 10-year Treasury yield target into year-end.
On the other hand, the less than favorable news for bond investors is that credit valuations are currently full and therefore further upside appreciation may be limited due to a mature business cycle, rising cost of capital and tighter liquidity from central banks. All of this means that investors may need to heighten their risk mitigation efforts and carefully navigate the credit markets over the coming quarters.
Sincerely,
Sage Advisory Services, Ltd. Co.
3880-NLD-9/22/2019
2
| Sage ESG Intermediate Credit ETF |
| PORTFOLIO REVIEW (Unaudited) |
| August 31, 2018 |
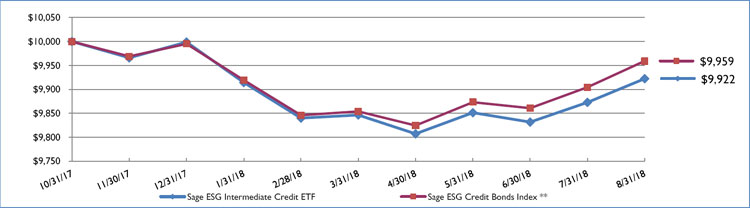
The Fund’s performance figures(*) for the period ended August 31, 2018, compared to its benchmark:
| Inception*** through | ||
| August 31, 2018 | ||
| (Annualized) | ||
| Sage ESG Intermediate Credit ETF | (0.78)% | |
| Sage ESG Intermediate Credit ETF - Market Price | (0.92)% | |
| Sage ESG Credit Bonds Index ** | (0.41)% |
| * | The performance data quoted here represents past performance. Current performance may be lower or higher than the performance data quoted above. Investment return and principal value will fluctuate, so that shares, when sold, may be worth more or less than their original cost. The returns shown do not reflect the deduction of taxes that a shareholder would pay on Fund distributions or on the sale of Fund shares. Past performance is no guarantee of future results. Performance figures for periods greater than 1 year are annualized. The Fund’s adviser has contractually agreed to reduce the Fund’s fees and/or absorb expenses of the Fund until at least December 31, 2018 to ensure that total annual Fund operating expenses after fee waiver and reimbursement (exclusive of any taxes, interest, brokerage commissions, expenses incurred in connection with any merger or reorganization, indirect expenses, expenses of other investment companies in which the Fund may invest, or extraordinary expenses such as litigation) will not exceed 0.35% of average daily net assets. This agreement may be terminated by the Fund’s Board of Trustees on 60 days’ written notice to the adviser. These fee waivers and expense reimbursements are subject to possible recoupment from the Fund in future years on a rolling three year basis (within the three years after the fees have been waived or reimbursed) if such recoupment can be achieved within the foregoing expense limits. Please review the Fund’s most recent prospectus for more detail on the expense waiver. |
The Fund’s per share net asset value or “NAV” is the value of one share of the Fund as calculated in accordance with the standard formula for valuing registered investment company shares. The NAV return is based on the NAV of the Fund and the market return is based on the market price per share of the Fund. The price used to calculate market return (“Market Price”) is determined by using the midpoint between the highest bid and the lowest offer on the primary stock exchange on which shares of the Fund are listed for trading, as of the time that the Fund’s NAV is calculated. Market and NAV returns assume that dividends and capital gain distributions have been reinvested in the Fund at Market Price and NAV, respectively. The Fund’s total annual operating expenses, are 0.35% per the most recent prospectus.
| ** | The Sage ESG Credit Bonds Index consists of corporate bonds selected from the Barclays Capital U.S. Intermediate Credit Bond Index that meet Environmental, Social and Governance (ESG) criteria jointly developed by the Adviser and Sustainalytics. The Fund’s portfolio holdings may differ significantly from the securities held in the Index, and unlike an exchange traded fund (“ETF”), an unmanaged index assumes no transaction costs, taxes, management fees or other expenses. Investors may not invest directly in an index. |
| *** | October 31, 2017. |
Comparison of the Change in Value of a $10,000 Investment
| Portfolio Composition as of August 31, 2018: | ||||
| Sectors | Percentage of Net Assets | |||
| Banks | 16.6 | % | ||
| Multi-National | 7.6 | % | ||
| Electric | 7.0 | % | ||
| Pharmaceuticals | 6.8 | % | ||
| Telecommunications | 6.1 | % | ||
| Biotechnology | 6.0 | % | ||
| Semiconductors | 5.9 | % | ||
| Oil & Gas | 5.1 | % | ||
| Healthcare-Products | 4.3 | % | ||
| Beverages | 3.9 | % | ||
| Other Assets Less Liabilities | 30.7 | % | ||
| 100.0 | % | |||
Please refer to the Schedule of Investments in this annual report for a detailed analysis of the Fund’s holdings.
3
| Sage ESG Intermediate Credit ETF |
| SCHEDULE OF INVESTMENTS |
| August 31, 2018 |
| Par Value | Coupon Rate (%) | Maturity | Fair Value | |||||||||
| BONDS - 97.0% | ||||||||||||
| AEROSPACE & DEFENSE - 2.0% | ||||||||||||
| $ | 143,000 | Embraer Netherlands Finance BV | 5.0500 | 6/15/2025 | $ | 143,538 | ||||||
| 57,000 | Embraer Netherlands Finance BV | 5.4000 | 2/1/2027 | 58,092 | ||||||||
| 35,000 | Northrop Grumman Corp. | 3.2500 | 1/15/2028 | 33,264 | ||||||||
| 60,000 | Rockwell Collins, Inc. | 3.2000 | 3/15/2024 | 58,329 | ||||||||
| 293,223 | ||||||||||||
| BANKS - 16.6% | ||||||||||||
| 250,000 | Australia & New Zealand Banking Group Ltd. | 2.3000 | 6/1/2021 | 243,626 | ||||||||
| 70,000 | Bank of America Corp., Quarterly US LIBOR +1.0400% * | 3.4190 | 12/20/2028 | 66,039 | ||||||||
| 15,000 | Bank of America Corp., Quarterly US LIBOR +0.6300% * | 3.4990 | 5/17/2022 | 15,033 | ||||||||
| 126,000 | Bank of America Corp. | 4.0000 | 1/22/2025 | 124,745 | ||||||||
| 138,000 | Bank of America Corp. | 4.4500 | 3/3/2026 | 138,614 | ||||||||
| 143,000 | Bank of New York Mellon Corp. | 2.6000 | 8/17/2020 | 141,978 | ||||||||
| 55,000 | Bank of Nova Scotia | 1.6500 | 6/14/2019 | 54,587 | ||||||||
| 130,000 | Bank of Nova Scotia | 4.5000 | 12/16/2025 | 131,981 | ||||||||
| 120,000 | Goldman Sachs Group, Inc. | 2.3000 | 12/13/2019 | 119,134 | ||||||||
| 147,000 | Goldman Sachs Group, Inc. | 2.8750 | 2/25/2021 | 145,899 | ||||||||
| 20,000 | Goldman Sachs Group, Inc. | 3.5000 | 11/16/2026 | 19,077 | ||||||||
| 150,000 | Kreditanstalt fuer Wiederaufbau | 1.6250 | 3/15/2021 | 145,722 | ||||||||
| 145,000 | Morgan Stanley & Co. | 2.6500 | 1/27/2020 | 144,253 | ||||||||
| 70,000 | Santander UK Group Holdings PLC | 3.1250 | 1/8/2021 | 69,237 | ||||||||
| 144,000 | Santander UK PLC | 2.3750 | 3/16/2020 | 142,340 | ||||||||
| 290,000 | Santander UK PLC | 3.4000 | 6/1/2021 | 290,177 | ||||||||
| 143,000 | State Street Corp. | 2.5500 | 8/18/2020 | 142,153 | ||||||||
| 155,000 | State Street Corp. | 2.6500 | 5/19/2026 | 145,805 | ||||||||
| 145,000 | State Street Corp. | 3.5500 | 8/18/2025 | 145,973 | ||||||||
| 2,426,373 | ||||||||||||
| BEVERAGES - 3.9% | ||||||||||||
| 139,000 | Anheuser-Busch InBev Worldwide, Inc. | 3.7500 | 1/15/2022 | 141,369 | ||||||||
| 150,000 | Keurig Dr Pepper, Inc. | 3.1300 | 12/15/2023 | 144,384 | ||||||||
| 145,000 | Molson Coors Brewing Co. | 1.4500 | 7/15/2019 | 143,212 | ||||||||
| 145,000 | PepsiCo, Inc. | 3.1000 | 7/17/2022 | 145,229 | ||||||||
| 574,194 | ||||||||||||
| BIOTECHNOLOGY - 6.0% | ||||||||||||
| 142,000 | Biogen, Inc. | 2.9000 | 9/15/2020 | 141,591 | ||||||||
| 140,000 | Biogen, Inc. | 3.6250 | 9/15/2022 | 141,039 | ||||||||
| 145,000 | Celgene Corp. | 2.8750 | 8/15/2020 | 144,365 | ||||||||
| 145,000 | Celgene Corp. | 3.5500 | 8/15/2022 | 145,003 | ||||||||
| 145,000 | Gilead Sciences, Inc. | 2.5500 | 9/1/2020 | 143,755 | ||||||||
| 36,000 | Gilead Sciences, Inc. | 3.2500 | 9/1/2022 | 35,999 | ||||||||
| 125,000 | Gilead Sciences, Inc. | 3.6500 | 3/1/2026 | 124,008 | ||||||||
| 875,760 | ||||||||||||
| COMMERCIAL SERVICES - 1.9% | ||||||||||||
| 141,000 | Automatic Data Processing, Inc. | 3.3750 | 9/15/2025 | 140,892 | ||||||||
| 142,000 | S&P Global, Inc. | 3.3000 | 8/14/2020 | 142,435 | ||||||||
| 283,327 | ||||||||||||
See accompanying notes to financial statements.
4
| Sage ESG Intermediate Credit ETF |
| SCHEDULE OF INVESTMENTS (Continued) |
| August 31, 2018 |
| Par Value | Coupon Rate (%) | Maturity | Fair Value | |||||||||
| COMPUTERS - 2.2% | ||||||||||||
| $ | 142,000 | DXC Technology Co. | 4.2500 | 4/15/2024 | $ | 142,902 | ||||||
| 140,000 | Hewlett Packard Enterprise Co. | 4.4000 | 10/15/2022 | 144,346 | ||||||||
| 30,000 | Seagate HDD Cayman | 4.8750 | 6/1/2027 | 28,224 | ||||||||
| 315,472 | ||||||||||||
| DIVERSIFIED FINANCIAL SERVICES - 1.8% | ||||||||||||
| 148,000 | American Express Credit Corp. | 2.7000 | 3/3/2022 | 144,666 | ||||||||
| 125,000 | BlackRock, Inc. | 3.2000 | 3/15/2027 | 122,372 | ||||||||
| 267,038 | ||||||||||||
| ELECTRIC - 7.0% | ||||||||||||
| 146,000 | DTE Energy Co. | 3.8000 | 3/15/2027 | 144,349 | ||||||||
| 143,000 | Entergy Corp. | 4.0000 | 7/15/2022 | 145,793 | ||||||||
| 145,000 | Exelon Corp. | 2.8500 | 6/15/2020 | 144,106 | ||||||||
| 145,000 | Exelon Corp. | 3.4970 | 6/1/2022 | 143,412 | ||||||||
| 13,000 | Exelon Generation Co. LLC | 2.9500 | 1/15/2020 | 12,958 | ||||||||
| 142,000 | Exelon Generation Co. LLC | 3.4000 | 3/15/2022 | 141,482 | ||||||||
| 150,000 | NSTAR Electric Co. | 3.2000 | 5/15/2027 | 145,585 | ||||||||
| 145,000 | PSEG Power LLC | 3.0000 | 6/15/2021 | 143,995 | ||||||||
| 1,021,680 | ||||||||||||
| ELECTRONICS - 2.0% | ||||||||||||
| 140,000 | Flex Ltd. | 4.7500 | 6/15/2025 | 142,273 | ||||||||
| 140,000 | Keysight Technologies, Inc. | 4.5500 | 10/30/2024 | 142,804 | ||||||||
| 285,077 | ||||||||||||
| FOOD - 2.3% | ||||||||||||
| 35,000 | Kellogg Co. | 2.6500 | 12/1/2023 | 33,615 | ||||||||
| 145,000 | Kellogg Co. | 4.3000 | 5/15/2028 | 146,715 | ||||||||
| 148,000 | McCormick & Co., Inc. | 3.1500 | 8/15/2024 | 143,304 | ||||||||
| 10,000 | Mondelez International, Inc. | 4.1250 | 5/7/2028 | 10,085 | ||||||||
| 333,719 | ||||||||||||
| FOREST PRODUCTS & PAPER - 1.6% | ||||||||||||
| 100,000 | Fibria Overseas Finance Ltd. | 4.0000 | 1/14/2025 | 92,188 | ||||||||
| 140,000 | Fibria Overseas Finance Ltd. | 5.5000 | 1/17/2027 | 138,601 | ||||||||
| 230,789 | ||||||||||||
| HEALTHCARE-PRODUCTS - 4.3% | ||||||||||||
| 145,000 | Abbott Laboratories | 3.4000 | 11/30/2023 | 144,620 | ||||||||
| 145,000 | Becton Dickinson and Co. | 2.1330 | 6/6/2019 | 144,234 | ||||||||
| 113,000 | Medtronic, Inc. | 2.5000 | 3/15/2020 | 112,298 | ||||||||
| 142,000 | Medtronic, Inc. | 3.1500 | 3/15/2022 | 141,757 | ||||||||
| 80,000 | Medtronic, Inc. | 3.5000 | 3/15/2025 | 80,029 | ||||||||
| 622,938 | ||||||||||||
| HEALTHCARE-SERVICES - 2.0% | ||||||||||||
| 150,000 | Aetna, Inc. | 2.8000 | 6/15/2023 | 144,811 | ||||||||
| 145,000 | UnitedHealth Group, Inc. | 3.3500 | 7/15/2022 | 145,835 | ||||||||
| 290,646 | ||||||||||||
| INTERNET - 1.0% | ||||||||||||
| 140,000 | eBay, Inc. | 3.8000 | 3/9/2022 | 142,082 | ||||||||
| MACHINERY - 1.0% | ||||||||||||
| 140,000 | CNH Industrial NV | 4.5000 | 8/15/2023 | 143,245 | ||||||||
| 7,000 | John Deere Capital Corp. | 2.8000 | 3/6/2023 | 6,879 | ||||||||
| 150,124 | ||||||||||||
| MEDIA - 1.9% | ||||||||||||
| 147,000 | Comcast Corp. | 3.0000 | 2/1/2024 | 143,208 | ||||||||
| 135,000 | Comcast Corp. | 3.3000 | 2/1/2027 | 129,817 | ||||||||
| 273,025 | ||||||||||||
See accompanying notes to financial statements.
5
| Sage ESG Intermediate Credit ETF |
| SCHEDULE OF INVESTMENTS (Continued) |
| August 31, 2018 |
| Par Value | Coupon Rate (%) | Maturity | Fair Value | |||||||||
| MULTI-NATIONAL - 7.6% | ||||||||||||
| $ | 155,000 | Asian Development Bank | 2.0000 | 4/24/2026 | $ | 144,774 | ||||||
| 151,000 | Asian Development Bank | 2.3750 | 8/10/2027 | 143,572 | ||||||||
| 150,000 | Asian Development Bank | 2.6250 | 1/12/2027 | 145,922 | ||||||||
| 5,000 | Council Of Europe Development Bank | 1.5000 | 5/17/2019 | 4,963 | ||||||||
| 6,000 | Council Of Europe Development Bank | 1.6250 | 3/16/2021 | 5,824 | ||||||||
| 139,000 | Council Of Europe Development Bank | 1.8750 | 1/27/2020 | 137,425 | ||||||||
| 60,000 | European Investment Bank | 2.2500 | 3/15/2022 | 58,724 | ||||||||
| 146,000 | Inter-American Development Bank | 2.1250 | 1/18/2022 | 142,618 | ||||||||
| 90,000 | International Bank for Reconstruction & Development | 1.3750 | 5/24/2021 | 86,637 | ||||||||
| 100,000 | International Bank for Reconstruction & Development | 1.6250 | 3/9/2021 | 97,220 | ||||||||
| 150,000 | International Bank for Reconstruction & Development | 1.7500 | 4/19/2023 | 143,018 | ||||||||
| 1,110,697 | ||||||||||||
| OIL & GAS - 5.1% | ||||||||||||
| 30,000 | BP Capital Markets PLC | 2.3150 | 2/13/2020 | 29,752 | ||||||||
| 142,000 | BP Capital Markets PLC | 3.0620 | 3/17/2022 | 141,242 | ||||||||
| 145,000 | BP Capital Markets PLC | 3.2240 | 4/14/2024 | 142,746 | ||||||||
| 146,000 | BP Capital Markets PLC | 3.5060 | 3/17/2025 | 145,794 | ||||||||
| 133,000 | ConocoPhillips Co. | 4.9500 | 3/15/2026 | 144,122 | ||||||||
| 145,000 | Continental Resources, Inc. | 4.3750 | 1/15/2028 | 144,358 | ||||||||
| 748,014 | ||||||||||||
| PHARMACEUTICALS - 6.8% | ||||||||||||
| 150,000 | AbbVie, Inc. | 2.8500 | 5/14/2023 | 145,305 | ||||||||
| 143,000 | Allergan Funding SCS | 3.0000 | 3/12/2020 | 142,671 | ||||||||
| 65,000 | Allergan Funding SCS | 3.8000 | 3/15/2025 | 64,513 | ||||||||
| 90,000 | Bristol-Myers Squibb Co. | 3.2500 | 2/27/2027 | 88,071 | ||||||||
| 150,000 | CVS Health Corp. | 2.1250 | 6/1/2021 | 145,284 | ||||||||
| 130,000 | CVS Health Corp. | 2.8750 | 6/1/2026 | 119,636 | ||||||||
| 145,000 | CVS Health Corp. | 3.5000 | 7/20/2022 | 144,425 | ||||||||
| 145,000 | Pfizer, Inc. | 1.9500 | 6/3/2021 | 141,581 | ||||||||
| 991,486 | ||||||||||||
| PIPELINES - 2.6% | ||||||||||||
| 150,000 | Andeavor Logistics LP | 4.2500 | 12/1/2027 | 148,357 | ||||||||
| 140,000 | Andeavor Logistics LP | 5.5000 | 10/15/2019 | 143,129 | ||||||||
| 82,000 | ONEOK, Inc. | 7.5000 | 9/1/2023 | 94,309 | ||||||||
| 385,795 | ||||||||||||
| REAL ESTATE - 1.0% | ||||||||||||
| 137,000 | CBRE Services, Inc. | 4.8750 | 3/1/2026 | 142,597 | ||||||||
| REAL ESTATE INVESTMENT TRUSTS (REITs) - 1.0% | ||||||||||||
| 145,000 | HCP, Inc. | 4.0000 | 12/1/2022 | 145,826 | ||||||||
| SEMICONDUCTORS - 5.9% | ||||||||||||
| 145,000 | Analog Devices, Inc. | 3.1250 | 12/5/2023 | 141,583 | ||||||||
| 145,000 | Intel Corp. | 2.4500 | 7/29/2020 | 144,119 | ||||||||
| 143,000 | Intel Corp. | 3.1000 | 7/29/2022 | 143,229 | ||||||||
| 143,000 | Lam Research Corp. | 2.7500 | 3/15/2020 | 142,392 | ||||||||
| 150,000 | Lam Research Corp. | 2.8000 | 6/15/2021 | 148,001 | ||||||||
| 140,000 | Lam Research Corp. | 3.8000 | 3/15/2025 | 140,054 | ||||||||
| 859,378 | ||||||||||||
| SOFTWARE - 2.0% | ||||||||||||
| 150,000 | Citrix Systems, Inc. | 4.5000 | 12/1/2027 | 146,200 | ||||||||
| 150,000 | Oracle Corp. | 2.4000 | 9/15/2023 | 143,938 | ||||||||
| 290,138 | ||||||||||||
| SOVEREIGN - 0.4% | ||||||||||||
| 65,000 | Export Development Canada | 2.5000 | 1/24/2023 | 64,015 | ||||||||
See accompanying notes to financial statements.
6
| Sage ESG Intermediate Credit ETF |
| SCHEDULE OF INVESTMENTS (Continued) |
| August 31, 2018 |
| Par Value | Coupon Rate (%) | Maturity | Fair Value | |||||||||
| TELECOMMUNICATIONS - 6.1% | ||||||||||||
| $ | 140,000 | AT&T, Inc. | 4.6000 | 2/15/2021 | $ | 143,739 | ||||||
| 137,000 | AT&T, Inc. | 5.0000 | 3/1/2021 | 142,334 | ||||||||
| 105,000 | AT&T, Inc. | 5.2000 | 3/15/2020 | 108,272 | ||||||||
| 138,000 | AT&T, Inc. | 5.8750 | 10/1/2019 | 142,119 | ||||||||
| 145,000 | Cisco Systems, Inc. | 2.4500 | 6/15/2020 | 144,169 | ||||||||
| 65,000 | Cisco Systems, Inc. | 3.0000 | 6/15/2022 | 64,829 | ||||||||
| 145,000 | Vodafone Group PLC | 4.3750 | 5/30/2028 | 144,470 | ||||||||
| 889,932 | ||||||||||||
| TRANSPORTATION - 1.0% | ||||||||||||
| 150,000 | United Parcel Service, Inc. | 2.5000 | 4/1/2023 | 145,426 | ||||||||
| TOTAL BONDS (Cost $14,312,423) | 14,158,771 | |||||||||||
| TOTAL INVESTMENTS - 97.0% (Cost $14,312,423) | $ | 14,158,771 | ||||||||||
| OTHER ASSETS LESS LIABILITIES - 3.0% | 434,841 | |||||||||||
| NET ASSETS - 100.0% | $ | 14,593,612 | ||||||||||
LLC - Limited Liability Company
PLC - Public Limited Company
| * | Variable rate, rate shown represents the rate at August 31, 2018. |
See accompanying notes to financial statements.
7
| Sage ESG Intermediate Credit ETF |
| STATEMENT OF ASSETS AND LIABILITIES |
| August 31, 2018 |
| ASSETS | ||||
| Investment securities: | ||||
| At cost | $ | 14,312,423 | ||
| At fair value | $ | 14,158,771 | ||
| Cash | 344,633 | |||
| Dividends and interest receivable | 129,793 | |||
| Prepaid expenses | 700 | |||
| TOTAL ASSETS | 14,633,897 | |||
| LIABILITIES | ||||
| Investment advisory fees payable | 958 | |||
| Payable to related parties | 7,137 | |||
| Accrued expenses and other liabilities | 32,190 | |||
| TOTAL LIABILITIES | 40,285 | |||
| NET ASSETS | $ | 14,593,612 | ||
| Net Assets Consist Of: | ||||
| Paid in capital | $ | 14,855,190 | ||
| Undistributed net investment income | 23,423 | |||
| Accumulated net realized loss from security transactions | (131,349 | ) | ||
| Net unrealized depreciation on investments | (153,652 | ) | ||
| NET ASSETS | $ | 14,593,612 | ||
| Net Asset Value Per Share: | ||||
| Shares: | ||||
| Net Assets | $ | 14,593,612 | ||
| Shares of beneficial interest outstanding (a) | 300,000 | |||
| Net asset value (Net Assets ÷ Shares Outstanding) and redemption price per share | $ | 48.65 | ||
| (a) | Unlimited number of shares of beneficial interest authorized, no par value. |
See accompanying notes to financial statements.
8
| Sage ESG Intermediate Credit ETF |
| STATEMENT OF OPERATIONS |
| For the Period* Ended August 31, 2018 |
| INVESTMENT INCOME | ||||
| Interest | $ | 254,361 | ||
| TOTAL INVESTMENT INCOME | 254,361 | |||
| EXPENSES | ||||
| Investment advisory fees | 17,900 | |||
| Professional fees | 36,510 | |||
| Administrative services fees | 24,707 | |||
| Compliance officer fees | 23,251 | |||
| Custodian fees | 14,235 | |||
| Transfer agent fees | 13,095 | |||
| Printing and postage expenses | 12,100 | |||
| Accounting services fees | 10,000 | |||
| Trustees’ fees and expenses | 4,413 | |||
| Insurance expense | 431 | |||
| Other expenses | 17,912 | |||
| TOTAL EXPENSES | 174,554 | |||
| Less: Fees waived and expenses reimbursed by the Advisor | (142,906 | ) | ||
| NET EXPENSES | 31,648 | |||
| NET INVESTMENT INCOME | 222,713 | |||
| REALIZED AND UNREALIZED LOSS FROM INVESTMENTS | ||||
| Net realized loss from investments | (131,349 | ) | ||
| Net change in unrealized depreciation on investments | (153,652 | ) | ||
| NET REALIZED AND UNREALIZED LOSS FROM INVESTMENTS | (285,001 | ) | ||
| NET DECREASE IN NET ASSETS RESULTING FROM OPERATIONS | $ | (62,288 | ) | |
| * | The Fund commenced operations on October 31, 2017. |
See accompanying notes to financial statements.
9
| Sage ESG Intermediate Credit ETF |
| STATEMENTS OF CHANGES IN NET ASSETS |
| For the | ||||
| Period Ended | ||||
| August 31, 2018 ** | ||||
| FROM OPERATIONS | ||||
| Net investment income | $ | 222,713 | ||
| Net realized loss from investments | (131,349 | ) | ||
| Net change in unrealized depreciation on investments | (153,652 | ) | ||
| Net decrease in net assets resulting from operations | (62,288 | ) | ||
| DISTRIBUTIONS TO SHAREHOLDERS | ||||
| From net investment income | (199,290 | ) | ||
| Net decrease in net assets from distributions to shareholders | (199,290 | ) | ||
| FROM SHARES OF BENEFICIAL INTEREST | ||||
| Proceeds from shares sold | 14,855,190 | |||
| Net increase in net assets from shares of beneficial interest | 14,855,190 | |||
| TOTAL INCREASE IN NET ASSETS | 14,593,612 | |||
| NET ASSETS | ||||
| Beginning of Period | — | |||
| End of Period * | $ | 14,593,612 | ||
| * Includes undistributed net investment income of: | $ | 23,423 | ||
| SHARE ACTIVITY | ||||
| Shares Sold | 300,000 | |||
| Net increase from share activity | 300,000 | |||
| ** | The Sage ESG Intermediate Credit ETF commenced operations on October 31, 2017. |
See accompanying notes to financial statements.
10
| Sage ESG Intermediate Credit ETF |
| FINANCIAL HIGHLIGHTS |
| Per Share Data and Ratios for a Share of Beneficial Interest Outstanding Throughout the Period Presented |
| For the | ||||
| Period Ended | ||||
| August 31, 2018 (a) | ||||
| Net asset value, beginning of period | $ | 50.00 | ||
| Activity from investment operations: | ||||
| Net investment income (b) | 1.01 | |||
| Net realized and unrealized loss on investments | (1.46 | ) | ||
| Total from investment operations | (0.45 | ) | ||
| Less distributions from: | ||||
| Net investment income | (0.90 | ) | ||
| Total distributions | (0.90 | ) | ||
| Net asset value, end of period | $ | 48.65 | ||
| Market price, end of period | $ | 48.63 | ||
| Total return (c)(d) | (0.78 | )% | ||
| Market Price Total return (c)(d) | (0.92 | )% | ||
| Net assets, end of period (000s) | $ | 14,594 | ||
| Ratio of gross expenses to average net assets (e) | 1.93 | % | ||
| Ratio of net expenses to average net assets (e) | 0.35 | % | ||
| Ratio of net investment income to average net assets (e) | 2.46 | % | ||
| Portfolio Turnover Rate (c) | 65 | % | ||
| (a) | The Sage ESG Intermediate Credit ETF shares commenced operations on October 31, 2017. |
| (b) | Per share amounts calculated using the average shares method, which more appropriately presents the per share data for the period. |
| (c) | Not annualized for periods less than one year. |
| (d) | Total return is calculated assuming a purchase of shares at net asset value on the first day and a sale at net asset value on the last day of the period. Distributions are assumed, for the purpose of this calculation, to be reinvested at the ex-dividend date net asset value per share on their respective payment dates. |
| (e) | Annualized. |
See accompanying notes to financial statements.
11
| Sage ESG Intermediate Credit ETF |
| NOTES TO FINANCIAL STATEMENTS |
| August 31, 2018 |
| (1) | ORGANIZATION |
The Sage ESG Intermediate Credit ETF (the “Fund”) is a diversified series of Northern Lights Fund Trust IV, a Delaware statutory trust organized on June 2, 2015 (the “Trust”). The Trust is registered as an open-end management investment company. The Trust is governed by its Board of Trustees (the “Board” or “Trustees”). The Fund commenced operations on October 31, 2017. The Fund is an actively managed exchange traded fund (“ETF”). The Fund seeks to replicate investment results that generally correspond, before fees and expenses, to the performance of the Sage ESG Intermediate Credit Index.
| (2) | SIGNIFICANT ACCOUNTING POLICIES |
The following is a summary of significant accounting policies consistently followed by the Fund in the preparation of its financial statements. The policies are in conformity with accounting principles generally accepted in the United States of America (’‘GAAP”), which require management to make estimates and assumptions that affect the reported amounts of assets and liabilities and disclosure of contingent assets and liabilities at the date of the financial statements and the reported amounts of increases and decreases in net assets from operations during the reporting period. Actual results could differ from those estimates. The Fund is an investment company and accordingly follows the investment company accounting and reporting guidance of the Financial Accounting Standards Board (FASB) Accounting Standard Codification Topic 946 “Financial Services Investment Companies” including FASB Accounting Standard Update ASU 2013-08.
Security Valuation – Securities listed on an exchange are valued at the last reported sale price at the close of the regular trading session of the exchange on the business day the value is being determined, or in the case of securities listed on NASDAQ at the NASDAQ Official Closing Price (“NOCP”). In the absence of a sale such securities shall be valued at the mean between the last bid and ask prices on the day of valuation. Debt securities (other than short-term obligations) are valued each day by an independent pricing service approved by the Board of Trustees (the “Board”) using methods which include current market quotations from a major market maker in the securities and based on methods which include the consideration of yields or prices of securities of comparable quality, coupon, maturity and type. Short-term debt obligations, excluding U.S. Treasury Bills, having 60 days or less remaining until maturity, at time of purchase, may be valued at amortized cost.
The Fund may hold securities, such as private investments, interests in commodity pools, other non-traded securities or temporarily illiquid securities, for which market quotations are not readily available or are determined to be unreliable. These securities will be valued using the “fair value” procedures approved by the Board. The Board has delegated execution of these procedures to a fair value team composed of one or more representatives from each of the (i) Trust, (ii) administrator, and (iii) adviser. The team may also enlist third party consultants such as a valuation specialist at a public accounting firm, valuation consultant, or financial officer of a security issuer on an as-needed basis to assist in determining a security-specific fair value.
Fair Valuation Process – As noted above, the fair value team is composed of one or more representatives from each of the (i) Trust, (ii) administrator, and (iii) Adviser. The applicable investments are valued collectively via inputs from each of these groups. For example, fair value determinations are required for the following securities: (i) securities for which market quotations are insufficient or not readily available on a particular business day (including securities for which there is a short and temporary lapse in the provision of a price by the regular pricing source), (ii) securities for which, in the judgment of the Adviser, the prices or values available do not represent the fair value of the instrument. Factors which may cause the Adviser to make such a judgment include, but are not limited to, the following: only a bid price or an asked price is available; the spread between bid and asked prices is substantial; the frequency of sales; the thinness of the market; the size of reported trades; and actions of the securities markets, such as the suspension or limitation of trading; (iii) securities determined to be illiquid; (iv) securities with respect to which an event that will affect the value thereof has occurred (a “significant event”) since the closing prices were established on the principal exchange on which they are traded, but prior to the Fund’s calculation of its net asset value. Restricted or illiquid securities, such as private investments or non-traded securities are valued via inputs from the Adviser based upon the current bid for the security from two or more independent dealers or other parties reasonably familiar with the facts and circumstances of the security (who should take into consideration all relevant factors as may be appropriate under the circumstances). If the Adviser is unable to obtain a current bid from such independent dealers or other independent parties, the fair value team shall determine the fair value of such security using the following factors: (i) the type of security; (ii) the cost at date of purchase; (iii) the size and nature of the Fund’s holdings; (iv) the discount from market value of unrestricted securities of the same class at the time of purchase and subsequent thereto; (v) information as to any transactions or offers with respect to the security; (vi) the nature and duration of restrictions on disposition of the security and the existence of any registration rights; (vii) how the yield of the security compares to similar securities of companies of similar or equal creditworthiness; (viii) the level of recent trades of similar or comparable securities; (ix) the liquidity characteristics of the security; (x) current market conditions; and (xi) the market value of any securities into which the security is convertible or exchangeable.
12
| Sage ESG Intermediate Credit ETF |
| NOTES TO FINANCIAL STATEMENTS (Continued) |
| August 31, 2018 |
Valuation of Underlying Funds – The Fund may invest in portfolios of open-end or closed-end investment companies (the “Underlying Funds”). Investment companies are valued at their respective net asset values as reported by such investment companies. Open-end investment companies value securities in their portfolios for which market quotations are readily available at their market values (generally the last reported sale price) and all other securities and assets at their fair value to the methods established by the board of directors of the open-end funds. The shares of many closed-end investment companies and exchange traded funds (“ETFs”), after their initial public offering, frequently trade at a price per share, which is different than the net asset value per share. The difference represents a market premium or market discount of such shares. There can be no assurances that the market discount or market premium on shares of any closed-end investment company or ETF purchased by the Fund will not change.
Exchange Traded Funds – The Fund may invest in exchange traded funds (“ETFs”). ETFs are a type of fund bought and sold on a securities exchange. An ETF trades like common stock and represents a fixed portfolio of securities. The risks of owning an ETF generally reflect the risks of owning the underlying securities in which it invests, although the lack of liquidity on an ETF could result in it being more volatile. Additionally, ETFs have fees and expenses that reduce their value.
Time Deposits – Time deposits are issued by a depository institution in exchange for the deposit of funds. The issuer agrees to pay the amount deposited plus interest to the depositor on the date specified with respect to the deposit. Time deposits do not trade in the secondary market prior to maturity. However, some time deposits may be redeemable prior to maturity and may be subject to withdrawal penalties.
In unusual circumstances, securities may be valued at their fair value as determined in good faith by the Trust’s Fair Value Committee and in accordance with the Trust’s Portfolio Securities Valuation Procedures (the “Procedures”). The Board will review the fair value method in use for securities requiring a fair market value determination at least quarterly. The Procedures consider, among others, the following factors to determine a security’s fair value: the nature and pricing history (if any) of the security; whether any dealer quotations for the security are available; and possible valuation methodologies that could be used to determine the fair value of the security.
The Fund utilizes various methods to measure the fair value of all of its investments on a recurring basis. GAAP establishes a hierarchy that prioritizes inputs to valuation methods. The three levels of input are:
Level 1 – Unadjusted quoted prices in active markets for identical assets and liabilities that the Fund has the ability to access.
Level 2 – Observable inputs other than quoted prices included in Level 1 that are observable for the asset or liability, either directly or indirectly. These inputs may include quoted prices for the identical instrument on an inactive market, prices for similar instruments, interest rates, prepayment speeds, credit risk, yield curves, default rates and similar data.
Level 3 – Unobservable inputs for the asset or liability, to the extent relevant observable inputs are not available, representing the Fund’s own assumptions about the assumptions a market participant would use in valuing the asset or liability, and would be based on the best information available.
The availability of observable inputs can vary from security to security and is affected by a wide variety of factors, including, for example, the type of security, whether the security is new and not yet established in the marketplace, the liquidity of markets, and other characteristics particular to the security. To the extent that valuation is based on models or inputs that are less observable or unobservable in the market, the determination of fair value requires more judgment. Accordingly, the degree of judgment exercised in determining fair value is greatest for instruments categorized in Level 3.
The inputs used to measure fair value may fall into different levels of the fair value hierarchy. In such cases, for disclosure purposes, the level in the fair value hierarchy within which the fair value measurement falls in its entirety, is determined based on the lowest level input that is significant to the fair value measurement in its entirety.
13
| Sage ESG Intermediate Credit ETF |
| NOTES TO FINANCIAL STATEMENTS (Continued) |
| August 31, 2018 |
The inputs or methodology used for valuing securities are not necessarily an indication of the risk associated with investing in those securities. The following tables summarize the inputs used as of August 31, 2018 for the Fund’s assets and liabilities measured at fair value:
| Assets * | Level 1 | Level 2 | Level 3 | Total | ||||||||||||
| Bonds | $ | — | $ | 14,158,771 | $ | — | $ | 14,158,771 | ||||||||
| Total | $ | — | $ | 14,158,771 | $ | — | $ | 14,158,771 | ||||||||
There were no transfers into or out of Level 1 and Level 2 during the current period presented. It is the Fund’s policy to recognize transfers into or out of Level 1 and Level 2 at the end of the reporting period. The Fund did not hold any Level 3 securities during the period.
| * | Refer to the Schedule of Investments for industry classification. |
Security Transactions and Related Income
Security transactions are accounted for on trade date basis. Interest income is recognized on an accrual basis. Discounts are accreted and premiums are amortized on securities purchased over the lives of the respective securities. Dividend income is recorded on the ex-dividend date. Realized gains or losses from sales of securities are determined by comparing the identified cost of the security lot sold with the net sales proceeds.
Dividends and Distributions to Shareholders
Ordinarily, dividends from net investment income, if any, are declared and paid monthly by the Fund. The Fund distributes its net realized capital gains, if any, to shareholders annually. Dividends from net investment income and distributions from net realized gains are recorded on ex-dividend date and determined in accordance with federal income tax regulations, which may differ from GAAP. These “book/tax” differences are considered either temporary (i.e., deferred losses, capital loss carry forwards) or permanent in nature. To the extent these differences are permanent in nature, such amounts are reclassified within the composition of net assets based on their federal tax-basis treatment; temporary differences do not require reclassification.
Federal Income Taxes
The Fund intends to continue to comply with the requirements of the Internal Revenue Code applicable to regulated investment companies and to distribute all of its taxable income to its shareholders. Therefore, no provision for federal income tax is required. The Fund recognizes the tax benefits of uncertain tax positions only where the position is “more likely than not” to be sustained assuming examination by tax authorities. Management has analyzed the Fund’s tax positions expected to be taken in the Fund’s August 31, 2018 tax returns and has concluded to date that no liability for unrecognized tax benefits should be recorded related to uncertain tax positions. The Fund identifies its major tax jurisdictions as U.S. Federal, and foreign jurisdictions where the Fund makes significant investments. The Funds are not aware of any tax positions for which it is reasonably possible that the total amounts of unrecognized tax benefits will change materially in the next twelve months.
Expenses
Expenses of the Trust that are directly identifiable to a specific fund are charged to that fund. Expenses, which are not readily identifiable to a specific fund, are allocated in such a manner as deemed equitable, taking into consideration the nature and type of expense and the relative sizes of the funds in the Trust.
Indemnification
The Trust indemnifies its officers and trustees for certain liabilities that may arise from the performance of their duties to the Fund. Additionally, in the normal course of business, the Fund enters into contracts that contain a variety of representations and warranties which provide general indemnities. The Fund’s maximum exposure under these arrangements is unknown, as this would involve future claims that may be made against the Fund that have not yet occurred. However, based on industry experience, the Fund expects the risk of loss due to these warranties and indemnities to be remote.
14
| Sage ESG Intermediate Credit ETF |
| NOTES TO FINANCIAL STATEMENTS (Continued) |
| August 31, 2018 |
| (3) | INVESTMENT TRANSACTIONS |
The cost of purchases and proceeds from the sale of securities, other than short-term securities, for the period ended August 31, 2018 amounted to $21,278,832 and $6,907,625, respectively.
| (4) | INVESTMENT ADVISORY AGREEMENT AND TRANSACTIONS WITH RELATED PARTIES |
Sage Advisory Services LTD Co. serves as the Fund’s investment advisor (the “Adviser”). Pursuant to an Investment Advisory Agreement with the Fund, the Adviser, under the oversight of the Board, directs the daily operations of the Fund and supervises the performance of administrative and professional services provided by others. As compensation for its services, the Fund pays to the Adviser a monthly investment management fees at an annual rate of 0.20% of its average daily net assets. For the fiscal period ended August 31, 2018, the Adviser earned $17,900 in investment management fees. As of August 31, 2018 the amount due to the Advisor totaled $958.
The Adviser, pursuant to an Expense Limitation Agreement (the “Agreement”) has contractually agreed to reduce the Fund’s fees and/or absorb expenses of the Fund until at least December 31, 2018 to ensure that total annual Fund operating expenses after fee waiver and reimbursement (exclusive of any taxes, interest, brokerage commissions, expenses incurred in connection with any merger or reorganization, indirect expenses, expenses of other investment companies in which the Fund may invest, or extraordinary expenses such as litigation) will not exceed 0.35% of average daily net assets. This Agreement may be terminated by the Fund’s Board of Trustees on 60 days’ written notice to the Adviser. These fee waivers and expense reimbursements are subject to possible recoupment from the Fund in future years on a rolling three year basis (within the three years after the fees have been waived or reimbursed) if such recoupment can be achieved within the foregoing expense limits. No reimbursement amount will be paid to the Adviser in any fiscal quarter unless the Board has determined in advance that a reimbursement is in the best interest of the Fund and its shareholders.
For the period ended August 31, 2018 the Adviser waived fees and reimbursed expenses in the amount of $142,906 in expenses to the Fund, which is subject to recapture through August 31, 2021, pursuant to the Waiver Agreement.
The distributor of the Fund is Northern Lights Distributors, LLC (the “Distributor”). The Fund has adopted a distribution and service plan (“Plan”) pursuant to Rule 12b-1 under the 1940 Act. Under the Plan, the Fund is authorized to pay distribution fees to the distributor and other firms that provide distribution and shareholder services (“Service Providers”). If a Service Provider provides these services, the Fund may pay fees at an annual rate not to exceed 0.25% of average daily net assets, pursuant to Rule 12b-1 under the 1940 Act.
No distribution or service fees are currently paid by the Fund, and there are no current plans to impose these fees. In the event Rule 12b-1 fees were charged, over time they would increase the cost of an investment in the Fund.
In addition, certain affiliates of the Distributor provide services to the Fund as follows:
Gemini Fund Services, LLC (“GFS”), an affiliate of the Distributor, provides administration, fund accounting, and transfer agent services to the Trust. Pursuant to separate servicing agreements with GFS, the Advisor (as a part of the unitary fee) pays GFS customary fees for providing administration, fund accounting and transfer agency services to the Fund. Certain officers of the Trust are also officers of GFS, and are not paid any fees directly by the Fund for serving in such capacities.
BluGiant, LLC (“BluGiant”), Blu Giant, an affiliate of GFS and the Distributor, provides EDGAR conversion and filing services as well as print management services for the Funds on an ad-hoc basis. For the provision of these services, Blu Giant receives customary fees from the Advisor (as a part of the unitary fee).
Northern Lights Compliance Services, LLC (“NLCS”), NLCS, an affiliate of GFS and the Distributor, provides a Chief Compliance Officer to the Trust, as well as related compliance services, pursuant to a consulting agreement between NLCS and the Trust. Under the terms of such agreement, NLCS receives customary fees from the Advisor (as a part of the unitary fee).
15
| Sage ESG Intermediate Credit ETF |
| NOTES TO FINANCIAL STATEMENTS (Continued) |
| August 31, 2018 |
| (5) | CAPITAL SHARE TRANSACTIONS |
Shares are not individually redeemable and may be redeemed by the Fund at NAV only in large blocks known as “Creation Units.” Shares are created and redeemed by the Fund only in Creation Unit size aggregations of 50,000 shares. Only Authorized Participants or transactions done through an Authorized Participant are permitted to purchase or redeem Creation Units from the Fund. An Authorized Participant is either (i) a broker-dealer or other participant in the clearing process through the Continuous Net Settlement System of the National Securities Clearing Corporation or (ii) a DTC participant and, in each case, must have executed a Participant Agreement with the Distributor. Such transactions are generally permitted on an in-kind basis, with a balancing cash component to equate the transaction to the NAV per share of the Fund on the transaction date. Cash may be substituted equivalent to the value of certain securities generally when they are not available in sufficient quantity for delivery, not eligible for trading by the Authorized Participant or as a result of other market circumstances. In addition, the Fund generally impose transaction fees on purchases and redemptions of Fund shares to cover the custodial and other costs incurred by the Funds in effecting trades, which is payable to the Custodian (“Fixed Fee”). Purchases and redemptions of Creation Units for cash or involving cash-in-lieu are required to pay an additional variable charge to compensate the Fund and its ongoing shareholders for brokerage and market impact expenses relating to Creation Unit transactions (“Variable Charge,” and together with the Fixed Fee, the “Transaction Fees”). Transactions in capital shares for the Fund are disclosed in the
Statements of Changes in Net Assets.
The Transaction Fees for the Fund are listed in the table below:
| Maximum Additional Variable Charge for Cash | |||||
| Fee for In-Kind and Cash Purchases | Purchases* | ||||
| $ 500 | 0.40% |
| * | The maximum Transaction Fee may be up to 2.00% of the amount invested. |
| (6) | FUND RISKS |
Fluctuation of Net Asset Value Risk- The NAV of the Fund’s shares will generally fluctuate with changes in the market value of the Fund’s holdings. The market prices of the shares will generally fluctuate in accordance with changes in NAV as well as the relative supply of and demand for the shares on the Exchange. The Adviser cannot predict whether the shares will trade below, at or above their NAV. Price differences may be due, in large part, to the fact that supply and demand forces at work in the secondary trading market for the shares will be closely related to, but not identical to, the same forces influencing the prices of the Fund’s holdings trading individually or in the aggregate at any point in time. In addition, unlike conventional ETFs, the Fund is not an index fund. The Fund is actively managed and does not seek to replicate the performance of a specified index. Index based ETFs have generally traded at prices which closely correspond to NAV per share. Actively managed ETFs have a limited trading history and, therefore, there can be no assurance as to whether and/or the extent to which the shares will trade at premiums or discounts to NAV.
Index Risk - Unlike many investment companies, the Funds do not utilize an investing strategy that seeks returns in excess of the Index. Therefore, they would not necessarily sell a security unless that security is removed from the Index, even if that security generally is underperforming.
Fixed Income Risk - When the Fund invests in fixed income securities or derivatives, the value of your investment in the Fund will fluctuate with changes in interest rates. Typically, a rise in interest rates causes a decline in the value of fixed income securities or derivatives owned by the Fund. In general, the market price of fixed income securities with longer maturities will increase or decrease more in response to changes in interest rates than shorter-term securities. Other risk factors include credit risk (the debtor may default) and prepayment risk (the debtor may pay its obligation early, reducing the amount of interest payments). These risks could affect the value of a particular investment by the Fund, possibly causing the Fund’s share price and total return to be reduced and fluctuate more than other types of investments.
16
| Sage ESG Intermediate Credit ETF |
| NOTES TO FINANCIAL STATEMENTS (Continued) |
| August 31, 2018 |
| (7) | DISTRIBUTIONS TO SHAREHOLDERS AND TAX COMPONENTS OF CAPITAL |
The below table represents aggregate cost for federal tax purposes as of August 31, 2018 and differs from market value by net unrealized appreciation/depreciation which consisted of:
| Total Unrealized | ||||||||||||||
| Gross Unrealized | Gross Unrealized | Appreciation/ | ||||||||||||
| Aggregate Cost | Appreciation | Depreciation | Depreciation | |||||||||||
| $ | 14,312,423 | $ | 10,223 | $ | (163,875 | ) | $ | (153,652 | ) | |||||
The tax character of distributions paid during the fiscal period ended August 31, 2018 was as follows:
| Fiscal Year Ended | ||||
| August 31, 2018 | ||||
| Ordinary Income | $ | 199,290 | ||
| Long-Term Capital Gain | — | |||
| Return of Capital | — | |||
| $ | 199,290 | |||
As of August 31, 2018, the components of accumulated earnings/ (deficit) on a tax basis were as follows:
| Undistributed | Undistributed | Post October Loss | Capital Loss | Other | Unrealized | Total | ||||||||||||||||||||
| Ordinary | Long-Term | and | Carry | Book/Tax | Appreciation/ | Accumulated | ||||||||||||||||||||
| Income | Gains | Late Year Loss | Forwards | Differences | (Depreciation) | Earnings/(Deficits) | ||||||||||||||||||||
| $ | 23,423 | $ | — | $ | (131,349 | ) | $ | — | $ | — | $ | (153,652 | ) | $ | (261,578 | ) | ||||||||||
Capital losses incurred after October 31 within the fiscal year are deemed to arise on the first business day of the following fiscal year for tax purposes. The Fund incurred and elected to defer such capital losses of $ 131,349.
| (8) | SUBSEQUENT EVENTS |
Subsequent events after the Statement of Assets and Liabilities date have been evaluated through the date the financial statements were issued. Management has determined that no events or transactions occurred requiring adjustment or disclosure in the financial statements.
17

REPORT OF INDEPENDENT REGISTERED PUBLIC ACCOUNTING FIRM
To the Board of Trustees of
Northern Lights Fund Trust IV and
Shareholders of Sage ESG Intermediate Credit ETF
Opinion on the Financial Statements
We have audited the accompanying statement of assets and liabilities of Sage ESG Intermediate Credit ETF, a series of Northern Lights Fund Trust IV, including the schedule of investments, as of August 31, 2018, the related statement of operations, the statements of changes in net assets and financial highlights for the period from October 31, 2017 to August 31, 2018, and the related notes (collectively referred to as the “financial statements”). In our opinion, the financial statements present fairly, in all material respects, the financial position of Sage ESG Intermediate Credit ETF as of August 31, 2018, the results of its operations, the changes in its net assets, and the financial highlights for the period then ended, in conformity with accounting principles generally accepted in the United States of America.
Basis for Opinion
These financial statements are the responsibility of the Fund’s management. Our responsibility is to express an opinion on the Fund’s financial statements based on our audit. We are a public accounting firm registered with the Public Company Accounting Oversight Board (United States) (“PCAOB”) and are required to be independent with respect to the Fund in accordance with the U.S. federal securities laws and the applicable rules and regulations of the Securities and Exchange Commission and the PCAOB. We have served as the
Trust’s auditor since 2018.
We conducted our audit in accordance with the standards of the PCAOB. Those standards require that we plan and perform the audit to obtain reasonable assurance about whether the financial statements are free of material misstatement, whether due to error or fraud. The Fund is not required to have, nor were we engaged to perform, an audit of its internal control over financial reporting. As part of our audit we are required to obtain an understanding of internal control over financial reporting, but not for the purpose of expressing an opinion on the effectiveness of the Fund’s internal control over financial reporting. Accordingly, we express no such opinion.
Our audit included performing procedures to assess the risks of material misstatement of the financial statements, whether due to error or fraud, and performing procedures that respond to those risks. Such procedures included examining, on a test basis, evidence regarding the amounts and disclosures in the financial statements. Our audit also included evaluating the accounting principles used and significant estimates made by management, as well as evaluating the overall presentation of the financial statements. Our procedures included confirmation of securities owned as of August 31, 2018 by correspondence with the custodian. We believe that our audit provides a reasonable basis for our opinion.
| TAIT, WELLER & BAKER LLP | |
| Philadelphia, Pennsylvania | |
| October 30, 2018 |
18
| Sage ESG Intermediate Credit ETF |
| ADDITIONAL INFORMATION |
| August 31, 2018 |
Approval of Investment advisory agreement Sage Advisory Services, Ltd. (Advisor to Sage ESG Intermediate Credit ETFs)
In connection with the Meeting of the Board of Trustees (the “Board”) of Northern Lights Fund Trust IV (the “Trust”), held on July 20, 2017 the Board, including a majority of the Trustees who are not “interested persons,” as that term is defined in the Investment Company Act of 1940, as amended, discussed the approval of an investment advisory agreement (the “Advisory Agreement”) between Sage Advisory Services, Ltd. (the “Adviser”) and the Trust, with respect to Sage ESG Intermediate Credit ETF (the “Sage ETF”). In considering the approval of the Advisory Agreement, the Board received materials specifically relating to the Advisory Agreement.
The Board reviewed and discussed the written materials that were provided in advance of the Meeting and deliberated on the approval of the Advisory Agreement. The Board relied upon the advice of independent legal counsel and their own business judgment in determining the material factors to be considered in evaluating the advisory agreement and the weight to be given to each factor considered. The conclusions reached by the Board were based on a comprehensive evaluation of all of the information provided and were not the result of any one factor. Moreover, each Trustee may have afforded different weight to the various factors in reaching his conclusions with respect to the approval of the Advisory Agreement.
Nature, Extent and Quality of Services. The Board noted that the Adviser has approximately $12.3 billion in assets under management and has been in operation since 1996. The Board noted the uniqueness of the investment strategies and time and research put into constructing the index. The Board found the portfolio managers to be dedicated to the strategy and noted they provided a detailed explanation of their methodology and plan for ongoing monitoring of the strategy. The Board noted the Adviser’s experience with fixed income portfolio management. After further discussion, the Board concluded that the Adviser has the ability to provide a level of service consistent with the Board’s expectations.
Performance. As the proposed Sage ETF is new, actual performance of the Sage ETF was not available to the Board to consider. However, the Board was able to consider the performance of separately managed account portfolios (the “SMA Portfolios”) managed by the Adviser with taxable fixed income strategies similar to that of the Sage ETF. They noted that for the one-year and since inception periods, the SMA Portfolios underperformed the respective benchmark indexes; however, the Board realized that this period was a relatively short period of time for measuring performance. After further discussion, the Board concluded that the Adviser has the potential to deliver positive returns to shareholders in line with the Board’s expectations.
Fees and Expenses. The Board reviewed the proposed management fee of 0.25% and noted that the fee was lower than the average management fee of the anticipated Morningstar category of 0.32% and lower than the peer group average of 0.36%. They noted the proposed expense limitation of 0.35% was below the average ranges of the peer group and Morningstar category. After further discussion, the Board concluded that the Sage ETF advisory fee is reasonable.
Profitability. The Board reviewed a profitability analysis provided by the Adviser and considered whether the level of anticipated profit is reasonable. They noted the Adviser does not anticipate realizing a profit in connection with its relationship with the Sage ETF in the initial two years of operation. The Board concluded, after further discussion, that excessive profit is not a concern at this time.
Economies of Scale. The Board noted that economies of scale have not yet been reached as the Sage ETF has not yet launched. The Board noted that consideration of economies of scale will be revisited as assets grow for the Sage ETF.
Conclusion. Having requested and received such information from the Adviser as the Board believed to be reasonably necessary to evaluate the terms of the Advisory Agreement and as assisted by the advice of independent counsel, the Board determined that approval of the Advisory Agreement is in the best interests of the Sage ETF and its future shareholders.
19
| Sage ESG Intermediate Credit ETF |
| EXPENSE EXAMPLES (Unaudited) |
| August 31, 2018 |
As a shareholder of the Fund, you incur two types of costs: (1) transaction costs; (2) ongoing costs, including management fees and other fund expenses. This example is intended to help you understand your ongoing costs (in dollars) of investing in the Fund and to compare these costs with the ongoing costs of investing in other mutual funds.
The Example is based on an investment of $1,000 invested at the beginning of the period and held for the entire period from March 1, 2018 (commencement of the Fund’s operations) to August 31, 2018 (the ’‘period’’).
Actual Expenses
The first line of the table below provides information about actual account values and actual expenses. You may use the information in this line, together with the amount you invested, to estimate the expenses that you paid over the period. Simply divide your account value by $1,000 (for example, an $8,600 account value divided by $1,000 = 8.6), then multiply the result by the number in the first line under the heading entitled ’‘Expenses Paid During the Period’’ to estimate the expenses you paid on your account during this period.
Hypothetical Example for Comparison Purposes
The second line of the table below provides information about hypothetical account values and hypothetical expenses based on the Fund’s actual expense ratio and an assumed rate of return of 5% per year before expenses, which is not the Fund’s actual return. The hypothetical account values and expenses may not be used to estimate the actual ending account balance or expenses you paid for the period. You may use this information to compare the ongoing costs of investing in the Fund and other funds. To do so, compare this 5% hypothetical example with the 5% hypothetical examples that appear in the shareholder reports of the other funds. Please note that the expenses shown in the table are meant to highlight your ongoing costs only and do not reflect any transactional costs, such as brokerage commissions on purchases or sales of Fund shares. Therefore, the second line of the table is useful in comparing ongoing costs only, and will not help you determine the relative total costs of owning different funds. In addition, if these transactional costs were included, your costs would have been higher.
| Beginning Account | Ending | Expenses Paid | Expense Ratio During the | |||||||||||
| Value | Account Value | During Period | Period 3/1/18 - 8/31/18 | |||||||||||
| Actual | 3/1/18 | 8/31/18 | 3/1/18 - 8/31/18* | |||||||||||
| $1,000.00 | $1,008.40 | $1.77 | 0.35% | |||||||||||
| Beginning Account | Ending | Expenses Paid | Expense Ratio During the | |||||||||||
| Hypothetical | Value | Account Value | During Period | Period 3/1/18 - 8/31/18 | ||||||||||
| (5% return before expenses) | 3/1/18 | 8/31/18 | 3/1/18 - 8/31/18* | |||||||||||
| $1,000.00 | $1,023.44 | $1.79 | 0.35% | |||||||||||
| * | Expenses are equal to the average account value over the period, multiplied by the Fund’s annualized expense ratio, multiplied by the number of days in the period (184) divided by the number of days in the fiscal year (365). |
20
Sage ESG Intermediate Credit ETF
SUPPLEMENTAL INFORMATION (Unaudited)
August 31, 2018
The following is a list of the Trustees and executive officers of the Trust and each person’s principal occupation over the last five years. Unless otherwise noted, the address of each Trustee and Officer is 17605 Wright Street, Suite 2, Omaha, Nebraska 68130.
Independent Trustees
| Name, Address and Year of Birth | Position/Term of Office* | Principal Occupation During the Past Five Years | Number of Portfolios in Fund Complex** Overseen by Trustee | Other Directorships held by Trustee During the Past Five Years |
| Joseph Breslin Year of Birth: 1953 | Independent Trustee and Chairman of the Board since 2015 | President and Consultant, Adviser Counsel, Inc. (formerly J.E. Breslin & Co.)(management consulting firm to investment advisers), 2009 to present. | 1 | Northern Lights Fund Trust IV (for series not affiliated with the Fund since 2015); Director, Kinetics Mutual Funds, Inc. (since 2000); Trustee, Kinetics Portfolios Trust (since 2000); Trustee, Forethought Variable Insurance Trust (since 2013); Trustee, BlueArc Multi-Strategy Fund (2014-2017); Hatteras Trust (2004-2016) |
| Thomas Sarkany Year of Birth: 1946 | Independent Trustee since 2015 | Founder and President, TTS Consultants, LLC (financial services), 2010 to present. | 1 | Northern Lights Fund Trust IV (for series not affiliated with the Fund since 2015); Arrow Investments Trust (since 2014), Arrow ETF Trust (since 2012), Trustee, Northern Lights Fund Trust II (since 2011); Director, Aquila Distributors (since 1981) |
| Charles Ranson Year of Birth: 1947 | Independent Trustee since 2015 | Principal, Ranson & Associates (strategic analysis and planning, including risk assessment and capital formation for entrepreneurial ventures), (since 2003); GR Group (since 2008). | 1 | Northern Lights Fund Trust IV (for series not affiliated with the Fund since 2015); Advisors Preferred Trust (since November 2012). |
8/31/18 NLFT IV_v1
21
| Sage ESG Intermediate Credit ETF |
| SUPPLEMENTAL INFORMATION (Unaudited) (Continued) |
| August 31, 2018 |
Officers
| Name, Address and Year of Birth | Position/Term of Office* | Principal Occupation During the Past Five Years | Number of Portfolios in Fund Complex** Overseen by Trustee | Other Directorships held by Trustee During the Past Five Years |
| Wendy Wang 80 Arkay Drive Hauppauge, NY 11788 Born in 1970 | President since 2015 | Senior Vice President, Director of Tax and Compliance Administration, Gemini Fund Services, LLC (since 2012). | N/A | N/A |
| Sam Singh 80 Arkay Drive Hauppauge, NY 11788 Born in 1976 | Treasurer since 2015 | Vice President, Gemini Fund Services, LLC (since 2015); Assistant Vice President, Gemini Fund Services, LLC, (2011-2014). | N/A | N/A |
| Jennifer Farrell 80 Arkay Drive Hauppauge, NY 11788 Born in 1969 | Secretary since 2017 | Manager, Legal Administration, Gemini Fund Services, LLC (since 2018); Senior Paralegal Gemini Fund Services, LLC (2015-2018); Legal Trainer Gemini Fund Services, LLC (2013-2015); Senior Paralegal, Gemini Fund Services, LLC (2006-2012). | N/A | N/A |
| Michael Quain Born in 1957 | Chief Compliance Officer | Consultant, Northern Lights Compliance Services, LLC (since 2015); Quain Compliance Consulting, LLC (since 2014); Artio Global Management, LLC (formerly Julius Baer), First Vice President & Chief Compliance Officer (2004-2013) | N/A | N/A |
| * | The term of office for each Trustee and officer listed above will continue indefinitely until the individual resigns or is removed. |
| ** | As of August 31, 2018 the Trust was comprised of 25 [other] active portfolios managed by unaffiliated investment advisers. The term “Fund Complex” applies only to the Fund. The Fund does not hold itself out as related to any other series within the Trust for investment purposes, nor do they share the same investment adviser with any other series. |
The Fund’s SAI includes additional information about the Trustees and is available free of charge, upon request, by calling toll-free at 1-888-724-3911.
8/31/18 NLFT IV_v1
22
PRIVACY NOTICE
Northern Lights Fund Trust IV
Rev. August 2015
| FACTS | WHAT DOES NORTHERN LIGHTS FUND TRUST IV DO WITH YOUR PERSONAL INFORMATION? |
| Why? | Financial companies choose how they share your personal information. Federal law gives consumers the right to limit some, but not all sharing. Federal law also requires us to tell you how we collect, share, and protect your personal information. Please read this notice carefully to understand what we do. |
| What? | The types of personal information we collect and share depends on the product or service that you have with us. This information can include:
● Social Security number and wire transfer instructions
● account transactions and transaction history
● investment experience and purchase history
When you are no longer our customer, we continue to share your information as described in this notice. |
| How? | All financial companies need to share customers’ personal information to run their everyday business. In the section below, we list the reasons financial companies can share their customers’ personal information; the reasons Northern Lights Fund Trust IV chooses to share; and whether you can limit this sharing. |
| Reasons we can share your personal information: | Does Northern Lights Fund Trust IV share information? | Can you limit this sharing? |
| For our everyday business purposes - such as to process your transactions, maintain your account(s), respond to court orders and legal investigations, or report to credit bureaus. | YES | NO |
| For our marketing purposes - to offer our products and services to you. | NO | We don’t share |
| For joint marketing with other financial companies. | NO | We don’t share |
| For our affiliates’ everyday business purposes - information about your transactions and records. | NO | We don’t share |
| For our affiliates’ everyday business purposes - information about your credit worthiness. | NO | We don’t share |
| For nonaffiliates to market to you | NO | We don’t share |
| QUESTIONS? | Call 1-866-270-0300 |
23
PRIVACY NOTICE
Northern Lights Fund Trust IV
| Page 2 |
| What we do: | |
How does Northern Lights Fund Trust IV protect my personal information? | To protect your personal information from unauthorized access and use, we use security measures that comply with federal law. These measures include computer safeguards and secured files and buildings.
Our service providers are held accountable for adhering to strict policies and procedures to prevent any misuse of your nonpublic personal information. |
How does Northern Lights Fund Trust IV collect my personal information? | We collect your personal information, for example, when you ● open an account or deposit money
● direct us to buy securities or direct us to sell your securities
● seek advice about your investments
We also collect your personal information from others, such as credit bureaus, affiliates, or other companies. |
Why can’t I limit all sharing? | Federal law gives you the right to limit only: ● sharing for affiliates’ everyday business purposes – information about your creditworthiness.
● affiliates from using your information to market to you.
● sharing for nonaffiliates to market to you.
State laws and individual companies may give you additional rights to limit sharing. |
| Definitions | |
| Affiliates | Companies related by common ownership or control. They can be financial and nonfinancial companies.
● Northern Lights Fund Trust IV has no affiliates. |
| Nonaffiliates | Companies not related by common ownership or control. They can be financial and nonfinancial companies.
● Northern Lights Fund Trust IV does not share with nonaffiliates so they can market to you. |
| Joint marketing | A formal agreement between nonaffiliated financial companies that together market financial products or services to you.
● Northern Lights Fund Trust IV does not jointly market. |
24
Proxy Voting Policy
Information regarding how the Fund votes proxies relating to portfolio securities for the twelve month period ended June 30th as well as a description of the policies and procedures that the Fund used to determine how to vote proxies is available without charge, upon request, by calling 1-888-724-3911 or by referring to the Securities and Exchange Commission’s (“SEC”) website at http://www.sec.gov.
Portfolio Holdings
The Fund files its complete schedule of portfolio holdings with the SEC for the first and third quarters of each fiscal year on Form N-Q. Form N-Q is available on the SEC’s website at http://www.sec.gov and may be reviewed and copied at the SEC’s Public Reference Room in Washington, DC (1-800-SEC-0330). The information on Form N-Q is available without charge, upon request, by calling 1-888-724-3911.
| Adviser |
| Sage Advisory Services LTD Co. |
| 5900 Southwest Parkway |
| Building 1 |
| Austin, TX 78735-6202 |
| Administrator |
| Gemini Fund Services, LLC |
| 80 Arkay Drive, Suite 110 |
| Hauppauge, NY 11788 |
This report and the financial statements contained herein are submitted for the general information of shareholders and are not authorized for distribution to prospective investors unless preceded or accompanied by an effective prospectus, which contains information about the Fund’s investment objective, risks, fees and expenses. Investors are reminded to read the prospectus carefully before investing in the Fund.
Item 2. Code of Ethics.
(a) As of the end of the period covered by this report, the registrant has adopted a code of ethics that applies to the registrant's principal executive officer, principal financial officer, principal accounting officer or controller, or persons performing similar functions, regardless of whether these individuals are employed by the registrant or a third party.
(b) For purposes of this item, “code of ethics” means written standards that are reasonably designed to deter wrongdoing and to promote:
| (1) | Honest and ethical conduct, including the ethical handling of actual or apparent conflicts of interest between personal and professional relationships; |
| (2) | Full, fair, accurate, timely, and understandable disclosure in reports and documents that a registrant files with, or submits to, the Commission and in other public communications made by the registrant; |
(3) Compliance with applicable governmental laws, rules, and regulations;
| (4) | The prompt internal reporting of violations of the code to an appropriate person or persons identified in the code; and |
(5) Accountability for adherence to the code.
(c) Amendments: During the period covered by the report, there have not been any amendments to the provisions of the code of ethics.
(d) Waivers: During the period covered by the report, the registrant has not granted any express or implicit waivers from the provisions of the code of ethics.
(e) The Code of Ethics is not posted on Registrant’ website.
(f) A copy of the Code of Ethics is attached as an exhibit.
Item 3. Audit Committee Financial Expert.
(a) The Registrant’s board of trustees has determined that Joseph Breslin is an audit committee financial expert, as defined in Item 3 of Form N-CSR. Mr. Breslin is independent for purposes of this Item 3.
Item 4. Principal Accountant Fees and Services.
| (a) | Audit Fees |
2018 $12,500
| (b) | Audit-Related Fees |
2018 – None
| (c) | Tax Fees |
2018 $2,500
Preparation of Federal & State income tax returns, assistance with calculation of required income, capital gain and excise distributions and preparation of Federal excise tax returns.
| (d) | All Other Fees |
2018 - None
| (e) | (1) Audit Committee’s Pre-Approval Policies |
The registrant’s Audit Committee is required to pre-approve all audit services and, when appropriate, any non-audit services (including audit-related, tax and all other services) to the registrant. The registrant’s Audit Committee also is required to pre-approve, when appropriate, any non-audit services (including audit-related, tax and all other services) to its adviser, or any entity controlling, controlled by or under common control with the adviser that provides ongoing services to the registrant, to the extent that the services may be determined to have an impact on the operations or financial reporting of the registrant. Services are reviewed on an engagement by engagement basis by the Audit Committee.
| (2) | Percentages of Services Approved by the Audit Committee |
| 2018 | |
| Audit-Related Fees: | 0.00% |
| Tax Fees: | 0.00% |
| All Other Fees: | 0.00% |
| (f) | During the audit of registrant's financial statements for the most recent fiscal year, less than 50 percent of the hours expended on the principal accountant's engagement were attributed to work performed by persons other than the principal accountant's full-time, permanent employees. |
| (g) | The aggregate non-audit fees billed by the registrant's accountant for services rendered to the registrant, and rendered to the registrant's investment adviser (not including any sub-adviser whose role is primarily portfolio management and is subcontracted with or overseen by another investment adviser), and any entity controlling, controlled by, or under common control with the adviser that provides ongoing services to the registrant: |
2018 - $0
(h) The registrant's audit committee has considered whether the provision of non-audit services to the registrant's investment adviser (not including any sub-adviser whose role is primarily portfolio management and is subcontracted with or overseen by another investment adviser), and any entity controlling, controlled by, or under common control with the investment adviser that provides ongoing services to the registrant, that were not pre-approved pursuant to paragraph (c)(7)(ii) of Rule 2-01 of Regulation S-X, is compatible with maintaining the principal accountant's independence.
Item 5. Audit Committee of Listed Companies. Not applicable to open-end investment companies.
Item 6. Schedule of Investments. Schedule of investments in securities of unaffiliated issuers is included under Item 1.
Item 7. Disclosure of Proxy Voting Policies and Procedures for Closed-End Funds. Not applicable to open-end investment companies.
Item 8. Portfolio Managers of Closed-End Management Investment Companies. Not applicable to open-end investment companies.
Item 9. Purchases of Equity Securities by Closed-End Funds. Not applicable to open-end investment companies.
Item 10. Submission of Matters to a Vote of Security Holders. None
Item 11. Controls and Procedures.
(a) Based on an evaluation of the Registrant’s disclosure controls and procedures as of a date within 90 days of filing date of this Form N-CSR, the principal executive officer and principal financial officer of the Registrant have concluded that the disclosure controls and procedures of the Registrant are reasonably designed to ensure that the information required in filings on Form N-CSR is recorded, processed, summarized, and reported by the filing date, including that information required to be disclosed is accumulated and communicated to the Registrant’s management, including the Registrant’s principal executive officer and principal financial officer, as appropriate to allow timely decisions regarding required disclosure.
(b) There were no significant changes in the Registrant’s internal control over financial reporting that occurred during the Registrant’s last fiscal half-year that have materially affected, or are reasonably likely to materially affect, the Registrant’s internal control over financial reporting.
Item 12. Exhibits.
(a)(1) Code of Ethics filed herewith.
(a)(2) Certifications required by Section 302 of the Sarbanes-Oxley Act of 2002 (and Item 11(a)(2) of Form N-CSR) are filed herewith.
(a)(3) Not applicable for open-end investment companies.
(b) Certifications required by Section 906 of the Sarbanes-Oxley Act of 2002 (and Item 11(b) of Form N-CSR) are filed herewith.
SIGNATURES
Pursuant to the requirements of the Securities Exchange Act of 1934 and the Investment Company Act of 1940, the registrant has duly caused this report to be signed on its behalf by the undersigned, thereunto duly authorized.
(Registrant) Northern Lights Fund Trust IV
By (Signature and Title)
/s/ Wendy Wang
Wendy Wang, Principal Executive Officer/President
Date 11/7/18
Pursuant to the requirements of the Securities Exchange Act of 1934 and the Investment Company Act of 1940, this report has been signed below by the following persons on behalf of the registrant and in the capacities and on the dates indicated.
By (Signature and Title)
/s/ Wendy Wang
Wendy Wang, Principal Executive Officer/President
Date 11/7/18
By (Signature and Title)
/s/ Sam Singh
Sam Singh, Principal Financial Officer/Treasurer
Date 11/7/18