UNITED STATES
SECURITIES AND EXCHANGE COMMISSION
WASHINGTON, D.C. 20549
FORM N-CSR
CERTIFIED SHAREHOLDER REPORT OF REGISTERED MANAGEMENT
INVESTMENT COMPANIES
| Investment Company Act file number | 811-23066 |
| Northern Lights Fund Trust IV |
| (Exact name of registrant as specified in charter) |
| 225 Pictoria Drive, Suite 450, Cincinnati, Ohio | 45246 |
| (Address of principal executive offices) | (Zip code) |
| The Corporation Trust Company |
| 1209 Orange Street Wilmington, DE 19801 |
| (Name and address of agent for service) |
| Registrant’s telephone number, including area code: | 631-490-4300 |
| Date of fiscal year end: | 11/30 | |
| | | |
| Date of reporting period: | 11/30/24 | |
Item 1. Reports to Stockholders.
Annual Shareholder Report - November 30, 2024
This annual shareholder report contains important information about Inspire 100 ETF for the period of December 1, 2023 to November 30, 2024. You can find additional information about the Fund at www.inspireetf.com. You can also request this information by contacting us at 1-877-658-9473.
What were the Fund’s costs for the last year?
(based on a hypothetical $10,000 investment)
| Fund Name | Costs of a $10,000 investment | Costs paid as a percentage of a $10,000 investment |
|---|
| Inspire 100 ETF | $40 | 0.35% |
|---|
How did the Fund perform during the reporting period?
The Fund had a return on the NAV for the past 12 months of 31.02%. This strong performance was driven by the upward momentum and security selection in the Information Technology and Industrials sectors. The other sectors that helped achieve this positive performance came from the Health Care and Financials sectors. Although still contributing positive return during the year, the sectors that caused the largest drag to performance were the Consumer Staples, Communication Services and Energy sectors. While there was volatility in the markets during the period due to uncertainty about the next move in interest rates by the Federal Reserve as well as the contentious political environment prior to the election, the Fund performed in line with the broader large cap market even though the Fund had minimal exposure to the Mega Cap Growth stocks that have been the driving force in the large cap markets for the past year. During the period ended November 30, 2024, the Fund's use of the current investment strategies did not cause the Fund's performance to materially deviate from the manager's expectations considering the uncertainty of the markets.
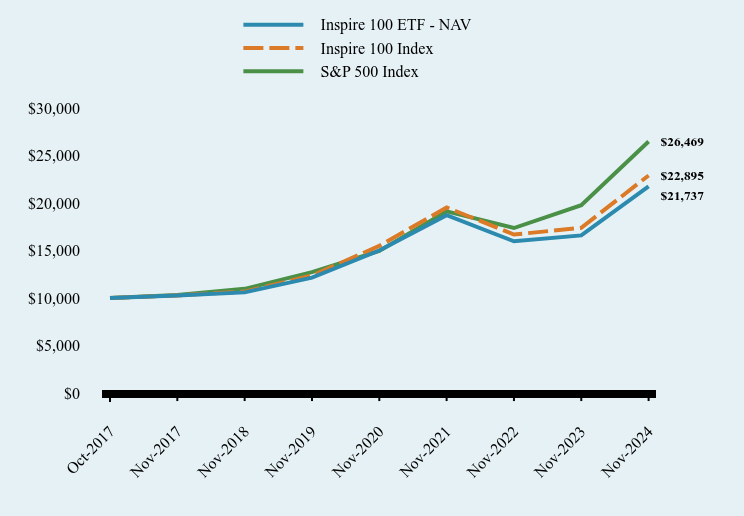
How has the Fund performed since inception?
Total Return Based on $10,000 Investment
| Inspire 100 ETF - NAV | Inspire 100 Index | S&P 500 Index |
|---|
| Oct-2017 | $10,000 | $10,000 | $10,000 |
|---|
| Nov-2017 | $10,276 | $10,274 | $10,317 |
|---|
| Nov-2018 | $10,594 | $10,674 | $10,964 |
|---|
| Nov-2019 | $12,144 | $12,361 | $12,730 |
|---|
| Nov-2020 | $14,997 | $15,489 | $14,953 |
|---|
| Nov-2021 | $18,715 | $19,531 | $19,128 |
|---|
| Nov-2022 | $15,966 | $16,678 | $17,366 |
|---|
| Nov-2023 | $16,591 | $17,393 | $19,769 |
|---|
| Nov-2024 | $21,737 | $22,895 | $26,469 |
|---|
Average Annual Total Returns
| 1 Year | 5 Years | Since Inception (October 30, 2017) |
|---|
| Inspire 100 ETF - NAV | 31.02% | 12.35% | 11.58% |
|---|
| Inspire 100 Index | 31.63% | 13.12% | 12.40% |
|---|
| S&P 500 Index | 33.89% | 15.77% | 14.73% |
|---|
The Fund's past performance is not a good predictor of how the Fund will perform in the future. The graph and table do not reflect the deduction of taxes that a shareholder would pay on fund distributions or redemption of fund shares.
- Net Assets$353,442,210
- Number of Portfolio Holdings100
- Advisory Fee (net of waivers)$820,116
- Portfolio Turnover26%
Asset Weighting (% of total investments)
| Value | Value |
|---|
| Common Stocks | 100.0% |
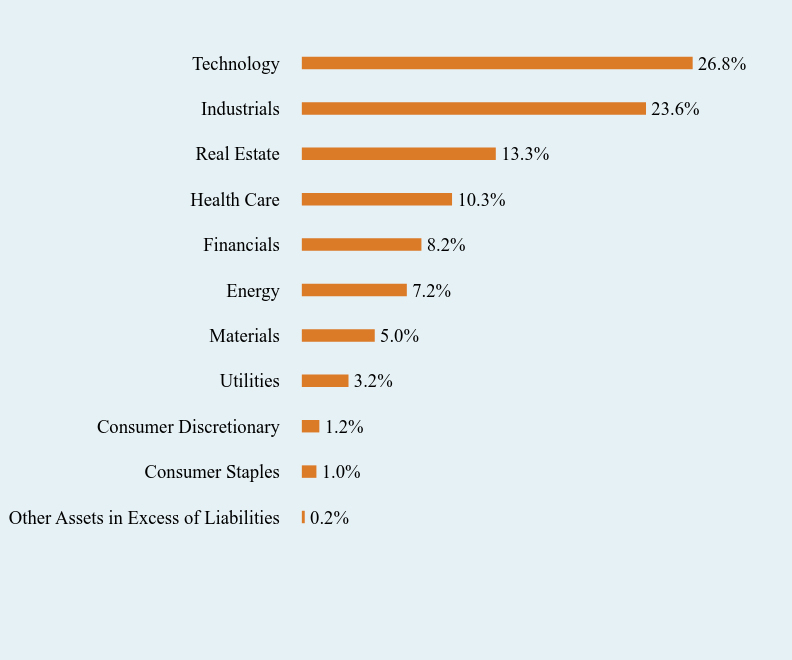
What did the Fund invest in?
Sector Weighting (% of net assets)
| Value | Value |
|---|
| Other Assets in Excess of Liabilities | 0.2% |
| Consumer Staples | 1.0% |
| Consumer Discretionary | 1.2% |
| Utilities | 3.2% |
| Materials | 5.0% |
| Energy | 7.2% |
| Financials | 8.2% |
| Health Care | 10.3% |
| Real Estate | 13.3% |
| Industrials | 23.6% |
| Technology | 26.8% |
Top 10 Holdings (% of net assets)
| Holding Name | % of Net Assets |
| Intuitive Surgical, Inc. | 4.9% |
| Caterpillar, Inc. | 4.7% |
| Progressive Corporation (The) | 4.0% |
| Arista Networks, Inc. | 3.2% |
| Prologis, Inc. | 2.8% |
| Cintas Corporation | 2.3% |
| Parker-Hannifin Corporation | 2.3% |
| Amphenol Corporation, Class A | 2.3% |
| Synopsys, Inc. | 2.2% |
| KLA Corporation | 2.2% |
No material changes occurred during the year ended November 30, 2024.
Annual Shareholder Report - November 30, 2024
Where can I find additional information about the Fund?
Additional information is available on the Fund's website ( www.inspireetf.com ), including its:
Prospectus
Financial information
Holdings
Proxy voting information
Annual Shareholder Report - November 30, 2024
This annual shareholder report contains important information about Inspire 500 ETF for the period of March 25, 2024 to November 30, 2024. You can find additional information about the Fund at www.inspireetf.com. You can also request this information by contacting us at 1-877-658-9473.
What were the Fund’s costs for the last year?
(based on a hypothetical $10,000 investment)
| Fund Name | Costs of a $10,000 investment | Costs paid as a percentage of a $10,000 investment |
|---|
| Inspire 500 ETF | $7 | 0.09%Footnote Reference* |
|---|
How did the Fund perform during the reporting period?
The Fund launched on March 25, 2024, and had a return on the NAV since inception of 13.52%. This strong performance was driven by the upward momentum and security selection in the Information Technology, Industrials and Financials sectors. The other sectors that contributed to the positive performance were the Consumer Discretionary and Utilities sectors. The sectors that caused the largest drag to performance were the Healthcare and Consumer Staples sectors. While there was volatility in the markets during the period due to uncertainty about the next move in interest rates by the Federal Reserve as well as the contentious political environment prior to the election, the Fund performed in line with the broader large cap market even though the Fund had minimal exposure to the Mega Cap Growth stocks that have been the driving force in the large cap markets for the past year. During the period ended November 30, 2024, the Fund's use of the current investment strategies did not cause the Fund's performance to materially deviate from the manager's expectations considering the uncertainty of the markets.
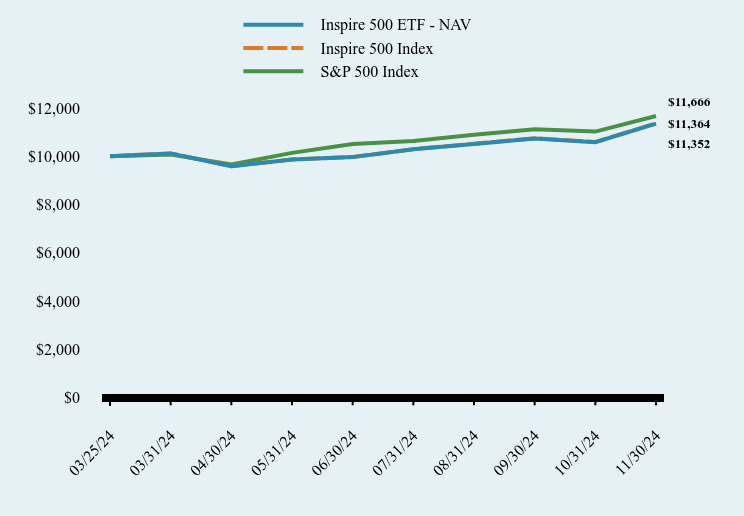
How has the Fund performed since inception?
Total Return Based on $10,000 Investment
| Inspire 500 ETF - NAV | Inspire 500 Index | S&P 500 Index |
|---|
| 03/25/24 | $10,000 | $10,000 | $10,000 |
|---|
| 03/31/24 | $10,115 | $10,114 | $10,071 |
|---|
| 04/30/24 | $9,588 | $9,587 | $9,659 |
|---|
| 05/31/24 | $9,860 | $9,862 | $10,138 |
|---|
| 06/30/24 | $9,961 | $9,965 | $10,502 |
|---|
| 07/31/24 | $10,284 | $10,290 | $10,630 |
|---|
| 08/31/24 | $10,510 | $10,517 | $10,888 |
|---|
| 09/30/24 | $10,737 | $10,745 | $11,120 |
|---|
| 10/31/24 | $10,579 | $10,588 | $11,020 |
|---|
| 11/30/24 | $11,352 | $11,364 | $11,666 |
|---|
Average Annual Total Returns
| Since Inception (March 25, 2024) |
|---|
| Inspire 500 ETF - NAV | 13.52% |
|---|
| Inspire 500 Index | 13.64% |
|---|
| S&P 500 Index | 16.66% |
|---|
The Fund's past performance is not a good predictor of how the Fund will perform in the future. The graph and table do not reflect the deduction of taxes that a shareholder would pay on fund distributions or redemption of fund shares.
- Net Assets$265,176,789
- Number of Portfolio Holdings501
- Advisory Fee $98,588
- Portfolio Turnover9%
Asset Weighting (% of total investments)
| Value | Value |
|---|
| Common Stocks | 100.0% |
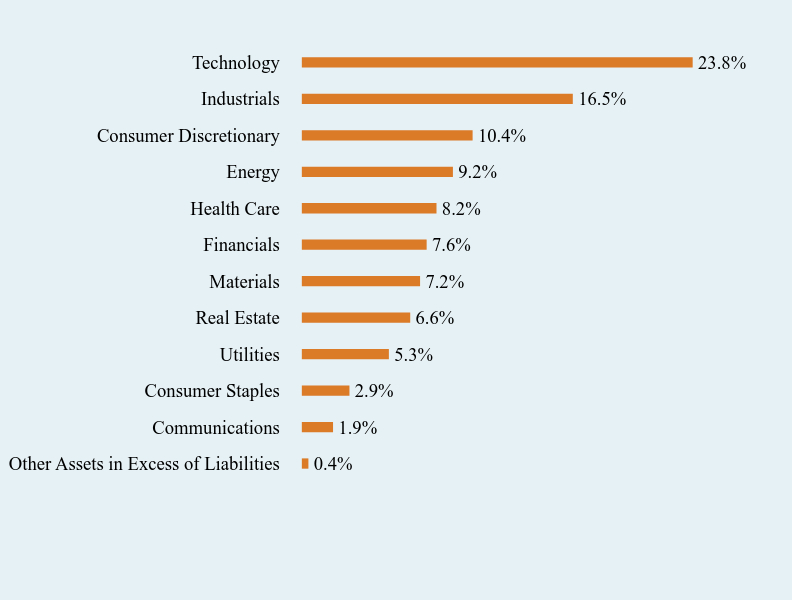
What did the Fund invest in?
Sector Weighting (% of net assets)
| Value | Value |
|---|
| Other Assets in Excess of Liabilities | 0.4% |
| Communications | 1.9% |
| Consumer Staples | 2.9% |
| Utilities | 5.3% |
| Real Estate | 6.6% |
| Materials | 7.2% |
| Financials | 7.6% |
| Health Care | 8.2% |
| Energy | 9.2% |
| Consumer Discretionary | 10.4% |
| Industrials | 16.5% |
| Technology | 23.8% |
Top 10 Holdings (% of net assets)
| Holding Name | % of Net Assets |
| Broadcom, Inc. | 5.0% |
| Exxon Mobil Corporation | 3.5% |
| Home Depot, Inc. (The) | 2.8% |
| Linde plc | 1.5% |
| Intuitive Surgical, Inc. | 1.3% |
| Caterpillar, Inc. | 1.3% |
| QUALCOMM, Inc. | 1.2% |
| Progressive Corporation (The) | 1.1% |
| NextEra Energy, Inc. | 1.1% |
| Palantir Technologies, Inc., Class A | 1.0% |
No material changes occurred during the year ended November 30, 2024.
Annual Shareholder Report - November 30, 2024
Where can I find additional information about the Fund?
Additional information is available on the Fund's website ( www.inspireetf.com ), including its:
Prospectus
Financial information
Holdings
Proxy voting information
Inspire Corporate Bond ETF
Annual Shareholder Report - November 30, 2024
This annual shareholder report contains important information about Inspire Corporate Bond ETF for the period of December 1, 2023 to November 30, 2024. You can find additional information about the Fund at www.inspireetf.com. You can also request this information by contacting us at 1-877-658-9473.
What were the Fund’s costs for the last year?
(based on a hypothetical $10,000 investment)
| Fund Name | Costs of a $10,000 investment | Costs paid as a percentage of a $10,000 investment |
|---|
| Inspire Corporate Bond ETF | $45 | 0.43% |
|---|
How did the Fund perform during the reporting period?
The Fund had a return on the NAV for the past 12 months of 7.44%. This strong positive performance was driven by falling interest rates across the yield curve spectrum as the Federal Reserve officially pivoted from raising interest rates to beginning a process of cutting interest rates. The investment grade quality fixed income portfolio of the Fund performed in line with the broader fixed income market even though the Fund had no exposure to US Treasuries or mortgage-backed securities. During the period ended November 30, 2024, the Fund's use of the current investment strategies did not cause the Fund's performance to materially deviate from the manager's expectations considering the uncertainty of the markets.
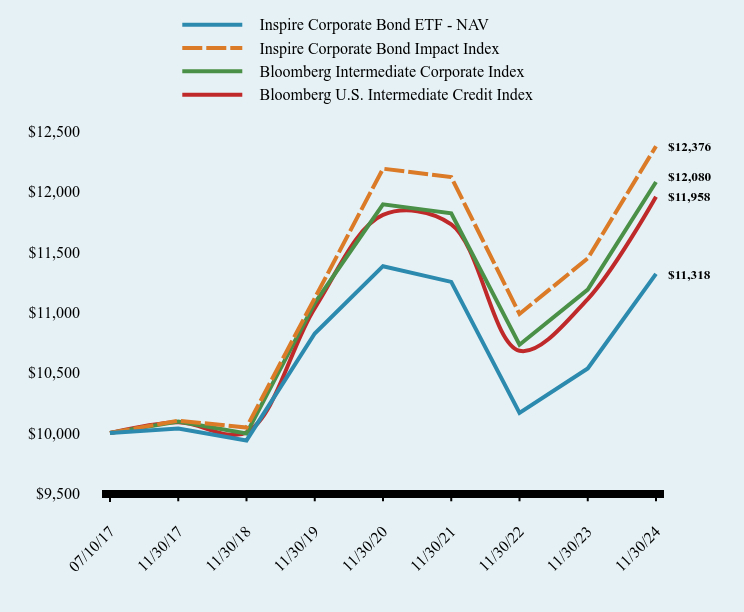
How has the Fund performed since inception?
Total Return Based on $10,000 Investment
| Inspire Corporate Bond ETF - NAV | Inspire Corporate Bond Impact Index | Bloomberg Intermediate Corporate Index | Bloomberg U.S. Intermediate Credit Index |
|---|
| 07/10/17 | $10,000 | $10,000 | $10,000 | $10,000 |
|---|
| 11/30/17 | $10,037 | $10,102 | $10,094 | $10,088 |
|---|
| 11/30/18 | $9,938 | $10,045 | $9,996 | $10,005 |
|---|
| 11/30/19 | $10,824 | $11,117 | $11,077 | $11,035 |
|---|
| 11/30/20 | $11,382 | $12,190 | $11,895 | $11,807 |
|---|
| 11/30/21 | $11,252 | $12,120 | $11,820 | $11,729 |
|---|
| 11/30/22 | $10,166 | $10,986 | $10,731 | $10,681 |
|---|
| 11/30/23 | $10,534 | $11,447 | $11,188 | $11,110 |
|---|
| 11/30/24 | $11,318 | $12,376 | $12,080 | $11,958 |
|---|
Average Annual Total Returns
| 1 Year | 5 years | Since Inception (July 10, 2017) |
|---|
| Inspire Corporate Bond ETF - NAV | 7.44% | 0.90% | 1.69% |
|---|
| Inspire Corporate Bond Impact Index | 8.12% | 2.17% | 2.93% |
|---|
| Bloomberg Intermediate Corporate Index | 7.97% | 1.75% | 2.59% |
|---|
| Bloomberg U.S. Intermediate Credit Index | 7.63% | 1.62% | 2.45% |
|---|
The Fund's past performance is not a good predictor of how the Fund will perform in the future. The graph and table do not reflect the deduction of taxes that a shareholder would pay on fund distributions or redemption of fund shares.
- Net Assets$332,549,864
- Number of Portfolio Holdings250
- Advisory Fee $881,466
- Portfolio Turnover26%
Asset Weighting (% of total investments)
| Value | Value |
|---|
| Corporate Bonds | 100.0% |
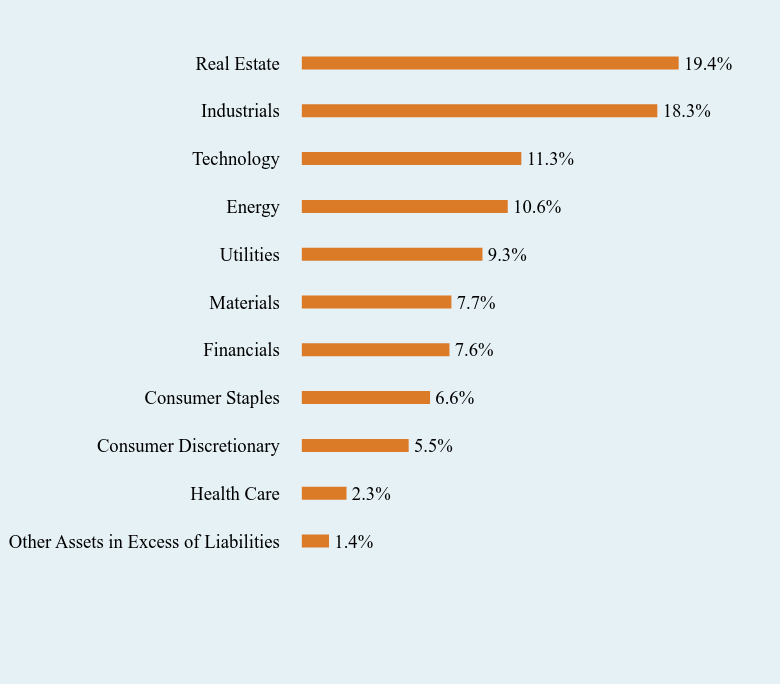
What did the Fund invest in?
Sector Weighting (% of net assets)
| Value | Value |
|---|
| Other Assets in Excess of Liabilities | 1.4% |
| Health Care | 2.3% |
| Consumer Discretionary | 5.5% |
| Consumer Staples | 6.6% |
| Financials | 7.6% |
| Materials | 7.7% |
| Utilities | 9.3% |
| Energy | 10.6% |
| Technology | 11.3% |
| Industrials | 18.3% |
| Real Estate | 19.4% |
Top 10 Holdings (% of net assets)
| Holding Name | % of Net Assets |
| Trimble, Inc., 4.900%, 06/15/28 | 1.4% |
| Alexandria Real Estate Equities, Inc., 4.900%, 12/15/30 | 1.4% |
| Camden Property Trust, 4.900%, 01/15/34 | 1.4% |
| Amphenol Corporation, 4.350%, 06/01/29 | 1.4% |
| Valero Energy Corporation, 4.350%, 06/01/28 | 1.4% |
| Arch Capital Finance, LLC, 4.011%, 12/15/26 | 1.4% |
| Cboe Global Markets, Inc., 3.650%, 01/12/27 | 1.4% |
| AutoZone, Inc., 3.750%, 06/01/27 | 1.4% |
| Dollar General Corporation, 3.875%, 04/15/27 | 1.4% |
| Republic Services, Inc., 3.950%, 05/15/28 | 1.4% |
No material changes occurred during the year ended November 30, 2024.
Inspire Corporate Bond ETF
Annual Shareholder Report - November 30, 2024
Where can I find additional information about the Fund?
Additional information is available on the Fund's website ( www.inspireetf.com ), including its:
Prospectus
Financial information
Holdings
Proxy voting information
Annual Shareholder Report - November 30, 2024
This annual shareholder report contains important information about Inspire Momentum ETF for the period of December 1, 2023 to November 30, 2024. You can find additional information about the Fund at www.inspireetf.com. You can also request this information by contacting us at 1-877-658-9473. This report describes changes to the Fund that occurred during the reporting period.
What were the Fund’s costs for the last year?
(based on a hypothetical $10,000 investment)
| Fund Name | Costs of a $10,000 investment | Costs paid as a percentage of a $10,000 investment |
|---|
| Inspire Momentum ETF | $92 | 0.80% |
|---|
How did the Fund perform during the reporting period?
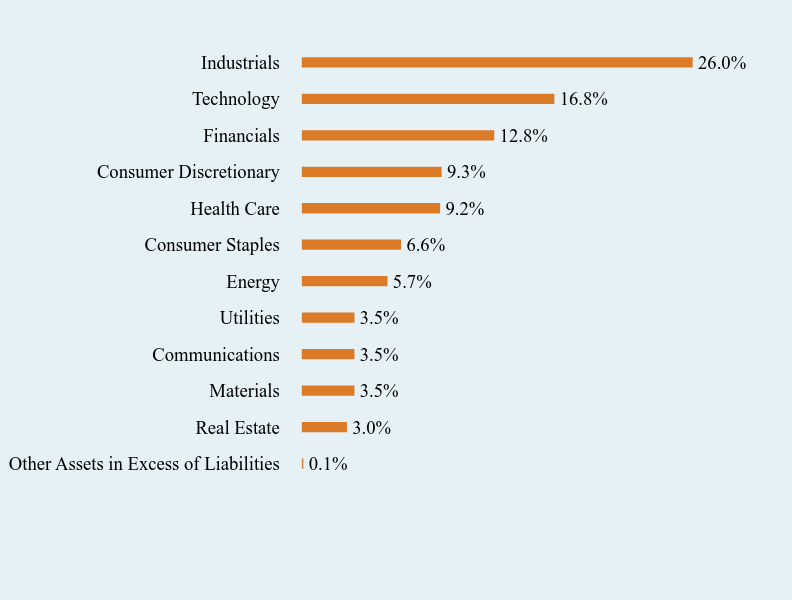
The Fund had a return on the NAV for the past 12 months of 30.00%. This strong performance was driven by the Fund’s focus on the momentum factor that was in favor over the past year as well as security selection in the Industrials, Consumer Discretionary and Financials sectors. The other sectors that helped achieve this positive performance came from the Healthcare, Materials, Consumer Staples and Real Estate sectors. The sector that caused the largest drag to performance was the Information Technology sector with a smaller drag from the Energy sector. Although there was volatility in the markets during the period due to uncertainty about the timing of the next move in interest rates by the Federal Reserve, as well as the momentum factor being out of favor for the past few months, the Fund performed well vs the broader market. During the period ended November 30, 2024, the Fund's use of the current investment strategies did not cause the Fund's performance to materially deviate from the manager's expectations considering the uncertainty of the markets.
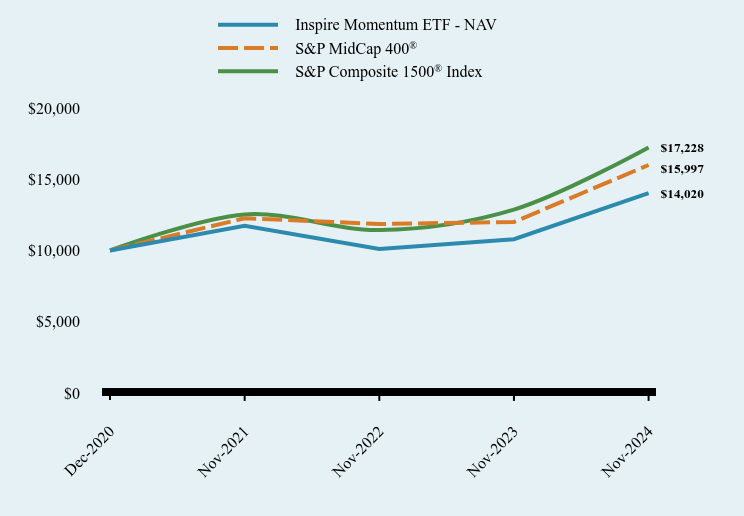
How has the Fund performed since inception?
Total Return Based on $10,000 Investment
| Inspire Momentum ETF - NAV | S&P MidCap 400® | S&P Composite 1500® Index |
|---|
| Dec-2020 | $10,000 | $10,000 | $10,000 |
|---|
| Nov-2021 | $11,735 | $12,260 | $12,530 |
|---|
| Nov-2022 | $10,105 | $11,857 | $11,427 |
|---|
| Nov-2023 | $10,785 | $11,996 | $12,869 |
|---|
| Nov-2024 | $14,020 | $15,997 | $17,228 |
|---|
Average Annual Total Returns
| 1 Year | Since Inception (December 7, 2020) |
|---|
| Inspire Momentum ETF - NAV | 30.00% | 8.86% |
|---|
S&P MidCap 400® | 33.36% | 12.53% |
|---|
S&P Composite 1500® Index | 33.87% | 14.64% |
|---|
The Fund's past performance is not a good predictor of how the Fund will perform in the future. The graph and table do not reflect the deduction of taxes that a shareholder would pay on fund distributions or redemption of fund shares.
- Net Assets$74,503,557
- Number of Portfolio Holdings33
- Advisory Fee (net of waivers)$298,206
- Portfolio Turnover82%
Asset Weighting (% of total investments)
| Value | Value |
|---|
| Common Stocks | 100.0% |
What did the Fund invest in?
Sector Weighting (% of net assets)
| Value | Value |
|---|
| Other Assets in Excess of Liabilities | 0.1% |
| Real Estate | 3.0% |
| Materials | 3.5% |
| Communications | 3.5% |
| Utilities | 3.5% |
| Energy | 5.7% |
| Consumer Staples | 6.6% |
| Health Care | 9.2% |
| Consumer Discretionary | 9.3% |
| Financials | 12.8% |
| Technology | 16.8% |
| Industrials | 26.0% |
Top 10 Holdings (% of net assets)
| Holding Name | % of Net Assets |
| EMCOR Group, Inc. | 3.8% |
| BWX Technologies, Inc. | 3.7% |
| Flowserve Corporation | 3.6% |
| NRG Energy, Inc. | 3.5% |
| Trade Desk, Inc. (The), Class A | 3.5% |
| Curtiss-Wright Corporation | 3.5% |
| SEI Investments Company | 3.5% |
| Sylvamo Corporation | 3.5% |
| Group 1 Automotive, Inc. | 3.5% |
| BJ's Wholesale Club Holdings, Inc. | 3.4% |
This is a summary of certain changes since December 1, 2023 to the Fund. For more information, you may review the Fund's current prospectus dated March 29, 2024, as supplemented, or the Fund's next prospectus, which we expect to be available by March 30, 2025 or by calling 1-877-658-9473. Effective August 9, 2024, the Fund's investment objective changed to the following:
The Fund seeks to outperform the results (before fees and expenses) of the broader stock market when momentum is in favor. Further, the Fund's policy to invest at least 80% of the Fund's net assets plus any borrowings for investment purposes in mid-cap stocks was eliminated, as well as references to Mid-Capitalization Company Risk in the Fund's Prospectus and Summary Prospectus.
Annual Shareholder Report - November 30, 2024
Where can I find additional information about the Fund?
Additional information is available on the Fund's website ( www.inspireetf.com ), including its:
Prospectus
Financial information
Holdings
Proxy voting information
Inspire Fidelis Multi Factor ETF
Annual Shareholder Report - November 30, 2024
This annual shareholder report contains important information about Inspire Fidelis Multi Factor ETF for the period of December 1, 2023 to November 30, 2024. You can find additional information about the Fund at www.inspireetf.com. You can also request this information by contacting us at 1-877-658-9473.
What were the Fund’s costs for the last year?
(based on a hypothetical $10,000 investment)
| Fund Name | Costs of a $10,000 investment | Costs paid as a percentage of a $10,000 investment |
|---|
| Inspire Fidelis Multi Factor ETF | $78 | 0.69% |
|---|
How did the Fund perform during the reporting period?
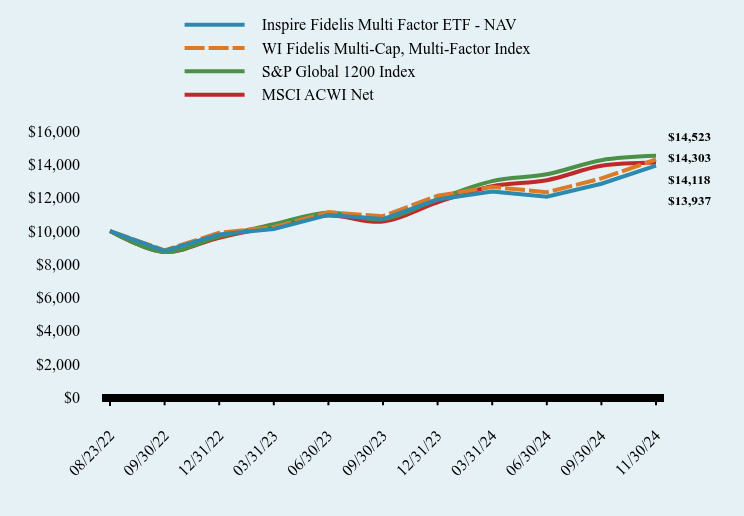
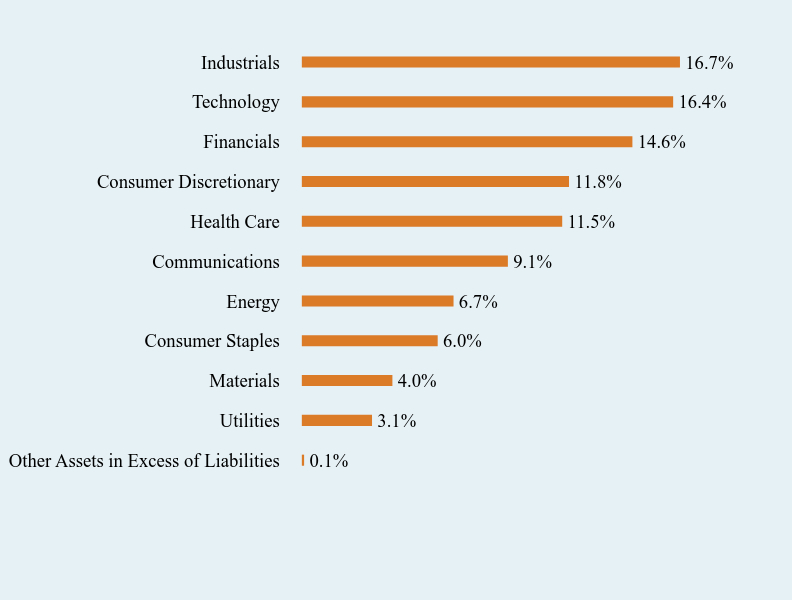
The Fund had a return on the NAV for the past 12 months of 27.12%. This strong performance was driven by the upward momentum and security selection in the Financials, Industrials and Information Technology sectors. The other sectors that helped achieve this positive performance came from the Consumer Staples and Consumer Discretionary sectors. The sector that caused the largest drag to performance was the Real Estate sector. Although there was volatility in the global markets during the period due to the wars in Ukraine and Gaza and geo-political tensions with Russia and China, the Fund performed in line with the broader global markets even though the Fund had minimal exposure to the Mega Cap US Growth stocks that have been the driving force in the US large cap markets for the past year. During the period ended November 30, 2024, the Fund's use of the current investment strategies did not cause the Fund's performance to materially deviate from the manager's expectations considering the uncertainty of the markets.
How has the Fund performed since inception?
Total Return Based on $10,000 Investment
| Inspire Fidelis Multi Factor ETF - NAV | WI Fidelis Multi-Cap, Multi-Factor Index | S&P Global 1200 Index | MSCI ACWI Net |
|---|
| 08/23/22 | $10,000 | $10,000 | $10,001 | $10,000 |
|---|
| 09/30/22 | $8,808 | $8,841 | $8,738 | $8,746 |
|---|
| 12/31/22 | $9,799 | $9,899 | $9,662 | $9,600 |
|---|
| 03/31/23 | $10,120 | $10,239 | $10,406 | $10,301 |
|---|
| 06/30/23 | $10,970 | $11,126 | $11,119 | $10,938 |
|---|
| 09/30/23 | $10,721 | $10,896 | $10,712 | $10,566 |
|---|
| 12/31/23 | $11,897 | $12,125 | $11,922 | $11,731 |
|---|
| 03/31/24 | $12,384 | $12,654 | $13,003 | $12,693 |
|---|
| 06/30/24 | $12,064 | $12,336 | $13,411 | $13,057 |
|---|
| 09/30/24 | $12,846 | $13,164 | $14,263 | $13,921 |
|---|
| 11/30/24 | $13,937 | $14,303 | $14,523 | $14,118 |
|---|
Average Annual Total Returns
| 1 Year | Since Inception (August 23, 2022) |
|---|
| Inspire Fidelis Multi Factor ETF - NAV | 27.12% | 15.74% |
|---|
| WI Fidelis Multi-Cap, Multi-Factor Index | 28.26% | 17.07% |
|---|
| S&P Global 1200 Index | 27.61% | 17.86% |
|---|
| MSCI ACWI Net | 26.12% | 16.40% |
|---|
The Fund's past performance is not a good predictor of how the Fund will perform in the future. The graph and table do not reflect the deduction of taxes that a shareholder would pay on fund distributions or redemption of fund shares.
- Net Assets$94,646,930
- Number of Portfolio Holdings101
- Advisory Fee $373,831
- Portfolio Turnover232%
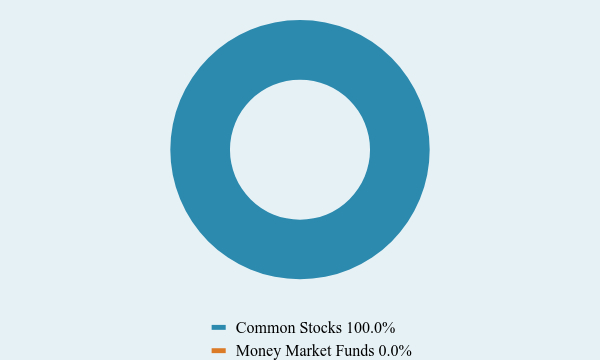
Asset Weighting (% of total investments)
| Value | Value |
|---|
| Common Stocks | 100.0% |
| Money Market Funds | 0.0% |
What did the Fund invest in?
Sector Weighting (% of net assets)
| Value | Value |
|---|
| Other Assets in Excess of Liabilities | 0.1% |
| Utilities | 3.1% |
| Materials | 4.0% |
| Consumer Staples | 6.0% |
| Energy | 6.7% |
| Communications | 9.1% |
| Health Care | 11.5% |
| Consumer Discretionary | 11.8% |
| Financials | 14.6% |
| Technology | 16.4% |
| Industrials | 16.7% |
Top 10 Holdings (% of net assets)
| Holding Name | % of Net Assets |
| Honest Company, Inc. (The) | 2.0% |
| Sprouts Farmers Market, Inc. | 1.4% |
| Telephone and Data Systems, Inc. | 1.3% |
| SimilarWeb Ltd. | 1.3% |
| Interactive Brokers Group, Inc., Class A | 1.3% |
| Powell Industries, Inc. | 1.3% |
| Tactile Systems Technology, Inc. | 1.3% |
| Interface, Inc. | 1.3% |
| DocuSign, Inc. | 1.2% |
| Opera Ltd. | 1.2% |
No material changes occurred during the year ended November 30, 2024.
Inspire Fidelis Multi Factor ETF
Annual Shareholder Report - November 30, 2024
Where can I find additional information about the Fund?
Additional information is available on the Fund's website ( www.inspireetf.com ), including its:
Prospectus
Financial information
Holdings
Proxy voting information
Annual Shareholder Report - November 30, 2024
This annual shareholder report contains important information about Inspire Global Hope ETF for the period of December 1, 2023 to November 30, 2024. You can find additional information about the Fund at www.inspireetf.com. You can also request this information by contacting us at 1-877-658-9473.
What were the Fund’s costs for the last year?
(based on a hypothetical $10,000 investment)
| Fund Name | Costs of a $10,000 investment | Costs paid as a percentage of a $10,000 investment |
|---|
| Inspire Global Hope ETF | $64 | 0.58% |
|---|
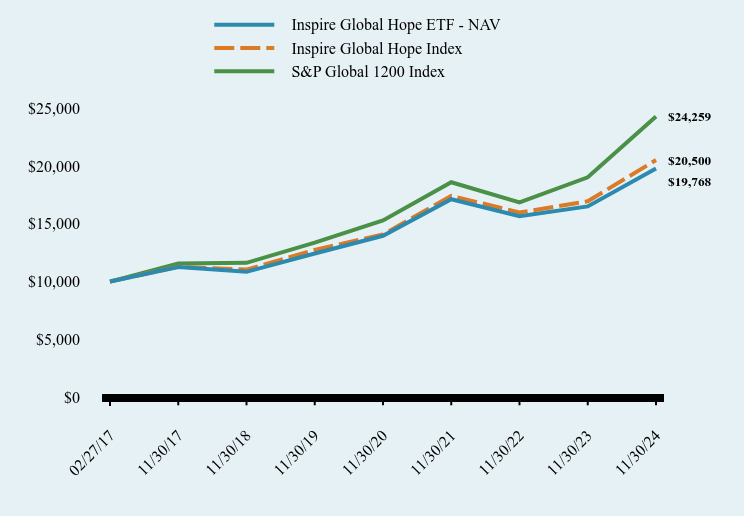
How did the Fund perform during the reporting period?
The Fund had a return on the NAV for the past 12 months of 19.83%. This strong performance was driven by the upward momentum and security selection in the Financials, Industrials and Information Technology sectors. The other sectors that helped achieve this positive performance came from the Industrials and Materials sectors. Although still contributing positive return during the year, the sectors that caused the largest drag to performance were the Consumer Staples, Communication Services and Energy sectors. While there was volatility in the global markets during the period due to the wars in Ukraine and Gaza and geo-political tensions with Russia and China, as well as the contentious US political environment prior to the election, the Fund performed in line with the broader global large cap market even though the Fund had minimal exposure to the Mega Cap Growth stocks that have been the driving force in the US large cap markets for the past year. During the period ended November 30, 2024, the Fund's use of the current investment strategies did not cause the Fund's performance to materially deviate from the manager's expectations considering the uncertainty of the markets.
How has the Fund performed since inception?
Total Return Based on $10,000 Investment
| Inspire Global Hope ETF - NAV | Inspire Global Hope Index | S&P Global 1200 Index |
|---|
| 02/27/17 | $10,000 | $10,000 | $9,999 |
|---|
| 11/30/17 | $11,263 | $11,284 | $11,560 |
|---|
| 11/30/18 | $10,841 | $11,034 | $11,620 |
|---|
| 11/30/19 | $12,424 | $12,730 | $13,360 |
|---|
| 11/30/20 | $13,958 | $14,067 | $15,282 |
|---|
| 11/30/21 | $17,117 | $17,406 | $18,582 |
|---|
| 11/30/22 | $15,646 | $15,970 | $16,838 |
|---|
| 11/30/23 | $16,496 | $16,937 | $19,007 |
|---|
| 11/30/24 | $19,768 | $20,500 | $24,259 |
|---|
Average Annual Total Returns
| 1 Year | 5 Years | Since Inception (February 27, 2017) |
|---|
| Inspire Global Hope ETF - NAV | 19.83% | 9.73% | 9.18% |
|---|
| Inspire Global Hope Index | 21.04% | 10.00% | 9.70% |
|---|
| S&P Global 1200 Index | 27.61% | 12.67% | 12.10% |
|---|
The Fund's past performance is not a good predictor of how the Fund will perform in the future. The graph and table do not reflect the deduction of taxes that a shareholder would pay on fund distributions or redemption of fund shares.
| Net Assets | $109,704,092 |
|---|
| Number of Portfolio Holdings | 402 |
|---|
| Advisory Fee | $396,167 |
|---|
| Portfolio Turnover | 41% |
|---|
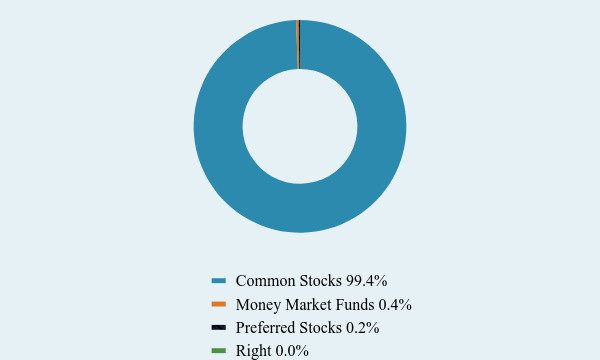
Asset Weighting (% of total investments)
| Value | Value |
|---|
| Common Stocks | 99.4% |
| Money Market Funds | 0.4% |
| Preferred Stocks | 0.2% |
| Right | 0.0% |
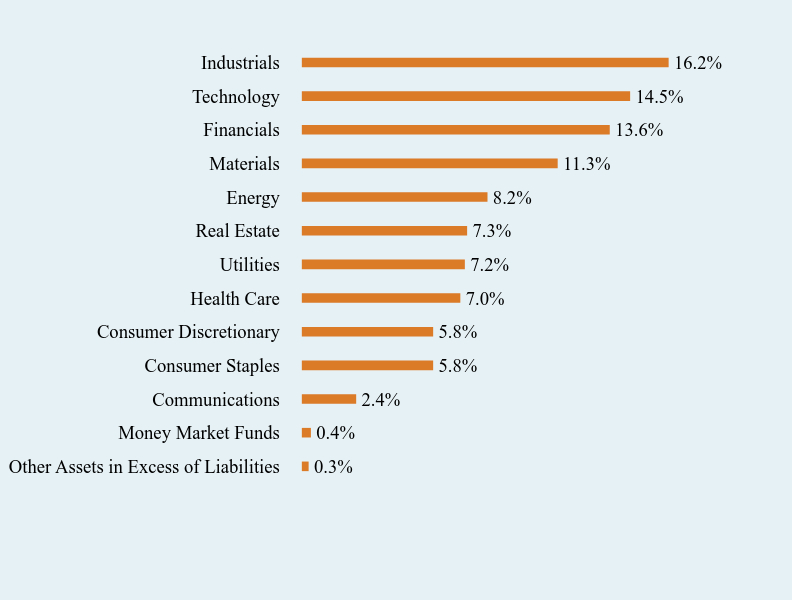
What did the Fund invest in?
Sector Weighting (% of net assets)
| Value | Value |
|---|
| Other Assets in Excess of Liabilities | 0.3% |
| Money Market Funds | 0.4% |
| Communications | 2.4% |
| Consumer Staples | 5.8% |
| Consumer Discretionary | 5.8% |
| Health Care | 7.0% |
| Utilities | 7.2% |
| Real Estate | 7.3% |
| Energy | 8.2% |
| Materials | 11.3% |
| Financials | 13.6% |
| Technology | 14.5% |
| Industrials | 16.2% |
Top 10 Holdings (% of net assets)
| Holding Name | % of Net Assets |
| Coinbase Global, Inc., Class A | 0.4% |
| Snowflake, Inc. | 0.4% |
| Fidelity Investments Money Market Government Portfolio, Institutional | 0.4% |
| Sprouts Farmers Market, Inc. | 0.4% |
| Targa Resources Corporation | 0.4% |
| Interactive Brokers Group, Inc., Class A | 0.3% |
| Datadog, Inc., Class A | 0.3% |
| Delta Electronics Thailand PCL | 0.3% |
| Marvell Technology, Inc. | 0.3% |
| Snap-on, Inc. | 0.3% |
No material changes occurred during the year ended November 30, 2024.
Annual Shareholder Report - November 30, 2024
Where can I find additional information about the Fund?
Additional information is available on the Fund's website ( www.inspireetf.com ), including its:
Prospectus
Financial information
Holdings
Proxy voting information
Inspire International ETF
Annual Shareholder Report - November 30, 2024
This annual shareholder report contains important information about Inspire International ETF for the period of December 1, 2023 to November 30, 2024. You can find additional information about the Fund at www.inspireetf.com. You can also request this information by contacting us at 1-877-658-9473.
What were the Fund’s costs for the last year?
(based on a hypothetical $10,000 investment)
| Fund Name | Costs of a $10,000 investment | Costs paid as a percentage of a $10,000 investment |
|---|
| Inspire International ETF | $70 | 0.66% |
|---|
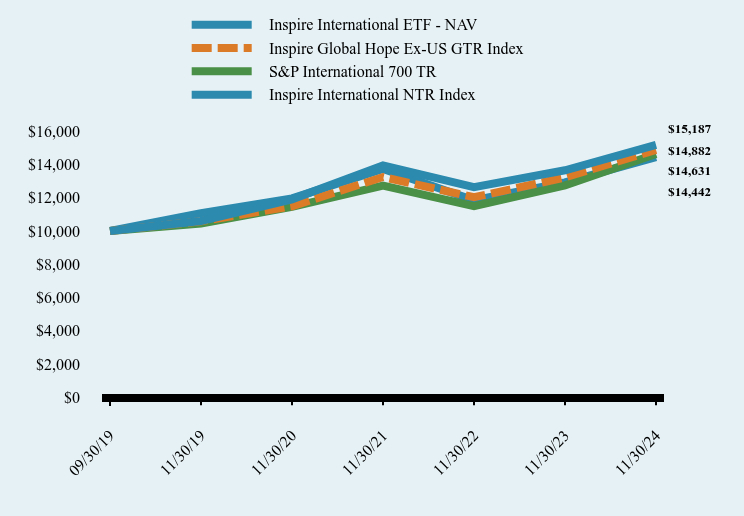
How did the Fund perform during the reporting period?
The Fund had a return on the NAV for the past 12 months of 11.20%. This positive performance was driven by the upward momentum and security selection in the Financials and Industrials sectors. The other sectors that helped achieve this positive performance came from the Consumer Discretionary and Healthcare sectors. The sectors that caused the largest drag to performance were the Consumer Staples and Energy sectors. Although there was volatility in the international markets during the period due to the wars in Ukraine and Gaza and geo-political tensions with Russia and China, the Fund performed in line with the broader global large cap market even though the Fund had no exposure to the mainland Chinese markets that have seen upward momentum recently and are a large portion of the international markets. During the period ended November 30, 2024, the Fund's use of the current investment strategies did not cause the Fund's performance to materially deviate from the manager's expectations considering the uncertainty of the markets.
How has the Fund performed since inception?
Total Return Based on $10,000 Investment
| Inspire International ETF - NAV | Inspire Global Hope Ex-US GTR Index | S&P International 700 TR | Inspire International NTR Index |
|---|
| 09/30/19 | $10,000 | $10,000 | $10,000 | $10,000 |
|---|
| 11/30/19 | $10,604 | $10,590 | $10,451 | $11,073 |
|---|
| 11/30/20 | $11,908 | $11,488 | $11,455 | $11,964 |
|---|
| 11/30/21 | $13,945 | $13,247 | $12,730 | $13,733 |
|---|
| 11/30/22 | $12,645 | $12,031 | $11,493 | $11,849 |
|---|
| 11/30/23 | $13,657 | $13,223 | $12,751 | $12,923 |
|---|
| 11/30/24 | $15,187 | $14,882 | $14,631 | $14,442 |
|---|
Average Annual Total Returns
| 1 Year | 5 years | Since Inception (September 30, 2019) |
|---|
| Inspire International ETF - NAV | 11.20% | 7.45% | 8.42% |
|---|
| Inspire Global Hope Ex-US GTR Index | 12.55% | 7.04% | 8.00% |
|---|
| S&P International 700 TR | 14.74% | 6.96% | 7.64% |
|---|
| Inspire International NTR Index | 11.75% | 5.46% | 7.37% |
|---|
The Fund's past performance is not a good predictor of how the Fund will perform in the future. The graph and table do not reflect the deduction of taxes that a shareholder would pay on fund distributions or redemption of fund shares.
| Net Assets | $302,084,548 |
|---|
| Number of Portfolio Holdings | 201 |
|---|
| Advisory Fee | $1,256,578 |
|---|
| Portfolio Turnover | 34% |
|---|
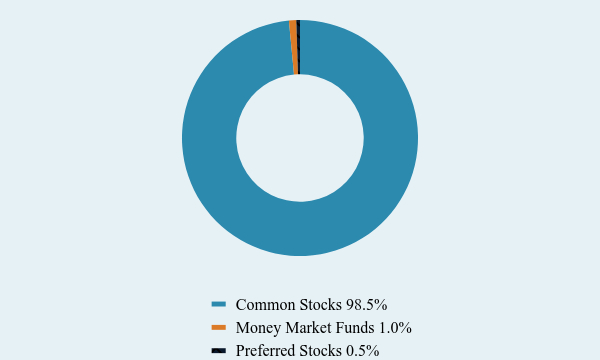
Asset Weighting (% of total investments)
| Value | Value |
|---|
| Common Stocks | 98.5% |
| Money Market Funds | 1.0% |
| Preferred Stocks | 0.5% |
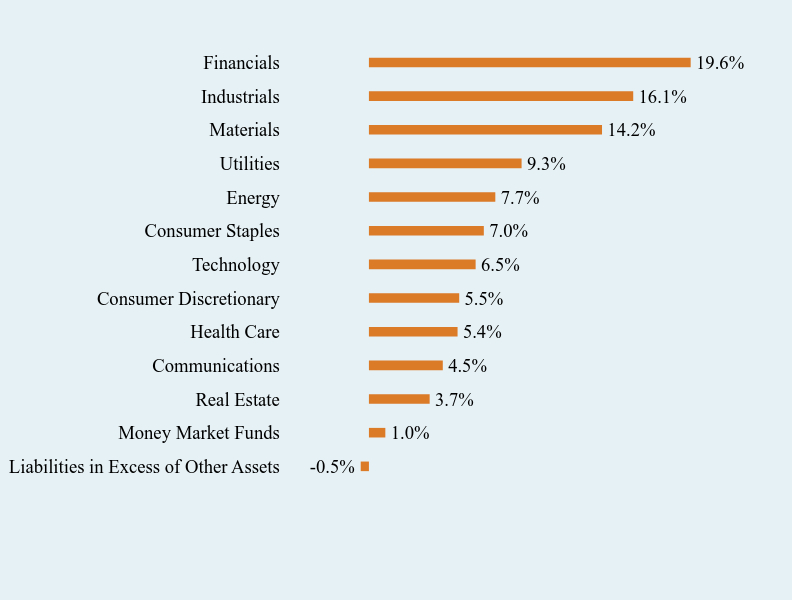
What did the Fund invest in?
Sector Weighting (% of net assets)
| Value | Value |
|---|
| Liabilities in Excess of Other Assets | -0.5% |
| Money Market Funds | 1.0% |
| Real Estate | 3.7% |
| Communications | 4.5% |
| Health Care | 5.4% |
| Consumer Discretionary | 5.5% |
| Technology | 6.5% |
| Consumer Staples | 7.0% |
| Energy | 7.7% |
| Utilities | 9.3% |
| Materials | 14.2% |
| Industrials | 16.1% |
| Financials | 19.6% |
Top 10 Holdings (% of net assets)
| Holding Name | % of Net Assets |
| Fidelity Investments Money Market Government Portfolio, Institutional | 1.0% |
| Delta Electronics Thailand PCL | 0.7% |
| Garmin Ltd. | 0.7% |
| REA Group Ltd. | 0.6% |
| Geely Automobile Holdings Ltd. | 0.6% |
| Advantest Corporation | 0.6% |
| Brookfield Corporation | 0.6% |
| Fairfax Financial Holdings Ltd. | 0.6% |
| Delek Group Ltd. | 0.6% |
| Commonwealth Bank of Australia | 0.6% |
No material changes occurred during the year ended November 30, 2024.
Inspire International ETF
Annual Shareholder Report - November 30, 2024
Where can I find additional information about the Fund?
Additional information is available on the Fund's website ( www.inspireetf.com ), including its:
Prospectus
Financial information
Holdings
Proxy voting information
Inspire Small/Mid Cap ETF
Annual Shareholder Report - November 30, 2024
This annual shareholder report contains important information about Inspire Small/Mid Cap ETF for the period of December 1, 2023 to November 30, 2024. You can find additional information about the Fund at www.inspireetf.com. You can also request this information by contacting us at 1-877-658-9473.
What were the Fund’s costs for the last year?
(based on a hypothetical $10,000 investment)
| Fund Name | Costs of a $10,000 investment | Costs paid as a percentage of a $10,000 investment |
|---|
| Inspire Small/Mid Cap ETF | $57 | 0.49% |
|---|
How did the Fund perform during the reporting period?
The Fund had a return on the NAV for the past 12 months of 32.53%. This strong performance was driven by the upward momentum and security selection in the Financials, Information Technology, Health Care and Industrials sectors. The other sectors that helped achieve this positive performance came from the Consumer Discretionary and Real Estate sectors. Although still contributing positive return during the year, the sectors that caused the largest drag to performance were the Energy, Utilities and Communication Services sectors. While there was volatility in the markets during the period due to uncertainty about the next move in interest rates by the Federal Reserve as well as the contentious political environment prior to the election, the Fund performed well vs the broader small and mid-cap markets. During the period ended November 30, 2024, the Fund's use of the current investment strategies did not cause the Fund's performance to materially deviate from the manager's expectations considering the uncertainty of the markets.
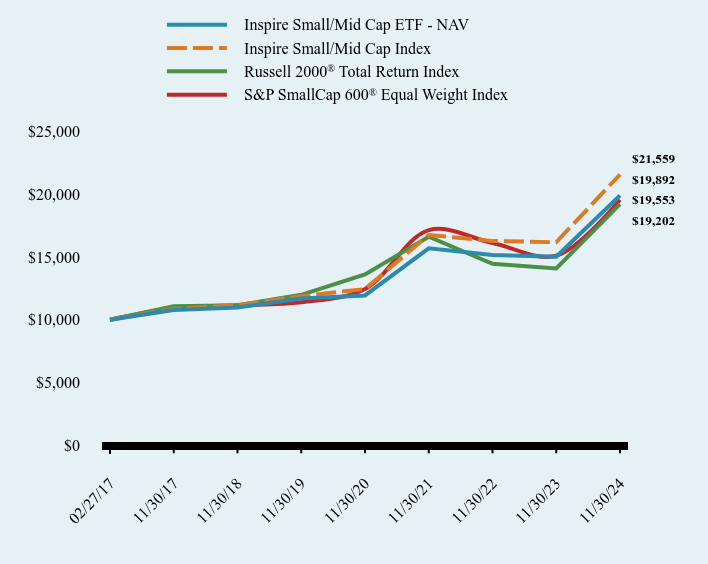
How has the Fund performed since inception?
Total Return Based on $10,000 Investment
| Inspire Small/Mid Cap ETF - NAV | Inspire Small/Mid Cap Index | Russell 2000® Total Return Index | S&P SmallCap 600® Equal Weight Index |
|---|
| 02/27/17 | $10,000 | $10,000 | $10,000 | $10,000 |
|---|
| 11/30/17 | $10,775 | $10,861 | $11,079 | $10,916 |
|---|
| 11/30/18 | $10,978 | $11,160 | $11,143 | $11,147 |
|---|
| 11/30/19 | $11,683 | $11,872 | $11,980 | $11,389 |
|---|
| 11/30/20 | $11,931 | $12,440 | $13,609 | $12,444 |
|---|
| 11/30/21 | $15,682 | $16,744 | $16,606 | $17,132 |
|---|
| 11/30/22 | $15,158 | $16,264 | $14,445 | $16,107 |
|---|
| 11/30/23 | $15,009 | $16,165 | $14,074 | $15,087 |
|---|
| 11/30/24 | $19,892 | $21,559 | $19,202 | $19,553 |
|---|
Average Annual Total Returns
| 1 Year | 5 years | Since Inception (February 27, 2017) |
|---|
| Inspire Small/Mid Cap ETF - NAV | 32.53% | 11.23% | 9.27% |
|---|
| Inspire Small/Mid Cap Index | 33.37% | 12.67% | 10.41% |
|---|
Russell 2000® Total Return Index | 36.43% | 9.90% | 8.78% |
|---|
S&P SmallCap 600® Equal Weight Index | 29.61% | 11.42% | 9.03% |
|---|
The Fund's past performance is not a good predictor of how the Fund will perform in the future. The graph and table do not reflect the deduction of taxes that a shareholder would pay on fund distributions or redemption of fund shares.
- Net Assets$212,862,569
- Number of Portfolio Holdings500
- Advisory Fee $554,759
- Portfolio Turnover46%
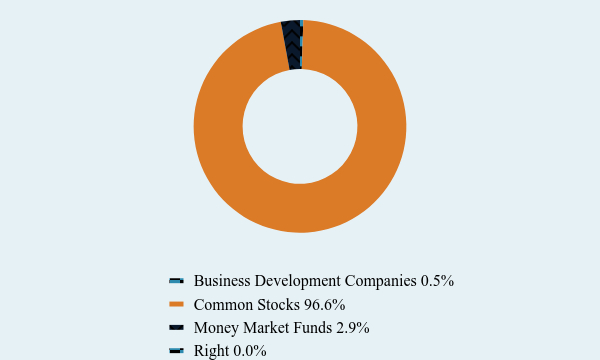
Asset Weighting (% of total investments)
| Value | Value |
|---|
| Business Development Companies | 0.5% |
| Common Stocks | 96.6% |
| Money Market Funds | 2.9% |
| Right | 0.0% |
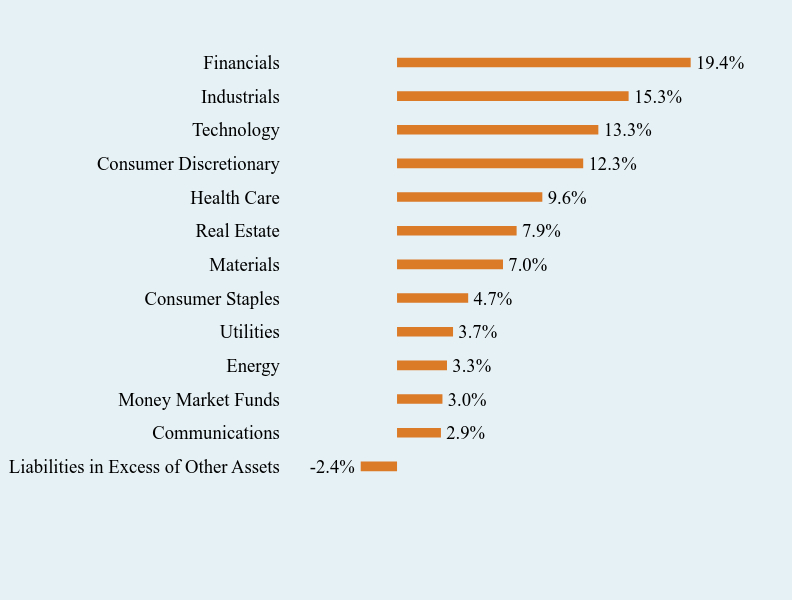
What did the Fund invest in?
Sector Weighting (% of net assets)
| Value | Value |
|---|
| Liabilities in Excess of Other Assets | -2.4% |
| Communications | 2.9% |
| Money Market Funds | 3.0% |
| Energy | 3.3% |
| Utilities | 3.7% |
| Consumer Staples | 4.7% |
| Materials | 7.0% |
| Real Estate | 7.9% |
| Health Care | 9.6% |
| Consumer Discretionary | 12.3% |
| Technology | 13.3% |
| Industrials | 15.3% |
| Financials | 19.4% |
Top 10 Holdings (% of net assets)
| Holding Name | % of Net Assets |
| Fidelity Investments Money Market Government Portfolio, Institutional | 3.0% |
| Aris Water Solutions, Inc., Class A | 0.3% |
Universal Technical Institute, Inc. | 0.3% |
| Natural Grocers by Vitamin Cottage, Inc. | 0.3% |
| Globalstar, Inc. | 0.3% |
| PAR Technology Corporation | 0.3% |
| Chart Industries, Inc. | 0.3% |
| MYR Group, Inc. | 0.3% |
| Paragon 28, Inc. | 0.3% |
| Argan, Inc. | 0.3% |
No material changes occurred during the year ended November 30, 2024.
Inspire Small/Mid Cap ETF
Annual Shareholder Report - November 30, 2024
Where can I find additional information about the Fund?
Additional information is available on the Fund's website ( www.inspireetf.com ), including its:
Prospectus
Financial information
Holdings
Proxy voting information
Inspire Tactical Balanced ETF
Annual Shareholder Report - November 30, 2024
This annual shareholder report contains important information about Inspire Tactical Balanced ETF for the period of December 1, 2023 to November 30, 2024. You can find additional information about the Fund at www.inspireetf.com. You can also request this information by contacting us at 1-877-658-9473.
What were the Fund’s costs for the last year?
(based on a hypothetical $10,000 investment)
| Fund Name | Costs of a $10,000 investment | Costs paid as a percentage of a $10,000 investment |
|---|
| Inspire Tactical Balanced ETF | $79 | 0.71% |
|---|
How did the Fund perform during the reporting period?
The Fund had a return on the NAV for the past 12 months of 21.38%. Since the Fund has a current target of 80% to be invested in US Large Cap stocks most of this positive performance was driven by the upward momentum and security selection in the Industrials and Financials sectors. The other sectors that helped achieve this positive performance came from the Information Technology and Consumer Discretionary sectors. The sectors that caused the largest drag to performance were the Healthcare and Communication Services sectors. The Fund is also currently invested at a 20% level in US Treasury exposure so part of the positive performance was driven by falling interest rates across the yield curve spectrum in anticipation of additional rate cuts by the Federal Reserve due to a slowing economy. Although there was volatility in both the equity and fixed income markets during the period the Fund performed in line with the broader large cap market as well as the broader fixed income markets. During the period ended November 30, 2024, the Fund's use of the current investment strategies did not cause the Fund's performance to materially deviate from the manager's expectations considering the uncertainty of the markets.
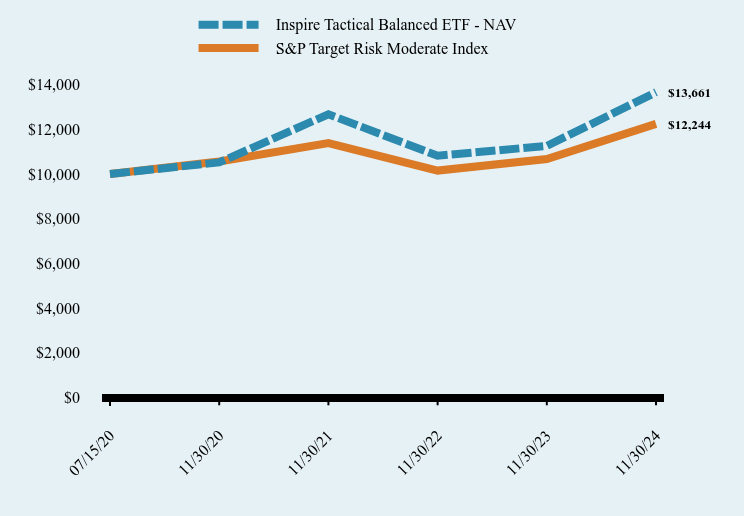
How has the Fund performed since inception?
Total Return Based on $10,000 Investment
| Inspire Tactical Balanced ETF - NAV | S&P Target Risk Moderate Index |
|---|
| 07/15/20 | $10,000 | $10,000 |
|---|
| 11/30/20 | $10,518 | $10,559 |
|---|
| 11/30/21 | $12,673 | $11,381 |
|---|
| 11/30/22 | $10,819 | $10,152 |
|---|
| 11/30/23 | $11,255 | $10,669 |
|---|
| 11/30/24 | $13,661 | $12,244 |
|---|
Average Annual Total Returns
| 1 Year | Since Inception (July 15, 2020) |
|---|
| Inspire Tactical Balanced ETF - NAV | 21.38% | 7.39% |
|---|
| S&P Target Risk Moderate Index | 14.76% | 4.73% |
|---|
The Fund's past performance is not a good predictor of how the Fund will perform in the future. The graph and table do not reflect the deduction of taxes that a shareholder would pay on fund distributions or redemption of fund shares.
- Net Assets$95,600,560
- Number of Portfolio Holdings77
- Advisory Fee $448,098
- Portfolio Turnover52%
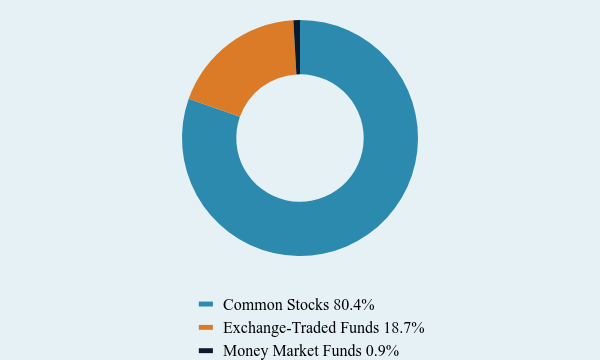
Asset Weighting (% of total investments)
| Value | Value |
|---|
| Common Stocks | 80.4% |
| Exchange-Traded Funds | 18.7% |
| Money Market Funds | 0.9% |
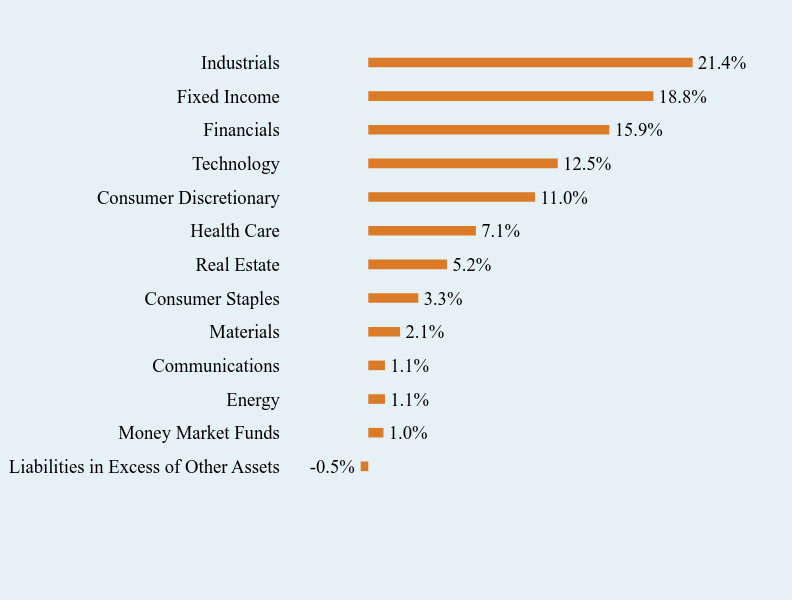
What did the Fund invest in?
Sector Weighting (% of net assets)
| Value | Value |
|---|
| Liabilities in Excess of Other Assets | -0.5% |
| Money Market Funds | 1.0% |
| Energy | 1.1% |
| Communications | 1.1% |
| Materials | 2.1% |
| Consumer Staples | 3.3% |
| Real Estate | 5.2% |
| Health Care | 7.1% |
| Consumer Discretionary | 11.0% |
| Technology | 12.5% |
| Financials | 15.9% |
| Fixed Income | 18.8% |
| Industrials | 21.4% |
Top 10 Holdings (% of net assets)
| Holding Name | % of Net Assets |
| WisdomTree Floating Rate Treasury Fund | 18.8% |
| NVR, Inc. | 1.3% |
| EPAM Systems, Inc. | 1.3% |
| Civista Bancshares, Inc. | 1.3% |
| Lithia Motors, Inc. | 1.2% |
| Markel Group, Inc. | 1.2% |
| Axos Financial, Inc. | 1.2% |
| Genpact Ltd. | 1.2% |
| Copart, Inc. | 1.2% |
| AMETEK, Inc. | 1.2% |
No material changes occurred during the year ended November 30, 2024.
Inspire Tactical Balanced ETF
Annual Shareholder Report - November 30, 2024
Where can I find additional information about the Fund?
Additional information is available on the Fund's website ( www.inspireetf.com ), including its:
Prospectus
Financial information
Holdings
Proxy voting information
Item 2. Code of Ethics.
| (a) | The registrant has, as of the end of the period covered by this report, adopted a code of ethics that applies to the registrant’s principal executive officer, principal financial officer, and principal accounting officer or controller, or persons performing similar functions, regardless of whether these individuals are employed by the registrant or a third party. |
| | |
| (b) | N/A |
| | |
| (c) | During the period covered by this report, there were no amendments to any provision of the code of ethics. |
| | |
| (d) | During the period covered by this report, there were no waivers or implicit waivers of a provision of the code of ethics. |
| | |
| (e) | N/A |
| | |
| (f) | See Item 19(a)(1) |
| | |
Item 3. Audit Committee Financial Expert.
(a)(1) The Registrant’s board of trustees has determined that Mark Gersten, Anthony J. Hertl, and Mark H. Taylor are audit committee financial experts, as defined in Item 3 of Form N-CSR. Mr. Gersten, Mr. Hertl and Mr. Taylor are independent for purposes of this Item.
(a)(2) Not applicable.
(a)(3) Not applicable.
Item 4. Principal Accountant Fees and Services.
| (a) | Audit Fees. The aggregate fees billed for each of the last two fiscal years for professional services rendered by the registrant’s principal accountant for the audit of the registrant’s annual financial statements or services that are normally provided by the accountant in connection with statutory and regulatory filings or engagements for those fiscal years are as follows: |
2024 - $124,650
2023 - $104,000
| (b) | Audit-Related Fees. There were no fees billed in each of the last two fiscal years for assurances and related services by the principal accountant that are reasonably related to the performance of the audit of the registrant’s financial statements and are not reported under paragraph (a) of this item. |
| (c) | Tax Fees. The aggregate fees billed in each of the last two fiscal years for professional services rendered by the principal accountant for tax compliance are as follows: |
2024 – $29,700
2023 – $26,000
Preparation of Federal & State income tax returns, assistance with calculation of required income, capital gain and excise distributions and preparation of Federal excise tax returns.
| (d) | All Other Fees. The aggregate fees billed in each of the last two fiscal years for products and services provided by the registrant’s principal accountant, other than the services reported in paragraphs (a) through (c) of this item were $0 and $0 for the fiscal years ended November 30, 2023, and 2024 respectively. |
| (e)(1) | The audit committee does not have pre-approval policies and procedures. Instead, the audit committee or audit committee chairman approves on a case-by-case basis each audit or non-audit service before the principal accountant is engaged by the registrant. |
| (e)(2) | There were no services described in each of paragraphs (b) through (d) of this Item that were approved by the audit committee pursuant to paragraph (c)(7)(i)(C) of Rule 2-01 of Regulation S-X. |
| (f) | Not applicable. The percentage of hours expended on the principal accountant’s engagement to audit the registrant’s financial statements for the most recent fiscal year that were attributed to work performed by persons other than the principal accountant’s full-time, permanent employees was zero percent (0%). |
| (g) | All non-audit fees billed by the registrant’s principal accountant for services rendered to the registrant for the fiscal years ended November 30, 2023, and 2024 respectively are disclosed in (b)-(d) above. There were no audit or non-audit services performed by the registrant’s principal accountant for the registrant’s adviser. |
Item 5. Audit Committee of Listed Companies. Not applicable to open-end investment companies.
Item 6. Schedule of Investments. The Registrant’s schedule of investments in unaffiliated issuers is included in the Financial Statements under Item 7 of this form.
Item 7. Financial Statements and Financial Highlights for Open-End Management Investment Companies.
| |
| |
| |
| |
| |
 |
| |
| |
| |
| |
| |
| Inspire Global Hope ETF (BLES) |
| |
| Inspire Small/Mid Cap ETF (ISMD) |
| |
| Inspire Corporate Bond ETF (IBD) |
| |
| Inspire 100 ETF (BIBL) |
| |
| Inspire International ETF (WWJD) |
| |
| Inspire Tactical Balanced ETF (RISN) |
| |
| Inspire Momentum ETF (GLRY) |
| |
| Inspire Fidelis Multi Factor ETF (FDLS) |
| |
| Inspire 500 ETF (PTL) |
| |
| |
| |
| |
| |
| Annual Financial Statements and Additional Information |
| |
| November 30, 2024 |
| INSPIRE GLOBAL HOPE ETF |
| SCHEDULE OF INVESTMENTS |
| November 30, 2024 |
| Shares | | | | | Fair Value | |
| | | | | COMMON STOCKS — 99.1% | | | | |
| | | | | APPAREL & TEXTILE PRODUCTS - 0.7% | | | | |
| | 1,721 | | | Deckers Outdoor Corporation(a) | | $ | 337,247 | |
| | 111 | | | Hermes International S.A. | | | 242,146 | |
| | 36,223 | | | PRADA SpA | | | 248,161 | |
| | | | | | | | 827,554 | |
| | | | | ASSET MANAGEMENT - 1.1% | | | | |
| | 6,090 | | | 3i Group plc | | | 287,413 | |
| | 5,172 | | | Brookfield Corporation | | | 317,881 | |
| | 4,499 | | | Julius Baer Group Ltd. | | | 297,714 | |
| | 184 | | | Partners Group Holding A.G. | | | 267,327 | |
| | | | | | | | 1,170,335 | |
| | | | | AUTOMOTIVE - 1.7% | | | | |
| | 7,560 | | | BorgWarner, Inc. | | | 259,459 | |
| | 4,138 | | | Continental A.G. | | | 271,203 | |
| | 18,562 | | | Denso Corporation | | | 264,165 | |
| | 585 | | | Ferrari N.V. | | | 253,984 | |
| | 181,052 | | | Geely Automobile Holdings Ltd. | | | 322,543 | |
| | 7,246 | | | Mahindra & Mahindra Ltd. - GDR | | | 255,784 | |
| | 3,579 | | | Toyota Industries Corporation | | | 266,754 | |
| | | | | | | | 1,893,892 | |
| | | | | BANKING - 5.6% | | | | |
| | 592,364 | | | Bank Mandiri Persero Tbk P.T. | | | 229,917 | |
| | 6,933 | | | Bank Polska Kasa Opieki S.A. | | | 231,624 | |
| | 85,948 | | | BOC Hong Kong Holdings Ltd. | | | 264,032 | |
| | 2,984 | | | Commonwealth Bank of Australia | | | 308,597 | |
| | 17,728 | | | Credit Agricole S.A. | | | 237,285 | |
| | 9,141 | | | Danske Bank A/S | | | 262,549 | |
| | 149 | | | First Citizens BancShares, Inc., Class A | | | 341,954 | |
| | 314,090 | | | First Financial Holding Company Ltd. | | | 262,910 | |
| | 38,760 | | | Grupo Financiero Banorte SAB de CV | | | 259,977 | |
| | 21,742 | | | Hang Seng Bank Ltd. | | | 258,362 | |
| | 63,966 | | | Intesa Sanpaolo SpA | | | 245,093 | |
| | 16,712 | | | KakaoBank Corporation | | | 267,901 | |
| | 3,448 | | | KBC Group N.V. | | | 248,565 | |
| | 10,839 | | | National Australia Bank Ltd. | | | 276,382 | |
See accompanying notes to financial statements.
| INSPIRE GLOBAL HOPE ETF |
| SCHEDULE OF INVESTMENTS (Continued) |
| November 30, 2024 |
| Shares | | | | | Fair Value | |
| | | | | COMMON STOCKS — 99.1% (Continued) | | | | |
| | | | | BANKING - 5.6% (Continued) | | | | |
| | 5,170 | | | OTP Bank Nyrt | | $ | 280,021 | |
| | 18,148 | | | Powszechna Kasa Oszczednosci Bank Polski S.A. | | | 249,852 | |
| | 818,496 | | | PT Bank Rakyat Indonesia (Persero) Tbk | | | 219,540 | |
| | 11,835 | | | Regions Financial Corporation | | | 322,621 | |
| | 81,395 | | | SCB X PCL | | | 271,625 | |
| | 2,843 | | | SouthState Corporation | | | 314,692 | |
| | 19,165 | | | Standard Bank Group Ltd. | | | 251,987 | |
| | 10,987 | | | United Overseas Bank Ltd. | | | 298,290 | |
| | 3,182 | | | Western Alliance Bancorp | | | 297,867 | |
| | | | | | | | 6,201,643 | |
| | | | | BEVERAGES - 0.5% | | | | |
| | 210 | | | Coca-Cola Consolidated, Inc. | | | 273,901 | |
| | 5,237 | | | Monster Beverage Corporation(a) | | | 288,716 | |
| | | | | | | | 562,617 | |
| | | | | BIOTECH & PHARMA - 2.0% | | | | |
| | 1,860 | | | Celltrion, Inc. | | | 249,473 | |
| | 5,691 | | | Chugai Pharmaceutical Company Ltd. | | | 251,001 | |
| | 1,404 | | | CSL Ltd. | | | 258,404 | |
| | 1,139 | | | Genmab A/S(a), | | | 246,287 | |
| | 4,141 | | | Incyte Corporation(a) | | | 308,877 | |
| | 2,383 | | | Neurocrine Biosciences, Inc.(a) | | | 302,045 | |
| | 9,721 | | | Royalty Pharma plc, Class A | | | 259,162 | |
| | 1,536 | | | UCB S.A. | | | 300,758 | |
| | | | | | | | 2,176,007 | |
| | | | | CABLE & SATELLITE - 0.3% | | | | |
| | 3,564 | | | Liberty Broadband Corporation - Series A(a) | | | 301,764 | |
| | | | | | | | | |
| | | | | CHEMICALS - 3.8% | | | | |
| | 3,843 | | | Akzo Nobel N.V. | | | 224,507 | |
| | 2,882 | | | Albemarle Corporation | | | 310,391 | |
| | 3,199 | | | CF Industries Holdings, Inc. | | | 286,822 | |
| | 470,060 | | | Chandra Asri Pacific Tbk P.T. | | | 206,180 | |
| | 18,094 | | | Clariant A.G. | | | 217,904 | |
| | 4,513 | | | Covestro A.G.(a), | | | 275,185 | |
See accompanying notes to financial statements.
| INSPIRE GLOBAL HOPE ETF |
| SCHEDULE OF INVESTMENTS (Continued) |
| November 30, 2024 |
| Shares | | | | | Fair Value | |
| | | | | COMMON STOCKS — 99.1% (Continued) | | | | |
| | | | | CHEMICALS - 3.8% (Continued) | | | | |
| | 4,778 | | | Croda International plc | | $ | 209,748 | |
| | 329 | | | EMS-Chemie Holding A.G. | | | 233,954 | |
| | 11,690 | | | Evonik Industries A.G. | | | 214,448 | |
| | 50 | | | Givaudan S.A. | | | 220,256 | |
| | 2,860 | | | LyondellBasell Industries N.V. | | | 238,352 | |
| | 5,736 | | | Nutrien Ltd. | | | 267,974 | |
| | 2,270 | | | RPM International, Inc. | | | 315,031 | |
| | 7,154 | | | Solvay S.A. | | | 247,208 | |
| | 2,009 | | | Symrise A.G. | | | 221,784 | |
| | 1,837 | | | Westlake Corporation | | | 235,871 | |
| | 8,725 | | | Yara International ASA | | | 245,447 | |
| | | | | | | | 4,171,062 | |
| | | | | COMMERCIAL SUPPORT SERVICES - 2.4% | | | | |
| | 27,935 | | | ALS Ltd. | | | 283,832 | |
| | 8,208 | | | Bureau Veritas S.A. | | | 249,726 | |
| | 1,335 | | | Cintas Corporation | | | 301,430 | |
| | 6,884 | | | Edenred S.E. | | | 227,624 | |
| | 3,942 | | | Intertek Group plc | | | 236,550 | |
| | 1,370 | | | Republic Services, Inc. | | | 299,071 | |
| | 5,428 | | | Rollins, Inc. | | | 273,191 | |
| | 2,443 | | | SGS S.A. | | | 242,575 | |
| | 1,322 | | | Waste Management, Inc. | | | 301,707 | |
| | 27,408 | | | Worley Ltd. | | | 247,912 | |
| | | | | | | | 2,663,618 | |
| | | | | CONSTRUCTION MATERIALS - 2.3% | | | | |
| | 613 | | | Carlisle Companies, Inc. | | | 279,957 | |
| | 2,976 | | | Cie de Saint-Gobain S.A. | | | 271,443 | |
| | 65,896 | | | Grupo Argos S.A./Colombia | | | 297,452 | |
| | 2,794 | | | Holcim A.G. | | | 284,595 | |
| | 512 | | | Martin Marietta Materials, Inc. | | | 307,200 | |
| | 1,573 | | | Owens Corning | | | 323,440 | |
| | 36,846 | | | Siam Cement PCL (The) | | | 197,058 | |
| | 825 | | | Sika A.G. | | | 213,596 | |
See accompanying notes to financial statements.
| INSPIRE GLOBAL HOPE ETF |
| SCHEDULE OF INVESTMENTS (Continued) |
| November 30, 2024 |
| Shares | | | | | Fair Value | |
| | | | | COMMON STOCKS — 99.1% (Continued) | | | | |
| | | | | CONSTRUCTION MATERIALS - 2.3% (Continued) | | | | |
| | 1,099 | | | Vulcan Materials Co. | | $ | 316,655 | |
| | | | | | | | 2,491,396 | |
| | | | | CONTAINERS & PACKAGING - 1.1% | | | | |
| | 1,714 | | | AptarGroup, Inc. | | | 296,453 | |
| | 6,932 | | | Huhtamaki OYJ | | | 250,155 | |
| | 5,588 | | | International Paper Company | | | 328,743 | |
| | 1,274 | | | Packaging Corp of America | | | 317,035 | |
| | | | | | | | 1,192,386 | |
| | | | | DATA CENTER REIT - 0.3% | | | | |
| | 1,700 | | | Digital Realty Trust, Inc. | | | 332,673 | |
| | | | | | | | | |
| | | | | DIVERSIFIED INDUSTRIALS - 0.8% | | | | |
| | 5,728 | | | Alfa Laval A.B. | | | 244,045 | |
| | 1,431 | | | Dover Corporation | | | 294,643 | |
| | 2,521 | | | Emerson Electric Company | | | 334,285 | |
| | | | | | | | 872,973 | |
| | | | | ELECTRIC UTILITIES - 5.5% | | | | |
| | 7,655 | | | Avangrid, Inc. | | | 276,346 | |
| | 9,316 | | | CenterPoint Energy, Inc. | | | 303,888 | |
| | 30,591 | | | CLP Holdings Ltd. | | | 256,761 | |
| | 3,881 | | | CMS Energy Corporation | | | 270,545 | |
| | 1,059 | | | Constellation Energy Corporation | | | 271,697 | |
| | 18,381 | | | E.ON S.E. | | | 236,607 | |
| | 60,026 | | | EDP - Energias de Portugal S.A. | | | 216,997 | |
| | 15,795 | | | EDP Renovaveis S.A. | | | 184,881 | |
| | 12,521 | | | Endesa S.A. | | | 274,335 | |
| | 2,729,669 | | | Enel Americas S.A. | | | 250,631 | |
| | 34,328 | | | Enel SpA | | | 246,961 | |
| | 2,083 | | | Entergy Corporation | | | 325,301 | |
| | 4,420 | | | Evergy, Inc. | | | 285,665 | |
| | 6,061 | | | Fortis, Inc. | | | 270,991 | |
| | 16,704 | | | Fortum OYJ | | | 251,725 | |
| | 18,065 | | | Iberdrola S.A. | | | 257,444 | |
| | 6,695 | | | OGE Energy Corporation | | | 294,312 | |
See accompanying notes to financial statements.
| INSPIRE GLOBAL HOPE ETF |
| SCHEDULE OF INVESTMENTS (Continued) |
| November 30, 2024 |
| Shares | | | | | Fair Value | |
| | | | | COMMON STOCKS — 99.1% (Continued) | | | | |
| | | | | ELECTRIC UTILITIES - 5.5% (Continued) | | | | |
| | 7,450 | | | RWE A.G. | | $ | 250,826 | |
| | 10,800 | | | SSE plc | | | 243,443 | |
| | 30,479 | | | Terna Rete Elettrica Nazionale SpA | | | 257,845 | |
| | 114,305 | | | Vector Ltd. | | | 265,338 | |
| | 3,307 | | | Verbund A.G. | | | 263,763 | |
| | 2,858 | | | WEC Energy Group, Inc. | | | 288,801 | |
| | | | | | | | 6,045,103 | |
| | | | | ELECTRICAL EQUIPMENT - 2.0% | | | | |
| | 3,044 | | | A O Smith Corporation | | | 226,748 | |
| | 2,554 | | | AAON, Inc. | | | 348,213 | |
| | 1,609 | | | AMETEK, Inc. | | | 312,757 | |
| | 4,253 | | | Amphenol Corporation, Class A | | | 308,980 | |
| | 81,726 | | | Delta Electronics Thailand PCL - GDR | | | 358,478 | |
| | 1,729 | | | Keysight Technologies, Inc.(a) | | | 295,382 | |
| | 4,445 | | | Trimble, Inc.(a) | | | 324,352 | |
| | | | | | | | 2,174,910 | |
| | | | | ENGINEERING & CONSTRUCTION - 1.0% | | | | |
| | 15,267 | | | AFRY A.B. | | | 212,384 | |
| | 644 | | | EMCOR Group, Inc. | | | 328,517 | |
| | 6,378 | | | Ferrovial S.E. | | | 262,909 | |
| | 1,571 | | | WSP Global, Inc. | | | 279,402 | |
| | | | | | | | 1,083,212 | |
| | | | | ENTERTAINMENT CONTENT - 0.2% | | | | |
| | 40,161 | | | Bollore S.E. | | | 247,559 | |
| | | | | | | | | |
| | | | | FOOD - 2.2% | | | | |
| | 6,866 | | | Ajinomoto Company, Inc. | | | 288,321 | |
| | 8,441 | | | Conagra Brands, Inc. | | | 232,550 | |
| | 79,858 | | | Grupo Bimbo S.A.B. de C.V. | | | 238,664 | |
| | 4,217 | | | Lamb Weston Holdings, Inc. | | | 325,720 | |
| | 3,308 | | | McCormick & Company, Inc. | | | 259,380 | |
| | 111,151 | | | Premier Foods PLC | | | 276,640 | |
| | 30,182 | | | Tate & Lyle PLC | | | 283,040 | |
| | 5,629 | | | The Campbell’s Company | | | 260,060 | |
See accompanying notes to financial statements.
| INSPIRE GLOBAL HOPE ETF |
| SCHEDULE OF INVESTMENTS (Continued) |
| November 30, 2024 |
| Shares | | | | | Fair Value | |
| | | | | COMMON STOCKS — 99.1% (Continued) | | | | |
| | | | | FOOD - 2.2% (Continued) | | | | |
| | 105,340 | | | Wilmar International Ltd. | | $ | 242,259 | |
| | | | | | | | 2,406,634 | |
| | | | | FORESTRY, PAPER & WOOD PRODUCTS - 0.5% | | | | |
| | 27,635 | | | Suzano S.A. | | | 285,406 | |
| | 8,287 | | | UPM-Kymmene OYJ | | | 217,987 | |
| | | | | | | | 503,393 | |
| | | | | GAS & WATER UTILITIES - 1.7% | | | | |
| | 1,890 | | | American Water Works Company, Inc. | | | 258,817 | |
| | 1,980 | | | Atmos Energy Corporation | | | 299,613 | |
| | 7,139 | | | Essential Utilities, Inc. | | | 285,774 | |
| | 68,582 | | | Hera SpA | | | 254,303 | |
| | 325,244 | | | Hong Kong & China Gas Company Ltd. | | | 246,651 | |
| | 10,553 | | | Naturgy Energy Group S.A. | | | 259,979 | |
| | 53,924 | | | Snam SpA | | | 251,334 | |
| | | | | | | | 1,856,471 | |
| | | | | HEALTH CARE FACILITIES & SERVICES - 1.4% | | | | |
| | 527 | | | Elevance Health, Inc. | | | 214,468 | |
| | 7,375 | | | Fresenius S.E. & Company KGaA(a), | | | 259,208 | |
| | 3,356 | | | HealthEquity, Inc.(a) | | | 340,769 | |
| | 969 | | | ICON plc(a) | | | 203,732 | |
| | 1,162 | | | IQVIA Holdings, Inc.(a) | | | 233,376 | |
| | 797 | | | Molina Healthcare, Inc.(a) | | | 237,426 | |
| | | | | | | | 1,488,979 | |
| | | | | HEALTH CARE REIT - 0.8% | | | | |
| | 12,075 | | | Healthpeak Properties, Inc. | | | 265,529 | |
| | 4,267 | | | Ventas, Inc. | | | 273,387 | |
| | 2,155 | | | Welltower, Inc. | | | 297,778 | |
| | | | | | | | 836,694 | |
| | | | | HOME & OFFICE PRODUCTS - 0.2% | | | | |
| | 2,364 | | | SEB S.A. | | | 224,263 | |
| | | | | | | | | |
| | | | | HOME CONSTRUCTION - 1.4% | | | | |
| | 1,446 | | | DR Horton, Inc. | | | 244,056 | |
| | 413 | | | Geberit A.G. | | | 248,638 | |
See accompanying notes to financial statements.
| INSPIRE GLOBAL HOPE ETF |
| SCHEDULE OF INVESTMENTS (Continued) |
| November 30, 2024 |
| Shares | | | | | Fair Value | |
| | | | | COMMON STOCKS — 99.1% (Continued) | | | | |
| | | | | HOME CONSTRUCTION - 1.4% (Continued) | | | | |
| | 1,474 | | | Lennar Corporation, Class A | | $ | 257,051 | |
| | 27 | | | NVR, Inc.(a) | | | 249,361 | |
| | 1,929 | | | PulteGroup, Inc. | | | 260,936 | |
| | 3,941 | | | Taylor Morrison Home Corporation(a) | | | 291,121 | |
| | | | | | | | 1,551,163 | |
| | | | | HOTEL REITS - 0.3% | | | | |
| | 15,548 | | | Host Hotels & Resorts, Inc. | | | 286,394 | |
| | | | | | | | | |
| | | | | HOUSEHOLD PRODUCTS - 0.4% | | | | |
| | 1,836 | | | Beiersdorf A.G. | | | 237,888 | |
| | 944 | | | LG H&H Company Ltd. | | | 210,234 | |
| | | | | | | | 448,122 | |
| | | | | INDUSTRIAL REIT - 0.5% | | | | |
| | 11,151 | | | Goodman Group | | | 275,684 | |
| | 2,180 | | | Prologis, Inc. | | | 254,580 | |
| | | | | | | | 530,264 | |
| | | | | INDUSTRIAL SUPPORT SERVICES - 2.0% | | | | |
| | 1,236 | | | Applied Industrial Technologies, Inc. | | | 339,554 | |
| | 3,516 | | | Ashtead Group PLC | | | 281,405 | |
| | 3,848 | | | Fastenal Company | | | 321,539 | |
| | 342 | | | United Rentals, Inc. | | | 296,172 | |
| | 150,752 | | | United Tractors Tbk P.T. | | | 254,742 | |
| | 561 | | | Watsco, Inc. | | | 309,448 | |
| | 1,645 | | | WESCO International, Inc. | | | 348,032 | |
| | | | | | | | 2,150,892 | |
| | | | | INSTITUTIONAL FINANCIAL SERVICES - 2.1% | | | | |
| | 139,766 | | | B3 S.A. - Brasil Bolsa Balcao | | | 213,209 | |
| | 1,342 | | | Cboe Global Markets, Inc. | | | 289,671 | |
| | 1,178 | | | Deutsche Boerse A.G. | | | 275,647 | |
| | 1,091 | | | Evercore, Inc., Class A | | | 335,919 | |
| | 6,977 | | | Hong Kong Exchanges & Clearing Ltd. | | | 259,890 | |
| | 1,979 | | | Interactive Brokers Group, Inc., Class A | | | 378,166 | |
| | 1,710 | | | Intercontinental Exchange, Inc. | | | 275,242 | |
See accompanying notes to financial statements.
| INSPIRE GLOBAL HOPE ETF |
| SCHEDULE OF INVESTMENTS (Continued) |
| November 30, 2024 |
| Shares | | | | | Fair Value | |
| | | | | COMMON STOCKS — 99.1% (Continued) | | | | |
| | | | | INSTITUTIONAL FINANCIAL SERVICES - 2.1% (Continued) | | | | |
| | 2,013 | | | London Stock Exchange Group plc | | $ | 288,669 | |
| | | | | | | | 2,316,413 | |
| | | | | INSURANCE - 4.6% | | | | |
| | 31,463 | | | AIA Group Ltd. | | | 235,165 | |
| | 42,507 | | | BB Seguridade Participacoes S.A. | | | 236,487 | |
| | 2,669 | | | Brown & Brown, Inc. | | | 301,864 | |
| | 2,021 | | | Cincinnati Financial Corporation | | | 323,017 | |
| | 10,528 | | | Dai-ichi Life Holdings, Inc. | | | 285,090 | |
| | 508 | | | Erie Indemnity Company, Class A | | | 223,804 | |
| | 222 | | | Fairfax Financial Holdings Ltd. | | | 314,995 | |
| | 1,429 | | | Intact Financial Corporation | | | 272,215 | |
| | 89,983 | | | Legal & General Group plc | | | 253,381 | |
| | 3,482 | | | Loews Corporation | | | 301,994 | |
| | 176 | | | Markel Group, Inc.(a) | | | 313,794 | |
| | 8,820 | | | Power Corp of Canada | | | 297,131 | |
| | 1,088 | | | Progressive Corporation (The) | | | 292,541 | |
| | 29,508 | | | Prudential PLC | | | 240,975 | |
| | 5,880 | | | Sampo OYJ, A Shares | | | 251,823 | |
| | 327 | | | Swiss Life Holding A.G. | | | 267,904 | |
| | 11,577 | | | Tryg A/S | | | 266,735 | |
| | 4,860 | | | W R Berkley Corporation | | | 313,713 | |
| | | | | | | | 4,992,628 | |
| | | | | INTERNET MEDIA & SERVICES - 0.8% | | | | |
| | 1,120 | | | Naspers Ltd. | | | 252,895 | |
| | 6,242 | | | Prosus N.V. | | | 254,204 | |
| | 2,001 | | | REA Group Ltd. | | | 328,232 | |
| | | | | | | | 835,331 | |
| | | | | MACHINERY - 4.4% | | | | |
| | 3,813 | | | ANDRITZ A.G. | | | 213,087 | |
| | 702 | | | Caterpillar, Inc. | | | 285,089 | |
| | 840 | | | Curtiss-Wright Corporation | | | 313,849 | |
| | 1,052 | | | Disco Corporation | | | 285,506 | |
| | 9,416 | | | FANUC Corporation | | | 244,656 | |
| | 5,589 | | | GEA Group A.G. | | | 279,391 | |
See accompanying notes to financial statements.
| INSPIRE GLOBAL HOPE ETF |
| SCHEDULE OF INVESTMENTS (Continued) |
| November 30, 2024 |
| Shares | | | | | Fair Value | |
| | | | | COMMON STOCKS — 99.1% (Continued) | | | | |
| | | | | MACHINERY - 4.4% (Continued) | | | | |
| | 3,135 | | | Graco, Inc. | | $ | 285,536 | |
| | 6,693 | | | KION Group A.G. | | | 238,773 | |
| | 1,905 | | | Krones A.G. | | | 237,471 | |
| | 1,047 | | | Nordson Corporation | | | 273,257 | |
| | 437 | | | Parker-Hannifin Corporation | | | 307,167 | |
| | 1,662 | | | Regal Rexnord Corporation | | | 287,044 | |
| | 12,215 | | | Sandvik A.B. | | | 226,083 | |
| | 620 | | | SMC Corporation | | | 263,338 | |
| | 952 | | | Snap-on, Inc. | | | 351,945 | |
| | 18,599 | | | TOMRA Systems ASA | | | 262,114 | |
| | 3,173 | | | Toro Company (The) | | | 276,305 | |
| | 26,788 | | | WEG S.A. | | | 239,355 | |
| | | | | | | | 4,869,966 | |
| | | | | MEDICAL EQUIPMENT & DEVICES - 3.6% | | | | |
| | 1,082 | | | Align Technology, Inc.(a) | | | 251,857 | |
| | 7,242 | | | Baxter International, Inc. | | | 244,128 | |
| | 830 | | | Bio-Rad Laboratories, Inc., Class A(a) | | | 282,640 | |
| | 2,099 | | | Coloplast A/S - Series B | | | 264,528 | |
| | 1,160 | | | EssilorLuxottica S.A. | | | 281,606 | |
| | 3,385 | | | Hologic, Inc.(a) | | | 269,108 | |
| | 546 | | | IDEXX Laboratories, Inc.(a) | | | 230,276 | |
| | 1,189 | | | Insulet Corporation(a) | | | 317,200 | |
| | 559 | | | Intuitive Surgical, Inc.(a) | | | 302,978 | |
| | 185 | | | Mettler-Toledo International, Inc.(a) | | | 231,472 | |
| | 1,134 | | | ResMed, Inc. | | | 282,389 | |
| | 768 | | | Sonova Holding A.G. | | | 262,212 | |
| | 1,136 | | | STERIS plc | | | 248,852 | |
| | 1,674 | | | Straumann Holding A.G. | | | 217,843 | |
| | 910 | | | West Pharmaceutical Services, Inc. | | | 296,369 | |
| | | | | | | | 3,983,458 | |
| | | | | METALS & MINING - 2.5% | | | | |
| | 3,368 | | | Agnico Eagle Mines Ltd. | | | 284,041 | |
| | 7,338 | | | Anglo American Platinum Ltd. | | | 241,845 | |
| | 10,118 | | | Antofagasta plc | | | 219,187 | |
See accompanying notes to financial statements.
| INSPIRE GLOBAL HOPE ETF |
| SCHEDULE OF INVESTMENTS (Continued) |
| November 30, 2024 |
| Shares | | | | | Fair Value | |
| | | | | COMMON STOCKS — 99.1% (Continued) | | | | |
| | | | | METALS & MINING - 2.5% (Continued) | | | | |
| | 8,953 | | | BHP Group Ltd. | | $ | 236,874 | |
| | 19,931 | | | Fortescue Ltd. | | | 246,830 | |
| | 2,200 | | | Franco-Nevada Corporation | | | 269,427 | |
| | 5,496 | | | Freeport-McMoRan, Inc. | | | 242,923 | |
| | 5,136 | | | Newmont Corporation | | | 215,404 | |
| | 3,142 | | | Rio Tinto Ltd. | | | 242,279 | |
| | 2,379 | | | Southern Copper Corporation | | | 238,733 | |
| | 4,409 | | | Wheaton Precious Metals Corporation | | | 274,387 | |
| | | | | | | | 2,711,930 | |
| | | | | MULTI ASSET CLASS REIT - 0.2% | | | | |
| | 4,435 | | | WP Carey, Inc. | | | 253,061 | |
| | | | | | | | | |
| | | | | OFFICE REIT - 0.5% | | | | |
| | 2,315 | | | Alexandria Real Estate Equities, Inc. | | | 255,182 | |
| | 3,423 | | | BXP, Inc. | | | 280,652 | |
| | | | | | | | 535,834 | |
| | | | | OIL & GAS PRODUCERS - 7.3% | | | | |
| | 12,946 | | | Aker BP ASA | | | 265,462 | |
| | 11,192 | | | APA Corporation | | | 253,499 | |
| | 8,318 | | | Canadian Natural Resources Ltd. | | | 282,359 | |
| | 16,611 | | | Cenovus Energy, Inc. | | | 263,186 | |
| | 2,635 | | | ConocoPhillips | | | 285,476 | |
| | 11,436 | | | Coterra Energy, Inc. | | | 305,570 | |
| | 2,535 | | | Delek Group Ltd. | | | 340,089 | |
| | 7,018 | | | Devon Energy Corporation | | | 266,333 | |
| | 1,602 | | | Diamondback Energy, Inc. | | | 284,499 | |
| | 49,921 | | | ENEOS Holdings, Inc. | | | 269,897 | |
| | 18,116 | | | Eni SpA | | | 256,564 | |
| | 2,243 | | | EOG Resources, Inc. | | | 298,902 | |
| | 11,053 | | | Equinor ASA | | | 267,490 | |
| | 3,318 | | | Expand Energy Corporation | | | 328,349 | |
| | 20,086 | | | Inpex Corporation | | | 265,042 | |
| | 12,438 | | | Kinder Morgan, Inc. | | | 351,623 | |
| | 36,649 | | | MOL Hungarian Oil & Gas plc | | | 251,103 | |
See accompanying notes to financial statements.
| INSPIRE GLOBAL HOPE ETF |
| SCHEDULE OF INVESTMENTS (Continued) |
| November 30, 2024 |
| Shares | | | | | Fair Value | |
| | | | | COMMON STOCKS — 99.1% (Continued) | | | | |
| | | | | OIL & GAS PRODUCERS - 7.3% (Continued) | | | | |
| | 5,335 | | | Occidental Petroleum Corporation | | $ | 269,844 | |
| | 6,660 | | | OMV A.G. | | | 266,794 | |
| | 3,025 | | | ONEOK, Inc. | | | 343,641 | |
| | 18,608 | | | ORLEN S.A. | | | 233,820 | |
| | 7,143 | | | Ovintiv, Inc. | | | 324,435 | |
| | 58,566 | | | Santos Ltd. | | | 252,459 | |
| | 1,868 | | | Targa Resources Corporation | | | 381,633 | |
| | 4,185 | | | TotalEnergies S.E. | | | 243,027 | |
| | 6,082 | | | Tourmaline Oil Corporation | | | 287,093 | |
| | 2,030 | | | Valero Energy Corporation | | | 282,332 | |
| | 16,448 | | | Woodside Energy Group Ltd. | | | 262,906 | |
| | | | | | | | 7,983,427 | |
| | | | | OIL & GAS SERVICES & EQUIPMENT - 0.5% | | | | |
| | 9,483 | | | Halliburton Company | | | 302,129 | |
| | 6,543 | | | Schlumberger N.V. | | | 287,499 | |
| | | | | | | | 589,628 | |
| | | | | REAL ESTATE OWNERS & DEVELOPERS - 1.3% | | | | |
| | 62,741 | | | CK Asset Holdings Ltd. | | | 256,449 | |
| | 215,517 | | | New World Development Company Ltd.(b) | | | 178,121 | |
| | 463,336 | | | SM Prime Holdings, Inc. | | | 208,738 | |
| | 8,209 | | | Sumitomo Realty & Development Company Ltd. | | | 254,504 | |
| | 136,247 | | | Swire Properties Ltd. | | | 271,445 | |
| | 7,497 | | | Vonovia S.E. | | | 248,686 | |
| | | | | | | | 1,417,943 | |
| | | | | REAL ESTATE SERVICES - 0.2% | | | | |
| | 17,270 | | | Savills PLC | | | 236,009 | |
| | | | | | | | | |
| | | | | RENEWABLE ENERGY - 0.4% | | | | |
| | 2,425 | | | Enphase Energy, Inc.(a) | | | 173,024 | |
| | 1,099 | | | First Solar, Inc.(a) | | | 218,997 | |
| | | | | | | | 392,021 | |
| | | | | RESIDENTIAL REIT - 2.0% | | | | |
| | 2,221 | | | Camden Property Trust | | | 279,402 | |
| | 3,864 | | | Equity LifeStyle Properties, Inc. | | | 275,619 | |
See accompanying notes to financial statements.
| INSPIRE GLOBAL HOPE ETF |
| SCHEDULE OF INVESTMENTS (Continued) |
| November 30, 2024 |
| Shares | | | | | Fair Value | |
| | | | | COMMON STOCKS — 99.1% (Continued) | | | | |
| | | | | RESIDENTIAL REIT - 2.0% (Continued) | | | | |
| | 3,701 | | | Equity Residential | | $ | 283,719 | |
| | 931 | | | Essex Property Trust, Inc. | | | 289,038 | |
| | 7,826 | | | Invitation Homes, Inc. | | | 268,041 | |
| | 1,730 | | | Mid-America Apartment Communities, Inc. | | | 283,997 | |
| | 2,038 | | | Sun Communities, Inc. | | | 257,461 | |
| | 6,061 | | | UDR, Inc. | | | 277,957 | |
| | | | | | | | 2,215,234 | |
| | | | | RETAIL - CONSUMER STAPLES - 2.3% | | | | |
| | 9,933 | | | Aeon Company Ltd. | | | 238,634 | |
| | 4,953 | | | Alimentation Couche-Tard, Inc. | | | 289,809 | |
| | 18,972 | | | BIM Birlesik Magazalar A/S | | | 258,914 | |
| | 131,570 | | | Cencosud S.A. | | | 276,945 | |
| | 3,260 | | | Dollar General Corporation | | | 251,900 | |
| | 3,884 | | | Dollar Tree, Inc.(a) | | | 276,813 | |
| | 13,724 | | | Jeronimo Martins SGPS S.A. | | | 267,347 | |
| | 29,306 | | | President Chain Store Corporation | | | 243,954 | |
| | 2,488 | | | Sprouts Farmers Market, Inc.(a) | | | 384,346 | |
| | | | | | | | 2,488,662 | |
| | | | | RETAIL - DISCRETIONARY - 1.2% | | | | |
| | 86 | | | AutoZone, Inc.(a) | | | 272,580 | |
| | 1,414 | | | Builders FirstSource, Inc.(a) | | | 263,669 | |
| | 1,959 | | | Genuine Parts Company | | | 248,264 | |
| | 238 | | | O’Reilly Automotive, Inc.(a) | | | 295,887 | |
| | 15,510 | | | SM Investments Corporation | | | 231,591 | |
| | | | | | | | 1,311,991 | |
| | | | | RETAIL REIT - 0.5% | | | | |
| | 3,823 | | | Regency Centers Corporation | | | 288,981 | |
| | 1,637 | | | Simon Property Group, Inc. | | | 300,553 | |
| | | | | | | | 589,534 | |
| | | | | SELF-STORAGE REIT - 0.5% | | | | |
| | 1,539 | | | Extra Space Storage, Inc. | | | 263,107 | |
| | 758 | | | Public Storage | | | 263,822 | |
| | | | | | | | 526,929 | |
See accompanying notes to financial statements.
| INSPIRE GLOBAL HOPE ETF |
| SCHEDULE OF INVESTMENTS (Continued) |
| November 30, 2024 |
| Shares | | | | | Fair Value | |
| | | | | COMMON STOCKS — 99.1% (Continued) | | | | |
| | | | | SEMICONDUCTORS - 4.2% | | | | |
| | 5,853 | | | Advantest Corporation | | $ | 322,389 | |
| | 327 | | | ASML Holding N.V. | | | 227,442 | |
| | 1,600 | | | Broadcom, Inc. | | | 259,328 | |
| | 2,443 | | | Entegris, Inc. | | | 258,054 | |
| | 6,787 | | | GLOBALFOUNDRIES, Inc.(a),(b) | | | 293,538 | |
| | 7,564 | | | Infineon Technologies A.G. | | | 246,234 | |
| | 358 | | | KLA Corporation | | | 231,637 | |
| | 5,170 | | | Lattice Semiconductor Corporation(a) | | | 293,398 | |
| | 3,845 | | | Marvell Technology, Inc. | | | 356,392 | |
| | 3,442 | | | Microchip Technology, Inc. | | | 234,641 | |
| | 300 | | | Monolithic Power Systems, Inc. | | | 170,292 | |
| | 1,127 | | | NXP Semiconductors N.V. | | | 258,500 | |
| | 3,807 | | | ON Semiconductor Corporation(a) | | | 270,754 | |
| | 1,624 | | | QUALCOMM, Inc. | | | 257,453 | |
| | 18,977 | | | Renesas Electronics Corporation | | | 249,076 | |
| | 2,799 | | | Skyworks Solutions, Inc. | | | 245,164 | |
| | 9,003 | | | STMicroelectronics N.V. | | | 230,829 | |
| | 2,074 | | | Teradyne, Inc. | | | 228,140 | |
| | | | | | | | 4,633,261 | |
| | | | | SOFTWARE - 5.2% | | | | |
| | 856 | | | ANSYS, Inc.(a) | | | 300,542 | |
| | 1,431 | | | Check Point Software Technologies Ltd.(a) | | | 260,442 | |
| | 3,428 | | | Cloudflare, Inc., Class A(a) | | | 342,217 | |
| | 85 | | | Constellation Software, Inc. | | | 287,454 | |
| | 6,750 | | | Dassault Systemes S.E. | | | 232,820 | |
| | 2,398 | | | Datadog, Inc., Class A(a) | | | 366,295 | |
| | 3,541 | | | Fortinet, Inc.(a) | | | 336,572 | |
| | 9,994 | | | Gen Digital, Inc. | | | 308,315 | |
| | 975 | | | Manhattan Associates, Inc.(a) | | | 278,304 | |
| | 4,643 | | | Nutanix, Inc., Class A(a) | | | 303,095 | |
| | 3,701 | | | Okta, Inc.(a) | | | 287,050 | |
| | 806 | | | Palo Alto Networks, Inc.(a) | | | 312,583 | |
| | 494 | | | Roper Technologies, Inc. | | | 279,821 | |
| | 2,388 | | | Snowflake, Inc.(a) | | | 417,421 | |
See accompanying notes to financial statements.
| INSPIRE GLOBAL HOPE ETF |
| SCHEDULE OF INVESTMENTS (Continued) |
| November 30, 2024 |
| Shares | | | | | Fair Value | |
| | | | | COMMON STOCKS — 99.1% (Continued) | | | | |
| | | | | SOFTWARE - 5.2% (Continued) | | | | |
| | 3,707 | | | SS&C Technologies Holdings, Inc. | | $ | 286,699 | |
| | 541 | | | Synopsys, Inc.(a) | | | 302,143 | |
| | 474 | | | Tyler Technologies, Inc.(a) | | | 298,227 | |
| | 1,310 | | | Veeva Systems, Inc., Class A(a) | | | 298,484 | |
| | 2,963 | | | WiseTech Global Ltd. | | | 247,529 | |
| | | | | | | | 5,746,013 | |
| | | | | SPECIALTY FINANCE - 0.2% | | | | |
| | 32,052 | | | UWM Holdings Corporation | | | 208,659 | |
| | | | | | | | | |
| | | | | STEEL - 1.0% | | | | |
| | 1,832 | | | Nucor Corporation | | | 283,392 | |
| | 953 | | | Reliance, Inc. | | | 306,142 | |
| | 2,190 | | | Steel Dynamics, Inc. | | | 318,141 | |
| | 10,564 | | | voestalpine A.G. | | | 204,450 | |
| | | | | | | | 1,112,125 | |
| | | | | TECHNOLOGY HARDWARE - 2.0% | | | | |
| | 717 | | | Arista Networks, Inc.(a) | | | 290,973 | |
| | 4,473 | | | Ciena Corporation(a) | | | 311,858 | |
| | 1,590 | | | Garmin Ltd. | | | 338,033 | |
| | 2,300 | | | Jabil, Inc. | | | 312,409 | |
| | 2,231 | | | NetApp, Inc. | | | 273,610 | |
| | 943 | | | Samsung SDI Company Ltd. | | | 172,135 | |
| | 6,560 | | | Super Micro Computer, Inc.(a) | | | 214,118 | |
| | 4,003 | | | Western Digital Corporation(a) | | | 292,179 | |
| | | | | | | | 2,205,315 | |
| | | | | TECHNOLOGY SERVICES - 3.1% | | | | |
| | 3,134 | | | Amdocs Ltd. | | | 271,780 | |
| | 1,531 | | | Coinbase Global, Inc., Class A(a) | | | 453,482 | |
| | 3,655 | | | CoStar Group, Inc.(a) | | | 297,298 | |
| | 1,387 | | | EPAM Systems, Inc.(a) | | | 338,317 | |
| | 937 | | | Equifax, Inc. | | | 245,082 | |
| | 141 | | | Fair Isaac Corporation(a) | | | 334,879 | |
| | 1,557 | | | Jack Henry & Associates, Inc. | | | 274,312 | |
| | 475 | | | MSCI, Inc. | | | 289,574 | |
See accompanying notes to financial statements.
| INSPIRE GLOBAL HOPE ETF |
| SCHEDULE OF INVESTMENTS (Continued) |
| November 30, 2024 |
| Shares | | | | | Fair Value | |
| | | | | COMMON STOCKS — 99.1% (Continued) | | | | |
| | | | | TECHNOLOGY SERVICES - 3.1% (Continued) | | | | |
| | 2,047 | | | Paychex, Inc. | | $ | 299,415 | |
| | 1,028 | | | Verisk Analytics, Inc. | | | 302,448 | |
| | 1,599 | | | Wolters Kluwer N.V. | | | 266,810 | |
| | | | | | | | 3,373,397 | |
| | | | | TELECOMMUNICATIONS - 1.1% | | | | |
| | 15,380 | | | Hellenic Telecommunications Organization S.A. | | | 242,739 | |
| | 67,480 | | | Koninklijke KPN N.V. | | | 261,694 | |
| | 49,552 | | | MTN Group Ltd. | | | 222,071 | |
| | 110,311 | | | Singapore Telecommunications Ltd. | | | 255,338 | |
| | 74,954 | | | Taiwan Mobile Company Ltd. | | | 260,649 | |
| | | | | | | | 1,242,491 | |
| | | | | TIMBER REIT - 0.2% | | | | |
| | 8,112 | | | Weyerhaeuser Company | | | 261,693 | |
| | | | | | | | | |
| | | | | TRANSPORTATION & LOGISTICS - 3.2% | | | | |
| | 1,232 | | | Aena SME S.A. | | | 266,547 | |
| | 2,378 | | | Canadian National Railway Company | | | 265,576 | |
| | 7,966 | | | CSX Corporation | | | 291,157 | |
| | 1,323 | | | DSV A/S | | | 282,511 | |
| | 13,473 | | | East Japan Railway Company | | | 262,979 | |
| | 232,967 | | | Eva Airways Corporation | | | 297,885 | |
| | 2,087 | | | Expeditors International of Washington, Inc. | | | 253,863 | |
| | 1,590 | | | JB Hunt Transport Services, Inc. | | | 300,685 | |
| | 1,003 | | | Kuehne + Nagel International A.G. | | | 239,758 | |
| | 1,385 | | | Old Dominion Freight Line, Inc. | | | 311,819 | |
| | 19,565 | | | Poste Italiane SpA | | | 274,584 | |
| | 6,083 | | | Ryanair Holdings plc - ADR | | | 267,895 | |
| | 30,530 | | | Transurban Group | | | 254,848 | |
| | | | | | | | 3,570,107 | |
| | | | | TRANSPORTATION EQUIPMENT - 0.3% | | | | |
| | 2,792 | | | PACCAR, Inc. | | | 326,664 | |
| | | | | | | | | |
| | | | | WHOLESALE - CONSUMER STAPLES - 0.4% | | | | |
| | 2,834 | | | Bunge Global S.A. | | | 254,323 | |
See accompanying notes to financial statements.
| INSPIRE GLOBAL HOPE ETF |
| SCHEDULE OF INVESTMENTS (Continued) |
| November 30, 2024 |
| Shares | | | | | | | | | Fair Value | |
| | | | | COMMON STOCKS — 99.1% (Continued) | | | | | | | | |
| | | | | WHOLESALE - CONSUMER STAPLES - 0.4% (Continued) | | | | | | | | |
| | 4,945 | | | ITOCHU Corporation | | | | | | $ | 244,080 | |
| | | | | | | | | | | | 498,403 | |
| | | | | WHOLESALE - DISCRETIONARY - 0.6% | | | | | | | | |
| | 5,248 | | | Copart, Inc.(a) | | | | | | | 332,671 | |
| | 733 | | | Pool Corporation | | | | | | | 276,407 | |
| | | | | | | | | | | | 609,078 | |
| | | | | | | | | | | | | |
| | | | | TOTAL COMMON STOCKS (Cost $94,681,722) | | | | | | | 108,729,178 | |
| | | | | | | | | | | | | |
| | | | | PREFERRED STOCK — 0.2% | | | | | | | | |
| | | | | CHEMICALS — 0.2% | | | | | | | | |
| | 6,658 | | | Sociedad Quimica y Minera de Chile S.A., Class B(a) (Cost $318,230) | | | | | | | 255,226 | |
| | | | | | | | | | | | | |
| | | | | | | Expiration
Date | | Exercise
Price | | | | |
| | | | | RIGHT — 0.0%(d) | | | | | | | | |
| | | | | MEDICAL EQUIPMENT & DEVICES – 0.0%(d) | | | | | | | | |
| | 1,226 | | | ABIOMED, Inc. - CVR(a)(f)(g) (Cost $0) | | 12/31/2029 | | $35 | | | — | |
See accompanying notes to financial statements.
| INSPIRE GLOBAL HOPE ETF |
| SCHEDULE OF INVESTMENTS (Continued) |
| November 30, 2024 |
| Shares | | | | | Fair Value | |
| | | | | COLLATERAL FOR SECURITIES LOANED - 0.4% | | | | |
| | | | | MONEY MARKET FUND - 0.4% | | | | |
| | 416,869 | | | Fidelity Investments Money Market Government Portfolio - Institutional Class, 4.55% (Cost $416,869)(c)(e) | | $ | 416,869 | |
| | | | | | | | | |
| | | | | TOTAL INVESTMENTS - 99.7% (Cost $95,416,821) | | $ | 109,401,273 | |
| | | | | OTHER ASSETS IN EXCESS OF LIABILITIES - 0.3% | | | 302,819 | |
| | | | | NET ASSETS - 100.0% | | $ | 109,704,092 | |
| A.B. | - Aktiebolag |
| | |
| ADR | - American Depositary Receipt |
| | |
| A.G. | - Aktiengesellschaft |
| | |
| ASA | - Allmennaksjeselskap |
| | |
| A/S | - Anonim Sirketi |
| | |
| CVR | - Contingent Value Right |
| | |
| GDR | - Global Depositary Receipt |
| | |
| KGaA | - Kommanditgesellschaft auf Aktien |
| | |
| LTD | - Limited Company |
| | |
| MSCI | - Morgan Stanley Capital International |
| | |
| N.V. | - Naamioze Vennootschap |
| | |
| OYJ | - Julkinen osakeyhtiö |
| | |
| PLC | - Public Limited Company |
| | |
| P.T. | - Perseroan Terbatas |
| | |
| REIT | - Real Estate Investment Trust |
| | |
| S.A. | - Société Anonyme |
| | |
| S.A.B. de C.V. | - Sociedad Anonima Bursátil de Capital Variable |
| | |
| S.E. | - Societas Europaea |
| | |
| SpA | - Società per azioni |
| (a) | Non-income producing security. |
| (b) | All or a portion of the security is on loan. The total fair value of the securities on loan as of November 30, 2024 was $406,316. |
| (c) | Security was purchased with cash received as collateral for securities on loan at November 30, 2024. Total collateral had a value of $416,869 at November 30, 2024. |
| (d) | Percentage rounds to less than 0.1%. |
| (e) | Rate disclosed is the seven day effective yield as of November 30, 2024. |
| (f) | The fair value of this investment is determined using significant unobservable inputs. |
| (g) | Illiquid security. The total fair value of these securities as of November 30, 2024 was $0, representing 0% of net assets. |
See accompanying notes to financial statements.
| INSPIRE SMALL/MID CAP ETF |
| SCHEDULE OF INVESTMENTS |
| November 30, 2024 |
| Shares | | | | | Fair Value | |
| | | | | COMMON STOCKS — 99.4% | | | | |
| | | | | AEROSPACE & DEFENSE - 0.8% | | | | |
| | 6,093 | | | AAR Corporation(a) | | $ | 423,585 | |
| | 6,049 | | | Ducommun, Inc.(a) | | | 405,283 | |
| | 6,441 | | | Hexcel Corporation | | | 408,295 | |
| | 12,249 | | | Spirit AeroSystems Holdings, Inc., Class A(a) | | | 396,378 | |
| | | | | | | | 1,633,541 | |
| | | | | APPAREL & TEXTILE PRODUCTS - 0.4% | | | | |
| | 54,179 | | | Hanesbrands, Inc.(a) | | | 471,357 | |
| | 4,589 | | | Oxford Industries, Inc. | | | 381,667 | |
| | | | | | | | 853,024 | |
| | | | | ASSET MANAGEMENT - 1.0% | | | | |
| | 4,150 | | | Cohen & Steers, Inc. | | | 434,339 | |
| | 17,977 | | | Compass Diversified Holdings | | | 426,055 | |
| | 2,463 | | | Diamond Hill Investment Group, Inc. | | | 407,257 | |
| | 7,784 | | | Oppenheimer Holdings, Inc., Class A | | | 480,350 | |
| | 26,461 | | | SLR Investment Corporation | | | 443,222 | |
| | | | | | | | 2,191,223 | |
| | | | | AUTOMOTIVE - 1.7% | | | | |
| | 64,436 | | | American Axle & Manufacturing Holdings, Inc.(a) | | | 425,922 | |
| | 37,710 | | | Dana, Inc. | | | 377,100 | |
| | 13,468 | | | Gentex Corporation | | | 411,582 | |
| | 8,555 | | | Gentherm, Inc.(a) | | | 360,166 | |
| | 44,944 | | | Goodyear Tire & Rubber Company (The)(a) | | | 482,699 | |
| | 3,649 | | | Lear Corporation | | | 357,018 | |
| | 3,003 | | | Modine Manufacturing Company(a) | | | 407,777 | |
| | 11,995 | | | Standard Motor Products, Inc. | | | 394,396 | |
| | 4,182 | | | Visteon Corporation(a) | | | 390,473 | |
| | | | | | | | 3,607,133 | |
| | | | | BANKING - 13.2% | | | | |
| | 6,650 | | | 1st Source Corporation | | | 431,519 | |
| | 17,405 | | | Alerus Financial Corporation | | | 383,606 | |
| | 6,382 | | | Ameris Bancorp | | | 448,527 | |
| | 3,784 | | | BancFirst Corporation | | | 477,844 | |
| | 10,927 | | | BankUnited, Inc. | | | 459,699 | |
| | 14,876 | | | Byline Bancorp, Inc. | | | 467,404 | |
See accompanying notes to financial statements.
| INSPIRE SMALL/MID CAP ETF |
| SCHEDULE OF INVESTMENTS (Continued) |
| November 30, 2024 |
| Shares | | | | | Fair Value | |
| | | | | COMMON STOCKS — 99.4% (Continued) | | | | |
| | | | | BANKING - 13.2% (Continued) | | | | |
| | 9,637 | | | Camden National Corporation | | $ | 453,999 | |
| | 11,284 | | | Capital City Bank Group, Inc. | | | 444,138 | |
| | 3,392 | | | City Holding Company | | | 445,437 | |
| | 6,858 | | | Community Financial System, Inc. | | | 474,779 | |
| | 8,573 | | | Customers Bancorp, Inc.(a) | | | 483,946 | |
| | 17,613 | | | Eagle Bancorp, Inc. | | | 517,118 | |
| | 26,336 | | | Farmers National Banc Corporation | | | 412,158 | |
| | 8,485 | | | FB Financial Corporation | | | 478,978 | |
| | 15,305 | | | First Busey Corporation | | | 408,490 | |
| | 23,213 | | | First Commonwealth Financial Corporation | | | 437,101 | |
| | 15,783 | | | First Financial Bancorp | | | 466,072 | |
| | 10,760 | | | First Financial Bankshares, Inc. | | | 448,477 | |
| | 25,642 | | | First Horizon Corporation | | | 541,815 | |
| | 12,980 | | | First Interstate BancSystem, Inc., Class A | | | 453,911 | |
| | 10,704 | | | First Merchants Corporation | | | 468,300 | |
| | 13,395 | | | Five Star Bancorp | | | 441,365 | |
| | 35,445 | | | Flagstar Financial, Inc. | | | 424,277 | |
| | 28,222 | | | FNB Corporation | | | 484,007 | |
| | 22,169 | | | Fulton Financial Corporation | | | 478,407 | |
| | 8,777 | | | Glacier Bancorp, Inc. | | | 508,101 | |
| | 12,382 | | | Hilltop Holdings, Inc. | | | 391,890 | |
| | 14,699 | | | Home BancShares, Inc. | | | 466,840 | |
| | 31,705 | | | Hope Bancorp, Inc. | | | 431,822 | |
| | 25,887 | | | Horizon Bancorp, Inc. | | | 473,473 | |
| | 6,776 | | | Independent Bank Group, Inc. | | | 453,450 | |
| | 6,660 | | | International Bancshares Corporation | | | 487,046 | |
| | 6,115 | | | Lakeland Financial Corporation | | | 449,208 | |
| | 8,407 | | | Live Oak Bancshares, Inc. | | | 398,492 | |
| | 9,108 | | | Mercantile Bank Corporation | | | 455,855 | |
| | 13,005 | | | Metrocity Bankshares, Inc. | | | 446,592 | |
| | 9,003 | | | NBT Bancorp, Inc. | | | 451,230 | |
| | 29,763 | | | Northwest Bancshares, Inc. | | | 436,921 | |
| | 13,234 | | | Peoples Bancorp, Inc. | | | 464,249 | |
| | 5,524 | | | Prosperity Bancshares, Inc. | | | 462,525 | |
See accompanying notes to financial statements.
| INSPIRE SMALL/MID CAP ETF |
| SCHEDULE OF INVESTMENTS (Continued) |
| November 30, 2024 |
| Shares | | | | | Fair Value | |
| | | | | COMMON STOCKS — 99.4% (Continued) | | | | |
| | | | | BANKING - 13.2% (Continued) | | | | |
| | 12,253 | | | Renasant Corporation | | $ | 460,958 | |
| | 6,099 | | | Republic Bancorp, Inc., Class A | | | 465,201 | |
| | 9,488 | | | S&T Bancorp, Inc. | | | 405,992 | |
| | 12,694 | | | Sandy Spring Bancorp, Inc. | | | 478,310 | |
| | 4,968 | | | ServisFirst Bancshares, Inc. | | | 475,835 | |
| | 18,487 | | | Simmons First National Corporation, Class A | | | 452,192 | |
| | 13,665 | | | SmartFinancial, Inc. | | | 495,493 | |
| | 11,912 | | | Southside Bancshares, Inc. | | | 418,349 | |
| | 8,955 | | | Synovus Financial Corporation | | | 511,062 | |
| | 5,573 | | | Texas Capital Bancshares, Inc.(a) | | | 492,932 | |
| | 30,965 | | | TFS Financial Corporation | | | 437,845 | |
| | 12,045 | | | Towne Bank | | | 441,208 | |
| | 3,789 | | | UMB Financial Corporation | | | 475,482 | |
| | 10,734 | | | United Bankshares, Inc. | | | 453,726 | |
| | 13,695 | | | United Community Banks, Inc. | | | 463,028 | |
| | 43,880 | | | Valley National Bancorp | | | 466,883 | |
| | 8,544 | | | Webster Financial Corporation | | | 527,848 | |
| | 13,373 | | | WesBanco, Inc. | | | 472,602 | |
| | 8,057 | | | Westamerica BanCorporation | | | 461,102 | |
| | 3,671 | | | Wintrust Financial Corporation | | | 506,635 | |
| | 8,434 | | | Zions Bancorporation | | | 510,426 | |
| | | | | | | | 28,082,177 | |
| | | | | BIOTECH & PHARMA - 4.3% | | | | |
| | 53,814 | | | 89bio, Inc.(a) | | | 483,788 | |
| | 20,025 | | | ADMA Biologics, Inc.(a) | | | 402,703 | |
| | 8,963 | | | Agios Pharmaceuticals, Inc.(a) | | | 532,312 | |
| | 37,160 | | | Amicus Therapeutics, Inc.(a) | | | 370,857 | |
| | 42,731 | | | Arcutis Biotherapeutics, Inc.(a) | | | 557,211 | |
| | 57,748 | | | Ardelyx, Inc.(a) | | | 327,431 | |
| | 52,397 | | | BioCryst Pharmaceuticals, Inc.(a) | | | 392,978 | |
| | 7,964 | | | Biohaven Ltd.(a) | | | 366,424 | |
| | 7,541 | | | Cytokinetics, Inc.(a) | | | 391,076 | |
| | 15,345 | | | Exelixis, Inc.(a) | | | 559,478 | |
| | 87,714 | | | Geron Corporation(a) | | | 361,382 | |
See accompanying notes to financial statements.
| INSPIRE SMALL/MID CAP ETF |
| SCHEDULE OF INVESTMENTS (Continued) |
| November 30, 2024 |
| Shares | | | | | Fair Value | |
| | | | | COMMON STOCKS — 99.4% (Continued) | | | | |
| | | | | BIOTECH & PHARMA - 4.3% (Continued) | | | | |
| | 5,443 | | | Intra-Cellular Therapies, Inc.(a) | | $ | 466,193 | |
| | 96,655 | | | Ironwood Pharmaceuticals, Inc.(a) | | | 340,226 | |
| | 26,461 | | | Pacira BioSciences, Inc.(a) | | | 447,456 | |
| | 5,523 | | | Prestige Consumer Healthcare, Inc.(a) | | | 468,185 | |
| | 8,850 | | | Protagonist Therapeutics, Inc.(a) | | | 387,630 | |
| | 10,734 | | | PTC Therapeutics, Inc.(a) | | | 471,008 | |
| | 76,729 | | | Revance Therapeutics, Inc.(a) | | | 276,992 | |
| | 55,154 | | | Sage Therapeutics, Inc.(a) | | | 301,692 | |
| | 20,687 | | | Syndax Pharmaceuticals, Inc.(a) | | | 345,887 | |
| | 6,294 | | | Viking Therapeutics, Inc.(a) | | | 333,204 | |
| | 19,803 | | | Xencor, Inc.(a) | | | 506,956 | |
| | | | | | | | 9,091,069 | |
| | | | | BUSINESS DEVELOPMENT COMPANIES - 0.5% | | | | |
| | 20,276 | | | Hercules Capital, Inc.(b) | | | 383,825 | |
| | 33,241 | | | New Mountain Finance Corporation | | | 396,897 | |
| | 74,434 | | | Prospect Capital Corporation(b) | | | 355,795 | |
| | | | | | | | 1,136,517 | |
| | | | | CABLE & SATELLITE - 0.2% | | | | |
| | 1,139 | | | Cable One, Inc. | | | 478,631 | |
| | | | | | | | | |
| | | | | CHEMICALS - 3.9% | | | | |
| | 13,108 | | | AdvanSix, Inc. | | | 425,617 | |
| | 2,262 | | | Balchem Corporation | | | 408,336 | |
| | 3,563 | | | Cabot Corporation | | | 390,576 | |
| | 22,348 | | | Calumet, Inc.(a),(b) | | | 503,724 | |
| | 19,666 | | | Chemours Company (The) | | | 427,539 | |
| | 3,125 | | | Hawkins, Inc. | | | 420,344 | |
| | 5,018 | | | HB Fuller Company | | | 385,834 | |
| | 10,211 | | | Ingevity Corporation(a) | | | 495,948 | |
| | 3,521 | | | Innospec, Inc. | | | 417,626 | |
| | 3,561 | | | Materion Corporation | | | 411,723 | |
| | 5,157 | | | Minerals Technologies, Inc. | | | 420,656 | |
| | 722 | | | NewMarket Corporation | | | 385,230 | |
| | 22,360 | | | Orion S.A. | | | 411,871 | |
See accompanying notes to financial statements.
| INSPIRE SMALL/MID CAP ETF |
| SCHEDULE OF INVESTMENTS (Continued) |
| November 30, 2024 |
| Shares | | | | | Fair Value | |
| | | | | COMMON STOCKS — 99.4% (Continued) | | | | |
| | | | | CHEMICALS - 3.9% (Continued) | | | | |
| | 2,363 | | | Quaker Chemical Corporation | | $ | 372,645 | |
| | 46,522 | | | Rayonier Advanced Materials, Inc.(a) | | | 409,859 | |
| | 3,523 | | | Rogers Corporation(a) | | | 364,912 | |
| | 4,964 | | | Sensient Technologies Corporation | | | 385,405 | |
| | 5,155 | | | Stepan Company | | | 396,420 | |
| | 9,518 | | | Valvoline, Inc.(a) | | | 377,960 | |
| | 1,545 | | | WD-40 Company | | | 428,104 | |
| | | | | | | | 8,240,329 | |
| | | | | COMMERCIAL SUPPORT SERVICES - 2.1% | | | | |
| | 7,579 | | | ABM Industries, Inc. | | | 433,291 | |
| | 116,098 | | | Advantage Solutions, Inc.(a) | | | 413,309 | |
| | 5,213 | | | Brady Corporation, Class A | | | 390,402 | |
| | 3,444 | | | Brink’s Company (The) | | | 333,069 | |
| | 5,918 | | | CBIZ, Inc.(a) | | | 488,709 | |
| | 1,219 | | | CorVel Corporation(a) | | | 445,423 | |
| | 10,247 | | | Heidrick & Struggles International, Inc. | | | 472,797 | |
| | 4,526 | | | Insperity, Inc. | | | 356,875 | |
| | 6,480 | | | Kforce, Inc. | | | 388,735 | |
| | 17,420 | | | National Research Corporation | | | 342,477 | |
| | 2,005 | | | UniFirst Corporation | | | 402,744 | |
| | | | | | | | 4,467,831 | |
| | | | | CONSTRUCTION MATERIALS - 0.6% | | | | |
| | 14,529 | | | MDU Resources Group, Inc. | | | 291,161 | |
| | 2,086 | | | Simpson Manufacturing Company, Inc. | | | 393,002 | |
| | 10,204 | | | Summit Materials, Inc., Class A(a) | | | 519,792 | |
| | | | | | | | 1,203,955 | |
| | | | | CONSUMER SERVICES - 1.6% | | | | |
| | 50,188 | | | Coursera, Inc.(a) | | | 398,995 | |
| | 485 | | | Graham Holdings Co., Class B | | | 451,593 | |
| | 2,808 | | | Grand Canyon Education, Inc.(a) | | | 462,169 | |
| | 23,975 | | | Laureate Education, Inc., Class A(a) | | | 455,525 | |
| | 17,166 | | | Matthews International Corporation, Class A | | | 517,727 | |
| | 24,491 | | | Universal Technical Institute, Inc.(a) | | | 633,582 | |
See accompanying notes to financial statements.
| INSPIRE SMALL/MID CAP ETF |
| SCHEDULE OF INVESTMENTS (Continued) |
| November 30, 2024 |
| Shares | | | | | Fair Value | |
| | | | | COMMON STOCKS — 99.4% (Continued) | | | | |
| | | | | CONSUMER SERVICES - 1.6% (Continued) | | | | |
| | 12,591 | | | Upbound Group, Inc. | | $ | 433,004 | |
| | | | | | | | 3,352,595 | |
| | | | | CONTAINERS & PACKAGING - 0.7% | | | | |
| | 28,815 | | | Myers Industries, Inc. | | | 334,254 | |
| | 7,587 | | | Silgan Holdings, Inc. | | | 436,480 | |
| | 15,599 | | | TriMas Corporation | | | 412,126 | |
| | 1,258 | | | UFP Technologies, Inc.(a) | | | 406,233 | |
| | | | | | | | 1,589,093 | |
| | | | | ELECTRIC UTILITIES - 1.8% | | | | |
| | 6,204 | | | ALLETE, Inc. | | | 402,516 | |
| | 6,516 | | | Black Hills Corporation | | | 417,480 | |
| | 41,118 | | | Hawaiian Electric Industries, Inc.(a) | | | 427,216 | |
| | 3,864 | | | IDACORP, Inc. | | | 457,768 | |
| | 4,354 | | | MGE Energy, Inc. | | | 454,035 | |
| | 9,808 | | | OGE Energy Corporation | | | 431,160 | |
| | 5,176 | | | Ormat Technologies, Inc. | | | 422,465 | |
| | 9,098 | | | TXNM Energy, Inc. | | | 446,257 | |
| | 6,573 | | | Unitil Corporation | | | 394,511 | |
| | | | | | | | 3,853,408 | |
| | | | | ELECTRICAL EQUIPMENT - 2.5% | | | | |
| | 3,693 | | | AAON, Inc. | | | 503,504 | |
| | 3,784 | | | Advanced Energy Industries, Inc. | | | 435,311 | |
| | 7,277 | | | Alarm.com Holdings, Inc.(a) | | | 474,024 | |
| | 3,926 | | | Argan, Inc. | | | 612,220 | |
| | 1,823 | | | Badger Meter, Inc. | | | 395,263 | |
| | 3,399 | | | Belden, Inc. | | | 416,038 | |
| | 290,672 | | | ChargePoint Holdings, Inc.(a),(b) | | | 354,620 | |
| | 9,831 | | | Cognex Corporation | | | 393,043 | |
| | 3,728 | | | Itron, Inc.(a) | | | 441,880 | |
| | 21,514 | | | Kimball Electronics, Inc.(a) | | | 421,890 | |
| | 2,623 | | | OSI Systems, Inc.(a) | | | 465,320 | |
| | 1,922 | | | Watts Water Technologies, Inc., Class A | | | 414,748 | |
| | | | | | | | 5,327,861 | |
See accompanying notes to financial statements.
| INSPIRE SMALL/MID CAP ETF |
| SCHEDULE OF INVESTMENTS (Continued) |
| November 30, 2024 |
| Shares | | | | | Fair Value | |
| | | | | COMMON STOCKS — 99.4% (Continued) | | | | |
| | | | | ENGINEERING & CONSTRUCTION - 1.3% | | | | |
| | 3,597 | | | Everus Construction Group, Inc.(a) | | $ | 228,985 | |
| | 3,455 | | | Exponent, Inc. | | | 341,043 | |
| | 1,616 | | | Installed Building Products, Inc. | | | 369,644 | |
| | 6,114 | | | KBR, Inc. | | | 371,915 | |
| | 3,896 | | | MYR Group, Inc.(a) | | | 615,179 | |
| | 17,036 | | | NV5 Global, Inc.(a) | | | 370,703 | |
| | 6,857 | | | Primoris Services Corporation | | | 573,999 | |
| | | | | | | | 2,871,468 | |
| | | | | ENTERTAINMENT CONTENT - 0.2% | | | | |
| | 49,102 | | | Reservoir Media, Inc.(a) | | | 463,523 | |
| | | | | | | | | |
| | | | | FOOD - 2.1% | | | | |
| | 5,320 | | | Cal-Maine Foods, Inc. | | | 519,285 | |
| | 10,724 | | | Darling Ingredients, Inc.(a) | | | 434,644 | |
| | 17,260 | | | Flowers Foods, Inc. | | | 390,421 | |
| | 46,144 | | | Hain Celestial Group, Inc. (The)(a) | | | 381,611 | |
| | 55,384 | | | Herbalife Ltd.(a) | | | 430,334 | |
| | 2,314 | | | J & J Snack Foods Corporation | | | 402,150 | |
| | 4,222 | | | John B Sanfilippo & Son, Inc. | | | 364,570 | |
| | 2,255 | | | Lancaster Colony Corporation | | | 419,069 | |
| | 15,068 | | | Limoneira Company | | | 418,890 | |
| | 3,441 | | | Post Holdings, Inc.(a) | | | 414,572 | |
| | 11,356 | | | Vital Farms, Inc.(a) | | | 377,019 | |
| | | | | | | | 4,552,565 | |
| | | | | FORESTRY, PAPER & WOOD PRODUCTS - 0.4% | | | | |
| | 3,706 | | | Louisiana-Pacific Corporation | | | 438,049 | |
| | 5,982 | | | Trex Company, Inc.(a) | | | 448,830 | |
| | | | | | | | 886,879 | |
| | | | | GAS & WATER UTILITIES - 1.9% | | | | |
| | 4,781 | | | American States Water Company | | | 407,867 | |
| | 23,606 | | | Aris Water Solutions, Inc., Class A | | | 635,002 | |
| | 3,206 | | | Chesapeake Utilities Corporation | | | 422,391 | |
| | 6,104 | | | Middlesex Water Company | | | 399,415 | |
| | 6,574 | | | National Fuel Gas Company | | | 420,539 | |
See accompanying notes to financial statements.
| INSPIRE SMALL/MID CAP ETF |
| SCHEDULE OF INVESTMENTS (Continued) |
| November 30, 2024 |
| Shares | | | | | Fair Value | |
| | | | | COMMON STOCKS — 99.4% (Continued) | | | | |
| | | | | GAS & WATER UTILITIES - 1.9% (Continued) | | | | |
| | 8,437 | | | New Jersey Resources Corporation | | $ | 435,180 | |
| | 5,352 | | | ONE Gas, Inc. | | | 417,295 | |
| | 5,399 | | | Southwest Gas Holdings, Inc. | | | 421,986 | |
| | 5,918 | | | Spire, Inc. | | | 433,138 | |
| | | | | | | | 3,992,813 | |
| | | | | HEALTH CARE FACILITIES & SERVICES - 2.6% | | | | |
| | 6,279 | | | Acadia Healthcare Company, Inc.(a) | | | 255,116 | |
| | 103,573 | | | Accolade, Inc.(a) | | | 399,792 | |
| | 2,993 | | | Addus HomeCare Corporation(a) | | | 367,660 | |
| | 101,329 | | | agilon health, Inc.(a) | | | 211,778 | |
| | 4,126 | | | Amedisys, Inc.(a) | | | 377,158 | |
| | 9,215 | | | Concentra Group Holdings Parent, Inc. | | | 201,071 | |
| | 4,861 | | | HealthEquity, Inc.(a) | | | 493,586 | |
| | 3,166 | | | National HealthCare Corporation | | | 396,383 | |
| | 26,958 | | | NeoGenomics, Inc.(a) | | | 477,965 | |
| | 25,380 | | | Owens & Minor, Inc.(a) | | | 341,869 | |
| | 19,917 | | | Premier, Inc., Class A | | | 456,099 | |
| | 5,741 | | | RadNet, Inc.(a) | | | 469,384 | |
| | 11,420 | | | Select Medical Holdings Corporation | | | 241,076 | |
| | 12,352 | | | Surgery Partners, Inc.(a) | | | 294,472 | |
| | 43,357 | | | Teladoc Health, Inc.(a) | | | 519,417 | |
| | | | | | | | 5,502,826 | |
| | | | | HEALTH CARE REIT - 1.0% | | | | |
| | 12,904 | | | CareTrust REIT, Inc. | | | 384,410 | |
| | 22,008 | | | Community Healthcare Trust, Inc. | | | 415,951 | |
| | 95,040 | | | Diversified Healthcare Trust | | | 247,104 | |
| | 68,072 | | | Medical Properties Trust, Inc.(b) | | | 298,836 | |
| | 4,738 | | | National Health Investors, Inc. | | | 363,168 | |
| | 21,399 | | | Sabra Health Care REIT, Inc. | | | 400,803 | |
| | | | | | | | 2,110,272 | |
| | | | | HOME & OFFICE PRODUCTS - 0.6% | | | | |
| | 72,800 | | | ACCO Brands Corporation | | | 423,696 | |
| | 7,396 | | | HNI Corporation | | | 418,983 | |
See accompanying notes to financial statements.
| INSPIRE SMALL/MID CAP ETF |
| SCHEDULE OF INVESTMENTS (Continued) |
| November 30, 2024 |
| Shares | | | | | Fair Value | |
| | | | | COMMON STOCKS — 99.4% (Continued) | | | | |
| | | | | HOME & OFFICE PRODUCTS - 0.6% (Continued) | | | | |
| | 51,851 | | | Newell Brands, Inc. | | $ | 497,251 | |
| | | | | | | | 1,339,930 | |
| | | | | HOME CONSTRUCTION - 2.4% | | | | |
| | 3,031 | | | Armstrong World Industries, Inc. | | | 484,445 | |
| | 4,768 | | | Green Brick Partners, Inc.(a) | | | 340,721 | |
| | 5,689 | | | Griffon Corporation | | | 479,583 | |
| | 20,992 | | | Interface, Inc. | | | 557,337 | |
| | 25,189 | | | JELD-WEN Holding, Inc.(a) | | | 274,308 | |
| | 4,647 | | | KB Home | | | 384,493 | |
| | 32,244 | | | Landsea Homes Corporation(a) | | | 368,549 | |
| | 3,360 | | | LGI Homes, Inc.(a) | | | 367,886 | |
| | 2,324 | | | M/I Homes, Inc.(a) | | | 383,530 | |
| | 1,941 | | | Meritage Homes Corporation | | | 370,867 | |
| | 2,796 | | | Patrick Industries, Inc. | | | 375,754 | |
| | 5,668 | | | Taylor Morrison Home Corporation(a) | | | 418,695 | |
| | 8,788 | | | Tri Pointe Homes, Inc.(a) | | | 382,542 | |
| | | | | | | | 5,188,710 | |
| | | | | HOTEL REIT - 0.8% | | | | |
| | 45,615 | | | DiamondRock Hospitality Company | | | 423,307 | |
| | 43,379 | | | RLJ Lodging Trust | | | 442,901 | |
| | 3,713 | | | Ryman Hospitality Properties, Inc. | | | 435,312 | |
| | 26,961 | | | Xenia Hotels & Resorts, Inc. | | | 414,660 | |
| | | | | | | | 1,716,180 | |
| | | | | HOUSEHOLD PRODUCTS - 1.6% | | | | |
| | 10,918 | | | Central Garden & Pet Company(a) | | | 433,991 | |
| | 13,953 | | | Clearwater Paper Corporation(a) | | | 378,405 | |
| | 10,959 | | | Edgewell Personal Care Company | | | 400,880 | |
| | 12,539 | | | Energizer Holdings, Inc. | | | 477,861 | |
| | 6,443 | | | Helen of Troy Ltd.(a) | | | 472,465 | |
| | 3,075 | | | Interparfums, Inc. | | | 423,305 | |
| | 54,033 | | | Nu Skin Enterprises, Inc., Class A | | | 394,441 | |
| | 14,350 | | | Quanex Building Products Corporation | | | 427,056 | |
| | | | | | | | 3,408,404 | |
See accompanying notes to financial statements.
| INSPIRE SMALL/MID CAP ETF |
| SCHEDULE OF INVESTMENTS (Continued) |
| November 30, 2024 |
| Shares | | | | | Fair Value | |
| | | | | COMMON STOCKS — 99.4% (Continued) | | | | |
| | | | | INDUSTRIAL INTERMEDIATE PRODUCT - 1.1% | | | | |
| | 3,207 | | | Chart Industries, Inc.(a) | | $ | 619,752 | |
| | 2,455 | | | Enpro, Inc. | | | 464,241 | |
| | 5,695 | | | Gibraltar Industries, Inc.(a) | | | 412,546 | |
| | 4,725 | | | Timken Company (The) | | | 365,951 | |
| | 1,373 | | | Valmont Industries, Inc. | | | 477,612 | |
| | | | | | | | 2,340,102 | |
| | | | | INDUSTRIAL REIT - 0.2% | | | | |
| | 7,117 | | | First Industrial Realty Trust, Inc. | | | 380,404 | |
| | | | | | | | | |
| | | | | INDUSTRIAL SUPPORT SERVICES - 0.5% | | | | |
| | 1,785 | | | Applied Industrial Technologies, Inc. | | | 490,375 | |
| | 2,370 | | | WESCO International, Inc. | | | 501,421 | |
| | | | | | | | 991,796 | |
| | | | | INFRASTRUCTURE REIT - 0.2% | | | | |
| | 70,476 | | | Uniti Group, Inc. | | | 416,513 | |
| | | | | | | | | |
| | | | | INSURANCE - 2.4% | | | | |
| | 8,240 | | | AMERISAFE, Inc. | | | 486,325 | |
| | 8,302 | | | Employers Holdings, Inc. | | | 442,995 | |
| | 58,135 | | | Genworth Financial, Inc., Class A(a) | | | 453,453 | |
| | 11,394 | | | Horace Mann Educators Corporation | | | 477,067 | |
| | 6,502 | | | Kemper Corporation | | | 464,828 | |
| | 6,323 | | | Mercury General Corporation | | | 499,264 | |
| | 9,669 | | | NMI Holdings, Inc., Class A(a) | | | 386,663 | |
| | 26,478 | | | ProAssurance Corporation(a) | | | 442,712 | |
| | 2,569 | | | RLI Corporation | | | 451,887 | |
| | 4,869 | | | Safety Insurance Group, Inc. | | | 417,955 | |
| | 9,486 | | | Trupanion, Inc.(a),(b) | | | 505,699 | |
| | | | | | | | 5,028,848 | |
| | | | | INTERNET MEDIA & SERVICES - 1.0% | | | | |
| | 154,349 | | | Angi, Inc., Class A(a) | | | 287,089 | |
| | 23,745 | | | Cars.com, Inc.(a) | | | 471,813 | |
| | 40,757 | | | Groupon, Inc.(a),(b) | | | 382,301 | |
| | 13,808 | | | HealthStream, Inc. | | | 457,045 | |
See accompanying notes to financial statements.
| INSPIRE SMALL/MID CAP ETF |
| SCHEDULE OF INVESTMENTS (Continued) |
| November 30, 2024 |
| Shares | | | | | Fair Value | |
| | | | | COMMON STOCKS — 99.4% (Continued) | | | | |
| | | | | INTERNET MEDIA & SERVICES - 1.0% (Continued) | | | | |
| | 16,287 | | | TechTarget, Inc.(a) | | $ | 522,975 | |
| | | | | | | | 2,121,223 | |
| | | | | LEISURE FACILITIES & SERVICES - 1.7% | | | | |
| | 9,820 | | | Cheesecake Factory, Inc. (The) | | | 497,285 | |
| | 14,288 | | | Cinemark Holdings, Inc.(a) | | | 493,222 | |
| | 8,556 | | | Jack in the Box, Inc. | | | 417,961 | |
| | 5,426 | | | Marriott Vacations Worldwide Corporation | | | 538,531 | |
| | 7,386 | | | Papa John’s International, Inc. | | | 368,044 | |
| | 51,384 | | | Playa Hotels & Resorts N.V.(a) | | | 503,049 | |
| | 6,830 | | | St Joe Company (The) | | | 348,876 | |
| | 7,871 | | | United Parks & Resorts, Inc.(a) | | | 461,555 | |
| | | | | | | | 3,628,523 | |
| | | | | LEISURE PRODUCTS - 0.7% | | | | |
| | 4,751 | | | Brunswick Corporation | | | 382,503 | |
| | 9,596 | | | Fox Factory Holding Corporation(a) | | | 311,678 | |
| | 4,783 | | | Polaris, Inc. | | | 330,027 | |
| | 3,623 | | | Thor Industries, Inc. | | | 404,327 | |
| | | | | | | | 1,428,535 | |
| | | | | MACHINERY - 3.4% | | | | |
| | 4,070 | | | AGCO Corporation | | | 411,925 | |
| | 4,481 | | | Albany International Corporation, Class A | | | 371,475 | |
| | 14,122 | | | CECO Environmental Corporation(a) | | | 452,610 | |
| | 11,062 | | | Columbus McKinnon Corporation | | | 434,626 | |
| | 22,900 | | | Energy Recovery, Inc.(a) | | | 356,324 | |
| | 3,089 | | | ESCO Technologies, Inc. | | | 458,438 | |
| | 3,799 | | | Franklin Electric Company, Inc. | | | 411,432 | |
| | 10,224 | | | Gorman-Rupp Company (The) | | | 435,542 | |
| | 8,364 | | | Helios Technologies, Inc. | | | 437,604 | |
| | 14,347 | | | Hillenbrand, Inc. | | | 488,228 | |
| | 6,244 | | | Hyster-Yale Materials Handling, Inc., Class A | | | 351,163 | |
| | 4,042 | | | John Bean Technologies Corporation | | | 509,374 | |
| | 1,179 | | | Kadant, Inc. | | | 486,679 | |
| | 15,357 | | | Kennametal, Inc. | | | 440,746 | |
| | 3,194 | | | Lindsay Corporation | | | 424,067 | |
See accompanying notes to financial statements.
| INSPIRE SMALL/MID CAP ETF |
| SCHEDULE OF INVESTMENTS (Continued) |
| November 30, 2024 |
| Shares | | | | | Fair Value | |
| | | | | COMMON STOCKS — 99.4% (Continued) | | | | |
| | | | | MACHINERY - 3.4% (Continued) | | | | |
| | 2,179 | | | Standex International Corporation | | $ | 452,992 | |
| | 4,146 | | | Tennant Company | | | 366,382 | |
| | | | | | | | 7,289,607 | |
| | | | | MEDICAL EQUIPMENT & DEVICES - 2.8% | | | | |
| | 13,962 | | | Castle Biosciences, Inc.(a) | | | 422,769 | |
| | 28,242 | | | Embecta Corporation | | | 588,281 | |
| | 3,057 | | | Glaukos Corporation(a) | | | 439,138 | |
| | 4,954 | | | Haemonetics Corporation(a) | | | 433,326 | |
| | 2,186 | | | ICU Medical, Inc.(a) | | | 358,417 | |
| | 21,917 | | | Integra LifeSciences Holdings Corporation(a) | | | 538,720 | |
| | 14,540 | | | Myriad Genetics, Inc.(a) | | | 236,566 | |
| | 23,689 | | | Neogen Corporation(a) | | | 335,910 | |
| | 25,493 | | | Orthofix Medical, Inc.(a) | | | 497,878 | |
| | 59,615 | | | Paragon 28, Inc.(a),(b) | | | 614,630 | |
| | 22,704 | | | Pulse Biosciences, Inc.(a),(b) | | | 485,866 | |
| | 10,268 | | | Surmodics, Inc.(a) | | | 405,073 | |
| | 11,699 | | | Veracyte, Inc.(a) | | | 502,472 | |
| | | | | | | | 5,859,046 | |
| | | | | METALS & MINING - 0.6% | | | | |
| | 57,926 | | | Coeur Mining, Inc.(a) | | | 374,202 | |
| | 33,130 | | | Compass Minerals International, Inc. | | | 511,196 | |
| | 59,612 | | | Hecla Mining Company | | | 329,058 | |
| | | | | | | | 1,214,456 | |
| | | | | MORTGAGE FINANCE - 0.9% | | | | |
| | 43,331 | | | Apollo Commercial Real Estate Finance, Inc. | | | 400,811 | |
| | 56,889 | | | Ares Commercial Real Estate Corporation | | | 410,738 | |
| | 31,306 | | | MFA Financial, Inc. | | | 347,810 | |
| | 27,925 | | | PennyMac Mortgage Investment Trust | | | 379,501 | |
| | 51,516 | | | Redwood Trust, Inc. | | | 368,855 | |
| | | | | | | | 1,907,715 | |
| | | | | MULTI ASSET CLASS REIT - 0.7% | | | | |
| | 20,740 | | | Alexander & Baldwin, Inc. | | | 408,163 | |
| | 36,770 | | | Armada Hoffler Properties, Inc. | | | 406,309 | |
| | 22,638 | | | Elme Communities | | | 383,488 | |
See accompanying notes to financial statements.
| INSPIRE SMALL/MID CAP ETF |
| SCHEDULE OF INVESTMENTS (Continued) |
| November 30, 2024 |
| Shares | | | | | Fair Value | |
| | | | | COMMON STOCKS — 99.4% (Continued) | | | | |
| | | | | MULTI ASSET CLASS REIT - 0.7% (Continued) | | | | |
| | 39,623 | | | LXP Industrial Trust | | $ | 370,475 | |
| | | | | | | | 1,568,435 | |
| | | | | OFFICE REIT - 2.1% | | | | |
| | 14,903 | | | American Assets Trust, Inc. | | | 423,841 | |
| | 75,160 | | | Brandywine Realty Trust | | | 420,896 | |
| | 22,665 | | | Douglas Emmett, Inc. | | | 438,794 | |
| | 35,940 | | | Empire State Realty Trust, Inc., Class A | | | 393,902 | |
| | 20,012 | | | Equity Commonwealth(a) | | | 407,044 | |
| | 11,885 | | | Highwoods Properties, Inc. | | | 385,787 | |
| | 83,310 | | | Hudson Pacific Properties, Inc. | | | 320,744 | |
| | 22,782 | | | JBG SMITH Properties | | | 389,344 | |
| | 10,289 | | | Kilroy Realty Corporation | | | 427,302 | |
| | 39,427 | | | Piedmont Office Realty Trust, Inc., Class A | | | 375,345 | |
| | 22,309 | | | Veris Residential, Inc. | | | 407,139 | |
| | | | | | | | 4,390,138 | |
| | | | | OIL & GAS PRODUCERS - 0.8% | | | | |
| | 128,046 | | | Clean Energy Fuels Corporation(a) | | | 394,382 | |
| | 22,613 | | | Par Pacific Holdings, Inc.(a) | | | 394,145 | |
| | 9,962 | | | SM Energy Company | | | 450,182 | |
| | 12,883 | | | World Kinect Corporation | | | 372,963 | |
| | | | | | | | 1,611,672 | |
| | | | | OIL & GAS SERVICES & EQUIPMENT - 1.9% | | | | |
| | 30,799 | | | DNOW, Inc.(a) | | | 463,525 | |
| | 27,127 | | | Innovex International, Inc.(a) | | | 441,356 | |
| | 6,166 | | | Nabors Industries Ltd.(a) | | | 452,769 | |
| | 16,013 | | | Oceaneering International, Inc.(a) | | | 480,070 | |
| | 51,986 | | | ProPetro Holding Corporation(a) | | | 436,682 | |
| | 62,613 | | | RPC, Inc. | | | 403,228 | |
| | 35,779 | | | Select Water Solutions, Inc., Class A | | | 528,456 | |
| | 128,457 | | | TETRA Technologies, Inc.(a) | | | 494,559 | |
| | 5,548 | | | Tidewater, Inc.(a) | | | 286,943 | |
| | | | | | | | 3,987,588 | |
| | | | | PUBLISHING & BROADCASTING - 0.3% | | | | |
| | 248,887 | | | Clear Channel Outdoor Holdings, Inc.(a) | | | 375,819 | |
See accompanying notes to financial statements.
| INSPIRE SMALL/MID CAP ETF |
| SCHEDULE OF INVESTMENTS (Continued) |
| November 30, 2024 |
| Shares | | | | | Fair Value | |
| | | | | COMMON STOCKS — 99.4% (Continued) | | | | |
| | | | | PUBLISHING & BROADCASTING - 0.3% (Continued) | | | | |
| | 12,441 | | | Scholastic Corporation | | $ | 328,194 | |
| | | | | | | | 704,013 | |
| | | | | REAL ESTATE OWNERS & DEVELOPERS - 0.2% | | | | |
| | 3,783 | | | McGrath RentCorporation | | | 460,959 | |
| | | | | | | | | |
| | | | | REAL ESTATE SERVICES - 0.2% | | | | |
| | 10,048 | | | Marcus & Millichap, Inc. | | | 418,097 | |
| | | | | | | | | |
| | | | | RENEWABLE ENERGY - 0.7% | | | | |
| | 10,495 | | | Ameresco, Inc., Class A(a) | | | 295,644 | |
| | 3,902 | | | EnerSys | | | 377,167 | |
| | 29,412 | | | Green Plains, Inc.(a) | | | 317,650 | |
| | 109,101 | | | OPAL Fuels, Inc.(a),(b) | | | 423,857 | |
| | | | | | | | 1,414,318 | |
| | | | | RESIDENTIAL REIT - 0.8% | | | | |
| | 44,051 | | | Apartment Investment and Management Company(a) | | | 389,411 | |
| | 19,425 | | | Independence Realty Trust, Inc. | | | 424,242 | |
| | 9,049 | | | NexPoint Residential Trust, Inc. | | | 425,936 | |
| | 20,246 | | | UMH Properties, Inc. | | | 388,723 | |
| | | | | | | | 1,628,312 | |
| | | | | RETAIL - CONSUMER STAPLES - 0.6% | | | | |
| | 13,413 | | | Natural Grocers by Vitamin Cottage, Inc. | | | 631,081 | |
| | 4,098 | | | Ollie’s Bargain Outlet Holdings, Inc.(a) | | | 405,497 | |
| | 17,769 | | | SpartanNash Company | | | 337,256 | |
| | | | | | | | 1,373,834 | |
| | | | | RETAIL - DISCRETIONARY - 2.6% | | | | |
| | 1,669 | | | Asbury Automotive Group, Inc.(a) | | | 433,656 | |
| | 4,555 | | | Avis Budget Group, Inc.(b) | | | 496,813 | |
| | 1,038 | | | Dillard’s, Inc., Class A(b) | | | 459,959 | |
| | 12,487 | | | Ethan Allen Interiors, Inc. | | | 383,726 | |
| | 4,398 | | | GMS, Inc.(a) | | | 441,339 | |
| | 14,496 | | | Haverty Furniture Companies, Inc. | | | 342,251 | |
| | 9,276 | | | La-Z-Boy, Inc. | | | 419,925 | |
| | 1,254 | | | Lithia Motors, Inc. | | | 485,173 | |
See accompanying notes to financial statements.
| INSPIRE SMALL/MID CAP ETF |
| SCHEDULE OF INVESTMENTS (Continued) |
| November 30, 2024 |
| Shares | | | | | Fair Value | |
| | | | | COMMON STOCKS — 99.4% (Continued) | | | | |
| | | | | RETAIL - DISCRETIONARY - 2.6% (Continued) | | | | |
| | 13,799 | | | Monro, Inc. | | $ | 388,028 | |
| | 36,501 | | | National Vision Holdings, Inc.(a) | | | 441,662 | |
| | 7,537 | | | Rush Enterprises, Inc., Class A | | | 466,917 | |
| | 21,737 | | | Sleep Number Corporation(a) | | | 326,055 | |
| | 6,809 | | | Sonic Automotive, Inc., Class A | | | 470,774 | |
| | | | | | | | 5,556,278 | |
| | | | | RETAIL REIT - 1.6% | | | | |
| | 16,961 | | | Acadia Realty Trust | | | 438,442 | |
| | 1,644 | | | Alexander’s, Inc. | | | 367,615 | |
| | 13,582 | | | Four Corners Property Trust, Inc. | | | 403,521 | |
| | 15,143 | | | Kite Realty Group Trust | | | 417,493 | |
| | 21,833 | | | Macerich Company (The) | | | 463,079 | |
| | 25,316 | | | Retail Opportunity Investments Corporation | | | 440,498 | |
| | 9,491 | | | Saul Centers, Inc. | | | 390,175 | |
| | 11,988 | | | Tanger, Inc. | | | 443,197 | |
| | | | | | | | 3,364,020 | |
| | | | | SEMICONDUCTORS - 3.7% | | | | |
| | 30,989 | | | Aehr Test Systems(a),(b) | | | 368,459 | |
| | 13,017 | | | Amkor Technology, Inc. | | | 344,169 | |
| | 3,205 | | | Cirrus Logic, Inc.(a) | | | 334,762 | |
| | 15,495 | | | Cohu, Inc.(a) | | | 409,068 | |
| | 6,214 | | | Diodes, Inc.(a) | | | 403,910 | |
| | 8,657 | | | FormFactor, Inc.(a) | | | 346,799 | |
| | 1,838 | | | Impinj, Inc.(a) | | | 353,282 | |
| | 5,359 | | | IPG Photonics Corporation(a) | | | 418,216 | |
| | 7,508 | | | Lattice Semiconductor Corporation(a) | | | 426,079 | |
| | 27,500 | | | MaxLinear, Inc., A(a) | | | 416,075 | |
| | 3,664 | | | MKS Instruments, Inc. | | | 416,377 | |
| | 19,008 | | | Penguin Solutions, Inc.(a) | | | 344,805 | |
| | 16,083 | | | Photronics, Inc.(a) | | | 400,628 | |
| | 6,211 | | | Power Integrations, Inc. | | | 406,883 | |
| | 8,721 | | | Semtech Corporation(a) | | | 558,494 | |
| | 3,446 | | | Silicon Laboratories, Inc.(a) | | | 381,300 | |
| | 43,949 | | | SkyWater Technology, Inc.(a),(b) | | | 348,955 | |
See accompanying notes to financial statements.
| INSPIRE SMALL/MID CAP ETF |
| SCHEDULE OF INVESTMENTS (Continued) |
| November 30, 2024 |
| Shares | | | | | Fair Value | |
| | | | | COMMON STOCKS — 99.4% (Continued) | | | | |
| | | | | SEMICONDUCTORS - 3.7% (Continued) | | | | |
| | 12,020 | | | Veeco Instruments, Inc.(a) | | $ | 334,997 | |
| | 21,058 | | | Vishay Intertechnology, Inc. | | | 402,208 | |
| | 41,054 | | | Wolfspeed, Inc.(a),(b) | | | 393,297 | |
| | | | | | | | 7,808,763 | |
| | | | | SOFTWARE - 4.2% | | | | |
| | 7,810 | | | ACI Worldwide, Inc.(a) | | | 443,764 | |
| | 44,394 | | | Amplitude, Inc.(a) | | | 459,034 | |
| | 4,704 | | | Blackbaud, Inc.(a) | | | 394,854 | |
| | 10,266 | | | Calix, Inc.(a) | | | 333,953 | |
| | 53,814 | | | Cantaloupe, Inc.(a) | | | 488,631 | |
| | 2,589 | | | CommVault Systems, Inc.(a) | | | 444,247 | |
| | 14,465 | | | Digi International, Inc.(a) | | | 480,527 | |
| | 6,049 | | | Donnelley Financial Solutions, Inc.(a) | | | 364,452 | |
| | 48,921 | | | Health Catalyst, Inc.(a) | | | 431,972 | |
| | 9,132 | | | Omnicell, Inc.(a) | | | 425,460 | |
| | 12,570 | | | PDF Solutions, Inc.(a) | | | 397,212 | |
| | 5,460 | | | Pegasystems, Inc. | | | 518,536 | |
| | 17,472 | | | Phreesia, Inc.(a) | | | 367,436 | |
| | 5,911 | | | Progress Software Corporation | | | 404,372 | |
| | 21,503 | | | PROS Holdings, Inc.(a) | | | 498,225 | |
| | 26,781 | | | PubMatic, Inc., Class A(a) | | | 427,157 | |
| | 4,992 | | | Q2 Holdings, Inc.(a) | | | 522,862 | |
| | 3,099 | | | Qualys, Inc.(a) | | | 476,006 | |
| | 44,996 | | | SecureWorks Corporation, Class A(a) | | | 379,766 | |
| | 2,050 | | | SPS Commerce, Inc.(a) | | | 395,794 | |
| | 7,051 | | | Varonis Systems, Inc.(a) | | | 352,268 | |
| | | | | | | | 9,006,528 | |
| | | | | SPECIALTY FINANCE - 1.4% | | | | |
| | 8,425 | | | Encore Capital Group, Inc.(a) | | | 414,384 | |
| | 4,753 | | | Enova International, Inc.(a) | | | 501,489 | |
| | 6,195 | | | Essent Group Ltd. | | | 357,947 | |
| | 2,125 | | | Federal Agricultural Mortgage Corporation, Class C | | | 453,624 | |
| | 15,555 | | | MGIC Investment Corporation | | | 408,474 | |
| | 3,515 | | | Nelnet, Inc., Class A | | | 382,854 | |
See accompanying notes to financial statements.
| INSPIRE SMALL/MID CAP ETF |
| SCHEDULE OF INVESTMENTS (Continued) |
| November 30, 2024 |
| Shares | | | | | Fair Value | |
| | | | | COMMON STOCKS — 99.4% (Continued) | | | | |
| | | | | SPECIALTY FINANCE - 1.4% (Continued) | | | | |
| | 3,375 | | | World Acceptance Corporation(a) | | $ | 408,105 | |
| | | | | | | | 2,926,877 | |
| | | | | STEEL - 0.8% | | | | |
| | 5,951 | | | ATI, Inc.(a) | | | 358,072 | |
| | 7,244 | | | Commercial Metals Company | | | 446,882 | |
| | 26,852 | | | Metallus, Inc.(a) | | | 447,623 | |
| | 8,825 | | | Northwest Pipe Company(a) | | | 494,774 | |
| | | | | | | | 1,747,351 | |
| | | | | TECHNOLOGY HARDWARE - 4.2% | | | | |
| | 67,154 | | | ADTRAN Holdings, Inc.(a) | | | 570,808 | |
| | 10,632 | | | Anterix, Inc.(a) | | | 368,930 | |
| | 2,997 | | | Arrow Electronics, Inc.(a) | | | 360,120 | |
| | 8,985 | | | Benchmark Electronics, Inc. | | | 435,683 | |
| | 65,175 | | | CommScope Holding Company, Inc.(a) | | | 310,885 | |
| | 30,846 | | | Daktronics, Inc.(a) | | | 475,028 | |
| | 8,916 | | | Diebold Nixdorf, Inc.(a) | | | 412,098 | |
| | 14,814 | | | Digimarc Corporation(a),(b) | | | 502,046 | |
| | 27,332 | | | Harmonic, Inc.(a) | | | 350,396 | |
| | 58,996 | | | Infinera Corporation(a),(b) | | | 389,964 | |
| | 2,821 | | | InterDigital, Inc. | | | 552,803 | |
| | 22,086 | | | Knowles Corporation(a) | | | 429,794 | |
| | 6,284 | | | Lumentum Holdings, Inc.(a) | | | 546,519 | |
| | 29,260 | | | NCR Voyix Corporation(a) | | | 424,563 | |
| | 18,308 | | | NetScout Systems, Inc.(a) | | | 400,579 | |
| | 7,648 | | | PAR Technology Corporation(a) | | | 620,558 | |
| | 2,914 | | | Plexus Corporation(a) | | | 479,062 | |
| | 79,644 | | | Powerfleet Inc NJ(a) | | | 560,694 | |
| | 21,821 | | | TTM Technologies, Inc.(a) | | | 531,996 | |
| | 33,352 | | | ViaSat, Inc.(a) | | | 311,174 | |
| | | | | | | | 9,033,700 | |
| | | | | TECHNOLOGY SERVICES - 1.1% | | | | |
| | 8,186 | | | CSG Systems International, Inc. | | | 448,675 | |
| | 10,439 | | | ExlService Holdings, Inc.(a) | | | 483,952 | |
| | 10,156 | | | Genpact Ltd. | | | 468,801 | |
See accompanying notes to financial statements.
| INSPIRE SMALL/MID CAP ETF |
| SCHEDULE OF INVESTMENTS (Continued) |
| November 30, 2024 |
| Shares | | | | | Fair Value | |
| | | | | COMMON STOCKS — 99.4% (Continued) | | | | |
| | | | | TECHNOLOGY SERVICES - 1.1% (Continued) | | | | |
| | 2,388 | | | ICF International, Inc. | | $ | 330,905 | |
| | 4,274 | | | MAXIMUS, Inc. | | | 318,413 | |
| | 1,898 | | | WEX, Inc.(a) | | | 358,077 | |
| | | | | | | | 2,408,823 | |
| | | | | TELECOMMUNICATIONS - 1.1% | | | | |
| | 16,094 | | | EchoStar Corporation, Class A(a) | | | 407,017 | |
| | 321,145 | | | Globalstar, Inc.(a) | | | 626,233 | |
| | 13,078 | | | Iridium Communications, Inc. | | | 388,678 | |
| | 28,222 | | | Shenandoah Telecommunications Company | | | 376,199 | |
| | 17,127 | | | Telephone and Data Systems, Inc. | | | 585,401 | |
| | | | | | | | 2,383,528 | |
| | | | | TIMBER REIT - 0.2% | | | | |
| | 12,374 | | | Rayonier, Inc. | | | 394,359 | |
| | | | | | | | | |
| | | | | TRANSPORTATION & LOGISTICS - 2.8% | | | | |
| | 24,597 | | | Air Transport Services Group, Inc.(a) | | | 540,150 | |
| | 7,231 | | | Allegiant Travel Company | | | 591,785 | |
| | 7,536 | | | Covenant Logistics Group, Inc. | | | 437,691 | |
| | 49,102 | | | CryoPort, Inc.(a) | | | 347,642 | |
| | 11,574 | | | Dorian, L.P.G Ltd. | | | 283,216 | |
| | 11,250 | | | Forward Air Corporation(b) | | | 412,763 | |
| | 20,421 | | | Genco Shipping & Trading Ltd. | | | 324,081 | |
| | 32,428 | | | Heartland Express, Inc. | | | 414,106 | |
| | 8,756 | | | Hub Group, Inc., Class A | | | 452,160 | |
| | 7,381 | | | Knight-Swift Transportation Holdings, Inc. | | | 438,136 | |
| | 2,108 | | | Landstar System, Inc. | | | 391,919 | |
| | 2,791 | | | Matson, Inc. | | | 427,525 | |
| | 2,732 | | | Ryder System, Inc. | | | 461,271 | |
| | 10,359 | | | Werner Enterprises, Inc. | | | 423,476 | |
| | | | | | | | 5,945,921 | |
| | | | | TRANSPORTATION EQUIPMENT - 0.8% | | | | |
| | 4,145 | | | Allison Transmission Holdings, Inc. | | | 491,182 | |
| | 8,304 | | | Blue Bird Corporation(a) | | | 337,558 | |
| | 11,428 | | | Trinity Industries, Inc. | | | 430,836 | |
See accompanying notes to financial statements.
| INSPIRE SMALL/MID CAP ETF |
| SCHEDULE OF INVESTMENTS (Continued) |
| November 30, 2024 |
| Shares | | | | | | | | | Fair Value | |
| | | | | COMMON STOCKS — 99.4% (Continued) | | | | | | | | |
| | | | | TRANSPORTATION EQUIPMENT - 0.8% (Continued) | | | | | | | | |
| | 20,898 | | | Wabash National Corporation | | | | | | $ | 414,407 | |
| | | | | | | | | | | | 1,673,983 | |
| | | | | WHOLESALE - CONSUMER STAPLES - 0.3% | | | | | | | | |
| | 7,971 | | | Andersons, Inc. (The) | | | | | | | 380,536 | |
| | 14,053 | | | Calavo Growers, Inc. | | | | | | | 389,408 | |
| | | | | | | | | | | | 769,944 | |
| | | | | WHOLESALE - DISCRETIONARY - 0.6% | | | | | | | | |
| | 4,049 | | | ePlus, Inc.(a) | | | | | | | 327,402 | |
| | 23,590 | | | OPENLANE, Inc.(a) | | | | | | | 476,518 | |
| | 8,292 | | | ScanSource, Inc.(a) | | | | | | | 418,000 | |
| | | | | | | | | | | | 1,221,920 | |
| | | | | | | | | | | | | |
| | | | | TOTAL COMMON STOCKS (Cost $181,292,944) | | | | | | | 211,548,086 | |
| | | | | | | | | | | | | |
| | | | | | | Expiration
Date | | Exercise
Price | | | Fair Value | |
| | | | | RIGHT — 0.0%(d) | | | | | | | | |
| | | | | BIOTECH & PHARMA - 0.0% (d) | | | | | | | | |
| | 6,384 | | | Bristol-Myers Squibb Company(a)(f)(g) (Cost $0) | | | | | | | — | |
See accompanying notes to financial statements.
| INSPIRE SMALL/MID CAP ETF |
| SCHEDULE OF INVESTMENTS (Continued) |
| November 30, 2024 |
| Shares | | | | | Fair Value | |
| | | | | COLLATERAL FOR SECURIT/ES LOANED - 3.0% | | | | |
| | | | | MONEY MARKET FUND - 3.0% | | | | |
| | 6,329,498 | | | Fidelity Investments Money Market Government Portfolio - Institutional Class, 4.55% (Cost $6,329,498)(c) (e) | | $ | 6,329,498 | |
| | | | | | | | | |
| | | | | | | | | |
| | | | | TOTAL INVESTMENTS - 102.4% (Cost $187,622,442) | | $ | 217,877,584 | |
| | | | | LIABILITIES IN EXCESS OF OTHER ASSETS - (2.4)% | | | (5,015,015 | ) |
| | | | | NET ASSETS - 100.0% | | $ | 212,862,569 | |
| LTD | - Limited Company |
| | |
| N.V. | - Naamioze Vennootschap |
| | |
| REIT | - Real Estate Investment Trust |
| | |
| S.A. | - Société Anonyme |
| (a) | Non-income producing security. |
| (b) | All or a portion of the security is on loan. The total fair value of the securities on loan as of November 30, 2024 was $6,259,268. |
| (c) | Security was purchased with cash received as collateral for securities on loan at November 30, 2024. Total collateral had a value of $6,329,498 at November 30, 2024. |
| (d) | Percentage rounds to less than 0.1%. |
| (e) | Rate disclosed is the seven day effective yield as of November 30, 2024. |
| (f) | The fair value of this investment is determined using significant unobservable inputs. |
| (g) | Illiquid security. The total fair value of these securities as of November 30, 2024 was $0, representing 0% of net assets. |
See accompanying notes to financial statements.
| INSPIRE CORPORATE BOND ETF |
| SCHEDULE OF INVESTMENTS |
| November 30, 2024 |
| Principal | | | | | Coupon Rate | | | | | |
| Amount ($) | | | | | (%) | | Maturity | | Fair Value | |
| | | | | CORPORATE BONDS — 98.6% | | | | | | | | |
| | | | | AUTOMOTIVE — 0.6% | | | | | | | | |
| | 1,000,000 | | | BorgWarner, Inc. | | 2.6500 | | 07/01/27 | | $ | 954,090 | |
| | 1,000,000 | | | BorgWarner, Inc. | | 5.4000 | | 08/15/34 | | | 1,008,674 | |
| | | | | | | | | | | | 1,962,764 | |
| | | | | BANKING — 0.9% | | | | | | | | |
| | 1,000,000 | | | First-Citizens Bank & Trust Company | | 6.1250 | | 03/09/28 | | | 1,036,702 | |
| | 1,000,000 | | | Regions Financial Corporation | | 1.8000 | | 08/12/28 | | | 900,546 | |
| | 1,000,000 | | | Zions Bancorp NA | | 3.2500 | | 10/29/29 | | | 891,070 | |
| | | | | | | | | | | | 2,828,318 | |
| | | | | BEVERAGES — 0.3% | | | | | | | | |
| | 1,000,000 | | | Coca-Cola Consolidated, Inc. | | 5.4500 | | 06/01/34 | | | 1,028,905 | |
| | | | | | | | | | | | | |
| | | | | BIOTECH & PHARMA — 0.3% | | | | | | | | |
| | 1,000,000 | | | Royalty Pharma plc | | 1.2000 | | 09/02/25 | | | 972,080 | |
| | | | | | | | | | | | | |
| | | | | CHEMICALS — 1.2% | | | | | | | | |
| | 1,000,000 | | | Albemarle Corporation | | 4.6500 | | 06/01/27 | | | 995,567 | |
| | 1,000,000 | | | Albemarle Corporation | | 5.0500 | | 06/01/32 | | | 975,750 | |
| | 1,000,000 | | | Cabot Corporation | | 5.0000 | | 06/30/32 | | | 997,707 | |
| | 1,000,000 | | | LYB International Finance III, LLC | | 1.2500 | | 10/01/25 | | | 971,588 | |
| | | | | | | | | | | | 3,940,612 | |
| | | | | COMMERCIAL SUPPORT SERVICES — 4.5% | | | | | | | | |
| | 1,000,000 | | | Cintas Corp No 2 | | 3.4500 | | 05/01/25 | | | 994,361 | |
| | 1,000,000 | | | Cintas Corp No 2 | | 3.7000 | | 04/01/27 | | | 982,342 | |
| | 1,000,000 | | | Cintas Corp No 2 B | | 4.0000 | | 05/01/32 | | | 955,077 | |
| | 1,000,000 | | | Republic Services, Inc. | | 3.3750 | | 11/15/27 | | | 969,929 | |
| | 4,800,000 | | | Republic Services, Inc. | | 3.9500 | | 05/15/28 | | | 4,699,439 | |
| | 1,000,000 | | | Republic Services, Inc. | | 2.3000 | | 03/01/30 | | | 889,283 | |
| | 1,000,000 | | | Republic Services, Inc. | | 1.4500 | | 02/15/31 | | | 826,350 | |
| | 1,000,000 | | | Republic Services, Inc. | | 1.7500 | | 02/15/32 | | | 817,878 | |
| | 1,000,000 | | | Waste Connections, Inc. | | 4.2500 | | 12/01/28 | | | 987,557 | |
| | 1,000,000 | | | Waste Management, Inc. | | 0.7500 | | 11/15/25 | | | 964,525 | |
| | 1,000,000 | | | Waste Management, Inc. | | 3.1500 | | 11/15/27 | | | 964,764 | |
| | 1,000,000 | | | Waste Management, Inc. | | 4.6250 | | 02/15/33 | | | 994,750 | |
| | | | | | | | | | | | 15,046,255 | |
See accompanying notes to financial statements.
| INSPIRE CORPORATE BOND ETF |
| SCHEDULE OF INVESTMENTS (Continued) |
| November 30, 2024 |
| Principal | | | | | Coupon Rate | | | | | |
| Amount ($) | | | | | (%) | | Maturity | | Fair Value | |
| | | | | CORPORATE BONDS — 98.6% (Continued) | | | | | | | | |
| | | | | CONSTRUCTION MATERIALS — 2.5% | | | | | | | | |
| | 1,000,000 | | | Carlisle Companies, Inc. | | 3.7500 | | 12/01/27 | | $ | 974,853 | |
| | 4,800,000 | | | Carlisle Companies, Inc. | | 2.7500 | | 03/01/30 | | | 4,339,081 | |
| | 1,000,000 | | | Carlisle Companies, Inc. | | 2.2000 | | 03/01/32 | | | 831,765 | |
| | 1,000,000 | | | Owens Corning | | 5.7000 | | 06/15/34 | | | 1,040,932 | |
| | 1,000,000 | | | Vulcan Materials Company | | 3.9000 | | 04/01/27 | | | 986,733 | |
| | | | | | | | | | | | 8,173,364 | |
| | | | | CONTAINERS & PACKAGING — 1.4% | | | | | | | | |
| | 1,000,000 | | | Amcor Finance USA, Inc. | | 3.6250 | | 04/28/26 | | | 983,855 | |
| | 1,000,000 | | | Amcor Finance USA, Inc. | | 4.5000 | | 05/15/28 | | | 989,022 | |
| | 1,000,000 | | | Amcor Flexibles North America, Inc. | | 2.6300 | | 06/19/30 | | | 891,558 | |
| | 1,000,000 | | | Amcor Flexibles North America, Inc. | | 2.6900 | | 05/25/31 | | | 875,048 | |
| | 1,000,000 | | | AptarGroup, Inc. | | 3.6000 | | 03/15/32 | | | 911,680 | |
| | | | | | | | | | | | 4,651,163 | |
| | | | | DIVERSIFIED INDUSTRIALS — 3.6% | | | | | | | | |
| | 1,000,000 | | | Dover Corporation | | 3.1500 | | 11/15/25 | | | 985,816 | |
| | 1,000,000 | | | Emerson Electric Company | | 1.8000 | | 10/15/27 | | | 931,799 | |
| | 1,000,000 | | | Emerson Electric Company | | 2.0000 | | 12/21/28 | | | 909,088 | |
| | 1,000,000 | | | Emerson Electric Company | | 1.9500 | | 10/15/30 | | | 866,976 | |
| | 1,000,000 | | | Emerson Electric Company | | 2.2000 | | 12/21/31 | | | 855,859 | |
| | 1,000,000 | | | Parker-Hannifin Corporation | | 3.2500 | | 03/01/27 | | | 972,141 | |
| | 1,000,000 | | | Parker-Hannifin Corporation | | 4.2500 | | 09/15/27 | | | 994,018 | |
| | 4,800,000 | | | Parker-Hannifin Corporation | | 3.2500 | | 06/14/29 | | | 4,542,890 | |
| | 1,000,000 | | | Parker-Hannifin Corporation | | 4.5000 | | 09/15/29 | | | 997,770 | |
| | | | | | | | | | | | 12,056,357 | |
| | | | | ELECTRIC UTILITIES — 5.9% | | | | | | | | |
| | 1,000,000 | | | Avangrid, Inc. | | 3.8000 | | 06/01/29 | | | 958,454 | |
| | 1,000,000 | | | CenterPoint Energy, Inc. | | 1.4500 | | 06/01/26 | | | 953,805 | |
| | 1,000,000 | | | CenterPoint Energy, Inc. | | 2.9500 | | 03/01/30 | | | 909,122 | |
| | 1,000,000 | | | CenterPoint Energy, Inc. | | 2.6500 | | 06/01/31 | | | 876,094 | |
| | 1,000,000 | | | DTE Energy Company | | 5.8500 | | 06/01/34 | | | 1,051,671 | |
| | 1,000,000 | | | Emera US Finance, L.P. | | 3.5500 | | 06/15/26 | | | 980,280 | |
| | 1,000,000 | | | Entergy Arkansas, LLC | | 3.5000 | | 04/01/26 | | | 987,018 | |
| | 1,000,000 | | | Entergy Corporation | | 0.9000 | | 09/15/25 | | | 969,381 | |
| | 1,000,000 | | | Entergy Corporation | | 1.9000 | | 06/15/28 | | | 911,609 | |
See accompanying notes to financial statements.
| INSPIRE CORPORATE BOND ETF |
| SCHEDULE OF INVESTMENTS (Continued) |
| November 30, 2024 |
| Principal | | | | | Coupon Rate | | | | | |
| Amount ($) | | | | | (%) | | Maturity | | Fair Value | |
| | | | | CORPORATE BONDS — 98.6% (Continued) | | | | | | | | |
| | | | | ELECTRIC UTILITIES — 5.9% (Continued) | | | | | | | | |
| | 1,000,000 | | | Entergy Corporation | | 2.8000 | | 06/15/30 | | $ | 904,760 | |
| | 1,000,000 | | | Entergy Corporation | | 2.4000 | | 06/15/31 | | | 859,652 | |
| | 4,800,000 | | | Evergy, Inc. | | 2.9000 | | 09/15/29 | | | 4,416,268 | |
| | 1,000,000 | | | Eversource Energy | | 5.9500 | | 07/15/34 | | | 1,049,988 | |
| | 1,000,000 | | | Exelon Corporation | | 5.1500 | | 03/15/29 | | | 1,016,195 | |
| | 1,000,000 | | | Exelon Corporation | | 4.0500 | | 04/15/30 | | | 963,447 | |
| | 1,000,000 | | | Exelon Corporation | | 5.4500 | | 03/15/34 | | | 1,025,234 | |
| | 1,000,000 | | | WEC Energy Group, Inc. | | 1.3750 | | 10/15/27 | | | 916,072 | |
| | | | | | | | | | | | 19,749,050 | |
| | | | | ELECTRICAL EQUIPMENT — 4.9% | | | | | | | | |
| | 4,800,000 | | | Amphenol Corporation | | 4.3500 | | 06/01/29 | | | 4,747,250 | |
| | 1,000,000 | | | Amphenol Corporation | | 2.8000 | | 02/15/30 | | | 913,806 | |
| | 1,000,000 | | | Amphenol Corporation | | 2.2000 | | 09/15/31 | | | 847,730 | |
| | 1,000,000 | | | Amphenol Corporation | | 5.2500 | | 04/05/34 | | | 1,022,611 | |
| | 1,000,000 | | | Keysight Technologies, Inc. | | 4.6000 | | 04/06/27 | | | 998,964 | |
| | 1,000,000 | | | Keysight Technologies, Inc. | | 3.0000 | | 10/30/29 | | | 923,190 | |
| | 1,000,000 | | | Otis Worldwide Corporation | | 5.2500 | | 08/16/28 | | | 1,020,482 | |
| | 4,800,000 | | | Trimble, Inc. | | 4.9000 | | 06/15/28 | | | 4,812,920 | |
| | 1,000,000 | | | Trimble, Inc. | | 6.1000 | | 03/15/33 | | | 1,054,748 | |
| | | | | | | | | | | | 16,341,701 | |
| | | | | ENGINEERING & CONSTRUCTION — 0.3% | | | | | | | | |
| | 1,000,000 | | | Quanta Services, Inc. | | 5.2500 | | 08/09/34 | | | 1,000,958 | |
| | | | | | | | | | | | | |
| | | | | FOOD — 3.4% | | | | | | | | |
| | 1,000,000 | | | Campbell Soup Company | | 4.1500 | | 03/15/28 | | | 983,765 | |
| | 1,000,000 | | | Campbell Soup Company | | 5.4000 | | 03/21/34 | | | 1,018,429 | |
| | 1,000,000 | | | Conagra Brands, Inc. | | 4.6000 | | 11/01/25 | | | 998,097 | |
| | 4,800,000 | | | Conagra Brands, Inc. | | 1.3750 | | 11/01/27 | | | 4,374,351 | |
| | 1,000,000 | | | Conagra Brands, Inc. | | 4.8500 | | 11/01/28 | | | 1,002,289 | |
| | 1,000,000 | | | McCormick & Co, Inc. | | 3.4000 | | 08/15/27 | | | 972,585 | |
| | 1,000,000 | | | McCormick & Co, Inc. | | 2.5000 | | 04/15/30 | | | 893,620 | |
| | 1,000,000 | | | McCormick & Co, Inc. | | 4.9500 | | 04/15/33 | | | 999,462 | |
| | | | | | | | | | | | 11,242,598 | |
See accompanying notes to financial statements.
| INSPIRE CORPORATE BOND ETF |
| SCHEDULE OF INVESTMENTS (Continued) |
| November 30, 2024 |
| Principal | | | | | Coupon Rate | | | | | |
| Amount ($) | | | | | (%) | | Maturity | | Fair Value | |
| | | | | CORPORATE BONDS — 98.6% (Continued) | | | | | | | | |
| | | | | GAS & WATER UTILITIES — 3.3% | | | | | | | | |
| | 1,000,000 | | | Atmos Energy Corporation | | 3.0000 | | 06/15/27 | | $ | 966,296 | |
| | 4,800,000 | | | Atmos Energy Corporation | | 2.6250 | | 09/15/29 | | | 4,422,929 | |
| | 1,000,000 | | | Atmos Energy Corporation | | 1.5000 | | 01/15/31 | | | 839,303 | |
| | 1,000,000 | | | Atmos Energy Corporation | | 5.9000 | | 11/15/33 | | | 1,074,689 | |
| | 1,000,000 | | | CenterPoint Energy Resources Corporation | | 1.7500 | | 10/01/30 | | | 849,240 | |
| | 1,000,000 | | | Essential Utilities, Inc. | | 2.7040 | | 04/15/30 | | | 899,513 | |
| | 1,000,000 | | | Essential Utilities, Inc. | | 5.3750 | | 01/15/34 | | | 1,015,590 | |
| | 1,000,000 | | | NiSource, Inc. | | 5.4000 | | 06/30/33 | | | 1,021,974 | |
| | | | | | | | | | | | 11,089,534 | |
| | | | | HEALTH CARE FACILITIES & SERVICES — 0.9% | | | | | | | | |
| | 1,000,000 | | | Anthem, Inc. | | 3.6500 | | 12/01/27 | | | 974,508 | |
| | 1,000,000 | | | Elevance Health, Inc. | | 1.5000 | | 03/15/26 | | | 961,298 | |
| | 1,000,000 | | | Elevance Health, Inc. | | 5.3750 | | 06/15/34 | | | 1,019,703 | |
| | | | | | | | | | | | 2,955,509 | |
| | | | | HOME CONSTRUCTION — 2.1% | | | | | | | | |
| | 1,000,000 | | | DR Horton, Inc. | | 2.6000 | | 10/15/25 | | | 982,364 | |
| | 1,000,000 | | | DR Horton, Inc. | | 1.3000 | | 10/15/26 | | | 939,827 | |
| | 1,000,000 | | | Fortune Brands Innovations, Inc. | | 3.2500 | | 09/15/29 | | | 935,341 | |
| | 1,000,000 | | | Fortune Brands Innovations, Inc. | | 5.8750 | | 06/01/33 | | | 1,045,884 | |
| | 1,000,000 | | | Mohawk Industries, Inc. | | 5.8500 | | 09/18/28 | | | 1,034,251 | |
| | 1,000,000 | | | Mohawk Industries, Inc. | | 3.6250 | | 05/15/30 | | | 937,712 | |
| | 1,000,000 | | | PulteGroup, Inc. | | 6.3750 | | 05/15/33 | | | 1,082,030 | |
| | | | | | | | | | | | 6,957,409 | |
| | | | | INSTITUTIONAL FINANCIAL SERVICES — 1.4% | | | | | | | | |
| | 4,800,000 | | | Cboe Global Markets, Inc. | | 3.6500 | | 01/12/27 | | | 4,719,500 | |
| | | | | | | | | | | | | |
| | | | | INSURANCE — 4.0% | | | | | | | | |
| | 4,800,000 | | | Arch Capital Finance, LLC | | 4.0110 | | 12/15/26 | | | 4,733,855 | |
| | 1,000,000 | | | Globe Life, Inc. | | 5.8500 | | 09/15/34 | | | 1,029,663 | |
| | 1,000,000 | | | Loews Corporation | | 3.7500 | | 04/01/26 | | | 988,502 | |
| | 1,000,000 | | | Loews Corporation | | 3.2000 | | 05/15/30 | | | 928,709 | |
| | 1,000,000 | | | Primerica, Inc. | | 2.8000 | | 11/19/31 | | | 868,845 | |
| | 1,000,000 | | | Progressive Corporation (The) | | 3.2000 | | 03/26/30 | | | 931,911 | |
| | 1,000,000 | | | Progressive Corporation (The) | | 4.9500 | | 06/15/33 | | | 1,013,247 | |
See accompanying notes to financial statements.
| INSPIRE CORPORATE BOND ETF |
| SCHEDULE OF INVESTMENTS (Continued) |
| November 30, 2024 |
| Principal | | | | | Coupon Rate | | | | | |
| Amount ($) | | | | | (%) | | Maturity | | Fair Value | |
| | | | | CORPORATE BONDS — 98.6% (Continued) | | | | | | | | |
| | | | | INSURANCE — 4.0% (Continued) | | | | | | | | |
| | 1,000,000 | | | Reinsurance Group of America, Inc. | | 3.9000 | | 05/15/29 | | $ | 963,538 | |
| | 1,000,000 | | | Reinsurance Group of America, Inc. | | 3.1500 | | 06/15/30 | | | 917,382 | |
| | 1,000,000 | | | Reinsurance Group of America, Inc. | | 6.0000 | | 09/15/33 | | | 1,056,906 | |
| | | | | | | | | | | | 13,432,558 | |
| | | | | LEISURE PRODUCTS — 0.3% | | | | | | | | |
| | 1,000,000 | | | Brunswick Corporation | | 4.4000 | | 09/15/32 | | | 937,750 | |
| | | | | | | | | | | | | |
| | | | | MACHINERY — 3.4% | | | | | | | | |
| | 1,000,000 | | | AGCO Corporation | | 5.8000 | | 03/21/34 | | | 1,026,898 | |
| | 1,000,000 | | | Caterpillar Financial Services Corporation | | 0.8000 | | 11/13/25 | | | 966,076 | |
| | 1,000,000 | | | Caterpillar Financial Services Corporation | | 0.9000 | | 03/02/26 | | | 958,580 | |
| | 4,800,000 | | | Caterpillar, Inc. | | 2.6000 | | 09/19/29 | | | 4,419,562 | |
| | 1,000,000 | | | Caterpillar, Inc. | | 1.9000 | | 03/12/31 | | | 864,678 | |
| | 1,000,000 | | | CNH Industrial Capital, LLC | | 1.8750 | | 01/15/26 | | | 967,998 | |
| | 1,000,000 | | | Ingersoll Rand, Inc. | | 5.7000 | | 08/14/33 | | | 1,043,328 | |
| | 1,000,000 | | | Nordson Corporation | | 5.8000 | | 09/15/33 | | | 1,055,260 | |
| | | | | | | | | | | | 11,302,380 | |
| | | | | MEDICAL EQUIPMENT & DEVICES — 1.1% | | | | | | | | |
| | 1,000,000 | | | Baxter International, Inc. | | 2.2720 | | 12/01/28 | | | 907,285 | |
| | 1,000,000 | | | Baxter International, Inc. | | 3.9500 | | 04/01/30 | | | 954,815 | |
| | 1,000,000 | | | Baxter International, Inc. | | 2.5390 | | 02/01/32 | | | 852,706 | |
| | 1,000,000 | | | DENTSPLY SIRONA, Inc. | | 3.2500 | | 06/01/30 | | | 896,919 | |
| | | | | | | | | | | | 3,611,725 | |
| | | | | METALS & MINING — 0.5% | | | | | | | | |
| | 1,000,000 | | | Newmont Corporation | | 2.2500 | | 10/01/30 | | | 875,026 | |
| | 1,000,000 | | | Newmont Corporation | | 2.6000 | | 07/15/32 | | | 864,543 | |
| | | | | | | | | | | | 1,739,569 | |
| | | | | OIL & GAS PRODUCERS — 9.7% | | | | | | | | |
| | 1,000,000 | | | Cheniere Energy Partners, L.P. | | 5.9500 | | 06/30/33 | | | 1,038,590 | |
| | 1,000,000 | | | Continental Resources, Inc. | | 4.3750 | | 01/15/28 | | | 979,003 | |
| | 1,000,000 | | | Devon Energy Corporation | | 5.8500 | | 12/15/25 | | | 1,007,378 | |
| | 1,000,000 | | | Devon Energy Corporation | | 4.5000 | | 01/15/30 | | | 978,843 | |
| | 1,000,000 | | | Devon Energy Corporation | | 7.8750 | | 09/30/31 | | | 1,151,385 | |
| | 1,000,000 | | | Devon Energy Corporation | | 5.2000 | | 09/15/34 | | | 977,521 | |
See accompanying notes to financial statements.
| INSPIRE CORPORATE BOND ETF |
| SCHEDULE OF INVESTMENTS (Continued) |
| November 30, 2024 |
| Principal | | | | | Coupon Rate | | | | | |
| Amount ($) | | | | | (%) | | Maturity | | Fair Value | |
| | | | | CORPORATE BONDS — 98.6% (Continued) | | | | | | | | |
| | | | | OIL & GAS PRODUCERS — 9.7% (Continued) | | | | | | | | |
| | 1,000,000 | | | Diamondback Energy, Inc. | | 3.2500 | | 12/01/26 | | $ | 974,704 | |
| | 1,000,000 | | | Diamondback Energy, Inc. | | 3.5000 | | 12/01/29 | | | 939,449 | |
| | 4,800,000 | | | Diamondback Energy, Inc. | | 3.1250 | | 03/24/31 | | | 4,316,687 | |
| | 1,000,000 | | | EOG Resources, Inc. | | 3.1500 | | 04/01/25 | | | 994,281 | |
| | 1,000,000 | | | EOG Resources, Inc. | | 4.1500 | | 01/15/26 | | | 995,169 | |
| | 1,000,000 | | | Kinder Morgan, Inc. | | 4.3000 | | 06/01/25 | | | 996,607 | |
| | 1,000,000 | | | Kinder Morgan, Inc. | | 4.3000 | | 03/01/28 | | | 988,939 | |
| | 1,000,000 | | | Kinder Morgan, Inc. | | 7.8000 | | 08/01/31 | | | 1,152,620 | |
| | 1,000,000 | | | Kinder Morgan, Inc. | | 5.2000 | | 06/01/33 | | | 999,957 | |
| | 1,000,000 | | | ONEOK, Inc. | | 5.8500 | | 01/15/26 | | | 1,009,940 | |
| | 1,000,000 | | | ONEOK, Inc. | | 4.0000 | | 07/13/27 | | | 982,378 | |
| | 1,000,000 | | | Ovintiv, Inc. | | 5.3750 | | 01/01/26 | | | 1,003,081 | |
| | 1,000,000 | | | Targa Resources Corporation | | 6.1500 | | 03/01/29 | | | 1,050,358 | |
| | 1,000,000 | | | Targa Resources Corporation | | 6.1250 | | 03/15/33 | | | 1,055,585 | |
| | 1,000,000 | | | Targa Resources Partners, L.P. / Targa Resources | | 5.0000 | | 01/15/28 | | | 995,945 | |
| | 1,000,000 | | | Tennessee Gas Pipeline Company, LLC | | 7.0000 | | 10/15/28 | | | 1,080,065 | |
| | 1,000,000 | | | Transcontinental Gas Pipe Line Company, LLC | | 7.8500 | | 02/01/26 | | | 1,027,144 | |
| | 1,000,000 | | | Valero Energy Corporation | | 3.4000 | | 09/15/26 | | | 977,617 | |
| | 4,800,000 | | | Valero Energy Corporation | | 4.3500 | | 06/01/28 | | | 4,746,098 | |
| | | | | | | | | | | | 32,419,344 | |
| | | | | OIL & GAS SERVICES & EQUIPMENT — 0.9% | | | | | | | | |
| | 1,000,000 | | | Schlumberger Holdings Corporation(a) | | 4.0000 | | 12/21/25 | | | 992,987 | |
| | 1,000,000 | | | Schlumberger Holdings Corporation(a) | | 3.9000 | | 05/17/28 | | | 979,148 | |
| | 1,000,000 | | | Schlumberger Holdings Corporation(a) | | 4.3000 | | 05/01/29 | | | 985,232 | |
| | | | | | | | | | | | 2,957,367 | |
| | | | | REAL ESTATE INVESTMENT TRUSTS — 19.4% | | | | | | | | |
| | 1,000,000 | | | Alexandria Real Estate Equities, Inc. | | 3.9500 | | 01/15/28 | | | 978,704 | |
| | 1,000,000 | | | Alexandria Real Estate Equities, Inc. | | 4.7000 | | 07/01/30 | | | 989,223 | |
| | 4,800,000 | | | Alexandria Real Estate Equities, Inc. | | 4.9000 | | 12/15/30 | | | 4,805,784 | |
| | 1,000,000 | | | Alexandria Real Estate Equities, Inc. | | 3.3750 | | 08/15/31 | | | 913,579 | |
| | 1,000,000 | | | Alexandria Real Estate Equities, Inc. | | 2.0000 | | 05/18/32 | | | 814,636 | |
| | 1,000,000 | | | Boston Properties, L.P. | | 3.6500 | | 02/01/26 | | | 985,122 | |
| | 1,000,000 | | | Boston Properties, L.P. | | 4.5000 | | 12/01/28 | | | 979,860 | |
| | 1,000,000 | | | Boston Properties, L.P. | | 3.4000 | | 06/21/29 | | | 926,371 | |
See accompanying notes to financial statements.
| INSPIRE CORPORATE BOND ETF |
| SCHEDULE OF INVESTMENTS (Continued) |
| November 30, 2024 |
| Principal | | | | | Coupon Rate | | | | | |
| Amount ($) | | | | | (%) | | Maturity | | Fair Value | |
| | | | | CORPORATE BONDS — 98.6% (Continued) | | | | | | | | |
| | | | | REAL ESTATE INVESTMENT TRUSTS — 19.4% (Continued) | | | | | | | | |
| | 4,800,000 | | | Boston Properties, L.P. | | 3.2500 | | 01/30/31 | | $ | 4,265,609 | |
| | 1,000,000 | | | Boston Properties, L.P. | | 2.5500 | | 04/01/32 | | | 823,393 | |
| | 4,800,000 | | | Camden Property Trust | | 4.9000 | | 01/15/34 | | | 4,776,921 | |
| | 1,000,000 | | | Crown Castle, Inc. | | 5.8000 | | 03/01/34 | | | 1,039,626 | |
| | 1,000,000 | | | Digital Realty Trust, L.P. | | 3.7000 | | 08/15/27 | | | 975,732 | |
| | 1,000,000 | | | Digital Realty Trust, L.P. | | 4.4500 | | 07/15/28 | | | 990,808 | |
| | 1,000,000 | | | Digital Realty Trust, L.P. | | 3.6000 | | 07/01/29 | | | 955,355 | |
| | 1,000,000 | | | Extra Space Storage, L.P. | | 3.9000 | | 04/01/29 | | | 963,552 | |
| | 4,800,000 | | | Extra Space Storage, L.P. | | 2.5500 | | 06/01/31 | | | 4,156,172 | |
| | 1,000,000 | | | Extra Space Storage, L.P. | | 2.3500 | | 03/15/32 | | | 833,219 | |
| | 1,000,000 | | | Invitation Homes Operating Partnership, L.P. | | 2.0000 | | 08/15/31 | | | 827,876 | |
| | 1,000,000 | | | Kite Realty Group Trust | | 4.7500 | | 09/15/30 | | | 990,781 | |
| | 1,000,000 | | | LXP Industrial Trust | | 2.7000 | | 09/15/30 | | | 873,812 | |
| | 1,000,000 | | | LXP Industrial Trust | | 2.3750 | | 10/01/31 | | | 827,131 | |
| | 1,000,000 | | | Mid-America Apartments, L.P. | | 4.0000 | | 11/15/25 | | | 993,992 | |
| | 1,000,000 | | | National Health Investors, Inc. | | 3.0000 | | 02/01/31 | | | 861,844 | |
| | 1,000,000 | | | NNN REIT, Inc. | | 2.5000 | | 04/15/30 | | | 885,614 | |
| | 1,000,000 | | | NNN REIT, Inc. | | 5.6000 | | 10/15/33 | | | 1,030,944 | |
| | 1,000,000 | | | Omega Healthcare Investors, Inc. | | 4.7500 | | 01/15/28 | | | 993,511 | |
| | 1,000,000 | | | Omega Healthcare Investors, Inc. | | 3.6250 | | 10/01/29 | | | 933,507 | |
| | 4,800,000 | | | Omega Healthcare Investors, Inc. | | 3.2500 | | 04/15/33 | | | 4,125,352 | |
| | 1,000,000 | | | Prologis, L.P. | | 3.8750 | | 09/15/28 | | | 977,124 | |
| | 1,000,000 | | | Prologis, L.P. | | 2.2500 | | 04/15/30 | | | 885,257 | |
| | 1,000,000 | | | Prologis, L.P. | | 1.2500 | | 10/15/30 | | | 828,704 | |
| | 1,000,000 | | | Prologis, L.P. | | 1.6250 | | 03/15/31 | | | 832,877 | |
| | 1,000,000 | | | Public Storage Operating Company | | 0.8750 | | 02/15/26 | | | 958,030 | |
| | 1,000,000 | | | Public Storage Operating Company | | 3.0940 | | 09/15/27 | | | 964,598 | |
| | 1,000,000 | | | Simon Property Group, L.P. | | 3.3000 | | 01/15/26 | | | 985,906 | |
| | 4,800,000 | | | Sun Communities Operating, L.P. | | 2.3000 | | 11/01/28 | | | 4,359,360 | |
| | 1,000,000 | | | Sun Communities Operating, L.P. | | 2.7000 | | 07/15/31 | | | 857,273 | |
| | 1,000,000 | | | UDR, Inc. | | 3.2000 | | 01/15/30 | | | 926,131 | |
| | 1,000,000 | | | UDR, Inc. | | 2.1000 | | 08/01/32 | | | 816,526 | |
| | 1,000,000 | | | Ventas Realty, L.P. | | 4.1250 | | 01/15/26 | | | 992,730 | |
| | 1,000,000 | | | Ventas Realty, L.P. | | 3.2500 | | 10/15/26 | | | 972,331 | |
See accompanying notes to financial statements.
| INSPIRE CORPORATE BOND ETF |
| SCHEDULE OF INVESTMENTS (Continued) |
| November 30, 2024 |
| Principal | | | | | Coupon Rate | | | | | |
| Amount ($) | | | | | (%) | | Maturity | | Fair Value | |
| | | | | CORPORATE BONDS — 98.6% (Continued) | | | | | | | | |
| | | | | REAL ESTATE INVESTMENT TRUSTS — 19.4% (Continued) | | | | | | | | |
| | 1,000,000 | | | Ventas Realty, L.P. | | 4.0000 | | 03/01/28 | | $ | 979,148 | |
| | 1,000,000 | | | Ventas Realty, L.P. | | 4.4000 | | 01/15/29 | | | 985,173 | |
| | 1,000,000 | | | Ventas Realty, L.P. | | 4.7500 | | 11/15/30 | | | 995,171 | |
| | 1,000,000 | | | WP Carey, Inc. | | 2.4000 | | 02/01/31 | | | 863,080 | |
| | 1,000,000 | | | WP Carey, Inc. | | 2.2500 | | 04/01/33 | | | 808,583 | |
| | | | | | | | | | | | 64,506,032 | |
| | | | | RETAIL - CONSUMER STAPLES — 2.0% | | | | | | | | |
| | 1,000,000 | | | Dollar General Corporation | | 4.1500 | | 11/01/25 | | | 992,420 | |
| | 4,800,000 | | | Dollar General Corporation | | 3.8750 | | 04/15/27 | | | 4,700,481 | |
| | 1,000,000 | | | Dollar Tree, Inc. | | 4.2000 | | 05/15/28 | | | 977,822 | |
| | | | | | | | | | | | 6,670,723 | |
| | | | | RETAIL - DISCRETIONARY — 2.6% | | | | | | | | |
| | 4,800,000 | | | AutoZone, Inc. | | 3.7500 | | 06/01/27 | | | 4,704,739 | |
| | 1,000,000 | | | Genuine Parts Company | | 6.5000 | | 11/01/28 | | | 1,059,138 | |
| | 1,000,000 | | | Genuine Parts Company | | 1.8750 | | 11/01/30 | | | 840,002 | |
| | 1,000,000 | | | Genuine Parts Company | | 2.7500 | | 02/01/32 | | | 859,008 | |
| | 1,000,000 | | | Tractor Supply Company B | | 5.2500 | | 05/15/33 | | | 1,014,355 | |
| | | | | | | | | | | | 8,477,242 | |
| | | | | SEMICONDUCTORS — 2.9% | | | | | | | | |
| | 1,000,000 | | | Broadcom, Inc. | | 3.4590 | | 09/15/26 | | | 980,101 | |
| | 1,000,000 | | | Broadcom, Inc. | | 4.1100 | | 09/15/28 | | | 982,151 | |
| | 1,000,000 | | | KLA Corporation | | 4.1000 | | 03/15/29 | | | 985,075 | |
| | 1,000,000 | | | KLA Corporation | | 4.6500 | | 07/15/32 | | | 998,528 | |
| | 1,000,000 | | | KLA Corporation | | 4.7000 | | 02/01/34 | | | 992,417 | |
| | 1,000,000 | | | Microchip Technology, Inc. | | 4.2500 | | 09/01/25 | | | 995,657 | |
| | 1,000,000 | | | QUALCOMM, Inc. | | 1.3000 | | 05/20/28 | | | 900,492 | |
| | 1,000,000 | | | QUALCOMM, Inc. | | 2.1500 | | 05/20/30 | | | 882,727 | |
| | 1,000,000 | | | QUALCOMM, Inc. | | 5.4000 | | 05/20/33 | | | 1,046,990 | |
| | 1,000,000 | | | Skyworks Solutions, Inc. | | 3.0000 | | 06/01/31 | | | 870,803 | |
| | | | | | | | | | | | 9,634,941 | |
| | | | | SOFTWARE — 2.3% | | | | | | | | |
| | 1,000,000 | | | Fortinet, Inc. | | 1.0000 | | 03/15/26 | | | 953,824 | |
| | 4,800,000 | | | Fortinet, Inc. | | 2.2000 | | 03/15/31 | | | 4,159,573 | |
| | 1,000,000 | | | Roper Technologies, Inc. | | 4.2000 | | 09/15/28 | | | 986,894 | |
See accompanying notes to financial statements.
| INSPIRE CORPORATE BOND ETF |
| SCHEDULE OF INVESTMENTS (Continued) |
| November 30, 2024 |
| Principal | | | | | Coupon Rate | | | | | |
| Amount ($) | | | | | (%) | | Maturity | | Fair Value | |
| | | | | CORPORATE BONDS — 98.6% (Continued) | | | | | | | | |
| | | | | SOFTWARE — 2.3% (Continued) | | | | | | | | |
| | 1,000,000 | | | Roper Technologies, Inc. | | 2.0000 | | 06/30/30 | | $ | 864,621 | |
| | 1,000,000 | | | Roper Technologies, Inc. | | 1.7500 | | 02/15/31 | | | 833,567 | |
| | | | | | | | | | | | 7,798,479 | |
| | | | | SPECIALTY FINANCE — 1.3% | | | | | | | | |
| | 4,800,000 | | | Air Lease Corporation | | 2.8750 | | 01/15/32 | | | 4,181,163 | |
| | | | | | | | | | | | | |
| | | | | STEEL — 2.2% | | | | | | | | |
| | 1,000,000 | | | Nucor Corporation | | 2.0000 | | 06/01/25 | | | 986,255 | |
| | 4,800,000 | | | Nucor Corporation | | 2.7000 | | 06/01/30 | | | 4,345,921 | |
| | 1,000,000 | | | Steel Dynamics, Inc. | | 3.4500 | | 04/15/30 | | | 936,590 | |
| | 1,000,000 | | | Steel Dynamics, Inc. | | 3.2500 | | 01/15/31 | | | 916,375 | |
| | | | | | | | | | | | 7,185,141 | |
| | | | | TECHNOLOGY HARDWARE — 4.0% | | | | | | | | |
| | 1,000,000 | | | Arrow Electronics, Inc. | | 3.8750 | | 01/12/28 | | | 969,319 | |
| | 1,000,000 | | | Arrow Electronics, Inc. | | 2.9500 | | 02/15/32 | | | 864,881 | |
| | 1,000,000 | | | Jabil, Inc. | | 3.9500 | | 01/12/28 | | | 973,879 | |
| | 1,000,000 | | | Jabil, Inc. | | 3.6000 | | 01/15/30 | | | 933,711 | |
| | 1,000,000 | | | Jabil, Inc. | | 3.0000 | | 01/15/31 | | | 893,633 | |
| | 1,000,000 | | | Juniper Networks, Inc. | | 2.0000 | | 12/10/30 | | | 841,595 | |
| | 1,000,000 | | | NetApp, Inc. | | 2.3750 | | 06/22/27 | | | 947,617 | |
| | 4,800,000 | | | NetApp, Inc. | | 2.7000 | | 06/22/30 | | | 4,296,691 | |
| | 1,000,000 | | | Teledyne FLIR, LLC | | 2.5000 | | 08/01/30 | | | 884,016 | |
| | 1,000,000 | | | Western Digital Corporation | | 2.8500 | | 02/01/29 | | | 896,023 | |
| | 1,000,000 | | | Western Digital Corporation | | 3.1000 | | 02/01/32 | | | 846,412 | |
| | | | | | | | | | | | 13,347,777 | |
| | | | | TECHNOLOGY SERVICES — 2.1% | | | | | | | | |
| | 1,000,000 | | | Amdocs Ltd. | | 2.5380 | | 06/15/30 | | | 884,194 | |
| | 1,000,000 | | | Equifax, Inc. | | 2.6000 | | 12/15/25 | | | 977,383 | |
| | 1,000,000 | | | Equifax, Inc. | | 5.1000 | | 12/15/27 | | | 1,012,079 | |
| | 1,000,000 | | | MSCI, Inc.(a) | | 3.6250 | | 11/01/31 | | | 911,980 | |
| | 1,000,000 | | | Verisk Analytics, Inc. | | 4.0000 | | 06/15/25 | | | 995,510 | |
| | 1,000,000 | | | Verisk Analytics, Inc. | | 4.1250 | | 03/15/29 | | | 981,157 | |
| | 1,000,000 | | | Verisk Analytics, Inc. | | 5.7500 | | 04/01/33 | | | 1,054,904 | |
| | | | | | | | | | | | 6,817,207 | |
See accompanying notes to financial statements.
| INSPIRE CORPORATE BOND ETF |
| SCHEDULE OF INVESTMENTS (Continued) |
| November 30, 2024 |
| Principal | | | | | Coupon Rate | | | | | |
| Amount ($) | | | | | (%) | | Maturity | | Fair Value | |
| | | | | CORPORATE BONDS — 98.6% (Continued) | | | | | | | | |
| | | | | TRANSPORTATION & LOGISTICS — 1.5% | | | | | | | | |
| | 1,000,000 | | | CSX Corporation | | 3.3500 | | 11/01/25 | | $ | 988,137 | |
| | 1,000,000 | | | CSX Corporation | | 3.8000 | | 03/01/28 | | | 979,029 | |
| | 1,000,000 | | | CSX Corporation | | 4.2500 | | 03/15/29 | | | 990,464 | |
| | 1,000,000 | | | JB Hunt Transport Services, Inc. | | 3.8750 | | 03/01/26 | | | 990,804 | |
| | 1,000,000 | | | Ryder System, Inc. | | 5.2500 | | 06/01/28 | | | 1,016,660 | |
| | | | | | | | | | | | 4,965,094 | |
| | | | | WHOLESALE - CONSUMER STAPLES — 0.9% | | | | | | | | |
| | 1,000,000 | | | Archer-Daniels-Midland Company | | 4.5000 | | 08/15/33 | | | 977,239 | |
| | 1,000,000 | | | Sysco Corporation | | 5.7500 | | 01/17/29 | | | 1,038,488 | |
| | 1,000,000 | | | Sysco Corporation | | 6.0000 | | 01/17/34 | | | 1,072,520 | |
| | | | | | | | | | | | 3,088,247 | |
| | | | | | | | | | | | | |
| | | | | TOTAL CORPORATE BONDS (Cost $327,366,744) | | | | | | | 327,788,816 | |
| | | | | | | | | | | | | |
| | | | | TOTAL INVESTMENTS - 98.6% (Cost $327,366,744) | | | | | | $ | 327,788,816 | |
| | | | | OTHER ASSETS IN EXCESS OF LIABILITIES - 1.4% | | | | | | | 4,761,048 | |
| | | | | NET ASSETS - 100.0% | | | | | | $ | 332,549,864 | |
| LLC | - Limited Liability Company |
| | |
| LP | - Limited Partnership |
| | |
| MSCI | - Morgan Stanley Capital International |
| | |
| PLC | - Public Limited Company |
| | |
| REIT | - Real Estate Investment Trust |
| (a) | Security exempt from registration under Rule 144A or Section 4(2) of the Securities Act of 1933. The security may be resold in transactions exempt from registration, normally to qualified institutional buyers. As of November 30, 2024 the total market value of 144A securities is $3,869,347 or 1.2% of net assets. |
See accompanying notes to financial statements.
| INSPIRE 100 ETF |
| SCHEDULE OF INVESTMENTS |
| November 30, 2024 |
| Shares | | | | | Fair Value | |
| | | | | COMMON STOCKS — 99.8% | | | | |
| | | | | BANKING - 1.1% | | | | |
| | 1,364 | | | First Citizens BancShares, Inc., Class A | | $ | 3,130,380 | |
| | 10,126 | | | Western Alliance Bancorp | | | 947,895 | |
| | | | | | | | 4,078,275 | |
| | | | | BIOTECH & PHARMA - 0.4% | | | | |
| | 17,283 | | | Incyte Corporation(a) | | | 1,289,139 | |
| | | | | | | | | |
| | | | | CHEMICALS - 0.3% | | | | |
| | 9,908 | | | Albemarle Corporation | | | 1,067,092 | |
| | | | | | | | | |
| | | | | COMMERCIAL SUPPORT SERVICES - 4.0% | | | | |
| | 35,793 | | | Cintas Corporation | | | 8,081,702 | |
| | 27,967 | | | Republic Services, Inc. | | | 6,105,196 | |
| | | | | | | | 14,186,898 | |
| | | | | CONSTRUCTION MATERIALS - 0.5% | | | | |
| | 4,027 | | | Carlisle Companies, Inc. | | | 1,839,131 | |
| | | | | | | | | |
| | | | | DATA CENTER REIT - 1.6% | | | | |
| | 29,591 | | | Digital Realty Trust, Inc. | | | 5,790,663 | |
| | | | | | | | | |
| | | | | DIVERSIFIED INDUSTRIALS - 2.6% | | | | |
| | 12,219 | | | Dover Corporation | | | 2,515,892 | |
| | 49,901 | | | Emerson Electric Company | | | 6,616,873 | |
| | | | | | | | 9,132,765 | |
| | | | | ELECTRIC UTILITIES - 2.6% | | | | |
| | 34,705 | | | Avangrid, Inc. | | | 1,252,851 | |
| | 56,148 | | | CenterPoint Energy, Inc. | | | 1,831,548 | |
| | 26,346 | | | CMS Energy Corporation | | | 1,836,580 | |
| | 18,523 | | | Entergy Corporation | | | 2,892,736 | |
| | 20,264 | | | Evergy, Inc. | | | 1,309,662 | |
| | | | | | | | 9,123,377 | |
| | | | | ELECTRICAL EQUIPMENT - 3.7% | | | | |
| | 12,224 | | | A O Smith Corporation | | | 910,566 | |
| | 108,943 | | | Amphenol Corporation, Class A | | | 7,914,709 | |
| | 15,174 | | | Keysight Technologies, Inc.(a) | | | 2,592,326 | |
See accompanying notes to financial statements.
| INSPIRE 100 ETF |
| SCHEDULE OF INVESTMENTS (Continued) |
| November 30, 2024 |
| Shares | | | | | Fair Value | |
| | | | | COMMON STOCKS — 99.8% (Continued) | | | | |
| | | | | ELECTRICAL EQUIPMENT - 3.7% (Continued) | | | | |
| | 21,225 | | | Trimble, Inc.(a) | | $ | 1,548,788 | |
| | | | | | | | 12,966,389 | |
| | | | | ENGINEERING & CONSTRUCTION - 0.6% | | | | |
| | 4,085 | | | EMCOR Group, Inc. | | | 2,083,840 | |
| | | | | | | | | |
| | | | | FOOD - 0.6% | | | | |
| | 42,996 | | | Conagra Brands, Inc. | | | 1,184,540 | |
| | 13,163 | | | Lamb Weston Holdings, Inc. | | | 1,016,710 | |
| | | | | | | | 2,201,250 | |
| | | | | GAS & WATER UTILITIES - 0.6% | | | | |
| | 13,652 | | | Atmos Energy Corporation | | | 2,065,821 | |
| | | | | | | | | |
| | | | | HEALTH CARE FACILITIES & SERVICES - 1.4% | | | | |
| | 17,120 | | | IQVIA Holdings, Inc.(a) | | | 3,438,381 | |
| | 5,380 | | | Molina Healthcare, Inc.(a) | | | 1,602,702 | |
| | | | | | | | 5,041,083 | |
| | | | | HEALTH CARE REIT - 2.8% | | | | |
| | 36,179 | | | Ventas, Inc. | | | 2,317,989 | |
| | 54,091 | | | Welltower, Inc. | | | 7,474,294 | |
| | | | | | | | 9,792,283 | |
| | | | | HOME CONSTRUCTION - 0.2% | | | | |
| | 9,541 | | | Taylor Morrison Home Corporation(a) | | | 704,794 | |
| | | | | | | | | |
| | | | | HOTEL REITS - 0.3% | | | | |
| | 65,750 | | | Host Hotels & Resorts, Inc. | | | 1,211,115 | |
| | | | | | | | | |
| | | | | INDUSTRIAL REIT - 2.8% | | | | |
| | 85,585 | | | Prologis, Inc. | | | 9,994,616 | |
| | | | | | | | | |
| | | | | INDUSTRIAL SUPPORT SERVICES - 2.0% | | | | |
| | 5,853 | | | United Rentals, Inc. | | | 5,068,698 | |
| | 3,661 | | | Watsco, Inc. | | | 2,019,408 | |
| | | | | | | | 7,088,106 | |
See accompanying notes to financial statements.
| INSPIRE 100 ETF |
| SCHEDULE OF INVESTMENTS (Continued) |
| November 30, 2024 |
| Shares | | | | | Fair Value | |
| | | | | COMMON STOCKS — 99.8% (Continued) | | | | |
| | | | | INSTITUTIONAL FINANCIAL SERVICES - 2.3% | | | | |
| | 3,477 | | | Evercore, Inc., Class A | | $ | 1,070,568 | |
| | 36,415 | | | Interactive Brokers Group, Inc., Class A | | | 6,958,543 | |
| | | | | | | | 8,029,111 | |
| | | | | INSURANCE - 4.5% | | | | |
| | 19,860 | | | Loews Corporation | | | 1,722,458 | |
| | 53,119 | | | Progressive Corporation (The) | | | 14,282,636 | |
| | | | | | | | 16,005,094 | |
| | | | | MACHINERY - 7.4% | | | | |
| | 40,969 | | | Caterpillar, Inc. | | | 16,637,920 | |
| | 5,081 | | | Nordson Corporation | | | 1,326,090 | |
| | 11,488 | | | Parker-Hannifin Corporation | | | 8,074,915 | |
| | | | | | | | 26,038,925 | |
| | | | | MEDICAL EQUIPMENT & DEVICES - 8.6% | | | | |
| | 7,679 | | | IDEXX Laboratories, Inc.(a) | | | 3,238,618 | |
| | 31,956 | | | Intuitive Surgical, Inc.(a) | | | 17,320,152 | |
| | 1,853 | | | Mettler-Toledo International, Inc.(a) | | | 2,318,474 | |
| | 13,110 | | | ResMed, Inc. | | | 3,264,652 | |
| | 8,769 | | | STERIS plc | | | 1,920,937 | |
| | 6,760 | | | West Pharmaceutical Services, Inc. | | | 2,201,597 | |
| | | | | | | | 30,264,430 | |
| | | | | METALS & MINING - 2.7% | | | | |
| | 118,513 | | | Freeport-McMoRan, Inc. | | | 5,238,274 | |
| | 102,998 | | | Newmont Corporation | | | 4,319,736 | |
| | | | | | | | 9,558,010 | |
| | | | | MULTI ASSET CLASS REIT - 0.3% | | | | |
| | 20,139 | | | WP Carey, Inc. | | | 1,149,131 | |
| | | | | | | | | |
| | | | | OFFICE REIT - 0.5% | | | | |
| | 16,513 | | | Alexandria Real Estate Equities, Inc. | | | 1,820,228 | |
| | | | | | | | | |
| | | | | OIL & GAS PRODUCERS - 4.8% | | | | |
| | 58,889 | | | Devon Energy Corporation | | | 2,234,838 | |
| | 27,986 | | | Diamondback Energy, Inc. | | | 4,970,034 | |
| | 195,907 | | | Kinder Morgan, Inc. | | | 5,538,290 | |
See accompanying notes to financial statements.
| INSPIRE 100 ETF |
| SCHEDULE OF INVESTMENTS (Continued) |
| November 30, 2024 |
| Shares | | | | | Fair Value | |
| | | | | COMMON STOCKS — 99.8% (Continued) | | | | |
| | | | | OIL & GAS PRODUCERS - 4.8% (Continued) | | | | |
| | 20,456 | | | Targa Resources Corporation | | $ | 4,179,161 | |
| | | | | | | | 16,922,323 | |
| | | | | OIL & GAS SERVICES & EQUIPMENT - 1.6% | | | | |
| | 129,484 | | | Schlumberger N.V. | | | 5,689,527 | |
| | | | | | | | | |
| | | | | RENEWABLE ENERGY - 0.8% | | | | |
| | 13,157 | | | Enphase Energy, Inc.(a) | | | 938,752 | |
| | 9,407 | | | First Solar, Inc.(a) | | | 1,874,533 | |
| | | | | | | | 2,813,285 | |
| | | | | RESIDENTIAL REIT - 2.5% | | | | |
| | 17,463 | | | Equity LifeStyle Properties, Inc. | | | 1,245,636 | |
| | 35,404 | | | Equity Residential | | | 2,714,071 | |
| | 56,535 | | | Invitation Homes, Inc. | | | 1,936,324 | |
| | 11,934 | | | Sun Communities, Inc. | | | 1,507,622 | |
| | 30,192 | | | UDR, Inc. | | | 1,384,605 | |
| | | | | | | | 8,788,258 | |
| | | | | RETAIL - CONSUMER STAPLES - 0.4% | | | | |
| | 8,552 | | | Sprouts Farmers Market, Inc.(a) | | | 1,321,113 | |
| | | | | | | | | |
| | | | | RETAIL - DISCRETIONARY - 1.0% | | | | |
| | 10,724 | | | Builders FirstSource, Inc.(a) | | | 1,999,704 | |
| | 12,451 | | | Genuine Parts Company | | | 1,577,915 | |
| | | | | | | | 3,577,619 | |
| | | | | RETAIL REIT - 1.5% | | | | |
| | 29,145 | | | Simon Property Group, Inc. | | | 5,351,022 | |
| | | | | | | | | |
| | | | | SELF-STORAGE REIT - 0.9% | | | | |
| | 19,205 | | | Extra Space Storage, Inc. | | | 3,283,287 | |
| | | | | | | | | |
| | | | | SEMICONDUCTORS - 6.1% | | | | |
| | 13,849 | | | Entegris, Inc. | | | 1,462,870 | |
| | 12,133 | | | KLA Corporation | | | 7,850,415 | |
| | 12,692 | | | Lattice Semiconductor Corporation(a) | | | 720,271 | |
| | 48,092 | | | Microchip Technology, Inc. | | | 3,278,432 | |
See accompanying notes to financial statements.
| INSPIRE 100 ETF |
| SCHEDULE OF INVESTMENTS (Continued) |
| November 30, 2024 |
| Shares | | | | | Fair Value | |
| | | | | COMMON STOCKS — 99.8% (Continued) | | | | |
| | | | | SEMICONDUCTORS - 6.1% (Continued) | | | | |
| | 4,272 | | | Monolithic Power Systems, Inc. | | $ | 2,424,958 | |
| | 39,528 | | | ON Semiconductor Corporation(a) | | | 2,811,231 | |
| | 14,466 | | | Skyworks Solutions, Inc. | | | 1,267,077 | |
| | 14,830 | | | Teradyne, Inc. | | | 1,631,300 | |
| | | | | | | | 21,446,554 | |
| | | | | SOFTWARE - 9.7% | | | | |
| | 7,918 | | | ANSYS, Inc.(a) | | | 2,780,010 | |
| | 67,153 | | | Fortinet, Inc.(a) | | | 6,382,893 | |
| | 54,427 | | | Gen Digital, Inc. | | | 1,679,073 | |
| | 5,419 | | | Manhattan Associates, Inc.(a) | | | 1,546,799 | |
| | 23,482 | | | Nutanix, Inc., Class A(a) | | | 1,532,905 | |
| | 15,636 | | | Okta, Inc.(a) | | | 1,212,728 | |
| | 9,703 | | | Roper Technologies, Inc. | | | 5,496,167 | |
| | 14,144 | | | Synopsys, Inc.(a) | | | 7,899,282 | |
| | 3,846 | | | Tyler Technologies, Inc.(a) | | | 2,419,788 | |
| | 15,085 | | | Veeva Systems, Inc., Class A(a) | | | 3,437,117 | |
| | | | | | | | 34,386,762 | |
| | | | | SPECIALTY FINANCE - 0.3% | | | | |
| | 146,086 | | | UWM Holdings Corporation | | | 951,020 | |
| | | | | | | | | |
| | | | | STEEL - 1.4% | | | | |
| | 21,125 | | | Nucor Corporation | | | 3,267,827 | |
| | 13,146 | | | Steel Dynamics, Inc. | | | 1,909,719 | |
| | | | | | | | 5,177,546 | |
| | | | | TECHNOLOGY HARDWARE - 4.7% | | | | |
| | 27,778 | | | Arista Networks, Inc.(a) | | | 11,272,868 | |
| | 9,416 | | | Jabil, Inc. | | | 1,278,975 | |
| | 18,112 | | | NetApp, Inc. | | | 2,221,256 | |
| | 56,270 | | | Super Micro Computer, Inc.(a) | | | 1,836,653 | |
| | | | | | | | 16,609,752 | |
| | | | | TECHNOLOGY SERVICES - 6.3% | | | | |
| | 39,050 | | | CoStar Group, Inc.(a) | | | 3,176,327 | |
| | 5,083 | | | EPAM Systems, Inc.(a) | | | 1,239,845 | |
| | 2,197 | | | Fair Isaac Corporation(a) | | | 5,217,941 | |
See accompanying notes to financial statements.
| INSPIRE 100 ETF |
| SCHEDULE OF INVESTMENTS (Continued) |
| November 30, 2024 |
| Shares | | | | | Fair Value | |
| | | | | COMMON STOCKS — 99.8% (Continued) | | | | |
| | | | | TECHNOLOGY SERVICES - 6.3% (Continued) | | | | |
| | 6,762 | | | MSCI, Inc. | | $ | 4,122,318 | |
| | 32,112 | | | Paychex, Inc. | | | 4,697,022 | |
| | 12,718 | | | Verisk Analytics, Inc. | | | 3,741,763 | |
| | | | | | | | 22,195,216 | |
| | | | | TRANSPORTATION & LOGISTICS - 1.8% | | | | |
| | 9,282 | | | JB Hunt Transport Services, Inc. | | | 1,755,319 | |
| | 19,960 | | | Old Dominion Freight Line, Inc. | | | 4,493,794 | |
| | | | | | | | 6,249,113 | |
| | | | | TRANSPORTATION EQUIPMENT - 1.6% | | | | |
| | 47,051 | | | PACCAR, Inc. | | | 5,504,967 | |
| | | | | | | | | |
| | | | | TOTAL COMMON STOCKS (Cost $297,055,993) | | | 352,788,930 | |
| | | | | | | | | |
| | | | | TOTAL INVESTMENTS - 99.8% (Cost $297,055,993) | | $ | 352,788,930 | |
| | | | | OTHER ASSETS IN EXCESS OF LIABILITIES - 0.2% | | | 653,280 | |
| | | | | NET ASSETS - 100.0% | | $ | 353,442,210 | |
| MSCI | - Morgan Stanley Capital International |
| | |
| NV | - Naamioze Vennootschap |
| | |
| PLC | - Public Limited Company |
| | |
| REIT | - Real Estate Investment Trust |
| (a) | Non-income producing security. |
See accompanying notes to financial statements.
| INSPIRE INTERNATIONAL ETF |
| SCHEDULE OF INVESTMENTS |
| November 30, 2024 |
| Shares | | | | | Fair Value | |
| | | | | COMMON STOCKS — 99.0% | | | | |
| | | | | APPAREL & TEXTILE PRODUCTS - 1.0% | | | | |
| | 653 | | | Hermes International S.A. | | $ | 1,424,514 | |
| | 213,234 | | | PRADA SpA | | | 1,460,850 | |
| | | | | | | | 2,885,364 | |
| | | | | ASSET MANAGEMENT - 2.3% | | | | |
| | 35,927 | | | 3i Group plc | | | 1,695,550 | |
| | 30,473 | | | Brookfield Corporation | | | 1,872,930 | |
| | 26,531 | | | Julius Baer Group Ltd. | | | 1,755,644 | |
| | 1,078 | | | Partners Group Holding A.G. | | | 1,566,185 | |
| | | | | | | | 6,890,309 | |
| | | | | AUTOMOTIVE - 3.2% | | | | |
| | 24,412 | | | Continental A.G. | | | 1,599,958 | |
| | 102,929 | | | Denso Corporation | | | 1,464,831 | |
| | 3,452 | | | Ferrari N.V. | | | 1,498,720 | |
| | 1,064,973 | | | Geely Automobile Holdings Ltd. | | | 1,897,248 | |
| | 42,779 | | | Mahindra & Mahindra Ltd. - GDR | | | 1,510,099 | |
| | 20,953 | | | Toyota Industries Corporation | | | 1,561,692 | |
| | | | | | | | 9,532,548 | |
| | | | | BANKING - 9.6% | | | | |
| | 3,493,514 | | | Bank Mandiri Persero Tbk P.T. | | | 1,355,955 | |
| | 40,927 | | | Bank Polska Kasa Opieki S.A. | | | 1,367,324 | |
| | 506,364 | | | BOC Hong Kong Holdings Ltd. | | | 1,555,546 | |
| | 17,568 | | | Commonwealth Bank of Australia | | | 1,816,835 | |
| | 104,547 | | | Credit Agricole S.A. | | | 1,399,335 | |
| | 53,859 | | | Danske Bank A/S | | | 1,546,944 | |
| | 1,852,123 | | | First Financial Holding Company Ltd. | | | 1,550,323 | |
| | 227,662 | | | Grupo Financiero Banorte S.A.B. de CV | | | 1,527,011 | |
| | 128,145 | | | Hang Seng Bank Ltd. | | | 1,522,757 | |
| | 377,018 | | | Intesa Sanpaolo SpA | | | 1,444,585 | |
| | 98,600 | | | KakaoBank Corporation | | | 1,580,604 | |
| | 20,315 | | | KBC Group N.V. | | | 1,464,500 | |
| | 63,799 | | | National Australia Bank Ltd. | | | 1,626,804 | |
| | 30,496 | | | OTP Bank Nyrt | | | 1,651,743 | |
| | 107,173 | | | Powszechna Kasa Oszczednosci Bank Polski S.A. | | | 1,475,500 | |
| | 4,830,453 | | | PT Bank Rakyat Indonesia (Persero) Tbk | | | 1,295,641 | |
See accompanying notes to financial statements.
| INSPIRE INTERNATIONAL ETF |
| SCHEDULE OF INVESTMENTS (Continued) |
| November 30, 2024 |
| Shares | | | | | Fair Value | |
| | | | | COMMON STOCKS — 99.0% (Continued) | | | | |
| | | | | BANKING - 9.6% (Continued) | | | | |
| | 479,736 | | | SCB X PCL | | $ | 1,600,938 | |
| | 113,056 | | | Standard Bank Group Ltd. | | | 1,486,496 | |
| | 64,727 | | | United Overseas Bank Ltd. | | | 1,757,294 | |
| | | | | | | | 29,026,135 | |
| | | | | BIOTECH & PHARMA - 2.5% | | | | |
| | 10,953 | | | Celltrion, Inc. | | | 1,469,073 | |
| | 31,625 | | | Chugai Pharmaceutical Company Ltd. | | | 1,394,816 | |
| | 8,268 | | | CSL Ltd. | | | 1,521,713 | |
| | 6,708 | | | Genmab A/S,(a) | | | 1,450,475 | |
| | 9,042 | | | UCB S.A. | | | 1,770,479 | |
| | | | | | | | 7,606,556 | |
| | | | | CHEMICALS - 5.4% | | | | |
| | 22,664 | | | Akzo Nobel N.V. | | | 1,324,022 | |
| | 2,776,747 | | | Chandra Asri Pacific Tbk P.T. | | | 1,217,948 | |
| | 106,641 | | | Clariant A.G. | | | 1,284,263 | |
| | 26,557 | | | Covestro A.G.,(a) | | | 1,619,343 | |
| | 28,177 | | | Croda International plc | | | 1,236,934 | |
| | 1,943 | | | EMS-Chemie Holding A.G. | | | 1,381,682 | |
| | 68,896 | | | Evonik Industries A.G. | | | 1,263,870 | |
| | 295 | | | Givaudan S.A. | | | 1,299,511 | |
| | 33,841 | | | Nutrien Ltd. | | | 1,580,982 | |
| | 42,105 | | | Solvay S.A. | | | 1,454,949 | |
| | 11,836 | | | Symrise A.G. | | | 1,306,636 | |
| | 51,392 | | | Yara International ASA | | | 1,445,732 | |
| | | | | | | | 16,415,872 | |
| | | | | COMMERCIAL SUPPORT SERVICES - 2.9% | | | | |
| | 164,483 | | | ALS Ltd. | | | 1,671,218 | |
| | 48,389 | | | Bureau Veritas S.A. | | | 1,472,220 | |
| | 40,685 | | | Edenred S.E. | | | 1,345,278 | |
| | 23,231 | | | Intertek Group plc | | | 1,394,037 | |
| | 14,398 | | | SGS S.A. | | | 1,429,635 | |
| | 161,302 | | | Worley Ltd. | | | 1,459,018 | |
| | | | | | | | 8,771,406 | |
See accompanying notes to financial statements.
| INSPIRE INTERNATIONAL ETF |
| SCHEDULE OF INVESTMENTS (Continued) |
| November 30, 2024 |
| Shares | | | | | Fair Value | |
| | | | | COMMON STOCKS — 99.0% (Continued) | | | | |
| | | | | CONSTRUCTION MATERIALS - 2.5% | | | | |
| | 17,547 | | | Cie de Saint-Gobain S.A. | | $ | 1,600,473 | |
| | 385,050 | | | Grupo Argos S.A./Colombia | | | 1,738,101 | |
| | 16,476 | | | Holcim A.G. | | | 1,678,232 | |
| | 217,161 | | | Siam Cement PCL (The) | | | 1,161,407 | |
| | 4,867 | | | Sika A.G. | | | 1,260,088 | |
| | | | | | | | 7,438,301 | |
| | | | | CONTAINERS & PACKAGING - 0.5% | | | | |
| | 40,888 | | | Huhtamaki OYJ | | | 1,475,527 | |
| | | | | | | | | |
| | | | | DIVERSIFIED INDUSTRIALS - 0.5% | | | | |
| | 33,751 | | | Alfa Laval A.B. | | | 1,437,983 | |
| | | | | | | | | |
| | | | | ELECTRIC UTILITIES - 7.3% | | | | |
| | 180,385 | | | CLP Holdings Ltd. | | | 1,514,034 | |
| | 108,333 | | | E.ON S.E. | | | 1,394,504 | |
| | 353,736 | | | EDP - Energias de Portugal S.A. | | | 1,278,771 | |
| | 93,045 | | | EDP Renovaveis S.A. | | | 1,089,096 | |
| | 73,791 | | | Endesa S.A. | | | 1,616,761 | |
| | 16,071,042 | | | Enel Americas S.A. | | | 1,475,599 | |
| | 202,295 | | | Enel SpA | | | 1,455,344 | |
| | 35,658 | | | Fortis, Inc. | | | 1,594,294 | |
| | 98,432 | | | Fortum OYJ | | | 1,483,343 | |
| | 106,353 | | | Iberdrola S.A. | | | 1,515,637 | |
| | 43,934 | | | RWE A.G. | | | 1,479,164 | |
| | 63,667 | | | SSE plc | | | 1,435,120 | |
| | 179,607 | | | Terna Rete Elettrica Nazionale SpA | | | 1,519,430 | |
| | 673,483 | | | Vector Ltd. | | | 1,563,364 | |
| | 19,493 | | | Verbund A.G. | | | 1,554,745 | |
| | | | | | | | 21,969,206 | |
| | | | | ELECTRICAL EQUIPMENT - 0.7% | | | | |
| | 482,061 | | | Delta Electronics Thailand PCL - GDR | | | 2,114,488 | |
| | | | | | | | | |
| | | | | ENGINEERING & CONSTRUCTION - 1.5% | | | | |
| | 89,908 | | | AFRY A.B. | | | 1,250,737 | |
See accompanying notes to financial statements.
| INSPIRE INTERNATIONAL ETF |
| SCHEDULE OF INVESTMENTS (Continued) |
| November 30, 2024 |
| Shares | | | | | Fair Value | |
| | | | | COMMON STOCKS — 99.0% (Continued) | | | | |
| | | | | ENGINEERING & CONSTRUCTION - 1.5% (Continued) | | | | |
| | 37,589 | | | Ferrovial S.E.(b) | | $ | 1,549,464 | |
| | 9,251 | | | WSP Global, Inc. | | | 1,645,287 | |
| | | | | | | | 4,445,488 | |
| | | | | ENTERTAINMENT CONTENT - 0.5% | | | | |
| | 236,989 | | | Bollore S.E. | | | 1,460,840 | |
| | | | | | | | | |
| | | | | FOOD - 2.6% | | | | |
| | 40,539 | | | Ajinomoto Company, Inc. | | | 1,702,337 | |
| | 469,372 | | | Grupo Bimbo S.A.B. de C.V. | | | 1,402,767 | |
| | 655,131 | | | Premier Foods PLC | | | 1,630,533 | |
| | 177,792 | | | Tate & Lyle PLC | | | 1,667,295 | |
| | 620,712 | | | Wilmar International Ltd. | | | 1,427,499 | |
| | | | | | | | 7,830,431 | |
| | | | | FORESTRY, PAPER & WOOD PRODUCTS - 1.0% | | | | |
| | 162,782 | | | Suzano S.A. | | | 1,681,163 | |
| | 48,805 | | | UPM-Kymmene OYJ | | | 1,283,799 | |
| | | | | | | | 2,964,962 | |
| | | | | GAS & WATER UTILITIES - 2.0% | | | | |
| | 404,217 | | | Hera SpA | | | 1,498,840 | |
| | 1,919,090 | | | Hong Kong & China Gas Company Ltd. | | | 1,455,357 | |
| | 62,203 | | | Naturgy Energy Group S.A. | | | 1,532,403 | |
| | 317,755 | | | Snam SpA | | | 1,481,022 | |
| | | | | | | | 5,967,622 | |
| | | | | HEALTH CARE FACILITIES & SERVICES - 0.9% | | | | |
| | 43,407 | | | Fresenius S.E. & Company KGaA,(a) | | | 1,525,619 | |
| | 5,700 | | | ICON plc(a) | | | 1,198,425 | |
| | | | | | | | 2,724,044 | |
| | | | | HOME & OFFICE PRODUCTS - 0.4% | | | | |
| | 13,939 | | | SEB S.A. | | | 1,322,335 | |
| | | | | | | | | |
| | | | | HOME CONSTRUCTION - 0.5% | | | | |
| | 2,444 | | | Geberit A.G. | | | 1,471,360 | |
See accompanying notes to financial statements.
| INSPIRE INTERNATIONAL ETF |
| SCHEDULE OF INVESTMENTS (Continued) |
| November 30, 2024 |
| Shares | | | | | Fair Value | |
| | | | | COMMON STOCKS — 99.0% (Continued) | | | | |
| | | | | HOUSEHOLD PRODUCTS - 0.9% | | | | |
| | 10,818 | | | Beiersdorf A.G. | | $ | 1,401,677 | |
| | 5,564 | | | LG H&H Company Ltd. | | | 1,239,132 | |
| | | | | | | | 2,640,809 | |
| | | | | INDUSTRIAL REIT - 0.5% | | | | |
| | 62,880 | | | Goodman Group | | | 1,554,572 | |
| | | | | | | | | |
| | | | | INDUSTRIAL SUPPORT SERVICES - 1.0% | | | | |
| | 20,730 | | | Ashtead Group PLC | | | 1,659,138 | |
| | 889,272 | | | United Tractors Tbk P.T. | | | 1,502,699 | |
| | | | | | | | 3,161,837 | |
| | | | | INSTITUTIONAL FINANCIAL SERVICES - 2.0% | | | | |
| | 824,228 | | | B3 S.A. - Brasil Bolsa Balcao | | | 1,257,339 | |
| | 6,941 | | | Deutsche Boerse A.G. | | | 1,624,162 | |
| | 38,334 | | | Hong Kong Exchanges & Clearing Ltd. | | | 1,427,922 | |
| | 11,855 | | | London Stock Exchange Group plc | | | 1,700,036 | |
| | | | | | | | 6,009,459 | |
| | | | | INSURANCE - 5.7% | | | | |
| | 185,128 | | | AIA Group Ltd. | | | 1,383,706 | |
| | 250,437 | | | BB Seguridade Participacoes S.A. | | | 1,393,305 | |
| | 62,101 | | | Dai-ichi Life Holdings, Inc. | | | 1,681,648 | |
| | 1,306 | | | Fairfax Financial Holdings Ltd. | | | 1,853,080 | |
| | 8,413 | | | Intact Financial Corporation | | | 1,602,622 | |
| | 530,395 | | | Legal & General Group plc | | | 1,493,529 | |
| | 51,985 | | | Power Corp of Canada | | | 1,751,289 | |
| | 173,873 | | | Prudential PLC | | | 1,419,922 | |
| | 34,651 | | | Sampo OYJ, A Shares | | | 1,483,997 | |
| | 1,927 | | | Swiss Life Holding A.G. | | | 1,578,748 | |
| | 68,210 | | | Tryg A/S | | | 1,571,561 | |
| | | | | | | | 17,213,407 | |
| | | | | INTERNET MEDIA & SERVICES - 1.6% | | | | |
| | 6,603 | | | Naspers Ltd. | | | 1,490,953 | |
| | 36,789 | | | Prosus N.V. | | | 1,498,221 | |
| | 11,787 | | | REA Group Ltd. | | | 1,933,470 | |
| | | | | | | | 4,922,644 | |
See accompanying notes to financial statements.
| INSPIRE INTERNATIONAL ETF |
| SCHEDULE OF INVESTMENTS (Continued) |
| November 30, 2024 |
| Shares | | | | | Fair Value | |
| | | | | COMMON STOCKS — 99.0% (Continued) | | | | |
| | | | | MACHINERY - 4.8% | | | | |
| | 22,490 | | | ANDRITZ A.G.(b) | | $ | 1,256,836 | |
| | 6,162 | | | Disco Corporation | | | 1,672,330 | |
| | 52,261 | | | FANUC Corporation | | | 1,357,896 | |
| | 32,938 | | | GEA Group AG | | | 1,646,552 | |
| | 39,532 | | | KION Group A.G. | | | 1,410,306 | |
| | 11,226 | | | Krones A.G. | | | 1,399,396 | |
| | 71,999 | | | Sandvik A.B. | | | 1,332,603 | |
| | 3,448 | | | SMC Corporation | | | 1,464,498 | |
| | 109,613 | | | TOMRA Systems ASA | | | 1,544,765 | |
| | 158,101 | | | WEG S.A. | | | 1,412,658 | |
| | | | | | | | 14,497,840 | |
| | | | | MEDICAL EQUIPMENT & DEVICES - 2.0% | | | | |
| | 12,369 | | | Coloplast A/S - Series B | | | 1,558,814 | |
| | 6,836 | | | EssilorLuxottica S.A. | | | 1,659,531 | |
| | 4,525 | | | Sonova Holding A.G. | | | 1,544,937 | |
| | 9,866 | | | Straumann Holding A.G. | | | 1,283,895 | |
| | | | | | | | 6,047,177 | |
| | | | | METALS & MINING - 3.9% | | | | |
| | 19,891 | | | Agnico Eagle Mines Ltd. | | | 1,677,511 | |
| | 43,345 | | | Anglo American Platinum Ltd. | | | 1,428,561 | |
| | 59,641 | | | Antofagasta plc | | | 1,292,007 | |
| | 50,608 | | | BHP Group Ltd. | | | 1,338,963 | |
| | 112,473 | | | Fortescue Ltd. | | | 1,392,893 | |
| | 12,982 | | | Franco-Nevada Corporation | | | 1,589,864 | |
| | 18,491 | | | Rio Tinto Ltd. | | | 1,425,835 | |
| | 26,084 | | | Wheaton Precious Metals Corporation | | | 1,623,298 | |
| | | | | | | | 11,768,932 | |
| | | | | OIL & GAS PRODUCERS - 7.7% | | | | |
| | 76,246 | | | Aker BP ASA | | | 1,563,451 | |
| | 49,088 | | | Canadian Natural Resources Ltd. | | | 1,666,318 | |
| | 98,171 | | | Cenovus Energy, Inc. | | | 1,555,431 | |
| | 13,725 | | | Delek Group Ltd. | | | 1,841,312 | |
| | 294,401 | | | ENEOS Holdings, Inc. | | | 1,591,676 | |
| | 106,728 | | | Eni SpA | | | 1,511,510 | |
See accompanying notes to financial statements.
| INSPIRE INTERNATIONAL ETF |
| SCHEDULE OF INVESTMENTS (Continued) |
| November 30, 2024 |
| Shares | | | | | Fair Value | |
| | | | | COMMON STOCKS — 99.0% (Continued) | | | | |
| | | | | OIL & GAS PRODUCERS - 7.7% (Continued) | | | | |
| | 65,075 | | | Equinor ASA | | $ | 1,574,858 | |
| | 118,449 | | | Inpex Corporation | | | 1,562,978 | |
| | 215,981 | | | MOL Hungarian Oil & Gas plc | | | 1,479,806 | |
| | 37,652 | | | OMV A.G. | | | 1,508,307 | |
| | 109,742 | | | ORLEN S.A. | | | 1,378,971 | |
| | 331,329 | | | Santos Ltd. | | | 1,428,254 | |
| | 24,671 | | | TotalEnergies S.E. | | | 1,432,669 | |
| | 35,813 | | | Tourmaline Oil Corporation | | | 1,690,507 | |
| | 92,299 | | | Woodside Energy Group Ltd. | | | 1,475,315 | |
| | | | | | | | 23,261,363 | |
| | | | | REAL ESTATE OWNERS & DEVELOPERS - 2.7% | | | | |
| | 369,590 | | | CK Asset Holdings Ltd. | | | 1,510,669 | |
| | 1,271,708 | | | New World Development Company Ltd.(b) | | | 1,051,043 | |
| | 2,734,679 | | | SM Prime Holdings, Inc. | | | 1,232,006 | |
| | 48,065 | | | Sumitomo Realty & Development Company Ltd. | | | 1,490,163 | |
| | 801,962 | | | Swire Properties Ltd. | | | 1,597,745 | |
| | 44,195 | | | Vonovia S.E. | | | 1,466,008 | |
| | | | | | | | 8,347,634 | |
| | | | | REAL ESTATE SERVICES - 0.4% | | | | |
| | 101,766 | | | Savills PLC | | | 1,390,720 | |
| | | | | | | | | |
| | | | | RETAIL - CONSUMER STAPLES - 3.1% | | | | |
| | 58,586 | | | Aeon Company Ltd. | | | 1,407,493 | |
| | 29,168 | | | Alimentation Couche-Tard, Inc. | | | 1,706,670 | |
| | 111,774 | | | BIM Birlesik Magazalar A/S | | | 1,525,396 | |
| | 776,657 | | | Cencosud S.A. | | | 1,634,807 | |
| | 80,957 | | | Jeronimo Martins SGPS S.A. | | | 1,577,062 | |
| | 172,768 | | | President Chain Store Corporation | | | 1,438,183 | |
| | | | | | | | 9,289,611 | |
| | | | | RETAIL - DISCRETIONARY - 0.4% | | | | |
| | 91,586 | | | SM Investments Corporation | | | 1,367,538 | |
| | | | | | | | | |
| | | | | SEMICONDUCTORS - 3.0% | | | | |
| | 34,268 | | | Advantest Corporation | | | 1,887,514 | |
See accompanying notes to financial statements.
| INSPIRE INTERNATIONAL ETF |
| SCHEDULE OF INVESTMENTS (Continued) |
| November 30, 2024 |
| Shares | | | | | Fair Value | |
| | | | | COMMON STOCKS — 99.0% (Continued) | | | | |
| | | | | SEMICONDUCTORS - 3.0% (Continued) | | | | |
| | 1,928 | | | ASML Holding N.V. | | $ | 1,341,005 | |
| | 44,661 | | | Infineon Technologies A.G. | | | 1,453,865 | |
| | 6,653 | | | NXP Semiconductors N.V. | | | 1,525,999 | |
| | 105,542 | | | Renesas Electronics Corporation | | | 1,385,257 | |
| | 53,137 | | | STMicroelectronics N.V. | | | 1,362,386 | |
| | | | | | | | 8,956,026 | |
| | | | | SOFTWARE - 2.0% | | | | |
| | 8,436 | | | Check Point Software Technologies Ltd.(a) | | | 1,535,352 | |
| | 503 | | | Constellation Software, Inc. | | | 1,701,049 | |
| | 39,831 | | | Dassault Systemes S.E. | | | 1,373,846 | |
| | 17,438 | | | WiseTech Global Ltd. | | | 1,456,768 | |
| | | | | | | | 6,067,015 | |
| | | | | STEEL - 0.4% | | | | |
| | 62,247 | | | voestalpine A.G.,(b) | | | 1,204,696 | |
| | | | | | | | | |
| | | | | TECHNOLOGY HARDWARE - 1.0% | | | | |
| | 9,358 | | | Garmin Ltd. | | | 1,989,511 | |
| | 5,557 | | | Samsung SDI Company Ltd. | | | 1,014,371 | |
| | | | | | | | 3,003,882 | |
| | | | | TECHNOLOGY SERVICES - 0.5% | | | | |
| | 9,429 | | | Wolters Kluwer N.V. | | | 1,573,326 | |
| | | | | | | | | |
| | | | | TELECOMMUNICATIONS - 2.4% | | | | |
| | 90,801 | | | Hellenic Telecommunications Organization S.A. | | | 1,433,094 | |
| | 397,547 | | | Koninklijke KPN N.V. | | | 1,541,723 | |
| | 292,646 | | | MTN Group Ltd. | | | 1,311,514 | |
| | 649,557 | | | Singapore Telecommunications Ltd. | | | 1,503,537 | |
| | 441,953 | | | Taiwan Mobile Company Ltd. | | | 1,536,873 | |
| | | | | | | | 7,326,741 | |
| | | | | TRANSPORTATION & LOGISTICS - 4.7% | | | | |
| | 7,262 | | | Aena SME S.A. | | | 1,571,157 | |
| | 13,986 | | | Canadian National Railway Company | | | 1,561,959 | |
| | 7,798 | | | DSV A/S | | | 1,665,172 | |
| | 79,510 | | | East Japan Railway Company | | | 1,551,954 | |
See accompanying notes to financial statements.
| INSPIRE INTERNATIONAL ETF |
| SCHEDULE OF INVESTMENTS (Continued) |
| November 30, 2024 |
| Shares | | | | | Fair Value | |
| | | | | COMMON STOCKS — 99.0% (Continued) | | | | |
| | | | | TRANSPORTATION & LOGISTICS - 4.7% (Continued) | | | | |
| | 1,372,638 | | | Eva Airways Corporation | | $ | 1,755,135 | |
| | 5,909 | | | Kuehne + Nagel International A.G. | | | 1,412,494 | |
| | 115,301 | | | Poste Italiane SpA | | | 1,618,185 | |
| | 35,604 | | | Ryanair Holdings plc - ADR | | | 1,568,000 | |
| | 179,805 | | | Transurban Group | | | 1,500,916 | |
| | | | | | | | 14,204,972 | |
| | | | | WHOLESALE - CONSUMER STAPLES - 0.5% | | | | |
| | 29,203 | | | ITOCHU Corporation | | | 1,441,429 | |
| | | | | | | | | |
| | | | | TOTAL COMMON STOCKS (Cost $279,768,515) | | | 299,002,407 | |
| | | | | | | | | |
| | | | | PREFERRED STOCK — 0.5% | | | | |
| | | | | CHEMICALS — 0.5% | | | | |
| | 39,215 | | | Sociedad Quimica y Minera de Chile S.A., Class B(a) (Cost $2,211,102) | | | 1,503,255 | |
| | | | | | | | | |
| | | | | COLLATERAL FOR SECURITIES LOANED - 1.0% | | | | |
| | | | | MONEY MARKET FUND - 1.0% | | | | |
| | 3,126,667 | | | Fidelity Investments Money Market Government Portfolio - Institutional Class, 4.55% (Cost $3,126,667)(c) (d) | | | 3,126,667 | |
| | | | | | | | | |
| | | | | TOTAL INVESTMENTS - 100.5% (Cost $285,106,284) | | $ | 303,632,329 | |
| | | | | LIABILITIES IN EXCESS OF OTHER ASSETS - (0.5)% | | | (1,547,781 | ) |
| | | | | NET ASSETS - 100.0% | | $ | 302,084,548 | |
| A.B. | - Aktiebolag |
| | |
| ADR | - American Depositary Receipt |
| | |
| A.G. | - Aktiengesellschaft |
| | |
| ASA | - Allmennaksjeselskap |
| | |
| A/S | - Anonim Sirketi |
| | |
| GDR | - Global Depositary Receipt |
| | |
| KGaA | - Kommanditgesellschaft auf Aktien |
| | |
| LTD | - Limited Company |
| | |
| N.V. | - Naamioze Vennootschap |
| | |
| OYJ | - Julkinen osakeyhtiö |
| | |
| PLC | - Public Limited Company |
| | |
| P.T. | - Perseroan Terbatas |
| | |
| REIT | - Real Estate Investment Trust |
| | |
| S.A. | - Société Anonyme |
| | |
| S.A.B. de C.V. | - Sociedad Anonima Bursátil de Capital Variable |
| | |
| S.E. | - Societas Europaea |
| | |
| SpA | - Società per azioni |
| (a) | Non-income producing security. |
| (b) | All or a portion of the security is on loan. The total fair value of the securities on loan as of November 30, 2024 was $2,939,572. |
| (c) | Security was purchased with cash received as collateral for securities on loan at November 30, 2024. Total collateral had a value of $3,126,667 at November 30, 2024. |
| (d) | Rate disclosed is the seven day effective yield as of November 30, 2024. |
See accompanying notes to financial statements.
| INSPIRE TACTICAL BALANCED ETF |
| SCHEDULE OF INVESTMENTS |
| November 30, 2024 |
| Shares | | | | | Fair Value | |
| | | | | COMMON STOCKS — 80.7% | | | | |
| | | | | APPAREL & TEXTILE PRODUCTS - 0.8% | | | | |
| | 14,580 | | | Carter’s, Inc. | | $ | 795,631 | |
| | | | | | | | | |
| | | | | AUTOMOTIVE - 1.0% | | | | |
| | 32,896 | | | Gentex Corporation | | | 1,005,302 | |
| | | | | | | | | |
| | | | | BANKING - 13.6% | | | | |
| | 14,297 | | | Axos Financial, Inc.(a) | | | 1,184,506 | |
| | 72,820 | | | Bank of the James Financial Group, Inc. | | | 1,122,156 | |
| | 52,892 | | | Civista Bancshares, Inc. | | | 1,210,170 | |
| | 35,255 | | | Columbia Banking System, Inc. | | | 1,093,258 | |
| | 7,830 | | | Cullen/Frost Bankers, Inc. | | | 1,101,055 | |
| | 406 | | | First Citizens BancShares, Inc., Class A | | | 931,770 | |
| | 33,861 | | | ICICI Bank Ltd. - ADR | | | 1,034,454 | |
| | 47,579 | | | MVB Financial Corporation | | | 1,026,755 | |
| | 35,289 | | | Northeast Community Bancorp, Inc. | | | 1,063,963 | |
| | 77,334 | | | Northfield Bancorp, Inc. | | | 1,034,729 | |
| | 59,344 | | | Pathfinder Bancorp, Inc. | | | 1,060,477 | |
| | 38,859 | | | Premier Financial Corporation | | | 1,076,783 | |
| | | | | | | | 12,940,076 | |
| | | | | BEVERAGES - 2.2% | | | | |
| | 810 | | | Coca-Cola Consolidated, Inc. | | | 1,056,475 | |
| | 18,356 | | | Monster Beverage Corporation(a) | | | 1,011,966 | |
| | | | | | | | 2,068,441 | |
| | | | | COMMERCIAL SUPPORT SERVICES - 1.0% | | | | |
| | 19,830 | | | Rollins, Inc. | | | 998,044 | |
| | | | | | | | | |
| | | | | CONSTRUCTION MATERIALS - 2.1% | | | | |
| | 2,026 | | | Carlisle Companies, Inc. | | | 925,274 | |
| | 1,754 | | | Martin Marietta Materials, Inc. | | | 1,052,400 | |
| | | | | | | | 1,977,674 | |
| | | | | CONSUMER SERVICES - 1.1% | | | | |
| | 54,623 | | | Medifast, Inc.(a) | | | 1,074,434 | |
See accompanying notes to financial statements.
| INSPIRE TACTICAL BALANCED ETF |
| SCHEDULE OF INVESTMENTS (Continued) |
| November 30, 2024 |
| Shares | | | | | Fair Value | |
| | | | | COMMON STOCKS — 80.7% (Continued) | | | | |
| | | | | ELECTRICAL EQUIPMENT - 2.2% | | | | |
| | 5,801 | | | AMETEK, Inc. | | $ | 1,127,598 | |
| | 3,777 | | | Littelfuse, Inc. | | | 931,673 | |
| | | | | | | | 2,059,271 | |
| | | | | ENGINEERING & CONSTRUCTION - 1.2% | | | | |
| | 2,162 | | | EMCOR Group, Inc. | | | 1,102,879 | |
| | | | | | | | | |
| | | | | ENTERTAINMENT CONTENT - 1.1% | | | | |
| | 12,265 | | | NetEase, Inc. - ADR | | | 1,072,942 | |
| | | | | | | | | |
| | | | | FOOD - 1.1% | | | | |
| | 26,308 | | | Darling Ingredients, Inc.(a) | | | 1,066,263 | |
| | | | | | | | | |
| | | | | HEALTH CARE FACILITIES & SERVICES - 2.9% | | | | |
| | 1,620 | | | Chemed Corporation | | | 927,272 | |
| | 2,157 | | | Elevance Health, Inc. | | | 877,813 | |
| | 3,373 | | | Molina Healthcare, Inc.(a) | | | 1,004,816 | |
| | | | | | | | 2,809,901 | |
| | | | | HOME CONSTRUCTION - 1.3% | | | | |
| | 135 | | | NVR, Inc.(a) | | | 1,246,803 | |
| | | | | | | | | |
| | | | | INDUSTRIAL INTERMEDIATE PRODUCT - 1.0% | | | | |
| | 19,288 | | | Omega Flex, Inc. | | | 953,213 | |
| | | | | | | | | |
| | | | | INDUSTRIAL REIT - 1.0% | | | | |
| | 5,395 | | | EastGroup Properties, Inc. | | | 929,073 | |
| | | | | | | | | |
| | | | | INDUSTRIAL SUPPORT SERVICES - 1.1% | | | | |
| | 12,560 | | | Fastenal Company | | | 1,049,514 | |
| | | | | | | | | |
| | | | | INSURANCE - 2.3% | | | | |
| | 9,184 | | | Brown & Brown, Inc. | | | 1,038,710 | |
| | 674 | | | Markel Group, Inc.(a) | | | 1,201,688 | |
| | | | | | | | 2,240,398 | |
See accompanying notes to financial statements.
| INSPIRE TACTICAL BALANCED ETF |
| SCHEDULE OF INVESTMENTS (Continued) |
| November 30, 2024 |
| Shares | | | | | Fair Value | |
| | | | | COMMON STOCKS — 80.7% (Continued) | | | | |
| | | | | LEISURE FACILITIES & SERVICES - 1.2% | | | | |
| | 5,398 | | | Texas Roadhouse, Inc. | | $ | 1,108,047 | |
| | | | | | | | | |
| | | | | MACHINERY - 5.5% | | | | |
| | 5,396 | | | Alamo Group, Inc. | | | 1,078,930 | |
| | 11,337 | | | Graco, Inc. | | | 1,032,574 | |
| | 4,990 | | | Lincoln Electric Holdings, Inc. | | | 1,090,215 | |
| | 7,019 | | | Middleby Corporation (The)(a) | | | 1,006,454 | |
| | 2,972 | | | Snap-on, Inc. | | | 1,098,719 | |
| | | | | | | | 5,306,892 | |
| | | | | MEDICAL EQUIPMENT & DEVICES - 4.2% | | | | |
| | 14,280 | | | Edwards Lifesciences Corporation(a) | | | 1,018,878 | |
| | 2,158 | | | IDEXX Laboratories, Inc.(a) | | | 910,137 | |
| | 4,052 | | | ResMed, Inc. | | | 1,009,029 | |
| | 3,371 | | | West Pharmaceutical Services, Inc. | | | 1,097,867 | |
| | | | | | | | 4,035,911 | |
| | | | | OFFICE REIT - 1.0% | | | | |
| | 22,970 | | | Kilroy Realty Corporation | | | 953,944 | |
| | | | | | | | | |
| | | | | OIL & GAS PRODUCERS - 1.1% | | | | |
| | 7,691 | | | EOG Resources, Inc. | | | 1,024,903 | |
| | | | | | | | | |
| | | | | RESIDENTIAL REIT - 2.2% | | | | |
| | 6,344 | | | Mid-America Apartment Communities, Inc. | | | 1,041,431 | |
| | 22,135 | | | UDR, Inc. | | | 1,015,111 | |
| | | | | | | | 2,056,542 | |
| | | | | RETAIL - DISCRETIONARY - 2.3% | | | | |
| | 3,108 | | | Lithia Motors, Inc. | | | 1,202,485 | |
| | 6,207 | | | Penske Automotive Group, Inc. | | | 1,033,714 | |
| | | | | | | | 2,236,199 | |
| | | | | SELF-STORAGE REIT - 1.0% | | | | |
| | 2,836 | | | Public Storage | | | 987,070 | |
| | | | | | | | | |
| | | | | SEMICONDUCTORS - 2.9% | | | | |
| | 14,156 | | | ON Semiconductor Corporation(a) | | | 1,006,775 | |
See accompanying notes to financial statements.
| INSPIRE TACTICAL BALANCED ETF |
| SCHEDULE OF INVESTMENTS (Continued) |
| November 30, 2024 |
| Shares | | | | | Fair Value | |
| | | | | COMMON STOCKS — 80.7% (Continued) | | | | |
| | | | | SEMICONDUCTORS - 2.9% (Continued) | | | | |
| | 9,972 | | | Skyworks Solutions, Inc. | | $ | 873,447 | |
| | 4,729 | | | Taiwan Semiconductor Manufacturing Company Ltd. - ADR | | | 873,257 | |
| | | | | | | | 2,753,479 | |
| | | | | SOFTWARE - 3.2% | | | | |
| | 18,918 | | | ACI Worldwide, Inc.(a) | | | 1,074,921 | |
| | 5,531 | | | Nice Ltd. - ADR(a) (b) | | | 1,009,075 | |
| | 1,754 | | | Roper Technologies, Inc. | | | 993,536 | |
| | | | | | | | 3,077,532 | |
| | | | | TECHNOLOGY SERVICES - 6.4% | | | | |
| | 1,891 | | | CACI International, Inc., Class A(a) | | | 869,633 | |
| | 12,550 | | | CoStar Group, Inc.(a) | | | 1,020,817 | |
| | 4,989 | | | EPAM Systems, Inc.(a) | | | 1,216,917 | |
| | 25,525 | | | Genpact Ltd. | | | 1,178,234 | |
| | 3,380 | | | MarketAxess Holdings, Inc. | | | 874,372 | |
| | 1,621 | | | MSCI, Inc. | | | 988,210 | |
| | | | | | | | 6,148,183 | |
| | | | | TRANSPORTATION & LOGISTICS - 8.4% | | | | |
| | 8,497 | | | Canadian National Railway Company | | | 949,030 | |
| | 12,006 | | | Canadian Pacific Kansas City LTD. | | | 919,540 | |
| | 29,539 | | | CSX Corporation | | | 1,079,650 | |
| | 8,094 | | | Expeditors International of Washington, Inc. | | | 984,554 | |
| | 3,505 | | | Grupo Aeroportuario del Sureste S.A.B. de C.V. - ADR | | | 911,791 | |
| | 5,668 | | | JB Hunt Transport Services, Inc. | | | 1,071,875 | |
| | 5,262 | | | Landstar System, Inc. | | | 978,311 | |
| | 4,858 | | | Old Dominion Freight Line, Inc. | | | 1,093,731 | |
| | | | | | | | 7,988,482 | |
| | | | | TRANSPORTATION EQUIPMENT - 1.1% | | | | |
| | 9,039 | | | PACCAR, Inc. | | | 1,057,563 | |
See accompanying notes to financial statements.
| INSPIRE TACTICAL BALANCED ETF |
| SCHEDULE OF INVESTMENTS (Continued) |
| November 30, 2024 |
| Shares | | | | | Fair Value | |
| | | | | COMMON STOCKS — 80.7% (Continued) | | | | |
| | | | | WHOLESALE - DISCRETIONARY - 3.2% | | | | |
| | 18,217 | | | Copart, Inc.(a) | | $ | 1,154,776 | |
| | 29,865 | | | G-III Apparel Group Ltd.(a) | | | 884,900 | |
| | 2,700 | | | Pool Corporation | | | 1,018,143 | |
| | | | | | | | 3,057,819 | |
| | | | | | | | | |
| | | | | TOTAL COMMON STOCKS (Cost $66,913,733) | | | 77,182,425 | |
| | | | | | | | | |
| | | | | EXCHANGE-TRADED FUND - 18.8% | | | | |
| | | | | FIXED INCOME - 18.8% | | | | |
| | 357,633 | | | WisdomTree Floating Rate Treasury Fund (Cost $18,013,181) | | | 17,988,940 | |
| | | | | | | | | |
| | | | | COLLATERAL FOR SECURITIES LOANED – 1.0% | | | | |
| | | | | MONEY MARKET FUND – 1.0% | | | | |
| | 899,150 | | | Fidelity Investments Money Market Government Portfolio - Institutional Class, 4.55% (Cost $899,150)(c)(d) | | | 899,150 | |
| | | | | | | | | |
| | | | | TOTAL INVESTMENTS - 100.5% (Cost $85,826,064) | | $ | 96,070,515 | |
| | | | | LIABILITIES IN EXCESS OF OTHER ASSETS - (0.5)% | | | (469,955 | ) |
| | | | | NET ASSETS - 100.0% | | $ | 95,600,560 | |
| ADR | - American Depositary Receipt |
| | |
| LTD | - Limited Company |
| | |
| MSCI | - Morgan Stanley Capital International |
| | |
| REIT | - Real Estate Investment Trust |
| (a) | Non-income producing security. |
| (b) | All or a portion of the security is on loan. The total fair value of the securities on loan as of November 30, 2024 was $893,956. |
| (c) | Security was purchased with cash received as collateral for securities on loan at November 30, 2024. Total collateral had a value of $899,150 at November 30, 2024. |
| (d) | Rate disclosed is the seven day effective yield as of November 30, 2024. |
See accompanying notes to financial statements.
| INSPIRE MOMENTUM ETF |
| SCHEDULE OF INVESTMENTS |
| November 30, 2024 |
| Shares | | | | | Fair Value | |
| | | | | COMMON STOCKS — 99.9% | | | | |
| | | | | ADVERTISING & MARKETING - 3.5% | | | | |
| | 20,475 | | | Trade Desk, Inc. (The), Class A(a) | | $ | 2,632,061 | |
| | | | | | | | | |
| | | | | BIOTECH & PHARMA - 3.0% | | | | |
| | 6,097 | | | United Therapeutics Corporation(a) | | | 2,258,878 | |
| | | | | | | | | |
| | | | | COMMERCIAL SUPPORT SERVICES - 5.5% | | | | |
| | 29,211 | | | Brady Corporation, Class A | | | 2,187,612 | |
| | 9,464 | | | FTI Consulting, Inc.(a) | | | 1,916,649 | |
| | | | | | | | 4,104,261 | |
| | | | | ELECTRIC UTILITIES - 3.5% | | | | |
| | 25,935 | | | NRG Energy, Inc. | | | 2,635,255 | |
| | | | | | | | | |
| | | | | ELECTRICAL EQUIPMENT - 6.8% | | | | |
| | 31,759 | | | Amphenol Corporation, Class A | | | 2,307,291 | |
| | 21,112 | | | BWX Technologies, Inc. | | | 2,762,506 | |
| | | | | | | | 5,069,797 | |
| | | | | ENGINEERING & CONSTRUCTION - 3.8% | | | | |
| | 5,505 | | | EMCOR Group, Inc. | | | 2,808,211 | |
| | | | | | | | | |
| | | | | FORESTRY, PAPER & WOOD PRODUCTS - 3.5% | | | | |
| | 27,846 | | | Sylvamo Corporation | | | 2,569,907 | |
| | | | | | | | | |
| | | | | HEALTH CARE FACILITIES & SERVICES - 6.1% | | | | |
| | 3,731 | | | Chemed Corporation | | | 2,135,587 | |
| | 23,660 | | | Encompass Health Corporation | | | 2,435,560 | |
| | | | | | | | 4,571,147 | |
| | | | | HEALTH CARE REIT - 3.0% | | | | |
| | 55,601 | | | Omega Healthcare Investors, Inc. | | | 2,257,957 | |
| | | | | | | | | |
| | | | | HOME CONSTRUCTION - 2.9% | | | | |
| | 26,026 | | | KB Home | | | 2,153,391 | |
See accompanying notes to financial statements.
| INSPIRE MOMENTUM ETF |
| SCHEDULE OF INVESTMENTS (Continued) |
| November 30, 2024 |
| Shares | | | | | Fair Value | |
| | | | | COMMON STOCKS — 99.9% (Continued) | | | | |
| | | | | INSTITUTIONAL FINANCIAL SERVICES - 3.5% | | | | |
| | 31,668 | | | SEI Investments Company | | $ | 2,616,727 | |
| | | | | | | | | |
| | | | | INSURANCE - 9.3% | | | | |
| | 4,368 | | | Kinsale Capital Group, Inc. | | | 2,220,866 | |
| | 61,243 | | | Old Republic International Corporation | | | 2,386,639 | |
| | 10,192 | | | Reinsurance Group of America, Inc. | | | 2,327,853 | |
| | | | | | | | 6,935,358 | |
| | | | | MACHINERY - 10.0% | | | | |
| | 7,007 | | | Curtiss-Wright Corporation | | | 2,618,025 | |
| | 44,317 | | | Flowserve Corporation | | | 2,704,223 | |
| | 12,012 | | | MSA Safety, Inc. | | | 2,087,806 | |
| | | | | | | | 7,410,054 | |
| | | | | OIL & GAS PRODUCERS - 5.7% | | | | |
| | 11,102 | | | Diamondback Energy, Inc. | | | 1,971,604 | |
| | 4,186 | | | Murphy USA, Inc. | | | 2,293,091 | |
| | | | | | | | 4,264,695 | |
| | | | | RETAIL - CONSUMER STAPLES - 6.6% | | | | |
| | 26,208 | | | BJ’s Wholesale Club Holdings, Inc.(a) | | | 2,523,831 | |
| | 5,642 | | | Casey’s General Stores, Inc. | | | 2,374,661 | |
| | | | | | | | 4,898,492 | |
| | | | | RETAIL - DISCRETIONARY - 6.4% | | | | |
| | 12,194 | | | AutoNation, Inc.(a) | | | 2,181,385 | |
| | 6,006 | | | Group 1 Automotive, Inc. | | | 2,557,355 | |
| | | | | | | | 4,738,740 | |
| | | | | SEMICONDUCTORS - 9.4% | | | | |
| | 12,649 | | | Broadcom, Inc. | | | 2,050,151 | |
| | 2,639 | | | KLA Corporation | | | 1,707,512 | |
| | 2,275 | | | Monolithic Power Systems, Inc. | | | 1,291,381 | |
| | 12,376 | | | QUALCOMM, Inc. | | | 1,961,967 | |
| | | | | | | | 7,011,011 | |
| | | | | SOFTWARE - 3.2% | | | | |
| | 14,105 | | | CommVault Systems, Inc.(a) | | | 2,420,277 | |
See accompanying notes to financial statements.
| INSPIRE MOMENTUM ETF |
| SCHEDULE OF INVESTMENTS (Continued) |
| November 30, 2024 |
| Shares | | | | | Fair Value | |
| | | | | COMMON STOCKS — 99.9% (Continued) | | | | |
| | | | | TECHNOLOGY HARDWARE - 4.2% | | | | |
| | 16,016 | | | NetApp, Inc. | | $ | 1,964,202 | |
| | 34,580 | | | Super Micro Computer, Inc.(a) | | | 1,128,691 | |
| | | | | | | | 3,092,893 | |
| | | | | | | | | |
| | | | | TOTAL COMMON STOCKS (Cost $61,292,183) | | | 74,449,112 | |
| | | | | | | | | |
| | | | | TOTAL INVESTMENTS - 99.9% (Cost $61,292,183) | | $ | 74,449,112 | |
| | | | | OTHER ASSETS IN EXCESS OF LIABILITIES - 0.1% | | | 54,445 | |
| | | | | NET ASSETS - 100.0% | | $ | 74,503,557 | |
| REIT | - Real Estate Investment Trust |
| (a) | Non-income producing security. |
See accompanying notes to financial statements.
| INSPIRE FIDELIS MULTI FACTOR ETF |
| SCHEDULE OF INVESTMENTS |
| November 30, 2024 |
| Shares | | | | | Fair Value | |
| | | | | COMMON STOCKS — 99.9% | | | | |
| | | | | ADVERTISING & MARKETING - 1.0% | | | | |
| | 43,079 | | | QuinStreet, Inc.(a) | | $ | 981,340 | |
| | | | | | | | | |
| | | | | AEROSPACE & DEFENSE - 2.1% | | | | |
| | 8,947 | | | Howmet Aerospace, Inc. | | | 1,059,146 | |
| | 5,192 | | | Woodward, Inc. | | | 936,221 | |
| | | | | | | | 1,995,367 | |
| | | | | APPAREL & TEXTILE PRODUCTS - 1.2% | | | | |
| | 5,697 | | | Deckers Outdoor Corporation(a) | | | 1,116,384 | |
| | | | | | | | | |
| | | | | BANKING - 7.2% | | | | |
| | 54,899 | | | First Bank | | | 811,956 | |
| | 444 | | | First Citizens BancShares, Inc., Class A | | | 1,018,980 | |
| | 37,667 | | | Northeast Community Bancorp, Inc. | | | 1,135,659 | |
| | 19,092 | | | OFG Bancorp | | | 867,159 | |
| | 68,598 | | | Primis Financial Corporation | | | 857,475 | |
| | 11,156 | | | QCR Holdings, Inc. | | | 1,027,579 | |
| | 31,039 | | | Third Coast Bancshares, Inc.(a) | | | 1,101,885 | |
| | | | | | | | 6,820,693 | |
| | | | | BIOTECH & PHARMA - 3.6% | | | | |
| | 44,405 | | | ADMA Biologics, Inc.(a) | | | 892,985 | |
| | 106,042 | | | BioCryst Pharmaceuticals, Inc.(a) | | | 795,315 | |
| | 40,760 | | | Catalyst Pharmaceuticals, Inc.(a) | | | 899,573 | |
| | 18,889 | | | Protagonist Therapeutics, Inc.(a) | | | 827,338 | |
| | | | | | | | 3,415,211 | |
| | | | | CHEMICALS - 0.9% | | | | |
| | 7,843 | | | Cabot Corporation | | | 859,750 | |
| | | | | | | | | |
| | | | | COMMERCIAL SUPPORT SERVICES - 2.0% | | | | |
| | 4,329 | | | Cintas Corporation | | | 977,445 | |
| | 21,084 | | | Willdan Group, Inc.(a) | | | 921,582 | |
| | | | | | | | 1,899,027 | |
| | | | | E-COMMERCE DISCRETIONARY - 3.8% | | | | |
| | 27,725 | | | Chewy, Inc.(a) | | | 926,292 | |
| | 227,879 | | | Honest Company, Inc. (The)(a) | | | 1,889,117 | |
See accompanying notes to financial statements.
| INSPIRE FIDELIS MULTI FACTOR ETF |
| SCHEDULE OF INVESTMENTS (Continued) |
| November 30, 2024 |
| Shares | | | | | Fair Value | |
| | | | | COMMON STOCKS — 99.9% (Continued) | | | | |
| | | | | E-COMMERCE DISCRETIONARY - 3.8% (Continued) | | | | |
| | 411 | | | MercadoLibre, Inc.(a) | | $ | 815,905 | |
| | | | | | | | 3,631,314 | |
| | | | | ELECTRIC UTILITIES - 2.0% | | | | |
| | 25,737 | | | Brookfield Infrastructure Partners, L.P. | | | 900,023 | |
| | 9,720 | | | Pinnacle West Capital Corporation | | | 910,764 | |
| | | | | | | | 1,810,787 | |
| | | | | ELECTRICAL EQUIPMENT - 5.1% | | | | |
| | 3,977 | | | Badger Meter, Inc. | | | 862,293 | |
| | 10,713 | | | Bel Fuse, Inc., Class B | | | 858,968 | |
| | 8,150 | | | Itron, Inc.(a) | | | 966,020 | |
| | 1,404 | | | Lennox International, Inc. | | | 936,651 | |
| | 4,551 | | | Powell Industries, Inc. | | | 1,216,845 | |
| | | | | | | | 4,840,777 | |
| | | | | ENGINEERING & CONSTRUCTION - 3.1% | | | | |
| | 2,280 | | | Comfort Systems USA, Inc. | | | 1,124,655 | |
| | 1,988 | | | EMCOR Group, Inc. | | | 1,014,119 | |
| | 80,525 | | | Mistras Group, Inc.(a) | | | 749,688 | |
| | | | | | | | 2,888,462 | |
| | | | | FOOD - 3.9% | | | | |
| | 43,963 | | | Nomad Foods Ltd. | | | 804,963 | |
| | 20,313 | | | Pilgrim’s Pride Corporation(a) | | | 1,048,353 | |
| | 14,097 | | | Tyson Foods, Inc., Class A | | | 909,257 | |
| | 26,510 | | | Vital Farms, Inc.(a) | | | 880,132 | |
| | | | | | | | 3,642,705 | |
| | | | | GAS & WATER UTILITIES - 1.1% | | | | |
| | 35,237 | | | UGI Corporation | | | 1,070,148 | |
| | | | | | | | | |
| | | | | HEALTH CARE FACILITIES & SERVICES - 4.7% | | | | |
| | 5,328 | | | DaVita, Inc.(a) | | | 885,354 | |
| | 9,435 | | | Encompass Health Corporation | | | 971,239 | |
| | 11,100 | | | HealthEquity, Inc.(a) | | | 1,127,093 | |
| | 5,217 | | | Tenet Healthcare Corporation(a) | | | 744,362 | |
| | 3,663 | | | Universal Health Services, Inc., Class B | | | 750,915 | |
| | | | | | | | 4,478,963 | |
See accompanying notes to financial statements.
| INSPIRE FIDELIS MULTI FACTOR ETF |
| SCHEDULE OF INVESTMENTS (Continued) |
| November 30, 2024 |
| Shares | | | | | Fair Value | |
| | | | | COMMON STOCKS — 99.9% (Continued) | | | | |
| | | | | HOME & OFFICE PRODUCTS - 1.0% | | | | |
| | 58,830 | | | Virco Mfg. Corporation | | $ | 965,989 | |
| | | | | | | | | |
| | | | | HOME CONSTRUCTION - 4.0% | | | | |
| | 4,440 | | | DR Horton, Inc. | | | 749,383 | |
| | 12,372 | | | Griffon Corporation | | | 1,042,960 | |
| | 45,399 | | | Interface, Inc. | | | 1,205,343 | |
| | 5,965 | | | PulteGroup, Inc. | | | 806,886 | |
| | | | | | | | 3,804,572 | |
| | | | | INSTITUTIONAL FINANCIAL SERVICES - 2.4% | | | | |
| | 6,517 | | | Interactive Brokers Group, Inc., Class A | | | 1,245,334 | |
| | 27,395 | | | Virtu Financial, Inc., Class A | | | 1,022,107 | |
| | | | | | | | 2,267,441 | |
| | | | | INSURANCE - 4.0% | | | | |
| | 3,441 | | | Progressive Corporation (The) | | | 925,216 | |
| | 3,996 | | | Reinsurance Group of America, Inc. | | | 912,686 | |
| | 3,330 | | | RenaissanceRe Holdings Ltd. | | | 952,880 | |
| | 15,023 | | | W R Berkley Corporation | | | 969,735 | |
| | | | | | | | 3,760,517 | |
| | | | | INTERNET MEDIA & SERVICES - 5.0% | | | | |
| | 306,195 | | | Angi, Inc., Class A(a) | | | 569,523 | |
| | 38,628 | | | EverQuote, Inc.(a) | | | 741,271 | |
| | 29,970 | | | HealthStream, Inc. | | | 992,007 | |
| | 58,608 | | | Opera Ltd. - ADR | | | 1,172,746 | |
| | 101,181 | | | SimilarWeb Ltd.(a) | | | 1,255,655 | |
| | | | | | | | 4,731,202 | |
| | | | | MACHINERY - 1.8% | | | | |
| | 2,331 | | | Caterpillar, Inc. | | | 946,642 | |
| | 13,986 | | | Hyster-Yale Materials Handling, Inc., Class A | | | 786,573 | |
| | | | | | | | 1,733,215 | |
| | | | | MEDICAL EQUIPMENT & DEVICES - 3.1% | | | | |
| | 28,194 | | | Castle Biosciences, Inc.(a) | | | 853,714 | |
| | 3,535 | | | ResMed, Inc. | | | 880,286 | |
| | 61,968 | | | Tactile Systems Technology, Inc.(a) | | | 1,210,855 | |
| | | | | | | | 2,944,855 | |
See accompanying notes to financial statements.
| INSPIRE FIDELIS MULTI FACTOR ETF |
| SCHEDULE OF INVESTMENTS (Continued) |
| November 30, 2024 |
| Shares | | | | | Fair Value | |
| | | | | COMMON STOCKS — 99.9% (Continued) | | | | |
| | | | | METALS & MINING - 2.0% | | | | |
| | 8,947 | | | CONSOL Energy, Inc. | | $ | 1,169,373 | |
| | 16,206 | | | Newmont Corporation | | | 679,680 | |
| | | | | | | | 1,849,053 | |
| | | | | OIL & GAS PRODUCERS - 4.9% | | | | |
| | 4,773 | | | Diamondback Energy, Inc. | | | 847,637 | |
| | 19,441 | | | MPLX, L.P. | | | 1,004,322 | |
| | 5,633 | | | Targa Resources Corporation | | | 1,150,823 | |
| | 143,819 | | | VAALCO Energy, Inc. | | | 736,353 | |
| | 22,089 | | | Western Midstream Partners, L.P. | | | 899,243 | |
| | | | | | | | 4,638,378 | |
| | | | | OIL & GAS SERVICES & EQUIPMENT - 1.1% | | | | |
| | 23,418 | | | Baker Hughes Company | | | 1,029,221 | |
| | | | | | | | | |
| | | | | RENEWABLE ENERGY - 0.7% | | | | |
| | 3,535 | | | First Solar, Inc.(a) | | | 704,419 | |
| | | | | | | | | |
| | | | | RETAIL - CONSUMER STAPLES - 1.4% | | | | |
| | 8,325 | | | Sprouts Farmers Market, Inc.(a) | | | 1,286,046 | |
| | | | | | | | | |
| | | | | RETAIL - DISCRETIONARY - 1.1% | | | | |
| | 26,179 | | | Build-A-Bear Workshop, Inc. | | | 994,540 | |
| | | | | | | | | |
| | | | | SEMICONDUCTORS - 2.6% | | | | |
| | 6,882 | | | Cirrus Logic, Inc.(a) | | | 718,825 | |
| | 4,995 | | | QUALCOMM, Inc. | | | 791,857 | |
| | 4,884 | | | Taiwan Semiconductor Manufacturing Company Ltd. - ADR | | | 901,879 | |
| | | | | | | | 2,412,561 | |
| | | | | SOFTWARE - 10.0% | | | | |
| | 17,649 | | | ACI Worldwide, Inc.(a) | | | 1,002,816 | |
| | 80,304 | | | American Software, Inc., Class A | | | 845,601 | |
| | 3,756 | | | Appfolio, Inc., Class A(a) | | | 953,085 | |
| | 5,633 | | | CommVault Systems, Inc.(a) | | | 966,566 | |
| | 14,802 | | | DocuSign, Inc.(a) | | | 1,179,572 | |
| | 32,301 | | | Gen Digital, Inc. | | | 996,486 | |
See accompanying notes to financial statements.
| INSPIRE FIDELIS MULTI FACTOR ETF |
| SCHEDULE OF INVESTMENTS (Continued) |
| November 30, 2024 |
| Shares | | | | | Fair Value | |
| | | | | COMMON STOCKS — 99.9% (Continued) | | | | |
| | | | | SOFTWARE - 10.0% (Continued) | | | | |
| | 3,159 | | | Monday.com Ltd.(a) | | $ | 901,452 | |
| | 14,802 | | | Nutanix, Inc., Class A(a) | | | 966,275 | |
| | 53,242 | | | OneSpan, Inc.(a) | | | 964,745 | |
| | 37,115 | | | Oscar Health, Inc. - Class A(a) | | | 643,203 | |
| | | | | | | | 9,419,801 | |
| | | | | SPECIALTY FINANCE - 1.0% | | | | |
| | 16,428 | | | Bread Financial Holdings, Inc. | | | 966,459 | |
| | | | | | | | | |
| | | | | STEEL - 1.1% | | | | |
| | 7,290 | | | Steel Dynamics, Inc. | | | 1,059,018 | |
| | | | | | | | | |
| | | | | TECHNOLOGY HARDWARE - 2.1% | | | | |
| | 19,869 | | | Diebold Nixdorf, Inc.(a) | | | 918,345 | |
| | 4,971 | | | Garmin Ltd. | | | 1,056,835 | |
| | | | | | | | 1,975,180 | |
| | | | | TECHNOLOGY SERVICES - 1.8% | | | | |
| | 75,127 | | | Magic Software Enterprises Ltd.(b) | | | 945,097 | |
| | 6,407 | | | Science Applications International Corporation | | | 796,070 | |
| | | | | | | | 1,741,167 | |
| | | | | TELECOMMUNICATIONS - 3.0% | | | | |
| | 28,949 | | | ATN International, Inc. | | | 572,611 | |
| | 36,741 | | | Telephone and Data Systems, Inc. | | | 1,255,808 | |
| | 270,204 | | | Vnet Group, Inc. - ADR(a) | | | 1,048,392 | |
| | | | | | | | 2,876,811 | |
| | | | | TRANSPORTATION & LOGISTICS - 2.6% | | | | |
| | 48,381 | | | Ardmore Shipping Corporation | | | 539,932 | |
| | 18,315 | | | Delta Air Lines, Inc. | | | 1,168,864 | |
| | 18,874 | | | Euroseas Ltd. | | | 719,099 | |
| | | | | | | | 2,427,895 | |
| | | | | WHOLESALE - CONSUMER STAPLES - 0.8% | | | | |
| | 8,658 | | | Bunge Global S.A. | | | 776,969 | |
See accompanying notes to financial statements.
| INSPIRE FIDELIS MULTI FACTOR ETF |
| SCHEDULE OF INVESTMENTS (Continued) |
| November 30, 2024 |
| Shares | | | | | Fair Value | |
| | | | | COMMON STOCKS — 99.9% (Continued) | | | | |
| | | | | WHOLESALE - DISCRETIONARY - 0.7% | | | | |
| | 8,616 | | | ePlus, Inc.(a) | | $ | 696,690 | |
| | | | | | | | | |
| | | | | TOTAL COMMON STOCKS (Cost $82,756,394) | | | 94,512,927 | |
| | | | | | | | | |
| | | | | COLLATERAL FOR SECURITIES LOANED - 0.0%(d) | | | | |
| | | | | MONEY MARKET FUND - 0.0% (d) | | | | |
| | 42,665 | | | Fidelity Investments Money Market Government Portfolio - Institutional Class, 4.55% (Cost $42,665)(c)(e) | | | 42,665 | |
| | | | | | | | | |
| | | | | TOTAL INVESTMENTS - 99.9% (Cost $82,799,059) | | $ | 94,555,592 | |
| | | | | OTHER ASSETS IN EXCESS OF LIABILITIES - 0.1% | | | 91,338 | |
| | | | | NET ASSETS - 100.0% | | $ | 94,646,930 | |
| ADR | - American Depositary Receipt |
| | |
| L.P. | - Limited Partnership |
| | |
| LTD | - Limited Company |
| | |
| S.A. | - Société Anonyme |
| (a) | Non-income producing security. |
| (b) | All or a portion of the security is on loan. The total fair value of the securities on loan as of November 30, 2024 was $44,030. |
| (c) | Security was purchased with cash received as collateral for securities on loan at November 30, 2024. Total collateral had a value of $42,665 at November 30, 2024. |
| (d) | Percentage rounds to less than 0.1%. |
| (e) | Rate disclosed is the seven day effective yield as of November 30, 2024. |
See accompanying notes to financial statements.
| INSPIRE 500 ETF |
| SCHEDULE OF INVESTMENTS |
| November 30, 2024 |
| Shares | | | | | Fair Value | |
| | | | | COMMON STOCKS — 99.6% | | | | |
| | | | | ADVERTISING & MARKETING - 0.4% | | | | |
| | 8,986 | | | Trade Desk, Inc. (The), Class A(a) | | $ | 1,155,150 | |
| | | | | | | | | |
| | | | | AEROSPACE & DEFENSE - 0.1% | | | | |
| | 4,684 | | | Leonardo DRS, Inc.(a) | | | 162,863 | |
| | 1,626 | | | Loar Holdings, Inc.(a) | | | 149,722 | |
| | | | | | | | 312,585 | |
| | | | | APPAREL & TEXTILE PRODUCTS - 0.2% | | | | |
| | 2,722 | | | Deckers Outdoor Corporation(a) | | | 533,403 | |
| | | | | | | | | |
| | | | | ASSET MANAGEMENT - 0.4% | | | | |
| | 24,897 | | | Blue Owl Capital, Inc. | | | 590,806 | |
| | 933 | | | Hamilton Lane, Inc., Class A | | | 179,509 | |
| | 1,837 | | | Stifel Financial Corporation | | | 212,725 | |
| | | | | | | | 983,040 | |
| | | | | AUTOMOTIVE - 0.2% | | | | |
| | 25,615 | | | Aurora Innovation, Inc.(a) | | | 165,729 | |
| | 3,865 | | | BorgWarner, Inc. | | | 132,647 | |
| | 4,156 | | | Gentex Corporation | | | 127,007 | |
| | 43,118 | | | Lucid Group, Inc.(a) | | | 93,997 | |
| | | | | | | | 519,380 | |
| | | | | BANKING - 1.2% | | | | |
| | 1,174 | | | BOK Financial Corporation | | | 139,553 | |
| | 1,183 | | | Cullen/Frost Bankers, Inc. | | | 166,353 | |
| | 2,514 | | | East West Bancorp, Inc. | | | 275,736 | |
| | 275 | | | First Citizens BancShares, Inc., Class A | | | 631,125 | |
| | 10,104 | | | First Horizon Corporation | | | 213,498 | |
| | 1,418 | | | Pinnacle Financial Partners, Inc. | | | 180,242 | |
| | 1,759 | | | Prosperity Bancshares, Inc. | | | 147,281 | |
| | 16,504 | | | Regions Financial Corporation | | | 449,899 | |
| | 1,443 | | | SouthState Corporation | | | 159,726 | |
| | 3,182 | | | Webster Financial Corporation | | | 196,584 | |
| | 2,016 | | | Western Alliance Bancorp | | | 188,718 | |
| | 1,216 | | | Wintrust Financial Corporation | | | 167,820 | |
See accompanying notes to financial statements.
| INSPIRE 500 ETF |
| SCHEDULE OF INVESTMENTS (Continued) |
| November 30, 2024 |
| Shares | | | | | Fair Value | |
| | | | | COMMON STOCKS — 99.6% (Continued) | | | | |
| | | | | BANKING - 1.2% (Continued) | | | | |
| | 2,727 | | | Zions Bancorporation | | $ | 165,038 | |
| | | | | | | | 3,081,573 | |
| | | | | BEVERAGES - 0.5% | | | | |
| | 4,476 | | | Celsius Holdings, Inc.(a) | | | 127,342 | |
| | 150 | | | Coca-Cola Consolidated, Inc. | | | 195,644 | |
| | 17,551 | | | Monster Beverage Corporation(a) | | | 967,586 | |
| | | | | | | | 1,290,572 | |
| | | | | BIOTECH & PHARMA - 1.8% | | | | |
| | 8,353 | | | Elanco Animal Health, Inc.(a) | | | 110,343 | |
| | 5,328 | | | Exelixis, Inc.(a) | | | 194,259 | |
| | 3,461 | | | Incyte Corporation(a) | | | 258,156 | |
| | 3,189 | | | Insmed, Inc.(a) | | | 239,685 | |
| | 1,969 | | | Intra-Cellular Therapies, Inc.(a) | | | 168,645 | |
| | 1,117 | | | Jazz Pharmaceuticals plc(a) | | | 135,816 | |
| | 1,921 | | | Neurocrine Biosciences, Inc.(a) | | | 243,487 | |
| | 1,314 | | | Nuvalent, Inc.(a) | | | 127,038 | |
| | 2,200 | | | Regeneron Pharmaceuticals, Inc.(a) | | | 1,650,483 | |
| | 3,055 | | | REVOLUTION Medicines, Inc.(a) | | | 176,732 | |
| | 13,873 | | | Roivant Sciences Ltd.(a) | | | 176,326 | |
| | 10,719 | | | Royalty Pharma plc, Class A | | | 285,768 | |
| | 14,725 | | | Summit Therapeutics, Inc.(a) | | | 271,824 | |
| | 771 | | | United Therapeutics Corporation(a) | | | 285,648 | |
| | 2,309 | | | Vaxcyte, Inc.(a) | | | 217,831 | |
| | 2,133 | | | Viking Therapeutics, Inc.(a) | | | 112,921 | |
| | | | | | | | 4,654,962 | |
| | | | | CABLE & SATELLITE - 0.1% | | | | |
| | 2,109 | | | Liberty Broadband Corporation - Series A(a) | | | 178,569 | |
| | | | | | | | | |
| | | | | CHEMICALS – 3.0% | | | | |
| | 1,995 | | | Albemarle Corporation | | | 214,862 | |
| | 4,023 | | | Axalta Coating Systems Ltd.(a) | | | 162,771 | |
| | 3,154 | | | CF Industries Holdings, Inc. | | | 282,788 | |
| | 4,559 | | | International Flavors & Fragrances, Inc. | | | 416,510 | |
| | 8,535 | | | Linde plc | | | 3,934,549 | |
See accompanying notes to financial statements.
| INSPIRE 500 ETF |
| SCHEDULE OF INVESTMENTS (Continued) |
| November 30, 2024 |
| Shares | | | | | Fair Value | |
| | | | | COMMON STOCKS — 99.6% (Continued) | | | | |
| | | | | CHEMICALS – 3.0% (Continued) | | | | |
| | 5,809 | | | LyondellBasell Industries N.V. | | $ | 484,122 | |
| | 2,383 | | | RPM International, Inc. | | | 330,713 | |
| | 4,527 | | | Sherwin-Williams Company (The) | | | 1,799,029 | |
| | 2,255 | | | Westlake Corporation | | | 289,542 | |
| | | | | | | | 7,914,886 | |
| | | | | COMMERCIAL SUPPORT SERVICES - 2.1% | | | | |
| | 7,181 | | | Cintas Corporation | | | 1,621,399 | |
| | 991 | | | Clean Harbors, Inc.(a) | | | 257,749 | |
| | 633 | | | FTI Consulting, Inc.(a) | | | 128,195 | |
| | 5,621 | | | Republic Services, Inc. | | | 1,227,064 | |
| | 1,792 | | | Robert Half, Inc. | | | 133,701 | |
| | 8,641 | | | Rollins, Inc. | | | 434,902 | |
| | 3,658 | | | UL Solutions, Inc., Class A | | | 196,544 | |
| | 7,068 | | | Waste Management, Inc. | | | 1,613,059 | |
| | | | | | | | 5,612,613 | |
| | | | | CONSTRUCTION MATERIALS - 1.5% | | | | |
| | 1,375 | | | Advanced Drainage Systems, Inc. | | | 186,024 | |
| | 807 | | | Carlisle Companies, Inc. | | | 368,557 | |
| | 12,268 | | | CRH plc | | | 1,254,649 | |
| | 612 | | | Eagle Materials, Inc. | | | 189,059 | |
| | 1,121 | | | Martin Marietta Materials, Inc. | | | 672,600 | |
| | 1,595 | | | Owens Corning | | | 327,964 | |
| | 760 | | | Simpson Manufacturing Company, Inc. | | | 143,184 | |
| | 3,276 | | | Summit Materials, Inc., Class A(a) | | | 166,879 | |
| | 2,386 | | | Vulcan Materials Co. | | | 687,478 | |
| | | | | | | | 3,996,394 | |
| | | | | CONSUMER SERVICES - 0.1% | | | | |
| | 1,040 | | | Bright Horizons Family Solutions, Inc.(a) | | | 120,255 | |
| | 2,669 | | | Service Corp International | | | 236,447 | |
| | | | | | | | 356,702 | |
| | | | | CONTAINERS & PACKAGING - 0.6% | | | | |
| | 1,168 | | | AptarGroup, Inc. | | | 202,017 | |
| | 2,081 | | | Berry Global Group, Inc. | | | 150,477 | |
| | 2,131 | | | Crown Holdings, Inc. | | | 196,244 | |
See accompanying notes to financial statements.
| INSPIRE 500 ETF |
| SCHEDULE OF INVESTMENTS (Continued) |
| November 30, 2024 |
| Shares | | | | | Fair Value | |
| | | | | COMMON STOCKS — 99.6% (Continued) | | | | |
| | | | | CONTAINERS & PACKAGING - 0.6% (Continued) | | | | |
| | 5,543 | | | Graphic Packaging Holding Company | | $ | 166,789 | |
| | 6,423 | | | International Paper Company | | | 377,865 | |
| | 1,606 | | | Packaging Corporation of America | | | 399,653 | |
| | | | | | | | 1,493,045 | |
| | | | | DATA CENTER REIT - 0.4% | | | | |
| | 5,899 | | | Digital Realty Trust, Inc. | | | 1,154,375 | |
| | | | | | | | | |
| | | | | DIVERSIFIED INDUSTRIALS - 0.8% | | | | |
| | 2,443 | | | Dover Corporation | | | 503,014 | |
| | 10,008 | | | Emerson Electric Company | | | 1,327,060 | |
| | 1,415 | | | ITT, Inc. | | | 220,910 | |
| | | | | | | | 2,050,984 | |
| | | | | E-COMMERCE DISCRETIONARY - 0.4% | | | | |
| | 8,569 | | | Chewy, Inc.(a) | | | 286,290 | |
| | 32,345 | | | Coupang, Inc.(a) | | | 820,269 | |
| | | | | | | | 1,106,559 | |
| | | | | ELECTRIC UTILITIES - 4.8% | | | | |
| | 4,599 | | | Ameren Corporation | | | 434,100 | |
| | 6,978 | | | Avangrid, Inc. | | | 251,906 | |
| | 11,283 | | | CenterPoint Energy, Inc. | | | 368,051 | |
| | 5,281 | | | CMS Energy Corporation | | | 368,139 | |
| | 6,104 | | | Consolidated Edison, Inc. | | | 614,001 | |
| | 4,516 | | | Constellation Energy Corporation | | | 1,158,625 | |
| | 3,591 | | | DTE Energy Company | | | 451,676 | |
| | 3,725 | | | Entergy Corporation | | | 581,733 | |
| | 4,072 | | | Evergy, Inc. | | | 263,173 | |
| | 6,333 | | | Eversource Energy | | | 408,415 | |
| | 17,355 | | | Exelon Corporation | | | 686,564 | |
| | 10,117 | | | FirstEnergy Corporation | | | 430,478 | |
| | 36,118 | | | NextEra Energy, Inc. | | | 2,841,402 | |
| | 3,342 | | | NRG Energy, Inc. | | | 339,581 | |
| | 3,559 | | | OGE Energy Corporation | | | 156,454 | |
| | 38,347 | | | PG&E Corporation | | | 829,446 | |
| | 2,045 | | | Pinnacle West Capital Corporation | | | 191,617 | |
See accompanying notes to financial statements.
| INSPIRE 500 ETF |
| SCHEDULE OF INVESTMENTS (Continued) |
| November 30, 2024 |
| Shares | | | | | Fair Value | |
| | | | | COMMON STOCKS — 99.6% (Continued) | | | | |
| | | | | ELECTRIC UTILITIES - 4.8% (Continued) | | | | |
| | 8,399 | | | Public Service Enterprise Group, Inc. | | $ | 792,026 | |
| | 890 | | | Talen Energy Corporation(a) | | | 190,825 | |
| | 4,798 | | | Vistra Corporation | | | 766,912 | |
| | 5,582 | | | WEC Energy Group, Inc. | | | 564,061 | |
| | | | | | | | 12,689,185 | |
| | | | | ELECTRICAL EQUIPMENT - 3.6% | | | | |
| | 2,440 | | | A O Smith Corporation | | | 181,756 | |
| | 1,361 | | | AAON, Inc. | | | 185,559 | |
| | 553 | | | Acuity Brands, Inc. | | | 177,342 | |
| | 4,168 | | | AMETEK, Inc. | | | 810,176 | |
| | 21,829 | | | Amphenol Corporation, Class A | | | 1,585,878 | |
| | 5,353 | | | API Group Corporation(a) | | | 202,236 | |
| | 1,476 | | | BWX Technologies, Inc. | | | 193,135 | |
| | 3,029 | | | Cognex Corporation | | | 121,099 | |
| | 4,687 | | | GE Vernova, LLC(a) | | | 1,566,020 | |
| | 993 | | | Generac Holdings, Inc.(a) | | | 186,883 | |
| | 947 | | | Hubbell, Inc. | | | 435,705 | |
| | 3,045 | | | Keysight Technologies, Inc.(a) | | | 520,208 | |
| | 657 | | | Lennox International, Inc. | | | 438,304 | |
| | 6,577 | | | Otis Worldwide Corporation | | | 677,299 | |
| | 846 | | | SPX Technologies, Inc.(a) | | | 149,268 | |
| | 5,420 | | | TE Connectivity plc | | | 819,070 | |
| | 4,255 | | | Trimble, Inc.(a) | | | 310,487 | |
| | 6,261 | | | Vertiv Holdings Company | | | 798,904 | |
| | 600 | | | Watts Water Technologies, Inc., Class A | | | 129,474 | |
| | | | | | | | 9,488,803 | |
| | | | | ENGINEERING & CONSTRUCTION - 1.1% | | | | |
| | 610 | | | Comfort Systems USA, Inc. | | | 300,895 | |
| | 822 | | | EMCOR Group, Inc. | | | 419,318 | |
| | 3,027 | | | Fluor Corporation(a) | | | 169,906 | |
| | 509 | | | Installed Building Products, Inc. | | | 116,429 | |
| | 2,196 | | | Jacobs Solutions, Inc. | | | 310,141 | |
| | 2,308 | | | KBR, Inc. | | | 140,396 | |
| | 1,409 | | | MasTec, Inc.(a) | | | 202,981 | |
See accompanying notes to financial statements.
| INSPIRE 500 ETF |
| SCHEDULE OF INVESTMENTS (Continued) |
| November 30, 2024 |
| Shares | | | | | Fair Value | |
| | | | | COMMON STOCKS — 99.6% (Continued) | | | | |
| | | | | ENGINEERING & CONSTRUCTION - 1.1% (Continued) | | | | |
| | 2,541 | | | Quanta Services, Inc. | | $ | 875,424 | |
| | 4,738 | | | Tetra Tech, Inc. | | | 196,674 | |
| | 559 | | | TopBuild Corporation(a) | | | 218,368 | |
| | | | | | | | 2,950,532 | |
| | | | | ENTERTAINMENT CONTENT - 1.1% | | | | |
| | 6,044 | | | AppLovin Corporation, Class A(a) | | | 2,035,317 | |
| | 8,219 | | | Endeavor Group Holdings, Inc., Class A | | | 249,611 | |
| | 3,243 | | | Take-Two Interactive Software, Inc.(a) | | | 610,916 | |
| | | | | | | | 2,895,844 | |
| | | | | FOOD - 0.8% | | | | |
| | 2,276 | | | BellRing Brands, Inc.(a) | | | 178,575 | |
| | 8,614 | | | Conagra Brands, Inc. | | | 237,316 | |
| | 2,655 | | | Lamb Weston Holdings, Inc. | | | 205,072 | |
| | 4,868 | | | McCormick & Company, Inc. | | | 381,700 | |
| | 3,945 | | | Pilgrim’s Pride Corporation(a) | | | 203,601 | |
| | 1,042 | | | Post Holdings, Inc.(a) | | | 125,540 | |
| | 5,597 | | | The Campbell’s Company | | | 258,581 | |
| | 6,634 | | | Tyson Foods, Inc., Class A | | | 427,894 | |
| | | | | | | | 2,018,279 | |
| | | | | FORESTRY, PAPER & WOOD PRODUCTS - 0.2% | | | | |
| | 1,226 | | | Louisiana-Pacific Corporation | | | 144,913 | |
| | 502 | | | Magnera Corporation(a) | | | 10,281 | |
| | 2,063 | | | Trex Company, Inc.(a) | | | 154,787 | |
| | 1,098 | | | UFP Industries, Inc. | | | 149,218 | |
| | | | | | | | 459,199 | |
| | | | | GAS & WATER UTILITIES - 0.5% | | | | |
| | 3,581 | | | American Water Works Company, Inc. | | | 490,383 | |
| | 2,739 | | | Atmos Energy Corporation | | | 414,465 | |
| | 4,912 | | | Essential Utilities, Inc. | | | 196,627 | |
| | 7,837 | | | NiSource, Inc. | | | 298,511 | |
| | | | | | | | 1,399,986 | |
| | | | | HEALTH CARE FACILITIES & SERVICES - 2.2% | | | | |
| | 2,127 | | | Acadia Healthcare Company, Inc.(a) | | | 86,420 | |
| | 3,561 | | | Cencora, Inc. | | | 895,770 | |
See accompanying notes to financial statements.
| INSPIRE 500 ETF |
| SCHEDULE OF INVESTMENTS (Continued) |
| November 30, 2024 |
| Shares | | | | | Fair Value | |
| | | | | COMMON STOCKS — 99.6% (Continued) | | | | |
| | | | | HEALTH CARE FACILITIES & SERVICES - 2.2% (Continued) | | | | |
| | 266 | | | Chemed Corporation | | $ | 152,256 | |
| | 1,504 | | | DaVita, Inc.(a) | | | 249,920 | |
| | 4,335 | | | Elevance Health, Inc. | | | 1,764,172 | |
| | 1,736 | | | Encompass Health Corporation | | | 178,704 | |
| | 1,076 | | | Ensign Group, Inc. (The) | | | 157,322 | |
| | 1,510 | | | HealthEquity, Inc.(a) | | | 153,325 | |
| | 3,423 | | | IQVIA Holdings, Inc.(a) | | | 687,475 | |
| | 1,533 | | | Labcorp Holdings, Inc. | | | 369,698 | |
| | 624 | | | Medpace Holdings, Inc.(a) | | | 212,553 | |
| | 1,078 | | | Molina Healthcare, Inc.(a) | | | 321,136 | |
| | 2,634 | | | Tempus AI, Inc.(a) | | | 164,862 | |
| | 1,721 | | | Tenet Healthcare Corporation(a) | | | 245,552 | |
| | 1,255 | | | Universal Health Services, Inc., Class B | | | 257,275 | |
| | | | | | | | 5,896,440 | |
| | | | | HEALTH CARE REIT - 1.0% | | | | |
| | 6,440 | | | Healthcare Realty Trust, Inc. | | | 117,981 | |
| | 12,197 | | | Healthpeak Properties, Inc. | | | 268,212 | |
| | 4,651 | | | Omega Healthcare Investors, Inc. | | | 188,877 | |
| | 7,226 | | | Ventas, Inc. | | | 462,970 | |
| | 10,816 | | | Welltower, Inc. | | | 1,494,556 | |
| | | | | | | | 2,532,596 | |
| | | | | HOME & OFFICE PRODUCTS - 0.2% | | | | |
| | 2,463 | | | SharkNinja, Inc.(a) | | | 247,655 | |
| | 3,107 | | | Tempur Sealy International, Inc. | | | 173,930 | |
| | | | | | | | 421,585 | |
| | | | | HOME CONSTRUCTION - 1.5% | | | | |
| | 6,087 | | | DR Horton, Inc. | | | 1,027,363 | |
| | 2,168 | | | Fortune Brands Innovations, Inc. | | | 169,754 | |
| | 5,016 | | | Lennar Corporation, Class A | | | 874,740 | |
| | 3,894 | | | Masco Corporation | | | 313,701 | |
| | 665 | | | Meritage Homes Corporation | | | 127,062 | |
| | 1,127 | | | Mohawk Industries, Inc.(a) | | | 156,461 | |
| | 53 | | | NVR, Inc.(a) | | | 489,486 | |
| | 3,773 | | | PulteGroup, Inc. | | | 510,374 | |
See accompanying notes to financial statements.
| INSPIRE 500 ETF |
| SCHEDULE OF INVESTMENTS (Continued) |
| November 30, 2024 |
| Shares | | | | | Fair Value | |
| | | | | COMMON STOCKS — 99.6% (Continued) | | | | |
| | | | | HOME CONSTRUCTION - 1.5% (Continued) | | | | |
| | 1,910 | | | Taylor Morrison Home Corporation(a) | | $ | 141,092 | |
| | 1,807 | | | Toll Brothers, Inc. | | | 298,462 | |
| | | | | | | | 4,108,495 | |
| | | | | HOTEL REIT - 0.1% | | | | |
| | 13,267 | | | Host Hotels & Resorts, Inc. | | | 244,378 | |
| | | | | | | | | |
| | | | | HOUSEHOLD PRODUCTS - 0.3% | | | | |
| | 34,355 | | | Kenvue, Inc. | | | 827,268 | |
| | | | | | | | | |
| | | | | INDUSTRIAL INTERMEDIATE PRODUCT - 0.1% | | | | |
| | 2,002 | | | Mueller Industries, Inc. | | | 161,702 | |
| | 524 | | | RBC Bearings, Inc.(a) | | | 175,597 | |
| | | | | | | | 337,299 | |
| | | | | INDUSTRIAL REIT - 1.2% | | | | |
| | 5,168 | | | Americold Realty Trust, Inc. | | | 123,308 | |
| | 898 | | | EastGroup Properties, Inc. | | | 154,645 | |
| | 2,404 | | | First Industrial Realty Trust, Inc. | | | 128,494 | |
| | 4,378 | | | Lineage, Inc. | | | 277,653 | |
| | 17,131 | | | Prologis, Inc. | | | 2,000,559 | |
| | 4,101 | | | Rexford Industrial Realty, Inc. | | | 172,570 | |
| | 3,403 | | | STAG Industrial, Inc. | | | 125,196 | |
| | 1,805 | | | Terreno Realty Corporation | | | 109,437 | |
| | | | | | | | 3,091,862 | |
| | | | | INDUSTRIAL SUPPORT SERVICES - 1.3% | | | | |
| | 679 | | | Applied Industrial Technologies, Inc. | | | 186,535 | |
| | 3,731 | | | Core & Main, Inc.(a) | | | 181,140 | |
| | 10,291 | | | Fastenal Company | | | 859,916 | |
| | 832 | | | SiteOne Landscape Supply, Inc.(a) | | | 127,504 | |
| | 3,228 | | | U-Haul Holding Company(a) | | | 228,123 | |
| | 1,172 | | | United Rentals, Inc. | | | 1,014,952 | |
| | 738 | | | Watsco, Inc. | | | 407,081 | |
| | 914 | | | WESCO International, Inc. | | | 193,375 | |
| | 3,480 | | | WillScot Holdings Corporation(a) | | | 133,075 | |
| | | | | | | | 3,331,701 | |
See accompanying notes to financial statements.
| INSPIRE 500 ETF |
| SCHEDULE OF INVESTMENTS (Continued) |
| November 30, 2024 |
| Shares | | | | | Fair Value | |
| | | | | COMMON STOCKS — 99.6% (Continued) | | | | |
| | | | | INFRASTRUCTURE REIT - 0.7% | | | | |
| | 7,653 | | | Crown Castle, Inc. | | $ | 813,131 | |
| | 1,911 | | | SBA Communications Corporation, Class A | | | 432,364 | |
| | 427 | | | Texas Pacific Land Corporation | | | 683,238 | |
| | | | | | | | 1,928,733 | |
| | | | | INSTITUTIONAL FINANCIAL SERVICES - 1.9% | | | | |
| | 1,917 | | | Cboe Global Markets, Inc. | | | 413,784 | |
| | 699 | | | Evercore, Inc., Class A | | | 215,222 | |
| | 1,262 | | | Houlihan Lokey, Inc. | | | 238,632 | |
| | 7,324 | | | Interactive Brokers Group, Inc., Class A | | | 1,399,543 | |
| | 10,268 | | | Intercontinental Exchange, Inc. | | | 1,652,737 | |
| | 3,759 | | | Jefferies Financial Group, Inc. | | | 297,487 | |
| | 2,334 | | | SEI Investments Company | | | 192,858 | |
| | 3,855 | | | Tradeweb Markets, Inc., Class A | | | 522,353 | |
| | | | | | | | 4,932,616 | |
| | | | | INSURANCE - 3.6% | | | | |
| | 9,795 | | | Aflac, Inc. | | | 1,116,630 | |
| | 1,520 | | | American Financial Group, Inc. | | | 223,227 | |
| | 11,767 | | | American International Group, Inc. | | | 904,647 | |
| | 5,098 | | | Brown & Brown, Inc. | | | 576,584 | |
| | 2,796 | | | Cincinnati Financial Corporation | | | 446,885 | |
| | 10,224 | | | Corebridge Financial, Inc. | | | 330,951 | |
| | 930 | | | Erie Indemnity Company, Class A | | | 409,721 | |
| | 1,651 | | | Globe Life, Inc. | | | 183,657 | |
| | 412 | | | Kinsale Capital Group, Inc. | | | 209,477 | |
| | 3,971 | | | Loews Corporation | | | 344,405 | |
| | 235 | | | Markel Group, Inc.(a) | | | 418,986 | |
| | 4,666 | | | Old Republic International Corporation | | | 181,834 | |
| | 599 | | | Primerica, Inc. | | | 181,347 | |
| | 10,621 | | | Progressive Corporation (The) | | | 2,855,774 | |
| | 1,198 | | | Reinsurance Group of America, Inc. | | | 273,623 | |
| | 811 | | | RLI Corporation | | | 142,655 | |
| | 4,473 | | | Ryan Specialty Group Holdings, Inc., Class A | | | 337,264 | |
| | 6,965 | | | W R Berkley Corporation | | | 449,591 | |
| | | | | | | | 9,587,258 | |
See accompanying notes to financial statements.
| INSPIRE 500 ETF |
| SCHEDULE OF INVESTMENTS (Continued) |
| November 30, 2024 |
| Shares | | | | | Fair Value | |
| | | | | COMMON STOCKS — 99.6% (Continued) | | | | |
| | | | | INTERNET MEDIA & SERVICES - 0.1% | | | | |
| | 4,703 | | | Maplebear, Inc.(a) | | $ | 205,380 | |
| | | | | | | | | |
| | | | | LEISURE FACILITIES & SERVICES - 0.8% | | | | |
| | 2,118 | | | Cava Group, Inc.(a) | | | 298,426 | |
| | 1,596 | | | Planet Fitness, Inc., A(a) | | | 158,882 | |
| | 1,145 | | | Texas Roadhouse, Inc. | | | 235,034 | |
| | 3,062 | | | TKO Group Holdings, Inc.(a) | | | 422,434 | |
| | 720 | | | Vail Resorts, Inc. | | | 129,053 | |
| | 529 | | | Wingstop, Inc. | | | 173,919 | |
| | 4,749 | | | Yum! Brands, Inc. | | | 659,826 | |
| | | | | | | | 2,077,574 | |
| | | | | MACHINERY - 3.4% | | | | |
| | 1,304 | | | AGCO Corporation | | | 131,978 | |
| | 8,230 | | | Caterpillar, Inc. | | | 3,342,286 | |
| | 1,006 | | | Crane Company | | | 183,172 | |
| | 663 | | | Curtiss-Wright Corporation | | | 247,717 | |
| | 2,149 | | | Donaldson Company, Inc. | | | 167,729 | |
| | 2,952 | | | Graco, Inc. | | | 268,868 | |
| | 1,328 | | | IDEX Corporation | | | 306,277 | |
| | 7,137 | | | Ingersoll Rand, Inc. | | | 743,461 | |
| | 990 | | | Lincoln Electric Holdings, Inc. | | | 216,295 | |
| | 993 | | | Middleby Corporation (The)(a) | | | 142,386 | |
| | 747 | | | MSA Safety, Inc. | | | 129,836 | |
| | 1,025 | | | Nordson Corporation | | | 267,515 | |
| | 2,284 | | | Parker-Hannifin Corporation | | | 1,605,424 | |
| | 1,257 | | | Regal Rexnord Corporation | | | 217,096 | |
| | 938 | | | Snap-on, Inc. | | | 346,769 | |
| | 1,827 | | | Toro Company (The) | | | 159,095 | |
| | 4,357 | | | Veralto Corporation | | | 471,384 | |
| | | | | | | | 8,947,288 | |
| | | | | MEDICAL EQUIPMENT & DEVICES - 4.2% | | | | |
| | 1,370 | | | Align Technology, Inc.(a) | | | 318,895 | |
| | 9,536 | | | Baxter International, Inc. | | | 321,459 | |
| | 518 | | | Bio-Rad Laboratories, Inc., Class A(a) | | | 176,395 | |
See accompanying notes to financial statements.
| INSPIRE 500 ETF |
| SCHEDULE OF INVESTMENTS (Continued) |
| November 30, 2024 |
| Shares | | | | | Fair Value | |
| | | | | COMMON STOCKS — 99.6% (Continued) | | | | |
| | | | | MEDICAL EQUIPMENT & DEVICES - 4.2% (Continued) | | | | |
| | 2,679 | | | Bruker Corporation | | $ | 155,248 | |
| | 7,795 | | | DexCom, Inc.(a) | | | 607,932 | |
| | 11,193 | | | Edwards Lifesciences Corporation(a) | | | 798,620 | |
| | 7,925 | | | GE HealthCare Technologies, Inc. | | | 659,518 | |
| | 961 | | | Glaukos Corporation(a) | | | 138,048 | |
| | 2,389 | | | Globus Medical, Inc., Class A(a) | | | 204,522 | |
| | 4,245 | | | Hologic, Inc.(a) | | | 337,478 | |
| | 1,537 | | | IDEXX Laboratories, Inc.(a) | | | 648,230 | |
| | 1,275 | | | Insulet Corporation(a) | | | 340,145 | |
| | 6,381 | | | Intuitive Surgical, Inc.(a) | | | 3,458,501 | |
| | 1,253 | | | Lantheus Holdings, Inc.(a) | | | 111,855 | |
| | 372 | | | Mettler-Toledo International, Inc.(a) | | | 465,446 | |
| | 739 | | | Penumbra, Inc.(a) | | | 180,405 | |
| | 1,007 | | | Repligen Corporation(a) | | | 151,594 | |
| | 2,638 | | | ResMed, Inc. | | | 656,915 | |
| | 2,213 | | | Revvity, Inc. | | | 257,018 | |
| | 3,265 | | | Solventum Corporation(a) | | | 233,480 | |
| | 1,762 | | | STERIS plc | | | 385,984 | |
| | 1,355 | | | West Pharmaceutical Services, Inc. | | | 441,296 | |
| | | | | | | | 11,048,984 | |
| | | | | METALS & MINING - 1.3% | | | | |
| | 4,253 | | | Alcoa Corporation | | | 197,467 | |
| | 23,648 | | | Freeport-McMoRan, Inc. | | | 1,045,242 | |
| | 20,679 | | | Newmont Corporation | | | 867,277 | |
| | 1,182 | | | Royal Gold, Inc. | | | 172,879 | |
| | 12,969 | | | Southern Copper Corporation | | | 1,301,439 | |
| | | | | | | | 3,584,304 | |
| | | | | MORTGAGE FINANCE - 0.2% | | | | |
| | 14,478 | | | AGNC Investment Corporation | | | 139,857 | |
| | 9,435 | | | Annaly Capital Management, Inc. | | | 188,040 | |
| | 6,280 | | | Starwood Property Trust, Inc. | | | 127,924 | |
| | | | | | | | 455,821 | |
| | | | | MULTI ASSET CLASS REIT - 0.1% | | | | |
| | 3,393 | | | Vornado Realty Trust | | | 146,069 | |
See accompanying notes to financial statements.
| INSPIRE 500 ETF |
| SCHEDULE OF INVESTMENTS (Continued) |
| November 30, 2024 |
| Shares | | | | | Fair Value | |
| | | | | COMMON STOCKS — 99.6% (Continued) | | | | |
| | | | | MULTI ASSET CLASS REIT - 0.1% (Continued) | | | | |
| | 4,029 | | | WP Carey, Inc. | | $ | 229,895 | |
| | | | | | | | 375,964 | |
| | | | | OFFICE REIT - 0.2% | | | | |
| | 3,288 | | | Alexandria Real Estate Equities, Inc. | | | 362,436 | |
| | 2,926 | | | BXP, Inc. | | | 239,903 | |
| | | | | | | | 602,339 | |
| | | | | OIL & GAS PRODUCERS - 8.0% | | | | |
| | 8,515 | | | Antero Midstream Corporation | | | 135,985 | |
| | 5,327 | | | Antero Resources Corporation(a) | | | 174,140 | |
| | 6,959 | | | APA Corporation | | | 157,621 | |
| | 4,136 | | | Cheniere Energy, Inc. | | | 926,505 | |
| | 1,182 | | | Chord Energy Corporation | | | 150,729 | |
| | 2,647 | | | ConocoPhillips | | | 286,776 | |
| | 13,147 | | | Coterra Energy, Inc. | | | 351,288 | |
| | 11,839 | | | Devon Energy Corporation | | | 449,290 | |
| | 5,624 | | | Diamondback Energy, Inc. | | | 998,766 | |
| | 1,731 | | | DT Midstream, Inc. | | | 183,694 | |
| | 10,571 | | | EOG Resources, Inc. | | | 1,408,691 | |
| | 3,445 | | | Expand Energy Corporation | | | 340,917 | |
| | 79,966 | | | Exxon Mobil Corporation | | | 9,432,789 | |
| | 4,312 | | | Hess Midstream, L.P., Class A | | | 163,425 | |
| | 3,670 | | | HF Sinclair Corporation | | | 150,213 | |
| | 39,299 | | | Kinder Morgan, Inc. | | | 1,110,983 | |
| | 2,915 | | | Kinetik Holdings, Inc. | | | 172,043 | |
| | 370 | | | Murphy USA, Inc. | | | 202,686 | |
| | 16,808 | | | Occidental Petroleum Corporation | | | 850,149 | |
| | 10,876 | | | ONEOK, Inc. | | | 1,235,514 | |
| | 5,051 | | | Ovintiv, Inc. | | | 229,416 | |
| | 15,149 | | | Permian Resources Corporation | | | 237,233 | |
| | 4,276 | | | Range Resources Corporation | | | 152,824 | |
| | 4,105 | | | Targa Resources Corporation | | | 838,652 | |
| | 5,968 | | | Valero Energy Corporation | | | 830,029 | |
| | 3,498 | | | Viper Energy, Inc. | | | 189,277 | |
| | | | | | | | 21,359,635 | |
See accompanying notes to financial statements.
| INSPIRE 500 ETF |
| SCHEDULE OF INVESTMENTS (Continued) |
| November 30, 2024 |
| Shares | | | | | Fair Value | |
| | | | | COMMON STOCKS — 99.6% (Continued) | | | | |
| | | | | OIL & GAS SERVICES & EQUIPMENT - 1.0% | | | | |
| | 18,056 | | | Baker Hughes Company | | $ | 793,561 | |
| | 16,350 | | | Halliburton Company | | | 520,911 | |
| | 26,156 | | | Schlumberger N.V. | | | 1,149,295 | |
| | 1,456 | | | Weatherford International plc | | | 119,829 | |
| | | | | | | | 2,583,596 | |
| | | | | PUBLISHING & BROADCASTING - 0.1% | | | | |
| | 10,473 | | | News Corporation, Class A | | | 307,383 | |
| | | | | | | | | |
| | | | | RENEWABLE ENERGY - 0.2% | | | | |
| | 2,621 | | | Enphase Energy, Inc.(a) | | | 187,008 | |
| | 1,895 | | | First Solar, Inc.(a) | | | 377,617 | |
| | | | | | | | 564,625 | |
| | | | | RESIDENTIAL REIT - 1.1% | | | | |
| | 6,877 | | | American Homes 4 Rent, Class A | | | 263,320 | |
| | 1,970 | | | Camden Property Trust | | | 247,826 | |
| | 3,503 | | | Equity LifeStyle Properties, Inc. | | | 249,869 | |
| | 7,087 | | | Equity Residential | | | 543,289 | |
| | 1,223 | | | Essex Property Trust, Inc. | | | 379,693 | |
| | 11,325 | | | Invitation Homes, Inc. | | | 387,881 | |
| | 2,178 | | | Mid-America Apartment Communities, Inc. | | | 357,540 | |
| | 2,401 | | | Sun Communities, Inc. | | | 303,318 | |
| | 6,056 | | | UDR, Inc. | | | 277,728 | |
| | | | | | | | 3,010,464 | |
| | | | | RETAIL - CONSUMER STAPLES - 0.6% | | | | |
| | 10,403 | | | Albertsons Companies, Inc. | | | 206,500 | |
| | 2,339 | | | BJ’s Wholesale Club Holdings, Inc.(a) | | | 225,246 | |
| | 654 | | | Casey’s General Stores, Inc. | | | 275,262 | |
| | 4,064 | | | Dollar General Corporation | | | 314,024 | |
| | 4,077 | | | Dollar Tree, Inc.(a) | | | 290,568 | |
| | 1,723 | | | Sprouts Farmers Market, Inc.(a) | | | 266,169 | |
| | | | | | | | 1,577,769 | |
| | | | | RETAIL - DISCRETIONARY - 6.5% | | | | |
| | 705 | | | AutoNation, Inc.(a) | | | 126,117 | |
| | 296 | | | AutoZone, Inc.(a) | | | 938,184 | |
See accompanying notes to financial statements.
| INSPIRE 500 ETF |
| SCHEDULE OF INVESTMENTS (Continued) |
| November 30, 2024 |
| Shares | | | | | Fair Value | |
| | | | | COMMON STOCKS — 99.6% (Continued) | | | | |
| | | | | RETAIL - DISCRETIONARY - 6.5% (Continued) | | | | |
| | 2,148 | | | Builders FirstSource, Inc.(a) | | $ | 400,538 | |
| | 2,859 | | | CarMax, Inc.(a) | | | 240,070 | |
| | 3,520 | | | Carvana Company, Class A(a) | | | 916,678 | |
| | 3,801 | | | Ferguson Enterprises, Inc. | | | 820,750 | |
| | 1,882 | | | Floor & Decor Holdings, Inc., Class A(a) | | | 211,179 | |
| | 908 | | | Freshpet, Inc.(a) | | | 138,969 | |
| | 6,633 | | | GameStop Corporation, Class A(a) | | | 192,689 | |
| | 6,409 | | | Gap, Inc. (The) | | | 155,418 | |
| | 2,495 | | | Genuine Parts Company | | | 316,191 | |
| | 17,310 | | | Home Depot, Inc. (The) | | | 7,428,241 | |
| | 457 | | | Lithia Motors, Inc. | | | 176,813 | |
| | 9,885 | | | Lowe’s Companies, Inc. | | | 2,692,971 | |
| | 1,026 | | | O’Reilly Automotive, Inc.(a) | | | 1,275,544 | |
| | 1,185 | | | Penske Automotive Group, Inc. | | | 197,350 | |
| | 1,856 | | | Tractor Supply Company | | | 526,492 | |
| | 2,207 | | | Williams-Sonoma, Inc. | | | 379,648 | |
| | | | | | | | 17,133,842 | |
| | | | | RETAIL REIT - 0.7% | | | | |
| | 1,786 | | | Agree Realty Corporation | | | 137,165 | |
| | 5,506 | | | Brixmor Property Group, Inc. | | | 165,565 | |
| | 1,514 | | | Federal Realty Investment Trust | | | 176,608 | |
| | 3,239 | | | NNN REIT, Inc. | | | 142,451 | |
| | 3,369 | | | Regency Centers Corporation | | | 254,663 | |
| | 5,825 | | | Simon Property Group, Inc. | | | 1,069,470 | |
| | | | | | | | 1,945,922 | |
| | | | | SELF-STORAGE REIT - 0.7% | | | | |
| | 4,060 | | | CubeSmart | | | 201,214 | |
| | 3,852 | | | Extra Space Storage, Inc. | | | 658,538 | |
| | 3,128 | | | Public Storage | | | 1,088,700 | |
| | | | | | | | 1,948,452 | |
| | | | | SEMICONDUCTORS - 9.1% | | | | |
| | 4,600 | | | Amkor Technology, Inc. | | | 121,624 | |
| | 2,573 | | | Astera Labs, Inc.(a) | | | 265,662 | |
| | 82,292 | | | Broadcom, Inc. | | | 13,337,886 | |
See accompanying notes to financial statements.
| INSPIRE 500 ETF |
| SCHEDULE OF INVESTMENTS (Continued) |
| November 30, 2024 |
| Shares | | | | | Fair Value | |
| | | | | COMMON STOCKS — 99.6% (Continued) | | | | |
| | | | | SEMICONDUCTORS - 9.1% (Continued) | | | | |
| | 2,674 | | | Coherent Corporation(a) | | $ | 267,828 | |
| | 2,779 | | | Entegris, Inc. | | | 293,546 | |
| | 10,159 | | | GLOBALFOUNDRIES, Inc.(a) | | | 439,377 | |
| | 2,419 | | | KLA Corporation | | | 1,565,166 | |
| | 2,538 | | | Lattice Semiconductor Corporation(a) | | | 144,032 | |
| | 1,222 | | | MACOM Technology Solutions Holdings, Inc.(a) | | | 162,306 | |
| | 16,238 | | | Marvell Technology, Inc. | | | 1,505,100 | |
| | 9,640 | | | Microchip Technology, Inc. | | | 657,159 | |
| | 1,268 | | | MKS Instruments, Inc. | | | 144,096 | |
| | 861 | | | Monolithic Power Systems, Inc. | | | 488,738 | |
| | 7,899 | | | ON Semiconductor Corporation(a) | | | 561,777 | |
| | 881 | | | Onto Innovation, Inc.(a) | | | 144,643 | |
| | 1,710 | | | Qorvo, Inc.(a) | | | 118,076 | |
| | 20,608 | | | QUALCOMM, Inc. | | | 3,266,986 | |
| | 2,916 | | | Skyworks Solutions, Inc. | | | 255,412 | |
| | 2,978 | | | Teradyne, Inc. | | | 327,580 | |
| | 865 | | | Universal Display Corporation | | | 142,310 | |
| | | | | | | | 24,209,304 | |
| | | | | SOFTWARE - 8.2% | | | | |
| | 1,518 | | | Altair Engineering, Inc., Class A(a) | | | 160,316 | |
| | 1,584 | | | ANSYS, Inc.(a) | | | 556,142 | |
| | 656 | | | Appfolio, Inc., Class A(a) | | | 166,460 | |
| | 1,150 | | | Aspen Technology, Inc.(a) | | | 287,500 | |
| | 6,018 | | | Bentley Systems, Inc., Class B | | | 297,891 | |
| | 11,153 | | | CCC Intelligent Solutions Holdings, Inc.(a) | | | 140,528 | |
| | 6,210 | | | Cloudflare, Inc., Class A(a) | | | 619,944 | |
| | 6,209 | | | Confluent, Inc., Class A(a) | | | 191,486 | |
| | 6,161 | | | Datadog, Inc., Class A(a) | | | 941,093 | |
| | 3,438 | | | DocuSign, Inc.(a) | | | 273,974 | |
| | 5,275 | | | Dynatrace, Inc.(a) | | | 296,402 | |
| | 1,882 | | | Elastic N.V.(a) | | | 206,004 | |
| | 13,438 | | | Fortinet, Inc.(a) | | | 1,277,282 | |
| | 10,886 | | | Gen Digital, Inc. | | | 335,833 | |
| | 3,028 | | | Gitlab, Inc.(a) | | | 193,035 | |
See accompanying notes to financial statements.
| INSPIRE 500 ETF |
| SCHEDULE OF INVESTMENTS (Continued) |
| November 30, 2024 |
| Shares | | | | | Fair Value | |
| | | | | COMMON STOCKS — 99.6% (Continued) | | | | |
| | | | | SOFTWARE - 8.2% (Continued) | | | | |
| | 1,422 | | | Guidewire Software, Inc.(a) | | $ | 288,510 | |
| | 3,716 | | | HashiCorp, Inc.(a) | | | 124,932 | |
| | 5,640 | | | Informatica, Inc., Class A(a) | | | 149,573 | |
| | 4,646 | | | Klaviyo, Inc.(a) | | | 172,552 | |
| | 1,080 | | | Manhattan Associates, Inc.(a) | | | 308,275 | |
| | 3,154 | | | MicroStrategy, Inc., Class A(a) | | | 1,222,080 | |
| | 1,402 | | | MongoDB, Inc.(a) | | | 452,131 | |
| | 4,727 | | | Nutanix, Inc., Class A(a) | | | 308,579 | |
| | 3,136 | | | Okta, Inc.(a) | | | 243,228 | |
| | 40,529 | | | Palantir Technologies, Inc., Class A(a) | | | 2,718,685 | |
| | 5,822 | | | Palo Alto Networks, Inc.(a) | | | 2,257,888 | |
| | 1,074 | | | Paycom Software, Inc. | | | 249,082 | |
| | 993 | | | Paylocity Holding Corporation(a) | | | 206,087 | |
| | 2,601 | | | Procore Technologies, Inc.(a) | | | 211,201 | |
| | 1,943 | | | Roper Technologies, Inc. | | | 1,100,593 | |
| | 10,071 | | | Samsara, Inc., Class A(a) | | | 538,698 | |
| | 6,063 | | | SentinelOne, Inc.(a) | | | 169,461 | |
| | 5,958 | | | Snowflake, Inc.(a) | | | 1,041,458 | |
| | 688 | | | SPS Commerce, Inc.(a) | | | 132,832 | |
| | 4,553 | | | SS&C Technologies Holdings, Inc. | | | 352,129 | |
| | 2,837 | | | Synopsys, Inc.(a) | | | 1,584,436 | |
| | 766 | | | Tyler Technologies, Inc.(a) | | | 481,944 | |
| | 9,770 | | | UiPath, Inc., Class A(a) | | | 138,832 | |
| | 6,525 | | | Unity Software, Inc.(a) | | | 157,318 | |
| | 3,022 | | | Veeva Systems, Inc., Class A(a) | | | 688,563 | |
| | 2,789 | | | Zscaler, Inc.(a) | | | 576,180 | |
| | | | | | | | 21,819,137 | |
| | | | | SPECIALTY FINANCE - 0.4% | | | | |
| | 1,912 | | | Essent Group Ltd. | | | 110,475 | |
| | 1,805 | | | FTAI Aviation Ltd. | | | 304,720 | |
| | 37,006 | | | Rocket Companies, Inc.(a) | | | 537,698 | |
| | 29,298 | | | UWM Holdings Corporation | | | 190,730 | |
| | | | | | | | 1,143,623 | |
See accompanying notes to financial statements.
| INSPIRE 500 ETF |
| SCHEDULE OF INVESTMENTS (Continued) |
| November 30, 2024 |
| Shares | | | | | Fair Value | |
| | | | | COMMON STOCKS — 99.6% (Continued) | | | | |
| | | | | SPECIALTY REIT - 0.1% | | | | |
| | 1,824 | | | Lamar Advertising Company, Class A | | $ | 244,452 | |
| | | | | | | | | |
| | | | | STEEL - 0.6% | | | | |
| | 2,141 | | | ATI, Inc.(a) | | | 128,824 | |
| | 866 | | | Carpenter Technology Corporation | | | 168,039 | |
| | 4,210 | | | Nucor Corporation | | | 651,244 | |
| | 978 | | | Reliance, Inc. | | | 314,173 | |
| | 2,629 | | | Steel Dynamics, Inc. | | | 381,915 | |
| | | | | | | | 1,644,195 | |
| | | | | TECHNOLOGY HARDWARE - 2.0% | | | | |
| | 5,594 | | | Arista Networks, Inc.(a) | | | 2,270,157 | |
| | 950 | | | Arrow Electronics, Inc.(a) | | | 114,152 | |
| | 2,444 | | | Ciena Corporation(a) | | | 170,396 | |
| | 1,615 | | | Dolby Laboratories, Inc., Class A | | | 126,487 | |
| | 1,038 | | | F5, Inc.(a) | | | 259,863 | |
| | 6,878 | | | Flex Ltd.(a) | | | 268,036 | |
| | 1,889 | | | Jabil, Inc. | | | 256,583 | |
| | 5,932 | | | Juniper Networks, Inc. | | | 213,077 | |
| | 3,625 | | | NetApp, Inc. | | | 444,570 | |
| | 11,270 | | | Super Micro Computer, Inc.(a) | | | 367,853 | |
| | 1,049 | | | Ubiquiti, Inc. | | | 363,468 | |
| | 5,964 | | | Western Digital Corporation(a) | | | 435,312 | |
| | | | | | | | 5,289,954 | |
| | | | | TECHNOLOGY SERVICES - 4.4% | | | | |
| | 6,584 | | | Affirm Holdings, Inc.(a) | | | 460,946 | |
| | 2,061 | | | Amdocs Ltd. | | | 178,730 | |
| | 1,862 | | | Amentum Holdings, Inc.(a) | | | 45,340 | |
| | 7,392 | | | Automatic Data Processing, Inc. | | | 2,268,826 | |
| | 386 | | | CACI International, Inc., Class A(a) | | | 177,514 | |
| | 2,411 | | | CDW Corporation | | | 424,167 | |
| | 4,378 | | | Coinbase Global, Inc., Class A(a) | | | 1,296,763 | |
| | 1,241 | | | Corpay, Inc.(a) | | | 473,044 | |
| | 7,859 | | | CoStar Group, Inc.(a) | | | 639,251 | |
| | 1,027 | | | EPAM Systems, Inc.(a) | | | 250,506 | |
See accompanying notes to financial statements.
| INSPIRE 500 ETF |
| SCHEDULE OF INVESTMENTS (Continued) |
| November 30, 2024 |
| Shares | | | | | Fair Value | |
| | | | | COMMON STOCKS — 99.6% (Continued) | | | | |
| | | | | TECHNOLOGY SERVICES - 4.4% (Continued) | | | | |
| | 2,312 | | | Equifax, Inc. | | $ | 604,727 | |
| | 436 | | | Fair Isaac Corporation(a) | | | 1,035,512 | |
| | 3,141 | | | Genpact Ltd. | | | 144,989 | |
| | 1,303 | | | Jack Henry & Associates, Inc. | | | 229,563 | |
| | 694 | | | MarketAxess Holdings, Inc. | | | 179,531 | |
| | 1,362 | | | MSCI, Inc. | | | 830,316 | |
| | 6,434 | | | Paychex, Inc. | | | 941,101 | |
| | 856 | | | Science Applications International Corporation | | | 106,358 | |
| | 1,597 | | | Shift4 Payments, Inc.(a) | | | 182,186 | |
| | 9,629 | | | Toast, Inc., Class A(a) | | | 419,247 | |
| | 2,547 | | | Verisk Analytics, Inc. | | | 749,353 | |
| | 717 | | | WEX, Inc.(a) | | | 135,269 | |
| | | | | | | | 11,773,239 | |
| | | | | TELECOMMUNICATIONS - 0.1% | | | | |
| | 5,310 | | | AST SpaceMobile, Inc.(a) | | | 126,431 | |
| | 5,076 | | | EchoStar Corporation, Class A(a) | | | 128,372 | |
| | 4,476 | | | Frontier Communications Parent, Inc.(a) | | | 155,810 | |
| | | | | | | | 410,613 | |
| | | | | TIMBER REIT - 0.2% | | | | |
| | 13,074 | | | Weyerhaeuser Company | | | 421,767 | |
| | | | | | | | | |
| | | | | TRANSPORTATION & LOGISTICS - 3.6% | | | | |
| | 1,976 | | | CH Robinson Worldwide, Inc. | | | 208,626 | |
| | 35,063 | | | CSX Corporation | | | 1,281,553 | |
| | 10,906 | | | Delta Air Lines, Inc. | | | 696,021 | |
| | 2,430 | | | Expeditors International of Washington, Inc. | | | 295,585 | |
| | 4,910 | | | FedEx Corporation | | | 1,486,110 | |
| | 1,868 | | | JB Hunt Transport Services, Inc. | | | 353,257 | |
| | 1,086 | | | Kirby Corporation(a) | | | 137,390 | |
| | 2,897 | | | Knight-Swift Transportation Holdings, Inc. | | | 171,966 | |
| | 622 | | | Landstar System, Inc. | | | 115,642 | |
| | 4,140 | | | Norfolk Southern Corporation | | | 1,142,019 | |
| | 4,000 | | | Old Dominion Freight Line, Inc. | | | 900,560 | |
| | 510 | | | Saia, Inc.(a) | | | 290,231 | |
See accompanying notes to financial statements.
| INSPIRE 500 ETF |
| SCHEDULE OF INVESTMENTS (Continued) |
| November 30, 2024 |
| Shares | | | | | Fair Value | |
| | | | | COMMON STOCKS — 99.6% (Continued) | | | | |
| | | | | TRANSPORTATION & LOGISTICS - 3.6% (Continued) | | | | |
| | 15,028 | | | United Parcel Service, Inc., | | $ | 2,039,601 | |
| | 2,284 | | | XPO, Inc.(a) | | | 348,104 | |
| | | | | | | | 9,466,665 | |
| | | | | TRANSPORTATION EQUIPMENT - 0.5% | | | | |
| | 1,474 | | | Allison Transmission Holdings, Inc. | | | 174,669 | |
| | 9,473 | | | PACCAR, Inc. | | | 1,108,341 | |
| | | | | | | | 1,283,010 | |
| | | | | WHOLESALE - CONSUMER STAPLES - 0.7% | | | | |
| | 8,897 | | | Archer-Daniels-Midland Company | | | 485,776 | |
| | 2,593 | | | Bunge Global S.A. | | | 232,696 | |
| | 2,746 | | | Performance Food Group Co.(a) | | | 242,307 | |
| | 8,411 | | | Sysco Corporation | | | 648,573 | |
| | 4,451 | | | US Foods Holding Corporation(a) | | | 310,546 | |
| | | | | | | | 1,919,898 | |
| | | | | WHOLESALE - DISCRETIONARY - 0.5% | | | | |
| | 17,230 | | | Copart, Inc.(a) | | | 1,092,210 | |
| | 678 | | | Pool Corporation | | | 255,667 | |
| | | | | | | | 1,347,877 | |
| | | | | | | | | |
| | | | | TOTAL COMMON STOCKS (Cost $238,709,380) | | | 264,239,927 | |
| | | | | | | | | |
| | | | | TOTAL INVESTMENTS - 99.6% (Cost $238,709,380) | | $ | 264,239,927 | |
| | | | | OTHER ASSETS IN EXCESS OF LIABILITIES - 0.4% | | | 936,862 | |
| | | | | NET ASSETS - 100.0% | | $ | 265,176,789 | |
| LLC | - Limited Liability Company |
| | |
| L.P. | - Limited Partnership |
| | |
| LTD | - Limited Company |
| | |
| MSCI | - Morgan Stanley Capital International |
| | |
| N.V. | - Naamioze Vennootschap |
| | |
| PLC | - Public Limited Company |
| | |
| REIT | - Real Estate Investment Trust |
| | |
| S.A. | - Société Anonyme |
| (a) | Non-income producing security. |
See accompanying notes to financial statements.
| The Inspire ETFs |
| STATEMENTS OF ASSETS AND LIABILITIES |
| November 30, 2024 |
| |
| | | Inspire Global Hope | | | Inspire Small/Mid | | | Inspire Corporate | | | | |
| | | ETF | | | Cap ETF | | | Bond ETF | | | Inspire 100 ETF | |
| ASSETS | | | | | | | | | | | | | | | | |
| Investment securities: | | | | | | | | | | | | | | | | |
| At cost | | $ | 95,416,821 | | | $ | 187,622,442 | | | $ | 327,366,744 | | | $ | 297,055,993 | |
| At value (includes securities on loan with a market value of $406,316, $6,259,268, $0, $0) | | $ | 109,401,273 | | | $ | 217,877,584 | | | $ | 327,788,816 | | | $ | 352,788,930 | |
| Cash | | | 235,254 | | | | 1,250,745 | | | | 1,236,003 | | | | 510,719 | |
| Foreign currencies (Cost $84,322, $0, $0 and $0, respectively) | | | 84,213 | | | | — | | | | — | | | | — | |
| Dividends and interest receivable | | | 116,017 | | | | 163,416 | | | | 3,665,015 | | | | 248,714 | |
| Reclaims receivable | | | 365,314 | | | | — | | | | — | | | | 2,700 | |
| Prepaid expenses | | | — | | | | 4,919 | | | | 5,991 | | | | 7,186 | |
| TOTAL ASSETS | | | 110,202,071 | | | | 219,296,664 | | | | 332,695,825 | | | | 353,558,249 | |
| | | | | | | | | | | | | | | | | |
| LIABILITIES | | | | | | | | | | | | | | | | |
| Securities lending collateral payable | | | 416,869 | | | | 6,329,498 | | | | — | | | | — | |
| Investment advisory fees payable | | | 26,603 | | | | 49,033 | | | | 80,789 | | | | 72,626 | |
| Custody fees payable | | | 16,376 | | | | 16,066 | | | | 7,945 | | | | 11,634 | |
| Audit fees payable | | | 16,917 | | | | 16,261 | | | | 16,261 | | | | — | |
| Payable to related parties | | | 9,300 | | | | 13,826 | | | | 28,434 | | | | 19,352 | |
| Accrued expenses and other liabilities | | | 11,914 | | | | 9,411 | | | | 12,532 | | | | 12,427 | |
| TOTAL LIABILITIES | | | 497,979 | | | | 6,434,095 | | | | 145,961 | | | | 116,039 | |
| NET ASSETS | | $ | 109,704,092 | | | $ | 212,862,569 | | | $ | 332,549,864 | | | $ | 353,442,210 | |
| | | | | | | | | | | | | | | | | |
| Net Assets Consist Of: | | | | | | | | | | | | | | | | |
| Paid in capital | | $ | 96,519,307 | | | $ | 191,403,833 | | | $ | 351,209,777 | | | $ | 347,801,721 | |
| Accumulated earnings (deficit) | | | 13,184,785 | | | | 21,458,736 | | | | (18,659,913 | ) | | | 5,640,489 | |
| NET ASSETS | | $ | 109,704,092 | | | $ | 212,862,569 | | | $ | 332,549,864 | | | $ | 353,442,210 | |
| | | | | | | | | | | | | | | | | |
| Net Asset Value Per Share: | | | | | | | | | | | | | | | | |
| Net Assets | | $ | 109,704,092 | | | $ | 212,862,569 | | | $ | 332,549,864 | | | $ | 353,442,210 | |
| Shares of beneficial interest outstanding ($0 par value, unlimited shares authorized) | | | 2,800,000 | | | | 5,250,000 | | | | 14,000,000 | | | | 8,350,000 | |
| Net asset value, offering and redemption price per share (Net Assets ÷ Shares Outstanding) | | $ | 39.18 | | | $ | 40.55 | | | $ | 23.75 | | | $ | 42.33 | |
| | | | | | | | | | | | | | | | | |
See accompanying notes to financial statements.
| The Inspire ETFs |
| STATEMENTS OF ASSETS AND LIABILITIES (Continued) |
| November 30, 2024 |
| |
| | | Inspire International | | | Inspire Tactical | | | Inspire | | | Inspire Fidelis Multi | | | | |
| | | ETF | | | Balanced ETF | | | Momentum ETF | | | Factor ETF | | | Inspire 500 ETF | |
| ASSETS | | | | | | | | | | | | | | | | | | | | |
| Investment securities: | | | | | | | | | | | | | | | | | | | | |
| At cost | | $ | 285,106,284 | | | $ | 85,826,064 | | | $ | 61,292,183 | | | $ | 82,799,059 | | | $ | 238,709,380 | |
| At value (includes securities on loan with a market value of $2,939,572, $893,956, $0, $44,030, $0) | | $ | 303,632,329 | | | $ | 96,070,515 | | | $ | 74,449,112 | | | $ | 94,555,592 | | | $ | 264,239,927 | |
| Cash | | | 90,636 | | | | 413,614 | | | | 94,572 | | | | 99,034 | | | | 614,553 | |
| Foreign currencies (Cost $280,986, $0, $0, $0 and $0, respectively) | | | 281,758 | | | | — | | | | — | | | | — | | | | — | |
| Dividends and interest receivable | | | 365,328 | | | | 89,084 | | | | 21,769 | | | | 89,272 | | | | 298,739 | |
| Reclaims receivable | | | 1,013,577 | | | | 4,968 | | | | 528 | | | | 16,273 | | | | 1,913 | |
| Receivable for fund shares sold | | | — | | | | — | | | | — | | | | — | | | | 5,642,073 | |
| Prepaid expenses | | | 4,694 | | | | 1,432 | | | | 2,930 | | | | 291 | | | | — | |
| TOTAL ASSETS | | | 305,388,322 | | | | 96,579,613 | | | | 74,568,911 | | | | 94,760,462 | | | | 270,797,205 | |
| | | | | | | | | | | | | | | | | | | | | |
| LIABILITIES | | | | | | | | | | | | | | | | | | | | |
| Securities lending collateral payable | | | 3,126,667 | | | | 899,150 | | | | — | | | | 42,665 | | | | — | |
| Investment advisory fees payable | | | 111,719 | | | | 38,243 | | | | 30,918 | | | | 33,683 | | | | 21,919 | |
| Custody fees payable | | | 24,701 | | | | 4,370 | | | | 3,862 | | | | 5,959 | | | | — | |
| Audit fees payable | | | 16,223 | | | | 16,262 | | | | 16,268 | | | | 16,279 | | | | — | |
| Payable to related parties | | | 13,128 | | | | 5,762 | | | | 7,108 | | | | 4,307 | | | | — | |
| Payable for investments purchased | | | — | | | | — | | | | — | | | | — | | | | 5,598,497 | |
| Accrued expenses and other liabilities | | | 11,336 | | | | 15,266 | | | | 7,198 | | | | 10,639 | | | | — | |
| TOTAL LIABILITIES | | | 3,303,774 | | | | 979,053 | | | | 65,354 | | | | 113,532 | | | | 5,620,416 | |
| NET ASSETS | | $ | 302,084,548 | | | $ | 95,600,560 | | | $ | 74,503,557 | | | $ | 94,646,930 | | | $ | 265,176,789 | |
| | | | | | | | | | | | | | | | | | | | | |
| Net Assets Consist Of: | | | | | | | | | | | | | | | | | | | | |
| Paid in capital | | $ | 292,847,893 | | | $ | 93,717,154 | | | $ | 66,473,259 | | | $ | 77,551,552 | | | $ | 239,521,117 | |
| Accumulated earnings | | | 9,236,655 | | | | 1,883,406 | | | | 8,030,298 | | | | 17,095,378 | | | | 25,655,672 | |
| NET ASSETS | | $ | 302,084,548 | | | $ | 95,600,560 | | | $ | 74,503,557 | | | $ | 94,646,930 | | | $ | 265,176,789 | |
| | | | | | | | | | | | | | | | | | | | | |
| Net Asset Value Per Share: | | | | | | | | | | | | | | | | | | | | |
| Net Assets | | $ | 302,084,548 | | | $ | 95,600,560 | | | $ | 74,503,557 | | | $ | 94,646,930 | | | $ | 265,176,789 | |
| Shares of beneficial interest outstanding ($0 par value, unlimited shares authorized) | | | 10,050,000 | | | | 3,375,000 | | | | 2,275,000 | | | | 2,775,000 | | | | 1,175,000 | |
| Net asset value, offering and redemption price per share (Net Assets ÷ Shares Outstanding) | | $ | 30.06 | | | $ | 28.33 | | | $ | 32.75 | | | $ | 34.11 | | | $ | 225.68 | |
| | | | | | | | | | | | | | | | | | | | | |
See accompanying notes to financial statements.
| The Inspire ETFs |
| STATEMENTS OF OPERATIONS |
| For the Year Ended November 30, 2024 |
| |
| | | Inspire Global Hope | | | Inspire Small/Mid | | | Inspire Corporate | | | | |
| | | ETF | | | Cap ETF | | | Bond ETF | | | Inspire 100 ETF | |
| INVESTMENT INCOME | | | | | | | | | | | | | | | | |
| Dividends | | $ | 3,264,348 | | | $ | 2,991,735 | | | $ | — | | | $ | 4,491,510 | |
| Interest | | | 17,222 | | | | 45,231 | | | | 13,539,606 | | | | 23,250 | |
| Securities lending income | | | 11,634 | | | | 175,651 | | | | 2,266 | | | | 731 | |
| Less: Foreign withholding taxes | | | (325,259 | ) | | | (426 | ) | | | — | | | | — | |
| TOTAL INVESTMENT INCOME | | | 2,967,945 | | | | 3,212,191 | | | | 13,541,872 | | | | 4,515,491 | |
| | | | | | | | | | | | | | | | | |
| EXPENSES | | | | | | | | | | | | | | | | |
| Investment advisory fees | | | 396,167 | | | | 554,759 | | | | 881,466 | | | | 1,006,857 | |
| Custodian fees | | | 130,788 | | | | 95,900 | | | | 22,469 | | | | 34,183 | |
| Administrative services | | | 122,987 | | | | 127,497 | | | | 227,106 | | | | 191,182 | |
| Printing and postage expenses | | | 20,704 | | | | 26,683 | | | | 38,361 | | | | 36,955 | |
| Audit fees | | | 17,014 | | | | 17,014 | | | | 17,000 | | | | 16,210 | |
| Professional fees | | | 16,695 | | | | 16,039 | | | | 20,776 | | | | 23,810 | |
| Legal fees | | | 16,077 | | | | 17,075 | | | | 19,421 | | | | 14,999 | |
| Trustees fees and expenses | | | 15,455 | | | | 15,320 | | | | 15,414 | | | | 11,598 | |
| Transfer agent fees | | | 14,873 | | | | 14,141 | | | | 15,175 | | | | 7,480 | |
| Insurance expense | | | 4,202 | | | | 4,000 | | | | 5,699 | | | | 6,192 | |
| Other Expenses | | | 13,542 | | | | 16,213 | | | | 11,106 | | | | 12,371 | |
| TOTAL EXPENSES | | | 768,504 | | | | 904,641 | | | | 1,273,993 | | | | 1,361,837 | |
| | | | | | | | | | | | | | | | | |
| Less: Fees waived by the Adviser | | | — | | | | — | | | | — | | | | (186,741 | ) |
| NET EXPENSES | | | 768,504 | | | | 904,641 | | | | 1,273,993 | | | | 1,175,096 | |
| | | | | | | | | | | | | | | | | |
| NET INVESTMENT INCOME | | | 2,199,441 | | | | 2,307,550 | | | | 12,267,879 | | | | 3,340,395 | |
| | | | | | | | | | | | | | | | | |
| REALIZED AND UNREALIZED GAIN (LOSS) ON INVESTMENTS | | | | | | | | | | | | | | | | |
| Net realized gain (loss) on: | | | | | | | | | | | | | | | | |
| In-kind redemptions | | | 18,586,155 | | | | 17,485,220 | | | | 1,692,524 | | | | 37,145,801 | |
| Investments | | | 8,378,834 | | | | 1,690,265 | | | | (998,219 | ) | | | (3,067,075 | ) |
| Foreign currency transactions | | | (20,195 | ) | | | — | | | | — | | | | — | |
| | | | 26,944,794 | | | | 19,175,485 | | | | 694,305 | | | | 34,078,726 | |
| Net change in unrealized appreciation (depreciation) on: | | | | | | | | | | | | | | | | |
| Investments | | | (1,766,347 | ) | | | 30,220,362 | | | | 8,382,659 | | | | 53,538,833 | |
| Foreign currency translations | | | (9,335 | ) | | | — | | | | — | | | | — | |
| | | | (1,775,682 | ) | | | 30,220,362 | | | | 8,382,659 | | | | 53,538,833 | |
| | | | | | | | | | | | | | | | | |
| NET REALIZED AND UNREALIZED GAIN ON INVESTMENTS | | | 25,169,112 | | | | 49,395,847 | | | | 9,076,964 | | | | 87,617,559 | |
| | | | | | | | | | | | | | | | | |
| NET INCREASE IN NET ASSETS RESULTING FROM OPERATIONS | | $ | 27,368,553 | | | $ | 51,703,397 | | | $ | 21,344,843 | | | $ | 90,957,954 | |
| | | | | | | | | | | | | | | | | |
See accompanying notes to financial statements.
| The Inspire ETFs |
| STATEMENTS OF OPERATIONS (Continued) |
| For the Year Ended November 30, 2024 |
| |
| | | Inspire International | | | Inspire Tactical | | | Inspire | | | Inspire Fidelis Multi | | | | |
| | | ETF | | | Balanced ETF | | | Momentum ETF | | | Factor ETF | | | Inspire 500 ETF * | |
| INVESTMENT INCOME | | | | | | | | | | | | | | | | | | | | |
| Dividends | | $ | 9,749,608 | | | $ | 1,866,732 | | | $ | 843,795 | | | $ | 1,343,349 | | | $ | 1,626,536 | |
| Interest | | | 40,249 | | | | 13,464 | | | | 39,791 | | | | — | | | | — | |
| Securities lending income | | | 58,141 | | | | 981 | | | | 281 | | | | 15,551 | | | | — | |
| Reclaims receivable | | | 435,328 | | | | — | | | | — | | | | — | | | | — | |
| Less: Foreign withholding taxes | | | (1,740,697 | ) | | | (14,567 | ) | | | — | | | | (15,374 | ) | | | — | |
| TOTAL INVESTMENT INCOME | | | 8,542,629 | | | | 1,866,610 | | | | 883,867 | | | | 1,343,526 | | | | 1,626,536 | |
| | | | | | | | | | | | | | | | | | | | | |
| EXPENSES | | | | | | | | | | | | | | | | | | | | |
| Investment advisory fees | | | 1,256,578 | | | | 448,098 | | | | 399,637 | | | | 373,831 | | | | 98,588 | |
| Administrative services | | | 184,935 | | | | 71,914 | | | | 75,874 | | | | 75,842 | | | | — | |
| Custodian fees | | | 244,858 | | | | 12,474 | | | | 8,675 | | | | 24,782 | | | | — | |
| Printing and postage expenses | | | 33,301 | | | | 16,369 | | | | 18,220 | | | | 16,940 | | | | — | |
| Transfer agent fees | | | 21,618 | | | | 11,200 | | | | 10,752 | | | | 11,832 | | | | — | |
| Professional fees | | | 20,330 | | | | 12,390 | | | | 9,082 | | | | 11,708 | | | | — | |
| Legal fees | | | 19,104 | | | | 15,536 | | | | 25,464 | | | | 15,178 | | | | — | |
| Audit fees | | | 17,014 | | | | 17,014 | | | | 17,014 | | | | 17,014 | | | | — | |
| Trustees fees and expenses | | | 14,679 | | | | 14,904 | | | | 15,365 | | | | 15,052 | | | | — | |
| Insurance expense | | | 4,798 | | | | 3,301 | | | | 2,701 | | | | 3,001 | | | | — | |
| Other Expenses | | | 19,905 | | | | 9,914 | | | | 11,151 | | | | 12,176 | | | | — | |
| TOTAL EXPENSES | | | 1,837,120 | | | | 633,114 | | | | 593,935 | | | | 577,356 | | | | 98,588 | |
| | | | | | | | | | | | | | | | | | | | | |
| Less: Fees waived by the Adviser | | | — | | | | — | | | | (101,431 | ) | | | — | | | | — | |
| NET EXPENSES | | | 1,837,120 | | | | 633,114 | | | | 492,504 | | | | 577,356 | | | | 98,588 | |
| | | | | | | | | | | | | | | | | | | | | |
| NET INVESTMENT INCOME | | | 6,705,509 | | | | 1,233,496 | | | | 391,363 | | | | 766,170 | | | | 1,527,948 | |
| | | | | | | | | | | | | | | | | | | | | |
| REALIZED AND UNREALIZED GAIN (LOSS) ON INVESTMENTS | | | | | | | | | | | | | | | | | | | | |
| Net realized gain (loss) on: | | | | | | | | | | | | | | | | | | | | |
| In-kind redemptions | | | 4,011,655 | | | | 1,318,317 | | | | 2,117,242 | | | | 5,224,171 | | | | 200,591 | |
| Investments | | | 9,403,590 | | | | 7,230,524 | | | | 812,081 | | | | 6,817,939 | | | | (352,515 | ) |
| Foreign currency transactions | | | (72,402 | ) | | | (87 | ) | | | — | | | | (25 | ) | | | — | |
| | | | 13,342,843 | | | | 8,548,754 | | | | 2,929,323 | | | | 12,042,085 | | | | (151,924 | ) |
| Net change in unrealized appreciation (depreciation) on: | | | | | | | | | | | | | | | | | | | | |
| Investments | | | 5,325,301 | | | | 7,521,778 | | | | 12,066,460 | | | | 6,853,011 | | | | 25,530,547 | |
| Foreign currency translations | | | (28,052 | ) | | | (97 | ) | | | (17 | ) | | | (167 | ) | | | — | |
| | | | 5,297,249 | | | | 7,521,681 | | | | 12,066,443 | | | | 6,852,844 | | | | 25,530,547 | |
| | | | | | | | | | | | | | | | | | | | | |
| NET REALIZED AND UNREALIZED GAIN ON INVESTMENTS | | | 18,640,092 | | | | 16,070,435 | | | | 14,995,766 | | | | 18,894,929 | | | | 25,378,623 | |
| | | | | | | | | | | | | | | | | | | | | |
| NET INCREASE IN NET ASSETS RESULTING FROM OPERATIONS | | $ | 25,345,601 | | | $ | 17,303,931 | | | $ | 15,387,129 | | | $ | 19,661,099 | | | $ | 26,906,571 | |
| | | | | | | | | | | | | | | | | | | | | |
| * | The Inspire 500 ETF commenced operations on March 25, 2024. |
See accompanying notes to financial statements.
| Inspire Global Hope ETF |
| STATEMENTS OF CHANGES IN NET ASSETS |
| |
| | | Year Ended | | | Year Ended | |
| | | November 30, 2024 | | | November 30, 2023 | |
| FROM OPERATIONS | | | | | | | | |
| Net investment income | | $ | 2,199,441 | | | $ | 2,805,100 | |
| Net realized gain (loss) on in-kind redemptions, investments and foreign currency transactions | | | 26,944,794 | | | | (2,940,962 | ) |
| Net change in unrealized appreciation (depreciation) on investments and foreign currency translations | | | (1,775,682 | ) | | | 8,378,731 | |
| Net increase in net assets resulting from operations | | | 27,368,553 | | | | 8,242,869 | |
| | | | | | | | | |
| DISTRIBUTIONS TO SHAREHOLDERS | | | | | | | | |
| From distributable earnings: | | | (2,698,930 | ) | | | (2,630,640 | ) |
| Net decrease in net assets resulting from distributions to shareholders | | | (2,698,930 | ) | | | (2,630,640 | ) |
| | | | | | | | | |
| FROM SHARES OF BENEFICIAL INTEREST | | | | | | | | |
| Proceeds from shares sold | | | — | | | | 25,848,597 | |
| Cost of shares redeemed | | | (81,741,323 | ) | | | (1,594,985 | ) |
| Net increase (decrease) in net assets resulting from shares of beneficial interest | | | (81,741,323 | ) | | | 24,253,612 | |
| | | | | | | | | |
| TOTAL INCREASE (DECREASE) IN NET ASSETS | | | (57,071,700 | ) | | | 29,865,841 | |
| | | | | | | | | |
| NET ASSETS | | | | | | | | |
| Beginning of Year | | | 166,775,792 | | | | 136,909,951 | |
| End of Year | | $ | 109,704,092 | | | $ | 166,775,792 | |
| | | | | | | | | |
| SHARE ACTIVITY | | | | | | | | |
| Shares Sold | | | — | | | | 800,000 | |
| Shares Redeemed | | | (2,200,000 | ) | | | (50,000 | ) |
| Net increase (decrease) in shares of beneficial interest outstanding | | | (2,200,000 | ) | | | 750,000 | |
| | | | | | | | | |
See accompanying notes to financial statements.
| Inspire Small/Mid Cap ETF |
| STATEMENTS OF CHANGES IN NET ASSETS |
| |
| | | Year Ended | | | Year Ended | |
| | | November 30, 2024 | | | November 30, 2023 | |
| FROM OPERATIONS | | | | | | | | |
| Net investment income | | $ | 2,307,550 | | | $ | 1,898,514 | |
| Net realized gain (loss) on in-kind redemptions and investments | | | 19,175,485 | | | | (4,035,381 | ) |
| Net change in unrealized appreciation (depreciation) on investments | | | 30,220,362 | | | | (1,610,631 | ) |
| Net increase (decrease) in net assets resulting from operations | | | 51,703,397 | | | | (3,747,498 | ) |
| | | | | | | | | |
| DISTRIBUTIONS TO SHAREHOLDERS | | | | | | | | |
| From distributable earnings: | | | (2,458,940 | ) | | | (1,603,670 | ) |
| Net decrease in net assets resulting from distributions to shareholders | | | (2,458,940 | ) | | | (1,603,670 | ) |
| | | | | | | | | |
| FROM SHARES OF BENEFICIAL INTEREST | | | | | | | | |
| Proceeds from shares sold | | | 63,933,739 | | | | 80,203,159 | |
| Cost of shares redeemed | | | (69,346,878 | ) | | | (30,933,514 | ) |
| Net increase (decrease) in net assets resulting from shares of beneficial interest | | | (5,413,139 | ) | | | 49,269,645 | |
| | | | | | | | | |
| TOTAL INCREASE IN NET ASSETS | | | 43,831,318 | | | | 43,918,477 | |
| | | | | | | | | |
| NET ASSETS | | | | | | | | |
| Beginning of Year | | | 169,031,251 | | | | 125,112,774 | |
| End of Year | | $ | 212,862,569 | | | $ | 169,031,251 | |
| | | | | | | | | |
| SHARE ACTIVITY | | | | | | | | |
| Shares Sold | | | 1,750,000 | | | | 2,500,000 | |
| Shares Redeemed | | | (1,950,000 | ) | | | (1,000,000 | ) |
| Net increase (decrease) in shares of beneficial interest outstanding | | | (200,000 | ) | | | 1,500,000 | |
| | | | | | | | | |
See accompanying notes to financial statements.
| Inspire Corporate Bond ETF |
| STATEMENTS OF CHANGES IN NET ASSETS |
| |
| | | Year Ended | | | Year Ended | |
| | | November 30, 2024 | | | November 30, 2023 | |
| FROM OPERATIONS | | | | | | | | |
| Net investment income | | $ | 12,267,879 | | | $ | 8,236,898 | |
| Net realized gain (loss) on in-kind redemptions and investments | | | 694,305 | | | | (6,487,434 | ) |
| Net change in unrealized appreciation on investments | | | 8,382,659 | | | | 6,281,553 | |
| Net increase in net assets resulting from operations | | | 21,344,843 | | | | 8,031,017 | |
| | | | | | | | | |
| DISTRIBUTIONS TO SHAREHOLDERS | | | | | | | | |
| From distributable earnings: | | | (12,185,950 | ) | | | (8,091,080 | ) |
| Net decrease in net assets resulting from distributions to shareholders | | | (12,185,950 | ) | | | (8,091,080 | ) |
| | | | | | | | | |
| FROM SHARES OF BENEFICIAL INTEREST | | | | | | | | |
| Proceeds from shares sold | | | 166,835,228 | | | | 85,503,385 | |
| Cost of shares redeemed | | | (76,104,963 | ) | | | (75,795,197 | ) |
| Net increase in net assets resulting from shares of beneficial interest | | | 90,730,265 | | | | 9,708,188 | |
| | | | | | | | | |
| TOTAL INCREASE IN NET ASSETS | | | 99,889,158 | | | | 9,648,125 | |
| | | | | | | | | |
| NET ASSETS | | | | | | | | |
| Beginning of Year | | | 232,660,706 | | | | 223,012,581 | |
| End of Year | | $ | 332,549,864 | | | $ | 232,660,706 | |
| | | | | | | | | |
| SHARE ACTIVITY | | | | | | | | |
| Shares Sold | | | 7,100,000 | | | | 3,700,000 | |
| Shares Redeemed | | | (3,200,000 | ) | | | (3,300,000 | ) |
| Net increase in shares of beneficial interest outstanding | | | 3,900,000 | | | | 400,000 | |
| | | | | | | | | |
See accompanying notes to financial statements.
| Inspire 100 ETF |
| STATEMENTS OF CHANGES IN NET ASSETS |
| |
| | | Year Ended | | | Year Ended | |
| | | November 30, 2024 | | | November 30, 2023 | |
| FROM OPERATIONS | | | | | | | | |
| Net investment income | | $ | 3,340,395 | | | $ | 3,062,442 | |
| Net realized gain (loss) on in-kind redemptions and investments | | | 34,078,726 | | | | (7,515,881 | ) |
| Net change in unrealized appreciation on investments | | | 53,538,833 | | | | 17,186,146 | |
| Net increase in net assets resulting from operations | | | 90,957,954 | | | | 12,732,707 | |
| | | | | | | | | |
| DISTRIBUTIONS TO SHAREHOLDERS | | | | | | | | |
| From distributable earnings: | | | (3,597,375 | ) | | | (2,666,835 | ) |
| Net decrease in net assets resulting from distributions to shareholders | | | (3,597,375 | ) | | | (2,666,835 | ) |
| | | | | | | | | |
| FROM SHARES OF BENEFICIAL INTEREST | | | | | | | | |
| Proceeds from shares sold | | | 116,829,272 | | | | 90,845,213 | |
| Cost of shares redeemed | | | (159,284,769 | ) | | | (69,911,978 | ) |
| Net increase (decrease) in net assets resulting from shares of beneficial interest | | | (42,455,497 | ) | | | 20,933,235 | |
| | | | | | | | | |
| TOTAL INCREASE IN NET ASSETS | | | 44,905,082 | | | | 30,999,107 | |
| | | | | | | | | |
| NET ASSETS | | | | | | | | |
| Beginning of Year | | | 308,537,128 | | | | 277,538,021 | |
| End of Year | | $ | 353,442,210 | | | $ | 308,537,128 | |
| | | | | | | | | |
| SHARE ACTIVITY | | | | | | | | |
| Shares Sold | | | 3,100,000 | | | | 2,900,000 | |
| Shares Redeemed | | | (4,200,000 | ) | | | (2,200,000 | ) |
| Net increase (decrease) in shares of beneficial interest outstanding | | | (1,100,000 | ) | | | 700,000 | |
| | | | | | | | | |
See accompanying notes to financial statements.
| Inspire International ETF |
| STATEMENTS OF CHANGES IN NET ASSETS |
| |
| | | Year Ended | | | Year Ended | |
| | | November 30, 2024 | | | November 30, 2023 | |
| FROM OPERATIONS | | | | | | | | |
| Net investment income | | $ | 6,705,509 | | | $ | 4,687,095 | |
| Net realized gain (loss) on in-kind redemptions, investments and foreign currency transactions | | | 13,342,843 | | | | (4,080,697 | ) |
| Net change in unrealized appreciation on investments and foreign currency translations | | | 5,297,249 | | | | 13,215,883 | |
| Net increase in net assets resulting from operations | | | 25,345,601 | | | | 13,822,281 | |
| | | | | | | | | |
| DISTRIBUTIONS TO SHAREHOLDERS | | | | | | | | |
| From distributable earnings: | | | (7,509,030 | ) | | | (4,410,875 | ) |
| Net decrease in net assets resulting from distributions to shareholders | | | (7,509,030 | ) | | | (4,410,875 | ) |
| | | | | | | | | |
| FROM SHARES OF BENEFICIAL INTEREST | | | | | | | | |
| Proceeds from shares sold | | | 76,917,626 | | | | 95,494,607 | |
| Cost of shares redeemed | | | (20,358,989 | ) | | | (18,045,544 | ) |
| Net increase in net assets resulting from shares of beneficial interest | | | 56,558,637 | | | | 77,449,063 | |
| | | | | | | | | |
| TOTAL INCREASE IN NET ASSETS | | | 74,395,208 | | | | 86,860,469 | |
| | | | | | | | | |
| NET ASSETS | | | | | | | | |
| Beginning of Year | | | 227,689,340 | | | | 140,828,871 | |
| End of Year | | $ | 302,084,548 | | | $ | 227,689,340 | |
| | | | | | | | | |
| SHARE ACTIVITY | | | | | | | | |
| Shares Sold | | | 2,550,000 | | | | 3,500,000 | |
| Shares Redeemed | | | (700,000 | ) | | | (650,000 | ) |
| Net increase in shares of beneficial interest outstanding | | | 1,850,000 | | | | 2,850,000 | |
| | | | | | | | | |
See accompanying notes to financial statements.
| Inspire Tactical Balanced ETF |
| STATEMENTS OF CHANGES IN NET ASSETS |
| |
| | | Year Ended | | | Year Ended | |
| | | November 30, 2024 | | | November 30, 2023 | |
| FROM OPERATIONS | | | | | | | | |
| Net investment income | | $ | 1,233,496 | | | $ | 2,301,321 | |
| Net realized gain (loss) on in-kind redemptions, investments and foreign currency transactions | | | 8,548,754 | | | | (786,475 | ) |
| Distributions of capital gains from underlying investment companies | | | — | | | | 187 | |
| Net change in unrealized appreciation on investments and foreign currency translations | | | 7,521,681 | | | | 1,719,431 | |
| Net increase in net assets resulting from operations | | | 17,303,931 | | | | 3,234,464 | |
| | | | | | | | | |
| DISTRIBUTIONS TO SHAREHOLDERS | | | | | | | | |
| From distributable earnings: | | | (1,260,097 | ) | | | (2,555,168 | ) |
| Net decrease in net assets resulting from distributions to shareholders | | | (1,260,097 | ) | | | (2,555,168 | ) |
| | | | | | | | | |
| FROM SHARES OF BENEFICIAL INTEREST | | | | | | | | |
| Proceeds from shares sold | | | 6,454,888 | | | | 3,449,743 | |
| Cost of shares redeemed | | | (10,328,616 | ) | | | (26,432,473 | ) |
| Net decrease in net assets resulting from shares of beneficial interest | | | (3,873,728 | ) | | | (22,982,730 | ) |
| | | | | | | | | |
| TOTAL INCREASE (DECREASE) IN NET ASSETS | | | 12,170,106 | | | | (22,303,434 | ) |
| | | | | | | | | |
| NET ASSETS | | | | | | | | |
| Beginning of Year | | | 83,430,454 | | | | 105,733,888 | |
| End of Year | | $ | 95,600,560 | | | $ | 83,430,454 | |
| | | | | | | | | |
| SHARE ACTIVITY | | | | | | | | |
| Shares Sold | | | 250,000 | | | | 150,000 | |
| Shares Redeemed | | | (400,000 | ) | | | (1,150,000 | ) |
| Net decrease in shares of beneficial interest outstanding | | | (150,000 | ) | | | (1,000,000 | ) |
| | | | | | | | | |
See accompanying notes to financial statements.
| Inspire Momentum ETF |
| STATEMENTS OF CHANGES IN NET ASSETS |
| |
| | | Year Ended | | | Year Ended | |
| | | November 30, 2024 | | | November 30, 2023 | |
| FROM OPERATIONS | | | | | | | | |
| Net investment income | | $ | 391,363 | | | $ | 513,918 | |
| Net realized gain on in-kind redemptions, investments and foreign currency transactions | | | 2,929,323 | | | | 2,439,617 | |
| Net change in unrealized appreciation (depreciation) on investments and foreign currency translations | | | 12,066,443 | | | | (312,533 | ) |
| Net increase in net assets resulting from operations | | | 15,387,129 | | | | 2,641,002 | |
| | | | | | | | | |
| DISTRIBUTIONS TO SHAREHOLDERS | | | | | | | | |
| From distributable earnings: | | | (497,272 | ) | | | (445,820 | ) |
| Net decrease in net assets resulting from distributions to shareholders | | | (497,272 | ) | | | (445,820 | ) |
| | | | | | | | | |
| FROM SHARES OF BENEFICIAL INTEREST | | | | | | | | |
| Proceeds from shares sold | | | 27,151,965 | | | | 20,970,873 | |
| Cost of shares redeemed | | | (12,633,966 | ) | | | (18,352,614 | ) |
| Net increase in net assets resulting from shares of beneficial interest | | | 14,517,999 | | | | 2,618,259 | |
| | | | | | | | | |
| TOTAL INCREASE IN NET ASSETS | | | 29,407,856 | | | | 4,813,441 | |
| | | | | | | | | |
| NET ASSETS | | | | | | | | |
| Beginning of Year | | | 45,095,701 | | | | 40,282,260 | |
| End of Year | | $ | 74,503,557 | | | $ | 45,095,701 | |
| | | | | | | | | |
| SHARE ACTIVITY | | | | | | | | |
| Shares Sold | | | 925,000 | | | | 875,000 | |
| Shares Redeemed | | | (425,000 | ) | | | (775,000 | ) |
| Net increase in shares of beneficial interest outstanding | | | 500,000 | | | | 100,000 | |
| | | | | | | | | |
See accompanying notes to financial statements.
| Inspire Fidelis Multi Factor ETF |
| STATEMENTS OF CHANGES IN NET ASSETS |
| |
| | | Year Ended | | | Year Ended | |
| | | November 30, 2024 | | | November 30, 2023 | |
| FROM OPERATIONS | | | | | | | | |
| Net investment income | | $ | 766,170 | | | $ | 641,466 | |
| Net realized gain on in-kind redemptions, investments and foreign currency transactions | | | 12,042,085 | | | | 1,345,813 | |
| Net change in unrealized appreciation on investments and foreign currency translations | | | 6,852,844 | | | | 1,175,033 | |
| Net increase in net assets resulting from operations | | | 19,661,099 | | | | 3,162,312 | |
| | | | | | | | | |
| DISTRIBUTIONS TO SHAREHOLDERS | | | | | | | | |
| From distributable earnings: | | | (954,623 | ) | | | (464,685 | ) |
| Net decrease in net assets resulting from distributions to shareholders | | | (954,623 | ) | | | (464,685 | ) |
| | | | | | | | | |
| FROM SHARES OF BENEFICIAL INTEREST | | | | | | | | |
| Proceeds from shares sold | | | 45,394,608 | | | | 23,509,996 | |
| Cost of shares redeemed | | | (40,032,935 | ) | | | (2,544,140 | ) |
| Net increase in net assets resulting from shares of beneficial interest | | | 5,361,673 | | | | 20,965,856 | |
| | | | | | | | | |
| TOTAL INCREASE IN NET ASSETS | | | 24,068,149 | | | | 23,663,483 | |
| | | | | | | | | |
| NET ASSETS | | | | | | | | |
| Beginning of Year | | | 70,578,781 | | | | 46,915,298 | |
| End of Year | | $ | 94,646,930 | | | $ | 70,578,781 | |
| | | | | | | | | |
| SHARE ACTIVITY | | | | | | | | |
| Shares Sold | | | 1,475,000 | | | | 900,000 | |
| Shares Redeemed | | | (1,300,000 | ) | | | (100,000 | ) |
| Net increase in shares of beneficial interest outstanding | | | 175,000 | | | | 800,000 | |
| | | | | | | | | |
See accompanying notes to financial statements.
| Inspire 500 ETF |
| STATEMENT OF CHANGES IN NET ASSETS |
| |
| | | Period Ended | |
| | | November 30, 2024 * | |
| FROM OPERATIONS | | | | |
| Net investment income | | $ | 1,527,948 | |
| Net realized loss on in-kind redemptions and investments | | | (151,924 | ) |
| Net change in unrealized appreciation on investments | | | 25,530,547 | |
| Net increase in net assets resulting from operations | | | 26,906,571 | |
| | | | | |
| DISTRIBUTIONS TO SHAREHOLDERS | | | | |
| From distributable earnings: | | | (1,049,460 | ) |
| Net decrease in net assets resulting from distributions to shareholders | | | (1,049,460 | ) |
| | | | | |
| FROM SHARES OF BENEFICIAL INTEREST | | | | |
| Proceeds from shares sold | | | 249,123,235 | |
| Cost of shares redeemed | | | (9,803,557 | ) |
| Net increase in net assets resulting from shares of beneficial interest | | | 239,319,678 | |
| | | | | |
| TOTAL INCREASE IN NET ASSETS | | | 265,176,789 | |
| | | | | |
| NET ASSETS | | | | |
| Beginning of Period | | | — | |
| End of Period | | $ | 265,176,789 | |
| | | | | |
| SHARE ACTIVITY | | | | |
| Shares Sold | | | 1,225,000 | |
| Shares Redeemed | | | (50,000 | ) |
| Net increase in shares of beneficial interest outstanding | | | 1,175,000 | |
| | | | | |
| * | The Inspire 500 ETF commenced operations on March 25, 2024. |
See accompanying notes to financial statements.
| Inspire Global Hope ETF |
| FINANCIAL HIGHLIGHTS |
| |
Per Share Data and Ratios for a Share of Beneficial Interest Outstanding Throughout Each Year Presented
| | | Year Ended | | | Year Ended | | | Year Ended | | | Year Ended | | | Year Ended | |
| | | November 30, 2024 | | | November 30, 2023 | | | November 30, 2022 | | | November 30, 2021 | | | November 30, 2020 | |
| Net asset value, beginning of year | | $ | 33.36 | | | $ | 32.21 | | | $ | 38.68 | | | $ | 32.12 | | | $ | 29.21 | |
| | | | | | | | | | | | | | | | | | | | | |
| Activity from investment operations: | | | | | | | | | | | | | | | | | | | | |
| Net investment income (1) | | | 0.61 | | | | 0.61 | | | | 0.57 | | | | 0.78 | | | | 0.50 | |
| Net realized and unrealized gain (loss) on investments | | | 5.96 | | | | 1.11 | | | | (3.62 | ) | | | 6.46 | | | | 2.96 | |
| Total from investment operations | | | 6.57 | | | | 1.72 | | | | (3.05 | ) | | | 7.24 | | | | 3.46 | |
| | | | | | | | | | | | | | | | | | | | | |
| Less distributions from: | | | | | | | | | | | | | | | | | | | | |
| Net investment income | | | (0.75 | ) | | | (0.57 | ) | | | (0.52 | ) | | | (0.68 | ) | | | (0.52 | ) |
| Net realized gains | | | — | | | | — | | | | (2.90 | ) | | | — | | | | (0.03 | ) |
| Total distributions | | | (0.75 | ) | | | (0.57 | ) | | | (3.42 | ) | | | (0.68 | ) | | | (0.55 | ) |
| | | | | | | | | | | | | | | | | | | | | |
| Net asset value, end of year | | $ | 39.18 | | | $ | 33.36 | | | $ | 32.21 | | | $ | 38.68 | | | $ | 32.12 | |
| Total return (3) | | | 19.83 | % | | | 5.43 | % | | | (8.59 | )% | | | 22.63 | % | | | 12.35 | % |
| Net assets, at end of year (000s) | | $ | 109,704 | | | $ | 166,776 | | | $ | 136,910 | | | $ | 137,329 | | | $ | 120,453 | |
| | | | | | | | | | | | | | | | | | | | | |
| Ratio of gross expenses to average net assets | | | 0.58 | % | | | 0.56 | % | | | 0.61 | % (5) | | | 0.49 | % | | | 0.61 | % |
| Ratio of net expenses to average net assets | | | 0.58 | % | | | 0.56 | % | | | 0.61 | % (4) | | | 0.49 | % | | | 0.61 | % |
| Ratio of net investment income to average net assets | | | 1.67 | % | | | 1.87 | % | | | 1.74 | % | | | 2.08 | % | | | 1.82 | % |
| Portfolio Turnover Rate (2) | | | 41 | % | | | 41 | % | | | 51 | % | | | 94 | % | | | 36 | % |
| | | | | | | | | | | | | | | | | | | | | |
| (1) | Per share amounts calculated using the average shares method, which more appropriately presents the per share data for the year. |
| (2) | Portfolio turnover rate excludes portfolio securities received or delivered as a result of processing capital share transactions in Creation Units. |
| (3) | Total return is calculated assuming a purchase of shares at net asset value on the first day and a sale at net asset value on the last day of the period. Distributions are assumed, for the purpose of this calculation, to be reinvested at the ex-dividend date net asset value per share on their respective payment dates. |
| (4) | Represents the ratio of net expenses to average net assets after adviser recapture of waived/reimbursed fees from prior years. |
| (5) | Represents the ratio of gross expenses to average net assets before adviser recapture of waived/reimbursed fees from prior years. |
See accompanying notes to financial statements.
| Inspire Small/Mid Cap ETF |
| FINANCIAL HIGHLIGHTS |
| |
Per Share Data and Ratios for a Share of Beneficial Interest Outstanding Throughout Each Year Presented
| | | Year Ended | | | Year Ended | | | Year Ended | | | Year Ended | | | Year Ended | |
| | | November 30, 2024 | | | November 30, 2023 | | | November 30, 2022 | | | November 30, 2021 | | | November 30, 2020 | |
| Net asset value, beginning of year | | $ | 31.01 | | | $ | 31.67 | | | $ | 36.13 | | | $ | 27.74 | | | $ | 27.56 | |
| | | | | | | | | | | | | | | | | | | | | |
| Activity from investment operations: | | | | | | | | | | | | | | | | | | | | |
| Net investment income (1) | | | 0.45 | | | | 0.40 | | | | 0.38 | | | | 0.38 | | | | 0.37 | |
| Net realized and unrealized gain (loss) on investments | | | 9.57 | | | | (0.72 | ) | | | (1.46 | ) | | | 8.32 | | | | 0.13 | (4) |
| Total from investment operations | | | 10.02 | | | | (0.32 | ) | | | (1.08 | ) | | | 8.70 | | | | 0.50 | |
| | | | | | | | | | | | | | | | | | | | | |
| Less distributions from: | | | | | | | | | | | | | | | | | | | | |
| Net investment income | | | (0.48 | ) | | | (0.34 | ) | | | (0.32 | ) | | | (0.31 | ) | | | (0.31 | ) |
| Net realized gains | | | — | | | | — | | | | (3.00 | ) | | | — | | | | (0.01 | ) |
| Return of capital | | | — | | | | — | | | | (0.06 | ) | | | — | | | | — | |
| Total distributions | | | (0.48 | ) | | | (0.34 | ) | | | (3.38 | ) | | | (0.31 | ) | | | (0.32 | ) |
| | | | | | | | | | | | | | | | | | | | | |
| Net asset value, end of year | | $ | 40.55 | | | $ | 31.01 | | | $ | 31.67 | | | $ | 36.13 | | | $ | 27.74 | |
| Total return (3) | | | 32.53 | % | | | (0.98 | )% | | | (3.34 | )% | | | 31.44 | % | | | 2.12 | % |
| Net assets, at end of year (000s) | | $ | 212,863 | | | $ | 169,031 | | | $ | 125,113 | | | $ | 124,658 | | | $ | 85,988 | |
| | | | | | | | | | | | | | | | | | | | | |
| Ratio of gross expenses to average net assets | | | 0.49 | % | | | 0.53 | % | | | 0.54 | % | | | 0.48 | % (6) | | | 0.57 | % (6) |
| Ratio of net expenses to average net assets | | | 0.49 | % | | | 0.53 | % | | | 0.54 | % | | | 0.52 | % (5) | | | 0.60 | % (5) |
| Ratio of net investment income to average net assets | | | 1.25 | % | | | 1.30 | % | | | 1.21 | % | | | 1.08 | % | | | 1.53 | % |
| Portfolio Turnover Rate (2) | | | 46 | % | | | 44 | % | | | 43 | % | | | 168 | % | | | 92 | % |
| | | | | | | | | | | | | | | | | | | | | |
| (1) | Per share amounts calculated using the average shares method, which more appropriately presents the per share data for the year. |
| (2) | Portfolio turnover rate excludes portfolio securities received or delivered as a result of processing capital share transactions in Creation Units. |
| (3) | Total return is calculated assuming a purchase of shares at net asset value on the first day and a sale at net asset value on the last day of the period. Distributions are assumed, for the purpose of this calculation, to be reinvested at the ex-dividend date net asset value per share on their respective payment dates. |
| (4) | The amount of net realized and unrealized gain (loss) on investments per share does not accord with the amounts in the Statements of Operations due to the timing of shareholder subscriptions and redemptions relative to fluctuating net asset values during the year. |
| (5) | Represents the ratio of net expenses to average net assets after adviser recapture of waived/reimbursed fees from prior years. |
| (6) | Represents the ratio of gross expenses to average net assets before adviser recapture of waived/reimbursed fees from prior years |
See accompanying notes to financial statements.
| Inspire Corporate Bond ETF |
| FINANCIAL HIGHLIGHTS |
| |
Per Share Data and Ratios for a Share of Beneficial Interest Outstanding Throughout Each Year Presented
| | | Year Ended | | | Year Ended | | | Year Ended | | | Year Ended | | | Year Ended | |
| | | November 30, 2024 | | | November 30, 2023 | | | November 30, 2022 | | | November 30, 2021 | | | November 30, 2020 | |
| Net asset value, beginning of year | | $ | 23.04 | | | $ | 22.99 | | | $ | 25.89 | | | $ | 26.48 | | | $ | 25.69 | |
| | | | | | | | | | | | | | | | | | | | | |
| Activity from investment operations: | | | | | | | | | | | | | | | | | | | | |
| Net investment income (1) | | | 0.98 | | | | 0.79 | | | | 0.37 | | | | 0.27 | | | | 0.45 | |
| Net realized and unrealized gain (loss) on investments | | | 0.71 | | | | 0.03 | (4) | | | (2.85 | ) | | | (0.57 | ) | | | 0.86 | |
| Total from investment operations | | | 1.69 | | | | 0.82 | | | | (2.48 | ) | | | (0.30 | ) | | | 1.31 | |
| | | | | | | | | | | | | | | | | | | | | |
| Less distributions from: | | | | | | | | | | | | | | | | | | | | |
| Net investment income | | | (0.98 | ) | | | (0.77 | ) | | | (0.35 | ) | | | (0.29 | ) | | | (0.44 | ) |
| Net realized gains | | | — | | | | — | | | | (0.07 | ) | | | — | | | | (0.08 | ) |
| Total distributions | | | (0.98 | ) | | | (0.77 | ) | | | (0.42 | ) | | | (0.29 | ) | | | (0.52 | ) |
| | | | | | | | | | | | | | | | | | | | | |
| Net asset value, end of year | | $ | 23.75 | | | $ | 23.04 | | | $ | 22.99 | | | $ | 25.89 | | | $ | 26.48 | |
| Total return (3) | | | 7.44 | % | | | 3.62 | % | | | (9.64 | )% | | | (1.15 | )% | | | 5.16 | % |
| Net assets, at end of year (000s) | | $ | 332,550 | | | $ | 232,661 | | | $ | 223,013 | | | $ | 238,225 | | | $ | 166,829 | |
| | | | | | | | | | | | | | | | | | | | | |
| Ratio of gross expenses to average net assets | | | 0.43 | % | | | 0.44 | % | | | 0.45 | % | | | 0.44 | % | | | 0.49 | % |
| Ratio of net expenses to average net assets | | | 0.43 | % | | | 0.44 | % | | | 0.45 | % | | | 0.44 | % | | | 0.49 | % |
| Ratio of net investment income to average net assets | | | 4.17 | % | | | 3.43 | % | | | 1.56 | % | | | 1.04 | % | | | 1.75 | % |
| Portfolio Turnover Rate (2) | | | 26 | % | | | 45 | % | | | 47 | % | | | 126 | % | | | 35 | % |
| | | | | | | | | | | | | | | | | | | | | |
| (1) | Per share amounts calculated using the average shares method, which more appropriately presents the per share data for the year. |
| (2) | Portfolio turnover rate excludes portfolio securities received or delivered as a result of processing capital share transactions in Creation Units. |
| (3) | Total return is calculated assuming a purchase of shares at net asset value on the first day and a sale at net asset value on the last day of the period. Distributions are assumed, for the purpose of this calculation, to be reinvested at the ex-dividend date net asset value per share on their respective payment dates. |
| (4) | Net realized and unrealized gain (loss) on investments per share are balancing amounts necessary to reconcile the change in net asset value per share for the year, and may not accord with the aggregate gains and losses in the Statement of Operations due to share transactions for the year. |
See accompanying notes to financial statements.
| Inspire 100 ETF |
| FINANCIAL HIGHLIGHTS |
| |
Per Share Data and Ratios for a Share of Beneficial Interest Outstanding Throughout Each Year Presented
| | | Year Ended | | | Year Ended | | | Year Ended | | | Year Ended | | | Year Ended | |
| | | November 30, 2024 | | | November 30, 2023 | | | November 30, 2022 | | | November 30, 2021 | | | November 30, 2020 | |
| Net asset value, beginning of year | | $ | 32.65 | | | $ | 31.72 | | | $ | 44.17 | | | $ | 35.98 | | | $ | 29.52 | |
| | | | | | | | | | | | | | | | | | | | | |
| Activity from investment operations: | | | | | | | | | | | | | | | | | | | | |
| Net investment income (1) | | | 0.38 | | | | 0.34 | | | | 0.35 | | | | 0.43 | | | | 0.41 | |
| Net realized and unrealized gain (loss) on investments | | | 9.70 | | | | 0.89 | | | | (5.81 | ) | | | 8.39 | | | | 6.43 | |
| Total from investment operations | | | 10.08 | | | | 1.23 | | | | (5.46 | ) | | | 8.82 | | | | 6.84 | |
| | | | | | | | | | | | | | | | | | | | | |
| Less distributions from: | | | | | | | | | | | | | | | | | | | | |
| Net investment income | | | (0.40 | ) | | | (0.30 | ) | | | (0.33 | ) | | | (0.43 | ) | | | (0.38 | ) |
| Net realized gains | | | — | | | | — | | | | (6.66 | ) | | | (0.20 | ) | | | — | |
| Total distributions | | | (0.40 | ) | | | (0.30 | ) | | | (6.99 | ) | | | (0.63 | ) | | | (0.38 | ) |
| | | | | | | | | | | | | | | | | | | | | |
| Net asset value, end of year | | $ | 42.33 | | | $ | 32.65 | | | $ | 31.72 | | | $ | 44.17 | | | $ | 35.98 | |
| Total return (3) | | | 31.02 | % | | | 3.91 | % | | | (14.69 | )% | | | 24.79 | % | | | 23.50 | % |
| Net assets, at end of year (000s) | | $ | 353,442 | | | $ | 308,537 | | | $ | 277,538 | | | $ | 295,962 | | | $ | 149,320 | |
| | | | | | | | | | | | | | | | | | | | | |
| Ratio of gross expenses to average net assets (4) | | | 0.41 | % | | | 0.43 | % | | | 0.45 | % | | | 0.42 | % | | | 0.48 | % |
| Ratio of net expenses to average net assets | | | 0.35 | % | | | 0.35 | % | | | 0.35 | % | | | 0.35 | % | | | 0.35 | % |
| Ratio of net investment income to average net assets | | | 0.99 | % | | | 1.06 | % | | | 1.05 | % | | | 1.04 | % | | | 1.31 | % |
| Portfolio Turnover Rate (2) | | | 26 | % | | | 33 | % | | | 28 | % | | | 100 | % | | | 60 | % |
| | | | | | | | | | | | | | | | | | | | | |
| (1) | Per share amounts calculated using the average shares method, which more appropriately presents the per share data for the year. |
| (2) | Portfolio turnover rate excludes portfolio securities received or delivered as a result of processing capital share transactions in Creation Units. |
| (3) | Total return is calculated assuming a purchase of shares at net asset value on the first day and a sale at net asset value on the last day of the period. Distributions are assumed, for the purpose of this calculation, to be reinvested at the ex-dividend date net asset value per share on their respective payment dates. |
| (4) | Represents the ratio of gross expenses to average net assets absent of fee waivers and/or expense reimbursements by the adviser. |
See accompanying notes to financial statements.
| Inspire International ETF |
| FINANCIAL HIGHLIGHTS |
| |
Per Share Data and Ratios for a Share of Beneficial Interest Outstanding Throughout Each Year Presented
| | | Year Ended | | | Year Ended | | | Year Ended | | | Year Ended | | | Year Ended | |
| | | November 30, 2024 | | | November 30, 2023 | | | November 30, 2022 | | | November 30, 2021 | | | November 30, 2020 | |
| Net asset value, beginning of year | | $ | 27.77 | | | $ | 26.32 | | | $ | 33.64 | | | $ | 29.40 | | | $ | 26.51 | |
| | | | | | | | | | | | | | | | | | | | | |
| Activity from investment operations: | | | | | | | | | | | | | | | | | | | | |
| Net investment income (1) | | | 0.72 | | | | 0.70 | | | | 0.61 | | | | 0.81 | | | | 0.36 | |
| Net realized and unrealized gain (loss) on investments | | | 2.38 | | | | 1.38 | | | | (3.36 | ) | | | 4.22 | | | | 2.81 | |
| Total from investment operations | | | 3.10 | | | | 2.08 | | | | (2.75 | ) | | | 5.03 | | | | 3.17 | |
| | | | | | | | | | | | | | | | | | | | | |
| Less distributions from: | | | | | | | | | | | | | | | | | | | | |
| Net investment income | | | (0.81 | ) | | | (0.63 | ) | | | (0.60 | ) | | | (0.79 | ) | | | (0.28 | ) |
| Net realized gains | | | — | | | | — | | | | (3.97 | ) | | | — | | | | — | |
| Total distributions | | | (0.81 | ) | | | (0.63 | ) | | | (4.57 | ) | | | (0.79 | ) | | | (0.28 | ) |
| | | | | | | | | | | | | | | | | | | | | |
| Net asset value, end of year | | $ | 30.06 | | | $ | 27.77 | | | $ | 26.32 | | | $ | 33.64 | | | $ | 29.40 | |
| Total return (3) | | | 11.20 | % | | | 8.01 | % | | | (9.32 | )% | | | 17.11 | % | | | 12.29 | % |
| Net assets, at end of year (000s) | | $ | 302,085 | | | $ | 227,689 | | | $ | 140,829 | | | $ | 111,009 | | | $ | 77,902 | |
| | | | | | | | | | | | | | | | | | | | | |
| Ratio of net expenses to average net assets | | | 0.66 | % | | | 0.73 | % | | | 0.80 | % | | | 0.69 | % | | | 0.94 | % |
| Ratio of net investment income to average net assets | | | 2.40 | % | | | 2.55 | % | | | 2.29 | % | | | 2.38 | % | | | 1.44 | % |
| Portfolio Turnover Rate (2) | | | 34 | % | | | 37 | % | | | 61 | % | | | 106 | % | | | 27 | % |
| | | | | | | | | | | | | | | | | | | | | |
| (1) | Per share amounts calculated using the average shares method, which more appropriately presents the per share data for the year. |
| (2) | Portfolio turnover rate excludes portfolio securities received or delivered as a result of processing capital share transactions in Creation Units. |
| (3) | Total return is calculated assuming a purchase of shares at net asset value on the first day and a sale at net asset value on the last day of the period. Distributions are assumed, for the purpose of this calculation, to be reinvested at the ex-dividend date net asset value per share on their respective payment dates. |
See accompanying notes to financial statements.
| Inspire Tactical Balanced ETF |
| FINANCIAL HIGHLIGHTS |
| |
Per Share Data and Ratios for a Share of Beneficial Interest Outstanding Throughout Each Year or Period Presented
| | | Year Ended | | | Year Ended | | | Year Ended | | | Year Ended | | | Period Ended | |
| | | November 30, 2024 | | | November 30, 2023 | | | November 30, 2022 | | | November 30, 2021 | | | November 30, 2020 (1) | |
| Net asset value, beginning of period | | $ | 23.67 | | | $ | 23.37 | | | $ | 30.09 | | | $ | 26.26 | | | $ | 25.00 | |
| | | | | | | | | | | | | | | | | | | | | |
| Activity from investment operations: | | | | | | | | | | | | | | | | | | | | |
| Net investment income (2) | | | 0.36 | | | | 0.57 | | | | 0.21 | | | | 0.20 | | | | 0.08 | |
| Net realized and unrealized gain (loss) on investments | | | 4.66 | | | | 0.34 | | | | (4.22 | ) | | | 4.93 | | | | 1.21 | |
| Total from investment operations | | | 5.02 | | | | 0.91 | | | | (4.01 | ) | | | 5.13 | | | | 1.29 | |
| | | | | | | | | | | | | | | | | | | | | |
| Less distributions from: | | | | | | | | | | | | | | | | | | | | |
| Net investment income | | | (0.36 | ) | | | (0.61 | ) | | | (0.11 | ) | | | (0.25 | ) | | | (0.03 | ) |
| Net realized gains | | | — | | | | — | | | | (2.60 | ) | | | (1.05 | ) | | | — | |
| Total distributions | | | (0.36 | ) | | | (0.61 | ) | | | (2.71 | ) | | | (1.30 | ) | | | (0.03 | ) |
| | | | | | | | | | | | | | | | | | | | | |
| Net asset value, end of period | | $ | 28.33 | | | $ | 23.67 | | | $ | 23.37 | | | $ | 30.09 | | | $ | 26.26 | |
| Total return (4) | | | 21.38 | % | | | 4.03 | % | | | (14.63 | )% | | | 20.49 | % | | | 5.18 | % (6) |
| Net assets, at end of period (000s) | | $ | 95,601 | | | $ | 83,430 | | | $ | 105,734 | | | $ | 109,824 | | | $ | 71,552 | |
| | | | | | | | | | | | | | | | | | | | | |
| Ratio of net expenses to average net assets (5) | | | 0.71 | % | | | 0.71 | % | | | 0.69 | % | | | 0.69 | % | | | 0.80 | % |
| Ratio of net investment income to average net assets (5) | | | 1.38 | % | | | 2.46 | % | | | 0.84 | % | | | 0.70 | % | | | 0.81 | % |
| Portfolio Turnover Rate (3) | | | 52 | % | | | 314 | % | | | 469 | % | | | 114 | % | | | 282 | % (6) |
| | | | | | | | | | | | | | | | | | | | | |
| (1) | The Inspire Tactical Balanced ETF commenced operations on July 15, 2020. |
| (2) | Per share amounts calculated using the average shares method, which more appropriately presents the per share data for the period. |
| (3) | Portfolio turnover rate excludes portfolio securities received or delivered as a result of processing capital share transactions in Creation Units. |
| (4) | Total return is calculated assuming a purchase of shares at net asset value on the first day and a sale at net asset value on the last day of the period. Distributions are assumed, for the purpose of this calculation, to be reinvested at the ex-dividend date net asset value per share on their respective payment dates. |
| (5) | Annualized for periods less than one year. |
See accompanying notes to financial statements.
| Inspire Momentum ETF |
| FINANCIAL HIGHLIGHTS |
| |
Per Share Data and Ratios for a Share of Beneficial Interest Outstanding Throughout Each Year or Period Presented
| | | Year Ended | | | Year Ended | | | Year Ended | | | Period Ended | |
| | | November 30, 2024 | | | November 30, 2023 | | | November 30, 2022 | | | November 30, 2021 (1) | |
| Net asset value, beginning of period | | $ | 25.41 | | | $ | 24.05 | | | $ | 29.30 | | | $ | 25.00 | |
| | | | | | | | | | | | | | | | | |
| Activity from investment operations: | | | | | | | | | | | | | | | | |
| Net investment income (2) | | | 0.19 | | | | 0.27 | | | | 0.28 | | | | 0.08 | |
| Net realized and unrealized gain (loss) on investments | | | 7.40 | | | | 1.33 | | | | (4.21 | ) | | | 4.26 | |
| Total from investment operations | | | 7.59 | | | | 1.60 | | | | (3.93 | ) | | | 4.34 | |
| | | | | | | | | | | | | | | | | |
| Less distributions from: | | | | | | | | | | | | | | | | |
| Net investment income | | | (0.25 | ) | | | (0.24 | ) | | | (0.24 | ) | | | (0.04 | ) |
| Net realized gains | | | — | | | | — | | | | (1.08 | ) | | | — | |
| Total distributions | | | (0.25 | ) | | | (0.24 | ) | | | (1.32 | ) | | | (0.04 | ) |
| | | | | | | | | | | | | | | | | |
| Net asset value, end of period | | $ | 32.75 | | | $ | 25.41 | | | $ | 24.05 | | | $ | 29.30 | |
| Total return (4) | | | 30.00 | % | | | 6.72 | % | | | (13.89 | )% | | | 17.35 | % (6) |
| Net assets, at end of period (000s) | | $ | 74,504 | | | $ | 45,096 | | | $ | 40,282 | | | $ | 43,944 | |
| | | | | | | | | | | | | | | | | |
| Ratio of gross expenses to average net assets (5) | | | 0.96 | % | | | 1.03 | % | | | 1.28 | % | | | 1.02 | % |
| Ratio of net expenses to average net assets (5) | | | 0.80 | % | | | 0.80 | % | | | 0.95 | % | | | 1.02 | % |
| Ratio of net investment income to average net assets (5) | | | 0.64 | % | | | 1.11 | % | | | 1.18 | % | | | 0.27 | % |
| Portfolio Turnover Rate (3) | | | 82 | % | | | 11 | % | | | 95 | % | | | 270 | % (6) |
| | | | | | | | | | | | | | | | | |
| (1) | The Inspire Momentum ETF commenced operations on December 7, 2020. |
| (2) | Per share amounts calculated using the average shares method, which more appropriately presents the per share data for the period. |
| (3) | Portfolio turnover rate excludes portfolio securities received or delivered as a result of processing capital share transactions in Creation Units. |
| (4) | Total return is calculated assuming a purchase of shares at net asset value on the first day and a sale at net asset value on the last day of the period. Distributions are assumed, for the purpose of this calculation, to be reinvested at the ex-dividend date net asset value per share on their respective payment dates. |
| (5) | Annualized for periods less than one year. |
See accompanying notes to financial statements.
| Inspire Fidelis Multi Factor ETF |
| FINANCIAL HIGHLIGHTS |
| |
Per Share Data and Ratios for a Share of Beneficial Interest Outstanding Throughout Each Year or Period Presented
| | | Year Ended | | | Year Ended | | | Period Ended | |
| | | November 30, 2024 | | | November 30, 2023 | | | November 30, 2022 (1) | |
| Net asset value, beginning of period | | $ | 27.15 | | | $ | 26.06 | | | $ | 25.00 | |
| | | | | | | | | | | | | |
| Activity from investment operations: | | | | | | | | | | | | |
| Net investment income (2) | | | 0.28 | | | | 0.30 | | | | 0.03 | |
| Net realized and unrealized gain on investments | | | 7.03 | | | | 1.01 | | | | 1.05 | |
| Total from investment operations | | | 7.31 | | | | 1.31 | | | | 1.08 | |
| | | | | | | | | | | | | |
| Less distributions from: | | | | | | | | | | | | |
| Net investment income | | | (0.35 | ) | | | (0.22 | ) | | | (0.02 | ) |
| Total distributions | | | (0.35 | ) | | | (0.22 | ) | | | (0.02 | ) |
| | | | | | | | | | | | | |
| Net asset value, end of period | | $ | 34.11 | | | $ | 27.15 | | | $ | 26.06 | |
| Total return (4) | | | 27.12 | % | | | 5.09 | % | | | 4.33 | % (6) |
| Net assets, at end of period (000s) | | $ | 94,647 | | | $ | 70,579 | | | $ | 46,915 | |
| | | | | | | | | | | | | |
| Ratio of net expenses to average net assets (5) | | | 0.69 | % | | | 0.76 | % | | | 1.09 | % |
| Ratio of net investment income to average net assets (5) | | | 0.92 | % | | | 1.13 | % | | | 0.48 | % |
| Portfolio Turnover Rate (3) | | | 232 | % | | | 235 | % | | | 61 | % (6) |
| | | | | | | | | | | | | |
| (1) | The Inspire Fidelis Multi Factor ETF commenced operations on August 23, 2022. |
| (2) | Per share amounts calculated using the average shares method, which more appropriately presents the per share data for the period. |
| (3) | Portfolio turnover rate excludes portfolio securities received or delivered as a result of processing capital share transactions in Creation Units. |
| (4) | Total return is calculated assuming a purchase of shares at net asset value on the first day and a sale at net asset value on the last day of the period. Distributions are assumed, for the purpose of this calculation, to be reinvested at the ex-dividend date net asset value per share on their respective payment dates. |
| (5) | Annualized for periods less than one year. |
See accompanying notes to financial statements.
| Inspire 500 ETF |
| FINANCIAL HIGHLIGHTS |
| |
Per Share Data and Ratios for a Share of Beneficial Interest Outstanding Throughout the Period Presented
| | | Period Ended | |
| | | November 30, 2024 (1) | |
| Net asset value, beginning of period | | $ | 200.00 | |
| | | | | |
| Activity from investment operations: | | | | |
| Net investment income (2) | | | 1.96 | |
| Net realized and unrealized gain on investments | | | 24.95 | |
| Total from investment operations | | | 26.91 | |
| | | | | |
| Less distributions from: | | | | |
| Net investment income | | | (1.23 | ) |
| Total distributions | | | (1.23 | ) |
| | | | | |
| Net asset value, end of period | | $ | 225.68 | |
| Total return (4) | | | 13.52 | % (6) |
| Net assets, at end of period (000s) | | $ | 265,177 | |
| | | | | |
| Ratio of net expenses to average net assets (5) | | | 0.09 | % |
| Ratio of net investment income to average net assets (5) | | | 1.38 | % |
| Portfolio Turnover Rate (3) | | | 9 | % (6) |
| | | | | |
| (1) | The Inspire 500 ETF commenced operations on March 25, 2024. |
| (2) | Per share amounts calculated using the average shares method, which more appropriately presents the per share data for the period. |
| (3) | Portfolio turnover rate excludes portfolio securities received or delivered as a result of processing capital share transactions in Creation Units. |
| (4) | Total return is calculated assuming a purchase of shares at net asset value on the first day and a sale at net asset value on the last day of the period. Distributions are assumed, for the purpose of this calculation, to be reinvested at the ex-dividend date net asset value per share on their respective payment dates. |
| (5) | Annualized for periods less than one year. |
See accompanying notes to financial statements.
The Inspire ETFs
NOTES TO FINANCIAL STATEMENTS
November 30, 2024
The Inspire Global Hope ETF (“BLES”), Inspire Small/Mid Cap ETF (“ISMD”), Inspire Corporate Bond ETF (“IBD”), Inspire 100 ETF (“BIBL”), Inspire International ETF (“WWJD”), Inspire Tactical Balanced ETF (“RISN”), Inspire Momentum ETF (“GLRY”), Inspire Fidelis Multi Factor ETF (“FDLS”), and Inspire 500 ETF (“PTL”) (each a “Fund” and collectively the “Funds”) are each a diversified series of Northern Lights Fund Trust IV (the “Trust”), a statutory trust organized under the laws of the State of Delaware on June 2, 2015, which is registered under the Investment Company Act of 1940, as amended (the “1940 Act”), as an open-end management investment company. BLES’s investment objective seeks to replicate investment results that generally correspond, before fees and expenses, to the performance of the Inspire Global Hope Index. ISMD’s investment objective seeks to replicate investment results that generally correspond, before fees and expenses, to the performance of the Inspire Small/Mid Cap Index. IBD’s investment objective seeks to replicate investment results that generally correspond, before fees and expenses, to the performance of the Inspire Corporate Bond Index. BIBL’s investment objective seeks to replicate investment results that generally correspond, before fees and expenses, to the performance of the Inspire 100 Index. WWJD’s investment objective seeks to replicate the investment results that generally correspond, before fees and expenses, to the performance of the Inspire International Index. RISN’s investment objective seeks to provide capital appreciation with lower volatility than the U.S. large cap stock market over the long term. GLRY’s investment objective seeks to outperform the results, before fees and expenses, of the broader U.S. midcap stock market when momentum is in favor. Effective August 9, 2024, GLRY’s investment objective seeks to outperform the results, before fees and expenses, of the broader U.S. stock market when momentum is in favor. FDLS’s investment objective seeks to replicate investment results that generally correspond, before fees and expenses, to the performance of the WI Fidelis Multi-Cap, Multi-Factor Index. PTL’s investment objective seeks to replicate investment results that generally correspond, before fees and expenses, to the performance of the Inspire 500 Index. The investment objectives are non-fundamental. BLES and ISMD commenced operations on February 27, 2017. IBD commenced operations on July 10, 2017. BIBL commenced operations on October 30, 2017. WWJD commenced operations on September 30, 2019. RISN commenced operations on July 15, 2020. GLRY commenced operations on December 7, 2020. FDLS commenced operations on August 23, 2022. PTL commenced operations on March 25, 2024.
Each Fund included herein is deemed to be an individual reporting segment and is not part of a consolidated reporting entity. The objective and strategy of each Fund is used by the Adviser to make investment decisions, and the results of the operations, as shown on the Statements of Operations and the financial highlights for each Fund is the information utilized for the day-to-day management of the Funds. Each Fund is party to the expense agreements as disclosed in the Notes to the Financial Statements and there are no resources allocated to a Fund based on performance measurements. Due to the significance of oversight and their role, the Adviser is deemed to be the Chief Operating Decision Maker.
| 2. | SIGNIFICANT ACCOUNTING POLICIES |
The following is a summary of significant accounting policies followed by the Funds in preparation of their financial statements. These policies are in conformity with generally accepted accounting principles in the United States of America (“GAAP”). The preparation of financial statements requires management
The Inspire ETFs
NOTES TO FINANCIAL STATEMENTS (Continued)
November 30, 2024
to make estimates and assumptions that affect the reported amounts of assets and liabilities and disclosure of contingent assets and liabilities at the date of the financial statements and the reported amounts of income and expenses for the period. Actual results could differ from those estimates. The Funds are investment companies and accordingly follow the investment company accounting and reporting guidance of the Financial Accounting Standards Board (“FASB”) Accounting Standards Codification Topic 946 “Financial Services – Investment Companies” including FASB Accounting Standards Update (“ASU”) 2013-08.
Securities valuation – Securities listed on an exchange are valued at the last reported sale price at the close of the regular trading session of the primary exchange on the business day the value is being determined or, in the case of securities listed on NASDAQ at the NASDAQ Official Closing Price (“NOCP”). In the absence of a sale, such securities shall be valued at the mean between the current bid and ask prices on the primary exchange on the day of valuation. Debt securities (other than short-term obligations) are valued each day by an independent pricing service approved by the Trust’s Board of Trustees (the “Board”) based on methods which include consideration of: yields or prices of securities of comparable quality, coupon, maturity and type, indications as to values from dealers, and general market conditions or market quotations from a major market maker in the securities. Investments valued in currencies other than the U.S. dollar are converted to U.S. dollars using exchange rates obtained from pricing services. The independent pricing service does not distinguish between smaller-sized bond positions known as “odd lots” and larger institutional-sized bond positions known as “round lots”. Short-term debt obligations having 60 days or less remaining until maturity, at time of purchase, may be valued at amortized cost. Investments in open-end investment companies are valued at net asset value (“NAV”).
The Funds may hold investments, such as private investments, interests in commodity pools, other non-traded securities or temporarily illiquid securities, for which market quotations are not readily available or are determined to be unreliable. These investments are valued using the “fair value” procedures approved by the Board. The Board has designated the adviser as its valuation designee (the “Valuation Designee”) to execute these procedures. The Board may also enlist third party consultants such a valuation specialist at a public accounting firm, valuation consultant or financial officer of a security issuer on an as-needed basis to assist the Valuation Designee in determining a security-specific fair value. The Board is responsible for reviewing and approving fair value methodologies utilized by the Valuation Designee, approval of which shall be based upon whether the Valuation Designee followed the valuation procedures established by the Board.
Fair Valuation Process – Applicable investments are valued by the Valuation Designee pursuant to valuation procedures established by the Board. For example, fair value determinations are required for the following securities: (i) securities for which market quotations are insufficient or not readily available on a particular business day (including securities for which there is a short and temporary lapse in the provision of a price by the regular pricing source); (ii) securities for which, in the judgment of the Valuation Designee, the prices or values available do not represent the fair value of the instrument; factors which may cause the Valuation Designee to make such a judgment include, but are not limited to, the following: only a bid price or an ask price is available; the spread between bid and ask prices is substantial; the frequency of sales; the thinness of the market; the size of reported trades; and actions of the securities markets, such as the suspension or limitation of trading; (iii) securities determined to be
The Inspire ETFs
NOTES TO FINANCIAL STATEMENTS (Continued)
November 30, 2024
illiquid; and (iv) securities with respect to which an event that affects the value thereof has occurred (a “significant event”) since the closing prices were established on the principal exchange on which they are traded, but prior to a Fund’s calculation of its NAV. Specifically, interests in commodity pools or managed futures pools are valued on a daily basis by reference to the closing market prices of each futures contract or other asset held by a pool, as adjusted for pool expenses. Restricted or illiquid investments, such as private investments or non -traded securities are valued based upon the current bid for the security from two or more independent dealers or other parties reasonably familiar with the facts and circumstances of the security (who should take into consideration all relevant factors as may be appropriate under the circumstances). If a current bid from such independent dealers or other independent parties is unavailable, the Valuation Designee shall determine the fair value of such security using the following factors: (i) the type of security; (ii) the cost at date of purchase; (iii) the size and nature of a Fund’s holdings; (iv) the discount from market value of unrestricted securities of the same class at the time of purchase and subsequent thereto; (v) information as to any transactions or offers with respect to the security; (vi) the nature and duration of restrictions on disposition of the security and the existence of any registration rights; (vii) how the yield of the security compares to similar securities of companies of similar or equal creditworthiness; (viii) the level of recent trades of similar or comparable securities; (ix) the liquidity characteristics of the security; (x) current market conditions; and (xi) the market value of any securities into which the security is convertible or exchangeable.
Securities Lending Risk – Securities lending involves exposure to certain risks, including operational risk (i.e., the risk of losses resulting from problems in the settlement and accounting process), “gap” risk (i.e., the risk of a mismatch between the return on cash collateral reinvestments and the fees a Fund has agreed to pay a borrower), and credit, legal, counterparty and market risk. In the event a borrower does not return a Fund’s securities as agreed, the Fund may experience losses if the proceeds received from liquidating the collateral do not at least equal the value of the loaned security at the time the collateral is liquidated plus the transaction costs incurred in purchasing replacement securities.
Fixed Income Risk – When a Fund invests in fixed income securities, the value of your investment in the Fund will fluctuate with changes in interest rates. Typically, a rise in interest rates causes a decline in the value of fixed income securities owned by a Fund. In general, the market price of fixed income securities with longer maturities will increase or decrease more in response to changes in interest rates than shorter-term securities. Other risk factors include credit risk (the debtor may default), extension risk (an issuer may exercise its right to repay principal on a fixed rate obligation held by a Fund later than expected), and prepayment risk (the debtor may pay its obligation early, reducing the amount of interest payments) . These risks could affect the value of a particular investment by each Fund, possibly causing the Fund’s share price and total return to be reduced and fluctuate more than other types of investments.
Foreign Securities Risk – Foreign companies are generally not subject to the same regulatory requirements of U.S. companies thereby resulting in less publicly available information about these companies. There is no context in this report for Inspire Impact scores. In addition, foreign accounting, auditing and financial reporting standards generally differ from those applicable to U.S. companies.
The Inspire ETFs
NOTES TO FINANCIAL STATEMENTS (Continued)
November 30, 2024
The Funds utilize various methods to measure the fair value of all of their investments on a recurring basis. GAAP establishes a hierarchy that prioritizes inputs to valuation methods. The three levels of input are:
Level 1 – Unadjusted quoted prices in active markets for identical assets and liabilities that the Funds have the ability to access.
Level 2 – Observable inputs other than quoted prices included in Level 1 that are observable for the asset or liability, either directly or indirectly. These inputs may include quoted prices for the identical instrument in an inactive market, prices for similar instruments, interest rates, prepayment speeds, credit risk, yield curves, default rates and similar data.
Level 3 – Unobservable inputs for the asset or liability, to the extent relevant observable inputs are not available, representing the Funds’ own assumptions about the assumptions a market participant would use in valuing the asset or liability, and would be based on the best information available.
The availability of observable inputs can vary from security to security and is affected by a wide variety of factors, including, for example, the type of security, whether the security is new and not yet established in the marketplace, the liquidity of markets, and other characteristics particular to the security. To the extent that valuation is based on models or inputs that are less observable or unobservable in the market, the determination of value requires more judgment. Accordingly, the degree of judgment exercised in determining value is greatest for instruments categorized in Level 3.
The inputs used to measure value may fall into different levels of the fair value hierarchy. In such cases, for disclosure purposes, the level in the fair value hierarchy within which the fair value measurement falls in its entirety, is determined based on the lowest level input that is significant to the fair value measurement in its entirety. The inputs or methodology used for valuing securities are not necessarily an indication of the risk associated with investing in those securities. The following tables summarize the inputs used as of November 30, 2024 for the Funds’ assets measured at value:
| BLES |
| Assets * | | Level 1 | | | Level 2 | | | Level 3 | | | Total | |
| Common Stocks | | $ | 108,729,178 | | | $ | — | | | $ | — | | | $ | 108,729,178 | |
| Collateral For Securities Loaned | | | 416,869 | | | | — | | | | — | | | | 416,869 | |
| Preferred Stock | | | 255,226 | | | | — | | | | — | | | | 255,226 | |
| Right | | | — | | | | — | | | | — | ^ | | | — | |
| Total | | $ | 109,401,273 | | | $ | — | | | $ | — | | | $ | 109,401,273 | |
| | | | | | | | | | | | | | | | | |
| ISMD |
| Assets * | | Level 1 | | | Level 2 | | | Level 3 | | | Total | |
| Common Stocks | | $ | 211,548,086 | | | $ | — | | | $ | — | | | $ | 211,548,086 | |
| Collateral For Securities Loaned | | | 6,329,498 | | | | — | | | | — | | | | 6,329,498 | |
| Right | | | — | | | | — | | | | — | ^ | | | — | |
| Total | | $ | 217,877,584 | | | $ | — | | | $ | — | | | $ | 217,877,584 | |
The Inspire ETFs
NOTES TO FINANCIAL STATEMENTS (Continued)
November 30, 2024
| IBD |
| Assets * | | Level 1 | | | Level 2 | | | Level 3 | | | Total | |
| Corporate Bonds | | $ | — | | | $ | 327,788,816 | | | $ | — | | | $ | 327,788,816 | |
| Total | | $ | — | | | $ | 327,788,816 | | | $ | — | | | $ | 327,788,816 | |
| BIBL |
| Assets * | | Level 1 | | | Level 2 | | | Level 3 | | | Total | |
| Common Stocks | | $ | 352,788,930 | | | $ | — | | | $ | — | | | $ | 352,788,930 | |
| Total | | $ | 352,788,930 | | | $ | — | | | $ | — | | | $ | 352,788,930 | |
| WWJD |
| Assets * | | Level 1 | | | Level 2 | | | Level 3 | | | Total | |
| Common Stocks | | $ | 299,002,407 | | | $ | — | | | $ | — | | | $ | 299,002,407 | |
| Collateral For Securities Loaned | | | 3,126,667 | | | | — | | | | — | | | | 3,126,667 | |
| Preferred Stock | | | 1,503,255 | | | | — | | | | — | | | | 1,503,255 | |
| Total | | $ | 303,632,329 | | | $ | — | | | $ | — | | | $ | 303,632,329 | |
| RISN |
| Assets * | | Level 1 | | | Level 2 | | | Level 3 | | | Total | |
| Common Stocks | | $ | 77,182,425 | | | $ | — | | | $ | — | | | $ | 77,182,425 | |
| Collateral For Securities Loaned | | | 899,150 | | | | — | | | | — | | | | 899,150 | |
| Exchange Traded Fund | | | 17,988,940 | | | | — | | | | — | | | | 17,988,940 | |
| Total | | $ | 96,070,515 | | | $ | — | | | $ | — | | | $ | 96,070,515 | |
| GLRY |
| Assets * | | Level 1 | | | Level 2 | | | Level 3 | | | Total | |
| Common Stocks | | $ | 74,449,112 | | | $ | — | | | $ | — | | | $ | 74,449,112 | |
| Total | | $ | 74,449,112 | | | $ | — | | | $ | — | | | $ | 74,449,112 | |
| FDLS |
| Assets * | | Level 1 | | | Level 2 | | | Level 3 | | | Total | |
| Common Stocks | | $ | 94,512,927 | | | $ | — | | | $ | — | | | $ | 94,512,927 | |
| Collateral For Securities Loaned | | | 42,665 | | | | — | | | | — | | | | 42,665 | |
| Total | | $ | 94,555,592 | | | $ | — | | | $ | — | | | $ | 94,555,592 | |
| PTL |
| Assets * | | Level 1 | | | Level 2 | | | Level 3 | | | Total | |
| Common Stocks | | $ | 264,239,927 | | | $ | — | | | $ | — | | | $ | 264,239,927 | |
| Total | | $ | 264,239,927 | | | $ | — | | | $ | — | | | $ | 264,239,927 | |
| * | See Schedule of Investments for industry classification. |
| ^ | Includes securities valued at $0. |
BLES and ISMD held Level 3 securities at the end of the year. The securities classified as Level 3 for BLES and ISMD are deemed immaterial.
The Inspire ETFs
NOTES TO FINANCIAL STATEMENTS (Continued)
November 30, 2024
Security Transactions and Related Income – Security transactions are accounted for on the trade date. Interest income is recognized on an accrual basis. Discounts are accreted and premiums are amortized on securities purchased over the lives of the respective securities using the effective yield method. Dividend income is recorded on the ex-dividend date. Realized gains or losses from sales of securities are determined by comparing the identified cost of the security lot sold with the net sales proceeds.
Withholding taxes on foreign dividends, if applicable, are paid (a portion of which may be reclaimable) or provided for in accordance with the applicable country’s tax rules and rates and are disclosed in the Statement of Operations. Withholding tax reclaims are filed in certain countries to recover a portion of the amounts previously withheld. The Funds record a reclaim receivable based on a number of factors, including a jurisdiction’s legal obligation to pay reclaims, as well as payment history and market convention. The Funds may be subject to foreign taxation related to capital gains on the sale of securities in the foreign jurisdictions in which they invest. When a capital gain tax is determined to apply, the Funds record an estimated deferred tax liability in an amount that may be payable if securities were disposed of on the valuation date.
Dividends and Distributions to Shareholders – Dividends from net investment income, if any, are declared and paid quarterly for BLES, ISMD, BIBL, WWJD, RISN, GLRY, FDLS, PTL and monthly for IBD. Dividends and distributions to shareholders are recorded on the ex-dividend date. Distributable net realized capital gains, if any, are declared and distributed annually. Dividends from net investment income and distributions from net realized gains are determined in accordance with federal income tax regulations, which may differ from GAAP. These “book/tax” differences are considered either temporary (e.g., deferred losses) or permanent in nature. To the extent these differences are permanent in nature, such amounts are reclassified within the composition of net assets based on their federal tax-basis treatment; temporary differences do not require reclassification.
Federal Income Taxes – The Funds comply with the requirements of the Internal Revenue Code applicable to regulated investment companies and to distribute all of their taxable income to shareholders. Therefore, no provision for federal income tax is required. The Funds recognize the tax benefits of uncertain tax positions only where the position is “more likely than not” to be sustained assuming examination by tax authorities. Management has analyzed the Funds’ tax positions and has concluded that no liability for unrecognized tax benefits should be recorded related to uncertain tax positions taken on returns filed for open tax years November 30, 2021 - November 30, 2023 or expected to be taken in the Funds’ November 30, 2024, year-end tax returns. Each Fund identifies its major tax jurisdictions as U.S. federal, Ohio and foreign jurisdictions where the Fund makes significant investments. Each Fund recognizes interest and penalties, if any, related to unrecognized tax benefits as income tax expenses, in the Statements of Operations. The Funds are not aware of any tax positions for which it is reasonably possible that the total amounts of unrecognized tax benefits will change materially in the next twelve months.
Exchange Traded Funds (“ETFs”) – The Funds may invest in ETFs. ETFs are generally a type of fund bought and sold on a securities exchange. An ETF trades like common stock and represents a portfolio of securities. The risks of owning an ETF generally reflect the risks of owning the underlying securities
The Inspire ETFs
NOTES TO FINANCIAL STATEMENTS (Continued)
November 30, 2024
they hold, although the lack of liquidity on an ETF could result in it being more volatile. Additionally, ETFs have fees and expenses that reduce their value.
Expenses – Expenses of the Trust that are directly identifiable to a specific fund are charged to that fund. Expenses, which are not readily identifiable to a specific fund, are allocated in such a manner as deemed equitable (as determined by the Board), taking into consideration the nature and type of expense and the relative sizes of the funds in the Trust.
Cash – The Funds consider their investments in an FDIC insured interest bearing savings account to be cash. The Funds maintain cash balances, which, at times, may exceed federally insured limits. The Funds maintain these balances with a high quality financial institution.
Foreign Currency – The accounting records of the Funds are maintained in U.S. dollars. Investment securities and other assets and liabilities denominated in a foreign currency, and income receipts and expense payments are translated into U.S. dollars using the prevailing exchange rate at the London market close. Purchases and sales of securities are translated into U.S. dollars at the contractual currency rates established at the approximate time of the trade. Net realized gains and losses on foreign currency transactions represent net gains and losses from currency realized between the trade and settlement dates on securities transactions, gains and losses on the purchase and sale of foreign currencies and the difference between income accrued versus income received. The effects of changes in foreign currency exchange rates on investments in securities are included with the net realized and unrealized gain or loss on investment securities.
Indemnification – The Trust indemnifies its officers and Trustees for certain liabilities that may arise from the performance of their duties to the Trust. Additionally, in the normal course of business, the Funds enter into contracts that contain a variety of representations and warranties and which provide general indemnities. The Funds’ maximum exposure under these arrangements is unknown, as this would involve future claims that may be made against the Funds that have not yet occurred. However, based on experience, the risk of loss due to these warranties and indemnities appears to be remote.
| 3. | INVESTMENT TRANSACTIONS |
For the year ended November 30, 2024, cost of purchases and proceeds from sales of portfolio securities (excluding in-kind transactions and short-term investments) for the Funds were as follows:
| Ticker | | Purchases | | | Sales | |
| BLES | | $ | 54,754,451 | | | $ | 58,887,798 | |
| ISMD | | $ | 85,054,580 | | | $ | 87,544,678 | |
| IBD | | $ | 87,388,143 | | | $ | 74,596,054 | |
| BIBL | | $ | 87,022,220 | | | $ | 90,793,957 | |
| WWJD | | $ | 101,425,351 | | | $ | 94,390,827 | |
| RISN | | $ | 46,180,374 | | | $ | 46,414,891 | |
| GLRY | | $ | 50,654,058 | | | $ | 49,758,398 | |
| FDLS | | $ | 224,481,551 | | | $ | 192,379,928 | |
| PTL | | $ | 14,973,991 | | | $ | 13,604,660 | |
The Inspire ETFs
NOTES TO FINANCIAL STATEMENTS (Continued)
November 30, 2024
For the year ended November 30, 2024, cost of purchases and proceeds from sales of portfolio securities for in-kind transactions for the Funds were as follows:
| Ticker | | Purchases | | | Sales | |
| BLES | | $ | — | | | $ | 77,928,480 | |
| ISMD | | $ | 62,613,570 | | | $ | 64,906,412 | |
| IBD | | $ | 151,090,528 | | | $ | 75,231,613 | |
| BIBL | | $ | 116,662,278 | | | $ | 155,365,439 | |
| WWJD | | $ | 66,563,209 | | | $ | 18,404,973 | |
| RISN | | $ | 6,366,080 | | | $ | 10,217,408 | |
| GLRY | | $ | 26,363,658 | | | $ | 12,337,492 | |
| FDLS | | $ | 13,972,137 | | | $ | 40,003,270 | |
| PTL | | $ | 247,270,530 | | | $ | 9,734,583 | |
| 4. | INVESTMENT ADVISORY AGREEMENT AND TRANSACTIONS WITH RELATED PARTIES |
The business activities of the Funds are overseen by the Board. Inspire Investing, LLC (the “Adviser”) serves as the Funds’ investment adviser pursuant to an Investment Advisory Agreement with the Trust (the “Advisory Agreement”). The Trust has entered into a Global Custody Agreement with Brown Brothers Harriman & Co. (the “Custodian”) to serve as custodian and to act as transfer and shareholder services agent. The Trust has also entered into an Underwriting Agreement with Foreside Financial Services, LLC (the “Distributor”) to serve as the principal underwriter and distributor for the Funds.
Pursuant to the Advisory Agreement, the Adviser, under the oversight of the Board, directs the daily operations of the Funds and supervises the performance of administrative and professional services provided by others. As compensation for its services and the related expenses borne by the Adviser, the Funds pay the Adviser a fee, computed and accrued daily and paid monthly, at an annual rate indicated below of each Fund’s average daily net assets. For the year ended November 30, 2024, each Fund incurred the following in advisory fees:
| Ticker | | ANNUAL RATE | | TOTAL ADVISORY FEE | |
| BLES | | 0.30% | | $ | 396,167 | |
| ISMD | | 0.30% | | $ | 554,759 | |
| IBD | | 0.30% | | $ | 881,466 | |
| BIBL | | 0.30% | | $ | 1,006,857 | |
| WWJD | | 0.45% | | $ | 1,256,578 | |
| RISN | | 0.50% | | $ | 448,098 | |
| GLRY | | 0.65% | | $ | 399,637 | |
| FDLS | | 0.45% | | $ | 373,831 | |
| PTL | | 0.09% | | $ | 98,588 | |
Pursuant to a written contract (the “Waiver Agreement”), the Adviser has agreed for BIBL and GLRY, at least until March 31, 2025, to waive a portion of its advisory fee and has agreed to reimburse the BIBL and GLRY for other expenses to the extent necessary so that total expenses incurred (exclusive of (i) any front-end or contingent deferred loads; (ii) brokerage fees and commissions, (iii) acquired fund fees
The Inspire ETFs
NOTES TO FINANCIAL STATEMENTS (Continued)
November 30, 2024
and expenses; (iv) fees and expenses associated with investments in other collective investment vehicles or derivative instruments (including for example option and swap fees and expenses); (v) borrowing costs (such as interest and dividend expense on securities sold short); (vi) taxes; and (vii) extraordinary expenses, such as litigation expenses (which may include indemnification of Fund officers and Trustees, contractual indemnification of Fund service providers (other than the Adviser)) will not exceed 0.35% and 0.80% of average daily net assets for BIBL and GLRY, respectively.
If the Adviser waives any fee or reimburses any expenses pursuant to the Waiver Agreement, and BIBL’s and GLRY’s operating expenses are subsequently lower than its expense limitation, or limitation in place at time of waiver, the Adviser, on a rolling three-year period, shall be entitled to reimbursement by the Fund provided that such reimbursement does not cause that Fund’s expense ratio (after the repayment is taken into account) to exceed both: (i) the Fund’s expense cap in place at the time such expenses were waived, and (ii) the Fund’s current expense cap at the time of recoupment. If a Fund’s operating expenses subsequently exceeds the expense limitation, the reimbursements for the Fund shall be suspended. For the year ended November 30, 2024, the Adviser waived fees and/or reimbursed expenses in the amount of $186,741 and $101,431 for BIBL and GLRY, respectively, pursuant to the Waiver Agreement.
The following amounts previously waived by the Adviser are subject to recapture by the Funds by the following dates:
| | | 11/30/2025 | | | 11/30/2026 | | | 11/30/2027 | |
| BLES | | $ | 3,420 | | | $ | — | | | $ | — | |
| BIBL | | $ | 279,811 | | | $ | 103,906 | | | $ | 186,741 | |
| GLRY | | $ | 88,117 | | | $ | 52,197 | | | $ | 101,431 | |
The Adviser may seek reimbursement only for expenses waived or paid by it during the three years prior to such reimbursement; provided, however, that such expenses may only be reimbursed to the extent they were waived or paid after the effective date of the Waiver Agreement (or any similar agreement).
The Board may terminate this expense reimbursement arrangement at any time on 60 days’ notice to the Adviser.
PTL’s unitary management fee is designed to pay PTL’s expenses and to compensate the Adviser for providing services for PTL. Out of the unitary management fee, the Adviser pays substantially all expenses of PTL, including the costs of transfer agency, custody, fund administration, legal, audit and other services and independent Trustees’ fees, but not any front-end or contingent deferred loads; brokerage fees and commissions; any Rule 12b- l fees; acquired advisory fees, fund fees and expenses; fees and expenses associated with investments in other collective investment vehicles or derivative instruments (including for example option and swap fees and expenses); borrowing costs (such as interest and dividend expense on securities sold short); taxes; and extraordinary expenses, such as litigation expenses (which may include indemnification of PTL officers and Trustees, contractual indemnification of PTL service providers (other than the Adviser)). The Adviser, and not PTLs shareholders, would benefit from any reduction in fees paid for third-party services, including reductions based on increases in net assets.
The Inspire ETFs
NOTES TO FINANCIAL STATEMENTS (Continued)
November 30, 2024
The Trust, with respect to the Funds, has adopted a distribution and service plan (“Plan”) pursuant to Rule 12b-1 under the 1940 Act. Under the Plan, the Funds are authorized to pay distribution fees to the distributor and other firms that provide distribution and shareholder services (“Service Providers”). If a Service Provider provides these services, the Funds may pay fees at an annual rate not to exceed 0.25% of average daily net assets, pursuant to Rule 12b-1 under the 1940 Act.
No distribution or service fees are currently paid by the Funds and there are no current plans to impose these fees. In the event Rule 12b-1 fees were charged, over time they would increase the cost of an investment in the Funds.
Ultimus Fund Solutions, LLC (“UFS”) – UFS provides administration and fund accounting services to the Trust. Pursuant to separate servicing agreements with UFS, the Funds pay UFS customary fees for providing administration and fund accounting services to the Funds. Certain officers of the Trust are also officers of UFS and are not paid any fees directly by the Funds for serving in such capacities.
Northern Lights Compliance Services, LLC (“NLCS”) – NLCS, an affiliate of UFS, provides a Chief Compliance Officer to the Trust, as well as related compliance services, pursuant to a consulting agreement between NLCS and the Trust. Under the terms of such agreement, NLCS receives customary fees from each Fund.
Blu Giant, LLC (“Blu Giant”) – Blu Giant, an affiliate of UFS, provides EDGAR conversion and filing services as well as print management services for the Funds on an ad-hoc basis. For the provision of these services, Blu Giant receives customary fees from the Funds.
| 5. | CAPITAL SHARE TRANSACTIONS |
Shares are not individually redeemable and may be redeemed by the Funds at the NAV only in large blocks known as “Creation Units.” Shares are created and redeemed by the Funds only in Creation Unit size aggregations of 50,000 shares for BLES, ISMD, BIBL, and WWJD, 100,000 shares for IBD, and 25,000 for RISN, GLRY, FDLS and PTL. Only Authorized Participants or transactions done through an Authorized Participant are permitted to purchase or redeem Creation Units from the Funds. An Authorized Participant is either (i) a broker-dealer or other participant in the clearing process through the Continuous Net Settlement System of the National Securities Clearing Corporation or (ii) a DTC participant and, in each case, must have executed a Participant Agreement with the Distributor. Such transactions are generally permitted on an in-kind basis, with a balancing cash component to equate the transaction to the NAV per share of the Funds on the transaction date. Cash may be substituted equivalent to the value of certain securities generally when they are not available in sufficient quantity for delivery, not eligible for trading by the Authorized Participant or as a result of other market circumstances. In addition, the Funds may impose transaction fees on purchases and redemptions of Fund shares to cover the custodial and other costs incurred by the Funds in effecting trades. A fixed fee may be imposed on each creation and redemption transaction regardless of the number of Creation Units involved in the transaction (“Fixed Fee”). Purchases and redemptions of Creation Units for cash or involving cash-in-lieu are required to pay an additional variable charge to compensate the Funds and their ongoing shareholders for brokerage and market impact expenses relating to Creation Unit transactions
The Inspire ETFs
NOTES TO FINANCIAL STATEMENTS (Continued)
November 30, 2024
(“Variable Charge,” and together with the Fixed Fee, the “Transaction Fees”). For the year ended November 30, 2024, the fixed and variable fees were as follows:
| | | FIXED FEES | | | VARIABLE FEES | |
| BLES | | $ | 4,500 | | | $ | — | |
| ISMD | | $ | 8,000 | | | $ | — | |
| IBD | | $ | 10,500 | | | $ | — | |
| BIBL | | $ | 14,500 | | | $ | — | |
| WWJD | | $ | 12,500 | | | $ | — | |
| RISN | | $ | 4,250 | | | $ | — | |
| GLRY | | $ | 6,750 | | | $ | — | |
| FDLS | | $ | 4,750 | | | $ | — | |
| PTL | | $ | 27,195 | | | $ | — | |
The Transaction Fees for the Funds are listed in the table below:
| Ticker | Fee for In-Kind and Cash
Purchases | Maximum Additional Variable
Charge for Cash Purchases* |
| BLES | $500 | 0.50% |
| ISMD | $250 | 0.00% |
| IBD | $250 | 0.00% |
| BIBL | $250 | 0.00% |
| WWJD | $500 | 0.50% |
| RISN | $250 | 0.00% |
| GLRY | $250 | 0.00% |
| FDLS | $250 | 0.00% |
| PTL | $777 | 0.00% |
| * | The maximum Transaction Fee may be up to 0.50% as a percentage of the amount invested. |
| 6. | DISTRIBUTIONS TO SHAREHOLDERS AND TAX COMPONENTS OF CAPITAL |
The tax character of fund distributions paid for the years ended November 30, 2024, and November 30, 2023, was as follows:
For the period ended November 30, 2024:
| | | Ordinary | | | Long-Term | | | Return | | | | |
| Portfolio | | Income | | | Capital Gains | | | Of Capital | | | Total | |
| Inspire Global Hope ETF | | $ | 2,698,930 | | | $ | — | | | $ | — | | | $ | 2,698,930 | |
| Inspire Small/Mid Cap ETF | | | 2,458,940 | | | | — | | | | — | | | | 2,458,940 | |
| Inspire Corporate Bond ETF | | | 12,185,950 | | | | — | | | | — | | | | 12,185,950 | |
| Inspire 100 ETF | | | 3,597,375 | | | | — | | | | — | | | | 3,597,375 | |
| Inspire International ETF | | | 7,509,030 | | | | — | | | | — | | | | 7,509,030 | |
| Inspire Tactical Balanced ETF | | | 1,260,097 | | | | — | | | | — | | | | 1,260,097 | |
| Inspire Momentum ETF | | | 497,272 | | | | — | | | | — | | | | 497,272 | |
| Inspire Fidelis Multi Factor ETF | | | 954,623 | | | | — | | | | — | | | | 954,623 | |
| Inspire 500 ETF | | | 1,049,460 | | | | — | | | | — | | | | 1,049,460 | |
The Inspire ETFs
NOTES TO FINANCIAL STATEMENTS (Continued)
November 30, 2024
| For the period ended November 30, 2023: |
| |
| | | Ordinary | | | Long-Term | | | Return | | | | |
| Portfolio | | Income | | | Capital Gains | | | Of Capital | | | Total | |
| Inspire Global Hope ETF | | $ | 2,630,640 | | | $ | — | | | $ | — | | | $ | 2,630,640 | |
| Inspire Small/Mid Cap ETF | | | 1,603,670 | | | | — | | | | — | | | | 1,603,670 | |
| Inspire Corporate Bond ETF | | | 8,091,080 | | | | — | | | | — | | | | 8,091,080 | |
| Inspire 100 ETF | | | 2,666,835 | | | | — | | | | — | | | | 2,666,835 | |
| Inspire International ETF | | | 4,410,875 | | | | — | | | | — | | | | 4,410,875 | |
| Inspire Tactical Balanced ETF | | | 2,555,168 | | | | — | | | | — | | | | 2,555,168 | |
| Inspire Momentum ETF | | | 445,820 | | | | — | | | | — | | | | 445,820 | |
| Inspire Fidelis Multi Factor ETF | | | 464,685 | | | | — | | | | — | | | | 464,685 | |
| Inspire 500 ETF | | | — | | | | — | | | | — | | | | — | |
As of November 30, 2024, the components of accumulated earnings/ (deficit) on a tax basis were as follows:
| | | Undistributed | | | Undistributed | | | Post October Loss | | | Capital Loss | | | Other | | | Unrealized | | | Total | |
| | | Ordinary | | | Long-Term | | | and | | | Carry | | | Book/Tax | | | Appreciation/ | | | Accumulated | |
| Portfolio | | Income | | | Capital Gains | | | Late Year Loss | | | Forwards | | | Differences | | | (Depreciation) | | | Earnings/(Deficits) | |
| Inspire Global Hope ETF | | $ | 125,908 | | | $ | — | | | $ | — | | | $ | (270,831 | ) | | $ | — | | | $ | 13,329,708 | | | $ | 13,184,785 | |
| Inspire Small/Mid Cap ETF | | | 118,957 | | | | — | | | | — | | | | (6,359,971 | ) | | | — | | | | 27,699,750 | | | | 21,458,736 | |
| Inspire Corporate Bond ETF | | | 395,679 | | | | — | | | | (17,399 | ) | | | (19,295,056 | ) | | | — | | | | 256,863 | | | | (18,659,913 | ) |
| Inspire 100 ETF | | | 191,127 | | | | — | | | | — | | | | (50,121,176 | ) | | | — | | | | 55,570,538 | | | | 5,640,489 | |
| Inspire International ETF | | | 1,822,655 | | | | — | | | | — | | | | (8,265,988 | ) | | | — | | | | 15,679,988 | | | | 9,236,655 | |
| Inspire Tactical Balanced ETF | | | 314,205 | | | | — | | | | — | | | | (8,649,357 | ) | | | — | | | | 10,218,558 | | | | 1,883,406 | |
| Inspire Momentum ETF | | | — | | | | — | | | | — | | | | (5,126,569 | ) | | | — | | | | 13,156,867 | | | | 8,030,298 | |
| Inspire Fidelis Multi Factor ETF | | | 1,440,360 | | | | 3,830,589 | | | | — | | | | — | | | | — | | | | 11,824,429 | | | | 17,095,378 | |
| Inspire 500 ETF | | | 469,215 | | | | — | | | | — | | | | (348,593 | ) | | | — | | | | 25,535,050 | | | | 25,655,672 | |
The difference between book basis and tax basis undistributed net investment income (loss), accumulated net realized gains (losses), and unrealized appreciation/(depreciation) from investments is primarily attributable to the tax deferral of losses on wash sales, the mark to market on passive foreign investment companies, and adjustments on partnerships, passive foreign investment companies and C-Corporation return of capital distributions.
Capital losses incurred after October 31 within the fiscal year are deemed to arise on the first business day of the following fiscal year for tax purposes. The Inspire Corporate Bond ETF incurred and elected to defer such capital losses of $17,399.
The Inspire ETFs
NOTES TO FINANCIAL STATEMENTS (Continued)
November 30, 2024
At November 30, 2024, the Funds had capital loss carry forwards for federal income tax purposes available to offset future capital gains and capital loss carry forwards utilized were as follows:
| Portfolio | | Short-Term | | | Long-Term | | | Total | | | Utilized | |
| Inspire Global Hope ETF | | $ | — | | | $ | 270,831 | | | $ | 270,831 | | | $ | 8,009,402 | |
| Inspire Small/Mid Cap ETF | | | — | | | | 6,359,971 | | | | 6,359,971 | | | | 4,194,860 | |
| Inspire Corporate Bond ETF | | | 5,115,998 | | | | 14,179,058 | | | | 19,295,056 | | | | — | |
| Inspire 100 ETF | | | 16,179,194 | | | | 33,941,982 | | | | 50,121,176 | | | | — | |
| Inspire International ETF | | | 1,769,309 | | | | 6,496,679 | | | | 8,265,988 | | | | 9,422,565 | |
| Inspire Tactical Balanced ETF | | | 8,649,357 | | | | — | | | | 8,649,357 | | | | 7,216,149 | |
| Inspire Momentum ETF | | | 3,966,565 | | | | 1,160,004 | | | | 5,126,569 | | | | 821,820 | |
| Inspire Fidelis Multi Factor ETF | | | — | | | | — | | | | — | | | | 1,507,497 | |
| Inspire 500 ETF | | | 348,593 | | | | — | | | | 348,593 | | | | — | |
Permanent book and tax differences, primarily attributable to realized gain (loss) on in-kind redemptions, adjustments for prior year tax returns, non-deductible expenses and distributions in excess, resulted in reclassifications for the Funds for the year ended November 30, 2024, as follows:
| | | Paid In | | | Accumulated | |
| Portfolio | | Capital | | | Earnings (Losses) | |
| Inspire Global Hope ETF | | $ | 18,214,827 | | | $ | (18,214,827 | ) |
| Inspire Small/Mid Cap ETF | | | 17,356,209 | | | | (17,356,209 | ) |
| Inspire Corporate Bond ETF | | | 1,692,524 | | | | (1,692,524 | ) |
| Inspire 100 ETF | | | 36,964,800 | | | | (36,964,800 | ) |
| Inspire International ETF | | | 3,842,323 | | | | (3,842,323 | ) |
| Inspire Tactical Balanced ETF | | | 1,305,624 | | | | (1,305,624 | ) |
| Inspire Momentum ETF | | | 2,120,225 | | | | (2,120,225 | ) |
| Inspire Fidelis Multi Factor ETF | | | 5,229,093 | | | | (5,229,093 | ) |
| Inspire 500 ETF | | | 201,439 | | | | (201,439 | ) |
| 7. | AGGREGATE UNREALIZED APPRECIATION AND DEPRECIATION – TAX BASIS |
At November 30, 2024, the aggregate cost for federal tax purposes, which differs from fair value by net unrealized appreciation (deprecation) of securities, are as follows:
| | | | | | Gross | | | Gross | | | Net Unrealized | |
| | | | | | Unrealized | | | Unrealized | | | Appreciation/ | |
| Portfolio | | Tax Cost | | | Appreciation | | | Depreciation | | | (Depreciation) | |
| Inspire Global Hope ETF | | $ | 96,058,042 | | | $ | 21,497,209 | | | $ | (8,153,978 | ) | | $ | 13,343,231 | |
| Inspire Small/Mid Cap ETF | | | 190,177,834 | | | | 40,680,448 | | | | (12,980,698 | ) | | | 27,699,750 | |
| Inspire Corporate Bond ETF | | | 327,531,953 | | | | 4,189,600 | | | | (3,932,737 | ) | | | 256,863 | |
| Inspire 100 ETF | | | 297,218,392 | | | | 72,455,126 | | | | (16,884,588 | ) | | | 55,570,538 | |
| Inspire International ETF | | | 287,925,444 | | | | 38,667,547 | | | | (22,960,662 | ) | | | 15,706,885 | |
| Inspire Tactical Balanced ETF | | | 85,851,850 | | | | 11,826,194 | | | | (1,607,529 | ) | | | 10,218,665 | |
| Inspire Momentum ETF | | | 61,292,183 | | | | 15,898,710 | | | | (2,741,781 | ) | | | 13,156,929 | |
| Inspire Fidelis Multi Factor ETF | | | 82,730,986 | | | | 14,930,636 | | | | (3,106,030 | ) | | | 11,824,606 | |
| Inspire 500 ETF | | | 238,704,877 | | | | 32,050,984 | | | | (6,515,934 | ) | | | 25,535,050 | |
The Inspire ETFs
NOTES TO FINANCIAL STATEMENTS (Continued)
November 30, 2024
Each Fund may lend up to 33 1/3% of the value of the securities in its portfolio to brokers, dealers and financial institutions (but not individuals) under terms of participation in a securities lending program administered by the Custodian. The securities lending agreement requires that loans are collateralized at all times in an amount equal to at least 100% of the value of any loaned securities at the time of the loan. Each Fund receives compensation in the form of fees. The amount of fees depends on a number of factors including the type of security and length of the loan. Each Fund continues to receive interest payments or dividends on the securities loaned during the borrowing period. Gain or loss in the fair value of securities loaned that may occur during the term of the loan will be for the account of each Fund. Each Fund has the right under the terms of the securities lending agreement to recall the securities from the borrower on demand. The cash collateral is held by the Custodian in accordance with the custody agreement. Each Fund could experience delays in recovering their securities and possible loss of income or value if the borrower fails to return the borrowed securities, although the Funds are indemnified from this risk by contract with the securities lending agent.
As of November 30, 2024, the below table shows the securities on loan and collateral for the loan, both of which are presented gross on the Statement of Assets and Liabilities. All individual open security loan transactions were overcollateralized. The remaining contractual maturity of those transactions are overnight and continuous. This cash is invested in the Fidelity Investments Money Market Government Portfolio – Institutional Class.
| | | Fair Value of | | | Collateral Value of | |
| Ticker | | Securities on Loan | | | Securities on Loan | |
| BLES | | $ | 406,316 | | | $ | 416,869 | |
| ISMD | | | 6,259,268 | | | | 6,329,498 | |
| WWJD | | | 2,939,572 | | | | 3,126,667 | |
| RISN | | | 893,956 | | | | 899,150 | |
| FDLS | | | 44,030 | | | | 42,665 | |
It is each Fund’s policy to obtain additional collateral from, or return excess collateral to, the borrower by the end of the next business day following the valuation date of the securities loaned. Therefore, the value of the collateral held may be temporarily less than that required under the lending contract. As of November 30, 2024 the collateral consisted of institutional government money market funds.
The following table breaks out the Funds’ securities lending transactions accounted for as secured borrowings with cash collateral of overnight and continuous maturities as of November 30, 2024:
| | | | | Overnight and | | | Up to | | | | | | Greater than | | | | |
| Ticker | | Collateral | | Continuous | | | 30 Days | | | 30-90 days | | | 90 days | | | Total | |
| BLES | | Fidelity Investments Money Market Government Portfolio - Institutional Class | | $ | 416,869 | | | $ | — | | | $ | — | | | $ | — | | | $ | 416,869 | |
| ISMD | | Fidelity Investments Money Market Government Portfolio - Institutional Class | | | 6,329,498 | | | | — | | | | — | | | | — | | | | 6,329,498 | |
| WWJD | | Fidelity Investments Money Market Government Portfolio - Institutional Class | | | 3,126,667 | | | | — | | | | — | | | | — | | | | 3,126,667 | |
| RISN | | Fidelity Investments Money Market Government Portfolio - Institutional Class | | | 899,150 | | | | — | | | | — | | | | — | | | | 899,150 | |
| FDLS | | Fidelity Investments Money Market Government Portfolio - Institutional Class | | | 42,665 | | | | — | | | | — | | | | — | | | | 42,665 | |
The Inspire ETFs
NOTES TO FINANCIAL STATEMENTS (Continued)
November 30, 2024
Subsequent events after the date of the Statements of Assets and Liabilities have been evaluated through the date the financial statements were issued.
Management has determined that no other events or transactions occurred requiring adjustment or disclosure in the financial statements other than the following.
The Board declared the following distributions after November 30, 2024:
| Ticker | | Income Dividend | | | Short Term Capital Gain | | | Long Term Capital Gain | | | Ex Date | | Record Date | | Payable Date |
| BLES | | $ | 0.0794 | | | $ | — | | | $ | — | | | 12/16/2024 | | 12/16/2024 | | 12/23/2024 |
| ISMD | | $ | 0.0769 | | | $ | — | | | $ | — | | | 12/16/2024 | | 12/16/2024 | | 12/23/2024 |
| IBD | | $ | 0.1181 | | | $ | — | | | $ | — | | | 12/16/2024 | | 12/16/2024 | | 12/23/2024 |
| BIBL | | $ | 0.0779 | | | $ | — | | | $ | — | | | 12/16/2024 | | 12/16/2024 | | 12/23/2024 |
| WWJD | | $ | 0.2023 | | | $ | — | | | $ | — | | | 12/16/2024 | | 12/16/2024 | | 12/23/2024 |
| RISN | | $ | 0.1308 | | | $ | — | | | $ | — | | | 12/16/2024 | | 12/16/2024 | | 12/23/2024 |
| GLRY | | $ | 0.0093 | | | $ | — | | | $ | — | | | 12/16/2024 | | 12/16/2024 | | 12/23/2024 |
| FDLS | | $ | 0.0088 | | | $ | 0.5191 | | | $ | 1.3804 | | | 12/16/2024 | | 12/16/2024 | | 12/23/2024 |
| PTL | | $ | 0.7245 | | | $ | — | | | $ | — | | | 12/16/2024 | | 12/16/2024 | | 12/23/2024 |

REPORT OF INDEPENDENT REGISTERED PUBLIC ACCOUNTING FIRM
To the Shareholders of the Inspire ETFs and
Board of Trustees of Northern Lights Fund Trust IV
Opinion on the Financial Statements
We have audited the accompanying statements of assets and liabilities, including the schedules of investments, of Northern Lights Fund Trust IV comprising the funds listed below (the “Funds”), as of November 30, 2024, the related statements of operations, the statements of changes in net assets, and the financial highlights for each of the periods indicated below, and the related notes (collectively referred to as the “financial statements”). In our opinion, the financial statements present fairly, in all material respects, the financial position of each of the Funds as of November 30, 2024, the results of their operations, the changes in net assets, and the financial highlights for each of the periods indicated below in conformity with accounting principles generally accepted in the United States of America.
The Funds’ financial highlights for the years/periods ended November 30, 2022, and prior, were audited by other auditors whose report dated January 27, 2023, expressed an unqualified opinion on those financial statements and financial highlights.
| | | Statements of | |
| | Statements of | Changes in Net | Financial |
| Fund Name | Operations | Assets | Highlights |
| Inspire Global Hope ETF, Inspire Small/Mid Cap ETF, Inspire Corporate Bond ETF, Inspire 100 ETF, Inspire International ETF, Inspire Tactical Balanced ETF, Inspire Momentum ETF, and Inspire Fidelis Multi-Factor ETF | For the year ended November 30, 2024 | For the years ended November 30, 2024 and 2023 |
| Inspire 500 ETF | For the period from March 25, 2024 (commencement of operations) through November 30, 2024 |
Basis for Opinion
These financial statements are the responsibility of the Funds’ management. Our responsibility is to express an opinion on the Funds’ financial statements based on our audits. We are a public accounting firm registered with the Public Company Accounting Oversight Board (United States) (“PCAOB”) and are required to be independent with respect to the Funds in accordance with the U.S. federal securities laws and the applicable rules and regulations of the Securities and Exchange Commission and the PCAOB.
We conducted our audits in accordance with the standards of the PCAOB. Those standards require that we plan and perform the audit to obtain reasonable assurance about whether the financial statements are free of material misstatement whether due to error or fraud.
| COHEN & COMPANY, LTD. |
| Registered with the Public Company Accounting Oversight Board |
| 800.229.1099 I 866.818.4538 fax I cohenco.com |
Our audits included performing procedures to assess the risks of material misstatement of the financial statements, whether due to error or fraud, and performing procedures that respond to those risks. Such procedures included examining, on a test basis, evidence regarding the amounts and disclosures in the financial statements. Our procedures included confirmation of securities owned as of November 30, 2024, by correspondence with the custodian and brokers; when replies were not received from brokers, we performed other auditing procedures. Our audits also included evaluating the accounting principles used and significant estimates made by management, as well as evaluating the overall presentation of the financial statements. We believe that our audits provide a reasonable basis for our opinion.
We have served as the Funds’ auditor since 2023.
COHEN & COMPANY, LTD.
Philadelphia, Pennsylvania
January 29, 2025
The Inspire ETFs
Additional Information (Unaudited)
November 30, 2024
FOREIGN TAX CREDIT (Unaudited)
The following funds intend to elect to pass through to shareholders the income tax credit for taxes paid to foreign countries. Foreign source income and foreign tax expense per outstanding share as of fiscal years ended November 30, 2024 and November 30, 2023, were as follows:
For fiscal year ended
11/30/2024 | | Foreign Taxes Paid | | | Foreign Source Income | |
| Inspire International ETF | | $ | 0.10 | | | $ | 0.78 | |
For fiscal year ended
11/30/2023 | | Foreign Taxes Paid | | | Foreign Source Income | |
| Inspire Global Hope ETF | | $ | 0.06 | | | $ | 0.41 | |
| Inspire International ETF | | | 0.07 | | | | 0.59 | |
The Inspire ETFs
Additional Information (Unaudited)
November 30, 2024
Changes in and Disagreements with Accountants
There were no changes in or disagreements with accountants during the period covered by this report.
Proxy Disclosures
Not applicable.
Remuneration Paid to Directors, Officers and Others
Refer to the financial statements included herein.
Statement Regarding Basis for Approval of Investment Advisory Agreement
Not applicable.
PROXY VOTING POLICY
Information regarding how the Funds voted proxies relating to portfolio securities for the most recent twelve-month period ended June 30 as well as a description of the policies and procedures that the Funds use to determine how to vote proxies is available without charge, upon request, by calling 1-877 -658-9473 or by referring to the Securities and Exchange Commission’s (“SEC”) website at http://www.sec.gov.
PORTFOLIO HOLDINGS
The Funds file a complete schedule of portfolio holdings with the SEC for the first and third quarters of each fiscal year as an exhibit to their reports on Form N-PORT, within sixty days after the end of the period. Form N-PORT reports are available at the SEC’s website at www.sec.gov.
PREMIUM/DISCOUNT INFORMATION
Information regarding how often the Shares of each Fund traded on the exchange at a price above (i.e. at a premium) or below (i.e. at a discount) the NAV of the Fund during the past calendar year can be found at www.inspireetf.com.
INVESTMENT ADVISER
Inspire Investing, LLC
3597 E Monarch Sky Lane, Suite 330
Meridian, ID 83646
ADMINISTRATOR
Ultimus Fund Solutions, LLC
4221 North 203rd Street, Suite 100
Elkhorn, NE 68022-3474
Item 8. Changes in and Disagreements with Accountants for Open-End Management Investment Companies. Not applicable
Item 9. Proxy Disclosures for Open-End Management Investment Companies. Not applicable
Item 10. Remuneration Paid to Directors, Officers, and Others of Open-End Management Investment Companies. Included under Item 7 of this Form.
Item 11. Statement Regarding Basis for Approval of Investment Advisory Contract.
Not applicable.
Item 12. Disclosure of Proxy Voting Policies and Procedures for Closed-End Management Investment Companies.
Not applicable.
Item 13. Portfolio Managers of Closed-End Management Investment Companies.
Not applicable.
Item 14. Purchases of Equity Securities by Closed-End Management Investment Company and Affiliated Purchasers.
Not applicable.
Item 15. Submission of Matters to a Vote of Security Holders.
None.
Item 16. Controls and Procedures.
| (a) | The registrant’s Principal Executive Officer and Principal Financial Officer have concluded that the registrant’s disclosure controls and procedures (as defined in Rule 30a-3(c) under the Act) are effective in design and operation and are sufficient to form the basis of the certifications required by Rule 30a-(2) under the Act, based on their evaluation of these disclosure controls and procedures as of a date within 90 days of this report on Form N-CSR. |
| (b) | There were no changes in the registrant’s internal control over financial reporting (as defined in Rule 30a-3(d) under the Act) during the period covered by this report that have materially affected, or are reasonably likely to materially affect, the registrant’s internal control over financial reporting. |
Item 17. Disclosure of Securities Lending Activities for Closed-End Management Investment Companies.
Not applicable.
Item 18. Recovery of Erroneously Awarded Compensation.
Item 19. Exhibits.
| (a)(1) | Code of Ethics for Principal Executive and Senior Financial Officers. Exhibit 99.CODE |
| (a)(3) | A separate certification for each principal executive officer and principal financial officer of the registrant as required by Rule 30a-2(a) under the Act (17 CFR 270.30a-2(a)): Attached hereto. Exhibit 99. CERT |
SIGNATURES
Pursuant to the requirements of the Securities Exchange Act of 1934 and the Investment Company Act of 1940, the registrant has duly caused this report to be signed on its behalf by the undersigned, thereunto duly authorized.
(Registrant) Northern Lights Fund Trust IV
| By (Signature and Title) | |
| /s/ Wendy Wang | |
| Wendy Wang, Principal Executive Officer/President |
| | |
Pursuant to the requirements of the Securities Exchange Act of 1934 and the Investment Company Act of 1940, this report has been signed below by the following persons on behalf of the registrant and in the capacities and on the dates indicated.
| By (Signature and Title) | |
| /s/ Wendy Wang | |
| Wendy Wang, Principal Executive Officer/President |
| | |
| By (Signature and Title) | |
| /s/ Sam Singh | |
| Sam Singh, Principal Financial Officer/Treasurer |
| | |