Exhibit (C)(8)(G)
|
PRELIMINARY ANALYSIS, SUBJECT TO FINAL PROJECTIONS
October 13, 2015
Strictly Private and Confidential
Preview of the Analysis of the Reorganization of Enersis S.A.
Prepared for the Enersis S.A. Board of Directors
Enersis
PRELIMINARY ANALYSIS, SUBJECT TO FINAL PROJECTIONS
|
Important information
This document has been prepared by IM Trust Asesorías Financieras [Financial Consultants], S.A. (hereinafter “IM Trust”) at the request of the Board of Directors of Enersis S.A. (“Enersis” or the “Company”) for the exclusive and private use of the Company and its Board of Directors.
The recommendations and conclusions of this document constitute the best view or opinion of IM Trust regarding the reorganization of Enersis at the time of issuance of this document, considering the methodologies used for this purpose and the information that was available. This document’s conclusions may vary if additional or other background information were available. IM Trust shall be under no obligation to report such variations nor when the opinions or information contained in the document are modified.
For the preparation of this document, IM Trust has based itself solely and exclusively on information provided by Enersis and public information, which IM Trust has assumed, without independent verification, to have complete and total integrity and accuracy. In this way, IM Trust assumes no responsibility with regard to the information reviewed nor the conclusions that may arise out of any error, inaccuracy and/or falsity of such information.
Likewise, the conclusions of the document may be based on assumptions that may be subject to significant uncertainties and economic and market contingencies, such as flows, projections, estimates, and interpretations, whose occurrence can be difficult to predict and many of them could even be beyond the reach of Enersis, so there is no certainty at all about the degree of fulfillment of such assumptions. Under no circumstances may the use or incorporation of such flows, projections or estimates be considered as a representation, warranty, or prediction of IM Trust regarding their occurrence, nor of the assumptions that underlie them.
Strictly Private and Confidential 2
|
PRELIMINARY ANALYSIS, SUBJECT TO FINAL PROJECTIONS
Contents
1. Introduction 4
2. Business Model Considerations 7
3. Stock Impacts of the Reorganization at Enersis 11 i. Enersis’ Stock Market Situation and Preliminary Assessments 11 ii. Business Models Differentiation and Corporate Structure Simplification 16 iii. Liquidity Considerations 22
4. Cash Flow Impacts of the Reorganization at Enersis 25
5. Conclusions and Next Steps 28
6. Attachments 31
Strictly Private and Confidential 3
|
PRELIMINARY ANALYSIS, SUBJECT TO FINAL PROJECTIONS
1 |
|
INTRODUCTION
Strictly Private and Confidential 4
|
PRELIMINARY ANALYSIS, SUBJECT TO FINAL PROJECTIONS
Preliminary Conclusions and Reflections
(September 8, 2015 Report)
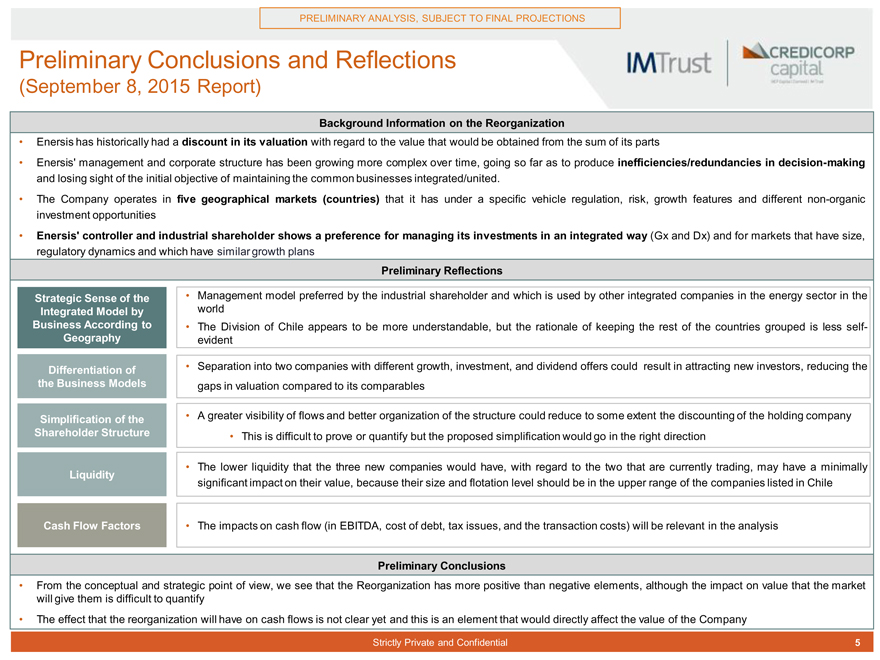
Background Information on the Reorganization
Enersis has historically had a discount in its valuation with regard to the value that would be obtained from the sum of its parts
Enersis’ management and corporate structure has been growing more complex over time, going so far as to produce inefficiencies/redundancies in decision-making and losing sight of the initial objective of maintaining the common businesses integrated/united.
The Company operates in five geographical markets (countries) that it has under a specific vehicle regulation, risk, growth features and different non-organic investment opportunities
Enersis’ controller and industrial shareholder shows a preference for managing its investments in an integrated way (Gx and Dx) and for markets that have size, regulatory dynamics and which have similar growth plans
Preliminary Reflections
Management model preferred by the industrial shareholder and which is used by other integrated companies in the energy sector in the
Strategic Sense of the
Integrated Model by world
Business According to The Division of Chile appears to be more understandable, but the rationale of keeping the rest of the countries grouped is less self-
Geography evident
Differentiation of Separation into two companies with different growth, investment, and dividend offers could result in attracting new investors, reducing the the Business Models gaps in valuation compared to its comparables
Simplification of the A greater visibility of flows and better organization of the structure could reduce to some extent the discounting of the holding company Shareholder Structure This is difficult to prove or quantify but the proposed simplification would go in the right direction
The lower liquidity that the three new companies would have, with regard to the two that are currently trading, may have a minimally
Liquidity significant impact on their value, because their size and flotation level should be in the upper range of the companies listed in Chile
Cash Flow Factors The impacts on cash flow (in EBITDA, cost of debt, tax issues, and the transaction costs) will be relevant in the analysis
Preliminary Conclusions
From the conceptual and strategic point of view, we see that the Reorganization has more positive than negative elements, although the impact on value that the market will give them is difficult to quantify
The effect that the reorganization will have on cash flows is not clear yet and this is an element that would directly affect the value of the Company
Strictly Private and Confidential 5
|
PRELIMINARY ANALYSIS, SUBJECT TO FINAL PROJECTIONS
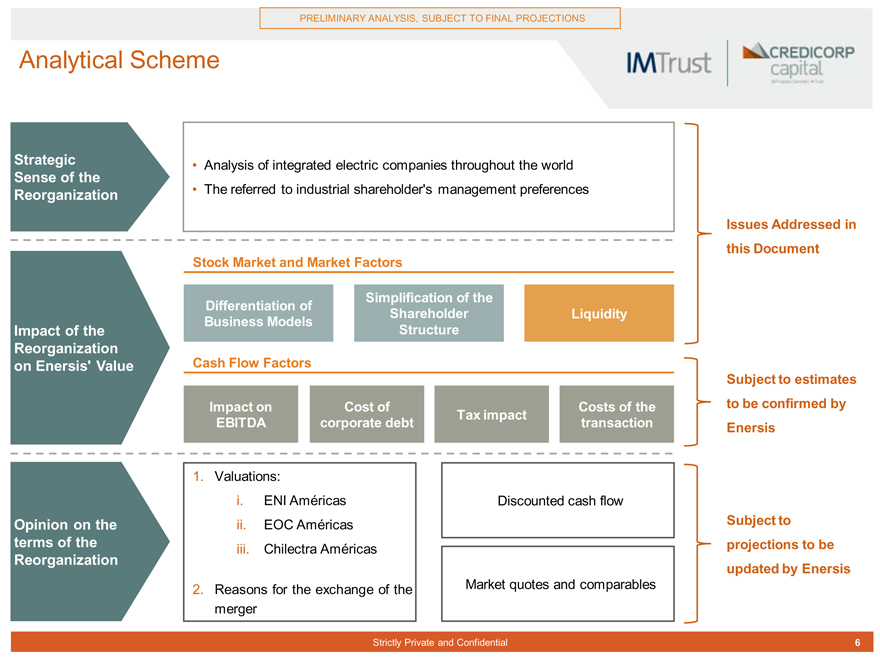
Analytical Scheme
Strategic Analysis of integrated electric companies throughout the world
Sense of the
Reorganization The referred to industrial shareholder’s management preferences
Issues Addressed in Stock Market and Market Factors this Document Simplification of the Differentiation of Shareholder Liquidity Business Models
Impact of the Structure Reorganization on Enersis’ Value Cash Flow Factors
Subject to estimates Impact on Cost of Costs of the to be confirmed by Tax impact EBITDA corporate debt transaction Enersis
1. Valuations: i. ENI Américas Discounted cash flow
Opinion on the ii. EOC Américas Subject to terms of the iii. Chilectra Américas projections to be
Reorganization updated by Enersis
2. Reasons for the exchange of the Market quotes and comparables merger
Strictly Private and Confidential 6
|
PRELIMINARY ANALYSIS, SUBJECT TO FINAL PROJECTIONS
BUSINESS MODEL CONSIDERATIONS 2
Strictly Private and Confidential 7
|
PRELIMINARY ANALYSIS, SUBJECT TO FINAL PROJECTIONS
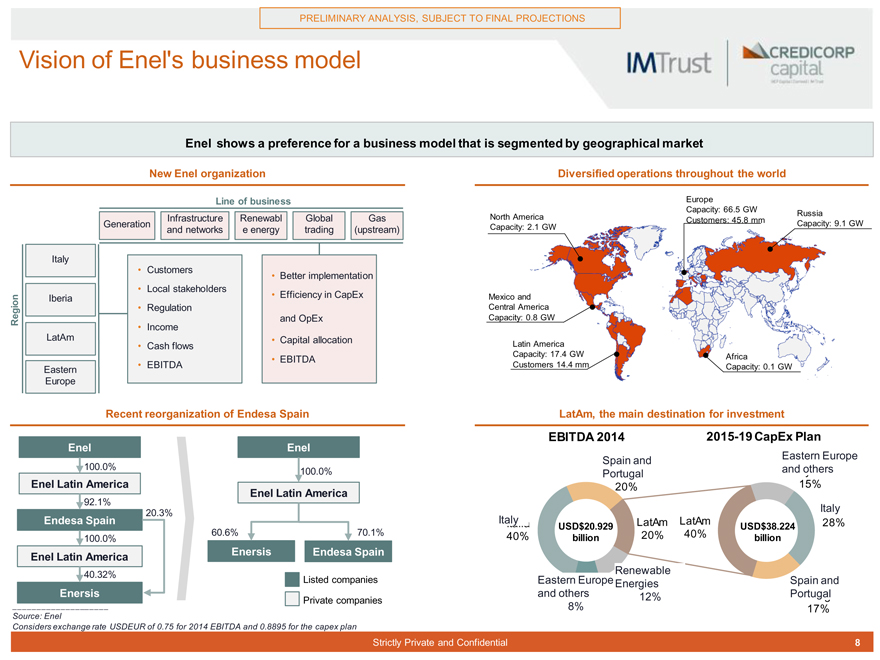
Vision of Enel’s business model
Enel shows a preference for a business model that is segmented by geographical market
New Enel organization Diversified operations throughout the world
Line of business Europe
Capacity: 66.5 GW Russia
Infrastructure Renewabl Global Gas North America Customers: 45.8 mm
Generation Capacity: 2.1 GW Capacity: 9.1 GW and networks e energy trading (upstream)
Italy
Customers
Better implementation
Local stakeholders
Iberia Efficiency in CapEx Mexico and
Regulation Central America
Region Income and OpEx Capacity: 0.8 GW LatAm Capital allocation
Cash flows Latin America
EBITDA Capacity: 17.4 GW Africa
Eastern EBITDA Customers 14.4 mm Capacity: 0.1 GW
Europe
Recent reorganization of Endesa Spain LatAm, the main destination for investment
Enel Enel EBITDA 2014 2015-19 CapEx Plan
100.0% Spain and Eastern Europe 100.0% Portugal and others
Enel Latin America 20% 15% Enel Latin America
92.1%
20.3% Italy Italy lia
Endesa Spain Italia LatAm LatAm 28%
USD$20.929 USD$38.224
60.6% 70.1% 40% 20% 40%
100.0% billion billion
Enel Latin America Enersis Endesa Spain
40.32% Renewable
Listed companies Eastern EuropeEnergies Spain and Enersis and others 12% Portugal
Private companies
8% 17% Source: Enel Considers exchange rate USDEUR of 0.75 for 2014 EBITDA and 0.8895 for the capex plan
Strictly Private and Confidential 8
|
PRELIMINARY ANALYSIS, SUBJECT TO FINAL PROJECTIONS
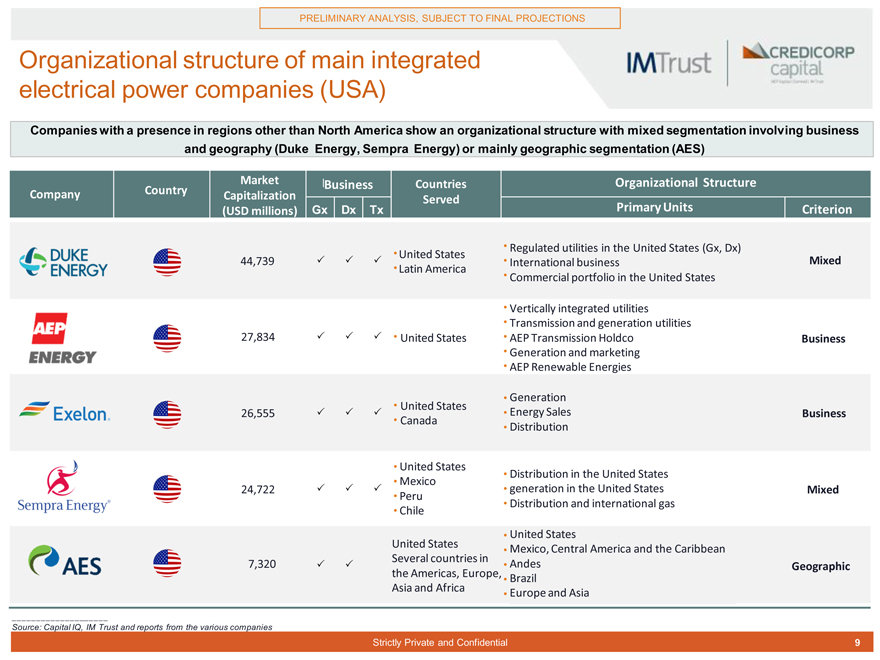
Organizational structure of main integrated electrical power companies (USA)
Companies with a presence in regions other than North America show an organizational structure with mixed segmentation involving business and geography (Duke Energy, Sempra Energy) or mainly geographic segmentation (AES)
Market Business Countries Organizational Structure
Company Country Capitalization
Served
(USD millions) Gx Dx Tx Primary Units Criterion
Regulated utilities in the United States (Gx, Dx) United States
44,739 International business Mixed Latin America
Commercial portfolio in the United States
Vertically integrated utilities
Transmission and generation utilities
27,834 United States AEP Transmission Holdco Business
Generation and marketing
AEP Renewable Energies
Generation
United States
26,555 Energy Sales Business
Canada
Distribution
United States
Distribution in the United States
Mexico
24,722 generation in the United States Mixed
Peru
Distribution and international gas
Chile
United States United States
Mexico, Central America and the Caribbean 7,320 Several countries in Andes
Geographic the Americas, Europe, Brazil
Asia and Africa Europe and Asia
Source: Capital IQ, IM Trust and reports from the various companies
Strictly Private and Confidential 9
|
PRELIMINARY ANALYSIS, SUBJECT TO FINAL PROJECTIONS
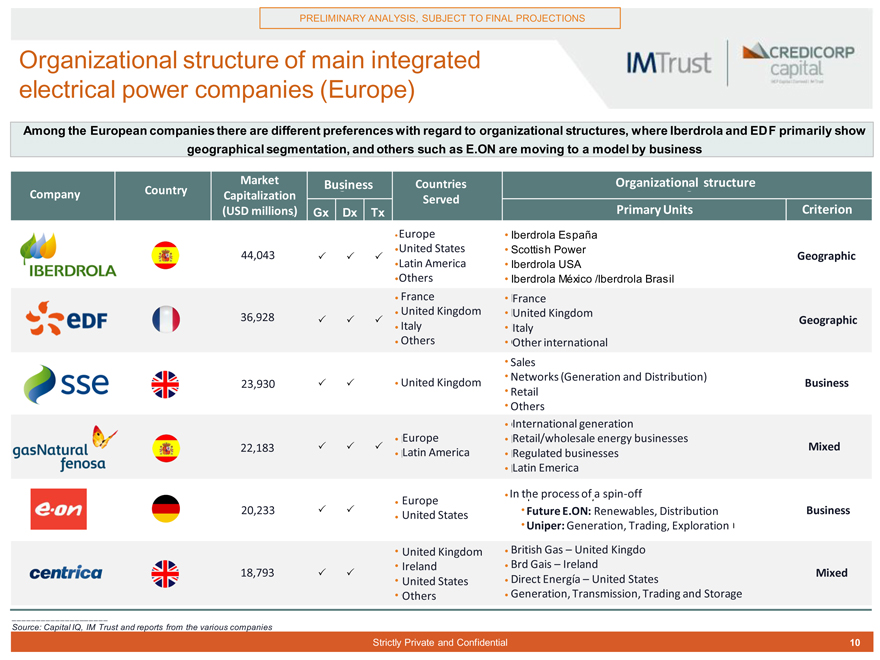
Organizational structure of main integrated electrical power companies (Europe)
Among the European companies there are different preferences with regard to organizational structures, where Iberdrola and EDF primarily show geographical segmentation, and others such as E.ON are moving to a model by business
Market Business Countries Organizational structure
Country Company Capitalization Served
(USD millions) Gx Dx Tx Primary Units Criterion
Europe Iberdrola España United States Scottish Power
44,043 Geographic
Latin America Iberdrola USA
Others Iberdrola México /Iberdrola Brasil
France France
United Kingdom United Kingdom
36,928 Geographic
Italy Italy
Others Other international
Sales
Networks (Generation and Distribution)
23,930 United Kingdom Business
Retail
Others
International generation
Europe Retail/wholesale energy businesses
22,183 Latin America Regulated businesses Mixed
Latin Emerica
In En the proceso process de of spin-off a spin-off
Europe
20,233 United States Future E.ON: Renewables, Distribution Business
Uniper: Generation, Trading, Exploration
United Kingdom British Gas – United Kingdo
Ireland Brd Gais – Ireland
18,793 Direct Energía – United States Mixed
United States
Others Generation, Transmission, Trading and Storage
Source: Capital IQ, IM Trust and reports from the various companies
Strictly Private and Confidential 10
|
PRELIMINARY ANALYSIS, SUBJECT TO FINAL PROJECTIONS
STOCK IMPACTS OF THE REORGANIZATION AT
ENERSIS 3 i. Enersis’ Stock Market Situation and Preliminary Assessments
Strictly Private and Confidential 11
|
PRELIMINARY ANALYSIS, SUBJECT TO FINAL PROJECTIONS
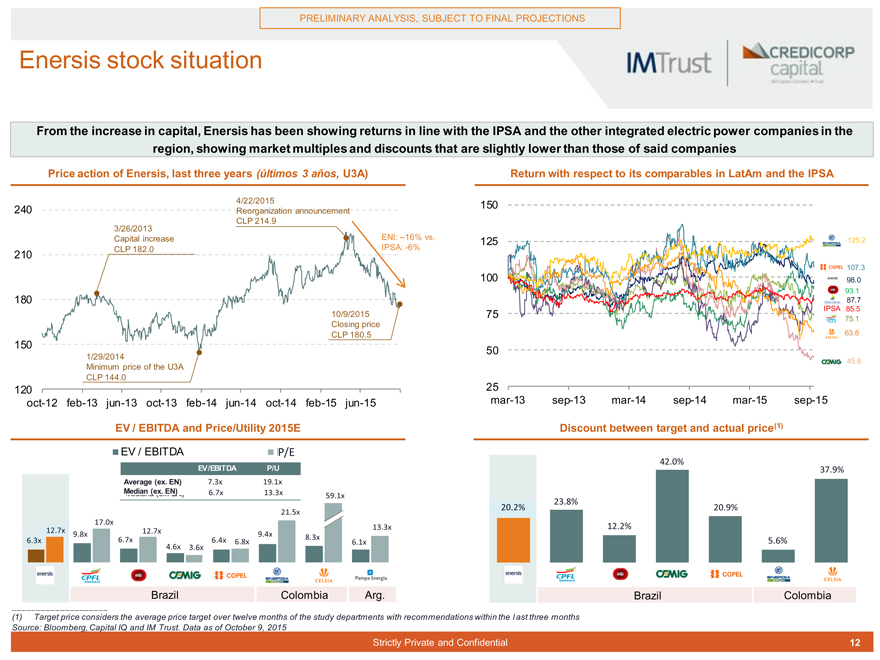
Enersis stock situation
From the increase in capital, Enersis has been showing returns in line with the IPSA and the other integrated electric power companies in the region, showing market multiples and discounts that are slightly lower than those of said companies
Price action of Enersis, last three years (últimos 3 años, U3A) Return with respect to its comparables in LatAm and the IPSA
4/22/2015 150 240 Reorganization announcement CLP 214.9 3/26/2013
Capital increase ENI: –16% vs. 125 1125. ,2 CLP 182.0 IPSA: -6%
210
100 1 107. ,3
98, 98.0 93. 3,1 1
180 85, 87, 87.7
IPSA 85.5
10/9/2015 75
75. |
| 5,1 1 |
Closing price
CLP 180.5 63. 3,8 8
150
50
1/29/2014
45, 45.6
Minimum price of the U3A CLP 144.0
120 25 oct-12 feb-13 jun-13 oct-13 feb-14 jun-14 oct-14 feb-15 jun-15 mar-13 sep-13 mar-14 sep-14 mar-15 sep-15
EV / EBITDA and Price/Utility 2015E Discount between target and actual price(1)
EV / EBITDA P/E 42,0% 42.0%
EV/EBITDA P/U 37. 7,9% 9%
Average (ex. EN) 7. 7,3xx 19,1 19.1x
Median (ex. EN)
6. 6,7xx 13,3 13.3x 59, 59.1x 23. 3,8% 8%
21, 20.2% 20. 0,9% 9%
21.5x 17. 7,0x
12. |
| 2,7x 7x 12, 13. 3,3x 12,2% 12.2% 9.8x 9, x 12.7x 9, 9.4x 6. 6,3xx 6.,7x x 6. 6,4xx 6,8 8.,3xx |
4,6x 6.8x 6,1 6.1x 5,6% 5.6% 4.6x 3. 3,6xx
Brazil Colombia Arg. Brazil Colombia
(1) Target price considers the average price target over twelve months of the study departments with recommendations within the last three months Source: Bloomberg, Capital IQ and IM Trust. Data as of October 9, 2015
Strictly Private and Confidential 12
|
PRELIMINARY ANALYSIS, SUBJECT TO FINAL PROJECTIONS
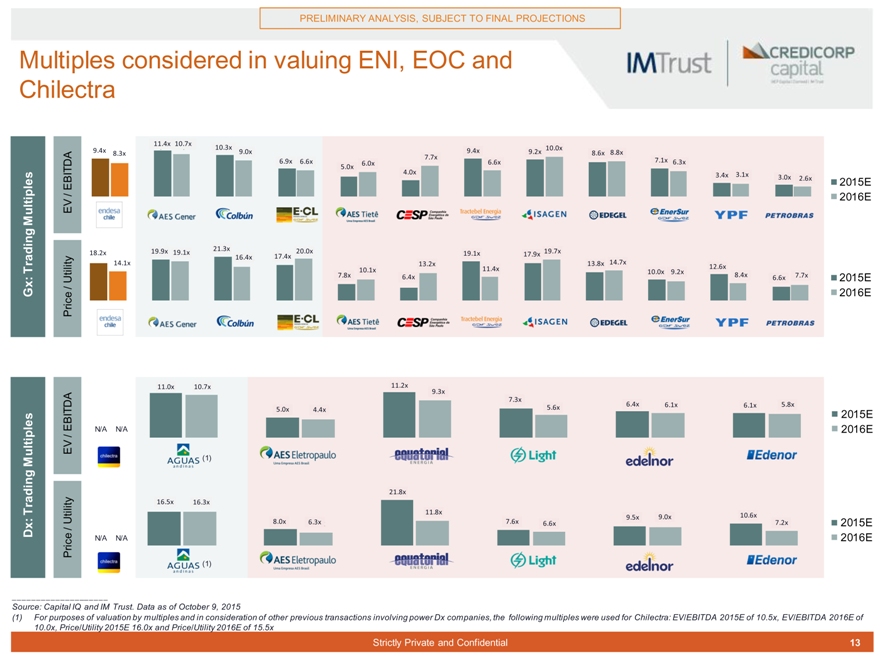
Multiples considered in valuing ENI, EOC and Chilectra
11,4x 11.4x 10. 10,7x 7x 10,
9. 9,4x 10.3x 9, 9.4x 9, 10, 10.0x
8, 8.3x 9. 9,0x 9.2x 8, 8.6x 8, 8.8x
6, 7. 7,7x 7x 7, 7.1x
6.9x 6. 6,6x 6. 6,0x 0x 6. 6,6x 6, 6.3x 5. 5,0x
4. 4,0x 3,4x 3.4x 3.1x
3, 3, 3.0x 2, 2.6x
EBITDA 2015E /
Multiples EV 2016E
19, 21. 21,3x 20, 19,
18.2x 19.9x 19. 19,1x 20.0x 19, 19.1x 19.7x
18, 16. 16,4x 17. 17,4x 17. 17,9x 14,
14, 14.1x 13. 13,2x 13, 13.8x 14.7x 12,6x Trading 10.1x 11, 11.4x 12.6x
10,1x 10, 10.0x 9. 9,2x 2x 8,
Utility 7. 7,8x 8x 6. 6,4x 8.4x 6, 6.6x 7, 7.7x 2015E
/
Gx: Price 2016E
11. |
| 11,0x 10, 10.7x 11,2x 11.2x |
9. 9,3x
7, 7.3x 6,
5. 5,6x 6.4x 6. 6,1x 6, 6.1x 5. 5,8x 8x 5, 5.0x 4.4x
EBITDA 4,4x 2015E
N/A N/A 2016E
/ EV
Multiples (1)
21, 21.8x Trading 16, 16.5x 16,3 16.3x x
11,8 11.8x x 10, 10.6x
8, 9, 9.5x 9. 9,0xx
Utility 8.0x 6. 6,3x x 7. 7,6x 6, 6.6xx 7, 7.2xx 2015E
Dx:/
Price N/A N/A 2016E (1)
Source: Capital IQ and IM Trust. Data as of October 9, 2015
(1) For purposes of valuation by multiples and in consideration of other previous transactions involving power Dx companies, the following multiples were used for Chilectra: EV/EBITDA 2015E of 10.5x, EV/EBITDA 2016E of 10.0x, Price/Utility 2015E 16.0x and Price/Utility 2016E of 15.5x
Strictly Private and Confidential 13
|
Strictly Private and Confidential 13
PRELIMINARY ANALYSIS, SUBJECT TO FINAL PROJECTIONS
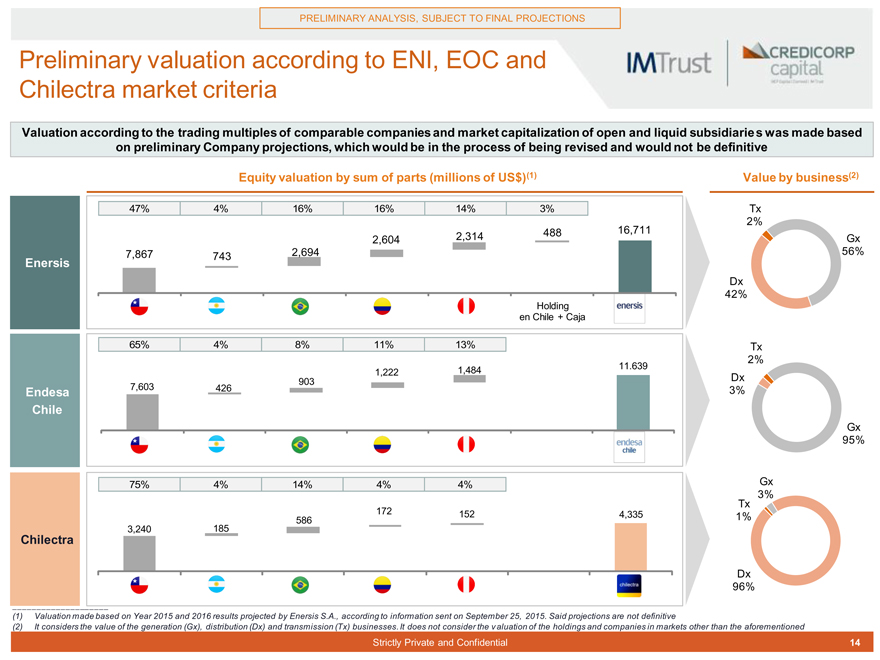
Preliminary valuation according to ENI, EOC and Chilectra market criteria
Valuation according to the trading multiples of comparable companies and market capitalization of open and liquid subsidiaries was made based on preliminary Company projections, which would be in the process of being revised and would not be definitive
Equity valuation by sum of parts (millions of US$)(1) Value by business(2)
47% 4% 16% 16% 14% 3% Tx 2%
488 16,711
2,604 2,314 Gx Enersis 7,867 743 2,694 56% Dx 42%
Holding en Chile + Caja
65% 4% 8% 11% 13% Tx 2%
1,484 11.639
903 1,222 Dx Endesa 7,603 426 3%
Chile
Gx 95%
75% 4% 14% 4% 4% Gx 3% Tx
172 152 4,335 1% 586
Chilectra 3,240 185
Dx 96%
(1) Valuation made based on Year 2015 and 2016 results projected by Enersis S.A., according to information sent on September 25, 2015. Said projections are not definitive
(2) It considers the value of the generation (Gx), distribution (Dx) and transmission (Tx) businesses. It does not consider the valuation of the holdings and companies in markets other than the aforementioned
Strictly Private and Confidential 14
|
PRELIMINARY ANALYSIS, SUBJECT TO FINAL PROJECTIONS
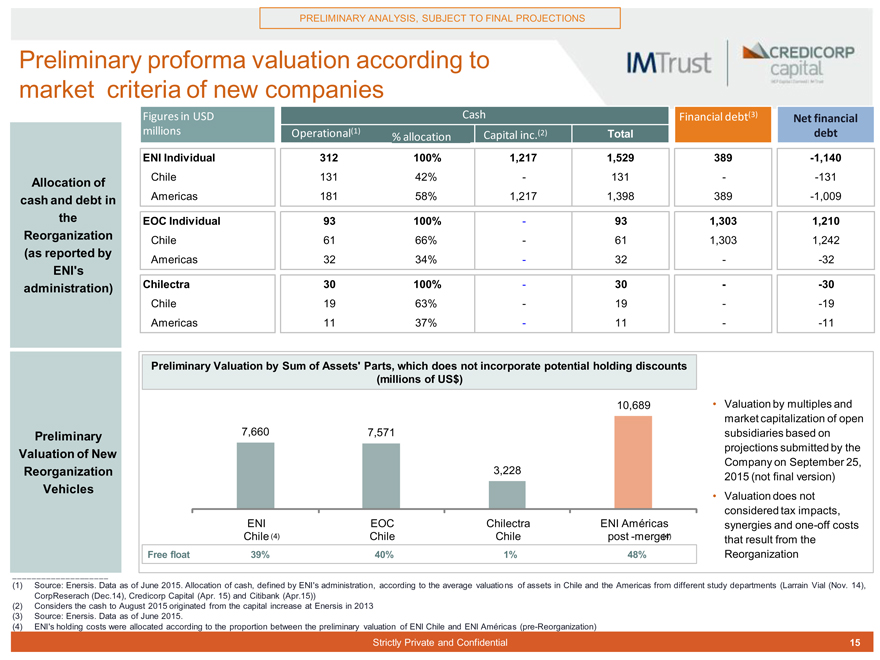
Preliminary proforma valuation according to market criteria of new companies
Figures in USD Cash Financial debt(3) Net financial millions Operational(1) % allocation asignación Capital Aum. capital inc.(2) (2) Total debt
(1) |
|
ENI Individual 312 100% 1,217 1,529 389 -1,140
Allocation of Chile 131 42%—131 —131 cash and debt in Americas 181 58% 1,217 1,398 389 -1,009 the EOC Individual 93 100%—93 1,303 1,210
Reorganization Chile 61 66%—61 1,303 1,242
(as reported by
Americas 32 34%—32 —32
ENI’s administration) Chilectra 30 100%—30 —30
Chile 19 63%—19 —19 Americas 11 37%—11 —11
Preliminary Valuation by Sum of Assets’ Parts, which does not incorporate potential holding discounts (millions of US$)
10,689 Valuation by multiples and market capitalization of open Preliminary 7,660 7,571 subsidiaries based on projections submitted by the
Valuation of New
Company on September 25,
Reorganization 3,228
2015 (not final version)
Vehicles
Valuation does not considered tax impacts, ENI EOC Chilectra ENI Américas synergies and one-off costs Chile (4) Chile Chile post -merger (4) that result from the
Free float 39% 40% 1% 48% Reorganization
(1) Source: Enersis. Data as of June 2015. Allocation of cash, defined by ENI’s administration, according to the average valuations of assets in Chile and the Americas from different study departments (Larrain Vial (Nov. 14), CorpReserach (Dec.14), Credicorp Capital (Apr. 15) and Citibank (Apr.15)) (2) Considers the cash to August 2015 originated from the capital increase at Enersis in 2013 (3) Source: Enersis. Data as of June 2015.
(4) ENI’s holding costs were allocated according to the proportion between the preliminary valuation of ENI Chile and ENI Américas (pre-Reorganization)
Strictly Private and Confidential 15
|
PRELIMINARY ANALYSIS, SUBJECT TO FINAL PROJECTIONS
STOCK IMPACTS OF THE REORGANIZATION AT
ENERSIS 3 ii. Business Models Differentiation and Corporate Structure Simplification
Strictly Private and Confidential 16
|
PRELIMINARY ANALYSIS, SUBJECT TO FINAL PROJECTIONS
ENI, EOC and Chilectra Holding Discount
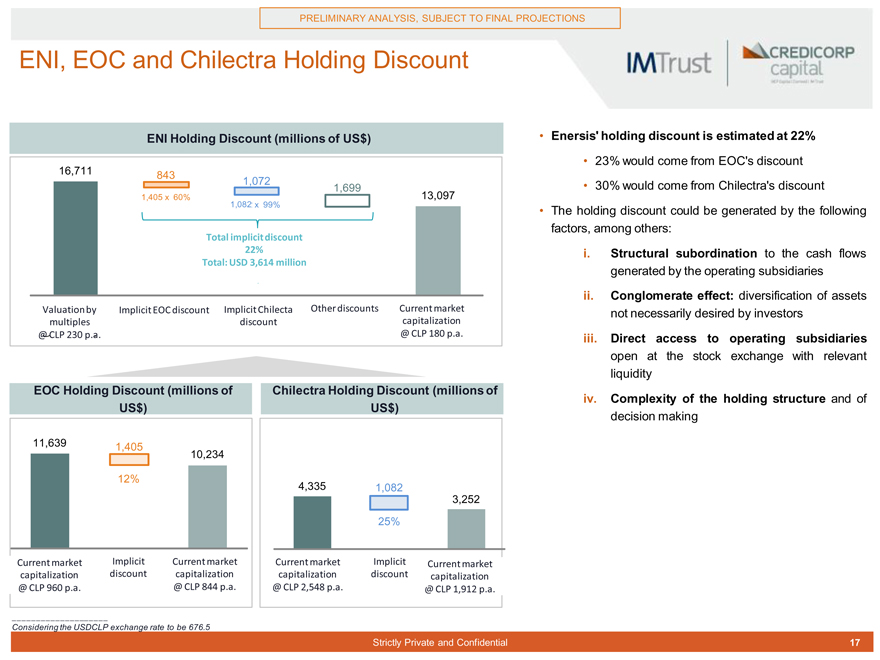
ENI Holding Discount (millions of US$) Enersis’ holding discount is estimated at 22%
23% would come from EOC’s discount
16,711
843
1,072 30% would come from Chilectra’s discount
1,699
1,405. x 60% 13,097
1,082 . x 99% The holding discount could be generated by the following factors, among others:
Total implicit discount
22% i. Structural subordination to the cash flows
Total: USD 3,614 million generated by the operating subsidiaries ii. Conglomerate effect: diversification of assets
Valuation by Implicit EOC discount Implicit Chilecta Other discounts Current market not necessarily desired by investors multiples discount capitalization
@ CLP 230 p.a. @ CLP 180 p.a. iii. Direct access to operating subsidiaries open at the stock exchange with relevant liquidity
EOC Holding Discount (millions of Chilectra Holding Discount (millions of iv. Complexity of the holding structure and of US$) US$) decision making
11,639 1,405 10,234 12% 4,335 1,082 3,252 25%
Current market Implicit Current market Current market Implicit Current market capitalization discount capitalization capitalization discount capitalization
@ CLP 960 p.a. @ CLP 844 p.a. @ CLP 2,548 p.a. @ CLP 1,912 p.a.
Considering the USDCLP exchange rate to be 676.5
Strictly Private and Confidential 17
|
PRELIMINARY ANALYSIS, SUBJECT TO FINAL PROJECTIONS
ENI, EOC and Chilectra holding discount in the context of the Chilean market
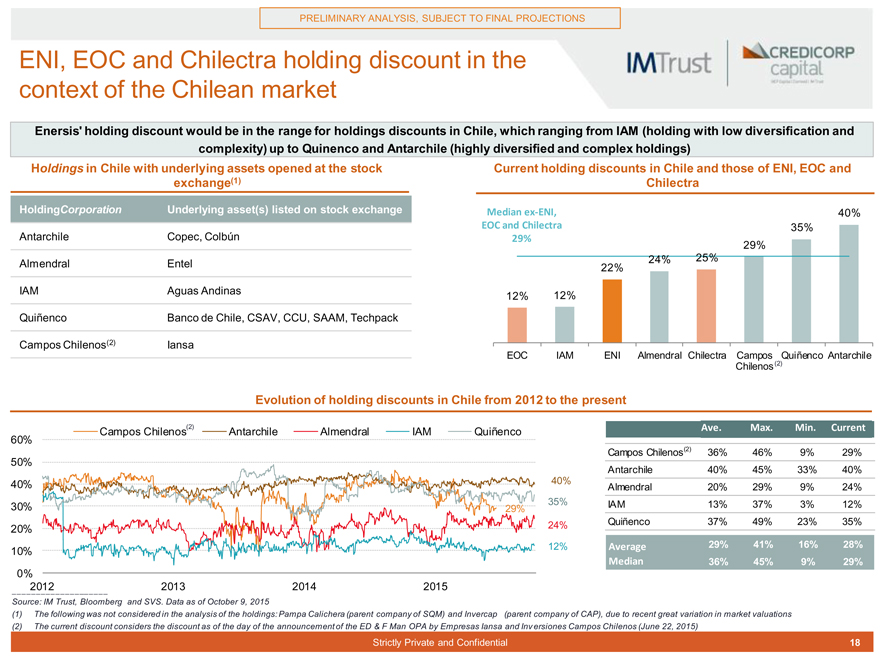
Enersis’ holding discount would be in the range for holdings discounts in Chile, which ranging from IAM (holding with low diversification and complexity) up to Quinenco and Antarchile (highly diversified and complex holdings) Holdings in Chile with underlying assets opened at the stock Current holding discounts in Chile and those of ENI, EOC and exchange(1) Chilectra
HoldingCorporation Underlying asset(s) listed on stock exchange Median ex-ENI, 40%
EOC and Chilectra 35%
Antarchile Copec, Colbún 29%
29% 24% 25%
Almendral Entel 22% IAM Aguas Andinas 12% 12% Quiñenco Banco de Chile, CSAV, CCU, SAAM, Techpack
Campos Chilenos(2) Iansa
EOC IAM ENI Almendral Chilectra Campos Quiñenco Antarchile Chilenos(2)
Evolution of holding discounts in Chile from 2012 to the present
Campos Chilenos(2) Antarchile Almendral IAM Quiñenco Ave. Max. Min. Current 60%
Campos Chilenos(2) 36% 46% 9% 29%
50%
Antarchile 40% 45% 33% 40%
40% 40%
Almendral 20% 29% 9% 24% 30% 35% IAM 13% 37% 3% 12%
29%
24% Quiñenco 37% 49% 23% 35%
20%
12% Average 29% 41% 16% 28%
10%
Median 36% 45% 9% 29%
0%
2012 2013 2014 2015 Source: IM Trust, Bloomberg and SVS. Data as of October 9, 2015
(1) The following was not considered in the analysis of the holdings: Pampa Calichera (parent company of SQM) and Invercap (parent company of CAP), due to recent great variation in market valuations (2) The current discount considers the discount as of the day of the announcement of the ED & F Man OPA by Empresas Iansa and Inversiones Campos Chilenos (June 22, 2015)
Strictly Private and Confidential 18
|
PRELIMINARY ANALYSIS, SUBJECT TO FINAL PROJECTIONS
Source of decrease of holding discount: Possible market re-valuations
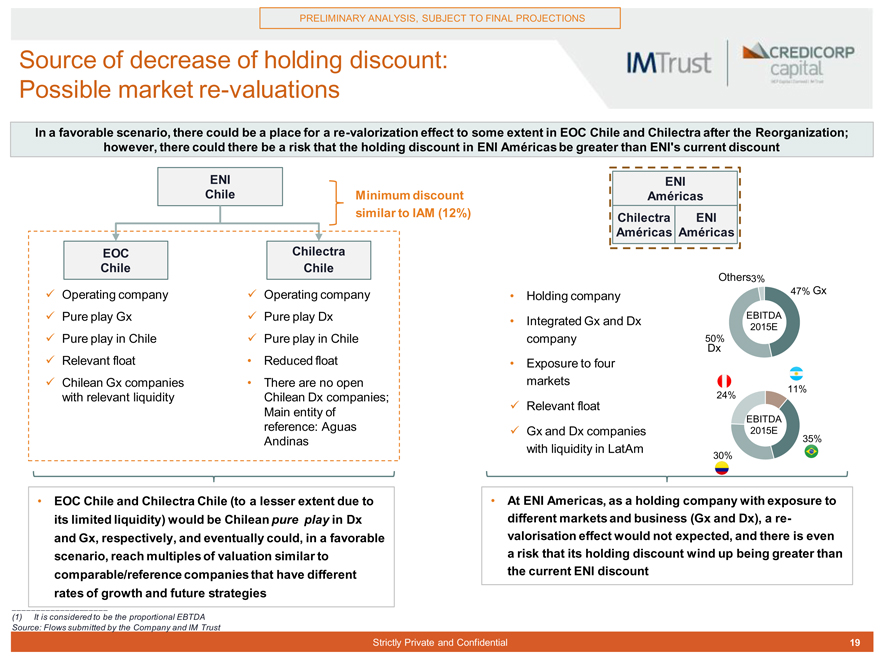
In a favorable scenario, there could be a place for a re-valorization effect to some extent in EOC Chile and Chilectra after the Reorganization; however, there could there be a risk that the holding discount in ENI Américas be greater than ENI’s current discount
ENI ENI Chile Minimum discount Américas similar to IAM (12%) Chilectra ENI
Américas Américas EOC Chilectra Chile Chile
Others3%
??Operating company ??Operating company Holding company 47% Gx ??Pure play Gx ??Pure play Dx Integrated Gx and Dx EBITDA
2015E
??Pure play in Chile ??Pure play in Chile company 50%
Dx
??Relevant float Reduced float Exposure to four ??Chilean Gx companies There are no open markets
11% with relevant liquidity Chilean Dx companies; 24% Main entity of ??Relevant float
EBITDA reference: Aguas ??Gx and Dx companies 2015E Andinas 35% with liquidity in LatAm
30%
EOC Chile and Chilectra Chile (to a lesser extent due to At ENI Americas, as a holding company with exposure to its limited liquidity) would be Chilean pure play in Dx different markets and business (Gx and Dx), a re-and Gx, respectively, and eventually could, in a favorable valorisation effect would not expected, and there is even scenario, reach multiples of valuation similar to a risk that its holding discount wind up being greater than comparable/reference companies that have different the current ENI discount rates of growth and future strategies
(1) |
| It is considered to be the proportional EBTDA Source: Flows submitted by the Company and IM Trust |
Strictly Private and Confidential 19
|
PRELIMINARY ANALYSIS, SUBJECT TO FINAL PROJECTIONS
Analysis on the revaluation space in EOC and Chilectra
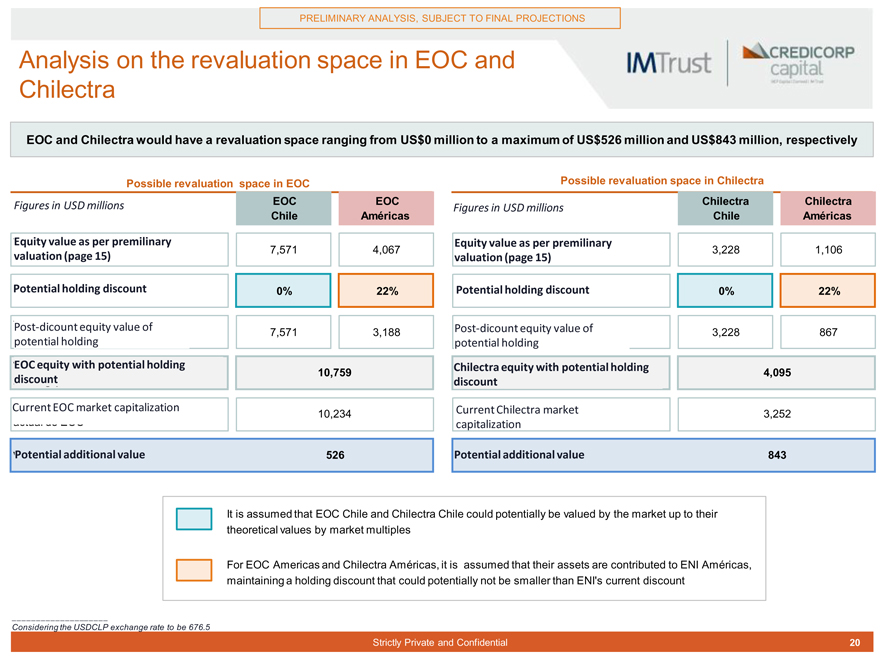
EOC and Chilectra would have a revaluation space ranging from US$0 million to a maximum of US$526 million and US$843 million, respectively
Possible revaluation space in EOC Possible revaluation space in Chilectra
Figures in USD millions EOC EOC Chilectra Chilectra
Figures in USD millions
Chile Américas Chile Américas
Equity value as per premilinary Equity value as per premilinary
7,571 4,067 3,228 1,106 valuation (page 15) valuation (page 15)
Potential holding discount 0% 22% Potential holding discount 0% 22%
Post-dicount equity value of Post-dicount equity value of
7,571 3,188 3,228 867 potential holding potential holding
EOC equity with potential holding Chilectra equity with potential holding
10,759 4,095 discount discount
Current EOC market capitalization Current Chilectra market
10,234 3,252 capitalization
Potential additional value 526 Potential additional value 843
It is assumed that EOC Chile and Chilectra Chile could potentially be valued by the market up to their theoretical values by market multiples
For EOC Americas and Chilectra Américas, it is assumed that their assets are contributed to ENI Américas, maintaining a holding discount that could potentially not be smaller than ENI’s current discount
Considering the USDCLP exchange rate to be 676.5
Strictly Private and Confidential 20
|
PRELIMINARY ANALYSIS, SUBJECT TO FINAL PROJECTIONS
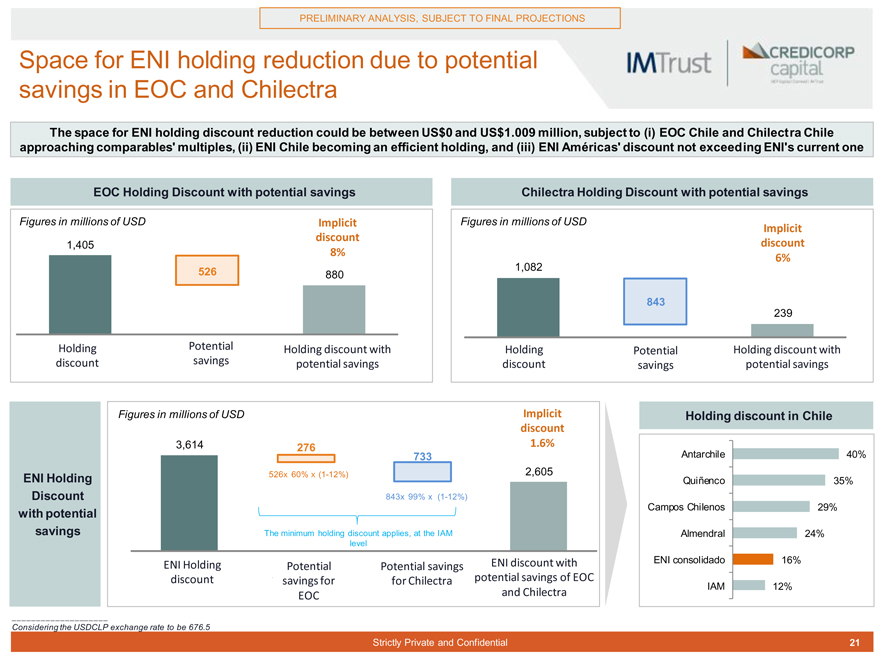
Space for ENI holding reduction due to potential savings in EOC and Chilectra
The space for ENI holding discount reduction could be between US$0 and US$1.009 million, subject to (i) EOC Chile and Chilectra Chile approaching comparables’ multiples, (ii) ENI Chile becoming an efficient holding, and (iii) ENI Américas’ discount not exceeding ENI’s current one
EOC Holding Discount with potential savings Chilectra Holding Discount with potential savings
Figures in millions of USD Implicit Figures in millions of USD
Implicit discount discount
1,405
8% 6%
526 1,082 880
843 239
Holding Potential Holding discount with Holding Potential Holding discount with discount savings potential savings discount savings potential savings
Figures in millions of USD Implicit Holding discount in Chile discount
3,614 276 1.6%
733 Antarchile 40%
526x 60% x (1-12%) 2,605
ENI Holding Quiñenco 35%
Discount 843x 99% x (1-12%) with potential Campos Chilenos 29% savings The minimum holding discount applies, at the IAM Almendral 24% level
ENI Holding ENI discount with ENI consolidado 16% Potential Potential savings discount savings for for Chilectra potential savings of EOC IAM and Chilectra 12% EOC
Considering the USDCLP exchange rate to be 676.5
Strictly Private and Confidential 21
|
PRELIMINARY ANALYSIS, SUBJECT TO FINAL PROJECTIONS
STOCK IMPACTS OF THE REORGANIZATION AT
ENERSIS 3 iii. Liquidity Considerations
Strictly Private and Confidential 22
|
PRELIMINARY ANALYSIS, SUBJECT TO FINAL PROJECTIONS
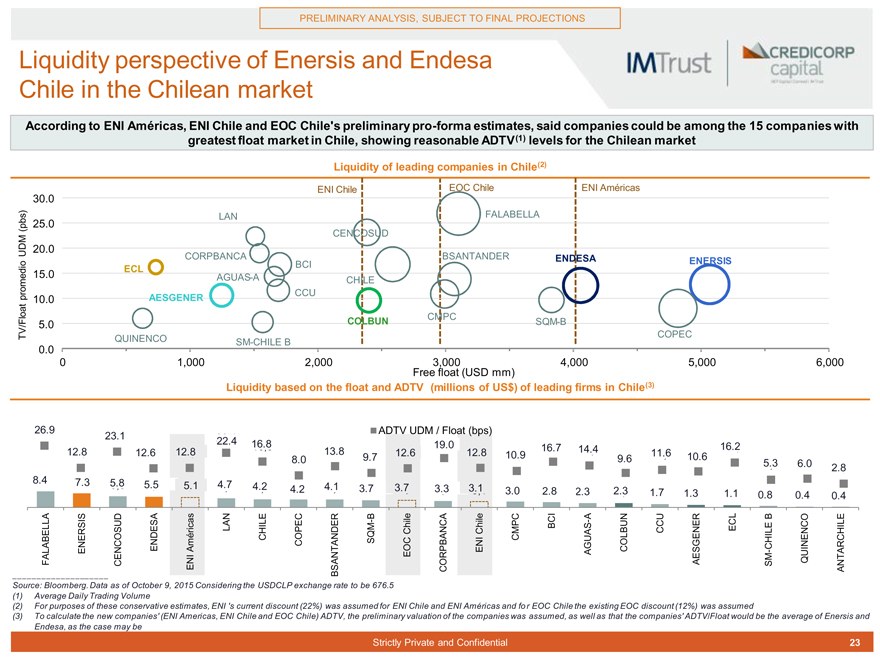
Liquidity perspective of Enersis and Endesa Chile in the Chilean market
According to ENI Américas, ENI Chile and EOC Chile’s preliminary pro-forma estimates, said companies could be among the 15 companies with greatest float market in Chile, showing reasonable ADTV(1) levels for the Chilean market
Liquidity of leading companies in Chile(2)
30.0 ENI Chile EOC Chile ENI Américas LAN FALABELLA
(pbs) 25.0
CENCOSUD
UDM 20.0
CORPBANCA BCI BSANTANDER ENDESA ENERSIS
15.0 ECL
AGUAS-A CHILE promedio AESGENER CCU
10.0
COLBUN CMPC
5.0 SQM-B
TV/Float QUINENCO COPEC SM-CHILE B
0.0
0 1,000 2,000 3,000 4,000 5,000 6,000 Free float (USD mm)
Liquidity based on the float and ADTV (millions of US$) of leading firms in Chile(3)
26, 26.9 ADTV UDM / Float (bps) 23. 23,1 1 22, 22.4
16. |
| 16,8 8 19. 19,0 16. 16,7 7 16.2 16,2 12.8 12,8 12.6 12,6 12.8 12,8 13.8 13, 12. 12,6 6 12.8 12,8 14.4 14,4 11.6 |
8.0 9.,7 7 10.9 10,9 9.6 ,6 11,6 10.6 10,
,0 5.3 ,3 6. 6,0 0
2.8 2,8 8.4 8,4 7.3 ,3 5.8 5.5 4.7
,8 5,5 5.1 ,1 4,7 4.2 4,2 4.2 ,2 4.1 4,1 3.7 3,7 3.7 3,7 3.3 3,3 3.1
3,1 3.0 3,0 2.8 2,8 2. 2,3 3 2.3 2,3 1.7 1,7 1.3 1,3 1.1 ,1 0.8 0,8 0.4 0,4 0.4 0,4
LAN B—Chile Chile BCI A—CCU ECL B ENDESA Américas CHILE COPEC SQM CMPC COLBUN CHILE
FALABELLA ENERSIS CENCOSUD EOC ENI AGUAS AESGENER—SM QUINENCO ENI BSANTANDER CORPBANCA ANTARCHILE
Source: Bloomberg. Data as of October 9, 2015 Considering the USDCLP exchange rate to be 676.5 (1) Average Daily Trading Volume
(2) For purposes of these conservative estimates, ENI ‘s current discount (22%) was assumed for ENI Chile and ENI Américas and for EOC Chile the existing EOC discount (12%) was assumed
(3) To calculate the new companies’ (ENI Americas, ENI Chile and EOC Chile) ADTV, the preliminary valuation of the companies was assumed, as well as that the companies’ ADTV/Float would be the average of Enersis and Endesa, as the case may be
Strictly Private and Confidential 23
|
PRELIMINARY ANALYSIS, SUBJECT TO FINAL PROJECTIONS
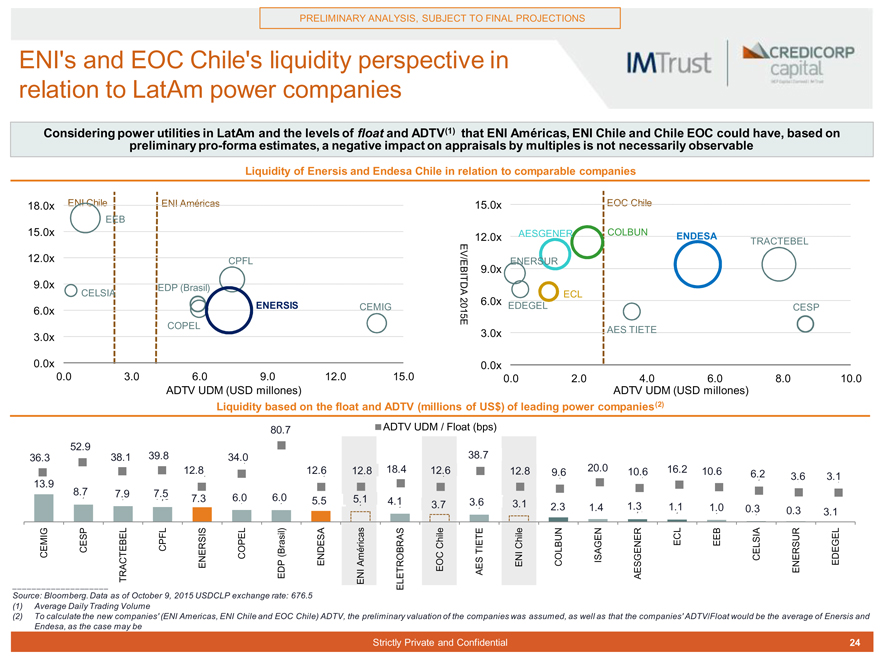
ENI’s and EOC Chile’s liquidity perspective in relation to LatAm power companies
Considering power utilities in LatAm and the levels of float and ADTV(1) that ENI Américas, ENI Chile and Chile EOC could have, based on preliminary pro-forma estimates, a negative impact on appraisals by multiples is not necessarily observable
Liquidity of Enersis and Endesa Chile in relation to comparable companies
18.0x ENI Chile ENI Américas 15.0x EOC Chile EEB
15.0x 12.0x AESGENER COLBUN ENDESA
TRACTEBEL 12.0x CPFL 9.0x ENERSUR
9.0x EDP (Brasil) EV/EBITDA
CELSIA ECL
ENERSIS 6.0x
6.0x CEMIG 2015E EDEGEL CESP COPEL 3.0x AES TIETE
3.0x
0.0x 0.0x
0.0 3.0 6.0 9.0 12.0 15.0 0.0 2.0 4.0 6.0 8.0 10.0 ADTV UDM (USD millones) ADTV UDM (USD millones)
Liquidity based on the float and ADTV (millions of US$) of leading power companies(2)
80. |
| 80,7 ADTV UDM / Float (bps) |
52. |
| 52,9 9 36. 36,3 3 38. 38,1 1 39. 39,8 8 34. 34,0 0 38. 38,7 7 |
12. |
| 12,8 8 12. 12,6 6 12, 12.8 18. 18,4 4 12. 12,6 12. 12,8 9.6 20. 20,0 0 10.6 16. 16,2 2 10. 12,1 6 |
13, 13.9 9,6 10,6 6. 6,2 2 3.,6 6 3. 3,1 1 8.7 8,7 7.9 ,9 7.5 7,5 7,3
7.3 6.0 6,0 6.0 6,0 5.5 5,5 5.1 ,1 4.1 3.6
4,1 3.7 ,7 3,6 3.1 ,1 2.,3 3 1. 1,4 4 1.3 1.1 1.0
1,3 1,1 ,0 0. 0,3 3 0. 0,3 3 3. 0,1 1
CPFL Chile Chile ECL EEB CESP TIETE
CEMIG ENERSIS COPEL(Brasil) ENDESA Américas ENI COLBUN ISAGEN CELSIA EDEGEL TRACTEBEL EDP ENI EOC AES AESGENER ENERSUR
ELETROBRAS Source: Bloomberg. Data as of October 9, 2015 USDCLP exchange rate: 676.5 (1) Average Daily Trading Volume
(2) To calculate the new companies’ (ENI Americas, ENI Chile and EOC Chile) ADTV, the preliminary valuation of the companies was assumed, as well as that the companies’ ADTV/Float would be the average of Enersis and Endesa, as the case may be
Strictly Private and Confidential 24
|
PRELIMINARY ANALYSIS, SUBJECT TO FINAL PROJECTIONS
CASH FLOW IMPACTS OF THE REORGANIZATION
AT ENERSIS 4
Strictly Private and Confidential 25
|
PRELIMINARY ANALYSIS, SUBJECT TO FINAL PROJECTIONS
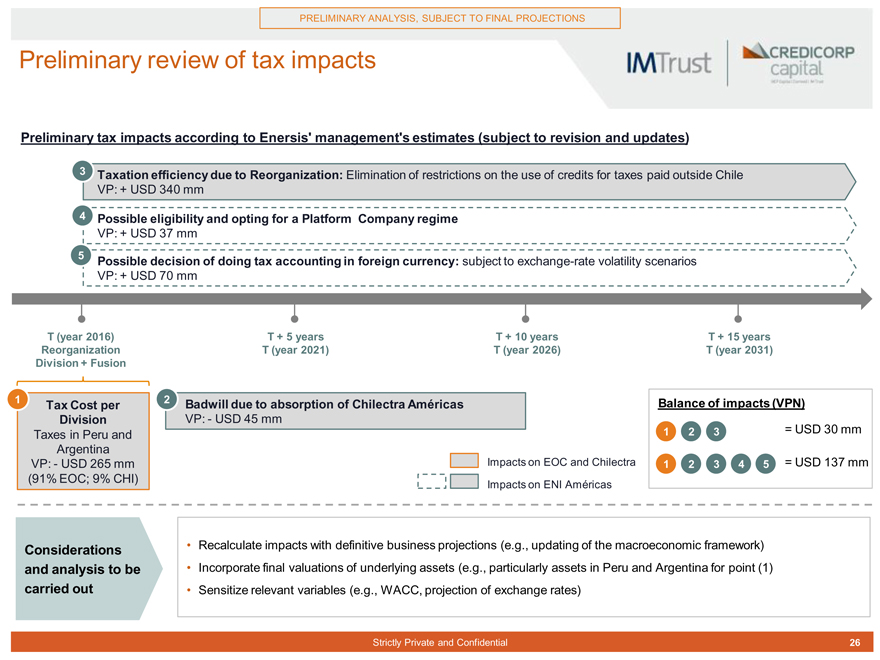
Preliminary review of tax impacts
Preliminary tax impacts according to Enersis’ management’s estimates (subject to revision and updates)
3 Taxation efficiency due to Reorganization: Elimination of restrictions on the use of credits for taxes paid outside Chile VP: + USD 340 mm
4 |
| Possible eligibility and opting for a Platform Company regime |
VP: + USD 37 mm
5 |
| Possible decision of doing tax accounting in foreign currency: subject to exchange-rate volatility scenarios |
VP: + USD 70 mm
T (year 2016) T + 5 years T + 10 years T + 15 years Reorganization T (year 2021) T (year 2026) T (year 2031) Division + Fusion
1 |
| Tax Cost per 2 Badwill due to absorption of Chilectra Américas Balance of impacts (VPN) |
Division VP:—USD 45 mm
Taxes in Peru and 1 2 3 = USD 30 mm Argentina
VP:—USD 265 mm Impacts on EOC and Chilectra 1 2 3 4 5 = USD 137 mm
(91% EOC; 9% CHI)
Impacts on ENI Américas
Considerations Recalculate impacts with definitive business projections (e.g., updating of the macroeconomic framework) and analysis to be Incorporate final valuations of underlying assets (e.g., particularly assets in Peru and Argentina for point (1) carried out Sensitize relevant variables (e.g., WACC, projection of exchange rates)
Strictly Private and Confidential 26
|
PRELIMINARY ANALYSIS, SUBJECT TO FINAL PROJECTIONS
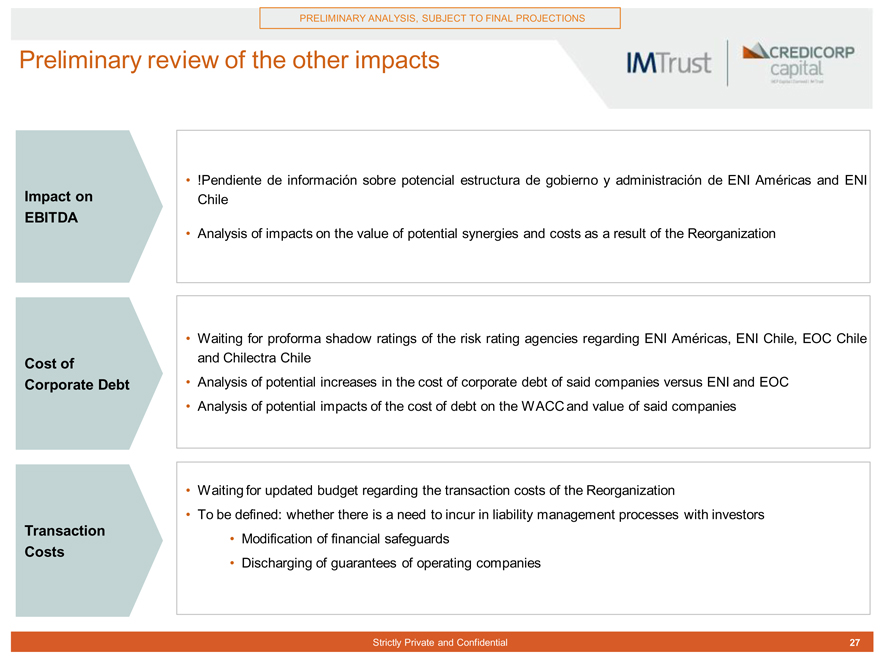
Preliminary review of the other impacts
!Pendiente de información sobre potencial estructura de gobierno y administración de ENI Américas and ENI
Impact on Chile EBITDA
Analysis of impacts on the value of potential synergies and costs as a result of the Reorganization
Waiting for proforma shadow ratings of the risk rating agencies regarding ENI Américas, ENI Chile, EOC Chile Cost of and Chilectra Chile Corporate Debt Analysis of potential increases in the cost of corporate debt of said companies versus ENI and EOC
Analysis of potential impacts of the cost of debt on the WACC and value of said companies
Waiting for updated budget regarding the transaction costs of the Reorganization
To be defined: whether there is a need to incur in liability management processes with investors
Transaction
Modification of financial safeguards
Costs
Discharging of guarantees of operating companies
Strictly Private and Confidential 27
|
PRELIMINARY ANALYSIS, SUBJECT TO FINAL PROJECTIONS
CONCLUSIONS AND FURTHER STEPS 5
Strictly Private and Confidential 28
|
PRELIMINARY ANALYSIS, SUBJECT TO FINAL PROJECTIONS
Conclusions
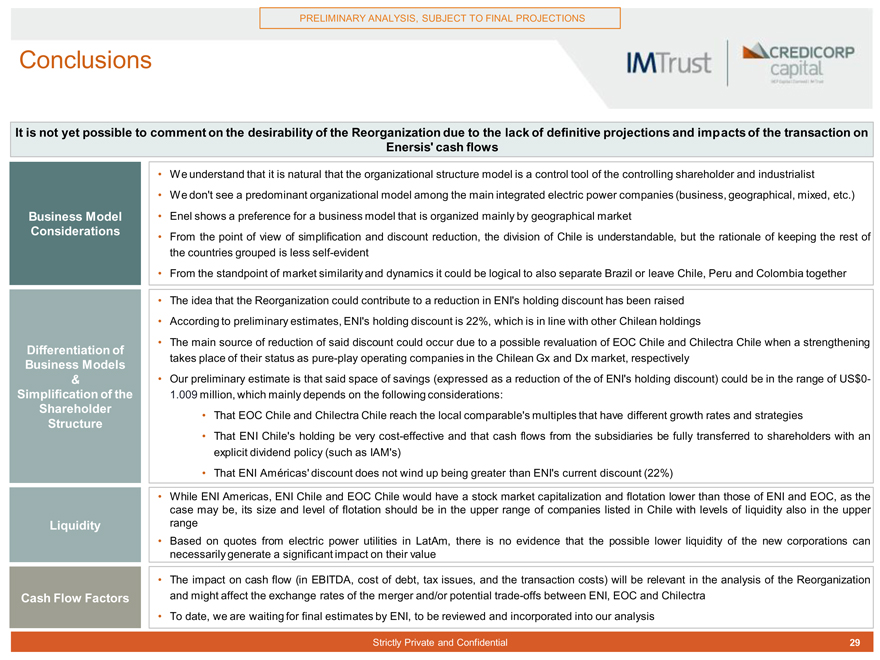
It is not yet possible to comment on the desirability of the Reorganization due to the lack of definitive projections and impacts of the transaction on Enersis’ cash flows
We understand that it is natural that the organizational structure model is a control tool of the controlling shareholder and industrialist
We don’t see a predominant organizational model among the main integrated electric power companies (business, geographical, mixed, etc.) Business Model Enel shows a preference for a business model that is organized mainly by geographical market Considerations From the point of view of simplification and discount reduction, the division of Chile is understandable, but the rationale of keeping the rest of the countries grouped is less self-evident
From the standpoint of market similarity and dynamics it could be logical to also separate Brazil or leave Chile, Peru and Colombia together
The idea that the Reorganization could contribute to a reduction in ENI’s holding discount has been raised
According to preliminary estimates, ENI’s holding discount is 22%, which is in line with other Chilean holdings
The main source of reduction of said discount could occur due to a possible revaluation of EOC Chile and Chilectra Chile when a strengthening
Differentiation of takes place of their status as pure-play operating companies in the Chilean Gx and Dx market, respectively
Business Models
& Our preliminary estimate is that said space of savings (expressed as a reduction of the of ENI’s holding discount) could be in the range of US$0-Simplification of the 1.009 million, which mainly depends on the following considerations:
Shareholder
That EOC Chile and Chilectra Chile reach the local comparable’s multiples that have different growth rates and strategies
Structure
That ENI Chile’s holding be very cost-effective and that cash flows from the subsidiaries be fully transferred to shareholders with an explicit dividend policy (such as IAM’s)
That ENI Américas’ discount does not wind up being greater than ENI’s current discount (22%)
While ENI Americas, ENI Chile and EOC Chile would have a stock market capitalization and flotation lower than those of ENI and EOC, as the case may be, its size and level of flotation should be in the upper range of companies listed in Chile with levels of liquidity also in the upper
Liquidity range
Based on quotes from electric power utilities in LatAm, there is no evidence that the possible lower liquidity of the new corporations can necessarily generate a significant impact on their value
The impact on cash flow (in EBITDA, cost of debt, tax issues, and the transaction costs) will be relevant in the analysis of the Reorganization Cash Flow Factors and might affect the exchange rates of the merger and/or potential trade-offs between ENI, EOC and Chilectra
To date, we are waiting for final estimates by ENI, to be reviewed and incorporated into our analysis
Strictly Private and Confidential 29
|
PRELIMINARY ANALYSIS, SUBJECT TO FINAL PROJECTIONS
Following steps
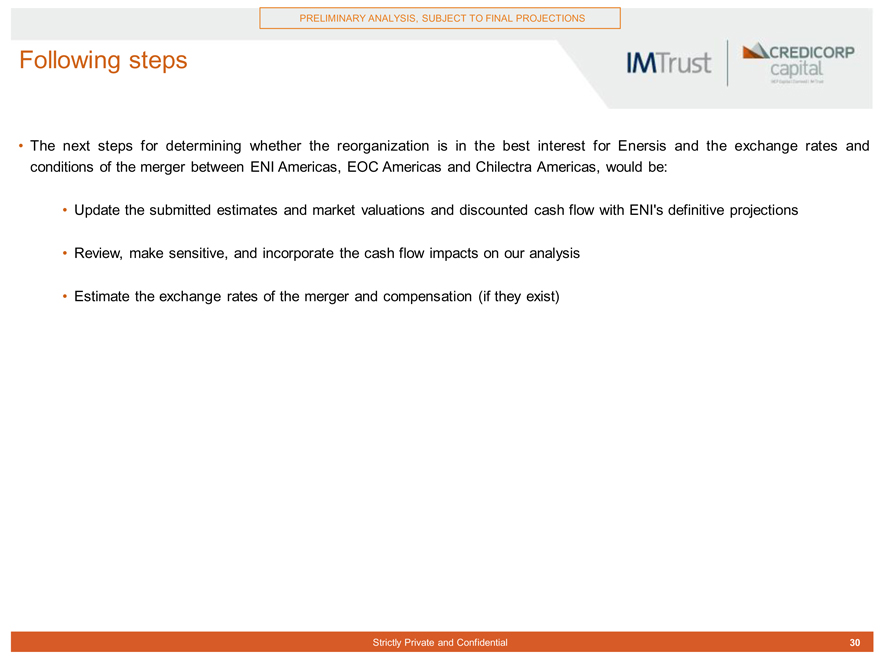
The next steps for determining whether the reorganization is in the best interest for Enersis and the exchange rates and conditions of the merger between ENI Americas, EOC Americas and Chilectra Americas, would be:
Update the submitted estimates and market valuations and discounted cash flow with ENI’s definitive projections
Review, make sensitive, and incorporate the cash flow impacts on our analysis
Estimate the exchange rates of the merger and compensation (if they exist)
Strictly Private and Confidential 30
|
PRELIMINARY ANALYSIS, SUBJECT TO FINAL PROJECTIONS
ATTACHMENTS 6
Strictly Private and Confidential 31
|
PRELIMINARY ANALYSIS, SUBJECT TO FINAL PROJECTIONS
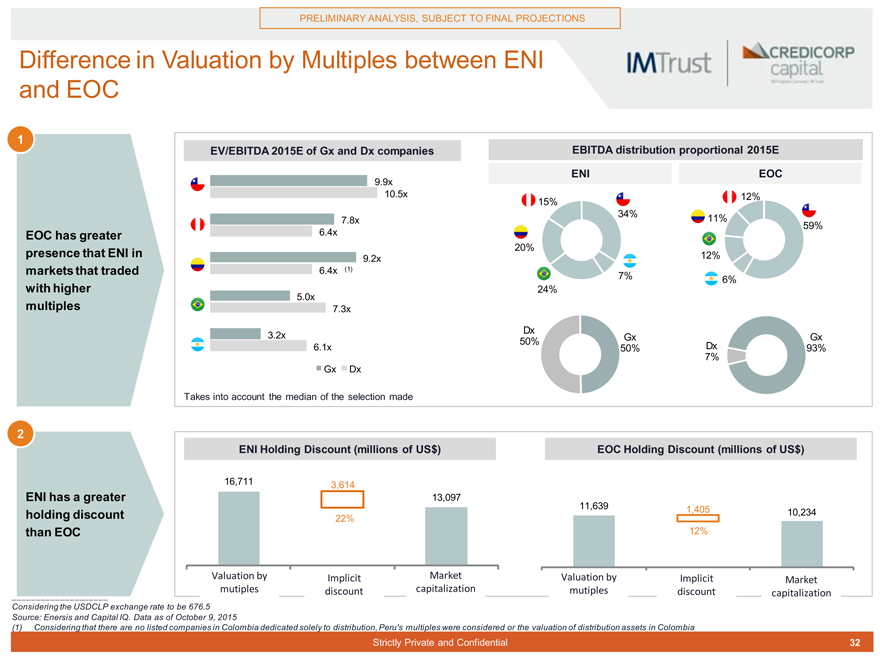
Difference in Valuation by Multiples between ENI and EOC
1 |
|
EV/EBITDA 2015E of Gx and Dx companies EBITDA distribution proportional 2015E ENI EOC
9.9x
10.5x 12% 15% 34% 11%
7.8x
59%
EOC has greater 6.4x presence that ENI in 20%
9.2x 12% markets that traded 6.4x (1)
7% 6% with higher 24%
5.0x multiples 7.3x
3.2x Dx
50% Gx Gx 6.1x 50% Dx 93% 7%
Gx Dx
Takes into account the median of the selection made
2 |
|
ENI Holding Discount (millions of US$) EOC Holding Discount (millions of US$)
16,711 3,614
ENI has a greater 13,097
11,639 1,405 holding discount 10,234
22% than EOC 12%
Valuation by Implicit Market Valuation by Implicit Market mutiples discount capitalization mutiples discount capitalization
Considering the USDCLP exchange rate to be 676.5 Source: Enersis and Capital IQ. Data as of October 9, 2015
(1) Considering that there are no listed companies in Colombia dedicated solely to distribution, Peru’s multiples were considered or the valuation of distribution assets in Colombia
Strictly Private and Confidential 32
|
PRELIMINARY ANALYSIS, SUBJECT TO FINAL PROJECTIONS
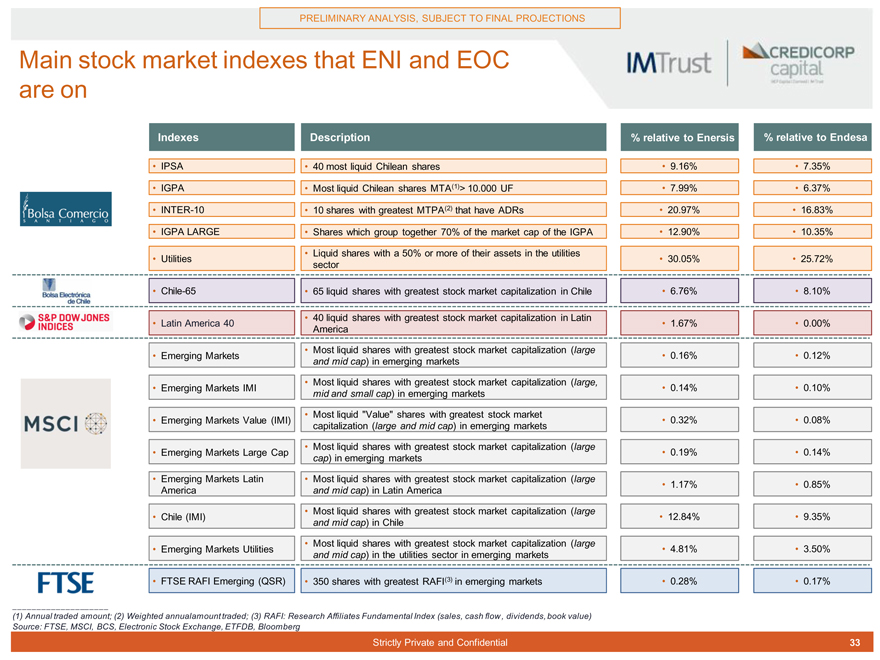
Main stock market indexes that ENI and EOC are on
Indexes Description % relative to Enersis % relative to Endesa
IPSA 40 most liquid Chilean shares 9.16% 7.35%
IGPA Most liquid Chilean shares MTA(1)> 10.000 UF 7.99% 6.37%
INTER-10 10 shares with greatest MTPA(2) that have ADRs 20.97% 16.83%
IGPA LARGE Shares which group together 70% of the market cap of the IGPA 12.90% 10.35%
Liquid shares with a 50% or more of their assets in the utilities
Utilities 30.05% 25.72% sector
Chile-65 65 liquid shares with greatest stock market capitalization in Chile 6.76% 8.10%
40 liquid shares with greatest stock market capitalization in Latin
Latin America 40 1.67% 0.00% America
Most liquid shares with greatest stock market capitalization (large
Emerging Markets 0.16% 0.12% and mid cap) in emerging markets
Most liquid shares with greatest stock market capitalization (large,
Emerging Markets IMI 0.14% 0.10% mid and small cap) in emerging markets
Most liquid “Value” shares with greatest stock market
Emerging Markets Value (IMI) 0.32% 0.08% capitalization (large and mid cap) in emerging markets
Most liquid shares with greatest stock market capitalization (large
Emerging Markets Large Cap 0.19% 0.14% cap) in emerging markets
Emerging Markets Latin Most liquid shares with greatest stock market capitalization (large
1.17% 0.85% America and mid cap) in Latin America
Most liquid shares with greatest stock market capitalization (large
Chile (IMI) 12.84% 9.35% and mid cap) in Chile
Most liquid shares with greatest stock market capitalization (large
Emerging Markets Utilities 4.81% 3.50% and mid cap) in the utilities sector in emerging markets
FTSE RAFI Emerging (QSR) 350 shares with greatest RAFI(3) in emerging markets 0.28% 0.17%
(1) Annual traded amount; (2) Weighted annualamount traded; (3) RAFI: Research Affiliates Fundamental Index (sales, cash flow, dividends, book value) Source: FTSE, MSCI, BCS, Electronic Stock Exchange, ETFDB, Bloomberg
Strictly Private and Confidential 33
|
PRELIMINARY ANALYSIS, SUBJECT TO FINAL PROJECTIONS
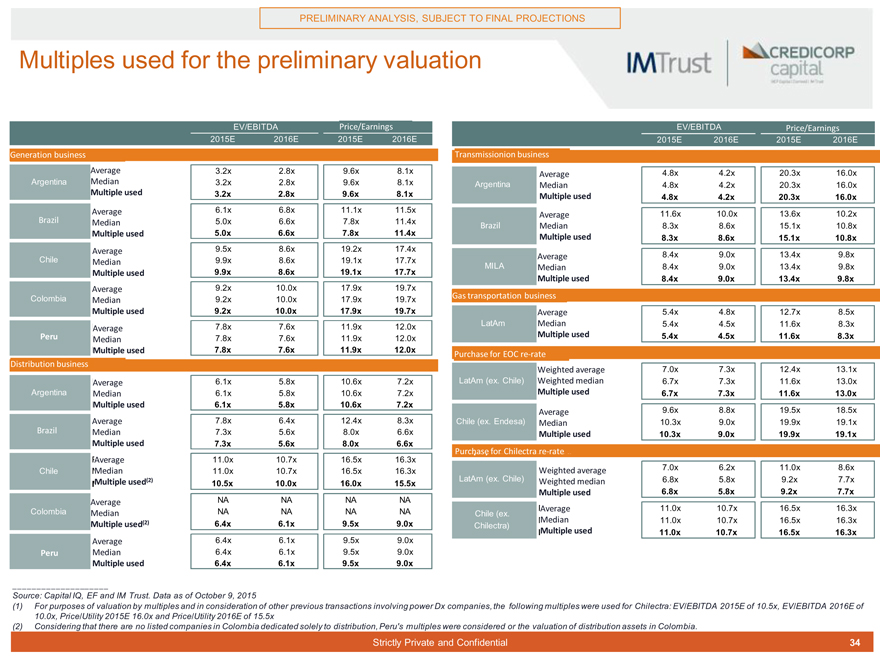
Multiples used for the preliminary valuation
EV/EBITDA Price/Earnings Precio/Utilidad EV/EBITDA Price/Earnings Precio/Utilidad 2015E 2016E 2015E 2016E 2015E 2016E 2015E 2016E
Generation Negoc o de business ge ración Negocio Transmissionion de transmisión business
Average 3.2x 2.8x 9.6x 8.1x Average 4.8x 4.2x 20.3x 16.0x Argentina Median 3.2x 2.8x 9.6x 8.1x Argentina Median 4.8x 4.2x 20.3x 16.0x
Multiple used 3.2x 2.8x 9.6x 8.1x Multiple used
4.8x 4.2x 20.3x 16.0x
Average 6.1x 6.8x 11.1x 11.5x 11.6x 10.0x 13.6x 10.2x
Average
Brazil Median 5.0x 6.6x 7.8x 11.4x
Brazil Median 8.3x 8.6x 15.1x 10.8x
Multiple used 5.0x 6.6x 7.8x 11.4x Multiple used
8.3x 8.6x 15.1x 10.8x
Average 9.5x 8.6x 19.2x 17.4x
Average 8.4x 9.0x 13.4x 9.8x Chile Median 9.9x 8.6x 19.1x 17.7x MILA Median 8.4x 9.0x 13.4x 9.8x
Multiple used 9.9x 8.6x 19.1x 17.7x
Multiple used 8.4x 9.0x 13.4x 9.8x
Average 9.2x 10.0x 17.9x 19.7x
Colombia 9.2x 10.0x 17.9x 19.7x Gas Negocio transportation t ansp rte business de gas
Median
Multiple used 9.2x 10.0x 17.9x 19.7x Average 5.4x 4.8x 12.7x 8.5x
7.8x 7.6x 11.9x 12.0x LatAm Median 5.4x 4.5x 11.6x 8.3x
Average
Peru 7.8x 7.6x 11.9x 12.0x Multiple used 5.4x 4.5x 11.6x 8.3x
Median
Multiple used 7.8x 7.6x 11.9x 12.0x Purchase Comp para for EOC re-rate re-rate EOC
Distribution Negocio de business distribución
Weighted average 7.0x 7.3x 12.4x 13.1x Average 6.1x 5.8x 10.6x 7.2x LatAm (ex. Chile) Weighted median 6.7x 7.3x 11.6x 13.0x Argentina Median 6.1x 5.8x 10.6x 7.2x Multiple used 6.7x 7.3x 11.6x 13.0x
Multiple used 6.1x 5.8x 10.6x 7.2x
Average 9.6x 8.8x 19.5x 18.5x Average 7.8x 6.4x 12.4x 8.3x Chile (ex. Endesa) Median 10.3x 9.0x 19.9x 19.1x
Brazil Median 7.3x 5.6x 8.0x 6.6x Multiple used 10.3x 9.0x 19.9x 19.1x Multiple used 7.3x 5.6x 8.0x 6.6x
Average 11.0x 10.7x 16.5x 16.3x Comps Purchase para for Chilectra re-rate Chilectra re-rate
Chile Median 11.0x 10.7x 16.5x 16.3x Weighted average 7.0x 6.2x 11.0x 8.6x Multiple used(2) LatAm (ex. Chile) Weighted median 6.8x 5.8x 9.2x 7.7x
10.5x 10.0x 16.0x 15.5x Multiple used 6.8x 5.8x 9.2x 7.7x
Average NA NA NA NA Average 11.0x 10.7x 16.5x 16.3x Colombia Median NA NA NA NA Chile (ex.
(2) |
| Median 11.0x 10.7x 16.5x 16.3x |
Multiple used 6.4x 6.1x 9.5x 9.0x Chilectra)
Multiple used 11.0x 10.7x 16.5x 16.3x
Average 6.4x 6.1x 9.5x 9.0x Peru Median 6.4x 6.1x 9.5x 9.0x
Multiple used 6.4x 6.1x 9.5x 9.0x
Source: Capital IQ, EF and IM Trust. Data as of October 9, 2015
(1) For purposes of valuation by multiples and in consideration of other previous transactions involving power Dx companies, the following multiples were used for Chilectra: EV/EBITDA 2015E of 10.5x, EV/EBITDA 2016E of 10.0x, Price/Utility 2015E 16.0x and Price/Utility 2016E of 15.5x (2) Considering that there are no listed companies in Colombia dedicated solely to distribution, Peru’s multiples were considered or the valuation of distribution assets in Colombia.
Strictly Private and Confidential 34
|
PRELIMINARY ANALYSIS, SUBJECT TO FINAL PROJECTIONS
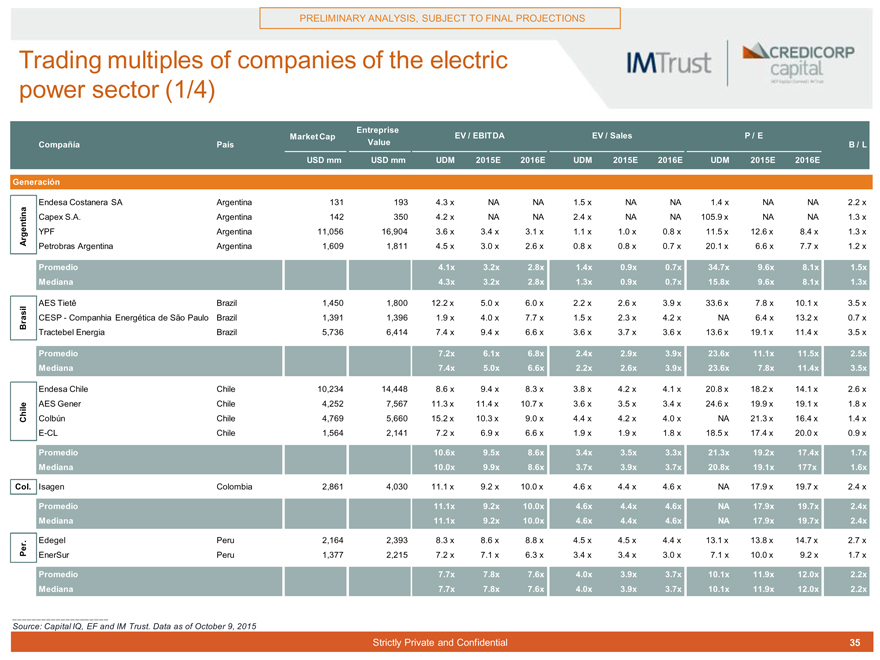
Trading multiples of companies of the electric power sector (1/4)
Entreprise
Market Cap EV / EBITDA EV / Sales P / E
Compañía País Value B / L USD mm USD mm UDM 2015E 2016E UDM 2015E 2016E UDM 2015E 2016E
Generación
Endesa Costanera SA Argentina 131 193 4.3 x NA NA 1.5 x NA NA 1.4 x NA NA 2.2 x Capex S.A. Argentina 142 350 4.2 x NA NA 2.4 x NA NA 105.9 x NA NA 1.3 x Argentina YPF Argentina 11,056 16,904 3.6 x 3.4 x 3.1 x 1.1 x 1.0 x 0.8 x 11.5 x 12.6 x 8.4 x 1.3 x Petrobras Argentina Argentina 1,609 1,811 4.5 x 3.0 x 2.6 x 0.8 x 0.8 x 0.7 x 20.1 x 6.6 x 7.7 x 1.2 x
Promedio 4.1x 3.2x 2.8x 1.4x 0.9x 0.7x 34.7x 9.6x 8.1x 1.5x Mediana 4.3x 3.2x 2.8x 1.3x 0.9x 0.7x 15.8x 9.6x 8.1x 1.3x
AES Tietê Brazil 1,450 1,800 12.2 x 5.0 x 6.0 x 2.2 x 2.6 x 3.9 x 33.6 x 7.8 x 10.1 x 3.5 x Brasil CESP—Companhia Energética de São Paulo Brazil 1,391 1,396 1.9 x 4.0 x 7.7 x 1.5 x 2.3 x 4.2 x NA 6.4 x 13.2 x 0.7 x Tractebel Energia Brazil 5,736 6,414 7.4 x 9.4 x 6.6 x 3.6 x 3.7 x 3.6 x 13.6 x 19.1 x 11.4 x 3.5 x
Promedio 7.2x 6.1x 6.8x 2.4x 2.9x 3.9x 23.6x 11.1x 11.5x 2.5x Mediana 7.4x 5.0x 6.6x 2.2x 2.6x 3.9x 23.6x 7.8x 11.4x 3.5x
Endesa Chile Chile 10,234 14,448 8.6 x 9.4 x 8.3 x 3.8 x 4.2 x 4.1 x 20.8 x 18.2 x 14.1 x 2.6 x AES Gener Chile 4,252 7,567 11.3 x 11.4 x 10.7 x 3.6 x 3.5 x 3.4 x 24.6 x 19.9 x 19.1 x 1.8 x Chile Colbún Chile 4,769 5,660 15.2 x 10.3 x 9.0 x 4.4 x 4.2 x 4.0 x NA 21.3 x 16.4 x 1.4 x E-CL Chile 1,564 2,141 7.2 x 6.9 x 6.6 x 1.9 x 1.9 x 1.8 x 18.5 x 17.4 x 20.0 x 0.9 x
Promedio 10.6x 9.5x 8.6x 3.4x 3.5x 3.3x 21.3x 19.2x 17.4x 1.7x Mediana 10.0x 9.9x 8.6x 3.7x 3.9x 3.7x 20.8x 19.1x 177x 1.6x
Col. Isagen Colombia 2,861 4,030 11.1 x 9.2 x 10.0 x 4.6 x 4.4 x 4.6 x NA 17.9 x 19.7 x 2.4 x
Promedio 11.1x 9.2x 10.0x 4.6x 4.4x 4.6x NA 17.9x 19.7x 2.4x Mediana 11.1x 9.2x 10.0x 4.6x 4.4x 4.6x NA 17.9x 19.7x 2.4x
Per. Edegel Peru 2,164 2,393 8.3 x 8.6 x 8.8 x 4.5 x 4.5 x 4.4 x 13.1 x 13.8 x 14.7 x 2.7 x EnerSur Peru 1,377 2,215 7.2 x 7.1 x 6.3 x 3.4 x 3.4 x 3.0 x 7.1 x 10.0 x 9.2 x 1.7 x
Promedio 7.7x 7.8x 7.6x 4.0x 3.9x 3.7x 10.1x 11.9x 12.0x 2.2x Mediana 7.7x 7.8x 7.6x 4.0x 3.9x 3.7x 10.1x 11.9x 12.0x 2.2x
Source: Capital IQ, EF and IM Trust. Data as of October 9, 2015
Strictly Private and Confidential 35
|
PRELIMINARY ANALYSIS, SUBJECT TO FINAL PROJECTIONS
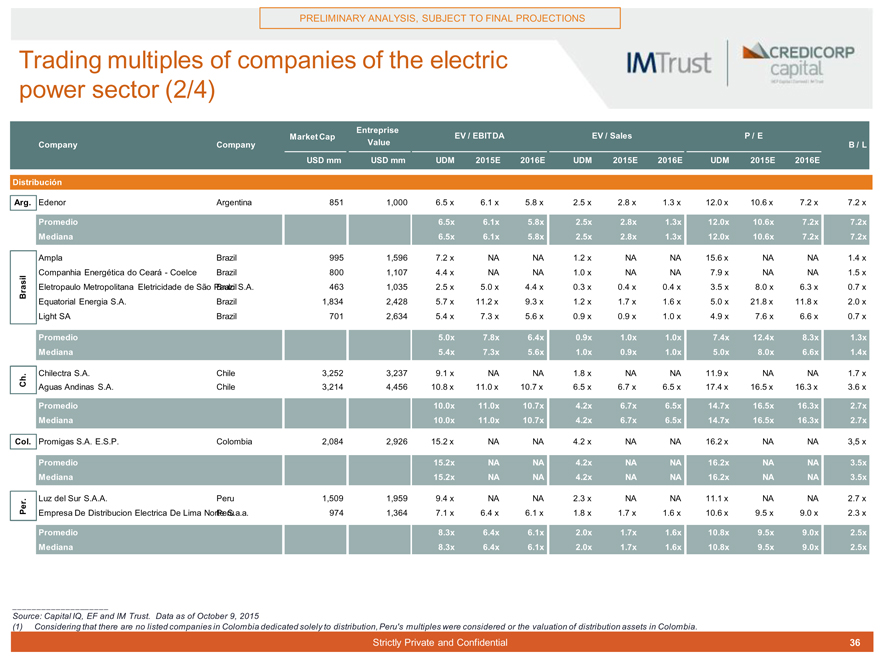
Trading multiples of companies of the electric power sector (2/4)
Entreprise
Market Cap EV / EBITDA EV / Sales P / E
Company Company Value B / L USD mm USD mm UDM 2015E 2016E UDM 2015E 2016E UDM 2015E 2016E
Distribución
Arg. Edenor Argentina 851 1,000 6.5 x 6.1 x 5.8 x 2.5 x 2.8 x 1.3 x 12.0 x 10.6 x 7.2 x 7.2 x
Promedio 6.5x 6.1x 5.8x 2.5x 2.8x 1.3x 12.0x 10.6x 7.2x 7.2x Mediana 6.5x 6.1x 5.8x 2.5x 2.8x 1.3x 12.0x 10.6x 7.2x 7.2x
Ampla Brazil 995 1,596 7.2 x NA NA 1.2 x NA NA 15.6 x NA NA 1.4 x Companhia Energética do Ceará—Coelce Brazil 800 1,107 4.4 x NA NA 1.0 x NA NA 7.9 x NA NA 1.5 x Brasil Eletropaulo Metropolitana Eletricidade de São Paulo Brazil S.A. 463 1,035 2.5 x 5.0 x 4.4 x 0.3 x 0.4 x 0.4 x 3.5 x 8.0 x 6.3 x 0.7 x Equatorial Energia S.A. Brazil 1,834 2,428 5.7 x 11.2 x 9.3 x 1.2 x 1.7 x 1.6 x 5.0 x 21.8 x 11.8 x 2.0 x Light SA Brazil 701 2,634 5.4 x 7.3 x 5.6 x 0.9 x 0.9 x 1.0 x 4.9 x 7.6 x 6.6 x 0.7 x
Promedio 5.0x 7.8x 6.4x 0.9x 1.0x 1.0x 7.4x 12.4x 8.3x 1.3x Mediana 5.4x 7.3x 5.6x 1.0x 0.9x 1.0x 5.0x 8.0x 6.6x 1.4x
Ch. Chilectra S.A. Chile 3,252 3,237 9.1 x NA NA 1.8 x NA NA 11.9 x NA NA 1.7 x Aguas Andinas S.A. Chile 3,214 4,456 10.8 x 11.0 x 10.7 x 6.5 x 6.7 x 6.5 x 17.4 x 16.5 x 16.3 x 3.6 x
Promedio 10.0x 11.0x 10.7x 4.2x 6.7x 6.5x 14.7x 16.5x 16.3x 2.7x Mediana 10.0x 11.0x 10.7x 4.2x 6.7x 6.5x 14.7x 16.5x 16.3x 2.7x
Col. Promigas S.A. E.S.P. Colombia 2,084 2,926 15.2 x NA NA 4.2 x NA NA 16.2 x NA NA 3,5 x
Promedio 15.2x NA NA 4.2x NA NA 16.2x NA NA 3.5x Mediana 15.2x NA NA 4.2x NA NA 16.2x NA NA 3.5x
Per. Luz del Sur S.A.A. Peru 1,509 1,959 9.4 x NA NA 2.3 x NA NA 11.1 x NA NA 2.7 x Empresa De Distribucion Electrica De Lima Nort Peru S. a.a. 974 1,364 7.1 x 6.4 x 6.1 x 1.8 x 1.7 x 1.6 x 10.6 x 9.5 x 9.0 x 2.3 x
Promedio 8.3x 6.4x 6.1x 2.0x 1.7x 1.6x 10.8x 9.5x 9.0x 2.5x Mediana 8.3x 6.4x 6.1x 2.0x 1.7x 1.6x 10.8x 9.5x 9.0x 2.5x
Source: Capital IQ, EF and IM Trust. Data as of October 9, 2015
(1) Considering that there are no listed companies in Colombia dedicated solely to distribution, Peru’s multiples were considered or the valuation of distribution assets in Colombia.
Strictly Private and Confidential 36
|
PRELIMINARY ANALYSIS, SUBJECT TO FINAL PROJECTIONS
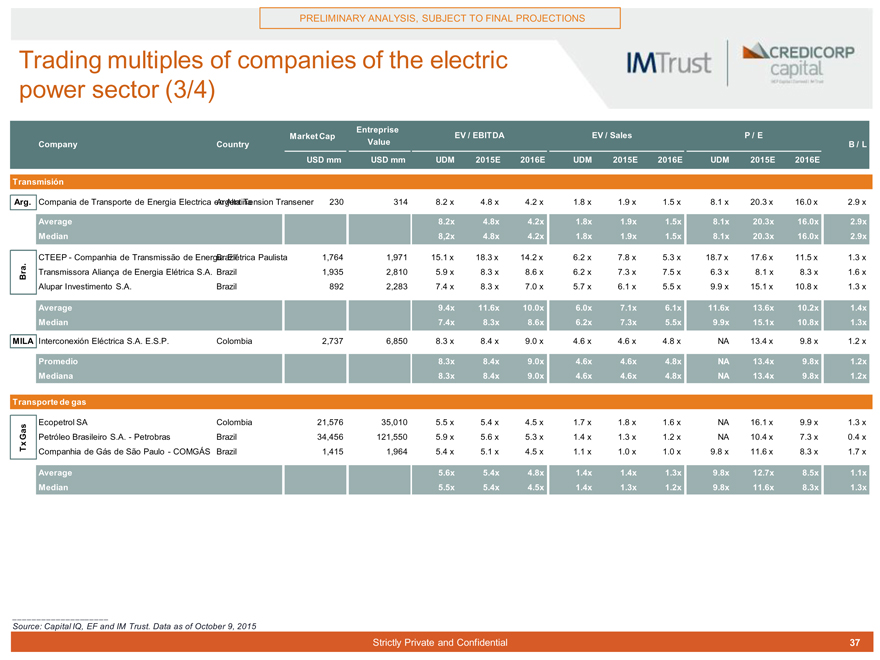
Trading multiples of companies of the electric power sector (3/4)
Entreprise
Market Cap EV / EBITDA EV / Sales P / E
Company Country Value B / L USD mm USD mm UDM 2015E 2016E UDM 2015E 2016E UDM 2015E 2016E
Transmisión
Arg. Compania de Transporte de Energia Electrica en Argentina Al a Tension Transener 230 314 8.2 x 4.8 x 4.2 x 1.8 x 1.9 x 1.5 x 8.1 x 20.3 x 16.0 x 2.9 x
Average 8.2x 4.8x 4.2x 1.8x 1.9x 1.5x 8.1x 20.3x 16.0x 2.9x Median 8,2x 4.8x 4.2x 1.8x 1.9x 1.5x 8.1x 20.3x 16.0x 2.9x
CTEEP—Companhia de Transmissão de Energia Brazil Elétrica Paulista 1,764 1,971 15.1 x 18.3 x 14.2 x 6.2 x 7.8 x 5.3 x 18.7 x 17.6 x 11.5 x 1.3 x Bra. Transmissora Aliança de Energia Elétrica S.A. Brazil 1,935 2,810 5.9 x 8.3 x 8.6 x 6.2 x 7.3 x 7.5 x 6.3 x 8.1 x 8.3 x 1.6 x Alupar Investimento S.A. Brazil 892 2,283 7.4 x 8.3 x 7.0 x 5.7 x 6.1 x 5.5 x 9.9 x 15.1 x 10.8 x 1.3 x
Average 9.4x 11.6x 10.0x 6.0x 7.1x 6.1x 11.6x 13.6x 10.2x 1.4x Median 7.4x 8.3x 8.6x 6.2x 7.3x 5.5x 9.9x 15.1x 10.8x 1.3x
MILA Interconexión Eléctrica S.A. E.S.P. Colombia 2,737 6,850 8.3 x 8.4 x 9.0 x 4.6 x 4.6 x 4.8 x NA 13.4 x 9.8 x 1.2 x
Promedio 8.3x 8.4x 9.0x 4.6x 4.6x 4.8x NA 13.4x 9.8x 1.2x Mediana 8.3x 8.4x 9.0x 4.6x 4.6x 4.8x NA 13.4x 9.8x 1.2x
Transporte de gas
Gas Ecopetrol SA Colombia 21,576 35,010 5.5 x 5.4 x 4.5 x 1.7 x 1.8 x 1.6 x NA 16.1 x 9.9 x 1.3 x Petróleo Brasileiro S.A.—Petrobras Brazil 34,456 121,550 5.9 x 5.6 x 5.3 x 1.4 x 1.3 x 1.2 x NA 10.4 x 7.3 x 0.4 x Tx Companhia de Gás de São Paulo—COMGÁS Brazil 1,415 1,964 5.4 x 5.1 x 4.5 x 1.1 x 1.0 x 1.0 x 9.8 x 11.6 x 8.3 x 1.7 x
Average 5.6x 5.4x 4.8x 1.4x 1.4x 1.3x 9.8x 12.7x 8.5x 1.1x Median 5.5x 5.4x 4.5x 1.4x 1.3x 1.2x 9.8x 11.6x 8.3x 1.3x
Source: Capital IQ, EF and IM Trust. Data as of October 9, 2015
Strictly Private and Confidential 37
|
PRELIMINARY ANALYSIS, SUBJECT TO FINAL PROJECTIONS
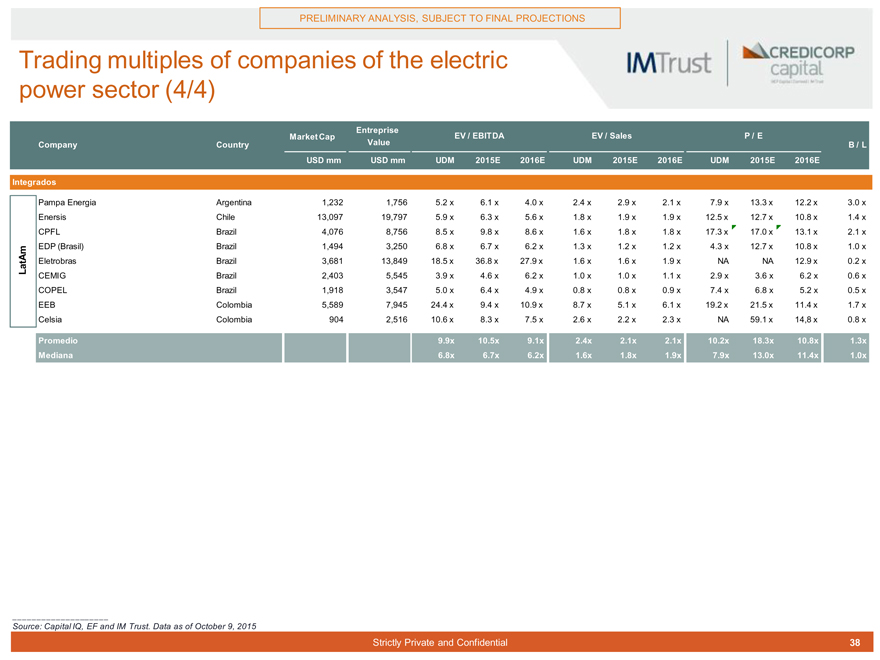
Trading multiples of companies of the electric power sector (4/4)
Entreprise
Market Cap EV / EBITDA EV / Sales P / E
Company Country Value B / L USD mm USD mm UDM 2015E 2016E UDM 2015E 2016E UDM 2015E 2016E
Integrados
Pampa Energia Argentina 1,232 1,756 5.2 x 6.1 x 4.0 x 2.4 x 2.9 x 2.1 x 7.9 x 13.3 x 12.2 x 3.0 x Enersis Chile 13,097 19,797 5.9 x 6.3 x 5.6 x 1.8 x 1.9 x 1.9 x 12.5 x 12.7 x 10.8 x 1.4 x CPFL Brazil 4,076 8,756 8.5 x 9.8 x 8.6 x 1.6 x 1.8 x 1.8 x 17.3 x 17.0 x 13.1 x 2.1 x EDP (Brasil) Brazil 1,494 3,250 6.8 x 6.7 x 6.2 x 1.3 x 1.2 x 1.2 x 4.3 x 12.7 x 10.8 x 1.0 x LatAm Eletrobras Brazil 3,681 13,849 18.5 x 36.8 x 27.9 x 1.6 x 1.6 x 1.9 x NA NA 12.9 x 0.2 x CEMIG Brazil 2,403 5,545 3.9 x 4.6 x 6.2 x 1.0 x 1.0 x 1.1 x 2.9 x 3.6 x 6.2 x 0.6 x COPEL Brazil 1,918 3,547 5.0 x 6.4 x 4.9 x 0.8 x 0.8 x 0.9 x 7.4 x 6.8 x 5.2 x 0.5 x EEB Colombia 5,589 7,945 24.4 x 9.4 x 10.9 x 8.7 x 5.1 x 6.1 x 19.2 x 21.5 x 11.4 x 1.7 x Celsia Colombia 904 2,516 10.6 x 8.3 x 7.5 x 2.6 x 2.2 x 2.3 x NA 59.1 x 14,8 x 0.8 x
Promedio 9.9x 10.5x 9.1x 2.4x 2.1x 2.1x 10.2x 18.3x 10.8x 1.3x Mediana 6.8x 6.7x 6.2x 1.6x 1.8x 1.9x 7.9x 13.0x 11.4x 1.0x
Source: Capital IQ, EF and IM Trust. Data as of October 9, 2015
Strictly Private and Confidential 38
|
PRELIMINARY ANALYSIS, SUBJECT TO FINAL PROJECTIONS
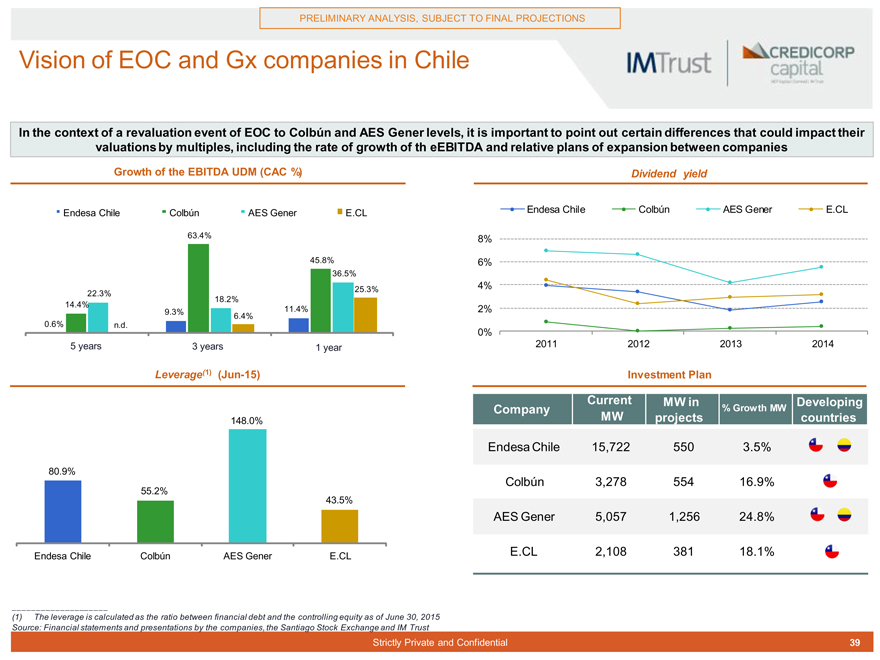
Vision of EOC and Gx companies in Chile
In the context of a revaluation event of EOC to Colbún and AES Gener levels, it is important to point out certain differences that could impact their valuations by multiples, including the rate of growth of th eEBITDA and relative plans of expansion between companies
Growth of the EBITDA UDM (CAC %) Dividend yield
Endesa Chile Colbún AES Gener E.CL Endesa Chile Colbún AES Gener E.CL
63.4% 8% 45.8% 6% 36.5% 25.3% 4% 22.3% 18.2% 14.4% 2% 9.3% 11.4% 0.6% n.d. 6.4%
0%
55 years años 33 years años 11 year año 2011 2012 2013 2014
Leverage(1) (Jun-15) Investment Plan
Current MW in Developing
Company % Growth MW
148.0% MW projects countries
Endesa Chile 15,722 550 3.5%
80.9%
Colbún 3,278 554 16.9%
55.2%
43.5%
AES Gener 5,057 1,256 24.8%
Endesa Chile Colbún AES Gener E.CL E.CL 2,108 381 18.1%
(1) The leverage is calculated as the ratio between financial debt and the controlling equity as of June 30, 2015 Source: Financial statements and presentations by the companies, the Santiago Stock Exchange and IM Trust
Strictly Private and Confidential 39
|
PRELIMINARY ANALYSIS, SUBJECT TO FINAL PROJECTIONS
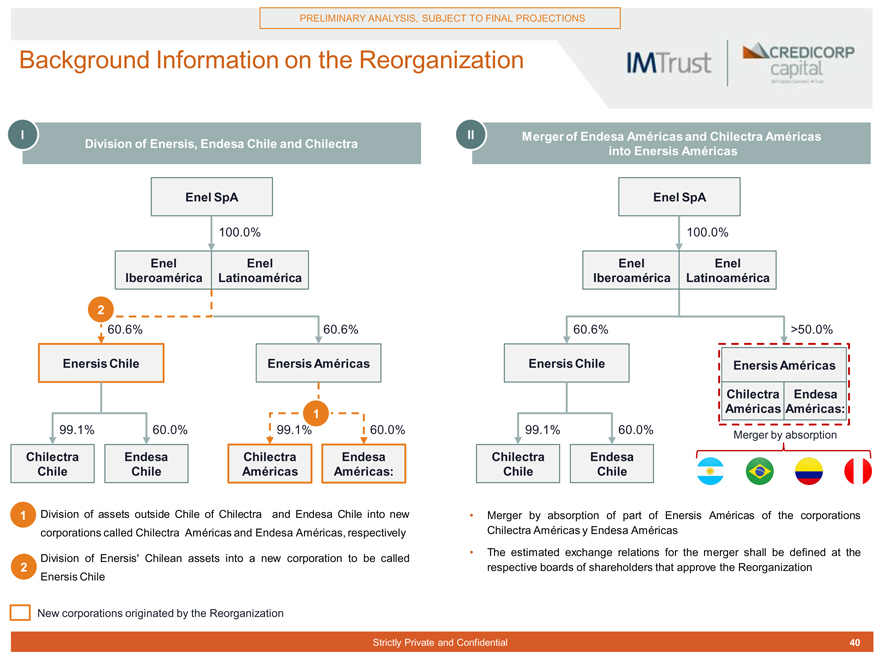
Background Information on the Reorganization
I II Merger of Endesa Américas and Chilectra Américas Division of Enersis, Endesa Chile and Chilectra into Enersis Américas
Enel SpA Enel SpA
100.0% 100.0%
Enel Enel Enel Enel Iberoamérica Latinoamérica Iberoamérica Latinoamérica
2 |
|
60.6% 60.6% 60.6% >50.0%
Enersis Chile Enersis Américas Enersis Chile Enersis Américas Chilectra Endesa
1 |
| Américas Américas: |
99.1% 60.0% 99.1% 60.0% 99.1% 60.0% Merger by absorption
Chilectra Endesa Chilectra Endesa Chilectra Endesa Chile Chile Américas Américas: Chile Chile
1. Division of assets outside Chile of Chilectra and Endesa Chile into new Merger by absorption of part of Enersis Américas of the corporations corporations called Chilectra Américas and Endesa Américas, respectively Chilectra Américas y Endesa Américas
The estimated exchange relations for the merger shall be defined at the
2. Division of Enersis’ Chilean assets into a new corporation to be called
2 |
| respective boards of shareholders that approve the Reorganization Enersis Chile |
New corporations originated by the Reorganization
Strictly Private and Confidential 40
|
PRELIMINARY ANALYSIS, SUBJECT TO FINAL PROJECTIONS
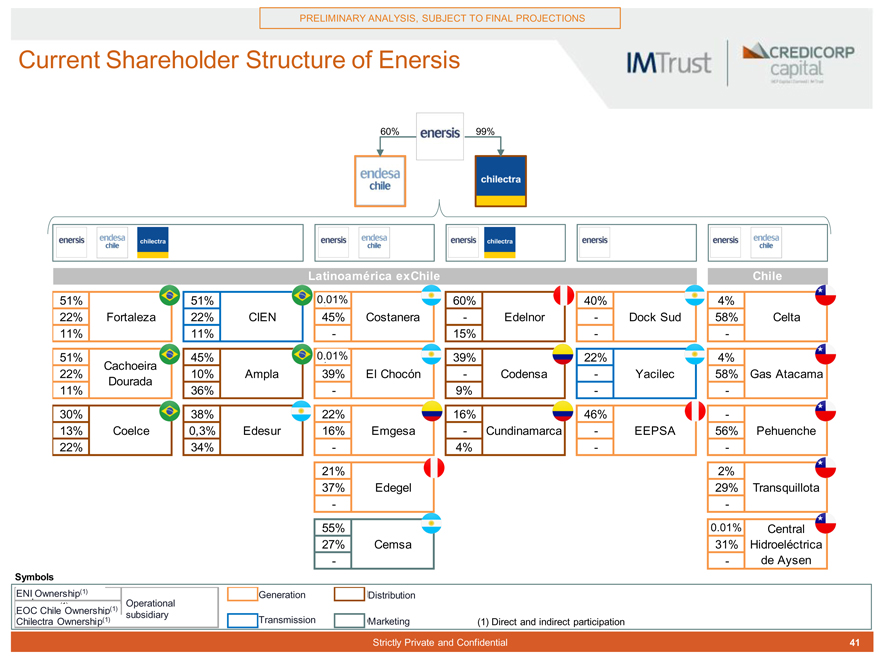
Current Shareholder Structure of Enersis
60% 99%
Latinoamérica exChile Chile
51% 51% 0. 0,01% 60% 40% 4%
22% Fortaleza 22% CIEN 45% Costanera—Edelnor—Dock Sud 58% Celta 11% 11%—15% —51% 45% 0. 0,01% 39% 22% 4% Cachoeira 22% 10% Ampla 39% El Chocón—Codensa—Yacilec 58% Gas Atacama Dourada 11% 36%—9% —30% 38% 22% 16% 46% -13% Coelce 0,3% Edesur 16% Emgesa—Cundinamarca—EEPSA 56% Pehuenche 22% 34%—4% —21% 2% 37% Edegel 29% Transquillota
—
55% 0, 0.01% Central 27% Cemsa 31% Hidroeléctrica
— de Aysen
Symbols
ENI Propiedad Ownership (1) ENI (1) Generation ación Distribution istribuc ón (1) Operational EOC Propiedad Chile Ownership EOC Chile (1) subsidiary
Chilectra Propiedad Ownership (1) Chilectra (1) Transmission ión Comercialización Marketing (1) Direct and indirect participation
Strictly Private and Confidential 41
|

PRELIMINARY ANALYSIS, SUBJECT TO FINAL PROJECTIONS
Santiago Office
Avenida Apoquindo 3721, Piso 9 Las Condes 7550177 Chile
+56 (2) 2450 1600