UNITED STATES
SECURITIES AND EXCHANGE COMMISSION
Washington, D.C. 20549
FORM N-CSR
CERTIFIED SHAREHOLDER REPORT OF REGISTERED
MANAGEMENT INVESTMENT COMPANIES
Investment Company Act file number | 811-23165 |
|
CION ARES DIVERSIFIED CREDIT FUND |
(Exact name of registrant as specified in charter) |
|
3 PARK AVENUE 36TH FLOOR NEW YORK, NEW YORK | | 10016 |
(Address of principal executive offices) | | (Zip code) |
|
Eric A. Pinero 3 Park Avenue, 36th Floor New York, New York 10016 |
(Name and address of agent for service) |
| | | |
Copy to:
Michael A. Reisner
Mark Gatto
CION Ares Management, LLC
3 Park Avenue, 36th Floor
New York, New York 10016 | | Richard Horowitz, Esq.
Matthew K. Kerfoot, Esq.
Dechert LLP
1095 Avenue of the Americas
New York, New York 10036 |
Registrant’s telephone number, including area code: | (646) 845-2577 | |
|
Date of fiscal year end: | October 31 | |
|
Date of reporting period: | October 31, 2019 | |
| | | | | |
Item 1. Report to Stockholders.


CION Ares Diversified Credit Fund
ANNUAL REPORT
OCTOBER 31, 2019
Beginning on January 1, 2021, as permitted by regulations adopted by the Securities and Exchange Commission, paper copies of the Fund's shareholder reports will no longer be sent by mail, unless you specifically request paper copies of the reports from the Fund or from your financial intermediary, such as a broker-dealer or bank. Instead, the reports will be made available on a website, and you will be notified by mail each time a report is posted and provided with a website link to access the report. If you already elected to receive shareholder reports electronically, you will not be affected by this change and you need not take any action. You may elect to receive shareholder reports and other communications from the Fund or your financial intermediary electronically by calling 888-729-4266 toll-free or by sending an e-mail request to CION Ares Diversified Credit Fund Investor Relations Department at ir@cioninvestments.com if you invest directly with the Fund, or by contacting your financial intermediary (such as a broker-dealer or bank) if you invest through your financial intermediary. Beginning on January 1, 2019, you may elect to receive all future reports in paper free of charge. You can inform the Fund or your financial intermediary that you wish to continue receiving paper copies of your shareholder reports by calling 888-729-4266 toll-free or by sending an e-mail request to CION Ares Diversified Credit Fund Investor Relations Department at ir@cioninvestments.com, or by contacting your financial intermediary. Your election to receive reports in paper will apply to all funds held in your account if you invest through your financial intermediary or all funds held with the fund complex if you invest directly with the Fund.
CION Ares Diversified Credit Fund
Letter to Shareholders | | | 2 | | |
Fund Profile & Financial Data | | | 5 | | |
Consolidated Schedule of Investments | | | 7 | | |
Consolidated Statement of Assets and Liabilities | | | 41 | | |
Consolidated Statement of Operations | | | 43 | | |
Consolidated Statements of Changes in Net Assets | | | 44 | | |
Consolidated Statement of Cash Flows | | | 46 | | |
Financial Highlights | | | 48 | | |
Notes to Consolidated Financial Statements | | | 54 | | |
Proxy & Portfolio Information | | | 78 | | |
Dividend Reinvestment Plan | | | 79 | | |
Corporate Information | | | 84 | | |
Privacy Notice | | | 85 | | |
Trustees and Executive Officers | | | 86 | | |
Annual Report 2019
CION Ares Diversified Credit Fund

Letter to Shareholders
October 31, 2019
Fellow Shareholders,
We are pleased to present the semi-annual report for the CION Ares Diversified Credit Fund (the "Fund"), for the period ending October 31, 2019.
We are also proud to report on the growth and performance of the Fund, having reached $629 million in total managed assets and achieved a 6.3% annualized return since inception with a current yield of 7.4% as of October 31, 2019.1 As of period-end, the Fund had 360 total investments, spread across more than 20 unique industries. Floating rate instruments accounted for 94% of the Fund and more than 50% of the Fund was deployed in investments directly originated by the investment advisor. The Fund has continued to gain traction with investors, and we are pleased to announce that the Fund has now launched on multiple platforms nationwide, which has led to strong asset growth.
Investment Philosophy and Process
The Fund remains focused on seeking to deliver attractive risk-adjusted returns for our shareholders across market cycles by utilizing a flexible strategy to invest in a diversified pool of liquid and illiquid credit instruments. We believe the optimal investment strategy for non-investment grade credit is an actively managed portfolio that encompasses a broad spectrum of credit asset classes including high yield bonds, leveraged loans, structured credit, real estate debt, and direct lending in the United States and Europe. We believe unconstrained flexibility within a single portfolio affords investors an opportunity to capitalize on inefficiencies and dislocations across the credit universe and capture the best relative value.
The process by which the Fund's investments are selected is rigorous. The Fund's Advisor, CION Ares Management ("CAM" or the "Advisor"), leveraging the resources of the broader Ares platform, conducts ongoing proprietary analysis at the asset-class level to compare current market conditions with historical and industry-level precedents to examine the rate environment, correlation to public markets, and local/regional risks. This information is brought before the 15-member investment allocation committee in semimonthly meetings, where senior members in each of the underlying asset classes within the Ares Credit Group share their observations with the Advisor's portfolio managers.
Investment Environment2
Throughout 2019 global capital markets have fared well following a swift recovery at the outset of the year after the dislocation during 4Q'18. The reversal in Federal Reserve ("Fed") policy, positive corporate earnings growth and optimism surrounding a resolution to global trade disputes led to a sustained market tailwind into the second and third quarters of 2019 (albeit more muted than the first quarter). However, in the latter half of the year, investors continued to grapple with renewed recession fears following concerns over slowing global economic growth and the inversion of the 2- and 10-Year Treasury yields. While these developments contributed to bouts of episodic volatility, accommodative global Central Banks and a renewed "hunt for yield" mentality amongst investors drove positive returns across capital markets. As a result, high yield markets in the U.S. and Europe have exhibited robust year-to-date returns of 11.76% and 9.12% through October month-end, receptively. Despite technical headwinds facing the floating rate asset class, leveraged loans have also demonstrated attractive absolute returns, notching year-to-date totals of 5.87% and 3.82% in the U.S. and Europe, respectively.
Specific to the U.S. markets, cracks have started to appear in the strength of the economy surrounding its resiliency amid prolonged trade tensions with China. A seemingly direct outcome of the continued negotiations has been the recent decline in U.S. manufacturing as the ISM index reported its September reading of 47.8%. The September output was the lowest since June 2009 and the second consecutive month of contraction as new exports sunk to 41%, the lowest reading in over 10 years. This macroeconomic backdrop has certainly impacted the leveraged credit markets in the U.S., as investors continue to demonstrate risk-off behavior with higher quality assets outperforming their lower tier counterparts. Consequently, the BB-rated segments of the high yield and leveraged loan markets have outperformed the CCC cohort. Bifurcation was also accentuated on a single-name basis with the market broadly punishing any issuers that missed earnings. This was exacerbated in the loan market with loan-only capital structures facing particularly punitive outcomes alongside several idiosyncratic credit events (i.e. McDermott). As a result, the CLO market began to experience turbulence with middle and lower tier managers suffering mark-downs in par. Spreads in mezzanine tranches began to widen and challenging CLO arbitrage curtailed new issue in the market. Moreover, a lack of two-way trading in CLO equity caused
Annual Report 2019
2
CION Ares Diversified Credit Fund
Letter to Shareholders (continued)
October 31, 2019
a meaningful widening in bid-ask spreads and underperformance across this asset class despite healthy cash pay throughout the latter half of the year. New issuance has been characterized by sloppy outcomes with syndicate banks pushing nontraditional structures, as well as increased manager tiering down the capital stack. Nonetheless, CLO formation year-to-date is only modestly lagging totals for the same period in 2018.3 Notably, CLO debt and equity markets began to recover in late October and into November alongside broader market tailwinds as we head into the final stretch of the year.
In Europe, slowing economic growth reared its ugly head early in 2019. As of October, Euro-area economic growth is expected to slow to 1.1% this year from 1.9% in 2018, which would result in its worst performance in six years, if forecasts materialize. The outlook for the Eurozone economy recently took another hit as confidence in industry dropped to its lowest in six years, reflecting the impact of trade uncertainty and worsening unease related to Brexit. With both Germany and Italy teetering on the precipice of recession, Mario Draghi, former President of the European Central Bank ("ECB"), has stepped in to reinstitute a new stimulus program. Most recently, the ECB cut the deposit rate another 10 bps to -0.50% in September and resumed quantitative easing ("QE") in November, with a commitment to continue QE into the foreseeable future. Owing to an increasingly dovish stance from the ECB coupled with approximately 40% of the European investment grade market generating negative yields, a steady flow of demand for high yield stemming from traditional IG buyers has driven strong performance in the higher quality segment of the market. Accordingly, European high yield funds have notched net inflows of €6.6 billion year-to-date through October. This is a marked difference relative to YTD 2018, where the high yield market reported net outflows of €6.7 billion. Similarly, the European leveraged loan market has demonstrated price stability amid muted supply (decrease of -30% compared to 2018 primary volumes) and steady demand from healthy CLO issuance (€26.2 billion year-to-date, up 12% year-over-year).4 Anecdotally, we continue to see robust demand for European leveraged loans through new SMA formation from institutional investors. As a result of this backdrop, we believe European leveraged loans are poised to demonstrate attractive returns through the remainder of the year.
With equity markets at all-time highs and resilient third quarter corporate earnings, we believe capital markets will remain stable into year-end with the potential for a "Santa Claus Rally". We expect many investors will be cautious and seek to protect strong year-to-date gains, potentially limiting both activity and liquidity in credit markets toward the end of the year. Looking ahead into 2020, more bouts of volatility are expected, particularly around the elections in the U.S., which should cause further sector and single-name dispersion. We believe this type of uncertain environment will create ample opportunities for bottom-up, fundamental active managers to uncover value. Specific to the Fund, we remain strategically focused on high-quality, floating rate assets in defensive sectors and will continue to increase our exposure to directly originated loans in the U.S. and Europe given the yield premium in those markets today. With CLO debt and equity still trading wide of historical levels, we will continue to swap into high quality paper on the margin. Owing to its flexible investment strategy, we believe the Fund offers a compelling combination of yield, diversification, and a level of downside protection. We maintain strong conviction in the current portfolio positioning and believe we will generate attractive risk-adjusted returns going forward.
Summary
The second and third quarters of 2019 were initially marked by an inversion of the yield curve and continued worry over trade. The beginning of a round of Fed rate cutting — termed by the Fed as a "mid-cycle correction" — did not initially outweigh recession fears, but hopeful news on trade and Fed messaging around further rate cuts led to record equity market performance through October. As the year closes, with volatility increasing and the Fed indicating it has paused, investors are again questioning the sustainability of the extended equity rally.
The credit markets continue to be an important source of stable income, and investors are beginning to value investments that have lower correlation to other assets in their portfolios. Against this backdrop, we believe our strategy, driven by our ability to dynamically allocate capital across credit sectors and geographies, is well situated to seek attractive risk-adjusted returns for our shareholders. We are pleased with the ongoing construction of the Fund's diversified portfolio and our resilient performance in the face of market headwinds. With eyes ahead to the beginning of a new decade, our Advisor will continue to leverage its position as a global leader in the liquid and illiquid credit markets to identify attractive investment opportunities in line with the stated objective of the Fund.
Annual Report 2019
3
CION Ares Diversified Credit Fund
Letter to Shareholders (continued)
October 31, 2019
We thank you for your investment in and continued support of CION Ares Diversified Credit Fund.
Sincerely,


Mark Gatto Michael A. Reisner
Co-CEO Co-CEO
CION Ares Management CION Ares Management
Views expressed are those of CION Ares Management as of the date of this communication, are subject to change at any time, and may differ from the views of other portfolio managers or of Ares as a whole. Although these views are not intended to be a forecast of future events, a guarantee of futures results, or investment advice, any forward-looking statements are not reliable indicators of future events and no guarantee is given that such activities will occur as expected or at all. Information contained herein has been obtained from sources believed to be reliable, but the accuracy and completeness of the information cannot be guaranteed. CION Ares Management does not undertake any obligation to publicly update or review any forward-looking information, whether as a result of new information, future developments or otherwise, except as required by law. All investments involve risk, including possible loss of principal. Past performance is not indicative of future results.
CION Securities, LLC ("CSL") is the wholesale marketing agent for CION Ares Diversified Credit Fund ("CADC" or the "Fund"), advised by CION Ares Management, LLC ("CAM") and distributed by ALPS Distributors, Inc ("ADI"). CSL, member FINRA, and CAM are not affiliated with ADI, member FINRA. Certain Ares fund securities may be offered through its affiliate, Ares Investor Services LLC ("AIS"), a broker-dealer registered with the SEC, and a member of FINRA and SIPC.
REF: CP-00369
1 Past performance is not indicative of future results. Portfolio characteristics of CADC are as of October 31, 2019 and are subject to change. Performance show here is the A-Share Class. The A-Share was incepted on January 26, 2017. Return shown here does not reflect the 5.75% front-load charge. Including this charge returns are 4.02% since inception.
2 Bank loan returns are represented by the Credit Suisse Leveraged Loan Index (CSLLI) and the Credit Suisse Western European Leveraged Loan Index (WELLI). High yield returns are represented by the ICE BofAML High Yield Master II index (H0A0) and the ICE BofAML European Currency High Yield Constrained Index (HPC0).
3 Source: JPMorgan High Yield Bond and Leveraged Loan Market Monitor
4 Source: S&P LCD
Annual Report 2019
4
CION Ares Diversified Credit Fund
Fund Fact Sheet — As of October 31, 2019
CLASS A CADEX | CLASS C CADCX | CLASS I CADUX
CLASS L CADWX | CLASS U CADZX | CLASS W CADFX
FUND OVERVIEW
CION Ares Diversified Credit Fund (CADC) is a diversified, unlisted closed-end management investment company registered under the 1940 Act as an interval fund. The Fund will seek to capitalize on market inefficiencies and relative value opportunities by dynamically allocating a portfolio of directly originated loans, secured floating and fixed rate syndicated loans, corporate bonds, asset-backed securities, commercial real estate loans and other types of credit instruments which, under normal circumstances, will represent at least 80% of the Fund's assets.
Fixed vs. Floating Rate

Excludes cash, other net assets and equity instruments.
KEY FACTS
CLASS A INCEPTION | | 1/26/2017 | |
CLASS C INCEPTION | | 7/12/2017 | |
CLASS I INCEPTION | | 7/12/2017 | |
CLASS L INCEPTION | | 11/2/2017 | |
CLASS U INCEPTION | | 7/25/2019 | |
CLASS W INCEPTION | | 12/4/2018 | |
TOTAL MANAGED ASSETS* | | | ~$629M | | |
TOTAL ISSUES | | | 360 | | |
DISTRIBUTIONS1 | | Monthly | |
CURRENT DISTRIBUTION
RATE2 | | | 5.47 | % | |
CLASS A SHARPE
RATIO (ANNUALIZED) | | | 1.91 | | |
CLASS A STANDARD
DEVIATION | | | 2.28 | % | |
CLASS C SHARPE
RATIO (ANNUALIZED) | | | 1.79 | | |
CLASS C STANDARD
DEVIATION | | | 2.47 | % | |
CLASS I SHARPE
RATIO (ANNUALIZED) | | | 1.78 | | |
CLASS I STANDARD
DEVIATION | | | 2.48 | % | |
CLASS L SHARPE
RATIO (ANNUALIZED) | | | 1.49 | | |
CLASS L STANDARD
DEVIATION | | | 2.62 | % | |
CLASS U SHARPE
RATIO (ANNUALIZED) | | | N/A | | |
CLASS U STANDARD
DEVIATION | | | N/A | | |
CLASS W SHARPE
RATIO (ANNUALIZED) | | | N/A | | |
CLASS W STANDARD
DEVIATION | | | N/A | | |
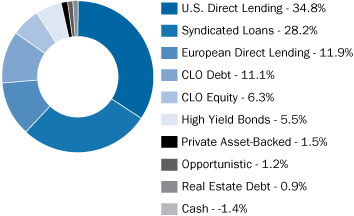
Portfolio Allocation*
Allocation by Asset Type
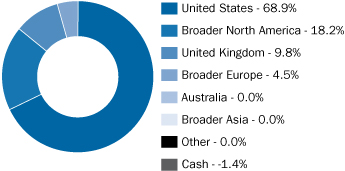
Allocation by Geography
Top 10 Holdings* % of Portfolio
True Potential Group Limited | | | 1.7 | % | |
Nelipak Holding Company | | | 1.6 | % | |
Bearcat Buyer, Inc. | | | 1.4 | % | |
DFC Global Facility Borrower III LLC | | | 1.2 | % | |
Reddy Ice LLC | | | 1.2 | % | |
Capnor Connery Holdco A/S | | | 1.2 | % | |
Cheyenne Petroleum Company Limited Partnership | | | 1.1 | % | |
Immucor, Inc. | | | 1.1 | % | |
Blackwood Midco Limited | | | 1.1 | % | |
Old Oak Holdings Limited | | | 1.0 | % | |
Allocation by Industry* % of Portfolio
Structured Products (CLOs & Private ABS) | | | 19.5 | % | |
Healthcare | | | 13.8 | % | |
Financial | | | 13.1 | % | |
Service | | | 10.9 | % | |
Information Technology | | | 9.7 | % | |
Energy | | | 5.1 | % | |
Gaming/Leisure | | | 4.1 | % | |
Food/Tobacco | | | 3.1 | % | |
Other | | | 22.0 | % | |
Cash | | | -1.4 | % | |
* Holdings and allocations, unless otherwise indicated, are based on the total managed assets and subject to change without notice. Total managed assets is defined as the total assets (including any assets attributable to financial leverage) minus accrued liabilities (other than debt representing financial leverage). Data shown is for informational purposes only and not a recommendation to buy or sell any security.
Annual Report 2019
5
CION Ares Diversified Credit Fund
Fund Fact Sheet — As of October 31, 2019 (continued)
CLASS A CADEX | CLASS C CADCX | CLASS I CADUX
CLASS L CADWX | CLASS U CADZX | CLASS W CADFX
MANAGEMENT TEAM
• Mitch Goldstein, Co-Head of Ares Credit Group | 25 Years of Experience
• Greg Margolies, Head of Markets, Ares Management | 31 Years of Experience
• CADC's allocation committee consists of an additional 13 members, averaging nearly 25 years of experience.
ABOUT CION INVESTMENTS
CION Investments is a leading manager of investment solutions designed to redefine the way individual investors can build their portfolios and help meet their long-term investment goals. With more than 30 years of experience in the alternative asset management industry, CION strives to level the playing field. CION currently manages CION Investment Corporation, a leading non-traded BDC, and sponsors, through CION Ares Management, CION Ares Diversified Credit Fund, a globally diversified interval fund.
ABOUT ARES MANAGEMENT
Ares Management Corporation (Ares) is a publicly traded, leading global alternative asset manager with approximately $144 billion of assets under management* and approximately 1,000 employees. Ares seeks to deliver attractive performance to its investors across its investment groups and strategies, including credit (high yield bonds, syndicated loans, alternative credit, and direct lending in the U.S. and Europe), private equity (corporate private equity, special opportunities, energy opportunities, and infrastructure and power) and real estate (equity and debt). The firm is headquartered in Los Angeles with offices across the United States, Europe, Asia, and Australia. Its common units are traded on the New York Stock Exchange under the ticker symbol "ARES".
* As of September 30, 2019, AUM amounts include funds managed by Ivy Hill Asset Management, L.P., a wholly owned portfolio company of Ares Capital Corporation and a registered investment advisor.
RISK DISCLOSURES & GLOSSARY
Risks and limitations include, but are not limited to, the following: investment instruments may be susceptible to economic downturns; most of the underlying credit instruments are rated below investment grade and considered speculative; there is no guarantee all shares can be repurchased; the Fund's business and operations may be impacted by fluctuations in the capital markets; the Fund is a diversified, closed-end investment company with limited operating history; diversification does not eliminate the risk of investment losses.
Sharpe Ratio — a risk-adjusted measure that measures reward per unit of risk. The higher the Sharpe Ratio, the better. The numerator is the difference between a portfolio's return and the return of a risk-free instrument. The denominator is the portfolio's standard deviation.
Standard Deviation — a widely used measure of an investment's performance volatility. Standard deviation shows how much variation from the mean exists with a larger number indicating the data points are more spread out over a larger range of values.
1 Monthly Distributions — There is no assurance monthly distributions paid by the fund will be maintained at the targeted level or paid at all.
2 Current Distribution Rate — Current distribution rate is expressed as a percentage equal to the projected annualized distribution amount (which is calculated by annualizing the current cash distribution per share without compounding), divided by the current net asset value. The current distribution rate shown may be rounded.
A portion of distributions may be a direct result of expense support payments provided by CION Ares Management, LLC (CAM), which are subject to repayment by CADC within three years. The purpose of this arrangement is to ensure that CADC bears an appropriate level of expenses. Any such distributions may not be entirely based on investment performance and can only be sustained if positive investment performance is achieved in future periods and/or CAM continues to make such expense support payments. Future repayments will reduce cash otherwise potentially available for distributions. There can be no assurance that such performance will be achieved in order to sustain these distributions. CAM has no obligation to provide expense support payments in future periods.
CADC may fund distributions from unlimited amounts of offering proceeds or borrowings, which may constitute a return of capital, as well as net income from operations, capital and non-capital gains from the sale of assets, dividends or distributions from equity investments and expense support payments from CAM, which are subject to repayment. For the year ending October 31, 2018, distributions were paid from taxable income and did not include a return of capital for tax purposes. It is not anticipated that the current distribution rate will contain a return of capital. If expense support payments from CAM were not provided, some or all of the distributions may have been a return of capital which would reduce the available capital for investment. The sources of distributions may vary periodically. Please refer to the semi-annual or annual reports filed with the SEC for the sources of distributions.
This is neither an offer to sell nor a solicitation to purchase the securities described herein. An offering is made only by the prospectus which must precede or accompany this piece. Please read the prospectus prior to making any investment decision and consider the risks, charges, expenses and other important information described therein. Additional copies of the prospectus may be obtained by contacting CION Securities at 800.435.5697 or by visiting cioninvestments.com.
Please be aware that the Fund, the Advisers, the Distributor or the Wholesale Marketing Agent and their respective officers directors, employees and affiliates do not undertake to provide impartial investment advice or to give advice in a Fiduciary capacity in connection with the Fund's public offering of shares.
CION Securities, LLC (CSL) is the wholesale marketing agent for CION Ares Diversified Credit Fund, advised by CION Ares Management, LLC (CAM) and distributed by ALPS Distributors, Inc (ADI). CSL, member FINRA, and CAM are not affiliated with ADI, member FINRA.
Annual Report 2019
6
CION Ares Diversified Credit Fund
Consolidated Schedule of Investments
October 31, 2019
Senior Loans 101.0%(b)(c)(d)
| | | Principal
Amount | | Value(a) | |
Aerospace & Defense 1.3% | |
B.C. Unlimited Liability Co., Initial
1st Lien Term Loan B-2, (Canada),
3M LIBOR + 4.00%,
6.10%, 04/06/2026 | | $ | 206,582 | | | $ | 206,874 | | |
Dynasty Acquisition Co., Inc., Initial
1st Lien Term Loan B-1,
3M LIBOR + 4.00%,
6.10%, 04/06/2026 | | | 384,243 | | | | 384,785 | | |
Radius Aerospace, Inc., Initial
1st Lien Term Loan,
3M LIBOR + 5.75%,
7.85%, 03/29/2025(e)(f)(h) | | | 2,558,571 | | | | 2,532,986 | | |
Radius Aerospace, Inc.,
1st Lien Revolver,
6M LIBOR + 5.75%,
7.97%, 03/29/2025(e)(g)(h) | | | 428,571 | | | | 124,286 | | |
SecurAmerica, LLC, 1st Lien
Delayed Draw Term Loan A,
1M LIBOR + 6.75%,
8.54%, 12/21/2023(e)(g)(h) | | | 620,118 | | | | 479,148 | | |
SecurAmerica, LLC, 1st Lien
Delayed Draw Term Loan B,
1M LIBOR + 6.75%,
8.57%, 12/21/2023(e)(h) | | | 111,740 | | | | 111,740 | | |
SecurAmerica, LLC, 1st Lien
Delayed Draw Term Loan C,
L + 6.75%, 12/21/2023(e)(g)(h) | | | 573,057 | | | | — | | |
SecurAmerica, LLC, 1st Lien
Revolver A, 1M LIBOR + 3.00%,
5.09%, 06/21/2023(e)(g)(h) | | | 1,000 | | | | 562 | | |
SecurAmerica, LLC, 1st Lien
Term Loan, 1M LIBOR + 6.75%,
8.55%, 12/21/2023(e)(f)(h) | | | 1,658,882 | | | | 1,658,882 | | |
Sequa Mezzanine Holdings, LLC,
Initial 1st Lien Term Loan,
3M LIBOR + 5.00%,
7.19%, 11/28/2021 | | | 386,768 | | | | 381,128 | | |
| | | | | | 5,880,391 | | |
Automotive 2.5% | |
GB Auto Service, Inc., 1st Lien
Delayed Draw Term Loan,
1M LIBOR + 6.00%,
7.79%, 10/19/2024(e)(g)(h) | | | 1,661,038 | | | | 1,483,260 | | |
GB Auto Service, Inc.,
1st Lien Revolver,
L + 6.00%, 10/19/2024(e)(g)(h) | | | 111,111 | | | | — | | |
Senior Loans(b)(c)(d) (continued)
| | | Principal
Amount | | Value(a) | |
GB Auto Service, Inc.,
1st Lien Term Loan A,
1M LIBOR + 6.00%,
7.80%, 10/19/2024(e)(f)(h) | | $ | 1,210,000 | | | $ | 1,210,000 | | |
Navistar, Inc., Tranche 1st Lien
Term Loan B, 1M LIBOR + 3.50%,
5.42%, 11/06/2024 | | | 1,714,299 | | | | 1,693,950 | | |
Panther BF Aggregator 2, LP, Initial
1st Lien Term Loan B,
1M LIBOR + 3.50%,
5.30%, 04/30/2026 | | | 1,631,188 | | | | 1,607,406 | | |
Truck Hero, Inc., Initial 1st Lien
Term Loan, 1M LIBOR + 3.75%,
5.54%, 04/22/2024 | | | 386,051 | | | | 353,429 | | |
Wand NewCo 3, Inc., Initial
1st Lien Term Loan,
1M LIBOR + 3.50%,
5.29%, 02/05/2026 | | | 2,509,621 | | | | 2,517,777 | | |
Wand NewCo 3, Inc., Initial
2nd Lien Term Loan,
1M LIBOR + 7.25%,
9.04%, 02/05/2027(e)(f)(h) | | | 3,000,000 | | | | 3,000,000 | | |
| | | | | | 11,865,822 | | |
Banking, Finance, Insurance & Real Estate 16.9% | |
A.U.L. Corp., 1st Lien Revolver,
L + 5.00%, 06/05/2023(e)(g)(h) | | | 1,000 | | | | — | | |
A.U.L. Corp., Initial 1st Lien
Term Loan, 1M LIBOR + 4.50%,
6.31%, 06/05/2023(e)(f)(h) | | | 42,070 | | | | 42,070 | | |
Acrisure, LLC, 1st Lien
Term Loan B, 3M LIBOR + 3.75%,
5.85%, 11/22/2023 | | | 613,098 | | | | 595,214 | | |
Alliant Holdings Intermediate, LLC,
1st Lien Term Loan B,
1M LIBOR + 3.25%,
5.17%, 05/09/2025 | | | 1,496,902 | | | | 1,469,958 | | |
Amynta Agency Borrower, Inc.,
1st Lien Incremental Term Loan B,
1M LIBOR + 4.50%,
6.29%, 02/28/2025(e)(f)(h) | | | 2,969,931 | | | | 2,895,682 | | |
AQ Sunshine, Inc., 1st Lien
Delayed Draw Term Loan,
L + 5.50%, 04/15/2025(e)(g)(h) | | | 211,557 | | | | (2,782 | ) | |
AQ Sunshine, Inc., Initial 1st Lien
Revolver, 3M LIBOR + 5.50%,
7.61%, 04/15/2024(e)(g)(h) | | | 136,423 | | | | 65,483 | | |
AQ Sunshine, Inc., Initial 1st Lien
Term Loan, 3M LIBOR + 5.50%,
7.60%, 04/15/2025(e)(f)(h) | | | 1,149,372 | | | | 1,126,384 | | |
Annual Report 2019
7
CION Ares Diversified Credit Fund
Consolidated Schedule of Investments (continued)
October 31, 2019
Senior Loans(b)(c)(d) (continued)
| | | Principal
Amount | | Value(a) | |
AQ Sunshine, Inc., Initial 1st Lien
Term Loan, 3M LIBOR + 5.50%,
7.60%, 04/15/2025(e)(h) | | $ | 247,299 | | | $ | 242,353 | | |
Asurion, LLC, 1st Lien
Term Loan B-4, 1M LIBOR + 3.00%,
4.79%, 08/04/2022 | | | 140,426 | | | | 140,451 | | |
Asurion, LLC, 1st Lien
Term Loan B-7, 1M LIBOR + 3.00%,
4.79%, 11/03/2024 | | | 595,764 | | | | 596,140 | | |
Asurion, LLC, 2nd Lien
Term Loan B-2, 1M LIBOR + 6.50%,
8.29%, 08/04/2025 | | | 884,056 | | | | 887,592 | | |
Asurion, LLC, Replacement 1st Lien
Term Loan B-6, 1M LIBOR + 3.00%,
4.79%, 11/03/2023 | | | 2,452,219 | | | | 2,454,843 | | |
Blackhawk Network Holdings, Inc.,
1st Lien Term Loan B,
1M LIBOR + 3.00%,
4.79%, 06/15/2025 | | | 1,925,345 | | | | 1,906,092 | | |
Blackhawk Network Holdings, Inc.,
2nd Lien Term Loan,
1M LIBOR + 7.00%,
8.94%, 06/15/2026 | | | 150,000 | | | | 149,532 | | |
Blackwood Bidco, Ltd., Facility
1st Lien Term Loan B-1, (Great Britain),
6M GBP LIBOR + 6.92%,
7.73%, 10/07/2026(e)(f)(h) | | £ | 2,782,609 | | | | 3,600,279 | | |
Blackwood Bidco, Ltd., Facility
1st Lien Term Loan B-1, (Great Britain),
6M LIBOR + 6.92%,
8.87%, 10/07/2026(e)(f)(h) | | $ | 3,473,530 | | | | 3,473,530 | | |
Blue Angel Buyer 1, LLC, 1st Lien
Delayed Draw Term Loan,
Prime + 3.00%,
7.75%, 01/02/2025(e)(g)(h) | | | 642,398 | | | | 53,961 | | |
Blue Angel Buyer 1, LLC,
1st Lien Revolver,
L + 4.00%, 01/02/2024(e)(g)(h) | | | 321,199 | | | | — | | |
Blue Angel Buyer 1, LLC, Initial
1st Lien Term Loan,
1M LIBOR + 4.00%,
6.01%, 01/02/2025(e)(f)(h) | | | 2,026,221 | | | | 2,026,221 | | |
Brookfield Property REIT, Inc.,
Initial 1st Lien Term Loan B,
1M LIBOR + 2.50%,
4.29%, 08/27/2025 | | | 1,199,289 | | | | 1,179,057 | | |
Focus Financial Partners, LLC,
Tranche 1st Lien Term Loan B-2,
1M LIBOR + 2.50%,
4.29%, 07/03/2024 | | | 704,100 | | | | 704,600 | | |
Senior Loans(b)(c)(d) (continued)
| | | Principal
Amount | | Value(a) | |
Forest City Enterprises, LP, Initial
1st Lien Term Loan B,
1M LIBOR + 4.00%,
5.79%, 12/08/2025 | | $ | 2,931,379 | | | $ | 2,945,303 | | |
Foundation Risk Partners Corp.,
1st Lien 1st Amendment
Delayed Draw Term Loan,
3M LIBOR + 4.75%,
6.85%, 11/10/2023(e)(g)(h) | | | 793,896 | | | | 792,407 | | |
Foundation Risk Partners Corp.,
1st Lien 1st Amendment Term Loan,
3M LIBOR + 4.75%,
6.85%, 11/10/2023(e)(f)(h) | | | 633,796 | | | | 633,796 | | |
Foundation Risk Partners Corp.,
1st Lien 2nd Amendment
Delayed Draw Term Loan,
3M LIBOR + 4.75%,
6.88%, 11/10/2023(e)(g)(h) | | | 3,245,297 | | | | 2,198,913 | | |
Foundation Risk Partners Corp.,
1st Lien Delayed Draw Term Loan,
3M LIBOR + 4.75%,
6.85%, 11/10/2023(e)(f)(h) | | | 140,515 | | | | 140,515 | | |
Foundation Risk Partners Corp.,
1st Lien Revolver,
1M LIBOR + 4.75%,
6.79%, 11/10/2023(e)(g)(h) | | | 3,000 | | | | 800 | | |
Foundation Risk Partners Corp.,
1st Lien Term Loan,
3M LIBOR + 4.75%,
6.85%, 11/10/2023(e)(f)(h) | | | 622,562 | | | | 622,562 | | |
Foundation Risk Partners Corp.,
2nd Lien 1st Amendment
Delayed Draw Term Loan,
3M LIBOR + 8.50%,
10.60%, 11/10/2024(e)(h) | | | 292,900 | | | | 292,900 | | |
Foundation Risk Partners Corp.,
2nd Lien 1st Amendment Loan,
3M LIBOR + 8.50%,
10.60%, 11/10/2024(e)(h) | | | 264,795 | | | | 264,795 | | |
Foundation Risk Partners Corp.,
2nd Lien 2nd Amendment
Delayed Draw Term Loan,
3M LIBOR + 8.50%,
10.63%, 11/10/2024(e)(g)(h) | | | 1,007,133 | | | | 592,826 | | |
Foundation Risk Partners Corp.,
2nd Lien Term Loan,
3M LIBOR + 8.50%,
10.60%, 11/10/2024(e)(h) | | | 221,778 | | | | 221,778 | | |
Foundation Risk Partners, Corp.,
1st Lien 3rd Amendment
Delayed Draw Term Loan,
L + 4.75%, 11/10/2023(e)(g)(h) | | | 1,259,713 | | | | — | | |
Annual Report 2019
8
CION Ares Diversified Credit Fund
Consolidated Schedule of Investments (continued)
October 31, 2019
Senior Loans(b)(c)(d) (continued)
| | | Principal
Amount | | Value(a) | |
Foundation Risk Partners, Corp.,
2nd Lien 3rd Amendment
Delayed Draw Term Loan,
L + 8.50%, 11/10/2024(e)(g)(h) | | $ | 720,610 | | | $ | — | | |
Gulf Finance, LLC, Tranche B
1st Lien Term Loan,
3M LIBOR + 5.25%,
7.29%, 08/25/2023 | | | 199,000 | | | | 145,395 | | |
Hammersmith Bidco, Ltd.,
Facility 1st Lien Term Loan B,
(Great Britain),
1M GBP LIBOR + 7.44%,
8.15%, 09/02/2026(e)(f)(h) | | £ | 4,112,437 | | | | 5,320,877 | | |
Hammersmith Bidco, Ltd.,
Acquisition Capex Facility 1st Lien
Term Loan, (Great Britain),
L + 7.44%, 09/02/2026(e)(g)(h) | | | 1,678,545 | | | | 39,411 | | |
Hub International, Ltd., 1st Lien
Incremental Term Loan B,
L + 4.00%, 04/25/2025(i) | | $ | 1,113,861 | | | | 1,111,634 | | |
Leo Bidco, Ltd., Facility 1st Lien
Term Loan B, (Great Britain),
3M GBP LIBOR + 6.25%,
7.08%, 03/30/2026(e)(f)(h) | | £ | 500,000 | | | | 646,925 | | |
London Acquisition Bidco B.V.,
EUR Facility 1st Lien Term
Loan B-1, (Netherlands),
3M EURIBOR + 6.75%,
7.25%, 02/09/2026(e)(f)(h) | | € | 476,852 | | | | 531,427 | | |
NXTGenpay Intressenter Bidco AB,
Facility 1st Lien Term Loan B,
(Sweden), 3M STIBOR + 6.75%,
6.75%, 06/30/2025(e)(h) | | SEK | 5,500,000 | | | | 569,178 | | |
NXTGenpay Intressenter Bidco AB,
Facility 1st Lien Term Loan D,
(Sweden), 3M STIBOR + 6.75%,
6.75%, 06/30/2025(e)(g)(h) | | | 4,500,000 | | | | 279,414 | | |
PI UK Holdco II, Ltd., Facility
1st Lien Term Loan B-1,
(Great Britain), 1M LIBOR + 3.25%,
5.04%, 01/03/2025 | | $ | 1,186,616 | | | | 1,178,309 | | |
Refinitiv U.S. Holdings, Inc., Initial
1st Lien Term Loan,
1M LIBOR + 3.75%,
5.54%, 10/01/2025 | | | 3,739,000 | | | | 3,756,760 | | |
Right Choice Holdings, Ltd.,
Facility 1st Lien Term Loan B,
(Great Britain),
6M GBP LIBOR + 6.50%,
7.37%, 06/06/2024(e)(f)(h) | | £ | 1,000,000 | | | | 1,293,850 | | |
Senior Loans(b)(c)(d) (continued)
| | | Principal
Amount | | Value(a) | |
SaintMichelCo, Ltd., Acquisition
Facility 1st Lien Term Loan,
(Great Britain),
3M GBP LIBOR + 7.00%,
7.77%, 09/09/2025(e)(g)(h) | | £ | 300,000 | | | $ | 207,016 | | |
SaintMichelCo, Ltd., Facility
1st Lien Term Loan B,
(Great Britain),
3M GBP LIBOR + 7.00%,
7.77%, 09/09/2025(e)(h) | | | 2,400,000 | | | | 3,105,240 | | |
SCM Insurance Services, Inc.,
1st Lien Revolver, (Canada),
CAD Prime + 4.00%,
8.75%, 08/29/2022(e)(g)(h) | | CAD | 1,000 | | | | 628 | | |
SCM Insurance Services, Inc.,
1st Lien Term Loan, (Canada),
1M CDOR + 5.00%,
6.96%, 08/29/2024(e)(f)(h) | | | 122,813 | | | | 89,556 | | |
SCM Insurance Services, Inc.,
2nd Lien Term Loan, (Canada),
1M CDOR + 9.00%,
10.96%, 03/01/2025(e)(h) | | | 125,000 | | | | 89,252 | | |
Sedgwick Claims Management
Services, Inc., Initial 1st Lien
Term Loan B, 1M LIBOR + 3.25%,
5.04%, 12/31/2025 | | $ | 802,172 | | | | 777,481 | | |
Spectra Finance, LLC, Initial
1st Lien Revolver,
1M LIBOR + 4.00%,
5.89%, 04/03/2023(e)(g)(h) | | | 1,000 | | | | 194 | | |
Spectra Finance, LLC, Initial
1st Lien Term Loan,
3M LIBOR + 4.25%,
6.35%, 04/02/2024(e)(f)(h) | | | 986,513 | | | | 986,513 | | |
Staysure Bidco, Ltd., Facility
1st Lien Term Loan B,
(Great Britain),
3M GBP LIBOR + 7.00%,
7.76%, 07/01/2025(e)(h) | | £ | 1,000,000 | | | | 1,293,850 | | |
Symbol Bidco I, Ltd., Facility
1st Lien Term Loan B,
(Great Britain),
L + 6.50%, 09/27/2026(e)(f)(g)(h) | | | 571,429 | | | | — | | |
Symbol Bidco I, Ltd., Acquisition
Capex Facility 1st Lien Term Loan
(Great Britain),
L + 6.50%, 09/27/2026(e)(g)(h) | | | 428,571 | | | | — | | |
TA/WEG Holdings, LLC, Initial
1st Lien Term Loan,
3M LIBOR + 6.00%,
8.02%, 10/02/2025(e)(f)(h) | | $ | 3,546,752 | | | | 3,511,285 | | |
Annual Report 2019
9
CION Ares Diversified Credit Fund
Consolidated Schedule of Investments (continued)
October 31, 2019
Senior Loans(b)(c)(d) (continued)
| | | Principal
Amount | | Value(a) | |
TA/WEG Holdings, LLC, 1st Lien
Revolver, 1M LIBOR + 6.00%,
8.02%, 10/02/2025(e)(g)(h) | | $ | 301,041 | | | $ | 37,028 | | |
TA/WEG Holdings, LLC, Initial
1st Lien Delayed Draw Term Loan,
L + 6.00%, 10/02/2025(e)(g)(h) | | | 1,400,034 | | | | (14,001 | ) | |
Tempo Acquisition, LLC, Initial
1st Lien Term Loan,
1M LIBOR + 3.00%,
4.79%, 05/01/2024 | | | 1,522,013 | | | | 1,521,693 | | |
Toscafund, Ltd., Facility 1st Lien
Term Loan, (Great Britain),
6M GBP LIBOR + 7.00%,
7.83%, 04/02/2025(e)(f)(h) | | £ | 4,680,000 | | | | 6,055,219 | | |
True Potential LLP, Facility 1st Lien
Term Loan B-2, (Great Britain),
6M GBP LIBOR + 7.17%,
8.03%, 10/16/2026(e)(f)(h) | | | 8,112,754 | | | | 10,496,688 | | |
True Potential LLP, Acquisition
Facility 1st Lien Term Loan,
(Great Britain),
6M GBP LIBOR + 7.17%,
8.03%, 10/16/2026(e)(g)(h) | | | 1,943,174 | | | | 451,504 | | |
Ultimus Group Midco, LLC (The),
1st Lien Revolver, Prime + 3.50%,
8.25%, 02/01/2024(e)(g)(h) | | $ | 396,226 | | | | 33,962 | | |
Ultimus Group Midco, LLC (The),
Initial 1st Lien Term Loan,
1M LIBOR + 4.50%,
6.29%, 02/01/2026(e)(f)(h) | | | 2,590,755 | | | | 2,590,755 | | |
Ultimus Group Midco, LLC (The),
Initial 1st Lien Term Loan,
1M LIBOR + 4.50%,
6.29%, 02/01/2026(e)(h) | | | 614,621 | | | | 614,621 | | |
| | | | | | 79,034,919 | | |
Beverage, Food & Tobacco 3.0% | |
CC Fly Holding II A/S, Facility
1st Lien Unitranche Term Loan A,
(Denmark), 3M CIBOR + 7.50%,
8.00%, 05/09/2025(e)(f)(h) | | DKK | 2,500,000 | | | | 372,912 | | |
CC Fly Holding II A/S, Facility
1st Lien Unitranche Term Loan B,
(Denmark), 3M CIBOR + 7.50%,
9.27%, 05/09/2025(e)(f)(h) | | | 2,500,000 | | | | 372,912 | | |
CC Fly Holding II A/S, Facility
1st Lien Term Loan, (Denmark),
3M CIBOR + 7.50%,
8.00%, 05/09/2025(e)(f)(h) | | | 520,833 | | | | 77,690 | | |
Senior Loans(b)(c)(d) (continued)
| | | Principal
Amount | | Value(a) | |
Ferraro Fine Foods Corp., 1st Lien
2nd Amendment Term Loan,
3M LIBOR + 4.25%,
6.43%, 05/09/2024(e)(f)(h) | | $ | 308,484 | | | $ | 308,484 | | |
Ferraro Fine Foods Corp., 1st Lien
Incremental Term Loan,
3M LIBOR + 4.25%,
6.35%, 05/09/2024(e)(h) | | | 75,028 | | | | 75,028 | | |
Ferraro Fine Foods Corp., 1st Lien
Revolver, 1M LIBOR + 4.25%,
6.24%, 05/09/2023(e)(g)(h) | | | 1,000 | | | | 123 | | |
Ferraro Fine Foods Corp., 1st Lien
Term Loan, 3M LIBOR + 4.25%,
6.43%, 05/09/2024(e)(f)(h) | | | 986,512 | | | | 986,512 | | |
Hometown Food Co.,
1st Lien Revolver,
L + 5.25%, 08/31/2023(e)(g)(h) | | | 1,000 | | | | — | | |
Hometown Food Co., 1st Lien
Term Loan, 1M LIBOR + 5.00%,
6.79%, 08/31/2023(e)(f)(h) | | | 1,846,854 | | | | 1,846,854 | | |
IRB Holding Corp., 1st Lien
Term Loan B, 3M LIBOR + 3.25%,
5.22%, 02/05/2025 | | | 2,209,271 | | | | 2,189,940 | | |
Jim N Nicks Management, LLC,
1st Lien Revolver,
3M LIBOR + 5.25%,
7.35%, 07/10/2023(e)(g)(h) | | | 1,000 | | | | 545 | | |
Jim N Nicks Management, LLC,
Initial 1st Lien Term Loan,
3M LIBOR + 5.25%,
7.35%, 07/10/2023(e)(f)(h) | | | 48,875 | | | | 47,409 | | |
Penn Virginia Holding Corp.,
2nd Lien Term Loan,
1M LIBOR + 7.00%,
8.80%, 09/29/2022(e)(h) | | | 500,000 | | | | 500,000 | | |
Reddy Ice Holdings, Inc., 1st Lien
Delayed Draw Term Loan,
L + 5.50%, 07/01/2025(e)(g)(h) | | | 955,102 | | | | (9,551 | ) | |
Reddy Ice Holdings, Inc.,
1st Lien Revolver,
L + 5.50%, 07/01/2024(e)(g)(h) | | | 955,102 | | | | (28,653 | ) | |
Reddy Ice Holdings, Inc., 1st Lien
Term Loan, 3M LIBOR + 5.50%,
7.60%, 07/01/2025(e)(f)(h) | | | 7,431,171 | | | | 7,356,860 | | |
| | | | | | 14,097,065 | | |
Capital Equipment 1.3% | |
Dynacast International, LLC,
1st Lien Term Loan B-2,
3M LIBOR + 3.25%,
5.35%, 01/28/2022(e) | | | 496,104 | | | | 456,416 | | |
Annual Report 2019
10
CION Ares Diversified Credit Fund
Consolidated Schedule of Investments (continued)
October 31, 2019
Senior Loans(b)(c)(d) (continued)
| | | Principal
Amount | | Value(a) | |
Flow Control Solutions, Inc.,
1st Lien Delayed Draw Term Loan,
L + 5.25%, 11/21/2024(e)(g)(h) | | $ | 994,201 | | | $ | (1 | ) | |
Flow Control Solutions, Inc.,
1st Lien Revolver,
L + 5.25%, 11/21/2024(e)(g)(h) | | | 372,825 | | | | — | | |
Flow Control Solutions, Inc.,
1st Lien Term Loan,
3M LIBOR + 5.25%,
7.35%, 11/21/2024(e)(f)(h) | | | 1,297,500 | | | | 1,297,500 | | |
Gates Global, LLC, Initial
1st Lien Term Loan B-2,
1M LIBOR + 2.75%,
4.54%, 04/01/2024 | | | 1,854,202 | | | | 1,813,725 | | |
IMIA Holdings, Inc.,
1st Lien Revolver,
L + 4.50%, 10/26/2024(e)(g)(h) | | | 408,163 | | | | — | | |
IMIA Holdings, Inc., 1st Lien
Term Loan, 3M LIBOR + 4.50%,
6.60%, 10/26/2024(e)(f)(h) | | | 2,572,398 | | | | 2,572,398 | | |
| | | | | | 6,140,038 | | |
Chemicals, Plastics & Rubber 2.5% | |
Atlas Intermediate III, LLC, Initial
1st Lien Term Loan,
3M LIBOR + 5.50%,
7.62%, 04/29/2025(e)(f)(h) | | | 1,158,756 | | | | 1,147,169 | | |
Atlas Intermediate III, LLC,
1st Lien Revolver,
L + 5.50%, 04/29/2025(e)(g)(h) | | | 226,621 | | | | (5,100 | ) | |
DCG Acquisition Corp., 1st Lien
Delayed Draw Term Loan,
L + 4.50%, 09/30/2026(i) | | | 373,483 | | | | 364,612 | | |
DCG Acquisition Corp., Initial
1st Lien Term Loan B,
3M LIBOR + 4.50%,
6.51%, 09/30/2026 | | | 1,765,555 | | | | 1,723,623 | | |
Laboratories Bidco, LLC, 1st Lien
Term Loan, 3M CDOR + 6.00%,
7.97%, 06/25/2024(e)(f)(h) | | CAD | 1,806,836 | | | | 1,358,730 | | |
Laboratories Bidco, LLC,
1st Lien Revolver,
L + 5.75%, 06/25/2024(e)(g)(h) | | $ | 513,489 | | | | (7,060 | ) | |
Laboratories Bidco, LLC, 1st Lien
Term Loan, 3M LIBOR + 5.75%,
7.81%, 06/25/2024(e)(f)(h) | | | 1,925,992 | | | | 1,906,732 | | |
Plaskolite PPC Intermediate II, LLC,
1st Lien Term Loan,
1M LIBOR + 4.25%,
6.10%, 12/15/2025(e)(h) | | | 993 | | | | 973 | | |
Senior Loans(b)(c)(d) (continued)
| | | Principal
Amount | | Value(a) | |
Plaskolite PPC Intermediate II, LLC,
2nd Lien Term Loan,
1M LIBOR + 7.75%,
9.68%, 12/14/2026(e)(f)(h) | | $ | 3,000,000 | | | $ | 2,910,000 | | |
Starfruit Finco B.V., Initial 1st Lien
Term Loan B, (Netherlands),
1M LIBOR + 3.25%,
5.19%, 10/01/2025 | | | 2,309,936 | | | | 2,249,808 | | |
| | | | | | 11,649,487 | | |
Construction & Building 1.9% | |
SRS Distribution, Inc., 1st Lien
1st Amendment Incremental Term
Loan, L + 4.50%, 05/23/2025(e)(i) | | | 2,500,000 | | | | 2,481,250 | | |
TAMKO Building Products, LLC,
Initial 1st Lien Term Loan B,
1M LIBOR + 3.25%,
5.04%, 05/29/2026 | | | 2,328,738 | | | | 2,328,738 | | |
The Hillman Group, Inc., Initial
1st Lien Term Loan B,
1M LIBOR + 4.00%,
5.79%, 05/30/2025(i) | | | 2,474,533 | | | | 2,332,247 | | |
Wilsonart, LLC, Tranche 1st Lien
Term Loan D, 3M LIBOR + 3.25%,
5.36%, 12/19/2023 | | | 1,889,629 | | | | 1,847,112 | | |
| | | | | | 8,989,347 | | |
Consumer goods: Durable 1.1% | |
AI Aqua Merger Sub, Inc., 1st Lien
5th Amendment Incremental
Term Loan, 3M LIBOR + 4.25%,
6.35%, 12/13/2023(e) | | | 2,500,000 | | | | 2,350,000 | | |
AI Aqua Merger Sub, Inc., Tranche
1st Lien Term Loan B-1,
1M LIBOR + 3.25%,
5.04%, 12/13/2023 | | | 1,989,770 | | | | 1,847,163 | | |
DecoPac, Inc., Initial 1st Lien
Revolver, 1M LIBOR + 4.25%,
6.04%, 09/29/2023(e)(g)(h) | | | 1,000 | | | | 140 | | |
DecoPac, Inc., Initial 1st Lien
Term Loan, 1M LIBOR + 4.25%,
6.04%, 09/30/2024(e)(f)(h) | | | 478,790 | | | | 478,790 | | |
Sigma Electric Manufacturing Corp.,
Tranche 1st Lien 3rd Amendment
Term Loan A-2, 3M LIBOR + 4.75%,
6.81%, 10/31/2023(e)(f)(h) | | | 133,300 | | | | 133,300 | | |
Sigma Electric Manufacturing Corp.,
1st Lien Revolver,
L + 4.75%, 10/31/2022(e)(g)(h) | | | 1,333 | | | | — | | |
Annual Report 2019
11
CION Ares Diversified Credit Fund
Consolidated Schedule of Investments (continued)
October 31, 2019
Senior Loans(b)(c)(d) (continued)
| | | Principal
Amount | | Value(a) | |
Sigma Electric Manufacturing Corp.,
1st Lien Term Loan A-2,
3M LIBOR + 4.75%,
6.85%, 10/31/2023(e)(f)(h) | | $ | 359,678 | | | $ | 359,678 | | |
| | | | | | 5,169,071 | | |
Consumer goods: Non-Durable 0.8% | |
Adient U.S., LLC, Initial 1st Lien
Term Loan B, 3M LIBOR + 4.25%,
6.89%, 05/06/2024(i) | | | 833,503 | | | | 811,882 | | |
LegalZoom.com, Inc., 1st Lien
Term Loan, 1M LIBOR + 4.50%,
6.29%, 11/21/2024 | | | 1,734,363 | | | | 1,725,691 | | |
Movati Athletic Group, Inc.,
1st Lien Delayed Draw Term Loan,
(Canada), 3M CDOR + 4.50%,
6.47%, 10/05/2022(e)(g)(h) | | CAD | 252,457 | | | | 54,259 | | |
Movati Athletic Group, Inc.,
1st Lien Term Loan A, (Canada),
3M CDOR + 4.50%,
6.47%, 10/05/2022(e)(f)(h) | | | 241,765 | | | | 183,643 | | |
William Morris Endeavor
Entertainment, LLC, 1st Lien Term
Loan B-1, 1M LIBOR + 2.75%,
4.54%, 05/18/2025 | | $ | 899,703 | | | | 868,402 | | |
| | | | | | 3,643,877 | | |
Containers, Packaging & Glass 4.1% | |
Anchor Packaging, LLC, 1st Lien
Delayed Draw Term Loan,
L + 4.00%, 07/18/2026(e)(g) | | | 574,359 | | | | (2,872 | ) | |
Anchor Packaging, LLC, Initial
1st Lien Term Loan B,
1M LIBOR + 4.00%,
5.79%, 07/18/2026(e) | | | 2,625,641 | | | | 2,612,513 | | |
Berry Global, Inc., 1st Lien Term
Loan U, 1M LIBOR + 2.50%,
4.44%, 07/01/2026 | | | 1,147,125 | | | | 1,150,475 | | |
BWAY Holding Co., Initial 1st Lien
Term Loan B, 3M LIBOR + 3.25%,
5.23%, 04/03/2024 | | | 1,757,801 | | | | 1,708,864 | | |
Charter NEX U.S., Inc., Initial
1st Lien Term Loan B,
1M LIBOR + 3.00%,
4.79%, 05/16/2024 | | | 1,794,582 | | | | 1,745,231 | | |
Charter NEX U.S., Inc., 1st Lien
3rd Amendment Incremental
Term Loan, 1M LIBOR + 3.50%,
5.29%, 05/16/2024 | | | 574,559 | | | | 567,917 | | |
Senior Loans(b)(c)(d) (continued)
| | | Principal
Amount | | Value(a) | |
IntraPac International, LLC, 1st Lien
Revolver, 3M LIBOR + 5.50%,
7.60%, 01/11/2025(e)(g)(h) | | $ | 415,407 | | | $ | 131,891 | | |
IntraPac International, LLC, 1st Lien
Term Loan, 3M LIBOR + 5.50%,
7.60%, 01/11/2026(e)(f)(h) | | | 1,594,945 | | | | 1,578,996 | | |
IntraPac International, LLC, 1st Lien
Term Loan, (Canada),
3M LIBOR + 5.50%,
7.60%, 01/11/2026(e)(f)(h) | | | 812,714 | | | | 804,587 | | |
Pregis Corp., Initial 1st Lien
Term Loan, 1M LIBOR + 4.00%,
5.79%, 07/31/2026 | | | 2,515,056 | | | | 2,476,274 | | |
Reynolds Group Holdings, Inc.,
1st Lien Incremental Term Loan,
1M LIBOR + 2.75%,
4.54%, 02/05/2023 | | | 1,239,780 | | | | 1,239,098 | | |
Ring Container Technologies Group,
LLC, Initial 1st Lien Term Loan,
1M LIBOR + 2.75%,
4.54%, 10/31/2024 | | | 1,474,620 | | | | 1,458,488 | | |
Tank Holding Corp., Initial 1st Lien
Term Loan B, 1M LIBOR + 4.00%,
6.79%, 03/26/2026 | | | 3,750,000 | | | | 3,720,712 | | |
| | | | | | 19,192,174 | | |
Energy: Oil & Gas 4.8% | |
Birch Permian, LLC, Additional
1st Lien Note,
L + 7.00%, 04/12/2023(e)(g)(h) | | | 1,731,049 | | | | (17,310 | ) | |
Birch Permian, LLC, Initial 1st Lien
Term Loan, 3M LIBOR + 8.00%,
10.34%, 04/12/2023(e)(h) | | | 5,231,049 | | | | 5,178,738 | | |
Blackstone CQP Holding Co.,
LP, Initial 1st Lien Term Loan B,
3M LIBOR + 3.50%,
5.66%, 09/30/2024 | | | 1,859,429 | | | | 1,848,979 | | |
Cheyenne Petroleum Co., LP,
2nd Lien Term Loan,
3M LIBOR + 8.50%,
10.60%, 01/10/2024(e)(h) | | | 7,244,000 | | | | 7,171,560 | | |
Petroleum Service Corp. Buyer, LLC,
1st Lien Delayed Draw Term Loan,
L + 5.50%, 07/23/2025(e)(g)(h) | | | 1,314,230 | | | | (26,284 | ) | |
Petroleum Service Corp. Buyer, LLC,
1st Lien Revolver, L + 5.50%,
07/23/2025(e)(g)(h) | | | 2,105,660 | | | | (42,113 | ) | |
Petroleum Service Corp. Buyer, LLC,
1st Lien Term Loan,
3M LIBOR + 5.50%,
7.43%, 07/23/2025(e)(f)(h) | | | 5,782,614 | | | | 5,666,961 | | |
Annual Report 2019
12
CION Ares Diversified Credit Fund
Consolidated Schedule of Investments (continued)
October 31, 2019
Senior Loans(b)(c)(d) (continued)
| | | Principal
Amount | | Value(a) | |
Sundance Energy, Inc., 2nd Lien
Term Loan, 3M LIBOR + 8.00%,
10.11%, 04/23/2023(e)(h) | | $ | 1,000,000 | | | $ | 980,000 | | |
Traverse Midstream Partners, LLC,
1st Lien Term Loan,
1M LIBOR + 4.00%,
5.80%, 09/27/2024 | | | 1,750,000 | | | | 1,531,250 | | |
| | | | | | 22,291,781 | | |
Environmental Industries 1.2% | |
GFL Environmental, Inc., 1st Lien
Term Loan B, (Canada),
1M LIBOR + 3.00%,
4.79%, 05/30/2025 | | | 1,640,312 | | | | 1,633,865 | | |
HD Supply Waterworks, Ltd., Initial
1st Lien Term Loan B,
1M LIBOR + 2.75%,
4.76%, 08/01/2024 | | | 1,061,378 | | | | 1,036,170 | | |
Restaurant Technologies, Inc.,
Initial 1st Lien Term Loan,
1M LIBOR + 3.25%,
5.04%, 10/01/2025 | | | 1,690,189 | | | | 1,689,766 | | |
Restaurant Technologies, Inc.,
Initial 2nd Lien Term Loan,
1M LIBOR + 6.50%,
8.29%, 10/01/2026 | | | 200,000 | | | | 197,000 | | |
VLS Recovery Services, LLC,
1st Lien 2nd Amendment
Incremental Term Loan,
1M LIBOR + 6.00%,
8.03%, 10/17/2023(e)(f)(h) | | | 733,146 | | | | 733,146 | | |
VLS Recovery Services, LLC,
1st Lien Delayed Draw Term Loan,
1M LIBOR + 6.00%,
8.03%, 10/17/2023(e)(f)(h) | | | 43,914 | | | | 43,914 | | |
VLS Recovery Services, LLC, 1st Lien
Delayed Draw Term Loan B,
1M LIBOR + 6.00%,
8.03%, 10/17/2023(e)(h) | | | 90,009 | | | | 90,009 | | |
VLS Recovery Services, LLC, 1st Lien
Delayed Draw Term Loan C,
L + 6.00%, 10/17/2023(e)(g)(h) | | | 1,070,365 | | | | — | | |
VLS Recovery Services, LLC,
1st Lien Revolver,
L + 6.00%, 10/17/2023(e)(g)(h) | | | 1,000 | | | | — | | |
VLS Recovery Services, LLC, 1st Lien
Term Loan, 1M LIBOR + 6.00%,
8.03%, 10/17/2023(e)(f)(h) | | | 266,352 | | | | 266,352 | | |
| | | | | | 5,690,222 | | |
Senior Loans(b)(c)(d) (continued)
| | | Principal
Amount | | Value(a) | |
Forest Products & Paper 0.7% | |
Nelipak Holding Co., 1st Lien
Incremental Term Loan,
1M LIBOR + 4.25%,
6.04%, 07/02/2026(e)(f)(h) | | $ | 304,752 | | | $ | 301,704 | | |
Nelipak Holding Co., 1st Lien
Revolver, 1M LIBOR + 4.25%,
6.04%, 07/02/2024(e)(g)(h) | | | 604,780 | | | | 233,047 | | |
Nelipak Holding Co., 1st Lien
Term Loan, 1M LIBOR + 4.25%,
6.04%, 07/02/2026(e)(f)(h) | | | 2,732,385 | | | | 2,705,061 | | |
| | | | | | 3,239,812 | | |
Healthcare & Pharmaceuticals 16.3% | |
Agiliti Health, Inc., 1st Lien
Term Loan, 1M LIBOR + 3.00%,
5.06%, 01/04/2026(e) | | | 1,010,578 | | | | 1,006,789 | | |
Albany Molecular Research, Inc.,
Initial 1st Lien Term Loan,
1M LIBOR + 3.25%,
5.04%, 08/30/2024 | | | 1,648,025 | | | | 1,597,761 | | |
Auris Luxembourg III SARL, Facility
1st Lien Term Loan B-2, (Luxembourg),
1M LIBOR + 3.75%,
5.54%, 02/27/2026 | | | 1,225,948 | | | | 1,201,735 | | |
Bambino CI, Inc., 1st Lien Revolver,
1M LIBOR + 5.50%,
7.29%, 10/17/2022(e)(g)(h) | | | 1,000 | | | | 375 | | |
Bambino CI, Inc., 1st Lien Term Loan,
1M LIBOR + 5.50%,
7.29%, 10/17/2023(e)(f)(h) | | | 342,890 | | | | 342,890 | | |
Bambino CI, Inc., 1st Lien Term Loan,
1M LIBOR + 5.50%,
7.29%, 10/17/2023(e)(h) | | | 19,886 | | | | 19,886 | | |
Bausch Health Companies Inc.,
1st Lien Term Loan B, (Canada),
1M LIBOR + 3.00%,
4.92%, 06/02/2025 | | | 1,903,030 | | | | 1,909,177 | | |
Bearcat Buyer, Inc., 1st Lien
Incremental Term Loan,
3M LIBOR + 4.25%,
6.35%, 07/09/2026(e)(f)(h) | | | 834,758 | | | | 826,410 | | |
Bearcat Buyer, Inc., 1st Lien
Delayed Draw Term Loan,
3M LIBOR + 4.25%,
6.35%, 07/09/2026(e)(g)(h) | | | 1,015,814 | | | | 313,451 | | |
Bearcat Buyer, Inc.,
1st Lien Revolver,
L + 4.25%, 07/09/2024(e)(g)(h) | | | 580,465 | | | | (11,609 | ) | |
Annual Report 2019
13
CION Ares Diversified Credit Fund
Consolidated Schedule of Investments (continued)
October 31, 2019
Senior Loans(b)(c)(d) (continued)
| | | Principal
Amount | | Value(a) | |
Bearcat Buyer, Inc., 1st Lien
Term Loan, 3M LIBOR + 4.25%,
6.35%, 07/09/2026(e)(f)(h) | | $ | 4,933,953 | | | $ | 4,884,614 | | |
Bearcat Buyer, Inc., 2nd Lien Delayed
Draw Term Loan, 3M LIBOR +8.25%,
10.35%, 07/09/2027(e)(g)(h) | | | 580,465 | | | | 178,493 | | |
Bearcat Buyer, Inc., 2nd Lien
Incremental Term Loan,
3M LIBOR + 8.25%,
10.35%, 07/09/2027(e)(h) | | | 617,308 | | | | 611,134 | | |
Bearcat Buyer, Inc., 2nd Lien Term
Loan, 3M LIBOR + 8.25%,
10.35%, 07/09/2027(e)(f)(h) | | | 2,249,302 | | | | 2,226,809 | | |
Comprehensive EyeCare Partners,
LLC, 1st Lien Delayed Draw Term
Loan, 3M LIBOR + 4.50%,
6.60%, 02/14/2024(e)(g)(h) | | | 420,910 | | | | 235,193 | | |
Comprehensive EyeCare Partners,
LLC, 1st Lien Revolver,
3M LIBOR + 4.50%,
6.60%, 02/14/2024(e)(g)(h) | | | 1,000 | | | | 175 | | |
Comprehensive EyeCare Partners,
LLC, 1st Lien Term Loan,
3M LIBOR + 4.50%,
6.60%, 02/14/2024(e)(f)(h) | | | 568,234 | | | | 562,552 | | |
Convey Health Solutions, Inc.,
1st Lien Term Loan,
3M LIBOR + 5.25%,
7.39%, 09/04/2026(e)(f)(h) | | | 3,151,432 | | | | 3,119,918 | | |
CPI Holdco, LLC, 1st Lien
Term Loan B, L + 4.25%,
10/29/2026(e)(i) | | | 1,388,889 | | | | 1,385,417 | | |
CVP Holdco, Inc., 1st Lien
Delayed Draw Term Loan,
L + 5.75%, 10/31/2025(e)(g)(h) | | | 2,729,041 | | | | (27,291 | ) | |
CVP Holdco, Inc., 1st Lien Revolver,
L + 5.75%, 10/31/2024(e)(g)(h) | | | 326,487 | | | | (8,162 | ) | |
CVP Holdco, Inc., 1st Lien Term Loan,
1M LIBOR + 5.75%,
7.54%, 10/31/2025(e)(f)(h) | | | 3,793,598 | | | | 3,755,662 | | |
Discovery Life Sciences, LLC,
1st Lien 2nd Amendment Term Loan,
3M LIBOR + 6.25%,
8.35%, 03/30/2024(e)(f)(h) | | | 561,404 | | | | 561,404 | | |
Discovery Life Sciences, LLC,
1st Lien 3rd Amendment Term Loan,
1M LIBOR + 6.25%,
8.04%, 03/30/2024(e)(h) | | | 601,001 | | | | 588,981 | | |
Senior Loans(b)(c)(d) (continued)
| | | Principal
Amount | | Value(a) | |
Discovery Life Sciences, LLC,
1st Lien Delayed Draw Term Loan,
3M LIBOR + 6.25%,
8.35%, 03/30/2024(e)(f)(h) | | $ | 170,536 | | | $ | 170,536 | | |
Discovery Life Sciences, LLC,
1st Lien Revolver,
L + 6.25%, 03/30/2024(e)(g)(h) | | | 88,719 | | | | — | | |
Discovery Life Sciences, LLC,
1st Lien Term Loan,
3M LIBOR + 6.25%,
8.35%, 03/30/2024(e)(f)(h) | | | 814,357 | | | | 814,357 | | |
Discovery Life Sciences, LLC,
1st Lien 1st Amendment Delayed
Draw Term Loan, 3M LIBOR + 6.25%,
8.35%, 03/30/2024(e)(h) | | | 1,111,111 | | | | 1,111,111 | | |
Discovery Life Sciences, LLC,
1st Lien 1st Amendment Term Loan,
3M LIBOR + 6.25%,
8.35%, 03/30/2024(e)(f)(h) | | | 882,222 | | | | 882,222 | | |
Discovery Life Sciences, LLC,
1st Lien Delayed Draw Term Loan,
L + 6.25%, 03/30/2024(e)(g)(h) | | | 350,877 | | | | — | | |
Emerus Holdings, Inc., 1st Lien
Fixed Rate Term Loan,
14.00%, 02/28/2022(e)(h) | | | 18,512 | | | | 18,512 | | |
Envision Healthcare Corp., Initial
1st Lien Term Loan,
1M LIBOR + 3.75%,
5.54%, 10/10/2025 | | | 1,591,589 | | | | 1,282,471 | | |
ExamWorks Group, Inc., 1st Lien
Term Loan B-1, 1M LIBOR + 3.25%,
5.04%, 07/27/2023 | | | 1,263,504 | | | | 1,262,973 | | |
Floss Midco, Ltd., Acquisition Facility
1st Lien Term Loan, (Great Britain),
L + 6.75%, 09/07/2026(e)(g)(h) | | £ | 1,194,030 | | | | — | | |
Floss Midco, Ltd., Facility 1st Lien
Term Loan B, (Great Britain),
3M GBP LIBOR + 6.50%,
7.28%, 09/07/2026(e)(f)(h) | | | 805,970 | | | | 1,042,804 | | |
Gentiva Health Services, Inc., Initial
1st Lien Closing Date Term Loan,
1M LIBOR + 3.75%,
5.56%, 07/02/2025 | | $ | 2,193,620 | | | | 2,188,136 | | |
Immucor, Inc., 1st Lien Term
Loan B-3, 3M LIBOR + 5.00%,
7.10%, 06/15/2021 | | | 1,597,597 | | | | 1,588,619 | | |
JDC Healthcare Management, LLC,
1st Lien Term Loan,
1M LIBOR + 7.75%,
9.54%, 04/10/2023(e)(f)(h)(j) | | | 107,832 | | | | 95,971 | | |
Annual Report 2019
14
CION Ares Diversified Credit Fund
Consolidated Schedule of Investments (continued)
October 31, 2019
Senior Loans(b)(c)(d) (continued)
| | | Principal
Amount | | Value(a) | |
Just Childcare, Ltd., Unitranche
Facility 1st Lien Term Loan,
(Great Britain),
3M GBP LIBOR + 7.00%,
7.76%, 09/13/2026(e)(f)(h) | | £ | 861,006 | | | $ | 1,114,013 | | |
Just Childcare, Ltd., Acquisition
Facility 1st Lien Term Loan,
(Great Britain),
L + 7.00%, 09/13/2026(e)(g)(h) | | | 426,945 | | | | — | | |
Kedleston Schools, Ltd., Facility
1st Lien Term Loan B-2, (Great Britain),
3M GBP LIBOR + 8.00%,
9.00%, 05/30/2024(e)(f)(h) | | | 1,000,000 | | | | 1,293,850 | | |
MB2 Dental Solutions, LLC, 1st Lien
Revolver, Prime + 3.75%,
8.50%, 09/29/2023(e)(g)(h) | | $ | 1,333 | | | | 378 | | |
MB2 Dental Solutions, LLC, Initial
1st Lien Term Loan,
3M LIBOR + 4.75%,
6.85%, 09/29/2023(e)(f)(h) | | | 527,298 | | | | 527,298 | | |
MB2 Dental Solutions, LLC, Initial
1st Lien Term Loan,
3M LIBOR + 4.75%,
6.85%, 09/29/2023(e)(h) | | | 57,830 | | | | 57,830 | | |
National Mentor Holdings, Inc., Initial
1st Lien Term Loan B,
1M LIBOR + 4.25%,
6.04%, 03/09/2026(i) | | | 3,517,212 | | | | 3,517,950 | | |
National Mentor Holdings, Inc., Initial
1st Lien Term Loan C,
1M LIBOR + 4.25%,
6.04%, 03/09/2026 | | | 126,225 | | | | 126,252 | | |
Nelipak European Holdings Co.,
1st Lien EUR Revolver, (Netherlands),
1M EURIBOR + 4.50%,
4.50%, 07/02/2024(e)(g)(h) | | € | 581,751 | | | | 26,460 | | |
Nelipak European Holdings Co.,
1st Lien EUR Term Loan,
(Netherlands), 1M EURIBOR + 4.50%,
4.50%, 07/02/2026(e)(f)(h) | | | 824,482 | | | | 909,656 | | |
Nuehealth Performance, LLC,
1st Lien Delayed Draw Term Loan,
L + 6.50%, 09/27/2023(e)(g)(h) | | $ | 737,459 | | | | — | | |
Nuehealth Performance, LLC,
1st Lien Incremental Delayed
Draw Term Loan, 1M LIBOR + 6.50%,
8.29%, 09/27/2023(e)(f)(h) | | | 292,034 | | | | 292,034 | | |
Nuehealth Performance, LLC,
1st Lien Revolver,
L + 6.50%, 09/27/2023(e)(g)(h) | | | 1,000 | | | | — | | |
Senior Loans(b)(c)(d) (continued)
| | | Principal
Amount | | Value(a) | |
Nuehealth Performance, LLC, 1st Lien
Term Loan, 1M LIBOR + 6.50%,
8.29%, 09/27/2023(e)(f)(h) | | $ | 1,946,892 | | | $ | 1,946,892 | | |
Olympia Acquisition, Inc., 1st Lien
Term Loan, 1M LIBOR + 5.50%,
7.32%, 09/24/2026(e)(f)(h) | | | 2,546,419 | | | | 2,520,955 | | |
Olympia Acquisition, Inc., 1st Lien
Delayed Draw Term Loan,
L + 5.50%, 09/24/2026(e)(g)(h) | | | 2,425,161 | | | | (24,252 | ) | |
Olympia Acquisition, Inc.,
1st Lien Revolver,
L + 5.50%, 09/24/2024(e)(g)(h) | | | 640,539 | | | | (16,014 | ) | |
OMH-HealthEdge Holdings, LLC,
1st Lien Revolver,
L + 5.50%, 10/24/2024(e)(g)(h) | | | 1,000 | | | | — | | |
OMH-HealthEdge Holdings, LLC,
1st Lien Term Loan,
1M LIBOR + 5.50%,
7.32%, 10/24/2025(e)(f)(h) | | | 1,437,980 | | | | 1,423,600 | | |
Ortho-Clinical Diagnostics, Inc.,
1st Lien Term Loan B,
3M LIBOR + 3.25%,
5.31%, 06/30/2025 | | | 1,730,249 | | | | 1,650,952 | | |
PAKNK Netherlands Treasury B.V.,
1st Lien Incremental Term Loan,
(Netherlands), 1M EURIBOR + 4.50%,
4.50%, 07/02/2026(e)(f)(h) | | € | 5,374,926 | | | | 5,930,183 | | |
PetVet Care Centers, LLC, 1st Lien
2nd Delayed Draw Term Loan,
1M LIBOR + 4.25%,
6.04%, 02/15/2025(e)(f)(g)(h) | | $ | 3,324,500 | | | | 1,227,120 | | |
Premise Health Holding Corp.,
1st Lien Delayed Draw Term Loan,
L + 3.50%, 07/10/2025(e)(g)(h) | | | 1,103 | | | | (8 | ) | |
Premise Health Holding Corp.,
1st Lien Revolver,
L + 3.50%, 07/10/2023(e)(g)(h) | | | 1,000 | | | | (7 | ) | |
Premise Health Holding Corp.,
1st Lien Term Loan,
3M LIBOR + 3.50%,
5.60%, 07/10/2025(e)(f)(h) | | | 13,758 | | | | 13,655 | | |
Premise Health Holding Corp.,
2nd Lien Term Loan,
3M LIBOR + 7.50%,
9.60%, 07/10/2026(e)(f)(h) | | | 2,000,000 | | | | 1,980,000 | | |
Provation Medical, Inc., 1st Lien
Last Out Term Loan,
3M LIBOR + 7.00%,
8.98%, 03/08/2024(e)(f)(h) | | | 985,000 | | | | 985,000 | | |
Annual Report 2019
15
CION Ares Diversified Credit Fund
Consolidated Schedule of Investments (continued)
October 31, 2019
Senior Loans(b)(c)(d) (continued)
| | | Principal
Amount | | Value(a) | |
Radiology Partners, Inc., 1st Lien
Term Loan B, 12M LIBOR + 4.75%,
6.62%, 07/09/2025 | | $ | 2,247,739 | | | $ | 2,175,812 | | |
Radnet Management, Inc., 1st Lien
Term Loan B-1, 3M LIBOR + 3.50%,
5.51%, 06/30/2023 | | | 338,645 | | | | 337,094 | | |
RegionalCare Hospital Partners
Holdings, Inc., 1st Lien Term Loan B,
1M LIBOR + 4.50%,
6.30%, 11/16/2025 | | | 3,063,670 | | | | 3,054,295 | | |
RTI Surgical, Inc., 2nd Lien Term Loan,
1M LIBOR + 8.75%,
10.75%, 12/05/2023(e)(f)(h)(j) | | | 3,103,709 | | | | 3,103,709 | | |
SCSG EA Acquisition Co., Inc.,
1st Lien Revolver A,
L + 4.25%, 09/01/2022(e)(g)(h) | | | 1,000 | | | | — | | |
SCSG EA Acquisition Co., Inc., Initial
1st Lien Term Loan,
3M LIBOR + 3.50%,
5.60%, 09/01/2023(e)(f)(h) | | | 342,020 | | | | 342,020 | | |
SiroMed Physician Services, Inc.,
1st Lien Revolver,
L + 4.75%, 03/26/2024(e)(g)(h) | | | 1,000 | | | | (140 | ) | |
SiroMed Physician Services, Inc.,
Initial 1st Lien Term Loan,
3M LIBOR + 4.75%,
6.85%, 03/26/2024(e)(f)(h) | | | 976,064 | | | | 839,415 | | |
Sterigenics-Nordion Topco, LLC,
1st Lien Incremental Term Loan,
3M LIBOR + 3.00%,
4.93%, 05/15/2022 | | | 994,898 | | | | 976,244 | | |
TerSera Therapeutics, LLC, 1st Lien
Term Loan, 3M LIBOR + 5.25%,
7.35%, 03/30/2023(e)(f)(h) | | | 48,750 | | | | 48,750 | | |
United Digestive MSO Parent, LLC,
1st Lien Delayed Draw Term Loan,
L + 4.50%, 12/16/2024(e)(g)(h) | | | 1,022,727 | | | | — | | |
United Digestive MSO Parent, LLC,
1st Lien Revolver,
L + 4.50%, 12/14/2023(e)(g)(h) | | | 511,364 | | | | — | | |
United Digestive MSO Parent, LLC,
1st Lien Term Loan,
6M LIBOR + 4.50%,
6.43%, 12/16/2024(e)(f)(h) | | | 1,454,915 | | | | 1,454,915 | | |
VVC Holding Corp., 2nd Lien Term
Loan, 3M LIBOR + 8.50%,
10.68%, 02/11/2027(e)(f)(h) | | | 2,187,621 | | | | 2,187,621 | | |
VVC Holding Corp., 1st Lien Revolver,
L + 2.75%, 02/12/2024(e)(g)(h) | | | 232,108 | | | | — | | |
Senior Loans(b)(c)(d) (continued)
| | | Principal
Amount | | Value(a) | |
VVC Holding Corp., 1st Lien Term
Loan B, 3M LIBOR + 4.50%,
6.68%, 02/11/2026(e)(f)(h) | | $ | 577,369 | | | $ | 577,369 | | |
| | | | | | 76,340,377 | | |
High Tech Industries 15.3% | |
Almonde, Inc., 1st Lien Term Loan,
3M LIBOR + 3.50%,
5.70%, 06/13/2024 | | | 588,394 | | | | 561,551 | | |
Ancestry.com Operations, Inc.,
1st Lien Term Loan,
1M LIBOR + 3.75%,
5.54%, 10/19/2023 | | | 446,576 | | | | 408,617 | | |
Applied Systems, Inc., 2nd Lien
Term Loan, 3M LIBOR + 7.00%,
9.10%, 09/19/2025 | | | 1,000,000 | | | | 1,009,170 | | |
Applied Systems, Inc., Initial 1st Lien
Term Loan, 3M LIBOR + 3.00%,
5.10%, 09/19/2024 | | | 1,685,411 | | | | 1,674,271 | | |
Atlanta Bidco, Ltd., EUR Facility
1st Lien Term Loan A, (Great Britain),
6M EURIBOR + 6.75%,
7.50%, 08/23/2024(e)(f)(h) | | € | 1,000,000 | | | | 1,114,450 | | |
Axiom Merger Sub, Inc., Facility
1st Lien Term Loan B,
3M LIBOR + 5.50%,
7.51%, 04/08/2026(e)(f)(h) | | $ | 1,841,538 | | | | 1,823,123 | | |
Axiom Merger Sub, Inc., 1st Lien
Delayed Draw Term Loan,
L + 5.50%, 04/08/2026(e)(g)(h) | | | 1,153,846 | | | | (11,538 | ) | |
Axiom Merger Sub, Inc., 1st Lien
EUR Facility Term Note B,
3M EURIBOR + 5.75%,
5.75%, 04/10/2026(e)(h) | | € | 680,539 | | | | 750,842 | | |
Axiom Merger Sub, Inc.,
1st Lien Revolver,
L + 5.50%, 10/08/2025(e)(g)(h) | | $ | 230,769 | | | | (6,346 | ) | |
Cority Software Inc., 1st Lien
Incremental Term Loan,
3M LIBOR + 5.50%,
7.50%, 07/02/2026(e)(f)(h) | | | 547,267 | | | | 547,267 | | |
Cority Software Inc.,
1st Lien Revolver,
L + 5.50%, 07/02/2025(e)(g)(h) | | | 230,579 | | | | (4,612 | ) | |
Cority Software Inc., 1st Lien
Term Loan, 3M LIBOR + 5.50%,
7.59%, 07/02/2026(e)(f)(h) | | | 1,759,074 | | | | 1,741,483 | | |
Creation Holdings, Inc., 1st Lien
Term Loan, 1M LIBOR + 5.75%,
7.64%, 08/15/2025(e)(f)(h) | | | 2,396,405 | | | | 2,372,441 | | |
Annual Report 2019
16
CION Ares Diversified Credit Fund
Consolidated Schedule of Investments (continued)
October 31, 2019
Senior Loans(b)(c)(d) (continued)
| | | Principal
Amount | | Value(a) | |
Creation Holdings, Inc., 1st Lien
Delayed Draw Term Loan,
L + 5.75%, 08/15/2025(e)(g)(h) | | $ | 449,326 | | | $ | (4,493 | ) | |
Creation Holdings, Inc., 1st Lien
Revolver, 1M LIBOR + 5.75%,
7.64%, 08/15/2024(e)(g)(h) | | | 544,813 | | | | 85,354 | | |
Cvent, Inc., 1st Lien Term Loan,
1M LIBOR + 3.75%,
5.79%, 11/29/2024 | | | 1,496,203 | | | | 1,456,927 | | |
Datix Bidco, Ltd., 1st Lien Term
Loan B-3, (Great Britain),
6M LIBOR + 4.50%,
6.43%, 04/28/2025(e)(f)(h) | | | 1,384,627 | | | | 1,384,627 | | |
Datix Bidco, Ltd., Additional Facility
1st Lien Term Loan, (Great Britain),
6M LIBOR + 4.50%,
6.43%, 04/28/2025(e)(f)(h) | | | 466,003 | | | | 466,003 | | |
Datix Bidco, Ltd., Facility 1st Lien
Term Loan B-1, (Great Britain),
6M LIBOR + 4.50%,
6.43%, 04/28/2025(e)(f)(h) | | | 1,000,000 | | | | 1,000,000 | | |
Doxim, Inc., 1st Lien Delayed Draw
Term Loan, 3M LIBOR + 6.00%,
8.15%, 02/28/2024(e)(h) | | | 327,399 | | | | 327,399 | | |
Doxim, Inc., 1st Lien Term Loan,
3M LIBOR + 6.00%,
8.33%, 02/28/2024(e)(f)(h) | | | 714,286 | | | | 714,286 | | |
DRB Holdings, LLC, 1st Lien Revolver,
L + 5.75%, 10/06/2023(e)(g)(h) | | | 1,000 | | | | (30 | ) | |
DRB Holdings, LLC, Initial 1st Lien
Term Loan, 3M LIBOR + 6.00%,
8.20%, 10/06/2023(e)(f)(h) | | | 490,268 | | | | 475,559 | | |
Dun & Bradstreet Corp., Initial
1st Lien Term Loan,
1M LIBOR + 5.00%,
6.80%, 02/06/2026 | | | 1,830,349 | | | | 1,834,541 | | |
Elemica Parent, Inc., 1st Lien
Delayed Draw Term Loan,
L + 5.50%, 09/18/2025(e)(g)(h) | | | 561,538 | | | | (5,615 | ) | |
Elemica Parent, Inc., 1st Lien
Revolver, 3M LIBOR + 5.50%,
7.65%, 09/18/2025(e)(g)(h) | | | 478,712 | | | | 107,710 | | |
Elemica Parent, Inc., 1st Lien
Term Loan, 3M LIBOR + 5.50%,
7.65%, 09/18/2025(e)(h) | | | 2,901,279 | | | | 2,872,267 | | |
Ellie Mae, Inc., 1st Lien Term Loan,
2M LIBOR + 4.00%,
5.86%, 04/17/2026(i) | | | 3,241,604 | | | | 3,219,983 | | |
Senior Loans(b)(c)(d) (continued)
| | | Principal
Amount | | Value(a) | |
Frontline Technologies Group, LLC,
1st Lien Closing Date Term Loan,
3M LIBOR + 6.50%,
8.60%, 09/18/2023(e)(f)(h) | | $ | 178,619 | | | $ | 178,619 | | |
Frontline Technologies Group, LLC,
1st Lien Closing Date Term Loan,
3M LIBOR + 6.50%,
8.60%, 09/18/2023(e)(h) | | | 285,964 | | | | 285,964 | | |
Frontline Technologies Intermediate
Holdings, LLC, 1st Lien Delayed
Draw Term Loan, 3M LIBOR + 6.50%,
8.60%, 09/18/2023(e)(h) | | | 57,149 | | | | 57,149 | | |
GraphPAD Software, LLC,
1st Lien Revolver A,
L + 6.00%, 12/21/2023(e)(g)(h) | | | 1,000 | | | | — | | |
GraphPAD Software, LLC, 1st Lien
Unitranche Term Loan,
3M LIBOR + 6.00%,
8.20%, 12/21/2023(e)(f)(h) | | | 1,603,046 | | | | 1,603,046 | | |
Greeneden U.S. Holdings I, LLC,
1st Lien Term Loan B,
1M LIBOR + 3.25%,
5.04%, 12/01/2023 | | | 790,489 | | | | 771,225 | | |
Huskies Parent, Inc., 1st Lien
Closing Date Term Loan,
1M LIBOR + 4.00%,
5.79%, 07/31/2026 | | | 2,742,601 | | | | 2,715,175 | | |
Invoice Cloud, Inc., 1st Lien Delayed
Draw Term Loan,
L + 6.50%, 02/11/2024(e)(g)(h) | | | 1,191,489 | | | | — | | |
Invoice Cloud, Inc., 1st Lien Revolver,
L + 5.50%, 02/11/2024(e)(g)(h) | | | 255,319 | | | | — | | |
Invoice Cloud, Inc., 1st Lien Term
Loan, 3M LIBOR + 6.50%,
8.68%, 02/11/2024(e)(h)(j) | | | 2,595,547 | | | | 2,595,547 | | |
MA FinanceCo., LLC, Tranche
1st Lien Term Loan B-2,
1M LIBOR + 2.25%,
4.05%, 11/19/2021 | | | 750,000 | | | | 743,437 | | |
MA FinanceCo., LLC, Tranche
1st Lien Term Loan B-3,
1M LIBOR + 2.50%,
4.30%, 06/21/2024 | | | 134,632 | | | | 130,510 | | |
MH Sub I, LLC, Initial 1st Lien
Term Loan, 1M LIBOR + 3.75%,
5.54%, 09/13/2024 | | | 1,070,745 | | | | 1,042,467 | | |
Mitchell International, Inc., Initial
1st Lien Term Loan,
1M LIBOR + 3.25%,
5.04%, 11/29/2024 | | | 1,422,778 | | | | 1,336,301 | | |
Annual Report 2019
17
CION Ares Diversified Credit Fund
Consolidated Schedule of Investments (continued)
October 31, 2019
Senior Loans(b)(c)(d) (continued)
| | | Principal
Amount | | Value(a) | |
Oakley Ekomid, Ltd., CAR Facility
1st Lien Term Loan, (Great Britain),
L + 6.25%, 06/23/2025(e)(g)(h) | | € | 750,000 | | | $ | — | | |
Oakley Ekomid, Ltd., Unitranche
Facility 1st Lien Term Loan,
(Great Britain), 6M EURIBOR + 6.25%,
6.50%, 06/23/2025(e)(h) | | | 750,000 | | | | 835,837 | | |
PDI TA Holdings, Inc., 1st Lien
Delayed Draw Term Loan 1,
L + 3.50%, 10/24/2024(e)(g)(h) | | $ | 46,902 | | | | — | | |
PDI TA Holdings, Inc., 1st Lien
Delayed Draw Term Loan 2,
L + 3.50%, 10/24/2024(e)(g)(h) | | | 126,855 | | | | — | | |
PDI TA Holdings, Inc., 1st Lien
Revolver, Prime + 3.50%,
8.25%, 10/24/2024(e)(h) | | | 205,023 | | | | 205,023 | | |
PDI TA Holdings, Inc., 2nd Lien
Delayed Draw Term Loan,
L + 8.50%, 10/24/2025(e)(g)(h) | | | 62,792 | | | | — | | |
PDI TA Holdings, Inc., 2nd Lien
Delayed Draw Term Loan 1,
L + 8.50%, 10/24/2025(e)(g)(h) | | | 19,730 | | | | — | | |
PDI TA Holdings, Inc., 2nd Lien
Term Loan, 3M LIBOR + 8.50%,
10.66%, 10/24/2025(e)(h) | | | 1,106,612 | | | | 1,106,612 | | |
PDI TA Holdings, Inc., Initial
1st Lien Term Loan,
3M LIBOR + 4.50%,
6.66%, 10/24/2024(e)(f)(h) | | | 2,419,926 | | | | 2,419,926 | | |
Perforce Software, Inc., 1st Lien
Term Loan B, 1M LIBOR + 4.50%,
6.29%, 07/01/2026(e) | | | 737,610 | | | | 726,546 | | |
Project Boost Purchaser, LLC,
1st Lien Term Loan B,
1M LIBOR + 3.50%,
5.29%, 06/01/2026(i) | | | 4,111,702 | | | | 4,038,473 | | |
QF Holdings, Inc., 1st Lien Delayed
Draw Term Loan,
L + 7.00%, 09/19/2024(e)(g)(h) | | | 262,533 | | | | (2,626 | ) | |
QF Holdings, Inc., 1st Lien Revolver,
L + 7.00%, 09/19/2024(e)(g)(h) | | | 1,000 | | | | (20 | ) | |
QF Holdings, Inc., 1st Lien Term Loan,
3M LIBOR + 7.00%,
9.15%, 09/19/2024(e)(h) | | | 1,312,663 | | | | 1,299,536 | | |
Raptor Technologies, LLC, 1st Lien
Delayed Draw Term Loan,
3M LIBOR + 6.00%,
8.10%, 12/17/2024(e)(g)(h) | | | 1,032,483 | | | | 660,193 | | |
Raptor Technologies, LLC,
1st Lien Revolver,
L + 6.00%, 12/17/2023(e)(g)(h) | | | 1,000 | | | | — | | |
Senior Loans(b)(c)(d) (continued)
| | | Principal
Amount | | Value(a) | |
Raptor Technologies, LLC, 1st Lien
Term Loan, 3M LIBOR + 6.00%,
8.10%, 12/17/2024(e)(f)(h) | | $ | 1,950,126 | | | $ | 1,950,126 | | |
Rocket Software, Inc., Initial 1st Lien
Term Loan, 1M LIBOR + 4.25%,
6.04%, 11/28/2025 | | | 1,279,221 | | | | 1,104,927 | | |
Seattle Spinco, Inc., Initial 1st Lien
Term Loan, 1M LIBOR + 2.50%,
4.30%, 06/21/2024 | | | 909,204 | | | | 881,364 | | |
Sophia, LP, 1st Lien Term Loan B,
3M LIBOR + 3.25%,
5.35%, 09/30/2022 | | | 555,537 | | | | 554,843 | | |
SpareFoot, LLC, 1st Lien Bader
Incremental Term Loan,
3M LIBOR + 4.25%,
6.31%, 04/13/2024(e)(f)(h) | | | 97,640 | | | | 97,640 | | |
SpareFoot, LLC, 1st Lien SBOA
Incremental Term Loan,
3M LIBOR + 4.25%,
6.31%, 04/13/2024(e)(f)(h) | | | 101,380 | | | | 101,380 | | |
SpareFoot, LLC, 2nd Lien Term Loan,
3M LIBOR + 8.25%,
10.31%, 04/13/2025(e)(f)(h) | | | 285,429 | | | | 285,429 | | |
SpareFoot, LLC, 1st Lien Incremental
Term Loan, 3M LIBOR + 4.25%,
6.31%, 04/13/2024(e)(f)(h) | | | 134,225 | | | | 134,225 | | |
SpareFoot, LLC, 1st Lien Incremental
Term Loan, 3M LIBOR + 4.25%,
6.31%, 04/13/2024(e)(h) | | | 74,487 | | | | 74,487 | | |
SpareFoot, LLC, 1st Lien Revolver,
6M LIBOR + 4.25%,
6.17%, 04/13/2023(e)(g)(h) | | | 1,000 | | | | 573 | | |
SpareFoot, LLC, 1st Lien StorSmart
Incremental Term Loan,
3M LIBOR + 4.25%,
6.31%, 04/13/2024(e)(f)(h) | | | 195,279 | | | | 195,279 | | |
SpareFoot, LLC, 2nd Lien Bader
Incremental Term Loan,
3M LIBOR + 8.25%,
10.31%, 04/13/2025(e)(f)(h) | | | 59,527 | | | | 59,527 | | |
SpareFoot, LLC, 2nd Lien Incremental
Term Loan, 3M LIBOR + 8.25%,
10.31%, 04/13/2025(e)(f)(h) | | | 195,750 | | | | 195,750 | | |
SpareFoot, LLC, 2nd Lien StorSmart
Incremental Term Loan,
3M LIBOR + 8.25%,
10.31%, 04/13/2025(e)(f)(h) | | | 119,054 | | | | 119,054 | | |
SpareFoot, LLC, Initial 1st Lien Term
Loan, 3M LIBOR + 4.25%,
6.31%, 04/13/2024(e)(f)(h) | | | 704,652 | | | | 704,652 | | |
Annual Report 2019
18
CION Ares Diversified Credit Fund
Consolidated Schedule of Investments (continued)
October 31, 2019
Senior Loans(b)(c)(d) (continued)
| | | Principal
Amount | | Value(a) | |
Sunk Rock Foundry Partners, LP,
1st Lien Term Loan A-1,
3M LIBOR + 4.75%,
6.85%, 10/31/2023(e)(f)(h) | | $ | 226,608 | | | $ | 226,608 | | |
TGG TS Acquisition Co., 1st Lien
Term Loan B, 1M LIBOR + 6.50%,
8.39%, 12/14/2025(e) | | | 202,521 | | | | 197,458 | | |
Tibco Software, Inc., 1st Lien
Term Loan B-2, 1M LIBOR + 4.00%,
6.00%, 06/30/2026 | | | 2,596,173 | | | | 2,579,947 | | |
TimeClock Plus, LLC, 1st Lien
Term Loan, 3M LIBOR + 5.50%,
7.62%, 08/28/2026(e)(f)(h) | | | 2,376,814 | | | | 2,353,046 | | |
TimeClock Plus, LLC, 1st Lien
Delayed Draw Term Loan,
L + 5.50%, 08/28/2026(e)(g)(h) | | | 495,170 | | | | (4,952 | ) | |
TimeClock Plus, LLC, 1st Lien
Revolver, 3M LIBOR + 5.50%,
7.62%, 08/29/2025(e)(g)(h) | | | 458,311 | | | | 48,123 | | |
Ultimate Software Group Inc. (The),
2nd Lien Term Loan,
1M LIBOR + 8.00%,
9.79%, 05/03/2027(e)(f)(h) | | | 3,000,000 | | | | 2,970,000 | | |
Ultimate Software Group, Inc.
(The), 1st Lien Revolver,
L + 3.75%, 05/03/2024(e)(g)(h) | | | 1,000 | | | | (23 | ) | |
Visolit Finco A/S, 1st Lien
NOK Committed Accordion
Term Loan, (Norway),
L + 5.85%, 07/02/2026(e)(g)(h) | | NOK | 11,180,680 | | | | — | | |
Visolit Finco A/S, NOK Facility
1st Lien Term Loan B-1, (Norway),
6M NIBOR + 5.85%,
7.57%, 07/02/2026(e)(h) | | | 33,624,031 | | | | 3,652,979 | | |
Visual Edge Technology, Inc.,
1st Lien Delayed Draw Term Loan,
3M LIBOR + 7.00%,
9.12%, 08/31/2022(e)(f)(h)(j) | | $ | 1,964,034 | | | | 1,944,393 | | |
Visual Edge Technology, Inc.,
1st Lien Term Loan,
3M LIBOR + 7.00%,
9.12%, 08/31/2022(e)(f)(h)(j) | | | 160,090 | | | | 158,489 | | |
WebPT, Inc., 1st Lien Delayed
Draw Term Loan,
L + 6.75%, 08/28/2024(e)(g)(h) | | | 255,205 | | | | (2,552 | ) | |
WebPT, Inc., 1st Lien Revolver,
L + 6.75%, 08/28/2024(e)(g)(h) | | | 216,015 | | | | (4,320 | ) | |
WebPT, Inc., Initial 1st Lien Term
Loan, 3M LIBOR + 6.75%,
8.89%, 08/28/2024(e)(h) | | | 2,041,641 | | | | 2,021,224 | | |
| | | | | | 71,263,853 | | |
Senior Loans(b)(c)(d) (continued)
| | | Principal
Amount | | Value(a) | |
Hotel, Gaming & Leisure 5.4% | |
Aimbridge Acquisition Co., Inc.,
Initial 2nd Lien Term Loan,
1M LIBOR + 7.50%,
9.53%, 02/01/2027(e)(f)(h) | | $ | 4,788,080 | | | $ | 4,788,080 | | |
Caesars Resort Collection, LLC,
1st Lien Term Loan B,
1M LIBOR + 2.75%,
4.54%, 12/23/2024 | | | 2,831,605 | | | | 2,787,659 | | |
Canopy Bidco, Ltd., Facility 1st Lien
Term Loan B, (Great Britain),
3M GBP LIBOR + 7.25%,
8.01%, 12/18/2024(e)(f)(h) | | £ | 500,000 | | | | 646,925 | | |
Canopy Bidco, Ltd., Senior Capex
Facility 1st Lien Term Loan,
(Great Britain),
3M GBP LIBOR + 7.25%,
8.01%, 12/18/2024(e)(f)(g)(h) | | | 500,000 | | | | 115,865 | | |
Concert Golf Partners Holdco, LLC,
1st Lien Delayed Draw Term Loan,
L + 4.50%, 08/20/2025(e)(g)(h) | | $ | 573,782 | | | | (5,737 | ) | |
Concert Golf Partners Holdco, LLC,
1st Lien Revolver,
3M LIBOR + 4.50%,
6.53%, 08/20/2025(e)(g)(h) | | | 764,512 | | | | 133,790 | | |
Concert Golf Partners Holdco, LLC,
1st Lien Term Loan,
3M LIBOR + 4.50%,
6.52%, 08/20/2025(e)(f)(h) | | | 3,442,695 | | | | 3,408,268 | | |
EuroParcs (Top) Holding B.V.,
Acquisition Facility 1st Lien Term
Loan, (Netherlands),
3M EURIBOR + 6.50%,
6.50%, 07/03/2026(e)(h) | | € | 312,500 | | | | 348,265 | | |
EuroParcs (Top) Holding B.V., Facility
1st Lien Term Loan B, (Netherlands),
3M EURIBOR + 6.50%,
6.50%, 07/03/2026(e)(h) | | | 2,187,500 | | | | 2,437,858 | | |
Golden Nugget, Inc., Initial
1st Lien Term Loan B,
L + 2.75%, 10/04/2023(i) | | $ | 3,659,443 | | | | 3,649,710 | | |
Scientific Games International, Inc.,
1st Lien Term Loan B-5,
1M LIBOR + 2.75%,
4.54%, 08/14/2024 | | | 1,008,869 | | | | 996,571 | | |
SFE Intermediate Holdco, LLC,
1st Lien Incremental Term Loan,
3M LIBOR + 4.75%,
6.88%, 07/31/2024(e)(f)(h) | | | 1,979,010 | | | | 1,979,010 | | |
Annual Report 2019
19
CION Ares Diversified Credit Fund
Consolidated Schedule of Investments (continued)
October 31, 2019
Senior Loans(b)(c)(d) (continued)
| | | Principal
Amount | | Value(a) | |
SFE Intermediate Holdco, LLC,
1st Lien Revolver,
L + 5.00%, 07/31/2023(e)(g)(h) | | $ | 2,000 | | | $ | — | | |
SFE Intermediate Holdco, LLC,
1st Lien Term Loan,
3M LIBOR + 4.75%,
6.68%, 07/31/2024(e)(f)(h) | | | 245,000 | | | | 245,000 | | |
UFC Holdings, LLC, 1st Lien Term
Loan, 1M LIBOR + 3.25%,
5.04%, 04/29/2026 | | | 1,672,521 | | | | 1,670,430 | | |
Whatabrands, LLC, 1st Lien Term
Loan B, 3M LIBOR + 3.25%,
5.52%, 08/02/2026 | | | 2,000,000 | | | | 2,004,720 | | |
| | | | | | 25,206,414 | | |
Media: Broadcasting & Subscription 2.4% | |
Commify, Ltd., Facility 1st Lien Term
Loan B, (Great Britain),
6M EURIBOR + 7.50%,
7.75%, 09/14/2026(e)(f)(h) | | € | 2,739,130 | | | | 3,052,622 | | |
Commify, Ltd., 1st Lien Acquisition
Term Loan, (Great Britain),
L + 6.25%, 09/14/2026(e)(g)(h) | | | 760,870 | | | | — | | |
Diamond Sports Group, LLC, 1st Lien
Term Loan, 1M LIBOR + 3.25%,
5.08%, 08/24/2026 | | $ | 1,111,111 | | | | 1,115,278 | | |
iHeartCommunications, Inc., Initial
1st Lien Term Loan,
1M LIBOR + 4.00%,
6.03%, 05/01/2026 | | | 2,500,000 | | | | 2,507,025 | | |
Nexstar Media Group, Inc., 1st Lien
Term Loan B-4, 1M LIBOR + 2.75%,
4.55%, 09/18/2026 | | | 1,425,981 | | | | 1,430,530 | | |
Production Resource Group, LLC,
1st Lien Term Loan,
3M LIBOR + 7.00%,
9.16%, 08/21/2024(e)(f)(h) | | | 2,000,000 | | | | 1,860,000 | | |
Sinclair Television Group, Inc.,
Tranche 1st Lien Term Loan B-2,
1M LIBOR + 2.50%,
4.43%, 09/30/2026 | | | 1,227,496 | | | | 1,227,876 | | |
| | | | | | 11,193,331 | | |
Media: Diversified & Production 1.9% | |
Cast and Crew Payroll, LLC, Initial
1st Lien Term Loan,
1M LIBOR + 4.00%,
5.79%, 02/09/2026 | | | 4,896,783 | | | | 4,917,203 | | |
Senior Loans(b)(c)(d) (continued)
| | | Principal
Amount | | Value(a) | |
Equinox Holdings, Inc., 1st Lien Term
Loan B-1, 1M LIBOR + 3.00%,
4.79%, 03/08/2024 | | $ | 2,633,071 | | | $ | 2,621,143 | | |
Life Time Fitness, Inc., 1st Lien
Refinancing Term Loan B,
3M LIBOR + 2.75%,
4.87%, 06/10/2022 | | | 490,000 | | | | 487,491 | | |
Sapphire Bidco, Ltd., Facility 1st Lien
Term Loan B, (Great Britain),
6M GBP LIBOR + 6.00%,
7.00%, 03/15/2023(e)(f)(h) | | £ | 833,333 | | | | 1,078,209 | | |
| | | | | | 9,104,046 | | |
Retail 0.9% | |
FWR Holding Corp., Initial 1st Lien
Delayed Draw Term Loan 4,
1M LIBOR + 5.50%,
7.32%, 08/21/2023(e)(h) | | $ | 42,916 | | | | 42,916 | | |
FWR Holding Corp., 1st Lien New
Delayed Draw Term Loan 2,
L + 5.50%, 08/21/2023(e)(g)(h) | | | 32,187 | | | | — | | |
FWR Holding Corp., Initial 1st Lien
Delayed Draw Term Loan 1,
1M LIBOR + 5.50%,
7.32%, 08/21/2023(e)(f)(h) | | | 386 | | | | 386 | | |
FWR Holding Corp., Initial 1st Lien
Delayed Draw Term Loan 2,
1M LIBOR + 5.50%,
7.32%, 08/21/2023(e)(h) | | | 608 | | | | 608 | | |
FWR Holding Corp., Initial 1st Lien
Delayed Draw Term Loan 3,
1M LIBOR + 5.50%,
7.32%, 08/21/2023(e)(h) | | | 32,106 | | | | 32,106 | | |
FWR Holding Corp., Initial 1st Lien
Revolver, 1M LIBOR + 5.50%,
7.32%, 08/21/2023(e)(g)(h) | | | 1,000 | | | | 525 | | |
FWR Holding Corp., Initial 1st Lien
Term Loan, 1M LIBOR + 5.50%,
7.32%, 08/21/2023(e)(f)(h) | | | 343,000 | | | | 343,000 | | |
Mister Car Wash Holdings, Inc.,
1st Lien Delayed Draw Term Loan 5,
L + 3.50%, 05/14/2026(g) | | | 187,650 | | | | (1,876 | ) | |
Mister Car Wash Holdings, Inc.,
Initial 1st Lien Term Loan B,
3M LIBOR + 3.50%,
5.66%, 05/14/2026 | | | 3,743,627 | | | | 3,706,191 | | |
| | | | | | 4,123,856 | | |
Annual Report 2019
20
CION Ares Diversified Credit Fund
Consolidated Schedule of Investments (continued)
October 31, 2019
Senior Loans(b)(c)(d) (continued)
| | | Principal
Amount | | Value(a) | |
Services: Business 9.0% | |
Alpha Luxco 2 SARL, Facility
1st Lien Term Loan B,
(Luxembourg),
3M EURIBOR + 5.75%,
6.25%, 01/09/2025(e)(f)(h) | | € | 1,000,000 | | | $ | 1,114,450 | | |
AMCP Clean Intermediate, LLC,
1st Lien 2nd Incremental
Term Loan, 3M LIBOR + 5.50%,
7.71%, 10/01/2024(e)(f)(h) | | $ | 181,531 | | | | 179,716 | | |
AMCP Clean Intermediate, LLC,
1st Lien 3rd Incremental
Term Loan, 3M LIBOR + 5.50%,
7.50%, 10/01/2024(e)(f)(h) | | | 136,069 | | | | 133,348 | | |
AMCP Clean Intermediate, LLC,
1st Lien Incremental Term Loan,
3M LIBOR + 5.50%,
7.60%, 10/01/2024(e)(h) | | | 452,223 | | | | 447,700 | | |
AMCP Clean Intermediate, LLC,
1st Lien Revolver,
3M LIBOR + 5.50%,
7.43%, 10/01/2024(e)(g)(h) | | | 1,100 | | | | 57 | | |
AMCP Clean Intermediate, LLC,
1st Lien Term Loan,
3M LIBOR + 5.50%,
7.60%, 10/01/2024(e)(f)(h) | | | 1,979,048 | | | | 1,959,257 | | |
AVSC Holding Corp., 1st Lien
Incremental Term Loan,
3M LIBOR + 4.50%,
6.49%, 10/15/2026 | | | 1,500,000 | | | | 1,468,125 | | |
AVSC Holding Corp., 1st Lien Term
Loan, 3M LIBOR + 3.25%,
5.23%, 03/03/2025 | | | 2,487,374 | | | | 2,389,446 | | |
Capnor Connery Bidco APS, EUR
Facility 1st Lien Term Loan B,
(Denmark), 1M EURIBOR + 7.63%,
7.63%, 04/30/2026(e)(f)(h) | | € | 2,954,439 | | | | 3,292,573 | | |
Capnor Connery Bidco APS, Facility
1st Lien Term Loan B, (Denmark),
1M EURIBOR + 7.63%,
7.63%, 04/30/2026(e)(f)(h) | | DKK | 22,064,516 | | | | 3,291,246 | | |
Capnor Connery Bidco APS, Facility
1st Lien Term Loan D, (Denmark),
L + 7.63%, 04/30/2026(e)(f)(g)(h) | | | 45,967,742 | | | | — | | |
Capnor Connery Bidco APS, NOK
Facility 1st Lien Term Loan B,
(Denmark), 1M NIBOR + 7.63%,
9.31%, 04/30/2026(e)(f)(h) | | NOK | 2,551,246 | | | | 277,172 | | |
Senior Loans(b)(c)(d) (continued)
| | | Principal
Amount | | Value(a) | |
Capnor Connery Bidco APS, SEK
Facility 1st Lien Term Loan B,
(Denmark), 1M STIBOR + 7.63%,
7.63%, 04/30/2026(e)(f)(h) | | SEK | 4,209,615 | | | $ | 435,640 | | |
Cypress Intermediate Holdings III,
Inc., Initial 1st Lien Term Loan,
1M LIBOR + 2.75%,
4.54%, 04/29/2024 | | $ | 673,372 | | | | 661,224 | | |
IRI Holdings, Inc., Initial 1st Lien
Term Loan, 3M LIBOR + 4.50%,
6.62%, 12/01/2025(e)(f)(h) | | | 1,516,689 | | | | 1,516,689 | | |
IRI Holdings, Inc., Initial 2nd Lien
Term Loan, 3M LIBOR + 8.00%,
10.12%, 11/30/2026(e)(f)(h) | | | 1,471,850 | | | | 1,471,850 | | |
P27 Bidco, Ltd., Capex Facility
1st Lien Term Loan, (Great Britain),
L + 6.75%, 07/31/2026(e)(g)(h) | | £ | 325,380 | | | | (1 | ) | |
P27 Bidco, Ltd., Facility 1st Lien
Term Loan B-1, (Great Britain),
6M GBP LIBOR + 6.75%,
7.56%, 07/31/2026(e)(h) | | | 1,705,510 | | | | 2,206,674 | | |
P27 Bidco, Ltd., Facility 1st Lien
Term Loan B-2, (Great Britain),
6M LIBOR + 6.75%,
8.95%, 07/31/2026(e)(h) | | $ | 609,527 | | | | 609,527 | | |
Packers Holdings, LLC, Initial
1st Lien Term Loan B,
3M LIBOR + 3.25%,
5.57%, 12/04/2024 | | | 2,358,082 | | | | 2,319,033 | | |
Project Accelerate Parent, LLC,
1st Lien Term Loan,
1M LIBOR + 4.25%,
6.16%, 01/02/2025(e) | | | 1,768,554 | | | | 1,733,183 | | |
Project Farm Bidco 2016, Ltd.,
Acquisition Capex Facility 1st Lien
Term Loan, (Great Britain),
3M LIBOR + 6.25%,
8.23%, 06/26/2026(e)(h) | | | 93,750 | | | | 93,750 | | |
Project Farm Bidco 2016, Ltd.,
Facility 1st Lien Term Loan B,
(Great Britain), 3M LIBOR + 6.50%,
8.60%, 06/26/2026(e)(h) | | | 1,406,250 | | | | 1,406,250 | | |
Puerto Rico Waste Investment, LLC,
1st Lien Term Loan, (Puerto Rico),
3M LIBOR + 7.00%,
9.08%, 09/20/2024(e)(f)(h) | | | 1,692,504 | | | | 1,675,579 | | |
Puerto Rico Waste Investment, LLC,
1st Lien Revolver, (Puerto Rico),
L + 7.00%, 09/20/2024(e)(g) | | | 157,737 | | | | (3,943 | ) | |
Annual Report 2019
21
CION Ares Diversified Credit Fund
Consolidated Schedule of Investments (continued)
October 31, 2019
Senior Loans(b)(c)(d) (continued)
| | | Principal
Amount | | Value(a) | |
Revint Intermediate II, LLC, 1st Lien
Delayed Draw Term Loan,
3M LIBOR + 4.50%,
6.83%, 12/13/2023(e)(f)(h) | | $ | 2,080,853 | | | $ | 2,060,045 | | |
Revint Intermediate II, LLC, 1st Lien
Incremental Term Loan,
1M LIBOR + 5.25%,
7.34%, 12/12/2023(e)(f)(h) | | | 1,252,907 | | | | 1,240,378 | | |
Revint Intermediate II, LLC, 1st Lien
Revolver, 3M LIBOR + 4.50%,
6.60%, 12/13/2023(e)(g)(h) | | | 1,000 | | | | 586 | | |
Revint Intermediate II, LLC, 1st Lien
Term Loan, 3M LIBOR + 4.50%,
6.60%, 12/13/2023(e)(f)(h) | | | 392,607 | | | | 388,681 | | |
RSK Group, Ltd., Acquisition 1st Lien
Term Loan, (Great Britain),
L + 5.00%, 10/17/2022(e)(g)(h) | | £ | 250,000 | | | | — | | |
RSK Group, Ltd., Acquisition Facility
1st Lien Term Loan, (Great Britain),
3M GBP LIBOR + 7.00%,
7.77%, 10/27/2025(e)(f)(g)(h)(j) | | | 503,638 | | | | 449,599 | | |
RSK Group, Ltd., Facility 1st Lien
Term Loan B, (Great Britain),
3M GBP LIBOR + 7.00%,
7.77%, 10/27/2025(e)(f)(h)(j) | | | 508,796 | | | | 658,305 | | |
Saldon Holdings, Inc., 1st Lien
1st Amendment Term Loan,
1M LIBOR + 5.65%,
7.44%, 03/13/2025(e)(f)(h) | | $ | 583,717 | | | | 577,880 | | |
Saldon Holdings, Inc.,
1st Lien Revolver,
L + 5.65%, 03/13/2024(e)(g)(h) | | | 380,952 | | | | (3,809 | ) | |
Saldon Holdings, Inc., 1st Lien
Term Loan, 1M LIBOR + 5.65%,
7.44%, 03/13/2025(e)(f)(h) | | | 3,610,000 | | | | 3,573,900 | | |
SOS Security Holdings, LLC, 1st Lien
Delayed Draw Term Loan,
3M LIBOR + 6.50%,
8.61%, 04/30/2025(e)(g)(h) | | | 335,294 | | | | 207,028 | | |
SOS Security Holdings, LLC, 1st Lien
Revolver, Prime + 5.50%,
10.25%, 04/30/2025(e)(g)(h) | | | 179,104 | | | | 105,224 | | |
SOS Security Holdings, LLC, 1st Lien
Term Loan, 2M LIBOR + 6.50%,
8.36%, 04/30/2025(e)(f)(h) | | | 2,143,881 | | | | 2,122,442 | | |
SOS Security Holdings, LLC, 1st Lien
Delayed Draw Term Loan Tranche B,
L + 6.50%, 04/30/2025(e)(g)(h) | | | 335,821 | | | | (3,358 | ) | |
Senior Loans(b)(c)(d) (continued)
| | | Principal
Amount | | Value(a) | |
Team Health Holdings, Inc., Initial
1st Lien Term Loan,
1M LIBOR + 2.75%,
4.54%, 02/06/2024 | | $ | 1,000,000 | | | $ | 767,500 | | |
West Corp., 1st Lien Term Loan B,
3M LIBOR + 4.00%,
5.93%, 10/10/2024 | | | 1,250,000 | | | | 1,037,050 | | |
| | | | | | 41,859,996 | | |
Services: Consumer 2.4% | |
Centric Brands, Inc., 1st Lien
Revolver, Prime + 4.50%,
9.25%, 04/29/2023(e)(g)(h) | | | 1,333 | | | | 907 | | |
Centric Brands, Inc., 1st Lien Term
Loan, 3M LIBOR + 6.00%,
7.93%, 10/30/2023(e)(f)(h) | | | 1,976,511 | | | | 1,936,981 | | |
CHG PPC Parent, LLC, 2nd Lien Term
Loan, 1M LIBOR + 7.50%,
9.29%, 03/30/2026(e)(f)(h) | | | 1,000,000 | | | | 1,000,000 | | |
CHG PPC Parent, LLC, 2nd Lien
Additional Term Loan,
1M LIBOR + 7.75%,
9.54%, 03/30/2026(e)(f)(h) | | | 2,000,000 | | | | 2,000,000 | | |
Goldcup 16786 AB, Unitranche
Facility 1st Lien Term Loan, (Sweden),
3M STIBOR + 7.00%,
7.50%, 06/02/2025(e)(f)(h) | | SEK | 10,000,000 | | | | 1,014,173 | | |
NMC Skincare Intermediate
Holdings II, LLC, 1st Lien Delayed
Draw Term Loan, 1M LIBOR + 4.75%,
6.54%, 10/31/2024(e)(g)(h) | | $ | 665,975 | | | | 137,642 | | |
NMC Skincare Intermediate
Holdings II, LLC, 1st Lien Revolver,
1M LIBOR + 4.75%,
6.69%, 10/31/2024(e)(g)(h) | | | 333,333 | | | | 166,666 | | |
NMC Skincare Intermediate
Holdings II, LLC, 1st Lien Term Loan,
1M LIBOR + 4.75%,
6.54%, 10/31/2024(e)(f)(h) | | | 1,985,000 | | | | 1,985,000 | | |
St. George's University Scholastic
Services, LLC, 1st Lien Term Loan B,
1M LIBOR + 3.50%,
5.29%, 07/17/2025 | | | 1,756,766 | | | | 1,756,766 | | |
Sunshine Sub, LLC, 1st Lien Delayed
Draw Term Loan, 1M LIBOR + 4.75%,
6.54%, 05/27/2024(e)(h) | | | 416,215 | | | | 416,215 | | |
Sunshine Sub, LLC, 1st Lien Revolver,
L + 4.75%, 05/27/2024(e)(g)(h) | | | 144,269 | | | | — | | |
Annual Report 2019
22
CION Ares Diversified Credit Fund
Consolidated Schedule of Investments (continued)
October 31, 2019
Senior Loans(b)(c)(d) (continued)
| | | Principal
Amount | | Value(a) | |
Sunshine Sub, LLC, 1st Lien Term
Loan, 1M LIBOR + 4.75%,
6.54%, 05/27/2024(e)(f)(h) | | $ | 708,622 | | | $ | 708,622 | | |
| | | | | | 11,122,972 | | |
Telecommunications 2.6% | |
Cablecom Networking Holdings, Ltd.,
Capex Facility 1st Lien Term Loan,
(Great Britain),
6M GBP LIBOR + 6.75%,
7.56%, 12/14/2023(e)(f)(h) | | £ | 438,596 | | | | 567,477 | | |
Cablecom Networking Holdings, Ltd.,
Facility 1st Lien Term Loan A-2,
(Great Britain),
6M GBP LIBOR + 6.75%,
7.58%, 12/14/2023(e)(f)(h) | | | 561,404 | | | | 726,373 | | |
Cablecom Networking Holdings, Ltd.,
Accordian Facility 1st Lien Term Loan,
(Great Britain),
L + 7.00%, 12/14/2023(e)(g)(h) | | | 146,199 | | | | — | | |
CB-SDG, Ltd., GBP Acquisition
Facility 1st Lien Term Loan,
(Great Britain),
L + 7.00%, 04/03/2026(e)(f)(g)(h) | | | 317,460 | | | | — | | |
CB-SDG, Ltd., GBP Facility 1st Lien
Term Loan B-1, (Great Britain),
3M GBP LIBOR + 7.13%,
7.89%, 04/03/2026(e)(f)(h)(j) | | | 2,342,217 | | | | 3,030,478 | | |
CB-SDG, Ltd., GBP Facility 1st Lien
Term Loan B-2, (Great Britain),
3M GBP LIBOR + 7.13%,
7.89%, 04/03/2026(e)(f)(h)(j) | | | 368,979 | | | | 477,403 | | |
Clear Channel Outdoor Holdings, Inc.,
1st Lien Term Loan B,
1M LIBOR + 3.50%,
5.29%, 08/21/2026 | | $ | 1,505,976 | | | | 1,508,401 | | |
Frontier Communications Corp.,
1st Lien Term Loan B-1,
1M LIBOR + 3.75%,
5.54%, 06/15/2024 | | | 198,983 | | | | 198,038 | | |
Iridium Communications, Inc.,
1st Lien Term Loan,
L + 3.75%, 10/16/2026(i) | | | 1,498,573 | | | | 1,506,530 | | |
Sprint Communications, Inc.,
1st Lien Incremental Term Loan B,
1M LIBOR + 3.00%,
4.81%, 02/02/2024 | | | 1,046,565 | | | | 1,039,585 | | |
Sprint Communications, Inc., Initial
1st Lien Term Loan B,
1M LIBOR + 2.50%,
4.31%, 02/02/2024 | | | 1,654,400 | | | | 1,634,415 | | |
Senior Loans(b)(c)(d) (continued)
| | | Principal
Amount | | Value(a) | |
Teligent, Inc., 1st Lien Revolver,
3M LIBOR + 3.75%,
5.88%, 12/13/2023(e)(h) | | $ | 1,100 | | | $ | 990 | | |
Teligent, Inc., 2nd Lien Delayed Draw
Term Loan A, 3M LIBOR + 8.75%,
10.85%, 06/13/2024(e)(g)(h)(j) | | | 671,761 | | | | 394,164 | | |
Teligent, Inc., 2nd Lien Delayed
Draw Term Loan B,
L + 8.75%, 06/13/2024(e)(g)(h) | | | 315,632 | | | | (31,564 | ) | |
Teligent, Inc., 2nd Lien Term Loan,
3M LIBOR + 8.75%,
10.88%, 06/13/2024(e)(h)(j) | | | 1,145,417 | | | | 1,030,875 | | |
| | | | | | 12,083,165 | | |
Transportation: Cargo 0.4% | |
Neovia Logistics Services, LLC,
Initial 2nd Lien Term Loan,
1M LIBOR + 10.25%,
12.18%, 11/08/2024(e)(h)(j) | | | 1,187,464 | | | | 1,187,467 | | |
Neovia Logistics Services, LLC,
Initial 1st Lien Term Loan,
1M LIBOR + 6.50%,
8.45%, 05/08/2024(e) | | | 689,000 | | | | 664,885 | | |
| | | | | | 1,852,352 | | |
Utilities: Electric 0.4% | |
Brookfield WEC Holdings, Inc.,
Initial 1st Lien Term Loan,
1M LIBOR + 3.50%,
5.29%, 08/01/2025 | | | 1,666,604 | | | | 1,654,805 | | |
Utilities: Oil & Gas 0.7% | |
Kene Acquisition, Inc., 1st Lien
Delayed Draw Term Loan,
L + 4.25%, 08/10/2026(e)(g)(h) | | | 635,021 | | | | (6,350 | ) | |
Kene Acquisition, Inc., 1st Lien
Revolver, Prime + 3.25%,
8.00%, 08/08/2024(e)(g)(h) | | | 675,812 | | | | 172,332 | | |
Kene Acquisition, Inc., 1st Lien
Term Loan, 3M LIBOR + 4.25%,
6.44%, 08/10/2026(e)(f)(h) | | | 2,913,795 | | | | 2,884,657 | | |
| | | | | | 3,050,639 | | |
Utilities: Water 0.3% | |
Storm U.S. Holdco, Inc., Initial
1st Lien Term Loan,
3M LIBOR + 5.50%,
7.60%, 05/05/2023(e)(f)(h) | | | 45,901 | | | | 45,901 | | |
Annual Report 2019
23
CION Ares Diversified Credit Fund
Consolidated Schedule of Investments (continued)
October 31, 2019
Senior Loans(b)(c)(d) (continued)
| | | Principal
Amount | | Value(a) | |
TWH Infrastructure Industries, Inc.,
1st Lien Revolver,
L + 5.50%, 04/09/2025(e)(g)(h) | | $ | 463,581 | | | $ | (9,272 | ) | |
TWH Infrastructure Industries, Inc.,
1st Lien Term Loan,
3M LIBOR + 5.50%,
7.60%, 04/09/2025(e)(f)(h) | | | 1,369,057 | | | | 1,355,367 | | |
| | | | | | 1,391,996 | | |
Wholesale 0.9% | |
Pet IQ, LLC, 1st Lien Term Loan,
1M LIBOR + 3.50%,
6.29%, 07/08/2025(e)(f)(h) | | | 4,321,260 | | | | 4,278,047 | | |
Total Senior Loans
(Cost: $467,275,692) | | | | | 471,409,855 | | |
Subordinated Loans 0.2%(b)(c)(d)(e)(h)
High Tech Industries 0.0% | |
Visual Edge Technology, Inc.,
1st Lien Senior Sub Note,
15.00%, 09/03/2024(j) | | | 164,090 | | | | 154,245 | | |
Transportation: Consumer 0.2% | |
Air Medical Group Holdings, Inc.,
Initial Unsecured Term Loan,
1M LIBOR + 7.88%,
9.66%, 03/13/2026(f) | | | 1,000,000 | | | | 990,000 | | |
Total Subordinated Loans
(Cost: $1,129,544) | | | | | 1,144,245 | | |
Corporate Bonds 7.6%
Aerospace & Defense 0.5% | |
Bombardier, Inc., 144A, (Canada),
6.00%, 10/15/2022(d)(k) | | | 2,210,000 | | | | 2,154,750 | | |
TransDigm Group Inc., 144A,
5.50%, 11/15/2027(d)(k) | | | 33,000 | | | | 32,891 | | |
| | | | | | 2,187,641 | | |
Automotive 0.1% | |
Panther BF Aggregator 2, LP, 144A,
8.50%, 05/15/2027(d) | | | 347,000 | | | | 349,603 | | |
Banking, Finance, Insurance & Real Estate 0.5% | |
Acrisure, LLC, 144A,
8.13%, 02/15/2024(d) | | | 2,190,000 | | | | 2,323,480 | | |
Beverage, Food & Tobacco 0.6% | |
IRB Holding Corp., 144A,
6.75%, 02/15/2026(d) | | | 2,795,000 | | | | 2,843,912 | | |
Corporate Bonds (continued)
| | | Principal
Amount | | Value(a) | |
Chemicals, Plastics & Rubber 0.4% | |
Kraton Polymers, LLC, 144A,
7.00%, 04/15/2025(d) | | $ | 2,000,000 | | | $ | 2,035,000 | | |
Construction & Building 0.6% | |
Tutor Perini Corp., 144A,
6.88%, 05/01/2025(d) | | | 2,654,000 | | | | 2,646,967 | | |
Containers, Packaging & Glass 0.2% | |
BWAY Holding Co., 144A,
7.25%, 04/15/2025(d) | | | 1,150,000 | | | | 1,099,687 | | |
Energy: Oil & Gas 1.4% | |
Centennial Resource Production,
LLC, 144A, 5.38%, 01/15/2026(d) | | | 1,377,000 | | | | 1,290,937 | | |
Exterran Energy Solutions, LP,
8.13%, 05/01/2025 | | | 2,405,000 | | | | 2,380,950 | | |
Great Western Petroleum, LLC,
144A, 9.00%, 09/30/2021(d) | | | 225,000 | | | | 182,813 | | |
Range Resources Corp.,
5.00%, 08/15/2022 | | | 863,000 | | | | 798,275 | | |
Summit Midstream Holdings, LLC,
5.75%, 04/15/2025 | | | 1,033,000 | | | | 800,575 | | |
Transocean Poseidon, 144A,
(Cayman Islands),
6.88%, 02/01/2027(d) | | | 796,000 | | | | 802,583 | | |
Vine Oil and Gas, LP, 144A,
9.75%, 04/15/2023(d) | | | 970,000 | | | | 368,600 | | |
| | | | | | 6,624,733 | | |
Environmental Industries 0.5% | |
Core & Main, LP, 144A,
6.13%, 08/15/2025(d) | | | 1,149,000 | | | | 1,167,671 | | |
GFL Environmental, Inc., 144A,
(Canada), 5.38%, 03/01/2023(d) | | | 320,000 | | | | 329,200 | | |
GFL Environmental, Inc., 144A,
(Canada), 7.00%, 06/01/2026(d) | | | 330,000 | | | | 349,800 | | |
GFL Environmental, Inc., 144A,
(Canada), 8.50%, 05/01/2027(d) | | | 385,000 | | | | 423,500 | | |
| | | | | | 2,270,171 | | |
Healthcare & Pharmaceuticals 1.2% | |
Envision Healthcare Corp., 144A,
8.75%, 10/15/2026(d) | | | 151,000 | | | | 86,825 | | |
Immucor, Inc., 144A,
11.13%, 02/15/2022(d) | | | 5,500,000 | | | | 5,502,750 | | |
| | | | | | 5,589,575 | | |
Annual Report 2019
24
CION Ares Diversified Credit Fund
Consolidated Schedule of Investments (continued)
October 31, 2019
Corporate Bonds (continued)
| | | Principal
Amount | | Value(a) | |
High Tech Industries 0.2% | |
Avaya Holdings Corp.,
2.25%, 06/15/2023 | | $ | 100,000 | | | $ | 87,645 | | |
Genesys Telecommunications
Laboratories, Inc., 144A,
10.00%, 11/30/2024(d) | | | 1,000,000 | | | | 1,080,000 | | |
| | | | | | 1,167,645 | | |
Hotel, Gaming & Leisure 0.4% | |
GEO Group, Inc. (The),
5.13%, 04/01/2023 | | | 2,000,000 | | | | 1,760,000 | | |
Media: Advertising, Printing & Publishing 0.0% | |
Lee Enterprises, Inc., 144A,
9.50%, 03/15/2022(d) | | | 210,000 | | | | 208,163 | | |
Media: Broadcasting & Subscription 0.9% | |
Cumulus Media New Holdings, Inc.,
144A, 6.75%, 07/01/2026(d) | | | 654,000 | | | | 693,240 | | |
Diamond Sports Group, LLC, 144A,
5.38%, 08/15/2026(d) | | | 336,000 | | | | 351,120 | | |
Diamond Sports Group, LLC, 144A,
6.63%, 08/15/2027(d) | | | 247,000 | | | | 254,410 | | |
Townsquare Media, Inc., 144A,
6.50%, 04/01/2023(d) | | | 2,862,000 | | | | 2,833,380 | | |
| | | | | | 4,132,150 | | |
Retail 0.1% | |
Nordstrom, Inc., 5.00%, 01/15/2044 | | | 50,000 | | | | 48,148 | | |
PetSmart, Inc., 144A,
8.88%, 06/01/2025(d) | | | 210,000 | | | | 197,400 | | |
| | | | | | 245,548 | | |
Total Corporate Bonds
(Cost: $35,797,058) | | | | | 35,484,275 | | |
Collateralized Loan Obligations 24.2%(d)(e)(l)
Collateralized Loan Obligations — Debt 15.4%(c) | |
AMMC CLO XI, Ltd., (Cayman Islands),
3M LIBOR + 5.80%,
7.74%, 04/30/2031 | | | 1,500,000 | | | | 1,284,237 | | |
AMMC CLO XIV, Ltd.,
(Cayman Islands),
3M LIBOR + 7.35%,
9.29%, 07/25/2029 | | | 250,000 | | | | 235,262 | | |
AMMC CLO XXII, Ltd.,
(Cayman Islands),
3M LIBOR + 5.50%,
7.44%, 04/25/2031 | | | 750,000 | | | | 681,569 | | |
Collateralized Loan Obligations(d)(e)(l) (continued)
| | | Principal
Amount | | Value(a) | |
Apidos CLO XV, Ltd., (Cayman Islands),
3M LIBOR + 5.70%,
7.67%, 04/20/2031 | | $ | 750,000 | | | $ | 692,162 | | |
Apidos CLO XX, Ltd., (Cayman Islands),
3M LIBOR + 5.70%,
7.70%, 07/16/2031 | | | 750,000 | | | | 690,327 | | |
Apidos CLO XX, Ltd., (Cayman Islands),
3M LIBOR + 8.70%,
10.70%, 07/16/2031 | | | 250,000 | | | | 202,953 | | |
Atlas Senior Loan Fund VII, Ltd.,
(Cayman Islands), 3M LIBOR + 8.05%,
10.18%, 11/27/2031 | | | 1,750,000 | | | | 1,311,110 | | |
Barings CLO, Ltd. 2019-II,
(Cayman Islands),
3M LIBOR + 3.85%,
5.85%, 04/15/2031 | | | 750,000 | | | | 740,141 | | |
Barings CLO, Ltd. 2019-II,
(Cayman Islands),
3M LIBOR + 6.69%,
8.69%, 04/15/2031 | | | 1,315,000 | | | | 1,259,544 | | |
Benefit Street Partners CLO XII, Ltd.,
(Cayman Islands),
3M LIBOR + 6.41%,
8.41%, 10/15/2030 | | | 1,500,000 | | | | 1,343,830 | | |
Canyon Capital CLO, Ltd.,
(Cayman Islands),
3M LIBOR + 5.75%,
7.75%, 07/15/2031 | | | 850,000 | | | | 735,633 | | |
Canyon Capital CLO, Ltd. 2019-1,
(Cayman Islands),
3M LIBOR + 6.68%,
8.68%, 04/15/2032 | | | 500,000 | | | | 447,583 | | |
Carlyle Global Market Strategies
CLO, Ltd. 2015-5, (Cayman Islands),
3M LIBOR + 6.70%,
8.67%, 01/20/2032 | | | 1,500,000 | | | | 1,354,368 | | |
Carlyle Global Market Strategies
CLO, Ltd. 2019-2, (Cayman Islands),
3M LIBOR + 6.60%,
8.73%, 07/15/2032 | | | 3,000,000 | | | | 2,771,439 | | |
CBAM, Ltd. 2017-3,
(Cayman Islands),
3M LIBOR + 6.50%,
8.50%, 10/17/2029 | | | 950,000 | | | | 914,746 | | |
Cedar Funding CLO VII, Ltd.,
(Cayman Islands),
3M LIBOR + 2.55%,
4.52%, 01/20/2031 | | | 500,000 | | | | 454,280 | | |
Cedar Funding CLO XI, Ltd.,
(Cayman Islands),
3M LIBOR + 6.85%,
8.97%, 05/29/2032 | | | 1,625,000 | | | | 1,454,892 | | |
Annual Report 2019
25
CION Ares Diversified Credit Fund
Consolidated Schedule of Investments (continued)
October 31, 2019
Collateralized Loan Obligations(d)(e)(l) (continued)
| | | Principal
Amount | | Value(a) | |
CIFC Funding, Ltd. 2013-IV,
(Cayman Islands),
3M LIBOR + 2.80%,
4.74%, 04/27/2031 | | $ | 500,000 | | | $ | 465,417 | | |
CIFC Funding, Ltd. 2018-IV,
(Cayman Islands),
3M LIBOR + 5.90%,
7.90%, 10/17/2031 | | | 1,000,000 | | | | 911,339 | | |
Cook Park CLO, Ltd.,
(Cayman Islands),
3M LIBOR + 5.40%,
7.40%, 04/17/2030 | | | 1,250,000 | | | | 1,099,321 | | |
Crestline Denali CLO XIV, Ltd.,
(Cayman Islands),
3M LIBOR + 6.35%,
8.28%, 10/23/2031 | | | 750,000 | | | | 619,398 | | |
Crestline Denali CLO XIV, Ltd.,
(Cayman Islands),
3M LIBOR + 8.10%,
10.03%, 10/23/2031 | | | 250,000 | | | | 186,310 | | |
Crestline Denali CLO XVI, Ltd.,
(Cayman Islands),
3M LIBOR + 2.60%,
4.57%, 01/20/2030 | | | 1,500,000 | | | | 1,354,246 | | |
Denali Capital CLO XII, Ltd.,
(Cayman Islands),
3M LIBOR + 5.90%,
7.90%, 04/15/2031 | | | 750,000 | | | | 632,429 | | |
Dewolf Park CLO, Ltd.,
(Cayman Islands),
3M LIBOR + 6.20%,
8.20%, 10/15/2030 | | | 1,750,000 | | | | 1,604,729 | | |
Dryden 26 Senior Loan Fund,
(Cayman Islands),
3M LIBOR + 5.54%,
7.54%, 04/15/2029 | | | 750,000 | | | | 673,107 | | |
Dryden 40 Senior Loan Fund,
(Cayman Islands),
3M LIBOR + 5.75%,
7.91%, 08/15/2031 | | | 1,000,000 | | | | 896,901 | | |
Dryden 55 Senior Loan Fund,
(Cayman Islands),
3M LIBOR + 5.40%,
7.40%, 04/15/2031 | | | 375,000 | | | | 323,304 | | |
Dryden 57 Senior Loan Fund,
(Cayman Islands),
3M LIBOR + 5.20%,
7.36%, 05/15/2031 | | | 750,000 | | | | 657,770 | | |
Dryden 58 Senior Loan Fund,
(Cayman Islands),
3M LIBOR + 5.35%,
7.35%, 07/17/2031 | | | 1,000,000 | | | | 867,517 | | |
Collateralized Loan Obligations(d)(e)(l) (continued)
| | | Principal
Amount | | Value(a) | |
Dryden 64 Senior Loan Fund,
(Cayman Islands),
3M LIBOR + 2.65%, 04/18/2031(k) | | $ | 250,000 | | | $ | 227,213 | | |
Goldentree Loan Opportunities X,
Ltd., (Cayman Islands),
3M LIBOR + 5.65%,
7.62%, 07/20/2031 | | | 750,000 | | | | 670,664 | | |
Highbridge Loan Management Ltd.
2013-2, (Cayman Islands),
3M LIBOR + 6.60%,
8.57%, 10/20/2029 | | | 250,000 | | | | 230,017 | | |
ICG CLO, Ltd. 2018-1X,
(Cayman Islands),
3M LIBOR + 5.15%,
7.12%, 04/21/2031 | | | 500,000 | | | | 429,121 | | |
KKR CLO 15, Ltd., (Cayman Islands),
3M LIBOR + 6.44%,
8.44%, 01/18/2032 | | | 2,500,000 | | | | 2,138,077 | | |
KKR CLO 24, Ltd., (Cayman Islands),
3M LIBOR + 6.38%,
8.35%, 04/20/2032 | | | 2,000,000 | | | | 1,807,410 | | |
LCM 29, Ltd., (Cayman Islands),
3M LIBOR + 6.90%,
8.90%, 04/15/2031 | | | 1,000,000 | | | | 930,000 | | |
LCM 30, Ltd., (Cayman Islands),
3M LIBOR + 6.95%,
8.92%, 04/20/2031 | | | 2,000,000 | | | | 1,953,890 | | |
LCM XVII, LP, (Cayman Islands),
3M LIBOR + 6.00%,
8.00%, 10/15/2031 | | | 1,250,000 | | | | 1,030,067 | | |
Madison Park Funding XIV, Ltd.,
(Cayman Islands),
3M LIBOR + 7.77%,
9.72%, 10/22/2030 | | | 1,000,000 | | | | 780,530 | | |
Madison Park Funding XXIII, Ltd.,
(Cayman Islands),
3M LIBOR + 6.25%,
8.19%, 07/27/2030 | | | 500,000 | | | | 463,147 | | |
Madison Park Funding XXIX, Ltd.,
(Cayman Islands),
3M LIBOR + 3.00%, 10/18/2030(k) | | | 1,000,000 | | | | 951,812 | | |
Madison Park Funding XXXIV, Ltd.,
(Cayman Islands),
3M LIBOR + 6.75%,
8.69%, 04/25/2031 | | | 1,500,000 | | | | 1,475,841 | | |
Madison Park Funding XXXVII, Ltd.,
(Cayman Islands),
3M LIBOR + 6.55%,
8.85%, 07/15/2032 | | | 1,000,000 | | | | 942,840 | | |
Annual Report 2019
26
CION Ares Diversified Credit Fund
Consolidated Schedule of Investments (continued)
October 31, 2019
Collateralized Loan Obligations(d)(e)(l) (continued)
| | | Principal
Amount | | Value(a) | |
Magnetite CLO XV, Ltd.,
(Cayman Islands),
3M LIBOR + 2.75%,
4.69%, 07/25/2031 | | $ | 500,000 | | | $ | 465,452 | | |
Magnetite CLO XV, Ltd. 2019 22A,
(Cayman Islands),
3M LIBOR + 6.75%,
8.75%, 04/15/2031 | | | 1,000,000 | | | | 960,561 | | |
Marble Point CLO XII, Ltd.,
(Cayman Islands),
3M LIBOR + 3.00%,
5.00%, 07/16/2031 | | | 1,000,000 | | | | 900,071 | | |
Marble Point CLO XIV, Ltd.,
(Cayman Islands),
3M LIBOR + 6.53%,
8.50%, 01/20/2032 | | | 700,000 | | | | 597,881 | | |
Mariner CLO, LLC 2019 1A E,
(Cayman Islands),
3M LIBOR + 6.89%,
8.83%, 04/30/2032 | | | 1,250,000 | | | | 1,139,941 | | |
Niagara Park CLO, Ltd.,
(Cayman Islands),
3M LIBOR + 6.45%,
8.45%, 07/17/2032 | | | 1,000,000 | | | | 969,362 | | |
Northwoods Capital XII-B, Ltd.,
(Cayman Islands),
3M LIBOR + 5.79%,
7.91%, 06/15/2031 | | | 750,000 | | | | 589,157 | | |
Oaktree CLO 2019-4, Ltd.,
(Cayman Islands),
3M LIBOR + 7.23%,
9.17%, 10/20/2032 | | | 850,000 | | | | 806,963 | | |
Oaktree CLO, Ltd. 2015-11,
(Cayman Islands),
3M LIBOR + 5.75%,
7.72%, 01/20/2032 | | | 1,250,000 | | | | 1,124,225 | | |
Octagon Investment Partners 20-R,
Ltd., (Cayman Islands),
3M LIBOR + 6.80%,
8.98%, 05/12/2031 | | | 1,000,000 | | | | 929,429 | | |
Octagon Investment Partners 35,
Ltd., (Cayman Islands),
3M LIBOR + 5.20%,
7.17%, 01/20/2031 | | | 1,500,000 | | | | 1,270,626 | | |
Octagon Investment Partners 41,
Ltd., (Cayman Islands),
3M LIBOR + 6.90%,
8.90%, 04/15/2031 | | | 3,000,000 | | | | 2,721,114 | | |
Octagon Investment Partners XXI,
Ltd., (Cayman Islands),
3M LIBOR + 7.00%, 02/14/2031(k) | | | 2,175,000 | | | | 2,012,849 | | |
Collateralized Loan Obligations(d)(e)(l) (continued)
| | | Principal
Amount | | Value(a) | |
Octagon Loan Funding, Ltd.,
(Cayman Islands),
3M LIBOR + 6.00%,
8.12%, 11/18/2031 | | $ | 2,000,000 | | | $ | 1,758,486 | | |
OZLM XXIII, Ltd. 2019-23A,
(Cayman Islands),
3M LIBOR + 6.80%,
8.80%, 04/15/2032 | | | 1,750,000 | | | | 1,640,574 | | |
Rockford Tower CLO, Ltd. 2018-2,
(Cayman Islands),
3M LIBOR + 3.10%,
5.07%, 10/20/2031 | | | 1,450,000 | | | | 1,367,286 | | |
Steele Creek CLO, Ltd.,
(Cayman Islands),
3M LIBOR + 7.70%,
9.83%, 07/15/2032 | | | 410,000 | | | | 391,565 | | |
Steele Creek CLO, Ltd. 2016-1,
(Cayman Islands),
3M LIBOR + 5.75%,
7.87%, 06/15/2031 | | | 750,000 | | | | 594,068 | | |
TCI Flatiron CLO, Ltd.,
(Cayman Islands),
3M LIBOR + 2.75%, 11/18/2030(k) | | | 750,000 | | | | 671,840 | | |
TCI-Symphony CLO, Ltd. 2017-1,
(Cayman Islands),
3M LIBOR + 6.45%,
8.45%, 07/15/2030 | | | 2,000,000 | | | | 1,841,176 | | |
TICP CLO XI, Ltd., (Cayman Islands),
3M LIBOR + 6.00%,
7.97%, 10/20/2031 | | | 300,000 | | | | 279,306 | | |
TICP CLO XI, Ltd. 2018-11X,
(Cayman Islands),
3M LIBOR + 6.00%,
7.97%, 10/20/2031 | | | 500,000 | | | | 465,511 | | |
Venture 28A CLO, Ltd.,
(Cayman Islands),
3M LIBOR + 6.16%,
8.13%, 10/20/2029 | | | 1,000,000 | | | | 898,924 | | |
Venture 37 CLO, Ltd.,
(Cayman Islands),
3M LIBOR + 6.95%,
8.95%, 07/15/2032 | | | 3,000,000 | | | | 2,675,613 | | |
Voya CLO, Ltd. 2013-3,
(Cayman Islands),
3M LIBOR + 5.90%,
7.90%, 10/18/2031 | | | 1,250,000 | | | | 1,099,961 | | |
Voya CLO, Ltd. 2015-3,
(Cayman Islands),
3M LIBOR + 6.20%,
8.17%, 10/20/2031 | | | 1,000,000 | | | | 866,168 | | |
Annual Report 2019
27
CION Ares Diversified Credit Fund
Consolidated Schedule of Investments (continued)
October 31, 2019
Collateralized Loan Obligations(d)(e)(l) (continued)
| | | Principal
Amount | | Value(a) | |
Voya CLO, Ltd. 2017-3,
(Cayman Islands),
3M LIBOR + 6.20%,
8.17%, 07/20/2030 | | $ | 1,400,000 | | | $ | 1,270,074 | | |
Voya CLO, Ltd. 2019-2,
(Cayman Islands),
3M LIBOR + 7.70%,
8.85%, 07/20/2032 | | | 1,000,000 | | | | 951,411 | | |
| | | | | | 72,156,087 | | |
Collateralized Loan Obligations — Equity 8.8% | |
Allegro CLO VIII, Ltd.,
(Cayman Islands),
16.52%, 07/15/2031 | | | 1,650,000 | | | | 1,155,000 | | |
AMMC CLO XXI, Ltd.,
(Cayman Islands),
8.92%, 11/02/2030 | | | 124,950 | | | | 93,695 | | |
Bain Capital Credit CLO 2019-1,
(Cayman Islands),
13.29%, 04/18/2032(k) | | | 1,400,000 | | | | 892,321 | | |
Bain Capital Credit CLO, Ltd. 2018-1,
(Cayman Islands),
10.53%, 04/23/2031 | | | 920,000 | | | | 701,717 | | |
Bain Capital Credit CLO, Ltd. 2019-2A,
(Cayman Islands),
9.24%, 10/17/2032 | | | 810,000 | | | | 639,054 | | |
Canyon Capital CLO, Ltd. 2016-1,
(Cayman Islands),
13.29%, 07/15/2031 | | | 1,000,000 | | | | 740,570 | | |
Canyon Capital CLO, Ltd. 2019-1,
(Cayman Islands),
11.78%, 04/15/2032 | | | 2,797,500 | | | | 2,173,266 | | |
Carlyle Global Market Strategies CLO,
Ltd. 2013-1, (Cayman Islands),
16.76%, 08/14/2030 | | | 500,000 | | | | 270,249 | | |
Carlyle Global Market Strategies CLO,
Ltd. 2018-3, (Cayman Islands),
13.05%, 10/15/2030 | | | 500,000 | | | | 350,511 | | |
Carlyle Global Market Strategies CLO,
Ltd. 2018-4, (Cayman Islands),
16.76%, 01/20/2031 | | | 2,310,000 | | | | 1,777,039 | | |
Carlyle Global Market Strategies CLO,
Ltd. 2019-3, (Cayman Islands),
12.28%, 10/20/2032 | | | 3,875,000 | | | | 3,205,648 | | |
Cedar Funding CLO V, Ltd.,
(Cayman Islands),
18.02%, 07/17/2031 | | | 2,300,000 | | | | 1,977,724 | | |
Cedar Funding CLO VIII, Ltd.,
(Cayman Islands),
10.58%, 10/17/2030 | | | 250,000 | | | | 170,210 | | |
Collateralized Loan Obligations(d)(e)(l) (continued)
| | | Principal
Amount | | Value(a) | |
Crestline Denali CLO XVI, Ltd.
2018-1A, (Cayman Islands),
13.51%, 01/20/2030 | | $ | 500,000 | | | $ | 350,000 | | |
Dryden 28 Senior Loan Fund,
(Cayman Islands),
17.45%, 08/15/2030 | | | 1,406,251 | | | | 609,457 | | |
Dryden 33 Senior Loan Fund,
(Cayman Islands),
21.94%, 04/15/2029 | | | 500,000 | | | | 249,888 | | |
Dryden 38 Senior Loan Fund,
(Cayman Islands),
16.39%, 07/15/2030 | | | 650,000 | | | | 386,425 | | |
Dryden 41 Senior Loan Fund,
(Cayman Islands),
30.37%, 04/15/2031 | | | 850,000 | | | | 488,502 | | |
Dryden 43 Senior Loan Fund,
(Cayman Islands),
26.91%, 07/20/2029 | | | 1,000,000 | | | | 527,998 | | |
Dryden 57 Senior Loan Fund,
(Cayman Islands),
15.97%, 05/15/2031 | | | 717,000 | | | | 611,681 | | |
Dryden 58 Senior Loan Fund,
(Cayman Islands),
17.99%, 07/17/2031 | | | 3,125,000 | | | | 2,319,484 | | |
Eastland Investors Corp.,
(Cayman Islands),
0.00%, 05/01/2022 | | | 300 | | | | 127,500 | | |
Highbridge Loan Management
3-2014, (Cayman Islands),
31.33%, 07/18/2029 | | | 3,077,500 | | | | 1,460,505 | | |
ICG U.S. CLO, Ltd. 2018-2,
(Cayman Islands),
11.80%, 07/22/2031 | | | 1,650,000 | | | | 1,443,750 | | |
LCM XVIII, LP, (Cayman Islands),
13.29%, 04/20/2031 | | | 1,400,000 | | | | 611,589 | | |
Madison Park Funding XXVII, Ltd.,
(Cayman Islands),
12.55%, 01/20/2047 | | | 250,000 | | | | 205,449 | | |
Madison Park Funding XXXI, Ltd.,
(Cayman Islands),
12.68%, 01/23/2048 | | | 4,250,000 | | | | 3,076,800 | | |
Madison Park Funding XXXII, Ltd.,
(Cayman Islands),
13.72%, 01/22/2048 | | | 1,510,000 | | | | 1,009,953 | | |
Magnetite CLO, Ltd. 2012-6,
(Cayman Islands),
0.00%, 09/15/2023 | | | 1,241,000 | | | | 496 | | |
Mariner CLO, Ltd. 2018-5,
(Cayman Islands),
6.10%, 04/25/2031 | | | 500,000 | | | | 368,532 | | |
Annual Report 2019
28
CION Ares Diversified Credit Fund
Consolidated Schedule of Investments (continued)
October 31, 2019
Collateralized Loan Obligations(d)(e)(l) (continued)
| | | Principal
Amount | | Value(a) | |
Momentum Capital Fund, Ltd.,
(Cayman Islands),
0.00%, 09/18/2021 | | $ | 913,000 | | | $ | 2,556 | | |
Oaktree CLO, Ltd. 2018-1,
(Cayman Islands),
15.96%, 10/20/2030 | | | 2,250,000 | | | | 1,735,983 | | |
Oaktree CLO, Ltd. 2019-2,
(Cayman Islands),
15.24%, 04/15/2031 | | | 3,860,000 | | | | 2,736,748 | | |
Oaktree CLO, Ltd. 2019-3,
(Cayman Islands),
17.13%, 07/20/2031 | | | 4,750,000 | | | | 4,119,808 | | |
OHA Credit Partners XI, Ltd.,
(Cayman Islands),
15.45%, 01/20/2032 | | | 300,000 | | | | 216,327 | | |
OHA Credit Partners XV, Ltd.,
(Cayman Islands),
16.23%, 01/20/2030 | | | 500,000 | | | | 365,517 | | |
OHA Loan Funding, Ltd. 2013-1,
(Cayman Islands),
15.28%, 07/23/2031 | | | 876,000 | | | | 437,879 | | |
OZLM XIX, Ltd. 2017-19A,
(Cayman Islands),
12.16%, 11/22/2030 | | | 1,000,000 | | | | 626,643 | | |
OZLM XIX, Ltd. 2017-19X,
(Cayman Islands),
7.73%, 11/22/2030 | | | 500,000 | | | | 313,321 | | |
OZLM XXI, Ltd. 2017-21A,
(Cayman Islands),
13.37%, 01/20/2031 | | | 800,000 | | | | 565,654 | | |
Steele Creek CLO, Ltd. 2017-1,
(Cayman Islands),
17.41%, 01/15/2030 | | | 250,000 | | | | 179,948 | | |
Symphony CLO XI, Ltd.,
(Cayman Islands),
0.00%, 01/17/2025 | | | 1,000 | | | | 160 | | |
Venture XVIII CLO, Ltd.,
(Cayman Islands),
16.48%, 10/15/2029 | | | 250,000 | | | | 112,646 | | |
Wellfleet CLO, Ltd. 2017-3,
(Cayman Islands),
17.23%, 01/17/2031 | | | 250,000 | | | | 177,947 | | |
Wellfleet CLO, Ltd. 2018-3,
(Cayman Islands),
14.65%, 01/20/2032 | | | 2,400,000 | | | | 1,661,350 | | |
| | | | | | 41,247,500 | | |
Total Collateralized Loan Obligations
(Cost: $121,939,104) | | | | | 113,403,587 | | |
Common Stocks 0.1%(d)
| | | Shares | | Value(a) | |
Automotive 0.0% | |
GB Auto Service Holdings, LLC(e)(h)(m) | | | 22,076 | | | $ | 36,592 | | |
Banking, Finance, Insurance & Real Estate 0.0% | |
First Trust Senior Floating Rate
Income Fund II | | | 4,200 | | | | 50,316 | | |
OMERS Bluejay Investment
Holdings, LP, Class A(e)(h)(m) | | | 25 | | | | 28,376 | | |
The Ultimus Group Aggregator,
LP/Blocker, Class A(e)(h)(m) | | | — | | | | — | | |
The Ultimus Group Aggregator,
LP/Blocker, Class B(e)(h)(m) | | | 182 | | | | — | | |
The Ultimus Group, LLC/Co.,
Class A(e)(h) | | | 1 | | | | 851 | | |
The Ultimus Group, LLC/Co.,
Class B(e)(h)(m) | | | 16095 | | | | — | | |
| | | | | | 79,543 | | |
Beverage, Food & Tobacco 0.0% | |
Italian Fine Foods Holdings, LP(e)(h)(m) | | | 25,000 | | | | 33,259 | | |
Chemicals, Plastics & Rubber 0.0% | |
Plaskolite PPC Blocker, LLC(e)(h)(m) | | | 10 | | | | 813 | | |
Containers, Packaging & Glass 0.0% | |
Berry Global Group, Inc.(m) | | | 1,050 | | | | 43,585 | | |
Energy: Oil & Gas 0.0% | |
FTS International, Inc.(m) | | | 7,500 | | | | 11,400 | | |
Healthcare & Pharmaceuticals 0.1%(m) | |
Acadia Healthcare Co., Inc. | | | 1,691 | | | | 50,713 | | |
Bearcat Parent, Inc.(e)(h) | | | 50 | | | | 50,000 | | |
Coherus Biosciences, Inc. | | | 2,015 | | | | 35,001 | | |
Nelipak Holding Co.(e)(h) | | | 100,000 | | | | 100,000 | | |
Olympia TopCo, LP, Class A(e)(h) | | | 50,000 | | | | 50,000 | | |
SiroMed Equity Holdings, LLC(e)(h) | | | 3,703 | | | | 1,743 | | |
Virence Intermediate Holding Corp.,
Class A(e)(h) | | | — | | | | 30,249 | | |
| | | | | | 317,706 | | |
High Tech Industries 0.0% | |
Frontline Technologies Group Holding,
LLC, Class A(e)(h) | | | 25 | | | | 30,034 | | |
Frontline Technologies Group Holding,
LLC, Class B(e)(h)(m) | | | 2,728 | | | | 9,394 | | |
Annual Report 2019
29
CION Ares Diversified Credit Fund
Consolidated Schedule of Investments (continued)
October 31, 2019
Common Stocks(d) (continued)
| | | Shares | | Value(a) | |
H&F Unite Partners, LP(e)(h)(m) | | | 50,032 | | | $ | 50,829 | | |
Insight PDI Holdings, LLC,
Class A,(e)(h)(m) | | | 25,000 | | | | 26,339 | | |
Project Falcon Parent, Inc.,
(Canada),(e)(h)(m) | | | 47,536 | | | | 500 | | |
Rocket Parent, LLC, Class A,(e)(h)(m) | | | 50,000 | | | | 54,409 | | |
| | | | | | 171,505 | | |
Services: Business 0.0%(m) | |
Display Holding Co.,(e)(h) | | | 50 | | | | 60,419 | | |
IRI Parent, LP, Class A-1,(e)(h) | | | 250 | | | | 26,097 | | |
SOS Co. Investment Vehicle, LP(e)(h) | | | 50,000 | | | | 54,827 | | |
| | | | | | 141,343 | | |
Services: Consumer 0.0% | |
Centric Brands, Inc.(e)(h)(m) | | | 3,125 | | | | 16,005 | | |
Utilities: Oil & Gas 0.0% | |
Kene Holdings, LP, Class A(e)(h)(m) | | | 50,000 | | | | 50,000 | | |
Total Common Stocks
(Cost: $934,569) | | | | | 901,751 | | |
Preferred Stocks 0.1%(e)(h)
Banking, Finance, Insurance & Real Estate 0.0% | |
Blue Angel Holdco, LLC, Class A | | | 243 | | | | 53,029 | | |
Peachtree Parent, Inc., Series A | | | 25 | | | | 26,830 | | |
| | | | | | 79,859 | | |
Healthcare & Pharmaceuticals 0.0% | |
Virence Intermediate Holding Corp. | | | 25 | | | | 26,338 | | |
High Tech Industries 0.1% | |
EZ Elemica Holdings, Inc. | | | 50 | | | | 50,000 | | |
Project Falcon Parent, Inc., (Canada) | | | 50 | | | | 50,614 | | |
| | | | | | 100,614 | | |
Services: Business 0.0% | |
IRI Holdings, Inc. | | | 25 | | | | 27,870 | | |
Total Preferred Stocks
(Cost: $224,973) | | | | | 234,681 | | |
Private Asset-Backed Debt 2.0%(d)(e)(g)(h)
| | | Principal
Amount | | Value(a) | |
Banking, Finance, Insurance & Real Estate 2.0% | |
BFS Receivables I, LLC, 1st Lien
Revolver, 1M LIBOR + 6.00%,
8.03%, 02/08/2022(n) | | $ | 500,000 | | | $ | 348,571 | | |
BFS Receivables I, LLC, 1st Lien
Revolver, 1M LIBOR + 6.00%,
8.03%, 02/09/2022 | | | 500,000 | | | | 348,571 | | |
DFC Funding No1, Ltd., Mezzanine
Revolver, (Great Britain),
1M GBP LIBOR + 9.75%,
10.50%, 12/12/2020 | | £ | 1,100,000 | | | | 1,034,250 | | |
DFC Global Facility Borrower III,
LLC, 1st Lien Revolver,
1M LIBOR + 10.75%,
12.78%, 09/27/2024 | | $ | 10,000,000 | | | | 7,365,044 | | |
Finfitsp, LLC, 1st Lien Revolver,
1M LIBOR + 9.25%,
11.28%, 10/18/2023 | | | 500,000 | | | | 200,000 | | |
Total Private Asset-Backed Debt
(Cost: $9,272,492) | | | | | 9,296,436 | | |
Real Estate Debt 1.2%(d)(e)(h)
Banking, Finance, Insurance & Real Estate 0.8% | |
285 Mezz LLC, Junior Mezzanine
Extension Upsize Term Loan,
20.00%, 04/06/2020 | | | 869,750 | | | | 869,750 | | |
285 Mezz LLC, Mezzanine
Construction Term Loan,
1M LIBOR + 14.00%,
16.28%, 03/31/2020(g)(j) | | | 2,376,007 | | | | 1,867,507 | | |
Hyatt House IMD, LLC, Mezzanine
Construction Term Loan,
1M LIBOR + 12.25%,
14.16%, 11/25/2021(g)(j) | | | 1,083,835 | | | | 923,836 | | |
| | | | | | 3,661,093 | | |
Hotel, Gaming & Leisure 0.4% | |
Mandarin Oriental Honolulu,
Extension Upsize Term Loan,
14.00%, 03/31/2020 | | | 775,833 | | | | 775,833 | | |
Mandarin Oriental Honolulu,
Mezzanine Land Term Loan,
14.00%, 03/31/2020(g)(j) | | | 999,974 | | | | 999,973 | | |
| | | | | | 1,775,806 | | |
Total Real Estate Debt
(Cost: $5,399,646) | | | | | 5,436,899 | | |
Annual Report 2019
30
CION Ares Diversified Credit Fund
Consolidated Schedule of Investments (continued)
October 31, 2019
Warrants 0.0%(d)(e)(h)
| | | Shares | | Value(a) | |
Healthcare & Pharmaceuticals 0.0% | |
Air Medical Buyer Corp. | | | 122 | | | $ | 1,470 | | |
High Tech Industries 0.0% | |
Visual Edge Technology, Inc.,
(Preferred) | | | 5,176 | | | | 3,344 | | |
Visual Edge Technology, Inc.,
(Common) | | | 4,540 | | | | — | | |
| | | | | | 3,344 | | |
Warrants(d)(e)(h) (continued)
| | | Shares | | Value(a) | |
Transportation: Cargo 0.0% | |
Neovia Logistics Holdings, Ltd. | | | 194,454 | | | $ | — | | |
Total Warrants
(Cost: $11,261) | | | | | 4,814 | | |
Total Investments — 136.4%
(Cost: $641,984,339) | | | | $ | 637,316,543 | | |
Liabilities in Excess of Other Assets — (36.4%) | | | | | (170,144,520 | ) | |
Net Assets — 100.0% | | | | $ | 467,172,023 | | |
Footnotes:
(a) Investment holdings in foreign currencies are converted to U.S. Dollars using period end spot rates. All investments are in United States enterprises unless otherwise noted.
(b) Interest rates on floating rate term loans adjust periodically based upon a predetermined schedule. Stated interest rates in this schedule represents the "all-in" rate as of October 31, 2019.
(c) Variable rate coupon rate shown as of October 31, 2019.
(d) All of CION Ares Diversified Credit Fund (the "Fund") Senior Loans, Subordinated Loans, Collateralized Loan Obligations, Common Stocks, Corporate Bonds issued as 144A, Preferred Stock, Private Asset Backed Debt, Real Estate Debt, and Warrants, which as of October 31, 2019 represented 135.7% of the Fund's net assets or 96.1% of the Fund's total assets, are subject to legal restrictions on sales.
(e) Investments whose values were determined using significant unobservable inputs (Level 3) (See Note 3 of the Notes to Financial Statements).
(f) These assets are held at CADEX Credit Financing, LLC, a wholly owned special purpose financing vehicle, and are pledged as collateral for a secured revolving credit facility (see "Note 1 — Organization").
(g) As of October 31, 2019, the Fund had entered into the following commitments to fund various revolving and delayed draw senior secured and subordinated loans. Such commitments are subject to the satisfaction of certain conditions set forth in the documents governing these loans and there can be no assurance that such conditions will be satisfied. See Note 2 of the Notes to Consolidated Financial Statements for further information on revolving and delayed draw loan commitments.
Unfunded security | | Total revolving and delayed
draw loan commitments | | Less: drawn commitments | | Total undrawn
commitments | |
285 Mezz LLC, Mezzanine Construction Term Loan,
1M LIBOR + 14.00%, 16.28%, 03/31/2020 | | $ | 2,376,007 | | | $ | 1,867,507 | | | $ | 508,500 | | |
A.U.L. Corp., 1st Lien Revolver,
L + 5.00%, 06/05/2023 | | | 1,000 | | | | — | | | | 1,000 | | |
AMCP Clean Intermediate, LLC, 1st Lien Revolver,
3M LIBOR + 5.50%, 7.43%, 10/01/2024 | | | 1,100 | | | | 68 | | | | 1,032 | | |
Anchor Packaging, LLC, 1st Lien Delayed Draw
Term Loan, L + 4.00%, 07/18/2026 | | | 574,359 | | | | — | | | | 574,359 | | |
AQ Sunshine, Inc., 1st Lien Delayed Draw
Term Loan, L + 5.50%, 04/15/2025 | | | 211,557 | | | | 72,451 | | | | 139,106 | | |
AQ Sunshine, Inc., Initial 1st Lien Revolver,
3M LIBOR + 5.50%, 7.61%, 04/15/2024 | | | 136,424 | | | | 68,212 | | | | 68,212 | | |
Atlas Intermediate III, LLC, 1st Lien Revolver,
L + 5.50%, 04/29/2025 | | | 226,621 | | | | — | | | | 226,621 | | |
Axiom Merger Sub, Inc., 1st Lien Revolver,
L + 5.50%, 10/08/2025 | | | 230,769 | | | | — | | | | 230,769 | | |
Annual Report 2019
31
CION Ares Diversified Credit Fund
Consolidated Schedule of Investments (continued)
October 31, 2019
Unfunded security | | Total revolving and delayed
draw loan commitments | | Less: drawn commitments | | Total undrawn
commitments | |
Axiom Merger Sub, Inc., 1st Lien Delayed Draw
Term Loan, L + 5.50%, 04/08/2026 | | $ | 1,153,846 | | | $ | — | | | $ | 1,153,846 | | |
Bambino CI, Inc., 1st Lien Revolver,
1M LIBOR + 5.50%, 7.29%, 10/17/2022 | | | 1,000 | | | | 375 | | | | 625 | | |
Bearcat Buyer, Inc., 1st Lien Delayed Draw Term Loan,
3M LIBOR + 4.25%, 6.35%, 07/09/2026 | | | 1,015,814 | | | | 323,609 | | | | 692,205 | | |
Bearcat Buyer, Inc., 1st Lien Revolver,
L + 4.25%, 07/09/2024 | | | 580,465 | | | | — | | | | 580,465 | | |
Bearcat Buyer, Inc., 2nd Lien Delayed Draw Term Loan,
3M LIBOR + 8.25%, 10.35%, 07/09/2027 | | | 580,465 | | | | 184,298 | | | | 396,167 | | |
BFS Receivables I, LLC, 1st Lien Revolver,
1M LIBOR + 6.00%, 8.03%, 02/08/2022 | | | 500,000 | | | | 348,571 | | | | 151,429 | | |
BFS Receivables I, LLC, 1st Lien Revolver,
1M LIBOR + 6.00%, 8.03%, 02/09/2022 | | | 500,000 | | | | 348,571 | | | | 151,429 | | |
Birch Permian, LLC, Additional 1st Lien Note,
L + 7.00%, 04/12/2023 | | | 1,731,049 | | | | — | | | | 1,731,049 | | |
Blue Angel Buyer 1, LLC, 1st Lien Revolver,
L + 4.00%, 01/02/2024 | | | 321,199 | | | | — | | | | 321,199 | | |
Blue Angel Buyer 1, LLC, 1st Lien Delayed Draw
Term Loan, Prime + 3.00%, 7.75%, 01/02/2025 | | | 642,398 | | | | 53,961 | | | | 588,437 | | |
Cablecom Networking Holdings, Ltd., Accordian
Facility 1st Lien Term Loan, (Great Britain),
L + 7.00%, 12/14/2023 | | | 189,160 | | | | — | | | | 189,160 | | |
Canopy Bidco, Ltd., Senior Capex Facility 1st Lien
Term Loan, (Great Britain),
3M GBP LIBOR + 7.25%, 8.01%, 12/18/2024 | | | 646,926 | | | | 115,866 | | | | 531,060 | | |
Capnor Connery Bidco APS, Facility 1st Lien Term
Loan D, (Denmark), L + 7.63%, 04/30/2026 | | | 6,856,763 | | | | — | | | | 6,856,763 | | |
CB-SDG, Ltd., GBP Acquisition Facility 1st Lien
Term Loan, (Great Britain), L + 7.00%, 04/03/2026 | | | 410,746 | | | | — | | | | 410,746 | | |
Centric Brands, Inc., 1st Lien Revolver,
Prime + 4.50%, 9.25%, 04/29/2023 | | | 1,333 | | | | 933 | | | | 400 | | |
Commify, Ltd., 1st Lien Acquisition Term Loan,
(Great Britain), L + 6.25%, 09/14/2026 | | | 847,951 | | | | — | | | | 847,951 | | |
Comprehensive EyeCare Partners, LLC, 1st Lien
Revolver, 3M LIBOR + 4.50%, 6.60%, 02/14/2024 | | | 1,000 | | | | 185 | | | | 815 | | |
Comprehensive EyeCare Partners, LLC, 1st Lien
Delayed Draw Term Loan,
3M LIBOR + 4.50%, 6.60%, 02/14/2024 | | | 420,909 | | | | 239,401 | | | | 181,508 | | |
Concert Golf Partners Holdco, LLC, 1st Lien
Delayed Draw Term Loan, L + 4.50%, 08/20/2025 | | | 573,782 | | | | — | | | | 573,782 | | |
Concert Golf Partners Holdco, LLC, 1st Lien
Revolver, 3M LIBOR + 4.50%, 6.53%, 08/20/2025 | | | 764,512 | | | | 149,080 | | | | 615,432 | | |
Cority Software Inc., 1st Lien Revolver,
L + 5.50%, 07/02/2025 | | | 230,579 | | | | — | | | | 230,579 | | |
Creation Holdings, Inc., 1st Lien Revolver,
1M LIBOR + 5.75%, 7.64%, 08/15/2024 | | | 544,813 | | | | 90,802 | | | | 454,011 | | |
Creation Holdings, Inc., 1st Lien Revolver,
1M LIBOR + 5.75%, 7.64%, 08/15/2024 | | | 449,326 | | | | — | | | | 449,326 | | |
Annual Report 2019
32
CION Ares Diversified Credit Fund
Consolidated Schedule of Investments (continued)
October 31, 2019
Unfunded security | | Total revolving and delayed
draw loan commitments | | Less: drawn commitments | | Total undrawn
commitments | |
CVP Holdco, Inc., 1st Lien Revolver,
L + 5.75%, 10/31/2024 | | $ | 326,487 | | | $ | — | | | $ | 326,487 | | |
CVP Holdco, Inc., 1st Lien Delayed Draw Term Loan,
L + 5.75%, 10/31/2025 | | | 2,729,041 | | | | — | | | | 2,729,041 | | |
DecoPac, Inc., Initial 1st Lien Revolver,
1M LIBOR + 4.25%, 6.04%, 09/29/2023 | | | 1,000 | | | | 140 | | | | 860 | | |
DFC Funding No1, Ltd., Mezzanine Revolver,
(Great Britain), 1M GBP LIBOR + 9.75%,
10.50%, 12/12/2020 | | | 1,423,235 | | | | 1,055,598 | | | | 367,637 | | |
DFC Global Facility Borrower III, LLC, 1st Lien
Revolver, 1M LIBOR + 10.75%, 12.78%, 09/27/2024 | | | 10,000,000 | | | | 7,440,044 | | | | 2,559,956 | | |
Discovery Life Sciences, LLC, 1st Lien Delayed
Draw Term Loan, L + 6.25%, 03/30/2024 | | | 350,877 | | | | — | | | | 350,877 | | |
Discovery Life Sciences, LLC, 1st Lien Revolver,
L + 6.25%, 03/30/2024 | | | 88,719 | | | | — | | | | 88,719 | | |
DRB Holdings, LLC, 1st Lien Revolver,
L + 5.75%, 10/06/2023 | | | 1,000 | | | | — | | | | 1,000 | | |
Elemica Parent, Inc., 1st Lien Revolver,
3M LIBOR + 5.50%, 7.65%, 09/18/2025 | | | 478,712 | | | | 119,678 | | | | 359,034 | | |
Elemica Parent, Inc., 1st Lien Delayed Draw Term
Loan, L + 5.50%, 09/18/2025 | | | 561,538 | | | | — | | | | 561,538 | | |
Ferraro Fine Foods Corp., 1st Lien Revolver,
1M LIBOR + 4.25%, 6.24%, 05/09/2023 | | | 1,000 | | | | 123 | | | | 877 | | |
Finfitsp, LLC, 1st Lien Revolver,
1M LIBOR + 9.25%, 11.28%, 10/18/2023 | | | 500,000 | | | | 200,000 | | | | 300,000 | | |
s Midco, Ltd., Acquisition Facility 1st Lien Term
Loan, (Great Britain), L + 6.75%, 09/07/2026 | | | 1,544,896 | | | | — | | | | 1,544,896 | | |
Flow Control Solutions, Inc., 1st Lien Delayed Draw
Term Loan, L + 5.25%, 11/21/2024 | | | 994,201 | | | | — | | | | 994,201 | | |
Flow Control Solutions, Inc., 1st Lien Revolver,
L + 5.25%, 11/21/2024 | | | 372,825 | | | | — | | | | 372,825 | | |
Foundation Risk Partners Corp., 1st Lien Revolver,
1M LIBOR + 4.75%, 6.79%, 11/10/2023 | | | 3,000 | | | | 800 | | | | 2,200 | | |
Foundation Risk Partners Corp., 1st Lien
1st Amendment Delayed Draw Term Loan,
3M LIBOR + 4.75%, 6.85%, 11/10/2023 | | | 793,900 | | | | 792,411 | | | | 1,489 | | |
Foundation Risk Partners Corp., 2nd Lien
2nd Amendment Delayed Draw Term Loan,
3M LIBOR + 8.50%, 10.63%, 11/10/2024 | | | 1,007,133 | | | | 592,826 | | | | 414,307 | | |
Foundation Risk Partners Corp., 1st Lien
2nd Amendment Delayed Draw Term Loan,
3M LIBOR + 4.75%, 6.88%, 11/10/2023 | | | 3,245,297 | | | | 2,198,913 | | | | 1,046,384 | | |
Foundation Risk Partners, Corp., 1st Lien
3rd Amendment Delayed Draw Term Loan,
L + 4.75%, 11/10/2023 | | | 1,259,713 | | | | — | | | | 1,259,713 | | |
Foundation Risk Partners, Corp., 2nd Lien
3rd Amendment Delayed Draw Term Loan,
L + 8.50%, 11/10/2024 | | | 720,610 | | | | — | | | | 720,610 | | |
Annual Report 2019
33
CION Ares Diversified Credit Fund
Consolidated Schedule of Investments (continued)
October 31, 2019
Unfunded security | | Total revolving and delayed
draw loan commitments | | Less: drawn commitments | | Total undrawn
commitments | |
FWR Holding Corp., 1st Lien New Delayed Draw
Term Loan 2, L + 5.50%, 08/21/2023 | | $ | 32,187 | | | $ | — | | | $ | 32,187 | | |
FWR Holding Corp., Initial 1st Lien Revolver,
1M LIBOR + 5.50%, 7.32%, 08/21/2023 | | | 1,000 | | | | 525 | | | | 475 | | |
GB Auto Service, Inc., 1st Lien Revolver,
L + 6.00%, 10/19/2024 | | | 111,111 | | | | — | | | | 111,111 | | |
GB Auto Service, Inc., 1st Lien Delayed Draw
Term Loan, 1M LIBOR + 6.00%, 7.79%, 10/19/2024 | | | 1,661,038 | | | | 1,483,260 | | | | 177,778 | | |
GraphPAD Software, LLC, 1st Lien Revolver A,
L + 6.00%, 12/21/2023 | | | 1,000 | | | | — | | | | 1,000 | | |
Hammersmith Bidco, Ltd., Acquisition Capex Facility
1st Lien Term Loan, (Great Britain),
L + 7.44%, 09/02/2026 | | | 2,171,786 | | | | 39,411 | | | | 2,132,375 | | |
Hometown Food Co., 1st Lien Revolver,
L + 5.25%, 08/31/2023 | | | 1,000 | | | | — | | | | 1,000 | | |
Hyatt House IMD, LLC, Mezzanine Construction
Term Loan, 1M LIBOR + 12.25%, 14.16%, 11/25/2021 | | | 1,083,835 | | | | 923,835 | | | | 160,000 | | |
IMIA Holdings, Inc., 1st Lien Revolver,
L + 4.50%, 10/26/2024 | | | 408,163 | | | | — | | | | 408,163 | | |
IntraPac International, LLC, 1st Lien Revolver,
3M LIBOR + 5.50%, 7.60%, 01/11/2025 | | | 415,407 | | | | 136,046 | | | | 279,361 | | |
Invoice Cloud, Inc., 1st Lien Delayed Draw
Term Loan, L + 6.50%, 02/11/2024 | | | 1,191,489 | | | | — | | | | 1,191,489 | | |
Invoice Cloud, Inc., 1st Lien Revolver,
L + 5.50%, 02/11/2024 | | | 255,319 | | | | — | | | | 255,319 | | |
Jim N Nicks Management, LLC, 1st Lien Revolver,
3M LIBOR + 5.25%, 7.35%, 07/10/2023 | | | 1,000 | | | | 575 | | | | 425 | | |
Just Childcare, Ltd., Acquisition Facility 1st Lien
Term Loan, (Great Britain), L + 7.00%, 09/13/2026 | | | 552,403 | | | | — | | | | 552,403 | | |
Kene Acquisition, Inc., 1st Lien Delayed Draw
Term Loan, L + 4.25%, 08/10/2026 | | | 635,021 | | | | — | | | | 635,021 | | |
Kene Acquisition, Inc., 1st Lien Revolver,
Prime + 3.25%, 8.00%, 08/08/2024 | | | 675,812 | | | | 185,848 | | | | 489,964 | | |
Laboratories Bidco, LLC, 1st Lien Revolver,
L + 5.75%, 06/25/2024 | | | 513,489 | | | | — | | | | 513,489 | | |
Mandarin Oriental Honolulu, Mezzanine Land
Term Loan, 14.00%, 03/31/2020 | | | 999,974 | | | | 999,973 | | | | 1 | | |
MB2 Dental Solutions, LLC, 1st Lien Revolver,
Prime + 3.75%, 8.50%, 09/29/2023 | | | 1,334 | | | | 379 | | | | 955 | | |
Mister Car Wash Holdings, Inc., 1st Lien Delayed
Draw Term Loan 5, L + 3.50%, 05/14/2026 | | | 187,650 | | | | — | | | | 187,650 | | |
Movati Athletic Group, Inc., 1st Lien Delayed Draw
Term Loan, (Canada), 3M CDOR + 4.50%,
6.47%, 10/05/2022 | | | 191,764 | | | | 54,259 | | | | 137,505 | | |
Nelipak European Holdings Co., 1st Lien EUR
Revolver, (Netherlands), 1M EURIBOR + 4.50%,
4.50%, 07/02/2024 | | | 648,332 | | | | 39,427 | | | | 608,905 | | |
Annual Report 2019
34
CION Ares Diversified Credit Fund
Consolidated Schedule of Investments (continued)
October 31, 2019
Unfunded security | | Total revolving and delayed
draw loan commitments | | Less: drawn commitments | | Total undrawn
commitments | |
Nelipak Holding Co., 1st Lien Revolver,
1M LIBOR + 4.25%, 6.04%, 07/02/2024 | | $ | 604,780 | | | $ | 245,143 | | | $ | 359,637 | | |
NMC Skincare Intermediate Holdings II, LLC,
1st Lien Delayed Draw Term Loan,
1M LIBOR + 4.75%, 6.54%, 10/31/2024 | | | 665,975 | | | | 137,642 | | | | 528,333 | | |
NMC Skincare Intermediate Holdings II, LLC,
1st Lien Revolver, 1M LIBOR + 4.75%,
6.69%, 10/31/2024 | | | 333,334 | | | | 166,667 | | | | 166,667 | | |
Nuehealth Performance, LLC, 1st Lien Revolver,
L + 6.50%, 09/27/2023 | | | 1,000 | | | | — | | | | 1,000 | | |
Nuehealth Performance, LLC, 1st Lien Delayed Draw
Term Loan, L + 6.50%, 09/27/2023 | | | 737,459 | | | | — | | | | 737,459 | | |
NXTGenpay Intressenter Bidco AB, Facility 1st Lien
Term Loan D, (Sweden), 3M STIBOR + 6.75%,
6.75%, 06/30/2025 | | | 465,692 | | | | 279,415 | | | | 186,277 | | |
Oakley Ekomid, Ltd., CAR Facility 1st Lien Term Loan,
(Great Britain), L + 6.25%, 06/23/2025 | | | 835,837 | | | | — | | | | 835,837 | | |
Olympia Acquisition, Inc., 1st Lien Delayed Draw
Term Loan, L + 5.50%, 09/24/2026 | | | 2,425,161 | | | | — | | | | 2,425,161 | | |
Olympia Acquisition, Inc., 1st Lien Revolver,
L + 5.50%, 09/24/2024 | | | 640,539 | | | | — | | | | 640,539 | | |
OMH-HealthEdge Holdings, LLC, 1st Lien Revolver,
L + 5.50%, 10/24/2024 | | | 1,000 | | | | — | | | | 1,000 | | |
P27 Bidco, Ltd., Capex Facility 1st Lien Term Loan,
(Great Britain), L + 6.75%, 07/31/2026 | | | 420,993 | | | | — | | | | 420,993 | | |
PDI TA Holdings, Inc., 1st Lien Delayed Draw
Term Loan 1, L + 3.50%, 10/24/2024 (e)(g)(h) | | | 46,902 | | | | — | | | | 46,902 | | |
PDI TA Holdings, Inc., 1st Lien Delayed Draw
Term Loan 2, L + 3.50%, 10/24/2024 | | | 126,855 | | | | — | | | | 126,855 | | |
PDI TA Holdings, Inc., 2nd Lien Delayed Draw
Term Loan 1, L + 8.50%, 10/24/2025 | | | 19,730 | | | | — | | | | 19,730 | | |
PDI TA Holdings, Inc., 2nd Lien Delayed Draw
Term Loan, L + 8.50%, 10/24/2025 | | | 62,792 | | | | — | | | | 62,792 | | |
Petroleum Service Corp. Buyer, LLC, 1st Lien
Delayed Draw Term Loan, L + 5.50%, 07/23/2025 | | | 1,314,230 | | | | — | | | | 1,314,230 | | |
Petroleum Service Corp. Buyer, LLC, 1st Lien
Revolver, L + 5.50%, 07/23/2025 | | | 2,105,660 | | | | — | | | | 2,105,660 | | |
PetVet Care Centers, LLC, 1st Lien 2nd Delayed
Draw Term Loan, 1M LIBOR + 4.25%,
6.04%, 02/15/2025 | | | 3,324,500 | | | | 1,260,365 | | | | 2,064,135 | | |
Premise Health Holding Corp., 1st Lien Revolver,
L + 3.50%, 07/10/2023 | | | 1,000 | | | | — | | | | 1,000 | | |
Premise Health Holding Corp., 1st Lien Delayed
Draw Term Loan, L + 3.50%, 07/10/2025 | | | 1,103 | | | | — | | | | 1,103 | | |
Puerto Rico Waste Investment, LLC, 1st Lien
Revolver, (Puerto Rico), L + 7.00%, 09/20/2024 | | | 157,737 | | | | — | | | | 157,737 | | |
QF Holdings, Inc., 1st Lien Delayed Draw Term Loan,
L + 7.00%, 09/19/2024 | | | 262,533 | | | | — | | | | 262,533 | | |
Annual Report 2019
35
CION Ares Diversified Credit Fund
Consolidated Schedule of Investments (continued)
October 31, 2019
Unfunded security | | Total revolving and delayed
draw loan commitments | | Less: drawn commitments | | Total undrawn
commitments | |
QF Holdings, Inc., 1st Lien Revolver,
L + 7.00%, 09/19/2024 | | $ | 1,000 | | | $ | — | | | $ | 1,000 | | |
Radius Aerospace, Inc., 1st Lien Revolver,
6M LIBOR + 5.75%, 7.97%, 03/29/2025 | | | 428,571 | | | | 128,571 | | | | 300,000 | | |
Raptor Technologies, LLC, 1st Lien Delayed Draw
Term Loan, 3M LIBOR + 6.00%, 8.10%, 12/17/2024 | | | 1,032,484 | | | | 660,194 | | | | 372,290 | | |
Raptor Technologies, LLC, 1st Lien Revolver,
L + 6.00%, 12/17/2023 | | | 1,000 | | | | — | | | | 1,000 | | |
Reddy Ice Holdings, Inc., 1st Lien Delayed Draw
Term Loan, L + 5.50%, 07/01/2025 | | | 955,102 | | | | — | | | | 955,102 | | |
Reddy Ice Holdings, Inc., 1st Lien Revolver,
L + 5.50%, 07/01/2024 | | | 955,102 | | | | — | | | | 955,102 | | |
Revint Intermediate II, LLC, 1st Lien Revolver,
3M LIBOR + 4.50%, 6.60%, 12/13/2023 | | | 1,000 | | | | 596 | | | | 404 | | |
RSK Group, Ltd., Acquisition Facility 1st Lien
Term Loan, (Great Britain), 3M GBP LIBOR + 7.00%,
7.77%, 10/27/2025 | | | 651,632 | | | | 449,599 | | | | 202,033 | | |
RSK Group, Ltd., Acquisition 1st Lien Term Loan,
(Great Britain), L + 5.00%, 10/17/2022 | | | 323,463 | | | | — | | | | 323,463 | | |
SaintMichelCo, Ltd., Acquisition Facility 1st Lien
Term Loan, (Great Britain), 3M GBP LIBOR + 7.00%,
7.77%, 09/09/2025 | | | 388,155 | | | | 207,016 | | | | 181,139 | | |
Saldon Holdings, Inc., 1st Lien Revolver,
L + 5.65%, 03/13/2024 | | | 380,952 | | | | — | | | | 380,952 | | |
SCM Insurance Services, Inc., 1st Lien Revolver,
(Canada), CAD Prime + 4.00%, 8.75%, 08/29/2022 | | | 760 | | | | 659 | | | | 101 | | |
SCSG EA Acquisition Co., Inc., 1st Lien Revolver A,
L + 4.25%, 09/01/2022 | | | 1,000 | | | | — | | | | 1,000 | | |
SecurAmerica, LLC, 1st Lien Revolver A,
1M LIBOR + 3.00%, 5.09%, 06/21/2023 | | | 1,000 | | | | 562 | | | | 438 | | |
SecurAmerica, LLC, 1st Lien Delayed Draw Term
Loan A, 1M LIBOR + 6.75%, 8.54%, 12/21/2023 | | | 620,117 | | | | 479,147 | | | | 140,970 | | |
SecurAmerica, LLC, 1st Lien Delayed Draw Term
Loan C, L + 6.75%, 12/21/2023 | | | 573,057 | | | | — | | | | 573,057 | | |
SFE Intermediate Holdco, LLC, 1st Lien Revolver,
L + 5.00%, 07/31/2023 | | | 2,000 | | | | — | | | | 2,000 | | |
Sigma Electric Manufacturing Corp., 1st Lien
Revolver, L + 4.75%, 10/31/2022 | | | 1,333 | | | | — | | | | 1,333 | | |
SiroMed Physician Services, Inc., 1st Lien Revolver,
L + 4.75%, 03/26/2024 | | | 1,000 | | | | — | | | | 1,000 | | |
SOS Security Holdings, LLC, 1st Lien Delayed Draw
Term Loan Tranche B, L + 6.50%, 04/30/2025 | | | 335,821 | | | | — | | | | 335,821 | | |
SOS Security Holdings, LLC, 1st Lien Revolver,
Prime + 5.50%, 10.25%, 04/30/2025 | | | 179,104 | | | | 110,149 | | | | 68,955 | | |
SOS Security Holdings, LLC, 1st Lien Delayed Draw
Term Loan, 3M LIBOR + 6.50%, 8.61%, 04/30/2025 | | | 335,293 | | | | 210,380 | | | | 124,913 | | |
SpareFoot, LLC, 1st Lien Revolver, 6M LIBOR + 4.25%,
6.17%, 04/13/2023 | | | 1,000 | | | | 573 | | | | 427 | | |
Annual Report 2019
36
CION Ares Diversified Credit Fund
Consolidated Schedule of Investments (continued)
October 31, 2019
Unfunded security | | Total revolving and delayed
draw loan commitments | | Less: drawn commitments | | Total undrawn
commitments | |
Spectra Finance, LLC, Initial 1st Lien Revolver,
1M LIBOR + 4.00%, 5.89%, 04/03/2023 | | $ | 1,000 | | | $ | 194 | | | $ | 806 | | |
Sunshine Sub, LLC, 1st Lien Revolver,
L + 4.75%, 05/27/2024 | | | 144,269 | | | | — | | | | 144,269 | | |
Symbol Bidco I, Ltd., Acquisition Capex Facility
1st Lien Term Loan (Great Britain),
L + 6.50%, 09/27/2026 | | | 554,507 | | | | — | | | | 554,507 | | |
Symbol Bidco I, Ltd., Facility 1st Lien Term Loan B,
(Great Britain), L + 6.50%, 09/27/2026 | | | 739,344 | | | | — | | | | 739,344 | | |
TA/WEG Holdings, LLC, 1st Lien Revolver,
1M LIBOR + 6.00%, 8.02%, 10/02/2025 | | | 301,041 | | | | 41,544 | | | | 259,497 | | |
TA/WEG Holdings, LLC, Initial 1st Lien Delayed Draw
Term Loan, L + 6.00%, 10/02/2025 | | | 1,400,034 | | | | — | | | | 1,400,034 | | |
Teligent, Inc., 2nd Lien Delayed Draw Term Loan A,
3M LIBOR + 8.75%, 10.85%, 06/13/2024 | | | 671,761 | | | | 461,340 | | | | 210,421 | | |
Teligent, Inc., 2nd Lien Delayed Draw Term Loan B,
L + 8.75%, 06/13/2024 | | | 315,632 | | | | — | | | | 315,632 | | |
TimeClock Plus, LLC, 1st Lien Revolver,
3M LIBOR + 5.50%, 7.62%, 08/29/2025 | | | 458,311 | | | | 57,289 | | | | 401,022 | | |
TimeClock Plus, LLC, 1st Lien Delayed Draw Term
Loan, L + 5.50%, 08/28/2026 | | | 495,170 | | | | — | | | | 495,170 | | |
True Potential LLP, Acquisition Facility 1st Lien
Term Loan, (Great Britain), 6M GBP LIBOR + 7.17%,
8.03%, 10/16/2026 | | | 2,514,177 | | | | 451,505 | | | | 2,062,672 | | |
TWH Infrastructure Industries, Inc., 1st Lien Revolver,
L + 5.50%, 04/09/2025 | | | 463,581 | | | | — | | | | 463,581 | | |
Ultimate Software Group, Inc. (The), 1st Lien Revolver,
L + 3.75%, 05/03/2024 | | | 1,000 | | | | — | | | | 1,000 | | |
Ultimus Group Midco, LLC (The), 1st Lien Revolver,
Prime + 3.50%, 8.25%, 02/01/2024 | | | 396,226 | | | | 33,962 | | | | 362,264 | | |
United Digestive MSO Parent, LLC, 1st Lien Delayed
Draw Term Loan, L + 4.50%, 12/16/2024 | | | 1,022,727 | | | | — | | | | 1,022,727 | | |
United Digestive MSO Parent, LLC, 1st Lien Revolver,
L + 4.50%, 12/14/2023 | | | 511,364 | | | | — | | | | 511,364 | | |
Visolit Finco A/S, 1st Lien NOK Committed Accordion
Term Loan, (Norway), L + 5.85%, 07/02/2026 | | | 1,214,691 | | | | — | | | | 1,214,691 | | |
VLS Recovery Services, LLC, 1st Lien Delayed Draw
Term Loan C, L + 6.00%, 10/17/2023 | | | 1,070,365 | | | | — | | | | 1,070,365 | | |
VLS Recovery Services, LLC, 1st Lien Revolver,
L + 6.00%, 10/17/2023 | | | 1,000 | | | | — | | | | 1,000 | | |
VVC Holding Corp., 1st Lien Revolver,
L + 2.75%, 02/12/2024 | | | 232,108 | | | | — | | | | 232,108 | | |
WebPT, Inc., 1st Lien Revolver,
L + 6.75%, 08/28/2024 | | | 216,015 | | | | — | | | | 216,015 | | |
WebPT, Inc., 1st Lien Delayed Draw Term Loan,
L + 6.75%, 08/28/2024 | | | 255,205 | | | | — | | | | 255,205 | | |
Total | | $ | 95,569,457 | | | $ | 25,510,473 | | | $ | 70,058,984 | | |
Annual Report 2019
37
CION Ares Diversified Credit Fund
Consolidated Schedule of Investments (continued)
October 31, 2019
(h) Security valued at fair value using methods determined in good faith by or under the direction of the board of trustees.
(i) This position or a portion of this position represents an unsettled loan purchase. The interest rate will be determined at the time of settlement and will be based upon the London-Interbank Offered Rate ("LIBOR" or "L") or the applicable LIBOR floor plus a spread which was determined at the time of purchase.
(j) Payment-In-Kind security ("PIK"), which may pay interest/dividends in additional par/shares.
(k) When-Issued or delayed delivery security based on typical market settlement convention for such security.
(l) Collateralized Loan Obligations are all issued as 144A securities.
(m) Non-income producing security as of October 31, 2019.
(n) The Fund sold a participating interest of $500,000 of aggregate principal amount of the portfolio company's first lien revolver. As the transaction did not qualify as a "true sale" in accordance with U.S. generally accepted accounting principles, the Fund recorded a corresponding $348,571 secured borrowing for the $348,571 that has been funded thus far.
As of October 31, 2019, the aggregate cost of securities for Federal income tax purposes was $641,923,847.
Unrealized appreciation and depreciation on investments for Federal income tax purposes are as follows:
Gross unrealized appreciation | | $ | 8,316,953 | | |
Gross unrealized depreciation | | | (13,577,311 | ) | |
Net unrealized depreciation | | $ | (5,260,358 | ) | |
Foreign Forward Currency Contracts
On October 31, 2019, CION Ares Diversified Credit Fund had entered into forward foreign currency contracts that obligate the Fund to deliver currencies at specified future dates. Unrealized appreciation and depreciation on these contracts is included in the accompanying financial statements. The terms of the open contracts were as follows:
Description | | Notional
Amount to be
Purchased | | Notional Amount
to be Sold | | Counterparty | | Settlement
Date | | Unrealized
Appreciation | | Unrealized
Depreciation | |
Foreign currency forward contract | | $ | (1,044,125 | ) | | SEK | (1,035,473 | ) | | Goldman Sachs | | November 15, 2019 | | $ | 8,652 | | | $ | — | | |
Foreign currency forward contract | | $ | (1,121,000 | ) | | € | (1,115,245 | ) | | Goldman Sachs | | November 15, 2019 | | | 5,755 | | | | — | | |
Foreign currency forward contract | | $ | (1,080,611 | ) | | £ | (1,094,172 | ) | | Goldman Sachs | | November 15, 2019 | | | — | | | | (13,561 | ) | |
Foreign currency forward contract | | $ | (114,459 | ) | | £ | (115,341 | ) | | Goldman Sachs | | November 15, 2019 | | | — | | | | (882 | ) | |
Foreign currency forward contract | | $ | (984,895 | ) | | £ | (1,043,714 | ) | | Goldman Sachs | | December 2, 2019 | | | — | | | | (58,819 | ) | |
Foreign currency forward contract | | £ | 993,922 | | | $ | 1,043,714 | | | Goldman Sachs | | December 2, 2019 | | | 49,792 | | | | — | | |
Foreign currency forward contract | | $ | (1,111,000 | ) | | € | (1,117,410 | ) | | Goldman Sachs | | December 13, 2019 | | | — | | | | (6,410 | ) | |
Foreign currency forward contract | | $ | (2,696,877 | ) | | £ | (2,850,728 | ) | | Goldman Sachs | | December 13, 2019 | | | — | | | | (153,851 | ) | |
Foreign currency forward contract | | $ | (238,861 | ) | | SEK | (238,548 | ) | | Goldman Sachs | | December 13, 2019 | | | 313 | | | | — | | |
Foreign currency forward contract | | $ | (835,650 | ) | | € | (838,057 | ) | | Goldman Sachs | | December 13, 2019 | | | — | | | | (2,407 | ) | |
Foreign currency forward contract | | $ | (616,325 | ) | | SEK | (617,115 | ) | | Goldman Sachs | | December 13, 2019 | | | — | | | | (790 | ) | |
Foreign currency forward contract | | $ | (77,493 | ) | | DKK | (77,919 | ) | | Goldman Sachs | | December 13, 2019 | | | — | | | | (426 | ) | |
Foreign currency forward contract | | $ | (1,252,350 | ) | | £ | (1,295,518 | ) | | Goldman Sachs | | December 13, 2019 | | | — | | | | (43,168 | ) | |
Foreign currency forward contract | | $ | (2,221,340 | ) | | € | (2,240,407 | ) | | Goldman Sachs | | December 13, 2019 | | | — | | | | (19,067 | ) | |
Foreign currency forward contract | | $ | (3,738,662 | ) | | NOK | (3,653,878 | ) | | Goldman Sachs | | December 13, 2019 | | | 84,784 | | | | — | | |
Foreign currency forward contract | | $ | (2,407,344 | ) | | € | (2,444,334 | ) | | Goldman Sachs | | December 13, 2019 | | | — | | | | (36,990 | ) | |
Foreign currency forward contract | | £ | 3,947,921 | | | $ | 4,146,246 | | | Goldman Sachs | | December 13, 2019 | | | 198,325 | | | | — | | |
Foreign currency forward contract | | $ | (11,486,526 | ) | | £ | (12,092,577 | ) | | Goldman Sachs | | January 17, 2020 | | | — | | | | (606,051 | ) | |
Foreign currency forward contract | | $ | (632,819 | ) | | NOK | (628,358 | ) | | Goldman Sachs | | January 17, 2020 | | | 4,461 | | | | — | | |
Foreign currency forward contract | | $ | (7,692,396 | ) | | € | (7,706,410 | ) | | Goldman Sachs | | January 17, 2020 | | | — | | | | (14,014 | ) | |
Foreign currency forward contract | | $ | (433,226 | ) | | SEK | (432,351 | ) | | Goldman Sachs | | January 17, 2020 | | | 875 | | | | — | | |
Foreign currency forward contract | | $ | (3,679,196 | ) | | DKK | (3,685,783 | ) | | Goldman Sachs | | January 17, 2020 | | | — | | | | (6,587 | ) | |
Foreign currency forward contract | | £ | 12,086,909 | | | $ | 12,092,577 | | | Goldman Sachs | | January 17, 2020 | | | 5,668 | | | | — | | |
Total | | | | | | | | | | $ | 358,625 | | | $ | (963,023 | ) | |
Annual Report 2019
38
CION Ares Diversified Credit Fund
Consolidated Schedule of Investments (continued)
October 31, 2019
Swap Agreements outstanding as of October 31, 2019 were as follows:
Swap Agreements: Centrally Cleared or Exchange Traded
Credit Default Swaps on Credit Indices — Buy Protection (1)
Description | | Payment
Frequency | | Fixed Deal
Pay Rate | | Expiration Date | | Exchange | | Notional
Amount (2) | | Value (3) | | Upfront
Premium
Paid
(Received) | | Unrealized
Appreciation
(Depreciation) | |
CDX.NA.HY S33 5Y | | | Q | | | | 5.00 | % | | December 20, 2024 | | ICE | | $ | 73,500 | | | $ | (5,243 | ) | | $ | (4,931 | ) | | $ | (312 | ) | |
Swap Agreements: Over the Counter
Credit Default Swaps on Credit Indices — Buy Protection (1)
Reference
Obligation | | Payment
Frequency | | Fixed Deal
Pay Rate | | Expiration Date | | Counterparty | | Notional
Amount (2) | | Value (3) | | Upfront
Premium
Paid
(Received) | | Unrealized
Appreciation
(Depreciation) | |
CDX.NA.HY S27
Tranche 0-15 | | | Q | | | | 5.00 | % | | December 20, 2021 | | Goldman Sachs | | $ | 271,688 | | | $ | 97,695 | | | $ | 98,487 | | | $ | (792 | ) | |
CDX.NA.HY S31
Tranche 15-25 | | | Q | | | | 5.00 | % | | December 20, 2023 | | Goldman Sachs | | | 4,103,000 | | | | (269,691 | ) | | | (230,692 | ) | | | (38,999 | ) | |
JWN CDS USD
SR 5Y D14 | | | Q | | | | 1.00 | % | | June 20, 2024 | | Goldman Sachs | | | 210,000 | | | | 5,479 | | | | 11,721 | | | | (6,242 | ) | |
| | | | | | | | | | | | | $ | (166,517 | ) | | $ | (120,484 | ) | | $ | (46,033 | ) | |
(1) If the Fund is a buyer of protection and a credit event occurs, as defined under the terms of that particular swap agreement, the Fund will either (i) receive from the seller of protection an amount equal to the notional amount of the swap and deliver the referenced obligation or underlying investments comprising the referenced index or (ii) receive a net settlement amount in the form of cash or investments equal to the notional amount of the swap less the recovery value of the referenced obligation or underlying investments comprising the referenced index.
(2) The maximum potential amount the Fund could be required to pay as a seller of credit protection or receive as a buyer of credit protection if a credit event occurs as defined under the terms of that particular swap agreement.
(3) The quoted market prices and resulting values for credit default swap agreements on credit indices serve as an indicator of the current status of the payment/performance risk and represent the expected amount paid or received for the credit derivative had the notional amount of the swap agreement been closed/sold as of year-end. Increasing values (buy protection) or decreasing values (sell protection), when compared to the notional amount of the swap, represent a deterioration of the referenced entity's credit soundness and a greater likelihood of risk of default or other credit event occurring as defined under the terms of the agreement.
Total Return Swaps — Short
Receive | | Pay | | Payment
Frequency
Receive
Rate/Pay
Rate | | Counterparty | | Expiration
Date | | Number of
Contracts | | Notional
Amount | | Value | | Upfront
Premium
Paid
(Received) | | Unrealized
Appreciation
(Depreciation) | |
IBOXX USD
Liquid Leveraged
Loan Index
Series 1
Version 3 | | 3-Month
USD LIBOR | | Q | | Goldman
Sachs | | December 20,
2019 | | 3,502 | | $600,000 | | $ | (2,311 | ) | | $ | — | | | $ | (2,311 | ) | |
Total Swap Agreements: Over the Counter | | | | | | | | | | | | | | $ | (168,828 | ) | | $ | (120,484 | ) | | $ | (48,344 | ) | |
Total Swap Agreements | | | | | | | | | | | | | | $ | (174,071 | ) | | $ | (125,415 | ) | | $ | (48,656 | ) | |
Annual Report 2019
39
CION Ares Diversified Credit Fund
Consolidated Schedule of Investments (continued)
October 31, 2019
The following is a summary of fair values of investments in forward currency contracts disclosed in the Fund's Statement of Assets and Liabilities, as of October 31, 2019:
| | | Assets | | Liabilities | |
Swap Credit Contracts | | $ | 103,174 | | | $ | 269,691 | | |
Swap Equity Contracts | | | — | | | | 2,311 | | |
Forward Foreign Currency Contracts | | | 358,625 | | | | 963,023 | | |
The following is a summary of the Fund's realized gain and/or (loss) and change in net unrealized gain and/or (loss) on derivative investments recognized in the Fund's Statement of Operations categorized by primary risk exposure as of October 31, 2019:
| | | Realized Gain (Loss) on Derivative Investments Recognized in the Statement of Operations | |
| | | Credit
Contracts | | Equity
Contracts | | Foreign
Currency
Contracts | | Total | |
Forward Foreign Currency Contracts | | $ | — | | | $ | — | | | $ | 2,141,218 | | | $ | 2,141,218 | | |
Purchased Options | | | — | | | | 8,687 | | | | — | | | | 8,687 | | |
Written Options | | | — | | | | (3,807 | ) | | | — | | | | (3,807 | ) | |
Swaps | | | 111,492 | | | | — | | | | — | | | | 111,492 | | |
| | | Change in Unrealized Gain (Loss) on Derivative Investments
Recognized in the Statement of Operations | |
| | | Credit
Contracts | | Interest
Rate
Contracts | | Foreign
Currency
Contracts | | Total | |
Forward Foreign Currency Contracts | | $ | — | | | $ | — | | | $ | (905,802 | ) | | $ | (905,802 | ) | |
Swaps | | | (46,345 | ) | | | (2,311 | ) | | | — | | | | (48,656 | ) | |
The average notional amounts of derivative contracts outstanding as of October 31, 2019 which are indicative of the volume of the derivative types were as follows:
| | | Credit
Contracts | | Equity
Contracts | | Foreign
Currency
Contracts | | Total | |
Forward Foreign Currency Contracts | |
Buy | | $ | — | | | $ | — | | | $ | 3,821,270 | | | $ | 3,821,270 | | |
Sell | | | — | | | | — | | | | 34,601,939 | | | | 34,601,939 | | |
Purchased Options | | | — | | | | 11 | | | | — | | | | 11 | | |
Swaps | | | | | | | | | |
Exchange Traded — Buy Protection | | | 127,279 | | | | — | | | | — | | | | 127,279 | | |
Over-the-Counter — Buy Protection | | | 887,081 | | | | — | | | | — | | | | 887,081 | | |
Over-the-Counter — Sell Protection | | | 35,833 | | | | — | | | | — | | | | 35,833 | | |
Abbreviations:
144A Certain conditions for public sale may exist. Unless otherwise noted, these securities are deemed to be liquid.
CLO Collateralized Loan Obligation
Currencies:
€ Euro Currency
£ British Pounds
$ U.S. Dollars
CAD Canadian Dollars
DKK Danish Krone
GBP British Pound
NOK Norwegian Krone
SEK Swedish Krone
USD U.S. Dollars
Annual Report 2019
40
CION Ares Diversified Credit Fund
Consolidated Statement of Assets and Liabilities
October 31, 2019
Assets: | |
Investments in unaffiliated issuers, at value (cost $641,984,339) | | $ | 637,316,543 | | |
Swaps, at fair value (cost $110,208) | | | 103,174 | | |
Cash | | | 6,521,514 | | |
Cash denominated in foreign currency, at value (cost $441,718) | | | 443,174 | | |
Receivable for securities sold | | | 5,026,211 | | |
Forward foreign currency contracts | | | 358,625 | | |
Variation margin on swaps | | | 69,515 | | |
Due from brokers | | | 2,902,455 | | |
Receivable for fund shares issued | | | 1,965,849 | | |
Interest and principal receivable | | | 4,121,701 | | |
Deferred debt issuance costs | | | 1,000,532 | | |
Other assets | | | 182,925 | | |
Total assets | | $ | 660,012,218 | | |
Liabilities: | |
Swaps, at fair value (cost $230,692) | | $ | 272,002 | | |
Line of credit outstanding | | | 163,753,423 | | |
Payable for securities purchased | | | 22,674,379 | | |
Forward foreign currency contracts | | | 963,023 | | |
Payable for distributions to shareholders | | | 1,171,914 | | |
Payable for investment advisory fees | | | 527,969 | | |
Payable for administration and transfer agent fees | | | 252,976 | | |
Payable for commitment fee | | | 213,267 | | |
Payable for interest expense | | | 203,247 | | |
Payable for distribution and shareholder service fees | | | 129,322 | | |
Payable for expense support | | | 1,474,390 | | |
Accrued expenses and other payables | | | 1,204,283 | | |
Total liabilities | | | 192,840,195 | | |
Net assets | | $ | 467,172,023 | | |
Net assets consist of: | |
Paid-in capital | | $ | 470,425,114 | | |
Distributable earnings accumulated loss | | | (3,253,091 | ) | |
Net assets | | $ | 467,172,023 | | |
Annual Report 2019
41
CION Ares Diversified Credit Fund
Consolidated Statement of Assets and Liabilities (continued)
October 31, 2019
Common shares: | |
Class A: | |
Net Assets | | $ | 54,385,716 | | |
Shares Outstanding ($.001 par value; unlimited shares authorized) | | | 2,138,352 | | |
Net Asset Value Per Share | | $ | 25.44 | | |
Maximum Offering Price Per Share | | $ | 26.98 | | |
Class C: | |
Net Assets | | $ | 59,912,232 | | |
Shares Outstanding ($.001 par value; unlimited shares authorized) | | | 2,355,755 | | |
Net Asset Value Per Share | | $ | 25.44 | | |
Class I: | |
Net Assets | | $ | 298,480,878 | | |
Shares Outstanding ($.001 par value; unlimited shares authorized) | | | 11,735,884 | | |
Net Asset Value Per Share | | $ | 25.44 | | |
Class L: | |
Net Assets | | $ | 5,536,090 | | |
Shares Outstanding ($.001 par value; unlimited shares authorized) | | | 217,673 | | |
Net Asset Value Per Share | | $ | 25.44 | | |
Maximum Offering Price Per Share | | $ | 26.56 | | |
Class U: | |
Net Assets | | $ | 10,433,963 | | |
Shares Outstanding ($.001 par value; unlimited shares authorized) | | | 410,270 | | |
Net Asset Value Per Share | | $ | 25.44 | | |
Class W: | |
Net Assets | | $ | 38,423,144 | | |
Shares Outstanding ($.001 par value; unlimited shares authorized) | | | 1,510,450 | | |
Net Asset Value Per Share | | $ | 25.44 | | |
Maximum Offering Price Per Share | | $ | 26.23 | | |
Annual Report 2019
42
CION Ares Diversified Credit Fund
Consolidated Statement of Operations
For the year ended October 31, 2019
Investment income: | |
Interest | | $ | 31,971,056 | | |
Dividend | | | 4,667 | | |
Total investment income | | | 31,975,723 | | |
Expenses: | |
Management fee (Note 6) | | | 4,757,628 | | |
Interest expense (Note 5) | | | 2,245,339 | | |
Administrative services of the adviser (Note 6) | | | 1,200,000 | | |
Legal fees | | | 670,000 | | |
Marketing expense | | | 230,864 | | |
Administration, custodian and transfer agent fees (Note 6) | | | 712,010 | | |
Insurance expense | | | 100,000 | | |
Amortization of debt issuance cost (Note 5) | | | 378,517 | | |
Audit fees | | | 250,000 | | |
Due diligence fees | | | 204,579 | | |
Trustee fees | | | 260,259 | | |
Commitment fee expense (Note 5) | | | 232,069 | | |
Printing expense | | | 194,611 | | |
Class A shareholder service expense | | | 127,836 | | |
Class C shareholder service expense | | | 117,284 | | |
Class L shareholder service expense | | | 9,452 | | |
Class C distribution fees | | | 351,851 | | |
Class L distribution fees | | | 9,452 | | |
Class U distribution fees(a) | | | 6,228 | | |
Class W distribution fees(b) | | | 59,162 | | |
Valuation expense | | | 578,662 | | |
Other expenses | | | 268,300 | | |
Total expenses | | | 12,964,103 | | |
Tax expense | | | 129,000 | | |
Expense support payments by the adviser (Note 6) | | | (660,980 | ) | |
Expense support recoupment (Note 6) | | | 2,123,291 | | |
Net expenses | | | 14,555,414 | | |
Net investment income | | | 17,420,309 | | |
Net realized and unrealized gain/(loss) on investments and foreign currency | |
Net realized gain on investments | | | 504,463 | | |
Net realized gain on foreign currency | | | 80,104 | | |
Net realized gain on forward foreign currency contracts | | | 2,141,218 | | |
Net realized gain on purchased options | | | 8,687 | | |
Net realized loss on written options | | | (3,807 | ) | |
Net realized gain on swaps | | | 111,492 | | |
Net unrealized loss on investments | | | (5,135,727 | ) | |
Net unrealized loss on foreign currency | | | (2,093,174 | ) | |
Net unrealized loss on forward foreign currency contracts | | | (905,802 | ) | |
Net unrealized loss on swaps | | | (48,656 | ) | |
Net realized and unrealized loss on investments, foreign currency and derivative contracts | | | (5,341,202 | ) | |
Total increase in net assets resulting from operations | | $ | 12,079,107 | | |
(a) Period from July 26, 2019, date operations commenced, through October 31, 2019.
(b) Period from December 21, 2018, date operations commenced, through October 31, 2019.
Annual Report 2019
43
CION Ares Diversified Credit Fund
Consolidated Statements of Changes in Net Assets
October 31, 2019
| | | Year Ended
October 31, 2019 | | Year Ended
October 31, 2018 | |
Increase (decrease) in net assets from operations: | |
Net investment income | | $ | 17,420,309 | | | $ | 4,678,785 | | |
Net realized loss on investments and foreign currency | | | 2,842,157 | | | | 459,834 | | |
Net unrealized gain/loss on investments and foreign currency | | | (8,183,359 | ) | | | 867,139 | | |
Net increase from operations | | | 12,079,107 | | | | 6,005,758 | | |
Distributions to shareholders from (Note 2): | |
Distributable earnings — Class A | | | (2,776,451 | ) | | | (1,247,228 | ) | |
Distributable earnings — Class C | | | (2,551,364 | ) | | | (839,690 | ) | |
Distributable earnings — Class I | | | (11,159,149 | ) | | | (2,184,203 | ) | |
Distributable earnings — Class L | | | (205,652 | ) | | | (33,178 | ) | |
Distributable earnings — Class U | | | (46,763 | ) | | | — | | |
Distributable earnings — Class W | | | (648,791 | ) | | | — | | |
Total distributions | | | (17,388,170 | ) | | | (4,304,299 | ) | |
Increase (decrease) in net assets from operations and distributions | | | (5,309,063 | ) | | | 1,701,459 | | |
Share transactions: | |
Class A: | |
Proceeds of shares issued | | | 29,509,300 | | | | 28,105,121 | | |
Value of distributions reinvested | | | 1,067,687 | | | | 530,167 | | |
Cost of shares redeemed | | | (13,557,079 | ) | | | (4,082,562 | ) | |
Net increase from share transactions | | | 17,019,908 | | | | 24,552,726 | | |
Class C: | |
Proceeds of shares issued | | | 31,409,887 | | | | 25,454,965 | | |
Value of distributions reinvested | | | 1,301,750 | | | | 425,452 | | |
Cost of shares redeemed | | | (1,992,142 | ) | | | (250,535 | ) | |
Net increase from share transactions | | | 30,719,495 | | | | 25,629,882 | | |
Class I: | |
Proceeds of shares issued | | | 210,089,276 | | | | 105,412,482 | | |
Value of distributions reinvested | | | 3,904,823 | | | | 586,372 | | |
Cost of shares redeemed | | | (23,791,402 | ) | | | (1,191,501 | ) | |
Net increase from share transactions | | | 190,202,697 | | | | 104,807,353 | | |
Class L:(a) | |
Proceeds of shares issued | | | 3,744,948 | | | | 1,902,441 | | |
Value of distributions reinvested | | | 131,384 | | | | 18,826 | | |
Cost of shares redeemed | | | (211,897 | ) | | | (485 | ) | |
Net increase from share transactions | | | 3,664,435 | | | | 1,920,782 | | |
Annual Report 2019
44
CION Ares Diversified Credit Fund
Consolidated Statements of Changes in Net Assets (continued)
October 31, 2019
| | | Year Ended
October 31, 2019 | | Year Ended
October 31, 2018 | |
Class U:(b) | |
Proceeds of shares issued | | | 10,506,151 | | | | — | | |
Value of distributions reinvested | | | 45,636 | | | | — | | |
Cost of shares redeemed | | | (151 | ) | | | — | | |
Net increase from share transactions | | | 10,551,636 | | | | — | | |
Class W:(c) | |
Proceeds of shares issued | | | 38,374,996 | | | | — | | |
Value of distributions reinvested | | | 526,013 | | | | — | | |
Cost of shares redeemed | | | (305 | ) | | | — | | |
Net increase from share transactions | | | 38,900,704 | | | | — | | |
Total increase in net assets | | | 285,749,812 | | | | 158,612,202 | | |
Net Assets, beginning of period | | | 181,422,211 | | | | 22,810,009 | | |
Net Assets, end of period | | $ | 467,172,023 | | | $ | 181,422,211 | | |
(a) Period from November 2, 2017, date operations commenced, through October 31, 2018.
(b) Period from July 26, 2019, date operations commenced, through October 31, 2019.
(c) Period from December 21, 2018, date operations commenced, through October 31, 2019.
Annual Report 2019
45
CION Ares Diversified Credit Fund
Consolidated Statement of Cash Flows
For the year ended October 31, 2019
Operating activities: | |
Net increase in net assets resulting from operations | | $ | 12,079,107 | | |
Adjustments to reconcile net increase in net assets resulting from operations to net cash used in operating activities: | |
Purchases of investments | | | (703,870,493 | ) | |
Proceeds from the sale of investments | | | 256,008,689 | | |
Proceeds from purchased options | | | 8,687 | | |
Payments on written options | | | (3,807 | ) | |
Proceeds from swaps | | | 231,664 | | |
Amortization and accretion of discounts and premiums, net | | | (914,419 | ) | |
Net realized gain on investments | | | (504,463 | ) | |
Net realized gain on purchased options | | | (8,687 | ) | |
Net realized loss on written options | | | 3,807 | | |
Net realized gain on swaps | | | (111,180 | ) | |
Net unrealized loss on investments | | | 5,135,727 | | |
Net unrealized loss on swaps | | | 48,344 | | |
Effect of exchange rate changes on line of credit | | | 2,361,654 | | |
Amortization of debt issuance cost | | | 378,517 | | |
Payment-in-kind interest | | | (720,842 | ) | |
Changes in operating assets and liabilities: | |
Receivable for securities sold | | | (3,679,594 | ) | |
Forward foreign currency contracts | | | (56,403 | ) | |
Variation margin on swaps | | | (69,515 | ) | |
Due from brokers | | | (2,102,455 | ) | |
Interest and principal receivable | | | (3,082,998 | ) | |
Receivable for expense support from the Advisor | | | 902,558 | | |
Other assets | | | (160,576 | ) | |
Payable for securities purchased | | | (515,650 | ) | |
Forward foreign currency contracts | | | 962,205 | | |
Payable for investment advisory fees | | | 315,348 | | |
Payable for administration and transfer agent fees | | | 252,976 | | |
Payable for commitment fees | | | 213,267 | | |
Payable for interest expense | | | 203,247 | | |
Payable for distribution and shareholder service fees | | | 83,430 | | |
Payable for expense support | | | 1,474,390 | | |
Accrued expenses and other payables | | | 324,990 | | |
Net cash used in operating activities | | | (434,812,475 | ) | |
Annual Report 2019
46
CION Ares Diversified Credit Fund
Consolidated Statement of Cash Flows (continued)
For the year ended October 31, 2019
Financing activities: | |
Borrowings on line of credit | | $ | 392,332,866 | | |
Paydowns on line of credit | | | (230,941,097 | ) | |
Deferred debt issuance costs | | | (1,277,876 | ) | |
Proceeds of shares issued | | | 325,284,983 | | |
Cost of shares redeemed | | | (39,552,976 | ) | |
Distributions paid to common shareholders | | | (9,718,544 | ) | |
Net cash provided by financing activities | | | 436,127,356 | | |
Net increase in cash | | | 1,314,881 | | |
Cash: | |
Beginning of period | | | 5,649,807 | | |
End of period | | $ | 6,964,688 | | |
Supplemental disclosure of cash flow information: | |
Cash paid during the period for interest | | $ | 2,042,092 | | |
Annual Report 2019
47
CION Ares Diversified Credit Fund
| | |
For the Year Ended
October 31, 2019 | |
For the Year Ended
October 31, 2018 | | For the Period from
January 26, 2017 to
October 31, 2017 | |
Class A | |
Per share data: | |
Net asset value, beginning of period | | $ | 25.80 | | | $ | 25.25 | | | $ | 25.00 | | |
Income from investment operations: | |
Net investment income(a) | | | 1.39 | | | | 1.52 | | | | 0.86 | | |
Net realized and unrealized gain (loss) | | | (0.36 | ) | | | 0.42 | | | | 0.44 | | |
Total income from investment operations | | | 1.03 | | | | 1.94 | | | | 1.30 | | |
Less distributions declared to shareholders: | |
From net investment income | | | (1.39 | ) | | | (1.39 | ) | | | (0.86 | ) | |
From net realized gains on investments | | | — | | | | — | | | | (0.12 | ) | |
From net unrealized gain on investments and foreign currency | | | — | | | | — | | | | (0.07 | ) | |
Total distributions | | | (1.39 | ) | | | (1.39 | ) | | | (1.05 | ) | |
Net asset value, end of period | | $ | 25.44 | | | $ | 25.80 | | | $ | 25.25 | | |
Total return, excluding expense support(b) | | | 4.37 | % | | | (2.44 | )% | | | (37.12 | )%(c) | |
Total return, including expense support(d) | | | 4.10 | % | | | 7.91 | % | | | 5.32 | %(c) | |
Ratios to average net assets/supplemental data: | |
Net assets, end of period | | $ | 54,385,716 | | | $ | 37,915,185 | | | $ | 12,864,545 | | |
Including interest expense: | |
Expenses, excluding expense support(e) | | | 4.03 | % | | | 5.98 | % | | | 58.85 | %(f) | |
Expenses, including expense support(e)(g) | | | 4.30 | % | | | 0.34 | % | | | 0.00 | %(f) | |
Excluding interest expense: | |
Expenses, excluding expense support | | | 3.38 | % | | | 5.97 | % | | | 58.85 | %(f) | |
Expenses, including expense support(g) | | | 3.65 | % | | | 0.33 | % | | | 0.00 | %(f) | |
Net investment income(e) | | | 5.56 | % | | | 5.91 | % | | | 4.48 | %(f) | |
Portfolio turnover rate | | | 63.58 | % | | | 28.36 | % | | | 164.09 | %(c) | |
(a) Per share net investment income has been calculated using the average shares outstanding during the period.
(b) Based on net asset value per share. Distributions, if any, are assumed for purposes of this calculation to be reinvested at prices obtained under the Fund's Dividend Reinvestment Plan. Total Return is not annualized for periods less than one year. Total return excludes expense support provided or recouped by the adviser.
(c) Not annualized.
(d) Based on net asset value per share. Distributions, if any, are assumed for purposes of this calculation to be reinvested at prices obtained under the Fund's Dividend Reinvestment Plan. Total Return is not annualized for periods less than one year. Total return includes expense support provided or recouped by the adviser.
(e) Includes organizational and offering costs.
(f) Annualized.
(g) Includes expense support provided or recouped by the adviser.
Annual Report 2019
48
CION Ares Diversified Credit Fund
Financial Highlights (continued)
| | |
For the Year Ended
October 31, 2019 | |
For the Year Ended
October 31, 2018 | | For the Period from
July 12, 2017
(commencement of
operations) to
October 31, 2017 | |
Class C | |
Per share data: | |
Net asset value, beginning of period | | $ | 25.80 | | | $ | 25.25 | | | $ | 24.95 | | |
Income from investment operations: | |
Net investment income(a) | | | 1.39 | | | | 1.52 | | | | 0.39 | | |
Net realized and unrealized gain (loss) | | | (0.36 | ) | | | 0.42 | | | | 0.33 | | |
Total income from investment operations | | | 1.03 | | | | 1.94 | | | | 0.72 | | |
Less distributions declared to shareholders: | |
From net investment income | | | (1.39 | ) | | | (1.39 | ) | | | (0.39 | ) | |
From net realized gains on investments | | | — | | | | — | | | | (0.02 | ) | |
From net unrealized gain on investments and foreign currency | | | — | | | | — | | | | (0.01 | ) | |
Total distributions | | | (1.39 | ) | | | (1.39 | ) | | | (0.42 | ) | |
Net asset value, end of period | | $ | 25.44 | | | $ | 25.80 | | | $ | 25.25 | | |
Total return, excluding expense support(b) | | | 3.70 | % | | | (3.19 | )% | | | (3.56 | )%(c) | |
Total return, including expense support(d) | | | 4.10 | % | | | 7.91 | % | | | 2.95 | %(c) | |
Ratios to average net assets/supplemental data: | |
Net assets, end of period | | $ | 59,912,232 | | | $ | 29,868,425 | | | $ | 3,897,826 | | |
Including interest expense: | |
Expenses, excluding expense support(e) | | | 4.82 | % | | | 6.73 | % | | | 22.59 | %(f) | |
Expenses, including expense support(e)(g) | | | 4.42 | % | | | 0.34 | % | | | 0.00 | %(f) | |
Excluding interest expense: | |
Expenses, excluding expense support | | | 4.15 | % | | | 6.72 | % | | | 22.59 | %(f) | |
Expenses, including expense support(g) | | | 3.75 | % | | | 0.33 | % | | | 0.00 | %(f) | |
Net investment income(e) | | | 5.48 | % | | | 5.91 | % | | | 5.17 | %(f) | |
Portfolio turnover rate | | | 63.58 | % | | | 28.36 | % | | | 164.09 | %(c) | |
(a) Per share net investment income has been calculated using the average shares outstanding during the period.
(b) Based on net asset value per share. Distributions, if any, are assumed for purposes of this calculation to be reinvested at prices obtained under the Fund's Dividend Reinvestment Plan. Total Return is not annualized for periods less than one year. Total return excludes expense support provided or recouped by the adviser.
(c) Not annualized.
(d) Based on net asset value per share. Distributions, if any, are assumed for purposes of this calculation to be reinvested at prices obtained under the Fund's Dividend Reinvestment Plan. Total Return is not annualized for periods less than one year. Total return includes expense support provided or recouped by the adviser.
(e) Includes organizational and offering costs.
(f) Annualized.
(g) Includes expense support provided or recouped by the adviser.
Annual Report 2019
49
CION Ares Diversified Credit Fund
Financial Highlights (continued)
| | |
For the Year Ended
October 31, 2019 | |
For the Year Ended
October 31, 2018 | | For the Period from
July 12, 2017
(commencement of
operations) to
October 31, 2017 | |
Class I | |
Per share data: | |
Net asset value, beginning of period | | $ | 25.80 | | | $ | 25.25 | | | $ | 24.95 | | |
Income from investment operations: | |
Net investment income(a) | | | 1.39 | | | | 1.52 | | | | 0.40 | | |
Net realized and unrealized gain (loss) | | | (0.36 | ) | | | 0.42 | | | | 0.32 | | |
Total income from investment operations | | | 1.03 | | | | 1.94 | | | | 0.72 | | |
Less distributions declared to shareholders: | |
From net investment income | | | (1.39 | ) | | | (1.39 | ) | | | (0.40 | ) | |
From net realized gains on investments | | | — | | | | — | | | | (0.01 | ) | |
From net unrealized gain on investments and foreign currency | | | — | | | | — | | | | (0.01 | ) | |
Total distributions | | | (1.39 | ) | | | (1.39 | ) | | | (0.42 | ) | |
Net asset value, end of period | | $ | 25.44 | | | $ | 25.80 | | | $ | 25.25 | | |
Total return, excluding expense support(b) | | | 4.78 | % | | | (2.19 | )% | | | (2.49 | )%(c) | |
Total return, including expense support(d) | | | 4.10 | % | | | 7.91 | % | | | 2.95 | %(c) | |
Ratios to average net assets/supplemental data: | |
Net assets, end of period | | $ | 298,480,878 | | | $ | 111,705,126 | | | $ | 6,047,638 | | |
Including interest expense: | |
Expenses, excluding expense support(e) | | | 3.87 | % | | | 5.73 | % | | | 18.62 | %(f) | |
Expenses, including expense support(e)(g) | | | 4.55 | % | | | 0.34 | % | | | 0.00 | %(f) | |
Excluding interest expense: | |
Expenses, excluding expense support | | | 3.17 | % | | | 5.71 | % | | | 18.62 | %(f) | |
Expenses, including expense support(g) | | | 3.85 | % | | | 0.32 | % | | | 0.00 | %(f) | |
Net investment income(e) | | | 5.38 | % | | | 5.91 | % | | | 5.19 | %(f) | |
Portfolio turnover rate | | | 63.58 | % | | | 28.36 | % | | | 164.09 | %(c) | |
(a) Per share net investment income has been calculated using the average shares outstanding during the period.
(b) Based on net asset value per share. Distributions, if any, are assumed for purposes of this calculation to be reinvested at prices obtained under the Fund's Dividend Reinvestment Plan. Total Return is not annualized for periods less than one year. Total return excludes expense support provided or recouped by the adviser.
(c) Not annualized.
(d) Based on net asset value per share. Distributions, if any, are assumed for purposes of this calculation to be reinvested at prices obtained under the Fund's Dividend Reinvestment Plan. Total Return is not annualized for periods less than one year. Total return includes expense support provided or recouped by the adviser.
(e) Includes organizational and offering costs.
(f) Annualized.
(g) Includes expense support provided or recouped by the adviser.
Annual Report 2019
50
CION Ares Diversified Credit Fund
Financial Highlights (continued)
| | |
For the Year Ended
October 31, 2019 | | For the Period from
November 2, 2017
(commencement of
operations) to
October 31, 2018 | |
Class L | |
Per share data: | |
Net asset value, beginning of period | | $ | 25.80 | | | $ | 25.23 | | |
Income from investment operations: | |
Net investment income(a) | | | 1.39 | | | | 1.52 | | |
Net realized and unrealized gain (loss) | | | (0.36 | ) | | | 0.43 | | |
Total income from investment operations | | | 1.03 | | | | 1.95 | | |
Less distributions declared to shareholders: | |
From net investment income | | | (1.39 | ) | | | (1.38 | ) | |
Total distributions | | | (1.39 | ) | | | (1.38 | ) | |
Net asset value, end of period | | $ | 25.44 | | | $ | 25.80 | | |
Total return, excluding expense support(b) | | | 4.32 | % | | | (2.69 | )% | |
Total return, including expense support(c) | | | 4.10 | % | | | 7.96 | % | |
Ratios to average net assets/supplemental data: | |
Net assets, end of period | | $ | 5,536,090 | | | $ | 1,933,475 | | |
Including interest expense: | |
Expenses, excluding expense support(d) | | | 4.38 | % | | | 6.23 | %(e) | |
Expenses, including expense support(d)(f) | | | 4.60 | % | | | 0.34 | %(e) | |
Excluding interest expense: | |
Expenses, excluding expense support | | | 3.67 | % | | | 6.21 | %(e) | |
Expenses, including expense support(f) | | | 3.89 | % | | | 0.32 | %(e) | |
Net investment income(d) | | | 5.35 | % | | | 5.91 | % | |
Portfolio turnover rate | | | 63.58 | % | | | 28.36 | % | |
(a) Per share net investment income has been calculated using the average shares outstanding during the period.
(b) Based on net asset value per share. Distributions, if any, are assumed for purposes of this calculation to be reinvested at prices obtained under the Fund's Dividend Reinvestment Plan. Total Return is not annualized for periods less than one year. Total return excludes expense support provided or recouped by the adviser.
(c) Based on net asset value per share. Distributions, if any, are assumed for purposes of this calculation to be reinvested at prices obtained under the Fund's Dividend Reinvestment Plan. Total Return is not annualized for periods less than one year. Total return includes expense support provided or recouped by the adviser.
(d) Includes organizational and offering costs.
(e) Annualized.
(f) Includes expense support provided or recouped by the adviser.
Annual Report 2019
51
CION Ares Diversified Credit Fund
Financial Highlights (continued)
| | | For the
Period from
July 26, 2019
(commencement of
operations) to
October 31, 2019 | |
Class U | |
Per share data: | |
Net asset value, beginning of period | | $ | 25.86 | | |
Income from investment operations: | |
Net investment income(a) | | | 0.40 | | |
Net realized and unrealized loss | | | (0.45 | ) | |
Total income from investment operations | | | (0.05 | ) | |
Less distributions declared to shareholders: | |
From net investment income | | | (0.37 | ) | |
Total distributions | | | (0.37 | ) | |
Net asset value, end of period | | $ | 25.44 | | |
Total return, excluding expense support(b) | | | 1.60 | %(c) | |
Total return, including expense support(d) | | | (0.14 | )%(c) | |
Ratios to average net assets/supplemental data: | |
Net assets, end of period | | $ | 10,433,963 | | |
Including interest expense: | |
Expenses, excluding expense support(e) | | | 4.85 | %(f) | |
Expenses, including expense support(e)(g) | | | 6.59 | %(f) | |
Excluding interest expense: | |
Expenses, excluding expense support | | | 3.88 | %(f) | |
Expenses, including expense support(g) | | | 5.62 | %(f) | |
Net investment income(e) | | | 12.08 | %(f) | |
Portfolio turnover rate | | | 63.58 | %(c) | |
(a) Per share net investment income has been calculated using the average shares outstanding during the period.
(b) Based on net asset value per share. Distributions, if any, are assumed for purposes of this calculation to be reinvested at prices obtained under the Fund's Dividend Reinvestment Plan. Total Return is not annualized for periods less than one year. Total return excludes expense support provided or recouped by the adviser.
(c) Not annualized.
(d) Based on net asset value per share. Distributions, if any, are assumed for purposes of this calculation to be reinvested at prices obtained under the Fund's Dividend Reinvestment Plan. Total Return is not annualized for periods less than one year. Total return includes expense support provided or recouped by the adviser.
(e) Includes organizational and offering costs.
(f) Annualized, except for certain non-recurring costs.
(g) Includes expense support provided or recouped by the adviser.
Annual Report 2019
52
CION Ares Diversified Credit Fund
Financial Highlights (continued)
| | | For the
Period from
December 21, 2018
(commencement of
operations) to
October 31, 2019 | |
Class W | |
Per share data: | |
Net asset value, beginning of period | | $ | 25.03 | | |
Income from investment operations: | |
Net investment income(a) | | | 1.23 | | |
Net realized and unrealized gains | | | 0.38 | | |
Total income from investment operations | | | 1.61 | | |
Less distributions declared to shareholders: | |
From net investment income | | | (1.20 | ) | |
Total distributions | | | (1.20 | ) | |
Net asset value, end of period | | $ | 25.44 | | |
Total return, excluding expense support(b) | | | 7.00 | %(c) | |
Total return, including expense support(d) | | | 6.25 | %(c) | |
Ratios to average net assets/supplemental data: | |
Net assets, end of period | | $ | 38,423,144 | | |
Including interest expense: | |
Expenses, excluding expense support(e) | | | 4.73 | %(f) | |
Expenses, including expense support(e)(g) | | | 5.47 | %(f) | |
Excluding interest expense: | |
Expenses, excluding expense support | | | 3.65 | %(f) | |
Expenses, including expense support(g) | | | 4.39 | %(f) | |
Net investment income(e) | | | 5.14 | %(f) | |
Portfolio turnover rate | | | 63.58 | %(c) | |
(a) Per share net investment income has been calculated using the average shares outstanding during the period.
(b) Based on net asset value per share. Distributions, if any, are assumed for purposes of this calculation to be reinvested at prices obtained under the Fund's Dividend Reinvestment Plan. Total Return is not annualized for periods less than one year. Total return excludes expense support provided or recouped by the adviser.
(c) Not annualized.
(d) Based on net asset value per share. Distributions, if any, are assumed for purposes of this calculation to be reinvested at prices obtained under the Fund's Dividend Reinvestment Plan. Total Return is not annualized for periods less than one year. Total return includes expense support provided or recouped by the adviser.
(e) Includes organizational and offering costs.
(f) Annualized, except for certain non-recurring costs.
(g) Includes expense support provided or recouped by the adviser.
Annual Report 2019
53
CION Ares Diversified Credit Fund
Notes to Consolidated Financial Statements
October 31, 2019
(1) Organization
CION Ares Diversified Credit Fund (the "Fund") is a diversified, closed-end management investment company that is registered under the Investment Company Act of 1940. The Fund is structured as an interval fund and continuously offers its shares. The Fund was organized as a Delaware statutory trust on June 21, 2016. CION Ares Management, LLC (the "Adviser") serves as the investment Adviser to the Fund and was registered as an investment adviser with the Securities and Exchange Commission ("SEC") under the Investment Advisers Act of 1940 (the "Advisers Act") on January 4, 2017. The Adviser is a joint venture between affiliates of Ares Management Corporation ("Ares") and CION Investment Group, LLC ("CION") and is controlled by Ares. The Adviser oversees the management of the Fund's activities and is responsible for making investment decisions for the Fund's portfolio.
On August 2, 2018, the Fund formed a wholly owned special purpose financing vehicle, CADEX Credit Financing, LLC (the "Financing Sub"), a Delaware limited liability company.
Investment Objective and Policies
The Fund's investment objective is to provide superior risk-adjusted returns across various market cycles by investing in a diversified portfolio of liquid and illiquid asset classes. The Fund seeks to capitalize on market inefficiencies and relative value opportunities throughout the entire global credit spectrum.
Fiscal Year End Change
On September 25, 2019, the Fund's board of trustees approved a change to the fiscal year end of the Fund from October 31 to December 31, which will take effect in the next reporting period.
(2) Significant Accounting Policies
Basis of Presentation
The accompanying consolidated financial statements have been prepared on an accrual basis of accounting in conformity with U.S. generally accepted accounting principles ("GAAP"), and includes the accounts of the Fund and its consolidated subsidiaries. The Fund is an investment company following accounting and reporting guidance in Financial Accounting Standards Board ("FASB") Accounting Standards Codification ("ASC") Topic 946, Financial Services — Investment Companies. The consolidated financial statements reflect all adjustments and reclassification, that, in the opinion of management, are necessary for the fair presentation of the results of operations and financial condition as of and for the periods presented. All significant intercompany balances and
transactions have been eliminated. The Adviser makes estimates and assumptions that affect the reported amounts and disclosures in the consolidated financial statements. Actual results may differ from those estimates and such differences may be material.
Investments Valuation
All investments in securities are recorded at their fair value. See Note 3 for more information on the Fund's valuation process.
Interest Income
Interest income is recorded on the accrual basis to the extent that such amounts are expected to be collected, and adjusted for accretion of discounts and amortization of premiums.
The Fund may have investments that contain payment-in-kind ("PIK") provisions. The PIK interest, computed at the contractual rate specified, may be added to the principal balance and adjusted cost of the investments and recorded as interest income. The PIK interest for the year ended October 31, 2019 was $720,842 recorded as interest income.
Discounts and Premiums
Discounts and premiums on securities purchased are accreted/amortized over the life of the respective security using the effective interest method. The adjusted cost of investments represents the original cost adjusted for PIK interest, the accretion of discounts, and amortization of premiums.
Cash and Cash Equivalents
The Fund considers all highly liquid investments with original maturities of 90 days or less to be cash equivalents. The Fund's cash and cash equivalents are maintained with a major United States financial institution, which is a member of the Federal Deposit Insurance Corporation. While the Fund's current cash balance exceeds insurance limits, the risk of loss is remote and there are no cash equivalents.
Investment Transactions, Related Investment Income and Expenses
Investment transactions are accounted for on the trade date. Investments for which market quotations are readily available are typically valued at such market quotations. In order to validate market quotations, the Fund looks at a number of factors to determine if the quotations are representative of fair value, including the source and nature of the quotations. Debt and equity securities that are not publicly traded or whose market prices are not readily available are valued at fair value as determined in good faith by the Adviser in accordance with the Fund's valuation policy (the "Valuation Policy"). The Valuation Policy is reviewed and approved at least annually by the Fund's board of trustees (the "Board").
Annual Report 2019
54
CION Ares Diversified Credit Fund
Notes to Consolidated Financial Statements (continued)
October 31, 2019
The Adviser has been authorized by the Board to utilize independent third-party pricing and valuation services to assist in the valuation of each portfolio investment without a readily available market quotation at least once during a trailing 12-month period (with certain de minimis exceptions) in accordance with the Valuation Policy and a consistently applied valuation process.
As part of the valuation process for investments that do not have readily available market prices, the Adviser may take into account the following types of factors, if relevant, in determining the fair value of the Fund's investments: the enterprise value of a portfolio company (the entire value of the portfolio company to a market participant, including the sum of the values of debt and equity securities used to capitalize the enterprise at a point in time), the nature and realizable value of any collateral, the portfolio company's ability to make payments and its earnings and discounted cash flow, the markets in which the portfolio company does business, a comparison of the portfolio company's securities to any similar publicly traded securities, changes in the interest rate environment and the credit markets, which may affect the price at which similar investments would trade in their principal markets and other relevant factors. When an external event such as a purchase transaction, public offering or subsequent equity sale occurs, the Adviser considers the pricing indicated by the external event to corroborate its valuation.
Due to the inherent uncertainty of determining the fair value of investments that do not have a readily available market value, the fair value of the Fund's investments may fluctuate from period to period. Additionally, the fair value of the Fund's investments may differ significantly from the values that would have been used had a ready market existed for such investments and may differ materially from the values that the Fund may ultimately realize. Further, such investments are generally subject to legal and other restrictions on resale or otherwise are less liquid than publicly traded securities. If the Fund was required to liquidate a portfolio investment in a forced or liquidation sale, the Fund could realize significantly less than the value at which the Fund has recorded it.
In addition, changes in the market environment and other events that may occur over the life of the investments may cause the gains or losses ultimately realized on these investments to be different than the unrealized gains or losses reflected in the valuations currently assigned.
See Note 3 for more information on the Fund's valuation process.
Interest income, adjusted for amortization of premiums and accretion of discounts on investments, is earned from settlement date and is recorded on the accrual basis. Realized
gains and losses are reported on the specific identification method. Expenses are recorded on the accrual basis as incurred.
Realized and unrealized gains and losses and net investment income, excluding class specific expenses are allocated daily to each class of shares based upon the relative proportion of net assets of each class. Differences in per share distributions by class are generally due to differences in class specific expenses.
Foreign Currency Transactions and Forward Foreign Currency Contracts
Amounts denominated in foreign currencies are translated into U.S. dollars on the following basis: (i) investments and other assets and liabilities denominated in foreign currencies are translated into U.S. dollars based upon currency exchange rates effective on the date of valuation; and (ii) purchases and sales of investments and income and expense items denominated in foreign currencies are translated into U.S. dollars based upon currency exchange rates prevailing on transaction dates.
The Fund does not isolate that portion of the results of operations resulting from the changes in foreign exchange rates on investments from fluctuations arising from changes in market prices of securities held. Such fluctuations are included within the net realized and unrealized gain (loss) on investments in the Consolidated Statement of Operations.
Reported net realized foreign exchange gains or losses arise from sales of foreign currencies, currency gains or losses realized between the trade and settlement dates of securities transactions, and the difference between the amounts of income and expense items recorded on the Fund's books and the U.S. dollar equivalent of the amounts actually received or paid. Net unrealized foreign currency gains and losses arise from the changes in fair values of assets and liabilities, other than investments in securities at period end, resulting from changes in exchange rates.
Investments in foreign companies and securities of foreign governments may involve special risks and considerations not typically associated with investing in U.S. companies and securities of the U.S. government. These risks include, among other things, revaluation of currencies, less reliable information about issuers, different transaction clearance and settlement practices, and potential future adverse political and economic developments. Moreover, investments in foreign companies and securities of foreign governments and their markets may be less liquid and their prices more volatile than those of comparable U.S. companies and the U.S. government.
The Fund may enter into forward foreign currency exchange contracts for operational purposes and to protect against
Annual Report 2019
55
CION Ares Diversified Credit Fund
Notes to Consolidated Financial Statements (continued)
October 31, 2019
adverse exchange rate fluctuations. A forward foreign currency contract is an agreement between the Fund and a counterparty to buy or sell a foreign currency at a specific exchange rate on a future date. The Fund may also enter into these contracts for purposes of increasing exposure to a foreign currency or to shift exposure to foreign currency fluctuations from one currency to another. The net U.S. dollar value of foreign currency underlying all contractual commitments held by the Fund and the resulting unrealized appreciation or depreciation are determined using foreign currency exchange rates from an independent pricing service. The Fund is subject to the credit risk that the other party will not complete the obligations of the contract. The fair values of the forward foreign currency exchange contracts are obtained from an independent pricing source.
Distributions to Shareholders
The Fund records distributions from net investment income daily. These distributions may be reinvested or paid monthly to shareholders. The Fund intends to pay common shareholders at least annually all or substantially all of its taxable income. The Fund intends to pay any capital gain distributions at least annually.
The Fund may make distributions, without limitation, from offering proceeds or borrowings, which may constitute a return of capital, as well as net investment income from operations, capital and non-capital gains from the sale of assets, and dividends or distributions from equity investments. Furthermore, a portion of the Fund's distributions during the year ended October 31, 2019 was derived from expense support payments made by the Adviser, which are subject to repayment by the Fund within three years. The purpose of such expense support payments is to ensure that the Fund bears an appropriate level of expenses. As such, the Fund's distributions may not be entirely based on investment performance and can only be sustained if positive investment performance is achieved in future periods and/or the Adviser continues to make such expense support payments. Any future repayments of expenses by the Fund will reduce cash otherwise potentially available for distributions. There can be no assurance that such performance will be achieved in order to sustain the current level of the Fund's distributions. After the expiration of the initial term of the Expense Support and Conditional Reimbursement Agreement (the "Agreement") on July 31, 2020, the Adviser has no obligation to make expense support payments in future periods. If the Adviser did not make any expense support payments or related capital contribution during such period, all or a portion of the Fund's distributions would have been a return of capital which would reduce the available capital for investment. The sources of the
Fund's distributions may vary periodically. Please refer to the Financial Highlights table for the sources of distributions.
Commitments and Contingencies
In the normal course of business, the Fund's investment activities involve executions, settlement and financing of various transactions resulting in receivables from, and payables to, brokers, dealers and the Fund's custodian. These activities may expose the Fund to risk in the event that such parties are unable to fulfill contractual obligations. Management does not anticipate any material losses from counterparties with whom it conducts business. Consistent with standard business practice, the Fund enters into contracts that contain a variety of indemnifications, and is engaged from time to time in various legal actions. The maximum exposure of the Fund under these arrangements and activities is unknown. However, the Fund expects the risk of material loss to be remote.
Commitments to extend credit include loan proceeds the Fund is obligated to advance, such as delayed draws or revolving credit arrangements. Commitments generally have fixed expiration dates or other termination clauses. Unrealized gains or losses associated with unfunded commitments are recorded in the consolidated financial statements and reflected as an adjustment to the fair value of the related security in the Consolidated Schedule of Investments. The par amount of the unfunded commitments is not recognized by the Fund until it becomes funded. As of October 31, 2019, the value of loans disclosed in the Schedule of Investments does not include unfunded commitments, which total $70,058,984.
Income Taxes
The Fund intends to distribute all or substantially all of its taxable income and to comply with the other requirements of Subchapter M of the U.S. Internal Revenue Code of 1986, as amended, applicable to Regulated Investment Companies. Accordingly, no provision for U.S. federal income taxes is required.
The Fund may elect to incur an excise tax if it is deemed prudent by its board of trustees from a cash management perspective or in the best interest of shareholders due to other facts and circumstances. For the year ended October 31, 2019, the Fund incurred U.S. federal excise tax of $129,000.
As of October 31, 2019, which is the end of the Fund's taxable year, the Fund had no uncertain tax positions that would require financial statement recognition, derecognition, or disclosure. The Fund files a U.S. federal income tax return annually after its fiscal year-end, which is subject to examination by the Internal Revenue Service for a period of three years from the date of filing.
Annual Report 2019
56
CION Ares Diversified Credit Fund
Notes to Consolidated Financial Statements (continued)
October 31, 2019
Net investment income and net realized gains and losses may differ for financial statement and tax purposes because of temporary or permanent book/tax differences. These differences are primarily due to differing treatments for foreign currency gains and losses, excise taxes, pay down gains and losses and losses due to wash sales and qualified electing fund ("QEF") income and capital gains. To the extent these differences are permanent, reclassifications are made to the appropriate capital accounts in the fiscal period that the differences arise. On the Statement of Assets and Liabilities, the following reclassifications were made:
Additional paid-in capital/(reduction) | | $ | (129,000 | ) | |
Distributable earnings accumulated loss | | | 129,000 | | |
The characterization of distributions made during the fiscal period from net investment income or net realized gains may differ from its ultimate characterization for federal income tax purposes. In addition, due to the timing of dividend distributions, the fiscal period in which amounts are distributed may differ from the fiscal period that the income or realized gains or losses were recorded by the Fund. The characterization of distributions paid during the fiscal years ended October 31, 2019 and October 31, 2018 were as follows:
| | | 2019 | | 2018 | |
Ordinary income | | $ | 17,388,170 | | | $ | 4,304,299 | | |
Capital gain | | | — | | | | — | | |
Return of capital | | | — | | | | — | | |
As of October 31, 2019, the components of accumulated earnings (deficit) on a tax basis were as follows:
Undistributed ordinary income | | $ | 3,866,027 | | |
Undistributed capital gains | | | — | | |
Accumulated capital and other losses | | | — | | |
Other undistributed ordinary losses | | | — | | |
Net unrealized appreciation (depreciation) | | | (7,119,118 | ) | |
Total accumulated deficit | | $ | (3,253,091 | ) | |
ASC 740, Income Taxes, provides guidance for how uncertain tax positions should be recognized, measured, presented, and disclosed in the financial statements. The Fund has evaluated the implications of ASC 740 for all open tax years and has determined there is no impact to the Fund's financial statements as of the year ended October 31, 2019. The Fund's federal and state income returns for which the applicable statutes of limitations have not expired remain subject to examination by the Internal Revenue Service and states department of revenue.
All penalties and interest associated with income taxes, if any, are included in other expenses in the Statement of Operations.
There were no penalties and interest incurred by the Fund for the current fiscal year.
Deferred Debt Issuance Costs
Debt issuance costs are amortized over the life of the related debt instrument using the straight line method.
Recently Issued Accounting Pronouncements
In March 2017, the FASB issued ASU No. 2017-08, Receivables — Nonrefundable Fees and Other Costs (Subtopic 310-20): Premium Amortization on Purchased Callable Debt Securities. The amendments in the ASU shorten the amortization period for certain callable debt securities, held at a premium, to be amortized to the earliest call date. The ASU does not require an accounting change for securities held at a discount, which continue to be amortized to maturity. The ASU is effective for fiscal years and for interim periods within those fiscal years beginning after December 15, 2018. Management does not expect this accounting pronouncement to have a material effect on The Fund's consolidated financial statements.
In August 2018, the FASB issued ASU No. 2018-13, Fair Value Measurement (Topic 820): Disclosure Framework — Changes to the Disclosure Requirements for Fair Value Measurement. The standard will modify the disclosure requirements for fair value measurements by removing, modifying, or adding certain disclosures. ASU No. 2018-13 is effective for annual reporting periods beginning after December 15, 2019, including interim periods within that reporting period. Early adoption is permitted upon issuance of this ASU. The Fund is permitted to early adopt any removed or modified disclosures upon issuance of this ASU and delay adoption of the additional disclosures until their effective date. The Fund has elected to early adopt ASU No. 2018-13 as of October 31, 2019.
(3) Investments
Fair Value Measurements
The Fund follows the provisions of ASC 820, Fair Value Measurements and Disclosures under U.S. GAAP, which among other matters, requires enhanced disclosures about investments that are measured and reported at fair value. This standard defines fair value and establishes a hierarchal disclosure framework, which prioritizes and ranks the level of market price observability used in measuring investments at fair value and expands disclosures about assets and liabilities measured at fair value. ASC 820 defines "fair value" as the price that would be received to sell an asset or paid to transfer a liability in an orderly transaction between market participants at the measurement date. The hierarchal disclosure framework establishes a three-tier hierarchy to maximize the use of observable data and minimize the use of
Annual Report 2019
57
CION Ares Diversified Credit Fund
Notes to Consolidated Financial Statements (continued)
October 31, 2019
unobservable inputs. Inputs refer broadly to the assumptions that market participants would use in pricing the asset or liability, including assumptions about risk, for example, the risk inherent in a particular valuation technique used to measure fair value (such as a pricing model) and/or the risk inherent in the inputs to the valuation technique.
Inputs may be observable or unobservable. Observable inputs are inputs that reflect the assumptions market participants would use in pricing the asset or liability based on market data obtained from sources independent of the reporting entity. Unobservable inputs are inputs that reflect the reporting entity's own assumptions about the assumptions market participants would use in pricing the asset or liability based on the best information available in the circumstances. The three tier hierarchy of inputs is summarized in the three broad levels listed below.
• Level 1 — Valuations based on quoted prices in active markets for identical assets or liabilities that the Fund has the ability to access.
• Level 2 — Valuations based on quoted prices in markets that are not active or for which all significant inputs are observable, either directly or indirectly.
• Level 3 — Valuations based on inputs that are unobservable and significant to the overall fair value measurement.
In addition to using the above inputs in investment valuations, the Fund continues to employ a valuation policy that is consistent with the provisions of ASC 820. Consistent with the Fund's valuation policy, it evaluates the source of inputs, including any markets in which the Fund's investments are trading (or any markets in which securities with similar attributes are trading), in determining fair value. The Fund's valuation policy considers the fact that because there may not be a readily available market value for the investments in the Fund's portfolio, therefore, the fair value of the investments may be determined using unobservable inputs.
The assets and liabilities classified as Level 1 or Level 2 are typically valued based on quoted market prices, forward foreign exchange rates, dealer quotations or alternative pricing sources supported by observable inputs. The Adviser obtains prices from independent pricing services which generally utilize broker quotes and may use various other pricing techniques which take into account appropriate factors such as yield, quality, coupon rate, maturity, type of issue, trading characteristics and other data. The Adviser is responsible for all inputs and assumptions related to the pricing of securities. The Adviser has internal controls in place that support its reliance on information received from third-party pricing sources. As part of its internal controls, the Adviser obtains,
reviews, and tests information to corroborate prices received from third-party pricing sources. For any security, if market or dealer quotations are not readily available, or if the Adviser determines that a quotation of a security does not represent a fair value, then the security is valued at a fair value as determined in good faith by the Adviser and will be classified as Level 3. In such instances, the Adviser will use valuation techniques consistent with the market or income approach to measure fair value and will give consideration to all factors which might reasonably affect the fair value.
The assets and liabilities classified as Level 3 (other than as described below in the following paragraph) are typically valued using two different valuation techniques. The first valuation technique is an analysis of the enterprise value ("EV") of the portfolio company. Enterprise value means the entire value of the portfolio company to a market participant, including the sum of the values of debt and equity securities used to capitalize the enterprise at a point in time. The primary method for determining EV uses a multiple analysis whereby appropriate multiples are applied to the portfolio company's EBITDA (generally defined as net income before net interest expense, income tax expense, depreciation and amortization). EBITDA multiples are typically determined based upon review of market comparable transactions and publicly traded comparable companies, if any. The Fund may also employ other valuation multiples to determine EV, such as revenues. The Fund may also use industry specific valuation analyses to determine enterprise value, such as capitalization rate analysis used in the real estate industry. The second method for determining EV uses a discounted cash flow analysis whereby future expected cash flows of the portfolio company are discounted to determine a present value using estimated discount rates (typically a weighted average cost of capital based on costs of debt and equity consistent with current market conditions). The EV analysis is performed to determine the value of equity investments, the value of debt investments in portfolio companies where the Fund has control or could gain control through an option or warrant security, and to determine if there is credit impairment for debt investments. If debt investments are credit impaired, an EV analysis may be used to value such debt investments; however, in addition to the methods outlined above, other methods such as a liquidation or wind down analysis may be utilized to estimate enterprise value. The second valuation technique is a yield analysis, which is typically performed for non-credit impaired debt investments in portfolio companies where the Fund does not own a controlling equity position. To determine fair value using a yield analysis, a current price is imputed for the investment based upon an assessment of the expected market yield for a similarly structured investment with a similar level of risk. In the yield analysis, the Fund considers
Annual Report 2019
58
CION Ares Diversified Credit Fund
Notes to Consolidated Financial Statements (continued)
October 31, 2019
the current contractual interest rate, the maturity and other terms of the investment relative to risk of the company and the specific investment. A key determinant of risk, among other things, is the leverage through the investment relative to the enterprise value of the portfolio company. As debt investments held by the Fund are substantially illiquid with no active transaction market, the Fund depends on primary market data, including newly funded transactions, as well as secondary market data with respect to high yield debt instruments and syndicated loans, as inputs in determining the appropriate market yield, as applicable.
The fair value of CLOs is estimated based on various valuation models from third-party pricing services as well as internal models. The valuation models generally utilize discounted cash flows and take into consideration prepayment and loss assumptions, based on historical experience and projected performance, economic factors, the characteristics and condition of the underlying collateral, comparable yields for similar securities and recent trading activity. These securities are classified as Level 3.
Private asset-backed securities classified as Level 3 are typically valued using two different valuation techniques. The first valuation technique is an analysis of the forecasted cash flows of the security. The forecasted cash flows take into consideration prepayment and loss assumptions, based on historical experience and projected performance, economic factors, and the characteristics and condition of the underlying collateral. For equity securities, the projected cash flows are present valued using a market discount rate to determine the fair value. For debt securities, the analysis is used to determine if the borrower has the ability to repay its obligations. If it is determined that the borrower does have the ability to repay its obligations, the second valuation technique that is utilized is a yield analysis. To determine fair value using a yield analysis, a current price is imputed for the investment based upon an assessment of the expected market yield for a similarly structured investment with a similar level of risk. In the yield analysis, the Fund considers the current contractual interest rate, the maturity and other terms of the investment relative to risk of the borrower and the specific investment. As the debt investments are substantially illiquid with no active transaction market, the Fund depends on primary market data, including newly funded transactions, as inputs in determining the appropriate market yield, as applicable.
The following is a summary of the inputs used as of October 31, 2019, in valuing the Fund's investments carried at fair value:
| | | Level 1 —
Quoted
Prices ($) | | Level 2 —
Other
Significant
Observable
Inputs ($) | | Level 3 —
Significant
Unobservable
Inputs ($) | | Total ($) | |
Senior Loans | | | — | | | | 166,766,504 | | | | 304,643,351 | | | | 471,409,855 | | |
Subordinated
Loans | | | — | | | | — | | | | 1,144,245 | | | | 1,144,245 | | |
Corporate
Bonds | | | — | | | | 35,484,275 | | | | — | | | | 35,484,275 | | |
Collateralized
Loan
Obligations | | | — | | | | — | | | | 113,403,587 | | | | 113,403,587 | | |
Preferred
Stocks | | | — | | | | — | | | | 234,681 | | | | 234,681 | | |
Common
Stocks | | | 191,015 | | | | — | | | | 710,736 | | | | 901,751 | | |
Private
Asset-Backed
Debt | | | — | | | | — | | | | 9,296,436 | | | | 9,296,436 | | |
Real Estate
Debt | | | — | | | | — | | | | 5,436,899 | | | | 5,436,899 | | |
Warrants | | | — | | | | — | | | | 4,814 | | | | 4,814 | | |
Total
Investments | | | 191,015 | | | | 202,250,779 | | | | 434,874,749 | | | | 637,316,543 | | |
Derivatives asset: | |
Foreign
Forward
Currency
Contracts | | | — | | | | 358,625 | | | | — | | | | 358,625 | | |
Credit Default
Swaps | | | — | | | | 103,174 | | | | — | | | | 103,174 | | |
Liabilities: | |
Secured
Borrowings | | | — | | | | — | | | | (348,571 | ) | | | (348,571 | ) | |
Foreign
Forward
Currency
Contracts | | | — | | | | (963,023 | ) | | | — | | | | (963,023 | ) | |
Credit Default
Swaps | | | — | | | | (274,934 | ) | | | — | | | | (274,934 | ) | |
Total Return
Swaps | | | — | | | | (2,311 | ) | | | — | | | | (2,311 | ) | |
Annual Report 2019
59
CION Ares Diversified Credit Fund
Notes to Consolidated Financial Statements (continued)
October 31, 2019
The following is a reconciliation of the Fund's investments in which significant unobservable inputs (Level 3) were used in determining fair value.
For the year ended October 31, 2019:
| | | Senior
Loans ($) | | Subordinated
Loans ($) | | Collateralized
Loan
Obligations
($) | | Common
Stocks
($) | | Preferred
Stocks
($) | | Private
Asset
Backed
Debt ($) | | Real Estate
Debt ($) | | Warrants
($) | | Total ($) | |
Balance as of
October 31, 2018 | | | 73,149,376 | | | | — | | | | 39,111,151 | | | | 150,973 | | | | — | | | | 1,185,732 | | | | 4,001,742 | | | | 12,462 | | | | 117,611,436 | | |
Purchases(a) | | | 251,784,124 | | | | — | | | | 93,086,285 | | | | 532,780 | | | | 224,973 | | | | 8,589,088 | | | | 3,480,083 | | | | — | | | | 357,697,333 | | |
Sales(b) | | | (21,180,192 | ) | | | — | | | | (9,856,672 | ) | | | — | | | | — | | | | (500,000 | ) | | | (2,044,926 | ) | | | — | | | | (33,581,790 | ) | |
Net Realized and
Unrealized Gains
(Loss) | | | 5,053,111 | | | | — | | | | (9,008,799 | ) | | | 26,983 | | | | 9,708 | | | | 14,668 | | | | (2,808 | ) | | | (7,648 | ) | | | (3,914,785 | ) | |
Accrued Discounts/
(premiums) | | | 538,306 | | | | — | | | | 71,622 | | | | — | | | | — | | | | 6,948 | | | | 2,808 | | | | — | | | | 619,684 | | |
Transfers in to Level 3 | | | 120,379 | | | | 1,144,245 | | | | — | | | | — | | | | — | | | | — | | | | — | | | | — | | | | 1,264,624 | | |
Transfers out
of Level 3 | | | (4,821,753 | ) | | | — | | | | — | | | | — | | | | — | | | | — | | | | — | | | | — | | | | (4,821,753 | ) | |
Balance as of
October 31, 2019 | | | 304,643,351 | | | | 1,144,245 | | | | 113,403,587 | | | | 710,736 | | | | 234,681 | | | | 9,296,436 | | | | 5,436,899 | | | | 4,814 | | | | 434,874,749 | | |
Net Change in
Unrealized appreciation/
(depreciation) from
investments held at
October 31, 2019 | | | 4,751,461 | | | | — | | | | (8,801,684 | ) | | | 27,165 | | | | 9,708 | | | | 15,750 | | | | (6,490 | ) | | | (7,647 | ) | | | (4,011,737 | ) | |
(a) Purchases include PIK interest and securities received from restructure.
(b) Sales include principal redemptions.
Investments were transferred into and out of Level 3 and out of and into Level 2 during the year ended October 31, due to changes in the quantity and quality of information obtained to support the fair value of each investment as assessed by the Adviser.
The following table summarizes the quantitative inputs and assumptions used for investments in securities at fair value categorized as Level 3 in the fair value hierarchy as of October 31, 2019.
| | | Fair Value
($) | | Valuation
Technique | | Unobservable
Inputs | | Range | |
Assets
Investments in securities | |
Senior Loans | | | 13,611,584
| | | Broker
Quotes
and/or
3rd Party
Pricing
Services | | N/A | | | N/A | | |
Senior Loans | | | 291,031,767
| | | Yield
Analysis | | Market
Yield | | | 4.90
14.84% | % - | |
Subordinated
Loans | | | 1,144,245
| | | Yield
Analysis | | Market
Yield | | | 10.17
17.62% | % - | |
| | | Fair Value
($) | | Valuation
Technique | | Unobservable
Inputs | | Range | |
Collateralized
Loan
Obligation | | | 3,213
| | | Liquidation
Value | | Estimated
Liquidation
Value | | $ | 160 -
$2,556 | | |
Collateralized
Loan
Obligation | | | 1,623,652
| | | Recent
Transaction | | Recent
Transaction
Price | | $ | 93.24 -
$94.02 | | |
Collateralized
Loan
Obligations | | | 111,776,722
| | | Broker
Quotes
and/or
3rd Party
Pricing
Services | | N/A | | | N/A | | |
Common
Stocks | | | 710,736
| | | EV Market
Multiple
Analysis | | EBITDA
Multiple | | | 8.73
23.17x | x - | |
Preferred
Stocks | | | 234,681
| | | EV Market
Multiple
Analysis | | EBITDA
Multiple
| | | 9.50
23.17x | x - | |
Private
Asset-Backed
Debt | | | 697,142
| | | Income
(Other) | | Cumulative
Collection
Rate | | | 122.0 | x | |
Annual Report 2019
60
CION Ares Diversified Credit Fund
Notes to Consolidated Financial Statements (continued)
October 31, 2019
| | | Fair Value
($) | | Valuation
Technique | | Unobservable
Inputs | | Range | |
Private
Asset-Backed
Debt | | | 1,234,250 | | | Income
(Other) | | Constant
Default
Rate (CDR)
Constant
Prepayment
Rate (CPR)
Recovery
Rate | | | 8.16
21.51x,
0% - 3%,
0% | % - | |
Private
Asset-Backed
Debt | | | 7,365,044
| | | Recent
Transaction | | Recent
Transaction
Price | | $ | 99.25 | | |
Real Estate
Debt | | | 5,436,899
| | | Yield
Analysis | | Market
Yield | | | 14.00
20.00% | % - | |
Warrants | | | 4,814
| | | EV Market
Multiple
Analysis | | EBITDA
Multiple | | | 7.50
8.50x | x - | |
Total Level 3
Investments | | | 434,874,749 | | | | | | | | |
Changes in market yields or discount rates, each in isolation, may change the fair value of certain of the investments. Generally, an increase in market yields or discount rates may result in a decrease in the fair value of certain of the investments.
Due to the inherent uncertainty of determining the fair value of investments that do not have a readily available market value, the fair value of the investments may fluctuate from period to period. Additionally, the fair value of the investments may differ significantly from the values that would have been used had a ready market existed for such investments and may differ materially from the values that the Fund may ultimately realize. Further, such investments are generally subject to legal and other restrictions on resale or otherwise are less liquid than publicly traded securities. If the Fund was required to liquidate a portfolio investment in a forced or liquidation sale, it could realize significantly less than the value at which the Fund has recorded it.
In addition, changes in the market environment and other events that may occur over the life of the investments may cause the gains or losses ultimately realized on these investments to be different than the unrealized gains or losses reflected in the values currently assigned.
(4) Common Stock
The Fund, pursuant to an exemptive order granted by the SEC on July 11, 2017, offers multiple classes of shares. On July 11, 2017, the Fund's registration statement offering Class A, Class C, and Class I shares became effective. On November 2, 2017, the Fund's registration statement offering Class L shares
became effective. On November 15, 2018, the Fund's registration statement offering Class U shares became effective and on November 30, 2018 the Fund's registration statement offering Class W shares became effective. The maximum sales load imposed on purchases, maximum contingent deferred sales charges, shareholder servicing and/or distribution fees charged will vary depending on each share class.
Common share transactions were as follows:
Class A | | For the Year Ended
October 31, 2019 | | For the Year Ended
October 31, 2018 | |
| | | Shares | | Amount ($) | | Shares | | Amount ($) | |
Common
shares
outstanding —
beginning of
period | | | 1,469,586 | | | | 37,359,676 | | | | 509,552 | | | | 12,806,950 | | |
Common
shares
issued | | | 1,154,918 | | | | 29,509,300 | | | | 1,098,766 | | | | 28,105,121 | | |
Reinvestment
of distributions | | | 41,637 | | | | 1,067,687 | | | | 20,721 | | | | 530,167 | | |
Common
shares
redeemed | | | (527,789 | ) | | | (13,557,079 | ) | | | (159,453 | ) | | | (4,082,562 | ) | |
Common
shares
outstanding —
end of period | | | 2,138,352 | | | | 54,379,584 | | | | 1,469,586 | | | | 37,359,676 | | |
Class C | | For the Year Ended
October 31, 2019 | | For the Year Ended
October 31, 2018 | |
| | | Shares | | Amount ($) | | Shares | | Amount ($) | |
Common
shares
outstanding —
beginning of
period | | | 1,157,690 | | | | 29,517,779 | | | | 154,356 | | | | 3,887,897 | | |
Common
shares
issued | | | 1,224,879 | | | | 31,409,887 | | | | 996,509 | | | | 25,454,965 | | |
Reinvestment
of distributions | | | 50,765 | | | | 1,301,750 | | | | 16,613 | | | | 425,452 | | |
Common
shares
redeemed | | | (77,579 | ) | | | (1,992,142 | ) | | | (9,788 | ) | | | (250,535 | ) | |
Common
shares
outstanding —
end of period | | | 2,355,755 | | | | 60,237,274 | | | | 1,157,690 | | | | 29,517,779 | | |
Annual Report 2019
61
CION Ares Diversified Credit Fund
Notes to Consolidated Financial Statements (continued)
October 31, 2019
Class I | | For the Year Ended
October 31, 2019 | | For the Year Ended
October 31, 2018 | |
| | | Shares | | Amount ($) | | Shares | | Amount ($) | |
Common
shares
outstanding —
beginning of
period | | | 4,329,674 | | | | 110,833,302 | | | | 239,494 | | | | 6,025,949 | | |
Common
shares
issued | | | 8,180,899 | | | | 210,089,276 | | | | 4,113,652 | | | | 105,412,482 | | |
Reinvestment
of distributions | | | 152,178 | | | | 3,904,823 | | | | 22,847 | | | | 586,372 | | |
Common
shares
redeemed | | | (926,867 | ) | | | (23,791,402 | ) | | | (46,319 | ) | | | (1,191,501 | ) | |
Common
shares
outstanding —
end of period | | | 11,735,884 | | | | 301,035,999 | | | | 4,329,674 | | | | 110,833,302 | | |
Class L | | For the Year Ended
October 31, 2019 | | For the Period from
November 2, 2017
(commencement of
operations)
to October 31, 2018 | |
| | | Shares | | Amount ($) | | Shares | | Amount ($) | |
Common
shares
outstanding —
beginning of
period | | | 74,939 | | | | 1,920,782 | | | | — | | | | — | | |
Common
shares
issued | | | 145,865 | | | | 3,744,948 | | | | 74,225 | | | | 1,902,441 | | |
Reinvestment
of distributions | | | 5,118 | | | | 131,384 | | | | 733 | | | | 18,826 | | |
Common
shares
redeemed | | | (8,249 | ) | | | (211,897 | ) | | | (19 | ) | | | (485 | ) | |
Common
shares
outstanding —
end of period | | | 217,673 | | | | 5,585,217 | | | | 74,939 | | | | 1,920,782 | | |
Class U | | For the Period from December 21,
2018 (commencement of
operations) to October 31, 2019 | |
| | | Shares | | Amount ($) | |
Common shares outstanding —
beginning of period | | | — | | | | — | | |
Common shares issued | | | 408,482 | | | | 10,506,151 | | |
Reinvestment of distributions | | | 1,794 | | | | 45,636 | | |
Common shares redeemed | | | (6 | ) | | | (151 | ) | |
Common shares outstanding —
end of period | | | 410,270 | | | | 10,551,636 | | |
Class W | | For the Period from December 21,
2018 (commencement of
operations) to October 31, 2019 | |
| | | Shares | | Amount ($) | |
Common shares outstanding —
beginning of period | | | — | | | | — | | |
Common shares issued | | | 1,489,969 | | | | 38,374,996 | | |
Reinvestment of distributions | | | 20,493 | | | | 526,013 | | |
Common shares redeemed | | | (12 | ) | | | (305 | ) | |
Common shares outstanding —
end of period | | | 1,510,450 | | | | 38,900,704 | | |
Share Repurchase Program
Beginning in the second quarter of 2017, the Fund began offering and currently intends to continue offering, the quarterly repurchase of shares in such amount as may be determined by the Fund's board of trustees in accordance with the Fund's fundamental policy to conduct repurchase offers for between 5%-25% of its outstanding shares each quarter.
The following table summarizes the share repurchases completed during the year ended October 31, 2019:
Three Months Ended | | Repurchase
Date | | Shares
Repurchased | | Purchase
Price
Per Share | | Aggregate
Consideration
for
Repurchased
Shares | | Size of
Repurchase
Offer | | % of
Outstanding
Shares
Offered to be
Repurchased | | % of
Outstanding
Shares
Repurchased | |
January 31, 2019 | | January 18, 2019 | | | 172,836 | | | $ | 25.36 | | | $ | 4,383,116 | | | | 465,642 | | | | 5.00 | % | | | 1.86 | % | |
April 30, 2019 | | April 18, 2019 | | | 309,256 | | | | 25.77 | | | | 7,969,527 | | | | 605,614 | | | | 5.00 | % | | | 2.55 | % | |
July 31, 2019 | | July 18, 2019 | | | 392,776 | | | | 25.87 | | | | 10,161,120 | | | | 738,873 | | | | 5.00 | % | | | 2.66 | % | |
October 31, 2019 | | October 17, 2019 | | | 527,538 | | | | 25.60 | | | | 13,504,977 | | | | 920,841 | | | | 5.00 | % | | | 2.86 | % | |
Total | | | | | 1,402,406 | | | | | $ | 36,018,740 | | | | | | | | |
Annual Report 2019
62
CION Ares Diversified Credit Fund
Notes to Consolidated Financial Statements (continued)
October 31, 2019
(5) Credit Facility
Wells Credit Facility
The Financing Sub is party to a senior secured revolving credit facility (as amended, the "Wells Credit Facility") with the Financing Sub, as the borrower, and Wells Fargo Bank, N.A., as the lender, that allows the Financing Sub to borrow up to $100 million. The Wells Credit Facility is secured by certain assets of the Financing Sub. The stated maturity date for the Wells Credit Facility is December 4, 2023.
As of October 31, 2019, there was $19,396,773 outstanding under the Wells Credit Facility. The interest rate charged under the Wells Credit Facility is generally based on an applicable LIBOR rate plus spread ranging from 1.75% to 2.15% (as defined in the agreements governing the Wells Credit Facility). The interest expense was $258,304 for the year ended October 31, 2019. Unused portions of the Wells Credit Facility accrue a commitment fee equal to an annual rate between 0.50% and 1.50%, depending on the usage. The unused commitment fee for the year ended October 31, 2019 was $201,379. Debt issuance costs including related legal expenses incurred by the Financing Sub in connection with the Wells Credit Facility were deferred and are amortized using the straight line method over the term of the Wells Credit Facility. These amounts are included in the Consolidated Statement of Operations as amortization of debt issuance cost. The fair value of the Financing Sub's borrowings under the Wells Credit Facility approximates the carrying amount presented in the accompanying Consolidated Statement of Assets and Liabilities at cost for the remaining maturity for which the Financing Sub has determined would be categorized as Level 2 in the fair value hierarchy.
The weighted average outstanding daily balance of the Wells Credit Facility during the year ended October 31, 2019 was approximately $13,194,231 with an average stated interest rate of 2.15%. As of October 31, 2019, the Financing Sub was in compliance in all material respects with the terms of the Wells Credit Facility.
State Street Credit Facility
The Fund is a party to a senior secured revolving credit facility (as amended, the "State Street Credit Facility") with the Fund, as the borrower, and State Street Bank and Trust Company, the lender, that allows the Fund to borrow up to $150 million at any one time outstanding. The State Street Credit Facility is secured by certain assets of the Fund. The State Street Credit Facility maturity date is July 8, 2019.
As of October 31, 2019, there was $142,356,650 outstanding under the State Street Credit Facility. The interest rate charged on the State Street Credit Facility is based on an applicable
LIBOR rate plus 0.95% (as defined in the agreements governing the State Street Credit Facility). The interest expense was $1,655,472 for the year ended October 31, 2019. Unused portions of the State Street Credit Facility accrue a commitment fee equal to 0.20%. The unused commitment fee for the year ended October 31, 2019 was $23,777. Debt issuance costs including related legal expenses incurred by the Fund in connection with the State Street Credit Facility were deferred and are amortized using the straight line method over the term of the State Street Credit Facility. These amounts are included in the Consolidated Statement of Operations as amortization of debt issuance cost. The fair value of the Fund's borrowings under the State Street Credit Facility approximates the carrying amount presented in the accompanying Consolidated Statement of Assets and Liabilities at cost for the remaining maturity for which the Fund has determined would be categorized as Level 2 in the fair value hierarchy.
The weighted average outstanding daily balance of the State Street Credit Facility during the year ended October 31, 2019 was approximately $108,492,186 with an average stated interest rate of 3.11%. A as of October 31, 2019, the Fund was in compliance in all material respects with the terms of the State Street Credit Facility.
Bank of Nova Scotia Credit Facility
The Fund was previously party to a credit agreement (the "Nova Scotia Credit Facility") with the Bank of Nova Scotia, as the lender, which allowed the Fund to borrow up to $30 million. The Nova Scotia Credit Facility was secured by certain assets of the Fund.
Loans under the Nova Scotia Credit Facility generally bore interest at the applicable LIBOR rate plus 0.95%. The Nova Scotia Credit Facility termination date was May 6, 2019 and all outstanding amounts were repaid. The interest expense was $331,563 for the year ended October 31, 2019. Unused portions of the Nova Scotia Credit Facility accrued at commitment fee equal to an annual rate between 0.15% and 0.25%, depending on the usage. The unused commitment fee for the year ended October 31, 2019 was $6,912. Debt issuance costs including related legal expenses incurred by the Fund in connection with the Nova Scotia Credit Facility were deferred and are amortized using the straight line method over the term of the Nova Scotia Credit Facility. These amounts are included in the Consolidated Statement of Operations as amortization of debt issuance cost.
The weighted average outstanding daily balance of the Nova Scotia Credit Facility during the year ended October 31, 2019 was approximately $6,930,719 with an average stated interest rate of 2.74%.
Annual Report 2019
63
CION Ares Diversified Credit Fund
Notes to Consolidated Financial Statements (continued)
October 31, 2019
(6) Investment Advisory and Other Agreements
The Adviser is registered as an investment adviser under the Advisers Act, as amended. The Adviser is an affiliate of Ares and leverages Ares' entire investment platform and benefits from the significant capital markets, trading and research expertise of all of Ares' investment professionals.
Pursuant to the investment advisory agreement, dated December 6, 2016 (the "Investment Advisory Agreement") (subsequently amended and restated as of December 12, 2017, that became effective on February 1, 2018), by and between the Fund and the Adviser, the Adviser provides certain investment advisory and administrative services to the Fund and in consideration of the advisory services provided, the Adviser is entitled to a fee consisting of two components — a base management fee (the "Management Fee") and an incentive fee (the "Incentive Fee"). Pursuant to the investment sub-advisory agreement, dated as of December 6, 2016 (the "Investment Sub-Advisory Agreement"), by and between the Adviser and the Fund, the Adviser pays the Ares Capital Management II LLC (the "Sub-Adviser") 40% of the Management Fee and Incentive Fee actually received and retained and not otherwise used to support expenses.
The Adviser provides certain investment advisory and administrative services to the Fund pursuant to the Investment Advisory Agreement. Pursuant to its Investment Advisory Agreement, the Fund has agreed to pay the Adviser the Management Fee at an annual rate of 1.25% of the average daily value of the Fund's total assets of the Fund (including any assets attributable to any preferred shares that may be issued or to indebtedness) minus the Fund's liabilities other than liabilities relating to indebtedness. The management fees incurred by the Fund for the year ended October 31, 2019 were $4,757,628.
The Incentive Fee is calculated and payable quarterly in arrears based upon the Fund's "pre-incentive fee net investment income" for the immediately preceding quarter, and is subject to a hurdle rate, expressed as a rate of return on the Fund's "adjusted capital," equal to 1.50% per quarter (or an annualized hurdle rate of 6.00%), subject to a "catch-up" feature. For this purpose, "pre-incentive fee net investment income" means interest income, dividend income and any other income accrued during the calendar quarter, minus the Fund's operating expenses for the quarter and taking into account the Expense Support and Conditional Reimbursement Agreement (as defined below). For such purposes, the Fund's operating expenses will include the Management Fee, expenses reimbursed to the Adviser under the administration
agreement, dated as of December 6, 2016 (the "Adviser Administrative Agreement"), by and between the Fund and the Adviser, and any interest expense and distributions paid on any issued and outstanding preferred shares, but will exclude the Incentive Fee. "Adjusted Capital" means the cumulative gross proceeds received by the Fund from the sale of the Fund's shares (including pursuant to the Fund's DRIP (as defined below), reduced by amounts paid in connection with purchases of the Fund's shares pursuant to the Fund's share repurchase program and further reduced by distribution representing a return of capital.
The "catch-up" provision is intended to provide the Adviser with an incentive fee of 15% on all of the Fund's pre-incentive fee net investment income when the Fund's pre-incentive fee net investment income reaches 1.765% of Adjusted Capital in any calendar quarter. During the year ended October 31, 2019 there were no incentive fees incurred.
The Adviser is obligated to pay expenses associated with providing the investment services stated in the Investment Advisory Agreement and Investment Sub-Advisory Agreement, including expenses associated with office space for their officers and employees, investment and economic research, trading and investment management of the Fund.
The Adviser and the Fund have entered into the second amended and restated expense support and conditional reimbursement agreement (the "Expense Support and Conditional Reimbursement Agreement") under which the Adviser has agreed contractually at their discretion, for a one year period ending July 31, 2020 to reimburse the Fund's initial organizational and offering costs, as well as the Fund's operating expenses to the extent that aggregate distributions made to each Class' shareholders during the applicable quarter exceed Available Operating Funds (as defined below). Additionally, during the term of the Expense Support and Conditional Reimbursement Agreement, the Adviser may reimburse the Fund's operating expenses to the extent that it otherwise deems appropriate in order to ensure that the Fund bears an appropriate level of expenses (each such payment, an "Expense Payment"). "Available Operating Funds" means the sum attributable to the applicable Class of (i) the Fund's net investment Fund taxable income (including net short-term capital gains reduced by net long term capital losses); (ii) the Fund's net capital gains (including the excess of net long-term capital gains over net short-term capital losses); and (iii) dividends and other distributions paid to or otherwise earned by the Fund on account of investments in portfolio companies (to the extend such amounts listed in clause (iii) are not included under clauses (i) and (ii) above).
Annual Report 2019
64
CION Ares Diversified Credit Fund
Notes to Consolidated Financial Statements (continued)
October 31, 2019
In consideration of the Adviser's agreement to reimburse the Fund's operating expenses, the Fund has agreed to repay the Adviser in the amount of any Fund expenses reimbursed subject to the limitation that a reimbursement (an "Adviser Reimbursement") will be made only if and to the extent that (i) it is payable not more than three years from the last business day of the calendar quarter in which the applicable Expense Payment was made by the Adviser; (ii) the Adviser Reimbursement does not cause other fund operating expenses attributable to the applicable Class (on an annualized basis and net of any reimbursements received by the Fund during such fiscal year) during the applicable quarter to exceed the percentage of the Fund's average net assets attributable to common shares represented by other fund operating expenses allocable to the applicable Class (as defined below) (on an annualized basis) during the quarter in which the applicable Expense Payment from the Adviser was made; and (iii) the distributions per share declared by the Fund for the applicable class at the time of the applicable Expense Payment are less than the effective rate of distributions per share for the applicable class at the time the Adviser Reimbursement would be paid. Other fund operating expenses is defined as, the
Fund's total Operating Expenses (as defined below), excluding the Management Fees, the Incentive Fees, offering expenses, financing fees and costs, interest expense and extraordinary expenses. "Operating Expenses" means all operating costs and expenses incurred by the Fund, as determined in accordance with GAAP for investment companies. The Expense Support and Conditional Reimbursement Agreement will remain in effect at least until July 31, 2020, unless and until the Fund's board of trustees approves it's modifications or termination. The Agreement was renewed for another year on July 31, 2019. This agreement may be terminated only by the Fund's board of trustees on notice to the Adviser. For the year ended October 31, 2019, the Adviser has provided $660,980 in expense support payments and incurred $2,123,291 in expense support recoupment.
The table below presents a summary of all expenses supported by CION Ares Management, LLC ("CAM") for each of the following three months periods in which the Fund received expense support from CAM and the associated dates through which such expenses are eligible for reimbursement from the Fund.
Fund Level Expense Support
Three Months Ended | | Expense
Support
from CAM
($) | | Recoupment
of Expense
Support
($) | | Unreimbursed
Expense
Support
($) | | Ratio of Other
Fund Operating
Expenses to
Average Net
Assets for the
Period(1) % | | Annualized
Distribution
Rate for the
Period(2)
($) | | Eligible for
Reimbursement
through | |
January 31, 2017 | | | 335,238 | | | | 335,238 | | | | — | | | | 17.21 | | | | 1.39257355 | | | January 31, 2020 | |
April 30, 2017 | | | 820,353 | | | | 820,353 | | | | — | | | | 24.11 | | | | 1.39257355 | | | April 30, 2020 | |
July 31, 2017 | | | 738,421 | | | | 738,421 | | | | — | | | | 8.46 | | | | 1.39257355 | | | July 31, 2020 | |
Total | | | 1,894,012 | | | | 1,894,012 | | | | — | | | | | | | | |
Class A
Three Months Ended | | Expense
Support
from CAM
($) | | Recoupment
of Expense
Support
($) | | Unreimbursed
Expense
Support
($) | | Ratio of Other
Fund Operating
Expenses to
Average Net
Assets for the
Period(1) % | | Annualized
Distribution
Rate for the
Period(2)
($) | | Eligible for
Reimbursement
through | |
July 31, 2017 | | | 193,243 | | | | 29,899 | | | | 163,344 | | | | 8.46 | | | | 1.39257355 | | | July 31, 2020 | |
October 31, 2017 | | | 592,329 | | | | — | | | | 592,329 | | | | 4.61 | | | | 1.39257355 | | | October 31, 2020 | |
January 31, 2018 | | | 412,396 | | | | — | | | | 412,396 | | | | 1.35 | | | | 1.39257355 | | | January 31, 2021 | |
April 30, 2018 | | | 306,581 | | | | — | | | | 306,581 | | | | 0.90 | | | | 1.39257355 | | | April 30, 2021 | |
July 31, 2018 | | | 282,399 | | | | — | | | | 282,399 | | | | 0.77 | | | | 1.39257355 | | | July 31, 2021 | |
October 31, 2018 | | | 351,380 | | | | — | | | | 351,380 | | | | 0.50 | | | | 1.39257355 | | | October 31, 2021 | |
January 31, 2019 | | | 112,892 | | | | — | | | | 112,892 | | | | 0.30 | | | | 1.39257355 | | | January 31, 2022 | |
April 30, 2019 | | | 10,033 | | | | — | | | | 10,033 | | | | 0.34 | | | | 1.39257355 | | | April 30, 2022 | |
Total | | | 2,261,253 | | | | 29,899 | | | | 2,231,354 | | | | | | | | |
Annual Report 2019
65
CION Ares Diversified Credit Fund
Notes to Consolidated Financial Statements (continued)
October 31, 2019
Class C
Three Months Ended | | Expense
Support
from CAM
($) | | Recoupment
of Expense
Support
($) | | Unreimbursed
Expense
Support
($) | | Ratio of Other
Fund Operating
Expenses to
Average Net
Assets for the
Period(1) % | | Annualized
Distribution
Rate for the
Period(2)
($) | | Eligible for
Reimbursement
through | |
October 31, 2017 | | | 98,889 | | | | 8,451 | | | | 90,438 | | | | 4.55 | | | | 1.39257355 | | | October 31, 2020 | |
January 31, 2018 | | | 173,902 | | | | — | | | | 173,902 | | | | 1.52 | | | | 1.39257355 | | | January 31, 2021 | |
April 30, 2018 | | | 206,018 | | | | — | | | | 206,018 | | | | 1.07 | | | | 1.39257355 | | | April 30, 2021 | |
July 31, 2018 | | | 263,530 | | | | — | | | | 263,530 | | | | 0.95 | | | | 1.39257355 | | | July 31, 2021 | |
October 31, 2018 | | | 312,501 | | | | — | | | | 312,501 | | | | 0.69 | | | | 1.39257355 | | | October 31, 2021 | |
January 31, 2019 | | | 163,026 | | | | — | | | | 163,026 | | | | 0.49 | | | | 1.39257355 | | | January 31, 2022 | |
April 30, 2019 | | | 84,215 | | | | — | | | | 84,215 | | | | 0.52 | | | | 1.39257355 | | | April 30, 2022 | |
Total | | | 1,302,081 | | | | 8,451 | | | | 1,293,630 | | | | | | | | |
Class I
Three Months Ended | | Expense
Support
from CAM
($) | | Recoupment
of Expense
Support
($) | | Unreimbursed
Expense
Support
($) | | Ratio of Other
Fund Operating
Expenses to
Average Net
Assets for the
Period(1) % | | Annualized
Distribution
Rate for the
Period(2)
($) | | Eligible for
Reimbursement
through | |
October 31, 2017 | | | 172,437 | | | | 172,437 | | | | — | | | | 4.10 | | | | 1.39257355 | | | October 31, 2020 | |
January 31, 2018 | | | 246,239 | | | | 16,344 | | | | 229,895 | | | | 1.26 | | | | 1.39257355 | | | January 31, 2021 | |
April 30, 2018 | | | 369,279 | | | | — | | | | 369,279 | | | | 0.82 | | | | 1.39257355 | | | April 30, 2021 | |
July 31, 2018 | | | 521,001 | | | | — | | | | 521,001 | | | | 0.69 | | | | 1.39257355 | | | July 31, 2021 | |
October 31, 2018 | | | 779,371 | | | | — | | | | 779,371 | | | | 0.45 | | | | 1.39257355 | | | October 31, 2021 | |
January 31, 2019 | | | 281,056 | | | | — | | | | 281,055 | | | | 0.24 | | | | 1.39257355 | | | January 31, 2022 | |
April 30, 2019 | | | — | | | | — | | | | — | | | | 0.00 | | | | 1.39257355 | | | April 30, 2022 | |
Total | | | 2,369,383 | | | | 188,781 | | | | 2,180,601 | | | | | | | | |
Class L
Three Months Ended | | Expense
Support
from CAM
($) | | Recoupment
of Expense
Support
($) | | Unreimbursed
Expense
Support
($) | | Ratio of Other
Fund Operating
Expenses to
Average Net
Assets for the
Period(1) % | | Annualized
Distribution
Rate for the
Period(2)
($) | | Eligible for
Reimbursement
through | |
January 31, 2018 | | | 27 | | | | 27 | | | | — | | | | 1.37 | | | | 1.39257355 | | | January 31, 2021 | |
April 30, 2018 | | | 3,558 | | | | 2,121 | | | | 1,437 | | | | 0.87 | | | | 1.39257355 | | | April 30, 2021 | |
July 31, 2018 | | | 9,112 | | | | — | | | | 9,112 | | | | 0.80 | | | | 1.39257355 | | | July 31, 2021 | |
October 31, 2018 | | | 16,193 | | | | — | | | | 16,193 | | | | 0.57 | | | | 1.39257355 | | | October 31, 2021 | |
January 31, 2019 | | | 7,456 | | | | — | | | | 7,456 | | | | 0.37 | | | | 1.39257355 | | | January 31, 2022 | |
April 30, 2019 | | | 2,303 | | | | — | | | | 2,303 | | | | 0.39 | | | | 1.39257355 | | | April 30, 2022 | |
Total | | | 38,649 | | | | 2,148 | | | | 36,501 | | | | | | | | |
Annual Report 2019
66
CION Ares Diversified Credit Fund
Notes to Consolidated Financial Statements (continued)
October 31, 2019
(1) Other Fund Operating Expenses is defined as, the Fund's total Operating Expenses (as defined below), excluding the management fees and Incentive fees, offering expenses, financing fees and costs, interest expense and extraordinary expenses. "Operating Expenses" means all operating costs and expenses incurred by the Fund, as determined in accordance with generally accepted accounting principles for investment companies.
(2) The Annualized Distribution Rate per Share equals the projected annualized distribution amount which is calculated based on the average regular cash distributions per share that were declared during record dates in the applicable Expense Support Payment Quarter.
Pursuant to the administration agreement between the Fund and CAM ("Adviser Administration Agreement"), the Adviser furnishes the Fund with office equipment and clerical, bookkeeping and record keeping services at the Adviser's office facilities. Under the Adviser Administrative Agreement, the Fund is obligated to reimburse the Adviser, at cost, based upon the Fund's allocable portion of the Adviser's overhead and other expenses (including travel expenses) incurred by the Adviser in performing its obligations under the Adviser Administrative Agreement, including the Fund's allocable portion of the compensation, rent and other expenses of certain of its officers (including but not limited to the chief compliance officer, chief financial officer, chief accounting officer, general counsel, treasurer and assistant treasurer) and their respective staffs. The Adviser Administration Agreement may be terminated by either party without penalty upon 60 days' written notice to the other party. The total of such expenses incurred for the year ended October 31, 2019 was $1,200,000.
Pursuant to an administration agreement between State Street Bank and Trust Company ("State Street") and the Fund, State Street performs, or oversees the performance of, certain of the Fund's required administrative services, which include, among other things, providing assistance in accounting, legal, compliance, operations, being responsible for the financial records that the Fund is required to maintain and preparing reports to the Fund's shareholders and reports filed with the SEC. In addition, State Street oversees the preparation and filing of the Fund's tax returns and generally oversees the payment of the Fund's expenses and the performance of administrative and professional services rendered to the Fund by others. The Fund pays State Street for these services. The total of such expenses incurred by the Fund for the year ended October 31, 2019 was $349,308.
Pursuant to a transfer agent agreement between DST Systems, Inc. ("DST") and the Fund, DST performs transfer agency services for the Fund. DST maintains the shareholder accounting records for the fund. The Fund pays DST for these services. The total of such expenses incurred for the year ended October 31, 2019 was $362,702.
Shareholder Service Expenses
The Fund has adopted a "Shareholder Services Plan" with respect to its Class A, Class C, and Class L Shares under which the Fund may compensate financial industry professionals for providing ongoing services in respect of clients with whom they have distributed shares of the Fund. Such services may include electronic processing of client orders, electronic fund transfers between clients and the Fund, account reconciliations with the Fund's transfer agent, facilitation of electronic delivery to clients of Fund documentation, monitoring client accounts for back-up withholding and any other special tax reporting obligations, maintenance of books and records with respect to the foregoing, and such other information and liaison services as the Fund or the Advisors may reasonably request. Under the Shareholder Services Plan, the Fund, with respect to Class A, Class C, and Class L Shares, may incur expenses on an annual basis equal up to 0.25% of its average net assets attributable to Class A, Class C, and Class L Shares, respectively.
Distribution Plan
The Fund, with respect to its Class C, Class L, Class U, and Class W Shares, is authorized under a "Distribution Plan" to pay to the Distributor a Distribution Fee for certain activities relating to the distribution of shares to investors. These activities include marketing and other activities to support the distribution of Class C, Class L, Class U, and Class W Shares. The Plan operates in a manner consistent with Rule 12b-1 under the 1940 Act, which regulates the manner in which an open-end investment company may directly or indirectly bear the expenses of distributing its shares. Although the Fund is not an open-end investment company, it has undertaken to comply with the terms of Rule 12b-1 as a condition of an exemptive order under the 1940 Act which permits it to have asset based distribution fees. Under the Distribution Plan, the Fund pays the Distributor a Distribution Fee at an annual rate of 0.75% of average daily net assets attributable to Class C Shares, 0.25% of the average daily net assets attributable to Class L Shares, 0.50% of the average daily net assets attributable to Class W Shares, and 0.75% of the average daily net assets attributable to Class U Shares.
Annual Report 2019
67
CION Ares Diversified Credit Fund
Notes to Consolidated Financial Statements (continued)
October 31, 2019
(7) Investment Transactions
For the year ended October 31, 2019, the cost of investments purchased and proceeds from sales of investments, excluding short obligations, were as follows:
Cost of Investments
Purchased | | Proceeds from the
Sale of Investments | |
| $ | 730,196,884 | | | $ | (253,064,954 | ) | |
(8) Derivative Instruments
The Fund recognizes all of its derivative instruments at fair value as either assets or liabilities in the Consolidated Statement of Assets and Liabilities. The changes in the fair value are included in the Consolidated Statement of Operations during the current year. The Fund is exposed to certain risks relating to its ongoing operations; the primary risks managed by using derivative instruments are market risk, credit risk, and foreign exchange risk. Additionally, the Fund holds certain derivative instruments for investment purposes. As of or during the year ended October 31, 2019, the Fund held the following instruments meeting the definition of a derivative instrument: foreign forward currency contracts, credit default swaps and total return swaps.
Qualitative Disclosures of Derivative Financial Instruments
The following is a description of the derivatives utilized by the Fund during the reporting period, including the primary underlying risk exposure related to each instrument type.
Foreign Forward Currency Contracts: the Fund enters into forward currency contracts from time to time to help mitigate the impact that an adverse change in foreign exchange rates would have on the value of the Fund's investments denominated in foreign currencies. As of October 31, 2019, the counterparty to the forward currency contracts was Goldman Sachs. Net unrealized gains or losses on forward currency contracts are included in "net realized gain on foreign currency contracts" in the accompanying Consolidated Statement of Operations.
Forward currency contracts are considered undesignated derivative instruments.
Certain information related to the Fund's foreign currency forward contracts is presented below as of October 31, 2019.
| | | As of October 31, 2019 | |
Description | | Notional
Amount | | Maturity Date | | Gross Amount
of Recognized
Assets | | Gross Amount
of Recognized
Liabilities | | Balance Sheet
Location of Net
Amounts | |
Foreign currency forward contract | | SEK | (1,035,473 | ) | | 11/15/2019 | | $ | 8,652 | | | $ | — | | | Forward foreign currency contracts | |
Foreign currency forward contract | | € | (1,115,245 | ) | | 11/15/2019 | | | 5,755 | | | | — | | | Forward foreign currency contracts | |
Foreign currency forward contract | | £ | (1,094,172 | ) | | 11/15/2019 | | | — | | | | (13,561 | ) | | Forward foreign currency contracts | |
Foreign currency forward contract | | £ | (115,341 | ) | | 11/15/2019 | | | — | | | | (882 | ) | | Forward foreign currency contracts | |
Foreign currency forward contract | | £ | (1,043,714 | ) | | 12/2/2019 | | | — | | | | (58,819 | ) | | Forward foreign currency contracts | |
Foreign currency forward contract | | $ | 1,043,714 | | | 12/2/2019 | | | 49,792 | | | | — | | | Forward foreign currency contracts | |
Foreign currency forward contract | | € | (1,117,410 | ) | | 12/13/2019 | | | — | | | | (6,410 | ) | | Forward foreign currency contracts | |
Foreign currency forward contract | | £ | (2,850,728 | ) | | 12/13/2019 | | | — | | | | (153,851 | ) | | Forward foreign currency contracts | |
Foreign currency forward contract | | SEK | (238,548 | ) | | 12/13/2019 | | | 313 | | | | — | | | Forward foreign currency contracts | |
Foreign currency forward contract | | € | (838,057 | ) | | 12/13/2019 | | | — | | | | (2,407 | ) | | Forward foreign currency contracts | |
Foreign currency forward contract | | SEK | (617,115 | ) | | 12/13/2019 | | | — | | | | (790 | ) | | Forward foreign currency contracts | |
Foreign currency forward contract | | DKK | (77,919 | ) | | 12/13/2019 | | | — | | | | (426 | ) | | Forward foreign currency contracts | |
Foreign currency forward contract | | £ | (1,295,518 | ) | | 12/13/2019 | | | — | | | | (43,168 | ) | | Forward foreign currency contracts | |
Foreign currency forward contract | | € | (2,240,407 | ) | | 12/13/2019 | | | — | | | | (19,067 | ) | | Forward foreign currency contracts | |
Foreign currency forward contract | | NOK | (3,653,878 | ) | | 12/13/2019 | | | 84,784 | | | | — | | | Forward foreign currency contracts | |
Foreign currency forward contract | | € | (2,444,334 | ) | | 12/13/2019 | | | — | | | | (36,990 | ) | | Forward foreign currency contracts | |
Foreign currency forward contract | | $ | 4,146,246 | | | 12/13/2019 | | | 198,325 | | | | — | | | Forward foreign currency contracts | |
Foreign currency forward contract | | £ | (12,092,577 | ) | | 1/17/2020 | | | — | | | | (606,051 | ) | | Forward foreign currency contracts | |
Foreign currency forward contract | | NOK | (628,358 | ) | | 1/17/2020 | | | 4,461 | | | | — | | | Forward foreign currency contracts | |
Annual Report 2019
68
CION Ares Diversified Credit Fund
Notes to Consolidated Financial Statements (continued)
October 31, 2019
| | | As of October 31, 2019 | |
Description | | Notional
Amount | | Maturity Date | | Gross Amount
of Recognized
Assets | | Gross Amount
of Recognized
Liabilities | | Balance Sheet
Location of Net
Amounts | |
Foreign currency forward contract | | € | (7,706,410 | ) | | 1/17/2020 | | $ | — | | | $ | (14,014 | ) | | Forward foreign currency contracts | |
Foreign currency forward contract | | SEK | (432,351 | ) | | 1/17/2020 | | | 875 | | | | — | | | Forward foreign currency contracts | |
Foreign currency forward contract | | DKK | (3,685,783 | ) | | 1/17/2020 | | | — | | | | (6,587 | ) | | Forward foreign currency contracts | |
Foreign currency forward contract | | $ | 12,092,577 | | | 1/17/2020 | | | 5,668 | | | | — | | | Forward foreign currency contracts | |
Total | | | | | | $ | 358,625 | | | $ | (963,023 | ) | | | |
Credit Default Swaps: The Fund enters into credit default swap contracts for investment purposes and to manage its credit risk. Credit default swap agreements involve one party making a stream of payments (referred to as the buyer of protection) to another party (the seller of protection) in exchange for the right to receive a specified return in the event of a default or other credit event for the referenced entity, obligation or index. The Fund may purchase or sell protection. A seller of protection generally receives an upfront payment or periodic payments throughout the term of the swap provided there is no credit event. Such periodic payments received are accrued daily and accounted for as realized gains. If a credit event occurs, as defined under the terms of the swap agreement, the Fund will either (i) pay to the buyer of protection an amount equal to the notional amount of the swap and take delivery of the referenced obligation or underlying securities comprising the referenced index or (ii) pay a net settlement amount in the form of cash or securities equal to the notional amount of the swap less the recovery value of the referenced obligation or underlying securities comprising the referenced index. The buyer of protection generally pays an upfront premium or periodic payments throughout the term of the swap provided there is no credit event. Such periodic payments paid are accrued daily and accounted for as realized losses.
Entering into credit default swaps involves, to varying degrees, elements of credit, market and documentation risk in excess of the related amounts recognized in the Consolidated Statement of Assets and Liabilities. Such risks involve the possibility that there will be no liquid market for these agreements, that the counterparty to the agreements may default on its obligations to perform or disagree as to the meaning of the contractual terms in the agreements, and that there will be unfavorable changes in net interest rates.
The Fund's derivative contracts are subject to either International Swaps and Derivatives Association ("ISDA")
Master Agreements, or futures contracts/OTC addendums which contain certain covenants and other provisions that, if violated, may require the Fund to post collateral on derivatives if the Fund is in a net liability position with its counterparties exceeding certain amounts. As of October 31, 2019, there are no derivative instruments with credit-risk-related contingent features that are in a net liability position after taking into effect permissible offsetting. Additionally, OTC derivative counterparties may immediately terminate these agreements and the related derivative contracts if the Fund fails to maintain sufficient asset coverage for its contracts or its net assets decline by stated percentages or amounts. As of October 31, 2019, the termination values of these derivative contracts were approximately equal to their fair values.
Total Return Swaps: Total return is used as substitutes for owning or shorting the physical securities that comprise a given market index, or to obtain long or short exposure in markets where no physical securities are available, such as an interest rate index. Total return refers to the payment (or receipt) of an index's total return, which is then exchanged for the receipt (or payment) of a floating interest rate. Total return swaps provide the Fund with the additional flexibility of gaining or shedding exposure to a market or sector index by using the most cost-effective vehicle available. To the extent the Fund uses total return swaps to hedge risk, basis risk may cause the hedge to be less effective or ineffective.
Offsetting Arrangements
Although The Fund generally presents derivative and other financial instruments on a gross basis in the Consolidated Statement of Assets and Liabilities, certain derivative and other financial instruments are subject to enforceable master netting arrangements with certain counterparties which allow for the derivative and other financial instruments to be offset.
Annual Report 2019
69
CION Ares Diversified Credit Fund
Notes to Consolidated Financial Statements (continued)
October 31, 2019
The following table presents the rights of offset and related arrangements associated with The Fund's derivative instruments:
| | | | | Gross Amounts Not Offset in
Statement of Assets and Liabilities | | | |
Description | | Gross Amounts
of Recognized
Assets
(Liabilities) | | Gross Amounts
Offset in
Assets
(Liabilities) | | Net Amounts
of Assets
(Liabilities)
Presented | | Financial
Instrument | | Collateral
(Received)
Pledged | | Net Amount | |
Assets: | |
Goldman Sachs: | |
Forward Foreign Currency Contracts | | $ | 358,625 | | | $ | — | | | $ | 358,625 | | | $ | (358,625 | ) | | $ | — | | | $ | — | | |
Swap Agreements | | | — | | | | — | | | | — | | | | — | | | | — | | | | — | | |
Total | | $ | 358,625 | | | $ | — | | | $ | 358,625 | | | $ | (358,625 | ) | | $ | — | | | $ | — | | |
Liabilities: | |
Goldman Sachs: | |
Forward Foreign Currency Contracts | | $ | (963,023 | ) | | $ | — | | | $ | (963,023 | ) | | $ | 358,625 | | | $ | 604,398 | | | $ | — | | |
Swap Agreements | | | (48,344 | ) | | | — | | | | (48,344 | ) | | | — | | | | 2,455 | | | | (45,889 | ) | |
Total | | $ | (1,011,367 | ) | | $ | — | | | $ | (1,011,367 | ) | | $ | 358,625 | | | $ | 606,853 | | | $ | (45,889 | ) | |
(9) Risk Factors
Senior Loans Risk
Although senior loans ("Senior Loans") are senior and typically secured in a first or second lien position in contrast to other below investment grade fixed income instruments, which are often subordinated or unsecured, the risks associated with such Senior Loans are generally similar to the risks of other below investment grade fixed income instruments. Investments in below investment grade Senior Loans are considered speculative because of the credit risk of the issuers of debt instruments (each, a "Borrower"). Such Borrowers are more likely than investment grade Borrowers to default on their payments of interest and principal owed to the Fund, and such defaults could reduce the net asset value of the Fund and income distributions. An economic downturn would generally lead to a higher non-payment rate, and a Senior Loan may lose significant market value before a default occurs. Moreover, any specific collateral used to secure a Senior Loan may decline in value or become illiquid, which could adversely affect the Senior Loan's value.
Senior Loans are subject to the risk of non-payment of scheduled interest or principal. Such non-payment would result in a reduction of income to the Fund, a reduction in the value of the investment and a potential decrease in the net asset value of the Fund. There can be no assurance that the liquidation of any collateral securing a Senior Loan would satisfy the Borrower's obligation in the event of nonpayment of scheduled interest or principal payments, whether when due or upon acceleration, or that the collateral could be liquidated, readily or otherwise. In the event of bankruptcy or insolvency of a Borrower, the Fund could experience delays or limitations
with respect to its ability to realize the benefits of the collateral, if any, securing a Senior Loan. The collateral securing a Senior Loan, if any, may lose all or substantially all of its value in the event of the bankruptcy or insolvency of a Borrower. Some Senior Loans are subject to the risk that a court, pursuant to fraudulent conveyance or other similar laws, could subordinate such Senior Loans to presently existing or future indebtedness of the Borrower or take other action detrimental to the holders of Senior Loans including, in certain circumstances, invalidating such Senior Loans or causing interest previously paid to be refunded to the Borrower. Additionally, a Senior Loan may be "primed" in bankruptcy, which reduces the ability of the holders of the Senior Loan to recover on the collateral.
There may be less readily available information about most Senior Loans and the Borrowers thereunder than is the case for many other types of securities, including securities issued in transactions registered under the Securities Act of 1933, as amended (the "Securities Act") or the Securities Exchange Act of 1934, as amended (the "Exchange Act"), and Borrowers subject to the periodic reporting requirements of Section 13 of the Exchange Act. Senior Loans may be issued by companies that are not subject to SEC reporting requirements and these companies, therefore, do not file reports with the SEC that must comply with SEC form requirements and, in addition, are subject to a less stringent liability disclosure regime than companies subject to SEC reporting requirements. As a result, the Adviser will rely primarily on its own evaluation of a Borrower's credit quality rather than on any available independent sources. Consequently, the Fund will be particularly dependent on the analytical abilities of the Adviser. In certain circumstances,
Annual Report 2019
70
CION Ares Diversified Credit Fund
Notes to Consolidated Financial Statements (continued)
October 31, 2019
Senior Loans may not be deemed to be securities under certain federal securities laws, other than the Investment Company Act. Therefore, in the event of fraud or misrepresentation by a Borrower or an arranger, the Fund may not have the protection of the antifraud provisions of the federal securities laws as would otherwise be available for bonds or stocks. Instead, in such cases, parties generally would rely on the contractual provisions in the Senior Loan agreement itself and common law fraud protections under applicable state law.
The secondary trading market for Senior Loans may be less liquid than the secondary trading market for registered investment grade debt securities. No active trading market may exist for certain Senior Loans, which may make it difficult to value them. Illiquidity and adverse market conditions may mean that the Fund may not be able to sell Senior Loans quickly or at a fair price. To the extent that a secondary market does exist for certain Senior Loans, the market for them may be subject to irregular trading activity, wide bid/ask spreads and extended trade settlement periods.
Senior Loans are subject to legislative risk. If legislation or state or federal regulations impose additional requirements or restrictions on the ability of financial institutions to make loans, the availability of Senior Loans for investment by the Fund may be adversely affected. In addition, such requirements or restrictions could reduce or eliminate sources of financing for certain Borrowers. This would increase the risk of default. If legislation or federal or state regulations require financial institutions to increase their capital requirements this may cause financial institutions to dispose of Senior Loans that are considered highly levered transactions. If the Fund attempts to sell a Senior Loan at a time when a financial institution is engaging in such a sale, the price the Fund could receive for the Senior Loan may be adversely affected.
Subordinated Loans Risk
Subordinated loans generally are subject to similar risks as those associated with investments in Senior Loans, except that such loans are subordinated in payment and/or lower in lien priority to first lien holders. In the event of default on a Subordinated Loan, the first priority lien holder has first claim to the underlying collateral of the loan to the extent such claim is secured. Additionally, an over secured creditor may be entitled to additional interest and other charges in bankruptcy increasing the amount of their allowed claim. Subordinated Loans are subject to the additional risk that the cash flow of the Borrower and property securing the loan or debt, if any, may be insufficient to meet scheduled payments after giving effect to the senior obligations of the Borrower. This risk is generally higher for subordinated unsecured loans or debt,
which are not backed by a security interest in any specific collateral. Subordinated Loans generally have greater price volatility than Senior Loans and may be less liquid.
Corporate Bonds Risk
The market value of a corporate bond generally may be expected to rise and fall inversely with interest rates. The market value of intermediate- and longer-term corporate bonds is generally more sensitive to changes in interest rates than is the market value of shorter-term corporate bonds. The market value of a corporate bond also may be affected by factors directly related to the Borrower, such as investors' perceptions of the creditworthiness of the Borrower, the Borrower's financial performance, perceptions of the Borrower in the market place, performance of management of the Borrower, the Borrower's capital structure and use of financial leverage and demand for the Borrower's goods and services. There is a risk that the Borrowers of corporate bonds may not be able to meet their obligations on interest or principal payments at the time called for by an instrument. High yield corporate bonds are often high risk and have speculative characteristics. High yield corporate bonds may be particularly susceptible to adverse Borrower-specific developments.
CLO Securities Risk
CLOs issue securities in tranches with different payment characteristics and different credit ratings. The rated tranches of securities issued by CLOs ("CLO Securities") are generally assigned credit ratings by one or more nationally recognized statistical rating organizations. The subordinated (or residual) tranches do not receive ratings. Below investment grade tranches of CLO Securities typically experience a lower recovery, greater risk of loss or deferral or non-payment of interest than more senior tranches of the CLO.
The riskiest portion of the capital structure of a CLO is the subordinated (or residual) tranche, which bears the bulk of defaults from the loans in the CLO and serves to protect the other, more senior tranches from default in all but the most severe circumstances. Since it is partially protected from defaults, a senior tranche from a CLO typically has higher ratings and lower yields than the underlying securities, and can be rated investment grade. Despite the protection from the subordinated tranche, CLO tranches can experience substantial losses due to actual defaults, increased sensitivity to defaults due to collateral default and disappearance of protecting tranches, market anticipation of defaults and aversion to CLO Securities as a class. The risks of an investment in a CLO depend largely on the collateral and the tranche of the CLO in which the Fund invests.
Annual Report 2019
71
CION Ares Diversified Credit Fund
Notes to Consolidated Financial Statements (continued)
October 31, 2019
The CLOs in which the Fund invests may have issued and sold debt tranches that will rank senior to the tranches in which the Fund invests. By their terms, such more senior tranches may entitle the holders to receive payment of interest or principal on or before the dates on which the Fund is entitled to receive payments with respect to the tranches in which the Fund invests. Also, in the event of insolvency, liquidation, dissolution, reorganization or bankruptcy of a CLO, holders of more senior tranches would typically be entitled to receive payment in full before the Fund receives any distribution. After repaying such senior creditors, such CLO may not have any remaining assets to use for repaying its obligation to the Fund. In the case of tranches ranking equally with the tranches in which the Fund invests, the Fund would have to share on an equal basis any distributions with other creditors holding such securities in the event of an insolvency, liquidation, dissolution, reorganization or bankruptcy of the relevant CLO. Therefore, the Fund may not receive back the full amount of its investment in a CLO.
The transaction documents relating to the issuance of CLO Securities may impose eligibility criteria on the assets of the CLO, restrict the ability of the CLO's investment manager to trade investments and impose certain portfolio-wide asset quality requirements. These criteria, restrictions and requirements may limit the ability of the CLO's investment manager to maximize returns on the CLO Securities. In addition, other parties involved in CLOs, such as third-party credit enhancers and investors in the rated tranches, may impose requirements that have an adverse effect on the returns of the various tranches of CLO Securities. Furthermore, CLO Securities issuance transaction documents generally contain provisions that, in the event that certain tests are not met (generally interest coverage and over-collateralization tests at varying levels in the capital structure), proceeds that would otherwise be distributed to holders of a junior tranche must be diverted to pay down the senior tranches until such tests are satisfied. Failure (or increased likelihood of failure) of a CLO to make timely payments on a particular tranche will have an adverse effect on the liquidity and market value of such tranche.
Payments to holders of CLO Securities may be subject to deferral. If cash flows generated by the underlying assets are insufficient to make all current and, if applicable, deferred payments on CLO Securities, no other assets will be available for payment of the deficiency and, following realization of the underlying assets, the obligations of the Borrower of the related CLO Securities to pay such deficiency will be extinguished.
The market value of CLO Securities may be affected by, among other things, changes in the market value of the underlying assets held by the CLO, changes in the
distributions on the underlying assets, defaults and recoveries on the underlying assets, capital gains and losses on the underlying assets, prepayments on underlying assets and the availability, prices and interest rate of underlying assets. Furthermore, the leveraged nature of each subordinated class may magnify the adverse impact on such class of changes in the value of the assets, changes in the distributions on the assets, defaults and recoveries on the assets, capital gains and losses on the assets, prepayment on assets and availability, price and interest rates of assets. Finally, CLO Securities are limited recourse and may not be paid in full and may be subject to up to 100% loss.
Asset-Backed Securities Risk
Asset-backed securities often involve risks that are different from or more acute than risks associated with other types of debt instruments. For instance, asset-backed securities may be particularly sensitive to changes in prevailing interest rates. In addition, the underlying assets are subject to prepayments that shorten the securities' weighted average maturity and may lower their return. Asset-backed securities are also subject to risks associated with their structure and the nature of the assets underlying the security and the servicing of those assets. Payment of interest and repayment of principal on asset-backed securities is largely dependent upon the cash flows generated by the assets backing the securities and, in certain cases, supported by letters of credit, surety bonds or other credit enhancements. The values of asset-backed securities may be substantially dependent on the servicing of the underlying asset pools, and are therefore subject to risks associated with the negligence by, or defalcation of, their servicers. Furthermore, debtors may be entitled to the protection of a number of state and federal consumer credit laws with respect to the assets underlying these securities, which may give the debtor the right to avoid or reduce payment. In addition, due to their often complicated structures, various asset-backed securities may be difficult to value and may constitute illiquid investments. If many Borrowers on the underlying loans default, losses could exceed the credit enhancement level and result in losses to investors in asset-backed securities.
Investment and Market Risk
An investment in the common shares of the Fund is subject to investment risk, including the possible loss of the entire principal amount invested. An investment in the common shares of the Fund represents an indirect investment in the portfolio of Senior Loans, Corporate Bonds, CLO Securities and other securities and loans owned by the Fund, and the value of these securities and loans may fluctuate, sometimes rapidly and unpredictably. For instance, during periods of global economic downturn, the secondary markets for Senior
Annual Report 2019
72
CION Ares Diversified Credit Fund
Notes to Consolidated Financial Statements (continued)
October 31, 2019
Loans and investments with similar economic characteristics (such as second lien loans and unsecured loans) and Corporate Bonds may experience sudden and sharp price swings, which can be exacerbated by large or sustained sales by major investors in these markets, a high-profile default by a major Borrower, movements in indices tied to these markets or related securities or investments, or a change in the market's perception of Senior Loans and investments with similar economic characteristics (such as second lien loans and unsecured loans) and Corporate Bonds. At any point in time, an investment in the common shares of the Fund may be worth less than the original amount invested, even after taking into account distributions paid by the Fund, if any, and the ability of common shareholders to reinvest dividends. The Fund may utilize leverage, which will magnify the Fund's risks and, in turn, the risks to the common shareholders.
Interest Rate Risk
The market value of Corporate Bonds and other fixed-income securities changes in response to interest rate changes and other factors. Interest rate risk is the risk that prices of bonds and other fixed-income securities will increase as interest rates fall and decrease as rates rise. Accordingly, an increase in market interest rates (which are currently considered low by historic standards) may cause a decrease in the price of a debt security and, therefore, a decline in the net asset value of the Fund's common shares. The magnitude of these fluctuations in the market price of bonds and other fixed-income securities is generally greater for those securities with longer maturities. Because Senior Loans with floating or variable rates reset their interest rates only periodically, changes in prevailing interest rates (and particularly sudden and significant changes) can be expected to cause some fluctuations in the net asset value of the Fund's common shares. In addition, Senior Loans or similar loans or securities may allow the Borrower to opt between LIBOR-based interest rates and interest rates based on bank prime rates, which may have an effect on the net asset value of the Fund's common shares.
LIBOR Rate Risk
Concerns have been publicized that some of the member banks surveyed by the British Bankers' Association ("BBA") in connection with the calculation of LIBOR across a range of maturities and currencies may have been under-reporting or otherwise manipulating the inter-bank lending rate applicable to them in order to profit on their derivatives positions or to avoid an appearance of capital insufficiency or adverse reputational or other consequences that may have resulted from reporting inter-bank lending rates higher than those they actually submitted. A number of BBA member banks have entered into settlements with their regulators and law enforcement agencies with respect to alleged manipulation of
LIBOR, and investigations by regulators and governmental authorities in various jurisdictions are ongoing.
On July 27, 2017, the United Kingdom's Financial Conduct Authority, which regulates LIBOR, announced that it intends to phase out LIBOR by the end of 2021. It is unclear if at that time whether or not LIBOR will cease to exist or if new methods of calculating LIBOR will be established such that it continues to exist after 2021. The U.S. Federal Reserve, in conjunction with the Alternative Reference Rates Committee, a steering committee comprised of large U.S. financial institutions, is considering replacing U.S. dollar LIBOR with a new index calculated by short-term repurchase agreements, backed by Treasury securities. The future of LIBOR at this time is uncertain. Potential changes, or uncertainty related to such potential changes, may adversely affect the market for LIBOR-based securities, including our portfolio of LIBOR-indexed, floating-rate debt securities, or the cost of our borrowings. In addition, changes or reforms to the determination or supervision of LIBOR may result in a sudden or prolonged increase or decrease in reported LIBOR, which could have an adverse impact on the market for LIBOR-based securities, including the value of the LIBOR-indexed, floating-rate debt securities in our portfolio, or the cost of our borrowings. Additionally, if LIBOR ceases to exist, we may need to renegotiate the credit agreements extending beyond 2021 that utilize LIBOR as a factor in determining the interest rate and certain of our existing credit facilities to replace LIBOR with the new standard that is established.
Liquidity Risk
The Fund may not be able to readily dispose of illiquid securities or loans at prices that approximate those at which the Fund could sell the securities or loans if they were more widely traded and, as a result of that illiquidity, the Fund may have to sell other investments or engage in borrowing transactions if necessary to raise cash to meet its obligations. Limited liquidity can also affect the market price of securities, thereby adversely affecting the net asset value of the common shares and ability to make dividend distributions. Some Senior Loans are not readily marketable and may be subject to restrictions on resale. Senior Loans generally are not listed on any national securities exchange and no active trading market may exist for the Senior Loans in which the Fund may invest. When a secondary market exists, if at all, the market for some Senior Loans may be subject to irregular trading activity, wide bid/ask spreads and extended trade settlement periods. Further, the lack of an established secondary market for illiquid securities may make it more difficult to value such securities, which may negatively affect the price the Fund would receive upon disposition of such securities.
Annual Report 2019
73
CION Ares Diversified Credit Fund
Notes to Consolidated Financial Statements (continued)
October 31, 2019
Duration and Maturity Risk
The Fund has no fixed policy regarding portfolio maturity or duration. Holding long duration and long maturity investments will expose the Fund to certain additional risks.
When interest rates rise, certain obligations will be paid off by the Borrower more slowly than anticipated, causing the value of these obligations to fall. Rising interest rates tend to extend the duration of securities, making them more sensitive to changes in interest rates. The value of longer-term securities generally changes more in response to changes in interest rates than shorter-term securities. As a result, in a period of rising interest rates, securities may exhibit additional volatility and may lose value.
When interest rates fall, certain obligations will be paid off by the Borrower more quickly than originally anticipated, and the Fund may have to invest the proceeds in securities with lower yields. In periods of falling interest rates, the rate of prepayments tends to increase (as does price fluctuation) as Borrowers are motivated to pay off debt and refinance at new lower rates. During such periods, reinvestment of the prepayment proceeds by the Adviser will generally be at lower rates of return than the return on the assets that were prepaid. Prepayment reduces the yield to maturity and the average life of the security.
Special Situations and Stressed Investments Risk
Although investments in debt and equity securities and other obligations of companies that may be in some level of financial or business distress, including companies involved in, or that have recently completed, bankruptcy or other reorganization and liquidation proceedings ("Stressed Issuers") (such investments, "Special Situation Investments") may result in significant returns for the Fund, they are speculative and involve a substantial degree of risk. The level of analytical sophistication, both financial and legal, necessary for successful investment in distressed assets is unusually high. Therefore, the Fund will be particularly dependent on the analytical abilities of the Adviser. In any reorganization or liquidation proceeding relating to a company in which the Fund invests, the Fund may lose its entire investment, may be required to accept cash or securities with a value less than the Fund's original investment and/or may be required to accept payment over an extended period of time. Among the risks inherent in investments in a troubled company is that it may be difficult to obtain information as to the true financial condition of such company. Troubled company investments and other distressed asset-based investments require active monitoring.
The Fund may make investments in Stressed Issuers when the Adviser believes it is reasonably likely that the Stressed Issuer will make an exchange offer or will be the subject to a plan of reorganization pursuant to which the Fund will receive new securities in return for a Special Situation Investment. There can be no assurance, however, that such an exchange offer will be made or that such a plan of reorganization will be adopted. In addition, a significant period of time may pass between the time at which the Fund makes its investment in the Special Situation Investment and the time that any such exchange offer or plan of reorganization is completed, if at all. During this period, it is unlikely that the Fund would receive any interest payments on the Special Situation Investment, the Fund would be subject to significant uncertainty whether the exchange offer or plan of reorganization will be completed and the Fund may be required to bear certain extraordinary expenses to protect and recover its investment. Therefore, to the extent the Fund seeks capital appreciation through investment in Special Situation Investments, the Fund's ability to achieve current income for its shareholders may be diminished. The Fund also will be subject to significant uncertainty as to when, in what manner and for what value the obligations evidenced by Special Situation Investments will eventually be satisfied (e.g., through a liquidation of the obligor's assets, an exchange offer or plan of reorganization involving the Special Situation Investments or a payment of some amount in satisfaction of the obligation). Even if an exchange offer is made or plan of reorganization is adopted with respect to Special Situation Investments held by the Fund, there can be no assurance that the securities or other assets received by the Fund in connection with such exchange offer or plan of reorganization will not have a lower value or income potential than may have been anticipated when the investment was made or even no value. Moreover, any securities received by the Fund upon completion of an exchange offer or plan of reorganization may be restricted as to resale. Similarly, if the Fund participates in negotiations with respect to any exchange offer or plan of reorganization with respect to an issuer of Special Situation Investments, the Fund may be restricted from disposing of such securities. To the extent that the Fund becomes involved in such proceedings, the Fund may have a more active participation in the affairs of the issuer than that assumed generally by an investor.
To the extent that the Fund holds interests in a Stressed Issuer that are different (or more senior or junior) than those held by other funds and/or accounts managed by Ares or its affiliates ("Other Accounts"), the Adviser is likely to be presented with decisions involving circumstances where the interests of such Other Accounts may be in conflict with the Fund's interests. Furthermore, it is possible that the Fund's interest may be
Annual Report 2019
74
CION Ares Diversified Credit Fund
Notes to Consolidated Financial Statements (continued)
October 31, 2019
subordinated or otherwise adversely affected by virtue of such Other Accounts' involvement and actions relating to their investment. In addition, when the Fund and Other Accounts hold investments in the same Stressed Issuer (including in the same level of the capital structure), the Fund may be prohibited by applicable law from participating in restructurings, work-outs, renegotiations or other activities related to its investment in the Stressed Issuer absent an exemption due to the fact that Other Accounts hold investments in the same Stressed Issuer. As a result, the Fund may not be permitted by law to make the same investment decisions as Other Accounts in the same or similar situations even if the Adviser believes it would be in the Fund's best economic interests to do so. Also, the Fund may be prohibited by applicable law from investing in a Stressed Issuer (or an affiliate) that Other Accounts are also investing in or currently invest in even if the Adviser believes it would be in the best economic interests of the Fund to do so. Furthermore, entering into certain transactions that are not deemed prohibited by law when made may potentially lead to a condition that raises regulatory or legal concerns in the future. This may be the case, for example, with Stressed Issuers who are near default and more likely to enter into restructuring or work-out transactions with their existing debt holders, which may include the Fund and its affiliates. In some cases, to avoid the potential of future prohibited transactions, the Adviser may avoid recommending allocating an investment opportunity to the Fund that it would otherwise recommend, subject to the Adviser's then-current allocation policy and any applicable exemptions.
Below Investment Grade Rating Risk
Debt instruments that are rated below investment grade are often referred to as "high yield" securities or "junk bonds." Below investment grade instruments are rated "Ba1" or lower by Moody's, "BB+" or lower by S&P or "BB+" or lower by Fitch or, if unrated, are judged by the Adviser to be of comparable credit quality. While generally providing greater income and opportunity for gain, below investment grade debt instruments may be subject to greater risks than securities or instruments that have higher credit ratings, including a higher risk of default. The credit rating of an instrument that is rated below investment grade does not necessarily address its market value risk, and ratings may from time to time change, positively or negatively, to reflect developments regarding the Borrower's financial condition. Below investment grade instruments often are considered to be speculative with respect to the capacity of the Borrower to timely repay principal and pay interest or dividends in accordance with the terms of the obligation and may have more credit risk than higher rated securities. Lower grade securities and similar debt instruments
may be particularly susceptible to economic downturns. It is likely that a prolonged or deepening economic recession could adversely affect the ability of some Borrowers issuing such debt instruments to repay principal and pay interest on the instrument, increase the incidence of default and severely disrupt the market value of the securities and similar debt instruments.
The secondary market for below investment grade instruments may be less liquid than that for higher rated instruments. Because unrated securities may not have an active trading market or may be difficult to value, the Fund might have difficulty selling them promptly at an acceptable price. To the extent that the Fund invests in unrated securities, the Fund's ability to achieve its investment objectives will be more dependent on the Adviser's credit analysis than would be the case when the Fund invests in rated securities.
Under normal market conditions, the Fund will invest in debt instruments rated in the lower rating categories ("Caa1" or lower by Moody's, "CCC+" or lower by S&P or "CCC+" or lower by Fitch) or unrated and of comparable quality. For these securities, the risks associated with below investment grade instruments are more pronounced. The Fund may incur additional expenses to the extent it is required to seek recovery upon a default in the payment of principal or interest on its portfolio holdings. In any reorganization or liquidation proceeding relating to an investment, the Fund may lose its entire investment or may be required to accept cash or securities with a value substantially less than its original investment.
European Risk
The Fund may invest a portion of its capital in debt securities issued by issuers domiciled in Europe, including issuers domiciled in the United Kingdom ("UK"). Concerns regarding the sovereign debt of various Eurozone countries and proposals for investors to incur substantial write-downs and reductions in the face value of the sovereign debt of certain countries give rise to concerns about sovereign defaults, the possibility that one or more countries might leave the European Union or the Eurozone and various proposals (still under consideration and unclear in material respects) for support of affected countries and the Euro as a currency. The outcome of any such situation cannot be predicted. Sovereign debt defaults and European Union and/or Eurozone exits could have material adverse effects on investments by the Fund in securities of European companies, including but not limited to the availability of credit to support such companies' financing needs, uncertainty and disruption in relation to financing, customer and supply contracts denominated in Euro and wider economic disruption in markets served by those
Annual Report 2019
75
CION Ares Diversified Credit Fund
Notes to Consolidated Financial Statements (continued)
October 31, 2019
companies, while austerity and other measures that have been introduced in order to limit or contain these issues may themselves lead to economic contraction and resulting adverse effects for the Fund. A number of the Fund's securities may be denominated in the Euro. Legal uncertainty about the funding of Euro denominated obligations following any breakup or exits from the Eurozone (particularly in the case of investments in securities of companies in affected countries) could also have material adverse effects on the Fund. The uncertainty in the wake of the UK's "Brexit" referendum and subsequent political developments could have a negative impact on both the UK economy and the economies of other countries in Europe. The Brexit process also may lead to greater volatility in the global currency and financial markets, which could adversely affect the Fund. In connection with investments in non-US issuers, the Fund may engage in foreign currency exchange transactions but is not required to hedge its currency exposure. As such, the Fund makes investments that are denominated in British pound sterling or Euros. The Fund's assets are valued in US dollars and the depreciation of the British pound sterling and/or the Euro in relation to the US dollar in anticipation of Brexit or otherwise adversely affects the Fund's investments denominated in British pound sterling or Euros that are not fully hedged regardless of the performance of the underlying issuer. Global central banks may maintain historically low interest rates longer than was anticipated prior to the Brexit vote, which could adversely affect the Fund's income and its level of distributions.
(10) Subsequent Events
The Adviser has evaluated the impact of all subsequent events on the Fund through the date the financial statements were issued and has determined that there were the following subsequent events:
The following common share distributions were declared for November and December 2019:
Record Date: daily
Payable Date: November 30, 2019
Per Share Amount: $0.1144581
Record Date: daily
Payable Date: December 31, 2019
Per Share Amount: $0.1182734
Quarterly Repurchase Offer
On December 13, 2019 the Fund filed a notification of repurchase offer with the SEC for the Fund's quarterly repurchase offer. The Fund is offering to repurchase up to 5% of its issued and outstanding common shares at a price equal to the net asset value on the repurchasing date, January 12, 2020.
Annual Report 2019
76
CION Ares Diversified Credit Fund
Report of Independent Registered Public Accounting Firm
To the Shareholders and the Board of Trustees of CION Ares Diversified Credit Fund
Opinion on the Financial Statements
We have audited the accompanying consolidated statement of assets and liabilities of CION Ares Diversified Credit Fund (the "Fund"), including the consolidated schedule of investments, as of October 31, 2019, and the related consolidated statements of operations and cash flows for the year then ended, the consolidated statements of changes in net assets for each of the two years in the period then ended, the consolidated financial highlights for each of the two years in the period then ended and for the period from January 26, 2017 (commencement of operations) through October 31, 2017 and the related notes (collectively referred to as the "financial statements"). In our opinion, the financial statements present fairly, in all material respects, the consolidated financial position of the Fund at October 31, 2019, the consolidated results of its operations and its cash flows for the year then ended, the consolidated changes in its net assets for each of the two years in the period then ended and its consolidated financial highlights for each of the two years in the period then ended and for the period from January 26, 2017 (commencement of operations) through October 31, 2017, in conformity with U.S. generally accepted accounting principles.
Basis for Opinion
These financial statements are the responsibility of the Fund's management. Our responsibility is to express an opinion on the Fund's financial statements based on our audits. We are a public accounting firm registered with the Public Company Accounting Oversight Board (United States) ("PCAOB") and are required to be independent with respect to the Fund in accordance with the U.S. federal securities laws and the applicable rules and regulations of the Securities and Exchange Commission and the PCAOB.
We conducted our audits in accordance with the standards of the PCAOB. Those standards require that we plan and perform the audit to obtain reasonable assurance about whether the financial statements are free of material misstatement, whether due to error or fraud. The Fund is not required to have, nor were we engaged to perform, an audit of the Fund's internal control over financial reporting. As part of our audits we are required to obtain an understanding of internal control over financial reporting but not for the purpose of expressing an opinion on the effectiveness of the Fund's internal control over financial reporting. Accordingly, we express no such opinion.
Our audits included performing procedures to assess the risks of material misstatement of the financial statements, whether due to error or fraud, and performing procedures that respond to those risks. Such procedures included examining, on a test basis, evidence regarding the amounts and disclosures in the financial statements. Our procedures included confirmation of securities owned as of October 31, 2019, by correspondence with the custodian and brokers or by other appropriate auditing procedures where replies from brokers were not received. Our audits also included evaluating the accounting principles used and significant estimates made by management, as well as evaluating the overall presentation of the financial statements. We believe that our audits provide a reasonable basis for our opinion.

We have served as the Fund's auditor since 2016.
Los Angeles, California
December 23, 2019
Annual Report 2019
77
CION Ares Diversified Credit Fund
Additional Information
October 31, 2019
Proxy Information
The policies and procedures used to determine how to vote proxies relating to securities held by the Fund are available (1) without charge, upon request, by calling 1-877-855-3434, or (2) on the SEC's website at http://www.sec.gov. Information regarding how the Fund voted proxies relating to portfolio securities during the most recent twelve-month period ended June 30 will be available on Form N-PX by August 31 of each year (1) without charge, upon request, by calling 1-877-855-3434, or (2) on the SEC's website at http://www.sec.gov.
Portfolio Information
The Fund files its complete schedule of portfolio holdings with the SEC for the first and third quarters of each fiscal year on Form N-Q. The Fund's Form N-Q will be available (1) without charge, upon request, by calling 1-877-855-3434; (2) on the SEC's website at http://www.sec.gov.
Annual Report 2019
78
CION Ares Diversified Credit Fund
Additional Information (continued)
October 31, 2019
Dividend Reinvestment Plan
The Fund will operate under a dividend reinvestment plan, (the "DRIP") administered by DST Systems, Inc. ("DST"). Pursuant to the plan, the Fund's distributions, net of any applicable U.S. withholding tax, are reinvested in the same class of shares of the Fund.
Shareholders automatically participate in the DRIP, unless and until an election is made to withdraw from the plan on behalf of such participating shareholder. A shareholder who does not wish to have distributions automatically reinvested may terminate participation in the DRIP at any time by written instructions to that effect to DST. Shareholders who elect not to participate in the DRIP will receive all distributions in cash paid to the shareholder of record (or, if the shares are held in street or other nominee name, then to such nominee). Such written instructions must be received by the DST 30 days prior to the record date of the distribution or the shareholder will receive such distribution in shares through the DRIP. Under the DRIP, the Fund's distributions to shareholders are automatically reinvested in full and fractional shares as described below.
When the Fund declares a distribution, DST, on the shareholder's behalf, will receive additional authorized shares from the Fund either newly issued or repurchased from shareholders by the Fund and held as treasury stock. The number of shares to be received when distributions are reinvested will be determined by dividing the amount of the Distribution by the Fund's Net Asset Value (the "NAV") per share.
DST will maintain all shareholder accounts and furnish written confirmations of all transactions in the accounts, including information needed by shareholders for personal and tax records. DST will hold shares in the account of the shareholders in non-certificated form in the name of the participant, and each shareholder's proxy, if any, will include those shares purchased pursuant to the DRIP. Each participant, nevertheless, has the right to request certificates for whole and fractional shares owned. The Fund will issue certificates in its sole discretion. DST will distribute all proxy solicitation materials, if any, to participating shareholders.
In the case of shareholders, such as banks, brokers or nominees, that hold shares for others who are beneficial owners participating under the DRIP, DST will administer the DRIP on the basis of the number of shares certified from time to time by the record shareholder as representing the total amount of shares registered in the shareholder's name and held for the account of beneficial owners participating under the DRIP.
Neither DST nor the Fund shall have any responsibility or liability beyond the exercise of ordinary care for any action taken or omitted pursuant to the DRIP, nor shall they have any duties, responsibilities or liabilities except such as expressly set forth herein. Neither shall they be liable hereunder for any act done in good faith or for any good faith omissions to act, including, without limitation, failure to terminate a participant's account prior to receipt of written notice of his or her death or with respect to prices at which shares are purchased or sold for the participants account and the terms on which such purchases and sales are made, subject to applicable provisions of the federal securities laws.
The automatic reinvestment of dividends will not relieve participants of any federal, state or local income tax that may be payable (or required to be withheld) on such dividends. See "Tax Aspects." The Fund reserves the right to amend or terminate the DRIP. There is no direct service charge to participants with regard to purchases under the DRIP; however, the Fund reserves the right to amend the DRIP to include a service charge payable by the participants.
All correspondence concerning the DRIP should be directed to DST at CION Ares Diversified Credit Fund c/o DST Systems, Inc., P.O. Box 219422, Kansas City, MO 64121-9422. Certain transactions can be performed by calling the toll free number 888-729-4266.
Annual Report 2019
79
CION Ares Diversified Credit Fund
Additional Information (continued)
October 31, 2019
Renewal of Investment Advisory Agreement and Investment Sub-Advisory Agreement
The Board of Trustees (the "Board") of CION Ares Diversified Credit Fund (the "Fund"), a majority of whom are not "interested persons" (as defined in the Investment Company Act of 1940, as amended (the "1940 Act")) of the Fund (the "Independent Trustees"), renewed the Second Amended Investment Advisory Agreement (the "Second Amended Advisory Agreement") between the Fund and CION Ares Management, LLC (the "Adviser") and the Investment Sub-Advisory Agreement by and among the Adviser, Ares Capital Management II LLC (the "Sub-Adviser") and the Fund (the "Sub-Advisory Agreement" and together, with the Second Amended Advisory Agreement, the "Agreements") at an in-person meeting held on September 25, 2019 (the "September Meeting"). The Board of the Fund, including a majority of the Independent Trustees, approved the Third Amended and Restated Investment Advisory Agreement between the Fund and the Adviser (the "Third Amended Advisory Agreement") at an in-person meeting held on October 30, 2019 to reflect a clarification to the language outlining the calculation of the incentive fee that is intended to provide for more equitable treatment of all shareholders of the Fund and reflect the overall business intent of each investor bearing an incentive fee on income as closely related as possible to the net income generated by their investment in the Fund and related changes that are necessary for the administration of the Fund. At the October 30, 2019 Board meeting, the Board also approved the submission of the Third Amended Advisory Agreement to the shareholders of the Fund for ratification and approval. The Second Amended Advisory Agreement will remain in effect until the Third Amended Advisory Agreement is ratified and approved by Fund shareholders.
At the October 30, 2019 Board meeting, the Board reviewed the changes to the Investment Advisory Agreement, and considered the mechanics of the changes and the Adviser's rationale for the changes. The Board noted that the Adviser proposed to modify the incentive fee such that it would be calculated based on (a) each share class's net investment income (rather than Fund-level net investment income) and (b) each share class's net asset value (rather than the Fund's "adjusted capital"). The Board considered the Adviser's belief that calculating the incentive fee on a class-by-class basis would provide for more equitable treatment of shareholders of each class and more closely align the incentive fee structure with each individual investor's actual investment performance. The Board also considered that the replacement of "adjusted capital" with net asset value in the denominator of the incentive fee calculation was primarily intended to streamline the calculation process and align it with the operational capabilities of the Fund's service providers. The Board noted that, calculating the incentive fee on a class-by-class basis could, under certain scenarios, cause shareholders that pay lower or no class-specific fees (i.e., shareholder servicing and distribution fees) to bear higher incentive fees, and could cause shareholders that pay higher class-specific fees to bear lower incentive fees. In addition, replacing "adjusted capital" with net asset value could raise or lower the incentive fees payable by shareholders depending on future Fund performance.
The Fund's Board has the responsibility under the 1940 Act to consider the renewal of the Fund's Agreements on an annual basis at an in-person meeting of the Board called for the purpose of voting on such renewal. In addition, the Fund's Board generally receives, reviews and evaluates information concerning the services and personnel of the Adviser and Sub-Adviser (together, the "Advisers") and their affiliates at quarterly meetings of the Board. While particular emphasis might be placed on information concerning the Fund's investment performance, comparability of fees, total expenses and profitability at any meeting at which a renewal of the Agreements is considered, the process of evaluating the Advisers and the Fund's investment advisory and administrative arrangements is an ongoing one.
In connection with the renewal of the Agreements, the Independent Trustees met with their independent counsel in executive session during the September Meeting. Counsel to the Independent Trustees reviewed with the Independent Trustees a memorandum outlining the legal duties of the Board under the 1940 Act and applicable state law and discussed the factors outlined by the federal courts as relevant to a board's consideration of the approval of an investment advisory agreement.
In considering whether to renew the Agreements, the Fund's Board reviewed certain information provided to the Board by the Advisers in advance of the Meeting, and supplemented orally at the Meeting, including, among other things, information concerning the services rendered to the Fund by the Advisers, comparative fee, expense and performance information, and other reports of and presentations by representatives of the Advisers concerning the Fund's and Advisers' operations, compliance programs and risk management. The Board also reviewed a report prepared by the Advisers which included information comparing (1) the Fund's performance with the performance of a group of comparable funds (the "Performance Group") for various periods ended July 31, 2019 and (2) the Fund's total expenses with those of a group of comparable
Annual Report 2019
80
CION Ares Diversified Credit Fund
Additional Information (continued)
October 31, 2019
funds (the "Expense Group"), which was identical to the Performance Group, the information for which was derived in part from Bloomberg and fund financial statements available to the Advisers as of the date of their analysis.
In determining whether to renew the Agreements, the Board considered all factors that it believed to be relevant, including those discussed below. The Board did not identify any one factor as dispositive, and each Trustee may have attributed different weights to the factors considered.
(a) The nature, extent and quality of services to be provided by the Advisers — With respect to the nature, extent and quality of services to be provided by the Advisers, the Board reviewed the information regarding the types of services to be provided under the Agreements and information describing the Advisers' organizations and businesses, including the quality of the investment research capabilities of the Advisers and the other resources dedicated to performing services for the Fund. The Board noted the professional experience and qualifications of the Fund's portfolio management team and other senior personnel of the Advisers involved with the Fund, including the portfolio management team's expertise in managing securities in which the Fund invests, the integrated platforms of the Advisers and their affiliates and the benefits, resources and opportunities of the platforms that the Advisers are able to access. Fund management discussed the size and experience of the Advisers' staff, the experience of their key personnel in providing investment management services, including the members of the Allocation Committee, the systems used by the Advisers' personnel and the ability of the Advisers to attract and retain capable personnel. The quality of administrative and other services, including the Adviser's role in coordinating the activities of the Fund's other service providers, were also considered. The Board also noted the reputation and track record of the Advisers' organizations as leading managers of credit assets.
(b) Investment performance of the Fund and the Advisers — With respect to investment performance of the Fund and the Advisers, the Board reviewed statistical information concerning the Fund's investment performance in relation to its stated objective, as well as comparative data with respect to the performance of unaffiliated closed-end funds engaging in similar investing, underwriting and origination activity provided by the Advisers. Representatives of the Advisers reviewed with the Board the Fund's performance. In connection with its review, the Board discussed the results of the performance comparisons provided by the Advisers.
In reviewing the Advisers' report, the Board took into consideration that the Advisers identified primarily interval funds that focused on global credit as the peer categories the Advisers believed were most comparable to the Fund given the Fund's flexible mandate and focus on a portfolio of directly originated loans, secured floating and fixed rate syndicated loans, corporate bonds, asset-backed securities, commercial real estate loans and other types of credit instruments. The Board noted that the Fund's total return performance, on a net asset value basis, had outperformed the average return of the Performance Group in the year-to-date, trailing one-year and inception to date periods ended July 31, 2019.
Representatives of the Advisers noted that the usefulness of performance comparisons may be affected by a number of factors, including different investment limitations that may be applicable to the Fund and comparable funds, highlighting, in particular, the difficulty in finding an appropriate universe of comparable funds. In discussing the Fund's performance, they noted, among other things, the outperformance may be attributable to its defensive investment posture, strong security selection and an overweight allocation to directly originated investments.
(c) Cost of the services to be provided and profits to be realized by the Advisers from the relationship with the Fund — The Board considered information about the profitability of the Fund to the Advisers, as well as the costs of services provided by the Advisers to the Fund. The Board received and reviewed information relating to the financial condition of the Advisers and their affiliates. Representatives of the Advisers reviewed the expenses allocated and profit received by the Advisers and their affiliates and the resulting profitability percentage for managing the Fund and the method used to determine the expenses and profit. The Board also considered that the Adviser pays the Sub-Adviser a portion of its advisory fee as compensation for the sub-advisory services.
(d) Economies of scale and whether fee levels reflect these economies of scale — The Board considered the extent to which economies of scale are expected to be realized and whether fee levels reflect these economies of scale. The Trustees noted that, while the Advisers are not currently experiencing any economies of scale in servicing the Fund, there is a possibility that economies of scale could be realized as asset levels increase.
Annual Report 2019
81
CION Ares Diversified Credit Fund
Additional Information (continued)
October 31, 2019
(e) Comparison of services to be rendered and fees to be paid to those under other investment advisory contracts, such as contracts of the same and other investment advisers or other clients — In evaluating the management fees and expenses, the Board considered the Fund's management fees and the Fund's expense ratios in absolute terms and as compared with the fees and expenses of the Expense Group. Based upon the comparative fee information provided, the Board noted that the Fund's advisory fees were generally in line with those of comparable funds in the Expense Group identified by the Advisers. The Board considered that the Agreements provide that the Advisers may earn an incentive fee and, to the extent the fee is earned and paid, would result in a higher rate of total compensation from the Fund to the Advisers than the fee rate stated in the Agreements. The Board also considered the Adviser's commitment pursuant to the Expense Support and Conditional Reimbursement Agreement with the Fund whereby the Adviser has agreed to reimburse the Fund's operating expenses. In addition, the Board also noted the reputation and track record of the Advisers' organizations as leading managers of credit assets.
In discussing the Fund's management fees and expenses, representatives of the Advisers noted, among other things, that the Advisers believe the management fees and expenses are reasonable when compared to, and are consistent with, other similar funds and portfolios. The previous decrease of the management fee to 1.25% of managed assets and of the incentive fee to 15% of pre-incentive fee net investment income were also noted. Representatives of the Advisers also noted that the Fund's investment strategy of investing in a portfolio of directly originated loans, secured floating and fixed rate syndicated loans, corporate bonds, asset-backed securities, commercial real estate loans and other types of credit instruments requires additional expertise and expense related to trade support, pricing and valuation, marketing, investor education and regulatory monitoring. In addition, representatives of the Advisers noted that the Fund's size is smaller than the average and median of the peer group, and thus has a smaller capital base over which to spread fixed costs.
(f) Benefits derived or to be derived by the Advisers from their relationship with the Fund — The Board also considered the extent to which benefits other than the fees and reimbursement amounts might accrue to the Advisers and their affiliates from their relationships with the Fund. The Board noted in this regard that while certain funds and accounts managed by the Advisers engage from time to time in cross trade and co-investment transactions with the Fund as permitted by the 1940 Act, neither the Advisers nor their affiliates execute portfolio transactions on behalf of the Fund, and that the Advisers had confirmed that the Fund does not invest in securities issued by affiliates of the Advisers, including collateralized loan obligations sponsored by the Advisers. However, the Board recognized that the Advisers might derive reputational and other benefits from their association with the Fund.
In determining whether to approve the Third Amended Advisory Agreement, the Board considered all factors that it believed to be relevant, including the terms of the modified incentive fee structure, and such information as the Board deemed relevant to evaluating the Third Amended Investment Advisory Agreement. The Independent Trustees recalled the substantial information that they received regarding the Adviser and the Fund in connection with the Independent Trustees' September 25, 2019 approval of the renewal of the Second Amended Advisory Agreement. The Board noted that the Adviser expected that the proposed changes to the Third Amended Advisory Agreement would not change the nature and quality of the investment advisory services currently being provided to the Fund by the Adviser. The Board, and separately a majority of the Independent Trustees of the Fund, determined that the compensation payable under the Third Amended Advisory Agreement was fair and reasonable and that such Agreement should be submitted to the shareholders of the Fund for ratification and approval.
Conclusion
At the conclusion of these discussions, the Board agreed that it had been furnished with sufficient information to make an informed business decision with respect to the renewal of the Agreements and the approval of the Third Amended Advisory Agreement. Based on the discussions and considerations at the September Meeting, and in reliance on information received on a routine and regular basis through the year relating to the operations of the Fund and the investment management and other services provided under the Agreements, the Board, including the Independent Trustees, voted to approve the renewal of the Agreements for an additional one-year period. In addition, based on the discussions and considerations at the October Meeting, and in reliance on information received in connection with the Independent Trustees' September 25, 2019 approval of the renewal of the Second Amended Advisory Agreement, the Board, including the Independent Trustees, voted to approve the Third Amended Advisory Agreement.
Annual Report 2019
82
CION Ares Diversified Credit Fund
Additional Information (continued)
October 31, 2019
Plan of Distribution
ALPS Distributors Inc. (the "Distributor") located at 1290 Broadway, Suite 1100, Denver, CO 80203, serves as the Fund's principal underwriter and acts as the Distributor of the Fund's shares on a best efforts basis, subject to various conditions. The Fund's shares are offered for sale through the Distributor at NAV plus the applicable sales load. The Distributor also may enter into agreements with financial intermediaries for the sale and servicing of the Fund's shares. In reliance on Rule 415 of the Securities Act of 1933, the Fund intends to offer to sell up to $1,061,000,000 of its shares, on a continual basis, through the Distributor. No arrangement has been made to place funds received in an escrow, trust or similar account. The Distributor is not required to sell any specific number or dollar amount of the Fund's shares, but will use its best efforts to solicit orders for the purchase of the shares. Shares of the Fund will not be listed on any national securities exchange and the Distributor will not act as a market marker in Fund shares.
The Distributor has entered into a wholesale marketing agreement with CION Securities, a registered broker-dealer and an affiliate of CION. Pursuant to the terms of the wholesale marketing agreement, CION Securities will seek to market and otherwise promote the Fund through various wholesale distribution channels, including regional and independent retail broker-dealers and registered investment advisers.
CION Securities has also entered into a dealer manager agreement with the Fund pursuant to which CION Securities has agreed to provide certain marketing and wholesale services in consideration of its receipt of the dealer manager fee.
The Advisers or their affiliates, in the Advisers' discretion and from their own resources, may pay additional compensation to financial intermediaries in connection with the sale of the Fund's shares. In return for the additional compensation, the Fund may receive certain marketing advantages including access to a financial intermediaries' registered representatives, placement on a list of investment options offered by a financial intermediary, or the ability to assist in training and educating the financial intermediaries'. The Additional Compensation may differ among financial intermediaries in amount or in the manner of calculation: payments of Additional Compensation may be fixed dollar amounts, or based on the aggregate value of outstanding shares held by Shareholders introduced by the financial intermediary, or determined in some other manner. The receipt of additional compensation by a selling financial intermediary may create potential conflicts of interest between an investor and its financial intermediary who is recommending the Fund over other potential investments. Additionally, the Fund pays a servicing fee to the financial intermediaries or financial institution for providing ongoing services in respect of clients holding shares of the Fund. Such services may include electronic processing of client orders, electronic fund transfers between clients and the Fund, account reconciliations with the Fund's transfer agent, facilitation of electronic delivery to clients of Fund documentation, monitoring client accounts for back-up withholding and any other special tax reporting obligations, maintenance of books and records with respect to the foregoing, and such other information and ongoing liaison services as the Fund or the Advisers may reasonably request.
The Fund and the Advisers have agreed to indemnify the Distributor against certain liabilities, including liabilities under the 1933 Act, or to contribute to payments the Distributor may be required to make because of any of those liabilities. Such agreement does not include indemnification of the Distributor against liability resulting from willful misfeasance, bad faith or negligence on the part of the Distributor in the performance of its duties or from reckless disregard by the Distributor of its obligations and duties under the Distribution Agreement.
Annual Report 2019
83
CION Ares Diversified Credit Fund
Additional Information (continued)
October 31, 2019
Investment Adviser
CION Ares Management, LLC
3 Park Avenue, 36th Floor
New York, NY 10016
Administrator and Custodian
State Street Bank and Trust Company
One Lincoln Street
Boston, MA 02111
Transfer Agent and DRIP Administrator
DST Systems, Inc.
333 W 11th Street
Kansas City, MO 64105
Distributor
ALPS Distributors Inc.
1290 Broadway, Suite 1100
Denver, CO 80203
Independent Registered Public Accounting Firm
Ernst & Young LLP
725 S. Figueroa Street
Los Angeles, CA 90017
Fund Counsel
Dechert LLP
1095 Avenue of the Americas
New York, New York 10036
Annual Report 2019
84
CION Ares Diversified Credit Fund
Additional Information (continued)
October 31, 2019
Privacy Notice
We are committed to maintaining the privacy of our shareholders and to safeguarding their nonpublic personal information. The following information is provided to help you understand what personal information we collect, how we protect that information and why, in certain cases, we may share information with select other parties.
Generally, we will not receive any non-public personal information about shareholders of the common stock of the Fund, although certain of our shareholders' non-public information may become available to us. The non-public personal information that we may receive falls into the following categories:
• Information we receive from shareholders, whether we receive it orally, in writing or electronically. This includes shareholders' communications to us concerning their investment;
• Information about shareholders' transactions and history with us; or
• Other general information that we may obtain about shareholders, such as demographic and contact information such as address.
We do not disclose any non-public personal information about shareholders, except:
• to our affiliates (such as our investment adviser) and their employees that have a legitimate business need for the information;
• to our service providers (such as our administrator, accountants, attorneys, custodians, transfer agent, underwriter and proxy solicitors) and their employees as is necessary to service shareholder accounts or otherwise provide the applicable service;
• to comply with court orders, subpoenas, lawful discovery requests, or other legal or regulatory requirements; or
• as allowed or required by applicable law or regulation.
When the Fund shares non-public shareholder personal information referred to above, the information is made available for limited business purposes and under controlled circumstances designed to protect our shareholders' privacy. The Fund does not permit use of shareholder information for any non-business or marketing purpose, nor does the Fund permit third parties to rent, sell, trade or otherwise release or disclose information to any other party.
The Fund's service providers, such as their adviser, administrator, and transfer agent, are required to maintain physical, electronic, and procedural safeguards to protect shareholder nonpublic personal information; to prevent unauthorized access or use; and to dispose of such information when it is no longer required.
Personnel of affiliates may access shareholder information only for business purposes. The degree of access is based on the sensitivity of the information and on personnel need for the information to service a shareholder's account or comply with legal requirements.
If a shareholder ceases to be a shareholder, we will adhere to the privacy policies and practices as described above. We may choose to modify our privacy policies at any time. Before we do so, we will notify shareholders and provide a description of our privacy policy.
In the event of a corporate change in control resulting from, for example, a sale to, or merger with, another entity, or in the event of a sale of assets, we reserve the right to transfer your non-public personal information to the new party in control or the party acquiring assets.
Annual Report 2019
85
CION Ares Diversified Credit Fund
Additional Information (continued)
October 31, 2019
Board of Trustees and Executive Officers
Trustees
Information regarding the members of the Board is set forth below. The Trustees have been divided into two groups — Interested Trustees and Independent Trustees. As set forth in the Fund's declaration of trust, each Trustee's term of office shall continue until his or her death, resignation or removal.
Name, Address(1)
and Year of Birth | | Position(s) Held
with the Trust | | Term of Office
and Length of
Time Served | | Principal
Occupation(s)
During Past 5 Years | | Number of
Portfolios
in Fund
Complex
Overseen
by Trustee(2) | | Other Directorships
Held by Trustee | |
Interested Trustees(3) | |
Mark Gatto 1972 | | Trustee | | | 2016 | | | Co-Chief Executive Officer and Co-President, CION Investment Group, LLC and Co-Chief Executive Officer, CION Investment Corporation; Director and Co-Chief Executive Officer, CION Ares Management, LLC | | | 1 | | | CION Investment Corporation; CION Ares Management, LLC | |
Mitch Goldstein 1967 | | Trustee | | | 2016 | | | Partner (Ares Credit Group), Ares Management LLC; Co-President, Ares Capital Corporation | | | 1 | | | None | |
Michael A. Reisner 1970 | | Trustee | | | 2016 | | | Co-Chief Executive Officer and Co-President, CION Investment Group, LLC and Co-Chief Executive Officer, CION Investment Corporation; Director and Co-Chief Executive Officer, CION Ares Management, LLC | | | 1 | | | CION Investment Corporation; CION Ares Management, LLC | |
David A. Sachs 1956 | | Trustee and Chairman of the Board | | | 2016 | | | Partner, Ares Management LLC | | | 2 | | | Terex Corporation; Ares Dynamic Credit Allocation Fund, Inc | |
Annual Report 2019
86
CION Ares Diversified Credit Fund
Additional Information (continued)
October 31, 2019
Trustees
Name, Address(1)
and Year of Birth | | Position(s) Held
with the Trust | | Term of Office
and Length of
Time Served | | Principal
Occupation(s)
During Past 5 Years | | Number of
Portfolios
in Fund
Complex
Overseen
by Trustee(2) | | Other Directorships
Held by Trustee | |
Independent Trustees | |
James K. Hunt 1951 | | Trustee | | | 2016 | | | Consultant, Tournament Capital Advisors, LLC; from 2015 to 2016, Managing Partner and Chief Executive Officer, Middle Market Credit platform — Kayne Anderson Capital Advisors LLC; from 2014 to 2015, Chairman, THL Credit, Inc.; from 2010 to 2014, Chief Executive Officer and Chief Investment Officer, THL Credit, Inc. and THL Credit Advisors LLC | | | 2 | | | PennyMac Financial Services, Inc.; Ares Dynamic Credit Allocation Fund, Inc. | |
Paula B. Pretlow 1955 | | Trustee | | | 2016 | | | Prior to 2012, Senior Vice President, The Capital Group Companies | | | 1 | | | The Kresge Foundation; The Harry & Jeanette Weinberg Foundation; Northwestern University | |
John Joseph Shaw 1951 | | Trustee | | | 2016 | | | Independent Consultant; prior to 2012, President, Los Angeles Rams | | | 2 | | | Ares Dynamic Credit Allocation Fund, Inc. | |
Bruce H. Spector 1942 | | Trustee | | | 2016 | | | Independent Consultant; from 2007 to 2015, Senior Advisor, Apollo Global Management, LLC | | | 2 | | | The Private Bank of California (2007-2013); Ares Dynamic Credit Allocation Fund, Inc. | |
Mark R. Yosowitz 1968 | | Trustee | | | 2016 | | | From 2014 to present, President, Mentored; from 2014 to present, Adjunct Professor, Brooklyn Law School; from 2008 to present, Senior Vice President, Corporate Development, ThinkEco Inc. | | | 1 | | | None | |
(1) The address of each Trustee is care of the Secretary of the Fund at 3 Park Avenue, 36th Floor, New York, NY 10016.
(2) The Fund Complex includes Ares Dynamic Credit Allocation Fund, Inc. ("ARDC") and is defined as two or more registered investment companies that (a) hold themselves out to investors as related companies for purposes of investment and investor services; or (b) have a common investment adviser or have an investment adviser that is an affiliated person of any of the other registered investment companies.
(3) "Interested person," as defined in the 1940 Act, of the Fund. Mr. Gatto, Mr. Goldstein, Mr. Reisner and Mr. Sachs are interested persons of the Fund due to their affiliation with the Adviser.
Annual Report 2019
87
CION Ares Diversified Credit Fund
Additional Information (continued)
October 31, 2019
Executive Officers
Name, Address(1)
and Year of Birth | | Position(s) Held
with the Trust | | Term of Office
and Length of
Time Served | | Principal Occupation(s) During Past 5 Years | |
Michael Reisner 1970 | | Co-President and Co-Chief Executive Officer | | | 2016 | | | Mr. Reisner is Co-Chief Executive Officer and Co-President of CION Investment Group, LLC as well as Co-Chief Executive Officer of CION Investment Corp. ("CIC"), a business development company focused on middle market loans. Mr. Reisner serves on the investment committee of CIC. In addition, Mr. Reisner is a Director and Co-Chief Executive Officer of CION Ares Management, LLC. Mr. Reisner joined CION in 2001. | |
Mark Gatto 1972 | | Co-President and Co-Chief Executive Officer | | | 2016 | | | Mr. Gatto is Co-Chief Executive Officer and Co-President of CION Investment Group, LLC as well as Co-Chief Executive Officer of CION Investment Corp., a business development company focused on middle market loans. Mr. Gatto serves on the investment committee of CIC. In addition, Mr. Gatto is a Director and Co-Chief Executive Officer of CION Ares Management, LLC. Mr. Gatto joined CION in 1999. | |
Greg Schill 1981 | | Vice President | | | 2016 | | | Mr. Schill is Senior Managing Director of CION Investment Group, LLC. Prior to this, he served as Managing Director since 2012. Mr. Schill joined CION in 2001. | |
Mitch Goldstein 1967 | | Vice President | | | 2016 | | | Mr. Goldstein is a Partner and Co-Head of the Ares Credit Group and a member of the Management Committee of Ares Management L.P. ("Ares Management"). He additionally serves as Co-President of ARCC. He is a member of the Ares Credit Group's U.S. Direct Lending and Commercial Finance Investment Committees and Ivy Hill Asset Management Investment Committee. Mr. Goldstein joined Ares Management in 2005. | |
Greg Margolies 1966 | | Vice President | | | 2016 | | | Mr. Margolies is a Partner in the Ares Credit Group, the Head of Markets for Ares Management LLC and a member of the Management Committee of Ares Management. Additionally, Mr. Margolies serves as a member of the Ares Credit Group's U.S. Liquid Credit and Global Structured Credit Investment Committees, the Ares Dynamic Credit Allocation Fund, Inc. ("ARDC") Investment Committee and the Ares Private Equity Group's Special Situations Funds Investment Committee. Mr. Margolies joined Ares in 2009. | |
Penni F. Roll 1965 | | Treasurer
Chief Financial Officer | | | 2019
2016-2019 | | | Ms. Roll is a Partner and the Chief Financial Officer of the Ares Credit Group. She also serves as the Chief Financial Officer of Ares Capital Corporation (NASDAQ:ARCC). She may additionally from time to time serve as an officer, director or principal of entities affiliated with Ares Management or of investment funds managed by Ares Management and its affiliates. | |
Scott Lem 1977 | | Chief Financial Officer
Treasurer | | | 2019
2016-2019 | | | Mr. Lem is a Partner and Chief Accounting Officer, Credit (Direct Lending) in the Ares Finance Department. Mr. Lem additionally serves as Chief Accounting Officer, Vice President and Treasurer of Ares Capital Corporation ("ARCC") and previously served as Assistant Treasurer of ARCC from May 2009 to May 2013. Mr. Lem also serves as Chief Financial Officer of ARDC, a NYSE-listed, closed end fund managed by an affiliate of Ares. He may from time to time serve as an officer, director or principal of entities affiliated with Ares Management or investment funds managed by Ares and its affiliates. From July 2003 to December 2008, Mr. Lem served as Controller of Ares Management. Mr. Lem joined Ares in 2003. | |
Miriam Krieger 1976 | | Chief Compliance Officer and Anti-Money Laundering Officer | | | 2017 | | | Ms. Krieger is a Partner and Global Chief Compliance Officer and is a member of Ares Operations Management Group. Ms. Krieger is the firm's Global Anti-Money Laundering Officer and Global Anti-Corruption Officer and also serves as Chief Compliance Officer of several entities affiliated with Ares Management or of investment funds managed by Ares Management and its affiliates, including Ares Capital Corporation ("ARCC") and Ivy Hill Asset Management, L.P. ("IHAM"). Ms. Krieger joined Ares in 2010. | |
Annual Report 2019
88
CION Ares Diversified Credit Fund
Additional Information (continued)
October 31, 2019
Executive Officers
Name, Address(1)
and Year of Birth | | Position(s) Held
with the Trust | | Term of Office
and Length of
Time Served | | Principal Occupation(s) During Past 5 Years | |
Ian Fitzgerald 1975 | | General Counsel, Chief Legal Officer and Secretary
Vice President and Assistant Secretary | | | 2019
2017-2019 | | | Mr. Fitzgerald is a Managing Director and Associate General Counsel (Credit) in the Ares Legal Group, where he focuses on credit matters. He also serves as Vice President and Assistant Secretary of Ivy Hill Asset Management, L.P. ("IHAM") and Vice President and Assistant Secretary of Ivy Hill Asset Management GP, LLC, IHAM's General Partner. Mr. Fitzgerald joined Ares in 2010. | |
John Atherton 1981 | | Vice President and Assistant Secretary | | | 2018 | | | Mr. Atherton is a Principal and Associate General Counsel, Credit in the Ares Legal Department. Prior to joining Ares in 2018, Mr. Atherton was General Counsel, Private Investment Structures at Schroder Adveq. Previously, Mr. Atherton was a Senior Associate in the London and Boston offices of Proskauer Rose LLP, where he focused on private investment funds. | |
Michael Weiner 1952 | | Vice President and Assistant Secretary | | | 2016 | | | Mr. Weiner is Executive Vice President and Chief Legal Officer of Ares Management GP LLC, Ares' general partner, a Partner and General Counsel in the Ares Legal Group and a member of the Management Committee of Ares Management. Mr. Weiner has been an officer of ARCC since 2006, including General Counsel from September 2006 to January 2010, and also serves as Vice President of Ares Commercial Real Estate Corporation ("ACRE") and Vice President and Assistant Secretary of ARDC. He additionally serves as a member of the Ares Operations Management Group and the Ares Enterprise Risk Committee. Mr. Weiner joined Ares in 2006. | |
Joshua Bloomstein 1973 | | Vice President and Assistant Secretary | | | 2016 | | | Mr. Bloomstein serves as a Partner and General Counsel (Credit) and Deputy General Counsel (Corporate) of Ares Management, where he focuses on direct lending matters. He is General Counsel, Vice President and Secretary of Ares Capital Corporation and Vice President and Assistant Secretary of Ares Commercial Real Estate Corporation. He is also a member of the Ares Enterprise Risk Committee. Mr. Bloomstein joined Ares in 2006. | |
Anton Feingold 1980 | | Vice President and Assistant Secretary | | | 2016 | | | Mr. Feingold is a Managing Director and Associate General Counsel (Real Estate) in the Ares Legal Group. He also serves as Vice President and Secretary of Ares Commercial Real Estate Corporation. Mr. Feingold joined Ares in 2014. | |
Keith Kooper 1975 | | Vice President and Assistant Secretary | | | 2016 | | | Mr. Kooper is a Partner and General Counsel (Real Estate) in the Ares Legal Group. He also serves as Vice President and Assistant Secretary of Ares Commercial Real Estate Corporation. Mr. Kooper additionally serves as a member of the Ares Enterprise Risk Committee. Mr. Kooper joined Ares in 2013. | |
Naseem Sagati Aghili 1981 | | Vice President and Assistant Secretary | | | 2019 | | | Ms. Sagati Aghili is a Partner and Co-General Counsel, Corporate and General Counsel, Private Equity, in the Ares Legal Group and is a member of the Management Committee of Ares Management. Ms. Sagati Aghili joined Ares in 2009. | |
Kevin Early 1971 | | Vice President | | | 2017 | | | Mr. Early is a Partner, European Finance in the Ares Finance Department. Mr. Early joined Ares in 2012. | |
Michael Dennis 1976 | | Vice President | | | 2017 | | | Mr. Dennis is a Partner and Co-Head of European Credit, in the Ares Credit Group. Additionally, Mr. Dennis serves as a member of the Management Committee of Ares Management and the Ares Credit Group's European Direct Lending and European Liquid Credit Investment Committees. Mr. Dennis joined Ares in 2007. | |
Annual Report 2019
89
CION Ares Diversified Credit Fund
Additional Information (continued)
October 31, 2019
Executive Officers
Name, Address(1)
and Year of Birth | | Position(s) Held
with the Trust | | Term of Office
and Length of
Time Served | | Principal Occupation(s) During Past 5 Years | |
Blair Jacobson 1972 | | Vice President | | | 2017 | | | Mr. Jacobson is a Partner and Co-Head of European Credit in the Ares Credit Group and a member of the Management Committee of Ares Management. He also serves on the boards of Ares Management Limited and Ares Management UK Limited. Additionally, Mr. Jacobson serves on the Ares Credit Group's European Direct Lending and European Liquid Credit Investment Committees. He joined Ares in 2012. | |
(1) The address of each officer is care of the Secretary of the Fund at 3 Park Avenue, 36th Floor, New York, NY 10016.
The Statement of Additional Information (SAI) includes additional information about the board members and is available, without charge, upon request. Shareholders may call 888-729-4266 to request the SAI.
Annual Report 2019
90
(This page intentionally left blank.)
Annual Report 2019
91
(This page intentionally left blank.)
Annual Report 2019
92

Item 2. Code of Ethics.
(a) CION Ares Diversified Credit Fund (the “Fund”) has adopted a Code of Ethics that applies to the Fund’s principal executive officer and principal financial officer (the “Code of Ethics”).
(c) The Fund has not made any amendment to its Code of Ethics during the period covered by this Form N-CSR.
(d) There have been no waivers, including any implicit waivers, granted by the Fund to individuals covered by the Fund’s Code of Ethics during the reporting period for this Form N-CSR.
(e) Not applicable.
(f) A copy of the Fund’s Code of Ethics is attached hereto as exhibit 13(a)(1).
Item 3. Audit Committee Financial Expert.
(a)(1) The Board of Trustees of the Fund has determined that the Fund has two members serving on the Fund’s Audit Committee that possess the attributes identified in Instruction 2(b) of Item 3 to Form N-CSR to qualify as an “audit committee financial expert.”
(a)(2) The names of the audit committee financial experts are John Joseph Shaw and James K. Hunt. Each of Messrs. Shaw and Hunt has been deemed to be “independent” for the purpose of this Item because he is not an “interested person” of the Fund as that term is defined in Section 2(a)(19) of the Investment Company Act of 1940, as amended (the “1940 Act”) and does not accept directly or indirectly any consulting, advisory, or other compensatory fee from the Fund.
Item 4. Principal Accountant Fees and Services.
(a) Audit Fees
For the fiscal year ended October 31, 2018 and for the fiscal year ended October 31, 2019, Ernst & Young LLP (“E&Y”), the Fund’s independent registered public accounting firm, billed the Fund aggregate fees of $144,000 and $250,000, respectively, for professional services rendered for the audit of the Fund’s annual financial statements or for services normally provided by E&Y in connection with statutory and regulatory filings or engagements.
(b) Audit-Related Fees
For the fiscal year ended October 31, 2018 and for the fiscal year ended October 31, 2019, the aggregate fees billed for assurance and related services rendered by E&Y that are reasonably related to the performance of the audit or review of the Fund’s financial statements and that are not reported under Audit Fees above were $23,000 and $51,000, respectively.
For the fiscal year ended October 31, 2018 and for the fiscal year ended October 31, 2019, aggregate Audit-Related Fees billed by E&Y that were required to be approved by the Fund’s Audit Committee for audit-related services rendered to the Fund’s investment adviser and any entity controlling, controlled by or under common control with the investment adviser that provides ongoing services to the Fund (the
“Affiliated Service Providers”) that relate directly to the operations and financial reporting of the Fund were $0 and $0, respectively.
(c) Tax Fees
For the fiscal year ended October 31, 2018 and for the fiscal year ended October 31, 2019, E&Y billed the Fund aggregate fees of $11,500 and $14,100 for professional services rendered for tax compliance, tax advice, and tax planning. The nature of the services comprising the Tax Fees was the review of the Fund’s income tax returns and tax distribution requirements.
For the fiscal year ended October 31, 2018 and for the fiscal year ended October 31, 2019, the aggregate Tax Fees billed by E&Y that were required to be approved by the Fund’s Audit Committee for tax compliance, tax advice and tax planning services rendered on behalf of Affiliated Service Providers that relate directly to the operations and financial reporting of the Fund were $0 and $0, respectively.
(d) All Other Fees
For the fiscal year ended October 31, 2018 and for the fiscal year ended October 31, 2019, the aggregate fees billed by E&Y to the Fund for all services other than services reported under Audit Fees, Audit-Related Fees, and Tax Fees were $0 and $0, respectively.
For the fiscal year ended October 31, 2018 and for the fiscal year ended October 31, 2019, the aggregate fees in this category billed by E&Y that were required to be approved by the Fund’s Audit Committee for services rendered on behalf of Affiliated Service Providers that relate directly to the operations and financial reporting of the Fund were $0 and $0, respectively.
(e)(1) Audit Committee’s Pre-Approval Policies and Procedures
The Fund’s Audit Committee Charter requires that the Audit Committee pre-approve all audit and non-audit services to be provided to the Fund by the Fund’s independent registered public accounting firm; provided, however, that the pre-approval requirement with respect to the provision of non-auditing services to the Fund by the Fund’s independent registered public accounting firm may be waived by the Audit Committee under the circumstances described in the Securities Exchange Act of 1934, as amended (the “1934 Act”).
(e)(2) Percentage of Services
All of the audit and tax services described above for which E&Y billed the Fund fees for the fiscal years ended October 31, 2018 and October 31, 2019, were pre-approved by the Audit Committee.
For the fiscal years ended October 31, 2018 and October 31, 2019, the Fund’s Audit Committee did not waive the pre-approval requirement of any non-audit services to be provided to the Fund by E&Y.
(f) Not applicable.
(g) For the fiscal year ended October 31, 2018 and for the fiscal year ended October 31, 2019, aggregate non-audit fees billed by E&Y for services rendered to the Fund were $0 and $0, respectively.
For the fiscal year ended October 31, 2018 and for the fiscal year ended October 31, 2019, aggregate non-audit fees billed by E&Y for services rendered to the Affiliated Service Providers were $0 and $0, respectively.
(h) E&Y notified the Fund’s Audit Committee of all non-audit services that were rendered by E&Y to the Fund’s Affiliated Service Providers that were not pre-approved pursuant to paragraph (c)(7)(ii) of Rule 2-01 of Regulation S-X, allowing the Fund’s Audit Committee to consider whether such services were compatible with maintaining E&Y’s independence.
Item 5. Audit Committee of Listed Registrants.
(a) The Fund has a separately-designated Audit Committee established in accordance with Section 3(a)(58)(A) of the 1934 Act. The members of the Fund’s Audit Committee are James K. Hunt, Paula B. Pretlow, John Joseph Shaw, Bruce H. Spector and Mark R. Yosowitz.
(b) Not applicable.
Item 6. Investments.
(a) Schedule of Investments is included as part of Item 1 of this Form N-CSR.
(b) Not applicable.
Item 7. Disclosure of Proxy Voting Policies and Procedures for Closed-End Investment Companies.
Attached to this Form N-CSR as exhibit 13(a)(5) is a copy of the proxy voting policies and procedures of the Fund and its investment adviser.
Item 8. Portfolio Managers of Closed-End Management Investment Companies.
(a)(1) As of the date of this filing, the portfolio managers of the Fund are as follows:
Mitch Goldstein
Partner, Co-Head of the Ares Credit Group and Portfolio Manager (since inception)
Investment Experience:
Mr. Goldstein is a Partner and Co-Head of the Ares Credit Group and a member of the Management Committee of Ares Management Corporation (“Ares Management”). He additionally serves as Co-President of Ares Capital Corporation (“ARCC”) and Vice President and interested trustee of the Fund. He is a member of the Ares Credit Group’s U.S. Direct Lending and Commercial Finance Investment Committees and the Ivy Hill Asset Management Investment Committee. Prior to joining Ares Management in May 2005, Mr. Goldstein worked at Credit Suisse First Boston (“CSFB”), where he was a Managing Director in the Financial Sponsors Group. At CSFB, Mr. Goldstein was responsible for providing investment banking services to private equity funds and hedge funds with a focus on M&A and restructurings as well as capital raisings, including high yield, bank debt, mezzanine debt, and initial public offerings. Mr. Goldstein joined CSFB in 2000 at the completion of the merger with Donaldson, Lufkin & Jenrette. From 1998 to 2000, Mr. Goldstein was at Indosuez Capital, where he was a member of the Investment Committee and a Principal, responsible for originating, structuring and executing leveraged transactions across a broad range of products and asset classes. From 1993 to 1998, Mr.
Goldstein worked at Bankers Trust. He also serves on the Board of Managers of Ivy Hill Asset Management GP, LLC.
Mr. Goldstein graduated summa cum laude from the State University of New York at Binghamton with a B.S. in Accounting, received an M.B.A. from Columbia University’s Graduate School of Business and is a Certified Public Accountant.
Greg Margolies
Partner, Head of Markets and Portfolio Manager (since inception)
Investment Experience:
Mr. Margolies is a Partner in the Ares Credit Group, the Head of Markets for Ares Management LLC (“Ares”), and a member of the Management Committee of Ares Management and is Vice President of the Fund. Additionally, Mr. Margolies serves as a member of the Ares Credit Group’s Alternative Credit Investment Committee, the Ares Dynamic Credit Allocation Fund Investment Committee and the Ares Private Equity Group’s Special Opportunities Investment Committee. Prior to joining Ares in 2009, Mr. Margolies served as a Managing Director and Global Head of Leveraged Finance and Capital Commitments at Merrill Lynch & Co. and was a member of the Executive Committee for Merrill Lynch’s Global Investment Banking Group. Previously, Mr. Margolies was Co-Head of the DB Capital Mezzanine Fund. Mr. Margolies serves on the Board of Directors for the International Organization for Women and Development, the Advisory Council for University of Michigan’s Life Science Institute and the Board of Trustees for The Juilliard School.
Mr. Margolies holds a B.A. from the University of Michigan in International Economics and Finance and an M.B.A. from the University of Pennsylvania Wharton School of Business.
(a)(2) As of September 30, 2019, the Portfolio Managers were primarily responsible for the day-to-day portfolio management of the following accounts:
Name of
Portfolio
Manager | | Type of
Accounts | | Total # of
Accounts
Managed | | Total Assets
(in millions) | | # of Accounts
Managed for
which Advisory
Fee is Based on
Performance | | Total Assets for
which Advisory Fee
is Based on
Performance
(in millions) | |
Mitch Goldstein | | Registered investment companies | | 1 | | $ | 644.73 | | 1 | | $ | 644.73 | |
| | Other pooled investment vehicles | | 3 | | $ | 4,870.75 | | 3 | | $ | 4,870.75 | |
| | Other accounts | | 18 | | $ | 12,316.39 | | 17 | | $ | 9,920.06 | |
| | | | | | | | | | | |
Greg Margolies | | Registered investment companies | | 1 | | $ | 644.73 | | 1 | | $ | 644.73 | |
| | Other pooled investment vehicles | | 2 | | $ | 2,078.73 | | 2 | | $ | 2,078.73 | |
| | Other accounts | | 1 | | $ | 280.20 | | 1 | | $ | 280.20 | |
Material Conflicts of Interest:
The Fund’s executive officers and trustees, and the employees of CION Ares Management, LLC (“CAM” or the “Advisor”) and Ares Capital Management II LLC (“Ares Capital” and collectively with CAM, the “Advisors”), serve or may serve as officers, trustees or principals of entities that operate in the same or a related line of business as the Fund or of other Ares- or CION Investment Group, LLC (“CION”)-advised funds (“Other Managed Funds”). As a result, they may have obligations to investors in those entities, the fulfillment of which might not be in the best interests of the Fund or its shareholders. Moreover, notwithstanding the difference in principal investment objectives between the Fund and the Other Managed Funds, such other funds, including potential new pooled investment vehicles or managed accounts not yet established (whether managed or sponsored by affiliates or the Advisors), have, and may from time to time have, overlapping investment objectives with the Fund and, accordingly, invest in, whether principally or secondarily, asset classes similar to those targeted by the Fund. To the extent the Other Managed Funds have overlapping investment objectives, the scope of opportunities otherwise available to the Fund may be adversely affected and/or reduced. Additionally, certain employees of the Advisors and their management may face conflicts in their time management and commitments as well as in the allocation of investment opportunities to other Ares funds.
The results of the Fund’s investment activities may differ significantly from the results achieved by the Other Managed Funds. It is possible that one or more of such funds will achieve investment results that are substantially more or less favorable than the results achieved by the Fund. Moreover, it is possible that the Fund will sustain losses during periods in which one or more affiliates achieve significant profits on their trading for proprietary or other accounts. The opposite result is also possible. The investment activities of one or more Advisor affiliates for their proprietary accounts and accounts under their management may also limit the investment opportunities for the Fund in certain markets.
The Advisors may determine that the Fund should invest on a side-by-side basis with one or more Other Managed Funds. In certain circumstances, negotiated co-investments may be made only in accordance with the terms of the exemptive order Ares received from the SEC (the “Order”). Co-investments made under the Order are subject to compliance with the conditions and other requirements contained in the Order, which could limit the Fund’s ability to participate in a co-investment transaction.
In the event investment opportunities are allocated among the Fund and Other Managed Funds, we may not be able to structure our investment portfolio in the manner desired. Although the Advisors endeavor to allocate investment opportunities in a fair and equitable manner, the Fund is not generally permitted to co-invest in any portfolio company in which a fund managed by Ares or any of its downstream affiliates (other than the Fund and its downstream affiliates) currently has an investment. However, the Fund may co-invest with funds managed by Ares or any of its downstream affiliates, subject to compliance with existing regulatory guidance, applicable regulations and its allocation procedures.
From time to time, the Fund and the Other Managed Funds may make investments at different levels of an issuer’s capital structure or otherwise in different classes of an issuer’s securities. Such investments may inherently give rise to conflicts of interest or perceived conflicts of interest between or among the various classes of securities that may be held by such entities.
The Advisors, their affiliates and their clients may pursue or enforce rights with respect to an issuer in which the Fund has invested, and those activities may have an adverse effect on the Fund. As a result, prices, availability, liquidity and terms of the Fund’s investments may be negatively impacted by the activities of the Advisors and their affiliates or their clients, and transactions for the Fund may be impaired or effected at prices or terms that may be less favorable than would otherwise have been the case.
The Advisors may enter into transactions and invest in securities, instruments and currencies on behalf of the Fund in which customers of its affiliates, to the extent permitted by applicable law, serve as the counterparty, principal or issuer. In such cases, such party’s interests in the transaction could be adverse to the interests of the Fund, and such party may have no incentive to assure that the Fund obtains the best possible prices or terms in connection with the transaction. In addition, the purchase, holding and sale of such investments by the Fund may enhance the profitability of the Advisors or their affiliates. One or more affiliates may also create, write or issue Derivatives for their customers, the underlying securities, currencies or instruments of which may be those in which the Fund invests or which may be based on the performance of the Fund. The Fund may, subject to applicable law, purchase investments that are the subject of an underwriting or other distribution by one or more Advisors affiliates and may also enter into transactions with other clients of an affiliate where such other clients have interests adverse to those of the Fund.
The Fund will be required to establish business relationships with its counterparties based on the Fund’s own credit standing. Neither the Advisors nor any of their affiliates will have any obligation to allow its credit to be used in connection with the Fund’s establishment of its business relationships, nor is it expected that the Fund’s counterparties will rely on the credit of the Advisors or their affiliates in evaluating the Fund’s creditworthiness.
The Advisors are paid a fee based on a percentage of the Fund’s Managed Assets. The participation of the Advisors’ investment professionals in the valuation process could therefore result in a conflict of interest. The Advisors also may have a conflict of interest in deciding whether to cause the Fund to incur leverage or to invest in more speculative investments or financial instruments, thereby potentially increasing the assets or the yield of the Fund and, accordingly, the Management Fees or Incentive Fees (as such terms are defined in the Fund’s Prospectus) received by the Advisors. Certain other Ares-advised funds pay the Advisors or their affiliates performance-based compensation, which could create an incentive for the Advisors or affiliate to favor such investment fund or account over the Fund.
By reason of the various activities of the Advisors and their affiliates, the Advisors and such affiliates may acquire confidential or material non-public information or otherwise be restricted from purchasing certain potential Fund investments that otherwise might have been purchased or be restricted from selling certain Fund investments that might otherwise have been sold at the time.
The Advisors have adopted policies and procedures designed to prevent conflicts of interest from influencing proxy voting decisions made on behalf of advisory clients, including the Fund, and to help ensure that such decisions are made in accordance with its fiduciary obligations to clients. Nevertheless, notwithstanding such proxy voting policies and procedures, actual proxy voting decisions may have the
effect of favoring the interests of other clients, provided that the Advisors believe such voting decisions to be in accordance with its fiduciary obligations.
(a)(3) Compensation Structure of Portfolio Manager(s) or Management Team Members
The Advisors’ financial arrangements with its portfolio managers, its competitive compensation and its career path emphasis at all levels reflect the value senior management places on key resources. Compensation may include a variety of components and may vary from year to year based on a number of factors. The portfolio managers may receive, all or some combination of, salary, an annual bonus and interests in the carried interest in certain of Ares’ funds.
Base Compensation.
Generally, when the Portfolio Managers receive base compensation from the Advisors it is based on their individual seniority and their position within the firm.
Discretionary Compensation.
In addition to base compensation, the Portfolio Managers may receive discretionary compensation from the Advisors. Discretionary compensation may be based on individual seniority and contribution.
(a)(4) Ownership of Securities
The following table sets forth, for each Portfolio Manager, the aggregate dollar range of the Fund’s equity securities beneficially owned as of October 31, 2019.
Portfolio Manager | | Dollar Range of Fund Shares Beneficially Owned |
Mitch Goldstein | | None |
Greg Margolies | | None |
(b) Not applicable.
Item 9. Purchases of Equity Securities by Closed-End Management Investment Company and Affiliated Purchasers.
None during the period covered by this Form N-CSR filing pursuant to a plan or program.
Item 10. Submission of Matters to a Vote of Security Holders.
There have been no material changes to the procedures by which shareholders may recommend nominees to the Fund’s Board of Trustees during the period covered by this Form N-CSR filing.
Item 11. Controls and Procedures.
(a) The Fund’s principal executive and principal financial officers have concluded that the Fund’s disclosure controls and procedures (as defined in Rule 30a-3(c) under the 1940 Act) (17 CFR 270.30a-3(c)) are effective, as of a date within 90 days of the filing date of this Form N-CSR based on their evaluation of these controls and procedures required by Rule 30a-3(b) under the
1940 Act (17 CFR 270.30a-3(b)) and Rules 13a-15(b) or 15d-15(b) under the 1934 Act, as amended (17 CFR 240.13a-15(b) or 240.15d-15(b)).
(b) There were no changes in the Fund’s internal control over financial reporting (as defined in Rule 30a-3(d) under the 1940 Act (17 CFR 270.30a-3(d))) that occurred during the Fund’s most recent fiscal quarter covered by this report that has materially affected, or is reasonably likely to materially affect, the Fund’s internal control over financial reporting.
Item 12. Disclosure of Securities Lending Activities for Closed-End Management Investment Companies.
(a) Not applicable.
(b) Not applicable.
Item 13. Exhibits.
(a)(1) Code of Ethics is attached hereto in response to Item 2(f).
(a)(2) The certifications required by Rule 30a-2(a) under the 1940 Act (17 CFR 270.30a-2(a)) are attached hereto.
(a)(3) Not applicable.
(a)(4) Not applicable.
(a)(5) Proxy voting policies and procedures of the Fund and its investment adviser are attached hereto in response to Item 7.
(b) The certifications required by Rule 30a-2(b) under the 1940 Act (17 CFR 270.30a-2(b)) and Section 906 of the Sarbanes-Oxley Act of 2002 are attached hereto.
SIGNATURES
Pursuant to the requirements of the Securities Exchange Act of 1934 and the Investment Company Act of 1940, the Fund has duly caused this report to be signed on its behalf by the undersigned, thereunto duly authorized.
CION ARES DIVERSIFIED CREDIT FUND | |
| |
| | |
By: | /s/ Michael A. Reisner | |
| Michael A. Reisner | |
| Co-President and Chief Executive Officer | |
| | |
| | |
Date: | January 3, 2020 | |
| | |
| | |
By: | /s/ Mark Gatto | |
| Mark Gatto | |
| Co-President and Chief Executive Officer | |
| | |
| | |
Date: | January 3, 2020 | |
Pursuant to the requirements of the Securities Exchange Act of 1934 and the Investment Company Act of 1940, this report has been signed below by the following persons on behalf of the Fund and in the capacities and on the dates indicated.
By: | /s/ Michael A. Reisner | |
| Michael A. Reisner | |
| Co-President and Chief Executive Officer | |
| | |
| | |
Date: | January 3, 2020 | |
| | |
| | |
By: | /s/ Mark Gatto | |
| Mark Gatto | |
| Co-President and Chief Executive Officer | |
| | |
| | |
Date: | January 3, 2020 | |
| | |
| | |
By: | /s/ Scott C. Lem | |
| Scott C. Lem | |
| Chief Financial Officer | |
| | |
| | |
Date: | January 3, 2020 | |