UNITED STATES
SECURITIES AND EXCHANGE COMMISSION
Washington, D.C. 20549
FORM N-CSR
CERTIFIED SHAREHOLDER REPORT OF REGISTERED
MANAGEMENT INVESTMENT COMPANIES
Investment Company Act file number: 811-23165
CION ARES DIVERSIFIED CREDIT FUND
(Exact name of registrant as specified in charter)
3 PARK AVENUE
36TH FLOOR
NEW YORK, NEW YORK 10016
(Address of principal executive offices)(Zip code)
Eric A. Pinero 3 Park Avenue, 36th Floor New York, New York 10016 (Name and Address of Agent for Service) | ||
| Copy to: | ||
Michael A. Reisner Mark Gatto CION Ares Diversified Credit Fund 3 Park Avenue, 36th Floor New York, New York 10016 | Richard Horowitz, Esq. Jonathan H. Gaines, Esq. Dechert LLP 1095 Avenue of the Americas New York, New York 10036
| |
Registrant’s telephone number, including area code: (646) 845-2577
Date of fiscal year end: December 31
Date of reporting period: January 1, 2021 – December 31, 2021
Item 1. Report to Stockholders.
(a)


CION Ares Diversified Credit Fund
ANNUAL REPORT
DECEMBER 31, 2021
Beginning on January 1, 2021, as permitted by regulations adopted by the Securities and Exchange Commission, paper copies of the Fund's shareholder reports will no longer be sent by mail, unless you specifically request paper copies of the reports from the Fund or from your financial intermediary, such as a broker-dealer or bank. Instead, the reports will be made available on a website, and you will be notified by mail each time a report is posted and provided with a website link to access the report. If you already elected to receive shareholder reports electronically, you will not be affected by this change and you need not take any action. You may elect to receive shareholder reports and other communications from the Fund or your financial intermediary electronically by calling 888-729-4266 toll-free or by sending an e-mail request to CION Ares Diversified Credit Fund Investor Relations Department at ir@cioninvestments.com if you invest directly with the Fund, or by contacting your financial intermediary (such as a broker-dealer or bank) if you invest through your financial intermediary. Beginning on January 1, 2019, you may elect to receive all future reports in paper free of charge. You can inform the Fund or your financial intermediary that you wish to continue receiving paper copies of your shareholder reports by calling 888-729-4266 toll-free or by sending an e-mail request to CION Ares Diversified Credit Fund Investor Relations Department at ir@cioninvestments.com, or by contacting your financial intermediary. Your election to receive reports in paper will apply to all funds held in your account if you invest through your financial intermediary or all funds held with the fund complex if you invest directly with the Fund.
CION Ares Diversified Credit Fund
Contents
Letter to Shareholders | 2 | ||||||
Fund Profile & Financial Data | 5 | ||||||
Performance Summary | 7 | ||||||
Consolidated Schedule of Investments | 9 | ||||||
Consolidated Statement of Assets and Liabilities | 92 | ||||||
Consolidated Statement of Operations | 94 | ||||||
Consolidated Statements of Changes in Net Assets | 95 | ||||||
Consolidated Statement of Cash Flows | 97 | ||||||
Financial Highlights | 98 | ||||||
Notes to Consolidated Financial Statements | 109 | ||||||
Report of Independent Registered Public Accounting Firm | 137 | ||||||
Proxy & Portfolio Information | 138 | ||||||
Dividend Reinvestment Plan | 139 | ||||||
Corporate Information | 141 | ||||||
Privacy Notice | 142 | ||||||
Trustees and Executive Officers | 143 | ||||||
Approval of Investment Sub-Advisory Agreement | 147 | ||||||
| |||
Annual Report 2021
CION Ares Diversified Credit Fund

Letter to Shareholders
December 31, 2021
Fellow Shareholders,
We are pleased to present the annual report for the CION Ares Diversified Credit Fund (the "Fund"), for the period ending December 31, 2021. We are happy to report that 2021 was an exceptional year for asset growth in the Fund, which surpassed $2 billion in total assets and concluded 2021 with $2.6 billion under management. The Fund returned an attractive 8.9%1 for the year, all while maintaining a diversified posture; as of period-end, the Fund had 614 total investments, spread across 24 unique industries. Secured debt instruments accounted for 94.5%2 of the Fund and more than 50% of the Fund was deployed in investments directly originated by the Ares platform. The Fund's relative value strategy across liquid and illiquid credit allowed us to capitalize quickly on market opportunities, which has been beneficial as markets and economies continue to emerge from the pandemic.
Investment Philosophy and Process
The Fund employs a dynamic asset allocation framework that seeks to offer enhanced yield and downside risk mitigation, while enabling the manager to respond to changing market conditions. We believe that the differentiated, diversified portfolio of directly originated and liquid investments can provide superior risk-adjusted returns for our shareholders. Active management across a broad spectrum of credit asset classes, including direct lending in the United States and Europe, high yield bonds, leveraged loans, structured credit, real estate debt, and other credit instruments provides the opportunity to generate attractive risk-adjusted returns by capturing the best relative value.
The Fund's investment process is rigorous and incorporates top-down and bottom-up factors. The Fund's Advisor, CION Ares Management ("CAM" or the "Advisor"), leverages the resources of the broader Ares platform to conduct ongoing proprietary analysis at the asset-class level that compares current market conditions with historical and industry-level precedents to examine the rate environment, correlation to public markets, and local/regional risks. This information is brought before the 15-member investment allocation committee in semimonthly meetings, where senior members overseeing each of the underlying asset classes share their observations with the Advisor's portfolio managers.
Investment Environment
Market sentiment was supportive for risk assets throughout 2021 due to macroeconomic tailwinds and strengthening corporate fundamentals. However, rising inflation concerns, global supply chain issues, the surging Omicron variant of COVID-19 and expectations for a shift in monetary policy contributed to elevated market volatility in the fourth quarter of the year. Central banks remained accomodative as market participants continued to navigate around pandemic-related devleopments, while additional fiscal measures, such as the $1.9 trillion stimulus package in the U.S., contributed to increased economic activity and elevated growth expectations alongside the rollout of COVID-19 vaccines. Labor market conditions tightened as these fiscal measures contributed to higher job openings, which reached a record 11.1 million in July3. Global supply chains came under pressure as a result of pent-up demand, which, combined with elevated commodity prices, contributed to heightened inflation in the U.S. and Europe. Central bank rhetoric turned hawkish as a result, and markets started to prepare for future tapering measures. Within global credit markets, sub-investment grade credit benefitted from increased demand due to low nominal and real rates as investors sought to enhance income and returns.
From a performance perspective, leveraged credit markets in the U.S. experienced positive returns owing to the continued economic recovery and appetite for credit risk. The syndicated loan market was a consistent source of positive returns, benefitting from record-high CLO issuance and $46.5 billion of retail fund inflows4. Demand in the high yield market was able to absorb record breaking issuance and issuer fundamentals exhbitied steady improvement throughout the year. Syndicated loans returned +5.40% and +4.63% in the U.S. and Europe5, respectively, due to a strong technical backdrop. Despite increased bouts of volatility in the fourth quarter, high yield bonds returned +5.36% and +3.33% in the U.S. and Europe5, respectively. Returns were driven by cyclical sectors and lower quality paper given risk-on market sentiment, and both credit sectors outperformed traditional fixed income asset categories due to their yield premium and relatively muted sensitivity to interest rates. In terms of fundamentals, the default environment was muted throughout the year and fell below one percent in both the syndicated loan and high yield bond markets6 as companies continued to utilize elevated liquidity to lower their cost of capital. Shifting to the middle market, elevated deployment was supported by a strong M&A environment and elevated levels of dry powder from private equity sponsors.
Annual Report 2021
2
CION Ares Diversified Credit Fund
Letter to Shareholders (continued)
December 31, 2021
Within Europe, markets exhibited similar trends as the U.S. during the period. European high yield and leveraged loan markets benefitted from modest corporate earnings growth, strong economic data prints and a supportive technical backdrop as issuance remained steady, though moderated towards year-end. Positive economic developments, such as the Euro Area Composite PMI reaching a 21-year high in July7, contributed to spread tightening throughout the year, while the default environment remained benign. Primary markets were active with new issuance surpassing 2020 volume for both syndicated loans and high yield bonds. While the European Central Bank announced tapering measures in December, risk assets reacted positively to the news given actions were broadly in-line with expectations and had reduced uncertainty around central bank policy for the time being.
As a new calendar year begins, global financial markets have experienced heightened volatility as a result of economic and political events affecting the world's major economies. Equities declined and government bond yields rose amid escalating geopolitical tensions in Eastern Europe and in anticipation of a more restrictive Federal Reserve ("Fed") in 2022. Within credit markets, we have observed diverging return patterns between high yield bonds and syndicated loans as floating rate credit has experienced strong interest from investors seeking protection from rising interest rates, while fixed rate assets have come under pressure. Looking forward, we expect a confluence of factors including inflation, supply chain issues, potential for new COVID-19 variants as well as Fed actions, will lead to increased dispersion and pockets of volatility, creating an opportunity for active managers. Within illiquid credit, the M&A backdrop is expected to remain strong in 2022, providing ample directly originated opportunities for the Fund. Overall, we believe the backdrop for credit is favorable as elevated private equity dry powder buoys supply while investor demand is supported by enhanced yields and reduced duration risk relative to traditional fixed income. We believe our scaled platform, tenured experience and cycle-tested investment process will allow us to successfully navigate these changing market environments and take advantage of any short-term bouts of volatility in the coming months.
Summary
The market's appetite for credit risk was apparent throughout the year as stimulus measures contributed to improved corporate fundamentals and economies "reopening" from the depths of the pandemic. However, investor appetite for rate risk has erorded in recent months as above-trend economic growth and elevated inflation have lead to increased expectations for tighter monetary policy and higher interest rates in the months to come. As a result, the Bloomberg U.S. Aggregate Index, comprised of longer duration assets, returned -1.54% in 2021 and declined by -2.15% in the first month of 20228, suggesting that apprehension around rate sensitive assets will persist over the near term. Conversely, floating rate assets such as syndicated loans have been resilient, performing well during January.
While economic forecasts are positive, we remain cautiously optimistic in our outlook. We continue to monitor fiscal and monetary policy in response to the recovery and elevated growth expectations, as well as labor market conditions and elevated inflation. Central bank missteps, rising geopolitical tensions and new virus strains are also potential concerns and areas of focus.
We are pleased with the ongoing construction of the Fund's diversified portfolio, and we believe the Fund is well positioned to find relative opportunities in a rising rate environment given our emphasis on floating rate assets. Our Advisor will continue to leverage Ares' position as a global leader in credit markets to identify attractive investment opportunities in line with the stated objective of the Fund.
We thank you for your investment in and continued support of CION Ares Diversified Credit Fund.
Sincerely,
|
| ||||||
| Mitch Goldstein Portfolio Manager CION Ares Diversified Credit Fund | Greg Margolies Portfolio Manager CION Ares Diversifed Credit Fund | ||||||


Annual Report 2021
3
CION Ares Diversified Credit Fund
Letter to Shareholders (continued)
December 31, 2021
Views expressed are those of CION Ares Management as of the date of this communication, are subject to change at any time, and may differ from the views of other portfolio managers or of Ares as a whole. Although these views are not intended to be a forecast of future events, a guarantee of futures results, or investment advice, any forward-looking statements are not reliable indicators of future events and no guarantee is given that such activities will occur as expected or at all. Information contained herein has been obtained from sources believed to be reliable, but the accuracy and completeness of the information cannot be guaranteed. CION Ares Management does not undertake any obligation to publicly update or review any forward-looking information, whether as a result of new information, future developments or otherwise, except as required by law. All investments involve risk, including possible loss of principal. Past performance is not indicative of future results.
The outbreak of a novel and highly contagious form of coronavirus ("COVID-19"), which the World Health Organization has declared to constitute a pandemic, has resulted in numerous deaths, adversely impacted global commercial activity and contributed to significant volatility in certain equity and debt markets. The global impact of the outbreak is rapidly evolving, and many countries have reacted by instituting quarantines, prohibitions on travel and the closure of offices, businesses, schools, retail stores and other public venues. Businesses are also implementing similar precautionary measures. Such measures, as well as the general uncertainty surrounding the dangers and impact of COVID-19, are creating significant disruption in supply chains and economic activity and are having a particularly adverse impact on energy, transportation, hospitality, tourism, entertainment and other industries. The impact of COVID-19 has led to significant volatility and declines in the global financial markets and oil prices and it is uncertain how long this volatility will continue. As COVID-19 continues to spread, the potential impacts, including a global, regional or other economic recession, are increasingly uncertain and difficult to assess. Any public health emergency, including any outbreak of COVID-19 or other existing or new epidemic diseases, or the threat thereof, and the resulting financial and economic market uncertainty could have a significant adverse impact on the Fund, the value of its investments and its portfolio companies. The performance information herein is as of December 31, 2021 and not all of the effects, directly and indirectly, resulting from COVID-19 and/or the current market environment, may be reflected herein. The full impact of COVID-19 and its ultimate potential effects on portfolio company performance and valuations is particularly uncertain and difficult to predict.
CION Securities, LLC ("CSL") is the wholesale marketing agent for CION Ares Diversified Credit Fund ("CADC" or the "Fund"), advised by CION Ares Management, LLC ("CAM") and distributed by ALPS Distributors, Inc ("ADI"). CSL, member FINRA, and CAM are not affiliated with ADI, member FINRA. Certain Ares fund securities may be offered through its affiliate, Ares Investor Services LLC ("AIS"), a broker-dealer registered with the SEC, and a member of FINRA and SIPC.
REF: CP-01036
1 Past performance is not indicative of future results. Performance shown here is the I-Share Class. The I-Share was incepted on July 12, 2017. Returns include reinvestment of distributions and reflect fund expenses inclusive of recoupment of previously provided expense support. The estimated expense ratio is 3.28%. Expense ratios are annualized and calculated as a percentage of estimated average net assets. Share values will fluctuate, therefore if repurchased, they may be worth more or less than their original cost.
2 Secured Debt Includes First and Second Lien assets, Structured Credit Debt, Structured Credit Equity
3 Source: U.S. Bureau of Labor Statistics
4 Source: JP Morgan. As of December 31, 2021
5 Source: Credit Suisse, ICE BofA. As of December 31, 2021.
6 Source: JP Morgan Default Monitor. As of December 31, 2021.
7 Source: IHS Markit. July 23, 2021.
8 Source: Bloomberg U.S. Aggregate Index. As of December 31, 2021.
Annual Report 2021
4
CION Ares Diversified Credit Fund
Fund Fact Sheet — As of December 31, 2021
CLASS A CADEX | CLASS C CADCX | CLASS I CADUX | CLASS L CADWX
CLASS U CADZX | CLASS U2 CADSX | CLASS W CADFX
FUND OVERVIEW
CION Ares Diversified Credit Fund (CADC) is a diversified, unlisted closed-end management investment company registered under the 1940 Act as an interval fund. The Fund will seek to capitalize on market inefficiencies and relative value opportunities by dynamically allocating a portfolio of directly originated loans, secured floating and fixed rate syndicated loans, corporate bonds, asset-backed securities, commercial real estate loans and other types of credit instruments which, under normal circumstances, will represent at least 80% of the Fund's assets.
Fixed vs. Floating Rate

Excludes cash, other net assets and equity instruments.
KEY FACTS
TOTAL MANAGED ASSETS* | ~$2.61B | ||||||
DISTRIBUTIONS1 | Monthly | ||||||
TOTAL ISSUES | 606 | ||||||
SHARE CLASS | INCEPTION | CURRENT DISTRIBUTION RATE2 | STANDARD DEVIATION3 | SHARPE RATIO4 (ANNUALIZED) | |||||||||||||||
CLASS A | 1/26/2017 | 5.41 | % | 4.16 | % | 1.15 | |||||||||||||
CLASS C | 7/12/2017 | 5.43 | % | 4.18 | % | 1.14 | |||||||||||||
CLASS I | 7/12/2017 | 5.35 | % | 4.17 | % | 1.21 | |||||||||||||
CLASS L | 11/2/2017 | 5.39 | % | 4.30 | % | 1.10 | |||||||||||||
CLASS U | 7/25/2019 | 5.38 | % | 5.37 | % | 0.94 | |||||||||||||
CLASS U-2 | 4/13/2020 | 5.39 | % | 3.23 | % | 4.68 | |||||||||||||
CLASS W | 12/4/2018 | 5.35 | % | 4.89 | % | 1.17 | |||||||||||||
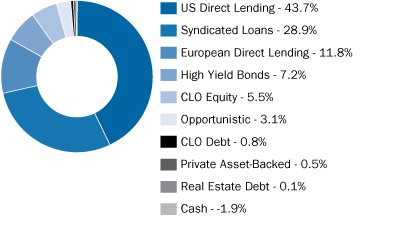
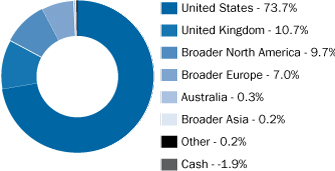
Portfolio Allocation*
Allocation by Asset Type
Allocation by Geography
Top 10 Holdings* % of Portfolio
Global Medical Response, Inc. | 1.4 | % | |||||
Cornerstone OnDemand, Inc. | 1.3 | % | |||||
TurnPoint Services | 1.2 | % | |||||
High Street Insurance Partners | 1.2 | % | |||||
CEP V I 5 Midco Limited (aka Mak System) | 1.0 | % | |||||
DecoPac, Inc. | 0.9 | % | |||||
DigiCert | 0.9 | % | |||||
European Camping Group | 0.8 | % | |||||
True Potential Group Limited | 0.7 | % | |||||
Ardonagh | 0.7 | % | |||||
Allocation by Industry* % of Portfolio
Software & Services | 20.2 | % | |||||
Health Care Equipment & Services | 8.8 | % | |||||
Diversified Financials | 8.2 | % | |||||
Commercial & Professional Services | 7.8 | % | |||||
Structured Products | 7.7 | % | |||||
Capital Goods | 7.7 | % | |||||
Consumer Services | 7.3 | % | |||||
Insurance | 6.8 | % | |||||
Other | 27.3 | % | |||||
Cash | -1.9 | % | |||||
* Holdings and allocations, unless otherwise indicated, are based on the total managed assets and subject to change without notice. Total managed assets is defined as the total assets (including any assets attributable to financial leverage) minus accrued liabilities (other than debt representing financial leverage). Data shown is for informational purposes only and not a recommendation to buy or sell any security.
Annual Report 2021
5
CION Ares Diversified Credit Fund
Fund Fact Sheet — As of December 31, 2021 (continued)
CLASS A CADEX | CLASS C CADCX | CLASS I CADUX | CLASS L CADWX
CLASS U CADZX | CLASS U2 CADSX | CLASS W CADFX
MANAGEMENT TEAM
• Mitch Goldstein, Co-Head of Ares Credit Group | 26 Years of Experience
• Greg Margolies, Head of Markets, Ares Management | 33 Years of Experience
• CADC's allocation committee consists of an additional 13 members, averaging nearly 25 years of experience.
ABOUT CION INVESTMENTS
CION Investments is a leading manager of investment solutions designed to redefine the way individual investors can build their portfolios and help meet their long-term investment goals. With more than 30 years of experience in the alternative asset management industry, CION strives to level the playing field. CION currently manages CION Investment Corporation, a leading non-traded BDC, and sponsors, through CION Ares Management, CION Ares Diversified Credit Fund, a globally diversified interval fund.
ABOUT ARES MANAGEMENT
Ares Management Corporation (NYSE: ARES) is a leading global alternative investment manager operating three integrated businesses across Credit, Private Equity and Real Estate. Ares Management's investment groups collaborate to deliver innovative investment solutions which seeks to provide consistent and attractive investment returns throughout market cycles. Ares Management's global platform had $305.8 billion of assets under management as of December 31, 2021 with over 2,000+ employees in over 25+ offices in more than 10 countries. Please visit www.aresmgmt.com for additional information.
RISK DISCLOSURES & GLOSSARY
Risks and limitations include, but are not limited to, the following: investment instruments may be susceptible to economic downturns; most of the underlying credit instruments are rated below investment grade and considered speculative; there is no guarantee all shares can be repurchased; the Fund's business and operations may be impacted by fluctuations in the capital markets; the Fund is a diversified, closed-end investment company with limited operating history; diversification does not eliminate the risk of investment losses.
1 Monthly Distributions — There is no assurance monthly distributions paid by the fund will be maintained at the targeted level or paid at all.
2 Current Distribution Rate — Current distribution rate is expressed as a percentage equal to the projected annualized distribution amount (which is calculated by annualizing the current cash distribution per share without compounding), divided by the net asset value. The current distribution rate shown may be rounded.
3 Standard Deviation — a widely used measure of an investment's performance volatility. Standard deviation shows how much variation from the mean exists with a larger number indicating the data points are more spread out over a larger range of values. Figures shown here are based on non-loaded daily NAV total returns utilizing data since inception.
4 Sharpe Ratio — a risk-adjusted measure that measures reward per unit of risk. The higher the Sharpe Ratio, the better. The numerator is the difference between a portfolio's return and the return of a risk-free instrument. The denominator is the portfolio's standard deviation. Figures shown here are based on non-loaded daily NAV total returns utilizing data since inception.
A portion of distributions may be a direct result of expense support payments provided by CION Ares Management, LLC (CAM), which are subject to repayment by CADC within three years. The purpose of this arrangement is to ensure that CADC bears an appropriate level of expenses. Any such distributions may not be entirely based on investment performance and can only be sustained if positive investment performance is achieved in future periods and/or CAM continues to make such expense support payments. Future repayments will reduce cash otherwise potentially available for distributions. There can be no assurance that such performance will be achieved in order to sustain these distributions. CAM has no obligation to provide expense support payments in future periods.
CADC may fund distributions from unlimited amounts of offering proceeds or borrowings, which may constitute a return of capital, as well as net income from operations, capital and non-capital gains from the sale of assets, dividends or distributions from equity investments and expense support payments from CAM, which are subject to repayment. For the year ending December 31, 2021, distributions were paid from taxable income and did not include a return of capital for tax purposes. If expense support payments from CAM were not provided, some or all of the distributions may have been a return of capital which would reduce the available capital for investment. The sources of distributions may vary periodically. Please refer to the semi-annual or annu-al reports filed with the SEC for the sources of distributions.
Annual Report 2021
6
CION Ares Diversified Credit Fund
Performance Summary
December 31, 2021
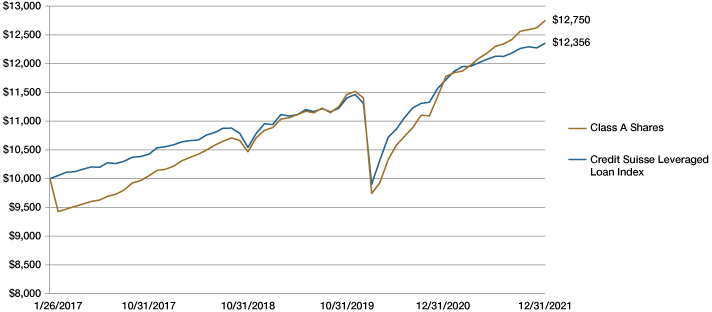
The following graph shows the value, as of December 31, 2021, of a $10,000 investment made on January 26, 2017 in Class A Shares at net asset value (with a sales charge of 5.75%). For comparative purposes, the performance of the Credit Suisse Leveraged Loan Index ("CSLLI") is shown. CSLLI is designed to mirror the investable universe of the U.S. Dollar-denominated leveraged loan market, and is deemed to be an appropriate broad-based securities market index for the Fund. Performance reflects applicable fee waivers and/or expense limitations in effect during the periods shown and in their absence, performance would be reduced. Returns do not reflect the deduction of taxes that a shareholder would pay on Fund distributions or the repurchase of Fund shares. The returns set forth below represent past performance. Past performance does not guarantee future results. The Fund's investment return and principal value will fluctuate so that an investor's shares, when repurchased, may be worth more or less than their original cost. Current performance may be lower or higher than the performance quoted below. Please visit our website at https://www.cioninvestments.com/products/cion-ares-diversified-credit-fund/ to obtain the most recent month-end returns.
CION Ares Diversified Credit Fund's Lifetime Performance
Performance of a $10,000 investment, including any applicable sales charges, with distributions
reinvested, from January 26, 2017 through December 31, 2021
Annual Report 2021
7
CION Ares Diversified Credit Fund
Performance Summary (continued)
December 31, 2021
Average Annual Total Returns through December 31, 2021*
Inception Date | One Year | Since Inception | |||||||||||||
Class A Common Shares | 1/26/2017 | ||||||||||||||
Excluding Sales Charge of 5.75% | 8.21 | % | 6.27 | % | |||||||||||
Including Sales Charge of 5.75% | 1.99 | % | 5.04 | % | |||||||||||
Class C Common Shares | 7/12/2017 | ||||||||||||||
Excluding Sales Charge of 1.00% | 8.16 | % | 5.98 | % | |||||||||||
Including Sales Charge of 1.00% | 7.07 | % | 5.98 | % | |||||||||||
Class I Common Shares | 7/12/2017 | 8.87 | % | 5.99 | % | ||||||||||
Class L Common Shares | 11/2/2017 | ||||||||||||||
Excluding Sales Charge of 4.25% | 8.58 | % | 5.28 | % | |||||||||||
Including Sales Charge of 4.25% | 3.96 | % | 4.42 | % | |||||||||||
Class U Common Shares | 7/25/2019 | 8.48 | % | 4.71 | % | ||||||||||
Class U-2 Common Shares | 4/13/2020 | ||||||||||||||
Excluding Sales Charge of 2.50% | 8.44 | % | 14.08 | % | |||||||||||
Including Sales Charge of 2.50% | 5.47 | % | 12.58 | % | |||||||||||
Class W Common Shares | 12/4/2018 | ||||||||||||||
Excluding Sales Charge of 3.00% | 8.73 | % | 5.34 | % | |||||||||||
Including Sales Charge of 3.00% | 5.73 | % | 4.59 | % | |||||||||||
* These returns assume reinvestment of all distributions at net asset value and reflect a maximum initial sales charge of 5.75% for Class A, 4.25% for Class L, 2.50% for Class U-2, and 3.00% for Class W and the assumed contingent deferred sales charge for Class C Shares of 1.00% (if repurchased during the first 365 days after their purchase). Because Class I and Class U Shares do not involve a sales charge, such a charge is not applied to their Average Annual Total Returns.
Annual Report 2021
8
CION Ares Diversified Credit Fund
Consolidated Schedule of Investments
December 31, 2021
(in thousands, except shares, percentages and as otherwise noted)
Senior Loans(b)(c)(d)
Company | Country(a) | Investment | Interest | Maturity Date | Acquisition Date | Shares | Principal Amount(a) | Fair Value(a) | Percentage of Net Assets | ||||||||||||||||||||||||||||||
Automobiles & Components | |||||||||||||||||||||||||||||||||||||||
| Automotive Keys Group, LLC | 1st Lien Term Loan | 6.00% (3M LIBOR + 5.00%) | 11/6/2025 | $ | 1,800 | $ | 1,800 | (e)(f) | |||||||||||||||||||||||||||||||
| Continental Acquisition Holdings, Inc. | 1st Lien Revolver | 4.50% (3M LIBOR + 3.50%) | 1/20/2026 | 1 | 1 | (e)(h) | |||||||||||||||||||||||||||||||||
| Continental Acquisition Holdings, Inc. | 1st Lien Term Loan | 7.75% (3M LIBOR + 6.75%) | 1/20/2027 | 6,211 | 6,211 | (e)(f) | |||||||||||||||||||||||||||||||||
| Continental Acquisition Holdings, Inc. | 1st Lien Term Loan | 7.75% (3M LIBOR + 6.75%) | 1/20/2027 | 500 | 500 | (e) | |||||||||||||||||||||||||||||||||
| Continental Acquisition Holdings, Inc. | 1st Lien Delayed Draw Term Loan | 7.75% (3M LIBOR + 6.75%) | 1/20/2027 | 1,461 | 1,461 | (e) | |||||||||||||||||||||||||||||||||
| Highline Aftermarket Acquisition, LLC | 1st Lien Revolver | 3.85% (1M LIBOR + 3.75%) | 11/10/2025 | 1 | 1 | (e)(h) | |||||||||||||||||||||||||||||||||
| Highline Aftermarket Acquisition, LLC | 2nd Lien Term Loan | 8.75% (3M LIBOR + 8.00%) | 11/9/2028 | 5,942 | 5,586 | (e)(f) | |||||||||||||||||||||||||||||||||
| Highline Aftermarket Acquisition, LLC | 2nd Lien Delayed Draw Term Loan | 8.75% (3M LIBOR + 8.00%) | 11/9/2028 | 4,209 | 3,956 | (e) | |||||||||||||||||||||||||||||||||
| Mavis Tire Express Services Topco Corp. | 1st Lien Revolver | 3.85% (1M LIBOR + 3.75%) | 5/4/2026 | 1 | — | (e)(h) | |||||||||||||||||||||||||||||||||
| Sun Acquirer Corp. | 1st Lien Revolver | 9/8/2027 | 1,059 | (21 | )(e)(h) | ||||||||||||||||||||||||||||||||||
| Sun Acquirer Corp. | 1st Lien Term Loan | 6.50% (1M LIBOR + 5.75%) | 9/8/2028 | 6,615 | 6,549 | (e) | |||||||||||||||||||||||||||||||||
| Sun Acquirer Corp. | 1st Lien Term Loan | 9/8/2028 | 1,766 | 1,748 | (e)(i) | ||||||||||||||||||||||||||||||||||
| Sun Acquirer Corp. | 1st Lien Delayed Draw Term Loan | 6.50% (3M LIBOR + 5.75%) | 9/8/2028 | 4,869 | 2,556 | (e)(h) | |||||||||||||||||||||||||||||||||
Truck Hero, Inc. | 1st Lien Term Loan | 4.00% (1M LIBOR + 3.25%) | 1/31/2028 | 7,475 | 7,426 | ||||||||||||||||||||||||||||||||||
| Wand Newco 3, Inc. | 1st Lien Term Loan | 3.18% (3M LIBOR + 3.00%) | 2/5/2026 | 4,191 | 4,126 | ||||||||||||||||||||||||||||||||||
| Wand Newco 3, Inc. | 2nd Lien Term Loan | 7.43% (3M LIBOR + 7.25%) | 2/5/2027 | 3,000 | 3,000 | (e)(f) | |||||||||||||||||||||||||||||||||
44,900 | 2.33 | % | |||||||||||||||||||||||||||||||||||||
Annual Report 2021
9
CION Ares Diversified Credit Fund
Consolidated Schedule of Investments (continued)
December 31, 2021
(in thousands, except shares, percentages and as otherwise noted)
Senior Loans(b)(c)(d) (continued)
Company | Country(a) | Investment | Interest | Maturity Date | Acquisition Date | Shares | Principal Amount(a) | Fair Value(a) | Percentage of Net Assets | ||||||||||||||||||||||||||||||
Capital Goods | |||||||||||||||||||||||||||||||||||||||
| Ali Group S.R.L. | Italy | 1st Lien Term Loan | 10/13/2028 | $ | 1,890 | $ | 1,877 | (i) | |||||||||||||||||||||||||||||||
| Alliance Laundry Systems LLC | 1st Lien Term Loan | 4.25% (3M LIBOR + 3.50%) | 10/8/2027 | 4,933 | 4,930 | ||||||||||||||||||||||||||||||||||
| Artera Services, LLC | 1st Lien Term Loan | 3.65% (3M LIBOR + 3.50%) | 3/6/2025 | 1,333 | 1,288 | ||||||||||||||||||||||||||||||||||
Box Bidco Limited | United Kingdom | 1st Lien Term Loan | 6.10% (6M LIBOR + 6.10%) | 11/24/2028 | 1,691 | 1,691 | (e)(f) | ||||||||||||||||||||||||||||||||
Box Bidco Limited | United Kingdom | 1st Lien Term Loan | 7.83% (6M EURIBOR + 7.83%) | 11/24/2028 | € | 878 | 1,000 | (e)(f) | |||||||||||||||||||||||||||||||
| Brookfield WEC Holdings Inc. | 1st Lien Term Loan | 3.25% (1M LIBOR + 2.75%) | 8/1/2025 | 6,901 | 6,843 | ||||||||||||||||||||||||||||||||||
Clarios Global LP | Canada | 1st Lien Term Loan | 3.34% (3M LIBOR + 3.25%) | 4/30/2026 | 1,925 | 1,912 | (i) | ||||||||||||||||||||||||||||||||
| Conair Holdings LLC | 1st Lien Term Loan | 4.25% (3M LIBOR + 3.75%) | 5/17/2028 | 3,526 | 3,524 | ||||||||||||||||||||||||||||||||||
| CP Atlas Buyer, Inc. | 1st Lien Term Loan | 4.25% (1M LIBOR + 3.75%) | 11/23/2027 | 8,512 | 8,465 | (i) | |||||||||||||||||||||||||||||||||
| Crown Subsea Communications Holding, Inc. | 1st Lien Term Loan | 5.50% (1M LIBOR + 4.75%) | 4/27/2027 | 1,212 | 1,216 | ||||||||||||||||||||||||||||||||||
| Dynamic NC Aerospace Holdings, LLC | 1st Lien Revolver | 12/30/2025 | 1,296 | (13 | )(e)(h) | ||||||||||||||||||||||||||||||||||
| Dynamic NC Aerospace Holdings, LLC | 1st Lien Term Loan | 7.50% (3M LIBOR + 6.50%) | 12/30/2026 | 3,293 | 3,260 | (e)(f) | |||||||||||||||||||||||||||||||||
| Dynasty Acquisition Co., Inc. | 1st Lien Term Loan | 3.63% (3M LIBOR + 3.50%) | 4/6/2026 | 5,985 | 5,814 | ||||||||||||||||||||||||||||||||||
Eleda BidCo AB | Sweden | 1st Lien Term Loan | 6.25% (3M STIBOR + 6.25%) | 6/30/2026 | SEK | 21,000 | 2,324 | (e)(f) | |||||||||||||||||||||||||||||||
Eleda BidCo AB | Sweden | 1st Lien Delayed Draw Term Loan | 6.25% (3M STIBOR + 6.25%) | 6/30/2026 | SEK | 9,070 | 1,004 | (e)(f) | |||||||||||||||||||||||||||||||
Eleda BidCo AB | Sweden | 1st Lien Delayed Draw Term Loan | 6/30/2026 | SEK | 8,000 | — | (e)(h)(i) | ||||||||||||||||||||||||||||||||
| EPS NASS Parent, Inc. | 1st Lien Revolver | 6.75% (1M LIBOR + 5.75%) | 4/17/2026 | 158 | 99 | (e)(h) | |||||||||||||||||||||||||||||||||
Annual Report 2021
10
CION Ares Diversified Credit Fund
Consolidated Schedule of Investments (continued)
December 31, 2021
(in thousands, except shares, percentages and as otherwise noted)
Senior Loans(b)(c)(d) (continued)
Company | Country(a) | Investment | Interest | Maturity Date | Acquisition Date | Shares | Principal Amount(a) | Fair Value(a) | Percentage of Net Assets | ||||||||||||||||||||||||||||||
| EPS NASS Parent, Inc. | 1st Lien Term Loan | 6.75% (3M LIBOR + 5.75%) | 4/19/2028 | $ | 5,832 | $ | 5,832 | (e)(f) | |||||||||||||||||||||||||||||||
| EPS NASS Parent, Inc. | 1st Lien Delayed Draw Term Loan | 4/19/2028 | 585 | — | (e)(h) | ||||||||||||||||||||||||||||||||||
| FCG Acquisitions, Inc. | 1st Lien Term Loan | 4.25% (3M LIBOR + 3.75%) | 3/31/2028 | 1,990 | 1,983 | ||||||||||||||||||||||||||||||||||
| Flow Control Solutions, Inc. | 1st Lien Revolver | 11/21/2024 | 373 | — | (e)(h) | ||||||||||||||||||||||||||||||||||
| Flow Control Solutions, Inc. | 1st Lien Term Loan | 6.50% (3M LIBOR + 5.50%) | 11/21/2024 | 1,268 | 1,268 | (e)(f) | |||||||||||||||||||||||||||||||||
| Flow Control Solutions, Inc. | 1st Lien Delayed Draw Term Loan | 6.50% (3M LIBOR + 5.50%) | 11/21/2024 | 1,118 | 1,118 | (e) | |||||||||||||||||||||||||||||||||
| Husky Injection Molding Systems Ltd. | Canada | 1st Lien Term Loan | 3.17% (3M LIBOR + 3.00%) | 3/28/2025 | 5,987 | 5,880 | |||||||||||||||||||||||||||||||||
| Kene Acquisition, Inc. | 1st Lien Revolver | 8/8/2024 | 676 | — | (e)(h) | ||||||||||||||||||||||||||||||||||
| Kene Acquisition, Inc. | 1st Lien Term Loan | 5.25% (3M LIBOR + 4.25%) | 8/10/2026 | 2,848 | 2,848 | (e)(f) | |||||||||||||||||||||||||||||||||
| Kene Acquisition, Inc. | 1st Lien Delayed Draw Term Loan | 5.25% (3M LIBOR + 4.25%) | 8/10/2026 | 476 | 476 | (e) | |||||||||||||||||||||||||||||||||
Kodiak BP, LLC | 1st Lien Term Loan | 4.00% (3M LIBOR + 3.25%) | 3/12/2028 | 8,512 | 8,441 | (i) | |||||||||||||||||||||||||||||||||
Madison IAQ LLC | 1st Lien Term Loan | 3.75% (6M LIBOR + 3.25%) | 6/21/2028 | 2,954 | 2,950 | ||||||||||||||||||||||||||||||||||
| Maverick Acquisition, Inc. | 1st Lien Term Loan | 7.00% (3M LIBOR + 6.00%) | 6/1/2027 | 5,348 | 5,294 | (e)(f) | |||||||||||||||||||||||||||||||||
| Maverick Acquisition, Inc. | 1st Lien Delayed Draw Term Loan | 7.00% (3M LIBOR + 6.00%) | 6/1/2027 | 1,915 | 1,197 | (e)(h) | |||||||||||||||||||||||||||||||||
| Maverick Acquisition, Inc. | 1st Lien Delayed Draw Term Loan | 6/1/2027 | 1,255 | (13 | )(e)(h) | ||||||||||||||||||||||||||||||||||
| Osmose Utilities Services, Inc. | 2nd Lien Term Loan | 7.25% (1M LIBOR + 6.75%) | 6/25/2029 | 8,237 | 8,155 | (e) | |||||||||||||||||||||||||||||||||
| Osmosis Buyer, Ltd. | 1st Lien Term Loan | 4.50% (1M LIBOR + 4.00%) | 7/31/2028 | 6,894 | 6,899 | ||||||||||||||||||||||||||||||||||
| Osmosis Buyer, Ltd. | 1st Lien Delayed Draw Term Loan | 7/31/2028 | 790 | 1 | (h)(i) | ||||||||||||||||||||||||||||||||||
Annual Report 2021
11
CION Ares Diversified Credit Fund
Consolidated Schedule of Investments (continued)
December 31, 2021
(in thousands, except shares, percentages and as otherwise noted)
Senior Loans(b)(c)(d) (continued)
Company | Country(a) | Investment | Interest | Maturity | Acquisition | Shares | Principal | Fair Value(a) | Percentage | ||||||||||||||||||||||||||||||
Patagonia BidCo | United | 1st Lien Term | 11/1/2028 | £ | 4,115 | $ | 5,528 | (i) | |||||||||||||||||||||||||||||||
Peraton Corp. | 1st Lien Term | 4.50% (1M | 2/1/2028 | 1,985 | 1,984 | ||||||||||||||||||||||||||||||||||
Radius Aerospace | United | 1st Lien | 3/29/2025 | £ | 186 | (2 | )(e)(h) | ||||||||||||||||||||||||||||||||
Radius Aerospace | United | 1st Lien Term | 6.75% (3M | 3/29/2025 | 1,594 | 1,578 | (e)(f) | ||||||||||||||||||||||||||||||||
Radius Aerospace, | 1st Lien | 3/29/2025 | 429 | (4 | )(e)(h) | ||||||||||||||||||||||||||||||||||
Radius Aerospace, | 1st Lien Term | 6.75% (3M | 3/29/2025 | 2,416 | 2,392 | (e)(f) | |||||||||||||||||||||||||||||||||
Setanta Aircraft | Ireland | 1st Lien Term | 2.14% (3M | 11/5/2028 | 2,000 | 1,998 | |||||||||||||||||||||||||||||||||
Sigma Electric | 1st Lien | 10/31/2022 | 1 | — | (e)(h) | ||||||||||||||||||||||||||||||||||
Sigma Electric | 1st Lien Term | 5.75% (3M | 10/31/2023 | 423 | 423 | (e)(f) | |||||||||||||||||||||||||||||||||
Specialty Building | 1st Lien Term | 10/15/2028 | 6,000 | 5,981 | (i) | ||||||||||||||||||||||||||||||||||
SRS Distribution | 1st Lien Term | 4.25% (3M | 6/2/2028 | 6,108 | 6,088 | ||||||||||||||||||||||||||||||||||
Star US Bidco LLC | 1st Lien Term | 5.25% (1M | 3/17/2027 | 3,576 | 3,564 | ||||||||||||||||||||||||||||||||||
Sunk Rock Foundry | 1st Lien Term | 5.75% (3M | 10/31/2023 | 201 | 201 | (e)(f) | |||||||||||||||||||||||||||||||||
Tank Holding Corp. | 1st Lien Term | 3.35% (1M | 3/26/2026 | 5,459 | 5,404 | (i) | |||||||||||||||||||||||||||||||||
Tank Holding Corp. | 1st Lien Term | 5.75% (1M | 3/26/2026 | 2,824 | 2,831 | (i) | |||||||||||||||||||||||||||||||||
TransDigm Group | 1st Lien Term | 2.35% (1M | 8/22/2024 | 423 | 418 | ||||||||||||||||||||||||||||||||||
TransDigm Group | 1st Lien Term | 2.35% (1M | 12/9/2025 | 2,970 | 2,926 | ||||||||||||||||||||||||||||||||||
Turbo Acquisitions | United | 1st Lien Term | 7.30% | 2/26/2027 | £ | 2,516 | 3,405 | (e)(f) | |||||||||||||||||||||||||||||||
Annual Report 2021
12
CION Ares Diversified Credit Fund
Consolidated Schedule of Investments (continued)
December 31, 2021
(in thousands, except shares, percentages and as otherwise noted)
Senior Loans(b)(c)(d) (continued)
Company | Country(a) | Investment | Interest | Maturity Date | Acquisition Date | Shares | Principal Amount(a) | Fair Value(a) | Percentage of Net Assets | ||||||||||||||||||||||||||||||
| Turbo Acquisitions 10 Bidco Limited | United Kingdom | 1st Lien Delayed Draw Term Loan | 7.42% (SONIA + 7.25%) | 2/26/2027 | £ | 2,827 | $ | 3,826 | (e)(f) | ||||||||||||||||||||||||||||||
| Turbo Acquisitions 10 Bidco Limited | United Kingdom | 1st Lien Delayed Draw Term Loan | 7.42% (SONIA + 7.25%) | 2/26/2027 | £ | 1,346 | 1,161 | (e)(h) | |||||||||||||||||||||||||||||||
| VC GB Holdings I Corp | 1st Lien Term Loan | 4.00% (3M LIBOR + 3.50%) | 7/21/2028 | 735 | 728 | ||||||||||||||||||||||||||||||||||
| VC GB Holdings I Corp | 2nd Lien Term Loan | 7.25% (3M LIBOR + 6.75%) | 7/23/2029 | 3,200 | 3,166 | (i) | |||||||||||||||||||||||||||||||||
Victory Buyer LLC | 1st Lien Term Loan | 11/19/2028 | 5,787 | 5,779 | (e)(i) | ||||||||||||||||||||||||||||||||||
Welbilt, Inc. | 1st Lien Term Loan | 2.60% (1M LIBOR + 2.50%) | 10/23/2025 | 7,902 | 7,866 | ||||||||||||||||||||||||||||||||||
Wilsonart LLC | 1st Lien Term Loan | 4.50% (3M LIBOR + 3.50%) | 12/31/2026 | 6,432 | 6,427 | ||||||||||||||||||||||||||||||||||
171,231 | 8.87 | % | |||||||||||||||||||||||||||||||||||||
Commercial & Professional Services | |||||||||||||||||||||||||||||||||||||||
| Aero Operating LLC | 1st Lien Term Loan | 8.00% (1M LIBOR + 6.50%) | 2/9/2026 | 2,874 | 2,874 | (e)(f) | |||||||||||||||||||||||||||||||||
| Aero Operating LLC | 1st Lien Term Loan | 8.00% (3M LIBOR + 6.50%) | 2/9/2026 | 91 | 91 | (e)(f) | |||||||||||||||||||||||||||||||||
| Aero Operating LLC | 1st Lien Delayed Draw Term Loan | 8.00% (3M LIBOR + 6.50%) | 2/9/2026 | 825 | 825 | (e) | |||||||||||||||||||||||||||||||||
AlixPartners, LLP | 1st Lien Term Loan | 3.25% (1M LIBOR + 2.75%) | 2/4/2028 | 1,985 | 1,976 | ||||||||||||||||||||||||||||||||||
| Argenbright Holdings V, LLC | 1st Lien Term Loan | 7.00% (1M LIBOR + 6.00%) | 11/30/2026 | 2,848 | 2,820 | (e)(f) | |||||||||||||||||||||||||||||||||
| Argenbright Holdings V, LLC | 1st Lien Delayed Draw Term Loan | 11/30/2026 | 178 | (2 | )(e)(h) | ||||||||||||||||||||||||||||||||||
| ASG Bidco Limited | United Kingdom | 1st Lien Delayed Draw Term Loan | 7.05% (SONIA + 7.00%) | 4/27/2027 | £ | 2,947 | 3,989 | (e)(f) | |||||||||||||||||||||||||||||||
| ASG Bidco Limited | United Kingdom | 1st Lien Delayed Draw Term Loan | 4/27/2027 | £ | 553 | — | (e)(h) | ||||||||||||||||||||||||||||||||
| Auxadi Midco S.L.U. | Spain | 1st Lien Term Loan | 4.75% (3M EURIBOR + 4.75%) | 7/17/2028 | € | 836 | 952 | (e) | |||||||||||||||||||||||||||||||
Annual Report 2021
13
CION Ares Diversified Credit Fund
Consolidated Schedule of Investments (continued)
December 31, 2021
(in thousands, except shares, percentages and as otherwise noted)
Senior Loans(b)(c)(d) (continued)
Company | Country(a) | Investment | Interest | Maturity Date | Acquisition Date | Shares | Principal Amount(a) | Fair Value(a) | Percentage of Net Assets | ||||||||||||||||||||||||||||||
| Auxadi Midco S.L.U. | Spain | 1st Lien Term Loan | 7/17/2028 | € | 1,273 | $ | — | (e)(h) | |||||||||||||||||||||||||||||||
| Capstone Acquisition Holdings, Inc. | 1st Lien Revolver | 7.00% (PRIME + 4.75%) | 11/12/2025 | 1,150 | 177 | (e)(h) | |||||||||||||||||||||||||||||||||
| Capstone Acquisition Holdings, Inc. | 1st Lien Term Loan | 5.75% (1M LIBOR + 4.75%) | 11/12/2027 | 10,953 | 10,953 | (e)(f) | |||||||||||||||||||||||||||||||||
| Capstone Acquisition Holdings, Inc. | 1st Lien Delayed Draw Term Loan | 5.75% (3M LIBOR + 4.75%) | 11/12/2027 | 1,679 | 642 | (e)(h) | |||||||||||||||||||||||||||||||||
| Capstone Acquisition Holdings, Inc. | 2nd Lien Term Loan | 9.75% (1M LIBOR + 8.75%) | 11/13/2028 | 3,008 | 3,008 | (e)(f) | |||||||||||||||||||||||||||||||||
| Capstone Acquisition Holdings, Inc. | 2nd Lien Delayed Draw Term Loan | 11/13/2028 | 531 | — | (e)(h) | ||||||||||||||||||||||||||||||||||
| CED France Holding | France | 1st Lien Term Loan | 6.00% (3M EURIBOR + 6.00%) | 12/10/2025 | € | 1,038 | 1,182 | (e)(f) | |||||||||||||||||||||||||||||||
| Deerfield Dakota Holding, LLC | 2nd Lien Term Loan | 7.50% (1M LIBOR + 6.75%) | 4/7/2028 | 2,050 | 2,086 | ||||||||||||||||||||||||||||||||||
| Dun & Bradstreet Corporation | 1st Lien Term Loan | 3.35% (1M LIBOR + 3.25%) | 2/6/2026 | 6,789 | 6,758 | ||||||||||||||||||||||||||||||||||
| Elevation Services Parent Holdings, LLC | 1st Lien Revolver | 7.00% (1M LIBOR + 6.00%) | 12/18/2026 | 386 | 296 | (e)(h) | |||||||||||||||||||||||||||||||||
| Elevation Services Parent Holdings, LLC | 1st Lien Term Loan | 7.00% (3M LIBOR + 6.00%) | 12/18/2026 | 1,337 | 1,337 | (e)(f) | |||||||||||||||||||||||||||||||||
| Elevation Services Parent Holdings, LLC | 1st Lien Delayed Draw Term Loan | 7.00% (3M LIBOR + 6.00%) | 12/18/2026 | 1,787 | 1,787 | (e) | |||||||||||||||||||||||||||||||||
| Eucalyptus BidCo Pty Ltd | Australia | 1st Lien Term Loan | 11/15/2027 | AUD | 1,337 | 1 | (e)(h)(i) | ||||||||||||||||||||||||||||||||
| Eucalyptus BidCo Pty Ltd | Australia | 1st Lien Term Loan | 12/23/2027 | AUD | 11,142 | 8,106 | (e)(f)(i) | ||||||||||||||||||||||||||||||||
| FC Sun Intressenter AB | Sweden | 1st Lien Term Loan | 12/20/2028 | € | 8,685 | 9,935 | (e)(f)(i) | ||||||||||||||||||||||||||||||||
| FC Sun Intressenter AB | Sweden | 1st Lien Delayed Draw Term Loan | 12/20/2028 | € | 10,909 | 2 | (e)(h)(i) | ||||||||||||||||||||||||||||||||
| GFL Environmental, Inc. | Canada | 1st Lien Term Loan | 3.50% (3M LIBOR + 3.00%) | 5/30/2025 | 2,572 | 2,577 | |||||||||||||||||||||||||||||||||
HH-Stella, Inc. | 1st Lien Revolver | 6.50% (1M LIBOR + 5.50%) | 4/22/2027 | 444 | 51 | (e)(h) | |||||||||||||||||||||||||||||||||
Annual Report 2021
14
CION Ares Diversified Credit Fund
Consolidated Schedule of Investments (continued)
December 31, 2021
(in thousands, except shares, percentages and as otherwise noted)
Senior Loans(b)(c)(d) (continued)
Company | Country(a) | Investment | Interest | Maturity Date | Acquisition Date | Shares | Principal Amount(a) | Fair Value(a) | Percentage of Net Assets | ||||||||||||||||||||||||||||||
HH-Stella, Inc. | 1st Lien Term Loan | 6.50% (1M LIBOR + 5.50%) | 4/24/2028 | $ | 6,154 | $ | 6,154 | (e)(f) | |||||||||||||||||||||||||||||||
HH-Stella, Inc. | 1st Lien Delayed Draw Term Loan | 6.50% (1M LIBOR + 5.50%) | 4/24/2028 | 1,979 | 311 | (e)(h) | |||||||||||||||||||||||||||||||||
IRI Holdings, Inc. | 1st Lien Term Loan | 4.35% (1M LIBOR + 4.25%) | 12/1/2025 | 1,635 | 1,635 | (e)(f) | |||||||||||||||||||||||||||||||||
IRI Holdings, Inc. | 2nd Lien Term Loan | 8.10% (1M LIBOR + 8.00%) | 11/30/2026 | 1,472 | 1,472 | (e)(f) | |||||||||||||||||||||||||||||||||
| Kellermeyer Bergensons Services, LLC | 1st Lien Term Loan | 6.75% (3M LIBOR + 5.75%) | 11/7/2026 | 1,764 | 1,764 | (e)(f) | |||||||||||||||||||||||||||||||||
| Kellermeyer Bergensons Services, LLC | 1st Lien Term Loan | 6.75% (3M LIBOR + 5.75%) | 11/7/2026 | 6,099 | 6,099 | (e) | |||||||||||||||||||||||||||||||||
| Kellermeyer Bergensons Services, LLC | 1st Lien Delayed Draw Term Loan | 6.75% (3M LIBOR + 5.75%) | 11/7/2026 | 4,947 | 2,772 | (e)(h) | |||||||||||||||||||||||||||||||||
| Laboratories Bidco LLC | 1st Lien Revolver | 7/23/2027 | 1,562 | — | (e)(h) | ||||||||||||||||||||||||||||||||||
| Laboratories Bidco LLC | 1st Lien Term Loan | 6.75% (3M CDOR + 5.75%) | 7/23/2027 | CAD | 1,780 | 1,407 | (e)(f) | ||||||||||||||||||||||||||||||||
| Laboratories Bidco LLC | 1st Lien Term Loan | 6.75% (3M LIBOR + 5.75%) | 7/23/2027 | 5,841 | 5,841 | (e)(f) | |||||||||||||||||||||||||||||||||
| Laboratories Bidco LLC | 1st Lien Term Loan | 6.75% (3M LIBOR + 5.75%) | 7/23/2027 | 4,006 | 4,006 | (e) | |||||||||||||||||||||||||||||||||
| Laboratories Bidco LLC | 1st Lien Delayed Draw Term Loan | 7/23/2027 | 2,201 | — | (e)(h) | ||||||||||||||||||||||||||||||||||
| Lavatio Midco Sarl | Luxembourg | 1st Lien Delayed Draw Term Loan | 7.50% (6M EURIBOR + 7.25%) | 11/30/2026 | € | 793 | 857 | (e)(f) | |||||||||||||||||||||||||||||||
| Lavatio Midco Sarl | Luxembourg | 1st Lien Delayed Draw Term Loan | 7.50% (6M EURIBOR + 7.25%) | 11/30/2026 | € | 982 | 641 | (e)(h) | |||||||||||||||||||||||||||||||
| Marmic Purchaser, LLC | 1st Lien Revolver | 7.00% (3M LIBOR + 6.00%) | 3/5/2027 | 287 | 100 | (e)(h) | |||||||||||||||||||||||||||||||||
| Marmic Purchaser, LLC | 1st Lien Term Loan | 7.00% (3M LIBOR + 6.00%) | 3/5/2027 | 2,047 | 2,047 | (e)(f) | |||||||||||||||||||||||||||||||||
| Marmic Purchaser, LLC | 1st Lien Delayed Draw Term Loan | 7.00% (3M LIBOR + 6.00%) | 3/5/2027 | 1,196 | 1,196 | (e) | |||||||||||||||||||||||||||||||||
Annual Report 2021
15
CION Ares Diversified Credit Fund
Consolidated Schedule of Investments (continued)
December 31, 2021
(in thousands, except shares, percentages and as otherwise noted)
Senior Loans(b)(c)(d) (continued)
Company | Country(a) | Investment | Interest | Maturity Date | Acquisition Date | Shares | Principal Amount(a) | Fair Value(a) | Percentage of Net Assets | ||||||||||||||||||||||||||||||
| MIP V Waste Holdings, LLC | 1st Lien Term Loan | 12/8/2028 | $ | 5,000 | $ | 4,981 | (i) | ||||||||||||||||||||||||||||||||
| MPLC Debtco Limited | Jersey | 1st Lien Delayed Draw Term Loan | 7.75% (6M GBP LIBOR + 7.25%) | 1/7/2027 | £ | 1,052 | 1,423 | (e)(f) | |||||||||||||||||||||||||||||||
| MPLC Debtco Limited | Jersey | 1st Lien Delayed Draw Term Loan | 8.75% (6M LIBOR + 7.25%) | 1/7/2027 | 2,100 | 2,100 | (e)(f) | ||||||||||||||||||||||||||||||||
| Nest Topco Borrower Inc. | 1st Lien Term Loan | 9.00% (3M LIBOR + 8.50%) | 8/31/2029 | 13,162 | 13,030 | (e) | |||||||||||||||||||||||||||||||||
| Nest Topco Borrower Inc. | 1st Lien Delayed Draw Term Loan | 8/31/2029 | 13,162 | (132 | )(e)(h) | ||||||||||||||||||||||||||||||||||
| North American Fire Holdings, LLC | 1st Lien Revolver | 5/19/2027 | 411 | — | (e)(h) | ||||||||||||||||||||||||||||||||||
| North American Fire Holdings, LLC | 1st Lien Term Loan | 7.00% (3M LIBOR + 6.00%) | 5/19/2027 | 2,327 | 2,327 | (e)(f) | |||||||||||||||||||||||||||||||||
| North American Fire Holdings, LLC | 1st Lien Delayed Draw Term Loan | 5/19/2027 | 2,462 | — | (e)(h) | ||||||||||||||||||||||||||||||||||
| North Haven Stack Buyer, LLC | 1st Lien Revolver | 7/16/2027 | 259 | (5 | )(e)(h) | ||||||||||||||||||||||||||||||||||
| North Haven Stack Buyer, LLC | 1st Lien Term Loan | 6.50% (3M LIBOR + 5.50%) | 7/16/2027 | 1,333 | 1,320 | (e) | |||||||||||||||||||||||||||||||||
| North Haven Stack Buyer, LLC | 1st Lien Delayed Draw Term Loan | 6.50% (3M LIBOR + 5.50%) | 7/16/2027 | 1,016 | 29 | (e)(h) | |||||||||||||||||||||||||||||||||
| P27 BIDCO Limited | United Kingdom | 1st Lien Delayed Draw Term Loan | 8.25% (6M GBP LIBOR + 7.50%) | 7/31/2026 | £ | 2,031 | 2,149 | (e)(h) | |||||||||||||||||||||||||||||||
| P27 BIDCO Limited | United Kingdom | 1st Lien Delayed Draw Term Loan | 8.25% (6M LIBOR + 7.50%) | 7/31/2026 | 610 | 555 | (e) | ||||||||||||||||||||||||||||||||
| Packers Holdings, LLC | 1st Lien Term Loan | 4.00% (3M LIBOR + 3.25%) | 3/9/2028 | 5,193 | 5,156 | ||||||||||||||||||||||||||||||||||
| Petroleum Service Group LLC | 1st Lien Revolver | 7.00% (3M LIBOR + 6.00%) | 7/23/2025 | 2,106 | 351 | (e)(h) | |||||||||||||||||||||||||||||||||
| Petroleum Service Group LLC | 1st Lien Term Loan | 7.00% (3M LIBOR + 6.00%) | 7/23/2025 | 8,930 | 8,930 | (e)(f) | |||||||||||||||||||||||||||||||||
| Petroleum Service Group LLC | 1st Lien Delayed Draw Term Loan | 1.00% (3M LIBOR + 1.00%) | 7/23/2025 | 1,607 | 102 | (e)(h) | |||||||||||||||||||||||||||||||||
| Petroleum Service Group LLC | 1st Lien Delayed Draw Term Loan | 7.00% (3M LIBOR + 6.00%) | 7/23/2025 | 107 | 107 | (e) | |||||||||||||||||||||||||||||||||
Annual Report 2021
16
CION Ares Diversified Credit Fund
Consolidated Schedule of Investments (continued)
December 31, 2021
(in thousands, except shares, percentages and as otherwise noted)
Senior Loans(b)(c)(d) (continued)
Company | Country(a) | Investment | Interest | Maturity Date | Acquisition Date | Shares | Principal Amount(a) | Fair Value(a) | Percentage of Net Assets | ||||||||||||||||||||||||||||||
| Registrar Intermediate, LLC | 1st Lien Revolver | 8/26/2027 | $ | 764 | $ | (15 | )(e)(h) | ||||||||||||||||||||||||||||||||
| Registrar Intermediate, LLC | 1st Lien Term Loan | 6.50% (3M LIBOR + 5.50%) | 8/26/2027 | 4,188 | 4,146 | (e) | |||||||||||||||||||||||||||||||||
| Registrar Intermediate, LLC | 1st Lien Delayed Draw Term Loan | 8/26/2027 | 2,327 | (23 | )(e)(h) | ||||||||||||||||||||||||||||||||||
| Rodeo AcquisitionCo LLC | 1st Lien Revolver | 7.00% (3M LIBOR + 6.00%) | 7/26/2027 | 311 | 37 | (e)(h) | |||||||||||||||||||||||||||||||||
| Rodeo AcquisitionCo LLC | 1st Lien Term Loan | 7.00% (3M LIBOR + 6.00%) | 7/26/2027 | 2,118 | 2,097 | (e) | |||||||||||||||||||||||||||||||||
| Rodeo AcquisitionCo LLC | 1st Lien Delayed Draw Term Loan | 7/26/2027 | 460 | (5 | )(e)(h) | ||||||||||||||||||||||||||||||||||
RSK Group Limited | United Kingdom | 1st Lien Term Loan | 5.05% (SONIA + 5.00%) | 8/7/2028 | £ | 3,276 | 2,789 | (e)(h) | |||||||||||||||||||||||||||||||
RSK Group Limited | United Kingdom | 1st Lien Term Loan | 5.25% | 8/7/2028 | € | 986 | 1,123 | (e)(f) | |||||||||||||||||||||||||||||||
RSK Group Limited | United Kingdom | 1st Lien Term Loan | 7.17% (SONIA + 7.00%) | 8/7/2028 | £ | 7,881 | 10,667 | (e)(f) | |||||||||||||||||||||||||||||||
| Schill Landscaping and Lawn Care Services, LLC | 1st Lien Revolver | 12/16/2027 | 720 | (14 | )(e)(h) | ||||||||||||||||||||||||||||||||||
| Schill Landscaping and Lawn Care Services, LLC | 1st Lien Term Loan | 6.75% (3M LIBOR + 5.75%) | 12/16/2027 | 2,590 | 2,564 | (e)(f) | |||||||||||||||||||||||||||||||||
| Schill Landscaping and Lawn Care Services, LLC | 1st Lien Delayed Draw Term Loan | 12/16/2027 | 1,542 | (15 | )(e)(h) | ||||||||||||||||||||||||||||||||||
SLR BD Limited | United Kingdom | 1st Lien Term Loan | 7.15% (6M LIBOR + 7.00%) | 9/22/2028 | 753 | 753 | (e)(f) | ||||||||||||||||||||||||||||||||
SLR BD Limited | United Kingdom | 1st Lien Term Loan | 7.33% (SONIA + 7.00%) | 9/22/2028 | £ | 1,226 | 1,660 | (e)(f) | |||||||||||||||||||||||||||||||
SLR BD Limited | United Kingdom | 1st Lien Term Loan | 7.33% (SONIA + 7.00%) | 9/22/2028 | £ | 1,232 | 233 | (e)(h) | |||||||||||||||||||||||||||||||
SSE Buyer, Inc. | 1st Lien Revolver | 3.00% (1M LIBOR + 2.00%) | 6/30/2025 | 3 | 1 | (e)(h) | |||||||||||||||||||||||||||||||||
SSE Buyer, Inc. | 1st Lien Term Loan | 10.22% (3M LIBOR + 9.22%) | 6/30/2026 | 620 | 576 | (e)(f) | |||||||||||||||||||||||||||||||||
| Stealth Holding LLC | 1st Lien Term Loan | 7.75% (3M LIBOR + 6.75%) | 3/2/2026 | 2,480 | 2,480 | (e)(f) | |||||||||||||||||||||||||||||||||
Annual Report 2021
17
CION Ares Diversified Credit Fund
Consolidated Schedule of Investments (continued)
December 31, 2021
(in thousands, except shares, percentages and as otherwise noted)
Senior Loans(b)(c)(d) (continued)
Company | Country(a) | Investment | Interest | Maturity Date | Acquisition Date | Shares | Principal Amount(a) | Fair Value(a) | Percentage of Net Assets | ||||||||||||||||||||||||||||||
| Stealth Holding LLC | 1st Lien Delayed Draw Term Loan | 7.75% (3M LIBOR + 6.75%) | 3/2/2026 | $ | 988 | $ | 711 | (e)(h) | |||||||||||||||||||||||||||||||
| Survitec Group Holdco Limited | United Kingdom | 1st Lien Term Loan | 7.55% (SONIA + 7.50%) | 4/6/2027 | £ | 9,000 | 12,182 | (e)(f) | |||||||||||||||||||||||||||||||
| Tempo Acquisition, LLC | 1st Lien Term Loan | 2.85% (1M LIBOR + 2.75%) | 5/1/2024 | 170 | 170 | ||||||||||||||||||||||||||||||||||
| Tempo Acquisition, LLC | 1st Lien Term Loan | 3.75% (1M LIBOR + 3.25%) | 11/2/2026 | 1,310 | 1,311 | ||||||||||||||||||||||||||||||||||
| Thermostat Purchaser III, Inc. | 1st Lien Revolver | 8/31/2026 | 100 | (2 | )(e)(h) | ||||||||||||||||||||||||||||||||||
| Thermostat Purchaser III, Inc. | 2nd Lien Term Loan | 8.00% (1M LIBOR + 7.25%) | 8/31/2029 | 3,575 | 3,539 | (e) | |||||||||||||||||||||||||||||||||
| Thermostat Purchaser III, Inc. | 2nd Lien Delayed Draw Term Loan | 8/31/2029 | 612 | (6 | )(e)(h) | ||||||||||||||||||||||||||||||||||
| UCIT Online Security Inc. | Canada | 1st Lien Term Loan | 7.75% (3M LIBOR + 6.75%) | 3/2/2026 | 1,653 | 1,653 | (e)(f) | ||||||||||||||||||||||||||||||||
| Visual Edge Technology, Inc. | 1st Lien Term Loan | 9.75% (3M LIBOR + 8.25%) | 8/31/2022 | 161 | 153 | (e)(f) | |||||||||||||||||||||||||||||||||
| Visual Edge Technology, Inc. | 1st Lien Delayed Draw Term Loan | 9.75% (3M LIBOR + 8.25%) | 8/31/2022 | 1,976 | 1,877 | (e)(f) | |||||||||||||||||||||||||||||||||
| VLS Recovery Services, LLC | 1st Lien Revolver | 6.50% (1M LIBOR + 5.50%) | 10/17/2024 | 622 | 53 | (e)(h) | |||||||||||||||||||||||||||||||||
| VLS Recovery Services, LLC | 1st Lien Term Loan | 6.50% (3M LIBOR + 5.50%) | 10/17/2024 | 974 | 974 | (e)(f) | |||||||||||||||||||||||||||||||||
| VLS Recovery Services, LLC | 1st Lien Term Loan | 6.50% (3M LIBOR + 5.50%) | 10/17/2024 | 3,912 | 3,912 | (e) | |||||||||||||||||||||||||||||||||
| VLS Recovery Services, LLC | 1st Lien Delayed Draw Term Loan | 6.50% (3M LIBOR + 5.50%) | 10/17/2024 | 1,157 | 1,157 | (e) | |||||||||||||||||||||||||||||||||
| VLS Recovery Services, LLC | 1st Lien Delayed Draw Term Loan | 6.50% (3M LIBOR + 5.50%) | 10/17/2024 | 43 | 43 | (e)(f) | |||||||||||||||||||||||||||||||||
| VLS Recovery Services, LLC | 1st Lien Delayed Draw Term Loan | 10/17/2024 | 1,385 | — | (e)(h) | ||||||||||||||||||||||||||||||||||
XSYS Global | Germany | 1st Lien Term Loan | 11/4/2028 | € | 5,000 | 5,691 | (i) | ||||||||||||||||||||||||||||||||
203,620 | 10.55 | % | |||||||||||||||||||||||||||||||||||||
Annual Report 2021
18
CION Ares Diversified Credit Fund
Consolidated Schedule of Investments (continued)
December 31, 2021
(in thousands, except shares, percentages and as otherwise noted)
Senior Loans(b)(c)(d) (continued)
Company | Country(a) | Investment | Interest | Maturity Date | Acquisition Date | Shares | Principal Amount(a) | Fair Value(a) | Percentage of Net Assets | ||||||||||||||||||||||||||||||
Consumer Durables & Apparel | |||||||||||||||||||||||||||||||||||||||
| Centric Brands LLC | 1st Lien Revolver | 6.50% (3M LIBOR + 5.50%) | 10/9/2024 | $ | 269 | $ | 79 | (e)(h) | |||||||||||||||||||||||||||||||
| Centric Brands LLC | 1st Lien Term Loan | 10.00% (3M LIBOR + 10.00%) | 10/9/2025 | 2,309 | 2,286 | (e) | |||||||||||||||||||||||||||||||||
| DRS Holdings III, Inc. | 1st Lien Revolver | 11/1/2025 | 173 | — | (e)(h) | ||||||||||||||||||||||||||||||||||
| DRS Holdings III, Inc. | 1st Lien Term Loan | 6.75% (1M LIBOR + 5.75%) | 11/1/2025 | 15,694 | 15,694 | (e)(f) | |||||||||||||||||||||||||||||||||
| Installed Building Products, Inc | 1st Lien Term Loan | 12/14/2028 | 5,000 | 5,000 | (i) | ||||||||||||||||||||||||||||||||||
| MSG National Properties, LLC | 1st Lien Term Loan | 7.00% (3M LIBOR + 6.25%) | 11/12/2025 | 743 | 757 | (e) | |||||||||||||||||||||||||||||||||
| Rawlings Sporting Goods Company, Inc. | 1st Lien Revolver | 4.75% (1M LIBOR + 3.75%) | 12/31/2025 | 1 | 1 | (e)(h) | |||||||||||||||||||||||||||||||||
| Rawlings Sporting Goods Company, Inc. | 1st Lien Term Loan | 7.75% (3M LIBOR + 6.75%) | 12/31/2026 | 6,729 | 6,729 | (e)(f) | |||||||||||||||||||||||||||||||||
| TGP Holdings III LLC | 1st Lien Term Loan | 4.25% (3M LIBOR + 3.50%) | 6/29/2028 | 7,308 | 7,268 | ||||||||||||||||||||||||||||||||||
| TGP Holdings III LLC | 1st Lien Delayed Draw Term Loan | 6/29/2028 | 964 | (5 | )(h) | ||||||||||||||||||||||||||||||||||
37,809 | 1.96 | % | |||||||||||||||||||||||||||||||||||||
Consumer Services | |||||||||||||||||||||||||||||||||||||||
A.U.L. Corp. | 1st Lien Revolver | 6/5/2023 | 1 | — | (e)(h) | ||||||||||||||||||||||||||||||||||
A.U.L. Corp. | 1st Lien Term Loan | 5.50% (1M LIBOR + 4.50%) | 6/5/2023 | 28 | 28 | (e)(f) | |||||||||||||||||||||||||||||||||
| Aimbridge Acquisition Co., Inc. | 2nd Lien Term Loan | 7.60% (1M LIBOR + 7.50%) | 2/1/2027 | 4,788 | 4,549 | (e)(f) | |||||||||||||||||||||||||||||||||
| Alterra Mountain Company | 1st Lien Term Loan | 4.00% (1M LIBOR + 3.50%) | 8/17/2028 | 2,886 | 2,878 | ||||||||||||||||||||||||||||||||||
| American Residential Services L.L.C. | 1st Lien Revolver | 10/15/2025 | 1 | — | (e)(h) | ||||||||||||||||||||||||||||||||||
| American Residential Services L.L.C. | 2nd Lien Term Loan | 9.50% (3M LIBOR + 8.50%) | 10/16/2028 | 8,314 | 8,314 | (e) | |||||||||||||||||||||||||||||||||
Annual Report 2021
19
CION Ares Diversified Credit Fund
Consolidated Schedule of Investments (continued)
December 31, 2021
(in thousands, except shares, percentages and as otherwise noted)
Senior Loans(b)(c)(d) (continued)
Company | Country(a) | Investment | Interest | Maturity | Acquisition | Shares | Principal | Fair Value(a) | Percentage | ||||||||||||||||||||||||||||||
Apollo Finco | Belgium | 1st Lien Term | 10/19/2028 | € | 5,000 | $ | 5,486 | (i) | |||||||||||||||||||||||||||||||
Aspris Bidco | United | 1st Lien Term | 6.42% | 8/23/2028 | £ | 3,234 | 4,378 | (e)(f) | |||||||||||||||||||||||||||||||
Aspris Bidco | United | 1st Lien Term | 8/23/2028 | £ | 1,406 | — | (e)(h) | ||||||||||||||||||||||||||||||||
Belron Finance | 1st Lien Term | 2.44% (3M | 10/30/2026 | 1,284 | 1,274 | ||||||||||||||||||||||||||||||||||
Caesars Resort | 1st Lien Term | 3.59% (1M | 7/21/2025 | 2,106 | 2,105 | ||||||||||||||||||||||||||||||||||
Canopy Bidco | United | 1st Lien Term | 7.75% (3M | 12/18/2024 | £ | 509 | 689 | (e)(f) | |||||||||||||||||||||||||||||||
Canopy Bidco | United | 1st Lien | 7.75% (3M | 12/18/2024 | £ | 502 | 178 | (e)(f)(h) | |||||||||||||||||||||||||||||||
CC Fly Holding II | Denmark | 1st Lien Term | 9.22% (3M | 5/9/2025 | DKK | 626 | 88 | (e)(f) | |||||||||||||||||||||||||||||||
CC Fly Holding II | Denmark | 1st Lien | 8.75% (3M | 5/9/2025 | DKK | 4,823 | 664 | (e)(f) | |||||||||||||||||||||||||||||||
CC Fly Holding II | Denmark | 1st Lien | 9.22% (3M | 5/9/2025 | DKK | 2,975 | 394 | (e)(f)(h) | |||||||||||||||||||||||||||||||
Entain PLC | Isle Of Man | 1st Lien Term | 3.00% (3M | 3/29/2027 | 4,975 | 4,958 | |||||||||||||||||||||||||||||||||
Equinox Holdings | 1st Lien Term | 4.00% (3M | 3/8/2024 | 2,573 | 2,438 | ||||||||||||||||||||||||||||||||||
Equinox Holdings | 2nd Lien Term | 8.00% (3M | 9/6/2024 | 5,736 | 5,109 | ||||||||||||||||||||||||||||||||||
Essential Services | 1st Lien | 11/17/2025 | 1,560 | — | (e)(h) | ||||||||||||||||||||||||||||||||||
Essential Services | 1st Lien Term | 6.75% (3M | 11/16/2026 | 9,717 | 9,717 | (e)(f) | |||||||||||||||||||||||||||||||||
Essential Services | 1st Lien | 6.75% (3M | 11/16/2026 | 22,105 | 22,105 | (e) | |||||||||||||||||||||||||||||||||
Essential Services | 1st Lien | 11/16/2026 | 8,146 | — | (e)(h) | ||||||||||||||||||||||||||||||||||
EuroParcs | Netherlands | 1st Lien Term | 5.75% (3M | 7/3/2026 | € | 2,652 | 3,020 | (e) | |||||||||||||||||||||||||||||||
Annual Report 2021
20
CION Ares Diversified Credit Fund
Consolidated Schedule of Investments (continued)
December 31, 2021
(in thousands, except shares, percentages and as otherwise noted)
Senior Loans(b)(c)(d) (continued)
Company | Country(a) | Investment | Interest | Maturity | Acquisition | Shares | Principal | Fair Value(a) | Percentage | ||||||||||||||||||||||||||||||
EuroParcs | Netherlands | 1st Lien | 5.75% (3M | 7/3/2026 | € | 313 | $ | 356 | (e) | ||||||||||||||||||||||||||||||
EuroParcs | Netherlands | 1st Lien | 6.25% (3M | 7/3/2026 | € | 2,830 | 3,221 | (e)(h) | |||||||||||||||||||||||||||||||
Flutter | Ireland | 1st Lien Term | 2.38% (3M | 7/21/2026 | 4,978 | 4,956 | |||||||||||||||||||||||||||||||||
Goldcup 16786 AB | Sweden | 1st Lien | 7.00% (6M | 8/18/2025 | SEK | 10,000 | 1,107 | (e)(f) | |||||||||||||||||||||||||||||||
Horizon Bidco | France | 1st Lien Term | 6.75% (6M | 10/2/2028 | € | 6,010 | 6,842 | (e)(f) | |||||||||||||||||||||||||||||||
Horizon Bidco | France | 1st Lien Term | 6.80% | 10/2/2028 | £ | 9,567 | 12,949 | (e)(f) | |||||||||||||||||||||||||||||||
Horizon Bidco | France | 1st Lien Term | 10/2/2028 | € | 3,082 | — | (e)(f)(h) | ||||||||||||||||||||||||||||||||
IRB Holding Corp. | 1st Lien Term | 3.75% (6M | 2/5/2025 | 8,004 | 7,985 | ||||||||||||||||||||||||||||||||||
IRB Holding Corp. | 1st Lien Term | 4.25% (3M | 12/15/2027 | 3,656 | 3,653 | ||||||||||||||||||||||||||||||||||
Jim N Nicks | 1st Lien | 6.25% (3M | 7/10/2023 | 1 | 1 | (e)(h) | |||||||||||||||||||||||||||||||||
Jim N Nicks | 1st Lien | 6.25% (3M | 7/10/2023 | 48 | 48 | (e)(f) | |||||||||||||||||||||||||||||||||
KeyStone Sub-Debt | 1st Lien Term | 10.00% (3M | 1/20/2027 | 1,075 | 1,043 | (e)(g) | |||||||||||||||||||||||||||||||||
Learning Care | 1st Lien Term | 4.25% (3M | 3/13/2025 | 216 | 211 | ||||||||||||||||||||||||||||||||||
Learning Care | 1st Lien Term | 9.50% (3M | 3/13/2025 | 985 | 983 | ||||||||||||||||||||||||||||||||||
Len The Plumber, | 1st Lien Term | 7.00% (3M | 2/17/2026 | 1,192 | 1,180 | (e)(f) | |||||||||||||||||||||||||||||||||
LGDN Finco | United | 1st Lien | 7/9/2027 | £ | 100 | — | (e)(h) | ||||||||||||||||||||||||||||||||
LGDN Finco | United | 1st Lien | 7.80% | 7/9/2027 | £ | 641 | 868 | (e) | |||||||||||||||||||||||||||||||
LGDN Finco | United | 1st Lien | 7.80% | 9/6/2027 | £ | 1,282 | 764 | (e)(h) | |||||||||||||||||||||||||||||||
Annual Report 2021
21
CION Ares Diversified Credit Fund
Consolidated Schedule of Investments (continued)
December 31, 2021
(in thousands, except shares, percentages and as otherwise noted)
Senior Loans(b)(c)(d) (continued)
Company | Country(a) | Investment | Interest | Maturity | Acquisition | Shares | Principal | Fair Value(a) | Percentage | ||||||||||||||||||||||||||||||
LGDN Finco | United | 1st Lien | 7.80% | 7/9/2027 | £ | 359 | $ | 486 | (e)(f) | ||||||||||||||||||||||||||||||
LSP HoldCo, LLC | 1st Lien | 10/7/2026 | 127 | (3 | )(e)(h) | ||||||||||||||||||||||||||||||||||
LSP HoldCo, LLC | 1st Lien Term | 7.00% (3M | 10/7/2026 | 907 | 898 | (e)(f) | |||||||||||||||||||||||||||||||||
LSP HoldCo, LLC | 1st Lien | 10/7/2026 | 1,994 | (20 | )(e)(h) | ||||||||||||||||||||||||||||||||||
MC Plato Bidco | United | 1st Lien Term | 6.33% | 8/17/2028 | £ | 5,702 | 7,717 | (e)(f) | |||||||||||||||||||||||||||||||
MC Plato Bidco | United | 1st Lien Term | 8/17/2028 | £ | 1,188 | — | (e)(h) | ||||||||||||||||||||||||||||||||
Mister Car Wash | 1st Lien Term | 3.10% (1M | 5/14/2026 | 4,681 | 4,652 | (i) | |||||||||||||||||||||||||||||||||
Movati Athletic | Canada | 1st Lien Term | 7.45% (3M | 10/5/2024 | CAD | 253 | 184 | (e)(f)(g) | |||||||||||||||||||||||||||||||
Movati Athletic | Canada | 1st Lien | 7.45% (3M | 10/5/2024 | CAD | 184 | 134 | (e)(g) | |||||||||||||||||||||||||||||||
Redwood Services, | 1st Lien | 9.25% | 12/31/2025 | 158 | 35 | (e)(h) | |||||||||||||||||||||||||||||||||
Redwood Services, | 1st Lien Term | 8.00% (3M | 12/31/2025 | 793 | 793 | (e) | |||||||||||||||||||||||||||||||||
Redwood Services, | 1st Lien | 8.00% (3M | 12/31/2025 | 2,796 | 1,383 | (e)(h) | |||||||||||||||||||||||||||||||||
Safe Home | 1st Lien Term | 8.25% (1M | 8/5/2024 | 1,300 | 1,300 | (e)(f) | |||||||||||||||||||||||||||||||||
Safe Home | 1st Lien | 8.25% (1M | 8/5/2024 | 287 | 41 | (e)(h) | |||||||||||||||||||||||||||||||||
Service Logic | 1st Lien | 10/30/2025 | 1,007 | (12 | )(e)(h) | ||||||||||||||||||||||||||||||||||
Service Logic | 1st Lien Term | 4.75% (3M | 10/29/2027 | 6,008 | 5,985 | (e) | |||||||||||||||||||||||||||||||||
Service Logic | 1st Lien | 10/29/2027 | 498 | (2 | )(e)(h) | ||||||||||||||||||||||||||||||||||
St. George's | 1st Lien Term | 3.37% (3M | 7/17/2025 | 2,463 | 2,451 | (i) | |||||||||||||||||||||||||||||||||
Annual Report 2021
22
CION Ares Diversified Credit Fund
Consolidated Schedule of Investments (continued)
December 31, 2021
(in thousands, except shares, percentages and as otherwise noted)
Senior Loans(b)(c)(d) (continued)
Company | Country(a) | Investment | Interest | Maturity Date | Acquisition Date | Shares | Principal Amount(a) | Fair Value(a) | Percentage of Net Assets | ||||||||||||||||||||||||||||||
| Sunshine Cadence HoldCo, LLC | 1st Lien Term Loan | 4.38% (3M LIBOR + 4.25%) | 3/23/2027 | $ | 1,064 | $ | 989 | (e) | |||||||||||||||||||||||||||||||
| Sunshine Cadence HoldCo, LLC | 2nd Lien Term Loan | 8.51% (3M LIBOR + 8.38%) | 3/23/2028 | 383 | 330 | (e) | |||||||||||||||||||||||||||||||||
Sunshine Sub, LLC | 1st Lien Revolver | 5/28/2024 | 144 | — | (e)(h) | ||||||||||||||||||||||||||||||||||
Sunshine Sub, LLC | 1st Lien Term Loan | 5.75% (1M LIBOR + 4.75%) | 5/28/2024 | 692 | 692 | (e)(f) | |||||||||||||||||||||||||||||||||
Sunshine Sub, LLC | 1st Lien Delayed Draw Term Loan | 5.75% (1M LIBOR + 4.75%) | 5/28/2024 | 407 | 407 | (e) | |||||||||||||||||||||||||||||||||
| SV-Burton Holdings, LLC | 1st Lien Revolver | 12/6/2027 | 555 | (11 | )(e)(h) | ||||||||||||||||||||||||||||||||||
| SV-Burton Holdings, LLC | 1st Lien Term Loan | 6.50% (1M LIBOR + 5.50%) | 12/6/2027 | 3,233 | 3,200 | (e)(f) | |||||||||||||||||||||||||||||||||
| SV-Burton Holdings, LLC | 1st Lien Delayed Draw Term Loan | 6.50% (1M LIBOR + 5.50%) | 12/6/2027 | 1,847 | 143 | (e)(h) | |||||||||||||||||||||||||||||||||
| United PF Holdings, LLC | 1st Lien Term Loan | 4.13% (3M LIBOR + 4.00%) | 12/30/2026 | 2,723 | 2,623 | ||||||||||||||||||||||||||||||||||
Whatabrands LLC | 1st Lien Term Loan | 3.75% (1M LIBOR + 3.25%) | 8/3/2028 | 7,201 | 7,168 | ||||||||||||||||||||||||||||||||||
| YE Brands Holdings, LLC | 1st Lien Revolver | 10/18/2027 | 165 | (4 | )(e)(h) | ||||||||||||||||||||||||||||||||||
| YE Brands Holdings, LLC | 1st Lien Term Loan | 6.25% (3M LIBOR + 5.50%) | 10/18/2027 | 1,082 | 1,071 | (e)(f) | |||||||||||||||||||||||||||||||||
167,169 | 8.66 | % | |||||||||||||||||||||||||||||||||||||
Diversified Financials | |||||||||||||||||||||||||||||||||||||||
| Alchemy Copyrights, LLC | 1st Lien Term Loan | 3.50% (3M LIBOR + 3.00%) | 3/10/2028 | 917 | 917 | (e) | |||||||||||||||||||||||||||||||||
Alpha Luxco 2 Sarl | Luxembourg | 1st Lien Delayed Draw Term Loan | 6.25% (3M EURIBOR + 5.75%) | 1/9/2025 | € | 1,005 | 1,144 | (e)(f)(g) | |||||||||||||||||||||||||||||||
| BCC Blueprint Holdings I, LLC | 1st Lien Term Loan | 7.00% (3M LIBOR + 6.25%) | 9/15/2027 | 7,377 | 7,303 | (e) | |||||||||||||||||||||||||||||||||
| Beacon Pointe Harmony, LLC | 1st Lien Revolver | 12/29/2027 | 909 | (18 | )(e)(h) | ||||||||||||||||||||||||||||||||||
| Beacon Pointe Harmony, LLC | 1st Lien Term Loan | 6.00% (3M LIBOR + 5.25%) | 12/29/2028 | 6,139 | 6,077 | (e) | |||||||||||||||||||||||||||||||||
Annual Report 2021
23
CION Ares Diversified Credit Fund
Consolidated Schedule of Investments (continued)
December 31, 2021
(in thousands, except shares, percentages and as otherwise noted)
Senior Loans(b)(c)(d) (continued)
Company | Country(a) | Investment | Interest | Maturity Date | Acquisition Date | Shares | Principal Amount(a) | Fair Value(a) | Percentage of Net Assets | ||||||||||||||||||||||||||||||
| Beacon Pointe Harmony, LLC | 1st Lien Delayed Draw Term Loan | 12/29/2028 | $ | 3,175 | $ | (32 | )(e)(h) | ||||||||||||||||||||||||||||||||
| Camelot U.S. Acquisition 1 Co. | 1st Lien Term Loan | 3.12% (3M LIBOR + 3.00%) | 10/30/2026 | 3,990 | 3,959 | (i) | |||||||||||||||||||||||||||||||||
| CD&R Firefly Bidco Limited | United Kingdom | 1st Lien Term Loan | 6/21/2025 | £ | 3,500 | 4,702 | (i) | ||||||||||||||||||||||||||||||||
Delta Topco, Inc. | 1st Lien Term Loan | 4.50% (3M LIBOR + 3.75%) | 12/1/2027 | 1,464 | 1,465 | ||||||||||||||||||||||||||||||||||
Delta Topco, Inc. | 2nd Lien Term Loan | 8.00% (3M LIBOR + 7.25%) | 12/1/2028 | 4,923 | 4,943 | ||||||||||||||||||||||||||||||||||
| Driven Holdings, LLC | 1st Lien Term Loan | 11/17/2028 | 7,000 | 6,982 | (e)(i) | ||||||||||||||||||||||||||||||||||
| Eagle Bidco Limited | United Kingdom | 1st Lien Term Loan | 4.33% (SONIA + 4.25%) | 3/20/2028 | £ | 2,000 | 2,691 | ||||||||||||||||||||||||||||||||
| Freeport LNG investments, LLLP | 1st Lien Term Loan | 4.00% (3M LIBOR + 3.50%) | 11/17/2028 | 2,000 | 1,979 | ||||||||||||||||||||||||||||||||||
| Integrated Power Services Holdings, Inc. | 2nd Lien Term Loan | 8.25% (1M LIBOR + 7.50%) | 11/22/2029 | 4,983 | 4,884 | (e) | |||||||||||||||||||||||||||||||||
| IU Finance Management GmbH | Germany | 1st Lien Term Loan | 12/8/2028 | € | 10,000 | 11,285 | (i) | ||||||||||||||||||||||||||||||||
| KREF Holdings X LLC | 1st Lien Term Loan | 3.69% (3M LIBOR + 3.50%) | 9/1/2027 | 1,299 | 1,296 | (e) | |||||||||||||||||||||||||||||||||
| LBM Acquisition LLC | 1st Lien Term Loan | 4.50% (3M LIBOR + 3.75%) | 12/17/2027 | 8,429 | 8,346 | (i) | |||||||||||||||||||||||||||||||||
| LBM Acquisition LLC | 1st Lien Delayed Draw Term Loan | 12/17/2027 | 1,502 | 1,487 | (i) | ||||||||||||||||||||||||||||||||||
MEDIAN B.V | Netherlands | 1st Lien Term Loan | 11/3/2027 | € | 5,000 | 5,607 | (i) | ||||||||||||||||||||||||||||||||
| Mercury Borrower, Inc. | 1st Lien Revolver | 5.75% (PRIME + 2.50%) | 7/31/2026 | 470 | 8 | (e)(h) | |||||||||||||||||||||||||||||||||
| Mercury Borrower, Inc. | 1st Lien Term Loan | 4.00% (3M LIBOR + 3.50%) | 8/2/2028 | 5,728 | 5,698 | (i) | |||||||||||||||||||||||||||||||||
| Mercury Borrower, Inc. | 2nd Lien Term Loan | 7.00% (3M LIBOR + 6.50%) | 8/2/2029 | 1,213 | 1,213 | (i) | |||||||||||||||||||||||||||||||||
| Monica Holdco (US), Inc. | 1st Lien Revolver | 1/8/2026 | 1,009 | — | (e)(h) | ||||||||||||||||||||||||||||||||||
Annual Report 2021
24
CION Ares Diversified Credit Fund
Consolidated Schedule of Investments (continued)
December 31, 2021
(in thousands, except shares, percentages and as otherwise noted)
Senior Loans(b)(c)(d) (continued)
Company | Country(a) | Investment | Interest | Maturity | Acquisition | Shares | Principal | Fair Value(a) | Percentage | ||||||||||||||||||||||||||||||
Monica Holdco | 1st Lien Term | 7.25% (3M | 1/7/2028 | $ | 8,179 | $ | 8,179 | (e)(f) | |||||||||||||||||||||||||||||||
NxtGenPay | Sweden | 1st Lien Term | 6.75% (3M | 6/30/2025 | SEK | 5,500 | 609 | (e) | |||||||||||||||||||||||||||||||
NxtGenPay | Sweden | 1st Lien | 6.75% (3M | 6/30/2025 | SEK | 2,700 | 299 | (e) | |||||||||||||||||||||||||||||||
Paysafe Group | 1st Lien Term | 3.25% (1M | 6/28/2028 | 1,378 | 1,336 | ||||||||||||||||||||||||||||||||||
Pegasus (Bidco) | Jersey | 1st Lien Term | 12/22/2027 | £ | 1,200 | — | (e)(h)(i) | ||||||||||||||||||||||||||||||||
Pegasus (Bidco) | Jersey | 1st Lien Term | 12/22/2028 | £ | 2,925 | 1 | (e)(f)(h)(i) | ||||||||||||||||||||||||||||||||
Pegasus (Bidco) | Jersey | 1st Lien | 12/22/2028 | £ | 822 | — | (e)(h)(i) | ||||||||||||||||||||||||||||||||
Phoenix Newco, | 1st Lien Term | 4.00% (1M | 11/15/2028 | 3,000 | 2,999 | ||||||||||||||||||||||||||||||||||
Project Accelerate | 1st Lien Term | 5.25% (1M | 1/2/2025 | 1,995 | 1,985 | (e) | |||||||||||||||||||||||||||||||||
ProService Finteco | Poland | 1st Lien Term | 12/3/2027 | € | 2,164 | 2,464 | (e)(f)(i) | ||||||||||||||||||||||||||||||||
ProService Finteco | Poland | 1st Lien Term | 12/3/2027 | PLN | 15,023 | 3,729 | (e)(i) | ||||||||||||||||||||||||||||||||
ProService Finteco | Poland | 1st Lien | 12/3/2027 | € | 451 | — | (e)(h)(i) | ||||||||||||||||||||||||||||||||
Redstone | 1st Lien Term | 5.50% (3M | 4/27/2028 | 1,307 | 1,245 | ||||||||||||||||||||||||||||||||||
SaintMichelCo | Jersey | 1st Lien Term | 8.25% (3M | 9/9/2025 | £ | 1,531 | 2,072 | (e) | |||||||||||||||||||||||||||||||
SaintMichelCo | Jersey | 1st Lien | 8.25% (3M | 9/9/2025 | £ | 2,421 | 3,276 | (e) | |||||||||||||||||||||||||||||||
Summer (BC) | 1st Lien Term | 5.25% (3M | 12/4/2026 | 4,988 | 4,980 | ||||||||||||||||||||||||||||||||||
Symbol Bidco I | United | 1st Lien | 6.42% | 12/21/2026 | £ | 571 | 773 | (e)(f) | |||||||||||||||||||||||||||||||
Symbol Bidco I | United | 1st Lien | 6.42% | 12/21/2026 | £ | 429 | 200 | (e)(h) | |||||||||||||||||||||||||||||||
Annual Report 2021
25
CION Ares Diversified Credit Fund
Consolidated Schedule of Investments (continued)
December 31, 2021
(in thousands, except shares, percentages and as otherwise noted)
Senior Loans(b)(c)(d) (continued)
Company | Country(a) | Investment | Interest | Maturity Date | Acquisition Date | Shares | Principal Amount(a) | Fair Value(a) | Percentage of Net Assets | ||||||||||||||||||||||||||||||
| TA/WEG Holdings, LLC | 1st Lien Revolver | 6.75% (3M LIBOR + 5.75%) | 10/4/2027 | $ | 914 | $ | 352 | (e)(h) | |||||||||||||||||||||||||||||||
| TA/WEG Holdings, LLC | 1st Lien Term Loan | 6.75% (3M LIBOR + 5.75%) | 10/4/2027 | 3,485 | 3,485 | (e)(f) | |||||||||||||||||||||||||||||||||
| TA/WEG Holdings, LLC | 1st Lien Delayed Draw Term Loan | 6.75% (3M LIBOR + 5.75%) | 10/4/2027 | 13,024 | 13,024 | (e) | |||||||||||||||||||||||||||||||||
| TA/WEG Holdings, LLC | 1st Lien Delayed Draw Term Loan | 6.75% (3M LIBOR + 6.25%) | 10/4/2027 | 1,714 | 912 | (e)(h) | |||||||||||||||||||||||||||||||||
| The Ultimus Group Midco, LLC | 1st Lien Revolver | 2/1/2024 | 396 | — | (e)(h) | ||||||||||||||||||||||||||||||||||
| The Ultimus Group Midco, LLC | 1st Lien Term Loan | 5.75% (3M LIBOR + 4.75%) | 2/1/2026 | 7,084 | 7,084 | (e)(f) | |||||||||||||||||||||||||||||||||
| TK Elevator Midco GmbH | Germany | 1st Lien Term Loan | 4.00% (6M LIBOR + 3.50%) | 7/30/2027 | 7,455 | 7,454 | (i) | ||||||||||||||||||||||||||||||||
Toscafund Limited | United Kingdom | 1st Lien Delayed Draw Term Loan | 7.33% (SONIA + 7.00%) | 4/2/2025 | £ | 4,206 | 5,693 | (e)(f) | |||||||||||||||||||||||||||||||
True Potential LLP | United Kingdom | 1st Lien Delayed Draw Term Loan | 6.50% (6M GBP LIBOR + 6.00%) | 10/16/2026 | £ | 2,159 | 2,981 | (e) | |||||||||||||||||||||||||||||||
True Potential LLP | United Kingdom | 1st Lien Delayed Draw Term Loan | 6.61% (6M GBP LIBOR + 6.11%) | 10/16/2026 | £ | 1,943 | 2,637 | (e) | |||||||||||||||||||||||||||||||
True Potential LLP | United Kingdom | 1st Lien Delayed Draw Term Loan | 6.61% (6M GBP LIBOR + 6.11%) | 10/16/2026 | £ | 8,113 | 11,008 | (e)(f) | |||||||||||||||||||||||||||||||
True Potential LLP | United Kingdom | 1st Lien Delayed Draw Term Loan | 7.00% (6M GBP LIBOR + 6.50%) | 10/16/2026 | £ | 2,159 | 2,981 | (e) | |||||||||||||||||||||||||||||||
| UPC Financing Partnership | 1st Lien Term Loan | 3.11% (1M LIBOR + 3.00%) | 1/31/2029 | 3,000 | 2,988 | ||||||||||||||||||||||||||||||||||
| Zephyr Bidco Limited | United Kingdom | 1st Lien Term Loan | 4.93% (1M GBP LIBOR + 4.75%) | 7/23/2025 | £ | 3,000 | 4,008 | ||||||||||||||||||||||||||||||||
180,690 | 9.36 | % | |||||||||||||||||||||||||||||||||||||
Energy | |||||||||||||||||||||||||||||||||||||||
| Birch Permian, LLC | 2nd Lien Term Loan | 9.50% (3M LIBOR + 8.00%) | 4/12/2023 | 5,989 | 5,989 | (e) | |||||||||||||||||||||||||||||||||
| Cheyenne Petroleum Company Limited Partnership | 2nd Lien Term Loan | 10.00% (3M LIBOR + 9.00%) | 1/10/2024 | 7,244 | 7,244 | (e) | |||||||||||||||||||||||||||||||||
Annual Report 2021
26
CION Ares Diversified Credit Fund
Consolidated Schedule of Investments (continued)
December 31, 2021
(in thousands, except shares, percentages and as otherwise noted)
Senior Loans(b)(c)(d) (continued)
Company | Country(a) | Investment | Interest | Maturity Date | Acquisition Date | Shares | Principal Amount(a) | Fair Value(a) | Percentage of Net Assets | ||||||||||||||||||||||||||||||
| Halcon Holdings, LLC | 1st Lien Term Loan | 7.17% (3M LIBOR + 7.00%) | 11/24/2025 | $ | 12,016 | $ | 11,896 | (e) | |||||||||||||||||||||||||||||||
| Halcon Holdings, LLC | 1st Lien Delayed Draw Term Loan | 11/24/2025 | 2,103 | (21 | )(e)(h) | ||||||||||||||||||||||||||||||||||
25,108 | 1.30 | % | |||||||||||||||||||||||||||||||||||||
Food & Staples Retailing | |||||||||||||||||||||||||||||||||||||||
| Continental Cafe, LLC | 1st Lien Revolver | 11/30/2027 | 786 | (16 | )(e)(h) | ||||||||||||||||||||||||||||||||||
| Continental Cafe, LLC | 1st Lien Term Loan | 8.00% (3M LIBOR + 7.00%) | 11/30/2027 | 6,969 | 6,900 | (e)(f) | |||||||||||||||||||||||||||||||||
| Continental Cafe, LLC | 1st Lien Delayed Draw Term Loan | 11/30/2027 | 2,788 | (28 | )(e)(h) | ||||||||||||||||||||||||||||||||||
DecoPac, Inc. | 1st Lien Revolver | 7.00% (1M LIBOR + 6.00%) | 5/14/2026 | 2,382 | 340 | (e)(h) | |||||||||||||||||||||||||||||||||
DecoPac, Inc. | 1st Lien Term Loan | 9.00% (3M LIBOR + 8.00%) | 5/15/2028 | 22,006 | 22,006 | (e)(f) | |||||||||||||||||||||||||||||||||
| SFE Intermediate HoldCo LLC | 1st Lien Revolver | 7/31/2023 | 2 | — | (e)(h) | ||||||||||||||||||||||||||||||||||
| SFE Intermediate HoldCo LLC | 1st Lien Term Loan | 5.75% (3M LIBOR + 4.75%) | 7/31/2024 | 2,107 | 2,107 | (e)(f) | |||||||||||||||||||||||||||||||||
31,309 | 1.62 | % | |||||||||||||||||||||||||||||||||||||
Food & Beverage | |||||||||||||||||||||||||||||||||||||||
| Berner Food & Beverage, LLC | 1st Lien Revolver | 7.50% (1M LIBOR + 6.50%) | 7/30/2026 | 262 | 105 | (e)(h) | |||||||||||||||||||||||||||||||||
| Berner Food & Beverage, LLC | 1st Lien Term Loan | 7.50% (1M LIBOR + 6.50%) | 7/30/2027 | 2,633 | 2,607 | (e) | |||||||||||||||||||||||||||||||||
| CHG PPC Parent LLC | 2nd Lien Term Loan | 7.25% (1M LIBOR + 6.75%) | 12/10/2029 | 3,000 | 2,970 | (e)(f) | |||||||||||||||||||||||||||||||||
Chobani, LLC | 1st Lien Term Loan | 4.50% (1M LIBOR + 3.50%) | 10/25/2027 | 2,499 | 2,503 | ||||||||||||||||||||||||||||||||||
| Florida Food Products, LLC | 1st Lien Term Loan | 5.75% (1M LIBOR + 5.00%) | 10/18/2028 | 1 | 1 | (e)(i) | |||||||||||||||||||||||||||||||||
| Florida Food Products, LLC | 2nd Lien Term Loan | 8.75% (1M LIBOR + 8.00%) | 10/18/2029 | 7,299 | 7,226 | (e)(i) | |||||||||||||||||||||||||||||||||
Annual Report 2021
27
CION Ares Diversified Credit Fund
Consolidated Schedule of Investments (continued)
December 31, 2021
(in thousands, except shares, percentages and as otherwise noted)
Senior Loans(b)(c)(d) (continued)
Company | Country(a) | Investment | Interest | Maturity Date | Acquisition Date | Shares | Principal Amount(a) | Fair Value(a) | Percentage of Net Assets | ||||||||||||||||||||||||||||||
| Hometown Food Company | 1st Lien Revolver | 8/31/2023 | $ | 1 | $ | — | (e)(h) | ||||||||||||||||||||||||||||||||
| Hometown Food Company | 1st Lien Term Loan | 6.25% (1M LIBOR + 5.00%) | 8/31/2023 | 1,022 | 1,022 | (e)(f) | |||||||||||||||||||||||||||||||||
| Quirch Foods Holdings, LLC | 1st Lien Term Loan | 5.50% (1M LIBOR + 4.50%) | 10/27/2027 | 5,391 | 5,404 | (e) | |||||||||||||||||||||||||||||||||
| Triton Water Holdings, Inc. | 1st Lien Term Loan | 4.00% (3M LIBOR + 3.50%) | 3/31/2028 | 7,000 | 6,917 | ||||||||||||||||||||||||||||||||||
| Watermill Express, LLC | 1st Lien Revolver | 4/20/2027 | 275 | — | (e)(h) | ||||||||||||||||||||||||||||||||||
| Watermill Express, LLC | 1st Lien Term Loan | 6.25% (3M LIBOR + 5.25%) | 4/20/2027 | 2,285 | 2,285 | (e)(f) | |||||||||||||||||||||||||||||||||
| Watermill Express, LLC | 1st Lien Delayed Draw Term Loan | 4/20/2027 | 219 | — | (e)(h) | ||||||||||||||||||||||||||||||||||
| Winebow Holdings, Inc. | 1st Lien Term Loan | 7.25% (1M LIBOR + 6.25%) | 7/1/2025 | 3,440 | 3,440 | (e)(f) | |||||||||||||||||||||||||||||||||
Woof Holdings, Inc. | 1st Lien Term Loan | 4.50% (3M LIBOR + 3.75%) | 12/21/2027 | 2,978 | 2,978 | ||||||||||||||||||||||||||||||||||
37,458 | 1.94 | % | |||||||||||||||||||||||||||||||||||||
Healthcare Equipment & Services | |||||||||||||||||||||||||||||||||||||||
| Air Methods Corporation | 1st Lien Term Loan | 4.50% (3M LIBOR + 3.50%) | 4/22/2024 | 1,508 | 1,429 | ||||||||||||||||||||||||||||||||||
Athenahealth, Inc. | 1st Lien Revolver | 2/12/2024 | 232 | — | (e)(h) | ||||||||||||||||||||||||||||||||||
| Auris Luxembourg III S.a r.l. | Luxembourg | 1st Lien Term Loan | 3.85% (1M LIBOR + 3.75%) | 2/27/2026 | 2,487 | 2,465 | |||||||||||||||||||||||||||||||||
| Auris Luxembourg III S.a r.l. | Luxembourg | 1st Lien Term Loan | 4.00% (6M EURIBOR + 4.00%) | 2/27/2026 | € | 4,000 | 4,539 | ||||||||||||||||||||||||||||||||
| Aveanna Healthcare LLC | 1st Lien Term Loan | 4.25% (3M LIBOR + 3.75%) | 7/17/2028 | 220 | 219 | ||||||||||||||||||||||||||||||||||
| Aveanna Healthcare LLC | 1st Lien Delayed Draw Term Loan | 7/17/2028 | 51 | 51 | (i) | ||||||||||||||||||||||||||||||||||
Bearcat Buyer, Inc. | 1st Lien Revolver | 7/9/2024 | 580 | — | (e)(h) | ||||||||||||||||||||||||||||||||||
Bearcat Buyer, Inc. | 1st Lien Term Loan | 5.25% (3M LIBOR + 4.25%) | 7/9/2026 | 5,454 | 5,454 | (e)(f) | |||||||||||||||||||||||||||||||||
Annual Report 2021
28
CION Ares Diversified Credit Fund
Consolidated Schedule of Investments (continued)
December 31, 2021
(in thousands, except shares, percentages and as otherwise noted)
Senior Loans(b)(c)(d) (continued)
Company | Country(a) | Investment | Interest | Maturity | Acquisition | Shares | Principal | Fair Value(a) | Percentage | ||||||||||||||||||||||||||||||
Bearcat Buyer, Inc. | 1st Lien Term | 5.75% (3M | 7/9/2026 | $ | 1 | $ | 1 | (e) | |||||||||||||||||||||||||||||||
Bearcat Buyer, Inc. | 1st Lien | 5.25% (3M | 7/9/2026 | 967 | 967 | (e) | |||||||||||||||||||||||||||||||||
Bearcat Buyer, Inc. | 1st Lien | 5.75% (3M | 7/9/2026 | 1 | 1 | (e)(h) | |||||||||||||||||||||||||||||||||
Bearcat Buyer, Inc. | 2nd Lien Term | 9.25% (3M | 7/9/2027 | 2,249 | 2,249 | (e)(f) | |||||||||||||||||||||||||||||||||
Bearcat Buyer, Inc. | 2nd Lien Term | 9.25% (3M | 7/9/2027 | 617 | 617 | (e) | |||||||||||||||||||||||||||||||||
Bearcat Buyer, Inc. | 2nd Lien | 9.25% (3M | 7/9/2027 | 580 | 184 | (e)(h) | |||||||||||||||||||||||||||||||||
Bearcat Buyer, Inc. | 2nd Lien | 7/9/2027 | 726 | — | (e)(h) | ||||||||||||||||||||||||||||||||||
CEP V I 5 UK | United | 1st Lien | 7.16% (3M | 2/18/2027 | 26,654 | 25,321 | (e)(f) | ||||||||||||||||||||||||||||||||
Change Healthcare | 1st Lien Term | 3.50% (1M | 3/1/2024 | 7,548 | 7,539 | ||||||||||||||||||||||||||||||||||
Comprehensive | 1st Lien | 7.00% (3M | 2/14/2024 | 1 | — | (e)(h) | |||||||||||||||||||||||||||||||||
Comprehensive | 1st Lien Term | 7.00% (3M | 2/14/2024 | 981 | 981 | (e)(f) | |||||||||||||||||||||||||||||||||
Comprehensive | 1st Lien | 7.00% (3M | 2/14/2024 | 758 | 758 | (e) | |||||||||||||||||||||||||||||||||
Convey Health | 1st Lien Term | 5.50% (1M | 9/4/2026 | 2,698 | 2,698 | (e)(f) | |||||||||||||||||||||||||||||||||
CVP Holdco, Inc. | 1st Lien | 8.00% | 10/31/2024 | 326 | 163 | (e)(h) | |||||||||||||||||||||||||||||||||
CVP Holdco, Inc. | 1st Lien Term | 6.75% (3M | 10/31/2025 | 3,424 | 3,424 | (e)(f) | |||||||||||||||||||||||||||||||||
CVP Holdco, Inc. | 1st Lien | 6.75% (1M | 10/31/2025 | 7,730 | 5,577 | (e)(h) | |||||||||||||||||||||||||||||||||
CVP Holdco, Inc. | 1st Lien | 6.75% (3M | 10/31/2025 | 2,630 | 2,630 | (e) | |||||||||||||||||||||||||||||||||
Annual Report 2021
29
CION Ares Diversified Credit Fund
Consolidated Schedule of Investments (continued)
December 31, 2021
(in thousands, except shares, percentages and as otherwise noted)
Senior Loans(b)(c)(d) (continued)
Company | Country(a) | Investment | Interest | Maturity | Acquisition | Shares | Principal | Fair Value(a) | Percentage | ||||||||||||||||||||||||||||||
Electron Bidco Inc. | 1st Lien Term | 3.75% (3M | 11/1/2028 | $ | 7,517 | $ | 7,492 | (i) | |||||||||||||||||||||||||||||||
Ensemble RCM | 1st Lien Term | 3.88% (3M | 8/3/2026 | 2,201 | 2,198 | ||||||||||||||||||||||||||||||||||
Floss Bidco | United | 1st Lien Term | 7.75% | 9/7/2026 | £ | 840 | 1,137 | (e)(f)(g) | |||||||||||||||||||||||||||||||
Floss Bidco | United | 1st Lien | 7.75% (3M | 9/7/2026 | £ | 1,211 | 555 | (e)(g)(h) | |||||||||||||||||||||||||||||||
Global Medical | 1st Lien Term | 5.25% (3M | 10/2/2025 | 6,451 | 6,427 | ||||||||||||||||||||||||||||||||||
Global Medical | 2nd Lien Term | 7.50% (3M | 12/17/2029 | 29,366 | 29,072 | (e) | |||||||||||||||||||||||||||||||||
Hanger, Inc. | 1st Lien Term | 3.60% (1M | 3/6/2025 | 2,946 | 2,941 | ||||||||||||||||||||||||||||||||||
JDC Healthcare | 1st Lien Term | 4/10/2023 | 119 | 84 | (e)(g)(j) | ||||||||||||||||||||||||||||||||||
Kedleston Schools | United | 1st Lien | 7.67% | 5/31/2024 | £ | 1,000 | 1,354 | (e)(f) | |||||||||||||||||||||||||||||||
MED ParentCo, LP | 1st Lien Term | 4.34% (1M | 8/31/2026 | 11,596 | 11,562 | ||||||||||||||||||||||||||||||||||
Medline Borrower, | 1st Lien Term | 3.75% (1M | 10/23/2028 | 12,199 | 12,194 | ||||||||||||||||||||||||||||||||||
NueHealth | 1st Lien | 8.25% (1M | 9/27/2023 | 1 | 1 | (e) | |||||||||||||||||||||||||||||||||
NueHealth | 1st Lien Term | 8.25% (1M | 9/27/2023 | 2,144 | 2,144 | (e)(f) | |||||||||||||||||||||||||||||||||
NueHealth | 1st Lien | 8.25% (1M | 9/27/2023 | 285 | 285 | (e)(f) | |||||||||||||||||||||||||||||||||
NueHealth | 1st Lien | 8.25% (1M | 9/27/2023 | 604 | 592 | (e)(h) | |||||||||||||||||||||||||||||||||
NueHealth | 1st Lien | 9/27/2023 | 566 | — | (e)(h) | ||||||||||||||||||||||||||||||||||
Olympia | 1st Lien | 8.50% | 9/24/2024 | 641 | 483 | (e)(h) | |||||||||||||||||||||||||||||||||
Annual Report 2021
30
CION Ares Diversified Credit Fund
Consolidated Schedule of Investments (continued)
December 31, 2021
(in thousands, except shares, percentages and as otherwise noted)
Senior Loans(b)(c)(d) (continued)
Company | Country(a) | Investment | Interest | Maturity | Acquisition | Shares | Principal | Fair Value(a) | Percentage | ||||||||||||||||||||||||||||||
Olympia | 1st Lien | 8.50% (3M | 9/24/2024 | $ | 12 | $ | 10 | (e) | |||||||||||||||||||||||||||||||
Olympia | 1st Lien Term | 8.50% | 9/24/2026 | 2,489 | 2,041 | (e)(f)(g) | |||||||||||||||||||||||||||||||||
Olympia | 1st Lien Term | 8.50% (1M | 9/24/2026 | 54 | 45 | (e)(f) | |||||||||||||||||||||||||||||||||
OMH-HealthEdge | 1st Lien | 10/24/2024 | 1 | — | (e)(h) | ||||||||||||||||||||||||||||||||||
OMH-HealthEdge | 1st Lien Term | 6.50% (3M | 10/24/2025 | 2,234 | 2,234 | (e)(f) | |||||||||||||||||||||||||||||||||
Ortho-Clinical | 1st Lien Term | 3.10% (1M | 6/30/2025 | 2,097 | 2,095 | ||||||||||||||||||||||||||||||||||
PetVet Care | 1st Lien Term | 4.25% (1M | 2/14/2025 | 9,082 | 9,070 | ||||||||||||||||||||||||||||||||||
Pluto Acquisition I, | 1st Lien Term | 4.18% (3M | 6/22/2026 | 2,458 | 2,445 | ||||||||||||||||||||||||||||||||||
Premise Health | 1st Lien | 3.25% (3M | 7/10/2023 | 1 | — | (e)(h) | |||||||||||||||||||||||||||||||||
Premise Health | 1st Lien Term | 3.65% (3M | 7/10/2025 | 11 | 11 | (e)(f) | |||||||||||||||||||||||||||||||||
Premise Health | 2nd Lien Term | 7.63% (3M | 7/10/2026 | 2,000 | 2,000 | (e)(f) | |||||||||||||||||||||||||||||||||
Radnet | 1st Lien Term | 3.75% (3M | 4/23/2028 | 2,488 | 2,485 | ||||||||||||||||||||||||||||||||||
RegionalCare | 1st Lien Term | 3.85% (1M | 11/16/2025 | 2,480 | 2,475 | ||||||||||||||||||||||||||||||||||
Rubicone Bidco | United | 1st Lien Term | 7.17% | 12/1/2028 | £ | 2,722 | 3,684 | (e)(f) | |||||||||||||||||||||||||||||||
Rubicone Bidco | United | 1st Lien Term | 12/1/2028 | £ | 1,667 | — | (e)(h) | ||||||||||||||||||||||||||||||||
SiroMed Physician | 1st Lien | 3/26/2024 | 1 | — | (e)(h) | ||||||||||||||||||||||||||||||||||
SiroMed Physician | 1st Lien Term | 5.75% (1M | 3/26/2024 | 653 | 561 | (e)(f) | |||||||||||||||||||||||||||||||||
Sotera Health | 1st Lien Term | 3.25% (3M | 12/11/2026 | 7,459 | 7,424 | ||||||||||||||||||||||||||||||||||
Annual Report 2021
31
CION Ares Diversified Credit Fund
Consolidated Schedule of Investments (continued)
December 31, 2021
(in thousands, except shares, percentages and as otherwise noted)
Senior Loans(b)(c)(d) (continued)
Company | Country(a) | Investment | Interest | Maturity | Acquisition | Shares | Principal | Fair Value(a) | Percentage | ||||||||||||||||||||||||||||||
Symplr Software | 1st Lien | 12/22/2025 | $ | 1 | $ | — | (e)(h) | ||||||||||||||||||||||||||||||||
Symplr Software | 1st Lien Term | 5.25% (6M | 12/22/2027 | 1 | 1 | (e) | |||||||||||||||||||||||||||||||||
Symplr Software | 2nd Lien Term | 8.63% (3M | 12/22/2028 | 10,160 | 10,160 | (e) | |||||||||||||||||||||||||||||||||
Teligent, Inc. | 1st Lien | 1/31/2022 | — | — | (e)(h)(j) | ||||||||||||||||||||||||||||||||||
Teligent, Inc. | 1st Lien Term | 1/31/2022 | 127 | 127 | (e)(j) | ||||||||||||||||||||||||||||||||||
Teligent, Inc. | 1st Lien | 1/31/2022 | 127 | 74 | (e)(h)(j) | ||||||||||||||||||||||||||||||||||
Teligent, Inc. | 2nd Lien Term | 12/29/2022 | 1,124 | 426 | (e)(j) | ||||||||||||||||||||||||||||||||||
Teligent, Inc. | 2nd Lien | 12/29/2022 | 696 | 264 | (e)(j) | ||||||||||||||||||||||||||||||||||
Therapy Brands | 2nd Lien Term | 7.50% (3M | 5/18/2029 | 3,050 | 3,050 | (e)(f) | |||||||||||||||||||||||||||||||||
Therapy Brands | 2nd Lien | 5/18/2029 | 1,284 | — | (e)(h) | ||||||||||||||||||||||||||||||||||
United Digestive | 1st Lien | 12/14/2023 | 511 | — | (e)(h) | ||||||||||||||||||||||||||||||||||
United Digestive | 1st Lien Term | 5.00% (3M | 12/16/2024 | 1,422 | 1,422 | (e)(f) | |||||||||||||||||||||||||||||||||
United Digestive | 1st Lien | 5.00% (2M | 12/16/2024 | 1,022 | 1,022 | (e) | |||||||||||||||||||||||||||||||||
VPP Intermediate | 1st Lien | 12/1/2027 | 315 | (6 | )(e)(h) | ||||||||||||||||||||||||||||||||||
VPP Intermediate | 1st Lien Term | 6.75% (3M | 12/1/2027 | 1,577 | 1,561 | (e)(f) | |||||||||||||||||||||||||||||||||
VPP Intermediate | 1st Lien | 6.75% (3M | 12/1/2027 | 472 | 5 | (e)(h) | |||||||||||||||||||||||||||||||||
Waystar | 1st Lien Term | 4.10% (1M | 10/22/2026 | 656 | 655 | ||||||||||||||||||||||||||||||||||
WSHP FC | 1st Lien | 7.00% (1M | 3/30/2027 | 106 | 21 | (e)(h) | |||||||||||||||||||||||||||||||||
WSHP FC | 1st Lien | 7.00% (1M | 3/30/2027 | 557 | 557 | (e)(f) | |||||||||||||||||||||||||||||||||
Annual Report 2021
32
CION Ares Diversified Credit Fund
Consolidated Schedule of Investments (continued)
December 31, 2021
(in thousands, except shares, percentages and as otherwise noted)
Senior Loans(b)(c)(d) (continued)
Company | Country(a) | Investment | Interest | Maturity Date | Acquisition Date | Shares | Principal Amount(a) | Fair Value(a) | Percentage of Net Assets | ||||||||||||||||||||||||||||||
| WSHP FC Acquisition LLC | 1st Lien Term Loan | 7.00% (3M LIBOR + 6.00%) | 3/30/2027 | $ | 2,794 | $ | 2,794 | (e)(f) | |||||||||||||||||||||||||||||||
| WSHP FC Acquisition LLC | 1st Lien Term Loan | 7.00% (3M LIBOR + 6.00%) | 3/30/2027 | 49 | 49 | (e) | |||||||||||||||||||||||||||||||||
| WSHP FC Acquisition LLC | 1st Lien Delayed Draw Term Loan | 7.00% (3M LIBOR + 6.00%) | 3/30/2027 | 167 | 167 | (e)(f) | |||||||||||||||||||||||||||||||||
| WSHP FC Acquisition LLC | 1st Lien Delayed Draw Term Loan | 7.00% (3M LIBOR + 6.00%) | 3/30/2027 | 1,436 | 1,269 | (e)(h) | |||||||||||||||||||||||||||||||||
205,986 | 10.68 | % | |||||||||||||||||||||||||||||||||||||
Household & Personal Products | |||||||||||||||||||||||||||||||||||||||
| CDI Holdings III Corp. | 1st Lien Revolver | 12/22/2027 | 410 | (8 | )(e)(h) | ||||||||||||||||||||||||||||||||||
| CDI Holdings III Corp. | 1st Lien Term Loan | 6.75% (3M LIBOR + 5.75%) | 12/22/2027 | 1,688 | 1,671 | (e)(f) | |||||||||||||||||||||||||||||||||
| Foundation Consumer Brands, LLC | 1st Lien Revolver | 10/1/2026 | 389 | — | (e)(h) | ||||||||||||||||||||||||||||||||||
| Foundation Consumer Brands, LLC | 1st Lien Term Loan | 7.38% (3M LIBOR + 6.38%) | 10/1/2026 | 4,729 | 4,729 | (e)(f) | |||||||||||||||||||||||||||||||||
| Premier Specialties, Inc. | 1st Lien Revolver | 8/20/2027 | 385 | (8 | )(e)(h) | ||||||||||||||||||||||||||||||||||
| Premier Specialties, Inc. | 1st Lien Term Loan | 6.75% (1M LIBOR + 5.75%) | 8/20/2027 | 3,043 | 3,012 | (e) | |||||||||||||||||||||||||||||||||
| Premier Specialties, Inc. | 1st Lien Delayed Draw Term Loan | 8/20/2027 | 829 | (8 | )(e)(h) | ||||||||||||||||||||||||||||||||||
| Sunshine Luxembourg VII S.a r.l. | Luxembourg | 1st Lien Term Loan | 4.50% (3M LIBOR + 3.75%) | 10/1/2026 | 4,139 | 4,152 | (i) | ||||||||||||||||||||||||||||||||
13,540 | 0.70 | % | |||||||||||||||||||||||||||||||||||||
Insurance | |||||||||||||||||||||||||||||||||||||||
Acrisure, LLC | 1st Lien Term Loan | 3.72% (3M LIBOR + 3.50%) | 2/15/2027 | 2,963 | 2,926 | ||||||||||||||||||||||||||||||||||
| Alliant Holdings Intermediate, LLC | 1st Lien Term Loan | 4.00% (1M LIBOR + 3.50%) | 11/5/2027 | 1,995 | 1,991 | ||||||||||||||||||||||||||||||||||
| Amynta Agency Borrower Inc. | 1st Lien Term Loan | 4.60% (1M LIBOR + 4.50%) | 2/28/2025 | 2,902 | 2,902 | (e)(f) | |||||||||||||||||||||||||||||||||
Annual Report 2021
33
CION Ares Diversified Credit Fund
Consolidated Schedule of Investments (continued)
December 31, 2021
(in thousands, except shares, percentages and as otherwise noted)
Senior Loans(b)(c)(d) (continued)
Company | Country(a) | Investment | Interest | Maturity | Acquisition | Shares | Principal | Fair Value(a) | Percentage | ||||||||||||||||||||||||||||||
AQ Sunshine, Inc. | 1st Lien | 7.00% (3M | 4/15/2024 | $ | 213 | $ | 57 | (e)(h) | |||||||||||||||||||||||||||||||
AQ Sunshine, Inc. | 1st Lien Term | 7.00% (3M | 4/15/2025 | 1,503 | 1,503 | (e)(f) | |||||||||||||||||||||||||||||||||
AQ Sunshine, Inc. | 1st Lien Term | 7.00% (3M | 4/15/2025 | 1,674 | 1,674 | (e) | |||||||||||||||||||||||||||||||||
AQ Sunshine, Inc. | 1st Lien Term | 7.00% (6M | 4/15/2025 | 3,565 | 3,565 | (e)(f) | |||||||||||||||||||||||||||||||||
AQ Sunshine, Inc. | 1st Lien | 7.00% (6M | 4/15/2025 | 61 | — | (e)(h) | |||||||||||||||||||||||||||||||||
Ardonagh | United | 1st Lien Term | 7.50% (6M | 7/14/2026 | £ | 1,491 | 2,018 | (e)(f) | |||||||||||||||||||||||||||||||
Ardonagh | United | 1st Lien Term | 7.75% (6M | 7/14/2026 | € | 190 | 216 | (e)(f) | |||||||||||||||||||||||||||||||
Ardonagh | United | 1st Lien | 6.25% (3M | 7/14/2026 | 16,452 | 16,452 | (e) | ||||||||||||||||||||||||||||||||
Ardonagh | United | 1st Lien | 7.50% (6M | 7/14/2026 | £ | 312 | 422 | (e) | |||||||||||||||||||||||||||||||
Ardonagh | United | 1st Lien | 7/14/2026 | £ | 1 | — | (e)(h) | ||||||||||||||||||||||||||||||||
AssuredPartners, | 1st Lien Term | 4.00% (1M | 2/12/2027 | 1,397 | 1,393 | ||||||||||||||||||||||||||||||||||
Benefytt | 1st Lien Term | 6.75% (3M | 8/12/2027 | 3,645 | 3,608 | (e) | |||||||||||||||||||||||||||||||||
Benefytt | 1st Lien | 8/12/2027 | 911 | (9 | )(e)(h) | ||||||||||||||||||||||||||||||||||
Blackwood Bidco | United | 1st Lien Term | 8.80% (6M | 10/8/2026 | 3,321 | 3,321 | (e)(f) | ||||||||||||||||||||||||||||||||
Blackwood Bidco | United | 1st Lien | 7.60% | 10/8/2026 | £ | 2,659 | 3,599 | (e)(f) | |||||||||||||||||||||||||||||||
Blackwood Bidco | United | 1st Lien | 7.80% (6M | 10/8/2026 | £ | 464 | 628 | (e)(f) | |||||||||||||||||||||||||||||||
Blackwood Bidco | United | 1st Lien | 8.05% (6M | 10/8/2026 | £ | 2,319 | 1,912 | (e)(f)(h) | |||||||||||||||||||||||||||||||
Annual Report 2021
34
CION Ares Diversified Credit Fund
Consolidated Schedule of Investments (continued)
December 31, 2021
(in thousands, except shares, percentages and as otherwise noted)
Senior Loans(b)(c)(d) (continued)
Company | Country(a) | Investment | Interest | Maturity | Acquisition | Shares | Principal | Fair Value(a) | Percentage | ||||||||||||||||||||||||||||||
Foundation Risk | 1st Lien | 10/29/2027 | $ | 2,627 | $ | (26 | )(e)(h) | ||||||||||||||||||||||||||||||||
Foundation Risk | 1st Lien Term | 6.50% (2M | 10/29/2028 | 16,078 | 15,917 | (e)(f) | |||||||||||||||||||||||||||||||||
Foundation Risk | 1st Lien | 6.50% (3M | 10/29/2028 | 3,495 | 1,962 | (e)(h) | |||||||||||||||||||||||||||||||||
Galway Borrower | 1st Lien | 9/30/2027 | 969 | (19 | )(e)(h) | ||||||||||||||||||||||||||||||||||
Galway Borrower | 1st Lien Term | 6.25% (3M | 9/29/2028 | 10,602 | 10,496 | (e) | |||||||||||||||||||||||||||||||||
Galway Borrower | 1st Lien | 9/29/2028 | 1,600 | (16 | )(e)(h) | ||||||||||||||||||||||||||||||||||
Hammersmith | United | 1st Lien Term | 12/13/2028 | £ | 2,098 | 29 | (e)(h)(i) | ||||||||||||||||||||||||||||||||
Hammersmith | United | 1st Lien | 7.94% (1M | 9/2/2026 | £ | 6,924 | 8,790 | (e)(h) | |||||||||||||||||||||||||||||||
Hammersmith | United | 1st Lien | 7.94% (1M | 9/2/2026 | £ | 4,112 | 5,566 | (e)(f) | |||||||||||||||||||||||||||||||
High Street | 1st Lien | 4/16/2027 | 688 | (14 | )(e)(h) | ||||||||||||||||||||||||||||||||||
High Street | 1st Lien Term | 6.75% (3M | 4/14/2028 | 4,783 | 4,735 | (e)(f) | |||||||||||||||||||||||||||||||||
High Street | 1st Lien | 6.75% (1M | 4/14/2028 | 2,769 | 2,741 | (e) | |||||||||||||||||||||||||||||||||
High Street | 1st Lien | 6.75% (3M | 4/14/2028 | 15,132 | 13,583 | (e)(h) | |||||||||||||||||||||||||||||||||
Hub International | 1st Lien Term | 4.00% (3M | 4/25/2025 | 1,995 | 1,993 | ||||||||||||||||||||||||||||||||||
Jewel Bidco | United | 1st Lien | 4.05% | 1/24/2028 | £ | 333 | 293 | (e)(f)(h) | |||||||||||||||||||||||||||||||
Jewel Bidco | United | 1st Lien | 6.55% | 7/24/2028 | £ | 6,203 | 8,395 | (e)(f) | |||||||||||||||||||||||||||||||
Jewel Bidco | United | 1st Lien Term | 6.66% | 7/24/2028 | £ | 3,797 | 1,611 | (e)(h) | |||||||||||||||||||||||||||||||
JMG Group | United | 1st Lien | 5.92% | 12/11/2028 | £ | 310 | 419 | (e)(f) | |||||||||||||||||||||||||||||||
Annual Report 2021
35
CION Ares Diversified Credit Fund
Consolidated Schedule of Investments (continued)
December 31, 2021
(in thousands, except shares, percentages and as otherwise noted)
Senior Loans(b)(c)(d) (continued)
Company | Country(a) | Investment | Interest | Maturity Date | Acquisition Date | Shares | Principal Amount(a) | Fair Value(a) | Percentage of Net Assets | ||||||||||||||||||||||||||||||
| JMG Group Investments Limited | United Kingdom | 1st Lien Term Loan | 12/11/2028 | £ | 1,190 | $ | — | (e)(h) | |||||||||||||||||||||||||||||||
| OneDigital Borrower LLC | 1st Lien Term Loan | 4.75% (SOFR + 4.25%) | 11/16/2027 | 1,785 | 1,779 | ||||||||||||||||||||||||||||||||||
| Optio Group Limited | United Kingdom | 1st Lien Delayed Draw Term Loan | 8.25% (6M GBP LIBOR + 7.50%) | 3/16/2026 | £ | 598 | 379 | (e)(h) | |||||||||||||||||||||||||||||||
| Optio Group Limited | United Kingdom | 1st Lien Delayed Draw Term Loan | 8.25% (6M GBP LIBOR + 7.50%) | 3/30/2026 | £ | 500 | 677 | (e)(f) | |||||||||||||||||||||||||||||||
| Patriot Growth Insurance Services, LLC | 1st Lien Revolver | 10/16/2028 | 250 | (5 | )(e)(h) | ||||||||||||||||||||||||||||||||||
| Patriot Growth Insurance Services, LLC | 1st Lien Term Loan | 6.25% (3M LIBOR + 5.50%) | 10/16/2028 | 1,304 | 1,291 | (e)(f) | |||||||||||||||||||||||||||||||||
| Patriot Growth Insurance Services, LLC | 1st Lien Delayed Draw Term Loan | 10/16/2028 | 501 | (5 | )(e)(h) | ||||||||||||||||||||||||||||||||||
| People Corporation | Canada | 1st Lien Revolver | 7.25% (3M CDOR + 6.25%) | 2/18/2027 | CAD | 898 | 307 | (e)(h) | |||||||||||||||||||||||||||||||
| People Corporation | Canada | 1st Lien Term Loan | 7.25% (3M CDOR + 6.25%) | 2/18/2028 | CAD | 7,166 | 5,669 | (e)(f) | |||||||||||||||||||||||||||||||
| People Corporation | Canada | 1st Lien Delayed Draw Term Loan | 6.25% (2M CDOR + 5.50%) | 2/18/2028 | CAD | 4,116 | 183 | (e)(h) | |||||||||||||||||||||||||||||||
| People Corporation | Canada | 1st Lien Delayed Draw Term Loan | 7.25% (3M CDOR + 6.25%) | 2/18/2028 | CAD | 2,338 | 1,848 | (e) | |||||||||||||||||||||||||||||||
| Project Hammond Bidco Limited | United Kingdom | 1st Lien Term Loan | 5.67% (SONIA + 5.50%) | 12/4/2028 | £ | 1,750 | 2,369 | (e)(f) | |||||||||||||||||||||||||||||||
| Project Hammond Bidco Limited | United Kingdom | 1st Lien Delayed Draw Term Loan | 12/4/2028 | £ | 1,750 | — | (e)(h)(i) | ||||||||||||||||||||||||||||||||
| Right Choice Holdings Limited | United Kingdom | 1st Lien Term Loan | 7.75% (6M GBP LIBOR + 7.00%) | 6/6/2024 | £ | 1,000 | 1,354 | (e)(f) | |||||||||||||||||||||||||||||||
| Right Choice Holdings Limited | United Kingdom | 1st Lien Delayed Draw Term Loan | 7.75% (6M GBP LIBOR + 7.00%) | 6/6/2024 | £ | 667 | 902 | (e)(f) | |||||||||||||||||||||||||||||||
| RSC Acquisition, Inc. | 1st Lien Revolver | 7.75% (PRIME + 4.50%) | 10/30/2026 | 1 | 1 | (e)(h) | |||||||||||||||||||||||||||||||||
| RSC Acquisition, Inc. | 1st Lien Term Loan | 6.25% (3M LIBOR + 5.50%) | 10/30/2026 | 3,178 | 3,178 | (e)(f) | |||||||||||||||||||||||||||||||||
Annual Report 2021
36
CION Ares Diversified Credit Fund
Consolidated Schedule of Investments (continued)
December 31, 2021
(in thousands, except shares, percentages and as otherwise noted)
Senior Loans(b)(c)(d) (continued)
Company | Country(a) | Investment | Interest | Maturity Date | Acquisition Date | Shares | Principal Amount(a) | Fair Value(a) | Percentage of Net Assets | ||||||||||||||||||||||||||||||
| Ryan Specialty Group, LLC | 1st Lien Term Loan | 3.75% (1M LIBOR + 3.00%) | 9/1/2027 | $ | 988 | $ | 986 | ||||||||||||||||||||||||||||||||
| SCM Insurance Services Inc. | Canada | 1st Lien Revolver | 8/29/2022 | CAD | 1 | — | (e)(h) | ||||||||||||||||||||||||||||||||
| SCM Insurance Services Inc. | Canada | 1st Lien Term Loan | 6.00% (1M CDOR + 5.00%) | 8/29/2024 | CAD | 120 | 95 | (e)(f) | |||||||||||||||||||||||||||||||
| SCM Insurance Services Inc. | Canada | 2nd Lien Term Loan | 10.00% (1M CDOR + 9.00%) | 3/1/2025 | CAD | 125 | 99 | (e) | |||||||||||||||||||||||||||||||
SelectQuote, Inc. | 1st Lien Term Loan | 5.75% (1M LIBOR + 5.00%) | 11/5/2024 | 7,308 | 7,308 | (e) | |||||||||||||||||||||||||||||||||
| SG Acquisition, Inc. | 1st Lien Term Loan | 5.50% (1M LIBOR + 5.00%) | 1/27/2027 | 2,876 | 2,876 | (e)(f) | |||||||||||||||||||||||||||||||||
| Spring Insurance Solutions, LLC | 1st Lien Term Loan | 7.50% (3M LIBOR + 6.50%) | 11/24/2025 | 3,454 | 3,315 | (e)(f) | |||||||||||||||||||||||||||||||||
| Spring Insurance Solutions, LLC | 1st Lien Delayed Draw Term Loan | 7.50% (3M LIBOR + 6.50%) | 11/24/2025 | 1,151 | 81 | (e)(h) | |||||||||||||||||||||||||||||||||
| Staysure Bidco Limited | United Kingdom | 1st Lien Delayed Draw Term Loan | 8.00% (3M GBP LIBOR + 7.25%) | 7/1/2025 | £ | 1,000 | 1,272 | (e) | |||||||||||||||||||||||||||||||
USI, Inc. | 1st Lien Term Loan | 3.47% (3M LIBOR + 3.25%) | 12/2/2026 | 6,487 | 6,437 | ||||||||||||||||||||||||||||||||||
167,029 | 8.66 | % | |||||||||||||||||||||||||||||||||||||
Materials | |||||||||||||||||||||||||||||||||||||||
| Anchor Packaging, LLC | 1st Lien Term Loan | 4.10% (1M LIBOR + 4.00%) | 7/18/2026 | 3,132 | 3,093 | ||||||||||||||||||||||||||||||||||
| Aruba Investments, Inc. | 2nd Lien Term Loan | 8.50% (3M LIBOR + 7.75%) | 11/24/2028 | 3,000 | 3,005 | ||||||||||||||||||||||||||||||||||
| ASP-R-Pac Acquisition Co LLC | 1st Lien Revolver | 6.75% (3M LIBOR + 6.00%) | 12/29/2027 | 839 | 151 | (e)(h) | |||||||||||||||||||||||||||||||||
| ASP-R-Pac Acquisition Co LLC | 1st Lien Term Loan | 6.75% (3M LIBOR + 6.00%) | 12/29/2027 | 6,244 | 6,182 | (e)(f) | |||||||||||||||||||||||||||||||||
| Berlin Packaging L.L.C. | 1st Lien Term Loan | 3.75% (3M LIBOR + 3.25%) | 3/11/2028 | 4,028 | 3,991 | ||||||||||||||||||||||||||||||||||
| Berlin Packaging L.L.C. | 1st Lien Term Loan | 4.25% (1M LIBOR + 3.75%) | 3/11/2028 | 4,702 | 4,692 | ||||||||||||||||||||||||||||||||||
Annual Report 2021
37
CION Ares Diversified Credit Fund
Consolidated Schedule of Investments (continued)
December 31, 2021
(in thousands, except shares, percentages and as otherwise noted)
Senior Loans(b)(c)(d) (continued)
Company | Country(a) | Investment | Interest | Maturity Date | Acquisition Date | Shares | Principal Amount(a) | Fair Value(a) | Percentage of Net Assets | ||||||||||||||||||||||||||||||
| DCG Acquisition Corp. | 1st Lien Term Loan | 4.60% (1M LIBOR + 4.50%) | 9/30/2026 | $ | 5,293 | $ | 5,280 | (e) | |||||||||||||||||||||||||||||||
| Groupe Solmax Inc. | Canada | 1st Lien Term Loan | 5.50% (1M LIBOR + 4.75%) | 5/29/2028 | 1,300 | 1,295 | |||||||||||||||||||||||||||||||||
| IntraPac Canada Corporation | Canada | 1st Lien Term Loan | 6.25% (3M LIBOR + 5.50%) | 1/11/2026 | 794 | 794 | (e)(f) | ||||||||||||||||||||||||||||||||
| IntraPac International LLC | 1st Lien Revolver | 6.25% (3M LIBOR + 5.50%) | 1/11/2025 | 415 | 135 | (e)(h) | |||||||||||||||||||||||||||||||||
| IntraPac International LLC | 1st Lien Term Loan | 6.25% (3M LIBOR + 5.50%) | 1/11/2026 | 4,318 | 4,318 | (e)(f) | |||||||||||||||||||||||||||||||||
| Kleopatra Finco S.a r.l. | Luxembourg | 1st Lien Term Loan | 4.75% (6M EURIBOR + 4.75%) | 2/12/2026 | € | 3,800 | 4,195 | ||||||||||||||||||||||||||||||||
| Mauser Packaging Solutions Holding Company | 1st Lien Term Loan | 3.35% (1M LIBOR + 3.25%) | 4/3/2024 | 2,720 | 2,681 | ||||||||||||||||||||||||||||||||||
| Nelipak European Holdings Cooperatief U.A. | Netherlands | 1st Lien Revolver | 7/2/2024 | € | 582 | — | (e)(h) | ||||||||||||||||||||||||||||||||
| Nelipak European Holdings Cooperatief U.A. | Netherlands | 1st Lien Term Loan | 4.50% (3M EURIBOR + 4.50%) | 7/2/2026 | € | 806 | 917 | (e)(f) | |||||||||||||||||||||||||||||||
| Nelipak Holding Company | 1st Lien Revolver | 5.25% (3M LIBOR + 4.25%) | 7/2/2024 | 605 | 253 | (e)(h) | |||||||||||||||||||||||||||||||||
| Nelipak Holding Company | 1st Lien Term Loan | 5.25% (3M LIBOR + 4.25%) | 7/2/2026 | 2,969 | 2,969 | (e)(f) | |||||||||||||||||||||||||||||||||
| Novipax Buyer, L.L.C. | 1st Lien Term Loan | 6.75% (3M LIBOR + 5.75%) | 12/1/2026 | 4,344 | 4,344 | (e)(f) | |||||||||||||||||||||||||||||||||
| PAKNK Netherlands Treasury B.V. | Netherlands | 1st Lien Term Loan | 4.50% (3M EURIBOR + 4.50%) | 7/2/2026 | € | 5,254 | 5,981 | (e)(f) | |||||||||||||||||||||||||||||||
| Plaskolite PPC Intermediate II LLC | 2nd Lien Term Loan | 8.00% (3M LIBOR + 7.00%) | 12/14/2026 | 2,960 | 2,960 | (e)(f) | |||||||||||||||||||||||||||||||||
| Pregis TopCo LLC | 1st Lien Term Loan | 4.09% (1M LIBOR + 4.00%) | 7/31/2026 | 3,876 | 3,856 | ||||||||||||||||||||||||||||||||||
Pregis TopCo LLC | 1st Lien Term Loan | 4.50% (1M LIBOR + 4.00%) | 7/31/2026 | 1,292 | 1,284 | ||||||||||||||||||||||||||||||||||
| Pretium PKG Holdings, Inc. | 1st Lien Term Loan | 4.50% (6M LIBOR + 4.00%) | 10/2/2028 | 6,034 | 6,017 | (i) | |||||||||||||||||||||||||||||||||
Annual Report 2021
38
CION Ares Diversified Credit Fund
Consolidated Schedule of Investments (continued)
December 31, 2021
(in thousands, except shares, percentages and as otherwise noted)
Senior Loans(b)(c)(d) (continued)
Company | Country(a) | Investment | Interest | Maturity Date | Acquisition Date | Shares | Principal Amount(a) | Fair Value(a) | Percentage of Net Assets | ||||||||||||||||||||||||||||||
| Pretium PKG Holdings, Inc. | 2nd Lien Term Loan | 7.25% (3M LIBOR + 6.75%) | 10/1/2029 | $ | 1,025 | $ | 1,020 | ||||||||||||||||||||||||||||||||
| Trident TPI Holdings, Inc. | 1st Lien Term Loan | 4.25% (3M LIBOR + 3.25%) | 10/17/2024 | 3,019 | 3,016 | ||||||||||||||||||||||||||||||||||
| Trident TPI Holdings, Inc. | 1st Lien Term Loan | 4.50% (3M LIBOR + 4.00%) | 9/15/2028 | 7,687 | 7,673 | (i) | |||||||||||||||||||||||||||||||||
| Trident TPI Holdings, Inc. | 1st Lien Delayed Draw Term Loan | 4.50% (3M LIBOR + 4.00%) | 9/15/2028 | 1,092 | 438 | (h)(i) | |||||||||||||||||||||||||||||||||
80,540 | 4.17 | % | |||||||||||||||||||||||||||||||||||||
Media & Entertainment | |||||||||||||||||||||||||||||||||||||||
| Aventine Intermediate LLC | 1st Lien Term Loan | 6.75% (3M LIBOR + 6.00%) | 6/18/2027 | 2,029 | 2,009 | (e)(f) | |||||||||||||||||||||||||||||||||
| Aventine Intermediate LLC | 1st Lien Delayed Draw Term Loan | 6/18/2027 | 812 | (8 | )(e)(h) | ||||||||||||||||||||||||||||||||||
| AVSC Holding Corp. | 1st Lien Term Loan | 6.50% (3M LIBOR + 5.50%) | 10/15/2026 | 2,026 | 1,876 | ||||||||||||||||||||||||||||||||||
| Diamond Sports Group, LLC | 1st Lien Term Loan | 3.35% (1M LIBOR + 3.25%) | 8/24/2026 | 1,104 | 509 | ||||||||||||||||||||||||||||||||||
| Global Music Rights, LLC | 1st Lien Revolver | 8/27/2027 | 473 | (9 | )(e)(h) | ||||||||||||||||||||||||||||||||||
| Global Music Rights, LLC | 1st Lien Term Loan | 6.50% (3M LIBOR + 5.75%) | 8/28/2028 | 5,018 | 4,967 | (e) | |||||||||||||||||||||||||||||||||
| Gray Television, Inc. | 1st Lien Term Loan | 12/1/2028 | 4,597 | 4,570 | (i) | ||||||||||||||||||||||||||||||||||
| MMax Investment Partners, Inc. | 1st Lien Term Loan | 10.00% (3M LIBOR + 10.00%) | 1/19/2026 | 550 | 495 | (e)(g) | |||||||||||||||||||||||||||||||||
| Nexstar Broadcasting Inc | 1st Lien Term Loan | 2.60% (1M LIBOR + 2.50%) | 9/18/2026 | 5,000 | 4,986 | ||||||||||||||||||||||||||||||||||
| Production Resource Group, LLC | 1st Lien Term Loan | 9.75% (3M LIBOR + 9.50%) | 8/21/2024 | 691 | 691 | (e)(g) | |||||||||||||||||||||||||||||||||
| Production Resource Group, LLC | 1st Lien Delayed Draw Term Loan | 6.00% (3M LIBOR + 5.00%) | 8/21/2024 | 443 | 395 | (e)(h) | |||||||||||||||||||||||||||||||||
| Production Resource Group, LLC | 1st Lien Delayed Draw Term Loan | 8.50% (3M LIBOR + 7.50%) | 8/21/2024 | 17 | 17 | (e) | |||||||||||||||||||||||||||||||||
Annual Report 2021
39
CION Ares Diversified Credit Fund
Consolidated Schedule of Investments (continued)
December 31, 2021
(in thousands, except shares, percentages and as otherwise noted)
Senior Loans(b)(c)(d) (continued)
Company | Country(a) | Investment | Interest | Maturity Date | Acquisition Date | Shares | Principal Amount(a) | Fair Value(a) | Percentage of Net Assets | ||||||||||||||||||||||||||||||
| Renaissance Holding Corp. | 1st Lien Term Loan | 3.35% (1M LIBOR + 3.25%) | 5/30/2025 | $ | 4,624 | $ | 4,576 | (i) | |||||||||||||||||||||||||||||||
| Rugby Australia Ltd | Australia | 1st Lien Term Loan | 7.75% (3M BBSY + 7.00%) | 3/31/2027 | AUD | 1,250 | 900 | (e) | |||||||||||||||||||||||||||||||
| Rugby Australia Ltd | Australia | 1st Lien Delayed Draw Term Loan | 3/31/2027 | AUD | 1,250 | (8 | )(e)(h) | ||||||||||||||||||||||||||||||||
| Storm Investment S.a.r.l. | Luxembourg | 1st Lien Term Loan | 3.75% | 6/22/2029 | € | 9,193 | 10,466 | (e) | |||||||||||||||||||||||||||||||
| The E.W. Scripps Company | 1st Lien Term Loan | 3.75% (1M LIBOR + 3.00%) | 1/7/2028 | 1,977 | 1,975 | ||||||||||||||||||||||||||||||||||
| UFC Holdings, LLC | 1st Lien Term Loan | 3.50% (6M LIBOR + 2.75%) | 4/29/2026 | 6,476 | 6,440 | (i) | |||||||||||||||||||||||||||||||||
| Univision Communications Inc | 1st Lien Term Loan | 3.75% (1M LIBOR + 2.75%) | 3/15/2024 | 1,700 | 1,698 | (i) | |||||||||||||||||||||||||||||||||
46,545 | 2.41 | % | |||||||||||||||||||||||||||||||||||||
Pharmaceuticals, Biotechnology & Life Sciences | |||||||||||||||||||||||||||||||||||||||
| Aspire Bidco Limited | Jersey | 1st Lien Revolver | 3/3/2028 | £ | 500 | — | (e)(h) | ||||||||||||||||||||||||||||||||
| Aspire Bidco Limited | Jersey | 1st Lien Term Loan | 6.80% (SONIA + 6.75%) | 3/3/2028 | £ | 1,200 | 1,624 | (e)(f) | |||||||||||||||||||||||||||||||
| Aspire Bidco Limited | Jersey | 1st Lien Term Loan | 6.80% (SONIA + 6.75%) | 9/4/2028 | £ | 3,559 | 4,817 | (e)(f) | |||||||||||||||||||||||||||||||
| Aspire Bidco Limited | Jersey | 1st Lien Term Loan | 3/3/2028 | £ | 700 | — | (e)(h) | ||||||||||||||||||||||||||||||||
| Aspire Bidco Limited | Jersey | 1st Lien Term Loan | 9/4/2028 | £ | 1,941 | — | (e)(h) | ||||||||||||||||||||||||||||||||
| Cambrex Corporation | 1st Lien Term Loan | 4.25% (1M LIBOR + 3.50%) | 12/4/2026 | 4,429 | 4,427 | ||||||||||||||||||||||||||||||||||
| Cobalt Buyer Sub, Inc. | 1st Lien Revolver | 5.25% (3M LIBOR + 5.25%) | 10/1/2027 | 895 | 72 | (e)(h) | |||||||||||||||||||||||||||||||||
| Cobalt Buyer Sub, Inc. | 1st Lien Term Loan | 6.00% (3M LIBOR + 5.25%) | 10/2/2028 | 7,427 | 7,353 | (e) | |||||||||||||||||||||||||||||||||
| Cobalt Buyer Sub, Inc. | 1st Lien Delayed Draw Term Loan | 10/2/2028 | 2,476 | (25 | )(e)(h) | ||||||||||||||||||||||||||||||||||
| Da Vinci Purchaser Corp. | 1st Lien Term Loan | 5.00% (1M LIBOR + 4.00%) | 1/8/2027 | 5,394 | 5,392 | ||||||||||||||||||||||||||||||||||
Annual Report 2021
40
CION Ares Diversified Credit Fund
Consolidated Schedule of Investments (continued)
December 31, 2021
(in thousands, except shares, percentages and as otherwise noted)
Senior Loans(b)(c)(d) (continued)
Company | Country(a) | Investment | Interest | Maturity Date | Acquisition Date | Shares | Principal Amount(a) | Fair Value(a) | Percentage of Net Assets | ||||||||||||||||||||||||||||||
| Icon Public Limited Company | Ireland | 1st Lien Term Loan | 2.75% (3M LIBOR + 2.25%) | 7/3/2028 | $ | 2,028 | $ | 2,028 | |||||||||||||||||||||||||||||||
| Jazz Financing Lux S.a.r.l. | Luxembourg | 1st Lien Term Loan | 4.00% (1M LIBOR + 3.50%) | 5/5/2028 | 2,488 | 2,496 | |||||||||||||||||||||||||||||||||
| NMC Skincare Intermediate Holdings II, LLC | 1st Lien Revolver | 6.00% (1M LIBOR + 5.00%) | 10/31/2024 | 333 | 223 | (e)(h) | |||||||||||||||||||||||||||||||||
| NMC Skincare Intermediate Holdings II, LLC | 1st Lien Term Loan | 6.00% (1M LIBOR + 5.00%) | 10/31/2024 | 1,940 | 1,921 | (e)(f) | |||||||||||||||||||||||||||||||||
| NMC Skincare Intermediate Holdings II, LLC | 1st Lien Delayed Draw Term Loan | 6.00% (1M LIBOR + 5.00%) | 10/31/2024 | 654 | 647 | (e) | |||||||||||||||||||||||||||||||||
| North American Science Associates, LLC | 1st Lien Revolver | 5.25% (3M LIBOR + 4.50%) | 3/15/2027 | 1 | 1 | (e)(h) | |||||||||||||||||||||||||||||||||
| North American Science Associates, LLC | 1st Lien Term Loan | 6.50% (3M LIBOR + 5.75%) | 9/15/2027 | 7,053 | 7,053 | (e)(f) | |||||||||||||||||||||||||||||||||
| North American Science Associates, LLC | 1st Lien Term Loan | 6.50% (3M LIBOR + 5.75%) | 9/15/2027 | 4,147 | 4,147 | (e) | |||||||||||||||||||||||||||||||||
| North American Science Associates, LLC | 1st Lien Delayed Draw Term Loan | 6.50% (3M LIBOR + 5.75%) | 9/15/2027 | 1,006 | 1,006 | (e) | |||||||||||||||||||||||||||||||||
| North American Science Associates, LLC | 1st Lien Delayed Draw Term Loan | 9/15/2027 | 916 | — | (e)(h) | ||||||||||||||||||||||||||||||||||
Organon & Co. | 1st Lien Term Loan | 3.50% (3M LIBOR + 3.00%) | 6/2/2028 | 4,993 | 4,994 | ||||||||||||||||||||||||||||||||||
| PROTON JVCO S.A R.L. | Luxembourg | 1st Lien Term Loan | 7.50% (6M EURIBOR + 7.25%) | 11/10/2026 | € | 1,667 | 1,897 | (e)(f) | |||||||||||||||||||||||||||||||
| PROTON JVCO S.A R.L. | Luxembourg | 1st Lien Term Loan | 11/10/2026 | € | 833 | — | (e)(h) | ||||||||||||||||||||||||||||||||
| TerSera Therapeutics LLC | 1st Lien Term Loan | 6.60% (3M LIBOR + 5.60%) | 3/30/2025 | 48 | 48 | (e)(f) | |||||||||||||||||||||||||||||||||
50,121 | 2.60 | % | |||||||||||||||||||||||||||||||||||||
Retailing | |||||||||||||||||||||||||||||||||||||||
| Atlas Intermediate III, L.L.C. | 1st Lien Revolver | 4/29/2025 | 264 | — | (e)(h) | ||||||||||||||||||||||||||||||||||
| Atlas Intermediate III, L.L.C. | 1st Lien Term Loan | 6.50% (3M LIBOR + 5.50%) | 4/29/2025 | 1,845 | 1,845 | (e)(f) | |||||||||||||||||||||||||||||||||
Annual Report 2021
41
CION Ares Diversified Credit Fund
Consolidated Schedule of Investments (continued)
December 31, 2021
(in thousands, except shares, percentages and as otherwise noted)
Senior Loans(b)(c)(d) (continued)
Company | Country(a) | Investment | Interest | Maturity Date | Acquisition Date | Shares | Principal Amount(a) | Fair Value(a) | Percentage of Net Assets | ||||||||||||||||||||||||||||||
| Atlas Intermediate III, L.L.C. | 1st Lien Delayed Draw Term Loan | 6.50% (3M LIBOR + 5.50%) | 4/29/2025 | $ | 404 | $ | 404 | (e) | |||||||||||||||||||||||||||||||
| Autokiniton US Holdings, Inc. | 1st Lien Term Loan | 5.00% (12M LIBOR + 4.50%) | 4/6/2028 | 3,102 | 3,104 | ||||||||||||||||||||||||||||||||||
| Bamboo Purchaser, Inc. | 1st Lien Revolver | 3.00% (3M LIBOR + 2.50%) | 11/5/2026 | 1 | — | (e)(h) | |||||||||||||||||||||||||||||||||
| Bamboo Purchaser, Inc. | 1st Lien Term Loan | 6.75% (3M LIBOR + 6.00%) | 11/5/2027 | 3,554 | 3,519 | (e)(f) | |||||||||||||||||||||||||||||||||
| Bamboo Purchaser, Inc. | 1st Lien Delayed Draw Term Loan | 6.75% (3M LIBOR + 6.00%) | 11/5/2027 | 836 | 410 | (e)(h) | |||||||||||||||||||||||||||||||||
| BCP V Modular Services Holdings IV Limited | United Kingdom | 1st Lien Term Loan | 10/7/2028 | € | 2,133 | 2,426 | (i) | ||||||||||||||||||||||||||||||||
| Grab Holdings, Inc. | Singapore | 1st Lien Term Loan | 5.50% (3M LIBOR + 4.50%) | 1/29/2026 | 6,502 | 6,510 | |||||||||||||||||||||||||||||||||
Hoya Midco, LLC | 1st Lien Term Loan | 4.50% (1M LIBOR + 3.50%) | 6/30/2024 | 4,303 | 4,298 | (i) | |||||||||||||||||||||||||||||||||
| Marcone Yellowstone Buyer Inc. | 1st Lien Term Loan | 6.25% (3M LIBOR + 5.50%) | 6/23/2028 | 8,420 | 8,336 | (e)(f) | |||||||||||||||||||||||||||||||||
| Marcone Yellowstone Buyer Inc. | 1st Lien Term Loan | 6/23/2028 | 2,500 | 2,475 | (e)(f)(i) | ||||||||||||||||||||||||||||||||||
| Marcone Yellowstone Buyer Inc. | 1st Lien Delayed Draw Term Loan | 6.25% (3M LIBOR + 5.50%) | 6/23/2028 | 2,790 | 2,762 | (e) | |||||||||||||||||||||||||||||||||
| Marcone Yellowstone Buyer Inc. | 1st Lien Delayed Draw Term Loan | 6/23/2028 | 800 | 792 | (e)(i) | ||||||||||||||||||||||||||||||||||
| Moon Valley Nursery of Arizona Retail, LLC | 1st Lien Revolver | 4.50% (1M LIBOR + 3.50%) | 10/8/2026 | 1 | — | (e)(h) | |||||||||||||||||||||||||||||||||
| Moon Valley Nursery of Arizona Retail, LLC | 1st Lien Term Loan | 6.75% (3M LIBOR + 5.75%) | 10/8/2027 | 8,408 | 8,324 | (e) | |||||||||||||||||||||||||||||||||
| Moon Valley Nursery of Arizona Retail, LLC | 1st Lien Delayed Draw Term Loan | 6.75% (3M LIBOR + 5.75%) | 10/8/2027 | 2,002 | 300 | (e)(h) | |||||||||||||||||||||||||||||||||
Pug LLC | 1st Lien Term Loan | 4.75% (1M LIBOR + 4.25%) | 2/12/2027 | 2,048 | 2,036 | ||||||||||||||||||||||||||||||||||
Reddy Ice LLC | 1st Lien Revolver | 7/1/2024 | 955 | — | (e)(h) | ||||||||||||||||||||||||||||||||||
Annual Report 2021
42
CION Ares Diversified Credit Fund
Consolidated Schedule of Investments (continued)
December 31, 2021
(in thousands, except shares, percentages and as otherwise noted)
Senior Loans(b)(c)(d) (continued)
Company | Country(a) | Investment | Interest | Maturity Date | Acquisition Date | Shares | Principal Amount(a) | Fair Value(a) | Percentage of Net Assets | ||||||||||||||||||||||||||||||
Reddy Ice LLC | 1st Lien Term Loan | 7.50% (3M LIBOR + 6.50%) | 7/1/2025 | $ | 7,264 | $ | 7,264 | (e)(f) | |||||||||||||||||||||||||||||||
Reddy Ice LLC | 1st Lien Delayed Draw Term Loan | 7.50% (1M LIBOR + 6.50%) | 7/1/2025 | 1,461 | 1,456 | (e)(h) | |||||||||||||||||||||||||||||||||
Reddy Ice LLC | 1st Lien Delayed Draw Term Loan | 7.50% (2M LIBOR + 6.50%) | 7/1/2025 | 551 | 551 | (e) | |||||||||||||||||||||||||||||||||
Reddy Ice LLC | 1st Lien Delayed Draw Term Loan | 7.50% (3M LIBOR + 6.50%) | 7/1/2025 | 686 | 686 | (e) | |||||||||||||||||||||||||||||||||
| Saldon Holdings, Inc. | 1st Lien Revolver | 3/13/2024 | 381 | — | (e)(h) | ||||||||||||||||||||||||||||||||||
| Saldon Holdings, Inc. | 1st Lien Term Loan | 6.65% (1M LIBOR + 5.65%) | 3/13/2025 | 7,147 | 7,147 | (e)(f) | |||||||||||||||||||||||||||||||||
| SCIH Salt Holdings Inc. | 1st Lien Term Loan | 4.75% (3M LIBOR + 4.00%) | 3/16/2027 | 5,611 | 5,550 | (i) | |||||||||||||||||||||||||||||||||
| Sweetwater Borrower, LLC | 1st Lien Term Loan | 5.50% (1M LIBOR + 4.75%) | 8/7/2028 | 385 | 385 | (e) | |||||||||||||||||||||||||||||||||
| US Salt Investors, LLC | 1st Lien Revolver | 7/20/2026 | 679 | (14 | )(e)(h) | ||||||||||||||||||||||||||||||||||
| US Salt Investors, LLC | 1st Lien Term Loan | 6.25% (3M LIBOR + 5.50%) | 7/19/2028 | 6,027 | 5,967 | (e)(f) | |||||||||||||||||||||||||||||||||
76,533 | 3.97 | % | |||||||||||||||||||||||||||||||||||||
Software & Services | |||||||||||||||||||||||||||||||||||||||
2U, Inc. | 1st Lien Term Loan | 6.50% (1M LIBOR + 5.75%) | 12/30/2024 | 7,732 | 7,732 | (e)(f) | |||||||||||||||||||||||||||||||||
| AffiniPay Midco, LLC | 1st Lien Revolver | 3/2/2026 | 766 | — | (e)(h) | ||||||||||||||||||||||||||||||||||
| AffiniPay Midco, LLC | 1st Lien Term Loan | 6.25% (3M LIBOR + 5.00%) | 3/2/2026 | 9,791 | 9,791 | (e)(f) | |||||||||||||||||||||||||||||||||
| Anaqua Parent Holdings, Inc. | 1st Lien Revolver | 10/10/2025 | 231 | — | (e)(h) | ||||||||||||||||||||||||||||||||||
| Anaqua Parent Holdings, Inc. | 1st Lien Term Loan | 6.25% (6M EURIBOR + 6.25%) | 4/10/2026 | € | 665 | 757 | (e) | ||||||||||||||||||||||||||||||||
| Anaqua Parent Holdings, Inc. | 1st Lien Term Loan | 7.00% (6M LIBOR + 6.00%) | 4/10/2026 | 3,796 | 3,796 | (e)(f) | |||||||||||||||||||||||||||||||||
| Anaqua Parent Holdings, Inc. | 1st Lien Delayed Draw Term Loan | 4/10/2026 | 523 | — | (e)(h) | ||||||||||||||||||||||||||||||||||
Annual Report 2021
43
CION Ares Diversified Credit Fund
Consolidated Schedule of Investments (continued)
December 31, 2021
(in thousands, except shares, percentages and as otherwise noted)
Senior Loans(b)(c)(d) (continued)
Company | Country(a) | Investment | Interest | Maturity Date | Acquisition Date | Shares | Principal Amount(a) | Fair Value(a) | Percentage of Net Assets | ||||||||||||||||||||||||||||||
| APG Intermediate Holdings Corporation | 1st Lien Revolver | 6.75% (3M LIBOR + 5.25%) | 1/3/2025 | $ | 1 | $ | — | (e)(h) | |||||||||||||||||||||||||||||||
| APG Intermediate Holdings Corporation | 1st Lien Term Loan | 6.75% (3M LIBOR + 5.25%) | 1/3/2025 | 997 | 997 | (e) | |||||||||||||||||||||||||||||||||
| APG Intermediate Holdings Corporation | 1st Lien Delayed Draw Term Loan | 6.75% (3M LIBOR + 5.25%) | 1/3/2025 | 59 | 59 | (e) | |||||||||||||||||||||||||||||||||
| Applied Systems, Inc. | 1st Lien Term Loan | 3.75% (3M LIBOR + 3.25%) | 9/19/2024 | 8,565 | 8,556 | ||||||||||||||||||||||||||||||||||
| Applied Systems, Inc. | 2nd Lien Term Loan | 6.25% (3M LIBOR + 5.50%) | 9/19/2025 | 989 | 995 | ||||||||||||||||||||||||||||||||||
| Appriss Health, LLC | 1st Lien Revolver | 5/6/2027 | 212 | — | (e)(h) | ||||||||||||||||||||||||||||||||||
| Appriss Health, LLC | 1st Lien Term Loan | 8.25% (3M LIBOR + 7.25%) | 5/6/2027 | 2,912 | 2,912 | (e) | |||||||||||||||||||||||||||||||||
| Apttus Corporation | 1st Lien Term Loan | 5.00% (3M LIBOR + 4.25%) | 5/8/2028 | 2,947 | 2,950 | ||||||||||||||||||||||||||||||||||
Asurion, LLC | 1st Lien Term Loan | 3.10% (1M LIBOR + 3.00%) | 11/3/2024 | 2,498 | 2,485 | ||||||||||||||||||||||||||||||||||
Asurion, LLC | 1st Lien Term Loan | 3.35% (1M LIBOR + 3.25%) | 12/23/2026 | 1,023 | 1,015 | ||||||||||||||||||||||||||||||||||
Asurion, LLC | 1st Lien Term Loan | 3.35% (1M LIBOR + 3.25%) | 7/31/2027 | 2,124 | 2,109 | ||||||||||||||||||||||||||||||||||
Asurion, LLC | 2nd Lien Term Loan | 5.35% (1M LIBOR + 5.25%) | 1/31/2028 | 570 | 572 | ||||||||||||||||||||||||||||||||||
Asurion, LLC | 2nd Lien Term Loan | 5.35% (1M LIBOR + 5.25%) | 1/20/2029 | 7,000 | 6,966 | ||||||||||||||||||||||||||||||||||
| Atlanta Bidco Limited | United Kingdom | 1st Lien Term Loan | 7.75% (6M EURIBOR + 7.00%) | 8/23/2024 | € | 1,000 | 1,116 | (e)(f) | |||||||||||||||||||||||||||||||
Avaya Inc. | 1st Lien Term Loan | 4.36% (1M LIBOR + 4.25%) | 12/15/2027 | 680 | 681 | ||||||||||||||||||||||||||||||||||
| Banyan Software Holdings, LLC | 1st Lien Revolver | 7.75% (2M LIBOR + 6.75%) | 10/30/2025 | 471 | 189 | (e)(h) | |||||||||||||||||||||||||||||||||
| Banyan Software Holdings, LLC | 1st Lien Term Loan | 7.75% (3M LIBOR + 6.75%) | 10/30/2026 | 3,556 | 3,556 | (e)(f) | |||||||||||||||||||||||||||||||||
Annual Report 2021
44
CION Ares Diversified Credit Fund
Consolidated Schedule of Investments (continued)
December 31, 2021
(in thousands, except shares, percentages and as otherwise noted)
Senior Loans(b)(c)(d) (continued)
Company | Country(a) | Investment | Interest | Maturity Date | Acquisition Date | Shares | Principal Amount(a) | Fair Value(a) | Percentage of Net Assets | ||||||||||||||||||||||||||||||
| Banyan Software Holdings, LLC | 1st Lien Delayed Draw Term Loan | 7.75% (3M LIBOR + 6.75%) | 10/30/2026 | $ | 1,526 | $ | 722 | (e)(h) | |||||||||||||||||||||||||||||||
| Banyan Software Holdings, LLC | 1st Lien Delayed Draw Term Loan | 10/30/2026 | 3,602 | — | (e)(h) | ||||||||||||||||||||||||||||||||||
| Bock Capital Bidco B.V. | 1st Lien Term Loan | 4.00% (3M EURIBOR + 4.00%) | 6/29/2028 | € | 10,000 | 11,381 | |||||||||||||||||||||||||||||||||
| Businessolver.com, Inc. | 1st Lien Term Loan | 6.50% (1M LIBOR + 5.75%) | 12/1/2027 | 4,445 | 4,400 | (e)(f) | |||||||||||||||||||||||||||||||||
| Businessolver.com, Inc. | 1st Lien Delayed Draw Term Loan | 12/1/2027 | 1,197 | (12 | )(e)(h) | ||||||||||||||||||||||||||||||||||
BYJU's Alpha, Inc. | 1st Lien Term Loan | 11/24/2026 | 3,999 | 4,037 | (i) | ||||||||||||||||||||||||||||||||||
| Capnor Connery Bidco A/S | Denmark | 1st Lien Term Loan | 7.63% (1M EURIBOR + 7.63%) | 4/30/2026 | € | 2,954 | 3,364 | (e)(f) | |||||||||||||||||||||||||||||||
| Capnor Connery Bidco A/S | Denmark | 1st Lien Term Loan | 7.63% (1M STIBOR + 7.63%) | 4/30/2026 | SEK | 4,210 | 466 | (e)(f) | |||||||||||||||||||||||||||||||
| Capnor Connery Bidco A/S | Denmark | 1st Lien Term Loan | 8.50% (1M NIBOR + 7.63%) | 4/30/2026 | NOK | 2,551 | 290 | (e)(f) | |||||||||||||||||||||||||||||||
| Capnor Connery Bidco A/S | Denmark | 1st Lien Delayed Draw Term Loan | 7.63% (1M CIBOR + 7.63%) | 4/30/2026 | DKK | 22,065 | 3,378 | (e)(f) | |||||||||||||||||||||||||||||||
| Capnor Connery Bidco A/S | Denmark | 1st Lien Delayed Draw Term Loan | 7.63% (1M CIBOR + 7.63%) | 4/30/2026 | DKK | 45,968 | 966 | (e)(h) | |||||||||||||||||||||||||||||||
| Cardinal Parent, Inc. | 1st Lien Revolver | 6.75% (PRIME + 3.50%) | 11/12/2025 | 1 | — | (e)(h) | |||||||||||||||||||||||||||||||||
| Cardinal Parent, Inc. | 2nd Lien Term Loan | 8.50% (3M LIBOR + 7.75%) | 11/13/2028 | 8,634 | 8,634 | (e)(f) | |||||||||||||||||||||||||||||||||
| Cast & Crew Payroll, LLC | 1st Lien Term Loan | 3.59% (1M LIBOR + 3.50%) | 2/9/2026 | 2,945 | 2,941 | ||||||||||||||||||||||||||||||||||
| CCC Intelligent Solutions, Inc. | 1st Lien Term Loan | 3.00% (3M LIBOR + 2.50%) | 9/21/2028 | 2,020 | 2,017 | ||||||||||||||||||||||||||||||||||
| CED Group Holding B.V. | Netherlands | 1st Lien Delayed Draw Term Loan | 6.00% (3M EURIBOR + 6.00%) | 12/9/2025 | € | 336 | 382 | (e)(f) | |||||||||||||||||||||||||||||||
Confirmasoft AB | Sweden | 1st Lien Delayed Draw Term Loan | 6.75% (3M EURIBOR + 6.75%) | 6/3/2027 | € | 1,995 | 2,271 | (e)(f) | |||||||||||||||||||||||||||||||
Annual Report 2021
45
CION Ares Diversified Credit Fund
Consolidated Schedule of Investments (continued)
December 31, 2021
(in thousands, except shares, percentages and as otherwise noted)
Senior Loans(b)(c)(d) (continued)
Company | Country(a) | Investment | Interest | Maturity Date | Acquisition Date | Shares | Principal Amount(a) | Fair Value(a) | Percentage of Net Assets | ||||||||||||||||||||||||||||||
Confirmasoft AB | Sweden | 1st Lien Delayed Draw Term Loan | 6.75% (3M EURIBOR + 6.75%) | 6/3/2027 | € | 1,505 | $ | 634 | (e)(h) | ||||||||||||||||||||||||||||||
| Consilio Midco Limited | United Kingdom | 1st Lien Revolver | 5/26/2028 | 123 | (2 | )(e)(h) | |||||||||||||||||||||||||||||||||
| Consilio Midco Limited | United Kingdom | 1st Lien Term Loan | 6.25% (3M EURIBOR + 6.25%) | 5/26/2028 | € | 2,024 | 2,281 | (e) | |||||||||||||||||||||||||||||||
| Consilio Midco Limited | United Kingdom | 1st Lien Term Loan | 6.75% (3M LIBOR + 5.75%) | 5/26/2028 | 6,875 | 6,806 | (e)(f) | ||||||||||||||||||||||||||||||||
| Consilio Midco Limited | United Kingdom | 1st Lien Delayed Draw Term Loan | 6.75% (3M LIBOR + 5.75%) | 5/26/2028 | 2,572 | 1,697 | (e)(h) | ||||||||||||||||||||||||||||||||
| Consilio Midco Limited | United Kingdom | 1st Lien Delayed Draw Term Loan | 5/26/2028 | € | 386 | (4 | )(e)(h) | ||||||||||||||||||||||||||||||||
| Cority Software Inc. | Canada | 1st Lien Revolver | 7/2/2025 | 231 | — | (e)(h) | |||||||||||||||||||||||||||||||||
| Cority Software Inc. | Canada | 1st Lien Term Loan | 6.00% (3M LIBOR + 5.00%) | 7/2/2026 | 1,737 | 1,737 | (e)(f) | ||||||||||||||||||||||||||||||||
| Cority Software Inc. | Canada | 1st Lien Term Loan | 6.00% (3M LIBOR + 5.00%) | 7/2/2026 | 130 | 130 | (e) | ||||||||||||||||||||||||||||||||
| Cornerstone OnDemand, Inc. | 1st Lien Revolver | 10/15/2026 | 100 | (10 | )(e)(h) | ||||||||||||||||||||||||||||||||||
| Cornerstone OnDemand, Inc. | 2nd Lien Term Loan | 10/15/2029 | 17,522 | 17,259 | (e)(i) | ||||||||||||||||||||||||||||||||||
Cvent, Inc. | 1st Lien Term Loan | 3.84% (1M LIBOR + 3.75%) | 11/29/2024 | 1,248 | 1,245 | ||||||||||||||||||||||||||||||||||
| Datix Bidco Limited | United Kingdom | 1st Lien Term Loan | 4.18% (6M LIBOR + 4.00%) | 4/28/2025 | 2,851 | 2,851 | (e)(f) | ||||||||||||||||||||||||||||||||
| Denali Holdco LLC | 1st Lien Revolver | 9/15/2027 | 592 | (12 | )(e)(h) | ||||||||||||||||||||||||||||||||||
| Denali Holdco LLC | 1st Lien Term Loan | 7.00% (3M LIBOR + 6.00%) | 9/15/2027 | 4,118 | 4,077 | (e) | |||||||||||||||||||||||||||||||||
| Diligent Corporation | 1st Lien Revolver | 8/4/2025 | 513 | — | (e)(h) | ||||||||||||||||||||||||||||||||||
| Diligent Corporation | 1st Lien Term Loan | 6.75% (3M LIBOR + 5.75%) | 8/4/2025 | 2,256 | 2,256 | (e)(f) | |||||||||||||||||||||||||||||||||
| Diligent Corporation | 1st Lien Term Loan | 7.25% (3M LIBOR + 6.25%) | 8/4/2025 | 188 | 188 | (e) | |||||||||||||||||||||||||||||||||
| Diligent Corporation | 1st Lien Term Loan | 7.25% (3M LIBOR + 6.25%) | 8/4/2025 | 3,051 | 3,051 | (e)(f) | |||||||||||||||||||||||||||||||||
Annual Report 2021
46
CION Ares Diversified Credit Fund
Consolidated Schedule of Investments (continued)
December 31, 2021
(in thousands, except shares, percentages and as otherwise noted)
Senior Loans(b)(c)(d) (continued)
Company | Country(a) | Investment | Interest | Maturity Date | Acquisition Date | Shares | Principal Amount(a) | Fair Value(a) | Percentage of Net Assets | ||||||||||||||||||||||||||||||
| Diligent Corporation | 1st Lien Delayed Draw Term Loan | 8/4/2025 | $ | 687 | $ | — | (e)(h) | ||||||||||||||||||||||||||||||||
Doxim Inc. | 1st Lien Term Loan | 7.75% (1M LIBOR + 6.75%) | 2/28/2024 | 3,422 | 3,422 | (e)(f) | |||||||||||||||||||||||||||||||||
Doxim Inc. | 1st Lien Term Loan | 8.00% (1M LIBOR + 7.00%) | 2/28/2024 | 828 | 828 | (e)(f) | |||||||||||||||||||||||||||||||||
Doxim Inc. | 1st Lien Term Loan | 9.00% (1M LIBOR + 8.00%) | 2/28/2024 | 6,298 | 6,298 | (e)(f) | |||||||||||||||||||||||||||||||||
Doxim Inc. | 1st Lien Last Out Term Loan | 7.00% (1M LIBOR + 6.00%) | 2/28/2024 | 710 | 710 | (e)(f) | |||||||||||||||||||||||||||||||||
Doxim Inc. | 1st Lien Last Out Delayed Draw Term Loan | 7.00% (1M LIBOR + 6.00%) | 2/28/2024 | 325 | 325 | (e) | |||||||||||||||||||||||||||||||||
| Drilling Info Holdings, Inc. | 2nd Lien Term Loan | 8.34% (1M LIBOR + 8.25%) | 7/30/2026 | 8,077 | 8,077 | (e)(f) | |||||||||||||||||||||||||||||||||
| DS Admiral Bidco, LLC | 1st Lien Revolver | 3/16/2026 | 358 | — | (e)(h) | ||||||||||||||||||||||||||||||||||
| DS Admiral Bidco, LLC | 1st Lien Term Loan | 6.75% (3M LIBOR + 5.75%) | 3/16/2028 | 2,426 | 2,426 | (e)(f) | |||||||||||||||||||||||||||||||||
| Dye & Durham Corporation | Canada | 1st Lien Revolver | 12/3/2026 | CAD | 1,659 | (21 | )(e)(h) | ||||||||||||||||||||||||||||||||
| Dye & Durham Corporation | Canada | 1st Lien Term Loan | 6.50% (1M CDOR + 5.75%) | 12/3/2027 | CAD | 11,928 | 9,288 | (e)(f) | |||||||||||||||||||||||||||||||
| Dye & Durham Corporation | Canada | 1st Lien Delayed Draw Term Loan | 12/3/2027 | CAD | 1,569 | (19 | )(e)(h) | ||||||||||||||||||||||||||||||||
| Elemica Parent, Inc. | 1st Lien Revolver | 6.50% (3M LIBOR + 5.50%) | 9/18/2025 | 479 | 268 | (e)(h) | |||||||||||||||||||||||||||||||||
| Elemica Parent, Inc. | 1st Lien Term Loan | 6.50% (3M LIBOR + 5.50%) | 9/18/2025 | 2,836 | 2,836 | (e) | |||||||||||||||||||||||||||||||||
| Elemica Parent, Inc. | 1st Lien Term Loan | 6.50% (3M LIBOR + 5.50%) | 9/18/2025 | 872 | 872 | (e)(f) | |||||||||||||||||||||||||||||||||
| Elemica Parent, Inc. | 1st Lien Delayed Draw Term Loan | 6.50% (3M LIBOR + 5.50%) | 9/18/2025 | 2,817 | 2,817 | (e) | |||||||||||||||||||||||||||||||||
| Enigma Acquisition B.V. | Netherlands | 1st Lien Delayed Draw Term Loan | 7.45% (6M EURIBOR + 7.25%) | 1/26/2028 | € | 4,074 | 4,639 | (e)(f) | |||||||||||||||||||||||||||||||
Annual Report 2021
47
CION Ares Diversified Credit Fund
Consolidated Schedule of Investments (continued)
December 31, 2021
(in thousands, except shares, percentages and as otherwise noted)
Senior Loans(b)(c)(d) (continued)
Company | Country(a) | Investment | Interest | Maturity Date | Acquisition Date | Shares | Principal Amount(a) | Fair Value(a) | Percentage of Net Assets | ||||||||||||||||||||||||||||||
| Epicor Software Corporation | 1st Lien Term Loan | 4.00% (1M LIBOR + 3.25%) | 7/30/2027 | $ | 2,436 | $ | 2,432 | ||||||||||||||||||||||||||||||||
| eResearch Technology, Inc. | 1st Lien Term Loan | 5.50% (1M LIBOR + 4.50%) | 2/4/2027 | 2,039 | 2,044 | ||||||||||||||||||||||||||||||||||
| eResearch Technology, Inc. | 2nd Lien Term Loan | 8.50% (1M LIBOR + 8.00%) | 2/4/2028 | 10,603 | 10,603 | (e)(f) | |||||||||||||||||||||||||||||||||
| eResearch Technology, Inc. | 2nd Lien Delayed Draw Term Loan | 8.50% (1M LIBOR + 8.00%) | 2/4/2028 | 1,343 | 672 | (e)(h) | |||||||||||||||||||||||||||||||||
| Evercommerce Solutions, Inc. | 1st Lien Term Loan | 3.50% (1M LIBOR + 3.00%) | 7/6/2028 | 3,227 | 3,214 | ||||||||||||||||||||||||||||||||||
| ExtraHop Networks, Inc. | 1st Lien Term Loan | 8.50% (3M LIBOR + 7.50%) | 7/22/2027 | 1,620 | 1,604 | (e) | |||||||||||||||||||||||||||||||||
| ExtraHop Networks, Inc. | 1st Lien Delayed Draw Term Loan | 8.50% (3M LIBOR + 7.50%) | 7/22/2027 | 933 | 94 | (e)(h) | |||||||||||||||||||||||||||||||||
| Flexsys Holdings, Inc. | 1st Lien Term Loan | 6.00% (3M LIBOR + 5.25%) | 11/1/2028 | 1,835 | 1,840 | (e) | |||||||||||||||||||||||||||||||||
| Frontline Technologies Holdings, LLC | 1st Lien Term Loan | 6.25% (3M LIBOR + 5.25%) | 9/18/2023 | 3,853 | 3,853 | (e)(f) | |||||||||||||||||||||||||||||||||
| Frontline Technologies Intermediate Holdings, LLC | 1st Lien Term Loan | 6.25% (3M LIBOR + 5.25%) | 9/18/2023 | 454 | 454 | (e)(f) | |||||||||||||||||||||||||||||||||
| Frontline Technologies Intermediate Holdings, LLC | 1st Lien Delayed Draw Term Loan | 6.25% (3M LIBOR + 5.25%) | 9/18/2023 | 56 | 56 | (e) | |||||||||||||||||||||||||||||||||
| Gainwell Acquisition Corp. | 1st Lien Term Loan | 4.75% (3M LIBOR + 4.00%) | 10/1/2027 | 7,097 | 7,107 | ||||||||||||||||||||||||||||||||||
Gilfoyle Bidco AB | Sweden | 1st Lien Term Loan | 6.25% (3M STIBOR + 6.25%) | 9/4/2028 | SEK | 80,000 | 7,065 | (e)(h) | |||||||||||||||||||||||||||||||
| GraphPAD Software, LLC | 1st Lien Revolver | 4/27/2027 | 2 | — | (e)(h) | ||||||||||||||||||||||||||||||||||
| GraphPAD Software, LLC | 1st Lien Term Loan | 6.50% (3M LIBOR + 5.50%) | 4/27/2027 | 1,999 | 1,979 | (e) | |||||||||||||||||||||||||||||||||
| GraphPAD Software, LLC | 1st Lien Term Loan | 7.00% (3M LIBOR + 6.00%) | 4/27/2027 | 4,724 | 4,724 | (e)(f) | |||||||||||||||||||||||||||||||||
| GraphPAD Software, LLC | 1st Lien Delayed Draw Term Loan | 4/27/2027 | 436 | (4 | )(e)(h) | ||||||||||||||||||||||||||||||||||
Annual Report 2021
48
CION Ares Diversified Credit Fund
Consolidated Schedule of Investments (continued)
December 31, 2021
(in thousands, except shares, percentages and as otherwise noted)
Senior Loans(b)(c)(d) (continued)
Company | Country(a) | Investment | Interest | Maturity Date | Acquisition Date | Shares | Principal Amount(a) | Fair Value(a) | Percentage of Net Assets | ||||||||||||||||||||||||||||||
| Heavy Construction Systems Specialists, LLC | 1st Lien Revolver | 11/16/2027 | $ | 410 | $ | (8 | )(e)(h) | ||||||||||||||||||||||||||||||||
| Heavy Construction Systems Specialists, LLC | 1st Lien Term Loan | 6.50% (3M LIBOR + 5.75%) | 11/16/2028 | 4,157 | 4,116 | (e)(f) | |||||||||||||||||||||||||||||||||
Idera, Inc. | 1st Lien Term Loan | 4.50% (3M LIBOR + 3.75%) | 3/2/2028 | 4,074 | 4,068 | ||||||||||||||||||||||||||||||||||
Idera, Inc. | 2nd Lien Term Loan | 7.50% (3M LIBOR + 6.75%) | 3/2/2029 | 3,567 | 3,567 | ||||||||||||||||||||||||||||||||||
| ION Trading Finance Limited | Ireland | 1st Lien Term Loan | 4.97% (3M LIBOR + 4.75%) | 4/1/2028 | 4,020 | 4,025 | |||||||||||||||||||||||||||||||||
IQS, Inc. | 1st Lien Term Loan | 6.00% (3M LIBOR + 5.00%) | 7/2/2026 | 540 | 540 | (e)(f) | |||||||||||||||||||||||||||||||||
IQS, Inc. | 1st Lien Term Loan | 6.00% (3M LIBOR + 5.75%) | 7/2/2026 | 1,094 | 1,094 | (e)(f) | |||||||||||||||||||||||||||||||||
IQS, Inc. | 1st Lien Term Loan | 8.00% (3M LIBOR + 7.00%) | 7/2/2026 | 139 | 139 | (e)(f) | |||||||||||||||||||||||||||||||||
| Ishtar Bidco Norway AS | United Kingdom | 1st Lien Delayed Draw Term Loan | 8.50% (6M GBP LIBOR + 7.75%) | 11/26/2025 | £ | 1,000 | 1,354 | (e)(f) | |||||||||||||||||||||||||||||||
| Ivanti Software, Inc. | 1st Lien Revolver | 12/1/2025 | 460 | (4 | )(e)(h) | ||||||||||||||||||||||||||||||||||
| Ivanti Software, Inc. | 1st Lien Term Loan | 4.75% (3M LIBOR + 4.00%) | 12/1/2027 | 89 | 88 | ||||||||||||||||||||||||||||||||||
| Ivanti Software, Inc. | 1st Lien Term Loan | 5.00% (3M LIBOR + 4.25%) | 12/1/2027 | 5,921 | 5,922 | (i) | |||||||||||||||||||||||||||||||||
| Ivanti Software, Inc. | 2nd Lien Term Loan | 7.75% (3M LIBOR + 7.25%) | 12/1/2028 | 5,000 | 4,991 | ||||||||||||||||||||||||||||||||||
| MA Financeco., LLC | 1st Lien Term Loan | 5.25% (3M LIBOR + 4.25%) | 6/5/2025 | 2,548 | 2,582 | ||||||||||||||||||||||||||||||||||
| Magenta Buyer LLC | 1st Lien Term Loan | 5.75% (3M LIBOR + 5.00%) | 7/27/2028 | 1,176 | 1,172 | ||||||||||||||||||||||||||||||||||
Majesco | 1st Lien Revolver | 9/21/2026 | 624 | — | (e)(h) | ||||||||||||||||||||||||||||||||||
Majesco | 1st Lien Term Loan | 8.25% (3M LIBOR + 7.25%) | 9/21/2027 | 7,992 | 7,992 | (e)(f) | |||||||||||||||||||||||||||||||||
Annual Report 2021
49
CION Ares Diversified Credit Fund
Consolidated Schedule of Investments (continued)
December 31, 2021
(in thousands, except shares, percentages and as otherwise noted)
Senior Loans(b)(c)(d) (continued)
Company | Country(a) | Investment | Interest | Maturity Date | Acquisition Date | Shares | Principal Amount(a) | Fair Value(a) | Percentage of Net Assets | ||||||||||||||||||||||||||||||
| MeridianLink, Inc. | 1st Lien Term Loan | 3.50% (3M LIBOR + 3.00%) | 11/10/2028 | $ | 6,000 | $ | 5,989 | ||||||||||||||||||||||||||||||||
MH Sub I, LLC | 2nd Lien Term Loan | 2/23/2029 | 3,000 | 3,014 | (i) | ||||||||||||||||||||||||||||||||||
| MH Sub I, LLC (Micro Holding Corp.) | 1st Lien Term Loan | 3.59% (1M LIBOR + 3.50%) | 9/13/2024 | 5,464 | 5,433 | ||||||||||||||||||||||||||||||||||
| MH Sub I, LLC (Micro Holding Corp.) | 1st Lien Term Loan | 4.75% (1M LIBOR + 3.75%) | 9/13/2024 | 2,568 | 2,571 | ||||||||||||||||||||||||||||||||||
| Mitchell International, Inc. | 1st Lien Term Loan | 4.25% (1M LIBOR + 3.75%) | 10/15/2028 | 3,517 | 3,493 | ||||||||||||||||||||||||||||||||||
| Mitchell International, Inc. | 2nd Lien Term Loan | 7.00% (1M LIBOR + 6.50%) | 10/15/2029 | 11,352 | 11,403 | ||||||||||||||||||||||||||||||||||
| MMIT Holdings, LLC | 1st Lien Revolver | 7.25% (3M LIBOR + 6.25%) | 9/15/2027 | 651 | 68 | (e)(h) | |||||||||||||||||||||||||||||||||
| MMIT Holdings, LLC | 1st Lien Term Loan | 7.25% (3M LIBOR + 6.25%) | 9/15/2027 | 7,629 | 7,553 | (e)(f) | |||||||||||||||||||||||||||||||||
| MRI Software LLC | 1st Lien Revolver | 2/10/2026 | 508 | — | (e)(h) | ||||||||||||||||||||||||||||||||||
| MRI Software LLC | 1st Lien Term Loan | 6.50% (3M LIBOR + 5.50%) | 2/10/2026 | 6,685 | 6,685 | (e)(f) | |||||||||||||||||||||||||||||||||
| MRI Software LLC | 1st Lien Term Loan | 6.50% (3M LIBOR + 5.50%) | 2/10/2026 | 497 | 497 | (e)(g) | |||||||||||||||||||||||||||||||||
| MRI Software LLC | 1st Lien Delayed Draw Term Loan | 2/10/2026 | 744 | — | (e)(h) | ||||||||||||||||||||||||||||||||||
| Oakley Ekomid Limited | United Kingdom | 1st Lien Term Loan | 7.00% (3M EURIBOR + 6.75%) | 6/21/2027 | € | 2,250 | 2,562 | (e) | |||||||||||||||||||||||||||||||
| Oakley Ekomid Limited | United Kingdom | 1st Lien Delayed Draw Term Loan | 7.00% (3M EURIBOR + 6.75%) | 6/21/2027 | € | 563 | 295 | (e)(h) | |||||||||||||||||||||||||||||||
| Oceankey (U.S.) II Corp. | 1st Lien Term Loan | 12/15/2028 | 4,000 | 3,980 | (i) | ||||||||||||||||||||||||||||||||||
OpenMarket Inc. | 1st Lien Term Loan | 7.00% (3M LIBOR + 6.25%) | 9/17/2026 | 6,834 | 6,765 | (e)(f) | |||||||||||||||||||||||||||||||||
| PDI TA Holdings, Inc. | 1st Lien Revolver | 10/24/2024 | 205 | — | (e)(h) | ||||||||||||||||||||||||||||||||||
| PDI TA Holdings, Inc. | 1st Lien Term Loan | 5.50% (3M LIBOR + 4.50%) | 10/24/2024 | 2,365 | 2,365 | (e)(f) | |||||||||||||||||||||||||||||||||
Annual Report 2021
50
CION Ares Diversified Credit Fund
Consolidated Schedule of Investments (continued)
December 31, 2021
(in thousands, except shares, percentages and as otherwise noted)
Senior Loans(b)(c)(d) (continued)
Company | Country(a) | Investment | Interest | Maturity Date | Acquisition Date | Shares | Principal Amount(a) | Fair Value(a) | Percentage of Net Assets | ||||||||||||||||||||||||||||||
| PDI TA Holdings, Inc. | 2nd Lien Term Loan | 9.50% (3M LIBOR + 8.50%) | 10/24/2025 | $ | 1,107 | $ | 1,107 | (e) | |||||||||||||||||||||||||||||||
| PDI TA Holdings, Inc. | 2nd Lien Term Loan | 9.50% (3M LIBOR + 8.50%) | 10/24/2025 | 245 | 245 | (e)(f) | |||||||||||||||||||||||||||||||||
| PDI TA Holdings, Inc. | 2nd Lien Delayed Draw Term Loan | 9.50% (3M LIBOR + 8.50%) | 10/24/2025 | 138 | 138 | (e) | |||||||||||||||||||||||||||||||||
| Perforce Software, Inc. | 1st Lien Term Loan | 3.84% (1M LIBOR + 3.75%) | 7/1/2026 | 1,198 | 1,188 | ||||||||||||||||||||||||||||||||||
Pluralsight, Inc. | 1st Lien Revolver | 4/6/2027 | 1,204 | — | (e)(h) | ||||||||||||||||||||||||||||||||||
Pluralsight, Inc. | 1st Lien Term Loan | 9.00% (3M LIBOR + 8.00%) | 4/6/2027 | 16,506 | 16,506 | (e) | |||||||||||||||||||||||||||||||||
| ProfitSolv Purchaser, Inc. | 1st Lien Revolver | 3/5/2027 | 608 | — | (e)(h) | ||||||||||||||||||||||||||||||||||
| ProfitSolv Purchaser, Inc. | 1st Lien Term Loan | 6.25% (1M LIBOR + 5.25%) | 3/5/2027 | 3,804 | 3,804 | (e)(f) | |||||||||||||||||||||||||||||||||
| ProfitSolv Purchaser, Inc. | 1st Lien Delayed Draw Term Loan | 6.25% (3M LIBOR + 5.25%) | 3/5/2027 | 2,554 | 530 | (e)(h) | |||||||||||||||||||||||||||||||||
| Project Boost Purchaser, LLC | 1st Lien Term Loan | 3.59% (1M LIBOR + 3.50%) | 6/1/2026 | 2,480 | 2,477 | ||||||||||||||||||||||||||||||||||
| Project Essential Bidco, Inc. | 1st Lien Revolver | 4/20/2027 | 121 | (2 | )(e)(h) | ||||||||||||||||||||||||||||||||||
| Project Essential Bidco, Inc. | 1st Lien Term Loan | 6.75% (3M LIBOR + 5.75%) | 4/20/2028 | 4,098 | 4,016 | (e)(f) | |||||||||||||||||||||||||||||||||
Proofpoint, Inc. | 1st Lien Revolver | 8/31/2026 | 240 | (5 | )(e)(h) | ||||||||||||||||||||||||||||||||||
Proofpoint, Inc. | 1st Lien Term Loan | 3.75% (3M LIBOR + 3.25%) | 8/31/2028 | 2,080 | 2,070 | ||||||||||||||||||||||||||||||||||
Proofpoint, Inc. | 2nd Lien Term Loan | 6.75% (3M LIBOR + 6.25%) | 8/31/2029 | 5,431 | 5,431 | (e) | |||||||||||||||||||||||||||||||||
QF Holdings, Inc. | 1st Lien Revolver | 12/15/2027 | 317 | — | (e)(h) | ||||||||||||||||||||||||||||||||||
QF Holdings, Inc. | 1st Lien Term Loan | 7.25% (3M LIBOR + 6.25%) | 12/15/2027 | 1,313 | 1,313 | (e) | |||||||||||||||||||||||||||||||||
QF Holdings, Inc. | 1st Lien Term Loan | 7.25% (3M LIBOR + 6.25%) | 12/15/2027 | 2,500 | 2,500 | (e)(f) | |||||||||||||||||||||||||||||||||
Annual Report 2021
51
CION Ares Diversified Credit Fund
Consolidated Schedule of Investments (continued)
December 31, 2021
(in thousands, except shares, percentages and as otherwise noted)
Senior Loans(b)(c)(d) (continued)
Company | Country(a) | Investment | Interest | Maturity Date | Acquisition Date | Shares | Principal Amount(a) | Fair Value(a) | Percentage of Net Assets | ||||||||||||||||||||||||||||||
QF Holdings, Inc. | 1st Lien Delayed Draw Term Loan | 7.50% (3M LIBOR + 6.50%) | 12/15/2027 | $ | 263 | $ | 263 | (e) | |||||||||||||||||||||||||||||||
QF Holdings, Inc. | 1st Lien Delayed Draw Term Loan | 12/15/2027 | 263 | — | (e)(h) | ||||||||||||||||||||||||||||||||||
| Raptor Technologies, LLC (Sycamore Bidco Ltd) | 1st Lien Revolver | 10/5/2027 | 498 | (9 | )(e)(h) | ||||||||||||||||||||||||||||||||||
| Raptor Technologies, LLC (Sycamore Bidco Ltd) | 1st Lien Term Loan | 7.00% (3M LIBOR + 6.00%) | 10/5/2028 | 3,199 | 3,167 | (e)(f) | |||||||||||||||||||||||||||||||||
RealPage, Inc. | 2nd Lien Term Loan | 7.25% (1M LIBOR + 6.50%) | 4/23/2029 | 9,423 | 9,423 | (e)(f) | |||||||||||||||||||||||||||||||||
Relativity ODA LLC | 1st Lien Revolver | 5/12/2027 | 1 | — | (e)(h) | ||||||||||||||||||||||||||||||||||
Relativity ODA LLC | 1st Lien Term Loan | 8.50% (1M LIBOR + 7.50%) | 5/12/2027 | 6,789 | 6,789 | (e) | |||||||||||||||||||||||||||||||||
| RMS Holdco II, LLC | 1st Lien Revolver | 12/16/2027 | 883 | (18 | )(e)(h) | ||||||||||||||||||||||||||||||||||
| RMS Holdco II, LLC | 1st Lien Term Loan | 6.50% (3M LIBOR + 5.75%) | 12/16/2027 | 7,229 | 7,157 | (e)(f) | |||||||||||||||||||||||||||||||||
| Sedgwick Claims Management Services, Inc. | 1st Lien Term Loan | 3.35% (1M LIBOR + 3.25%) | 12/31/2025 | 5,361 | 5,315 | (i) | |||||||||||||||||||||||||||||||||
| Sedgwick Claims Management Services, Inc. | 1st Lien Term Loan | 3.85% (1M LIBOR + 3.75%) | 9/3/2026 | 353 | 353 | ||||||||||||||||||||||||||||||||||
Smarsh Inc. | 1st Lien Term Loan | 9.25% (3M LIBOR + 8.25%) | 11/20/2025 | 2,420 | 2,420 | (e) | |||||||||||||||||||||||||||||||||
Sophia, L.P. | 1st Lien Term Loan | 4.00% (3M LIBOR + 3.50%) | 10/7/2027 | 1,182 | 1,181 | ||||||||||||||||||||||||||||||||||
Sophia, L.P. | 2nd Lien Term Loan | 9.00% (3M LIBOR + 8.00%) | 10/9/2028 | 10,498 | 10,498 | (e)(f) | |||||||||||||||||||||||||||||||||
Storable, Inc. | 2nd Lien Term Loan | 7.50% (3M LIBOR + 6.75%) | 4/16/2029 | 7,683 | 7,683 | (e)(f) | |||||||||||||||||||||||||||||||||
| Sundance Group Holdings, Inc. | 1st Lien Revolver | 7.75% (3M LIBOR + 6.75%) | 7/2/2027 | 1 | — | (e)(h) | |||||||||||||||||||||||||||||||||
| Sundance Group Holdings, Inc. | 1st Lien Term Loan | 7.75% (3M LIBOR + 6.75%) | 7/2/2027 | 1,510 | 1,495 | (e)(f) | |||||||||||||||||||||||||||||||||
Annual Report 2021
52
CION Ares Diversified Credit Fund
Consolidated Schedule of Investments (continued)
December 31, 2021
(in thousands, except shares, percentages and as otherwise noted)
Senior Loans(b)(c)(d) (continued)
Company | Country(a) | Investment | Interest | Maturity Date | Acquisition Date | Shares | Principal Amount(a) | Fair Value(a) | Percentage of Net Assets | ||||||||||||||||||||||||||||||
| Sundance Group Holdings, Inc. | 1st Lien Delayed Draw Term Loan | 7/2/2027 | $ | 453 | $ | (5 | )(e)(h) | ||||||||||||||||||||||||||||||||
| TCP Hawker Intermediate LLC | 1st Lien Revolver | 7.75% (PRIME + 4.50%) | 8/29/2025 | 458 | 34 | (e)(h) | |||||||||||||||||||||||||||||||||
| TCP Hawker Intermediate LLC | 1st Lien Term Loan | 6.50% (3M LIBOR + 5.50%) | 8/28/2026 | 2,763 | 2,763 | (e)(f) | |||||||||||||||||||||||||||||||||
| TCP Hawker Intermediate LLC | 1st Lien Delayed Draw Term Loan | 6.50% (3M LIBOR + 5.50%) | 8/28/2026 | 985 | 985 | (e) | |||||||||||||||||||||||||||||||||
| TCP Hawker Intermediate LLC | 1st Lien Delayed Draw Term Loan | 6.50% (3M LIBOR + 5.50%) | 8/31/2026 | 921 | 406 | (e)(h) | |||||||||||||||||||||||||||||||||
| The Ultimate Software Group, Inc. | 1st Lien Revolver | 5/3/2024 | 1 | — | (e)(h) | ||||||||||||||||||||||||||||||||||
| ThoughtWorks, Inc. | 1st Lien Term Loan | 3.50% (1M LIBOR + 3.00%) | 3/24/2028 | 1,814 | 1,809 | ||||||||||||||||||||||||||||||||||
| TIBCO Software Inc | 1st Lien Term Loan | 3.85% (1M LIBOR + 3.75%) | 6/30/2026 | 2,286 | 2,267 | ||||||||||||||||||||||||||||||||||
| TIBCO Software Inc | 2nd Lien Term Loan | 3/3/2028 | 2,000 | 2,004 | (i) | ||||||||||||||||||||||||||||||||||
| TIGER UK BIDCO LIMITED | United Kingdom | 1st Lien Revolver | 5.91% (SONIA + 5.75%) | 12/30/2027 | £ | 333 | 75 | (e)(h) | |||||||||||||||||||||||||||||||
| TIGER UK BIDCO LIMITED | United Kingdom | 1st Lien Delayed Draw Term Loan | 5.80% (SONIA + 5.75%) | 12/30/2027 | £ | 1,114 | 1,508 | (e)(f) | |||||||||||||||||||||||||||||||
| TIGER UK BIDCO LIMITED | United Kingdom | 1st Lien Delayed Draw Term Loan | 5.80% (SONIA + 5.75%) | 12/30/2027 | £ | 814 | 1,046 | (e)(h) | |||||||||||||||||||||||||||||||
| TIGER UK BIDCO LIMITED | United Kingdom | 1st Lien Delayed Draw Term Loan | 5.80% (SONIA + 5.75%) | 6/30/2028 | £ | 5,529 | 7,483 | (e)(f) | |||||||||||||||||||||||||||||||
| TIGER UK BIDCO LIMITED | United Kingdom | 1st Lien Delayed Draw Term Loan | 5.80% (SONIA + 5.75%) | 6/30/2028 | £ | 1,543 | 1,981 | (e)(h) | |||||||||||||||||||||||||||||||
WebPT, Inc. | 1st Lien Revolver | 7.75% (3M LIBOR + 6.75%) | 8/28/2024 | 216 | 65 | (e)(h) | |||||||||||||||||||||||||||||||||
WebPT, Inc. | 1st Lien Term Loan | 7.75% (3M LIBOR + 6.75%) | 8/28/2024 | 2,042 | 2,042 | (e) | |||||||||||||||||||||||||||||||||
| Wellness AcquisitionCo, Inc. | 1st Lien Revolver | 1/20/2027 | 504 | — | (e)(h) | ||||||||||||||||||||||||||||||||||
Annual Report 2021
53
CION Ares Diversified Credit Fund
Consolidated Schedule of Investments (continued)
December 31, 2021
(in thousands, except shares, percentages and as otherwise noted)
Senior Loans(b)(c)(d) (continued)
Company | Country(a) | Investment | Interest | Maturity Date | Acquisition Date | Shares | Principal Amount(a) | Fair Value(a) | Percentage of Net Assets | ||||||||||||||||||||||||||||||
| Wellness AcquisitionCo, Inc. | 1st Lien Term Loan | 6.50% (6M LIBOR + 5.50%) | 1/20/2027 | $ | 2,790 | $ | 2,790 | (e)(f) | |||||||||||||||||||||||||||||||
| WorkWave Intermediate II, LLC | 1st Lien Revolver | 6/29/2027 | 460 | — | (e)(h) | ||||||||||||||||||||||||||||||||||
| WorkWave Intermediate II, LLC | 1st Lien Term Loan | 8.00% (3M LIBOR + 7.25%) | 6/29/2027 | 4,081 | 4,081 | (e) | |||||||||||||||||||||||||||||||||
| WorkWave Intermediate II, LLC | 1st Lien Delayed Draw Term Loan | 8.00% (3M LIBOR + 7.25%) | 6/29/2027 | 1,333 | 1,333 | (e) | |||||||||||||||||||||||||||||||||
471,171 | 24.43 | % | |||||||||||||||||||||||||||||||||||||
Technology Hardware & Equipment | |||||||||||||||||||||||||||||||||||||||
Chariot Buyer LLC | 1st Lien Revolver | 3.59% (1M LIBOR + 3.50%) | 11/3/2026 | 100 | 21 | (e)(h) | |||||||||||||||||||||||||||||||||
Chariot Buyer LLC | 2nd Lien Term Loan | 7.50% (1M LIBOR + 6.75%) | 11/5/2029 | 13,662 | 13,526 | (e)(f) | |||||||||||||||||||||||||||||||||
| FL Hawk Intermediate Holdings, Inc. | 1st Lien Revolver | 2/22/2027 | 1,312 | — | (e)(h) | ||||||||||||||||||||||||||||||||||
| FL Hawk Intermediate Holdings, Inc. | 1st Lien Term Loan | 5.75% (3M LIBOR + 4.75%) | 2/22/2028 | 7,401 | 7,401 | (e)(f) | |||||||||||||||||||||||||||||||||
| FL Hawk Intermediate Holdings, Inc. | 1st Lien Delayed Draw Term Loan | 2/22/2028 | 1,017 | — | (e)(h) | ||||||||||||||||||||||||||||||||||
Ingram Micro Inc. | 1st Lien Term Loan | 4.00% (3M LIBOR + 3.50%) | 6/30/2028 | 2,295 | 2,294 | ||||||||||||||||||||||||||||||||||
| Micromeritics Instrument Corp. | 1st Lien Revolver | 12/18/2025 | 331 | — | (e)(h) | ||||||||||||||||||||||||||||||||||
| Micromeritics Instrument Corp. | 1st Lien Term Loan | 6.00% (3M LIBOR + 5.00%) | 12/18/2025 | 2,586 | 2,586 | (e)(f) | |||||||||||||||||||||||||||||||||
MWG BidCo ApS | Denmark | 1st Lien Term Loan | 6.90% (3M CIBOR + 6.90%) | 2/29/2028 | DKK | 20,066 | 3,072 | (e) |
| ||||||||||||||||||||||||||||||
MWG BidCo ApS | Denmark | 1st Lien Term Loan | 2/29/2028 | DKK | 4,934 | — | (e)(h) | ||||||||||||||||||||||||||||||||
| Orbit Private Holdings I Ltd | United Kingdom | 1st Lien Term Loan | 12/11/2028 | £ | 4,915 | 6,619 | (e)(i) |
| |||||||||||||||||||||||||||||||
Repairify, Inc. | 1st Lien Revolver | 6/14/2027 | 766 | (8 | )(e)(h) | ||||||||||||||||||||||||||||||||||
Repairify, Inc. | 1st Lien Term Loan | 6.00% (6M LIBOR + 5.00%) | 6/14/2027 | 3,562 | 3,526 | (e)(f) | |||||||||||||||||||||||||||||||||
Annual Report 2021
54
CION Ares Diversified Credit Fund
Consolidated Schedule of Investments (continued)
December 31, 2021
(in thousands, except shares, percentages and as otherwise noted)
Senior Loans(b)(c)(d) (continued)
Company | Country(a) | Investment | Interest | Maturity Date | Acquisition Date | Shares | Principal Amount(a) | Fair Value(a) | Percentage of Net Assets | ||||||||||||||||||||||||||||||
| Sorenson Communications, LLC | 1st Lien Term Loan | 6.25% (3M LIBOR + 5.50%) | 3/17/2026 | $ | 273 | $ | 273 | ||||||||||||||||||||||||||||||||
| TGG TS Acquisition Company | 1st Lien Term Loan | 6.59% (1M LIBOR + 6.50%) | 12/14/2025 | 1,465 | 1,464 | ||||||||||||||||||||||||||||||||||
| Wildcat BuyerCo, Inc. | 1st Lien Revolver | 2/27/2026 | 255 | — | (e)(h) | ||||||||||||||||||||||||||||||||||
| Wildcat BuyerCo, Inc. | 1st Lien Term Loan | 6.75% (3M LIBOR + 5.75%) | 2/27/2026 | 3,220 | 3,220 | (e)(f) | |||||||||||||||||||||||||||||||||
| Wildcat BuyerCo, Inc. | 1st Lien Delayed Draw Term Loan | 6.75% (3M LIBOR + 5.75%) | 2/27/2026 | 1,074 | 1,074 | (e) | |||||||||||||||||||||||||||||||||
| Wildcat BuyerCo, Inc. | 1st Lien Delayed Draw Term Loan | 2/27/2026 | 732 | — | (e)(h) | ||||||||||||||||||||||||||||||||||
45,068 | 2.34 | % | |||||||||||||||||||||||||||||||||||||
Telecommunication Services | |||||||||||||||||||||||||||||||||||||||
CB-SDG LIMITED | United Kingdom | 1st Lien Delayed Draw Term Loan | 7.88% (3M GBP LIBOR + 7.13%) | 4/3/2026 | £ | 2,829 | 3,064 | (e)(f)(g) | |||||||||||||||||||||||||||||||
CB-SDG LIMITED | United Kingdom | 1st Lien Delayed Draw Term Loan | 4/3/2026 | £ | 317 | (86 | )(e)(h) |
| |||||||||||||||||||||||||||||||
Commify Limited | United Kingdom | 1st Lien Delayed Draw Term Loan | 6.50% (6M EURIBOR + 6.25%) | 9/14/2026 | € | 761 | 277 | (e)(h) |
| ||||||||||||||||||||||||||||||
Commify Limited | United Kingdom | 1st Lien Delayed Draw Term Loan | 7.42% (6M EURIBOR + 7.17%) | 9/14/2026 | € | 2,771 | 3,155 | (e)(f) | |||||||||||||||||||||||||||||||
| Iridium Satellite LLC | 1st Lien Term Loan | 3.25% (1M LIBOR + 2.50%) | 11/4/2026 | 2,975 | 2,973 | ||||||||||||||||||||||||||||||||||
| Zayo Group Holdings, Inc. | 1st Lien Term Loan | 3.10% (1M LIBOR + 3.00%) | 3/9/2027 | 2,631 | 2,593 | ||||||||||||||||||||||||||||||||||
11,976 | 0.62 | % | |||||||||||||||||||||||||||||||||||||
Transportation | |||||||||||||||||||||||||||||||||||||||
| AAdvantage Loyality IP, Ltd. | 1st Lien Term Loan | 5.50% (3M LIBOR + 4.75%) | 4/20/2028 | 3,796 | 3,927 | ||||||||||||||||||||||||||||||||||
Air Canada | Canada | 1st Lien Term Loan | 4.25% (3M LIBOR + 3.50%) | 8/11/2028 | 1,866 | 1,858 | |||||||||||||||||||||||||||||||||
| Commercial Trailer Leasing, Inc. | 1st Lien Revolver | 1/19/2026 | 741 | — | (e)(h) | ||||||||||||||||||||||||||||||||||
Annual Report 2021
55
CION Ares Diversified Credit Fund
Consolidated Schedule of Investments (continued)
December 31, 2021
(in thousands, except shares, percentages and as otherwise noted)
Senior Loans(b)(c)(d) (continued)
Company | Country(a) | Investment | Interest | Maturity Date | Acquisition Date | Shares | Principal Amount(a) | Fair Value(a) | Percentage of Net Assets | ||||||||||||||||||||||||||||||
| Commercial Trailer Leasing, Inc. | 1st Lien Term Loan | 7.25% (3M LIBOR + 6.25%) | 1/19/2026 | $ | 12,275 | $ | 12,275 | (e)(f) | |||||||||||||||||||||||||||||||
| Commercial Trailer Leasing, Inc. | 1st Lien Delayed Draw Term Loan | 7.25% (3M LIBOR + 6.25%) | 1/19/2026 | 1,465 | 1,169 | (e)(h) | |||||||||||||||||||||||||||||||||
| Commercial Trailer Leasing, Inc. | 2nd Lien Term Loan | 13.00% (3M LIBOR + 13.00%) | 1/19/2027 | 2,222 | 2,222 | (e)(f) | |||||||||||||||||||||||||||||||||
| First Student Bidco Inc. | 1st Lien Term Loan | 3.50% (3M LIBOR + 3.00%) | 7/21/2028 | 9,141 | 9,099 | (i) | |||||||||||||||||||||||||||||||||
| Neovia Logistics, LP | 1st Lien Term Loan | 6.63% (3M LIBOR + 6.50%) | 5/8/2024 | 689 | 688 | (e) | |||||||||||||||||||||||||||||||||
| Neovia Logistics, LP | 2nd Lien Term Loan | 11.39% (3M LIBOR + 11.25%) | 11/8/2024 | 1,372 | 1,386 | (e) | |||||||||||||||||||||||||||||||||
PODS, LLC | 1st Lien Term Loan | 3.75% (3M LIBOR + 3.00%) | 3/31/2028 | 6,450 | 6,423 | (i) | |||||||||||||||||||||||||||||||||
| Shur-Co Acquisition, Inc. | 1st Lien Revolver | 7.00% (3M LIBOR + 6.00%) | 6/30/2027 | 441 | 88 | (e)(h) | |||||||||||||||||||||||||||||||||
| Shur-Co Acquisition, Inc. | 1st Lien Term Loan | 7.00% (3M LIBOR + 6.00%) | 6/30/2027 | 2,378 | 2,378 | (e)(f) | |||||||||||||||||||||||||||||||||
41,513 | 2.15 | % | |||||||||||||||||||||||||||||||||||||
Utilities | |||||||||||||||||||||||||||||||||||||||
| WIN Waste Innovations Holdings, Inc. | 1st Lien Term Loan | 3.25% (3M LIBOR + 2.75%) | 3/24/2028 | 3,485 | 3,475 | (i) | |||||||||||||||||||||||||||||||||
3,475 | 0.18 | % | |||||||||||||||||||||||||||||||||||||
Total Senior Loans (Cost $2,093,586) | 2,112,791 | 109.50 | % | ||||||||||||||||||||||||||||||||||||
Subordinated Loans(b)(c)(d) | |||||||||||||||||||||||||||||||||||||||
Commercial & Professional Services | |||||||||||||||||||||||||||||||||||||||
| Visual Edge Technology, Inc. | Subordinated Notes | 9/3/2024 | 234 | 211 | (e)(j) | ||||||||||||||||||||||||||||||||||
211 | 0.01 | % | |||||||||||||||||||||||||||||||||||||
Consumer Services | |||||||||||||||||||||||||||||||||||||||
| KeyStone Sub-Debt HoldCo, LLC | Mezzanine Term Loan | 10.00% (3M LIBOR + 10.00%) | 1/20/2027 | 8,065 | 7,823 | (e) | |||||||||||||||||||||||||||||||||
7,823 | 0.41 | % | |||||||||||||||||||||||||||||||||||||
Annual Report 2021
56
CION Ares Diversified Credit Fund
Consolidated Schedule of Investments (continued)
December 31, 2021
(in thousands, except shares, percentages and as otherwise noted)
Subordinated Loans(b)(c)(d) (continued)
Company | Country(a) | Investment | Interest | Maturity Date | Acquisition Date | Shares | Principal Amount(a) | Fair Value(a) | Percentage of Net Assets | ||||||||||||||||||||||||||||||
Diversified Financials | |||||||||||||||||||||||||||||||||||||||
| eCapital Finance Corp. | Canada | Subordinated Term Loan | 9.00% (1M LIBOR + 7.50%) | 1/31/2025 | $ | 2,023 | $ | 2,023 | (e) | ||||||||||||||||||||||||||||||
| eCapital Finance Corp. | Canada | Subordinated Delayed Draw Term Loan | 9.00% (1M LIBOR + 7.50%) | 1/31/2025 | 2,803 | 2,803 | (e) | ||||||||||||||||||||||||||||||||
4,826 | 0.25 | % | |||||||||||||||||||||||||||||||||||||
Insurance | |||||||||||||||||||||||||||||||||||||||
| Ardonagh Midco 2 PLC | United Kingdom | Unsecured Notes | 11.50% | 1/15/2027 | 36 | 41 | |||||||||||||||||||||||||||||||||
41 | 0.00 | % | |||||||||||||||||||||||||||||||||||||
Software & Services | |||||||||||||||||||||||||||||||||||||||
| AffiniPay Intermediate Holdings, LLC | Subordinated Notes | 12.75% | 2/28/2028 | 2,967 | 2,967 | (e) | |||||||||||||||||||||||||||||||||
2,967 | 0.15 | % | |||||||||||||||||||||||||||||||||||||
Total Subordinated Loans (Cost $15,421) | 15,868 | 0.82 | % | ||||||||||||||||||||||||||||||||||||
Corporate Bonds(b)(c) | |||||||||||||||||||||||||||||||||||||||
Capital Goods | |||||||||||||||||||||||||||||||||||||||
| American Builders & Contractors Supply Co., Inc. | 3.88% | 11/15/2029 | 392 | 391 | (d) | ||||||||||||||||||||||||||||||||||
| American Builders & Contractors Supply Co., Inc. | 4.00% | 1/15/2028 | 3,000 | 3,070 | (d) | ||||||||||||||||||||||||||||||||||
| Assemblin Financing AB | Sweden | 5.00% (3M EURIBOR + 5.00%) | 5/15/2025 | € | 2,000 | 2,274 | |||||||||||||||||||||||||||||||||
| Cargo Aircraft Management, Inc. | 4.75% | 2/1/2028 | 2,647 | 2,694 | (d) | ||||||||||||||||||||||||||||||||||
Pike Corporation | 5.50% | 9/1/2028 | 276 | 277 | (d) | ||||||||||||||||||||||||||||||||||
| PowerTeam Services, LLC | 9.03% | 12/4/2025 | 10,505 | 11,114 | (d) | ||||||||||||||||||||||||||||||||||
| Specialty Building Products Holdings LLC | 6.38% | 9/30/2026 | 2,340 | 2,452 | (d) | ||||||||||||||||||||||||||||||||||
| SRS Distribution Inc. | 6.00% | 12/1/2029 | 5,000 | 5,035 | (d) | ||||||||||||||||||||||||||||||||||
| Tutor Perini Corporation | 6.88% | 5/1/2025 | 2,753 | 2,774 | (d) | ||||||||||||||||||||||||||||||||||
30,081 | 1.56 | % | |||||||||||||||||||||||||||||||||||||
Annual Report 2021
57
CION Ares Diversified Credit Fund
Consolidated Schedule of Investments (continued)
December 31, 2021
(in thousands, except shares, percentages and as otherwise noted)
Corporate Bonds(b)(c) (continued)
Company | Country(a) | Investment | Interest | Maturity Date | Acquisition Date | Shares | Principal Amount(a) | Fair Value(a) | Percentage of Net Assets | ||||||||||||||||||||||||||||||
Commercial & Professional Services | |||||||||||||||||||||||||||||||||||||||
| GFL Environmental, Inc. | Canada | 4.38% | 8/15/2029 | $ | 1,475 | $ | 1,461 | (d) | |||||||||||||||||||||||||||||||
| Neighborly Issuer LLC | 3.58% | 4/30/2051 | 25 | 25 | (d)(e) | ||||||||||||||||||||||||||||||||||
1,486 | 0.08 | % | |||||||||||||||||||||||||||||||||||||
Consumer Durables & Apparel | |||||||||||||||||||||||||||||||||||||||
| Ashton Woods USA LLC | 4.63% | 8/1/2029 | 1,600 | 1,580 | (d) | ||||||||||||||||||||||||||||||||||
| Ashton Woods USA LLC | 4.63% | 4/1/2030 | 520 | 511 | (d) | ||||||||||||||||||||||||||||||||||
2,091 | 0.11 | % | |||||||||||||||||||||||||||||||||||||
Consumer Services | |||||||||||||||||||||||||||||||||||||||
| 1011778 BC ULC | Canada | 4.00% | 10/15/2030 | 2,001 | 1,966 | (d) | |||||||||||||||||||||||||||||||||
| 1011778 BC ULC | Canada | 4.38% | 1/15/2028 | 1,961 | 2,000 | (d) | |||||||||||||||||||||||||||||||||
AB Issuer LLC | 3.73% | 7/30/2051 | 25 | 25 | (d)(e) | ||||||||||||||||||||||||||||||||||
| Caesars Entertainment, Inc. | 6.25% | 7/1/2025 | 275 | 289 | (d) | ||||||||||||||||||||||||||||||||||
| Gamma Bidco SpA | Italy | 5.13% | 7/15/2025 | € | 2,000 | 2,288 | |||||||||||||||||||||||||||||||||
| Paganini BidCo S.p.A. | Italy | 4.25% (3M EURIBOR + 4.25%) | 10/30/2028 | € | 1,250 | 1,429 | |||||||||||||||||||||||||||||||||
| Peninsula Pacific Entertainment, LLC | 8.50% | 11/15/2027 | 3,085 | 3,332 | (d) | ||||||||||||||||||||||||||||||||||
| ServiceMaster Funding LLC | 3.34% | 1/30/2051 | 25 | 25 | (d)(e) | ||||||||||||||||||||||||||||||||||
| Stonegate Pub Co. Financing 2019 PLC | United Kingdom | 8.00% | 7/13/2025 | £ | 2,000 | 2,748 | |||||||||||||||||||||||||||||||||
14,102 | 0.73 | % | |||||||||||||||||||||||||||||||||||||
Diversified Financials | |||||||||||||||||||||||||||||||||||||||
| BCC Blueprint Investments, LLC | 9.30% | 9/15/2026 | 611 | 611 | (e) | ||||||||||||||||||||||||||||||||||
| BCP V Modular Services Finance II PLC | United Kingdom | 6.13% | 11/30/2028 | £ | 1,280 | 1,724 | |||||||||||||||||||||||||||||||||
ITT Holdings LLC | 6.50% | 8/1/2029 | 7,137 | 7,066 | (d) | ||||||||||||||||||||||||||||||||||
Annual Report 2021
58
CION Ares Diversified Credit Fund
Consolidated Schedule of Investments (continued)
December 31, 2021
(in thousands, except shares, percentages and as otherwise noted)
Corporate Bonds(b)(c) (continued)
Company | Country(a) | Investment | Interest | Maturity Date | Acquisition Date | Shares | Principal Amount(a) | Fair Value(a) | Percentage of Net Assets | ||||||||||||||||||||||||||||||
| LBM Acquisition LLC | 6.25% | 1/15/2029 | $ | 8,174 | $ | 8,082 | (d) | ||||||||||||||||||||||||||||||||
17,483 | 0.91 | % | |||||||||||||||||||||||||||||||||||||
Energy | |||||||||||||||||||||||||||||||||||||||
| Ascent Resources - Utica LLC | 9.00% | 11/1/2027 | 688 | 918 | (d) | ||||||||||||||||||||||||||||||||||
| Blue Racer Midstream LLC | 7.63% | 12/15/2025 | 1,652 | 1,751 | (d) | ||||||||||||||||||||||||||||||||||
| Cheniere Energy Partners LP | 4.00% | 3/1/2031 | 300 | 315 | |||||||||||||||||||||||||||||||||||
CITGO Holding Inc | 9.25% | 8/1/2024 | 3,300 | 3,317 | (d) | ||||||||||||||||||||||||||||||||||
| Exterran Energy Solutions LP | 8.13% | 5/1/2025 | 3,100 | 2,883 | |||||||||||||||||||||||||||||||||||
| Laredo Petroleum, Inc. | 9.50% | 1/15/2025 | 451 | 460 | |||||||||||||||||||||||||||||||||||
| New Fortress Energy, Inc. | 6.50% | 9/30/2026 | 5,340 | 5,300 | (d) | ||||||||||||||||||||||||||||||||||
| NGL Energy Operating LLC | 7.50% | 2/1/2026 | 928 | 957 | (d) | ||||||||||||||||||||||||||||||||||
| Summit Midstream Holdings LLC | 5.75% | 4/15/2025 | 596 | 539 | |||||||||||||||||||||||||||||||||||
| Summit Midstream Holdings LLC | 8.50% | 10/15/2026 | 482 | 502 | (d) | ||||||||||||||||||||||||||||||||||
16,942 | 0.88 | % | |||||||||||||||||||||||||||||||||||||
Food & Staples Retailing | |||||||||||||||||||||||||||||||||||||||
NBC Funding LLC | 2.99% | 7/30/2051 | 25 | 25 | (d)(e) | ||||||||||||||||||||||||||||||||||
25 | 0.00 | % | |||||||||||||||||||||||||||||||||||||
Food & Beverage | |||||||||||||||||||||||||||||||||||||||
| Simmons Food Inc | 4.63% | 3/1/2029 | 3,500 | 3,447 | (d) | ||||||||||||||||||||||||||||||||||
| Triton Water Holdings, Inc. | 6.25% | 4/1/2029 | 100 | 96 | (d) | ||||||||||||||||||||||||||||||||||
3,543 | 0.18 | % | |||||||||||||||||||||||||||||||||||||
Healthcare Equipment & Services | |||||||||||||||||||||||||||||||||||||||
| Air Methods Corporation | 8.00% | 5/15/2025 | 8,017 | 6,865 | (d) | ||||||||||||||||||||||||||||||||||
| Lifepoint Health Inc | 4.38% | 2/15/2027 | 1,613 | 1,625 | (d) | ||||||||||||||||||||||||||||||||||
Annual Report 2021
59
CION Ares Diversified Credit Fund
Consolidated Schedule of Investments (continued)
December 31, 2021
(in thousands, except shares, percentages and as otherwise noted)
Corporate Bonds(b)(c) (continued)
Company | Country(a) | Investment | Interest | Maturity Date | Acquisition Date | Shares | Principal Amount(a) | Fair Value(a) | Percentage of Net Assets | ||||||||||||||||||||||||||||||
| Mozart Debt Merger Sub, Inc. | 3.88% | 4/1/2029 | $ | 3,500 | $ | 3,488 | (d) | ||||||||||||||||||||||||||||||||
| Mozart Debt Merger Sub, Inc. | 5.25% | 10/1/2029 | 1,885 | 1,911 | (d) | ||||||||||||||||||||||||||||||||||
| Team Health Holdings, Inc. | 6.38% | 2/1/2025 | 3,898 | 3,669 | (d) | ||||||||||||||||||||||||||||||||||
17,558 | 0.91 | % | |||||||||||||||||||||||||||||||||||||
Insurance | |||||||||||||||||||||||||||||||||||||||
NFP Corp. | 6.88% | 8/15/2028 | 2,624 | 2,631 | (d) | ||||||||||||||||||||||||||||||||||
2,631 | 0.14 | % | |||||||||||||||||||||||||||||||||||||
Materials | |||||||||||||||||||||||||||||||||||||||
Chemours Co. | 4.63% | 11/15/2029 | 3,003 | 2,980 | (d) | ||||||||||||||||||||||||||||||||||
Constellium SE | France | 5.63% | 6/15/2028 | 1,000 | 1,052 | (d) | |||||||||||||||||||||||||||||||||
Constellium SE | France | 5.88% | 2/15/2026 | 250 | 253 | (d) | |||||||||||||||||||||||||||||||||
| Freeport- McMoRan, Inc. | 4.63% | 8/1/2030 | 2,597 | 2,785 | |||||||||||||||||||||||||||||||||||
| Freeport- McMoRan, Inc. | 5.40% | 11/14/2034 | 807 | 983 | |||||||||||||||||||||||||||||||||||
| Kobe US Midco 2, Inc. | 9.25% | 11/1/2026 | 666 | 682 | (d) | ||||||||||||||||||||||||||||||||||
| Kraton Polymers LLC | 4.25% | 12/15/2025 | 4,132 | 4,277 | (d) | ||||||||||||||||||||||||||||||||||
| Mauser Packaging Solutions Holding Company | 7.25% | 4/15/2025 | 5,143 | 5,156 | (d) | ||||||||||||||||||||||||||||||||||
| Venator Materials LLC | Luxembourg | 5.75% | 7/15/2025 | 4,245 | 4,075 | (d) | |||||||||||||||||||||||||||||||||
| Venator Materials LLC | Luxembourg | 9.50% | 7/1/2025 | 287 | 313 | (d) | |||||||||||||||||||||||||||||||||
22,556 | 1.17 | % | |||||||||||||||||||||||||||||||||||||
Media & Entertainment | |||||||||||||||||||||||||||||||||||||||
| Altice Financing S.A. | Luxembourg | 5.00% | 1/15/2028 | 7,000 | 6,831 | (d) | |||||||||||||||||||||||||||||||||
| Aventine Holdings II LLC | 10.25% | 12/23/2030 | 10,965 | 10,855 | (e) | ||||||||||||||||||||||||||||||||||
CCO Holdings LLC | 4.25% | 2/1/2031 | 969 | 977 | (d) | ||||||||||||||||||||||||||||||||||
CSC Holdings LLC | 3.38% | 2/15/2031 | 4,000 | 3,745 | (d) | ||||||||||||||||||||||||||||||||||
CSC Holdings LLC | 4.50% | 11/15/2031 | 870 | 859 | (d) | ||||||||||||||||||||||||||||||||||
CSC Holdings LLC | 4.63% | 12/1/2030 | 2,000 | 1,893 | (d) | ||||||||||||||||||||||||||||||||||
| Dolya Holdco 18 DAC | Ireland | 5.00% | 7/15/2028 | 3,000 | 3,023 | (d) | |||||||||||||||||||||||||||||||||
Annual Report 2021
60
CION Ares Diversified Credit Fund
Consolidated Schedule of Investments (continued)
December 31, 2021
(in thousands, except shares, percentages and as otherwise noted)
Corporate Bonds(b)(c) (continued)
Company | Country(a) | Investment | Interest | Maturity Date | Acquisition Date | Shares | Principal Amount(a) | Fair Value(a) | Percentage of Net Assets | ||||||||||||||||||||||||||||||
| Telenet Finance Luxembourg Notes Sarl | Luxembourg | 5.50% | 3/1/2028 | $ | 400 | $ | 412 | (d) | |||||||||||||||||||||||||||||||
28,595 | 1.48 | % | |||||||||||||||||||||||||||||||||||||
Real Estate | |||||||||||||||||||||||||||||||||||||||
HAT Holdings I LLC | 3.75% | 9/15/2030 | 4,880 | 4,868 | (d) | ||||||||||||||||||||||||||||||||||
Iron Mountain, Inc. | 4.88% | 9/15/2029 | 1,049 | 1,086 | (d) | ||||||||||||||||||||||||||||||||||
Iron Mountain, Inc. | 5.25% | 7/15/2030 | 4,089 | 4,309 | (d) | ||||||||||||||||||||||||||||||||||
10,263 | 0.53 | % | |||||||||||||||||||||||||||||||||||||
Retailing | |||||||||||||||||||||||||||||||||||||||
HSE Finance Sarl | Luxembourg | 5.75% (3M EURIBOR + 5.75%) | 10/15/2026 | € | 4,034 | 4,651 | |||||||||||||||||||||||||||||||||
Shiba Bidco SpA | Italy | 4.50% | 10/31/2028 | € | 3,000 | 3,450 | |||||||||||||||||||||||||||||||||
8,101 | 0.42 | % | |||||||||||||||||||||||||||||||||||||
Software & Services | |||||||||||||||||||||||||||||||||||||||
Avaya Inc. | 6.13% | 9/15/2028 | 1,302 | 1,380 | (d) | ||||||||||||||||||||||||||||||||||
| Castle US Holding Corporation | 9.50% | 2/15/2028 | 594 | 619 | (d) | ||||||||||||||||||||||||||||||||||
| CommScope Technologies LLC | 6.00% | 6/15/2025 | 373 | 373 | (d) | ||||||||||||||||||||||||||||||||||
| Insightful Science Intermediate I, LLC | 10.50% | 4/28/2032 | 1,337 | 1,324 | (e) | ||||||||||||||||||||||||||||||||||
Microstrategy Inc | 0.00% | 2/15/2027 | 500 | 361 | |||||||||||||||||||||||||||||||||||
4,057 | 0.21 | % | |||||||||||||||||||||||||||||||||||||
Technology Hardware & Equipment | |||||||||||||||||||||||||||||||||||||||
CommScope, Inc. | 8.25% | 3/1/2027 | 3,553 | 3,648 | (d) | ||||||||||||||||||||||||||||||||||
Viasat, Inc. | 6.50% | 7/15/2028 | 2,790 | 2,797 | (d) | ||||||||||||||||||||||||||||||||||
6,445 | 0.33 | % | |||||||||||||||||||||||||||||||||||||
Telecommunication Services | |||||||||||||||||||||||||||||||||||||||
| Consolidated Communications, Inc. | 5.00% | 10/1/2028 | 614 | 620 | (d) | ||||||||||||||||||||||||||||||||||
| Consolidated Communications, Inc. | 6.50% | 10/1/2028 | 5,395 | 5,665 | (d) | ||||||||||||||||||||||||||||||||||
Telesat Canada | Canada | 5.63% | 12/6/2026 | 5,001 | 4,696 | (d) | |||||||||||||||||||||||||||||||||
Annual Report 2021
61
CION Ares Diversified Credit Fund
Consolidated Schedule of Investments (continued)
December 31, 2021
(in thousands, except shares, percentages and as otherwise noted)
Corporate Bonds(b)(c) (continued)
Company | Country(a) | Investment | Interest | Maturity Date | Acquisition Date | Shares | Principal Amount(a) | Fair Value(a) | Percentage of Net Assets | ||||||||||||||||||||||||||||||
Telesat Canada | Canada | 6.50% | 10/15/2027 | $ | 2,509 | $ | 1,947 | (d) | |||||||||||||||||||||||||||||||
12,928 | 0.67 | % | |||||||||||||||||||||||||||||||||||||
Utilities | |||||||||||||||||||||||||||||||||||||||
| Calpine Corporation | 4.50% | 2/15/2028 | 1,750 | 1,811 | (d) | ||||||||||||||||||||||||||||||||||
Vistra Energy Corp | 7.00% | 6/15/2170 | 7,000 | 7,090 | (d) | ||||||||||||||||||||||||||||||||||
8,901 | 0.46 | % | |||||||||||||||||||||||||||||||||||||
Total Corporate Bonds (Cost $207,892) | 207,788 | 10.77 | % | ||||||||||||||||||||||||||||||||||||
Collateralized Loan Obligations — Debt(b)(c)(d)(e) | |||||||||||||||||||||||||||||||||||||||
| AIMCO CLO 15, Ltd. | Cayman Islands | 6.04% (3M LIBOR + 5.95%) | 10/17/2034 | 1,000 | 983 | ||||||||||||||||||||||||||||||||||
| AMMC CLO XI, Ltd. | Cayman Islands | 5.93% (3M LIBOR + 5.80%) | 4/30/2031 | 1,500 | 1,405 | ||||||||||||||||||||||||||||||||||
| AMMC CLO XXI, Ltd. | Cayman Islands | 6.63% (3M LIBOR + 6.50%) | 11/2/2030 | 100 | 95 | ||||||||||||||||||||||||||||||||||
| AMMC CLO XXII, Ltd. | Cayman Islands | 5.62% (3M LIBOR + 5.50%) | 4/25/2031 | 750 | 704 | ||||||||||||||||||||||||||||||||||
| Apidos CLO XX, Ltd. | Cayman Islands | 8.82% (3M LIBOR + 8.70%) | 7/16/2031 | 250 | 228 | ||||||||||||||||||||||||||||||||||
| Atlas Senior Loan Fund VII, Ltd. | Cayman Islands | 8.23% (3M LIBOR + 8.05%) | 11/27/2031 | 1,750 | 1,415 | ||||||||||||||||||||||||||||||||||
Atrium IX | Cayman Islands | 6.63% (3M LIBOR + 6.45%) | 5/28/2030 | 1,000 | 979 | ||||||||||||||||||||||||||||||||||
Atrium XIII | Cayman Islands | 6.17% (3M LIBOR + 6.05%) | 11/21/2030 | 900 | 880 | ||||||||||||||||||||||||||||||||||
| Bain Capital Credit CLO 2021-3, Ltd. | Cayman Islands | 6.69% (3M LIBOR + 6.50%) | 7/24/2034 | 500 | 492 | ||||||||||||||||||||||||||||||||||
| Canyon Capital CLO 2018-1, Ltd. | Cayman Islands | 5.87% (3M LIBOR + 5.75%) | 7/15/2031 | 850 | 807 | ||||||||||||||||||||||||||||||||||
| Canyon Capital CLO 2020-1, Ltd. | Cayman Islands | 6.47% (3M LIBOR + 6.35%) | 7/15/2034 | 1,452 | 1,421 | ||||||||||||||||||||||||||||||||||
| CIFC Funding 2014-III, Ltd. | Cayman Islands | 6.23% (3M LIBOR + 6.10%) | 10/22/2031 | 522 | 508 | ||||||||||||||||||||||||||||||||||
Annual Report 2021
62
CION Ares Diversified Credit Fund
Consolidated Schedule of Investments (continued)
December 31, 2021
(in thousands, except shares, percentages and as otherwise noted)
Collateralized Loan Obligations — Debt(b)(c)(d)(e) (continued)
Company | Country(a) | Investment | Interest | Maturity Date | Acquisition Date | Shares | Principal Amount(a) | Fair Value(a) | Percentage of Net Assets | ||||||||||||||||||||||||||||||
| Crestline Denali CLO XIV, Ltd. | Cayman Islands | 6.47% (3M LIBOR + 6.35%) | 10/23/2031 | $ | 750 | $ | 681 | ||||||||||||||||||||||||||||||||
| Crestline Denali CLO XIV, Ltd. | Cayman Islands | 8.22% (3M LIBOR + 8.10%) | 10/23/2031 | 250 | 197 | ||||||||||||||||||||||||||||||||||
| Crestline Denali CLO XVI, Ltd. | Cayman Islands | 2.73% (3M LIBOR + 2.60%) | 1/20/2030 | 1,500 | 1,421 | ||||||||||||||||||||||||||||||||||
| Denali Capital CLO XII, Ltd. | Cayman Islands | 6.02% (3M LIBOR + 5.90%) | 4/15/2031 | 750 | 677 | ||||||||||||||||||||||||||||||||||
| Dryden 28 Senior Loan Fund | Cayman Islands | 7.91% (3M LIBOR + 7.75%) | 8/15/2030 | 500 | 475 | ||||||||||||||||||||||||||||||||||
| Dryden 55 Senior Loan Fund | Cayman Islands | 5.52% (3M LIBOR + 5.40%) | 4/15/2031 | 375 | 360 | ||||||||||||||||||||||||||||||||||
| Dryden 57 Senior Loan Fund | Cayman Islands | 5.36% (3M LIBOR + 5.20%) | 5/15/2031 | 500 | 474 | ||||||||||||||||||||||||||||||||||
| Dryden 58 Senior Loan Fund | Cayman Islands | 5.47% (3M LIBOR + 5.35%) | 7/17/2031 | 1,000 | 957 | ||||||||||||||||||||||||||||||||||
| Elmwood CLO VIII, Ltd. | Cayman Islands | 8.13% (3M LIBOR + 8.00%) | 1/20/2034 | 750 | 738 | ||||||||||||||||||||||||||||||||||
| Goldentree Loan Opportunities X, Ltd. | Cayman Islands | 5.78% (3M LIBOR + 5.65%) | 7/20/2031 | 750 | 733 | ||||||||||||||||||||||||||||||||||
| ICG U.S. CLO, Ltd. 2018-1 | Cayman Islands | 5.28% (3M LIBOR + 5.15%) | 4/21/2031 | 500 | 450 | ||||||||||||||||||||||||||||||||||
| INGIM, Ltd. 2013-3 | Cayman Islands | 6.02% (3M LIBOR + 5.90%) | 10/18/2031 | 1,250 | 1,160 | ||||||||||||||||||||||||||||||||||
KKR CLO 34, Ltd. | Cayman Islands | 7.02% (3M LIBOR + 6.85%) | 7/15/2034 | 600 | 594 | ||||||||||||||||||||||||||||||||||
| Madison Park Funding XIV, Ltd. | Cayman Islands | 7.90% (3M LIBOR + 7.77%) | 10/22/2030 | 1,000 | 872 | ||||||||||||||||||||||||||||||||||
| Madison Park Funding XLVI, Ltd. | Cayman Islands | 6.37% (3M LIBOR + 6.25%) | 10/15/2034 | 250 | 248 | ||||||||||||||||||||||||||||||||||
| Madison Park Funding XXII, Ltd. | Cayman Islands | 6.82% (3M LIBOR + 6.70%) | 1/15/2033 | 550 | 545 | ||||||||||||||||||||||||||||||||||
| Madison Park Funding XXVII, Ltd. | Cayman Islands | 5.13% (3M LIBOR + 5.00%) | 4/20/2030 | 650 | 616 | ||||||||||||||||||||||||||||||||||
Annual Report 2021
63
CION Ares Diversified Credit Fund
Consolidated Schedule of Investments (continued)
December 31, 2021
(in thousands, except shares, percentages and as otherwise noted)
Collateralized Loan Obligations — Debt(b)(c)(d)(e) (continued)
Company | Country(a) | Investment | Interest | Maturity Date | Acquisition Date | Shares | Principal Amount(a) | Fair Value(a) | Percentage of Net Assets | ||||||||||||||||||||||||||||||
| Madison Park Funding XXVIII, Ltd. | Cayman Islands | 7.72% (3M LIBOR + 7.60%) | 7/15/2030 | $ | 500 | $ | 472 | ||||||||||||||||||||||||||||||||
| Madison Park Funding XXXVI, Ltd. | Cayman Islands | 7.37% (3M LIBOR + 7.25%) | 1/15/2033 | 833 | 833 | ||||||||||||||||||||||||||||||||||
| Northwoods Capital XII-B, Ltd. | Cayman Islands | 5.99% (3M LIBOR + 5.79%) | 6/15/2031 | 750 | 676 | ||||||||||||||||||||||||||||||||||
| Octagon Investment Partners 35, Ltd. | Cayman Islands | 5.33% (3M LIBOR + 5.20%) | 1/20/2031 | 1,500 | 1,401 | ||||||||||||||||||||||||||||||||||
| OHA Credit Funding 9, Ltd. | Cayman Islands | 6.43% (3M LIBOR + 6.25%) | 7/19/2035 | 950 | 943 | ||||||||||||||||||||||||||||||||||
| OHA Loan Funding 2015-1, Ltd. | Cayman Islands | 6.86% (3M LIBOR + 6.65%) | 1/19/2037 | 860 | 857 | ||||||||||||||||||||||||||||||||||
| OHA Loan Funding 2016-1, Ltd. | Cayman Islands | 6.48% (3M LIBOR + 6.35%) | 1/20/2033 | 4,000 | 3,980 | ||||||||||||||||||||||||||||||||||
Riserva CLO, Ltd. | Cayman Islands | 6.62% (3M LIBOR + 6.50%) | 1/18/2034 | 500 | 496 | ||||||||||||||||||||||||||||||||||
| Venture 36A CLO, Ltd. | Cayman Islands | 7.05% (3M LIBOR + 6.92%) | 4/20/2032 | 300 | 278 | ||||||||||||||||||||||||||||||||||
| Venture 37A CLO, Ltd. | Cayman Islands | 7.07% (3M LIBOR + 6.95%) | 7/15/2032 | 3,000 | 2,889 | ||||||||||||||||||||||||||||||||||
| Voya CLO 2019-4, Ltd. | Cayman Islands | 6.95% (3M LIBOR + 6.71%) | 1/15/2035 | 500 | 490 | ||||||||||||||||||||||||||||||||||
| Wellfleet CLO 2017-3, Ltd. | Cayman Islands | 5.67% (3M LIBOR + 5.55%) | 1/17/2031 | 1,000 | 931 | ||||||||||||||||||||||||||||||||||
| Wellfleet CLO 2018-3, Ltd. | Cayman Islands | 6.38% (3M LIBOR + 6.25%) | 1/20/2032 | 250 | 240 | ||||||||||||||||||||||||||||||||||
Total Collateralized Loan Obligations — Debt (Cost $36,643) | 35,601 | 1.85 | % | ||||||||||||||||||||||||||||||||||||
Collateralized Loan Obligations — Equity(d)(e) | |||||||||||||||||||||||||||||||||||||||
| AIMCO CLO 16, Ltd. | Cayman Islands | 13.98% | 1/17/2035 | 5,600 | 5,137 | ||||||||||||||||||||||||||||||||||
| AIMCO CLO XI, Ltd. | Cayman Islands | 17.72% | 10/17/2034 | 7,258 | 7,326 | ||||||||||||||||||||||||||||||||||
| Allegro CLO VII, Ltd. 2018-2A | Cayman Islands | 16.15% | 7/15/2031 | 2,150 | 1,216 | ||||||||||||||||||||||||||||||||||
Annual Report 2021
64
CION Ares Diversified Credit Fund
Consolidated Schedule of Investments (continued)
December 31, 2021
(in thousands, except shares, percentages and as otherwise noted)
Collateralized Loan Obligations — Equity(d)(e) (continued)
Company | Country(a) | Investment | Interest | Maturity Date | Acquisition Date | Shares | Principal Amount(a) | Fair Value(a) | Percentage of Net Assets | ||||||||||||||||||||||||||||||
ALM, Ltd. | Cayman Islands | 13.98% | 10/15/2035 | $ | 1,166 | $ | 1,033 | ||||||||||||||||||||||||||||||||
| AMMC CLO XXI, Ltd. | Cayman Islands | 20.67% | 11/2/2030 | 500 | 279 | ||||||||||||||||||||||||||||||||||
| Anchorage Capital CLO 20, Ltd. | Cayman Islands | 13.98% | 1/20/2035 | 4,650 | 4,120 | ||||||||||||||||||||||||||||||||||
| Anchorage Credit Funding 3, Ltd. | Cayman Islands | 5.28% | 1/28/2039 | 520 | 427 | ||||||||||||||||||||||||||||||||||
Atrium XV | Cayman Islands | 13.49% | 1/23/2031 | 4,080 | 2,831 | ||||||||||||||||||||||||||||||||||
| Avery Point VI CLO, Ltd. | Cayman Islands | 65.44% | 8/5/2027 | 314 | 51 | ||||||||||||||||||||||||||||||||||
| Bain Capital Credit CLO 2017-2, Ltd. | Cayman Islands | 0.00% | 7/25/2034 | 3,461 | 3,094 | ||||||||||||||||||||||||||||||||||
| Bain Capital Credit CLO 2018-1, Ltd. | Cayman Islands | 14.11% | 4/23/2031 | 1,420 | 923 | ||||||||||||||||||||||||||||||||||
| Bain Capital Credit CLO 2019-1, Ltd. | Cayman Islands | 18.94% | 4/18/2032 | 1,400 | 1,055 | ||||||||||||||||||||||||||||||||||
| Bain Capital Credit CLO 2019-2, Ltd. | Cayman Islands | 13.96% | 10/17/2032 | 810 | 643 | ||||||||||||||||||||||||||||||||||
| Bain Capital Credit CLO 2020-1, Ltd. | Cayman Islands | 23.10% | 4/18/2033 | 1,250 | 1,022 | ||||||||||||||||||||||||||||||||||
| Bain Capital Credit CLO 2020-2, Ltd. | Cayman Islands | 37.61% | 7/19/2034 | 800 | 646 | ||||||||||||||||||||||||||||||||||
| Bain Capital Credit CLO 2021-2, Ltd. | Cayman Islands | 13.98% | 7/16/2034 | 1,000 | 793 | ||||||||||||||||||||||||||||||||||
Bardot CLO, Ltd. | Cayman Islands | 15.92% | 10/22/2032 | 2,250 | 1,961 | ||||||||||||||||||||||||||||||||||
| Barings CLO, Ltd. 2021-II | Cayman Islands | 13.98% | 7/15/2034 | 5,000 | 4,681 | ||||||||||||||||||||||||||||||||||
| Canyon Capital CLO 2019-1, Ltd. | Cayman Islands | 16.96% | 4/15/2032 | 2,798 | 2,082 | ||||||||||||||||||||||||||||||||||
| Carlyle Global Market Strategies CLO, Ltd. 2013-1 | Cayman Islands | 19.89% | 8/14/2030 | 500 | 221 | ||||||||||||||||||||||||||||||||||
| Carlyle Global Market Strategies CLO, Ltd. 2018-3 | Cayman Islands | 16.61% | 10/15/2030 | 750 | 421 | ||||||||||||||||||||||||||||||||||
| Carlyle Global Market Strategies CLO, Ltd. 2018-4 | Cayman Islands | 18.65% | 1/20/2031 | 2,310 | 1,628 | ||||||||||||||||||||||||||||||||||
Annual Report 2021
65
CION Ares Diversified Credit Fund
Consolidated Schedule of Investments (continued)
December 31, 2021
(in thousands, except shares, percentages and as otherwise noted)
Collateralized Loan Obligations — Equity(d)(e) (continued)
Company | Country(a) | Investment | Interest | Maturity Date | Acquisition Date | Shares | Principal Amount(a) | Fair Value(a) | Percentage of Net Assets | ||||||||||||||||||||||||||||||
| Carlyle Global Market Strategies CLO, Ltd. 2019-3 | Cayman Islands | 12.22% | 10/20/2032 | $ | 3,875 | $ | 3,098 | ||||||||||||||||||||||||||||||||
| Cedar Funding CLO V, Ltd. | Cayman Islands | 16.54% | 7/17/2031 | 2,300 | 1,891 | ||||||||||||||||||||||||||||||||||
| Cedar Funding CLO VIII, Ltd. | Cayman Islands | 9.02% | 10/17/2034 | 365 | 218 | ||||||||||||||||||||||||||||||||||
| CIFC Funding 2015-IV, Ltd. | Cayman Islands | 13.00% | 4/20/2034 | 2,252 | 1,045 | ||||||||||||||||||||||||||||||||||
| CIFC Funding 2018-V, Ltd. | Cayman Islands | 17.58% | 1/15/2032 | 625 | 438 | ||||||||||||||||||||||||||||||||||
| CIFC Funding 2019-I, Ltd. | Cayman Islands | 22.61% | 4/20/2032 | 1,500 | 1,128 | ||||||||||||||||||||||||||||||||||
| CIFC Funding 2020-III, Ltd. | Cayman Islands | 13.98% | 10/20/2034 | 1,000 | 921 | ||||||||||||||||||||||||||||||||||
| CIFC Funding 2021-V, Ltd. | Cayman Islands | 13.17% | 7/15/2034 | 5,200 | 4,709 | ||||||||||||||||||||||||||||||||||
| Dryden 28 Senior Loan Fund | Cayman Islands | 16.77% | 8/15/2030 | 1,406 | 461 | ||||||||||||||||||||||||||||||||||
| Dryden 43 Senior Loan Fund | Cayman Islands | 23.98% | 4/20/2034 | 1,610 | 1,106 | ||||||||||||||||||||||||||||||||||
| Dryden 58 Senior Loan Fund | Cayman Islands | 17.42% | 7/17/2031 | 3,125 | 2,289 | ||||||||||||||||||||||||||||||||||
| Dryden 75 CLO, Ltd. | Cayman Islands | 13.47% | 7/15/2030 | 1,200 | 1,165 | ||||||||||||||||||||||||||||||||||
| Dryden 78 Senior Loan Fund | Cayman Islands | 19.29% | 4/17/2033 | 10,625 | 9,106 | ||||||||||||||||||||||||||||||||||
| East West Investment Management CLO 2019-1, Ltd. | Cayman Islands | 13.98% | 1/20/2033 | 2,175 | 1,836 | ||||||||||||||||||||||||||||||||||
Eastland CLO, Ltd. | Cayman Islands | 0.00% | 5/1/2022 | — | 132 | ||||||||||||||||||||||||||||||||||
| Elmwood CLO V, Ltd. | Cayman Islands | 0.00% | 7/24/2031 | 2,500 | 2,681 | ||||||||||||||||||||||||||||||||||
| Elmwood CLO XI, Ltd. | Cayman Islands | 13.98% | 10/20/2034 | 4,050 | 3,982 | ||||||||||||||||||||||||||||||||||
| Generate CLO 7, Ltd. | Cayman Islands | 16.08% | 1/22/2033 | 4,000 | 3,216 | ||||||||||||||||||||||||||||||||||
| ICG U.S. CLO, Ltd. 2018-2 | Cayman Islands | 19.07% | 7/22/2031 | 1,650 | 1,045 | ||||||||||||||||||||||||||||||||||
| ICG U.S. CLO, Ltd. 2020-1 | Cayman Islands | 14.36% | 1/20/2035 | 500 | 391 | ||||||||||||||||||||||||||||||||||
| ICG U.S. CLO, Ltd. 2021-1 | Cayman Islands | 13.80% | 4/17/2034 | 2,600 | 2,067 | ||||||||||||||||||||||||||||||||||
| Invesco CLO 2021-3, Ltd. | Cayman Islands | 13.98% | 10/22/2034 | 4,022 | 2,936 | ||||||||||||||||||||||||||||||||||
Invesco CLO, Ltd. | Cayman Islands | 0.00% | 7/15/2034 | 44 | 12 | ||||||||||||||||||||||||||||||||||
Annual Report 2021
66
CION Ares Diversified Credit Fund
Consolidated Schedule of Investments (continued)
December 31, 2021
(in thousands, except shares, percentages and as otherwise noted)
Collateralized Loan Obligations — Equity(d)(e) (continued)
Company | Country(a) | Investment | Interest | Maturity Date | Acquisition Date | Shares | Principal Amount(a) | Fair Value(a) | Percentage of Net Assets | ||||||||||||||||||||||||||||||
Invesco CLO, Ltd. | Cayman Islands | 14.56% | 7/15/2034 | $ | 440 | $ | 346 | ||||||||||||||||||||||||||||||||
| Madison Park Funding L, Ltd. | Cayman Islands | 13.98% | 4/19/2034 | 2,500 | 2,520 | ||||||||||||||||||||||||||||||||||
| Madison Park Funding LIX, Ltd. | Cayman Islands | 13.98% | 1/18/2034 | 6,000 | 6,000 | ||||||||||||||||||||||||||||||||||
| Madison Park Funding XXII, Ltd. | Cayman Islands | 11.90% | 1/15/2033 | 7,400 | 5,477 | ||||||||||||||||||||||||||||||||||
| Madison Park Funding XXVII, Ltd. | Cayman Islands | 16.78% | 1/20/2047 | 250 | 193 | ||||||||||||||||||||||||||||||||||
| Madison Park Funding XXVIII, Ltd. | Cayman Islands | 16.78% | 7/15/2030 | 3,000 | 2,144 | ||||||||||||||||||||||||||||||||||
| Madison Park Funding XXXI, Ltd. | Cayman Islands | 16.92% | 1/23/2048 | 4,250 | 3,344 | ||||||||||||||||||||||||||||||||||
| Madison Park Funding XXXII, Ltd. | Cayman Islands | 22.98% | 1/22/2048 | 1,250 | 998 | ||||||||||||||||||||||||||||||||||
| Madison Park Funding XXXVII, Ltd. | Cayman Islands | 18.25% | 7/15/2049 | 7,500 | 7,508 | ||||||||||||||||||||||||||||||||||
Magnetite VI, Ltd. | Cayman Islands | 0.00% | 9/15/2023 | 1,241 | — | ||||||||||||||||||||||||||||||||||
| Magnetite XXVIII, Ltd. | Cayman Islands | 15.66% | 10/25/2031 | 5,250 | 4,499 | ||||||||||||||||||||||||||||||||||
| Neuberger Berman CLO XXIII, Ltd. | Cayman Islands | 94.84% | 10/17/2027 | 29 | 3 | ||||||||||||||||||||||||||||||||||
| Newark BSL CLO 1, Ltd. | Cayman Islands | 54.85% | 7/25/2030 | 250 | 151 | ||||||||||||||||||||||||||||||||||
| Oaktree CLO 2018-1, Ltd. | Cayman Islands | 19.65% | 10/20/2030 | 2,850 | 1,481 | ||||||||||||||||||||||||||||||||||
| Oaktree CLO 2019-2, Ltd. | Cayman Islands | 17.71% | 4/15/2031 | 3,860 | 2,284 | ||||||||||||||||||||||||||||||||||
| Oaktree CLO 2019-3, Ltd. | Cayman Islands | 8.24% | 10/20/2034 | 6,229 | 4,160 | ||||||||||||||||||||||||||||||||||
| OHA Credit Partners X-R, Ltd. | Cayman Islands | 10.10% | 4/20/2034 | 1,493 | 732 | ||||||||||||||||||||||||||||||||||
| OHA Credit Partners X-R, Ltd. | Cayman Islands | 13.98% | 4/20/2034 | 750 | 368 | ||||||||||||||||||||||||||||||||||
| OHA Credit Partners XV, Ltd. | Cayman Islands | 18.61% | 1/20/2030 | 1,360 | 928 | ||||||||||||||||||||||||||||||||||
| OHA Credit Partners XVI | Cayman Islands | 13.98% | 10/18/2034 | 4,575 | 4,203 | ||||||||||||||||||||||||||||||||||
| OHA Loan Funding 2013-1, Ltd. | Cayman Islands | 15.88% | 7/23/2031 | 876 | 412 | ||||||||||||||||||||||||||||||||||
| OHA Loan Funding 2016-1, Ltd. | Cayman Islands | 15.87% | 1/20/2033 | 8,800 | 6,809 | ||||||||||||||||||||||||||||||||||
Annual Report 2021
67
CION Ares Diversified Credit Fund
Consolidated Schedule of Investments (continued)
December 31, 2021
(in thousands, except shares, percentages and as otherwise noted)
Collateralized Loan Obligations — Equity(d)(e) (continued)
Company | Country(a) | Investment | Interest | Maturity Date | Acquisition Date | Shares | Principal Amount(a) | Fair Value(a) | Percentage of Net Assets | ||||||||||||||||||||||||||||||
OZLM XXI, Ltd. | Cayman Islands | 14.54% | 1/20/2031 | $ | 1,500 | $ | 758 | ||||||||||||||||||||||||||||||||
| Reese Park CLO, Ltd | Cayman Islands | 0.00% | 10/15/2032 | 703 | — | ||||||||||||||||||||||||||||||||||
| Reese Park CLO, Ltd | Cayman Islands | 17.30% | 10/15/2032 | 703 | 531 | ||||||||||||||||||||||||||||||||||
| Rockland Park CLO, Ltd. | Cayman Islands | 13.98% | 4/20/2034 | 6,300 | 1,778 | ||||||||||||||||||||||||||||||||||
RR 14, Ltd. | Cayman Islands | 13.11% | 4/15/2121 | 750 | 682 | ||||||||||||||||||||||||||||||||||
RR 2, Ltd. | Cayman Islands | 12.76% | 10/15/2117 | 500 | 406 | ||||||||||||||||||||||||||||||||||
RR 6, Ltd. | Cayman Islands | 12.44% | 4/15/2036 | 1,000 | 1,026 | ||||||||||||||||||||||||||||||||||
RR 8, Ltd. | Cayman Islands | 13.54% | 4/15/2120 | 550 | 486 | ||||||||||||||||||||||||||||||||||
| Signal Peak CLO 5, Ltd. | Cayman Islands | 16.33% | 4/25/2031 | 2,500 | 1,600 | ||||||||||||||||||||||||||||||||||
| Signal Peak CLO 8, Ltd. | Cayman Islands | 17.10% | 4/20/2033 | 6,350 | 5,671 | ||||||||||||||||||||||||||||||||||
| Steele Creek CLO, Ltd. 2017-1 | Cayman Islands | 12.98% | 10/15/2030 | 250 | 120 | ||||||||||||||||||||||||||||||||||
| Symphony CLO XI Ltd | Cayman Islands | 0.00% | 1/17/2025 | 1 | — | ||||||||||||||||||||||||||||||||||
| THL Credit Wind River 2018-3 CLO, Ltd. | Cayman Islands | 14.96% | 1/20/2031 | 250 | 194 | ||||||||||||||||||||||||||||||||||
| THL Credit Wind River 2018-3 CLO, Ltd. | Cayman Islands | 23.28% | 1/20/2031 | 3,875 | 3,002 | ||||||||||||||||||||||||||||||||||
| Voya CLO 2020-1, Ltd. | Cayman Islands | 19.32% | 7/16/2034 | 567 | 502 | ||||||||||||||||||||||||||||||||||
| Wellfleet CLO 2017-3, Ltd. | Cayman Islands | 13.61% | 1/17/2031 | 250 | 144 | ||||||||||||||||||||||||||||||||||
| Wellfleet CLO 2018-3, Ltd. | Cayman Islands | 14.35% | 1/20/2032 | 2,400 | 1,611 | ||||||||||||||||||||||||||||||||||
| Wellfleet CLO 2020-1, Ltd. | Cayman Islands | 16.18% | 4/15/2033 | 5,955 | 4,332 | ||||||||||||||||||||||||||||||||||
| Wellman Park CLO, Ltd. | Cayman Islands | 0.00% | 7/15/2034 | 5,100 | 1 | ||||||||||||||||||||||||||||||||||
| Wellman Park CLO, Ltd. | Cayman Islands | 12.28% | 7/15/2034 | 2,550 | 2,232 | ||||||||||||||||||||||||||||||||||
Total Collateralized Loan Obligations — Equity (Cost $154,391) | 167,099 | 8.66 | % | ||||||||||||||||||||||||||||||||||||
Annual Report 2021
68
CION Ares Diversified Credit Fund
Consolidated Schedule of Investments (continued)
December 31, 2021
(in thousands, except shares, percentages and as otherwise noted)
Common Stocks(d)
Company | Country(a) | Investment | Interest | Maturity Date | Acquisition Date | Shares | Principal Amount(a) | Fair Value(a) | Percentage of Net Assets | ||||||||||||||||||||||||||||||
Automobiles & Components | |||||||||||||||||||||||||||||||||||||||
| Automotive Keys Investor, LLC | Class A | 11/6/2020 | 37,749 | $ | 5 | (e)(k) | |||||||||||||||||||||||||||||||||
| Highline PPC Blocker LLC | 11/4/2020 | 500 | 30 | (e)(k) | |||||||||||||||||||||||||||||||||||
Metis Topco, LP | 5/4/2021 | 50 | 55 | (e)(k) | |||||||||||||||||||||||||||||||||||
Sun TopCo, LP | Class A | 9/8/2021 | 1,000 | 122 | (e)(k) | ||||||||||||||||||||||||||||||||||
212 | 0.01 | % | |||||||||||||||||||||||||||||||||||||
Capital Goods | |||||||||||||||||||||||||||||||||||||||
| Dynamic NC Investment Holdings, LP | 12/30/2020 | 50,000 | 44 | (e)(k) | |||||||||||||||||||||||||||||||||||
| Kene Holdings, L.P. | Class A | 8/8/2019 | 50,000 | 58 | (e)(k) | ||||||||||||||||||||||||||||||||||
| Tutor Perini Corporation | 5/19/2021 | 12,650 | 156 | ||||||||||||||||||||||||||||||||||||
US Global Jets ETF | 9/1/2021 | 13,838 | 292 | (k) | |||||||||||||||||||||||||||||||||||
550 | 0.03 | % | |||||||||||||||||||||||||||||||||||||
Commercial & Professional Services | |||||||||||||||||||||||||||||||||||||||
| Bedrock Parent Holdings, LP | Class A | 4/22/2021 | 500 | 57 | (e)(k) | ||||||||||||||||||||||||||||||||||
| Capstone Parent Holdings, LP | Class A | 11/12/2020 | 50 | 68 | (e)(k) | ||||||||||||||||||||||||||||||||||
IRI Parent, L.P. | Class A-1 | 11/29/2018 | 250 | 72 | (e)(k) | ||||||||||||||||||||||||||||||||||
| KKR Nest Co-Invest L.P. | 9/28/2021 | 50,000 | 50 | (e)(k) | |||||||||||||||||||||||||||||||||||
| Laboratories Topco LLC | Class A | 7/23/2021 | 33,333 | 44 | (e)(k) | ||||||||||||||||||||||||||||||||||
| Landscape Parallel Partners, L.P. | Class D | 12/16/2021 | 13 | 32 | (e)(k) | ||||||||||||||||||||||||||||||||||
| North American Fire Ultimate Holdings, LLC | 5/19/2021 | 68,175 | 91 | (e)(k) | |||||||||||||||||||||||||||||||||||
| PSP Registrar Co-Investment Fund, L.P. | Class A | 8/26/2021 | 50,000 | 50 | (e)(k) | ||||||||||||||||||||||||||||||||||
| RC V Tecmo Investor LLC | 8/14/2020 | 50,000 | 100 | (e)(k) | |||||||||||||||||||||||||||||||||||
SSE Parent, LP | Class A-1 | 6/30/2020 | 25 | 7 | (e)(k) | ||||||||||||||||||||||||||||||||||
SSE Parent, LP | Class A-2 | 6/30/2020 | 25 | 7 | (e)(k) | ||||||||||||||||||||||||||||||||||
578 | 0.03 | % | |||||||||||||||||||||||||||||||||||||
Annual Report 2021
69
CION Ares Diversified Credit Fund
Consolidated Schedule of Investments (continued)
December 31, 2021
(in thousands, except shares, percentages and as otherwise noted)
Common Stocks(d) (continued)
Company | Country(a) | Investment | Interest | Maturity Date | Acquisition Date | Shares | Principal Amount(a) | Fair Value(a) | Percentage of Net Assets | ||||||||||||||||||||||||||||||
Consumer Durables & Apparel | |||||||||||||||||||||||||||||||||||||||
| Centric Brands GP LLC | 10/9/2020 | 9,495 | $ | 390 | (e)(k) | ||||||||||||||||||||||||||||||||||
| DRS Holdings I, Inc. | 11/1/2019 | 50 | 66 | (e)(k) | |||||||||||||||||||||||||||||||||||
456 | 0.02 | % | |||||||||||||||||||||||||||||||||||||
Consumer Services | |||||||||||||||||||||||||||||||||||||||
| LBC Breeze Holdings LLC | Class A | 12/6/2021 | 50 | 50 | (e)(k) | ||||||||||||||||||||||||||||||||||
| OMERS Mahomes Investment Holdings LLC | Class A | 11/16/2020 | 16 | 88 | (e)(k) | ||||||||||||||||||||||||||||||||||
| ZBS Mechanical Group Co-Invest Fund 2, LLC | 10/7/2021 | 50,000 | 50 | (e)(k) | |||||||||||||||||||||||||||||||||||
188 | 0.01 | % | |||||||||||||||||||||||||||||||||||||
Diversified Financials | |||||||||||||||||||||||||||||||||||||||
| Apollo Tactical Income Fund Inc | 1/12/2021 | 811 | 12 | ||||||||||||||||||||||||||||||||||||
| BCC Blueprint Investments, LLC | 9/15/2021 | 569,311 | 557 | (e)(k) | |||||||||||||||||||||||||||||||||||
| Blackstone Strategic Credit Fund | 10/28/2020 | 3,073 | 41 | ||||||||||||||||||||||||||||||||||||
| Blackstone/GSO Long-Short Credit Income Fund | 1/14/2021 | 70 | 1 | ||||||||||||||||||||||||||||||||||||
| LaRousseCo Limited | Jersey | Class A | 9/24/2021 | 6,784 | 205 | (e)(k) | |||||||||||||||||||||||||||||||||
| Owl Rock Capital Corp | 8/18/2020 | 2,500 | 35 | ||||||||||||||||||||||||||||||||||||
Sera 2021 LLC | Class A | 3/30/2021 | 3 | — | (e)(k) | ||||||||||||||||||||||||||||||||||
| The Ultimus Group Aggregator, LP | Class A | 2/1/2019 | — | — | (e)(k) | ||||||||||||||||||||||||||||||||||
| The Ultimus Group Aggregator, LP | Class B | 2/1/2019 | 182 | — | (e)(k) | ||||||||||||||||||||||||||||||||||
| The Ultimus Group, LLC | Class B | 2/1/2019 | 1,609 | — | (e)(k) | ||||||||||||||||||||||||||||||||||
| Tiger Parent Inc. (IPS) | 11/22/2021 | 268 | 2,683 | (e)(k) | |||||||||||||||||||||||||||||||||||
3,534 | 0.18 | % | |||||||||||||||||||||||||||||||||||||
Annual Report 2021
70
CION Ares Diversified Credit Fund
Consolidated Schedule of Investments (continued)
December 31, 2021
(in thousands, except shares, percentages and as otherwise noted)
Common Stocks(d) (continued)
Company | Country(a) | Investment | Interest | Maturity Date | Acquisition Date | Shares | Principal Amount(a) | Fair Value(a) | Percentage of Net Assets | ||||||||||||||||||||||||||||||
Energy | |||||||||||||||||||||||||||||||||||||||
| Antero Resources Corp | 7/28/2021 | 11,111 | $ | 194 | (k) | ||||||||||||||||||||||||||||||||||
| Civitas Resources, Inc. | 1/21/2021 | 2,197 | 108 | ||||||||||||||||||||||||||||||||||||
| Extraction Oil & Gas Inc | 1/21/2021 | 209 | 14 | (k) | |||||||||||||||||||||||||||||||||||
| Occidental Petroleum Corporation | 12/7/2021 | 7,840 | 227 | ||||||||||||||||||||||||||||||||||||
| Sundance Energy Inc. | 4/23/2018 | 2,602 | 1,130 | (e)(k) | |||||||||||||||||||||||||||||||||||
1,673 | 0.09 | % | |||||||||||||||||||||||||||||||||||||
Food & Staples Retailing | |||||||||||||||||||||||||||||||||||||||
| KCAKE Holdings Inc. | 5/14/2021 | 50 | 52 | (e)(k) | |||||||||||||||||||||||||||||||||||
52 | 0.00 | % | |||||||||||||||||||||||||||||||||||||
Food & Beverage | |||||||||||||||||||||||||||||||||||||||
| PPC CHG Blocker LLC | 12/10/2021 | 1 | 50 | (e)(k) | |||||||||||||||||||||||||||||||||||
| Sanderson Farms Inc | 9/9/2021 | 2,821 | 539 | ||||||||||||||||||||||||||||||||||||
589 | 0.03 | % | |||||||||||||||||||||||||||||||||||||
Healthcare Equipment & Services | |||||||||||||||||||||||||||||||||||||||
| Bearcat Parent, Inc. | 7/9/2019 | 51 | 132 | (e)(k) | |||||||||||||||||||||||||||||||||||
| Olympia TopCo, L.P. | Class A | 9/24/2019 | 50,000 | — | (e)(k) | ||||||||||||||||||||||||||||||||||
| OMERS Bluejay Investment Holdings LP | Class A | 7/10/2018 | 25 | 45 | (e)(k) | ||||||||||||||||||||||||||||||||||
| OMERS Wildcats Investment Holdings LLC | Class A | 10/31/2019 | 169 | 83 | (e)(k) | ||||||||||||||||||||||||||||||||||
| SiroMed Equity Holdings, LLC | 3/26/2018 | 3,703 | 4 | (e)(k) | |||||||||||||||||||||||||||||||||||
| Virence Holdings LLC | Class A | 2/11/2019 | — | 126 | (e)(k) | ||||||||||||||||||||||||||||||||||
| VPP Group Holdings, L.P. | 12/1/2021 | 50 | 50 | (e)(k) | |||||||||||||||||||||||||||||||||||
440 | 0.02 | % | |||||||||||||||||||||||||||||||||||||
Annual Report 2021
71
CION Ares Diversified Credit Fund
Consolidated Schedule of Investments (continued)
December 31, 2021
(in thousands, except shares, percentages and as otherwise noted)
Common Stocks(d) (continued)
Company | Country(a) | Investment | Interest | Maturity Date | Acquisition Date | Shares | Principal Amount(a) | Fair Value(a) | Percentage of Net Assets | ||||||||||||||||||||||||||||||
Household & Personal Products | |||||||||||||||||||||||||||||||||||||||
| CDI Holdings I Corp. | 12/22/2021 | 50 | $ | 50 | (e)(k) | ||||||||||||||||||||||||||||||||||
| RMCF V CIV XLIV, L.P. | 8/20/2021 | 50,000 | 44 | (e)(k) | |||||||||||||||||||||||||||||||||||
94 | 0.01 | % | |||||||||||||||||||||||||||||||||||||
Insurance | |||||||||||||||||||||||||||||||||||||||
| High Street HoldCo LLC | Series A | 4/16/2021 | 50,000 | 119 | (e)(k) | ||||||||||||||||||||||||||||||||||
| High Street HoldCo LLC | Series C | 4/16/2021 | 437,659 | 1,046 | (e)(k) | ||||||||||||||||||||||||||||||||||
1,165 | 0.06 | % | |||||||||||||||||||||||||||||||||||||
Materials | |||||||||||||||||||||||||||||||||||||||
| ASP-R-Pac Holdings LP | Class A | 12/29/2021 | 500 | 50 | (e)(k) | ||||||||||||||||||||||||||||||||||
| Berry Global Group Inc | 6/11/2020 | 4,487 | 331 | (k) | |||||||||||||||||||||||||||||||||||
| KNPAK Holdings, LP | Class A | 7/2/2019 | 100,000 | 105 | (e)(k) | ||||||||||||||||||||||||||||||||||
| Novipax Parent Holding Company, L.L.C. | Class C | 12/1/2020 | 50 | — | (e)(k) | ||||||||||||||||||||||||||||||||||
| Plaskolite PPC Blocker LLC | 12/14/2018 | 10 | 2 | (e)(k) | |||||||||||||||||||||||||||||||||||
488 | 0.03 | % | |||||||||||||||||||||||||||||||||||||
Media & Entertainment | |||||||||||||||||||||||||||||||||||||||
| Storm Investment S.a.r.l. | Luxembourg | Class A | 6/24/2021 | 491,621 | 225 | (e)(k) |
| ||||||||||||||||||||||||||||||||
| Storm Investment S.a.r.l. | Luxembourg | Class B | 6/24/2021 | 491,621 | 225 | (e)(k) |
| ||||||||||||||||||||||||||||||||
| Storm Investment S.a.r.l. | Luxembourg | Class C | 6/24/2021 | 491,621 | 225 | (e)(k) |
| ||||||||||||||||||||||||||||||||
| Storm Investment S.a.r.l. | Luxembourg | Class D | 6/24/2021 | 491,621 | 225 | (e)(k) |
| ||||||||||||||||||||||||||||||||
| Storm Investment S.a.r.l. | Luxembourg | Class E | 6/24/2021 | 491,621 | 225 | (e)(k) |
| ||||||||||||||||||||||||||||||||
| Storm Investment S.a.r.l. | Luxembourg | Class F | 6/24/2021 | 491,621 | 225 | (e)(k) |
| ||||||||||||||||||||||||||||||||
| Storm Investment S.a.r.l. | Luxembourg | Class G | 6/24/2021 | 491,621 | 225 | (e)(k) |
| ||||||||||||||||||||||||||||||||
| Storm Investment S.a.r.l. | Luxembourg | Class H | 6/24/2021 | 491,621 | 225 | (e)(k) |
| ||||||||||||||||||||||||||||||||
Annual Report 2021
72
CION Ares Diversified Credit Fund
Consolidated Schedule of Investments (continued)
December 31, 2021
(in thousands, except shares, percentages and as otherwise noted)
Common Stocks(d) (continued)
Company | Country(a) | Investment | Interest | Maturity Date | Acquisition Date | Shares | Principal Amount(a) | Fair Value(a) | Percentage of Net Assets | ||||||||||||||||||||||||||||||
| Storm Investment S.a.r.l. | Luxembourg | Class I | 6/24/2021 | 491,621 | $ | 225 | (e)(k) |
| |||||||||||||||||||||||||||||||
| Storm Investment S.a.r.l. | Luxembourg | 6/24/2021 | 590 | 1 | (e)(k) |
| |||||||||||||||||||||||||||||||||
2,026 | 0.10 | % | |||||||||||||||||||||||||||||||||||||
Pharmaceuticals, Biotechnology & Life Sciences | |||||||||||||||||||||||||||||||||||||||
| Cobalt Holdings I, LP | Class A | 10/1/2021 | 500 | 45 | (e)(k) | ||||||||||||||||||||||||||||||||||
| Coherus Biosciences Inc | 11/2/2018 | 2,456 | 39 | (k) | |||||||||||||||||||||||||||||||||||
84 | 0.00 | % | |||||||||||||||||||||||||||||||||||||
Real Estate | |||||||||||||||||||||||||||||||||||||||
| Illinois Investment S.a.r.l. | Luxembourg | Class A | 9/15/2021 | 3,400,700 | 30 | (e)(k) |
| ||||||||||||||||||||||||||||||||
| Illinois Investment S.a.r.l. | Luxembourg | Class B | 9/15/2021 | 3,400,700 | 30 | (e)(k) |
| ||||||||||||||||||||||||||||||||
| Illinois Investment S.a.r.l. | Luxembourg | Class C | 9/15/2021 | 3,400,700 | 30 | (e)(k) |
| ||||||||||||||||||||||||||||||||
| Illinois Investment S.a.r.l. | Luxembourg | Class D | 9/15/2021 | 3,400,700 | 30 | (e)(k) |
| ||||||||||||||||||||||||||||||||
| Illinois Investment S.a.r.l. | Luxembourg | Class E | 9/15/2021 | 3,400,700 | 30 | (e)(k) |
| ||||||||||||||||||||||||||||||||
| Illinois Investment S.a.r.l. | Luxembourg | Class F | 9/15/2021 | 3,400,700 | 30 | (e)(k) |
| ||||||||||||||||||||||||||||||||
| Illinois Investment S.a.r.l. | Luxembourg | Class G | 9/15/2021 | 3,400,700 | 30 | (e)(k) |
| ||||||||||||||||||||||||||||||||
| Illinois Investment S.a.r.l. | Luxembourg | Class H | 9/15/2021 | 3,400,700 | 30 | (e)(k) |
| ||||||||||||||||||||||||||||||||
| Illinois Investment S.a.r.l. | Luxembourg | Class I | 9/15/2021 | 3,400,700 | 30 | (e)(k) |
| ||||||||||||||||||||||||||||||||
| Illinois Investment S.a.r.l. | Luxembourg | 9/15/2021 | 4,081 | — | (e)(k) |
| |||||||||||||||||||||||||||||||||
270 | 0.01 | % | |||||||||||||||||||||||||||||||||||||
Retailing | |||||||||||||||||||||||||||||||||||||||
ARKO Corp. | 12/22/2020 | 106 | 1 | (e)(k) | |||||||||||||||||||||||||||||||||||
| Emerald Lake Pearl Acquisition-A, L.P. | 7/19/2021 | 43,500 | 43 | (e)(k) | |||||||||||||||||||||||||||||||||||
| Fastsigns Holdings Inc. | 3/13/2019 | 50 | 83 | (e)(k) | |||||||||||||||||||||||||||||||||||
| Marcone Yellowstone Holdings, LLC | Class A | 6/23/2021 | 92 | 153 | (e)(k) | ||||||||||||||||||||||||||||||||||
Annual Report 2021
73
CION Ares Diversified Credit Fund
Consolidated Schedule of Investments (continued)
December 31, 2021
(in thousands, except shares, percentages and as otherwise noted)
Common Stocks(d) (continued)
Company | Country(a) | Investment | Interest | Maturity Date | Acquisition Date | Shares | Principal Amount(a) | Fair Value(a) | Percentage of Net Assets | ||||||||||||||||||||||||||||||
| Stonecourt IV Partners LP | 10/8/2021 | 2,423,676 | $ | 2,424 | (e)(k) | ||||||||||||||||||||||||||||||||||
2,704 | 0.14 | % | |||||||||||||||||||||||||||||||||||||
Software & Services | |||||||||||||||||||||||||||||||||||||||
| APG Holdings, LLC | Class A | 1/3/2020 | 50,000 | 59 | (e)(k) | ||||||||||||||||||||||||||||||||||
| Astorg VII Co-Invest ERT | Luxembourg | 1/31/2020 | 1,208,500 | 1,636 | (e)(k) |
| |||||||||||||||||||||||||||||||||
| Consilio Investment Holdings, L.P. | 5/28/2021 | 50,000 | 63 | (e)(k) | |||||||||||||||||||||||||||||||||||
Cority Parent, Inc. | Canada | Class B-1 | 7/2/2019 | 47,536 | 1 | (e)(k) | |||||||||||||||||||||||||||||||||
Denali Topco LLC | Class A | 9/15/2021 | 50,000 | 50 | (e)(k) | ||||||||||||||||||||||||||||||||||
| Destiny Digital Holdings, L.P. | 5/27/2021 | 3,076 | 51 | (e)(k) | |||||||||||||||||||||||||||||||||||
| EQT IX Co-Investment (E) SCSP | 4/16/2021 | 5,000 | �� | 55 | (e)(k) | ||||||||||||||||||||||||||||||||||
| Frontline Technologies Parent, LLC | Class B | 9/18/2017 | 2,728 | 43 | (e)(k) | ||||||||||||||||||||||||||||||||||
| H&F Unite Partners, L.P. | 5/1/2019 | 50,032 | 60 | (e)(k) | |||||||||||||||||||||||||||||||||||
| Insight PDI Holdings, LLC | Class A | 3/19/2019 | 26,548 | 37 | (e)(k) | ||||||||||||||||||||||||||||||||||
Magic Topco, L.P. | Class B | 9/21/2020 | 12,975 | — | (e)(k) | ||||||||||||||||||||||||||||||||||
PS Co-Invest, L.P. | 3/5/2021 | 50,000 | 51 | (e)(k) | |||||||||||||||||||||||||||||||||||
| RMS Group Holdings, Inc. | 12/16/2021 | 5 | 50 | (e)(k) | |||||||||||||||||||||||||||||||||||
Rocket Parent, LLC | Class A | 12/17/2018 | 74,502 | 125 | (e)(k) | ||||||||||||||||||||||||||||||||||
| Skywalker TopCo, LLC | 11/20/2020 | 14,925 | 53 | (e)(k) | |||||||||||||||||||||||||||||||||||
| Sunshine Software Holdings, Inc. | Class A-1 | 10/15/2021 | 5,000 | 49 | (e)(k) | ||||||||||||||||||||||||||||||||||
2,383 | 0.12 | % | |||||||||||||||||||||||||||||||||||||
Technology Hardware & Equipment | |||||||||||||||||||||||||||||||||||||||
| Repairify Holdings, LLC | Class A | 6/14/2021 | 1,655 | 49 | (e)(k) | ||||||||||||||||||||||||||||||||||
Wildcat Parent, LP | 2/27/2020 | 535 | 83 | (e)(k) | |||||||||||||||||||||||||||||||||||
132 | 0.01 | % | |||||||||||||||||||||||||||||||||||||
Annual Report 2021
74
CION Ares Diversified Credit Fund
Consolidated Schedule of Investments (continued)
December 31, 2021
(in thousands, except shares, percentages and as otherwise noted)
Common Stocks(d) (continued)
Company | Country(a) | Investment | Interest | Maturity Date | Acquisition Date | Shares | Principal Amount(a) | Fair Value(a) | Percentage of Net Assets | ||||||||||||||||||||||||||||||
Transportation | |||||||||||||||||||||||||||||||||||||||
| Allegiant Travel Co. | 9/1/2021 | 823 | $ | 154 | (k) | ||||||||||||||||||||||||||||||||||
| Delta Air Lines, Inc. | 9/1/2021 | 4,000 | 156 | (k) | |||||||||||||||||||||||||||||||||||
| Shur-Co HoldCo, Inc. | 6/30/2021 | 50,000 | 58 | (e)(k) | |||||||||||||||||||||||||||||||||||
368 | 0.02 | % | |||||||||||||||||||||||||||||||||||||
Utilities | |||||||||||||||||||||||||||||||||||||||
| Apex Clean Energy TopCo, LLC | Class A | 11/17/2021 | 149,776 | 8,871 | (e)(k) | ||||||||||||||||||||||||||||||||||
8,871 | 0.46 | % | |||||||||||||||||||||||||||||||||||||
Total Common Stocks (Cost $24,400) | 26,857 | 1.38 | % | ||||||||||||||||||||||||||||||||||||
Preferred Stock(b)(c)(d)(e) | |||||||||||||||||||||||||||||||||||||||
Automobiles & Components | |||||||||||||||||||||||||||||||||||||||
| Automotive Keys Investor, LLC | 9.00% | 11/6/2020 | 37,749 | 42 | (g) | ||||||||||||||||||||||||||||||||||
| McLaren Group Limited | United Kingdom | 12.50% | 8/2/2021 | 63,529 | 8,599 | (g) |
| ||||||||||||||||||||||||||||||||
Metis Holdco, Inc. | Class A | 7.00% | 5/4/2021 | 7,959 | 8,326 | (g) | |||||||||||||||||||||||||||||||||
16,967 | 0.88 | % | |||||||||||||||||||||||||||||||||||||
Commercial & Professional Services | |||||||||||||||||||||||||||||||||||||||
| IRI Group Holdings, Inc. | Series A-1 | 11.50% (6M LIBOR + 10.50%) | 11/29/2018 | 25 | 35 | (g) | |||||||||||||||||||||||||||||||||
Marmic Topco, L.P. | 8.00% | 3/5/2021 | 57,624 | 73 | (g) | ||||||||||||||||||||||||||||||||||
108 | 0.01 | % | |||||||||||||||||||||||||||||||||||||
Consumer Services | |||||||||||||||||||||||||||||||||||||||
| Aragorn Parent Holdings LP | Series A | 10.00% | 10/15/2020 | 50,000 | 74 | (g) | |||||||||||||||||||||||||||||||||
| Redwood Services Holdco, LLC | Series D | 8.00% | 12/31/2020 | 27,076 | 59 | (g) | |||||||||||||||||||||||||||||||||
133 | 0.01 | % | |||||||||||||||||||||||||||||||||||||
Diversified Financials | |||||||||||||||||||||||||||||||||||||||
| LaRousseCo Limited | Jersey | Class A | 9/24/2021 | 297,963 | 403 | (k) |
| ||||||||||||||||||||||||||||||||
| LaRousseCo Limited | Jersey | 9/24/2021 | 21,247 | 30 | (k) |
| |||||||||||||||||||||||||||||||||
Annual Report 2021
75
CION Ares Diversified Credit Fund
Consolidated Schedule of Investments (continued)
December 31, 2021
(in thousands, except shares, percentages and as otherwise noted)
Preferred Stock(b)(c)(d)(e) (continued)
Company | Country(a) | Investment | Interest | Maturity Date | Acquisition Date | Shares | Principal Amount(a) | Fair Value(a) | Percentage of Net Assets | ||||||||||||||||||||||||||||||
| The Ultimus Group, LLC | Class A | 2/1/2019 | 1 | $ | 1 | (g)(k) | |||||||||||||||||||||||||||||||||
434 | 0.02 | % | |||||||||||||||||||||||||||||||||||||
Energy | |||||||||||||||||||||||||||||||||||||||
Ferrellgas, L.P. | 8.96% | 3/30/2021 | 8,734 | 8,734 | (g) | ||||||||||||||||||||||||||||||||||
8,734 | 0.45 | % | |||||||||||||||||||||||||||||||||||||
Food & Beverage | |||||||||||||||||||||||||||||||||||||||
| Watermill Express Holdings, LLC | Class A | 8.00% | 4/20/2021 | 5,000 | 48 | (g) | |||||||||||||||||||||||||||||||||
48 | 0.00 | % | |||||||||||||||||||||||||||||||||||||
Healthcare Equipment & Services | |||||||||||||||||||||||||||||||||||||||
| Olympia TopCo, L.P. | 15.00% | 7/28/2021 | 2,184 | 1 | (g) | ||||||||||||||||||||||||||||||||||
| Symplr Software Intermediate Holdings, Inc. | Series C-1 | 11.00% | 12/22/2020 | 50 | 56 | (g) | |||||||||||||||||||||||||||||||||
| Symplr Software Intermediate Holdings, Inc. | Series C-2 | 11.00% | 6/18/2021 | 5,980 | 6,344 | (g) | |||||||||||||||||||||||||||||||||
| Symplr Software Intermediate Holdings, Inc. | Series C-3 | 11.00% | 10/12/2021 | 789 | 808 | (g) | |||||||||||||||||||||||||||||||||
Teligent, Inc. | 12/11/2018 | 1,797 | — | (k) | |||||||||||||||||||||||||||||||||||
7,209 | 0.37 | % | |||||||||||||||||||||||||||||||||||||
Insurance | |||||||||||||||||||||||||||||||||||||||
| High Street HoldCo LLC | Series A | 10.00% | 4/16/2021 | 8,505,042 | 8,893 | (g) | |||||||||||||||||||||||||||||||||
8,893 | 0.46 | % | |||||||||||||||||||||||||||||||||||||
Materials | |||||||||||||||||||||||||||||||||||||||
| Novipax Parent Holding Company, L.L.C. | Class A | 10.00% | 12/1/2020 | 50 | 66 | (g) | |||||||||||||||||||||||||||||||||
66 | 0.00 | % | |||||||||||||||||||||||||||||||||||||
Media & Entertainment | |||||||||||||||||||||||||||||||||||||||
PRG III, LLC | Class A | 10/6/2020 | 2,250 | 15 | (g)(k) | ||||||||||||||||||||||||||||||||||
15 | 0.00 | % | |||||||||||||||||||||||||||||||||||||
Annual Report 2021
76
CION Ares Diversified Credit Fund
Consolidated Schedule of Investments (continued)
December 31, 2021
(in thousands, except shares, percentages and as otherwise noted)
Preferred Stock(b)(c)(d)(e) (continued)
Company | Country(a) | Investment | Interest | Maturity Date | Acquisition Date | Shares | Principal Amount(a) | Fair Value(a) | Percentage of Net Assets | ||||||||||||||||||||||||||||||
Pharmaceuticals, Biotechnology & Life Sciences | |||||||||||||||||||||||||||||||||||||||
| Cardinal Topco Holdings, L.P. | Class A | 8.00% | 9/15/2020 | 83 | $ | 201 | (g) | ||||||||||||||||||||||||||||||||
| Cobalt Holdings I, LP | 8.00% | 10/1/2021 | 50 | 5 | (g) | ||||||||||||||||||||||||||||||||||
| Cobalt Intermediate I, Inc. | Series A | 10.75% (3M LIBOR + 10.00%) | 10/1/2021 | 8,582 | 8,582 | (g) | |||||||||||||||||||||||||||||||||
8,788 | 0.46 | % | |||||||||||||||||||||||||||||||||||||
Software & Services | |||||||||||||||||||||||||||||||||||||||
| Appriss Health Intermediate Holdings, Inc. | Series A | 11.00% | 5/6/2021 | 3,657 | 3,929 | (g) | |||||||||||||||||||||||||||||||||
| Cority Parent, Inc. | Canada | Class A-1 | 9.00% | 7/2/2019 | 50 | 139 | (g) | ||||||||||||||||||||||||||||||||
| DCert Preferred Holdings, Inc. | Series A | 10.50% | 5/25/2021 | 22,284 | 23,707 | (g) | |||||||||||||||||||||||||||||||||
| Diligent Preferred Issuer, Inc. | 10.50% | 4/6/2021 | 1,476 | 1,552 | (g) | ||||||||||||||||||||||||||||||||||
| EZ Elemica Holdings, Inc. | 9/18/2019 | 50 | 59 | (k) | |||||||||||||||||||||||||||||||||||
| Frontline Technologies Parent, LLC | Class A | 9.00% | 9/18/2017 | 25 | 37 | (g) | |||||||||||||||||||||||||||||||||
| GSV PracticeTek Holdings, LLC | Class A | 8.00% | 3/31/2021 | 216,667 | 151 | (g) | |||||||||||||||||||||||||||||||||
| Insightful Science Holdings, LLC | 14.00% | 4/28/2021 | 62,340 | 1,721 | (g) | ||||||||||||||||||||||||||||||||||
Magic Topco, L.P. | Class A | 9.00% | 9/21/2020 | 58 | 92 | (g) | |||||||||||||||||||||||||||||||||
| Packers Software Intermediate Holdings, Inc. | Series A | 11.13% (3M LIBOR + 11.00%) | 11/12/2020 | 50 | 56 | (g) | |||||||||||||||||||||||||||||||||
| Packers Software Intermediate Holdings, Inc. | Series A-2 | 11.13% (3M LIBOR + 11.00%) | 12/23/2020 | 18 | 20 | (g) | |||||||||||||||||||||||||||||||||
| Packers Software Intermediate Holdings, Inc. | Series A-3 | 11.00% | 11/24/2021 | 24 | 26 | (g) | |||||||||||||||||||||||||||||||||
| Peachtree Parent, Inc. | Series A | 13.25% | 3/19/2019 | 25 | 36 | (g) | |||||||||||||||||||||||||||||||||
| Project Essential Super Parent, Inc. | 10.50% (3M LIBOR + 9.50%) | 4/20/2021 | 2,963 | 3,189 | (g) | ||||||||||||||||||||||||||||||||||
| Sunshine Software Holdings, Inc. | Series A | 10.50% | 10/15/2021 | 15,929 | 16,282 | (g) | |||||||||||||||||||||||||||||||||
Annual Report 2021
77
CION Ares Diversified Credit Fund
Consolidated Schedule of Investments (continued)
December 31, 2021
(in thousands, except shares, percentages and as otherwise noted)
Preferred Stock(b)(c)(d)(e) (continued)
Company | Country(a) | Investment | Interest | Maturity Date | Acquisition Date | Shares | Principal Amount(a) | Fair Value(a) | Percentage of Net Assets | ||||||||||||||||||||||||||||||
| Titan DI Preferred Holdings, Inc. | 13.50% | 2/11/2020 | — | $ | 64 | (g) | |||||||||||||||||||||||||||||||||
51,060 | 2.65 | % | |||||||||||||||||||||||||||||||||||||
Total Preferred Stock (Cost $97,970) | 102,455 | 5.31 | % | ||||||||||||||||||||||||||||||||||||
Private Asset-Backed Debt(b)(c)(d)(e) | |||||||||||||||||||||||||||||||||||||||
Diversified Financials | |||||||||||||||||||||||||||||||||||||||
| Affirm Operational Loans VI Trust | 1st Lien Revolver | 10.36% (1M LIBOR + 9.76%) | 12/17/2026 | $ | 500 | $ | 113 | (g)(h) | |||||||||||||||||||||||||||||||
| ARM Funding 2019-1, LLC | 1st Lien Revolver | 8.95% (1M LIBOR + 7.95%) | 2/29/2024 | 2,500 | 782 | (h) | |||||||||||||||||||||||||||||||||
| BFS Receivables I LLC | 1st Lien Revolver | 3/14/2025 | 1,250 | — | (h) | ||||||||||||||||||||||||||||||||||
| DFC Global Facility Borrower III LLC | 1st Lien Revolver | 8.00% (1M CDOR + 7.50%) | 6/28/2026 | CAD | 8,582 | 4,795 | (h)(o)(p) |
| |||||||||||||||||||||||||||||||
| DFC Global Facility Borrower III LLC | 1st Lien Revolver | 8.00% (3M CDOR + 7.50%) | 6/28/2026 | CAD | 8,582 | 4,795 | (h) |
| |||||||||||||||||||||||||||||||
| Finance Ireland Loan and Treasury DAC | Ireland | 1st Lien Term Loan | 9.25% (3M EURIBOR + 9.25%) | 6/29/2026 | € | 2,500 | 982 | (h) |
| ||||||||||||||||||||||||||||||
| NSF Funding 2020 Limited | United Kingdom | 1st Lien Revolver | 6/10/2026 | £ | 11,500 | 2 | (h) |
| |||||||||||||||||||||||||||||||
Reliant SPV, LLC | 1st Lien Revolver | 7.00% (1M LIBOR + 6.00%) | 5/28/2024 | 500 | 329 | (h) | |||||||||||||||||||||||||||||||||
| SAVOYSPECIAL LLC | 1st Lien Revolver | 8.25% (1M LIBOR + 7.50%) | 7/1/2024 | 750 | 305 | (h) | |||||||||||||||||||||||||||||||||
Sera 2021 LLC | 1st Lien Delayed Draw Term Loan | 6.25% (3M LIBOR + 5.75%) | 3/30/2026 | 1,500 | 1,293 | (h) | |||||||||||||||||||||||||||||||||
| Spring Oaks Capital SPV, LLC | 1st Lien Revolver | 9.50% (1M LIBOR + 8.50%) | 11/12/2025 | 9,000 | 2,769 | (h) | |||||||||||||||||||||||||||||||||
| Woodchester Funding Limited | United Kingdom | 1st Lien Revolver | 6.80% (1M GBP LIBOR + 6.55%) | 3/15/2026 | £ | 2,182 | 854 | (h)(m) |
| ||||||||||||||||||||||||||||||
17,019 | 0.88 | % | |||||||||||||||||||||||||||||||||||||
Real Estate | |||||||||||||||||||||||||||||||||||||||
| Illinois Investment S.a.r.l. | Luxembourg | 1st Lien Term Loan | 5.17% | 12/31/2026 | SEK | 14,277 | 1,580 |
| |||||||||||||||||||||||||||||||
1,580 | 0.08 | % | |||||||||||||||||||||||||||||||||||||
Annual Report 2021
78
CION Ares Diversified Credit Fund
Consolidated Schedule of Investments (continued)
December 31, 2021
(in thousands, except shares, percentages and as otherwise noted)
Private Asset-Backed Debt(b)(c)(d)(e) (continued)
Company | Country(a) | Investment | Interest | Maturity Date | Acquisition Date | Shares | Principal Amount(a) | Fair Value(a) | Percentage of Net Assets | ||||||||||||||||||||||||||||||
Retailing | |||||||||||||||||||||||||||||||||||||||
| Tricolor Funding SPV 3 LLC | 1st Lien Revolver | 8.50% (1M LIBOR + 7.50%) | 8/6/2027 | $ | 2,273 | $ | 1,244 | (h)(n) | |||||||||||||||||||||||||||||||
1,244 | 0.07 | % | |||||||||||||||||||||||||||||||||||||
Total Private Asset-Backed Debt (Cost $19,510) | 19,843 | 1.03 | % | ||||||||||||||||||||||||||||||||||||
Real Estate Debt(b)(c)(d)(e) | |||||||||||||||||||||||||||||||||||||||
Real Estate | |||||||||||||||||||||||||||||||||||||||
| 285 Mezz LLC | Mezzanine Term Loan | 16.28% (1M LIBOR + 14.00%) | 5/5/2023 | 2,898 | 2,360 | (h) | |||||||||||||||||||||||||||||||||
| 285 Mezz LLC | Mezzanine Term Loan | 20.00% (1M LIBOR + 20.00%) | 5/5/2023 | 1,082 | 1,071 | ||||||||||||||||||||||||||||||||||
Total Real Estate Debt (Cost $3,453) | 3,431 | 0.18 | % | ||||||||||||||||||||||||||||||||||||
Warrants(d)(e)(k) | |||||||||||||||||||||||||||||||||||||||
Automobiles & Components | |||||||||||||||||||||||||||||||||||||||
| McLaren Group Limited | United Kingdom | Common | 8/2/2021 | 19,998 | 2,063 |
| |||||||||||||||||||||||||||||||||
2,063 | 0.12 | % | |||||||||||||||||||||||||||||||||||||
Commercial & Professional Services | |||||||||||||||||||||||||||||||||||||||
| Visual Edge Technology, Inc. | Common | 3/22/2018 | 27,334 | — | |||||||||||||||||||||||||||||||||||
— | 0.00 | % | |||||||||||||||||||||||||||||||||||||
Consumer Services | |||||||||||||||||||||||||||||||||||||||
| KeyStone Sub-Debt HoldCo, LLC | Common | 1/20/2021 | 4 | 618 | |||||||||||||||||||||||||||||||||||
| LGDN Finco Limited | United Kingdom | Common | 6/22/2021 | 25 | 17 |
| |||||||||||||||||||||||||||||||||
635 | 0.03 | % | |||||||||||||||||||||||||||||||||||||
Diversified Financials | |||||||||||||||||||||||||||||||||||||||
| BFS Receivables I LLC | Common | 8/16/2021 | 34,662 | — | |||||||||||||||||||||||||||||||||||
| SAVOYSPECIAL LLC | Common | 7/14/2021 | 345,508 | 2 | |||||||||||||||||||||||||||||||||||
2 | 0.00 | % | |||||||||||||||||||||||||||||||||||||
Annual Report 2021
79
CION Ares Diversified Credit Fund
Consolidated Schedule of Investments (continued)
December 31, 2021
(in thousands, except shares, percentages and as otherwise noted)
Warrants(d)(e)(k) (continued)
Company | Country(a) | Investment | Interest | Maturity Date | Acquisition Date | Shares | Principal Amount(a) | Fair Value(a) | Percentage of Net Assets | ||||||||||||||||||||||||||||||
Healthcare Equipment & Services | |||||||||||||||||||||||||||||||||||||||
| Air Medical Buyer Corp | Common | 3/14/2018 | 122 | $ | 3 | ||||||||||||||||||||||||||||||||||
GMR Buyer Corp. | Common | 12/17/2021 | 1,927 | 49 | |||||||||||||||||||||||||||||||||||
Teligent, Inc. | Common | 4/6/2020 | 11,342 | — | |||||||||||||||||||||||||||||||||||
Teligent, Inc. | Common | 7/20/2020 | 2,834 | — | |||||||||||||||||||||||||||||||||||
52 | 0.00 | % | |||||||||||||||||||||||||||||||||||||
Media & Entertainment | |||||||||||||||||||||||||||||||||||||||
PFL MMA, Inc. | Common | 1/19/2021 | 115,111 | 69 | |||||||||||||||||||||||||||||||||||
69 | 0.00 | % | |||||||||||||||||||||||||||||||||||||
Retailing | |||||||||||||||||||||||||||||||||||||||
ARKO Corp. | Common | 12/22/2020 | 55 | — | |||||||||||||||||||||||||||||||||||
— | 0.00 | % | |||||||||||||||||||||||||||||||||||||
Transportation | |||||||||||||||||||||||||||||||||||||||
| Neovia Logistics Holdings Ltd. | Common | 4/26/2019 | 194,454 | — | |||||||||||||||||||||||||||||||||||
— | 0.00 | % | |||||||||||||||||||||||||||||||||||||
Total Warrants (Cost $2,915) | 2,821 | 0.15 | % | ||||||||||||||||||||||||||||||||||||
Total Investments (Cost $2,656,181) | 2,694,554 | 139.65 | % | ||||||||||||||||||||||||||||||||||||
Liabilities in Excess of Other Assets | (764,996 | ) | (39.65 | )% | |||||||||||||||||||||||||||||||||||
Net Assets | $ | 1,929,558 | 100.00 | % | |||||||||||||||||||||||||||||||||||
(a) Investment holdings in foreign currencies are converted to U.S. Dollars using period end spot rates. Investments are in United States enterprises and all principal balances shown are in U.S. Dollars unless otherwise noted.
(b) Variable rate loans bear interest at a rate that may be determined by reference to either the London Interbank Offered Rate ("LIBOR") or an alternate base rate such as the Bank Bill Swap Bid Rate ("BBSY"), Canadian Dollar Offered Rate ("CDOR"), Copenhagen Interbank Offered Rate ("CIBOR"), Euro Interbank Offered Rate ("EURIBOR"), Norwegian Interbank Offered Rate ("NIBOR"), Prime Rate ("PRIME"), Secured Overnight Financing Rate ("SOFR") Sterling Overnight Index Average ("SONIA"), or Stockholm Interbank Offered Rate ("STIBOR"), at the borrower's option. Stated interest rates in this schedule represents the "all-in" rate as of December 31, 2021.
(c) Variable rate coupon rate shown as of December 31, 2021.
(d) These investments, which as of December 31, 2021 represented 137.59% of the Fund's net assets or 90.12% of the Fund's total assets, may be subject to legal restrictions on sales. Acquisition dates are included above for equity securities that may be subject to legal restrictions on sales.
(e) Investments whose values were determined using significant unobservable inputs (Level 3) (See Note 4 of the Notes to Consolidated Financial Statements).
(f) These assets are held at CADEX Credit Financing, LLC, a wholly owned special purpose financing vehicle, and are pledged as collateral for a secured revolving credit facility (see Note 6 of the Notes to Consolidated Financial Statements).
(g) Includes a payment-in-kind provision.
(h) As of December 31, 2021, the Fund had entered into the following commitments to fund various revolving and delayed draw senior secured and subordinated loans. Such commitments are subject to the satisfaction of certain conditions set forth in the documents governing these loans and there can be no assurance that such conditions will be satisfied.
Annual Report 2021
80
CION Ares Diversified Credit Fund
Consolidated Schedule of Investments (continued)
December 31, 2021
(in thousands, except shares, percentages and as otherwise noted)
Company | Investment Type | Total revolving and delayed draw loan commitments | Less: funded commitments | Total unfunded commitments | |||||||||||||||
| 285 Mezz LLC | Mezzanine Term Loan | $ | 2,898 | $ | (2,389 | ) | $ | 509 | |||||||||||
A.U.L. Corp. | 1st Lien Revolver Loan | 1 | — | 1 | |||||||||||||||
AffiniPay Midco, LLC | 1st Lien Revolver Loan | 766 | — | 766 | |||||||||||||||
Affirm Operational Loans VI Trust | 1st Lien Revolver Loan | 500 | (113 | ) | 387 | ||||||||||||||
American Residential Services L.L.C. | 1st Lien Revolver Loan | 1 | — | 1 | |||||||||||||||
Anaqua Parent Holdings, Inc. | 1st Lien Delay Draw Loan | 523 | — | 523 | |||||||||||||||
Anaqua Parent Holdings, Inc. | 1st Lien Revolver Loan | 231 | — | 231 | |||||||||||||||
APG Intermediate Holdings Corporation | 1st Lien Revolver Loan | 1 | — | 1 | |||||||||||||||
Appriss Health, LLC | 1st Lien Revolver Loan | 212 | — | 212 | |||||||||||||||
AQ Sunshine, Inc. | 1st Lien Delay Draw Loan | 61 | — | 61 | |||||||||||||||
AQ Sunshine, Inc. | 1st Lien Revolver Loan | 213 | (57 | ) | 156 | ||||||||||||||
Ardonagh Midco 3 PLC | 1st Lien Delay Draw Loan | 1 | — | 1 | |||||||||||||||
Argenbright Holdings V, LLC | 1st Lien Delay Draw Loan | 178 | — | 178 | |||||||||||||||
ARM Funding 2019-1, LLC | 1st Lien Revolver Loan | 2,500 | (782 | ) | 1,718 | ||||||||||||||
| ASG Bidco Limited | 1st Lien Delay Draw Loan | 748 | — | 748 | |||||||||||||||
Aspire Bidco Limited | 1st Lien Revolver Loan | 677 | — | 677 | |||||||||||||||
Aspire Bidco Limited | 1st Lien Term Loan | 3,574 | — | 3,574 | |||||||||||||||
Aspris Bidco Limited | 1st Lien Term Loan | 1,903 | — | 1,903 | |||||||||||||||
ASP-R-Pac Acquisition Co LLC | 1st Lien Revolver Loan | 839 | (168 | ) | 671 | ||||||||||||||
Athenahealth, Inc. | 1st Lien Revolver Loan | 232 | — | 232 | |||||||||||||||
Atlas Intermediate III, L.L.C. | 1st Lien Revolver Loan | 264 | — | 264 | |||||||||||||||
Auxadi Midco S.L.U. | 1st Lien Term Loan | 1,449 | — | 1,449 | |||||||||||||||
Aventine Intermediate LLC | 1st Lien Delay Draw Loan | 812 | — | 812 | |||||||||||||||
Bamboo Purchaser, Inc. | 1st Lien Delay Draw Loan | 836 | (418 | ) | 418 | ||||||||||||||
Bamboo Purchaser, Inc. | 1st Lien Revolver Loan | 1 | — | 1 | |||||||||||||||
Banyan Software Holdings, LLC | 1st Lien Delay Draw Loan | 5,128 | (722 | ) | 4,406 | ||||||||||||||
Banyan Software Holdings, LLC | 1st Lien Revolver Loan | 471 | (189 | ) | 282 | ||||||||||||||
Beacon Pointe Harmony, LLC | 1st Lien Delay Draw Loan | 3,175 | — | 3,175 | |||||||||||||||
Beacon Pointe Harmony, LLC | 1st Lien Revolver Loan | 909 | — | 909 | |||||||||||||||
Bearcat Buyer, Inc. | 1st Lien Delay Draw Loan | 1 | (1 | ) | — | ||||||||||||||
Bearcat Buyer, Inc. | 1st Lien Revolver Loan | 580 | — | 580 | |||||||||||||||
Bearcat Buyer, Inc. | 2nd Lien Delay Draw Loan | 1,306 | (184 | ) | 1,122 | ||||||||||||||
Benefytt Technologies, Inc. | 1st Lien Delay Draw Loan | 911 | — | 911 | |||||||||||||||
Berner Food & Beverage, LLC | 1st Lien Revolver Loan | 262 | (110 | ) | 152 | ||||||||||||||
BFS Receivables I LLC | 1st Lien Revolver Loan | 1,250 | — | 1,250 | |||||||||||||||
Blackwood Bidco Limited | 1st Lien Delay Draw Loan | 3,139 | (1,912 | ) | 1,227 | ||||||||||||||
Businessolver.com, Inc. | 1st Lien Delay Draw Loan | 1,197 | — | 1,197 | |||||||||||||||
Canopy Bidco Limited | 1st Lien Delay Draw Loan | 680 | (178 | ) | 502 | ||||||||||||||
Capnor Connery Bidco A/S | 1st Lien Delay Draw Loan | 7,037 | (966 | ) | 6,071 | ||||||||||||||
Annual Report 2021
81
CION Ares Diversified Credit Fund
Consolidated Schedule of Investments (continued)
December 31, 2021
(in thousands, except shares, percentages and as otherwise noted)
Company | Investment Type | Total revolving and delayed draw loan commitments | Less: funded commitments | Total unfunded commitments | |||||||||||||||
Capstone Acquisition Holdings, Inc. | 1st Lien Delay Draw Loan | $ | 1,679 | $ | (642 | ) | $ | 1,037 | |||||||||||
Capstone Acquisition Holdings, Inc. | 1st Lien Revolver Loan | 1,150 | (177 | ) | 973 | ||||||||||||||
Capstone Acquisition Holdings, Inc. | 2nd Lien Delay Draw Loan | 531 | — | 531 | |||||||||||||||
Cardinal Parent, Inc. | 1st Lien Revolver Loan | 1 | — | 1 | |||||||||||||||
CB-SDG LIMITED | 1st Lien Delay Draw Loan | 430 | — | 430 | |||||||||||||||
CC Fly Holding II A/S | 1st Lien Delay Draw Loan | 456 | (439 | ) | 17 | ||||||||||||||
CDI Holdings III Corp. | 1st Lien Revolver Loan | 410 | — | 410 | |||||||||||||||
Centric Brands LLC | 1st Lien Revolver Loan | 269 | (79 | ) | 190 | ||||||||||||||
Chariot Buyer LLC | 1st Lien Revolver Loan | 100 | (22 | ) | 78 | ||||||||||||||
Cobalt Buyer Sub, Inc. | 1st Lien Delay Draw Loan | 2,476 | — | 2,476 | |||||||||||||||
Cobalt Buyer Sub, Inc. | 1st Lien Revolver Loan | 895 | (89 | ) | 806 | ||||||||||||||
Commercial Trailer Leasing, Inc. | 1st Lien Delay Draw Loan | 1,465 | (1,169 | ) | 296 | ||||||||||||||
Commercial Trailer Leasing, Inc. | 1st Lien Revolver Loan | 741 | — | 741 | |||||||||||||||
Commify Limited | 1st Lien Delay Draw Loan | 866 | (277 | ) | 589 | ||||||||||||||
Comprehensive EyeCare Partners, LLC | 1st Lien Revolver Loan | 1 | — | 1 | |||||||||||||||
Confirmasoft AB | 1st Lien Delay Draw Loan | 1,714 | (634 | ) | 1,080 | ||||||||||||||
Consilio Midco Limited | 1st Lien Delay Draw Loan | 3,012 | (1,723 | ) | 1,289 | ||||||||||||||
Consilio Midco Limited | 1st Lien Revolver Loan | 123 | — | 123 | |||||||||||||||
Continental Acquisition Holdings, Inc. | 1st Lien Revolver Loan | 1 | (1 | ) | — | ||||||||||||||
Continental Cafe, LLC | 1st Lien Delay Draw Loan | 2,788 | — | 2,788 | |||||||||||||||
Continental Cafe, LLC | 1st Lien Revolver Loan | 786 | — | 786 | |||||||||||||||
Cority Software Inc. | 1st Lien Revolver Loan | 231 | — | 231 | |||||||||||||||
Cornerstone OnDemand, Inc. | 1st Lien Revolver Loan | 100 | — | 100 | |||||||||||||||
CVP Holdco, Inc. | 1st Lien Delay Draw Loan | 7,730 | (5,577 | ) | 2,153 | ||||||||||||||
CVP Holdco, Inc. | 1st Lien Revolver Loan | 326 | (163 | ) | 163 | ||||||||||||||
DecoPac, Inc. | 1st Lien Revolver Loan | 2,382 | (340 | ) | 2,042 | ||||||||||||||
Denali Holdco LLC | 1st Lien Revolver Loan | 592 | — | 592 | |||||||||||||||
DFC Global Facility Borrower III LLC | 1st Lien Revolver Loan | 13,569 | (9,590 | ) | 3,979 | ||||||||||||||
Diligent Corporation | 1st Lien Delay Draw Loan | 687 | — | 687 | |||||||||||||||
Diligent Corporation | 1st Lien Revolver Loan | 513 | — | 513 | |||||||||||||||
DRS Holdings III, Inc. | 1st Lien Revolver Loan | 173 | — | 173 | |||||||||||||||
DS Admiral Bidco, LLC | 1st Lien Revolver Loan | 358 | — | 358 | |||||||||||||||
Dye & Durham Corporation | 1st Lien Delay Draw Loan | 1,242 | — | 1,242 | |||||||||||||||
Dye & Durham Corporation | 1st Lien Revolver Loan | 1,313 | — | 1,313 | |||||||||||||||
Dynamic NC Aerospace Holdings, LLC | 1st Lien Revolver Loan | 1,296 | — | 1,296 | |||||||||||||||
Eleda BidCo AB (fka EISG BidCo AB) | 1st Lien Delay Draw Loan | 886 | — | 886 | |||||||||||||||
Elemica Parent, Inc. | 1st Lien Revolver Loan | 479 | (268 | ) | 211 | ||||||||||||||
Elevation Services Parent Holdings, LLC | 1st Lien Revolver Loan | 386 | (296 | ) | 90 | ||||||||||||||
EPS NASS Parent, Inc. | 1st Lien Delay Draw Loan | 585 | — | 585 | |||||||||||||||
Annual Report 2021
82
CION Ares Diversified Credit Fund
Consolidated Schedule of Investments (continued)
December 31, 2021
(in thousands, except shares, percentages and as otherwise noted)
Company | Investment Type | Total revolving and delayed draw loan commitments | Less: funded commitments | Total unfunded commitments | |||||||||||||||
EPS NASS Parent, Inc. | 1st Lien Revolver Loan | $ | 158 | $ | (99 | ) | $ | 59 | |||||||||||
eResearch Technology, Inc. | 2nd Lien Delay Draw Loan | 1,343 | (672 | ) | 671 | ||||||||||||||
Essential Services Holding Corporation | 1st Lien Delay Draw Loan | 8,146 | — | 8,146 | |||||||||||||||
Essential Services Holding Corporation | 1st Lien Revolver Loan | 1,560 | — | 1,560 | |||||||||||||||
Eucalyptus BidCo Pty Ltd | 1st Lien Term Loan | 973 | (1 | ) | 972 | ||||||||||||||
EuroParcs Topholding B.V. | 1st Lien Delay Draw Loan | 930 | (929 | ) | 1 | ||||||||||||||
ExtraHop Networks, Inc. | 1st Lien Delay Draw Loan | 933 | (103 | ) | 830 | ||||||||||||||
FC Sun Intressenter AB | 1st Lien Delay Draw Loan | 12,420 | (2 | ) | 12,418 | ||||||||||||||
Finance Ireland Loan and Treasury DAC | 1st Lien Term Loan | 2,846 | (1,029 | ) | 1,817 | ||||||||||||||
FL Hawk Intermediate Holdings, Inc. | 1st Lien Delay Draw Loan | 1,017 | — | 1,017 | |||||||||||||||
FL Hawk Intermediate Holdings, Inc. | 1st Lien Revolver Loan | 1,312 | — | 1,312 | |||||||||||||||
Floss Bidco Limited | 1st Lien Delay Draw Loan | 1,640 | (555 | ) | 1,085 | ||||||||||||||
Flow Control Solutions, Inc. | 1st Lien Revolver Loan | 373 | — | 373 | |||||||||||||||
Foundation Consumer Brands, LLC | 1st Lien Revolver Loan | 389 | — | 389 | |||||||||||||||
Foundation Risk Partners, Corp. | 1st Lien Delay Draw Loan | 3,495 | (1,997 | ) | 1,498 | ||||||||||||||
Foundation Risk Partners, Corp. | 1st Lien Revolver Loan | 2,627 | — | 2,627 | |||||||||||||||
Galway Borrower LLC | 1st Lien Delay Draw Loan | 1,600 | — | 1,600 | |||||||||||||||
Galway Borrower LLC | 1st Lien Revolver Loan | 969 | — | 969 | |||||||||||||||
Gilfoyle Bidco AB | 1st Lien Term Loan | 2,146 | (358 | ) | 1,788 | ||||||||||||||
Global Music Rights, LLC | 1st Lien Revolver Loan | 473 | — | 473 | |||||||||||||||
GraphPAD Software, LLC | 1st Lien Delay Draw Loan | 436 | — | 436 | |||||||||||||||
GraphPAD Software, LLC | 1st Lien Revolver Loan | 2 | — | 2 | |||||||||||||||
Halcon Holdings, LLC | 1st Lien Delay Draw Loan | 2,103 | — | 2,103 | |||||||||||||||
Hammersmith Bidco Limited | 1st Lien Delay Draw Loan | 4,260 | (3,607 | ) | 653 | ||||||||||||||
Hammersmith Bidco Limited | 1st Lien Term Loan | 2,840 | — | 2,840 | |||||||||||||||
| Heavy Construction Systems Specialists, LLC | 1st Lien Revolver Loan | 410 | — | 410 | |||||||||||||||
HH-Stella, Inc. | 1st Lien Delay Draw Loan | 1,979 | (311 | ) | 1,668 | ||||||||||||||
HH-Stella, Inc. | 1st Lien Revolver Loan | 444 | (51 | ) | 393 | ||||||||||||||
High Street Buyer, Inc. | 1st Lien Delay Draw Loan | 8,819 | (7,421 | ) | 1,398 | ||||||||||||||
High Street Buyer, Inc. | 1st Lien Revolver Loan | 688 | — | 688 | |||||||||||||||
Highline Aftermarket Acquisition, LLC | 1st Lien Revolver Loan | 1 | (1 | ) | — | ||||||||||||||
Hometown Food Company | 1st Lien Revolver Loan | 1 | — | 1 | |||||||||||||||
Horizon Bidco S.A.S | 1st Lien Term Loan | 3,509 | — | 3,509 | |||||||||||||||
IntraPac International LLC | 1st Lien Revolver Loan | 415 | (135 | ) | 280 | ||||||||||||||
Ivanti Software, Inc. | 1st Lien Revolver Loan | 460 | — | 460 | |||||||||||||||
Jewel Bidco Limited | 1st Lien Revolver Loan | 451 | (293 | ) | 158 | ||||||||||||||
Jewel Bidco Limited | 1st Lien Term Loan | 5,140 | (1,611 | ) | 3,529 | ||||||||||||||
Jim N Nicks Management LLC | 1st Lien Revolver Loan | 1 | (1 | ) | — | ||||||||||||||
JMG Group Investments Limited | 1st Lien Term Loan | 1,611 | — | 1,611 | |||||||||||||||
Annual Report 2021
83
CION Ares Diversified Credit Fund
Consolidated Schedule of Investments (continued)
December 31, 2021
(in thousands, except shares, percentages and as otherwise noted)
Company | Investment Type | Total revolving and delayed draw loan commitments | Less: funded commitments | Total unfunded commitments | |||||||||||||||
Kellermeyer Bergensons Services, LLC | 1st Lien Delay Draw Loan | $ | 4,559 | $ | (2,384 | ) | $ | 2,175 | |||||||||||
Kene Acquisition, Inc. | 1st Lien Revolver Loan | 676 | — | 676 | |||||||||||||||
Laboratories Bidco LLC | 1st Lien Delay Draw Loan | 2,201 | — | 2,201 | |||||||||||||||
Laboratories Bidco LLC | 1st Lien Revolver Loan | 1,562 | — | 1,562 | |||||||||||||||
Lavatio Midco Sarl | 1st Lien Delay Draw Loan | 1,117 | (697 | ) | 420 | ||||||||||||||
LGDN Finco Limited | 1st Lien Revolver Loan | 135 | — | 135 | |||||||||||||||
LGDN Finco Limited | 1st Lien Term Loan | 1,736 | (764 | ) | 972 | ||||||||||||||
LSP HoldCo, LLC | 1st Lien Delay Draw Loan | 1,994 | — | 1,994 | |||||||||||||||
LSP HoldCo, LLC | 1st Lien Revolver Loan | 127 | — | 127 | |||||||||||||||
Majesco | 1st Lien Revolver Loan | 624 | — | 624 | |||||||||||||||
Marmic Purchaser, LLC | 1st Lien Revolver Loan | 287 | (100 | ) | 187 | ||||||||||||||
Maverick Acquisition, Inc. | 1st Lien Delay Draw Loan | 3,170 | (1,216 | ) | 1,954 | ||||||||||||||
Mavis Tire Express Services Topco Corp. | 1st Lien Revolver Loan | 1 | — | 1 | |||||||||||||||
MC Plato Bidco Limited | 1st Lien Term Loan | 1,608 | — | 1,608 | |||||||||||||||
Mercury Borrower, Inc. | 1st Lien Revolver Loan | 470 | (13 | ) | 457 | ||||||||||||||
Micromeritics Instrument Corp. | 1st Lien Revolver Loan | 331 | — | 331 | |||||||||||||||
MMIT Holdings, LLC | 1st Lien Revolver Loan | 651 | (81 | ) | 570 | ||||||||||||||
Monica Holdco (US), Inc. | 1st Lien Revolver Loan | 1,009 | — | 1,009 | |||||||||||||||
Moon Valley Nursery of Arizona Retail, LLC | 1st Lien Delay Draw Loan | 2,002 | (320 | ) | 1,682 | ||||||||||||||
Moon Valley Nursery of Arizona Retail, LLC | 1st Lien Revolver Loan | 1 | (1 | ) | — | ||||||||||||||
MRI Software LLC | 1st Lien Delay Draw Loan | 744 | — | 744 | |||||||||||||||
MRI Software LLC | 1st Lien Revolver Loan | 508 | — | 508 | |||||||||||||||
MWG BidCo ApS | 1st Lien Term Loan | 755 | — | 755 | |||||||||||||||
Nelipak European Holdings Cooperatief U.A. | 1st Lien Revolver Loan | 662 | — | 662 | |||||||||||||||
Nelipak Holding Company | 1st Lien Revolver Loan | 605 | (253 | ) | 352 | ||||||||||||||
Nest Topco Borrower Inc. | 1st Lien Delay Draw Loan | 13,162 | — | 13,162 | |||||||||||||||
NMC Skincare Intermediate Holdings II, LLC | 1st Lien Revolver Loan | 333 | (227 | ) | 106 | ||||||||||||||
North American Fire Holdings, LLC | 1st Lien Delay Draw Loan | 2,462 | — | 2,462 | |||||||||||||||
North American Fire Holdings, LLC | 1st Lien Revolver Loan | 411 | — | 411 | |||||||||||||||
North American Science Associates, LLC | 1st Lien Delay Draw Loan | 916 | — | 916 | |||||||||||||||
North American Science Associates, LLC | 1st Lien Revolver Loan | 1 | (1 | ) | — | ||||||||||||||
North Haven Stack Buyer, LLC | 1st Lien Delay Draw Loan | 1,016 | (39 | ) | 977 | ||||||||||||||
North Haven Stack Buyer, LLC | 1st Lien Revolver Loan | 259 | — | 259 | |||||||||||||||
NSF Funding 2020 Limited | 1st Lien Revolver Loan | 15,565 | (2 | ) | 15,563 | ||||||||||||||
NueHealth Performance, LLC | 1st Lien Delay Draw Loan | 1,170 | (592 | ) | 578 | ||||||||||||||
Oakley Ekomid Limited | 1st Lien Delay Draw Loan | 641 | (295 | ) | 346 | ||||||||||||||
Olympia Acquisition, Inc. | 1st Lien Revolver Loan | 641 | (598 | ) | 43 | ||||||||||||||
OMH-HealthEdge Holdings, LLC | 1st Lien Revolver Loan | 1 | — | 1 | |||||||||||||||
Optio Group Limited | 1st Lien Delay Draw Loan | 809 | (379 | ) | 430 | ||||||||||||||
Annual Report 2021
84
CION Ares Diversified Credit Fund
Consolidated Schedule of Investments (continued)
December 31, 2021
(in thousands, except shares, percentages and as otherwise noted)
Company | Investment Type | Total revolving and delayed draw loan commitments | Less: funded commitments | Total unfunded commitments | |||||||||||||||
Osmosis Buyer Limited | 1st Lien Delay Draw Loan | $ | 790 | $ | — | $ | 790 | ||||||||||||
P27 BIDCO LIMITED | 1st Lien Delay Draw Loan | 440 | (88 | ) | 352 | ||||||||||||||
Patriot Growth Insurance Services, LLC | 1st Lien Delay Draw Loan | 501 | — | 501 | |||||||||||||||
Patriot Growth Insurance Services, LLC | 1st Lien Revolver Loan | 250 | — | 250 | |||||||||||||||
PDI TA Holdings, Inc. | 1st Lien Revolver Loan | 205 | — | 205 | |||||||||||||||
Pegasus (Bidco) Limited | 1st Lien Delay Draw Loan | 1,112 | — | 1,112 | |||||||||||||||
Pegasus (Bidco) Limited | 1st Lien Term Loan | 5,583 | (1 | ) | 5,582 | ||||||||||||||
People Corporation | 1st Lien Delay Draw Loan | 3,254 | (183 | ) | 3,071 | ||||||||||||||
People Corporation | 1st Lien Revolver Loan | 710 | (307 | ) | 403 | ||||||||||||||
Petroleum Service Group LLC | 1st Lien Delay Draw Loan | 1,607 | (102 | ) | 1,505 | ||||||||||||||
Petroleum Service Group LLC | 1st Lien Revolver Loan | 2,106 | (351 | ) | 1,755 | ||||||||||||||
Pluralsight, Inc. | 1st Lien Revolver Loan | 1,204 | — | 1,204 | |||||||||||||||
Premier Specialties, Inc. | 1st Lien Delay Draw Loan | 829 | — | 829 | |||||||||||||||
Premier Specialties, Inc. | 1st Lien Revolver Loan | 385 | — | 385 | |||||||||||||||
Premise Health Holding Corp. | 1st Lien Revolver Loan | 1 | — | 1 | |||||||||||||||
Production Resource Group, LLC | 1st Lien Delay Draw Loan | 147 | (98 | ) | 49 | ||||||||||||||
ProfitSolv Purchaser, Inc. | 1st Lien Delay Draw Loan | 2,554 | (530 | ) | 2,024 | ||||||||||||||
ProfitSolv Purchaser, Inc. | 1st Lien Revolver Loan | 608 | — | 608 | |||||||||||||||
Project Essential Bidco, Inc. | 1st Lien Revolver Loan | 121 | — | 121 | |||||||||||||||
Project Hammond Bidco Limited | 1st Lien Delay Draw Loan | 2,369 | — | 2,369 | |||||||||||||||
Proofpoint, Inc. | 1st Lien Revolver Loan | 240 | — | 240 | |||||||||||||||
ProService Finteco Sp. z o.o. | 1st Lien Delay Draw Loan | 513 | — | 513 | |||||||||||||||
PROTON JVCO S.A R.L. | 1st Lien Term Loan | 949 | — | 949 | |||||||||||||||
QF Holdings, Inc. | 1st Lien Delay Draw Loan | 263 | — | 263 | |||||||||||||||
QF Holdings, Inc. | 1st Lien Revolver Loan | 317 | — | 317 | |||||||||||||||
Radius Aerospace Europe Limited | 1st Lien Revolver Loan | 251 | — | 251 | |||||||||||||||
Radius Aerospace, Inc. | 1st Lien Revolver Loan | 429 | — | 429 | |||||||||||||||
| Raptor Technologies, LLC (Sycamore Bidco Ltd) | 1st Lien Revolver Loan | 498 | — | 498 | |||||||||||||||
Rawlings Sporting Goods Company, Inc. | 1st Lien Revolver Loan | 1 | (1 | ) | — | ||||||||||||||
Reddy Ice LLC | 1st Lien Delay Draw Loan | 1,461 | (1,456 | ) | 5 | ||||||||||||||
Reddy Ice LLC | 1st Lien Revolver Loan | 955 | — | 955 | |||||||||||||||
Redwood Services, LLC | 1st Lien Delay Draw Loan | 1,729 | (316 | ) | 1,413 | ||||||||||||||
Redwood Services, LLC | 1st Lien Revolver Loan | 158 | (35 | ) | 123 | ||||||||||||||
Registrar Intermediate, LLC | 1st Lien Delay Draw Loan | 2,327 | — | 2,327 | |||||||||||||||
Registrar Intermediate, LLC | 1st Lien Revolver Loan | 764 | — | 764 | |||||||||||||||
Relativity ODA LLC | 1st Lien Revolver Loan | 1 | — | 1 | |||||||||||||||
Reliant SPV, LLC | 1st Lien Revolver Loan | 500 | (329 | ) | 171 | ||||||||||||||
Repairify, Inc. | 1st Lien Revolver Loan | 766 | — | 766 | |||||||||||||||
RMS Holdco II, LLC | 1st Lien Revolver Loan | 883 | — | 883 | |||||||||||||||
Annual Report 2021
85
CION Ares Diversified Credit Fund
Consolidated Schedule of Investments (continued)
December 31, 2021
(in thousands, except shares, percentages and as otherwise noted)
Company | Investment Type | Total revolving and delayed draw loan commitments | Less: funded commitments | Total unfunded commitments | |||||||||||||||
Rodeo AcquisitionCo LLC | 1st Lien Delay Draw Loan | $ | 460 | $ | — | $ | 460 | ||||||||||||
Rodeo AcquisitionCo LLC | 1st Lien Revolver Loan | 311 | (44 | ) | 267 | ||||||||||||||
RSC Acquisition, Inc. | 1st Lien Revolver Loan | 1 | (1 | ) | — | ||||||||||||||
RSK Group Limited | 1st Lien Term Loan | 4,435 | (2,790 | ) | 1,645 | ||||||||||||||
Rubicone Bidco Limited | 1st Lien Term Loan | 2,256 | — | 2,256 | |||||||||||||||
Rugby Australia Ltd | 1st Lien Delay Draw Loan | 909 | (1 | ) | 908 | ||||||||||||||
Safe Home Security, Inc. | 1st Lien Delay Draw Loan | 287 | (41 | ) | 246 | ||||||||||||||
Saldon Holdings, Inc. | 1st Lien Revolver Loan | 381 | — | 381 | |||||||||||||||
SAVOYSPECIAL LLC | 1st Lien Revolver Loan | 750 | (305 | ) | 445 | ||||||||||||||
| Schill Landscaping and Lawn Care Services, LLC | 1st Lien Delay Draw Loan | 1,542 | — | 1,542 | |||||||||||||||
| Schill Landscaping and Lawn Care Services, LLC | 1st Lien Revolver Loan | 720 | — | 720 | |||||||||||||||
SCM Insurance Services Inc. | 1st Lien Revolver Loan | 1 | — | 1 | |||||||||||||||
Sera 2021 LLC | 1st Lien Delay Draw Loan | 1,500 | (1,293 | ) | 207 | ||||||||||||||
Service Logic Acquisition, Inc. | 1st Lien Delay Draw Loan | 498 | — | 498 | |||||||||||||||
Service Logic Acquisition, Inc. | 1st Lien Revolver Loan | 1,007 | — | 1,007 | |||||||||||||||
SFE Intermediate HoldCo LLC | 1st Lien Revolver Loan | 2 | — | 2 | |||||||||||||||
Shur-Co Acquisition, Inc. | 1st Lien Revolver Loan | 441 | (88 | ) | 353 | ||||||||||||||
Sigma Electric Manufacturing Corporation | 1st Lien Revolver Loan | 1 | — | 1 | |||||||||||||||
SiroMed Physician Services, Inc. | 1st Lien Revolver Loan | 1 | — | 1 | |||||||||||||||
SLR BD Limited | 1st Lien Term Loan | 1,668 | (233 | ) | 1,435 | ||||||||||||||
Spring Insurance Solutions, LLC | 1st Lien Delay Draw Loan | 1,151 | (127 | ) | 1,024 | ||||||||||||||
Spring Oaks Capital SPV, LLC | 1st Lien Revolver Loan | 9,000 | (2,769 | ) | 6,231 | ||||||||||||||
SSE Buyer, Inc. | 1st Lien Revolver Loan | 3 | (1 | ) | 2 | ||||||||||||||
Stealth Holding LLC | 1st Lien Delay Draw Loan | 988 | (711 | ) | 277 | ||||||||||||||
Sun Acquirer Corp. | 1st Lien Delay Draw Loan | 4,869 | (2,605 | ) | 2,264 | ||||||||||||||
Sun Acquirer Corp. | 1st Lien Revolver Loan | 1,059 | — | 1,059 | |||||||||||||||
Sundance Group Holdings, Inc. | 1st Lien Delay Draw Loan | 453 | — | 453 | |||||||||||||||
Sundance Group Holdings, Inc. | 1st Lien Revolver Loan | 1 | — | 1 | |||||||||||||||
Sunshine Sub, LLC | 1st Lien Revolver Loan | 144 | — | 144 | |||||||||||||||
SV-Burton Holdings, LLC | 1st Lien Delay Draw Loan | 1,847 | (162 | ) | 1,685 | ||||||||||||||
SV-Burton Holdings, LLC | 1st Lien Revolver Loan | 555 | — | 555 | |||||||||||||||
Symbol Bidco I Limited | 1st Lien Delay Draw Loan | 580 | (200 | ) | 380 | ||||||||||||||
Symplr Software Inc. | 1st Lien Revolver Loan | 1 | — | 1 | |||||||||||||||
TA/WEG Holdings, LLC | 1st Lien Delay Draw Loan | 1,714 | (912 | ) | 802 | ||||||||||||||
TA/WEG Holdings, LLC | 1st Lien Revolver Loan | 914 | (352 | ) | 562 | ||||||||||||||
TCP Hawker Intermediate LLC | 1st Lien Delay Draw Loan | 921 | (406 | ) | 515 | ||||||||||||||
TCP Hawker Intermediate LLC | 1st Lien Revolver Loan | 458 | (34 | ) | 424 | ||||||||||||||
Teligent, Inc. | 1st Lien Delay Draw Loan | 127 | (74 | ) | 53 | ||||||||||||||
Annual Report 2021
86
CION Ares Diversified Credit Fund
Consolidated Schedule of Investments (continued)
December 31, 2021
(in thousands, except shares, percentages and as otherwise noted)
Company | Investment Type | Total revolving and delayed draw loan commitments | Less: funded commitments | Total unfunded commitments | |||||||||||||||
Teligent, Inc. | 1st Lien Revolver Loan | $ | — | $ | — | $ | — | ||||||||||||
TGP Holdings III LLC | 1st Lien Delay Draw Loan | 964 | — | 964 | |||||||||||||||
The Ultimate Software Group, Inc. | 1st Lien Revolver Loan | 1 | — | 1 | |||||||||||||||
The Ultimus Group Midco, LLC | 1st Lien Revolver Loan | 396 | — | 396 | |||||||||||||||
Therapy Brands Holdings LLC | 2nd Lien Delay Draw Loan | 1,284 | — | 1,284 | |||||||||||||||
Thermostat Purchaser III, Inc. | 1st Lien Revolver Loan | 100 | — | 100 | |||||||||||||||
Thermostat Purchaser III, Inc. | 2nd Lien Delay Draw Loan | 612 | — | 612 | |||||||||||||||
TIGER UK BIDCO LIMITED | 1st Lien Delay Draw Loan | 3,190 | (3,026 | ) | 164 | ||||||||||||||
TIGER UK BIDCO LIMITED | 1st Lien Revolver Loan | 451 | (75 | ) | 376 | ||||||||||||||
Tricolor Funding SPV 3 LLC | 1st Lien Revolver Loan | 2,273 | (1,244 | ) | 1,029 | ||||||||||||||
Trident TPI Holdings, Inc. | 1st Lien Delay Draw Loan | 1,092 | (439 | ) | 653 | ||||||||||||||
Turbo Acquisitions 10 Bidco Limited | 1st Lien Delay Draw Loan | 1,822 | (1,161 | ) | 661 | ||||||||||||||
United Digestive MSO Parent, LLC | 1st Lien Revolver Loan | 511 | — | 511 | |||||||||||||||
US Salt Investors, LLC | 1st Lien Revolver Loan | 679 | — | 679 | |||||||||||||||
VLS Recovery Services, LLC | 1st Lien Delay Draw Loan | 1,385 | — | 1,385 | |||||||||||||||
VLS Recovery Services, LLC | 1st Lien Revolver Loan | 622 | (53 | ) | 569 | ||||||||||||||
VPP Intermediate Holdings, LLC | 1st Lien Delay Draw Loan | 472 | (9 | ) | 463 | ||||||||||||||
VPP Intermediate Holdings, LLC | 1st Lien Revolver Loan | 315 | — | 315 | |||||||||||||||
Watermill Express, LLC | 1st Lien Delay Draw Loan | 219 | — | 219 | |||||||||||||||
Watermill Express, LLC | 1st Lien Revolver Loan | 275 | — | 275 | |||||||||||||||
WebPT, Inc. | 1st Lien Revolver Loan | 216 | (65 | ) | 151 | ||||||||||||||
Wellness AcquisitionCo, Inc. | 1st Lien Revolver Loan | 504 | — | 504 | |||||||||||||||
Wildcat BuyerCo, Inc. | 1st Lien Delay Draw Loan | 732 | — | 732 | |||||||||||||||
Wildcat BuyerCo, Inc. | 1st Lien Revolver Loan | 255 | — | 255 | |||||||||||||||
Woodchester Funding Limited | 1st Lien Revolver Loan | 2,953 | (854 | ) | 2,099 | ||||||||||||||
WorkWave Intermediate II, LLC | 1st Lien Revolver Loan | 460 | — | 460 | |||||||||||||||
WSHP FC Acquisition LLC | 1st Lien Delay Draw Loan | 350 | (183 | ) | 167 | ||||||||||||||
WSHP FC Acquisition LLC | 1st Lien Revolver Loan | 106 | (21 | ) | 85 | ||||||||||||||
YE Brands Holdings, LLC | 1st Lien Revolver Loan | 165 | — | 165 | |||||||||||||||
Total | $ | 344,192 | $ | (80,889 | ) | $ | 263,303 | ||||||||||||
(i) This loan or a portion of this loan represents an unsettled loan purchase. The interest rate will be determined at the time of settlement and will be based upon a spread plus the applicable reference rate determined at the time of purchase.
(j) Loan or bond was on non-accrual status as of December 31, 2021.
(k) Non-income producing security as of December 31, 2021.
(l) When-Issued or delayed delivery security based on typical market settlement convention for such security.
(m) The Fund sold a participating interest of £1,200 in aggregate principal amount outstanding of the portfolio company's first lien senior secured revolver. As the transaction did not qualify as a "true sale" in accordance with U.S. generally accepted accounting principles ("GAAP"), the Fund recorded a corresponding secured borrowing of $464 at fair value, included in "accrued expenses and other payables" in the accompanying consolidated statement of assets and liabilities. As of December 31, 2021, the interest rate in effect for the secured borrowing was 4.75%.
(n) The Fund sold a participating interest of $1,023 in aggregate principal amount outstanding of the portfolio company's first lien senior secured revolver. As the transaction did not qualify as a "true sale" in accordance with GAAP, the Fund recorded a corresponding secured borrowing of
Annual Report 2021
87
CION Ares Diversified Credit Fund
Consolidated Schedule of Investments (continued)
December 31, 2021
(in thousands, except shares, percentages and as otherwise noted)
$560 at fair value, included in "accrued expenses and other payables" in the accompanying consolidated statement of assets and liabilities. As of December 31, 2021, the interest rate in effect for the secured borrowing was 8.50%.
(o) The Fund sold a participating interest of CAD 3,862 in aggregate principal amount outstanding of the portfolio company's first lien senior secured revolver. As the transaction did not qualify as a "true sale" in accordance with GAAP, the Fund recorded a corresponding secured borrowing of $2,138 at fair value, included in "accrued expenses and other payables" in the accompanying consolidated statement of assets and liabilities. As of December 31, 2021, the interest rate in effect for the secured borrowing was 4.25%.
(p) The Fund sold a participating interest of CAD 4,720 in aggregate principal amount outstanding of the portfolio company's first lien senior secured revolver. As the transaction did not qualify as a "true sale" in accordance with GAAP, the Fund recorded a corresponding secured borrowing of $2,614 at fair value, included in "accrued expenses and other payables" in the accompanying consolidated statement of assets and liabilities. As of December 31, 2021, the interest rate in effect for the secured borrowing was 4.25%.
As of December 31, 2021, the aggregate cost of securities for Federal income tax purposes was $2,662,257. Unrealized appreciation and depreciation on investments for Federal income tax purposes are as follows:
Gross unrealized appreciation | $ | 53,365 | |||||
Gross unrealized depreciation | (18,688 | ) | |||||
Net unrealized appreciation | $ | 34,677 | |||||
Securities sold short as of December 31, 2021 were as follows:
Corporate Bonds Sold Short
Company | Industry | Interest Rate | Maturity Date | Principal Amount | Value | Percentage of Net Assets | |||||||||||||||||||||
At Home Group Inc. | Retailing | 7.13 | % | 7/15/2029 | $ | (946 | ) | $ | (932 | ) | |||||||||||||||||
CoreCivic, Inc | Commercial & Professional Services | 8.25 | % | 4/15/2026 | (275 | ) | (288 | ) | |||||||||||||||||||
Hormel Foods Corp | Food, Beverage & Tobacco | 1.80 | % | 6/11/2030 | (390 | ) | (384 | ) | |||||||||||||||||||
| Occidental Petroleum Corporation | Energy | 4.40 | % | 4/15/2046 | (980 | ) | (1,008 | ) | |||||||||||||||||||
Tenet Healthcare Corp | Health Care Equipment & Services | 6.25 | % | 2/1/2027 | (63 | ) | (66 | ) | |||||||||||||||||||
| Weight Watchers International, Inc. | Consumer Services | 4.50 | % | 4/15/2029 | (769 | ) | (738 | ) | |||||||||||||||||||
Total Corporate Bonds Sold Short (Cost $(3,400)) | $ | (3,416 | ) | (0.18 | )% | ||||||||||||||||||||||
Common Stocks Sold Short
Company | Industry | Shares | Value | Percentage of Net Assets | |||||||||||||||
Invesco Senior Loan ETF | Diversified Financials | (294 | ) | $ | (6,497 | ) | |||||||||||||
Total Common Stocks Sold Short (Cost $(6,426)) | $ | (6,497 | ) | (0.34 | )% | ||||||||||||||
Forward currency contracts as of December 31, 2021 were as follows:
Description | Notional Amount to be Purchased | Notional Amount to be Sold | Counterparty | Settlement Date | Unrealized Appreciation | Unrealized Depreciation | |||||||||||||||||||||
Forward currency contract | $ | (1,251 | ) | € | (1,277 | ) | Goldman Sachs | January 5, 2022 | $ | 27 | $ | — | |||||||||||||||
Forward currency contract | $ | (944 | ) | £ | (923 | ) | Goldman Sachs | January 19, 2022 | — | (22 | ) | ||||||||||||||||
Forward currency contract | $ | (10,810 | ) | CAD | (10,691 | ) | Goldman Sachs | January 19, 2022 | — | (120 | ) | ||||||||||||||||
Forward currency contract | $ | (333 | ) | £ | (339 | ) | Goldman Sachs | January 21, 2022 | 5 | — | |||||||||||||||||
Forward currency contract | $ | (248 | ) | DKK | (253 | ) | Goldman Sachs | January 21, 2022 | 5 | — | |||||||||||||||||
Forward currency contract | $ | (5,789 | ) | CAD | (5,929 | ) | Goldman Sachs | January 21, 2022 | 140 | — | |||||||||||||||||
Forward currency contract | $ | (3,172 | ) | DKK | (3,248 | ) | Goldman Sachs | January 21, 2022 | 76 | — | |||||||||||||||||
Forward currency contract | $ | (32,776 | ) | € | (33,579 | ) | Goldman Sachs | January 21, 2022 | 803 | — | |||||||||||||||||
Forward currency contract | $ | (55,987 | ) | £ | (57,015 | ) | Goldman Sachs | January 21, 2022 | 1,028 | — | |||||||||||||||||
Annual Report 2021
88
CION Ares Diversified Credit Fund
Consolidated Schedule of Investments (continued)
December 31, 2021
(in thousands, except shares, percentages and as otherwise noted)
Description | Notional Amount to be Purchased | Notional Amount to be Sold | Counterparty | Settlement Date | Unrealized Appreciation | Unrealized Depreciation | |||||||||||||||||||||
Forward currency contract | $ | (508 | ) | NOK | (535 | ) | Goldman Sachs | January 21, 2022 | $ | 27 | $ | — | |||||||||||||||
Forward currency contract | $ | (9,245 | ) | SEK | (9,721 | ) | Goldman Sachs | January 21, 2022 | 476 | — | |||||||||||||||||
Forward currency contract | $ | (262 | ) | £ | (268 | ) | Goldman Sachs | January 21, 2022 | 5 | — | |||||||||||||||||
Forward currency contract | $ | (251 | ) | CAD | (257 | ) | Goldman Sachs | January 21, 2022 | 5 | — | |||||||||||||||||
Forward currency contract | $ | (358 | ) | £ | (361 | ) | Goldman Sachs | January 21, 2022 | 3 | — | |||||||||||||||||
Forward currency contract | $ | (1,367 | ) | € | (1,389 | ) | Goldman Sachs | January 21, 2022 | 22 | — | |||||||||||||||||
Forward currency contract | $ | (269 | ) | £ | (268 | ) | Goldman Sachs | January 21, 2022 | — | (1 | ) | ||||||||||||||||
Forward currency contract | $ | (2,305 | ) | € | (2,268 | ) | Goldman Sachs | January 21, 2022 | — | (37 | ) | ||||||||||||||||
Forward currency contract | $ | (177 | ) | CAD | (176 | ) | Goldman Sachs | January 21, 2022 | — | (2 | ) | ||||||||||||||||
Forward currency contract | $ | (72 | ) | CAD | (71 | ) | Goldman Sachs | January 21, 2022 | — | (1 | ) | ||||||||||||||||
Forward currency contract | $ | (380 | ) | € | (376 | ) | Goldman Sachs | January 21, 2022 | — | (3 | ) | ||||||||||||||||
Forward currency contract | $ | (405 | ) | £ | (397 | ) | Goldman Sachs | January 21, 2022 | — | (8 | ) | ||||||||||||||||
Forward currency contract | $ | (491 | ) | £ | (480 | ) | Goldman Sachs | January 21, 2022 | — | (11 | ) | ||||||||||||||||
Forward currency contract | $ | (3,966 | ) | € | (3,938 | ) | Goldman Sachs | January 21, 2022 | — | (28 | ) | ||||||||||||||||
Forward currency contract | $ | (7,843 | ) | AUD | (7,742 | ) | Goldman Sachs | January 21, 2022 | — | (101 | ) | ||||||||||||||||
Forward currency contract | $ | (2,391 | ) | € | (2,378 | ) | Goldman Sachs | January 21, 2022 | — | (13 | ) | ||||||||||||||||
Forward currency contract | $ | (6,004 | ) | £ | (5,902 | ) | Goldman Sachs | January 21, 2022 | — | (102 | ) | ||||||||||||||||
Forward currency contract | $ | (3,724 | ) | PLN | (3,660 | ) | Goldman Sachs | January 21, 2022 | — | (64 | ) | ||||||||||||||||
Forward currency contract | $ | (5,247 | ) | SEK | (5,243 | ) | Goldman Sachs | January 21, 2022 | — | (4 | ) | ||||||||||||||||
Forward currency contract | $ | (5,954 | ) | € | (5,917 | ) | Goldman Sachs | January 21, 2022 | — | (37 | ) | ||||||||||||||||
Forward currency contract | $ | (1,428 | ) | SEK | (1,493 | ) | Goldman Sachs | September 18, 2022 | 66 | — | |||||||||||||||||
Total | $ | 2,688 | $ | (554 | ) | ||||||||||||||||||||||
Purchased options outstanding as of December 31, 2021 were as follows:
Options on Equity Indices — Buy Protection
Description | Exercise Price | Expiration Date | Counterparty | Notional Amount | Premium | Fair Value | |||||||||||||||||||||
| Call-Chicago Board Options Exchange-VIX US | $ | 30 | 1/19/2022 | Citigroup Global Markets Inc. | $ | 155 | $ | 15 | $ | 5 | |||||||||||||||||
Total Purchased Options | $ | 15 | $ | 5 | |||||||||||||||||||||||
Written options outstanding as of December 31, 2021 were as follows:
Options on Equity Indices — Sell Protection
Description | Exercise Price | Expiration Date | Counterparty | Notional Amount | Premium | Fair Value | |||||||||||||||||||||
| Call-Chicago Board Options Exchange-VIX US | $ | 40 | 1/19/2022 | Citigroup Global Markets Inc. | $ | (155 | ) | $ | (8 | ) | $ | (3 | ) | ||||||||||||||
Total Written Options | $ | (8 | ) | $ | (3 | ) | |||||||||||||||||||||
Annual Report 2021
89
CION Ares Diversified Credit Fund
Consolidated Schedule of Investments (continued)
December 31, 2021
(in thousands, except shares, percentages and as otherwise noted)
Swap Agreements outstanding as of December 31, 2021 were as follows:
Swap Agreements: Centrally Cleared or Exchange Traded
Credit Default Swaps on Credit Indices — Buy Protection (1)
Description | Payment Frequency | Fixed Deal Pay Rate | Expiration Date | Exchange | Notional Amount (2) | Value (3) | Upfront Premiums Paid (Received) | Unrealized Appreciation (Depreciation) | |||||||||||||||||||||||||||
| AXL CDS USD SR 5Y | Q | 5.00 | % | 06/20/2025 | ICE | $ | 250 | $ | (18 | ) | $ | (2 | ) | $ | (16 | ) | |||||||||||||||||||
| CDX.NA.HY S35 5Y | Q | 5.00 | % | 12/20/2025 | ICE | 5,331 | (473 | ) | (522 | ) | 49 | ||||||||||||||||||||||||
| CDX.NA.HY S37 5Y | Q | 5.00 | % | 12/20/2026 | ICE | 865 | (80 | ) | (79 | ) | (1 | ) | |||||||||||||||||||||||
| KSS CDS USD SR 5Y | Q | 1.00 | % | 12/20/2025 | ICE | 62 | — | 7 | (7 | ) | |||||||||||||||||||||||||
Total Swap Agreements — Buy Protection: Centrally Cleared or Exchange Traded | $ | (571 | ) | $ | (596 | ) | $ | 25 | |||||||||||||||||||||||||||
Credit Default Swaps on Credit Indices — Sell Protection (4)
Description | Payment Frequency | Fixed Deal Pay Rate | Expiration Date | Exchange | Notional Amount (2) | Value (3) | Upfront Premiums Paid (Received) | Unrealized Appreciation (Depreciation) | |||||||||||||||||||||||||||
| TSLA CDS USD SR 5Y | Q | 1.00 | % | 06/20/2026 | ICE | $ | 275 | $ | (2 | ) | $ | 7 | $ | (9 | ) | ||||||||||||||||||||
Total Swap Agreements — Sell Protection: Centrally Cleared or Exchange Traded | $ | (2 | ) | $ | 7 | $ | (9 | ) | |||||||||||||||||||||||||||
Swap Agreements: Over the Counter
Credit Default Swaps on Credit Indices — Buy Protection (1)
Description | Payment Frequency | Fixed Deal Pay Rate | Expiration Date | Counterparty | Notional Amount (2) | Value (3) | Upfront Premiums Paid (Received) | Unrealized Appreciation (Depreciation) | |||||||||||||||||||||||||||
| CDX.NA.HY S33 5Y Tranche 25-35 | Q | 5.00 | % | 12/20/2024 | Goldman Sachs | $ | 1,814 | $ | (207 | ) | $ | (210 | ) | $ | 3 | ||||||||||||||||||||
| CDX.NA.HY S35 5Y Tranche 15-25 | Q | 5.00 | % | 12/20/2025 | Goldman Sachs | 3,105 | (253 | ) | (209 | ) | (44 | ) | |||||||||||||||||||||||
| CMBX.NA.BBB— S9 | M | 3.00 | % | 09/17/2058 | Goldman Sachs | 1,030 | 100 | 246 | (146 | ) | |||||||||||||||||||||||||
Total Swap Agreements — Buy Protection: Over the Counter | $ | (360 | ) | $ | (173 | ) | $ | (187 | ) | ||||||||||||||||||||||||||
(1) If the Fund is a buyer of protection and a credit event occurs, as defined under the terms of that particular swap agreement, the Fund will either (i) receive from the seller of protection an amount equal to the notional amount of the swap and deliver the referenced obligation or underlying investments comprising the referenced index or (ii) receive a net settlement amount in the form of cash or investments equal to the notional amount of the swap less the recovery value of the referenced obligation or underlying investments comprising the referenced index.
(2) The maximum potential amount the Fund could be required to pay as a seller of credit protection or receive as a buyer of credit protection if a credit event occurs as defined under the terms of that particular swap agreement.
Annual Report 2021
90
CION Ares Diversified Credit Fund
Consolidated Schedule of Investments (continued)
December 31, 2021
(in thousands, except shares, percentages and as otherwise noted)
(3) The quoted market prices and resulting values for credit default swap agreements on credit indices serve as an indicator of the current status of the payment/performance risk and represent the expected amount paid or received for the credit derivative had the notional amount of the swap agreement been closed/sold as of year-end. Increasing values (buy protection) or decreasing values (sell protection), when compared to the notional amount of the swap, represent a deterioration of the referenced entity's credit soundness and a greater likelihood of risk of default or other credit event occurring as defined under the terms of the agreement.
(4) If the Fund is a seller of protection and a credit event occurs, as defined under the terms of that particular swap agreement, the Fund will either (i) pay to the buyer of protection an amount equal to the notional amount of the swap and take delivery of the referenced obligation or underlying securities comprising the referenced index or (ii) pay a net settlement amount in the form of cash or securities equal to the notional amount of the swap less the recovery value of the referenced obligation or underlying securities comprising the referenced index.
Abbreviations:
144A Certain conditions for public sale may exist. Unless otherwise noted, these securities are deemed to be liquid.
CLO Collateralized Loan Obligation
Currencies:
€ Euro Currency
£ British Pounds
$ U.S. Dollars
AUD Australian Dollars
CAD Canadian Dollars
DKK Danish Krone
GBP British Pound
NOK Norwegian Krone
SEK Swedish Krone
USD U.S. Dollars
Annual Report 2021
91
CION Ares Diversified Credit Fund
Consolidated Statement of Assets and Liabilities
December 31, 2021
(in thousands)
Assets | |||||||
Investments in unaffiliated issuers, at fair value (cost $2,656,181) | $ | 2,694,554 | |||||
Derivatives | 2,793 | ||||||
Cash | 87,433 | ||||||
Cash denominated in foreign currency, at value (cost $44,295) | 44,581 | ||||||
Due from brokers | 15,500 | ||||||
Receivable for common shares issued by the Fund | 27,342 | ||||||
Receivable for securities sold | 55,309 | ||||||
Interest and principal receivable | 12,875 | ||||||
Other assets | 5,597 | ||||||
Total assets | 2,945,984 | ||||||
Liabilities | |||||||
Debt | $ | 402,468 | |||||
| Mandatory redeemable preferred shares (liquidation preference $300,000, net of unamortized deferred issuance costs of $3,138) | 296,862 | ||||||
Securities sold short (cost $(9,826)) | 9,913 | ||||||
Derivatives | 1,017 | ||||||
Payable for securities purchased | 273,900 | ||||||
Interest and facility fees payable | 2,486 | ||||||
Payable for expense support recoupment | 224 | ||||||
Accrued expenses and other payables | 29,556 | ||||||
Total liabilities | 1,016,426 | ||||||
Commitments and contingencies (See Note 2) | |||||||
Net Assets | $ | 1,929,558 | |||||
Net assets consist of: | |||||||
Paid-in capital | 1,887,454 | ||||||
Accumulated undistributed earnings | 42,104 | ||||||
Net assets | $ | 1,929,558 | |||||
Annual Report 2021
92
CION Ares Diversified Credit Fund
Consolidated Statement of Assets and Liabilities (continued)
December 31, 2021
(in thousands, except per share data)
Common shares: | |||||||
Class A: | |||||||
Net Assets | $ | 62,031 | |||||
Shares Outstanding ($.001 par value; unlimited shares authorized) | 2,408 | ||||||
Net Asset Value Per Share | $ | 25.75 | |||||
Maximum Offering Price Per Share | $ | 27.33 | |||||
Class C: | |||||||
Net Assets | $ | 77,361 | |||||
Shares Outstanding ($.001 par value; unlimited shares authorized) | 3,015 | ||||||
Net Asset Value Per Share | $ | 25.65 | |||||
Class I: | |||||||
Net Assets | $ | 1,339,091 | |||||
Shares Outstanding ($.001 par value; unlimited shares authorized) | 51,483 | ||||||
Net Asset Value Per Share | $ | 26.01 | |||||
Class L: | |||||||
Net Assets | $ | 9,845 | |||||
Shares Outstanding ($.001 par value; unlimited shares authorized) | 381 | ||||||
Net Asset Value Per Share | $ | 25.85 | |||||
Maximum Offering Price Per Share | $ | 27.00 | |||||
Class U: | |||||||
Net Assets | $ | 345,691 | |||||
Shares Outstanding ($.001 par value; unlimited shares authorized) | 13,359 | ||||||
Net Asset Value Per Share | $ | 25.87 | |||||
Class U-2: | |||||||
Net Assets | $ | 56,851 | |||||
Shares Outstanding ($.001 par value; unlimited shares authorized) | 2,199 | ||||||
Net Asset Value Per Share | $ | 25.85 | |||||
Maximum Offering Price Per Share | $ | 26.51 | |||||
Class W: | |||||||
Net Assets | $ | 38,688 | |||||
Shares Outstanding ($.001 par value; unlimited shares authorized) | 1,486 | ||||||
Net Asset Value Per Share | $ | 26.03 | |||||
Maximum Offering Price Per Share | $ | 26.84 | |||||
Annual Report 2021
93
CION Ares Diversified Credit Fund
Consolidated Statement of Operations
For the year ended December 31, 2021
(in thousands)
| For the Year Ended December 31, 2021 | |||||||
Investment income: | |||||||
Interest | $ | 126,405 | |||||
Dividend | 5,025 | ||||||
Total investment income | 131,430 | ||||||
Expenses: | |||||||
Management fee (Note 3) | 21,825 | ||||||
Incentive fee (Note 3) | 3,000 | ||||||
Interest and credit facility fees (Note 6 and 7) | 9,325 | ||||||
Shareholder service expense and distribution fees (Note 3) | 3,227 | ||||||
Other expenses | 8,393 | ||||||
Total operating expenses | 45,770 | ||||||
Tax expenses | 256 | ||||||
Expense support recoupment (Note 3) | 752 | ||||||
Total expenses | 46,778 | ||||||
Net Investment Income | 84,652 | ||||||
Realized and unrealized gains (losses) on investments, foreign currency and derivative contracts | |||||||
Net realized gains on investments | 12,026 | ||||||
Net realized losses on derivative contracts | (59 | ) | |||||
Net realized losses on foreign currency | (357 | ) | |||||
Net unrealized gains on investments | 4,907 | ||||||
Net unrealized gains on derivative contracts | 2,544 | ||||||
Net unrealized gains on foreign currency | 10,600 | ||||||
Net realized and unrealized gains on investments, foreign currency and other transactions | 29,661 | ||||||
Net increase in net assets resulting from operations | $ | 114,313 | |||||
Annual Report 2021
94
CION Ares Diversified Credit Fund
Consolidated Statements of Changes in Net Assets
(in thousands, except per share data, percentages and as otherwise noted)
For the Years Ended December 31, | |||||||||||
2021 | 2020 | ||||||||||
Increase (decrease) in net assets from operations: | |||||||||||
Net investment income | $ | 84,652 | $ | 43,413 | |||||||
Net realized gains (losses) on investments, foreign currency and other transactions | 11,610 | (26,916 | ) | ||||||||
Net unrealized gains on investments, foreign currency and other transactions | 18,051 | 19,461 | |||||||||
Net increase from operations | 114,313 | 35,958 | |||||||||
Distributions to shareholders from (Note 2): | |||||||||||
Distributed earnings — Class A | (3,274 | ) | (3,171 | ) | |||||||
Distributed earnings — Class C | (3,972 | ) | (3,680 | ) | |||||||
Distributed earnings — Class I | (48,871 | ) | (25,067 | ) | |||||||
Distributed earnings — Class L | (506 | ) | (373 | ) | |||||||
Distributed earnings — Class U | (14,207 | ) | (6,939 | ) | |||||||
Distributed earnings — Class U-2 | (1,559 | ) | (153 | )(a) | |||||||
Distributed earnings — Class W | (2,119 | ) | (2,162 | ) | |||||||
Total distributions | (74,508 | ) | (41,545 | ) | |||||||
Increase (decrease) in net assets from operations and distributions | 39,805 | (5,587 | ) | ||||||||
Share transactions: | |||||||||||
Class A: | |||||||||||
Proceeds of shares issued | 9,921 | 16,609 | |||||||||
Value of distributions reinvested | 959 | 1,067 | |||||||||
Cost of shares redeemed | (9,228 | ) | (17,200 | ) | |||||||
Net increase from share transactions | 1,652 | 476 | |||||||||
Class C: | |||||||||||
Proceeds of shares issued | 12,690 | 12,311 | |||||||||
Value of distributions reinvested | 1,965 | 1,876 | |||||||||
Cost of shares redeemed | (7,080 | ) | (9,732 | ) | |||||||
Net increase from share transactions | 7,575 | 4,455 | |||||||||
Class I: | |||||||||||
Proceeds of shares issued | 796,866 | 299,889 | |||||||||
Value of distributions reinvested | 15,507 | 10,193 | |||||||||
Cost of shares redeemed | (104,271 | ) | (56,812 | ) | |||||||
Net increase from share transactions | 708,102 | 253,270 | |||||||||
Class L: | |||||||||||
Proceeds of shares issued | 2,344 | 2,402 | |||||||||
Value of distributions reinvested | 376 | 250 | |||||||||
Cost of shares redeemed | (500 | ) | (1,444 | ) | |||||||
Net increase from share transactions | 2,220 | 1,208 | |||||||||
Annual Report 2021
95
CION Ares Diversified Credit Fund
Consolidated Statements of Changes in Net Assets (continued)
(in thousands, except per share data, percentages and as otherwise noted)
For the Years Ended December 31, | |||||||||||
2021 | 2020 | ||||||||||
Class U: | |||||||||||
Proceeds of shares issued | 141,102 | 151,704 | |||||||||
Value of distributions reinvested | 11,759 | 5,937 | |||||||||
Cost of shares redeemed | (13,305 | ) | (4,230 | ) | |||||||
Net increase from share transactions | 139,556 | 153,411 | |||||||||
Class U-2: | |||||||||||
Proceeds of shares issued | 43,467 | 11,418 | (a) | ||||||||
Value of distributions reinvested | 1,106 | 82 | (a) | ||||||||
Cost of shares redeemed | (460 | ) | — | (a) | |||||||
Net increase from share transactions | 44,113 | 11,500 | (a) | ||||||||
Class W: | |||||||||||
Proceeds of shares issued | 2 | — | |||||||||
Value of distributions reinvested | 1,522 | 1,620 | |||||||||
Cost of shares redeemed | (3,833 | ) | (311 | ) | |||||||
Net increase from share transactions | (2,309 | ) | 1,309 | ||||||||
Total increase in net assets | 940,714 | 420,042 | |||||||||
Net Assets, beginning of period | 988,844 | 568,802 | |||||||||
Net Assets, end of period | $ | 1,929,558 | $ | 988,844 | |||||||
(a) Period from April 13, 2020, date operations commenced, through December 31, 2020.
Annual Report 2021
96
CION Ares Diversified Credit Fund
Consolidated Statement of Cash Flows
For the year ended December 31, 2021
(in thousands, except per share data, percentages and as otherwise noted)
| For the Year Ended December 31, 2021 | |||||||
Operating activities: | |||||||
Net increase in net assets resulting from operations | $ | 114,313 | |||||
Adjustments to reconcile net increase in net assets resulting from operations to net cash used in operating activities: | |||||||
Purchases of investments | (2,170,301 | ) | |||||
Proceeds from the sale of investments | 843,186 | ||||||
Proceeds from securities sold short | 11,481 | ||||||
Purchases to cover securities sold short | (2,313 | ) | |||||
Purchases of derivative contracts | 3,067 | ||||||
Proceeds from the sale of derivative contracts | (2,785 | ) | |||||
Amortization and accretion of discounts and premiums, net | 4,077 | ||||||
Net realized gains on investments | (12,026 | ) | |||||
Net realized losses on derivative contracts | 59 | ||||||
Net unrealized gains on investments | (4,907 | ) | |||||
Net unrealized gains on derivative contracts | (2,544 | ) | |||||
Net realized and unrealized gains on foreign currency | (10,243 | ) | |||||
Amortization of debt issuance cost | 1,234 | ||||||
Payment-in-kind ("PIK") interest and dividends | (2,837 | ) | |||||
Collections of PIK interest and dividends | 330 | ||||||
Changes in operating assets and liabilities: | |||||||
Due from brokers | (12,869 | ) | |||||
Interest and principal receivable | (3,482 | ) | |||||
Other assets | 239 | ||||||
Interest and facility fees payable | 2,174 | ||||||
Payable for expense support | 140 | ||||||
Accrued expenses and other payables | 14,214 | ||||||
Net cash used in operating activities | (1,229,793 | ) | |||||
Financing activities: | |||||||
Borrowings on debt | 888,840 | ||||||
Repayments of debt | (667,500 | ) | |||||
Proceeds from issuance of mandatory redeemable preferred shares | 300,000 | ||||||
Deferred debt and mandatory redeemable preferred shares issuance costs | (8,265 | ) | |||||
Proceeds of common shares issued | 1,012,966 | ||||||
Cost of common shares redeemed | (138,678 | ) | |||||
Distributions to shareholders | (70,420 | ) | |||||
Value of distributions reinvested | 33,194 | ||||||
Net cash provided by financing activities | 1,350,137 | ||||||
Change in Cash | 120,344 | ||||||
Cash, Beginning of Period | 11,670 | ||||||
Cash, End of Period | $ | 132,014 | |||||
Supplemental disclosure of cash flow information: | |||||||
Cash paid for interest and credit facility fees during the period | $ | 7,151 | |||||
Cash paid for taxes during the period | $ | 236 | |||||
Annual Report 2021
97
CION Ares Diversified Credit Fund
Financial Highlights
(in thousands, except per share data, percentages and as otherwise noted)
| For the Year Ended December 31, 2021 | For the Year Ended December 31, 2020 | For the Period Ended December 31, 2019* | For the Year Ended October 31, 2019 | For the Year Ended October 31, 2018 | For the Period from January 26, 2017 (commencement of operations) to October 31, 2017 | ||||||||||||||||||||||
Class A | |||||||||||||||||||||||||||
Per share data: | |||||||||||||||||||||||||||
| Net asset value, beginning of period | $ | 25.13 | $ | 25.93 | $ | 25.44 | $ | 25.80 | $ | 25.25 | $ | 25.00 | |||||||||||||||
| Income from investment operations: | |||||||||||||||||||||||||||
Net investment income(a) | 1.46 | 1.40 | 0.23 | 1.39 | 1.52 | 0.86 | |||||||||||||||||||||
| Net realized and unrealized gains (losses) | 0.55 | (0.80 | ) | 0.49 | (0.36 | ) | 0.42 | 0.44 | |||||||||||||||||||
| Total income from investment operations | 2.01 | 0.60 | 0.72 | 1.03 | 1.94 | 1.30 | |||||||||||||||||||||
| Less distributions declared to shareholders: | |||||||||||||||||||||||||||
From net investment income | (1.39 | ) | (1.40 | ) | (0.23 | ) | (1.39 | ) | (1.39 | ) | (0.86 | ) | |||||||||||||||
| From net realized gains on investments | — | — | — | — | — | (0.12 | ) | ||||||||||||||||||||
| From net unrealized gains on investments and foreign currency | — | — | — | — | — | (0.07 | ) | ||||||||||||||||||||
Total distributions | (1.39 | ) | (1.40 | ) | (0.23 | ) | (1.39 | ) | (1.39 | ) | (1.05 | ) | |||||||||||||||
Net asset value, end of period | $ | 25.75 | $ | 25.13 | $ | 25.93 | $ | 25.44 | $ | 25.80 | $ | 25.25 | |||||||||||||||
| Total return, excluding expense support(b) | 8.93 | % | 3.61 | % | 2.86 | %(c) | 4.37 | % | (2.44 | )% | (37.12 | )%(c) | |||||||||||||||
| Total return, including expense support(d) | 8.21 | % | 2.77 | % | 2.86 | %(c) | 4.10 | % | 7.91 | % | 5.32 | %(c) | |||||||||||||||
| Ratios to average net assets/ supplemental data: | |||||||||||||||||||||||||||
Net assets, end of period | $ | 62,031 | $ | 58,881 | $ | 60,203 | $ | 54,386 | $ | 37,915 | $ | 12,865 | |||||||||||||||
Including interest expense: | |||||||||||||||||||||||||||
| Expenses, excluding expense support(e)(h) | 3.11 | % | 3.44 | % | 4.01 | %(f) | 4.03 | % | 5.98 | % | 58.85 | %(f) | |||||||||||||||
| Expenses, including expense support(e)(g)(h) | 3.83 | % | 4.28 | % | 4.01 | %(f) | 4.30 | % | 0.34 | % | 0.00 | %(f) | |||||||||||||||
Excluding interest expense: | |||||||||||||||||||||||||||
| Expenses, excluding expense support(h) | 2.46 | % | 2.90 | % | 3.33 | %(f) | 3.38 | % | 5.97 | % | 58.85 | %(f) | |||||||||||||||
| Expenses, including expense support(g)(h) | 3.18 | % | 3.73 | % | 3.33 | %(f) | 3.65 | % | 0.33 | % | 0.00 | %(f) | |||||||||||||||
Net investment income(e) | 5.72 | % | 5.86 | % | 5.27 | %(f) | 5.56 | % | 5.91 | % | 4.48 | %(f) | |||||||||||||||
Portfolio turnover rate | 43.72 | % | 59.77 | % | 5.42 | %(c) | 63.58 | % | 28.36 | % | 164.09 | %(c) | |||||||||||||||
* For the two month period ended December 31, 2019. See Note 1 of Notes to Financial Statements.
(a) Per share net investment income has been calculated using the average shares outstanding during the period.
Annual Report 2021
98
CION Ares Diversified Credit Fund
Financial Highlights (continued)
(in thousands, except per share data, percentages and as otherwise noted)
(b) Based on net asset value per share. Distributions, if any, are assumed for purposes of this calculation to be reinvested at prices obtained under the Fund's Dividend Reinvestment Plan. Total Return is not annualized for periods less than one year. Total return excludes expense support provided or recouped by the adviser.
(c) Not annualized.
(d) Based on net asset value per share. Distributions, if any, are assumed for purposes of this calculation to be reinvested at prices obtained under the Fund's Dividend Reinvestment Plan. Total Return is not annualized for periods less than one year. Total return includes expense support provided or (recouped) by the adviser.
(e) Includes organizational and offering costs.
(f) Annualized, except for certain non-recurring costs.
(g) Includes expense support provided or recouped by the adviser.
(h) For the year ended December 31, 2021, the ratio of operating expenses to average net assets consisted of 1.58% of base management fees, 0.65% of the cost of borrowing, 0.72% of net expense support and 0.88% of other operating expenses. For the year ended December 31, 2020, the ratio of operating expenses to average net assets consisted of 1.56% of base management fees, 0.54% of the cost of borrowing, 0.84% of net expense support and 1.35% of other operating expenses. For the period ended December 31, 2019, the ratio of operating expenses to average net assets consisted of 1.56% of base management fees, 0.68% of the cost of borrowing, 0.00% of net expense support and 1.77% of other operating expenses. For the year ended October 31, 2019, the ratio of operating expenses to average net assets consisted of 1.47% of base management fees, 0.65% of the cost of borrowing, 0.27% of net expense support and 1.91% of other operating expenses. For the year ended October 31, 2018, the ratio of operating expenses to average net assets consisted of 1.49% of base management fees, 0.00% of the cost of borrowing, (5.91)% of net expense support and 4.76% of other operating expenses. For the period ended October 31, 2017, the ratio of operating expenses to average net assets consisted of 1.49% of base management fees, 0.00% of the cost of borrowing, (56.68)% of net expense support and 55.19% of other operating expenses.
Annual Report 2021
99
CION Ares Diversified Credit Fund
Financial Highlights (continued)
(in thousands, except per share data, percentages and as otherwise noted)
| For the Year Ended December 31, 2021 | For the Year Ended December 31, 2020 | For the Period Ended December 31, 2019* | For the Year Ended October 31, 2019 | For the Year Ended October 31, 2018 | For the Period from July 12, 2017 (commencement of operations) to October 31, 2017 | ||||||||||||||||||||||
Class C | |||||||||||||||||||||||||||
Per share data: | |||||||||||||||||||||||||||
| Net asset value, beginning of period | $ | 25.05 | $ | 25.90 | $ | 25.44 | $ | 25.80 | $ | 25.25 | $ | 24.95 | |||||||||||||||
| Income from investment operations: | |||||||||||||||||||||||||||
Net investment income(a) | 1.43 | 1.35 | 0.19 | 1.39 | 1.52 | 0.39 | |||||||||||||||||||||
| Net realized and unrealized gains (losses) | 0.56 | (0.80 | ) | 0.50 | (0.36 | ) | 0.42 | 0.33 | |||||||||||||||||||
| Total income from investment operations | 1.99 | 0.55 | 0.69 | 1.03 | 1.94 | 0.72 | |||||||||||||||||||||
| Less distributions declared to shareholders: | |||||||||||||||||||||||||||
From net investment income | (1.39 | ) | (1.40 | ) | (0.23 | ) | (1.39 | ) | (1.39 | ) | (0.39 | ) | |||||||||||||||
| From net realized gains on investments | — | — | — | — | — | (0.02 | ) | ||||||||||||||||||||
| From net unrealized gains on investments and foreign currency | — | — | — | — | — | (0.01 | ) | ||||||||||||||||||||
Total distributions | (1.39 | ) | (1.40 | ) | (0.23 | ) | (1.39 | ) | (1.39 | ) | (0.42 | ) | |||||||||||||||
Net asset value, end of period | $ | 25.65 | $ | 25.05 | $ | 25.90 | $ | 25.44 | $ | 25.80 | $ | 25.25 | |||||||||||||||
| Total return, excluding expense support(b) | 8.20 | % | 2.81 | % | 2.74 | %(c) | 3.70 | % | (3.19 | )% | (3.56 | )%(c) | |||||||||||||||
| Total return, including expense support(d) | 8.16 | % | 2.57 | % | 2.74 | %(c) | 4.10 | % | 7.91 | % | 2.95 | %(c) | |||||||||||||||
| Ratios to average net assets/ supplemental data: | |||||||||||||||||||||||||||
Net assets, end of period | $ | 77,361 | $ | 68,039 | $ | 65,779 | $ | 59,912 | $ | 29,868 | $ | 3,898 | |||||||||||||||
Including interest expense: | |||||||||||||||||||||||||||
| Expenses, excluding expense support(e)(h) | 3.87 | % | 4.18 | % | 4.76 | %(f) | 4.82 | % | 6.73 | % | 25.59 | %(f) | |||||||||||||||
| Expenses, including expense support(e)(g)(h) | 3.91 | % | 4.41 | % | 4.76 | %(f) | 4.42 | % | 0.34 | % | 0.00 | %(f) | |||||||||||||||
Excluding interest expense: | |||||||||||||||||||||||||||
| Expenses, excluding expense support(h) | 3.22 | % | 3.64 | % | 4.07 | %(f) | 4.15 | % | 6.72 | % | 22.59 | %(f) | |||||||||||||||
| Expenses, including expense support(g)(h) | 3.26 | % | 3.88 | % | 4.07 | %(f) | 3.75 | % | 0.33 | % | 0.00 | %(f) | |||||||||||||||
Net investment income(e) | 5.65 | % | 5.66 | % | 4.52 | %(f) | 5.48 | % | 5.91 | % | 5.17 | %(f) | |||||||||||||||
Portfolio turnover rate | 43.72 | % | 59.77 | % | 5.42 | %(c) | 63.58 | % | 28.36 | % | 164.09 | %(c) | |||||||||||||||
* For the two month period ended December 31, 2019. See Note 1 of Notes to Financial Statements.
(a) Per share net investment income has been calculated using the average shares outstanding during the period.
(b) Based on net asset value per share. Distributions, if any, are assumed for purposes of this calculation to be reinvested at prices obtained under the Fund's Dividend Reinvestment Plan. Total Return is not annualized for periods less than one year. Total return excludes expense support provided or recouped by the adviser.
Annual Report 2021
100
CION Ares Diversified Credit Fund
Financial Highlights (continued)
(in thousands, except per share data, percentages and as otherwise noted)
(c) Not annualized.
(d) Based on net asset value per share. Distributions, if any, are assumed for purposes of this calculation to be reinvested at prices obtained under the Fund's Dividend Reinvestment Plan. Total Return is not annualized for periods less than one year. Total return includes expense support provided or (recouped) by the adviser.
(e) Includes organizational and offering costs.
(f) Annualized, except for certain non-recurring costs.
(g) Includes expense support provided or recouped by the adviser.
(h) For the year ended December 31, 2021, the ratio of operating expenses to average net assets consisted of 1.58% of base management fees, 0.65% of the cost of borrowing, 0.04% of net expense support and 1.64% of other operating expenses. For the year ended December 31, 2020, the ratio of operating expenses to average net assets consisted of 1.56% of base management fees, 0.52% of the cost of borrowing, 0.24% of net expense support and 2.09% of other operating expenses. For the period ended December 31, 2019, the ratio of operating expenses to average net assets consisted of 1.56% of base management fees, 0.68% of the cost of borrowing, 0.00% of net expense support and 2.52% of other operating expenses. For the year ended October 31, 2019, the ratio of operating expenses to average net assets consisted of 1.47% of base management fees, 0.67% of the cost of borrowing, (0.40)% of net expense support and 2.67% of other operating expenses. For the year ended October 31, 2018, the ratio of operating expenses to average net assets consisted of 1.49% of base management fees, 0.00% of the cost of borrowing, (6.20)% of net expense support and 5.05% of other operating expenses. For the period ended October 31, 2017, the ratio of operating expenses to average net assets consisted of 1.49% of base management fees, 0.00% of the cost of borrowing, (33.93)% of net expense support and 32.44% of other operating expenses.
Annual Report 2021
101
CION Ares Diversified Credit Fund
Financial Highlights (continued)
(in thousands, except per share data, percentages and as otherwise noted)
| For the Year Ended December 31, 2021 | For the Year Ended December 31, 2020 | For the Period Ended December 31, 2019* | For the Year Ended October 31, 2019 | For the Year Ended October 31, 2018 | For the Period from July 12, 2017 (commencement of operations) to October 31, 2017 | ||||||||||||||||||||||
Class I | |||||||||||||||||||||||||||
Per share data: | |||||||||||||||||||||||||||
| Net asset value, beginning of period | $ | 25.22 | $ | 25.93 | $ | 25.44 | $ | 25.80 | $ | 25.25 | $ | 24.95 | |||||||||||||||
| Income from investment operations: | |||||||||||||||||||||||||||
Net investment income(a) | 1.62 | 1.49 | 0.23 | 1.39 | 1.52 | 0.40 | |||||||||||||||||||||
| Net realized and unrealized gains (losses) | 0.56 | (0.80 | ) | 0.49 | (0.36 | ) | 0.42 | 0.32 | |||||||||||||||||||
| Total income from investment operations | 2.18 | 0.69 | 0.72 | 1.03 | 1.94 | 0.72 | |||||||||||||||||||||
| Less distributions declared to shareholders: | |||||||||||||||||||||||||||
From net investment income | (1.39 | ) | (1.40 | ) | (0.23 | ) | (1.39 | ) | (1.39 | ) | (0.40 | ) | |||||||||||||||
| From net realized gains on investments | — | — | — | — | — | (0.01 | ) | ||||||||||||||||||||
| From net unrealized gains on investments and foreign currency | — | — | — | — | — | (0.01 | ) | ||||||||||||||||||||
Total distributions | (1.39 | ) | (1.40 | ) | (0.23 | ) | (1.39 | ) | (1.39 | ) | (0.42 | ) | |||||||||||||||
Net asset value, end of period | $ | 26.01 | $ | 25.22 | $ | 25.93 | $ | 25.44 | $ | 25.80 | $ | 25.25 | |||||||||||||||
| Total return, excluding expense support(b) | 8.90 | % | 3.55 | % | 2.88 | %(c) | 4.78 | % | (2.19 | )% | (2.49 | )%(c) | |||||||||||||||
| Total return, including expense support(d) | 8.87 | % | 3.12 | % | 2.86 | %(c) | 4.10 | % | 7.91 | % | 2.95 | %(c) | |||||||||||||||
| Ratios to average net assets/ supplemental data: | |||||||||||||||||||||||||||
Net assets, end of period | $ | 1,339,092 | $ | 603,536 | $ | 354,144 | $ | 298,481 | $ | 111,705 | $ | 6,048 | |||||||||||||||
Including interest expense: | |||||||||||||||||||||||||||
| Expenses, excluding expense support(e)(h) | 3.25 | % | 3.50 | % | 3.74 | %(f) | 3.87 | % | 5.73 | % | 18.62 | %(f) | |||||||||||||||
| Expenses, including expense support(e)(g)(h) | 3.28 | % | 3.93 | % | 3.87 | %(f) | 4.55 | % | 0.34 | % | 0.00 | %(f) | |||||||||||||||
Excluding interest expense: | |||||||||||||||||||||||||||
| Expenses, excluding expense support(h) | 2.56 | % | 2.97 | % | 3.06 | %(f) | 3.17 | % | 5.71 | % | 18.62 | %(f) | |||||||||||||||
| Expenses, including expense support(g)(h) | 2.59 | % | 3.39 | % | 3.19 | %(f) | 3.85 | % | 0.32 | % | 0.00 | %(f) | |||||||||||||||
Net investment income(e) | 6.34 | % | 6.24 | % | 5.44 | %(f) | 5.38 | % | 5.91 | % | 5.19 | %(f) | |||||||||||||||
Portfolio turnover rate | 43.72 | % | 59.77 | % | 5.42 | %(c) | 63.58 | % | 28.36 | % | 164.09 | %(c) | |||||||||||||||
* For the two month period ended December 31, 2019. See Note 1 of Notes to Financial Statements.
(a) Per share net investment income has been calculated using the average shares outstanding during the period.
(b) Based on net asset value per share. Distributions, if any, are assumed for purposes of this calculation to be reinvested at prices obtained under the Fund's Dividend Reinvestment Plan. Total Return is not annualized for periods less than one year. Total return excludes expense support provided or recouped by the adviser.
Annual Report 2021
102
CION Ares Diversified Credit Fund
Financial Highlights (continued)
(in thousands, except per share data, percentages and as otherwise noted)
(c) Not annualized.
(d) Based on net asset value per share. Distributions, if any, are assumed for purposes of this calculation to be reinvested at prices obtained under the Fund's Dividend Reinvestment Plan. Total Return is not annualized for periods less than one year. Total return includes expense support provided or (recouped) by the adviser.
(e) Includes organizational and offering costs.
(f) Annualized, except for certain non-recurring costs.
(g) Includes expense support provided or recouped by the adviser.
(h) For the year ended December 31, 2021, the ratio of operating expenses to average net assets consisted of 1.60% of base management fees, 0.33% of incentive fees, 0.69% of the cost of borrowing, 0.03% of net expense support and 0.63% of other operating expenses. For the year ended December 31, 2020, the ratio of operating expenses to average net assets consisted of 1.59% of base management fees, 0.25% of incentive fee, 0.53% of the cost of borrowing, 0.43% of net expense support and 1.14% of other operating expenses. For the period ended December 31, 2019, the ratio of operating expenses to average net assets consisted of 1.56% of base management fees, 0.68% of the cost of borrowing, 0.13% of net expense support and 1.51% of other operating expenses. For the year ended October 31, 2019, the ratio of operating expenses to average net assets consisted of 1.48% of base management fees, 0.71% of the cost of borrowing, 0.68% of net expense support and 1.68% of other operating expenses. For the year ended October 31, 2018, the ratio of operating expenses to average net assets consisted of 1.49% of base management fees, 0.00% of the cost of borrowing, (4.79)% of net expense support and 3.64% of other operating expenses. For the period ended October 31, 2017, the ratio of operating expenses to average net assets consisted of 1.49% of base management fees, 0.00% of the cost of borrowing, (29.81)% of net expense support and 28.33% of other operating expenses.
Annual Report 2021
103
CION Ares Diversified Credit Fund
Financial Highlights (continued)
(in thousands, except per share data, percentages and as otherwise noted)
| For the Year Ended December 31, 2021 | For the Year Ended December 31, 2020 | For the Period Ended December 31, 2019* | For the Year Ended October 31, 2019 | For the Period from November 2, 2017 (commencement of operations) to October 31, 2018 | |||||||||||||||||||
Class L | |||||||||||||||||||||||
Per share data: | |||||||||||||||||||||||
Net asset value, beginning of period | $ | 25.14 | $ | 25.92 | $ | 25.44 | $ | 25.80 | $ | 25.23 | |||||||||||||
Income from investment operations: | |||||||||||||||||||||||
Net investment income(a) | 1.54 | 1.44 | 0.19 | 1.39 | 1.52 | ||||||||||||||||||
Net realized and unrealized gains (losses) | 0.56 | (0.82 | ) | 0.52 | (0.36 | ) | 0.43 | ||||||||||||||||
Total income from investment operations | 2.10 | 0.62 | 0.71 | 1.03 | 1.95 | ||||||||||||||||||
Less distributions declared to shareholders: | |||||||||||||||||||||||
From net investment income | (1.39 | ) | (1.40 | ) | (0.23 | ) | (1.39 | ) | (1.38 | ) | |||||||||||||
Total distributions | (1.39 | ) | (1.40 | ) | (0.23 | ) | (1.39 | ) | (1.38 | ) | |||||||||||||
Net asset value, end of period | $ | 25.85 | $ | 25.14 | $ | 25.92 | $ | 25.44 | $ | 25.80 | |||||||||||||
Total return, excluding expense support(b) | 8.69 | % | 3.27 | % | 2.82 | %(c) | 4.32 | % | (2.69 | )%(c) | |||||||||||||
Total return, including expense support(d) | 8.58 | % | 2.85 | % | 2.82 | %(c) | 4.10 | % | 7.96 | %(c) | |||||||||||||
Ratios to average net assets/supplemental data: | |||||||||||||||||||||||
Net assets, end of period | $ | 9,845 | $ | 7,364 | $ | 6,325 | $ | 5,536 | $ | 1,933 | |||||||||||||
Including interest expense: | |||||||||||||||||||||||
Expenses, excluding expense support(e)(h) | 3.40 | % | 3.82 | % | 4.24 | %(f) | 4.38 | % | 6.23 | %(f) | |||||||||||||
Expenses, including expense support(e)(g)(h) | 3.51 | % | 4.24 | % | 4.24 | %(f) | 4.60 | % | 0.34 | %(f) | |||||||||||||
Excluding interest expense: | |||||||||||||||||||||||
Expenses, excluding expense support(h) | 2.75 | % | 3.27 | % | 3.56 | %(f) | 3.67 | % | 6.21 | %(f) | |||||||||||||
Expenses, including expense support(g)(h) | 2.86 | % | 3.69 | % | 3.56 | %(f) | 3.89 | % | 0.32 | %(f) | |||||||||||||
Net investment income(e) | 6.05 | % | 6.04 | % | 4.47 | %(f) | 5.35 | % | 5.19 | %(f) | |||||||||||||
Portfolio turnover rate | 43.72 | % | 59.77 | % | 5.42 | %(c) | 63.58 | % | 28.36 | %(c) | |||||||||||||
* For the two month period ended December 31, 2019. See Note 1 of Notes to Financial Statements.
(a) Per share net investment income has been calculated using the average shares outstanding during the period.
(b) Based on net asset value per share. Distributions, if any, are assumed for purposes of this calculation to be reinvested at prices obtained under the Fund's Dividend Reinvestment Plan. Total Return is not annualized for periods less than one year. Total return excludes expense support provided or recouped by the adviser.
(c) Not annualized.
(d) Based on net asset value per share. Distributions, if any, are assumed for purposes of this calculation to be reinvested at prices obtained under the Fund's Dividend Reinvestment Plan. Total Return is not annualized for periods less than one year. Total return includes expense support provided or (recouped) by the adviser.
(e) Includes organizational and offering costs.
(f) Annualized, except for certain non-recurring costs.
(g) Includes expense support provided or recouped by the adviser.
(h) For the year ended December 31, 2021, the ratio of operating expenses to average net assets consisted of 1.58% of base management fees, 0.05% of incentive fees, 0.65% of the cost of borrowing, 0.11% of net expense support and 1.12% of other operating expenses. For the year ended December 31, 2020, the ratio of operating expenses to average net assets consisted of 1.58% of base management fees, 0.02% of incentive fees, 0.55% of the cost of borrowing, 0.42% of net expense support and 1.68% of other operating expenses. For the period ended December 31, 2019, the ratio of operating expenses to average net assets consisted of 1.56% of base management fees, 0.68% of the cost of borrowing, 0.00% of net expense support and 2.01% of other operating expenses. For the year ended October 31, 2019, the ratio of operating expenses to average net assets consisted of 1.49% of base management fees, 0.72% of the cost of borrowing, 0.21% of net expense support and 2.18% of other operating expenses. For the period ended October 31, 2018, the ratio of operating expenses to average net assets consisted of 1.48% of base management fees, 0.00% of the cost of borrowing, (4.71)% of net expense support and 3.57% of other operating expenses.
Annual Report 2021
104
CION Ares Diversified Credit Fund
Financial Highlights (continued)
(in thousands, except per share data, percentages and as otherwise noted)
| For the Year Ended December 31, 2021 | For the Year Ended December 31, 2020 | For the Period Ended December 31, 2019* | For the Period from July 26, 2019 (commencement of operations) to October 31, 2019 | ||||||||||||||||
Class U | |||||||||||||||||||
Per share data: | |||||||||||||||||||
Net asset value, beginning of period | $ | 25.18 | $ | 25.92 | $ | 25.44 | $ | 25.86 | |||||||||||
Income from investment operations: | |||||||||||||||||||
Net investment income(a) | 1.52 | 1.42 | 0.20 | 0.40 | |||||||||||||||
Net realized and unrealized gains (losses) | 0.56 | (0.76 | ) | 0.51 | (0.45 | ) | |||||||||||||
Total income from investment operations | 2.08 | 0.66 | 0.71 | (0.05 | ) | ||||||||||||||
Less distributions declared to shareholders: | |||||||||||||||||||
From net investment income | (1.39 | ) | (1.40 | ) | (0.23 | ) | (0.37 | ) | |||||||||||
Total distributions | (1.39 | ) | (1.40 | ) | (0.23 | ) | (0.37 | ) | |||||||||||
Net asset value, end of period | $ | 25.87 | $ | 25.18 | $ | 25.92 | $ | 25.44 | |||||||||||
Total return, excluding expense support(b)(c) | 8.48 | % | 3.01 | % | 2.74 | % | 1.60 | % | |||||||||||
Total return, including expense support(c)(d) | 8.48 | % | 2.99 | % | 2.82 | % | (0.14 | )% | |||||||||||
Ratios to average net assets/supplemental data: | |||||||||||||||||||
Net assets, end of period | $ | 345,691 | $ | 199,175 | $ | 42,902 | $ | 10,434 | |||||||||||
Including interest expense: | |||||||||||||||||||
Expenses, excluding expense support(e)(f)(h) | 3.64 | % | 4.00 | % | 4.31 | % | 4.85 | % | |||||||||||
Expenses, including expense support(e)(f)(g)(h) | 3.64 | % | 4.02 | % | 3.83 | % | 6.59 | % | |||||||||||
Excluding interest expense: | |||||||||||||||||||
Expenses, excluding expense support(f)(h) | 2.97 | % | 3.51 | % | 3.66 | % | 3.88 | % | |||||||||||
Expenses, including expense support(f)(g)(h) | 2.97 | % | 3.54 | % | 4.48 | % | 5.62 | % | |||||||||||
Net investment income(e)(f) | 5.96 | % | 5.98 | % | 5.39 | % | 12.08 | % | |||||||||||
Portfolio turnover rate | 43.72 | % | 59.77 | % | 5.42 | %(c) | 63.58 | %(c) | |||||||||||
* For the two month period ended December 31, 2019. See Note 1 of Notes to Financial Statements.
(a) Per share net investment income has been calculated using the average shares outstanding during the period.
(b) Based on net asset value per share. Distributions, if any, are assumed for purposes of this calculation to be reinvested at prices obtained under the Fund's Dividend Reinvestment Plan. Total Return is not annualized for periods less than one year. Total return excludes expense support provided or recouped by the adviser.
(c) Not annualized.
(d) Based on net asset value per share. Distributions, if any, are assumed for purposes of this calculation to be reinvested at prices obtained under the Fund's Dividend Reinvestment Plan. Total Return is not annualized for periods less than one year. Total return includes expense support provided or (recouped) by the adviser.
(e) Includes organizational and offering costs.
(f) Annualized, except for certain non-recurring costs.
(g) Includes expense support provided or recouped by the adviser.
(h) For the year ended December 31, 2021, the ratio of operating expenses to average net assets consisted of 1.59% of base management fees, 0.67% of the cost of borrowing and 1.38% of other operating expenses. For the year ended December 31, 2020, the ratio of operating expenses to average net assets consisted of 1.60% of base management fees, 0.48% of the cost of borrowing, 0.02% of net expense support and 1.92% of other operating expenses. For the period ended December 31, 2019, the ratio of operating expenses to average net assets consisted of 1.56% of base management fees, 0.65% of the cost of borrowing, (0.47)% of net expense support and 2.10% of other operating expenses. For the period ended October 31, 2019, the ratio of operating expenses to average net assets consisted of 1.61% of base management fees, 0.89% of the cost of borrowing, 1.74% of net expense support and 2.35% of other operating expenses.
Annual Report 2021
105
CION Ares Diversified Credit Fund
Financial Highlights (continued)
(in thousands, except per share data, percentages and as otherwise noted)
| For the Year Ended December 31, 2021 | For the Period from April 13, 2020 (commencement of operations) to December 31, 2020 | ||||||||||
Class U-2 | |||||||||||
Per share data: | |||||||||||
Net asset value, beginning of period | $ | 25.17 | $ | 21.79 | |||||||
Income from investment operations: | |||||||||||
Net investment income(a) | 1.52 | 0.76 | |||||||||
Net realized and unrealized gains | 0.55 | 3.62 | |||||||||
Total income from investment operations | 2.07 | 4.38 | |||||||||
Less distributions declared to shareholders: | |||||||||||
From net investment income | (1.39 | ) | (1.00 | ) | |||||||
Total distributions | (1.39 | ) | (1.00 | ) | |||||||
Net asset value, end of period | $ | 25.85 | $ | 25.17 | |||||||
Total return, excluding expense support(b)(c) | 8.44 | % | 19.71 | % | |||||||
Total return, including expense support(c)(d) | 8.44 | % | 19.71 | % | |||||||
Ratios to average net assets/supplemental data: | |||||||||||
Net assets, end of period | $ | 56,851 | $ | 12,018 | |||||||
Including interest expense: | |||||||||||
Expenses, excluding expense support(e)(f)(h) | 3.74 | % | 4.10 | % | |||||||
Expenses, including expense support(e)(f)(g)(h) | 3.74 | % | 4.10 | % | |||||||
Excluding interest expense: | |||||||||||
Expenses, excluding expense support(f)(h) | 3.00 | % | 3.69 | % | |||||||
Expenses, including expense support(f)(g)(h) | 3.00 | % | 3.69 | % | |||||||
Net investment income(e)(f) | 5.98 | % | 4.48 | % | |||||||
Portfolio turnover rate(c) | 43.72 | % | 59.77 | % | |||||||
(a) Per share net investment income has been calculated using the average shares outstanding during the period.
(b) Based on net asset value per share. Distributions, if any, are assumed for purposes of this calculation to be reinvested at prices obtained under the Fund's Dividend Reinvestment Plan. Total Return is not annualized for periods less than one year. Total return excludes expense support provided or recouped by the adviser.
(c) Not annualized.
(d) Based on net asset value per share. Distributions, if any, are assumed for purposes of this calculation to be reinvested at prices obtained under the Fund's Dividend Reinvestment Plan. Total Return is not annualized for periods less than one year. Total return includes expense support provided or (recouped) by the adviser.
(e) Includes organizational and offering costs.
(f) Annualized.
(g) Includes expense support provided or recouped by the adviser.
(h) For the year ended December 31, 2021, the ratio of operating expenses to average net assets consisted of 1.62% of base management fees, 0.74% of the cost of borrowing and 1.38% of other operating expenses. For the year ended December 31, 2020, the ratio of operating expenses to average net assets consisted of 1.54% of base management fees, 0.39% of the cost of borrowing, 0.00% of net expense support and 2.17% of other operating expenses.
Annual Report 2021
106
CION Ares Diversified Credit Fund
Financial Highlights (continued)
(in thousands, except per share data, percentages and as otherwise noted)
| For the Year Ended December 31, 2021 | For the Year Ended December 31, 2020 | For the Period Ended December 31, 2019* | For the Period from December 21, 2018 (commencement of operations) to October 31, 2019 | ||||||||||||||||
Class W | |||||||||||||||||||
Per share data: | |||||||||||||||||||
Net asset value, beginning of period | $ | 25.27 | $ | 25.92 | $ | 25.44 | $ | 25.03 | |||||||||||
Income from investment operations: | |||||||||||||||||||
Net investment income(a) | 1.58 | 1.50 | 0.25 | 1.23 | |||||||||||||||
Net realized and unrealized gains (losses) | 0.57 | (0.75 | ) | 0.46 | 0.38 | ||||||||||||||
Total income from investment operations | 2.15 | 0.75 | 0.71 | 1.61 | |||||||||||||||
Less distributions declared to shareholders: | |||||||||||||||||||
From net investment income | (1.39 | ) | (1.40 | ) | (0.23 | ) | (1.20 | ) | |||||||||||
Total distributions | (1.39 | ) | (1.40 | ) | (0.23 | ) | (1.20 | ) | |||||||||||
Net asset value, end of period | $ | 26.03 | $ | 25.27 | $ | 25.92 | $ | 25.44 | |||||||||||
Total return, excluding expense support(b)(c) | 8.73 | % | 3.35 | % | 2.82 | % | 7.00 | % | |||||||||||
Total return, including expense support(c)(d) | 8.73 | % | 3.35 | % | 2.82 | % | 6.25 | % | |||||||||||
Ratios to average net assets/supplemental data: | |||||||||||||||||||
Net assets, end of period | $ | 38,688 | $ | 39,831 | $ | 39,449 | $ | 38,423 | |||||||||||
Including interest expense: | |||||||||||||||||||
Expenses, excluding expense support(e)(f)(g) | 3.39 | % | 3.65 | % | 4.28 | % | 4.73 | % | |||||||||||
Expenses, including expense support(e)(f)(g)(h) | 3.39 | % | 3.65 | % | 4.28 | % | 5.47 | % | |||||||||||
Excluding interest expense: | |||||||||||||||||||
Expenses, excluding expense support(f)(h) | 2.75 | % | 3.14 | % | 3.59 | % | 3.65 | % | |||||||||||
Expenses, including expense support(f)(g)(h) | 2.75 | % | 3.14 | % | 3.59 | % | 4.39 | % | |||||||||||
Net investment income(e)(f) | 6.17 | % | 6.23 | % | 4.97 | % | 5.14 | % | |||||||||||
Portfolio turnover rate | 43.72 | % | 59.77 | % | 5.42 | %(c) | 63.58 | %(c) | |||||||||||
* For the two month period ended December 31, 2019. See Note 1 of Notes to Financial Statements.
(a) Per share net investment income has been calculated using the average shares outstanding during the period.
(b) Based on net asset value per share. Distributions, if any, are assumed for purposes of this calculation to be reinvested at prices obtained under the Fund's Dividend Reinvestment Plan. Total Return is not annualized for periods less than one year. Total return excludes expense support provided or recouped by the adviser.
(c) Not annualized.
(d) Based on net asset value per share. Distributions, if any, are assumed for purposes of this calculation to be reinvested at prices obtained under the Fund's Dividend Reinvestment Plan. Total Return is not annualized for periods less than one year. Total return includes expense support provided or (recouped) by the adviser.
(e) Includes organizational and offering costs.
(f) Annualized, except for certain non-recurring costs.
(g) Includes expense support provided or recouped by the adviser.
(h) For the year ended December 31, 2021, the ratio of operating expenses to average net assets consisted of 1.58% of base management fees, 0.06% of incentive fees, 0.64% of the cost of borrowing and 1.11% of other operating expenses. For the year ended December 31, 2020, the ratio of operating expenses to average net assets consisted of 1.54% of base management fees, 0.03% of incentive fees, 0.50% of the cost of borrowing, 0.00% of net expense support and 1.58% of other operating expenses. For the period ended December 31, 2019, the ratio of operating expenses to average net assets consisted of 1.56% of base management fees, 0.68% of the cost of borrowing, 0.00% of net expense support and 2.03% of other operating expenses. For the period ended October 31, 2019, the ratio of operating expenses to average net assets consisted of 1.57% of base management fees, 0.91% of the cost of borrowing, 0.74% of net expense support and 2.24% of other operating expenses.
Annual Report 2021
107
CION Ares Diversified Credit Fund
Financial Highlights (continued)
(in thousands, except per share data, percentages and as otherwise noted)
Information about the Fund's senior securities as of December 31, 2021, December 31, 2020, December 31, 2019 and October 31, 2019 is shown in the following table.
| Total Amount Outstanding Exclusive of Treasury Securities(a) | Asset Coverage Per Unit(b) | Involuntary Liquidating Preference Per Unit(c) | Average Market Value Per Unit(d) | ||||||||||||||||
Class and Period Ended | |||||||||||||||||||
Revolving Credit Facility (Wells Fargo Bank, N.A.) | |||||||||||||||||||
December 31, 2021 | $ | 225,664 | $ | 6,461 | — | N/A | |||||||||||||
December 31, 2020 | 77,025 | 6,233 | — | N/A | |||||||||||||||
December 31, 2019 | 19,054 | 5,383 | — | N/A | |||||||||||||||
October 31, 2019 | 19,397 | 3,847 | — | N/A | |||||||||||||||
Revolving Credit Facility (State Street Bank and Trust Company) | |||||||||||||||||||
December 31, 2021 | $ | 176,803 | $ | 6,461 | — | N/A | |||||||||||||
December 31, 2020 | 111,283 | 6,233 | — | N/A | |||||||||||||||
December 31, 2019 | 110,387 | 5,383 | — | N/A | |||||||||||||||
October 31, 2019 | 144,357 | 3,847 | — | N/A | |||||||||||||||
Mandatory Redeemable Preferred Shares* | |||||||||||||||||||
December 31, 2021 | $ | 300,000 | $ | 3,724 | $ | 25.00 | N/A | ||||||||||||
* There were no mandatory redeemable preferred shares outstanding as of December 31, 2020, December 31, 2019 and October 31, 2019.
(a) Total amount of each class of senior securities outstanding at principal value at the end of the period presented.
(b) The asset coverage ratio for a class of senior securities representing indebtedness is calculated as our consolidated total assets, less all liabilities and indebtedness not represented by senior securities, divided by total senior securities representing indebtedness. This asset coverage ratio is multiplied by $1,000 to determine the "Asset Coverage Per Unit''.
(c) The amount to which such class of senior security would be entitled upon our involuntary liquidation in preference to any security junior to it. The "-" in this column indicates that the Securities and Exchange Commission expressly does not require this information to be disclosed for certain types of senior securities.
(d) Not applicable to senior securities outstanding as of period end.
Annual Report 2021
108
CION Ares Diversified Credit Fund
Notes to Consolidated Financial Statements
December 31, 2021
(in thousands, except per share data, percentages and as otherwise noted)
(1) Organization
CION Ares Diversified Credit Fund (the "Fund") is a closed-end, diversified management investment company that is registered under the Investment Company Act of 1940, as amended (together with the rules and regulations promulgated thereunder, the "Investment Company Act"). The Fund is structured as an interval fund and continuously offers its shares. The Fund was organized as a Delaware statutory trust on June 21, 2016.
The Fund's investment objective is to provide superior risk-adjusted returns across various market cycles by investing in a diversified portfolio of liquid and illiquid asset classes. The Fund seeks to capitalize on market inefficiencies and relative value opportunities throughout the entire global credit spectrum.
The Fund is externally managed by CION Ares Management, LLC (the "Adviser") pursuant to an investment advisory and management agreement. The Adviser was registered as an investment adviser with the Securities and Exchange Commission ("SEC") under the Investment Advisers Act of 1940 (the "Advisers Act") on January 4, 2017. The Adviser is a joint venture between affiliates of Ares Management Corporation ("Ares Management"), a publicly traded, leading global alternative investment manager, and CION Investment Group, LLC ("CION") and is controlled by Ares Management. The Adviser oversees the management of the Fund's activities and is responsible for making investment decisions for the Fund's portfolio. Ares Operations LLC ("Ares Operations"), a subsidiary of Ares Management, provides certain administrative and other services necessary for the Fund to operate.
Fiscal Year End Change
On September 25, 2019, the Board of trustees (the "Board") approved a change to the fiscal year end of the Fund from October 31 to December 31. Accordingly, the Fund's financial statements and related notes include information as of and for the year ended December 31, 2020, the two month period ended December 31, 2019 and the year ended October 31, 2019.
(2) Significant Accounting Policies
Basis of Presentation
The accompanying consolidated financial statements have been prepared on the accrual basis of accounting in conformity with U.S. generally accepted accounting principles ("GAAP"), and include the accounts of the Fund and its consolidated subsidiaries. The Fund is an investment company following accounting and reporting guidance in Accounting Standards Codification ("ASC") Topic 946, Financial Services — Investment Companies. The consolidated financial
statements reflect all adjustments and reclassifications, that, in the opinion of management, are necessary for the fair presentation of the results of operations and financial condition as of and for the periods presented. All significant intercompany balances and transactions have been eliminated.
Cash and Cash Equivalents
Cash and cash equivalents include funds from time to time deposited with financial institutions. Cash and cash equivalents are carried at cost, which approximates fair value.
Concentration of Credit Risk
The Fund places its cash and cash equivalents with financial institutions and, at times, cash held in money market accounts may exceed the Federal Deposit Insurance Corporation insured limit.
Investment Transactions
Investment transactions are recorded on the trade date. Realized gains or losses are measured by the difference between the net proceeds from the repayment or sale and the amortized cost basis of the investment using the specific identification method without regard to unrealized gains or losses previously recognized, and include investments charged off during the period, net of recoveries. Unrealized gains or losses primarily reflect the change in investment values, including the reversal of previously recorded unrealized gains or losses when gains or losses are realized.
Investments for which market quotations are readily available are typically valued at such market quotations. In order to validate market quotations, the Fund looks at a number of factors to determine if the quotations are representative of fair value, including the source and nature of the quotations. Debt and equity securities that are not publicly traded or whose market prices are not readily available are valued at fair value as determined in good faith by the Board in accordance with the Fund's valuation policy (the "Valuation Policy"). The Valuation Policy is reviewed and approved at least annually by the Board. The Adviser has been authorized by the Board to utilize independent third-party pricing and valuation services to assist in the valuation of each portfolio investment without a readily available market quotation in accordance with the Valuation Policy and a consistently applied valuation process.
As part of the valuation process for investments that do not have readily available market prices, the Adviser may take into account the following types of factors, if relevant, in determining the fair value of the Fund's investments: the enterprise value of a portfolio company (the entire value of the portfolio company to a market participant, including the sum of the values of debt and equity securities used to capitalize the enterprise at a point in time), the nature and realizable
Annual Report 2021
109
CION Ares Diversified Credit Fund
Notes to Consolidated Financial Statements (continued)
December 31, 2021
(in thousands, except per share data, percentages and as otherwise noted)
value of any collateral, the portfolio company's ability to make payments and its earnings and discounted cash flow, the markets in which the portfolio company does business, a comparison of the portfolio company's securities to any similar publicly traded securities, changes in the interest rate environment and the credit markets, which may affect the price at which similar investments would trade in their principal markets and other relevant factors. When an external event such as a purchase transaction, public offering or subsequent sale occurs, the Adviser considers the pricing indicated by the external event to corroborate its valuation.
Due to the inherent uncertainty of determining the fair value of investments that do not have a readily available market value, the fair value of the Fund's investments may fluctuate from period to period. Additionally, the fair value of the Fund's investments may differ significantly from the values that would have been used had a ready market existed for such investments and may differ materially from the values that the Fund may ultimately realize. Further, such investments are generally subject to legal and other restrictions on resale or otherwise are less liquid than publicly traded securities. If the Fund was required to liquidate a portfolio investment in a forced or liquidation sale, the Fund could realize significantly less than the value at which the Fund has recorded it. In addition, changes in the market environment and other events that may occur over the life of the investments may cause the gains or losses ultimately realized on these investments to be different than the unrealized gains or losses reflected in the valuations currently assigned. All investments in securities are recorded at their fair value. See Note 4 for more information on the Fund's valuation process.
Interest Income Recognition
Interest income is recorded on an accrual basis and includes the accretion of discounts, amortization of premiums and payment-in-kind ("PIK") interest. Discounts from and premiums to par value on investments purchased are accreted/amortized into interest income over the life of the respective security using the effective yield method. To the extent loans contain PIK provisions, PIK interest, computed at the contractual rate specified in each applicable agreement, is accrued and recorded as interest income and added to the principal balance of the loan. PIK interest income added to the principal balance is generally collected upon repayment of the outstanding principal. The amortized cost of investments represents the original cost adjusted for any accretion of discounts, amortization of premiums and PIK interest.
Loans are generally placed on non-accrual status when principal or interest payments are past due 30 days or more or when there is reasonable doubt that principal or interest will be collected in full. Accrued and unpaid interest is generally
reversed when a loan is placed on non-accrual status. Interest payments received on non-accrual loans may be recognized as income or applied to principal depending upon the Fund's judgment regarding collectability. Non-accrual loans are restored to accrual status when past due principal and interest are paid or there is no longer any reasonable doubt that such principal or interest will be collected in full and, in the Fund's judgment, are likely to remain current. The Fund may make exceptions to this policy if the loan has sufficient collateral value (i.e., typically measured as enterprise value of the portfolio company) or is in the process of collection.
Collateralized loan obligation ("CLO") equity investments recognize investment income by utilizing an effective interest methodology based upon an effective yield to maturity utilizing projected cash flows, as required by ASC 325-40, Beneficial Interest in Securitized Financial Assets.
Dividend Income Recognition
Dividend income on preferred equity securities is recorded on an accrual basis to the extent that such amounts are payable by the portfolio company and are expected to be collected. Dividend income on common equity securities is recorded on the record date for private portfolio companies or on the ex-dividend date for publicly traded portfolio companies. To the extent preferred equity securities contain PIK provisions, PIK dividends, computed at the contractual rate specified in each applicable agreement, are accrued and recorded as dividend income and added to the principal balance of the preferred equity security. PIK dividends added to the principal balance are generally collected upon redemption of the equity security.
Foreign Currency Transactions and Forward Currency Contracts
The Fund's books and records are maintained in U.S. dollars. Any foreign currency amounts are translated into U.S. dollars on the following basis: (i) fair value of investment securities, other assets and liabilities at the exchange rates prevailing at the end of the period; and (ii) purchases and sales of investment securities, income and expense at the exchange rates prevailing on the respective dates of such transactions, income or expenses.
The Fund does not isolate that portion of the results of operations resulting from the changes in foreign exchange rates on investments from fluctuations arising from changes in market prices of securities held. Such fluctuations are included within the net realized and unrealized gain (loss) on investments in the consolidated statement of operations.
Reported net realized foreign exchange gains or losses arise from sales of foreign currencies, currency gains or losses realized between the trade and settlement dates of securities transactions, and the difference between the amounts of
Annual Report 2021
110
CION Ares Diversified Credit Fund
Notes to Consolidated Financial Statements (continued)
December 31, 2021
(in thousands, except per share data, percentages and as otherwise noted)
income and expense items recorded on the Fund's books and the U.S. dollar equivalent of the amounts actually received or paid. Net unrealized foreign currency gains and losses arise from the changes in fair values of assets and liabilities, other than investments in securities at period end, resulting from changes in exchange rates.
Investments in foreign companies and securities of foreign governments may involve special risks and considerations not typically associated with investing in U.S. companies and securities of the U.S. government. These risks include, among other things, revaluation of currencies, less reliable information about issuers, different transaction clearance and settlement practices, and potential future adverse political and economic developments. Moreover, investments in foreign companies and securities of foreign governments and their markets may be less liquid and their prices more volatile than those of comparable U.S. companies and the U.S. government.
The Fund may enter into forward currency contracts for operational purposes and to protect against adverse exchange rate fluctuations. A forward currency contract is an agreement between the Fund and a counterparty to buy or sell a foreign currency at a specific exchange rate on a future date. The Fund may also enter into these contracts for purposes of increasing exposure to a foreign currency or to shift exposure to foreign currency fluctuations from one currency to another. The net U.S. dollar value of foreign currency underlying all contractual commitments held by the Fund and the resulting unrealized appreciation or depreciation are determined using foreign currency exchange rates from an independent pricing service. The Fund is subject to the credit risk that the other party will not complete the obligations of the contract. The fair values of the forward currency contracts are obtained from an independent pricing source.
Derivative Instruments
The Fund values its derivatives at fair value with the unrealized gains or losses recorded in "net realized and unrealized gains (losses) on investments, from forward currency and derivative contracts" in the consolidated statement of operations.
Mandatory Redeemable Preferred Shares
The Fund carries its mandatory redeemable preferred shares at amortized cost and such shares are included as a liability on the consolidated statement of assets and liabilities. See Note 7 for further details.
Debt and Mandatory Redeemable Preferred Shares Issuance Costs
Debt and mandatory redeemable preferred shares issuance costs are amortized over the life of the relevant senior secured revolving credit facilities and mandatory redeemable preferred shares.
Secured Borrowings
The Fund follows the guidance in ASC Topic 860, Transfers and Servicing, when accounting for participations and other partial loan sales. Certain loan sales do not qualify for sale accounting under ASC 860 because these sales do not meet the definition of a "participating interest," as defined in the guidance, in order for sale treatment to be allowed. Participations or other partial loan sales which do not meet the definition of a participating interest or which are not eligible for sale accounting remain as an investment on the consolidated statement of assets and liabilities as required under GAAP and the proceeds are recorded as a secured borrowing. Secured borrowings are carried at fair value and included in "accrued expenses and other payables" in the accompanying consolidated statement of assets and liabilities.
Income Taxes
The Fund has elected to be treated as a regulated investment company ("RIC") under the Internal Revenue Code of 1986, as amended (the "Code"), and operates in a manner so as to qualify for the tax treatment applicable to RICs. To qualify as a RIC, the Fund must (among other requirements) meet certain source-of-income and asset diversification requirements and timely distribute to its shareholders all or substantially all of its investment company taxable income, as defined by the Code, for each year. The Fund has made and intends to continue to make the requisite distributions to its shareholders, which will generally relieve the Fund from U.S. federal corporate-level income taxes.
Depending on the level of taxable income earned in a tax year, the Fund may choose to carry forward taxable income in excess of current year dividend distributions from such current year taxable income into the next tax year and pay a 4% excise tax on such income, as required. To the extent that the Fund determines that its estimated current year taxable income will be in excess of estimated dividend distributions for the current year from such income, the Fund accrues excise tax, if any, on estimated excess taxable income as such taxable income is earned.
For tax purposes, the distributions to holders of mandatory redeemable preferred shares as described in Note 7 are treated as dividends.
Commitments and Contingencies
In the normal course of business, the Fund's investment activities involve executions, settlement and financing of various transactions resulting in receivables from, and payables to, brokers, dealers and the Fund's custodian. These activities may expose the Fund to risk in the event that such parties are unable to fulfill contractual obligations. Management does not anticipate any material losses from
Annual Report 2021
111
CION Ares Diversified Credit Fund
Notes to Consolidated Financial Statements (continued)
December 31, 2021
(in thousands, except per share data, percentages and as otherwise noted)
counterparties with whom it conducts business. Consistent with standard business practice, the Fund enters into contracts that contain a variety of indemnifications, and is engaged from time to time in various legal actions. The maximum exposure of the Fund under these arrangements and activities is unknown. However, the Fund expects the risk of material loss to be remote.
Commitments to extend credit include loan proceeds the Fund is obligated to advance, such as delayed draws or revolving credit arrangements. Commitments generally have fixed expiration dates or other termination clauses. Unrealized gains or losses associated with unfunded commitments are recorded in the consolidated financial statements and reflected as an adjustment to the fair value of the related security in the Consolidated Schedule of Investments. The par amount of the unfunded commitments is not recognized by the Fund until it becomes funded.
Distributions to Shareholders
The Fund records distributions from net investment income daily. These distributions may be reinvested or paid monthly to shareholders. The Fund intends to pay common shareholders at least annually all or substantially all of its taxable income. The Fund intends to pay any capital gains distributions at least annually.
The Fund may make distributions, without limitation, from offering proceeds or borrowings, which may constitute a return of capital, as well as net investment income from operations, capital and non-capital gains from the sale of assets, and dividends or distributions from equity investments. Furthermore, a portion of the Fund's distributions may be derived from expense support payments made by the Adviser, which are subject to repayment by the Fund within three years pursuant to the Expense Support and Conditional Reimbursement Agreement (the "Expense Support Agreement"). The purpose of such expense support payments is to ensure that the Fund bears an appropriate level of expenses. As such, the Fund's distributions may not be entirely based on investment performance and can only be sustained if positive investment performance is achieved in future periods and/or the Adviser continues to make such expense support payments. Any future repayments of expenses by the Fund will reduce cash otherwise potentially available for distributions. There can be no assurance that sufficient performance will be achieved in order to sustain the current level of the Fund's distributions. After the expiration of the current term of the Expense Support Agreement on July 31, 2022, the Adviser has no obligation to make expense support payments in future periods. If the Adviser did not make any expense support payments during such period, all or a portion of the Fund's distributions would have been a return of capital which would reduce the available capital for investment. The sources of the
Fund's distributions may vary periodically. Please refer to the Financial Highlights table for the sources of distributions.
Shareholders' Allocations
The Fund currently offers Class A, Class C, Class I, Class L, Class U, Class U-2 and Class W common shares (See Note 5). Realized and unrealized gains and losses and net investment income, excluding class specific expenses, if any, are allocated daily to each class of common shares based upon the relative proportion of net assets of each class. Differences in per share distributions by class are generally due to differences in class specific expenses.
Use of Estimates in the Preparation of Financial Statements
The preparation of financial statements in conformity with GAAP requires the Adviser to make estimates and assumptions that affect the reported amounts and disclosures in the consolidated financial statements. Actual results could differ from those estimates and such differences may be material.
Recent Accounting Pronouncement
In March 2020, the Financial Accounting Standards Board ("FASB") issued Accounting Standards Update ("ASU") No. 2020-04, "Reference Rate Reform (Topic 848)," which provides optional expedients and exceptions for applying GAAP to contracts, hedging relationships, and other transactions affected by reference rate reform if certain criteria are met. The amendments apply only to contracts, hedging relationships, and other transactions that reference London Interbank Offered Rate ("LIBOR") or another reference rate expected to be discontinued because of reference rate reform. In January 2021, the FASB issued ASU No. 2021-01, Reference Rate Reform (Topic 848), which expanded the scope of Topic 848 to include derivative instruments impacted by discounting transition. ASU 2020-04 and ASU 2021-04 are effective for all entities as of March 12, 2020 through December 31, 2022. The expedients and exceptions provided by the amendments do not apply to contract modifications and hedging relationships entered into or evaluated after December 31, 2022, except for hedging transactions as of December 31, 2022, that an entity has elected certain optional expedients for and that are retained through the end of the hedging relationship. The Fund is currently evaluating the impact of adopting ASU 2020-04 and 2021-01 on the Fund's consolidated financial statements.
(3) Investment Advisory and Other Agreements
The Adviser is registered as an investment adviser under the Advisers Act. The Adviser is an affiliate of Ares Management
Annual Report 2021
112
CION Ares Diversified Credit Fund
Notes to Consolidated Financial Statements (continued)
December 31, 2021
(in thousands, except per share data, percentages and as otherwise noted)
and leverages Ares Management's entire investment platform and benefits from the significant capital markets, trading and research expertise of all of Ares Management's investment professionals.
Pursuant to the investment advisory agreement, dated December 6, 2016 (the "Investment Advisory Agreement") (most recently amended and restated as of May 22, 2020), by and between the Fund and the Adviser, the Adviser provides certain investment advisory and administrative services to the Fund and in consideration of the advisory services provided, the Adviser is entitled to a fee consisting of two components — a base management fee (the "Management Fee") and an incentive fee (the "Incentive Fee"). Pursuant to the investment sub-advisory agreement, dated as of December 6, 2016 (the "Investment Sub-Advisory Agreement"), by and between the Adviser and the Fund, the Adviser pays Ares Capital Management II LLC (the "Sub-Adviser") 40% of the Management Fee and Incentive Fee actually received and retained and not otherwise used to support expenses.
Pursuant to the Investment Advisory Agreement, the Fund has agreed to pay the Adviser the Management Fee at an annual rate of 1.25% of the average daily value of the Fund's total assets (including any assets attributable to any preferred shares issued or to indebtedness) minus the Fund's liabilities other than liabilities relating to indebtedness. During the year ended December 31, 2021, the Fund incurred $21,825 of Management Fees.
The Incentive Fee is calculated and payable quarterly in arrears based upon each share class's "pre-incentive fee net investment income" for the immediately preceding quarter, and is subject to a hurdle rate, expressed as a rate of return on each share class's "average daily net asset value," equal to 1.50% per quarter (or an annualized hurdle rate of 6.00%), subject to a "catch-up" feature. For this purpose, "pre-incentive fee net investment income" means interest income, dividend income and any other income accrued during the calendar quarter, minus each share class's operating expenses for the quarter and taking into account the Expense Support Agreement. For such purposes, each share class's operating expenses will include the Management Fee, expenses reimbursed to the Adviser under the administration agreement, dated as of December 6, 2016 (the "Adviser Administration Agreement"), by and between the Fund and the Adviser, and any interest expense and distributions paid on any issued and outstanding preferred shares, but will exclude the Incentive Fee.
The "catch-up" provision is intended to provide the Adviser with an Incentive Fee of 15% on each share class's pre-incentive fee net investment income when the share class's
pre-incentive fee net investment income reaches 1.765% of average daily net asset value in any calendar quarter. During the year ended December 31, 2021, Class I, Class L and Class W incurred a total of $3,000 of Incentive Fees.
Prior to May 22, 2020, the Incentive Fee was calculated and payable quarterly in arrears based upon the Fund's (rather than each class's) "pre-incentive fee net investment income" for the immediately preceding quarter, and was subject to a hurdle rate, expressed as a rate of return on the Fund's "adjusted capital," equal to 1.50% per quarter (or an annualized hurdle rate of 6.00%), subject to a "catch-up" feature. "Adjusted Capital" previously was defined as the cumulative gross proceeds received by the Fund from the sale of the Fund's shares (including pursuant to the Fund's DRIP (as defined below), reduced by amounts paid in connection with purchases of the Fund's shares pursuant to the Fund's share repurchase program and further reduced by distribution representing a return of capital. In calculating any Incentive Fee, "pre-incentive fee net investment income" means interest income, dividend income and any other income accrued during the calendar quarter, minus the Fund's operating expenses for the quarter.
The Adviser is obligated to pay expenses associated with providing the investment services stated in the Investment Advisory Agreement and Investment Sub-Advisory Agreement, including expenses associated with office space for their officers and employees, investment and economic research, trading and investment management of the Fund.
Under the Expense Support Agreement, the Adviser may at its discretion, through the period ending July 31, 2022, reimburse the Fund's operating expenses to the extent that aggregate distributions made to each class' shareholders during the applicable quarter exceed Available Operating Funds (as defined below). Additionally, during the term of the Expense Support Agreement, the Adviser may reimburse the Fund's operating expenses to the extent that it otherwise deems appropriate such that the Fund bears an appropriate level of expenses (each such payment, an "Expense Payment"). "Available Operating Funds" means the sum attributable to the applicable class of (i) the Fund's net investment Fund taxable income (including net short-term capital gains reduced by net long term capital losses); (ii) the Fund's net capital gains (including the excess of net long-term capital gains over net short-term capital losses); and (iii) dividends and other distributions paid to or otherwise earned by the Fund on account of investments in portfolio companies (to the extend such amounts listed in clause (iii) are not included under clauses (i) and (ii) above).
In consideration of the Adviser's agreement to reimburse the Fund's operating expenses, the Fund has agreed to repay the
Annual Report 2021
113
CION Ares Diversified Credit Fund
Notes to Consolidated Financial Statements (continued)
December 31, 2021
(in thousands, except per share data, percentages and as otherwise noted)
Adviser in the amount of any Fund expenses reimbursed subject to the limitation that a reimbursement (an "Adviser Reimbursement") will be made only if and to the extent that (i) it is payable not more than three years from the last business day of the calendar quarter in which the applicable Expense Payment was made by the Adviser; (ii) the Adviser Reimbursement does not cause other fund operating expenses attributable to the applicable class (on an annualized basis and net of any reimbursements received by the Fund during such fiscal year) during the applicable quarter to exceed the percentage of the Fund's average net assets attributable to common shares represented by other fund operating expenses allocable to the applicable class (as defined below) (on an annualized basis) during the quarter in which the applicable Expense Payment from the Adviser was made; and (iii) the distributions per share declared by the Fund for the applicable class at the time of the applicable Expense Payment are less than the effective rate of distributions per share for the applicable class at the time the Adviser Reimbursement would
be paid. Other fund operating expenses is defined as, the Fund's total Operating Expenses (as defined below), excluding the Management Fees, the Incentive Fees, offering expenses, financing fees and costs, interest expense and extraordinary expenses. "Operating Expenses" means all operating costs and expenses incurred by the Fund, as determined in accordance with GAAP for investment companies. The Expense Support Agreement was renewed for another year in May 2021 and is set to expire on July 31, 2022, unless renewed by the mutual agreement of the Adviser and the Board. The Expense Support Agreement may be terminated only by the Board on notice to the Adviser. For the year ended December 31, 2021, the Adviser did not provide any expense support and the Fund incurred $752 in Adviser Reimbursement.
The table below presents a summary of all expenses supported by the Adviser for each of the following three month periods in which the Fund received expense support from the Adviser and associated dates through which such expenses are eligible for reimbursement from the Fund.
Fund Level Expense Support
Three Months Ended | Expense Support from the Adviser ($) | Recoupment of Expense Support ($) | Expense Support No Longer Eligible for Reimbursement ($) | Unreimbursed Expense Support ($) | Ratio of Other Fund Operating Expenses to Average Net Assets for the Period(a) % | Annualized Distribution Ratios for the Period(b) ($) | Eligible for Reimbursement through | ||||||||||||||||||||||||
January 31, 2017 | 335 | 335 | — | — | 68.82 | — | January 31, 2020 | ||||||||||||||||||||||||
April 30, 2017 | 820 | 820 | — | — | 54.97 | 1.39 | April 30, 2020 | ||||||||||||||||||||||||
July 31, 2017 | 738 | 738 | — | — | 37.93 | 1.39 | July 31, 2020 | ||||||||||||||||||||||||
Total | 1,893 | 1,893 | — | — | |||||||||||||||||||||||||||
Class A
Three Months Ended | Expense Support from the Adviser ($) | Recoupment of Expense Support ($) | Expense Support No Longer Eligible for Reimbursement ($) | Unreimbursed Expense Support ($) | Ratio of Other Fund Operating Expenses to Average Net Assets for the Period(a) % | Annualized Distribution Ratios for the Period(b) ($) | Eligible for Reimbursement through | ||||||||||||||||||||||||
July 31, 2017 | 193 | 193 | — | — | 9.01 | 1.39 | July 31, 2020 | ||||||||||||||||||||||||
October 31, 2017 | 592 | 291 | 301 | — | 7.68 | 1.39 | October 31, 2020 | ||||||||||||||||||||||||
January 31, 2018 | 412 | 111 | 301 | — | 5.42 | 1.39 | January 31, 2021 | ||||||||||||||||||||||||
April 30, 2018 | 307 | 118 | 189 | — | 4.43 | 1.39 | April 30, 2021 | ||||||||||||||||||||||||
July 31, 2018 | 282 | 137 | 145 | — | 3.86 | 1.39 | July 31, 2021 | ||||||||||||||||||||||||
October 31, 2018 | 351 | 66 | 285 | — | 3.15 | 1.39 | October 31, 2021 | ||||||||||||||||||||||||
January 31, 2019 | 113 | — | — | 113 | 1.21 | 1.39 | January 31, 2022 | ||||||||||||||||||||||||
April 30, 2019 | 10 | — | — | 10 | 1.29 | 1.39 | April 30, 2022 | ||||||||||||||||||||||||
Total | 2,260 | 916 | 1,221 | 123 | |||||||||||||||||||||||||||
Annual Report 2021
114
CION Ares Diversified Credit Fund
Notes to Consolidated Financial Statements (continued)
December 31, 2021
(in thousands, except per share data, percentages and as otherwise noted)
Class C
Three Months Ended | Expense Support from the Adviser ($) | Recoupment of Expense Support ($) | Expense Support No Longer Eligible for Reimbursement ($) | Unreimbursed Expense Support ($) | Ratio of Other Fund Operating Expenses to Average Net Assets for the Period(a) % | Annualized Distribution Ratios for the Period(b) ($) | Eligible for Reimbursement through | ||||||||||||||||||||||||
July 31, 2017 | — | — | — | — | — | — | July 31, 2020 | ||||||||||||||||||||||||
October 31, 2017 | 99 | 99 | — | — | 5.32 | 1.39 | October 31, 2020 | ||||||||||||||||||||||||
January 31, 2018 | 174 | 64 | 110 | — | 6.07 | 1.39 | January 31, 2021 | ||||||||||||||||||||||||
April 30, 2018 | 206 | 2 | 204 | — | 4.94 | 1.39 | April 30, 2021 | ||||||||||||||||||||||||
July 31, 2018 | 264 | 21 | 243 | — | 4.33 | 1.39 | July 31, 2021 | ||||||||||||||||||||||||
October 31, 2018 | 313 | — | 313 | — | 3.66 | 1.39 | October 31, 2021 | ||||||||||||||||||||||||
January 31, 2019 | 163 | — | — | 163 | 1.96 | 1.39 | January 31, 2022 | ||||||||||||||||||||||||
April 30, 2019 | 84 | — | — | 84 | 2.03 | 1.39 | April 30, 2022 | ||||||||||||||||||||||||
Total | 1,303 | 186 | 870 | 247 | |||||||||||||||||||||||||||
Class I
Three Months Ended | Expense Support from the Adviser ($) | Recoupment of Expense Support ($) | Expense Support No Longer Eligible for Reimbursement ($) | Unreimbursed Expense Support ($) | Ratio of Other Fund Operating Expenses to Average Net Assets for the Period(a) % | Annualized Distribution Ratios for the Period(b) ($) | Eligible for Reimbursement through | ||||||||||||||||||||||||
July 31, 2017 | — | — | — | — | — | — | July 31, 2020 | ||||||||||||||||||||||||
October 31, 2017 | 172 | 172 | — | — | 4.81 | 1.39 | October 31, 2020 | ||||||||||||||||||||||||
January 31, 2018 | 246 | 246 | — | — | 5.03 | 1.39 | January 31, 2021 | ||||||||||||||||||||||||
April 30, 2018 | 369 | 369 | — | — | 3.84 | 1.39 | April 30, 2021 | ||||||||||||||||||||||||
July 31, 2018 | 521 | 521 | — | — | 3.19 | 1.39 | July 31, 2021 | ||||||||||||||||||||||||
October 31, 2018 | 779 | 779 | — | — | 2.45 | 1.39 | October 31, 2021 | ||||||||||||||||||||||||
January 31, 2019 | 281 | 281 | — | — | 0.96 | 1.39 | January 31, 2022 | ||||||||||||||||||||||||
April 30, 2019 | — | — | — | — | — | 1.39 | April 30, 2022 | ||||||||||||||||||||||||
Total | 2,368 | 2,368 | — | — | |||||||||||||||||||||||||||
Class L
Three Months Ended | Expense Support from the Adviser ($) | Recoupment of Expense Support ($) | Expense Support No Longer Eligible for Reimbursement ($) | Unreimbursed Expense Support ($) | Ratio of Other Fund Operating Expenses to Average Net Assets for the Period(a) % | Annualized Distribution Ratios for the Period(b) ($) | Eligible for Reimbursement through | ||||||||||||||||||||||||
July 31, 2017 | — | — | — | — | — | — | July 31, 2020 | ||||||||||||||||||||||||
October 31, 2017 | — | — | — | — | — | — | October 31, 2020 | ||||||||||||||||||||||||
January 31, 2018 | — | — | — | — | 5.49 | 1.39 | January 31, 2021 | ||||||||||||||||||||||||
April 30, 2018 | 4 | 4 | — | — | 3.54 | 1.39 | April 30, 2021 | ||||||||||||||||||||||||
July 31, 2018 | 9 | 9 | — | — | 3.23 | 1.39 | July 31, 2021 | ||||||||||||||||||||||||
October 31, 2018 | 16 | 16 | — | — | 2.62 | 1.39 | October 31, 2021 | ||||||||||||||||||||||||
January 31, 2019 | 7 | 7 | — | — | 1.46 | 1.39 | January 31, 2022 | ||||||||||||||||||||||||
April 30, 2019 | 2 | 2 | — | — | 1.54 | 1.39 | April 30, 2022 | ||||||||||||||||||||||||
Total | 38 | 38 | — | — | |||||||||||||||||||||||||||
Annual Report 2021
115
CION Ares Diversified Credit Fund
Notes to Consolidated Financial Statements (continued)
December 31, 2021
(in thousands, except per share data, percentages and as otherwise noted)
Class U
Three Months Ended | Expense Support from the Adviser ($) | Recoupment of Expense Support ($) | Expense Support No Longer Eligible for Reimbursement ($) | Unreimbursed Expense Support ($) | Ratio of Other Fund Operating Expenses to Average Net Assets for the Period(a) % | Annualized Distribution Ratios for the Period(b) ($) | Eligible for Reimbursement through | ||||||||||||||||||||||||
December 31, 2019 | 27 | 27 | — | — | 1.72 | 1.39 | December 31, 2022 | ||||||||||||||||||||||||
Total | 27 | 27 | — | — | |||||||||||||||||||||||||||
(a) Other Fund Operating Expenses is defined as, the Fund's total Operating Expenses (as defined below), excluding the management fees and Incentive fees, offering expenses, financing fees and costs, interest expense and extraordinary expenses. "Operating Expenses" means all operating costs and expenses incurred by the Fund, as determined in accordance with generally accepted accounting principles for investment companies.
(b) The Annualized Distribution Rate per Share equals the projected annualized distribution amount which is calculated based on the average regular cash distributions per share that were declared during record dates in the applicable Expense Support Payment Quarter.
Pursuant to the Adviser Administration Agreement, the Adviser furnishes the Fund with office equipment and clerical, bookkeeping and record keeping services at the Adviser's office facilities. Under the Adviser Administration Agreement, the Fund is obligated to reimburse the Adviser, at cost, based upon the Fund's allocable portion of the Adviser's overhead and other expenses (including travel expenses) incurred by the Adviser in performing its obligations under the Adviser Administration Agreement, including the Fund's allocable portion of the compensation, rent and other expenses of certain of its officers (including but not limited to the chief compliance officer, chief financial officer, chief accounting officer, general counsel, treasurer and assistant treasurer) and their respective staffs. The Adviser Administration Agreement may be terminated by either party without penalty upon 60 days' written notice to the other party. The total of such expenses incurred for the year ended December 31, 2021 was $2,078.
Pursuant to an administration agreement between ALPS Fund Services, Inc. ("ALPS") and the Fund, ALPS performs, or administers the performance of, certain of the Fund's required administrative services, which include, among other things, providing assistance in accounting, legal, compliance, and operations, preparing the financial records that the Fund is required to maintain and preparing reports to the Fund's shareholders and reports filed with the SEC. In addition, ALPS coordinates the preparation and filing of the Fund's tax returns and generally coordinates the payment of the Fund's expenses and the performance of administrative and professional services rendered to the Fund by others. The Fund pays ALPS for these services. The total of such expenses incurred by the Fund for the year ended December 31, 2021 was $1,380.
Pursuant to a transfer agent agreement between DST Systems, Inc. ("DST") and the Fund, DST performs transfer agency
services for the Fund. DST maintains the shareholder accounting records for the Fund. The Fund pays DST for these services. The total of such expenses incurred for the year ended December 31, 2021 was $518.
Shareholder Service Expenses
The Fund has adopted a "Shareholder Services Plan" with respect to its Class A, Class C, Class L and Class U-2 Shares under which the Fund may compensate financial industry professionals for providing ongoing services in respect of clients with whom they have distributed shares of the Fund. Such services may include electronic processing of client orders, electronic fund transfers between clients and the Fund, account reconciliations with the Fund's transfer agent, facilitation of electronic delivery to clients of Fund documentation, monitoring client accounts for back-up withholding and any other special tax reporting obligations, maintenance of books and records with respect to the foregoing, and such other information and liaison services as the Fund or the Adviser may reasonably request. Under the Shareholder Services Plan, the Fund, with respect to Class A, Class C, Class L and Class U-2 Shares, may incur expenses on an annual basis equal to 0.25% of its average net assets attributable to Class A, Class C, Class L and Class U-2 Shares, respectively.
Distribution Plan
The Fund, with respect to its Class C, Class L, Class U, Class W and Class U-2 Shares, is authorized under a "Distribution Plan" to pay to ALPS Distributor, Inc. (the "Distributor") a distribution fee for certain activities relating to the distribution of shares to investors. These activities include marketing and other activities to support the distribution of Class C, Class L, Class U, Class W and Class U-2 shares. The Distribution Plan operates in a manner consistent with Rule 12b-1 under the Investment Company
Annual Report 2021
116
CION Ares Diversified Credit Fund
Notes to Consolidated Financial Statements (continued)
December 31, 2021
(in thousands, except per share data, percentages and as otherwise noted)
Act, which regulates the manner in which an open-end investment company may directly or indirectly bear the expenses of distributing its shares. Although the Fund is not an open-end investment company, it has undertaken to comply with the terms of Rule 12b-1 as a condition of an exemptive order under the Investment Company Act which permits it to offer multiple classes of shares. Under the Distribution Plan, the Fund pays the Distributor a distribution fee at an annual rate of 0.75% of average daily net assets attributable to Class C Shares, 0.25% of the average daily net assets attributable to Class L Shares, 0.50% of the average daily net assets attributable to Class W Shares and Class U-2 Shares, and 0.75% of the average daily net assets attributable to Class U Shares. Some or all of such distribution fees may be paid by the Distributor to certain financial intermediaries.
The Fund may be limited in its ability to declare any cash distribution on its capital stock or purchase its capital stock unless, at the time of such declaration or purchase, the Fund has an asset coverage (on its indebtedness) of at least 300% after deducting the amount of such distribution or purchase price, as applicable. For non-public indebtedness issued by the Fund or its subsidiaries (for example, the State Street Credit Facility and the Wells Credit Facility, both as defined below), the Fund may be able to continue to pay distributions on its capital stock or purchase its capital stock even if the asset coverage ratio on its indebtedness falls below 300%.
(4) Fair Value of Financial Instruments
The Fund follows the provisions of ASC 820-10, Fair Value Measurements and Disclosures ("ASC 820-10"), which among other matters, requires enhanced disclosures about investments that are measured and reported at fair value. ASC 820-10 defines fair value, establishes a framework for measuring fair value in accordance with GAAP and expands disclosure of fair value measurements. ASC 820-10 determines fair value to be the price that would be received for an investment in a current sale, which assumes an orderly transaction between market participants on the measurement date. ASC 820-10 requires the Fund to assume that the portfolio investment is sold in its principal market to market participants or, in the absence of a principal market, the most advantageous market, which may be a hypothetical market. Market participants are defined as buyers and sellers in the principal or most advantageous market that are independent, knowledgeable, and willing and able to transact. In accordance with ASC 820-10, the Fund has considered its principal market as the market in which the Fund exits its portfolio investments with the greatest volume and level of activity. ASC 820-10 specifies a hierarchy of valuation techniques based on whether
the inputs to those valuation techniques are observable or unobservable. In accordance with ASC 820-10, these inputs are summarized in the three broad levels listed below:
• Level 1 — Valuations based on quoted prices in active markets for identical assets or liabilities that the Fund has the ability to access.
• Level 2 — Valuations based on quoted prices in markets that are not active or for which all significant inputs are observable, either directly or indirectly.
• Level 3 — Valuations based on inputs that are unobservable and significant to the overall fair value measurement.
In addition to using the above inputs in investment valuations, the Fund continues to employ a Valuation Policy that is approved by the Board that is consistent with the provisions of ASC 820-10 (See Note 2 for more information). Consistent with the Fund's Valuation Policy, it evaluates the source of inputs, including any markets in which the Fund's investments are trading (or any markets in which securities with similar attributes are trading), in determining fair value. The Fund's Valuation Policy considers the fact that because there may not be a readily available market value for the investments in the Fund's portfolio, therefore, the fair value of the investments may be determined using unobservable inputs.
The assets and liabilities classified as Level 1 or Level 2 are typically valued based on quoted market prices, forward foreign exchange rates, dealer quotations or alternative pricing sources supported by observable inputs. The Adviser obtains prices from independent pricing services which generally utilize broker quotes and may use various other pricing techniques which take into account appropriate factors such as yield, quality, coupon rate, maturity, type of issue, trading characteristics and other data. The Adviser is responsible for all inputs and assumptions related to the pricing of securities. The Adviser has internal controls in place that support its reliance on information received from third-party pricing sources. As part of its internal controls, the Adviser obtains, reviews, and tests information to corroborate prices received from third-party pricing sources. For any security, if market or dealer quotations are not readily available, or if the Adviser determines that a quotation of a security does not represent a fair value, then the security is valued at a fair value as determined in good faith by the Adviser and will be classified as Level 3. In such instances, the Adviser will use valuation techniques consistent with the market or income approach to measure fair value and will give consideration to all factors which might reasonably affect the fair value.
Annual Report 2021
117
CION Ares Diversified Credit Fund
Notes to Consolidated Financial Statements (continued)
December 31, 2021
(in thousands, except per share data, percentages and as otherwise noted)
The investments classified as Level 3 (other than as described below in the following paragraph) are typically valued using two different valuation techniques. The first valuation technique is an analysis of the enterprise value ("EV") of the portfolio company. Enterprise value means the entire value of the portfolio company to a market participant, including the sum of the values of debt and equity securities used to capitalize the enterprise at a point in time. The primary method for determining EV uses a multiple analysis whereby appropriate multiples are applied to the portfolio company's EBITDA (generally defined as net income before net interest expense, income tax expense, depreciation and amortization). EBITDA multiples are typically determined based upon review of market comparable transactions and publicly traded comparable companies, if any. The Fund may also employ other valuation multiples to determine EV, such as revenues. The Fund may also use industry specific valuation analyses to determine enterprise value, such as capitalization rate analysis used in the real estate industry. The second method for determining EV uses a discounted cash flow analysis whereby future expected cash flows of the portfolio company are discounted to determine a present value using estimated discount rates (typically a weighted average cost of capital based on costs of debt and equity consistent with current market conditions). The EV analysis is performed to determine the value of equity investments, the value of debt investments in portfolio companies where the Fund has control or could gain control through an option or warrant security, and to determine if there is credit impairment for debt investments. If debt investments are credit impaired, an EV analysis may be used to value such debt investments; however, in addition to the methods outlined above, other methods such as a liquidation or wind down analysis may be utilized to estimate enterprise value. The second valuation technique is a yield analysis, which is typically performed for non-credit impaired debt investments in portfolio companies where the Fund does not own a controlling equity position. To determine fair value using a yield analysis, a current price is imputed for the investment based upon an assessment of the expected market yield for a similarly structured investment with a similar level of risk. In the yield analysis, the Fund considers the current contractual interest rate, the maturity and other terms of the investment relative to risk of the company and the specific investment. A key determinant of risk, among other
things, is the leverage through the investment relative to the enterprise value of the portfolio company. As debt investments held by the Fund are substantially illiquid with no active transaction market, the Fund depends on primary market data, including newly funded transactions, as well as secondary market data with respect to high yield debt instruments and syndicated loans, as inputs in determining the appropriate market yield, as applicable.
The fair value of CLOs is estimated based on various valuation models from third-party pricing services. The provided prices are checked using internally developed models. The valuation models generally utilize discounted cash flows and take into consideration prepayment and loss assumptions, based on historical experience and projected performance, economic factors, the characteristics and condition of the underlying collateral, comparable yields for similar securities and recent trading activity. These securities are classified as Level 3.
Private asset-backed securities classified as Level 3 are typically valued using two different valuation techniques. The first valuation technique is an analysis of the forecasted cash flows of the security. The forecasted cash flows take into consideration prepayment and loss assumptions, based on historical experience and projected performance, economic factors, and the characteristics and condition of the underlying collateral. For equity securities, the projected cash flows are present valued using a market discount rate to determine the fair value. For debt securities, the analysis is used to determine if the borrower has the ability to repay its obligations. If it is determined that the borrower does have the ability to repay its obligations, the second valuation technique that is utilized is a yield analysis. To determine fair value using a yield analysis, a current price is imputed for the investment based upon an assessment of the expected market yield for a similarly structured investment with a similar level of risk. In the yield analysis, the Fund considers the current contractual interest rate, the maturity and other terms of the investment relative to risk of the borrower and the specific investment. As the debt investments are substantially illiquid with no active transaction market, the Fund depends on primary market data, including newly funded transactions, as inputs in determining the appropriate market yield, as applicable.
Annual Report 2021
118
CION Ares Diversified Credit Fund
Notes to Consolidated Financial Statements (continued)
December 31, 2021
(in thousands, except per share data, percentages and as otherwise noted)
The following is a summary of the inputs used as of December 31, 2021, in valuing the Fund's investments carried at fair value:
| Level 1 — Quoted Prices ($) | Level 2 — Other Significant Observable Inputs ($) | Level 3 — Significant Unobservable Inputs ($) | Total ($) | ||||||||||||||||
Senior Loans | — | 722,763 | 1,390,028 | 2,112,791 | |||||||||||||||
| Subordinated Loans | — | 41 | 15,827 | 15,868 | |||||||||||||||
| Corporate Bonds | — | 194,898 | 12,890 | 207,788 | |||||||||||||||
| Collateralized Loan Obligations | — | — | 202,700 | 202,700 | |||||||||||||||
| Common Stocks | 2,299 | — | 24,558 | 26,857 | |||||||||||||||
| Preferred Stocks | — | — | 102,455 | 102,455 | |||||||||||||||
| Private Asset-Backed Debt | — | — | 19,843 | 19,843 | |||||||||||||||
| Real Estate Debt | — | — | 3,431 | 3,431 | |||||||||||||||
Warrants | — | — | 2,821 | 2,821 | |||||||||||||||
| Total Investments | 2,299 | 917,702 | 1,774,553 | 2,694,554 | |||||||||||||||
| Level 1 — Quoted Prices ($) | Level 2 — Other Significant Observable Inputs ($) | Level 3 — Significant Unobservable Inputs ($) | Total ($) | ||||||||||||||||
Derivative assets: | |||||||||||||||||||
| Forward Currency Contracts | — | 2,688 | — | 2,688 | |||||||||||||||
| Purchased Equity Options | 5 | — | — | 5 | |||||||||||||||
| Credit Default Swaps | — | 100 | — | 100 | |||||||||||||||
Derivative liabilities: | |||||||||||||||||||
| Common Stocks Sold Short | (6,497 | ) | — | — | (6,497 | ) | |||||||||||||
| Corporate Bonds Sold Short | — | (3,416 | ) | — | (3,416 | ) | |||||||||||||
| Forward Currency Contracts | — | (554 | ) | — | (554 | ) | |||||||||||||
| Written Equity Options | (3 | ) | — | — | (3 | ) | |||||||||||||
| Credit Default Swaps | — | (1,033 | ) | — | (1,033 | ) | |||||||||||||
The following is a reconciliation of the Fund's investments in which significant unobservable inputs (Level 3) were used in determining fair value for the year ended December 31, 2021:
| Senior Loans ($) | Subordinated Loans ($) | Corporate Bonds ($) | Collateralized Loan Obligations ($) | Common Stocks ($) | Preferred Stocks ($) | Private Asset Backed Debt ($) | Real Estate Debt ($) | Warrants ($) | Total ($) | ||||||||||||||||||||||||||||||||||
| Balance as of December 31, 2020 | 600,554 | 10,693 | 2,811 | 168,707 | 2,624 | 926 | 9,067 | 5,999 | 558 | 801,939 | |||||||||||||||||||||||||||||||||
Purchases | 981,274 | 7,447 | 19,912 | 77,007 | 19,996 | 97,312 | 18,582 | 387 | 2,915 | 1,224,832 | |||||||||||||||||||||||||||||||||
| Sales and principal redemptions | (205,233 | ) | (2,616 | ) | (5,264 | ) | (44,827 | ) | (248 | ) | (361 | ) | (11,082 | ) | (3,021 | ) | (10 | ) | (272,662 | ) | |||||||||||||||||||||||
| Net realized and unrealized gains (losses) | 9,155 | 312 | 345 | 1,758 | 2,186 | 4,578 | (798 | ) | 64 | (642 | ) | 16,958 | |||||||||||||||||||||||||||||||
| Accrued discounts (premiums) | 2,801 | 29 | 28 | 55 | — | — | 25 | 2 | — | 2,940 | |||||||||||||||||||||||||||||||||
| Transfers in to Level 3(a) | 7,265 | — | — | — | — | — | 4,049 | — | — | 11,314 | |||||||||||||||||||||||||||||||||
| Transfers out of Level 3(a) | (5,788 | ) | (38 | ) | (4,942 | ) | — | — | — | — | — | — | (10,768 | ) | |||||||||||||||||||||||||||||
| Balance as of December 31, 2021 | 1,390,028 | 15,827 | 12,890 | 202,700 | 24,558 | 102,455 | 19,843 | 3,431 | 2,821 | 1,774,553 | |||||||||||||||||||||||||||||||||
| Net change in unrealized gains (losses) from investments held at December 31, 2021 | 9,673 | 288 | 182 | 1,605 | 2,043 | 4,433 | (724 | ) | 44 | (96 | ) | 17,448 | |||||||||||||||||||||||||||||||
(a) Investments were transferred into and out of Level 3 during the year ended December 31, 2021. Transfers between Levels 2 and 3 were as a result of changes in the observability of significant inputs or available market data for certain portfolio companies.
Annual Report 2021
119
CION Ares Diversified Credit Fund
Notes to Consolidated Financial Statements (continued)
December 31, 2021
(in thousands, except per share data, percentages and as otherwise noted)
The following table summarizes the quantitative inputs and assumptions used for investments in securities at fair value categorized as Level 3 in the fair value hierarchy as of December 31, 2021.
Fair Value | Primary | Inputs | Estimated | Weighted | |||||||||||||||||||
Assets | |||||||||||||||||||||||
Senior Loans | 1,340,605 | Yield | Market | 3.4% - | 7.4% | ||||||||||||||||||
Senior Loans | 44,539 | Broker | N/A | N/A | N/A | ||||||||||||||||||
Senior Loans | 4,884 | Other | Recent Price | 98 | 98 | ||||||||||||||||||
Subordinated | 15,827 | Yield | Market | 7.8% - | 10.6% | ||||||||||||||||||
Corporate Bonds | 12,890 | Yield | Market | 7.1% - | 7.5% | ||||||||||||||||||
Collateralized | 202,700 | Broker | N/A | N/A | N/A | ||||||||||||||||||
Common Stocks | 21,605 | EV Market | EBITDA | 3.1x - | 17.1x | ||||||||||||||||||
Common Stocks | 2,953 | Other | Recent | 0 - | 9,088 | ||||||||||||||||||
Preferred Stocks | 102,455 | EV Market | EBITDA | 6.7x - | 17.2x | ||||||||||||||||||
Private | 17,282 | Income | Constant | 1.0% - | 22.0% | ||||||||||||||||||
Private | 2,561 | Other | Recent | 98 - | 99 | ||||||||||||||||||
Real Estate Debt | 3,431 | Yield | Market | 16.3% - | 17.4% | ||||||||||||||||||
Warrants | 2,821 | EV Market | EBITDA | 6.8x - | 15.5x | ||||||||||||||||||
Total Level 3 | 1,774,553 | ||||||||||||||||||||||
(a) Weighted averages are calculated based on fair value of investments.
Changes in market yields, discount rates or EBITDA multiples, each in isolation, may change the fair value of certain of the Fund's investments. Generally, an increase in market yields or discount rates or decrease in EBITDA
multiples may result in a decrease in the fair value of certain of the Fund's investments.
Due to the inherent uncertainty of determining the fair value of investments that do not have a readily available market value, the fair value of the investments may fluctuate from period to period. Additionally, the fair value of the investments may differ significantly from the values that would have been used had a ready market existed for such investments and may differ materially from the values that the Fund may ultimately realize. Further, such investments are generally subject to legal and other restrictions on resale or otherwise are less liquid than publicly traded securities. If the Fund was required to liquidate a portfolio investment in a forced or liquidation sale, it could realize significantly less than the value at which the Fund has recorded it.
In addition, changes in the market environment and other events that may occur over the life of the investments may cause the gains or losses ultimately realized on these investments to be different than the unrealized gains or losses reflected in the valuations currently assigned.
The following are the carrying and fair values of the Fund's senior secured revolving credit facilities and mandatory redeemable preferred shares as of December 31, 2021.
| Carrying value ($) | Fair value ($) | Level 1 ($) | Level 2 ($) | Level 3 ($) | |||||||||||||||||||
| Wells Credit Facility(a) | 225,664 | 225,664 | — | 225,664 | — | ||||||||||||||||||
| State Street Credit Facility(a) | 176,804 | 176,804 | — | 176,804 | — | ||||||||||||||||||
| Series A Mandatory Redeemable Preferred Shares | 59,395 | 60,000 | — | 60,000 | — | ||||||||||||||||||
| Series B Mandatory Redeemable Preferred Shares | 89,059 | 90,000 | — | 90,000 | — | ||||||||||||||||||
| Series C Mandatory Redeemable Preferred Shares | 148,408 | 150,000 | — | 150,000 | — | ||||||||||||||||||
699,330 | 702,468 | — | 702,468 | — | |||||||||||||||||||
(a) The Wells Credit Facility and the State Street Credit Facility carrying values are the same as the principal amounts outstanding.
(5) Common Stock
The Fund, pursuant to an exemptive order granted by the SEC on July 11, 2017, offers multiple classes of shares. On July 11, 2017, the Fund's registration statement offering Class A, Class C, and Class I shares became effective. On November 2, 2017, the Fund's registration statement offering Class L shares became effective. On November 15, 2018, the Fund's registration statement offering Class U shares became
Annual Report 2021
120
CION Ares Diversified Credit Fund
Notes to Consolidated Financial Statements (continued)
December 31, 2021
(in thousands, except per share data, percentages and as otherwise noted)
effective and on November 30, 2018 the Fund's registration statement offering Class W shares became effective. On March 31, 2020, the Fund's registration statement offering Class U-2 shares became effective. The maximum sales load imposed on purchases, maximum contingent deferred sales charges, shareholder servicing and/or distribution fees charged will vary depending on each share class.
Common share transactions were as follows:
Class A | For the Year Ended December 31, 2021 | ||||||||||
Shares | Amount ($) | ||||||||||
| Common shares outstanding — beginning of period | 2,343 | 59,555 | |||||||||
Common shares issued | 391 | 9,921 | |||||||||
Reinvestment of distributions | 38 | 959 | |||||||||
Common shares redeemed | (364 | ) | (9,228 | ) | |||||||
Common shares outstanding — end of period | 2,408 | 61,207 | |||||||||
Class C | For the Year Ended December 31, 2021 | ||||||||||
Shares | Amount ($) | ||||||||||
| Common shares outstanding — beginning of period | 2,716 | 69,404 | |||||||||
Common shares issued | 501 | 12,690 | |||||||||
Reinvestment of distributions | 77 | 1,965 | |||||||||
Common shares redeemed | (279 | ) | (7,080 | ) | |||||||
Common shares outstanding — end of period | 3,015 | 76,979 | |||||||||
Class I | For the Year Ended December 31, 2021 | ||||||||||
Shares | Amount ($) | ||||||||||
| Common shares outstanding — beginning of period | 23,927 | 603,397 | |||||||||
Common shares issued | 31,018 | 796,866 | |||||||||
Reinvestment of distributions | 604 | 15,507 | |||||||||
Common shares redeemed | (4,066 | ) | (104,271 | ) | |||||||
Common shares outstanding — end of period | 51,483 | 1,311,499 | |||||||||
Class L | For the Year Ended December 31, 2021 | ||||||||||
Shares | Amount ($) | ||||||||||
| Common shares outstanding — beginning of period | 293 | 7,467 | |||||||||
Common shares issued | 93 | 2,344 | |||||||||
Reinvestment of distributions | 15 | 376 | |||||||||
Common shares redeemed | (20 | ) | (500 | ) | |||||||
Common shares outstanding — end of period | 381 | 9,687 | |||||||||
Class U | For the Year Ended December 31, 2021 | ||||||||||
Shares | Amount ($) | ||||||||||
| Common shares outstanding — beginning of period | 7,909 | 195,677 | |||||||||
Common shares issued | 5,515 | 141,102 | |||||||||
Reinvestment of distributions | 459 | 11,759 | |||||||||
Common shares redeemed | (524 | ) | (13,305 | ) | |||||||
Common shares outstanding — end of period | 13,359 | 335,233 | |||||||||
Class U-2 | For the Year Ended December 31, 2021 | ||||||||||
Shares | Amount ($) | ||||||||||
| Common shares outstanding — beginning of period | 477 | 11,500 | |||||||||
Common shares issued | 1,697 | 43,467 | |||||||||
Reinvestment of distributions | 43 | 1,106 | |||||||||
Common shares redeemed | (18 | ) | (460 | ) | |||||||
Common shares outstanding — end of period | 2,199 | 55,613 | |||||||||
Class W | For the Year Ended December 31, 2021 | ||||||||||
Shares | Amount ($) | ||||||||||
| Common shares outstanding — beginning of period | 1,576 | 40,494 | |||||||||
Common shares issued | — | 2 | |||||||||
Reinvestment of distributions | 59 | 1,522 | |||||||||
Common shares redeemed | (149 | ) | (3,833 | ) | |||||||
Common shares outstanding — end of period | 1,486 | 38,185 | |||||||||
Repurchase Program
Beginning in the second quarter of 2017, the Fund began offering and currently intends to continue offering, the quarterly repurchase of shares in such amount as may be determined by the Board in accordance with the Fund's fundamental policy to conduct repurchase offers for between 5%-25% of its outstanding shares each quarter.
Annual Report 2021
121
CION Ares Diversified Credit Fund
Notes to Consolidated Financial Statements (continued)
December 31, 2021
(in thousands, except per share data, percentages and as otherwise noted)
The following table summarizes the share repurchases completed during the year ended December 31, 2021:
Three Months Ended | Repurchase Date | Shares Repurchased | Purchase Price Per Share | Aggregate Consideration for Repurchased Shares | Size of Repurchased Offer | % of Outstanding Shares Offered to be Repurchased | % of Outstanding Shares Repurchased | ||||||||||||||||||||||||
December 31, 2020 | January 15, 2021 | 1,226 | 25.24 | $ | 30,933 | 2,003 | 5.00 | % | 3.06 | % | |||||||||||||||||||||
March 31, 2021 | April 15, 2021 | 1,110 | 25.35 | 28,137 | 2,282 | 5.00 | % | 2.43 | % | ||||||||||||||||||||||
June 30, 2021 | July 15, 2021 | 1,517 | 25.72 | 39,009 | 2,719 | 5.00 | % | 2.79 | % | ||||||||||||||||||||||
September 30, 2021 | October 14, 2021 | 1,568 | 25.89 | 40,596 | 3,227 | 5.00 | % | 2.43 | % | ||||||||||||||||||||||
Total | 5,421 | $ | 138,675 | ||||||||||||||||||||||||||||
(6) Debt
In accordance with the Investment Company Act, the Fund is allowed to borrow amounts with respect to senior securities representing indebtedness (such as the senior secured revolving credit facilities), such that its asset coverage, calculated pursuant to the Investment Company Act, is at least 300% after such borrowing.
State Street Credit Facility
The Fund is a party to a senior secured revolving credit facility (as amended, the "State Street Credit Facility"), that allows the Fund to borrow up to $400,000 at any one time outstanding. The State Street Credit Facility stated maturity date is July 21, 2023. Under the State Street Credit Facility, the Fund is required to comply with various covenants, reporting requirements and other customary requirements for similar revolving credit facilities, including, without limitation, covenants related to: (a) limitations on the incurrence of additional indebtedness, including additional mandatory redeemable preferred shares, and liens, (b) limitations on certain restricted payments and (c) maintaining a ratio of total assets (less total liabilities other than senior securities representing indebtedness) to senior securities representing indebtedness plus the involuntary liquidation preference of the mandatory redeemable preferred shares of the Fund and its consolidated subsidiaries (subject to certain exceptions) of not less than 2:1. These covenants are subject to important limitations and exceptions that are described in the documents governing the State Street Credit Facility. Amounts available to borrow under the State Street Credit Facility (and the incurrence of certain other permitted debt) are also subject to compliance with a borrowing base that applies different advance rates to different types of assets in the Fund's portfolio that are pledged as collateral. As of December 31, 2021, the Fund was in compliance with the terms of the State Street Credit Facility. See Note 12 for a subsequent event relating to the State Street Credit Facility.
As of December 31, 2021, there was $176,804 outstanding under the State Street Credit Facility. The interest rate charged on the State Street Credit Facility is based on an applicable LIBOR rate plus 1.00% (as defined in the agreements governing the State Street Credit Facility). The Fund is required to pay a commitment fee of 0.25% per annum on any unused portion of the State Street Credit Facility.
For the year ended December 31, 2021, the components of interest and unused commitment fees expense, average stated interest rates (i.e., rate in effect plus the spread) and average outstanding balances for the State Street Credit Facility were as follows:
| For the Year Ended December 31, 2021 ($) | |||||||
Stated interest expense | 2,044 | ||||||
Unused commitment fees | 258 | ||||||
Amortization of debt issuance costs | 389 | ||||||
Total interest and credit facility fees expense | 2,691 | ||||||
Average stated interest rate | 1.10 | % | |||||
Average outstanding balance | 184,979 | ||||||
Wells Credit Facility
The Fund and one of the Fund's consolidated subsidiaries, CADEX Credit Financing, LLC (the "Financing Sub"), are party to a revolving funding facility (as amended, the "Wells Credit Facility"), that allows the Financing Sub to borrow up to $500,000 at any one time outstanding. The Wells Credit Facility is secured by all of the assets held by, and the membership interest in, the Financing Sub. The end of the reinvestment period and the stated maturity date for the Wells Credit Facility are November 16, 2024 and November 16, 2026, respectively.
Amounts available to borrow under the Wells Credit Facility are subject to a borrowing base that applies different advance rates to different types of assets held by the Financing Sub.
Annual Report 2021
122
CION Ares Diversified Credit Fund
Notes to Consolidated Financial Statements (continued)
December 31, 2021
(in thousands, except per share data, percentages and as otherwise noted)
The Financing Sub is also subject to limitations with respect to the loans securing the Wells Credit Facility, including restrictions on loan size, borrower domicile, payment frequency and status, collateral interests, and loans with fixed rates, as well as restrictions on portfolio company leverage, which may also affect the borrowing base and therefore amounts available to borrow. The Fund and the Financing Sub are also required to comply with various covenants, reporting requirements and other customary requirements for similar facilities. These covenants are subject to important limitations and exceptions that are described in the agreements governing the Wells Credit Facility. As of December 31, 2021, the Fund and the Financing Sub were in compliance with the terms of the Wells Credit Facility.
As of December 31, 2021, there was $225,664 outstanding under the Wells Credit Facility. The interest rate charged on the Wells Credit Facility is based on an applicable LIBOR rate plus spread of 2.00% (as defined in the agreements governing the Wells Credit Facility). The Financing Sub is also required to pay a commitment fee of between 0.50% and 1.25% per annum depending on the size of the unused portion of the Wells Credit Facility.
For the year ended December 31, 2021, the components of interest and unused commitment fees expense, average stated interest rates (i.e., rate in effect plus the spread) and average outstanding balances for the Wells Credit Facility were as follows:
| For the Year Ended December 31, 2021 ($) | |||||||
Stated interest expense | 2,523 | ||||||
Unused commitment fees | 795 | ||||||
Amortization of debt issuance costs | 678 | ||||||
Total interest and credit facility fees expense | 3,996 | ||||||
Average stated interest rate | 2.30 | % | |||||
Average outstanding balance | 109,615 | ||||||
(7) Mandatory Redeemable Preferred Shares
The Fund has authorized and issued 2,400 shares of Series A Mandatory Redeemable Preferred Shares (the "Series A MRP Shares") for gross proceeds of $60,000, 3,600 shares of Series B Mandatory Redeemable Preferred Shares (the "Series B MRP Shares") for gross proceeds of $90,000 and 6,000 shares of Series C Mandatory Redeemable Preferred Shares (the "Series C MRP Shares" and together with the Series A MRP Shares and Series B MRP Shares, the "MRP Shares") for gross proceeds of $150,000. Each of the MRP Shares has a
liquidation preference of $25.00 per share. The aggregate redemption amount of the MRP Shares is $300,000.
The redemption date for the Series A MRP Shares, Series B MRP Shares and Series C MRP Shares are July 30, 2026, September 30, 2026 and September 30, 2028, respectively.
The Series A MRP Shares and the Series B MRP Shares have a dividend rate of 2.68% per annum, payable quarterly, with a redemption date of five years from issuance. The Series C MRP shares have a dividend rate of 3.07% per annum, payable quarterly, with a redemption date of seven years from issuance. The weighted average dividend rate for the MRP shares is 2.88% per annum. The MRP Shares are subject to optional and mandatory redemption in certain circumstances. The MRP Shares will be subject to redemption, at the option of the Fund, in whole or in part at any time only for the purposes of decreasing leverage of the Fund. The Fund may be obligated to redeem certain of the MRP Shares if the Fund fails to maintain an asset coverage ratio, calculated in accordance with the Investment Company Act, greater than or equal to 225%. Holders of the MRP Shares are entitled to receive quarterly cumulative cash dividend payments on the first business day following each quarterly dividend date.
The redemption price per share is equal to the sum of the liquidation preference per share plus any accumulated but unpaid dividends plus, in some cases, an early redemption premium, which may vary based on the date of redemption. The Fund is subject to certain restrictions relating to the MRP Shares such as maintaining certain asset coverage ratio requirements. Failure to comply with these restrictions could preclude the Fund from declaring any dividends to common shareholders and could trigger the mandatory redemption of the MRP Shares. Additionally, in accordance with the Investment Company Act, the Fund may not issue additional MRP Shares if immediately after such issuance the Fund will not have an asset coverage of at least 200%. As of December 31, 2021, the Fund was in compliance with the terms applicable to the MRP Shares.
The Fund's MRP Shares activity for the year ended December 31, 2021 was as follows:
| Series A MRP Shares | Series B MRP Shares | Series C MRP Shares | |||||||||||||
| Shares outstanding — beginning of period | — | — | — | ||||||||||||
Shares issued | 2,400 | 3,600 | 6,000 | ||||||||||||
Shares repurchased | — | — | — | ||||||||||||
| Shares outstanding — end of period | 2,400 | 3,600 | 6,000 | ||||||||||||
Annual Report 2021
123
CION Ares Diversified Credit Fund
Notes to Consolidated Financial Statements (continued)
December 31, 2021
(in thousands, except per share data, percentages and as otherwise noted)
The Fund's MRP Shares balance as of December 31, 2021 were as follows:
| Series A MRP Shares ($) | Series B MRP Shares ($) | Series C MRP Shares ($) | Total ($) | ||||||||||||||||
Principal amount | 60,000 | 90,000 | 150,000 | 300,000 | |||||||||||||||
| Unamortized issuance cost | (605 | ) | (941 | ) | (1,592 | ) | (3,138 | ) | |||||||||||
Carrying value | 59,395 | 89,059 | 148,408 | 296,862 | |||||||||||||||
Dividends on the MRP Shares are accrued on a daily basis and included in interest and credit facility fee expense on the consolidated statement of operations and in interest and facility fees payable on the consolidated statement of assets and liabilities. The table below summarizes the components of interest expense, the effective dividend rates and cash paid on the Fund's MRP Shares for the year ended December 31, 2021:
| Series A MRP Shares ($) | Series B MRP Shares ($) | Series C MRP Shares ($) | Total ($) | ||||||||||||||||
Stated dividends | 679 | 616 | 1,177 | 2,472 | |||||||||||||||
| Amortization of issuance costs | 56 | 50 | 60 | 166 | |||||||||||||||
| Total interest expense | 735 | 666 | 1,237 | 2,638 | |||||||||||||||
| Weighted average stated dividend rate | 2.68 | % | 2.68 | % | 3.07 | % | 2.88 | % | |||||||||||
| Cash paid for dividends | 402 | — | — | 402 | |||||||||||||||
See Note 12 for a subsequent event relating to additional issuances of mandatory redeemable preferred shares.
(8) Investment Transactions
For the year ended December 31, 2021, the cost of investments purchased and proceeds from the sale of investments, excluding short obligations and derivatives, were as follows:
| For the Year Ended December 31, 2021 ($) | |||||||
Cost of investments purchased | 2,170,301 | ||||||
Proceeds from the sale of investments | 843,186 | ||||||
(9) Derivative Instruments
The Fund recognizes all of its derivative instruments at fair value as either assets or liabilities in the consolidated statement of assets and liabilities. The changes in the fair value are included in the consolidated statement of operations
during the current year. Purchases of derivative contracts and proceeds from the sale of derivative contracts, as disclosed in the consolidated statement of cash flows, are indicative of the volume of derivative activity during the year ended December 31, 2021. The Fund is exposed to certain risks relating to its ongoing operations; the primary risks managed by using derivative instruments are market risk, credit risk, and foreign exchange risk. Additionally, the Fund holds certain derivative instruments for investment purposes. As of or during the year ended December 31, 2021, the Fund held the following instruments meeting the definition of a derivative instrument: forward currency contracts, credit default swaps and equity options.
Qualitative Disclosures of Derivative Financial Instruments
The following is a description of the derivatives utilized by the Fund during the reporting period, including the primary underlying risk exposure related to each instrument type.
Forward Currency Contracts
The Fund enters into forward currency contracts from time to time to help mitigate the impact that an adverse change in foreign exchange rates would have on the value of the Fund's investments denominated in foreign currencies. As of December 31, 2021, the counterparty to these forward currency contracts was Goldman Sachs.
Forward currency contracts are considered undesignated derivative instruments.
Equity Options
The Fund is subject to equity price risk in the normal course of pursuing its investment objectives. The Fund may enter into options contracts based on an equity index or specific security in order to manage its exposure to changes in market conditions. The risks of entering into equity price risk derivative instruments include the possible lack of liquidity, failure of the counterparty to meet its obligations, and that there may be unfavorable changes in the underlying investments or instruments. The Fund may purchase or write an option contract to protect against declines in market value on the underlying index or security. A purchased option contract provides the Fund a right, but not an obligation, to buy (call) or sell (put) an equity-related asset at a specified exercise price within a certain period or on a specific date. A written option contract holds the corresponding obligation to sell (call writing) or buy (put writing) the underlying equity-related asset if the purchaser exercises the option contract. The buyer pays the seller an initial purchase price (premium) for this right. Option contracts purchased by the Fund are
Annual Report 2021
124
CION Ares Diversified Credit Fund
Notes to Consolidated Financial Statements (continued)
December 31, 2021
(in thousands, except per share data, percentages and as otherwise noted)
accounted for in the same manner as marketable portfolio securities. The premium received by the Fund for option contracts written is recorded as a liability. The proceeds from securities sold through the exercise of option contracts are decreased by the premium paid to purchase the option contracts. The Fund may recognize a realized gain or loss when the option contract is closed, exercised or expires. Net realized gains or losses occurring during the holding period of purchased options contracts are included in the "net realized gains or losses on derivative contracts" in the accompanying consolidated statement of operations. Net unrealized gains or losses occurring during the holding period of written options contracts are included in the "net realized gains or losses on derivative contracts" in the accompanying consolidated statement of operations.
Credit Default Swaps
The Fund enters into credit default swap contracts for investment purposes and to manage its credit risk. Credit default swap agreements involve one party making a stream of payments (referred to as the buyer of protection) to another party (the seller of protection) in exchange for the right to receive a specified return in the event of a default or other credit event for the referenced entity, obligation or index. The Fund may purchase or sell protection. A seller of protection generally receives an upfront payment or periodic payments throughout the term of the swap provided there is no credit event. Such periodic payments received are accrued daily and accounted for as realized gains. If a credit event occurs, as defined under the terms of the swap agreement, the Fund will either (i) pay to the buyer of protection an amount equal to the notional amount of the swap and take delivery of the referenced obligation or underlying securities comprising the referenced index or (ii) pay a net settlement amount in the form of cash or securities equal to the notional amount of the
swap less the recovery value of the referenced obligation or underlying securities comprising the referenced index. The buyer of protection generally pays an upfront premium or periodic payments throughout the term of the swap provided there is no credit event. Such periodic payments paid are accrued daily and accounted for as realized losses.
Entering into credit default swaps involves, to varying degrees, elements of credit, market and documentation risk in excess of the related amounts recognized in the consolidated statement of assets and liabilities. Such risks involve the possibility that there will be no liquid market for these agreements, that the counterparty to the agreements may default on its obligations to perform or disagree as to the meaning of the contractual terms in the agreements, and that there will be unfavorable changes in net interest rates.
The Fund's derivative contracts are subject to either International Swaps and Derivatives Association Master Agreements, or futures contracts/OTC addenda which contain certain covenants and other provisions that, if violated, may require the Fund to post collateral on derivatives if the Fund is in a net liability position with its counterparties exceeding certain amounts. As of December 31, 2021, there are no derivative instruments with credit-risk-related contingent features that are in a net liability position after taking into effect permissible offsetting. Additionally, OTC derivative counterparties may immediately terminate these agreements and the related derivative contracts if the Fund fails to maintain sufficient asset coverage for its contracts or its net assets decline by stated percentages or amounts. As of December 31, 2021, the termination values of these derivative contracts were approximately equal to their fair values.
Certain information related to the Fund's derivative instruments as of December 31, 2021 is presented below.
As of December 31, 2021 | |||||||||||||||||||||||
Derivative Instrument | Notional Amount | Maturity Date | Gross Amount of Recognized Assets | Gross Amount of Recognized Liabilities | Balance Sheet Location of Net Amounts | ||||||||||||||||||
Forward currency contract | € | (1,277 | ) | 1/5/2022 | $ | 27 | $ | — | Derivatives | ||||||||||||||
Forward currency contract | £ | (923 | ) | 1/19/2022 | — | (22 | ) | Derivatives | |||||||||||||||
Forward currency contract | CAD | (10,691 | ) | 1/19/2022 | — | (120 | ) | Derivatives | |||||||||||||||
Forward currency contract | £ | (339 | ) | 1/21/2022 | 5 | — | Derivatives | ||||||||||||||||
Forward currency contract | DKK | (253 | ) | 1/21/2022 | 5 | — | Derivatives | ||||||||||||||||
Forward currency contract | CAD | (5,929 | ) | 1/21/2022 | 140 | — | Derivatives | ||||||||||||||||
Forward currency contract | DKK | (3,248 | ) | 1/21/2022 | 76 | — | Derivatives | ||||||||||||||||
Forward currency contract | € | (33,579 | ) | 1/21/2022 | 803 | — | Derivatives | ||||||||||||||||
Forward currency contract | £ | (57,015 | ) | 1/21/2022 | 1,028 | — | Derivatives | ||||||||||||||||
Annual Report 2021
125
CION Ares Diversified Credit Fund
Notes to Consolidated Financial Statements (continued)
December 31, 2021
(in thousands, except per share data, percentages and as otherwise noted)
As of December 31, 2021 | |||||||||||||||||||||||
Derivative Instrument | Notional Amount | Maturity Date | Gross Amount of Recognized Assets | Gross Amount of Recognized Liabilities | Balance Sheet Location of Net Amounts | ||||||||||||||||||
Forward currency contract | NOK | (535 | ) | 1/21/2022 | $ | 27 | $ | — | Derivatives | ||||||||||||||
Forward currency contract | SEK | (9,721 | ) | 1/21/2022 | 476 | — | Derivatives | ||||||||||||||||
Forward currency contract | £ | (268 | ) | 1/21/2022 | 5 | — | Derivatives | ||||||||||||||||
Forward currency contract | CAD | (257 | ) | 1/21/2022 | 5 | — | Derivatives | ||||||||||||||||
Forward currency contract | £ | (361 | ) | 1/21/2022 | 3 | — | Derivatives | ||||||||||||||||
Forward currency contract | € | (1,389 | ) | 1/21/2022 | 22 | — | Derivatives | ||||||||||||||||
Forward currency contract | £ | (268 | ) | 1/21/2022 | — | (1 | ) | Derivatives | |||||||||||||||
Forward currency contract | € | (2,268 | ) | 1/21/2022 | — | (37 | ) | Derivatives | |||||||||||||||
Forward currency contract | CAD | (176 | ) | 1/21/2022 | — | (2 | ) | Derivatives | |||||||||||||||
Forward currency contract | CAD | (71 | ) | 1/21/2022 | — | (1 | ) | Derivatives | |||||||||||||||
Forward currency contract | € | (376 | ) | 1/21/2022 | — | (3 | ) | Derivatives | |||||||||||||||
Forward currency contract | £ | (397 | ) | 1/21/2022 | — | (8 | ) | Derivatives | |||||||||||||||
Forward currency contract | £ | (480 | ) | 1/21/2022 | — | (11 | ) | Derivatives | |||||||||||||||
Forward currency contract | € | (3,938 | ) | 1/21/2022 | — | (28 | ) | Derivatives | |||||||||||||||
Forward currency contract | AUD | (7,742 | ) | 1/21/2022 | — | (101 | ) | Derivatives | |||||||||||||||
Forward currency contract | € | (2,378 | ) | 1/21/2022 | — | (13 | ) | Derivatives | |||||||||||||||
Forward currency contract | £ | (5,902 | ) | 1/21/2022 | — | (102 | ) | Derivatives | |||||||||||||||
Forward currency contract | PLN | (3,660 | ) | 1/21/2022 | — | (64 | ) | Derivatives | |||||||||||||||
Forward currency contract | SEK | (5,243 | ) | 1/21/2022 | — | (4 | ) | Derivatives | |||||||||||||||
Forward currency contract | € | (5,917 | ) | 1/21/2022 | — | (37 | ) | Derivatives | |||||||||||||||
Forward currency contract | SEK | (1,493 | ) | 9/18/2022 | 66 | — | Derivatives | ||||||||||||||||
| Call-Chicago Board Options Exchange-VIX US | $ | 155 | 1/19/2022 | 5 | — | Derivatives | |||||||||||||||||
| Call-Chicago Board Options Exchange-VIX US | $ | (155 | ) | 1/19/2022 | — | (3 | ) | Derivatives | |||||||||||||||
CDX.NA.HY S33 5Y Tranche 25-35 | $ | 1,814 | 12/20/2024 | — | (207 | ) | Derivatives | ||||||||||||||||
CDX.NA.HY S35 5Y Tranche 15-25 | $ | 3,105 | 12/20/2025 | — | (253 | ) | Derivatives | ||||||||||||||||
CMBX.NA.BBB- S9 | $ | 1,030 | 9/17/2058 | 100 | — | Derivatives | |||||||||||||||||
$ | 2,793 | $ | (1,017 | ) | |||||||||||||||||||
Net realized gains (losses) on derivative instruments recognized by the Fund for the year ended December 31, 2021 is in the following location in the consolidated statement of operations:
Derivative Instrument | Statement Location | For the Year Ended December 31, 2021 ($) | |||||||||
Forward currency contract | Net realized loss on derivative contracts | 1,362 | |||||||||
Written options | Net realized loss on derivative contracts | (501 | ) | ||||||||
Credit default swaps | Net realized loss on derivative contracts | (920 | ) | ||||||||
Total | (59 | ) | |||||||||
Annual Report 2021
126
CION Ares Diversified Credit Fund
Notes to Consolidated Financial Statements (continued)
December 31, 2021
(in thousands, except per share data, percentages and as otherwise noted)
Net unrealized gains (losses) on derivative instruments recognized by the Fund for the year ended December 31, 2021 is in the following location in the consolidated statement of operations:
Derivative Instrument | Statement Location | For the Year Ended December 31, 2021 ($) | |||||||||
Forward currency contract | Net unrealized gain on derivative contracts | 2,229 | |||||||||
Written options | Net unrealized gain on derivative contracts | 43 | |||||||||
Credit default swaps | Net unrealized gain on derivative contracts | 272 | |||||||||
Total | 2,544 | ||||||||||
Offsetting Arrangements
Although the Fund generally presents derivative and other financial instruments on a gross basis in the consolidated statement of assets and liabilities, certain derivative and other financial instruments are subject to enforceable master netting arrangements with certain counterparties which allow for the derivative and other financial instruments to be offset.
The following table presents the rights of offset and related arrangements associated with the Fund's derivative instruments as of December 31, 2021:
| Gross Amounts Not Offset in Statement of Assets and Liabilities | |||||||||||||||||||||||||||
Description | Gross Amount of Recognized Assets (Liabilities) | Gross Amount Offset in Assets (Liabilities) | Net Amounts of Assets (Liabilities) Presented | Financial Instrument | Collateral (Received) Pledged | Net Amount | |||||||||||||||||||||
Assets: | |||||||||||||||||||||||||||
Goldman Sachs: | |||||||||||||||||||||||||||
Forward Foreign Currency Contracts | $ | 2,748 | $ | — | $ | 2,748 | $ | (554 | ) | $ | — | $ | 2,194 | ||||||||||||||
Total | $ | 2,748 | $ | — | $ | 2,748 | $ | (554 | ) | $ | — | $ | 2,194 | ||||||||||||||
Liabilities: | |||||||||||||||||||||||||||
Goldman Sachs: | |||||||||||||||||||||||||||
Forward foreign currency contracts | $ | (554 | ) | $ | — | $ | (554 | ) | $ | 554 | $ | — | $ | — | |||||||||||||
Swap agreements | (187 | ) | — | (187 | ) | — | 187 | — | |||||||||||||||||||
Total | $ | (741 | ) | $ | — | $ | (741 | ) | $ | 554 | $ | 187 | $ | — | |||||||||||||
(10) Income Taxes
For U.S. federal income tax purposes, the characterization of distributions made during the fiscal period from net investment income or net realized gains may differ from its ultimate characterization for federal income tax purposes. In addition, due to the timing of dividend distributions, the fiscal period in which amounts are distributed may differ from the fiscal period that the income or realized gains or losses were recorded by the Fund. The characterization of distributions
paid during the fiscal years ended December 31, 2021 and 2020 were as follows:
| December 31, 2021 ($) | December 31, 2020 ($) | ||||||||||
Ordinary income | 74,910 | 41,545 | |||||||||
Capital gain | — | — | |||||||||
Return of capital | — | — | |||||||||
Annual Report 2021
127
CION Ares Diversified Credit Fund
Notes to Consolidated Financial Statements (continued)
December 31, 2021
(in thousands, except per share data, percentages and as otherwise noted)
Taxable income generally differs from net increase in net assets resulting from operations for financial reporting purposes due to temporary and permanent differences in the recognition of income and expenses for book but not tax, and generally excludes net unrealized gains or losses, as unrealized gains or losses are generally not included in taxable income until they are realized. For the year ended December 31, 2021, the Fund estimated U.S. federal taxable income exceeded its distributions made from such taxable income during the year; consequently the Fund incurred U.S. federal excise taxes of $256.
The Fund may adjust the classification of net assets as a result of permanent book-to-tax differences. On the consolidated statement of assets and liabilities, the following reclassifications were made for the year ended December 31, 2021:
| December 31, 2021 ($) | |||||||
Additional paid-in capital/(reduction) | (422 | ) | |||||
Distributable earnings accumulated gains | 422 | ||||||
As of December 31, 2021, which is the end of the Fund's taxable year, the Fund had no uncertain tax positions that would require financial statement recognition, derecognition, or disclosure. The Fund files a U.S. federal income tax return annually after its fiscal year-end, which is subject to examination by the Internal Revenue Service for a period of three years from the date of filing.
As of December 31, 2021, the components of accumulated earnings on a tax basis were as follows:
| December 31, 2021 ($) | |||||||
Undistributed ordinary income | 15,307 | ||||||
Accumulated capital and other losses | (5,809 | ) | |||||
Net unrealized appreciation | 34,676 | ||||||
Other cumulative effect of timing differences | (2,070 | ) | |||||
Total accumulated earnings | 42,104 | ||||||
Under current law, capital losses maintain their character as short-term or long-term and are carried forward to the next tax year without expiration. As of the current fiscal year end, the following amounts are available as carry forwards to the next tax year:
| December 31, 2021 ($) | |||||||
Short-Term | 3,970 | ||||||
Long-Term | 1,840 | ||||||
ASC 740, Income Taxes, provides guidance for how uncertain tax positions should be recognized, measured, presented, and disclosed in the financial statements. The Fund has evaluated the implications of ASC 740 for all open tax years and has determined there is no impact to the Fund's financial statements as of the year ended December 31, 2021. The Fund's federal and state income returns for which the applicable statutes of limitations have not expired remain subject to examination by the Internal Revenue Service and states department of revenue.
All penalties and interest associated with income taxes, if any, are included in other expenses in the consolidated statement of operations. There were no penalties and interest incurred by the Fund for the current fiscal year.
(11) Risk Factors
Senior Loans Risk
Although senior loans ("Senior Loans") are senior and typically secured in a first lien (including "unitranche" loans, which are loans that combine both senior and subordinated debt, generally in a first lien position) or second lien position in contrast to other below investment grade fixed income instruments, which are often subordinated or unsecured, the risks associated with such Senior Loans are generally similar to the risks of other below investment grade fixed income instruments. Investments in below investment grade Senior Loans are considered speculative because of the credit risk of the issuers of debt instruments (each, a "Borrower"). Such Borrowers are more likely than investment grade Borrowers to default on their payments of interest and principal owed to the Fund, and such defaults could reduce the net asset value of the Fund and income distributions. An economic downturn would generally lead to a higher non-payment rate, and a Senior Loan may lose significant market value before a default occurs. Moreover, any specific collateral used to secure a Senior Loan may decline in value or become illiquid, which could adversely affect the Senior Loan's value.
Senior Loans are subject to the risk of non-payment of scheduled interest or principal. Such non-payment would result in a reduction of income to the Fund, a reduction in the value of the investment and a potential decrease in the net asset value of the Fund. There can be no assurance that the liquidation of any collateral securing a Senior Loan would satisfy the Borrower's obligation in the event of nonpayment of scheduled interest or principal payments, whether when due or upon acceleration, or that the collateral could be liquidated, readily or otherwise. In the event of bankruptcy or insolvency of a Borrower, the Fund could experience delays or limitations with respect to its ability to realize the benefits of the
Annual Report 2021
128
CION Ares Diversified Credit Fund
Notes to Consolidated Financial Statements (continued)
December 31, 2021
(in thousands, except per share data, percentages and as otherwise noted)
collateral, if any, securing a Senior Loan. The collateral securing a Senior Loan, if any, may lose all or substantially all of its value in the event of the bankruptcy or insolvency of a Borrower. Some Senior Loans are subject to the risk that a court, pursuant to fraudulent conveyance or other similar laws, could subordinate such Senior Loans to presently existing or future indebtedness of the Borrower or take other action detrimental to the holders of Senior Loans including, in certain circumstances, invalidating such Senior Loans or causing interest previously paid to be refunded to the Borrower. Additionally, a Senior Loan may be "primed" in bankruptcy, which reduces the ability of the holders of the Senior Loan to recover on the collateral.
There may be less readily available information about most Senior Loans and the Borrowers thereunder than is the case for many other types of securities, including securities issued in transactions registered under the Securities Act of 1933, as amended (the "Securities Act") or the Securities Exchange Act of 1934, as amended (the "Exchange Act"), and Borrowers subject to the periodic reporting requirements of Section 13 of the Exchange Act. Senior Loans may be issued by companies that are not subject to SEC reporting requirements and these companies, therefore, do not file reports with the SEC that must comply with SEC form requirements and, in addition, are subject to a less stringent liability disclosure regime than companies subject to SEC reporting requirements. As a result, the Adviser will rely primarily on its own evaluation of a Borrower's credit quality rather than on any available independent sources. Consequently, the Fund will be particularly dependent on the analytical abilities of the Adviser. In certain circumstances, Senior Loans may not be deemed to be securities under certain federal securities laws, other than the Investment Company Act. Therefore, in the event of fraud or misrepresentation by a
Borrower or an arranger, the Fund may not have the protection of the antifraud provisions of the federal securities laws as would otherwise be available for bonds or stocks. Instead, in such cases, parties generally would rely on the contractual provisions in the Senior Loan agreement itself and common law fraud protections under applicable state law.
The secondary trading market for Senior Loans may be less liquid than the secondary trading market for registered investment grade debt securities. No active trading market may exist for certain Senior Loans, which may make it difficult to value them. Illiquidity and adverse market conditions may mean that the Fund may not be able to sell Senior Loans quickly or at a fair price. To the extent that a secondary market does exist for certain Senior Loans, the market for them may be subject to irregular trading activity, wide bid/ask spreads and extended trade settlement periods.
Senior Loans are subject to legislative risk. If legislation or state or federal regulations impose additional requirements or restrictions on the ability of financial institutions to make loans, the availability of Senior Loans for investment by the Fund may be adversely affected. In addition, such requirements or restrictions could reduce or eliminate sources of financing for certain Borrowers. This would increase the risk of default. If legislation or federal or state regulations require financial institutions to increase their capital requirements this may cause financial institutions to dispose of Senior Loans that are considered highly levered transactions. If the Fund attempts to sell a Senior Loan at a time when a financial institution is engaging in such a sale, the price the Fund could receive for the Senior Loan may be adversely affected.
Subordinated Loans Risk
Subordinated loans generally are subject to similar risks as those associated with investments in Senior Loans, except that such loans are subordinated in payment and/or lower in lien priority to first lien holders. In the event of default on a Subordinated Loan, the first priority lien holder has first claim to the underlying collateral of the loan to the extent such claim is secured. Additionally, an over secured creditor may be entitled to additional interest and other charges in bankruptcy increasing the amount of their allowed claim. Subordinated Loans are subject to the additional risk that the cash flow of the Borrower and property securing the loan or debt, if any, may be insufficient to meet scheduled payments after giving effect to the senior obligations of the Borrower. This risk is generally higher for subordinated unsecured loans or debt, which are not backed by a security interest in any specific collateral. Subordinated Loans generally have greater price volatility than Senior Loans and may be less liquid.
Corporate Bonds Risk
The market value of a corporate bond generally may be expected to rise and fall inversely with interest rates. The market value of intermediate- and longer-term corporate bonds is generally more sensitive to changes in interest rates than is the market value of shorter-term corporate bonds. The market value of a corporate bond also may be affected by factors directly related to the Borrower, such as investors' perceptions of the creditworthiness of the Borrower, the Borrower's financial performance, perceptions of the Borrower in the market place, performance of management of the Borrower, the Borrower's capital structure and use of financial leverage and demand for the Borrower's goods and services. There is a risk that the Borrowers of corporate bonds may not be able to meet their obligations on interest or principal payments at the time called for by an instrument. High yield corporate bonds are often high risk and have
Annual Report 2021
129
CION Ares Diversified Credit Fund
Notes to Consolidated Financial Statements (continued)
December 31, 2021
(in thousands, except per share data, percentages and as otherwise noted)
speculative characteristics. High yield corporate bonds may be particularly susceptible to adverse Borrower-specific developments.
CLO Securities Risk
CLOs issue securities in tranches with different payment characteristics and different credit ratings. The rated tranches of securities issued by CLOs ("CLO Securities") are generally assigned credit ratings by one or more nationally recognized statistical rating organizations. The subordinated (or residual) tranches do not receive ratings. Below investment grade tranches of CLO Securities typically experience a lower recovery, greater risk of loss or deferral or non-payment of interest than more senior tranches of the CLO.
The riskiest portion of the capital structure of a CLO is the subordinated (or residual) tranche, which bears the bulk of defaults from the loans in the CLO and serves to protect the other, more senior tranches from default in all but the most severe circumstances. Since it is partially protected from defaults, a senior tranche from a CLO typically has higher ratings and lower yields than the underlying securities, and can be rated investment grade. Despite the protection from the subordinated tranche, CLO tranches can experience substantial losses due to actual defaults, increased sensitivity to defaults due to collateral default and disappearance of protecting tranches, market anticipation of defaults and aversion to CLO Securities as a class. The risks of an investment in a CLO depend largely on the collateral and the tranche of the CLO in which the Fund invests.
The CLOs in which the Fund invests may have issued and sold debt tranches that will rank senior to the tranches in which the Fund invests. By their terms, such more senior tranches may entitle the holders to receive payment of interest or principal on or before the dates on which the Fund is entitled to receive payments with respect to the tranches in which the Fund invests.
Also, in the event of insolvency, liquidation, dissolution, reorganization or bankruptcy of a CLO, holders of more senior tranches would typically be entitled to receive payment in full before the Fund receives any distribution. After repaying such senior creditors, such CLO may not have any remaining assets to use for repaying its obligation to the Fund. In the case of tranches ranking equally with the tranches in which the Fund invests, the Fund would have to share on an equal basis any distributions with other creditors holding such securities in the event of an insolvency, liquidation, dissolution, reorganization or bankruptcy of the relevant CLO. Therefore, the Fund may not receive back the full amount of its investment in a CLO.
The transaction documents relating to the issuance of CLO Securities may impose eligibility criteria on the assets of the
CLO, restrict the ability of the CLO's investment manager to trade investments and impose certain portfolio-wide asset quality requirements. These criteria, restrictions and requirements may limit the ability of the CLO's investment manager to maximize returns on the CLO Securities. In addition, other parties involved in CLOs, such as third-party credit enhancers and investors in the rated tranches, may impose requirements that have an adverse effect on the returns of the various tranches of CLO Securities. Furthermore, CLO Securities issuance transaction documents generally contain provisions that, in the event that certain tests are not met (generally interest coverage and over-collateralization tests at varying levels in the capital structure), proceeds that would otherwise be distributed to holders of a junior tranche must be diverted to pay down the senior tranches until such tests are satisfied. Failure (or increased likelihood of failure) of a CLO to make timely payments on a particular tranche will have an adverse effect on the liquidity and market value of such tranche.
Payments to holders of CLO Securities may be subject to deferral. If cash flows generated by the underlying assets are insufficient to make all current and, if applicable, deferred payments on CLO Securities, no other assets will be available for payment of the deficiency and, following realization of the underlying assets, the obligations of the Borrower of the related CLO Securities to pay such deficiency will be extinguished.
The market value of CLO Securities may be affected by, among other things, changes in the market value of the underlying assets held by the CLO, changes in the distributions on the underlying assets, defaults and recoveries on the underlying assets, capital gains and losses on the underlying assets, prepayments on underlying assets and the availability, prices and interest rate of underlying assets. Furthermore, the leveraged nature of each subordinated class may magnify the adverse impact on such class of changes in the value of the assets, changes in the distributions on the assets, defaults and recoveries on the assets, capital gains and losses on the assets, prepayment on assets and availability, price and interest rates of assets. Finally, CLO Securities are limited recourse and may not be paid in full and may be subject to up to 100% loss.
Asset-Backed Securities Risk
Asset-backed securities often involve risks that are different from or more acute than risks associated with other types of debt instruments. For instance, asset-backed securities may be particularly sensitive to changes in prevailing interest rates. In addition, the underlying assets are subject to prepayments that shorten the securities' weighted average maturity and may lower their return. Asset-backed securities are also subject to
Annual Report 2021
130
CION Ares Diversified Credit Fund
Notes to Consolidated Financial Statements (continued)
December 31, 2021
(in thousands, except per share data, percentages and as otherwise noted)
risks associated with their structure and the nature of the assets underlying the security and the servicing of those assets. Payment of interest and repayment of principal on asset-backed securities is largely dependent upon the cash flows generated by the assets backing the securities and, in certain cases, supported by letters of credit, surety bonds or other credit enhancements. The values of asset-backed securities may be substantially dependent on the servicing of the underlying asset pools, and are therefore subject to risks associated with the negligence by, or defalcation of, their servicers. Furthermore, debtors may be entitled to the protection of a number of state and federal consumer credit laws with respect to the assets underlying these securities, which may give the debtor the right to avoid or reduce payment. In addition, due to their often complicated structures, various asset-backed securities may be difficult to value and may constitute illiquid investments. If many Borrowers on the underlying loans default, losses could exceed the credit enhancement level and result in losses to investors in asset-backed securities.
"Covenant-Lite" Loans Risk
Some of the loans in which the Fund may invest directly or indirectly through its investments in CDOs, CLOs or other types of structured securities may be "covenant-lite" loans, which means the loans contain fewer maintenance covenants than other loans (in some cases, none) and do not include terms which allow the lender to monitor the performance of the borrower and declare a default if certain criteria are breached. An investment by the Fund in a covenant-lite loan may potentially hinder the ability to reprice credit risk associated with the issuer and reduce the ability to restructure a problematic loan and mitigate potential loss. The Fund may also experience delays in enforcing its rights on its holdings of covenant-lite loans. As a result of these risks, the Fund's exposure to losses may be increased, which could result in an adverse impact on the Fund's net income and net asset value.
Investment and Market Risk
An investment in the common shares of the Fund is subject to investment risk, including the possible loss of the entire principal amount invested. An investment in the common shares of the Fund represents an indirect investment in the portfolio of Senior Loans, Corporate Bonds, CLO Securities and other securities and loans owned by the Fund, and the value of these securities and loans may fluctuate, sometimes rapidly and unpredictably. For instance, during periods of global economic downturn, the secondary markets for Senior Loans and investments with similar economic characteristics (such as second lien loans and unsecured loans) and Corporate Bonds may experience sudden and sharp price swings, which can be exacerbated by large or sustained sales by major
investors in these markets, a high-profile default by a major Borrower, movements in indices tied to these markets or related securities or investments, or a change in the market's perception of Senior Loans and investments with similar economic characteristics (such as second lien loans and unsecured loans) and Corporate Bonds. At any point in time, an investment in the common shares of the Fund may be worth less than the original amount invested, even after taking into account distributions paid by the Fund, if any, and the ability of common shareholders to reinvest dividends. The Fund currently intends to utilize leverage, which will magnify the Fund's risks and, in turn, the risks to the common shareholders.
Interest Rate Risk
The market value of Corporate Bonds and other fixed-income securities changes in response to interest rate changes and other factors. Interest rate risk is the risk that prices of bonds and other fixed-income securities will increase as interest rates fall and decrease as rates rise. Accordingly, an increase in market interest rates (which are currently considered low by historic standards) may cause a decrease in the price of a debt security and, therefore, a decline in the net asset value of the Fund's common shares. The magnitude of these fluctuations in the market price of bonds and other fixed-income securities is generally greater for those securities with longer maturities. Because Senior Loans with floating or variable rates reset their interest rates only periodically, changes in prevailing interest rates (and particularly sudden and significant changes) can be expected to cause some fluctuations in the net asset value of the Fund's common shares. In addition, Senior Loans or similar loans or securities may allow the Borrower to opt between LIBOR-based interest rates and interest rates based on bank prime rates, which may have an effect on the net asset value of the Fund's common shares.
LIBOR and Reference Rate Risk
National and international regulators and law enforcement agencies have conducted investigations into a number of rates or indices that are deemed to be "reference rates." Actions by such regulators and law enforcement agencies may result in changes to the manner in which certain reference rates are determined, their discontinuance, or the establishment of alternative reference rates. In particular, on July 27, 2017, the Chief Executive of the U.K. Financial Conduct Authority (the "FCA"), which regulates LIBOR, announced that the FCA will no longer persuade or compel banks to submit rates for the calculation of LIBOR after 2021. On November 30, 2020, ICE Benchmark Administration ("IBA"), the administrator of LIBOR tenors, with the support of the U.S. Federal Reserve and the FCA, announced plans to consult on ceasing publication of USD LIBOR on December 31, 2021 for only
Annual Report 2021
131
CION Ares Diversified Credit Fund
Notes to Consolidated Financial Statements (continued)
December 31, 2021
(in thousands, except per share data, percentages and as otherwise noted)
the one-week and two-month USD LIBOR, and on June 30, 2023 for all other USD LIBOR tenors. The U.S. Federal Reserve concurrently issued a statement advising banks to stop new USD LIBOR issuances by the end of 2021. On March 5, 2021, the IBA confirmed its intention to cease publication of (i) one-week and two-month USD LIBOR tenors after December 31, 2021 and (ii) remaining USD LIBOR tenors after June 30, 2023.
On the same day, the FCA, as supervisor of IBA, made its announcement on the future cessation and loss of representativeness of the LIBOR benchmarks. The U.S. Federal Reserve, in conjunction with the Alternative Reference Rates Committee, a steering committee comprised of large U.S. financial institutions, is expected to replace U.S. dollar LIBOR with a new index calculated by short-term repurchase agreements, backed by Treasury securities. (the "Secured Overnight Financing Rate," "SOFR"), plus a recommended spread adjustment as LIBOR's replacement. Although there have been certain issuances utilizing SOFR or the Sterling Over Night Index Average (an alternative reference rate that is based on transactions), it is unknown whether SOFR or any other alternative reference rates will attain market acceptance as replacements for LIBOR.
Given the inherent differences between LIBOR and SOFR, or any other alternative reference rates that may be established, the transition from LIBOR may disrupt the overall financial markets and adversely affect the market for LIBOR-based securities, including the Fund's portfolio of LIBOR indexed, floating rate debt securities, or the cost of the Fund's borrowings. In addition, changes or reforms to the determination or supervision of LIBOR may result in a sudden or prolonged increase or decrease in reported LIBOR, which could have an adverse impact on the market for LIBOR-based securities, including the value and/or transferability of the LIBOR indexed, floating rate debt securities in the Fund's portfolio, or the cost of the Fund's borrowings. Additionally, if as currently expected LIBOR ceases to exist, the Fund may need to renegotiate the credit agreements extending beyond June 30, 2023 with the Fund's lenders and the Fund's portfolio companies that utilize LIBOR as a factor in determining the interest rate to replace LIBOR with SOFR or other alternative reference rates, The transition from LIBOR to SOFR or other alternative reference rates may also introduce operational risks in our accounting, financial reporting, loan servicing, liability management and other aspects of our business. We are assessing the impact of a transition from LIBOR; however, we cannot reasonably estimate the impact of the transition at this time.
Additionally, the phase-out or replacement of LIBOR may decrease the demand for floating-rate loans, which could adversely impact our business and financial condition. We
may need to renegotiate the credit agreements extending beyond June 30, 2023 with our credit facility lenders and our portfolio companies that utilize LIBOR as a factor in determining the interest rate to replace LIBOR with SOFR or other alternative reference rates, which could require us to incur significant expense and may subject us to disputes or litigation over the appropriateness or comparability to the relevant replacement reference index. The transition from LIBOR to SOFR or other alternative reference rates may also introduce operational risks in our accounting, financial reporting, loan servicing, liability management and other aspects of our business. We are assessing the impact of a transition from LIBOR; however, we cannot reasonably estimate the impact of the transition at this time.
Liquidity Risk
The Fund may not be able to readily dispose of illiquid securities or loans at prices that approximate those at which the Fund could sell the securities or loans if they were more widely traded and, as a result of that illiquidity, the Fund may have to sell other investments or engage in borrowing transactions if necessary to raise cash to meet its obligations. Limited liquidity can also affect the market price of securities, thereby adversely affecting the net asset value of the common shares and ability to make dividend distributions. The Fund's investments may not be readily marketable and may be subject to restrictions on resale. Generally, the Fund's investments are not listed on any national securities exchange and no active trading market may exist. When a secondary market exists, the market may be subject to irregular trading activity, wide bid/ask spreads and extended trade settlement periods. Further, the lack of an established secondary market for illiquid securities may make it more difficult to value such securities, which may negatively affect the price the Fund would receive upon disposition of such securities.
Duration and Maturity Risk
The Fund has no fixed policy regarding portfolio maturity or duration. Holding long duration and long maturity investments will expose the Fund to certain additional risks.
When interest rates rise, certain obligations will be paid off by the Borrower more slowly than anticipated, causing the value of these obligations to fall. Rising interest rates tend to extend the duration of securities, making them more sensitive to changes in interest rates. The value of longer-term securities generally changes more in response to changes in interest rates than shorter-term securities. As a result, in a period of rising interest rates, securities may exhibit additional volatility and may lose value.
When interest rates fall, certain obligations will be paid off by the Borrower more quickly than originally anticipated, and the
Annual Report 2021
132
CION Ares Diversified Credit Fund
Notes to Consolidated Financial Statements (continued)
December 31, 2021
(in thousands, except per share data, percentages and as otherwise noted)
Fund may have to invest the proceeds in securities with lower yields. In periods of falling interest rates, the rate of prepayments tends to increase (as does price fluctuation) as Borrowers are motivated to pay off debt and refinance at new lower rates. During such periods, reinvestment of the prepayment proceeds by the Adviser will generally be at lower rates of return than the return on the assets that were prepaid. Prepayment reduces the yield to maturity and the average life of the security.
Special Situations and Stressed Investments Risk
Although investments in debt and equity securities and other obligations of companies that may be in some level of financial or business distress, including companies involved in, or that have recently completed, bankruptcy or other reorganization and liquidation proceedings ("Stressed Issuers") (such investments, "Special Situation Investments") may result in significant returns for the Fund, they are speculative and involve a substantial degree of risk. The level of analytical sophistication, both financial and legal, necessary for successful investment in distressed assets is unusually high. Therefore, the Fund will be particularly dependent on the analytical abilities of the Adviser. In any reorganization or liquidation proceeding relating to a company in which the Fund invests, the Fund may lose its entire investment, may be required to accept cash or securities with a value less than the Fund's original investment and/or may be required to accept payment over an extended period of time. Among the risks inherent in investments in a troubled company is that it may be difficult to obtain information as to the true financial condition of such company. Troubled company investments and other distressed asset-based investments require active monitoring.
The Fund may make investments in Stressed Issuers when the Adviser believes it is reasonably likely that the Stressed Issuer will make an exchange offer or will be the subject to a plan of reorganization pursuant to which the Fund will receive new securities in return for a Special Situation Investment. There can be no assurance, however, that such an exchange offer will be made or that such a plan of reorganization will be adopted. In addition, a significant period of time may pass between the time at which the Fund makes its investment in the Special Situation Investment and the time that any such exchange offer or plan of reorganization is completed, if at all. During this period, it is unlikely that the Fund would receive any interest payments on the Special Situation Investment, the Fund would be subject to significant uncertainty whether the exchange offer or plan of reorganization will be completed and the Fund may be required to bear certain extraordinary expenses to protect and recover its investment. Therefore, to the extent the Fund seeks capital appreciation through investment in Special
Situation Investments, the Fund's ability to achieve current income for its shareholders may be diminished. The Fund also will be subject to significant uncertainty as to when, in what manner and for what value the obligations evidenced by Special Situation Investments will eventually be satisfied (e.g., through a liquidation of the obligor's assets, an exchange offer or plan of reorganization involving the Special Situation Investments or a payment of some amount in satisfaction of the obligation). Even if an exchange offer is made or plan of reorganization is adopted with respect to Special Situation Investments held by the Fund, there can be no assurance that the securities or other assets received by the Fund in connection with such exchange offer or plan of reorganization will not have a lower value or income potential than may have been anticipated when the investment was made or even no value. Moreover, any securities received by the Fund upon completion of an exchange offer or plan of reorganization may be restricted as to resale. Similarly, if the Fund participates in negotiations with respect to any exchange offer or plan of reorganization with respect to an issuer of Special Situation Investments, the Fund may be restricted from disposing of such securities. To the extent that the Fund becomes involved in such proceedings, the Fund may have a more active participation in the affairs of the issuer than that assumed generally by an investor.
To the extent that the Fund holds interests in a Stressed Issuer that are different (or more senior or junior) than those held by other funds and/or accounts managed by the Adviser or its affiliates ("Other Accounts"), the Adviser is likely to be presented with decisions involving circumstances where the interests of such Other Accounts may be in conflict with the Fund's interests. Furthermore, it is possible that the Fund's interest may be subordinated or otherwise adversely affected by virtue of such Other Accounts' involvement and actions relating to their investment. In addition, when the Fund and Other Accounts hold investments in the same Stressed Issuer (including in the same level of the capital structure), the Fund may be prohibited by applicable law from participating in restructurings, work-outs, renegotiations or other activities related to its investment in the Stressed Issuer absent an exemption due to the fact that Other Accounts hold investments in the same Stressed Issuer. As a result, the Fund may not be permitted by law to make the same investment decisions as Other Accounts in the same or similar situations even if the Adviser believes it would be in the Fund's best economic interests to do so. Also, the Fund may be prohibited by applicable law from investing in a Stressed Issuer (or an affiliate) that Other Accounts are also investing in or currently invest in even if the Adviser believes it would be in the best economic interests of the Fund to do so. Furthermore, entering into certain transactions that are not deemed prohibited by law
Annual Report 2021
133
CION Ares Diversified Credit Fund
Notes to Consolidated Financial Statements (continued)
December 31, 2021
(in thousands, except per share data, percentages and as otherwise noted)
when made may potentially lead to a condition that raises regulatory or legal concerns in the future. This may be the case, for example, with Stressed Issuers who are near default and more likely to enter into restructuring or work-out transactions with their existing debt holders, which may include the Fund and its affiliates. In some cases, to avoid the potential of future prohibited transactions, the Adviser may avoid recommending allocating an investment opportunity to the Fund that it would otherwise recommend, subject to the Adviser's then-current allocation policy and any applicable exemptions.
Below Investment Grade Rating Risk
Debt instruments that are rated below investment grade are often referred to as ("high yield") securities or "junk bonds." Below investment grade instruments are rated "Ba1" or lower by Moody's, "BB+" or lower by S&P or "BB+" or lower by Fitch or, if unrated, are judged by the Adviser to be of comparable credit quality. While generally providing greater income and opportunity for gain, below investment grade debt instruments may be subject to greater risks than securities or instruments that have higher credit ratings, including a higher risk of default. The credit rating of an instrument that is rated below investment grade does not necessarily address its market value risk, and ratings may from time to time change, positively or negatively, to reflect developments regarding the Borrower's financial condition. Below investment grade instruments often are considered to be speculative with respect to the capacity of the Borrower to timely repay principal and pay interest or dividends in accordance with the terms of the obligation and may have more credit risk than higher rated securities. Lower grade securities and similar debt instruments may be particularly susceptible to economic downturns. It is likely that a prolonged or deepening economic recession could adversely affect the ability of some Borrowers issuing such debt instruments to repay principal and pay interest on the instrument, increase the incidence of default and severely disrupt the market value of the securities and similar debt instruments.
The secondary market for below investment grade instruments may be less liquid than that for higher rated instruments. Because unrated securities may not have an active trading market or may be difficult to value, the Fund might have difficulty selling them promptly at an acceptable price. To the extent that the Fund invests in unrated securities, the Fund's ability to achieve its investment objectives will be more dependent on the Adviser's credit analysis than would be the case when the Fund invests in rated securities.
Under normal market conditions, the Fund will invest in debt instruments rated in the lower rating categories ("Caa1" or lower by Moody's, "CCC+" or lower by S&P or "CCC+" or
lower by Fitch) or unrated and of comparable quality. For these securities, the risks associated with below investment grade instruments are more pronounced. The Fund may incur additional expenses to the extent it is required to seek recovery upon a default in the payment of principal or interest on its portfolio holdings. In any reorganization or liquidation proceeding relating to an investment, the Fund may lose its entire investment or may be required to accept cash or securities with a value substantially less than its original investment.
European Risk
The Fund may invest a portion of its capital in debt securities issued by issuers domiciled in Europe, including issuers domiciled in the United Kingdom (the "UK"). Concerns regarding the sovereign debt of various Eurozone countries and proposals for investors to incur substantial write-downs and reductions in the face value of the sovereign debt of certain countries give rise to concerns about sovereign defaults, the possibility that one or more countries might leave the European Union (the "EU") or the Eurozone and various proposals (still under consideration and unclear in material respects) for support of affected countries and the Euro as a currency. The outcome of any such situation cannot be predicted. Sovereign debt defaults and EU and/or Eurozone exits could have material adverse effects on investments by the Fund in securities of European companies, including but not limited to the availability of credit to support such companies' financing needs, uncertainty and disruption in relation to financing, customer and supply contracts denominated in Euro and wider economic disruption in markets served by those companies, while austerity and other measures that have been introduced in order to limit or contain these issues may themselves lead to economic contraction and resulting adverse effects for the Fund. A number of the Fund's securities may be denominated in the Euro. Legal uncertainty about the funding of Euro denominated obligations following any breakup or exits from the Eurozone (particularly in the case of investments in securities of companies in affected countries) could also have material adverse effects on the Fund. The UK ceased to be a member state of the EU on January 31, 2020 commonly referred to as "Brexit," and the transition period provided for in the withdrawal agreement entered by the UK and the EU ended on December 31, 2020. In December 2020, the UK and the EU agreed on a trade and cooperation agreement, which was subsequently ratified by the parties. The trade and cooperation agreement covers the general objectives and framework of the relationship between the UK and the EU. The impact of Brexit on the UK and EU and the broader global economy is unknown but could be significant and could result in increased volatility and illiquidity and potentially lower economic growth. Brexit also may lead to
Annual Report 2021
134
CION Ares Diversified Credit Fund
Notes to Consolidated Financial Statements (continued)
December 31, 2021
(in thousands, except per share data, percentages and as otherwise noted)
greater volatility in the global currency and financial markets, which could adversely affect the Fund. In connection with investments in non-U.S. issuers, the Fund may engage in foreign currency exchange transactions but is not required to hedge its currency exposure. As such, the Fund makes investments that are denominated in British pound sterling or Euros. The Fund's assets are valued in U.S. dollars and the depreciation of the British pound sterling and/or the Euro in relation to the U.S. dollar could adversely affect the Fund's investments denominated in British pound sterling or Euros that are not fully hedged regardless of the performance of the underlying issuer.
Market Disruption Risk
Disease outbreaks, public health emergencies, the European sovereign debt crisis, instability in the Middle East, Afghanistan and Pakistan, the aftermath of the war in Iraq, terrorist attacks in the U.S. and around the world, the impact of natural disasters, growing social and political discord in the U.S., the European debt crisis, the response of the international community — through economic sanctions and otherwise — to Russia's annexation of the Crimea region of Ukraine and invasion of Ukraine, increasingly strained relations between the United States and a number of foreign countries, including traditional allies, such as certain European countries, and historical adversaries, such as North Korea, Iran, China and Russia, and the international community generally, new and continued political unrest in various countries, such as Venezuela and Spain, and other similar events may result in market volatility, may have long-term adverse effects on the United States and worldwide financial markets and may cause further economic uncertainties in the United States and worldwide. The Fund does not know how long the financial markets may be affected by these events and cannot predict the effects of these events or similar events in the future on the U.S. and global economies and financial markets. Wars and occupation, terrorism and related geopolitical risks have led, and may in the future lead, to increased shortterm market volatility and may have adverse long-term effects on U.S. and global economies and markets generally. These events could have an acute effect on individual issuers or related groups of issuers. These events could also impact interest rates, secondary trading, ratings, credit risk, inflation and other factors relating to an investment in the common shares. The Fund may be adversely affected by abrogation of international agreements and national laws which have created the market instruments in which the Fund may invest, failure of the designated national and international authorities to enforce compliance with the same laws and agreements, failure of local, national and international organization to carry out their duties
prescribed to them under the relevant agreements, revisions of these laws and agreements which dilute their effectiveness or conflicting interpretation of provisions of the same laws and agreements.
The novel coronavirus ("COVID-19") pandemic has adversely impacted global commercial activity and contributed to significant volatility in the capital markets. Many states, including those in which the Fund's portfolio companies operate, have issued orders requiring the closure of, or certain restrictions on the operation of certain businesses. Such actions and effects remain ongoing and the ultimate duration and severity of the COVID-19 pandemic, including COVID-19 variants, such as the recent Delta and Omicron variants, remain uncertain. The COVID-19 pandemic and restrictive measures taken to contain or mitigate its spread have caused, and are continuing to cause, business shutdowns, or the re-introduction of business shutdowns, cancellations of events and restrictions on travel, significant reductions in demand for certain good and services, reductions in business activity and financial transactions, supply chain interruptions, labor shortages, increased inflationary pressure and overall economic and financial market instability both globally and in the United States. While several countries, as well as certain states, counties and cities in the United States, relaxed the public health restrictions throughout 2021 partly as a result of the introduction of vaccines, recurring COVID-19 outbreaks caused by different virus variants continue to lead to the re-introduction of certain restrictions in certain states in the United States and globally. Even after the COVID-19 pandemic subsides, the U.S. economy and most other major global economies may experience a recession, and the Fund and its operations, as well as the business and operations of its portfolio companies, could be materially adversely affected by a prolonged recession in the U.S. and other major markets.
The COVID-19 pandemic has adversely impacted the fair value of certain of the Fund's investments, including those reported as of December 31, 2021, and the values reported may differ materially from the values that the Fund may ultimately realize with respect to its investments. The impact of the COVID-19 pandemic may not yet be fully reflected in the fair value of the Fund's investments as the Fund's valuations, and particularly valuations of private investments and private companies, are inherently uncertain, may fluctuate over short periods of time and are often based on estimates, comparisons and qualitative evaluations of private information that is often from a time period earlier, generally two to three months, than the quarter for which the Fund is reporting. The valuation of the Fund's investments may not show the complete or the continuing impact of the COVID-19 pandemic and the resulting restrictive measures taken in response
Annual Report 2021
135
CION Ares Diversified Credit Fund
Notes to Consolidated Financial Statements (continued)
December 31, 2020
(in thousands, except per share data, percentages and as otherwise noted)
thereto. As a result, the Fund may continue to see a negative impact to the fair value of its investments.
(12) Subsequent Events
The Adviser has evaluated subsequent events through the date of issuance of the financial statements included herein. There have been no subsequent events that occurred during such period that would require disclosure or would be required to be recognized in the financial statements as of and for the year ended December 31, 2021, except as discussed below:
Subsequent to December 31, 2021, the Fund paid previously declared dividends of $2,741 on the MRP Shares through February 28, 2022.
In January 2022, the Fund authorized and issued 2,200 shares of Series D Mandatory Redeemable Preferred Shares (the "Series D MRP Shares") and 2,600 shares of Series E Mandatory Redeemable Preferred Shares (the "Series E MRP Shares") for gross proceeds of $55,000 and $65,000, respectively. The Series D and Series E MRP Shares have a liquidation preference of $25.00 per share. The Series D MRP Shares have a dividend rate of 2.96% per annum, payable quarterly, and a redemption date of January 6, 2027. The Series E MRP Shares have a dividend rate of 3.48% per annum, payable quarterly, and a redemption date of January 6, 2032. The weighted average dividend rate for the Series D and the Series E MRP Shares is 3.24% per annum. The Series D and the Series E MRP Shares are subject to optional and mandatory redemption in certain circumstances.
The following common share distributions were declared for January and February 2022:
Record Date: daily
Payable Date: January 31, 2022
Per Share Amount: $0.11827337
Record Date: daily
Payable Date: February 28, 2022
Per Share Amount: $0.10682756
Annual Report 2020
136
CION Ares Diversified Credit Fund
Report of Independent Registered Public Accounting Firm
To the Shareholders and the Board of Trustees of CION Ares Diversified Credit Fund
Opinion on the Financial Statements
We have audited the accompanying consolidated statement of assets and liabilities of CION Ares Diversified Credit Fund (the "Fund"), including the consolidated schedule of investments, as of December 31, 2021, and the related consolidated statements of operations and cash flows for the year then ended, the consolidated statements of changes in net assets for each of the two years in the period then ended, the consolidated financial highlights for each of the two years in the period then ended, the period from November 1, 2019 to December 31, 2019, each of the two years in the period ended October 31, 2019, and for the period from January 26, 2017 (commencement of operations) through October 31, 2017 and the related notes (collectively referred to as the "financial statements"). In our opinion, the financial statements present fairly, in all material respects, the consolidated financial position of the Fund at December 31, 2021, the consolidated results of its operations and its cash flows for the year then ended, the consolidated changes in its net assets for each of the two years in the period then ended and its consolidated financial highlights for each of the two years in the period then ended, the period from November 1, 2019 to December 31, 2019, each of the two years in the period ended October 31, 2019, and for the period from January 26, 2017 (commencement of operations) through October 31, 2017, in conformity with U.S. generally accepted accounting principles.
Basis for Opinion
These financial statements are the responsibility of the Fund's management. Our responsibility is to express an opinion on the Fund's financial statements based on our audits. We are a public accounting firm registered with the Public Company Accounting Oversight Board (United States) ("PCAOB") and are required to be independent with respect to the Fund in accordance with the U.S. federal securities laws and the applicable rules and regulations of the Securities and Exchange Commission and the PCAOB.
We conducted our audits in accordance with the standards of the PCAOB. Those standards require that we plan and perform the audit to obtain reasonable assurance about whether the financial statements are free of material misstatement, whether due to error or fraud. The Fund is not required to have, nor were we engaged to perform, an audit of the Fund's internal control over financial reporting. As part of our audits, we are required to obtain an understanding of internal control over financial reporting but not for the purpose of expressing an opinion on the effectiveness of the Fund's internal control over financial reporting. Accordingly, we express no such opinion.
Our audits included performing procedures to assess the risks of material misstatement of the financial statements, whether due to error or fraud, and performing procedures that respond to those risks. Such procedures included examining, on a test basis, evidence regarding the amounts and disclosures in the financial statements. Our procedures included confirmation of securities owned as of December 31, 2021, by correspondence with the custodian and brokers or by other appropriate auditing procedures where replies from brokers were not received. Our audits also included evaluating the accounting principles used and significant estimates made by management, as well as evaluating the overall presentation of the financial statements. We believe that our audits provide a reasonable basis for our opinion.
We have served as the Fund's auditor since 2016.

Los Angeles, California
February 28, 2022
Annual Report 2021
137
CION Ares Diversified Credit Fund
Additional Information
December 31, 2021
Proxy Information
The policies and procedures used to determine how to vote proxies relating to securities held by the Fund are available (1) without charge, upon request, by calling 1-877-855-3434, or (2) on the SEC's website at http://www.sec.gov. Information regarding how the Fund voted proxies relating to portfolio securities during the most recent twelve-month period ended June 30 will be available on Form N-PX by August 31 of each year (1) without charge, upon request, by calling 1-877-855-3434, or (2) on the SEC's website at http://www.sec.gov.
Portfolio Information
The Fund files its complete schedule of portfolio holdings for the first quarter and the third quarter of each fiscal year on SEC Form N-PORT. The Fund's Form N-PORT reports are available (1) without charge, upon request, by calling 1-877-855-3434; and (2) on the SEC's website at http://www.sec.gov.
Annual Report 2021
138
CION Ares Diversified Credit Fund
Additional Information (continued)
December 31, 2021
Dividend Reinvestment Plan
The Fund will operate under a dividend reinvestment plan, (the "DRIP") administered by DST Systems, Inc. ("DST"). Pursuant to the plan, the Fund's distributions, net of any applicable U.S. withholding tax, are reinvested in the same class of shares of the Fund.
Shareholders automatically participate in the DRIP, unless and until an election is made to withdraw from the plan on behalf of such participating shareholder. A shareholder who does not wish to have distributions automatically reinvested may terminate participation in the DRIP at any time by written instructions to that effect to DST. Shareholders who elect not to participate in the DRIP will receive all distributions in cash paid to the shareholder of record (or, if the shares are held in street or other nominee name, then to such nominee). Such written instructions must be received by the DST 30 days prior to the record date of the distribution or the shareholder will receive such distribution in shares through the DRIP. Under the DRIP, the Fund's distributions to shareholders are automatically reinvested in full and fractional shares as described below.
When the Fund declares a distribution, DST, on the shareholder's behalf, will receive additional authorized shares from the Fund either newly issued or repurchased from shareholders by the Fund and held as treasury stock. The number of shares to be received when distributions are reinvested will be determined by dividing the amount of the distribution by the Fund's net asset value per share.
DST will maintain all shareholder accounts and furnish written confirmations of all transactions in the accounts, including information needed by shareholders for personal and tax records. DST will hold shares in the account of the shareholders in non-certificated form in the name of the participant, and each shareholder's proxy, if any, will include those shares purchased pursuant to the DRIP. Each participant, nevertheless, has the right to request certificates for whole and fractional shares owned. The Fund will issue certificates in its sole discretion. DST will distribute all proxy solicitation materials, if any, to participating shareholders.
In the case of shareholders, such as banks, brokers or nominees, that hold shares for others who are beneficial owners participating under the DRIP, DST will administer the DRIP on the basis of the number of shares certified from time to time by the record shareholder as representing the total amount of shares registered in the shareholder's name and held for the account of beneficial owners participating under the DRIP.
Neither DST nor the Fund shall have any responsibility or liability beyond the exercise of ordinary care for any action taken or omitted pursuant to the DRIP, nor shall they have any duties, responsibilities or liabilities except such as expressly set forth herein. Neither shall they be liable hereunder for any act done in good faith or for any good faith omissions to act, including, without limitation, failure to terminate a participant's account prior to receipt of written notice of his or her death or with respect to prices at which shares are purchased or sold for the participants account and the terms on which such purchases and sales are made, subject to applicable provisions of the federal securities laws.
The automatic reinvestment of dividends will not relieve participants of any federal, state or local income tax that may be payable (or required to be withheld) on such dividends. The Fund reserves the right to amend or terminate the DRIP. There is no direct service charge to participants with regard to purchases under the DRIP; however, the Fund reserves the right to amend the DRIP to include a service charge payable by the participants.
All correspondence concerning the DRIP should be directed to DST at CION Ares Diversified Credit Fund c/o DST Systems, Inc., P.O. Box 219422, Kansas City, MO 64121-9422. Certain transactions can be performed by calling the toll free number 888-729-4266.
Annual Report 2021
139
CION Ares Diversified Credit Fund
Additional Information (continued)
December 31, 2021
Plan of Distribution
ALPS Distributors, Inc. located at 1290 Broadway, Suite 1100, Denver, CO 80203, serves as the Fund's principal underwriter and acts as the Distributor of the Fund's shares on a best efforts basis, subject to various conditions. The Fund's shares are offered for sale through the Distributor at net asset value plus the applicable sales load. The Distributor also may enter into agreements with financial intermediaries for the sale and servicing of the Fund's shares. In reliance on Rule 415 of the Securities Act of 1933, the Fund intends to offer to sell an unlimited number of common shares, on a continual basis, through the Distributor. No arrangement has been made to place funds received in an escrow, trust or similar account. The Distributor is not required to sell any specific number or dollar amount of the Fund's shares, but will use its best efforts to solicit orders for the purchase of the shares. Shares of the Fund will not be listed on any national securities exchange and the Distributor will not act as a market marker in Fund shares.
The Distributor has entered into a wholesale marketing agreement with CION Securities, a registered broker-dealer and an affiliate of CION. Pursuant to the terms of the wholesale marketing agreement, CION Securities will seek to market and otherwise promote the Fund through various wholesale distribution channels, including regional and independent retail broker-dealers and registered investment advisers.
CION Securities has also entered into a dealer manager agreement with the Fund pursuant to which CION Securities has agreed to provide certain marketing and wholesale services in consideration of its receipt of the dealer manager fee.
The Advisers or its affiliates, in the Adviser's discretion and from their own resources, may pay additional compensation to financial intermediaries in connection with the sale of the Fund's shares. In return for the additional compensation, the Fund may receive certain marketing advantages including access to a financial intermediaries' registered representatives, placement on a list of investment options offered by a financial intermediary, or the ability to assist in training and educating the financial intermediaries. The additional compensation may differ among financial intermediaries in amount or in the manner of calculation: payments of additional compensation may be fixed dollar amounts, or based on the aggregate value of outstanding shares held by shareholders introduced by the financial intermediary, or determined in some other manner. The receipt of additional compensation by a selling financial intermediary may create potential conflicts of interest between an investor and its financial intermediary who is recommending the Fund over other potential investments. Additionally, the Fund pays a servicing fee to the financial intermediaries or financial institution for providing ongoing services in respect of clients holding shares of the Fund. Such services may include electronic processing of client orders, electronic fund transfers between clients and the Fund, account reconciliations with the Fund's transfer agent, facilitation of electronic delivery to clients of Fund documentation, monitoring client accounts for back-up withholding and any other special tax reporting obligations, maintenance of books and records with respect to the foregoing, and such other information and ongoing liaison services as the Fund or the Adviser may reasonably request.
The Fund and the Adviser have agreed to indemnify the Distributor against certain liabilities, including liabilities under the 1933 Act, or to contribute to payments the Distributor may be required to make because of any of those liabilities. Such agreement does not include indemnification of the Distributor against liability resulting from willful misfeasance, bad faith or negligence on the part of the Distributor in the performance of its duties or from reckless disregard by the Distributor of its obligations and duties under the Distribution Agreement.
Annual Report 2021
140
CION Ares Diversified Credit Fund
Additional Information (continued)
December 31, 2021
Investment Adviser
CION Ares Management, LLC
3 Park Avenue, 36th Floor
New York, NY 10016
Administrator
ALPS Fund Services, Inc.
1290 Broadway, Suite 1100
Denver, CO 80203
Custodian
State Street Bank and Trust Company
One Lincoln Street
Boston, MA 02111
Transfer Agent and DRIP Administrator
DST Systems, Inc.
333 W 11th Street
Kansas City, MO 64105
Distributor
ALPS Distributors, Inc.
1290 Broadway, Suite 1100
Denver, CO 80203
Independent Registered Public Accounting Firm
Ernst & Young LLP
725 S. Figueroa Street
Los Angeles, CA 90017
Fund Counsel
Dechert LLP
1095 Avenue of the Americas
New York, New York 10036
Annual Report 2021
141
CION Ares Diversified Credit Fund
Additional Information (continued)
December 31, 2021
Privacy Notice
We are committed to maintaining the privacy of our shareholders and to safeguarding their nonpublic personal information. The following information is provided to help you understand what personal information we collect, how we protect that information and why, in certain cases, we may share information with select other parties.
Generally, we will not receive any non-public personal information about shareholders of the common shares of the Fund, although certain of our shareholders' non-public information may become available to us. The non-public personal information that we may receive falls into the following categories:
• Information we receive from shareholders, whether we receive it orally, in writing or electronically. This includes shareholders' communications to us concerning their investment;
• Information about shareholders' transactions and history with us; or
• Other general information that we may obtain about shareholders, such as demographic and contact information such as address.
• We do not disclose any non-public personal information about shareholders, except:
• to our affiliates (such as our investment adviser) and their employees that have a legitimate business need for the information;
• to our service providers (such as our administrator, accountants, attorneys, custodians, transfer agent, underwriter and proxy solicitors) and their employees as is necessary to service shareholder accounts or otherwise provide the applicable service;
• to comply with court orders, subpoenas, lawful discovery requests, or other legal or regulatory requirements; or
• as allowed or required by applicable law or regulation.
When the Fund shares non-public shareholder personal information referred to above, the information is made available for limited business purposes and under controlled circumstances designed to protect our shareholders' privacy. The Fund does not permit use of shareholder information for any non-business or marketing purpose, nor does the Fund permit third parties to rent, sell, trade or otherwise release or disclose information to any other party.
The Fund's service providers, such as their adviser, administrator, and transfer agent, are required to maintain physical, electronic, and procedural safeguards to protect shareholder nonpublic personal information; to prevent unauthorized access or use; and to dispose of such information when it is no longer required.
Personnel of affiliates may access shareholder information only for business purposes. The degree of access is based on the sensitivity of the information and on personnel need for the information to service a shareholder's account or comply with legal requirements.
If a shareholder ceases to be a shareholder, we will adhere to the privacy policies and practices as described above. We may choose to modify our privacy policies at any time. Before we do so, we will notify shareholders and provide a description of our privacy policy.
In the event of a corporate change in control resulting from, for example, a sale to, or merger with, another entity, or in the event of a sale of assets, we reserve the right to transfer your non-public personal information to the new party in control or the party acquiring assets.
Annual Report 2021
142
CION Ares Diversified Credit Fund
Additional Information (continued)
December 31, 2021
Board of Trustees and Executive Officers
Trustees
Information regarding the members of the Board is set forth below. The Trustees have been divided into two groups — Interested Trustees and Independent Trustees. As set forth in the Fund's declaration of trust, each Trustee's term of office shall continue until his or her death, resignation or removal.
| Name, address(1) and Year of Birth | Position(s) Held with the Trust | Term of Office and Length of Time Served | Principal Occupation(s) During Past 5 Years | Number of Portfolios in Fund Complex Overseen by Trustee(2) | Other Directorships Held by Trustee | ||||||||||||||||||
Interested Trustees(3) | |||||||||||||||||||||||
| Mark Gatto 1972 | Trustee | 2016 | Co-Chief Executive Officer and Co-President, CION Investment Group, LLC and Co-Chief Executive Officer, CION Investment Corporation; Director, CION Ares Management, LLC | 1 | CION Investment Corporation; CION Ares Management, LLC | ||||||||||||||||||
| Mitch Goldstein 1967 | Trustee | 2016 | Partner of Ares Management; Co-President, Ares Capital Corporation | 1 | None | ||||||||||||||||||
| Michael A. Reisner 1970 | Trustee | 2016 | Co-Chief Executive Officer and Co-President, CION Investment Group, LLC and Co-Chief Executive Officer, CION Investment Corporation; Director, CION Ares Management, LLC | 1 | CION Investment Corporation; CION Ares Management, LLC | ||||||||||||||||||
| David A. Sachs 1959 | Trustee and Chairman of the Board | 2016 | Partner of Ares Management | 1 | Terex Corporation; Ares Dynamic Credit Allocation Fund, Inc | ||||||||||||||||||
Annual Report 2021
143
CION Ares Diversified Credit Fund
Additional Information (continued)
December 31, 2021
Trustees
| Name, address(1) and Year of Birth | Position(s) Held with the Trust | Term of Office and Length of Time Served | Principal Occupation(s) During Past 5 Years | Number of Portfolios in Fund Complex Overseen by Trustee(2) | Other Directorships Held by Trustee | ||||||||||||||||||
Independent Trustees | |||||||||||||||||||||||
| Jeffrey Perlowitz 1956 | Trustee | 2020 | Prior to 2016, Managing Director, Citigroup, Inc. | 1 | PennyMac Financial Services, Inc. | ||||||||||||||||||
| Paula B. Pretlow 1955 | Trustee | 2016 | Prior to 2012, Senior Vice President, The Capital Group Companies | 1 | The Kresge Foundation; The Harry & Jeanette Weinberg Foundation; Northwestern University; Ares Dynamic Credit Allocation Fund, Inc. | ||||||||||||||||||
| John Joseph Shaw 1951 | Trustee | 2016 | Independent Consultant; prior to 2012, President, Los Angeles Rams | 1 | Ares Dynamic Credit Allocation Fund, Inc. | ||||||||||||||||||
| Bruce H. Spector 1942 | Trustee | 2016 | Independent Consultant; from 2007 to 2015, Senior Advisor, Apollo Global Management, LLC (private equity) | 1 | The Private Bank of California (2007-2013); Ares Dynamic Credit Allocation Fund, Inc. | ||||||||||||||||||
| Mark R. Yosowitz 1968 | Trustee | 2016 | From 2014 to present, President, Mentored; from 2014 to present, Adjunct Professor, Brooklyn Law School; from 2008 to present, Senior Vice President, Corporate Development, ThinkEco Inc. | 1 | None | ||||||||||||||||||
(1) The address of each Trustee is care of the Secretary of the Fund at 3 Park Avenue, 36th Floor, New York, NY 10016.
(2) The term "Fund Complex" means two or more registered investment companies that share the same investment adviser or have an investment adviser that is an affiliated person of the investment adviser of any of the other registered investment companies or hold themselves out to investors as related companies for the purpose of investment and investor services.
(3) "Interested person," as defined in the Investment Company Act, of the Fund. Mr. Gatto, Mr. Goldstein, Mr. Reisner and Mr. Sachs are interested persons of the Fund due to their affiliation with the Adviser.
Annual Report 2021
144
CION Ares Diversified Credit Fund
Additional Information (continued)
December 31, 2021
Executive Officers
| Name, address(1) and Year of Birth | Position(s) Held with the Trust | Term of Office and Length of Time Served | Principal Occupation(s) During Past 5 Years | ||||||||||||
| John Atherton 1981 | Vice President and Assistant Secretary | 2018 | Mr. Atherton is a Managing Director and Associate General Counsel, Credit in the Ares Legal Department. Prior to joining Ares in 2018, Mr. Atherton was General Counsel, Private Investment Structures at Schroder Adveq. Previously Mr. Atherton was a Senior Associate in the London and Boston offices of Proskauer Rose LLP, where he focused on private investment funds. | ||||||||||||
| Joshua Bloomstein 1973 | Vice President and Assistant Secretary | 2016 | Mr. Bloomstein serves as a Partner and General Counsel (Credit) and Deputy General Counsel (Corporate) of Ares Management, where he focuses on credit matters. He is General Counsel, Vice President and Secretary of Ares Capital Corporation and Vice President and Assistant Secretary of Ares Commercial Real Estate Corporation. He is also a member of the Ares Enterprise Risk Committee. Mr. Bloomstein joined Ares in 2006. | ||||||||||||
| Michael Dennis 1976 | Vice President | 2017 | Mr. Dennis is a Partner and Co-Head of European Credit, in the Ares Credit Group. Additionally, Mr. Dennis serves as a member of the Executive Management Committee of Ares Management and the Ares Credit Group's European Direct Lending and European Liquid Credit Investment Committees. Mr. Dennis joined Ares in 2007. | ||||||||||||
| Kevin Early 1971 | Vice President | 2017 | Mr. Early is a Partner, European Chief Financial Officer in the Ares Finance Department. Mr. Early joined Ares in 2012. | ||||||||||||
| Anton Feingold 1980 | Vice President and Assistant Secretary | 2016 | Mr. Feingold is a Partner and Associate General Counsel in the Ares Legal Group and Assistant Secretary of Ares Management. He also serves as General Counsel, Vice President and Secretary of Ares Commercial Real Estate Corporation. Mr. Feingold joined Ares in 2014. | ||||||||||||
| Ian Fitzgerald 1975 | General Counsel and Secretary Vice President and Assistant Secretary | 2019 2017-2019 | Mr. Fitzgerald is a Managing Director and Associate General Counsel (Credit) in the Ares Legal Group, where he focuses on credit matters. He also serves as Vice President and Assistant Secretary of Ivy Hill Asset Management, L.P. and Vice President and Assistant Secretary of Ivy Hill Asset Management GP, LLC, Ivy Hill Asset Management's General Partner. Mr. Fitzgerald joined Ares in 2010. | ||||||||||||
| Mark Gatto 1972 | Co-President and Co- Chief Executive Officer | 2016 | Mr. Gatto is Co-Chief Executive Officer and Co-President of CION Investment Group, LLC as well as Co-Chief Executive Officer of CION Investment Corp., a business development company focused on middle market loans. Mr. Gatto serves on the investment committee of CIC. In addition, Mr. Gatto is a Director of CION Ares Management, LLC. Mr. Gatto joined CION in 1999. | ||||||||||||
| Mitch Goldstein 1967 | Vice President | 2016 | Mr. Goldstein is a Partner and Co-Head of the Ares Credit Group and a member of the Executive Management Committee of Ares Management. He additionally serves as Co-President of Ares Capital Corporation ("ARCC"). He is a member of the Ares Credit Group's U.S. Direct Lending and Commercial Finance Investment Committees and Ivy Hill Asset Management Investment Committee. Mr. Goldstein joined Ares Management in 2005. | ||||||||||||
| Blair Jacobson 1972 | Vice President | 2017 | Mr. Jacobson is a Partner and Co-Head of European Credit in the Ares Credit Group and a member of the Management Committee of Ares Management. He also serves on the boards of Ares Management Limited and Ares Management UK Limited. Additionally, Mr. Jacobson serves on the Ares Credit Group's European Direct Lending and European Liquid Credit Investment Committees. He joined Ares in 2012. | ||||||||||||
| Keith Kooper 1975 | Vice President and Assistant Secretary | 2016 | Mr. Kooper is a Partner and General Counsel (Real Estate) in the Ares Legal Group. He also serves as Vice President and Assistant Secretary of Ares Commercial Real Estate Corporation. Mr. Kooper additionally serves as a member of the Ares Enterprise Risk Committee. Mr. Kooper joined Ares in 2013. | ||||||||||||
Annual Report 2021
145
CION Ares Diversified Credit Fund
Additional Information (continued)
December 31, 2021
Executive Officers
| Name, address(1) and Year of Birth | Position(s) Held with the Trust | Term of Office and Length of Time Served | Principal Occupation(s) During Past 5 Years | ||||||||||||
| Scott Lem 1977 | Chief Financial Officer Treasurer | 2019 2016-2019 | Mr. Lem is a Partner and Chief Accounting Officer, Credit (Direct Lending) in the Ares Finance Department. Mr. Lem additionally serves as Chief Accounting Officer, Vice President and Treasurer of ARCC and previously served as Assistant Treasurer of ARCC from May 2009 to May 2013. Mr. Lem also serves as Chief Financial Officer of Ares Dynamic Credit Allocation Fund, Inc. ("ARDC"), a NYSE-listed, closed end fund managed by an affiliate of Ares. He may from time to time serve as an officer, director or principal of entities affiliated with Ares Management or investment funds managed by Ares Management and its affiliates. From July 2003 to December 2008, Mr. Lem served as Controller of Ares Management. Mr. Lem joined Ares in 2003. | ||||||||||||
| Greg Margolies 1966 | Vice President | 2016 | Mr. Margolies is a Partner in the Ares Credit Group, the Head of Markets for Ares Management and a member of the Executive Management Committee of Ares Management. Additionally, Mr. Margolies serves as a member of the Ares Credit Group's Alternative Credit Investment Committee, the ARDC Investment Committee and the Ares Private Equity Group's Special Opportunities Investment Committee. Mr. Margolies joined Ares in 2009. | ||||||||||||
| Lisa Morgan 1976 | Chief Compliance Officer and Anti-Money Laundering Officer | 2021 | Ms. Morgan is a Managing Director and Head of Regulatory Compliance in the Ares Compliance Department. She also serves as the Chief Compliance Officer of ARCC and Ares Dynamic Credit Allocation Fund, Inc. ("ARDC"). Ms. Morgan joined Ares in September 2017. | ||||||||||||
| Michael Reisner 1970 | Co-President and Co- Chief Executive Officer | 2016 | Mr. Reisner is Co-Chief Executive Officer and Co-President of CION Investment Group, LLC as well as Co-Chief Executive Officer of CION Investment Corp. ("CIC"), a business development company focused on middle market loans. Mr. Reisner serves on the investment committee of CIC. In addition, Mr. Reisner is a Director of CION Ares Management, LLC. Mr. Reisner joined CION in 2001. | ||||||||||||
| Penni F. Roll 1965 | Treasurer Chief Financial Officer | 2019 2016-2019 | Ms. Roll is a Partner and the Chief Financial Officer of the Ares Credit Group. She also serves as the Chief Financial Officer of ARCC and is Treasurer of ARDC. She may additionally from time to time serve as an officer, director or principal of entities affiliated with Ares Management or of investment funds managed by Ares Management and its affiliates. Ms. Roll also serves as a member of the Ares Diversity, Equity and Inclusion Council. Ms. Roll joined Ares in 2010. | ||||||||||||
| Naseem Sagati Aghili 1981 | Vice President and Assistant Secretary | 2019 | Ms. Sagati Aghili is a Partner, General Counsel and Secretary of Ares Management. She is a Partner in and Head of the Ares Legal Group and additionally serves on the Ares Executive Management Committee, Business Advisory Group, Enterprise Risk Committee and Communications Committee and the Ares Diversity, Equity and Inclusion Council. She also serves as Vice President of ARCC and ARDC. Prior to being named the firm's General Counsel in 2020, Ms. Sagati Aghili served in a variety of roles at Ares Management, including most recently Co-General Counsel and General Counsel, Private Equity. Ms. Sagati Aghili joined Ares in 2009. | ||||||||||||
| Greg Schill 1981 | Vice President | 2016 | Mr. Schill is Senior Managing Director of CION Investment Group, LLC. Prior to this, he served as Managing Director since 2012. Mr. Schill joined CION in 2001. | ||||||||||||
(1) The address of each officer is care of the Secretary of the Fund at 3 Park Avenue, 36th Floor, New York, NY 10016.
The Statement of Additional Information (SAI) includes additional information about the board members and is available, without charge, upon request. Shareholders may call 888-729-4266 to request the SAI.
Annual Report 2021
146
CION Ares Diversified Credit Fund
Additional Information (continued)
December 31, 2021
Approval of Investment Sub-Advisory Agreement
The Board of Trustees (the "Board") of CION Ares Diversified Credit Fund (the "Fund"), a majority of whom are not "interested persons" (as defined in the Investment Company Act of 1940, as amended (the "1940 Act")) of the Fund (the "Independent Trustees"), renewed the Investment Sub-Advisory Agreement by and among the CION Ares Management, LLC (the "Adviser"), Ares Capital Management II LLC (the "Sub-Adviser") and the Fund (the "Agreement") at a meeting held on August 10, 2021 (the "Meeting").
The Fund's Board has the responsibility under the 1940 Act to consider the renewal of the Fund's Agreement on an annual basis called for the purpose of voting on such renewal. In addition, the Fund's Board generally receives, reviews and evaluates information concerning the services and personnel of the Sub-Adviser and its affiliates at quarterly meetings of the Board. While particular emphasis might be placed on information concerning the Fund's investment performance, comparability of fees, total expenses and profitability at any meeting at which a renewal of the Agreement is considered, the process of evaluating the Sub-Adviser and the Fund's investment advisory and administrative arrangements is an ongoing one.
In connection with the renewal of the Agreement, the Independent Trustees met with their independent counsel in executive session. Counsel to the Independent Trustees reviewed with the Independent Trustees a memorandum outlining the legal duties of the Board under the 1940 Act and applicable state law and discussed the factors outlined by the federal courts as relevant to a board's consideration of the approval of an investment advisory agreement.
In considering whether to renew the Agreement, the Fund's Board reviewed certain information provided to the Board by the Sub-Adviser in advance of the Meeting, and supplemented orally at the Meeting, including, among other things, information concerning the services rendered to the Fund by the Sub-Adviser, comparative fee, expense and performance information, and other reports of and presentations by representatives of the Sub-Adviser concerning the Fund's and Sub-Adviser's operations, compliance programs and risk management. The Board also reviewed a report prepared by the Sub-Adviser which included information comparing (1) the Fund's performance with the performance of a group of comparable funds (the "Performance Group") for various periods ended June 30, 2021 and (2) the Fund's total expenses with those of a group of comparable funds (the "Expense Group"), which was identical to the Performance Group, the information for which was derived in part from Bloomberg and fund financial statements available to the Sub-Adviser as of the date of their analysis.
In determining whether to renew the Agreement, the Board considered all factors that it believed to be relevant, including those discussed below. The Board did not identify any one factor as dispositive, and each Trustee may have attributed different weights to the factors considered.
a. The nature, extent and quality of services to be provided by the Sub-Adviser — With respect to the nature, extent and quality of services to be provided by the Sub-Adviser, the Board reviewed the information regarding the types of services to be provided under the Agreement and information describing the Sub-Adviser's organization and business, including the quality of the investment research capabilities of the Sub-Adviser and the other resources dedicated to performing services for the Fund. The Board noted the professional experience and qualifications of the Fund's portfolio management team and other senior personnel of the Sub-Adviser involved with the Fund, including the portfolio management team's expertise in managing securities in which the Fund invests, the integrated platforms of the Sub-Adviser and its affiliates and the benefits, resources and opportunities of the platforms that the Sub-Adviser is able to access. Fund management discussed the size and experience of the Sub-Adviser's staff, the experience of their key personnel in providing investment management services, including the members of the allocation committee, the systems used by the Sub-Adviser's personnel and the ability of the Sub-Adviser to attract and retain capable personnel. The quality of administrative and other services were also considered. The Board also noted the reputation and track record of the Sub-Adviser's organization as a leading manager of credit assets.
b. Investment performance of the Fund and the Sub-Adviser — With respect to investment performance of the Fund and the Sub-Adviser, the Board reviewed statistical information concerning the Fund's investment performance in relation to its stated objective, as well as comparative data with respect to the performance of unaffiliated closed-end funds operating as interval funds that engage in similar investing, underwriting and origination activity provided by the Sub-Adviser. Representatives of the Sub-Adviser reviewed with the Board the Fund's performance. In connection with its review, the Board discussed the results of the performance comparisons provided by the Sub-Adviser.
Annual Report 2021
147
CION Ares Diversified Credit Fund
Additional Information (continued)
December 31, 2021
In reviewing the Sub-Adviser's report, the Board took into consideration that the Sub-Adviser identified primarily interval funds that focused on global credit as the peer categories the Sub-Adviser believed were most comparable to the Fund given the Fund's flexible mandate and focus on a portfolio of directly originated loans, secured floating and fixed rate syndicated loans, corporate bonds, asset-backed securities, commercial real estate loans and other types of credit instruments. The Board noted that the Fund's total return performance, on a net asset value basis, had outperformed the average return of the Performance Group in the year-to-date, trailing one-year and inception to date periods ended June 30, 2021.
Representatives of the Sub-Adviser noted that the usefulness of performance comparisons may be affected by a number of factors, including different investment limitations that may be applicable to the Fund and comparable funds, highlighting, in particular, the difficulty in finding an appropriate universe of comparable funds. In discussing the Fund's performance, they noted, among other things, the outperformance may be attributable to its relative value-focused direct origination strategy which yields a defensive investment posture, strong security selection and an overweight allocation to directly originated investments.
c. Cost of the services to be provided and profits to be realized by the Sub-Adviser from the relationship with the Fund — The Board considered information about the profitability of the Fund to the Sub-Adviser, as well as the costs of services provided by the Sub-Adviser to the Fund. The Board received and reviewed information relating to the financial condition of the Sub-Adviser and its affiliates. Representatives of the Sub-Adviser reviewed the expenses allocated and profit received by the Sub-Adviser and its affiliates and the resulting profitability percentage for managing the Fund and the method used to determine the expenses and profit. The Board also considered that the Adviser pays the Sub-Adviser a portion of its advisory fee as compensation for the sub-advisory services.
d. Economies of scale and whether fee levels reflect these economies of scale — The Board considered the extent to which economies of scale are expected to be realized and whether fee levels reflect these economies of scale. The Trustees noted that while the Sub-Adviser is not currently experiencing any economies of scale in servicing the Fund there is a possibility that modest economies of scale related to administrative costs could be realized as asset levels increase.
e. Comparison of services to be rendered and fees to be paid to those under other investment advisory contracts, such as contracts of the same and other investment Sub-Adviser or other clients — In evaluating the management fees and expenses, the Board considered the Fund's management fees and the Fund's expense ratios in absolute terms and as compared with the fees and expenses of the Expense Group. Based upon the comparative fee information provided, the Board noted that the Fund's advisory fees were generally in line with those of comparable funds in the Expense Group identified by the Sub-Adviser. The Board considered that the Agreement provides that the Sub-Adviser may earn a portion of the incentive fee and, to the extent the fee is earned and paid, would effectively result in a higher rate of total compensation from the Fund to the Sub-Adviser than the base-management fee rate stated in the Agreement. In addition, the Board also noted the reputation and track record of the Sub-Adviser's organization as a leading manager of credit assets.
In discussing the Fund's management fees and expenses, representatives of the Sub-Adviser noted, among other things, that the Sub-Adviser believes the management fees and expenses are reasonable when compared to, and are consistent with, other similar funds and portfolios, particularly in light of the Fund's performance. The previous decrease of the management fee to 1.25% of managed assets and of the incentive fee to 15% of pre-incentive fee net investment income was also noted. Representatives of the Sub-Adviser also noted that the Fund's investment strategy of investing in a portfolio of directly originated loans, secured floating and fixed rate syndicated loans, corporate bonds, asset-backed securities, commercial real estate loans and other types of credit instruments requires additional expertise and expense related to trade support, pricing and valuation, marketing, investor education and regulatory monitoring. In addition, representatives of the Sub-Adviser noted that the Fund's size is smaller than the average and median of the peer group, and thus has a smaller capital base over which to spread fixed costs.
f. Benefits derived or to be derived by the Sub-Adviser from their relationship with the Fund — The Board also considered the extent to which benefits other than the fees and reimbursement amounts might accrue to the Sub-Adviser and its affiliates from their relationships with the Fund. The Board noted in this regard that, while certain funds
Annual Report 2021
148
CION Ares Diversified Credit Fund
Additional Information (continued)
December 31, 2021
and accounts managed by the Sub-Adviser engage from time to time in cross trade and co-investment transactions with the Fund as permitted by the 1940 Act, neither the Adviser or its affiliate execute portfolio transactions on behalf of the Fund, and that the Sub-Adviser had confirmed that the Fund does not invest in securities issued by affiliates of the Sub-Adviser, including collateralized loan obligations sponsored by the Sub-Adviser. However, the Board recognized that the Sub-Adviser might derive reputational and other benefits from their association with the Fund, including access to a different investor base than historically serviced by the Sub-Advisor and its affiliates.
Conclusion
At the conclusion of these discussions, the Board agreed that it had been furnished with information sufficiently responsive to allow it to make an informed business decision with respect to the renewal of the Agreement. Based on the discussions and considerations at the Meeting, and in reliance on information received on a routine and regular basis through the year relating to the operations of the Fund and the investment management and other services provided under the Agreement, the Board, including the Independent Trustees, supported the approval of the renewal of the Agreement for an additional one-year period ending November 1, 2022.
Annual Report 2021
149

(b) Not applicable.
Item 2. Code of Ethics.
(a) CION Ares Diversified Credit Fund (the “Fund”) has adopted a Code of Ethics that applies to the Fund’s principal executive officer and principal financial officer (the “Code of Ethics”).
(c) The Fund has not made any amendment to its Code of Ethics during the period covered by this Form N-CSR.
(d) There have been no waivers, including any implicit waivers, granted by the Fund to individuals covered by the Fund’s Code of Ethics during the reporting period for this Form N-CSR.
(e) Not applicable.
(f) The registrant’s Code of Ethics is attached herewith as Exhibit 13(a)(1).
Item 3. Audit Committee Financial Expert.
(a)(1) The Board of Trustees of the Fund has determined that the Fund has three members serving on the Fund’s Audit Committee that possess the attributes identified in Instruction 2(b) of Item 3 to Form N-CSR to qualify as an “audit committee financial expert.”
(a)(2) The names of the audit committee financial experts as of the date of filing of this Form N-CSR are John Joseph Shaw and Paula B. Pretlow. Both Mr. Shaw and Ms. Pretlow have been deemed to be “independent” for the purpose of this Item because he or she is not an “interested person” of the Fund as that term is defined in Section 2(a)(19) of the Investment Company Act of 1940, as amended (the “1940 Act”) and does not accept directly or indirectly any consulting, advisory, or other compensatory fee from the Fund.
Item 4. Principal Accountant Fees and Services.
(a) Audit Fees
For the fiscal years ended December 31, 2021 and December 31, 2020, Ernst & Young LLP (“E&Y”), the Fund’s independent registered public accounting firm, billed the Fund aggregate fees of $306,900 and $271,900, respectively, for professional services rendered for the audit of the Fund’s annual financial statements or for services normally provided by E&Y in connection with statutory and regulatory filings or engagements.
(b) Audit-Related Fees
For the fiscal years ended December 31, 2021 and December 31, 2020, the aggregate fees billed for assurance and related services rendered by E&Y that are reasonably related to the performance of the audit or review of the Fund’s financial statements and that are not reported under Audit Fees above were $42,100 and $46,000, respectively.
For the fiscal years ended December 31, 2021 and December 31, 2020, aggregate Audit-Related Fees billed by E&Y that were required to be approved by the Fund’s Audit Committee for audit-related services rendered to the Fund’s investment adviser and any entity controlling, controlled by or under common control with the investment adviser that provides ongoing services to the Fund (the “Affiliated Service Providers”) that relate directly to the operations and financial reporting of the Fund were $0 and $0, respectively.
(c) Tax Fees
For the fiscal years ended December 31, 2021 and December 31, 2020, E&Y billed the Fund aggregate fees of $36,440 and $14,950, respectively, for professional services rendered for tax compliance, tax advice, and tax planning. The nature of the services comprising the Tax Fees was the review of the Fund’s income tax returns and tax distribution requirements.
For the fiscal years ended December 31, 2020 and December 31, 2020, the aggregate Tax Fees billed by E&Y that were required to be approved by the Fund’s Audit Committee for tax compliance, tax advice and tax planning services rendered on behalf of Affiliated Service Providers that relate directly to the operations and financial reporting of the Fund were $0 and $0, respectively.
(d) All Other Fees
For the fiscal years ended December 31, 2020 and December 31, 2020, the aggregate fees billed by E&Y to the Fund for all services other than services reported under Audit Fees, Audit-Related Fees, and Tax Fees were $0 and $0, respectively.
For the fiscal years ended December 31, 2020 and December 31, 2020, the aggregate fees in this category billed by E&Y that were required to be approved by the Fund’s Audit Committee for services rendered on behalf of Affiliated Service Providers that relate directly to the operations and financial reporting of the Fund were $0 and $0, respectively.
(e)(1) Audit Committee’s Pre-Approval Policies and Procedures
The Fund’s Audit Committee Charter requires that the Audit Committee pre-approve all audit and non-audit services to be provided to the Fund by the Fund’s independent registered public accounting firm; provided, however, that the pre-approval requirement with respect to the provision of non-auditing services to the Fund by the Fund's independent registered public accounting firm may be waived by the Audit Committee under the circumstances described in the Securities Exchange Act of 1934, as amended (the “1934 Act”).
(e)(2) Percentage of Services
All of the audit and tax services described above for which E&Y billed the Fund fees for the fiscal years ended December 31, 2020 and December 31, 2020, were pre-approved by the Audit Committee.
For the fiscal years ended December 31, 2020 and December 31, 2020, the Fund’s Audit Committee did not waive the pre-approval requirement of any non-audit services to be provided to the Fund by E&Y.
(f) Not applicable.
(g) For the fiscal years ended December 31, 2020 and h December 31, 2020, aggregate non-audit fees billed by E&Y for services rendered to the Fund were $0 and $0, respectively.
For the fiscal years ended December 31, 2020 December 31, 2020, aggregate non-audit fees billed by E&Y for services rendered to the Affiliated Service Providers were $0 and $0, respectively.
(h) E&Y notified the Fund’s Audit Committee of all non-audit services that were rendered by E&Y to the Fund’s Affiliated Service Providers that were not pre-approved pursuant to paragraph (c)(7)(ii) of Rule 2-01 of Regulation S-X, allowing the Fund’s Audit Committee to consider whether such services were compatible with maintaining E&Y’s independence.
Item 5. Audit Committee of Listed Registrants.
(a) The Fund has a separately-designated Audit Committee established in accordance with Section 3(a)(58)(A) of the 1934 Act. The members of the Fund’s Audit Committee are Jeffrey Perlowitz, Paula B. Pretlow, John Joseph Shaw, Bruce H. Spector and Mark R. Yosowitz.
(b) Not applicable.
Item 6. Investments.
(a) Schedule of Investments is included as part of Item 1 of this Form N-CSR.
(b) Not applicable.
Item 7. Disclosure of Proxy Voting Policies and Procedures for Closed-End Investment Companies.
Attached to this Form N-CSR as exhibit 13(a)(5) is a copy of the proxy voting policies and procedures of the Fund and its investment adviser.
Item 8. Portfolio Managers of Closed-End Management Investment Companies.
(a)(1) As of the date of this filing, the portfolio managers of the Fund are as follows:
Mitch Goldstein
Partner, Co-Head of the Ares Credit Group and Portfolio Manager (since inception)
Investment Experience:
Mr. Goldstein is a Partner and Co-Head of the Ares Credit Group. He serves on the Ares Executive Management Committee and the firm's Partners Committee. He additionally serves as Co-President of Ares Capital Corporation and Vice President and interested trustee and Portfolio Manager of the Fund. He is a member of the Ares Credit Group's U.S. Direct Lending and Commercial Finance Investment Committees and the Ivy Hill Asset Management Investment Committee. Prior to joining Ares Management in May 2005, Mr. Goldstein worked at Credit Suisse First Boston, where he was a Managing Director in the Financial Sponsors Group. At CSFB, Mr. Goldstein was responsible for providing investment banking services to private equity funds and hedge funds with a focus on M&A and restructurings as well as capital raisings, including high yield, bank debt, mezzanine debt, and IPOs. Mr. Goldstein joined CSFB in 2000 at the completion of the merger with Donaldson, Lufkin & Jenrette. From 1998 to 2000, Mr. Goldstein was at Indosuez Capital, where he was a member of the Investment Committee and a Principal, responsible for originating, structuring and executing leveraged transactions across a broad range of products and asset classes. From 1993 to 1998, Mr. Goldstein worked at Bankers Trust. He also serves on the Board of Managers of Ivy Hill Asset Management GP, LLC. Mr. Goldstein graduated summa cum laude from the State University of New York at Binghamton with a B.S. in Accounting and received an M.B.A. from Columbia University's Graduate School of Business.
Greg Margolies
Partner, Head of Markets and Portfolio Manager (since inception)
Investment Experience:
Mr. Margolies is a Partner in the Ares Credit Group and is Vice President of the Fund. Additionally, Mr. Margolies serves as a member of the Ares Credit Group's Alternative Credit Investment Committee, the Ares Dynamic Credit Allocation Fund Investment Committee, the Ares Private Equity Group's Special Opportunities Investment Committee and is on the Board of Directors of the Ares Charitable Foundation. Prior to joining Ares in 2009, Mr. Margolies served as a Managing Director and Global Head of Leveraged Finance and Capital Commitments at Merrill Lynch & Co. and was a member of the Executive Committee for Merrill Lynch's Global Investment Banking Group. Previously, Mr. Margolies was Co-Head of the DB Capital Mezzanine Fund. Mr. Margolies serves on the Board of Directors for the International Organization for Women and Development, the Advisory Council for University of Michigan's Life Science Institute and the Board of Trustees for The Juilliard School. Mr. Margolies holds a B.A. from the University of Michigan in International Economics and Finance and an M.B.A. from the University Of Pennsylvania Wharton School Of Business.
(a)(2) As of December 31, 2021, the Portfolio Managers were primarily responsible for the day-to-day portfolio management of the following accounts:
| Name of Portfolio Manager | Type of Accounts | Total # of Accounts Managed | Total Assets (in millions) | # of Accounts Managed for which Advisory Fee is Based on Performance | Total Assets for which Advisory Fee is Based on Performance (in millions) | |||||||||||||
| Mitch Goldstein | Registered investment companies | 2 | $ | 27,243 | 2 | $ | 27,243 | |||||||||||
| Other pooled investment vehicles | 4 | $ | 19,972 | 4 | $ | 19,972 | ||||||||||||
| Other accounts | 23 | $ | 12,223 | 22 | 9,746 | |||||||||||||
| Greg Margolies | Registered investment companies | 1 | $ | 3,129 | 1 | $ | 3,129 | |||||||||||
| Other pooled investment vehicles | 2 | $ | 2,080 | 2 | $ | 2,080 | ||||||||||||
| Other accounts | 3 | $ | 1,193 | 3 | $ | 1,193 | ||||||||||||
Material Conflicts of Interest:
The Fund’s executive officers and trustees, and the employees of CION Ares Management, LLC (“CAM” or the “Advisor”) and Ares Capital Management II LLC (“Ares Capital” and collectively with CAM, the “Advisors”), serve or may serve as officers, trustees or principals of entities that operate in the same or a related line of business as the Fund or of other Ares- or CION Investment Group, LLC (“CION”)-advised funds (“Other Managed Funds”). As a result, they may have obligations to investors in those entities, the fulfillment of which might not be in the best interests of the Fund or its shareholders. Moreover, notwithstanding the difference in principal investment objectives between the Fund and the Other Managed Funds, such other funds, including potential new pooled investment vehicles or managed accounts not yet established (whether managed or sponsored by affiliates or the Advisors), have, and may from time to time have, overlapping investment objectives with the Fund and, accordingly, invest in, whether principally or secondarily, asset classes similar to those targeted by the Fund. To the extent the Other Managed Funds have overlapping investment objectives, the scope of opportunities otherwise available to the Fund may be adversely affected and/or reduced. Additionally, certain employees of the Advisors and their management may face conflicts in their time management and commitments as well as in the allocation of investment opportunities to other Ares funds.
The results of the Fund’s investment activities may differ significantly from the results achieved by the Other Managed Funds. It is possible that one or more of such funds will achieve investment results that are substantially more or less favorable than the results achieved by the Fund. Moreover, it is possible that the Fund will sustain losses during periods in which one or more affiliates achieve significant profits on their trading for proprietary or other accounts. The opposite result is also possible. The investment activities of one or more Advisor affiliates for their proprietary accounts and accounts under their management may also limit the investment opportunities for the Fund in certain markets.
The Advisors may determine that the Fund should invest on a side-by-side basis with one or more Other Managed Funds. In certain circumstances, negotiated co-investments may be made only in accordance with the terms of the exemptive order Ares received from the SEC (the “Order”). Co-investments made under the Order are subject to compliance with the conditions and other requirements contained in the Order, which could limit the Fund’s ability to participate in a co-investment transaction.
In the event investment opportunities are allocated among the Fund and Other Managed Funds, we may not be able to structure our investment portfolio in the manner desired. Although the Advisors endeavor to allocate investment opportunities in a fair and equitable manner, the Fund is not generally permitted to co-invest in any portfolio company in which a fund managed by Ares or any of its downstream affiliates (other than the Fund and its downstream affiliates) currently has an investment. However, the Fund may co-invest with funds managed by Ares or any of its downstream affiliates, subject to compliance with existing regulatory guidance, applicable regulations and its allocation procedures.
From time to time, the Fund and the Other Managed Funds may make investments at different levels of an issuer’s capital structure or otherwise in different classes of an issuer’s securities. Such investments may inherently give rise to conflicts of interest or perceived conflicts of interest between or among the various classes of securities that may be held by such entities.
The Advisors, their affiliates and their clients may pursue or enforce rights with respect to an issuer in which the Fund has invested, and those activities may have an adverse effect on the Fund. As a result, prices, availability, liquidity and terms of the Fund’s investments may be negatively impacted by the activities of the Advisors and their affiliates or their clients, and transactions for the Fund may be impaired or effected at prices or terms that may be less favorable than would otherwise have been the case.
The Advisors may enter into transactions and invest in securities, instruments and currencies on behalf of the Fund in which customers of its affiliates, to the extent permitted by applicable law, serve as the counterparty, principal or issuer. In such cases, such party’s interests in the transaction could be adverse to the interests of the Fund, and such party may have no incentive to assure that the Fund obtains the best possible prices or terms in connection with the transaction. In addition, the purchase, holding and sale of such investments by the Fund may enhance the profitability of the Advisors or their affiliates. One or more affiliates may also create, write or issue Derivatives for their customers, the underlying securities, currencies or instruments of which may be those in which the Fund invests or which may be based on the performance of the Fund. The Fund may, subject to applicable law, purchase investments that are the subject of an underwriting or other distribution by one or more Advisors affiliates and may also enter into transactions with other clients of an affiliate where such other clients have interests adverse to those of the Fund.
The Fund will be required to establish business relationships with its counterparties based on the Fund’s own credit standing. Neither the Advisors nor any of their affiliates will have any obligation to allow its credit to be used in connection with the Fund’s establishment of its business relationships, nor is it expected that the Fund’s counterparties will rely on the credit of the Advisors or their affiliates in evaluating the Fund’s creditworthiness.
The Advisors are paid a fee based on a percentage of the Fund’s Managed Assets. The participation of the Advisors’ investment professionals in the valuation process could therefore result in a conflict of interest. The Advisors also may have a conflict of interest in deciding whether to cause the Fund to incur leverage or to invest in more speculative investments or financial instruments, thereby potentially increasing the assets or the yield of the Fund and, accordingly, the Management Fees or Incentive Fees (as such terms are defined in the Fund’s Prospectus) received by the Advisors. Certain other Ares-advised funds pay the Advisors or their affiliates performance-based compensation, which could create an incentive for the Advisors or affiliate to favor such investment fund or account over the Fund.
By reason of the various activities of the Advisors and their affiliates, the Advisors and such affiliates may acquire confidential or material non-public information or otherwise be restricted from purchasing certain potential Fund investments that otherwise might have been purchased or be restricted from selling certain Fund investments that might otherwise have been sold at the time.
The Advisors have adopted policies and procedures designed to prevent conflicts of interest from influencing proxy voting decisions made on behalf of advisory clients, including the Fund, and to help ensure that such decisions are made in accordance with its fiduciary obligations to clients. Nevertheless, notwithstanding such proxy voting policies and procedures, actual proxy voting decisions may have the effect of favoring the interests of other clients, provided that the Advisors believe such voting decisions to be in accordance with its fiduciary obligations.
(a)(3) Compensation Structure of Portfolio Manager(s) or Management Team Members
Compensation is determined by Advisors’ executive leadership, with recommendations made by the head of each applicable business unit. Compensation may include a variety of components and may vary from year to year based on a number of factors. Generally, Portfolio Managers receive a base salary and are eligible for a discretionary year-end bonus based on performance, a portion of which may be paid in the form of shares of Class A Common Stock of Ares Capital’s publicly traded parent company.
Base Compensation.
Generally, when the Portfolio Managers receive base compensation from the Advisors it is based on their individual seniority and their position within the firm.
Discretionary Compensation.
In addition to base compensation, the Portfolio Managers may receive discretionary year-end bonus compensation from the Advisors or its ultimate parent company. Subject to a minimum compensation threshold, a portion of year-end bonus may be paid in the form of shares of Class A Common Stock of the Ares Capital’s publicly traded parent company, which vests over time. Discretionary compensation may be based on individual seniority and contribution, and, if applicable, may include direct carried interest and/or profit participations with respect to funds in which the Portfolio Managers are involved and may also include similar incentive awards relating to the funds in the firm’s other investment groups.
(a)(4) Ownership of Securities
The following table sets forth, for each Portfolio Manager, the aggregate dollar range of the Fund's equity securities beneficially owned as of December 31, 2021.
| Portfolio Manager | Dollar Range of Fund Shares Beneficially Owned |
| Mitch Goldstein | None |
| Greg Margolies | None |
(b) Not applicable.
Item 9. Purchases of Equity Securities by Closed-End Management Investment Company and Affiliated Purchasers.
None during the period covered by this Form N-CSR filing pursuant to a plan or program.
Item 10. Submission of Matters to a Vote of Security Holders.
There have been no material changes to the procedures by which shareholders may recommend nominees to the Fund’s Board of Trustees during the period covered by this Form N-CSR filing.
Item 11. Controls and Procedures.
| (a) | The Fund’s principal executive and principal financial officers have concluded that the Fund’s disclosure controls and procedures (as defined in Rule 30a-3(c) under the 1940 Act) (17 CFR 270.30a-3(c)) are effective, as of a date within 90 days of the filing date of this Form N-CSR based on their evaluation of these controls and procedures required by Rule 30a-3(b) under the 1940 Act (17 CFR 270.30a-3(b)) and Rules 13a-15(b) or 15d-15(b) under the 1934 Act, as amended (17 CFR 240.13a-15(b) or 240.15d-15(b)). |
| (b) | There were no changes in the Fund’s internal control over financial reporting (as defined in Rule 30a-3(d) under the 1940 Act (17 CFR 270.30a-3(d))) that occurred during the period covered by this report that has materially affected, or is reasonably likely to materially affect, the Fund’s internal control over financial reporting. |
Item 12. Disclosure of Securities Lending Activities for Closed-End Management Investment Companies.
| (a) | Not applicable. |
| (b) | Not applicable. |
Item 13. Exhibits.
| (a)(2) | The certifications required by Rule 30a-2(a) under the 1940 Act (17 CFR 270.30a-2(a)) are attached hereto. |
| (a)(3) | Not applicable. |
| (a)(4) | Not applicable. |
| (a)(5) | Proxy voting policies and procedures of the Fund and its investment adviser are attached hereto in response to Item 7. |
| (b) | The certifications required by Rule 30a-2(b) under the 1940 Act (17 CFR 270.30a-2(b)) and Section 906 of the Sarbanes-Oxley Act of 2002 are attached hereto. |
SIGNATURES
Pursuant to the requirements of the Securities Exchange Act of 1934 and the Investment Company Act of 1940, the Fund has duly caused this report to be signed on its behalf by the undersigned, thereunto duly authorized.
CION ARES DIVERSIFIED CREDIT FUND
| By: | /s/ Michael A. Reisner | |
| Michael A. Reisner | ||
| Co-President and Chief Executive Officer | ||
| Date: | March 9, 2022 | |
| By: | /s/ Mark Gatto | |
| Mark Gatto | ||
| Co-President and Chief Executive Officer | ||
| Date: | March 9, 2022 |
Pursuant to the requirements of the Securities Exchange Act of 1934 and the Investment Company Act of 1940, this report has been signed below by the following persons on behalf of the Fund and in the capacities and on the dates indicated.
| By: | /s/ Michael A. Reisner | |
| Michael A. Reisner | ||
| Co-President and Co-Chief Executive Officer | ||
| Date: | March 9, 2022 | |
| By: | /s/ Mark Gatto | |
| Mark Gatto | ||
| Co-President and Co-Chief Executive Officer | ||
| Date: | March 9, 2022 | |
| By: | /s/ Scott C. Lem | |
| Scott C. Lem | ||
| Chief Financial Officer | ||
| Date: | March 9, 2022 |