UNITED STATES
SECURITIES AND EXCHANGE COMMISSION
Washington, D.C. 20549
FORM N-CSR
CERTIFIED SHAREHOLDER REPORT OF REGISTERED
MANAGEMENT INVESTMENT COMPANIES
Investment Company Act file number: 811-23270
Blackstone / GSO Floating Rate Enhanced Income Fund
(exact name of Registrant as specified in charter)
345 Park Avenue, 31st Floor
New York, New York 10154
(Address of principal executive offices) (Zip code)
(Name and address of agent for service)
Marisa Beeney
345 Park Avenue, 31st Floor
New York, New York 10154
Registrant’s telephone number, including area code:(877) 876-1121
Date of fiscal year end:September 30
Date of reporting period:March 31, 2019
Item 1.Report to Stockholders.
Beginning with the Fund’s shareholder report for the period ending March 31, 2021, as permitted by regulations adopted by the Securities and Exchange Commission, paper copies of the Fund’s shareholder reports will no longer be sent by mail, unless you specifically request paper copies of the reports from the Fund or from your financial intermediary, such as a broker-dealer or bank. Instead, the reports will be made available on the Fund’s website and you will be notified by mail each time a report is posted and provided with a website link to access the report.
If you already elected to receive shareholder reports electronically, you will not be affected by this change and you need not take any action. Shareholders who hold accounts directly with Blackstone Advisory Partners L.P. (the “Distributor”) or the Fund may elect to receive shareholder reports and other communications from the Fund electronically by calling 1-212-583-5200 to make such arrangements. For shareholders who hold accounts through an investment advisor, bank, or broker-dealer, please contact that financial intermediary directly for information on how to receive shareholder reports and other communications electronically.
You may elect to receive all future reports in paper free of charge. If you hold accounts directly with the Distributor, you can inform the Fund that you wish to continue receiving paper copies of your shareholder reports by calling 1-212-583-5200 to make such arrangements. For shareholders who hold accounts through an investment advisor, bank, or broker-dealer, please contact your financial intermediary directly to inform them that you wish to continue receiving paper copies of your shareholder reports. If your common shares are held through a financial intermediary, your election to receive reports in paper will apply to all funds held with that financial intermediary.
Table of Contents
| Manager Commentary | 2 |
| Fund Summary | 4 |
| Portfolio of Investments | 6 |
| Statement of Assets and Liabilities | 17 |
| Statement of Operations | 18 |
| Statements of Changes in Net Assets | 19 |
| Statement of Cash Flows | 21 |
| Financial Highlights | 22 |
| Notes to Financial Statements | 25 |
| Additional Information | 36 |
| Privacy Procedures | 37 |
| Trustees & Officers | 44 |
| Blackstone / GSO Floating Rate Enhanced Income Fund | Manager Commentary |
March 31, 2019 (Unaudited)
To Our Shareholders:
The market’s rebound was as strong in the first quarter of 2019 as its drop was severe in the fourth quarter of 2018. Meanwhile, expectations for coordinated central bank easing have replaced fears of an impending recession in the U.S., and many important economic indicators appear to have troughed and now seem to be on the rise. The labor market remains at its strongest in decades; manufacturing, industrial production, consumer confidence, and business confidence largely are stable; and housing conditions appear to be improving. At the same time, inflation remains low both in the U.S. and globally. With conditions set for increased growth in the second half of 2019, this cycle may continue longer than many investors expect.
During the fourth quarter of 2018, a change in investor risk sentiment contributed to outflows from open-end loan funds. The velocity of these outflows drove average U.S. loan prices down to $93.81 (per $100 of principal) on December 28, their lowest level since July 2016. However, the U.S. corporate credit markets rallied quickly in the first quarter of 2019, recovering all of the prior quarter’s losses. The S&P/LSTA Leveraged Loan Index recorded a return of 4.0% in the first quarter, with January and February representing the best first two performing months of a year since 2009. As loan mutual fund outflows abated and the forward new issue calendar remained light, loan prices appreciated on average by $3 over the quarter, reaching $97 (per $100 of principal) on February 27. The rally experienced a brief setback in March, we believe largely in reaction to further dovish rhetoric from the Fed and temporary uncertainty around potential regulatory changes for Japan’s AAA Collateralized Loan Obligation (“CLO”) buyer base, but regained momentum in April.
During the selloff in the fourth quarter of 2018, the larger, more liquid loans experienced the most selling pressure as loan mutual fund managers quickly exited them to raise cash. These loans then outperformed smaller loans in the first quarter of 2019 as technicals soon normalized. Following a year-long period of underperformance, BB-rated loans outperformed the CCC/Split CCC-rated loan cohort by over 2% during the quarter.
| 6-Month Total Return as of March 31, 2019 | |
| US Loans (S&P/LSTA Leveraged Loan Index) | 0.40% |
| US High Yield Bonds (Bloomberg Barclays U.S. High Yield Index) | 2.39% |
| 3-month Treasury Bills (Bloomberg Barclays U.S. Treasury Bellwethers: 3 Month) | 1.18% |
| 10-Year Treasuries (Bloomberg Barclays U.S. Treasury Bellwethers: 10 Year) | 7.07% |
| US Aggregate Bonds (Bloomberg Barclays U.S. Aggregate Index) | 4.63% |
| US Investment Grade Bonds (Bloomberg Barclays U.S. Corporate Investment Grade Index) | 4.96% |
| Emerging Markets (Bloomberg Barclays EM USD Aggregate Index) | 5.25% |
| US Large Cap Equities (S&P 500® Index) | -1.73% |
Sources: Bloomberg, Barclays, S&P/LCD
Past performance is no guarantee of future results. Index performance is shown for illustrative purposes only. You cannot invest directly in an index.
Atypically, loans and high yield moved in opposite directions in March; loan prices retreated while high yield advanced, as the rate rally more than offset spread widening. As a result, loans appeared cheap on a yield basis compared to high yield with spreads in every rating cohort higher than their high yield counterpart. As of March 31, loans are trading 17 basis points (“bp”) higher than high yield versus the average since 2010 of trading 60bp lower than high yield. This spread gap between loans and high yield suggests better relative value in loans.
After monthly loan new issuance decreased to a four-year low in December 2018, loan supply was still subdued in the first quarter of 2019 as the market recovered from the fourth quarter sell-off. Total gross loan issuance for the first quarter totaled $67 billion, a 72% decrease year-over-year compared to the first quarter of 2018. Loan issuance net of refinancing and repricing activity also slowed, with net loan issuance totaling just $54 billion for the quarter, a 30% decrease year-over-year. Loan issuance year-to-date through March was largely driven by M&A activity, which accounted for 66% of gross total issuance.
December 2018 experienced the largest ever monthly withdrawal from open-end loan funds totaling $15.3 billion, according to Lipper, and fourth quarter outflows totaled $20.7 billion. Net outflows from open-end loan funds continued into the beginning of 2019, although at a slower pace. First quarter 2019 loan outflows totaled over $11 billion, bringing cumulative outflows to $31.7 billion since October. This compares to approximately $45 billion of total inflows since July 2016 through September 2018.
Despite an anemic January, U.S. CLO issuance lags just 9% in the first quarter of 2019 compared to the same period last year at $29 billion in total. The favorable regulatory ruling from the Japan Financial Services Agency in March removed uncertainty around demand for CLO AAA-rated debt and resulted in resumed CLO issuance despite challenging economics for equity investors. CLOs remain the majority investor for the loan asset class, and, as more stable investors in loans compared to retail funds, this reduces the risk of long-term adverse impacts to the asset class from fund flows. Retail investors have decreased in size to just 10% of the asset class following the recent loan retail fund outflows.
| Blackstone / GSO Floating Rate Enhanced Income Fund | Manager Commentary |
March 31, 2019 (Unaudited)
Although default activity in the loan market picked up slightly in the first quarter as compared to the fourth quarter, both loan and high yield default rates decreased quarter-over-quarter due to the iHeart default rolling off the LTM period. The par-weighted LTM loan default rate ending March 2019 per JP Morgan was 1.00%, down 63bp year-over-year. The par-weighted LTM high yield default rate for the same period per JP Morgan was 0.94%, down 87bp from last year. JP Morgan continues to expect 2019 year-end default rates of just 1.5% and 2020 default rates of 2.0% for both loans and high yield, both of which are below the long-term average. Lower default rate expectations are supported by the fact that only 6% of outstanding loans and high yield bonds mature before 2021.
We continue to believe that floating rate senior loans offer a compelling risk-reward opportunity. The seniority of loans in the corporate structure should offer a defensive positioning unique to the asset class and one that may be well suited for portfolio construction in a late cycle environment. We are constructive on credit due to strong corporate fundamentals and low projected default rates.
At GSO / Blackstone, we value your continued investment and confidence in us and in our family of funds. Additional information about our funds is available on our website at www.blackstone-gso.com and www.bgfrei.com.
Sincerely,
GSO / Blackstone Debt Funds Management LLC

| Semi-Annual Report | March 31, 2019 | 3 |
| Blackstone / GSO Floating Rate Enhanced Income Fund | Fund Summary |
March 31, 2019 (Unaudited)
Fund Overview
Blackstone / GSO Floating Rate Enhanced Income Fund (“BGFREI” or herein, the “Fund”) is a non-diversified, closed-end management investment company that continuously offers its shares and is operated as an “interval fund.” The Fund’s investment objective is to provide attractive current income with low sensitivity to rising interest rates. Under normal market conditions, the Fund will invest at least 80% of its Managed Assets in floating rate loans, notes or bonds. “Managed Assets” means net assets plus the amount of any borrowings and the liquidation preference of any preferred shares that may be outstanding. In addition, the Fund may invest up to 20% of its Managed Assets in each of (i) structured products, (ii) derivatives, (iii) warrants and equity securities that are incidental to the Fund’s purchase of floating rate instruments or acquired in connection with a reorganization of a Borrower (as defined below) or issuer, (iv) fixed rate instruments, and (v) equity investments in other investment companies, including exchanged-traded funds. In pursuing the Fund’s investment objective, the Adviser will seek to enhance the Fund’s return with the use of leverage.
Portfolio Management Commentary
Fund Performance
BGFREI’s Class I outperformed the Fund’s benchmark, the S&P/LSTA Leveraged Loan Index (“S&P LLI”), for the three-month and 1-year periods and since inception and underperformed for the six-month period. BGFREI’s Class T outperformed the S&P LLI for the three-month period and underperformed for the six-month period and since inception. BGFREI’s Class D outperformed the S&P LLI for the three-month period and underperformed for the six-month period and since inception.
NAV Performance Factors
The Fund’s outperformance relative to the benchmark for the six months ending March 31, 2019 was primary attributable to credit selection within loans and the allocation to high yield bonds, partially offset by the allocation to BB-rated CLO debt securities, which underperformed during this time period. The Fund’s 7.3% average allocation to second lien loans during the period contributed 0.23% compared to 0.03% for second lien loans held in the Index, and the Fund’s 4.5% average allocation to high yield bonds contributed 0.07% during the period. By issuer, the largest positive contributors to performance relative to the benchmark were Energizer, Rocket Software, and U.S. Renal, and the most significant detractors were Envision Healthcare, Southern Graphics, and Riverbed Technology.
Portfolio Activity and Positioning1
During the period, we continued to dynamically manage the Fund, using the secondary market to add or exit positions based on relative value while continuing to take advantage of new issue discounts in the primary market. The Fund’s largest sector overweights were Healthcare, Electronics/Electrical, and Business Equipment & Services, and the largest sector underweights included Cable, Lodging & Casinos, and Retailers. The Fund slightly reduced its allocation to loans during the period in favor of high yield and CLO liabilities.
As of March 31, 2019, the Fund held 85.4% of its Managed Assets in first lien loans, 6.9% in second lien loans, 4.9% in corporate bonds, 3.5% in CLO investments, and 1.4% in an exchange traded fund (ETF). BGFREI’s investments represented the obligations of 270 companies, with an average position size representing 0.32% of Managed Assets of the Fund. Healthcare; Electronics/Electrical; and Business Equipment & Services represented the Fund’s top sector weightings.
| 1 | Industries per S&P’s Global Industry Classification Standard (GICS). |
| Blackstone / GSO Floating Rate Enhanced Income Fund | Fund Summary |
March 31, 2019 (Unaudited)
Portfolio Composition*
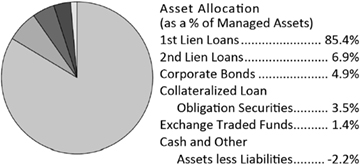
| * | The Fund’s Cash & Other represents net cash and other assets and liabilities, which includes amounts payable for investments purchased but not yet settled and amounts receivable for investments sold but not yet settled. At period end, the amounts payable for investments purchased but not yet settled exceeded the amount of cash on hand. The Fund uses sales proceeds or its leverage program to settle amounts payable for investments purchased, but such amounts are not reflected in the Fund’s net cash. |
Moody’s Rating Distribution**
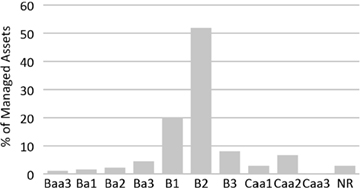
| ** | For more information on Moody's ratings and descriptions refer to www.moodys.com. |
| Portfolio Characteristics | |
| Weighted Average Coupon | 6.41% |
| Current Dividend Yield – I Share^ | 6.93% |
| Current Dividend Yield – T Share^ | 6.43% |
| Current Dividend Yield – D Share^ | 6.68% |
| Average Duration^^ | 0.31 yr |
| Average Position* | 0.32% |
| Leverage* | 31.54% |
| ^ | Represents annualized distribution rate of I Share, T Share, and D Share. Reflects March month cumulative distribution rate annualized. The cumulative distribution rate for the month presented represents the sum of the daily dividend distribution rate as calculated by dividing the daily dividend per share by the daily NAV per share, for each respective class, for each day in the month for which a daily dividend is declared. |
| ^^ | Please note that the duration calculation methodology changed. Previously, loan durations were treated as 3 months because of typical LIBOR resets. Currently, loan durations are based on the actual remaining time until LIBOR is reset for each individual loan. As such, the weighted average loan duration has decreased when compared to prior financial reports. We believe this methodology provides a more accurate representation of the portfolio’s weighted average duration. |
| * | As a percentage of Managed Assets. |
| Top 10 Issuers* | |
| U.S. Renal Care, Inc. | 1.4% |
| SPDR Blackstone / GSO Senior Loan ETF | 1.4% |
| Envision Healthcare Corp. | 1.3% |
| Prime Security Services Borrower | 1.2% |
| Travelport Finance | 1.1% |
| Rocket Software, Inc. | 0.8% |
| GFL Enviromental, Inc. | 0.8% |
| Flexera Software LLC | 0.8% |
| Jaguar Holding Company LLC | 0.8% |
| Press Ganey Holdings, Inc. | 0.7% |
| Top 10 Issuers | 10.3% |
| * | As a percentage of Managed Assets. |
Portfolio holdings and distributions are subject to change and are not recommendations to buy or sell any security.
| Top 5 Industries*^ | |
| Healthcare | 17.5% |
| Electronics/Electrical | 13.5% |
| Business Equipment & Services | 12.7% |
| Containers & Glass Products | 4.0% |
| Building & Development | 3.8% |
| Top 5 Industries | 51.5% |
| * | As a percentage of Managed Assets. |
| ^ | S&P Industry Classification Schema. |
Total Return
| | 3 Month | 6 Month | 1 Year | Since Inception |
| BGFREI* – Class I | 5.00% | 0.37% | 3.30%** | 3.32%** |
| BGFREI* – Class T | 4.92% | 0.15% | N/A | 2.15% |
| BGFREI* – Class T w/ 2.5% Sales Load*** | 2.30% | -2.40% | N/A | -0.40% |
| BGFREI* – Class D | 4.98% | 0.26% | N/A | 0.26% |
| S&P/LSTA Leveraged Loan Index**** | 4.00% | 0.40% | 2.97% | 3.26% |
| * | Assumes distributions are reinvested pursuant to the Fund's dividend reinvestment plan. Performance data quoted represents past performance and does not guarantee future results. |
| *** | Assumes payment of the full front-end 2.5% sales load at initial subscription. |
| **** | Inception to date returns for the S&P LLI are based on the I Share inception date of 1/18/18. |
| Semi-Annual Report | March 31, 2019 | 5 |
| Blackstone / GSO Floating Rate Enhanced Income Fund | Portfolio of Investments |
March 31, 2019 (Unaudited)
| | | | | | | |
| | | Principal Amount | | | Value | |
| | | | | | | |
| FLOATING RATE LOAN INTERESTS(a) - 134.93% | | | | | | | | |
| Aerospace & Defense - 1.39% | | | | | | | | |
| DAE Aviation Holdings, Inc. Series Initial, 1M US L + 3.75%, 07/07/2022 | | $ | 2,679,177 | | | $ | 2,685,889 | |
| Transdigm, Inc. Series New Tranche G, 1M US L + 2.50%, 08/22/2024 | | | 1,581,985 | | | | 1,544,808 | |
| Vectra Co. Series Initial, 1M US L + 3.25%, 03/08/2025 | | | 890,287 | | | | 849,668 | |
| | | | | | | | 5,080,365 | |
| | | | | | | | | |
| Air Transport - 1.09% | | | | | | | | |
| Air Medical Group Holdings, Inc. Series 2018 New, 1M US L + 4.25%, 03/14/2025 | | | 3,170,432 | | | | 2,988,132 | |
| American Airlines, Inc. Series 2018 Replacement, 1M US L + 1.75%, 06/27/2025 | | | 300,000 | | | | 292,367 | |
| Atlantic Aviation FBO, Inc. Series B, 1M US L + 3.75%, 12/06/2025(b) | | | 704,755 | | | | 711,803 | |
| | | | | | | | 3,992,302 | |
| | | | | | | | | |
| Automotive - 1.22% | | | | | | | | |
| KAR Auction Services, Inc. Series Tranche B-4, 3M US L + 2.25%, 03/11/2021 | | | 1,000,000 | | | | 1,001,250 | |
| Panther BF Aggregator 2 L P Series B, 3M US L + 3.50%, 03/18/2026 | | | 2,000,000 | | | | 1,979,980 | |
| Wand Newco 3, Inc. Series Initial, 3M US L + 3.50%, 02/05/2026 | | | 1,500,000 | | | | 1,503,563 | |
| | | | | | | | 4,484,793 | |
| | | | | | | | | |
| Brokers, Dealers & Investment Houses - 3.43% | | | | | | | | |
| Advisor Group, Inc. Series Initial, 3M US L + 3.75%, 08/15/2025 | | | 2,288,500 | | | | 2,294,576 | |
| AssetMark Financial Holdings, Inc. Series Initial, 3M US L + 3.50%, 11/14/2025 | | | 1,477,778 | | | | 1,477,785 | |
| Deerfield Dakota Holding LLC Series Initial, 3M US L + 3.25%, 02/13/2025 | | | 3,618,182 | | | | 3,554,122 | |
| Edelman Financial Center LLC: | | | | | | | | |
| Series Initial, 3M US L + 3.25%, 07/21/2025 | | | 2,509,434 | | | | 2,492,972 | |
| Series Initial, 3M US L + 6.75%, 06/26/2026 | | | 384,615 | | | | 387,500 | |
| Newport Group Holdings II, Inc. Series Initial, 3M US L + 3.75%, 09/12/2025 | | | 2,396,250 | | | | 2,376,781 | |
| | | | | | | | 12,583,736 | |
| | | | | | | | | |
| Building & Development - 5.38% | | | | | | | | |
| American Bath Group LLC Series 2018 Replacement, 3M US L + 4.25%, 09/30/2023(b) | | | 1,240,602 | | | | 1,231,297 | |
| Builders FirstSource, Inc. Series Refinancing, 3M US L + 3.00%, 02/29/2024 | | | 1,260,815 | | | | 1,224,044 | |
| CHI Doors Holdings Corp. Series Initial, 1M US L + 3.25%, 07/29/2022 | | | 3,084,409 | | | | 3,057,421 | |
| CPG International LLC Series New, 3M US L + 3.75%, 05/05/2024(b) | | | 496,202 | | | | 492,481 | |
| DiversiTech Holdings, Inc. Series Tranche B-1, 3M US L + 3.00%, 06/03/2024 | | | 1,154,129 | | | | 1,118,062 | |
| Forest City Enterprises LP Series Initial, 1M US L + 4.00%, 12/08/2025 | | | 1,412,369 | | | | 1,420,314 | |
| HD Supply Waterworks, Ltd. Series Initial, 3M US L + 3.00%, 08/01/2024 | | | 2,586,902 | | | | 2,572,881 | |
| Henry Holdings, Inc. Series Initial, 1M US L + 4.00%, 10/05/2023 | | | 740,530 | | | | 738,912 | |
| Hillman Group, Inc. Series Initial, 3M US L + 3.50%, 05/30/2025 | | | 1,638,869 | | | | 1,567,168 | |
| LBM Borrower LLC Series Tranche C, 2M US L + 3.75%, 08/19/2022 | | | 763,892 | | | | 735,819 | |
| Ply Gem Midco, Inc. Series Initial, 3M US L + 3.75%, 04/12/2025 | | | 2,191,784 | | | | 2,106,852 | |
| Siteone Landscape Supply LLC Series Tranche E, 1M US L + 2.75%, 10/29/2024 | | | 1,170,934 | | | | 1,163,984 | |
| SRS Distribution, Inc. Series Initial, 2M US L + 3.25%, 05/23/2025 | | | 1,266,364 | | | | 1,212,018 | |
| USS Ultimate Holdings, Inc. Series Initial, 1M US L + 3.75%, 08/25/2024 | | | 1,101,076 | | | | 1,095,108 | |
| | | | | | | | 19,736,361 | |
| | | | | | | | | |
| Business Equipment & Services - 18.60% | | | | | | | | |
| Access CIG LLC: | | | | | | | | |
| Series B, 1M US L + 3.75%, 02/27/2025 | | | 2,674,918 | | | | 2,648,169 | |
| Series Initial, 1M US L + 7.75%, 02/27/2026 | | | 909,091 | | | | 903,032 | |
| Allied Universal Holdco LLC: | | | | | | | | |
| Series Incremental, 1M US L + 4.25%, 07/28/2022 | | | 1,559,920 | | | | 1,526,772 | |
| Series Initial, 1M US L + 3.75%, 07/28/2022 | | | 2,133,798 | | | | 2,068,717 | |
| AqGen Ascensus, Inc.: | | | | | | | | |
| Series Replacement, 2M US L + 3.50%, 12/03/2022 | | | 3,107,068 | | | | 3,103,185 | |
| L + 4.00%, 12/12/2022(b) | | | 594,595 | | | | 593,851 | |
| Blackstone / GSO Floating Rate Enhanced Income Fund | Portfolio of Investments |
March 31, 2019 (Unaudited)
| | | | | | | |
| | | Principal Amount | | | Value | |
| | | | | | | |
| Business Equipment & Services (continued) | | | | | | | | |
| Autodata, Inc. Series Initial, 1M US L + 3.25%, 12/12/2024 | | $ | 1,933,477 | | | $ | 1,904,475 | |
| BMC Acquisition, Inc. Series Initial, 3M US L + 5.25%, 12/27/2024(b) | | | 992,462 | | | | 967,651 | |
| Capri Acquisitions BidCo, Ltd. Series Initial Dollar, 3M US L + 3.25%, 11/01/2024 | | | 3,314,219 | | | | 3,270,720 | |
| Cast & Crew Payroll LLC Series Initial, 1M US L + 4.00%, 02/09/2026 | | | 2,455,696 | | | | 2,468,896 | |
| DG Investment Intermediate Holdings 2, Inc.: | | | | | | | | |
| Series Initial, 1M US L + 3.00%, 02/03/2025 | | | 1,074,337 | | | | 1,042,778 | |
| Series Initial, 3M US L + 6.75%, 02/01/2026(b) | | | 850,000 | | | | 830,875 | |
| Dun & Bradstreet Corp. Series Initial Borrowing, 1M US L + 5.00%, 02/06/2026 | | | 2,355,856 | | | | 2,333,770 | |
| Epicor Software Corp. Series B, 1M US L + 3.25%, 06/01/2022 | | | 1,715,862 | | | | 1,698,832 | |
| Explorer Holdings, Inc. Series Initial, 3M US L + 3.75%, 05/02/2023 | | | 1,240,434 | | | | 1,231,912 | |
| GI Revelation Acquisition LLC Series Initial, 1M US L + 5.00%, 04/16/2025(b) | | | 2,712,076 | | | | 2,661,224 | |
| GlobalLogic Holdings, Inc. Series Initial, 3M US L + 3.25%, 07/25/2025(b) | | | 2,499,742 | | | | 2,493,493 | |
| IG Investments Holdings LLC Series Refinancing, 1M US L + 3.50%, 05/23/2025 | | | 3,000,301 | | | | 2,987,174 | |
| Informatica LLC Series Dollar B-1, 1M US L + 3.25%, 08/05/2022 | | | 2,976,369 | | | | 2,975,774 | |
| KUEHG Corp. Series B-3, 3M US L + 3.75%, 02/21/2025 | | | 2,519,412 | | | | 2,495,263 | |
| Learning Care Group No. 2, Inc. Series Initial, 1M US L + 3.25%, 03/13/2025 | | | 503,343 | | | | 494,849 | |
| Mitchell International, Inc.: | | | | | | | | |
| Series Initial, 1M US L + 3.25%, 11/29/2024 | | | 2,159,925 | | | | 2,081,973 | |
| Series Initial, 1M US L + 7.25%, 12/01/2025 | | | 1,566,667 | | | | 1,529,458 | |
| National Intergovernmental Purchasing Alliance Co. Series Initial, 2M US L + 3.75%, 05/19/2025 | | | 2,211,494 | | | | 2,201,818 | |
| PricewaterhouseCoopers Public Sector LLP: | | | | | | | | |
| Series Initial, 1M US L + 3.25%, 05/01/2025(b) | | | 1,240,625 | | | | 1,228,219 | |
| Series Initial, 1M US L + 7.50%, 05/01/2026(b) | | | 750,000 | | | | 740,625 | |
| PT Intermediate Holdings III LLC Series B, 3M US L + 4.00%, 12/09/2024 | | | 2,185,167 | | | | 2,152,389 | |
| Red Ventures LLC Series B-1, 1M US L + 3.00%, 11/08/2024 | | | 2,883,862 | | | | 2,870,163 | |
| RevSpring, Inc. Series Initial, 1M US L + 4.25%, 10/11/2025(b) | | | 1,795,500 | | | | 1,777,545 | |
| Sedgwick Holdings, Inc. Series Initial, 1M US L + 3.25%, 12/31/2025 | | | 2,758,065 | | | | 2,706,061 | |
| St. George's University Scholastic Services LLC, 1M US L + 3.50%, 07/17/2025 | | | 1,819,189 | | | | 1,819,189 | |
| ThoughtWorks, Inc. Series Replacement, 1M US L + 4.00%, 10/11/2024 | | | 2,483,737 | | | | 2,482,185 | |
| Trugreen LP Series Initial Refinancing, 1M US L + 3.75%, 03/19/2026 | | | 2,302,424 | | | | 2,309,619 | |
| Weld North Education LLC Series Initial, 3M US L + 4.25%, 02/15/2025 | | | 3,644,950 | | | | 3,621,039 | |
| | | | | | | | 68,221,695 | |
| | | | | | | | | |
| Chemical & Plastics - 2.27% | | | | | | | | |
| Alpha 3 B.V. Series Initial B-1, 3M US L + 3.00%, 01/31/2024 | | | 1,069,587 | | | | 1,048,698 | |
| Composite Resins Holding B.V. Series Initial, 3M US L + 4.25%, 06/27/2025(b) | | | 992,500 | | | | 987,537 | |
| Spectrum Holdings III Corp.: | | | | | | | | |
| Series Closing Date, 1M US L + 3.25%, 01/31/2025 | | | 809,798 | | | | 769,308 | |
| Series Closing Date, 1M US L + 7.00%, 01/26/2026 | | | 350,000 | | | | 337,312 | |
| Starfruit Finco B.V. Series Initial Dollar, 1M US L + 3.25%, 10/01/2025 | | | 2,179,104 | | | | 2,153,239 | |
| Vantage Specialty Chemicals, Inc.: | | | | | | | | |
| Series Closing Date, 3M US L + 4.00%, 10/28/2024 | | | 1,887,178 | | | | 1,854,162 | |
| Series Initial, 3M US L + 8.25%, 10/27/2025 | | | 1,200,000 | | | | 1,171,002 | |
| | | | | | | | 8,321,258 | |
| | | | | | | | | |
| Conglomerates - 2.31% | | | | | | | | |
| Genuine Financial Holdings LLC Series Initial, 2M US L + 3.75%, 07/11/2025 | | | 2,609,836 | | | | 2,585,382 | |
| Spring Education Group, Inc. Series Initial, 1M US L + 4.25%, 07/30/2025 | | | 2,650,085 | | | | 2,629,097 | |
| VT Topco, Inc.: | | | | | | | | |
| Series Delayed Draw, 3M US L + 0.00%, 08/01/2025(c) | | | 366,384 | | | | 364,438 | |
| Series Initial, 3M US L + 3.75%, 08/01/2025 | | | 2,924,035 | | | | 2,908,508 | |
| | | | | | | | 8,487,425 | |
| Semi-Annual Report | March 31, 2019 | 7 |
| Blackstone / GSO Floating Rate Enhanced Income Fund | Portfolio of Investments |
March 31, 2019 (Unaudited)
| | | Principal Amount | | | Value | |
| | | | | | | |
| Containers & Glass Products - 5.61% | | | | | | | | |
| Berlin Packaging LLC Series Initial, 1M US L + 3.00%, 11/07/2025 | | $ | 2,745,295 | | | $ | 2,666,711 | |
| Charter NEX US, Inc. Series Initial, 1M US L + 3.00%, 05/16/2024 | | | 3,024,936 | | | | 2,946,166 | |
| Flex Acquisition Co., Inc. Series Incremental B-2018, 3M US L + 3.25%, 06/29/2025 | | | 3,283,334 | | | | 3,190,103 | |
| Plaze, Inc., 3M US L + 3.50%, 07/31/2022 | | | 1,840,696 | | | | 1,833,794 | |
| ProAmpac PG Borrower LLC Series Initial, 3M US L + 3.50%, 11/20/2023 | | | 1,684,292 | | | | 1,630,075 | |
| Ranpak Corp.: | | | | | | | | |
| Series Tranche B-1 USD, 1M US L + 3.25%, 10/01/2021 | | | 2,237,118 | | | | 2,238,527 | |
| Series Initial, 1M US L + 7.25%, 10/03/2022(b) | | | 1,192,593 | | | | 1,188,120 | |
| Strategic Materials Holding Corp. Series Initial, 3M US L + 3.75%, 11/01/2024 | | | 740,625 | | | | 657,305 | |
| Transcendia Holdings, Inc. Series 2017 Refinancing, 1M US L + 3.50%, 05/30/2024 | | | 1,280,792 | | | | 1,211,950 | |
| Tricorbraun Holdings, Inc. Series Closing Date, 3M US L + 3.75%, 11/30/2023 | | | 1,414,157 | | | | 1,411,626 | |
| Trident TPI Holdings, Inc. Series Tranche B-1, 1M US L + 3.25%, 10/17/2024 | | | 1,664,354 | | | | 1,608,182 | |
| | | | | | | | 20,582,559 | |
| | | | | | | | | |
| Diversified Insurance - 3.91% | | | | | | | | |
| Acrisure LLC Series 2018-1 Additional, 3M US L + 3.75%, 11/22/2023 | | | 1,512,169 | | | | 1,493,266 | |
| Alliant Holdings Intermediate LLC Series 2018 Initial, 1M US L + 3.00%, 05/09/2025 | | | 1,527,269 | | | | 1,472,150 | |
| BroadStreet Partners, Inc. Series Tranche B-2, 1M US L + 3.25%, 11/08/2023 | | | 2,684,191 | | | | 2,669,106 | |
| CP VI Bella Midco LLC Series Initial, 1M US L + 3.00%, 02/14/2025 | | | 663,477 | | | | 639,426 | |
| HUB International, Ltd. Series Initial, 3M US L + 3.00%, 04/18/2025 | | | 1,375,321 | | | | 1,332,487 | |
| NFP Corp, Senior Secured First Lien Term B Term Loan, Series B, 1M US L + 3.00%, 01/08/2024 | | | 1,865,458 | | | | 1,802,667 | |
| USI, Inc. Series 2017 New, 3M US L + 3.00%, 05/16/2024 | | | 3,870,097 | | | | 3,763,669 | |
| York Risk Services Holding Corp., 1M US L + 3.75%, 10/01/2021 | | | 1,238,345 | | | | 1,165,592 | |
| | | | | | | | 14,338,363 | |
| | | | | | | | | |
| Drugs - 3.86% | | | | | | | | |
| Albany Molecular Research, Inc.: | | | | | | | | |
| Series Initial, 1M US L + 3.25%, 08/30/2024 | | | 1,918,498 | | | | 1,889,720 | |
| Series Initial, 1M US L + 7.00%, 08/30/2025 | | | 1,425,000 | | | | 1,410,750 | |
| Amneal Pharmaceuticals LLC Series Initial, 1M US L + 3.50%, 03/21/2025 | | | 1,561,253 | | | | 1,559,950 | |
| Avantor, Inc. Series Initial B-1 Dollar, 1M US L + 4.00%, 11/21/2024 | | | 3,895,565 | | | | 3,906,512 | |
| Bausch Health Companies, Inc.: | | | | | | | | |
| Series Initial, 1M US L + 3.00%, 06/02/2025 | | | 3,081,368 | | | | 3,065,144 | |
| Series First Incremental, 1M US L + 2.75%, 11/27/2025 | | | 716,981 | | | | 709,646 | |
| Horizon Pharma, Inc. Series Fourth Amendment Refinanced, 1M US L + 3.00%, 03/29/2024 | | | 1,618,503 | | | | 1,621,052 | |
| | | | | | | | 14,162,774 | |
| | | | | | | | | |
| Ecological Services & Equipment - 2.65% | | | | | | | | |
| EnergySolutions LLC Series Initial, 3M US L + 3.75%, 05/09/2025 | | | 1,569,940 | | | | 1,392,011 | |
| GFL Environmental, Inc. Series Effective Date Incremental, 3M US L + 2.75%, 05/30/2025 | | | 3,514,897 | | | | 3,406,146 | |
| Gopher Resource LLC Series Initial, 1M US L + 3.25%, 03/06/2025(b) | | | 2,703,697 | | | | 2,698,628 | |
| Tunnel Hill Partners LP Series Initial, 1M US L + 3.50%, 02/06/2026 | | | 2,238,938 | | | | 2,229,143 | |
| | | | | | | | 9,725,928 | |
| | | | | | | | | |
| Electronics/Electrical - 18.75% | | | | | | | | |
| AppLovin Corp. Series Initial, 3M US L + 3.75%, 08/15/2025 | | | 2,265,970 | | | | 2,263,138 | |
| Boxer Parent Co., Inc. Series Initial Dollar, 3M US L + 4.25%, 10/02/2025 | | | 2,493,750 | | | | 2,447,104 | |
| Brave Parent Holdings, Inc. Series Initial, 1M US L + 4.00%, 04/18/2025 | | | 994,987 | | | | 984,625 | |
| CommerceHub, Inc. Series Initial, 1M US L + 3.75%, 05/21/2025(b) | | | 1,551,675 | | | | 1,530,340 | |
| Compuware Corp., 1M US L + 3.50%, 08/25/2025 | | | 2,213,806 | | | | 2,219,352 | |
| ConvergeOne Holdings, Corp. Series Initial, 1M US L + 5.00%, 01/04/2026 | | | 3,000,000 | | | | 2,879,070 | |
| CPI International Inc, Senior Secured First Lien Initial Term Loan, Series Initial, 1M US L + 3.50%, 07/26/2024 | | | 1,496,203 | | | | 1,466,278 | |
| Blackstone / GSO Floating Rate Enhanced Income Fund | Portfolio of Investments |
March 31, 2019 (Unaudited)
| | | Principal Amount | | | Value | |
| | | | | | | |
| Electronics/Electrical (continued) | | | | | | | | |
| DigiCert, Inc.: | | | | | | | | |
| 1M US L + 4.75%, 09/20/2024 | | $ | 1,762,644 | | | $ | 1,735,473 | |
| Series Initial, 1M US L + 8.00%, 10/31/2025 | | | 1,500,000 | | | | 1,470,938 | |
| Dynatrace LLC, 1M US L + 3.25%, 08/22/2025 | | | 2,593,500 | | | | 2,586,692 | |
| EXC Holdings III Corp. Series Initial USD, 3M US L + 3.50%, 12/02/2024 | | | 740,625 | | | | 738,311 | |
| Flexera Software LLC: | | | | | | | | |
| Series Initial, 1M US L + 3.25%, 02/26/2025 | | | 1,850,389 | | | | 1,843,912 | |
| Series Initial, 1M US L + 7.25%, 02/26/2026 | | | 2,395,161 | | | | 2,380,192 | |
| Gigamon, Inc. Series Initial, 3M US L + 4.50%, 12/27/2024(b) | | | 1,859,006 | | | | 1,835,768 | |
| Help/Systems Holdings, Inc., 1M US L + 3.75%, 03/28/2025(b) | | | 2,768,984 | | | | 2,737,832 | |
| Hyland Software, Inc.: | | | | | | | | |
| Series 2018 Refinancing, 1M US L + 3.50%, 07/01/2024 | | | 2,067,400 | | | | 2,067,183 | |
| Series Initial, 1M US L + 7.00%, 07/07/2025 | | | 1,598,031 | | | | 1,599,029 | |
| Idera, Inc. Series Initial, 1M US L + 4.50%, 06/28/2024 | | | 469,765 | | | | 470,157 | |
| Imperva, Inc.: | | | | | | | | |
| 1M US L + 4.00%, 01/12/2026 | | | 1,363,636 | | | | 1,354,902 | |
| 1M US L + 7.75%, 01/11/2027 | | | 588,235 | | | | 579,412 | |
| Ivanti Software, Inc., 1M US L + 4.25%, 01/20/2024 | | | 2,078,828 | | | | 2,067,145 | |
| McAfee LLC Series B USD, 1M US L + 3.75%, 09/30/2024 | | | 3,106,916 | | | | 3,108,873 | |
| MH Sub I LLC Series Amendment No. 2 Initial, 1M US L + 3.75%, 09/13/2024 | | | 3,188,975 | | | | 3,150,882 | |
| MLN US HoldCo LLC Series B, 3M US L + 4.50%, 11/30/2025 | | | 913,204 | | | | 899,278 | |
| Ping Identity Corp., 1M US L + 3.75%, 01/23/2025 | | | 926,333 | | | | 926,912 | |
| Plantronics, Inc. Series Initial B, 1M US L + 2.50%, 07/02/2025 | | | 2,110,755 | | | | 2,076,455 | |
| Presidio Holdings, Inc. Series B, 3M US L + 2.75%, 02/02/2024 | | | 1,822,826 | | | | 1,803,467 | |
| Project Alpha Intermediate Holding, Inc.: | | | | | | | | |
| 3M US L + 3.50%, 04/26/2024 | | | 2,481,061 | | | | 2,425,237 | |
| Series B, L + 4.50%, 04/26/2024 | | | 909,091 | | | | 910,227 | |
| Project Angel Parent LLC Series Initial, 1M US L + 4.00%, 05/30/2025(b) | | | 297,015 | | | | 292,560 | |
| Project Leopard Holdings, Inc. Series 2018 Repricing, 1M US L + 4.00%, 07/07/2023 | | | 1,984,925 | | | | 1,963,845 | |
| Quest Software US Holdings, Inc. Series Initial, 3M US L + 8.25%, 05/17/2026 | | | 500,000 | | | | 494,375 | |
| Riverbed Technology, Inc. Series First Amendment, 1M US L + 3.25%, 04/24/2022 | | | 1,596,070 | | | | 1,455,815 | |
| Rocket Software, Inc.: | | | | | | | | |
| Series Initial, 1M US L + 4.25%, 11/28/2025 | | | 2,333,864 | | | | 2,330,958 | |
| Series Initial, 1M US L + 8.25%, 11/27/2026 | | | 2,000,000 | | | | 1,977,500 | |
| RP Crown Parent LLC Series Initial, 1M US L + 2.75%, 10/12/2023 | | | 740,530 | | | | 731,970 | |
| SolarWinds Holdings, Inc. Series 2018 Refinancing, 1M US L + 3.00%, 02/05/2024 | | | 2,586,068 | | | | 2,563,440 | |
| Vero Parent, Inc. Series 2018 Refinancing, 1M US L + 4.50%, 08/16/2024 | | | 1,847,056 | | | | 1,843,021 | |
| Web.com Group, Inc.: | | | | | | | | |
| Series B, 3M US L + 3.75%, 10/10/2025 | | | 1,817,352 | | | | 1,795,780 | |
| Series Initial, 3M US L + 7.75%, 10/09/2026(b) | | | 779,428 | | | | 769,685 | |
| | | | | | | | 68,777,133 | |
| | | | | | | | | |
| Equipment Leasing - 0.86% | | | | | | | | |
| CSC SW Holdco, Inc. Series B-1, 2M US L + 3.25%, 11/14/2022 | | | 3,247,776 | | | | 3,168,205 | |
| | | | | | | | | |
| Financial Intermediaries - 2.18% | | | | | | | | |
| ION Trading Technologies S.A.R.L. Series 2018 Initial Dollar, 3M US L + 4.00%, 11/21/2024 | | | 1,500,000 | | | | 1,460,888 | |
| NorthStar Financial Services Group LLC Series Initial, 2M US L + 3.50%, 05/25/2025 | | | 1,188,822 | | | | 1,172,476 | |
| Pre-Paid Legal Services, Inc. Series Initial, 1M US L + 3.25%, 05/01/2025 | | | 3,581,510 | | | | 3,545,695 | |
| SS&C Technologies Holdings, Inc.: | | | | | | | | |
| Series B-3, 1M US L + 2.50%, 02/28/2025 | | | 407,362 | | | | 404,616 | |
| Series B-4, 1M US L + 2.50%, 02/28/2025 | | | 292,892 | | | | 290,918 | |
| Series B-5, 1M US L + 2.25%, 04/16/2025 | | | 1,123,076 | | | | 1,115,063 | |
| | | | | | | | 7,989,656 | |
| Semi-Annual Report | March 31, 2019 | 9 |
| Blackstone / GSO Floating Rate Enhanced Income Fund | Portfolio of Investments |
March 31, 2019 (Unaudited)
| | | Principal Amount | | | Value | |
| | | | | | | |
| Food Products - 2.23% | | | | | | | | |
| CHG PPC Parent LLC Series Initial, 1M US L + 2.75%, 03/31/2025 | | $ | 1,709,970 | | | $ | 1,684,320 | |
| Dole Food Co., Inc. Series Tranche B, 1M US L + 2.75%, 04/06/2024 | | | 1,358,163 | | | | 1,303,837 | |
| Mastronardi Produce, Ltd. Series Initial, 1M US L + 3.25%, 05/01/2025 | | | 1,877,905 | | | | 1,875,558 | |
| TKC Holdings, Inc.: | | | | | | | | |
| Series Initial, 1M US L + 3.75%, 02/01/2023 | | | 2,215,837 | | | | 2,179,829 | |
| Series Initial, 1M US L + 8.00%, 02/01/2024 | | | 1,150,000 | | | | 1,125,028 | |
| | | | | | | | 8,168,572 | |
| | | | | | | | | |
| Food Service - 3.54% | | | | | | | | |
| Agro Merchants North America Holdings, Inc. Series Effective Date, 3M US L + 3.75%, 12/06/2024 | | | 2,527,696 | | | | 2,504,012 | |
| Big Jack Holdings LP Series 2018 Refinancing, 1M US L + 3.25%, 04/05/2024(b) | | | 1,487,527 | | | | 1,428,026 | |
| Flynn Restaurant Group LP Series Initial, 1M US L + 3.50%, 06/27/2025 | | | 2,727,291 | | | | 2,648,895 | |
| Fogo de Chao, Inc. Series 2018 Refinancing, 1M US L + 4.25%, 04/07/2025 | | | 1,557,548 | | | | 1,550,734 | |
| IRB Holding Corp. Series B, 1M US L + 3.25%, 02/05/2025 | | | 2,431,467 | | | | 2,375,458 | |
| K-Mac Holdings Corp. Series Initial, 1M US L + 6.75%, 03/09/2026 | | | 1,250,000 | | | | 1,241,556 | |
| Tacala Investment Corp. Series Initial, 1M US L + 7.00%, 01/30/2026 | | | 1,250,000 | | | | 1,247,813 | |
| | | | | | | | 12,996,494 | |
| | | | | | | | | |
| Food/Drug Retailers - 0.96% | | | | | | | | |
| EG Group, Ltd.: | | | | | | | | |
| Series Additional Facility, 3M US L + 4.00%, 02/07/2025 | | | 3,270,601 | | | | 3,201,918 | |
| Series Facility B, 3M US L + 4.00%, 02/07/2025 | | | 343,750 | | | | 336,531 | |
| | | | | | | | 3,538,449 | |
| | | | | | | | | |
| Health Insurance - 1.01% | | | | | | | | |
| MPH Acquisition Holdings LLC Series Initial, 3M US L + 2.75%, 06/07/2023 | | | 3,802,626 | | | | 3,689,460 | |
| | | | | | | | | |
| Healthcare - 23.76% | | | | | | | | |
| Acadia Healthcare Company, Inc. Series Tranche B-3, L + 2.50%, 02/11/2022 | | | 1,147,811 | | | | 1,142,072 | |
| ADMI Corp. Series Initial, 1M US L + 3.25%, 04/30/2025 | | | 1,894,150 | | | | 1,879,158 | |
| ATI Holdings Acquisition, Inc. Series Initial, 1M US L + 3.50%, 05/10/2023 | | | 1,385,751 | | | | 1,351,107 | |
| Auris Luxembourg III S.a r.l. Series Facility B2, 3M US L + 3.75%, 02/27/2026 | | | 2,576,923 | | | | 2,580,144 | |
| Carestream Health, Inc. Series Extended, 1M US L + 9.50%, 06/07/2021(b) | | | 1,515,000 | | | | 1,492,275 | |
| Certara Holdco, Inc. Series Replacement, 3M US L + 3.50%, 08/15/2024(b) | | | 1,297,640 | | | | 1,287,907 | |
| Change Healthcare Holdings, Inc. Series Closing Date, 1M US L + 2.75%, 03/01/2024 | | | 967,254 | | | | 955,923 | |
| CHG Healthcare Services, Inc. Series 2017 New, 2M US L + 3.00%, 06/07/2023 | | | 3,039,026 | | | | 3,027,630 | |
| CPI Holdco LLC Series Closing Date, 3M US L + 3.50%, 03/21/2024(b) | | | 2,436,469 | | | | 2,412,104 | |
| CryoLife, Inc. Series Initial, 3M US L + 4.00%, 11/15/2024 | | | 2,485,340 | | | | 2,485,340 | |
| Dentalcorp Health Services ULC: | | | | | | | | |
| Series Delayed Draw, 3M US L + 2.18%, 06/06/2025(c) | | | 51,502 | | | | 50,343 | |
| Series Initial, 1M US L + 3.75%, 06/06/2025 | | | 279,577 | | | | 273,287 | |
| Endo Luxembourg Finance Company I S.a r.l. Series Initial, 1M US L + 4.25%, 04/29/2024 | | | 1,037,555 | | | | 1,021,343 | |
| Envision Healthcare Corp. Series Initial, 3M US L + 3.75%, 10/10/2025 | | | 5,454,073 | | | | 5,115,484 | |
| Equian Buyer Corp. Series 2018 Incremental, 1M US L + 3.25%, 05/20/2024 | | | 2,090,325 | | | | 2,056,357 | |
| Femur Buyer, Inc. Series Initial, 3M US L + 4.50%, 03/02/2026(b) | | | 1,760,000 | | | | 1,765,500 | |
| GHX Ultimate Parent Corp. Series Initial, 3M US L + 3.00%, 06/28/2024 | | | 1,187,909 | | | | 1,165,636 | |
| Heartland Dental LLC: | | | | | | | | |
| Series Delayed Draw, 3M US L + 3.75%, 04/30/2025(c) | | | 22,826 | | | | 22,209 | |
| Series Initial, 3M US L + 3.75%, 04/30/2025 | | | 1,191,418 | | | | 1,159,215 | |
| Jaguar Holding Company I LLC Series 2018, 1M US L + 2.50%, 08/18/2022 | | | 4,115,464 | | | | 4,080,648 | |
| LifeScan Global Corp. Series Initial, 3M US L + 6.00%, 10/01/2024 | | | 1,473,750 | | | | 1,420,327 | |
| Maravai Intermediate Holdings LLC Series Initial, 1M US L + 4.25%, 08/02/2025 | | | 914,758 | | | | 912,471 | |
| Navicure, Inc. Series Initial, 1M US L + 3.75%, 11/01/2024 | | | 2,555,314 | | | | 2,520,178 | |
| Netsmart Technologies, Inc. Series D-1, 1M US L + 3.75%, 04/19/2023(b) | | | 2,300,265 | | | | 2,288,764 | |
| | | | | | | | | |
| Blackstone / GSO Floating Rate Enhanced Income Fund | Portfolio of Investments |
March 31, 2019 (Unaudited)
| | | Principal Amount | | | Value | |
| | | | | | | |
| Healthcare (continued) | | | | | | | | |
| nThrive, Inc. Series Additional B-2, 1M US L + 4.50%, 10/20/2022 | | $ | 1,433,358 | | | $ | 1,379,607 | |
| NVA Holdings, Inc. Series B-3, 1M US L + 2.75%, 02/02/2025 | | | 2,101,084 | | | | 2,036,087 | |
| Onex TSG Holdings II Corp. Series Initial, 1M US L + 4.00%, 07/29/2022 | | | 1,250,000 | | | | 1,232,037 | |
| PAREXEL International Corp. Series Initial, 1M US L + 2.75%, 09/27/2024 | | | 2,777,897 | | | | 2,683,157 | |
| Pearl Intermediate Parent LLC: | | | | | | | | |
| Series Delayed Draw, 3M US L + 1.48%, 02/14/2025(c) | | | 141,349 | | | | 134,459 | |
| Series Initial, 1M US L + 2.75%, 02/14/2025 | | | 627,477 | | | | 596,887 | |
| Series Initial, 1M US L + 6.25%, 02/13/2026(b) | | | 1,770,588 | | | | 1,726,324 | |
| Phoenix Guarantor, Inc. Series Initial, 1M US L + 4.50%, 03/05/2026 | | | 1,751,592 | | | | 1,727,508 | |
| Press Ganey Holdings, Inc.: | | | | | | | | |
| Series Incremental B-2018, 1M US L + 2.75%, 10/23/2023 | | | 2,000,000 | | | | 1,963,130 | |
| Series Initial, 1M US L + 6.50%, 10/21/2024 | | | 2,000,000 | | | | 2,004,170 | |
| Prospect Medical Holdings, Inc. Series B-1, 1M US L + 5.50%, 02/22/2024 | | | 2,136,860 | | | | 1,953,443 | |
| Regionalcare Hospital Partners Holdings, Inc. Series B, 1M US L + 4.50%, 11/16/2025 | | | 2,950,647 | | | | 2,924,371 | |
| Sterigenics-Nordion Holdings LLC Series Incremental, 3M US L + 3.00%, 05/15/2022 | | | 1,881,817 | | | | 1,852,413 | |
| Surgery Center Holdings, Inc. Series Initial, 2M US L + 3.25%, 09/02/2024 | | | 2,891,793 | | | | 2,845,409 | |
| Team Health Holdings, Inc. Series Initial, 1M US L + 2.75%, 02/06/2024 | | | 2,232,940 | | | | 1,992,899 | |
| Tecostar Holdings, Inc. Series 2017, 1M US L + 3.50%, 05/01/2024 | | | 2,967,283 | | | | 2,955,236 | |
| U.S. Anesthesia Partners, Inc. Series Initial, 1M US L + 3.00%, 06/23/2024 | | | 2,865,689 | | | | 2,841,689 | |
| U.S. Renal Care, Inc. Series Initial, 3M US L + 4.25%, 12/30/2022 | | | 7,616,003 | | | | 7,613,642 | |
| Verscend Holding Corp. Series B, 1M US L + 4.50%, 08/27/2025 | | | 1,243,750 | | | | 1,237,531 | |
| Viant Medical Holdings, Inc. Series Initial, 3M US L + 3.75%, 07/02/2025 | | | 829,167 | | | | 830,464 | |
| Wink Holdco, Inc.: | | | | | | | | |
| Series Initial, 1M US L + 3.00%, 12/01/2024 | | | 740,625 | | | | 719,332 | |
| Series Initial, 1M US L + 6.75%, 12/01/2025(b) | | | 279,569 | | | | 273,977 | |
| Zest Acquisition Corp. Series Initial, 3M US L + 3.50%, 03/07/2025 | | | 1,192,500 | | | | 1,113,497 | |
| | | | | | | | 87,102,691 | |
| | | | | | | | | |
| Home Furnishings - 1.82% | | | | | | | | |
| AI Aqua Merger Sub, Inc. Series Tranche B-1, 1M US L + 3.25%, 12/13/2023 | | | 3,543,112 | | | | 3,396,958 | |
| Prime Security Services Borrower LLC Series December 2018 Incremental B-1, 1M US L + 2.75%, 05/02/2022 | | | 3,305,963 | | | | 3,277,053 | |
| | | | | | | | 6,674,011 | |
| | | | | | | | | |
| Industrial Equipment - 3.26% | | | | | | | | |
| Blount International, Inc. Series New Refinancing, 1M US L + 3.75%, 04/12/2023 | | | 2,743,125 | | | | 2,747,116 | |
| Helix Acquisition Holdings, Inc. Series 2018 New, 3M US L + 3.50%, 09/30/2024 | | | 685,079 | | | | 671,377 | |
| LTI Holdings, Inc. Series Initial, 1M US L + 3.50%, 09/06/2025 | | | 1,583,777 | | | | 1,527,680 | |
| Minimax Viking GmbH Series Facility B1C, 1M US L + 3.00%, 07/31/2025 | | | 3,036,724 | | | | 3,031,652 | |
| MTS Systems Corp. Series New Tranche B, 1M US L + 3.25%, 07/05/2023 | | | 671,536 | | | | 668,178 | |
| Pro Mach Group, Inc. Series Initial, 1M US L + 3.00%, 03/07/2025 | | | 1,892,456 | | | | 1,835,295 | |
| Robertshaw US Holding Corp. Series Initial, 1M US L + 3.50%, 02/14/2025 | | | 706,247 | | | | 664,755 | |
| Titan Acquisition, Ltd. Series Initial, 1M US L + 3.00%, 03/28/2025 | | | 887,489 | | | | 827,806 | |
| | | | | | | | 11,973,859 | |
| | | | | | | | | |
| Insurance - 1.92% | | | | | | | | |
| Cypress Intermediate Holdings III, Inc.: | | | | | | | | |
| Series Initial, 1M US L + 3.00%, 04/29/2024 | | | 1,137,548 | | | | 1,119,660 | |
| Series Initial, 1M US L + 6.75%, 04/28/2025 | | | 1,807,054 | | | | 1,804,795 | |
| HIG Finance 2, Ltd. Series Initial Dollar, 1M US L + 3.50%, 12/20/2024 | | | 1,699,425 | | | | 1,694,998 | |
| Outcomes Group Holdings, Inc.: | | | | | | | | |
| Series Initial, 1M US L + 3.50%, 10/24/2025 | | | 2,085,682 | | | | 2,046,575 | |
| 1M US L + 7.50%, 10/26/2026 | | | 384,615 | | | | 382,692 | |
| | | | | | | | 7,048,720 | |
| Semi-Annual Report | March 31, 2019 | 11 |
| Blackstone / GSO Floating Rate Enhanced Income Fund | Portfolio of Investments |
March 31, 2019 (Unaudited)
| | | Principal Amount | | | Value | |
| | | | | | | |
| Leisure Goods/Activities/Movies - 3.91% | | | | | | | | |
| Alterra Mountain Company Series Initial Bluebird, 1M US L + 3.00%, 07/31/2024 | | $ | 2,570,345 | | | $ | 2,561,118 | |
| AMC Entertainment Holdings, Inc. Series B, L + 3.00%, 03/20/2026 | | | 2,000,000 | | | | 1,988,500 | |
| Bulldog Purchaser, Inc. Series Initial, 1M US L + 3.75%, 09/05/2025 | | | 486,310 | | | | 480,537 | |
| Crown Finance US, Inc. Series Initial Dollar Tranche, 1M US L + 2.50%, 02/28/2025 | | | 1,183,632 | | | | 1,158,308 | |
| Travel Leaders Group LLC Series 2018 Refinancing, 1M US L + 4.00%, 01/25/2024 | | | 2,315,833 | | | | 2,323,545 | |
| Travelport Finance S.à r.l.: | | | | | | | | |
| Series Initial, 3M US L + 5.00%, 03/18/2026 | | | 4,000,000 | | | | 3,895,000 | |
| L + 9.00%, 03/18/2027(b) | | | 2,000,000 | | | | 1,950,000 | |
| | | | | | | | 14,357,008 | |
| | | | | | | | | |
| Lodging & Casinos - 1.37% | | | | | | | | |
| AP Gaming I LLC Series Incremental B, 1M US L + 3.50%, 02/15/2024 | | | 3,090,411 | | | | 3,086,548 | |
| Scientific Games International, Inc. Series Initial B-5, 2M US L + 2.75%, 08/14/2024 | | | 1,981,861 | | | | 1,933,553 | |
| | | | | | | | 5,020,101 | |
| | | | | | | | | |
| Nonferrous Metals/Minerals - 1.00% | | | | | | | | |
| Aleris International, Inc. Series Initial, 1M US L + 4.75%, 02/27/2023 | | | 3,190,114 | | | | 3,195,697 | |
| American Rock Salt Co. LLC Series Initial, 1M US L + 3.75%, 03/21/2025 | | | 484,239 | | | | 484,239 | |
| | | | | | | | 3,679,936 | |
| | | | | | | | | |
| Oil & Gas - 1.96% | | | | | | | | |
| BCP Raptor LLC Series Initial, 2M US L + 4.25%, 06/24/2024 | | | 1,079,916 | | | | 1,016,304 | |
| Equitrans Midstream Corp. Series Holdco B Facility, 1M US L + 4.50%, 01/31/2024 | | | 673,986 | | | | 677,073 | |
| Lucid Energy Group II Borrower LLC Series Initial, 1M US L + 3.00%, 02/17/2025 | | | 863,556 | | | | 819,623 | |
| MRC Global, Inc. Series 2018 Refinancing, 1M US L + 3.00%, 09/20/2024(b) | | | 3,277,471 | | | | 3,277,471 | |
| Oryx Southern Delaware Holdings LLC Series Initial, 1M US L + 3.25%, 02/28/2025 | | | 1,455,882 | | | | 1,411,602 | |
| | | | | | | | 7,202,073 | |
| | | | | | | | | |
| Property & Casualty Insurance - 3.11% | | | | | | | | |
| Applied Systems, Inc. Series Initial, 3M US L + 7.00%, 09/19/2025 | | | 1,500,000 | | | | 1,517,347 | |
| AssuredPartners, Inc. Series 2017 September Refinancing, 1M US L + 3.25%, 10/22/2024 | | | 2,175,889 | | | | 2,111,700 | |
| Asurion LLC Series Replacement B-2, 1M US L + 6.00%, 08/04/2025 | | | 1,547,368 | | | | 1,572,351 | |
| Confie Seguros Holding II Co. Series B, 1M US L + 5.25%, 04/19/2022 | | | 1,745,518 | | | | 1,736,066 | |
| ExamWorks Group, Inc. Series B-1, 1M US L + 3.25%, 07/27/2023 | | | 3,180,128 | | | | 3,172,178 | |
| Solera LLC Series Dollar, 1M US L + 2.75%, 03/03/2023 | | | 1,290,026 | | | | 1,281,705 | |
| | | | | | | | 11,391,347 | |
| | | | | | | | | |
| Publishing - 2.59% | | | | | | | | |
| Ancestry.com Operations, Inc., 1M US L + 3.25%, 10/19/2023 | | | 3,079,080 | | | | 3,067,534 | |
| Champ Acquisition Corp. Series Initial, 3M US L + 5.50%, 12/19/2025 | | | 1,488,806 | | | | 1,491,605 | |
| Meredith Corp. Series Tranche B-1, 1M US L + 2.75%, 01/31/2025 | | | 1,870,058 | | | | 1,868,244 | |
| Recorded Books, Inc. Series Initial, 1M US L + 4.50%, 08/29/2025 | | | 872,807 | | | | 873,898 | |
| SESAC Holdco II LLC Series Initial, 1M US L + 3.00%, 02/23/2024 | | | 740,554 | | | | 724,510 | |
| Southern Graphics, Inc. Series Refinancing, 1M US L + 3.25%, 12/31/2022 | | | 1,733,432 | | | | 1,486,417 | |
| | | | | | | | 9,512,208 | |
| | | | | | | | | |
| Radio & Television - 0.36% | | | | | | | | |
| William Morris Endeavor Entertainment LLC Series B-1, 2M US L + 2.75%, 05/19/2025 | | | 1,383,891 | | | | 1,317,000 | |
| | | | | | | | | |
| Steel - 0.99% | | | | | | | | |
| Graftech International, Ltd. Series Initial, 1M US L + 3.50%, 02/12/2025 | | | 2,545,601 | | | | 2,542,419 | |
| Phoenix Services International LLC Series B, 1M US L + 3.75%, 03/01/2025 | | | 1,097,312 | | | | 1,091,831 | |
| | | | | | | | 3,634,250 | |
| Blackstone / GSO Floating Rate Enhanced Income Fund | Portfolio of Investments |
March 31, 2019 (Unaudited)
| | | Principal Amount | | | Value | |
| | | | | | | |
| Surface Transport - 0.53% | | | | | | | | |
| Lineage Logistics LLC, 1M US L + 3.00%, 02/16/2025 | | $ | 1,991,748 | | | $ | 1,939,474 | |
| | | | | | | | | |
| Telecommunications - 4.44% | | | | | | | | |
| Avaya, Inc. Series Tranche B, 1M US L + 4.25%, 12/15/2024 | | | 2,332,286 | | | | 2,326,211 | |
| Commscope, Inc. Series B, L + 3.25%, 02/06/2026 | | | 2,528,571 | | | | 2,530,670 | |
| Cyxtera DC Holdings, Inc. Series Initial, 3M US L + 7.25%, 05/01/2025 | | | 500,000 | | | | 457,500 | |
| Greeneden U.S. Holdings I LLC Series Tranche B-3 Dollar, 1M US L + 3.50%, 12/01/2023 | | | 740,625 | | | | 732,571 | |
| Masergy Holdings, Inc.: | | | | | | | | |
| Series 2017 Replacement, 3M US L + 3.25%, 12/15/2023 | | | 1,835,914 | | | | 1,799,195 | |
| Series Initial, 3M US L + 7.50%, 12/16/2024 | | | 1,000,000 | | | | 982,500 | |
| Peak 10 Holding Corp.: | | | | | | | | |
| Series Initial, 3M US L + 3.50%, 08/01/2024 | | | 494,987 | | | | 454,926 | |
| Series Initial, 3M US L + 7.25%, 08/01/2025 | | | 250,000 | | | | 221,250 | |
| Securus Technologies Holdings, Inc.: | | | | | | | | |
| Series Delayed, 3M US L + 4.50%, 11/01/2024 | | | 206,061 | | | | 203,098 | |
| Series Initial, 1M US L + 4.50%, 11/01/2024 | | | 1,837,431 | | | | 1,828,630 | |
| TierPoint LLC: | | | | | | | | |
| Series Initial, 1M US L + 3.75%, 05/06/2024 | | | 1,187,418 | | | | 1,127,798 | |
| Series Initial, 1M US L + 7.25%, 05/05/2025 | | | 1,170,000 | | | | 1,112,962 | |
| Vertiv Group Corp. Series B, 1M US L + 4.00%, 11/30/2023 | | | 2,650,000 | | | | 2,498,725 | |
| | | | | | | | 16,276,036 | |
| | | | | | | | | |
| Utilities - 2.66% | | | | | | | | |
| Brookfield WEC Holdings, Inc.: | | | | | | | | |
| Series Initial, 1M US L + 3.75%, 07/31/2025 | | | 1,798,125 | | | | 1,797,253 | |
| Series Initial, 1M US L + 6.75%, 08/03/2026 | | | 724,611 | | | | 728,052 | |
| Calpine Corp. Series 2015, 3M US L + 2.50%, 01/15/2023 | | | 748,067 | | | | 747,768 | |
| Eastern Power LLC, 1M US L + 3.75%, 10/02/2023 | | | 1,199,311 | | | | 1,196,613 | |
| Granite Acquisition, Inc.: | | | | | | | | |
| Series B, 3M US L + 3.50%, 12/20/2021 | | | 1,494,720 | | | | 1,494,017 | |
| Series B, 3M US L + 7.25%, 12/19/2022 | | | 1,551,137 | | | | 1,555,015 | |
| Pike Corp. Series 2018 Initial, 1M US L + 3.50%, 03/23/2025 | | | 2,226,783 | | | | 2,228,174 | |
| | | | | | | | 9,746,892 | |
| | | | | | | | | |
| TOTAL FLOATING RATE LOAN INTERESTS | | | | | | | | |
| (Cost $502,198,805) | | | | | | | 494,921,134 | |
| | | | | | | | | |
| COLLATERALIZED LOAN OBLIGATION SECURITIES(a)- 5.10% | | | | | | | | |
| Structured Finance Obligations - 5.10% | | | | | | | | |
| Ares XLII Clo, Ltd. Series 2017-42A, 3M US L + 3.45%, 01/22/2028(b)(d) | | | 1,100,000 | | | | 1,094,442 | |
| Babson CLO, Ltd. 2015-I Series 2015-IA, 3M US L + 5.50%, 01/20/2031(b)(d) | | | 250,000 | | | | 231,799 | |
| Carlyle Global Market Strategies CLO 2016-1, Ltd. Series 2018-1A, 3M US L + 5.20%, 04/20/2027(b)(d) | | | 1,500,000 | | | | 1,438,288 | |
| Dryden 40 Senior Loan Fund Series 2018-40A, 3M US L + 5.75%, 08/15/2031(b)(d) | | | 1,500,000 | | | | 1,429,524 | |
| Galaxy XVIII CLO, Ltd. Series 2018-28A, 3M US L + 3.00%, 07/15/2031(b)(d) | | | 1,000,000 | | | | 962,285 | |
| Galaxy XXIII CLO, Ltd. Series 2017-23A, 3M US L + 3.48%, 04/24/2029(b)(d) | | | 500,000 | | | | 500,213 | |
| Highbridge Loan Management 6 -2015, Ltd. Series 2018-2015, 3M US L + 5.10%, 02/05/2031(b)(d) | | | 833,000 | | | | 756,089 | |
| Highbridge Loan Management 8-2016, Ltd. Series 2018-2016, 3M US L + 5.50%, 07/20/2030(b)(d) | | | 500,000 | | | | 457,276 | |
| KKR CLO 14, Ltd. Series 2018-14, 3M US L + 6.15%, 07/15/2031(b)(d) | | | 500,000 | | | | 471,264 | |
| Madison Park Funding XI, Ltd. Series 2017-11A, 3M US L + 3.25%, 07/23/2029(b)(d) | | | 1,000,000 | | | | 988,760 | |
| Neuberger Berman CLO XIV, Ltd. Series 2017-14A, 3M US L + 3.65%, 01/28/2030(b)(d) | | | 500,000 | | | | 502,535 | |
| Neuberger Berman CLO XV Series 2017-15A, 3M US L + 6.75%, 10/15/2029(b)(d) | | | 745,000 | | | | 735,323 | |
| Octagon Investment Partners 18-R, Ltd. Series 2018-18A, 3M US L + 5.51%, 04/16/2031(b)(d) | | | 1,000,000 | | | | 931,167 | |
| Semi-Annual Report | March 31, 2019 | 13 |
| Blackstone / GSO Floating Rate Enhanced Income Fund | Portfolio of Investments |
March 31, 2019 (Unaudited)
| | | Principal Amount | | | Value | |
| | | | | | | |
| Structured Finance Obligations (continued) | | | | | | | | |
| Parallel 2018-2, Ltd. Series 2018-2A, 3M US L + 3.15%, 10/20/2031(b)(d) | | $ | 2,000,000 | | | $ | 1,906,520 | |
| TIAA CLO I, Ltd. Series 2018-1A, 3M US L + 6.20%, 07/20/2031(b)(d) | | | 1,500,000 | | | | 1,440,194 | |
| TIAA CLO IV, Ltd. Series 2018-1A, 3M US L + 5.95%, 01/20/2032(b)(d) | | | 2,000,000 | | | | 1,884,439 | |
| Venture XXIII CLO, Ltd. Series 2018-23A, 3M US L + 3.05%, 07/19/2028(b)(d) | | | 1,500,000 | | | | 1,479,521 | |
| Voya CLO 2015-2, Ltd. Series 2018-2A, 3M US L + 2.95%, 07/23/2027(b)(d) | | | 1,500,000 | | | | 1,490,624 | |
| | | | | | | | 18,700,263 | |
| | | | | | | | | |
| TOTAL COLLATERALIZED LOAN OBLIGATION SECURITIES | | | | | | | | |
| (Cost $19,274,151) | | | | | | | 18,700,263 | |
| | | | | | | | | |
| CORPORATE BONDS - 7.14% | | | | | | | | |
| Aerospace & Defense - 0.23% | | | | | | | | |
| TransDigm, Inc., 6.250%, 03/15/2026(d) | | | 800,000 | | | | 832,000 | |
| | | | | | | | | |
| Automotive - 0.08% | | | | | | | | |
| Panther BF Aggregator 2 LP / Panther Finance Co., Inc., 6.250%, 05/15/2026(d) | | | 291,000 | | | | 297,548 | |
| | | | | | | | | |
| Brokers, Dealers & Investment Houses - 0.40% | | | | | | | | |
| LPL Holdings, Inc., 5.750%, 09/15/2025(d) | | | 1,450,000 | | | | 1,472,185 | |
| | | | | | | | | |
| Building & Development - 0.18% | | | | | | | | |
| Hillman Group, Inc., 6.375%, 07/15/2022(d) | | | 750,000 | | | | 673,125 | |
| | | | | | | | | |
| Chemical & Plastics - 0.15% | | | | | | | | |
| Starfruit Finco BV / Starfruit US Holdco LLC, 8.000%, 10/01/2026(d) | | | 540,000 | | | | 546,750 | |
| | | | | | | | | |
| Containers & Glass Products - 0.19% | | | | | | | | |
| Trident Merger Sub, Inc., 6.625%, 11/01/2025(d) | | | 750,000 | | | | 705,000 | |
| | | | | | | | | |
| Diversified Insurance - 0.62% | | | | | | | | |
| HUB International, Ltd., 7.000%, 05/01/2026(d) | | | 1,650,000 | | | | 1,637,625 | |
| York Risk Services Holding Corp., 8.500%, 10/01/2022(d) | | | 750,000 | | | | 615,000 | |
| | | | | | | | 2,252,625 | |
| | | | | | | | | |
| Ecological Services & Equipment - 0.22% | | | | | | | | |
| GFL Environmental, Inc., 5.375%, 03/01/2023(d) | | | 868,000 | | | | 824,600 | |
| | | | | | | | | |
| Electronics/Electrical - 0.92% | | | | | | | | |
| Banff Merger Sub, Inc., 9.750%, 09/01/2026(d) | | | 912,000 | | | | 886,920 | |
| Energizer Holdings, Inc.: | | | | | | | | |
| 6.375%, 07/15/2026(d) | | | 1,250,000 | | | | 1,284,375 | |
| 7.750%, 01/15/2027(d) | | | 150,000 | | | | 160,312 | |
| Infor US, Inc., 6.500%, 05/15/2022 | | | 1,000,000 | | | | 1,017,500 | |
| | | | | | | | 3,349,107 | |
| | | | | | | | | |
| Food Service - 0.19% | | | | | | | | |
| IRB Holding Corp., 6.750%, 02/15/2026(d) | | | 750,000 | | | | 706,875 | |
| | | | | | | | | |
| Healthcare - 1.83% | | | | | | | | |
| Envision Healthcare Corp., 8.750%, 10/15/2026(d) | | | 2,084,000 | | | | 1,862,575 | |
| NVA Holdings, Inc., 6.875%, 04/01/2026(d) | | | 1,650,000 | | | | 1,639,687 | |
| Surgery Center Holdings, Inc., 8.875%, 04/15/2021(d) | | | 750,000 | | | | 785,850 | |
| Team Health Holdings, Inc., 6.375%, 02/01/2025(d) | | | 750,000 | | | | 612,188 | |
| Blackstone / GSO Floating Rate Enhanced Income Fund | Portfolio of Investments |
March 31, 2019 (Unaudited)
| | | Principal Amount | | | Value | |
| | | | | | | |
| Healthcare (continued) | | | | | | | | |
| Tenet Healthcare Corp., 7.000%, 08/01/2025 | | $ | 1,750,000 | | | $ | 1,778,437 | |
| | | | | | | | 6,678,737 | |
| | | | | | | | | |
| Home Furnishings - 0.83% | | | | | | | | |
| Prime Security Services Borrower LLC / Prime Finance, Inc.: | | | | | | | | |
| 5.250%, 04/15/2024(d) | | | 1,400,000 | | | | 1,403,500 | |
| 5.750%, 04/15/2026(d) | | | 1,624,000 | | | | 1,628,060 | |
| | | | | | | | 3,031,560 | |
| | | | | | | | | |
| Industrial Equipment - 0.20% | | | | | | | | |
| Titan Acquisition, Ltd. / Titan Co.-Borrower LLC, 7.750%, 04/15/2026(d) | | | 857,000 | | | | 741,305 | |
| | | | | | | | | |
| Property & Casualty Insurance - 0.29% | | | | | | | | |
| AssuredPartners, Inc., 7.000%, 08/15/2025(d) | | | 1,150,000 | | | | 1,069,500 | |
| | | | | | | | | |
| Surface Transport - 0.33% | | | | | | | | |
| XPO Logistics, Inc., 6.750%, 08/15/2024(d) | | | 1,167,000 | | | | 1,193,258 | |
| | | | | | | | | |
| Telecommunications - 0.49% | | | | | | | | |
| CommScope Finance LLC, 6.000%, 03/01/2026(d) | | | 1,738,000 | | | | 1,802,080 | |
| | | | | | | | | |
| TOTAL CORPORATE BONDS | | | | | | | | |
| (Cost $26,372,353) | | | | | | | 26,176,255 | |
| | | | | | | | | |
| | | | Shares | | | | Value | |
| EXCHANGE TRADED FUNDS - 2.06% | | | | | | | | |
| Financial Intermediaries - 2.06% | | | | | | | | |
| SPDR Blackstone / GSO Senior Loan ETF | | | 164,175 | | | | 7,560,259 | |
| | | | | | | | | |
| TOTAL EXCHANGE TRADED FUNDS | | | | | | | | |
| (Cost $7,754,436) | | | | | | | 7,560,259 | |
| | | | | | | | | |
| SHORT TERM INVESTMENTS - 3.93% | | | | | | | | |
| Fidelity Treasury Portfolio | | | | | | | | |
| (1.916% 7-Day Yield) | | | 14,405,215 | | | | 14,405,215 | |
| | | | | | | | | |
| TOTAL SHORT TERM INVESTMENTS | | | | | | | | |
| (Cost $14,405,215) | | | | | | | 14,405,215 | |
| | | | | | | | | |
| Total Investments - 153.16% | | | | | | | | |
| (Cost $570,004,960) | | | | | | | 561,763,126 | |
| | | | | | | | | |
| Liabilities in Excess of Other Assets - (7.08)% | | | | | | | (25,977,011 | ) |
| | | | | | | | | |
| Leverage Facility - (46.08)% | | | | | | | (169,000,000 | ) |
| | | | | | | | | |
| Net Assets - 100.00% | | | | | | $ | 366,786,115 | |
Amounts above are shown as a percentage of net assets as of March 31, 2019.
| Semi-Annual Report | March 31, 2019 | 15 |
| Blackstone / GSO Floating Rate Enhanced Income Fund | Portfolio of Investments |
March 31, 2019 (Unaudited)
Investment Abbreviations:
LIBOR - London Interbank Offered Rate
Libor Rates:
1M US L - 1 Month LIBOR as of March 31, 2019 was 2.49%
2M US L - 2 Month LIBOR as of March 31, 2019 was 2.56%
3M US L - 3 Month LIBOR as of March 31, 2019 was 2.60%
| (a) | Floating or variable rate security. The reference rate is described above. The rate in effect as of March 31, 2019 is based on the reference rate plus the displayed spread as of the security's last reset date. |
| (b) | Level 3 asset valued using significant unobservable inputs as a result of unavailable quoted prices from an active market or the unavailability of other significant observable inputs. |
| (c) | A portion of this position was not funded as of March 31, 2019. The Portfolio of Investments records only the funded portion of each position. As of March 31, 2019, the Fund has unfunded delayed draw loans in the amount of $896,172. Fair value of these unfunded delayed draw loans was $886,761. |
| (d) | Security exempt from registration under Rule 144A of the Securities Act of 1933. Total market value of Rule 144A securities amounts to $42,080,581, which represented approximately 11.47% of net assets as of March 31, 2019. Such securities have been deemed to be liquid under procedures approved by the Fund's Board of Trustees and may normally be sold to qualified institutional buyers in transactions exempt from registration. |
See Notes to Financial Statements.
| Blackstone / GSO Floating Rate Enhanced Income Fund | Statement of Assets and Liabilities |
March 31, 2019 (Unaudited)
| ASSETS: | | | |
| Investments, at fair value (Cost $570,004,960) | | $ | 561,763,126 | |
| Cash | | | 583,623 | |
| Receivable for investment securities sold | | | 14,893,086 | |
| Interest receivable | | | 1,715,482 | |
| Receivable for shares sold | | | 1,568,310 | |
| Prepaid expenses and other assets | | | 103,767 | |
| Total Assets | | | 580,627,394 | |
| | | | | |
| LIABILITIES: | | | | |
| Payable for investment securities purchased | | | 42,047,355 | |
| Leverage facility | | | 169,000,000 | |
| Interest due on leverage facility | | | 254,224 | |
| Distributions payable to common shareholders | | | 2,064,842 | |
| Accrued investment advisory fee payable | | | 25,178 | |
| Accrued trustees' fees payable | | | 58,512 | |
| Accrued distribution fees payable | | | 32,054 | |
| Accrued shareholder servicing fees payable | | | 32,063 | |
| Accrued transfer agent fees payable | | | 21,906 | |
| Other payables and accrued expenses | | | 305,145 | |
| Total Liabilities | | | 213,841,279 | |
| Net Assets Attributable to Common Shareholders | | $ | 366,786,115 | |
| | | | | |
| COMPOSITION OF NET ASSETS ATTRIBUTABLE TO COMMON SHARES: | | | | |
| Paid-in capital | | $ | 376,490,974 | |
| Total distributable earnings | | | (9,704,859 | ) |
| Net Assets Attributable to Common Shareholders | | $ | 366,786,115 | |
| | | | | |
| NET ASSET VALUE | | | | |
| Class I: | | | | |
| Net asset value per share | | $ | 24.23 | |
| Net assets | | | 203,692,044 | |
| Shares of beneficial interest outstanding (unlimited shares authorized, par value $0.001 per share) | | | 8,405,056 | |
| | | | | |
| Class T: | | | | |
| Net asset value per share | | | 24.18 | |
| Net assets | | | 163,035,071 | |
| Shares of beneficial interest outstanding (unlimited shares authorized, par value $0.001 per share) | | | 6,741,557 | |
| | | | | |
| Class D: | | | | |
| Net asset value per share | | | 24.23 | |
| Net assets | | | 59,000 | |
| Shares of beneficial interest outstanding (unlimited shares authorized, par value $0.001 per share) | | | 2,435 | |
See Notes to Financial Statements.
| Semi-Annual Report | March 31, 2019 | 17 |
| Blackstone / GSO Floating Rate Enhanced Income Fund | Statement of Operations |
For the Six Months Ended March 31, 2019 (Unaudited)
| INVESTMENT INCOME: | | | |
| Dividends | | $ | 303,557 | |
| Interest | | | 15,767,506 | |
| Total Investment Income | | | 16,071,063 | |
| | | | | |
| EXPENSES: | | | | |
| Advisory fee | | | 1,702,477 | |
| Fund accounting and administration fees | | | 195,369 | |
| Distribution fees | | | 178,318 | |
| Shareholder servicing fees | | | 178,380 | |
| Offering cost | | | 392,277 | |
| Insurance expense | | | 56,870 | |
| Legal and audit fees | | | 317,217 | |
| Custodian fees | | | 98,969 | |
| Trustees' fees and expenses | | | 59,892 | |
| Printing expense | | | 42,533 | |
| Transfer agent fees | | | 126,840 | |
| Interest on leverage facility | | | 2,611,744 | |
| Facility and other fees | | | 30,731 | |
| Other expenses | | | 27,844 | |
| Total expenses | | | 6,019,461 | |
| Reimbursement from Adviser/Advisory fee waiver | | | (1,436,425 | ) |
| Net Expenses | | | 4,583,036 | |
| Net Investment Income | | | 11,488,027 | |
| | | | | |
| REALIZED AND UNREALIZED GAIN/(LOSS) ON INVESTMENTS: | | | | |
| Net realized gain/(loss) on: | | | | |
| Investment securities | | | (1,285,692 | ) |
| Net realized loss | | | (1,285,692 | ) |
| Change in Unrealized appreciation/depreciation on: | | | | |
| Investment securities | | | (8,856,710 | ) |
| Net change in unrealized depreciation on investments | | | (8,856,710 | ) |
| Net Realized and Unrealized Loss on Investments | | | (10,142,402 | ) |
| | | | | |
| Net Increase in Net Assets Attributable to Common Shares from Operations | | $ | 1,345,625 | |
See Notes to Financial Statements.
| Blackstone / GSO Floating Rate Enhanced Income Fund | Statements of Changes in Net Assets |
| | | For the Six Months Ended March 31, 2019 (Unaudited) | | | For the Period January 18, 2018 (Commencement of Operations) to September 30, 2018 | |
| FROM OPERATIONS: | | | | | | | | |
| Net investment income | | $ | 11,488,027 | | | $ | 6,734,252 | |
| Net realized loss on investments | | | (1,285,692 | ) | | | (196,227 | ) |
| Net change in unrealized appreciation/depreciation on investments | | | (8,856,710 | ) | | | 614,876 | |
| Net Increase in Net Assets Attributable to Common Shares from Operations | | | 1,345,625 | | | | 7,152,901 | |
| | | | | | | | | |
| DISTRIBUTIONS TO COMMON SHAREHOLDERS: | | | | | | | | |
| Class I | | | (6,926,828 | ) | | | (5,121,970 | ) |
| Class T | | | (4,646,269 | ) | | | (1,683,829 | ) |
| Class D | | | (1,703 | ) | | | – | |
| Net Decrease in Net Assets from Distributions to Common Shareholders | | | (11,574,800 | ) | | | (6,805,799 | ) |
| | | | | | | | | |
| SHARES TRANSACTIONS, IN DOLLARS: | | | | | | | | |
| Class I(a) | | | | | | | | |
| Proceeds from shares sold | | | 25,988,249 | | | | 184,572,712 | |
| Distributions reinvested | | | 4,092,281 | | | | 3,163,910 | |
| Cost of shares redeemed | | | (8,270,686 | ) | | | (459 | ) |
| Class T(b) | | | | | | | | |
| Proceeds from shares sold | | | 48,445,152 | | | | 116,536,794 | |
| Distributions reinvested | | | 2,214,058 | | | | 944,631 | |
| Cost of shares redeemed | | | (1,140,308 | ) | | | (61,257 | ) |
| Redemption fees | | | 22,545 | | | | – | |
| Class D(c) | | | | | | | | |
| Proceeds from shares sold | | | 45,000 | | | | 15,000 | |
| Distributions reinvested | | | 566 | | | | – | |
| Net Increase from Capital Share Transactions | | | 71,396,857 | | | | 305,171,331 | |
| Net Increase in Net Assets | | | 61,167,682 | | | | 305,518,433 | |
| | | | | | | | | |
| NET ASSETS | | | | | | | | |
| Beginning of period | | | 305,618,433 | | | | 100,000 | |
| End of period | | $ | 366,786,115 | | | $ | 305,618,433 | |
| (a) | The Fund's Class I commenced operations on January 18, 2018. |
| (b) | The Fund's Class T commenced operations on May 7, 2018. |
| (c) | The Fund's Class D inception date is September 28, 2018 and commenced operations on October 1, 2018. |
See Notes to Financial Statements.
| Semi-Annual Report | March 31, 2019 | 19 |
| Blackstone / GSO Floating Rate Enhanced Income Fund | Statements of Changes in Net Assets |
| | | For the Six Months Ended March 31, 2019 (Unaudited) | | | For the Period January 18, 2018 (Commencement of Operations) to September 30, 2018 | |
| SHARE TRANSACTIONS, IN SHARES: | | | | | | |
| Class I(a) | | | | | | | | |
| Beginning shares | | | 7,517,587 | | | | 4,000 | |
| Shares sold | | | 1,060,700 | | | | 7,386,868 | |
| Reinvestment in shares | | | 168,918 | | | | 126,737 | |
| Shares redeemed | | | (342,149 | ) | | | (18 | ) |
| Net change in shares resulting from shares transactions | | | 887,469 | | | | 7,513,587 | |
| Ending shares | | | 8,405,056 | | | | 7,517,587 | |
| | | | | | | | | |
| Class T(b) | | | | | | | | |
| Beginning shares | | | 4,717,010 | | | | – | |
| Shares sold | | | 1,979,731 | | | | 4,681,508 | |
| Reinvestment in shares | | | 91,647 | | | | 37,964 | |
| Shares redeemed | | | (46,831 | ) | | | (2,462 | ) |
| Net change in shares resulting from shares transactions | | | 2,024,547 | | | | 4,717,010 | |
| Ending shares | | | 6,741,557 | | | | 4,717,010 | |
| | | | | | | | | |
| Class D(c) | | | | | | | | |
| Beginning shares | | | 600 | | | | – | |
| Shares sold | | | 1,812 | | | | 600 | |
| Reinvestment in shares | | | 23 | | | | – | |
| Net change in shares resulting from shares transactions | | | 1,835 | | | | 600 | |
| Ending shares | | | 2,435 | | | | 600 | |
| (a) | The Fund's Class I commenced operations on January 18, 2018. |
| (b) | The Fund's Class T commenced operations on May 7, 2018. |
| (c) | The Fund's Class D inception date is September 28, 2018 and commenced operations on October 1, 2018. |
See Notes to Financial Statements.
| Blackstone / GSO Floating Rate Enhanced Income Fund | Statement of Cash Flows |
For the Six Months Ended March 31, 2019 (Unaudited)
| CASH FLOWS FROM OPERATING ACTIVITIES: | | | |
| Net increase in net assets attributable to common shares from operations | | $ | 1,345,625 | |
| Adjustments to reconcile net increase in net assets attributable to common shares from operations to net cash used in operating activities: | | | | |
| Purchases of investment securities | | | (267,447,890 | ) |
| Proceeds from disposition of investment securities | | | 140,322,870 | |
| Discounts accreted/premiums amortized | | | 23,929 | |
| Net realized loss on: | | | | |
| Investment securities | | | 1,285,692 | |
| Net change in unrealized appreciation/depreciation on: | | | | |
| Investment securities | | | 8,856,710 | |
| Net purchase of short term investments | | | (8,142,116 | ) |
| (Increase)/Decrease in assets: | | | | |
| Interest receivable | | | (390,505 | ) |
| Prepaid offering costs | | | 392,277 | |
| Prepaid expenses and other assets | | | (30,023 | ) |
| Increase/(Decrease) in liabilities: | | | | |
| Payable to Adviser for offering costs | | | (20,282 | ) |
| Interest due on leverage facility | | | 132,595 | |
| Accrued distribution fees payable | | | (10,350 | ) |
| Accrued investment advisory fees payable | | | 25,178 | |
| Accrued trustees' fees payable | | | 9,950 | |
| Accrued shareholder servicing fees payable | | | (10,341 | ) |
| Accrued transfer agency fees payable | | | 3,638 | |
| Other payables and accrued expenses | | | (721,977 | ) |
| Net Cash Used in Operating Activities | | | (124,375,020 | ) |
| | | | | |
| CASH FLOWS FROM FINANCING ACTIVITIES: | | | | |
| Proceeds from leverage facility | | | 63,000,000 | |
| Payments on leverage facility | | | (9,000,000 | ) |
| Cost of shares redeemed - common shares | | | (9,388,449 | ) |
| Proceeds from shares sold - common shares | | | 83,479,474 | |
| Distributions paid - common shareholders - net | | | (3,944,464 | ) |
| Net Cash Provided by (Used in) Financing Activities | | | 124,146,561 | |
| | | | | |
| Net Decrease in Cash | | | (228,459 | ) |
| Cash, beginning balance | | $ | 812,082 | |
| Cash, ending balance | | $ | 583,623 | |
| | | | | |
| Supplemental disclosure of cash flow information: | | | | |
| Cash paid on interest on leverage facility | | $ | 2,479,149 | |
| Reinvestment of distributions | | $ | 6,306,905 | |
See Notes to Financial Statements.
| Semi-Annual Report | March 31, 2019 | 21 |
| Blackstone / GSO Floating Rate Enhanced Income Fund – Class I | Financial Highlights |
For a Share Outstanding Throughout the Periods Indicated
| | | For the Six Months Ended March 31, 2019 (Unaudited) | | | For the Period January 18, 2018 (Commencement of Operations) to September 30, 2018 | |
| PER SHARE OPERATING PERFORMANCE: | | | | | | |
| Net asset value - beginning of period | | $ | 25.00 | | | $ | 25.00 | |
| INCOME FROM INVESTMENT OPERATIONS: | | | | | | | | |
| Net investment income(a) | | | 0.84 | | | | 0.90 | |
| Net realized and unrealized loss on investments | | | (0.76 | ) | | | (0.01 | ) |
| Total Income from Investment Operations | | | 0.08 | | | | 0.89 | |
| | | | | | | | | |
| DISTRIBUTIONS TO SHAREHOLDERS: | | | | | | | | |
| From net investment income | | | (0.85 | ) | | | (0.89 | ) |
| Total Distributions to Shareholders | | | (0.85 | ) | | | (0.89 | ) |
| | | | | | | | | |
| Net asset value - end of period | | $ | 24.23 | | | $ | 25.00 | |
| | | | | | | | | |
| Total Investment Return - Net Asset Value(b) | | | 0.37 | % | | | 3.61 | % |
| | | | | | | | | |
| RATIOS TO AVERAGE NET ASSETS | | | | | | | | |
| Expenses before reimbursement from Adviser and Advisory fee waiver | | | 0.65 | %(c) | | | 1.60 | %(d) |
| Advisory Fee | | | 1.00 | %(c) | | | 1.00 | %(d) |
| Interest on leverage | | | 1.53 | %(c) | | | 0.80 | %(d) |
| Total expenses before reimbursement from Adviser and Advisory fee waiver | | | 3.18 | %(c) | | | 3.40 | %(d) |
| Reimbursement from Adviser and Advisory fee waiver | | | (0.71 | %)(c) | | | (2.15 | %)(d) |
| Total expenses after reimbursement from Adviser and Advisory fee waiver | | | 2.47 | %(c) | | | 1.25 | %(d) |
| Excluded expenses(e) | | | (2.12 | %)(c) | | | (0.90 | %)(d) |
| Total expenses, net of excluded expenses, after reimbursement from Adviser and Advisory fee waiver | | | 0.35 | %(c) | | | 0.35 | %(d) |
| Net investment income | | | 6.95 | % | | | 5.17 | % |
| | | | | | | | | |
| Net assets, end of period (000s) | | $ | 203,692 | | | $ | 187,942 | |
| Portfolio turnover rate | | | 27 | %(f) | | | 40 | %(f) |
| (a) | Calculated using average common shares outstanding. |
| (b) | Total investment return is calculated assuming a purchase of common share at the opening on the first day and a sale at closing on the last day of each period reported. Dividends and distributions are assumed for purposes of this calculation to be reinvested at prices obtained under the Fund's dividend reinvestment plan. Total investment returns do not reflect brokerage commissions, if any, and are not annualized. |
| (c) | Financial ratios have been annualized except for non-recurring costs such as offering costs. |
| (d) | Financial ratios have been annualized except for non-recurring costs such as audit, offering and organizational costs. |
| (e) | Represents expenses excluded from reimbursement by the Adviser, as defined in the Expense Limitation and Reimbursement Agreement. See Note 3. |
| (f) | Percentage represents the results for the period and is not annualized. |
See Notes to Financial Statements.
| Blackstone / GSO Floating Rate Enhanced Income Fund – Class T | Financial Highlights |
For a Share Outstanding Throughout the Periods Indicated
| | | For the Six Months Ended March 31, 2019 (Unaudited) | | | For the Period May 7, 2018 (Commencement of Operations) to September 30, 2018 | |
| PER SHARE OPERATING PERFORMANCE: | | | | | | |
| Net asset value - beginning of period | | $ | 24.94 | | | $ | 25.00 | |
| INCOME FROM INVESTMENT OPERATIONS: | | | | | | | | |
| Net investment income(a) | | | 0.78 | | | | 0.58 | |
| Net realized and unrealized loss on investments | | | (0.75 | ) | | | (0.09 | ) |
| Total Income from Investment Operations | | | 0.03 | | | | 0.49 | |
| | | | | | | | | |
| DISTRIBUTIONS TO SHAREHOLDERS: | | | | | | | | |
| From net investment income | | | (0.79 | ) | | | (0.55 | ) |
| Total Distributions to Shareholders | | | (0.79 | ) | | | (0.55 | ) |
| | | | | | | | | |
| Net asset value - end of period | | $ | 24.18 | | | $ | 24.94 | |
| | | | | | | | | |
| Total Investment Return - Net Asset Value(b) | | | 0.15 | % | | | 2.00 | % |
| | | | | | | | | |
| RATIOS TO AVERAGE NET ASSETS | | | | | | | | |
| Expenses before reimbursement from Adviser and Advisory fee waiver | | | 1.19 | %(c) | | | 1.83 | %(d) |
| Advisory Fee | | | 1.00 | %(c) | | | 1.00 | %(d) |
| Interest on leverage | | | 1.54 | %(c) | | | 1.07 | %(d) |
| Total expenses before reimbursement from Adviser and Advisory fee waiver | | | 3.73 | %(c) | | | 3.90 | %(d) |
| Reimbursement from Adviser and Advisory fee waiver | | | (0.75 | %)(c) | | | (1.85 | %)(d) |
| Total expenses after reimbursement from Adviser and Advisory fee waiver | | | 2.98 | %(c) | | | 2.05 | %(d) |
| Excluded expenses(e) | | | (2.63 | %)(c) | | | (1.70 | %)(d) |
| Total expenses, net of excluded expenses, after reimbursement from Adviser and Advisory fee waiver | | | 0.35 | %(c) | | | 0.35 | %(d) |
| Net investment income | | | 6.46 | % | | | 5.86 | % |
| | | | | | | | | |
| Net assets, end of period (000s) | | $ | 163,035 | | | $ | 117,661 | |
| Portfolio turnover rate | | | 27 | %(f) | | | 40 | %(f) |
| (a) | Calculated using average common shares outstanding. |
| (b) | Total investment return is calculated assuming a purchase of common share at the opening on the first day and a sale at closing on the last day of each period reported. Dividends and distributions are assumed for purposes of this calculation to be reinvested at prices obtained under the Fund's dividend reinvestment plan. Total investment returns do not reflect brokerage commissions, if any, and are not annualized. |
| (c) | Financial ratios have been annualized except for non-recurring costs such as offering costs. |
| (d) | Financial ratios have been annualized except for non-recurring costs such as audit, offering and organizational costs. |
| (e) | Represents expenses excluded from reimbursement by the Adviser, as defined in the Expense Limitation and Reimbursement Agreement. See Note 3. |
| (f) | Percentage represents the results for the period and is not annualized. |
See Notes to Financial Statements.
| Semi-Annual Report | March 31, 2019 | 23 |
| Blackstone / GSO Floating Rate Enhanced Income Fund – Class D | Financial Highlights |
For a Share Outstanding Throughout the Period Indicated
| | | For the Period October 1, 2018 (Commencement of Operations) to March 31, 2019 (Unaudited) | |
| PER SHARE OPERATING PERFORMANCE: | | | |
| Net asset value - beginning of period | | $ | 25.00 | |
| INCOME FROM INVESTMENT OPERATIONS: | | | | |
| Net investment income(a) | | | 0.81 | |
| Net realized and unrealized loss on investments | | | (0.76 | ) |
| Total Income from Investment Operations | | | 0.05 | |
| | | | | |
| DISTRIBUTIONS TO SHAREHOLDERS: | | | | |
| From net investment income | | | (0.82 | ) |
| Total Distributions to Shareholders | | | (0.82 | ) |
| | | | | |
| Net asset value - end of period | | $ | 24.23 | |
| | | | | |
| Total Investment Return - Net Asset Value(b) | | | 0.26 | % |
| | | | | |
| RATIOS TO AVERAGE NET ASSETS(c) | | | | |
| Expenses before reimbursement from Adviser and Advisory fee waiver | | | 1.09 | % |
| Advisory Fee | | | 1.00 | % |
| Interest on leverage | | | 1.57 | % |
| Total expenses before reimbursement from Adviser and Advisory fee waiver | | | 3.66 | % |
| Reimbursement from Adviser and Advisory fee waiver | | | (0.97 | %) |
| Total expenses after reimbursement from Adviser and Advisory fee waiver | | | 2.69 | % |
| Excluded expenses(d) | | | (2.34 | %) |
| Total expenses, net of excluded expenses, after reimbursement from Adviser and Advisory fee waiver | | | 0.35 | % |
| Net investment income | | | 6.76 | % |
| | | | | |
| Net assets, end of period (000s) | | $ | 59 | |
| Portfolio turnover rate | | | 27 | %(e) |
| (a) | Calculated using average common shares outstanding. |
| (b) | Total investment return is calculated assuming a purchase of common share at the opening on the first day and a sale at closing on the last day of each period reported. Dividends and distributions are assumed for purposes of this calculation to be reinvested at prices obtained under the Fund's dividend reinvestment plan. Total investment returns do not reflect brokerage commissions, if any, and are not annualized. |
| (c) | Financial ratios have been annualized except for non-recurring costs such as offering costs. |
| (d) | Represents expenses excluded from reimbursement by the Adviser, as defined in the Expense Limitation and Reimbursement Agreement. See Note 3. |
| (e) | Percentage represents the results for the period and is not annualized. |
See Notes to Financial Statements.
Blackstone / GSO Floating Rate
Enhanced Income Fund | Notes to Financial Statements |
March 31, 2019 (Unaudited)
NOTE 1. ORGANIZATION
Blackstone / GSO Floating Rate Enhanced Income Fund (the “Fund”) is registered under the Investment Company Act of 1940 (the “1940 Act”), as amended, as a non-diversified, closed-end management investment company. The Fund engages in continuous offering of shares and operates as an interval fund that offers to make monthly repurchases of shares at the net asset value (the “NAV”).
The Fund’s investment objective is to provide attractive current income with low sensitivity to rising interest rates.
The Fund was organized as a Delaware statutory trust on June 20, 2017 pursuant to a Declaration of Trust governed by the laws of the State of Delaware. The Fund had no operations from that date to November 10, 2017, other than those related to organizational matters and the registration of its shares under applicable securities laws. GSO / Blackstone Debt Funds Management LLC (the “Adviser”) purchased 4,000 Institutional Class I Common Shares (“Class I Shares”) at a NAV of $25.00 per share on November 10, 2017. The Fund is authorized to issue an unlimited number of Class I Shares, Advisory Class D Common Shares (“Class D Shares”), Brokerage Class T Common Shares (“Class T Shares”) and Brokerage Class T-I Common Shares (“Class T-I Shares”), and a maximum offering of $3,000,000,000 of common shares. Class I Shares commenced operations on January 18, 2018, Class T Shares commenced operations on May 7, 2018 and Class D Shares commenced operations on October 1, 2018. Class T-I Shares had not commenced operations as of March 31, 2019. As of March 31, 2019, Class I Shares (BGFLX), Class T Shares (BGFTX), and Class D Shares (BGFDX) were outstanding.
NOTE 2. SIGNIFICANT ACCOUNTING POLICIES
Basis of Presentation: The Fund's financial statements are prepared in accordance with accounting principles generally accepted in the United States of America (“U.S. GAAP”) and are stated in U.S. dollars. The Fund is considered an Investment Company under U.S. GAAP and follows the accounting and reporting guidance applicable to investment companies in the Financial Accounting Standards Board Accounting Standards Codification Topic 946.
The preparation of financial statements requires management to make certain estimates and assumptions that affect the reported amounts of assets and liabilities at the date of the financial statement. Actual results could differ from these estimates.
Portfolio Valuation: The Fund’s net asset value (“NAV”) is determined daily on each day that the New York Stock Exchange (“Exchange”) is open for business, as of the close of the regular trading session on the Exchange. The Fund calculates NAV per share by subtracting liabilities (including accrued expenses or dividends) from the total assets of the Fund (the value of the securities plus cash or other assets, including interest accrued but not yet received) and dividing the result by the total number of outstanding common shares of the Fund.
Loans are primarily valued by using a composite loan price from a nationally recognized loan pricing service. The methodology used by the Fund’s nationally recognized loan pricing provider for composite loan prices is to value loans at the mean of the bid and ask prices from one or more brokers or dealers. Collateralized loan obligation securities (“CLOs”) are valued at the price provided by a nationally recognized pricing service. The prices provided by the nationally recognized pricing service are typically based on the evaluated mid-price of each of the CLOs. Corporate bonds and convertible bonds, other than short-term investments, are valued at the price provided by a nationally recognized pricing service. The prices provided by the nationally recognized pricing service are typically based on the mean of bid and ask prices for each corporate bond security. In determining the value of a particular investment, pricing services may use certain information with respect to transactions in such investments, quotations from dealers, pricing matrices, market transactions in comparable investments, various relationships observed in the market between investments and calculated yield measures based on valuation technology commonly employed in the market for such investments. Equity securities for which market quotations are available are generally valued at the last sale price or official closing price on the primary market or exchange on which they trade. Futures contracts, if any, are ordinarily valued at the last sales price on the securities or commodities exchange on which they are traded. Written and purchased options, if any, are ordinarily valued at the closing price on the securities or commodities exchange on which they are traded. Short-term debt investments, if any, having a remaining maturity of 60 days or less when purchased would be valued at cost adjusted for amortization of premiums and accretion of discounts. Any investments and other assets for which such current market quotations are not readily available are valued at fair value (“Fair Valued Assets”) as determined in good faith by a committee of the Adviser (“Fair Valued Asset Committee”) under procedures established by, and under the general supervision and responsibility of, the Fund’s Boards of Trustees. Such methods may include, but are not limited to, the use of a market comparable and/or income approach methodologies. A Fair Valued Asset Committee meeting may be called at any time by any member of the Fair Valued Asset Committee. The pricing of all Fair Valued Assets and determinations thereof shall be reported by the Fair Valued Asset Committee to the Board at each regularly scheduled quarterly meeting. The Fund has procedures to identify and investigate potentially stale prices for investments which are valued using a nationally recognized pricing service, exchange price or broker-dealer quotations. After performing such procedures, any prices which are deemed to be stale are reviewed by the Fair Valued Asset Committee and an alternative pricing source is determined.
Various inputs are used to determine the value of the Fund’s investments. Observable inputs are inputs that reflect the assumptions market participants would use in pricing the asset or liability developed based on market data obtained from sources independent of the reporting entity. Unobservable inputs are inputs that reflect the reporting entity’s own assumptions about the assumptions market participants would use in pricing the asset or liability developed based on the best information available in the circumstances. The three-tier hierarchy of inputs is summarized in the three broad levels listed below.
| Semi-Annual Report | March 31, 2019 | 25 |
Blackstone / GSO Floating Rate
Enhanced Income Fund | Notes to Financial Statements |
March 31, 2019 (Unaudited)
Level 1— Unadjusted quoted prices in active markets for identical investments at the measurement date.
Level 2— Significant observable inputs (including quoted prices for similar investments, interest rates, prepayment speeds, credit risk, etc.).
Level 3— Significant unobservable inputs (including the Fund’s own assumptions in determining the fair value of investments).
The categorization of investments and other financial instruments is based on the pricing transparency of the investment and other financial instrument and does not necessarily correspond to the Fund’s perceived risk of investing in those securities. Investments measured and reported at fair value are classified and disclosed in one of the following levels within the fair value hierarchy based on the lowest level of input that is significant to the fair value measurement.
The following tables summarize valuation of the Fund’s investments under the fair value hierarchy levels as of March 31, 2019:
Blackstone / GSO Floating Rate Enhanced Income Fund
| Investments in Securities at Value* | | Level 1 - Quoted Prices | | | Level 2 - Significant
Observable Inputs | | | Level 3 - Significant
Unobservable Inputs | | | Total | |
| Floating Rate Loan Interests | | | | | | | | | | | | | | | | |
| Air Transport | | $ | – | | | $ | 3,280,499 | | | $ | 711,803 | | | $ | 3,992,302 | |
| Building & Development | | | – | | | | 18,012,583 | | | | 1,723,778 | | | | 19,736,361 | |
| Business Equipment & Services | | | – | | | | 56,928,212 | | | | 11,293,483 | | | | 68,221,695 | |
| Chemical & Plastics | | | – | | | | 7,333,721 | | | | 987,537 | | | | 8,321,258 | |
| Containers & Glass Products | | | – | | | | 19,394,439 | | | | 1,188,120 | | | | 20,582,559 | |
| Ecological Services & Equipment | | | – | | | | 7,027,300 | | | | 2,698,628 | | | | 9,725,928 | |
| Electronics/Electrical | | | – | | | | 61,610,948 | | | | 7,166,185 | | | | 68,777,133 | |
| Food Service | | | – | | | | 11,568,468 | | | | 1,428,026 | | | | 12,996,494 | |
| Healthcare | | | – | | | | 75,855,840 | | | | 11,246,851 | | | | 87,102,691 | |
| Leisure Goods/Activities/Movies | | | – | | | | 12,407,008 | | | | 1,950,000 | | | | 14,357,008 | |
| Oil & Gas | | | – | | | | 3,924,602 | | | | 3,277,471 | | | | 7,202,073 | |
| Other | | | – | | | | 173,905,632 | | | | – | | | | 173,905,632 | |
| Collateralized Loan Obligation Securities | | | | | | | | | | | | | | | | |
| Structured Finance Obligations | | | – | | | | – | | | | 18,700,263 | | | | 18,700,263 | |
| Corporate Bonds | | | – | | | | 26,176,255 | | | | – | | | | 26,176,255 | |
| Exchange Traded Funds | | | 7,560,259 | | | | – | | | | – | | | | 7,560,259 | |
| Short Term Investments | | | 14,405,215 | | | | – | | | | – | | | | 14,405,215 | |
| Total | | | 21,965,474 | | | | 477,425,507 | | | | 62,372,145 | | | | 561,763,126 | |
| * | Refer to the Fund's Portfolio of Investments for a listing of securities by type. |
The changes of the fair value of investments for which the Fund has used Level 3 inputs to determine the fair value are as follows:
| Blackstone / GSO Floating Rate Enhanced Income Fund | | Floating Rate Loan Interests | | | Collateralized Loan
Obligation Securities | | | Total | |
| Balance as of September 30, 2018 | | $ | 26,450,492 | | | $ | 13,399,115 | | | $ | 39,849,607 | |
| Accrued discount/ premium | | | (4,371 | ) | | | 2,183 | | | | (2,188 | ) |
| Realized Gain/(Loss) | | | (13,192 | ) | | | (135,841 | ) | | | (149,033 | ) |
| Change in Unrealized Appreciation/(Depreciation) | | | (391,890 | ) | | | (527,931 | ) | | | (919,821 | ) |
| Purchases | | | 15,270,834 | | | | 7,867,150 | | | | 23,137,984 | |
| Sales Proceeds | | | (1,615,725 | ) | | | (1,904,413 | ) | | | (3,520,138 | ) |
| Transfer into Level 3 | | | 21,904,591 | | | | – | | | | 21,904,591 | |
| Transfer out of Level 3 | | | (17,928,857 | ) | | | – | | | | (17,928,857 | ) |
| Balance as of March 31, 2019 | | $ | 43,671,882 | | | $ | 18,700,263 | | | $ | 62,372,145 | |
| Net change in unrealized appreciation/(depreciation) included in the Statements of Operations attributable to Level 3 investments held at March 31, 2019 | | $ | (567,880 | ) | | $ | (548,446 | ) | | $ | (1,116,326 | ) |
Blackstone / GSO Floating Rate
Enhanced Income Fund | Notes to Financial Statements |
March 31, 2019 (Unaudited)
Information about Level 3 fair value measurements as of March 31, 2019:
| | | Fair Value | | | Valuation Technique(s) | | Unobservable Input(s) | | Value/Range (Weighted Average) | |
| Floating Rate Loan Interests | | $ | 43,671,882 | | | Third-party vendor pricing service | | Broker quotes | | N/A | |
| Collateralized Loan Obligation Securities | | $ | 18,700,263 | | | Third-party vendor pricing service | | Broker quotes | | N/A | |
Securities Transactions and Investment Income: Securities transactions are recorded on trade date for financial reporting purposes and amounts payable or receivable for trades not settled at the time of year end are reflected as liabilities and assets, respectively. Interest income, including accretion of discount and amortization of premium, is recorded on the accrual basis. Realized gains and losses from securities transactions and foreign currency transactions, if any, are recorded on the basis of identified cost and stated separately in the Statement of Operations.
Federal Income Taxes: The Fund intends to continue to qualify as a regulated investment company under Subchapter M of the Internal Revenue Code (the “Code”) and distribute all of its taxable income and net realized gains, if any, to shareholders. Accordingly, no provision for Federal income taxes has been made.
Income distributions and capital gain distributions are determined in accordance with income tax regulations, which may differ from GAAP. These differences are primarily due to differing treatments of income and gains on various investment securities held by the Fund, timing differences and differing characterization of distributions made by the Fund as a whole.
As of and during the period ended March 31, 2019, the Fund did not have a liability for any unrecognized tax benefits. The Fund files U.S. federal, state, and local tax returns as required. The Fund’s tax returns are subject to examination by the relevant tax authorities until expiration of the applicable statute of limitations which is generally three years after the filing of the tax return for federal purposes and four years for most state returns.
Distributions to Shareholders: The Fund intends to distribute substantially all of its net investment income to shareholders in the form of dividends. The Fund declares income dividends daily and distributes them monthly. In addition, the Fund intends to distribute any net capital gains it earns from the sale of portfolio securities to shareholders no less frequently than annually. Net short-term capital gains may be paid more frequently.
Offering Costs: Offering costs incurred by the Fund of $1,301,645 were treated as deferred charges until operations commenced and were amortized over a 12-month period using the straight line method. During the six month period ended March 31, 2019, $392,277 in offering costs were amortized.
NOTE 3. FEES AND EXPENSES
Investment Advisory
The Adviser, a wholly-owned subsidiary of GSO Capital Partners LP (collectively with its affiliates in the credit-focused business of The Blackstone Group L.P., “GSO”), is a registered investment adviser and is responsible for the day-to-day management of, and provides administrative and compliance oversight services to, the Fund.
Management Fees
The investment advisory agreement between the Fund and the Adviser provides for the Fund to pay a management fee to the Adviser at an annual rate equal to 1.00% of the average daily value of the Fund’s net assets (the “Management Fee”). The Adviser voluntarily agreed to temporarily reduce its Management Fee to an annual rate of 0.30% of the average daily value of the Fund’s net assets from October 1, 2018 until October 23, 2018. On October 24, 2018, the Adviser amended such Management Fee reduction to voluntarily and temporarily reduce its Management Fee to an annual rate equal to 0.40% of the average daily value of the Fund’s net assets effective from October 24, 2018 until December 31, 2018. On November 30, 2018, the Adviser further amended such Management Fee reduction to voluntarily and temporarily reduce its Management Fee to an annual rate equal to 0.50% of the average daily value of the Fund’s net assets effective from November 30, 2018 until December 31, 2018. On December 26, 2018, the Adviser further amended such Management Fee reduction to voluntarily and temporarily reduce its Management Fee to an annual rate equal to 0.60% of the average daily value of the Fund’s net assets effective from December 26, 2018 until January 31, 2019. On January 30, 2019, the Adviser voluntarily agreed to temporarily reduce its Management Fee to an annual rate equal to 0.80% of the average daily value of the Fund’s net assets effective from February 1, 2019 until February 28, 2019 and to an annual rate of 0.90% of the average daily value of the Fund’s net assets effective from March 1, 2019 until March 31, 2019. All voluntarily waived management fees are permanently waived and not recoupable by the Adviser. During the six months ended March 31, 2019, the Adviser voluntarily waived $715,784 of management fees, of which $417,586 were waived for Class I, $298,075 were waived for Class T, and $123 were waived for Class D.
| Semi-Annual Report | March 31, 2019 | 27 |
Blackstone / GSO Floating Rate
Enhanced Income Fund | Notes to Financial Statements |
March 31, 2019 (Unaudited)
Expense Limitation and Reimbursement
Pursuant to an Expense Limitation and Reimbursement Agreement, through September 27, 2020, the Adviser will waive its compensation (and, to the extent necessary, bear other expenses of or make payments to the Fund) so that certain of the Fund’s expenses (“Specified Expenses”) will not exceed 0.35% of net assets (annualized). The Fund has agreed to repay these amounts, when and if requested by the Adviser, but only if and to the extent that Specified Expenses are less than 0.35% of net assets (annualized) (or, if a lower expense limit is then in effect, such lower limit) within the three-year period after the Adviser bears the expense; provided, however, that the Adviser may recapture a Specified Expense in the same year it is incurred. “Specified Expenses” is defined to include all expenses incurred in the business of the Fund, including organizational and certain offering costs, with the exception of (i) the management fee, (ii) the service fee, (iii) the distribution fee, (iv) brokerage costs, (v) dividend/interest payments (including any dividend payments, interest expenses, commitment fees, or other expenses related to any leverage incurred by the Fund), (vi) taxes, and (vii) extraordinary expenses (as determined in the sole discretion of the Adviser). Pursuant to the Expense Limitation and Reimbursement Agreement, the Adviser reimbursed $720,641 in fees and expenses during the six months ended March 31, 2019.
As of March 31, 2019, the repayments that potentially may be made by the Fund are as follows:
| | | Expenses reimbursed on
November, 2017(1) | | | Expenses reimbursed in period ending September 30, 2018 | | | Expenses reimbursed in period ending March 31, 2019 | |
| Class | | Subject to repayment until expiration date of
November, 2020(1) | | | Subject to repayment until maximum expiration date of September 30, 2021 | | | Subject to repayment until maximum expiration date of March 31, 2022 | |
| Class I | | $ | 897,049 | | | $ | 1,442,711 | | | $ | 401,830 | |
| Class T | | | ─ | | | $ | 397,972 | | | | 318,689 | |
| Class D | | | ─ | | | | ─ | | | | 122 | |
| (1) | Class I commenced operations on January 18, 2018. Amount reflects remaining repayment related to reimbursement of organization expenses incurred as of November 10, 2017. |
Officer and Trustee Compensation
In 2018, the Fund and the Blackstone / GSO Senior Floating Rate Fund, the Blackstone / GSO Long-Short Credit Income Fund and the Blackstone / GSO Strategic Credit Fund (the “Funds”) paid every Trustee who is not a director, officer, employee, or affiliate of GSO or ALPS, a retainer fee of $120,000 per annum. Effective January 1, 2019, the Funds will pay a retainer fee of $130,000 per annum. The Chairman of the Audit Committee and the Chairman of the Nominating and Governance Committee also will receive a retainer fee of $10,000 per annum from the Funds. The Lead Independent Trustee will also receive a retainer fee of $14,000 per annum from the Funds.
Distribution and Servicing Fees
Blackstone Advisory Partners L.P. (the “Distributor”), an affiliate of the Fund and of the Adviser, serves as the principal underwriter and distributor in the continuous public offering of the Fund’s Class I Shares, Class D Shares and Class T Shares pursuant to a distribution agreement (“Distribution Agreement”) with the Fund, which is subject to annual approval by the Board. The Fund pays the Distributor a Service Fee that is calculated monthly and accrued daily at an annualized rate of 0.25% of the net assets of the Fund attributable to Class T Shares and Class D Shares, respectively. The Fund pays the Distributor a Distribution Fee that is calculated monthly and accrued daily at an annualized rate of 0.25% of the net assets of the Fund attributable to Class T Shares. For the period ended March 31, 2019, Class T and Class D incurred servicing fees of $178,318 and $62, respectively, and Class T incurred distribution fees of $178,318. Class I Shares do not incur a Service Fee or a Distribution Fee.
Other Agreements
ALPS Fund Services, Inc. (“ALPS”) serves as administrator to the Fund. Under the administration agreement, ALPS is responsible for calculating the net asset value of the common shares and generally managing the administrative affairs of the Fund.
The Bank of New York Mellon serves as the Fund’s primary custodian. UMB Bank, N.A. serves as the Fund’s custodian for purposes of processing investor subscriptions and repurchases.
DST Systems Inc. serves as transfer, dividend paying and shareholder servicing agent for the Fund (the “Transfer Agent”).
ALPS, The Bank of New York Mellon, UMB Bank, N.A. and DST Systems Inc., are not considered affiliates of the Fund as defined under the 1940 Act.
Blackstone / GSO Floating Rate
Enhanced Income Fund | Notes to Financial Statements |
March 31, 2019 (Unaudited)
NOTE 4. SECURITIES TRANSACTIONS
Investment transactions for the period ended March 31, 2019, excluding temporary short-term investments, were as follows:
| Fund | | Cost of Investments
Purchased | | | Proceeds from
Investments Sold | |
| Blackstone / GSO Floating Rate Enhanced Income Fund | | $ | 240,515,312 | | | $ | 138,991,519 | |
NOTE 5. RELATED PARTY TRANSACTIONS
The Adviser and the Distributor are related parties of the Fund. Fees payable to related parties are disclosed in Note 3 and accrued amounts are disclosed in the Statement of Operations.
Blackstone Holdings Finance Co. L.L.C (“FINCO”), an affiliate of the investment adviser, pays expenses on behalf of the Fund from time to time. The Fund reimburses FINCO for such expenses paid on behalf of the Fund. FINCO does not charge any fees for providing such services. The amount of $185,151 as of period ended March 31, 2019, is recorded as other payables and accrued expenses to the Fund’s Statement of Assets and Liabilities.
As of March 31, 2019 the Fund had invested in SPDR Blackstone / GSO Senior Loan ETF (“SRLN”), which is sub-advised by the Adviser. The percentage of the Fund’s net assets invested in SRLN was 2.06%. As a shareholder in an investment company, the Fund will bear its ratable share of that investment company’s expenses and would remain subject to payment of the Fund’s management fees (except with respect to investments in affiliated investment companies) and other expenses with respect to assets so invested. Common shareholders would therefore be subject to duplicative expenses to the extent the Fund invests in other non-affiliated investment companies. The Fund does not charge management fees with respect to its investments in SRLN.
During the period ended March 31, 2019, the Fund did not engage in cross trades with an affiliate pursuant to Rule 17a-7.
NOTE 6. LOANS AND OTHER INVESTMENTS
Under normal market conditions, the Fund will invest at least 80% of its Managed Assets in floating rate loans, notes, or bonds. “Managed Assets” means net assets plus the amount of any borrowings and the liquidation preference of any preferred shares that may be outstanding. Under current market conditions, the Fund anticipates that its portfolio of floating rate instruments will primarily consist of floating rate loans (“Loans”). Loans are made to U.S. and non-U.S. corporations, partnerships and other business entities (“Borrowers”) that operate in various industries and geographical regions. At March 31, 2019, 92.37% of the Fund’s Managed Assets were held in floating rate loan interests.
Loans hold a senior position in the capital structure of a business entity, are secured with specific collateral and have a claim on the assets and/or stock of the Borrower that is senior to that held by unsecured creditors, subordinated debt holders and stockholders of the Borrower.
Loans often require prepayments from Borrowers’ excess cash flows or permit the Borrowers to repay at their election. The degree to which Borrowers repay, whether as a contractual requirement or at their election, cannot be predicted with accuracy. As a result, the actual remaining maturity may be substantially less than the stated maturities shown. However, floating rate loans typically have an expected average life of two to four years. Floating rate loans typically have rates of interest which are re-determined periodically, either daily, monthly, quarterly or semi-annually by reference to a floating base lending rate, primarily the London Interbank Offered Rate (“LIBOR”), plus a premium or credit spread.
Loans are subject to the risk of payment defaults of scheduled interest or principal. Such non-payment could result in a reduction of income, a reduction in the value of the investment and a potential decrease in the NAV of the Fund. Risk of loss of income is generally higher for subordinated unsecured loans or debt, which are not backed by a security interest in any specific collateral. There can be no assurance that the liquidation of any collateral securing a Loan would satisfy the Borrower’s obligation to the Fund in the event of non-payment of scheduled interest or principal payments, or that such collateral could be readily liquidated.
Second lien loans generally are subject to similar risks as those associated with investments in first lien loans except that such loans are subordinated in payment and/or lower in lien priority to first lien holders. In the event of default on a second lien loan, the first priority lien holder has first claim to the underlying collateral of the loan. Second lien loans are subject to the additional risk that the cash flow of the Borrower and property securing the loan or debt, if any, may be insufficient to meet scheduled payments after giving effect to the senior obligations of the Borrower. At March 31, 2019, the Fund had invested $37,215,413 in second lien secured loans.
Loans can be rated below investment grade or may also be unrated. As a result, the risks associated with Loans may be similar to the risks of other below investment grade securities, although they are senior and secured in contrast to other below investment grade securities, which are often subordinated or unsecured. The Fund typically invests in Loans rated below investment grade, which are considered speculative because of the credit risk of the Borrowers. Such companies are more likely than investment grade issuers to default on their payments of interest and principal owed to the Fund, and such defaults could reduce NAV and income distributions. The amount of public information available with respect to below investment grade loans will generally be less extensive than that available for registered or exchange-listed securities. In evaluating the creditworthiness of Borrowers, the Adviser will consider, and may rely in part, on analyses performed by others. The Adviser’s established best execution procedures and guidelines require trades to be placed for execution only with broker-dealer counterparties approved by a committee of the Adviser. The factors considered by such committee when selecting and approving brokers and dealers include, but are not limited to: (i) quality, accuracy, and timeliness of execution, (ii) review of the reputation, financial strength and stability of the financial institution, (iii) willingness and ability of the counterparty to commit capital, (iv) ongoing reliability and (v) access to underwritten offerings and secondary markets. The committee regularly reviews each broker-dealer counterparty based on the foregoing factors.
| Semi-Annual Report | March 31, 2019 | 29 |
Blackstone / GSO Floating Rate
Enhanced Income Fund | Notes to Financial Statements |
March 31, 2019 (Unaudited)
The Fund may acquire Loans through assignments or participations. The Fund typically acquires these Loans through assignment, and if the Fund acquires a Loan through participation, it will seek to elevate a participation interest into an assignment as soon as practicably possible. The purchaser of an assignment typically succeeds to all the rights and obligations of the assigning institution and becomes a lender under the credit agreement with respect to the debt obligation. A participation typically results in a contractual relationship only with the institution participating out the interest, not with the Borrower. Sellers of participations typically include banks, broker-dealers, other financial institutions and lending institutions. The Adviser has adopted best execution procedures and guidelines to mitigate credit and counterparty risk in the atypical situation when the Fund must acquire a Loan through participation.
The Fund invests in CLOs. A CLO security is a financing company (generally called a special purpose vehicle (“SPV”)), created to reapportion the risk and return characteristics of a pool of assets. While the assets underlying CLO securities are typically secured Loans, the assets may also include (i) unsecured loans, (ii) debt securities that are rated below investment grade, and (iii) equity securities incidental to investments in secured Loans. When investing in CLO securities, the Fund will not invest in equity tranches, which are the lowest tranche. However, the Fund may invest in lower tranches of CLO securities, which typically experience a lower recovery, greater risk of loss or deferral or non-payment of interest than more senior tranches of the CLO. In addition, the Fund intends to invest in CLO securities consisting primarily of individual secured Loans of Borrowers and not repackaged CLO securities from other high risk pools. The underlying secured Loans purchased by CLOs are generally performing at the time of purchase but may become non-performing, distressed or defaulted. CLOs with underlying assets of non-performing, distressed or defaulted loans are not contemplated to comprise a significant portion of the Fund’s investments in CLOs. The key feature of the CLO structure is the prioritization of the cash flows from a pool of debt securities among the several classes of the CLO. The SPV is a company founded solely for the purpose of securitizing payment claims arising out of this diversified asset pool. On this basis, marketable securities are issued by the SPV which, due to the diversification of the underlying risk, generally represent a lower level of risk than the original assets. The redemption of the securities issued by the SPV typically takes place on a date earlier then legal maturity from a refinancing of the senior debt tranches of the secured loans.
The Fund may invest up to 20% of its Managed Assets in securities of other open- or closed-end investment companies, including exchange-traded funds (“ETFs”), net of other permissible investments in this 20% basket, to the extent that such investments are permissible under the 1940 Act, including interpretations or modifications by the Securities and Exchange Commission (“SEC”). ETFs are pooled investment vehicles that are often designed to provide investment results corresponding to an index. These indexes may be either broad-based, sector or international. ETFs usually are units of beneficial interest in an investment trust or represent undivided ownership interests in a portfolio of securities (or commodities), in each case with respect to a portfolio of all or substantially all of the component securities of, and in substantially the same weighting as, the relevant benchmark index. ETFs are listed on an exchange and trade in the secondary market on a per-share basis. The Fund may invest in other investment companies to gain broad market or sector exposure, including during periods when it has large amounts of uninvested cash (such as the period shortly after the Fund receives the proceeds of the offering of its common shares), or when the Adviser believes share prices of other investment companies offer attractive values or as part of the Adviser’s liquidity management for purposes of meeting repurchase requests. The Fund may invest in investment companies that are advised or sub-advised by the Adviser or its affiliates to the extent permitted by applicable law and/or pursuant to exemptive relief from the SEC. As a shareholder in an investment company, the Fund will bear its ratable share of that investment company’s expenses and would remain subject to payment of the Fund’s management fees (except with respect to investments in affiliated investment companies) and other expenses with respect to assets so invested. Common shareholders would therefore be subject to duplicative expenses to the extent the Fund invests in other investment companies.
NOTE 7. LEVERAGE
The Fund entered into a Credit Agreement (the "Agreement") with a syndicate of lenders party thereto to borrow money pursuant to a one-year revolving line of credit ("Leverage Facility") dated January 18, 2018, as amended on June 22, 2018, and as further amended on August 16, 2018 and as amended and restated on October 23, 2018 and as further amended and restated on December 28, 2018 to borrow up to an aggregate limit of $225,000,000 under two loan tranches, Tranche A and Tranche B. The Tranche A commitment allows for borrowings up to $200,000,000. The Tranche B commitment allows for borrowings up to $25,000,000 and has a swing line sub facility equal to the aggregate amount of the commitments under Tranche B (currently $25,000,000). Borrowings under the Agreement are secured by the assets of the Fund. Interest is charged at a rate of (a) 0.85% above LIBOR for each Tranche A loan, with LIBOR measured for the period commencing on the date of the making of such LIBOR loan (or the last date upon which any other loan was converted to, or continued as, such LIBOR loan) and ending on the numerically corresponding day in the calendar month that is one (1), three (3), six (6) or nine (9) months thereafter, as the Fund may elect, or such other periods as the lender may agree in its sole and absolute discretion and (b) 0.90% above LIBOR with respect to each Tranche B Loan and each Swing Line Loan with, LIBOR measured for the period commencing on the date of the making of such LIBOR loan (or the last date upon which any other loan was converted to, or continued as, such LIBOR loan) and ending on the numerically corresponding day in the calendar month that is one (1) month thereafter. Under the terms of the Agreement, the Fund must pay a commitment fee on any undrawn amounts. The commitment fee payable is (a) 0.25%, subject to a stepdown to 0.15% depending on utilization, on the undrawn amounts for Tranche A loans and (b) 0.15% for Tranche B loans. Interest and fees are payable quarterly. The Fund may elect to extend the Agreement for a further period with the consent of the lending bank. At March 31, 2019, the Fund had borrowings outstanding under its Leverage Facility of $169,000,000, at an interest rate of 3.37%. Due to the short term nature of the Agreement, face value approximates fair value at March 31, 2019. For the days leverage was drawn during the period ended March 31, 2019, the average borrowings under the Fund’s Leverage Facility and the average interest rate was $155,813,187 and 3.26%, respectively.
Blackstone / GSO Floating Rate
Enhanced Income Fund | Notes to Financial Statements |
March 31, 2019 (Unaudited)
Under the Agreement, the Fund has agreed to certain covenants and additional investment limitations while the leverage is outstanding. The Fund agreed to maintain asset coverage of three times over borrowings. Compliance with the investment restrictions and calculations are performed by the Fund's custodian, The Bank of New York Mellon.
The use of borrowings to leverage the common shares of the Fund can create risks. Changes in the value of the Fund's portfolio, including securities bought with the proceeds of leverage, are borne entirely by the holders of common shares of the Fund. All costs and expenses related to any form of leverage used by the Fund are borne entirely by common shareholders. If there is a net decrease or increase in the value of the Fund's investment portfolio, the leverage may decrease or increase, as the case may be, the NAV per common share to a greater extent than if the Fund did not utilize leverage.
NOTE 8. REPURCHASE OFFERS
The Board has adopted a repurchase offer fundamental policy setting forth that the Fund will conduct monthly repurchase offers. This fundamental policy may be changed only with the approval of a majority of the outstanding voting securities of the Fund. The Fund is required to offer to repurchase at least 5% of its outstanding common shares with each repurchase offer and, under normal market conditions, the Board expects to authorize a 5% offer (“Repurchase Offer”) each month. The Fund may not offer to repurchase less than 5% nor more than 25% of its outstanding common shares during any three month period.
The time and dates by which Repurchase Offers must be accepted (“Repurchase Request Deadline”) are 4:00 p.m. Eastern time on the eighth business day of each month. The repurchase price will be the Fund’s NAV determined on the repurchase pricing date, which will be a date not more than 14 calendar days following the Repurchase Request Deadline (“Repurchase Offer Amount”). Payment for all common shares repurchased pursuant to these offers will be made not later than 7 calendar days after the repurchase pricing date. Under normal circumstances, it is expected that the Repurchase Request Deadline will be the same date as the repurchase pricing date. Payment for common shares tendered will normally be made by the fourth business day (but in any case no later than the seventh calendar day) following the repurchase pricing date and, in every case, at least five business days before sending notification of the next monthly Repurchase Offer. If the tendered shares have been purchased immediately prior to the tender, the Fund will not release repurchase proceeds until payment for the tendered shares has settled.
The Fund may impose redemption fees of up to 2.00% on shares accepted for repurchase that have been held for less than one year. The Fund has elected not to impose the redemption fee on repurchases of common shares acquired through the reinvestment of dividends and distributions or submitted pursuant to an auto-rebalancing mechanism of a shareholder account.
During the six months ended March 31, 2019, the Fund completed 6 monthly repurchase offers. In these offers, the Fund offered to repurchase no less than 5% of the number of its outstanding shares as of the Repurchase Pricing Dates. No repurchase offer was oversubscribed. The result of the repurchase offers were as follows:
| Repurchase Offer | | Commencement Date | | Repurchase Request Deadline | | Repurchase Pricing Date | | Amount Repurchased | | | Shares Repurchased | |
| October | | October 1, 2018 | | October 10, 2018 | | October 10, 2018 | | $ | 276,720 | | | | 11,104 | |
| November | | November 1, 2018 | | November 12, 2018 | | November 12, 2018 | | | 127,686 | | | | 5,148 | |
| December | | December 3, 2018 | | December 12, 2018 | | December 12, 2018 | | | 632,116 | | | | 26,293 | |
| January | | January 2, 2019 | | January 11, 2019 | | January 11, 2019 | | | 707,690 | | | | 29,403 | |
| February | | February 1, 2019 | | February 12, 2019 | | February 12, 2019 | | | 5,095,389 | | | | 211,340 | |
| March | | March 1, 2019 | | March 12, 2019 | | March 12, 2019 | | | 2,571,393 | | | | 105,692 | |
| Semi-Annual Report | March 31, 2019 | 31 |
Blackstone / GSO Floating Rate
Enhanced Income Fund | Notes to Financial Statements |
March 31, 2019 (Unaudited)
NOTE 9. PRINCIPAL RISKS
In the normal course of business, the Fund invests in financial instruments and enters into financial transactions where risk of potential loss exists due to such things as changes in the market (market risk) or failure or inability of the other party to a transaction to perform (credit and counterparty risk). See below for a detailed description of select principal risks. For a more comprehensive list of potential risks the Fund may be subject to, please refer to the Fund’s Prospectus and Statement of Additional Information (“SAI”).
Limited Operating History: The Fund is a non-diversified, closed-end management investment company with a limited operating history. As a result, prospective investors have a limited track record or history on which to base their investment decision. The Adviser acts as an investment adviser for CLO vehicles, separately managed accounts, listed investment companies (including closed-end funds and an ETF) and other investment vehicles.
Investment and Market Risk: The Fund is subject to investment risk, including the possible loss of the entire principal amount invested. An investment in the Fund’s Common Shares represents an indirect investment in the portfolio of floating rate instruments, other securities and derivative investments owned by the Fund, and the value of these investments may fluctuate, sometimes rapidly and unpredictably. At any point in time an investment in the Fund’s Common Shares may be worth less than the original amount invested, even after taking into account distributions paid by the Fund and the ability of shareholders to reinvest dividends. The Fund may also use leverage, which would magnify the Fund’s investment, market and certain other risks.
Repurchase Offers Risk:An investment in the Fund is suitable only for long-term investors who can bear the risks associated with the limited liquidity of the Common Shares. The Fund is an “interval fund” and, in order to provide liquidity to shareholders, the Fund, subject to applicable law, will conduct repurchase offers of the Fund’s outstanding Common Shares at NAV, subject to approval of the Board. The Fund believes that these repurchase offers are generally beneficial to the Fund’s shareholders, and repurchases generally will be funded from available cash, cash from the sale of Common Shares or sales of portfolio securities. However, repurchase offers and the need to fund repurchase obligations may affect the ability of the Fund to be fully invested or force the Fund to maintain a higher percentage of its assets in liquid investments, which may harm the Fund’s investment performance. Moreover, diminution in the size of the Fund through repurchases may result in untimely sales of portfolio securities (with associated imputed transaction costs, which may be significant), and may limit the ability of the Fund to participate in new investment opportunities or to achieve its investment objective. The Fund may accumulate cash by holding back (i.e., not reinvesting) payments received in connection with the Fund’s investments and cash from the sale of Common Shares. The Fund believes that it can meet the maximum potential amount of the Fund’s repurchase obligations. If at any time cash and other liquid assets held by the Fund are not sufficient to meet the Fund’s repurchase obligations, the Fund intends, if necessary, to sell investments. In addition, if the Fund borrows to finance repurchases, interest on that borrowing will negatively affect Common Shareholders who do not tender their Common Shares by increasing the Fund’s expenses and reducing any net investment income.
Loans Risk: Under normal market conditions, the Fund will invest primarily in Loans. The Loans that the Fund may invest in include Loans that are first lien, second lien, third lien or that are unsecured. In addition, the Loans the Fund will invest in will usually be rated below investment grade or may also be unrated. Loans are subject to a number of risks described elsewhere in this Prospectus, including credit risk, liquidity risk, below investment grade instruments risk and management risk.
Although certain Loans in which the Fund may invest will be secured by collateral, there can be no assurance that such collateral could be readily liquidated or that the liquidation of such collateral would satisfy the Borrower’s obligation in the event of non-payment of scheduled interest or principal. In the event of the bankruptcy or insolvency of a Borrower, the Fund could experience delays or limitations with respect to its ability to realize the benefits of the collateral securing a Loan. In the event of a decline in the value of the already pledged collateral, if the terms of a Loan do not require the Borrower to pledge additional collateral, the Fund will be exposed to the risk that the value of the collateral will not at all times equal or exceed the amount of the Borrower’s obligations under the Loans. To the extent that a Loan is collateralized by stock in the Borrower or its subsidiaries, such stock may lose some or all of its value in the event of the bankruptcy or insolvency of the Borrower. Those Loans that are under-collateralized involve a greater risk of loss.
In general, the secondary trading market for Loans is not fully-developed. No active trading market may exist for certain Loans, which may make it difficult to value them. Illiquidity and adverse market conditions may mean that the Fund may not be able to sell certain Loans quickly or at a fair price. To the extent that a secondary market does exist for certain Loans, the market for them may be subject to irregular trading activity, wide bid/ask spreads and extended trade settlement periods.
Below Investment Grade, or High Yield, Instruments Risk: The Fund anticipates that it may invest substantially all of its assets in instruments that are rated below investment grade. Below investment grade instruments are commonly referred to as “junk” or high-yield instruments and are regarded as predominantly speculative with respect to the issuer’s capacity to pay interest and repay principal. Lower grade instruments may be particularly susceptible to economic downturns, which could adversely affect the ability of the issuers of such instruments to repay principal and pay interest thereon, increase the incidence of default for such instruments and severely disrupt the market value of such instruments.
Blackstone / GSO Floating Rate
Enhanced Income Fund | Notes to Financial Statements |
March 31, 2019 (Unaudited)
Valuation Risk: The Fund’s investments generally trade on an “over-the-counter” market which may be anywhere in the world where the buyer and seller can settle on a price. Due to the lack of centralized information and trading, the valuation of floating rate instruments may carry more risk than that of common stock. Uncertainties in the conditions of the financial market, unreliable reference data, lack of transparency and inconsistency of valuation models and processes may lead to inaccurate asset pricing. In addition, other market participants may value securities differently than the Fund. As a result, the Fund may be subject to the risk that when an instrument is sold in the market, the amount received by the Fund is less than the value of such floating rate instruments carried on the Fund’s books.
Liquidity Risk: To the extent consistent with the applicable liquidity requirements for interval funds under Rule 23c-3 of the 1940 Act, the Fund may invest up to 20% of its Managed Assets in securities that, at the time of investment, are illiquid (determined using the SEC’s standard applicable to registered investment companies,i.e., securities that cannot be disposed of by the Fund within seven days in the ordinary course of business at approximately the amount at which the Fund has valued the securities). However, securities that cannot be disposed of within seven days due solely to applicable laws or the Adviser’s compliance policies and procedures will not be subject to the limitations set forth above. The Fund may also invest in restricted securities. Investments in restricted securities could have the effect of increasing the amount of the Fund’s assets invested in illiquid securities if qualified institutional buyers are unwilling to purchase these securities.
Credit Risk: Credit risk is the risk that one or more Loans or other floating rate instruments in the Fund’s portfolio will decline in price or fail to pay interest or principal when due because the issuer of the instrument experiences a decline in its financial status. While a senior position in the capital structure of a Borrower or issuer may provide some protection with respect to the Fund’s investments in certain Loans, losses may still occur because the market value of Loans is affected by the creditworthiness of Borrowers or issuers and by general economic and specific industry conditions and the Fund’s other investments will often be subordinate to other debt in the issuer’s capital structure. To the extent the Fund invests in below investment grade instruments, it will be exposed to a greater amount of credit risk than a fund that invests in investment grade securities. The prices of lower grade instruments are more sensitive to negative developments, such as a decline in the issuer’s revenues or a general economic downturn, than are the prices of higher grade instruments. Instruments of below investment grade quality are predominantly speculative with respect to the issuer’s capacity to pay interest and repay principal when due and therefore involve a greater risk of default. In addition, the Fund may enter into credit derivatives which may expose it to additional risk in the event that the instruments underlying the derivatives default.
Interest Rate Risk: The fixed-income instruments that the Fund may invest in are subject to the risk that market values of such securities will decline as interest rates increase. These changes in interest rates have a more pronounced effect on securities with longer durations. Typically, the impact of changes in interest rates on the market value of an instrument will be more pronounced for fixed-rate instruments, such as most corporate bonds, than it will for Loans or other floating rate instruments. Fluctuations in the value of portfolio securities will not affect interest income on existing portfolio securities but will be reflected in the Fund’s NAV.
Structured Products Risk: The Fund may invest up to 20% of its Managed Assets in structured products, including CLOs, floating rate mortgagebacked securities and credit linked notes. Holders of structured products bear risks of the underlying investments, index or reference obligation and may be subject to counterparty risk.
CLO Risk: In addition to the general risks associated with debt securities and structured products discussed herein, CLO securities carry additional risks, including, but not limited to (i) the possibility that distributions from collateral securities will not be adequate to make interest or other payments; (ii) the quality of the collateral may decline in value or default; (iii) the possibility that the investments in CLO securities are subordinate to other classes or tranches thereof; (iv) the potential of spread compression in the underlying loans of the CLO securities, which could reduce credit enhancement in the CLO securities; and (v) the complex structure of the security may not be fully understood at the time of investment and may produce disputes with the issuer or unexpected investment results.
Leverage Risk: Under current market conditions, the Fund generally intends to utilize leverage in an amount up to 33 1/3% of the Fund’s total assets principally through Borrowings. In the future, the Fund may elect to utilize leverage in an amount up to 50% of the Fund’s total assets through the issuance of Preferred Shares. Leverage may result in greater volatility of the net asset value and distributions on the Common Shares because changes in the value of the Fund’s portfolio investments, including investments purchased with the proceeds from Borrowings or the issuance of Preferred Shares, if any, are borne entirely by Common Shareholders. Common Share income may fall if the interest rate on Borrowings or the dividend rate on Preferred Shares rises, and may fluctuate as the interest rate on Borrowings or the dividend rate on Preferred Shares varies. In addition, the Fund’s use of leverage will result in increased operating costs. Thus, to the extent that the then-current cost of any leverage, together with other related expenses, approaches the net return on the Fund’s investment portfolio, the benefit of leverage to Common Shareholders will be reduced, and if the then-current cost of any leverage together with related expenses were to exceed the net return on the Fund’s portfolio, the Fund’s leveraged capital structure would result in a lower rate of return to Common Shareholders than if the Fund were not so leveraged. In addition, the costs associated with the Fund’s incursion and maintenance of leverage could increase over time. There can be no assurance that the Fund’s leveraging strategy will be successful.
| Semi-Annual Report | March 31, 2019 | 33 |
Blackstone / GSO Floating Rate
Enhanced Income Fund | Notes to Financial Statements |
March 31, 2019 (Unaudited)
NOTE 10. TAX BASIS INFORMATION
Financial reporting records are adjusted for permanent book/tax differences in order to reflect tax character. For the six month period ended March 31, 2019, the Fund noted no permanent book/tax differences.
Under the Regulated Investment Company Modernization Act of 2010, a fund is permitted to carry forward any new capital losses for an unlimited period. Additionally, such capital losses that are carried forward will retain their character as either short-term or long-term capital losses rather than being considered all short-term under previous law. As of the most recently ended fiscal year, September 30, 2018, the Fund had the following post-effective capital losses with no expiration:
| Fund | | Short Term | | | Long Term | |
| Blackstone / GSO Floating Rate Enhanced Income Fund | | $ | 204,926 | | | $ | – | |
Distributions are determined in accordance with federal income tax regulations, which differ from GAAP, and therefore may differ significantly in amount and/or character from net investment income and realized gains or losses for financial reporting purposes. The tax character of distributions paid by the Fund during the six month period ended March 31, 2019, are as follows:
| | | Blackstone / GSO Floating | |
| 2019 | | Rate Enhanced Income Fund | |
| Distributions Paid From: | | | | |
| Ordinary Income | | $ | 11,574,800 | |
| Total | | $ | 11,574,800 | |
At March 31, 2019, the components of distributable earnings, as calculated on a tax basis using book/tax differences as of the most recently ended fiscal year, September 30, 2018, are as follows:
| | Blackstone / GSO Floating | |
| | Rate Enhanced Income Fund | |
| Undistributed ordinary income | | $ | 78,633 | |
| Accumulated capital losses | | | (1,490,618 | ) |
| Unrealized depreciation | | | (8,287,249 | ) |
| Other Cumulative effect of timing differences | | | (5,625 | ) |
| Total | | $ | (9,704,859 | ) |
The amount of net tax unrealized appreciation/(depreciation) and the tax cost of investments at March 31, 2019, calculated using book/tax differences as of the most recently ended fiscal year, September 30, 2018, are as follows:
| | Blackstone / GSO Floating | |
| | Rate Enhanced Income Fund | |
| Cost of investments for income tax purposes | | $ | 570,050,375 | |
| Gross appreciation (excess of value over tax cost) | | $ | 903,413 | |
| Gross depreciation (excess of tax cost over value) | | | (9,190,662 | ) |
| Net unrealized depreciation | | $ | (8,287,249 | ) |
Blackstone / GSO Floating Rate
Enhanced Income Fund | Notes to Financial Statements |
March 31, 2019 (Unaudited)
NOTE 11. RECENT ACCOUNTING PRONOUNCEMENT
In November 2016, the Financial Accounting Standards Board (“FASB”) issued Accounting Standards Update (“ASU”) No. 2016-18, Statement of Cash Flows (Topic 230) - Restricted Cash. The new guidance is intended to change the presentation of restricted cash on the statement of cash flows. The new standard affects all entities that have restricted cash or restricted cash equivalents and are required to present a statement of cash flows under Topic 230. The new guidance is effective for fiscal years beginning after December 15, 2017, including interim periods within those annual periods. The adoption of ASU No. 2016-18 did not have an impact on the Fund’s financial statements.
In August 2018, the FASB issued ASU 2018-13, Fair Value Measurement (Topic 820): Disclosure Framework - Changes to the Disclosure Requirements for Fair Value Measurements, which amended guidance on the disclosure requirements for fair value measurement. The update to Topic 820 includes added, eliminated and modified disclosure requirements for investments measured at fair value. ASU 2018-13 is effective for fiscal years beginning after December 15, 2019, including interim periods. Early adoption is permitted for any eliminated or modified disclosures. The impact of the amended guidance on the Fund was the removal of the requirements to disclose (a) amount of and reasons for transfers between Level 1 and 2 (b) the valuation processes for Level 3 fair value measurements, and (c) the policy for timing of transfers between levels. Management has evaluated the impact of this ASU and has adopted the changes into the Fund’s financial statements.
In March 2017, the FASB issued ASU 2017-08, Receivables - Nonrefundable Fees and Other Costs (Subtopic 310-20): Premium Amortization on Purchased Callable Debt Securities, which provides guidance related to the amortization period for certain purchased callable debt securities purchased at a premium. Specifically, it required the premium to be amortized to the earliest call date. The ASU is effective for annual periods beginning after December 15, 2018, and interim periods within those annual periods. The Fund have adopted and applied ASU 2017-08 on a modified retrospective basis through a cumulative-effect adjustment as of the beginning of the period of adoption. As a result of the adoption of ASU 2017-08, as of January 1, 2019, the amortized cost basis of investments was reduced by $3,570 and unrealized appreciation of investments was increased by $3,570. The adoption of ASU 2017-08 had no impact on beginning net assets, the current period results from operations, or any prior period information presented in the financial statements. Management has evaluated the impact of this ASU and has adopted the changes into these financial statements.
On October 17, 2018, the Securities and Exchange Commission (“SEC”) adopted changes to Regulation S-X to simplify the reporting of information by registered investment companies in financial statements. The amendments require presentation of the total, rather than the components, of distributable earnings on the Statement of Assets and Liabilities and also require presentation of the total, rather than the components, of distributions to shareholders, except for tax return of capital distributions, if any, on the Statement of Changes in Net Assets. The amendments also removed the requirement for parenthetical disclosure of undistributed net investment income on the Statement of Changes in Net Assets. These Regulation S-X amendments are reflected in the Fund’s financial statements for the period ended March 31, 2019. The distributions to shareholders in the period ended September 30, 2018 Statement of Changes in Net Assets presented herein conform to the current year presentation.
NOTE 12. SUBSEQUENT EVENTS
In preparing these financial statements, the Fund’s management has evaluated events and transactions for potential recognition or disclosure through the date the financial statements were issued.
The Fund completed a monthly repurchase offer on April 10, 2019, and 3,777 shares were repurchased for $92,159.
The Fund completed a monthly repurchase offer on May 10, 2019, and 7,326 shares were repurchased for $179,547.
Effective April 1, 2019, the Adviser’s agreement to temporarily reduce its Management Fee terminated and the Adviser began receiving a Management Fee at an annual rate of 1.00% of the average daily value of the Fund's net assets.
On April 18, 2019, Class T-I Shares commenced operations. The Fund is authorized to issue an unlimited number of Class T-I Shares on a continuous basis at NAV per share, plus a maximum sales load of 3.50% of the offering price.
| Semi-Annual Report | March 31, 2019 | 35 |
Blackstone / GSO Floating Rate
Enhanced Income Fund | Additional Information |
March 31, 2019 (Unaudited)
Portfolio Information.The Fund files its complete schedule of portfolio holdings with the Securities and Exchange Commission (the “SEC”) for the first and third quarters of each fiscal year on Form N-Q. Beginning April 30, 2019, the Fund will be required to use new Form N-PORT on a quarterly basis to disclose portfolio holdings, with every third month made available to the public by the SEC 60 days after the end of the Fund’s fiscal quarter, and Form N-Q filings will no longer be required. The Fund’s Forms N-Q or Forms N-PORT will be available (1) on the Fund’s website located at http://www.bgfrei.com; (2) on the SEC’s website at http://www.sec.gov; or (3) for review and copying at the SEC’s Public Reference Room (the “PRR”) in Washington, DC. Information regarding the operation of the PRR may be obtained by calling 1-800-SEC-0330.
Proxy Information. The policies and procedures used to determine how to vote proxies relating to securities held by the Fund are available (1) without charge, upon request, by calling 1-877-876-1121, (2) on the Fund’s website located at http://www.bgfrei.com, and (3) on the SEC’s website at http://www.sec.gov. Information regarding how the Fund voted proxies relating to portfolio securities during the most recent twelve-month period ended June 30 is available on Form N-PX by August 31 of each year (1) without charge, upon request, by calling 1-877-876-1121, (2) on the Fund’s website located at http://www.bgfrei.com, and (3) on the SEC’s website at http://www.sec.gov.
| Blackstone / GSO Floating Rate Enhanced Income Fund | Privacy Procedures |
March 31, 2019 (Unaudited)
This privacy policy sets forth the Adviser’s policies with respect to nonpublic personal information of individual investors, shareholders, prospective investors and former investors of investment funds managed by the Adviser. These policies apply to individuals only and are subject to change.
| FACTS | WHAT DO BLACKSTONE REGISTERED FUNDS DO WITH YOUR PERSONAL INFORMATION? |
| Why? | Financial companies choose how they share your personal information. Federal law gives consumers the right to limit some but not all sharing. Federal law also requires us to tell you how we collect, share, and protect your personal information. Please read this notice carefully to understand what we do. |
| What? | The types of personal information we collect and share depend on the product or service you have with us. This information can include: |
| | ● Social Security number and income ● Assets and investment experience ●Risk tolerance and transaction history |
| How? | All financial companies need to share customers' personal information to run their everyday business. In the section below, we list the reasons financial companies can share their customers' personal information; the reasons Blackstone Registered Funds (as defined below) choose to share; and whether you can limit this sharing. |
| Reasons we can share your personal information | Do Blackstone Registered Funds share? | Can you limit this sharing? |
| For our everyday business purposes – such as to process your transactions, maintain your account(s), respond to court orders and legal investigations, or report to credit bureaus | Yes | No |
| For our marketing purposes – to offer our products and services to you | Yes | No |
| For joint marketing with other financial companies | No | We don't share |
| For our affiliates' everyday business purposes – information about your transactions and experiences | No | We don't share |
| For our affiliates' everyday business purposes – information about your creditworthiness | No | We don't share |
| For our affiliates to market to you | No | We don't share |
| For nonaffiliates to market to you | No | We don't share |
| Questions? | Email us at GLB.privacy@blackstone.com |
| Who We Are | |
| Who is providing this notice? | Blackstone Registered Funds include Blackstone Alternative Alpha Fund, Blackstone Alternative Alpha Fund II, Blackstone Real Estate Income Fund, Blackstone Real Estate Income Fund II, Blackstone Alternative Investment Funds, on behalf of its series Blackstone Alternative Multi-Strategy Fund, Blackstone Diversified Multi-Strategy Fund, a sub-fund of Blackstone Alternative Investment Funds plc, and the GSO Funds, consisting of Blackstone / GSO Senior Floating Rate Term Fund, Blackstone / GSO Long-Short Credit Income Fund, Blackstone / GSO Strategic Credit Fund, Blackstone / GSO Floating Rate Enhanced Income Fund and Blackstone / GSO Secured Lending Fund. |
| What We Do | |
| How do Blackstone Registered Funds protect my personal information? | To protect your personal information from unauthorized access and use, we use security measures that comply with federal law. These measures include computer safeguards and secured files and buildings. |
| Semi-Annual Report | March 31, 2019 | 37 |
| Blackstone / GSO Floating Rate Enhanced Income Fund | Privacy Procedures |
March 31, 2019 (Unaudited)
| How do Blackstone Registered Funds collect my personal information? | We collect your personal information, for example, when you: |
● open an account or give us your income information ●provide employment information or give us your contact information ●tell us about your investment or retirement portfolio |
| | We also collect your personal information from others, such as credit bureaus, affiliates, or other companies. |
| Why can't I limit all sharing? | Federal law gives you the right to limit only: |
| | ●sharing for affiliates' everyday business purposes—information about your creditworthiness ●affiliates from using your information to market to you ●sharing for nonaffiliates to market to you |
| | State laws and individual companies may give you additional rights to limit sharing. See below for more on your rights under state law. |
| What happens when I limit sharing for an account I hold jointly with someone else? | Your choices will apply to everyone on your account—unless you tell us otherwise. |
| Definitions | |
| Affiliates | Companies related by common ownership or control. They can be financial and nonfinancial companies. |
| | ● Our affiliates include companies with a Blackstone name and financial companies such as GSO Capital Partners LP and Strategic Partners Fund Solutions. |
| Nonaffiliates | Companies not related by common ownership or control. They can be financial and nonfinancial companies. |
| | ● Blackstone Registered Funds do not share with nonaffiliates so they can market to you. |
| Joint marketing | A formal agreement between nonaffiliated financial companies that together market financial products or services to you. |
| | ● Our joint marketing partners include financial services companies. |
| Other Important Information | |
California Residents — In accordance with California law, we will not share information we collect about California residents with nonaffiliates except as permitted by law, such as with the consent of the customer or to service the customer’s accounts. We will also limit the sharing of information about you with our affiliates to the extent required by applicable California law.
Vermont Residents — In accordance with Vermont law, we will not share information we collect about Vermont residents with nonaffiliates except as permitted by law, such as with the consent of the customer or to service the customer’s accounts. We will not share creditworthiness information about Vermont residents among Blackstone Registered Funds' affiliates except with the authorization or consent of the Vermont resident.
| Blackstone / GSO Floating Rate Enhanced Income Fund | Privacy Procedures |
March 31, 2019 (Unaudited)
DATA PRIVACY NOTICE FOR INVESTORS
Why are you seeing this notice?
| ● | This Data Privacy Notice applies to you to the extent that European Union ("EU") data protection legislation applies to our processing of your Personal Data (defined below) or to the extent you are a resident of the EU or the European Economic Area ("EEA"). If this Data Privacy Notice applies to you, you have certain rights with respect to your Personal Data which are contained in this Data Privacy Notice. |
| ● | You may need to provide Personal Data to us as part of your investment into Blackstone / GSO Floating Rate Enhanced Income Fund (the "Fund"). |
| ● | We want you to understand how and why we use, store and otherwise process your Personal Data when you deal with us or our relevant affiliates. |
| ● | "Personal Data" has the meaning given in the EU data protection legislation and includes any information relating to an identifiable individual (such as name, address, date of birth or economic information). |
Please read the information below carefully. It explains how and why Personal Data is processed by us.
Who is providing this notice?
The Fund is committed to protecting and respecting your privacy.
The Fund-related entities on whose behalf this privacy statement is made are: (i) the Fund, (ii) GSO / Blackstone Debt Funds Management LLC, (the "Investment Adviser"), (iii), their respective affiliates, and in each case such persons' legal and other advisors and agents (together, the "Fund Parties").
Where we use the terms "we", "us" and "our" in this Data Privacy Notice, we are referring to the Fund and the Fund Parties.
When you provide us with your Personal Data, the Fund acts as a "data controller". In simple terms, this means that:
| ● | we "control" the Personal Data that you provide – including making sure that it is kept secure |
| ● | we make certain decisions on how to use and protect your Personal Data – but only to the extent that we have informed you about the use or are otherwise permitted by law |
What Personal Data do we collect about you?
The types of Personal Data we collect and share depends on the product or service you have with us and the nature of your investment. This information can include or be related to:
| ● | name, date of birth, country(ies) of citizenship, mailing and permanent address, email address, and telephone number |
| ● | photo identification, including passports, driving license, and other government-issued IDs |
| ● | bank and brokerage account information, including routing and account numbers |
| ● | national insurance number and tax identification number |
| ● | source of wealth, employment information, education history, number of dependents and income |
| ● | investment strategy, experience, and activity |
| ● | risk tolerance and transaction history |
| ● | internet protocol address |
| ● | information about your third-party representatives |
The Personal Data collected about you will help us provide you with a better service and facilitate our business relationship.
| ● | We may combine Personal Data that you provide to us with Personal Data that we collect from, or about you, in some circumstances. |
| ● | This will include Personal Data collected in an online or offline context. |
| Semi-Annual Report | March 31, 2019 | 39 |
| Blackstone / GSO Floating Rate Enhanced Income Fund | Privacy Procedures |
March 31, 2019 (Unaudited)
Where do we obtain your Personal Data?
We collect, and have collected, Personal Data about you from a number of sources, including from you directly:
| WHAT | HOW |
| Personal Data that you give us | ● from the forms and any associated documentation that you complete when subscribing for an investment, shares and/or opening an account with us. This will include information about your name, address, date of birth, passport details or other national identifier, driving license, your national insurance or social security number and income, employment information and details about your investment or retirement portfolio(s) ●when you provide it to us in correspondence and conversations ●when you make transactions with respect to the Fund ●when you purchase shares from us and/or tell us where to send money |
| Personal Data we obtain from others | ● publicly available and accessible directories and sources ●bankruptcy registers ●tax authorities, including those that are based outside the United Kingdom and the EEA if you are subject to tax in another jurisdiction ●governmental and competent regulatory authorities to whom we have regulatory obligations |
Why do we process your Personal Data?
We process your Personal Data for the following reasons:
| WHY | HOW |
| Contract | It is necessary to perform our contract with you to: |
| | ● administer, manage and set up your investor account(s) to allow you to purchase your holding (of shares) in our funds ●meet the resulting contractual obligations we have to you ●facilitate the continuation or termination of the contractual relationship between you and the Fund ●facilitate the transfer of funds, and administering and facilitating any other transaction, between you and the Fund |
| Compliance with law | It is necessary for compliance with an applicable legal or regulatory obligation to which we are subject to: |
| ● undertake our client and investor due diligence, and on-boarding checks ●carry out verification, know your client (KYC), terrorist financing and anti-money laundering checks ●verify the identity and addresses of our investors (and, if applicable their beneficial owners) ●comply with requests from regulatory, governmental, tax and law enforcement authorities ●surveillance and investigation ●carry out audit checks ●maintain statutory registers ●prevent and detect fraud ●comply with sanctions laws |
| Our legitimate interests | For our legitimate interests or those of a third party to: |
| | ● manage and administer your holding in any funds in which you are invested, and any related accounts on an ongoing basis ●assess and process any applications or requests made by you ●open, maintain or close accounts in connection with your investment in, or withdrawal from, the Fund ●send updates, information and notices or otherwise correspond with you in connection with your investment in the Fund ●address or investigate any complaints, claims, proceedings or disputes ●provide you with, and inform you about, our investment products and services ●monitor and improve our relationships with investors ●comply with applicable regulatory obligations ●manage our risk and operations |
| Blackstone / GSO Floating Rate Enhanced Income Fund | Privacy Procedures |
March 31, 2019 (Unaudited)
| | ● comply with our accounting and tax reporting requirements ●comply with our audit requirements ●assist with internal compliance with our policies and process ●ensure appropriate group management and governance ●keep our internal records ●prepare reports on incidents / accidents ●protect our business against fraud, breach of confidence, theft of proprietary materials, and other financial or business crimes (to the extent that this is not required of us by law) ●analyze and manage commercial risks ●seek professional advice, including legal advice ●enable any actual or proposed, assignee or transferee, participant or sub-participant of the Fund's or ●Fund vehicles' rights or obligations to evaluate proposed transactions ●facilitate business asset transactions involving the ●Fund or Fund-related vehicles ●monitor communications to/from us using our systems ●protect the security and integrity of our IT systems |
| | We only rely on these interests where we have considered that, on balance, our legitimate interests are not overridden by your interests, fundamental rights or freedoms. |
Monitoring as described at (3) above
We monitor communications where the law requires us to do so. We will also monitor where we are required to do so to comply with our regulatory rules and practices and, where we are permitted to do so, to protect our business and the security of our systems.
Who we share your Personal Data with
We will share your Personal Data with the following persons for the following reasons:
| WHO | WHY |
| Fund associates | We share your Personal Data with our associates, related parties and members of our group. This is to: |
| | ● manage our relationship with you ●the purposes set out in this Data Privacy Notice |
| Fund Managers, Depositories, Administrators, Custodians, Investment Advisers | ●delivering the services you require ●managing your investment ●supporting and administering investment-related activities ●complying with applicable investment laws and regulations |
| | Fund and investment specific details of these third parties can be found in the relevant subscription documents you have been provided with |
| Tax Authorities | ● to comply with applicable laws and regulations ●where required by EEA tax authorities (who, in turn, may share your Personal Data with foreign tax authorities) ●where required by foreign tax authorities, including outside of the EEA |
| Service Providers | ● delivering and facilitating the services needed to support our business relationship with you ●supporting and administering investment-related activities |
| Our lawyers, auditors and other professional advisors | ● providing you with investment-related services ●to comply with applicable legal and regulatory requirements |
| Semi-Annual Report | March 31, 2019 | 41 |
| Blackstone / GSO Floating Rate Enhanced Income Fund | Privacy Procedures |
March 31, 2019 (Unaudited)
In exceptional circumstances, we will share your Personal Data with:
| ● | competent regulatory, prosecuting and other governmental agencies or litigation counterparties, in any country or territory |
| ● | organizations and agencies – where we are required to do so by law |
Do you have to provide us with this Personal Data?
Unless otherwise indicated, you should assume that we require the Personal Data for business and/or compliance purposes.
Where we collect Personal Data from you that is purely voluntary and there are no implications for you if you do not wish to provide us with it, we will indicate as such.
Some of the Personal Data we request is necessary for us to perform our contract with you and if you do not wish to provide us with this Personal Data, it will affect our ability to provide our services to you and manage your investment.
Sending your Personal Data internationally
We will transfer your Personal Data to our group members, shareholders of the Fund and related parties, and to third party service providers outside of the EEA, which do not have similarly strict data protection and privacy laws.
Where we transfer Personal Data to other members of our group, or our service providers, we have put in place data transfer agreements and safeguards using European Commission approved terms.
Please contact us if you would like to know more about these agreements or receive a copy of them. Please see below for our contact details.
Consent – and your right to withdraw it
We do not generally rely on obtaining your consent to process your Personal Data.
If we do, you have the right to withdraw this consent at any time.
Please contact us or send us an email at GDPRqueries@blackstone.com at any time if you wish to do so.
Retention and deletion of your Personal Data
We keep your Personal Data for as long as it is required by us for our legitimate business purposes, to perform our contractual obligations, or where longer, such longer period as is required by law or regulatory obligations which apply to us.
| ● | We will generally retain Personal Data about you throughout the life cycle of any investment you are involved in |
| ● | Some Personal Data will be retained after your relationship with us ends As a general principle, we do not retain your Personal Data for longer than we need it. |
We will usually delete your Personal Data (at the latest) after you cease to be an investor in any investment vehicle related to the Fund and there is no longer any legal or regulatory requirement or other legitimate business purpose for retaining your Personal Data.
Your rights
You have certain data protection rights, including:
| ● | the right to access your Personal Data |
| ● | the right to restrict the use of your Personal Data |
| ● | the right to have incomplete or inaccurate Personal Data corrected |
| ● | the right to ask us to stop processing your Personal Data |
| ● | the right to require us to delete your Personal Data in some limited circumstances |
| Blackstone / GSO Floating Rate Enhanced Income Fund | Privacy Procedures |
March 31, 2019 (Unaudited)
From 25 May 2018, you also have the right in some circumstances to request for us to "port" your Personal Data in a portable, re-usable format to other organizations (where this is possible).
Concerns or queries
We take your concerns very seriously. We encourage you to bring it to our attention if you have any concerns about our processing your Personal Data.
This Data Privacy Notice was drafted with simplicity and clarity in mind. We are, of course, happy to provide any further information or explanation needed. Our contact details are below.
If you want to make a complaint, you can also contact the body regulating data protection in your country, where you live or work, or the location where the data protection issue arose. A list of the EU data protection authorities is available by clicking this link: http://ec.europa.eu/newsroom/article29/item-detail.cfm?item_id=612080.
Contact us
Please contact us if you have any questions about this Data Privacy Notice or the Personal Data we hold about you.
Contact us by email at GDPRqueries@blackstone.com.
Contact us in writing using the address below:
| Address | The Blackstone Group |
| | Attn: Legal and Compliance |
| | 345 Park Avenue |
| | New York, NY 10154 |
Changes to this Data Privacy Notice
We keep this Data Privacy Notice under regular review.
This Data Privacy Notice was last updated on 24 May 2018.
| Semi-Annual Report | March 31, 2019 | 43 |
| Blackstone / GSO Floating Rate Enhanced Income Fund | Trustees & Officers |
March 31, 2019 (Unaudited)
The Board of Trustees is vested with the authority to supervise and direct the management of the business and affairs of the Fund, including oversight of the Adviser. The Fund’s executive officers will be chosen each year at a regular meeting of the Board of Trustees to hold office until their respective successors are duly elected and qualified.
Below is a list of the Trustees and officers of the Fund and their present positions and principal occupations during the past five years. The business address of the Fund, the Trustees, the Fund’s officers, and the Adviser is 345 Park Avenue, 31st Floor, New York, NY 10154, unless specified otherwise below.
NON-INTERESTED TRUSTEES
Name, Address and
Year of Birth(1) | Position(s) Held with the Fund | Length of
Time Served | Principal Occupation(s)
During Past 5 Years | Number of Portfolios in Fund Complex Overseen by Trustee(2) | Other Directorships Held by Trustee |
Edward H. D'Alelio Birth Year: 1952 | Lead Independent Trustee and member of Audit and Nominating and Governance Committees | Since Inception | Mr D'Alelio was formerly a Managing Director and CIO for Fixed Income at Putnam Investments, Boston where he retired in 2002. He currently is an Executive in Residence with the School of Management, Univ. of Mass Boston. | 7 | Owl Rock Capital Corp. business development companies (3 portfolios overseen in Fund Complex). |
Michael F. Holland Birth Year: 1944 | Trustee and member of Audit and Nominating and Governance Committees | Since Inception | Mr. Holland is the Chairman of Holland & Company, a private investment firm he founded in 1995. He is also President and Founder of the Holland Balanced Fund. | 7 | State Street Master Funds; Reaves Utility Income Fund. |
Thomas W. Jasper Birth Year: 1948 | Trustee, Chairman of Audit Committee and member of Nominating and Governance Committee | Since Inception | Mr. Jasper is the Managing Partner of Manursing Partners LLC, a consulting firm. He was Chief Executive Officer of Primus Guaranty, Ltd. from 2001-2010. | 7 | Ciner Resources LP (master limited partnership). |
Gary S. Schpero Birth Year: 1953 | Trustee, Chairman of Nominating and Governance Committee and member of Audit Committee | Since Inception | Mr. Schpero is retired. Prior to January 2000, he was a partner at the law firm of Simpson Thacher & Bartlett LLP where he served as managing partner of the Investment Management and Investment Company Practice Group. | 4 | AXA Premier VIP Trust; EQ Advisors Trust; 1290 Funds. |
| Blackstone / GSO Floating Rate Enhanced Income Fund | Trustees & Officers |
March 31, 2019 (Unaudited)
| INTERESTED TRUSTEE(3) | | | | |
Name, Address and
Year of Birth(1) | Position(s) Held with the Fund | Length of
Time Served | Principal Occupation(s)
During Past 5 Years | Number of Portfolios in Fund Complex Overseen by Trustee(2) | Other Directorships Held by Trustee |
Daniel H. Smith, Jr. Birth Year: 1963 | Chairman of the Board, President, Chief Executive Officer, Trustee | Since Inception | Mr. Smith is a Senior Managing Director of GSO and is Head of GSO / Blackstone Debt Funds Management LLC. Mr. Smith joined GSO from the Royal Bank of Canada in July 2005 where he was a Managing Partner and Co-head of RBC Capital Market's Alternative Investments Unit. | 4 | Blackstone / GSO Secured Lending Fund. |
OFFICERS
Name, Address and
Year of Birth(1) | Position(s) Held with the Fund | Length of
Time Served | Principal Occupation During the Past Five Years |
Daniel H. Smith, Jr. Birth Year: 1963 | Chairman, President, Chief Executive Officer, Trustee | Since Inception | Mr. Smith is a Senior Managing Director of GSO and is Head of GSO / Blackstone Debt Funds Management LLC. Mr. Smith joined GSO from the Royal Bank of Canada in July 2005 where he was a Managing Partner and Co-head of RBC Capital Market's Alternative Investments Unit. |
Robert W. Busch Birth Year: 1982 | Chief Financial Officer and Treasurer | Since 2019 | Robert W. Busch is a Senior Vice President of The Blackstone Group L.P. Before joining GSO, Mr. Busch worked previously at Fifth Street Asset Management from 2012 to 2018, where he was Senior Vice President of Finance and served as Controller of the firm's two publicly traded business development companies and publicly traded alternative asset manager. Prior to that, Mr. Busch worked at Deloitte & Touche LLP, a global public accounting firm. |
Robert Zable Birth Year: 1972 | Executive Vice President and Assistant Secretary | Since Inception | Mr. Zable is a Senior Managing Director of The Blackstone Group L.P. Before joining GSO, Mr. Zable was a Vice President at FriedbergMilstein LLC, where he was responsible for credit opportunity investments and junior capital origination and execution. Prior to that, Mr. Zable was a Principal with Abacus Advisors Group, a restructuring and distressed investment firm. Mr. Zable began his career at JP Morgan Securities Inc., where he focused on leveraged finance in New York and London. |
| Semi-Annual Report | March 31, 2019 | 45 |
| Blackstone / GSO Floating Rate Enhanced Income Fund | Trustees & Officers |
March 31, 2019 (Unaudited)
| OFFICERS (continued) |
Name, Address and
Year of Birth(1) | Position(s) Held with the Fund | Length of
Time Served | Principal Occupation During the Past Five Years |
Marisa Beeney Birth Year: 1970 | Chief Compliance Officer, Chief Legal Officer and Secretary | Since Inception | Ms. Beeney is a Senior Managing Director of The Blackstone Group L.P. and General Counsel of GSO. Before joining GSO, she was with the finance group of DLA Piper. Ms. Beeney began her career at Latham & Watkins LLP working primarily on project finance and development transactions, as well as other structured credit products. |
Jane Lee Birth Year: 1972 | Public Relations Officer | Since Inception | Ms. Lee is a Senior Managing Director of The Blackstone Group L.P. and Head of GSO's capital formation efforts. Ms. Lee joined GSO from Royal Bank of Canada in July 2005, where she was most recently a partner in the Debt Investments Group and was responsible for origination of new CLO transactions and investor relations. |
| (1) | The address of each Trustee/Nominee and Officer, unless otherwise noted, is GSO Capital Partners LP, 345 Park Avenue, 31st Floor, New York, NY 10154. |
| (2) | The “Fund Complex” consists of the Fund, Blackstone / GSO Senior Floating Rate Term Fund, Blackstone / GSO Long-Short Credit Income Fund, and Blackstone / GSO Strategic Credit Fund, as well as the “Blackstone Real Estate Funds,” (Blackstone Real Estate Income Fund, Blackstone Real Estate Income Fund II and Blackstone Real Estate Income Master Fund), the “Blackstone Alternative Alpha Funds” (Blackstone Alternative Alpha Fund, Blackstone Alternative Alpha Fund II and Blackstone Alternative Alpha Master Fund), and the “Blackstone Alternative Investment Funds” (Blackstone Alternative Multi-Manager Fund and Blackstone Alternative Multi-Strategy Fund). |
| (3) | “Interested person” of the Fund as defined in Section 2(a)(19) of the 1940 Act. Mr. Smith is an interested person due to his employment with the Adviser. |
Page Intentionally Left Blank

Not applicable to this Report.
| Item 3. | Audit Committee Financial Expert. |
Not applicable to this Report.
| Item 4. | Principal Accountant Fees and Services. |
Not applicable to this Report.
| Item 5. | Audit Committee of Listed Registrants. |
Not applicable to registrant.
| (a) | Schedule of Investments in securities of unaffiliated issuers as of the close of the reporting period is included as part of the Report to Stockholders filed under Item 1 of this Form N-CSR. |
| Item 7. | Disclosure of Proxy Voting Policies and Procedures for Closed-End Management Investment Companies. |
Not applicable to this Report.
| Item 8. | Portfolio Managers of Closed-End Management Investment Companies. |
| (a) | Not applicable to this Report. |
| Item9. | Purchases of Equity Securities by Closed-End Management Investment Company and Affiliated Purchasers. |
None.
| Item 10. | Submission of Matters to a Vote of Security Holders. |
There have been no material changes to the procedures by which shareholders may recommend nominees to the registrant’s Board of Trustees, where those changes were implemented after the registrant last provided disclosure in response to the requirements of Item 407(c)(2) of Regulation S-K, or this Item.
| Item 11. | Controls and Procedures. |
| (a) | The registrant’s principal executive officer and principal financial officer have concluded that the registrant’s disclosure controls and procedures (as defined in Rule 30a-3(c) under the Investment Company Act of 1940, as amended) are effective as of a date within 90 days of the filing date of this document. |
| (b) | There was no change in the registrant’s internal control over financial reporting (as defined in Rule 30a-3(d) under the Investment Company Act of 1940, as amended) that occurred during the period covered by this Report that has materially affected, or is reasonably likely to materially affect, the registrant’s internal control over financial reporting. |
| Item12. | Disclosure of Securities Lending Activities for Closed-End Management Investment Companies. |
Not applicable.
| (a)(1) | Not applicable to this Report. |
| (a)(2) | The certifications required by Rule 30a-2(a) of the Investment Company Act of 1940, as amended, are attached hereto as Exhibit 99.302Cert. |
| (a)(3) | Not applicable to registrant. |
| (b) | The certifications by the registrant’s principal executive officer and principal financial officer, as required by Rule 30a-2(b) of the Investment Company Act of 1940, as amended, are attached hereto as Exhibit 99.906Cert. |
SIGNATURES
Pursuant to the requirements of the Securities Exchange Act of 1934 and the Investment Company Act of 1940, the Registrant has duly caused this report to be signed on its behalf by the undersigned, thereunto duly authorized.
Blackstone / GSO Floating Rate Enhanced Income Fund
| By: | /s/ Daniel H. Smith, Jr. | |
| | Daniel H. Smith, Jr. (Principal Executive Officer) | |
| | Chief Executive Officer and President | |
| | | |
| Date: | June 7, 2019 | |
| | | |
| By: | /s/ Robert W. Busch | |
| | Robert W. Busch (Principal Financial Officer) | |
| | Treasurer and Chief Financial Officer | |
| | | |
| Date: | June 7, 2019 | |
Pursuant to the requirements of the Securities Exchange Act of 1934 and the Investment Company Act of 1940,this report has been signed below by the following persons on behalf of the Registrant and in the capacities and on the dates indicated.
Blackstone / GSO Floating Rate Enhanced Income Fund
| By: | /s/ Daniel H. Smith, Jr. | |
| | Daniel H. Smith, Jr. (Principal Executive Officer) | |
| | Chief Executive Officer and President | |
| | | |
| Date: | June 7, 2019 | |
| | | |
| By: | /s/ Robert W. Busch | |
| | Robert W. Busch (Principal Financial Officer) | |
| | Treasurer and Chief Financial Officer | |
| | | |
| Date: | June 7, 2019 | |