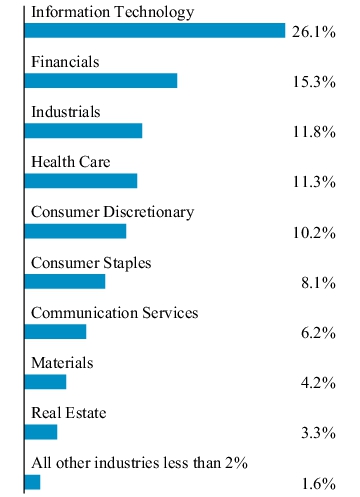
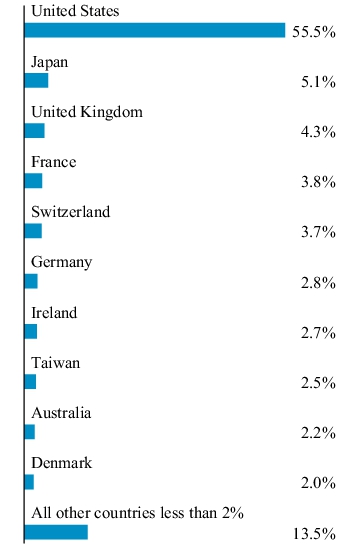
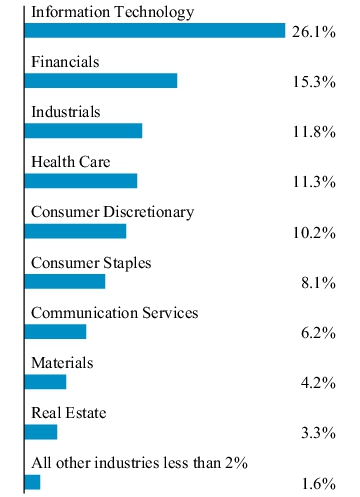
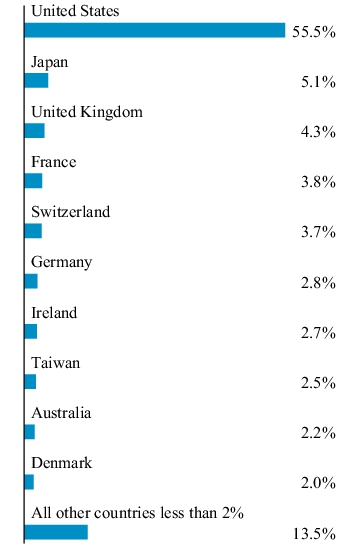
Fund (Class) | Cost of a $10,000 investment | Costs paid as a percentage of a $10,000 investment |
Trillium ESG Global Equity Fund (Institutional Shares/PORIX) | $106 | 1.00% |
Average Annual Total Returns | 1 year | 5 year | 10 year |
Trillium ESG Global Equity Fund (Institutional Shares/PORIX) | 11.72% | 10.61% | 9.18% |
MSCI ACWI | 19.37% | 10.76% | 8.43% |
Fund net assets | $959,065,191% |
Total number of portfolio holdings | $96% |
Total advisory fees paid | $7,674,673% |
Portfolio turnover rate as of the end of the reporting period | $27.31% |
Microsoft Corp. | 5.8% |
NVIDIA Corp. | 5.4% |
Alphabet, Inc. - Class A | 4.7% |
Apple, Inc. | 2.9% |
Taiwan Semiconductor Manufacturing Co. Ltd. - ADR | 2.5% |
Novo Nordisk A/S - Class B | 2.0% |
Visa, Inc. - Class A | 2.0% |
TJX Cos. (The), Inc. | 1.6% |
Unilever PLC | 1.6% |
Target Corp. | 1.5% |
Fund (Class) | Cost of a $10,000 investment | Costs paid as a percentage of a $10,000 investment |
Trillium ESG Global Equity Fund (Investor Shares/PORTX) | $131 | 1.24% |
Average Annual Total Returns | 1 year | 5 year | 10 year |
Trillium ESG Global Equity Fund (Investor Shares/PORTX) | 11.45% | 10.31% | 8.88% |
MSCI ACWI | 19.37% | 10.76% | 8.43% |
Fund net assets | $959,065,191% |
Total number of portfolio holdings | $96% |
Total advisory fees paid | $7,674,673% |
Portfolio turnover rate as of the end of the reporting period | $27.31% |
Microsoft Corp. | 5.8% |
NVIDIA Corp. | 5.4% |
Alphabet, Inc. - Class A | 4.7% |
Apple, Inc. | 2.9% |
Taiwan Semiconductor Manufacturing Co. Ltd. - ADR | 2.5% |
Novo Nordisk A/S - Class B | 2.0% |
Visa, Inc. - Class A | 2.0% |
TJX Cos. (The), Inc. | 1.6% |
Unilever PLC | 1.6% |
Target Corp. | 1.5% |
Fund (Class) | Cost of a $10,000 investment | Costs paid as a percentage of a $10,000 investment |
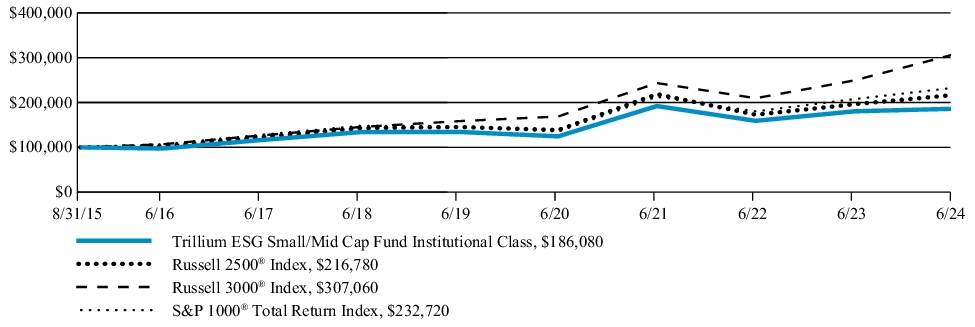
Trillium ESG Small/Mid Cap Fund (Institutional Shares/TSMDX) | $100 | 0.98% |
Average Annual Total Returns | 1 year | 5 year | Since Inception |
Trillium ESG Small/Mid Cap Fund (Institutional Shares/TSMDX) | 3.14% | 6.72% | 7.28% |
Russell 2500® Index | 10.47% | 8.31% | 9.15% |
Russell 3000® Index | 23.13% | 14.14% | 13.54% |
S&P 1000® Total Return Index | 12.08% | 9.61% | 10.03% |
Fund net assets | $40,220,306% |
Total number of portfolio holdings | $71% |
Total advisory fees paid | $239,549% |
Portfolio turnover rate as of the end of the reporting period | $31.34% |
BJ's Wholesale Club Holdings, Inc. | 2.8% |
CyberArk Software Ltd. | 2.7% |
LPL Financial Holdings, Inc. | 2.4% |
Burlington Stores, Inc. | 2.4% |
Merit Medical Systems, Inc. | 2.3% |
Jones Lang LaSalle, Inc. | 2.2% |
East West Bancorp, Inc. | 2.2% |
MYR Group, Inc. | 2.1% |
Tetra Tech, Inc. | 2.1% |
New York Times (The) Co. - Class A | 2.0% |
(b) Not Applicable.
Item 2. Code of Ethics.
As of June 30, 2024, the registrant had adopted a "code of ethics" (as such term is defined in Item 2 of Form N-CSR) that applies to the registrant's principal executive officer and principal financial officer. There were no substantive amendments or waivers to the code of ethics during the period covered by this report.
Item 3. Audit Committee Financial Expert.
The registrant's Board of Trustees has determined the registrant has at least one "audit committee financial expert" (as such term is defined in Item 3 of Form N-CSR) serving on its Audit Committee. The "audit committee financial expert" is Joseph P. Gennaco, who is "independent" for purposes of this Item 3 of Form N-CSR.
Item 4. Principal Accountant Fees and Services.
(a) Audit Fees
2024: $66,880
2023: $45,400
The fees paid to PricewaterhouseCoopers LLP for 2024 and Tait, Weller & Baker LLP for 2023 relate to the audits of the registrant's annual financial statements and letters for filings of the registrant's Form N-CEN and N-1A.
(b) Audit Related Fees
2024: $0
2023: $0
(c) Tax Fees
2024: $20,240
2023: $5,800
The fees to PricewaterhouseCoopers LLP for 2024 and Tait, Weller & Baker LLP for 2023 relate to the preparation of the registrant's tax returns, review of annual distributions, and additional tax provision support fees.
(d) All Other Fees
2024: $0
2023: $0
(e)(1) Except as permitted by rule 2-01(c)(7)(i)(C) of regulation S-X the registrant’s audit committee must pre-approve all audit and non-audit services provided by the independent accountants relating to the operations or financial reporting of the registrant. Prior to the commencement of any audit or non-audit services to the registrant, the audit committee reviews the services to determine whether they are appropriate and permissible under applicable law.
(e)(2) 2024: 0.00%
2023: 0.00%
(f) Not applicable.
(g) 2024: $95,240
2023: $5,800
(h) The Audit Committee considered the non-audit services rendered to the registrant's investment adviser and believes the services are compatible with the principal accountant's independence.
(i) The registrant has not been identified by the U.S. Securities and Exchange Commission as having filed an annual report issued by a registered public accounting firm branch or office that is located in a foreign jurisdiction where the Public Company Accounting Oversight Board is unable to inspect or completely investigate because of a position taken by an authority in that jurisdiction.
(j) The registrant is not a foreign issuer.
Item 5. Audit Committee of Listed Registrants.
Not applicable.
Item 6. Investments.
(a) The Schedule of Investments in securities of unaffiliated issuers is included in the Financial Statements filed under Item 7 of this Form.
(b) Not applicable.
Item 7. Financial Statements and Financial Highlights for Open-End Management Investment Companies.
(a) - (b) The Financial Statements and Financial Highlights are included herewith.
TRILLIUM ESG GLOBAL EQUITY FUND TRILLIUM ESG SMALL/MID CAP FUND
ANNUAL REPORT
For The Year Ended
June 30, 2024
Percentage of Net Assets | Shares | Value | |
COMMON STOCKS | 97.3 % | ||
Apparel & Textile Products | 0.0 %(a) | ||
NIKE, Inc. - Class B | 55 | $4,145 | |
Asset Management | 0.8 % | ||
LPL Financial Holdings, Inc. | 25,984 | 7,257,331 | |
Automotive | 2.0 % | ||
Aptiv PLC(b) | 56,565 | 3,983,307 | |
Cie Generale des Etablissements Michelin S.C.A. | 218,463 | 8,443,838 | |
Denso Corp. | 460,400 | 7,186,402 | |
19,613,547 | |||
Banking | 6.7 % | ||
Bank Rakyat Indonesia Persero Tbk PT | 15,410,759 | 4,321,123 | |
Credicorp Ltd. | 33,707 | 5,437,950 | |
DNB Bank ASA | 357,002 | 7,004,694 | |
Grupo Financiero Banorte S.A.B. de C.V., Series O | 687,365 | 5,356,150 | |
Hang Seng Bank Ltd. | 418,340 | 5,378,326 | |
HDFC Bank Ltd. - ADR | 126,048 | 8,108,668 | |
KBC Group N.V. | 141,918 | 9,999,893 | |
PNC Financial Services Group (The), Inc. | 66,519 | 10,342,374 | |
Sumitomo Mitsui Trust Holdings, Inc. | 373,249 | 8,577,708 | |
64,526,886 | |||
Biotechnology & Pharmaceuticals | 7.0 % | ||
AstraZeneca PLC | 53,440 | 8,317,031 | |
CSL Ltd. | 39,552 | 7,756,040 | |
Gilead Sciences, Inc. | 121,029 | 8,303,800 | |
Merck & Co., Inc. | 105,736 | 13,090,117 | |
Novo Nordisk A/S - Class B | 134,518 | 19,247,490 | |
Roche Holding A.G. (Genusschein) | 36,337 | 10,067,487 | |
66,781,965 | |||
Chemicals | 2.4 % | ||
Air Liquide S.A. | 49,746 | 8,585,602 | |
Croda International PLC | 84,771 | 4,217,279 | |
Ecolab, Inc. | 44,890 | 10,683,820 | |
23,486,701 | |||
Commercial Support Services | 3.3 % | ||
Brambles Ltd. | 723,545 | 6,982,160 | |
Compass Group PLC | 275,441 | 7,503,932 | |
Recruit Holdings Co. Ltd. | 109,574 | 5,895,867 | |
Waste Management, Inc. | 51,389 | 10,963,329 | |
31,345,288 | |||
Construction Materials | 0.6 % | ||
Sika A.G. - REG | 20,557 | 5,868,196 |
Percentage of Net Assets | Shares | Value | |
Containers & Packaging | 1.2 % | ||
Ball Corp. | 138,622 | $8,320,092 | |
Klabin S.A. | 948,094 | 3,636,274 | |
11,956,366 | |||
E-Commerce Discretionary | 1.0 % | ||
MercadoLibre, Inc.(b) | 5,594 | 9,193,180 | |
Electric Utilities | 0.7 % | ||
Terna - Rete Elettrica Nazionale | 857,733 | 6,611,946 | |
Electrical Equipment | 2.5 % | ||
Assa Abloy AB - Class B | 252,416 | 7,148,559 | |
Rockwell Automation, Inc. | 26,147 | 7,197,746 | |
Trane Technologies PLC | 28,035 | 9,221,553 | |
23,567,858 | |||
Engineering & Construction | 0.9 % | ||
Quanta Services, Inc. | 34,695 | 8,815,653 | |
Entertainment Content | 0.9 % | ||
Walt Disney (The) Co. | 89,048 | 8,841,576 | |
Food | 2.7 % | ||
Kerry Group PLC - Class A | 66,190 | 5,363,982 | |
McCormick & Co., Inc. (Non Voting) | 86,501 | 6,136,381 | |
Nestle S.A. - REG | 136,985 | 13,982,646 | |
25,483,009 | |||
Gas & Water Utilities | 0.9 % | ||
American Water Works Co., Inc. | 68,495 | 8,846,814 | |
Health Care Facilities & Services | 0.9 % | ||
CVS Health Corp. | 138,377 | 8,172,546 | |
Home Construction | 0.9 % | ||
Daiwa House Industry Co. Ltd. | 322,599 | 8,213,332 | |
Household Products | 3.2 % | ||
Kao Corp. | 117,283 | 4,748,434 | |
L'Oreal S.A. | 23,679 | 10,422,680 | |
Unilever PLC | 277,414 | 15,217,892 | |
30,389,006 | |||
Industrial Intermediate Products | 1.2 % | ||
Prysmian S.p.A. | 190,999 | 11,791,703 | |
Industrial Support Services | 0.9 % | ||
Ferguson PLC | 44,974 | 8,625,426 | |
Institutional Financial Services | 1.9 % | ||
Bank of New York Mellon (The) Corp. | 176,527 | 10,572,202 | |
Intercontinental Exchange, Inc. | 59,445 | 8,137,426 | |
18,709,628 | |||
Insurance | 3.1 % | ||
AIA Group Ltd. | 885,433 | 5,990,618 | |
Allianz S.E. - REG | 33,790 | 9,384,526 |
Percentage of Net Assets | Shares | Value | |
Aviva PLC | 935,677 | $5,635,870 | |
Travelers (The) Cos., Inc. | 44,811 | 9,111,869 | |
30,122,883 | |||
Internet Media & Services | 4.7 % | ||
Alphabet, Inc. - Class A | 246,659 | 44,928,937 | |
IT Services | 1.1 % | ||
Accenture PLC - Class A | 35,516 | 10,775,910 | |
Leisure Facilities & Services | 2.1 % | ||
Chipotle Mexican Grill, Inc.(b) | 102,780 | 6,439,167 | |
Marriott International, Inc. - Class A | 34,695 | 8,388,210 | |
Starbucks Corp. | 70,378 | 5,478,928 | |
20,306,305 | |||
Machinery | 1.7 % | ||
Atlas Copco AB - Class A | 451,398 | 8,475,565 | |
Kurita Water Industries Ltd. | 178,473 | 7,583,672 | |
16,059,237 | |||
Medical Equipment & Devices | 3.4 % | ||
Cochlear Ltd. | 29,435 | 6,497,482 | |
Edwards Lifesciences Corp.(b) | 104,503 | 9,652,942 | |
Hoya Corp. | 57,500 | 6,724,013 | |
Thermo Fisher Scientific, Inc. | 18,011 | 9,960,083 | |
32,834,520 | |||
Real Estate Investment Trusts | 1.4 % | ||
American Tower Corp. | 34,125 | 6,633,217 | |
Prologis, Inc. | 60,428 | 6,786,669 | |
13,419,886 | |||
Real Estate Services | 1.0 % | ||
Jones Lang LaSalle, Inc.(b) | 44,477 | 9,130,239 | |
Renewable Energy | 0.6 % | ||
First Solar, Inc.(b) | 26,889 | 6,062,394 | |
Retail - Consumer Staples | 2.2 % | ||
Jeronimo Martins SGPS S.A. | 341,296 | 6,670,281 | |
Target Corp. | 97,923 | 14,496,521 | |
21,166,802 | |||
Retail - Discretionary | 4.3 % | ||
Industria de Diseno Textil S.A. | 158,437 | 7,862,179 | |
Lululemon Athletica, Inc.(b) | 28,775 | 8,595,093 | |
TJX Cos. (The), Inc. | 140,842 | 15,506,704 | |
Tractor Supply Co. | 34,862 | 9,412,740 | |
41,376,716 | |||
Semiconductors | 10.7 % | ||
Applied Materials, Inc. | 43,907 | 10,361,613 | |
Infineon Technologies A.G. | 246,256 | 9,037,669 | |
Intel Corp. | 246,988 | 7,649,218 |
Percentage of Net Assets | Shares | Value | |
NVIDIA Corp. | 420,970 | $52,006,634 | |
Taiwan Semiconductor Manufacturing Co. Ltd. - ADR | 135,422 | 23,537,698 | |
102,592,832 | |||
Software | 10.3 % | ||
Adobe, Inc.(b) | 19,894 | 11,051,913 | |
Dassault Systemes S.E. | 237,619 | 8,934,707 | |
Microsoft Corp. | 124,072 | 55,453,980 | |
Palo Alto Networks, Inc.(b) | 19,737 | 6,691,040 | |
SAP S.E. | 41,523 | 8,340,957 | |
ServiceNow, Inc.(b) | 10,362 | 8,151,475 | |
98,624,072 | |||
Specialty Finance | 2.0 % | ||
Visa, Inc. - Class A | 72,270 | 18,968,707 | |
Technology Hardware | 3.4 % | ||
Apple, Inc. | 134,675 | 28,365,249 | |
Cisco Systems, Inc. | 95,291 | 4,527,275 | |
32,892,524 | |||
Telecommunications | 0.6 % | ||
Verizon Communications, Inc. | 134,926 | 5,564,348 | |
Transportation & Logistics | 2.1 % | ||
Canadian Pacific Kansas City Ltd. | 89,293 | 7,032,219 | |
Kuehne + Nagel International A.G. - REG | 18,336 | 5,276,774 | |
United Parcel Service, Inc. - Class B | 59,445 | 8,135,048 | |
20,444,041 | |||
TOTAL COMMON STOCKS (Cost $618,337,696) | 933,372,455 | ||
PREFERRED STOCKS | 0.8 % | ||
Banking | 0.8 % | ||
Itau Unibanco Holding S.A. - ADR, 3.85%(c) | 1,228,536 | 7,174,650 | |
Containers & Packaging | 0.0 %(a) | ||
Klabin S.A., 1.27%(c) | 1 | 1 | |
PREFERRED STOCKS (Cost $6,756,382) | 7,174,651 | ||
SHORT-TERM INVESTMENTS | 0.7 % | ||
Northern Institutional Treasury Portfolio (Premier Class), 5.15%(d) | 6,864,965 | 6,864,965 | |
TOTAL SHORT-TERM INVESTMENTS (Cost $6,864,965) | 6,864,965 | ||
TOTAL INVESTMENTS (Cost $631,959,043) | 98.8 % | 947,412,071 | |
NET OTHER ASSETS (LIABILITIES) | 1.2 % | 11,653,120 | |
NET ASSETS | 100.0 % | $959,065,191 |
(a)Amount rounds to less than 0.05%. |
(b)Non-income producing security. |
(c)Current yield is disclosed. Dividends are calculated based on a percentage of issuer's net income. |
(d)7-day current yield as of June 30, 2024 is disclosed. |
Abbreviations: |
ADR – American Depositary Receipt |
REG – Registered |
Country Allocation (Unaudited) | Percentage of Net Assets |
United States | 56.2% |
Japan | 5.1 |
United Kingdom | 4.3 |
France | 3.8 |
Switzerland | 3.7 |
Germany | 2.8 |
Ireland | 2.7 |
Taiwan | 2.5 |
Australia | 2.2 |
Denmark | 2.0 |
Italy | 1.9 |
Sweden | 1.6 |
Jersey | 1.3 |
Hong Kong | 1.2 |
Brazil | 1.2 |
Belgium | 1.0 |
India | 0.8 |
Spain | 0.8 |
Canada | 0.7 |
Norway | 0.7 |
Portugal | 0.7 |
Peru | 0.6 |
Mexico | 0.6 |
Indonesia | 0.4 |
Total | 98.8% |
Percentage of Net Assets | Shares | Value | |
COMMON STOCKS | 97.9 % | ||
Aerospace & Defense | 1.4 % | ||
Hexcel Corp. | 9,091 | $567,733 | |
Apparel & Textile Products | 2.5 % | ||
Deckers Outdoor Corp.(a) | 695 | 672,725 | |
Levi Strauss & Co. - Class A | 17,062 | 328,956 | |
1,001,681 | |||
Asset Management | 3.9 % | ||
LPL Financial Holdings, Inc. | 3,503 | 978,388 | |
Stifel Financial Corp. | 6,933 | 583,412 | |
1,561,800 | |||
Banking | 5.7 % | ||
Columbia Banking System, Inc. | 17,852 | 355,076 | |
East West Bancorp, Inc. | 11,870 | 869,240 | |
Live Oak Bancshares, Inc. | 11,212 | 393,093 | |
Webster Financial Corp. | 15,146 | 660,214 | |
2,277,623 | |||
Chemicals | 4.4 % | ||
Avery Dennison Corp. | 2,370 | 518,200 | |
Ingevity Corp.(a) | 6,684 | 292,158 | |
Rogers Corp.(a) | 3,481 | 419,843 | |
Sensient Technologies Corp. | 7,430 | 551,232 | |
1,781,433 | |||
Commercial Support Services | 0.6 % | ||
AMN Healthcare Services, Inc.(a) | 4,373 | 224,029 | |
Construction Materials | 1.4 % | ||
Trex Co., Inc.(a) | 7,672 | 568,649 | |
Consumer Services | 1.8 % | ||
Bright Horizons Family Solutions, Inc.(a) | 6,450 | 710,016 | |
Containers & Packaging | 2.4 % | ||
AptarGroup, Inc. | 4,066 | 572,533 | |
Ball Corp. | 6,341 | 380,587 | |
953,120 | |||
E-Commerce Discretionary | 1.1 % | ||
Etsy, Inc.(a) | 7,599 | 448,189 | |
Electric Utilities | 1.2 % | ||
Ormat Technologies, Inc. | 6,955 | 498,673 | |
Electrical Equipment | 3.4 % | ||
Allegion PLC | 3,072 | 362,957 | |
nVent Electric PLC | 4,944 | 378,760 | |
Trimble, Inc.(a) | 10,956 | 612,659 | |
1,354,376 |
Percentage of Net Assets | Shares | Value | |
Engineering & Construction | 4.2 % | ||
MYR Group, Inc.(a) | 6,304 | $855,516 | |
Tetra Tech, Inc. | 4,183 | 855,340 | |
1,710,856 | |||
Food | 3.5 % | ||
Darling Ingredients, Inc.(a) | 7,218 | 265,262 | |
Lamb Weston Holdings, Inc. | 9,164 | 770,509 | |
McCormick & Co., Inc. (Non Voting) | 5,149 | 365,270 | |
1,401,041 | |||
Gas & Water Utilities | 0.6 % | ||
Essential Utilities, Inc. | 6,450 | 240,778 | |
Health Care Facilities & Services | 4.7 % | ||
Encompass Health Corp. | 5,346 | 458,633 | |
ICON PLC(a) | 2,340 | 733,520 | |
Quest Diagnostics, Inc. | 5,171 | 707,807 | |
1,899,960 | |||
Industrial Intermediate Products | 1.7 % | ||
Valmont Industries, Inc. | 2,538 | 696,554 | |
Insurance | 4.1 % | ||
Hanover Insurance Group (The), Inc. | 4,907 | 615,534 | |
Horace Mann Educators Corp. | 10,539 | 343,782 | |
Reinsurance Group of America, Inc. | 3,415 | 700,997 | |
1,660,313 | |||
Leisure Facilities & Services | 2.8 % | ||
Domino's Pizza, Inc. | 1,192 | 615,465 | |
InterContinental Hotels Group PLC - ADR | 4,988 | 528,479 | |
1,143,944 | |||
Leisure Products | 0.9 % | ||
YETI Holdings, Inc.(a) | 9,632 | 367,461 | |
Machinery | 5.2 % | ||
Lincoln Electric Holdings, Inc. | 3,569 | 673,256 | |
Middleby (The) Corp.(a) | 5,339 | 654,615 | |
MSA Safety, Inc. | 4,117 | 772,720 | |
2,100,591 | |||
Medical Equipment & Devices | 6.1 % | ||
Azenta, Inc.(a) | 4,534 | 238,579 | |
Merit Medical Systems, Inc.(a) | 10,897 | 936,597 | |
Omnicell, Inc.(a) | 11,702 | 316,773 | |
Penumbra, Inc.(a) | 3,562 | 641,053 | |
TransMedics Group, Inc.(a) | 2,128 | 320,520 | |
2,453,522 | |||
Publishing & Broadcasting | 2.0 % | ||
New York Times (The) Co. - Class A | 15,490 | 793,243 | |
Real Estate Investment Trusts | 5.2 % | ||
Camden Property Trust | 2,918 | 318,383 |
Percentage of Net Assets | Shares | Value | |
CubeSmart | 9,178 | $414,570 | |
EastGroup Properties, Inc. | 3,445 | 585,995 | |
Federal Realty Investment Trust | 3,935 | 397,317 | |
LTC Properties, Inc. | 10,714 | 369,633 | |
2,085,898 | |||
Real Estate Services | 2.2 % | ||
Jones Lang LaSalle, Inc.(a) | 4,337 | 890,299 | |
Renewable Energy | 1.5 % | ||
First Solar, Inc.(a) | 2,370 | 534,340 | |
SolarEdge Technologies, Inc.(a) | 2,640 | 66,687 | |
601,027 | |||
Retail - Consumer Staples | 2.8 % | ||
BJ's Wholesale Club Holdings, Inc.(a) | 12,762 | 1,121,014 | |
Retail - Discretionary | 4.9 % | ||
Burlington Stores, Inc.(a) | 3,979 | 954,960 | |
Freshpet, Inc.(a) | 4,754 | 615,120 | |
Tractor Supply Co. | 1,470 | 396,900 | |
1,966,980 | |||
Semiconductors | 3.8 % | ||
Allegro MicroSystems, Inc.(a) | 25,897 | 731,331 | |
IPG Photonics Corp.(a) | 6,385 | 538,830 | |
Wolfspeed, Inc.(a) | 11,658 | 265,336 | |
1,535,497 | |||
Software | 5.7 % | ||
CyberArk Software Ltd.(a) | 3,993 | 1,091,766 | |
Dynatrace, Inc.(a) | 17,391 | 778,073 | |
Paylocity Holding Corp.(a) | 3,101 | 408,867 | |
2,278,706 | |||
Specialty Finance | 2.0 % | ||
Jack Henry & Associates, Inc. | 4,739 | 786,769 | |
Transportation & Logistics | 1.8 % | ||
JB Hunt Transport Services, Inc. | 4,512 | 721,920 | |
Transportation Equipment | 1.7 % | ||
Westinghouse Air Brake Technologies Corp. | 4,344 | 686,569 | |
Wholesale - Discretionary | 0.7 % | ||
LKQ Corp. | 6,670 | 277,405 | |
TOTAL COMMON STOCKS (Cost $39,167,565) | 39,367,669 | ||
SHORT-TERM INVESTMENTS | 2.4 % | ||
Northern Institutional Treasury Portfolio (Premier Class), 5.15%(b) | 970,891 | 970,891 | |
TOTAL SHORT-TERM INVESTMENTS (Cost $970,891) | 970,891 | ||
TOTAL INVESTMENTS (Cost $40,138,456) | 100.3 % | 40,338,560 | |
NET OTHER ASSETS (LIABILITIES) | (0.3 %) | (118,254 ) | |
NET ASSETS | 100.0 % | $40,220,306 |
(a)Non-income producing security. |
(b)7-day current yield as of June 30, 2024 is disclosed. |
Abbreviations: |
ADR – American Depositary Receipt |
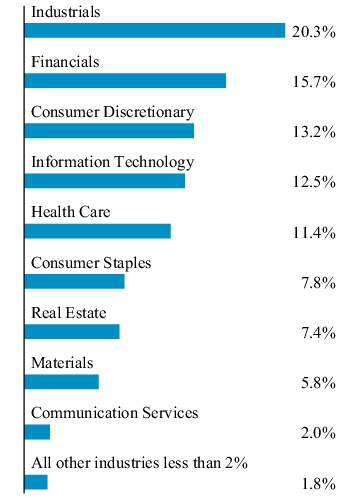
Sector Allocation (Unaudited) | % of Net Assets |
Industrials | 20.3% |
Financials | 15.7 |
Consumer Discretionary | 13.2 |
Information Technology | 12.5 |
Health Care | 11.4 |
Consumer Staples | 7.8 |
Real Estate | 7.4 |
Materials | 5.8 |
Communication Services | 2.0 |
Utilities | 1.8 |
Total | 97.9% |
Trillium ESG Global Equity Fund | Trillium ESG Small/Mid Cap Fund | |
Assets: | ||
Investments, at cost | $631,959,043 | $40,138,456 |
Investments, at value | 947,412,071 | 40,338,560 |
Cash | 125,653 | — |
Foreign currencies (Cost: $363,792 and $0, respectively) | 363,895 | — |
Receivable for dividends | 488,712 | 16,904 |
Reclaims receivable | 2,202,314 | — |
Receivable for investments sold | 11,440,026 | — |
Receivables for capital shares sold | 201,176 | 4,862 |
Prepaid expenses | 19,251 | 12,312 |
Total Assets | 962,253,098 | 40,372,638 |
Liabilities: | ||
Cash overdraft | — | 122 |
Capital shares redeemed payable | 1,905,594 | 65,129 |
Investment advisory fees payable | 675,513 | 38,545 |
Accounting and Administration fees payable | 233,046 | 16,248 |
Shareholder Services fees payable - Institutional Shares | 59,214 | — |
Distribution (Rule 12b-1) fees payable - Investor Shares | 51,709 | — |
Treasurer Service fees payable | 3,180 | 131 |
Accrued Audit fees payable | 60,367 | 24,087 |
Accrued expenses and other payables | 199,284 | 8,070 |
Total Liabilities | 3,187,907 | 152,332 |
Net Assets | $959,065,191 | $40,220,306 |
Net Assets: | ||
Paid in capital | $586,514,878 | $38,188,466 |
Distributable earnings (loss) | 372,550,313 | 2,031,840 |
Net Assets | $959,065,191 | $40,220,306 |
Net Assets: | ||
Investor Shares | $250,806,361 | $— |
Institutional Shares | 708,258,830 | 40,220,306 |
Share of Common Stock Outstanding: | ||
Investor Shares | 4,082,113 | — |
Institutional Shares | 11,587,929 | 2,646,262 |
Net Asset Value per Share: | ||
Investor Shares | $61.44 | $— |
Institutional Shares | 61.12 | 15.20 |
Trillium ESG Global Equity Fund | Trillium ESG Small/Mid Cap Fund | |
Income: | ||
Dividend income (Net of foreign withholding tax and issuance fees of $1,457,134 and 0, respectively) | $17,417,313 | $465,288 |
Income from securities lending, net | 2,210 | — |
Total investment income | 17,419,523 | 465,288 |
Expenses: | ||
Investment advisory fees | 7,674,673 | 305,330 |
Distribution (Rule 12b-1) fees - Investor Shares | 593,925 | — |
Accounting and Administration fees | 695,928 | 63,541 |
Investment advisory waiver recoupments | — | 14,967 |
Treasurer Service fees | 25,190 | 1,103 |
Audit fees | 61,700 | 25,420 |
Shareholder Services - Investor Shares | 33,606 | — |
Shareholder Services - Institutional Shares | 117,714 | — |
Compliance fees | 33,277 | 4,541 |
Trustee fees | 71,765 | 10,566 |
Legal fees | 122,479 | 12,142 |
Registration fees | 166,014 | 27,436 |
Interest expense | 1,864 | 3,172 |
Other | 57,745 | 11,908 |
Expenses before reductions | 9,655,880 | 480,126 |
Less: Expense reductions by investment advisor | — | (80,748 ) |
Net expenses | 9,655,880 | 399,378 |
Net investment income | 7,763,643 | 65,910 |
Realized and Unrealized Gain (Loss) on Investments: | ||
Net realized gains from investment transactions | 72,163,940 | 3,489,313 |
Net realized losses from foreign currency transactions | (176,314 ) | — |
Change in unrealized appreciation (depreciation) on investments | 23,097,019 | (2,278,338 ) |
Change in unrealized appreciation (depreciation) on foreign currency | (20,021 ) | — |
Net realized and unrealized gains from investment activities | 95,064,624 | 1,210,975 |
Net increase (decrease) in net assets resulting from operations | $102,828,267 | $1,276,885 |
Trillium ESG Global Equity Fund | Trillium ESG Small/Mid Cap Fund | |||
2024 | 2023 | 2024 | 2023 | |
Increase (decrease) in net assets: | ||||
Operations: | ||||
Net investment income | $7,763,643 | $6,746,557 | $65,910 | $46,018 |
Net realized gains (losses) from investments and foreign currency transactions | 71,987,626 | 47,769,794 | 3,489,313 | (6,587 ) |
Change in unrealized appreciation (depreciation) on investments and foreign currency | 23,076,998 | 77,394,949 | (2,278,338 ) | 4,728,218 |
Change in net assets resulting from operations | 102,828,267 | 131,911,300 | 1,276,885 | 4,767,649 |
Dividends paid to shareholders: | ||||
From distributable earnings: | ||||
Investor Shares | (13,891,654 ) | (10,810,705 ) | — | — |
Institutional Shares | (38,928,844 ) | (28,695,278 ) | (1,088,247 ) | (1,066,880 ) |
Total dividends paid to shareholders | (52,820,498 ) | (39,505,983 ) | (1,088,247 ) | (1,066,880 ) |
Net Capital Transactions: | ||||
Investor Shares | (10,244,322 ) | (9,397,619 ) | — | — |
Institutional Shares | 25,837,500 | (30,195,193 ) | (3,748,747 ) | 6,902,784 |
Change in net assets from capital transactions | 15,593,178 | (39,592,812 ) | (3,748,747 ) | 6,902,784 |
Total Increase (Decrease) in Net Assets | 65,600,947 | 52,812,505 | (3,560,109 ) | 10,603,553 |
Net assets: | ||||
Beginning of year | 893,464,244 | 840,651,739 | 43,780,415 | 33,176,862 |
End of year | $959,065,191 | $893,464,244 | $40,220,306 | $43,780,415 |
Investor Shares | |||||
Trillium ESG Global Equity Fund | Year Ended June 30, 2024 | Year Ended June 30, 2023 | Year Ended June 30, 2022 | Year Ended June 30, 2021 | Year Ended June 30, 2020 |
Net asset value, beginning of year | $58.42 | $52.71 | $65.97 | $45.99 | $44.81 |
Income (loss) from investment operations: | |||||
Net investment income(a) | 0.39 | 0.33 | 0.20 | 0.06 | 0.10 |
Net realized and unrealized gains (losses) from investments and foreign currency | 5.97 | 7.93 | (11.64 ) | 21.00 | 2.19 |
Total from investment operations | 6.36 | 8.26 | (11.44 ) | 21.06 | 2.29 |
Less distributions paid: | |||||
From net investment income | (0.37 ) | (0.22 ) | (0.03 ) | (0.07 ) | (0.24 ) |
From net realized gains | (2.97 ) | (2.33 ) | (1.79 ) | (1.01 ) | (0.87 ) |
Total distributions paid | (3.34 ) | (2.55 ) | (1.82 ) | (1.08 ) | (1.11 ) |
Change in net asset value | 3.02 | 5.71 | (13.26 ) | 19.98 | 1.18 |
Net asset value, end of year | $61.44 | $58.42 | $52.71 | $65.97 | $45.99 |
Total return | 11.45 % | 16.36 % | (17.94 %) | 46.14 % | 5.02 % |
Ratios/Supplemental data: | |||||
Net assets, end of year (000's) | $250.8 | $248.3 | $232.5 | $297.8 | $217.8 |
Ratio of expenses to average net assets | 1.24 % | 1.31 % | 1.30 % | 1.30 % | 1.30 % |
Ratio of net investment income to average net assets | 0.67 % | 0.60 % | 0.30 % | 0.11 % | 0.22 % |
Portfolio turnover rate(b) | 27.31 % | 10.00 % | 7.00 % | 10.00 % | 11.00 % |
(a) | Net investment income (loss) for the period ended was calculated using the average shares outstanding method. |
(b) | Portfolio turnover is calculated at the fund level without regard to each class of shares. |
Institutional Shares | |||||
Trillium ESG Global Equity Fund | Year Ended June 30, 2024 | Year Ended June 30, 2023 | Year Ended June 30, 2022 | Year Ended June 30, 2021 | Year Ended June 30, 2020 |
Net asset value, beginning of year | $58.15 | $52.50 | $65.70 | $45.80 | $44.61 |
Income (loss) from investment operations: | |||||
Net investment income(a) | 0.53 | 0.48 | 0.41 | 0.23 | 0.22 |
Net realized and unrealized gains (losses) from investments and foreign currency | 5.94 | 7.89 | (11.61 ) | 20.89 | 2.20 |
Total from investment operations | 6.47 | 8.37 | (11.20 ) | 21.12 | 2.42 |
Less distributions paid: | |||||
From net investment income | (0.53 ) | (0.39 ) | (0.21 ) | (0.21 ) | (0.36 ) |
From net realized gains | (2.97 ) | (2.33 ) | (1.79 ) | (1.01 ) | (0.87 ) |
Total distributions paid | (3.50 ) | (2.72 ) | (2.00 ) | (1.22 ) | (1.23 ) |
Change in net asset value | 2.97 | 5.65 | (13.20 ) | 19.90 | 1.19 |
Net asset value, end of year | $61.12 | $58.15 | $52.50 | $65.70 | $45.80 |
Total return | 11.72 % | 16.69 % | (17.70 %) | 46.52 % | 5.34 % |
Ratios/Supplemental data: | |||||
Net assets, end of year (000's) | $708.3 | $645.1 | $608.1 | $622.1 | $360.6 |
Ratio of expenses to average net assets | 1.00 % | 1.03 % | 1.01 % | 1.02 % | 1.03 % |
Ratio of net investment income to average net assets | 0.93 % | 0.89 % | 0.65 % | 0.40 % | 0.49 % |
Portfolio turnover rate(b) | 27.31 % | 10.00 % | 7.00 % | 10.00 % | 11.00 % |
(a) | Net investment income (loss) for the period ended was calculated using the average shares outstanding method. |
(b) | Portfolio turnover is calculated at the fund level without regard to each class of shares. |
Institutional Shares | |||||
Trillium ESG Small/Mid Cap Fund | Year Ended June 30, 2024 | Year Ended June 30, 2023 | Year Ended June 30, 2022 | Year Ended June 30, 2021 | Year Ended June 30, 2020 |
Net asset value, beginning of year | $15.11 | $13.73 | $16.96 | $11.01 | $12.36 |
Income (loss) from investment operations: | |||||
Net investment income (loss)(a) | 0.02 | 0.02 | (0.02 ) | (0.02 ) | 0.04 |
Net realized and unrealized gains (losses) from investments and foreign currency | 0.44 | 1.78 | (2.82 ) | 5.99 | (0.90 ) |
Total from investment operations | 0.46 | 1.80 | (2.84 ) | 5.97 | (0.86 ) |
Less distributions paid: | |||||
From net investment income | (0.01 ) | (0.01 ) | — | (0.02 ) | (0.05 ) |
From net realized gains | (0.36 ) | (0.41 ) | (0.39 ) | — | (0.45 ) |
Total distributions paid | (0.37 ) | (0.42 ) | (0.39 ) | (0.02 ) | (0.50 ) |
Proceeds from redemption fees | — | — (b) | — (b) | — (b) | 0.01 |
Change in net asset value | 0.09 | 1.38 | (3.23 ) | 5.95 | (1.35 ) |
Net asset value, end of year | $15.20 | $15.11 | $13.73 | $16.96 | $11.01 |
Total return | 3.14 % | 13.37 % | (17.16 %) | 54.23 % | (7.34 %) |
Ratios/Supplemental data: | |||||
Net assets, end of year (000's) | $40.2 | $43.8 | $33.2 | $31.7 | $14.0 |
Ratio of net expenses to average net assets | 0.98 % | 0.98 % | 0.98 % | 0.98 % | 0.98 % |
Ratio of net investment income (loss) to average net assets | 0.16 % | 0.12 % | (0.12 %) | (0.15 %) | 0.34 % |
Ratio of gross expenses to average net assets | 1.18 % | 1.39 % | 1.36 % | 1.77 % | 1.93 % |
Portfolio turnover rate | 31.34 % | 26.00 % | 21.00 % | 20.00 % | 35.00 % |
(a) | Net investment income (loss) for the period ended was calculated using the average shares outstanding method. |
(b) | Amount is less than $0.005 per share. |
Professionally Managed Portfolios ("PMP") | Perpetual Americas Funds Trust |
Trillium ESG Global Equity Fund | Trillium ESG Global Equity Fund |
Retail Class | Investor Shares |
Institutional Class | Institutional Shares |
Trillium ESG Small/Mid Cap Fund | Trillium ESG Small/Mid Cap Fund |
Institutional Class | Institutional Shares |
Fund Name | Record Date Outstanding Shares | Total Voted Shares | % of Outstanding Shares Voted | % of Voted Shares “FOR” Proposal |
Trillium ESG Global Equity Fund | 15,221,629 | 8,086,529 | 53.13% | 89.90% |
Trillium ESG Small/Mid Cap Fund | 2,804,875 | 1,704,954 | 60.79% | 99.37% |
Fund | Level 1 - Quoted Prices | Level 2 - Other Significant Observable Inputs | Level 3 - Significant Unobservable Inputs | Total |
Trillium ESG Global Equity Fund | ||||
Common Stocks | ||||
Automotive | $3,983,307 | $15,630,240 | $— | $19,613,547 |
Banking | 29,245,142 | 35,281,744 | — | 64,526,886 |
Biotechnology & Pharmaceuticals | 21,393,917 | 45,388,048 | — | 66,781,965 |
Chemicals | 10,683,820 | 12,802,881 | — | 23,486,701 |
Commercial Support Services | 10,963,329 | 20,381,959 | — | 31,345,288 |
Construction Materials | — | 5,868,196 | — | 5,868,196 |
Electric Utilities | — | 6,611,946 | — | 6,611,946 |
Electrical Equipment | 16,419,299 | 7,148,559 | — | 23,567,858 |
Food | 6,136,381 | 19,346,628 | — | 25,483,009 |
Home Construction | — | 8,213,332 | — | 8,213,332 |
Household Products | — | 30,389,006 | — | 30,389,006 |
Industrial Intermediate Products | — | 11,791,703 | — | 11,791,703 |
Industrial Support Services | — | 8,625,426 | — | 8,625,426 |
Insurance | 9,111,869 | 21,011,014 | — | 30,122,883 |
Machinery | — | 16,059,237 | — | 16,059,237 |
Medical Equipment & Devices | 19,613,025 | 13,221,495 | — | 32,834,520 |
Retail - Consumer Staples | 14,496,521 | 6,670,281 | — | 21,166,802 |
Retail - Discretionary | 33,514,537 | 7,862,179 | — | 41,376,716 |
Semiconductors | 93,555,163 | 9,037,669 | — | 102,592,832 |
Software | 81,348,408 | 17,275,664 | — | 98,624,072 |
Transportation & Logistics | 15,167,267 | 5,276,774 | — | 20,444,041 |
Other* | 243,846,489 | — | — | 243,846,489 |
Total common stocks | $609,478,474 | $323,893,981 | $ — | $933,372,455 |
Preferred stocks* | $7,174,651 | $— | $— | $7,174,651 |
Short-Term Investments | 6,864,965 | — | — | 6,864,965 |
Total Investments | $623,518,090 | $323,893,981 | $ — | $947,412,071 |
Trillium ESG Small/Mid Cap Fund | ||||
Common Stocks* | $39,367,669 | $— | $— | $39,367,669 |
Short-Term Investments | 970,891 | — | — | 970,891 |
Total Investments | $40,338,560 | $ — | $ — | $40,338,560 |
* | See additional categories in the Schedule of Investments. |
Common Stocks | |
Balance as of June 30, 2023 | $4,121,466 |
Acquisitions | — |
Dispositions | (3,404,322 ) |
Accrued discounts/premiums | — |
Realized gain (loss) | (1,601,685 ) |
Change in unrealized appreciation/(depreciation) | 884,541 |
Transfer in and/or out of Level 3 | — |
Balance as of June 30, 2024 | $ — |
what fits within this category of investments. As a result, the Fund may invest in issuers that do not reflect the beliefs and values of any particular investor. Trillium’s exclusion of certain investments from the Fund’s investment universe may adversely affect the Fund’s relative performance at times when such investments are performing well.
Fund | Class | Advisory Fee | Expense Limitation* |
Trillium ESG Global Equity Fund | Investor | 0.85%(a) | 1.24% |
Trillium ESG Global Equity Fund | Institutional | 0.85%(a) | 0.99% |
Trillium ESG Small/Mid Cap Fund | Institutional | 0.75% | 0.97% |
* | Effective October 30, 2023. |
(a) | 0.72% of average daily net assets in excess of $1 billion. |
Fund | Advisory Fee to PAFS | Expenses Reduced by PAFS | Advisory Waivers Recouped by PAFS |
Trillium ESG Global Equity Fund | $5,296,933 | $— | $— |
Trillium ESG Small/Mid Cap Fund | 204,495 | — | 14,967 |
For the year ended: | Expiring | Trillium ESG Global Equity Fund | Trillium ESG Small/Mid Cap Fund |
Year ended June 30, 2022 | June 30, 2025 | $ — | $119,452 |
Year ended June 30, 2023 | June 30, 2026 | — | 158,734 |
Year ended June 30, 2024 | June 30, 2027 | — | 80,748 |
Balances of Recoverable Expenses to PAFS | $ — | $358,934 |
Fund | Dollar Amount | Days Outstanding | Rate |
Trillium ESG Global Equity Fund | $5,000,000 | 2 | 6.71 % |
Trillium ESG Small/Mid Cap Fund | 745,435 | 23 | 6.61 |
Fund | Cost of Purchases | Proceeds from sales |
Trillium ESG Global Equity Fund | $244,067,741 | $284,061,378 |
Trillium ESG Small/Mid Cap Fund | 12,623,230 | 17,396,719 |
Fund | Cost | Gross Unrealized Appreciation | Gross Unrealized (Depreciation) | Net Unrealized Appreciation (Depreciation) |
Trillium ESG Global Equity Fund | $632,125,768 | $341,848,720 | $ (26,562,417 ) | $315,286,303 |
Trillium ESG Small/Mid Cap Fund | 40,477,374 | 5,006,249 | (5,145,063 ) | (138,814 ) |
Distributions From | ||||
Fund | Ordinary Income 2024 | Long-Term Capital Gains** 2024 | Ordinary Income 2023 | Long-Term Capital Gains 2023 |
Trillium ESG Global Equity Fund | $7,365,404 | $45,455,094 | $5,129,550 | $34,376,433 |
Trillium ESG Small/Mid Cap Fund | 42,401 | 1,045,846 | 24,265 | 1,042,615 |
** | The amounts do not include tax equalization utilized of $3,368,255 and $284,892 in net long term capital gains in which the Global Equity Fund and SMID Fund, respectively, designated as being distributed to shareholders on their redemption of shares. |
Fund | Undistributed Ordinary Income | Undistributed Long-Term Capital Gains | Accumulated Capital and Other Losses | Other Temporary Differences | Unrealized Appreciation (Depreciation) | Total Accumulated Earnings (Deficit) |
Trillium ESG Global Equity Fund | $5,804,686 | $51,478,548 | $— | $— | $315,267,079 | $372,550,313 |
Trillium ESG Small/Mid Cap Fund | 51,573 | 2,119,081 | — | — | (138,814 ) | 2,031,840 |
Fund | Distributable Earnings (Loss) | Paid-in Capital |
Trillium ESG Global Equity Fund | $ (3,368,255 ) | $3,368,255 |
Trillium ESG Small/Mid Cap Fund | (284,892 ) | 284,892 |
Fund | Class | Proceeds from Shares Sold | Reinvestments of Dividends | Payments for Shares Redeemed | Net Increase (Decrease) in Net Assets |
Trillium ESG Global Equity Fund | Investor Shares | $18,968,767 | $13,520,206 | $ (42,733,295) | $ (10,244,322) |
Trillium ESG Global Equity Fund | Institutional Shares | 122,029,135 | 33,460,954 | (129,652,589) | 25,837,500 |
Trillium ESG Small/Mid Cap Fund | Institutional Shares | 9,513,933 | 962,668 | (14,225,348) | (3,748,747) |
Fund | Class | Shares Sold | Shares From Reinvested Dividends | Shares Redeemed | Net Increase (Decrease) in Shares |
Trillium ESG Global Equity Fund | Investor Shares | 330,544 | 242,211 | (741,516) | (168,761) |
Trillium ESG Global Equity Fund | Institutional Shares | 2,141,524 | 603,335 | (2,251,384) | 493,475 |
Trillium ESG Small/Mid Cap Fund | Institutional Shares | 642,663 | 66,163 | (960,095) | (251,269) |
Fund | Class | Proceeds from Shares Sold | Reinvestments of Dividends | Payments for Shares Redeemed | Net Increase (Decrease) in Net Assets |
Trillium ESG Global Equity Fund | Investor Shares | $14,201,851 | $10,444,225 | $ (34,043,695) | $ (9,397,619) |
Trillium ESG Global Equity Fund | Institutional Shares | 133,691,106 | 24,091,969 | (187,978,268) | (30,195,193) |
Trillium ESG Small/Mid Cap Fund | Institutional Shares | 11,505,929 | 1,037,417 | (5,640,562) | 6,902,784 |
Fund | Class | Shares Sold | Shares From Reinvested Dividends | Shares Redeemed | Net Increase (Decrease) in Shares |
Trillium ESG Global Equity Fund | Investor Shares | 263,771 | 204,268 | (628,826) | (160,787) |
Trillium ESG Global Equity Fund | Institutional Shares | 2,499,654 | 474,065 | (3,462,078) | (488,359) |
Trillium ESG Small/Mid Cap Fund | Institutional Shares | 799,058 | 75,067 | (392,813) | 481,312 |
Chicago, Illinois
August 22, 2024
Fund | QDI Percentage |
Trillium ESG Global Equity Fund | 100.00 % |
Trillium ESG Small/Mid Cap Fund | 100.00 % |
Fund | Corporate DRD Percentage |
Trillium ESG Global Equity Fund | 85.63 % |
Trillium ESG Small/Mid Cap Fund | 100.00 % |
Investment Subadviser
Trillium Asset Management, LLC
1 Congress St, Suite 3101
Boston, MA 02114
Investment Adviser
Perpetual Americas Funds Services
1 Congress St, Suite 3101
Boston, MA 02114
Custodian
The Northern Trust Company
50 South LaSalle Street
Chicago, Illinois 60603
Independent Registered
Public Accounting Firm
PricewaterhouseCoopers LLP
One North Wacker Drive
Chicago, Illinois 60606
Legal Counsel
Ropes & Gray LLP
Prudential Tower, 800 Boylston Street
Boston, Massachusetts 02199
Distributor
Perpetual Americas Funds Distributors, LLC
3 Canal Plaza, Suite 100
Portland, Maine 04101
For Additional Information, call
866-260-9549 (toll free) or 312-557-5913
Item 8. Changes in and Disagreements with Accountants for Open-End Management Investment Companies.
Included as part of the Financial Statements under Item 7 of this Form N-CSR.
Item 9. Proxy Disclosures for Open-End Management Investment Companies.
Included as part of the Financial Statements under Item 7 of this Form N-CSR.
Item 10. Remuneration Paid to Directors, Officers, and Others of Open-End Management Investment Companies.
Included as part of the Financial Statements under Item 7 of this Form N-CSR.
Item 11. Statement Regarding Basis for Approval of Investment Advisory Contract.
Included as part of the Financial Statements under Item 7 of this Form N-CSR.
Item 12. Disclosure of Proxy Voting Policies and Procedures for Closed-End Management Investment Companies.
Not applicable.
Item 13. Portfolio Managers of Closed-End Management Investment Companies.
Not applicable.
Item 14. Purchases of Equity Securities by Closed-End Management Investment Company and Affiliated Purchasers.
Not applicable.
Item 15. Submission of Matters to a Vote of Security Holders.
Not applicable.
Item 16. Controls and Procedures.
(a) The registrant’s principal executive officer and principal financial officer have concluded, based on their evaluation of the registrant’s disclosure controls and procedures as conducted within 90 days of the filing date of this report, that these disclosure controls and procedures are adequately designed and are operating effectively to ensure that information required to be disclosed by the registrant on Form N-CSR is recorded, processed, summarized and reported within the time periods specified in the Securities and Exchange Commission’s rules and forms.
(b) There were no changes in the registrant’s internal control over financial reporting (as defined in Rule 30a-3(d) under the Investment Company Act of 1940) that occurred during the period covered by this report that have materially affected or are reasonably likely to materially affect, the registrant’s internal control over financial reporting.
Item 17. Disclosure of Securities Lending Activities for Closed-End Management Investment Companies.
Not applicable.
Item 18. Recovery of Erroneously Awarded Compensation.
Not applicable.
Item 19. Exhibits.
(a)(2) Not applicable.
(a)(3) Certifications pursuant to Rule 30a-2(a) are filed herewith.
(a)(4) Not applicable.
(a)(5) The previous independent public accountant's letter is filed herewith.
(b) Certification pursuant to Rule 30a-2(b) is furnished herewith.
SIGNATURES
Pursuant to the requirements of the Securities Exchange Act of 1934 and the Investment Company Act of 1940, the registrant has duly caused this report to be signed on its behalf by the undersigned, thereunto duly authorized.
Perpetual Americas Funds Trust
|
|
|
By: |
| /s/ Troy Sheets |
|
| Troy Sheets |
|
| Treasurer and Principal Financial Officer |
|
| |
Date: |
| September 4, 2024 |
Pursuant to the requirements of the Securities Exchange Act of 1934 and the Investment Company Act of 1940, this report has been signed below by the following persons on behalf of the registrant and in the capacities and on the dates indicated.
|
|
|
By: |
| /s/ Jonathan Weitz |
|
| Jonathan Weitz |
|
| President and Principal Executive Officer |
|
| |
Date: |
| September 4, 2024 |
|
|
|
By: |
| /s/ Troy Sheets |
|
| Troy Sheets |
|
| Treasurer and Principal Financial Officer |
|
| |
Date: |
| September 4, 2024 |