UNITED STATES
SECURITIES AND EXCHANGE COMMISSION
Washington, D.C. 20549
FORM N-CSR
CERTIFIED SHAREHOLDER REPORT OF REGISTERED
MANAGEMENT INVESTMENT COMPANIES
Investment Company Act file number: 811 - 23615
JOHCM Funds Trust
(Exact name of registrant as specified in charter)
53 State Street, 13th Floor
Boston, Massachusetts 02109
(Address of principal executive offices) (Zip code)
Mary Lomasney
53 State Street, 13th Floor
Boston, Massachusetts 02109
(Name and address of agent for service)
Registrant’s telephone number, including area code: (617) 933 - 0712
Date of fiscal year end: September 30
Date of reporting period: September 30, 2023
Form N-CSR is to be used by management investment companies to file reports with the Commission not later than 10 days after the transmission to stockholders of any report that is required to be transmitted to stockholders under Rule 30e-1 under the Investment Company Act of 1940 (17 CFR 270.30e-1). The Commission may use the information provided on Form N-CSR in its regulatory, disclosure review, inspection, and policymaking roles.
A registrant is required to disclose the information specified by Form N-CSR, and the Commission will make this information public. A registrant is not required to respond to the collection of information contained in Form N-CSR unless the Form displays a currently valid Office of Management and Budget (“OMB”) control number. Please direct comments concerning the accuracy of the information collection burden estimate and any suggestions for reducing the burden to Secretary, Securities and Exchange Commission, 450 Fifth Street, NW, Washington, DC 20549-0609. The OMB has reviewed this collection of information under the clearance requirements of 44 U.S.C. § 3507.
Item 1. Reports to Stockholders.
(a) The following is a copy of the report transmitted to shareholders pursuant to Rule 30e-1 under the Investment Company Act of 1940 (17 CFR 270.30e-1).

ANNUAL REPORT
SEPTEMBER 30, 2023
The Securities and Exchange Comission (“SEC”) recently adopted a rule requiring mutual funds to produce “concise and visually engaging” annual and semi-annual reports to shareholders. This streamlined format is intended to highlight key information for retail shareholders to permit them to assess and monitor their fund investments. More detailed information that has historically been part of shareholder reports, such as the shareholder letter, financial statements and financial highlights, will not appear in the new streamlined shareholder reports, but will be available free of charge upon request to the Fund or via the Fund’s Form N-CSR filed with the SEC on its EDGAR database. The compliance date for funds to implement streamlined shareholder reports is July 24, 2024; therefore, the Funds will issue its first streamlined shareholder reports beginning with its September 30, 2024 annual report. The new rule requires that each series and class of a mutual fund issue a separate streamlined shareholder report. For example, if you are a shareholder of two (2) share classes of four (4) series of the JOHCM Funds Trust, you will receive eight (8) separate streamlined shareholder reports, one for each share class of each Fund, upon implementation of the new rule. In addition, the new rule requires that a hard copy of a Fund’s streamlined shareholder report be mailed to each shareholder, unless the shareholder elects to receive such reports electronically. If you wish to `opt-in’ for electronic delivery of the Funds’ annual and semi-annual shareholder reports, please contact your financial advisor (or for direct shareholders, please contact the Funds at 866-260-9549 (toll free) or 312-557-5913) for assistance in enrolling your account in paperless (i.e., electronic) delivery of shareholder materials.
This report is submitted for the general information of the shareholders of the Funds. It is not authorized for the distribution to prospective investors unless preceded or accompanied by an effective prospectus.
JOHCM FUNDS TRUST
TABLE OF CONTENTS
September 30, 2023

DEAR SHAREHOLDER:
I am pleased to present the Annual Report for the 12-months ended September 30, 2023, for each series of JOHCM Funds Trust (the “Trust”).
On January 23, 2023, Perpetual Limited completed the acquisition of Pendal Group Limited (“Pendal”), the parent of JOHCM (USA) Inc (“JOHCM”) and Thompson, Siegel & Walmsley LLC (“TSW”). The acquisition created a global leader in multi-boutique asset management with significant scale, diversified investment strategies, world-class environment, social and governance “ESG” capabilities and a stronger global distribution capability, complemented by high-quality wealth management and trustee businesses. Perpetual’s total assets under management as of September 30, 2023, were approximately $136.6 billion.
In the U.S., the acquisition brings the investment expertise of Trillium Asset Management (“Trillium”) and Barrow, Hanley, Mewhinney & Strauss under the same ownership as JOHCM and TSW. The combined Perpetual Limited U.S. business represents $77.5 billion in assets under management across 52 strategies available in the U.S. as of September 30, 2023.
Trillium, based in Boston, is a leading specialist ESG investment firm with assets under management of $4.5 billion dollars, across eight key strategies as of September 30, 2023. Trillium has a team of 61 staff, including 24 investment professionals with an investment process that integrates ESG factors to identify the companies best positioned to deliver strong long-term performance.
On October 30, 2023, the Trillium ESG Global Equity Fund and the Trillium ESG Small/Mid Cap Fund were reorganized as new series of the Trust. The reorganizations add a third affiliate of Perpetual in the U.S. to the Trust platform and expand the Trust’s product offering for clients.
It is anticipated that the Trust will be rebranded as “Perpetual Americas Funds Trust” in Q1 2024 to strategically align with Perpetual Limited and acknowledge the evolution into a multi-affiliate, investment management structure.
We thank you for the continued trust and confidence that you have placed in us.
Respectfully submitted,

Jonathan Weitz
President
i
JOHCM FUNDS TRUST
PORTFOLIO COMMENTARY
September 30, 2023 (Unaudited)
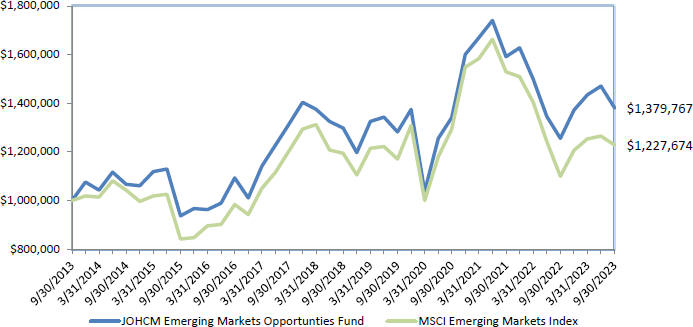
JOHCM Emerging Markets Opportunities Fund
Change in value of a hypothetical $1,000,000 investment in the Fund’s Institutional Shares
from September 30, 2013 to September 30, 2023
| | | | | | | | | | | | | | | | | | | | |
Average Annual Total Returns as of September 30, 2023 | |
| | | | | |
| | | One Year | | | Five Year | | | Ten Year | | | Gross Expense | | | Net Expense | |
| | | Return | | | Return | | | Return | | | Ratio * | | | Ratio * | |
Institutional Shares | | | 9.89 | % | | | 1.23 | % | | | 3.27 | % | | | 1.03 | % | | | 1.03 | % |
Advisor Shares | | | 9.83 | % | | | 1.13 | % | | | 3.18 | % | | | 1.11 | % | | | 1.11 | % |
Investor Shares | | | 9.63 | % | | | 0.98 | % | | | 3.04 | % | | | 1.26 | % | | | 1.26 | % |
MSCI Emerging Markets Index | | | 11.70 | % | | | 0.55 | % | | | 2.07 | % | | | — | | | | — | |
Data as of September 30, 2023. The Fund’s performance reflects the performance of the predecessor JOHCM Emerging Markets Opportunities Fund of the Advisers Investment Trust and the predecessor JOHCM Emerging Markets Opportunities Fund of the Scotia Institutional Funds for periods prior to the reorganization into the JOHCM Funds Trust on July 19, 2021. The performance also reflects the reinvestment of dividends as well as the impact of transaction costs and the deduction of fees and expenses. The performance does not reflect taxes that a shareholder would pay on Fund distributions or on the redemption of Fund shares.
The Institutional Shares, Advisor Shares, and Investor Shares of the Fund commenced operations on July 19, 2021. Historical performance for Institutional Shares, Advisor Shares, and Investor Shares prior to their inception is based on performance of predecessor share classes of the predecessor JOHCM Emerging Markets Opportunities Fund of the Advisers Investment Trust and the predecessor JOHCM Emerging Markets Opportunities Fund of the Scotia Institutional Funds.
Historical performance for Investor Shares prior to its July 19, 2021 inception is based on the performance of the Class II Shares predecessor share class. The performance of the Class II Shares predecessor share class, which commenced operations on December 18, 2013, is based on the performance of the Class I Shares predecessor share class, which commenced operations on November 21, 2012, for periods prior to the Class II Shares predecessor share class inception date. Performance of the Class II Shares predecessor share class was adjusted to reflect differences in expenses.
| * | Expense ratios are per the most recent Fund Prospectus dated January 27, 2023, as revised from time to time. The Adviser has entered into a contractual expense limitation agreement with respect to the Fund until January 28, 2024. |
ii
JOHCM FUNDS TRUST
PORTFOLIO COMMENTARY
September 30, 2023 (Unaudited)
The performance data quoted represents past performance; past performance does not guarantee future results. The investment return and principal value of an investment will fluctuate so that an investor’s shares, when redeemed, may be worth more or less than their original cost. The Fund’s current performance may be lower or higher than the performance data quoted. Investors may obtain performance information current to the most recent month-end, within 7 business days, by calling 866-260-9549 or 312-557-5913.
The Fund’s benchmark for performance comparison purposes is the Morgan Stanley Capital International (“MSCI”) Emerging Markets Index. The Index is a free float-adjusted market capitalization index that is designed to measure equity market performance in the global emerging markets. The table reflects the theoretical reinvestment of dividends on securities in the Index. The impact of transaction costs and the deduction of expenses associated with a mutual fund, such as investment management and administration fees, are not reflected in the Index calculations. It is not possible to invest directly in an index.
Investment Philosophy and Process
The Fund seeks long-term capital appreciation by investing, under normal circumstances, at least 80% of its net assets (plus the amount of any borrowings for investment purposes) in equity securities of companies located in emerging market countries. Emerging market countries are those countries included in the MSCI Emerging Markets Index and MSCI Frontier Markets Index, countries with low to middle-income economies according to the International Bank for Reconstruction and Development (more commonly referred to as the World Bank) and other countries with similar emerging market characteristics. The Fund may invest in companies of any size, including small- and mid-capitalization companies. The Fund may also invest up to 5% of its assets in frontier markets, which are generally smaller, less liquid, and less developed than emerging markets.
Performance
The 12-month period ended September 30, 2023 was a positive one for global equity markets, including emerging markets, although most of the gains came in the early part of the period. An end to lockdowns in China, a period of stable bond yields, a weaker U.S. dollar and lower energy prices drove a powerful recovery in equity markets from October 2022 to January 2023. However, the later part of the period saw a return to rising bond yields, a stronger dollar and a higher oil price. Overall, the MSCI Emerging Markets Index returned 11.7% for the 12 months ended September 30, 2023.
At the start of the period, Chinese authorities began a controlled re-opening of the economy. The Chinese economy then began a weak and asymmetric recovery. Parts of the consumer and services economy benefited from re-opening, but data from the manufacturing and real estate sectors largely reflected weak economic conditions. In the financial system, money supply growth failed to stimulate loan growth, reflecting the continuing build-up of deposits by cautious households and companies. MSCI China returned 5.2% for the 12 months ended September 30, 2023. The Fund’s portfolio remained underweight in China during the period, which positively contributed to performance.
The markets more exposed to technology and manufacturing recovered from weak prior performance. MSCI Korea returned 26.2% and MSCI Taiwan 21.8% for the 12 months ended September 30, 2023, despite ongoing challenges from weak exports and growth. Noting the ongoing slowdown in global trade relative to industrial production, we remained underweight in these two markets, which detracted from performance.
Despite a difficult external macroeconomic environment, healthy trade dynamics enabled domestic demand growth in traditionally high-beta, weaker current account economies. We held overweight positions in Indonesia, India and Mexico in the period. We also held an overweight position in Brazil, where growth has been slower to recover, but where large interest rate cuts are being delivered by the central bank. The equity markets in this group of countries had varied performance in the period. MSCI Mexico returned 33.6%, MSCI Brazil 15.2%, MSCI India 10.1% and MSCI Indonesia 1.5% for the 12 months ended September 30, 2023. Within this group, we increased our allocation to Indonesia and rotated our holdings in Brazil away from commodity exporters and towards interest-rate-sensitive companies.
iii
JOHCM FUNDS TRUST
PORTFOLIO COMMENTARY
September 30, 2023 (Unaudited)
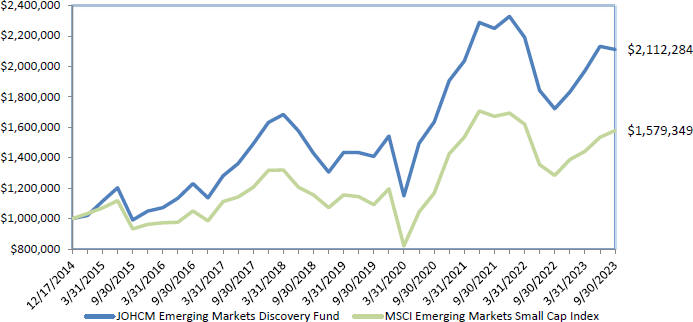
JOHCM Emerging Markets Discovery Fund
Change in value of a hypothetical $1,000,000 investment in the Fund’s Institutional Shares
from December 17, 2014 to September 30, 2023
| | | | | | | | | | | | | | | | | | | | |
| Average Annual Total Returns as of September 30, 2023 | |
| | | | | |
| | | One Year | | | Five Year | | | Since Inception | | | Gross Expense | | | Net Expense | |
| | | Return | | | Return | | | Return | | | Ratio * | | | Ratio * | |
Institutional Shares | | | 22.58 | % | | | 8.12 | % | | | 8.88 | % | | | 1.76 | % | | | 1.49 | % |
Advisor Shares | | | 22.49 | % | | | 8.05 | % | | | 8.79 | % | | | 1.86 | % | | | 1.59 | % |
MSCI Emerging Markets Small Cap Index | | | 23.06 | % | | | 6.45 | % | | | 5.34 | % | | | — | | | | — | |
Data as of September 30, 2023. The Fund’s performance reflects the performance of the predecessor JOHCM Emerging Markets Small Mid Cap Equity Fund of the Advisers Investment Trust for periods prior to the reorganization into the JOHCM Funds Trust on July 19, 2021. The performance also reflects the reinvestment of dividends as well as the impact of transaction costs and the deduction of fees and expenses. The performance does not reflect taxes that a shareholder would pay on Fund distributions or on the redemption of Fund shares.
The Institutional Shares and Advisor Shares of the Fund commenced operations on July 19, 2021. Historical performance for Institutional Shares and Advisor Shares prior to their inception is based on performance of predecessor share classes of the JOHCM Emerging Markets Small Mid Cap Equity Fund of the Advisers Investment Trust.
Historical performance for Advisor Shares prior to its July 19, 2021 inception is based on the performance of the Class I Shares predecessor share class. The performance of the Class I Shares predecessor share class, which commenced operations on January 28, 2016, is based on performance of the Institutional Shares predecessor share class, which commenced operations on December 17, 2014, for periods prior to the Class I Shares predecessor share class inception date. Performance of the Class I Shares predecessor share class was adjusted to reflect differences in expenses.
| * | Expense ratios are per the most recent Fund Prospectus dated January 27, 2023, as revised from time to time. The Adviser has entered into a contractual expense limitation agreement with respect to the Fund until January 28, 2024. |
The performance data quoted represents past performance; past performance does not guarantee future results. The investment return and principal value of an investment will fluctuate so that an iv investor’s shares, when redeemed, may be worth more or less
iv
JOHCM FUNDS TRUST
PORTFOLIO COMMENTARY
September 30, 2023 (Unaudited)
than their original cost. The Fund’s current performance may be lower or higher than the performance data quoted. Investors may obtain performance information current to the most recent month-end, within 7 business days, by calling 866-260-9549 or 312-557-5913.
The Fund’s benchmark for performance comparison purposes is the Morgan Stanley Capital International (“MSCI”) Emerging Markets Small Cap Index. The Index includes small cap representation across 24 Emerging Markets countries and covers approximately 14% of the free float-adjusted market capitalization in each country. The table reflects the theoretical reinvestment of dividends on securities in the Index. The impact of transaction costs and the deduction of expenses associated with a mutual fund, such as investment management and administration fees, are not reflected in the Index calculations. It is not possible to invest directly in an index.
Investment Philosophy and Process
The Fund seeks long-term capital appreciation by investing, under normal circumstances, at least 80% of its net assets (plus the amount of any borrowings for investment purposes) in equity securities issued by companies located in emerging markets, including frontier markets. Equity securities include common and preferred stocks, and include rights and warrants to subscribe to common stock or other equity securities. The Fund may achieve its equity exposure either directly or indirectly, such as through depositary receipts, exchange-traded funds and participatory notes (commonly known as “P-notes”). Emerging market countries are those countries included in the MSCI Emerging Markets Index and MSCI Frontier Markets Index, countries with low to middle-income economies according to the International Bank for Reconstruction and Development (more commonly referred to as the World Bank), and other countries with similar emerging market characteristics.
Performance
In a challenging and volatile year for most asset classes, emerging markets experienced an equally, if not even more chaotic period partially reflective of the developments in developed markets. In addition to the uncertainties surrounding the rate environment in the U.S., the slowdown in the Chinese domestic economy and the balance sheet challenges hovering over the country’s property sector created strong headwinds for emerging markets equities. Furthermore, the continuation of the war in Ukraine has exacerbated issues with higher commodity prices and disrupted supply chains, intensifying the magnitude of market moves. The positive countries for the Fund were Taiwan, Greece, and Indonesia (relatively speaking). In particular, the Fund benefited meaningfully from its exposure to the rise in the artificial intelligence (AI) sector. Taiwan’s technology supply chain is the backbone of AI servers and the Fund’s fast action and timely exposure to the AI supply chain at the beginning of the year drove significant alpha generation.
For the 12-month period ended September 30, 2023 the Fund underperformed in South Korea and Mexico. In South Korea, Ray Co Ltd and Hyundai Mipo drove negative attribution as both companies missed earnings expectations. In Mexico, Volaris, a low-cost airline based in the country, came under pressure during the period as a result of higher jet fuel cost and unforeseen problems with its fleet’s engine performance.
v
JOHCM FUNDS TRUST
PORTFOLIO COMMENTARY
September 30, 2023 (Unaudited)
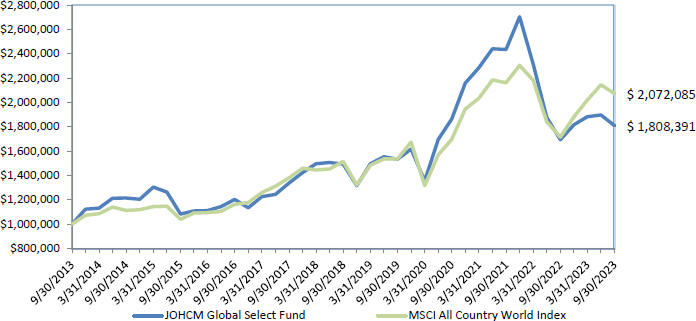
JOHCM Global Select Fund
Change in value of a hypothetical $1,000,000 investment in the Fund’s Institutional Shares
from September 30, 2013 to September 30, 2023
| | | | | | | | | | | | | | | | | | | | |
| Average Annual Total Returns as of September 30, 2023 | |
| | | | | |
| | | One Year | | | Five Year | | | Ten Year | | | Gross Expense | | | Net Expense | |
| | | Return | | | Return | | | Return | | | Ratio * | | | Ratio * | |
Institutional Shares | | | 6.74 | % | | | 3.89 | % | | | 6.10 | % | | | 0.99 | % | | | 0.98 | % |
Advisor Shares | | | 6.73 | % | | | 3.81 | % | | | 6.01 | % | | | 1.09 | % | | | 1.08 | % |
MSCI All Country World Index | | | 20.80 | % | | | 6.46 | % | | | 7.56 | % | | | — | | | | — | |
Data as of September 30, 2023. The Fund’s performance reflects the performance of the predecessor JOHCM Global Equity Fund of the Advisers Investment Trust and the predecessor JOHCM Global Equity Fund of the Scotia Institutional Funds for periods prior to the reorganization into the JOHCM Funds Trust on July 19, 2021. The performance also reflects the reinvestment of dividends as well as the impact of transaction costs and the deduction of fees and expenses. The performance does not reflect taxes that a shareholder would pay on Fund distributions or on the redemption of Fund shares.
The Institutional Shares and Advisor Shares of the Fund commenced operations on July 19, 2021. Historical performance for Institutional Shares and Advisor Shares prior to their inception is based on performance of predecessor share classes of the predecessor JOHCM Global Equity Fund of the Advisers Investment Trust and the predecessor JOHCM Global Equity Fund of the Scotia Institutional Funds.
| * | Expense ratios are per the most recent Fund Prospectus dated January 27, 2023, as revised from time to time. The Adviser has entered into a contractual expense limitation agreement with respect to the Fund until January 28, 2024. |
The performance data quoted represents past performance; past performance does not guarantee future results. The investment return and principal value of an investment will fluctuate so that an investor’s shares, when redeemed, may be worth more or less than their original cost. The Fund’s current performance may be lower or higher than the performance data quoted. Investors may obtain performance information current to the most recent month-end, within 7 business days, by calling 866-260-9549 or 312-557-5913.
vi
JOHCM FUNDS TRUST
PORTFOLIO COMMENTARY
September 30, 2023 (Unaudited)
The Fund’s benchmark for performance comparison purposes is the Morgan Stanley Capital International (“MSCI”) All Country World Index (ACWI). The Index is a free float-adjusted market capitalization weighted index that is designed to measure the equity market performance of developed and emerging markets. The table reflects the theoretical reinvestment of dividends on securities in the Index. The impact of transaction costs and the deduction of expenses associated with a mutual fund, such as investment management and administration fees, are not reflected in the Index calculations. It is not possible to invest directly in an index.
Investment Philosophy and Process
The Fund seeks long-term capital appreciation by investing primarily in common stocks and other equity securities of U.S. and non-U.S. companies, including direct and indirect investments in common and preferred stock, rights, and warrants. The Fund may obtain its exposure to equity securities indirectly through participatory notes, depositary receipts and exchange-traded funds. The Fund can invest without limit in non-U.S. securities and can invest in any country, including emerging market countries. The Fund normally invests at least 40% of its assets in companies located in countries other than the U.S., provided that the Fund reserves the flexibility to invest as little as 30% of its assets in companies located outside the U.S. when market conditions are unfavorable. Notwithstanding the previous sentence, the Fund may invest a percentage lower than 40% in such non-U.S. securities if the weighting of non-U.S. securities in the Fund’s performance benchmark (currently, the MSCI ACWI) drops below 45%, in which case the minimum level for investments in non-U.S. securities must remain within 5% of the benchmark’s weighting (e.g. if the weighting of non-U.S. securities in the Fund’s performance benchmark is 38%, the minimum level for investing in non-U.S. securities for the Fund would be 33%). Typically, the Fund invests in a number of different countries. The Fund is not required to allocate its investments in any set percentages in any particular countries. The Fund may invest in companies of any size, including small- and mid-capitalization companies, in order to achieve its objective.
Performance
The Fund underperformed its benchmark, the MSCI ACWI Index for the 12 months ended September 30, 2023. The past year was a wild ride for the markets. Firstly, turmoil in the U.S. and European banking sector (e.g., Silicon Valley Bank, Signature Bank, and Credit Suisse crises) initially weighed on equity returns, then quick central bank and regulatory intervention prompted an equity bounce. Secondly, the S&P 500 shows a notable dispersion when compared to the top 10 largest stocks in the index, with the latter significantly outperforming the former. This is the widest dispersion between the top 10 and the rest of the index since records began, and it is a major reason why the Fund underperformed the benchmark. We believe this dispersion is unsustainable, and the second half of the year will see a mean reversion, with the 10 largest stocks starting to underperform and other stocks/sectors/regions starting to outperform. We are particularly interested in defensive sectors, such as staples, healthcare, utilities, and telecoms. These sectors have been beaten down in recent months but are now trading at attractive valuations.
The Fund underperformed the benchmark in the period mainly due to the negative effect of stock selection in the information technology, financial and healthcare sectors, which was not offset by the positive effect of stock selection in the materials sector. In the technology sector, not owning Apple, Nvidia and other U.S. mega-cap technology stocks that rallied on the AI theme/bubble.
The main positive contributors in the period included Novo Nordisk (health care), Linde (materials), ANSYS (information technology), United Rentals (industrials) and Fortescue Metals Group (materials). The main negative contributors in the period included Epam Systems (information technology), Orsted (utilities), Keysight Technologies (information technology), Morningstar (financials) and Estée Lauder (consumer staples).
We made the following thematic and stock-specific changes to the Fund’s portfolio during the period. Following earnings downgrades, we sold the Fund’s Epam and Morningstar holdings, as we do not believe the downgrades will be one-offs. The team worries that the slowdown in China may be more structural than cyclical due to the 4Ds of Demographics, Demand, Debt and Decoupling. The Fund owns zero China direct stocks and sold stocks with a high percentage of revenue risk from China, such as Agilent, Estée Lauder, Infineon, Keyence and Keysight. Japan is experiencing a regime shift from “sell the rallies” to “buy the dips”, due to corporate restructuring and the potential end of unconventional monetary policy. The Fund purchased Daifuku (supply chain automation). The team missed the first order AI winners like Nvidia, which do not fit our process. The Fund bought the second order winners that do fit our process such as Adobe, Amazon, Dynatrace and Hynix. We have added European/UK-based companies with a substantial valuation gap compared to their U.S. counterparts. We have identified that such companies’ valuation gap closes when they pursue a listing in the U.S. For instance, we added CRH, a company trading at a 40% discount relative to its U.S. industry peers, which has plans for a U.S. listing.
vii
JOHCM FUNDS TRUST
PORTFOLIO COMMENTARY
September 30, 2023 (Unaudited)
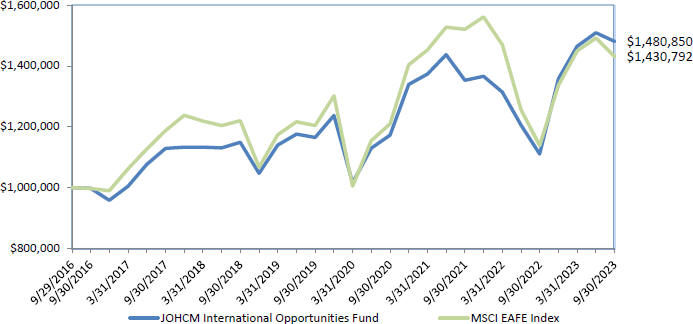
JOHCM International Opportunities Fund
Change in value of a hypothetical $1,000,000 investment in the Fund’s Institutional Shares
from September 29, 2016 to September 30, 2023
| | | | | | | | | | | | | | | | | | | | |
Average Annual Total Returns as of September 30, 2023 | |
| | | | | |
| | | One Year | | | Five Year | | | Since Inception | | | Gross Expense | | | Net Expense | |
| | | Return | | | Return | | | Return | | | Ratio * | | | Ratio * | |
Institutional Shares | | | 33.32 | % | | | 5.21 | % | | | 5.77 | % | | | 3.04 | % | | | 0.50 | % |
MSCI EAFE Index | | | 25.65 | % | | | 3.24 | % | | | 5.25 | % | | | — | | | | — | |
Data as of September 30, 2023. The Fund’s performance reflects the performance of the predecessor JOHCM International Opportunities Fund of the Advisers Investment Trust for periods prior to the reorganization into the JOHCM Funds Trust on July 19, 2021. The performance also reflects the reinvestment of dividends as well as the impact of transaction costs and the deduction of fees and expenses. The performance does not reflect taxes that a shareholder would pay on Fund distributions or on the redemption of Fund shares.
The Institutional Shares of the Fund commenced operations on July 19, 2021. Historical performance for Institutional Shares prior to their inception is based on performance of the predecessor share class of the JOHCM International Opportunities Fund of the Advisers Investment Trust.
| * | Expense ratios are per the most recent Fund Prospectus dated January 27, 2023, as revised from time to time. The Adviser has entered into a contractual expense limitation agreement with respect to the Fund until January 28, 2026. |
The performance data quoted represents past performance; past performance does not guarantee future results. The investment return and principal value of an investment will fluctuate so that an investor’s shares, when redeemed, may be worth more or less than their original cost. The Fund’s current performance may be lower or higher than the performance data quoted. Investors may obtain performance information current to the most recent month-end, within 7 business days, by calling 866-260-9549 or 312-557-5913.
The Fund’s benchmark for performance comparison purposes is the Morgan Stanley Capital International (“MSCI”) Europe, Australasia and Far East (“EAFE”) Index. The Index is a free float-adjusted market capitalization index that is designed to measure the equity market performance of developed markets, excluding the US & Canada. The table reflects the theoretical reinvestment of
viii
JOHCM FUNDS TRUST
PORTFOLIO COMMENTARY
September 30, 2023 (Unaudited)
dividends on securities in the Index. The impact of transaction costs and the deduction of expenses associated with a mutual fund, such as investment management and administration fees, are not reflected in the Index calculations. It is not possible to invest directly in an index.
Investment Philosophy and Process
The Fund seeks to achieve long-term total return by investing, under normal market conditions, primarily in equity securities of companies located outside the United States, including those located in emerging market countries. The Fund may invest in non-U.S. companies of any size, including small- and mid-capitalization companies, in order to achieve its objective. Equity securities include common and preferred stocks, and include rights and warrants to subscribe to common stock or other equity securities. The Fund may achieve its equity exposure either directly or indirectly, such as through participatory notes, though it does not use such indirect instruments as a means of achieving leverage.
Performance
Following a very challenging nine months, equity markets rallied strongly between October 2022 and January 2023, with the MSCI EAFE index increasing by 25% during those four months. This was led by optimism around China’s post-Covid reopening and Europe’s mild winter averting an energy crisis. Cyclical sectors led the way, with industrials and materials up around 30%, along with technology (especially semiconductors) and consumer discretionary. In contrast to the ‘magnificent seven’ in the U.S., the EAFE index then flat-lined until September, before fading a little into the end of the period in the face of rising bond yields, energy prices and the U.S. dollar. Nevertheless, the 12-month period ended September 30, 2023 saw strong returns for equity investors in non-U.S. equities.
The Fund outperformed strongly during the year, particularly in the first quarter’s rally and the last quarter’s fall. A lot of the positive contributors were found in the aforementioned cyclical sectors, although in most cases, the share price strength was driven more by idiosyncratic factors and cheap starting valuations than purely macroeconomic tailwinds. For example, Cameco in energy, CRH in materials, Wartsila in industrials, B&M in consumer discretionary and publications, and Informa in media.
The Fund added nine new names during the year and sold seven. Purchases were biased towards Asia and included four Japanese companies: two industrials (Komatsu and Daifuku), an insurer (Tokio Marine) and Dentsu, the advertising agency. In the context of increasing competition for capital, our sales were generally names where we lost conviction in either the business model or the balance sheet, including ENEL, Proximus and Galp.
ix
JOHCM FUNDS TRUST
PORTFOLIO COMMENTARY
September 30, 2023 (Unaudited)
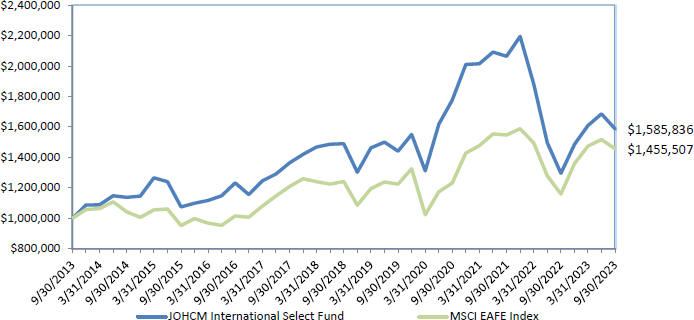
JOHCM International Select Fund
Change in value of a hypothetical $1,000,000 investment in the Fund’s Institutional Shares
from September 30, 2013 to September 30, 2023
| | | | | | | | | | | | | | | | | | | | |
Average Annual Total Returns as of September 30, 2023 | |
| | | | | |
| | | One Year | | | Five Year | | | Ten Year | | | Gross Expense | | | Net Expense | |
| | | Return | | | Return | | | Return | | | Ratio * | | | Ratio * | |
Institutional Shares | | | 22.41 | % | | | 1.25 | % | | | 4.72 | % | | | 0.98 | % | | | 0.98 | % |
Investor Shares | | | 22.13 | % | | | 1.00 | % | | | 4.46 | % | | | 1.21 | % | | | 1.21 | % |
MSCI EAFE Index | | | 25.65 | % | | | 3.24 | % | | | 3.82 | % | | | — | | | | — | |
Data as of September 30, 2023. The Fund’s performance reflects the performance of the predecessor JOHCM International Select Fund of the Advisers Investment Trust and the predecessor JOHCM International Select Fund of the Scotia Institutional Funds for periods prior to the reorganization into the JOHCM Funds Trust on July 19, 2021. The performance also reflects the reinvestment of dividends as well as the impact of transaction costs and the deduction of fees and expenses. The performance does not reflect taxes that a shareholder would pay on Fund distributions or on the redemption of Fund shares.
The Institutional Shares and Investor Shares of the Fund commenced operations on July 19, 2021. Historical performance for Institutional Shares and Investor Shares prior to their inception is based on performance of predecessor share classes of the predecessor JOHCM International Select Fund of the Advisers Investment Trust and the predecessor JOHCM International Select Fund of the Scotia Institutional Funds.
Historical performance for Investor Shares prior to its July 19, 2021 inception is based on the performance of the Class II Shares predecessor share class. The performance of the Class II Shares predecessor share class, which commenced operations on March 31, 2010, is based on performance of the Class I Shares predecessor share class, which commenced operations on July 29, 2009, for periods prior to the Class II Shares predecessor share class inception date. Performance of the Class II Shares predecessor share class was adjusted to reflect differences in expenses.
| * | Expense ratios are per the most recent Fund Prospectus dated January 27, 2023, as revised from time to time. The Adviser has entered into a contractual expense limitation agreement with respect to the Fund until January 28, 2024. |
x
JOHCM FUNDS TRUST
PORTFOLIO COMMENTARY
September 30, 2023 (Unaudited)
The performance data quoted represents past performance; past performance does not guarantee future results. The investment return and principal value of an investment will fluctuate so that an investor’s shares, when redeemed, may be worth more or less than their original cost. The Fund’s current performance may be lower or higher than the performance data quoted. Investors may obtain performance information current to the most recent month-end, within 7 business days, by calling 866-260-9549 or 312-557-5913.
The Fund’s benchmark for performance comparison purposes is the Morgan Stanley Capital International (“MSCI”) Europe, Australasia and Far East (“EAFE”) Index. The Index is a free float-adjusted market capitalization index that is designed to measure the equity market performance of developed markets, excluding the US & Canada. The table reflects the theoretical reinvestment of dividends on securities in the Index. The impact of transaction costs and the deduction of expenses associated with a mutual fund, such as investment management and administration fees, are not reflected in the Index calculations. It is not possible to invest directly in an index.
Investment Philosophy and Process
The Fund seeks long-term capital appreciation by investing primarily in common stocks and other equity securities of companies located outside the United States, including those located in emerging market countries. The Fund’s equity securities include direct and indirect investments in common and preferred stocks, and rights and warrants to subscribe for common stock or other equity securities. The Fund may obtain its exposure to equity securities indirectly through participatory notes, depositary receipts and exchange-traded funds. The Fund may invest in companies of any size, including small- and mid-capitalization companies, in order to achieve its objective.
Performance
The Fund underperformed its benchmark, the MSCI EAFE Index for the 12 months ended September 30, 2023. After experiencing gains for international equities in the first half of 2023, the MSCI EAFE index posted a negative return in the third quarter of 2023 as markets worried about rising oil prices, rising U.S. interest rates, and geopolitical concerns.
After a good first half of the year, the Fund underperformed the benchmark. This was due to being underweight in the energy sector and the negative effect of stock selections in the consumer, financial and utilities sectors, which was not offset by the positive effect of stock selection in the health care sector.
The main positive contributors in the period were Advantest (information technology), B&M European Value (consumer discretionary) and Ferguson (industrials). In the information technology sector, Advantest, the Japanese semiconductor testing company, benefitted from AI’s need for more complex chip testing. In the consumer discretionary sector, B&M Bargains, the leading UK discount retailer, expanding into Europe, and Compass, the UK based global catering services company, were also positive contributors. In the industrials sector, Ferguson, the UK’s leading industrial supplies company, is benefitting from global expansion. The main negative contributors in the period included European stocks Orsted (utilities), Ono Pharmaceutical (health care) and Lonza Group (health care). Ono Pharmaceutical and Lonza were all weak during the 12-month period ended September 30, 2023 after strong relative share prices last year.
The team made certain thematic and stock-specific changes to the Fund’s portfolio during the period. In the second quarter of 2023, the Fund sold ICON on concerns over deteriorating future earnings and bought Danone on expectations of improving future earnings growth. The team worries that the slowdown in China is more structural than cyclical due to the 4Ds - Demographics, Demand, Debt and Decoupling. The Fund owns zero China direct stocks and sold stocks with a high percentage of revenue risk from China, such as Fanuc, Keyence, L’Oreal and Richemont. Japan is experiencing a regime shift from “sell the rallies” to “buy the dips” due to corporate restructuring and the potential end of unconventional monetary policy. The team purchased Daifuku (supply chain automation), Hitachi (energy transition), Komatsu (construction equipment). The Fund benefited from investments in AI names, trimmed its first order winners like Advantest, and bought second order winners whose earnings are positively inflecting, such as Hynix (High Bandwidth Memory). We have added European/UK-based companies with a substantial valuation gap compared to their U.S. counterparts. We have identified that such companies’ valuation gap closes when they pursue a listing in the U.S. For instance, we added CRH, a company trading at a 40% discount relative to its U.S. industry peers, which has plans for a U.S. listing.
xi
JOHCM FUNDS TRUST
PORTFOLIO COMMENTARY
September 30, 2023 (Unaudited)
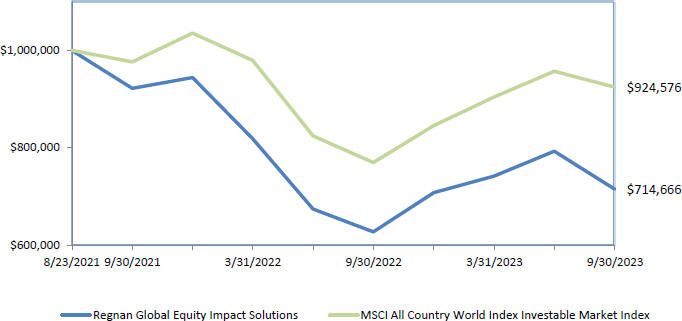
Regnan Global Equity Impact Solutions
Change in value of a hypothetical $1,000,000 investment in the Fund’s Institutional Shares
from August 23, 2021 to September 30, 2023
| | | | | | | | | | | | | | | | |
| Average Annual Total Returns as of September 30, 2023 | |
| | | | |
| | | One Year | | | Since Inception | | | Gross Expense | | | Net Expense | |
| | | Return | | | Return | | | Ratio * | | | Ratio * | |
Institutional Shares | | | 13.98 | % | | | -14.76 | % | | | 4.03 | % | | | 0.89 | % |
MSCI All Country World Index Investable Market Index | | | 20.24 | % | | | -3.66 | % | | | — | | | | — | |
Data as of September 30, 2023. The Fund’s performance reflects the reinvestment of dividends as well as the impact of transaction costs and the deduction of fees and expenses. The performance does not reflect taxes that a shareholder would pay on Fund distributions or on the redemption of Fund shares.
| * | Expense ratios are per the most recent Fund Prospectus dated January 27, 2023, as revised from time to time. The Adviser has entered into a contractual expense limitation agreement with respect to the Fund until January 28, 2024. |
The performance data quoted represents past performance; past performance does not guarantee future results. The investment return and principal value of an investment will fluctuate so that an investor’s shares, when redeemed, may be worth more or less than their original cost. The Fund’s current performance may be lower or higher than the performance data quoted. Investors may obtain performance information current to the most recent month-end, within 7 business days, by calling 866-260-9549 or 312-557-5913.
The Fund’s benchmark for performance comparison purposes is the Morgan Stanley Capital International (“MSCI”) All Country World Index (“ACWI”) Investable Markets Index (“IMI”). The Index captures large, mid and small cap representation across 23 Developed Markets and 24 Emerging Markets countries. With 9,248 constituents, the Index is comprehensive, covering approximately 99% of the global equity investment opportunity set. The table reflects the theoretical reinvestment of dividends on securities in the Index. The impact of transaction costs and the deduction of expenses associated with a mutual fund, such as investment management and administration fees, are not reflected in the Index calculations. It is not possible to invest directly in an index.
xii
JOHCM FUNDS TRUST
PORTFOLIO COMMENTARY
September 30, 2023 (Unaudited)
Investment Philosophy and Process
The Fund seeks to achieve long-term capital appreciation by investing in companies that contribute solutions to addressing the world’s major social and environmental challenges. The Fund seeks to achieve this objective by investing primarily in a high-conviction global equity portfolio of companies the portfolio managers believe have the potential to contribute solutions to the world’s major social and environmental challenges. The Fund invests, under normal circumstances, at least 80% of its assets (net assets plus the amount of borrowings for investment purposes) in equity securities of companies that the portfolio managers believe satisfy their criteria for positive social or environmental impact. The portfolio managers currently measure this impact by applying the Regnan Taxonomy and a proprietary impact assessment based upon objective criteria, including the measurement of the activities that currently constitute, or that the portfolio managers expect over the long term will constitute, a significant portion (i.e., at least 30%) of a company’s business (using metrics that may include, without limitation, any of the following: revenues, earnings, capital expenditures, research and development investment, or book value). The Fund gains exposure to equity securities either directly or indirectly, including through equity-linked instruments such as participatory notes or index exchange-traded funds, and may invest in preferred stocks.
Performance
The Fund returned 13.98% for the 12-month period ended September 30, 2023. The Fund’s top contributors were Novo Nordisk, Abcam and ATS. Novo Nordisk, the global leader in diabetes and obesity care, was the largest positive contributor, driven by strong growth in Wegovy, its flagship obesity drug, as well as the outcome of its SELECT study demonstrating benefits beyond weight, specifically in cardiovascular health. Abcam also performed strongly during the period, following reports of takeover interest from multiple players, with a takeover bid from Danaher, which is now expected to be approved and close in 2024. ATS is an automation equipment and service company specialising in applications in industries such as life sciences, electric vehicle battery production and food processing, where precision and reliability are mission-critical to ensure product quality and safety, and where the cost of failure is high. The company has seen accelerating traction for its services, in particular in life sciences, where diabetes drugs and devices are a key end market with strong growth momentum, and in transportation, where ATS provides battery assembly automation as the U.S. electric vehicle industry ramps up capacity.
The Fund’s top detractors were Alfen, Orsted and Sartorius Stedim Biotech. Alfen, the Dutch energy transition specialist, fell on the back of destocking by clients, which remains ongoing in its EV Charging business. We believe that Alfen remains well-positioned to benefit from growth in EV adoption, which is still at an early stage and will require substantial further investment in charging infrastructure, due to its strong position in the European market. Orsted, the global leader in offshore wind construction and operation, fell following the announcement of a potential impairment of up to DKK16bn due to supply chain delays, U.S. tax credit delays and further interest rate rises. Sartorius Stedim Biotech detracted following a significant cut to its 2023 targets, which was also driven by customer destocking.
xiii
JOHCM FUNDS TRUST
PORTFOLIO COMMENTARY
September 30, 2023 (Unaudited)
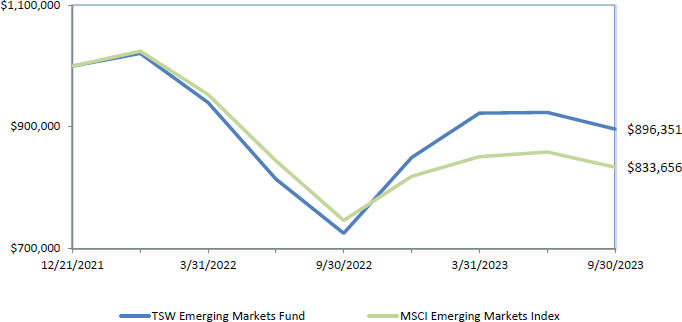
TSW Emerging Markets Fund
Change in value of a hypothetical $1,000,000 investment in the Fund’s Institutional Shares
from December 21, 2021 to September 30, 2023
| | | | | | | | | | | | | | | | |
| Average Annual Total Returns as of September 30, 2023 | |
| | | | |
| | | One Year | | | Since Inception | | | Gross Expense | | | Net Expense | |
| | | Return | | | Return | | | Ratio * | | | Ratio * | |
Institutional Shares | | | 23.63 | % | | | -5.98 | % | | | 2.22 | % | | | 0.99 | % |
MSCI Emerging Markets Index | | | 11.70 | % | | | -9.74 | % | | | — | | | | — | |
Data as of September 30, 2023. The Fund’s performance reflects the reinvestment of dividends as well as the impact of transaction costs and the deduction of fees and expenses. The performance does not reflect taxes that a shareholder would pay on Fund distributions or on the redemption of Fund shares.
| * | Expense ratios are per the most recent Fund Prospectus dated January 27, 2023, as revised from time to time. The Adviser has entered into a contractual expense limitation agreement with respect to the Fund until January 28, 2024. |
The performance data quoted represents past performance; past performance does not guarantee future results. The investment return and principal value of an investment will fluctuate so that an investor’s shares, when redeemed, may be worth more or less than their original cost. The Fund’s current performance may be lower or higher than the performance data quoted. Investors may obtain performance information current to the most recent month-end, within 7 business days, by calling 866-260-9549 or 312-557-5913.
The Fund’s benchmark for performance comparison purposes is the Morgan Stanley Capital International (“MSCI”) Emerging Markets Index. The Index is a free float-adjusted market capitalization index that is designed to measure equity market performance in the global emerging markets. The table reflects the theoretical reinvestment of dividends on securities in the Index. The impact of transaction costs and the deduction of expenses associated with a mutual fund, such as investment management and administration fees, are not reflected in the Index calculations. It is not possible to invest directly in an index.
Investment Philosophy and Process
The Fund aims to maximize long-term capital appreciation. The Fund invests, under normal circumstances, at least 80% of its assets (net assets plus the amount of borrowings for investment purposes) in equity securities of companies that are domiciled in or tied
xiv
JOHCM FUNDS TRUST
PORTFOLIO COMMENTARY
September 30, 2023 (Unaudited)
economically to emerging market countries, including frontier markets. Emerging market countries are those countries included in the MSCI Emerging Markets Index and MSCI Frontier Markets Index and other countries with similar emerging or frontier market characteristics. The Fund may invest in emerging market companies of any size, including small- and mid-capitalization companies in order to achieve its objective.
Performance
The TSW Emerging Markets Fund has returned 23.63% for the twelve months ending September 30, 2023 (Total Return-Net). The benchmark returned 11.70% over the same period. On a sector basis, Financials were the top contributor to performance. Kaspi.kz (Kazahstan) and Georgia Capital (Georgia) were leaders within the group. Both businesses were relatively insulated from the nearby Russia-Ukraine conflict. The Energy sector was a laggard with Reliance Industries (India) as a notable underperformer. The company used its strong balance sheet to further invest in its clean energy and retail businesses, but its core refining division saw margins decline in recent months as crude oil prices rose. We view this as a temporary issue and expect refining margins to stabilize over the long term as Reliance grows the size and profitability of its other segments.
China was the top contributor at the country level with NetEase as the best performing position. NetEase is a video game developer that has grown revenue and earnings with a slate of successful game releases. While its near-term prospects are somewhat dependent on government approval of its games, NetEase has deep experience developing titles appropriate for the Chinese market and has expanded its global market share substantially over the last decade. The Fund’s portfolio holdings in Taiwan were a drag on performance with E Ink Holdings as the largest detractor. E Ink’s innovative products are used to write on “digital paper” such as the Amazon Kindle tablet. The company is investing in capacity expansion as its technology is used in a growing number of applications including hospital and supermarket displays. Having completed the research and development of its proprietary products over the last decade, we believe the company has a long runway for earnings and cash flow growth as more customers adopt E Ink.
xv
JOHCM FUNDS TRUST
PORTFOLIO COMMENTARY
September 30, 2023 (Unaudited)
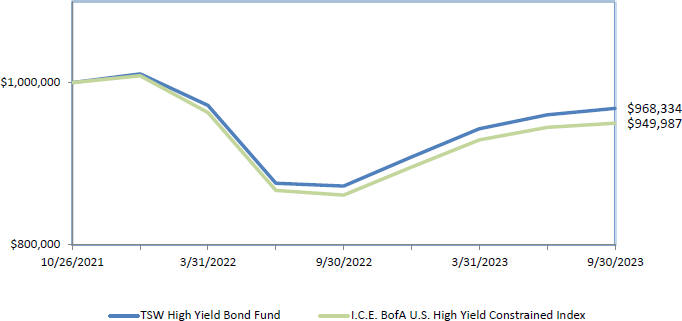
TSW High Yield Bond Fund
Change in value of a hypothetical $1,000,000 investment in the Fund’s Institutional Shares
from October 26, 2021 to September 30, 2023
| | | | | | | | | | | | | | | | |
| Average Annual Total Returns as of September 30, 2023 | |
| | | | |
| | | One Year | | | Since Inception | | | Gross Expense | | | Net Expense | |
| | | Return | | | Return | | | Ratio * | | | Ratio * | |
Institutional Shares | | | 10.98 | % | | | -1.65 | % | | | 1.90 | % | | | 0.65 | % |
ICE BofA U.S. High Yield Constrained Index | | | 10.28 | % | | | -2.62 | % | | | — | | | | — | |
Data as of September 30, 2023. The Fund’s performance reflects the reinvestment of dividends as well as the impact of transaction costs and the deduction of fees and expenses. The performance does not reflect taxes that a shareholder would pay on Fund distributions or on the redemption of Fund shares.
| * | Expense ratios are per the most recent Fund Prospectus dated January 27, 2023, as revised from time to time. The Adviser has entered into a contractual expense limitation agreement with respect to the Fund until January 28, 2024. |
The performance data quoted represents past performance; past performance does not guarantee future results. The investment return and principal value of an investment will fluctuate so that an investor’s shares, when redeemed, may be worth more or less than their original cost. The Fund’s current performance may be lower or higher than the performance data quoted. Investors may obtain performance information current to the most recent month-end, within 7 business days, by calling 866-260-9549 or 312-557-5913.
The Fund’s benchmark for performance comparison purposes is the I.C.E. BofA U.S. High Yield Constrained Index. The Index tracks the performance of US dollar denominated below investment grade rated corporate debt publicly issued in the US domestic market. The table reflects the theoretical reinvestment of dividends on securities in the Index. The impact of transaction costs and the deduction of expenses associated with a mutual fund, such as investment management and administration fees, are not reflected in the Index calculations. It is not possible to invest directly in an index.
Investment Philosophy and Process
The primary investment objective of the Fund is to seek high current income with a secondary focus on capital appreciation. The Fund follows a disciplined, bottom-up research process (i.e., focusing on analyzing individual companies rather than beginning with a
xvi
JOHCM FUNDS TRUST
PORTFOLIO COMMENTARY
September 30, 2023 (Unaudited)
“top down” allocation, such as to particular countries, regions, markets or sectors) in order to identify securities showing stable or improving credit metrics and offering strong relative value in relation to the high yield market. The Fund evaluates both qualitative (industry attractiveness, competitive positioning, management’s transparency and philosophy toward bondholders) and quantitative (asset/interest coverage, leverage, financial flexibility, and cash-flow) factors and attempts to reduce risk through diversification and credit analysis. Securities may be sold in order to (i) manage overall portfolio risk, (ii) achieve attractive total return, (iii) respond to a negative change in a company’s risk/return profile or (iv) take advantage of more favorable risk-adjusted opportunities.
Performance
The Fund outperformed its benchmark, the ICE BofA High Yield Constrained Index, for the one-year period ending September 30, 2023. Intermediate duration bonds outperformed longer duration as the Bloomberg U.S. Corporate High Yield Intermediate Index returned 10.3% versus 8.1% for the Long Index. Lower quality credits outperformed higher quality credits during the period with the Bloomberg U.S. High Yield BA Index returning 8.4% and the Bloomberg U.S. High Yield CAA Index returning 12.7%.
xvii
JOHCM FUNDS TRUST
PORTFOLIO COMMENTARY
September 30, 2023 (Unaudited)
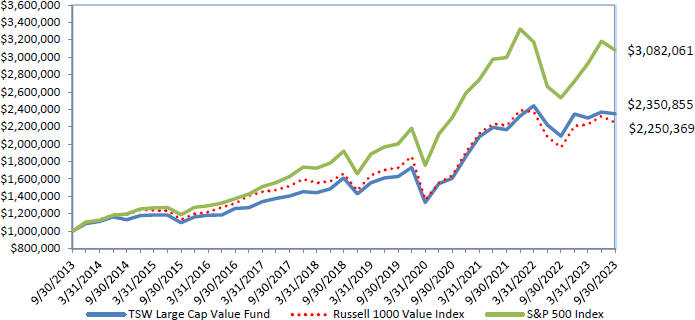
TSW Large Cap Value Fund
Change in value of a hypothetical $1,000,000 investment in the Fund’s Institutional Shares
from September 30, 2013 to September 30, 2023
| | | | | | | | | | | | | | | | | | | | |
Average Annual Total Returns as of September 30, 2023 | |
| | | | | |
| | | One Year | | | Five Year | | | Ten Year | | | Gross Expense | | | Net Expense | |
| | | Return | | | Return | | | Return | | | Ratio * | | | Ratio * | |
Institutional Shares | | | 12.28 | % | | | 7.84 | % | | | 8.92 | % | | | 0.87 | % | | | 0.75 | % |
Russell 1000 Value Index | | | 14.44 | % | | | 6.23 | % | | | 8.45 | % | | | — | | | | — | |
Data as of September 30, 2023. The Fund’s performance reflects the performance of the predecessor TS&W Equity Portfolio of the Advisors’ Inner Circle Fund for periods prior to the reorganization into the JOHCM Funds Trust on December 6, 2021. The performance also reflects the reinvestment of dividends as well as the impact of transaction costs and the deduction of fees and expenses. The performance does not reflect taxes that a shareholder would pay on Fund distributions or on the redemption of Fund shares.
The Institutional Shares of the Fund commenced operations on December 6, 2021. Historical performance for Institutional Shares prior to their inception is based on the performance of predecessor share class of the predecessor TS&W Equity Portfolio of the Advisors’ Inner Circle Fund.
| * | Expense ratios are per the most recent Fund Prospectus dated January 27, 2023, as revised from time to time. The Adviser has entered into a contractual expense limitation agreement with respect to the Fund until January 28, 2024. |
The performance data quoted represents past performance; past performance does not guarantee future results. The investment return and principal value of an investment will fluctuate so that an investor’s shares, when redeemed, may be worth more or less than their original cost. The Fund’s current performance may be lower or higher than the performance data quoted. Investors may obtain performance information current to the most recent month-end, within 7 business days, by calling 866-260-9549 or 312-557-5913.
The Fund’s benchmark for performance comparison purposes is the Russell 1000 Value Index. The Russell 1000 Value Index measures the performance of the large-cap value segment of the US equity universe.
xviii
JOHCM FUNDS TRUST
PORTFOLIO COMMENTARY
September 30, 2023 (Unaudited)
Investment Philosophy and Process
The Fund seeks maximum long-term total return, consistent with reasonable risk to principal by investing, under normal circumstances, at least 80% of its net assets (plus the amount of any borrowings for investment purposes) in equity securities of companies with large market capitalizations. The Fund considers a company’s market capitalization to be large if it equals or exceeds that of the smallest company in the Russell 1000 Index. The Fund will invest primarily in a diversified portfolio of common stocks. Although the Fund will primarily draw its holdings from larger, more seasoned or established companies, it may also invest in companies of varying size as measured by assets, sales or market capitalization. The Fund may invest up to 20% of its total assets in American Depositary Receipts, which are certificates evidencing ownership of shares of a non-U.S. issuer that are issued by depositary banks and traded on U.S. exchanges.
Performance
The Fund underperformed the 14.44% return of the Russell 1000 Value Index. While favoritism in the marketplace shifted in significant ways during the 12-month period ended September 30, 2023 in aggregate it could be characterized as a generally lower quality environment (e.g., outperformance by companies with lower net profit margins and higher beta postures) where value underperformed growth. This market posture appeared more notable in large cap stocks given the significant demand for anything related to Artificial Intelligence, which was concentrated in mega cap tech stocks, many of which were in the value index over the past year but have since migrated out. Specifically, not owning Meta Platforms alone accounted for almost the entire detraction in the year.
The leading industries in terms of relative contribution to Large Cap Value portfolio’s relative return were Financials, Health Care and Real Estate. Within Financials, the portfolio’s overweight to the insurance sector, along with positive stock selection across the industry were the primary drivers of excess return, and further complemented by the Fund’s underweight exposure to banks. At the stock level, Arch Capital, a provider of property and casualty insurance and reinsurance, and Progressive Corporation, an auto insurer, were the top relative contributors. Arch moved higher, driven by continued strength in both their mortgage and specialty insurance segments, along with promising rate increases in the new year. Progressive shares recovered from an earlier sell-off in the year due to improving fundamentals and robust premium growth.
Within Health Care, stock selection drove results, primarily driven by positions in Merck and Regeneron, both pharmaceutical manufacturers. Both benefited from strong fundamental performance and extension of key blockbuster drugs. Lastly, Real Estate outperformance was purely driven by our underweight allocation to the industry.
The primary detractors from relative performance were Energy, Basic Materials and Consumer Staples. Within Energy, the Fund’s underweight to oil beta, and positions in Kinder Morgan, a midstream energy company, and Chesapeake, a natural gas producer, were the primary sources of detraction given their exposure to natural gas.
Within Basic Materials, the only detractor was Mosaic, a fertilizer producer. The stock struggled during the year because of a sharp decline in fertilizer prices. While we see a positive skew in the stock from potential for earnings to revert to mid-cycle norms, we sold the position into strength during the third quarter of 2023 to focus on higher risk/reward opportunities.
Lastly, within Consumer Staples, our detraction was attributable to CVS, a pharmacy operator and provider of various healthcare solutions, and Post Holdings, a diversified consumer packaged goods holding company. CVS sold off after management retreated on its medium-term earnings guidance and legislation was introduced targeting pharmacy benefit managers. Post had a positive return over the year but lagged the index. Post’s exposure to cereal, which is perceived as a secularly challenged category, may have been a contributing factor. The Fund continues to hold both stocks.
xix
JOHCM FUNDS TRUST
JOHCM EMERGING MARKETS DISCOVERY FUND
SCHEDULE OF INVESTMENTS
September 30, 2023
| | | | | | | | | | | | |
| | | Percentage | | | | | | | |
| | | of Net | | | | | | | |
| | | Assets | | | Shares | | | Value | |
COMMON STOCKS | | | 90.0 | % | | | | | | | | |
Belgium | | | 0.7 | % | | | | | | | | |
Cenergy Holdings S.A. | | | | | | | 50,569 | | | $ | 349,973 | |
| | | | | | | | | | | | |
Brazil | | | 3.8 | % | | | | | | | | |
Arcos Dorados Holdings, Inc. - Class A | | | | | | | 41,266 | | | | 390,376 | |
Cyrela Brazil Realty S.A. Empreendimentos e Participacoes | | | | | | | 55,900 | | | | 225,422 | |
Dexco S.A.(a) | | | | | | | 314,700 | | | | 482,078 | |
Locaweb Servicos de Internet S.A.(b) | | | | | | | 210,400 | | | | 267,471 | |
Pagseguro Digital Ltd. - Class A(a) | | | | | | | 21,874 | | | | 188,335 | |
Santos Brasil Participacoes S.A. | | | | | | | 206,000 | | | | 351,219 | |
| | | | | | | | | | | | |
| | | | | | | | | | | 1,904,901 | |
| | | | | | | | | | | | |
Canada | | | 2.2 | % | | | | | | | | |
Capstone Copper Corp.(a) | | | | | | | 72,879 | | | | 309,062 | |
Pan American Silver Corp. | | | | | | | 28,064 | | | | 406,367 | |
Parex Resources, Inc. | | | | | | | 8,120 | | | | 152,386 | |
Sigma Lithium Corp.(a) | | | | | | | 7,485 | | | | 242,813 | |
| | | | | | | | | | | | |
| | | | | | | | | | | 1,110,628 | |
| | | | | | | | | | | | |
Chile | | | 1.9 | % | | | | | | | | |
Cencosud S.A. | | | | | | | 213,085 | | | | 403,893 | |
Cia Cervecerias Unidas S.A. - ADR | | | | | | | 18,950 | | | | 238,770 | |
Enel Chile S.A. | | | | | | | 5,449,981 | | | | 330,917 | |
| | | | | | | | | | | | |
| | | | | | | | | | | 973,580 | |
| | | | | | | | | | | | |
China | | | 5.7 | % | | | | | | | | |
Airtac International Group | | | | | | | 16,300 | | | | 495,237 | |
EEKA Fashion Holdings Ltd. | | | | | | | 146,000 | | | | 276,541 | |
Kingsemi Co. Ltd. - Class A | | | | | | | 7,348 | | | | 133,723 | |
Maoyan Entertainment(a)(b) | | | | | | | 222,200 | | | | 329,158 | |
Proya Cosmetics Co. Ltd. - Class A | | | | | | | 19,080 | | | | 266,224 | |
SooChow Securities Co. Ltd. - Class A | | | | | | | 233,599 | | | | 270,544 | |
Tongcheng Travel Holdings Ltd.(a) | | | | | | | 239,600 | | | | 524,074 | |
Xtep International Holdings Ltd. | | | | | | | 253,500 | | | | 233,491 | |
ZJLD Group, Inc.(a)(b) | | | | | | | 223,600 | | | | 342,293 | |
| | | | | | | | | | | | |
| | | | | | | | | | | 2,871,285 | |
| | | | | | | | | | | | |
Germany | | | 0.7 | % | | | | | | | | |
AIXTRON S.E. | | | | | | | 4,203 | | | | 153,951 | |
Krones A.G. | | | | | | | 2,073 | | | | 213,335 | |
| | | | | | | | | | | | |
| | | | | | | | | | | 367,286 | |
| | | | | | | | | | | | |
Greece | | | 2.5 | % | | | | | | | | |
JUMBO S.A. | | | | | | | 9,316 | | | | 256,098 | |
Motor Oil Hellas Corinth Refineries S.A. | | | | | | | 10,797 | | | | 272,710 | |
Mytilineos S.A. | | | | | | | 4,592 | | | | 169,021 | |
OPAP S.A. | | | | | | | 33,116 | | | | 554,418 | |
| | | | | | | | | | | | |
| | | | | | | | | | | 1,252,247 | |
| | | | | | | | | | | | |
Hong Kong | | | 2.1 | % | | | | | | | | |
China Overseas Grand Oceans Group Ltd. | | | | | | | 1,003,000 | | | | 416,938 | |
See Notes to Financial Statements.
1
JOHCM FUNDS TRUST
JOHCM EMERGING MARKETS DISCOVERY FUND
SCHEDULE OF INVESTMENTS
September 30, 2023
| | | | | | | | | | | | |
| | | Percentage | | | | | | | |
| | | of Net | | | | | | | |
| | | Assets | | | Shares | | | Value | |
Melco International Development Ltd.(a) | | | | | | | 247,000 | | | $ | 197,115 | |
Pacific Basin Shipping Ltd. | | | | | | | 415,000 | | | | 119,233 | |
Sinotruk Hong Kong Ltd. | | | | | | | 175,500 | | | | 337,508 | |
| | | | | | | | | | | | |
| | | | | | | | | | | 1,070,794 | |
| | | | | | | | | | | | |
Hungary | | | 0.4 | % | | | | | | | | |
Richter Gedeon Nyrt | | | | | | | 8,000 | | | | 193,535 | |
| | | | | | | | | | | | |
India | | | 20.0 | % | | | | | | | | |
Aster DM Healthcare Ltd.(a)(b) | | | | | | | 96,136 | | | | 378,965 | |
Brigade Enterprises Ltd. | | | | | | | 69,263 | | | | 472,808 | |
CreditAccess Grameen Ltd.(a) | | | | | | | 36,694 | | | | 581,106 | |
EPL Ltd. | | | | | | | 174,148 | | | | 390,907 | |
Exide Industries Ltd. | | | | | | | 135,573 | | | | 424,631 | |
Genus Power Infrastructures Ltd. | | | | | | | 299,208 | | | | 917,575 | |
Jyothy Labs Ltd. | | | | | | | 86,346 | | | | 374,443 | |
KPIT Technologies Ltd. | | | | | | | 72,428 | | | | 1,001,375 | |
Lemon Tree Hotels Ltd.(a)(b) | | | | | | | 406,695 | | | | 555,171 | |
Narayana Hrudayalaya Ltd. | | | | | | | 55,267 | | | | 722,045 | |
One 97 Communications Ltd.(a) | | | | | | | 21,867 | | | | 225,248 | |
PB Fintech Ltd.(a) | | | | | | | 44,378 | | | | 407,675 | |
Phoenix Mills (The) Ltd. | | | | | | | 48,067 | | | | 1,049,190 | |
PNC Infratech Ltd. | | | | | | | 148,352 | | | | 652,875 | |
Shriram Finance Ltd. | | | | | | | 21,354 | | | | 492,793 | |
Sobha Ltd. | | | | | | | 50,645 | | | | 429,235 | |
Varun Beverages Ltd. | | | | | | | 87,059 | | | | 988,412 | |
| | | | | | | | | | | | |
| | | | | | | | | | | 10,064,454 | |
| | | | | | | | | | | | |
Indonesia | | | 3.5 | % | | | | | | | | |
Ace Hardware Indonesia Tbk PT | | | | | | | 10,854,600 | | | | 526,070 | |
Indosat Tbk PT | | | | | | | 1,578,100 | | | | 1,002,906 | |
Jasa Marga Persero Tbk PT | | | | | | | 910,000 | | | | 252,418 | |
| | | | | | | | | | | | |
| | | | | | | | | | | 1,781,394 | |
| | | | | | | | | | | | |
Malaysia | | | 2.0 | % | | | | | | | | |
Bermaz Auto Bhd. | | | | | | | 409,000 | | | | 216,647 | |
Dayang Enterprise Holdings Bhd. | | | | | | | 1,015,700 | | | | 415,731 | |
Gamuda Bhd. | | | | | | | 419,600 | | | | 395,913 | |
| | | | | | | | | | | | |
| | | | | | | | | | | 1,028,291 | |
| | | | | | | | | | | | |
Mexico | | | 3.2 | % | | | | | | | | |
Controladora Vuela Cia de Aviacion S.A.B. de C.V. - ADR(a) | | | | | | | 32,353 | | | | 219,677 | |
Corp. Inmobiliaria Vesta S.A.B. de C.V. | | | | | | | 203,500 | | | | 671,308 | |
Grupo Traxion S.A.B de C.V.(a)(b) | | | | | | | 429,955 | | | | 734,704 | |
| | | | | | | | | | | | |
| | | | | | | | | | | 1,625,689 | |
| | | | | | | | | | | | |
Netherlands | | | 1.3 | % | | | | | | | | |
AMG Critical Materials N.V. | | | | | | | 7,745 | | | | 232,430 | |
Fugro N.V.(a) | | | | | | | 27,994 | | | | 429,158 | |
| | | | | | | | | | | | |
| | | | | | | | | | | 661,588 | |
| | | | | | | | | | | | |
See Notes to Financial Statements.
2
JOHCM FUNDS TRUST
JOHCM EMERGING MARKETS DISCOVERY FUND
SCHEDULE OF INVESTMENTS
September 30, 2023
| | | | | | | | | | | | |
| | | Percentage | | | | | | | |
| | | of Net | | | | | | | |
| | | Assets | | | Shares | | | Value | |
Philippines | | | 1.8 | % | | | | | | | | |
Bloomberry Resorts Corp.(a) | | | | | | | 2,221,700 | | | $ | 397,052 | |
Century Pacific Food, Inc. | | | | | | | 508,600 | | | | 251,868 | |
GT Capital Holdings, Inc. | | | | | | | 25,800 | | | | 259,510 | |
| | | | | | | | | | | | |
| | | | | | | | | | | 908,430 | |
| | | | | | | | | | | | |
Poland | | | 0.5 | % | | | | | | | | |
PGE Polska Grupa Energetyczna S.A.(a) | | | | | | | 144,808 | | | | 247,622 | |
| | | | | | | | | | | | |
Russia | | | 0.0 | % | | | | | | | | |
Ozon Holdings PLC - ADR(a)** | | | | | | | 7,516 | | | | — | |
| | | | | | | | | | | | |
Saudi Arabia | | | 0.8 | % | | | | | | | | |
Saudi Ground Services Co.(a) | | | | | | | 53,775 | | | | 424,793 | |
| | | | | | | | | | | | |
South Africa | | | 0.6 | % | | | | | | | | |
Aspen Pharmacare Holdings Ltd. | | | | | | | 30,528 | | | | 276,526 | |
| | | | | | | | | | | | |
South Korea | | | 9.1 | % | | | | | | | | |
Cosmax, Inc.(a) | | | | | | | 6,026 | | | | 575,432 | |
Eo Technics Co. Ltd. | | | | | | | 3,944 | | | | 408,474 | |
Eugene Technology Co. Ltd. | | | | | | | 19,885 | | | | 566,176 | |
Han Kuk Carbon Co. Ltd. | | | | | | | 43,205 | | | | 401,139 | |
HPSP Co. Ltd. | | | | | | | 21,058 | | | | 469,303 | |
Hyundai Autoever Corp. | | | | | | | 3,809 | | | | 525,912 | |
Innox Advanced Materials Co. Ltd. | | | | | | | 12,812 | | | | 301,996 | |
Jeisys Medical, Inc.(a) | | | | | | | 42,103 | | | | 374,945 | |
NH Investment & Securities Co. Ltd. | | | | | | | 22,615 | | | | 171,182 | |
Park Systems Corp. | | | | | | | 2,118 | | | | 255,710 | |
Ray Co. Ltd.(a) | | | | | | | 11,168 | | | | 180,597 | |
WONIK IPS Co. Ltd. | | | | | | | 14,779 | | | | 349,743 | |
| | | | | | | | | | | | |
| | | | | | | | | | | 4,580,609 | |
| | | | | | | | | | | | |
Taiwan | | | 19.7 | % | | | | | | | | |
Acer E-Enabling Service Business, Inc. | | | | | | | 39,174 | | | | 313,293 | |
Alchip Technologies Ltd. | | | | | | | 7,793 | | | | 653,216 | |
Arcadyan Technology Corp. | | | | | | | 150,000 | | | | 753,710 | |
Asia Vital Components Co. Ltd. | | | | | | | 55,000 | | | | 585,224 | |
ASPEED Technology, Inc. | | | | | | | 4,570 | | | | 393,671 | |
E Ink Holdings, Inc. | | | | | | | 102,000 | | | | 568,751 | |
Elan Microelectronics Corp. | | | | | | | 51,000 | | | | 211,079 | |
Elite Material Co. Ltd. | | | | | | | 60,000 | | | | 797,957 | |
Ennoconn Corp. | | | | | | | 56,000 | | | | 456,816 | |
Global Unichip Corp. | | | | | | | 10,200 | | | | 434,336 | |
Gold Circuit Electronics Ltd. | | | | | | | 76,000 | | | | 517,853 | |
Hu Lane Associate, Inc. | | | | | | | 73,000 | | | | 333,016 | |
Ingentec Corp. | | | | | | | 63,983 | | | | 407,563 | |
Kaori Heat Treatment Co. Ltd. | | | | | | | 22,000 | | | | 202,528 | |
King Yuan Electronics Co. Ltd. | | | | | | | 240,000 | | | | 565,988 | |
Kura Sushi Asia Co. Ltd. | | | | | | | 32,000 | | | | 130,564 | |
M31 Technology Corp. | | | | | | | 13,200 | | | | 328,720 | |
See Notes to Financial Statements.
3
JOHCM FUNDS TRUST
JOHCM EMERGING MARKETS DISCOVERY FUND
SCHEDULE OF INVESTMENTS
September 30, 2023
| | | | | | | | | | | | |
| | | Percentage | | | | | | | |
| | | of Net | | | | | | | |
| | | Assets | | | Shares | | | Value | |
Makalot Industrial Co. Ltd. | | | | | | | 61,000 | | | $ | 635,291 | |
Sercomm Corp. | | | | | | | 92,000 | | | | 350,675 | |
Universal Vision Biotechnology Co. Ltd. | | | | | | | 840 | | | | 8,751 | |
Visual Photonics Epitaxy Co. Ltd. | | | | | | | 146,000 | | | | 670,692 | |
Voltronic Power Technology Corp. | | | | | | | 11,550 | | | | 568,802 | |
| | | | | | | | | | | | |
| | | | | | | | | | | 9,888,496 | |
| | | | | | | | | | | | |
Thailand | | | 1.4 | % | | | | | | | | |
Fabrinet(a) | | | | | | | 2,579 | | | | 429,713 | |
Ichitan Group PCL - NVDR | | | | | | | 536,600 | | | | 247,041 | |
| | | | | | | | | | | | |
| | | | | | | | | | | 676,754 | |
| | | | | | | | | | | | |
Turkey | | | 1.8 | % | | | | | | | | |
Kardemir Karabuk Demir Celik Sanayi ve Ticaret A.S. - Class D | | | | | | | 203,829 | | | | 219,118 | |
MLP Saglik Hizmetleri A.S.(a)(b) | | | | | | | 62,167 | | | | 323,944 | |
Turkiye Sise ve Cam Fabrikalari A.S. | | | | | | | 185,567 | | | | 369,120 | |
| | | | | | | | | | | | |
| | | | | | | | | | | 912,182 | |
| | | | | | | | | | | | |
United Arab Emirates | | | 1.8 | % | | | | | | | | |
Burjeel Holdings PLC | | | | | | | 569,367 | | | | 466,641 | |
Emaar Development PJSC | | | | | | | 230,740 | | | | 439,287 | |
| | | | | | | | | | | | |
| | | | | | | | | | | 905,928 | |
| | | | | | | | | | | | |
United Kingdom | | | 1.4 | % | | | | | | | | |
Hikma Pharmaceuticals PLC | | | | | | | 26,774 | | | | 679,877 | |
| | | | | | | | | | | | |
United States | | | 1.1 | % | | | | | | | | |
Globant S.A.(a) | | | | | | | 2,689 | | | | 532,019 | |
| | | | | | | | | | | | |
TOTAL COMMON STOCKS (Cost $40,900,262) | | | | | | | | | | | 45,288,881 | |
| | | | | | | | | | | | |
EXCHANGE TRADED FUNDS | | | 2.6 | % | | | | | | | | |
iShares MSCI India ETF | | | | | | | 28,209 | | | | 1,247,402 | |
iShares MSCI India Small-Cap ETF | | | | | | | 962 | | | | 60,721 | |
| | | | | | | | | | | | |
TOTAL EXCHANGE TRADED FUNDS (Cost $1,298,157) | | | | | | | | | | | 1,308,123 | |
| | | | | | | | | | | | |
EQUITY-LINKED SECURITIES | | | 3.5 | % | | | | | | | | |
India | | | 3.5 | % | | | | | | | | |
CIE Automotive India Ltd., Issued by CLSA Global Markets Pte. Ltd., Maturity Date 4/27/28(a) | | | | | | | 77,941 | | | | 450,184 | |
Federal Bank Ltd., Issued by CLSA Global Markets Pte. Ltd., Maturity Date 10/25/27(a) | | | | | | | 327,017 | | | | 578,021 | |
Shriram Transport Finance Co. Ltd., Issued by CLSA Global Markets Pte. Ltd., Maturity Date 6/30/24(a) | | | | | | | 11,174 | | | | 257,866 | |
VA Tech Wabag Ltd., Issued by CLSA Global Markets Pte. Ltd., Maturity Date 7/30/26(a) | | | | | | | 91,330 | | | | 502,850 | |
| | | | | | | | | | | | |
| | | | | | | | | | | 1,788,921 | |
| | | | | | | | | | | | |
TOTAL EQUITY-LINKED SECURITIES (Cost $1,537,474) | | | | | | | | | | | 1,788,921 | |
| | | | | | | | | | | | |
PREFERRED STOCKS | | | 1.1 | % | | | | | | | | |
Brazil | | | 0.5 | % | | | | | | | | |
Marcopolo S.A., 1.58 %(c) | | | | | | | 237,800 | | | | 275,337 | |
| | | | | | | | | | | | |
See Notes to Financial Statements.
4
JOHCM FUNDS TRUST
JOHCM EMERGING MARKETS DISCOVERY FUND
SCHEDULE OF INVESTMENTS
September 30, 2023
| | | | | | | | | | | | |
| | | Percentage | | | | | | | |
| | | of Net | | | | | | | |
| | | Assets | | | Shares | | | Value | |
Colombia | | | 0.6 | % | | | | | | | | |
Bancolombia S.A. - ADR, 13.37%(c) | | | | | | | 11,236 | | | $ | 299,777 | |
| | | | | | | | | | | | |
TOTAL PREFERRED STOCKS (Cost $531,405) | | | | | | | | | | | 575,114 | |
| | | | | | | | | | | | |
SHORT-TERM INVESTMENTS | | | 3.0 | % | | | | | | | | |
Northern Institutional Treasury Portfolio (Premier Class), 5.20%(d) | | | | | | | 1,490,003 | | | | 1,490,003 | |
| | | | | | | | | | | | |
TOTAL SHORT-TERM INVESTMENTS (Cost $1,490,003) | | | | | | | | | | | 1,490,003 | |
| | | | | | | | | | | | |
TOTAL INVESTMENTS
(Cost $45,757,301) | | | 100.2 | % | | | | | | | 50,451,042 | |
NET OTHER ASSETS (LIABILITIES) | | | (0.2 | %) | | | | | | | (112,793 | ) |
| | | | | | | | | | | | |
NET ASSETS | | | 100.0 | % | | | | | | $ | 50,338,249 | |
| | | | | | | | | | | | |
| (a) | Non-income producing security. |
| (b) | Securities purchased in a transaction exempt from registration under Rule 144A of the Securities Act of 1933. These securities may not be publicly traded without registration under the Securities Act of 1933. The value of these securities is determined by valuations supplied by a pricing service or brokers. |
| (c) | Current yield is disclosed. Dividends are calculated based on a percentage of issuer’s net income. |
| (d) | 7-day current yield as of September 30, 2023 is disclosed. |
| ** | Security valued pursuant to Level 3 unobservable inputs and is restricted for trading. |
Abbreviations:
ADR – American Depositary Receipt
NVDR – Non-Voting Depositary Receipt
At September 30, 2023 the industry sectors (excluding short-term investments) for the JOHCM Emerging Markets Discovery Fund were:
| | | | |
Sector Allocation (Unaudited) | | % of Net Assets | |
Communication Services | | | 2.6 | % |
Consumer Discretionary | | | 12.6 | |
Consumer Staples | | | 7.3 | |
Energy | | | 1.7 | |
Financials | | | 9.5 | |
Health Care | | | 7.2 | |
Industrials | | | 13.6 | |
Information Technology | | | 27.6 | |
Materials | | | 6.1 | |
Real Estate | | | 6.9 | |
Utilities | | | 2.1 | |
| | | | |
Total | | | 97.2 | % |
| | | | |
See Notes to Financial Statements.
5
JOHCM FUNDS TRUST
JOHCM EMERGING MARKETS DISCOVERY FUND
SCHEDULE OF INVESTMENTS
September 30, 2023
At September 30, 2023 the JOHCM Emerging Markets Discovery Fund’s investments were concentrated as follows:
| | | | |
Market Exposure (Unaudited) | |
Equity and Equity-Linked Securities | | % of Net Assets | |
Semiconductors | | | 10.6 | % |
Technology Hardware | | | 8.4 | |
Real Estate Owners & Developers | | | 5.2 | |
Automotive | | | 4.6 | |
Leisure Facilities & Services | | | 4.2 | |
Transportation & Logistics | | | 4.1 | |
Health Care Facilities & Services | | | 3.8 | |
Beverages | | | 3.7 | |
Technology Services | | | 3.6 | |
Engineering & Construction | | | 3.1 | |
Electrical Equipment | | | 2.9 | |
Specialty Finance | | | 2.6 | |
Investment Companies | | | 2.6 | |
Biotechnology & Pharmaceuticals | | | 2.4 | |
Apparel & Textile Products | | | 2.3 | |
Household Products | | | 2.3 | |
Internet Media & Services | | | 2.2 | |
Real Estate Services | | | 2.1 | |
Telecommunications | | | 2.0 | |
Retail - Discretionary | | | 1.9 | |
Metals & Mining | | | 1.9 | |
Machinery | | | 1.8 | |
Banking | | | 1.7 | |
Industrial Intermediate Products | | | 1.6 | |
Oil, Gas Services & Equipment | | | 1.6 | |
Construction Materials | | | 1.5 | |
Electric Utilities | | | 1.5 | |
Chemicals | | | 1.3 | |
Medical Equipment & Devices | | | 1.2 | |
Forestry, Paper & Wood Products | | | 1.0 | |
Oil & Gas Producers | | | 0.9 | |
Institutional Financial Services | | | 0.8 | |
Retail - Consumer Staples | | | 0.8 | |
Renewable Energy | | | 0.8 | |
Containers & Packaging | | | 0.8 | |
Software | | | 0.8 | |
Transportation Equipment | | | 0.7 | |
Asset Management | | | 0.7 | |
Food | | | 0.5 | |
Steel | | | 0.4 | |
Wholesale - Consumer Staples | | | 0.3 | |
E-Commerce Discretionary | | | 0.0 | (a) |
| | | | |
Total | | | 97.2 | % |
| | | | |
| (a) | Amount rounds to less than 0.01%. |
| | | | |
5 Largest Equity Positions | |
Issuer | | % of Net Assets | |
iShares MSCI India ETF | | | 2.5 | % |
Phoenix Mills (The) Ltd. | | | 2.1 | |
Indosat Tbk PT | | | 2.0 | |
KPIT Technologies Ltd | | | 2.0 | |
Varun Beverages Ltd | | | 2.0 | |
| | | | |
Total | | | 10.6 | % |
| | | | |
See Notes to Financial Statements.
6
JOHCM FUNDS TRUST
JOHCM EMERGING MARKETS OPPORTUNITIES FUND
SCHEDULE OF INVESTMENTS
September 30, 2023
| | | | | | | | | | | | |
| | | Percentage | | | | | | | |
| | | of Net | | | | | | | |
| | | Assets | | | Shares | | | Value | |
COMMON STOCKS | | | 93.8 | % | | | | | | | | |
Brazil | | | 5.5 | % | | | | | | | | |
Ambev S.A. - ADR(a) | | | | | | | 11,005,685 | | | $ | 28,394,667 | |
Arcos Dorados Holdings, Inc. - Class A | | | | | | | 607,773 | | | | 5,749,533 | |
B3 S.A. - Brasil Bolsa Balcao | | | | | | | 840,137 | | | | 2,054,149 | |
Suzano S.A. - ADR | | | | | | | 276,773 | | | | 2,975,310 | |
Vamos Locacao de Caminhoes Maquinas e Equipamentos S.A. | | | | | | | 5,813,618 | | | | 11,276,676 | |
| | | | | | | | | | | | |
| | | | | | | | | | | 50,450,335 | |
| | | | | | | | | | | | |
Canada | | | 2.4 | % | | | | | | | | |
Barrick Gold Corp. | | | | | | | 1,526,982 | | | | 22,217,588 | |
| | | | | | | | | | | | |
China | | | 23.5 | % | | | | | | | | |
China Oilfield Services Ltd. - Class H | | | | | | | 12,432,384 | | | | 14,878,428 | |
China Resources Land Ltd. | | | | | | | 5,416,000 | | | | 21,507,690 | |
ENN Energy Holdings Ltd. | | | | | | | 1,995,376 | | | | 16,442,299 | |
Imeik Technology Development Co. Ltd. - Class A | | | | | | | 240,400 | | | | 12,913,337 | |
Meituan - Class B(a)(b) | | | | | | | 915,212 | | | | 13,248,784 | |
Proya Cosmetics Co. Ltd. - Class A | | | | | | | 1,198,883 | | | | 16,728,048 | |
Tencent Holdings Ltd. | | | | | | | 1,514,751 | | | | 58,717,746 | |
TravelSky Technology Ltd. - Class H | | | | | | | 5,146,922 | | | | 8,875,068 | |
Trip.com Group Ltd.(a) | | | | | | | 632,231 | | | | 22,283,952 | |
Tsingtao Brewery Co. Ltd. - Class H | | | | | | | 2,690,320 | | | | 21,907,202 | |
Xinyi Solar Holdings Ltd. | | | | | | | 11,759,325 | | | | 8,741,427 | |
| | | | | | | | | | | | |
| | | | | | | | | | | 216,243,981 | |
| | | | | | | | | | | | |
Hong Kong | | | 3.0 | % | | | | | | | | |
Hong Kong Exchanges & Clearing Ltd. | | | | | | | 743,763 | | | | 27,603,106 | |
| | | | | | | | | | | | |
India | | | 18.4 | % | | | | | | | | |
HDFC Bank Ltd. - ADR | | | | | | | 535,158 | | | | 31,579,674 | |
ICICI Bank Ltd. - ADR | | | | | | | 439,951 | | | | 10,171,667 | |
Jio Financial Services Ltd.(a) | | | | | | | 268,289 | | | | 746,959 | |
Larsen & Toubro Ltd. | | | | | | | 1,102,227 | | | | 40,047,104 | |
Mahindra & Mahindra Ltd. | | | | | | | 1,952,565 | | | | 36,461,886 | |
Reliance Industries Ltd. | | | | | | | 277,785 | | | | 7,820,946 | |
State Bank of India | | | | | | | 4,613,192 | | | | 33,137,067 | |
UltraTech Cement Ltd. | | | | | | | 98,812 | | | | 9,798,880 | |
| | | | | | | | | | | | |
| | | | | | | | | | | 169,764,183 | |
| | | | | | | | | | | | |
Indonesia | | | 9.5 | % | | | | | | | | |
Astra International Tbk PT | | | | | | | 43,075,500 | | | | 17,301,698 | |
Bank Mandiri Persero Tbk PT | | | | | | | 74,699,703 | | | | 29,075,136 | |
Bank Rakyat Indonesia Persero Tbk PT | | | | | | | 79,873,354 | | | | 26,975,860 | |
Mitra Adiperkasa Tbk PT | | | | | | | 121,568,409 | | | | 14,305,956 | |
| | | | | | | | | | | | |
| | | | | | | | | | | 87,658,650 | |
| | | | | | | | | | | | |
Jersey | | | 0.3 | % | | | | | | | | |
Centamin PLC | | | | | | | 2,313,227 | | | | 2,350,525 | |
| | | | | | | | | | | | |
Mexico | | | 8.9 | % | | | | | | | | |
Becle S.A.B. de C.V. | | | | | | | 3,083,308 | | | | 7,342,263 | |
See Notes to Financial Statements.
7
JOHCM FUNDS TRUST
JOHCM EMERGING MARKETS OPPORTUNITIES FUND
SCHEDULE OF INVESTMENTS
September 30, 2023
| | | | | | | | | | | | |
| | | Percentage | | | | | | | |
| | | of Net | | | | | | | |
| | | Assets | | | Shares | | | Value | |
Bolsa Mexicana de Valores S.A.B. de C.V. | | | | | | | 2,717,379 | | | $ | 5,100,299 | |
Cemex S.A.B. de C.V. - ADR(a) | | | | | | | 2,714,815 | | | | 17,646,298 | |
Grupo Financiero Banorte S.A.B. de C.V., Series O | | | | | | | 3,662,139 | | | | 30,702,919 | |
Megacable Holdings S.A.B. de C.V. - CPO | | | | | | | 792,369 | | | | 1,744,098 | |
Wal-Mart de Mexico S.A.B. de C.V. | | | | | | | 5,101,746 | | | | 19,203,818 | |
| | | | | | | | | | | | |
| | | | | | | | | | | 81,739,695 | |
| | | | | | | | | | | | |
Russia | | | 0.0 | % | | | | | | | | |
Gazprom PJSC - ADR(a)** | | | | | | | 306,786 | | | | — | |
Globaltrans Investment PLC - REG - GDR(a)** | | | | | | | 757,185 | | | | — | |
| | | | | | | | | | | | |
| | | | | | | | | | | — | |
| | | | | | | | | | | | |
South Africa | | | 3.3 | % | | | | | | | | |
FirstRand Ltd. | | | | | | | 9,022,364 | | | | 30,382,110 | |
| | | | | | | | | | | | |
South Korea | | | 4.9 | % | | | | | | | | |
Samsung Electronics Co. Ltd. | | | | | | | 461,406 | | | | 23,325,981 | |
Samsung Electronics Co. Ltd. - REG - GDR | | | | | | | 7,021 | | | | 8,829,001 | |
SK Hynix, Inc. | | | | | | | 51,601 | | | | 4,368,783 | |
SK Square Co. Ltd.(a) | | | | | | | 268,034 | | | | 8,415,321 | |
| | | | | | | | | | | | |
| | | | | | | | | | | 44,939,086 | |
| | | | | | | | | | | | |
Taiwan | | | 8.9 | % | | | | | | | | |
President Chain Store Corp. | | | | | | | 389,927 | | | | 3,169,853 | |
Taiwan Semiconductor Manufacturing Co. Ltd. | | | | | | | 1,207,816 | | | | 19,694,943 | |
Taiwan Semiconductor Manufacturing Co. Ltd. - ADR | | | | | | | 455,414 | | | | 39,575,477 | |
Yuanta Financial Holding Co. Ltd. | | | | | | | 24,926,967 | | | | 19,363,628 | |
| | | | | | | | | | | | |
| | | | | | | | | | | 81,803,901 | |
| | | | | | | | | | | | |
United Arab Emirates | | | 5.2 | % | | | | | | | | |
Emaar Properties PJSC | | | | | | | 19,956,426 | | | | 43,673,359 | |
Fertiglobe PLC | | | | | | | 4,596,376 | | | | 4,367,355 | |
| | | | | | | | | | | | |
| | | | | | | | | | | 48,040,714 | |
| | | | | | | | | | | | |
TOTAL COMMON STOCKS (Cost $836,932,937) | | | | | | | | | | | 863,193,874 | |
| | | | | | | | | | | | |
PREFERRED STOCKS | | | 4.1 | % | | | | | | | | |
Brazil | | | 4.1 | % | | | | | | | | |
Azul S.A. - ADR(a) | | | | | | | 1,050,564 | | | | 9,024,345 | |
Itau Unibanco Holding S.A. - ADR(a) | | | | | | | 5,297,178 | | | | 28,445,846 | |
| | | | | | | | | | | | |
| | | | | | | | | | | 37,470,191 | |
| | | | | | | | | | | | |
TOTAL PREFERRED STOCKS (Cost $42,335,056) | | | | | | | | | | | 37,470,191 | |
| | | | | | | | | | | | |
SHORT-TERM INVESTMENTS | | | 4.2 | % | | | | | | | | |
Northern Institutional Treasury Portfolio (Premier Class), 5.20%(c) | | | | | | | 39,309,027 | | | | 39,309,027 | |
| | | | | | | | | | | | |
TOTAL SHORT-TERM INVESTMENTS (Cost $39,309,027) | | | | | | | | | | | 39,309,027 | |
| | | | | | | | | | | | |
TOTAL INVESTMENTS
(Cost $918,577,020) | | | 102.1 | % | | | | | | | 939,973,092 | |
NET OTHER ASSETS (LIABILITIES) | | | (2.1 | %) | | | | | | | (19,740,987 | ) |
| | | | | | | | | | | | |
NET ASSETS | | | 100.0 | % | | | | | | $ | 920,232,105 | |
| | | | | | | | | | | | |
See Notes to Financial Statements.
8
JOHCM FUNDS TRUST
JOHCM EMERGING MARKETS OPPORTUNITIES FUND
SCHEDULE OF INVESTMENTS
September 30, 2023
| (a) | Non-income producing security. |
| (b) | Securities purchased in a transaction exempt from registration under Rule 144A of the Securities Act of 1933. These securities may not be publicly traded without registration under the Securities Act of 1933. The value of these securities is determined by valuations supplied by a pricing service or brokers. |
| (c) | 7-day current yield as of September 30, 2023 is disclosed. |
| ** | Security valued pursuant to Level 3 unobservable inputs and is restricted for trading. |
Abbreviations:
ADR – American Depositary Receipt
CPO – Certificados de Partcipatión Ordinario
GDR – Global Depositary Receipt
REG – Registered
At September 30, 2023 the industry sectors (excluding short-term investments) for the JOHCM Emerging Markets Opportunities Fund were:
| | | | |
Sector Allocation (Unaudited) | | % of Net Assets | |
Communication Services | | | 6.6 | % |
Consumer Discretionary | | | 11.0 | |
Consumer Staples | | | 10.5 | |
Energy | | | 2.5 | |
Financials | | | 29.9 | |
Health Care | | | 1.4 | |
Industrials | | | 9.3 | |
Information Technology | | | 11.4 | |
Materials | | | 6.4 | |
Real Estate | | | 7.1 | |
Utilities | | | 1.8 | |
| | | | |
Total | | | 97.9 | % |
| | | | |
See Notes to Financial Statements.
9
JOHCM FUNDS TRUST
JOHCM EMERGING MARKETS OPPORTUNITIES FUND
SCHEDULE OF INVESTMENTS
September 30, 2023
At September 30, 2023 the JOHCM Emerging Markets Opportunities Fund’s investments were concentrated as follows:
| | | | |
Market Exposure (Unaudited) | |
Equity Securities | | % of Net Assets | |
Banking | | | 23.9 | % |
Internet Media & Services | | | 10.2 | |
Real Estate Owners & Developers | | | 7.0 | |
Semiconductors | | | 6.9 | |
Beverages | | | 6.3 | |
Institutional Financial Services | | | 5.9 | |
Engineering & Construction | | | 4.3 | |
Automotive | | | 4.0 | |
Technology Hardware | | | 3.5 | |
Retail - Discretionary | | | 3.4 | |
Construction Materials | | | 3.0 | |
Metals & Mining | | | 2.7 | |
Retail - Consumer Staples | | | 2.5 | |
Gas & Water Utilities | | | 1.8 | |
Household Products | | | 1.8 | |
Oil, Gas Services & Equipment | | | 1.6 | |
Biotechnology & Pharmaceuticals | | | 1.4 | |
Industrial Support Services | | | 1.3 | |
Technology Services | | | 1.0 | |
Renewable Energy | | | 1.0 | |
Transportation & Logistics | | | 1.0 | |
Asset Management | | | 0.9 | |
Oil & Gas Producers | | | 0.8 | |
Leisure Facilities & Services | | | 0.6 | |
Chemicals | | | 0.5 | |
Forestry, Paper & Wood Products | | | 0.3 | |
Telecommunications | | | 0.2 | |
Specialty Finance | | | 0.1 | |
| | | | |
Total | | | 97.9 | % |
| | | | |
| | | | |
5 Largest Equity Positions | |
Issuer | | % of Net Assets | |
Tencent Holdings Ltd. | | | 6.4 | % |
Emaar Properties PJSC | | | 4.7 | |
Larsen & Toubro Ltd. | | | 4.4 | |
Taiwan Semiconductor Manufacturing Co. Ltd. - ADR | | | 4.3 | |
Mahindra & Mahindra Ltd. | | | 4.0 | |
| | | | |
Total | | | 23.8 | % |
| | | | |
See Notes to Financial Statements.
10
JOHCM FUNDS TRUST
JOHCM GLOBAL SELECT FUND
SCHEDULE OF INVESTMENTS
September 30, 2023
| | | | | | | | | | | | |
| | | Percentage | | | | | | | |
| | | of Net | | | | | | | |
| | | Assets | | | Shares | | | Value | |
COMMON STOCKS | | | 97.4 | % | | | | | | | | |
Australia | | | 2.4 | % | | | | | | | | |
Fortescue Metals Group Ltd. | | | | | | | 129,215 | | | $ | 1,717,661 | |
| | | | | | | | | | | | |
Brazil | | | 2.0 | % | | | | | | | | |
B3 S.A. - Brasil Bolsa Balcao | | | | | | | 587,359 | | | | 1,436,103 | |
| | | | | | | | | | | | |
Denmark | | | 2.6 | % | | | | | | | | |
Novo Nordisk A/S - Class B | | | | | | | 20,312 | | | | 1,849,433 | |
| | | | | | | | | | | | |
France | | | 2.5 | % | | | | | | | | |
Danone S.A. | | | | | | | 31,823 | | | | 1,755,285 | |
| | | | | | | | | | | | |
Indonesia | | | 2.8 | % | | | | | | | | |
Bank Mandiri Persero Tbk PT | | | | | | | 5,000,261 | | | | 1,946,236 | |
| | | | | | | | | | | | |
Ireland | | | 7.8 | % | | | | | | | | |
Accenture PLC - Class A | | | | | | | 6,025 | | | | 1,850,338 | |
CRH PLC | | | | | | | 30,041 | | | | 1,656,285 | |
Linde PLC | | | | | | | 5,366 | | | | 1,998,030 | |
| | | | | | | | | | | | |
| | | | | | | | | | | 5,504,653 | |
| | | | | | | | | | | | |
Japan | | | 4.6 | % | | | | | | | | |
Daifuku Co. Ltd. | | | | | | | 79,275 | | | | 1,496,445 | |
Sony Group Corp. | | | | | | | 20,779 | | | | 1,699,215 | |
| | | | | | | | | | | | |
| | | | | | | | | | | 3,195,660 | |
| | | | | | | | | | | | |
Jersey | | | 2.3 | % | | | | | | | | |
Aptiv PLC(a) | | | | | | | 16,632 | | | | 1,639,749 | |
| | | | | | | | | | | | |
Netherlands | | | 2.1 | % | | | | | | | | |
CNH Industrial N.V. | | | | | | | 122,785 | | | | 1,485,699 | |
| | | | | | | | | | | | |
South Korea | | | 2.4 | % | | | | | | | | |
SK Hynix, Inc. | | | | | | | 19,687 | | | | 1,666,794 | |
| | | | | | | | | | | | |
United Kingdom | | | 5.0 | % | | | | | | | | |
Compass Group PLC | | | | | | | 70,476 | | | | 1,715,498 | |
Unilever PLC | | | | | | | 35,672 | | | | 1,764,580 | |
| | | | | | | | | | | | |
| | | | | | | | | | | 3,480,078 | |
| | | | | | | | | | | | |
United States | | | 60.9 | % | | | | | | | | |
Adobe, Inc.(a) | | | | | | | 3,087 | | | | 1,574,061 | |
Alphabet, Inc. - Class A(a) | | | | | | | 15,686 | | | | 2,052,670 | |
Amazon.com, Inc.(a) | | | | | | | 12,296 | | | | 1,563,068 | |
ANSYS, Inc.(a) | | | | | | | 5,783 | | | | 1,720,732 | |
Ares Management Corp. - Class A | | | | | | | 17,226 | | | | 1,772,039 | |
Chart Industries, Inc.(a) | | | | | | | 9,450 | | | | 1,598,184 | |
Dynatrace, Inc.(a) | | | | | | | 33,592 | | | | 1,569,754 | |
Elevance Health, Inc. | | | | | | | 3,746 | | | | 1,631,083 | |
Globant S.A.(a) | | | | | | | 10,103 | | | | 1,998,879 | |
GXO Logistics, Inc.(a) | | | | | | | 29,034 | | | | 1,702,844 | |
Henry Schein, Inc.(a) | | | | | | | 22,503 | | | | 1,670,848 | |
Intercontinental Exchange, Inc. | | | | | | | 17,146 | | | | 1,886,403 | |
Intuit, Inc. | | | | | | | 3,188 | | | | 1,628,877 | |
MercadoLibre, Inc.(a) | | | | | | | 1,301 | | | | 1,649,512 | |
See Notes to Financial Statements.
11
JOHCM FUNDS TRUST
JOHCM GLOBAL SELECT FUND
SCHEDULE OF INVESTMENTS
September 30, 2023
| | | | | | | | | | | | |
| | | Percentage | | | | | | | |
| | | of Net | | | | | | | |
| | | Assets | | | Shares | | | Value | |
Microsoft Corp. | | | | | | | 6,588 | | | $ | 2,080,161 | |
PTC, Inc.(a) | | | | | | | 12,959 | | | | 1,836,031 | |
Regeneron Pharmaceuticals, Inc.(a) | | | | | | | 2,342 | | | | 1,927,372 | |
Repligen Corp.(a) | | | | | | | 12,008 | | | | 1,909,392 | |
S&P Global, Inc. | | | | | | | 4,570 | | | | 1,669,924 | |
Tenaris S.A. - ADR | | | | | | | 62,634 | | | | 1,979,234 | |
Thermo Fisher Scientific, Inc. | | | | | | | 3,564 | | | | 1,803,990 | |
TPG, Inc. | | | | | | | 56,457 | | | | 1,700,485 | |
UnitedHealth Group, Inc. | | | | | | | 3,553 | | | | 1,791,387 | |
Vertex Pharmaceuticals, Inc.(a) | | | | | | | 5,872 | | | | 2,041,929 | |
| | | | | | | | | | | | |
| | | | | | | | | | | 42,758,859 | |
| | | | | | | | | | | | |
TOTAL COMMON STOCKS (Cost $57,439,898) | | | | | | | | | | | 68,436,210 | |
| | | | | | | | | | | | |
SHORT-TERM INVESTMENTS | | | 2.2 | % | | | | | | | | |
Northern Institutional Treasury Portfolio (Premier Class), 5.20%(b) | | | | | | | 1,571,338 | | | | 1,571,338 | |
| | | | | | | | | | | | |
TOTAL SHORT-TERM INVESTMENTS (Cost $1,571,338) | | | | | | | | | | | 1,571,338 | |
| | | | | | | | | | | | |
TOTAL INVESTMENTS
(Cost $59,011,236) | | | 99.6 | % | | | | | | | 70,007,548 | |
NET OTHER ASSETS (LIABILITIES) | | | 0.4 | % | | | | | | | 257,961 | |
| | | | | | | | | | | | |
NET ASSETS | | | 100.0 | % | | | | | | $ | 70,265,509 | |
| | | | | | | | | | | | |
| (a) | Non-income producing security. |
| (b) | 7-day current yield as of September 30, 2023 is disclosed. |
Abbreviations:
ADR – American Depositary Receipt
At September 30, 2023 the industry sectors (excluding short-term investments) for the JOHCM Global Select Fund were:
| | | | |
Sector Allocation (Unaudited) | | % of Net Assets | |
Communication Services | | | 2.9 | % |
Consumer Discretionary | | | 11.8 | |
Consumer Staples | | | 5.0 | |
Energy | | | 2.8 | |
Financials | | | 14.8 | |
Health Care | | | 20.8 | |
Industrials | | | 8.9 | |
Information Technology | | | 22.7 | |
Materials | | | 7.7 | |
| | | | |
Total | | | 97.4 | % |
| | | | |
See Notes to Financial Statements.
12
JOHCM FUNDS TRUST
JOHCM GLOBAL SELECT FUND
SCHEDULE OF INVESTMENTS
September 30, 2023
At September 30, 2023 the JOHCM Global Select Fund’s investments were concentrated as follows:
| | | | |
Market Exposure (Unaudited) | |
Equity Securities | | % of Net Assets | |
Software | | | 14.8 | % |
Biotechnology & Pharmaceuticals | | | 8.2 | |
Technology Services | | | 7.9 | |
Health Care Facilities & Services | | | 7.3 | |
Medical Equipment & Devices | | | 5.3 | |
Asset Management | | | 4.9 | |
Institutional Financial Services | | | 4.7 | |
E-Commerce Discretionary | | | 4.6 | |
Machinery | | | 4.3 | |
Internet Media & Services | | | 2.9 | |
Steel | | | 2.8 | |
Banking | | | 2.8 | |
Chemicals | | | 2.8 | |
Household Products | | | 2.5 | |
Food | | | 2.5 | |
Commercial Support Services | | | 2.5 | |
Technology Hardware | | | 2.4 | |
Metals & Mining | | | 2.4 | |
Semiconductors | | | 2.4 | |
Construction Materials | | | 2.4 | |
Transportation & Logistics | | | 2.4 | |
Industrial Intermediate Products | | | 2.3 | |
Automotive | | | 2.3 | |
| | | | |
Total | | | 97.4 | % |
| | | | |
| | | | |
5 Largest Security Positions | |
Issuer | | % of Net Assets | |
Microsoft Corp. | | | 3.0 | % |
Alphabet, Inc. - Class A | | | 2.9 | |
Vertex Pharmaceuticals, Inc. | | | 2.9 | |
Globant S.A. | | | 2.9 | |
Linde PLC | | | 2.9 | |
| | | | |
Total | | | 14.6 | % |
| | | | |
See Notes to Financial Statements.
13
JOHCM FUNDS TRUST
JOHCM INTERNATIONAL OPPORTUNITIES FUND
SCHEDULE OF INVESTMENTS
September 30, 2023
| | | | | | | | | | | | |
| | | Percentage | | | | | | | |
| | | of Net | | | | | | | |
| | | Assets | | | Shares | | | Value | |
COMMON STOCKS | | | 96.5 | % | | | | | | | | |
Canada | | | 7.6 | % | | | | | | | | |
Alimentation Couche-Tard, Inc. | | | | | | | 1,153 | | | $ | 58,556 | |
Cameco Corp. | | | | | | | 1,490 | | | | 59,117 | |
Intact Financial Corp. | | | | | | | 215 | | | | 31,345 | |
| | | | | | | | | | | | |
| | | | | | | | | | | 149,018 | |
| | | | | | | | | | | | |
Finland | | | 3.1 | % | | | | | | | | |
Kone OYJ - Class B | | | | | | | 526 | | | | 22,166 | |
Wartsila OYJ Abp | | | | | | | 3,526 | | | | 39,963 | |
| | | | | | | | | | | | |
| | | | | | | | | | | 62,129 | |
| | | | | | | | | | | | |
France | | | 15.6 | % | | | | | | | | |
Publicis Groupe S.A. | | | | | | | 659 | | | | 49,881 | |
Sanofi | | | | | | | 835 | | | | 89,658 | |
Schneider Electric S.E. | | | | | | | 223 | | | | 36,749 | |
Thales S.A. | | | | | | | 513 | | | | 72,099 | |
TotalEnergies S.E. | | | | | | | 897 | | | | 58,977 | |
| | | | | | | | | | | | |
| | | | | | | | | | | 307,364 | |
| | | | | | | | | | | | |
Germany | | | 12.3 | % | | | | | | | | |
Continental A.G. | | | | | | | 631 | | | | 44,336 | |
Deutsche Boerse A.G. | | | | | | | 439 | | | | 75,814 | |
Infineon Technologies A.G. | | | | | | | 1,245 | | | | 41,235 | |
Merck KGaA | | | | | | | 484 | | | | 80,686 | |
| | | | | | | | | | | | |
| | | | | | | | | | | 242,071 | |
| | | | | | | | | | | | |
Ireland | | | 4.5 | % | | | | | | | | |
CRH PLC | | | | | | | 1,617 | | | | 89,152 | |
| | | | | | | | | | | | |
Japan | | | 14.9 | % | | | | | | | | |
Daifuku Co. Ltd. | | | | | | | 2,808 | | | | 53,006 | |
Dentsu Group, Inc. | | | | | | | 1,291 | | | | 37,970 | |
KDDI Corp. | | | | | | | 906 | | | | 27,733 | |
Komatsu Ltd. | | | | | | | 2,000 | | | | 53,942 | |
Nippon Gas Co. Ltd. | | | | | | | 2,345 | | | | 34,707 | |
Nitori Holdings Co. Ltd. | | | | | | | 480 | | | | 53,518 | |
Tokio Marine Holdings, Inc. | | | | | | | 1,414 | | | | 32,739 | |
| | | | | | | | | | | | |
| | | | | | | | | | | 293,615 | |
| | | | | | | | | | | | |
Netherlands | | | 5.0 | % | | | | | | | | |
Heineken Holding N.V. | | | | | | | 921 | | | | 69,408 | |
SBM Offshore N.V. | | | | | | | 2,304 | | | | 30,205 | |
| | | | | | | | | | | | |
| | | | | | | | | | | 99,613 | |
| | | | | | | | | | | | |
Singapore | | | 2.7 | % | | | | | | | | |
DBS Group Holdings Ltd. | | | | | | | 2,129 | | | | 52,288 | |
| | | | | | | | | | | | |
South Korea | | | 0.8 | % | | | | | | | | |
LG H&H Co. Ltd. | | | | | | | 48 | | | | 15,836 | |
| | | | | | | | | | | | |
See Notes to Financial Statements.
14
JOHCM FUNDS TRUST
JOHCM INTERNATIONAL OPPORTUNITIES FUND
SCHEDULE OF INVESTMENTS
September 30, 2023
| | | | | | | | | | | | |
| | | Percentage | | | | | | | |
| | | of Net | | | | | | | |
| | | Assets | | | Shares | | | Value | |
Spain | | | 3.1 | % | | | | | | | | |
Bankinter S.A. | | | | | | | 4,033 | | | $ | 25,658 | |
Iberdrola S.A. | | | | | | | 3,202 | | | | 35,813 | |
| | | | | | | | | | | | |
| | | | | | | | | | | 61,471 | |
| | | | | | | | | | | | |
Sweden | | | 4.3 | % | | | | | | | | |
Sandvik AB | | | | | | | 1,571 | | | | 28,907 | |
Svenska Handelsbanken AB - Class A | | | | | | | 6,354 | | | | 56,538 | |
| | | | | | | | | | | | |
| | | | | | | | | | | 85,445 | |
| | | | | | | | | | | | |
Switzerland | | | 3.3 | % | | | | | | | | |
Roche Holding A.G. | | | | | | | 240 | | | | 65,520 | |
| | | | | | | | | | | | |
United Kingdom | | | 16.3 | % | | | | | | | | |
B&M European Value Retail S.A. | | | | | | | 9,372 | | | | 66,849 | |
Beazley PLC | | | | | | | 7,332 | | | | 49,302 | |
Compass Group PLC | | | | | | | 2,976 | | | | 72,441 | |
Diageo PLC | | | | | | | 761 | | | | 28,057 | |
Rio Tinto PLC | | | | | | | 379 | | | | 23,798 | |
Shell PLC | | | | | | | 2,577 | | | | 81,676 | |
| | | | | | | | | | | | |
| | | | | | | | | | | 322,123 | |
| | | | | | | | | | | | |
United States | | | 3.0 | % | | | | | | | | |
Philip Morris International, Inc. | | | | | | | 634 | | | | 58,696 | |
| | | | | | | | | | | | |
TOTAL COMMON STOCKS (Cost $1,752,950) | | | | | | | | | | | 1,904,341 | |
| | | | | | | | | | | | |
SHORT-TERM INVESTMENTS | | | 2.6 | % | | | | | | | | |
Northern Institutional Treasury Portfolio (Premier Class), 5.20%(a) | | | | | | | 51,443 | | | | 51,443 | |
| | | | | | | | | | | | |
TOTAL SHORT-TERM INVESTMENTS (Cost $51,443) | | | | | | | | | | | 51,443 | |
| | | | | | | | | | | | |
TOTAL INVESTMENTS
(Cost $1,804,393) | | | 99.1 | % | | | | | | | 1,955,784 | |
NET OTHER ASSETS (LIABILITIES) | | | 0.9 | % | | | | | | | 16,808 | |
| | | | | | | | | | | | |
NET ASSETS | | | 100.0 | % | | | | | | $ | 1,972,592 | |
| | | | | | | | | | | | |
| (a) | 7-day current yield as of September 30, 2023 is disclosed. |
At September 30, 2023 the industry sectors (excluding short-term investments) for the JOHCM International Opportunities Fund were:
| | | | |
Sector Allocation (Unaudited) | | % of Net Assets | |
Communication Services | | | 5.9 | % |
Consumer Discretionary | | | 12.0 | |
Consumer Staples | | | 11.7 | |
Energy | | | 11.7 | |
Financials | | | 16.4 | |
Health Care | | | 11.9 | |
Industrials | | | 15.5 | |
Information Technology | | | 2.1 | |
Materials | | | 5.7 | |
Utilities | | | 3.6 | |
| | | | |
Total | | | 96.5 | % |
| | | | |
See Notes to Financial Statements.
15
JOHCM FUNDS TRUST
JOHCM INTERNATIONAL OPPORTUNITIES FUND
SCHEDULE OF INVESTMENTS
September 30, 2023
At September 30, 2023 the JOHCM International Opportunities Fund’s investments were concentrated as follows:
| | | | |
Market Exposure (Unaudited) | |
Equity Securities | | % of Net Assets | |
Biotechnology & Pharmaceuticals | | | 11.9 | % |
Machinery | | | 8.8 | |
Oil & Gas Producers | | | 7.1 | |
Banking | | | 6.9 | |
Retail - Consumer Staples | | | 6.4 | |
Insurance | | | 5.8 | |
Beverages | | | 4.9 | |
Construction Materials | | | 4.5 | |
Advertising & Marketing | | | 4.4 | |
Metals & Mining | | | 4.2 | |
Institutional Financial Services | | | 3.8 | |
Aerospace & Defense | | | 3.7 | |
Commercial Support Services | | | 3.7 | |
Tobacco & Cannabis | | | 3.0 | |
Electrical Equipment | | | 3.0 | |
Retail - Discretionary | | | 2.7 | |
Automotive | | | 2.3 | |
Semiconductors | | | 2.1 | |
Electric Utilities | | | 1.8 | |
Gas & Water Utilities | | | 1.8 | |
Oil, Gas Services & Equipment | | | 1.5 | |
Telecommunications | | | 1.4 | |
Household Products | | | 0.8 | |
| | | | |
Total | | | 96.5 | % |
| | | | |
| | | | |
5 Largest Equity Positions | |
Issuer | | % of Net Assets | |
Sanofi | | | 4.6 | % |
CRH PLC | | | 4.5 | |
Shell PLC | | | 4.1 | |
Merck KGaA | | | 4.1 | |
Deutsche Boerse A.G. | | | 3.9 | |
| | | | |
Total | | | 21.2 | % |
| | | | |
See Notes to Financial Statements.
16
JOHCM FUNDS TRUST
JOHCM INTERNATIONAL SELECT FUND
SCHEDULE OF INVESTMENTS
September 30, 2023
| | | | | | | | | | | | |
| | | Percentage | | | | | | | |
| | | of Net | | | | | | | |
| | | Assets | | | Shares | | | Value | |
COMMON STOCKS | | | 93.2 | % | | | | | | | | |
Australia | | | 2.1 | % | | | | | | | | |
Fortescue Metals Group Ltd. | | | | | | | 8,347,042 | | | $ | 110,957,644 | |
| | | | | | | | | | | | |
Brazil | | | 1.8 | % | | | | | | | | |
B3 S.A. - Brasil Bolsa Balcao | | | | | | | 39,750,142 | | | | 97,189,771 | |
| | | | | | | | | | | | |
Denmark | | | 2.1 | % | | | | | | | | |
Novo Nordisk A/S - Class B | | | | | | | 1,225,046 | | | | 111,541,986 | |
| | | | | | | | | | | | |
France | | | 9.1 | % | | | | | | | | |
Air Liquide S.A. | | | | | | | 676,971 | | | | 114,023,306 | |
Danone S.A. | | | | | | | 2,013,558 | | | | 111,063,343 | |
Sanofi | | | | | | | 1,193,960 | | | | 128,201,778 | |
Schneider Electric S.E. | | | | | | | 757,985 | | | | 124,910,020 | |
| | | | | | | | | | | | |
| | | | | | | | | | | 478,198,447 | |
| | | | | | | | | | | | |
Germany | | | 3.9 | % | | | | | | | | |
Deutsche Boerse A.G. | | | | | | | 611,753 | | | | 105,647,781 | |
Merck KGaA | | | | | | | 599,612 | | | | 99,959,721 | |
| | | | | | | | | | | | |
| | | | | | | | | | | 205,607,502 | |
| | | | | | | | | | | | |
Indonesia | | | 2.2 | % | | | | | | | | |
Bank Rakyat Indonesia Persero Tbk PT | | | | | | | 341,441,281 | | | | 115,315,958 | |
| | | | | | | | | | | | |
Ireland | | | 7.0 | % | | | | | | | | |
Accenture PLC - Class A | | | | | | | 371,435 | | | | 114,071,403 | |
CRH PLC | | | | | | | 2,373,902 | | | | 130,883,089 | |
Linde PLC | | | | | | | 331,463 | | | | 123,420,248 | |
| | | | | | | | | | | | |
| | | | | | | | | | | 368,374,740 | |
| | | | | | | | | | | | |
Japan | | | 19.2 | % | | | | | | | | |
Advantest Corp. | | | | | | | 3,701,388 | | | | 103,244,720 | |
Daifuku Co. Ltd. | | | | | | | 5,923,884 | | | | 111,822,963 | |
Hitachi Ltd. | | | | | | | 1,744,909 | | | | 108,145,239 | |
Japan Exchange Group, Inc. | | | | | | | 7,152,978 | | | | 132,518,212 | |
Komatsu Ltd. | | | | | | | 4,216,647 | | | | 113,727,783 | |
Ono Pharmaceutical Co. Ltd. | | | | | | | 5,781,705 | | | | 110,883,767 | |
ORIX Corp. | | | | | | | 6,688,308 | | | | 124,886,782 | |
Socionext, Inc. | | | | | | | 964,489 | | | | 95,042,971 | |
Sony Group Corp. | | | | | | | 1,331,685 | | | | 108,899,319 | |
| | | | | | | | | | | | |
| | | | | | | | | | | 1,009,171,756 | |
| | | | | | | | | | | | |
Jersey | | | 4.3 | % | | | | | | | | |
Aptiv PLC(a) | | | | | | | 1,073,167 | | | | 105,803,534 | |
Ferguson PLC | | | | | | | 718,641 | | | | 118,266,885 | |
| | | | | | | | | | | | |
| | | | | | | | | | | 224,070,419 | |
| | | | | | | | | | | | |
Netherlands | | | 3.9 | % | | | | | | | | |
CNH Industrial N.V. | | | | | | | 7,550,214 | �� | | | 91,656,932 | |
Koninklijke Ahold Delhaize N.V. | | | | | | | 3,753,158 | | | | 113,119,027 | |
| | | | | | | | | | | | |
| | | | | | | | | | | 204,775,959 | |
| | | | | | | | | | | | |
South Korea | | | 1.9 | % | | | | | | | | |
SK Hynix, Inc. | | | | | | | 1,190,946 | | | | 100,831,075 | |
| | | | | | | | | | | | |
See Notes to Financial Statements.
17
JOHCM FUNDS TRUST
JOHCM INTERNATIONAL SELECT FUND
SCHEDULE OF INVESTMENTS
September 30, 2023
| | | | | | | | | | | | |
| | | Percentage | | | | | | | |
| | | of Net | | | | | | | |
| | | Assets | | | Shares | | | Value | |
Sweden | | | 2.1 | % | | | | | | | | |
EQT AB | | | | | | | 5,682,880 | | | $ | 111,969,707 | |
| | | | | | | | | | | | |
Switzerland | | | 8.5 | % | | | | | | | | |
Alcon, Inc. | | | | | | | 1,344,158 | | | | 103,725,249 | |
Lonza Group A.G. - REG | | | | | | | 214,946 | | | | 99,422,651 | |
Novartis A.G. - REG | | | | | | | 1,175,803 | | | | 120,083,164 | |
Partners Group Holding A.G. | | | | | | | 113,051 | | | | 126,910,521 | |
| | | | | | | | | | | | |
| | | | | | | | | | | 450,141,585 | |
| | | | | | | | | | | | |
United Kingdom | | | 18.6 | % | | | | | | | | |
Anglo American PLC | | | | | | | 2,702,123 | | | | 74,199,247 | |
Ashtead Group PLC | | | | | | | 1,845,434 | | | | 111,911,975 | |
AstraZeneca PLC | | | | | | | 818,460 | | | | 110,397,577 | |
B&M European Value Retail S.A. | | | | | | | 17,951,475 | | | | 128,044,898 | |
Compass Group PLC | | | | | | | 5,249,896 | | | | 127,790,852 | |
GSK PLC | | | | | | | 6,443,893 | | | | 116,594,497 | |
London Stock Exchange Group PLC | | | | | | | 1,053,277 | | | | 105,565,675 | |
Rio Tinto PLC | | | | | | | 1,679,286 | | | | 105,446,561 | |
Unilever PLC | | | | | | | 2,040,623 | | | | 100,943,101 | |
| | | | | | | | | | | | |
| | | | | | | | | | | 980,894,383 | |
| | | | | | | | | | | | |
United States | | | 6.5 | % | | | | | | | | |
Globant S.A.(a) | | | | | | | 539,901 | | | | 106,819,413 | |
MercadoLibre, Inc.(a) | | | | | | | 97,685 | | | | 123,852,858 | |
Tenaris S.A. | | | | | | | 6,943,855 | | | | 109,684,853 | |
| | | | | | | | | | | | |
| | | | | | | | | | | 340,357,124 | |
| | | | | | | | | | | | |
TOTAL COMMON STOCKS (Cost $4,584,989,271) | | | | | | | | | | | 4,909,398,056 | |
| | | | | | | | | | | | |
PREFERRED STOCKS | | | 3.8 | % | | | | | | | | |
Brazil | | | 2.0 | % | | | | | | | | |
Itau Unibanco Holding S.A. - ADR(a) | | | | | | | 19,331,732 | | | | 103,811,401 | |
| | | | | | | | | | | | |
Germany | | | 1.8 | % | | | | | | | | |
Sartorius A.G., 0.45%(b) | | | | | | | 281,832 | | | | 95,454,802 | |
| | | | | | | | | | | | |
TOTAL PREFERRED STOCKS (Cost $217,801,504) | | | | | | | | | | | 199,266,203 | |
| | | | | | | | | | | | |
SHORT-TERM INVESTMENTS | | | 2.7 | % | | | | | | | | |
Northern Institutional Treasury Portfolio (Premier Class), 5.20%(c) | | | | | | | 140,357,129 | | | | 140,357,129 | |
| | | | | | | | | | | | |
TOTAL SHORT-TERM INVESTMENTS (Cost $140,357,129) | | | | | | | | | | | 140,357,129 | |
| | | | | | | | | | | | |
TOTAL INVESTMENTS
(Cost $4,943,147,904) | | | 99.7 | % | | | | | | | 5,249,021,388 | |
NET OTHER ASSETS (LIABILITIES) | | | 0.3 | % | | | | | | | 18,181,897 | |
| | | | | | | | | | | | |
NET ASSETS | | | 100.0 | % | | | | | | $ | 5,267,203,285 | |
| | | | | | | | | | | | |
| (a) | Non-income producing security. |
| (b) | Current yield is disclosed. Dividends are calculated based on a percentage of the issuer’s net income. |
| (c) | 7-day current yield as of September 30, 2023 is disclosed. |
Abbreviations:
ADR – American Depositary Receipt
REG – Registered
See Notes to Financial Statements.
18
JOHCM FUNDS TRUST
JOHCM INTERNATIONAL SELECT FUND
SCHEDULE OF INVESTMENTS
September 30, 2023
At September 30, 2023 the industry sectors (excluding short-term investments) for the JOHCM International Select Fund were:
| | | | |
Sector Allocation (Unaudited) | | % of Net Assets | |
Consumer Discretionary | | | 11.3 | % |
Consumer Staples | | | 6.2 | |
Energy | | | 2.1 | |
Financials | | | 19.4 | |
Health Care | | | 20.8 | |
Industrials | | | 14.8 | |
Information Technology | | | 9.9 | |
Materials | | | 12.5 | |
| | | | |
Total | | | 97.0 | % |
| | | | |
At September 30, 2023 the JOHCM International Select Fund’s investments were concentrated as follows:
| | | | |
Market Exposure (Unaudited) | |
Equity Securities | | % of Net Assets | |
Biotechnology & Pharmaceuticals | | | 15.1 | % |
Institutional Financial Services | | | 8.3 | |
Machinery | | | 6.0 | |
Semiconductors | | | 5.7 | |
Metals & Mining | | | 5.5 | |
Retail - Consumer Staples | | | 4.7 | |
Chemicals | | | 4.5 | |
Asset Management | | | 4.5 | |
Industrial Support Services | | | 4.4 | |
Banking | | | 4.2 | |
Technology Services | | | 4.2 | |
Medical Equipment & Devices | | | 3.7 | |
Construction Materials | | | 2.5 | |
Electrical Equipment | | | 2.4 | |
Specialty Finance | | | 2.4 | |
Commercial Support Services | | | 2.4 | |
E-Commerce Discretionary | | | 2.4 | |
Technology Hardware | | | 2.1 | |
Steel | | | 2.1 | |
Food | | | 2.1 | |
Diversified Industrials | | | 2.0 | |
Automotive | | | 2.0 | |
Household Products | | | 1.9 | |
Health Care Facilities & Services | | | 1.9 | |
| | | | |
Total | | | 97.0 | % |
| | | | |
| | | | |
5 Largest Security Positions | |
Issuer | | % of Net Assets | |
Japan Exchange Group, Inc. | | | 2.5 | % |
CRH PLC | | | 2.5 | |
Sanofi | | | 2.5 | |
B&M European Value Retail S.A. | | | 2.4 | |
Compass Group PLC | | | 2.4 | |
| | | | |
Total | | | 12.3 | % |
| | | | |
See Notes to Financial Statements.
19
JOHCM FUNDS TRUST
REGNAN GLOBAL EQUITY IMPACT SOLUTIONS
SCHEDULE OF INVESTMENTS
September 30, 2023
| | | | | | | | | | | | |
| | | Percentage | | | | | | | |
| | | of Net | | | | | | | |
| | | Assets | | | Shares | | | Value | |
CLOSED-END FUNDS | | | 0.9 | % | | | | | | | | |
Guernsey | | | 0.9 | % | | | | | | | | |
Syncona Ltd.(a) | | | | | | | 56,606 | | | $ | 80,385 | |
| | | | | | | | | | | | |
TOTAL CLOSED-END FUNDS (Cost $142,392) | | | | | | | | | | | 80,385 | |
| | | | | | | | | | | | |
COMMON STOCKS | | | 97.6 | % | | | | | | | | |
Austria | | | 0.9 | % | | | | | | | | |
Lenzing A.G.(a) | | | | | | | 2,003 | | | | 82,084 | |
| | | | | | | | | | | | |
Belgium | | | 1.0 | % | | | | | | | | |
Umicore S.A. | | | | | | | 3,568 | | | | 84,478 | |
| | | | | | | | | | | | |
Brazil | | | 9.8 | % | | | | | | | | |
Afya Ltd. - Class A(a) | | | | | | | 28,001 | | | | 442,416 | |
YDUQS Participacoes S.A. | | | | | | | 111,311 | | | | 440,013 | |
| | | | | | | | | | | | |
| | | | | | | | | | | 882,429 | |
| | | | | | | | | | | | |
Canada | | | 4.1 | % | | | | | | | | |
ATS Corp.(a) | | | | | | | 8,643 | | | | 368,437 | |
| | | | | | | | | | | | |
Denmark | | | 7.4 | % | | | | | | | | |
Novo Nordisk A/S - Class B | | | | | | | 4,681 | | | | 426,211 | |
Orsted A/S(b) | | | | | | | 4,410 | | | | 239,918 | |
| | | | | | | | | | | | |
| | | | | | | | | | | 666,129 | |
| | | | | | | | | | | | |
France | | | 3.8 | % | | | | | | | | |
Hoffmann Green Cement Technologies S.A.S.(a) | | | | | | | 2,082 | | | | 18,562 | |
Sartorius Stedim Biotech | | | | | | | 682 | | | | 162,250 | |
Valeo S.E. | | | | | | | 9,403 | | | | 161,355 | |
| | | | | | | | | | | | |
| | | | | | | | | | | 342,167 | |
| | | | | | | | | | | | |
Germany | | | 10.8 | % | | | | | | | | |
AIXTRON S.E. | | | | | | | 13,924 | | | | 510,019 | |
Carl Zeiss Meditec A.G. - Bearer | | | | | | | 2,270 | | | | 197,882 | |
Duerr A.G. | | | | | | | 9,605 | | | | 259,911 | |
| | | | | | | | | | | | |
| | | | | | | | | | | 967,812 | |
| | | | | | | | | | | | |
Indonesia | | | 4.5 | % | | | | | | | | |
Bank Rakyat Indonesia Persero Tbk PT | | | | | | | 1,196,411 | | | | 404,067 | |
| | | | | | | | | | | | |
Italy | | | 4.7 | % | | | | | | | | |
Stevanato Group S.p.A. | | | | | | | 14,048 | | | | 417,507 | |
| | | | | | | | | | | | |
Japan | | | 4.9 | % | | | | | | | | |
Horiba Ltd. | | | | | | | 8,191 | | | | 442,523 | |
| | | | | | | | | | | | |
Netherlands | | | 6.7 | % | | | | | | | | |
Alfen N.V.(a)(b) | | | | | | | 4,495 | | | | 189,756 | |
QIAGEN N.V.(a) | | | | | | | 10,116 | | | | 408,177 | |
| | | | | | | | | | | | |
| | | | | | | | | | | 597,933 | |
| | | | | | | | | | | | |
Norway | | | 1.4 | % | | | | | | | | |
TOMRA Systems ASA | | | | | | | 11,024 | | | | 125,276 | |
| | | | | | | | | | | | |
Spain | | | 0.9 | % | | | | | | | | |
Befesa S.A.(b) | | | | | | | 2,655 | | | | 80,927 | |
| | | | | | | | | | | | |
Sweden | | | 4.3 | % | | | | | | | | |
Munters Group AB(b) | | | | | | | 30,113 | | | | 386,254 | |
| | | | | | | | | | | | |
See Notes to Financial Statements.
20
JOHCM FUNDS TRUST
REGNAN GLOBAL EQUITY IMPACT SOLUTIONS
SCHEDULE OF INVESTMENTS
September 30, 2023
| | | | | | | | | | | | |
| | | Percentage | | | | | | | |
| | | of Net | | | | | | | |
| | | Assets | | | Shares | | | Value | |
Switzerland | | | 3.8 | % | | | | | | | | |
Lonza Group A.G. - REG | | | | | | | 745 | | | $ | 344,598 | |
| | | | | | | | | | | | |
United Kingdom | | | 6.6 | % | | | | | | | | |
Abcam PLC - ADR(a) | | | | | | | 20,222 | | | | 457,624 | |
Autolus Therapeutics PLC - ADR(a) | | | | | | | 53,788 | | | | 125,326 | |
Ilika PLC(a) | | | | | | | 11,547 | | | | 4,428 | |
| | | | | | | | | | | | |
| | | | | | | | | | | 587,378 | |
| | | | | | | | | | | | |
United States | | | 22.0 | % | | | | | | | | |
Agilent Technologies, Inc. | | | | | | | 2,951 | | | | 329,981 | |
ANSYS, Inc.(a) | | | | | | | 1,351 | | | | 401,990 | |
Ecolab, Inc. | | | | | | | 2,524 | | | | 427,566 | |
PTC, Inc.(a) | | | | | | | 2,825 | | | | 400,246 | |
Xylem, Inc. | | | | | | | 4,579 | | | | 416,826 | |
| | | | | | | | | | | | |
| | | | | | | | | | | 1,976,609 | |
| | | | | | | | | | | | |
TOTAL COMMON STOCKS (Cost $8,993,139) | | | | | | | | | | | 8,756,608 | |
| | | | | | | | | | | | |
SHORT-TERM INVESTMENTS | | | 0.0 | %(c) | | | | | | | | |
Northern Institutional Treasury Portfolio (Premier Class), 5.20%(d) | | | | | | | 3,478 | | | | 3,478 | |
| | | | | | | | | | | | |
TOTAL SHORT-TERM INVESTMENTS (Cost $3,478) | | | | | | | | | | | 3,478 | |
| | | | | | | | | | | | |
TOTAL INVESTMENTS
(Cost $9,139,009) | | | 98.5 | % | | | | | | | 8,840,471 | |
NET OTHER ASSETS (LIABILITIES) | | | 1.5 | % | | | | | | | 134,873 | |
| | | | | | | | | | | | |
NET ASSETS | | | 100.0 | % | | | | | | $ | 8,975,344 | |
| | | | | | | | | | | | |
| (a) | Non-income producing security. |
| (b) | Securities purchased in a transaction exempt from registration under Rule 144A of the Securities Act of 1933. These securities may not be publicly traded without registration under the Securities Act of 1933. The value of these securities is determined by valuations supplied by a pricing service or brokers. |
| (c) | Amount rounds to less than 0.005% |
| (d) | 7-day current yield as of September 30, 2023 is disclosed. |
Abbreviations:
ADR – American Depositary Receipt
REG – Registered
At September 30, 2023 the industry sectors (excluding short-term investments) for the Regnan Global Equity Impact Solutions were:
| | | | |
Sector Allocation (Unaudited) | | % of Net Assets | |
Consumer Discretionary | | | 11.6 | % |
Financials | | | 5.4 | |
Health Care | | | 32.0 | |
Industrials | | | 20.4 | |
Information Technology | | | 19.6 | |
Materials | | | 6.8 | |
Utilities | | | 2.7 | |
| | | | |
Total | | | 98.5 | % |
| | | | |
See Notes to Financial Statements.
21
JOHCM FUNDS TRUST
REGNAN GLOBAL EQUITY IMPACT SOLUTIONS
SCHEDULE OF INVESTMENTS
September 30, 2023
At September 30, 2023 the Regnan Global Equity Impact Solutions’ investments were concentrated as follows:
| | | | |
Market Exposure (Unaudited) | |
Equity Securities | | % of Net Assets | |
Medical Equipment & Devices | | | 17.0 | % |
Machinery | | | 13.0 | |
Biotechnology & Pharmaceuticals | | | 11.2 | |
Consumer Services | | | 9.8 | |
Software | | | 8.9 | |
Chemicals | | | 6.7 | |
Semiconductors | | | 5.7 | |
Electrical Equipment | | | 4.9 | |
Banking | | | 4.5 | |
Industrial Support Services | | | 4.3 | |
Health Care Facilities & Services | | | 3.8 | |
Electric Utilities | | | 2.7 | |
Engineering & Construction | | | 2.1 | |
Automotive | | | 1.8 | |
Commercial Support Services | | | 0.9 | |
Closed-End Funds | | | 0.9 | |
Construction Materials | | | 0.2 | |
Technology Hardware | | | 0.1 | |
| | | | |
Total | | | 98.5 | % |
| | | | |
| | | | |
5 Largest Security Positions | |
Issuer | | % of Net Assets | |
AIXTRON S.E. | | | 5.7 | % |
Abcam PLC - ADR | | | 5.1 | |
Horiba Ltd. | | | 5.0 | |
Afya Ltd. - Class A | | | 4.9 | |
YDUQS Participacoes S.A | | | 4.9 | |
| | | | |
Total | | �� | 25.6 | % |
| | | | |
See Notes to Financial Statements.
22
JOHCM FUNDS TRUST
TSW EMERGING MARKETS FUND
SCHEDULE OF INVESTMENTS
September 30, 2023
| | | | | | | | | | | | |
| | | Percentage | | | | | | | |
| | | of Net | | | | | | | |
| | | Assets | | | Shares | | | Value | |
COMMON STOCKS | | | 98.8 | % | | | | | | | | |
Brazil | | | 5.3 | % | | | | | | | | |
Ambev S.A.(a) | | | | | | | 30,000 | | | $ | 78,245 | |
Banco BTG Pactual S.A.(a) | | | | | | | 20,600 | | | | 127,332 | |
Braskem S.A.(a) | | | | | | | 5,000 | | | | 22,033 | |
JBS S.A. | | | | | | | 17,000 | | | | 61,046 | |
Localiza Rent a Car S.A.(a) | | | | | | | 4,012 | | | | 46,740 | |
NU Holdings Ltd. - Class A(a) | | | | | | | 2,500 | | | | 18,125 | |
| | | | | | | | | | | | |
| | | | | | | | | | | 353,521 | |
| | | | | | | | | | | | |
Canada | | | 1.3 | % | | | | | | | | |
Fairfax India Holdings Corp.(a)(b) | | | | | | | 6,700 | | | | 87,435 | |
| | | | | | | | | | | | |
China | | | 19.0 | % | | | | | | | | |
Alibaba Group Holding Ltd.(a) | | | | | | | 20,000 | | | | 216,844 | |
Kingboard Holdings Ltd. | | | | | | | 23,000 | | | | 51,516 | |
Kingdee International Software Group Co. Ltd.(a) | | | | | | | 50,000 | | | | 61,194 | |
Kingsoft Corp. Ltd. | | | | | | | 18,000 | | | | 64,860 | |
NetEase, Inc. | | | | | | | 17,000 | | | | 340,871 | |
Postal Savings Bank of China Co. Ltd. - Class H(b) | | | | | | | 130,000 | | | | 65,461 | |
Tencent Holdings Ltd. | | | | | | | 8,000 | | | | 310,112 | |
Topsports International Holdings Ltd.(b) | | | | | | | 97,000 | | | | 73,336 | |
Zijin Mining Group Co. Ltd. - Class H | | | | | | | 50,000 | | | | 75,800 | |
| | | | | | | | | | | | |
| | | | | | | | | | | 1,259,994 | |
| | | | | | | | | | | | |
Czech Republic | | | 1.6 | % | | | | | | | | |
Colt CZ Group S.E. | | | | | | | 4,500 | | | | 108,610 | |
| | | | | | | | | | | | |
Egypt | | | 1.2 | % | | | | | | | | |
Commercial International Bank Egypt S.A.E. - REG - GDR | | | | | | | 62,742 | | | | 82,587 | |
| | | | | | | | | | | | |
Greece | | | 4.7 | % | | | | | | | | |
JUMBO S.A. | | | | | | | 2,400 | | | | 65,976 | |
Motor Oil Hellas Corinth Refineries S.A. | | | | | | | 5,000 | | | | 126,290 | |
OPAP S.A. | | | | | | | 7,000 | | | | 117,192 | |
| | | | | | | | | | | | |
| | | | | | | | | | | 309,458 | |
| | | | | | | | | | | | |
Guatemala | | | 2.1 | % | | | | | | | | |
Millicom International Cellular S.A.(a) | | | | | | | 8,950 | | | | 138,277 | |
| | | | | | | | | | | | |
Hong Kong | | | 3.8 | % | | | | | | | | |
Lenovo Group Ltd. | | | | | | | 145,000 | | | | 148,673 | |
Sinotruk Hong Kong Ltd. | | | | | | | 52,000 | | | | 100,002 | |
| | | | | | | | | | | | |
| | | | | | | | | | | 248,675 | |
| | | | | | | | | | | | |
Hungary | | | 2.7 | % | | | | | | | | |
Richter Gedeon Nyrt | | | | | | | 7,500 | | | | 181,439 | |
| | | | | | | | | | | | |
India | | | 7.7 | % | | | | | | | | |
ICICI Bank Ltd. - ADR | | | | | | | 9,500 | | | | 219,640 | |
ICICI Securities Ltd.(b) | | | | | | | 6,000 | | | | 44,872 | |
Indian Energy Exchange Ltd.(b) | | | | | | | 20,000 | | | | 31,758 | |
Reliance Industries Ltd. - GDR(b) | | | | | | | 3,800 | | | | 211,877 | |
| | | | | | | | | | | | |
| | | | | | | | | | | 508,147 | |
| | | | | | | | | | | | |
See Notes to Financial Statements.
23
JOHCM FUNDS TRUST
TSW EMERGING MARKETS FUND
SCHEDULE OF INVESTMENTS
September 30, 2023
| | | | | | | | | | | | |
| | | Percentage | | | | | | | |
| | | of Net | | | | | | | |
| | | Assets | | | Shares | | | Value | |
Indonesia | | | 1.0 | % | | | | | | | | |
Sarana Menara Nusantara Tbk PT | | | | | | | 1,100,000 | | | $ | 68,302 | |
| | | | | | | | | | | | |
Kazakhstan | | | 1.9 | % | | | | | | | | |
Kaspi.KZ JSC - REG - GDR | | | | | | | 1,300 | | | | 125,482 | |
| | | | | | | | | | | | |
Malaysia | | | 1.4 | % | | | | | | | | |
Hibiscus Petroleum Bhd. | | | | | | | 400,000 | | | | 95,663 | |
| | | | | | | | | | | | |
Mexico | | | 4.9 | % | | | | | | | | |
Becle S.A.B. de C.V. | | | | | | | 46,000 | | | | 109,540 | |
Fibra Uno Administracion S.A. de C.V. | | | | | | | 64,000 | | | | 106,682 | |
Promotora y Operadora de Infraestructura S.A.B. de C.V. - Class L | | | | | | | 18,000 | | | | 107,850 | |
| | | | | | | | | | | | |
| | | | | | | | | | | 324,072 | |
| | | | | | | | | | | | |
Poland | | | 1.5 | % | | | | | | | | |
Text S.A. | | | | | | | 3,000 | | | | 99,662 | |
| | | | | | | | | | | | |
Puerto Rico | | | 0.9 | % | | | | | | | | |
Liberty Latin America Ltd. - Class C(a) | | | | | | | 7,000 | | | | 57,120 | |
| | | | | | | | | | | | |
South Africa | | | 2.7 | % | | | | | | | | |
Naspers Ltd. - Class N | | | | | | | 1,100 | | | | 175,988 | |
| | | | | | | | | | | | |
South Korea | | | 12.0 | % | | | | | | | | |
AfreecaTV Co. Ltd. | | | | | | | 900 | | | | 55,901 | |
Doosan Bobcat, Inc. | | | | | | | 1,200 | | | | 45,293 | |
Fila Holdings Corp. | | | | | | | 4,500 | | | | 120,224 | |
Hugel, Inc.(a) | | | | | | | 700 | | | | 64,675 | |
LG Chem Ltd. | | | | | | | 300 | | | | 109,841 | |
Samsung Electronics Co. Ltd. | | | | | | | 5,800 | | | | 293,214 | |
Shinhan Financial Group Co. Ltd. | | | | | | | 4,000 | | | | 105,273 | |
| | | | | | | | | | | | |
| | | | | | | | | | | 794,421 | |
| | | | | | | | | | | | |
Taiwan | | | 9.4 | % | | | | | | | | |
Chailease Holding Co. Ltd. | | | | | | | 16,269 | | | | 91,354 | |
E Ink Holdings, Inc. | | | | | | | 22,000 | | | | 122,672 | |
Taiwan Semiconductor Manufacturing Co. Ltd. | | | | | | | 25,000 | | | | 407,656 | |
| | | | | | | | | | | | |
| | | | | | | | | | | 621,682 | |
| | | | | | | | | | | | |
Thailand | | | 2.9 | % | | | | | | | | |
Bangkok Bank PCL - REG | | | | | | | 25,500 | | | | 117,092 | |
CP ALL PCL - REG | | | | | | | 45,000 | | | | 74,576 | |
| | | | | | | | | | | | |
| | | | | | | | | | | 191,668 | |
| | | | | | | | | | | | |
Turkey | | | 3.3 | % | | | | | | | | |
KOC Holding A.S. | | | | | | | 20,000 | | | | 106,909 | |
Sok Marketler Ticaret A.S. | | | | | | | 53,000 | | | | 112,415 | |
| | | | | | | | | | | | |
| | | | | | | | | | | 219,324 | |
| | | | | | | | | | | | |
United Kingdom | | | 2.0 | % | | | | | | | | |
Georgia Capital PLC(a) | | | | | | | 11,000 | | | | 131,900 | |
| | | | | | | | | | | | |
United States | | | 5.1 | % | | | | | | | | |
MercadoLibre, Inc.(a) | | | | | | | 100 | | | | 126,788 | |
Parade Technologies Ltd. | | | | | | | 2,400 | | | | 73,459 | |
See Notes to Financial Statements.
24
JOHCM FUNDS TRUST
TSW EMERGING MARKETS FUND
SCHEDULE OF INVESTMENTS
September 30, 2023
| | | | | | | | | | | | |
| | | Percentage | | | | | | | |
| | | of Net | | | | | | | |
| | | Assets | | | Shares | | | Value | |
Tecnoglass, Inc. | | | | | | | 800 | | | $ | 26,368 | |
Yum China Holdings, Inc. | | | | | | | 2,000 | | �� | | 111,440 | |
| | | | | | | | | | | | |
| | | | | | | | | | | 338,055 | |
| | | | | | | | | | | | |
Vietnam | | | 0.4 | % | | | | | | | | |
Vinhomes JSC(a)(b) | | | | | | | 14,000 | | | | 26,141 | |
| | | | | | | | | | | | |
TOTAL COMMON STOCKS (Cost $6,952,310) | | | | | | | | | | | 6,547,623 | |
| | | | | | | | | | | | |
PREFERRED STOCKS | | | 0.3 | % | | | | | | | | |
Brazil | | | 0.3 | % | | | | | | | | |
Braskem S.A. - Class A(a) | | | | | | | 5,500 | | | | 22,453 | |
| | | | | | | | | | | | |
TOTAL PREFERRED STOCKS (Cost $33,038) | | | | | | | | | | | 22,453 | |
| | | | | | | | | | | | |
RIGHTS | | | 0.0 | % | | | | | | | | |
Brazil | | | 0.0 | % | | | | | | | | |
Localiza Rent a Car S.A.(a) | | | | | | | 29 | | | | 92 | |
| | | | | | | | | | | | |
TOTAL RIGHTS (Cost $—) | | | | | | | | | | | 92 | |
| | | | | | | | | | | | |
SHORT-TERM INVESTMENTS | | | 1.1 | % | | | | | | | | |
Northern Institutional Treasury Portfolio (Premier Class), 5.20%(c) | | | | | | | 71,621 | | | | 71,621 | |
| | | | | | | | | | | | |
TOTAL SHORT-TERM INVESTMENTS (Cost $71,621) | | | | | | | | | | | 71,621 | |
| | | | | | | | | | | | |
TOTAL INVESTMENTS
(Cost $7,056,969) | | | 100.2 | % | | | | | | | 6,641,789 | |
NET OTHER ASSETS (LIABILITIES) | | | (0.2 | %) | | | | | | | (14,901 | ) |
| | | | | | | | | | | | |
NET ASSETS | | | 100.0 | % | | | | | | $ | 6,626,888 | |
| | | | | | | | | | | | |
| (a) | Non-income producing security. |
| (b) | Securities purchased in a transaction exempt from registration under Rule 144A of the Securities Act of 1933. These securities may not be publicly traded without registration under the Securities Act of 1933. The value of these securities is determined by valuations supplied by a pricing service or brokers. |
| (c) | 7-day current yield as of September 30, 2023 is disclosed. |
Abbreviations:
ADR – American Depositary Receipt
GDR – Global Depositary Receipt
REG – Registered
At September 30, 2023 the industry sectors (excluding short-term investments) for the TSW Emerging Markets Fund were:
| | | | |
Sector Allocation (Unaudited) | | % of Net Assets | |
Communication Services | | | 15.6 | % |
Consumer Discretionary | | | 15.2 | |
Consumer Staples | | | 6.6 | |
Energy | | | 6.5 | |
Financials | | | 18.8 | |
Health Care | | | 3.7 | |
Industrials | | | 8.2 | |
Information Technology | | | 19.0 | |
Materials | | | 3.5 | |
Real Estate | | | 2.0 | |
| | | | |
Total | | | 99.1 | % |
| | | | |
See Notes to Financial Statements.
25
JOHCM FUNDS TRUST
TSW EMERGING MARKETS FUND
SCHEDULE OF INVESTMENTS
September 30, 2023
At September 30, 2023 the TSW Emerging Markets Fund’s investments were concentrated as follows:
| | | | |
Market Exposure (Unaudited) | |
Equity Securities | | % of Net Assets | |
Internet Media & Services | | | 9.7 | % |
Technology Hardware | | | 9.6 | |
Banking | | | 9.2 | |
Oil & Gas Producers | | | 8.1 | |
Semiconductors | | | 6.2 | |
Entertainment Content | | | 6.1 | |
E-Commerce Discretionary | | | 5.2 | |
Biotechnology & Pharmaceuticals | | | 3.7 | |
Leisure Facilities & Services | | | 3.5 | |
Asset Management | | | 3.3 | |
Chemicals | | | 3.1 | |
Beverages | | | 2.9 | |
Retail - Discretionary | | | 2.8 | |
Retail - Consumer Staples | | | 2.8 | |
Software | | | 2.8 | |
Institutional Financial Services | | | 2.6 | |
Telecommunications | | | 2.1 | |
Apparel & Textile Products | | | 1.8 | |
Real Estate Investment Trusts | | | 1.6 | |
Leisure Products | | | 1.6 | |
Transportation & Logistics | | | 1.6 | |
Transportation Equipment | | | 1.5 | |
Specialty Finance | | | 1.4 | |
Metals & Mining | | | 1.1 | |
Engineering & Construction | | | 1.0 | |
Food | | | 0.9 | |
Cable & Satellite | | | 0.9 | |
Machinery | | | 0.7 | |
Electric, Gas Marketing & Trading | | | 0.5 | |
Construction Materials | | | 0.4 | |
Real Estate Owners & Developers | | | 0.4 | |
| | | | |
Total | | | 99.1 | % |
| | | | |
| | | | |
5 Largest Security Positions | |
Issuer | | % of Net Assets | |
Taiwan Semiconductor Manufacturing Co. Ltd. | | | 6.2 | % |
NetEase, Inc. | | | 5.2 | |
Tencent Holdings Ltd. | | | 4.7 | |
Samsung Electronics Co. Ltd. | | | 4.4 | |
ICICI Bank Ltd. - ADR | | | 3.3 | |
| | | | |
Total | | | 23.8 | % |
| | | | |
See Notes to Financial Statements.
26
JOHCM FUNDS TRUST
TSW HIGH YIELD BOND FUND
SCHEDULE OF INVESTMENTS
September 30, 2023
| | | | | | | | | | | | |
| | | Percentage | | | | | | | |
| | | of Net | | | | | | | |
| | | Assets | | | Principal Amount | | | Value | |
CORPORATE BONDS | | | 85.2 | % | | | | | | | | |
Appropriation | | | 1.9 | % | | | | | | | | |
Blackstone Private Credit Fund
7.05%, 09/29/25 | | | | | | $ | 250,000 | | | $ | 250,384 | |
| | | | | | | | | | | | |
Asset Management | | | 1.8 | % | | | | | | | | |
Icahn Enterprises L.P./Icahn Enterprises Finance Corp.
6.38%, 12/15/25 | | | | | | | 250,000 | | | | 237,817 | |
| | | | | | | | | | | | |
Automotive | | | 5.3 | % | | | | | | | | |
Clarios Global L.P./Clarios U.S. Finance Co.
6.25%, 05/15/26(a) | | | | | | | 224,000 | | | | 219,171 | |
Ford Motor Credit Co. LLC
7.35%, 03/06/30 | | | | | | | 300,000 | | | | 303,804 | |
Goodyear Tire & Rubber (The) Co.
5.00%, 07/15/29 | | | | | | | 200,000 | | | | 172,264 | |
| | | | | | | | | | | | |
| | | | | | | | | | | 695,239 | |
| | | | | | | | | | | | |
Banking | | | 1.1 | % | | | | | | | | |
Associated Banc-Corp.
4.25%, 01/15/25 | | | | | | | 150,000 | | | | 144,251 | |
| | | | | | | | | | | | |
Cable & Satellite | | | 1.6 | % | | | | | | | | |
CCO Holdings LLC/CCO Holdings Capital Corp.
4.50%, 05/01/32(a) | | | | | | | 100,000 | | | | 78,485 | |
Sirius XM Radio, Inc.
4.00%, 07/15/28(a) | | | | | | | 150,000 | | | | 128,035 | |
| | | | | | | | | | | | |
| | | | | | | | | | | 206,520 | |
| | | | | | | | | | | | |
Commercial Support Services | | | 2.5 | % | | | | | | | | |
CoreCivic, Inc.
8.25%, 04/15/26 | | | | | | | 75,000 | | | | 76,094 | |
GEO Group (The), Inc.
10.50%, 06/30/28 | | | | | | | 250,000 | | | | 250,653 | |
| | | | | | | | | | | | |
| | | | | | | | | | | 326,747 | |
| | | | | | | | | | | | |
Construction Materials | | | 3.3 | % | | | | | | | | |
Eco Material Technologies, Inc.
7.88%, 01/31/27(a) | | | | | | | 200,000 | | | | 190,658 | |
Summit Materials LLC/Summit Materials Finance Corp.
6.50%, 03/15/27(a) | | | | | | | 250,000 | | | | 244,084 | |
| | | | | | | | | | | | |
| | | | | | | | | | | 434,742 | |
| | | | | | | | | | | | |
Consumer Services | | | 2.0 | % | | | | | | | | |
Upbound Group, Inc.
6.38%, 02/15/29(a) | | | | | | | 300,000 | | | | 266,250 | |
| | | | | | | | | | | | |
Electric Utilities | | | 1.1 | % | | | | | | | | |
Vistra Operations Co. LLC
6.95%, 10/15/33(a) | | | | | | | 150,000 | | | | 147,125 | |
| | | | | | | | | | | | |
Electrical Equipment | | | 1.1 | % | | | | | | | | |
WESCO Distribution, Inc.
7.25%, 06/15/28(a) | | | | | | | 150,000 | | | | 150,728 | |
| | | | | | | | | | | | |
See Notes to Financial Statements.
27
JOHCM FUNDS TRUST
TSW HIGH YIELD BOND FUND
SCHEDULE OF INVESTMENTS
September 30, 2023
| | | | | | | | | | | | |
| | | Percentage | | | | | | | |
| | | of Net | | | | | | | |
| | | Assets | | | Principal Amount | | | Value | |
Engineering & Construction | | | 1.4 | % | | | | | | | | |
Installed Building Products, Inc.
5.75%, 02/01/28(a) | | | | | | $ | 200,000 | | | $ | 184,087 | |
| | | | | | | | | | | | |
Food | | | 1.1 | % | | | | | | | | |
Post Holdings, Inc.
5.63%, 01/15/28(a) | | | | | | | 150,000 | | | | 141,805 | |
| | | | | | | | | | | | |
Forestry, Paper & Wood Products | | | 0.5 | % | | | | | | | | |
Glatfelter Corp.
4.75%, 11/15/29(a) | | | | | | | 100,000 | | | | 65,850 | |
| | | | | | | | | | | | |
Home Construction | | | 1.2 | % | | | | | | | | |
Forestar Group, Inc.
5.00%, 03/01/28(a) | | | | | | | 175,000 | | | | 157,105 | |
| | | | | | | | | | | | |
Household Products | | | 1.3 | % | | | | | | | | |
Edgewell Personal Care Co.
5.50%, 06/01/28(a) | | | | | | | 183,000 | | | | 169,046 | |
| | | | | | | | | | | | |
Institutional Financial Services | | | 2.7 | % | | | | | | | | |
Jane Street Group/JSG Finance, Inc.
4.50%, 11/15/29(a) | | | | | | | 175,000 | | | | 150,370 | |
StoneX Group, Inc.
8.63%, 06/15/25(a) | | | | | | | 200,000 | | | | 201,500 | |
| | | | | | | | | | | | |
| | | | | | | | | | | 351,870 | |
| | | | | | | | | | | | |
Internet Media & Services | | | 1.7 | % | | | | | | | | |
TripAdvisor, Inc.
7.00%, 07/15/25(a) | | | | | | | 225,000 | | | | 224,573 | |
| | | | | | | | | | | | |
Leisure Facilities & Services | | | 11.7 | % | | | | | | | | |
Carnival Corp.
5.75%, 03/01/27(a) | | | | | | | 150,000 | | | | 135,784 | |
Cinemark U.S.A., Inc.
5.88%, 03/15/26(a) | | | | | | | 175,000 | | | | 168,021 | |
Light & Wonder International, Inc.
7.50%, 09/01/31(a) | | | | | | | 250,000 | | | | 247,088 | |
Live Nation Entertainment, Inc.
4.75%, 10/15/27(a) | | | | | | | 80,000 | | | | 73,250 | |
Marriott Ownership Resorts, Inc.
4.75%, 01/15/28 | | | | | | | 250,000 | | | | 218,807 | |
NCL Corp. Ltd.
5.88%, 03/15/26(a) | | | | | | | 200,000 | | | | 184,649 | |
Raptor Acquisition Corp./Raptor Co-Issuer LLC
4.88%, 11/01/26(a) | | | | | | | 100,000 | | | | 93,625 | |
Royal Caribbean Cruises Ltd.
3.70%, 03/15/28 | | | | | | | 125,000 | | | | 105,767 | |
Travel + Leisure Co.
6.60%, 10/01/25 | | | | | | | 175,000 | | | | 173,250 | |
VOC Escrow Ltd.
5.00%, 02/15/28(a) | | | | | | | 150,000 | | | | 136,426 | |
| | | | | | | | | | | | |
| | | | | | | | | | | 1,536,667 | |
| | | | | | | | | | | | |
See Notes to Financial Statements.
28
JOHCM FUNDS TRUST
TSW HIGH YIELD BOND FUND
SCHEDULE OF INVESTMENTS
September 30, 2023
| | | | | | | | | | | | |
| | | Percentage | | | | | | | |
| | | of Net | | | | | | | |
| | | Assets | | | Principal Amount | | | Value | |
Leisure Products | | | 2.0 | % | | | | | | | | |
Vista Outdoor, Inc.
4.50%, 03/15/29(a) | | | | | | $ | 312,000 | | | $ | 261,040 | |
| | | | | | | | | | | | |
Oil & Gas Producers | | | 7.8 | % | | | | | | | | |
Blue Racer Midstream LLC/Blue Racer Finance Corp.
7.63%, 12/15/25(a) | | | | | | | 100,000 | | | | 100,373 | |
Crestwood Midstream Partners L.P./Crestwood Midstream Finance Corp.
7.38%, 02/01/31(a) | | | | | | | 250,000 | | | | 254,613 | |
Earthstone Energy Holdings LLC
9.88%, 07/15/31(a) | | | | | | | 250,000 | | | | 271,868 | |
Permian Resources Operating LLC
5.88%, 07/01/29(a) | | | | | | | 250,000 | | | | 235,171 | |
Sunoco L.P./Sunoco Finance Corp.
5.88%, 03/15/28 | | | | | | | 175,000 | | | | 167,880 | |
| | | | | | | | | | | | |
| | | | | | | | | | | 1,029,905 | |
| | | | | | | | | | | | |
Publishing & Broadcasting | | | 1.1 | % | | | | | | | | |
Nexstar Media, Inc.
4.75%, 11/01/28(a) | | | | | | | 175,000 | | | | 144,849 | |
| | | | | | | | | | | | |
Real Estate Investment Trusts | | | 3.3 | % | | | | | | | | |
Iron Mountain, Inc.
4.88%, 09/15/27(a) | | | | | | | 200,000 | | | | 184,471 | |
RHP Hotel Properties L.P./RHP Finance Corp.
7.25%, 07/15/28(a) | | | | | | | 250,000 | | | | 245,623 | |
| | | | | | | | | | | | |
| | | | | | | | | | | 430,094 | |
| | | | | | | | | | | | |
Retail - Consumer Staples | | | 2.6 | % | | | | | | | | |
Albertsons Cos., Inc./Safeway, Inc./New Albertsons L.P./Albertsons LLC
4.63%, 01/15/27(a) | | | | | | | 250,000 | | | | 236,055 | |
Arko Corp.
5.13%, 11/15/29(a) | | | | | | | 125,000 | | | | 100,817 | |
| | | | | | | | | | | | |
| | | | | | | | | | | 336,872 | |
| | | | | | | | | | | | |
Retail - Discretionary | | | 8.2 | % | | | | | | | | |
Academy Ltd.
6.00%, 11/15/27(a) | | | | | | | 100,000 | | | | 94,520 | |
BlueLinx Holdings, Inc.
6.00%, 11/15/29(a) | | | | | | | 150,000 | | | | 132,155 | |
Builders FirstSource, Inc.
5.00%, 03/01/30(a) | | | | | | | 150,000 | | | | 133,741 | |
Dillard’s, Inc.
7.75%, 07/15/26 | | | | | | | 175,000 | | | | 176,873 | |
Foot Locker, Inc.
4.00%, 10/01/29(a) | | | | | | | 175,000 | | | | 126,219 | |
Macy’s Retail Holdings LLC
5.88%, 04/01/29(a) | | | | | | | 100,000 | | | | 87,559 | |
Patrick Industries, Inc.
4.75%, 05/01/29(a) | | | | | | | 300,000 | | | | 250,500 | |
Sonic Automotive, Inc.
4.63%, 11/15/29(a) | | | | | | | 100,000 | | | | 82,895 | |
| | | | | | | | | | | | |
| | | | | | | | | | | 1,084,462 | |
| | | | | | | | | | | | |
See Notes to Financial Statements.
29
JOHCM FUNDS TRUST
TSW HIGH YIELD BOND FUND
SCHEDULE OF INVESTMENTS
September 30, 2023
| | | | | | | | | | | | |
| | | Percentage | | | | | | | |
| | | of Net | | | | | | | |
| | | Assets | | | Principal Amount | | | Value | |
Software | | | 1.5 | % | | | | | | | | |
Concentrix Corp.
6.60%, 08/02/28 | | | | | | $ | 200,000 | | | $ | 192,966 | |
| | | | | | | | | | | | |
Specialty Finance | | | 9.3 | % | | | | | | | | |
Burford Capital Global Finance LLC
6.25%, 04/15/28(a) | | | | | | | 200,000 | | | | 184,940 | |
Credit Acceptance Corp.
6.63%, 03/15/26 | | | | | | | 100,000 | | | | 96,409 | |
Enova International, Inc.
8.50%, 09/15/25(a) | | | | | | | 200,000 | | | | 195,500 | |
Fortress Transportation and Infrastructure Investors LLC
6.50%, 10/01/25(a) | | | | | | | 214,000 | | | | 210,329 | |
ILFC E-Capital Trust I
(Variable, 3M CME Term SOFR +1.55%)
7.21%, 12/21/65(a) | | | | | | | 150,000 | | | | 109,578 | |
PRA Group, Inc.
5.00%, 10/01/29(a) | | | | | | | 200,000 | | | | 151,898 | |
Rithm Capital Corp.
6.25%, 10/15/25(a) | | | | | | | 200,000 | | | | 189,762 | |
World Acceptance Corp.
7.00%, 11/01/26(a) | | | | | | | 100,000 | | | | 85,115 | |
| | | | | | | | | | | | |
| | | | | | | | | | | 1,223,531 | |
| | | | | | | | | | | | |
Steel | | | 1.3 | % | | | | | | | | |
Cleveland-Cliffs, Inc.
5.88%, 06/01/27 | | | | | | | 175,000 | | | | 166,567 | |
| | | | | | | | | | | | |
Transportation & Logistics | | | 1.5 | % | | | | | | | | |
American Airlines, Inc.
7.25%, 02/15/28(a) | | | | | | | 100,000 | | | | 95,610 | |
Spirit Loyalty Cayman Ltd./Spirit IP Cayman Ltd.
8.00%, 09/20/25(a) | | | | | | | 60,000 | | | | 59,970 | |
United Airlines Holdings, Inc.
4.88%, 01/15/25 | | | | | | | 50,000 | | | | 48,375 | |
| | | | | | | | | | | | |
| | | | | | | | | | | 203,955 | |
| | | | | | | | | | | | |
Wholesale - Consumer Staples | | | 2.2 | % | | | | | | | | |
Performance Food Group, Inc.
5.50%, 10/15/27(a) | | | | | | | 150,000 | | | | 142,116 | |
United Natural Foods, Inc.
6.75%, 10/15/28(a) | | | | | | | 200,000 | | | | 152,460 | |
| | | | | | | | | | | | |
| | | | | | | | | | | 294,576 | |
| | | | | | | | | | | | |
Wholesale - Discretionary | | | 1.1 | % | | | | | | | | |
G-III Apparel Group Ltd.
7.88%, 08/15/25(a) | | | | | | | 150,000 | | | | 148,875 | |
| | | | | | | | | | | | |
TOTAL CORPORATE BONDS (Cost $11,839,060) | | | | | | | | | | | 11,208,498 | |
| | | | | | | | | | | | |
FOREIGN ISSUER BONDS | | | 11.8 | % | | | | | | | | |
Aerospace & Defense | | | 1.5 | % | | | | | | | | |
Rolls-Royce PLC
5.75%, 10/15/27(a) | | | | | | | 200,000 | | | | 192,972 | |
| | | | | | | | | | | | |
See Notes to Financial Statements.
30
JOHCM FUNDS TRUST
TSW HIGH YIELD BOND FUND
SCHEDULE OF INVESTMENTS
September 30, 2023
| | | | | | | | | | | | |
| | | Percentage | | | | | | | |
| | | of Net | | | | | | | |
| | | Assets | | | Principal Amount | | | Value | |
Automotive | | | 1.4 | % | | | | | | | | |
Adient Global Holdings Ltd.
4.88%, 08/15/26(a) | | | | | | $ | 200,000 | | | $ | 188,628 | |
| | | | | | | | | | | | |
Chemicals | | | 1.7 | % | | | | | | | | |
Methanex Corp.
5.25%, 12/15/29 | | | | | | | 250,000 | | | | 222,936 | |
| | | | | | | | | | | | |
Electric Utilities | | | 0.8 | % | | | | | | | | |
TransAlta Corp.
7.75%, 11/15/29 | | | | | | | 100,000 | | | | 101,250 | |
| | | | | | | | | | | | |
Metals & Mining | | | 1.5 | % | | | | | | | | |
First Quantum Minerals Ltd.
6.88%, 10/15/27(a) | | | | | | | 200,000 | | | | 191,875 | |
| | | | | | | | | | | | |
Telecommunications | | | 1.7 | % | | | | | | | | |
Sable International Finance Ltd.
5.75%, 09/07/27(a) | | | | | | | 250,000 | | | | 226,875 | |
| | | | | | | | | | | | |
Transportation & Logistics | | | 3.2 | % | | | | | | | | |
Air Canada
3.88%, 08/15/26(a) | | | | | | | 250,000 | | | | 226,890 | |
Stena International S.A.
6.13%, 02/01/25(a) | | | | | | | 200,000 | | | | 197,000 | |
| | | | | | | | | | | | |
| | | | | | | | | | | 423,890 | |
| | | | | | | | | | | | |
TOTAL FOREIGN ISSUER BONDS (Cost $1,655,354) | | | | | | | | | | | 1,548,426 | |
| | | | | | | | | | | | |
| | | |
| | | Percentage | | | | | | | |
| | | of Net | | | | | | | |
| | | Assets | | | Shares | | | Value | |
SHORT-TERM INVESTMENTS | | | 1.8 | % | | | | | | | | |
Northern Institutional Treasury Portfolio (Premier Class), 5.20%(b) | | | | | | | 235,886 | | | | 235,886 | |
| | | | | | | | | | | | |
TOTAL SHORT-TERM INVESTMENTS (Cost $235,886) | | | | | | | | | | | 235,886 | |
| | | | | | | | | | | | |
TOTAL INVESTMENTS
(Cost $13,730,300) | | | 98.8 | % | | | | | | | 12,992,810 | |
NET OTHER ASSETS (LIABILITIES) | | | 1.2 | % | | | | | | | 160,564 | |
| | | | | | | | | | | | |
NET ASSETS | | | 100.0 | % | | | | | | $ | 13,153,374 | |
| | | | | | | | | | | | |
| (a) | Securities purchased in a transaction exempt from registration under Rule 144A of the Securities Act of 1933. These securities may not be publicly traded without registration under the Securities Act of 1933. The value of these securities is determined by valuations supplied by a pricing service or brokers. |
| (b) | 7-day current yield as of September 30, 2023 is disclosed. |
See Notes to Financial Statements.
31
JOHCM FUNDS TRUST
TSW HIGH YIELD BOND FUND
SCHEDULE OF INVESTMENTS
September 30, 2023
At September 30, 2023 the TSW High Yield Bond Fund’s investments were concentrated as follows:
| | | | |
Fixed Income Credit Ratings (Unaudited) | | % of Net Assets | |
BAA | | | 7.8 | % |
BA | | | 43.8 | |
B | | | 43.5 | |
CAA | | | 1.9 | |
Cash equivalents | | | 1.8 | |
| | | | |
Total | | | 98.8 | % |
| | | | |
| | | | |
5 Largest Security Positions | |
Issuer | | % of Net Assets | |
Ford Motor Credit Co. LLC
7.35%, 3/6/30 | | | 2.3 | % |
Earthstone Energy Holdings LLC
9.88%, 7/15/31 | | | 2.1 | |
Upbound Group, Inc.
6.38%, 2/15/29 | | | 2.0 | |
Vista Outdoor, Inc.
4.50%, 3/15/29 | | | 2.0 | |
Crestwood Midstream Partners L.P./Crestwood Midstream Finance Corp.
7.38%, 2/1/31 | | | 2.0 | |
| | | | |
Total | | | 10.4 | % |
| | | | |
See Notes to Financial Statements.
32
JOHCM FUNDS TRUST
TSW LARGE CAP VALUE FUND
SCHEDULE OF INVESTMENTS
September 30, 2023
| | | | | | | | | | | | |
| | | Percentage | | | | | | | |
| | | of Net | | | | | | | |
| | | Assets | | | Shares | | | Value | |
COMMON STOCKS | | | 91.0 | % | | | | | | | | |
Belgium | | | 3.2 | % | | | | | | | | |
Anheuser-Busch InBev S.A./N.V. - ADR | | | | | | | 20,000 | | | $ | 1,106,000 | |
| | | | | | | | | | | | |
Germany | | | 2.4 | % | | | | | | | | |
Bayer A.G. - ADR | | | | | | | 70,000 | | | | 840,000 | |
| | | | | | | | | | | | |
Ireland | | | 2.4 | % | | | | | | | | |
Willis Towers Watson PLC | | | | | | | 4,000 | | | | 835,840 | |
| | | | | | | | | | | | |
Japan | | | 3.5 | % | | | | | | | | |
Nintendo Co. Ltd. - ADR | | | | | | | 119,000 | | | | 1,231,650 | |
| | | | | | | | | | | | |
United States | | | 79.5 | % | | | | | | | | |
Activision Blizzard, Inc. | | | | | | | 4,000 | | | | 374,520 | |
Alphabet, Inc. - Class C(a) | | | | | | | 7,740 | | | | 1,020,519 | |
Applied Materials, Inc. | | | | | | | 4,000 | | | | 553,800 | |
Arch Capital Group Ltd.(a) | | | | | | | 8,000 | | | | 637,680 | |
Bank of America Corp. | | | | | | | 21,000 | | | | 574,980 | |
Berkshire Hathaway, Inc. - Class B(a) | | | | | | | 4,800 | | | | 1,681,440 | |
Bio-Rad Laboratories, Inc. - Class A(a) | | | | | | | 2,000 | | | | 716,900 | |
Charles Schwab (The) Corp. | | | | | | | 10,100 | | | | 554,490 | |
Chesapeake Energy Corp. | | | | | | | 8,000 | | | | 689,840 | |
Cigna (The) Group | | | | | | | 2,709 | | | | 774,964 | |
Cisco Systems, Inc. | | | | | | | 14,000 | | | | 752,640 | |
Crown Castle, Inc. | | | | | | | 7,000 | | | | 644,210 | |
CVS Health Corp. | | | | | | | 9,200 | | | | 642,344 | |
Dell Technologies, Inc. - Class C | | | | | | | 8,000 | | | | 551,200 | |
Dominion Energy, Inc. | | | | | | | 27,000 | | | | 1,206,090 | |
Exelon Corp. | | | | | | | 10,000 | | | | 377,900 | |
FedEx Corp. | | | | | | | 3,000 | | | | 794,760 | |
FleetCor Technologies, Inc.(a) | | | | | | | 3,000 | | | | 766,020 | |
Kinder Morgan, Inc. | | | | | | | 62,600 | | | | 1,037,908 | |
Kraft Heinz (The) Co. | | | | | | | 26,100 | | | | 878,004 | |
Liberty Broadband Corp. - Class C(a) | | | | | | | 12,100 | | | | 1,104,972 | |
Liberty Media Corp. - Liberty SiriusXM(a) | | | | | | | 22,225 | | | | 565,849 | |
Lockheed Martin Corp. | | | | | | | 1,800 | | | | 736,128 | |
Lowe’s Cos., Inc. | | | | | | | 2,000 | | | | 415,680 | |
McKesson Corp. | | | | | | | 2,100 | | | | 913,185 | |
Merck & Co., Inc. | | | | | | | 7,000 | | | | 720,650 | |
News Corp. - Class A | | | | | | | 17,000 | | | | 341,020 | |
Occidental Petroleum Corp. | | | | | | | 10,000 | | | | 648,800 | |
Pfizer, Inc. | | | | | | | 29,700 | | | | 985,149 | |
Post Holdings, Inc.(a) | | | | | | | 6,500 | | | | 557,310 | |
Progressive (The) Corp. | | | | | | | 5,600 | | | | 780,080 | |
Regeneron Pharmaceuticals, Inc.(a) | | | | | | | 1,300 | | | | 1,069,848 | |
RTX Corp. | | | | | | | 9,000 | | | | 647,730 | |
TJX Cos. (The), Inc. | | | | | | | 3,000 | | | | 266,640 | |
Verizon Communications, Inc. | | | | | | | 30,125 | | | | 976,351 | |
See Notes to Financial Statements.
33
JOHCM FUNDS TRUST
TSW LARGE CAP VALUE FUND
SCHEDULE OF INVESTMENTS
September 30, 2023
| | | | | | | | | | | | |
| | | Percentage | | | | | | | |
| | | of Net | | | | | | | |
| | | Assets | | | Shares | | | Value | |
Wells Fargo & Co. | | | | | | | 20,000 | | | $ | 817,200 | |
Williams Cos. (The), Inc. | | | | | | | 33,325 | | | | 1,122,719 | |
| | | | | | | | | | | | |
| | | | | | | | | | | 27,899,520 | |
| | | | | | | | | | | | |
TOTAL COMMON STOCKS (Cost $27,623,361) | | | | | | | | | | | 31,913,010 | |
| | | | | | | | | | | | |
SHORT-TERM INVESTMENTS | | | 9.0 | % | | | | | | | | |
Northern Institutional Treasury Portfolio (Premier Class), 5.20%(b) | | | | | | | 3,157,334 | | | | 3,157,334 | |
| | | | | | | | | | | | |
TOTAL SHORT-TERM INVESTMENTS (Cost $3,157,334) | | | | | | | | | | | 3,157,334 | |
| | | | | | | | | | | | |
TOTAL INVESTMENTS
(Cost $30,780,695) | | | 100.0 | % | | | | | | | 35,070,344 | |
NET OTHER ASSETS (LIABILITIES) | | | 0.0 | % | | | | | | | 7,441 | |
| | | | | | | | | | | | |
NET ASSETS | | | 100.0 | % | | | | | | $ | 35,077,785 | |
| | | | | | | | | | | | |
| (a) | Non-income producing security. |
| (b) | 7-day current yield as of September 30, 2023 is disclosed. |
Abbreviations:
ADR – American Depositary Receipt
At September 30, 2023 the industry sectors (excluding short-term investments) for the TSW Large Cap Value Fund were:
| | | | |
Sector Allocation (Unaudited) | | % of Net Assets | |
Communication Services | | | 16.0 | % |
Consumer Discretionary | | | 2.0 | |
Consumer Staples | | | 7.2 | |
Energy | | | 10.0 | |
Financials | | | 19.0 | |
Health Care | | | 19.0 | |
Industrials | | | 6.2 | |
Information Technology | | | 5.3 | |
Real Estate | | | 1.8 | |
Utilities | | | 4.5 | |
| | | | |
Total | | | 91.0 | % |
| | | | |
See Notes to Financial Statements.
34
JOHCM FUNDS TRUST
TSW LARGE CAP VALUE FUND
SCHEDULE OF INVESTMENTS
September 30, 2023
At September 30, 2023 the TSW Large Cap Value Fund’s investments were concentrated as follows:
| | | | |
Market Exposure (Unaudited) | |
Equity Securities | | % of Net Assets | |
Insurance | | | 11.2 | % |
Biotechnology & Pharmaceuticals | | | 10.3 | |
Oil & Gas Producers | | | 10.0 | |
Technology Hardware | | | 7.2 | |
Health Care Facilities & Services | | | 6.6 | |
Electric Utilities | | | 4.5 | |
Food | | | 4.1 | |
Aerospace & Defense | | | 3.9 | |
Banking | | | 3.9 | |
Cable & Satellite | | | 3.2 | |
Beverages | | | 3.2 | |
Internet Media & Services | | | 2.9 | |
Telecommunications | | | 2.8 | |
Publishing & Broadcasting | | | 2.6 | |
Transportation & Logistics | | | 2.3 | |
Technology Services | | | 2.2 | |
Medical Equipment & Devices | | | 2.0 | |
Retail - Discretionary | | | 2.0 | |
Real Estate Investment Trusts | | | 1.8 | |
Semiconductors | | | 1.6 | |
Asset Management | | | 1.6 | |
Entertainment Content | | | 1.1 | |
| | | | |
Total | | | 91.0 | % |
| | | | |
| | | | |
5 Largest Equity Positions | |
Issuer | | % of Net Assets | |
Berkshire Hathaway, Inc. - Class B | | | 4.8 | % |
Nintendo Co. Ltd. - ADR | | | 3.5 | |
Dominion Energy, Inc. | | | 3.5 | |
Williams Cos. (The), Inc | | | 3.2 | |
Anheuser-Busch InBev S.A./N.V. - ADR | | | 3.2 | |
| | | | |
Total | | | 18.2 | % |
| | | | |
See Notes to Financial Statements.
35
JOHCM FUNDS TRUST
STATEMENTS OF ASSETS & LIABILITIES
September 30, 2023
| | | | | | | | | | | | |
| | | JOHCM | | | JOHCM | | | JOHCM | |
| | | Emerging Markets | | | Emerging Markets | | | Global | |
| | | Discovery Fund | | | Opportunities Fund | | | Select Fund | |
Assets: | | | | | | | | | | | | |
Investments, at cost | | $ | 45,757,301 | | | $ | 918,577,020 | | | $ | 59,011,236 | |
Investments, at value | | | 50,451,042 | | | | 939,973,092 | | | | 70,007,548 | |
Foreign currencies (Cost:$127,909, $1,801,136 and $88,668, respectively) | | | 127,247 | | | | 1,801,137 | | | | 88,730 | |
Receivable for dividends | | | 36,064 | | | | 879,477 | | | | 34,708 | |
Reclaims receivable | | | 63,644 | | | | 631,079 | | | | 318,077 | |
Receivable for investments sold | | | 364,149 | | | | — | | | | 889 | |
Receivables for capital shares sold | | | 996 | | | | 1,292,151 | | | | 587 | |
Receivable from investment adviser | | | 34,802 | | | | 8,080 | | | | 16,684 | |
Prepaid expenses | | | 15,287 | | | | 58,526 | | | | 20,960 | |
| | | | | | | | | | | | |
Total Assets | | | 51,093,231 | | | | 944,643,542 | | | | 70,488,183 | |
| | | | | | | | | | | | |
Liabilities: | | | | | | | | | | | | |
Securities purchased payable | | | 259,975 | | | | 16,746,489 | | | | — | |
Capital shares redeemed payable | | | 2,800 | | | | 649,936 | | | | 67,342 | |
Investment advisory fees payable | | | 54,665 | | | | 673,668 | | | | 53,144 | |
Accounting and Administration fees payable | | | 53,925 | | | | 299,331 | | | | 61,513 | |
Shareholder Services fees - Institutional Shares payable | | | — | | | | 73,291 | | | | — | |
Distribution (Rule 12b-1) fees payable | | | 296 | | | | 9,136 | | | | 1,291 | |
Treasurer Service fees payable | | | 337 | | | | 6,154 | | | | 582 | |
JOHCM Compliance fees payable | | | 696 | | | | 12,316 | | | | 1,008 | |
Trustee fees payable | | | 1,420 | | | | 25,068 | | | | 2,025 | |
Deferred foreign capital gains tax payable | | | 344,726 | | | | 5,766,325 | | | | — | |
Accrued Audit fees payable | | | 19,080 | | | | 41,504 | | | | 20,317 | |
Accrued expenses and other payables | | | 17,062 | | | | 108,219 | | | | 15,452 | |
| | | | | | | | | | | | |
Total Liabilities | | | 754,982 | | | | 24,411,437 | | | | 222,674 | |
| | | | | | | | | | | | |
Net Assets | | $ | 50,338,249 | | | $ | 920,232,105 | | | $ | 70,265,509 | |
| | | | | | | | | | | | |
Net Assets: | | | | | | | | | | | | |
Paid in capital | | $ | 47,822,353 | | | $ | 974,770,154 | | | $ | 54,327,626 | |
Distributable earnings (loss) | | | 2,515,896 | | | | (54,538,049 | ) | | | 15,937,883 | |
| | | | | | | | | | | | |
Net Assets | | $ | 50,338,249 | | | $ | 920,232,105 | | | $ | 70,265,509 | |
| | | | | | | | | | | | |
Net Assets: | | | | | | | | | | | | |
Advisor | | $ | 4,452,728 | | | $ | 37,589,938 | | | $ | 15,415,978 | |
Investor | | | — | | | | 24,013,636 | | | | — | |
Institutional Class | | | 45,885,521 | | | | 858,628,531 | | | | 54,849,531 | |
Share of Common Stock Outstanding: | | | | | | | | | | | | |
Advisor | | | 353,569 | | | | 3,632,569 | | | | 1,257,673 | |
Investor | | | — | | | | 2,323,861 | | | | — | |
Institutional Class | | | 3,641,001 | | | | 82,739,179 | | | | 4,459,624 | |
Net Asset Value per Share: | | | | | | | | | | | | |
Advisor | | $ | 12.59 | | | $ | 10.35 | | | $ | 12.26 | |
Investor | | | — | | | | 10.33 | | | | — | |
Institutional Class | | | 12.60 | | | | 10.38 | | | | 12.30 | |
| | | | | | | | | | | | |
See Notes to Financial Statements.
36
JOHCM FUNDS TRUST
STATEMENTS OF ASSETS & LIABILITIES
September 30, 2023
| | | | | | | | | | | | |
| | | JOHCM | | | JOHCM | | | Regnan Global | |
| | | International | | | International | | | Equity Impact | |
| | | Opportunities Fund | | | Select Fund | | | Solutions | |
Assets: | | | | | | | | | | | | |
Investments, at cost | | $ | 1,804,393 | | | $ | 4,943,147,904 | | | $ | 9,139,009 | |
Investments, at value | | | 1,955,784 | | | | 5,249,021,388 | | | | 8,840,471 | |
Cash | | | 5 | | | | — | | | | — | |
Foreign currencies (Cost:$643, $5,362,969 and $283, respectively) | | | 634 | | | | 5,367,141 | | | | 283 | |
Receivable for dividends | | | 4,629 | | | | 12,155,411 | | | | 10,269 | |
Reclaims receivable | | | 10,311 | | | | 21,088,438 | | | | 13,316 | |
Receivable for investments sold | | | 10,655 | | | | 54,051 | | | | 1,134,786 | |
Receivables for capital shares sold | | | — | | | | 3,129,085 | | | | — | |
Receivable from investment adviser | | | 14,056 | | | | 238,213 | | | | 12,977 | |
Prepaid expenses | | | 7,481 | | | | 230,104 | | | | 26,019 | |
| | | | | | | | | | | | |
Total Assets | | | 2,003,555 | | | | 5,291,283,831 | | | | 10,038,121 | |
| | | | | | | | | | | | |
Liabilities: | | | | | | | | | | | | |
Securities purchased payable | | | — | | | | 11,195,717 | | | | — | |
Capital shares redeemed payable | | | — | | | | 5,718,265 | | | | 171,754 | |
Investment advisory fees payable | | | 1,236 | | | | 3,991,103 | | | | 7,751 | |
Accounting and Administration fees payable | | | 6,431 | | | | 1,872,529 | | | | 9,261 | |
Shareholder Services fees - Institutional Shares payable | | | — | | | | 200,852 | | | | — | |
Distribution (Rule 12b-1) fees payable | | | — | | | | 74,986 | | | | — | |
Treasurer Service fees payable | | | 13 | | | | 36,763 | | | | 87 | |
JOHCM Compliance fees payable | | | 27 | | | | 74,283 | | | | 179 | |
Trustee fees payable | | | 55 | | | | 150,931 | | | | 363 | |
Accrued Audit fees payable | | | 17,797 | | | | 168,492 | | | | 18,085 | |
Accrued expenses and other payables | | | 5,404 | | | | 596,625 | | | | 5,297 | |
Credit Facility Payable | | | — | | | | — | | | | 850,000 | |
| | | | | | | | | | | | |
Total Liabilities | | | 30,963 | | | | 24,080,546 | | | | 1,062,777 | |
| | | | | | | | | | | | |
Net Assets | | $ | 1,972,592 | | | $ | 5,267,203,285 | | | $ | 8,975,344 | |
| | | | | | | | | | | | |
Net Assets: | | | | | | | | | | | | |
Paid in capital | | $ | 1,811,418 | | | $ | 5,709,972,272 | | | $ | 11,463,586 | |
Distributable earnings (loss) | | | 161,174 | | | | (442,768,987 | ) | | | (2,488,242 | ) |
| | | | | | | | | | | | |
Net Assets | | $ | 1,972,592 | | | $ | 5,267,203,285 | | | $ | 8,975,344 | |
| | | | | | | | | | | | |
Net Assets: | | | | | | | | | | | | |
Investor | | $ | — | | | $ | 356,041,196 | | | $ | — | |
Institutional Class | | | 1,972,592 | | | | 4,911,162,089 | | | | 8,975,344 | |
Share of Common Stock Outstanding: | | | | | | | | | | | | |
Investor | | | — | | | | 16,644,347 | | | | — | |
Institutional Class | | | 181,792 | | | | 229,865,955 | | | | 1,257,109 | |
Net Asset Value per Share: | | | | | | | | | | | | |
Investor | | $ | — | | | $ | 21.39 | | | $ | — | |
Institutional Class | | | 10.85 | | | | 21.37 | | | | 7.14 | |
| | | | | | | | | | | | |
See Notes to Financial Statements.
37
JOHCM FUNDS TRUST
STATEMENTS OF ASSETS & LIABILITIES
September 30, 2023
| | | | | | | | | | | | |
| | | TSW | | | TSW | | | TSW | |
| | | Emerging Markets | | | High Yield | | | Large Cap | |
| | | Fund | | | Bond Fund | | | Value Fund | |
Assets: | | | | | | | | | | | | |
Investments, at cost | | $ | 7,056,969 | | | $ | 13,730,300 | | | $ | 30,780,695 | |
Investments, at value | | | 6,641,789 | | | | 12,992,810 | | | | 35,070,344 | |
Foreign currencies (Cost:$14,026, $0 and $0, respectively) | | | 13,686 | | | | — | | | | — | |
Receivable for interest | | | — | | | | 195,706 | | | | — | |
Receivable for dividends | | | 7,233 | | | | 3,279 | | | | 39,759 | |
Reclaims receivable | | | 2,884 | | | | — | | | | 7,619 | |
Receivable from investment adviser | | | 18,562 | | | | 12,882 | | | | 3,387 | |
Prepaid expenses | | | 250 | | | | 13,696 | | | | 11,418 | |
Total Assets | | | 6,684,404 | | | | 13,218,373 | | | | 35,132,527 | |
| | | | | | | | | | | | |
Liabilities: | | | | | | | | | | | | |
| | | | | | | | | | | | |
Securities purchased payable | | | 18,181 | | | | — | | | | — | |
Capital shares redeemed payable | | | — | | | | 519 | | | | — | |
Distributions payable to shareholders | | | — | | | | 27,972 | | | | — | |
Investment advisory fees payable | | | 4,474 | | | | 5,362 | | | | 17,023 | |
Accounting and Administration fees payable | | | 8,377 | | | | 8,091 | | | | 10,676 | |
Treasurer Service fees payable | | | 45 | | | | 84 | | | | 237 | |
JOHCM Compliance fees payable | | | 89 | | | | 169 | | | | 482 | |
Trustee fees payable | | | 181 | | | | 346 | | | | 981 | |
Deferred foreign capital gains tax payable | | | 418 | | | | — | | | | — | |
Accrued Audit fees payable | | | 17,924 | | | | 18,075 | | | | 18,699 | |
Accrued expenses and other payables | | | 7,827 | | | | 4,381 | | | | 6,644 | |
| | | | | | | | | | | | |
Total Liabilities | | | 57,516 | | | | 64,999 | | | | 54,742 | |
| | | | | | | | | | | | |
Net Assets | | $ | 6,626,888 | | | $ | 13,153,374 | | | $ | 35,077,785 | |
| | | | | | | | | | | | |
Net Assets: | | | | | | | | | | | | |
Paid in capital | | $ | 7,893,887 | | | $ | 14,632,105 | | | $ | 28,403,203 | |
Distributable earnings (loss) | | | (1,266,999 | ) | | | (1,478,731 | ) | | | 6,674,582 | |
| | | | | | | | | | | | |
Net Assets | | $ | 6,626,888 | | | $ | 13,153,374 | | | $ | 35,077,785 | |
| | | | | | | | | | | | |
Net Assets: | | | | | | | | | | | | |
Institutional | | $ | 6,626,888 | | | $ | 13,153,374 | | | $ | 35,077,785 | |
Share of Common Stock Outstanding: | | | | | | | | | | | | |
Institutional | | | 751,479 | | | | 1,510,763 | | | | 2,771,587 | |
Net Asset Value per Share: | | | | | | | | | | | | |
Institutional | | $ | 8.82 | | | $ | 8.71 | | | $ | 12.66 | |
| | | | | | | | | | | | |
See Notes to Financial Statements.
38
JOHCM FUNDS TRUST
STATEMENTS OF OPERATIONS
For the year ended September 30, 2023
| | | | | | | | |
| | | JOHCM | | | JOHCM | |
| | | Emerging Markets | | | Emerging Markets | |
| | | Discovery Fund | | | Opportunities Fund | |
Investment Income: | | | | | | | | |
Dividend income (Net of foreign withholding tax of $127,047, and $2,976,809, respectively) | | $ | 816,363 | | | $ | 22,883,575 | |
Operating expenses: | | | | | | | | |
Investment advisory | | | 567,209 | | | | 7,518,980 | |
Distribution (Rule 12b-1) fees - Advisor Shares | | | 9,094 | | | | 71,260 | |
Distribution (Rule 12b-1) fees - Investor Shares | | | — | | | | 69,878 | |
Accounting and Administration | | | 133,209 | | | | 458,350 | |
Treasurer Service fees | | | 1,743 | | | | 33,365 | |
Audit fees | | | 21,407 | | | | 39,916 | |
Shareholder Services - Institutional Shares | | | — | | | | 154,299 | |
JOHCM Compliance | | | 1,994 | | | | 36,229 | |
Trustees | | | 4,135 | | | | 78,178 | |
Legal | | | 18,661 | | | | 144,168 | |
Registration | | | 23,995 | | | | 57,894 | |
Interest expense | | | 33 | | | | — | |
Other | | | 42,793 | | | | 150,735 | |
| | | | | | | | |
Total expenses before reductions | | | 824,273 | | | | 8,813,252 | |
Expenses reduced by investment advisor | | | (165,037 | ) | | | (8,080 | ) |
| | | | | | | | |
Net expenses | | | 659,236 | | | | 8,805,172 | |
| | | | | | | | |
Net investment income | | | 157,127 | | | | 14,078,403 | |
| | | | | | | | |
Realized and Unrealized Gains (Losses) from Investment Activities: | | | | | | | | |
Net realized gains (losses) from investment transactions | | | 634,438 | | | | (39,103,109 | ) |
Net realized gains (losses) from foreign currency transactions | | | (46,580 | ) | | | 150,024 | |
Change in unrealized appreciation (depreciation) on investments | | | 7,526,770 | | | | 84,679,034 | |
Change in unrealized appreciation (depreciation) on foreign currency | | | 1,230 | | | | (25,224 | ) |
| | | | | | | | |
Net realized and unrealized gains from investment activities | | | 8,115,858 | | | | 45,700,725 | |
| | | | | | | | |
Change in Net Assets Resulting from Operations | | $ | 8,272,985 | | | $ | 59,779,128 | |
| | | | | | | | |
See Notes to Financial Statements.
39
JOHCM FUNDS TRUST
STATEMENTS OF OPERATIONS
For the year ended September 30, 2023
| | | | | | | | | | | | | | | | |
| | | JOHCM | | | JOHCM | | | JOHCM | | | Regnan Global | |
| | | Global | | | International | | | International | | | Equity Impact | |
| | | Select Fund | | | Opportunities Fund | | | Select Fund | | | Solutions | |
Investment Income: | | | | | | | | | | | | | | | | |
Dividend income (Net of foreign withholding tax of $181,125, $8,293, $12,477,835, and $19,673, respectively) | | $ | 2,692,767 | | | $ | 52,810 | | | $ | 129,888,629 | | | $ | 139,788 | |
Operating expenses: | | | | | | | | | | | | | | | | |
Investment advisory | | | 1,592,168 | | | | 14,244 | | | | 52,428,888 | | | | 95,900 | |
Distribution (Rule 12b-1) fees - Advisor Shares | | | 22,340 | | | | — | | | | — | | | | — | |
Distribution (Rule 12b-1) fees - Investor Shares | | | — | | | | — | | | | 960,168 | | | | — | |
Accounting and Administration | | | 74,145 | | | | 16,347 | | | | 2,023,952 | | | | 5,260 | |
Treasurer Service fees | | | 7,150 | | | | 76 | | | | 235,223 | | | | 508 | |
Audit fees | | | 18,228 | | | | 17,728 | | | | 150,442 | | | | 20,512 | |
Shareholder Services - Institutional Shares | | | 856 | | | | — | | | | 373,131 | | | | — | |
JOHCM Compliance | | | 8,811 | | | | 100 | | | | 301,448 | | | | 509 | |
Trustees | | | 15,943 | | | | 182 | | | | 550,774 | | | | 1,180 | |
Legal | | | 34,054 | | | | 7,346 | | | | 979,110 | | | | 9,856 | |
Registration | | | 32,649 | | | | 14,713 | | | | 50,046 | | | | 28,233 | |
Interest expense | | | 10,889 | | | | — | | | | 76,503 | | | | 1,130 | |
Other | | | 38,529 | | | | 9,048 | | | | 953,506 | | | | 7,547 | |
| | | | | | | | | �� | | | | | | | |
Total expenses before reductions | | | 1,855,762 | | | | 79,784 | | | | 59,083,191 | | | | 170,635 | |
Expenses reduced by investment advisor | | | (69,362 | ) | | | (65,002 | ) | | | (290,951 | ) | | | (56,432 | ) |
| | | | | | | | | | | | | | | | |
Net expenses | | | 1,786,400 | | | | 14,782 | | | | 58,792,240 | | | | 114,203 | |
| | | | | | | | | | | | | | | | |
Net investment income | | | 906,367 | | | | 38,028 | | | | 71,096,389 | | | | 25,585 | |
| | | | | | | | | | | | | | | | |
Realized and Unrealized Gains (Losses) from | | | | | | | | | | | | | | | | |
Investment Activities: | | | | | | | | | | | | | | | | |
Net realized gains (losses) from investment transactions | | | 11,375,278 | | | | 2,250 | | | | (102,312,957 | ) | | | (966,831 | ) |
Net realized gains (losses) from foreign currency transactions | | | 45,390 | | | | (1,567 | ) | | | 171,114 | | | | 3,229 | |
Change in unrealized appreciation (depreciation) on investments | | | 11,461,114 | | | | 458,787 | | | | 1,294,623,494 | | | | 1,907,874 | |
Change in unrealized appreciation (depreciation) on foreign currency | | | 21,915 | | | | 1,076 | | | | 1,781,960 | | | | 3,304 | |
| | | | | | | | | | | | | | | | |
Net realized and unrealized gains from investment activities | | | 22,903,697 | | | | 460,546 | | | | 1,194,263,611 | | | | 947,576 | |
| | | | | | | | | | | | | | | | |
Change in Net Assets Resulting from Operations | | $ | 23,810,064 | | | $ | 498,574 | | | $ | 1,265,360,000 | | | $ | 973,161 | |
| | | | | | | | | | | | | | | | |
See Notes to Financial Statements.
40
JOHCM FUNDS TRUST
STATEMENTS OF OPERATIONS
For the year ended September 30, 2023
| | | | | | | | | | | | |
| | | TSW | | | TSW | | | TSW | |
| | | Emerging Markets | | | High Yield | | | Large Cap | |
| | | Fund | | | Bond Fund | | | Value Fund | |
Investment Income: | | | | | | | | | | | | |
Dividend income (Net of foreign withholding tax of $24,052, $0, and $9,548, respectively) | | $ | 178,405 | | | $ | 14,684 | | | $ | 800,864 | |
Interest income | | | — | | | | 769,964 | | | | — | |
| | | | | | | | | | | | |
Total investment income | | | 178,405 | | | | 784,648 | | | | 800,864 | |
| | | | | | | | | | | | |
Operating expenses: | | | | | | | | | | | | |
Investment advisory | | | 55,978 | | | | 60,148 | | | | 207,061 | |
Accounting and Administration | | | 19,906 | | | | 17,734 | | | | 21,966 | |
Investment advisory waiver recoupments | | | — | | | | — | | | | 7,472 | |
Treasurer Service fees | | | 280 | | | | 481 | | | | 1,423 | |
Audit fees | | | 17,905 | | | | 18,048 | | | | 12,178 | |
JOHCM Compliance | | | 264 | | | | 494 | | | | 1,333 | |
Trustees | | | 658 | | | | 1,153 | | | | 3,365 | |
Legal | | | 49,949 | | | | 32,805 | | | | — | |
Registration | | | — | | | | 23,028 | | | | 3,871 | |
Other | | | 9,882 | | | | 3,864 | | | | 1,942 | |
| | | | | | | | | | | | |
Total expenses before reductions | | | 154,822 | | | | 157,755 | | | | 260,611 | |
Expenses reduced by investment advisor | | | (85,549 | ) | | | (79,563 | ) | | | — | |
| | | | | | | | | | | | |
Net expenses | | | 69,273 | | | | 78,192 | | | | 260,611 | |
| | | | | | | | | | | | |
Net investment income | | | 109,132 | | | | 706,456 | | | | 540,253 | |
| | | | | | | | | | | | |
Realized and Unrealized Gains (Losses) from Investment Activities: | | | | | | | | | | | | |
Net realized gains (losses) from investment transactions | | | (574,205 | ) | | | (696,696 | ) | | | 3,328,554 | |
Net realized losses from foreign currency transactions | | | (4,483 | ) | | | — | | | | — | |
Change in unrealized appreciation (depreciation) on investments | | | 2,081,483 | | | | 1,339,748 | | | | 307,202 | |
Change in unrealized appreciation (depreciation) on foreign currency | | | (323 | ) | | | — | | | | — | |
| | | | | | | | | | | | |
Net realized and unrealized gains from investment activities | | | 1,502,472 | | | | 643,052 | | | | 3,635,756 | |
| | | | | | | | | | | | |
Change in Net Assets Resulting from Operations | | $ | 1,611,604 | | | $ | 1,349,508 | | | $ | 4,176,009 | |
| | | | | | | | | | | | |
See Notes to Financial Statements.
41
JOHCM FUNDS TRUST
STATEMENTS OF CHANGES IN NET ASSETS
For the years ended September 30, 2023 and 2022
| | | | | | | | | | | | | | | | |
| | | JOHCM | | | JOHCM | |
| | | Emerging Markets | | | Emerging Markets | |
| | | Discovery Fund | | | Opportunities Fund | |
| | | 2023 | | | 2022 | | | 2023 | | | 2022 | |
Increase (decrease) in net assets: | | | | | | | | | | | | | | | | |
Operations: | | | | | | | | | | | | | | | | |
Net investment income | | $ | 157,127 | | | $ | 288,520 | | | $ | 14,078,403 | | | $ | 20,768,537 | |
Net realized gains (losses) from investments and foreign currency transactions | | | 587,858 | | | | (1,937,827 | ) | | | (38,953,085 | ) | | | (24,665,391 | ) |
Change in unrealized appreciation (depreciation) on investments and foreign currency | | | 7,528,000 | | | | (9,547,843 | ) | | | 84,653,810 | | | | (171,775,985 | ) |
| | | | | | | | | | | | | | | | |
Change in net assets resulting from operations | | | 8,272,985 | | | | (11,197,150 | ) | | | 59,779,128 | | | | (175,672,839 | ) |
| | | | | | | | | | | | | | | | |
Dividends paid to shareholders: | | | | | | | | | | | | | | | | |
From distributable earnings: | | | | | | | | | | | | | | | | |
Advisor Shares | | | (93,652 | ) | | | (4,038,103 | ) | | | (1,480,100 | ) | | | (3,261,214 | ) |
Investor Shares | | | — | | | | — | | | | (549,286 | ) | | | (328,686 | ) |
Institutional Shares | | | (347,071 | ) | | | (8,452,708 | ) | | | (13,430,843 | ) | | | (30,794,394 | ) |
| | | | | | | | | | | | | | | | |
Total dividends paid to shareholders | | | (440,723 | ) | | | (12,490,811 | ) | | | (15,460,229 | ) | | | (34,384,294 | ) |
| | | | | | | | | | | | | | | | |
Net Capital Transactions: | | | | | | | | | | | | | | | | |
Advisor Shares | | | (6,473,679 | ) | | | 940,803 | | | | (34,382,214 | ) | | | 7,797,295 | |
Investor Shares | | | — | | | | — | | | | 13,267,523 | | | | 2,287,247 | |
Institutional Shares | | | 15,651,660 | | | | 8,587,662 | | | | 246,111,924 | | | | 21,038,694 | |
| | | | | | | | | | | | | | | | |
Change in net assets from capital transactions | | | 9,177,981 | | | | 9,528,465 | | | | 224,997,233 | | | | 31,123,236 | |
| | | | | | | | | | | | | | | | |
Change in net assets | | | 17,010,243 | | | | (14,159,496 | ) | | | 269,316,132 | | | | (178,933,897 | ) |
Net assets: | | | | | | | | | | | | | | | | |
Beginning of year | | | 33,328,006 | | | | 47,487,502 | | | | 650,915,973 | | | | 829,849,870 | |
| | | | | | | | | | | | | | | | |
End of year | | $ | 50,338,249 | | | $ | 33,328,006 | | | $ | 920,232,105 | | | $ | 650,915,973 | |
| | | | | | | | | | | | | | | | |
See Notes to Financial Statements.
42
JOHCM FUNDS TRUST
STATEMENTS OF CHANGES IN NET ASSETS
For the years ended September 30, 2023 and 2022
| | | | | | | | | | | | | | | | |
| | | JOHCM | | | JOHCM | |
| | | Global | | | International | |
| | | Select Fund | | | Opportunities Fund | |
| | | 2023 | | | 2022 | | | 2023 | | | 2022 | |
Increase (decrease) in net assets: | | | | | | | | | | | | | | | | |
Operations: | | | | | | | | | | | | | | | | |
Net investment income | | $ | 906,367 | | | $ | 1,426,582 | | | $ | 38,028 | | | $ | 40,187 | |
Net realized gains (losses) from investments and foreign currency transactions | | | 11,420,668 | | | | 24,082,723 | | | | 683 | | | | 34,305 | |
Change in unrealized appreciation (depreciation) on investments and foreign currency | | | 11,483,029 | | | | (171,983,382 | ) | | | 459,863 | | | | (470,923 | ) |
| | | | | | | | | | | | | | | | |
Change in net assets resulting from operations | | | 23,810,064 | | | | (146,474,077 | ) | | | 498,574 | | | | (396,431 | ) |
| | | | | | | | | | | | | | | | |
Dividends paid to shareholders: | | | | | | | | | | | | | | | | |
From distributable earnings: | | | | | | | | | | | | | | | | |
Advisor Shares | | | (2,351,410 | ) | | | (7,478,429 | ) | | | — | | | | — | |
Institutional Shares | | | (18,982,642 | ) | | | (87,938,605 | ) | | | (38,383 | ) | | | (370,628 | ) |
| | | | | | | | | | | | | | | | |
Total dividends paid to shareholders | | | (21,334,052 | ) | | | (95,417,034 | ) | | | (38,383 | ) | | | (370,628 | ) |
| | | | | | | | | | | | | | | | |
Net Capital Transactions: | | | | | | | | | | | | | | | | |
Advisor Shares | | | (10,320,906 | ) | | | (4,391,486 | ) | | | — | | | | — | |
Institutional Shares | | | (203,910,095 | ) | | | (44,688,032 | ) | | | 4,100 | | | | (1,189,513 | ) |
| | | | | | | | | | | | | | | | |
Change in net assets from capital transactions | | | (214,231,001 | ) | | | (49,079,518 | ) | | | 4,100 | | | | (1,189,513 | ) |
| | | | | | | | | | | | | | | | |
Change in net assets | | | (211,754,989 | ) | | | (290,970,629 | ) | | | 464,291 | | | | (1,956,572 | ) |
Net assets: | | | | | | | | | | | | | | | | |
Beginning of year | | | 282,020,498 | | | | 572,991,127 | | | | 1,508,301 | | | | 3,464,873 | |
| | | | | | | | | | | | | | | | |
End of year | | $ | 70,265,509 | | | $ | 282,020,498 | | | $ | 1,972,592 | | | $ | 1,508,301 | |
| | | | | | | | | | | | | | | | |
See Notes to Financial Statements.
43
JOHCM FUNDS TRUST
STATEMENTS OF CHANGES IN NET ASSETS
For the years ended September 30, 2023 and 2022
| | | | | | | | | | | | | | | | |
| | | JOHCM | | | Regnan Global | |
| | | International | | | Equity Impact | |
| | | Select Fund | | | Solutions | |
| | | 2023 | | | 2022 | | | 2023 | | | 2022 | |
Increase (decrease) in net assets: | | | | | | | | | | | | | | | | |
Operations: | | | | | | | | | | | | | | | | |
Net investment income | | $ | 71,096,389 | | | $ | 113,421,787 | | | $ | 25,585 | | | $ | 22,685 | |
Net realized gains (losses) from investments and foreign currency transactions | | | (102,141,843 | ) | | | (673,204,980 | ) | | | (963,602 | ) | | | (1,261,789 | ) |
Change in unrealized appreciation (depreciation) on investments and foreign currency | | | 1,296,405,454 | | | | (3,925,940,627 | ) | | | 1,911,178 | | | | (2,055,812 | ) |
| | | | | | | | | | | | | | | | |
Change in net assets resulting from operations | | | 1,265,360,000 | | | | (4,485,723,820 | ) | | | 973,161 | | | | (3,294,916 | ) |
| | | | | | | | | | | | | | | | |
Dividends paid to shareholders: | | | | | | | | | | | | | | | | |
From distributable earnings: | | | | | | | | | | | | | | | | |
Investor Shares | | | (4,744,223 | ) | | | (73,348,632 | ) | | | — | | | | — | |
Institutional Shares | | | (92,712,488 | ) | | | (1,189,249,109 | ) | | | (12,268 | ) | | | — | |
| | | | | | | | | | | | | | | | |
Total dividends paid to shareholders | | | (97,456,711 | ) | | | (1,262,597,741 | ) | | | (12,268 | ) | | | — | |
| | | | | | | | | | | | | | | | |
Net Capital Transactions: | | | | | | | | | | | | | | | | |
Investor Shares | | | (93,919,291 | ) | | | (75,588,299 | ) | | | — | | | | — | |
Institutional Shares | | | (2,149,386,653 | ) | | | (907,760,129 | ) | | | 657,798 | | | | 8,783,874 | |
| | | | | | | | | | | | | | | | |
Change in net assets from capital transactions | | | (2,243,305,944 | ) | | | (983,348,428 | ) | | | 657,798 | | | | 8,783,874 | |
| | | | | | | | | | | | | | | | |
Change in net assets | | | (1,075,402,655 | ) | | | (6,731,669,989 | ) | | | 1,618,691 | | | | 5,488,958 | |
Net assets: | | | | | | | | | | | | | | | | |
Beginning of year | | | 6,342,605,940 | | | | 13,074,275,929 | | | | 7,356,653 | | | | 1,867,695 | |
| | | | | | | | | | | | | | | | |
End of year | | $ | 5,267,203,285 | | | $ | 6,342,605,940 | | | $ | 8,975,344 | | | $ | 7,356,653 | |
| | | | | | | | | | | | | | | | |
See Notes to Financial Statements.
44
JOHCM FUNDS TRUST
STATEMENTS OF CHANGES IN NET ASSETS
For the year ended September 30, 2023 and periods ended 2022
| | | | | | | | | | | | | | | | |
| | | TSW | | | TSW | |
| | | Emerging Markets | | | High Yield | |
| | | Fund | | | Bond Fund | |
| | | 2023 | | | 2022(a) | | | 2023 | | | 2022(b) | |
Increase (decrease) in net assets: | | | | | | | | | | | | | | | | |
Operations: | | | | | | | | | | | | | | | | |
Net investment income | | $ | 109,132 | | | $ | 130,164 | | | $ | 706,456 | | | $ | 542,884 | |
Net realized gains (losses) from investments and foreign currency transactions | | | (578,688 | ) | | | (380,152 | ) | | | (696,696 | ) | | | (46,754 | ) |
Change in unrealized appreciation (depreciation) on investments and foreign currency | | | 2,081,160 | | | | (2,497,243 | ) | | | 1,339,748 | | | | (2,077,238 | ) |
| | | | | | | | | | | | | | | | |
Change in net assets resulting from operations | | | 1,611,604 | | | | (2,747,231 | ) | | | 1,349,508 | | | | (1,581,108 | ) |
| | | | | | | | | | | | | | | | |
Dividends paid to shareholders: | | | | | | | | | | | | | | | | |
From distributable earnings: | | | | | | | | | | | | | | | | |
Institutional Shares | | | (137,485 | ) | | | — | | | | (706,449 | ) | | | (548,885 | ) |
| | | | | | | | | | | | | | | | |
Total dividends paid to shareholders | | | (137,485 | ) | | | — | | | | (706,449 | ) | | | (548,885 | ) |
| | | | | | | | | | | | | | | | |
Capital Transactions: | | | | | | | | | | | | | | | | |
Institutional Shares | | | (2,100,000 | ) | | | 10,000,000 | | | | 1,326,728 | | | | 13,313,580 | |
| | | | | | | | | | | | | | | | |
Change in net assets from capital transactions | | | (2,100,000 | ) | | | 10,000,000 | | | | 1,326,728 | | | | 13,313,580 | |
| | | | | | | | | | | | | | | | |
Change in net assets | | | (625,881 | ) | | | 7,252,769 | | | | 1,969,787 | | | | 11,183,587 | |
Net assets: | | | | | | | | | | | | | | | | |
Beginning of year | | | 7,252,769 | | | | — | | | | 11,183,587 | | | | — | |
| | | | | | | | | | | | | | | | |
End of year | | $ | 6,626,888 | | | $ | 7,252,769 | | | $ | 13,153,374 | | | $ | 11,183,587 | |
| | | | | | | | | | | | | | | | |
| (a) | For the period from December 21, 2021, commencement of operations, to September 30, 2022. |
| (b) | For the period from October 26, 2021, commencement of operations, to September 30, 2022. |
See Notes to Financial Statements.
45
JOHCM FUNDS TRUST
STATEMENTS OF CHANGES IN NET ASSETS
For the year ended September 30, 2023 and periods ended 2022 and 2021
| | | | | | | | | | | | |
| | | TSW | |
| | | Large Cap | |
| | | Value Fund | |
| | | 2023 | | | 2022(a) | | | 2021(b) | |
Increase (decrease) in net assets: | | | | | | | | | | | | |
Operations: | | | | | | | | | | | | |
Net investment income | | $ | 540,253 | | | $ | 394,434 | | | $ | 89,552 | |
Net realized gains (losses) from investments and foreign currency transactions | | | 3,328,554 | | | | 2,931,779 | | | | 4,746,582 | |
Change in unrealized appreciation (depreciation) on investments and foreign currency | | | 307,202 | | | | (5,986,727 | ) | | | 7,908,854 | |
| | | | | | | | | | | | |
Change in net assets resulting from operations | | | 4,176,009 | | | | (2,660,514 | ) | | | 12,744,988 | |
| | | | | | | | | | | | |
Dividends paid to shareholders: | | | | | | | | | | | | |
From distributable earnings: | | | | | | | | | | | | |
Institutional Shares | | | (4,111,104 | ) | | | (5,044,727 | ) | | | (1,689,380 | ) |
| | | | | | | | | | | | |
Total dividends paid to shareholders | | | (4,111,104 | ) | | | (5,044,727 | ) | | | (1,689,380 | ) |
| | | | | | | | | | | | |
Capital Transactions: | | | | | | | | | | | | |
Institutional Shares | | | (201,693 | ) | | | 3,474,901 | | | | (2,204,155 | ) |
| | | | | | | | | | | | |
Change in net assets from capital transactions | | | (201,693 | ) | | | 3,474,901 | | | | (2,204,155 | ) |
| | | | | | | | | | | | |
Change in net assets | | | (136,788 | ) | | | (4,230,340 | ) | | | 8,851,453 | |
Net assets: | | | | | | | | | | | | |
Beginning of year | | | 35,214,573 | | | | 39,444,913 | | | | 30,593,460 | |
| | | | | | | | | | | | |
End of year | | $ | 35,077,785 | | | $ | 35,214,573 | | | $ | 39,444,913 | |
| | | | | | | | | | | | |
| (a) | For the period from November 1, 2021 to September 30, 2022. |
| (b) | For the TSW Predecessor Fund’s year ended October 31, 2021. |
See Notes to Financial Statements.
46
JOHCM FUNDS TRUST
FINANCIAL HIGHLIGHTS
For the periods indicated
| | | | | | | | | | | | | | | | | | | | |
| | | Advisor Shares | |
| | | Year Ended | | | Year Ended | | | Year Ended | | | Year Ended | | | Year Ended | |
| | | September 30, | | | September 30, | | | September 30, | | | September 30, | | | September 30, | |
JOHCM Emerging Markets Discovery Fund | | 2023 | | | 2022 | | | 2021 | | | 2020 | | | 2019 | |
Net asset value, beginning of year | | $ | 10.38 | | | $ | 18.35 | | | $ | 13.40 | | | $ | 11.62 | | | $ | 11.85 | |
| | | | | | | | | | | | | | | | | | | | |
Income (loss) from investment operations: | | | | | | | | | | | | | | | | | | | | |
Net investment income(a) | | | 0.03 | | | | 0.07 | | | | 0.01 | | | | 0.15 | | | | 0.02 | |
Net realized and unrealized gains (losses) from investments and foreign currency | | | 2.29 | | | | (3.22 | ) | | | 5.00 | | | | 1.70 | | | | (0.20 | ) |
| | | | | | | | | | | | | | | | | | | | |
Total from investment operations | | | 2.32 | | | | (3.15 | ) | | | 5.01 | | | | 1.85 | | | | (0.18 | ) |
| | | | | | | | | | | | | | | | | | | | |
Less distributions paid: | | | | | | | | | | | | | | | | | | | | |
From net investment income | | | (0.11 | ) | | | (0.05 | ) | | | (0.06 | ) | | | (0.07 | ) | | | (0.05 | ) |
From net realized gains | | | — | | | | (4.77 | ) | | | — | | | | — | | | | — | |
| | | | | | | | | | | | | | | | | | | | |
Total distributions paid | | | (0.11 | ) | | | (4.82 | ) | | | (0.06 | ) | | | (0.07 | ) | | | (0.05 | ) |
| | | | | | | | | | | | | | | | | | | | |
Change in net asset value | | | 2.21 | | | | (7.97 | ) | | | 4.95 | | | | 1.78 | | | | (0.23 | ) |
| | | | | | | | | | | | | | | | | | | | |
Net asset value, end of year | | $ | 12.59 | | | $ | 10.38 | | | $ | 18.35 | | | $ | 13.40 | | | $ | 11.62 | |
| | | | | | | | | | | | | | | | | | | | |
Total return | | | 22.49 | %(b) | | | (23.44 | %) | | | 37.50 | % | | | 15.95 | % | | | (1.51 | %) |
Ratios/Supplemental data: | | | | | | | | | | | | | | | | | | | | |
Net assets, end of year (000’s) | | $ | 4,453 | | | $ | 8,946 | | | $ | 15,209 | | | $ | 14,365 | | | $ | 415 | |
Ratio of net expenses to average net assets | | | 1.59 | % | | | 1.59 | % | | | 1.63 | % | | | 1.64 | % | | | 1.64 | % |
Ratio of net investment income to average net assets | | | 0.27 | % | | | 0.53 | % | | | 0.06 | % | | | 1.21 | % | | | 0.15 | % |
Ratio of gross expenses to average net assets | | | 1.95 | % | | | 1.86 | % | | | 1.94 | % | | | 2.29 | % | | | 2.66 | % |
Portfolio turnover rate(c) | | | 155.29 | % | | | 123.95 | % | | | 163.54 | % | | | 136.73 | % | | | 133.43 | % |
| (a) | Net investment income (loss) for the period ended was calculated using the average shares outstanding method. |
| (b) | The Adviser reimbursed the Fund $12,829 during the period in connection with an error. Such reimbursement was 0.04% to the Fund’s total return on the payment date. |
| (c) | Portfolio turnover is calculated at the fund level without regard to each class of shares. |
See Notes to Financial Statements.
47
JOHCM FUNDS TRUST
FINANCIAL HIGHLIGHTS
For the periods indicated
| | | | | | | | | | | | | | | | | | | | |
| | | Institutional Shares | |
| | | Year Ended | | | Year Ended | | | Year Ended | | | Year Ended | | | Year Ended | |
| | | September 30, | | | September 30, | | | September 30, | | | September 30, | | | September 30, | |
JOHCM Emerging Markets Discovery Fund | | 2023 | | | 2022 | | | 2021 | | | 2020 | | | 2019 | |
Net asset value, beginning of year | | $ | 10.39 | | | $ | 18.38 | | | $ | 13.42 | | | $ | 11.64 | | | $ | 11.87 | |
| | | | | | | | | | | | | | | | | | | | |
Income (loss) from investment operations: | | | | | | | | | | | | | | | | | | | | |
Net investment income(a) | | | 0.05 | | | | 0.09 | | | | 0.03 | | | | 0.04 | | | | 0.04 | |
Net realized and unrealized gains (losses) from investments and foreign currency | | | 2.28 | | | | (3.24 | ) | | | 5.00 | | | | 1.83 | | | | (0.21 | ) |
| | | | | | | | | | | | | | | | | | | | |
Total from investment operations | | | 2.33 | | | | (3.15 | ) | | | 5.03 | | | | 1.87 | | | | (0.17 | ) |
| | | | | | | | | | | | | | | | | | | | |
Less distributions paid: | | | | | | | | | | | | | | | | | | | | |
From net investment income | | | (0.12 | ) | | | (0.07 | ) | | | (0.07 | ) | | | (0.09 | ) | | | (0.06 | ) |
From net realized gains | | | — | | | | (4.77 | ) | | | — | | | | — | | | | — | |
| | | | | | | | | | | | | | | | | | | | |
Total distributions paid | | | (0.12 | ) | | | (4.84 | ) | | | (0.07 | ) | | | (0.09 | ) | | | (0.06 | ) |
| | | | | | | | | | | | | | | | | | | | |
Change in net asset value | | | 2.21 | | | | (7.99 | ) | | | 4.96 | | | | 1.78 | | | | (0.23 | ) |
| | | | | | | | | | | | | | | | | | | | |
Net asset value, end of year | | $ | 12.60 | | | $ | 10.39 | | | $ | 18.38 | | | $ | 13.42 | | | $ | 11.64 | |
| | | | | | | | | | | | | | | | | | | | |
Total return | | | 22.58 | %(b) | | | (23.44 | %) | | | 37.60 | % | | | 16.09 | % | | | (1.42 | %) |
Ratios/Supplemental data: | | | | | | | | | | | | | | | | | | | | |
Net assets, end of year (000’s) | | $ | 45,886 | | | $ | 24,382 | | | $ | 32,279 | | | $ | 29,282 | | | $ | 23,870 | |
Ratio of net expenses to average net assets | | | 1.49 | % | | | 1.49 | % | | | 1.53 | % | | | 1.54 | % | | | 1.54 | % |
Ratio of net investment income to average net assets | | | 0.38 | % | | | 0.71 | % | | | 0.18 | % | | | 0.33 | % | | | 0.36 | % |
Ratio of gross expenses to average net assets | | | 1.87 | % | | | 1.76 | % | | | 1.84 | % | | | 2.19 | % | | | 2.56 | % |
Portfolio turnover rate(c) | | | 155.29 | % | | | 123.95 | % | | | 163.54 | % | | | 136.73 | % | | | 133.43 | % |
| (a) | Net investment income (loss) for the period ended was calculated using the average shares outstanding method. |
| (b) | The Adviser reimbursed the Fund $12,829 during the period in connection with an error. Such reimbursement was 0.04% to the Fund’s total return on the payment date. |
| (c) | Portfolio turnover is calculated at the fund level without regard to each class of shares. |
See Notes to Financial Statements.
48
JOHCM FUNDS TRUST
FINANCIAL HIGHLIGHTS
For the periods indicated
| | | | | | | | | | | | | | | | | | | | |
| | | Advisor Shares | |
| | | Year Ended | | | Year Ended | | | Year Ended | | | Year Ended | | | Year Ended | |
| | | September 30, | | | September 30, | | | September 30, | | | September 30, | | | September 30, | |
JOHCM Emerging Markets Opportunities Fund | | 2023 | | | 2022 | | | 2021 | | | 2020 | | | 2019 | |
Net asset value, beginning of year | | $ | 9.61 | | | $ | 12.69 | | | $ | 10.81 | | | $ | 10.75 | | | $ | 11.38 | |
| | | | | | | | | | | | | | | | | | | | |
Income (loss) from investment operations: | | | | | | | | | | | | | | | | | | | | |
Net investment income(a) | | | 0.18 | | | | 0.29 | | | | 0.20 | | | | 0.08 | | | | 0.40 | |
Net realized and unrealized gains (losses) from investments and foreign currency | | | 0.77 | | | | (2.87 | ) | | | 1.81 | | | | 0.40 | | | | (0.59 | ) |
| | | | | | | | | | | | | | | | | | | | |
Total from investment operations | | | 0.95 | | | | (2.58 | ) | | | 2.01 | | | | 0.48 | | | | (0.19 | ) |
| | | | | | | | | | | | | | | | | | | | |
Less distributions paid: | | | | | | | | | | | | | | | | | | | | |
From net investment income | | | (0.21 | ) | | | (0.50 | ) | | | (0.13 | ) | | | (0.42 | ) | | | (0.10 | ) |
From net realized gains | | | — | | | | — | | | | — | | | | — | | | | (0.34 | ) |
| | | | | | | | | | | | | | | | | | | | |
Total distributions paid | | | (0.21 | ) | | | (0.50 | ) | | | (0.13 | ) | | | (0.42 | ) | | | (0.44 | ) |
| | | | | | | | | | | | | | | | | | | | |
Change in net asset value | | | 0.74 | | | | (3.08 | ) | | | 1.88 | | | | 0.06 | | | | (0.63 | ) |
| | | | | | | | | | | | | | | | | | | | |
Net asset value, end of year | | $ | 10.35 | | | $ | 9.61 | | | $ | 12.69 | | | $ | 10.81 | | | $ | 10.75 | |
| | | | | | | | | | | | | | | | | | | | |
Total return | | | 9.83 | % | | | (21.18 | %) | | | 18.64 | % | | | 4.37 | % | | | (1.31 | %) |
Ratios/Supplemental data: | | | | | | | | | | | | | | | | | | | | |
Net assets, end of year (000’s) | | $ | 37,590 | | | $ | 65,363 | | | $ | 81,462 | | | $ | 75,971 | | | $ | 83,555 | |
Ratio of net expenses to average net assets | | | 1.11 | % | | | 1.10 | % | | | 1.12 | % | | | 1.20 | % | | | 1.32 | % |
Ratio of net investment income to average net assets | | | 1.68 | % | | | 2.55 | % | | | 1.51 | % | | | 0.81 | % | | | 3.71 | % |
Ratio of gross expenses to average net assets | | | 1.11 | % | | | 1.11 | % | | | 1.13 | % | | | 1.20 | % | | | 1.32 | % |
Ratio of expense recoupment to average net assets | | | — | | | | — | | | | — | | | | — | | | | — | (b) |
Portfolio turnover rate(c) | | | 29.34 | % | | | 41.23 | % | | | 38.60 | % | | | 53.30 | % | | | 35.35 | % |
| (a) | Net investment income (loss) for the period ended was calculated using the average shares outstanding method. |
| (b) | Amount rounds to less than 0.005%. |
| (c) | Portfolio turnover is calculated at the fund level without regard to each class of shares. |
See Notes to Financial Statements.
49
JOHCM FUNDS TRUST
FINANCIAL HIGHLIGHTS
For the periods indicated
| | | | | | | | | | | | | | | | | | | | |
| | | Investor Shares | |
| | | Year Ended | | | Year Ended | | | Year Ended | | | Year Ended | | | Year Ended | |
| | | September 30, | | | September 30, | | | September 30, | | | September 30, | | | September 30, | |
JOHCM Emerging Markets Opportunities Fund | | 2023 | | | 2022 | | | 2021 | | | 2020 | | | 2019 | |
Net asset value, beginning of year | | $ | 9.61 | | | $ | 12.67 | | | $ | 10.80 | | | $ | 10.74 | | | $ | 11.36 | |
| | | | | | | | | | | | | | | | | | | | |
Income (loss) from investment operations: | | | | | | | | | | | | | | | | | | | | |
Net investment income(a) | | | 0.17 | | | | 0.28 | | | | 0.19 | | | | 0.08 | | | | 0.41 | |
Net realized and unrealized gains (losses) from investments and foreign currency | | | 0.76 | | | | (2.88 | ) | | | 1.80 | | | | 0.38 | | | | (0.60 | ) |
| | | | | | | | | | | | | | | | | | | | |
Total from investment operations | | | 0.93 | | | | (2.60 | ) | | | 1.99 | | | | 0.46 | | | | (0.19 | ) |
| | | | | | | | | | | | | | | | | | | | |
Less distributions paid: | | | | | | | | | | | | | | | | | | | | |
From net investment income | | | (0.21 | ) | | | (0.46 | ) | | | (0.12 | ) | | | (0.40 | ) | | | (0.09 | ) |
From net realized gains | | | — | | | | — | | | | — | | | | — | | | | (0.34 | ) |
| | | | | | | | | | | | | | | | | | | | |
Total distributions paid | | | (0.21 | ) | | | (0.46 | ) | | | (0.12 | ) | | | (0.40 | ) | | | (0.43 | ) |
| | | | | | | | | | | | | | | | | | | | |
Change in net asset value | | | 0.72 | | | | (3.06 | ) | | | 1.87 | | | | 0.06 | | | | (0.62 | ) |
| | | | | | | | | | | | | | | | | | | | |
Net asset value, end of year | | $ | 10.33 | | | $ | 9.61 | | | $ | 12.67 | | | $ | 10.80 | | | $ | 10.74 | |
| | | | | | | | | | | | | | | | | | | | |
Total return | | | 9.63 | % | | | (21.33 | %) | | | 18.42 | % | | | 4.26 | % | | | (1.37 | %) |
Ratios/Supplemental data: | | | | | | | | | | | | | | | | | | | | |
Net assets, end of year (000’s) | | $ | 24,014 | | | $ | 10,044 | | | $ | 9,854 | | | $ | 14,268 | | | $ | 13,348 | |
Ratio of net expenses to average net assets | | | 1.27 | % | | | 1.25 | % | | | 1.27 | % | | | 1.35 | % | | | 1.47 | % |
Ratio of net investment income to average net assets | | | 1.59 | % | | | 2.43 | % | | | 1.47 | % | | | 0.76 | % | | | 3.86 | % |
Ratio of gross expenses to average net assets | | | 1.27 | % | | | 1.26 | % | | | 1.28 | % | | | 1.35 | % | | | 1.47 | % |
Ratio of expense recoupment to average net assets | | | — | | | | — | | | | — | | | | — | | | | — | (b) |
Portfolio turnover rate(c) | | | 29.34 | % | | | 41.23 | % | | | 38.60 | % | | | 53.30 | % | | | 35.35 | % |
| (a) | Net investment income (loss) for the period ended was calculated using the average shares outstanding method. |
| (b) | Amount rounds to less than 0.005%. |
| (c) | Portfolio turnover is calculated at the fund level without regard to each class of shares. |
See Notes to Financial Statements.
50
JOHCM FUNDS TRUST
FINANCIAL HIGHLIGHTS
For the periods indicated
| | | | | | | | | | | | | | | | | | | | |
| | | Institutional Shares | |
| | | Year Ended | | | Year Ended | | | Year Ended | | | Year Ended | | | Year Ended | |
| | | September 30, | | | September 30, | | | September 30, | | | September 30, | | | September 30, | |
JOHCM Emerging Markets Opportunities Fund | | 2023 | | | 2022 | | | 2021 | | | 2020 | | | 2019 | |
Net asset value, beginning of year | | $ | 9.64 | | | $ | 12.73 | | | $ | 10.85 | | | $ | 10.78 | | | $ | 11.41 | |
| | | | | | | | | | | | | | | | | | | | |
Income (loss) from investment operations: | | | | | | | | | | | | | | | | | | | | |
Net investment income(a) | | | 0.18 | | | | 0.31 | | | | 0.21 | | | | 0.11 | | | | 0.48 | |
Net realized and unrealized gains (losses) from investments and foreign currency | | | 0.77 | | | | (2.88 | ) | | | 1.81 | | | | 0.39 | | | | (0.66 | ) |
| | | | | | | | | | | | | | | | | | | | |
Total from investment operations | | | 0.95 | | | | (2.57 | ) | | | 2.02 | | | | 0.50 | | | | (0.18 | ) |
| | | | | | | | | | | | | | | | | | | | |
Less distributions paid: | | | | | | | | | | | | | | | | | | | | |
From net investment income | | | (0.21 | ) | | | (0.52 | ) | | | (0.14 | ) | | | (0.43 | ) | | | (0.11 | ) |
From net realized gains | | | — | | | | — | | | | — | | | | — | | | | (0.34 | ) |
| | | | | | | | | | | | | | | | | | | | |
Total distributions paid | | | (0.21 | ) | | | (0.52 | ) | | | (0.14 | ) | | | (0.43 | ) | | | (0.45 | ) |
| | | | | | | | | | | | | | | | | | | | |
Change in net asset value | | | 0.74 | | | | (3.09 | ) | | | 1.88 | | | | 0.07 | | | | (0.63 | ) |
| | | | | | | | | | | | | | | | | | | | |
Net asset value, end of year | | $ | 10.38 | | | $ | 9.64 | | | $ | 12.73 | | | $ | 10.85 | | | $ | 10.78 | |
| | | | | | | | | | | | | | | | | | | | |
Total return | | | 9.89 | % | | | (21.11 | %) | | | 18.70 | % | | | 4.56 | % | | | (1.21 | %) |
Ratios/Supplemental data: | | | | | | | | | | | | | | | | | | | | |
Net assets, end of year (000’s) | | $ | 858,629 | | | $ | 575,508 | | | $ | 738,534 | | | $ | 543,987 | | | $ | 486,372 | |
Ratio of net expenses to average net assets | | | 1.04 | % | | | 1.02 | % | | | 1.02 | % | | | 1.10 | % | | | 1.22 | % |
Ratio of net investment income to average net assets | | | 1.69 | % | | | 2.70 | % | | | 1.61 | % | | | 1.04 | % | | | 4.46 | % |
Ratio of gross expenses to average net assets | | | 1.04 | % | | | 1.03 | % | | | 1.03 | % | | | 1.10 | % | | | 1.22 | % |
Ratio of expense recoupment to average net assets | | | — | | | | — | | | | — | | | | — | | | | — | (b) |
Portfolio turnover rate(c) | | | 29.34 | % | | | 41.23 | % | | | 38.60 | % | | | 53.30 | % | | | 35.35 | % |
| (a) | Net investment income (loss) for the period ended was calculated using the average shares outstanding method. |
| (b) | Amount rounds to less than 0.005%. |
| (c) | Portfolio turnover is calculated at the fund level without regard to each class of shares. |
See Notes to Financial Statements.
51
JOHCM FUNDS TRUST
FINANCIAL HIGHLIGHTS
For the periods indicated
| | | | | | | | | | | | | | | | | | | | |
| | | Advisor Shares | |
| | | Year Ended | | | Year Ended | | | Year Ended | | | Year Ended | | | Year Ended | |
| | | September 30, | | | September 30, | | | September 30, | | | September 30, | | | September 30, | |
JOHCM Global Select Fund | | 2023 | | | 2022 | | | 2021 | | | 2020 | | | 2019 | |
Net asset value, beginning of year | | $ | 12.53 | | | $ | 21.39 | | | $ | 17.28 | | | $ | 16.41 | | | $ | 16.73 | |
| | | | | | | | | | | | | | | | | | | | |
Income (loss) from investment operations: | | | | | | | | | | | | | | | | | | | | |
Net investment income (loss)(a) | | | 0.07 | | | | 0.03 | | | | 0.01 | | | | (0.04 | ) | | | 0.10 | |
Net realized and unrealized gains (losses) from investments and foreign currency | | | 0.82 | | | | (5.22 | ) | | | 5.12 | | | | 3.17 | | | | 0.25 | |
| | | | | | | | | | | | | | | | | | | | |
Total from investment operations | | | 0.89 | | | | (5.19 | ) | | | 5.13 | | | | 3.13 | | | | 0.35 | |
| | | | | | | | | | | | | | | | | | | | |
Less distributions paid: | | | | | | | | | | | | | | | | | | | | |
From net investment income | | | (0.06 | ) | | | (0.01 | ) | | | — | | | | (0.02 | ) | | | (0.18 | ) |
From net realized gains | | | (1.10 | ) | | | (3.66 | ) | | | (1.02 | ) | | | (2.24 | ) | | | (0.49 | ) |
| | | | | | | | | | | | | | | | | | | | |
Total distributions paid | | | (1.16 | ) | | | (3.67 | ) | | | (1.02 | ) | | | (2.26 | ) | | | (0.67 | ) |
| | | | | | | | | | | | | | | | | | | | |
Change in net asset value | | | (0.27 | ) | | | (8.86 | ) | | | 4.11 | | | | 0.87 | | | | (0.32 | ) |
| | | | | | | | | | | | | | | | | | | | |
Net asset value, end of year | | $ | 12.26 | | | $ | 12.53 | | | $ | 21.39 | | | $ | 17.28 | | | $ | 16.41 | |
| | | | | | | | | | | | | | | | | | | | |
Total return | | | 6.73 | % | | | (30.52 | %) | | | 30.60 | % | | | 21.26 | % | | | 2.66 | % |
Ratios/Supplemental data: | | | | | | | | | | | | | | | | | | | | |
Net assets, end of year (000’s) | | $ | 15,416 | | | $ | 26,125 | | | $ | 49,721 | | | $ | 39,213 | | | $ | 157,452 | |
Ratio of net expenses to average net assets | | | 1.09 | % | | | 1.07 | % | | | 1.07 | % | | | 1.16 | % | | | 1.16 | % |
Ratio of net investment income (loss) to average net assets | | | 0.55 | % | | | 0.20 | % | | | 0.04 | % | | | (0.28 | %) | | | 0.63 | % |
Ratio of gross expenses to average net assets | | | 1.14 | % | | | 1.07 | % | | | 1.08 | % | | | 1.16 | % | | | 1.17 | % |
Ratio of expense recoupment to average net assets | | | — | | | | — | | | | — | | | | — | | | | — | (b) |
Portfolio turnover rate(c) | | | 42.65 | % | | | 54.44 | % | | | 53.91 | % | | | 40.21 | % | | | 46.36 | % |
| (a) | Net investment income (loss) for the period ended was calculated using the average shares outstanding method. |
| (b) | Amount rounds to less than 0.005%. |
| (c) | Portfolio turnover is calculated at the fund level without regard to each class of shares. |
See Notes to Financial Statements.
52
JOHCM FUNDS TRUST
FINANCIAL HIGHLIGHTS
For the periods indicated
| | | | | | | | | | | | | | | | | | | | |
| | | Institutional Shares | |
| | | Year Ended | | | Year Ended | | | Year Ended | | | Year Ended | | | Year Ended | |
| | | September 30, | | | September 30, | | | September 30, | | | September 30, | | | September 30, | |
JOHCM Global Select Fund | | 2023 | | | 2022 | | | 2021 | | | 2020 | | | 2019 | |
Net asset value, beginning of year | | $ | 12.58 | | | $ | 21.46 | | | $ | 17.32 | | | $ | 16.44 | | | $ | 16.76 | |
| | | | | | | | | | | | | | | | | | | | |
Income (loss) from investment operations: | | | | | | | | | | | | | | | | | | | | |
Net investment income(a) | | | 0.06 | | | | 0.05 | | | | 0.03 | | | | — | (b) | | | 0.10 | |
Net realized and unrealized gains (losses) from investments and foreign currency | | | 0.83 | | | | (5.24 | ) | | | 5.13 | | | | 3.15 | | | | 0.26 | |
| | | | | | | | | | | | | | | | | | | | |
Total from investment operations | | | 0.89 | | | | (5.19 | ) | | | 5.16 | | | | 3.15 | | | | 0.36 | |
| | | | | | | | | | | | | | | | | | | | |
Less distributions paid: | | | | | | | | | | | | | | | | | | | | |
From net investment income | | | (0.07 | ) | | | (0.03 | ) | | | — | | | | (0.04 | ) | | | (0.19 | ) |
From net realized gains | | | (1.10 | ) | | | (3.66 | ) | | | (1.02 | ) | | | (2.23 | ) | | | (0.49 | ) |
| | | | | | | | | | | | | | | | | | | | |
Total distributions paid | | | (1.17 | ) | | | (3.69 | ) | | | (1.02 | ) | | | (2.27 | ) | | | (0.68 | ) |
| | | | | | | | | | | | | | | | | | | | |
Change in net asset value | | | (0.28 | ) | | | (8.88 | ) | | | 4.14 | | | | 0.88 | | | | (0.32 | ) |
| | | | | | | | | | | | | | | | | | | | |
Net asset value, end of year | | $ | 12.30 | | | $ | 12.58 | | | $ | 21.46 | | | $ | 17.32 | | | $ | 16.44 | |
| | | | | | | | | | | | | | | | | | | | |
Total return | | | 6.74 | % | | | (30.43 | %) | | | 30.71 | % | | | 21.43 | % | | | 2.76 | % |
Ratios/Supplemental data: | | | | | | | | | | | | | | | | | | | | |
Net assets, end of year (000’s) | | $ | 54,850 | | | $ | 255,895 | | | $ | 523,270 | | | $ | 422,745 | | | $ | 225,884 | |
Ratio of net expenses to average net assets | | | 0.99 | % | | | 0.98 | % | | | 0.98 | % | | | 1.06 | % | | | 1.06 | % |
Ratio of net investment income to average net assets | | | 0.50 | % | | | 0.32 | % | | | 0.13 | % | | | 0.01 | % | | | 0.66 | % |
Ratio of gross expenses to average net assets | | | 1.02 | % | | | 0.99 | % | | | 0.98 | % | | | 1.06 | % | | | 1.07 | % |
Ratio of expense recoupment to average net assets | | | — | | | | — | | | | — | | | | — | | | | — | (c) |
Portfolio turnover rate(d) | | | 42.65 | % | | | 54.44 | % | | | 53.91 | % | | | 40.21 | % | | | 46.36 | % |
| (a) | Net investment income (loss) for the period ended was calculated using the average shares outstanding method. |
| (b) | Amount is less than $0.005 per share. |
| (c) | Amount rounds to less than 0.005%. |
| (d) | Portfolio turnover is calculated at the fund level without regard to each class of shares. |
See Notes to Financial Statements.
53
JOHCM FUNDS TRUST
FINANCIAL HIGHLIGHTS
For the periods indicated
| | | | | | | | | | | | | | | | | | | | |
| | | Institutional Shares | |
| | | Year Ended | | | Year Ended | | | Year Ended | | | Year Ended | | | Year Ended | |
| | | September 30, | | | September 30, | | | September 30, | | | September 30, | | | September 30, | |
JOHCM International Opportunities Fund | | 2023 | | | 2022 | | | 2021 | | | 2020 | | | 2019 | |
Net asset value, beginning of year | | $ | 8.31 | | | $ | 11.82 | | | $ | 10.48 | | | $ | 10.65 | | | $ | 10.71 | |
| | | | | | | | | | | | | | | | | | | | |
Income (loss) from investment operations: | | | | | | | | | | | | | | | | | | | | |
Net investment income(a) | | | 0.21 | | | | 0.17 | | | | 0.22 | | | | 0.17 | | | | 0.24 | |
Net realized and unrealized gains (losses) from investments and foreign currency | | | 2.54 | | | | (2.03 | ) | | | 1.39 | | | | (0.09 | ) | | | (0.10 | ) |
| | | | | | | | | | | | | | | | | | | | |
Total from investment operations | | | 2.75 | | | | (1.86 | ) | | | 1.61 | | | | 0.08 | | | | 0.14 | |
| | | | | | | | | | | | | | | | | | | | |
Less distributions paid: | | | | | | | | | | | | | | | | | | | | |
From net investment income | | | (0.21 | ) | | | (0.27 | ) | | | (0.17 | ) | | | (0.23 | ) | | | (0.18 | ) |
From net realized gains | | | — | | | | (1.38 | ) | | | (0.10 | ) | | | (0.02 | ) | | | (0.02 | ) |
| | | | | | | | | | | | | | | | | | | | |
Total distributions paid | | | (0.21 | ) | | | (1.65 | ) | | | (0.27 | ) | | | (0.25 | ) | | | (0.20 | ) |
| | | | | | | | | | | | | | | | | | | | |
Change in net asset value | | | 2.54 | | | | (3.51 | ) | | | 1.34 | | | | (0.17 | ) | | | (0.06 | ) |
| | | | | | | | | | | | | | | | | | | | |
Net asset value, end of year | | $ | 10.85 | | | $ | 8.31 | | | $ | 11.82 | | | $ | 10.48 | | | $ | 10.65 | |
| | | | | | | | | | | | | | | | | | | | |
Total return | | | 33.32 | % | | | (17.89 | %) | | | 15.39 | % | | | 0.62 | % | | | 1.42 | % |
Ratios/Supplemental data: | | | | | | | | | | | | | | | | | | | | |
Net assets, end of year (000’s) | | $ | 1,973 | | | $ | 1,508 | | | $ | 3,465 | | | $ | 2,935 | | | $ | 2,301 | |
Ratio of net expenses to average net assets | | | 0.78 | % | | | 0.88 | % | | | 0.89 | % | | | 0.89 | % | | | 0.89 | % |
Ratio of net investment income to average net assets | | | 2.00 | % | | | 1.66 | % | | | 1.83 | % | | | 1.60 | % | | | 2.29 | % |
Ratio of gross expenses to average net assets | | | 4.20 | % | | | 3.34 | % | | | 5.73 | % | | | 9.42 | % | | | 8.61 | % |
Portfolio turnover rate(b) | | | 34.88 | % | | | 68.19 | % | | | 47.85 | % | | | 64.62 | %�� | | | 34.58 | % |
| (a) | Net investment income (loss) for the period ended was calculated using the average shares outstanding method. |
| (b) | Portfolio turnover is calculated at the fund level without regard to each class of shares. |
See Notes to Financial Statements.
54
JOHCM FUNDS TRUST
FINANCIAL HIGHLIGHTS
For the periods indicated
| | | | | | | | | | | | | | | | | | | | |
| | | Investor Shares | |
| | | Year Ended | | | Year Ended | | | Year Ended | | | Year Ended | | | Year Ended | |
| | | September 30, | | | September 30, | | | September 30, | | | September 30, | | | September 30, | |
JOHCM International Select Fund | | 2023 | | | 2022 | | | 2021 | | | 2020 | | | 2019 | |
Net asset value, beginning of year | | $ | 17.73 | | | $ | 31.07 | | | $ | 27.53 | | | $ | 22.54 | | | $ | 23.68 | |
| | | | | | | | | | | | | | | | | | | | |
Income (loss) from investment operations: | | | | | | | | | | | | | | | | | | | | |
Net investment income(a) | | | 0.22 | | | | 0.21 | | | | 0.10 | | | | 0.05 | | | | 0.23 | |
Net realized and unrealized gains (losses) from investments and foreign currency | | | 3.69 | | | | (10.70 | ) | | | 4.25 | | | | 5.11 | | | | (1.10 | ) |
| | | | | | | | | | | | | | | | | | | | |
Total from investment operations | | | 3.91 | | | | (10.49 | ) | | | 4.35 | | | | 5.16 | | | | (0.87 | ) |
| | | | | | | | | | | | | | | | | | | | |
Less distributions paid: | | | | | | | | | | | | | | | | | | | | |
From net investment income | | | (0.25 | ) | | | (0.23 | ) | | | (0.04 | ) | | | (0.17 | ) | | | (0.27 | ) |
From net realized gains | | | — | | | | (2.62 | ) | | | (0.77 | ) | | | — | | | | — | |
| | | | | | | | | | | | | | | | | | | | |
Total distributions paid | | | (0.25 | ) | | | (2.85 | ) | | | (0.81 | ) | | | (0.17 | ) | | | (0.27 | ) |
| | | | | | | | | | | | | | | | | | | | |
Change in net asset value | | | 3.66 | | | | (13.34 | ) | | | 3.54 | | | | 4.99 | | | | (1.14 | ) |
| | | | | | | | | | | | | | | | | | | | |
Net asset value, end of year | | $ | 21.39 | | | $ | 17.73 | | | $ | 31.07 | | | $ | 27.53 | | | $ | 22.54 | |
| | | | | | | | | | | | | | | | | | | | |
Total return | | | 22.13 | % | | | (37.43 | %) | | | 15.94 | % | | | 23.02 | % | | | (3.59 | %) |
Ratios/Supplemental data: | | | | | | | | | | | | | | | | | | | | |
Net assets, end of year (000’s) | | $ | 356,041 | | | $ | 376,893 | | | $ | 800,457 | | | $ | 643,607 | | | $ | 588,729 | |
Ratio of net expenses to average net assets | | | 1.21 | % | | | 1.21 | % | | | 1.21 | % | | | 1.23 | % | | | 1.24 | % |
Ratio of net investment income to average net assets | | | 1.03 | % | | | 0.82 | % | | | 0.33 | % | | | 0.20 | % | | | 1.03 | % |
Ratio of gross expenses to average net assets | | | 1.23 | % | | | 1.21 | % | | | 1.21 | % | | | 1.23 | % | | | 1.24 | % |
Portfolio turnover rate(b) | | | 32.29 | % | | | 58.91 | % | | | 53.34 | % | | | 43.51 | % | | | 33.06 | % |
| (a) | Net investment income (loss) for the period ended was calculated using the average shares outstanding method. |
| (b) | Portfolio turnover is calculated at the fund level without regard to each class of shares. |
See Notes to Financial Statements.
55
JOHCM FUNDS TRUST
FINANCIAL HIGHLIGHTS
For the periods indicated
| | | | | | | | | | | | | | | | | | | | |
| | | Institutional Shares | |
| | | Year Ended | | | Year Ended | | | Year Ended | | | Year Ended | | | Year Ended | |
| | | September 30, | | | September 30, | | | September 30, | | | September 30, | | | September 30, | |
JOHCM International Select Fund | | 2023 | | | 2022 | | | 2021 | | | 2020 | | | 2019 | |
Net asset value, beginning of year | | $ | 17.74 | | | $ | 31.08 | | | $ | 27.53 | | | $ | 22.54 | | | $ | 23.66 | |
| | | | | | | | | | | | | | | | | | | | |
Income (loss) from investment operations: | | | | | | | | | | | | | | | | | | | | |
Net investment income(a) | | | 0.26 | | | | 0.27 | | | | 0.18 | | | | 0.11 | | | | 0.28 | |
Net realized and unrealized gains (losses) from investments and foreign currency | | | 3.70 | | | | (10.69 | ) | | | 4.24 | | | | 5.11 | | | | (1.09 | ) |
| | | | | | | | | | | | | | | | | | | | |
Total from investment operations | | | 3.96 | | | | (10.42 | ) | | | 4.42 | | | | 5.22 | | | | (0.81 | ) |
| | | | | | | | | | | | | | | | | | | | |
Less distributions paid: | | | | | | | | | | | | | | | | | | | | |
From net investment income | | | (0.33 | ) | | | (0.30 | ) | | | (0.10 | ) | | | (0.23 | ) | | | (0.31 | ) |
From net realized gains | | | — | | | | (2.62 | ) | | | (0.77 | ) | | | — | | | | — | |
| | | | | | | | | | | | | | | | | | | | |
Total distributions paid | | | (0.33 | ) | | | (2.92 | ) | | | (0.87 | ) | | | (0.23 | ) | | | (0.31 | ) |
| | | | | | | | | | | | | | | | | | | | |
Change in net asset value | | | 3.63 | | | | (13.34 | ) | | | 3.55 | | | | 4.99 | | | | (1.12 | ) |
| | | | | | | | | | | | | | | | | | | | |
Net asset value, end of year | | $ | 21.37 | | | $ | 17.74 | | | $ | 31.08 | | | $ | 27.53 | | | $ | 22.54 | |
| | | | | | | | | | | | | | | | | | | | |
Total return | | | 22.41 | % | | | (37.27 | %) | | | 16.24 | % | | | 23.30 | % | | | (3.31 | %) |
Ratios/Supplemental data: | | | | | | | | | | | | | | | | | | | | |
Net assets, end of year (000’s) | | $ | 4,911,162 | | | $ | 5,965,713 | | | $ | 12,273,819 | | | $ | 9,631,884 | | | $ | 7,822,739 | |
Ratio of net expenses to average net assets | | | 0.98 | % | | | 0.98 | % | | | 0.96 | % | | | 0.98 | % | | | 0.99 | % |
Ratio of net investment income to average net assets | | | 1.22 | % | | | 1.05 | % | | | 0.57 | % | | | 0.45 | % | | | 1.27 | % |
Ratio of gross expenses to average net assets | | | 0.98 | % | | | 0.98 | % | | | 0.97 | % | | | 0.98 | % | | | 0.99 | % |
Portfolio turnover rate(b) | | | 32.29 | % | | | 58.91 | % | | | 53.34 | % | | | 43.51 | % | | | 33.06 | % |
| (a) | Net investment income (loss) for the period ended was calculated using the average shares outstanding method. |
| (b) | Portfolio turnover is calculated at the fund level without regard to each class of shares. |
See Notes to Financial Statements.
56
JOHCM FUNDS TRUST
FINANCIAL HIGHLIGHTS
For the periods indicated
| | | | | | | | | | | | |
| | | Institutional Shares | |
| | | Year Ended | | | Year Ended | | | Period Ended | |
| | | September 30, | | | September 30, | | | September 30, | |
Regnan Global Equity Impact Solutions | | 2023 | | | 2022 | | | 2021(a) | |
Net asset value, beginning of year | | $ | 6.27 | | | $ | 9.22 | | | $ | 10.00 | |
| | | | | | | | | | | | |
Income (loss) from investment operations: | | | | | | | | | | | | |
Net investment income(b) | | | 0.01 | | | | 0.02 | | | | (— | )(c) |
Net realized and unrealized gains (losses) from investments and foreign currency | | | 0.87 | | | | (2.97 | ) | | | (0.78 | ) |
| | | | | | | | | | | | |
Total from investment operations | | | 0.88 | | | | (2.95 | ) | | | (0.78 | ) |
| | | | | | | | | | | | |
Less distributions paid: | | | | | | | | | | | | |
From net investment income | | | (0.01 | ) | | | — | | | | — | |
| | | | | | | | | | | | |
Total distributions paid | | | (0.01 | ) | | | — | | | | — | |
| | | | | | | | | | | | |
Change in net asset value | | | 0.87 | | | | (2.95 | ) | | | (0.78 | ) |
| | | | | | | | | | | | |
Net asset value, end of year | | $ | 7.14 | | | $ | 6.27 | | | $ | 9.22 | |
| | | | | | | | | | | | |
Total return | | | 13.98 | % | | | (32.00 | %)(d) | | | (7.80 | %)(e) |
Ratios/Supplemental data: | | | | | | | | | | | | |
Net assets, end of year (000’s) | | $ | 8,975 | | | $ | 7,357 | | | $ | 1,868 | |
Ratio of net expenses to average net assets | | | 0.89 | % | | | 0.89 | % | | | 0.89 | %(f) |
Ratio of net investment income (loss) to average net assets | | | 0.20 | % | | | 0.28 | % | | | (0.61 | %)(f) |
Ratio of gross expenses to average net assets | | | 1.33 | % | | | 4.03 | % | | | 8.76 | %(f) |
Portfolio turnover rate | | | 65.32 | % | | | 49.28 | % | | | 4.30 | %(e) |
| (a) | For the period from August 23, 2021, commencement of operations, to September 30, 2021. |
| (b) | Net investment income (loss) for the period ended was calculated using the average shares outstanding method. |
| (c) | Amount is less than $0.005 per share. |
| (d) | The Adviser reimbursed the Fund $7,869 during the period in connection with an error. Such reimbursement was 0.13% to the Fund’s total return on the payment date. |
| (e) | Not annualized for periods less than one year. |
| (f) | Annualized for periods less than one year. |
See Notes to Financial Statements.
57
JOHCM FUNDS TRUST
FINANCIAL HIGHLIGHTS
For the periods indicated
| | | | | | | | |
| | | Institutional Shares | |
| | | Year Ended | | | Period Ended | |
| | | September 30, | | | September 30, | |
TSW Emerging Markets Fund | | 2023 | | | 2022(a) | |
Net asset value, beginning of year | | $ | 7.25 | | | $ | 10.00 | |
| | | | | | | | |
Income (loss) from investment operations: | | | | | | | | |
Net investment income(b) | | | 0.14 | | | | 0.13 | |
Net realized and unrealized gains (losses) from investments and foreign currency | | | 1.57 | | | | (2.88 | ) |
Total from investment operations | | | 1.71 | | | | (2.75 | ) |
Less distributions paid: | | | | | | | | |
From net investment income | | | (0.14 | ) | | | — | |
| | | | | | | | |
Total distributions paid | | | (0.14 | ) | | | — | |
| | | | | | | | |
Change in net asset value | | | 1.57 | | | | (2.75 | ) |
| | | | | | | | |
Net asset value, end of year | | $ | 8.82 | | | $ | 7.25 | |
| | | | | | | | |
Total return | | | 23.63 | % | | | (27.50 | %)(c) |
Ratios/Supplemental data: | | | | | | | | |
Net assets, end of year (000’s) | | $ | 6,627 | | | $ | 7,253 | |
Ratio of net expenses to average net assets | | | 0.99 | % | | | 0.99 | %(d) |
Ratio of net investment income to average net assets | | | 1.56 | % | | | 1.88 | %(d) |
Ratio of gross expenses to average net assets | | | 2.21 | % | | | 2.22 | %(d) |
Portfolio turnover rate(e) | | | 18.44 | % | | | 11.47 | %(c) |
| (a) | For the period from December 21, 2021, commencement of operations, to September 30, 2022. |
| (b) | Net investment income (loss) for the period ended was calculated using the average shares outstanding method. |
| (c) | Not annualized for periods less than one year. |
| (d) | Annualized for periods less than one year. |
| (e) | Portfolio turnover is calculated at the fund level without regard to each class of shares. |
See Notes to Financial Statements.
58
JOHCM FUNDS TRUST
FINANCIAL HIGHLIGHTS
For the periods indicated
| | | | | | | | |
| | | Institutional Shares | |
| | | Year Ended | | | Period Ended | |
| | | September 30, | | | September 30, | |
TSW High Yield Bond Fund | | 2023 | | | 2022(a) | |
Net asset value, beginning of year | | $ | 8.32 | | | $ | 10.00 | |
| | | | | | | | |
Income (loss) from investment operations: | | | | | | | | |
Net investment income(b) | | | 0.51 | | | | 0.43 | |
Net realized and unrealized gains (losses) from investments and foreign currency | | | 0.39 | | | | (1.67 | ) |
Total from investment operations | | | 0.90 | | | | (1.24 | ) |
Less distributions paid: | | | | | | | | |
From net investment income | | | (0.51 | ) | | | (0.44 | ) |
| | | | | | | | |
Total distributions paid | | | (0.51 | ) | | | (0.44 | ) |
| | | | | | | | |
Change in net asset value | | | 0.39 | | | | (1.68 | ) |
| | | | | | | | |
Net asset value, end of year | | $ | 8.71 | | | $ | 8.32 | |
| | | | | | | | |
Total return | | | 10.98 | % | | | (12.75 | %)(c) |
Ratios/Supplemental data: | | | | | | | | |
Net assets, end of year (000’s) | | $ | 13,153 | | | $ | 11,184 | |
Ratio of net expenses to average net assets | | | 0.65 | % | | | 0.65 | %(d) |
Ratio of net investment income to average net assets | | | 5.87 | % | | | 5.01 | %(d) |
Ratio of gross expenses to average net assets | | | 1.31 | % | | | 1.90 | %(d) |
Portfolio turnover rate(e) | | | 74.03 | % | | | 31.64 | %(c) |
| (a) | For the period from October 26, 2021, commencement of operations, to September 30, 2022. |
| (b) | Net investment income (loss) for the period ended was calculated using the average shares outstanding method. |
| (c) | Not annualized for periods less than one year. |
| (d) | Annualized for periods less than one year. |
| (e) | Portfolio turnover is calculated at the fund level without regard to each class of shares. |
See Notes to Financial Statements.
59
JOHCM FUNDS TRUST
FINANCIAL HIGHLIGHTS
For the periods indicated
| | | | | | | | | | | | | | | | | | | | | | | | |
| | | Institutional Shares | |
| | | Year Ended | | | Period Ended | | | Year
Ended | | | Year
Ended | | | Year
Ended | | | Year
Ended | |
| | | September 30, | | | September 30, | | | October 31, | | | October 31, | | | October 31, | | | October 31, | |
TSW Large Cap Value Fund | | 2023 | | | 2022(a) | | | 2021 | | | 2020 | | | 2019 | | | 2018 | |
Net asset value, beginning of year | | $ | 12.71 | | | $ | 15.60 | | | $ | 11.46 | | | $ | 12.50 | | | $ | 13.69 | | | $ | 13.37 | |
| | | | | | | | | | | | | | | | | | | | | | | | |
Income (loss) from investment operations: | | | | | | | | | | | | | | | | | | | | | | | | |
Net investment income(b) | | | 0.20 | | | | 0.14 | | | | 0.03 | | | | 0.08 | | | | 0.22 | | | | 0.07 | |
Net realized and unrealized gains (losses) from investments and foreign currency | | | 1.37 | | | | (1.10 | ) | | | 4.74 | | | | (0.58 | ) | | | 0.39 | | | | 1.35 | |
| | | | | | | | | | | | | | | | | | | | | | | | |
Total from investment operations | | | 1.57 | | | | (0.96 | ) | | | 4.77 | | | | (0.50 | ) | | | 0.61 | | | | 1.42 | |
| | | | | | | | | | | | | | | | | | | | | | | | |
Less distributions paid: | | | | | | | | | | | | | | | | | | | | | | | | |
From net investment income | | | (0.19 | ) | | | (0.11 | ) | | | (0.05 | ) | | | (0.10 | ) | | | (0.20 | ) | | | (0.07 | ) |
From net realized gains | | | (1.43 | ) | | | (1.82 | ) | | | (0.58 | ) | | | (0.44 | ) | | | (1.60 | ) | | | (1.03 | ) |
| | | | | | | | | | | | | | | | | | | | | | | | |
Total distributions paid | | | (1.62 | ) | | | (1.93 | ) | | | (0.63 | ) | | | (0.54 | ) | | | (1.80 | ) | | | (1.10 | ) |
| | | | | | | | | | | | | | | | | | | | | | | | |
Change in net asset value | | | (0.05 | ) | | | (2.89 | ) | | | 4.14 | | | | (1.04 | ) | | | (1.19 | ) | | | 0.32 | |
| | | | | | | | | | | | | | | | | | | | | | | | |
Net asset value, end of year | | $ | 12.66 | | | $ | 12.71 | | | $ | 15.60 | | | $ | 11.46 | | | $ | 12.50 | | | $ | 13.69 | |
| | | | | | | | | | | | | | | | | | | | | | | | |
Total return | | | 12.28 | % | | | (7.11 | %)(c) | | | 42.90 | % | | | (4.25 | %) | | | 6.38 | % | | | 11.03 | % |
Ratios/Supplemental data: | | | | | | | | | | | | | | | | | | | | | | | | |
Net assets, end of year (000’s) | | $ | 35,078 | | | $ | 35,215 | | | $ | 39,445 | | | $ | 30,593 | | | $ | 35,956 | | | $ | 41,099 | |
Ratio of net expenses to average net assets | | | 0.73 | % | | | 0.78 | %(d) | | | 1.20 | % | | | 1.20 | % | | | 1.20 | % | | | 1.20 | % |
Ratio of net investment income to average net assets | | | 1.51 | % | | | 1.03 | %(d) | | | 0.24 | % | | | 0.70 | % | | | 1.78 | % | | | 0.54 | % |
Ratio of gross expenses to average net assets | | | 0.73 | % | | | 0.98 | %(d) | | | 1.77 | % | | | 1.88 | % | | | 1.74 | % | | | 1.68 | % |
Ratio of expense recoupment to average net assets | | | 0.02 | % | | | — | | | | — | | | | — | | | | — | | | | — | |
Portfolio turnover rate(e) | | | 21.24 | % | | | 46.37 | %(c) | | | 29.00 | % | | | 64.00 | % | | | 46.00 | % | | | 60.00 | % |
| (a) | For the period from November 1, 2021 to September 30, 2022. |
| (b) | Net investment income (loss) for the period ended was calculated using the average shares outstanding method. |
| (c) | Not annualized for periods less than one year. |
| (d) | Annualized for periods less than one year. |
| (e) | Portfolio turnover is calculated at the fund level without regard to each class of shares. |
See Notes to Financial Statements.
60
JOHCM FUNDS TRUST
NOTES TO FINANCIAL STATEMENTS
September 30, 2023
JOHCM Funds Trust (the “Trust”) is a Massachusetts business trust operating under an Amended and Restated Agreement and Declaration of Trust (the “Trust Agreement”) dated December 4, 2020. As an open-end registered investment company (as defined in Financial Accounting Standards Board (“FASB”) Accounting Standards Update (“ASU”) 2013-08), the Trust follows accounting and reporting guidance under FASB Accounting Standards Codification (“ASC”) Topic 946, “Financial Services - Investment Companies”. The JOHCM Emerging Markets Opportunities Fund, the JOHCM Emerging Markets Discovery Fund, the JOHCM Global Select Fund, the JOHCM International Opportunities Fund, the JOHCM International Select Fund, the Regnan Global Equity Impact Solutions, the TSW High Yield Bond Fund, the TSW Large Cap Value Fund and the TSW Emerging Markets Fund (each, a “Fund” and collectively, the “Funds”) are each a diversified fund, a series of the Trust, and registered under the Investment Company Act of 1940, as amended (the “1940 Act”), as a management investment company. The Trust Agreement permits the Board of Trustees (the “Trustees” or “Board”) to authorize and issue an unlimited number of shares of beneficial interest in separate series of the Trust. On March 16, 2023, the Board of Trustees of the Trust approved the liquidation of the JOHCM Credit Income Fund and the JOHCM Global Income Builder Fund. The JOHCM Credit Income Fund liquidation took place on April 5, 2023 and the JOHCM Global Income Builder Fund liquidation took place on May 26, 2023.
Each Fund is authorized to issue up to four classes of shares as follows: Advisor, Investor, Institutional and Class Z shares. Each class of shares is distinguished by the class-specific shareholder servicing and distribution (Rule 12b-1) fees and/or sub-transfer agency fees incurred, as applicable. As of September 30, 2023, the following classes of shares were in operation:
| | | | |
Fund | | Commencement Date | | Investment Objective |
| JOHCM Emerging Markets Discovery Fund | | Advisor Shares: January 28, 2016 | | to seek long-term capital appreciation |
| | Institutional Shares: December 17, 2014 | | |
| | |
| JOHCM Emerging Markets Opportunities Fund | | Advisor Shares: November 21, 2012 Investor Shares: December 18, 2013 Institutional Shares: November 21, 2012 | | to seek long-term capital appreciation |
| | |
| JOHCM Global Select Fund | | Advisor Shares: March 22, 2013 Institutional Class Shares: March 22, 2013 | | to seek long-term capital appreciation |
| | |
| JOHCM International Opportunities Fund | | Institutional Shares: September 29, 2016 | | to achieve long-term total return by investing in a focused portfolio of international equity securities |
| | |
| JOHCM International Select Fund | | Investor Shares: March 31, 2010 Institutional Shares: July 29, 2009 | | to seek long-term capital appreciation |
| | |
| Regnan Global Equity Impact Solutions | | Institutional Shares: August 23, 2021 | | to seek to achieve long-term capital appreciation by investing in companies that contribute solutions to addressing the world’s major social and environmental challenges |
| | |
| TSW Emerging Markets Fund | | Institutional Shares: December 21, 2021 | | to maximize long-term capital appreciation |
| | |
| TSW High Yield Bond Fund | | Institutional Shares: October 26, 2021 | | to seek high current income with a secondary focus on capital appreciation |
| | |
| TSW Large Cap Value Fund | | Institutional Shares: July 16, 1992 | | to seek maximum long-term total return, consistent with reasonable risk to principal |
Under the Trust’s organizational documents, its officers and Trustees are indemnified against certain liabilities arising out of the performance of their duties to the Trust and Funds. In addition, in the normal course of business, the Trust enters into contracts with its vendors and others that provide for general indemnifications. The Funds’ maximum exposure under these arrangements is unknown, as this would involve future claims that may be made against the Funds.
61
JOHCM FUNDS TRUST
NOTES TO FINANCIAL STATEMENTS
September 30, 2023
Prior to July 19, 2021, the JOHCM Emerging Markets Opportunities Fund, the JOHCM Emerging Markets Discovery Fund, the JOHCM Global Select Fund, the JOHCM International Opportunities Fund, and the JOHCM International Select Fund were each a series of Advisers Investment Trust (together the “AIT Predecessor Funds”; each an “AIT Predecessor Fund”). On July 19, 2021 the AIT Predecessor Funds were reorganized into JOHCM Funds Trust. Prior to December 6, 2021, the TSW Large Cap Value Fund operated as the TS&W Equity Portfolio, a series of Advisors’ Inner Circle Fund (the “TSW Predecessor Fund”), which was reorganized into the JOHCM Funds Trust on December 6, 2021.
| A. | Significant accounting policies related to Investments are as follows: |
INVESTMENT VALUATION
Investments are recorded at fair value. Fair value is defined as the price that would be received to sell an asset or paid to transfer a liability in an orderly transaction between market participants at the measurement date. The valuation techniques employed by the Funds, as described below, maximize the use of observable inputs and minimize the use of unobservable inputs in determining fair value. These inputs are summarized in the following three broad levels:
| • | | Level 1 — quoted prices in active markets for identical assets |
| • | | Level 2 — other significant observable inputs (including quoted prices of similar securities, interest rates, prepayment speeds, credit risk, etc.) |
| • | | Level 3 — significant unobservable inputs (including the Fund’s own assumptions in determining the fair value of investments) |
The inputs or methodology used for valuing securities are not necessarily an indication of the risk associated with investing in those securities. For example, certain short-term debt securities may be valued using amortized cost. Generally, amortized cost approximates the current value of a security, but since this valuation is not obtained from a quoted price in an active market, such securities would be reflected as Level 2 in the fair value hierarchy.
Security prices are generally provided by a third party pricing service approved by the Trustees as of the close of the New York Stock Exchange, normally at 4:00 p.m. Eastern Time, each business day on which the share price of the Funds are calculated. Equity securities listed or traded on a primary exchange are valued at the closing price, if available, or the last sales price on the primary exchange. If no sale occurred on the valuation date, the securities will be valued at the latest quotations as of the close of the primary exchange. Closed-end investment companies, are valued at the last quoted sales prices or official closing prices taken from the primary market, or composite in which each security trades. Investments in other open-end registered investment companies, including money market funds, are valued at their respective net asset value as reported by such companies. In these types of situations, valuations are typically categorized as Level 1 in the fair value hierarchy.
Debt and other fixed income securities, if any, are generally valued at an evaluated price provided by an independent pricing source approved by the Trustees. To value debt securities, pricing services may use various pricing techniques, which take into account appropriate factors such as market activity, yield, quality, coupon rate, maturity, type of issue, trading characteristics, call features, credit ratings and other data, as well as broker quotes. Short-term debt securities of sufficient credit quality that mature within sixty days may be valued at amortized cost, which approximates fair value. In each of these situations, valuations are typically categorized as Level 2 in the fair value hierarchy.
The Trustees have designated JOHCM (USA) Inc, investment adviser to the Funds, as the Funds’Valuation Designee with responsibility for establishing fair value, in accordance with the Trust’s valuation policy, when the price of a security is not readily available or deemed unreliable (e.g., an approved pricing service did not provide a price, a furnished price was in error, certain stale prices, or an event occurred that materially affected the furnished price). In addition, fair value pricing may be used if events materially affecting the value of non-U.S. securities occur between the time when the exchange on which they are traded closes and the time when a Fund’s net asset value is
62
JOHCM FUNDS TRUST
NOTES TO FINANCIAL STATEMENTS
September 30, 2023
calculated. The Funds identify possible fluctuations in international securities by monitoring the increase or decrease in the value of a designated benchmark index. In the event of an increase or decrease greater than predetermined levels, the Funds generally use a systematic valuation model provided by an approved independent third party pricing service to fair value their international equity securities.
In the fair value situations noted above, while the Trust’s valuation policy is intended to result in a calculation of each Fund’s net asset value that fairly reflects security values as of the time of pricing, the Trust cannot ensure that fair values determined pursuant to these guidelines would accurately reflect the price that the Fund could obtain for a security if it were to dispose of that security as of the time of pricing (for instance, in a forced or distressed sale). The prices used by the Funds may differ from the value that would be realized if the securities were sold, and these differences could be material to the financial statements. Depending on the source and relative significance of the valuation inputs in these instances, the instruments may be classified as Level 2 or Level 3 in the fair value hierarchy.
The following is a summary of the valuation inputs used as of September 30, 2023 in valuing each Fund’s investments based upon the three fair value levels defined above:
| | | | | | | | | | | | | | | | |
| | | | | | | | | Level 3 - | | | | |
| | | | | | Level 2 - | | | Significant | | | | |
| | | Level 1 - | | | Other Significant | | | Unobservable | | | | |
Fund | | Quoted Prices | | | Observable Inputs | | | Inputs | | | Total | |
JOHCM Emerging Markets Discovery Fund | | | | | | | | | | | | | | | | |
Common Stocks: | | | | | | | | | | | | | | | | |
Brazil | | $ | 1,904,901 | | | $ | — | | | $ | — | | | $ | 1,904,901 | |
Canada | | | 1,110,628 | | | | — | | | | — | | | | 1,110,628 | |
Chile | | | 238,770 | | | | 734,810 | | | | — | | | | 973,580 | |
Mexico | | | 1,625,689 | | | | — | | | | — | | | | 1,625,689 | |
Russia | | | — | | | | — | | | | — | ** | | | — | |
Thailand | | | 429,713 | | | | 247,041 | | | | — | | | | 676,754 | |
United States | | | 532,019 | | | | — | | | | — | | | | 532,019 | |
Other* | | | — | | | | 38,465,310 | | | | — | | | | 38,465,310 | |
| | | | | | | | | | | | | | | | |
Total common stocks | | $ | 5,841,720 | | | $ | 39,447,161 | | | $ | — | | | $ | 45,288,881 | |
| | | | | | | | | | | | | | | | |
Equity-Linked Securities | | $ | — | | | $ | 1,788,921 | | | $ | — | | | $ | 1,788,921 | |
Exchange Traded Funds | | | 1,308,123 | | | | — | | | | — | | | | 1,308,123 | |
Preferred Stocks* | | | 575,114 | | | | — | | | | — | | | | 575,114 | |
Short-Term Investments | | | 1,490,003 | | | | — | | | | — | | | | 1,490,003 | |
| | | | | | | | | | | | | | | | |
Total Investments | | $ | 9,214,960 | | | $ | 41,236,082 | | | $ | — | | | $ | 50,451,042 | |
| | | | | | | | | | | | | | | | |
JOHCM Emerging Markets Opportunities Fund | | | | | | | | | | | | | | | | |
Common Stocks: | | | | | | | | | | | | | | | | |
Brazil | | $ | 50,450,335 | | | $ | — | | | $ | — | | | $ | 50,450,335 | |
Canada | | | 22,217,588 | | | | — | | | | — | | | | 22,217,588 | |
India | | | 42,498,300 | | | | 127,265,883 | | | | — | | | | 169,764,183 | |
Mexico | | | 81,739,695 | | | | — | | | | — | | | | 81,739,695 | |
Russia | | | — | | | | — | | | | — | ** | | | — | |
Taiwan | | | 39,575,477 | | | | 42,228,424 | | | | — | | | | 81,803,901 | |
Other* | | | — | | | | 457,218,172 | | | | — | | | | 457,218,172 | |
| | | | | | | | | | | | | | | | |
Total common stocks | | $ | 236,481,395 | | | $ | 626,712,479 | | | $ | — | | | $ | 863,193,874 | |
| | | | | | | | | | | | | | | | |
Preferred Stocks | | $ | 37,470,191 | | | $ | — | | | $ | — | | | $ | 37,470,191 | |
Short-Term Investments | | | 39,309,027 | | | | — | | | | — | | | | 39,309,027 | |
| | | | | | | | | | | | | | | | |
Total Investments | | $ | 313,260,613 | | | $ | 626,712,479 | | | $ | — | | | $ | 939,973,092 | |
| | | | | | | | | | | | | | | | |
JOHCM Global Select Fund | | | | | | | | | | | | | | | | |
Common Stocks: | | | | | | | | | | | | | | | | |
Brazil | | $ | 1,436,103 | | | $ | — | | | $ | — | | | $ | 1,436,103 | |
63
JOHCM FUNDS TRUST
NOTES TO FINANCIAL STATEMENTS
September 30, 2023
| | | | | | | | | | | | | | | | |
| | | | | | | | | Level 3 - | | | | |
| | | | | | Level 2 - | | | Significant | | | | |
| | | Level 1 - | | | Other Significant | | | Unobservable | | | | |
Fund | | Quoted Prices | | | Observable Inputs | | | Inputs | | | Total | |
Ireland | | $ | 3,848,368 | | | $ | 1,656,285 | | | $ | — | | | $ | 5,504,653 | |
Jersey | | | 1,639,749 | | | | — | | | | — | | | | 1,639,749 | |
Netherlands | | | 1,485,699 | | | | — | | | | — | | | | 1,485,699 | |
United States | | | 42,758,859 | | | | — | | | | — | | | | 42,758,859 | |
Other* | | | — | | | | 15,611,147 | | | | — | | | | 15,611,147 | |
| | | | | | | | | | | | | | | | |
Total common stocks | | $ | 51,168,778 | | | $ | 17,267,432 | | | $ | — | | | $ | 68,436,210 | |
| | | | | | | | | | | | | | | | |
Short-Term Investments | | $ | 1,571,338 | | | $ | — | | | $ | — | | | $ | 1,571,338 | |
| | | | | | | | | | | | | | | | |
Total Investments | | $ | 52,740,116 | | | $ | 17,267,432 | | | $ | — | | | $ | 70,007,548 | |
| | | | | | | | | | | | | | | | |
JOHCM International Opportunities Fund | | | | | | | | | | | | | | | | |
Common Stocks: | | | | | | | | | | | | | | | | |
Canada | | $ | 149,018 | | | $ | — | | | $ | — | | | $ | 149,018 | |
United States | | | 58,696 | | | | — | | | | — | | | | 58,696 | |
Other* | | | — | | | | 1,696,627 | | | | — | | | | 1,696,627 | |
| | | | | | | | | | | | | | | | |
Total common stocks | | $ | 207,714 | | | $ | 1,696,627 | | | $ | — | | | $ | 1,904,341 | |
| | | | | | | | | | | | | | | | |
Short-Term Investments | | $ | 51,443 | | | $ | — | | | $ | — | | | $ | 51,443 | |
| | | | | | | | | | | | | | | | |
Total Investments | | $ | 259,157 | | | $ | 1,696,627 | | | $ | — | | | $ | 1,955,784 | |
| | | | | | | | | | | | | | | | |
JOHCM International Select Fund | | | | | | | | | | | | | | | | |
Common Stocks: | | | | | | | | | | | | | | | | |
Brazil | | $ | 97,189,771 | | | $ | — | | | $ | — | | | $ | 97,189,771 | |
Ireland | | | 237,491,651 | | | | 130,883,089 | | | | — | | | | 368,374,740 | |
Jersey | | | 105,803,534 | | | | 118,266,885 | | | | — | | | | 224,070,419 | |
United States | | | 230,672,271 | | | | 109,684,853 | | | | — | | | | 340,357,124 | |
Other* | | | — | | | | 3,879,406,002 | | | | — | | | | 3,879,406,002 | |
| | | | | | | | | | | | | | | | |
Total common stocks | | $ | 671,157,227 | | | $ | 4,238,240,829 | | | $ | — | | | $ | 4,909,398,056 | |
| | | | | | | | | | | | | | | | |
Preferred Stocks: | | | | | | | | | | | | | | | | |
Brazil | | $ | 103,811,401 | | | $ | — | | | $ | — | | | $ | 103,811,401 | |
Germany | | | — | | | | 95,454,802 | | | | — | | | | 95,454,802 | |
| | | | | | | | | | | | | | | | |
Total preferred stocks | | $ | 103,811,401 | | | $ | 95,454,802 | | | $ | — | | | $ | 199,266,203 | |
| | | | | | | | | | | | | | | | |
Short-Term Investments | | $ | 140,357,129 | | | $ | — | | | $ | — | | | $ | 140,357,129 | |
| | | | | | | | | | | | | | | | |
Total Investments | | $ | 915,325,757 | | | $ | 4,333,695,631 | | | $ | — | | | $ | 5,249,021,388 | |
| | | | | | | | | | | | | | | | |
Regnan Global Equity Impact Solutions | | | | | | | | | | | | | | | | |
Closed-End Funds | | $ | — | | | $ | 80,385 | | | $ | — | | | $ | 80,385 | |
Common Stocks: | | | | | | | | | | | | | | | | |
Brazil | | | 882,429 | | | | — | | | | — | | | | 882,429 | |
Canada | | | 368,437 | | | | — | | | | — | | | | 368,437 | |
Italy | | | 417,507 | | | | — | | | | — | | | | 417,507 | |
United Kingdom | | | 582,950 | | | | 4,428 | | | | — | | | | 587,378 | |
United States | | | 1,976,609 | | | | — | | | | — | | | | 1,976,609 | |
Other* | | | — | | | | 4,524,248 | | | | — | | | | 4,524,248 | |
| | | | | | | | | | | | | | | | |
Total common stocks | | $ | 4,227,932 | | | $ | 4,528,676 | | | $ | — | | | $ | 8,756,608 | |
| | | | | | | | | | | | | | | | |
Short-Term Investments | | $ | 3,478 | | | $ | — | | | $ | — | | | $ | 3,478 | |
| | | | | | | | | | | | | | | | |
Total Investments | | $ | 4,231,410 | | | $ | 4,609,061 | | | $ | — | | | $ | 8,840,471 | |
| | | | | | | | | | | | | | | | |
TSW Emerging Markets Fund | | | | | | | | | | | | | | | | |
Common Stocks: | | | | | | | | | | | | | | | | |
Brazil | | $ | 353,521 | | | $ | — | | | $ | — | | | $ | 353,521 | |
Canada | | | 87,435 | | | | — | | | | — | | | | 87,435 | |
64
JOHCM FUNDS TRUST
NOTES TO FINANCIAL STATEMENTS
September 30, 2023
| | | | | | | | | | | | | | | | |
| | | | | | | | | Level 3 - | | | | |
| | | | | | Level 2 - | | | Significant | | | | |
| | | Level 1 - | | | Other Significant | | | Unobservable | | | | |
Fund | | Quoted Prices | | | Observable Inputs | | | Inputs | | | Total | |
Guatemala | | $ | 138,277 | | | $ | — | | | $ | — | | | $ | 138,277 | |
India | | | 219,640 | | | | 288,507 | | | | — | | | | 508,147 | |
Mexico | | | 324,072 | | | | — | | | | — | | | | 324,072 | |
Puerto Rico | | | 57,120 | | | | — | | | | — | | | | 57,120 | |
United States | | | 264,596 | | | | 73,459 | | | | — | | | | 338,055 | |
Other* | | | — | | | | 4,740,996 | | | | — | | | | 4,740,996 | |
| | | | | | | | | | | | | | | | |
Total common stocks | | $ | 1,444,661 | | | $ | 5,102,962 | | | $ | — | | | $ | 6,547,623 | |
| | | | | | | | | | | | | | | | |
Preferred Stocks | | $ | 22,453 | | | $ | — | | | $ | — | | | $ | 22,453 | |
Rights | | | 92 | | | | — | | | | — | | | | 92 | |
Short-Term Investments | | | 71,621 | | | | — | | | | — | | | | 71,621 | |
| | | | | | | | | | | | | | | | |
Total Investments | | $ | 1,538,827 | | | $ | 5,102,962 | | | $ | — | | | $ | 6,641,789 | |
| | | | | | | | | | | | | | | | |
TSW High Yield Bond Fund | | | | | | | | | | | | | | | | |
Corporate Bonds* | | $ | — | | | $ | 11,208,498 | | | $ | — | | | $ | 11,208,498 | |
Foreign Issuer Bonds* | | | — | | | | 1,548,426 | | | | — | | | | 1,548,426 | |
Short-Term Investments | | | 235,886 | | | | — | | | | — | | | | 235,886 | |
| | | | | | | | | | | | | | | | |
Total Investments | | $ | 235,886 | | | $ | 12,756,924 | | | $ | — | | | $ | 12,992,810 | |
| | | | | | | | | | | | | | | | |
TSW Large Cap Value Fund | | | | | | | | | | | | | | | | |
Common Stocks* | | $ | 31,913,010 | | | $ | — | | | $ | — | | | $ | 31,913,010 | |
Short-Term Investments | | | 3,157,334 | | | | — | | | | — | | | | 3,157,334 | |
| | | | | | | | | | | | | | | | |
Total Investments | | $ | 35,070,344 | | | $ | — | | | $ | — | | | $ | 35,070,344 | |
| | | | | | | | | | | | | | | | |
| * | See additional categories in the Schedule of Investments. |
As of September 30, 2023, there were Level 3 investments held in certain Funds as noted above and in the corresponding Schedules of Investments. These investments relate to Russian securities held in certain Funds that halted from trading in 2022 when United States (“U.S.”) sanctions were imposed after the Russian invasion of Ukraine. There was no other Level 3 activity during the year. The value of these securities compared to each Fund’s total net assets is not material and, therefore, the reconciliation of Level 3 securities and related valuation techniques are not disclosed.
EQUITY-LINKED SECURITIES
The Funds may invest in equity-linked securities, also known as participation notes. The Funds may use these instruments as an alternate means to gain exposure to what is generally an emerging securities market, such as countries in which it does not have local accounts. These instruments represent interests in securities listed on certain foreign exchanges, and thus present similar risks to investing directly in such equity securities. These instruments are generally issued by the associates of foreign-based foreign brokerages and domestic institutional brokerages. Accordingly, the equity-linked securities also expose investors to counterparty risk, which is the risk that the entity issuing the note may not be able to honor its financial commitments.
At September 30, 2023, the Funds held equity-linked securities issued by counterparties as follows:
| | | | | | | | | | |
| | | | | | | | % of | |
Fund | | Counterparty | | Value | | | Net Assets | |
JOHCM Emerging Markets Discovery Fund | | CLSA Global Markets Pte. Ltd. | | $ | 1,788,921 | | | | 3.5 | % |
65
JOHCM FUNDS TRUST
NOTES TO FINANCIAL STATEMENTS
September 30, 2023
CURRENCY TRANSACTIONS
The functional and reporting currency for the Funds is the U.S. dollar. The market values of foreign securities, currency holdings and other assets and liabilities are translated into U.S. dollars based on the current exchange rates each business day. Purchases and sales of securities and income and expense items denominated in foreign currencies are translated into U.S. dollars at the exchange rate in effect on the transaction date. The Funds do not separately report the effects of changes in foreign exchange rates from changes in market prices on securities held. Such changes are included in net realized and unrealized gains (losses) from investment activities on the Statements of Operations. The Funds may invest in foreign currency-denominated securities and may engage in foreign currency transactions either on a spot (cash) basis at the rate prevailing in the currency exchange market at the time or through a forward foreign currency contract. Realized foreign exchange gains or losses arising from sales of spot foreign currencies, currency gains or losses realized between the trade and settlement dates on securities transactions and the difference between the recorded amounts of dividends, interest, and foreign withholding taxes and the U.S. dollar equivalent of the amounts actually received or paid are included in net realized gains (losses) from foreign currency transactions on the Statements of Operations. Net unrealized foreign exchange gains (losses) arising from changes in foreign exchange rates on foreign denominated assets and liabilities other than investments in securities held at the end of the reporting period are included in Change in unrealized appreciation (depreciation) on foreign currency on the Statements of Operations.
The Funds may engage in spot currency transactions for the purpose of foreign security settlement and operational processes. Certain Funds are authorized to enter into forward foreign currency exchange contracts, for the purchase or sale of a specific foreign currency at a specified exchange rate on a future date as a hedge against either specific transactions or portfolio positions, or as a cross-hedge transaction or for speculative purposes. The objective of a Fund’s foreign currency hedging transactions is to reduce the risk that the U.S. dollar value of a Fund’s foreign currency denominated securities will decline in value due to change in foreign currency exchange rates. Changes in foreign currency exchange rates will affect the value of a Funds’ securities and the price of a Funds’ shares. Generally, when the value of the U.S. dollar rises in value relative to a foreign currency, an investment in that country loses value because that currency is worth fewer U.S. dollars. Devaluation of a currency by a country’s government or banking authority also may have a significant impact on the value of any investments denominated in that currency. Currency markets generally are not as regulated as securities markets.
All forward foreign currency exchange contracts are marked-to-market daily at the applicable exchange rates. Any unrealized gains or losses are recorded in Net change in unrealized appreciation (depreciation) on forward foreign currency exchange contracts in the Statements of Operations. Gains or losses are recorded for financial statement purposes as unrealized until settlement date. Realized gains or losses, if any, are included in Net realized gains (losses) on forward foreign exchange contracts in the Statements of Operations.
Risks may arise upon entering into these contracts from the potential inability of counterparties to meet the terms of their contracts and from unanticipated movements in the value of a foreign currency relative to the U.S. dollar. The contractual amounts of forward foreign currency exchange contracts do not necessarily represent the amounts potentially subject to risk. The Funds bear the market risk from changes in forward foreign currency exchange rates and the credit risk if the counterparty to the contract fails to perform. The institutions that deal in forward foreign currency exchange contracts are not required to continue to make markets in the currencies they trade and these markets can experience periods of illiquidity.
There were no forward currency exchange contracts as of or for the year ended September 30, 2023.
INVESTMENT TRANSACTIONS AND INCOME
Investment transactions are accounted for no later than one business day after trade date. For financial reporting purposes, investments are reported as of the trade date. The Funds determine the gain or loss realized from investment transactions by using an identified cost basis method. Interest income is recognized on an accrual basis and includes, where applicable, the amortization of premium or accretion of discount. Dividend income is recognized on the ex-dividend date. Dividends from foreign securities are recorded on the ex-dividend date, or as soon as the information is available, and reflect applicable foreign withholdings taxes and any related reclaim amounts. Non-cash dividends are recognized as investment income at the fair value of the asset received.
66
JOHCM FUNDS TRUST
NOTES TO FINANCIAL STATEMENTS
September 30, 2023
EXPENSE ALLOCATIONS
Expenses directly attributable to a Fund are charged to that Fund, while expenses that are attributable to more than one Fund are allocated among the applicable Funds on a pro-rata basis based on relative net assets or another reasonable basis. Certain expenses that arise in connection with a class of shares are charged to that class of shares.
The investment income, expenses (other than class-specific expenses charged to a class), and realized/unrealized gains/losses on investments are allocated to each class of shares based upon relative net assets on the date income is earned or expenses and realized/unrealized gains/losses are incurred.
DIVIDENDS AND DISTRIBUTIONS
Distributions of dividends from net investment income, if any, are declared and paid by the Funds as follows:
| | | | |
| | | Declaration and
Payment Frequency | |
JOHCM Emerging Markets Discovery Fund | | | Annually | |
JOHCM Emerging Markets Opportunities Fund | | | Annually | |
JOHCM Global Select Fund | | | Annually | |
JOHCM International Opportunities Fund | | | Annually | |
JOHCM International Select Fund | | | Annually | |
Regnan Global Equity Impact Solutions | | | Annually | |
TSW Emerging Markets Fund | | | Annually | |
TSW High Yield Bond Fund | | | Daily/Monthly | |
TSW Large Cap Value Fund | | | Quarterly | |
The Funds intend to distribute their net realized long-term capital gains and their net realized short-term capital gains at least once a year.
Distributions from net investment income and from net realized capital gain are determined in accordance with U.S. federal income tax regulations, which may differ from accounting principles generally accepted in the United States of America (“GAAP”). These “book/tax” differences are either considered temporary or permanent in nature. To the extent these differences are permanent in nature (e.g. treatment of certain dividend distributions, gains/losses, return of capital, etc.), such amounts are reclassified within the composition of net assets based on their U.S. federal tax-basis treatment; temporary differences do not require reclassification. Distributions to shareholders that exceed net investment income and net realized capital gains for tax purposes are reported as return of capital.
U.S. FEDERAL INCOME TAX INFORMATION
No provision is made for U.S. federal income taxes as each Fund intends to qualify each year as a “regulated investment company” under Subchapter M of the Internal Revenue Code of 1986, as amended (the “Code”), and distribute substantially all of its net investment income and net realized capital gain in accordance with the Code.
The Funds analyzed all open tax years, as defined by the applicable statute of limitations, for all major jurisdictions that remain subject to examination. The Funds’, excluding the TSW Large Cap Value Fund, U.S. federal income tax returns for the tax years ended September 30, 2020 through September 30, 2023, as applicable, remain subject to examination by the Internal Revenue Service. The TSW Large Cap Value Fund’s U.S. federal income tax returns for the tax years ended October 31, 2020 through October 31, 2021, and for the tax years ended September 30, 2022 through September 30, 2023, remain subject to examination by the Internal Revenue Service. Interest or penalties incurred, if any, on future unknown or uncertain tax positions taken by the Funds will be recorded as interest expense on the Statements of Operations.
Management is not aware of any tax positions for which it is reasonably possible that the total amounts of unrecognized tax benefits will significantly change in the next twelve months.
67
JOHCM FUNDS TRUST
NOTES TO FINANCIAL STATEMENTS
September 30, 2023
USE OF ESTIMATES
The preparation of financial statements in conformity with GAAP requires management to make estimates and assumptions that affect the reported amounts of assets and liabilities and disclosure of contingent assets and liabilities at the date of the financial statements and the reported amounts of revenues and expenses during the reporting period. Actual results could differ from these estimates.
CAPITAL GAIN TAXES
Investments in certain foreign securities may subject the Funds to capital gain taxes on the disposal of those securities. Any capital gains assessed will reduce the proceeds received on the sale and be reflected in net realized gain/loss on the transaction. The Funds estimate and accrue foreign capital gain taxes on certain investments held which impact the amount of unrealized appreciation/depreciation on such investments. The JOHCM Emerging Markets Discovery Fund and JOHCM Emerging Markets Opportunities Fund paid $20,439 and $483,311, respectively, in capital gain taxes which are netted with any refunds received during the year. This amount is included in the net realized gains (losses) from investment transactions on the Statement of Operations.
OTHER RISKS
Securities markets outside the U.S., while growing in volume, have for the most part substantially less volume than U.S. markets, and many securities traded on these foreign markets are less liquid and their prices are more volatile than securities of comparable U.S. companies. In addition, settlement of trades in some non-U.S. markets is much slower and more subject to failure than in U.S. markets. Other risks associated with investing in foreign securities include, among other things, imposition of exchange control regulation by the U.S. or foreign governments, U.S. and foreign withholding taxes, limitations on the removal of funds or other assets, policies of governments with respect to possible nationalization of their industries, and economic or political instability in foreign nations. There may be less publicly available information about certain foreign companies than would be the case for comparable companies in the U.S., and certain foreign companies may not be subject to accounting, auditing and financial reporting standards and requirements comparable to or as uniform as those of U.S. companies.
Certain Funds may invest in emerging market securities. Investing in emerging market securities involves risks which are in addition to the usual risks inherent in foreign investments. These countries generally are located in the Asia and Pacific regions, the Middle East, Eastern Europe, Central America, South America and Africa. Some countries with emerging securities markets have experienced substantial, and in some periods extremely high, rates of inflation for many years. Inflation and rapid fluctuations in inflation rates have had and may continue to have negative effects on the economies and securities markets of certain countries. Moreover, the economies of some countries may differ favorably or unfavorably from the U.S. economy in such respects as rate of growth of gross domestic product, rate of inflation, capital reinvestment, resource self-sufficiency, number and depth of industries forming the economy’s base, condition and stability of financial institutions, governmental controls and investment restrictions that are subject to political change and balance of payments position. Further, a Fund may face greater difficulties or restrictions with respect to investments made in emerging markets countries than in the U.S. Satisfactory custodial services may not be available in some emerging markets countries, which may result in a Fund incurring additional costs and delays in the trading and custody of such securities.
Natural or environmental disasters, such as earthquakes, fires, floods, hurricanes, tsunamis and other severe weather-related phenomena generally, and widespread disease, including pandemics and epidemics, have been and may be highly disruptive to economies and markets, adversely impacting individual companies, sectors, industries, markets, currencies, interest and inflation rates, credit ratings, investor sentiment, and other factors affecting the value of a Fund’s investments. Given the increasing interdependence among global economies and markets, conditions in one country, market, or region are increasingly likely to adversely affect markets, issuers, and/or foreign exchange rates in other countries, for example, an epidemic or pandemic can result in travel restrictions, closed international borders, enhanced health screenings at ports of entry and elsewhere, disruption of and delays in healthcare service preparation and delivery, prolonged quarantines, cancellations, supply chain disruptions, and lower consumer demand, as well as general concern and uncertainty. All of these disruptive effects were present, for example, in the global pandemic linked to the outbreak of respiratory disease caused by a novel coronavirus designated as COVID-19 that was first reported in China in December 2019. The effects of any disease outbreak may be greater in countries with less developed disease prevention and control programs and may also exacerbate other pre-existing political, social, economic, market and financial risks. A pandemic and its effects may be short term or may last for an extended period of time, and
68
JOHCM FUNDS TRUST
NOTES TO FINANCIAL STATEMENTS
September 30, 2023
in either case can result in significant market volatility, exchange trading suspensions and closures, declines in global financial markets, higher default rates, and a substantial economic downturn or recession. Infectious illness outbreaks can adversely affect the economies of many nations or the entire global economy, individual issuers and capital markets in ways that cannot necessarily be foreseen. Any such events could have a significant adverse impact on the value of a Fund’s investments.
Specific risks vary greatly between the various Eastern European markets, but they include, among others, corporate governance, fiscal stability, banking regulations, European Union accession and continued membership, global commodity prices, political stability and market liquidity.
For example, in February 2022, Russia commenced a military invasion of Ukraine. This outbreak of hostilities could result in more widespread conflict and have a severe adverse effect on the region and the markets for securities and commodities. Russia’s invasion of Ukraine has led to, and may lead to, additional sanctions being levied by the United States, European Union and other countries and organizations against Russia and Belarus. Russia’s invasion and the resulting sanctions could adversely affect global energy, commodity and financial markets, and thus could affect the value of the Funds’ investments and broader global markets and economies, even beyond any direct exposure the Funds may have to Russian or Ukrainian issuers or the adjoining geographic regions. The extent and duration of the military action, sanctions and resulting market disruptions are impossible to predict, but could be substantial, and may put significant pressure on global financial systems, including on banks and custodians. The market capitalizations of many Russian companies have already experienced significant declines, and Russia closed its securities markets for an extended period of time, before reopening with limited trading. These market disruptions may result in the decline in the value and liquidity of Russian securities, devaluation of Russian currency, a downgrade in Russia’s credit rating, the inability to freely trade sanctioned companies (either due to the sanctions imposed or related operational issues) and/or other adverse consequences to the Russian economy, any of which could negatively impact a Fund’s investments in Russian securities. Sanctions could result in the immediate freeze of Russian securities, impairing the ability of a Fund to buy, sell, receive or deliver those securities. Both the current and potential future sanctions and other government actions against Russia also could result in Russia taking counter measures or retaliatory actions, which may impair further the value or liquidity of Russian securities and negatively impact a Fund or the broader global markets. Any or all of these potential results could lead Russian and other economic regions into a recession.
| B. | Fees and Transactions with Affiliates and Other Parties |
The Funds have entered into an Investment Advisory Agreement (the “Agreement”) with JOHCM (USA) Inc (the “Adviser” or “JOHCM”), which is registered under the Investment Advisers Act of 1940, as amended (the “Advisers Act”), to provide investment management services to the Funds.
Total fees incurred pursuant to the Agreement are reflected as “Investment Advisory” fees on the Statement of Operations. Under the terms of the Agreement, JOHCM receives an annual fee, computed daily and payable monthly, at the annual rates set forth in the following table (expressed as a percentage of each Fund’s respective average daily net assets). JOHCM has contractually agreed to waive fees and reimburse expenses to the extent that Total Annual Operating Expenses (excluding taxes, extraordinary expenses, expenses associated with investments in underlying investment companies, brokerage commissions, interest, dividends, litigation and indemnification expenses) exceed the rates in the table below (expressed as a percentage of each Fund’s respective average daily net assets).
69
JOHCM FUNDS TRUST
NOTES TO FINANCIAL STATEMENTS
September 30, 2023
| | | | | | | | | | |
| | | | | | | | Expense | |
Fund | | Class | | Advisory Fee | | | Limitation | |
JOHCM Emerging Markets Discovery Fund | | Advisor | | | 1.30 | % | | | 1.59 | % |
JOHCM Emerging Markets Discovery Fund | | Institutional | | | 1.30 | % | | | 1.49 | % |
JOHCM Emerging Markets Opportunities Fund | | Advisor | | | 0.90 | % | | | 1.12 | % |
JOHCM Emerging Markets Opportunities Fund | | Investor | | | 0.90 | % | | | 1.27 | % |
JOHCM Emerging Markets Opportunities Fund | | Institutional | | | 0.90 | % | | | 1.04 | % |
JOHCM Global Select Fund | | Advisor | | | 0.89 | % | | | 1.08 | % |
JOHCM Global Select Fund | | Institutional | | | 0.89 | % | | | 0.98 | % |
JOHCM International Opportunities Fund | | Institutional | | | 0.75 | % | | | 0.50 | %(a) |
JOHCM International Select Fund | | Investor | | | 0.89 | % | | | 1.21 | % |
JOHCM International Select Fund | | Institutional | | | 0.89 | % | | | 0.98 | % |
Regnan Global Equity Impact Solutions | | Institutional | | | 0.75 | % | | | 0.89 | % |
TSW Emerging Markets Fund | | Institutional | | | 0.80 | % | | | 0.99 | % |
TSW High Yield Bond Fund | | Institutional | | | 0.50 | % | | | 0.65 | % |
TSW Large Cap Value Fund | | Institutional | | | 0.58 | % | | | 0.73 | % |
| (a) | Prior to July 1, 2023 the expense limit was 0.88%. |
The expense limitation agreement is effective until January 28, 2024 for the Funds except for the JOHCM International Opportunities Fund, which is effective until January 28, 2026. If it becomes unnecessary for the Adviser to waive fees or make reimbursements, the Adviser may recapture any of its prior waivers or reimbursements, including prior waivers or reimbursements in the AIT Predecessor Funds that were available for recoupment by J O Hambro Capital Management Limited at the time of the AIT reorganizations, for a period not to exceed three years from the date on which the waiver or reimbursement was made to the extent that such a recapture does not cause the Total Annual Fund Operating Expenses (exclusive of brokerage and other transaction expenses relating to the purchase or sale of portfolio investments, interest, taxes, short sale dividends and financing costs associated with the use of the cash proceeds on securities sold short, litigation and indemnification expenses, expenses associated with the investments in underlying investment companies and extraordinary expenses) to exceed the current expense limitation at the time of repayment or the applicable expense limitation that was in effect at the time of the waiver or reimbursement. The agreement to waive fees and reimburse expenses may be terminated by the Board at any time and will terminate automatically upon termination of the Agreement.
Thompson, Siegel & Walmsley LLC (the “Sub-Adviser”) serves as the investment sub-adviser to the TSW Emerging Markets Fund, the TSW High Yield Bond Fund, and the TSW Large Cap Value Fund. For its services, the Sub-Adviser is paid a fee of 0.65%, 0.35%, and 0.43%, based on average daily net assets of the TSW Emerging Markets Fund, the TSW High Yield Bond Fund, and the TSW Large Cap Value Fund, respectively, by the Adviser.
For the year ended September 30, 2023, the Funds incurred advisory fees payable to JOHCM, received expense waivers/reimbursements from JOHCM, and paid expense recoupments to JOHCM as follows:
70
JOHCM FUNDS TRUST
NOTES TO FINANCIAL STATEMENTS
September 30, 2023
| | | | | | | | | | | | |
| | | Advisory | | | Expenses | | | Advisory
Waivers | |
| | | Fee to | | | Reduced | | | Recouped | |
Fund | | JOHCM | | | by JOHCM | | | by JOHCM | |
JOHCM Emerging Markets Discovery Fund | | $ | 567,209 | | | $ | 165,037 | | | $ | — | |
JOHCM Emerging Markets Opportunities Fund | | | 7,518,980 | | | | 8,080 | | | | — | |
JOHCM Global Select Fund | | | 1,592,168 | | | | 69,362 | | | | — | |
JOHCM International Opportunities Fund | | | 14,244 | | | | 65,002 | | | | — | |
JOHCM International Select Fund | | | 52,428,888 | | | | 290,951 | | | | — | |
Regnan Global Equity Impact Solutions | | | 95,900 | | | | 56,432 | | | | — | |
TSW Emerging Markets Fund | | | 55,978 | | | | 85,549 | | | | — | |
TSW High Yield Bond Fund | | | 60,148 | | | | 79,563 | | | | — | |
TSW Large Cap Value Fund | | | 207,061 | | | | — | | | | 7,472 | |
The balances of recoverable expenses to JOHCM by Funds at September 30, 2023 were as follows:
| | | | | | | | | | | | | | | | | | | | | | | | | | | | | | | | | | | | | | |
For the year ended: | | Expiring | | JOHCM
Emerging
Markets
Discovery
Fund | | | JOHCM
Emerging
Markets
Opportunities
Fund | | | JOHCM
Global
Select
Fund | | | JOHCM
International
Opportunities
Fund | | | JOHCM
International
Select
Fund | | | Regnan
Global
Equity
Impact
Solutions | | | TSW
Emerging
Markets
Fund | | | TSW
High
Yield
Bond
Fund | | | TSW
Large
Cap
Value
Fund | |
September 30, 2021 | | September 30, 2024 | | $ | 121,344 | | | $ | — | | | $ | — | | | $ | 47,711 | | | $ | — | | | $ | 16,338 | | | $ | — | | | $ | — | | | $ | — | |
September 30, 2022 | | September 30, 2025 | | | 108,217 | | | | — | | | | 26,536 | | | | 52,934 | | | | — | | | | 250,001 | | | | 84,709 | * | | | 135,241 | ** | | | 40,060 | *** |
September 30, 2023 | | September 30, 2026 | | | 165,037 | | | | 8,080 | | | | 69,362 | | | | 65,002 | | | | 290,951 | | | | 56,432 | | | | 85,549 | | | | 79,563 | | | | — | |
| | | | | | | | | | | | | | | | | | | | | | | | | | | | | | | | | | | | | | |
Balances of Recoverable Expenses to JOHCM | | | | $ | 394,598 | | | $ | 8,080 | | | $ | 95,898 | | | $ | 165,647 | | | $ | 290,951 | | | $ | 322,771 | | | $ | 170,258 | | | $ | 214,804 | | | $ | 40,060 | |
| | | | | | | | | | | | | | | | | | | | | | | | | | | | | | | | | | | | | | |
| * | For the period from December 21, 2021, commencement of operations, to September 30, 2022. |
| ** | For the period from October 26, 2021, commencement of operations, to September 30, 2022. |
| *** | For the period from December 6, 2021 to September 30, 2022. |
Perpetual Americas Funds Distributors, LLC (f/k/a JOHCM Funds Distributors, LLC), provides distribution services to the Funds pursuant to a distribution agreement with the Trust, on behalf of the Funds. The Distributor acts as an agent of the Trust in connection with the offering of the shares of the Funds on a continuous basis. JOHCM, at its own expense, pays the Distributor an annual base fee, an asset-based fee and reimbursement for certain expenses and out-of-pocket costs incurred on behalf of the Funds.
The Northern Trust Company (“Northern Trust”) serves as the administrator, transfer agent, custodian and fund accounting agent for the Funds pursuant to written agreements with the Trust on behalf of the Funds. The Funds have agreed to pay Northern Trust a tiered basis-point fee based on the JOHCM Funds Trust’s complex level net assets, certain per account and transaction charges, other fees for additional service activities, and reimbursement of certain expense. Total fees paid to Northern Trust for their services are reflected as “Accounting and Administration” fees on the Statements of Operations.
Foreside Fund Officer Services, LLC, an affiliate of Foreside Financial Group, LLC (d/b/a ACA Group) (“ACA Group”) provides principal financial officer and treasurer services for the Funds pursuant to a written agreement with the Trust on behalf of the Funds. The Funds have agreed to pay ACA Group an annual fee based on the level of net assets in the Fund complex, subject to an overall minimum annual fee of $200,000 for these services, and reimburse for certain expenses incurred on behalf of the Funds. Total fees paid to ACA Group pursuant to these agreements are reflected as “Treasurer Service” fees on the Statements of Operations.
71
JOHCM FUNDS TRUST
NOTES TO FINANCIAL STATEMENTS
September 30, 2023
JOHCM and the Trust have entered into an Administration and Compliance Support Services Agreement (the “ACSS Agreement”) pursuant to which JOHCM provides, coordinates or otherwise supports the provision of, administration and compliance services for the Trust. As full compensation for the services rendered and expenses borne by JOHCM in connection with the services JOHCM provides under the ACSS Agreement, the Trust, on behalf of each Fund, agrees to reimburse JOHCM in such amounts as are approved by the Board of Trustees of the Trust (the “Board”) from time to time. Total fees paid to JOHCM pursuant to the ACSS Agreement are reflected as “JOHCM Compliance” fees in the Statements of Operations.
JOHCM and the Trust have entered into an Institutional Class Shareholder Services, Recordkeeping and Sub-Transfer Agency Agreement (the “Shareholder Services Agreement”). Pursuant to the Shareholder Services Agreement, the Trust, on behalf of each Fund, agrees that Institutional Class shares of each Fund shall reimburse JOHCM or its designee for any payments JOHCM or such designee makes to third-party service providers for personal services, accounting or subaccounting, recordkeeping and/or other administrative services provided to beneficial holders of Institutional Class shares of the Funds. Payments by a Fund pursuant to the Shareholder Services Agreement shall not exceed such amounts as are approved by the Board from time to time. Total fees reimbursed to JOHCM pursuant to the Shareholder Services Agreement are reflected as “Shareholder Services - Institutional” fees in the Statements of Operations.
Certain officers and Trustees of the Trust are affiliated with JOHCM, ACA Group, Northern Trust, or the Distributor and receive no compensation directly from the Funds for serving in their respective roles. The Trust pays each Independent Trustee compensation for their services based on an annual retainer of $120,000, certain committee and chairperson retainers and reimbursement for certain expenses. For the year ended September 30, 2023, the aggregate Trustee compensation paid by the Trust was $626,667. The amount of total Trustee compensation and reimbursement of out-of-pocket expenses allocated from the Trust to the Funds are reflected as “Trustees” expenses on the Statements of Operations.
During the year ended September 30, 2023, the JOHCM Emerging Markets Discovery Fund received a $12,829 cash contribution from JOHCM in connection with a trade error. This amount is included in Net Capital Transactions on the Statements of Changes in Net Assets and represented $0.004 per share and 0.04% to the total return of the Fund on the payment date.
The Funds adopted an amended plan under Rule 12b-1 that is applicable to Advisor Shares and Investor Shares to pay for certain distribution and promotional activities related to marketing of their shares. Each Fund will pay the Distributor a fee for the principal underwriter’s services in connection with the sales and promotion of the Funds, including its expenses in connection therewith at annual rates of 0.10% and 0.25% of the average daily net assets of the outstanding Advisor Shares and Investor Shares, respectively. Total fees paid pursuant to the plan are reflected as “12b-1 Fees” on the Statements of Operations.
The Trust, on behalf of certain of the Funds, entered into a $100 million revolving credit facility agreement (the “Credit Agreement”) with Northern Trust for liquidity or for other temporary or emergency purposes effective July 19, 2021 and amended July 18, 2022 and July 17, 2023. The Credit Agreement will expire on July 16, 2024 unless extended or renewed. The Credit Agreement permits the applicable Funds to borrow up to an aggregate amount of $100 million, $50 million of which is committed and $50 million of which is uncommitted. Any advance under the Credit Agreement will accrue interest at a rate per annum equivalent to the Borrower’s option of the sum of the U.S. Federal Funds Target Rate plus 1.30% or daily Simple Secured Overnight Financing Rate plus 1.40%.
72
JOHCM FUNDS TRUST
NOTES TO FINANCIAL STATEMENTS
September 30, 2023
During the year ended September 30, 2023, the following Funds had borrowings with the average loan and weighted interest rate as disclosed below:
| | | | | | | | | | | | |
Fund | | Dollar Amount | | | Days Outstanding | | | Rate | |
JOHCM Emerging Markets Discovery Fund | | $ | 61,250 | | | | 4 | | | | 4.29 | % |
JOHCM Global Select Fund | | | 3,835,353 | | | | 17 | | | | 6.01 | |
JOHCM International Select Fund | | | 17,751,724 | | | | 29 | | | | 5.35 | |
Regnan Global Equity Impact Solutions | | | 516,667 | | | | 12 | | | | 6.56 | |
As of September 30, 2023, Regnan Global Equity Impact Solutions had outstanding borrowings of $850,000 shown as “Credit Facility Payable” on the Statements of Assets & Liabilities.
The JOHCM Emerging Markets Discovery Fund, the JOHCM Global Select Fund, the JOHCM International Select Fund, and the Regnan Global Equity Impact Solutions incurred interest expense of $33, $10,889, $76,503 and $1,130, respectively, related to borrowings under the Credit Agreements during the year ended September 30, 2023. The amounts are included in the “Interest Expense” on the Statements of Operations.
| E. | Investment Transactions |
For the year ended September 30, 2023, the aggregate cost of purchases and proceeds from sales of securities (excluding short-term investments) for the Funds were as follows:
| | | | | | | | |
Fund | | Cost of Purchases | | | Proceeds from sales | |
JOHCM Emerging Markets Discovery Fund | | $ | 72,588,439 | | | $ | 65,473,323 | |
JOHCM Emerging Markets Opportunities Fund | | | 455,118,595 | | | | 237,090,315 | |
JOHCM Global Select Fund | | | 74,752,351 | | | | 304,437,758 | |
JOHCM International Opportunities Fund | | | 643,080 | | | | 630,950 | |
JOHCM International Select Fund | | | 1,858,643,137 | | | | 4,203,568,857 | |
Regnan Global Equity Impact Solutions | | | 8,499,539 | | | | 7,814,809 | |
TSW Emerging Markets Fund | | | 1,267,129 | | | | 3,301,899 | |
TSW High Yield Bond Fund | | | 10,159,856 | | | | 8,671,413 | |
TSW Large Cap Value Fund | | | 6,906,239 | | | | 10,645,030 | |
73
JOHCM FUNDS TRUST
NOTES TO FINANCIAL STATEMENTS
September 30, 2023
| F. | U.S. Federal Income Tax |
As of September 30, 2023, the cost, gross unrealized appreciation and gross unrealized depreciation on investments, for U.S. Federal income tax purposes, for the Funds were as follows:
| | | | | | | | | | | | | | | | |
| | | | | | Gross | | | Gross | | | Net Unrealized | |
| | | | | | Unrealized | | | Unrealized | | | Appreciation | |
Fund | | Cost | | | Appreciation | | | (Depreciation) | | | (Depreciation) | |
JOHCM Emerging Markets Discovery Fund | | $ | 46,376,031 | | | $ | 6,332,884 | | | $ | (2,257,694 | ) | | $ | 4,075,190 | |
JOHCM Emerging Markets Opportunities Fund | | | 931,184,901 | | | | 89,658,984 | | | | (80,870,793 | ) | | | 8,788,191 | |
JOHCM Global Select Fund | | | 60,380,489 | | | | 12,056,533 | | | | (2,429,474 | ) | | | 9,627,059 | |
JOHCM International Opportunities Fund | | | 1,819,930 | | | | 222,219 | | | | (86,365 | ) | | | 135,854 | |
JOHCM International Select Fund | | | 4,995,527,451 | | | | 581,329,179 | | | | (327,835,242 | ) | | | 253,493,937 | |
Regnan Global Equity Impact Solutions | | | 9,546,583 | | | | 1,191,257 | | | | (1,897,369 | ) | | | (706,112 | ) |
TSW Emerging Markets Fund | | | 7,156,550 | | | | 615,123 | | | | (1,129,884 | ) | | | (514,761 | ) |
TSW High Yield Bond Fund | | | 13,730,300 | | | | 62,987 | | | | (800,477 | ) | | | (737,490 | ) |
TSW Large Cap Value Fund | | | 30,780,702 | | | | 6,330,340 | | | | (2,040,698 | ) | | | 4,289,642 | |
The tax character of distributions paid by the Funds during the latest tax years ended September 30, 2023 and September 30, 2022 were as follows:
| | | | | | | | | | | | | | | | | | | | | | | | |
| | | Distributions From | |
| | | Ordinary | | | Long-Term | | | Ordinary | | | Long-Term | | | Ordinary | | | Long-Term | |
| | | Income* | | | Capital Gains | | | Income* | | | Capital Gains | | | Income* | | | Capital Gains | |
Fund | | 2023 | | | 2023 | | | 2022 | | | 2022 | | | 2021 | | | 2021 | |
JOHCM Emerging Markets Discovery Fund | | $ | 440,723 | | | $ | — | | | $ | 8,448,031 | | | $ | 4,042,780 | | | $ | 221,726 | ** | | $ | — | ** |
JOHCM Emerging Markets Opportunities Fund | | | 15,460,229 | | | | — | | | | 34,384,294 | | | | — | | | | 8,272,143 | | | | — | |
JOHCM Global Select Fund | | | 1,328,041 | | | | 20,006,011 | **** | | | 10,311,082 | | | | 85,105,952 | *** | | | 202,822 | | | | 26,778,354 | |
JOHCM International Opportunities Fund | | | 38,383 | | | | — | | | | 261,431 | | | | 109,197 | | | | 48,597 | | | | 27,795 | |
JOHCM International Select Fund | | | 97,456,711 | | | | — | | | | 234,506,832 | | | | 1,028,090,909 | | | | 60,638,266 | | | | 267,191,558 | |
Regnan Global Equity Impact Solutions | | | 12,268 | | | | — | | | | — | | | | — | | | | — | | | | — | |
TSW Emerging Markets Fund | | | 137,485 | | | | — | | | | — | | | | — | | | | — | | | | — | |
TSW High Yield Bond Fund | | | 727,639 | | | | — | | | | 499,723 | | | | — | | | | — | | | | — | |
TSW Large Cap Value Fund***** | | | 738,192 | | | | 3,372,912 | **** | | | 2,034,512 | | | | 3,010,215 | *** | | | 140,896 | | | | 1,548,484 | |
| * | Ordinary income includes short-term capital gains, if any. |
| ** | The amounts do not include tax equalization utilized of $1,962,464 and $904,584 in ordinary income and net long term capital gains, respectively, in which the Fund designated as being distributed to shareholders on their redemption of shares. |
| *** | The amounts do not include tax equalization utilized of $5,900,925 and $263,881 in net long term capital gains in which the JOHCM Global Select Fund and TSW Large Cap Value Fund, respectively, designated as being distributed to shareholders on their redemption of shares. |
| **** | The amounts do not include tax equalization utilized of $5,425,075 and $114,889 in net long term capital gains in which the JOHCM Global Select Fund and TSW Large Cap Value Fund, respectively, designated as being distributed to shareholders on their redemption of shares. |
| ***** | For the TSW Predecessor Fund’s prior tax years ended October 31, 2021 and 2020, respectively. |
74
JOHCM FUNDS TRUST
NOTES TO FINANCIAL STATEMENTS
September 30, 2023
As of the tax year ended September 30, 2023, the components of accumulated earnings on a tax basis were as follows:
| | | | | | | | | | | | | | | | | | | | | | | | |
| | | | | | Undistributed | | | | | | | | | | | | Total | |
| | | Undistributed | | | Long-Term | | | Accumulated | | | | | | Unrealized | | | Accumulated | |
| | | Ordinary | | | Capital | | | Capital and | | | Other Temporary | | | Appreciation | | | Earnings | |
Fund | | Income | | | Gains | | | Other Losses | | | Differences | | | (Depreciation) | | | (Deficit) | |
JOHCM Emerging Markets Discovery Fund | | $ | 378,655 | | | $ | — | | | $ | (1,589,032 | ) | | $ | — | | | $ | 3,726,273 | | | $ | 2,515,896 | |
JOHCM Emerging Markets Opportunities Fund | | | 15,976,556 | | | | — | | | | (73,485,265 | ) | | | — | | | | 2,970,660 | | | | (54,538,049 | ) |
JOHCM Global Select Fund | | | 951,791 | | | | 5,381,755 | | | | — | | | | — | | | | 9,604,337 | | | | 15,937,883 | |
JOHCM International Opportunities Fund | | | 36,463 | | | | — | | | | (10,601 | ) | | | — | | | | 135,312 | | | | 161,174 | |
JOHCM International Select Fund | | | 104,424,608 | | | | — | | | | (799,645,731 | ) | | | — | | | | 252,452,136 | | | | (442,768,987 | ) |
Regnan Global Equity Impact Solutions | | | 37,453 | | | | — | | | | (1,819,581 | ) | | | — | | | | (706,114 | ) | | | (2,488,242 | ) |
TSW Emerging Markets Fund . | | | 197,350 | | | | — | | | | (948,685 | ) | | | — | | | | (515,664 | ) | | | (1,266,999 | ) |
TSW High Yield Bond Fund | | | 30,181 | | | | — | | | | (743,450 | ) | | | (27,972 | ) | | | (737,490 | ) | | | (1,478,731 | ) |
TSW Large Cap Value Fund | | | 151,291 | | | | 2,233,649 | | | | — | | | | — | | | | 4,289,642 | | | | 6,674,582 | |
As of the tax year ended September 30, 2023, capital losses incurred by the Funds are carried forward indefinitely under the provisions of the Regulated Investment Company Modernization Act of 2010 and are as follows:
| | | | | | | | |
| | | Short-Term | | | Long-Term | |
| | | Capital Loss | | | Capital Loss | |
Fund | | Carry-Forward | | | Carry-Forward | |
JOHCM Emerging Markets Discovery Fund | | $ | 1,589,032 | | | $ | — | |
JOHCM Emerging Markets Opportunities Fund | | | 37,367,217 | | | | 36,118,048 | |
JOHCM International Opportunities Fund | | | 10,601 | | | | — | |
JOHCM International Select Fund | | | 799,645,731 | | | | — | |
Regnan Global Equity Impact Solutions* | | | 1,545,855 | | | | 273,726 | |
TSW Emerging Markets Fund | | | 876,179 | | | | 72,506 | |
TSW High Yield Bond Fund* | | | 48,999 | | | | 694,451 | |
| * | A portion of the capital loss carryforward may be subject to limitations under Section 382 of the Internal Revenue Service Code, and is available to the extent by tax law to offset future net capital gains, if any |
Primarily as a result of differing book/tax treatment of non-deductible expenses and tax equalization, the Funds made reclassifications among certain capital accounts. These reclassifications have no effect on net assets or net asset value per share. As of September 30, 2023, the following reclassifications were made to the Funds’ Statements of Assets and Liabilities:
| | | | | | | | |
| | | Distributable | | | Paid-in | |
Fund | | Earnings (Loss) | | | Capital | |
JOHCM Emerging Markets Opportunities Fund | | $ | (492,818 | ) | | $ | 492,818 | |
JOHCM Global Select Fund | | | (5,425,075 | ) | | | 5,425,075 | |
TSW Emerging Markets Fund | | | 372 | | | | (372 | ) |
TSW Large Cap Value Fund | | | (110,583 | ) | | | 110,583 | |
75
JOHCM FUNDS TRUST
NOTES TO FINANCIAL STATEMENTS
September 30, 2023
| G. | Capital Share Transactions |
Transactions in dollars for fund shares for the year ended September 30, 2023, were as follows:
| | | | | | | | | | | | | | | | | | |
| | | | | | | | | | | Payments | | | Net Increase | |
| | | | | Proceeds from | | | Reinvestments | | | for Shares | | | (Decrease) in | |
Fund | | Class | | Shares Sold | | | of Dividends | | | Redeemed | | | Net Assets | |
JOHCM Emerging Markets Discovery Fund | | Advisor Shares | | $ | 2,898,113 | | | $ | 72,324 | | | $ | (9,444,116 | ) | | $ | (6,473,679 | ) |
JOHCM Emerging Markets Discovery Fund | | Institutional Shares | | | 26,443,371 | | | | 217,933 | | | | (11,009,644 | ) | | | 15,651,660 | |
JOHCM Emerging Markets Opportunities Fund | | Advisor Shares | | | 32,523,387 | | | | 969,196 | | | | (67,874,797 | ) | | | (34,382,214 | ) |
JOHCM Emerging Markets Opportunities Fund | | Investor Shares | | | 34,610,871 | | | | 536,155 | | | | (21,879,503 | ) | | | 13,267,523 | |
JOHCM Emerging Markets Opportunities Fund | | Institutional Shares | | | 430,328,400 | | | | 10,912,961 | | | | (195,129,437 | ) | | | 246,111,924 | |
JOHCM Global Select Fund | | Advisor Shares | | | 1,067,323 | | | | 2,330,798 | | | | (13,719,027 | ) | | | (10,320,906 | ) |
JOHCM Global Select Fund | | Institutional Shares | | | 11,863,544 | | | | 16,763,683 | | | | (232,537,322 | ) | | | (203,910,095 | ) |
JOHCM International Opportunities Fund | | Institutional Shares | | | 4,100 | | | | — | | | | — | | | | 4,100 | |
JOHCM International Select Fund | | Investor Shares | | | 9,488,689 | | | | 4,640,813 | | | | (108,048,793 | ) | | | (93,919,291 | ) |
JOHCM International Select Fund | | Institutional Shares | | | 936,828,719 | | | | 56,232,368 | | | | (3,142,447,740 | ) | | | (2,149,386,653 | ) |
Regnan Global Equity Impact Solutions | | Institutional Shares | | | 7,133,550 | | | | 10,899 | | | | (6,486,651 | ) | | | 657,798 | |
TSW Emerging Markets Fund | | Institutional Shares | | | — | | | | — | | | | (2,100,000 | ) | | | (2,100,000 | ) |
TSW High Yield Bond Fund | | Institutional Shares | | | 6,589,668 | | | | 319,451 | | | | (5,582,391 | ) | | | 1,326,728 | |
TSW Large Cap Value Fund | | Institutional Shares | | | 4,654,485 | | | | 4,046,455 | | | | (8,902,633 | ) | | | (201,693 | ) |
Transactions in shares of fund shares for the year ended September 30, 2023, were as follows: | |
| | | | | | | | Shares From | | | | | | Net Increase | |
| | | | | Shares | | | Reinvested | | | Shares | | | (Decrease) | |
Fund | | Class | | Sold | | | Dividends | | | Redeemed | | | in Shares | |
JOHCM Emerging Markets Discovery Fund | | Advisor Shares | | | 229,069 | | | | 6,522 | | | | (743,797 | ) | | | (508,206 | ) |
JOHCM Emerging Markets Discovery Fund | | Institutional Shares | | | 2,231,246 | | | | 19,651 | | | | (956,725 | ) | | | 1,294,172 | |
JOHCM Emerging Markets Opportunities Fund | | Advisor Shares | | | 3,050,492 | | | | 93,282 | | | | (6,313,289 | ) | | | (3,169,515 | ) |
JOHCM Emerging Markets Opportunities Fund | | Investor Shares | | | 3,259,999 | | | | 51,603 | | | | (2,032,579 | ) | | | 1,279,023 | |
JOHCM Emerging Markets Opportunities Fund | | Institutional Shares | | | 40,334,819 | | | | 1,048,315 | | | | (18,352,495 | ) | | | 23,030,639 | |
JOHCM Global Select Fund | | Advisor Shares | | | 84,370 | | | | 182,951 | | | | (1,094,465 | ) | | | (827,144 | ) |
JOHCM Global Select Fund | | Institutional Shares | | | 930,451 | | | | 1,312,739 | | | | (18,129,928 | ) | | | (15,886,738 | ) |
JOHCM International Opportunities Fund | | Institutional Shares | | | 379 | | | | — | | | | — | | | | 379 | |
JOHCM International Select Fund | | Investor Shares | | | 451,269 | | | | 223,870 | | | | (5,285,079 | ) | | | (4,609,940 | ) |
JOHCM International Select Fund | | Institutional Shares | | | 44,887,078 | | | | 2,720,482 | | | | (154,046,382 | ) | | | (106,438,822 | ) |
Regnan Global Equity Impact Solutions | | Institutional Shares | | | 982,085 | | | | 1,485 | | | | (899,946 | ) | | | 83,624 | |
TSW Emerging Markets Fund | | Institutional Shares | | | — | | | | — | | | | (248,521 | ) | | | (248,521 | ) |
TSW High Yield Bond Fund | | Institutional Shares | | | 772,449 | | | | 36,554 | | | | (643,085 | ) | | | 165,918 | |
TSW Large Cap Value Fund | | Institutional Shares | | | 360,491 | | | | 313,606 | | | | (673,937 | ) | | | 160 | |
76
JOHCM FUNDS TRUST
NOTES TO FINANCIAL STATEMENTS
September 30, 2023
Transactions in dollars for fund shares for the year ended September 30, 2022, were as follows:
| | | | | | | | | | | | | | | | | | |
| | | | | | | | | | | Payments | | | Net Increase | |
| | | | | Proceeds from | | | Reinvestments | | | for Shares | | | (Decrease) in | |
Fund | | Class | | Shares Sold | | | of Dividends | | | Redeemed | | | Net Assets | |
JOHCM Emerging Markets Discovery Fund | | Advisor Shares | | $ | 1,407,750 | | | $ | 3,303,179 | | | $ | (3,770,126 | ) | | $ | 940,803 | |
JOHCM Emerging Markets Discovery Fund | | Institutional Shares | | | 10,540,313 | | | | 7,719,433 | | | | (9,672,084 | ) | | | 8,587,662 | |
JOHCM Emerging Markets Opportunities Fund | | Advisor Shares | | | 35,573,321 | | | | 2,027,795 | | | | (29,803,821 | ) | | | 7,797,295 | |
JOHCM Emerging Markets Opportunities Fund | | Investor Shares | | | 12,683,392 | | | | 323,106 | | | | (10,719,251 | ) | | | 2,287,247 | |
JOHCM Emerging Markets Opportunities Fund | | Institutional Shares | | | 285,279,477 | | | | 25,240,159 | | | | (289,480,942 | ) | | | 21,038,694 | |
JOHCM Global Select Fund | | Advisor Shares | | | 5,138,615 | | | | 7,412,087 | | | | (16,942,188 | ) | | | (4,391,486 | ) |
JOHCM Global Select Fund | | Institutional Shares | | | 17,740,444 | | | | 76,791,960 | | | | (139,220,436 | ) | | | (44,688,032 | ) |
JOHCM International Opportunities Fund | | Institutional Shares | | | — | | | | 331,277 | | | | (1,520,790 | ) | | | (1,189,513 | ) |
JOHCM International Select Fund | | Investor Shares | | | 26,569,860 | | | | 72,404,775 | | | | (174,562,934 | ) | | | (75,588,299 | ) |
JOHCM International Select Fund | | Institutional Shares | | | 2,579,824,065 | | | | 754,625,044 | | | | (4,242,209,238 | ) | | | (907,760,129 | ) |
Regnan Global Equity Impact Solutions | | Institutional Shares | | | 10,461,500 | | | | — | | | | (1,677,626 | ) | | | 8,783,874 | |
TSW Emerging Markets Fund* | | Institutional Shares | | | 10,000,000 | | | | — | | | | — | | | | 10,000,000 | |
TSW High Yield Bond Fund** | | Institutional Shares | | | 13,016,972 | | | | 296,608 | | | | — | | | | 13,313,580 | |
TSW Large Cap Value Fund*** | | Institutional Shares | | | 4,954,476 | | | | 5,001,015 | | | | (6,480,590 | ) | | | 3,474,901 | |
* For the period from December 21, 2021, commencement of operations, to September 30, 2022. ** For the period from October 26, 2021, commencement of operations, to September 30, 2022. *** For the period from November 1, 2021 to September 30, 2022. Transactions in shares of fund shares for the year ended September 30, 2022, were as follows: | |
| | | | | | | | Shares From | | | | | | Net Increase | |
| | | | | Shares | | | Reinvested | | | Shares | | | (Decrease) | |
Fund | | Class | | Sold | | | Dividends | | | Redeemed | | | in Shares | |
JOHCM Emerging Markets Discovery Fund | | Advisor Shares | | | 102,086 | | | | 242,169 | | | | (311,291 | ) | | | 32,964 | |
JOHCM Emerging Markets Discovery Fund | | Institutional Shares | | | 863,049 | | | | 565,112 | | | | (837,673 | ) | | | 590,488 | |
JOHCM Emerging Markets Opportunities Fund | | Advisor Shares | | | 3,031,927 | | | | 164,727 | | | | (2,812,338 | ) | | | 384,316 | |
JOHCM Emerging Markets Opportunities Fund | | Investor Shares | | | 1,145,993 | | | | 26,205 | | | | (904,819 | ) | | | 267,379 | |
JOHCM Emerging Markets Opportunities Fund | | Institutional Shares | | | 25,523,191 | | | | 2,045,394 | | | | (25,865,081 | ) | | | 1,703,504 | |
JOHCM Global Select Fund | | Advisor Shares | | | 296,932 | | | | 376,248 | | | | (912,811 | ) | | | (239,631 | ) |
JOHCM Global Select Fund | | Institutional Shares | | | 1,019,426 | | | | 3,886,233 | | | | (8,943,362 | ) | | | (4,037,703 | ) |
JOHCM International Opportunities Fund | | Institutional Shares | | | — | | | | 33,769 | | | | (145,378 | ) | | | (111,609 | ) |
JOHCM International Select Fund | | Investor Shares | | | 1,049,147 | | | | 2,450,246 | | | | (8,007,868 | ) | | | (4,508,475 | ) |
JOHCM International Select Fund | | Institutional Shares | | | 100,054,720 | | | | 25,580,510 | | | | (184,249,895 | ) | | | (58,614,665 | ) |
Regnan Global Equity Impact Solutions | | Institutional Shares | | | 1,209,512 | | | | — | | | | (238,520 | ) | | | 970,992 | |
TSW Emerging Markets Fund* | | Institutional Shares | | | 1,000,000 | | | | — | | | | — | | | | 1,000,000 | |
TSW High Yield Bond Fund** | | Institutional Shares | | | 1,313,944 | | | | 30,901 | | | | — | | | | 1,344,845 | |
TSW Large Cap Value Fund*** | | Institutional Shares | | | 331,208 | | | | 360,439 | | | | (449,065 | ) | | | 242,582 | |
* For the period from December 21, 2021, commencement of operations, to September 30, 2022. ** For the period from October 26, 2021, commencement of operations, to September 30, 2022. *** For the period from November 1, 2021 to September 30, 2022. Transactions in dollars for the TSW Predecessor Fund shares for the year ended October 31, 2021, were as follows: | |
| | | | | | | | | | | Payments | | | Net Increase | |
| | | | | Proceeds from | | | Reinvestments | | | for Shares | | | (Decrease) in | |
Fund | | Class | | Shares Sold | | | of Dividends | | | Redeemed | | | Net Assets | |
TSW Large Cap Value Fund* | | Institutional Shares | | $ | 1,350,906 | | | $ | 1,668,777 | | | $ | (5,223,838 | ) | | $ | (2,204,155 | ) |
| * | For the TSW Predecessor Fund’s prior fiscal year ended October 31, 2021. Payments for Shares Redeemed is net of redemption fees of $489. |
77
JOHCM FUNDS TRUST
NOTES TO FINANCIAL STATEMENTS
September 30, 2023
Transactions in shares of the TSW Predecessor Fund shares for the year ended October 31, 2021, were as follows:
| | | | | | | | | | | | | | | | | | |
| | | | | | | | Shares From | | | | | | Net Increase | |
| | | | | Shares | | | Reinvested | | | Shares | | | (Decrease) | |
Fund | | Class | | Sold | | | Dividends | | | Redeemed | | | in Shares | |
TSW Large Cap Value Fund* | | Institutional Shares | | | 96,540 | | | | 130,958 | | | | (368,264 | ) | | | (140,766 | ) |
| * | For the TSW Predecessor Fund’s prior fiscal year ended October 31, 2021. |
| H. | Concentration of Ownership |
A significant portion of a Fund’s shares may be held in a limited number of shareholder accounts, including in certain omnibus or institutional accounts which typically hold shares for the benefit of other underlying investors. To the extent that a shareholder or group of shareholders redeem a significant portion of the shares issued by a Fund, this could have a disruptive impact on the efficient implementation of a Fund’s investment strategy.
As of September 30, 2023, JOHCM or JOHCM affiliates held outstanding shares of the below Funds as follows:
| | | | | | |
| | | | | % | |
Fund | | Class | | Ownership | |
JOHCM Emerging Markets Discovery Fund | | Advisor Shares | | | 0.5 | |
JOHCM Emerging Markets Discovery Fund | | Institutional Shares | | | 20.6 | |
JOHCM International Opportunities Fund | | Institutional Shares | | | 99.7 | |
Regnan Global Equity Impact Solutions | | Institutional Shares | | | 16.6 | |
TSW Emerging Markets Fund | | Institutional Shares | | | 100.0 | |
TSW High Yield Bond Fund | | Institutional Shares | | | 43.7 | |
TSW Large Cap Value Fund | | Institutional Shares | | | 6.8 | |
On May 16, 2023 the Board approved the Agreement and Plan of Reorganization relating to the proposed reorganizations of the Trillium ESG Global Equity Fund and Trillium ESG Small/Mid Cap Fund (each a series of the Professionally Managed Portfolios, and together, the Trillium Target Funds) with and into the Trillium ESG Global Equity Fund and the Trillium ESG Small/Mid Cap Fund, respectively (each a series of the Trust, and together, the Trillium Acquiring Funds). The Target Trillium Funds’ shareholders subsequently approved the reorganizations, and such reorganizations took place on October 30, 2023.
78
Report of Independent Registered Public Accounting Firm
To the Board of Trustees of JOHCM Funds Trust and Shareholders of each of the nine funds listed in the table below
Opinions on the Financial Statements
We have audited the accompanying statements of assets and liabilities, including the schedules of investments, of each of the funds listed in the table below (constituting JOHCM Funds Trust, hereafter collectively referred to as the “Funds”) as of September 30, 2023, the related statements of operations for the year ended September 30, 2023, the statements of changes in net assets for each of the periods indicated in the table below, including the related notes, and the financial highlights for each of the periods indicated in the table below (collectively referred to as the “financial statements”). In our opinion, the financial statements present fairly, in all material respects, the financial position of each of the Funds as of September 30, 2023, the results of each of their operations for the year then ended, the changes in each of their net assets for each of the periods indicated in the table below and each of the financial highlights for each of the periods indicated in the table below in conformity with accounting principles generally accepted in the United States of America.
JOHCM Emerging Markets Discovery Fund (1)
JOHCM Emerging Markets Opportunities Fund (1)
JOHCM Global Select Fund (1)
JOHCM International Opportunities Fund (1)
JOHCM International Select Fund (1)
Regnan Global Equity Impact Solutions (2)
TSW Emerging Markets Fund (3)
TSW High Yield Bond Fund (4)
TSW Large Cap Value Fund (5)
| | (1) | Statements of changes in net assets for each of the two years in the period ended September 30, 2023 and the financial highlights for each of the five years in the period ended September 30, 2023 |
| | (2) | Statement of changes in net assets for each of the two years in the period ended September 30, 2023 and the financial highlights for the years ended September 30, 2023 and 2022 and the period from August 23, 2021 (commencement of operations) to September 30, 2021 |
| | (3) | Statement of changes in net assets and the financial highlights for the year ended September 30, 2023 and the period from December 21, 2021 (commencement of operations) to September 30, 2022 |
| | (4) | Statement of changes in net assets and the financial highlights for the year ended September 30, 2023 and the period from October 26, 2021 (commencement of operations) to September 30, 2022 |
| | (5) | Statement of changes in net assets and the financial highlights for the year ended September 30, 2023 and the period from November 1, 2021 to September 30, 2022 |
The financial statements of TSW Large Cap Value Fund (formerly known as TS&W Equity Portfolio) as of and for the year ended October 31, 2021 and the financial highlights for each of the periods ended on or prior to October 31, 2021 (not presented herein, other than the financial highlights) were audited by other auditors whose report dated December 23, 2021 expressed an unqualified opinion on those financial statements and financial highlights.
79
Basis for Opinions
These financial statements are the responsibility of the Funds’ management. Our responsibility is to express an opinion on the Funds’ financial statements based on our audits. We are a public accounting firm registered with the Public Company Accounting Oversight Board (United States) (PCAOB) and are required to be independent with respect to the Funds in accordance with the U.S. federal securities laws and the applicable rules and regulations of the Securities and Exchange Commission and the PCAOB.
We conducted our audits of these financial statements in accordance with the standards of the PCAOB. Those standards require that we plan and perform the audit to obtain reasonable assurance about whether the financial statements are free of material misstatement, whether due to error or fraud.
Our audits included performing procedures to assess the risks of material misstatement of the financial statements, whether due to error or fraud, and performing procedures that respond to those risks. Such procedures included examining, on a test basis, evidence regarding the amounts and disclosures in the financial statements. Our audits also included evaluating the accounting principles used and significant estimates made by management, as well as evaluating the overall presentation of the financial statements. Our procedures included confirmation of securities owned as of September 30, 2023 by correspondence with the custodian and brokers; when replies were not received from brokers, we performed other auditing procedures. We believe that our audits provide a reasonable basis for our opinions.
/s/ PricewaterhouseCoopers LLP
Chicago, Illinois
November 20, 2023
We have served as the auditor of one or more investment companies in JOHCM Funds Trust since 2014.
80
JOHCM FUNDS TRUST
ADDITIONAL INFORMATION
September 30, 2023 (Unaudited)
As a Fund shareholder, you may incur two types of costs: (1) transaction costs, and (2) ongoing costs, including management fees; distribution (12b-1) fees; and other Fund expenses. The examples below are intended to help you understand your ongoing costs (in dollars) of investing in the Funds and to compare these costs with the ongoing costs of investing in other mutual funds. Please note that the expenses shown in the tables are meant to highlight your ongoing costs only and do not reflect any transactional costs. Therefore, the examples are useful in comparing ongoing costs only and will not help you determine the relative total cost of owning different funds. In addition, if these transactional costs were included, your costs would have been higher.
The examples below are based on an investment of $1,000 invested at April 1, 2023 and held for the entire period through September 30, 2023.
The Actual Expense Example below provides information about actual account values and actual expenses. You may use this information, together with the amount you invested, to estimate the expenses that you paid over the period. Simply divide your account value by $1,000 (for example, an $8,600 account value divided by $1,000 = 8.6), then multiply the result by the number in the table under the heading entitled “Expenses Paid” to estimate the expenses you paid on your account during this period.
The Hypothetical Expense Example below provides information about hypothetical account values and hypothetical expenses based on a Fund’s actual expense ratio and an assumed rate of return of 5% per year before expenses, which is not a Fund’s actual return. The hypothetical account values and expenses may not be used to estimate the actual ending account balance or expenses you paid for the period. You may use this information to compare the ongoing costs of investing in the Funds and other funds. To do so, compare this 5% hypothetical example with the 5% hypothetical examples that appear in the shareholder reports of the other funds.
Actual Expense Example
| | | | | | | | | | | | | | | | | | |
Fund | | Class | | Expense
Ratio | | | Beginning
Account Value
4/1/2023 | | | Ending
Account Value
9/30/2023 | | | Expenses
Paid*
4/1/23–9/30/23 | |
JOHCM Emerging Markets Discovery Fund | | Advisor Shares | | | 1.59 | % | | $ | 1,000.00 | | | $ | 1,070.60 | | | $ | 8.25 | |
JOHCM Emerging Markets Discovery Fund | | Institutional Shares | | | 1.49 | % | | | 1,000.00 | | | | 1,071.40 | | | | 7.74 | |
JOHCM Emerging Markets Opportunities Fund | | Advisor Shares | | | 1.11 | % | | | 1,000.00 | | | | 961.90 | | | | 5.46 | |
JOHCM Emerging Markets Opportunities Fund | | Investor Shares | | | 1.27 | % | | | 1,000.00 | | | | 960.00 | | | | 6.24 | |
JOHCM Emerging Markets Opportunities Fund | | Institutional Shares | | | 1.04 | % | | | 1,000.00 | | | | 962.00 | | | | 5.12 | |
JOHCM Global Select Fund | | Advisor Shares | | | 1.09 | % | | | 1,000.00 | | | | 960.10 | | | | 5.36 | |
JOHCM Global Select Fund | | Institutional Shares | | | 0.99 | % | | | 1,000.00 | | | | 960.20 | | | | 4.86 | |
JOHCM International Opportunities Fund | | Institutional Shares | | | 0.69 | % | | | 1,000.00 | | | | 1,011.20 | | | | 3.48 | |
JOHCM International Select Fund | | Investor Shares | | | 1.21 | % | | | 1,000.00 | | | | 984.30 | | | | 6.02 | |
JOHCM International Select Fund | | Institutional Shares | | | 0.98 | % | | | 1,000.00 | | | | 985.70 | | | | 4.88 | |
Regnan Global Equity Impact Solutions | | Institutional Shares | | | 0.90 | % | | | 1,000.00 | | | | 963.60 | | | | 4.43 | |
TSW Emerging Markets Fund | | Institutional Shares | | | 0.99 | % | | | 1,000.00 | | | | 971.40 | | | | 4.89 | |
TSW High Yield Bond Fund | | Institutional Shares | | | 0.65 | % | | | 1,000.00 | | | | 1,026.80 | | | | 3.30 | |
TSW Large Cap Value Fund | | Institutional Shares | | | 0.73 | % | | | 1,000.00 | | | | 1,020.60 | | | | 3.70 | |
| * | Actual expenses are calculated using each Fund’s annualized expense ratio (as disclosed in the table), multiplied by the average account value for the period, multiplied by the actual number of operational days in the most recent half fiscal year (183) and divided by the number of days in the current year (365). |
81
JOHCM FUNDS TRUST
ADDITIONAL INFORMATION
September 30, 2023 (Unaudited)
Hypothetical Expense Example
| | | | | | | | | | | | | | | | | | |
Fund | | Class | | Expense
Ratio | | | Beginning
Account Value
4/1/2023 | | | Ending
Account Value
9/30/2023 | | | Expenses
Paid*
4/1/23–9/30/23 | |
JOHCM Emerging Markets Discovery Fund | | Advisor Shares | | | 1.59 | % | | $ | 1,000.00 | | | $ | 1,017.10 | | | $ | 8.04 | |
JOHCM Emerging Markets Discovery Fund | | Institutional Shares | | | 1.49 | % | | | 1,000.00 | | | | 1,017.60 | | | | 7.54 | |
JOHCM Emerging Markets Opportunities Fund | | Advisor Shares | | | 1.11 | % | | | 1,000.00 | | | | 1,019.50 | | | | 5.62 | |
JOHCM Emerging Markets Opportunities Fund | | Investor Shares | | | 1.27 | % | | | 1,000.00 | | | | 1,018.70 | | | | 6.43 | |
JOHCM Emerging Markets Opportunities Fund | | Institutional Shares | | | 1.04 | % | | | 1,000.00 | | | | 1,019.85 | | | | 5.27 | |
JOHCM Global Select Fund | | Advisor Shares | | | 1.09 | % | | | 1,000.00 | | | | 1,019.60 | | | | 5.52 | |
JOHCM Global Select Fund | | Institutional Shares | | | 0.99 | % | | | 1,000.00 | | | | 1,020.10 | | | | 5.01 | |
JOHCM International Opportunities Fund | | Institutional Shares | | | 0.69 | % | | | 1,000.00 | | | | 1,021.61 | | | | 3.50 | |
JOHCM International Select Fund | | Investor Shares | | | 1.21 | % | | | 1,000.00 | | | | 1,019.00 | | | | 6.12 | |
JOHCM International Select Fund | | Institutional Shares | | | 0.98 | % | | | 1,000.00 | | | | 1,020.16 | | | | 4.96 | |
Regnan Global Equity Impact Solutions | | Institutional Shares | | | 0.90 | % | | | 1,000.00 | | | | 1,020.56 | | | | 4.56 | |
TSW Emerging Markets Fund | | Institutional Shares | | | 0.99 | % | | | 1,000.00 | | | | 1,020.10 | | | | 5.01 | |
TSW High Yield Bond Fund | | Institutional Shares | | | 0.65 | % | | | 1,000.00 | | | | 1,021.81 | | | | 3.29 | |
TSW Large Cap Value Fund | | Institutional Shares | | | 0.73 | % | | | 1,000.00 | | | | 1,021.41 | | | | 3.70 | |
| * | Hypothetical expenses are calculated using each Fund’s annualized expense ratio (as disclosed in the table), multiplied by the average account value for the period, multiplied by the actual number of operational days in the most recent half fiscal year (183) and divided by the number of days in the current year (365). |
82
JOHCM FUNDS TRUST
ADDITIONAL INFORMATION
September 30, 2023 (Unaudited)
| B. | Qualified Dividend Income (QDI) |
Under the Jobs and Growth Tax Relief Reconciliation Act of 2003 (the “Act”), the following percentages of ordinary dividends paid during the fiscal year ended September 30, 2023 for the below Funds are designated as Qualified Dividend Income (“QDI”), as defined in the Act, subject to reduced tax rates in 2023:
| | | | |
Fund | | QDI Percentage | |
JOHCM Emerging Markets Discovery Fund | | | 100.00 | % |
JOHCM Emerging Markets Opportunities Fund | | | 100.00 | % |
JOHCM Global Select Fund | | | 100.00 | % |
JOHCM International Opportunities Fund | | | 100.00 | % |
JOHCM International Select Fund | | | 100.00 | % |
Regnan Global Equity Impact Solutions | | | 100.00 | % |
TSW Emerging Markets Fund | | | 100.00 | % |
TSW Large Cap Value Fund | | | 63.99 | % |
| C. | Corporate Dividends Received Deduction (DRD) |
A percentage of the dividends distributed during the fiscal year ended September 30, 2023 for the Funds below qualifies for the Dividends-Received Deduction (“DRD”) for corporate shareholders:
| | | | |
Fund | | Corporate DRD Percentage | |
JOHCM Global Select Fund | | | 100.00 | % |
JOHCM International Opportunities Fund | | | 7.40 | % |
JOHCM International Select Fund | | | 0.99 | % |
Regnan Global Equity Impact Solutions | | | 100.00 | % |
TSW Emerging Markets Fund | | | 0.91 | % |
TSW Large Cap Value Fund | | | 55.92 | % |
The Funds below intends to make an election that will allow shareholders to treat their proportionate share of foreign taxes paid by the Funds as having been paid by them. The amounts per share which represent income from sources within, and taxes paid to, foreign countries are as follows:
| | | | | | | | |
Fund | | Foreign Tax Credit | | | Foreign Source Income | |
JOHCM Emerging Markets Discovery Fund | | $ | 0.0335 | | | $ | 0.0684 | |
JOHCM Emerging Markets Opportunities Fund | | $ | 0.0290 | | | $ | 0.1878 | |
JOHCM International Opportunities Fund | | $ | 0.0419 | | | $ | 0.2386 | |
JOHCM International Select Fund | | $ | 0.0452 | | | $ | 0.3329 | |
Regnan Global Equity Impact Solutions | | $ | 0.0157 | | | $ | 0.0299 | |
TSW Emerging Markets Fund | | $ | 0.0259 | | | $ | 0.1731 | |
Investors may obtain, without charge, a copy of the proxy voting policies and procedures by writing to the Trust in the name of a Fund c/o The Northern Trust Company, P.O. Box 4766, Chicago, Illinois 60680-4766, or by calling a Fund at 866-260-9549 (toll free) or 312-557-5913 and on the SEC’s website at www.sec.gov. Information about how the Funds voted proxies relating to portfolio securities for each 12 month period ending June 30 is available without charge, upon request, by calling the Trust at 866-260-9549 (toll free) or 312-557-5913 and on the SEC’s website at www.sec.gov.
83
JOHCM FUNDS TRUST
ADDITIONAL INFORMATION
September 30, 2023 (Unaudited)
The Funds file their complete schedule of portfolio holdings with the SEC for the first and third quarters of each fiscal year as an exhibit to their reports on Form N-PORT. The Funds’ Form N-PORT reports are available on the SEC website at www.sec.gov.
84
JOHCM FUNDS TRUST
ADDITIONAL INFORMATION
September 30, 2023 (Unaudited)
The following table provides information regarding each Trustee who is not an “interested person” of the Trust, as defined in the 1940 Act (each an “Independent Trustee”).
| | | | | | | | | | |
Name,Address and Year of Birth1 | | Position(s)
Held with the Trust | | Term of
Office/Length
of Time Served | | Principal Occupation(s) During Past 5 Years | | Number of
Portfolios
in the Trust
Overseen
by Trustee | | Other Directorships
Held by Trustee
During Past 5 Years |
Joseph P. Gennaco (1961) | | Trustee | | Since inception | | Sole Principal at JPG Consulting, LLC (April 2019 – present); Independent Non-Executive Director at BNY Mellon International Limited (January 2019 – May 2021); Executive at BNY Mellon (July 2005 – December 2018). | | 12 | | None |
| | | | | |
Barbara A. McCann (1961) | | Trustee | | Since inception | | None | | 12 | | None |
| | | | | |
Kevin J. McKenna (1957) | | Trustee | | Since Inception | | None | | 12 | | None |
| | | | | |
Beth K. Werths (1968) | | Trustee and Chair | | Since Inception | | Executive Vice President and International General Counsel at Natixis Investmenlt Management (February 2007 - November 2020). | | 12 | | None |
| 1 | The mailing address of each Trustee is 53 State Street, 13th Floor Boston, MA, 02109. |
85
JOHCM FUNDS TRUST
ADDITIONAL INFORMATION
September 30, 2023 (Unaudited)
The following table provides information regarding each Trustee who is an “interested person” of the Trust, as defined in the 1940 Act and each officer of the Trust.
| | | | | | | | | | |
Name,Address and Year of Birth1 | | Position(s)
Held with the Trust | | Term of
Office/Length
of Time Served | | Principal Occupation(s) During Past 5 Years | | Number of
Portfolios
in the Trust
Overseen
by Trustee | | Other Directorships
Held by Trustee
During Past 5 Years |
Jonathan Weitz (1976) | | President and Chief Executive Officer | | Since inception | | Chief Operating Officer, US, JOHCM (USA) Inc (2020 to present); Senior Vice President—Business Manager JOHCM (USA) Inc (2016 to 2020); Partner and Management Committee Member Century Capital Management (2003 to 2016). | | N/A | | N/A |
| | | | | |
Max Kadis (1970) | | Vice President | | Since 2022 | | Operations Manager, US, JOHCM (USA) Inc (2022 – present); Vice President BNY Mellon Asset Servicing (2006 – 2022). | | N/A | | N/A |
| | | | | |
Troy Sheets (1971) | | Treasurer | | Since inception | | Senior Director, Foreside Financial Group, LLC (2016 – present). | | N/A | | N/A |
| | | | | |
David Lebisky (1972) | | Chief Compliance Officer | | Since 2021 | | Compliance Manager, US, JOHCM (USA) Inc (March 2021 to present); President, Lebisky Compliance Consulting LLC (2015 to 2020). | | N/A | | N/A |
| | | | | |
Mary Lomasney (1957) | | Secretary | | Since inception | | Head of Legal and Compliance, US, JOHCM (USA) Inc (2016 to present); Managing Director BNY Mellon (2007 to 2015). | | N/A | | N/A |
| | | | | |
Matthew J. Broucek (1988) | | Assistant Secretary | | Since inception | | Vice President, Northern Trust Global Fund Services Fund Governance Solutions (2016 to present). | | N/A | | N/A |
| 1 | The mailing address of each Trustee and Officer is 53 State Street, 13th Floor Boston, MA, 02109. |
The Funds’ Statement of Additional Information includes additional information about the Trust’s Trustees and Officers. To receive your free copy of the Statement of Additional Information, call toll-free 866-260-9549.
86
JOHCM FUNDS TRUST
We recognize and respect the privacy expectations of each of our investors and we believe the confidentiality and protection of investor information is one of our fundamental responsibilities. New technologies have dramatically changed the way information is gathered and used, but our continuing commitment to preserving the security and confidentiality of investor information has remained a core value of the Trust.
| II. | Information We Collect And Sources Of Information |
We may collect information about our customers to help identify you, evaluate your application, service and manage your account and offer services and products you may find valuable. We collect this information from a variety of sources including:
| | • | | Information we receive from you on applications or other forms (e.g. your name, address, date of birth, social security number and investment information); |
| | • | | Information about your transactions and experiences with us and our affiliates (e.g. your account balance, transaction history and investment selections); and |
| | • | | Information we obtain from third parties regarding their brokerage, investment advisory, custodial or other relationship with you (e.g. your account number, account balance and transaction history. |
| III. | Information We Share With Service Providers |
We may disclose all non-public personal information we collect, as described above, to companies (including affiliates) that perform services on our behalf, including those that assist us in responding to inquiries, processing transactions, preparing and mailing account statements and other forms of shareholder services provided they use the information solely for these purposes and they enter into confidentiality agreements regarding the information.
| IV. | Information We May Share With Affiliates |
If we have affiliates which are financial service providers that offer investment advisory, brokerage and other financial services, we may (subject to Board approval) share information among our affiliates to better assist you in achieving your financial goals.
| V. | Safeguarding Customer Information |
We will safeguard, according to federal standards of security and confidentiality, any non-public personal information our customers share with us.
We will limit the collection and use of non-public customer information to the minimum necessary to deliver superior service to our customers which includes advising our customers about our products and services and to administer our business.
We will permit only authorized employees who are trained in the proper handling of non-public customer information to have access to that information.
We will not reveal non-public customer information to any external organization unless we have previously informed the customer in disclosures or agreements, have been authorized by the customer or are required by law or our regulators.
We value you as a customer and take your personal privacy seriously. We will inform you of our policies for collecting, using, securing and sharing nonpublic personal information the first time we do business and, except as described below, every year that you are a customer of the Trust, or anytime we make a material change to our privacy policy.
We may combine a privacy notice with another document (for example, an account statement, annual report, prospectus, trade confirmation) or may deliver the notice electronically where appropriate consent has been obtained. We generally will not deliver an annual notice as long as (i) we disclose non-public personal information only as described above policy, and (ii) we have not changed our policies and practices with regard to disclosing non-public personal information from the policies and practices that were disclosed in the most recent disclosure sent to consumers pursuant to this policy.
(This page has been intentionally left blank)
(This page has been intentionally left blank)
Investment Adviser
JOHCM (USA) Inc
53 State Street, 13th Floor
Boston, Massachusetts 02109
Custodian
The Northern Trust Company
50 South LaSalle Street
Chicago, Illinois 60603
Independent Registered Public Accounting Firm
PricewaterhouseCoopers LLP
One North Wacker Drive
Chicago, IL 60606
Legal Counsel
Ropes & Gray LLP
Prudential Tower, 800 Boylston Street
Boston, MA 02199
Distributor
Perpetual Americas Funds Distributors, LLC
3 Canal Plaza, Suite 100
Portland, Maine 04101
For Additional Information, call
866-260-9549 (toll free) or 312-557-5913
JFT 09/23
(b) Not applicable.
Item 2. Code of Ethics.
As of September 30, 2023, the registrant had adopted a “code of ethics” (as such term is defined in Item 2 of Form N-CSR) that applies to the registrant’s principal executive officer and principal financial officer. This code is incorporated by reference at Exhibit 13(a)(1) hereto. There were no substantive amendments or waivers to the code of ethics during the period covered by this report.
Item 3. Audit Committee Financial Expert.
The registrant’s Board of Trustees has determined the registrant has at least one “audit committee financial expert” (as such term is defined in Item 3 of Form N-CSR) serving on its Audit Committee. The “audit committee financial expert” is Joseph P. Gennaco, who is “independent” for purposes of this Item 3 of Form N-CSR.
Item 4. Principal Accountant Fees and Services.
2023: $265,950
2022: $309,650
The fees paid to PricewaterhouseCoopers LLP relate to the audit of the registrant’s annual financial statements and letters for filings of the registrant’s Form N-CEN and N-1A.
(b) Audit-Related Fees
2023: $0
2022: $0
(c) Tax Fees
2023: $78,840
2022: $62,260
The fees to PricewaterhouseCoopers LLP relate to the preparation of the registrant’s tax returns, review of annual distributions, additional tax provision support fees, and local tax services in certain foreign markets.
(d) All Other Fees
2023: $0
2022: $0
(e)(1)
Except as permitted by rule 2-01(c)(7)(i)(C) of regulation S-X the registrant’s audit committee must pre-approve all audit and non-audit services provided by the independent accountants relating to the operations or financial reporting of the registrant. Prior to the commencement of any audit or non-audit services to the registrant, the audit committee reviews the services to determine whether they are appropriate and permissible under applicable law.
(e)(2)
2023: 0%
2022: 0%
(f)
Not applicable.
(g)
2023: $128,840
2022: $412,979
(h)
The Audit Committee considered the non-audit services rendered to the registrant’s investment adviser and believes the services are compatible with the principal accountant’s independence.
(i)
The registrant has not been identified by the U.S. Securities and Exchange Commission as having filed an annual report issued by a registered public accounting firm branch or office that is located in a foreign jurisdiction where the Public Company Accounting Oversight Board is unable to inspect or completely investigate because of a position taken by an authority in that jurisdiction.
(j)
The registrant is not a foreign issuer.
Item 5. Audit Committee of Listed Registrants.
Not applicable.
Item 6. Investments.
| (a) | The Schedule of Investments in securities of unaffiliated issuers is included in the report to shareholders filed under Item 1 of this Form. |
Item 7. Disclosure of Proxy Voting Policies and Procedures for Closed-End Management Investment Companies.
Not applicable.
Item 8. Portfolio Managers of Closed-End Management Investment Companies.
Not applicable.
Item 9. Purchases of Equity Securities by Closed-End Management Investment Company and Affiliated Purchasers.
Not applicable.
Item 10. Submission of Matters to a Vote of Security Holders.
Not applicable.
Item 11. Controls and Procedures.
| (a) | The registrant’s principal executive officer and principal financial officer have concluded, based on their evaluation of the registrant’s disclosure controls and procedures as conducted within 90 days of the filing date of this report, that these disclosure controls and procedures are adequately designed and are operating effectively to ensure that information required to be disclosed by the registrant on Form N-CSR is recorded, processed, summarized and reported within the time periods specified in the Securities and Exchange Commission’s rules and forms. |
| (b) | There were no changes in the registrant’s internal control over financial reporting (as defined in Rule 30a-3(d) under the Investment Company Act of 1940) that occurred during the period covered by this report that have materially affected or are reasonably likely to materially affect, the registrant’s internal control over financial reporting. |
Item 12. Disclosure of Securities Lending Activities for Closed-End Management Investment Companies.
Not applicable.
Item 13. Exhibits.
(a)(3) Not applicable.
(a)(4) Not applicable.
SIGNATURES
Pursuant to the requirements of the Securities Exchange Act of 1934 and the Investment Company Act of 1940, the registrant has duly caused this report to be signed on its behalf by the undersigned, thereunto duly authorized.
| | |
| JOHCM Funds Trust |
| |
| By: | | /s/ Troy Sheets |
| | Troy Sheets |
| | Treasurer and Principal Financial Officer |
| |
| Date: | | November 30, 2023 |
Pursuant to the requirements of the Securities Exchange Act of 1934 and the Investment Company Act of 1940, this report has been signed below by the following persons on behalf of the registrant and in the capacities and on the dates indicated.
| | |
| By: | | /s/ Jonathan Weitz |
| | Jonathan Weitz |
| | President and Principal Executive Officer |
| |
| Date: | | November 30, 2023 |
| |
| By: | | /s/ Troy Sheets |
| | Troy Sheets |
| | Treasurer and Principal Financial Officer |
| |
| Date: | | November 30, 2023 |