Exhibit (c)(3)

Presentation to the Special Committee May 23 rd , 2024

PROJECT CHELIOS This presentation, and any supplemental information (written or oral) or other documents provided in connection therewith (co llectively, the “materials”), are provided solely for the information of the Special Committee (the “Special Committee”) of the Board of Directors (the “Board”) of Keypath Education International, Inc. (the “Company”) by BMO Capital Markets Corp. (“BMO”) in connection with the Special Committee’s consideration of a potential transaction (the “Transaction”) involving the Company. This presentation is incomplete without reference to, and should be considered in conjunction with, any supplemental information provided by and discussions with BMO in connection therewith. Any defined terms used herein shall have the meanings set forth herein, even if such defined terms have been given different meanings elsewhere in the materials. The materials are for discussion purposes only. BMO expressly disclaims any and all liability which may be based on the materials and any errors therein or omissions therefrom. The materials were prepared for specific persons familiar with the business and affairs of the Company for use in a specific context and were not prepared with a view to public disclosure or to conform with any disclosure standards under any state, federal or international securities laws or other laws, rules or regulations, and none of the Special Committee, Board, the Company or BMO takes any responsibility for the use of the materials by persons other than the Special Committee. The materials are provided on a confidential basis for the information of the Special Committee and may not be disclosed, summarized, reproduced, disseminated or quoted or otherwise referred to, in whole or in part, without BMO’s express prior written consent except to the extent required by applicable laws or the rules of the ASX. Notwithstanding any other provision herein, the Company (and each employee, representative or other agent of the Company) may disclose to any and all persons without limitation of any kind, the tax treatment and tax structure of any transaction and all materials of any kind (including opinions or other tax analyses, if any) that are provided to the Company relating to such tax treatment and structure. However, any information relating to the tax treatment and tax structure shall remain confidential (and the foregoing sentence shall not apply) to the extent necessary to enable any person to comply with securities laws. For this purpose, the tax treatment of a transaction is the purported or claimed U.S. income or franchise tax treatment of the transaction and the tax structure of a transaction is any fact that may be relevant to understanding the purported or claimed U.S. income or franchise tax treatment of the transaction. If the Company plans to disclose information pursuant to the first sentence of this paragraph, the Company shall inform those to whom it discloses any such information that they may not rely upon such information for any purpose without BMO’s prior written consent. BMO is not an expert on, and nothing contained in the materials should be construed as advice with regard to, legal, accounting, regulatory, insurance, tax or other specialist matters. BMO’s role in reviewing any information is limited solely to performing such a review as it shall deem necessary to support i ts own advice and analysis and shall not be on behalf of the Special Committee or the Board. The materials necessarily are based on financial, economic, market and other conditions as in effect on, and the information available to B MO as of, the date of the materials. Although subsequent developments may affect the contents of the materials, BMO has not undertaken, and is under no obligation, to update, revise or reaffirm the materials, except as may be expressly contemplated by BMO’s engagement letter. The materials are not intended to provide the sole basis for evaluation of the Transaction and do not purport to contain all information that may be required. The materials do not address the underlying business decision of the Company or any other party to proceed with or effect the Transaction, or the relative merits of the Transaction as compared to any alternative business strategies or transactions that might be available for the Company or any other party. The materials do not constitute any opinion, nor do the materials constitute a recommendation to the Special Committee, the Board, the Company, any security holder of the Company or any other party as to how to vote or act with respect to any matter relating to the Transaction or otherwise or whether to buy or sell any assets or securities of any company. BMO’s only opinion is the opinion, if any, that is actually delivered to the Special Committee. The materials may not reflect information known to other professionals in other business areas of BMO and its affiliates. The preparation of the materials was a complex process involving quantitative and qualitative judgments and determinations with respect to the financial, comparative and other analytic methods employed and the adaption and applicatio n of these methods to the unique facts and circumstances presented and, therefore, is not readily susceptible to partial analysis or summary description. Furthermore, BMO did not attribute any particular weight to any analysis or factor considered by it, but rather made qualitative judgments as to the significance and relevance of each analysis and factor. Each analytical technique has inherent strengths and weaknesses, and the nature of the available in formation may further affect the value of particular techniques. Accordingly, the analyses contained in the materials must be considered as a whole. Selecting portions of the analyses, analytic methods and factors without considering all analyses and factors could create a misleading or incomplete view. The materials reflect judgments and assumptions with regard to industry performance, general business, economic, regulatory, market and financial conditions and other matters, many of which are beyond the control of the participants in the Transaction. Any estimates of value contained in the materials are not necessarily indicative of actual value or predictive of future results or values, which may be significantly more or less favorable. Any analyses relating to the value of assets, businesses or securities do not purport to be appraisals or to reflect the prices at which any assets, businesses or securities may actually be sold. The materials do not constitute a valuation opinion or credit rating. In preparing the materials, BMO has not conducted any physical inspection or independent appraisal or evaluation of any of the assets, properties or liabilit ies (contingent or otherwise) of the Company or any other party and has no obligation to evaluate the solvency of the Company or any other party under any law. All budgets, projections, estimates, financial analyses, reports and other information with respect to operations (including estimates of potential cost savings and expenses) reflected in the materials have been prepared by management of the relevant party or are derived from such budgets, projections, estimates , financial analyses, reports and other information or from other sources, which involve numerous and significant subjective determinations made by management of the relevant party and/or which such management has reviewed and found reasonable. The budgets, projections and estimates (including, without limitation, estimates of potential cost savings and synergies) contained in the materials may or may not be achieved and differences between projected results and those actually achieved may be material. BMO has relied upon representations made by management of the Company that such budgets, projections and estimates have been reasonably prepared in good faith on bases r eflecting the best currently available estimates and judgments of such management (or, with respect to information obtained from public sources, represent reasonable estimates), and BMO expresses no opinion with respect to such budgets, projections or estimates or the assumptions on which they are based. The scope of the financial analysis contained herein is based on discussions with the Special Committee (including, without limitation, regard ing the methodologies to be utilized), and BMO does not make any representation, express or implied, as to the sufficiency or adequacy of such financial analysis or the scope thereof for any particular purpose. BMO has assumed and relied upon the accuracy and completeness of the financial and other information provided to, discussed with or reviewed by it without (and without assuming responsibility for) independent verification of such information, makes no representation or warranty (express or implied) in respect of the accuracy or completeness of such information and has further relied upon the assurances of the Company that it is not aware of any facts or circumstances that would make such information inaccurate or misleading. In addition, BMO has relied upon and assumed, without independent verification, that there has been no change in the business, assets, liabilities, financial condition, results of operations, cash flows or prospects of the Company or any other participant in the Transaction since the respective dates of the most recent financial statements and other information, financial or otherwise, provided to BMO that would be material to its analyses, and that the final forms of any draft documents reviewed by BMO will not differ in any material respect from such draft documents. The materials are not an offer to sell or a solicitation of an indication of interest to purchase any security, option, commodity, future, loan or currency. The materials do not constitute a commitment by BMO or any of its affiliates to underwrite, subscribe for or place any securities, to extend or arrange credit, or to provide any other services. In the ordinary course of business, certain of BMO’s affiliates and employees, as well as investment funds in which they may have financial interests or with which they may co - invest, may acquire, hold or sell, long or short positions, or trade or otherwise effect transactions, in debt, equity, and other securities and financial instruments (including loans and other obligations) of, or investments in, one or more parties that may be involved in the Transaction and their respective affiliates or any currency or commodity that may be involved in the Transaction. BMO provides mergers and acquisitions, restructuring and other advisory and consulting services to clients. BMO’s personnel may make statements or provide advice that is contrary to information contained in the materials. BMO’s or its affiliates’ proprietary interests may conflict with the Company’s interests. BMO may have advised, may seek to advise and may in the future advise one or more participants in the Transaction and/or other companies mentioned in the materials. 1 Disclaimer

2 PROJECT CHELIOS Section 1: Situation Overview SITUATION OVERVIEW Situation Overview Section 1 Preliminary Financial Analysis Section 2 Appendix

3 PROJECT CHELIOS Source: FactSet SITUATION OVERVIEW On April 18, after various rounds of negotiation, the Special Committee indicated its willingness to move forward with negotiating definitive documentation with the Sterling purchaser (the “Purchaser”) based on the latest offer received from Sterling for AUD$0.87 in cash per share for all of the outstanding shares of common stock not already owned by Sterling or any rollover stockholders (the "Transaction") As of May 23, 2024, the offer represents: – 63% premium to the current share price – 65% premium to 30 - day VWAP – 44% premium to 90 - day VWAP Sterling owns approximately 66% of the Company’s common stock as of February 23, 2024 BMO Capital Markets Corp . (“BMO”, “we”, or “our”) has been engaged by the Special Committee of the Board of Directors (the “Special Committee”) of the Company to render an opinion to the Special Committee, as to the fairness, from a financial point of view, to the Company’s “Unaffiliated Stockholders” (as defined in the merger agreement) of the consideration to be received by such stockholders in the Transaction Keypath Education International, Inc. (“Keypath”) is headquartered in Chicago, IL and is listed on the Australian Securities Exchange (ASX) The Transaction will be structured as a take - private acquisition whereby the Purchaser will acquire the outstanding equity owned by the Unaffiliated Stockholders and de - list the stock from the Australian Securities Exchange BMO has relied, with the consent of the Special Committee, on Keypath management with respect to adjusted historical and projected financial data Executive Summary

Source: Draft Merger Agreement dated May 23, 2024 4 PROJECT CHELIOS SITUATION OVERVIEW Summary of Merger Agreement Reverse triangular merger in which Merger Sub will merge into the Company, with the Company surviving as a wholly owned subsidiary of Purchaser Transaction Structure A$0.87 per share in cash, without interest Consideration Committed debt financing under Credit Agreement Rollover (valued at approximately A$132.3mm) Financing Customary representations and warranties and interim operating covenants Representations, Warranties and Covenants No - shop provision Voting agreement from major shareholder Limited guaranty provided by certain affiliates of Purchaser and Merger Sub Company Termination Fee of $1.5mm Reverse Termination Fee of $2.0mm Select Deal Protections Stockholder approval, including approval by holders of a majority of the outstanding shares held by Unaffiliated Stockholders Other customary closing conditions Key Closing Conditions Outside date of September 20, 2024 Expected to close in Q1 FY25 Estimated Timing

5 PROJECT CHELIOS SITUATION OVERVIEW Summary of Sterling’s Non - Binding Proposals Source: Sterling Funds Proposal Letters, FactSet 1. Premiums / VWAPs as of 22 - Mar - 24. Implied Premiums Valuation Date As of the date the proposal was received, the offer represented: 38% premium to the then prevailing price 41% premium to 30 - day VWAP 76% premium to 90 - day VWAP A$0.65 per share (with adjustment for expenses) February 23, 2024 Initial Offer As of the date the proposal was received, the offer represented (1) : 45% premium to the then prevailing price 32% premium to 30 - day VWAP 36% premium to 90 - day VWAP A$0.80 per share Offer submitted with supporting valuation materials from Macquarie (financial advisor) March 22, 2024 Initial Revised Offer As of May 23, 2024, the offer represents: 63% premium to the current share price 65% premium to 30 - day VWAP 44% premium to 90 - day VWAP A$0.87 per share Special Committee indicated its willingness to move forward based on the offer, conditioned upon mutual agreement on other key terms and conditions included in the definitive agreement April 18, 2024 Subsequent Revised Offer
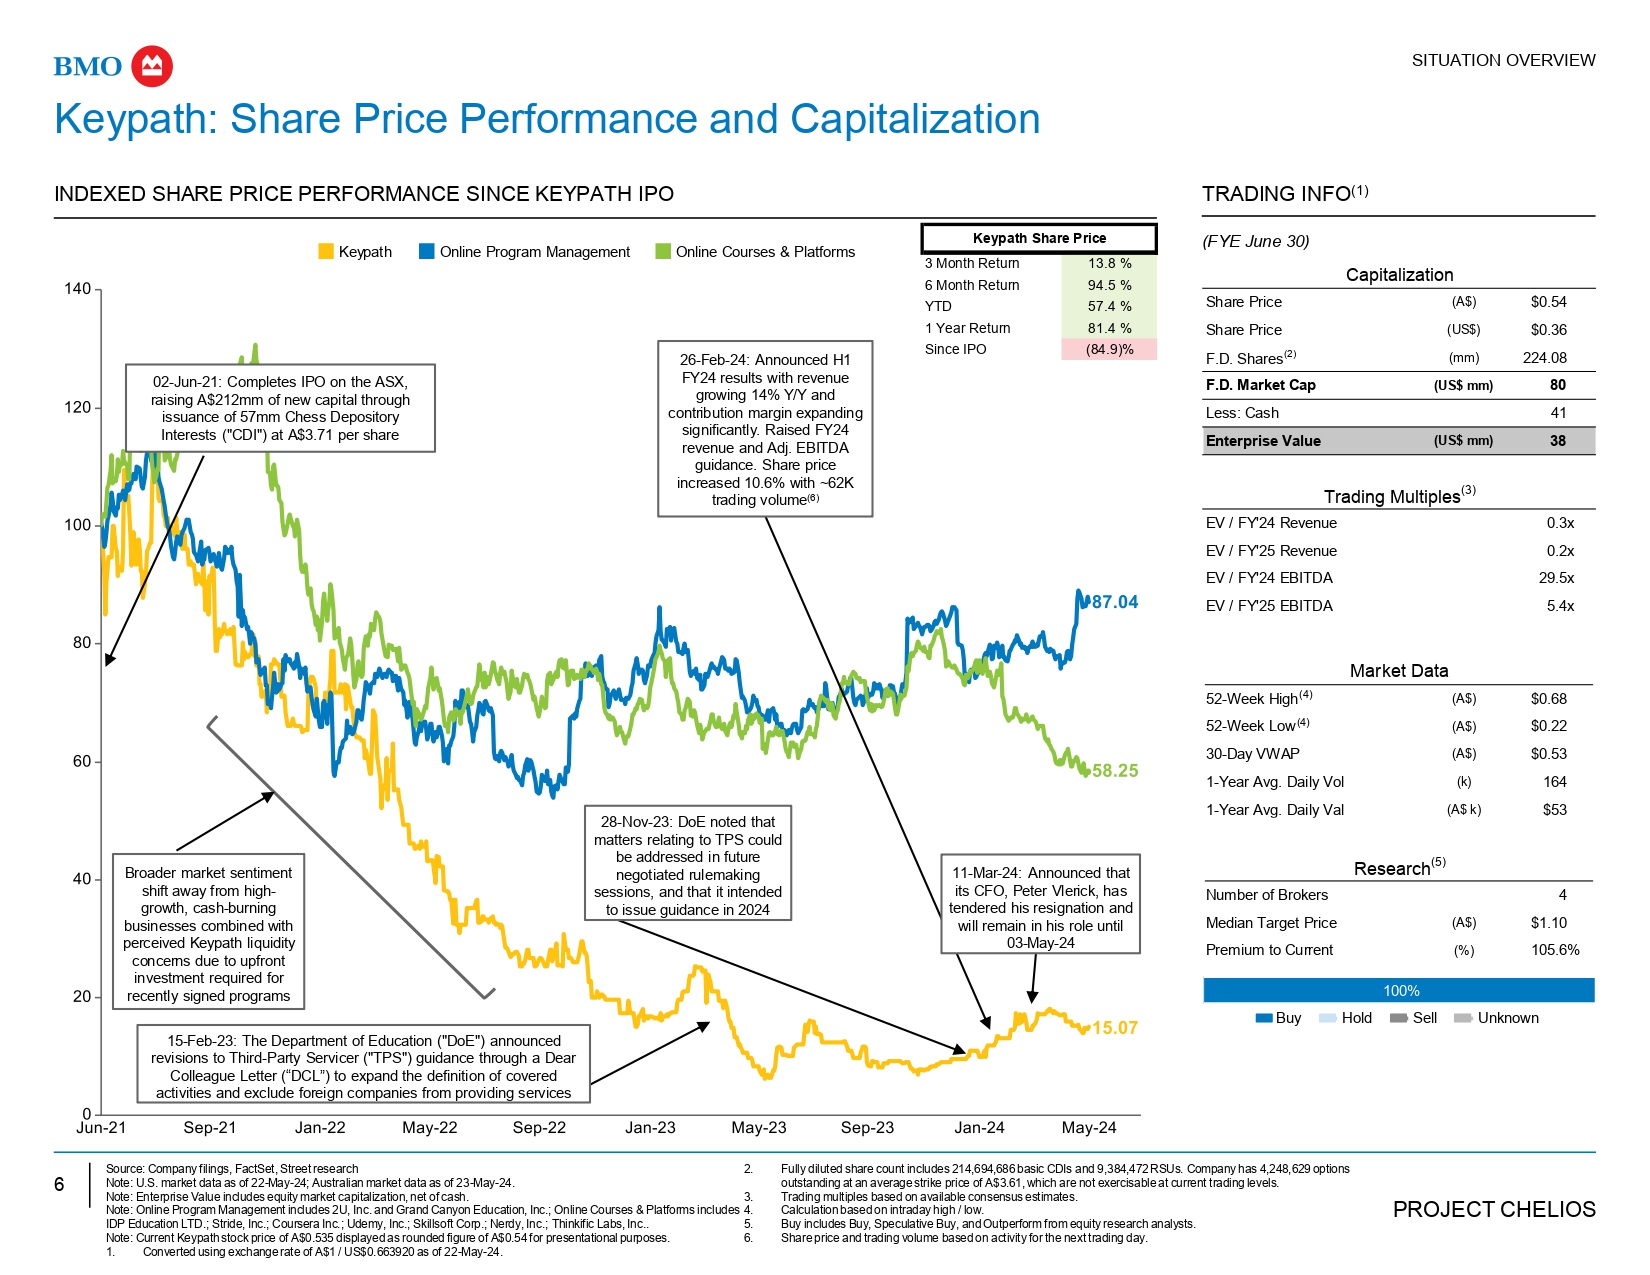
6 PROJECT CHELIOS Research (5) Number of Brokers Median Target Price Premium to Current 4 $1.10 105.6% (A$) (%) 100% Buy Hold Sell Unknown Capitalization $0.54 (A$) Share Price $0.36 (US$) Share Price 224.08 (mm) F.D. Shares (2) 80 (US$ mm) F.D. Market Cap 41 Less: Cash 38 (US$ mm) Enterprise Value Trading Multiples (3) 0.3x EV / FY'24 Revenue 0.2x EV / FY'25 Revenue 29.5x EV / FY'24 EBITDA 5.4x EV / FY'25 EBITDA Market Data $0.68 (A$) 52 - Week High (4) $0.22 (A$) 52 - Week Low (4) $0.53 (A$) 30 - Day VWAP 164 (k) 1 - Year Avg. Daily Vol 1 - Year Avg. Daily Val (A$ k) $53 Source: Company filings, FactSet, Street research Note: U.S. market data as of 22 - May - 24; Australian market data as of 23 - May - 24. Note: Enterprise Value includes equity market capitalization, net of cash. IDP Education LTD.; Stride, Inc.; Coursera Inc.; Udemy, Inc.; Skillsoft Corp.; Nerdy, Inc.; Thinkific Labs, Inc.. Note: Current Keypath stock price of A$0.535 displayed as rounded figure of A$0.54 for presentational purposes. 1. Converted using exchange rate of A$1 / US$0.663920 as of 22 - May - 24. 2. Fully diluted share count includes 214,694,686 basic CDIs and 9,384,472 RSUs. Company has 4,248,629 options outstanding at an average strike price of A$3.61, which are not exercisable at current trading levels. Trading multiples based on available consensus estimates. Calculation based on intraday high / low. Buy includes Buy, Speculative Buy, and Outperform from equity research analysts. Share price and trading volume based on activity for the next trading day. 3. Note: Online Program Management includes 2U, Inc. and Grand Canyon Education, Inc.; Online Courses & Platforms includes 4. 5. 6. Keypath: Share Price Performance and Capitalization INDEXED SHARE PRICE PERFORMANCE SINCE KEYPATH IPO TRADING INFO (1) SITUATION OVERVIEW Keypath Online Program Management Online Courses & Platforms (FYE June 30) 02 - Jun - 21: Completes IPO on the ASX, raising A$212mm of new capital through issuance of 57mm Chess Depository Interests ("CDI") at A$3.71 per share 28 - Nov - 23: DoE noted that matters relating to TPS could be addressed in future negotiated rulemaking sessions, and that it intended to issue guidance in 2024 26 - Feb - 24: Announced H1 FY24 results with revenue growing 14% Y/Y and contribution margin expanding significantly. Raised FY24 revenue and Adj. EBITDA guidance. Share price increased 10.6% with ~62K trading volume (6) 15 - Feb - 23: The Department of Education ("DoE") announced revisions to Third - Party Servicer ("TPS") guidance through a Dear Colleague Letter (“DCL”) to expand the definition of covered activities and exclude foreign companies from providing services Broader market sentiment shift away from high - growth, cash - burning businesses combined with perceived Keypath liquidity concerns due to upfront investment required for recently signed programs 11 - Mar - 24: Announced that its CFO, Peter Vlerick, has tendered his resignation and will remain in his role until 03 - May - 24 Keypath Share Price 13.8 % 3 Month Return 94.5 % 6 Month Return 57.4 % YTD 81.4 % 1 Year Return (84.9)% Since IPO

7 PROJECT CHELIOS Source: Company filings, FactSet, Street research Note: U.S. market data as of 22 - May - 24. Note: Enterprise Value includes equity market capitalization and market value of debt, net of cash 1. Fully diluted share count includes 83.6mm common shares, 3.5mm RSUs, 2.9mm performance RSUs. Company has 2.8mm options outstanding at an average strike price of $34.23, which are not exercisable at current trading levels 2. Trading multiples based on available consensus estimates. 3. Market capitalization and trading levels of debt as of 22 - May - 24 from Bloomberg. 2U, Inc. (“2U”): Relative Performance Analysis and Trading Metrics INDEXED 2YR SHARE PRICE PERFORMANCE TRADING INFO 09 - Jan - 23: Announces agreement to refinance its term loan, extending maturity from Dec - 24 to Dec - 26, along with 1L RCF of $40mm 15 - Apr - 22: Chief Accounting Officer John Ellis resigns; Morgan Stanley cuts price target 28 - Jul - 22: Reported Q2’22 results and cut guidance for FY22; net losses widened 09 - Feb - 22: Announces Q4’21 results; net loss widened while enrollment growth slowed down; brokerages downgrade and cut down price targets following earnings results 09 - Nov - 23: USC partnership terminated, agreed on transitioning 2U - managed programs to USC over the following 15 months SITUATION OVERVIEW Research Number of Brokers Median Target Price Premium to Current 5 $0.88 166.4% (US$) (%) 60% 40% Buy Hold Sell Unknown 17 - Nov - 23: Co - founder and CEO, Chip Paucek, resigns after high profile USC partnership ends. CFO Paul Lalljie takes over the CEO position 02 - Feb - 23: Included in Q4 and FY23 results the following statement about company liquidity: “The company expects that if it does not amend or refinance its term loan or raise capital to reduce its debt in the short term, and in the event the obligations under its term loan accelerate or come due within twelve months from the date of its financial statement issuance in accordance with its current terms, there is substantial doubt about its ability to continue as a going concern.” 15 - Feb - 23: The Department of Education ("DoE") announced revisions to Third - Party Servicer ("TPS") guidance through a Dear Colleague Letter (“DCL”) to expand the definition of covered activities and exclude foreign companies from providing services 28 - Nov - 23: DoE noted that matters relating to TPS could be addressed in future negotiated rulemaking sessions, and that it intended to issue guidance in 2024 Capitalization Share Price (US$) $0.33 Add: Debt (Market Value) Less: Cash 643 125 Enterprise Value (US$ mm) 548 TWOU Share Price 3 Month Return 6 Month Return (17.5)% (71.9)% 90.59 (mm) F.D. Shares (1) (73.3)% YTD 30 (US$ mm) F.D. Market Cap (92.0)% 1 Year Return Since IPO (99.1)% Trading Multiples (2) 0.7x EV / CY24 Revenue 0.6x EV / CY25 Revenue 4.6x EV / CY24 EBITDA 3.8x EV / CY25 EBITDA Total Debt (3) Principal Pricing Debt Type Trading Due Jun - 26 $344 91.630% $375 Sr. Sec. Term Loan May - 25 $206 54.190% $380 Bond 1 Feb - 30 $48 32.850% $147 Bond 2 - $40 n.a. $40 Revolving Credit Facility - $5 n.a. $5 Other Borrowings $643 $947 Total Debt
8 PROJECT CHELIOS Section 2: Preliminary Financial Analysis PRELIMINARY FINANCIAL ANALYSIS Situation Overview Section 1 Preliminary Financial Analysis Section 2 Appendix

CAGR Management Projections CAGR Historical 2024E - 2028P 2028P 2027P 2026P 2025P 2024E 2021A - 2023A 2023A 2022A 2021A FYE June 9.4% $197.1 $177.5 $161.3 $146.5 $137.8 12.3% $123.8 $118.3 $98.1 Revenue 11.1% 10.0% 10.1% 6.3% 11.3% 4.7% 20.6% n.a. % growth ($126.1) ($120.7) ($115.3) ($106.5) ($102.1) ($101.4) ($96.1) ($72.4) Total Direct Expenses $71.0 $56.8 $46.0 $40.0 $35.7 $22.5 $22.3 $25.7 Contribution Margin 36.0% 32.0% 28.5% 27.3% 25.9% 18.1% 18.8% 26.2% % margin ($38.0) ($36.2) ($34.5) ($32.9) ($37.1) ($40.1) ($39.4) ($67.9) Total Indirect Expenses n.m. $33.0 $20.6 $11.4 $7.1 ($1.4) n.m. ($17.6) ($17.1) ($42.1) EBITDA 16.7% 11.6% 7.1% 4.9% (1.0%) (14.2%) (14.5%) (42.9%) % margin $1.4 $1.4 $1.4 $1.5 $4.4 $7.5 $6.6 $48.8 Management EBITDA Adjustments (1) 82.8% $34.4 $22.0 $12.8 $8.6 $3.1 n.m. ($10.1) ($10.5) $6.6 Adj. EBITDA 17.4% 12.4% 7.9% 5.8% 2.2% (8.2%) (8.9%) 6.7% % margin $8.1 $7.5 $6.9 $6.2 $5.6 $5.4 $4.7 $4.1 Depreciation & Amortization 4.1% 4.2% 4.3% 4.2% 4.1% 4.3% 4.0% 4.1% % of revenue $8.5 $7.6 $6.9 $6.3 $5.5 $5.4 $4.9 $4.1 Capital Expenditures ($1.1) ($1.7) ($4.7) ($3.0) ($4.6) $6.4 $8.3 ($10.9) Decrease / (Increase) in NWC and Other (2) 9 PROJECT CHELIOS PRELIMINARY FINANCIAL ANALYSIS Historical and Projected Financials (US$ in millions) Source: Company filings, Financial projections per Company management as updated on 25 - Apr - 24 (“Management Projections”), FactSet, Capital IQ 1. Includes non - cash stock - based compensation, contingent compensation, and one - time SEC expenses. 2. Includes change in working capital, deferred income taxes, payments of taxes from withheld shares, and effect for FX changes.

10 PROJECT CHELIOS Source: Public filings, FactSet, Department of Education, BMO research, and Street research Note: Market capitalization and trading levels of debt as of 22 - May - 24. PRELIMINARY FINANCIAL ANALYSIS Preliminary Advisor Valuation Perspectives Selected Public Companies: Online Program Management (“OPM”) 2U, Inc. (“2U”): has experienced a 90%+ decrease in share price over the last year, as 2U recently announced a termination of a significant partnership, replaced its CEO with its CFO, and is facing concerns that its liquidity may not be sufficient to pay off its debt balance – 2U’s debt is currently trading below par value: $376mm term loan (trading at 91.630), $380mm bond (trading at 54.190), and $147mm bond (trading at 32.850) – 2U noted in its Q4 and FY23 results that if it does not amend or refinance its term loan, or raise capital to reduce its debt in the short term, and in the event the obligations under its term loan accelerate, there is substantial doubt about its ability to continue as a going concern Grand Canyon Education, Inc. (“GCE”): benefits from the stability of being deeply intertwined with its most significant university partner, Grand Canyon University (“GCU”), which comprises ~97% of GCE’s enrollment and was consummated through an asset purchase agreement with GCE – In conjunction with purchase, GCU signed a 15 - year agreement with GCE (expires 30 - Jun - 2033) in which GCE receives ~60% of GCU’s tuition and fee revenue – With ~79% of GCU’s students being online, there is long - term alignment with the institution’s strategic importance of online offerings – GCE has a ~32% EBITDA margin and its market capitalization is ~$4.3bn – Brian Mueller, GCE’s CEO, also serves as the President of GCU Online Courses & Platforms While these selected public companies enable online education for learners, there are significant differences to Keypath, including but not limited to: servicing end - segments in addition to or other than higher education (i.e., K - 12, corporate enterprises), services provided (i.e., tutoring, learning marketplaces, etc.), sources of revenue (public pay vs. private pay), payment models (i.e., subscription or transactional vs. revenue - share agreements), and exposure to recently contemplated changes to regulation from the Department of Education (“DoE”)
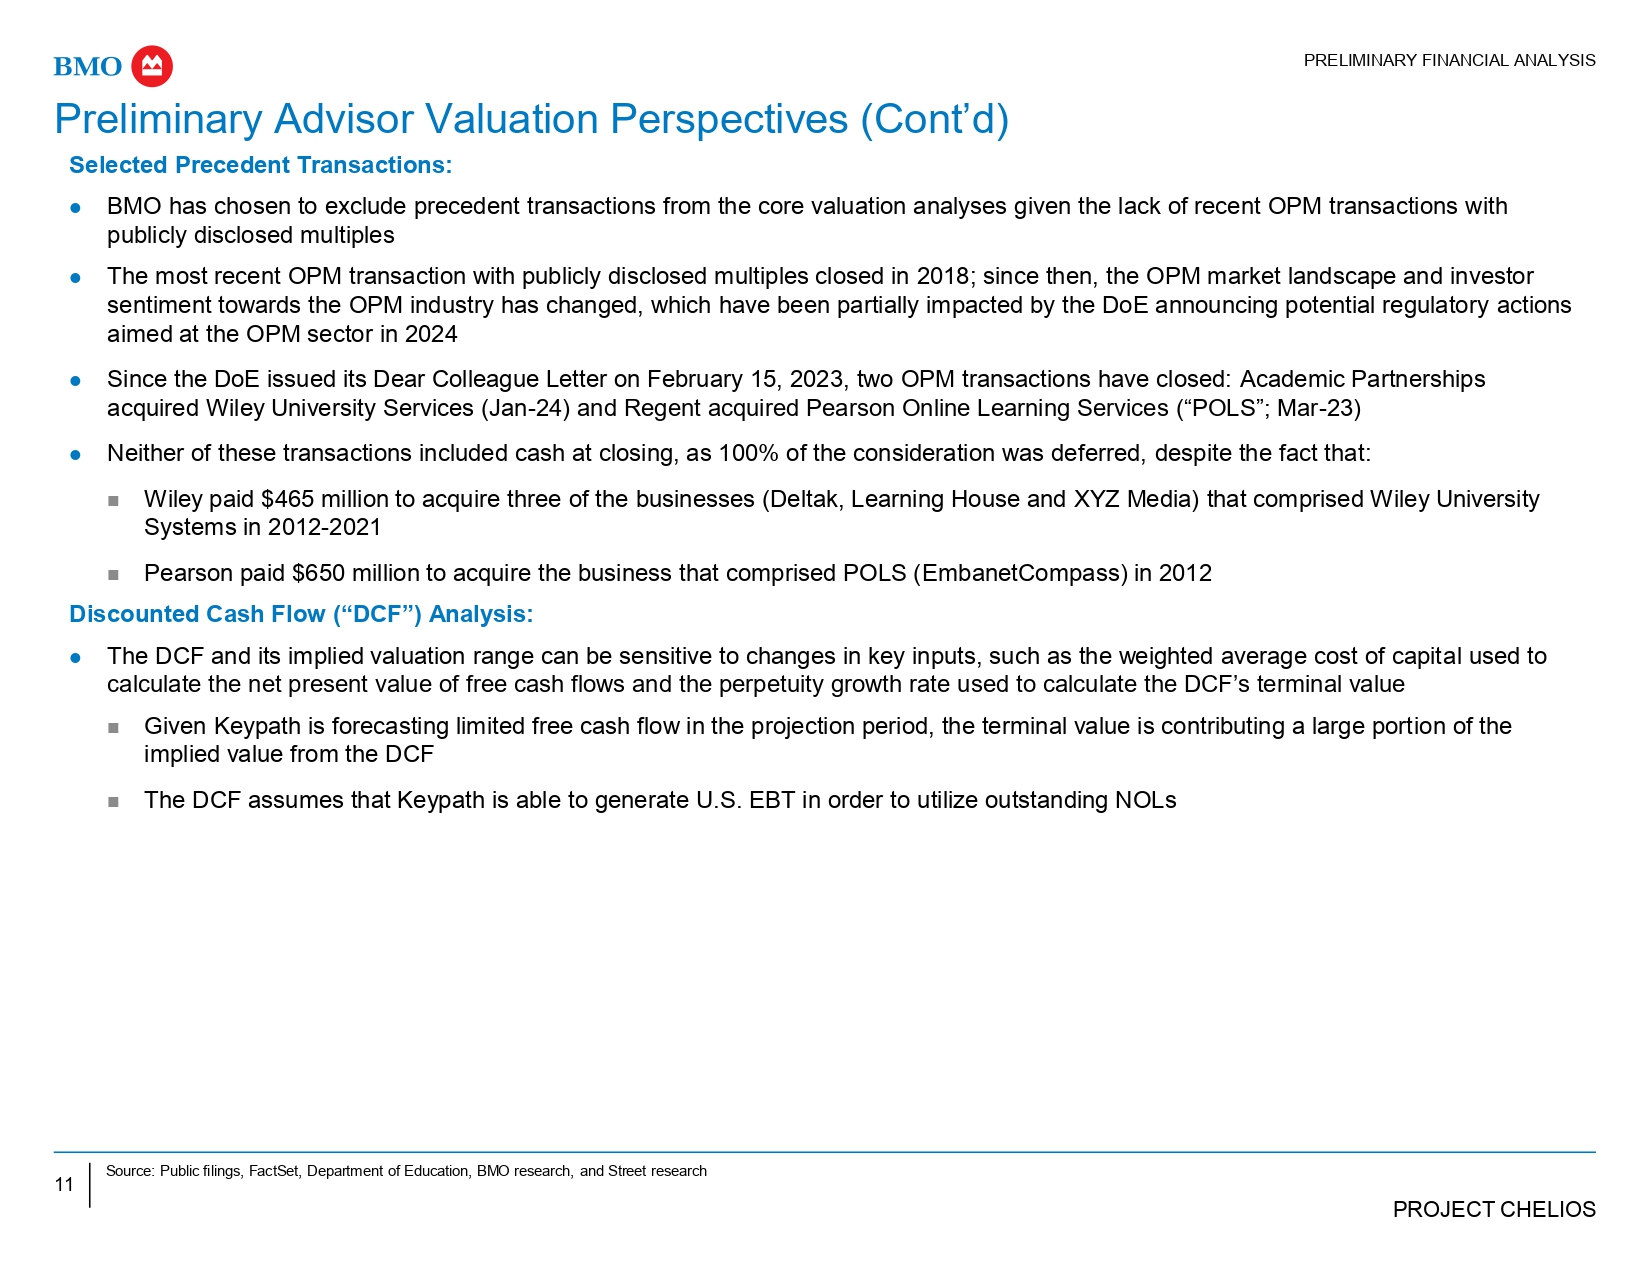
11 PROJECT CHELIOS Source: Public filings, FactSet, Department of Education, BMO research, and Street research PRELIMINARY FINANCIAL ANALYSIS Preliminary Advisor Valuation Perspectives (Cont’d) Selected Precedent Transactions: BMO has chosen to exclude precedent transactions from the core valuation analyses given the lack of recent OPM transactions with publicly disclosed multiples The most recent OPM transaction with publicly disclosed multiples closed in 2018; since then, the OPM market landscape and investor sentiment towards the OPM industry has changed, which have been partially impacted by the DoE announcing potential regulatory actions aimed at the OPM sector in 2024 Since the DoE issued its Dear Colleague Letter on February 15, 2023, two OPM transactions have closed: Academic Partnerships acquired Wiley University Services (Jan - 24) and Regent acquired Pearson Online Learning Services (“POLS”; Mar - 23) Neither of these transactions included cash at closing, as 100% of the consideration was deferred, despite the fact that: Wiley paid $465 million to acquire three of the businesses (Deltak, Learning House and XYZ Media) that comprised Wiley University Systems in 2012 - 2021 Pearson paid $650 million to acquire the business that comprised POLS (EmbanetCompass) in 2012 Discounted Cash Flow (“DCF”) Analysis: The DCF and its implied valuation range can be sensitive to changes in key inputs, such as the weighted average cost of capital used to calculate the net present value of free cash flows and the perpetuity growth rate used to calculate the DCF’s terminal value Given Keypath is forecasting limited free cash flow in the projection period, the terminal value is contributing a large portion of the implied value from the DCF The DCF assumes that Keypath is able to generate U.S. EBT in order to utilize outstanding NOLs

12 PROJECT CHELIOS For Informational Purposes ONLY For Valuation Purposes Equity Research Analyst Price Targets 52 - Week Range (3) Premiums Paid Analysis Selected Public Companies (FY 25 Adj. EBITDA) Selected Public Companies (FY 25 Revenue) Selected Public Companies (FY 24 Revenue) Discounted Cash Flow Analysis Share Price Range Share Price Range Premium to Current: 40.0% - 60.0% FY 25 Adj. EBITDA (Jun - 25) Multiple Range: 4.1x - 13.3x FY 25 Revenue (Jun - 25) Multiple Range: 0.7x - 1.4x FY 24 Revenue (Jun - 24) Multiple Range: 0.6x - 1.6x WACC Range: 17.0% - 21.0% Value Drivers Low - High Low - High Current Share Price: A$0.54 FY 25 Adj. EBITDA (Jun - 25): $8.6 FY 25 Revenue (Jun - 25): $146.5 FY 24 Revenue (Jun - 24): $137.8 Perpetuity Growth Range: 2.5% - 4.5% 0.4x - 1.6x (0.1x) - 0.4x 0.5x - 0.6x 0.3x - 0.8x 0.7x - 1.5x 0.6x - 1.6x 0.4x - 0.6x EV / FY 24 Revenue (Jun - 24) ($137.8) 0.4x - 1.5x (0.1x) - 0.4x 0.5x - 0.6x 0.2x - 0.8x 0.7x - 1.4x 0.6x - 1.5x 0.3x - 0.6x EV / FY 25 Revenue (Jun - 25) ($146.5) 6.8x - 26.4x (1.0x) - 7.0x 8.2x - 10.1x 4.1x - 13.3x 12.0x - 23.9x 9.6x - 25.7x 5.9x - 10.3x EV / FY 25 Adj. EBITDA (Jun - 25) ($8.6) 25% - 236% (59%) - 27% 40% - 60% (4%) - 95% 81% - 209% 56% - 229% 15% - 63% Implied Premium / (Discount) to Current Stock Price A$0.62 A$0.83 A$0.97 A$0.51 A$0.22 A$0.87 A$1.76 A$1.66 A$1.04 A$0.86 A$0.75 A$0.68 A$1.80 - - A$0.25 A$0.50 A$0.75 A$1.00 A$1.25 A$1.50 A$1.75 A$2.00 A$2.25 A$2.50 A$2.75 A$3.00 PRELIMINARY FINANCIAL ANALYSIS Preliminary Financial Perspectives (US$ in millions, except share prices in A$) ASSESSMENT METHODOLOGIES Source: Company filings, Management Projections, FactSet Note: Fiscal year ends June 30 th . Share prices converted using exchange rate of A$1 / US$0.663920 as of 22 - May - 24. Fully diluted shares outstanding adjusted for vesting of restricted stock units and in - the - money stock options. Note: Current Keypath stock price of A$0.535 displayed as rounded figure of A$0.54 for presentational purposes. 1. Present value of equity research analyst price targets calculated using an assumed cost of equity range of 17.0% - 21.0% and discount period of one year. 2. Illustratively assumed U.S. Federal NOL savings range of A$0.03 - A$0.04 per share. 3. Calculation based on intraday high / low. Merger Price per Share: $0.58 / A$0.87 Present Value of Equity Research Analyst Price Targets (1) A$1.54 A$0.67 A$0.55 A$0.91 A$0.65 DCF Including NPV of Future Tax Savings from U.S. Federal NOLs (2) Keypath Current Share Price: A$0.54
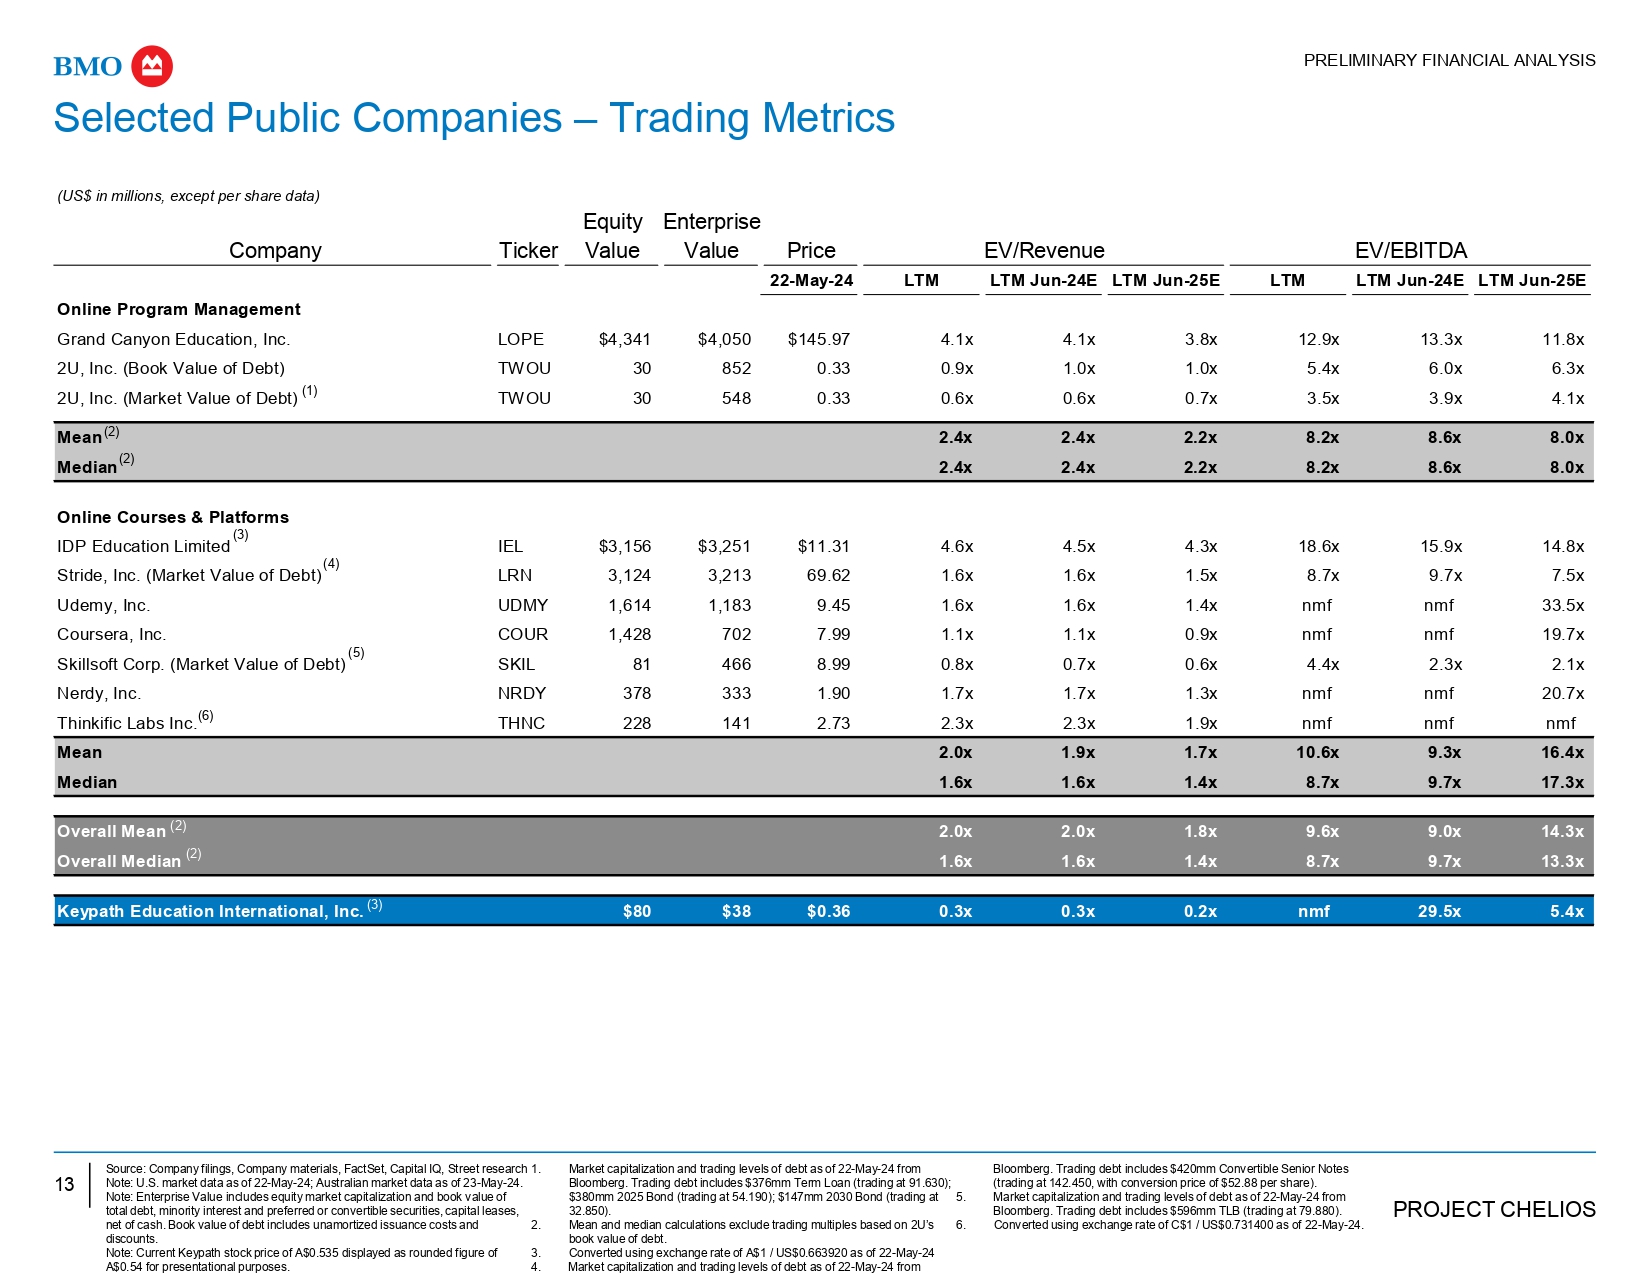
13 PROJECT CHELIOS Enterprise Equity (US$ in millions, except per share data) EV/EBITDA EV/Revenue Price Value Value Ticker Company LTM Jun - 25E LTM Jun - 24E LTM LTM Jun - 25E LTM Jun - 24E LTM 22 - May - 24 Online Program Management 11.8x 13.3x 12.9x 3.8x 4.1x 4.1x $145.97 $4,050 $4,341 LOPE Grand Canyon Education, Inc. 6.3x 6.0x 5.4x 1.0x 1.0x 0.9x 0.33 852 30 TWOU 2U, Inc. (Book Value of Debt) 4.1x 3.9x 3.5x 0.7x 0.6x 0.6x 0.33 548 30 TWOU 2U, Inc. (Market Value of Debt) (1) 8.0x 8.6x 8.2x 2.2x 2.4x 2.4x Mean (2) 8.0x 8.6x 8.2x 2.2x 2.4x 2.4x Median (2) Online Courses & Platforms 14.8x 15.9x 18.6x 4.3x 4.5x 4.6x $11.31 $3,251 $3,156 IEL (3) IDP Education Limited 7.5x 9.7x 8.7x 1.5x 1.6x 1.6x 69.62 3,213 3,124 LRN (4) Stride, Inc. (Market Value of Debt) 33.5x nmf nmf 1.4x 1.6x 1.6x 9.45 1,183 1,614 UDMY Udemy, Inc. 19.7x nmf nmf 0.9x 1.1x 1.1x 7.99 702 1,428 COUR Coursera, Inc. 2.1x 2.3x 4.4x 0.6x 0.7x 0.8x 8.99 466 81 SKIL (5) Skillsoft Corp. (Market Value of Debt) 20.7x nmf nmf 1.3x 1.7x 1.7x 1.90 333 378 NRDY Nerdy, Inc. nmf nmf nmf 1.9x 2.3x 2.3x 2.73 141 228 THNC Thinkific Labs Inc. (6) 16.4x 9.3x 10.6x 1.7x 1.9x 2.0x Mean 17.3x 9.7x 8.7x 1.4x 1.6x 1.6x Median 14.3x 9.0x 9.6x 1.8x 2.0x 2.0x Overall Mean (2) 13.3x 9.7x 8.7x 1.4x 1.6x 1.6x Overall Median (2) 5.4x 29.5x nmf 0.2x 0.3x 0.3x $0.36 $38 $80 Keypath Education International, Inc. (3) net of cash. Book value of debt includes unamortized issuance costs and discounts. Note: Current Keypath stock price of A$0.535 displayed as rounded figure of A$0.54 for presentational purposes. Source: Company filings, Company materials, FactSet, Capital IQ, Street research 1. Note: U.S. market data as of 22 - May - 24; Australian market data as of 23 - May - 24. Note: Enterprise Value includes equity market capitalization and book value of total debt, minority interest and preferred or convertible securities, capital leases, Market capitalization and trading levels of debt as of 22 - May - 24 from Bloomberg. Trading debt includes $376mm Term Loan (trading at 91.630); $380mm 2025 Bond (trading at 54.190); $147mm 2030 Bond (trading at 5. 32.850). Mean and median calculations exclude trading multiples based on 2U’s 6. book value of debt. Converted using exchange rate of A$1 / US$0.663920 as of 22 - May - 24 Market capitalization and trading levels of debt as of 22 - May - 24 from 2. 3. 4. Bloomberg. Trading debt includes $420mm Convertible Senior Notes (trading at 142.450, with conversion price of $52.88 per share). Market capitalization and trading levels of debt as of 22 - May - 24 from Bloomberg. Trading debt includes $596mm TLB (trading at 79.880). Converted using exchange rate of C$1 / US$0.731400 as of 22 - May - 24. Selected Public Companies – Trading Metrics PRELIMINARY FINANCIAL ANALYSIS

14 PROJECT CHELIOS Source: Company filings, Company materials, FactSet, Capital IQ, Street research. Note: U.S. market data as of 22 - May - 24; Australian market data as of 23 - May - 24. 1. Given filing currency is A$, LTM financials were converted based on average exchange rate of A$1 / US$0.681663. 2. Forward multiples converted using exchange rate of A$1 / US$0.663920 as of 22 - May - 24. 3. Book value of debt includes unamortized issuance costs and discounts. Selected Public Companies – Operating Metrics PRELIMINARY FINANCIAL ANALYSIS (1,2) (3) (US$ in millions) Operating Performance Financial Data Company Ticker LTM Operating Margins Revenue EBITDA Leverage Net Total LTM Jun - 24E LTM Jun - 25E LTM LTM Jun - 24E LTM Jun - 25E LTM EBIT EBITDA Gross Online Program Management (0.9x) - - $342 $305 $314 $1,070 $991 $985 26.3% 31.9% 52.5% LOPE Grand Canyon Education, Inc. 5.2x 6.0x 135 141 158 820 893 906 (25.7%) 17.4% 54.5% TWOU 2U, Inc. (Book Value of Debt) 2.1x 3.0x $238 $223 $236 $945 $942 $946 0.3% 24.7% 53.5% Mean 2.1x 3.0x $238 $223 $236 $945 $942 $946 0.3% 24.7% 53.5% Median 0.5x 1.1x $219 $204 $175 $765 $723 $707 23.9% 24.7% 35.1% IEL Online Courses & Platforms IDP Education Limited (0.2x) 1.3x 430 332 367 2,188 1,983 1,989 11.6% 18.5% 37.6% LRN Stride, Inc. (Book Value of Debt) nmf - - 35 3 21 845 753 749 (13.0%) 2.7% 58.7% UDMY Udemy, Inc. nmf - - 36 (7) 6 745 659 657 (20.7%) 0.9% 52.0% COUR Coursera, Inc. 4.8x 6.1x 221 202 105 761 712 553 (55.8%) 19.0% 72.3% SKIL Skillsoft Corp. (Book Value of Debt) nmf nmf 16 (13) (4) 264 197 198 (29.8%) (1.9%) 70.3% NRDY Nerdy, Inc. nmf - - 2 0 0 73 62 61 (11.9%) 0.5% 75.2% THNC Thinkific Labs Inc. 1.7x 1.4x $137 $103 $96 $806 $727 $702 (13.7%) 9.2% 57.3% Mean 0.5x 0.5x $36 $3 $21 $761 $712 $657 (13.0%) 2.7% 58.7% Median 1.9x 1.8x $160 $130 $127 $837 $775 $756 (10.6%) 12.6% 56.5% Overall Mean 0.5x 0.5x $135 $141 $105 $765 $723 $707 (13.0%) 17.4% 54.5% Overall Median nmf nmf $7 $1 ($19) $172 $152 $135 (0.6%) (14.0%) 25.1% Keypath Education International, Inc.

15 PROJECT CHELIOS Terminal (2) 2028P 2027P 2026P 2025P Q4 24E (1) 2023A $197 $197 $177 $161 $147 $35 $124 Revenue - - 11% 10% 10% 6% n.a. - - Annual Growth (%) $33 $33 $21 $11 $7 $1 - - EBITDA (3) 17% 17% 12% 7% 5% 2% - - Margin (%) $26 $25 $13 $5 $1 ($1) - - EBIT (0) (0) (0) (0) (0) (0) - - Less: Other Expenses (4) $26 $25 $13 $4 $1 ($1) - - Pre - Tax Income (5) (5) (5) (4) (3) (1) - - Less: Cash Taxes $20 $20 $8 $0 ($2) ($2) - - After - Tax Income 7 8 7 7 6 1 - - Plus: D&A (8) (8) (8) (7) (6) (1) - - Less: Capex - - (1) (2) (5) (3) (4) - - Less: Increase in Net Working Capital & Other (5) $19 $18 $6 ($4) ($5) ($6) - - Unlevered Free Cash Flow Fiscal Year Ending June 30, PRELIMINARY FINANCIAL ANALYSIS Discounted Cash Flow Summary (US$ in millions, except share prices in A$) PROJECTED FREE CASH FLOWS IMPLIED VALUE PER SHARE SENSITIVITY ANALYSIS Source: Company filings, Management Projections Note: Valuation as of 31 - Mar - 24. Share prices converted using exchange rate of A$1 / US$0.663920 as of 22 - May - 24. 1. Only Q4 FY24 cash flows attributed to valuation due to assumed valuation date of 31 - Mar - 24. 2. Normalized depreciation equal to 83.6% of capital expenditures based on 2.5% inflation and 15 - year depreciation period. 3. EBITDA figures burdened by stock - based compensation. 4. Includes interest expense on Microsoft licenses. 5. Includes change in working capital, deferred income taxes, payments of taxes from withheld shares, and effect for FX changes. 6. Supporting WACC calculation included in the appendix. 7. Roughly in - line with long - term GDP and inflationary growth expectations. 8. PV of Cash Flows assumes mid - year discounting convention. 9. PV of Terminal Value discounted from 30 - Dec - 27. 10. Balance sheet per Q3 FY24 Activity Report; assumes cash of ~$41mm. 11. Represents fully diluted shares outstanding adjusted for vesting of restricted stock units. $88 $81 $75 $71 $66 $61 $58 $54 $51 A$0.87 A$0.82 A$0.78 A$0.75 A$0.72 A$0.69 A$0.67 A$0.64 A$0.62 5.2x 4.8x 4.4x 4.5x 4.2x 3.9x 4.0x 3.8x 3.5x Enterprise Value Equity Value per Share (A$) Implied Terminal Multiple Perpetuity Growth Perpetuity Growth Perpetuity Growth 2.5% 3.5% 4.5% 2.5% 3.5% 4.5% 2.5% 3.5% 4.5% 17.0% 17.0% 17.0% 19.0% 19.0% 19.0% 21.0% 21.0% 21.0% WACC WACC WACC Low High Cost of Capital (6) 21.0% 17.0% Perpetuity Growth (7) 2.5% 4.5% Terminal Value PV of Cash Flows (8) PV of Terminal Value (9) $105 (1) 52 $159 0 88 Enterprise Value $51 $88 Less: Net Debt (10) 41 41 Implied Equity Value $92 $129 F.D. Shares Outstanding (11) 224.079 224.079 Implied Value per Share (US$) Implied Value per Share (A$) $0.41 A$0.62 $0.58 A$0.87
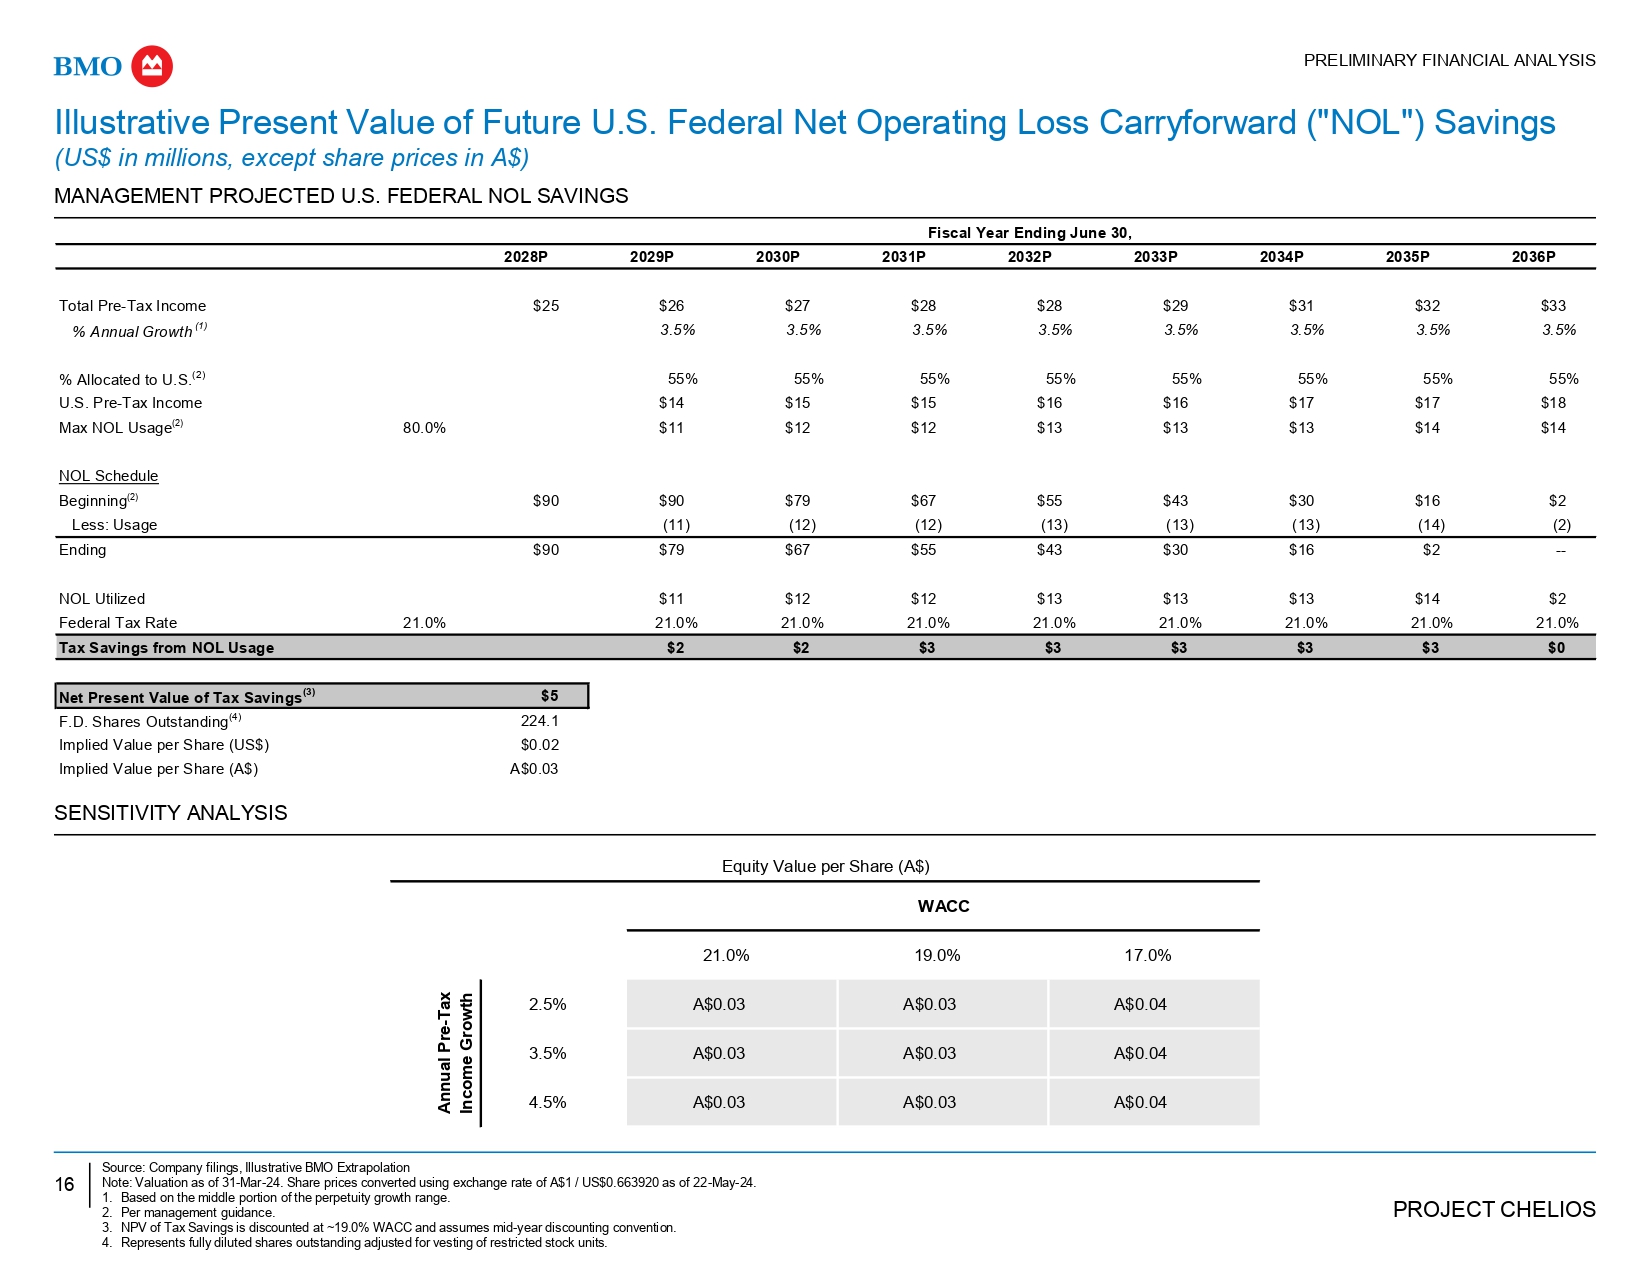
16 PROJECT CHELIOS PRELIMINARY FINANCIAL ANALYSIS Illustrative Present Value of Future U.S. Federal Net Operating Loss Carryforward ("NOL") Savings (US$ in millions, except share prices in A$) MANAGEMENT PROJECTED U.S. FEDERAL NOL SAVINGS Year Ending June 30, Fiscal 2036P 2035P 2034P 2033P 2032P 2031P 2030P 2029P 2028P $33 $32 $31 $29 $28 $28 $27 $26 $25 Total Pre - Tax Income 3.5% 3.5% 3.5% 3.5% 3.5% 3.5% 3.5% 3.5% % Annual Growth (1) 55% 55% 55% 55% 55% 55% 55% 55% % Allocated to U.S. (2) $18 $17 $17 $16 $16 $15 $15 $14 U.S. Pre - Tax Income $14 $14 $13 $13 $13 $12 $12 $11 80.0% Max NOL Usage (2) NOL Schedule $2 $16 $30 $43 $55 $67 $79 $90 $90 Beginning (2) (2) (14) (13) (13) (13) (12) (12) (11) Less: Usage - - $2 $16 $30 $43 $55 $67 $79 $90 Ending $2 $14 $13 $13 $13 $12 $12 $11 NOL Utilized 21.0% 21.0% 21.0% 21.0% 21.0% 21.0% 21.0% 21.0% 21.0% Federal Tax Rate $0 $3 $3 $3 $3 $3 $2 $2 Tax Savings from NOL Usage $5 Net Present Value of Tax Savings (3) 224.1 F.D. Shares Outstanding (4) $0.02 Implied Value per Share (US$) A$0.03 Implied Value per Share (A$) SENSITIVITY ANALYSIS Source: Company filings, Illustrative BMO Extrapolation Note: Valuation as of 31 - Mar - 24. Share prices converted using exchange rate of A$1 / US$0.663920 as of 22 - May - 24. 1. Based on the middle portion of the perpetuity growth range. 2. Per management guidance. 3. NPV of Tax Savings is discounted at ~19.0% WACC and assumes mid - year discounting convention. 4. Represents fully diluted shares outstanding adjusted for vesting of restricted stock units. A$0.04 A$0.03 A$0.03 A$0.04 A$0.03 A$0.03 A$0.04 A$0.03 A$0.03 Equity Value per Share (A$) WACC 21.0% 19.0% 17.0% 2.5% 3.5% 4.5% Annual Pre - Tax Income Growth

17 PROJECT CHELIOS 38% 49% 57% 34% 47% 52% 42% 50% 54% All Stocks Micro Cap Stocks Low Liquidity Micro Cap Stocks Unaffected 1 Day 30 Day PRELIMINARY FINANCIAL ANALYSIS For Informational Purposes: Take - Private Premiums Paid Analysis All Stocks Premiums paid statistics since May - 2019 for U.S. and Australian targets across all industries 542 transactions included in data set Micro Cap Stocks Premiums paid statistics since May - 2019 for U.S. and Australian targets across all industries for transaction values between US$1 million and US$500 million 283 transactions included in data set Low Liquidity Micro Cap Stocks A subset of the Micro Cap stocks with less than US$100k per day trading volume for the 6 months leading up to announcement 120 transactions included in data set LAST 5 YEARS MEDIAN PREMIUM RELATIVE TO PRE - ANNOUNCEMENT SHARE PRICE Source: FactSet Note: Data set includes completed and pending take - private transactions in the U.S. and Australia.
18 PROJECT CHELIOS Appendix APPENDIX Situation Overview Section 1 Preliminary Financial Analysis Section 2 Appendix
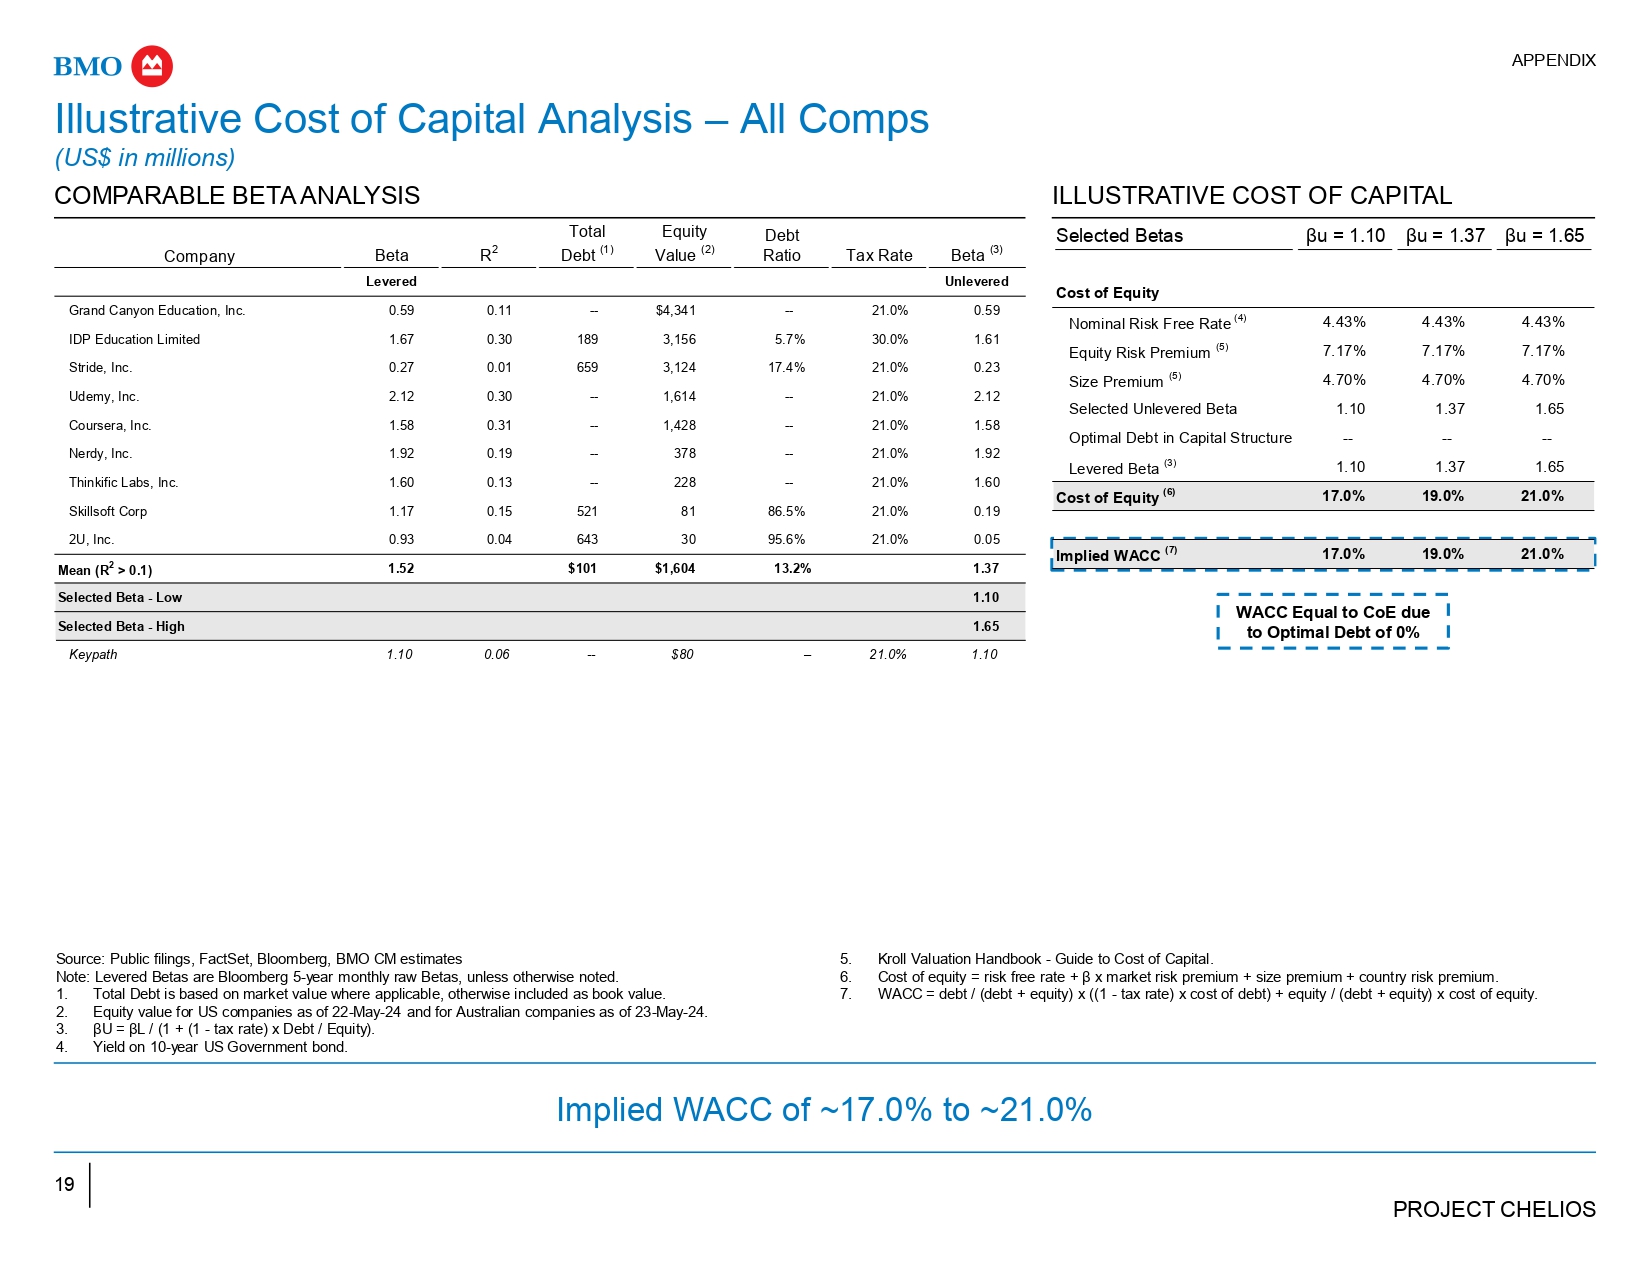
19 PROJECT CHELIOS Source: Public filings, FactSet, Bloomberg, BMO CM estimates Note: Levered Betas are Bloomberg 5 - year monthly raw Betas, unless otherwise noted. 1. Total Debt is based on market value where applicable, otherwise included as book value. 2. Equity value for US companies as of 22 - May - 24 and for Australian companies as of 23 - May - 24. 3. βU = βL / (1 + (1 - tax rate) x Debt / Equity). 4. Yield on 10 - year US Government bond. APPENDIX Illustrative Cost of Capital Analysis – All Comps (US$ in millions) COMPARABLE BETA ANALYSIS Implied WACC of ~17.0% to ~21.0% ILLUSTRATIVE COST OF CAPITAL βu = 1.65 βu = 1.37 βu = 1.10 Selected Betas Cost of Equity 4.43% 4.43% 4.43% Nominal Risk Free Rate (4) 7.17% 7.17% 7.17% Equity Risk Premium (5) 4.70% 4.70% 4.70% Size Premium (5) 1.65 1.37 1.10 Selected Unlevered Beta - - - - - - Optimal Debt in Capital Structure 1.65 1.37 1.10 Levered Beta (3) 21.0% 19.0% 17.0% Cost of Equity (6) 5. Kroll Valuation Handbook - Guide to Cost of Capital. 6. Cost of equity = risk free rate + β x market risk premium + size premium + country risk premium. 7. WACC = debt / (debt + equity) x ((1 - tax rate) x cost of debt) + equity / (debt + equity) x cost of equity. WACC Equal to CoE due to Optimal Debt of 0% 0.59 21.0% - - $4,341 - - 0.11 0.59 Grand Canyon Education, Inc. 1.61 30.0% 5.7% 3,156 189 0.30 1.67 IDP Education Limited 0.23 21.0% 17.4% 3,124 659 0.01 0.27 Stride, Inc. 2.12 21.0% - - 1,614 - - 0.30 2.12 Udemy, Inc. 1.58 21.0% - - 1,428 - - 0.31 1.58 Coursera, Inc. 1.92 21.0% - - 378 - - 0.19 1.92 Nerdy, Inc. 1.60 21.0% - - 228 - - 0.13 1.60 Thinkific Labs, Inc. 0.19 21.0% 86.5% 81 521 0.15 1.17 Skillsoft Corp 0.05 21.0% 95.6% 30 643 0.04 0.93 2U, Inc. 1.37 13.2% $1,604 $101 1.52 Mean (R 2 > 0.1) 1.10 Selected Beta - Low 1.65 Selected Beta - High Company Beta R 2 Total Debt (1) Equity Value (2) Debt Ratio Tax Rate Beta (3) Levered Unlevered Keypath 1.10 0.06 - - $80 – 21.0% 1.10 Implied WACC (7) 17.0% 19.0% 21.0%
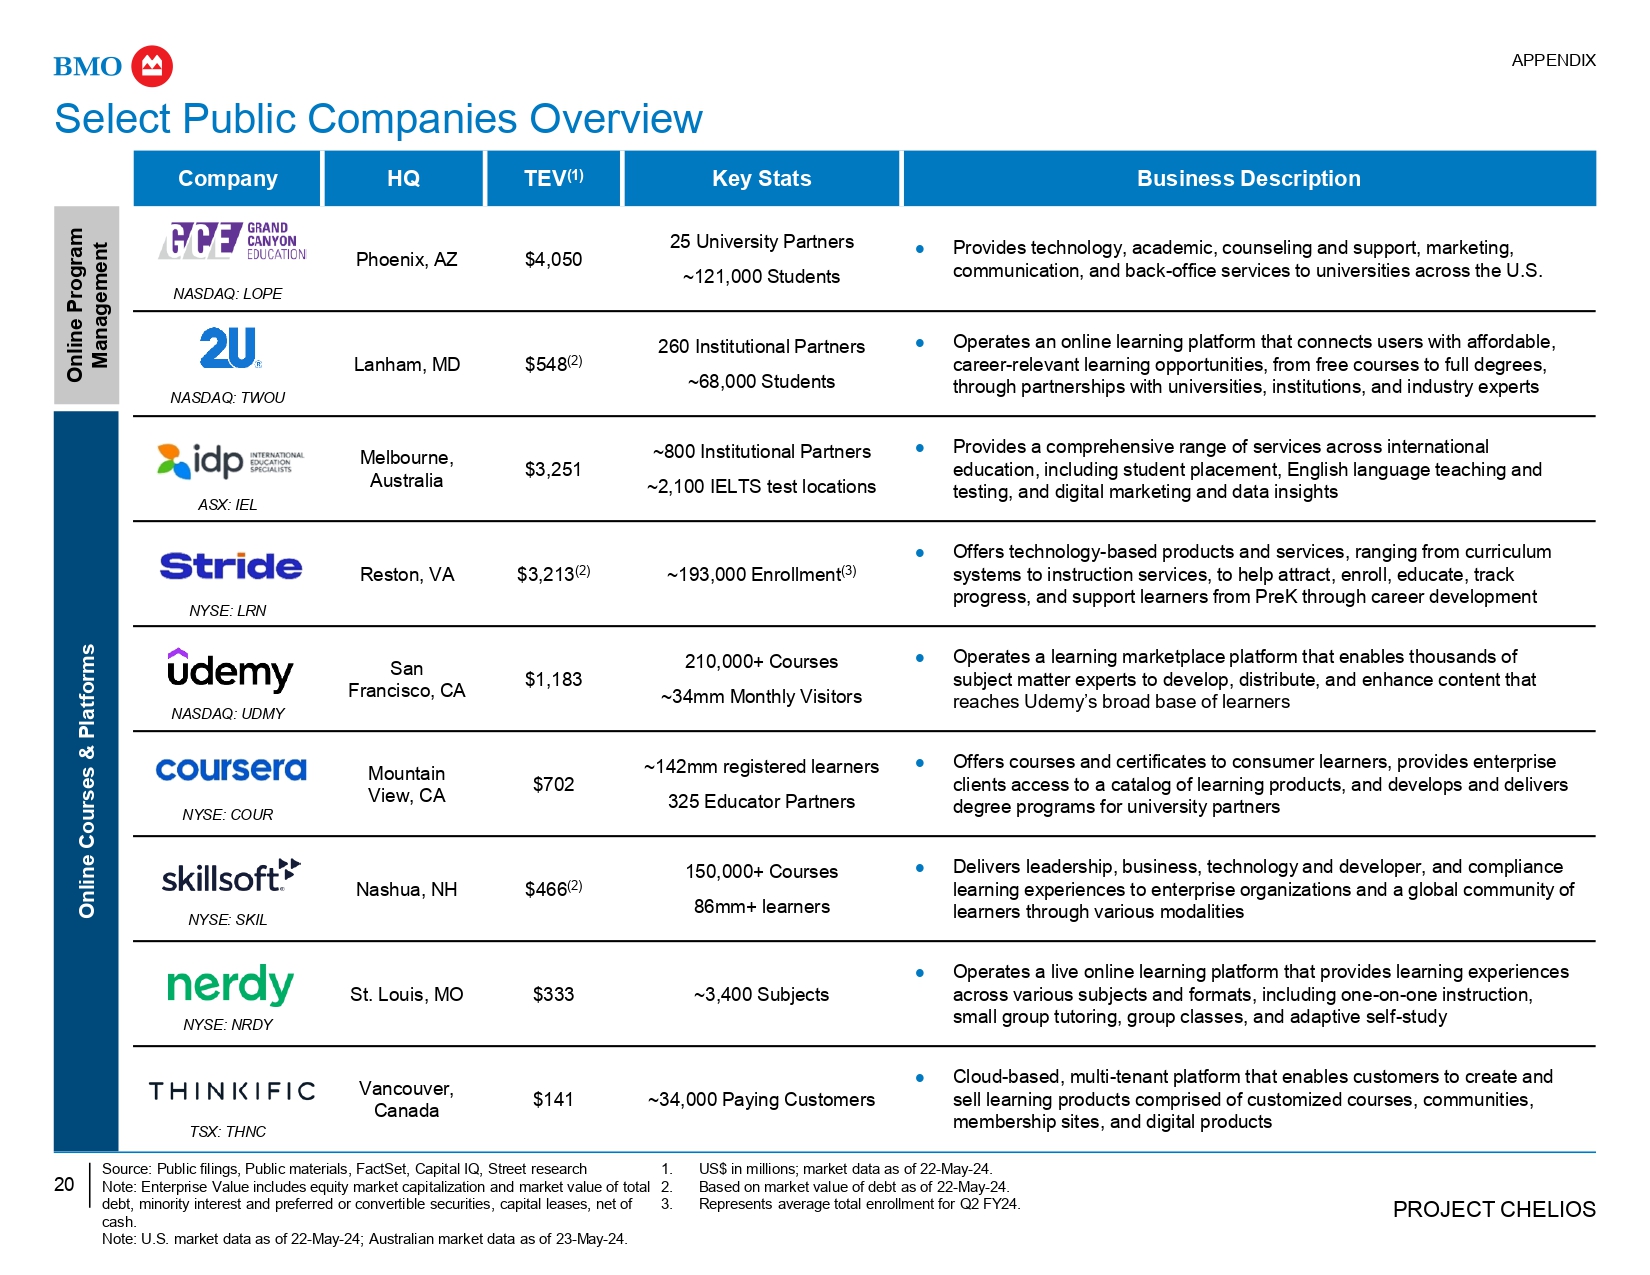
20 PROJECT CHELIOS debt, minority interest and preferred or convertible securities, capital leases, net of cash. Note: U.S. market data as of 22 - May - 24; Australian market data as of 23 - May - 24. Source: Public filings, Public materials, FactSet, Capital IQ, Street research 1. Note: Enterprise Value includes equity market capitalization and market value of total 2. US$ in millions; market data as of 22 - May - 24. Based on market value of debt as of 22 - May - 24. 3. Represents average total enrollment for Q2 FY24. APPENDIX Business Description Key Stats TEV (1) HQ Company Provides technology, academic, counseling and support, marketing, communication, and back - office services to universities across the U.S. 25 University Partners ~121,000 Students $4,050 Phoenix, AZ NASDAQ: LOPE Progra m gemen t Operates an online learning platform that connects users with affordable, career - relevant learning opportunities, from free courses to full degrees, through partnerships with universities, institutions, and industry experts 260 Institutional Partners ~68,000 Students $548 (2) Lanham, MD NASDAQ: TWOU Onlin e Man a Provides a comprehensive range of services across international education, including student placement, English language teaching and testing, and digital marketing and data insights ~800 Institutional Partners ~2,100 IELTS test locations $3,251 Melbourne, Australia ASX: IEL Offers technology - based products and services, ranging from curriculum systems to instruction services, to help attract, enroll, educate, track progress, and support learners from PreK through career development ~193,000 Enrollment (3) $3,213 (2) Reston, VA NYSE: LRN Operates a learning marketplace platform that enables thousands of subject matter experts to develop, distribute, and enhance content that reaches Udemy’s broad base of learners 210,000+ Courses ~34mm Monthly Visitors $1,183 San Francisco, CA NASDAQ: UDMY latform s Offers courses and certificates to consumer learners, provides enterprise clients access to a catalog of learning products, and develops and delivers degree programs for university partners ~142mm registered learners 325 Educator Partners $702 Mountain View, CA NYSE: COUR ourses & P Delivers leadership, business, technology and developer, and compliance learning experiences to enterprise organizations and a global community of learners through various modalities 150,000+ Courses 86mm+ learners $466 (2) Nashua, NH NYSE: SKIL Onlin e C Operates a live online learning platform that provides learning experiences across various subjects and formats, including one - on - one instruction, small group tutoring, group classes, and adaptive self - study ~3,400 Subjects $333 St. Louis, MO NYSE: NRDY Cloud - based, multi - tenant platform that enables customers to create and sell learning products comprised of customized courses, communities, membership sites, and digital products ~34,000 Paying Customers $141 Vancouver, Canada TSX: THNC Select Public Companies Overview

21 PROJECT CHELIOS Source: Department of Education, BMO research, and Street research APPENDIX OPM Industry Government Regulation Recent U.S. Higher Education & Third - Party Servicer Regulatory Updates: On February 15, 2023, the Department of Education issued a Dear Colleague Letter (“DCL”) indicating it was considering regulatory actions aimed at the OPM sector: New third - party servicer (“TPS”) guidance that was subsequently rescinded and planned for re - release in 2024 A review of whether to keep or amend tuition revenue - sharing agreements In the Feb. 15, 2023 DCL, the DoE announced plans to hold “virtual listening sessions” to gain insight into how the incentive compensation rule and its bundling exemption for OPMs has affected the growth of online education and student debt The incentive compensation rule prohibits institutions that accept Title IV financial aid from providing any form of commission or bonus based on recruiting activities or the awarding of financial aid – In March 2011, the DoE issued guidance exempting tuition revenue sharing arrangements with third parties, such as OPMs, if they provide a bundled set of services, including student recruitment The DoE’s DCL aimed to expand the definition of covered activities and to exclude foreign companies from contracting with U.S. higher education institutions to provide such services; most notably, including OPMs in the definition of TPS On February 28, 2023, following concerns expressed by both service providers and universities, the DoE announced that it was delaying the effective date of this implementation from May 1, 2023 until September 1, 2023 In a blog posted on April 11, 2023, Undersecretary of Education James Kvaal announced that the DoE would revise its initial letter, with the effective date at least six months after the final guidance letter is published On November 28, 2023, the DoE announced that it intends to issue updated guidance on TPS in early 2024 On March 18, 2024, the DoE announced that it is still in the process of reviewing feedback received from the community in response to its February 2023 DCL and that it does not anticipate issuing revised TPS guidance in the next 90 days
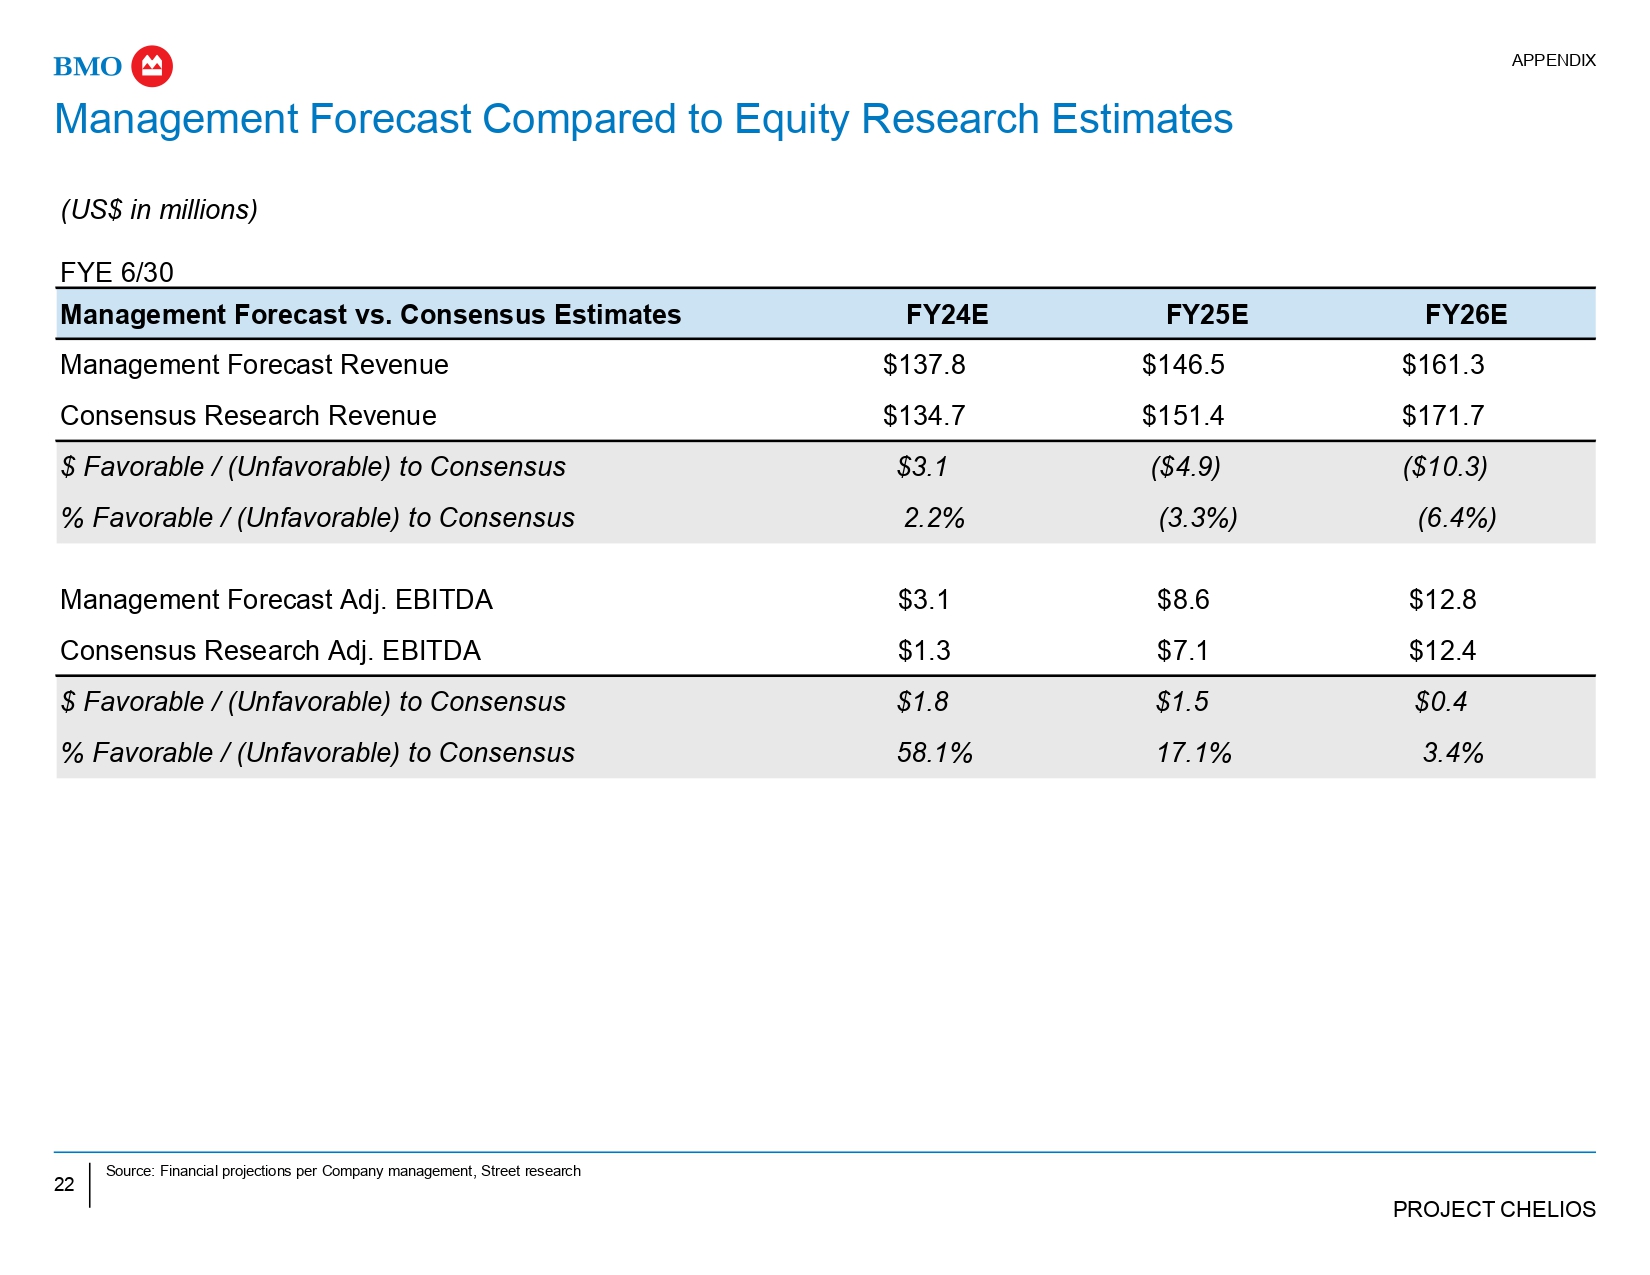
22 PROJECT CHELIOS Source: Financial projections per Company management, Street research APPENDIX Management Forecast Compared to Equity Research Estimates (US$ in millions) FYE 6/30 FY26E FY25E FY24E Management Forecast vs. Consensus Estimates $161.3 $146.5 $137.8 Management Forecast Revenue $171.7 $151.4 $134.7 Consensus Research Revenue ($10.3) ($4.9) $3.1 $ Favorable / (Unfavorable) to Consensus (6.4%) (3.3%) 2.2% % Favorable / (Unfavorable) to Consensus $12.8 $8.6 $3.1 Management Forecast Adj. EBITDA $12.4 $7.1 $1.3 Consensus Research Adj. EBITDA $0.4 $1.5 $1.8 $ Favorable / (Unfavorable) to Consensus 3.4% 17.1% 58.1% % Favorable / (Unfavorable) to Consensus


