UNITED STATES
SECURITIES AND EXCHANGE COMMISSION
Washington, D.C. 20549
FORM N-CSR
CERTIFIED SHAREHOLDER REPORT OF REGISTERED
MANAGEMENT INVESTMENT COMPANIES
| | |
Investment Company Act file number | | 811-02753 |
SBL FUND
|
| (Exact name of registrant as specified in charter) |
| | |
| ONE SECURITY BENEFIT PLACE, TOPEKA, KANSAS | | 66636-0001 |
| (Address of principal executive offices) | | (Zip code) |
MICHAEL G. ODLUM, PRESIDENT
SBL FUND
ONE SECURITY BENEFIT PLACE
TOPEKA, KANSAS 66636-0001
|
| (Name and address of agent for service) |
Registrant’s telephone number, including area code: (785) 438-3000
Date of fiscal year end: December 31
Date of reporting period: December 31, 2006
Form N-CSR is to be used by management investment companies to file reports with the Commission not later than 10 days after the transmission to stockholders of any report that is required to be transmitted to stockholders under Rule 30e-1 under the Investment Company Act of 1940 (17 CFR 270.30e-1). The Commission may use the information provided on Form N-CSR in its regulatory, disclosure review, inspection, and policymaking roles.
A registrant is required to disclose the information specified by Form N-CSR, and the Commission will make this information public. A registrant is not required to respond to the collection of information contained in Form N-CSR unless the Form displays a currently valid Office of Management and Budget (“OMB”) control number. Please direct comments concerning the accuracy of the information collection burden estimate and any suggestions for reducing the burden to Secretary, Securities and Exchange Commission, 450 Fifth Street, NW, Washington, DC 20549-0609. The OMB has reviewed this collection of information under the clearance requirements of 44 U.S.C. §3507.
| Item 1. | Reports to Stockholders. |
SBL Fund
December 31, 2006
Annual Report
Table of Contents
1
This page left blank intentionally.
2
| | |
| | Series A |
| Manager’s Commentary | | (Equity Series) |
| February 15, 2007 | | (unaudited) |

Advisor, Security Management Company, LLC

Mark A. Mitchell
Portfolio Manager
To Our Shareholders:
Series A of the SBL Fund - Equity Series returned 12.89% during the year, lagging the benchmark S&P 500 Index’s return of 15.79% and the Series’ peer group median return of 13.92%. Over the last few years, higher beta, smaller capitalization companies have helped drive equity markets higher. In such environments, we tend to under perform. We still believe the market is not yet recognizing the potential in several high quality large capitalization companies. Our performance has been disappointing and we feel not indicative of our potential. We are focused on improving your Series’ returns by upgrading the talent on our equity research team and strengthening our research process. We believe that our approach will deliver good performance over a long-term investment horizon.
Our investment philosophy is centered around three key tenants: First, good investments are purchased at less than their intrinsic value; second, a long-term approach and patience are critical to successful investing; and lastly, we concentrate our investments in companies that have the greatest return potential.
Our process is a bottom-up research driven investment process that attempts to identify companies that have a competitive advantage or have the ability to become more competitive in the future. We focus on owning these companies for three to five years or longer which we believe differentiates us from a majority of our peers and ultimately allows us to make better investment decisions. We buy these companies when their current price trades below their intrinsic value. We closely monitor each company’s progress. We will sell a company if the valuation no longer makes sense, we’ve made a mistake, our investment thesis is no longer valid, or we have a more attractive investment alternative. For this Series, we apply the approach to a broad range of both growth and value names.
Financial, Technology, and Industrial Stocks Top Performers
The Series’ financial holdings were up 35% compared to 19% for the Index. This was driven almost entirely by our position in First Marblehead Corporation, up over 150%. Ill-placed short-term concerns over the company’s competitive position offered a great buying opportunity for a leading student lender with a significant competitive advantage as a result of their loan under writing capability, superior economics, and additional value-added services.
The technology sector was up over 17% versus the comparable sector Index return of 9%. The largest contributor was Unisys Corporation, up 34%. The company benefited from improving its competitive position by lowering costs and improving business execution. Not owning Intel, down 17% and Yahoo, down 34%, helped the Series as well. While both are good companies, the valuations did not meet our criteria for an attractive risk/reward profile.
General Dynamics Corporation in the industrial sector was up 32%, with the company benefiting from strong results in its defense related segment and corporate aircraft segment.
Energy and Telecom Disappointing
Energy overall negatively impacted the Series. In the Series the sector was up just over 6% versus up 24% for the energy sector return within the Index. This was driven in part by Evergreen Energy, Inc., down over 42% (previously known as KFx), and Halliburton Company, up only 1%. Evergreen Energy was hurt by concerns over the viability of the initial production results of its proprietary clean coal technology. Halliburton was impacted more generally by the recent exodus from oil services related names as a result of a weakening energy commodity market.
The telecom sector in the benchmark was up over 36%, while our sector return was down 11%. Not owning AT&T, up 53%, and Bell South, up 80%, negatively impacted the Series. It appears the market is more confident in the newly-merged telecom players. We've avoided these names because we believe it’s very difficult to determine which, if any, company will be able to create a lasting competitive advantage that allows them to generate acceptable returns on the significant capital expenditures required to build out their services offerings. Our position in Sprint Nextel Corporation, down 10%, hurt the Series’ performance. Concerns over how the integration of Nextel was progressing and lack of improvement in its core legacy Sprint operations contributed to the weakness. We still believe in management’s ability to show steady improvement as demonstrated by the spinoff of its slower growing wireline business.
2007 Market Outlook
The current low return investment environment that exists outside of equities has continued to make available ample liquidity in the U.S. equity market. Falling energy prices have helped increase consumer confidence and provide support to corporate profit margins through lower raw material input prices. Additionally, businesses have very healthy balance sheets to help drive future growth initiatives.
3
| | |
| | | Series A |
| Manager’s Commentary | | (Equity Series) |
| February 15, 2007 | | (unaudited) |
As we noted in last year’s shareholder letter, we’ve been concerned about a slowdown in U.S. consumer spending for some time. This concern has yet to materialize, but we still think it will happen. Lower energy prices will help, however, higher interest rates and a housing market slowdown provide likely headwinds. The Federal Reserve is walking a fine line between managing inflation risks while supporting economic growth. We’re unsure, like most in the market, what the Fed’s next move is. This uncertainty will weigh on the markets until it’s resolved.
We believe that investing is a long-term pursuit that requires patience and a consistent approach. Dollar cost averaging is a sound way to build long-term value1. We recognize there are many investment fund alternatives available today and thank you for your business and the confidence you place in us.
|
| Sincerely, |
|
| |
| Mark A. Mitchell, Portfolio Manager |
1 | Dollar cost averaging does not assure profits or protect against loss in a declining market. |
PERFORMANCE
Series A vs. S&P 500 Index
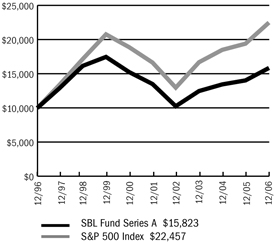
$10,000 Over 10 Years
The chart above assumes a hypothetical $10,000 investment in Series A (Equity Series) on December 31, 1996 and reflects the fees and expenses of Series A. The S&P 500 Index is a capitalization-weighted index composed of 500 selected common stocks that represent the broad domestic economy and is a widely recognized unmanaged index of market performance.
Average Annual Returns
| | | | | | | | | |
Periods Ended 12-31-061 | | 1 Year | | | 5 Years | | | 10 Years | |
Series A | | 12.89 | % | | 3.24 | % | | 4.70 | % |
1 | Performance figures do not reflect fees and expenses associated with an investment in variable insurance products offered by Security Benefit Life Insurance Company. If returns had taken into account these fees and expenses, performance would have been lower. Shares of a Series of SBL Fund are available only through the purchase of such products. |
The performance data quoted above represents past performance. Past performance is not predictive of future performance. The investment return and principal value of an investment will fluctuate so that an investor’s shares, when redeemed, may be worth more or less than their original cost.
Portfolio Composition by Sector
| | | |
Consumer Discretionary | | 11.51 | % |
Consumer Staples | | 8.58 | |
Energy | | 10.50 | |
Financials | | 20.43 | |
Health Care | | 17.08 | |
Industrials | | 16.40 | |
Information Technology | | 10.83 | |
Materials | | 0.88 | |
Telecommunication Services | | 2.11 | |
Asset Backed Commercial Paper | | 1.53 | |
Commercial Paper | | 0.29 | |
Repurchase Agreement | | 0.08 | |
Liabilities, less cash & other assets | | (0.22 | ) |
Total net assets | | 100.00 | % |
| | | |
See accompanying notes.
4
| | |
| | | Series A |
| Manager’s Commentary | | (Equity Series) |
| December 31, 2006 | | (unaudited) |
PERFORMANCE
Information About Your Series Expenses
Calculating your ongoing series expenses
Example
As a shareholder of the Series, you incur ongoing costs, including management fees and other series expenses. Performance figures and expense ratios do not reflect fees and expenses associated with an investment in variable insurance products. Shares of a Series of SBL Fund are available only through the purchase of such products. This example is intended to help you understand your ongoing costs (in dollars) of investing in the Series and to compare these costs with ongoing costs of investing in other mutual funds. The example is based on an investment of $1,000 invested at the beginning of the period and held for the entire period, July 1, 2006 - December 31, 2006.
Actual Expenses
The first line in the table provides information about actual account values and actual expenses. You may use the information in this table, together with the amount you invested, to estimate the expenses that you paid over the period. Simply divide your account value by $1,000 (for example, an $8,600 account value divided by $1,000 = 8.6), then multiply the result by the number in the table under the heading entitled “Expenses Paid During Period” to estimate the expenses you paid on your account during this period.
Hypothetical Example for Comparison Purposes
The second line in the table provides information about hypothetical account values and hypothetical expenses based on the Series actual expense ratio and an assumed rate of return of 5% per year before expenses, which is not the Series actual return. The hypothetical account values and expenses may not be used to estimate the actual ending account balance or expenses you paid for the period. You may use this information to compare the ongoing costs of investing in the Series and other funds. To do so, compare this 5% hypothetical example with the 5% hypothetical examples that appear in the shareholder reports of the other mutual funds.
Please note that the expenses shown in the table are meant to highlight your ongoing costs only and do not reflect any fees and expenses associated with an investment in variable insurance products. Therefore, the second line is useful in comparing ongoing costs only, and will not help you determine the relative total costs of owning different funds. In addition, if these fees and expenses associated with an investment in variable insurance products were included, your costs would have been higher.
Series Expenses
| | | | | | | | | |
| | | Beginning Account Value 07-01-06 | | Ending Account Value 12-31-061 | | Expenses Paid During Period2 |
| | | |
| | | |
Series A (Equity Series) | | | | | | | | | |
Actual | | $ | 1,000.00 | | $ | 1,107.60 | | $ | 4.83 |
Hypothetical | | | 1,000.00 | | | 1,020.62 | | | 4.63 |
1 | The actual ending account value is based on the actual total return of the Series for the period July 1, 2006 to December 31, 2006 after actual expenses and will differ from the hypothetical ending account value which is based on the Series expense ratio and a hypothetical annual return of 5% before expenses. The actual cumulative return at net asset value for the period July 1, 2006 to December 31, 2006 was 10.76%. |
2 | Expenses are equal to the Series annualized expense ratio of 0.91%, net of earnings credits, multiplied by the average account value over the period, multiplied by 184/365 (to reflect the one-half year period). |
5
| | |
| Schedule of Investments | | Series A (Equity Series) |
| December 31, 2006 | | |
| | | | | | |
| | | Shares | | Value |
COMMON STOCK - 98.3% | | | | | | |
Aerospace & Defense - 4.0% | | | | | | |
General Dynamics Corporation | | | 184,100 | | $ | 13,687,835 |
L-3 Communications Holdings, Inc. | | | 46,000 | | | 3,761,880 |
| | | | | | |
| | | | | | 17,449,715 |
| | | | | | |
Air Freight & Logistics - 2.9% | | | | | | |
FedEx Corporation | | | 119,500 | | | 12,980,090 |
| | | | | | |
Biotechnology - 3.4% | | | | | | |
Amgen, Inc. * | | | 220,150 | | | 15,038,447 |
| | | | | | |
Broadcasting & Cable TV - 2.3% | | | | | | |
CBS Corporation (CI.B) | | | 152,950 | | | 4,768,981 |
Univision Communications, Inc. * | | | 155,500 | | | 5,507,810 |
| | | | | | |
| | | | | | 10,276,791 |
| | | | | | |
Coal & Consumable Fuels - 2.0% | | | | | | |
Evergreen Energy, Inc. * | | | 872,400 | | | 8,628,036 |
| | | | | | |
Communications Equipment - 1.6% | | | | | | |
ADC Telecommunications, Inc. * | | | 474,114 | | | 6,888,876 |
| | | | | | |
Construction & Engineering - 2.2% | | | | | | |
Shaw Group, Inc. * (1) | | | 292,200 | | | 9,788,700 |
| | | | | | |
Consumer Finance - 6.4% | | | | | | |
American Express Company | | | 222,700 | | | 13,511,209 |
First Marblehead Corporation | | | 267,900 | | | 14,640,735 |
| | | | | | |
| | | | | | 28,151,944 |
| | | | | | |
Data Processing & Outsourced Services - 3.1% | | | | | | |
First Data Corporation | | | 208,700 | | | 5,326,024 |
Western Union Company | | | 382,000 | | | 8,564,440 |
| | | | | | |
| | | | | | 13,890,464 |
| | | | | | |
Drug Retail - 2.9% | | | | | | |
CVS Corporation | | | 419,500 | | | 12,966,745 |
| | | | | | |
Health Care Equipment - 3.1% | | | | | | |
Hospira, Inc. * | | | 128,000 | | | 4,298,240 |
Zimmer Holdings, Inc. * | | | 121,300 | | | 9,507,494 |
| | | | | | |
| | | | | | 13,805,734 |
| | | | | | |
Health Care Services - 2.5% | | | | | | |
Medco Health Solutions, Inc. * | | | 206,200 | | | 11,019,328 |
| | | | | | |
Home Improvement Retail - 4.0% | | | | | | |
Home Depot, Inc. | | | 445,200 | | | 17,879,232 |
| | | | | | |
Hotels, Resorts & Cruise Lines - 2.6% | | | | | | |
Carnival Corporation | | | 237,500 | | | 11,649,375 |
| | | | | | |
Hypermarkets & Super Centers - 5.7% | | | | | | |
Costco Wholesale Corporation | | | 231,000 | | | 12,212,970 |
Wal-Mart Stores, Inc. | | | 275,800 | | | 12,736,444 |
| | | | | | |
| | | | | | 24,949,414 |
| | | | | | |
Industrial Conglomerates - 7.3% | | | | | | |
General Electric Company | | | 522,700 | | | 19,449,667 |
Tyco International, Ltd. | | | 419,600 | | | 12,755,840 |
| | | | | | |
| | | | | | 32,205,507 |
| | | | | | |
Industrial Gases - 0.9% | | | | | | |
Praxair, Inc. | | | 65,800 | | | 3,903,914 |
| | | | | | |
Integrated Oil & Gas - 6.5% | | | | | | |
Chevron Corporation | | | 134,000 | | | 9,853,020 |
Exxon Mobil Corporation | | | 246,900 | | | 18,919,947 |
| | | | | | |
| | | | | | 28,772,967 |
| | | | | | |
IT Consulting & Other Services - 2.7% | | | | | | |
Unisys Corporation * | | | 1,505,850 | | | 11,805,864 |
| | | | | | |
Managed Health Care - 5.1% | | | | | | |
UnitedHealth Group, Inc. | | | 172,000 | | | 9,241,560 |
WellPoint, Inc. * | | | 166,600 | | | 13,109,754 |
| | | | | | |
| | | | | | 22,351,314 |
| | | | | | |
Movies & Entertainment - 2.5% | | | | | | |
Time Warner, Inc. | | | 505,000 | | | 10,998,900 |
| | | | | | |
Multi-Line Insurance - 5.1% | | | | | | |
American International Group, Inc. | | | 315,800 | | | 22,630,228 |
| | | | | | |
Oil & Gas Drilling - 0.7% | | | | | | |
Transocean, Inc. * (1) | | | 40,200 | | | 3,251,778 |
| | | | | | |
Oil & Gas Equipment & Services - 1.3% | | | | | | |
BJ Services Company | | | 70,900 | | | 2,078,788 |
Halliburton Company | | | 117,700 | | | 3,654,585 |
| | | | | | |
| | | | | | 5,733,373 |
| | | | | | |
Other Diversified Financial Services - 5.3% | | | | | | |
Citigroup, Inc. | | | 278,600 | | | 15,518,020 |
JPMorgan Chase & Company | | | 165,900 | | | 8,012,970 |
| | | | | | |
| | | | | | 23,530,990 |
| | | | | | |
Pharmaceuticals - 3.0% | | | | | | |
Johnson & Johnson | | | 201,400 | | | 13,296,428 |
| | | | | | |
Property & Casually Insurance - 3.6% | | | | | | |
Berkshire Hathaway, Inc. * | | | 145 | | | 15,948,550 |
| | | | | | |
Systems Software -3.5% | | | | | | |
Microsoft Corporation | | | 510,200 | | | 15,234,572 |
| | | | | | |
Wireless Telecommunication Services - 2.1% | | | | | | |
Sprint Nextel Corporation | | | 492,800 | | | 9,308,992 |
| | | | | | |
TOTAL COMMON STOCK (Cost $350,874,900) | | | | | $ | 434,336,268 |
| | | | | | |
| | |
| | | Principal
Amount | | Value |
ASSET BACKED COMMERCIAL PAPER - 1.5% | | | | | | |
Financial Companies - Miscellaneous Receivables - 1.0% | | | | | | |
Fairway Finance Corporation | | | | | | |
5.35%, 1/5/2007 | | $ | 1,200,000 | | | 1,199,291 |
The accompanying notes are an integral part of the financial statements.
6
| | |
| Schedule of Investments | | Series A (Equity Series) |
| December 31, 2006 - continued | | |
| | | | | | | |
| | | Principal
Amount | | Value | |
ASSET BACKED COMMERCIAL PAPER (continued) | | | | | | | |
Financial Companies - Miscellaneous Receivables (continued) | | | | | | | |
Fairway Finance Corporation (continued) | | | | | | | |
5.35%, 1/9/2007 | | $ | 1,800,000 | | $ | 1,797,880 | |
Jupiter Securitization Corporation | | | | | | | |
5.35%, 1/8/2007 | | | 1,275,000 | | | 1,273,683 | |
| | | | | | | |
| | | | | | 4,270,854 | |
| | | | | | | |
Financial Companies - Trade Receivables - 0.5% | | | | | | | |
Old Line Funding LLC | | | 1,000,000 | | | 999,555 | |
5.26%, 1/4/2007 | | | | | | | |
Sheffield Receivables Corporation | | | 1,500,000 | | | 1,499,781 | |
5.265%, 1/2/2007 | | | | | | | |
| | | | | | | |
| | | | | | 2,499,336 | |
| | | | | | | |
TOTAL ASSET BACKED COMMERCIAL PAPER (Cost $6,770,190) | | | | | $ | 6,770,190 | |
| | | | | | | |
COMMERCIAL PAPER - 0.3% | | | | | | | |
Brokerage - 0.3% | | | | | | | |
ING (U.S.) Funding LLC | | | | | | | |
5.35%, 1/3/2007 | | | 1,300,000 | | | 1,299,614 | |
| | | | | | | |
TOTAL COMMERCIAL PAPER (Cost $1,299,614) | | | | | $ | 1,299,614 | |
| | | | | | | |
REPURCHASE AGREEMENT - 0.1% | | | | | | | |
United Missouri Bank, 4.85%, dated 12-29-06, matures 01-02-07; repurchase amount of $340,183 (Collateralized by FHLMC, 5.00%, 08-15-35 with a value of $346,821) | | $ | 340,000 | | $ | 340,000 | |
| | | | | | | |
TOTAL REPURCHASE AGREEMENT (Cost $340,000) | | | | | $ | 340,000 | |
| | | | | | | |
Total Investments (SBL A Fund) | | | | | $ | 442,746,072 | |
(Cost $359,284,704) - 100.2% | | | | | | | |
Liabilities in Excess of Other Assets - (0.2)% | | | | | | (957,992 | ) |
| | | | | | | |
TOTAL NET ASSETS - 100.0% | | | | | $ | 441,788,080 | |
| | | | | | | |
Footnotes
Percentages are stated as a percent of net assets.
For federal income tax purposes the identified cost of investments owned at 12/31/2006 was $359,423,041.
| * | - Non-income producing security |
| 1 | - Security is segregated as collateral for open written options contracts. |
See notes to financial statements.
The accompanying notes are an integral part of the financial statements.
7
Series A
(Equity Series)
Statement of Assets and Liabilities
December 31, 2006
| | | |
Assets: | | | |
Investments, at value1 | | $ | 442,746,072 |
Cash | | | 9 |
Receivables: | | | |
Fund shares sold | | | 70,395 |
Dividends | | | 334,570 |
Prepaid expenses | | | 9,800 |
| | | |
Total assets | | | 443,160,846 |
| | | |
Liabilities: | | | |
Payable for: | | | |
Fund shares redeemed | | | 780,398 |
Written options, at value (premiums received $121,596) | | | 178,500 |
Management fees | | | 280,197 |
Custodian fees | | | 8,088 |
Transfer agent/maintenance fees | | | 2,083 |
Administration fees | | | 35,581 |
Professional fees | | | 41,968 |
Directors’ fees | | | 10,000 |
Other | | | 35,951 |
| | | |
Total liabilities | | | 1,372,766 |
| | | |
Net Assets | | $ | 441,788,080 |
| | | |
Net assets consist of: | | | |
Paid in capital | | $ | 309,680,133 |
Undistributed net investment income | | | 1,466,765 |
Undistributed net realized gain on sale of investments and options written | | | 47,236,718 |
Net unrealized appreciation in value of investments and options written | | | 83,404,464 |
| | | |
Net assets | | $ | 441,788,080 |
| | | |
Capital shares authorized | | | unlimited |
Capital shares outstanding | | | 17,106,488 |
Net asset value per share (net assets divided by shares outstanding) | | $ | 25.83 |
| | | |
1Investments, at cost | | $ | 359,284,704 |
Statement of Operations
For the Year Ended December 31, 2006
| | | | |
Investment Income: | | | | |
Dividends | | $ | 5,216,765 | |
Interest | | | 237,743 | |
| | | | |
Total investment income | | | 5,454,508 | |
| | | | |
Expenses: | | | | |
Management fees | | | 3,321,940 | |
Administration fees | | | 421,083 | |
Transfer agent/maintenance fees | | | 25,229 | |
Custodian fees | | | 37,756 | |
Directors’ fees | | | 20,095 | |
Professional fees | | | 55,862 | |
Reports to shareholders | | | 84,267 | |
Other expenses | | | 21,517 | |
| | | | |
Total expenses | | | 3,987,749 | |
Less: Earnings credits applied | | | (6 | ) |
| | | | |
Net expenses | | | 3,987,743 | |
| | | | |
Net investment income | | | 1,466,765 | |
| | | | |
Net Realized and Unrealized Gain (Loss): | | | | |
Net realized gain during the year on: | | | | |
Investments | | | 45,524,152 | |
Options written | | | 1,712,566 | |
| | | | |
Net realized gain | | | 47,236,718 | |
| | | | |
Net unrealized appreciation (depreciation) during the year on: | | | | |
Investments | | | 4,576,552 | |
Options written | | | (131,470 | ) |
| | | | |
Net unrealized appreciation | | | 4,445,082 | |
| | | | |
Net realized and unrealized gain | | | 51,681,800 | |
| | | | |
Net increase in net assets resulting from operations | | $ | 53,148,565 | |
| | | | |
See accompanying notes.
8
| | |
| Statement of Changes in Net Assets | | Series A |
| | | (Equity Series) |
| | | | | | | | |
| | | Year Ended
December 31, 2006 | | | Year Ended
December 31, 2005 | |
Increase (decrease) in net assets from operations: | | | | | | | | |
Net investment income | | $ | 1,466,765 | | | $ | 2,686,549 | |
Net realized gain during the year on investments and options written | | | 47,236,718 | | | | 25,155,673 | |
Net unrealized appreciation (depreciation) during the year on investments and options written | | | 4,445,082 | | | | (9,007,148 | ) |
| | | | | | | | |
Net increase in net assets resulting from operations | | | 53,148,565 | | | | 18,835,074 | |
| | | | | | | | |
Capital share transactions: | | | | | | | | |
Proceeds from sale of shares | | | 37,464,659 | | | | 44,233,911 | |
Cost of shares redeemed | | | (115,755,780 | ) | | | (126,234,284 | ) |
| | | | | | | | |
Net decrease from capital share transactions | | | (78,291,121 | ) | | | (82,000,373 | ) |
| | | | | | | | |
Net decrease in net assets | | | (25,142,556 | ) | | | (63,165,299 | ) |
| | | | | | | | |
Net assets: | | | | | | | | |
Beginning of year | | | 466,930,636 | | | | 530,095,935 | |
| | | | | | | | |
End of year | | $ | 441,788,080 | | | $ | 466,930,636 | |
| | | | | | | | |
Undistributed net investment income at end of year | | $ | 1,466,765 | | | $ | 2,686,549 | |
| | | | | | | | |
Capital Share Activity: | | | | | | | | |
Shares sold | | | 1,582,979 | | | | 2,025,092 | |
Shares redeemed | | | (4,888,558 | ) | | | (5,789,676 | ) |
| | | | | | | | |
Total capital share activity | | | (3,305,579 | ) | | | (3,764,584 | ) |
| | | | | | | | |
See accompanying notes.
9
| | |
| Financial Highlights | | Series A |
| Selected data for each share of capital stock outstanding throughout each year | | (Equity Series) |
| | | | | | | | | | | | | | | | | | | | |
| | | 2006 | | | 2005 | | | 2004 | | | 2003 | | | Year Ended,
December 31,
2002 | |
Per Share Data | | | | | | | | | | | | | | | | | | | | |
Net asset value, beginning of period | | $ | 22.88 | | | $ | 21.93 | | | $ | 20.37 | | | $ | 16.83 | | | $ | 22.36 | |
| | | | | | | | | | | | | | | | | | | | |
Income (loss) from investment operations: | | | | | | | | | | | | | | | | | | | | |
Net investment income | | | 0.11 | | | | 0.16 | | | | 0.18 | | | | 0.13 | | | | 0.10 | |
Net gain (loss) on securities (realized and unrealized) | | | 2.84 | | | | 0.79 | | | | 1.40 | | | | 3.53 | | | | (5.47 | ) |
| | | | | | | | | | | | | | | | | | | | |
Total from investment operations | | | 2.95 | | | | 0.95 | | | | 1.58 | | | | 3.66 | | | | (5.37 | ) |
| | | | | | | | | | | | | | | | | | | | |
Less distributions: | | | | | | | | | | | | | | | | | | | | |
Dividends from net investment income | | | — | | | | — | | | | (0.02 | ) | | | (0.12 | ) | | | (0.16 | ) |
| | | | | | | | | | | | | | | | | | | | |
Total distributions | | | — | | | | — | | | | (0.02 | ) | | | (0.12 | ) | | | (0.16 | ) |
| | | | | | | | | | | | | | | | | | | | |
Net asset value, end of period | | $ | 25.83 | | | $ | 22.88 | | | $ | 21.93 | | | $ | 20.37 | | | $ | 16.83 | |
| | | | | | | | | | | | | | | | | | | | |
Total Returna | | | 12.89 | % | | | 4.33 | % | | | 7.77 | % | | | 21.74 | % | | | (24.10 | %) |
| | | | | | | | | | | | | | | | | | | | |
Ratios/Supplemental Data | | | | | | | | | | | | | | | | | | | | |
Net assets, end of period (in thousands) | | $ | 441,788 | | | $ | 466,931 | | | $ | 530,096 | | | $ | 559,290 | | | $ | 517,837 | |
| | | | | | | | | | | | | | | | | | | | |
Ratios to average net assets: | | | | | | | | | | | | | | | | | | | | |
Net investment income | | | 0.33 | % | | | 0.55 | % | | | 0.81 | % | | | 0.66 | % | | | 0.49 | % |
Total expensesb | | | 0.90 | % | | | 0.89 | % | | | 0.87 | % | | | 0.82 | % | | | 0.82 | % |
Net expensesc | | | 0.90 | % | | | 0.89 | % | | | 0.87 | % | | | 0.82 | % | | | 0.82 | % |
Expenses prior to custodian earnings credits and net of expense waivers | | | 0.90 | % | | | 0.89 | % | | | 0.87 | % | | | 0.82 | % | | | 0.82 | % |
| | | | | | | | | | | | | | | | | | | | |
Portfolio turnover rate | | | 26 | % | | | 37 | % | | | 27 | % | | | 53 | % | | | 25 | % |
a | Total return does not take into account any of the expenses associated with an investment in variable insurance products offered by Security Benefit Life Insurance Company. If total return had taken into account these expenses, performance would have been lower. Shares of a series of SBL Fund are available only through the purchase of such products. |
b | Total expense information reflects expense ratios absent fund expense reductions by the Investment Manager, and earnings credits, as applicable. |
c | Net expense information reflects the expense ratios after voluntary expense waivers, reimbursements and custodian earnings credits, as applicable. |
See accompanying notes.
10
| | |
| | Series B |
| Manager’s Commentary | | (Large Cap Value Series) |
| February 15, 2007 | | (unaudited) |
Advisor, Security Management Company, LLC

Mark Mitchell
Portfolio Manager
To Our Shareholders:
Series B of the SBL Fund - Large Cap Value series returned 22.00% during the year, lagging the benchmark Russell 1000 Value Index’s return of 22.25%, but out performing the Series’ peer group median return of 18.86%. Good stock selection was offset slightly by our sector weights in 2006. While being disappointed that our results were below the benchmark, we believe that our approach delivers performance over the long-term.
Our investment philosophy is centered around three key tenants: first, good investments are purchased at less than their intrinsic value; second, a long-term approach and patience are critical to successful investing; and lastly, we concentrate our investments in companies that have the greatest return potential.
Our process is a bottom-up research driven investment process that attempts to identify companies that have the ability to become more competitive in the future. We focus on owning these companies for three to five years or longer which we believe differentiates us from a majority of our peers and ultimately allows us to make better investment decisions. We buy these companies when their current price trades below their intrinsic value. We closely monitor each company’s progress. We will sell a company if the valuation no longer makes sense, we’ve made a mistake and our investment thesis is no longer valid, or we have a more attractive investment alternative. For this Series, we apply this philosophy to a broad range of value names.
Financials and Industrial Stocks Top Performers
The Series’ Financial holdings were up 37% compared to 20% for the Index. This was driven almost entirely by our position in First Marblehead Corporation, up over 150%. Ill-placed short-term concerns over the company’s competitive position offered a great buying opportunity for a leading student lender with a significant competitive advantage as a result of their loan underwriting capability, superior economics, and additional value-added services.
Holdings International, Inc., the industrial sector were up 28%. McDermott appreciated 71%, driven by strong demand for its energy infrastructure construction related services. Hughes Supply was up 27% as it agreed to be acquired by Home Depot, Inc. Hughes’ strong position in the professional contractor market fits well into Home Depot’s expansion plans in that segment.
Telecom and Energy Disappointing
The telecom sector in the benchmark was up over 39%, while our sector return was up just 1%. Not owning AT&T, up 53%, and Bell South, up 80%, negatively impacted the Series. It appears the market is more confident in the newly-merged telecom players. We’ve avoided these names because we believe it’s very difficult to determine which, if any, company will be able to create a lasting competitive advantage that allows them to generate acceptable returns on the significant capital expenditures required to build out their services offerings. Our position in Sprint Nextel Corporation, down 10%, hurt the Series’ performance. Concerns over how the integration of Nextel was progressing and lack of improvement in its core legacy Sprint operations contributed to the weakness. We still believe in management’s ability to show steady improvement as demonstrated by the spinoff of its slower growing wireline business.
Poor stock selection in the energy sector negatively impacted the Series as the sector underperformed the value index. Specifically, Halliburton Company, up just 1%, and an underweight position in Exxon Mobil Corporation, up 39%, had the largest negative impact. Halliburton was impacted more generally by the recent exodus from oil services related names as a result of a weakening energy commodity market. Exxon outperformed formed the diversified group of integrated oil companies we owned.
2007 Market Outlook
The current low return investment environment that exists outside of equities has continued to make available ample liquidity in the U.S. equity market. Falling energy prices have helped increase consumer confidence and provide support to corporate profit margins through lower raw material input prices. Additionally, businesses have very healthy balance sheets to help drive future growth initiatives.
As we noted in last year’s shareholder letter, we’ve been concerned about a slowdown in U.S. consumer spending for some time. This concern has yet to materialize, but we still think it will happen. Lower energy prices will help; however, higher interest rates and a housing market slowdown provide likely headwinds. The Federal Reserve is walking a fine line between managing inflation risks while supporting economic growth. We’re unsure, like most in the market, what the Fed’s next move is. This uncertainty will weigh on the markets until it’s resolved.
We believe that investing is a long-term pursuit that requires patience and a consistent approach. Dollar cost averaging is a sound way to build long-term value1. We recognize there are many investment fund alternatives available today and thank you for your business and the confidence you place in us.
|
| Sincerely, |
|
| |
| Mark A. Mitchell, Portfolio Manager |
1 | Dollar cost averaging does not assure profits or protect against loss in a declining market. |
11
| | |
| | Series B |
| Manager’s Commentary | | (Large Cap Value Series) |
| December 31, 2006 | | (unaudited) |
PERFORMANCE
Series B vs. Russell 1000 Value Index
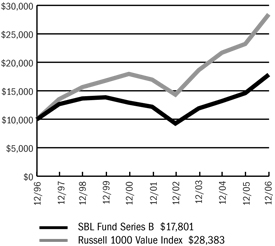
$10,000 Over 10 Years
The chart above assumes a hypothetical $10,000 investment in Series B (Large Cap Value Series) on December 31, 1996 and reflects the fees and expenses of Series B. The Russell 1000 Value Index is an unmanaged index representing the performance of those Russell 1000 Index companies with lower price-to-book ratios and lower forecasted growth values.
Average Annual Returns
| | | | | | | | | |
Periods Ended 12-31-061 | | 1 Year | | | 5 Years | | | 10 Years | |
Series B | | 22.00 | % | | 7.86 | % | | 5.94 | % |
1 | Performance figures do not reflect fees and expenses associated with an investment in variable insurance products offered by Security Benefit Life Insurance Company. If returns had taken into account these fees and expenses, performance would have been lower. Shares of a Series of SBL Fund are available only through the purchase of such products. |
The performance data quoted above represents past performance. Past performance is not predictive of future performance. The investment return and principal value of an investment will fluctuate so that an investor’s shares, when redeemed, may be worth more or less than their original cost.
Portfolio Composition by Sector
| | | |
Consumer Discretionary | | 11.09 | % |
Consumer Staples | | 9.67 | |
Energy | | 14.20 | |
Financials | | 16.89 | |
Health Care | | 6.65 | |
Industrials | | 16.84 | |
Information Technology | | 4.92 | |
Materials | | 5.86 | |
Telecommunication Services | | 3.57 | |
Utilities | | 1.86 | |
Exchange Traded Funds | | 5.93 | |
Asset Backed Commercial Paper | | 2.37 | |
Commercial Paper | | 0.48 | |
Repurchase Agreement | | 0.10 | |
Liabilities, less cash & other assets | | (0.43 | ) |
Total net assets | | 100.00 | % |
| | | |
See accompanying notes.
12
| | |
| | Series B |
| Manager’s Commentary | | (Large Cap Value Series) |
| December 31, 2006 | | (unaudited) |
PERFORMANCE
Information About Your Series Expenses
Calculating your ongoing series expenses
Example
As a shareholder of the Series, you incur ongoing costs, including management fees and other series expenses. Performance figures and expense ratios do not reflect fees and expenses associated with an investment in variable insurance products. Shares of a Series of SBL Fund are available only through the purchase of such products This example is intended to help you understand your ongoing costs (in dollars) of investing in the Series and to compare these costs with ongoing costs of investing in other mutual funds. The example is based on an investment of $1,000 invested at the beginning of the period and held for the entire period, July 1, 2006 - December 31, 2006.
Actual Expenses
The first line in the table provides information about actual account values and actual expenses. You may use the information in this table, together with the amount you invested, to estimate the expenses that you paid over the period. Simply divide your account value by $1,000 (for example, an $8,600 account value divided by $1,000 = 8.6), then multiply the result by the number in the table under the heading entitled “Expenses Paid During Period” to estimate the expenses you paid on your account during this period.
Hypothetical Example for Comparison Purposes
The second line in the table provides information about hypothetical account values and hypothetical expenses based on the Series actual expense ratio and an assumed rate of return of 5% per year before expenses, which is not the Series actual return. The hypothetical account values and expenses may not be used to estimate the actual ending account balance or expenses you paid for the period. You may use this information to compare the ongoing costs of investing in the Series and other funds. To do so, compare this 5% hypothetical example with the 5% hypothetical examples that appear in the shareholder reports of the other mutual funds.
Please note that the expenses shown in the table are meant to highlight your ongoing costs only and do not reflect any fees and expenses associated with an investment in variable insurance products. Therefore, the second line is useful in comparing ongoing costs only, and will not help you determine the relative total costs of owning different funds. In addition, if these fees and expenses associated with an investment in variable insurance products were included, your costs would have been higher.
Series Expenses
| | | | | | | | | |
| | | Beginning
Account Value
07-01-06 | | Ending
Account Value
12-31-061 | | Expenses Paid
During
Period2 |
Series B (Large Cap Value Series) | | | | | | | | | |
Actual | | $ | 1,000.00 | | $ | 1,099.10 | | $ | 4.18 |
Hypothetical | | | 1,000.00 | | | 1,021.22 | | | 4.02 |
1 | The actual ending account value is based on the actual total return of the Series for the period July 1, 2006 to December 31, 2006 after actual expenses and will differ from the hypothetical ending account value which is based on the Series expense ratio and a hypothetical annual return of 5% before expenses. The actual cumulative return at net asset value for the period July 1, 2006 to December 31, 2006 was 9.91%. |
2 | Expenses are equal to the Series annualized expense ratio of 0.79%, net of earnings credits, multiplied by the average account value over the period, multiplied by 184/365 (to reflect the one-half year period). |
13
| | |
| Schedule of Investments | | Series B (Large Cap Value Series) |
| December 31, 2006 | | |
| | | | | |
| | | Shares | | Value |
COMMON STOCK - 97.5% | | | | | |
Aerospace & Defense - 3.0% | | | | | |
United Technologies Corporation | | 228,400 | | $ | 14,279,568 |
| | | | | |
Agricultural Products - 1.9% | | | | | |
Archer-Daniels-Midland Company | | 281,400 | | | 8,993,544 |
| | | | | |
Aluminum - 0.7% | | | | | |
Alcoa, Inc. | | 119,600 | | | 3,589,196 |
| | | | | |
Broadcasting & Cable TV - 2.6% | | | | | |
CBS Corporation (CI.B) | | 402,100 | | | 12,537,478 |
| | | | | |
Computer Hardware - 2.8% | | | | | |
Hewlett-Packard Company | | 331,200 | | | 13,642,128 |
| | | | | |
Construction & Engineering - 2.9% | | | | | |
Shaw Group, Inc. * (1) | | 423,700 | | | 14,193,950 |
| | | | | |
Consumer Finance - 3.2% | | | | | |
First Marblehead Corporation | | 279,225 | | | 15,259,646 |
| | | | | |
Diversified Chemicals - 3.3% | | | | | |
Dow Chemical Company | | 176,400 | | | 7,045,416 |
E.I. Du Pont de Nemours & Company | | 178,600 | | | 8,699,606 |
| | | | | |
| | | | | 15,745,022 |
| | | | | |
Drug Retail - 3.1% | | | | | |
CVS Corporation | | 477,800 | | | 14,768,798 |
| | | | | |
Electric Utilities - 1.9% | | | | | |
Edison International | | 196,300 | | | 8,927,724 |
| | | | | |
Exchange Traded Funds - 5.9% | | | | | |
iShares Russell 1000 Value Index Fund | | 170,600 | | | 14,093,266 |
iShares S&P 500 Value Index Fund | | 187,600 | | | 14,424,564 |
| | | | | |
| | | | | 28,517,830 |
| | | | | |
Health Care Equipment - 1.0% | | | | | |
Hospira, Inc. * | | 139,000 | | | 4,667,620 |
| | | | | |
Health Care Services - 2.9% | | | | | |
Medco Health Solutions, Inc. * | | 258,200 | | | 13,798,208 |
| | | | | |
Home Improvement Retail - 2.0% | | | | | |
Home Depot, Inc. | | 242,000 | | | 9,718,720 |
| | | | | |
Hypermarkets & Super Centers - 2.8% | | | | | |
Costco Wholesale Corporation | | 254,200 | | | 13,439,554 |
| | | | | |
Industrial Conglomerates - 8.6% | | | | | |
General Electric Company | | 383,900 | | | 14,284,919 |
McDermott International, Inc. * | | 286,500 | | | 14,571,390 |
Tyco International, Ltd. | | 406,600 | | | 12,360,640 |
| | | | | |
| | | | | 41,216,949 |
| | | | | |
Integrated Oil & Gas - 9.7% | | | | | |
Chevron Corporation | | 151,000 | | | 11,103,030 |
ConocoPhillips | | 92,500 | | | 6,655,375 |
Exxon Mobil Corporation | | 204,600 | | | 15,678,498 |
Sasol, Ltd. ADR | | 360,500 | | | 13,302,450 |
| | | | | |
| | | | | 46,739,353 |
| | | | | |
Integrated Telecommunication Services - 1.0% | | | | | |
Windstream Corporation | | 331,932 | | | 4,720,073 |
| | | | | |
IT Consulting & Other Services - 2.1% | | | | | |
Unisys Corporation * | | 1,273,500 | | | 9,984,240 |
| | | | | |
Managed Health Care - 2.8% | | | | | |
WellPoint, Inc. * | | 171,500 | | | 13,495,335 |
| | | | | |
Movies & Entertainment - 6.5% | | | | | |
News Corporation | | 488,800 | | | 10,499,424 |
Time Warner, Inc. | | 712,600 | | | 15,520,428 |
Viacom, Inc. (CI.B) * | | 122,100 | | | 5,009,763 |
| | | | | |
| | | | | 31,029,615 |
| | | | | |
Multi-Line Insurance - 4.1% | | | | | |
American International Group, Inc. | | 272,600 | | | 19,534,516 |
| | | | | |
Oil & Gas Drilling - 0.7% | | | | | |
Transocean, Inc. * (1) | | 39,100 | | | 3,162,799 |
| | | | | |
Oil & Gas Equipment & Services - 1.5% | | | | | |
Halliburton Company | | 232,600 | | | 7,222,230 |
| | | | | |
Oil & Gas Storage & Transportation - 2.3% | | | | | |
Williams Companies, Inc. | | 426,800 | | | 11,148,016 |
| | | | | |
Other Diversified Financial Services - 5.3% | | | | | |
Citigroup, Inc. | | 266,300 | | | 14,832,910 |
JPMorgan Chase & Company | | 221,700 | | | 10,708,110 |
| | | | | |
| | | | | 25,541,020 |
| | | | | |
Packaged Foods & Meats - 0.3% | | | | | |
Tyson Foods, Inc. | | 83,700 | | | 1,376,865 |
| | | | | |
Property & Casually Insurance - 4.3% | | | | | |
Berkshire Hathaway, Inc. * | | 190 | | | 20,898,100 |
| | | | | |
Railroads - 2.3% | | | | | |
Union Pacific Corporation | | 122,800 | | | 11,300,056 |
| | | | | |
Specialty Chemicals - 1.8% | | | | | |
Rohm & Haas Company | | 172,200 | | | 8,802,864 |
| | | | | |
Tobacco - 1.6% | | | | | |
Altria Group, Inc. | | 91,800 | | | 7,878,276 |
| | | | | |
Wireless Telecommunication Services - 2.6% | | | | | |
Alltel Corporation | | 59,900 | | | 3,622,752 |
The accompanying notes are an integral part of the financial statements.
14
| | |
| Schedule of Investments | | Series B (Large Cap Value Series) |
| December 31, 2006 - continued | | |
| | | | | | | |
| | | Shares | | Value | |
COMMON STOCK (continued) | | | | | | | |
Wireless Telecommunication Services (continued) | | | | | | | |
Sprint Nextel Corporation | | | 466,600 | | $ | 8,814,074 | |
| | | | | | | |
| | | | | | 12,436,826 | |
| | | | | | | |
TOTAL COMMON STOCK (Cost $366,787,659) | | | | | $ | 468,566,119 | |
| | | | | | | |
| | |
| | | Principal
Amount | | Value | |
ASSET BACKED COMMERCIAL PAPER - 2.3% | | | | | | | |
Financial Companies - Diversified - 0.5% | | | | | | | |
Amsterdam Funding Corporation | | | | | | | |
5.28%, 1/4/2007 | | $ | 1,000,000 | | | 999,562 | |
5.28%, 1/10/2007 | | | 1,600,000 | | | 1,597,888 | |
| | | | | | | |
| | | | | | 2,597,450 | |
| | | | | | | |
Financial Companies - Miscellaneous Receivables - 0.9% | | | | | | | |
Fairway Finance Corporation | | | | | | | |
5.35%, 1/9/2007 | | | 1,608,000 | | | 1,606,088 | |
Falcon Asset Securitization Corporation | | | | | | | |
5.27%, 1/8/2007 | | | 1,300,000 | | | 1,298,668 | |
5.30%, 1/11/2007 | | | 1,500,000 | | | 1,497,791 | |
| | | | | | | |
| | | | | | 4,402,547 | |
| | | | | | | |
Financial Companies - Trade Receivables - 0.9% | | | | | | | |
Old Line Funding LLC | | | | | | | |
5.26%, 1/12/2007 | | | 1,400,000 | | | 1,397,750 | |
5.28%, 1/16/2007 | | | 1,500,000 | | | 1,496,700 | |
Sheffield Receivables Corporation | | | | | | | |
5.265%, 1/2/2007 | | | 1,500,000 | | | 1,499,781 | |
| | | | | | | |
| | | | | | 4,394,231 | |
| | | | | | | |
TOTAL ASSET BACKED COMMERCIAL PAPER (Cost $11,394,228) | | | | | $ | 11,394,228 | |
| | | | | | | |
COMMERCIAL PAPER - 0.5% | | | | | | | |
Brokerage - 0.5% | | | | | | | |
Credit Suisse First Boston USA | | | | | | | |
5.28%, 1/3/2007 | | | 1,300,000 | | | 1,299,619 | |
Goldman Sachs Group, Inc. | | | | | | | |
5.23%, 1/5/2007 | | | 1,000,000 | | | 999,419 | |
| | | | | | | |
| | | | | | 2,299,038 | |
| | | | | | | |
TOTAL COMMERCIAL PAPER (Cost $2,299,038) | | | | | $ | 2,299,038 | |
| | | | | | | |
REPURCHASE AGREEMENT - 0.1% | | | | | | | |
United Missouri Bank, 4. 85%, dated 12-29-06, matures 01-02-07; repurchase amount of $502,271 (Collateralized by FHLMC, 5.00%, 10-15-36 & FMNA, 5.00%, 06-01-18 with a combined value of $512,039) | | | 502,000 | | $ | 502,000 | |
| | | | | | | |
TOTAL REPURCHASE AGREEMENT (Cost $502,000) | | | | | $ | 502,000 | |
| | | | | | | |
Total Investments (SBL B Fund) (Cost $380,982,925) - 100.4% | | | | | $ | 482,761,385 | |
Liabilities in Excess of Other Assets - (0.4)% | | | | | | (2,077,978 | ) |
| | | | | | | |
TOTAL NET ASSETS - 100.0% | | | | | $ | 480,683,407 | |
| | | | | | | |
Footnotes
Percentages are stated as a percent of net assets.
For federal income tax purposes the identified cost of investments owned at 12/31/2006 was $381,029,891.
| * | - Non-income producing security |
| 1 | - Security is segregated as collateral for open written options contracts. |
Glossary:
ADR - American Depositary Receipt
See notes to financial statements.
The accompanying notes are an integral part of the financial statements.
15
Series B
(Large Cap Value Series)
Statement of Assets and Liabilities
December 31, 2006
| | | | |
Assets: | | | | |
Investments, at value1 | | $ | 482,761,385 | |
Cash | | | 471 | |
Receivables: | | | | |
Fund shares sold | | | 940,605 | |
Dividends | | | 584,404 | |
Prepaid expenses | | | 10,064 | |
| | | | |
Total assets | | | 484,296,929 | |
| | | | |
Liabilities: | | | | |
Payable for: | | | | |
Fund shares redeemed | | | 442,154 | |
Securities purchased | | | 2,665,073 | |
Written options, at value (premiums received $101,419) | | | 122,210 | |
Management fees | | | 262,073 | |
Directors’ fees | | | 10,000 | |
Custodian fees | | | 2,625 | |
Transfer agent/maintenance fees | | | 2,083 | |
Administration fees | | | 38,453 | |
Professional fees | | | 35,837 | |
Other | | | 33,014 | |
| | | | |
Total liabilities | | | 3,613,522 | |
| | | | |
Net Assets | | $ | 480,683,407 | |
| | | | |
Net assets consist of: | | | | |
Paid in capital | | $ | 602,529,743 | |
Undistributed net investment income | | | 3,504,848 | |
Accumulated net realized loss on sale of investments and options written | | | (227,108,853 | ) |
Net unrealized appreciation in value of investments and options written | | | 101,757,669 | |
| | | | |
Net assets | | $ | 480,683,407 | |
| | | | |
Capital shares authorized | | | unlimited | |
Capital shares outstanding | | | 18,206,160 | |
Net asset value per share (net assets divided by shares outstanding) | | $ | 26.40 | |
| | | | |
1Investments, at cost | | $ | 380,982,925 | |
Statement of Operations
For the Year Ended December 31, 2006
| | | | |
Investment Income: | | | | |
Dividends | | $ | 6,404,311 | |
Interest | | | 569,285 | |
| | | | |
Total investment income | | | 6,973,596 | |
| | | | |
Expenses: | | | | |
Management fees | | | 2,840,902 | |
Administration fees | | | 415,647 | |
Custodian fees | | | 22,097 | |
Transfer agent/maintenance fees | | | 25,234 | |
Directors’ fees | | | 20,120 | |
Professional fees | | | 45,859 | |
Reports to shareholders | | | 79,949 | |
Other expenses | | | 18,972 | |
| | | | |
Total expenses | | | 3,468,780 | |
Less: Earnings credits applied | | | (32 | ) |
| | | | |
Net expenses | | | 3,468,748 | |
| | | | |
Net investment income | | | 3,504,848 | |
| | | | |
Net Realized and Unrealized Gain (Loss): | | | | |
Net realized gain during the year on: | | | | |
Investments | | | 25,798,929 | |
Options written | | | 1,220,908 | |
| | | | |
Net realized gain | | | 27,019,837 | |
| | | | |
Net unrealized appreciation (depreciation) during the year on: | | | | |
Investments | | | 57,175,374 | |
Options written | | | (91,355 | ) |
| | | | |
Net unrealized appreciation | | | 57,084,019 | |
| | | | |
Net realized and unrealized gain | | | 84,103,856 | |
| | | | |
Net increase in net assets resulting from operations | | $ | 87,608,704 | |
| | | | |
See accompanying notes.
16
| | |
| | Series B |
| Statement of Changes in Net Assets | | (Large Cap Value Series) |
| | | | | | | | |
| | | Year Ended
December 31, 2006 | | | Year Ended
December 31, 2005 | |
Increase (decrease) in net assets from operations: | | | | | | | | |
Net investment income | | $ | 3,504,848 | | | $ | 3,971,506 | |
Net realized gain during the year on investments and options written | | | 27,019,837 | | | | 48,032,291 | |
Net unrealized appreciation (depreciation) during the year on investments and options written | | | 57,084,019 | | | | (11,665,891 | ) |
| | | | | | | | |
Net increase in net assets resulting from operations | | | 87,608,704 | | | | 40,337,906 | |
| | | | | | | | |
Capital share transactions: | | | | | | | | |
Proceeds from sale of shares | | | 88,964,012 | | | | 39,815,974 | |
Cost of shares redeemed | | | (106,581,077 | ) | | | (98,954,660 | ) |
| | | | | | | | |
Net decrease from capital share transactions | | | (17,617,065 | ) | | | (59,138,686 | ) |
| | | | | | | | |
Net increase (decrease) in net assets | | | 69,991,639 | | | | (18,800,780 | ) |
| | | | | | | | |
Net assets: | | | | | | | | |
Beginning of year | | | 410,691,768 | | | | 429,492,548 | |
| | | | | | | | |
End of year | | $ | 480,683,407 | | | $ | 410,691,768 | |
| | | | | | | | |
Undistributed net investment income at end of year | | $ | 3,504,848 | | | $ | 3,971,506 | |
| | | | | | | | |
Capital Share Activity: | | | | | | | | |
Shares sold | | | 3,705,999 | | | | 1,980,149 | |
Shares redeemed | | | (4,475,464 | ) | | | (4,944,509 | ) |
| | | | | | | | |
Total capital share activity | | | (769,465 | ) | | | (2,964,360 | ) |
| | | | | | | | |
See accompanying notes.
17
| | | |
| Financial Highlights | | Series B | |
| Selected data for each share of capital stock outstanding throughout each year | | (Large Cap Value Series | ) |
| | | | | | | | | | | | | | | | | | | | |
| | | 2006 | | | 2005d | | | 2004 | | | 2003 | | | Year Ended,
December 31,
2002 | |
Per Share Data | | | | | | | | | | | | | | | | | | | | |
Net asset value, beginning of period | | $ | 21.64 | | | $ | 19.58 | | | $ | 17.68 | | | $ | 13.84 | | | $ | 18.59 | |
| | | | | | | | | | | | | | | | | | | | |
Income (loss) from investment operations: | | | | | | | | | | | | | | | | | | | | |
Net investment income | | | 0.20 | | | | 0.24 | | | | 0.21 | | | | 0.14 | | | | 0.13 | |
Net gain (loss) on securities (realized and unrealized) | | | 4.56 | | | | 1.82 | | | | 1.70 | | | | 3.84 | | | | (4.58 | ) |
| | | | | | | | | | | | | | | | | | | | |
Total from investment operations | | | 4.76 | | | | 2.06 | | | | 1.91 | | | | 3.98 | | | | (4.45 | ) |
| | | | | | | | | | | | | | | | | | | | |
Less distributions: | | | | | | | | | | | | | | | | | | | | |
Dividends from net investment income | | | — | | | | — | | | | (0.01 | ) | | | (0.14 | ) | | | (0.30 | ) |
| | | | | | | | | | | | | | | | | | | | |
Total distributions | | | — | | | | — | | | | (0.01 | ) | | | (0.14 | ) | | | (0.30 | ) |
| | | | | | | | | | | | | | | | | | | | |
Net asset value, end of period | | $ | 26.40 | | | $ | 21.64 | | | $ | 19.58 | | | $ | 17.68 | | | $ | 13.84 | |
| | | | | | | | | | | | | | | | | | | | |
Total Returna | | | 22.00 | % | | | 10.52 | % | | | 10.82 | % | | | 28.81 | % | | | (24.14 | %) |
| | | | | | | | | | | | | | | | | | | | |
Ratios/Supplemental Data | | | | | | | | | | | | | | | | | | | | |
Net assets, end of period (in thousands) | | $ | 480,683 | | | $ | 410,692 | | | $ | 429,493 | | | $ | 434,575 | | | $ | 370,746 | |
| | | | | | | | | | | | | | | | | | | | |
Ratios to average net assets: | | | | | | | | | | | | | | | | | | | | |
Net investment income | | | 0.80 | % | | | 0.98 | % | | | 1.09 | % | | | 0.93 | % | | | 0.74 | % |
Total expensesb | | | 0.79 | % | | | 0.84 | % | | | 0.92 | % | | | 0.89 | % | | | 0.91 | % |
Net expensesc | | | 0.79 | % | | | 0.84 | % | | | 0.87 | % | | | 0.83 | % | | | 0.82 | % |
| | | | | | | | | | | | | | | | | | | | |
Portfolio turnover rate | | | 20 | % | | | 99 | % | | | 73 | % | | | 60 | % | | | 68 | % |
a | Total return does not take into account any of the expenses associated with an investment in variable insurance products offered by Security Benefit Life Insurance Company. If total return had taken into account these expenses, performance would have been lower. Shares of a series of SBL Fund are available only through the purchase of such products. |
b | Total expense information reflects expense ratios absent fund expense reductions by the Investment Manager, and earnings credits, as applicable. |
c | Net expense information reflects the expense ratios after voluntary expense waivers, reimbursements and custodian earnings credits, as applicable. |
d | SMC became the advisor of Series B effective June 30, 2005. Prior to June 30, 2005, SMC paid Dreyfus Corporation for sub-advisory services. |
See accompanying notes.
18
| | |
| | Series C |
| Manager’s Commentary | | (Money Market Series) |
| February 15, 2007 | | (unaudited) |
Advisor, Security Management Company, LLC

Christi Fletcher
Portfolio Manager
To Our Shareholders:
The first half of 2006 proved to be comparable to 2005. The Federal Reserve Board’s campaign to increase interest rates resulted in four rate increases during the Series’ fiscal year ending at 5.25%. The yield of the Series C of the SBL Fund—Money Market Series rose accordingly, returning 4.43% for the year ended December 31, 2006, which exceeded the benchmark I-Money Net Retail Tier 1 of 4.30% for the same period.
Aside from the increases in short-term interest rates, the continued threat of higher inflation and a flat yield curve the past year proved positive for credit issuers. Companies continued to display solid balance sheet fundamentals, strong cash flows and good profit growth. In addition, the trend continues as firms utilize the excess cash flows for increasing dividends or share repurchases (shareholder friendly), rather than bolstering credit quality.
Characteristics of Portfolio Assets
At December 31, 2006, the average maturity of Series C was 51 days, which was a couple of days longer than the benchmark. This strategy positioned the Series to take advantage of longer dated securities, as the threat of decreasing rates loomed.
The yield curve for money market instruments went from upward trending during the first half of 2006 to relatively flat in the second half. This made for interesting challenges for additional yield along the maturity spectrum and among various types of money market instruments. The majority of the Series assets lie in the corporate debt sector via commercial paper, floating rate securities and Yankee CD’s, due to the strong balance sheet fundamentals of credit and because it represented good value against other sectors. At year end, approximately 52% of the Series was made up of Commercial Paper, 30% in Floating Rate securities (which includes Corporate and U.S. Government-Backed), 7% in U.S. Government/Agency obligations, 7% in Yankee CD’s, 3% in funding agreements, and 1% Mortgage-related products.
Outlook for 2007
In 2006, the economy continued to grow but with strong head winds from the long anticipated correction in the housing market, the Federal Reserve rate increases that started to take effect, and commodity prices yet again hitting all time highs. Looking forward to 2007, the economy will continue to grow but at a slower pace versus recent years. We expect short-term rates to remain at 5.25% for most of 2007. We believe the approach the Federal Reserve will take is one of a wait-and-see attitude. We are not anticipating a cut in short-term rates but have not factored in an increase either, unless we see an increase in inflation. At this point, there is limited evidence of either situation unfolding during 2007.
With a stable U.S. economy predicted in 2007, as fundamentals in the corporate sector remain solid and companies continue to generate strong cash flows and earnings growth, the Series will continue to be invested heavily in the corporate debt sectors within the money market arena.
As always, we will continue to monitor the economic and market conditions when deciding portfolio strategies and will adjust the asset mix and maturity structure in the portfolio accordingly.
Thank you for your investment in Series C. We appreciate the confidence that you have placed in us and remain focused on achieving the Series’ investment goals.
|
| Sincerely, |
|
| |
Christina Fletcher Portfolio Manager |
19
| | | |
| | Series C | |
Manager’s Commentary | | (Money Market Series | ) |
December 31, 2006 | | (unaudited | ) |
PERFORMANCE
Portfolio Composition by Quality Ratings (Based on Standard and Poor’s Ratings)
| | | |
Tier 1 investments | | 106.78 | % |
Repurchase Agreement | | 0.24 | |
Liabilities, less cash & other assets | | (7.02 | ) |
Total net assets | | 100.00 | % |
| | | |
Average Annual Returns
| | | | | | | | | |
Periods Ended 12-31-061 | | 1 Year | | | 5 Years | | | 10 Years | |
Series C | | 4.43 | % | | 1.91 | % | | 3.41 | % |
1 | Performance figures do not reflect fees and expenses associated with an investment in variable insurance products offered by Security Benefit Life Insurance Company. If returns had taken into account these fees and expenses, performance would have been lower. Shares of a Series of SBL Fund are available only through the purchase of such products. |
The performance data quoted above represents past performance. Past performance is not predictive of future performance. The investment return and principal value of an investment will fluctuate so that an investor’s shares, when redeemed, may be worth more or less than their original cost.
See accompanying notes.
20
| | | |
| | Series C | |
Manager’s Commentary | | (Money Market Series | ) |
December 31, 2006 | | (unaudited | ) |
PERFORMANCE
Information About Your Series Expenses
Calculating your ongoing series expenses
Example
As a shareholder of the Series, you incur ongoing costs, including management fees and other series expenses. Performance figures and expense ratios do not reflect fees and expenses associated with an investment in variable insurance products. Shares of a Series of SBL Fund are available only through the purchase of such products. This example is intended to help you understand your ongoing costs (in dollars) of investing in the Series and to compare these costs with ongoing costs of investing in other mutual funds. The example is based on an investment of $1,000 invested at the beginning of the period and held for the entire period, July 1, 2006 - December 31, 2006.
Actual Expenses
The first line in the table provides information about actual account values and actual expenses. You may use the information in this table, together with the amount you invested, to estimate the expenses that you paid over the period. Simply divide your account value by $1,000 (for example, an $8,600 account value divided by $1,000 = 8.6), then multiply the result by the number in the table under the heading entitled “Expenses Paid During Period” to estimate the expenses you paid on your account during this period.
Hypothetical Example for Comparison Purposes
The second line in the table provides information about hypothetical account values and hypothetical expenses based on the Series actual expense ratio and an assumed rate of return of 5% per year before expenses, which is not the Series actual return. The hypothetical account values and expenses may not be used to estimate the actual ending account balance or expenses you paid for the period. You may use this information to compare the ongoing costs of investing in the Series and other funds. To do so, compare this 5% hypothetical example with the 5% hypothetical examples that appear in the shareholder reports of the other mutual funds.
Please note that the expenses shown in the table are meant to highlight your ongoing costs only and do not reflect any fees and expenses associated with an investment in variable insurance products. Therefore, the second line is useful in comparing ongoing costs only, and will not help you determine the relative total costs of owning different funds. In addition, if these fees and expenses associated with an investment in variable insurance products were included, your costs would have been higher.
Series Expenses
| | | | | | | | | |
| | | Beginning
Account Value
07-01-06 | | Ending
Account Value
12-31-061 | | Expenses Paid
During
Period2 |
Series C (Money Market Series) | | | | | | | | | |
Actual | | $ | 1,000.00 | | $ | 1,024.10 | | $ | 3.47 |
Hypothetical | | | 1,000.00 | | | 1,021.78 | | | 3.47 |
1 | The actual ending account value is based on the actual total return of the Series for the period July 1, 2006 to December 31, 2006 after actual expenses and will differ from the hypothetical ending account value which is based on the Series expense ratio and a hypothetical annual return of 5% before expenses. The actual cumulative return at net asset value for the period July 1, 2006 to December 31, 2006 was 2.41%. |
2 | Expenses are equal to the Series annualized expense ratio of 0.68%, net of earnings credits, multiplied by the average account value over the period, multiplied by 184/365 (to reflect the one-half year period). |
21
| | | |
Schedule of Investments | | Series C | |
December 31, 2006 | | (Money Market Series | ) |
| | | | | | |
| | | Principal
Amount | | Value |
CERTIFICATE OF DEPOSIT - 8.1% | | | | | | |
Bank of Ireland | | | | | | |
5.32%, 2/08/2007 | | $ | 3,000,000 | | $ | 2,999,898 |
Barclay’s Bank pic NY | | | | | | |
5.31%, 4/02/2007 (1) | | | 3,000,000 | | | 3,000,000 |
BNP Paribas NY Branch | | | | | | |
5.33%, 3/16/2007 | | | 2,000,000 | | | 1,999,889 |
| | | | | | |
TOTAL CERTIFICATE OF DEPOSIT (Cost $8,000,000) | | | | | $ | 7,999,787 |
| | | | | | |
CORPORATE BOND - 30.8% | | | | | | |
Automotive - 6.1% | | | | | | |
American Honda Finance Corporation | | | | | | |
5.476%, 2/12/2007 (2)(3)(4)(5) | | $ | 1,550,000 | | | 1,550,970 |
Toyota Motor Credit Corporation | | | | | | |
5.21%, 1/02/2007 (2)(3) | | | 2,000,000 | | | 2,000,040 |
5.265%, 1/02/2007 (2)(3) | | | 2,500,000 | | | 2,501,173 |
| | | | | | |
| | | | | | 6,052,183 |
| | | | | | |
Brokerage - 12.5% | | | | | | |
Bear Stearns Companies, Inc. | | | | | | |
5.534%, 1/16/2007 (2)(3) | | | 1,300,000 | | | 1,300,083 |
Goldman Sachs Group, Inc. | | | | | | |
5.476%, 2/12/2007 (2)(3) | | | 1,100,000 | | | 1,100,495 |
5.50%, 1/02/2007 (2)(3) | | | 2,000,000 | | | 2,001,896 |
Lehman Brothers Holdings, Inc. | | | | | | |
5.35%, 1/02/2007 (2)(3) | | | 1,000,000 | | | 1,000,599 |
5.494%, 1/22/2007 (2)(3) | | | 2,000,000 | | | 2,001,306 |
Merrill Lynch & Company, Inc. | | | | | | |
5.30%, 1/03/2007 (2)(3) | | | 1,000,000 | | | 1,000,189 |
5.505%, 1/26/2007 (2)(3) | | | 2,385,000 | | | 2,385,267 |
Morgan Stanley | | | | | | |
5.50%, 2/15/2007 (2)(3) | | | 1,600,000 | | | 1,600,285 |
| | | | | | |
| | | | | | 12,390,120 |
| | | | | | |
Financial Companies - Captive - 7.7% | | | | | | |
Caterpillar Financial Services Corporate | | | | | | |
5.39%, 1/29/2007 (2)(3) | | | 2,000,000 | | | 2,000,918 |
General Electric Capital Corporation | | | | | | |
5.375%, 3/15/2007 | | | 1,000,000 | | | 1,000,117 |
HSBC Finance Corporation | | | | | | |
5.41%, 2/28/2007 (2)(3) | | | 3,000,000 | | | 3,000,519 |
5.525%, 2/09/2007 (2)(3) | | | 1,550,000 | | | 1,550,313 |
| | | | | | |
| | | | | | 7,551,867 |
| | | | | | |
Financial Companies - Noncaptive Consumer - 2.5% | | | | | | |
SLM Corporation | | | | | | |
5.50%, 1/25/2007 (2)(3) | | | 2,500,000 | | | 2,500,273 |
| | | | | | |
Non U.S. Banking - 2.0% | | | | | | |
Royal Bank of Scotland pic | | | | | | |
5.364%, 3/30/2007 (2)(3)(4) | | | 2,000,000 | | | 2,000,586 |
| | | | | | |
TOTAL CORPORATE BOND (Cost $30,491,715) | | | | | $ | 30,495,029 |
| | | | | | |
MISCELLANEOUS ASSET - 3.0% | | | | | | |
Life Insurance - 3.0% | | | | | | |
United of Omaha Life Insurance Company | | | | | | |
5.40%, 1/01/2007 (2) | | | 3,000,000 | | | 3,000,000 |
| | | | | | |
TOTAL MISCELLANEOUS ASSET (Cost $3,000,000) | | | | | $ | 3,000,000 |
| | | | | | |
MORTGAGE BACKED SECURITIES -1.5% | | | | | | |
Other Non-Agency - 1.5% | | | | | | |
Pass-Thru’s - 1.5% | | | | | | |
Small Business Administration Pools | | | | | | |
#503295, 5.75% - | | | | | | |
1/01/2007 (2)(3) | | | 131,048 | | | 131,769 |
#503303, 5.75% - | | | | | | |
1/01/2007 (2)(3) | | | 207,296 | | | 208,436 |
#503308, 5.75% - | | | | | | |
1/01/2007 (2)(3) | | | 148,783 | | | 148,783 |
#503459, 5.75% - | | | | | | |
1/01/2007 (2)(3) | | | 78,808 | | | 78,512 |
#503176, 5.87%- | | | | | | |
1/01/2007 (2)(3) | | | 25,335 | | | 25,462 |
#503343, 5.87% - | | | | | | |
1/01/2007 (2)(3) | | | 237,983 | | | 237,983 |
#503347, 5.87% - | | | | | | |
1/01/2007 (2)(3) | | | 416,797 | | | 416,797 |
#502353, 6.00% - | | | | | | |
1/01/2007 (2)(3) | | | 40,409 | | | 40,409 |
#502163,6.25% - | | | | | | |
1/01/2007 (2)(3) | | | 209,503 | | | 209,503 |
| | | | | | |
| | | | | | 1,497,654 |
| | | | | | |
TOTAL MORTGAGE BACKED SECURITIES (Cost $1,496,004) | | | | | $ | 1,497,654 |
| | | | | | |
U.S. GOVERNMENT SPONSORED AGENCY BONDS & NOTES - 7.6% | | | | | | |
Federal Home Loan Bank | | | | | | |
5.35% -11/21/2007 | | | 2,000,000 | | | 1,998,944 |
5.40% - 9/12/2007 | | | 2,000,000 | | | 1,999,638 |
5.50% -10/02/2007 | | | 2,000,000 | | | 2,000,000 |
Federal Home Loan Mortgage Corporate | | | | | | |
4.85% - 2/27/2007 | | | 1,500,000 | | | 1,499,386 |
| | | | | | |
TOTAL U.S. GOVERNMENT SPONSORED AGENCY BONDS & NOTES (Cost $7,499,862) | | | | | $ | 7,497,968 |
| | | | | | |
ASSET BACKED COMMERCIAL PAPER - 33.0% | | | | | | |
Financial Companies - Diversified - 8.3% | | | | | | |
Amstel Funding Corporation | | | | | | |
5.27%, 1/18/2007 | | | 1,900,000 | | | 1,895,272 |
Amsterdam Funding Corporation | | | | | | |
5.28%, 1/4/2007 | | | 1,500,000 | | | 1,499,340 |
5.25%, 1/5/2007 | | | 1,700,000 | | | 1,699,248 |
Govco, Inc. | | | | | | |
5.25%, 1/22/2007 | | | 2,000,000 | | | 1,994,064 |
5.23%, 3/7/2007 | | | 1,100,000 | | | 1,089,661 |
| | | | | | |
| | | | | | 8,177,585 |
| | | | | | |
The accompanying notes are an integral part of the financial statements.
22
| | |
Schedule of Investments | | Series C (Money Market Series) |
December 31, 2006 - continued | | |
| | | | | | | |
| | | Principal
Amount | | Value | |
ASSET BACKED COMMERCIAL PAPER (continued) | | | | | | | |
Financial Companies - Miscellaneous | | | | | | | |
Receivables - 8.8% | | | | | | | |
Fairway Finance Corporation | | | | | | | |
5.28%, 1/3/2007 | | $ | 1,500,000 | | $ | 1,499,557 | |
5.30%, 1/12/2007 | | | 1,500,000 | | | 1,497,584 | |
Falcon Asset Securitization Corporation | | | | | | | |
5.25%, 1/30/2007 | | | 1,500,000 | | | 1,493,656 | |
5.30%, 2/6/2007 | | | 1,000,000 | | | 994,700 | |
5.27%, 2/12/2007 | | | 1,300,000 | | | 1,292,007 | |
Jupiter Securitization Corporation | | | | | | | |
5.27%, 2/5/2007 | | | 2,000,000 | | | 1,989,753 | |
| | | | | | | |
| | | | | | 8,767,257 | |
| | | | | | | |
Financial Companies - Securities - 3.9% | | | | | | | |
Galaxy Funding, Inc. | | | | | | | |
5.275%, 1/10/2007 | | | 1,900,000 | | | 1,897,494 | |
5.255%, 1/29/2007 | | | 2,000,000 | | | 1,992,020 | |
| | | | | | | |
| | | | | | 3,889,514 | |
| | | | | | | |
Financial Companies - Trade & Term Receivables - 3.5% | | | | | | | |
Eureka Securitization | | | | | | | |
5.264%, 1/8/2007 | | | 700,000 | | | 699,375 | |
5.27%, 1/8/2007 | | | 1,500,000 | | | 1,498,463 | |
5.26%, 1/11/2007 | | | 1,300,000 | | | 1,298,258 | |
| | | | | | | |
| | | | | | 3,496,096 | |
| | | | | | | |
Financial Companies - Trade Receivables - 8.5% | | | | | | | |
Old Line Funding LLC | | | | | | | |
5.27%, 1/3/2007 | | | 1,400,000 | | | 1,399,590 | |
5.26%, 1/4/2007 | | | 1,300,000 | | | 1,299,430 | |
5.26%, 1/19/2007 | | | 1,400,000 | | | 1,396,318 | |
Sheffield Receivables Corporation | | | | | | | |
5.265%, 1/2/2007 | | | 2,000,000 | | | 1,999,708 | |
5.27%, 1/5/2007 | | | 1,300,000 | | | 1,299,239 | |
5.27%, 1/9/2007 | | | 1,000,000 | | | 998,829 | |
| | | | | | | |
| | | | | | 8,393,114 | |
| | | | | | | |
TOTAL ASSET BACKED COMMERCIAL PAPER (Cost $32,722,646) | | | | | $ | 32,723,566 | |
| | | | | | | |
COMMERCIAL PAPER - 22.8% | | | | | | | |
Banking - 1.1% | | | | | | | |
UBS Finance (DE) LLC | | | | | | | |
5.27%, 3/8/2007 (1) | | | 1,100,000 | | | 1,089,050 | |
| | | | | | | |
Brokerage - 6.0% | | | | | | | |
Goldman Sachs Group, Inc. | | | | | | | |
5.29%, 2/1/2007 | | | 1,100,000 | | | 1,094,989 | |
ING (US) Funding LLC | | | | | | | |
5.24%, 1/24/2007 | | | 1,600,000 | | | 1,594,858 | |
5.28%, 2/20/2007 | | | 1,000,000 | | | 992,667 | |
Morgan Stanley | | | | | | | |
5.20%, 5/21/2007 | | | 2,300,000 | | | 2,253,546 | |
| | | | | | | |
| | | | | | 5,936,060 | |
| | | | | | | |
Financial - Other - 4.0% | | | | | | | |
Bank of America | | | | | | | |
5.17%, 4/4/2007 | | | 3,000,000 | | | 2,959,750 | |
Countrywide Financial Corporation | | | | | | | |
5.42%, 1/2/2007 | | | 1,000,000 | | | 999,849 | |
| | | | | | | |
| | | | | | 3,959,599 | |
| | | | | | | |
Financial Companies - Trade & Term | | | | | | | |
Receivables - 2.3% | | | | | | | |
Countrywide Financial Corporation | | | | | | | |
5.27%, 2/2/2007 | | | 2,234,000 | | | 2,223,535 | |
| | | | | | | |
Non U.S. Banking - 9.4% | | | | | | | |
Danske Corporation | | | | | | | |
5.30%, 1/30/2007 | | | 1,100,000 | | | 1,095,304 | |
Societe Generale | | | | | | | |
5.23%, 3/5/2007 | | | 1,100,000 | | | 1,090,075 | |
5.26%, 3/12/2007 | | | 1,600,000 | | | 1,583,949 | |
5.22%, 3/29/2007 | | | 1,100,000 | | | 1,086,275 | |
Westpac Banking Corporation | | | | | | | |
5.26%, 1/3/2007 | | | 1,400,000 | | | 1,399,591 | |
5.30%, 2/5/2007 | | | 1,700,000 | | | 1,691,240 | |
5.27%, 2/16/2007 | | | 1,400,000 | | | 1,390,573 | |
| | | | | | | |
| | | | | | 9,337,007 | |
| | | | | | | |
TOTAL COMMERCIAL PAPER (Cost $22,544,877) | | | | | $ | 22,545,251 | |
| | | | | | | |
REPURCHASE AGREEMENT - 0.2% | | | | | | | |
United Missouri Bank, 4.85%, dated 12-29-06, matures 01-02-07; repurchase amount $236,127 (Collateralized by FHLMC, 5.00%, 08-15-35 with a value of $241,694) | | $ | 236,000 | | $ | 236,000 | |
| | | | | | | |
TOTAL REPURCHASE AGREEMENT (Cost $236,000) | | | | | $ | 236,000 | |
| | | | | | | |
Total Investments (SBL C Fund) (Cost $105,991,104) - 107.0% | | | | | $ | 105,995,255 | |
Liabilities in Excess of Other Assets - (7.0)% | | | | | | (6,950,983 | ) |
| | | | | | | |
TOTAL NET ASSETS - 100.0% | | | | | $ | 99,044,272 | |
| | | | | | | |
Footnotes
Percentages are stated as a percent of net assets.
For federal income tax purposes the identified cost of investments owned at 12/31/2006 was $105,991,104.
| | |
1 | | - Security is fair valued by the Board of Directors. See Notes to financial statements. |
| |
2 | | - Maturity date indicated is next interest reset date. |
| |
3 | | - Variable rate security. Rate indicated is rate effective at December 31, 2006. |
| |
4 | | - Security was acquired through a private placement. |
| |
5 | | - Security is a 144A security, which places restrictions on resale. See Notes to financial statements. |
The accompanying notes are an integral part of the financial statements.
23
| | |
Schedule of Investments | | Series C (Money Market Series) |
December 31, 2006 - continued | | |
Glossary:
plc -Public Limited Company
See notes to financial statements.
The accompanying notes are an integral part of the financial statements.
24
Series C
(Money Market Series)
Statement of Assets and Liabilities
December 31, 2006
| | | |
Assets: | | | |
Investments, at value1 | | $ | 105,995,255 |
Cash | | | 27,464 |
Receivables: | | | |
Fund shares sold | | | 737,267 |
Securities sold | | | 7,292 |
Interest | | | 424,664 |
Prepaid expenses | | | 2,513 |
| | | |
Total assets | | | 107,194,455 |
| | | |
Liabilities: | | | |
Payable for: | | | |
Fund shares redeemed | | | 3,053,248 |
Securities purchased | | | 5,023,831 |
Management fees | | | 41,650 |
Custodian fees | | | 3,021 |
Transfer agent/maintenance fees | | | 2,084 |
Administration fees | | | 8,889 |
Professional fees | | | 9,834 |
Directors’ fees | | | 2,000 |
Other fees | | | 5,626 |
| | | |
Total liabilities | | | 8,150,183 |
| | | |
Net Assets | | $ | 99,044,272 |
| | | |
Net assets consist of: | | | |
Paid in capital | | $ | 94,863,364 |
Undistributed net investment income | | | 4,176,757 |
Net unrealized appreciation in value of investments | | | 4,151 |
| | | |
Net assets | | $ | 99,044,272 |
| | | |
Capital shares authorized | | | unlimited |
Capital shares outstanding | | | 7,778,335 |
Net asset value per share (net assets divided by shares outstanding) | | $ | 12.73 |
| | | |
1Investments, at cost | | $ | 105,991,104 |
Statement of Operations
For the Year Ended December 31, 2006
| | | | |
Investment Income: | | | | |
Interest | | $ | 4,819,560 | |
| | | | |
Total investment income | | | 4,819,560 | |
| | | | |
Expenses: | | | | |
Management fees | | | 470,472 | |
Custodian fees | | | 16,944 | |
Transfer agent/maintenance fees | | | 25,277 | |
Administration fees | | | 92,803 | |
Directors’ fees | | | 4,321 | |
Professional fees | | | 15,113 | |
Reports to shareholders | | | 14,239 | |
Other expenses | | | 3,644 | |
| | | | |
Total expenses | | | 642,813 | |
Less: Earnings credits applied | | | (10 | ) |
| | | | |
Net expenses | | | 642,803 | |
| | | | |
Net investment income | | | 4,176,757 | |
| | | | |
Net Unrealized Gain: | | | | |
Net unrealized appreciation during the year on: | | | | |
Investments | | | 17,627 | |
| | | | |
Net increase in net assets resulting from operations | | $ | 4,194,384 | |
| | | | |
See accompanying notes.
25
| | |
| | Series C |
| Statement of Changes in Net Assets | | (Money Market Series) |
| | | | | | | | |
| | | Year Ended
December 31, 2006 | | | Year Ended
December 31, 2005 | |
Increase (decrease) in net assets from operations: | | | | | | | | |
Net investment income | | $ | 4,176,757 | | | $ | 2,001,810 | |
Net unrealized appreciation (depreciation) during the year on investments | | | 17,627 | | | | (2,778 | ) |
| | | | | | | | |
Net increase in net assets resulting from operations | | | 4,194,384 | | | | 1,999,032 | |
| | | | | | | | |
Capital share transactions: | | | | | | | | |
Proceeds from sale of shares | | | 290,303,698 | | | | 201,348,365 | |
Cost of shares redeemed | | | (267,108,743 | ) | | | (197,776,333 | ) |
| | | | | | | | |
Net increase from capital share transactions | | | 23,194,955 | | | | 3,572,032 | |
| | | | | | | | |
Net increase in net assets | | | 27,389,339 | | | | 5,571,064 | |
| | | | | | | | |
Net assets: | | | | | | | | |
Beginning of year | | | 71,654,933 | | | | 66,083,869 | |
| | | | | | | | |
End of year | | $ | 99,044,272 | | | $ | 71,654,933 | |
| | | | | | | | |
Undistributed net investment income at end of year | | $ | 4,176,757 | | | $ | 2,001,810 | |
| | | | | | | | |
Capital Share Activity: | | | | | | | | |
Shares sold | | | 23,327,782 | | | | 16,766,162 | |
Shares redeemed | | | (21,430,027 | ) | | | (16,450,894 | ) |
| | | | | | | | |
Total capital share activity | | | 1,897,755 | | | | 315,268 | |
| | | | | | | | |
See accompanying notes.
26
| | |
| Financial Highlights | | Series C |
| Selected data for each share of capital stock outstanding throughout each year | | (Money Market Series) |
| | | | | | | | | | | | | | | | | | | | |
| | | 2006 | | | 2005 | | | 2004 | | | 2003 | | | Year Ended,
December 31,
2002 | |
Per Share Data | | | | | | | | | | | | | | | | | | | | |
Net asset value, beginning of period | | $ | 12.19 | | | $ | 11.87 | | | $ | 11.79 | | | $ | 11.82 | | | $ | 12.20 | |
| | | | | | | | | | | | | | | | | | | | |
Income (loss) from investment operations: | | | | | | | | | | | | | | | | | | | | |
Net investment income | | | 0.45 | | | | 0.33 | | | | 0.11 | | | | 0.09 | | | | 0.16 | |
Net gain (loss) on securities (realized and unrealized) | | | 0.09 | | | | (0.01 | ) | | | (0.02 | ) | | | (0.02 | ) | | | (0.02 | ) |
| | | | | | | | | | | | | | | | | | | | |
Total from investment operations | | | 0.54 | | | | 0.32 | | | | 0.09 | | | | 0.07 | | | | 0.14 | |
| | | | | | | | | | | | | | | | | | | | |
Less distributions: | | | | | | | | | | | | | | | | | | | | |
Dividends from net investment income | | | — | | | | — | | | | (0.01 | ) | | | (0.10 | ) | | | (0.52 | ) |
| | | | | | | | | | | | | | | | | | | | |
Total distributions | | | — | | | | — | | | | (0.01 | ) | | | (0.10 | ) | | | (0.52 | ) |
| | | | | | | | | | | | | | | | | | | | |
Net asset value, end of period | | $ | 12.73 | | | $ | 12.19 | | | $ | 11.87 | | | $ | 11.79 | | | $ | 11.82 | |
| | | | | | | | | | | | | | | | | | | | |
Total Returna | | | 4.43 | % | | | 2.70 | % | | | 0.72 | % | | | 0.55 | % | | | 1.20 | % |
| | | | | | | | | | | | | | | | | | | | |
Ratios/Supplemental Data | | | | | | | | | | | | | | | | | | | | |
Net assets, end of period (in thousands) | | $ | 99,044 | | | $ | 71,655 | | | $ | 66,084 | | | $ | 86,458 | | | $ | 117,297 | |
| | | | | | | | | | | | | | | | | | | | |
Ratios to average net assets: | | | | | | | | | | | | | | | | | | | | |
Net investment income | | | 4.43 | % | | | 2.63 | % | | | 0.70 | % | | | 0.63 | % | | | 1.26 | % |
Total expensesb | | | 0.68 | % | | | 0.69 | % | | | 0.65 | % | | | 0.59 | % | | | 0.58 | % |
Net expensesc | | | 0.68 | % | | | 0.69 | % | | | 0.65 | % | | | 0.59 | % | | | 0.58 | % |
| | | | | | | | | | | | | | | | | | | | |
a | Total return does not take into account any of the expenses associated with an investment in variable insurance products offered by Security Benefit Life Insurance Company. If total return had taken into account these expenses, performance would have been lower. Shares of a series of SBL Fund are available only through the purchase of such products. |
b | Total expense information reflects expense ratios absent fund expense reductions by the Investment Manager, and earnings credits, as applicable. |
c | Net expense information reflects the expense ratios after voluntary expense waivers, reimbursements and custodian earnings credits, as applicable. |
See accompanying notes.
27
This page left blank intentionally.
28
| | |
| | | Series D |
| Manager’s Commentary | | (Global Series) |
| February 15, 2007 | | (unaudited) |

Subadvisor, OppenheimerFunds, Inc.

Rajeev Bhaman
Portfolio Manager
To Our Shareholders
Series D of the SBL Fund - Global Series returned 17.34% under-performing the benchmark, Morgan Stanley Capital International, Inc. (MSCI) World Index return of 20.07% for the year ended December 31, 2006. Our investment philosophy is based on the idea that earnings growth drives stock prices and that we are most likely to identify long-term earnings growth opportunities by examining trends that provide tailwinds for growth in the coming decade. We are very interested in attributes of industries and companies within those industries that are likely to be beneficiaries of these long-term trends. Ideally, we like to buy these businesses at a bargain price, that is, a price where we have the opportunity to double our investment in three to five years. This rarely happens except when there is a perception that something has gone wrong with an excellent business. If we can determine that the difficulty is temporary rather than permanent, then we consider it to be a good investment.
We had notable successes with a number of our larger holdings, such as Infosys Technologies Ltd., Reckitt Benckiser plc and H&M Hennes & Mauritz AB. However, there were significant underperformers, most notably eBay, Inc., Advanced Micro Devices, Inc. and Boston Scientific Corporation.
Additionally there were other disappointments, including a significant market slowdown in the demand for implantable cardiac defibrillators as well as a deceleration in the growth rate of knee and hip replacements, both of which impacted our holdings. We remain confident that the long-term opportunity for all of the segments that faced setbacks in the past year remains excellent and that our original thesis will come to pass.
Our investments in software companies, Intuit, Inc. and Adobe Systems, Inc., continue to remain positive, as the companies remain innovative with new products that not only impress their existing customer bases but achieve broader appeal. Our investments in Inditex S.A., the owner of Zara stores, and Tesco plc, the UK’s leading grocery chain, have been worthwhile as they continue to grow rapidly worldwide, leveraging their scale and supply chain to achieve high economic returns. Our investments in television companies, Zee Telefilms Ltd. in India, and Grupo Televisa SA in Mexico, contributed positively to the Series’ performance as they continue to retain high market shares in their respective markets and as the appeal of their programming grows worldwide.
We are finding excellent opportunities across a variety of areas particularly in technology. It should be noted that our investment philosophy is based on returns over a three to five year period rather than the next quarter or two. We continue to favor a number of our existing holdings, such as L.M. Ericsson and Juniper Networks, Inc. Additional investments may be made as the opportunity for communication network build-outs remains robust. Additionally, we are finding quality investment opportunities in the areas of analog and mixed signal semiconductors.
Companies such as Maxim Integrated Products, Inc. and Linear Technology Corporation. continue to see high margin profitable growth and are now available at a fraction of their valuations of only a few years ago. Leading companies in the Programmable Logic Devices arena such as Altera Corporation. and Xilinx, Inc., we believe, also provide significant investment upside. We have also invested significantly in companies such as Carnival Corporation. which operates the Carnival Cruise Lines, and the car manufacturer Bayerische Motoren Werke AG (BMW), which we feel has solid franchises. Both are available at bargain prices. Automatic Data Processing, Inc., the leading payroll processor in the world, is another investment we highly favor. Its business opportunities expand as more companies look to outsource more of their non-core activities to high-quality, lower cost providers. As global growth continues to be positive and interest rates remain relatively low, we remain optimistic about markets generally. As such, we expect to continue to see productive opportunities for investment. We remain focused on our long-term investment philosophy that looks for “good companies in good businesses at good prices.”
In closing, please remember that investing in foreign markets entails additional risks, including the risks associated with currency fluctuations and political uncertainties, as described in the prospectus.
|
| Sincerely, |
|
| |
Rajeev Bhaman Portfolio Manager |
29
| | |
| | | Series D |
| Manager’s Commentary | | (Global Series) |
| December 31, 2006 | | (unaudited) |
PERFORMANCE
Series D vs. MSCI World Index
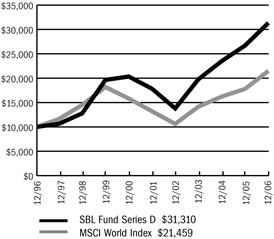
$10,000 Over Ten Years
The chart above assumes a hypothetical $10,000 investment in Series D (Global Series) on December 31, 1996 and reflects the fees and expenses of Series D. The MSCI World Index is an unmanaged capitalization-weighted index that is designed to measure global developed market equity performance.
Portfolio Composition by Sector
| | | |
Consumer Discretionary | | 20.77 | % |
Consumer Staples | | 8.25 | |
Energy | | 6.16 | |
Financials | | 15.43 | |
Health Care | | 10.99 | |
Industrials | | 9.37 | |
Information Technology | | 23.62 | |
Materials | | 0.42 | |
Telecommunication Services | | 3.86 | |
Utilities | | 0.62 | |
Cash & other assets, less liabilities | | 0.51 | |
Total net assets | | 100.00 | % |
| | | |
Average Annual Returns
| | | | | | | | | |
Periods Ended 12-31-061 | | 1 Year | | | 5 Years | | | 10 Years | |
Series D | | 17.34 | % | | 11.90 | % | | 12.09 | % |
1 | Performance figures do not reflect fees and expenses associated with an investment in variable insurance products offered by Security Benefit Life Insurance Company. If returns had taken into account these fees and expenses, performance would have been lower. Shares of a Series of SBL Fund are available only through the purchase of such products. |
The performance data quoted above represents past performance. Past performance is not predictive of future performance. The investment return and principal value of an investment will fluctuate so that an investor’s shares, when redeemed, may be worth more or less than their original cost.
See accompanying notes.
30
| | |
| | | Series D |
| Manager’s Commentary | | (Global Series) |
| December 31, 2006 | | (unaudited) |
PERFORMANCE
Information About Your Series Expenses
Calculating your ongoing series expenses
Example
As a shareholder of the Series, you incur ongoing costs, including management fees and other series expenses. Performance figures and expense ratios do not reflect fees and expenses associated with an investment in variable insurance products. Shares of a Series of SBL Fund are available only through the purchase of such products. This example is intended to help you understand your ongoing costs (in dollars) of investing in the Series and to compare these costs with ongoing costs of investing in other mutual funds. The example is based on an investment of $1,000 invested at the beginning of the period and held for the entire period, July 1, 2006 - December 31, 2006.
Actual Expenses
The first line in the table provides information about actual account values and actual expenses. You may use the information in this table, together with the amount you invested, to estimate the expenses that you paid over the period. Simply divide your account value by $1,000 (for example, an $8,600 account value divided by $1,000 = 8.6), then multiply the result by the number in the table under the heading entitled “Expenses Paid During Period” to estimate the expenses you paid on your account during this period.
Hypothetical Example for Comparison Purposes
The second line in the table provides information about hypothetical account values and hypothetical expenses based on the Series actual expense ratio and an assumed rate of return of 5% per year before expenses, which is not the Series actual return. The hypothetical account values and expenses may not be used to estimate the actual ending account balance or expenses you paid for the period. You may use this information to compare the ongoing costs of investing in the Series and other funds. To do so, compare this 5% hypothetical example with the 5% hypothetical examples that appear in the shareholder reports of the other mutual funds.
Please note that the expenses shown in the table are meant to highlight your ongoing costs only and do not reflect any fees and expenses associated with an investment in variable insurance products. Therefore, the second line is useful in comparing ongoing costs only, and will not help you determine the relative total costs of owning different funds. In addition, if these fees and expenses associated with an investment in variable insurance products were included, your costs would have been higher.
Series Expenses
| | | | | | | | | |
| | | Beginning
Account Value
07-01-06 | | Ending
Account Value
12-31-061 | | Expenses Paid
During
Period2 |
Series D (Global Series) | | | | | | | | | |
Actual | | $ | 1,000.00 | | $ | 1,132.40 | | $ | 6.72 |
Hypothetical | | | 1,000.00 | | | 1,018.90 | | | 6.36 |
1 | The actual ending account value is based on the actual total return of the Series for the period July 1, 2006 to December 31, 2006 after actual expenses and will differ from the hypothetical ending account value which is based on the Series expense ratio and a hypothetical annual return of 5% before expenses. The actual cumulative return at net asset value for the period July 1, 2006 to December 31, 2006 was 13.24%. |
2 | Expenses are equal to the Series annualized expense ratio of 1.25%, net of earnings credits, multiplied by the average account value over the period, multiplied by 184/365 (to reflect the one-half year period). |
31
| | |
| Schedule of Investments | | Series D (Global Series) |
| December 31, 2006 | | |
| | | | | |
| | | Shares | | Value |
COMMON STOCK - 98.8% | | | | | |
Bermuda - 0.3% | | | | | |
Everest Re Group, Ltd. | | 16,400 | | $ | 1,609,004 |
| | | | | |
Brazil - 1.5% | | | | | |
Companhia de Bebidas das Americas ADR | | 72,756 | | | 3,550,493 |
Empresa Brasileira de Aeronautica S.A. ADR | | 124,326 | | | 5,148,340 |
| | | | | |
| | | | | 8,698,833 |
| | | | | |
Canada - 1.6% | | | | | |
Husky Energy, Inc. | | 94,000 | | | 6,290,311 |
Manulife Financial Corporation | | 86,766 | | | 2,927,664 |
| | | | | |
| | | | | 9,217,975 |
| | | | | |
Cayman Islands - 3.1% | | | | | |
ACE, Ltd. | | 59,999 | | | 3,634,139 |
GlobalSantaFe Corporation | | 84,700 | | | 4,978,666 |
Transocean, Inc. * | | 78,600 | | | 6,357,954 |
XL Capital, Ltd. | | 39,800 | | | 2,866,396 |
| | | | | |
| | | | | 17,837,155 |
| | | | | |
Denmark - 0.3% | | | | | |
Novo-Nordisk A/S (CI.B) | | 21,600 | | | 1,799,203 |
| | | | | |
Finland - 0.7% | | | | | |
Fortum Oyj | | 125,300 | | | 3,566,059 |
Neste Oil Oyj | | 15,975 | | | 485,650 |
| | | | | |
| | | | | 4,051,709 |
| | | | | |
France - 5.5% | | | | | |
Arkema * | | 20,137 | | | 1,034,827 |
LVMH Moet Hennessy Louis Vuitton S.A. | | 68,300 | | | 7,208,217 |
NicOx S.A. * | | 25,810 | | | 778,167 |
Sanofi-Aventis | | 95,340 | | | 8,803,423 |
Societe Generale | | 30,275 | | | 5,139,417 |
Technip S.A. | | 90,310 | | | 6,199,089 |
Total S.A. | | 34,432 | | | 2,483,940 |
| | | | | |
| | | | | 31,647,080 |
| | | | | |
Germany - 4.9% | | | | | |
Allianz AG | | 35,357 | | | 7,223,087 |
Bayerische Motoren Werke (BMW) AG * | | 94,810 | | | 5,445,427 |
SAP AG | | 118,648 | | | 6,305,549 |
Siemens AG | | 92,992 | | | 9,223,706 |
| | | | | |
| | | | | 28,197,769 |
| | | | | |
Hong Kong - 0.4% | | | | | |
Hutchison Whampoa, Ltd. | | 212,918 | | | 2,163,862 |
| | | | | |
India - 3.1% | | | | | |
Hindustan Lever, Ltd. | | 608,300 | | | 2,979,507 |
ICICI Bank, Ltd. ADR | | 35,950 | | | 1,500,553 |
Infosys Technologies, Ltd. | | 145,765 | | | 7,396,385 |
Zee Entertainment Enterprises, Ltd. (1) | | 642,400 | | | 5,591,492 |
| | | | | |
| | | | | 17,467,937 |
| | | | | |
Italy - 0.5% | | | | | |
Bulgari SpA | | 199,500 | | | 2,831,001 |
| | | | | |
Japan - 10.6% | | | | | |
Canon, Inc. | | 41,100 | | | 2,313,937 |
Chugai Pharmaceutical Company, Ltd. | | 98,800 | | | 2,038,183 |
Credit Saison Company, Ltd. | | 104,600 | | | 3,603,714 |
Fanuc, Ltd. | | 16,200 | | | 1,595,429 |
Hoya Corporation | | 94,600 | | | 3,688,450 |
KDDI Corporation | | 817 | | | 5,540,263 |
Keyence Corporation | | 12,600 | | | 3,122,340 |
Kyocera Corporation | | 31,000 | | | 2,922,734 |
Murata Manufacturing Company, Ltd. | | 77,400 | | | 5,235,662 |
Nidec Corporation | | 21,400 | | | 1,654,384 |
Nintendo Company, Ltd. | | 12,800 | | | 3,323,558 |
Resona Holdings, Inc. | | 795 | | | 2,171,127 |
Secom Company, Ltd. | | 45,000 | | | 2,333,095 |
Sega Sammy Holdings, Inc. | | 34,700 | | | 935,986 |
Seven & I Holdings Company, Ltd. | | 45,375 | | | 1,410,760 |
Shionogi & Company, Ltd. | | 149,000 | | | 2,929,793 |
Sony Corporation | | 154,100 | | | 6,604,008 |
Square Enix Company, Ltd. | | 83,400 | | | 2,186,530 |
Sumitomo Mitsui Financial Group, Inc. | | 116 | | | 1,189,194 |
Toyota Motor Corporation | | 86,800 | | | 5,805,874 |
| | | | | |
| | | | | 60,605,021 |
| | | | | |
Mexico - 2.5% | | | | | |
Fomento Economico Mexicano, S.A. de C.V. * | | 372,300 | | | 4,319,693 |
Grupo Modelo, S.A. de C.V. (CI.C) | | 514,300 | | | 2,846,776 |
Grupo Televisa S.A. ADR | | 251,432 | | | 6,791,178 |
| | | | | |
| | | | | 13,957,647 |
| | | | | |
Netherlands - 2.3% | | | | | |
European Aeronautic Defence and Space Company N.V. | | 186,080 | | | 6,411,046 |
Koninklijke (Royal) Philips Electronics N.V. | | 177,900 | | | 6,709,264 |
| | | | | |
| | | | | 13,120,310 |
| | | | | |
Norway - 0.4% | | | | | |
Tandberg ASA | | 165,500 | | | 2,495,188 |
| | | | | |
Panama - 1.3% | | | | | |
Carnival Corporation | | 149,000 | | | 7,308,450 |
| | | | | |
Republic of Korea - 2.0% | | | | | |
Hyundai Heavy Industries Company, Ltd. * | | 13,810 | | | 1,873,046 |
The accompanying notes are an integral part of the financial statements.
32
| | |
| Schedule of Investments | | Series D (Global Series) |
| December 31, 2006 - continued | | |
| | | | | |
| | | Shares | | Value |
COMMON STOCK (continued) | | | | | |
Republic of Korea (continued) | | | | | |
Samsung Electronics Company, Ltd.* | | 5,821 | | $ | 3,840,983 |
SK Telecom Company, Ltd. ADR | | 203,980 | | | 5,401,391 |
| | | | | |
| | | | | 11,115,420 |
| | | | | |
Singapore - 0.2% | | | | | |
Singapore Press Holdings, Ltd. | | 467,466 | | | 1,304,613 |
| | | | | |
Spain - 1.0% | | | | | |
Industria de Diseno Textil S.A. | | 100,100 | | | 5,392,490 |
| | | | | |
Sweden - 6.4% | | | | | |
Hennes & Mauritz AB (CI.B) | | 221,900 | | | 11,213,946 |
lnvestor AB (CI.B) (2) | | 143,293 | | | 3,516,084 |
Telefonaktiebolaget LM Ericsson (CI.B) | | 5,441,000 | | | 21,973,483 |
| | | | | |
| | | | | 36,703,513 |
| | | | | |
Switzerland - 3.4% | | | | | |
Credit Suisse Group | | 111,974 | | | 7,834,045 |
Novartis AG | | 52,111 | | | 3,004,348 |
Roche Holding AG | | 40,237 | | | 7,215,252 |
Syngenta AG | | 7,282 | | | 1,354,804 |
| | | | | |
| | | | | 19,408,449 |
| | | | | |
Taiwan - 1.5% | | | | | |
Benq Corporation | | 1,782,000 | | | 954,228 |
MediaTek, Inc. | | 394,200 | | | 4,076,575 |
Taiwan Semiconductor Manufacturing Company, Ltd. ADR | | 332,047 | | | 3,629,274 |
| | | | | |
| | | | | 8,660,077 |
| | | | | |
United Kingdom - 12.7% | | | | | |
3i Group plc (2) | | 74,126 | | | 1,464,665 |
BP plc ADR | | 66,075 | | | 4,433,633 |
Burberry Group plc | | 201,264 | | | 2,548,070 |
CadburySchweppes plc | | 558,965 | | | 5,982,069 |
Diageo plc | | 164,364 | | | 3,226,768 |
Experian Group, Ltd. * | | 100,232 | | | 1,175,736 |
Home Retail Group | | 89,232 | | | 714,695 |
HSBC Holdings plc | | 309,619 | | | 5,676,262 |
Pearson plc | | 162,540 | | | 2,454,095 |
Prudential plc | | 392,576 | | | 5,377,595 |
Reckitt Benckiser plc | | 182,633 | | | 8,351,083 |
Royal Bank of Scotland Group plc | | 240,400 | | | 9,387,205 |
Smith & Nephew plc | | 289,023 | | | 3,016,729 |
Tesco plc | | 592,005 | | | 4,692,334 |
Vodafone Group plc | | 4,000,277 | | | 11,084,680 |
WPP Group plc | | 208,300 | | | 2,818,668 |
| | | | | |
| | | | | 72,404,287 |
| | | | | |
United States - 32.6% | | | | | |
3M Company | | 69,700 | | | 5,431,721 |
Adobe Systems, Inc. * | | 177,300 | | | 7,290,576 |
Advanced Micro Devices, Inc. * | | 309,700 | | | 6,302,395 |
Affymetrix, Inc. * | | 50,100 | | | 1,155,306 |
Altera Corporation * | | 179,600 | | | 3,534,528 |
Amgen, Inc. * | | 38,900 | | | 2,657,259 |
Atherogenics, Inc. * | | 118,200 | | | 1,171,362 |
Automatic Data Processing, Inc. | | 134,600 | | | 6,629,050 |
Avis Budget Group, Inc. | | 20,500 | | | 444,645 |
Avon Products, Inc. | | 77,500 | | | 2,560,600 |
Berkshire Hathaway, Inc. (CI.B) * | | 940 | | | 3,446,040 |
Biomet, Inc. | | 85,900 | | | 3,545,093 |
Boeing Company | | 43,300 | | | 3,846,772 |
Boston Scientific Corporation * | | 221,247 | | | 3,801,023 |
Chevron Corporation | | 53,454 | | | 3,930,473 |
Cisco Systems, Inc. * | | 95,400 | | | 2,607,282 |
Coach, Inc. * | | 76,400 | | | 3,282,144 |
Colgate-Palmolive Company | | 52,800 | | | 3,444,672 |
Corning, Inc. * | | 263,100 | | | 4,922,601 |
Cree, Inc. * | | 88,800 | | | 1,538,016 |
eBay, Inc. * | | 275,800 | | | 8,293,306 |
Emerson Electric Company | | 129,300 | | | 5,698,251 |
Express Scripts, Inc. * | | 28,000 | | | 2,004,800 |
Genentech, Inc. * | | 28,800 | | | 2,336,544 |
Getty Images, Inc. * | | 35,500 | | | 1,520,110 |
Gilead Sciences, Inc. * | | 65,900 | | | 4,278,887 |
International Game Technology | | 79,300 | | | 3,663,660 |
International Rectifier Corporation * | | 54,600 | | | 2,103,738 |
Intuit, Inc. * | | 145,100 | | | 4,427,001 |
Johnson & Johnson | | 21,800 | | | 1,439,236 |
JPMorgan Chase & Company | | 58,792 | | | 2,839,654 |
Juniper Networks, Inc. * | | 276,100 | | | 5,229,334 |
Linear Technology Corporation | | 55,100 | | | 1,670,632 |
Lockheed Martin Corporation | | 34,700 | | | 3,194,829 |
Maxim Integrated Products, Inc. | | 127,000 | | | 3,888,740 |
McDonald’s Corporation | | 83,500 | | | 3,701,555 |
Medtronic, Inc. | | 39,700 | | | 2,124,347 |
Microsoft Corporation | | 346,200 | | | 10,337,532 |
Morgan Stanley | | 76,900 | | | 6,261,967 |
Nektar Therapeutics * | | 42,668 | | | 648,980 |
Northern Trust Corporation | | 90,200 | | | 5,474,238 |
Northrop Grumman Corporation | | 38,600 | | | 2,613,220 |
Nuvelo, Inc. * | | 29,800 | | | 119,200 |
Qualcomm, Inc. | | 7,640 | | | 288,716 |
Quest Diagnostics, Inc. | | 44,500 | | | 2,358,500 |
Raytheon Company | | 63,800 | | | 3,368,640 |
Realogy Corporation * | | 54,550 | | | 1,653,956 |
Regeneron Pharmaceuticals, Inc. * | | 27,100 | | | 543,897 |
Sirius Satellite Radio, Inc. * | | 1,083,900 | | | 3,837,006 |
Theravance, Inc. * | | 42,000 | | | 1,297,380 |
Tiffany & Company | | 116,800 | | | 4,583,232 |
Wal-Mart Stores, Inc. | | 112,300 | | | 5,186,014 |
The accompanying notes are an integral part of the financial statements.
33
| | |
| Schedule of Investments | | Series D (Global Series) |
| December 31, 2006 – continued | | |
| | | | | |
| | | Shares | | Value |
COMMON STOCK (continued) | | | | | |
United States (continued) | | | | | |
Walt Disney Company | | 115,800 | | $ | 3,968,466 |
Xilinx, Inc. | | 120,000 | | | 2,857,200 |
Yahoo!, Inc. * | | 38,600 | | | 985,844 |
| | | | | |
| | | | | 186,340,170 |
| | | | | |
TOTAL COMMON STOCK (Cost $390,132,725) | | | | $ | 564,337,163 |
| | | | | |
PREFERRED STOCK - 0.7% | | | | | |
Germany - 0.7% | | | | | |
Porsche AG | | 2,971 | | | 3,780,902 |
| | | | | |
TOTAL PREFERRED STOCK (Cost $823,264) | | | | $ | 3,780,902 |
| | | | | |
Total Investments (SBL D Fund) (Cost $390,955,989) - 99.5% | | | | $ | 568,118,065 |
Other Assets in Excess of Liabilities - 0.5% | | | | | 2,887,537 |
| | | | | |
TOTAL NET ASSETS - 100.0% | | | | $ | 571,005,602 |
| | | | | |
INVESTMENT CONCENTRATION
At December 31, 2006, the investment diversification of the fund was as follows:
| | | | | | |
Industry | | %of Net Assets | | | Value |
Communications Equipment | | 6.4 | % | | $ | 37,516,604 |
Semiconductors | | 5.9 | | | | 33,442,081 |
Pharmaceuticals | | 5.1 | | | | 28,400,801 |
Aerospace & Defense | | 4.3 | | | | 24,582,846 |
Diversified Banks | | 4.0 | | | | 22,892,631 |
Wireless Telecommunication Services | | 3.9 | | | | 22,026,333 |
Application Software | | 3.2 | | | | 18,023,126 |
Integrated Oil & Gas | | 3.0 | | | | 17,138,357 |
Industrial Conglomerates | | 2.9 | | | | 16,819,289 |
Electronic Equipment Manufacturers | | 2.9 | | | | 16,623,570 |
Apparel Retail | | 3.0 | | | | 16,606,436 |
Broadcasting & Cable TV | | 2.9 | | | | 16,219,676 |
Apparel, Accessories & Luxury Goods | | 2.9 | | | | 15,869,432 |
Automobile Manufacturers | | 2.6 | | | | 15,032,203 |
Household Products | | 2.6 | | | | 14,775,262 |
Consumer Electronics | | 2.3 | | | | 13,313,272 |
Health Care Equipment | | 2.2 | | | | 12,487,193 |
Biotechnology | | 2.0 | | | | 12,011,334 |
Oil & Gas Drilling | | 2.0 | | | | 11,336,620 |
Systems Software | | 1.8 | | | | 10,337,532 |
Property & Casualty Insurance | | 1.7 | | | | 9,946,575 |
Internet Software & Services | | 1.6 | | | | 9,279,150 |
Life & Health Insurance | | 1.4 | | | | 8,305,260 |
Diversified Capital Markets | | 1.4 | | | | 7,834,045 |
IT Consulting & Other Services | | 1.3 | | | | 7,396,385 |
Hotels, Resorts & Cruise Lines | | 1.3 | | | | 7,308,450 |
Multi-Line Insurance | | 1.3 | | | | 7,223,087 |
Asset Management & Custody Banks | | 1.2 | | | | 6,938,903 |
Data Processing & Outsourced Services | | 1.2 | | | | 6,629,050 |
Brewers | | 1.1 | | | | 6,397,269 |
Investment Banking & Brokerage | | 1.1 | | | | 6,261,967 |
Oil & Gas Equipment & Services | | 1.1 | | | | 6,199,089 |
Food Retail | | 1.0 | | | | 6,103,094 |
Packaged Foods & Meats | | 1.0 | | | | 5,982,069 |
Electrical Components & Equipment | | 1.0 | | | | 5,698,251 |
Home Entertainment Software | | 1.0 | | | | 5,510,088 |
Publishing | | 0.9 | | | | 5,278,817 |
Hypermarkets & Super Centers | | 0.9 | | | | 5,186,014 |
Specialty Stores | | 0.8 | | | | 4,583,232 |
Health Care Services | | 0.8 | | | | 4,363,300 |
Soft Drinks | | 0.8 | | | | 4,319,693 |
Movies & Entertainment | | 0.7 | | | | 3,968,466 |
Diversified Commercial & Professional Services | | 0.7 | | | | 3,953,476 |
Restaurants | | 0.6 | | | | 3,701,555 |
Casinos & Gaming | | 0.6 | | | | 3,663,660 |
Consumer Finance | | 0.6 | | | | 3,603,714 |
Electric Utilities | | 0.6 | | | | 3,566,059 |
Multi-Sector Holdings | | 0.6 | | | | 3,516,084 |
Distillers & Vintners | | 0.6 | | | | 3,226,768 |
Other Diversified Financial Services | | 0.5 | | | | 2,839,654 |
Advertising | | 0.5 | | | | 2,818,668 |
Personal Products | | 0.4 | | | | 2,560,600 |
Office Electronics | | 0.4 | | | | 2,313,937 |
Regional Banks | | 0.4 | | | | 2,171,127 |
Construction & Farm Machinery & Heavy Trucks | | 0.3 | | | | 1,873,046 |
Life Sciences Tools & Services | | 0.3 | | | | 1,804,286 |
Real Estate Management & Development | | 0.3 | | | | 1,653,956 |
Reinsurance | | 0.3 | | | | 1,609,004 |
Industrial Machinery | | 0.3 | | | | 1,595,429 |
Fertilizers & Agricultural Chemicals | | 0.2 | | | | 1,354,804 |
Commodity Chemicals | | 0.2 | | | | 1,034,827 |
Computer Storage & Peripherals | | 0.2 | | | | 954,228 |
Leisure Products | | 0.2 | | | | 935,986 |
Catalog Retail | | 0.1 | | | | 714,695 |
Oil & Gas Refining & Marketing | | 0.1 | | | | 485,650 |
| | | | | | |
Total Investments | | 99.5 | | | | 568,118,065 |
Other Assets and Liabilities, Net | | 0.5 | | | | 2,887,537 |
| | | | | | |
Net Assets | | 100 | % | | $ | 571,005,602 |
| | | | | | |
Footnotes
Percentages are stated as a percent of net assets.
For federal income tax purposes the identified cost of investments owned at 12/31/2006 was $394,187,632.
| * | - Non-income producing security |
| 1 | - Security is fair valued by the Board of Directors. See Notes to financial statements. |
| 2 | - Security is a PFIC (Passive Foreign Investment Company) |
The accompanying notes are an integral part of the financial statements.
34
| | |
| Schedule of Investments | | Series D (Global Series) |
| December 31, 2006 - continued | | |
Glossary:
| ADR | - American Depositary Receipt |
| plc | - Public Limited Company |
See notes to financial statements.
The accompanying notes are an integral part of the financial statements.
35
Series D
(Global Series)
Statement of Assets and Liabilities
December 31, 2006
| | | |
Assets: | | | |
Investments, at value1 | | $ | 568,118,065 |
Cash denominated in a foreign currency, at value2 | | | 4,163,115 |
Receivables: | | | |
Fund shares sold | | | 344,104 |
Securities sold | | | 1,855,583 |
Dividends | | | 528,500 |
Foreign taxes recoverable | | | 115,212 |
Prepaid expenses | | | 12,838 |
| | | |
Total assets | | | 575,137,417 |
| | | |
Liabilities: | | | |
Cash Overdraft | | | 2,912,530 |
Payable for: | | | |
Fund shares redeemed | | | 556,197 |
Management fees | | | 487,094 |
Custodian fees | | | 3,209 |
Transfer agent/maintenance fees | | | 2,083 |
Administration fees | | | 76,664 |
Professional fees | | | 57,896 |
Directors’ fees | | | 9,250 |
Other fees | | | 26,892 |
| | | |
Total liabilities | | | 4,131,815 |
| | | |
Net Assets | | $ | 571,005,602 |
| | | |
Net assets consist of: | | | |
Paid in capital | | $ | 348,318,376 |
Undistributed net investment income | | | 709,006 |
Undistributed net realized gain on sale of investments, options purchased and foreign currency transactions | | | 44,780,149 |
Net unrealized appreciation in value of investments and translation of assets and liabilities in foreign currency | | | 177,198,071 |
| | | |
Net assets | | $ | 571,005,602 |
| | | |
Capital shares authorized | | | unlimited |
Capital shares outstanding | | | 51,752,419 |
Net asset value per share (net assets divided by shares outstanding) | | $ | 11.03 |
| | | |
1Investments, at cost | | $ | 390,955,989 |
2Cash denominated in a foreign currency,at cost | | | 4,137,401 |
Statement of Operations
For the Year Ended December 31, 2006
| | | | |
Investment Income: | | | | |
Dividends (net of foreign withholding tax of $689,997) | | $ | 8,369,156 | |
Interest | | | 123,121 | |
| | | | |
Total investment income | | | 8,492,277 | |
| | | | |
Expenses: | | | | |
Management fees | | | 5,452,108 | |
Custodian fees | | | 231,402 | |
Transfer agent/maintenance fees | | | 25,252 | |
Administration fees | | | 830,629 | |
Directors’ fees | | | 24,231 | |
Professional fees | | | 87,133 | |
Reports to shareholders | | | 83,785 | |
Other expenses | | | 32,245 | |
| | | | |
Total expenses | | | 6,766,785 | |
| | | | |
Less: Earnings credits applied | | | (5,053 | ) |
| | | | |
Net expenses | | | 6,761,732 | |
| | | | |
Net investment income | | | 1,730,545 | |
| | | | |
Net Realized and Unrealized Gain (Loss): | | | | |
Net realized gain (loss) during the year on: | | | | |
Investments | | | 45,732,544 | |
Options purchased | | | 10,370 | |
Foreign currency transactions | | | (74,126 | ) |
| | | | |
Net realized gain | | | 45,668,788 | |
| | | | |
Net unrealized appreciation during the year on: | | | | |
Investments | | | 39,176,497 | |
Translation of assets and liabilities in foreign currencies | | | 42,248 | |
| | | | |
Net unrealized appreciation | | | 39,218,745 | |
| | | | |
Net realized and unrealized gain | | | 84,887,533 | |
| | | | |
Net increase in net assets resulting from operations | | $ | 86,618,078 | |
| | | | |
See accompanying notes.
36
| | |
| Statement of Changes in Net Assets | | Series D |
| | (Global Series) |
| | | | | | | | |
| | | Year Ended
December 31, 2006 | | | Year Ended
December 31, 2005 | |
Increase in net assets from operations: | | | | | | | | |
Net investment income | | $ | 1,730,545 | | | $ | 1,399,179 | |
Net realized gain during the year on investments, options purchased and foreign currency transactions | | | 45,668,788 | | | | 47,319,645 | |
Net unrealized appreciation during the year on investments and translation of assets and liabilities in foreign currencies | | | 39,218,745 | | | | 12,433,781 | |
| | | | | | | | |
Net increase in net assets resulting from operations | | | 86,618,078 | | | | 61,152,605 | |
| | | | | | | | |
Capital share transactions: | | | | | | | | |
Proceeds from sale of shares | | | 160,312,177 | | | | 116,417,418 | |
Cost of shares redeemed | | | (192,137,583 | ) | | | (127,933,968 | ) |
| | | | | | | | |
Net decrease from capital share transactions | | | (31,825,406 | ) | | | (11,516,550 | ) |
| | | | | | | | |
Net increase (decrease) in net assets | | | 54,792,672 | | | | 49,636,055 | |
| | | | | | | | |
Net assets: | | | | | | | | |
Beginning of year | | | 516,212,930 | | | | 466,576,875 | |
| | | | | | | | |
End of year | | $ | 571,005,602 | | | $ | 516,212,930 | |
| | | | | | | | |
Undistributed net investment income at end of year | | $ | 709,006 | | | $ | 269,487 | |
| | | | | | | | |
Capital Share Activity: | | | | | | | | |
Shares sold | | | 16,063,388 | | | | 13,632,840 | |
Shares redeemed | | | (19,215,494 | ) | | | (15,082,993 | ) |
| | | | | | | | |
Total capital share activity | | | (3,152,106 | ) | | | (1,450,153 | ) |
| | | | | | | | |
See accompanying notes.
37
| | |
| Financial Highlights | | Series D |
| Selected data for each share of capital stock outstanding throughout each year | | (Global Series) |
| | | | | | | | | | | | | | | | | | | | |
| | | 2006 | | | 2005 | | | 2004 | | | 2003c | | | Year Ended,
December 31,
2002b | |
Per Share Data | | | | | | | | | | | | | | | | | | | | |
Net asset value, beginning of period | | $ | 9.40 | | | $ | 8.28 | | | $ | 6.97 | | | $ | 4.87 | | | $ | 6.31 | |
| | | | | | | | | | | | | | | | | | | | |
Income (loss) from investment operations: | | | | | | | | | | | | | | | | | | | | |
Net investment income | | | 0.03 | | | | 0.03 | | | | 0.03 | | | | 0.03 | | | | 0.02 | |
Net gain (loss) on securities (realized and unrealized) | | | 1.60 | | | | 1.09 | | | | 1.28 | | | | 2.09 | | | | (1.45 | ) |
| | | | | | | | | | | | | | | | | | | | |
Total from investment operations | | | 1.63 | | | | 1.12 | | | | 1.31 | | | | 2.12 | | | | (1.43 | ) |
| | | | | | | | | | | | | | | | | | | | |
Less distributions: | | | | | | | | | | | | | | | | | | | | |
Dividends from net investment income | | | — | | | | — | | | | — | | | | (0.02 | ) | | | (0.01 | ) |
| | | | | | | | | | | | | | | | | | | | |
Total distributions | | | — | | | | — | | | | — | | | | (0.02 | ) | | | (0.01 | ) |
| | | | | | | | | | | | | | | | | | | | |
Net asset value, end of period | | $ | 11.03 | | | $ | 9.40 | | | $ | 8.28 | | | $ | 6.97 | | | $ | 4.87 | |
| | | | | | | | | | | | | | | | | | | | |
Total Returna | | | 17.34 | % | | | 13.53 | % | | | 18.79 | % | | | 43.45 | % | | | (22.71 | %) |
| | | | | | | | | | | | | | | | | | | | |
Ratios/Supplemental Data | | | | | | | | | | | | | | | | | | | | |
Net assets, end of period (in thousands) | | $ | 571,006 | | | $ | 516,213 | | | $ | 466,577 | | | $ | 427,609 | | | $ | 305,053 | |
| | | | | | | | | | | | | | | | | | | | |
Ratios to average net assets: | | | | | | | | | | | | | | | | | | | | |
Net investment income | | | 0.32 | % | | | 0.30 | % | | | 0.37 | % | | | 0.44 | % | | | 0.27 | % |
Total expensesd | | | 1.24 | % | | | 1.24 | % | | | 1.23 | % | | | 1.25 | % | | | 1.23 | % |
Net expensese | | | 1.24 | % | | | 1.24 | % | | | 1.23 | % | | | 1.25 | % | | | 1.23 | % |
| | | | | | | | | | | | | | | | | | | | |
Portfolio turnover rate | | | 23 | % | | | 33 | % | | | 28 | % | | | 44 | % | | | 48 | % |
a | Total return does not take into account any of the expenses associated with an investment in variable insurance products offered by Security Benefit Life Insurance Company. If total return had taken into account these expenses, performance would have been lower. Shares of a series of SBL Fund are available only through the purchase of such products. |
b | The financial highlights for Series D exclude the historical financial highlights of Series M. The assets of Series M were acquired by Series D on August 27, 2002. |
c | The financial highlights for Series D exclude the historical financial highlights of Series I. The assets of Series I were acquired by Series D on October 3, 2003. |
d | Total expense information reflects expense ratios absent fund expense reductions, by the Investment Manager, and earnings credits, as applicable. |
e | Net expense information reflects the expense ratios after voluntary expense waivers, reimbursements and custodian earnings credits, as applicable. |
See accompanying notes.
38
| | |
| | Series E |
| Manager’s Commentary | | (Diversified Income Series) |
| February 15, 2007 | | (unaudited) |
Advisor, Security Management Company, LLC
| | |
 | |  |
Steven M. Bowser Portfolio Manager | | Christopher L. Phalen Portfolio Manager |
To Our Shareholders:
2006 proved to be an interesting year for the fixed income markets. Interest rates across the yield curve increased, with long-term rates increasing less than short-term rates resulting in a more inverted yield curve. The Federal Reserve held the Fed funds’ rate unchanged at the August meeting after 17 consecutive increases, citing moderating economic growth, a slow down in the housing market, and the lagged effects of previous interest rate increases. Inflation still remained above levels preferred by the Fed so for the remainder of the year the market debated whether economic growth would slow down causing an interest rate cut, or inflation would continue to be high and cause another increase. The market also debated the impact of the inverted yield curve, which historically is a good indicator of future economic weakness, as equities and credit spreads continued to generate good performance signaling strong economic growth. Series E of the SBL Fund - Diversified Income Series earned a return of 3.80% for the year ended December 31, 2006, which lagged the benchmark Lehman Brothers Aggregate Index return of 4.33% for the same period.
Factors Affecting Performance in 2006
The returns for the bond market were again impacted by the Federal Reserve Bank’s four interest rate increases in the first half of 2006. As bond interest rates moved up across the yield curve, prices of bonds fell. The yield curve also inverted, with short-term rates higher than long term rates, which historically increases the risk of recession. Treasury securities underperformed the other fixed income sectors due to their lower yield.
During 2006, the Series was positioned shorter than the average maturity of its benchmark to mitigate the impact of rising rates. This strategy was correct and protected the Series from loss due to declining bond prices. The Series was slightly overweighted corporate bonds to take advantage of the strong credit fundamentals and low volatility of corporate spreads. While the corporate overweight was correct, it should have been larger given the strong performance of the sector. We kept the corporate weighting lower due to concerns about valuations and event risk in the sector. Mortgage-backed securities were slightly overweighted to take advantage of the additional yield and low volatility levels. This over weight proved successful as mortgage-backed securities were the top performing sector in the Lehman Aggregate Index. Again, to maximize performance the overweight should have been larger.
The Composition of Portfolio Assets
At the end of the year, the Series held 22% in mortgage backed securities, 2% in asset-backed and commercial mortgage-backed securities, 31% in corporate issues, 43% in U.S. Treasury and Government agencies, and 2% in cash. This portfolio composition is over weighted corporate bonds and mortgage-backed securities and underweighted in Treasury and Agency issues relative to the benchmark.
Outlook for 2007
In 2006 the economy continued to grow but with strong head winds from the long anticipated correction in the housing market, the Federal Reserves rate increases starting to take effect, and commodity prices hitting all time highs. Looking for ward to 2007 the economy should continue to grow but at a slower rate than the recent past. One of the main concerns widely discussed in 2006 was the slowdown in the housing market. The housing slowdown had a negative impact on economic growth in 2006, but it does not appear to be enough to push the economy into a recession with unemployment near all time lows and wage inflation still relatively high. The strong labor market should also drive consumer spending to continue growing at a reasonable rate. Commodity prices also declined in late 2006, which should add some positive stimulus to the economy and lower inflation expectations.
The yield curve remains flat or inverted which traditionally has been a sign of future economic weakness. In the current environment we believe that the strong demand for long U.S. Treasury securities from global investors and investors searching to match long liabilities has largely contributed to this situation rather than a pending recession.
We expect short term rates to remain at 5.25% for most of 2007. We believe the Fed has paused and will remain paused with a wait-and-see attitude. We believe it won’t raise rates because there’s no compelling reason to do so. On the other hand, we believe it won’t cut rates either. For the Fed to raise rates again, inflation would have to increase while the economy remained strong. For the Fed to cut rates, inflation would have to decline into its preferred range and economic growth would have to slow down. At this point, there is limited evidence of either situation. Also, due to the increasing amounts of leverage in the capital markets we believe cutting rates
39
| | |
| | Series E |
| Manager’s Commentary | | (Diversified Income Series) |
| February 15, 2007 | | (unaudited) |
will also send an unwarranted bullish signal to the credit and equity markets. Our bias will be to position the portfolio short of the average maturity of the benchmark because the market is pricing in a higher probability of a Fed rate decrease than we believe will occur.
With a stable and growing economy predicted in 2007, the Series will be overweighted corporate bonds for their additional yield. Fundamentals in the corporate sector remain strong as companies generate strong cash flow and profit growth. The primary short-term risk in corporate bonds is increased share repurchases and leveraged buyouts, which negatively impact credit quality. Our focus will continue to be on companies and sectors where this activity has a low probability.
Our primary concern for 2007 is that most risk assets are priced at high valuations and the economy is entering the fifth year of an expansion. We find ourselves constantly asking when the wind will blow the other direction with the economy slowing and credit spreads widening. At this point the evidence tells us to continue to own the additional yield these assets provide but be prepared to change our views if the data changes.
|
| Sincerely, |
|
| |
Steven M. Bowser and Christopher L. Phalen Portfolio Managers |
PERFORMANCE
Series E vs. Lehman Brothers
Aggregate Bond Index
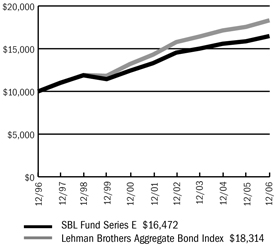
$10,000 Over 10 Years
The chart above assumes a hypothetical $10,000 investment in Series E (Diversified Income Series) on December 31, 1996 and reflects the fees and expenses of Series E. The Lehman Brothers Aggregate Bond Index is an unmanaged index that tracks investment grade bonds including U.S. Treasury and agency issues, corporate bond issues, asset-backed, commercial mortgage-backed and mortgage-backed securities and Yankee issues.
Average Annual Returns
| | | | | | | | | |
Periods Ended 12-31-061 | | 1 Year | | | 5 Years | | | 10 Years | |
Series E | | 3.80 | % | | 4.36 | % | | 5.12 | % |
1 | Performance figures do not reflect fees and expenses associated with an investment in variable insurance products offered by Security Benefit Life Insurance Company. If returns had taken into account these fees and expenses, performance would have been lower. Shares of a Series of SBL Fund are available only through the purchase of such products. |
The performance data quoted above represents past performance. Past performance is not predictive of future performance. The investment return and principal value of an investment will fluctuate so that an investor’s shares, when redeemed, may be worth more or less than their original cost.
Portfolio Composition by Quality Ratings (Based on Standard and Poor’s Ratings)
| | | |
AAA | | 68.43 | % |
AA | | 2.02 | |
A | | 10.21 | |
BBB | | 14.05 | |
BB | | 2.47 | |
B | | 0.43 | |
Asset Backed Commercial Paper | | 0.79 | |
Commercial Paper | | 0.66 | |
Repurchase Agreement | | 0.29 | |
Cash & other assets, less liabilities | | 0.65 | |
Total net assets | | 100.00 | % |
| | | |
See accompanying notes.
40
| | |
| | Series E |
| Managers’ Commentary | | (Diversified Income Series) |
| December 31, 2006 | | (unaudited) |
PERFORMANCE
Information About Your Series Expenses
Calculating your ongoing series expenses
Example
As a shareholder of the Series, you incur ongoing costs, including management fees and other series expenses. Performance figures and expense ratios do not reflect fees and expenses associated with an investment in variable insurance products. Shares of a Series of SBL Fund are available only through the purchase of such products. This example is intended to help you understand your ongoing costs (in dollars) of investing in the Series and to compare these costs with ongoing costs of investing in other mutual funds. The example is based on an investment of $1,000 invested at the beginning of the period and held for the entire period, July 1, 2006 - December 31, 2006.
Actual Expenses
The first line in the table provides information about actual account values and actual expenses. You may use the information in this table, together with the amount you invested, to estimate the expenses that you paid over the period. Simply divide your account value by $1,000 (for example, an $8,600 account value divided by $1,000 = 8.6), then multiply the result by the number in the table under the heading entitled “Expenses Paid During Period” to estimate the expenses you paid on your account during this period.
Hypothetical Example for Comparison Purposes
The second line in the table provides information about hypothetical account values and hypothetical expenses based on the Series actual expense ratio and an assumed rate of return of 5% per year before expenses, which is not the Series actual return. The hypothetical account values and expenses may not be used to estimate the actual ending account balance or expenses you paid for the period. You may use this information to compare the ongoing costs of investing in the Series and other funds. To do so, compare this 5% hypothetical example with the 5% hypothetical examples that appear in the shareholder reports of the other mutual funds.
Please note that the expenses shown in the table are meant to highlight your ongoing costs only and do not reflect any fees and expenses associated with an investment in variable insurance products. Therefore, the second line is useful in comparing ongoing costs only, and will not help you determine the relative total costs of owning different funds. In addition, if these fees and expenses associated with an investment in variable insurance products were included, your costs would have been higher.
Series Expenses
| | | | | | | | | |
| | | Beginning
Account Value
07-01-06 | | Ending
Account Value
12-31-061 | | Expenses Paid
During
Period2 |
Series E (Diversified Income Series) | | | | | | | | | |
Actual | | $ | 1,000.00 | | $ | 1,048.00 | | $ | 4.08 |
Hypothetical | | | 1,000.00 | | | 1,021.22 | | | 4.02 |
1 | The actual ending account value is based on the actual total return of the Series for the period July 1, 2006 to December 31, 2006 after actual expenses and will differ from the hypothetical ending account value which is based on the Series expense ratio and a hypothetical annual return of 5% before expenses. The actual cumulative return at net asset value for the period July 1, 2006 to December 31, 2006 was 4.80%. |
2 | Expenses are equal to the Series annualized expense ratio of 0.79%, net of expense waivers and earnings credits, multiplied by the average account value over the period, multiplied by 184/365 (to reflect the one-half year period). |
41
| | |
| Schedule of Investments | | Series E (Diversified Income Series) |
| December 31, 2006 | | |
| | | | | | |
| | | Principal Amount | | Value |
CORPORATE BOND - 28.0% | | | | | | |
Automotive - 2.5% | | | | | | |
Ford Motor Credit Company | | | | | | |
6.50%, 2007 | | $ | 650,000 | | $ | 650,109 |
GMAC LLC | | | | | | |
6.274%, 2007 (1) | | | 3,000,000 | | | 2,999,979 |
6.31%, 2007 | | | 105,000 | | | 104,343 |
| | | | | | |
| | | | | | 3,754,431 |
| | | | | | |
Banking - 3.5% | | | | | | |
BankBoston Capital Trust IV | | | | | | |
5.95%, 2028 (1) | | | 1,200,000 | | | 1,167,324 |
BOI Capital Funding No. 2, LP | | | | | | |
5.57%, 2049 (1)(2)(3) | | | 650,000 | | | 634,800 |
Chase Capital III | | | | | | |
5.92%, 2027 (1) | | | 1,200,000 | | | 1,160,095 |
Danske Bank A | | | | | | |
7.40%, 2010 (1)(2)(3) | | | 800,000 | | | 807,486 |
Rabobank Capital Funding II | | | | | | |
5.26%, 2049 (1)(2)(3) | | | 1,200,000 | | | 1,173,534 |
US Central Federal Credit Union | | | | | | |
2.70%, 2009 | | | 340,909 | | | 327,334 |
| | | | | | |
| | | | | | 5,270,573 |
| | | | | | |
Building Materials - 0.4% | | | | | | |
CRH America, Inc. | | | | | | |
6.95%, 2012 | | | 600,000 | | | 634,203 |
| | | | | | |
Chemicals - 0.5% | | | | | | |
PPG Industries, Inc. | | | | | | |
7.40%, 2019 | | | 650,000 | | | 732,189 |
| | | | | | |
Electric - 2.4% | | | | | | |
Arizona Public Service Company | | | | | | |
6.38%, 2011 | | | 600,000 | | | 615,810 |
Cincinnati Gas & Electric | | | | | | |
5.70%, 2012 | | | 600,000 | | | 605,627 |
East Coast Power LLC | | | | | | |
6.74%, 2008 | | | 34,376 | | | 34,668 |
7.07%, 2012 | | | 140,867 | | | 142,570 |
Kansas Gas & Electric | | | | | | |
5.65%, 2021 | | | 650,000 | | | 631,157 |
TXU Electric Delivery Company | | | | | | |
6.38%, 2015 | | | 600,000 | | | 618,466 |
WPS Resources Corporation | | | | | | |
6.11%, 2066 (1) | | | 900,000 | | | 893,482 |
| | | | | | |
| | | | | | 3,541,780 |
| | | | | | |
Financial - Other - 1.9% | | | | | | |
Berkshire Hathaway Finance Corporation | | | | | | |
4.75%, 2012 | | | 1,800,000 | | | 1,764,153 |
Willis North America, Inc. | | | | | | |
5.63%, 2015 | | | 1,200,000 | | | 1,148,666 |
| | | | | | |
| | | | | | 2,912,819 |
| | | | | | |
Financial Companies - Captive - 3.2% | | | | | | |
CIT Group Funding Company of Canada | | | | | | |
4.65%, 2010 (4) | | | 1,800,000 | | | 1,761,424 |
Residential Capital LLC | | | | | | |
7.204%, 2009 (1)(2)(3) | | | 3,000,000 | | | 3,016,098 |
| | | | | | |
| | | | | | 4,777,522 |
| | | | | | |
Financial Companies - Noncaptive Consumer - 2.5% | | | | | | |
Capital One Financial Corporation | | | | | | |
4.74%, 2007 | | | 650,000 | | | 648,121 |
Nelnet, Inc. | | | | | | |
7.40%, 2036 (1) | | | 2,500,000 | | | 2,574,395 |
SLM Corporation | | | | | | |
5.05%, 2014 | | | 600,000 | | | 581,741 |
| | | | | | |
| | | | | | 3,804,257 |
| | | | | | |
Financial Companies - Noncaptive Diversified - 0.4% | | | | | | |
General Electric Capital Corporation | | | | | | |
5.88%, 2012 | | | 600,000 | | | 616,988 |
| | | | | | |
Healthcare - 0.4% | | | | | | |
Anthem, Inc. | | | | | | |
6.80%, 2012 | | | 600,000 | | | 636,405 |
| | | | | | |
Independent Energy - 0.4% | | | | | | |
Devon Financing Corporation ULC | | | | | | |
6.88%, 2011 | | | 600,000 | | | 634,451 |
| | | | | | |
Insurance - Life - 3.4% | | | | | | |
AIG SunAmerica Global Financing X | | | | | | |
6.90%, 2032 (2)(3) | | | 1,200,000 | | | 1,373,559 |
AXA S.A. | | | | | | |
6.379%, 2049 (1)(2)(3) | | | 700,000 | | | 691,154 |
Lincoln National Corporation | | | | | | |
7.00%, 2066 (1) | | | 2,000,000 | | | 2,119,772 |
Metlife, Inc. | | | | | | |
6.40%, 2036 (1) | | | 1,000,000 | | | 1,004,607 |
| | | | | | |
| | | | | | 5,189,092 |
| | | | | | |
Insurance - Properly & Casually - 1.8% | | | | | | |
Nationwide Mutual Insurance Company | | | | | | |
8.25%, 2031 (2)(3) | | | 650,000 | | | 796,824 |
Navigators Group, Inc. | | | | | | |
7.00%, 2016 | | | 700,000 | | | 715,758 |
Swiss Re Capital I, LP | | | | | | |
6.854%, 2049 (1)(2)(3) | | | 1,200,000 | | | 1,258,919 |
| | | | | | |
| | | | | | 2,771,501 |
| | | | | | |
Media - Cable - 0.3% | | | | | | |
Jones Intercable, Inc. | | | | | | |
7.63%, 2008 | | | 500,000 | | | 513,348 |
| | | | | | |
Natural Gas Pipelines - 0.7% | | | | | | |
Consolidated Natural Gas Company | | | | | | |
6.63%, 2013 | | | 600,000 | | | 634,501 |
The accompanying notes are an integral part of the financial statements.
42
| | |
| Schedule of Investments | | Series E (Diversified Income Series) |
| December 31, 2006 - continued | | |
| | | | | | |
| | | Principal | | |
| | | Amount | | Value |
CORPORATE BOND (continued) | | | | | | |
Natural Gas Pipelines (continued) | | | | | | |
Express Pipeline, LP | | | | | | |
6.47%, 2013 (2)(3) | | $ | 338,400 | | $ | 347,425 |
| | | | | | |
| | | | | | 981,926 |
| | | | | | |
Railroads - 0.9% | | | | | | |
Canadian National Railway Company | | | | | | |
6.25%, 2034 | | | 1,200,000 | | | 1,281,554 |
| | | | | | |
REIP’s - 0.8% | | | | | | |
Reckson Operating Partnership, LP | | | | | | |
5.15%, 2011 | | | 1,200,000 | | | 1,173,067 |
| | | | | | |
Services - 0.0% | | | | | | |
American ECO Corporation | | | | | | |
9.625%, 2008 (2)(5)(6)(7) | | | 500,000 | | | — |
| | | | | | |
Technology - 0.4% | | | | | | |
Science Applications International | | | | | | |
Corporation | | | | | | |
7.13%, 2032 | | | 600,000 | | | 646,381 |
| | | | | | |
Telecommunications - Wireless - 0.8% | | | | | | |
Nextel Communications, Inc. | | | | | | |
6.88%, 2013 | | | 1,200,000 | | | 1,212,396 |
| | | | | | |
Transportation Services - 0.4% | | | | | | |
TTX Company | | | | | | |
4.90%, 2015 (2)(3) | | | 650,000 | | | 620,070 |
| | | | | | |
U.S. Banking - 0.4% | | | | | | |
PartnerRe Finance II | | | | | | |
6.44%, 2066 (1) | | | 650,000 | | | 652,403 |
| | | | | | |
| | |
TOTAL CORPORATE BOND (Cost $42,643,776) | | | | | $ | 42,357,356 |
| | | | | | |
PREFERRED STOCK - 2.4% | | | | | | |
Insurance Brokers - 0.8% | | | | | | |
WoodBourne Pass-Through Trust | | | | | | |
6.45%, 2008 (1)(2)(3) | | | 12 | | | 1,201,875 |
| | | | | | |
Property & Casually Insurance - 0.8% | | | | | | |
Aspen Insurance Holdings, Ltd. | | | | | | |
7.401%, 2017 (1)(4) | | | 48,000 | | | 1,228,800 |
| | | | | | |
U.S. Banking - 0.8% | | | | | | |
Washington Mutual Preferred Funding | | | | | | |
Delaware | | | | | | |
6.53%, 2041 (1)(2)(3) | | | 1,250,000 | | | 1,235,625 |
| | | | | | |
TOTAL PREFERRED STOCK (Cost $3,660,506) | | | | | $ | 3,666,300 |
| | | | | | |
| | |
MORTGAGE BACKED SECURITIES - 58.9% | | | | | | |
Other Non - Agency - 12.1% | | | | | | |
CMO’s - 12.1% | | | | | | |
Chase Commercial Mortgage Securities | | | | | | |
Corporation | | | | | | |
1998-1, 6.56% - 2030 | | | 500,000 | | | 506,580 |
Chase Mortgage Finance Corporation | | | | | | |
2005-A1 2A2, 5.247% - 2035 (1) | | | 2,413,393 | | | 2,390,960 |
Chaseflex Trust | | | | | | |
2006-1, 5.94% - 2036 (1) | | | 3,000,000 | | | 3,016,474 |
Homebanc Mortgage Trust | | | | | | |
2006-1, 6.18% - 2037 (1) | | | 2,519,668 | | | 2,553,410 |
JP Morgan Alternative Loan Trust | | | | | | |
2006-S2, 5.81% - 2036 | | | 3,007,000 | | | 3,003,877 |
2006-S3, 6.00% - 2036 | | | 3,000,000 | | | 2,993,414 |
JP Morgan Mortgage Trust | | | | | | |
2006-A3, 5.38% - 2036 (1) | | | 2,100,564 | | | 2,096,698 |
Washington Mutual, Inc. | | | | | | |
2005-AR16 1A1, 5.11% - 2035 (1) | | | 1,754,275 | | | 1,736,948 |
| | | | | | |
| | | | | | 18,298,361 |
| | | | | | |
U.S. Government Sponsored | | | | | | |
Agencies - 42.4% | | | | | | |
CMO’s - 6.7% | | | | | | |
Federal Home Loan Mortgage Corporation | | | | | | |
FHR 2520 AG, 5.00% - 2016 | | | 2,238,791 | | | 2,222,805 |
FHR 188 H, 7.00% - 2021 | | | 2,114 | | | 2,102 |
Federal National Mortgage Association | | | | | | |
FNR 2005-46 TW, 5.00% - 2018 | | | 3,000,000 | | | 2,932,298 |
FNR 1990-68 J, 6.95% - 2020 | | | 5,250 | | | 5,428 |
FNR 1990-103 K, 7.50% - 2020 | | | 1,500 | | | 1,517 |
FNR 2005-24 AH, 5.00% - 2029 (8) | | | 5,087,149 | | | 5,015,808 |
| | | | | | |
| | | | | | 10,179,958 |
| | | | | | |
Pass-Thru’s - 35.7% | | | | | | |
Federal Home Loan Mortgage Corporation | | | | | | |
#E01378, 5.00% - 2018 | | | 1,999,006 | | | 1,969,598 |
#E01488, 5.00% - 2018 | | | 1,794,452 | | | 1,767,324 |
#E01538, 5.00% - 2018 | | | 1,829,997 | | | 1,801,984 |
#C44050, 7.00% - 2030 | | | 48,811 | | | 50,239 |
#C01079, 7.50% - 2030 | | | 24,657 | | | 25,663 |
#C01172, 6.50% - 2031 | | | 78,368 | | | 79,822 |
#C01210, 6.50% - 2031 | | | 95,742 | | | 97,987 |
#C50964, 6.50% - 2031 | | | 94,268 | | | 96,016 |
#C50967, 6.50% - 2031 | | | 22,555 | | | 23,084 |
#C01277, 7.00% - 2031 | | | 134,289 | | | 137,758 |
#C01292, 6.00% - 2032 | | | 392,430 | | | 396,526 |
#C62801, 6.00% - 2032 | | | 177,318 | | | 179,168 |
#C01287, 6.50% - 2032 | | | 221,561 | | | 225,669 |
#C76358, 5.00% - 2033 | | | 2,435,646 | | | 2,355,128 |
#C78238, 5.50% - 2033 | | | 2,264,327 | | | 2,242,668 |
#A16943, 6.00% - 2033 | | | 1,160,910 | | | 1,171,442 |
#G08014, 5.00% - 2034 | | | 2,365,995 | | | 2,285,339 |
#G08015, 5.50% - 2034 | | | 2,169,616 | | | 2,147,911 |
#A17903, 6.00% - 2034 | | | 1,430,121 | | | 1,441,759 |
#1B2544, 5.292% - 2036 (1) | | | 3,158,813 | | | 3,152,651 |
#G02109, 6.00% - 2036 | | | 2,740,149 | | | 2,761,033 |
The accompanying notes are an integral part of the financial statements.
43
| | |
| Schedule of Investments | | Series E (Diversified Income Series) |
| December 31, 2006 - continued | | |
| | | | | | |
| | | Principal Amount | | Value |
| | |
MORTGAGE BACKED SECURITIES (continued) | | | | | | |
U.S. Government Sponsored Agencies (continued) | | | | | | |
Pass - Thru’s (continued) | | | | | | |
Federal National Mortgage Association | | | | | | |
#254473, 5.50% - 2017 | | $ | 1,755,909 | | $ | 1,760,099 |
#720714, 4.50% - 2018 | | | 1,841,156 | | | 1,780,489 |
#555549, 5.00% - 2018 | | | 2,108,020 | | | 2,071,889 |
#750465, 5.00% - 2018 | | | 1,839,663 | | | 1,812,592 |
#839353, 5.50% - 2018 | | | 1,289,032 | | | 1,294,115 |
#780952, 4.00% - 2019 | | | 2,300,499 | | | 2,168,088 |
#252806, 7.50% - 2029 | | | 78,621 | | | 82,054 |
#252874, 7.50% - 2029 | | | 28,179 | | | 29,410 |
#535277, 7.00% - 2030 | | | 46,135 | | | 47,356 |
#551262, 7.50% - 2030 | | | 18,008 | | | 18,752 |
#190307, 8.00% - 2030 | | | 32,670 | | | 34,458 |
#253356, 8.00% - 2030 | | | 36,507 | | | 38,505 |
#541735, 8.00% - 2030 | | | 40,450 | | | 42,664 |
#535838, 6.50% - 2031 | | | 69,656 | | | 70,971 |
#585348, 6.50% - 2031 | | | 69,194 | | | 70,500 |
#591381, 6.50% - 2031 | | | 123,946 | | | 126,285 |
#254477, 5.50% - 2032 | | | 1,030,406 | | | 1,018,256 |
#254198, 6.00% - 2032 | | | 384,837 | | | 387,450 |
#254377, 6.00% - 2032 | | | 644,402 | | | 650,282 |
#254478, 6.00% - 2032 | | | 301,824 | | | 304,578 |
#666750, 6.00% - 2032 | | | 653,647 | | | 658,086 |
#254346, 6.50% - 2032 | | | 176,518 | | | 179,850 |
#545691, 6.50% - 2032 | | | 264,784 | | | 269,782 |
#659790, 6.50% - 2032 | | | 239,576 | | | 245,067 |
#702879, 5.00% - 2033 | | | 1,379,513 | | | 1,334,443 |
#709805, 5.00% - 2033 | | | 1,943,763 | | | 1,880,259 |
#658077, 5.50% - 2033 | | | 1,250,140 | | | 1,237,654 |
#688328, 5.50% - 2033 | | | 1,175,426 | | | 1,163,445 |
#689108, 5.50% - 2033 | | | 1,123,810 | | | 1,112,585 |
#709748, 5.50% - 2033 | | | 1,878,586 | | | 1,859,822 |
#713971, 5.50% - 2033 | | | 1,865,959 | | | 1,846,938 |
#754903, 5.50% - 2033 | | | 1,058,328 | | | 1,041,461 |
#725033, 6.00% - 2034 | | | 836,763 | | | 843,818 |
#255554, 5.50% - 2035 | | | 2,161,791 | | | 2,138,615 |
| | | | | | |
| | | | | | 54,029,387 |
| | | | | | |
| | | | | | 64,209,345 |
| | | | | | |
U.S. Government Sponsored Securities - 4.4% | | | | | | |
CMO’s - 3.1% | | | | | | |
Government National Mortgage Association | | | | | | |
GNR 2006 - 23 A, 6.00% - 2033 | | | 4,766,453 | | | 4,714,843 |
| | | | | | |
Pass - Thru’s - 1.3% | | | | | | |
Government National Mortgage Association | | | | | | |
G2 181907, 9.50% - 2020 | | | 14,421 | | | 15,882 |
#301465, 9.00% - 2021 | | | 20,751 | | | 22,488 |
#305617, 9.00% - 2021 | | | 16,629 | | | 18,020 |
#313107, 7.00% - 2022 | | | 107,862 | | | 111,430 |
#352022, 7.00% - 2023 | | | 71,175 | | | 73,529 |
#369303, 7.00% - 2023 | | | 108,246 | | | 111,826 |
#780454, 7.00% - 2026 | | | 112,491 | | | 116,212 |
G2 2445, 8.00% - 2027 | | | 46,678 | | | 49,237 |
#462680, 7.00% - 2028 | | | 69,339 | | | 71,632 |
#482668, 7.00% - 2028 | | | 52,284 | | | 54,014 |
#518436, 7.25% - 2029 | | | 19,574 | | | 20,294 |
#494109, 7.50% - 2029 | | | 23,737 | | | 24,726 |
#510704, 7.50% - 2029 | | | 26,721 | | | 27,834 |
#781079, 7.50% - 2029 | | | 25,008 | | | 26,049 |
#479229, 8.00% - 2030 | | | 17,421 | | | 18,446 |
#479232, 8.00% - 2030 | | | 21,209 | | | 22,457 |
#508342, 8.00% - 2030 | | | 42,631 | | | 45,138 |
G2 2909, 8.00% - 2030 | | | 25,695 | | | 27,104 |
#538285, 6.50% - 2031 | | | 84,309 | | | 86,502 |
#561561, 6.50% - 2031 | | | 165,679 | | | 170,267 |
#564472, 6.50% - 2031 | | | 243,118 | | | 249,850 |
#781414, 5.50% - 2032 | | | 354,440 | | | 352,736 |
#552324, 6.50% - 2032 | | | 148,756 | | | 152,625 |
| | | | | | |
| | | | | | 1,868,298 |
| | | | | | |
| | | | | | 6,583,141 |
| | | | | | |
TOTAL MORTGAGE BACKED SECURITIES (Cost $90,302,172) | | | | | $ | 89,090,847 |
| | | | | | |
U.S. GOVERNMENT SPONSORED AGENCY BONDS NOTES - 2.7% | | | | | | |
Federal National Mortgage Association | | | | | | |
5.00% - 2013 (4)(8) | | | 1,935,000 | | | 1,895,683 |
6.63% - 2030 (8) | | | 750,000 | | | 894,973 |
7.13% - 2030 (8) | | | 1,000,000 | | | 1,255,204 |
| | | | | | |
TOTAL U.S. GOVERNMENT SPONSORED AGENCY BONDS & NOTES (Cost $3,786,785) | | | | | $ | 4,045,860 |
| | | | | | |
U.S. GOVERNMENT SECURITIES - 3.6% | | | | | | |
U.S. Treasury Bill | | | | | | |
4.85%, 2007 | | | 130,000 | | | 129,872 |
4.87%, 2007 | | | 35,000 | | | 34,698 |
U.S. Treasury Bonds | | | | | | |
5.38%, 2031 | | | 5,000,000 | | | 5,355,860 |
| | | | | | |
TOTAL U.S. GOVERNMENT SECURITIES (Cost $5,738,605) | | | | | $ | 5,520,430 |
| | | | | | |
The accompanying notes are an integral part of the financial statements.
44
| | |
| Schedule of Investments | | Series E (Diversified Income Series) |
| December 31, 2006 - continued | | |
| | | | | | |
| | | Principal
Amount | | Value |
ASSET BACKED SECURITIES - 2.0% | | | | | | |
Home Equity Loans - 2.0% | | | | | | |
Credit-Based Asset Servicing and Securitization LLC | | | | | | |
2005-CB5, 5.61%, 2035 (1) | | $ | 3,000,000 | | $ | 3,012,982 |
| | | | | | |
TOTAL ASSET BACKED SECURITIES (Cost $3,000,000) | | | | | $ | 3,012,982 |
| | | | | | |
ASSET BACKED COMMERCIAL PAPER - 0.8% | | | | | | |
Financial Companies - Trade | | | | | | |
Receivables - 0.8% | | | | | | |
Old Line Funding LLC | | | | | | |
5.26%, 1/4/2007 | | | 1,200,000 | | | 1,199,467 |
| | | | | | |
TOTAL ASSET BACKED COMMERCIAL PAPER (Cost $1,199,467) | | | | | $ | 1,199,467 |
| | | | | | |
COMMERCIAL PAPER - 0.7% | | | | | | |
Financial-Other - 0.7% | | | | | | |
Countrywide Financial Corporation | | | | | | |
5.42%, 1/2/2007 | | | 1,000,000 | | | 999,851 |
| | | | | | |
TOTAL COMMERCIAL PAPER (Cost $999,851) | | | | | $ | 999,851 |
| | | | | | |
REPURCHASE AGREEMENT - 0.3% | | | | | | |
United Missouri Bank, 4.85%, 12-29-06, matures 01-02-07; repurchase amount $436,235 (Collateralized by FHLMC, 5.00%, 08-15-35 with a value of $445,070) | | $ | 436,000 | | $ | 436,000 |
| | | | | | |
TOTAL REPURCHASE AGREEMENT (Cost $436,000) | | | | | $ | 436,000 |
| | | | | | |
Total Investments (SBL E Fund) (Cost $151,767,162) - 99.4% | | | | | $ | 150,329,093 |
Other Assets in Excess of Liabilities - 0.6% | | | | | | 981,904 |
| | | | | | |
TOTAL NET ASSETS -100.0% | | | | | $ | 151,310,997 |
| | | | | | |
Footnotes
Percentages are stated as a percent of net assets.
For federal income tax purposes the identified cost of investments
owned at 12/31/2006 was $152,768,800.
| 1 | - Variable rate security. Rate indicated is rate effective at December 31, 2006. |
| 2 | - Security was acquired through a private placement. |
| 3 | - Security is a 144A security, which places restrictions on resale. See Notes to financial statements. |
| 4 | - Security is a step-up bond. Rate indicated is rate effective at December 31, 2006. |
| 5 | - Security is deemed illiquid. See Notes to financial statements. |
| 6 | - Security is in default of interest and/or principal obligations. |
| 7 | - Security is fair valued by the Board of Directors. See Notes to financial statements. |
| 8 | - Security is segregated as collateral for open futures contracts. |
See notes to financial statements.
The accompanying notes are an integral part of the financial statements.
45
Series E
(Diversified Income Series)
Statement of Assets and Liabilities
December 31, 2006
| | | | |
Assets: | | | | |
Investments, at value1 | | $ | 150,329,093 | |
Cash | | | 46,289 | |
Receivables: | | | | |
Fund shares sold | | | 89,178 | |
Securities sold | | | 4,220 | |
Dividend | | | 16,206 | |
Interest | | | 1,234,753 | |
Prepaid expenses | | | 3,667 | |
| | | | |
Total assets | | | 151,723,406 | |
| | | | |
Liabilities: | | | | |
Payable for: | | | | |
Variation margin on futures | | | 9,000 | |
Fund shares redeemed | | | 271,576 | |
Management fees | | | 77,567 | |
Directors’ fees | | | 4,000 | |
Transfer agent/maintenance fees | | | 2,083 | |
Administration fees | | | 15,057 | |
Professional fees | | | 16,560 | |
Other | | | 16,566 | |
| | | | |
Total liabilities | | | 412,409 | |
| | | | |
Net Assets | | $ | 151,310,997 | |
| | | | |
Net assets consist of: | | | | |
Paid in capital | | $ | 159,715,964 | |
Undistributed net investment income | | | 6,546,424 | |
Accumulated net realized loss on sale of investments and futures | | | (13,409,473 | ) |
Net unrealized depreciation in value of investments and futures | | | (1,541,918 | ) |
| | | | |
Net assets | | $ | 151,310,997 | |
| | | | |
Capital shares authorized | | | unlimited | |
Capital shares outstanding | | | 12,603,079 | |
Net asset value per share (net assets divided by shares outstanding) | | $ | 12.01 | |
| | | | |
1Investments, at cost | | $ | 151,767,162 | |
Statement of Operations
For the Year Ended December 31, 2006
| | | | |
Investment Income: | | | | |
Interest | | $ | 8,516,144 | |
Dividends | | | 84,592 | |
| | | | |
Total investment income | | | 8,600,736 | |
| | | | |
Expenses: | | | | |
Management fees | | | 1,184,769 | |
Administration fees | | | 160,834 | |
Transfer agent/maintenance fees | | | 25,224 | |
Custodian fees | | | 27,140 | |
Professional fees | | | 22,584 | |
Directors’ fees | | | 7,613 | |
Reports to shareholders | | | 28,330 | |
Other expenses | | | 6,973 | |
| | | | |
Total expenses | | | 1,463,467 | |
Less: Expenses waived | | | (236,955 | ) |
Earning credits | | | (49 | ) |
| | | | |
Net expenses | | | 1,226,463 | |
| | | | |
Net investment income | | | 7,374,273 | |
| | | | |
Net Realized and Unrealized Gain (Loss): | | | | |
Net realized gain (loss) during the year on: | | | | |
Investments | | | (1,565,239 | ) |
Futures | | | 53,513 | |
| | | | |
Net realized loss | | | (1,511,726 | ) |
| | | | |
Net unrealized depreciation during the year on: | | | | |
Investments | | | (182,938 | ) |
Futures | | | (103,849 | ) |
| | | | |
Net unrealized depreciation | | | (286,787 | ) |
| | | | |
Net realized and unrealized loss | | | (1,798,513 | ) |
| | | | |
Net increase in net assets resulting from operations | | $ | 5,575,760 | |
| | | | |
See accompanying notes.
46
| | |
| | Series E |
| Statement of Changes in Net Assets | | (Diversified Income Series) |
| | | | | | | | |
| | | Year Ended
December 31, 2006 | | | Year Ended
December 31, 2005 | |
Increase (decrease) in net assets from operations: | | | | | | | | |
Net investment income | | $ | 7,374,273 | | | $ | 6,633,185 | |
Net realized gain (loss) during the year on investments and futures | | | (1,511,726 | ) | | | 975,729 | |
Net unrealized depreciation during the year on investments and futures | | | (286,787 | ) | | | (4,694,841 | ) |
| | | | | | | | |
Net increase in net assets resulting from operations | | | 5,575,760 | | | | 2,914,073 | |
| | | | | | | | |
Capital share transactions: | | | | | | | | |
Proceeds from sale of shares | | | 61,806,779 | | | | 63,916,593 | |
Cost of shares redeemed | | | (75,457,709 | ) | | | (66,971,923 | ) |
| | | | | | | | |
Net decrease from capital share transactions | | | (13,650,930 | ) | | | (3,055,330 | ) |
| | | | | | | | |
Net decrease in net assets | | | (8,075,170 | ) | | | (141,257 | ) |
| | | | | | | | |
Net assets: | | | | | | | | |
Beginning of year | | | 159,386,167 | | | | 159,527,424 | |
| | | | | | | | |
End of year | | $ | 151,310,997 | | | $ | 159,386,167 | |
| | | | | | | | |
Undistributed net investment income at end of year | | $ | 6,546,424 | | | $ | 5,900,401 | |
| | | | | | | | |
Capital Share Activity: | | | | | | | | |
Shares sold | | | 5,337,585 | | | | 5,569,608 | |
Shares redeemed | | | (6,512,120 | ) | | | (5,836,749 | ) |
| | | | | | | | |
Total capital share activity | | | (1,174,535 | ) | | | (267,141 | ) |
| | | | | | | | |
See accompanying notes.
47
| | | |
| Financial Highlights | | Series E | |
| Selected data for each share of capital stock outstanding throughout each year | | (Diversified Income Series | ) |
| | | | | | | | | | | | | | | | | | | | |
| | | 2006 | | | 2005 | | | 2004 | | | 2003 | | | Year Ended,
December 31, 2002 | |
Per Share Data | | | | | | | | | | | | | | | | | | | | |
Net asset value, beginning of period | | $ | 11.57 | | | $ | 11.36 | | | $ | 11.04 | | | $ | 11.83 | | | $ | 11.40 | |
Income (loss) from investment operations: | | | | | | | | | | | | | | | | | | | | |
Net investment income | | | 0.63 | | | | 0.49 | | | | 0.50 | | | | 0.68 | | | | 0.51 | |
Net gain (loss) on securities (realized and unrealized) | | | (0.19 | ) | | | (0.28 | ) | | | (0.08 | ) | | | (0.31 | ) | | | 0.51 | |
| | | | | | | | | | | | | | | | | | | | |
Total from investment operations | | | 0.44 | | | | 0.21 | | | | 0.42 | | | | 0.37 | | | | 1.02 | |
| | | | | | | | | | | | | | | | | | | | |
Less distributions: | | | | | | | | | | | | | | | | | | | | |
Dividends from net investment income | | | — | | | | — | | | | (0.10 | ) | | | (1.16 | ) | | | (0.59 | ) |
| | | | | | | | | | | | | | | | | | | | |
Total distributions | | | — | | | | — | | | | (0.10 | ) | | | (1.16 | ) | | | (0.59 | ) |
| | | | | | | | | | | | | | | | | | | | |
Net asset value, end of period | | $ | 12.01 | | | $ | 11.57 | | | $ | 11.36 | | | $ | 11.04 | | | $ | 11.83 | |
| | | | | | | | | | | | | | | | | | | | |
Total Returna | | | 3.80 | % | | | 1.85 | % | | | 3.82 | % | | | 3.19 | % | | | 9.29 | % |
| | | | | | | | | | | | | | | | | | | | |
Ratios/Supplemental Data | | | | | | | | | | | | | | | | | | | | |
Net assets, end of period (in thousands) | | $ | 151,311 | | | $ | 159,386 | | | $ | 159,527 | | | $ | 159,472 | | | $ | 195,754 | |
| | | | | | | | | | | | | | | | | | | | |
Ratios to average net assets: | | | | | | | | | | | | | | | | | | | | |
Net investment income | | | 4.67 | % | | | 4.23 | % | | | 4.42 | % | | | 4.39 | % | | | 5.00 | % |
Total expensesb | | | 0.93 | % | | | 0.92 | % | | | 0.89 | % | | | 0.84 | % | | | 0.83 | % |
Net expensesc | | | 0.78 | % | | | 0.77 | % | | | 0.75 | % | | | 0.84 | % | | | 0.83 | % |
| | | | | | | | | | | | | | | | | | | | |
Portfolio turnover rate | | | 64 | % | | | 60 | % | | | 39 | % | | | 45 | % | | | 32 | % |
a | Total return does not take into account any of the expenses associated with an investment in variable insurance products offered by Security Benefit Life Insurance Company. If total return had taken into account these expenses, performance would have been lower. Shares of a series of SBL Fund are available only through the purchase of such products. |
b | Total expense information reflects expense ratios absent fund expense reductions by the Investment Manager, and earnings credits, as applicable. |
c | Net expense information reflects the expense ratios after voluntary expense waivers, reimbursements and custodian earnings credits, as applicable. |
See accompanying notes.
48
| | |
| | Series H |
| Manager’s Commentary | | (Enhanced Index Series) |
| February 15, 2007 | | (unaudited) |

Advisor, Northern Trust
To Our Shareholders:
Series H of the SBL Fund - Enhanced Index Series posted a total return of 15.55% for the year ended December 31, 2006. Its benchmark, the S&P 500 Index, was up 15.79%.
The U.S. equity market ended up for the fourth straight year in 2006. The first half of 2006 was characterized by mixed macroeconomic and earnings reports, inflation concerns, record oil prices, and increased geopolitical risk. The second half of the year saw a sustained market rally fed by falling oil prices, the announcement of several large M&A deals, and the Fed’s decision to pause on rates.
The Series Management Criteria
The Series is managed using a proprietary quantitative stock selection model that assigns each company in the S&P 500 an expected return based upon multiple factors. These factors are based on four broad characteristics: Valuation (is the stock reasonably priced?), Momentum (price and earnings momentum), Earnings (earnings quality and stability) and Management Signals (signals given by management and insiders trading in company stock). Additionally, there are strict risk constraints that limit deviations from the benchmark with respect to the individual stocks, sectors, industries, style and size.
Keys to the Series’ Gain
Driving the Series’ positive outperformance in 2006 was the portfolio’s exposure to companies with healthy accruals, management share buybacks, and book-to-price, whereas exposure to companies with analyst diffusion and momentum was a detractor.
During 2006, the market rewarded moderately valued securities that displayed attractive growth characteristics, especially within the Information Technology sector, where our bottom up stock selection model worked most effectively. Within that sector, the fund achieved a 15.4% return relative to the benchmark sector return of 8.6%, while maintaining neutral exposure to sectors at the portfolio level. The Series’ portfolio construction methodology is designed to ensure the portfolio will have neutral exposures to all sectors in line with the benchmark, and relies on stock selection within sectors to enhance returns.
Despite a discernable slowdown in U.S. economic growth, global financial markets powered ahead in the final quarter of 2006. Still-higher corporate profits and falling oil prices were the most prominent catalysts driving further advances in risk-based security prices. As 2006 came to a close, a series of positive economic reports also suggested that investors’ percolating recession fears were perhaps overblown, and the U.S. economy’s much-coveted soft-landing was safely “wheels down.”
Investors enter 2007 with a backdrop of favorable economic and financial trends: Global growth remains solid and the global economy appears set to strengthen in the first half of this year, sustaining the strongest business cycle since the early 1970s; credit and liquidity are plentiful; company balance sheet strength is its strongest in a decade; and corporate earnings remains in record territory as U.S. companies report better-than-expected results for the fourth quarter.
We express our gratitude to our shareholders for their confidence in the Series and assure them that we will continue to apply our disciplined, quantitative approach while adhering to our strict risk control process.
|
| Sincerely, |
|
| |
| Enhanced Index Team |
49
| | |
| | Series H |
| Managers’ Commentary | | (Enhanced Index Series) |
| December 31, 2006 | | (unaudited) |
PERFORMANCE
Series H vs. S&P 500 Index
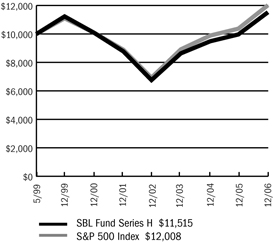
$10,000 Since Inception
The chart above assumes a hypothetical $10,000 investment in Series H (Enhanced Index Series) on May 3, 1999 (date of inception) and reflects the fees and expenses of Series H. The S&P 500 Index is a capitalization-weighted index composed of 500 selected common stocks that represent the broad domestic economy and is a widely recognized unmanaged index of market performance.
Portfolio Composition by Sector
| | | |
Consumer Discretionary | | 10.03 | % |
Consumer Staples | | 9.20 | |
Energy | | 9.42 | |
Financials | | 21.50 | |
Health Care | | 11.67 | |
Industrials | | 10.80 | |
Information Technology | | 15.07 | |
Materials | | 3.10 | |
Telecommunication Services | | 3.46 | |
Utilities | | 3.33 | |
U.S. Government Securities | | 0.18 | |
Repurchase Agreement | | 2.20 | |
Cash & other assets, less liabilities | | 0.04 | |
Total net assets | | 100.00 | % |
| | | |
Average Annual Returns
| | | | | | | | | |
Periods Ended 12-31-061 | | 1 Year | | | 5 Years | | | Since Inception
(5-3-99) | |
Series H | | 15.55 | % | | 5.58 | % | | 1.86 | % |
1 | Performance figures do not reflect fees and expenses associated with an investment in variable insurance products offered by Security Benefit Life Insurance Company. If returns had taken into account these fees and expenses, performance would have been lower. Shares of a Series of SBL Fund are available only through the purchase of such products. |
The performance data quoted above represents past performance. Past performance is not predictive of future performance. The investment return and principal value of an investment will fluctuate so that an investor’s shares, when redeemed, may be worth more or less than their original cost.
See accompanying notes
50
| | |
| | | Series H |
| Managers’ Commentary | | (Enhanced Index Series) |
| December 31, 2006 | | (unaudited) |
PERFORMANCE
Information About Your Series Expenses
Calculating your ongoing series expenses
Example
As a shareholder of the Series, you incur ongoing costs, including management fees and other series expenses. Performance figures and expense ratios do not reflect fees and expenses associated with an investment in variable insurance products. Shares of a Series of SBL Fund are available only through the purchase of such products. This example is intended to help you understand your ongoing costs (in dollars) of investing in the Series and to compare these costs with ongoing costs of investing in other mutual funds. The example is based on an investment of $1,000 invested at the beginning of the period and held for the entire period, July 1, 2006 - December 31, 2006.
Actual Expenses
The first line in the table provides information about actual account values and actual expenses. You may use the information in this table, together with the amount you invested, to estimate the expenses that you paid over the period. Simply divide your account value by $1,000 (for example, an $8,600 account value divided by $1,000 = 8.6), then multiply the result by the number in the table under the heading entitled “Expenses Paid During Period” to estimate the expenses you paid on your account during this period.
Hypothetical Example for Comparison Purposes
The second line in the table provides information about hypothetical account values and hypothetical expenses based on the Series actual expense ratio and an assumed rate of return of 5% per year before expenses, which is not the Series actual return. The hypothetical account values and expenses may not be used to estimate the actual ending account balance or expenses you paid for the period. You may use this information to compare the ongoing costs of investing in the Series and other funds. To do so, compare this 5% hypothetical example with the 5% hypothetical examples that appear in the shareholder reports of the other mutual funds.
Please note that the expenses shown in the table are meant to highlight your ongoing costs only and do not reflect any fees and expenses associated with an investment in variable insurance products. Therefore, the second line is useful in comparing ongoing costs only, and will not help you determine the relative total costs of owning different funds. In addition, if these fees and expenses associated with an investment in variable insurance products were included, your costs would have been higher.
Series Expenses
| | | | | | | | | |
| | | Beginning
Account Value
07-01-06 | | Ending
Account Value
12-31-061 | | Expenses Paid
During
Period2 |
Series H (Enhanced Index Series) | | | | | | | | | |
Actual | | $ | 1,000.00 | | $ | 1,128.40 | | $ | 3.86 |
Hypothetical | | | 1,000.00 | | | 1,021.58 | | | 3.67 |
1 | The actual ending account value is based on the actual total return of the Series for the period July 1, 2006 to December 31, 2006 after actual expenses and will differ from the hypothetical ending account value which is based on the Series expense ratio and a hypothetical annual return of 5% before expenses. The actual cumulative return at net asset value for the period July 1, 2006 to December 31, 2006 was 12.84%. |
2 | Expenses are equal to the Series annualized expense ratio of 0.72%, net of expense waivers and earnings credits, multiplied by the average account value over the period, multiplied by 184/365 (to reflect the one-half year period). |
51
| | |
| Schedule of Investments | | Series H (Enhanced Index Series) |
| December 31, 2006 | | |
| | | | | |
| | | Shares | | Value |
COMMON STOCK -9 7.6% | | | | | |
Advertising - 0.4% | | | | | |
Omnicom Group, Inc. | | 3,800 | | $ | 397,252 |
| | | | | |
Aerospace & Defense - 2.6% | | | | | |
Boeing Company | | 10,771 | | | 956,896 |
Honeywell International, Inc. | | 10,975 | | | 496,509 |
Lockheed Martin Corporation | | 7,247 | | | 667,231 |
Northrop Grumman Corporation | | 8,022 | | | 543,089 |
United Technologies Corporation | | 3,365 | | | 210,380 |
| | | | | |
| | | | | 2,874,105 |
| | | | | |
Agricultural Products - 0.5% | | | | | |
Archer-Daniels-Midland Company | | 17,300 | | | 552,908 |
| | | | | |
Air Freight & Logistics - 1.1% | | | | | |
FedEx Corporation | | 5,800 | | | 629,996 |
United Parcel Service, Inc. (CI.B) | | 7,793 | | | 584,319 |
| | | | | |
| | | | | 1,214,315 |
| | | | | |
Airlines - 0.1% | | | | | |
Southwest Airlines Company | | 6,571 | | | 100,668 |
| | | | | |
Apparel Retail - 0.4% | | | | | |
TJX Companies, Inc. | | 17,000 | | | 484,160 |
| | | | | |
Apparel, Accessories & Luxury Goods - 0.4% | | | | | |
Jones Apparel Group, Inc. | | 11,700 | | | 391,131 |
| | | | | |
Application Software - 0.8% | | | | | |
Citrix Systems, Inc. * | | 14,382 | | | 389,033 |
Intuit, Inc. * | | 15,200 | | | 463,752 |
| | | | | |
| | | | | 852,785 |
| | | | | |
Asset Management & Custody Banks - 0.5% | | | | | |
Ameriprise Financial, Inc. | | 8,133 | | | 443,249 |
Mellon Financial Corporation | | 3,455 | | | 145,628 |
| | | | | |
| | | | | 588,877 |
| | | | | |
Automobile Manufacturers - 0.4% | | | | | |
Ford Motor Company | | 400 | | | 3,004 |
General Motors Corporation | | 15,900 | | | 488,448 |
| | | | | |
| | | | | 491,452 |
| | | | | |
Automotive Retail - 0.1% | | | | | |
Autonation, Inc. * | | 7,124 | | | 151,884 |
| | | | | |
Biotechnology - 1.3% | | | | | |
Amgen, Inc. * | | 15,242 | | | 1,041,181 |
Gilead Sciences, Inc. * | | 5,900 | | | 383,087 |
| | | | | |
| | | | | 1,424,268 |
| | | | | |
Brewers - 0.0% | | | | | |
Molson Coors Brewing Company | | 300 | | | 22,932 |
| | | | | |
Broadcasting & Cable TV - 1.7% | | | | | |
CBS Corporation (CI.B) | | 18,400 | | | 573,712 |
Comcast Corporation * | | 26,324 | | | 1,114,295 |
DIRECTV Group, Inc. * | | 6,500 | | | 162,110 |
| | | | | |
| | | | | 1,850,117 |
| | | | | |
Building Products - 0.3% | | | | | |
Masco Corporation | | 10,796 | | | 322,476 |
| | | | | |
Communications Equipment - 2.9% | | | | | |
Ciena Corporation * | | 14,192 | | | 393,260 |
Cisco Systems, Inc. * | | 60,283 | | | 1,647,535 |
JDS Uniphase Corporation * | | 11,300 | | | 188,258 |
Motorola, Inc. | | 3,629 | | | 74,612 |
Qualcomm, Inc. | | 19,324 | | | 730,254 |
Tellabs, Inc. * | | 11,449 | | | 117,467 |
| | | | | |
| | | | | 3,151,386 |
| | | | | |
Computer & Electronics Retail - 0.4% | | | | | |
Best Buy Company, Inc. | | 2,600 | | | 127,894 |
Circuit City Stores, Inc. | | 17,773 | | | 337,332 |
| | | | | |
| | | | | 465,226 |
| | | | | |
Computer Hardware - 3.6% | | | | | |
Apple Computer, Inc. * | | 2,746 | | | 232,971 |
Dell, Inc. * | | 5,176 | | | 129,866 |
Hewlett-Packard Company | | 32,436 | | | 1,336,039 |
International Business Machines Corporation | | 16,716 | | | 1,623,959 |
NCR Corporation * | | 3,798 | | | 162,402 |
Sun Microsystems, Inc. * | | 88,324 | | | 478,716 |
| | | | | |
| | | | | 3,963,953 |
| | | | | |
Computer Storage & Peripherals - 0.4% | | | | | |
Lexmark International, Inc. * | | 5,500 | | | 402,600 |
| | | | | |
Construction & Farm Machinery & Heavy Trucks - 0.6% | | | | | |
Caterpillar, Inc. | | 11,594 | | | 711,060 |
| | | | | |
Consumer Finance - 0.8% | | | | | |
American Express Company | | 4,222 | | | 256,149 |
Capital One Financial Corporation | | 1,178 | | | 90,494 |
SLM Corporation | | 11,100 | | | 541,347 |
| | | | | |
| | | | | 887,990 |
| | | | | |
Data Processing & Outsourced Services - 0.9% | | | | | |
Automatic Data Processing, Inc. | | 12,300 | | | 605,775 |
Convergys Corporation * | | 11,800 | | | 280,604 |
Paychex, Inc. | | 100 | | | 3,954 |
Western Union Company | | 3,500 | | | 78,470 |
| | | | | |
| | | | | 968,803 |
| | | | | |
Department Stores - 1.2% | | | | | |
Dillard’s, Inc. | | 10,900 | | | 381,173 |
JC Penney Company, Inc. | | 5,722 | | | 442,654 |
Kohl's Corporation * | | 7,000 | | | 479,010 |
| | | | | |
| | | | | 1,302,837 |
| | | | | |
The accompanying notes are an integral part of the financial statements.
52
| | |
| Schedule of Investments | | Series H (Enhanced Index Series) |
| December 31, 2006 - continued | | |
| | | | | |
| | | Shares | | Value |
COMMON STOCK (continued) | | | | | |
Distillers & Vintners - 0.0% | | | | | |
Brown-Forman Corporation | | 100 | | $ | 6,624 |
| | | | | |
Diversified Banks - 2.4% | | | | | |
U.S. Bancorp | | 4,325 | | | 156,522 |
Wachovia Corporation | | 19,728 | | | 1,123,510 |
Wells Fargo & Company | | 39,138 | | | 1,391,747 |
| | | | | |
| | | | | 2,671,779 |
| | | | | |
Diversified Chemicals -1.0% | | | | | |
Dow Chemical Company | | 8,089 | | | 323,075 |
E.I. Du Pont de Nemours & Company | | 7,005 | | | 341,213 |
PPG Industries, Inc. | | 7,160 | | | 459,744 |
| | | | | |
| | | | | 1,124,032 |
| | | | | |
Diversified Metals & Mining - 0.2% | | | | | |
Phelps Dodge Corporation | | 1,642 | | | 196,580 |
| | | | | |
Drug Retail - 0.7% | | | | | |
CVS Corporation | | 19,600 | | | 605,836 |
Walgreen Company | | 4,193 | | | 192,417 |
| | | | | |
| | | | | 798,253 |
| | | | | |
Electric Utilities - 1.3% | | | | | |
Allegheny Energy, Inc. * | | 9,671 | | | 443,996 |
Edison International | | 1,278 | | | 58,123 |
Exelon Corporation | | 6,200 | | | 383,718 |
FirstEnergy Corporation | | 8,900 | | | 535,869 |
Progress Energy, Inc. - Contingent Value Obligation * (1) | | 1,100 | | | 341 |
| | | | | |
| | | | | 1,422,047 |
| | | | | |
Electrical Components & Equipment - 0.4% | | | | | |
Cooper Industries, Ltd. | | 98 | | | 8,862 |
Emerson Electric Company | | 142 | | | 6,258 |
Rockwell Automation, Inc. | | 6,100 | | | 372,588 |
| | | | | |
| | | | | 387,708 |
| | | | | |
Electronic Manufacturing Services - 0.4% | | | | | |
Molex, Inc. | | 13,042 | | | 412,518 |
| | | | | |
Environmental & Facilities Services - 0.5% | | | | | |
Waste Management, Inc. | | 14,873 | | | 546,880 |
| | | | | |
Food Retail - 0.5% | | | | | |
Kroger Company | | 22,100 | | | 509,847 |
| | | | | |
Gas Utilities - 0.3% | | | | | |
Questar Corporation | | 4,200 | | | 348,810 |
| | | | | |
General Merchandise Stores - 0.2% | | | | | |
Family Dollar Stores, Inc. | | 5,900 | | | 173,047 |
Target Corporation | | 865 | | | 49,348 |
| | | | | |
| | | | | 222,395 |
| | | | | |
Health Care Distributors - 0.9% | | | | | |
AmerisourceBergen Corporation | | 9,884 | | | 444,385 |
Cardinal Health, Inc. | | 9,107 | | | 586,764 |
| | | | | |
| | | | | 1,031,149 |
| | | | | |
Health Care Equipment - 1.3% | | | | | |
Baxter International, Inc. | | 7,200 | | | 334,008 |
Becton Dickinson & Company | | 4,036 | | | 283,125 |
Medtronic, Inc. | | 15,325 | | | 820,041 |
| | | | | |
| | | | | 1,437,174 |
| | | | | |
Health Care Services - 0.8% | | | | | |
Laboratory Corporation of America Holdings * | | 6,258 | | | 459,775 |
Quest Diagnostics, Inc. | | 8,600 | | | 455,800 |
| | | | | |
| | | | | 915,575 |
| | | | | |
Health Care Technology - 0.0% | | | | | |
IMS Health, Inc. | | 1,400 | | | 38,472 |
| | | | | |
Home Furnishings - 0.4% | | | | | |
Leggett & Platt, Inc. | | 17,100 | | | 408,690 |
| | | | | |
Home Improvement Retail - 0.3% | | | | | |
Home Depot, Inc. | | 7,776 | | | 312,284 |
Lowe’s Companies, Inc. | | 752 | | | 23,425 |
| | | | | |
| | | | | 335,709 |
| | | | | |
Hotels, Resorts & Cruise Lines - 0.6% | | | | | |
Starwood Hotels & Resorts Worldwide, Inc. | | 7,600 | | | 475,000 |
Wyndham Worldwide Corporation * | | 7,228 | | | 231,441 |
| | | | | |
| | | | | 706,441 |
| | | | | |
Household Appliances - 0.2% | | | | | |
Black & Decker Corporation | | 900 | | | 71,973 |
Whirlpool Corporation | | 1,600 | | | 132,832 |
| | | | | |
| | | | | 204,805 |
| | | | | |
Household Products - 1.9% | | | | | |
Clorox Company | | 995 | | | 63,829 |
Colgate-Palmolive Company | | 100 | | | 6,524 |
Kimberly-Clark Corporation | | 9,500 | | | 645,525 |
Procter & Gamble Company | | 21,329 | | | 1,370,815 |
| | | | | |
| | | | | 2,086,693 |
| | | | | |
Hypermarkets & Super Centers -1.2% | | | | | |
Wal-Mart Stores, Inc. | | 28,513 | | | 1,316,730 |
| | | | | |
Independent Power Producers & Energy Traders - 0.5% | | | | | |
TXU Corporation | | 10,789 | | | 584,872 |
| | | | | |
Industrial Conglomerates - 3.7% | | | | | |
3M Company | | 11,076 | | | 863,153 |
General Electric Company | | 82,469 | | | 3,068,671 |
Tyco International, Ltd. | | 4,685 | | | 142,424 |
| | | | | |
| | | | | 4,074,248 |
| | | | | |
The accompanying notes are an integral part of the financial statements.
53
| | |
| Schedule of Investments | | Series H (Enhanced Index Series) |
| December 31, 2006 - continued | | |
| | | | | |
| | | Shares | | Value |
COMMON STOCK (continued) | | | | | |
Industrial Machinery - 0.6% | | | | | |
Ingersoll-Rand Company, Ltd. | | 5,022 | | $ | 196,511 |
Parker Hannifin Corporation | | 5,800 | | | 445,904 |
| | | | | |
| | | | | 642,415 |
| | | | | |
Integrated Oil & Gas - 5.8% | | | | | |
Chevron Corporation | | 13,768 | | | 1,012,361 |
ConocoPhillips | | 19,117 | | | 1,375,468 |
Exxon Mobil Corporation (2) | | 47,541 | | | 3,643,067 |
Marathon Oil Corporation | | 3,300 | | | 305,250 |
| | | | | |
| | | | | 6,336,146 |
| | | | | |
Integrated Telecommunication Services - 3.1% | | | | | |
AT&T, Inc. | | 28,555 | | | 1,020,841 |
BellSouth Corporation | | 14,889 | | | 701,421 |
CenturyTel, Inc. | | 5,300 | | | 231,398 |
Qwest Communications International, Inc. * | | 60,227 | | | 504,100 |
Verizon Communications, Inc. | | 25,642 | | | 954,908 |
| | | | | |
| | | | | 3,412,668 |
| | | | | |
Internet Software & Services - 1.1% | | | | | |
Google, Inc. * | | 2,375 | | | 1,093,640 |
VeriSign, Inc. * | | 4,098 | | | 98,557 |
| | | | | |
| | | | | 1,192,197 |
| | | | | |
Investment Banking & Brokerage - 1.9% | | | | | |
Goldman Sachs Group, Inc. | | 5,436 | | | 1,083,667 |
Lehman Brothers Holdings, Inc. | | 700 | | | 54,684 |
Merrill Lynch & Company, Inc. | | 9,853 | | | 917,314 |
| | | | | |
| | | | | 2,055,665 |
| | | | | |
Leisure Products - 0.2% | | | | | |
Mattel, Inc. | | 10,000 | | | 226,600 |
| | | | | |
Life & Health Insurance - 1.3% | | | | | |
Aflac, Inc. | | 8,011 | | | 368,506 |
Metlife, Inc. | | 12,864 | | | 759,105 |
Principal Financial Group, Inc. | | 807 | | | 47,371 |
Prudential Financial, Inc. | | 2,311 | | | 198,422 |
| | | | | |
| | | | | 1,373,404 |
| | | | | |
Life Sciences Tools & Services - 0.0% | | | | | |
Applera Corporation - Applied Biosystems Group | | 1,000 | | | 36,690 |
Thermo Fisher Scientific, Inc. * | | 100 | | | 4,529 |
| | | | | |
| | | | | 41,219 |
| | | | | |
Managed Health Care - 0.8% | | | | | |
Aetna, Inc. | | 2,300 | | | 99,314 |
UnitedHealth Group, Inc. | | 14,620 | | | 785,533 |
WellPoint, Inc. * | | 384 | | | 30,217 |
| | | | | |
| | | | | 915,064 |
| | | | | |
Motorcycle Manufacturers - 0.2% | | | | | |
Harley-Davidson, Inc. * | | 2,331 | | | 164,266 |
| | | | | |
Movies & Entertainment - 1.3% | | | | | |
News Corporation | | 2,594 | | | 55,719 |
Time Warner, Inc. | | 16,358 | | | 356,277 |
Walt Disney Company | | 28,422 | | | 974,022 |
| | | | | |
| | | | | 1,386,018 |
| | | | | |
Multi-Line Insurance - 1.4% | | | | | |
American International Group, Inc. | | 16,765 | | | 1,201,380 |
Genworth Financial, Inc. | | 3,165 | | | 108,274 |
Hartford Financial Services Group, Inc. | | 2,187 | | | 204,069 |
| | | | | |
| | | | | 1,513,723 |
| | | | | |
Multi-Utilities - 1.2% | | | | | |
CMS Energy Corporation * | | 5,600 | | | 93,520 |
Dominion Resources, Inc. | | 300 | | | 25,152 |
PG&E Corporation | | 10,916 | | | 516,654 |
Public Service Enterprise Group, Inc. | | 7,600 | | | 504,488 |
Sempra Energy | | 100 | | | 5,597 |
Xcel Energy, Inc. | | 6,900 | | | 159,114 |
| | | | | |
| | | | | 1,304,525 |
| | | | | |
Oil & Gas Drilling - 0.4% | | | | | |
Nabors Industries, Ltd. * | | 8,376 | | | 249,437 |
Transocean, Inc. * | | 2,100 | | | 169,869 |
| | | | | |
| | | | | 419,306 |
| | | | | |
Oil & Gas Equipment & Services - 1.0% | | | | | |
Baker Hughes, Inc. | | 100 | | | 7,466 |
BJ Services Company | | 4,800 | | | 140,736 |
Halliburton Company | | 4,356 | | | 135,254 |
National Oilwell Varco, Inc. * | | 1,931 | | | 118,139 |
Schlumberger, Ltd. | | 7,047 | | | 445,088 |
Weatherford International, Ltd. * | | 7,100 | | | 296,709 |
| | | | | |
| | | | | 1,143,392 |
| | | | | |
Oil & Gas Exploration & Production - 1.3% | | | | | |
Anadarko Petroleum Corporation | | 12,500 | | | 544,000 |
Devon Energy Corporation | | 7,022 | | | 471,036 |
EOG Resources, Inc. | | 6,825 | | | 426,221 |
| | | | | |
| | | | | 1,441,257 |
| | | | | |
Oil & Gas Refining & Marketing - 0.9% | | | | | |
Sunoco, Inc. | | 6,600 | | | 411,576 |
Valero Energy Corporation | | 10,184 | | | 521,013 |
| | | | | |
| | | | | 932,589 |
| | | | | |
Oil & Gas Storage & Transportation - 0.1% | | | | | |
Kinder Morgan, Inc. | | 847 | | | 89,570 |
| | | | | |
Other Diversified Financial Services - 6.4% | | | | | |
Bank of America Corporation | | 44,628 | | | 2,382,689 |
Citigroup, Inc. | | 34,780 | | | 1,937,246 |
JPMorgan Chase & Company | | 33,810 | | | 1,633,023 |
The accompanying notes are an integral part of the financial statements.
54
| | |
| Schedule of Investments | | Series H (Enhanced Index Series) |
| December 31, 2006 - continued | | |
| | | | | |
| | | Shares | | Value |
COMMON STOCK (continued) | | | | | |
Other Diversified Financial Services (continued) | | | | | |
Morgan Stanley | | 13,693 | | $ | 1,115,021 |
| | | | | |
| | | | | 7,067,979 |
| | | | | |
Packaged Foods & Meats - 0.3% | | | | | |
McCormick & Company, Inc. | | 8,800 | | | 339,328 |
| | | | | |
Paper Packaging - 0.4% | | | | | |
Temple-Inland, Inc. | | 8,649 | | | 398,113 |
| | | | | |
Paper Products - 0.3% | | | | | |
International Paper Company | | 9,700 | | | 330,770 |
| | | | | |
Personal Products - 0.4% | | | | | |
Estee Lauder Companies, Inc. | | 10,000 | | | 408,200 |
| | | | | |
Pharmaceuticals - 6.4% | | | | | |
Abbott Laboratories | | 5,747 | | | 279,936 |
Barr Pharmaceuticals, Inc. * | | 7,825 | | | 392,189 |
Bristol-Myers Squibb Company | | 1,875 | | | 49,350 |
Eli Lilly & Company | | 1,771 | | | 92,269 |
Forest Laboratories, Inc. * | | 1,000 | | | 50,600 |
Johnson & Johnson | | 30,183 | | | 1,992,682 |
King Pharmaceuticals, Inc. * | | 25,489 | | | 405,785 |
Merck & Company, Inc. | | 16,476 | | | 718,354 |
Mylan Laboratories, Inc. | | 20,173 | | | 402,653 |
Pfizer, Inc. | | 75,638 | | | 1,959,024 |
Schering-Plough Corporation | | 20,382 | | | 481,830 |
Wyeth | | 4,155 | | | 211,573 |
| | | | | |
| | | | | 7,036,245 |
| | | | | |
Photographic Products - 0.0% | | | | | |
Eastman Kodak Company | | 1,400 | | | 36,120 |
| | | | | |
Property & Casually Insurance - 2.4% | | | | | |
ACE, Ltd. | | 3,700 | | | 224,109 |
Allstate Corporation | | 11,065 | | | 720,442 |
AMBAC Financial Group, Inc. | | 5,200 | | | 463,164 |
Chubb Corporation | | 10,800 | | | 571,428 |
Cincinnati Financial Corporation | | 9,628 | | | 436,245 |
Progressive Corporation | | 4,200 | | | 101,724 |
St. Paul Travelers Companies, Inc. | | 1,981 | | | 106,360 |
| | | | | |
| | | | | 2,623,472 |
| | | | | |
Publishing - 0.4% | | | | | |
Gannett Company, Inc. | | 471 | | | 28,477 |
McGraw-Hill Companies, Inc. | | 6,600 | | | 448,932 |
| | | | | |
| | | | | 477,409 |
| | | | | |
Railroads - 0.9% | | | | | |
Norfolk Southern Corporation | | 9,200 | | | 462,668 |
Union Pacific Corporation | | 6,045 | | | 556,261 |
| | | | | |
| | | | | 1,018,929 |
| | | | | |
Regional Banks - 1.9% | | | | | |
Keycorp | | 13,465 | | | 512,074 |
M&T Bank Corporation | | 700 | | | 85,512 |
National City Corporation | | 15,700 | | | 573,992 |
PNC Financial Services Group, Inc. | | 622 | | | 46,053 |
Regions Financial Corporation | | 16,300 | | | 609,620 |
Synovus Financial Corporation | | 7,700 | | | 237,391 |
Zions Bancorporation | | 400 | | | 32,976 |
| | | | | |
| | | | | 2,097,618 |
| | | | | |
Residential REIPs - 0.4% | | | | | |
Apartment Investment & Management Company | | 1,000 | | | 56,020 |
Archstone-Smith Trust | | 6,164 | | | 358,806 |
| | | | | |
| | | | | 414,826 |
| | | | | |
Restaurants - 0.7% | | | | | |
Darden Restaurants, Inc. | | 10,589 | | | 425,360 |
McDonald’s Corporation | | 1,775 | | | 78,686 |
Starbucks Corporation * | | 6,800 | | | 240,856 |
Yum! Brands, Inc. | | 200 | | | 11,760 |
| | | | | |
| | | | | 756,662 |
| | | | | |
Retail REITs - 0.5% | | | | | |
Simon Property Group, Inc. | | 5,458 | | | 552,841 |
| | | | | |
Semiconductor Equipment - 0.3% | | | | | |
Novellus Systems, Inc. * | | 11,000 | | | 378,620 |
| | | | | |
Semiconductors - 2.2% | | | | | |
Advanced Micro Devices, Inc. * | | 21,865 | | | 444,953 |
Intel Corporation | | 61,091 | | | 1,237,093 |
LSI Logic Corporation * | | 15,929 | | | 143,361 |
National Semiconductor Corporation | | 4,947 | | | 112,297 |
Texas Instruments, Inc. | | 18,494 | | | 532,627 |
| | | | | |
| | | | | 2,470,331 |
| | | | | |
Soft Drinks - 2.2% | | | | | |
Coca-Cola Company | | 24,934 | | | 1,203,066 |
Pepsi Bottling Group, Inc. | | 11,273 | | | 348,448 |
PepsiCo, Inc. | | 14,347 | | | 897,405 |
| | | | | |
| | | | | 2,448,919 |
| | | | | |
Specialized Finance - 0.4% | | | | | |
CIT Group, Inc. | | 8,536 | | | 476,053 |
| | | | | |
Specialty Chemicals - 0.4% | | | | | |
Rohm & Haas Company | | 8,340 | | | 426,341 |
| | | | | |
Specialty Stores - 0.5% | | | | | |
Office Depot, Inc. * | | 11,336 | | | 432,695 |
Staples, Inc. | | 5,000 | | | 133,500 |
| | | | | |
| | | | | 566,195 |
| | | | | |
Steel - 0.9% | | | | | |
Nucor Corporation | | 9,211 | | | 503,473 |
United States Steel Corporation | | 5,900 | | | 431,526 |
| | | | | |
| | | | | 934,999 |
| | | | | |
Systems Software - 2.5% | | | | | |
Microsoft Corporation | | 85,250 | | | 2,545,565 |
The accompanying notes are an integral part of the financial statements.
55
| | |
| Schedule of Investments | | Series H (Enhanced Index Series) |
| December 31, 2006 - continued | | |
| | | | | | |
| | | Shares | | Value |
COMMON STOCK (continued) | | | | | | |
Systems Software (continued) | | | | | | |
Oracle Corporation * | | | 14,929 | | $ | 255,883 |
| | | | | | |
| | | | | | 2,801,448 |
| | | | | | |
Thrifts & Mortgage Finance - 1.2% | | | | | | |
Federal Home Loan Mortgage Corporation | | | 689 | | | 46,783 |
Federal National Mortgage Association | | | 2,169 | | | 128,817 |
MGIC Investment Corporation | | | 6,640 | | | 415,265 |
Washington Mutual, Inc. | | | 16,359 | | | 744,171 |
| | | | | | |
| | | | | | 1,335,036 |
| | | | | | |
Tobacco - 1.5% | | | | | | |
Altria Group, Inc. | | | 16,500 | | | 1,416,030 |
Reynolds American, Inc. | | | 3,168 | | | 207,409 |
| | | | | | |
| | | | | | 1,623,439 |
| | | | | | |
Wireless Telecommunication | | | | | | |
Services - 0.4% | | | | | | |
Alltel Corporation | | | 5,100 | | | 308,448 |
Sprint Nextel Corporation | | | 4,854 | | | 91,692 |
| | | | | | |
| | | | | | 400,140 |
| | | | | | |
TOTAL COMMON STOCK (Cost $97,285,731) | | | | | $ | 107,371,273 |
| | | | | | |
| | |
| | | Principal Amount | | Value |
U.S. GOVERNMENT SECURITIES - 0.2% | | | | | | |
U.S. Treasury Bill 4.85%, 2007 | | $ | 195,000 | | | 193,693 |
| | | | | | |
TOTAL U.S. GOVERNMENT SECURITIES (Cost $193,634) | | | | | $ | 193,693 |
| | | | | | |
REPURCHASE AGREEMENT - 2.2% | | | | | | |
United Missouri Bank, 4.85%, dated 12-29-06, matures 01-02-07; repurchase amount of $2,425,306 (Collateralized by GNMA, 4.50%, 11-16-31 & U.S. Treasury Note, 2.25%, 02-15-07 with a combined value of $2,473,400) | | $ | 2,424,000 | | $ | 2,424,000 |
| | | | | | |
TOTAL REPURCHASE AGREEMENT (Cost $2,424,000) | | | | | $ | 2,424,000 |
| | | | | | |
Total Investments (SBL H Fund) (Cost $99,903,365) - 100.0% | | | | | $ | 109,988,966 |
Other Assets in Excess of Liabilities - 0.0% | | | | | | 40,784 |
| | | | | | |
TOTAL NET ASSETS - 100.0% | | | | | $ | 110,029,750 |
| | | | | | |
Footnotes
Percentages are stated as a percent of net assets.
For federal income tax purposes the identified cost of investments owned at 12/31/2006 was $101,473,483.
| * | - Non-income producing security |
| 1 | - Security is deemed illiquid. See Notes to financial statements. |
| 2 | - Security is segregated as collateral for open futures contracts. |
See notes to financial statements.
The accompanying notes are an integral part of the financial statements.
56
Series H
(Enhanced Index Series)
Statement of Assets and Liabilities
December 31, 2006
| | | | |
Assets: | | | | |
Investments, at value1 | | $ | 109,988,966 | |
Cash | | | 1,095 | |
Receivables: | | | | |
Fund shares sold | | | 58,330 | |
Dividends | | | 147,246 | |
Prepaid expenses | | | 2,240 | |
| | | | |
Total assets | | | 110,197,877 | |
| | | | |
Liabilities: | | | | |
Payable for: | | | | |
Fund shares redeemed | | | 69,297 | |
Variation margin on futures | | | 9,614 | |
Management fees | | | 46,513 | |
Custodian fees | | | 5,293 | |
Transfer agent/maintenance fees | | | 2,073 | |
Administration fees | | | 10,338 | |
Professional fees | | | 19,301 | |
Directors’ fees | | | 1,800 | |
Other | | | 3,898 | |
| | | | |
Total liabilities | | | 168,127 | |
| | | | |
Net Assets | | $ | 110,029,750 | |
| | | | |
Net assets consist of: | | | | |
Paid in capital | | $ | 103,829,469 | |
Undistributed net investment income | | | 914,052 | |
Accumulated net realized loss on sale of investments and futures | | | (4,798,811 | ) |
Net unrealized appreciation in value of investments and futures | | | 10,085,040 | |
| | | | |
Net assets | | $ | 110,029,750 | |
| | | | |
Capital shares authorized | | | unlimited | |
Capital shares outstanding | | | 9,937,987 | |
Net asset value per share (net assets divided by shares outstanding) | | $ | 11.07 | |
| | | | |
1Investments, at cost | | $ | 99,903,365 | |
Statement of Operations
For the Year Ended December 31, 2006
| | | | |
Investment Income: | | | | |
Dividends | | $ | 1,414,720 | |
Interest | | | 41,806 | |
| | | | |
Total investment income | | | 1,456,526 | |
| | | | |
Expenses: | | | | |
Management fees | | | 554,933 | |
Custodian fees | | | 36,577 | |
Transfer agent/maintenance fees | | | 25,139 | |
Administration fees | | | 75,825 | |
Directors’ fees | | | 3,486 | |
Professional fees | | | 20,730 | |
Reports to shareholders | | | 8,730 | |
Other expenses | | | 2,088 | |
| | | | |
Total expenses | | | 727,508 | |
Less: Expenses waived | | | (184,978 | ) |
Earnings credits | | | (56 | ) |
| | | | |
Net expenses | | | 542,474 | |
| | | | |
Net investment income | | | 914,052 | |
| | | | |
Net Realized and Unrealized Gain: | | | | |
Net realized gain during the year on: | | | | |
Investments | | | 5,639,944 | |
Futures | | | 256,194 | |
| | | | |
Net realized gain | | | 5,896,138 | |
| | | | |
Net unrealized appreciation during the year on: | | | | |
Investments | | | 8,174,946 | |
Futures | | | 8,304 | |
| | | | |
Net unrealized appreciation | | | 8,183,250 | |
| | | | |
Net realized and unrealized gain | | | 14,079,388 | |
| | | | |
Net increase in net assets resulting from operations | | $ | 14,993,440 | |
| | | | |
See accompanying notes.
57
| | |
| | Series H |
| Statement of Changes in Net Assets | | (Enhanced Index Series) |
| | | | | | | | |
| | | Year Ended
December 31, 2006 | | | Year Ended
December 31, 2005 | |
Increase (decrease) in net assets from operations: | | | | | | | | |
Net investment income | | $ | 914,052 | | | $ | 436,418 | |
Net realized gain during the year on investments and futures | | | 5,896,138 | | | | 2,299,595 | |
Net unrealized appreciation (depreciation) during the year on investments and futures | | | 8,183,250 | | | | (780,247 | ) |
| | | | | | | | |
Net increase in net assets resulting from operations | | | 14,993,440 | | | | 1,955,766 | |
| | | | | | | | |
Capital share transactions: | | | | | | | | |
Proceeds from sale of shares | | | 42,070,411 | | | | 13,631,499 | |
Issuance of shares in connection with SBL Series W merger (Note 13) | | | 52,171,107 | | | | — | |
Cost of shares redeemed | | | (39,306,280 | ) | | | (14,308,225 | ) |
| | | | | | | | |
Net increase (decrease) from capital share transactions | | | 54,935,238 | | | | (676,726 | ) |
| | | | | | | | |
Net increase in net assets | | | 69,928,678 | | | | 1,279,040 | |
| | | | | | | | |
Net assets: | | | | | | | | |
Beginning of year | | | 40,101,072 | | | | 38,822,032 | |
| | | | | | | | |
End of year | | $ | 110,029,750 | | | $ | 40,101,072 | |
| | | | | | | | |
Undistributed net investment income at end of year | | $ | 914,052 | | | $ | 436,418 | |
| | | | | | | | |
Capital Share Activity: | | | | | | | | |
Shares sold | | | 4,166,677 | | | | 1,494,268 | |
Shares issued in connection with SBL Series W merger (Note 13) | | | 5,481,948 | | | | — | |
Shares redeemed | | | (3,896,675 | ) | | | (1,563,791 | ) |
| | | | | | | | |
Total capital share activity | | | 5,751,950 | | | | (69,523 | ) |
| | | | | | | | |
See accompanying notes.
58
| | |
| Financial Highlights | | Series H |
| Selected data for each share of capital stock outstanding throughout each year | | (Enhanced Index Series) |
| | | | | | | | | | | | | | | | | | | | |
| | | 2006e | | | 2005 | | | 2004 | | | 2003d | | | Year Ended,
December 31,
2002 | |
Per Share Data | | | | | | | | | | | | | | | | | | | | |
Net asset value, beginning of period | | $ | 9.58 | | | $ | 9.12 | | | $ | 8.31 | | | $ | 6.55 | | | $ | 8.62 | |
| | | | | | | | | | | | | | | | | | | | |
Income (loss) from investment operations: | | | | | | | | | | | | | | | | | | | | |
Net investment income | | | 0.03 | | | | 0.11 | | | | 0.11 | | | | 0.07 | | | | 0.05 | |
Net gain (loss) on securities (realized and unrealized) | | | 1.46 | | | | 0.35 | | | | 0.71 | | | | 1.75 | | | | (2.02 | ) |
| | | | | | | | | | | | | | | | | | | | |
Total from investment operations | | | 1.49 | | | | 0.46 | | | | 0.82 | | | | 1.82 | | | | (1.97 | ) |
| | | | | | | | | | | | | | | | | | | | |
Less distributions: | | | | | | | | | | | | | | | | | | | | |
Dividends from net investment income | | | — | | | | — | | | | (0.01 | ) | | | (0.06 | ) | | | (0.10 | ) |
| | | | | | | | | | | | | | | | | | | | |
Total distributions | | | — | | | | — | | | | (0.01 | ) | | | (0.06 | ) | | | (0.10 | ) |
| | | | | | | | | | | | | | | | | | | | |
Net asset value, end of period | | $ | 11.07 | | | $ | 9.58 | | | $ | 9.12 | | | $ | 8.31 | | | $ | 6.55 | |
| | | | | | | | | | | | | | | | | | | | |
Total Returna | | | 15.55 | % | | | 5.04 | % | | | 9.85 | % | | | 27.78 | % | | | (22.98 | %) |
| | | | | | | | | | | | | | | | | | | | |
Ratios/Supplemental Data | | | | | | | | | | | | | | | | | | | | |
Net assets, end of period (in thousands) | | $ | 110,030 | | | $ | 40,101 | | | $ | 38,822 | | | $ | 33,371 | | | $ | 25,052 | |
| | | | | | | | | | | | | | | | | | | | |
Ratios to average net assets: | | | | | | | | | | | | | | | | | | | | |
Net investment income | | | 1.23 | % | | | 1.15 | % | | | 1.32 | % | | | 0.94 | % | | | 0.56 | % |
Total expensesb | | | 0.98 | % | | | 1.04 | % | | | 0.99 | % | | | 0.96 | % | | | 0.99 | % |
Net expensesc | | | 0.73 | % | | | 0.79 | % | | | 0.74 | % | | | 0.77 | % | | | 0.99 | % |
| | | | | | | | | | | | | | | | | | | | |
Portfolio turnover rate | | | 119 | % | | | 106 | % | | | 98 | % | | | 44 | % | | | 74 | % |
a | Total return does not take into account any of the expenses associated with an investment in variable insurance products offered by Security Benefit Life Insurance Company. If total return had taken into account these expenses, performance would have been lower. Shares of a series of SBL Fund are available only through the purchase of such products. |
b | Total expense information reflects expense ratios absent fund expense reductions by the Investment Manager, and earnings credits, as applicable. |
c | Net expense information reflects the expense ratios after voluntary expense waivers, reimbursements and custodian earnings credits, as applicable. |
d | Northern Trust became the sub–adviser of Series H effective May 1, 2003. Prior to May 1, 2003, Security Management Company, LLC (SMC) paid Deutsche Asset Management for sub–advisory services. |
e | The financial highlights for Series H as set forth herein exclude the historical financial highlights for Series W. The assets of Series W were acquired by Series H on June 16, 2006. A total of $53,926,052 was excluded from purchases in the portfolio turnover calculation, which represents the cost of the securities Series H received as a result of the merger. |
See accompanying notes.
59
This page left blank intentionally.
60
| | |
| | | Series J |
| Manager’s Commentary | | (Mid Cap Growth Series) |
| February 15, 2007 | | (unaudited) |
Advisor, Security Management Company, LLC

James P. Schier
Senior Portfolio Manager
To Our Shareholders:
Series J of the SBL Fund - - Mid Cap Growth Series posted a return of 4.93% for the year. These results lagged the benchmark, the Russell 2500 Growth, which gained 12.26%, and the median peer return of 8.70%.
Our approach to the Series is to seek securities of companies that are able to grow and/or reinvest in increasingly profitable ventures and hold them over three to five years to capture the best part of the improvements in profits or profitability. We are focused in investing in securities when we find opportunities, with our individual position sizes reflecting the magnitude and the confidence in the opportunity. For this Series, we target securities of companies that appear likely to generate above average profitability at prices that, as of yet, do not reflect that potential.
Stock Selection in Financials and Materials Helped Performance
Stock selection in financials was driven predominantly by First Marblehead Corporation, appreciating 76%. First Marblehead was driven brutally low on misplaced fears of competition and client losses that eventually proved to be ill-founded concerns. The Series benefited by acquiring the stock during this period of opportunity.
Stock selection was also positive in the materials sector lead by a 63% gain in Pactiv Corporation. Pactiv is a packaging company best known for its Hefty consumer plastic bag lines. It posted very solid earnings results in the face of commodity price input pressures.
Overweight Energy Sector Weight and Energy Stock Selection Negatively Affected Returns
The Series’ average energy weighting of 17% versus 7% for the benchmark provided a headwind as energy was a below average performer in 2006. Evergreen Energy, Inc., formerly known as KFx, declined 42%. Evergreen Energy suffered as investors moved away from the coal industry and short sellers spread negative rumors about the company. None of the rumors have proven to have any validity to date. We remain confident that the weakness in the stock is transitory and that the stock’s prior price levels can be easily re-attained. Evergreen Energy has a significant technological lead as the first company to provide a clean coal technology. We believe the clean coal industry has substantial competitive barriers, but will be a scalable business with a large addressable market for its product.
2007 Market Outlook
We continue to expect lack-luster returns for the market in 2007. This is similar to our outlook for the past two years, though the market did quite well.
Despite this, we remain firm on our outlook based on our bottom-up research rather than any global macro forecast. Most companies appear to be operating at very high levels of profitability and it is very difficult to confidently predict continued margin expansion. At present, the market is acting with a high degree of complacency.
The prevailing attitude appears to assume that either the Federal Reserve will panic and ease in the face of any operating weakness that is widespread or that the private equity market will bid for any public company that trades down. We view the recent M&A activity as somewhat bearish. If companies had abundant reinvestment opportunities in their core businesses, they wouldn’t need to pay inflated prices for acquisition candidates. Most recent mergers seem to fit the “acquisition out of desperation” category rather than the “acquisition of opportunity” camp.
Also in this environment, we have seen fewer companies with large revenue growth or large profit margin expansion potential. This is the major reason we maintained the energy overweight last year, even though the commodity price appeared extended and inventories were starting to build. The world consumes about six to seven barrels of oil for every new barrel discovered. Our research suggests that there is less excess capacity than is generally perceived. This coupled with the general political instability in key geographical regions suggests to us that energy could have a move again.
Industrials are also another sector that seems to offer good opportunity. The holdings we have in this sector are generally biased toward infrastructure and energy efficiency names that should benefit from pent up demand and a weaker dollar environment.
On behalf of Security Management Company, I would like to thank you for placing your trust and money with us.
|
| Sincerely, |
|
| |
| James P. Schier, Senior Portfolio Manager |
61
| | |
| | Series J |
| Manager’s Commentary | | (Mid Cap Growth Series) |
| December 31, 2006 | | (unaudited) |
PERFORMANCE
Series J vs. Russell 2500 Growth Index

$10,000 Over 10 Years
The chart above assumes a hypothetical $10,000 investment in Series J (Mid Cap Growth Series) on December 31, 1996 and reflects the fees and expenses of Series J. The Russell 2500 Growth Index is an unmanaged index that measures the performance of securities of small-to-mid U.S. companies with greater-than-average growth orientation.
Average Annual Returns
| | | | | | | | | |
Periods Ended 12-31-061 | | 1 Year | | | 5 Years | | | 10 Years | |
Series J | | 4.93 | % | | 6.55 | % | | 12.07 | % |
1 | Performance figures do not reflect fees and expenses associated with an investment in variable insurance products offered by Security Benefit Life Insurance Company. If returns had taken into account these fees and expenses, performance would have been lower. Shares of a Series of SBL Fund are available only through the purchase of such products. |
The performance data quoted above represents past performance. Past performance is not predictive of future performance. The investment return and principal value of an investment will fluctuate so that an investor’s shares, when redeemed, may be worth more or less than their original cost.
Portfolio Composition by Sector
| | | |
Consumer Discretionary | | 5.79 | % |
Consumer Staples | | 1.97 | |
Energy | | 16.56 | |
Financials | | 9.42 | |
Health Care | | 10.63 | |
Industrials | | 22.77 | |
Information Technology | | 26.98 | |
Materials | | 5.56 | |
Warrants | | 0.21 | |
Repurchase Agreement | | 0.26 | |
Liabilities, less cash & other assets | | (0.15 | ) |
Total net assets | | 100.00 | % |
| | | |
See accompanying notes.
62
| | |
| | Series J |
| Manager’s Commentary | | (Mid Cap Growth Series) |
| December 31, 2006 | | (unaudited) |
PERFORMANCE
Information About Your Series Expenses
Calculating your ongoing series expenses
Example
As a shareholder of the Series, you incur ongoing costs, including management fees and other series expenses. Performance figures and expense ratios do not reflect fees and expenses associated with an investment in variable insurance products. Shares of a Series of SBL Fund are available only through the purchase of such products. This example is intended to help you understand your ongoing costs (in dollars) of investing in the Series and to compare these costs with ongoing costs of investing in other mutual funds. The example is based on an investment of $1,000 invested at the beginning of the period and held for the entire period, July 1, 2006 - December 31, 2006.
Actual Expenses
The first line in the table provides information about actual account values and actual expenses. You may use the information in this table, together with the amount you invested, to estimate the expenses that you paid over the period. Simply divide your account value by $1,000 (for example, an $8,600 account value divided by $1,000 = 8.6), then multiply the result by the number in the table under the heading entitled “Expenses Paid During Period” to estimate the expenses you paid on your account during this period.
Hypothetical Example for Comparison Purposes
The second line in the table provides information about hypothetical account values and hypothetical expenses based on the Series actual expense ratio and an assumed rate of return of 5% per year before expenses, which is not the Series actual return. The hypothetical account values and expenses may not be used to estimate the actual ending account balance or expenses you paid for the period. You may use this information to compare the ongoing costs of investing in the Series and other funds. To do so, compare this 5% hypothetical example with the 5% hypothetical examples that appear in the shareholder reports of the other mutual funds.
Please note that the expenses shown in the table are meant to highlight your ongoing costs only and do not reflect any fees and expenses associated with an investment in variable insurance products. Therefore, the second line is useful in comparing ongoing costs only, and will not help you determine the relative total costs of owning different funds. In addition, if these fees and expenses associated with an investment in variable insurance products were included, your costs would have been higher.
Series Expenses
| | | | | | | | | |
| | | Beginning
Account Value
07-01-06 | | Ending
Account Value
12-31-061 | | Expenses Paid
During
Period2 |
Series J (Mid Cap Growth Series) | | | | | | | | | |
Actual | | $ | 1,000.00 | | $ | 1,029.60 | | $ | 4.66 |
Hypothetical | | | 1,000.00 | | | 1,020.62 | | | 4.63 |
1 | The actual ending account value is based on the actual total return of the Series for the period July 1, 2006 to December 31, 2006 after actual expenses and will differ from the hypothetical ending account value which is based on the Series expense ratio and a hypothetical annual return of 5% before expenses. The actual cumulative return at net asset value for the period July 1, 2006 to December 31, 2006 was 2.96%. |
2 | Expenses are equal to the Series annualized expense ratio of 0.91%, net of earnings credits, multiplied by the average account value over the period, multiplied by 184/365 (to reflect the one-half year period). |
63
| | |
| Schedule of Investments | | Series J (Mid Cap Growth Series) |
| December 31, 2006 | | |
| | | | | |
| | | Shares | | Value |
COMMON STOCK - 99.6% | | | | | |
Aerospace & Defense - 1.0% | | | | | |
Argon ST, Inc. * | | 185,850 | | $ | 4,003,209 |
| | | | | |
Apparel, Accessories & Luxury Goods - 0.7% | | | | | |
Maidenform Brands, Inc. * | | 148,000 | | | 2,681,760 |
| | | | | |
Application Software - 1.2% | | | | | |
TIBCO Software, Inc. * | | 490,000 | | | 4,625,600 |
| | | | | |
Asset Management & Custody Banks - 3.2% | | | | | |
Northern Trust Corporation (1) | | 200,900 | | | 12,192,621 |
| | | | | |
Auto Parts & Equipment - 0.6% | | | | | |
HydroGen Corporation * (2) | | 435,324 | | | 2,146,148 |
| | | | | |
Biotechnology - 4.1% | | | | | |
Cell Genesys, Inc. * | | 391,800 | | | 1,328,202 |
Combinatorx, Inc. * | | 276,700 | | | 2,396,222 |
Human Genome Sciences, Inc. * | | 312,700 | | | 3,889,988 |
Incyte Corporation * | | 598,400 | | | 3,494,656 |
lomai Corporation * (2) | | 417,700 | | | 2,080,146 |
Isis Pharmaceuticals, Inc. * | | 94,000 | | | 1,045,280 |
Zymogenetics, Inc. * | | 102,600 | | | 1,597,482 |
| | | | | |
| | | | | 15,831,976 |
| | | | | |
Broadcasting & Cable TV - 1.4% | | | | | |
Salem Communications Corporation | | 311,700 | | | 3,724,815 |
WorldSpace, Inc. * | | 508,800 | | | 1,780,800 |
| | | | | |
| | | | | 5,505,615 |
| | | | | |
Coal & Consumable Fuels - 5.0% | | | | | |
Evergreen Energy, Inc. * | | 1,912,500 | | | 18,914,625 |
| | | | | |
Communications Equipment - 7.4% | | | | | |
ADC Telecommunications, Inc. * | | 366,000 | | | 5,317,980 |
Finisar Corporation * | | 3,620,100 | | | 11,692,923 |
PC-Tel, Inc. * | | 461,000 | | | 4,310,350 |
Symmetricom, Inc. * | | 751,700 | | | 6,705,164 |
| | | | | |
| | | | | 28,026,417 |
| | | | | |
Computer Storage & Peripherals - 0.9% | | | | | |
Novatel Wireless, Inc. * | | 353,000 | | | 3,413,510 |
| | | | | |
Construction & Engineering - 6.4% | | | | | |
Insituform Technologies, Inc. * | | 306,600 | | | 7,928,676 |
Shaw Group, Inc. * (1) | | 491,400 | | | 16,461,900 |
| | | | | |
| | | | | 24,390,576 |
| | | | | |
Consumer Finance - 2.1% | | | | | |
First Marblehead Corporation | | 147,450 | | | 8,058,143 |
| | | | | |
Data Processing & Outsourced Services -1.2% | | | | | |
Euronet Worldwide, Inc. * | | 157,000 | | | 4,661,330 |
| | | | | |
Diversified Commercial & Professional Services - 2.3% | | | | | |
Equifax, Inc. | | 77,000 | | | 3,126,200 |
Navigant Consulting, Inc. * | | 289,000 | | | 5,710,640 |
| | | | | |
| | | | | 8,836,840 |
| | | | | |
Electrical Components & Equipment - 7.7% | | | | | |
Lime Energy Company * (2) | | 218,800 | | | 196,920 |
Millennium Cell, Inc. * | | 262,700 | | | 246,938 |
Power-One, Inc. * | | 2,351,400 | | | 17,118,192 |
Roper Industries, Inc. | | 184,500 | | | 9,269,280 |
UQM Technologies, Inc. * (2) | | 961,172 | | | 2,633,611 |
| | | | | |
| | | | | 29,464,941 |
| | | | | |
Electronic Equipment Manufacturers - 4.9% | | | | | |
Aeroflex, Inc. * | | 380,000 | | | 4,453,600 |
Cogent, Inc. * | | 163,000 | | | 1,794,630 |
Flir Systems, Inc. * | | 386,500 | | | 12,302,295 |
| | | | | |
| | | | | 18,550,525 |
| | | | | |
Electronic Manufacturing Services - 2.3% | | | | | |
Maxwell Technologies, Inc. * | | 632,700 | | | 8,826,165 |
| | | | | |
Health Care Equipment - 0.8% | | | | | |
Orthovita, Inc. * | | 800,000 | | | 2,904,000 |
| | | | | |
Health Care Facilities - 2.2% | | | | | |
United Surgical Partners International, Inc. * | | 221,300 | | | 6,273,855 |
US Physical Therapy, Inc. * | | 171,500 | | | 2,100,875 |
| | | | | |
| | | | | 8,374,730 |
| | | | | |
Health Care Services - 2.3% | | | | | |
Hythiam, Inc. * | | 216,400 | | | 1,999,536 |
Providence Service Corporation * | | 268,700 | | | 6,752,431 |
| | | | | |
| | | | | 8,751,967 |
| | | | | |
Health Care Supplies - 0.4% | | | | | |
Regeneration Technologies, Inc. * | | 286,700 | | | 1,680,062 |
| | | | | |
Heavy Electrical Equipment - 0.9% | | | | | |
Plug Power, Inc. * | | 864,800 | | | 3,364,072 |
| | | | | |
Homefurnishing Retail - 0.3% | | | | | |
Kirkland’s, Inc. * (2) | | 221,565 | | | 1,112,256 |
| | | | | |
Industrial Machinery -1.3% | | | | | |
Basin Water, Inc. * | | 416,500 | | | 2,819,705 |
Tennant Company | | 68,600 | | | 1,989,400 |
| | | | | |
| | | | | 4,809,105 |
| | | | | |
IT Consulting & Other Services - 0.5% | | | | | |
Keane, Inc. * | | 170,700 | | | 2,033,037 |
| | | | | |
Marine Ports & Services - 0.0% | | | | | |
Aegean Marine Petroleum Network, Inc. * | | | | | |
| | 6,000 | | | 98,400 |
| | | | | |
The accompanying notes are an integral part of the financial statements.
64
| | |
| Schedule of Investments | | Series J (Mid Cap Growth Series) |
| December 31, 2006 - continued | | |
| | | | | |
| | | Shares | | Value |
COMMON STOCK (continued) | | | | | |
Metal & Glass Containers - 5.6% | | | | | |
Pactiv Corporation * | | 593,100 | | | $21,167,739 |
Oil & Gas Drilling - 3.9% | | | | | |
ENSCO International, Inc. | | 150,900 | | | 7,554,054 |
Helmerich & Payne, Inc. | | 296,300 | | | 7,250,461 |
| | | | | |
| | | | | 14,804,515 |
| | | | | |
Oil & Gas Equipment & Services - 1.4% | | | | | |
BJ Services Company | | 143,000 | | | 4,192,760 |
Superior Energy Services, Inc. * | | 31,300 | | | 1,022,884 |
| | | | | |
| | | | | 5,215,644 |
| | | | | |
Oil & Gas Refining & Marketing - 4.5% | | | | | |
Nova Biosource Fuels, Inc. * | | 716,200 | | | 1,683,070 |
Rentech, Inc. * | | 3,581,600 | | | 13,502,632 |
Syntroleum Corporation * | | 527,000 | | | 1,823,420 |
| | | | | |
| | | | | 17,009,122 |
| | | | | |
Oil & Gas Storage & Transportation - 1.9% | | | | | |
Williams Companies, Inc. | | 271,600 | | | 7,094,192 |
| | | | | |
Packaged Foods & Meats - 2.0% | | | | | |
Hormel Foods Corporation | | 201,000 | | | 7,505,340 |
| | | | | |
Pharmaceuticals - 0.8% | | | | | |
Artes Medical, Inc. * | | 128,700 | | | 1,074,645 |
Hollis-Eden Pharmaceuticals, Inc. * | | 353,000 | | | 1,856,780 |
| | | | | |
| | | | | 2,931,425 |
| | | | | |
Publishing - 0.7% | | | | | |
Dow Jones & Company, Inc. | | 70,400 | | | 2,675,200 |
| | | | | |
Railroads - 1.8% | | | | | |
Kansas City Southern * | | 242,300 | | | 7,021,854 |
| | | | | |
Regional Banks - 1.1% | | | | | |
Boston Private Financial Holdings, Inc. | | 145,600 | | | 4,107,376 |
| | | | | |
Semiconductor Equipment - 0.0% | | | | | |
Semitool, Inc. * | | 10,900 | | | 145,079 |
| | | | | |
Semiconductors - 6.2% | | | | | |
Applied Micro Circuits Corporation * | | 1,765,000 | | | 6,283,400 |
IXYS Corporation * (2) | | 1,057,400 | | | 9,410,860 |
Mindspeed Technologies, Inc. * | | 2,613,700 | | | 4,992,167 |
Netlogic Microsystems, Inc. * | | 65,400 | | | 1,418,526 |
QuickLogic Corporation * | | 517,900 | | | 1,538,163 |
| | | | | |
| | | | | 23,643,116 |
| | | | | |
Specialized Consumer Services - 2.1% | | | | | |
Weight Watchers International, Inc. | | 150,900 | | | 7,926,777 |
| | | | | |
Systems Software - 2.3% | | | | | |
Progress Software Corporation * | | 150,000 | | | 4,189,500 |
Sybase, Inc. * | | 185,800 | | | 4,589,260 |
| | | | | |
| | | | | 8,778,760 |
| | | | | |
Thrifts & Mortgage Finance - 3.0% | | | | | |
Clayton Holdings, Inc. * | | 613,500 | | | 11,478,585 |
| | | | | |
Trading Companies & Distributors - 1.2% | | | | | |
MSC Industrial Direct Company, Inc. | | 115,000 | | | 4,502,250 |
| | | | | |
TOTAL COMMON STOCK (Cost $303,177,380) | | | | $ | 379,264,604 |
| | | | | |
PREFERRED STOCK - 0.0% | | | | | |
Environmental & Facilities | | | | | |
Services - 0.0% | | | | | |
ThermoEnergy Corporation PIPE * (2)(3)(4)(5)(6) | | 1,380,000 | | | 193,200 |
| | | | | |
TOTAL PREFERRED STOCK (Cost $1,302,103) | | | | $ | 193,200 |
| | | | | |
WARRANTS - 0.2% | | | | | |
Warrants - 0.2% | | | | | |
Hollis-Eden Pharmaceuticals, Inc. | | | | | |
$ 15.45, 6/19/2007 (4) | | 18,126 | | | 227 |
Lime Energy Company | | | | | |
$ 1.00, 3/19/2009 (2)(4) | | 43,050 | | | 20,530 |
Nova Oil, Inc. | | | | | |
$ 2.40, 7/5/2011 (4) | | 358,100 | | | 594,803 |
Orthovita, Inc. | | | | | |
$ 4.00, 6/26/2008 (4) | | 175,000 | | | 102,837 |
Syntroleum Corporation | | | | | |
$ 7.60, 5/26/2008 | | 29,100 | | | 23,280 |
ThermoEnergy Corporation | | | | | |
$ 0.75, 7/14/2008 (2)(3)(4)(6) | | 1,380,000 | | | 61,962 |
| | | | | |
| | | | | 803,639 |
| | | | | |
TOTAL WARRANTS (Cost $1,676,719) | | | | $ | 803,639 |
| | | | | |
| | | | | | | |
| | | Principal Amount | | Value | |
REPURCHASE AGREEMENT - 0.3% | | | | | | | |
United Missouri Bank, 4.85%, dated 12-29-06, matures 01-02-07; repurchase amount of $970,523 (Collateralized by FHLMC, 5.00%, 08-15-35 & FHLMC, 5.00%, 09-15-36 with a combined value of $990,037) | | $ | 970,000 | | $ | 970,000 | |
| | | | | | | |
TOTAL REPURCHASE AGREEMENT (Cost $970,000) | | | | | $ | 970,000 | |
| | | | | | | |
Total Investments (SBL J Fund) (Cost $307,126,202) - 100.1% | | | | | $ | 381,231,443 | |
Liabilities in Excess of Other Assets - (0.1)% | | | | | | (567,443 | ) |
| | | | | | | |
TOTAL NET ASSETS - 100.0% | | | | | $ | 380,664,000 | |
| | | | | | | |
Footnotes
Percentages are stated as a percent of net assets.
The accompanying notes are an integral part of the financial statements.
65
| | |
| Schedule of Investments | | Series J (Mid Cap Growth Series) |
| December 31, 2006 - continued | | |
For federal income tax purposes the identified cost of investments owned at 12/31/2006 was $307,131,832.
| * | - Non-income producing security |
| 1 | - Security is segregated as collateral for open written options contracts. |
| 2 | - Security is deemed illiquid. See Notes to financial statements. |
| 3 | - Security is restricted from resale. See Notes to financial statements. |
| 4 | - Security is fair valued by the Board of Directors. See Notes to financial statements. |
| 5 | - PIPE (Private Investment in Public Equity)-Stock issued by a company in the secondary market as a means of raising capital more quickly and less expensively than through registration of a secondary public offering. |
| 6 | - Investment in an affiliated issuer. See Notes to Financials. |
See notes to financial statements.
The accompanying notes are an integral part of the financial statements.
66
Series J
(Mid Cap Growth Series)
Statement of Assets and Liabilities
December 31, 2006
| | | |
Assets: | | | |
Investments in unaffiliated issues, at value1 | | $ | 380,976,281 |
Investments in affiliated issues, at value2 | | | 255,162 |
Receivables: | | | |
Securities sold | | | 415,780 |
Fund shares sold | | | 74,447 |
Dividends | | | 83,776 |
Prepaid expenses | | | 9,476 |
| | | |
Total assets | | | 381,814,922 |
| | | |
Liabilities: | | | |
Payable for: | | | |
Fund shares redeemed . | | | 396,342 |
Securities purchased | | | 30,133 |
Written options, at value (premiums received, $ 273,294) | | | 366,750 |
Management fees | | | 241,143 |
Custodian fees | | | 4,735 |
Transfer agent/maintenance fees . | | | 2,083 |
Aministration fees | | | 30,995 |
Professional fees | | | 38,552 |
Directors’ fees | | | 10,000 |
Other fees | | | 30,189 |
| | | |
Total liabilities | | | 1,150,922 |
| | | |
Net Assets | | $ | 380,664,000 |
| | | |
Net assets consist of: | | | |
Paid in capital | | $ | 266,550,022 |
Undistributed net realized gain on sale of investments and options written | | | 40,102,194 |
Net unrealized appreciation in value of investments and options written | | | 74,011,784 |
| | | |
Net assets | | $ | 380,664,000 |
| | | |
Capital shares authorized | | | unlimited |
Capital shares outstanding | | | 12,176,028 |
Net asset value per share (net assets divided by shares outstanding) | | $ | 31.26 |
| | | |
1Investments in unaffiliated issues, at cost | | $ | 305,470,202 |
2Investments in affiliated issues, at cost | | $ | 1,656,000 |
Statement of Operations
For the Year Ended December 31, 2006
| | | | |
Investment Income: | | | | |
Dividends | | $ | 1,277,044 | |
Interest | | | 441,876 | |
| | | | |
Total investment income | | | 1,718,920 | |
| | | | |
Expenses: | | | | |
Management fees | | | 3,091,598 | |
Custodian fees | | | 31,279 | |
Transfer agent/maintenance fees | | | 25,190 | |
Administration fees | | | 393,448 | |
Directors' fees | | | 19,862 | |
Professional fees | | | 55,066 | |
Reports to shareholders | | | 76,778 | |
Other expenses | | | 18,296 | |
| | | | |
Total expenses . | | | 3,711,517 | |
Less: Earnings credits applied | | | (195 | ) |
| | | | |
Net expenses | | | 3,711,322 | |
| | | | |
Net investment loss | | | (1,992,402 | ) |
| | | | |
Net Realized and Unrealized Gain (Loss): | | | | |
Net realized gain during the year on: | | | | |
Investments | | | 41,479,934 | |
Options written | | | 1,427,852 | |
| | | | |
Net realized gain | | | 42,907,786 | |
| | | | |
Net unrealized depreciation during the year on: | | | | |
Investments | | | (20,891,208 | ) |
Options written | | | (183,400 | ) |
| | | | |
Net unrealized depreciation | | | (21,074,608 | ) |
| | | | |
Net realized and unrealized gain | | | 21,833,178 | |
| | | | |
Net increase in net assets resulting from operations | | $ | 19,840,776 | |
| | | | |
See accompanying notes.
67
| | |
| | | Series J |
| Statement of Changes in Net Assets | | (Mid Cap Growth Series) |
| | | | | | | | |
| | | Year Ended
December 31, 2006 | | | Year Ended
December 31, 2005 | |
Increase (decrease) in net assets from operations: | | | | | | | | |
Net investment loss | | $ | (1,992,402 | ) | | $ | (1,885,536 | ) |
Net realized gain during the year on investments and options written | | | 42,907,786 | | | | 38,242,429 | |
Net unrealized depreciation during the year on investments and options written | | | (21,074,608 | ) | | | (7,948,763 | ) |
| | | | | | | | |
Net increase in net assets resulting from operations | | | 19,840,776 | | | | 28,408,130 | |
| | | | | | | | |
Capital share transactions: | | | | | | | | |
Proceeds from sale of shares | | | 76,838,640 | | | | 68,323,999 | |
Cost of shares redeemed | | | (136,813,260 | ) | | | (113,722,888 | ) |
| | | | | | | | |
Net decrease from capital share transactions | | | (59,974,620 | ) | | | (45,398,889 | ) |
| | | | | | | | |
Net decrease in net assets | | | (40,133,844 | ) | | | (16,990,759 | ) |
| | | | | | | | |
Net assets: | | | | | | | | |
Beginning of year | | | 420,797,844 | | | | 437,788,603 | |
| | | | | | | | |
End of year | | $ | 380,664,000 | | | $ | 420,797,844 | |
| | | | | | | | |
Accumulated net investment loss at end of year | | $ | — | | | $ | — | |
| | | | | | | | |
Capital Share Activity: | | | | | | | | |
Shares sold | | | 2,485,919 | | | | 2,526,797 | |
Shares redeemed | | | (4,435,068 | ) | | | (4,248,530 | ) |
| | | | | | | | |
Total capital share activity | | | (1,949,149 | ) | | | (1,721,733 | ) |
| | | | | | | | |
See accompanying notes.
68
| | |
| Financial Highlights | | Series J |
| Selected data for each share of capital stock outstanding throughout each year | | (Mid Cap Growth Series) |
| | | | | | | | | | | | | | | | | | | | |
| | | 2006 | | | 2005 | | | 2004 | | | 2003d | | | Year Ended,
December 31,
2002 | |
Per Share Data | | | | | | | | | | | | | | | | | | | | |
Net asset value, beginning of period | | $ | 29.79 | | | $ | 27.63 | | | $ | 25.09 | | | $ | 16.05 | | | $ | 24.12 | |
| | | | | | | | | | | | | | | | | | | | |
Income (loss) from investment operations: | | | | | | | | | | | | | | | | | | | | |
Net investment income (loss) | | | (0.16 | ) | | | (0.13 | ) | | | (0.14 | ) | | | (0.11 | ) | | | (0.11 | ) |
Net gain (loss) on securities (realized and unrealized) | | | 1.63 | | | | 2.29 | | | | 2.68 | | | | 9.15 | | | | (6.69 | ) |
| | | | | | | | | | | | | | | | | | | | |
Total from investment operations | | | 1.47 | | | | 2.16 | | | | 2.54 | | | | 9.04 | | | | (6.80 | ) |
| | | | | | | | | | | | | | | | | | | | |
Less distributions: | | | | | | | | | | | | | | | | | | | | |
Distributions from realized gains | | | — | | | | — | | | | — | | | | — | | | | (1.27 | ) |
| | | | | | | | | | | | | | | | | | | | |
Total distributions | | | — | | | | — | | | | — | | | | — | | | | (1.27 | ) |
| | | | | | | | | | | | | | | | | | | | |
Net asset value, end of period | | $ | 31.26 | | | $ | 29.79 | | | $ | 27.63 | | | $ | 25.09 | | | $ | 16.05 | |
| | | | | | | | | | | | | | | | | | | | |
Total Returna | | | 4.93 | % | | | 7.82 | % | | | 10.12 | % | | | 56.32 | % | | | (29.48 | %) |
| | | | | | | | | | | | | | | | | | | | |
Ratios/Supplemental Data | | | | | | | | | | | | | | | | | | | | |
Net assets, end of period (in thousands) | | $ | 380,664 | | | $ | 420,798 | | | $ | 437,789 | | | $ | 447,928 | | | $ | 293,378 | |
| | | | | | | | | | | | | | | | | | | | |
Ratios to average net assets: | | | | | | | | | | | | | | | | | | | | |
Net investment income (loss) | | | (0.48 | %) | | | (0.47 | %) | | | (0.53 | %) | | | (0.55 | %) | | | (0.56 | %) |
Total expensesb | | | 0.90 | % | | | 0.90 | % | | | 0.88 | % | | | 0.83 | % | | | 0.83 | % |
Net expensesc | | | 0.90 | % | | | 0.90 | % | | | 0.88 | % | | | 0.83 | % | | | 0.83 | % |
| | | | | | | | | | | | | | | | | | | | |
Portfolio turnover rate | | | 29 | % | | | 29 | % | | | 37 | % | | | 61 | % | | | 41 | % |
a | Total return does not take into account any of the expenses associated with an investment in variable insurance products offered by Security Benefit Life Insurance Company. If total return had taken into account these expenses, performance would have been lower. Shares of a series of SBL Fund are available only through the purchase of such products. |
b | Total expense information reflects expense ratios absent fund expense reductions by the Investment Manager, and earnings credits, as applicable. |
c | Net expense information reflects the expense ratios after voluntary expense waivers, reimbursements and custodian earnings credits, as applicable. |
d | The financial highlights for Series J exclude the historical financial highlights of Series T. The assets of Series T were acquired by Series J on October 3, 2003. |
See accompanying notes.
69
This page left blank intentionally.
70
| | |
| | Series N |
| Manager’s Commentary | | (Managed Asset Allocation Series) |
| February 15, 2007 | | (unaudited) |

Advisor, T. Rowe Price Associates, Inc.

Edmund M. Notzon
Portfolio Manager
Environment
Despite a sharp decline from mid-May through mid-June, U.S. stocks rose strongly in 2006, the market’s fourth consecutive year of gains since the end of the 2000-2002 bear market. In fact, several major indexes reached six-year highs, if not record levels. Equities were lifted by substantial merger and leveraged buyout activity, continued strong corporate earnings growth despite an economic deceleration, and declining oil prices and long-term interest rates in the second half of the year. Investors were also pleased that the Federal Reserve, which increased the federal funds target rate to 5.25% by mid-year, refrained from raising it in the last six months in anticipation that slower economic growth would allow inflation to moderate over time.
U.S. bonds produced good returns in 2006, thanks primarily to favorable performance stemming from falling intermediate- and long-term interest rates in the last six months. The economy appears to be in the middle of a “soft landing”, a period of below-average growth during an economic expansion that allows inflation and interest rates to ease but does not result in a recession. High-yield corporate bonds substantially outperformed investment-grade issues, as investors seeking higher returns continued to embrace risk. In the high-quality universe, mortgage-backed securities fared best, but asset-backed and corporate securities also did well. Treasuries lagged, as yields across all maturities at the end of 2006 were higher than at the end of 2005.
Non-U.S. stocks outperformed their domestic counterparts, as returns were enhanced by the U.S. dollar’s weakness versus European and some Asian currencies. Emerging markets did best, led by shares in Latin America. In the developed regions of the world, European equities produced excellent returns, whereas Japanese stock gains in U.S. dollar terms were more moderate. The MSCI EAFE Index, which measures the performance of equities in Europe, Australia, and the Far East, returned 10.40%.
Performance
Series N of the SBL Fund - Managed Asset Allocation Series returned 12.08% for the year ended December 31, 2006, outperforming its 60% S&P 500/40% Lehman Brothers U.S. Aggregate benchmark, which returned 11.11%. Overweighting stocks relative to bonds added to results. The S&P 500 returned 15.79% over the past year, and the Lehman Brothers U.S. Aggregate Index returned 4.33%.
Portfolio Highlights
At the start of the year, the Series had a 6% overweight in stocks and ended with a 3.5% overweight in stocks which benefited overall performance. Although we remain over weight stocks versus bonds, we have moderated our overweight position in light of lower economic growth expectations.
Stocks significantly outperformed bonds during the year. Series performance was helped by both the U.S. large-cap and international equity components. Following a prolonged period of outperformance by small-cap stocks and due to less compelling valuations, we have been favoring large-cap over small-cap stocks. Against a backdrop of potentially lower U.S. growth, sectors that are more sensitive to the domestic economy, such as small-cap stocks, may face a more challenging profit environment.
Outlook
Economic growth and corporate profits remain supportive of equities, although both are likely to trend lower reflecting the more moderate growth environment and input price pressures.
|
| Sincerely, |
|
| |
Edmund N. Notzon, Portfolio Manager |
71
| | |
| | Series N |
| Manager’s Commentary | | (Managed Asset Allocation Series) |
| December 31, 2006 | | (unaudited) |
PERFORMANCE
Series N vs. Blended Index and S&P 500 Index
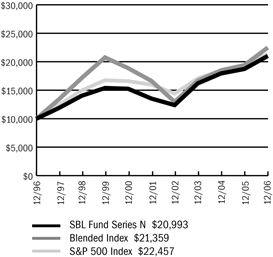
$10,000 Over 10 Years
The chart above assumes a hypothetical $10,000 investment in Series N (Managed Asset Allocation Series) on December 31, 1996 and reflects the fees and expenses of Series N. The blended index is 60% S&P 500 Index and 40% Lehman Brothers Aggregate Bond Index. The S&P 500 Index is a capitalization-weighted index composed of 500 selected common stocks that represent the broad domestic economy and is a widely recognized unmanaged index of market performance. The Lehman Brothers Aggregate Bond Index is an unmanaged index that tracks investment grade bonds including U.S. Treasury and agency issues, corporate bond issues, asset-backed, commercial mortgage-backed and mortgage-backed securities and Yankee issues.
Average Annual Returns
| | | | | | | | | |
Periods Ended 12-31-061 | | 1 Year | | | 5 Years | | | 10 Years | |
Series N | | 12.08 | % | | 7.71 | % | | 7.70 | % |
1 | Performance figures do not reflect fees and expenses associated with an investment in variable insurance products offered by Security Benefit Life Insurance Company. If returns had taken into account these fees and expenses, performance would have been lower. Shares of a Series of SBL Fund are available only through the purchase of such products. |
The performance data quoted above represents past performance. Past performance is not predictive of future performance. The investment return and principal value of an investment will fluctuate so that an investor’s shares, when redeemed, may be worth more or less than their original cost.
Portfolio Composition by Sector for Equity Holdings & Quality Ratings (Based on Standard and Poor’s Ratings) for Fixed Income Holdings
| | | |
Consumer Discretionary | | 7.09 | % |
Consumer Staples | | 5.23 | |
Energy | | 6.20 | |
Financials | | 15.23 | |
Health Care | | 7.46 | |
Industrials | | 7.63 | |
Information Technology | | 8.92 | |
Materials | | 2.26 | |
Telecommunication Services | | 2.31 | |
Utilities | | 2.27 | |
AAA | | 23.95 | |
AA | | 0.79 | |
A | | 2.80 | |
BBB | | 3.14 | |
BB | | 1.15 | |
B | | 2.23 | |
CCC | | 0.10 | |
Not Rated | | 0.61 | |
Short Term Investments | | 0.51 | |
Cash & other assets, less liabilities | | 0.12 | |
Total net assets | | 100.00 | % |
| | | |
See accompanying notes.
72
| | |
| | Series N |
| Manager’s Commentary | | (Managed Asset Allocation Series) |
| December 31, 2006 | | (unaudited) |
PERFORMANCE
Information About Your Series Expenses
Calculating your ongoing series expenses
Example
As a shareholder of the Series, you incur ongoing costs, including management fees and other series expenses. Performance figures and expense ratios do not reflect fees and expenses associated with an investment in variable insurance products. Shares of a Series of SBL Fund are available only through the purchase of such products. This example is intended to help you understand your ongoing costs (in dollars) of investing in the Series and to compare these costs with ongoing costs of investing in other mutual funds. The example is based on an investment of $1,000 invested at the beginning of the period and held for the entire period, July 1, 2006 - December 31, 2006.
Actual Expenses
The first line in the table provides information about actual account values and actual expenses. You may use the information in this table, together with the amount you invested, to estimate the expenses that you paid over the period. Simply divide your account value by $1,000 (for example, an $8,600 account value divided by $1,000 = 8.6), then multiply the result by the number in the table under the heading entitled “Expenses Paid During Period” to estimate the expenses you paid on your account during this period.
Hypothetical Example for Comparison Purposes
The second line in the table provides information about hypothetical account values and hypothetical expenses based on the Series actual expense ratio and an assumed rate of return of 5% per year before expenses, which is not the Series actual return. The hypothetical account values and expenses may not be used to estimate the actual ending account balance or expenses you paid for the period. You may use this information to compare the ongoing costs of investing in the Series and other funds. To do so, compare this 5% hypothetical example with the 5% hypothetical examples that appear in the shareholder reports of the other mutual funds.
Please note that the expenses shown in the table are meant to highlight your ongoing costs only and do not reflect any fees and expenses associated with an investment in variable insurance products. Therefore, the second line is useful in comparing ongoing costs only, and will not help you determine the relative total costs of owning different funds. In addition, if these fees and expenses associated with an investment in variable insurance products were included, your costs would have been higher.
Series Expenses
| | | | | | | | | |
| | | Beginning
Account Value
07-01-06 | | Ending
Account Value
12-31-061 | | Expenses Paid
During
Period2 |
Series N (Managed Asset Allocation Series) | | | | | | | | | |
Actual | | $ | 1,000.00 | | $ | 1,097.60 | | $ | 7.51 |
Hypothetical | | | 1,000.00 | | | 1,018.05 | | | 7.22 |
1 | The actual ending account value is based on the actual total return of the Series for the period July 1, 2006 to December 31, 2006 after actual expenses and will differ from the hypothetical ending account value which is based on the Series expense ratio and a hypothetical annual return of 5% before expenses. The actual cumulative return at net asset value for the period July 1, 2006 to December 31, 2006 was 9.76%. |
2 | Expenses are equal to the Series annualized expense ratio of 1.42%, net of earnings credits, multiplied by the average account value over the period, multiplied by 184/365 (to reflect the one-half year period). |
73
| | |
| Schedule of Investments | | Series N (Managed Asset Allocation Series) |
| December 31, 2006 | | |
| | | | | |
| | | Shares | | Value |
COMMON STOCK - 55.1% | | | | | |
Advertising - 0.1% | | | | | |
Lamar Advertising Company * | | 2,300 | | $ | 150,397 |
WPP Group plc ADR | | 100 | | | 6,774 |
| | | | | |
| | | | | 157,171 |
| | | | | |
Aerospace & Defense - 1.2% | | | | | |
Boeing Company | | 2,790 | | | 247,864 |
DRS Technologies, Inc. | | 105 | | | 5,531 |
General Dynamics Corporation | | 1,400 | | | 104,090 |
Honeywell International, Inc. | | 4,700 | | | 212,628 |
L-3 Communications Holdings, Inc. | | 200 | | | 16,356 |
MTC Technologies, Inc. * | | 300 | | | 7,065 |
Raytheon Company | | 3,400 | | | 179,520 |
Rockwell Collins, Inc. | | 3,800 | | | 240,502 |
Teledyne Technologies, Inc. * | | 100 | | | 4,013 |
Triumph Group, Inc. | | 300 | | | 15,729 |
United Technologies Corporation | | 3,710 | | | 231,949 |
| | | | | |
| | | | | 1,265,247 |
| | | | | |
Agricultural Products - 0.1% | | | | | |
Archer-Daniels-Midland Company | | 1,700 | | | 54,332 |
| | | | | |
Air Freight & Logistics - 0.3% | | | | | |
Expediters International Washington, Inc. | | 3,700 | | | 149,850 |
FedEx Corporation | | 400 | | | 43,448 |
United Parcel Service, Inc. (CI.B) | | 1,100 | | | 82,478 |
UTi Worldwide, Inc. | | 900 | | | 26,910 |
| | | | | |
| | | | | 302,686 |
| | | | | |
Airlines - 0.2% | | | | | |
Republic Airways Holdings, Inc. * | | 800 | | | 13,424 |
Skywest, Inc. | | 800 | | | 20,408 |
Southwest Airlines Company | | 9,100 | | | 139,412 |
| | | | | |
| | | | | 173,244 |
| | | | | |
Aluminum - 0.1% | | | | | |
Alcoa, Inc. | | 2,000 | | | 60,020 |
| | | | | |
Apparel Retail - 0.3% | | | | | |
AnnTaylor Stores Corporation * | | 100 | | | 3,284 |
Chico’s FAS, Inc. * | | 1,000 | | | 20,690 |
HOT Topic, Inc. * | | 400 | | | 5,336 |
Pacific Sunwear of California * | | 600 | | | 11,748 |
Ross Stores, Inc. | | 3,800 | | | 111,340 |
TJX Companies, Inc. | | 6,500 | | | 185,120 |
| | | | | |
| | | | | 337,518 |
| | | | | |
Apparel, Accessories & Luxury Goods - 0.0% | | | | | |
Fossil, Inc. * | | 600 | | | 13,548 |
Quiksilver, Inc. * | | 300 | | | 4,725 |
| | | | | |
| | | | | 18,273 |
| | | | | |
Application Software - 0.3% | | | | | |
Autodesk, Inc. * | | 3,700 | | | 149,702 |
Cadence Design Systems, Inc. * | | 400 | | | 7,164 |
Factset Research Systems, Inc. | | 250 | | | 14,120 |
Fair Isaac Corporation | | 645 | | | 26,219 |
Jack Henry & Associates, Inc. | | 300 | | | 6,420 |
NAVTEQ Corporation * | | 1,800 | | | 62,946 |
| | | | | |
| | | | | 266,571 |
| | | | | |
Asset Management & Custody Banks - 0.8% | | | | | |
Affiliated Managers Group, Inc. * | | 1,050 | | | 110,386 |
Ameriprise Financial, Inc. | | 1,740 | | | 94,830 |
Eaton Vance Corporation | | 600 | | | 19,806 |
Franklin Resources, Inc. | | 1,000 | | | 110,170 |
Investors Financial Services Corporation | | 2,600 | | | 110,942 |
Legg Mason, Inc. | | 1,100 | | | 104,555 |
Northern Trust Corporation | | 1,100 | | | 66,759 |
State Street Corporation | | 3,700 | | | 249,528 |
| | | | | |
| | | | | 866,976 |
| | | | | |
Auto Parts & Equipment - 0.0% | | | | | |
Autoliv, Inc. | | 500 | | | 30,150 |
Gentex Corporation | | 700 | | | 10,892 |
| | | | | |
| | | | | 41,042 |
| | | | | |
Automobile Manufacturers - 0.0% | | | | | |
Winnebago Industries | | 100 | | | 3,291 |
| | | | | |
Biotechnology - 0.9% | | | | | |
Alkermes, Inc. * | | 900 | | | 12,033 |
Amgen, Inc. * | | 5,210 | | | 355,895 |
Biogen Idec, Inc. * | | 2,000 | | | 98,380 |
Celgene Corporation * | | 2,000 | | | 115,060 |
Cephalon, Inc. * | | 895 | | | 63,017 |
Digene Corporation * | | 300 | | | 14,376 |
Genentech, Inc. * | | 1,300 | | | 105,469 |
Genzyme Corporation * | | 600 | | | 36,948 |
Gilead Sciences, Inc. * | | 2,400 | | | 155,832 |
Martek Biosciences Corporation * | | 200 | | | 4,668 |
Neurocrine Biosciences, Inc. * | | 300 | | | 3,126 |
Senomyx, Inc. * | | 200 | | | 2,598 |
| | | | | |
| | | | | 967,402 |
| | | | | |
Brewers - 0.2% | | | | | |
Anheuser-Busch Companies, Inc. | | 4,200 | | | 206,640 |
Boston Beer Company, Inc. * | | 400 | | | 14,392 |
Compania Cervecerias Unidas S.A. ADR | | 900 | | | 26,730 |
| | | | | |
| | | | | 247,762 |
| | | | | |
Broadcasting & Cable TV - 0.7% | | | | | |
Comcast Corporation * | | 7,700 | | | 325,941 |
Cox Radio, Inc. * | | 500 | | | 8,150 |
DIRECTV Group, Inc. * | | 1,340 | | | 33,420 |
Discovery Holding Company * | | 966 | | | 15,543 |
EchoStar Communications Corporation * | | 3,800 | | | 144,514 |
The accompanying notes are an integral part of the financial statements.
74
| | |
| Schedule of Investments | | Series N (Managed Asset Allocation Series) |
| December 31, 2006 - continued | | |
| | | | | |
| | | Shares | | Value |
COMMON STOCK (continued) | | | | | |
Broadcasting & Cable TV (continued) | | | | | |
Emmis Communications Corporation | | 200 | | $ | 1,648 |
EW Scripps Company | | 600 | | | 29,964 |
Liberty Global, Inc. * | | 275 | | | 8,016 |
Liberty Media Corporation - Capital * | | 1,198 | | | 117,380 |
Radio One, Inc. (CI.D) * | | 1,000 | | | 6,740 |
| | | | | |
| | | | | 691,316 |
| | | | | |
Building Products - 0.1% | | | | | |
American Standard Companies, Inc. | | 700 | | | 32,095 |
Masco Corporation | | 2,700 | | | 80,649 |
Trex Company, Inc. * | | 100 | | | 2,289 |
Universal Forest Products, Inc. | | 200 | | | 9,324 |
| | | | | |
| | | | | 124,357 |
| | | | | |
Casinos & Gaming - 0.4% | | | | | |
Harrah’s Entertainment, Inc. | | 1,300 | | | 107,536 |
International Game Technology | | 3,500 | | | 161,700 |
Shuffle Master, Inc. * | | 400 | | | 10,480 |
Station Casinos, Inc. | | 400 | | | 32,668 |
Wynn Resorts, Ltd. | | 1,400 | | | 131,390 |
| | | | | |
| | | | | 443,774 |
| | | | | |
Catalog Retail - 0.0% | | | | | |
Liberty Media Corporation - Interactive * | | 1,341 | | | 28,925 |
| | | | | |
Coal & Consumable Fuels - 0.1% | | | | | |
Consol Energy, Inc. | | 2,300 | | | 73,899 |
| | | | | |
Communications Equipment - 1.5% | | | | | |
Alcatel-Lucent ADR | | 4,372 | | | 62,172 |
Blue Coat Systems, Inc. * | | 300 | | | 7,185 |
Ciena Corporation * | | 600 | | | 16,626 |
Cisco Systems, Inc. * | | 23,000 | | | 628,590 |
F5 Networks, Inc. * | | 400 | | | 29,684 |
Inter-Telephone, Inc. | | 600 | | | 13,296 |
Juniper Networks, Inc. * | | 15,400 | | | 291,676 |
Motorola, Inc. | | 13,200 | | | 271,392 |
Nokia Oyj ADR | | 1,100 | | | 22,352 |
Plantronics, Inc. | | 200 | | | 4,240 |
Polycom, Inc. * | | 500 | | | 15,455 |
Qualcomm, Inc. | | 5,000 | | | 188,950 |
| | | | | |
| | | | | 1,551,618 |
| | | | | |
Computer & Electronics Retail - 0.1% | | | | | |
Best Buy Company, Inc. | | 2,325 | | | 114,367 |
| | | | | |
Computer Hardware - 1.7% | | | | | |
Apple Computer, Inc. * | | 5,800 | | | 492,072 |
Avid Technology, Inc. * | | 600 | | | 22,356 |
Dell, Inc. * | | 15,200 | | | 381,368 |
Hewlett-Packard Company | | 7,600 | | | 313,044 |
International Business Machines Corporation | | 1,420 | | | 137,953 |
Sun Microsystems, Inc. * | | 72,800 | | | 394,576 |
| | | | | |
| | | | | 1,741,369 |
| | | | | |
Computer Storage & Peripherals - 0.2% | | | | | |
EMC Corporation * | | 7,500 | | | 99,000 |
Network Appliance, Inc. * | | 1,400 | | | 54,992 |
Rackable Systems, Inc. * | | 100 | | | 3,097 |
SanDisk Corporation * | | 1,100 | | | 47,333 |
| | | | | |
| | | | | 204,422 |
| | | | | |
Construction & Engineering - 0.0% | | | | | |
Fluor Corporation | | 500 | | | 40,825 |
Insituform Technologies, Inc. * | | 400 | | | 10,344 |
| | | | | |
| | | | | 51,169 |
| | | | | |
Construction & Farm Machinery & Heavy Trucks - 0.1% | | | | | |
Caterpillar, Inc. | | 700 | | | 42,931 |
Joy Global, Inc. | | 1,200 | | | 58,008 |
Oshkosh Truck Corporation | | 700 | | | 33,894 |
| | | | | |
| | | | | 134,833 |
| | | | | |
Consumer Electronics - 0.0% | | | | | |
Harman International Industries, Inc. | | 400 | | | 39,964 |
| | | | | |
Consumer Finance - 0.4% | | | | | |
American Express Company | | 4,100 | | | 248,747 |
SLM Corporation | | 3,600 | | | 175,572 |
| | | | | |
| | | | | 424,319 |
| | | | | |
Data Processing & Outsourced Services - 0.6% | | | | | |
Affiliated Computer Services, Inc. * | | 1,000 | | | 48,840 |
Automatic Data Processing, Inc. | | 3,800 | | | 187,150 |
Checkfree Corporation * | | 900 | | | 36,144 |
Computer Sciences Corporation * | | 700 | | | 37,359 |
DST Systems, Inc. * | | 500 | | | 31,315 |
Fidelity National Information Services, Inc. | | 600 | | | 24,054 |
First Data Corporation | | 3,700 | | | 94,424 |
Global Payments, Inc. | | 400 | | | 18,520 |
Heartland Payment Systems, Inc. | | 100 | | | 2,825 |
Iron Mountain, Inc. * | | 750 | | | 31,005 |
Western Union Company | | 3,700 | | | 82,954 |
| | | | | |
| | | | | 594,590 |
| | | | | |
Department Stores - 0.5% | | | | | |
Kohl’s Corporation * | | 7,170 | | | 490,643 |
Lotte Shopping Company, Ltd. GDR * (1)(2)(3) | | 900 | | | 18,678 |
| | | | | |
| | | | | 509,321 |
| | | | | |
The accompanying notes are an integral part of the financial statements.
75
| | |
| Schedule of Investments | | Series N (Managed Asset Allocation Series) |
| December 31, 2006 - continued | | |
| | | | | |
| | | Shares | | Value |
COMMON STOCK (continued) | | | | | |
Distributors - 0.1% | | | | | |
Genuine Parts Company | | 1,400 | | $ | 66,402 |
| | | | | |
Diversified Banks - 1.3% | | | | | |
U.S. Bancorp | | 15,100 | | | 546,469 |
Wells Fargo & Company | | 21,840 | | | 776,630 |
| | | | | |
| | | | | 1,323,099 |
| | | | | |
Diversified Chemicals - 0.3% | | | | | |
Cabot Corporation | | 300 | | | 13,071 |
Dow Chemical Company | | 4,000 | | | 159,760 |
E.I. Du Pont de Nemours & Company | | 3,851 | | | 187,582 |
| | | | | |
| | | | | 360,413 |
| | | | | |
Diversified Commercial & Professional Services - 0.1% | | | | | |
Advisory Board Company * | | 400 | | | 21,416 |
ChoicePoint, Inc. * | | 266 | | | 10,475 |
Corporate Executive Board Company | | 500 | | | 43,850 |
Global Cash Access Holdings, Inc. * | | 400 | | | 6,492 |
Navigant Consulting, Inc. * | | 300 | | | 5,928 |
| | | | | |
| | | | | 88,161 |
| | | | | |
Diversified Metals & Mining - 0.1% | | | | | |
Phelps Dodge Corporation | | 200 | | | 23,944 |
Rio Tinto plc ADR | | 500 | | | 106,245 |
| | | | | |
| | | | | 130,189 |
| | | | | |
Drug Retail - 0.3% | | | | | |
CVS Corporation | | 3,500 | | | 108,185 |
Walgreen Company | | 4,400 | | | 201,916 |
| | | | | |
| | | | | 310,101 |
| | | | | |
Education Services - 0.0% | | | | | |
Apollo Group, Inc. * | | 500 | | | 19,485 |
Corinthian Colleges, Inc. * | | 100 | | | 1,363 |
| | | | | |
| | | | | 20,848 |
| | | | | |
Electric Utilities - 1.1% | | | | | |
American Electric Power Company, Inc. | | 1,100 | | | 46,838 |
Duke Energy Corporation | | 7,200 | | | 239,112 |
Edison International | | 2,800 | | | 127,344 |
El Paso Electric Company * | | 300 | | | 7,311 |
Entergy Corporation | | 2,600 | | | 240,032 |
Exelon Corporation | | 4,760 | | | 294,596 |
Great Plains Energy, Inc. | | 900 | | | 28,620 |
Pinnacle West Capital Corporation | | 800 | | | 40,512 |
PPL Corporation | | 3,700 | | | 132,608 |
| | | | | |
| | | | | 1,156,973 |
| | | | | |
Electrical Components & Equipment - 0.0% | | | | | |
Belden CDT, Inc. | | 300 | | | 11,727 |
| | | | | |
Electronic Equipment Manufacturers - 0.1% | | | | | |
AVX Corporation | | 800 | | | 11,832 |
Color Kinetics, Inc. * | | 600 | | | 12,810 |
Flir Systems, Inc. * | | 600 | | | 19,098 |
Littelfuse, Inc. * | | 200 | | | 6,376 |
Tektronix, Inc. | | 1,000 | | | 29,170 |
| | | | | |
| | | | | 79,286 |
| | | | | |
Electronic Manufacturing Services - 0.1% | | | | | |
Cyberoptics Corporation * | | 700 | | | 8,869 |
Flextronics International, Ltd. * | | 3,700 | | | 42,476 |
Jabil Circuit, Inc. | | 2,900 | | | 71,195 |
Mercury Computer Systems, Inc. * | | 300 | | | 4,008 |
Plexus Corporation * | | 600 | | | 14,328 |
TTM Technologies, Inc. * | | 1,200 | | | 13,596 |
| | | | | |
| | | | | 154,472 |
| | | | | |
Environmental & Facilities Services - 0.2% | | | | | |
Republic Services, Inc. | | 2,700 | | | 109,809 |
Waste Connections, Inc. * | | 300 | | | 12,465 |
Waste Management, Inc. | | 2,400 | | | 88,248 |
| | | | | |
| | | | | 210,522 |
| | | | | |
Fertilizers & Agricultural Chemicals - 0.1% | | | | | |
Monsanto Company | | 2,400 | | | 126,072 |
Mosaic Company * | | 800 | | | 17,088 |
| | | | | |
| | | | | 143,160 |
| | | | | |
Food Distributors - 0.2% | | | | | |
Performance Food Group Company * | | 300 | | | 8,292 |
Sysco Corporation | | 3,900 | | | 143,364 |
United Natural Foods, Inc. * | | 500 | | | 17,960 |
| | | | | |
| | | | | 169,616 |
| | | | | |
Food Retail - 0.1% | | | | | |
Kroger Company | | 2,100 | | | 48,447 |
Whole Foods Market, Inc. | | 300 | | | 14,079 |
| | | | | |
| | | | | 62,526 |
| | | | | |
Footwear - 0.1% | | | | | |
Nike, Inc. (CI.B) | | 640 | | | 63,379 |
| | | | | |
Forest Products - 0.1% | | | | | |
Weyerhaeuser Company | | 1,400 | | | 98,910 |
| | | | | |
Gas Utilities - 0.1% | | | | | |
AGL Resources, Inc. | | 1,400 | | | 54,474 |
National Fuel Gas Company | | 900 | | | 34,686 |
WGL Holdings, Inc. | | 600 | | | 19,548 |
| | | | | |
| | | | | 108,708 |
| | | | | |
General Merchandise Stores - 0.3% | | | | | |
Dollar Tree Stores, Inc. * | | 200 | | | 6,020 |
The accompanying notes are an integral part of the financial statements.
76
| | |
| Schedule of Investments | | Series N (Managed Asset Allocation Series) |
| December 31, 2006 - continued | | |
| | | | | |
| | | Shares | | Value |
COMMON STOCK (continued) | | | | | |
General Merchandise Stores (continued) | | | | | |
Target Corporation | | 5,300 | | $ | 302,365 |
| | | | | |
| | | | | 308,385 |
| | | | | |
Gold - 0.1% | | | | | |
Newmont Mining Corporation | | 2,400 | | | 108,360 |
| | | | | |
Health Care Equipment - 0.8% | | | | | |
Aspect Medical Systems, Inc. * | | 500 | | | 9,405 |
Baxter International, Inc. | | 1,200 | | | 55,668 |
Becton Dickinson & Company | | 1,000 | | | 70,150 |
Boston Scientific Corporation * | | 7,300 | | | 125,414 |
CR Bard, Inc. | | 400 | | | 33,188 |
Cytyc Corporation * | | 1,000 | | | 28,300 |
Edwards Lifesciences Corporation * | | 300 | | | 14,112 |
Hospira, Inc. * | | 1,300 | | | 43,654 |
Medtronic, Inc. | | 6,100 | | | 326,411 |
Respironics, Inc. * | | 100 | | | 3,775 |
St. Jude Medical, Inc. * | | 2,800 | | | 102,368 |
STERIS Corporation | | 700 | | | 17,619 |
Thoratec Corporation * | | 700 | | | 12,306 |
Zimmer Holdings, Inc. * | | 200 | | | 15,676 |
| | | | | |
| | | | | 858,046 |
| | | | | |
Health Care Facilities - 0.1% | | | | | |
Community Health Systems, Inc. * | | 400 | | | 14,608 |
LifePoint Hospitals, Inc. * | | 200 | | | 6,740 |
Manor Care, Inc. | | 1,800 | | | 84,456 |
Symbion, Inc. * | | 400 | | | 7,404 |
Triad Hospitals, Inc. * | | 210 | | | 8,784 |
United Surgical Partners International, Inc. * | | 400 | | | 11,340 |
| | | | | |
| | | | | 133,332 |
| | | | | |
Health Care Services - 0.5% | | | | | |
Caremark Rx, Inc. | | 3,000 | | | 171,330 |
DaVita, Inc. * | | 550 | | | 31,284 |
Express Scripts, Inc. * | | 1,400 | | | 100,240 |
Medco Health Solutions, Inc. * | | 2,963 | | | 158,343 |
Omnicare, Inc. | | 2,700 | | | 104,301 |
| | | | | |
| | | | | 565,498 |
| | | | | |
Health Care Supplies - 0.1% | | | | | |
Alcon, Inc. | | 600 | | | 67,062 |
Dentsply International, Inc. | | 600 | | | 17,910 |
Merit Medical Systems, Inc. * | | 700 | | | 11,088 |
| | | | | |
| | | | | 96,060 |
| | | | | |
Health Care Technology - 0.0% | | | | | |
Computer Programs & Systems, Inc. | | 800 | | | 27,192 |
| | | | | |
Home Entertainment Software - 0.1% | | | | | |
Activision, Inc. * | | 1,033 | | | 17,809 |
Electronic Arts, Inc. * | | 1,100 | | | 55,396 |
| | | | | |
| | | | | 73,205 |
| | | | | |
Home Furnishings - 0.0% | | | | | |
Mohawk Industries, Inc. * | | 200 | | | 14,972 |
| | | | | |
Home Improvement Retail - 0.6% | | | | | |
Home Depot, Inc. | | 10,550 | | | 423,688 |
Lowe’s Companies, Inc. | | 5,900 | | | 183,785 |
| | | | | |
| | | | | 607,473 |
| | | | | |
Homebuilding - 0.2% | | | | | |
DR Horton, Inc. | | 3,100 | | | 82,119 |
Lennar Corporation | | 2,100 | | | 110,166 |
Meritage Homes Corporation * | | 150 | | | 7,158 |
Toll Brothers, Inc. * | | 600 | | | 19,338 |
| | | | | |
| | | | | 218,781 |
| | | | | |
Homefurnishing Retail - 0.3% | | | | | |
Bed Bath & Beyond, Inc. * | | 6,600 | | | 251,460 |
Cost Plus, Inc. * | | 200 | | | 2,060 |
Williams-Sonoma, Inc. | | 400 | | | 12,576 |
| | | | | |
| | | | | 266,096 |
| | | | | |
Hotels, Resorts & Cruise Lines - 0.2% | | | | | |
Hilton Hotels Corporation | | 1,700 | | | 59,330 |
Marriott International, Inc. | | 2,800 | | | 133,616 |
Wyndham Worldwide Corporation * | | 880 | | | 28,178 |
| | | | | |
| | | | | 221,124 |
| | | | | |
Household Appliances - 0.0% | | | | | |
iRobot Corporation * | | 200 | | | 3,612 |
| | | | | |
Household Products - 1.2% | | | | | |
Clorox Company | | 1,100 | | | 70,565 |
Colgate-Palmolive Company | | 1,900 | | | 123,956 |
Kimberly-Clark Corporation | | 1,200 | | | 81,540 |
Procter & Gamble Company | | 15,715 | | | 1,010,003 |
| | | | | |
| | | | | 1,286,064 |
| | | | | |
Housewares & Specialties - 0.1% | | | | | |
Fortune Brands, Inc. | | 600 | | | 51,234 |
Jarden Corporation * | | 100 | | | 3,479 |
| | | | | |
| | | | | 54,713 |
| | | | | |
Human Resource & Employment Services - 0.2% | | | | | |
Manpower, Inc. | | 200 | | | 14,986 |
Monster Worldwide, Inc. * | | 2,100 | | | 97,944 |
Robert Half International, Inc. | | 1,200 | | | 44,544 |
Taleo Corporation * | | 1,200 | | | 16,404 |
| | | | | |
| | | | | 173,878 |
| | | | | |
Hypermarkets & Super Centers - 0.6% | | | | | |
Costco Wholesale Corporation | | 2,200 | | | 116,314 |
Wal-Mart Stores, Inc. | | 11,100 | | | 512,598 |
| | | | | |
| | | | | 628,912 |
| | | | | |
Independent Power Producers & Energy - 0.1% | | | | | |
Constellation Energy Group, Inc. | | 1,300 | | | 89,531 |
| | | | | |
The accompanying notes are an integral part of the financial statements.
77
| | |
| Schedule of Investments | | Series N (Managed Asset Allocation Series) |
| December 31, 2006 - continued | | |
| | | | | |
| | | Shares | | Value |
COMMON STOCK (continued) | | | | | |
Independent Power Producers & Energy Traders - 0.3% | | | | | |
AES Corporation * | | 7,200 | | $ | 158,688 |
Dynegy, Inc. * | | 11,614 | | | 84,085 |
Mirant Corporation * | | 1,500 | | | 47,355 |
NRG Energy, Inc. * | | 800 | | | 44,808 |
| | | | | |
| | | | | 334,936 |
| | | | | |
Industrial Conglomerates - 2.6% | | | | | |
3M Company | | 4,800 | | | 374,064 |
General Electric Company | | 44,800 | | | 1,667,008 |
Tyco International, Ltd. | | 21,600 | | | 656,640 |
| | | | | |
| | | | | 2,697,712 |
| | | | | |
Industrial Gases - 0.1% | | | | | |
Praxair, Inc. | | 1,300 | | | 77,129 |
| | | | | |
Industrial Machinery - 0.7% | | | | | |
Actuant Corporation | | 700 | | | 33,355 |
Briggs & Stratton Corporation | | 400 | | | 10,780 |
Danaher Corporation | | 4,500 | | | 325,980 |
Eaton Corporation | | 800 | | | 60,112 |
Harsco Corporation | | 300 | | | 22,830 |
Illinois Tool Works, Inc. | | 5,900 | | | 272,521 |
Nordson Corporation | | 200 | | | 9,966 |
Pall Corporation | | 1,100 | | | 38,005 |
| | | | | |
| | | | | 773,549 |
| | | | | |
Industrial REIPs - 0.1% | | | | | |
AMB Property Corporation | | 200 | | | 11,722 |
EastGroup Properties, Inc. | | 400 | | | 21,424 |
First Potomac Realty Trust | | 200 | | | 5,822 |
Prologis | | 1,700 | | | 103,309 |
| | | | | |
| | | | | 142,277 |
| | | | | |
Insurance Brokers - 0.3% | | | | | |
AON Corporation | | 3,500 | | | 123,690 |
Arthur J Gallagher & Company | | 500 | | | 14,775 |
Marsh & McLennan Companies, Inc. | | 2,500 | | | 76,650 |
Willis Group Holdings, Ltd. | | 1,700 | | | 67,507 |
| | | | | |
| | | | | 282,622 |
| | | | | |
Integrated Oil & Gas - 3.4% | | | | | |
BP pic ADR | | 200 | | | 13,420 |
Chevron Corporation | | 9,250 | | | 680,153 |
ConocoPhillips | | 5,100 | | | 366,945 |
Exxon Mobil Corporation | | 26,380 | | | 2,021,499 |
Murphy Oil Corporation | | 2,700 | | | 137,295 |
Occidental Petroleum Corporation | | 2,200 | | | 107,426 |
Petroleo Brasileiro S.A. ADR | | 1,000 | | | 93,480 |
Royal Dutch Shell pic (CI.B) ADR | | 100 | | | 7,115 |
Total S.A. ADR | | 1,400 | | | 100,688 |
| | | | | |
| | | | | 3,528,021 |
| | | | | |
Integrated Telecommunication Services - 1.2% | | | | | |
AT&T, Inc. | | 14,500 | | | 518,375 |
BellSouth Corporation | | 8,900 | | | 419,279 |
TELUS Corporation | | 1,700 | | | 75,939 |
Verizon Communications, Inc. | | 5,734 | | | 213,534 |
| | | | | |
| | | | | 1,227,127 |
| | | | | |
Internet Retail - 0.2% | | | | | |
Amazon.com, Inc. * | | 5,100 | | | 201,246 |
Drugstore.com * | | 1,500 | | | 5,490 |
Expedia, Inc. * | | 450 | | | 9,441 |
IAC* | | 550 | | | 20,438 |
| | | | | |
| | | | | 236,615 |
| | | | | |
Internet Software & Services - 0.8% | | | | | |
CNET Networks, Inc. * | | 1,600 | | | 14,544 |
Cybersource Corporation * | | 500 | | | 5,510 |
Digital Insight Corporation * | | 500 | | | 19,245 |
Google, Inc. * | | 1,210 | | | 557,181 |
VeriSign, Inc. * | | 4,900 | | | 117,845 |
Websense, Inc. * | | 900 | | | 20,547 |
Yahoo!, Inc. * | | 4,800 | | | 122,592 |
| | | | | |
| | | | | 857,464 |
| | | | | |
Investment Banking & Brokerage - 1.6% | | | | | |
Charles Schwab Corporation | | 4,900 | | | 94,766 |
E*Trade Financial Corporation * | | 8,800 | | | 197,296 |
Goldman Sachs Group, Inc. | | 2,600 | | | 518,310 |
Lehman Brothers Holdings, Inc. | | 4,100 | | | 320,292 |
Merrill Lynch & Company, Inc. | | 900 | | | 83,790 |
Morgan Stanley | | 5,100 | | | 415,293 |
Stifel Financial Corporation * | | 200 | | | 7,846 |
TD Ameritrade Holding Corporation | | 1,200 | | | 19,416 |
TradeStation Group, Inc. * | | 1,300 | | | 17,875 |
| | | | | |
| | | | | 1,674,884 |
| | | | | |
IT Consulting & Other Services - 0.1% | | | | | |
Accenture, Ltd. | | 2,900 | | | 107,097 |
CACI International, Inc. * | | 100 | | | 5,650 |
Cognizant Technology Solutions Corporation * | | 300 | | | 23,148 |
Inforte Corporation * | | 1,500 | | | 5,610 |
NCI, Inc. * | | 200 | | | 3,058 |
SRA International, Inc. * | | 400 | | | 10,696 |
| | | | | |
| | | | | 155,259 |
| | | | | |
Leisure Products - 0.1% | | | | | |
Brunswick Corporation | | 1,000 | | | 31,900 |
Hasbro, Inc. | | 1,600 | | | 43,600 |
Marvel Entertainment, Inc. * | | 400 | | | 10,764 |
Pool Corporation | | 612 | | | 23,972 |
| | | | | |
| | | | | 110,236 |
| | | | | |
Life & Health Insurance - 0.6% | | | | | |
Metlife, Inc. | | 5,500 | | | 324,555 |
Protective Life Corporation | | 500 | | | 23,750 |
Prudential Financial, Inc. | | 3,000 | | | 257,580 |
The accompanying notes are an integral part of the financial statements.
78
| | |
| Schedule of Investments | | Series N (Managed Asset Allocation Series) |
| December 31, 2006 - continued | | |
| | | | | |
| | | Shares | | Value |
COMMON STOCK (continued) | | | | | |
Life & Health Insurance (continued) | | | | | |
Stancorp Financial Group, Inc. | | 500 | | $ | 22,525 |
| | | | | |
| | | | | 628,410 |
| | | | | |
Life Sciences Tools & Services - 0.2% | | | | | |
Charles River Laboratories International, Inc. * | | 300 | | | 12,975 |
Invitrogen Corporation * | | 316 | | | 17,882 |
Techne Corporation * | | 200 | | | 11,090 |
Thermo Fisher Scientific, Inc. * | | 2,300 | | | 104,167 |
Waters Corporation * | | 500 | | | 24,485 |
| | | | | |
| | | | | 170,599 |
| | | | | |
Managed Health Care - 0.9% | | | | | |
Aetna, Inc. | | 2,300 | | | 99,314 |
Cigna Corporation | | 900 | | | 118,413 |
Healthspring, Inc. * | | 100 | | | 2,035 |
Humana, Inc. * | | 1,200 | | | 66,372 |
UnitedHealth Group, Inc. | | 6,500 | | | 349,245 |
WellPoint, Inc. * | | 3,300 | | | 259,677 |
| | | | | |
| | | | | 895,056 |
| | | | | |
Mortgage REIT’s - 0.0% | | | | | |
CapitalSource, Inc. | | 300 | | | 8,193 |
| | | | | |
Motorcycle Manufacturers - 0.1% | | | | | |
Harley-Davidson, Inc. | | 1,500 | | | 105,705 |
| | | | | |
Movies & Entertainment - 0.9% | | | | | |
DreamWorks Animation SKG, Inc.* | | 400 | | | 11,796 |
News Corporation | | 7,200 | | | 154,656 |
Time Warner, Inc. | | 12,700 | | | 276,606 |
Viacom, Inc. (CI.B) * | | 4,800 | | | 196,944 |
Walt Disney Company | | 8,000 | | | 274,160 |
| | | | | |
| | | | | 914,162 |
| | | | | |
Multi-Line Insurance - 1.3% | | | | | |
American International Group, Inc. | | 12,875 | | | 922,623 |
Assurant, Inc. | | 500 | | | 27,625 |
Genworth Financial, Inc. | | 3,700 | | | 126,577 |
Hartford Financial Services Group, Inc. | | 2,200 | | | 205,282 |
Loews Corporation | | 1,400 | | | 58,058 |
| | | | | |
| | | | | 1,340,165 |
| | | | | |
Multi-Utilities - 0.3% | | | | | |
Alliant Energy Corporation | | 800 | | | 30,216 |
Energy East Corporation | | 1,000 | | | 24,800 |
NiSource, Inc. | | 1,000 | | | 24,100 |
OGE Energy Corporation | | 1,000 | | | 40,000 |
Public Service Enterprise Group, Inc. | | 1,200 | | | 79,656 |
TECO Energy, Inc. | | 3,800 | | | 65,474 |
| | | | | |
| | | | | 264,246 |
| | | | | |
Office REIT’s - 0.3% | | | | | |
Boston Properties, Inc. | | 1,400 | | | 156,632 |
Corporate Office Properties Trust SBI MD | | 100 | | | 5,047 |
Duke Realty Corporation | | 500 | | | 20,450 |
Reckson Associates Realty Corporation | | 500 | | | 22,800 |
SL Green Realty Corporation | | 500 | | | 66,390 |
| | | | | |
| | | | | 271,319 |
| | | | | |
Office Services & Supplies - 0.2% | | | | | |
Avery Dennison Corporation | | 1,100 | | | 74,723 |
Herman Miller, Inc. | | 1,000 | | | 36,360 |
Pitney Bowes, Inc. | | 1,800 | | | 83,142 |
| | | | | |
| | | | | 194,225 |
| | | | | |
Oil & Gas Drilling - 0.3% | | | | | |
Grey Wolf, Inc. * | | 1,500 | | | 10,290 |
Helmerich & Payne, Inc. | | 1,000 | | | 24,470 |
Nabors Industries, Ltd. * | | 2,400 | | | 71,472 |
Patterson-UTI Energy, Inc. | | 800 | | | 18,584 |
Transocean, Inc. * | | 2,809 | | | 227,220 |
| | | | | |
| | | | | 352,036 |
| | | | | |
Oil & Gas Equipment & Services - 1.0% | | | | | |
Baker Hughes, Inc. | | 2,200 | | | 164,252 |
BJ Services Company | | 2,000 | | | 58,640 |
Cameron International Corporation * | | 500 | | | 26,525 |
FMC Technologies, Inc. * | | 1,871 | | | 115,310 |
Grant Prideco, Inc. * | | 2,900 | | | 115,333 |
Halliburton Company | | 1,100 | | | 34,155 |
National Oilwell Varco, Inc. * | | 600 | | | 36,708 |
Schlumberger, Ltd. | | 7,300 | | | 461,068 |
Smith International, Inc. | | 100 | | | 4,107 |
| | | | | |
| | | | | 1,016,098 |
| | | | | |
Oil & Gas Exploration & Production - 0.4% | | | | | |
Anadarko Petroleum Corporation | | 1,126 | | | 49,004 |
Bois d’Arc Energy, Inc. * | | 300 | | | 4,389 |
Comstock Resources, Inc. * | | 1,000 | | | 31,060 |
Devon Energy Corporation | | 1,000 | | | 67,080 |
EOG Resources, Inc. | | 1,400 | | | 87,430 |
Forest Oil Corporation * | | 400 | | | 13,072 |
Newfield Exploration Company * | | 800 | | | 36,760 |
Pioneer Natural Resources Company | | 700 | | | 27,783 |
XTO Energy, Inc. | | 1,800 | | | 84,690 |
| | | | | |
| | | | | 401,268 |
| | | | | |
Oil & Gas Refining & Marketing - 0.1% | | | | | |
Valero Energy Corporation | | 2,200 | | | 112,552 |
| | | | | |
Oil & Gas Storage & Transportation - 0.2% | | | | | |
Williams Companies, Inc. | | 8,900 | | | 232,468 |
| | | | | |
The accompanying notes are an integral part of the financial statements.
79
| | |
| Schedule of Investments | | Series N (Managed Asset Allocation Series) |
| December 31, 2006 - continued | | |
| | | | | |
| | | Shares | | Value |
COMMON STOCK (continued) | | | | | |
Other Diversified Financial Services - 2.6% | | | | | |
Bank of America Corporation | | 13,776 | | $ | 735,501 |
Citigroup, Inc. | | 25,773 | | | 1,435,556 |
JPMorgan Chase & Company | | 11,936 | | | 576,509 |
| | | | | |
| | | | | 2,747,566 |
| | | | | |
Packaged Foods & Meats - 0.3% | | | | | |
General Mills, Inc. | | 2,500 | | | 144,000 |
Kellogg Company | | 1,800 | | | 90,108 |
Kraft Foods, Inc. | | 700 | | | 24,990 |
Sara Lee Corporation | | 1,300 | | | 22,139 |
SunOpta, Inc. * | | 2,900 | | | 25,520 |
Tootsie Roll Industries, Inc. | | 169 | | | 5,526 |
| | | | | |
| | | | | 312,283 |
| | | | | |
Paper Packaging - 0.0% | | | | | |
Smurfit-Stone Container Corporation * | | 900 | | | 9,504 |
| | | | | |
Paper Products - 0.2% | | | | | |
Bowater, Inc. | | 1,200 | | | 27,000 |
International Paper Company | | 4,100 | | | 139,810 |
| | | | | |
| | | | | 166,810 |
| | | | | |
Personal Products - 0.1% | | | | | |
Avon Products, Inc. | | 4,300 | | | 142,072 |
| | | | | |
Pharmaceuticals - 3.1% | | | | | |
Abbott Laboratories | | 5,000 | | | 243,550 |
Allergan, Inc. | | 1,100 | | | 131,714 |
Barr Pharmaceuticals, Inc. * | | 900 | | | 45,108 |
Bristol-Myers Squibb Company | | 1,500 | | | 39,480 |
Eli Lilly & Company | | 4,840 | | | 252,164 |
GlaxoSmithKline plc ADR | | 500 | | | 26,380 |
Johnson & Johnson | | 13,058 | | | 862,089 |
Medicis Pharmaceutical Corporation | | 300 | | | 10,539 |
Merck & Company, Inc. | | 9,800 | | | 427,280 |
Noven Pharmaceuticals, Inc. * | | 600 | | | 15,270 |
Pfizer, Inc. | | 28,773 | | | 745,221 |
Schering-Plough Corporation | | 8,200 | | | 193,848 |
Sepracor, Inc. * | | 300 | | | 18,474 |
Wyeth | | 5,900 | | | 300,428 |
| | | | | |
| | | | | 3,311,545 |
| | | | | |
Property & Casualty Insurance - 0.4% | | | | | |
Axis Capital Holdings, Ltd. | | 1,800 | | | 60,066 |
Infinity Property & Casualty Corporation | | 200 | | | 9,678 |
James River Group, Inc. * | | 100 | | | 3,232 |
Markel Corporation * | | 70 | | | 33,607 |
Mercury General Corporation | | 200 | | | 10,546 |
Ohio Casualty Corporation | | 200 | | | 5,962 |
ProAssurance Corporation * | | 200 | | | 9,984 |
Progressive Corporation | | 3,000 | | | 72,660 |
Selective Insurance Group | | 100 | | | 5,729 |
St. Paul Travelers Companies, Inc. | | 2,114 | | | 113,501 |
XL Capital, Ltd. | | 1,300 | | | 93,626 |
| | | | | |
| | | | | 418,591 |
| | | | | |
Publishing - 0.2% | | | | | |
Gannett Company, Inc. | | 680 | | | 41,113 |
Getty Images, Inc. * | | 400 | | | 17,128 |
Idearc, Inc. * | | 110 | | | 3,151 |
McGraw-Hill Companies, Inc. | | 1,300 | | | 88,426 |
Meredith Corporation | | 300 | | | 16,905 |
Scholastic Corporation * | | 200 | | | 7,168 |
Tribune Company | | 1,500 | | | 46,170 |
| | | | | |
| | | | | 220,061 |
| | | | | |
Railroads - 0.5% | | | | | |
Norfolk Southern Corporation | | 6,100 | | | 306,769 |
Union Pacific Corporation | | 2,300 | | | 211,646 |
| | | | | |
| | | | | 518,415 |
| | | | | |
Regional Banks - 1.2% | | | | | |
City National Corporation | | 100 | | | 7,120 |
Commerce Bancshares, Inc. | | 570 | | | 27,601 |
East West Bancorp, Inc. | | 500 | | | 17,710 |
Fifth Third Bancorp | | 6,400 | | | 261,952 |
First Horizon National Corporation | | 4,300 | | | 179,654 |
Mercantile Bankshares Corporation | | 750 | | | 35,092 |
Popular, Inc. | | 1,100 | | | 19,745 |
SunTrust Banks, Inc. | | 5,100 | | | 430,695 |
Synovus Financial Corporation | | 7,200 | | | 221,976 |
TCF Financial Corporation | | 300 | | | 8,226 |
UCBH Holdings, Inc. | | 1,400 | | | 24,584 |
Virginia Commerce Bancorp, Inc. * | | 150 | | | 2,982 |
Westamerica Bancorporation | | 100 | | | 5,063 |
Wilmington Trust Corporation | | 600 | | | 25,302 |
| | | | | |
| | | | | 1,267,702 |
| | | | | |
Residential REIT’s - 0.2% | | | | | |
Archstone-Smith Trust | | 2,800 | | | 162,988 |
Camden Property Trust | | 500 | | | 36,925 |
| | | | | |
| | | | | 199,913 |
| | | | | |
Restaurants - 0.0% | | | | | |
California Pizza Kitchen, Inc. * | | 300 | | | 9,993 |
Cheesecake Factory * | | 200 | | | 4,920 |
PF Chang’s China Bistro, Inc. * | | 200 | | | 7,676 |
Sonic Corporation * | | 900 | | | 21,555 |
| | | | | |
| | | | | 44,144 |
| | | | | |
Retail REIT’s - 0.2% | | | | | |
Kimco Realty Corporation | | 900 | | | 40,455 |
Kite Realty Group Trust | | 300 | | | 5,586 |
Pennsylvania Real Estate Investment Trust | | 100 | | | 3,938 |
Regency Centers Corporation | | 600 | | | 46,902 |
The accompanying notes are an integral part of the financial statements.
80
| | |
| Schedule of Investments | | Series N (Managed Asset Allocation Series) |
| December 31, 2006 - continued | | |
| | | | | |
| | | Shares | | Value |
COMMON STOCK (continued) | | | | | |
Retail REIT’s (continued) | | | | | |
Simon Property Group, Inc. | | 800 | | $ | 81,032 |
Weingarten Realty Investors | | 800 | | | 36,888 |
| | | | | |
| | | | | 214,801 |
| | | | | |
Semiconductor Equipment - 0.3% | | | | | |
Advanced Energy Industries, Inc. * | | 500 | | | 9,435 |
Applied Materials, Inc. | | 9,800 | | | 180,810 |
ASML Holding N.V. * | | 2,300 | | | 56,649 |
ATMI, Inc. * | | 200 | | | 6,106 |
Cymer, Inc. * | | 200 | | | 8,790 |
Entegris, Inc. * | | 1,112 | | | 12,032 |
Tessera Technologies, Inc. * | | 500 | | | 20,170 |
Varian Semiconductor Equipment Associates, Inc. * | | 300 | | | 13,656 |
| | | | | |
| | | | | 307,648 |
| | | | | |
Semiconductors - 1.2% | | | | | |
Advanced Micro Devices, Inc. * | | 7,500 | | | 152,625 |
Analog Devices, Inc. | | 3,900 | | | 128,193 |
Broadcom Corporation * | | 2,000 | | | 64,620 |
Intel Corporation | | 24,900 | | | 504,225 |
Intersil Corporation | | 1,100 | | | 26,312 |
Marvell Technology Group, Ltd. * | | 10,200 | | | 195,738 |
Maxim Integrated Products, Inc. | | 3,000 | | | 91,860 |
Microchip Technology, Inc. | | 400 | | | 13,080 |
Omnivision Technologies, Inc. * | | 900 | | | 12,285 |
Semtech Corporation * | | 900 | | | 11,763 |
Texas Instruments, Inc. | | 3,100 | | | 89,280 |
Zoran Corporation * | | 989 | | | 14,420 |
| | | | | |
| | | | | 1,304,401 |
| | | | | |
Soft Drinks - 0.8% | | | | | |
Coca-Cola Company | | 9,700 | | | 468,025 |
PepsiCo, Inc. | | 6,800 | | | 425,340 |
| | | | | |
| | | | | 893,365 |
| | | | | |
Specialized Consumer Services - 0.1% | | | | | |
H&R Block, Inc. | | 2,700 | | | 62,208 |
Jackson Hewitt Tax Service, Inc. | | 500 | | | 16,985 |
| | | | | |
| | | | | 79,193 |
| | | | | |
Specialized Finance - 0.5% | | | | | |
Chicago Mercantile Exchange Holdings, Inc. | | 550 | | | 280,363 |
IntercontinentalExchange, Inc. * | | 1,300 | | | 140,270 |
Moody’s Corporation | | 1,000 | | | 69,060 |
| | | | | |
| | | | | 489,693 |
| | | | | |
Specialized REIT’s - 0.1% | | | | | |
LaSalle Hotel Properties | | 1,200 | | | 55,020 |
Potlatch Corporation | | 710 | | | 31,112 |
| | | | | |
| | | | | 86,132 |
| | | | | |
Specialty Chemicals - 0.1% | | | | | |
Arch Chemicals, Inc. | | 700 | | | 23,317 |
Ecolab, Inc. | | 1,600 | | | 72,320 |
Sigma-Aldrich Corporation | | 300 | | | 23,316 |
Symyx Technologies * | | 700 | | | 15,113 |
Valspar Corporation | | 200 | | | 5,528 |
| | | | | |
| | | | | 139,594 |
| | | | | |
Specialty Stores - 0.1% | | | | | |
AC Moore Arts & Crafts, Inc. * | | 300 | | | 6,501 |
Dick’s Sporting Goods, Inc. * | | 100 | | | 4,899 |
Hibbett Sporting Goods, Inc. * | | 800 | | | 24,424 |
PetSmart, Inc. | | 500 | | | 14,430 |
Staples, Inc. | | 2,850 | | | 76,095 |
| | | | | |
| | | | | 126,349 |
| | | | | |
Steel - 0.1% | | | | | |
Nucor Corporation | | 2,140 | | | 116,972 |
Steel Dynamics, Inc. | | 1,000 | | | 32,450 |
| | | | | |
| | | | | 149,422 |
| | | | | |
Systems Software - 1.6% | | | | | |
Borland Software Corporation * | | 600 | | | 3,264 |
Macrovision Corporation * | | 100 | | | 2,826 |
McAfee, Inc. * | | 3,700 | | | 105,006 |
Microsoft Corporation | | 39,400 | | | 1,176,484 |
Oracle Corporation * | | 10,000 | | | 171,400 |
Red Hat, Inc. * | | 8,600 | | | 197,800 |
| | | | | |
| | | | | 1,656,780 |
| | | | | |
Technology Distributors - 0.0% | | | | | |
CDW Corporation | | 200 | | | 14,064 |
Insight Enterprises, Inc. * | | 600 | | | 11,322 |
Tech Data Corporation * | | 400 | | | 15,148 |
| | | | | |
| | | | | 40,534 |
| | | | | |
Thrifts & Mortgage Finance - 0.5% | | | | | |
BankAtlantic Bancorp, Inc. | | 1,700 | | | 23,477 |
Countrywide Financial Corporation | | 6,100 | | | 258,945 |
IndyMac Bancorp, Inc. | | 500 | | | 22,580 |
PMI Group, Inc. | | 500 | | | 23,585 |
Radian Group, Inc. | | 300 | | | 16,173 |
Sovereign Bancorp, Inc. | | 2,200 | | | 55,858 |
Triad Guaranty, Inc. * | | 400 | | | 21,948 |
Washington Mutual, Inc. | | 2,600 | | | 118,274 |
| | | | | |
| | | | | 540,840 |
| | | | | |
Tobacco - 0.8% | | | | | |
Altria Group, Inc. | | 10,130 | | | 869,357 |
| | | | | |
Trading Companies & Distributors - 0.0% | | | | | |
Fastenal Company | | 1,000 | | | 35,880 |
| | | | | |
Trucking - 0.0% | | | | | |
Dollar Thrifty Automotive Group * | | 700 | | | 31,927 |
Old Dominion Freight Line, Inc. * | | 850 | | | 20,460 |
| | | | | |
| | | | | 52,387 |
| | | | | |
Wireless Telecommunication Services - 0.8% | | | | | |
America Movil S.A. de CV ADR | | 1,500 | | | 67,830 |
American Tower Corporation * | | 7,930 | | | 295,630 |
The accompanying notes are an integral part of the financial statements.
81
| | |
| Schedule of Investments | | Series N (Managed Asset Allocation Series) |
| December 31, 2006 - continued | | |
| | | | | |
| | | Shares | | Value |
COMMON STOCK (continued) | | | | | |
Wireless Telecommunication Services (continued) | | | | | |
Crown Castle International Corporation * | | 8,800 | | $ | 284,240 |
NTELOS Holdings Corporation * | | 300 | | | 5,364 |
Rogers Communications, Inc. (CI.B) | | 2,100 | | | 125,160 |
Vodafone Group plc ADR | | 3,900 | | | 108,342 |
Wireless Facilities, Inc. * | | 1,100 | | | 3,135 |
| | | | | |
| | | | | 889,701 |
| | | | | |
TOTAL COMMON STOCK (Cost $48,935,546) | | | | $ | 58,022,520 |
| | | | | |
FOREIGN STOCK- 9.5% | | | | | |
Australia - 0.7% | | | | | |
Alinta, Ltd. | | 5,488 | | | 51,200 |
Australia & New Zealand Banking Group, Ltd. | | 5,218 | | | 116,185 |
Babcock & Brown, Ltd. | | 3,497 | | | 68,452 |
BlueScope Steel, Ltd. | | 12,621 | | | 85,870 |
CSL, Ltd. | | 707 | | | 36,479 |
Goodman Fielder, Ltd. | | 9,400 | | | 16,471 |
Insurance Australia Group, Ltd. | | 10,631 | | | 53,283 |
Macquarie Bank, Ltd. | | 1,050 | | | 65,414 |
Macquarie Infrastructure Group (4) | | 7,634 | | | 20,848 |
Mirvac Group | | 7,631 | | | 33,669 |
Pacific Brands, Ltd. | | 8,506 | | | 17,523 |
QBE Insurance Group, Ltd. | | 4,419 | | | 100,626 |
Rio Tinto, Ltd. | | 944 | | | 55,361 |
Sydney Roads Group | | 1 | | | 1 |
| | | | | |
| | | | | 721,382 |
| | | | | |
Belgium - 0.2% | | | | | |
Fortis | | 1,940 | | | 82,742 |
KBC Groep N.V. (4) | | 538 | | | 65,976 |
| | | | | |
| | | | | 148,718 |
| | | | | |
Bermuda - 0.1% | | | | | |
Esprit Holdings, Ltd. | | 5,000 | | | 55,828 |
| | | | | |
China - 0.0% | | | | | |
Industrial & Commercial Bank of China * | | 36,000 | | | 22,355 |
| | | | | |
Finland - 0.4% | | | | | |
Cargotec Corporation (CI.B) | | 2,209 | | | 122,763 |
Kesko Oyj | | 2,122 | | | 112,101 |
Nokia Oyj | | 6,752 | | | 137,972 |
Sanoma-WSOY Oyj | | 1,464 | | | 41,260 |
| | | | | |
| | | | | 414,096 |
| | | | | |
France - 1.1% | | | | | |
Accor S.A. | | 891 | | | 69,041 |
Arkema * | | 36 | | | 1,824 |
AXA S.A. | | 2,922 | | | 118,299 |
BNP Paribas | | 1,206 | | | 131,577 |
Bouygues | | 1,504 | | | 96,548 |
Pernod-Ricard S.A. | | 615 | | | 141,258 |
Publicis Groupe | | 2,561 | | | 108,011 |
Sanofi-Aventis | | 1,765 | | | 162,975 |
Societe Generale | | 661 | | | 112,210 |
Technip S.A. | | 536 | | | 36,792 |
Total S.A. | | 1,862 | | | 134,290 |
| | | | | |
| | | | | 1,112,825 |
| | | | | |
Germany - 0.6% | | | | | |
Adidas AG | | 1,092 | | | 54,387 |
BASF AG | | 648 | | | 63,170 |
Bayerische Motoren Werke (BMW) AG | | 1,712 | | | 98,329 |
Celesio AG | | 798 | | | 42,810 |
E.ON AG | | 1,410 | | | 191,394 |
Hypo Real Estate Holding AG | | 661 | | | 41,656 |
Muenchener Rueckversicherungs AG | | 426 | | | 73,340 |
ThyssenKrupp AG | | 1,251 | | | 58,938 |
Wacker Chemie AG * | | 174 | | | 22,643 |
| | | | | |
| | | | | 646,667 |
| | | | | |
Hong Kong - 0.2% | | | | | |
China Communications Construction Company, Ltd. * | | 9,000 | | | 8,898 |
China Overseas Land & Investment, Ltd. | | 76,000 | | | 102,007 |
China Petroleum & Chemical Corporation | | 44,000 | | | 40,728 |
Hutchison Whampoa, Ltd. | | 2,700 | | | 27,440 |
| | | | | |
| | | | | 179,073 |
| | | | | |
Ireland - 0.2% | | | | | |
Allied Irish Banks plc | | 1,942 | | | 57,679 |
DCC plc | | 3,790 | | | 128,827 |
| | | | | |
| | | | | 186,506 |
| | | | | |
Italy - 0.4% | | | | | |
AEM SpA | | 12,299 | | | 41,116 |
Banco Popolare di Verona e Novara SCRL * | | 3,145 | | | 90,296 |
ENI SpA | | 4,017 | | | 135,111 |
Piaggio & C SpA * | | 6,078 | | | 25,233 |
Saipem SpA | | 2,548 | | | 66,395 |
UniCredito Italiano SpA | | 11,300 | | | 99,045 |
| | | | | |
| | | | | 457,196 |
| | | | | |
Japan - 1.9% | | | | | |
Ajinomoto Company, Inc. | | 3,000 | | | 39,654 |
Bank of Yokohama, Ltd. | | 6,000 | | | 46,990 |
Canon, Inc. | | 1,700 | | | 95,710 |
Eisai Company, Ltd. | | 900 | | | 49,460 |
Fanuc, Ltd. | | 400 | | | 39,393 |
Goldcrest Company, Ltd. | | 530 | | | 27,345 |
Hamamatsu Photonics KK | | 1,000 | | | 29,999 |
The accompanying notes are an integral part of the financial statements.
82
| | |
| Schedule of Investments | | Series N (Managed Asset Allocation Series) |
| December 31, 2006 - continued | | |
| | | | | |
| | | Shares | | Value |
FOREIGN STOCK (continued) | | | | | |
Japan (continued) | | | | | |
Haseko Corporation * | | 6,000 | | $ | 21,478 |
Hitachi Maxell, Ltd. | | 1,900 | | | 28,339 |
Honda Motor Company, Ltd. | | 2,100 | | | 82,938 |
Hoya Corporation | | 700 | | | 27,293 |
JS Group Corporation | | 1,300 | | | 27,364 |
KDDI Corporation | | 8 | | | 54,250 |
Kobayashi Pharmaceutical Company, Ltd. | | 1,100 | | | 41,040 |
Mitsubishi Electric Corporation | | 4,000 | | | 36,503 |
Mitsubishi Gas Chemical Company, Inc. | | 4,000 | | | 41,847 |
Mitsubishi UFJ Financial Group, Inc. | | 5 | | | 61,762 |
Mitsui & Company, Ltd. | | 5,000 | | | 74,787 |
Mitsui Sumitomo Insurance Company, Ltd. | | 5,000 | | | 54,704 |
Nichias Corporation | | 3,000 | | | 22,411 |
Nikon Corporation | | 3,000 | | | 65,795 |
Nippon Mining Holdings, Inc. | | 2,500 | | | 17,982 |
Nippon Oil Corporation | | 3,000 | | | 20,066 |
Nippon Steel Corporation | | 26,000 | | | 149,439 |
Nippon Yusen KK | | 8,000 | | | 58,485 |
Resona Holdings, Inc. | | 15 | | | 40,965 |
Seven & I Holdings Company, Ltd. | | 1,700 | | | 52,855 |
Sony Corporation | | 1,900 | | | 81,425 |
Sumitomo Trust & Banking Company, Ltd. | | 14,000 | | | 146,817 |
Takeda Pharmaceutical Company, Ltd. | | 1,100 | | | 75,518 |
Tokyo Electric Power Company, Inc. | | 2,400 | | | 77,644 |
Tokyo Electron, Ltd. | | 800 | | | 63,056 |
Tosoh Corporation | | 6,000 | | | 26,520 |
Toyoda Gosei Company, Ltd. | | 1,700 | | | 39,355 |
Toyota Motor Corporation | | 2,600 | | | 173,909 |
Uniden Corporation | | 1,000 | | | 6,832 |
Yusen Air & Sea Service Company, Ltd. | | 1,000 | | | 21,722 |
| | | | | |
| | | | | 2,021,652 |
| | | | | |
Mexico - 0.2% | | | | | |
Cemex S.A. de CV * | | 12,896 | | | 43,701 |
Grupo Financiero Banorte S.A. de CV | | 29,116 | | | 113,839 |
Wal-Mart de Mexico S.A. de CV | | 8,700 | | | 38,276 |
| | | | | |
| | | | | 195,816 |
| | | | | |
Netherlands - 0.1% | | | | | |
Aegon N.V. | | 3,996 | | | 76,170 |
TomTom N.V. * | | 991 | | | 42,803 |
| | | | | |
| | | | | 118,973 |
| | | | | |
Norway - 0.1% | | | | | |
Statoil ASA | | 1,597 | | | 42,327 |
Telenor ASA | | 3,600 | | | 67,701 |
| | | | | |
| | | | | 110,028 |
| | | | | |
Papua New Guinea - 0.0% | | | | | |
Oil Search, Ltd. | | 12,681 | | | 33,530 |
| | | | | |
Singapore - 0.2% | | | | | |
DBS Group Holdings, Ltd. | | 6,000 | | | 88,419 |
SembCorp Industries, Ltd. | | 25,900 | | | 64,851 |
StarHub, Ltd. | | 29,000 | | | 49,733 |
Venture Corporation, Ltd. | | 2,000 | | | 17,606 |
| | | | | |
| | | | | 220,609 |
| | | | | |
Spain - 0.4% | | | | | |
Acciona S.A. | | 945 | | | 176,014 |
Banco Santander Central Hispano S.A. | | 6,628 | | | 123,715 |
Telefonica S.A. | | 4,935 | | | 105,012 |
| | | | | |
| | | | | 404,741 |
| | | | | |
Sweden - 0.5% | | | | | |
Autoliv, Inc. | | 850 | | | 51,336 |
Nordea Bank AB | | 9,127 | | | 140,639 |
Ssab Svenskt Staal AB | | 6,359 | | | 150,927 |
Svenska Handelsbanken AB | | 3,039 | | | 91,881 |
TeliaSonera AB | | 8,500 | | | 69,834 |
Volvo AB | | 800 | | | 55,093 |
| | | | | |
| | | | | 559,710 |
| | | | | |
Switzerland - 0.5% | | | | | |
Holcim, Ltd. | | 470 | | | 43,085 |
Nestle S.A. | | 399 | | | 141,787 |
Novartis AG | | 2,516 | | | 145,054 |
Panalpina Welttransport Holding AG | | 309 | | | 42,147 |
Swiss Life Holding | | 284 | | | 71,146 |
UBS AG | | 2,072 | | | 125,918 |
| | | | | |
| | | | | 569,137 |
| | | | | |
Taiwan, Province of China - 0.0% | | | | | |
Acer, Inc. | | 3,060 | | | 6,385 |
| | | | | |
United Kingdom - 1.7% | | | | | |
Aegis Group plc | | 24,867 | | | 68,054 |
Alliance Boots plc | | 2,752 | | | 45,108 |
Anglo American plc | | 2,338 | | | 114,004 |
Arriva plc | | 3,345 | | | 50,046 |
Aviva plc | | 4,700 | | | 75,702 |
Barclays plc | | 10,783 | | | 154,465 |
BP plc | | 11,598 | | | 128,892 |
Bradford & Bingley plc | | 3,908 | | | 35,969 |
Close Brothers Group plc | | 1,387 | | | 27,623 |
Corus Group plc | | 7,634 | | | 79,307 |
GKN plc | | 5,382 | | | 29,247 |
GlaxoSmithKline plc | | 5,174 | | | 136,176 |
HBOS plc | | 2,930 | | | 65,009 |
The accompanying notes are an integral part of the financial statements.
83
| | |
| Schedule of Investments | | Series N (Managed Asset Allocation Series) |
| December 31, 2006 - continued | | |
| | | | | | |
| | | Shares | | Value |
FOREIGN STOCK (continued) | | | | | | |
United Kingdom (continued) | | | | | | |
Informa plc | | | 3,491 | | $ | 40,745 |
Persimmon plc | | | 1,234 | | | 36,828 |
QinetiQ plc | | | 4,600 | | | 17,318 |
Rolls-Royce Group plc * | | | 4,155 | | | 36,412 |
Royal Bank of Scotland Group plc | | | 5,816 | | | 227,105 |
Royal Dutch Shell plc (CI.B) | | | 4,491 | | | 157,425 |
Tesco plc | | | 10,338 | | | 81,941 |
Tomkins plc | | | 3,587 | | | 17,262 |
Unilever plc | | | 1,239 | | | 34,648 |
United Utilities plc | | | 5,013 | | | 76,621 |
Vodafone Group plc | | | 12,059 | | | 33,416 |
WPP Group plc | | | 3,118 | | | 42,192 |
| | | | | | |
| | | | | | 1,811,515 |
| | | | | | |
TOTAL FOREIGN STOCK (Cost $6,838,024) | | | | | $ | 9,996,742 |
| | | | | | |
PREFERRED STOCK - 0.0% | | | | | | |
Apparel, Accessories & Luxury Goods - 0.0% | | | | | | |
Anvil Holdings, Inc. (CI.B) * (1)(5) | | | 469 | | | 469 |
| | | | | | |
TOTAL PREFERRED STOCK (Cost $6,135) | | | | | $ | 469 |
| | | | | | |
WARRANTS- 0.0% | | | | | | |
Warrants - 0.0% | | | | | | |
Travelcenters of America, Inc. | | | | | | |
$ 0.001, 5/1/2009 * (1)(5) | | | 150 | | | 7,659 |
| | | | | | |
TOTAL WARRANTS (Cost $2) | | | | | $ | 7,659 |
| | | | | | |
| | |
| | | Principal
Amount | | Value |
CORPORATE BOND - 10.3% | | | | | | |
Aerospace & Defense - 0.1% | | | | | | |
BE Aerospace, Inc. | | | | | | |
8.88%, 2011 | | $ | 25,000 | | | 25,875 |
Bombardier, Inc. | | | | | | |
6.75%, 2012 (2)(3) | | | 50,000 | | | 49,000 |
United Technologies Corporation | | | | | | |
5.40%, 2035 | | | 20,000 | | | 19,323 |
| | | | | | |
| | | | | | 94,198 |
| | | | | | |
Automotive - 0.4% | | | | | | |
Adesa, Inc. | | | | | | |
7.63%, 2012 | | | 25,000 | | | 25,812 |
Autonation, Inc. | | | | | | |
7.374%, 2013 (6) | | | 25,000 | | | 25,125 |
7.00%, 2014 | | | 25,000 | | | 25,188 |
DaimlerChrysler North America Holding Corporation | | | | | | |
5.82%, 2009 (6) | | | 30,000 | | | 30,049 |
6.50%, 2013 | | | 50,000 | | | 51,335 |
Erac USA Finance Company | | | | | | |
5.60%, 2015 (1)(2)(3) | | | 40,000 | | | 39,706 |
Ford Motor Credit Company | | | | | | |
5.80%, 2009 | | | 65,000 | | | 63,820 |
General Motors Acceptance Corporation | | | | | | |
6.75%, 2014 | | | 100,000 | | | 102,713 |
Hertz Corporation | | | | | | |
8.88%, 2014(2)(3) | | | 100,000 | | | 104,750 |
| | | | | | |
| | | | | | 468,498 |
| | | | | | |
Banking - 1.1% | | | | | | |
BAC CAP TRUST VI | | | | | | |
5.63%, 2035 | | | 35,000 | | | 33,132 |
Bank of America Corporation | | | | | | |
4.88%, 2012 | | | 55,000 | | | 53,901 |
5.75%, 2016 | | | 40,000 | | | 40,825 |
Bank One Corporation | | | | | | |
5.25%, 2013 | | | 160,000 | | | 158,669 |
BB&T Capital Trust II | | | | | | |
6.75%, 2036 | | | 60,000 | | | 65,517 |
BCP Crystal US Holdings Corporation | | | | | | |
9.63%, 2014(3) | | | 100,000 | | | 110,500 |
Bear Stearns Companies, Inc. | | | | | | |
5.50%, 2011 | | | 35,000 | | | 35,345 |
5.55%, 2017 | | | 20,000 | | | 19,983 |
Capital One Bank | | | | | | |
6.50%, 2013 | | | 65,000 | | | 68,518 |
Countrywide Financial Corporation | | | | | | |
6.25%, 2016 | | | 60,000 | | | 61,154 |
Credit Suisse USA, Inc. | | | | | | |
5.50%, 2011 | | | 30,000 | | | 30,327 |
HSBC Finance Corporation | | | | | | |
5.00%, 2015 | | | 50,000 | | | 48,618 |
Huntington National Bank | | | | | | |
4.38%, 2010 | | | 45,000 | | | 43,646 |
Merrill Lynch & Company, Inc. | | | | | | |
6.22%, 2026 | | | 30,000 | | | 30,914 |
Mizuho Capital Investment 1, Ltd. | | | | | | |
6.686%, 2049(1)(2)(3)(6) | | | 16,000 | | | 16,143 |
Morgan Stanley | | | | | | |
6.25%, 2026 | | | 15,000 | | | 15,685 |
Northern Trust Company | | | | | | |
4.60%, 2013 | | | 25,000 | | | 24,029 |
Northern Trust Corporation | | | | | | |
5.30%, 2011 | | | 30,000 | | | 30,100 |
Residential Capital LLC | | | | | | |
6.13%, 2008 | | | 25,000 | | | 25,124 |
Svensk Exportkredit AB | | | | | | |
4.875%, 2011 | | | 35,000 | | | 34,693 |
U.S. Bancorp | | | | | | |
4.50%, 2010 | | | 45,000 | | | 43,974 |
Wachovia Corporation | | | | | | |
6.40%, 2008 | | | 20,000 | | | 20,250 |
5.50%, 2035 | | | 25,000 | | | 23,824 |
Webster Financial Corporation | | | | | | |
5.13%, 2014 | | | 45,000 | | | 43,139 |
The accompanying notes are an integral part of the financial statements.
84
| | |
| Schedule of Investments | | Series N (Managed Asset Allocation Series) |
| December 31, 2006 - continued | | |
| | | | | | |
| | | Principal
Amount | | Value |
CORPORATE BOND (continued) | | | | | | |
Banking (continued) | | | | | | |
Wells Fargo & Company | | | | | | |
4.88%, 2011 | | $ | 90,000 | | $ | 89,106 |
| | | | | | |
| | | | | | 1,167,116 |
| | | | | | |
Basic Industry - Other - 0.0% | | | | | | |
Vale Overseas, Ltd. | | | | | | |
6.875%, 2036 | | | 35,000 | | | 35,898 |
Xstrata Finance Canada, Ltd. | | | | | | |
5.50%, 2011 (1)(2)(3) | | | 15,000 | | | 14,996 |
| | | | | | |
| | | | | | 50,894 |
| | | | | | |
Brokerage - 0.4% | | | | | | |
Allied Capital Corporation | | | | | | |
6.00%, 2012 | | | 35,000 | | | 34,497 |
Citigroup, Inc. | | | | | | |
5.00%, 2014 | | | 60,000 | | | 58,584 |
Franklin Resources, Inc. | | | | | | |
3.70%, 2008 | | | 15,000 | | | 14,691 |
Goldman Sachs Group, Inc. | | | | | | |
6.35%, 2034 | | | 100,000 | | | 101,225 |
Jefferies Group, Inc. | | | | | | |
6.25%, 2036 | | | 35,000 | | | 33,952 |
Legg Mason, Inc. | | | | | | |
6.75%, 2008 | | | 20,000 | | | 20,397 |
Lehman Brothers Holdings, Inc. | | | | | | |
5.75%, 2017 | | | 50,000 | | | 50,640 |
Merrill Lynch & Company, Inc. | | | | | | |
6.05%, 2016 | | | 100,000 | | | 103,504 |
| | | | | | |
| | | | | | 417,490 |
| | | | | | |
Building Materials - 0.1% | | | | | | |
Celulosa Arauco y Constitucion S.A. | | | | | | |
5.13%, 2013 | | | 40,000 | | | 38,662 |
Centex Corporation | | | | | | |
5.45%, 2012 | | | 40,000 | | | 39,358 |
Collins & Aikman Floor Cover | | | | | | |
9.75%, 2010 | | | 25,000 | | | 25,562 |
CRH America, Inc. | | | | | | |
6.00%, 2016 | | | 30,000 | | | 30,282 |
Lafarge S.A. | | | | | | |
6.15%, 2011 | | | 20,000 | | | 20,471 |
| | | | | | |
| | | | | | 154,335 |
| | | | | | |
Capital Goods - Other - 0.1% | | | | | | |
Freescale Semiconductor, Inc. | | | | | | |
8.875%, 2014 (2)(3) | | | 100,000 | | | 99,625 |
| | | | | | |
Chemicals - 0.1% | | | | | | |
Dow Chemical Company | | | | | | |
6.13%, 2011 | | | 30,000 | | | 30,840 |
El Du Pont de Nemours & Company | | | | | | |
5.60%, 2036 | | | 50,000 | | | 47,969 |
Hercules, Inc. | | | | | | |
6.75%, 2029 | | | 50,000 | | | 49,000 |
Huntsman International LLC | | | | | | |
7.875%, 2014 (2)(3) | | | 25,000 | | | 25,187 |
| | | | | | |
| | | | | | 152,996 |
| | | | | | |
Communications - Other - 0.2% | | | | | | |
CanWest MediaWorks, Inc. | | | | | | |
8.00%, 2012 | | | 34,875 | | | 36,401 |
Dun & Bradstreet Corporation | | | | | | |
5.50%, 2011 | | | 25,000 | | | 25,062 |
Lamar Media Corporation | | | | | | |
6.625%, 2015 | | | 100,000 | | | 99,125 |
| | | | | | |
| | | | | | 160,588 |
| | | | | | |
Construction Machinery - 0.0% | | | | | | |
Owens Corning, Inc. | | | | | | |
6.50%, 2016 (1)(2)(3) | | | 15,000 | | | 15,238 |
| | | | | | |
Consumer Cyclical - Other - 0.1% | | | | | | |
Procter & Gamble Company | | | | | | |
4.95%, 2014 | | | 65,000 | | | 63,480 |
| | | | | | |
Consumer Products - 0.2% | | | | | | |
Bunge, Ltd. Finance Corporation | | | | | | |
4.38%, 2008 | | | 50,000 | | | 48,946 |
Eastman Kodak Company | | | | | | |
7.25%, 2013 | | | 100,000 | | | 99,413 |
Fortune Brands, Inc. | | | | | | |
5.13%, 2011 | | | 30,000 | | | 29,439 |
Sealy Mattress Company | | | | | | |
8.25%, 2014 | | | 25,000 | | | 26,125 |
Visant Corporation | | | | | | |
7.63%, 2012 | | | 25,000 | | | 25,312 |
| | | | | | |
| | | | | | 229,235 |
| | | | | | |
Distributors - 0.1% | | | | | | |
Atmos Energy Corporation | | | | | | |
4.00%, 2009 | | | 45,000 | | | 43,290 |
Southern California Gas Company | | | | | | |
5.75%, 2035 | | | 45,000 | | | 44,902 |
| | | | | | |
| | | | | | 88,192 |
| | | | | | |
Diversified Manufacturing - 0.0% | | | | | | |
Hawk Corporation | | | | | | |
8.75%, 2014 | | | 25,000 | | | 24,937 |
| | | | | | |
Electric - 0.8% | | | | | | |
AES Corporation | | | | | | |
9.00%, 2015 (2)(3) | | | 25,000 | | | 26,875 |
Alabama Power Company | | | | | | |
5.56%, 2009 (6) | | | 60,000 | | | 60,212 |
Appalachian Power Company | | | | | | |
6.38%, 2036 | | | 25,000 | | | 25,670 |
Black Hills Corporation | | | | | | |
6.50%, 2013 | | | 30,000 | | | 30,126 |
CE Electric UK Funding Company | | | | | | |
7.00%, 2007 (1)(2)(3) | | | 35,000 | | | 35,457 |
The accompanying notes are an integral part of the financial statements.
85
| | |
| Schedule of Investments | | Series N (Managed Asset Allocation Series) |
| December 31, 2006 - continued | | |
| | | | | | |
| | | Principal
Amount | | Value |
CORPORATE BOND (continued) | | | | | | |
Electric (continued) | | | | | | |
Centerpoint Energy, Inc. | | | | | | |
7.25%, 2010 | | $ | 25,000 | | $ | 26,341 |
El Paso Electric Company | | | | | | |
6.00%, 2035 | | | 45,000 | | | 43,136 |
Exelon Generation Company LLC | | | | | | |
5.35%, 2014 | | | 25,000 | | | 24,487 |
FirstEnergy Corporation | | | | | | |
6.45%, 2011 | | | 40,000 | | | 41,712 |
Florida Power & Light Company | | | | | | |
6.20%, 2036 (1)(3) | | | 20,000 | | | 21,283 |
Midamerican Energy Holdings Company | | | | | | |
6.125%, 2036 | | | 35,000 | | | 35,282 |
Mirant Americas Generation LLC | | | | | | |
8.30%, 2011 | | | 100,000 | | | 102,500 |
Monongahela Power Company | | | | | | |
5.70%, 2017 (1)(2)(3) | | | 40,000 | | | 39,972 |
Pacific Gas & Electric Company | | | | | | |
4.80%, 2014 | | | 30,000 | | | 28,756 |
Progress Energy, Inc. | | | | | | |
5.63%, 2016 | | | 30,000 | | | 29,930 |
Public Service Company of New Mexico | | | | | | |
4.40%, 2008 | | | 40,000 | | | 39,267 |
Public Service Electric & Gas Company | | | | | | |
5.70%, 2036 | | | 50,000 | | | 48,703 |
Sierra Pacific Resources | | | | | | |
7.80%, 2012 (1) | | | 25,000 | | | 26,161 |
Southern California Edison Company | | | | | | |
4.65%, 2015 | | | 30,000 | | | 28,349 |
Virginia Electric and Power Company | | | | | | |
6.00%, 2036 | | | 40,000 | | | 39,808 |
Westar Energy, Inc. | | | | | | |
5.10%, 2020 | | | 25,000 | | | 23,246 |
Western Power Distribution Holdings, Ltd. | | | | | | |
6.88%, 2007 (1)(2)(3) | | | 25,000 | | | 25,144 |
| | | | | | |
| | | | | | 802,417 |
| | | | | | |
Energy - Other - 0.0% | | | | | | |
Dresser-Rand Group, Inc. | | | | | | |
7.375%, 2014 (7) | | | 22,000 | | | 22,165 |
| | | | | | |
Entertainment - 0.1% | | | | | | |
AMF Bowling Worldwide, Inc. | | | | | | |
10.00%, 2010 | | | 25,000 | | | 25,906 |
Diageo Capital plc | | | | | | |
5.125%, 2012 | | | 50,000 | | | 49,376 |
International Speedway Corporation | | | | | | |
4.20%, 2009 | | | 20,000 | | | 19,419 |
K2, Inc. | | | | | | |
7.38%, 2014 | | | 25,000 | | | 25,250 |
| | | | | | |
| | | | | | 119,951 |
| | | | | | |
Environmental - 0.0% | | | | | | |
Allied Waste North America, Inc. | | | | | | |
8.50%, 2008 | | | 25,000 | | | 26,281 |
Casella Waste Systems, Inc. | | | | | | |
9.75%, 2013 | | | 25,000 | | | 26,188 |
| | | | | | |
| | | | | | 52,469 |
| | | | | | |
Financial - Other - 0.2% | | | | | | |
AvalonBay Communities, Inc. | | | | | | |
6.13%, 2012 | | | 30,000 | | | 31,081 |
Boeing Capital Corporation, Ltd. | | | | | | |
6.10%, 2011 | | | 50,000 | | | 51,656 |
EnCana Holdings Finance Corporation | | | | | | |
5.80%, 2014 | | | 45,000 | | | 45,268 |
Kinder Morgan Finance Company ULC | | | | | | |
5.70%, 2016 | | | 45,000 | | | 41,288 |
Orion Power Holdings, Inc. | | | | | | |
12.00%, 2010 | | | 25,000 | | | 28,375 |
Sovereign Capital Trust VI | | | | | | |
7.908%, 2036 | | | 35,000 | | | 39,368 |
| | | | | | |
| | | | | | 237,036 |
| | | | | | |
Financial Companies - Noncaptive Consumer - 0.2% | | | | | | |
American Express Company | | | | | | |
5.25%, 2011 | | | 40,000 | | | 40,043 |
American General Finance Corporation | | | | | | |
5.40%, 2015 | | | 50,000 | | | 49,497 |
SLM Corporation | | | | | | |
3.19%, 2009 (6) | | | 35,000 | | | 34,031 |
5.577%, 2009 (6) | | | 55,000 | | | 55,194 |
| | | | | | |
| | | | | | 178,765 |
| | | | | | |
Financial Companies - Noncaptive Diversified - 0.4% | | | | | | |
CIT Group, Inc. | | | | | | |
6.00%, 2036 | | | 30,000 | | | 29,579 |
FIA Card Services North America | | | | | | |
4.63%, 2009 | | | 45,000 | | | 44,385 |
General Electric Capital Corporation | | | | | | |
5.88%, 2012 | | | 70,000 | | | 71,982 |
6.00%, 2012 | | | 140,000 | | | 144,924 |
5.375%, 2016 | | | 60,000 | | | 60,080 |
International Lease Finance Corporation | | | | | | |
5.45%, 2011 | | | 50,000 | | | 50,168 |
John Deere Capital Corporation | | | | | | |
7.00%, 2012 | | | 45,000 | | | 48,156 |
| | | | | | |
| | | | | | 449,274 |
| | | | | | |
Food & Beverage - 0.1% | | | | | | |
B&G Foods, Inc. | | | | | | |
8.00%, 2011 | | | 25,000 | | | 25,250 |
McCormick & Company, Inc. | | | | | | |
5.20%, 2015 | | | 40,000 | | | 38,993 |
Pantry, Inc. | | | | | | |
7.75%, 2014 | | | 25,000 | | | 25,156 |
The accompanying notes are an integral part of the financial statements.
86
| | |
| Schedule of Investments | | Series N (Managed Asset Allocation Series) |
| December 31, 2006 - continued | | |
| | | | | | |
| | | Principal
Amount | | Value |
CORPORATE BOND (continued) | | | | | | |
Food & Beverage (continued) | | | | | | |
SABMiller plc | | | | | | |
6.20%, 2011(1)(2)(3) | | $ | 50,000 | | $ | 51,177 |
WM Wrigley Jr Company | | | | | | |
4.65%, 2015 | | | 15,000 | | | 14,259 |
| | | | | | |
| | | | | | 154,835 |
| | | | | | |
Gaming - 0.0% | | | | | | |
Harrah’s Operating Company, Inc. | | | | | | |
5.50%, 2010 | | | 45,000 | | | 44,107 |
| | | | | | |
Health Care - 0.3% | | | | | | |
Amgen, Inc. | | | | | | |
4.00%, 2009 | | | 25,000 | | | 24,255 |
Cardinal Health, Inc. | | | | | | |
5.64%, 2009(1)(2)(3)(6) | | | 30,000 | | | 30,014 |
Concentra Operating Corporation | | | | | | |
9.13%, 2012 | | | 25,000 | | | 26,250 |
Genentech, Inc. | | | | | | |
4.75%, 2015 | | | 35,000 | | | 33,507 |
Genesis HealthCare Corporation | | | | | | |
8.00%, 2013 | | | 25,000 | | | 26,062 |
Highmark, Inc. | | | | | | |
6.80%, 2013(1)(2)(3) | | | 30,000 | | | 31,464 |
Kroger Company | | | | | | |
8.05%, 2010 | | | 45,000 | | | 48,148 |
Medtronic, Inc. | | | | | | |
4.75%, 2015 | | | 55,000 | | | 52,102 |
Vanguard Health Holding Company II LLC | | | | | | |
9.00%, 2014 | | | 25,000 | | | 25,312 |
WellPoint, Inc. | | | | | | |
5.00%, 2011 | | | 30,000 | | | 29,634 |
| | | | | | |
| | | | | | 326,748 |
| | | | | | |
Home Construction - 0.2% | | | | | | |
DR Horton, Inc. | | | | | | |
5.63%, 2014 | | | 30,000 | | | 28,976 |
Lennar Corporation | | | | | | |
5.60%, 2015 | | | 30,000 | | | 28,685 |
MDC Holdings, Inc. | | | | | | |
5.50%, 2013 | | | 55,000 | | | 52,586 |
NVR, Inc. | | | | | | |
5.00%, 2010 | | | 20,000 | | | 19,510 |
Pulte Homes, Inc. | | | | | | |
5.20%, 2015 | | | 50,000 | | | 47,638 |
| | | | | | |
| | | | | | 177,395 |
| | | | | | |
Independent Energy - 0.2% | | | | | | |
Devon Financing Corporation ULC | | | | | | |
6.88%, 2011 | | | 55,000 | | | 58,158 |
Forest Oil Corporation | | | | | | |
8.00%, 2011 | | | 25,000 | | | 26,000 |
Hilcorp Energy I, LP | | | | | | |
10.50%, 2010(2)(3) | | | 50,000 | | | 53,500 |
NRG Energy, Inc. | | | | | | |
7.25%, 2014 | | | 25,000 | | | 25,187 |
| | | | | | |
| | | | | | 162,845 |
| | | | | | |
Insurance - Life - 0.4% | | | | | | |
Genworth Financial, Inc. | | | | | | |
5.75%, 2014 | | | 40,000 | | | 40,757 |
6.15%, 2066 (6) | | | 18,000 | | | 17,975 |
Hartford Financial Services Group, Inc. | | | | | | |
5.25%, 2011 | | | 25,000 | | | 24,945 |
4.75%, 2014 | | | 55,000 | | | 52,223 |
Metlife, Inc. | | | | | | |
6.13%, 2011 | | | 50,000 | | | 51,687 |
Nationwide Financial Services | | | | | | |
5.90%, 2012 | | | 50,000 | | | 50,958 |
NLV Financial Corporation | | | | | | |
7.50%, 2033 (1)(2)(3) | | | 30,000 | | | 32,672 |
Principal Financial Group, Inc. | | | | | | |
6.05%, 2036 | | | 30,000 | | | 30,710 |
Principal Life Global Funding I | | | | | | |
5.13%, 2013 (1)(2)(3) | | | 45,000 | | | 44,563 |
Sun Life Financial Global Funding, LP | | | | | | |
5.614%, 2013 (1)(2)(3)(6) | | | 45,000 | | | 44,947 |
Torchmark Corporation | | | | | | |
6.38%, 2016 | | | 30,000 | | | 30,987 |
| | | | | | |
| | | | | | 422,424 |
| | | | | | |
Insurance - Property & Casualty - 0.1% | | | | | | |
Ace INA Holdings, Inc. | | | | | | |
5.88%, 2014 | | | 35,000 | | | 35,672 |
Fund American Companies, Inc. | | | | | | |
5.88%, 2013 | | | 45,000 | | | 44,731 |
Nationwide Mutual Insurance Company | | | | | | |
6.60%, 2034 (1)(2)(3) | | | 25,000 | | | 24,471 |
| | | | | | |
| | | | | | 104,874 |
| | | | | | |
Integrated Energy - 0.1% | | | | | | |
ConocoPhillips | | | | | | |
5.90%, 2032 | | | 40,000 | | | 40,635 |
Hess Corporation | | | | | | |
7.88%, 2029 | | | 20,000 | | | 23,346 |
Petro-Canada | | | | | | |
5.95%, 2035 | | | 40,000 | | | 37,930 |
| | | | | | |
| | | | | | 101,911 |
| | | | | | |
Media - Cable - 0.5% | | | | | | |
Charter Communications Operating LLC | | | | | | |
8.00%, 2012 (2)(3) | | | 25,000 | | | 25,969 |
Comcast Cable Communications Holdings Inc. | | | | | | |
8.38%, 2013 | | | 45,000 | | | 51,258 |
Comcast Corporation | | | | | | |
4.95%, 2016 | | | 30,000 | | | 28,065 |
5.875%, 2018 | | | 45,000 | | | 44,516 |
The accompanying notes are an integral part of the financial statements.
87
| | |
| Schedule of Investments | | Series N (Managed Asset Allocation Series) |
| December 31, 2006 - continued | | |
| | | | | | |
| | | Principal
Amount | | Value |
CORPORATE BOND (continued) | | | | | | |
Media - Cable (continued) | | | | | | |
COX Communications, Inc. | | | | | | |
7.13%, 2012 | | $ | 50,000 | | $ | 53,303 |
CSC Holdings, Inc. | | | | | | |
7.25%, 2008 | | | 100,000 | | | 100,875 |
Rogers Cable, Inc. | | | | | | |
5.50%, 2014 | | | 40,000 | | | 38,248 |
Time Warner Entertainment Company, LP | | | | | | |
7.25%, 2008 | | | 40,000 | | | 41,125 |
8.38%, 2023 | | | 40,000 | | | 46,926 |
Time Warner, Inc. | | | | | | |
5.50%, 2011 | | | 30,000 | | | 29,923 |
Viacom, Inc. | | | | | | |
6.25%, 2016 | | | 35,000 | | | 34,758 |
| | | | | | |
| | | | | | 494,966 |
| | | | | | |
Media - Non Cable - 0.2% | | | | | | |
Advanstar Communications, Inc. | | | | | | |
10.75%, 2010 | | | 25,000 | | | 26,906 |
Affinity Group, Inc. | | | | | | |
9.00%, 2012 | | | 25,000 | | | 24,750 |
Dex Media East LLC | | | | | | |
9.88%, 2009 | | | 25,000 | | | 26,187 |
12.13%, 2012 | | | 32,000 | | | 35,240 |
Idearc, Inc. | | | | | | |
8.00%, 2016 (2)(3) | | | 100,000 | | | 101,500 |
News America, Inc. | | | | | | |
6.40%, 2035 | | | 45,000 | | | 44,705 |
| | | | | | |
| | | | | | 259,288 |
| | | | | | |
Metals & Mining - 0.2% | | | | | | |
Alcan, Inc. | | | | | | |
5.00%, 2015 | | | 55,000 | | | 52,312 |
Alcoa, Inc. | | | | | | |
6.00%, 2012 | | | 30,000 | | | 30,784 |
Newmont Mining Corporation | | | | | | |
5.88%, 2035 | | | 20,000 | | | 18,591 |
Russel Metals, Inc. | | | | | | |
6.38%, 2014 | | | 25,000 | | | 23,844 |
Sunoco, Inc. | | | | | | |
5.75%, 2017 | | | 34,000 | | | 33,262 |
| | | | | | |
| | | | | | 158,793 |
| | | | | | |
Natural Gas Pipelines - 0.1% | | | | | | |
Boardwalk Pipelines LLC | | | | | | |
5.50%, 2017 | | | 10,000 | | | 9,633 |
Duke Capital LLC | | | | | | |
6.25%, 2013 | | | 40,000 | | | 41,213 |
Williams Companies, Inc. | | | | | | |
8.75%, 2032 (7) | | | 25,000 | | | 28,250 |
| | | | | | |
| | | | | | 79,096 |
| | | | | | |
Oil Field Services - 0.4% | | | | | | |
Baker Hughes, Inc. | | | | | | |
6.88%, 2029 | | | 55,000 | | | 60,839 |
Chesapeake Energy Corporation | | | | | | |
6.50%, 2017 | | | 100,000 | | | 97,750 |
Denbury Resources, Inc. | | | | | | |
7.50%, 2015 | | | 50,000 | | | 51,000 |
Diamond Offshore Drilling, Inc. | | | | | | |
5.15%, 2014 | | | 25,000 | | | 23,994 |
Halliburton Company | | | | | | |
5.50%, 2010 | | | 60,000 | | | 59,893 |
Pemex Project Funding Master Trust | | | | | | |
6.66%, 2010 (1)(2)(3)(6) | | | 45,000 | | | 46,192 |
5.75%, 2015 | | | 45,000 | | | 44,685 |
XTO Energy, Inc. | | | | | | |
5.65%, 2016 | | | 25,000 | | | 24,715 |
| | | | | | |
| | | | | | 409,068 |
| | | | | | |
Packaging - 0.1% | | | | | | |
BWAY Corporation | | | | | | |
10.00%, 2010 (7) | | | 25,000 | | | 26,187 |
Graphic Packaging International Corporation | | | | | | |
8.50%, 2011 | | | 25,000 | | | 25,875 |
Owens Brockway Glass Container, Inc. | | | | | | |
8.88%, 2009 | | | 25,000 | | | 25,563 |
8.75%, 2012 | | | 25,000 | | | 26,500 |
Owens-Illinois, Inc. | | | | | | |
7.35%, 2008 | | | 25,000 | | | 25,156 |
| | | | | | |
| | | | | | 129,281 |
| | | | | | |
Paper - 0.2% | | | | | | |
Boise Cascade LLC | | | | | | |
7.13%, 2014 | | | 25,000 | | | 24,187 |
Georgia-Pacific Corporation | | | | | | |
7.13%, 2017 (2)(3) | | | 100,000 | | | 99,750 |
Sealed Air Corporation | | | | | | |
5.38%, 2008 (1)(2)(3) | | | 40,000 | | | 39,808 |
| | | | | | |
| | | | | | 163,745 |
| | | | | | |
Pharmaceuticals - 0.2% | | | | | | |
HCA, Inc. | | | | | | |
8.75%, 2010 | | | 125,000 | | | 130,312 |
Teva Pharmaceutical Finance LLC | | | | | | |
5.55%, 2016 | | | 20,000 | | | 19,557 |
VWR International, Inc. | | | | | | |
8.00%, 2014 | | | 25,000 | | | 25,750 |
| | | | | | |
| | | | | | 175,619 |
| | | | | | |
Pipelines - 0.1% | | | | | | |
ANR Pipeline Company | | | | | | |
8.88%, 2010 | | | 25,000 | | | 26,227 |
Panhandle Eastern Pipe Line | | | | | | |
4.80%, 2008 | | | 20,000 | | | 19,703 |
Roseton | | | | | | |
7.27%, 2010 | | | 25,000 | | | 25,563 |
The accompanying notes are an integral part of the financial statements.
88
| | |
| Schedule of Investments | | Series N (Managed Asset Allocation Series) |
| December 31, 2006 - continued | | |
| | | | | | |
| | | Principal
Amount | | Value |
CORPORATE BOND (continued) | | | | | | |
Pipelines (continued) | | | | | | |
Williams Companies, Inc. | | | | | | |
7.75%, 2031 | | $ | 25,000 | | $ | 26,250 |
| | | | | | |
| | | | | | 97,743 |
| | | | | | |
Railroads - 0.1% | | | | | | |
CSX Corporation | | | | | | |
6.00%, 2036 | | | 25,000 | | | 24,996 |
Norfolk Southern Corporation | | | | | | |
6.00%, 2008 | | | 50,000 | | | 50,394 |
| | | | | | |
| | | | | | 75,390 |
| | | | | | |
Refining - 0.1% | | | | | | |
Denbury Resources, Inc. | | | | | | |
7.50%, 2013 | | | 25,000 | | | 25,375 |
Diamond Offshore Drilling, Inc. | | | | | | |
4.88%, 2015 | | | 30,000 | | | 28,160 |
Valero Energy Corporation | | | | | | |
3.50%, 2009 | | | 35,000 | | | 33,611 |
| | | | | | |
| | | | | | 87,146 |
| | | | | | |
REITs - 0.1% | | | | | | |
Archstone-Smith Operating Trust | | | | | | |
5.25%, 2015 | | | 40,000 | | | 39,247 |
Federal Realty Invs Trust | | | | | | |
6.00%, 2012 | | | 15,000 | | | 15,309 |
Reckson Operating Partnership, LP | | | | | | |
6.00%, 2016 | | | 30,000 | | | 29,278 |
Simon Property Group, LP | | | | | | |
3.75%, 2009 | | | 45,000 | | | 43,706 |
| | | | | | |
| | | | | | 127,540 |
| | | | | | |
Retailers - 0.3% | | | | | | |
AmeriGas Partners, LP | | | | | | |
7.125%, 2016 | | | 100,000 | | | 100,000 |
Home Depot, Inc. | | | | | | |
5.40%, 2016 | | | 65,000 | | | 63,573 |
JC Penney Corporation, Inc. | | | | | | |
9.00%, 2012 | | | 30,000 | | | 34,303 |
Wal-Mart Stores, Inc. | | | | | | |
5.25%, 2035 | | | 45,000 | | | 41,324 |
Yum! Brands, Inc. | | | | | | |
7.70%, 2012 | | | 25,000 | | | 27,329 |
| | | | | | |
| | | | | | 266,529 |
| | | | | | |
Services - 0.0% | | | | | | |
Brickman Group, Ltd. | | | | | | |
11.75%, 2009 | | | 25,000 | | | 26,562 |
| | | | | | |
Sovereigns - 0.2% | | | | | | |
Federal Home Loan Mortgage Corporation | | | | | | |
5.13%, 2009 | | | 75,000 | | | 74,889 |
Italy Government International Bond | | | | | | |
5.25%, 2016 | | | 85,000 | | | 85,585 |
| | | | | | |
| | | | | | 160,474 |
| | | | | | |
Technology - 0.3% | | | | | | |
Cisco Systems, Inc. | | | | | | |
5.25%, 2011 | | | 45,000 | | | 45,113 |
Oracle Corporation and Ozark Holding, Inc. | | | | | | |
5.00%, 2011 (3) | | | 50,000 | | | 49,497 |
STATS ChipPAC, Ltd. | | | | | | |
6.75%, 2011 | | | 25,000 | | | 24,500 |
Sungard Data Systems, Inc. | | | | | | |
9.125%, 2013 | | | 100,000 | | | 105,000 |
Xerox Corporation | | | | | | |
6.75%, 2017 | | | 100,000 | | | 104,500 |
| | | | | | |
| | | | | | 328,610 |
| | | | | | |
Telecommunications - Wireless - 0.4% | | | | | | |
America Movil S.A. de CV | | | | | | |
6.38%, 2035 | | | 25,000 | | | 24,391 |
New Cingular Wireless Services, Inc. | | | | | | |
7.88%, 2011 | | | 30,000 | | | 32,723 |
Rogers Wireless, Inc. | | | | | | |
9.63%, 2011 | | | 100,000 | | | 113,500 |
Sprint Capital Corporation | | | | | | |
6.88%, 2028 | | | 7,000 | | | 7,007 |
TELUS Corporation | | | | | | |
8.00%, 2011 | | | 55,000 | | | 60,145 |
UbiquiTel Operating Company | | | | | | |
9.88%, 2011 | | | 25,000 | | | 27,000 |
Verizon Communications, Inc. | | | | | | |
5.55%, 2016 | | | 75,000 | | | 74,741 |
Verizon Global Funding Corporation | | | | | | |
7.75%, 2030 | | | 40,000 | | | 46,919 |
| | | | | | |
| | | | | | 386,426 |
| | | | | | |
Telecommunications - Wirelines - 0.6% | | | | | | |
AT&T, Inc. | | | | | | |
5.30%, 2010 | | | 30,000 | | | 30,004 |
5.10%, 2014 | | | 35,000 | | | 33,983 |
6.45%, 2034 | | | 60,000 | | | 60,890 |
Citizens Communications Company | | | | | | |
6.25%, 2013 | | | 100,000 | | | 98,125 |
Qwest Corporation | | | | | | |
7.50%, 2014 | | | 100,000 | | | 106,000 |
Telecom Italia Capital S.A. | | | | | | |
5.25%, 2013 | | | 95,000 | | | 90,582 |
Telefonica Emisiones SAU | | | | | | |
6.42%, 2016 | | | 75,000 | | | 77,371 |
Telefonos de Mexico S.A. de CV | | | | | | |
5.50%, 2015 | | | 30,000 | | | 29,204 |
Windstream Corporation | | | | | | |
8.63%, 2016 (2)(3) | | | 100,000 | | | 109,500 |
| | | | | | |
| | | | | | 635,659 |
| | | | | | |
Textile - 0.1% | | | | | | |
Invista | | | | | | |
9.25%, 2012 (2)(3) | | | 100,000 | | | 107,250 |
| | | | | | |
The accompanying notes are an integral part of the financial statements.
89
| | |
| Schedule of Investments | | Series N (Managed Asset Allocation Series) |
| December 31, 2006 - continued | | |
| | | | | | |
| | | Principal
Amount | | Value |
CORPORATE BOND (continued) | | | | | | |
Transportation Services - 0.0% | | | | | | |
GATX Financial Corporation | | | | | | |
5.50%, 2012 | | $ | 30,000 | | $ | 29,806 |
| | | | | | |
Utility - Other - 0.1% | | | | | | |
NRG Energy, Inc. | | | | | | |
7.38%, 2016 | | | 75,000 | | | 75,375 |
| | | | | | |
TOTAL CORPORATE BOND (Cost $10,773,681) | | | | | $ | 10,818,404 |
| | | | | | |
FOREIGN BOND - 0.1% | | | | | | |
Luxembourg - 0.1% | | | | | | |
Tyco International Group S.A. | | | | | | |
6.38%, 2011 | | | 40,000 | | | 41,860 |
| | | | | | |
United Kingdom - 0.0% | | | | | | |
HBOS plc | | | | | | |
6.00%, 2033 (1)(2)(3) | | | 40,000 | | | 40,885 |
| | | | | | |
TOTAL FOREIGN BOND (Cost $82,237) | | | | | $ | 82,745 |
| | | | | | |
MUNICIPAL BOND 0.1% | | | | | | |
Kansas - 0.0% | | | | | | |
Kansas Development Finance Authority Revenue Bonds | | | | | | |
5.50%, 2034 | | | 30,000 | | | 30,074 |
| | | | | | |
New York - 0.1% | | | | | | |
New York City Housing Development Corporation Revenue Bonds | | | | | | |
6.42%, 2027 | | | 30,000 | | | 31,005 |
| | | | | | |
Oregon - 0.0% | | | | | | |
State of Oregon General Obligation Unlimited | | | | | | |
5.89%, 2027 | | | 15,000 | | | 15,706 |
| | | | | | |
TOTAL MUNICIPAL BOND (Cost $75,000) | | | | | $ | 76,785 |
| | | | | | |
FOREIGN GOVERNMENT BOND - 0.1 | | | | | | |
Mexico - 0.0% | | | | | | |
Mexico Government International Bond | | | | | | |
6.38%, 2013 | | | 45,000 | | | 47,318 |
| | | | | | |
South Africa - 0.1% | | | | | | |
South Africa Government International Bond | | | | | | |
6.50%, 2014 | | | 65,000 | | | 68,331 |
| | | | | | |
TOTAL FOREIGN GOVERNMENT BOND (Cost $112,468) | | | | | $ | 115,649 |
| | | | | | |
MORTGAGE BACKED SECURITIES - 10.2% | | | | | | |
Federal Home Loan Mortgage Corporation - 0.4% | | | | | | |
Pass-Thru’s - 0.4% | | | | | | |
Federal Home Loan Mortgage Corporation | | | | | | |
#G12463, 5.50% - 2021 | | | 82,822 | | | 82,927 |
#J03615, 6.00% - 2021 | | | 122,948 | | | 124,603 |
#J03640, 6.00% - 2021 | | | 81,230 | | | 82,324 |
#J03672, 6.00% - 2021 | | | 36,712 | | | 37,206 |
#1H2581, 5.145% - 2036 (6) | | | 91,391 | | | 91,279 |
| | | | | | |
| | | | | | 418,339 |
| | | | | | |
Other Non - Agency - 1.7% | | | | | | |
CMO’s - 1.7% | | | | | | |
Banc of America Commercial Mortgage Inc. | | | | | | |
2003-1, 4.65% - 2036 | | | 75,000 | | | 72,711 |
Banc of America Mortgage Securities | | | | | | |
2005-J, 5.266% - 2035 (6) | | | 48,265 | | | 47,704 |
Banc of America Mortgage Securities, Inc. | | | | | | |
2004-A, 4.116% - 2034 (6) | | | 56,875 | | | 55,916 |
2004-D, 4.197% - 2034 (6) | | | 4,571 | | | 4,504 |
2003-L, 4.259% - 2034 (6) | | | 101,060 | | | 99,530 |
2004-H, 4.75% - 2034 (6) | | | 26,906 | | | 26,691 |
2004-I, 4.92% - 2034 (6) | | | 27,918 | | | 27,544 |
Bear Stearns Commercial Mortgage Securities | | | | | | |
2005-PW10, 5.09% - 2040 | | | 132,843 | | | 132,238 |
2005-PWR8, 4.67% - 2041 | | | 60,000 | | | 57,439 |
2006-PW13, 5.54% - 2041 | | | 150,000 | | | 152,168 |
Citigroup | | | | | | |
2005-CD1, 5.225% - 2044 (6) | | | 60,000 | | | 59,613 |
Citigroup Mortgage Loan Trust, Inc. | | | | | | |
2006-AR2, 5.59% - 2036 | | | 45,370 | | | 45,325 |
Commercial Mortgage Pass Through Certificates | | | | | | |
2005-LP5, 4.24% - 2043 | | | 71,375 | | | 70,190 |
DLJ Commercial Mortgage Corporation | | | | | | |
1999-CG2, 7.30% - 2032 | | | 75,000 | | | 77,884 |
GMAC Commercial Mortgage Securities Inc. | | | | | | |
2001-C2, 6.70% - 2034 | | | 125,000 | | | 131,880 |
Greenwich Capital Commercial Funding Corporation | | | | | | |
2004-GG1, 3.84% - 2036 | | | 16,277 | | | 16,152 |
JP Morgan Chase Commercial Mortgage Securities Corporation | | | | | | |
2001-CIBC, 6.26% - 2033 | | | 104,664 | | | 107,884 |
2001-CIB2, 6.24% - 2035 | | | 47,561 | | | 48,127 |
2004-LDP4, 4.82% - 2042 (6) | | | 75,000 | | | 73,088 |
LB-UBS Commercial Mortgage Trust | | | | | | |
2004-C4, 4.567% - 2029 (6) | | | 75,000 | | | 73,874 |
2006-C1, 5.16% - 2031 | | | 150,000 | | | 148,183 |
Morgan Stanley Dean Witter Capital I | | | | | | |
2002-TOP7, 5.98% - 2039 | | | 200,000 | | | 206,368 |
The accompanying notes are an integral part of the financial statements.
90
| | |
| Schedule of Investments | | Series N (Managed Asset Allocation Series) |
| December 31, 2006 - continued | | |
| | | | | | |
| | | Principal
Amount | | Value |
MORTGAGE BACKED SECURITIES (continued) | | | | | | |
Other Non-Agency (continued) | | | | | | |
CMO’s (continued) | | | | | | |
Washington Mutual, Inc. | | | | | | |
2004-AR1, 4.23% - 2034 (6) | | $ | 31,190 | | $ | 30,639 |
| | | | | | |
| | | | | | 1,765,652 |
| | | | | | |
U.S. Government Sponsored Agencies - 7.3% | | | | | | |
CMO’s - 0.4% | | | | | | |
Federal Home Loan Mortgage Corporation | | | | | | |
FHR 2631 IG, 4.50% - 2011 (1)(8) | | | 92,311 | | | 1,304 |
FHR 2614 IH, 4.50% - 2016 (1)(8) | | | 102,000 | | | 10,444 |
FHR 2681 PC, 5.00% - 2019 | | | 100,000 | | | 99,197 |
Federal National Mortgage Association | | | | | | |
FNR 2003-92 NM, 3.50% - 2013 | | | 58,026 | | | 57,020 |
FNR 2002-74 PJ, 5.00% - 2015 | | | 150,000 | | | 149,037 |
FNR 2003-40 NI, 5.50% - 2028 (1)(8) | | | 13,441 | | | 1,088 |
FNR 2006-35 GK, 6.00% - 2032 | | | 121,554 | | | 122,718 |
FNS 319 2, 6.50% - 2032 (1)(8) | | | 14,699 | | | 3,354 |
| | | | | | |
| | | | | | 444,162 |
| | | | | | |
Pass-Thru’s - 6.9% | | | | | | |
Federal Home Loan Mortgage Corporation | | | | | | |
#M80714, 5.00% - 2008 | | | 24,338 | | | 24,166 |
#E81544, 6.00% - 2009 | | | 123,000 | | | 123,028 |
#B10343, 5.00% - 2018 | | | 7,644 | | | 7,527 |
#E99933, 5.00% - 2018 | | | 4,819 | | | 4,745 |
#E99966, 5.00% - 2018 | | | 27,340 | | | 26,921 |
#E01341, 5.50% - 2018 | | | 8,684 | | | 8,698 |
#G11759, 5.50% - 2018 | | | 228,239 | | | 228,626 |
#B19214, 5.50%-2020 | | | 32,806 | | | 32,779 |
#J02272, 5.50% - 2020 | | | 81,236 | | | 81,170 |
#J02554, 5.50% - 2020 | | | 88,802 | | | 88,729 |
#J03203, 6.00% - 2021 | | | 96,032 | | | 97,325 |
#J03254, 6.00% - 2021 | | | 30,104 | | | 30,509 |
#1B0527, 4.52% - 2032 (6) | | | 11,352 | | | 11,331 |
#C72128, 6.00% -2032 | | | 70,922 | | | 71,614 |
#C68205, 7.00% - 2032 | | | 6,756 | | | 6,945 |
#A12118, 5.00% - 2033 | | | 57,812 | | | 55,880 |
#A15852, 5.00% - 2033 | | | 20,787 | | | 20,092 |
#A15907, 5.00% - 2033 | | | 27,791 | | | 26,863 |
#D86309, 5.00% - 2033 | | | 32,078 | | | 31,006 |
#G01628, 6.00% - 2033 | | | 139,221 | | | 140,484 |
#A21263, 4.50% - 2034 | | | 143,038 | | | 134,188 |
#A46897, 4.50% - 2035 | | | 99,298 | | | 93,051 |
#G01805, 4.50% - 2035 | | | 323,834 | | | 304,862 |
#1G1762, 5.061% - 2035 (6) | | | 42,523 | | | 42,170 |
#1G0661, 5.428% - 2036 (6) | | | 22,747 | | | 22,820 |
Federal National Mortgage Association | | | | | | |
#254140, 5.50% - 2017 | | | 6,112 | | | 6,130 |
#254234, 5.50% - 2017 | | | 6,030 | | | 6,047 |
#625931, 5.50% - 2017 | | | 5,396 | | | 5,412 |
#357280, 6.50% - 2017 | | | 26,610 | | | 27,254 |
#254720, 4.50% - 2018 | | | 119,703 | | | 115,759 |
#555345, 5.50% - 2018 | | | 6,008 | | | 6,025 |
#555446, 5.50% - 2018 | | | 9,185 | | | 9,207 |
#555526, 5.50% - 2018 | | | 142,691 | | | 143,031 |
#555693, 5.50% - 2018 | | | 83,223 | | | 83,421 |
#685202, 5.50% - 2018 | | | 74,199 | | | 74,340 |
#725098, 5.50% - 2018 | | | 17,985 | | | 18,020 |
#357475, 4.50% - 2019 | | | 122,930 | | | 118,879 |
#725528, 5.50% - 2019 | | | 13,940 | | | 13,966 |
#789885, 5.50% - 2019 | | | 16,459 | | | 16,491 |
#829028, 4.50% - 2020 | | | 200,155 | | | 193,109 |
#896595, 6.00% - 2021 | | | 117,823 | | | 119,482 |
TBA, 7.00% - 2031 | | | 75,000 | | | 76,969 |
#254514, 5.50% - 2032 | | | 3,376 | | | 3,342 |
#254550, 6.50% - 2032 | | | 21,844 | | | 22,345 |
#545759, 6.50% - 2032 | | | 131,050 | | | 133,524 |
#650075, 6.50% - 2032 | | | 19,786 | | | 20,240 |
#728720, 5.00% - 2033 | | | 125,237 | | | 121,146 |
#745944, 5.00% - 2033 | | | 74,591 | | | 72,004 |
#254767, 5.50% - 2033 | | | 166,212 | | | 164,518 |
#254983, 5.50% - 2033 | | | 78,843 | | | 78,039 |
#744692, 5.50% - 2033 | | | 41,748 | | | 41,323 |
#744750, 5.50% - 2033 | | | 17,107 | | | 16,932 |
#747387, 5.50% - 2033 | | | 26,885 | | | 26,611 |
#747549, 5.50% - 2033 | | | 8,657 | | | 8,569 |
#750362, 5.50% - 2033 | | | 33,814 | | | 33,469 |
#756190, 5.50% - 2033 | | | 40,706 | | | 40,291 |
#555417, 6.00% - 2033 | | | 92,184 | | | 93,087 |
#725232, 5.00% - 2034 | | | 24,377 | | | 23,581 |
#255028, 5.50% - 2034 | | | 19,326 | | | 19,098 |
#725424, 5.50% - 2034 | | | 372,180 | | | 368,386 |
#725773, 5.50% - 2034 | | | 285,922 | | | 282,550 |
#762076, 5.50% - 2034 | | | 49,562 | | | 49,057 |
#789293, 5.50% - 2034 | | | 157,759 | | | 156,338 |
#796104, 5.50% - 2034 | | | 41,359 | | | 40,916 |
#804395, 5.50% - 2034 | | | 108,706 | | | 107,541 |
#255459, 6.00% - 2034 | | | 46,168 | | | 46,514 |
#725162, 6.00% - 2034 | | | 85,609 | | | 86,331 |
#725690, 6.00% - 2034 | | | 47,495 | | | 47,851 |
#725704, 6.00% - 2034 | | | 393,666 | | | 396,985 |
#790044, 6.00% - 2034 | | | 48,766 | | | 49,132 |
#790217, 6.00% - 2034 | | | 19,430 | | | 19,575 |
#790237, 6.00% - 2034 | | | 45,942 | | | 46,287 |
The accompanying notes are an integral part of the financial statements.
91
| | |
| Schedule of Investments | | Series N (Managed Asset Allocation Series) |
| December 31, 2006 - continued | | |
| | | | | | |
| | | Principal Amount | | Value |
MORTGAGE BACKED SECURITIES (continued) | | | | | | |
U.S. Government Sponsored Agencies (continued) | | | | | | |
Pass-Thru’s (continued) | | | | | | |
Federal National Mortgage Association (continued) | | | | | | |
#790629, 6.00% - 2034 | | $ | 45,831 | | $ | 46,175 |
#790788, 6.00% - 2034 | | | 51,265 | | | 51,649 |
#791574, 6.00% - 2034 | | | 48,725 | | | 49,090 |
#745216, 4.777% - 2035 (6) | | | 76,386 | | | 76,167 |
#821765, 4.801% - 2035 (6) | | | 39,097 | | | 38,938 |
#830880, 5.00% - 2035 | | | 77,957 | | | 75,286 |
#835753, 5.00% - 2035 | | | 654,032 | | | 631,627 |
#850863, 5.32% - 2035 (6) | | | 37,057 | | | 37,044 |
#846551, 5.353% - 2035 (6) | | | 43,594 | | | 43,625 |
#848476, 5.517% - 2035 (6) | | | 66,140 | | | 66,430 |
#848522, 5.669% - 2035 (6) | | | 20,887 | | | 20,938 |
#745275, 5.00% - 2036 | | | 34,842 | | | 33,649 |
#745167, 5.674% - 2036 (6) | | | 44,186 | | | 44,260 |
#893353, 6.00% - 2036 | | | 65,273 | | | 65,715 |
#745554, 6.50% - 2036 | | | 498,954 | | | 508,465 |
#896329, 6.50% - 2036 | | | 48,746 | | | 49,665 |
| | | | | | |
| | | | | | 7,203,376 |
| | | | | | |
| | | | | | 7,647,538 |
| | | | | | |
U.S. Government Sponsored | | | | | | |
Securities - 0.8% | | | | | | |
Pass-Thru’s - 0.8% | | | | | | |
Government National Mortgage | | | | | | |
Association | | | | | | |
#780766, 7.00% - 2013 | | | 5,215 | | | 5,266 |
#781312, 7.00% - 2013 | | | 25,997 | | | 26,831 |
#67365,11.50% - 2013 | | | 1,564 | | | 1,725 |
G2 2102, 8.00% - 2025 | | | 1,152 | | | 1,216 |
#427029, 8.50% - 2026 | | | 7,970 | | | 8,550 |
G2 3295, 5.50% - 2032 | | | 14,026 | | | 13,947 |
#604639, 5.00% - 2033 | | | 75,035 | | | 73,065 |
#612919, 5.00%-2033 | | | 204,475 | | | 199,106 |
#615278, 5.00% - 2033 | | | 93,741 | | | 91,279 |
G2 3442, 5.00% - 2033 | | | 181,679 | | | 176,190 |
G2 3458, 5.00% - 2033 | | | 51,150 | | | 49,599 |
G2 3443, 5.50% - 2033 | | | 60,786 | | | 60,412 |
G2 3490, 6.50% - 2033 | | | 11,864 | | | 12,135 |
G2 3513, 5.00% - 2034 | | | 64,325 | | | 62,340 |
G2 3529, 5.00% - 2034 | | | 16,094 | | | 15,597 |
G2 3530, 5.50% - 2034 | | | 28,337 | | | 28,148 |
G2 3517, 6.00% - 2034 | | | 39,551 | | | 40,027 |
G2 3612, 6.50% - 2034 | | | 21,350 | | | 21,830 |
| | | | | | |
| | | | | | 887,263 |
| | | | | | |
TOTAL MORTGAGE BACKED SECURITIES (Cost $10,850,580) | | | | | $ | 10,718,792 |
| | | | | | |
| | | | | |
| | | Principal
Amount | | Value |
U.S. GOVERNMENT SPONSORED AGENCY BONDS & NOTES - 2.0% | | | | | |
Federal Home Loan Bank | | | | | |
5.60% - 2011 | | 10,000 | | | 10,259 |
5.125% - 2013 | | 165,000 | | | 166,362 |
5.25% - 2014 | | 135,000 | | | 137,206 |
Federal Home Loan Mortgage Corporation | | | | | |
4.13% - 2010 | | 145,000 | | | 141,016 |
Federal National Mortgage Association | | | | | |
3.25% - 2008 | | 690,000 | | | 670,636 |
3.38% - 2008 | | 185,000 | | | 179,354 |
6.63% - 2010 | | 140,000 | | | 148,269 |
6.00% - 2011 | | 362,000 | | | 376,926 |
4.38% - 2012 | | 105,000 | | | 102,018 |
4.875% - 2016 | | 165,000 | | | 163,153 |
| | | | | |
TOTAL U.S. GOVERNMENT SPONSORED AGENCY BONDS & NOTES (Cost $2,122,107) | | | | $ | 2,095,199 |
| | | | | |
U.S. GOVERNMENT SECURITIES - 10.8% | | | | | |
U.S. Treasury Bonds | | | | | |
3.50%, 2010 | | 925,000 | | | 892,481 |
4.25%, 2013 | | 1,240,000 | | | 1,207,257 |
4.25%, 2014 | | 330,000 | | | 320,126 |
7.50%, 2016 | | 215,000 | | | 261,258 |
8.50%, 2020 | | 55,000 | | | 74,280 |
6.25%, 2023 | | 55,000 | | | 63,306 |
5.50%, 2028 | | 505,000 | | | 545,558 |
6.25%, 2030 | | 80,000 | | | 95,300 |
5.38%, 2031 | | 195,000 | | | 208,878 |
4.50%, 2036 | | 300,000 | | | 285,282 |
U.S. Treasury Inflation Indexed Bonds | | | | | |
2.00%, 2014 | | 317,208 | | | 307,877 |
U.S. Treasury Notes | | | | | |
3.63%, 2007 | | 775,000 | | | 769,793 |
4.25%, 2007 | | 50,000 | | | 49,656 |
3.38%, 2008 | | 325,000 | | | 316,672 |
4.375%, 2008 | | 455,000 | | | 451,339 |
4.00%, 2009 | | 765,000 | | | 751,821 |
3.875%, 2010 | | 180,000 | | | 174,973 |
5.75%, 2010 | | 795,000 | | | 822,421 |
5.00%, 2011 | | 1,225,000 | | | 1,242,130 |
4.88%, 2012 | | 1,650,000 | | | 1,665,083 |
4.75%, 2014 | | 55,000 | | | 55,142 |
5.125%, 2016 | | 560,000 | | | 576,822 |
United States Treasury Inflation Indexed Bonds | | | | | |
2.50%, 2016 | | 296,074 | | | 298,317 |
| | | | | |
TOTAL U.S. GOVERNMENT SECURITIES (Cost $11,472,630) | | | | $ | 11,435,772 |
| | | | | |
The accompanying notes are an integral part of the financial statements.
92
| | |
| Schedule of Investments | | Series N (Managed Asset Allocation Series) |
| December 31, 2006 - continued | | |
| | | | | | |
| | | Principal
Amount | | Value |
ASSET BACKED SECURITIES - 1.2% | | | | | | |
Auto - 0.6% | | | | | | |
AmeriCredit Automobile Receivables Trust | | | | | | |
2006-RM, 5.53%, 2014 | | $ | 150,000 | | $ | 151,589 |
Capital Auto Receivables Asset Trust | | | | | | |
2006-1, 5.26%, 2010 | | | 60,000 | | | 59,874 |
2006-SN1A B, 5.32%, | | | | | | |
2010 (1)(2)(3) | | | 175,000 | | | 175,198 |
2006-SN1A A4A, 5.50%, | | | | | | |
2010 (1)(2)(3) | | | 25,000 | | | 25,055 |
Hyundai Auto Receivables Trust | | | | | | |
2006-A, 5.26%, 2012 | | | 70,000 | | | 70,095 |
Triad Auto Receivables Owner Trust | | | | | | |
2006-B, 5.52%, 2012 | | | 100,000 | | | 100,897 |
| | | | | | |
| | | | | | 582,708 |
| | | | | | |
| | |
Credit Cards - 0.1% | | | | | | |
Capital One Multi-Asset Execution Trust | | | | | | |
2005-A7, 4.70%, 2015 | | | 70,000 | | | 68,811 |
GE Capital Credit Card Master Note Trust | | | | | | |
2006-1, 5.08%, 2012 | | | 50,000 | | | 50,064 |
| | | | | | |
| | | | | | 118,875 |
| | | | | | |
| | |
Home Equity Loans - 0.1% | | | | | | |
BankBoston Home Equity Loan Trust | | | | | | |
1998-1, 6.35%, 2013 | | | 16,369 | | | 16,418 |
Chase Funding Mortgage Loan | | | | | | |
Asset-Backed Certificates | | | | | | |
2002-2, 5.60%, 2031 | | | 9,072 | | | 9,008 |
New Century Home Equity Loan Trust | | | | | | |
2005-A, 4.95%, 2035 | | | 50,000 | | | 48,586 |
2005-A, 5.34%, 2035 | | | 45,000 | | | 44,073 |
| | | | | | |
| | | | | | 118,085 |
| | | | | | |
| | |
Other - 0.4% | | | | | | |
CenterPoint Energy Transition Bond | | | | | | |
Company LLC | | | | | | |
2001-1, 5.63%, 2015 | | | 75,000 | | | 76,701 |
GE Equipment Small Ticket LLC | | | | | | |
2005-1A, 4.51%, 2014 (1)(2)(3) | | | 100,000 | | | 98,564 |
Marriott Vacation Club Owner Trust | | | | | | |
2006-2A, 5.362%, | | | | | | |
2028 (1)(2)(3)(5) | | | 44,924 | | | 44,875 |
2006-1A, 5.74%, | | | | | | |
2028 (1)(2)(3)(5) | | | 120,822 | | | 122,195 |
Peco Energy Transition Trust | | | | | | |
2001-A, 6.52%, 2010 (3) | | | 100,000 | | | 104,336 |
| | | | | | |
| | | | | | 446,671 |
| | | | | | |
TOTAL ASSET BACKED SECURITIES (Cost $1,269,672) | | | | | $ | 1,266,339 |
| | | | | | |
SHORT TERM INVESTMENTS - 0.5% | | | | | | |
State Street GA Money Market Fund | | $ | 30,158 | | $ | 30,158 |
| | |
T. Rowe Price Reserve Investment Fund | | $ | 502,471 | | $ | 502,471 |
| | | | | | |
TOTAL SHORT TERM INVESTMENTS (Cost $532,629) | | | | | $ | 532,629 |
| | | | | | |
Total Investments (SBL N Fund) (Cost $93,070,711) - 99.9% | | | | | $ | 105,169,704 |
Other Assets in Excess of Liabilities - 0.1% | | | | | | 130,609 |
| | | | | | |
TOTAL NET ASSETS - 100.0% | | | | | $ | 105,300,313 |
| | | | | | |
Footnotes
Percentages are stated as a percent of net assets.
For federal income tax purposes the identified cost of investments owned at 12/31/2006 was $93,739,930.
| * | - Non-income producing security |
| 1 | - Security is deemed illiquid. See Notes to financial statements. |
| 2 | - Security was acquired through a private placement. |
| 3 | - Security is a 144A security, which places restrictions on resale. See Notes to financial statements. |
| 4 | - Security is a PFIC (Passive Foreign Investment Company) |
| 5 | - Security is fair valued by the Board of Directors. See Notes to financial statements. |
| 6 | - Variable rate security. Rate indicated is rate effective at December 31, 2006. |
| 7 | - Security is a step-up bond. Rate indicated is rate effective at December 31, 2006. |
| 8 | - Security is an interest-only strip. Rate indicated is effective yield at December 31, 2006. |
| ADR | - American Depositary Receipt |
| GDR | - Global Depositary Reciept |
| plc | - Public Limited Company |
See notes to financial statements.
The accompanying notes are an integral part of the financial statements.
93
Series N
(Managed Asset Allocation Series)
Statement of Assets and Liabilities
December 31, 2006
| | | |
Assets: | | | |
Investments, at value1 | | $ | 105,169,704 |
Cash | | | 17,082 |
Cash denominated in a foreign currency, at value2 | | | 11,682 |
Receivables: | | | |
Fund shares sold | | | 102,456 |
Securities sold | | | 552,310 |
Interest | | | 391,079 |
Dividends | | | 87,633 |
Foreign taxes recoverable | | | 3,701 |
Prepaid expenses | | | 2,374 |
| | | |
Total assets | | | 106,338,021 |
| | | |
Liabilities: | | | |
Payable for: | | | |
Securities purchased | | | 601,152 |
Fund shares redeemed | | | 269,398 |
Management fees | | | 89,713 |
Custodian fees | | | 8,732 |
Transfer agent/maintenance fees | | | 2,083 |
Administration fees | | | 43,457 |
Professional fees | | | 14,036 |
Directors’ fees | | | 2,500 |
Other fees | | | 6,637 |
| | | |
Total liabilities | | | 1,037,708 |
| | | |
Net Assets | | $ | 105,300,313 |
| | | |
Net assets consist of: | | | |
Paid in capital | | $ | 85,982,212 |
Undistributed net investment income | | | 1,461,148 |
Undistributed net realized gain on sale of investments and foreign currency transactions | | | 5,759,233 |
Net unrealized appreciation in value of investments and translation of assets and liabilities in foreign currency | | | 12,097,720 |
| | | |
Net assets | | $ | 105,300,313 |
| | | |
Capital shares authorized | | | unlimited |
Capital shares outstanding | | | 5,677,439 |
Net asset value per share (net assets divided by shares outstanding) | | $ | 18.55 |
| | | |
1Investments, at cost | | $ | 93,070,711 |
2Cash denominated in a foreign currency, at cost | | | 11,627 |
Statement of Operations
For the Year Ended December 31, 2006
| | | | |
Investment Income: | | | | |
Dividends (net of foreign withholding tax of $ 33,171) | | $ | 1,263,356 | |
Interest | | | 1,823,255 | |
| | | | |
Total investment income | | | 3,086,611 | |
| | | | |
Expenses: | | | | |
Management fees | | | 1,017,950 | |
Administration fees | | | 273,424 | |
Custodian fees | | | 67,754 | |
Transfer agent/maintenance fees | | | 25,210 | |
Directors’ fees | | | 4,861 | |
Professional fees | | | 18,704 | |
Reports to shareholders | | | 17,755 | |
Other expenses | | | 5,872 | |
| | | | |
Total expenses | | | 1,431,530 | |
Less: Earnings credits applied | | | (1,034 | ) |
| | | | |
Net expenses | | | 1,430,496 | |
| | | | |
Net investment income | | | 1,656,115 | |
| | | | |
| |
Net Realized and Unrealized Gain (Loss): | | | | |
Net realized gain (loss) during the year on: | | | | |
Investments | | | 6,403,318 | |
Securities sold short | | | (79,576 | ) |
Foreign currency transactions | | | (3,476 | ) |
| | | | |
Net realized gain | | | 6,320,266 | |
| | | | |
Net unrealized appreciation during the year on: | | | | |
Investments | | | 3,602,340 | |
Securities sold short | | | 2,143 | |
Translation of assets and liabilities in foreign currencies | | | 601 | |
| | | | |
Net unrealized appreciation | | | 3,605,084 | |
| | | | |
Net realized and unrealized gain | | | 9,925,350 | |
| | | | |
Net increase in net assets resulting from operations | | $ | 11,581,465 | |
| | | | |
See accompanying notes.
94
| | |
| | | Series N |
| Statement of Changes in Net Assets | | (Managed Asset Allocation Series) |
| | | | | | | | |
| | | Year Ended
December 31, 2006 | | | Year Ended
December 31, 2005 | |
Increase (decrease) in net assets from operations: | | | | | | | | |
Net investment income | | $ | 1,656,115 | | | $ | 1,346,957 | |
Net realized gain during the year on investments and foreign currency transactions | | | 6,320,266 | | | | 6,118,086 | |
Net unrealized appreciation (depreciation) during the year on investments and translation of assets and liabilities in foreign currencies | | | 3,605,084 | | | | (3,416,224 | ) |
| | | | | | | | |
Net increase in net assets resulting from operations | | | 11,581,465 | | | | 4,048,819 | |
| | | | | | | | |
Capital share transactions: | | | | | | | | |
Proceeds from sale of shares | | | 28,766,803 | | | | 23,341,178 | |
Cost of shares redeemed | | | (32,737,523 | ) | | | (22,787,887 | ) |
| | | | | | | | |
Net increase (decrease) from capital share transactions | | | (3,970,720 | ) | | | 553,291 | |
| | | | | | | | |
Net increase in net assets | | | 7,610,745 | | | | 4,602,110 | |
| | | | | | | | |
Net assets: | | | | | | | | |
Beginning of year | | | 97,689,568 | | | | 93,087,458 | |
| | | | | | | | |
End of year | | $ | 105,300,313 | | | $ | 97,689,568 | |
| | | | | | | | |
Undistributed net investment income at end of year | | $ | 1,461,148 | | | $ | 1,197,845 | |
| | | | | | | | |
| | |
Capital Share Activity: | | | | | | | | |
Shares sold | | | 1,670,487 | | | | 1,455,631 | |
Shares redeemed | | | (1,896,770 | ) | | | (1,421,396 | ) |
| | | | | | | | |
Total capital share activity | | | (226,283 | ) | | | 34,235 | |
| | | | | | | | |
See accompanying notes.
95
| | |
| Financial Highlights | | Series N |
| Selected data for each share of capital stock outstanding throughout each year | | (Managed Asset Allocation Series) |
| | | | | | | | | | | | | | | | | | | | |
| | | 2006 | | | 2005 | | | 2004 | | | 2003 | | | Year Ended,
December 31,
2002 | |
Per Share Data | | | | | | | | | | | | | | | | | | | | |
Net asset value, beginning of period | | $ | 16.55 | | | $ | 15.86 | | | $ | 14.40 | | | $ | 11.80 | | | $ | 13.63 | |
| | | | | | | | | | | | | | | | | | | | |
Income (loss) from investment operations: | | | | | | | | | | | | | | | | | | | | |
Net investment income | | | 0.30 | | | | 0.23 | | | | 0.27 | | | | 0.23 | | | | 0.30 | |
Net gain (loss) on securities (realized and unrealized) | | | 1.70 | | | | 0.46 | | | | 1.27 | | | | 2.59 | | | | (1.59 | ) |
| | | | | | | | | | | | | | | | | | | | |
Total from investment operations | | | 2.00 | | | | 0.69 | | | | 1.54 | | | | 2.82 | | | | (1.29 | ) |
| | | | | | | | | | | | | | | | | | | | |
Less distributions: | | | | | | | | | | | | | | | | | | | | |
Dividends from net investment income | | | — | | | | — | | | | (0.08 | ) | | | (0.22 | ) | | | (0.54 | ) |
| | | | | | | | | | | | | | | | | | | | |
Total distributions | | | — | | | | — | | | | (0.08 | ) | | | (0.22 | ) | | | (0.54 | ) |
| | | | | | | | | | | | | | | | | | | | |
Net asset value, end of period | | $ | 18.55 | | | $ | 16.55 | | | $ | 15.86 | | | $ | 14.40 | | | $ | 11.80 | |
| | | | | | | | | | | | | | | | | | | | |
Total Returna | | | 12.08 | % | | | 4.35 | % | | | 10.72 | % | | | 23.90 | % | | | (9.63 | %) |
| | | | | | | | | | | | | | | | | | | | |
Ratios/Supplemental Data | | | | | | | | | | | | | | | | | | | | |
Net assets, end of period (in thousands) | | $ | 105,300 | | | $ | 97,690 | | | $ | 93,087 | | | $ | 86,383 | | | $ | 67,762 | |
| | | | | | | | | | | | | | | | | | | | |
Ratios to average net assets: | | | | | | | | | | | | | | | | | | | | |
Net investment income | | | 1.63 | % | | | 1.44 | % | | | 1.75 | % | | | 1.86 | % | | | 2.22 | % |
Total expensesb | | | 1.41 | % | | | 1.41 | % | | | 1.39 | % | | | 1.23 | % | | | 1.26 | % |
Net expensesc | | | 1.40 | % | | | 1.41 | % | | | 1.39 | % | | | 1.23 | % | | | 1.26 | % |
| | | | | | | | | | | | | | | | | | | | |
Portfolio turnover rate | | | 63 | % | | | 67 | % | | | 79 | % | | | 98 | % | | | 116 | % |
a | Total return does not take into account any of the expenses associated with an investment in variable insurance products offered by Security Benefit Life Insurance Company. If total return had taken into account these expenses, performance would have been lower. Shares of a series of SBL Fund are available only through the purchase of such products. |
b | Total expense information reflects expense ratios absent fund expense reductions by the Investment Manager, and earnings credits, as applicable. |
c | Net expense information reflects the expense ratios after voluntary expense waivers, reimbursements and custodian earnings credits, as applicable. |
See accompanying notes.
96
| | |
| | | Series O |
| Manager’s Commentary | | (Equity Income Series) |
| February 15, 2007 | | (unaudited) |
Subadvisor, T. Rowe Price Associates, Inc.

Brian C. Rogers
Portfolio Manager
Performance
Series O of the SBL Fund - Equity Income Series returned 18.82% during the year, outperforming its benchmark the S&P 500 Index return of 15.79%. The portfolio also outpaced the Lipper Equity Income Funds Index, a measure of the performance of leading equity income funds. Effective stock selection and allocation decisions across a number of sectors helped the portfolio beat its benchmark. Energy was the only sector that detracted from relative returns.
Market Environment
Every sector contributed positively to the index’s gains for the year, led by telecommunication services; energy and utilities also per formed very well. Health care performed the worst of the broad sectors but was still up more than 7%. Information technology was the only other sector in the index to post single-digit returns for the year. Looking at returns by size among the S&P indexes, large- and small-caps outperformed shares of medium-sized companies, while value again outperformed growth by a wide margin.
Portfolio Review
Stock selection in industrials and business services was key to the portfolio’s outperformance, led by positioning in the machinery and commercial services and supplies industries. The single largest contributor in the sector was equipment company Deere, which enjoyed record fourth-quarter earnings. Waste Management was a leading contributor in the commercial services industry, as healthy economic growth early in the year meant strong demand for its products.
In information technology, effective stock selection and an under weight to this lagging sector contributed to relative results. In particular, the portfolio had no exposure to the relatively poor performing Internet software and services industry. It was a similar story in computers and peripherals, where the portfolio was overweight in Dell, which had negative returns for the year. At the same time, we were over weight in IBM, which rallied after reporting strong third-quarter revenue growth. It’s worth mentioning that we added select tech names where we saw attractive values, building a sizable position in Microsoft during the year.
Health care was another sector where stock selection and an underweight position helped relative returns. The portfolio’s health care holdings are focused largely on the pharmaceutical industry, which performed well for the full year. Merck was the leading contributor in this segment, benefiting when one of its vaccines was made part of the routine vaccination schedule for girls.
At the other end of the spectrum, our performance would have been even better relative to the benchmark but for disappointing stock selection among energy shares. An underweight to ExxonMobil and poor performance by portfolio holding Anadarko limited the portfolio’s relative return.
In addition, our stock selection detracted in both the telecommunication services and consumer discretionary sectors; however, overweights to these winning sectors made them positive contributors overall.
Outlook
Going forward, we expect the pace of corporate earnings growth to slow along with the economy, though we still find equity valuations to be reasonable-valuations are neither too high nor compellingly attractive, and liquidity is good. Overall, we’re generally constructive on the outlook for stocks over the next few years, and we think the greater risk today is not a substantial decline from current levels but rather the improbability of earning higher-than-average returns over the foreseeable future. We will continue to employ the discipline that has served investors well over the years, seeking out reasonably valued stocks of high-quality companies while monitoring general economic conditions.
Sincerely,
Brian C. Rogers, Portfolio Manager
97
| | |
| | | Series O |
| Manager’s Commentary | | (Equity Income Series) |
| December 31, 2006 | | (unaudited) |
PERFORMANCE
Series O vs. S&P 500 Index
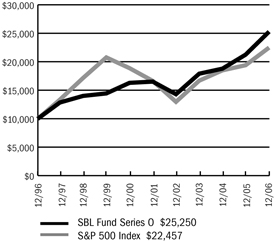
$10,000 Over 10 Years
The chart above assumes a hypothetical $10,000 investment in Series O (Equity Income Series) on December 31, 1996, and reflects the fees and expenses of Series O. The S&P 500 Index is a capitalization-weighted index composed of 500 selected common stocks that represent the broad domestic economy and is a widely recognized unmanaged index of market performance.
Portfolio Composition by Sector
| | | |
Consumer Discretionary | | 14.58 | % |
Consumer Staples | | 8.69 | |
Energy | | 9.35 | |
Financials | | 17.45 | |
Health Care | | 9.29 | |
Industrials | | 12.95 | |
Information Technology | | 6.70 | |
Materials | | 5.23 | |
Telecommunication Services | | 5.34 | |
Utilities | | 5.55 | |
Convertible Bond | | 0.44 | |
Short Term Investments | | 4.44 | |
Liabilities, less cash & other assets | | (0.01 | ) |
Total net assets | | 100.00 | % |
| | | |
Average Annual Returns
| | | | | | |
| Periods Ended 12-31-061 | | 1 Year | | 5 Years | | 10 Years |
Series O | | 18.82% | | 8.87% | | 9.70% |
1 | Performance figures do not reflect fees and expenses associated with an investment in variable insurance products offered by Security Benefit Life Insurance Company. If returns had taken into account these fees and expenses, performance would have been lower. Shares of a Series of SBL Fund are available only through the purchase of such products. |
The performance data quoted above represents past performance. Past performance is not predictive of future performance. The investment return and principal value of an investment will fluctuate so that an investor’s shares, when redeemed, may be worth more or less than their original cost.
See accompanying notes.
98
| | |
| | | Series O |
| Manager’s Commentary | | (Equity Income Series) |
| December 31, 2006 | | (unaudited) |
PERFORMANCE
Information About Your Series Expenses
Calculating your ongoing series expenses
Example
As a shareholder of the Series, you incur ongoing costs, including management fees and other series expenses. Performance figures and expense ratios do not reflect fees and expenses associated with an investment in variable insurance products. Shares of a Series of SBL Fund are available only through the purchase of such products. This example is intended to help you understand your ongoing costs (in dollars) of investing in the Series and to compare these costs with ongoing costs of investing in other mutual funds. The example is based on an investment of $1,000 invested at the beginning of the period and held for the entire period, July 1, 2006 - December 31, 2006.
Actual Expenses
The first line in the table provides information about actual account values and actual expenses. You may use the information in this table, together with the amount you invested, to estimate the expenses that you paid over the period. Simply divide your account value by $1,000 (for example, an $8,600 account value divided by $1,000 = 8.6), then multiply the result by the number in the table under the heading entitled “Expenses Paid During Period” to estimate the expenses you paid on your account during this period.
Hypothetical Example for Comparison Purposes
The second line in the table provides information about hypothetical account values and hypothetical expenses based on the Series actual expense ratio and an assumed rate of return of 5% per year before expenses, which is not the Series actual return. The hypothetical account values and expenses may not be used to estimate the actual ending account balance or expenses you paid for the period. You may use this information to compare the ongoing costs of investing in the Series and other funds. To do so, compare this 5% hypothetical example with the 5% hypothetical examples that appear in the shareholder reports of the other mutual funds.
Please note that the expenses shown in the table are meant to highlight your ongoing costs only and do not reflect any fees and expenses associated with an investment in variable insurance products. Therefore, the second line is useful in comparing ongoing costs only, and will not help you determine the relative total costs of owning different funds. In addition, if these fees and expenses associated with an investment in variable insurance products were included, your costs would have been higher.
Series Expenses
| | | | | | | | | |
| | | Beginning
Account Value
07-01-06 | | Ending Account Value
12-31-061 | | Expenses Paid
During Period2 |
Series O (Equity Income Series) | | | | | | | | | |
Actual | | $ | 1,000.00 | | $ | 1,132.50 | | $ | 6.18 |
Hypothetical | | | 1,000.00 | | | 1,019.41 | | | 5.85 |
1 | The actual ending account value is based on the actual total return of the Series for the period July 1, 2006 to December 31, 2006 after actual expenses and will differ from the hypothetical ending account value which is based on the Series expense ratio and a hypothetical annual return of 5% before expenses. The actual cumulative return at net asset value for the period July 1, 2006 to December 31, 2006 was 13.25%. |
2 | Expenses are equal to the Series annualized expense ratio of 1.15%, net of earnings credits, multiplied by the average account value over the period, multiplied by 184/365 (to reflect the one-half year period). |
99
| | |
| Schedule of Investments | | Series O (Equity Income Series) |
| December 31, 2006 | | |
| | | | | |
| | | Shares | | Value |
COMMON STOCK - 94.5% | | | | | |
Aerospace & Defense - 1.9% | | | | | |
Honeywell International, Inc. | | 77,100 | | $ | 3,488,004 |
Raytheon Company | | 42,100 | | | 2,222,880 |
| | | | | |
| | | | | 5,710,884 |
| | | | | |
Aluminum - 0.6% | | | | | |
Alcoa, Inc. | | 56,000 | | | 1,680,560 |
| | | | | |
Asset Management & Custody Banks - 2.0% | | | | | |
Mellon Financial Corporation | | 79,200 | | | 3,338,280 |
State Street Corporation | | 38,800 | | | 2,616,672 |
| | | | | |
| | | | | 5,954,952 |
| | | | | |
Automobile Manufacturers - 0.2% | | | | | |
Ford Motor Company | | 74,300 | | | 557,993 |
| | | | | |
Biotechnology - 0.4% | | | | | |
Medimmune, Inc. * | | 39,100 | | | 1,265,667 |
| | | | | |
Brewers - 1.1% | | | | | |
Anheuser-Busch Companies, Inc. | | 65,600 | | | 3,227,520 |
| | | | | |
Broadcasting & Cable TV - 1.0% | | | | | |
CBS Corporation (CLB) | | 70,200 | | | 2,188,836 |
EchoStar Communications Corporation * | | 18,200 | | | 692,146 |
| | | | | |
| | | | | 2,880,982 |
| | | | | |
Building Products - 0.6% | | | | | |
Masco Corporation | | 60,700 | | | 1,813,109 |
| | | | | |
Communications Equipment - 1.6% | | | | | |
Cisco Systems, Inc. * | | 44,300 | | | 1,210,719 |
Motorola, Inc. | | 59,300 | | | 1,219,208 |
Nokia Oyj ADR | | 109,400 | | | 2,223,008 |
| | | | | |
| | | | | 4,652,935 |
| | | | | |
Computer & Electronics Retail - 0.2% | | | | | |
RadioShack Corporation | | 43,100 | | | 723,218 |
| | | | | |
Computer Hardware - 2.0% | | | | | |
Dell, Inc. * | | 92,500 | | | 2,320,825 |
International Business Machines Corporation | | 37,100 | | | 3,604,265 |
| | | | | |
| | | | | 5,925,090 |
| | | | | |
Construction & Farm Machinery & Heavy Trucks - 0.0% | | | | | |
Deere & Company | | 700 | | | 66,549 |
| | | | | |
Construction Materials - 0.7% | | | | | |
Vulcan Materials Company | | 22,200 | | | 1,995,114 |
| | | | | |
Data Processing & Outsourced Services - 0.2% | | | | | |
Computer Sciences Corporation * | | 8,800 | | | 469,656 |
| | | | | |
Distributors - 0.6% | | | | | |
Genuine Parts Company | | 35,600 | | | 1,688,508 |
| | | | | |
Diversified Banks - 0.9% | | | | | |
U.S. Bancorp | | 40,700 | | | 1,472,933 |
Wells Fargo & Company | | 33,000 | | | 1,173,480 |
| | | | | |
| | | | | 2,646,413 |
| | | | | |
Diversified Chemicals - 1.0% | | | | | |
E.I. Du Pont de Nemours & Company | | 60,500 | | | 2,946,955 |
| | | | | |
Electric Utilities - 2.7% | | | | | |
Entergy Corporation | | 30,700 | | | 2,834,224 |
FirstEnergy Corporation | | 30,557 | | | 1,839,837 |
Pinnacle West Capital Corporation | | 23,900 | | | 1,210,296 |
Progress Energy, Inc. | | 43,000 | | | 2,110,440 |
| | | | | |
| | | | | 7,994,797 |
| | | | | |
Electrical Components & Equipment - 0.5% | | | | | |
Cooper Industries, Ltd. | | 16,088 | | | 1,454,838 |
| | | | | |
Environmental & Facilities Services - 0.6% | | | | | |
Waste Management, Inc. | | 51,222 | | | 1,883,433 |
| | | | | |
Food Distributors - 0.3% | | | | | |
Sysco Corporation | | 24,500 | | | 900,620 |
| | | | | |
Health Care Equipment - 1.0% | | | | | |
Baxter International, Inc. | | 39,000 | | | 1,809,210 |
Boston Scientific Corporation * | | 68,400 | | | 1,175,112 |
| | | | | |
| | | | | 2,984,322 |
| | | | | |
Home Improvement Retail - 1.0% | | | | | |
Home Depot, Inc. | | 72,000 | | | 2,891,520 |
| | | | | |
Homebuilding - 0.5% | | | | | |
DR Horton, Inc. | | 51,700 | | | 1,369,533 |
| | | | | |
Homefurnishing Retail - 0.5% | | | | | |
Bed Bath & Beyond, Inc. * | | 38,100 | | | 1,451,610 |
| | | | | |
Household Products - 1.9% | | | | | |
Colgate-Palmolive Company | | 56,300 | | | 3,673,012 |
Kimberly-Clark Corporation | | 28,100 | | | 1,909,395 |
| | | | | |
| | | | | 5,582,407 |
| | | | | |
Housewares & Specialties - 1.6% | | | | | |
Fortune Brands, Inc. | | 22,800 | | | 1,946,892 |
Newell Rubbermaid, Inc. | | 92,600 | | | 2,680,770 |
| | | | | |
| | | | | 4,627,662 |
| | | | | |
Hypermarkets & Super Centers - 0.9% | | | | | |
Wal-Mart Stores, Inc. | | 59,100 | | | 2,729,238 |
| | | | | |
Industrial Conglomerates - 4.6% | | | | | |
3M Company | | 32,300 | | | 2,517,139 |
General Electric Company | | 235,100 | | | 8,748,071 |
Tyco International, Ltd. | | 77,600 | | | 2,359,040 |
| | | | | |
| | | | | 13,624,250 |
| | | | | |
The accompanying notes are an integral part of the financial statements.
100
| | |
| Schedule of Investments | | Series O (Equity Income Series) |
| December 31, 2006 - continued | | |
| | | | | |
| | | Shares | | Value |
COMMON STOCK (continued) | | | | | |
Industrial Machinery - 2.0% | | | | | |
Eaton Corporation | | 15,300 | | $ | 1,149,642 |
Illinois Tool Works, Inc. | | 37,700 | | | 1,741,363 |
Ingersoll-Rand Company, Ltd. | | 34,200 | | | 1,338,246 |
Pall Corporation | | 51,000 | | | 1,762,050 |
| | | | | |
| | | | | 5,991,301 |
| | | | | |
Insurance Brokers - 1.6% | | | | | |
Marsh & McLennan Companies, Inc. | | 149,500 | | | 4,583,670 |
| | | | | |
Integrated Oil & Gas - 8.0% | | | | | |
BP plc ADR | | 34,384 | | | 2,307,166 |
Chevron Corporation | | 78,332 | | | 5,759,752 |
Exxon Mobil Corporation | | 75,968 | | | 5,821,428 |
Hess Corporation | | 63,000 | | | 3,122,910 |
Murphy Oil Corporation | | 40,900 | | | 2,079,765 |
Royal Dutch Shell plc ADR | | 64,000 | | | 4,530,560 |
| | | | | |
| | | | | 23,621,581 |
| | | | | |
Integrated Telecommunication Services - 3.8% | | | | | |
AT&T, Inc. | | 150,201 | | | 5,369,686 |
Qwest Communications International, Inc. * | | 323,901 | | | 2,711,051 |
Verizon Communications, Inc. | | 69,636 | | | 2,593,245 |
Windstream Corporation | | 42,804 | | | 608,673 |
| | | | | |
| | | | | 11,282,655 |
| | | | | |
Investment Banking & Brokerage - 1.0% | | | | | |
Charles Schwab Corporation | | 155,400 | | | 3,005,436 |
| | | | | |
Leisure Products - 1.0% | | | | | |
Mattel, Inc. | | 127,400 | | | 2,886,884 |
| | | | | |
Life & Health Insurance - 1.5% | | | | | |
Lincoln National Corporation | | 41,924 | | | 2,783,753 |
UnumProvident Corporation | | 82,700 | | | 1,718,506 |
| | | | | |
| | | | | 4,502,259 |
| | | | | |
Movies & Entertainment - 3.0% | | | | | |
Time Warner, Inc. | | 187,800 | | | 4,090,284 |
Viacom, Inc. (CLB) * | | 48,000 | | | 1,969,440 |
Walt Disney Company | | 78,300 | | | 2,683,341 |
| | | | | |
| | | | | 8,743,065 |
| | | | | |
Multi-Line Insurance - 1.3% | | | | | |
American International Group, Inc. | | 52,500 | | | 3,762,150 |
| | | | | |
Multi-Utilities - 2.8% | | | | | |
Duke Energy Corporation | | 88,400 | | | 2,935,764 |
NiSource, Inc. | | 123,900 | | | 2,985,990 |
TECO Energy, Inc. | | 30,800 | | | 530,684 |
Xcel Energy, Inc. | | 83,700 | | | 1,930,122 |
| | | | | |
| | | | | 8,382,560 |
| | | | | |
Office Services & Supplies - 0.9% | | | | | |
Avery Dennison Corporation | | 38,200 | | | 2,594,926 |
| | | | | |
Oil & Gas Equipment & Services - 0.7% | | | | | |
Schlumberger, Ltd. | | 31,800 | | $ | 2,008,488 |
| | | | | |
Oil & Gas Exploration & Production - 0.7% | | | | | |
Anadarko Petroleum Corporation | | 45,000 | | | 1,958,400 |
| | | | | |
Other Diversified Financial Services - 4.7% | | | | | |
Bank of America Corporation | | 6,588 | | | 351,733 |
Citigroup, Inc. | | 57,233 | | | 3,187,878 |
JPMorgan Chase & Company | | 149,762 | | | 7,233,505 |
Morgan Stanley | | 37,800 | | | 3,078,054 |
| | | | | |
| | | | | 13,851,170 |
| | | | | |
Packaged Foods & Meats - 2.1% | | | | | |
Campbell Soup Company | | 37,600 | | | 1,462,264 |
General Mills, Inc. | | 42,900 | | | 2,471,040 |
Hershey Company | | 3,300 | | | 164,340 |
McCormick & Company, Inc. | | 32,100 | | | 1,237,776 |
Sara Lee Corporation | | 41,600 | | | 708,448 |
| | | | | |
| | | | | 6,043,868 |
| | | | | |
Paper Products - 1.9% | | | | | |
International Paper Company | | 125,920 | | | 4,293,872 |
MeadWestvaco Corporation | | 47,300 | | | 1,421,838 |
| | | | | |
| | | | | 5,715,710 |
| | | | | |
Personal Products - 0.8% | | | | | |
Avon Products, Inc. | | 73,300 | | | 2,421,832 |
| | | | | |
Pharmaceuticals - 7.9% | | | | | |
Abbott Laboratories | | 48,400 | | | 2,357,564 |
Bristol-Myers Squibb Company | | 82,900 | | | 2,181,928 |
Eli Lilly & Company | | 65,900 | | | 3,433,390 |
Johnson & Johnson | | 45,700 | | | 3,017,114 |
Merck & Company, Inc. | | 103,000 | | | 4,490,800 |
Pfizer, Inc. | | 125,100 | | | 3,240,090 |
Schering-Plough Corporation | | 51,900 | | | 1,226,916 |
Wyeth | | 63,100 | | | 3,213,052 |
| | | | | |
| | | | | 23,160,854 |
| | | | | |
Photographic Products - 0.7% | | | | | |
Eastman Kodak Company | | 81,500 | | | 2,102,700 |
| | | | | |
Property & Casualty Insurance - 1.3% | | | | | |
Chubb Corporation | | 22,100 | | | 1,169,311 |
St. Paul Travelers Companies, Inc. | | 51,184 | | | 2,748,069 |
| | | | | |
| | | | | 3,917,380 |
| | | | | |
Publishing - 3.1% | | | | | |
Dow Jones & Company, Inc. | | 58,800 | | | 2,234,400 |
Gannett Company, Inc. | | 12,800 | | | 773,888 |
Idearc, Inc. * | | 3,481 | | | 99,731 |
New York Times Company | | 109,400 | | | 2,664,984 |
Tribune Company | | 111,000 | | | 3,416,580 |
| | | | | |
| | | | | 9,189,583 |
| | | | | |
The accompanying notes are an integral part of the financial statements.
101
| | |
| Schedule of Investments | | Series O (Equity Income Series) |
| December 31, 2006 - continued | | |
| | | | | |
| | | Shares | | Value |
COMMON STOCK (continued) | | | | | |
Railroads - 1.7% | | | | | |
Norfolk Southern Corporation | | 25,400 | | $ | 1,277,366 |
Union Pacific Corporation | | 41,200 | | | 3,791,224 |
| | | | | |
| | | | | 5,068,590 |
| | | | | |
Regional Banks - 2.6% | | | | | |
Fifth Third Bancorp | | 75,400 | | | 3,086,122 |
Mercantile Bankshares Corporation | | 21,450 | | | 1,003,645 |
National City Corporation | | 33,800 | | | 1,235,728 |
SunTrust Banks, Inc. | | 28,600 | | | 2,415,270 |
| | | | | |
| | | | | 7,740,765 |
| | | | | |
Semiconductors - 1.2% | | | | | |
Analog Devices, Inc. | | 68,900 | | | 2,264,743 |
Intel Corporation | | 62,900 | | | 1,273,725 |
| | | | | |
| | | | | 3,538,468 |
| | | | | |
Soft Drinks - 1.1% | | | | | |
Coca-Cola Company | | 68,300 | | | 3,295,475 |
| | | | | |
Specialized Consumer Services - 0.7% | | | | | |
H&R Block, Inc. | | 89,800 | | | 2,068,992 |
| | | | | |
Specially Chemicals - 1.0% | | | | | |
Chemtura Corporation | | 55,100 | | | 530,613 |
International Flavors & Fragrances, Inc. | | 52,000 | | | 2,556,320 |
| | | | | |
| | | | | 3,086,933 |
| | | | | |
Systems Software - 1.8% | | | | | |
Microsoft Corporation | | 173,300 | | | 5,174,738 |
| | | | | |
Thrifts & Mortgage Finance - 0.5% | | | | | |
Federal National Mortgage Association | | 25,700 | | | 1,526,323 |
| | | | | |
Tobacco - 0.5% | | | | | |
UST, Inc. | | 24,500 | | | 1,425,900 |
| | | | | |
Wireless Telecommunication Services - 1.5% | | | | | |
Alltel Corporation | | 39,100 | | | 2,364,768 |
Sprint Nextel Corporation | | 112,000 | | | 2,115,680 |
| | | | | |
| | | | | 4,480,448 |
| | | | | |
TOTAL COMMON STOCK (Cost $224,366,036) | | | | $ | 278,833,439 |
| | | | | |
FOREIGN STOCK - 0.6% | | | | | |
Japan - 0.6% | | | | | |
Sony Corporation | | 42,700 | | | 1,829,923 |
| | | | | |
TOTAL FOREIGN STOCK (Cost $1,583,432) | | | | $ | 1,829,923 |
| | | | | |
| | | | | | |
| | | Principal Amount | | Value |
CONVERTIBLE BOND - 0.4% | | | | | | |
Automotive - 0.1% | | | | | | |
Ford Motor Company | | | | | | |
4.25%, 2036 | | $ | 380,000 | | | 406,125 |
| | | | | | |
Communications - 0.3% | | | | | | |
Lucent Technologies, Inc. | | | | | | |
8.00%, 2031 | | $ | 895,000 | | $ | 895,000 |
| | | | | | |
TOTAL CONVERTIBLE BOND (Cost $1,0033,216) | | | | | $ | 1,301,125 |
| | | | | | |
SHORT TERM INVESTMENTS - 4.5% | | | | | | |
State Street GA Money Market Fund | | $ | 6,342,080 | | $ | 6,342,080 |
T. Rowe Price Reserve Investment Fund | | | 6,784,102 | | | 6,784,102 |
| | | | | | |
TOTAL SHORT TERM INVESTMENTS (Cost $13,126,182) | | | | | $ | 13,126,182 |
| | | | | | |
Total Investments (SBLO Fund) (Cost $240,108,866) - 100.0% | | | | | | $295,090,669 |
Liabilities in Excess of Other Assets - 0.0% | | | | | | (41.325) |
| | | | | | |
TOTAL NET ASSETS - 100.0% | | | | | | $295,049,344 |
| | | | | | |
Footnotes
Percentages are stated as a percent of net assets.
For federal income tax purposes the identified cost of investments owned at 12/31/2006 was $241,346,882.
| * | - Non-income producing security |
Glossary:
| ADR | - American Depositary Receipt |
| plc | - Public Limited Company |
See notes to financial statements.
The accompanying notes are an integral part of the financial statements.
102
Series O
(Equity Income Series)
Statement of Assets and Liabilities
December 31, 2006
| | | |
Assets: | | | |
Investments, at value1 | | $ | 295,090,669 |
Cash denominated in a foreign currency, at value2 | | | 3,751 |
Receivables: | | | |
Fund shares sold | | | 208,958 |
Securities sold | | | 984,153 |
Interest | | | 80,984 |
Dividends | | | 401,160 |
Prepaid expenses | | | 6,403 |
| | | |
Total assets | | | 296,776,078 |
| | | |
Liabilities: | | | |
Cash overdraft | | | 32,875 |
Payable for: | | | |
Fund shares redeemed | | | 387,933 |
Securities purchased | | | 983,212 |
Management fees | | | 250,629 |
Custodian fees | | | 1,728 |
Transfer agent/maintenance fees | | | 2,083 |
Administration fees | | | 24,559 |
Professional fees | | | 23,828 |
Directors’ fees | | | 5,000 |
Other fees | | | 14,887 |
| | | |
Total liabilities | | | 1,726,734 |
| | | |
Net Assets . | | $ | 295,049,344 |
| | | |
Net assets consist of: | | | |
Paid in capital | | $ | 223,816,430 |
Undistributed net investment income | | | 3,879,221 |
Undistributed net realized gain on sale of investments and foreign currency transactions | | | 12,372,003 |
Net unrealized appreciation in value of investments and translation of assets and liabilities in foreign currency | | | 54,981,690 |
| | | |
Net assets | | $ | 295,049,344 |
| | | |
Capital shares authorized | | | unlimited |
Capital shares outstanding | | | 12,982,017 |
Net asset value per share | | | |
(net assets divided by shares outstanding) | | $ | 22.73 |
| | | |
1Investments, at cost | | $ | 240,108,866 |
2Cash denominated in a foreign currency, at cost | | | 3,638 |
Statement of Operations
For the Year Ended December 31, 2006
| | | | |
Investment Income: | | | | |
Dividends (net of foreign withholding tax of $ 1,845) | | $ | 6,440,802 | |
Interest | | | 597,493 | |
| | | | |
Total investment income | | | 7,038,295 | |
| | | | |
Expenses: | | | | |
Management fees | | | 2,753,696 | |
Custodian fees | | | 19,413 | |
Transfer agent/maintenance fees | | | 25,216 | |
Administration fees | | | 264,495 | |
Directors’ fees | | | 12,226 | |
Professional fees | | | 33,185 | |
Reports to shareholders | | | 43,429 | |
Other expenses | | | 12,012 | |
| | | | |
Total expenses | | | 3,163,672 | |
Less: Earnings credits applied | | | (2,279 | ) |
| | | | |
Net expenses | | | 3,161,393 | |
| | | | |
Net investment income | | | 3,876,902 | |
| | | | |
Net Realized and Unrealized Gain (Loss): | | | | |
Net realized gain (loss) during the year on: | | | | |
Investments | | | 14,012,498 | |
Foreign currency transactions | | | (2,272 | ) |
| | | | |
Net realized gain | | | 14,010,226 | |
| | | | |
Net unrealized appreciation during the year on: | | | | |
Investments | | | 29,953,376 | |
Translation of assets and liabilities in foreign currencies | | | 27 | |
| | | | |
Net unrealized appreciation | | | 29,953,403 | |
| | | | |
Net realized and unrealized gain | | | 43,963,629 | |
| | | | |
Net increase in net assets resulting from operations | | $ | 47,840,531 | |
| | | | |
See accompanying notes.
103
| | |
| | | Series O |
| Statement of Changes in Net Assets | | (Equity Income Series) |
| | | | | | | | |
| | | Year Ended
December 31, 2006 | | | Year Ended
December 31, 2005 | |
Increase (decrease) in net assets from operations: | | | | | | | | |
Net investment income | | $ | 3,876,902 | | | $ | 3,214,208 | |
Net realized gain during the year on investments and foreign currency transactions | | | 14,010,226 | | | | 13,982,774 | |
Net unrealized appreciation (depreciation) during the year on investments and translation of assets and liabilities in foreign currencies | | | 29,953,403 | | | | (7,751,800 | ) |
| | | | | | | | |
Net increase in net assets resulting from operations | | | 47,840,531 | | | | 9,445,182 | |
| | | | | | | | |
Capital share transactions: | | | | | | | | |
Proceeds from sale of shares | | | 67,270,515 | | | | 74,046,642 | |
Cost of shares redeemed | | | (79,789,663 | ) | | | (64,596,753 | ) |
| | | | | | | | |
Net increase (decrease) from capital share transactions | | | (12,519,148 | ) | | | 9,449,889 | |
| | | | | | | | |
Net increase in net assets | | | 35,321,383 | | | | 18,895,071 | |
| | | | | | | | |
Net assets: | | | | | | | | |
Beginning of year | | | 259,727,961 | | | | 240,832,890 | |
| | | | | | | | |
End of year | | $ | 295,049,344 | | | $ | 259,727,961 | |
| | | | | | | | |
Undistributed net investment income at end of year | | $ | 3,879,221 | | | $ | 3,213,835 | |
| | | | | | | | |
Capital Share Activity: | | | | | | | | |
Shares sold | | | 3,278,641 | | | | 3,984,349 | |
Shares redeemed | | | (3,873,880 | ) | | | (3,466,553 | ) |
| | | | | | | | |
Total capital share activity | | | (595,239 | ) | | | 517,796 | |
| | | | | | | | |
See accompanying notes.
104
| | |
Financial Highlights Selected data for each share of capital stock outstanding throughout each year | | Series O (Equity Income Series) |
| | | | | | | | | | | | | | | | | | | | |
| | | 2006 | | | 2005 | | | 2004 | | | 2003 | | | Year Ended,
December 31,
2002 | |
Per Share Data | | | | | | | | | | | | | | | | | | | | |
Net asset value, beginning of period | | $ | 19.13 | | | $ | 18.44 | | | $ | 16.14 | | | $ | 13.17 | | | $ | 16.00 | |
| | | | | | | | | | | | | | | | | | | | |
Income (loss) from investment operations: | | | | | | | | | | | | | | | | | | | | |
Net investment income | | | 0.31 | | | | 0.23 | | | | 0.21 | | | | 0.22 | | | | 0.20 | |
Net gain (loss) on securities (realized and unrealized) | | | 3.29 | | | | 0.46 | | | | 2.12 | | | | 3.09 | | | | (2.26 | ) |
| | | | | | | | | | | | | | | | | | | | |
Total from investment operations | | | 3.60 | | | | 0.69 | | | | 2.33 | | | | 3.31 | | | | (2.06 | ) |
| | | | | | | | | | | | | | | | | | | | |
Less distributions: | | | | | | | | | | | | | | | | | | | | |
Dividends from net investment income | | | — | | | | — | | | | (0.03 | ) | | | (0.20 | ) | | | (0.39 | ) |
Distributions from realized gains | | | — | | | | — | | | | — | | | | (0.14 | ) | | | (0.38 | ) |
| | | | | | | | | | | | | | | | | | | | |
Total distributions | | | — | | | | — | | | | (0.03 | ) | | | (0.34 | ) | | | (0.77 | ) |
| | | | | | | | | | | | | | | | | | | | |
Net asset value, end of period | | $ | 22.73 | | | $ | 19.13 | | | $ | 18.44 | | | $ | 16.14 | | | $ | 13.17 | |
| | | | | | | | | | | | | | | | | | | | |
Total Returna | | | 18.82 | % | | | 3.74 | % | | | 14.43 | % | | | 25.25 | % | | | (13.43 | %) |
| | | | | | | | | | | | | | | | | | | | |
Ratios/Supplemental Data | | | | | | | | | | | | | | | | | | | | |
Net assets, end of period (in thousands) | | $ | 295,049 | | | $ | 259,728 | | | $ | 240,833 | | | $ | 196,720 | | | $ | 163,555 | |
| | | | | | | | | | | | | | | | | | | | |
Ratios to average net assets: | | | | | | | | | | | | | | | | | | | | |
Net investment income | | | 1.41 | % | | | 1.29 | % | | | 1.31 | % | | | 1.55 | % | | | 1.40 | % |
Total expensesb | | | 1.15 | % | | | 1.15 | % | | | 1.13 | % | | | 1.09 | % | | | 1.09 | % |
Net expensesc | | | 1.15 | % | | | 1.15 | % | | | 1.13 | % | | | 1.08 | % | | | 1.08 | % |
| | | | | | | | | | | | | | | | | | | | |
Portfolio turnover rate | | | 18 | % | | | 20 | % | | | 20 | % | | | 19 | % | | | 23 | % |
a | Total return does not take into account any of the expenses associated with an investment in variable insurance products offered by Security Benefit Life Insurance Company. If total return had taken into account these expenses, performance would have been lower. Shares of a series of SBL Fund are available only through the purchase of such products. |
b | Total expense information reflects expense ratios absent fund expense reductions by the Investment Manager, and earnings credits, as applicable. |
c | Net expense information reflects the expense ratios after voluntary expense waivers, reimbursements and custodian earnings credits, as applicable. |
See accompanying notes.
105
This page left blank intentionally.
106
| | |
Manager’s Commentary February 15, 2007 | | Series P (High Yield Series) (unaudited) |
Advisor, Security Management Company, LLC

David Toussaint
Portfolio Manager
To Our Shareholders:
The high yield market, after producing lackluster results in 2005, came roaring back with an 11.9% return in 2006, its second best year since 1997. The U.S. economy’s continued growth allowed corporations to continue to increase profits and to further generate cash flow and improve their balance sheets, which helped move the high yield default rate near historic lows. At mid-year 2006, the Federal Reserve paused in its interest rate tightening cycle and this provided a spark to the equity and high yield markets. Series P of the SBL Fund—High Yield Series recorded a 11.18% return and the Series’ peer group was up 10.1% for the year. Part of the index's strong return is due to the large index weightings of automotive giants, General Motors and Ford. Both of these are around 6% of the index and GM returned 25% and Ford 22% during 2006. The high yield index without these two would have returned 10.2%, a full 1.7% lower. The high yield market was able to keep pace with the S&P 500’s return of 15.8% and easily outdistanced other competing fixed income returns such as government bonds which returned 3.5%, higher quality corporate bonds at 4.3%, and leveraged bank loans at 7.1%.
One of the primary reasons for high yield’s strong performance was the high yield corporate bond default rate nearly reaching historic lows. The high yield corporate default rate, which was expected to increase from 2005’s 2.3%, actually fell throughout the second half of 2006 and finished the year at 1.8%, the lowest since April 1997’s 1.7%. As a result, high yield corporate bond spreads, after widening slightly in the second quarter, tightened significantly in the second half and nearly reached historic lows by year-end.
The biggest story for 2006 was the amount of new issuance in the high yield market. In 2006, a record $142.4 billion was issued, surpassing the previous record of $137.3 in 1998. The issuance resulted from highly publicized mergers, acquisitions and leveraged buyouts. In fact, the top three LBO-related issues were almost $6 billion each. New issuance is expected to remain near these levels in 2007 as these transactions continue.
Shorter Maturity Bonds Provide Stable Income
The Series’ core holdings in shorter maturity bonds provided solid income generation and stable current yields for the Series during the year. These shor ter maturity bonds are not as sensitive to interest rate movements. Therefore, as rates moved higher during the year, these bonds lost little, if any, of their principal value while collecting their interest payments. Furthermore, most of these positions were in higher coupon issues. With ample liquidity in the bank loan market, these companies were able to refinance these bonds and tendered them at a premium. One such holding, Evergreen Aviation, returned 30% as it was able to refinance its bonds with a new bank loan.
Specific Portfolio Investments Enhanced Returns
The Series was able to enhance its return by investing in some lower quality, higher yielding securities. As the liquidity in the market was abundant, many of the Series’ holdings benefited. One of the Series’ best contributors was Worldspan, a travel services company, which returned 31% as air travel and lodging soared and the company was acquired in December. GMAC, the finance subsidiary of General Motors, returned 25% as a controlling interest in the company was sold to a private equity consortium and the corporate credit ratings were upgraded. United Rentals, an equipment rental company that is leveraged to the economy and to commercial construction booms, returned 20%.
Airline Exposure Proved Successful
The Series’ overweight to the airline sector helped the Fund. The Series was positioned in EETCs (Enhanced Equipment Trust Certificates) that performed well with the recovery in the airline industry and with the increasing value of the underlying aircraft collateral, returning around 20%, The Series’ position in these securities was a more conservative strategy to increase exposure to a risky industry.
Underweight to Riskier Large Issuers Hurt Performance versus Index
As mentioned earlier, some of the largest issuers in the index produced great returns in 2006. GM and Ford, each with a weighting of 6% of the index, returned approximately 25% and 22%, respectively. Charter Communications, a highly leveraged cable television company and 1.5% of the index, returned 34%. The Series had only a 2% weight in GM and 0.5% weight in Ford throughout the year and did not hold Charter. The Series does not think it is prudent to hold large concentrations in one issuer and typically will not hold more than 3% in any one issuer. Charter remained free cash flow negative throughout the year but was helped by some debt restructuring and the liquidity in the market.
107
| | |
Manager’s Commentary February 15, 2007 | | Series P (High Yield Series) (unaudited) |
Outlook and Strategy for 2007
For 2007, the economy’s growth rate is expected to moderate. The corporate default rate is expected to slightly increase throughout the year and possibly reach 2.5% to 3% by year-end, but still remain well below the long run average of around 5%. The significant increase in mergers, acquisitions and leveraged buyouts may continue to help the high yield bonds for those companies being acquired. However, as a result of these leveraging transactions, new issuance will be of much lower quality. Additionally, highly levered issuers will be less able to weather an economic slowdown. Lower quality issuance may cause the default rate to increase over the next few years. Therefore, the Series will continue to hold shor ter maturity bonds to reduce interest rate and credit risk, while oppor tunistically adding selective lower quality securities to enhance returns.
Thank you for being an investor in the Series.
|
| Sincerely, |
|
| |
| David Toussaint, Portfolio Manager |
PERFORMANCE
Series P vs. Lehman Brothers High Yield Indes
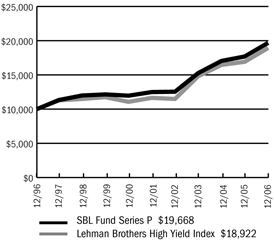
$10,000 over 10 Years
The chart above assumes a hypothetical $10,000 investment in Series P (High Yield Series) on December 31, 1996 (date of inception) and reflects the fees and expenses of Series P. The Lehman Brothers High Yield Index is an unmanaged index that tracks below investment grade bonds.
Average Annual Returns
| | | | | | | | | |
Periods Ended 12-31-061 | | 1 Year | | | 5 Years | | | Since Inception (8-5-96) | |
Series P | | 11.18 | % | | 9.50 | % | | 7.00 | % |
1 | Performance figures do not reflect fees and expenses associated with an investment in variable insurance products offered by Security Benefit Life Insurance Company. If returns had taken into account these fees and expenses, performance would have been lower. Shares of a Series of SBL Fund are available only through the purchase of such products. |
The performance data quoted above represents past performance. Past performance is not predictive of future performance. The investment return and principal value of an investment will fluctuate so that an investor’s shares, when redeemed, may be worth more or less than their original cost.
Quality Ratings
| | | |
A | | 0.12 | % |
BBB | | 4.10 | |
BB | | 20.84 | |
B | | 42.56 | |
CCC | | 16.69 | |
CC | | 0.02 | |
D | | 0.06 | |
NR | | 6.16 | |
Common Stocks | | 0.72 | |
Repurchase Agreement | | 5.74 | |
Cash & other assets, less liablities | | 2.99 | |
Total net assets | | 100.00 | % |
| | | |
See accompanying notes.
108
| | |
Manager’s Commentary December 31, 2006 | | Series P (High Yield Series) (unaudited) |
PERFORMANCE
Information About Your Series Expenses
Calculating your ongoing series expenses
Example
As a shareholder of the Series, you incur ongoing costs, including management fees and other series expenses. Performance figures and expense ratios do not reflect fees and expenses associated with an investment in variable insurance products. Shares of a Series of SBL Fund are available only through the purchase of such products. This example is intended to help you understand your ongoing costs (in dollars) of investing in the Series and to compare these costs with ongoing costs of investing in other mutual funds. The example is based on an investment of $1,000 invested at the beginning of the period and held for the entire period, July 1, 2006 - December 31, 2006.
Actual Expenses
The first line in the table provides information about actual account values and actual expenses. You may use the information in this table, together with the amount you invested, to estimate the expenses that you paid over the period. Simply divide your account value by $1,000 (for example, an $8,600 account value divided by $1,000 = 8.6), then multiply the result by the number in the table under the heading entitled “Expenses Paid During Period” to estimate the expenses you paid on your account during this period.
Hypothetical Example for Comparison Purposes
The second line in the table provides information about hypothetical account values and hypothetical expenses based on the Series actual expense ratio and an assumed rate of return of 5% per year before expenses, which is not the Series actual return. The hypothetical account values and expenses may not be used to estimate the actual ending account balance or expenses you paid for the period. You may use this information to compare the ongoing costs of investing in the Series and other funds. To do so, compare this 5% hypothetical example with the 5% hypothetical examples that appear in the shareholder reports of the other mutual funds.
Please note that the expenses shown in the table are meant to highlight your ongoing costs only and do not reflect any fees and expenses associated with an investment in variable insurance products. Therefore, the second line is useful in comparing ongoing costs only, and will not help you determine the relative total costs of owning different funds. In addition, if these fees and expenses associated with an investment in variable insurance products were included, your costs would have been higher.
Series Expenses
| | | | | | | | | |
| | | Beginning
Account Value
07-01-06 | | Ending
Account Value
12-31-061 | | Expenses Paid
During
Period2 |
Series P (High Yield Series) | | | | | | | | | |
Actual | | $ | 1,000.00 | | $ | 1,067.00 | | $ | 4.79 |
Hypothetical | | | 1,000.00 | | | 1,020.57 | | | 4.69 |
1 | The actual ending account value is based on the actual total return of the Series for the period July 1, 2006 to December 31, 2006 after actual expenses and will differ from the hypothetical ending account value which is based on the Series expense ratio and a hypothetical annual return of 5% before expenses. The actual cumulative return at net asset value for the period July 1, 2006 to December 31, 2006 was 6.70%. |
2 | Expenses are equal to the Series annualized expense ratio of 0.92%, net of earnings credits, multiplied by the average account value over the period, multiplied by 184/365 (to reflect the one-half year period). |
109
| | |
| Schedule of Investments | | Series P (High Yield Series) |
| December 31, 2006 | | |
| | | | | | |
| | | Shares | | Value |
COMMON STOCK - 0.7% | | | | | | |
Air Freight & Logistics - 0.0% | | | | | | |
Atlas Air Worldwide Holdings, Inc. * | | | 26 | | $ | 1,153 |
| | | | | | |
Airlines - 0.0% | | | | | | |
ACE Aviation Holdings, Inc. | | | 32 | | | 1,039 |
| | | | | | |
Broadcasting & Cable TV - 0.0% | | | | | | |
Cebridge Connections * (1)(2) | | | 558 | | | — |
| | | | | | |
Electronic Manufacturing Services - 0.0% | | | | | | |
Viasystems Group, Inc. * (1)(2) | | | 1,207 | | | — |
| | | | | | |
Health Care Equipment - 0.0% | | | | | | |
MEDIQ, Inc. * (1)(2) | | | 92 | | | — |
| | | | | | |
Household Products - 0.0% | | | | | | |
WKI Holding Company, Inc. * (1)(2) | | | 202 | | | — |
| | | | | | |
Mortgage REIT’s - 0.3% | | | | | | |
HomeBanc Corporation | | | 30,000 | | | 126,900 |
Opteum, Inc. | | | 30,450 | | | 231,420 |
| | | | | | |
| | | | | | 358,320 |
| | | | | | |
Oil & Gas Storage & Transportation - 0.4% | | | | | | |
Double Hull Tankers, Inc. | | | 25,000 | | | 404,750 |
| | | | | | |
TOTAL COMMON STOCK (Cost $1,087,807) | | | | | $ | 765,262 |
| | | | | | |
PREFERRED STOCK - 0.0% | | | | | | |
Steel - 0.0% | | | | | | |
Weirton Steel Corporation * (1)(2) | | | 315 | | | — |
| | | | | | |
TOTAL PREFERRED STOCK (Cost $264) | | | | | $ | — |
| | | | | | |
| | |
| | | Principal
Amount | | Value |
CONVERTIBLE BOND - 2.1% | | | | | | |
Aerospace & Defense - 0.8% | | | | | | |
DRS Technologies, Inc. | | | | | | |
2.00%, 2026 (3)(4) | | $ | 800,000 | | | 842,000 |
| | | | | | |
Automobiles (including Replacement Parts) - 0.6% | | | | | | |
Sonic Automotive, Inc. | | | | | | |
5.25%, 2009 | | | 650,000 | | | 637,000 |
| | | | | | |
Telecommunications - 0.7% | | | | | | |
Nextel Communications, Inc. | | | | | | |
5.25%, 2010 | | | 750,000 | | | 737,813 |
| | | | | | |
TOTAL CONVERTIBLE BOND
(Cost $2,162,778 | | | | | $ | 2,216,813 |
| | | | | | |
CORPORATE BOND - 83.4% | | | | | | |
Aerospace & Defense - 4.7% | | | | | | |
Bombardier, Inc. | | | | | | |
6.75%, 2012 (3)(4) | | | 1,075,000 | | | 1,053,500 |
Esterline Technologies Corporation | | | | | | |
7.75%, 2013 (4) | | | 610,000 | | | 622,200 |
L-3 Communications Corporation | | | | | | |
7.63%, 2012 | | | 1,275,000 | | | 1,319,625 |
Sequa Corporation | | | | | | |
8.875%, 2008 | | | 280,000 | | | 288,400 |
9.00%, 2009 | | | 200,000 | | | 214,000 |
Vought Aircraft Industries, Inc. | | | | | | |
8.00%, 2011 | | | 1,575,000 | | | 1,515,937 |
| | | | | | |
| | | | | | 5,013,662 |
| | | | | | |
Airlines - 3.2% | | | | | | |
Calair Capital Corporation | | | | | | |
8.13%, 2008 | | | 675,000 | | | 676,688 |
Continental Airlines, Inc. | | | | | | |
7.03%, 2011 | | | 398,379 | | | 396,885 |
8.31%, 2011 | | | 621,768 | | | 624,877 |
Delta Air Lines, Inc. | | | | | | |
7.90%, 2009 (5) | | | 75,000 | | | 50,250 |
7.71%, 2011 | | | 530,000 | | | 528,012 |
7.78%, 2012 | | | 1,146,500 | | | 1,139,334 |
Northwest Airlines, Inc. | | | | | | |
9.875%, 2007(5) | | | 10,000 | | | 9,650 |
| | | | | | |
| | | | | | 3,425,696 |
| | | | | | |
Automotive - 4.4% | | | | | | |
Dura Operating Corporation | | | | | | |
8.625%, 2012(5) | | | 10,000 | | | 3,400 |
General Motors Acceptance Corporation | | | | | | |
6.75%, 2014 | | | 650,000 | | | 667,636 |
8.00%, 2031 | | | 1,250,000 | | | 1,435,085 |
Group 1 Automotive, Inc. | | | | | | |
8.25%, 2013 | | | 1,050,000 | | | 1,076,250 |
Sonic Automotive, Inc. | | | | | | |
8.63%, 2013 | | | 600,000 | | | 618,000 |
Tenneco, Inc. | | | | | | |
8.63%, 2014 | | | 550,000 | | | 561,000 |
TRW Automotive, Inc. | | | | | | |
9.38%, 2013 | | | 312,000 | | | 334,620 |
| | | | | | |
| | | | | | 4,695,991 |
| | | | | | |
Banking - 3.2% | | | | | | |
Cardtronics, Inc. | | | | | | |
9.25%, 2013(6) | | | 900,000 | | | 947,250 |
Doral Financial Corporation | | | | | | |
6.204%, 2007(7) | | | 2,250,000 | | | 2,044,697 |
E*Trade Financial Corporation | | | | | | |
8.00%, 2011 | | | 300,000 | | | 313,500 |
FCB Capital Trust | | | | | | |
8.05%, 2028 | | | 75,000 | | | 78,855 |
Western Financial Bank | | | | | | |
9.625%, 2012 | | | 5,000 | | | 5,463 |
| | | | | | |
| | | | | | 3,389,765 |
| | | | | | |
The accompanying notes are an integral part of the financial statements.
110
| | |
| Schedule of Investments | | Series P (High Yield Series) |
| December 31, 2006 - continued | | |
| | | | | | |
| | | Principal
Amount | | Value |
CORPORATE BOND (continued) | | | | | | |
Basic Industry - Other - 0.1% | | | | | | |
Mobile Services Group, Inc. | | | | | | |
9.75%, 2014 (3)(4) | | $ | 125,000 | | $ | 130,625 |
| | | | | | |
Building Materials - 1.7% | | | | | | |
Building Materials Corporation of America | | | | | | |
8.00%, 2007 | | | 550,000 | | | 558,965 |
8.00%, 2008 | | | 825,000 | | | 862,125 |
Interline Brands, Inc. | | | | | | |
8.13%, 2014 | | | 400,000 | | | 411,000 |
| | | | | | |
| | | | | | 1,832,090 |
| | | | | | |
Chemicals - 0.3% | | | | | | |
CNA Holdings, Inc. | | | | | | |
7.13%, 2009 (2) | | | 145,000 | | | 142,825 |
Lyondell Chemical Company | | | | | | |
8.25%, 2016 | | | 150,000 | | | 157,500 |
Methanex Corporation | | | | | | |
8.75%, 2012 | | | 5,000 | | | 5,437 |
| | | | | | |
| | | | | | 305,762 |
| | | | | | |
Communications - Other - 1.6% | | | | | | |
Lamar Media Corporation | | | | | | |
6.63%, 2015 | | | 150,000 | | | 148,688 |
Satelites Mexicanos S.A. de CV | | | | | | |
14.11%, 2011 (7) | | | 1,464,175 | | | 1,548,365 |
| | | | | | |
| | | | | | 1,697,053 |
| | | | | | |
Construction Machinery - 1.8% | | | | | | |
Case New Holland, Inc. | | | | | | |
9.25%, 2011 | | | 650,000 | | | 688,187 |
United Rentals North America, Inc. | | | | | | |
6.50%, 2012 | | | 625,000 | | | 617,188 |
7.00%, 2014 | | | 625,000 | | | 613,281 |
| | | | | | |
| | | | | | 1,918,656 |
| | | | | | |
Consumer Products - 0.2% | | | | | | |
Hanesbrands, Inc. | | | | | | |
8.735%, 2014 (3)(4)(7) | | | 150,000 | | | 152,625 |
Hasbro, Inc. | | | | | | |
6.15%, 2008 | | | 56,000 | | | 56,402 |
Icon Health & Fitness | | | | | | |
11.25%, 2012 | | | 25,000 | | | 26,000 |
| | | | | | |
| | | | | | 235,027 |
| | | | | | |
Distributors - 1.1% | | | | | | |
SemGroup, LP | | | | | | |
8.75%, 2015 (3)(4) | | | 1,200,000 | | | 1,206,000 |
| | | | | | |
Diversified Manufacturing - 0.6% | | | | | | |
Briggs & Stratton Corporation | | | | | | |
8.88%, 2011 | | | 625,000 | | | 676,563 |
| | | | | | |
Electric - 4.3% | | | | | | |
AES Corporation | | | | | | |
9.50%, 2009 | | | 1,400,000 | | | 1,498,000 |
Avista Corporation | | | | | | |
9.75%, 2008 | | | 50,000 | | | 52,419 |
CMS Energy Corporation | | | | | | |
9.875%, 2007 | | | 10,000 | | | 10,312 |
7.50%, 2009 | | | 610,000 | | | 629,063 |
East Coast Power LLC | | | | | | |
6.74%, 2008 | | | 20,625 | | | 20,801 |
7.07%, 2012 | | | 84,520 | | | 85,542 |
GrafTech Finance, Inc. | | | | | | |
10.25%, 2012 | | | 890,000 | | | 937,838 |
Reliant Energy, Inc. | | | | | | |
9.25%, 2010 | | | 550,000 | | | 577,500 |
6.75%, 2014 | | | 650,000 | | | 635,375 |
Westar Energy, Inc. | | | | | | |
7.125%, 2009 | | | 90,000 | | | 93,025 |
| | | | | | |
| | | | | | 4,539,875 |
| | | | | | |
Entertainment - 0.9% | | | | | | |
AMC Entertainment, Inc. | | | | | | |
9.88%, 2012 | | | 300,000 | | | 315,000 |
Speedway Motorsports, Inc. | | | | | | |
6.75%, 2013 | | | 625,000 | | | 625,000 |
| | | | | | |
| | | | | | 940,000 |
| | | | | | |
Environmental - 0.4% | | | | | | |
Allied Waste North America, Inc. | | | | | | |
8.50%, 2008 | | | 20,000 | | | 21,025 |
Casella Waste Systems, Inc. | | | | | | |
9.75%, 2013 | | | 400,000 | | | 419,000 |
| | | | | | |
| | | | | | 440,025 |
| | | | | | |
Financial - Other - 0.3% | | | | | | |
Ford Motor Credit Company | | | | | | |
9.824%, 2012 (7) | | | 300,000 | | | 317,922 |
| | | | | | |
Food & Beverage - 2.5% | | | | | | |
Dean Foods Company | | | | | | |
8.15%, 2007 | | | 650,000 | | | 658,125 |
Dole Food Company, Inc. | | | | | | |
7.25%, 2010 | | | 400,000 | | | 381,000 |
8.88%, 2011 | | | 200,000 | | | 197,000 |
Harry & David Holdings, Inc. | | | | | | |
9.00%, 2013 | | | 900,000 | | | 877,950 |
Land O’ Lakes, Inc. | | | | | | |
8.75%, 2011 | | | 60,000 | | | 62,400 |
Pilgrim’s Pride Corporation | | | | | | |
9.63%, 2011 | | | 450,000 | | | 470,250 |
| | | | | | |
| | | | | | 2,646,725 |
| | | | | | |
Gaming - 3.7% | | | | | | |
American Casino & Entertainment Properties LLC | | | | | | |
7.85%, 2012 | | | 300,000 | | | 306,375 |
The accompanying notes are an integral part of the financial statements.
111
| | |
| Schedule of Investments | | Series P (High Yield Series) |
| December 31, 2006 - continued | | |
| | | | | | |
| | | Principal
Amount | | Value |
CORPORATE BOND (continued) | | | | | | |
Gaming (continued) | | | | | | |
Galaxy Entertainment Finance Company, Ltd. | | | | | | |
9.88%, 2012 (3)(4) | | $ | 975,000 | | $ | 1,044,469 |
Mandalay Resort Group | | | | | | |
10.25%, 2007 | | | 45,000 | | | 46,069 |
6.50%, 2009 | | | 300,000 | | | 303,375 |
MGM Mirage | | | | | | |
8.50%, 2010 | | | 15,000 | | | 16,050 |
8.375%, 2011 | | | 55,000 | | | 57,062 |
6.75%, 2012 | | | 625,000 | | | 615,625 |
6.75%, 2013 (4) | | | 500,000 | | | 488,750 |
Station Casinos, Inc. | | | | | | |
6.00%, 2012 | | | 925,000 | | | 877,594 |
Turning Stone Resort Casino Enterprise | | | | | | |
9.13%, 2014 (3)(4) | | | 150,000 | | | 153,375 |
| | | | | | |
| | | | | | 3,908,744 |
| | | | | | |
HealthCare - 3.4% | | | | | | |
Coventry Health Care, Inc. | | | | | | |
6.13%, 2015 | | | 575,000 | | | 566,663 |
HCA, Inc. | | | | | | |
6.50%, 2016 | | | 1,850,000 | | | 1,558,625 |
Johnsondiversey, Inc. | | | | | | |
9.625%, 2012 | | | 5,000 | | | 5,238 |
U.S. Oncology Holdings, Inc. | | | | | | |
10.675%, 2015 (7) | | | 1,400,000 | | | 1,438,500 |
| | | | | | |
| | | | | | 3,569,026 |
| | | | | | |
Home Construction - 0.0% | | | | | | |
KB Home | | | | | | |
9.50%, 2011 | | | 35,000 | | | 36,050 |
| | | | | | |
Independent Energy - 2.8% | | | | | | |
El Paso Production Holding Company | | | | | | |
7.75%, 2013 | | | 250,000 | | | 261,562 |
Forest Oil Corporation | | | | | | |
8.00%, 2008 | | | 15,000 | | | 15,356 |
Hilcorp Energy I, LP | | | | | | |
10.50%, 2010 (3)(4) | | | 1,200,000 | | | 1,284,000 |
Magnum Hunter Resources, Inc. | | | | | | |
9.60%, 2012 | | | 918,000 | | | 965,048 |
MarkWest Energy Partners, LP | | | | | | |
8.50%, 2016 (3)(4) | | | 400,000 | | | 416,000 |
Range Resources Corporation | | | | | | |
7.38%, 2013 | | | 75,000 | | | 76,875 |
| | | | | | |
| | | | | | 3,018,841 |
| | | | | | |
Industrial - Other - 2.7% | | | | | | |
Anixter International, Inc. | | | | | | |
5.95%, 2015 | | | 250,000 | | | 231,250 |
Corrections Corporation of America | | | | | | |
7.50%, 2011 | | | 200,000 | | | 206,000 |
Iron Mountain, Inc. | | | | | | |
8.25%, 2011 | | | 800,000 | | | 802,000 |
USEC, Inc. | | | | | | |
6.75%, 2009 | | $ | 1,625,000 | | $ | 1,576,250 |
| | | | | | |
| | | | | | 2,815,500 |
| | | | | | |
Insurance - Life - 0.2% | | | | | | |
Genamerica Capital I | | | | | | |
8.53%, 2027 (3)(4) | | | 175,000 | | | 184,327 |
| | | | | | |
Insurance - Property & Casualty - 2.6% | | | | | | |
Fairfax Financial Holdings, Ltd. | | | | | | |
7.75%, 2012 | | | 2,825,000 | | | 2,782,625 |
| | | | | | |
Lodging - 0.6% | | | | | | |
Starwood Hotels & Resorts Worldwide, Inc. | | | | | | |
7.375%, 2007 (6) | | | 600,000 | | | 602,451 |
| | | | | | |
Media - Cable - 1.5% | | | | | | |
Cablevision Systems Corporation | | | | | | |
9.87%, 2009 (7) | | | 250,000 | | | 263,750 |
CSC Holdings, Inc. | | | | | | |
7.25%, 2008 | | | 375,000 | | | 378,281 |
8.125%, 2009 to 2009 | | | 35,000 | | | 36,269 |
6.75%, 2012 (3)(4)(6) | | | 325,000 | | | 316,875 |
Frontiervision Holdings, LP | | | | | | |
11.875%, 2007 (5) | | | 20,000 | | | 26,500 |
Jones Intercable, Inc. | | | | | | |
7.63%, 2008 | | | 200,000 | | | 205,339 |
Shaw Communications, Inc. | | | | | | |
7.25%, 2011 | | | 375,000 | | | 389,531 |
| | | | | | |
| | | | | | 1,616,545 |
| | | | | | |
Media-Non Cable - 3.6% | | | | | | |
Block Communications, Inc. | | | | | | |
8.25%, 2015 (3)(4) | | | 975,000 | | | 972,562 |
CMP Susquehanna Corporation | | | | | | |
9.88%, 2014 (3)(4) | | | 1,200,000 | | | 1,194,000 |
Fisher Communications, Inc. | | | | | | |
8.63%, 2014 | | | 250,000 | | | 265,000 |
Historic TW, Inc. | | | | | | |
9.125%, 2013 | | | 30,000 | | | 34,950 |
Intelsat, Ltd. | | | | | | |
7.63%, 2012 | | | 725,000 | | | 676,062 |
Morris Publishing Group LLC | | | | | | |
7.00%, 2013 (4) | | | 625,000 | | | 592,188 |
RH Donnelley Finance Corporation I | | | | | | |
10.88%, 2012 (3) | | | 125,000 | | | 136,250 |
| | | | | | |
| | | | | | 3,871,012 |
| | | | | | |
Metals & Mining - 3.5% | | | | | | |
AK Steel Corporation | | | | | | |
7.88%, 2009 | | | 1,495,000 | | | 1,495,000 |
Asia Aluminum Holdings, Ltd. | | | | | | |
8.00%, 2011 (3)(4) | | | 1,400,000 | | | 1,396,500 |
Bulong Operations Pty, Ltd. | | | | | | |
12.50%, 2008 (1)(2)(5) | | | 185,000 | | | — |
The accompanying notes are an integral part of the financial statements.
112
| | |
| Schedule of Investments | | Series P (High Yield Series) |
| December 31, 2006 - continued | | |
| | | | | | |
| | | Principal
Amount | | Value |
CORPORATE BOND (continued) | | | | | | |
Metals & Mining (continued) | | | | | | |
National Steel Corporation | | | | | | |
9.875%, 2009 (1)(2)(5) | | $ | 15,915 | | $ | — |
Noble Group, Ltd. | | | | | | |
6.63%, 2015 (3)(4) | | | 550,000 | | | 499,598 |
PNA Group, Inc. | | | | | | |
10.75%, 2016 (3)(4) | | | 325,000 | | | 335,969 |
Steel Dynamics, Inc. | | | | | | |
9.50%, 2009 | | | 5,000 | | | 5,150 |
| | | | | | |
| | | | | | 3,732,217 |
| | | | | | |
Natural Gas Pipelines - 1.7% | | | | | | |
Regency Energy Partners, LP | | | | | | |
8.38%, 2013 (3)(4) | | | 300,000 | | | 300,750 |
Sonat, Inc. | | | | | | |
7.63%, 2011 | | | 1,050,000 | | | 1,113,000 |
Williams Companies, Inc. | | | | | | |
6.38%, 2010 (3)(4) | | | 200,000 | | | 201,250 |
Williams Partners, LP | | | | | | |
7.25%, 2017 (3)(4) | | | 150,000 | | | 153,000 |
| | | | | | |
| | | | | | 1,768,000 |
| | | | | | |
Oil Field Services - 0.5% | | | | | | |
Parker Drilling Company | | | | | | |
10.119%, 2010 (7) | | | 450,000 | | | 460,125 |
Pemex Project Funding Master Trust | | | | | | |
8.50%, 2008 | | | 30,000 | | | 30,900 |
7.875%, 2009 (6) | | | 35,000 | | | 36,680 |
9.125%, 2010 | | | 40,000 | | | 44,860 |
| | | | | | |
| | | | | | 572,565 |
| | | | | | |
Packaging - 5.1% | | | | | | |
Ball Corporation | | | | | | |
6.88%, 2012 | | | 250,000 | | | 255,000 |
Graham Packaging Company, Inc. | | | | | | |
9.88%, 2014 | | | 1,300,000 | | | 1,313,000 |
Owens Brockway Glass Container, Inc. | | | | | | |
7.75%, 2011 | | | 200,000 | | | 205,500 |
Owens-Illinois, Inc. | | | | | | |
8.10%, 2007 | | | 575,000 | | | 576,437 |
7.50%, 2010 | | | 30,000 | | | 30,113 |
Smurfit-Stone Container Enterprises, Inc. | | | | | | |
9.75%, 2011 | | | 1,699,000 | | | 1,752,094 |
Solo Cup Company | | | | | | |
8.50%, 2014 | | | 1,425,000 | | | 1,232,625 |
| | | | | | |
| | | | | | 5,364,769 |
| | | | | | |
Paper -1.7% | | | | | | |
Georgia-Pacific Corporation | | | | | | |
7.13%, 2017 (3)(4) | | | 325,000 | | | 324,187 |
Sino-Forest Corporation | | | | | | |
9.13%, 2011 (3)(4) | | | 1,375,000 | | | 1,486,719 |
| | | | | | |
| | | | | | 1,810,906 |
| | | | | | |
Pharmaceuticals - 0.8% | | | | | | |
Valeant Pharmaceuticals International | | | | | | |
7.00%, 2011 | | | 850,000 | | | 816,000 |
| | | | | | |
Refining - 0.3% | | | | | | |
Frontier Oil Corporation | | | | | | |
6.63%, 2011 | | | 300,000 | | | 299,250 |
| | | | | | |
REITs - 1.4% | | | | | | |
American Real Estate Partners, LP | | | | | | |
8.13%, 2012 | | | 1,000,000 | | | 1,032,500 |
7.13%, 2013 | | | 400,000 | | | 402,000 |
| | | | | | |
| | | | | | 1,434,500 |
| | | | | | |
Retailers - 2.1% | | | | | | |
GSC Holdings Corporation | | | | | | |
8.00%, 2012 | | | 625,000 | | | 653,125 |
JC Penney Corporation, Inc. | | | | | | |
7.375%, 2008 | | | 40,000 | | | 40,962 |
Michaels Stores, Inc. | | | | | | |
11.38%, 2016 (3)(4) | | | 1,500,000 | | | 1,563,750 |
PCA LLC | | | | | | |
11.875%, 2009 (2) | | | 30,000 | | | 5,400 |
| | | | | | |
| | | | | | 2,263,237 |
| | | | | | |
Services - 0.2% | | | | | | |
American Commercial Lines | | | | | | |
9.50%, 2015 | | | 146,000 | | | 162,242 |
American ECO Corporation | | | | | | |
9.625%, 2008 (1)(2)(3)(5) | | | 200,000 | | | — |
| | | | | | |
| | | | | | 162,242 |
| | | | | | |
Supermarkets - 0.0% | | | | | | |
Fleming Companies, Inc. | | | | | | |
9.88%, 2012 (1)(2)(5) | | | 400,000 | | | — |
| | | | | | |
Technology - 4.7% | | | | | | |
Amkor Technology, Inc. | | | | | | |
7.75%, 2013 | | | 1,200,000 | | | 1,104,000 |
Freescale Semiconductor, Inc. | | | | | | |
10.13%, 2016 (3)(4) | | | 1,275,000 | | | 1,276,594 |
NXP BV | | | | | | |
9.50%, 2015 (3)(4) | | | 650,000 | | | 666,250 |
Seagate Technology HDD Holdings | | | | | | |
6.80%, 2016 | | | 650,000 | | | 653,250 |
Worldspan, LP | | | | | | |
11.624%, 2011 (7) | | | 1,250,000 | | | 1,287,500 |
| | | | | | |
| | | | | | 4,987,594 |
| | | | | | |
Telecommunications - Wireless - 4.6% | | | | | | |
American Cellular Corporation | | | | | | |
10.00%, 2011 | | | 975,000 | | | 1,031,062 |
Dobson Communications Corporation | | | | | | |
9.624%, 2012 (7) | | | 350,000 | | | 357,000 |
iPCS, Inc. | | | | | | |
11.50%, 2012 | | | 500,000 | | | 555,000 |
The accompanying notes are an integral part of the financial statements.
113
| | |
| Schedule of Investments | | Series P (High Yield Series) |
| December 31, 2006 - continued | | |
| | | | | | |
| | | Principal
Amount | | Value |
CORPORATE BOND (continued) | | | | | | |
Telecommunications - Wireless (continued) | | | | | | |
MetroPCS Wireless, Inc. | | | | | | |
9.25%, 2014 (3)(4) | | $ | 500,000 | | $ | 522,500 |
Rural Cellular Corporation | | | | | | |
9.75%, 2010 | | | 1,175,000 | | | 1,207,313 |
11.121%, 2012 (7) | | | 650,000 | | | 677,625 |
UbiquiTel Operating Company | | | | | | |
9.88%, 2011 | | | 500,000 | | | 540,000 |
| | | | | | |
| | | | | | 4,890,500 |
| | | | | | |
Telecommunications-Wirelines - 2.7% | | | | | | |
EXDS, Inc. | | | | | | |
11.625%, 2010 (1)(2)(5) | | | 340,726 | | | — |
LCI International, Inc. | | | | | | |
7.25%, 2007 | | | 2,675,000 | | | 2,681,688 |
Qwest Corporation | | | | | | |
7.88%, 2011 | | | 150,000 | | | 159,750 |
Telecommunications Technique | | | | | | |
9.75%, 2008 (1)(2)(5) | | | 30,000 | | | — |
| | | | | | |
| | | | | | 2,841,438 |
| | | | | | |
Textile - 0.3% | | | | | | |
Invista | | | | | | |
9.25%, 2012 (3)(4) | | | 250,000 | | | 268,125 |
| | | | | | |
Transportation Services - 1.4% | | | | | | |
Overseas Shipholding Group | | | | | | |
8.25%, 2013 | | | 400,000 | | | 420,500 |
Stena AB | | | | | | |
9.63%, 2012 | | | 425,000 | | | 452,625 |
U.S. Shipping Partners, LP Shipping Finance Corporation | | | | | | |
13.00%, 2014 (3)(4) | | | 625,000 | | | 656,250 |
| | | | | | |
| | | | | | 1,529,375 |
| | | | | | |
TOTAL CORPORATE BOND (Cost $87,226,741) | | | | | $ | 88,557,276 |
| | | | | | |
FOREIGN BOND - 0.1% | | | | | | |
Tunisia - 0.1% | | | | | | |
Banque Centrale de Tunisie | | | | | | |
7.375%, 2012 | | | 80,000 | | | 86,640 |
| | | | | | |
TOTAL FOREIGN BOND (Cost $79,198) | | | | | $ | 86,640 |
| | | | | | |
FOREIGN GOVERNMENT BOND - 0.8% | | | | | | |
Chile - 0.1% | | | | | | |
Chile Government International Bond | | | | | | |
5.625%, 2007 | | | 100,000 | | | 100,140 |
7.125%, 2012 | | | 25,000 | | | 26,925 |
| | | | | | |
| | | | | | 127,065 |
| | | | | | |
Mexico - 0.2% | | | | | | |
Mexico Government International Bond | | | | | | |
8.375%, 2011 | | | 85,000 | | | 94,563 |
7.50%, 2012 | | | 116,000 | | | 127,136 |
| | | | | | |
| | | | | | 221,699 |
| | | | | | |
Peru - 0.1% | | | | | | |
Peru Government International Bond | | | | | | |
5.00%, 2017 (6)(7) | | | 110,400 | | | 109,572 |
| | | | | | |
Philippines - 0.0% | | | | | | |
Philippine Government International Bond | | | | | | |
8.375%, 2009 | | | 30,000 | | | 31,875 |
| | | | | | |
Russia - 0.2% | | | | | | |
Russia Government International Bond | | | | | | |
10.00%, 2007 | | | 100,000 | | | 102,120 |
8.25%, 2010 (3)(4) | | | 28,389 | | | 29,667 |
Russian Ministry of Finance | | | | | | |
3.00%, 2011 | | | 80,000 | | | 72,174 |
| | | | | | |
| | | | | | 203,961 |
| | | | | | |
South Africa - 0.2% | | | | | | |
South Africa Government International Bond | | | | | | |
9.125%, 2009 | | | 95,000 | | | 102,600 |
7.375%, 2012 | | | 35,000 | | | 37,625 |
| | | | | | |
| | | | | | 140,225 |
| | | | | | |
Ukraine - 0.0% | | | | | | |
Ukraine Government International Bond | | | | | | |
11.00%, 2007 | | | 7,002 | | | 7,070 |
| | | | | | |
TOTAL FOREIGN GOVERNMENT BOND (Cost $750,981) | | | | | $ | 841,467 |
| | | | | | |
SENIOR FLOATING RATE INTERESTS - 4.2% | | | | | | |
Automotive - 1.2% | | | | | | |
Ford Motor Company | | | | | | |
8.36%, 2013 (7)(8) | | | 1,300,000 | | | 1,300,812 |
| | | | | | |
Business Equipment & Services - 1.2% | | | | | | |
VNU | | | | | | |
8.125%, 2013 (7)(8) | | | 1,250,000 | | | 1,258,160 |
| | | | | | |
Health Care - 0.9% | | | | | | |
DaVita, Inc. | | | | | | |
7.422%, 2012 (7)(8) | | | 920,985 | | | 925,425 |
| | | | | | |
Utilities - 0.9% | | | | | | |
NRG Energy, Inc. | | | | | | |
7.364%, 2013 (7)(8) | | | 924,642 | | | 929,266 |
| | | | | | |
TOTAL SENIOR FLOATING RATE INTERESTS (Cost $4,415,854) | | | | | $ | 4,413,663 |
| | | | | | |
ASSET BACKED SECURITIES - 0.0% | | | | | | |
Other - 0.0% | | | | | | |
Pegasus Aviation Lease Securitization | | | | | | |
2000-1, 8.42%, 2030 (1)(2)(3)(5) | | | 489,231 | | | — |
TOTAL ASSET BACKED SECURITIES (Cost $370,950) | | $ | | | | — |
The accompanying notes are an integral part of the financial statements.
114
| | |
| Schedule of Investments | | Series P (High Yield Series) |
| December 31, 2006 - continued | | |
| | | | | | |
| | | Principal
Amount | | Value |
REPURCHASE AGREEMENT - 5.7% | | | | | | |
United Missouri Bank, 4.85%, 12-29-06, matures 01-02-07; repuchase amount $6,099,285 (Collateralized by FHLMC, 4.00%, 05-01-09, FHLB, 5.125%, 09-10-10, FNMA, 5.00%, 09-25-30 & GNMA, 4.50%-5.00%, 10-16-28 thru 11-20-29, with a combined value of $6,218,111) | | $ | 6,096,000 | | $ | 6,096,000 |
| | | | | | |
TOTAL REPURCHASE AGREEMENT (Cost $6,096,000) | | | | | $ | 6,096,000 |
| | | | | | |
Total Investments (SBL P Fund) (Cost $102,190,573) - 97.0% | | | | | $ | 102,977,121 |
Other Assets in Excess of Liabilities - 3.0% | | | | | | 3,166,991 |
| | | | | | |
TOTAL NET ASSETS -100.0% | | | | | $ | 106,144,112 |
| | | | | | |
Footnotes
Percentages are stated as a percent of net assets.
For federal income tax purposes the identified cost of investments owned at 12/31/2006 was $101,458,943.
| * | - Non-income producing security |
| 1 | - Security is deemed illiquid. See Notes to financial statements. |
| 2 | - Security is fair valued by the Board of Directors. See Notes to financial statements. |
| 3 | - Security was acquired through a private placement. |
| 4 | - Security is a 144A security, which places restrictions on resale. See Notes to financial statements. |
| 5 | - Security is in default of interest and/or principal obligations. |
| 6 | - Security is a step-up bond. Rate indicated is rate effective at December 31, 2006. |
| 7 | - Variable rate security. Rate indicated is rate effective at December 31, 2006. |
| 8 | - Security is a senior floating rate interest. See Notes to financial statements. |
See notes to financial statements.
The accompanying notes are an integral part of the financial statements.
115
| | |
| | Series P |
| | (High Yield Series) |
Statement of Assets and Liabilities
December 31, 2006
| | | |
Assets: | | | |
Investments, at value1 | | $ | 102,977,121 |
Cash | | | 170,870 |
Receivables: | | | |
Fund shares sold | | | 1,333,393 |
Interest | | | 1,892,447 |
Dividends | | | 7,523 |
Prepaid expenses | | | 1,985 |
| | | |
Total assets | | | 106,383,339 |
| | | |
Liabilities: | | | |
Payable for: | | | |
Fund shares redeemed | | | 140,482 |
Management fees | | | 65,624 |
Custodian fees | | | 996 |
Transfer agent/maintenance fees | | | 2,083 |
Administration fees | | | 11,912 |
Professional fees | | | 11,072 |
Directors’ fees | | | 1,500 |
Other | | | 5,558 |
| | | |
Total liabilities | | | 239,227 |
| | | |
Net Assets | | $ | 106,144,112 |
| | | |
Net assets consist of: | | | |
Paid in capital | | $ | 97,837,797 |
Undistributed net investment income | | | 6,964,398 |
Undistributed net realized gain on sale of investments | | | 555,369 |
Net unrealized appreciation in value of investments | | | 786,548 |
| | | |
Net assets | | $ | 106,144,112 |
| | | |
Capital shares authorized | | | unlimited |
Capital shares outstanding | | | 5,650,298 |
Net asset value per share (net assets divided by shares outstanding) | | $ | 18.79 |
| | | |
1Investments, at cost | | $ | 102,190,573 |
Statement of Operations
For the Year Ended December 31, 2006
| | | | |
Investment Income: | | | | |
Dividends | | $ | 87,673 | |
Interest | | | 7,090,784 | |
| | | | |
Total investment income | | | 7,178,457 | |
| | | | |
Expenses: | | | | |
Management fees | | | 658,247 | |
Custodian fees | | | 6,048 | |
Transfer agent/maintenance fees | | | 25,153 | |
Administration fees | | | 96,700 | |
Directors’ fees | | | 3,810 | |
Professional fees | | | 12,458 | |
Reports to shareholders | | | 12,380 | |
Other expenses | | | 3,305 | |
| | | | |
Total expenses | | | 818,101 | |
Less: Earnings credits applied | | | (215 | ) |
| | | | |
Net expenses | | | 817,886 | |
| | | | |
Net investment income | | | 6,360,571 | |
| | | | |
Net Realized and Unrealized Gain (Loss): | | | | |
Net realized gain during the year on: | | | | |
Investments | | | 1,004,753 | |
| | | | |
Net realized gain | | | 1,004,753 | |
| | | | |
Net unrealized appreciation during the year on: | | | | |
Investments | | | 1,995,013 | |
| | | | |
Net unrealized appreciation | | | 1,995,013 | |
| | | | |
Net realized and unrealized gain | | | 2,999,766 | |
| | | | |
Net increase in net assets resulting from operations | | $ | 9,360,337 | |
| | | | |
See accompanying notes.
116
| | |
| | Series P |
| Statement of Changes in Net Assets | | (High Yield Series) |
| | | | | | | | |
| | | Year Ended
December 31, 2006 | | | Year Ended
December 31, 2005 | |
Increase (decrease) in net assets from operations: | | | | | | | | |
Net investment income | | $ | 6,360,571 | | | $ | 5,102,008 | |
Net realized gain during the year on investments | | | 1,004,753 | | | | 1,405,466 | |
Net unrealized appreciation (depreciation) during the year on investments | | | 1,995,013 | | | | (3,797,233 | ) |
| | | | | | | | |
Net increase in net assets resulting from operations | | | 9,360,337 | | | | 2,710,241 | |
| | | | | | | | |
Capital share transactions: | | | | | | | | |
Proceeds from sale of shares | | | 63,798,723 | | | | 47,469,252 | |
Cost of shares redeemed | | | (44,986,293 | ) | | | (46,523,696 | ) |
| | | | | | | | |
Net increase from capital share transactions | | | 18,812,430 | | | | 945,556 | |
| | | | | | | | |
Net increase in net assets | | | 28,172,767 | | | | 3,655,797 | |
| | | | | | | | |
Net assets: | | | | | | | | |
Beginning of year | | | 77,971,345 | | | | 74,315,548 | |
| | | | | | | | |
End of year | | $ | 106,144,112 | | | $ | 77,971,345 | |
| | | | | | | | |
Undistributed net investment income at end of year | | $ | 6,964,398 | | | $ | 5,556,465 | |
| | | | | | | | |
Capital Share Activity: | | | | | | | | |
Shares sold | | | 3,584,516 | | | | 2,888,743 | |
Shares redeemed | | | (2,547,382 | ) | | | (2,840,004 | ) |
| | | | | | | | |
Total capital share activity | | | 1,037,134 | | | | 48,739 | |
| | | | | | | | |
See accompanying notes.
117
| | | |
| Financial Highlights | | Series P | |
| Selected data for each share of capital stock outstanding throughout each year | | (High Yield Series | ) |
| | | | | | | | | | | | | | | | | | | | |
| | | 2006 | | | 2005 | | | 2004 | | | 2003 | | | Year Ended,
December 31,
2002d | |
| Per Share Data | | | | | | | | | | | | | | | | | | | | |
Net asset value, beginning of period | | $ | 16.90 | | | $ | 16.28 | | | $ | 14.71 | | | $ | 12.79 | | | $ | 13.60 | |
Income (loss) from investment operations: | | | | | | | | | | | | | | | | | | | | |
Net investment income | | | 0.90 | | | | 1.09 | | | | 1.12 | | | | 0.90 | | | | 0.93 | |
Net gain (loss) on securities (realized and unrealized) | | | 0.99 | | | | (0.47 | ) | | | 0.58 | | | | 1.87 | | | | (0.88 | ) |
| | | | | | | | | | | | | | | | | | | | |
Total from investment operations | | | 1.89 | | | | 0.62 | | | | 1.70 | | | | 2.77 | | | | 0.05 | |
| | | | | | | | | | | | | | | | | | | | |
Less distributions: | | | | | | | | | | | | | | | | | | | | |
Dividends from net investment income | | | — | | | | — | | | | (0.13 | ) | | | (0.85 | ) | | | (0.86 | ) |
| | | | | | | | | | | | | | | | | | | | |
Total distributions | | | — | | | | — | | | | (0.13 | ) | | | (0.85 | ) | | | (0.86 | ) |
| | | | | | | | | | | | | | | | | | | | |
Net asset value, end of period | | $ | 18.79 | | | $ | 16.90 | | | $ | 16.28 | | | $ | 14.71 | | | $ | 12.79 | |
| | | | | | | | | | | | | | | | | | | | |
Total Returna | | | 11.18 | % | | | 3.81 | % | | | 11.61 | % | | | 21.71 | % | | | 0.41 | % |
| | | | | | | | | | | | | | | | | | | | |
| Ratios/Supplemental Data | | | | | | | | | | | | | | | | | | | | |
Net assets, end of period (in thousands) | | $ | 106,144 | | | $ | 77,971 | | | $ | 74,316 | | | $ | 78,491 | | | $ | 41,381 | |
| | | | | | | | | | | | | | | | | | | | |
Ratios to average net assets: | | | | | | | | | | | | | | | | | | | | |
Net investment income | | | 7.24 | % | | | 7.13 | % | | | 7.08 | % | | | 7.53 | % | | | 8.12 | % |
Total expensesb | | | 0.93 | % | | | 0.97 | % | | | 0.94 | % | | | 0.87 | % | | | 0.88 | % |
Net expensesc | | | 0.93 | % | | | 0.97 | % | | | 0.94 | % | | | 0.87 | % | | | 0.88 | % |
| | | | | | | | | | | | | | | | | | | | |
Portfolio turnover rate | | | 52 | % | | | 64 | % | | | 63 | % | | | 52 | % | | | 80 | % |
a | Total return does not take into account any of the expenses associated with an investment in variable insurance products offered by Security Benefit Life Insurance Company. If total return had taken into account these expenses, performance would have been lower. Shares of a series of SBL Fund are available only through the purchase of such products. |
b | Total expense information reflects expense ratios absent fund expense reductions by the Investment Manager, and earnings credits, as applicable. |
c | Net expense information reflects the expense ratios after voluntary expense waivers, reimbursements and custodian earnings credits, as applicable. |
d | The financial highlights for Series P exclude the historical financial highlights of Series K. The assets of Series K were acquired by Series P on August 27, 2002. |
See accompanying notes.
118
This page left blank intentionally.
119
| | | |
| | Series Q | |
| Manager’s Commentary | | (Small Cap Value Series | ) |
| February 15, 2007 | | (unaudited | ) |

Subadvisor, Wells Capital Management

I. Charles Rinaldi
Portfolio Manager
To Our Shareholders:
This year’s market performance surprised many investors, especially those who thought the small cap, emerging and real estate markets had cooled off at the end of 2005. Small cap stocks, evidenced by value stocks in the Russell 2000 Index, turned in a very strong 4th quarter to finish the year at 23.48%. Series Q of the SBL Fund - Small Cap Value Series returned 13.41% in 2006, underperforming the Russell 2000 Value. As we look back to September 2005, we note the value of the portfolio’s energy stocks contributed to the overall investment results for 2005. We believe the portfolio’s natural gas infrastructure and crude oil producers stand to outperform the market as domestic companies race to ramp up supply across all energy sub-industries, in light of strong global demand for natural resources. In addition, our thorough stock selection in a number of industries has positioned the portfolio to outperform the market. With respect to the index’s strong performance in 2006, our significant underweight in banks and real estate investment trusts (REITs) was a major source of underperformance versus the benchmark. On a capitalization basis, large caps outperformed in December but small caps outperformed for the year. This was the eighth straight year that the Russell 2000 Index outperformed the S&P 500 Index. The two most recent years, however, have seen that margin narrow.
Our selection of materials and industrial processing stocks for the Series is comprised of 29 stocks that have met our requirements for inclusion in the portfolio. For the year, our materials stocks, specifically steel, chemical and gold, added the most value in terms of contribution to return. Much of the drive behind steel stocks has been the winds of worldwide steel mergers. While the steel stocks in the portfolio make up a small percentage of the total, the excellent returns in this area added over 1% to the year’s return. Chemicals stocks were also strong; a welcome change. Our identification of these stocks took place a number of years ago, with many of the companies coming through our intrinsic value process.
Gold dipped late in the year, yet still finished up 20% for the year. Gold mining stocks represent a small part of the portfolio, and have been solid performers, displaying sustained strength over the past four years. Paper companies staged a turnaround after a tough year in 2005. A top ten holding, Chicago Bridge & Iron, was up in the year. The power, environmental and natural gas services company continues to win large projects and has a significant backlog in the pipeline. We saw weakness in synthetic fiber company, Wellman and in Intertape Polymer, a resin and synthetic products company. Higher commodity prices, among other factors, caused pressure on these companies. Fifteen industries are represented in this sector, diversifying exposure to a broad slice of these types of stocks. For 2007, we look to the high cash levels at companies and the overall liquidity in the system to push projects at each of these industrials.
Total holdings in technology, a place where we have found cheap stocks and good values, have increased in the year. At least one of the themes we are seeing materialize is in radio frequency identification (RFID), a technology to allow for better inventory control in warehouses and stores. We’ve identified undervalued companies with excellent prospects and strong balance sheets as potential candidates. Technology stocks are represented by 17 companies spread throughout multiple sub-industries, including enterprise software, semi-conductors, testing hardware, and networking to name a few. For the year, we saw a small group of unrelated companies experience increased volatility in their prices. A significant detractor was Embarcadero, mired in an accounting issue. On the positive side, Symbol Technologies, a maker of handheld scanners commonly used at checkouts, was acquired by Motorola in September.
Cray Computer had a strong year, adding value to the portfolio’s return. The supercomputer maker in Seattle won a number of government and education contracts, fueling its stock price. Cray, a small niche player in a large market, has a long history developing large scale computers. Intermec, a company involved in barcode technology and also RFID research and development, was down sharply in the year. The company is in the midst of restructuring and has announced a reduction in its workforce. For 2007, we look to our selection of technology stocks to add value relative to the index.
The portfolio’s consumer stocks were up in the year; however, they underperformed the benchmark’s return in this sector. Our over weight in commercial services proved to add value to the year’s results from a broad group of companies.
Consumer stocks represent about 17% of the portfolio, with half of these stocks in commercial services, an area where we have found attractive valuations. ABM Industries, a company servicing high rise buildings, is an
120
| | | |
| | Series Q | |
| Manager’s Commentary | | (Small Cap Value Series | ) |
| February 15, 2007 | | (unaudited | ) |
example of a well run company with large contracts to run everything from janitorial to security operations for companies. Commercial information services company ProQuest was off sharply, dragging down the sector following its announcement of a potential restatement of quarterly earnings. Traditional retailers contributed to performance, but underperformed the market. We have found the best value in companies with predictable revenue streams, such as those found in commercial services.
Our overweight in energy stocks helped boost performance for the year. Despite widespread concern over energy prices in the summer of 2006, the portfolio’s oil well and natural gas equipment and service stocks per formed well relative to the index, adding almost 200 basis points to the year’s return. We believe we are in a multi-year period of capital projects expansion in this industry, due to an extended time of underinvestment in domestic energy projects. Under water pipeline repair company Oceaneering International had a strong year, up over 50%. The company, which utilizes remote operated vehicles to repair lines, serves a niche market in deep water pipeline repair and has been an excellent addition to the portfolio. Global Industries, a top holding in the portfolio, began serving the offshore oil and gas industry over 25 years ago and has evolved into one of the largest providers of offshore services in the Gulf of Mexico. The company’s earnings have been improving as the framework laid a number of years ago has continued to reap benefits for shareholders.
Key Energy Services, also a top holding, continues to post improving rig hours in the U.S. and internationally amid strong demand for its services. The company has yet to file regulatory documents for previous years, a situation we are monitoring closely. Helmerich & Payne, a Tulsa, OK-based driller, was down in the year, despite a rather strong earnings announcement in November. Since September 2005, we have been reducing portfolio holdings in crude oil related companies, on our thesis that while there is opportunity in the long-term in these stocks, near term pressure may not be favorable to owning oil stocks. We witnessed extended volatility in oil throughout the year and used our vast research to steer us from a negative impact on performance. Lastly, another Tulsa-based oil service company, Matrix Service, positively contributed to the year’s return. In utilities, Cincinnati Bell continues to increase its revenue and operating income, sending its shares up in the past year. The company fits our investment criteria, having a solid customer base and multiple lines of business.
Financials were very strong in the year and our under weight in the area hurt our performance. The benchmark’s financials sector makes up 35% of the entire index, dominated by banks and real estate investment trusts (REIT). Our bottom-up process has identified a small number of REITs. The portfolio currently maintains approximately 4 percent in property and casualty insurance companies, an area where we believe value exists. REITs have been a large part of the index’s performance for the year; however, in December the small cap portfolio outperformed in this area.
Our underweight in banking and REITs has been an area of underperformance due to the continued extraordinary returns seen in commercial property, hotels and other related real estate vehicles. We have found a select number of REITs, of which some are recent IPOs, and added them to the portfolio throughout the year. We also continue to favor some insurance companies on the thesis their valuations may not be fully realized.
In healthcare, the services industry comprised of companies providing ser vices to hospitals, nursing homes, prisons and clinics, was the leading contributor in our healthcare stocks for the year. Gentiva Health Services and Healthcare Services Group were steady per formers throughout the year. Gentiva provides comprehensive home health services including nursing in the U.S. In February, Gentiva acquired the Healthfield Group, another provider of services to southeastern states with over 130 locations. Healthcare Services Group provides housekeeping, laundry, linen and food services to the healthcare industry. Laundry and linen represent a significant part of the company’s revenue. The portfolio is slightly over weight in the index in healthcare.
Our healthcare facilities stocks added value to the year’s performance. The portfolio has a small exposure to biotech research companies. One stock is Infinity Pharmaceuticals, a cancer drug development company, which had a busy year making progress on a number of its cancer drugs and completing a reverse merger with Discovery Partners. In pharma stocks, the portfolio’s holdings detracted largely due to CV Therapeutics, which was pushed lower on a delay in obtaining regulatory approval for its main drug Ranexa. Late in the year, the company filed for EU approval of its heart drug, in the face of domestic regulatory challenges.
The eight transportation stocks added a small contribution to the year’s return, with railroader Rail America coming in with a strong year, up nearly 50%. The short-haul transporter agreed to be sold to a hedge fund group at a 32% premium to its trading price in mid-November. In air transport, an industry in which the portfolio has 5 holdings, results were flat for the year. EGL Inc. was a detractor in this sector, pushed lower by flat revenue from its air transport segment, which accounts for over 60% of its sales. Slightly over 5% of the portfolio is invested in transportation related stocks.
121
| | | |
| | Series Q | |
| Manager’s Commentary | | (Small Cap Value Series | ) |
| February 15, 2007 | | (unaudited | ) |
Producer durables account for approximately 2% of the portfolio, versus 6% in the index. Our allocation to this area was a detractor to performance; in addition, stock selection also did not work in our favor. In the past year, we have begun adding manufactured housing related stocks, on our belief that the value proposition for these types of companies fits well into current housing climate. Late in the year, these stocks were not favored by investors, being dragged down by the market’s overall negative investment view towards housing.
Thank you for your confidence in our investment team. We wish you all the best in 2007 and look forward to our partnership for many years to come.
|
| Sincerely, |
|
| |
I. Charles Rinaldi Portfolio Manager |
PERFORMANCE
Series Q vs. Russell 2000 Index
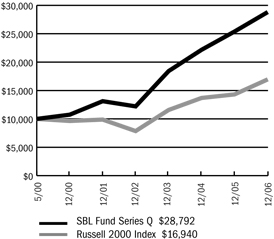
$10,000 Since Inception
The chart above assumes a hypothetical $10,000 investment in Series Q (Small Cap Value Series) on May 1, 2000 (date of inception), and reflects the fees and expenses of Series Q. The Russell 2000 Index is a capitalization-weighted index that measures the performance of the 2,000 smallest companies in the Russell 3000 Index, which represents approximately 10% of the total market capitalization of the Russell 3000 Index.
Average Annual Returns
| | | | | | | | | |
Periods Ended 12-31-061 | | 1 Year | | | 5 Years | | | Since Inception
(5-1-00) | |
Series Q | | 13.41 | % | | 17.02 | % | | 17.18 | % |
1 | Performance figures do not reflect fees and expenses associated with an investment in variable insurance products offered by Security Benefit Life Insurance Company. If returns had taken into account these fees and expenses, performance would have been lower. Shares of a Series of SBL Fund are available only through the purchase of such products. |
The performance data quoted above represents past performance. Past performance is not predictive of future performance. The investment return and principal value of an investment will fluctuate so that an investor’s shares, when redeemed, may be worth more or less than their original cost.
Portfolio Composition by Sector
| | | |
Consumer Discretionary | | 6.87 | % |
Consumer Staples | | 2.01 | |
Energy | | 25.56 | |
Financials | | 2.16 | |
Health Care | | 6.93 | |
Industrials | | 12.83 | |
Information Technology | | 14.44 | |
Materials | | 20.82 | |
Telecommunication Services | | 0.72 | |
Repurchase Agreement | | 9.81 | |
Liabilities, less cash & other assets | | (2.15 | ) |
Total net assets | | 100.00 | % |
| | | |
See accompanying notes.
| | |
| | Series Q |
| Manager’s Commentary | | (Small Cap Value Series) |
| December 31, 2006 | | (unaudited) |
PERFORMANCE
Information About Your Series Expenses
Calculating your ongoing series expenses
Example
As a shareholder of the Series, you incur ongoing costs, including management fees and other series expenses. Performance figures and expense ratios do not reflect fees and expenses associated with an investment in variable insurance products. Shares of a Series of SBL Fund are available only through the purchase of such products. This example is intended to help you understand your ongoing costs (in dollars) of investing in the Series and to compare these costs with ongoing costs of investing in other mutual funds. The example is based on an investment of $1,000 invested at the beginning of the period and held for the entire period, July 1, 2006 - December 31, 2006.
Actual Expenses
The first line in the table provides information about actual account values and actual expenses. You may use the information in this table, together with the amount you invested, to estimate the expenses that you paid over the period. Simply divide your account value by $1,000 (for example, an $8,600 account value divided by $1,000 = 8.6), then multiply the result by the number in the table under the heading entitled “Expenses Paid During Period” to estimate the expenses you paid on your account during this period.
Hypothetical Example for Comparison Purposes
The second line in the table provides information about hypothetical account values and hypothetical expenses based on the Series actual expense ratio and an assumed rate of return of 5% per year before expenses, which is not the Series actual return. The hypothetical account values and expenses may not be used to estimate the actual ending account balance or expenses you paid for the period. You may use this information to compare the ongoing costs of investing in the Series and other funds. To do so, compare this 5% hypothetical example with the 5% hypothetical examples that appear in the shareholder reports of the other mutual funds.
Please note that the expenses shown in the table are meant to highlight your ongoing costs only and do not reflect any fees and expenses associated with an investment in variable insurance products. Therefore, the second line is useful in comparing ongoing costs only, and will not help you determine the relative total costs of owning different funds. In addition, if these fees and expenses associated with an investment in variable insurance products were included, your costs would have been higher.
Series Expenses
| | | | | | | | | |
| | | Beginning
Account Value
07-01-06 | | Ending
Account Value
12-31-061 | | Expenses Paid
During
Period2 |
Series Q (Small Cap Value Series) | | | | | | | | | |
Actual | | $ | 1,000.00 | | $ | 1,057.00 | | $ | 6.58 |
Hypothetical | | | 1,000.00 | | | 1,018.80 | | | 6.46 |
1 | The actual ending account value is based on the actual total return of the Series for the period July 1, 2006 to December 31, 2006 after actual expenses and will differ from the hypothetical ending account value which is based on the Series expense ratio and a hypothetical annual return of 5% before expenses. The actual cumulative return at net asset value for the period July 1, 2006 to December 31, 2006 was 5.70%. |
2 | Expenses are equal to the Series annualized expense ratio of 1.27%, net of earnings credits, multiplied by the average account value over the period, multiplied by 184/365 (to reflect the one-half year period). |
123
| | |
| Schedule of Investments | | Series Q (Small Cap Value Series) |
| December 31, 2006 | | |
| | | | | |
| | | Shares | | Value |
COMMON STOCK - 91.6% | | | | | |
Aerospace & Defense - 0.8% | | | | | |
Armor Holdings, Inc. * | | 22,000 | | $ | 1,206,700 |
| | | | | |
Air Freight & Logistics - 0.6% | | | | | |
EGL, Inc. * (1) | | 29,600 | | | 881,488 |
| | | | | |
Airlines - 0.9% | | | | | |
Lan Airlines S.A. ADR | | 27,700 | | | 1,520,453 |
| | | | | |
Apparel Retail - 1.5% | | | | | |
Bakers Footwear Group, Inc. * | | 44,295 | | | 400,427 |
Foot Locker, Inc. | | 49,565 | | | 1,086,960 |
Payless ShoeSource, Inc. * (1) | | 4,000 | | | 131,280 |
Tween Brands, Inc. * (1) | | 20,700 | | | 826,551 |
| | | | | |
| | | | | 2,445,218 |
| | | | | |
Apparel, Accessories & Luxury Goods - 0.6% | | | | | |
Hanesbrands, Inc. * | | 39,600 | | | 935,352 |
| | | | | |
Automobile Manufacturers - 0.6% | | | | | |
Fleetwood Enterprises, Inc. * | | 123,800 | | | 979,258 |
| | | | | |
Biotechnology - 1.8% | | | | | |
CV Therapeutics, Inc. * (1) | | 188,000 | | | 2,624,480 |
Infinity Pharmaceuticals, Inc. * | | 19,500 | | | 242,775 |
| | | | | |
| | | | | 2,867,255 |
| | | | | |
Broadcasting & Cable TV - 0.5% | | | | | |
Discovery Holding Company * | | 51,700 | | | 831,853 |
| | | | | |
Casinos & Gaming - 1.2% | | | | | |
Boyd Gaming Corporation (1) | | 13,200 | | | 598,092 |
Empire Resorts, Inc. * | | 55,200 | | | 478,584 |
Progressive Gaming International Corporation * | | 87,000 | | | 789,090 |
| | | | | |
| | | | | 1,865,766 |
| | | | | |
Coal & Consumable Fuels - 0.3% | | | | | |
Aventine Renewable Energy Holdings, Inc. * | | 22,840 | | | 538,110 |
| | | | | |
Commercial Printing - 0.4% | | | | | |
Deluxe Corporation | | 27,000 | | | 680,400 |
| | | | | |
Commodity Chemicals - 0.5% | | | | | |
Calgon Carbon Corporation (1) | | 79,500 | | | 492,900 |
Wellman, Inc. | | 89,200 | | | 284,548 |
| | | | | |
| | | | | 777,448 |
| | | | | |
Communications Equipment - 2.8% | | | | | |
3Com Corporation * | | 335,600 | | | 1,379,316 |
China GrenTech Corporation, Ltd. ADR * | | 59,280 | | | 1,093,123 |
Mastec, Inc. * | | 80,700 | | | 931,278 |
Nortel Networks Corporation * | | 40,230 | | | 1,075,348 |
| | | | | |
| | | | | 4,479,065 |
| | | | | |
Computer Hardware - 0.9% | | | | | |
Cray, Inc. * | | 122,815 | | | 1,459,042 |
| | | | | |
Computer Storage & Peripherals - 2.6% | | | | | |
Electronics for Imaging * | | 27,500 | | | 730,950 |
Intermec, Inc. * | | 138,300 | | | 3,356,541 |
| | | | | |
| | | | | 4,087,491 |
| | | | | |
Construction & Engineering - 2.6% | | | | | |
Chicago Bridge & Iron Company N.V. (1) | | 150,600 | | | 4,117,404 |
| | | | | |
Construction Materials - 0.6% | | | | | |
U.S. Concrete, Inc. * (1) | | 129,200 | | | 919,904 |
| | | | | |
Data Processing & Outsourced Services - 1.1% | | | | | |
Lightbridge, Inc. * | | 124,700 | | | 1,688,438 |
| | | | | |
Diversified Chemicals - 0.5% | | | | | |
Ashland, Inc. (1) | | 12,500 | | | 864,750 |
| | | | | |
Diversified Commercial & Professional Services - 1.9% | | | | | |
Geo Group, Inc. * | | 66,755 | | | 2,504,648 |
Healthcare Services Group | | 20,400 | | | 590,784 |
| | | | | |
| | | | | 3,095,432 |
| | | | | |
Electrical Components & Equipment - 2.2% | | | | | |
Encore Wire Corporation * (1) | | 42,250 | | | 929,922 |
GrafTech International, Ltd. * | | 220,655 | | | 1,526,933 |
Power-One, Inc. * | | 152,900 | | | 1,113,112 |
| | | | | |
| | | | | 3,569,967 |
| | | | | |
Electronic Equipment Manufacturers - 4.1% | | | | | |
Cognex Corporation | | 41,700 | | | 993,294 |
Coherent, Inc. * | | 38,600 | | | 1,218,602 |
OSI Systems, Inc. * | | 50,200 | | | 1,050,686 |
Symbol Technologies, Inc. | | 225,800 | | | 3,373,452 |
| | | | | |
| | | | | 6,636,034 |
| | | | | |
Environmental & Facilities Services - 2.1% | | | | | |
ABM Industries, Inc. (1) | | 102,520 | | | 2,328,229 |
Layne Christensen Company * | | 29,900 | | | 981,617 |
| | | | | |
| | | | | 3,309,846 |
| | | | | |
Gold - 8.5% | | | | | |
Goldcorp, Inc. | | 264,990 | | | 7,536,316 |
Meridian Gold, Inc. | | 47,500 | | | 1,320,025 |
Randgold Resources, Ltd. ADR * | | 199,900 | | | 4,689,654 |
| | | | | |
| | | | | 13,545,995 |
| | | | | |
Health Care Facilities - 1.0% | | | | | |
Manor Care, Inc. | | 34,800 | | | 1,632,816 |
| | | | | |
Health Care Services - 1.7% | | | | | |
Cross Country Healthcare, Inc. * | | 52,465 | | | 1,144,786 |
Gentiva Health Services, Inc. * | | 78,618 | | | 1,498,459 |
The accompanying notes are an integral part of the financial statements.
124
| | |
| Schedule of Investments | | Series Q (Small Cap Value Series) |
| December 31, 2006 - continued | | |
| | | | | |
| | | Shares | | Value |
COMMON STOCK (continued) | | | | | |
Health Care Services (continued) | | | | | |
Omnicare, Inc. (1) | | 3,000 | | $ | 115,890 |
| | | | | |
| | | | | 2,759,135 |
| | | | | |
Health Care Supplies - 0.9% | | | | | |
OraSure Technologies, Inc. * | | 179,200 | | | 1,480,192 |
| | | | | |
Homebuilding - 0.1% | | | | | |
Champion Enterprises, Inc. * | | 20,800 | | | 194,688 |
| | | | | |
Housewares & Specialties - 0.3% | | | | | |
Jarden Corporation * (1) | | 12,600 | | | 438,354 |
| | | | | |
Human Resource & Employment Services - 0.9% | | | | | |
CDI Corporation | | 15,770 | | | 392,673 |
Kforce, Inc. * | | 87,100 | | | 1,060,007 |
| | | | | |
| | | | | 1,452,680 |
| | | | | |
Integrated Oil & Gas - 1.1% | | | | | |
InterOil Corporation * (1) | | 56,900 | | | 1,723,501 |
| | | | | |
Integrated Telecommunication Services - 0.7% | | | | | |
Cincinnati Bell, Inc. * | | 251,000 | | | 1,147,070 |
| | | | | |
Internet Software & Services - 0.9% | | | | | |
Earthlink, Inc. * | | 11,200 | | | 79,520 |
Vignette Corporation * | | 76,300 | | | 1,302,441 |
| | | | | |
| | | | | 1,381,961 |
| | | | | |
IT Consulting & Other Services - 0.7% | | | | | |
MPS Group, Inc. * (1) | | 47,500 | | | 673,550 |
Tier Technologies, Inc. (CI.B) * | | 63,700 | | | 404,495 |
| | | | | |
| | | | | 1,078,045 |
| | | | | |
Life Sciences Tools & Services - 0.7% | | | | | |
Applera Corporation - Applied Biosystems Group (1) | | 8,600 | | | 315,534 |
MDS, Inc. | | 43,800 | | | 796,284 |
| | | | | |
| | | | | 1,111,818 |
| | | | | |
Metal & Glass Containers - 0.8% | | | | | |
Constar International, Inc. * | | 32,000 | | | 224,000 |
Intertape Polymer Group, Inc. * | | 206,000 | | | 1,087,680 |
| | | | | |
| | | | | 1,311,680 |
| | | | | |
Office REITs - 0.6% | | | | | |
Government Properties Trust, Inc. | | 86,800 | | | 920,080 |
| | | | | |
Oil & Gas Drilling - 3.0% | | | | | |
Helmerich & Payne, Inc. | | 83,500 | | | 2,043,245 |
Parker Drilling Company * (1) | | 30,800 | | | 251,636 |
Pride International, Inc. * | | 41,416 | | | 1,242,480 |
Transocean, Inc. * (1) | | 15,500 | | | 1,253,795 |
| | | | | |
| | | | | 4,791,156 |
| | | | | |
Oil & Gas Equipment & Services - 11.3% | | | | | |
Global Industries, Ltd. * | | 502,100 | | | 6,547,384 |
Hydril * (1) | | 9,800 | | | 736,862 |
Input/Output, Inc. * | | 56,200 | | | 766,006 |
Key Energy Services, Inc. * | | 158,835 | | | 2,484,179 |
Matrix Service Company * (1) | | 28,200 | | | 454,020 |
Newpark Resources * | | 262,300 | | | 1,891,183 |
Oceaneering International, Inc. * (1) | | 51,200 | | | 2,032,640 |
PHI, Inc. (Non Voting) * | | 34,900 | | | 1,142,277 |
PHI, Inc. * | | 6,400 | | | 202,688 |
Smith International, Inc. (1) | | 13,700 | | | 562,659 |
Willbros Group, Inc. * | | 67,500 | | | 1,275,750 |
| | | | | |
| | | | | 18,095,648 |
| | | | | |
Oil & Gas Exploration & Production - 8.9% | | | | | |
Forest Oil Corporation * (1) | | 37,900 | | | 1,238,572 |
Helix Energy Solutions Group, Inc.* | | 41,200 | | | 1,292,444 |
Mariner Energy, Inc. * (1) | | 20,800 | | | 407,680 |
McMoRan Exploration Company * (1) | | 108,885 | | | 1,548,345 |
Newfield Exploration Company * (1) | | 22,500 | | | 1,033,875 |
Noble Energy, Inc. (1) | | 26,200 | | | 1,285,634 |
PetroHawk Energy Corporation * (1) | | 27,200 | | | 312,800 |
Petroquest Energy, Inc. * | | 39,400 | | | 501,956 |
Pioneer Natural Resources Company (1) | | 17,100 | | | 678,699 |
Range Resources Corporation | | 216,417 | | | 5,942,811 |
| | | | | |
| | | | | 14,242,816 |
| | | | | |
Oil & Gas Storage & Transportation - 0.4% | | | | | |
El Paso Corporation | | 37,400 | | | 571,472 |
| | | | | |
Packaged Foods & Meats - 1.4% | | | | | |
Del Monte Foods Company | | 203,360 | | | 2,243,061 |
| | | | | |
Paper Packaging - 0.3% | | | | | |
Chesapeake Corporation | | 26,950 | | | 458,689 |
| | | | | |
Paper Products - 0.9% | | | | | |
Wausau Paper Corporation | | 93,700 | | | 1,404,563 |
| | | | | |
Personal Products - 0.6% | | | | | |
Prestige Brands Holdings, Inc. * | | 74,100 | | | 964,782 |
| | | | | |
Pharmaceuticals - 0.8% | | | | | |
Alpharma, Inc. | | 50,800 | | | 1,224,280 |
| | | | | |
Precious Metals & Minerals - 2.0% | | | | | |
Apex Silver Mines, Ltd. * | | 202,300 | | | 3,214,547 |
| | | | | |
Properly & Casualty Insurance - 1.3% | | | | | |
Argonaut Group, Inc. * | | 37,075 | | | 1,292,434 |
Donegal Group, Inc. | | 7,850 | | | 153,782 |
The accompanying notes are an integral part of the financial statements.
125
| | |
| Schedule of Investments | | Series Q (Small Cap Value Series) |
| December 31, 2006 - continued | | |
| | | | | | | |
| | | Shares | | Value | |
COMMON STOCK (continued) | | | | | | | |
Property & Casualty Insurance (continued) | | | | | | | |
Mercury General Corporation | | | 11,900 | | $ | 627,487 | |
| | | | | | | |
| | | | | | 2,073,703 | |
| | | | | | | |
Publishing - 1.9% | | | | | | | |
McClatchy Company | | | 17,500 | | | 757,750 | |
ProQuest Company * | | | 39,400 | | | 411,730 | |
RH Donnelley Corporation | | | 30,600 | | | 1,919,538 | |
| | | | | | | |
| | | | | | 3,089,018 | |
| | | | | | | |
Regional Banks - 0.3% | | | | | | | |
Colonial BancGroup, Inc. | | | 18,100 | | | 465,894 | |
| | | | | | | |
Semiconductor Equipment - 0.6% | | | | | | | |
Credence Systems Corporation * | | | 186,175 | | | 968,110 | |
| | | | | | | |
Semiconductors - 0.8% | | | | | | | |
STATS ChipPAC, Ltd. ADR * | | | 169,333 | | | 1,300,478 | |
| | | | | | | |
Specialty Chemicals - 0.5% | | | | | | | |
OM Group, Inc. * (1) | | | 18,100 | | | 819,568 | |
| | | | | | | |
Specialty Stores - 0.1% | | | | | | | |
Hancock Fabrics, Inc. * | | | 15,500 | | | 53,320 | |
Sharper Image Corporation * | | | 16,340 | | | 151,145 | |
| | | | | | | |
| | | | | | 204,465 | |
| | | | | | | |
Steel - 6.2% | | | | | | | |
Carpenter Technology Corporation (1) | | | 20,100 | | | 2,060,652 | |
IPSCO, Inc. (1) | | | 41,500 | | | 3,895,605 | |
Steel Dynamics, Inc. (1) | | | 97,440 | | | 3,161,928 | |
United States Steel Corporation (1) | | | 5,700 | | | 416,898 | |
Webco Industries, Inc. * | | | 4,740 | | | 369,720 | |
| | | | | | | |
| | | | | | 9,904,803 | |
| | | | | | | |
Trucking - 0.3% | | | | | | | |
Covenant Transport, Inc. * | | | 40,850 | | | 465,690 | |
| | | | | | | |
TOTAL COMMON STOCK (Cost $109,770,030) | | | | | $ | 146,437,432 | |
| | | | | | | |
FOREIGN STOCK- 0.8% | | | | | | | |
Canada - 0.8% | | | | | | | |
Air Canada * | | | 11,400 | | | 172,046 | |
Air Canada * (2) | | | 2,450 | | | 36,975 | |
Southwestern Resources Corporation * | | | 9,850 | | | 67,063 | |
Trilogy Energy Trust | | | 92,000 | | | 899,331 | |
| | | | | | | |
| | | | | | 1,175,415 | |
| | | | | | | |
TOTAL FOREIGN STOCK (Cost $1,703,864) | | | | | $ | 1,175,415 | |
| | | | | | | |
REPURCHASE AGREEMENT - 9.8% | | | | | | | |
State Street, 2.75%, dated 12-29-06, matures 01-02-07; repurchase amount of $15,684,401 (Collateralized by FHLB, 04-16-07 with a value of $15,996,200) | | $ | 15,679,610 | | $ | 15,679,611 | |
| | | | | | | |
TOTAL REPURCHASE AGREEMENT (Cost $15,679,611) | | | | | $ | 15,679,611 | |
| | | | | | | |
Total Investments (SBL Q Fund) (Cost $127,153,505) - 102.2% | | | | | $ | 163,292,458 | |
Liabilities in Excess of Other Assets - (2.2)% (1) | | | | | | (3,440,525 | ) |
| | | | | | | |
TOTAL NET ASSETS - 100.0% | | | | | $ | 159,851,933 | |
| | | | | | | |
Footnotes
Percentages are stated as a percent of net assets.
For federal income tax purposes the identified cost of investments owned at 12/31/2006 was $127,753,000.
| * | - Non-income producing security |
| 1 | - Security is segregated as collateral for open written options contracts. |
| 2 | - Security is a 144A security, which places restrictions on resale. See Notes to financial statements. |
Glossary:
| ADR | - American Depositary Receipt |
See notes to financial statements.
The accompanying notes are an integral part of the financial statements.
126
Series Q
(Small Cap Value Series)
Statement of Assets and Liabilities
December 31, 2006
| | | | |
Assets: | | | | |
Investments, at value1 | | $ | 163,292,458 | |
Cash | | | 109,676 | |
Receivables: | | | | |
Fund shares sold | | | 603,765 | |
Securities sold | | | 637,611 | |
Dividends | | | 42,449 | |
Prepaid expenses | | | 3,777 | |
| | | | |
Total assets | | | 164,689,736 | |
| | | | |
Liabilities: | | | | |
Payable for: | | | | |
Securities purchased | | | 2,001,405 | |
Fund shares redeemed | | | 377,770 | |
Written options, at value (premiums received $2,869,580) | | | 2,267,495 | |
Management fees | | | 136,100 | |
Custodian fees | | | 11,728 | |
Transfer agent/maintenance fees | | | 2,083 | |
Administration fees | | | 16,529 | |
Professional fees | | | 13,028 | |
Directors’ fees | | | 2,500 | |
Other | | | 9,165 | |
| | | | |
Total liabilities | | | 4,837,803 | |
| | | | |
Net Assets | | $ | 159,851,933 | |
| | | | |
Net assets consist of: | | | | |
Paid in capital | | $ | 108,719,396 | |
Accumulated net investment loss | | | (152 | ) |
Undistributed net realized gain on sale of investments, options written and foreign currency transactions | | | 14,391,860 | |
Net unrealized appreciation in value of investments, options written and translation of assets and liabilities in foreign currency | | | 36,740,829 | |
| | | | |
Net assets | | $ | 159,851,933 | |
| | | | |
Capital shares authorized | | | Unlimited | |
Capital shares outstanding | | | 6,115,641 | |
Net asset value per share (net assets divided by shares outstanding) | | $ | 26.14 | |
| | | | |
1Investments, at cost | | $ | 127,153,505 | |
Statement of Operations
For the Year Ended December 31, 2006
| | | | |
Investment Income: | | | | |
Dividends (net of foreign tax withholding of $14,590) | | $ | 854,577 | |
Interest | | | 536,386 | |
| | | | |
Total investment income | | | 1,390,963 | |
| | | | |
Expenses: | | | | |
Management fees | | | 1,571,718 | |
Custodian fees | | | 145,616 | |
Transfer agent/maintenance fees | | | 25,143 | |
Administration fees | | | 164,480 | |
Directors’ fees | | | 7,091 | |
Professional fees | | | 17,958 | |
Reports to shareholders | | | 22,964 | |
Other expenses | | | 5,638 | |
| | | | |
Total expenses | | | 1,960,608 | |
Less: Earnings credits applied | | | (5,984 | ) |
| | | | |
Net expenses | | | 1,954,624 | |
| | | | |
Net investment loss | | | (563,661 | ) |
| | | | |
Net Realized and Unrealized Gain (Loss): | | | | |
Net realized gain (loss) during the year on: | | | | |
Investments | | | 16,032,712 | |
Options written | | | (1,150,323 | ) |
Foreign currency transactions | | | (35 | ) |
| | | | |
Net realized gain | | | 14,882,354 | |
| | | | |
Net unrealized appreciation during the year on: | | | | |
Investments | | | 3,652,999 | |
Options written | | | 958,158 | |
Translation of assets and liabilities in foreign currencies | | | (253 | ) |
| | | | |
Net unrealized appreciation | | | 4,610,904 | |
| | | | |
Net realized and unrealized gain | | | 19,493,258 | |
| | | | |
Net increase in net assets resulting from operations | | $ | 18,929,597 | |
| | | | |
See accompanying notes.
127
| | |
| | Series Q |
| Statement of Changes in Net Assets | | (Small Cap Value Series) |
| | | | | | | | |
| | | Year Ended
December 31, 2006 | | | Year Ended
December 31, 2005 | |
Increase (decrease) in net assets from operations: | | | | | | | | |
Net investment loss | | $ | (563,661 | ) | | $ | (705,100 | ) |
Net realized gain during the year on investments, options written and foreign currency transactions | | | 14,882,354 | | | | 12,654,238 | |
Net unrealized appreciation during the year on investments, options written and translation of assets and liabilities in foreign currencies | | | 4,610,904 | | | | 4,976,015 | |
| | | | | | | | |
Net increase in net assets resulting from operations | | | 18,929,597 | | | | 16,925,153 | |
| | | | | | | | |
Capital share transactions: | | | | | | | | |
Proceeds from sale of shares | | | 72,004,481 | | | | 66,615,051 | |
Cost of shares redeemed | | | (75,248,438 | ) | | | (51,506,782 | ) |
| | | | | | | | |
Net increase from capital share transactions | | | (3,243,957 | ) | | | 15,108,269 | |
| | | | | | | | |
Net increase in net assets | | | 15,685,640 | | | | 32,033,422 | |
| | | | | | | | |
Net assets: | | | | | | | | |
Beginning of year | | | 144,166,293 | | | | 112,132,871 | |
| | | | | | | | |
End of year | | $ | 159,851,933 | | | $ | 144,166,293 | |
| | | | | | | | |
Accumulated net investment loss at end of year | | $ | (152 | ) | | $ | — | |
| | | | | | | | |
Capital Share Activity: | | | | | | | | |
Shares sold | | | 2,918,282 | | | | 3,141,404 | |
Shares redeemed | | | (3,057,766 | ) | | | (2,458,032 | ) |
| | | | | | | | |
Total capital share activity | | | (139,484 | ) | | | 683,372 | |
| | | | | | | | |
See accompanying notes.
128
| | |
| Financial Highlights | | Series Q |
| Selected data for each share of capital stock outstanding throughout each year | | (Small Cap Value Series) |
| | | | | | | | | | | | | | | | | | | | |
| | | 2006 | | | 2005 | | | 2004 | | | 2003 | | | Year Ended,
December 31,
2002 | |
Per Share Data | | | | | | | | | | | | | | | | | | | | |
Net asset value, beginning of period | | $ | 23.05 | | | $ | 20.13 | | | $ | 16.84 | | | $ | 11.24 | | | $ | 12.79 | |
| | | | | | | | | | | | | | | | | | | | |
Income (loss) from investment operations: | | | | | | | | | | | | | | | | | | | | |
Net investment loss | | | (0.09 | ) | | | (0.11 | ) | | | (0.12 | ) | | | (0.03 | ) | | | (0.09 | ) |
Net gain (loss) on securities (realized and unrealized) | | | 3.18 | | | | 3.03 | | | | 3.53 | | | | 5.73 | | | | (0.79 | ) |
| | | | | | | | | | | | | | | | | | | | |
Total from investment operations | | | 3.09 | | | | 2.92 | | | | 3.41 | | | | 5.70 | | | | (0.88 | ) |
| | | | | | | | | | | | | | | | | | | | |
Less distributions: | | | | | | | | | | | | | | | | | | | | |
Distributions from realized gains | | | — | | | | — | | | | (0.12 | ) | | | (0.10 | ) | | | (0.67 | ) |
| | | | | | | | | | | | | | | | | | | | |
Total distributions | | | — | | | | — | | | | (0.12 | ) | | | (0.10 | ) | | | (0.67 | ) |
| | | | | | | | | | | | | | | | | | | | |
Net asset value, end of period | | $ | 26.14 | | | $ | 23.05 | | | $ | 20.13 | | | $ | 16.84 | | | $ | 11.24 | |
| | | | | | | | | | | | | | | | | | | | |
Total Returna | | | 13.41 | % | | | 14.51 | % | | | 20.37 | % | | | 50.90 | % | | | (6.96 | %) |
| | | | | | | | | | | | | | | | | | | | |
Ratios/Supplemental Data | | | | | | | | | | | | | | | | | | | | |
Net assets, end of period (in thousands) | | $ | 159,852 | | | $ | 144,166 | | | $ | 112,133 | | | $ | 87,297 | | | $ | 50,830 | |
| | | | | | | | | | | | | | | | | | | | |
Ratios to average net assets: | | | | | | | | | | | | | | | | | | | | |
Net investment loss | | | (0.36 | %) | | | (0.58 | %) | | | (0.68 | %) | | | (0.28 | %) | | | (0.59 | %) |
Total expensesb | | | 1.25 | % | | | 1.22 | % | | | 1.19 | % | | | 1.22 | % | | | 1.22 | % |
Net expensesc | | | 1.24 | % | | | 1.22 | % | | | 1.19 | % | | | 1.22 | % | | | 1.22 | % |
| | | | | | | | | | | | | | | | | | | | |
Portfolio turnover rate | | | 46 | % | | | 37 | % | | | 43 | % | | | 37 | % | | | 56 | % |
a | Total return does not take into account any of the expenses associated with an investment in variable insurance products offered by Security Benefit Life Insurance Company. If total return had taken into account these expenses, performance would have been lower. Shares of a series of SBL Fund are available only through the purchase of such products. |
b | Total expense information reflects expense ratios absent fund expense reductions by the Investment Manager, and earnings credits, as applicable. |
c | Net expense information reflects the expense ratios after voluntary expense waivers, reimbursements and custodian earnings credits, as applicable. |
See accompanying notes.
129
This page left blank intentionally.
130
| | |
| | | Series V |
| Manager’s Commentary | | (Mid Cap Value Series) |
| February 15, 2007 | | (unaudited) |
Advisor, Security Management Company, LLC

James P. Schier
Portfolio Manager
To Our Shareholders:
Series V of the SBL Fund - Mid Cap Value Series posted a solid return year gaining 14.66%. While these numbers were better than most broad market indices, the results lagged the gains provided by the Series’ benchmark. The Russell 2500 Value index was up 20.18%, but exceeded the Series’ median peer fund return of 14.46%.
Our approach to the Mid-Cap Value Series is to seek appreciable securities of companies that are able to grow and/or reinvest in increasingly profitable ventures and hold them over three to five years to capture the better part of the improvements in profitability. We are focused on investing in securities when we find opportunities, with our individual position sizes reflecting the magnitude and the confidence in the opportunity. For this Series, we target securities priced at or below a market multiple that are able to increase their return on invested capital over time.
Stock Selection in Energy, Consumer Staples, and Financials Drove Outperformance
McDermott, an energy company, gained 71% during the year. The company benefited from strong end markets in marine oil drilling construction and nuclear power. The company was also the beneficiary of a favorable resolution and settlement of its asbestos liabilities.
Archer Daniels Midland gained 55% as it continued to benefit from interest in its ethanol production capabilities. Having realized a four-fold appreciation in our investment in this stock since 1999, we sold our entire position in 2006.
Stock selection was also favorable in financials driven predominantly by First Marblehead, appreciating 151% during 2006. First Marblehead was driven brutally low on misplaced fears of competition and client losses that eventually proved to be ill-founded concerns. The Series benefited by acquiring the stock during this period of opportunity.
Overweight Energy Sector Weight and Energy Stock Selection Negatively Affected Returns
The Series’ average energy weighting of 15% versus 4% for the benchmark provided a headwind as energy was a below average performer in 2006. Evergreen Energy, formerly known as KFx, declined 42%. Evergreen Energy suffered as investors moved away from the coal industry and short sellers spread negative rumors about the company. None of the rumors have proven to have any validity to date. We remain confident that the weakness in the stock is transitory and that the stock’s prior price levels can be easily re-attained. Evergreen Energy has a significant technological lead as the first company to provide a clean coal technology. We believe the clean coal industry has substantial competitive barriers, but will be a scalable business with a large addressable market for its product.
2007 Market Outlook
We continue to expect lack-luster returns for the market in 2007. This is similar to our outlook for the past two years, though the market has done quite well.
Despite this, we remain firm in our outlook based on our bottom-up research rather than any global macro forecast. Most companies appear to be operating at very high levels of profitability and it is very difficult to confidently predict continued margin expansion. At present, the market is acting with a high degree of complacency.
The prevailing attitude appears to assume that either the Federal Reserve will panic and ease in the face of any operating weakness that is widespread or that the private equity market will bid for any public company that trades down. We view the recent M&A activity as somewhat bearish. If companies had abundant reinvestment opportunities in their core businesses, they wouldn’t need to pay inflated prices for acquisition candidates. Most recent mergers seem to fit the “acquisition out of desperation” category rather than the “acquisition of opportunity” camp.
Also in this environment, we have seen fewer companies with large revenue growth or large profit margin expansion potential. This is the major reason we maintained the energy overweight last year, even though the commodity price appeared extended and inventories were starting to build. The world consumes about six to seven barrels of oil for every new barrel discovered. Our research suggests that there is less excess capacity than is generally perceived. This coupled with the general political instability in key geographical regions suggests to us that energy could have a move again.
Industrials are also another sector that seems to offer good opportunity. The holdings we have in this sector are generally biased toward infrastructure and energy efficiency names that should benefit from pent up demand and a weaker dollar environment.
On behalf of Security Management Company, I would like to thank you for placing your trust and money with us.
|
| Sincerely, |
|
| |
| James P. Schier, Senior Portfolio Manager |
131
| | |
| | | Series V |
| Manager’s Commentary | | (Mid Cap Value Series) |
| December 31, 2006 | | (unaudited) |
PERFORMANCE
Series V vs. Russell 2500 Value Index
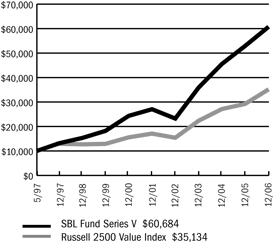
$10,000 Since Inception
The chart above assumes a hypothetical $10,000 investment in Series V (Mid Cap Value Series) on May 1, 1997 (date of inception) and reflects the fees and expenses of Series V. The Russell 2500 Value Index is an unmanaged index that measures the performance of securities of small-to-mid cap U.S. companies with greater-than-average value orientation.
Average Annual Returns
| | | | | | | | | |
Periods Ended 12-31-061 | | 1 Year | | | 5 Years | | | Since Inception
(5-1-97) | |
Series V | | 14.66 | % | | 17.53 | % | | 20.41 | % |
1 | Performance figures do not reflect fees and expenses associated with an investment in variable insurance products offered by Security Benefit Life Insurance Company. If returns had taken into account these fees and expenses, performance would have been lower. Shares of a Series of SBL Fund are available only through the purchase of such products. |
The performance data quoted above represents past performance. Past performance is not predictive of future performance. The investment return and principal value of an investment will fluctuate so that an investor’s shares, when redeemed, may be worth more or less than their original cost.
Portfolio Composition by Sector
| | | |
Consumer Discretionary | | 5.52 | % |
Consumer Staples | | 8.25 | |
Energy | | 18.13 | |
Financials | | 12.49 | |
Health Care | | 2.51 | |
Industrials | | 20.90 | |
Information Technology | | 15.61 | |
Materials | | 3.63 | |
Utilities | | 6.71 | |
Warrants | | 0.15 | |
Convertible Bonds | | 0.37 | |
Commercial Paper | | 2.27 | |
Asset Backed Commercial Paper | | 3.56 | |
U.S. Government Sponsored Agencies | | 0.45 | |
Repurchase Agreement | | 0.17 | |
Liabilities, less cash & other assets | | (0.72 | ) |
Total net assets | | 100.00 | % |
| | | |
See accompanying notes.
132
| | |
| | | Series V |
| Manager’s Commentary | | (Mid Cap Value Series) |
| December 31, 2006 | | (unaudited) |
PERFORMANCE
Information About Your Series Expenses
Calculating your ongoing series expenses
Example
As a shareholder of the Series, you incur ongoing costs, including management fees and other series expenses. Performance figures and expense ratios do not reflect fees and expenses associated with an investment in variable insurance products. Shares of a Series of SBL Fund are available only through the purchase of such products. This example is intended to help you understand your ongoing costs (in dollars) of investing in the Series and to compare these costs with ongoing costs of investing in other mutual funds. The example is based on an investment of $1,000 invested at the beginning of the period and held for the entire period, July 1, 2006 -December 31, 2006.
Actual Expenses
The first line in the table provides information about actual account values and actual expenses. You may use the information in this table, together with the amount you invested, to estimate the expenses that you paid over the period. Simply divide your account value by $1,000 (for example, an $8,600 account value divided by $1,000 = 8.6), then multiply the result by the number in the table under the heading entitled “Expenses Paid During Period” to estimate the expenses you paid on your account during this period.
Hypothetical Example for Comparison Purposes
The second line in the table provides information about hypothetical account values and hypothetical expenses based on the Series actual expense ratio and an assumed rate of return of 5% per year before expenses, which is not the Series actual return. The hypothetical account values and expenses may not be used to estimate the actual ending account balance or expenses you paid for the period. You may use this information to compare the ongoing costs of investing in the Series and other funds. To do so, compare this 5% hypothetical example with the 5% hypothetical examples that appear in the shareholder reports of the other mutual funds.
Please note that the expenses shown in the table are meant to highlight your ongoing costs only and do not reflect any fees and expenses associated with an investment in variable insurance products. Therefore, the second line is useful in comparing ongoing costs only, and will not help you determine the relative total costs of owning different funds. In addition, if these fees and expenses associated with an investment in variable insurance products were included, your costs would have been higher.
Series Expenses
| | | | | | | | | |
| | | Beginning
Account Value
07-01-06 | | Ending
Account Value
12-31-061 | | Expenses Paid
During
Period2 |
Series V (Mid Cap Value Series) | | | | | | | | | |
Actual | | $ | 1,000.00 | | $ | 1,049.10 | | $ | 4.65 |
Hypothetical | | | 1,000.00 | | | 1,020.67 | | | 4.58 |
1 | The actual ending account value is based on the actual total return of the Series for the period July 1, 2006 to December 31, 2006 after actual expenses and will differ from the hypothetical ending account value which is based on the Series expense ratio and a hypothetical annual return of 5% before expenses. The actual cumulative return at net asset value for the period July 1, 2006 to December 31, 2006 was 4.91%. |
2 | Expenses are equal to the Series annualized expense ratio of 0.90%, net of earnings credits, multiplied by the average account value over the period, multiplied by 184/365 (to reflect the one-half year period). |
133
| | |
| Schedule of Investments | | Series V (Mid Cap Value Series) |
| December 31, 2006 | | |
| | | | | |
| | | Shares | | Value |
COMMON STOCK - 93.5% | | | | | |
Aerospace & Defense -1.7% | | | | | |
Orbital Sciences Corporation * | | 402,500 | | $ | 7,422,100 |
| | | | | |
Agricultural Products - 0.9% | | | | | |
Corn Products International, Inc. | | 119,800 | | | 4,137,892 |
| | | | | |
Air Freight & Logistics - 0.0% | | | | | |
Stonepath Group, Inc. * | | 520,000 | | | 83,200 |
| | | | | |
Application Software - 2.0% | | | | | |
EPIQ Systems, Inc. * | | 383,100 | | | 6,501,207 |
PLATO Learning, Inc. * | | 440,000 | | | 2,380,400 |
| | | | | |
| | | | | 8,881,607 |
| | | | | |
Auto Parts & Equipment - 0.4% | | | | | |
HydroGen Corporation * (1) | | 403,000 | | | 1,986,790 |
| | | | | |
Building Products - 0.6% | | | | | |
Quixote Corporation | | 126,300 | | | 2,484,321 |
| | | | | |
Coal & Consumable Fuels - 6.7% | | | | | |
Arch Coal, Inc. | | 300,000 | | | 9,009,000 |
Consol Energy, Inc. | | 145,400 | | | 4,671,702 |
Evergreen Energy, Inc. * | | 958,000 | | | 9,474,620 |
USEC, Inc. | | 533,100 | | | 6,781,032 |
| | | | | |
| | | | | 29,936,354 |
| | | | | |
Communications Equipment - 2.7% | | | | | |
Dycom Industries, Inc. * | | 127,000 | | | 2,682,240 |
Mastec, Inc. * | | 580,000 | | | 6,693,200 |
MRV Communications, Inc. * | | 780,000 | | | 2,761,200 |
| | | | | |
| | | | | 12,136,640 |
| | | | | |
Computer & Electronics Retail - 1.1% | | | | | |
RadioShack Corporation | | 290,000 | | | 4,866,200 |
| | | | | |
Construction & Engineering - 9.4% | | | | | |
Granite Construction, Inc. (2) | | 50,000 | | | 2,516,000 |
Insituform Technologies, Inc. * | | 163,750 | | | 4,234,575 |
Quanta Services, Inc. * | | 600,700 | | | 11,815,769 |
Shaw Group, Inc. * (2) | | 700,000 | | | 23,450,000 |
| | | | | |
| | | | | 42,016,344 |
| | | | | |
Consumer Finance - 1.6% | | | | | |
First Marblehead Corporation | | 132,000 | | | 7,213,800 |
| | | | | |
Data Processing & Outsourced Services - 5.4% | | | | | |
Affiliated Computer Services, Inc. * | | 225,000 | | | 10,989,000 |
Computer Sciences Corporation * | | 250,000 | | | 13,342,500 |
| | | | | |
| | | | | 24,331,500 |
| | | | | |
Diversified Commercial & Professional Services - 2.6% | | | | | |
FTI Consulting, Inc. * | | 225,000 | | | 6,275,250 |
PHH Corporation * | | 185,000 | | | 5,340,950 |
| | | | | |
| | | | | 11,616,200 |
| | | | | |
Drug Retail - 1.0% | | | | | |
Longs Drug Stores Corporation | | 105,700 | | | 4,479,566 |
| | | | | |
Electric Utilities - 6.2% | | | | | |
Allete, Inc. | | 33,500 | | | 1,559,090 |
Empire District Electric Company | | 48,200 | | | 1,190,058 |
Great Plains Energy, Inc. | | 661,350 | | | 21,030,930 |
Northeast Utilities | | 125,300 | | | 3,528,448 |
Pepco Holdings, Inc. | | 1,400 | | | 36,414 |
Westar Energy, Inc. | | 15,600 | | | 404,976 |
| | | | | |
| | | | | 27,749,916 |
| | | | | |
Electrical Components & Equipment - 2.0% | | | | | |
Lime Energy Company * | | 80,000 | | | 72,000 |
Powell Industries, Inc. * | | 63,000 | | | 1,988,910 |
Power-One, Inc. * | | 925,000 | | | 6,734,000 |
| | | | | |
| | | | | 8,794,910 |
| | | | | |
Electronic Manufacturing Services - 2.6% | | | | | |
Maxwell Technologies, Inc. * | | 343,200 | | | 4,787,640 |
Merix Corporation * | | 735,000 | | | 6,828,150 |
| | | | | |
| | | | | 11,615,790 |
| | | | | |
Gas Utilities - 0.5% | | | | | |
Southern Union Company | | 78,000 | | | 2,180,100 |
| | | | | |
General Merchandise Stores - 0.3% | | | | | |
Dollar General Corporation | | 98,350 | | | 1,579,501 |
| | | | | |
Health Care Equipment - 0.4% | | | | | |
HealthTronics, Inc. * | | 250,000 | | | 1,665,000 |
| | | | | |
Health Care Facilities - 2.1% | | | | | |
Community Health Systems, Inc. * | | 90,000 | | | 3,286,800 |
Triad Hospitals, Inc. * | | 150,000 | | | 6,274,500 |
| | | | | |
| | | | | 9,561,300 |
| | | | | |
Home Furnishings - 0.7% | | | | | |
Leggett & Platt, Inc. | | 130,200 | | | 3,111,780 |
| | | | | |
Independent Power Producers & Energy Traders - 0.0% | | | | | |
Dynegy, Inc. * | | 11,430 | | | 82,753 |
| | | | | |
Industrial Conglomerates - 3.4% | | | | | |
McDermott International, Inc. * | | 295,900 | | | 15,049,474 |
| | | | | |
Insurance Brokers - 0.3% | | | | | |
Hub International, Ltd. | | 45,700 | | | 1,434,523 |
| | | | | |
Integrated Oil & Gas - 1.6% | | | | | |
Murphy Oil Corporation | | 137,000 | | | 6,966,450 |
| | | | | |
Life & Health Insurance - 0.9% | | | | | |
KMG America Corporation * | | 438,600 | | | 4,206,174 |
| | | | | |
Mortgage REITs - 2.1% | | | | | |
HomeBanc Corporation | | 321,600 | | | 1,360,368 |
The accompanying notes are an integral part of the financial statements.
134
| | |
| Schedule of Investments | | Series V (Mid Cap Value Series) |
| December 31, 2006 - continued | | |
| | | | | |
| | | Shares | | Value |
COMMON STOCK (continued) | | | | | |
Mortgage REIT’s (continued) | | | | | |
MFA Mortgage Investments, Inc. | | 276,400 | | $ | 2,125,516 |
Opteum, Inc. | | 768,100 | | | 5,837,560 |
| | | | | |
| | | | | 9,323,444 |
| | | | | |
Multi - Line Insurance - 1.6% | | | | | |
American Financial Group, Inc. | | 198,000 | | | 7,110,180 |
| | | | | |
Multi-Utilities - 0.0% | | | | | |
TECO Energy, Inc. | | 1,300 | | | 22,399 |
| | | | | |
Oil & Gas Drilling - 2.0% | | | | | |
Helmerich & Payne, Inc. | | 365,000 | | | 8,931,550 |
| | | | | |
Oil & Gas Equipment & Services - 1.2% | | | | | |
Key Energy Services, Inc. * | | 350,000 | | | 5,474,000 |
| | | | | |
Oil & Gas Exploration & Production -1.7% | | | | | |
Gulfport Energy Corporation * | | 125,300 | | | 1,702,827 |
Newfield Exploration Company * | | 129,000 | | | 5,927,550 |
| | | | | |
| | | | | 7,630,377 |
| | | | | |
Oil & Gas Refining & Marketing - 0.4% | | | | | |
Nova Biosource Fuels, Inc. * | | 738,700 | | | 1,735,945 |
| | | | | |
Oil & Gas Storage & Transportation - 4.6% | | | | | |
Double Hull Tankers, Inc. | | 274,200 | | | 4,439,298 |
Williams Companies, Inc. | | 611,500 | | | 15,972,380 |
| | | | | |
| | | | | 20,411,678 |
| | | | | |
Packaged Foods & Meats - 4.0% | | | | | |
Hormel Foods Corporation | | 233,000 | | | 8,700,220 |
JM Smucker Company | | 150,000 | | | 7,270,500 |
Tyson Foods, Inc. | | 105,000 | | | 1,727,250 |
| | | | | |
| | | | | 17,697,970 |
| | | | | |
Paper Packaging - 2.9% | | | | | |
Bemis Company, Inc. | | 172,000 | | | 5,844,560 |
Sonoco Products Company | | 184,700 | | | 7,029,682 |
| | | | | |
| | | | | 12,874,242 |
| | | | | |
Personal Products - 2.4% | | | | | |
Alberto-Culver Company | | 90,000 | | | 1,930,500 |
Playtex Products, Inc. * | | 600,000 | | | 8,634,000 |
| | | | | |
| | | | | 10,564,500 |
| | | | | |
Properly & Casualty Insurance - 4.8% | | | | | |
Alleghany Corporation * | | 14,357 | | | 5,220,205 |
First American Corporation | | 174,000 | | | 7,078,320 |
Hanover Insurance Group, Inc. | | 16,200 | | | 790,560 |
North Pointe Holdings Corporation * (1) | | 254,000 | | | 2,692,400 |
United America Indemnity, Ltd. * | | 70,000 | | �� | 1,773,100 |
W.R. Berkley Corporation | | 115,900 | | | 3,999,709 |
| | | | | |
| | | | | 21,554,294 |
| | | | | |
Regional Banks - 1.1% | | | | | |
Wilmington Trust Corporation | | 113,000 | | | 4,765,210 |
| | | | | |
Reinsurance - 0.0% | | | | | |
Arch Capital Group, Ltd. * | | 3,500 | | | 236,635 |
| | | | | |
Semiconductor Equipment - 0.9% | | | | | |
Ultratech, Inc. * | | 310,000 | | | 3,868,800 |
| | | | | |
Semiconductors - 2.0% | | | | | |
Applied Micro Circuits Corporation * | | 460,000 | | | 1,637,600 |
IXYS Corporation * | | 450,000 | | | 4,005,000 |
STATS ChipPAC, Ltd. ADR * | | 434,000 | | | 3,333,120 |
| | | | | |
| | | | | 8,975,720 |
| | | | | |
Specialized Consumer Services - 1.1% | | | | | |
Regis Corporation | | 129,900 | | | 5,136,246 |
| | | | | |
Specialty Chemicals - 0.5% | | | | | |
Material Sciences Corporation * | | 57,000 | | | 737,580 |
Minerals Technologies, Inc. | | 29,600 | | | 1,740,184 |
| | | | | |
| | | | | 2,477,764 |
| | | | | |
Specialty Stores - 0.2% | | | | | |
Sally Beauty Holdings, Inc. * | | 90,000 | | | 702,000 |
| | | | | |
Tires & Rubber - 1.6% | | | | | |
Bandag, Inc. | | 145,000 | | | 7,312,350 |
| | | | | |
Trading Companies & Distributors - 1.3% | | | | | |
United Rentals, Inc. * (2) | | 230,000 | | | 5,848,900 |
| | | | | |
TOTAL COMMON STOCK (Cost $304,158,616) | | | | $ | 418,244,389 |
| | | | | |
PREFERRED STOCK - 0.2% | | | | | |
Diversified Metals & Mining - 0.2% | | | | | |
Arch Coal, Inc. | | 5,200 | | | 759,200 |
| | | | | |
Environmental & Facilities Services - 0.0% | | | | | |
ThermoEnergy Corporation PIPE * (1)(3)(4)(5) | | 1,130,000 | | | 158,200 |
| | | | | |
Metal & Glass Containers - 0.0% | | | | | |
Owens-Illinois, Inc. | | 3,700 | | | 136,900 |
| | | | | |
TOTAL PREFERRED STOCK (Cost $1,462,275) | | | | $ | 1,054,300 |
| | | | | |
WARRANTS - 0.1% | | | | | |
Warrants - 0.1% | | | | | |
Electric City Corporation $1.00, 3/19/2009 (4) | | 23,333 | | | 11,127 |
Nova Oil, Inc. $2.40, 7/5/2011 (4) | | 369,350 | | | 613,490 |
ThermoEnergy Corporation $0.75, 7/14/2008 (3)(4) | | 1,130,000 | | | 50,737 |
| | | | | 675,354 |
| | | | | |
TOTAL WARRANTS (Cost $999,024) | | | | $ | 675,354 |
| | | | | |
The accompanying notes are an integral part of the financial statements.
135
| | |
| Schedule of Investments | | Series V (Mid Cap Value Series) |
| December 31, 2006 - continued | | |
| | | | | | | |
| | | Principal
Amount | | Value | |
CONVERTIBLE BOND - 0.4% | | | | | | | |
Natural Gas - 0.4% | | | | | | | |
Hanover Compressor Company | | | | | | | |
4.75%, 2008 | | $ | 1,700,000 | | $ | 1,663,875 | |
| | | | | | | |
TOTAL CONVERTIBLE BOND (Cost $1,676,332) | | | | | $ | 1,663,875 | |
| | | | | | | |
U.S. GOVERNMENT SPONSORED AGENCY BONDS & NOTES - 0.4% | | | | | | | |
Federal National Mortgage Association | | | | | | | |
5.15% - 2007 | | | 2,000,000 | | | 1,998,856 | |
| | | | | | | |
TOTAL U.S. GOVERNMENT SPONSORED AGENCY BONDS & NOTES | | | | | $ | 1,998,856 | |
| | | | | | | |
(Cost $1,998,856) | | | | | | | |
ASSET BACKED COMMERCIAL PAPER - 3.6% | | | | | | | |
Financial Companies - Diversified - 1.6% | | | | | | | |
Amstel Funding Corporation | | | | | | | |
5.275%, 1/16/2007 | | | 1,420,000 | | | 1,416,835 | |
5.27%, 1/18/2007 | | | 2,000,000 | | | 1,995,023 | |
Amsterdam Funding Corporation | | | | | | | |
5.25%, 1/5/2007 | | | 1,300,000 | | | 1,299,424 | |
5.26%, 1/17/2007 | | | 1,000,000 | | | 997,662 | |
Govco, Inc. | | | | | | | |
5.28%, 1/8/2007 | | | 1,330,000 | | | 1,328,635 | |
| | | | | | | |
| | | | | | 7,037,579 | |
| | | | | | | |
Financial Companies - Miscellaneous Receivables - 0.5% | | | | | | | |
Fairway Finance Corporation | | | | | | | |
5.35%, 1/11/2007 | | | 1,000,000 | | | 998,536 | |
5.26%, 1/16/2007 | | | 1,200,000 | | | 1,197,370 | |
| | | | | | | |
| | | | | | 2,195,906 | |
| | | | | | | |
Financial Companies - Securities - 0.2% | | | | | | | |
Perry Global Funding LLC | | | | | | | |
5.35%, 1/9/2007 | | | 1,000,000 | | | 998,811 | |
| | | | | | | |
Financial Companies - Trade & Term Receivables - 0.2% | | | | | | | |
Eureka Securitization | | | | | | | |
5.264%, 1/8/2007 | | | 1,000,000 | | | 998,977 | |
| | | | | | | |
Financial Companies - Trade Receivables - 1.1% | | | | | | | |
Old Line Funding LLC | | | | | | | |
5.27%, 1/3/2007 | | | 1,000,000 | | | 999,707 | |
5.31%, 1/11/2007 | | | 1,200,000 | | | 1,198,223 | |
5.26%, 1/12/2007 | | | 1,500,000 | | | 1,497,585 | |
Sheffield Receivables Corporation | | | | | | | |
5.265%, 1/2/2007 | | | 1,000,000 | | | 999,854 | |
| | | | | | | |
| | | | | | 4,695,369 | |
| | | | | | | |
TOTAL ASSET BACKED COMMERCIAL PAPER (Cost $15,926,445) | | | | | $ | 15,926,642 | |
| | | | | | | |
COMMERCIAL PAPER - 2.3% | | | | | | | |
Automotive - 0.2% | | | | | | | |
American Honda Finance | | | | | | | |
5.23%, 1/9/2007 | | | 1,000,000 | | | 998,838 | |
| | | | | | | |
Banking - 0.4% | | | | | | | |
UBS Finance (DE) LLC | | | | | | | |
5.28%, 1/2/2007 | | | 1,591,000 | | | 1,590,767 | |
| | | | | | | |
Brokerage - 1.1% | | | | | | | |
Citigroup Funding, Inc. | | | | | | | |
5.25%, 1/4/2007 | | | 1,000,000 | | | 999,563 | |
5.25%, 1/10/2007 | | | 1,500,000 | | | 1,498,031 | |
Goldman Sachs Group, Inc. | | | | | | | |
5.30%, 1/12/2007 | | | 2,200,000 | | | 2,196,437 | |
| | | | | | | |
| | | | | | 4,694,031 | |
| | | | | | | |
Electric - 0.3% | | | | | | | |
Florida Power & Light Company | | | | | | | |
5.30%, 1/3/2007 | | | 1,384,000 | | | 1,383,592 | |
| | | | | | | |
Non U.S. Banking - 0.3% | | | | | | | |
Societe Generale | | | | | | | |
5.35%, 1/4/2007 | | | 1,500,000 | | | 1,499,331 | |
| | | | | | | |
TOTAL COMMERCIAL PAPER (Cost $10,166,559) | | | | | $ | 10,166,559 | |
| | | | | | | |
REPURCHASE AGREEMENT - 0.2% | | | | | | | |
United Missouri Bank, 4.85%, dated 12-29-06, matures 01-02-07; repurchase amount of $779,420 (Collateralized by FHLMC, 5.00%, 09-15-36 with a value of $794,735) | | $ | 779,000 | | $ | 779,000 | |
| | | | | | | |
TOTAL REPURCHASE AGREEMENT (Cost $779,000) | | | | | $ | 779,000 | |
| | | | | | | |
Total Investments (SBL V Fund) (Cost $337,167,107) - 100.7% | | | | | $ | 450,508,975 | |
Liabilities in Excess of Other Assets - (0.7)% | | | | | | (3,238,440 | ) |
| | | | | | | |
TOTAL NET ASSETS -100.0% | | | | | $ | 447,270,535 | |
| | | | | | | |
Footnotes
Percentages are stated as a percent of net assets.
For federal income tax purposes the identified cost of investments owned at 12/31/2006 was $337,165,274.
| * | - Non-income producing security |
| 1 | - Security is deemed illiquid. See Notes to financial statements. |
| 2 | - Security is segregated as collateral for open written options contracts. |
| 3 | - Security is restricted from resale. See Notes to financial statements. |
| 4 | - Security is fair valued by the Board of Directors. See Notes to financial statements. |
The accompanying notes are an integral part of the financial statements.
136
| | |
| Schedule of Investments | | Series V (Mid Cap Value Series) |
| December 31, 2006 - continued | | |
| 5 | - PIPE (Private Investment in Public Equity) - Stock issued by a company in the secondary market as a means of raising capital more quickly and less expensively than through registration of a secondary public offering. |
Glossary:
| ADR | - American Depositary Receipt |
See notes to financial statements.
The accompanying notes are an integral part of the financial statements.
137
Series V
(Mid Cap Value Series)
Statement of Assets and Liabilities
December 31, 2006
| | | |
Assets: | | | |
Investments, at value1 | | $ | 450,508,975 |
Cash | | | 3,341 |
Receivables: | | | |
Fund shares sold | | | 255,275 |
Securities sold | | | 262,130 |
Interest | | | 24,001 |
Dividends | | | 246,472 |
Prepaid expenses | | | 10,158 |
| | | |
Total assets | | | 451,310,352 |
| | | |
Liabilities: | | | |
Payable for: | | | |
Securities purchased | | | 2,846,342 |
Fund shares redeemed | | | 543,669 |
Written options, at value (premiums received, $305,606) | | | 259,000 |
Management fees | | | 287,101 |
Custodian fees | | | 5,277 |
Transfer agent/maintenance fees | | | 2,083 |
Administration fees | | | 36,936 |
Professional fees | | | 30,722 |
Directors’ fees | | | 7,000 |
Other fees | | | 21,687 |
| | | |
Total liabilities | | | 4,039,817 |
| | | |
Net Assets | | $ | 447,270,535 |
| | | |
Net assets consist of: | | | |
Paid in capital | | $ | 285,437,694 |
Undistributed net investment income | | | 4,271,958 |
Undistributed net realized gain on sale of investments and options written | | | 44,172,409 |
Net unrealized appreciation in value of investments and options written | | | 113,388,474 |
| | | |
Net assets | | $ | 447,270,535 |
| | | |
Capital shares authorized | | | unlimited |
Capital shares outstanding | | | 9,560,754 |
Net asset value per share (net assets divided by shares outstanding) | | $ | 46.78 |
| | | |
1Investments, at cost | | $ | 337,167,107 |
Statement of Operations
For the Year Ended December 31, 2006
| | | | |
Investment Income: | | | | |
Dividends | | $ | 7,212,760 | |
Interest | | | 848,283 | |
| | | | |
Total investment income | | | 8,061,043 | |
| | | | |
Expenses: | | | | |
Management fees | | | 3,183,614 | |
Custodian fees | | | 33,020 | |
Transfer agent/maintenance fees | | | 25,148 | |
Administration fees | | | 405,418 | |
Directors’ fees | | | 18,827 | |
Professional fees | | | 46,853 | |
Reports to shareholders | | | 60,978 | |
Other expenses | | | 15,375 | |
| | | | |
Total expenses | | | 3,789,233 | |
Less: Earnings credits | | | (148 | ) |
| | | | |
Net expenses | | | 3,789,085 | |
| | | | |
Net investment income | | | 4,271,958 | |
| | | | |
Net Realized and Unrealized Gain (Loss): | | | | |
Net realized gain during the year on: | | | | |
Investments | | | 42,182,046 | |
Options written | | | 1,990,362 | |
| | | | |
Net realized gain | | | 44,172,408 | |
| | | | |
Net unrealized appreciation (depreciation) during the year on: | | | | |
Investments | | | 9,136,507 | |
Options written | | | (608,132 | ) |
| | | | |
Net unrealized appreciation | | | 8,528,375 | |
| | | | |
Net realized and unrealized gain | | | 52,700,783 | |
| | | | |
Net increase in net assets resulting from operations | | $ | 56,972,741 | |
| | | | |
See Accompanying notes.
138
| | |
| | | Series V |
| Statement of Changes in Net Assets | | (Mid Cap Value Series) |
| | | | | | | | |
| | | Year Ended
December 31,
2006 | | | Year Ended
December 31,
2005 | |
Increase in net assets from operations: | | | | | | | | |
Net investment income | | $ | 4,271,958 | | | $ | 1,434,043 | |
Net realized gain during the year on investments and options written | | | 44,172,408 | | | | 37,176,541 | |
Net unrealized appreciation during the year on investments and options written | | | 8,528,375 | | | | 13,415,356 | |
| | | | | | | | |
Net increase in net assets resulting from operations | | | 56,972,741 | | | | 52,025,940 | |
| | | | | | | | |
Capital share transactions: | | | | | | | | |
Proceeds from sale of shares | | | 138,329,829 | | | | 112,313,976 | |
Cost of shares redeemed | | | (132,525,763 | ) | | | (87,382,578 | ) |
| | | | | | | | |
Net increase from capital share transactions | | | 5,804,066 | | | | 24,931,398 | |
| | | | | | | | |
Net increase in net assets | | | 62,776,807 | | | | 76,957,338 | |
| | | | | | | | |
Net assets: | | | | | | | | |
Beginning of year | | | 384,493,728 | | | | 307,536,390 | |
| | | | | | | | |
End of year | | $ | 447,270,535 | | | $ | 384,493,728 | |
| | | | | | | | |
Undistributed net investment income at end of year | | $ | 4,271,958 | | | $ | 1,434,043 | |
| | | | | | | | |
Capital Share Activity: | | | | | | | | |
Shares sold | | | 3,124,489 | | | | 3,070,386 | |
Shares redeemed | | | (2,988,899 | ) | | | (2,407,774 | ) |
| | | | | | | | |
Total capital share activity | | | 135,590 | | | | 662,612 | |
| | | | | | | | |
See accompanying notes.
139
| | |
| Financial Highlights | | Series V |
| Selected data for each share of capital stock outstanding throughout each year | | (Mid Cap Value Series) |
| | | | | | | | | | | | | | | | | | | | |
| | | 2006 | | | 2005 | | | 2004 | | | 2003 | | | Year Ended,
December 31,
2002 | |
Per Share Data | | | | | | | | | | | | | | | | | | | | |
Net asset value, beginning of period | | $ | 40.79 | | | $ | 35.10 | | | $ | 28.33 | | | $ | 18.68 | | | $ | 23.49 | |
| | | | | | | | | | | | | | | | | | | | |
Income (loss) from investment operations: | | | | | | | | | | | | | | | | | | | | |
Net investment income | | | 0.44 | | | | 0.14 | | | | 0.11 | | | | 0.07 | | | | 0.10 | |
Net gain (loss) on securities (realized and unrealized) | | | 5.55 | | | | 5.55 | | | | 7.39 | | | | 10.03 | | | | (3.16 | ) |
| | | | | | | | | | | | | | | | | | | | |
Total from investment operations | | | 5.99 | | | | 5.69 | | | | 7.50 | | | | 10.10 | | | | (3.06 | ) |
| | | | | | | | | | | | | | | | | | | | |
Less distributions: | | | | | | | | | | | | | | | | | | | | |
Dividends from net investment income | | | — | | | | — | | | | (0.01 | ) | | | (0.06 | ) | | | (0.19 | ) |
Distributions from realized gains | | | — | | | | — | | | | (0.72 | ) | | | (0.39 | ) | | | (1.56 | ) |
| | | | | | | | | | | | | | | | | | | | |
Total distributions | | | — | | | | — | | | | (0.73 | ) | | | (0.45 | ) | | | (1.75 | ) |
| | | | | | | | | | | | | | | | | | | | |
Net asset value, end of period | | $ | 46.78 | | | $ | 40.79 | | | $ | 35.10 | | | $ | 28.33 | | | $ | 18.68 | |
| | | | | | | | | | | | | | | | | | | | |
Total Returna | | | 14.66 | % | | | 16.21 | % | | | 26.97 | % | | | 54.27 | % | | | (14.07 | %) |
| | | | | | | | | | | | | | | | | | | | |
Ratios/Supplemental Data | | | | | | | | | | | | | | | | | | | | |
Net assets, end of period (in thousands) | | $ | 447,271 | | | $ | 384,494 | | | $ | 307,536 | | | $ | 223,658 | | | $ | 147,512 | |
| | | | | | | | | | | | | | | | | | | | |
Ratios to average net assets: | | | | | | | | | | | | | | | | | | | | |
Net investment income | | | 1.01 | % | | | 0.44 | % | | | 0.37 | % | | | 0.36 | % | | | 0.46 | % |
Total expensesb | | | 0.89 | % | | | 0.90 | % | | | 0.88 | % | | | 0.83 | % | | | 0.84 | % |
Net expensesc | | | 0.89 | % | | | 0.90 | % | | | 0.88 | % | | | 0.83 | % | | | 0.84 | % |
| | | | | | | | | | | | | | | | | | | | |
Portfolio turnover rate | | | 42 | % | | | 29 | % | | | 43 | % | | | 59 | % | | | 65 | % |
a | Total return does not take into account any of the expenses associated with an investment in variable insurance products offered by Security Benefit Life Insurance Company. If total return had taken into account these expenses, performance would have been lower. Shares of a series of SBL Fund are available only through the purchase of such products. |
b | Total expense information reflects expense ratios absent fund expense reductions by the Investment Manager, and earnings credits, as applicable. |
c | Net expense information reflects expense ratios after expense reductions, fee waivers or reduction to custodian expenses, as applicable. |
See accompanying notes.
140
| | |
| | Series X |
| Manager’s Commentary | | (Small Cap Growth Series) |
| February 15, 2007 | | (unaudited) |

Subadvisor, RS Investments

Bill Wolfenden
Portfolio Manager
To Our Shareholders:
The stock market and small-cap stocks continued their strong run in 2006. After three years of solid performance, 2006 proved to be a strong follow-on to what is now a multi-year small-cap rally. Unfortunately, Series X of the SBL Fund - Small-Cap Growth Series did not fare as well in 2006. The portfolio finished the fourth quarter with a 7.68% gross of fees (7.53% net of fees) rise, slightly trailing the 8.77% return of the benchmark Russell 2000® Growth Index. For the calendar year, the portfolio was up a disappointing 5.71% gross of fees (5.13% net of fees) compared with a strong increase of 13.35% for the benchmark.
Although the portfolio has often trailed in sharp small-cap rallies like those in the first and fourth quarters of 2006, our underperformance for the calendar year can be attributed to poor stock selection. We endured a number of problem stocks in the technology sector, which contributed nearly 50% of our 2006 underperformance. We are disappointed with this year’s return, but retain confidence in our investment process, which has served investors well over longer periods of time. In fact, we saw some encouraging performance signs in the fourth quarter that give us reason for optimism as we enter 2007.
Technology, Energy Sectors Yield Positive Returns
The technology sector was a source of positive returns in the fourth quarter. Over the past two quarters, our tech exposure has eased as we seek to concentrate assets in only the highest-conviction companies. That paid off as we experienced healthy gains from a number of top 20 positions, and avoided any further meaningful tech stock problems.
Omniture provides online business optimization software to a broad range of institutional clients. The company went public in summer 2006, and we started our position at that time. We built the position as the stock treaded water for much of the summer. In Omniture we have a business in a large secular growth market that is capable of growing both the revenue and the earnings line at more than 50% year over year. The stock provided a strong source of fourth quarter returns. We also enjoyed strong gains from Equinix, a leading provider of co-location data centers for businesses’ critical Internet and Internet Protocol operations. The stock was a strong contributor to gains in the second half of 2006.
One company in the tech universe that exhibits the attributes we look for in our process is SRS Labs. SRS had a breakout year in 2006, and we believe that the future looks bright for the company. SRS has a patented, defensible market position in delivering surround-sound systems and audio enhancement products for the flat-panel TV, mobile handset, automotive, PDA, PC and home theater markets. While operating results were satisfactory, the stock treaded water. We remained patient because the company possesses the critical elements that we look for: a definable competitive advantage, attractive valuation, and solid long-term anchor points (long-term goals and objectives that we or the company’s management team have set) around which it was growing its business.
We believed that SRS Labs could shed its money-losing semiconductor business and focus solely on its licensing business, which would greatly lower costs and improve margins, and free up management bandwidth to focus on new licensees and accelerate growth. In addition we believed that over time, SRS would gain market share to the point that it could tap into high-volume applications such as flat-panel TVs in China and mobile handsets (Motorola and Samsung were major wins). Management executed on its plan and now has a huge unit-growth opportunity as its technology is designed into many of the above-mentioned customers’ appliances. In essence, SRS has built a solid franchise through its design wins, and a waterfall of license revenues is imminent. We saw that come through in strong third quarter 2006 earnings results, and the stock responded with a 150% increase over its August low. This sharp rise in a short period of time has prompted us to reduce our position. We think SRS is in the early stages of discovery by other small-cap investors, however, and that we will be rewarded for early recognition and patience.
Energy-related positions also contributed positive returns in the final quarter, after proving difficult for much of the year. We had good returns from Superior Energy Services and Oil States International. Both companies provide equipment and services to offshore and land-based oil and natural gas drillers. The stocks had been beaten down over the summer and enjoyed a nice rally through the fourth quarter. We finished the year with modest energy exposure of approximately 5%, less than the benchmark weighting. We expect a tougher environment for these stocks in 2007.
Financial Sector Mixed
Financial services currently represent approximately 14% of the portfolio, a healthy overweighting with the index. We own a broad range of companies in this segment, ranging from specialty insurance providers, to asset management and private banking, to companies leverging technology across a number of financial ser vices applications. Some of these companies endured stock declines in the fourth quarter, detracting from our returns during the period. Investment Technology Group provides a number of trade management and execution services to money managers. Its stock declined during the fourth quarter as October trade volumes from its client base were lower than expected. We viewed the trade volume decline as transitory, and confirmed that long-term anchor points for the business remained solidly in place. The weakness hurt fourth quarter returns, but the stock has climbed back from much of the decline.
Online Resources Corporation is a leading provider of online banking technology services to small banks. It’s capturing significant market share as the small-bank market seeks to modernize its ser vice offering with online banking and automated bill payment. The company acquired Princeton eCom last year, thereby bolstering its client reach and removing a
141
| | |
| | Series X |
| Manager’s Commentary | | (Small Cap Growth Series) |
| February 15, 2007 | | (unaudited) |
competitor from the marketplace. The acquisition looks to be dilutive in the short-term, which prompted a decline in the stock in the fourth quarter. We remain optimistic about the long-term opportunity and retain our position in Online Resources.
2007 Outlook
Interest rates have stopped rising (at least for the time being), oil prices have declined, and it seems as though the housing correction is near an end. These headwinds have historically been bad for the consumer and for small companies, yet the broad stock market, and small-caps have per formed well throughout. I am looking forward to a time when the wind may actually be at our backs for a change, and that could be 2007. As I have mentioned in previous letters, however, the Series is not dependent on positive macro events and is structured for flat-to-modestly positive growth in the Gross Domestic Product. The Series holds companies offering unique products, services, and/or business models that can grow sales and earnings by creating new markets or capturing market share. We measure the success (or the lack thereof) by pegging them to anchor points. We believe that fast-growing companies with seasoned management teams, unique business models, and a strong competitive advantage can usually achieve their goals over time and hit these anchor points. When this execution success occurs, great stock performance often accompanies it.
Looking to 2007, I continue to believe that our investment process works over the long-term, which is reflected in our long-term results. As a fellow investor in the strategy, I thank you for your continued confidence and support.
|
| Sincerely, |
|
| |
| Bill Wolfenden, Portfolio Manager |
PERFORMANCE
Series X vs. Russell 2000 Growth Index
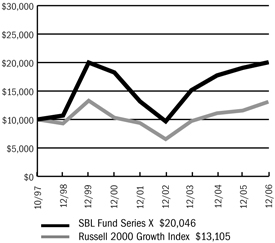
$10,000 Since Inception
The chart above assumes a hypothetical $10,000 investment in Series X (Small Cap Growth Series) on October 15, 1997 (date of inception), and reflects the fees and expenses of Series X. The Russell 2000 Growth Index measures the performance of those Russell 2000 companies with higher price-to-book ratios and higher forecasted growth values.
Average Annual Returns
| | | | | | | | | |
Periods Ended 12-31-061 | | 1 Year | | | 5 Years | | | Since Inception
(10-15-97) | |
Series X | | 5.13 | % | | 8.77 | % | | 7.84 | % |
1 | Performance figures do not reflect fees and expenses associated with an investment in variable insurance products offered by Security Benefit Life Insurance Company. If returns had taken into account these fees and expenses, performance would have been lower. Shares of a Series of SBL Fund are available only through the purchase of such products. |
The performance data quoted above represents past per formance. Past performance is not predictive of future performance. The investment return and principal value of an investment will fluctuate so that an investor’s shares, when redeemed, may be worth more or less than their original cost.
Portfolio Composition by Sector
| | | |
Consumer Discretionary | | 14.87 | % |
Consumer Staples | | 3.17 | |
Energy | | 4.42 | |
Financials | | 14.30 | |
Health Care | | 21.55 | |
Industrials | | 14.82 | |
Information Technology | | 19.49 | |
Telecommunications Services | | 1.10 | |
Repurchase Agreement | | 5.83 | |
Cash & other assets, less liabilities | | 0.45 | |
Total net assets | | 100.00 | % |
| | | |
See accompanying notes.
142
| | |
| | Series X |
| Manager’s Commentary | | (Small Cap Growth Series) |
| December 31, 2006 | | (unaudited) |
PERFORMANCE
Information About Your Series Expenses
Calculating your ongoing series expenses
Example
As a shareholder of the Series, you incur ongoing costs, including management fees and other series expenses. Performance figures and expense ratios do not reflect fees and expenses associated with an investment in variable insurance products. Shares of a Series of SBL Fund are available only through the purchase of such products. This example is intended to help you understand your ongoing costs (in dollars) of investing in the Series and to compare these costs with ongoing costs of investing in other mutual funds. The example is based on an investment of $1,000 invested at the beginning of the period and held for the entire period, July 1, 2006 - December 31, 2006.
Actual Expenses
The first line in the table provides information about actual account values and actual expenses. You may use the information in this table, together with the amount you invested, to estimate the expenses that you paid over the period. Simply divide your account value by $1,000 (for example, an $8,600 account value divided by $1,000 = 8.6), then multiply the result by the number in the table under the heading entitled “Expenses Paid During Period” to estimate the expenses you paid on your account during this period.
Hypothetical Example for Comparison Purposes
The second line in the table provides information about hypothetical account values and hypothetical expenses based on the Series actual expense ratio and an assumed rate of return of 5% per year before expenses, which is not the Series actual return. The hypothetical account values and expenses may not be used to estimate the actual ending account balance or expenses you paid for the period. You may use this information to compare the ongoing costs of investing in the Series and other funds. To do so, compare this 5% hypothetical example with the 5% hypothetical examples that appear in the shareholder reports of the other mutual funds.
Please note that the expenses shown in the table are meant to highlight your ongoing costs only and do not reflect any fees and expenses associated with an investment in variable insurance products. Therefore, the second line is useful in comparing ongoing costs only, and will not help you determine the relative total costs of owning different funds. In addition, if these fees and expenses associated with an investment in variable insurance products were included, your costs would have been higher.
Series Expenses
| | | | | | | | | |
| | | Beginning
Account Value
07-01-06 | | Ending
Account Value
12-31-061 | | Expenses
Paid During
Period2 |
Series X (Small Cap Growth Series) | | | | | | | | | |
Actual | | $ | 1,000.00 | | $ | 1,036.00 | | $ | 6.21 |
Hypothetical | | | 1,000.00 | | | 1,019.11 | | | 6.16 |
1 | The actual ending account value is based on the actual total return of the Series for the period July 1, 2006 to December 31, 2006 after actual expenses and will differ from the hypothetical ending account value which is based on the Series expense ratio and a hypothetical annual return of 5% before expenses. The actual cumulative return at net asset value for the period July 1, 2006 to December 31, 2006 was 3.60%. |
2 | Expenses are equal to the Series annualized expense ratio of 1.21%, net of earnings credits, multiplied by the average account value over the period, multiplied by 184/365 (to reflect the one-half year period). |
143
| | |
| Schedule of Investments | | |
| December 31, 2006 | | Series X (Small Cap Value Series) |
| | | | | |
| | | Shares | | Value |
COMMON STOCK - 93.7% | | | | | |
Aerospace & Defense - 3.5% | | | | | |
BE Aerospace, Inc. * | | 54,130 | | $ | 1,390,058 |
Ceradyne, Inc. * | | 22,130 | | | 1,250,345 |
Heico Corporation | | 14,960 | | | 580,897 |
| | | | | |
| | | | | 3,221,300 |
| | | | | |
Alternative Carriers - 1.1% | | | | | |
Time Warner Telecom, Inc. * | | 51,030 | | | 1,017,028 |
| | | | | |
Apparel Retail - 2.7% | | | | | |
Cache, Inc. * | | 54,050 | | | 1,364,222 |
Jos A. Bank Clothiers, Inc. * | | 37,627 | | | 1,104,352 |
| | | | | |
| | | | | 2,468,574 |
| | | | | |
Apparel, Accessories & Luxury Goods - 0.9% | | | | | |
Carter’s, Inc. * | | 31,490 | | | 802,995 |
| | | | | |
Application Software - 2.7% | | | | | |
Advent Software, Inc. * | | 36,890 | | | 1,301,848 |
Concur Technologies, Inc. * | | 72,750 | | | 1,166,910 |
| | | | | |
| | | | | 2,468,758 |
| | | | | |
Automotive Retail - 1.3% | | | | | |
Midas, Inc. * | | 53,080 | | | 1,220,840 |
| | | | | |
Biotechnology - 1.1% | | | | | |
Solexa, Inc. * | | 80,530 | | | 1,058,970 |
| | | | | |
Casinos & Gaming - 4.2% | | | | | |
Century Casinos, Inc. * | | 131,770 | | | 1,470,553 |
Pinnacle Entertainment, Inc. * | | 19,500 | | | 646,230 |
Scientific Games Corporation * | | 58,690 | | | 1,774,199 |
| | | | | |
| | | | | 3,890,982 |
| | | | | |
Communications Equipment - 1.6% | | | | | |
Occam Networks, Inc. * | | 42,480 | | | 700,920 |
Oplink Communications, Inc. * | | 40,350 | | | 829,596 |
| | | | | |
| | | | | 1,530,516 |
| | | | | |
Computer Hardware - 0.9% | | | | | |
Cray, Inc. * | | 68,800 | | | 817,344 |
| | | | | |
Construction & Farm Machinery & Heavy Trucks - 1.4% | | | | | |
American Railcar Industries, Inc. | | 38,270 | | | 1,302,711 |
| | | | | |
Diversified Commercial & Professional Services - 1.7% | | | | | |
FirstService Corporation * | | 68,730 | | | 1,587,663 |
| | | | | |
Electrical Components & Equipment - 0.7% | | | | | |
Regal-Beloit Corporation | | 12,960 | | | 680,530 |
| | | | | |
Environmental & Facilities Services - 3.1% | | | | | |
Rollins, Inc. | | 62,590 | | | 1,383,865 |
Team, Inc. * | | 43,260 | | | 1,506,746 |
| | | | | |
| | | | | 2,890,611 |
| | | | | |
Food Distributors - 0.9% | | | | | |
Central European Distribution Corporation * | | 26,740 | | | 794,178 |
| | | | | |
Footwear - 1.2% | | | | | |
Iconix Brand Group, Inc. * | | 59,730 | | | 1,158,165 |
| | | | | |
Health Care Equipment - 12.3% | | | | | |
American Medical Systems Holdings, Inc. * | | 80,260 | | | 1,486,415 |
Angiodynamics, Inc. * | | 67,250 | | | 1,445,203 |
Arthrocare Corporation * | | 19,120 | | | 763,270 |
Cutera, Inc. * | | 37,010 | | | 999,270 |
Kyphon, Inc. * | | 16,400 | | | 662,560 |
LeMaitre Vascular, Inc. * | | 126,680 | | | 760,080 |
Micrus Endovascular Corporation * | | 58,900 | | | 1,123,812 |
NuVasive, Inc. * | | 34,790 | | | 803,649 |
Orthovita, Inc. * | | 201,550 | | | 731,627 |
Resmed, Inc. * | | 21,670 | | | 1,066,597 |
Spectranetics Corporation * | | 124,640 | | | 1,407,186 |
Vital Signs, Inc. | | 3,370 | | | 168,230 |
| | | | | |
| | | | | 11,417,899 |
| | | | | |
Health Care Facilities - 2.8% | | | | | |
Five Star Quality Care, Inc. * | | 158,700 | | | 1,769,505 |
NovaMed, Inc. * | | 104,100 | | | 788,037 |
| | | | | |
| | | | | 2,557,542 |
| | | | | |
Health Care Services - 1.9% | | | | | |
AMN Healthcare Services, Inc. * | | 33,820 | | | 931,403 |
HMS Holdings Corporation * | | 57,190 | | | 866,428 |
| | | | | |
| | | | | 1,797,831 |
| | | | | |
Health Care Supplies - 1.6% | | | | | |
PolyMedica Corporation | | 36,646 | | | 1,480,865 |
| | | | | |
Health Care Technology - 1.3% | | | | | |
Systems Xcellence, Inc. * | | 21,300 | | | 429,621 |
Vital Images, Inc. * | | 23,130 | | | 804,924 |
| | | | | |
| | | | | 1,234,545 |
| | | | | |
Home Entertainment Software - 1.6% | | | | | |
The9, Ltd. ADR * | | 44,760 | | | 1,442,167 |
| | | | | |
Hotels, Resorts & Cruise Lines - 0.5% | | | | | |
Ctrip.com International, Ltd. ADR | | 7,400 | | | 462,352 |
| | | | | |
Household Products - 1.3% | | | | | |
Central Garden and Pet Company * | | 25,390 | | | 1,229,384 |
| | | | | |
Human Resource & Employment Services - 1.3% | | | | | |
Barrett Business Services | | 50,810 | | | 1,189,970 |
| | | | | |
Industrial Machinery - 1.2% | | | | | |
Flow International Corporation * | | 103,150 | | | 1,136,713 |
| | | | | |
The accompanying notes are an integral part of the financial statements.
144
| | |
| Schedule of Investments | | |
| December 31, 2006 - continued | | Series X (Small Cap Value Series) |
| | | | | | |
| | | Shares | | Value |
COMMON STOCK (continued) | | | | | | |
Internet Retail - 1.5% | | | | | | |
Nutri/System, Inc. * | | | 22,030 | | $ | 1,396,482 |
| | | | | | |
Internet Software & Services - 8.4% | | | | | | |
DealerTrack Holdings, Inc. * | | | 29,570 | | | 869,949 |
Equinix, Inc. * | | | 9,510 | | | 719,146 |
j2 Global Communications, Inc. * | | | 51,540 | | | 1,404,465 |
Marchex, Inc. (CI.B) | | | 74,140 | | | 991,993 |
Online Resources Corporation * | | | 116,270 | | | 1,187,117 |
Perficient, Inc. * | | | 48,130 | | | 789,813 |
RADVision, Ltd. * | | | 41,830 | | | 839,947 |
WebEx Communications, Inc. * | | | 28,540 | | | 995,761 |
| | | | | | |
| | | | | | 7,798,191 |
| | | | | | |
Investment Banking & Brokerage - 4.3% | | | | | | |
Greenhill & Company, Inc. | | | 13,300 | | | 981,540 |
Investment Technology Group, Inc. * | | | 40,430 | | | 1,733,638 |
optionsXpress Holdings, Inc. | | | 23,450 | | | 532,081 |
TradeStation Group, Inc. * | | | 55,740 | | | 766,425 |
| | | | | | |
| | | | | | 4,013,684 |
| | | | | | |
Leisure Facilities - 1.2% | | | | | | |
Life Time Fitness, Inc. * | | | 23,760 | | | 1,152,598 |
| | | | | | |
Marine Ports & Services - 0.9% | | | | | | |
Aegean Marine Petroleum Network, Inc. * | | | 48,400 | | | 793,760 |
| | | | | | |
Mortgage REIT’s - 1.5% | | | | | | |
KKR Financial Corporation | | | 52,250 | | | 1,399,778 |
| | | | | | |
Office Services & Supplies -1.0% | | | | | | |
American Reprographics Company * | | | 28,340 | | | 944,005 |
| | | | | | |
Oil & Gas Equipment & Services - 4.4% | | | | | | |
Core Laboratories N.V. * | | | 5,230 | | | 423,630 |
Dril-Quip, Inc. * | | | 24,280 | | | 950,805 |
Oil States International, Inc. * | | | 42,280 | | | 1,362,684 |
Superior Energy Services, Inc. * | | | 41,840 | | | 1,367,331 |
| | | | | | |
| | | | | | 4,104,450 |
| | | | | | |
Packaged Foods & Meats - 1.0% | | | | | | |
SunOpta, Inc. * | | | 104,350 | | | 918,280 |
| | | | | | |
Pharmaceuticals -0.5% | | | | | | |
KV Pharmaceutical Company * | | | 19,090 | | | 453,960 |
| | | | | | |
Property & Casualty Insurance - 5.1% | | | | | | |
Amerisafe, Inc. * | | | 95,290 | | | 1,473,183 |
Amtrust Financial Services, Inc. | | | 95,850 | | | 819,518 |
First Mercury Financial Corporation * | | | 44,490 | | | 1,046,405 |
Security Capital Assurance, Ltd. | | | 48,780 | | | 1,357,547 |
| | | | | | |
| | | | | | 4,696,653 |
| | | | | | |
Regional Banks - 0.6% | | | | | | |
PrivateBancorp, Inc. | | | 14,280 | | | 594,476 |
| | | | | | |
Semiconductor Equipment - 0.8% | | | | | | |
Cymer, Inc. * | | | 16,650 | | | 731,767 |
| | | | | | |
Semiconductors - 3.5% | | | | | | |
Atheros Communications, Inc. * | | | 41,250 | | | 879,450 |
Silicon Image, Inc. * | | | 69,110 | | | 879,079 |
Silicon Motion Technology Corporation ADR * | | | 61,080 | | | 969,340 |
SRS Labs, Inc. * | | | 52,030 | | | 562,964 |
| | | | | | |
| | | | | | 3,290,833 |
| | | | | | |
Specialized Consumer Services - 1.4% | | | | | | |
Steiner Leisure, Ltd. * | | | 27,610 | | | 1,256,255 |
| | | | | | |
Specialized Finance - 2.8% | | | | | | |
International Securities Exchange Holdings, Inc. | | | 9,750 | | | 456,203 |
NewStar Financial, Inc. * | | | 41,130 | | | 758,849 |
Portfolio Recovery Associates, Inc. * | | | 28,750 | | | 1,342,337 |
| | | | | | |
| | | | | | 2,557,389 |
| | | | | | |
TOTAL COMMON STOCK (Cost $77,512,369) | | | | | $ | 86,962,994 |
| | | | | | |
| | |
| | | Principal
Amount | | Value |
REPURCHASE AGREEMENT - 5.9% | | | | | | |
United Missouri Bank, 4.85%, dated 12-29-06, matures 01-02-07; repurchase amount $5,416,918 (Collateralized by FHLB, 5.25%, 06-10-11, FNMA, 5.00%, 09-25-30 & U.S. Treasury Notes, 3.375% & 3.50%, 10-15-09 & 08-15-09, with a combined value of $5,523,547) | | $ | 5,414,000 | | $ | 5,414,000 |
| | | | | | |
TOTAL REPURCHASE AGREEMENT (Cost $5,414,000) | | | | | $ | 5,414,000 |
| | | | | | |
Total Investments (SBL X Fund) (Cost $82,926,369) - 99.6% | | | | | $ | 92,376,994 |
Other Assets in Excess of Liabilities - 0.4% | | | | | | 412,500 |
| | | | | | |
TOTAL NET ASSETS -100.0% | | | | | $ | 92,789,494 |
| | | | | | |
Footnotes
Percentages are stated as a percent of net assets.
For federal income tax purposes the identified cost of investments owned at 12/31/2006 was $83,061,778.
| * | - Non-income producing security |
Glossary:
| ADR | - American Depositary Receipt |
See notes to financial statements.
The accompanying notes are an integral part of the financial statements.
145
Series X
(Small Cap Growth Series)
Statement of Assets and Liabilities
December 31, 2006
| | | | |
Assets: | | | | |
Investments, at value1 | | $ | 92,376,994 | |
Cash | | | 411,985 | |
Receivables: | | | | |
Fund shares sold | | | 31,146 | |
Securities sold | | | 495,772 | |
Dividends | | | 4,592 | |
Prepaid expenses | | | 2,055 | |
| | | | |
Total assets | | | 93,322,544 | |
| | | | |
Liabilities: | | | | |
Payable for: | | | | |
Securities purchased | | | 217,068 | |
Fund shares redeemed | | | 205,538 | |
Management fees | | | 79,271 | |
Custodian fees | | | 3,517 | |
Transfer agent/maintenance fees | | | 2,083 | |
Administration fees | | | 8,071 | |
Professional fees | | | 10,625 | |
Directors’ fees | | | 2,000 | |
Other fees | | | 4,877 | |
| | | | |
Total liabilities | | | 533,050 | |
| | | | |
Net Assets | | $ | 92,789,494 | |
| | | | |
Net assets consist of: | | | | |
Paid in capital | | $ | 101,022,486 | |
Accumulated net realized loss on sale of investments | | | (17,683,617 | ) |
Net unrealized appreciation in value of investments | | | 9,450,625 | |
| | | | |
Net assets | | $ | 92,789,494 | |
| | | | |
Capital shares authorized | | | unlimited | |
Capital shares outstanding | | | 4,815,752 | |
Net asset value per share (net assets divided by shares outstanding) | | $ | 19.27 | |
| | | | |
1Investments, at cost | | $ | 82,926,369 | |
Statement of Operations
For the Year Ended December 31, 2006
| | | | |
Investment Income: | | | | |
Dividends | | $ | 213,154 | |
Interest | | | 278,795 | |
| | | | |
Total investment income | | | 491,949 | |
| | | | |
Expenses: | | | | |
Management fees | | | 928,345 | |
Custodian fees | | | 26,048 | |
Transfer agent/maintenance fees | | | 25,148 | |
Administration fees | | | 90,282 | |
Directors’ fees | | | 4,334 | |
Professional fees | | | 17,769 | |
Reports to shareholders | | | 15,700 | |
Other expenses | | | 3,864 | |
| | | | |
Total expenses | | | 1,111,490 | |
Less: Earnings credits applied | | | (2,190 | ) |
| | | | |
Net expenses | | | 1,109,300 | |
| | | | |
Net investment loss | | | (617,351 | ) |
| | | | |
Net Realized and Unrealized Gain (Loss): | | | | |
Net realized gain during the year on: | | | | |
Investments | | | 7,308,120 | |
| | | | |
Net realized gain | | | 7,308,120 | |
| | | | |
Net unrealized depreciation during the year on: | | | | |
Investments | | | (2,144,750 | ) |
| | | | |
Net unrealized depreciation | | | (2,144,750 | ) |
| | | | |
Net realized and unrealized gain | | | 5,163,370 | |
| | | | |
Net increase in net assets resulting from operations | | $ | 4,546,019 | |
| | | | |
See accompanying notes.
146
| | |
| | Series X |
| Statement of Changes in Net Assets | | (Small Cap Growth Series) |
| | | | | | | | |
| | | Year Ended
December 31,
2006 | | | Year Ended
December 31,
2005 | |
Increase (decrease) in net assets from operations: | | | | | | | | |
Net investment loss | | $ | (617,351 | ) | | $ | (726,687 | ) |
Net realized gain during the year on investments | | | 7,308,120 | | | | 8,252,526 | |
Net unrealized depreciation during the year on investments | | | (2,144,750 | ) | | | (1,603,848 | ) |
| | | | | | | | |
Net increase in net assets resulting from operations | | | 4,546,019 | | | | 5,921,991 | |
| | | | | | | | |
Capital share transactions: | | | | | | | | |
Proceeds from sale of shares | | | 40,950,861 | | | | 25,405,430 | |
Cost of shares redeemed | | | (43,378,540 | ) | | | (32,524,330 | ) |
| | | | | | | | |
Net decrease from capital share transactions | | | (2,427,679 | ) | | | (7,118,900 | ) |
| | | | | | | | |
Net increase (decrease) in net assets | | | 2,118,340 | | | | (1,196,909 | ) |
| | | | | | | | |
Net assets: | | | | | | | | |
Beginning of year | | | 90,671,154 | | | | 91,868,063 | |
| | | | | | | | |
End of year | | $ | 92,789,494 | | | $ | 90,671,154 | |
| | | | | | | | |
Accumulated net investment loss at end of year | | $ | — | | | $ | — | |
| | | | | | | | |
Capital Share Activity: | | | | | | | | |
Shares sold | | | 2,187,874 | | | | 1,479,550 | |
Shares redeemed | | | (2,319,526 | ) | | | (1,920,417 | ) |
| | | | | | | | |
Total capital share activity | | | (131,652 | ) | | | (440,867 | ) |
| | | | | | | | |
See accompanying notes.
147
| | |
| Financial Highlights | | Series X |
| Selected data for each share of capital stock outstanding throughout each year | | (Small Cap Growth Series) |
| | | | | | | | | | | | | | | | | | | | |
| | | 2006 | | | 2005 | | | 2004 | | | 2003 | | | Year Ended,
December 31,
2002d | |
Per Share Data | | | | | | | | | | | | | | | | | | | | |
Net asset value, beginning of period | | $ | 18.33 | | | $ | 17.05 | | | $ | 14.55 | | | $ | 9.30 | | | $ | 12.66 | |
Income (loss) from investment operations: | | | | | | | | | | | | | | | | | | | | |
Net investment loss | | | (0.13 | ) | | | (0.15 | ) | | | (0.14 | ) | | | (0.10 | ) | | | (0.10 | ) |
Net gain (loss) on securities (realized and unrealized) | | | 1.07 | | | | 1.43 | | | | 2.64 | | | | 5.35 | | | | (3.26 | ) |
| | | | | | | | | | | | | | | | | | | | |
Total from investment operations | | | 0.94 | | | | 1.28 | | | | 2.50 | | | | 5.25 | | | | (3.36 | ) |
| | | | | | | | | | | | | | | | | | | | |
Net asset value, end of period | | $ | 19.27 | | | $ | 18.33 | | | $ | 17.05 | | | $ | 14.55 | | | $ | 9.30 | |
| | | | | | | | | | | | | | | | | | | | |
Total Returna | | | 5.13 | % | | | 7.51 | % | | | 17.18 | % | | | 56.45 | % | | | (26.54 | %) |
| | | | | | | | | | | | | | | | | | | | |
Ratios/Supplemental Data | | | | | | | | | | | | | | | | | | | | |
Net assets, end of period (in thousands) | | $ | 92,789 | | | $ | 90,671 | | | $ | 91,868 | | | $ | 89,740 | | | $ | 48,193 | |
| | | | | | | | | | | | | | | | | | | | |
Ratios to average net assets: | | | | | | | | | | | | | | | | | | | | |
Net investment loss | | | (0.66 | %) | | | (0.85 | %) | | | (0.89 | %) | | | (1.00 | %) | | | (0.89 | %) |
Total expensesb | | | 1.20 | % | | | 1.19 | % | | | 1.17 | % | | | 1.17 | % | | | 1.15 | % |
Net expensesc | | | 1.19 | % | | | 1.18 | % | | | 1.17 | % | | | 1.16 | % | | | 1.15 | % |
| | | | | | | | | | | | | | | | | | | | |
Portfolio turnover rate | | | 149 | % | | | 116 | % | | | 146 | % | | | 208 | % | | | 282 | % |
a | Total return does not take into account any of the expenses associated with an investment in variable insurance products offered by Security Benefit Life Insurance Company. If total return had taken into account these expenses, performance would have been lower. Shares of a series of SBL Fund are available only through the purchase of such products. |
b | Total expense information reflects expense ratios absent fund expense reductions by the Investment Manager, and earnings credits, as applicable. |
c | Net expense information reflects the expense ratios after voluntary expense waivers, reimbursements and custodian earnings credits, as applicable. |
d | RS Investments, Inc. became the sub–adviser of Series X effective September 3, 2002. Prior to September 3, 2002, Security Management Company, LLC (SMC) paid Strong Capital Management, Inc. for sub–advisory services. |
See accompanying notes.
148
| | |
| | Series Y |
| Manager’s Commentary | | (Select 25 Series) |
| February 15, 2007 | | (unaudited) |
Advisor Security Management Company, LLC
Mark A. Mitchell
Portfolio Manager
To Our Shareholders:
Series Y of the SBL Fund - Select 25 Series returned 7.54% in the year, lagging the benchmark Russell 1000 Growth Index’s return of 9.07%, but out performing the Series’ peer group median return of 6.37%. Poor stock selection was only partially offset by solid sector positioning in 2006. While being disappointed that our results were below the benchmark, we believe that our approach delivers performance over the long-term.
Our investment philosophy is centered around three key tenants: first, good investments are purchased at less than their intrinsic value; second, a long-term approach and patience are critical to successful investing; and lastly, we concentrate our investments in companies that have the greatest return potential.
Our bottom-up research driven investment process attempts to identify companies that have a competitive advantage or have the ability to become more competitive in the future. We focus on owning these companies for three to five years or longer which we believe differentiates us from a majority of our peers and ultimately allows us to make better investment decisions. We buy these companies when their current price trades below their intrinsic value. We closely monitor each company’s progress. We will sell a company if the valuation no longer makes sense, we’ve made a mistake and our investment thesis is no longer valid, or we have a more attractive investment alternative.
We ultimately structure the portfolio with 25-30 names. This philosophy is applied to a broad range of growth names.
Financials and Technology Stocks Top Performers
The Series’ Financial holdings were up 54% compared to 17% for the index. This was driven almost entirely by our position in First Marblehead, up over 150%. III-placed short-term concerns over the company’s competitive position offered a great buying opportunity for a leading student lender with a significant competitive advantage as a result of its loan underwriting capability, superior economics, and additional value-added services.
The Technology sector was up 12% versus the comparable sector index return of 7%. The largest contributor was an overweight position in Cisco, up 60%. Cisco benefited from strong enterprise equipment demand and continued solid business execution. ADC Telecom had a negative impact, down 35%. The company was hurt by unanticipated spending delays by telecom carriers as the industry has undergone significant consolidation.
Energy and Industrial Sectors Disappoint
The Energy sector was down over 14%, compared to up 4% for the benchmark. Evergreen Energy, down 42% (previously known as KFx), and BJ Services, down 20%, both contributed negatively to the fund. Evergreen Energy was hurt by concerns over the viability of the initial production results of its proprietary clean coal technology. BJ Services was impacted more generally by the recent exodus from oil services related names as a result of a weakening energy commodity market.
Holdings in the Industrial sector performed poorly this year. We were positioned to take advantage of several unique opportunities in companies that benefit broadly from strong global economic growth. Concerns regarding a slowdown in the U.S. have impacted the group. We still like the fundamentals of the companies we own, including FedEx Corporation, W.W. Grainger, L-3 Communications, and Shaw Group.
2007 Market Outlook
The current low return investment environment that exists outside of equities has continued to make available ample liquidity in the U.S. equity market. Falling energy prices have helped increase consumer confidence and provide support to corporate profit margins through lower raw material input prices. Additionally, businesses have very healthy balance sheets to help drive future growth initiatives.
As we noted in last year’s shareholder letter, we’ve been concerned about a slowdown in U.S. consumer spending for some time. This concern has yet to materialize, but we still think in will happen. Lower energy prices will help, however, higher interest rates and a housing market slowdown provide likely headwinds. The Federal Reserve is walking a fine line between managing inflation risks while supporting economic growth. We’re unsure, like most in the market, what the Fed’s next move is. This uncertainty will weigh on the markets until it’s resolved.
149
| | |
| |
| | Series Y |
| Manager’s Commentary | | (Select 25 Series) |
| February 15, 2007 | | (unaudited) |
We believe that investing is a long-term pursuit that requires patience and a consistent approach. Dollar cost averaging is a sound way to build long-term value.1 We recognize there are many investment fund alternatives available today and thank you for your business and the confidence you place in us.
|
| Sincerely, |
|
| |
| Mark A. Mitchell, Portfolio Manager |
1 | Dollar cost averaging does not assure profits or protect against loss in a declining market. |
PERFORMANCE
Series Y vs. Russell 1000 Growth Index
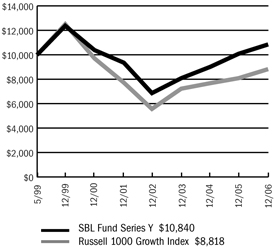
$10,000 Since Inception
The chart above assumes a hypothetical $10,000 investment in Series Y (Select 25 Series) on May 3, 1999 (date of inception), and reflects the fees and expenses of Series Y. The Russell 1000 Growth Index is an unmanaged capitalization-weighted index which includes stocks incorporated in the United States and its territories and measures the performance of the Russell 1000 companies with higher price-to-book ratios and higher forecasted growth values.
Average Annual Returns
| | | | | | | | | |
Periods Ended 12-31-061 | | 1 Year | | | 5 Years | | | Since Inception
(5-3-99) | |
Series Y | | 7.54 | % | | 3.00 | % | | 1.06 | % |
1 | Performance figures do not reflect fees and expenses associated with an investment in variable insurance products offered by Security Benefit Life Insurance Company. If returns had taken into account these fees and expenses, performance would have been lower. Shares of a Series of SBL Fund are available only through the purchase of such products. |
The performance data quoted above represents past performance. Past performance is not predictive of future performance. The investment return and principal value of an investment will fluctuate so that an investor’s shares, when redeemed, may be worth more or less than their original cost.
Portfolio Composition by Sector
| | | |
Consumer Discretionary | | 14.97 | % |
Consumer Staples | | 5.20 | |
Energy | | 11.96 | |
Financials | | 14.38 | |
Health Care | | 15.94 | |
Industrials | | 16.09 | |
Information Technology | | 11.66 | |
Materials | | 0.82 | |
Exchange Traded Funds | | 6.31 | |
Asset Backed Commercial Paper | | 2.80 | |
Repurchase Agreement | | 0.30 | |
Liabilities, less cash & other assets | | (0.43 | ) |
Total net assets | | 100.00 | % |
| | | |
See accompanying notes.
150
| | |
| | Series Y |
| Manager’s Commentary | | (Select 25 Series) |
| December 31, 2006 | | (unaudited) |
PERFORMANCE
Information About Your Series Expenses
Calculating your ongoing series expenses
Example
As a shareholder of the Series, you incur ongoing costs, including management fees and other series expenses. Performance figures and expense ratios do not reflect fees and expenses associated with an investment in variable insurance products. Shares of a Series of SBL Fund are available only through the purchase of such products. This example is intended to help you understand your ongoing costs (in dollars) of investing in the Series and to compare these costs with ongoing costs of investing in other mutual funds. The example is based on an investment of $1,000 invested at the beginning of the period and held for the entire period, July 1, 2006 - December 31, 2006.
Actual Expenses
The first line in the table provides information about actual account values and actual expenses. You may use the information in this table, together with the amount you invested, to estimate the expenses that you paid over the period. Simply divide your account value by $1,000 (for example, an $8,600 account value divided by $1,000 = 8.6), then multiply the result by the number in the table under the heading entitled “Expenses Paid During Period” to estimate the expenses you paid on your account during this period.
Hypothetical Example for Comparison Purposes
The second line in the table provides information about hypothetical account values and hypothetical expenses based on the Series actual expense ratio and an assumed rate of return of 5% per year before expenses, which is not the Series actual return. The hypothetical account values and expenses may not be used to estimate the actual ending account balance or expenses you paid for the period. You may use this information to compare the ongoing costs of investing in the Series and other funds. To do so, compare this 5% hypothetical example with the 5% hypothetical examples that appear in the shareholder reports of the other mutual funds.
Please note that the expenses shown in the table are meant to highlight your ongoing costs only and do not reflect any fees and expenses associated with an investment in variable insurance products. Therefore, the second line is useful in comparing ongoing costs only, and will not help you determine the relative total costs of owning different funds. In addition, if these fees and expenses associated with an investment in variable insurance products were included, your costs would have been higher.
Series Expenses
| | | | | | | | | |
| | | Beginning
Account Value
07-01-06 | | Ending
Account Value
12-31-061 | | Expenses Paid
During
Period2 |
Series Y (Select 25 Series) | | | | | | | | | |
Actual | | $ | 1,000.00 | | $ | 1,061.70 | | $ | 4.94 |
Hypothetical | | | 1,000.00 | | | 1,020.42 | | | 4.84 |
1 | The actual ending account value is based on the actual total return of the Series for the period July 1, 2006 to December 31, 2006 after actual expenses and will differ from the hypothetical ending account value which is based on the Series expense ratio and a hypothetical annual return of 5% before expenses. The actual cumulative return at net asset value for the period July 1, 2006 to December 31, 2006 was 6.17%. |
2 | Expenses are equal to the Series annualized expense ratio of 0.95%, net of earnings credits, multiplied by the average account value over the period, multiplied by 184/365 (to reflect the one-half year period). |
151
| | |
| Schedule of Investments | | Series Y (Select 25 Series) |
December 31, 2006 | | |
| | | | | |
| | | Shares | | Value |
COMMON STOCK - 97.3% | | | | | |
Aerospace & Defense - 2.0% | | | | | |
L-3 Communications Holdings, Inc. | | 21,300 | | $ | 1,741,914 |
| | | | | |
Air Freight & Logistics - 4.5% | | | | | |
FedEx Corporation | | 35,600 | | | 3,866,872 |
| | | | | |
Biotechnology - 5.3% | | | | | |
Amgen, Inc. * | | 66,400 | | | 4,535,784 |
| | | | | |
Broadcasting & Cable TV - 3.6% | | | | | |
CBS Corporation (CI.B) | | 40,300 | | | 1,256,554 |
Univision Communications, Inc. * | | 52,600 | | | 1,863,092 |
| | | | | |
| | | | | 3,119,646 |
| | | | | |
Coal & Consumable Fuels - 2.7% | | | | | |
Evergreen Energy, Inc. * | | 233,000 | | | 2,304,370 |
| | | | | |
Communications Equipment - 5.4% | | | | | |
ADC Telecommunications, Inc. * | | 155,071 | | | 2,253,175 |
Cisco Systems, Inc. * | | 86,800 | | | 2,372,244 |
| | | | | |
| | | | | 4,625,419 |
| | | | | |
Construction & Engineering - 5.1% | | | | | |
Shaw Group, Inc. * (1) | | 131,000 | | | 4,388,500 |
| | | | | |
Consumer Finance - 5.5% | | | | | |
First Marblehead Corporation | | 85,650 | | | 4,680,773 |
| | | | | |
Data Processing & Outsourced Services - 4.2% | | | | | |
First Data Corporation | | 59,600 | | | 1,520,992 |
Western Union Company | | 94,300 | | | 2,114,206 |
| | | | | |
| | | | | 3,635,198 |
| | | | | |
Exchange Traded Funds - 6.3% | | | | | |
iShares Russell 1000 Growth Index Fund | | 50,000 | | | 2,750,000 |
iShares S&P 500 Growth Index Fund | | 41,000 | | | 2,661,310 |
| | | | | |
| | | | | 5,411,310 |
| | | | | |
Health Care Equipment - 2.2% | | | | | |
Zimmer Holdings, Inc. * | | 24,200 | | | 1,896,796 |
| | | | | |
Home Improvement Retail - 5.1% | | | | | |
Home Depot, Inc. | | 107,900 | | | 4,333,264 |
| | | | | |
Hotels, Resorts & Cruise Lines - 4.3% | | | | | |
Carnival Corporation | | 75,900 | | | 3,722,895 |
| | | | | |
Hypermarkets & Super Centers - 3.7% | | | | | |
Wal-Mart Stores, Inc. | | 68,100 | | | 3,144,858 |
| | | | | |
Industrial Gases - 0.8% | | | | | |
Praxair, Inc. | | 11,900 | | | 706,027 |
| | | | | |
Life Sciences Tools & Services - 4.1% | | | | | |
Covance, Inc. * | | 59,300 | | | 3,493,363 |
| | | | | |
Movies & Entertainment - 1.9% | | | | | |
Viacom, Inc. (CI.B) * | | 40,300 | | | 1,653,509 |
| | | | | |
Multi-Line Insurance - 5.7% | | | | | |
American International Group, Inc. | | 67,600 | | | 4,844,216 |
| | | | | |
Oil & Gas Equipment & Services - 3.4% | | | | | |
BJ Services Company | | 98,600 | | | 2,890,952 |
| | | | | |
Oil & Gas Storage & Transportation - 5.9% | | | | | |
Williams Companies, Inc. | | 193,500 | | | 5,054,220 |
| | | | | |
Other Diversified Financial Services - 3.3% | | | | | |
Citigroup, Inc. | | 50,200 | | | 2,796,140 |
| | | | | |
Pharmaceuticals - 4.4% | | | | | |
Johnson & Johnson | | 56,500 | | | 3,730,130 |
| | | | | |
Soft Drinks -1.5% | | | | | |
PepsiCo, Inc. | | 21,000 | | | 1,313,550 |
| | | | | |
Systems Software -2.0% | | | | | |
Microsoft Corporation | | 57,900 | | | 1,728,894 |
| | | | | |
Trading Companies & Distributors - 4.4% | | | | | |
W.W. Grainger, Inc. | | 54,200 | | | 3,790,748 |
| | | | | |
TOTAL COMMON STOCK (Cost $70,345,176) | | | | $ | 83,409,348 |
| | | | | |
| | | | | | | |
| | | Principal
Amount | | Value | |
ASSET BACKED COMMERCIAL PAPER - 2.8% | | | | | | | |
Financial Companies - Diversified -1.2% | | | | | | | |
Amsterdam Funding Corporation | | | | | | | |
5.31%, 1/3/2007 | | | 1,000,000 | | | 999,705 | |
| | | | | | | |
Financial Companies - Miscellaneous Receivables -1.6% | | | | | | | |
Fairway Finance Corporation | | | | | | | |
5.35%, 1/5/2007 | | | 1,400,000 | | | 1,399,174 | |
| | | | | | | |
TOTAL ASSET BACKED COMMERCIAL PAPER (Cost $2,398,879) | | | | | $ | 2,398,879 | |
| | | | | | | |
REPURCHASE AGREEMENT - 0.3% | | | | | | | |
United Missouri Bank, 4.85%, dated 12-29-06, matures 01-02-07; repurchase amount of $257,138 (Collateralized by FHLMC, 5.00%, 09-15-36 with a value of $262,957) | | $ | 257,000 | | $ | 257,000 | |
| | | | | | | |
TOTAL REPURCHASE AGREEMENT (Cost $257,000) | | | | | $ | 257,000 | |
| | | | | | | |
Total Investments (SBL Y Fund) (Cost $73,001,055) -100.4% | | | | | $ | 86,065,227 | |
Liabilities in Excess of Other Assets - (0.4)% | | | | | | (370,179 | ) |
| | | | | | | |
TOTAL NET ASSETS -100.0% | | | | | $ | 85,695,048 | |
| | | | | | | |
Footnotes
Percentages are stated as a percent of net assets.
The accompanying notes are an integral part of the financial statements.
152
| | |
| Schedule of Investments | | Series Y (Select 25 Series) |
December 31, 2006 - continued | | |
For federal income tax purposes the identified cost of investments owned at 12/31/2006 was $73,388,747.
| * | - Non-income producing security |
| 1 | - Security is segregated as collateral for open written options contracts. |
See notes to financial statements.
The accompanying notes are an integral part of the financial statements.
153
Series Y
(Select 25 Series)
Statement of Assets and Liabilities
December 31, 2006
| | | | |
Assets: | | | | |
Investments, at value1 | | $ | 86,065,227 | |
Cash | | | 104 | |
Receivables: | | | | |
Fund shares sold | | | 49,787 | |
Dividends | | | 35,689 | |
Prepaid expenses | | | 2,368 | |
| | | | |
Total assets | | | 86,153,175 | |
| | | | |
Liabilities: | | | | |
Payable for: | | | | |
Fund shares redeemed | | | 85,708 | |
Written options, at value | | | | |
(premiums received, $ 93,926) | | | 286,560 | |
Management fees | | | 54,491 | |
Custodian fees | | | 1,641 | |
Transfer agent/maintenance fees | | | 2,083 | |
Administration fees | | | 6,992 | |
Professional fees | | | 15,757 | |
Other | | | 3,495 | |
Directors’ fees | | | 1,400 | |
| | | | |
Total liabilities | | | 458,127 | |
| | | | |
Net Assets | | $ | 85,695,048 | |
| | | | |
Net assets consist of: | | | | |
Paid in capital | | $ | 105,799,928 | |
Undistributed net investment income | | | 140,430 | |
Accumulated net realized loss on sale of investments and options written | | | (33,116,848 | ) |
Net unrealized appreciation in value of investments and options written | | | 12,871,538 | |
| | | | |
Net assets | | $ | 85,695,048 | |
| | | | |
Capital shares authorized | | | Unlimited | |
Capital shares outstanding | | | 7,905,694 | |
Net asset value per share (net assets divided by shares outstanding) | | $ | 10.84 | |
| | | | |
1Investments, at cost | | $ | 73,001,055 | |
Statement of Operations
For the Year Ended December 31, 2006
| | | | |
Investment Income: | | | | |
Dividends | | $ | 594,899 | |
Interest | | | 165,948 | |
| | | | |
Total investment income | | | 760,847 | |
| | | | |
Expenses: | | | | |
Management fees | | | 490,145 | |
Custodian fees | | | 11,975 | |
Transfer agent/maintenance fees | | | 25,148 | |
Administration fees | | | 62,343 | |
Directors’ fees | | | 2,944 | |
Professional fees | | | 17,389 | |
Reports to shareholders | | | 8,597 | |
Other expenses | | | 1,888 | |
| | | | |
Total expenses | | | 620,429 | |
Less: Earnings credits applied | | | (12 | ) |
| | | | |
Net expenses | | | 620,417 | |
| | | | |
Net investment income | | | 140,430 | |
| | | | |
Net Realized and Unrealized Gain: | | | | |
Net realized gain during the year on: | | | | |
Investments | | | 3,680,983 | |
Options written | | | 176,247 | |
| | | | |
Net realized gain | | | 3,857,230 | |
| | | | |
Net unrealized appreciation (depreciation) during the year on: | | | | |
Investments | | | 5,719,478 | |
Options written | | | (202,405 | ) |
| | | | |
Net unrealized appreciation | | | 5,517,073 | |
| | | | |
Net realized and unrealized gain | | | 9,374,303 | |
| | | | |
Net increase in net assets resulting from operations | | $ | 9,514,733 | |
| | | | |
See accompanying notes.
154
| | |
| | | Series Y |
| Statement of Changes in Net Assets | | (Select 25 Series) |
| | | | | | | | |
| | | Year Ended
December 31, 2006 | | | Year Ended
December 31, 2005 | |
Increase (decrease) in net assets from operations: | | | | | | | | |
Net investment income (loss) | | $ | 140,430 | | | $ | (13,661 | ) |
Net realized gain during the year on investments and options written | | | 3,857,230 | | | | 1,552,451 | |
Net unrealized appreciation during the year on investments and options written | | | 5,517,073 | | | | 2,068,207 | |
| | | | | | | | |
Net increase in net assets resulting from operations | | | 9,514,733 | | | | 3,606,997 | |
| | | | | | | | |
Capital share transactions: | | | | | | | | |
Proceeds from sale of shares | | | 37,946,575 | | | | 13,147,535 | |
Issuance of shares in connection with SBL G merger (Note 14) | | | 42,870,151 | | | | — | |
Cost of shares redeemed | | | (41,654,270 | ) | | | (13,568,691 | ) |
| | | | | | | | |
Net increase (decrease) from capital share transactions | | | 39,162,456 | | | | (421,156 | ) |
| | | | | | | | |
Net increase in net assets | | | 48,677,189 | | | | 3,185,841 | |
| | | | | | | | |
Net assets: | | | | | | | | |
Beginning of year | | | 37,017,859 | | | | 33,832,018 | |
| | | | | | | | |
End of year | | $ | 85,695,048 | | | $ | 37,017,859 | |
| | | | | | | | |
Undistributed net investment income at end of year | | $ | 140,430 | | | $ | — | |
| | | | | | | | |
Capital Share Activity: | | | | | | | | |
Shares sold | | | 3,680,058 | | | | 1,425,367 | |
Shares issued in connection with SBL Series G merger (Note 14) | | | 4,606,863 | | | | — | |
Shares redeemed | | | (4,055,072 | ) | | | (1,501,879 | ) |
| | | | | | | | |
Total capital share activity | | | 4,231,849 | | | | (76,512 | ) |
| | | | | | | | |
See accompanying notes.
155
| | | |
| Financial Highlights | | Series Y | |
| Selected data for each share of capital stock outstanding throughout each year | | (Select 25 Series | ) |
| | | | | | | | | | | | | | | | | | | | |
| | | 2006d | | | 2005 | | | 2004 | | | 2003 | | | Year Ended,
December 31,
2002 | |
Per Share Data | | | | | | | | | | | | | | | | | | | | |
Net asset value, beginning of period | | $ | 10.08 | | | $ | 9.02 | | | $ | 8.08 | | | $ | 6.86 | | | $ | 9.35 | |
| | | | | | | | | | | | | | | | | | | | |
Income (loss) from investment operations: | | | | | | | | | | | | | | | | | | | | |
Net investment income (loss) | | | 0.02 | | | | — | | | | (0.01 | ) | | | — | | | | (0.01 | ) |
Net gain (loss) on securities (realized and unrealized) | | | 0.74 | | | | 1.06 | | | | 0.95 | | | | 1.22 | | | | (2.48 | ) |
| | | | | | | | | | | | | | | | | | | | |
Total from investment operations | | | 0.76 | | | | 1.06 | | | | 0.94 | | | | 1.22 | | | | (2.49 | ) |
| | | | | | | | | | | | | | | | | | | | |
Net asset value, end of period | | $ | 10.84 | | | $ | 10.08 | | | $ | 9.02 | | | $ | 8.08 | | | $ | 6.86 | |
| | | | | | | | | | | | | | | | | | | | |
Total Returna | | | 7.54 | % | | | 11.75 | % | | | 11.63 | % | | | 17.78 | % | | | (26.63 | %) |
| | | | | | | | | | | | | | | | | | | | |
Ratios/Supplemental Data | | | | | | | | | | | | | | | | | | | | |
Net assets, end of period (in thousands) | | $ | 85,695 | | | $ | 37,018 | | | $ | 33,832 | | | $ | 34,790 | | | $ | 34,286 | |
| | | | | | | | | | | | | | | | | | | | |
Ratios to average net assets: | | | | | | | | | | | | | | | | | | | | |
Net investment income (loss) | | | 0.21 | % | | | (0.04 | %) | | | (0.15 | %) | | | (0.01 | %) | | | (0.18 | %) |
Total expensesb | | | 0.95 | % | | | 0.99 | % | | | 0.95 | % | | | 0.93 | % | | | 0.89 | % |
Net expensesc | | | 0.95 | % | | | 0.99 | % | | | 0.95 | % | | | 0.93 | % | | | 0.89 | % |
| | | | | | | | | | | | | | | | | | | | |
Portfolio turnover rate | | | 40 | % | | | 28 | % | | | 42 | % | | | 49 | % | | | 34 | % |
a | Total return does not take into account any of the expenses associated with an investment in variable insurance products offered by Security Benefit Life Insurance Company. If total return had taken into account these expenses, performance would have been lower. Shares of a series of SBL Fund are available only through the purchase of such products. |
b | Total expense information reflects expense ratios absent fund expense reductions by the Investment Manager, and earnings credits, as applicable. |
c | Net expense information reflects the expense ratios after voluntary expense waivers, reimbursements and custodian earnings credits, as applicable. |
d | The financial highlights for Series Y as set forth herein exclude the historical financial highlights of Series G. The assets of Series G were acquired by Series Y on June 16, 2006. A total of $40,543,215 was excluded from purchases in the portfolio turnover calculation, which represents the cost of the securities Series Y received as a result of the merger. |
See accompanying notes.
156
| | |
| | | Series Z |
| Managers’ Commentary | | (Alpha Opportunity Series) |
| February 15, 2007 | | (unaudited) |
| | | | | | |
| Advised by: | | | | | | |
| | and | |  | | Subadvisor, Mainstream Investment Advisers |
| | | | |
| | |
 | |  |
| Bill Jenkins | | Mark Lamb |
| Co-Portfolio Manager | | Co-Portfolio Manager |
To Our Shareholders:
For the year ended December 31, 2006, Series Z of the SBL Fund - Alpha Opportunity Series total return was 13.13%, trailing the Series’ median peer group return of 13.92% and the 15.79% return for the costless S&P 500 Total Return Index. Although disappointed with the Series’ return that trailed its S&P 500 benchmark, we believe our investment approach delivers significant long-term value, as demonstrated by the Series’ cumulative total return of 60.72% since its July 7, 2003 inception, which exceeded the S&P 500’s Total Return by 10.27%.
During this period, the performance of the Series’ assets managed using the active value strategy underperformed the index, while the passive strategy of the Series performed as expected. The passive strategy replicates the index by investing in high-quality, short-term fixed income instruments and by being long the index futures. While the passive strategy provides the necessary liquidity, the active strategy focuses on adding long-term value while maintaining a risk profile that is less than the marketplace in general.
The 2006 underperformance of the Series’ assets managed using the active value strategy can be partially attributed to the strong rise in stocks in 2006 which made it difficult to make absolute return in the portfolio’s short positions. Further contributing to underperformance were the strong performances by non-theme sectors such as finance where we were not only underweighted but short in some portions.
The fundamental investment philosophy of the active value strategy rests first upon the belief that it is critical to identify the long-term investment theme governing the equity markets. These themes may persist for 15 to 20 years. Second, while we also believe that valuation adds important perspective to investment decisions, it is not an efficient means of timing purchase and sale decisions. We believe those decisions are best made using technical analysis. We believe technical analysis, the study of price trends, allows us to efficiently capture gains and avoid material losses. The third tenet of our philosophy is that changes in stock prices lead changes in fundamental corporate developments. A proactive asset management approach helps to keep our investment themes fresh and our risk levels moderate.
2006 was a year marked by great volatility. Our active value strategy investments in the Energy sector performed well as that sector returned over 22% during the year. Individual holdings remain broadly diversified within sector concentrations in Industrials and Materials of 23.5% and 22.5%, respectively. Our top five profitable positions were in these three sectors: McDermott in Energy; General Cable, Amphenol and Commscope in Industrials; and Votorantim Cellulose in Materials.
We were most disappointed in the short exposure of the active value strategy portfolio. It is very difficult to achieve an absolute positive return in a year when stocks record double digit gains. We ended the year at a low 4% short position, for the active value portion of the Series, primarily due to our constructive view of the 2007 market. The most disappointing short position for us was PNC Bank. Despite this disappointment, however, we remain negative on regional banks and select consumer stocks. Regional bank profits should continue to suffer from a competitive lending environment and an inverted yield curve. Subdued economic growth in 2007 will put added pressure on the consumer, negatively impacting the profits of restaurants and other retail companies.
We are optimistic on the outlook for stocks in 2007. Equity valuations in general remain fair across most sectors, with no individual sector appearing meaningfully overvalued. Also favoring stocks is the large amount of cash on the sidelines. These large cash positions, coupled with net equity exposures for long/short funds near historic lows, suggest stock prices will continue to trend higher in 2007. Fundamentally, the revision of third quarter GDP growth up from 1.6% to 2.0% leads us to believe that the U.S. economy is basing, thereby averting recession next year. This should allow for the resumption of the secular uptrend in commodities.
157
| | |
| | | Series Z |
| Managers’ Commentary | | (Alpha Opportunity Series) |
| February 15, 2007 | | (unaudited) |
There continue to be opportunities within commodities and companies related to their production. In our active value strategy, we like a broad spectrum of agricultural related stocks ranging from seed producers, such as Monsanto, to makers of fertilizers, like Potash. The agricultural theme carries over into industrial companies such as Deere and Case New Holland. Current weakness in commodities may take awhile to work out. In the meantime, opportunities in transportation and infrastructure are being addressed.
|
| All the best for 2007, |
|
| |
| Mark Lamb |
| Co-Portfolio Manager |
| Security Management Company, LLC |
|
|
| |
| William H. Jenkins |
| Mainstream Investment Advisers, LLC |
| (Sub-adviser for the active value portion of the Fund) |
PERFORMANCE
Series Z vs. S&P 500 Index
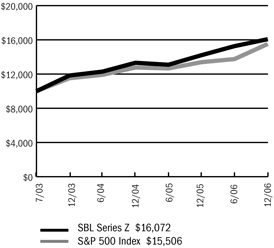
$10,000 Since Inception
The chart above assumes a hypothetical $10,000 investment in Series Z (Alpha Opportunity Series) on July 7, 2003 (date of inception), and reflects the fees and expenses of Series Z. The S&P 500 Index is a capitalization weighted index composed of 500 selected common stocks that represent the broad domestic economy and is a widely recognized unmanaged index of market performance.
Average Annual Returns
| | | | |
Periods Ended 12-31-061 | | 1 Year | | Since Inception (7-7-03) |
Series Z | | 13.13% | | 14.59% |
1 | Performance figures do not reflect fees and expenses associated with an investment in variable insurance products offered by Security Benefit Life Insurance Company. If returns had taken into account these fees and expenses, performance would have been lower. Shares of a Series of SBL Fund are available only through the purchase of such products. |
The performance data quoted above represents past performance. Past performance is not predictive of future performance. The investment return and principal value of an investment will fluctuate so that an investor’s shares, when redeemed, may be worth more or less than their original cost.
Portfolio Composition by Sector*
| | | |
Consumer Discretionary | | 2.82 | % |
Consumer Staples | | 0.67 | |
Energy | | 4.55 | |
Financials | | (0.54 | ) |
Industrials | | 16.88 | |
Information Technology | | 3.54 | |
Materials | | 12.48 | |
Exchange Traded Funds | | 0.03 | |
U.S. Agency Bonds & Notes | | 41.24 | |
Cash & other assets, less liabilities | | 18.33 | |
Total net assets | | 100.00 | % |
| | | |
| * | Securities sold short are netted with long positions in common stocks in the appropriate sectors. |
See accompanying notes.
158
| | |
| | Series Z |
| Managers’ Commentary | | (Alpha Opportunity Series) |
| December 31, 2006 | | (unaudited) |
PERFORMANCE
Information About Your Series Expenses
Calculating your ongoing series expenses
Example
As a shareholder of the Series, you incur ongoing costs, including management fees and other series expenses. Performance figures and expense ratios do not reflect fees and expenses associated with an investment in variable insurance products. Shares of a Series of SBL Fund are available only through the purchase of such products. This example is intended to help you understand your ongoing costs (in dollars) of investing in the Series and to compare these costs with ongoing costs of investing in other mutual funds. The example is based on an investment of $1,000 invested at the beginning of the period and held for the entire period, July 1, 2006 - December 31, 2006.
Actual Expenses
The first line in the table provides information about actual account values and actual expenses. You may use the information in this table, together with the amount you invested, to estimate the expenses that you paid over the period. Simply divide your account value by $1,000 (for example, an $8,600 account value divided by $1,000 = 8.6), then multiply the result by the number in the table under the heading entitled “Expenses Paid During Period” to estimate the expenses you paid on your account during this period.
Hypothetical Example for Comparison Purposes
The second line in the table provides information about hypothetical account values and hypothetical expenses based on the Series actual expense ratio and an assumed rate of return of 5% per year before expenses, which is not the Series actual return. The hypothetical account values and expenses may not be used to estimate the actual ending account balance or expenses you paid for the period. You may use this information to compare the ongoing costs of investing in the Series and other funds. To do so, compare this 5% hypothetical example with the 5% hypothetical examples that appear in the shareholder reports of the other mutual funds.
Please note that the expenses shown in the table are meant to highlight your ongoing costs only and do not reflect any fees and expenses associated with an investment in variable insurance products. Therefore, the second line is useful in comparing ongoing costs only, and will not help you determine the relative total costs of owning different funds. In addition, if these fees and expenses associated with an investment in variable insurance products were included, your costs would have been higher.
Series Expenses
| | | | | | | | | |
| | | Beginning
Account Value
07-01-06 | | Ending
Account Value
12-31-061 | | Expenses Paid
During
Period2 |
Series Z (Alpha Opportunity Series) | | | | | | | | | |
Actual | | $ | 1,000.00 | | $ | 1,052.80 | | $ | 13.35 |
Hypothetical | | | 1,000.00 | | | 1,012.20 | | | 13.09 |
1 | The actual ending account value is based on the actual total return of the Series for the period July 1, 2006 to December 31, 2006 after actual expenses and will differ from the hypothetical ending account value which is based on the Series expense ratio and a hypothetical annual return of 5% before expenses. The actual cumulative return at net asset value for the period July 1, 2006 to December 31, 2006 was 5.28%. |
2 | Expenses are equal to the Series annualized expense ratio of 2.58%, net of earnings credits, multiplied by the average account value over the period, multiplied by 184/365 (to reflect the one-half year period). |
159
| | |
| Schedule of Investments | | Series Z (Alpha Opportunity Series) |
| December 31, 2006 | | |
| | | | | |
| | | Shares | | Value |
COMMON STOCK - 42.2% | | | | | |
Aerospace & Defense - 1.0% | | | | | |
Empresa Brasileira de Aeronautica S.A. ADR | | 5,300 | | $ | 219,473 |
Goodrich Corporation | | 3,200 | | | 145,760 |
| | | | | |
| | | | | 365,233 |
| | | | | |
Airlines - 1.9% | | | | | |
Continental Airlines, Inc. * | | 2,700 | | | 111,375 |
Copa Holdings S.A. | | 1,000 | | | 46,560 |
JetBlue Airways Corporation * | | 17,300 | | | 245,660 |
US Airways Group, Inc. * | | 5,700 | | | 306,945 |
| | | | | |
| | | | | 710,540 |
| | | | | |
Apparel Retail - 0.3% | | | | | |
Guess ?, Inc. * | | 1,800 | | | 114,174 |
| | | | | |
Apparel, Accessories & Luxury Goods - 1.2% | | | | | |
Jones Apparel Group, Inc. | | 10,300 | | | 344,329 |
Kellwood Company | | 3,100 | | | 100,812 |
| | | | | |
| | | | | 445,141 |
| | | | | |
Building Products - 0.3% | | | | | |
American Standard Companies, Inc. | | 2,000 | | | 91,700 |
| | | | | |
Commodity Chemicals - 0.0% | | | | | |
Lyondell Chemical Company | | 600 | | | 15,342 |
| | | | | |
Computer Hardware - 0.3% | | | | | |
Sun Microsystems, Inc. * | | 18,200 | | | 98,644 |
| | | | | |
Computer Storage & Peripherals - 0.9% | | | | | |
Imation Corporation | | 6,700 | | | 311,081 |
| | | | | |
Construction & Engineering - 2.9% | | | | | |
Chicago Bridge & Iron Company N.V. | | 4,200 | | | 114,828 |
EMCOR Group, Inc. * | | 2,400 | | | 136,440 |
Insituform Technologies, Inc. * | | 4,200 | | | 108,612 |
URS Corporation * | | 9,400 | | | 402,790 |
Washington Group International, Inc. * | | 5,100 | | | 304,929 |
| | | | | |
| | | | | 1,067,599 |
| | | | | |
Construction & Farm Machinery & Heavy Trucks - 3.8% | | | | | |
AGCO Corporation * | | 7,900 | | | 244,426 |
American Railcar Industries, Inc. | | 600 | | | 20,424 |
CNH Global N.V. | | 500 | | | 13,650 |
Deere & Company (1) | | 6,200 | | | 589,434 |
Lindsay Corporation | | 12,400 | | | 404,860 |
Trinity Industries, Inc. | | 3,400 | | | 119,680 |
| | | | | |
| | | | | 1,392,474 |
| | | | | |
Construction Materials - 0.7% | | | | | |
Texas Industries, Inc. | | 3,800 | | | 244,074 |
| | | | | |
Diversified Chemicals - 0.3% | | | | | |
Dow Chemical Company | | 2,500 | | | 99,850 |
| | | | | |
Diversified Commercial & Professional Services - 0.3% | | | | | |
Ritchie Bros Auctioneers, Inc. | | 2,000 | | | 107,080 |
| | | | | |
Diversified Metals & Mining - 3.1% | | | | | |
AMCOL International Corporation | | 2,400 | | | 66,576 |
Anglo American plc ADR | | 9,300 | | | 227,013 |
Brush Engineered Materials, Inc. * | | 1,400 | | | 47,278 |
Freeport-McMoRan Copper & Gold, Inc. (CI.B) | | 7,400 | | | 412,402 |
Northern Orion Resources, Inc. * | | 1,100 | | | 4,026 |
Peru Copper, Inc. * | | 28,500 | | | 97,470 |
Teck Cominco, Ltd. (CI.B) | | 2,900 | | | 218,515 |
Titanium Metals Corporation * | | 1,600 | | | 47,216 |
| | | | | |
| | | | | 1,120,496 |
| | | | | |
Electrical Components & Equipment - 2.1% | | | | | |
Belden CDT, Inc. | | 3,200 | | | 125,088 |
General Cable Corporation * | | 6,600 | | | 288,486 |
Thomas & Betts Corporation * | | 7,500 | | | 354,600 |
| | | | | |
| | | | | 768,174 |
| | | | | |
Environmental & Facilities Services - 0.5% | | | | | |
Allied Waste Industries, Inc. * | | 3,100 | | | 38,099 |
Layne Christensen Company * | | 1,500 | | | 49,245 |
Waste Connections, Inc. * | | 2,200 | | | 91,410 |
| | | | | |
| | | | | 178,754 |
| | | | | |
Exchange Traded Funds - 0.0% | | | | | |
PowerShares DB Commodity Index Tracking Fund | | 400 | | | 9,832 |
| | | | | |
Fertilizers & Agricultural Chemicals - 3.8% | | | | | |
Agrium, Inc. | | 1,700 | | | 53,533 |
Mosaic Company * | | 3,400 | | | 72,624 |
Potash Corporation of Saskatchewan, Inc. (1) | | 6,500 | | | 932,620 |
Sociedad Quimicay Minera de Chile S.A. ADR | | 2,400 | | | 325,368 |
| | | | | |
| | | | | 1,384,145 |
| | | | | |
General Merchandise Stores - 0.2% | | | | | |
Dollar General Corporation | | 4,200 | | | 67,452 |
| | | | | |
Gold - 1.3% | | | | | |
Barrick Gold Corporation | | 5,600 | | | 171,920 |
Bema Gold Corporation * | | 2,600 | | | 13,650 |
Miramar Mining Corporation * | | 2,500 | | | 11,300 |
Randgold Resources, Ltd. ADR * | | 12,600 | | | 295,596 |
| | | | | |
| | | | | 492,466 |
| | | | | |
The accompanying notes are an integral part of the financial statements.
160
| | |
| Schedule of Investments | | Series Z (Alpha Opportunity Series) |
| December 31, 2006 - continued | | |
| | | | | | |
| | | Shares | | Value |
COMMON STOCK (continued) | | | | | | |
Homefurnishing Retail - 1.2% | | | | | | |
Bed Bath & Beyond, Inc. * | | | 11,200 | | $ | 426,720 |
| | | | | | |
Hotels, Resorts & Cruise Lines - 0.4% | | | | | | |
Lodgian, Inc. * | | | 1,600 | | | 21,760 |
Starwood Hotels & Resorts Worldwide, Inc. | | | 1,800 | | | 112,500 |
| | | | | | |
| | | | | | 134,260 |
| | | | | | |
Industrial Conglomerates - 0.5% | | | | | | |
McDermott International, Inc. * | | | 3,400 | | | 172,924 |
| | | | | | |
Industrial Gases - 0.2% | | | | | | |
Praxair, Inc. | | | 1,000 | | | 59,330 |
| | | | | | |
Industrial Machinery - 2.1% | | | | | | |
Ampco-Pittsburgh Corporation | | | 3,300 | | | 110,484 |
Badger Meter, Inc. | | | 400 | | | 11,080 |
Barnes Group, Inc. | | | 3,900 | | | 84,825 |
Nordson Corporation | | | 1,100 | | | 54,813 |
Valmont Industries, Inc. | | | 9,200 | | | 510,508 |
| | | | | | |
| | | | | | 771,710 |
| | | | | | |
Integrated Oil & Gas - 1.8% | | | | | | |
Imperial Oil, Ltd. | | | 600 | | | 22,098 |
Suncor Energy, Inc. (1) | | | 8,100 | | | 639,171 |
| | | | | | |
| | | | | | 661,269 |
| | | | | | |
Marine - 0.6% | | | | | | |
Kirby Corporation * | | | 5,900 | | | 201,367 |
| | | | | | |
Office Electronics - 0.2% | | | | | | |
Xerox Corporation * | | | 5,300 | | | 89,835 |
| | | | | | |
Oil & Gas Drilling - 0.8% | | | | | | |
ENSCO International, Inc. | | | 2,200 | | | 110,132 |
Pride International, Inc. * | | | 1,000 | | | 30,000 |
Rowan Companies, Inc. | | | 4,400 | | | 146,080 |
| | | | | | |
| | | | | | 286,212 |
| | | | | | |
Oil & Gas Equipment & Services - 0.7% | | | | | | |
Lone Star Technologies, Inc. * | | | 5,400 | | | 261,414 |
| | | | | | |
Oil & Gas Exploration & Production - 0.9% | | | | | | |
Devon Energy Corporation | | | 4,900 | | | 328,692 |
| | | | | | |
Oil & Gas Storage & Transportation - 0.3% | | | | | | |
Tsakos Energy Navigation, Ltd. | | | 2,600 | | | 119,340 |
| | | | | | |
Packaged Foods & Meats - 0.3% | | | | | | |
Dean Foods Company * | | | 2,400 | | | 101,472 |
Perdigao S.A. ADR * | | | 400 | | | 11,028 |
| | | | | | |
| | | | | | 112,500 |
| | | | | | |
Paper Products - 1.4% | | | | | | |
Aracruz Celulose S.A. ADR | | | 1,900 | | | 116,356 |
Stora Enso Oyj ADR | | | 3,800 | | | 60,002 |
Votorantim Celulose e Papel S.A. ADR | | | 16,800 | | | 329,448 |
| | | | | | |
| | | | | | 505,806 |
| | | | | | |
Personal Products - 0.4% | | | | | | |
Estee Lauder Companies, Inc. | | | 3,200 | | | 130,624 |
| | | | | | |
Precious Metals & Minerals - 0.3% | | | | | | |
Coeur d’Alene Mines Corporation * | | | 2,900 | | | 14,355 |
Stillwater Mining Company * | | | 6,200 | | | 77,438 |
| | | | | | |
| | | | | | 91,793 |
| | | | | | |
Real Estate Management & Development - 0.3% | | | | | | |
Brookfield Asset Management, Inc. | | | 2,500 | | | 120,450 |
| | | | | | |
Semiconductor Equipment - 0.2% | | | | | | |
MEMC Electronic Materials, Inc. * | | | 2,300 | | | 90,022 |
| | | | | | |
Semiconductors - 0.1% | | | | | | |
Volterra Semiconductor Corporation * | | | 2,100 | | | 31,500 |
| | | | | | |
Specially Chemicals - 0.5% | | | | | | |
Chemtura Corporation | | | 14,900 | | | 143,487 |
Nalco Holding Company * | | | 2,800 | | | 57,288 |
| | | | | | |
| | | | | | 200,775 |
| | | | | | |
Steel - 0.9% | | | | | | |
Gerdau Ameristeel Corporation | | | 2,000 | | | 17,840 |
Reliance Steel & Aluminum Company | | | 1,700 | | | 66,946 |
Steel Technologies, Inc. | | | 14,100 | | | 247,455 |
| | | | | | |
| | | | | | 332,241 |
| | | | | | |
Technology Distributors - 2.2% | | | | | | |
Anixter International, Inc. * (1) | | | 14,900 | | | 809,070 |
| | | | | | |
Trading Companies & Distributors - 1.0% | | | | | | |
UAP Holding Corporation | | | 14,200 | | | 357,556 |
| | | | | | |
TOTAL COMMON STOCK (Cost $15,632,007) | | | | | $ | 15,379,661 |
| | | | | | |
| | |
| | | Principal
Amount | | Value |
U.S. GOVERNMENT SPONSORED AGENCY BONDS & NOTES - 41.2% | | | | | | |
Federal Farm Credit Discount Note | | | | | | |
5.13% - 2007 (1) | | $ | 1,150,000 | | | 1,147,866 |
Federal Home Loan Bank | | | | | | |
5.125% - 2007 (1) | | | 725,000 | | | 716,338 |
5.14% - 2007 (1) | | | 375,000 | | | 372,382 |
5.14% - 2007 (1) | | | 1,000,000 | | | 992,732 |
Federal Home Loan Mortgage Corporation | | | | | | |
5.087% - 2007 (2) | | | 2,975,000 | | | 2,972,450 |
5.125% - 2007 (1) | | | 200,000 | | | 198,379 |
5.143% - 2007 (1) | | | 300,000 | | | 298,547 |
The accompanying notes are an integral part of the financial statements.
161
| | |
| Schedule of Investments | | Series Z (Alpha Opportunity Series) |
| December 31, 2006 - continued | | |
| | | | | | |
| | | Principal
Amount | | Value |
U.S. GOVERNMENT SPONSORED AGENCY BONDS & NOTES (continued) | | | | | | |
Federal Home Loan Mortgage Corporation (continued) | | | | | | |
5.16% - 2007 (1) | | $ | 475,000 | | $ | 471,277 |
5.155% - 2007 (1) | | | 350,000 | | | 346,565 |
Federal National Mortgage Association | | | | | | |
5.115% - 2007 (1) | | | 2,017,000 | | | 2,017,000 |
5.13% - 2007 (1) | | | 1,550,000 | | | 1,544,910 |
5.14% - 2007 (1) | | | 700,000 | | | 697,107 |
5.14% - 2007 (1) | | | 250,000 | | | 248,753 |
5.14% - 2007 (1) | | | 1,200,000 | | | 1,192,818 |
5.15% - 2007 (1) | | | 575,000 | | | 573,276 |
5.145% - 2007 (1) | | | 175,000 | | | 173,581 |
5.152% - 2007 (1) | | | 575,000 | | | 569,848 |
5.16% - 2007 (1) | | | 500,000 | | | 494,525 |
| | | | | | |
TOTAL U.S. GOVERNMENT SPONSORED AGENCY BONDS & NOTES (Cost $15,023,912) | | | | | $ | 15,028,354 |
| | | | | | |
Total Investments (SBL Z Fund) (Cost $30,655,919) - 83.4% | | | | | $ | 30,408,015 |
Other Assets in Excess of Liabilities - 16.6% | | | | | | 6.034.151 |
| | | | | | |
TOTAL NET ASSETS - 100.0% | | | | | $ | 36,442,166 |
| | | | | | |
Schedule of Securities Sold Short
December 31, 2006
SBL Z Fund
| | | | | | | |
| | | Shares | | | Value | |
COMMON STOCK - (1.8)% | | | | | | | |
Asset Management & Custody Banks - (0.2)% | | | | | | | |
Calamos Asset Management, Inc. | | (2,100 | ) | | $ | (56,343 | ) |
| | | | | | | |
Building Products - (0.1)% | | | | | | | |
Griffon Corporation * | | (1,000 | ) | | | (25,500 | ) |
| | | | | | | |
Computer & Electronics Retail - (0.3)% | | | | | | | |
RadioShack Corporation | | (6,500 | ) | | | (109,070 | ) |
| | | | | | | |
Electronic Equipment Manufacturers - 0.0% | | | | | | | |
AU Optronics Corporation ADR | | (500 | ) | | | (6,905 | ) |
| | | | | | | |
Regional Banks - (0.7)% | | | | | | | |
Sterling Bancorp | | (2,900 | ) | | | (57,130 | ) |
UnionBanCal Corporation | | (500 | ) | | | (30,625 | ) |
Zions Bancorporation | | (1,900 | ) | | | (156,636 | ) |
| | | | | | | |
| | | | | | (244,391 | ) |
| | | | | | | |
Restaurants - (0.1)% | | | | | | | |
Wendy’s International, Inc. | | (1,500 | ) | | | (49,635 | ) |
| | | | | | | |
Semiconductor Equipment - (0.2)% | | | | | | | |
Rudolph Technologies, Inc. * | | (4,400 | ) | | | (70,048 | ) |
| | | | | | | |
Systems Software - (0.2)% | | | | | | | |
CA, Inc. | | (3,100 | ) | | | (70,215 | ) |
| | | | | | | |
Thrifts & Mortgage Finance - 0.0% | | | | | | | |
Flagstar Bancorp, Inc. | | (1,000 | ) | | | (14,840 | ) |
| | | | | | | |
TOTAL COMMON STOCK (Proceeds $641,909) | | | | | | (646,947 | ) |
| | | | | | | |
Total Securities Sold Short (SBL Z Fund) (Proceeds $641,909) | | | | | | (646,947 | ) |
| | | | | | | |
Footnotes
Percentages are stated as a percent of net assets.
For federal income tax purposes the identified cost of investments owned at 12/31/2006 was $30,738,165.
| * | - Non-income producing security |
| 1 | - Security is segregated as collateral for open futures contracts. |
| 2 | - Security is segregated as collateral for short positions. |
| ADR | - American Depositary Receipt |
| plc | - Public Limited Company |
See notes to financial statements.
The accompanying notes are an integral part of the financial statements.
162
Series Z
(Alpha Opportunity Series)
Statement of Assets and Liabilities
December 31, 2006
| | | | |
Assets: | | | | |
Investments, at value1 | | $ | 30,408,015 | |
Cash | | | 6,192,633 | |
Receivables: | | | | |
Fund shares sold | | | 57,395 | |
Securities sold | | | 3,254,705 | |
Dividends | | | 11,925 | |
Prepaid expenses | | | 1,865 | |
| | | | |
Total assets | | | 39,926,538 | |
| | | | |
Liabilities: | | | | |
Securities sold short, at value2 | | | 646,947 | |
Payable for: | | | | |
Securities purchased | | | 2,638,087 | |
Fund shares redeemed | | | 55,577 | |
Variation margin in futures | | | 57,756 | |
Management fees | | | 61,782 | |
Transfer agent/maintenance fees | | | 2,083 | |
Administration fees | | | 6,034 | |
Professional fees | | | 14,245 | |
Directors’ fees | | | 500 | |
Other fees | | | 1,361 | |
| | | | |
Total liabilities | | | 3,484,372 | |
| | | | |
Net Assets | | $ | 36,442,166 | |
| | | | |
Net assets consist of: | | | | |
Paid in capital | | $ | 32,916,558 | |
Undistributed net realized gain on sale of investments, futures and securities sold short | | | 3,781,561 | |
Net unrealized depreciation in value of investments, futures and securities sold short | | | (255,953 | ) |
| | | | |
Net assets | | $ | 36,442,166 | |
| | | | |
Capital shares authorized | | | unlimited | |
Capital shares outstanding | | | 2,611,313 | |
Net asset value per share (net assets divided by shares outstanding) | | $ | 13.96 | |
| | | | |
1Investments, at cost | | $ | 30,655,919 | |
2Securites sold short, at proceeds | | | 641,909 | |
Statement of Operations
For the Year Ended December 31, 2006
| | | | |
Investment Income: | | | | |
Dividends | | $ | 156,474 | |
Interest | | | 622,197 | |
| | | | |
Total investment income | | | 778,671 | |
| | | | |
Expenses: | | | | |
Management fees | | | 646,278 | |
Custodian fees | | | 56,134 | |
Transfer agent/maintenance fees | | | 25,104 | |
Administration fees | | | 49,468 | |
Directors’ fees | | | 1,299 | |
Professional fees | | | 23,603 | |
Reports to shareholders | | | 4,073 | |
Other expenses | | | 1,001 | |
Dividends on securities sold short | | | 27,219 | |
| | | | |
Total expenses | | | 834,179 | |
| | | | |
Less: Earnings credits applied | | | (47,753 | ) |
| | | | |
Net expenses | | | 786,426 | |
| | | | |
Net investment loss | | | (7,755 | ) |
| | | | |
Net Realized and Unrealized Gain (Loss): | | | | |
Net realized gain (loss) during the year on: | | | | |
Investments | | | 3,008,951 | |
Futures | | | 1,135,612 | |
Securities sold short | | | (431,843 | ) |
| | | | |
Net realized gain | | | 3,712,720 | |
| | | | |
Net unrealized appreciation (depreciation) during the year on: | | | | |
Investments | | | (169,373 | ) |
Futures | | | 132,809 | |
Securities sold short | | | (5,038 | ) |
| | | | |
Net unrealized depreciation | | | (41,602 | ) |
| | | | |
Net realized and unrealized gain | | | 3,671,118 | |
| | | | |
Net increase in net assets resulting from operations | | $ | 3,663,363 | |
| | | | |
See accompanying notes.
163
| | |
| | Series Z |
| Statement of Changes in Net Assets | | (Alpha Opportunity Series) |
| | | | | | | | |
| | | Year Ended
December 31, 2006 | | | Year Ended
December 31, 2005 | |
Increase (decrease) in net assets from operations: | | | | | | | | |
Net investment loss | | $ | (7,755 | ) | | $ | (45,586 | ) |
Net realized gain during the year on investments, futures, and securities sold short | | | 3,712,720 | | | | 2,178,395 | |
Net unrealized depreciation during the year on investments, futures, and securities sold short | | | (41,602 | ) | | | (576,530 | ) |
| | | | | | | | |
Net increase in net assets resulting from operations | | | 3,663,363 | | | | 1,556,279 | |
| | | | | | | | |
Capital share transactions: | | | | | | | | |
Proceeds from sale of shares | | | 19,973,403 | | | | 14,871,584 | |
Cost of shares redeemed | | | (12,854,101 | ) | | | (9,929,853 | ) |
| | | | | | | | |
Net increase from capital share transactions | | | 7,119,302 | | | | 4,941,731 | |
| | | | | | | | |
Net increase in net assets | | | 10,782,665 | | | | 6,498,010 | |
| | | | | | | | |
Net assets: | | | | | | | | |
Beginning of year | | | 25,659,501 | | | | 19,161,491 | |
| | | | | | | | |
End of year | | $ | 36,442,166 | | | $ | 25,659,501 | |
| | | | | | | | |
Accumulated net investment loss at end of year | | $ | — | | | $ | — | |
| | | | | | | | |
Capital Share Activity: | | | | | | | | |
Shares sold | | | 1,505,711 | | | | 1,269,271 | |
Shares redeemed | | | (973,096 | ) | | | (846,525 | ) |
| | | | | | | | |
Total capital share activity | | | 532,615 | | | | 422,746 | |
| | | | | | | | |
See accompanying notes.
164
| | |
| Financial Highlights | | Series Z |
| Selected data for each share of capital stock outstanding throughout each period | | (Alpha Opportunity Series) |
| | | | | | | | | | | | | | | | |
| | | Period Ended, December 31, | |
| | | 2006 | | | 2005 | | | 2004 | | | 2003d | |
Per Share Data | | | | | | | | | | | | | | | | |
Net asset value, beginning of period | | $ | 12.34 | | | $ | 11.57 | | | $ | 11.18 | | | $ | 10.00 | |
| | | | | | | | | | | | | | | | |
Income (loss) from investment operations: | | | | | | | | | | | | | | | | |
Net investment income (loss) | | | — | | | | (0.02 | ) | | | (0.07 | ) | | | (0.06 | ) |
Net gain (loss) on securities (realized and unrealized) | | | 1.62 | | | | 0.79 | | | | 1.42 | | | | 1.88 | |
| | | | | | | | | | | | | | | | |
Total from investment operations | | | 1.62 | | | | 0.77 | | | | 1.35 | | | | 1.82 | |
| | | | | | | | | | | | | | | | |
Less distributions: | | | | | | | | | | | | | | | | |
Distributions from realized gains | | | — | | | | — | | | | (0.96 | ) | | | (0.64 | ) |
| | | | | | | | | | | | | | | | |
Total distributions | | | — | | | | — | | | | (0.96 | ) | | | (0.64 | ) |
| | | | | | | | | | | | | | | | |
Net asset value, end of period | | $ | 13.96 | | | $ | 12.34 | | | $ | 11.57 | | | $ | 11.18 | |
| | | | | | | | | | | | | | | | |
Total Returna | | | 13.13 | % | | | 6.66 | % | | | 12.58 | % | | | 18.33 | % |
| | | | | | | | | | | | | | | | |
Ratios/Supplemental Data | | | | | | | | | | | | | | | | |
Net assets, end of period (in thousands) | | $ | 36,442 | | | $ | 25,660 | | | $ | 19,161 | | | $ | 6,738 | |
| | | | | | | | | | | | | | | | |
Ratios to average net assets: | | | | | | | | | | | | | | | | |
Net investment loss | | | (0.03 | %) | | | (0.21 | %) | | | (1.12 | %) | | | (1.33 | %) |
Total expensesb | | | 2.94 | % | | | 2.50 | % | | | 2.78 | % | | | 2.62 | % |
Net expensesc | | | 2.62 | % | | | 2.50 | % | | | 2.57 | % | | | 2.50 | % |
Expenses prior to custodian earnings credits and net of expense waivers | | | 2.78 | % | | | 2.50 | % | | | 2.57 | % | | | 2.52 | % |
Net expenses prior to performance fee adjustmente | | | 2.47 | % | | | 2.47 | % | | | — | | | | — | |
| | | | | | | | | | | | | | | | |
Portfolio turnover rate | | | 1,285 | % | | | 1,509 | % | | | 1,054 | % | | | 966 | % |
a | Total return does not take into account any of the expenses associated with an investment in variable insurance products offered by Security Benefit Life Insurance Company. If total return had taken into account these expenses, performance would have been lower. Shares of a series of SBL Fund are available only through the purchase of such products. |
b | Total expense information reflects expense ratios absent fund expense reductions by the Investment Manager, and earnings credits, as applicable. |
c | Net expense information reflects the expense ratios after voluntary expense waivers, reimbursements and custodian earnings credits, as applicable. |
d | Series Z was initially capitalized on July 7, 2003 with a net asset value of $10 per share. Percentage amounts for the period, except for total return, have been annualized. |
e | Net expenses prior to performance fee adjustment reflect ratios after voluntary expense waivers, reimbursements, custodian earnings credits, and before performance fee adjustments, as applicable. |
See accompanying notes.
165
Notes to Financial Statements
December 31, 2006
| 1. | Significant Accounting Policies |
SBL Fund (The Fund) is registered under the Investment Company Act of 1940, as amended, as an open-end management investment company of the series type. Each series, in effect, represents a separate fund. The Fund is required to account for the assets of each series separately and to allocate general liabilities of the Fund to each series based on the net asset value of each series. Shares of the Fund will be sold only to separate accounts of Security Benefit Life Insurance Company (SBL). The following is a summary of the significant accounting policies followed by the Fund in the preparation of its financial statements.
A. Security Valuation - Valuations of the Fund’s securities are supplied by pricing services approved by the Board of Directors. The Fund’s officers, under the general supervision of the Board of Directors, regularly review procedures used by, and valuations provided by, the pricing services. Each security owned by a Fund that is listed on a securities exchange is valued at its last sale price on that exchange on the date as of which assets are valued. Where the security is listed on more than one exchange, the Fund will use the price of that exchange that it generally considers to be the principal exchange on which the stock is traded. Securities listed on the Nasdaq Stock Market, Inc. (“Nasdaq”) will be valued at the Nasdaq Official Closing Price. Securities for which market quotations are not readily available are valued by a pricing service considering securities with similar yields, quality, type of issue, coupon, duration and rating. If there is no bid price or if the bid price is deemed to be unsatisfactory by the Board of Directors or by the Fund's investment manager, then the securities are valued in good faith by such method as the Board of Directors determines will reflect the fair value. If events occur after the close of a foreign exchange that will affect the value of a fund’s portfolio securities before the time as of which the NAV is calculated (a “significant event”), the security will generally be priced using a fair value procedure. If the Valuation Committee determines a significant event has occurred, it will evaluate the impact of that event on an affected security or securities, to determine whether a fair value adjustment would materially affect the Fund’s net asset value per share. Some of the factors which may be considered by the Board of Directors in determining fair value are fundamental analytical data relating to the investment; the nature and duration of any restrictions on disposition; trading in similar securities of the same issuer or comparable companies; information from broker-dealers; and an evaluation of the forces that influence the market in which the securities are purchased and sold. The Fund generally will value short-term debt securities at prices based on market quotations for such securities or securities of similar type, yield, quality and duration, except those securities purchased with 60 days or less to maturity are valued on the basis of amortized cost which approximates market value.
Generally, trading in foreign securities markets is substantially completed each day at various times prior to the close of the New York Stock Exchange. The values of foreign securities are determined as of the close of such foreign markets or the close of the New York Stock Exchange, if earlier. All investments quoted in foreign currency are valued in U.S. dollars on the basis of the foreign currency exchange rates prevailing at the close of business. Investments in foreign securities may involve risks not present in domestic investments. The Valuation Committee will determine the current value of such foreign securities by taking into consideration certain factors which may include those discussed above, as well as the following factors, among others: the value of the securities traded on other foreign markets, ADR trading, closed-end fund trading, foreign currency exchange activity, and the trading prices of financial products that are tied to foreign securities such as WEBS®. In addition, the Board of Directors has authorized the Valuation Committee and Administrator to use prices and other information supplied by Interactive Data Corporation’s Fair Value Information Service in valuing foreign securities. Since foreign securities may be denominated in a foreign currency and involve settlement and pay interest or dividends in foreign currencies, changes in the relationship of these foreign currencies to the U.S. dollar can significantly affect the value of the investments and earnings of the Fund. Foreign investments may also subject the Series to foreign government exchange restrictions, expropriation, taxation or other political, social or economic developments, all of which could affect the market value and/or credit risk of the investments.
The senior floating rate interests (loans) in which Series P invests are not listed on any securities exchange or board of trade. Accordingly, determinations of the value of loans may be based on infrequent and dated trades. Typically loans are valued using information provided by an independent third party pricing service. If the pricing service cannot or does not provide a valuation for a particular loan or such valuation is deemed unreliable, such loan is fair valued. In determining fair value, consideration is given to several factors, which may include, among others, one or more of the following: the fundamental business data relating to the issuer or borrower; an evaluation of the forces which influence the market in which these loans are purchased and sold; type of holding; financial statements of the borrower; cost at date of purchase; size of holding; credit worthiness and cash flow of issuer; information as to any transactions in, or offers for, the holding; price and extent of public trading in similar securities (or equity securities) of the issuer/borrower, or comparable companies; coupon payments; quality, value and saleability of collateral securing the loan; business prospects of the issuer/borrower, including any ability to obtain money or resources from a parent or affiliate; the portfolio manager’s and/or the market’s assessment of the borrower’s management; prospects for the borrower’s industry, and multiples (of earnings and/or cash flow) being paid for similar businesses in that industry; borrower’s competitive position within the industry; borrower’s ability to access additional liquidity through public and/or private markets; and other relevant factors.
B. Repurchase Agreements - In connection with transactions in repurchase agreements, it is the Fund’s policy that its custodian take possession of the underlying collateral and that the fair value of the collateral exceed the principal amount of the repurchase transaction, including accrued interest, at all times. If the seller defaults, and the fair value of the collateral declines, realization of the collateral by the Funds may be delayed or limited.
166
Notes to Financial Statements
December 31, 2006
C. Foreign Currency Transactions – The accounting records of the Fund are maintained in U.S. dollars. All assets and liabilities initially expressed in foreign currencies are converted into U.S. dollars at prevailing exchange rates. Purchases and sales of investment securities, dividend and interest income, and certain expenses are translated at the rates of exchange prevailing on the respective dates of such transactions.
The Fund does not isolate that portion of the results of operations resulting from changes in the foreign exchange rates on investments from the fluctuations arising from changes in the market prices of securities held. Such fluctuations are included with the net realized and unrealized gain or loss on investments.
Net realized foreign exchange gains and losses arise from sales of portfolio securities, sales of foreign currencies, and the difference between asset and liability amounts initially stated in foreign currencies and the U.S. dollar value of the amounts actually received or paid. Net unrealized foreign exchange gains or losses arise from changes in the value of other assets and liabilities at the end of the reporting period, resulting from changes in the exchange rates.
D. Forward Foreign Currency Exchange Contracts – The Fund may enter into forward foreign exchange contracts in order to manage foreign currency risk from purchase or sale of securities denominated in foreign currency. A series may also enter into such contracts to manage the effect of changes in foreign currency exchange rates on portfolio positions. These contracts are marked to market daily, by recognizing the difference between the contract exchange rate and the current market rate as unrealized gains or losses. Realized gains or losses are recognized when contracts are settled and are reflected in the Statement of Operations. These contracts involve market risk in excess of the amount reflected in the Statement of Assets and Liabilities. The face or contract amount in U.S. dollars reflects the total exposure these funds have in that particular currency contract. Losses may arise due to changes in the value of the foreign currency or if the counterparty does not perform under the contract.
E. Futures – The Fund may utilize futures contracts to a limited extent, with the objectives of maintaining full exposure to the underlying stock market, enhancing returns, maintaining liquidity, minimizing transaction costs and hedging possible variations in foreign exchange rates. The Fund may purchase or sell financial and foreign currency futures contracts to immediately position incoming cash in the market, thereby simulating a fully invested position in the underlying index while maintaining a cash balance for liquidity. In the event of redemptions, the series may pay from its cash balances and reduce its future positions accordingly. Returns may be enhanced by purchasing futures contracts instead of the underlying securities when futures are believed to be priced more attractively than the underlying securities. The primary risks associated with the use of futures contracts are imperfect correlation between changes in market values of stocks contained in the indexes and the prices of futures contracts, and the possibility of an illiquid market. Futures contracts are valued based upon their quoted daily settlement prices. Upon entering into a futures contract, the series are required to deposit and maintain as collateral either cash or securities, representing the initial margin, equal to a certain percentage of the contract value. Cash deposits are shown as restricted cash on the Statement of Assets and Liabilities; securities held as collateral are noted in the Schedule of Investments. Subsequent changes in the value of the contract are recorded as unrealized gains or losses. The variation margin is paid or received in cash daily by the series. The series realizes a gain or loss when the contract is closed or expires.
F. Options Written – The Fund may purchase put and call options and write such options on a covered basis on securities that are traded on recognized securities exchanges and over-the-counter markets. Call and put options on securities give the holder the right to purchase or sell (and the writer the obligation to sell or purchase), respectively, a security at a specified price, until a certain date. Options may be used to hedge the series portfolio, to increase returns or to maintain exposure to the equity markets. The primary risks associated with the use of options are an imperfect correlation between the change in market value of the securities held by the series and the price of the option, the possibility of an illiquid market, and the inability of the counterparty to meet the terms of the contract.
The premium received for a written option is recorded as an asset with an equal liability which is marked to market based on the option’s quoted daily settlement price. Fluctuations in the value of such instruments are recorded as unrealized appreciation (depreciation) until terminated, at which time realized gains and losses are recognized.
G. Security Transactions and Investment Income – Security transactions are accounted for on the date the securities are purchased or sold (trade date). Realized gains and losses are reported on an identified cost basis. Dividend income is accrued as of the ex-dividend date, except that certain dividends for foreign securities where the ex-dividend date may have passed are recorded as soon as the fund is informed of the dividend in the exercise of reasonable diligence. Interest income is recognized on the accrual basis including the amortization of premiums and accretion of discounts on debt securities.
H. Expenses – Expenses that are directly related to one of the series are charged directly to that series. Other operating expenses are allocated to the series on the basis of relative net assets within the Fund.
I. Distributions to Shareholders – Distributions to shareholders are recorded on the ex-dividend date. The character of distributions made during the year from net investment income or net realized gains may differ from their ultimate characterization for federal income tax purposes.
J. Taxes – The Fund intends to comply with the requirements of the Internal Revenue Code applicable to regulated investment companies and distribute all of its taxable net income and net realized gains sufficient to relieve it from all, or substantially all, federal income, excise and state income taxes. Therefore, no provision for federal or state income tax is required.
167
Notes to Financial Statements
December 31, 2006
K. Earnings Credits – Under the fee agreement with the custodian, the Fund may earn credits based on overnight custody cash balances. These credits are utilized to reduce related custodial expenses. The custodian fees disclosed in the Statement of Operations are before the reduction in expense from the related earnings credits.
L. Use of Estimates – The preparation of financial statements in conformity with U.S. generally accepted accounting principles requires management to make estimates and assumptions that affect the reported amounts of assets and liabilities and disclosure of contingent assets and liabilities at the date of the financial statements and the reported amounts of increases and decreases in net assets from operations during the reporting period. Actual results could differ from those estimates.
M. Securities Sold Short – Certain of the Series may make short sales “against the box,” in which the Series enters into a short sale of a security it owns. At no time will more than 15% of the value of the Series’ net assets be in deposits on short sales against the box. If a Series makes a short sale, the Series does not immediately deliver from its own account the securities sold and does not receive the proceeds from the sale. To complete the sale, the Series must borrow the security (generally from the broker through which the short sale is made) in order to make delivery to the buyer. The Series must replace the security borrowed by purchasing it at the market price at the time of replacement or delivering the security from its own portfolio. The Series is said to have a “short position” in securities sold until it delivers them to the broker, at which time it receives the proceeds of the sale. Certain Series may make short sales that are not “against the box,” which create opportunities to increase the Series’ return but, at the same time, involve specific risk considerations and may be considered a speculative technique. Such short sales theoretically involve unlimited loss potential, as the market price of securities sold short may continually increase, although a Series may mitigate such losses by replacing the securities sold short before the market price has increased significantly. For financial statement purposes, an amount equal to the settlement amount is included in the Statement of Assets and Liabilities as an asset and an equivalent liability. The amount of the liability is subsequently marked-to-market to reflect the current value of the short position. Subsequent fluctuations in the market prices of securities sold, but not yet purchased, may require purchasing the securities at prices which differ from the market value reflected on the Statement of Assets and Liabilities. The Series are liable for any dividends or interest payable on securities while those securities are in a short position. As collateral for its short positions, the Series are required under the Investment Company Act of 1940 to maintain segregated assets consisting of cash, cash equivalents or liquid securities. These segregated assets are valued consistent with Note 1a above. These segregated assets are required to be adjusted daily to reflect changes in the market value of the securities sold short.
N. Indemnifications – Under the Fund’s organizational documents, its Officers and Directors are indemnified against certain liabilities arising out of the performance of their duties to the Fund. In addition, in the normal course of business, the Fund enters into contracts that provide general indemnification to other parties. The Fund’s maximum exposure under these arrangements is unknown as this would involve future claims that may be made against the Fund that have not yet occurred, and may not occur. However, the Fund has not had prior claims or losses pursuant to these contracts and expects the risk of loss to be remote.
O. Recent Accounting Pronouncements – On July 13, 2006, the Financial Accounting Standards Board (“FASB”) released FASB interpretation No. 48, “Accounting for Uncertainty in Income Taxes” (“FIN 48”). FIN 48 provides guidance for how uncertain tax positions should be recognized, measured, presented and disclosed in the financial statements. FIN 48 requires the evaluation of tax positions taken or expected to e taken in the course of preparing the Company’s tax returns to determine whether the tax positions are “more-likely-than-not” of being sustained by the applicable tax authority. Tax positions not deemed to meet the more-likely-than-not threshold would be recorded as a tax benefit or expense in the current year. Adoption of FIN 48 is required for fiscal years beginning after December 15, 2006 but not before its last NAV calculation in the first required financial statement reporting period for its fiscal year beginning after December 15, 2006 and is to be applied to all open tax years as of the effective date. At this time, management is evaluating the implication of FIN 48 and its impact in the financial statements has not yet been determined.
In September 2006, FASB issued Statement of Financial Accounting Standards No. 157, “Fair Value Measurements” (FAS 157). This standard clarifies the definition of fair value for financial reporting, establishes a framework for measuring fair value and requires additional disclosure about the use of fair value requirements. FAS 157 is effective for financial statements issued for fiscal years beginning after November 15, 2007 and interim periods within those fiscal years. As of December 31, 2006, the Fund is currently evaluating the impact of FAS 157.
P. Senior Loans – Senior loans in which certain of the Series invests generally pay interest rates which are periodically adjusted by reference to short-term, floating rate plus a premium. These base lending rates are generally (i) the lending rate offered by one or more major European banks, such as the London Inter-Bank Offered Rate (LIBOR), (ii) the prime rate offered by one or more major United States banks, or (iii) the bank’s certificate of deposit rate. Senior floating rate interests often require prepayments from excess cash flows or permit the borrower to repay at its election. The rate at which the borrower repays cannot be predicted with accuracy. As a result, the actual remaining maturity may be substantially less than the stated maturities shown. The interest rate indicated is the rate in effect at December 31, 2006.
168
Notes to Financial Statements
December 31, 2006
| 2. | Management fees and other transactions with affiliates |
Management fees are paid monthly to Security Management Company, LLC (SMC), based on the following annual rates:
| | | | | |
| | | Management
Fees (as a %
of net assets) | | | Management
Fee Waivers
(as a % of
net assets) |
Series A (Equity Series) | | 0.75 | % | | N/A |
Series B (Large Cap Value Series) | | 0.65 | | | N/A |
Series C (Money Market Series) | | 0.50 | | | N/A |
Series D (Global Series) | | 1.00 | | | N/A |
Series E (Diversified Income Series) | | 0.75 | | | 0.15 |
Series H (Enhanced Index Series) | | 0.75 | | | 0.25 |
Series J (Mid Cap Growth Series) | | 0.75 | | | N/A |
Series N (Managed Asset Allocation Series) | | 1.00 | | | N/A |
Series O (Equity Income Series) | | 1.00 | | | N/A |
Series P (High Yield Series) | | 0.75 | | | N/A |
Series Q (Small Cap Value Series) | | 1.00 | | | N/A |
Series V (Mid Cap Value Series) | | 0.75 | | | N/A |
Series X (Small Cap Growth Series) | | 1.00 | | | N/A |
Series Y (Select 25 Series) | | 0.75 | | | N/A |
Series Z (Alpha Opportunity Series)* | | 2.15 | 1 | | N/A |
| * | Series Z’s management fee will range from 1.25% to 2.75% of average daily net assets as discussed below. |
1 | SMC receives a management fee from Series Z that consists of two components. The first component is an annual base fee equal to 2.00% of Series Z’s average daily net assets. The second component is a base fee adjustment that either increases or decreases the base fee, depending on how Series Z performed relative to the S&P 500 Index over the prior 12-month period (the “Measuring Period”). SMC will receive the base fee of 2.00% without adjustment if the performance of Series Z matches the performance of the S&P 500 Index. The maximum base fee adjustment at each calculation period is 0.75% up or down in the event that Series Z outperforms or underperforms the S&P 500 Index by 15% or more. SMC calculates the base fee adjustment each month based upon Series Z’s performance relative to the S&P 500 Index during the Performance Period ending on the last day of the month. If Series Z outperforms the S&P 500 Index over the Measuring Period, the base fee is adjusted upward. The upward adjustment is equal to the amount by which Series Z’s performance exceeds that of the S&P 500 Index divided by 15 and multiplied by the average daily net assets of Series Z during the Measuring Period to determine the base fee adjustment for the month. If Series Z underperforms the Index, the base fee is adjusted downward on the same basis. SMC will determine the dollar amount of any performance adjustment each month by multiplying the adjustment percentage by the average daily net assets of Series Z during the Measuring Period and dividing by that number by the number of days in the Measuring Period and then multiplying that amount by the number of days in the current month. |
SMC also acts as the administrative agent and transfer agent for the Fund, and as such performs administrative functions, transfer agency and dividend disbursing services, and the bookkeeping, accounting and pricing functions for each series. For these services, the Investment Manager receives the following:
| | | |
| | | Administrative Fees
(as a % of net assets)* | |
Series A (Equity Series) | | 0.095 | % |
Series B (Large Cap Value Series) | | 0.095 | |
Series C (Money Market Series) | | 0.095 | |
Series D (Global Series) | | 0.150 | |
Series E (Diversified Income Series) | | 0.095 | |
Series H (Enhanced Index Series) | | 0.095 | |
Series J (Mid Cap Growth Series) | | 0.095 | |
Series N (Managed Asset Allocation Series) | | 0.150 | |
Series O (Equity Income Series) | | 0.095 | |
Series P (High Yield Series) | | 0.095 | |
Series Q (Small Cap Value Series) | | 0.095 | |
Series V (Mid Cap Value Series) | | 0.095 | |
Series X (Small Cap Growth Series) | | 0.095 | |
Series Y (Select 25 Series) | | 0.095 | |
Series Z (Alpha Opportunity Series) | | 0.150 | |
| * | The minimum annual charge for administrative fees is $25,000 for Series A, B, C, E, H, J, O, P, Q, V, X, Y and Z and $60,000 for Series D and N. |
SMC is paid the following for providing transfer agent services to the Fund:
| | | |
Annual charge per account | | $ | 5.00 - $8.00 |
Transaction fee | | $ | 0.60 -$1.10 |
Minimum annual charge per series | | $ | 25,000 |
Certain out-of-pocket charges | | | Varies |
The investment advisory contract between the Fund and SMC provides that the total annual expenses of each series (including management fees, but excluding interest, taxes, brokerage commissions and extraordinary expenses) will not exceed the level of expenses which the series is permitted to bear under the most restrictive expense limitation imposed by any state in which shares of the Fund are then offered for sale. For the year ended December 31, 2006, SMC agreed to limit the total expenses for Series P, V and X to an annual rate of 2% of the average daily net asset value of each respective series, and limit Series H, Q and Y to an annual rate of 1.75%. SMC has agreed to limit the total other expenses for Series Z to 0.50%.
At December 31, 2006, Security Benefit Life Insurance Company, through their insurance company separate accounts, owned 100% of the outstanding shares of each Series of the Fund, except for Series P in which it owned 99%.
169
Notes to Financial Statements
December 31, 2006
| 3. | Unrealized Appreciation/Depreciation |
For federal income tax purposes, the amounts of unrealized appreciation (depreciation) on investments at December 31, 2006, were as follows:
| | | | | | | | | | | |
| | | Gross
unrealized
appreciation | | Gross
unrealized
(depreciation) | | | Net unrealized
appreciation
(depreciation) | |
Series A
(Equity) | | $ | 102,291,232 | | $ | (18,968,201 | ) | | $ | 83,323,031 | |
Series B
(Large Cap Value) | | | 102,885,813 | | | (1,154,319 | ) | | | 101,731,494 | |
Series C
(Money Market) | | | 6,903 | | | (2,752 | ) | | | 4,151 | |
Series D
(Global) | | | 180,148,650 | | | (6,218,217 | ) | | | 173,930,433 | |
Series E
(Diversified Income) | | | 260,906 | | | (2,700,613 | ) | | | (2,439,707 | ) |
Series H
(Enhanced Index) | | | 9,836,898 | | | (1,321,415 | ) | | | 8,515,483 | |
Series J
(Mid Cap Growth) | | | 107,612,153 | | | (33,512,542 | ) | | | 74,099,611 | |
Series N
(Managed Asset Allocation) | | | 13,195,817 | | | (1,766,043 | ) | | | 11,429,774 | |
Series O
(Equity Income) | | | 59,392,156 | | | (5,648,369 | ) | | | 53,743,787 | |
Series P
(High Yield) | | | 3,808,267 | | | (2,290,089 | ) | | | 1,518,178 | |
Series Q
(Small Cap Value) | | | 39,441,814 | | | (3,902,356 | ) | | | 35,539,458 | |
Series V
(Mid Cap Value) | | | 126,436,208 | | | (13,092,507 | ) | | | 113,343,701 | |
Series X
(Small Cap Growth) | | | 10,891,692 | | | (1,576,476 | ) | | | 9,315,216 | |
Series Y
(Select 25) | | | 14,684,897 | | | (2,008,417 | ) | | | 12,676,480 | |
Series Z
(Alpha Opportunity) | | | 61,680 | | | (391,830 | ) | | | (330,150 | ) |
As of December 31, 2006, the following funds contained restricted securities. Market value, cost, percentage of total net assets and acquisition dates are as follows:
| | | | | | | | | | | | | | | | |
| | | Number of
Shares | | Price Per
Share | | Market
Value | | Cost | | % of
Net Assets | | | Acquisition
Dates |
Series J | | | | | | | | | | | | | | | | |
ThermoEnergy Corporation PIPE | | 1,380,000 | | $ | 0.14 | | $ | 193,200 | | $ | 1,302,103 | | 0.1 | % | | 07-14-05 |
ThermoEnergy Corporation Warrant | | 1,380,000 | | | 0.0449 | | | 61,962 | | | 353,897 | | 0.0 | % | | 07-14-05 |
Series V | | | | | | | | | | | | | | | | |
ThermoEnergy Corporation PIPE | | 1,130,000 | | | 0.14 | | | 158,200 | | | 1,066,215 | | 0.1 | % | | 07-14-05 |
ThermoEnergy Corporation Warrant | | 1,130,000 | | | 0.0449 | | | 50,737 | | | 289,785 | | 0.0 | % | | 07-14-05 |
These securities have been valued after considering certain pertinent factors, including the results of operations since the date of purchase, and the recent sales price of its common stock. No quoted market price exists for these shares. It is possible that the estimated value may differ significantly from the amount that might ultimately be realized in the near term, and difference could be material.
170
Notes to Financial Statements
December 31, 2006
As of December 31, 2006, the following Series contained securities that were valued using procedures approved by the Board of Directors. Market value, cost and percentage of total net assets are as follows:
| | | | | | |
| | | Market
Value | | % of
Net Assets | |
Series C | | $ | 4,089,050 | | 4.1 | % |
Series D | | | 5,591,492 | | 1.0 | % |
Series E | | | — | | 0.0 | % |
Series J | | | 973,559 | | 0.3 | % |
Series N | | | 175,198 | | 0.2 | % |
Series P | | | 148,225 | | 0.1 | % |
Series V | | | 833,554 | | 0.2 | % |
As of December 31, 2006, the following Series contained securities that were considered illiquid. Market value, cost and percentage of total net assets are as follows:
| | | | | | | | | |
| | | Market Value | | Cost | | % of
Net Assets | |
Series E | | $ | — | | $ | 500,000 | | 0.0 | % |
Series H | | | 341 | | | 529 | | 0.0 | % |
Series J | | | 17,855,633 | | | 30,572,514 | | 4.7 | % |
Series N | | | 1,110,498 | | | 1,121,209 | | 1.1 | % |
Series P | | | — | | | 1,463,258 | | 0.0 | % |
Series V | | | 4,837,390 | | | 6,027,030 | | 1.1 | % |
As of December 31, 2006, the following Series contained securities that were considered 144A securities. Market value, cost and percentage of total net assets are as follows:
| | | | | | | | | |
| | | Market Value | | Cost | | % of
Net Assets | |
Series C | | $ | 1,550,970 | | $ | 1,550,805 | | 1.6 | % |
Series E | | | 13,157,369 | | | 13,140,000 | | 8.7 | % |
Series N | | | 2,145,936 | | | 2,113,596 | | 2.0 | % |
Series P | | | 20,334,605 | | | 19,919,651 | | 19.2 | % |
Series Q | | | 36,975 | | | 45,053 | | 0.0 | % |
| 8. | Investment Transactions |
Investment transactions for the year ended December 31, 2006, (excluding overnight investments, short–term commercial paper and U.S. government securities) were as follows:
| | | | | | |
| | | Purchases | | Proceeds from
Sales |
Series A
(Equity) | | $ | 111,472,345 | | $ | 186,930,966 |
Series B
(Large Cap Value) | | | 83,940,646 | | | 105,861,994 |
Series C
(Money Market) | | | — | | | — |
Series D
(Global) | | | 124,296,345 | | | 153,042,585 |
Series E
(Diversified Income) | | | 60,407,639 | | | 43,776,619 |
Series H
(Enhanced Index) | | | 86,529,588 | | | 86,084,192 |
Series J
(Mid Cap Growth) | | | 118,239,439 | | | 176,426,524 |
Series N
(Managed Asset Allocation) | | | 40,671,217 | | | 43,203,719 |
Series O
(Equity Income) | | | 48,225,625 | | | 60,158,090 |
Series P
(High Yield) | | | 63,306,592 | | | 41,822,498 |
Series Q
(Small Cap Value) | | | 65,231,022 | | | 64,581,454 |
Series V
(Mid Cap Value) | | | 179,157,774 | | | 171,467,116 |
Series X
(Small Cap Growth) | | | 130,127,584 | | | 134,893,273 |
Series Y
(Select 25) | | | 25,189,264 | | | 27,220,905 |
Series Z
(Alpha Opportunity) | | | 204,129,353 | | | 206,158,761 |
Open futures contracts for Series E, Series H and Series Z as of December 31, 2006 were as follows:
| | | | | | | | | | | | | | | | |
| | | Position | | Number of
Contracts | | Expiration
Date | | Contract
Amount | | Market Value | | Unrealized
Loss | |
Series E | | | | | | | | | | | | | | | | |
U.S. 5-Year Note Future | | Long | | 15 | | 03-30-2007 | | $ | 1,587,474 | | $ | 1,575,938 | | $ | (11,536 | ) |
U.S. 10-Year Note Future | | Long | | 57 | | 03-21-2007 | | | 6,196,278 | | | 6,125,719 | | | (70,559 | ) |
U.S. Long Bond Future | | Long | | 10 | | 03-21-2007 | | | 1,136,129 | | | 1,114,375 | | | (21,754 | ) |
| | | | | | | | | | | | | | | | |
| | | | | | | | $ | 8,919,881 | | $ | 8,816,032 | | $ | (103,849 | ) |
| | | | | | | | | | | | | | | | |
Series H | | | | | | | | | | | | | | | | |
S&P 500 E-Mini Future | | Long | | 37 | | 03-16-2007 | | $ | 2,644,273 | | $ | 2,642,725 | | $ | (1,548 | ) |
Series Z | | | | | | | | | | | | | | | | |
S&P 500 Index Future | | Long | | 42 | | 03-16-2007 | | $ | 15,001,211 | | $ | 14,998,200 | | $ | (3,0.11 | ) |
171
Notes to Financial Statements
December 31, 2006
Information as to options written by the Series during the year ended December 31, 2006 and options outstanding at year end is provided below.
Series A Call Options Outstanding
| | | | | | | | | | |
Common Stock | | Expiration
Date | | Exercise
Price | | Number of
Contracts | | Market
Value |
Shaw Group, Inc. | | 1-19-07 | | $ | 30.00 | | 373 | | $ | 134,280 |
Transocean, Inc. | | 1-12-07 | | | 85.00 | | 402 | | | 44,220 |
| | | | | | | | | | |
Total call options outstanding (premiums received, $121,596) | | | | | | | 775 | | $ | 178,500 |
| | | | | | | | | | |
Series A Call Options Written
| | | | | | | |
| | | Number of
Contracts | | | Premium
Amount | |
Balance at December 31, 2005 | | — | | | $ | — | |
Opened | | 9,531 | | | | 1,117,698 | |
Expired | | (2,952 | ) | | | (409,330 | ) |
Exercised | | (5,804 | ) | | | (586,772 | ) |
| | | | | | | |
Balance at December 31, 2006 | | 775 | | | $ | 121,596 | |
| | | | | | | |
Series A Put Options Written
| | | | | | | |
| | | Number of
Contracts | | | Premium
Amount | |
Balance at December 31, 2005 | | 747 | | | $ | 149,266 | |
Opened | | 10,665 | | | | 1,483,632 | |
Bought Back | | (166 | ) | | | (49,466 | ) |
Expired | | (8,915 | ) | | | (1,268,212 | ) |
Exercised | | (2,331 | ) | | | (315,220 | ) |
| | | | | | | |
Balance at December 31, 2006 | | — | | | $ | — | |
| | | | | | | |
Series B Call Options Outstanding
| | | | | | | | | | |
Common Stock | | Expiration
Date | | Exercise
Price | | Number of
Contracts | | Market
Value |
Shaw Group, Inc. | | 1-19-07 | | $ | 30.00 | | 220 | | $ | 79,200 |
Transocean, Inc. | | 1-12-07 | | | 85.00 | | 391 | | | 43,010 |
| | | | | | | | | | |
Total call options outstanding (premiums received, $101,419) | | | | | | | 611 | | $ | 122,210 |
| | | | | | | | | | |
Series B Call Options Written
| | | | | | | |
| | | Number of
Contracts | | | Premium
Amount | |
Balance at December 31, 2005 | | — | | | $ | — | |
Opened | | 10,170 | | | | 1,206,872 | |
Expired | | (4,158 | ) | | | (436,846 | ) |
Exercised | | (5,401 | ) | | | (668,607 | ) |
| | | | | | | |
Balance at December 31, 2006 | | 611 | | | $ | 101,419 | |
| | | | | | | |
Series B Put Options Written
| | | | | | | |
| | | Number of
Contracts | | | Premium
Amount | |
Balance at December 31, 2005 | | 650 | | | $ | 135,564 | |
Opened | | 3,268 | | | | 779,019 | |
Bought Back | | (161 | ) | | | (47,976 | ) |
Expired | | (3,366 | ) | | | (750,093 | ) |
Exercised | | (391 | ) | | | (116,514 | ) |
| | | | | | | |
Balance at December 31, 2006 | | — | | | $ | — | |
| | | | | | | |
Series J Call Options Outstanding
| | | | | | | | | | |
Common Stock | | Expiration
Date | | Exercise
Price | | Number of
Contracts | | Market
Value |
Northern Trust Corporation | | 1-19-07 | | $ | 55.00 | | 500 | | $ | 295,000 |
Shaw Group, Inc. | | 2-16-07 | | | 35.00 | | 574 | | | 71,750 |
| | | | | | | | | | |
Total call options outstanding (premiums received, $273,293) | | | | | | | 1,074 | | $ | 366,750 |
| | | | | | | | | | |
Series J Call Options Written
| | | | | | | |
| | | Number of
Contracts | | | Premium
Amount | |
Balance at December 31, 2005 | | 2,630 | | | $ | 664,314 | |
Opened | | 10,165 | | | | 1,470,097 | |
Bought Back | | (1,132 | ) | | | (82,634 | ) |
Expired | | (6,985 | ) | | | (960,675 | ) |
Exercised | | (3,604 | ) | | | (817,809 | ) |
| | | | | | | |
Balance at December 31, 2006 | | 1,074 | | | $ | 273,293 | |
| | | | | | | |
Series J Put Options Written
| | | | | | | |
| | | Number of
Contracts | | | Premium
Amount | |
Balance at December 31, 2005 | | 2,118 | | | $ | 350,735 | |
Opened | | 929 | | | | 202,174 | |
Expired | | (3,047 | ) | | | (552,909 | ) |
| | | | | | | |
Balance at December 31, 2006 | | — | | | $ | — | |
| | | | | | | |
Series Q Call Options Outstanding
| | | | | | | | | | |
Common Stock | | Expiration
Date | | Exercise
Price | | Number of
Contracts | | Market
Value |
ABM Industries, Inc. | | 01-19-07 | | $ | 20.00 | | 5 | | $ | 1,275 |
Applera Corporation - Applied Biosystems Group | | 01-19-07
03-16-07 | |
| 35.00
40.00 | | 55
25 | |
| 10,450
1,375 |
Ashland, Inc. | | 01-19-07
02-16-07
04-20-07 | |
| 65.00
65.00
60.00 | | 15
55
55 | |
| 21,300
28,600
56,650 |
Boyd Gaming Corporation | | 01-19-07
01-19-07
03-16-07 | |
| 40.00
50.00
45.00 | | 10
10
25 | |
| 5,300
300
7,750 |
Calgon Carbon Corporation | | 01-19-07 | | | 5.00 | | 25 | | | 3,125 |
172
Notes to Financial Statements
December 31, 2006
| | | | | | | | | | |
Common Stock (con’t) | | Expiration
Date | | Exercise
Price | | Number of
Contracts | | Market
Value |
Carpenter Technology Corporation | | 03-16-07
03-16-07 | | $
| 90.00
95.00 | | 91
110 | | $
| 141,960
134,200 |
Chicago Bridge & Iron Company N.V. | | 01-19-07
01-19-07
04-20-07 | |
| 22.50
25.00
30.00 | | 105
180
25 | |
| 50,400
42,300
2,500 |
CV Therapeutics, Inc. | | 02-16-07
02-16-07
04-20-07
04-20-07
04-20-07
04-20-07
04-20-07 | |
| 12.50
15.00
10.00
12.50
15.00
17.50
20.00 | | 10
10
10
20
65
90
40 | |
| 2,250
900
5,200
7,400
17,875
15,750
4,400 |
EGL, Inc. | | 02-16-07
02-16-07 | |
| 30.00
35.00 | | 180
5 | |
| 27,900
100 |
Encore Wire Corporation | | 02-16-07
02-16-07 | |
| 20.00
22.50 | | 215
207 | |
| 53,750
22,770 |
Forest Oil Corporation Hydril | | 01-19-07
03-16-07
03-16-07 | |
| 35.00
60.00
65.00 | | 50
75
15 | |
| 750
123,750
18,600 |
InterOil Corporation | | 01-19-07
02-16-07
02-16-07 | |
| 30.00
30.00
35.00 | | 15
5
20 | |
| 3,600
1,750
3,800 |
IPSCO, Inc. | | 03-16-07
01-19-07
01-19-07
01-19-07
03-16-07 | |
| 90.00
80.00
85.00
90.00
85.00 | | 60
70
120
5
125 | |
| 52,800
98,700
93,600
2,650
147,500 |
Jarden Corporation | | 01-19-07
01-19-07
04-20-07 | |
| 30.00
35.00
25.00 | | 60
30
35 | |
| 27,600
1,950
35,000 |
Mariner Energy, Inc. | | 02-16-07
02-16-07 | |
| 17.50
20.00 | | 45
65 | |
| 10,350
4,875 |
Matrix Service Company | | 02-16-07
02-16-07 | |
| 12.50
15.00 | | 30
30 | |
| 11,400
4,950 |
McMoRan Exploration Company | | 02-16-07 | | | 17.50 | | 40 | | | 200 |
MPS Group, Inc. | | 03-16-07 | | | 15.00 | | 35 | | | 1,750 |
Newfield Exploration Company | | 01-19-07
03-16-07
03-16-07 | |
| 35.00
45.00
50.00 | | 35
20
40 | |
| 38,150
7,200
5,800 |
Noble Energy, Inc. | | 01-19-07
02-16-07
02-16-07
02-16-07
05-18-07 | |
| 50.00
55.00
40.00
50.00
50.00 | | 10
5
20
10
10 | |
| 750
200
18,600
1,800
3,600 |
Oceaneering International, Inc. | | 01-19-07
01-19-07 | |
| 35.00
37.50 | | 15
25 | |
| 7,050
6,250 |
OM Group, Inc. | | 01-19-07
03-16-07
03-16-07 | |
| 45.00
40.00
45.00 | | 41
70
70 | |
| 9,840
50,400
28,000 |
Omnicare, Inc. | | 01-19-07
03-16-07 | |
| 40.00
37.50 | | 5
20 | |
| 150
5,800 |
Parker Drilling Company | | 01-19-07 | | | 7.50 | | 25 | | | 1,625 |
Payless ShoeSource, Inc. | | 03-16-07 | | | 25.00 | | 40 | | | 32,800 |
Petrowawk Energy Corporation | | 03-16-07 | | | 10.00 | | 25 | | | 4,750 |
Pioneer Natural Resources Company | | 01-19-07
01-19-07
03-16-07
03-16-07 | |
| 35.00
40.00
35.00
40.00 | | 55
35
20
15 | |
| 25,850
2,625
10,600
3,450 |
Smith International, Inc. | | 01-19-07 | | | 37.50 | | 40 | | | 14,800 |
Steel Dynamics, Inc. | | 01-19-07
02-16-07
02-16-07
02-16-07
05-18-07
05-18-07 | |
| 27.50
25.00
27.50
30.00
30.00
32.50 | | 75
484
50
165
25
25 | |
| 37,500
372,680
27,500
59,400
12,250
8,750 |
Transocean, Inc. | | 02-16-07 | | | 80.00 | | 10 | | | 5,200 |
Tween Brands, Inc. | | 02-16-07
02-16-07
05-18-07
05-18-07 | |
| 35.00
40.00
35.00
40.00 | | 45
80
25
25 | |
| 24,300
15,600
18,000
8,750 |
U.S. Concrete, Inc. | | 03-16-07 | | | 7.50 | | 40 | | | 2,200 |
United States Steel Corporation | | 01-19-07
01-19-07
01-19-07 | |
| 50.00
60.00
55.00 | | 20
12
10 | |
| 46,000
15,720
18,000 |
| | | | | | | | | | |
Total call options outstanding (premiums received $2,865,200) | | | | | | | 4,315 | | $ | 2,263,295 |
| | | | | | | | | | |
Series Q Put Options Outstanding
| | | | | | | | | | |
Common Stock | | Expiration
Date | | Exercise
Price | | Number of
Contracts | | Market
Value |
CV Therapeutics, Inc. | | 2-16-07 | | $ | 12.50 | | 25 | | $ | 1,500 |
| | 2-16-07 | | | 15.00 | | 15 | | | 2,700 |
| | | | | | | | | | |
Total put options outstanding (premiums received, $4,380) | | | | | | | 40 | | $ | 4,200 |
| | | | | | | | | | |
Series Q Call Options Written
| | | | | | | |
| | | Number of
Contracts | | | Premium
Amount | |
Balance at December 31, 2005 | | 6,197 | | | $ | 2,559,077 | |
Opened | | 54,858 | | | | 23,348,210 | |
Bought Back | | (53,449 | ) | | | (21,997,615 | ) |
Expired | | (1,815 | ) | | | (294,975 | ) |
Exercised | | (1,476 | ) | | | (749,497 | ) |
| | | | | | | |
Balance at December 31, 2006 | | 4,315 | | | $ | 2,865,200 | |
| | | | | | | |
Series Q Put Options Written
| | | | | |
| | | Number of
Contracts | | Premium
Amount |
Balance at December 31, 2005 | | — | | $ | — |
Opened | | 40 | | | 4,380 |
| | | | | |
Balance at December 31, 2006 | | 40 | | $ | 4,380 |
| | | | | |
173
Notes to Financial Statements
December 31, 2006
Series V Call Options Outstanding
| | | | | | | | | | |
Common Stock | | Expiration
Date | | Exercise
Price | | Number of
Contracts | | Market
Value |
Granite Construction, Inc. | | 2-16-07 | | $ | 50.00 | | 500 | | $ | 135,000 |
Shaw Group, Inc. | | 2-16-07 | | | 35.00 | | 650 | | | 81,250 |
United Rentals, Inc. | | 2-16-07 | | | 25.00 | | 342 | | | 42,750 |
| | | | | | | | | | |
Total call options outstanding (premiums received, $305,606) | | | | | | | 1,492 | | $ | 259,000 |
| | | | | | | | | | |
Series V Call Options Written
| | | | | | | |
| | | Number of
Contracts | | | Premium
Amount | |
Balance at December 31, 2005 | | 2,226 | | | $ | 307,776 | |
Opened | | 16,480 | | | | 3,499,860 | |
Bought Back | | (870 | ) | | | (392,348 | ) |
Expired | | (5,889 | ) | | | (1,063,709 | ) |
Exercised | | (10,455 | ) | | | (2,045,973 | ) |
| | | | | | | |
Balance at December 31, 2006 | | 1,492 | | | $ | 305,606 | |
| | | | | | | |
Series V Put Options Written
| | | | | | | |
| | | Number of
Contracts | | | Premium
Amount | |
Balance at December 31, 2005 | | 2,794 | | | $ | 448,752 | |
Opened | | 5,696 | | | | 629,240 | |
Expired | | (5,275 | ) | | | (747,393 | ) |
Exercised | | (3,215 | ) | | | (330,599 | ) |
| | | | | | | |
Balance at December 31, 2006 | | — | | | $ | — | |
| | | | | | | |
Series Y Call Options Outstanding
| | | | | | | | | | |
Common Stock | | Expiration
Date | | Exercise
Price | | Number of
Contracts | | Market
Value |
Shaw Group, Inc. | | 1-19-07 | | $ | 30.00 | | 796 | | $ | 286,560 |
| | | | | | | | | | |
Total call options outstanding (premiums received, $93,926) | | | | | | | 796 | | $ | 286,560 |
| | | | | | | | | | |
Series Y Call Options Written
| | | | | | | |
| | | Number of
Contracts | | | Premium
Amount | |
Balance at December 31, 2005 | | — | | | $ | — | |
Opened | | 2,256 | | | | 275,248 | |
Bought Back | | (787 | ) | | | (109,880 | ) |
Expired | | (673 | ) | | | (71,442 | ) |
| | | | | | | |
Balance at December 31, 2006 | | 796 | | | $ | 93,926 | |
| | | | | | | |
Series Y Put Options Written
| | | | | | | |
| | | Number of
Contracts | | | Premium
Amount | |
Balance at December 31, 2005 | | 90 | | | $ | 18,771 | |
Opened | | 330 | | | | 61,192 | |
Expired | | (288 | ) | | | (66,367 | ) |
Exercised | | (132 | ) | | | (13,596 | ) |
| | | | | | | |
Balance at December 31, 2006 | | — | | | $ | — | |
| | | | | | | |
Net investment income and net realized gains (losses) may differ for financial statement and tax purposes because of temporary or permanent book/tax differences. These differences are primarily due to interest income accrued for defaulted and variable rate securities for tax purposes, differing book and tax amortization methods for premium and market discount, consent dividends, ordinary net operating losses and the expiration of capital loss carryovers. To the extent these differences are permanent differences, adjustments are made to the approriate equity accounts in the period that the differences arise. The following adjustments were made to the Statement of Assets and Liabilities at December 31, 2006 to reflect permanent differences:
| | | | | | | | | | | | |
| | | Accumulated
Net Realized
Gain/(Loss) | | | Undistributed
Net Investment
Income | | | Paid-in-Capital | |
Series A | | $ | (19,401,500 | ) | | $ | (2,686,549 | ) | | $ | 22,088,049 | |
Series B | | | — | | | | (3,971,506 | ) | | | 3,971,506 | |
Series C | | | — | | | | (2,001,810 | ) | | | 2,001,810 | |
Series D | | | (24,721,481 | ) | | | (1,291,026 | ) | | | 26,012,507 | |
Series E | | | (199,200 | ) | | | (6,728,250 | ) | | | 6,927,450 | |
Series H | | | (498,555 | ) | | | (436,418 | ) | | | 934,973 | |
Series J | | | (36,353,377 | ) | | | 1,992,402 | | | | 34,360,975 | |
Series N | | | (6,083,139 | ) | | | (1,392,812 | ) | | | 7,475,951 | |
Series O | | | (13,704,200 | ) | | | (3,211,516 | ) | | | 16,915,716 | |
Series P | | | 204,950 | | | | (4,952,638 | ) | | | 4,747,688 | |
Series Q | | | (12,111,328 | ) | | | 563,509 | | | | 11,547,819 | |
Series V | | | (37,176,541 | ) | | | (1,434,043 | ) | | | 38,610,584 | |
Series X | | | — | | | | 617,351 | | | | (617,351 | ) |
Series Z | | | (1,843,787 | ) | | | 7,755 | | | | 1,836,032 | |
174
Notes to Financial Statements
December 31, 2006
| 11. | Federal Tax Matters (continued) |
At December 31, 2006, the following funds had capital loss carryovers and deferred post-October losses to offset future realized capital gains as follows:
| | | | | | | | | | | |
| | | Capital Loss
Carryover
Utilized
in 2006 | | Capital Loss
Carryovers | | Expires In | | Deferred
Post-October
Losses |
Series B | | $ | 27,019,837 | | $ | 108,210,500 | | 2008 | | $ | — |
| | | — | | | 5,057,813 | | 2009 | | | |
| | | — | | | 87,172,720 | | 2010 | | | |
| | | — | | | 26,620,854 | | 2011 | | | |
| | | | | | | | | | | |
| | $ | 27,019,837 | | $ | 227,061,887 | | | | | |
| | | | | | | | | | | |
| | | | |
Series E | | $ | — | | $ | 389,008 | | 2007 | | | 700 |
| | | — | | | 9,322,945 | | 2008 | | | |
| | | — | | | 719,015 | | 2010 | | | |
| | | — | | | 350,320 | | 2012 | | | |
| | | — | | | 2,731,334 | | 2014 | | | |
| | | | | | | | | | | |
| | $ | — | | $ | 13,512,622 | | | | | |
| | | | | | | | | | | |
| | | | |
Series H | | $ | 207,817 | | $ | — | | 2009 | | | 193,640 |
| | | 3,351,705 | | | — | | 2010 | | | |
| | | 2,047,588 | | | 3,036,601 | | 2011 | | | |
| | | | | | | | | | | |
| | $ | 5,607,110 | | $ | 3,036,601 | | | | | |
| | | | | | | | | | | |
| | | | |
Series J | | $ | — | | $ | — | | | | | 157,698 |
| | | | | | | | | | | |
| | $ | — | | $ | — | | | | | |
| | | | | | | | | | | |
| | | | |
Series P | | $ | 653,319 | | $ | — | | 2011 | | | 32,945 |
| | | | | | | | | | | |
| | $ | 653,319 | | $ | — | | | | | |
| | | | | | | | | | | |
| | | | |
Series Q | | $ | — | | $ | — | | | | | 152 |
| | | | | | | | | | | |
| | $ | — | | $ | — | | | | | |
| | | | | | | | | | | |
| | | | |
Series X | | $ | 7,214,871 | | $ | 7,775,955 | | 2009 | | | — |
| | | – | | | 9,772,253 | | 2010 | | | |
| | | | | | | | | | | |
| | $ | 7,214,871 | | $ | 17,548,208 | | | | | |
| | | | | | | | | | | |
| | | | |
Series Y | | $ | 3,128,347 | | $ | — | | 2007 | | | — |
| | | 477,438 | | | 6,578,402 | | 2008 | | | |
| | | — | | | 10,435,906 | | 2009 | | | |
| | | — | | | 9,284,391 | | 2010 | | | |
| | | — | | | 6,092,310 | | 2011 | | | |
| | | — | | | 338,14 | | 2012 | | | |
| | | | | | | | | | | |
| | $ | 3,605,785 | | $ | 32,729,156 | | | | | |
| | | | | | | | | | | |
175
Notes to Financial Statements
December 31, 2006
| 11. | Federal Tax Matters (continued) |
The Fund declared ordinary and long-term capital gain consent dividends for the year ended December 31, 2005, as shown below. These amounts have been deemed paid and contributed to the Fund as additional paid in capital.
| | | | | | |
| | | Ordinary Consent
Dividends | | Long-term Capital Gain
Consent Dividends |
Series A | | $ | 2,686,549 | | $ | 19,401,500 |
Series B | | | 3,971,506 | | | — |
Series C | | | 2,001,810 | | | — |
Series D | | | 1,801,782 | | | 24,210,725 |
Series E | | | 6,927,450 | | | — |
Series H | | | 436,418 | | | — |
Series J | | | — | | | 34,360,975 |
Series N | | | 2,204,979 | | | 5,270,972 |
Series O | | | 4,493,249 | | | 12,422,467 |
Series P | | | 4,747,688 | | | — |
Series Q | | | — | | | 12,111,362 |
Series V | | | 4,649,462 | | | 33,961,122 |
Series Z | | | 1,764,168 | | | 71,864 |
Short term distributions are treated as ordinary distributions for federal income tax purposes.
It is the Fund’s intent to utilize consent dividends for their 2006 taxable earnings.
As of December 31, 2006, the components of distributable earnings/(deficit) on a tax basis were as follows:
| | | | | | | | | | | | | | | | | | |
| | | Undistributed
Ordinary
Income | | Undistributed
Long-term
Gain | | Accumulated
Capital and
Other Losses | | | Unrealized
Appreciation
(Depreciation) | | | Distributable
Earnings (Deficit) | |
Series A | | $ | 13,085,742 | | $ | 35,756,077 | | $ | — | | | $ | 83,266,128 | | | $ | 132,107,947 | |
Series B | | | 3,504,848 | | | — | | | (227,061,887 | ) | | | 101,710,703 | | | | (121,846,336 | ) |
Series C | | | 4,176,757 | | | — | | | — | | | | 4,151 | | | | 4,180,908 | |
Series D | | | 4,908,631 | | | 43,812,167 | | | — | | | | 173,966,428 | | | | 222,687,226 | |
Series E | | | 7,548,062 | | | — | | | (13,513,322 | ) | | | (2,439,707 | ) | | | (8,404,967 | ) |
Series H | | | 914,052 | | | — | | | (3,230,241 | ) | | | 8,516,470 | | | | 6,200,281 | |
Series J | | | 6,393,748 | | | 33,871,774 | | | (157,698 | ) | | | 74,006,154 | | | | 114,113,978 | |
Series N | | | 3,036,928 | | | 4,852,672 | | | — | | | | 11,428,501 | | | | 19,318,101 | |
Series O | | | 4,582,353 | | | 12,906,887 | | | — | | | | 53,743,674 | | | | 71,232,914 | |
Series P | | | 6,792,790 | | | 308,596 | | | (32,945 | ) | | | 1,237,874 | | | | 8,306,315 | |
Series Q | | | — | | | 14,991,355 | | | (152 | ) | | | 36,141,334 | | | | 51,132,537 | |
Series V | | | 14,196,620 | | | 34,245,913 | | | — | | | | 113,390,308 | | | | 161,832,841 | |
Series X | | | — | | | — | | | (17,548,208 | ) | | | 9,315,216 | | | | (8,232,992 | ) |
Series Y | | | 140,430 | | | — | | | (32,729,156 | ) | | | 12,483,846 | | | | (20,104,880 | ) |
Series Z | | | 3,099,744 | | | 761,053 | | | — | | | | (335,189 | ) | | | 3,525,608 | |
The difference between book basis and tax basis unrealized appreciation (depreciation) is attributable primarily to the tax deferral of losses on wash sales, the realization for tax purposes of unrealized gains on certain forward foreign currency contracts and passive foreign investment companies.
176
Notes to Financial Statements
December 31, 2006
For federal income tax purposes, the following Series designate the amounts set forth below as capital gain dividends for the year ended December 31, 2006:
| | | |
| | | Long-Term Capital
Gain Distributions* |
Series A | | $ | 35,756,077 |
Series D | | | 43,812,167 |
Series J | | | 33,871,774 |
Series N | | | 4,852,672 |
Series O | | | 12,906,887 |
Series P | | | 308,596 |
Series Q | | | 14,991,355 |
Series V | | | 34,245,913 |
Series Z | | | 761,053 |
| * | Paid via consent dividends |
| 12. | Affiliated Transactions* |
Investments representing 5% or more of the outstanding voting securities of a portfolio company of a fund result in that portfolio company being considered an affiliated company of such fund, as defined in the 1940 Act. The aggregate market value of all securities of affiliated companies held in Series J as of December 31, 2006 amounted to $255,162 which represents 0.06% of net assets. There were no affiliated companies held in any other Series. Transactions in Series J during the year ended December 31, 2006 in which the portfolio company is an “affiliated person” are as follows:
| | | | | | |
| | | ThermoEnergy
Corporation
PIPE | | ThermoEnergy
Corporation
Warrants |
December 31, 2005 | | | | | | |
Balance | | | | | | |
Shares | | | 1,380,000 | | | 1,380,000 |
Cost | | $ | 1,302,103 | | $ | 353,897 |
Gross Additions | | | | | | |
Shares | | | — | | | — |
Cost | | $ | — | | $ | — |
| | |
Gross Reductions | | | | | | |
Shares | | | — | | | — |
Cost | | $ | — | | $ | — |
| | |
December 31, 2006 | | | | | | |
Balance | | | | | | |
Shares | | | 1,380,000 | | | 1,380,000 |
Cost | | $ | 1,302,103 | | $ | 353,897 |
| | |
Realized Gain/(Loss) | | | — | | | — |
| | |
Investment Income | | | — | | | — |
| * | As a result of Series J’s beneficial ownership of the common stock of these portfolio companies, applicable regulations require that the Series state that it may be deemed an affiliate of the respective portfolio company. The Series disclaims that the “affiliated persons” are affiliates of the Distributor, Advisor, Series or any other client of the Advisor. |
| 13. | Acquisition of Series W of SBL Fund |
Pursuant to a plan of reorganization approved by the stockholders of Series W of SBL Fund, Series H of SBL Fund acquired all of the net assets of Series W on June 16, 2006 which totaled $52,914,356. A total of 5,615,796 shares of Series W were exchanged for 5,481,948 shares of Series H immediately after the closing date. This exchange qualified as a tax-free reorganization under Section 368(a)(1)(c) of the Internal Revenue Code. Series W’s net assets included $743,249 of unrealized appreciation. The aggregate net assets of Series H immediately before the acquisition totaled $43,263,368 and following the acquisition, the combined net assets of Series H totalled $96,177,724.
| 14. | Acquisition of Series G of SBL Fund |
Pursuant to a plan of reorganization approved by the stockholders of Series G of SBL Fund, Series Y of SBL Fund acquired all of the net assets of Series G on June 16, 2006 which totaled $46,089,706. A total of 7,094,570 shares of Series G were exchanged for 4,606,863 shares of Series Y immediately after the closing date. This exchange qualified as a tax-free reorganization under Section 368(a)(1)(c) of the Internal Revenue Code. Series G’s net assets included $3,219,555 of unrealized appreciation and $16,205,387 of accumulated realized loss on sale of investments. The aggregate net assets of Series Y immediately before the acquisition totaled $45,276,152 and following the acquisition, the combined net assets of Series Y totalled $91,365,858.
| 15. | Acquisition of Series S of SBL Fund |
Pursuant to a plan of reorganization approved by the stockholders of Series S of SBL Fund, Neuberger Berman AMT Socially Responsive, Class S shares acquired all of the net assets of Series S on June 16, 2006 which totaled $85,059,343. This exchange qualified as a tax-free reorganization under Section 368(a)(1)(c) of the Internal Revenue Code.
177
Report of Independent Registered Public Accounting Firm
To the Contractholders and Board of Directors
SBL Fund
We have audited the accompanying statements of assets and liabilities, including the schedules of investments, of SBL Fund (comprised of Series A, B, C, D, E, H, J, N, O, P, Q, V, X, Y and Z portfolios) (the Fund), as of December 31, 2006, and the related statements of operations for the year then ended, the statement of changes in net assets for each of the two years in the period then ended, and the financial highlights for each of the periods indicated therein. These financial statements and financial highlights are the responsibility of the Fund’s management. Our responsibility is to express an opinion on these financial statements and financial highlights based on our audits.
We conducted our audits in accordance with the standards of the Public Company Accounting Oversight Board (United States). Those standards require that we plan and perform the audit to obtain reasonable assurance about whether the financial statements and financial highlights are free of material misstatement. We were not engaged to perform an audit of the Fund’s internal control over financial reporting. Our audits included consideration of internal control over financial reporting as a basis for designing audit procedures that are appropriate in the circumstances, but not for the purpose of expressing an opinion of the effectiveness of the Fund’s internal control over financial reporting. Accordingly, we express no such opinion. An audit also includes examining, on a test basis, evidence supporting the amounts and disclosures in the financial statements and financial highlights, assessing the accounting principles used and significant estimates made by management, and evaluating the overall financial statement presentation. Our procedures included confirmation of investments owned as of December 31, 2006, by correspondence with custodians and brokers or by other appropriate auditing procedures where replies from brokers were not received. We believe that our audits provide a reasonable basis for our opinion.
In our opinion, the financial statements and financial highlights referred to above present fairly, in all material respects, the financial position of each of the respective Series constituting the Fund at December 31, 2006, the results of their operations for the year then ended, the changes in their net assets for each of the two years in the period then ended, and the financial highlights for each of the periods indicated therein, in conformity with U.S. generally accepted accounting principles.

Kansas City, Missouri
February 23, 2007
178
Directors’ Disclosure
(unaudited)
Director Approval of Investment Advisory Agreement
At an in-person meeting of the Fund’s Boards of Directors held on November 16-17, 2006, called for the purpose of, among other things, voting on the renewal of the investment advisory and sub-advisory agreements applicable to the Fund, the Fund’s Board of Directors, including the Independent Directors, unanimously approved the continuation for a one-year period of the investment advisory agreement between the Fund and Security Management Company, LLC (“SMC”), as well as each investment sub-advisory agreement applicable to the Fund. In reaching this conclusion, the Directors requested and obtained from SMC and each investment sub-adviser such information as the Directors deemed reasonably necessary to evaluate the proposed renewal of the agreements. The Fund’s Board of Directors carefully evaluated this information, and was advised by legal counsel with respect to its deliberations.
In considering the proposed continuation of the investment advisory and sub-advisory agreements, the Independent Directors evaluated a number of considerations, including, among others, (1) the nature, extent, and quality of the advisory services to be provided by SMC and the investment sub-advisers; (2) the investment performance of the Fund, SMC and the various investment sub-advisers; (3) the costs of the services to be provided and profits to be realized by SMC and its affiliates from the relationship with the Fund; (4) the extent to which economies of scale would be realized as the Fund grows; and (5) whether advisory and sub-advisory fee levels reflect these economies of scale for the benefit of Fund investors. Each Board of Directors also took into account other considerations that it believed, in light of the legal advice furnished to the Independent Directors by their independent legal counsel and the Directors’ own business judgment, to be relevant. Following its review, the Fund’s Board of Directors determined that the investment advisory agreement and each investment sub-advisory agreement applicable to the Fund (if any) will enable Fund shareholders to obtain high quality services at a cost that is appropriate, reasonable, and in the best interests of shareholders. Accordingly, the Directors, including the Independent Directors, unanimously approved the renewal of the investment advisory and investment sub-advisory agreements based upon the following considerations, among others:
| | • | | The nature, extent and quality of the advisory services to be provided. The Board of Directors concluded that SMC and the investment sub-advisers retained to provide portfolio management services with respect to the Fund are capable of providing high quality services to the Fund, as indicated by the nature and quality of services provided in the past, SMC’s management capabilities demonstrated with respect to the Fund and other mutual funds managed by SMC, the professional qualifications and experience of SMC’s and the various sub-advisers’ portfolio managers, and SMC’s investment and management oversight processes. The Directors also determined that SMC and the sub-advisers proposed to provide investment and related services that were of the same quality and quantity as services provided to the Fund in the past, and that these services are appropriate in scope and extent in light of the Fund’s operations, the competitive landscape of the investment company business and investor needs. |
| | • | | The investment performance of the Fund. With respect to the Fund, the Directors concluded on the basis of information supplied by Lipper that SMC and the investment sub-advisers had achieved investment performance that was acceptable, and competitive or superior relative to comparable funds over trailing periods. On the basis of the Directors’ assessment of the nature, extent and quality of advisory services to be provided or procured by SMC, the Directors concluded that SMC is capable of generating a level of long-term investment performance that is appropriate in light of the Fund’s investment objectives, policies and strategies and competitive with many other investment companies. |
| | • | | The cost of advisory services provided and the level of profitability. On the basis of each Board’s review of the fees to be charged by SMC for investment advisory and other services, and the estimated profitability of SMC's relationship with the Fund, each Board concluded that the level of investment advisory fees and SMC’s profitability are appropriate in light of the management fees and overall expense ratios of comparable investment companies and the anticipated profitability of the relationship between the Fund and SMC and its affiliates. On the basis of comparative information supplied by Lipper the Directors determined that the advisory fees and estimated overall expense ratio of the Fund are consistent with, and often below, industry medians, particularly with respect to mutual funds of comparable size. With respect to the Series Z (Alpha Opportunity Series), the Directors noted that the Series had a competitive performance record for the year to date, and one year periods ended September 30, 2006 and strong performance for the three year period which helped to compensate for Series Z’s higher than average expense ratio. Further, the Directors noted that the Series Z’s investment advisory fee and expense ratio were above median due, at least in part, to its strong performance relative to its benchmark index, which increased the advisory fee payable under that Fund’s “fulcrum” advisory fee arrangement. |
| | • | | Whether the advisory fees reflect economies of scale. The Directors concluded that the Fund’s investment advisory fees appropriately reflect the current economic environment for SMC and the competitive nature of the mutual fund market. The Directors further determined that the Fund has yet to achieve meaningful economies of scale, which, therefore, cannot be reflected in the investment advisory fees. |
179
Directors’ Disclosure
(unaudited) (continued)
| | • | | The extent to which economies of scale will be realized as the Fund grows. While the Fund’s investment advisory fees do not reduce should Fund assets grow meaningfully, the Directors determined that the investment advisory fees payable by the Fund other than Series Z (Alpha Opportunity Series) (whose investment advisory fee varies depending on that Fund’s performance relative to its benchmark index) already reflect potential future economies of scale to some extent by virtue of their competitive levels (determined with reference to industry standards as reported by Lipper and SMC’s estimated profitability at current or foreseeable asset levels. The Directors also considered that they will have the opportunity to periodically reexamine whether a Fund has achieved economies of scale, and the appropriateness of investment advisory fees payable to SMC and fees payable by SMC to the investment sub-advisers, in the future. |
| | • | | Benefits (such as soft dollars) to SMC from its relationship with the Fund (and any corresponding benefits to the Fund). The Directors concluded that other benefits described by SMC and the investment sub-advisers from their relationships with the Fund, including “soft dollar” benefits in connection with Fund brokerage transactions, are reasonable and fair, and consistent with industry practice and the best interests of the Fund and their shareholders. In addition, the Directors determined that the administration, transfer agency and fund accounting fees paid by the Fund to SMC are reasonable, fair and in the best interests of Fund shareholders in light of the nature and quality of the services provided, the associated costs, and the necessity of the services for the Fund’s operations. |
| | • | | Other Considerations: In approving the investment advisory and sub-advisory agreements, the Directors determined that SMC has made a substantial commitment to the recruitment and retention of high quality personnel, and maintains the financial, compliance and operational resources reasonably necessary to manage the Fund in a professional manner that is consistent with the best interests of the Fund and their shareholders. In this regard, the Directors favorably considered the compliance track record of the Fund and SMC. The Directors also concluded that SMC has made a significant entrepreneurial commitment to the management and success of the Fund, which entails a substantial financial and professional commitment, including investment advisory fee waivers and expense limitation arrangements with respect to the Fund to the benefit of Fund shareholders. |
180
Special Shareholders’ Meeting
(unaudited)
A special meeting of the shareholders of Series G, Series S and Series W of the SBL Fund was held on June 1, 2006. Each matter voted upon at the meeting, as well as the number of votes cast for, against or withheld, and the number of abstentions with respect to such matters are set forth below:
| | (1) | The approval of a plan of reorganization providing for the acquisition of all of the assets and liabilities of SBL Fund Series G solely in exchange for shares of the SBL Fund Series Y, followed by the complete liquidation of Series G. The following votes were cast regarding this matter: |
| | | | |
| | | Votes For | | Votes Against/Abstentions |
Series G | | 7,012,314 | | 961,409 |
| | (2) | The approval of a plan of reorganization providing for the acquisition of all of the assets and liabilities of SBL Fund Series W solely in exchange for shares of the SBL Fund Series H, followed by the complete liquidation of Series W. The following votes were cast regarding this matter: |
| | | | |
| | | Votes For | | Votes Against/Abstentions |
Series W | | 3,582,282 | | 491,142 |
| | (3) | The approval of a plan of reorganization providing for the acquisition of all of the assets and liabilities of the SBL Fund Series S solely in exchange for shares of Neuberger Berman AMT Socially Responsive Fund, Class S shares, followed by the complete liquidation of Series S. The following votes were cast regarding this matter: |
| | | | |
| | | Votes For | | Votes Against/Abstentions |
Series S | | 3,351,972 | | 459,565 |
181
Directors and Officers (unaudited)
The business address of each director and officer is One Security Benefit Place, Topeka, KS 66636-0001.
Directors
| | |
Name
(Date of Birth)
Year Elected*** | | Principal Occupation(s) During Past 5 Years |
Donald A. Chubb, Jr.** | | Business broker, Griffith & Blair Realtors |
(12-14-46) | | Director - Jayhawk Area Boy Scouts Council |
1994 | | |
| |
Harry W. Craig, Jr.** | | Chairman, CEO, Secretary & Director, The Martin Tractor Company, Inc.; |
(05-11-39) | | Director - Stormont-Vail Corporation |
2004 | | Director - Concerned Citizens for Topeka |
| | Director - Oscar S. Stauffer Executive in Residence |
| |
Jerry B. Farley** | | President, Washburn University |
(09-20-46) | | President, J&J Bonanza |
2005 | | |
| |
Penny A. Lumpkin** | | Partner, Vivians’ Gift Shop (Corporate Retail) |
(08-20-39) | | Vice President, Palmer Companies, Inc. (Small Business and Shopping Center Development) |
1993 | | Vice President, PLB (Real Estate Equipment Leasing) |
| | Vice President, Town Crier (Retail) |
| | Prior to 1999: |
| | Vice President & Treasurer, Palmer News, Inc. |
| | Vice President, M/S News, Inc. |
| | Secretary, Kansas City Periodicals |
| | Prior to 2002: |
| | Vice President, Bellaire Shopping Center (Managing and Leasing) |
| | Partner, Goodwin Enterprises (Retail) |
| |
Maynard F. Oliverius** | | President & Chief Executive Officer, Stormont-Vail HealthCare |
(12-18-43) | | Director - VHA Mid-America |
1998 | | Director - Go Topeka |
| |
Michael G. Odlum* | | President & Managing Member Representative, Security Management Company, LLC |
(01-12-52) | | Senior Vice President and Chief Investment Officer, Security Benefit Corporation and |
2006 (Acting Chairman | | Security Benefit Life Insurance Company |
of the Board) | | Vice President & Director, Security Distributors, Inc. |
2004 (President) | | Director, Vice President and Chief Investment Officer, First Security Benefit Life Insurance and |
2004 (Director) | | Annuity Company of New York |
| * | This director is deemed to be an “interested person” of the Funds under the Investment Company Act of 1940, as amended, by reason of his position with the Funds’ Investment Manager and/or the parent of the Investment Manager. |
| ** | These directors serve on the Fund’s joint audit committee, the purpose of which is to meet with the independent registered public accounting firm, to review the work of the independent registered public accounting firm, and to oversee the handling by Security Management Company, LLC of the accounting function for the Fund. |
| *** | Each director oversees 28 Security Fund portfolios and serves until the next annual meeting, or until a successor has been duly elected and qualified. |
182
Directors and Officers (unaudited) (continued)
Officers
| | |
Name (Date of Birth) Title - Year Elected* | | Principal Occupation(s) During Past 5 Years |
| Steven M. Bowser | | Vice President & Senior Portfolio Manager, Security Management Company, LLC; |
| (02-11-60) | | Vice President & Senior Portfolio Manager, Security Benefit Life Insurance Company |
| Vice President - 2003 | | |
| |
| Christina Fletcher | | Vice President & Portfolio Manager, Security Management Company, LLC |
| (07-25-72) | | Credit Analyst/Portfolio Manager, Horizon Cash Management |
| Vice President - 2005 | | Senior Money Market Trader, Scudder Investments |
| |
| Brenda M. Harwood | | Vice President & Chief Compliance Officer, Security Management Company, LLC; |
| (11-03-63) | | Assistant Vice President, Security Benefit Life Insurance Company |
| Chief Compliance Officer - 2004 | | Vice President, Assistant Treasurer & Director, Security Distributors, Inc. |
| Treasurer - 1988 | | |
| |
| Richard J. King | | Vice President & Head of Fixed Income Asset Management, Security Management Company, LLC; |
| (03-59) | | Vice President & Head of Fixed Income Asset Management, Security Benefit Life Insurance Company |
| Vice President - 2005 | | Partner, Head of Portfolio Management, INVESCO |
| |
| Mark Lamb | | Vice President, Security Management Company, LLC, |
| (02-03-60) | | Vice President, Security Benefit Life Insurance Company |
| Vice President - 2003 | | |
| |
| Amy J. Lee | | Secretary, Security Management Company, LLC.; |
| (06-05-61) | | Secretary & Chief Compliance Officer, Security Distributors, Inc. |
| Secretary - 1987 | | Vice President, Associate General Counsel & Assistant Secretary, Security Benefit Corporation & Security Benefit Life Insurance Company |
| | Director, Brecek & Young Advisors, Inc. |
| |
| Mark Mitchell | | Vice President & Portfolio Manager, Security Management Company, LLC |
| (08-24-64) | | Vice President & Portfolio Manager, Security Benefit Life Insurance Company |
| Vice President - 2003 | | |
| |
| Christopher Phalen | | Vice President & Portfolio Manager, Security Management |
| (11-9-70) | | Company, LLC; |
| Vice President - 2002 | | Assistant Vice President & Portfolio Manager, Security Benefit Life Insurance Company |
| |
| James P. Schier | | Vice President & Senior Portfolio Manager, Security Management Company, LLC; |
| (12-28-57) | | Vice President & Senior Portfolio Manager, Security Benefit Life Insurance Company |
| Vice President - 1998 | | |
| |
| Cindy L. Shields | | Vice President & Head of Equity Asset Management, Security Management Company, LLC, |
| (06-05-67) | | Vice President & Head of Equity Asset Management, Security Benefit Life Insurance Company |
| Vice President - 1988 | | |
| |
| Christopher D. Swickard | | Assistant Secretary, Security Management Company, LLC; |
| (10-09-65) | | Second Vice President & Assistant General Counsel, Security Benefit Corporation & |
| Assistant Secretary - 1996 | | Security Benefit Life Insurance Company |
| | Assistant Secretary, Security Distributors, Inc. |
| |
| David G. Toussaint | | Vice President & Portfolio Manager, Security Management Company, LLC; |
| (10-10-66) | | Assistant Vice President & Portfolio Manager, Security Benefit Life Insurance Company |
| Vice President - 2001 | | |
| |
| Eric Welt | | Vice President, Director of Portfolio Risk Analysis & Consultant Relations, |
| (10-31-67) | | Portfolio Risk Manager, Security Management Company, LLC; |
| Vice President - 2006 | | Associate Director - Senior Due Diligence Analyst, Bear Stearns & Company |
| * | Officers serve until the next annual meeting or until a successor has been duly elected and qualified. |
183
This page left blank intentionally.
184
Other Information
Each of the Security Funds files a complete schedule of portfolio holdings with the U.S. Securities and Exchange Commission for the first and third quarters of each fiscal year on Form N-Q. The Forms N-Q of each such Fund are available on the Commission’s website at www.sec.gov. The Forms N-Q may be reviewed and copied at the Commission’s Public Reference Room in Washington, DC. Information on the operation of the Public Reference Room may be obtained by calling 1-800-SEC-0330. The portfolio holdings of each of the Security Funds are available on their website, www.securitybenefit.com or by calling 1-800-888-2461.
A description of the policies and procedures that the Security Funds use to determine how to vote proxies relating to portfolio securities is available upon request, free of charge by calling 1-800-888-2461, or accessing the U.S. Securities and Exchange Commission website at www.sec.gov. Information regarding how the Security Funds voted proxies relating to portfolio securities during the 12 month period ended June 30, 2006 is available upon request, free of charge by calling 1-800-888-2461, or accessing the U.S. Securities and Exchange Commission website at www.sec.gov.
The statement of additional information (“SAI”) includes additional information about the Funds’ Directors and is available upon request without charge by calling 1-800-888-2461.
185
The Security Group of Mutual Funds
Security Equity Fund
| | • | | Alpha Opportunity Series |
| | • | | Small Cap Growth Series |
Security Large Cap Value Fund
Security Mid Cap Growth Fund
Security Income Fund
| | • | | Capital Preservation Series |
| | • | | Diversified Income Series |
| | • | | Income Opportunity Series |
Security Cash Fund
Security Funds Officers and Directors
Directors
Donald A. Chubb, Jr.
Harry W. Craig, Jr.
Jerry B. Farley
Penny A. Lumpkin
Michael G. Odlum
Maynard F. Oliverius
Officers
Michael G. Odlum, President
Steve M. Bowser, Vice President
Christina Fletcher, Vice President
Richard J. King, Vice President
Mark Lamb, Vice President
Mark Mitchell, Vice President
Christopher Phalen, Vice President
James P. Schier, Vice President
Cindy L. Shields, Vice President
David G. Toussaint, Vice President
Eric Welt, Vice President
Amy J. Lee, Secretary
Christopher D. Swickard, Assistant Secretary
Brenda M. Harwood, Chief Compliance Officer & Treasurer
This report is submitted for the general information of the shareholders of the Funds. The report is not authorized for distribution to prospective investors in the Funds unless preceded or accompanied by an effective prospectus which contains details concerning the sales charges and other pertinent information.

One Security Benefit Place Ÿ Topeka, Kansas 66636-0001 Ÿ securitybenefit.com
The Registrant has adopted a code of ethics that applies to its principal executive officer and principal financial officer. A copy of the Registrant’s code of ethics is filed herewith as Exhibit 10(a)(1). No amendments were made to the provisions of the code of ethics during the period covered by this report. No implicit or explicit waivers to the provisions of the code of ethics were granted during the period covered by this report. The Registrant hereby undertakes to provide any person without charge, upon request, a copy of its Code by calling the Registrant at 1-800-888-2461.
| Item 3. | Audit Committee Financial Expert. |
The Registrant’s Board of Directors has determined that Maynard Oliverius, a member of the Audit Committee of the Board, is an audit committee financial expert. Mr. Oliverius is “independent” for purposes of this item.
| Item 4. | Principal Accountant Fees and Services. |
| (a) | Audit Fees. The aggregate fees billed for each of the last two fiscal years (the “Reporting Periods”) for professional services rendered by the Registrant’s principal accountant (the “Auditor”) for the audit of the Registrant’s annual financial statements, or services that are normally provided by the Auditor in connection with the statutory and regulatory filings or engagements for the Reporting Periods, were $327,000 in 2005 and $327,000 in 2006. |
| (b) | Audit-Related Fees. The aggregate fees billed in the Reporting Periods for assurance and related services by the Auditor that are reasonably related to the performance of the audit of the Registrant’s financial statements and are not reported under paragraph (a) of this Item 4 were $5,000 in 2005 and $5,000 in 2006. These services consisted of a review of the Registrant’s semi-annual financial statements. |
The aggregate fees billed in the Reporting Periods for assurance and related services by the Auditor to the Registrant’s investment adviser (not including any sub-investment adviser whose role is primarily portfolio management and is subcontracted with or overseen by another investment adviser), and any entity controlling, controlled by or under common control with the investment adviser that provides ongoing services to the Registrant (“Service Affiliates”) which required pre-approval by the Audit Committee were $17,000 in 2005 and $18,000 in 2006, which related to the review of the transfer agent function.
| (c) | Tax Fees. The aggregate fees billed to the Registrant in the Reporting Periods for professional services rendered by the Auditor for tax compliance, tax advice and tax planning (“Tax Services”) were $37,000 in 2005 and $45,000 in 2006. These services consisted of (i) review or preparation of U.S. federal, state and excise tax returns; (ii) U.S. federal and state tax planning, advice and assistance regarding statutory, regulatory or administrative developments, (iii) tax advice regarding tax qualification matters and/or treatment of various financial instruments held or proposed to be acquired or held, and (iv) calculation of tax adjustments for potential Passive Foreign Investment Companies (as determined by Fund personnel) and (v) review of U.S. federal excise distribution calculations. |
The aggregate fees billed in the Reporting Periods for Tax Services by the Auditor to Service Affiliates which required pre-approval by the Audit Committee were $0 in 2005 and $0 in 2006.
| (d) | All Other Fees. The aggregate fees billed to the Registrant in the Reporting Periods for products and services provided by the Auditor, other than the services reported in paragraphs (a) through (c) of this Item, were $0 in 2005 and $0 in 2006. |
The aggregate fees billed in the Reporting Periods for Non-Audit Services by the Auditor to Service Affiliates, other than the services reported in paragraphs (b) through (d) of this Item, which required pre-approval by the Audit Committee were $0 in 2005 and $0 in 2006.
| (e) (1) | Audit Committee Pre-Approval Policies and Procedures. The Registrant’s Audit Committee has established policies and procedures for pre-approval of the auditor’s engagements for audit and non-audit services to the Registrant. Pre-approval considerations include whether the proposed services are compatible with maintaining the auditor’s independence as specified in applicable rules. |
| (e) (2) | Percentage of Non-Audit Services Approved under (c)(7)(i)(C). The percentage of the services described in each of (b) through (d) of this Item 4 (only those that relate to the Registrant) that were approved by the Audit Committee pursuant to paragraph (c)(7)(i)(C) of Rule 2-01 of Regulation S-X was 0%, 0% and 0%, respectively. |
| (g) | Non-Audit Fees. The aggregate non-audit fees billed by the Auditor for services rendered to the Registrant, and rendered to Service Affiliates, for the Reporting Periods were $59,000 in 2005 and $68,000 in 2006. |
| (h) | Auditor Independence. The Registrant’s Audit Committee was provided with information relating to the provision of non-audit services by Ernst & Young, LLP to the Registrant (and its affiliates) that were not pre-approved by the Audit Committee so that a determination could be made whether the provision of such services is compatible with maintaining Ernst & Young, LLP’s independence. |
| Item 5. | Audit Committee of Listed Registrants. |
Not applicable.
| Item 6. | Schedule of Investments. |
The Schedule of Investments is included under Item 1 of this form.
| Item 7. | Disclosure of Proxy Voting Policies and Procedures for Closed-End Management Investment Companies. |
Not applicable.
| Item 8. | Portfolio Managers of Closed-End Management Investment Companies. |
Not applicable.
| Item 9. | Purchases of Equity Securities by Closed-End Management Investment Company and Affiliated Purchasers. |
Not applicable.
| Item 10. | Submission of Matters to a Vote of Security Holders. |
The registrant does not currently have in place procedures by which shareholders may recommend nominees to the registrant’s board.
There have been no changes to the procedures by which shareholders may recommend nominees to the registrant’s board.
| Item 11. | Controls and Procedures. |
| (a) | The registrant’s President and Treasurer have concluded that the registrant’s disclosure controls and procedures (as defined in rule 30a-3(c) under the Investment Company Act of 1940) are effective based on their evaluation of these disclosure controls and procedures within 90 days of the filing date of this report on Form N-CSR. |
| (b) | There were no significant changes in the registrant’s internal controls, or in other factors that could significantly affect these controls subsequent to the date of their evaluation, including any corrective actions with regard to significant deficiencies and material weaknesses. |
| (a) (1) | Code of Ethics pursuant to Item 2 above. |
| | (2) | Certifications pursuant to Section 302 of the Sarbanes-Oxley Act of 2002 and required by Rule 30a-2(a) under the Investment Company Act of 1940, are attached hereto. |
| (b) | Certifications pursuant to Section 906 of the Sarbanes-Oxley Act of 2002 and required by Rule 30a-2(a) under the Investment Company Act of 1940, are attached hereto. |
SIGNATURES
Pursuant to the requirements of the Securities Exchange Act of 1934 and the Investment Company Act of 1940, the registrant has duly caused this report to be signed on its behalf by the undersigned, thereunto duly authorized.
| | |
| SBL FUND |
| |
| By: | | /s/ MICHAEL G. ODLUM |
| | Michael G. Odlum, President |
| |
| Date: | | March 5, 2007 |
Pursuant to the requirements of the Securities Exchange Act of 1934 and the Investment Company Act of 1940, this report has been signed below by the following persons on behalf of the registrant and in the capacities and on the dates indicated.
| | |
| By: | | /s/ MICHAEL G. ODLUM |
| | Michael G. Odlum, President |
| |
| Date: | | March 5, 2007 |
| |
| By: | | /s/ BRENDA M. HARWOOD |
| | Brenda M. Harwood, Treasurer |
| |
| Date: | | March 5, 2007 |