UNITED STATES
SECURITIES AND EXCHANGE COMMISSION
Washington, D.C. 20549
FORM N-CSR
CERTIFIED SHAREHOLDER REPORT OF REGISTERED
MANAGEMENT INVESTMENT COMPANIES
| | |
Investment Company Act file number | | 811-02753 |
SBL FUND
| | | | |
| (Exact name of registrant as specified in charter) |
| | |
| ONE SECURITY BENEFIT PLACE, TOPEKA, KANSAS | | 66636-0001 |
| (Address of principal executive offices) | | (Zip code) |
RICHARD M. GOLDMAN, PRESIDENT
SBL FUND
ONE SECURITY BENEFIT PLACE
TOPEKA, KANSAS 66636-0001
|
| (Name and address of agent for service) |
Registrant’s telephone number, including area code: (785) 438-3000
Date of fiscal year end: December 31
Date of reporting period: December 31, 2009
Form N-CSR is to be used by management investment companies to file reports with the Commission not later than 10 days after the transmission to stockholders of any report that is required to be transmitted to stockholders under Rule 30e-1 under the Investment Company Act of 1940 (17 CFR 270.30e-1). The Commission may use the information provided on Form N-CSR in its regulatory, disclosure review, inspection, and policymaking roles.
A registrant is required to disclose the information specified by Form N-CSR, and the Commission will make this information public. A registrant is not required to respond to the collection of information contained in Form N-CSR unless the Form displays a currently valid Office of Management and Budget (“OMB”) control number. Please direct comments concerning the accuracy of the information collection burden estimate and any suggestions for reducing the burden to Secretary, Securities and Exchange Commission, 450 Fifth Street, NW, Washington, DC 20549-0609. The OMB has reviewed this collection of information under the clearance requirements of 44 U.S.C. §3507.
| Item 1. | Reports to Stockholders. |
SBL Fund
December 31, 2009
Annual Report
Table of Contents
1
Information About Your Series Expenses
December 31, 2009 (unaudited)
Calculating your ongoing Series expenses
As a shareholder of the Series, you incur ongoing costs, including management fees and other series expenses. Performance figures and expense ratios do not reflect fees and expenses associated with an investment in variable insurance products. Shares of a Series of SBL Fund are available only through the purchase of such products. This example is intended to help you understand your ongoing costs (in dollars) of investing in the Series and to compare these costs with ongoing costs of investing in other mutual funds. The example is based on an investment of $1,000 invested at the beginning of the period and held for the entire period, July 1, 2009 through December 31, 2009.
Actual Expenses
The first table provides information about actual account values and actual expenses. You may use the information in this table, together with the amount you invested, to estimate the expenses that you paid over the period. Simply divide your account value by $1,000 (for example, an $8,600 account value divided by $1,000 = 8.6), then multiply the result by the number in the table under the heading entitled “Expenses Paid During the Period” to estimate the expenses you paid on your account during this period.
Hypothetical Example for Comparison Purposes
The second table provides information about hypothetical account values and hypothetical expenses based on the Series actual expense ratio and an assumed rate of return of 5% per year before expenses, which is not the Series actual return. The hypothetical account values and expenses may not be used to estimate the actual ending account balance or expenses you paid for the period. You may use this information to compare the ongoing costs of investing in the Series and other funds. To do so, compare this 5% hypothetical example with the 5% hypothetical examples that appear in the shareholder reports of the other mutual funds.
Please note that the expenses shown in the table are meant to highlight your ongoing costs only and do not reflect any fees and expenses associated with an investment in variable insurance products. Therefore, the second table is useful in comparing ongoing costs only, and will not help you determine the relative total costs of owning different funds. In addition, if these fees and expenses associated with an investment in variable insurance products were included, your costs would have been higher.
| | | | | | | | | | | | | | | |
| | | Expense
Ratio1 | | | Fund Return | | | Beginning
Account
Value
7/1/2009 | | Ending
Account Value
12/31/2009 | | Expenses
Paid
During
Period2 |
Table 1. Based on actual Series return3 | | | | | | | | | | | | | | | |
Series A (Equity Series) | | 0.91 | % | | 22.82 | % | | $ | 1,000.00 | | $ | 1,228.17 | | $ | 5.11 |
Series B (Large Cap Value Series) | | 0.80 | % | | 21.58 | % | | | 1,000.00 | | | 1,215.77 | | | 4.47 |
Series C (Money Market Series) | | 0.68 | % | | (0.29 | )% | | | 1,000.00 | | | 997.06 | | | 3.42 |
Series D (Global Series) | | 1.26 | % | | 16.73 | % | | | 1,000.00 | | | 1,167.33 | | | 6.88 |
Series E (U.S. Intermediate Bond Series) | | 0.76 | % | | 3.82 | % | | | 1,000.00 | | | 1,038.17 | | | 3.90 |
Series H (Enhanced Index Series) | | 0.76 | % | | 22.95 | % | | | 1,000.00 | | | 1,229.49 | | | 4.27 |
Series J (Mid Cap Growth Series) | | 0.91 | % | | 20.64 | % | | | 1,000.00 | | | 1,206.38 | | | 5.06 |
Series N (Managed Asset Allocation Series) | | 1.67 | % | | 16.36 | % | | | 1,000.00 | | | 1,163.65 | | | 9.11 |
Series O (All Cap Value Series) | | 0.85 | % | | 22.61 | % | | | 1,000.00 | | | 1,226.14 | | | 4.77 |
Series P (High Yield Series) | | 0.92 | % | | 23.67 | % | | | 1,000.00 | | | 1,236.67 | | | 5.19 |
Series Q (Small Cap Value Series) | | 1.12 | % | | 25.57 | % | | | 1,000.00 | | | 1,255.69 | | | 6.37 |
Series V (Mid Cap Value Series) | | 0.91 | % | | 23.37 | % | | | 1,000.00 | | | 1,233.65 | | | 5.12 |
Series X (Small Cap Growth Series) | | 1.07 | % | | 26.26 | % | | | 1,000.00 | | | 1,262.61 | | | 6.10 |
Series Y (Select 25 Series) | | 0.98 | % | | 23.80 | % | | | 1,000.00 | | | 1,238.03 | | | 5.53 |
Series Z (Alpha Opportunity Series) | | 1.65 | % | | 25.49 | % | | | 1,000.00 | | | 1,254.92 | | | 9.38 |
| | | | | |
Table 2. Based on hypothetical 5% return (before expenses) | | | | | | | | | | | | | | | |
Series A (Equity Series) | | 0.91 | % | | 5.00 | % | | $ | 1,000.00 | | $ | 1,020.62 | | $ | 4.63 |
Series B (Large Cap Value Series) | | 0.80 | % | | 5.00 | % | | | 1,000.00 | | | 1,021.17 | | | 4.08 |
Series C (Money Market Series) | | 0.68 | % | | 5.00 | % | | | 1,000.00 | | | 1,021.78 | | | 3.47 |
Series D (Global Series) | | 1.26 | % | | 5.00 | % | | | 1,000.00 | | | 1,018.85 | | | 6.41 |
Series E (U.S. Intermediate Bond Series) | | 0.76 | % | | 5.00 | % | | | 1,000.00 | | | 1,021.37 | | | 3.87 |
Series H (Enhanced Index Series) | | 0.76 | % | | 5.00 | % | | | 1,000.00 | | | 1,021.37 | | | 3.87 |
Series J (Mid Cap Growth Series) | | 0.91 | % | | 5.00 | % | | | 1,000.00 | | | 1,020.62 | | | 4.63 |
Series N (Managed Asset Allocation Series) | | 1.67 | % | | 5.00 | % | | | 1,000.00 | | | 1,016.79 | | | 8.49 |
Series O (All Cap Value Series) | | 0.85 | % | | 5.00 | % | | | 1,000.00 | | | 1,020.92 | | | 4.33 |
Series P (High Yield Series) | | 0.92 | % | | 5.00 | % | | | 1,000.00 | | | 1,020.57 | | | 4.69 |
Series Q (Small Cap Value Series) | | 1.12 | % | | 5.00 | % | | | 1,000.00 | | | 1,019.56 | | | 5.70 |
Series V (Mid Cap Value Series) | | 0.91 | % | | 5.00 | % | | | 1,000.00 | | | 1,020.62 | | | 4.63 |
Series X (Small Cap Growth Series) | | 1.07 | % | | 5.00 | % | | | 1,000.00 | | | 1,019.81 | | | 5.45 |
Series Y (Select 25 Series) | | 0.98 | % | | 5.00 | % | | | 1,000.00 | | | 1,020.27 | | | 4.99 |
Series Z (Alpha Opportunity Series) | | 1.65 | % | | 5.00 | % | | | 1,000.00 | | | 1,016.89 | | | 8.39 |
| 2 | Expenses are equal to the Series annualized expense ratio, net of any applicable fee waivers, multiplied by the average account value over the period, multiplied by 184/365 (to reflect the one-half year period). |
| 3 | Actual cumulative return at net asset value for the period July 1, 2009 to December 31, 2009. |
2
Managers’ Commentary
February 15, 2010
| | | | |
| | Advised by: | |  |
To Our Shareholders:
Series A of the SBL Fund – Equity Series returned 29.84% during the year, outperforming the benchmark S&P 500 Index’s return of 26.46% and the Series’ peer group median return of 27.77%.
The Series’ strategy uses a blended approach, investing in growth and value stocks. Growth oriented stocks are securities of established companies that typically have a record of consistent earnings growth greater than the overall market. Value oriented stocks are securities of companies that are believed to be trading well below their intrinsic value.
Our strategy is to buy companies that are trading at a significant discount to their intrinsic value. Our investment approach is a defined and disciplined process of three clear philosophical tenants that drive our investment decisions: a valuation focus, a long-term perspective and an opportunistic approach.
This investment process is fundamentally driven and quantitatively aided. We use proprietary screens to identify potential companies for investment and then perform rigorous fundamental analysis to identify the best ideas. Through this fundamental research, we determine an estimate of intrinsic value and thus a valuation target for each idea. We construct the portfolios based on the level of conviction generated by this bottom-up analysis and the upside/downside profile associated with each company.
Health Care and Industrials Top Performers
While the health care sector was an underweighted position, portfolio holdings nearly doubled that of the S&P 500 Index, 39% to 20%. Schering-Plough Corporation and Hospira, Inc. led the sector for the portfolio with gains of 67% and 90%, respectively, due to the larger weight based on our conviction. Other health care holdings that were of benefit to the strategy were Amgen, Inc., Pfizer, Inc., and Medco Health Solutions, Inc.
Superior stock selection boosted performance in the industrials sector as the portfolio holdings increased 35% compared to a 21% gain for the Index. Underweighting General Electric Company, which produced a negative return for the year, helped portfolio performance. Adding to returns for the strategy were Union Pacific Corporation Parker Hannifin Corporation and Goodrich Corporation.
Financials and Consumer Discretionary Disappoint
The largest detractor for the Series was the financials sector due to stock selection, gaining just 7% against the 13% return posted by the benchmark. The sector was a close weight to the Index. Capital One Financial Corporation declined 68% in the portfolio while MetLife, Inc. lost 61%.
Stock selection in the consumer discretionary sector also hurt strategy performance. Gains for the portfolio were 20%, which was well below the 42% increase for the benchmark. Best Buy Company, Inc. and Coach, Inc. were the biggest losers for the strategy. If held during the entire period, Coach, Inc. would have generated a gain of 77%. Instead, the position lost 32% while held in the portfolio. Darden Restaurants, Inc. and Lowe’s Companies, Inc. were other holdings in the sector that hurt overall performance.
Market Outlook
Our bottom-up approach looks at market uncertainty in the context of the potential long-term impact on individual companies. It is in times as these when our core philosophy and disciplined process becomes paramount. We continue to use a rigorous fundamental research process to identify strong companies from a risk perspective. Our focus is on identifying companies with the ability to be substantially better over the next three to five years or have the potential to maintain their return on capital at current levels in a difficult economic environment. We are confident in our ability to find these companies.
We believe that investing is a long-term pursuit that requires patience and a consistent approach. We recognize there are many investment fund alternatives available today and thank you for the confidence you place in us.
Sincerely,
Mark A. Mitchell, Portfolio Manager
Mark P. Bronzo, Portfolio Manager
3
| | |
| Performance Summary | | Series A (Equity Series) |
December 31, 2009 | | (unaudited) |
PERFORMANCE
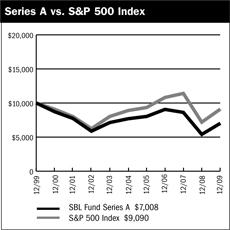
$10,000 Over 10 Years
The chart above assumes a hypothetical $10,000 investment in Series A (Equity Series) on December 31, 1999 and reflects the fees and expenses of Series A. The S&P 500 Index is a capitalization-weighted index composed of 500 selected common stocks that represent the broad domestic economy and is a widely recognized unmanaged index of market performance.
Average Annual Returns
| | | | | | | | | |
Periods Ended 12-31-091 | | 1 Year | | | 5 Years | | | 10 Years | |
Series A | | 29.84 | % | | (1.86 | )% | | (3.49 | )% |
| 1 | Performance figures do not reflect fees and expenses associated with an investment in variable insurance products offered by Security Benefit Life Insurance Company. If returns had taken into account these fees and expenses, performance would have been lower. Shares of a Series of SBL Fund are available only through the purchase of such products. |
The performance data quoted above represents past performance. Past performance is not predictive of future performance. The investment return and principal value of an investment will fluctuate so that an investor’s shares, when redeemed, may be worth more or less than their original cost.
Portfolio Composition by Sector
| | | |
Consumer Discretionary | | 11.39 | % |
Consumer Staples | | 7.22 | |
Energy | | 11.72 | |
Financials | | 11.12 | |
Health Care | | 11.45 | |
Industrials | | 17.95 | |
Information Technology | | 20.93 | |
Materials | | 4.11 | |
Telecommunication Services | | 0.58 | |
Utilities | | 2.14 | |
Cash & Other Assets, Less Liabilities | | 1.39 | |
Total Net Assets | | 100.00 | % |
| | | |
The accompanying notes are an integral part of the financial statements
4
| | |
| Schedule of Investments | | Series A |
December 31, 2009 | | (Equity Series) |
| | | | | |
| | | Shares | | Value |
COMMON STOCKS—98.6% | | | | | |
Advertising—1.7% | | | | | |
Omnicom Group, Inc. | | 81,000 | | $ | 3,171,150 |
| | | | | |
Aerospace & Defense—5.1% | | | | | |
Boeing Company | | 57,600 | | | 3,117,888 |
Goodrich Corporation | | 51,260 | | | 3,293,454 |
Precision Castparts Corporation | | 1,333 | | | 147,097 |
United Technologies Corporation | | 39,400 | | | 2,734,754 |
| | | | | |
| | | | | 9,293,193 |
| | | | | |
Air Freight & Logistics—1.4% | | | | | |
FedEx Corporation | | 31,500 | | | 2,628,675 |
| | | | | |
Apparel Retail—1.6% | | | | | |
TJX Companies, Inc. | | 82,000 | | | 2,997,100 |
| | | | | |
Application Software—0.5% | | | | | |
Synopsys, Inc.* | | 41,800 | | | 931,304 |
| | | | | |
Asset Management & Custody Banks—0.7% | | | | | |
Bank of New York Mellon Corporation | | 46,900 | | | 1,311,793 |
| | | | | |
Biotechnology—1.7% | | | | | |
Amgen, Inc.* | | 56,700 | | | 3,207,519 |
| | | | | |
Building Products—1.2% | | | | | |
USG Corporation* | | 163,200 | | | 2,292,960 |
| | | | | |
Coal & Consumable Fuels—1.6% | | | | | |
Peabody Energy Corporation | | 64,260 | | | 2,905,195 |
| | | | | |
Communications Equipment—3.4% | | | | | |
Cisco Systems, Inc.* | | 127,700 | | | 3,057,138 |
Qualcomm, Inc. | | 66,265 | | | 3,065,419 |
| | | | | |
| | | | | 6,122,557 |
| | | | | |
Computer Hardware—3.8% | | | | | |
Apple, Inc.* | | 20,720 | | | 4,369,018 |
Hewlett-Packard Company | | 47,900 | | | 2,467,329 |
| | | | | |
| | | | | 6,836,347 |
| | | | | |
Computer Storage & Peripherals—2.1% | | | | | |
EMC Corporation* | | 226,760 | | | 3,961,497 |
| | | | | |
Construction Materials—0.2% | | | | | |
Vulcan Materials Company | | 7,900 | | | 416,093 |
| | | | | |
Consumer Finance—0.1% | | | | | |
First Marblehead Corporation* | | 103,452 | | | 220,353 |
| | | | | |
Data Processing & Outsourced Services—2.3% | | | | | |
Western Union Company | | 231,100 | | | 4,356,235 |
| | | | | |
Department Stores—2.4% | | | | | |
JC Penney Company, Inc. | | 61,400 | | | 1,633,854 |
Kohl’s Corporation* | | 50,950 | | | 2,747,734 |
| | | | | |
| | | | | 4,381,588 |
| | | | | |
Diversified Banks—2.0% | | | | | |
U.S. Bancorp | | 85,875 | | | 1,933,047 |
Wells Fargo & Company | | 66,564 | | | 1,796,562 |
| | | | | |
| | | | | 3,729,609 |
| | | | | |
Diversified Chemicals—0.8% | | | | | |
Dow Chemical Company | | 52,500 | | | 1,450,575 |
| | | | | |
Diversified Metals & Mining—1.5% | | | | | |
Freeport-McMoRan Copper & Gold, Inc. (CI.B) | | 35,500 | | | 2,850,295 |
| | | | | |
Drug Retail—1.0% | | | | | |
CVS Caremark Corporation | | 58,000 | | | 1,868,180 |
| | | | | |
Electric Utilities—1.6% | | | | | |
Edison International | | 86,300 | | | 3,001,514 |
| | | | | |
Electrical Components & Equipment—3.3% | | | | | |
Cooper Industries plc | | 72,780 | | | 3,103,338 |
Emerson Electric Company | | 70,690 | | | 3,011,394 |
| | | | | |
| | | | | 6,114,732 |
| | | | | |
Electronic Manufacturing Services—1.1% | | | | | |
Tyco Electronics, Ltd. | | 85,200 | | | 2,091,660 |
| | | | | |
Fertilizers & Agricultural Chemicals—1.6% | | | | | |
Potash Corporation of Saskatchewan, Inc. | | 26,905 | | | 2,919,193 |
| | | | | |
Health Care Equipment—4.1% | | | | | |
Covidien plc | | 105,670 | | | 5,060,536 |
Hospira, Inc.* | | 48,400 | | | 2,468,400 |
| | | | | |
| | | | | 7,528,936 |
| | | | | |
Health Care Services—0.9% | | | | | |
Medco Health Solutions, Inc.* | | 27,300 | | | 1,744,743 |
| | | | | |
Home Improvement Retail—1.5% | | | | | |
Lowe’s Companies, Inc. | | 117,500 | | | 2,748,325 |
| | | | | |
Hotels, Resorts & Cruise Lines—1.5% | | | | | |
Carnival Corporation* | | 89,900 | | | 2,848,931 |
| | | | | |
Household Products—1.7% | | | | | |
Colgate-Palmolive Company | | 38,050 | | | 3,125,808 |
| | | | | |
Hypermarkets & Super Centers—2.8% | | | | | |
Costco Wholesale Corporation | | 45,100 | | | 2,668,567 |
Wal-Mart Stores, Inc. | | 47,800 | | | 2,554,910 |
| | | | | |
| | | | | 5,223,477 |
| | | | | |
Independent Power Producers & Energy Traders—0.5% | | | | | |
NRG Energy, Inc.* | | 41,600 | | | 982,176 |
| | | | | |
Industrial Conglomerates—3.2% | | | | | |
3M Company | | 39,000 | | | 3,224,130 |
McDermott International, Inc.* | | 117,000 | | | 2,809,170 |
| | | | | |
| | | | | 6,033,300 |
| | | | | |
The accompanying notes are an integral part of the financial statements
5
| | |
| Schedule of Investments | | Series A |
December 31, 2009 | | (Equity Series) |
| | | | | |
| | | Shares | | Value |
COMMON STOCKS—98.6% (continued) | | | | | |
Industrial Machinery—1.0% | | | | | |
Parker Hannifin Corporation | | 33,603 | | $ | 1,810,530 |
| | | | | |
Insurance Brokers—0.9% | | | | | |
AON Corporation | | 45,700 | | | 1,752,138 |
| | | | | |
Integrated Oil & Gas—5.0% | | | | | |
Chevron Corporation | | 31,700 | | | 2,440,583 |
ConocoPhillips | | 15,200 | | | 776,264 |
Exxon Mobil Corporation | | 48,400 | | | 3,300,396 |
Occidental Petroleum Corporation | | 36,000 | | | 2,928,600 |
| | | | | |
| | | | | 9,445,843 |
| | | | | |
Integrated Telecommunication Services—0.6% | | | | | |
Windstream Corporation | | 98,200 | | | 1,079,218 |
| | | | | |
Internet Software & Services—2.5% | | | | | |
AOL, Inc.* | | 5,945 | | | 138,400 |
Google, Inc.* | | 7,235 | | | 4,485,555 |
| | | | | |
| | | | | 4,623,955 |
| | | | | |
Investment Banking & Brokerage—1.6% | | | | | |
Morgan Stanley | | 100,500 | | | 2,974,800 |
| | | | | |
IT Consulting & Other Services—1.6% | | | | | |
Cognizant Technology Solutions Corporation* | | 67,440 | | | 3,055,032 |
| | | | | |
Managed Health Care—0.8% | | | | | |
Aetna, Inc. | | 49,600 | | | 1,572,320 |
| | | | | |
Movies & Entertainment—1.0% | | | | | |
Time Warner, Inc. | | 65,400 | | | 1,905,756 |
| | | | | |
Oil & Gas Drilling—1.9% | | | | | |
Transocean, Ltd.* | | 41,840 | | | 3,464,352 |
| | | | | |
Oil & Gas Equipment & Services—1.2% | | | | | |
Halliburton Company | | 74,200 | | | 2,232,678 |
| | | | | |
Oil & Gas Exploration & Production—0.9% | | | | | |
Chesapeake Energy Corporation | | 64,200 | | | 1,661,496 |
| | | | | |
Oil & Gas Storage & Transportation—1.1% | | | | | |
Williams Companies, Inc. | | 99,500 | | | 2,097,460 |
| | | | | |
Other Diversified Financial Services—2.4% | | | | | |
JPMorgan Chase & Company | | 104,106 | | | 4,338,096 |
| | | | | |
Pharmaceuticals—3.9% | | | | | |
Merck & Company, Inc. | | 17,358 | | | 634,261 |
Pfizer, Inc. | | 169,900 | | | 3,090,481 |
Teva Pharmaceutical Industries, Ltd. ADR | | 62,490 | | | 3,510,689 |
| | | | | |
| | | | | 7,235,431 |
| | | | | |
Property & Casualty Insurance—2.2% | | | | | |
Berkshire Hathaway, Inc.* | | 42 | | | 4,166,400 |
| | | | | |
Railroads—1.3% | | | | | |
Union Pacific Corporation | | 37,200 | | | 2,377,080 |
| | | | | |
Regional Banks—1.2% | | | | | |
BB&T Corporation | | 33,700 | | | 854,969 |
Fifth Third Bancorp | | 41,000 | | | 399,750 |
Regions Financial Corporation | | 178,000 | | | 941,620 |
| | | | | |
| | | | | 2,196,339 |
| | | | | |
Research & Consulting Services—1.5% | | | | | |
Equifax, Inc. | | 91,900 | | | 2,838,791 |
| | | | | |
Semiconductor Equipment—1.6% | | | | | |
Lam Research Corporation* | | 75,750 | | | 2,970,158 |
| | | | | |
Semiconductors—2.1% | | | | | |
Intel Corporation | | 195,050 | | | 3,979,020 |
| | | | | |
Soft Drinks—2.1% | | | | | |
PepsiCo, Inc. | | 63,810 | | | 3,879,648 |
| | | | | |
Tobacco—1.3% | | | | | |
Altria Group, Inc. | | 50,500 | | | 991,315 |
Philip Morris International, Inc. | | 30,500 | | | 1,469,795 |
| | | | | |
| | | | | 2,461,110 |
| | | | | |
TOTAL COMMON STOCKS (cost $172,811,350) | | | | $ | 183,412,664 |
| | | | | |
Total Investments—98.6%1 (cost $172,811,350) | | | | $ | 183,412,664 |
Cash & Other Assets, Less Liabilities—1.4% | | | | | 2,594,781 |
| | | | | |
Total Net Assets—100.0% | | | | $ | 186,007,445 |
| | | | | |
For federal income tax purposes the identified cost of investments owned at December 31, 2009 was $173,165,753.
| * | Non-income producing security |
| 1 | Unless otherwise indicated, the values of the securities of the Portfolio are determined based on Level 1 inputs. |
The accompanying notes are an integral part of the financial statements
6
Statement of Assets and Liabilities
December 31, 2009
| | | | |
Assets: | | | | |
Investments, at value* | | $ | 183,412,664 | |
Cash | | | 2,932,270 | |
Receivables: | | | | |
Fund shares sold | | | 391,256 | |
Securities sold | | | 296,724 | |
Dividends | | | 243,233 | |
Prepaid expenses | | | 3,665 | |
| | | | |
Total assets | | | 187,279,812 | |
| | | | |
| |
Liabilities: | | | | |
| |
Payable for: | | | | |
Fund shares redeemed | | | 395,157 | |
Securities purchased | | | 643,830 | |
Management fees | | | 118,522 | |
Administration fees | | | 15,133 | |
Transfer agent/maintenance fees | | | 2,083 | |
Custodian fees | | | 1,176 | |
Directors’ fees | | | 5,478 | |
Professional fees | | | 33,350 | |
Other fees | | | 57,638 | |
| | | | |
Total liabilities | | | 1,272,367 | |
| | | | |
Net assets | | $ | 186,007,445 | |
| | | | |
| |
Net assets consist of: | | | | |
Paid in capital | | $ | 230,763,789 | |
Undistributed net investment income | | | 1,140,095 | |
Accumulated net realized loss on sale of investments | | | (56,497,753 | ) |
Net unrealized appreciation in value of investments | | | 10,601,314 | |
| | | | |
Net assets | | $ | 186,007,445 | |
| | | | |
| |
Capital shares authorized | | | unlimited | |
Capital shares outstanding | | | 9,314,012 | |
Net asset value per share (net assets divided by shares outstanding) | | $ | 19.97 | |
| | | | |
| |
* Investments, at cost | | $ | 172,811,350 | |
Statement of Operations
For Year Ended December 31, 2009
| | | | |
Investment Income: | | | | |
Dividends | | $ | 2,678,032 | |
Interest | | | 4,423 | |
| | | | |
Total investment income | | | 2,682,455 | |
| | | | |
| |
Expenses: | | | | |
Management fees | | | 1,253,402 | |
Administration fees | | | 159,095 | |
Transfer agent/maintenance fees | | | 25,315 | |
Custodian fees | | | 7,740 | |
Directors’ fees | | | 15,695 | |
Professional fees | | | 41,123 | |
Reports to shareholders | | | 28,002 | |
Other | | | 11,988 | |
| | | | |
Total expenses | | | 1,542,360 | |
| | | | |
Net investment income | | | 1,140,095 | |
| | | | |
| |
Net Realized and Unrealized Gain (Loss): | | | | |
Net realized gain (loss) during the year on: | | | | |
Investments | | | (27,019,679 | ) |
Options written | | | 7,098 | |
| | | | |
Net realized loss | | | (27,012,581 | ) |
| | | | |
Net unrealized appreciation (depreciation) during the year on: | | | | |
Investments | | | 69,815,569 | |
| | | | |
Net unrealized appreciation | | | 69,815,569 | |
| | | | |
Net realized and unrealized gain | | | 42,802,988 | |
| | | | |
Net increase in net assets resulting from operations | | $ | 43,943,083 | |
| | | | |
The accompanying notes are an integral part of the financial statements
7
| | |
| | Series A |
| Statement of Changes in Net Assets | | (Equity Series) |
| | | | | | | | |
| | | Year Ended
December 31, 2009 | | | Year Ended
December 31, 2008 | |
Increase (decrease) in net assets from operations: | | | | | | | | |
Net investment income | | $ | 1,140,095 | | | $ | 1,665,710 | |
Net realized loss during the year on investments | | | (27,012,581 | ) | | | (21,709,270 | ) |
Net unrealized appreciation (depreciation) during the year on investments | | | 69,815,569 | | | | (85,457,350 | ) |
| | | | | | | | |
Net increase (decrease) in net assets resulting from operations | | | 43,943,083 | | | | (105,500,910 | ) |
| | | | | | | | |
| | |
Capital share transactions: | | | | | | | | |
Proceeds from sale of shares | | | 17,506,604 | | | | 24,426,853 | |
Cost of shares redeemed | | | (40,551,126 | ) | | | (82,812,481 | ) |
| | | | | | | | |
Net decrease from capital share transactions | | | (23,044,522 | ) | | | (58,385,628 | ) |
| | | | | | | | |
Net increase (decrease) in net assets | | | 20,898,561 | | | | (163,886,538 | ) |
| | | | | | | | |
| | |
Net assets: | | | | | | | | |
Beginning of year | | | 165,108,884 | | | | 328,995,422 | |
| | | | | | | | |
End of year | | $ | 186,007,445 | | | $ | 165,108,884 | |
| | | | | | | | |
Undistributed net investment income at end of year | | $ | 1,140,095 | | | $ | 1,665,710 | |
| | | | | | | | |
| | |
Capital share activity: | | | | | | | | |
Shares sold | | | 1,102,467 | | | | 1,174,494 | |
Shares redeemed | | | (2,524,592 | ) | | | (3,831,105 | ) |
| | | | | | | | |
Total capital share activity | | | (1,422,125 | ) | | | (2,656,611 | ) |
| | | | | | | | |
The accompanying notes are an integral part of the financial statements
8
| | |
| Financial Highlights | | Series A |
Selected data for each share of capital stock outstanding throughout each year | | (Equity Series) |
| | | | | | | | | | | | | | | | | | | | |
| | | 2009 | | | 2008 | | | 2007 | | | 2006 | | | Year Ended
December 31,
2005 | |
Per Share Data | | | | | | | | | | | | | | | | | | | | |
Net asset value, beginning of period | | $ | 15.38 | | | $ | 24.57 | | | $ | 25.83 | | | $ | 22.88 | | | $ | 21.93 | |
| | | | | | | | | | | | | | | | | | | | |
Income (loss) from investment operations: | | | | | | | | | | | | | | | | | | | | |
Net investment incomea | | | 0.11 | | | | 0.14 | | | | 0.14 | | | | 0.11 | | | | 0.16 | |
Net gain (loss) on securities (realized and unrealized) | | | 4.48 | | | | (9.33 | ) | | | (1.40 | ) | | | 2.84 | | | | 0.79 | |
| | | | | | | | | | | | | | | | | | | | |
Total from investment operations | | | 4.59 | | | | (9.19 | ) | | | (1.26 | ) | | | 2.95 | | | | 0.95 | |
| | | | | | | | | | | | | | | | | | | | |
Net asset value, end of period | | $ | 19.97 | | | $ | 15.38 | | | $ | 24.57 | | | $ | 25.83 | | | $ | 22.88 | |
| | | | | | | | | | | | | | | | | | | | |
Total Returnb | | | 29.84 | % | | | (37.40 | )% | | | (4.88 | )% | | | 12.89 | % | | | 4.33 | % |
| | | | | | | | | | | | | | | | | | | | |
| | | | | |
Ratios/Supplemental Data | | | | | | | | | | | | | | | | | | | | |
Net assets, end of period (in thousands) | | $ | 186,007 | | | $ | 165,109 | | | $ | 328,995 | | | $ | 441,788 | | | $ | 466,931 | |
| | | | | | | | | | | | | | | | | | | | |
Ratios to average net assets: | | | | | | | | | | | | | | | | | | | | |
Net investment income | | | 0.68 | % | | | 0.66 | % | | | 0.52 | % | | | 0.33 | % | | | 0.55 | % |
Total expensesc | | | 0.92 | % | | | 0.90 | % | | | 0.89 | % | | | 0.90 | % | | | 0.89 | % |
Net expensesd | | | 0.92 | % | | | 0.90 | % | | | 0.89 | % | | | 0.90 | % | | | 0.89 | % |
Net expenses prior to custodian earnings credits and net of expense waivers | | | 0.92 | % | | | 0.90 | % | | | 0.89 | % | | | 0.90 | % | | | 0.89 | % |
| | | | | | | | | | | | | | | | | | | | |
Portfolio turnover rate | | | 78 | % | | | 142 | %e | | | 14 | % | | | 26 | % | | | 37 | % |
| a | Net investment income (loss) was computed using average shares outstanding throughout the period. |
| b | Total return does not take into account any of the expenses associated with an investment in variable insurance products offered by Security Benefit Life Insurance Company. If total return had taken into account these expenses, performance would have been lower. Shares of a series of SBL Fund are available only through the purchase of such products. |
| c | Total expense information reflects the expense ratios absent expense reductions by the Investment Manager and custodian earnings credits, as applicable. |
| d | Net expense information reflects the expense ratios after voluntary expense waivers, reimbursements and custodian earnings credits, as applicable. |
| e | Significant variation in the portfolio turnover rate is due to Investment Manager’s appointment of new portfolio manager for the Series. |
The accompanying notes are an integral part of the financial statements
9
This page left blank intentionally.
10
Manager’s Commentary
February 15, 2010
| | | | |
| | Advised by: | | |
To Our Shareholders:
Series B of the SBL Fund – Large Cap Value Series returned 26.50% during the year, leading the benchmark Russell 1000 Value Index’s return of 19.69%. The Series outperformed its peer group median return of 24.28%.
Our strategy is to buy companies that are trading at a significant discount to their intrinsic value. Our investment approach is a defined and disciplined process with three clear philosophical tenets that drive our investment decisions: a valuation focus, a long-term perspective and an opportunistic approach.
Our investment process is fundamentally driven and quantitatively aided. We use proprietary screens to identify potential companies for investment and then perform rigorous fundamental analysis to identify the best ideas. Through this fundamental research, we determine an estimate of intrinsic value and thus a valuation target for each idea. We construct the portfolios based on the level of conviction generated by this bottom-up analysis and the upside/downside profile associated with each company. For Series B, we apply this philosophy to a broad range of value names.
Health Care and Industrials Top Performers
The Series’ health care sector led the portfolio due to superior security selection. While a slightly underweight position, holdings in the strategy increased 67% compared to a 23% return for the benchmark. Schering-Plough Corporation added the largest relative return to the sector while returns for Hospira, Inc. were 90%. Another contributor for the portfolio in the sector was Medco Health Solutions, Inc.
The Series has a significant overweight position in the industrials sector at 22%, more than double the 9% weight of the benchmark. Holdings in the sector for the portfolio outdistanced that of the Index 40% to 15%, respectively. Leaders for the portfolio were USG Corporation and Union Pacific Corporation, which increased 75% and 37%, respectively. Other contributing performers in the sector were General Electric Company and FedEx Corporation.
Financials and Consumer Discretionary Disappoint
The largest detractor from the portfolio was the financials sector due to underperforming stock selection. Capital One Financial Corporation dropped 71% during the period causing it to the be largest drag on performance for the sector. While JPMorgan Chase & Company gained 34% during the year, it was a significant underweight against the benchmark allowing the Index to increase its relative return. Finally, AON Corporation was a drag on portfolio performance due to its large relative overweight in a security that had negative returns.
The strategy’s consumer discretionary sector was an even weight position but held the portfolio back due to security selection. While the sector in the portfolio gained 27%, it was well short of the 47% return for the benchmark. Portfolio securities in the sector that detracted from performance were Lowe’s Companies, Inc., CBS Corporation (Cl B), and News Corporation (Cl A). Had the portfolio held CBS Corporation and News Corporation during the entire year, it would have realized the Index’s gains of 77% and 53%, respectively, rather than the actual 7% and 3% returns.
Market Outlook
Our bottom-up approach looks at market uncertainty in the context of the potential long-term impact on individual companies. Often times, volatility provides opportunity. We are maintaining flexibility in the portfolios to take advantage of these opportunities as they arise. Our focus is on identifying companies with the ability to be substantially better over the next three to five years or have the potential to maintain their return on capital at current levels in a difficult economic environment. We are confident in our ability to find these companies.
We believe that investing is a long-term pursuit that requires patience and a consistent approach. We recognize there are many investment fund alternatives available today and thank you for your business and the confidence you place in us.
Sincerely,
Mark A. Mitchell, Portfolio Manager
11
| | |
| | Series B |
| Performance Summary | | (Large Cap Value Series) |
December 31, 2009 | | (unaudited) |
PERFORMANCE
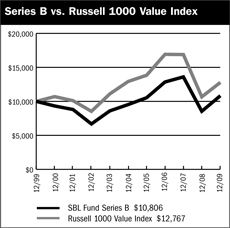
$10,000 Over 10 Years
The chart above assumes a hypothetical $10,000 investment in Series B (Large Cap Value Series) on December 31, 1999 and reflects the fees and expenses of Series B. The Russell 1000 Value Index is an unmanaged index representing the performance of those Russell 1000 Index companies with lower price-to-book ratios and lower forecasted growth values.
Average Annual Returns
| | | | | | | | | |
Periods Ended 12-31-091 | | 1 Year | | | 5 Years | | | 10 Years | |
Series B | | 26.50 | % | | 2.54 | % | | 0.78 | % |
| 1 | Performance figures do not reflect fees and expenses associated with an investment in variable insurance products offered by Security Benefit Life Insurance Company. If returns had taken into account these fees and expenses, performance would have been lower. Shares of a Series of SBL Fund are available only through the purchase of such products. |
The performance data quoted above represents past performance. Past performance is not predictive of future performance. The investment return and principal value of an investment will fluctuate so that an investor’s shares, when redeemed, may be worth more or less than their original cost.
Portfolio Composition by Sector
| | | |
Consumer Discretionary | | 7.22 | % |
Consumer Staples | | 10.17 | |
Energy | | 13.68 | |
Financials | | 16.68 | |
Health Care | | 8.96 | |
Industrials | | 20.07 | |
Information Technology | | 11.13 | |
Materials | | 2.22 | |
Telecommunication Services | | 1.30 | |
Utilities | | 4.62 | |
Exchange Traded Funds | | 1.01 | |
Commercial Paper | | 1.25 | |
Cash & Other Assets, Less Liabilities | | 1.69 | |
Total Net Assets | | 100.00 | % |
| | | |
The accompanying notes are an integral part of the financial statements
12
| | |
| Schedule of Investments | | Series B |
December 31, 2009 | | (Large Cap Value Series) |
| | | | | |
| | | Shares | | Value |
COMMON STOCKS—97.1% | | | | | |
Aerospace & Defense—3.1% | | | | | |
Precision Castparts Corporation | | 4,180 | | $ | 461,263 |
United Technologies Corporation | | 117,300 | | | 8,141,793 |
| | | | | |
| | | | | 8,603,056 |
| | | | | |
Air Freight & Logistics—3.0% | | | | | |
FedEx Corporation | | 101,643 | | | 8,482,108 |
| | | | | |
Application Software—1.1% | | | �� | | |
Synopsys, Inc.* | | 134,800 | | | 3,003,344 |
| | | | | |
Asset Management & Custody Banks—1.5% | | | | | |
Bank of New York Mellon Corporation | | 151,400 | | | 4,234,658 |
| | | | | |
Building Products—2.6% | | | | | |
USG Corporation* | | 528,000 | | | 7,418,400 |
| | | | | |
Computer Hardware—2.5% | | | | | |
Hewlett-Packard Company | | 137,300 | | | 7,072,323 |
| | | | | |
Construction Materials—0.5% | | | | | |
Vulcan Materials Company | | 25,400 | | | 1,337,818 |
| | | | | |
Consumer Finance—0.2% | | | | | |
First Marblehead Corporation* | | 317,112 | | | 675,449 |
| | | | | |
Data Processing & Outsourced Services—4.9% | | | | | |
Western Union Company | | 737,500 | | | 13,901,875 |
| | | | | |
Department Stores—1.9% | | | | | |
JC Penney Company, Inc. | | 198,800 | | | 5,290,068 |
| | | | | |
Diversified Banks—4.6% | | | | | |
U.S. Bancorp | | 277,806 | | | 6,253,413 |
Wells Fargo & Company | | 242,405 | | | 6,542,511 |
| | | | | |
| | | | | 12,795,924 |
| | | | | |
Diversified Chemicals—1.7% | | | | | |
Dow Chemical Company | | 176,400 | | | 4,873,932 |
| | | | | |
Drug Retail—2.1% | | | | | |
CVS Caremark Corporation | | 186,200 | | | 5,997,502 |
| | | | | |
Electric Utilities—3.5% | | | | | |
Edison International | | 282,400 | | | 9,821,872 |
| | | | | |
Electronic Manufacturing Services—2.4% | | | | | |
Tyco Electronics, Ltd. | | 273,950 | | | 6,725,473 |
| | | | | |
Exchange Traded Funds—1.0% | | | | | |
iShares Russell 1000 Value Index Fund | | 49,500 | | | 2,840,805 |
| | | | | |
Health Care Equipment—4.5% | | | | | |
Covidien plc | | 101,650 | | | 4,868,019 |
Hospira, Inc.* | | 148,000 | | | 7,547,999 |
| | | | | |
| | | | | 12,416,018 |
| | | | | |
Health Care Services—2.0% | | | | | |
Medco Health Solutions, Inc.* | | 88,200 | | | 5,636,862 |
| | | | | |
Home Improvement Retail—2.8% | | | | | |
Lowe’s Companies, Inc. | | 343,500 | | | 8,034,465 |
| | | | | |
Hypermarkets & Super Centers—5.7% | | | | | |
Costco Wholesale Corporation | | 126,400 | | | 7,479,088 |
Wal-Mart Stores, Inc. | | 154,500 | | | 8,258,025 |
| | | | | |
| | | | | 15,737,113 |
| | | | | |
Independent Power Producers & Energy Traders—1.1% | | | | | |
NRG Energy, Inc.* | | 133,500 | | | 3,151,935 |
| | | | | |
Industrial Conglomerates—3.3% | | | | | |
McDermott International, Inc.* | | 379,900 | | | 9,121,399 |
| | | | | |
Industrial Machinery—2.1% | | | | | |
Parker Hannifin Corporation | | 109,810 | | | 5,916,563 |
| | | | | |
Insurance Brokers—2.0% | | | | | |
AON Corporation | | 147,900 | | | 5,670,486 |
| | | | | |
Integrated Oil & Gas—7.1% | | | | | |
Chevron Corporation | | 98,600 | | | 7,591,214 |
ConocoPhillips | | 41,200 | | | 2,104,084 |
Exxon Mobil Corporation | | 151,700 | | | 10,344,423 |
| | | | | |
| | | | | 20,039,721 |
| | | | | |
Integrated Telecommunication Services—1.3% | | | | | |
Windstream Corporation | | 331,932 | | | 3,647,933 |
| | | | | |
Internet Software & Services—0.2% | | | | | |
AOL, Inc.* | | 21,593 | | | 502,685 |
| | | | | |
Managed Health Care—1.8% | | | | | |
Aetna, Inc. | | 158,000 | | | 5,008,600 |
| | | | | |
Movies & Entertainment—2.5% | | | | | |
Time Warner, Inc. | | 237,533 | | | 6,921,712 |
| | | | | |
Oil & Gas Equipment & Services—2.6% | | | | | |
Halliburton Company | | 244,000 | | | 7,341,960 |
| | | | | |
Oil & Gas Exploration & Production—1.7% | | | | | |
Chesapeake Energy Corporation | | 179,200 | | | 4,637,696 |
| | | | | |
Oil & Gas Storage & Transportation—2.3% | | | | | |
Williams Companies, Inc. | | 300,700 | | | 6,338,756 |
| | | | | |
Other Diversified Financial Services—1.0% | | | | | |
JPMorgan Chase & Company | | 69,469 | | | 2,894,773 |
| | | | | |
The accompanying notes are an integral part of the financial statements
13
| | |
| Schedule of Investments | | Series B |
| December 31, 2009 | | (Large Cap Value Series) |
| | | | | | |
| | | Shares | | Value |
COMMON STOCKS—97.1% (continued) | | | | | | |
Pharmaceuticals—0.7% | | | | | | |
Merck & Company, Inc. | | | 56,170 | | $ | 2,052,452 |
| | | | | | |
Property & Casualty Insurance—4.9% | | | | | | |
Berkshire Hathaway, Inc.* | | | 135 | | | 13,392,000 |
| | | | | | |
Railroads—2.7% | | | | | | |
Union Pacific Corporation | | | 120,000 | | | 7,668,000 |
| | | | | | |
Regional Banks—2.5% | | | | | | |
BB&T Corporation | | | 109,200 | | | 2,770,404 |
Fifth Third Bancorp | | | 133,000 | | | 1,296,750 |
Regions Financial Corporation | | | 575,500 | | | 3,044,395 |
| | | | | | |
| | | | | | 7,111,549 |
| | | | | | |
Research & Consulting Services—3.3% | | | | | | |
Equifax, Inc. | | | 295,500 | | | 9,127,994 |
| | | | | | |
Tobacco—2.4% | | | | | | |
Altria Group, Inc. | | | 108,000 | | | 2,120,040 |
Philip Morris International, Inc. | | | 97,100 | | | 4,679,249 |
| | | | | | |
| | | | | | 6,799,289 |
| | | | | | |
TOTAL COMMON STOCKS (cost $262,147,025) | | | | | $ | 272,244,568 |
| | | | | | |
| | |
| | | Principal
Amount | | Value |
COMMERCIAL PAPER—1.2% | | | | | | |
Automotive—1.2% | | | | | | |
Toyota Motor Credit Corporation | | | | | | |
0.03%, 01/04/20101 | | $ | 3,500,000 | | $ | 3,499,991 |
| | | | | | |
TOTAL COMMERCIAL PAPER (cost $3,499,991) | | | | | $ | 3,499,991 |
| | | | | | |
Total Investments—98.3%2 (cost $265,647,016) | | | | | $ | 275,744,559 |
Cash & Other Assets, Less Liabilities—1.7% | | | | | | 4,728,827 |
| | | | | | |
Total Net Assets—100.0% | | | | | $ | 280,473,386 |
| | | | | | |
For federal income tax purposes the identified cost of investments owned at December 31, 2009 was $265,859,070.
| plc | Public Limited Company |
| * | Non-income producing security |
| 1 | Value determined based on Level 2 inputs. |
| 2 | Unless otherwise indicated, the values of the securities of the Portfolio are determined based on Level 1 inputs. |
The accompanying notes are an integral part of the financial statements
14
Series B
(Large Cap Value Series)
Statement of Assets and Liabilities
December 31, 2009
| | | | |
Assets: | | | | |
Investments, at value* | | $ | 275,744,559 | |
Cash | | | 5,589,947 | |
Receivables: | | | | |
Fund shares sold | | | 204,743 | |
Securities sold | | | 959,225 | |
Dividends | | | 457,031 | |
Prepaid expenses | | | 5,473 | |
| | | | |
Total assets | | | 282,960,978 | |
| | | | |
Liabilities: | | | | |
| |
Payable for: | | | | |
Fund shares redeemed | | | 133,054 | |
Securities purchased | | | 2,074,253 | |
Management fees | | | 155,170 | |
Administration fees | | | 22,768 | |
Transfer agent/maintenance fees | | | 2,083 | |
Custodian fees | | | 556 | |
Directors’ fees | | | 4,182 | |
Professional fees | | | 43,600 | |
Other fees | | | 51,926 | |
| | | | |
Total liabilities | | | 2,487,592 | |
| | | | |
Net assets | | $ | 280,473,386 | |
| | | | |
Net assets consist of: | | | | |
Paid in capital | | $ | 441,314,284 | |
Undistributed net investment income | | | 2,616,829 | |
Accumulated net realized loss on sale of investments | | | (173,555,270 | ) |
Net unrealized appreciation in value of investments | | | 10,097,543 | |
| | | | |
Net assets | | $ | 280,473,386 | |
| | | | |
| |
Capital shares authorized | | | unlimited | |
Capital shares outstanding | | | 12,635,575 | |
Net asset value per share (net assets divided by shares outstanding) | | $ | 22.20 | |
| | | | |
| |
* Investments, at cost | | $ | 265,647,016 | |
|
Statement of Operations For Year Ended December 31, 2009 | |
Investment Income: | | | | |
Dividends | | $ | 4,664,091 | |
Interest | | | 11,183 | |
| | | | |
Total investment income | | | 4,675,274 | |
| | | | |
| |
Expenses: | | | | |
Management fees | | | 1,647,391 | |
Administration fees | | | 241,019 | |
Transfer agent/maintenance fees | | | 25,352 | |
Custodian fees | | | 10,111 | |
Directors’ fees | | | 23,688 | |
Professional fees | | | 48,545 | |
Reports to shareholders | | | 44,240 | |
Other | | | 18,099 | |
| | | | |
Total expenses | | | 2,058,445 | |
| | | | |
Net investment income | | | 2,616,829 | |
| | | | |
| |
Net Realized and Unrealized Gain (Loss): | | | | |
Net realized gain (loss) during the year on: | | | | |
Investments | | | (21,745,604 | ) |
Options written | | | 22,775 | |
| | | | |
Net realized loss | | | (21,722,829 | ) |
| | | | |
| |
Net unrealized appreciation (depreciation) during the year on: | | | | |
Investments | | | 77,753,258 | |
| | | | |
Net unrealized appreciation | | | 77,753,258 | |
| | | | |
Net realized and unrealized gain | | | 56,030,429 | |
| | | | |
Net increase in net assets resulting from operations | | $ | 58,647,258 | |
| | | | |
The accompanying notes are an integral part of the financial statements
15
| | |
| Series B |
| Statement of Changes in Net Assets | | (Large Cap Value Series) |
| | | | | | | | |
| | | Year Ended
December 31, 2009 | | | Year Ended
December 31, 2008 | |
Increase (decrease) in net assets from operations: | | | | | | | | |
Net investment income | | $ | 2,616,829 | | | $ | 4,509,471 | |
Net realized loss during the year on investments | | | (21,722,829 | ) | | | (35,097,727 | ) |
Net unrealized appreciation (depreciation) during the year on investments | | | 77,753,258 | | | | (128,705,287 | ) |
| | | | | | | | |
Net increase (decrease) in net assets resulting from operations | | | 58,647,258 | | | | (159,293,543 | ) |
| | | | | | | | |
| | |
Capital share transactions: | | | | | | | | |
Proceeds from sale of shares | | | 40,712,808 | | | | 97,567,905 | |
Cost of shares redeemed | | | (69,858,540 | ) | | | (167,274,870 | ) |
| | | | | | | | |
Net decrease from capital share transactions | | | (29,145,732 | ) | | | (69,706,965 | ) |
| | | | | | | | |
Net increase (decrease) in net assets | | | 29,501,526 | | | | (229,000,508 | ) |
| | | | | | | | |
| | |
Net assets: | | | | | | | | |
Beginning of year | | | 250,971,860 | | | | 479,972,368 | |
| | | | | | | | |
End of year | | $ | 280,473,386 | | | $ | 250,971,860 | |
| | | | | | | | |
| | |
Undistributed net investment income at end of year | | $ | 2,616,829 | | | $ | 4,509,471 | |
| | | | | | | | |
| | |
Capital share activity: | | | | | | | | |
Shares sold | | | 2,258,834 | | | | 3,899,132 | |
Shares redeemed | | | (3,921,822 | ) | | | (6,778,642 | ) |
| | | | | | | | |
Total capital share activity | | | (1,662,988 | ) | | | (2,879,510 | ) |
| | | | | | | | |
The accompanying notes are an integral part of the financial statements
16
| | |
| Financial Highlights | | Series B |
Selected data for each share of capital stock outstanding throughout each year | | (Large Cap Value Series) |
| | | | | | | | | | | | | | | | | | | | |
| | | 2009 | | | 2008 | | | 2007 | | | 2006 | | | Year Ended
December 31,
2005a | |
Per Share Data | | | | | | | | | | | | | | | | | | | | |
Net asset value, beginning of period | | $ | 17.55 | | | $ | 27.94 | | | $ | 26.40 | | | $ | 21.64 | | | $ | 19.58 | |
| | | | | | | | | | | | | | | | | | | | |
Income (loss) from investment operations: | | | | | | | | | | | | | | | | | | | | |
Net investment incomeb | | | 0.19 | | | | 0.29 | | | | 0.25 | | | | 0.20 | | | | 0.24 | |
Net gain (loss) on securities (realized and unrealized) | | | 4.46 | | | | (10.68 | ) | | | 1.29 | | | | 4.56 | | | | 1.82 | |
| | | | | | | | | | | | | | | | | | | | |
Total from investment operations | | | 4.65 | | | | (10.39 | ) | | | 1.54 | | | | 4.76 | | | | 2.06 | |
| | | | | | | | | | | | | | | | | | | | |
Net asset value, end of period | | $ | 22.20 | | | $ | 17.55 | | | $ | 27.94 | | | $ | 26.40 | | | $ | 21.64 | |
| | | | | | | | | | | | | | | | | | | | |
| | | | | |
Total Returnc | | | 26.50 | % | | | (37.19 | )% | | | 5.83 | % | | | 22.00 | % | | | 10.52 | % |
| | | | | | | | | | | | | | | | | | | | |
Ratios/Supplemental Data | | | | | | | | | | | | | | | | | | | | |
Net assets, end of period (in thousands) | | $ | 280,473 | | | $ | 250,972 | | | $ | 479,972 | | | $ | 480,683 | | | $ | 410,692 | |
| | | | | | | | | | | | | | | | | | | | |
Ratios to average net assets: | | | | | | | | | | | | | | | | | | | | |
Net investment income | | | 1.03 | % | | | 1.21 | % | | | 0.90 | % | | | 0.80 | % | | | 0.98 | % |
Total expensesd | | | 0.81 | % | | | 0.80 | % | | | 0.79 | % | | | 0.79 | % | | | 0.84 | % |
Net expensese | | | 0.81 | % | | | 0.80 | % | | | 0.79 | % | | | 0.79 | % | | | 0.84 | % |
Net expenses prior to custodian earnings credits and net of expense waivers | | | 0.81 | % | | | 0.80 | % | | | 0.79 | % | | | 0.79 | % | | | 0.84 | % |
| | | | | | | | | | | | | | | | | | | | |
Portfolio turnover rate | | | 16 | % | | | 32 | % | | | 29 | % | | | 20 | % | | | 99 | % |
| a | Security Global Investors (SGI), formerly Security Management Company, LLC, became the advisor of Series B effective June 30, 2005. Prior to June 30, 2005, SGI paid Dreyfus Corporation for sub-advisory services. |
| b | Net investment income (loss) was computed using average shares outstanding throughout the period. |
| c | Total return does not take into account any of the expenses associated with an investment in variable insurance products offered by Security Benefit Life Insurance Company. If total return had taken into account these expenses, performance would have been lower. Shares of a series of SBL Fund are available only through the purchase of such products. |
| d | Total expense information reflects the expense ratios absent expense reductions by the Investment Manager and custodian earnings credits, as applicable. |
| e | Net expense information reflects the expense ratios after voluntary expense waivers, reimbursements and custodian earnings credits, as applicable. |
The accompanying notes are an integral part of the financial statements
17
This page left blank intentionally.
18
Manager’s Commentary
February 15, 2010
| | | | |
| | Advised by: | | |
To Our Shareholders:
Series C of the SBL Fund – Money Market Series returned -0.37% for the year ended December 31, 2009, less than the benchmark I-Money Net Retail Tier 1 of 0.18% and the 0.13% performance of its peer group for the same period.
The Federal Reserve Board continues to hold rates near 0%, making it a challenge to maintain a positive yield. The Fed has signaled that it will continue to keep rates low in the near future.
Composition of Portfolio Assets
At December 31, 2009, the average maturity of the holdings in the Series was 84 days.
The Series’ assets were concentrated in commercial paper and U.S. government sponsored agency bonds and notes. At year-end, approximately 52% of the Series consisted of commercial paper and 48% in U.S. government/ agency obligations, less liabilities.
Market Review
A Federal Funds rate near 0% continued to be challenging for money market portfolios, as there was very little yield available. Bond markets were choppy in the first half of 2009 while the last half of the year was better due to less headline volatility. Unlike some peer competitors, the Series did not experience any security defaults that required firm backing.
While earnings were stronger and the economy improved in the third and fourth quarters, it remained necessary to manage the portfolio in a conservative manner since the economy was unable to gain a strong foothold. Adding to uncertainty were newly proposed SEC regulations regarding average weighted maturity, floating NAVs, liquidity constraints, and additional reporting requirements.
The Money Market Series does not invest in SIVs, or Structured Investment Vehicles securities. The manager remained focused on liquidity and credit quality, and the sub-prime mortgage securities never passed these tests. While a small portion of the portfolio was invested in asset-backed commercial paper, which posed no risk to the portfolio, we chose to take the conservative approach and keep exposure to this type of investment low.
Market Outlook
The upcoming year should prove to be another challenging year with respect to yields as the Federal Reserve has stated its intention to keep rates low for the foreseeable future. Our philosophy in managing the Money Market Series is to take a conservative approach that doesn’t add risk to the portfolio by reaching for marginal gains in yield. With the yield environment likely to remain as is for the time being, we will continue to manage the Series’ conservatively with expectations of low returns. As always, we will continue to monitor the economic and market conditions when deciding portfolio strategies and will adjust the asset mix and maturity structure in the portfolio accordingly.
Thank you for your investment in the Money Market Series.
We appreciate the confidence that you have placed in us and continue to focus on achieving the Series’ investment goals.
Sincerely,
Christina Fletcher, Portfolio Manager
19
| | |
| Performance Summary | | Series C (Money Market Series) |
| December 31, 2009 | | (unaudited) |
PERFORMANCE
Portfolio Composition by Quality Ratings
| | | |
Tier 1 Investments | | 99.43 | % |
Cash & Other Assets, Less Liabilities | | 0.57 | |
Total Net Assets | | 100.00 | % |
| | | |
Average Annual Returns
| | | | | | | | | |
Periods Ended 12-31-091 | | 1 Year | | | 5 Years | | | 10 Years | |
Series C | | (0.37 | )% | | 2.70 | % | | 2.56 | % |
| 1 | Performance figures do not reflect fees and expenses associated with an investment in variable insurance products offered by Security Benefit Life Insurance Company. If returns had taken into account these fees and expenses, performance would have been lower. Shares of a Series of SBL Fund are available only through the purchase of such products. |
The performance data quoted above represents past performance. Past performance is not predictive of future performance. The investment return and principal value of an investment will fluctuate so that an investor’s shares, when redeemed, may be worth more or less than their original cost.
The accompanying notes are an integral part of the financial statements
20
| | |
| Schedule of Investments | | Series C |
| December 31, 2009 | | (Money Market Series) |
| | | | | | |
| | | Principal
Amount | | Value |
ASSET BACKED SECURITIES—0.3% | | | | | | |
Other Non-Agency—0.3% | | | | | | |
Small Business Administration Pools | | | | | | |
#503308, 0.75%, 20101,2,3 | | $ | 64,007 | | $ | 64,007 |
#503343, 0.88%, 20101,2,3 | | | 123,168 | | | 123,168 |
#503347, 0.88%, 20101,2,3 | | | 72,840 | | | 72,839 |
#502353, 1.00%, 20101,2,3 | | | 31,163 | | | 31,163 |
#503295, 0.75%, 20101,2,3 | | | 67,972 | | | 67,189 |
#503303, 0.75%, 20101,2,3 | | | 123,627 | | | 122,204 |
| | | | | | |
| | | | | $ | 480,570 |
| | | | | | |
TOTAL ASSET BACKED SECURITIES (cost $482,896) | | | | | $ | 480,570 |
| | | | | | |
| | |
| | | Principal
Amount | | Value |
U.S. GOVERNMENT SPONSORED AGENCY BONDS & NOTES—51.4% | | | | | | |
Federal Farm Credit Bank | | | | | | |
0.17%, 5/26/20101,2 | | $ | 2,000,000 | | $ | 1,999,988 |
0.50%, 6/1/20101 | | | 2,000,000 | | | 2,002,938 |
0.22%, 7/9/20101 | | | 2,000,000 | | | 1,997,934 |
0.20%, 8/3/20101 | | | 3,120,000 | | | 3,115,610 |
0.40%, 10/1/20101 | | | 3,000,000 | | | 2,996,451 |
0.45%, 10/21/20101 | | | 2,000,000 | | | 1,998,098 |
0.39%, 12/1/20101 | | | 2,500,000 | | | 2,495,658 |
0.38%, 12/1/20101 | | | 3,000,000 | | | 2,994,519 |
Federal Home Loan Mortgage Corporation | | | | | | |
0.57%, 1/8/20101,2 | | | 1,000,000 | | | 1,000,035 |
0.13%, 1/27/20101 | | | 2,300,000 | | | 2,299,970 |
0.03%, 2/22/20101 | | | 2,200,000 | | | 2,199,905 |
0.17%, 3/16/20101 | | | 2,000,000 | | | 1,999,802 |
0.17%, 5/4/20101 | | | 2,000,000 | | | 1,999,200 |
0.15%, 5/24/20101 | | | 2,389,000 | | | 2,387,884 |
Federal Home Loan Bank | | | | | | |
0.17%, 1/8/20101,2 | | | 1,000,000 | | | 1,000,002 |
0.50%, 8/24/20101,4 | | | 1,500,000 | | | 1,500,062 |
0.51%, 10/28/20101 | | | 3,035,000 | | | 3,033,491 |
0.55%, 11/3/20101 | | | 2,000,000 | | | 1,999,638 |
0.40%, 12/27/20101 | | | 2,000,000 | | | 1,996,228 |
0.45%, 12/29/20101 | | | 2,000,000 | | | 1,996,964 |
0.41%, 12/29/20101 | | | 2,000,000 | | | 1,996,178 |
0.45%, 12/30/20101 | | | 2,000,000 | | | 1,996,950 |
0.16%, 1/14/20111,2 | | | 2,000,000 | | | 1,998,946 |
Federal National Mortgage Association | | | | | | |
0.20%, 1/22/20101 | | | 2,000,000 | | | 1,999,980 |
0.21%, 2/8/20101,2 | | | 3,000,000 | | | 3,000,651 |
0.17%, 2/24/20101 | | | 1,300,000 | | | 1,299,945 |
0.05%, 4/1/20101 | | | 1,154,000 | | | 1,153,721 |
0.18%, 5/12/20101 | | | 2,000,000 | | | 1,999,146 |
0.18%, 5/26/20101 | | | 1,528,000 | | | 1,527,277 |
0.17%, 7/13/20101,2 | | | 1,800,000 | | | 1,799,809 |
0.20%, 8/2/20101 | | | 2,000,000 | | | 1,997,200 |
0.30%, 9/13/20101 | | | 2,000,000 | | | 1,996,500 |
0.31%, 10/1/20101 | | | 1,100,000 | | | 1,097,608 |
0.34%, 11/1/20101 | | | 3,500,000 | | | 3,490,344 |
0.38%, 12/1/20101 | | | 3,600,000 | | | 3,587,753 |
0.40%, 12/2/20101 | | | 4,900,000 | | | 4,883,280 |
| | | | | | |
TOTAL U.S. GOVERNMENT SPONSORED AGENCY BONDS & NOTES (cost $78,862,983) | | | | | $ | 78,839,665 |
| | | | | | |
| | |
| | | Principal
Amount | | Value |
COMMERCIAL PAPER—47.7% | | | | | | |
Automotive—8.9% | | | | | | |
American Honda Finance | | | | | | |
0.20%, 01/05/20101 | | $ | 2,000,000 | | $ | 1,999,955 |
0.17%, 01/13/20101 | | | 2,600,000 | | | 2,599,854 |
0.15%, 01/26/20101 | | | 2,000,000 | | | 1,999,792 |
0.15%, 01/27/20101 | | | 1,000,000 | | | 999,892 |
Toyota Motor Credit Corporation | | | | | | |
0.04%, 01/06/20101 | | | 1,500,000 | | | 1,499,969 |
0.15%, 01/14/20101 | | | 2,500,000 | | | 2,499,865 |
0.15%, 01/15/20101 | | | 2,000,000 | | | 1,999,891 |
| | | | | | |
| | | | | | 13,599,218 |
| | | | | | |
Banking—3.7% | | | | | | |
JP Morgan Chase & Company | | | | | | |
0.14%, 01/19/20101 | | | 2,000,000 | | | 1,999,860 |
JP Morgan Chase Funding | | | | | | |
018% 01/19/20101,5 | | | 2,500,000 | | | 2,499,776 |
0.17%, 01/26/20101,5 | | | 1,200,000 | | | 1,199,843 |
| | | | | | |
| | | | | | 5,699,479 |
| | | | | | |
Brokerage—3.1% | | | | | | |
Goldman Sachs Group, Inc. | | | | | | |
0.15%, 01/21/20101 | | | 2,000,000 | | | 1,999,801 |
0.11%, 01/22/20101 | | | 1,500,000 | | | 1,499,904 |
0.11%, 01/25/20101 | | | 1,300,000 | | | 1,299,905 |
| | | | | | |
| | | | | | 4,799,610 |
| | | | | | |
Electric—6.6% | | | | | | |
FPL Group Capital, Inc. | | | | | | |
0.14%, 01/11/20101,5 | | | 1,700,000 | | | 1,699,934 |
0.15%, 01/13/20101,5 | | | 1,200,000 | | | 1,199,940 |
0.12%, 01/15/20101,5 | | | 1,200,000 | | | 1,199,944 |
0.15%, 01/20/20101,5 | | | 3,500,000 | | | 3,499,715 |
Southern Company Funding Corporation | | | | | | |
0.12%, 01/12/20101,5 | | | 2,500,000 | | | 2,499,908 |
| | | | | | |
| | | | | | 10,099,441 |
| | | | | | |
Food & Beverage—8.1% | | | | | | |
Cargill, Inc. | | | | | | |
0.13%, 01/05/20101,5 | | | 2,000,000 | | | 1,999,971 |
0.13%, 01/12/20101,5 | | | 1,800,000 | | | 1,799,929 |
0.15%, 02/01/20101,5 | | | 2,000,000 | | | 1,999,742 |
0.13%, 02/08/20101,5 | | | 1,500,000 | | | 1,499,794 |
Coca-Cola Company | | | | | | |
0.11%, 01/13/20101 | | | 1,100,000 | | | 1,099,960 |
0.10%, 01/28/20101 | | | 2,000,000 | | | 1,999,850 |
0.13%, 02/03/20101 | | | 2,000,000 | | | 1,999,739 |
| | | | | | |
| | | | | | 12,398,985 |
| | | | | | |
Life Insurance—2.9% | | | | | | |
General Reinsurance Corporation | | | | | | |
0.12%, 01/21/20101 | | | 3,000,000 | | | 2,999,795 |
Swiss Re Treasury U.S. Corporation | | | | | | |
0.19%, 01/29/20101,5 | | | 1,400,000 | | | 1,399,793 |
| | | | | | |
| | | | | | 4,399,588 |
| | | | | | |
Non U.S. Banking—3.3% | | | | | | |
BNP Paribas Finance, Inc. | | | | | | |
0.16%, 01/14/20101 | | | 2,000,000 | | | 1,999,884 |
| | | | |
0.18%, 01/26/20101 | | 1,600,000 | | 1,599,800 |
0.12%, 01/29/20101 | | 1,500,000 | | 1,499,860 |
| | | | |
| | | | 5,099,544 |
| | | | |
Pharmaceuticals—11.1% | | | | |
Abbott Laboratories | | | | |
0.10%, 01/11/20101,5 | | 2,000,000 | | 1,999,944 |
The accompanying notes are an integral part of the financial statements
21
| | |
| Schedule of Investments | | Series C |
| December 31, 2009 | | (Money Market Series) |
| | | | | | |
| | | Principal
Amount | | Value |
COMMERCIAL PAPER—47.7% (continued) | | | | | | |
Pharmaceuticals—11.1% (continued) | | | | | | |
Abbott Laboratories, Inc. | | | | | | |
0.10%, 02/08/20101,5 | | $ | 1,985,000 | | $ | 1,984,790 |
GlaxoSmithKline Finance plc | | | | | | |
0.11%, 01/06/20101,5 | | | 2,500,000 | | | 2,499,962 |
0.11%, 01/20/20101,5 | | | 2,000,000 | | | 1,999,884 |
0.12%, 01/27/20101,5 | | | 1,800,000 | | | 1,799,844 |
Johnson & Johnson, Inc. | | | | | | |
0.16%, 04/19/20101,5 | | | 2,000,000 | | | 1,998,898 |
0.15%, 04/20/20101,5 | | | 2,200,000 | | | 2,198,770 |
0.20%, 05/25/20101,5 | | | 2,500,000 | | | 2,497,563 |
| | | | | | |
| | | | | | 16,979,655 |
| | | | | | |
TOTAL COMMERCIAL PAPER (cost $73,076,385) | | | | | $ | 73,075,520 |
| | | | | | |
Total Investments—99.4%6 (cost $152,422,264) | | | | | $ | 152,395,755 |
Cash & Other Assets, Less Liabilities—0.6% | | | | | | 865,881 |
| | | | | | |
Total Net Assets—100.0% | | | | | $ | 153,261,636 |
| | | | | | |
For federal income tax purposes the identified cost of investments owned at December 31, 2009 was $152,422,264.
| plc | Public Limited Company |
| 1 | Value determined based on Level 2 inputs. |
| 2 | Variable rate security. Rate indicated is rate effective at December 31, 2009. |
| 3 | Maturity date indicated is next interest reset date. |
| 4 | Security is a step up/step down bond. The coupon increases or decreases at regular intervals until the bond reaches full maturity. |
| 5 | Security is a 144A or Section 4(2) security. The total market value of 144A or Section 4(2) securities is $39,477,944 (cost $39,478,768), or 25.8% of total net assets. |
| 6 | Unless otherwise indicated, the values of the securities of the Portfolio are determined based on Level 1. |
The accompanying notes are an integral part of the financial statements
22
Series C
(Money Market Series)
Statement of Assets and Liabilities
December 31, 2009
| | | | |
Assets: | | | | |
Investments, at value* | | $ | 152,395,755 | |
Cash | | | 849,412 | |
Receivables: | | | | |
Fund shares sold | | | 438,914 | |
Securities sold | | | 3,983 | |
Interest | | | 19,539 | |
Prepaid expenses | | | 3,540 | |
| | | | |
Total assets | | | 153,711,143 | |
| | | | |
Liabilities: | | | | |
| |
Payable for: | | | | |
Fund shares redeemed | | | 324,292 | |
Management fees | | | 65,323 | |
Administration fees | | | 15,711 | |
Transfer agent/maintenance fees | | | 2,083 | |
Custodian fees | | | 438 | |
Directors’ fees | | | 2,285 | |
Professional fees | | | 15,375 | |
Other fees | | | 24,000 | |
| | | | |
Total liabilities | | | 449,507 | |
| | | | |
Net assets | | $ | 153,261,636 | |
| | | | |
Net assets consist of: | | | | |
Paid in capital | | $ | 153,288,145 | |
Net unrealized depreciation in value of investments | | | (26,509 | ) |
| | | | |
Net assets | | $ | 153,261,636 | |
| | | | |
| |
Capital shares authorized | | | unlimited | |
Capital shares outstanding | | | 11,298,797 | |
Net asset value per share (net assets divided by shares outstanding) | | $ | 13.56 | |
| | | | |
| |
* Investments, at cost | | $ | 152,422,264 | |
|
Statement of Operations For Year Ended December 31, 2009 | |
Investment Income: | | | | |
Interest | | | 923,773 | |
| | | | |
Total investment income | | | 923,773 | |
| | | | |
| |
Expenses: | | | | |
Management fees | | | 1,043,540 | |
Administration fees | | | 213,547 | |
Transfer agent/maintenance fees | | | 25,381 | |
Custodian fees | | | 18,350 | |
Directors’ fees | | | 21,611 | |
Professional fees | | | 24,398 | |
Reports to shareholders | | | 46,298 | |
Other | | | 10,618 | |
| | | | |
Total expenses | | | 1,403,743 | |
| | | | |
Net investment loss | | | (479,970 | ) |
| | | | |
| |
Net Unrealized Gain (Loss): | | | | |
Net unrealized appreciation (depreciation) during the year on: | | | | |
Investments | | | (209,951 | ) |
| | | | |
Net decrease in net assets resulting from operations | | $ | (689,921 | ) |
| | | | |
The accompanying notes are an integral part of the financial statements
23
| | |
| | Series C |
| Statement of Changes in Net Assets | | (Money Market Series) |
| | | | | | | | |
| | | Year Ended
December 31, 2009 | | | Year Ended
December 31, 2008 | |
Increase (decrease) in net assets from operations: | | | | | | | | |
Net investment income (loss) | | $ | (479,970 | ) | | $ | 4,249,459 | |
Net unrealized appreciation (depreciation) during the year on investments | | | (209,951 | ) | | | 190,920 | |
| | | | | | | | |
Net increase (decrease) in net assets resulting from operations | | | (689,921 | ) | | | 4,440,379 | |
| | | | | | | | |
| | |
Capital share transactions: | | | | | | | | |
Proceeds from sale of shares | | | 191,606,637 | | | | 533,443,332 | |
Cost of shares redeemed | | | (305,973,233 | ) | | | (438,227,047 | ) |
| | | | | | | | |
Net increase (decrease) from capital share transactions | | | (114,366,596 | ) | | | 95,216,285 | |
| | | | | | | | |
Net increase (decrease) in net assets | | | (115,056,517 | ) | | | 99,656,664 | |
| | | | | | | | |
| | |
Net assets: | | | | | | | | |
Beginning of year | | | 268,318,153 | | | | 168,661,489 | |
| | | | | | | | |
End of year | | $ | 153,261,636 | | | $ | 268,318,153 | |
| | | | | | | | |
Undistributed net investment income at end of year | | $ | — | | | $ | 4,249,459 | |
| | | | | | | | |
| | |
Capital share activity: | | | | | | | | |
Shares sold | | | 14,085,993 | | | | 39,510,948 | |
Shares redeemed | | | (22,496,450 | ) | | | (32,452,086 | ) |
| | | | | | | | |
Total capital share activity | | | (8,410,457 | ) | | | 7,058,862 | |
| | | | | | | | |
The accompanying notes are an integral part of the financial statements
24
| | | |
| Financial Highlights | | Series C | |
Selected data for each share of capital stock outstanding throughout each year | | (Money Market Series | ) |
| | | | | | | | | | | | | | | | | | | | |
| | | 2009 | | | 2008 | | | 2007 | | | 2006 | | | Year Ended
December 31,
2005 | |
Per Share Data | | | | | | | | | | | | | | | | | | | | |
Net asset value, beginning of period | | $ | 13.61 | | | $ | 13.33 | | | $ | 12.73 | | | $ | 12.19 | | | $ | 11.87 | |
| | | | | | | | | | | | | | | | | | | | |
Income (loss) from investment operations: | | | | | | | | | | | | | | | | | | | | |
Net investment income (loss)a | | | (0.03 | ) | | | 0.26 | | | | 0.60 | | | | 0.45 | | | | 0.33 | |
Net gain (loss) on securities (realized and unrealized) | | | (0.02 | ) | | | 0.02 | | | | — | | | | 0.09 | | | | (0.01 | ) |
| | | | | | | | | | | | | | | | | | | | |
Total from investment operations | | | (0.05 | ) | | | 0.28 | | | | 0.60 | | | | 0.54 | | | | 0.32 | |
| | | | | | | | | | | | | | | | | | | | |
Net asset value, end of period | | $ | 13.56 | | | $ | 13.61 | | | $ | 13.33 | | | $ | 12.73 | | | $ | 12.19 | |
| | | | | | | | | | | | | | | | | | | | |
| | | | | |
Total Returnb | | | (0.37 | )% | | | 2.10 | % | | | 4.71 | % | | | 4.43 | % | | | 2.70 | % |
| | | | | | | | | | | | | | | | | | | | |
Ratios/Supplemental Data | | | | | | | | | | | | | | | | | | | | |
Net assets, end of period (in thousands) | | $ | 153,262 | | | $ | 268,318 | | | $ | 168,661 | | | $ | 99,044 | | | $ | 71,655 | |
| | | | | | | | | | | | | | | | | | | | |
Ratios to average net assets: | | | | | | | | | | | | | | | | | | | | |
Net investment income (loss) | | | (0.23 | )% | | | 1.94 | % | | | 4.59 | % | | | 4.43 | % | | | 2.63 | % |
Total expensesc | | | 0.67 | % | | | 0.65 | % | | | 0.66 | % | | | 0.68 | % | | | 0.69 | % |
Net expensesd | | | 0.67 | % | | | 0.65 | % | | | 0.66 | % | | | 0.68 | % | | | 0.69 | % |
Net expenses prior to custodian earnings credits and net of expense waivers | | | 0.67 | % | | | 0.65 | % | | | 0.66 | % | | | 0.68 | % | | | 0.69 | % |
| a | Net investment income (loss) was computed using average shares outstanding throughout the period. |
| b | Total return does not take into account any of the expenses associated with an investment in variable insurance products offered by Security Benefit Life Insurance Company. If total return had taken into account these expenses, performance would have been lower. Shares of a series of SBL Fund are available only through the purchase of such products. |
| c | Total expense information reflects the expense ratios absent expense reductions by the Investment Manager and custodian earnings credits, as applicable. |
| d | Net expense information reflects the expense ratios after voluntary expense waivers, reimbursements and custodian earnings credits, as applicable. |
The accompanying notes are an integral part of the financial statements
25
This page left blank intentionally.
26
Managers’ Commentary
February 15, 2010
| | | | |
| | Advised by: | | |
To Our Shareholders
Series D of the SBL Fund – Global Series returned 19.73%, underperforming the benchmark, Morgan Stanley Capital International, Inc. (MSCI) World Index return of 29.99% and the peer group median return of 33.23%.
The SGI global team believes that excess return opportunities exist in global stock markets and that those opportunities are best identified and captured at the security level. Investing globally offers the greatest exposure to excess return opportunities while enhancing the ability to diversify risk. Successfully identifying and exploiting these opportunities requires thorough fundamental research. Superior stock selection continues to be the trademark for the team’s performance as selection effect accounts for nearly all the return of the portfolio.
The investment team employs a bottom-up approach to the global equity universe to identify and invest in the best opportunities around the world. The team melds sophisticated screening techniques, input from management meetings, and insights into global/regional trends to identify investment opportunities from around the world. Relative valuation and relative business momentum is a specific focus of the screening criteria. The team’s fundamental research is original and uses primary sources to substantiate forecasts and investment theses.
Energy and Information Technology Top Performers
The Global Series held an underweight position in energy during the year however, the sector was the best performing sector in the portfolio due to stock selection that generated 46% returns. A significant weight in Oil Search, Ltd. generated a return of 72%. Avoiding Exxon Mobil Corporation benefited performance as the stock dropped 13% during the period. Other gainers in the sector for the strategy included CNOOC, Ltd. and Transocean, Ltd.
As an even weight, the portfolio benefited from superior stock selection in the information technology sector, gaining 64% over the year. Check Point Software Technologies, Ltd., a significant holding during the period, gained 55% while Gree, Inc. soared 108%. Other sector holdings that contributed to performance include Google, Inc. (Cl A) and Tandberg ASA.
Consumer Staples, Consumer Discretionary, and Industrials Disappoint
The Series’ performance was especially hurt in the consumer staples, consumer discretionary, and industrials sectors, mainly due to security selection. As an over-weight position, the consumer staples holdings underperformed with a return of 10%. Holdings in Spartan Stores, Inc. and Winn-Dixie Stores, Inc. detracted from portfolio performance as both lost more than 40%. Other holdings hurting returns were Cal-Maine Foods, Inc. and Kirin Holdings Company, Ltd.
Performance in the strategy’s consumer discretionary sector did not keep pace with the benchmark even though it was up 19°%. Ubisoft Entertainment S.A., William Hill PLC, and Harley-Davidson, Inc. all posted negative returns for the strategy, even though two of the three were up significantly over the full period.
The largest industrials sector detractor was Foster Wheeler AG, which lost 56% during the year. Other holdings in the sector that pulled down performance include Brink’s Company, JGC Corporation, and Watson Wyatt Worldwide, Inc.
Market Outlook
The Series’ core strategy continues to focus on identifying companies with sustainable long-term earnings and cash flow, strong economic returns on invested capital, and healthy balance sheets. Our approach remains to identify the best possible investments in all phases of the market and economic cycle. The day-in day-out work of our analysts is speaking with companies around the world, interviewing their customers, suppliers and regulators and generating excess risk-adjusted returns through superior stock selection.
As we anticipated in last year’s report, unemployment did continue to rise and reached double digits. While global banking systems and economies appear to have stabilized, significant challenges remain. Foremost among these will be removal of the extraordinary measures taken by central banks and governments around the world to stimulate and re-liquefy economies. While growth has re-emerged in many areas of the world, the recovery remains fragile and measurement somewhat suspect.
We recognize there are many investment alternatives available today and thank you for your business and the confidence you place in us.
Sincerely,
David Whittall, Portfolio Manager
Scott Klimo, Portfolio Manager
27
| | |
| Performance Summary | | Series D (Global Series) |
December 31, 2009 | | (unaudited) |
PERFORMANCE
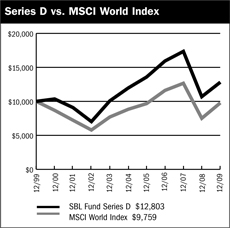
$10,000 Over Ten Years
The chart above assumes a hypothetical $10,000 investment in Series D (Global Series) on December 31, 1999 and reflects the fees and expenses of Series D. The MSCI World Index is an unmanaged capitalization-weighted index that is designed to measure global developed market equity performance.
Average Annual Returns
| | | | | | | | | |
Periods Ended 12-31-091 | | 1 Year | | | 5 Years | | | 10 Years | |
Series D | | 19.73 | % | | 1.36 | % | | 2.50 | % |
| 1 | Performance figures do not reflect fees and expenses associated with an investment in variable insurance products offered by Security Benefit Life Insurance Company. If returns had taken into account these fees and expenses, performance would have been lower. Shares of a Series of SBL Fund are available only through the purchase of such products. |
The performance data quoted above represents past performance. Past performance is not predictive of future performance. The investment return and principal value of an investment will fluctuate so that an investor’s shares, when redeemed, may be worth more or less than their original cost.
Portfolio Composition by Sector
| | | |
Consumer Discretionary | | 10.17 | % |
Consumer Staples | | 15.30 | |
Energy | | 9.63 | |
Financials | | 15.56 | |
Health Care | | 8.73 | |
Industrials | | 12.32 | |
Information Technology | | 15.19 | |
Materials | | 5.63 | |
Telecommunication Services | | 0.46 | |
Utilities | | 5.23 | |
Exchange Traded Funds | | 0.77 | |
Short Term Investments | | 0.78 | |
Cash & Other Assets, Less Liabilities | | 0.23 | |
Total Net Assets | | 100 | % |
| | | |
The accompanying notes are an integral part of the financial statements
28
| | |
| Schedule of Investments | | Series D |
December 31, 2009 | | (Global Series) |
| | | | | |
| | | Shares | | Value |
COMMON STOCKS—54.3% | | | | | |
Airlines—2.8% | | | | | |
Alaska Air Group, Inc.* | | 64,400 | | $ | 2,225,664 |
Allegiant Travel Company* | | 112,415 | | | 5,302,616 |
| | | | | |
| | | | | 7,528,280 |
| | | | | |
Automotive Retail—0.8% | | | | | |
AutoNation, Inc.* | | 106,800 | | | 2,045,220 |
| | | | | |
| | |
Cable & Satellite—1.7% | | | | | |
Time Warner Cable, Inc. | | 110,363 | | | 4,567,925 |
| | | | | |
| | |
Communications Equipment—2.2% | | | | | |
Polycom, Inc.* | | 238,400 | | | 5,952,848 |
| | | | | |
| | |
Computer Hardware—2.0% | | | | | |
Apple, Inc.* | | 26,117 | | | 5,507,031 |
| | | | | |
| | |
Construction & Farm Machinery & Heavy Trucks—0.5% | | | | | |
Trinity Industries, Inc. | | 76,663 | | | 1,337,003 |
| | | | | |
| | |
Data Processing & Outsourced Services—0.9% | | | | | |
Hewitt Associates, Inc.* | | 56,200 | | | 2,375,012 |
| | | | | |
| | |
Diversified Banks—2.1% | | | | | |
ICICI Bank, Ltd. ADR | | 150,625 | | | 5,680,069 |
| | | | | |
| | |
Education Services—2.3% | | | | | |
Corinthian Colleges, Inc.* | | 120,800 | | | 1,663,416 |
ITT Educational Services, Inc.* | | 46,705 | | | 4,481,812 |
| | | | | |
| | | | | 6,145,228 |
| | | | | |
Electric Utilities—1.4% | | | | | |
Allegheny Energy, Inc. | | 68,800 | | | 1,615,424 |
Northeast Utilities | | 89,000 | | | 2,295,310 |
| | | | | |
| | | | | 3,910,734 |
| | | | | |
Electrical Components & Equipment—1.7% | | | | | |
Suntech Power Holdings Company, Ltd. ADR* | | 272,503 | | | 4,531,725 |
| | | | | |
| | |
Exchange Traded Funds—0.8% | | | | | |
iShares MSCI EAFE Index Fund | | 37,400 | | | 2,068,220 |
| | | �� | | |
| | |
Gas Utilities—1.0% | | | | | |
UGI Corporation | | 109,300 | | | 2,643,967 |
| | | | | |
| | |
General Merchandise Stores—0.8% | | | | | |
Dollar Tree, Inc.* | | 43,000 | | | 2,076,900 |
| | | | | |
| | |
Health Care Services—4.1% | | | | | |
Express Scripts, Inc.* | | 92,200 | | | 7,970,689 |
Medco Health Solutions, Inc.* | | 44,800 | | | 2,863,168 |
| | | | | |
| | | | | 10,833,857 |
| | | | | |
Home Entertainment Software—2.3% | | | | | |
Perfect World Company, Ltd. ADR* | | 95,700 | | | 3,774,408 |
Shanda Interactive Entertainment, Ltd. ADR* | | 44,900 | | | 2,362,189 |
| | | | | |
| | | | | 6,136,597 |
| | | | | |
Home Improvement Retail—0.8% | | | | | |
Home Depot, Inc. | | 77,100 | | | 2,230,503 |
| | | | | |
| | |
Household Products—1.9% | | | | | |
Kimberly-Clark Corporation | | 82,074 | | | 5,228,935 |
| | | | | |
| | |
Independent Power Producers & Energy Traders—0.3% | | | | | |
Mirant Corporation* | | 61,900 | | | 945,213 |
| | | | | |
| | |
Integrated Oil & Gas—1.3% | | | | | |
Occidental Petroleum Corporation | | 43,600 | | | 3,546,860 |
| | | | | |
| | |
Life Sciences Tools & Services—3.1% | | | | | |
Life Technologies Corporation* | | 161,100 | | | 8,414,253 |
| | | | | |
| | |
Multi-Line Insurance—0.7% | | | | | |
Hartford Financial Services Group, Inc. | | 77,400 | | | 1,800,324 |
| | | | | |
| | |
Multi-Utilities—0.8% | | | | | |
Xcel Energy, Inc. | | 107,000 | | | 2,271,610 |
| | | | | |
| | |
Oil & Gas Exploration & Production—1.3% | | | | | |
Forest Oil Corporation* | | 152,740 | | | 3,398,465 |
| | | | | |
| | |
Oil & Gas Refining & Marketing—0.8% | | | | | |
World Fuel Services Corporation | | 77,600 | | | 2,078,904 |
| | | | | |
| | |
Other Diversified Financial Services—1.8% | | | | | |
JPMorgan Chase & Company | | 118,878 | | | 4,953,646 |
| | | | | |
| | |
Packaged Foods & Meats—0.8% | | | | | |
Campbell Soup Company | | 64,500 | | | 2,180,100 |
| | | | | |
| | |
Paper Packaging—0.7% | | | | | |
Rock-Tenn Company | | 39,700 | | | 2,001,277 |
| | | | | |
| | |
Pharmaceuticals—0.7% | | | | | |
Endo Pharmaceuticals Holdings, Inc.* | | 89,600 | | | 1,837,696 |
| | | | | |
| | |
Property & Casualty Insurance—4.0% | | | | | |
ACE, Ltd. | | 124,135 | | | 6,256,404 |
Old Republic International Corporation | | 171,800 | | | 1,724,872 |
Tower Group, Inc. | | 32,400 | | | 758,484 |
W.R. Berkley Corporation | | 84,000 | | | 2,069,760 |
| | | | | |
| | | | | 10,809,520 |
| | | | | |
Security & Alarm Services—0.6% | | | | | |
Brink’s Company | | 66,300 | | | 1,613,742 |
| | | | | |
| | |
Specialty Stores—1.3% | | | | | |
Cabela’s, Inc.* | | 99,700 | | | 1,421,722 |
Tractor Supply Company* | | 40,200 | | | 2,128,992 |
| | | | | |
| | | | | 3,550,714 |
| | | | | |
The accompanying notes are an integral part of the financial statements
29
| | | | |
| Schedule of Investments | | | | Series D |
| December 31, 2009 | | | | (Global Series) |
| | | | | | |
| | | Shares | | Value |
COMMON STOCKS—54.3% (continued) | | | | | | |
Systems Software—2.3% | | | | | | |
Check Point Software Technologies * | | | 187,067 | | $ | 6,337,830 |
| | | | | | |
| | |
Tobacco—3.7% | | | | | | |
Altria Group, Inc. | | | 278,232 | | | 5,461,693 |
Philip Morris International, Inc. | | | 94,861 | | | 4,571,352 |
| | | | | | |
| | | | | | 10,033,045 |
| | | | | | |
TOTAL COMMON STOCKS (cost $129,000,402) | | | | | $ | 146,573,253 |
| | | | | | |
| | |
FOREIGN STOCKS—44.7% | | | | | | |
Aerospace & Defense—2.6% | | | | | | |
BAE Systems plc1,2 | | | 1,213,196 | | | 7,004,281 |
| | | | | | |
| | |
Automobile Manufacturers—2.5% | | | | | | |
Honda Motor Company, Ltd.1,2 | | | 120,000 | | | 4,073,631 |
Renault S.A.1,2 | | | 54,036 | | | 2,768,542 |
| | | | | | |
| | | | | | 6,842,173 |
| | | | | | |
Diversified Banks—3.8% | | | | | | |
DBS Group Holdings, Ltd.1,2 | | | 576,000 | | | 6,260,571 |
Standard Chartered plc1,2 | | | 164,678 | | | 4,140,113 |
| | | | | | |
| | | | | | 10,400,684 |
| | | | | | |
Electric Utilities—0.6% | | | | | | |
Endesa S.A.1,2 | | | 47,182 | | | 1,625,075 |
| | | | | | |
| | |
Electrical Components & Equipment—2.8% | | | | | | |
Prysmian SpA1,2 | | | 421,212 | | | 7,343,079 |
| | | | | | |
| | |
Fertilizers & Agricultural Chemicals—2.0% | | | | | | |
Syngenta AG1,2 | | | 19,163 | | | 5,406,296 |
| | | | | | |
| | |
Food Retail—1.0% | | | | | | |
Empire Company, Ltd. | | | 29,804 | | | 1,352,408 |
Metro, Inc. | | | 37,543 | | | 1,400,719 |
| | | | | | |
| | | | | | 2,753,127 |
| | | | | | |
Gold—1.4% | | | | | | |
Randgold Resources, Ltd.1,2 | | | 48,145 | | | 3,836,118 |
| | | | | | |
| | |
Health Care Equipment—0.9% | | | | | | |
Smith & Nephew plc1,2 | | | 242,798 | | | 2,499,005 |
| | | | | | |
| | |
Human Resources & Employment Services—1.4% | | | | | | |
Seek, Ltd.1,2 | | | 634,078 | | | 3,915,615 |
| | | | | | |
| | |
Integrated Oil & Gas—1.9% | | | | | | |
BG Group plc1,2 | | | 153,372 | | | 2,773,449 |
ENI SpA1,2 | | | 36,454 | | | 927,160 |
Repsol YPF S.A.1,2 | | | 61,074 | | | 1,636,829 |
| | | | | | |
| | | | | | 5,337,438 |
| | | | | | |
Integrated Telecommunication Services—0.5% | | | | | | |
Telstra Corporation, Ltd.1,2 | | | 401,946 | | | 1,235,764 |
| | | | | | |
| | |
Internet Software & Services—2.6% | | | | | | |
Gree, Inc.1,2 | | | 111,984 | | | 6,927,655 |
| | | | | | |
| | |
Life & Health Insurance—0.6% | | | | | | |
CNP Assurances1,2 | | | 16,221 | | | 1,568,786 |
| | | | | | |
| | |
Multi-Utilities—1.0% | | | | | | |
Veolia Environnement1,2 | | | 82,959 | | | 2,731,141 |
| | | | | | |
| | |
Office Electronics—0.5% | | | | | | |
Neopost S.A.1,2 | | | 16,387 | | | 1,350,802 |
| | | | | | |
| | |
Oil & Gas Exploration & Production—3.8% | | | | | | |
CNOOC, Ltd.1.,2 | | | 2,243,322 | | | 3,494,515 |
Oil Search, Ltd.1,2 | | | 1,244,315 | | | 6,822,460 |
| | | | | | |
| | | | | | 10,316,975 |
| | | | | | |
Oil & Gas Refining & Marketing—0.5% | | | | | | |
Neste Oil Oyj1,2 | | | 75,521 | | | 1,340,320 |
| | | | | | |
| | |
Packaged Foods & Meats—5.7% | | | | | | |
Marine Harvest1,2* | | | 7,616,260 | | | 5,517,097 |
Parmalat SpA1,2 | | | 1,780,174 | | | 4,970,586 |
Toyo Suisan Kaisha, Ltd.1,2 | | | 220,703 | | | 5,092,286 |
| | | | | | |
| | | | | | 15,579,969 |
| | | | | | |
Property & Casualty Insurance—1.3% | | | | | | |
Lancashire Holdings, Ltd.1,2 | | | 483,997 | | | 3,479,933 |
| | | | | | |
| | |
Regional Banks—0.6% | | | | | | |
Seven Bank, Ltd.1,2 | | | 772 | | | 1,542,014 |
| | | | | | |
| | |
Semiconductor Equipment—2.4% | | | | | | |
Tokyo Electron, Ltd.1,2 | | | 100,100 | | | 6,428,675 |
| | | | | | |
| | |
Specialized Finance—0.7% | | | | | | |
Bolsas y Mercados Espanoles S.A.1,2 | | | 23,944 | | | 771,304 |
Osaka Securities Exchange Company, Ltd.1,2 | | | 213 | | | 1,015,813 |
| | | | | | |
| | | | | | 1,787,117 |
| | | | | | |
Steel—1.5% | | | | | | |
Voestalpine AG1,2 | | | 108,959 | | | 3,975,640 |
| | | | | | |
| | |
Tobacco—2.1% | | | | | | |
Imperial Tobacco Group plc1,2 | | | 176,120 | | | 5,550,923 |
| | | | | | |
TOTAL FOREIGN STOCKS (cost $109,375,770) | | | | | $ | 120,778,605 |
| | | | | | |
| | |
| | | Principal
Amount | | Value |
SHORT TERM INVESTMENTS—0.8% | | | | | | |
State Street General Account U.S. Government Fund1 | | $ | 2,109,842 | | $ | 2,109,842 |
| | | | | | |
TOTAL SHORT TERM INVESTMENTS (cost $2,109,842) | | | | | $ | 2,109,842 |
| | | | | | |
Total Investments—99.8%3 (cost $240,486,014) | | | | | $ | 269,461,700 |
Cash & Other Assets, Less Liabilities—0.2% | | | | | | 619,743 |
| | | | | | |
Total Net Assets—100.0% | | | | | $ | 270,081,443 |
| | | | | | |
The accompanying notes are an integral part of the financial statements
30
| | |
| Schedule of Investments | | Series D |
| December 31, 2009 | | (Global Series) |
INVESTMENT CONCENTRATION
At December 31, 2009, the investment diversification of the Series was as follows:
| | | | | | |
Country | | % of Net
Assets | | | Value |
United States | | 44.4 | % | | $ | 119,740,470 |
Japan | | 9.4 | | | | 25,080,074 |
United Kingdom | | 8.1 | | | | 21,967,771 |
Italy | | 4.9 | | | | 13,240,825 |
Switzerland | | 4.3 | | | | 11,662,700 |
Cayman Islands | | 4.0 | | | | 10,668,322 |
France | | 3.1 | | | | 8,419,271 |
Papua New Guinea | | 2.5 | | | | 6,822,460 |
Israel | | 2.3 | | | | 6,337,830 |
Singapore | | 2.3 | | | | 6,260,571 |
India | | 2.1 | | | | 5,680,069 |
Norway | | 2.0 | | | | 5,517,097 |
Australia | | 1.9 | | | | 5,151,379 |
Spain | | 1.5 | | | | 4,033,208 |
Austria | | 1.5 | | | | 3,975,640 |
Jersey | | 1.4 | | | | 3,836,118 |
Hong Kong | | 1.3 | | | | 3,494,515 |
Bermuda | | 1.3 | | | | 3,479,933 |
Canada | | 1.0 | | | | 2,753,127 |
Finland | | 0.5 | | | | 1,340,320 |
| | | | | | |
Total Investments | | 99.8 | | | $ | 269,461,700 |
| | | | | | |
For federal income tax purposes the identified cost of investments owned at December 31, 2009 was $241,875,662.
| | |
ADR | | American Depositary Receipt |
plc | | Public Limited Company |
| * | Non-income producing security |
| 1 | Value determined based on Level 2 inputs. |
| 2 | Security was subject to the fair value trigger at December 31, 2009. The total market value off air valued securities amounts to $118,025,478 (cost $107,000,295) or 43.7% of total net assets. |
| 3 | Unless otherwise indicated, the values of the securities of the Portfolio are determined based on Level 1 inputs. |
The accompanying notes are an integral part of the financial statements
31
Series D
(Global Series)
Statement of Assets and Liabilities
December 31, 2009
| | | | |
Assets: | | | | |
Investments, at value* | | $ | 269,461,700 | |
Cash denominated in a foreign currency, at value** | | | 679 | |
Receivables: | | | | |
Fund shares sold | | | 309,922 | |
Dividends | | | 945,192 | |
Foreign taxes recoverable | | | 182,385 | |
Prepaid expenses | | | 5,452 | |
| | | | |
Total assets | | | 270,905,330 | |
| | | | |
| |
Liabilities: | | | | |
Payable for: | | | | |
Fund shares redeemed | | | 421,821 | |
Management fees | | | 228,664 | |
Administration fees | | | 35,499 | |
Transfer agent/maintenance fees | | | 2,083 | |
Custodian fees | | | 4,279 | |
Directors’ fees | | | 3,710 | |
Professional fees | | | 57,250 | |
Other fees | | | 70,581 | |
| | | | |
Total liabilities | | | 823,887 | |
| | | | |
Net assets | | $ | 270,081,443 | |
| | | | |
| |
Net assets consist of: | | | | |
Paid in capital | | $ | 350,560,600 | |
Undistributed net investment income | | | 1,919,749 | |
Accumulated net realized loss on sale of investments and foreign currency transactions | | | (111,362,797 | ) |
Net unrealized appreciation in value of investments and translation of assets and liabilities in foreign currencies | | | 28,963,891 | |
| | | | |
Net assets | | $ | 270,081,443 | |
| | | | |
Capital shares authorized | | | unlimited | |
Capital shares outstanding | | | 30,474,571 | |
Net asset value per share (net assets divided by shares outstanding) | | $ | 8.86 | |
| | | | |
| |
* investments, at cost | | $ | 240,486,014 | |
** Cash denominated in a foreign currency, at cost | | | 678 | |
|
Statement of Operations For Year Ended December 31, 2009 | |
|
| |
Investment Income: | | | | |
Dividends (net of foreign withholding tax $347,423) | | $ | 6,138,630 | |
Interest | | | 2,148 | |
| | | | |
Total investment income | | | 6,140,778 | |
| | | | |
| |
Expenses: | | | | |
Management fees | | | 2,566,995 | |
Administration fees | | | 390,656 | |
Transfer agent/maintenance fees | | | 25,352 | |
Custodian fees | | | 83,950 | |
Directors’ fees | | | 27,362 | |
Professional fees | | | 90,708 | |
Reports to shareholders | | | 54,090 | |
Other | | | 20,010 | |
| | | | |
Total expenses | | | 3,259,123 | |
| | | | |
Net investment income | | | 2,881,655 | |
| | | | |
| |
Net Realized and Unrealized Gain (Loss): | | | | |
Net realized gain (loss) during the year on: | | | | |
Investments | | | 1,024,997 | |
Foreign currency transactions | | | (961,906 | ) |
| | | | |
Net realized gain | | | 63,091 | |
| | | | |
Net unrealized appreciation (depreciation) during the year on: | | | | |
Investments | | | 42,167,814 | |
Translation of assets and liabilities in foreign currencies | | | (1,636 | ) |
| | | | |
Net unrealized appreciation | | | 42,166,178 | |
| | | | |
Net realized and unrealized gain | | | 42,229,269 | |
| | | | |
Net increase in net assets resulting from operations | | $ | 45,110,924 | |
| | | | |
The accompanying notes are an integral part of the financial statements
32
| | |
| Statement of Changes in Net Assets | | Series D (Global Series) |
| | | | | | | | |
| | | Year Ended
December 31, 2009 | | | Year Ended
December 31, 2008 | |
Increase (decrease) in net assets from operations: | | | | | | | | |
Net investment income | | $ | 2,881,655 | | | $ | 4,539,604 | |
Net realized gain (loss) during the year on investments and foreign currency transactions | | | 63,091 | | | | (107,176,596 | ) |
Net unrealized appreciation (depreciation) during the year on investments and translation of assets and liabilities in foreign currencies | | | 42,166,178 | | | | (87,984,897 | ) |
| | | | | | | | |
Net increase (decrease) in net assets resulting from operations | | | 45,110,924 | | | | (190,621,889 | ) |
| | | | | | | | |
| | |
Capital share transactions: | | | | | | | | |
Proceeds from sale of shares | | | 26,124,600 | | | | 71,253,122 | |
Cost of shares redeemed | | | (77,119,578 | ) | | | (154,842,547 | ) |
| | | | | | | | |
Net decrease from capital share transactions | | | (50,994,978 | ) | | | (83,589,425 | ) |
| | | | | | | | |
Net decrease in net assets | | | (5,884,054 | ) | | | (274,211,314 | ) |
| | | | | | | | |
| | |
Net assets: | | | | | | | | |
Beginning of year | | | 275,965,497 | | | | 550,176,811 | |
| | | | | | | | |
End of year | | $ | 270,081,443 | | | $ | 275,965,497 | |
| | | | | | | | |
Undistributed net investment income at end of year | | $ | 1,919,749 | | | $ | 7,455,215 | |
| | | | | | | | |
| | |
Capital share activity: | | | | | | | | |
Shares sold | | | 3,505,475 | | | | 7,091,222 | |
Shares redeemed | | | (10,300,582 | ) | | | (15,639,694 | ) |
| | | | | | | | |
Total capital share activity | | | (6,795,107 | ) | | | (8,548,472 | ) |
| | | | | | | | |
The accompanying notes are an integral part of the financial statements
33
| | | |
| Financial Highlights | | Series D | |
Selected data for each share of capital stock outstanding throughout each year | | (Global Series | ) |
| | | | | | | | | | | | | | | | | | | | |
| | | 2009 | | | 2008a | | | 2007b | | | 2006 | | | Year Ended
December 31,
2005 | |
Per Share Data | | | | | | | | | | | | | | | | | | | | |
Net asset value, beginning of period | | $ | 7.40 | | | $ | 12.01 | | | $ | 11.03 | | | $ | 9.40 | | | $ | 8.28 | |
| | | | | | | | | | | | | | | | | | | | |
Income (loss) from investment operations: | | | | | | | | | | | | | | | | | | | | |
Net investment incomec | | | 0.09 | | | | 0.11 | | | | 0.08 | | | | 0.03 | | | | 0.03 | |
Net gain (loss) on securities (realized and unrealized) | | | 1.37 | | | | (4.72 | ) | | | 0.90 | | | | 1.60 | | | | 1.09 | |
| | | | | | | | | | | | | | | | | | | | |
Total from investment operations | | | 1.46 | | | | (4.61 | ) | | | 0.98 | | | | 1.63 | | | | 1.12 | |
| | | | | | | | | | | | | | | | | | | | |
Net asset value, end of period | | $ | 8.86 | | | $ | 7.40 | | | $ | 12.01 | | | $ | 11.03 | | | $ | 9.40 | |
| | | | | | | | | | | | | | | | | | | | |
| | | | | |
Total Returnd | | | 19.73 | % | | | (38.38 | %) | | | 8.88 | % | | | 17.34 | % | | | 13.53 | % |
| | | | | | | | | | | | | | | | | | | | |
Ratios/Supplemental Data | | | | | | | | | | | | | | | | | | | | |
Net assets, end of period (in thousands) | | $ | 270,081 | | | $ | 275,965 | | | $ | 550,177 | | | $ | 571,006 | | | $ | 516,213 | |
| | | | | | | | | | | | | | | | | | | | |
Ratios to average net assets: | | | | | | | | | | | | | | | | | | | | |
Net investment income | | | 1.12 | % | | | 1.09 | % | | | 0.67 | % | | | 0.32 | % | | | 0.30 | % |
Total expensese | | | 1.27 | % | | | 1.26 | % | | | 1.26 | % | | | 1.24 | % | | | 1.24 | % |
Net expensesf | | | 1.27 | % | | | 1.25 | % | | | 1.26 | % | | | 1.24 | % | | | 1.24 | % |
Net expenses prior to custodian earnings credits and net of expense waivers | | | 1.27 | % | | | 1.26 | % | | | 1.26 | % | | | 1.24 | % | | | 1.24 | % |
| | | | | | | | | | | | | | | | | | | | |
Portfolio turnover rate | | | 317 | % | | | 302 | %g | | | 115 | % | | | 23 | % | | | 33 | % |
| a | SGI became the sub-advisor of Series D effective May 1, 2008. Prior to May 1, 2008, Security Investors (SI) paid Oppenheimer Funds for sub-advising 50% of Series D. SGI sub-advised the remaining 50%. |
| b | Security Global Investors, LLC (SGI) became sub-advisor of 50% of Series D effective August 1, 2007. OppenheimerFunds sub-advised the remaining 50%. Prior to August 1, 2007, OppenheimerFunds sub-advised the entire Series. |
| c | Net investment income (loss) was computed using average shares outstanding throughout the period. |
| d | Total return does not take into account any of the expenses associated with an investment in variable insurance products offered by Security Benefit Life Insurance Company. If total return had taken into account these expenses, performance would have been lower. Shares of a series of SBL Fund are available only through the purchase of such products. |
| e | Total expense information reflects the expense ratios absent expense reductions by the Investment Manager and custodian earnings credits, as applicable. |
| f | Net expense information reflects the expense ratios after voluntary expense waivers, reimbursements and custodian earnings credits, as applicable. |
| g | Significant variation in the portfolio turnover rate is due to the re-alignment of the Series portfolio following the appointment of SGI as sub-advisor. |
The accompanying notes are an integral part of the financial statements
34
Manager’s Commentary
February 15, 2010
| | | | |
| | Advised by: | | |
To Our Shareholders:
Series E of the SBL Fund – U.S. Intermediate Bond Series earned a return of 8.41%1 for the year ended December 31, 2009, outperforming the benchmark Barclays Capital Intermediate U.S. Government/Credit Index return of 5.24%.
The U.S. Intermediate Bond Series will primarily invest in a diversified portfolio of investment grade debt securities and maintain a dollar-weighted average duration of 3 to 10 years. The Series’ investment approach uses a bottom-up process in selecting asset classes and securities. We emphasize rigorous credit analysis and relative value in selecting securities. Credit analysis includes assessing factors such as an issuer’s management experience, cash flow, position in its market, capital structure, and general economic and market factors. Relative value analysis includes earnings growth, profitability trends, the issuer’s financial strength, and valuation analysis. Relative valuation also compares the credit risk and yield of a security to that of other securities of the same or another asset class.
Composition of Portfolio Assets
At the end of the year, the Series held 44% in corporate issues, 5% in mortgage-backed securities, 30% in U.S. government securities, and 16% in U.S. government sponsored agency bonds and notes. Other securities, such as asset-backed securities, preferred stock, and cash constituted 5% of the portfolio.
U.S. Intermediate Bond Market Review
Turbulent does not begin to describe 2009 in the fixed income markets. U.S. treasuries had their worst total return in thirty years after starting the year as the global investor’s safe haven of choice. U.S. investment grade bond issuance was approximately $1 trillion, a remarkable 30% improvement from 2008. Corporate bonds performed extremely well as supply served to strengthen the balance sheets of many financial institutions and also to extend the maturities of many high yield issuers, lessening their near-term principal repayment risk.
The U.S. Treasury and Federal Reserve each played a key role in unlocking what were once frozen credit markets in 2009. At the height of the credit freeze, investors were fearful that impending corporate debt maturities would go unpaid for fear of companies not being able to roll over their debt. Through a variety of programs and security purchases, the U.S. Treasury, FDIC, and Federal Reserve enabled corporations to once again issue debt and meet near-term obligations. Because this served to reduce implied default rates, corporations were then able to tender for other debt and amend covenants to their benefit, leaving many issuers with less onerous debt covenants and reduced near-term maturities.
Fixed-income factors we follow point to improving economic growth as the yield curve remains historically steep and monetary policy remains accommodative. The cost of capital is cheap, as interest rates remain very low with no sign of inflation. Therefore, companies are able to expand but it is through merger and acquisition activity rather than organic growth.
Market Outlook
Increased government bond issuance, particularly of longer duration securities, combined with the removal of a buyer (the Federal Reserve) that purchased approximately 20% of total new cash raised by the U.S. treasury in 2009, caused us to be underweight U.S. treasuries and agencies in 2010. We expect the trend of corporate out-performance versus U.S. treasuries to continue as we enter 2010. Therefore, we will continue to overweight corporate bonds and underweight U.S. treasuries as the improving credit trend plays out over the next 12 months.
The Federal Reserve’s U.S. treasury purchases have ended and its agency purchases are scheduled to end early in 2010, removing a significant source of demand from both markets. However, government bond supply will remain robust as JP Morgan forecasts nearly a 20% increase in gross issuance of coupon treasury securities in 2010. The U.S. treasury has also stated its intention to lengthen the average maturity of its debt. We will continue to monitor the economic and market conditions and will adjust the asset mix and maturity structure in the portfolio accordingly.
Thank you for your investment in the U.S. Intermediate Bond Series.
We recognize there are many investment fund alternatives available today and appreciate the confidence you place in us.
Sincerely,
Daniel Portanova, Portfolio Manager
| 1 | Fee waivers and/or reimbursements reduce Series expenses and in the absence of such waivers, the performance quoted would be reduced. |
35
| | |
| | Series E |
| Performance Summary | | (U.S. Intermediate Bond Series) |
| December 31, 2009 | | (unaudited) |
PERFORMANCE
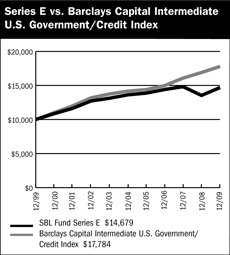
$10,000 Over 10 Years
The chart above assumes a hypothetical $10,000 investment in Series E (U.S. Intermediate Bond Series) on December 31, 1999 and reflects the fees and expenses of Series E. The Barclays Capital Intermediate U.S. Government Credit Index is an unmanaged Index that tracks U.S. dollar denominated U.S. treasuries, government-related and investment grade U.S. corporate securities that have a remaining maturing of greater than or equal to 1 year and less than 10 years.
Average Annual Returns
| | | | | | | | | |
Periods Ended 12-31-091 | | 1 Year | | | 5 Years | | | 10 Years | |
Series E | | 8.41 | % | | 1.50 | % | | 3.91 | % |
| 1 | Performance figures do not reflect fees and expenses associated with an investment in variable insurance products offered by Security Benefit Life Insurance Company. If returns had taken into account these fees and expenses, performance would have been lower. Shares of a Series of SBL Fund are available only through the purchase of such products. |
The performance data quoted above represents past performance. Past performance is not predictive of future performance. The investment return and principal value of an investment will fluctuate so that an investor’s shares, when redeemed, may be worth more or less than their original cost.
Portfolio Composition by Quality Ratings
(Based on Standard and Poor’s Ratings)
| | | |
AAA | | 52.07 | % |
AA | | 12.01 | |
A | | 16.58 | |
BBB | | 15.52 | |
CCC | | 0.35 | |
CC | | 0.21 | |
Preferred Stock | | 0.17 | |
Cash & Other Assets, Less Liabilities | | 3.09 | |
Total Net Assets | | 100.00 | % |
| | | |
The accompanying notes are an integral part of the financial statements
36
| | |
| Performance Summary | | Series E |
| December 31, 2009 | | (U.S. Intermediate Bond Series) |
| | | | | | |
| | | Principal
Amount | | Value |
CORPORATE BONDS—48.4% | | | | | | |
Banking—6.5% | | | | | | |
BOI Capital Funding No. 2, LP | | | | | | |
5.57%, 20491,2,3,4 | | $ | 650,000 | | $ | 273,000 |
Citigroup, Inc. | | | | | | |
6.38%, 20141 | | | 500,000 | | | 523,454 |
8.50%, 20191 | | | 1,000,000 | | | 1,154,753 |
JPMorgan Chase & Company | | | | | | |
4.65%, 20141 | | | 2,000,000 | | | 2,106,877 |
6.30%, 20191 | | | 1,000,000 | | | 1,100,077 |
Standard Chartered plc | | | | | | |
6.41%, 20491,2,3,4 | | | 1,750,000 | | | 1,389,019 |
Wells Fargo & Company | | | | | | |
4.38%, 20131 | | | 2,000,000 | | | 2,077,360 |
| | | | | | |
| | | | | | 8,624,540 |
| | | | | | |
Brokerage—2.9% | | | | | | |
BlackRock, Inc. | | | | | | |
6.25%, 20171 | | | 1,500,000 | | | 1,612,835 |
Raymond James Financial, Inc. | | | | | | |
8.60%, 20191 | | | 2,000,000 | | | 2,163,710 |
| | | | | | |
| | | | | | 3,776,545 |
| | | | | | |
Building Materials—0.5% | | | | | | |
CRH America, Inc. | | | | | | |
6.95%, 20121 | | | 600,000 | | | 649,926 |
| | | | | | |
Chemicals—4.2% | | | | | | |
Airgas, Inc. | | | | | | |
4.50%, 20141 | | | 1,000,000 | | | 1,015,150 |
PPG Industries, Inc. | | | | | | |
7.40%, 20191 | | | 650,000 | | | 724,718 |
Praxair, Inc. | | | | | | |
4.38%, 20141 | | | 1,000,000 | | | 1,054,449 |
4.63%, 20151 | | | 1,500,000 | | | 1,595,330 |
5.20%, 20171 | | | 1,000,000 | | | 1,048,576 |
| | | | | | |
| | | | | | 5,438,223 |
| | | | | | |
Diversified Manufacturing—2.7% | | | | | | |
Amphenol Corporation | | | | | | |
4.75%, 20141 | | | 2,000,000 | | | 2,000,702 |
ITT Corporation | | | | | | |
4.90%, 20141 | | | 1,500,000 | | | 1,571,783 |
| | | | | | |
| | | | | | 3,572,485 |
| | | | | | |
Electric—4.0% | | | | | | |
American Water Capital Corporation | | | | | | |
6.09%, 20171 | | | 3,000,000 | | | 3,134,711 |
Arizona Public Service Company | | | | | | |
6.38%, 20111 | | | 600,000 | | | 642,293 |
Cincinnati Gas & Electric | | | | | | |
5.70%, 20121 | | | 600,000 | | | 650,716 |
East Coast Power LLC | | | | | | |
7.07%, 20121 | | | 77,467 | | | 80,425 |
Oncor Electric Delivery Company | | | | | | |
6.38%, 20151 | | | 600,000 | | | 654,503 |
| | | | | | |
| | | | | | 5,162,648 |
| | | | | | |
Entertainment—0.6% | | | | | | |
Walt Disney Company | | | | | | |
4.50%, 20131 | | | 700,000 | | | 743,572 |
| | | | | | |
Financial Companies—Noncaptive | | | | | | |
Consumer—0.3% | | | | | | |
Residential Capital LLC | | | | | | |
8.50%, 20121 | | | 650,000 | | | 455,000 |
| | | | | | |
Financial Companies—Noncaptive Diversified—1.7% | | | | | | |
General Electric Capital Corporation | | | | | | |
6.00%, 20121 | | | 2,000,000 | | | 2,155,814 |
| | | | | | |
Food & Beverage—3.4% | | | | | | |
Brown-Forman Corporation | | | | | | |
5.00%, 20141 | | | 2,000,000 | | | 2,101,968 |
General Mills, Inc. | | | | | | |
5.25%, 20131 | | | 1,000,000 | | | 1,078,840 |
5.70%, 20171 | | | 1,200,000 | | | 1,297,744 |
| | | | | | |
| | | | | | 4,478,552 |
| | | | | | |
Independent Energy—1.3% | | | | | | |
Devon Financing Corporation ULC | | | | | | |
6.88%, 20111 | | | 1,600,000 | | | 1,738,104 |
| | | | | | |
Industrial—Other—1.2% | | | | | | |
Johns Hopkins University | | | | | | |
5.25%, 20191 | | | 1,500,000 | | | 1,560,225 |
| | | | | | |
Insurance—Life—0.8% | | | | | | |
RenaissanceRe Holdings, Ltd. | | | | | | |
5.88%, 20131 | | | 1,000,000 | | | 1,014,986 |
| | | | | | |
Insurance—Property & Casualty—1.5% | | | | | | |
Berkshire Hathaway Finance Corporation | | | | | | |
4.75%, 20121 | | | 1,800,000 | | | 1,918,919 |
| | | | | | |
Integrated Energy—2.8% | | | | | | |
BP Capital Markets plc | | | | | | |
5.25%, 20131 | | | 2,000,000 | | | 2,178,458 |
Statoil ASA | | | | | | |
2.90%, 20141 | | | 1,500,000 | | | 1,493,796 |
| | | | | | |
| | | | | | 3,672,254 |
| | | | | | |
Media—Cable—3.7% | | | | | | |
Omnicom Group, Inc. | | | | | | |
6.25%, 20191 | | | 4,500,000 | | | 4,854,821 |
| | | | | | |
Natural Gas Pipelines—0.1% | | | | | | |
Express Pipeline, LP | | | | | | |
6.47%, 20131,3,4 | | | 136,000 | | | 137,550 |
| | | | | | |
Pharmaceuticals—4.3% | | | | | | |
AstraZeneca plc | | | | | | |
5.90%, 20171 | | | 1,750,000 | | | 1,944,549 |
GlaxoSmithKline Capital, Inc. | | | | | | |
4.85%, 20131 | | | 500,000 | | | 536,725 |
Novartis Securities Investment, Ltd. | | | | | | |
5.13%, 20191 | | | 1,000,000 | | | 1,050,526 |
Wyeth | | | | | | |
5.50%,20131 | | | 2,000,000 | | | 2,174,575 |
| | | | | | |
| | | | | | 5,706,375 |
| | | | | | |
The accompanying notes are an integral part of the financial statements
37
| | |
| Schedule of Investments | | Series E |
| December 31, 2009 | | (U.S. Intermediate Bond Series) |
| | | | | | |
| | | Principal
Amount | | Value |
CORPORATE BONDS—48.4% (continued) | | | | | | |
Restaurants—1.6% | | | | | | |
Starbucks Corporation | | | | | | |
6.25%, 20171 | | $ | 2,000,000 | | $ | 2,115,316 |
| | | | | | |
Technology—0.8% | | | | | | |
Microsoft Corporation | | | | | | |
2.95%, 20141 | | | 1,000,000 | | | 1,010,712 |
| | | | | | |
Telecommunications—Wireless—1.1% | | | | | | |
AT&T, Inc. | | | | | | |
4.85%, 20141 | | | 1,300,000 | | | 1,382,284 |
| | | | | | |
Transportation Services—0.8% | | | | | | |
United Parcel Service, Inc. | | | | | | |
3.88%, 20141 | | | 1,000,000 | | | 1,038,974 |
| | | | | | |
U.S. Banking—1.6% | | | | | | |
American Express Bank FSB | | | | | | |
3.15%, 20111 | | | 2,000,000 | | | 2,066,936 |
| | | | | | |
TOTAL CORPORATE BOND (cost $61,144,860) | | | | | $ | 63,274,761 |
| | | | | | |
| | |
| | | Principal
Amount | | Value |
PREFERRED STOCK—0.2% | | | | | | |
Insurance Brokers—0.2% | | | | | | |
Woodbourne Capital Trust I | | | | | | |
1.53%, 20492,3,5,6 | | | 300,000 | | | 56,176 |
Woodbourne Capital Trust II | | | | | | |
1.57%, 20492,3,5,6 | | | 300,000 | | | 56,177 |
Woodbourne Capital Trust III | | | | | | |
1.58%, 20492,3,5,6 | | | 300,000 | | | 56,177 |
Woodbourne Capital Trust IV | | | | | | |
1.58%, 20492,3,5,6 | | | 300,000 | | | 56,176 |
| | | | | | |
| | | | | | 224,706 |
| | | | | | |
TOTAL PREFERRED STOCK (cost $1,205,796) | | | | | $ | 224,706 |
| | | | | | |
| | |
| | | Principal
Amount | | Value |
MORTGAGE BACKED SECURITIES—2.8% | | | | | | |
Other Non-Agency—2.8% | | | | | | |
C.M.O.’s—2.8% | | | | | | |
Chase Mortgage Finance Corporation | | | | | | |
2005-A1 2A2, 5.23%, 20351,2 | | $ | 998,286 | | $ | 921,927 |
Homebanc Mortgage Trust | | | | | | |
2006-1, 3.74%, 20371,2 | | | 1,176,297 | | | 722,395 |
JP Morgan Alternative Loan Trust | | | | | | |
2006-S3, 6.00%, 20361 | | | 3,000,000 | | | 1,775,543 |
JP Morgan Mortgage Trust | | | | | | |
2006-A3, 3.97%, 20361,2 | | | 307,927 | | | 260,922 |
| | | | | | |
| | | | | | 3,680,787 |
| | | | | | |
| | | | | | 3,680,787 |
| | | | | | |
U.S. Government Sponsored Agencies—0.0% | | | | | | |
C.M.O.’s—0.0% | | | | | | |
Federal Home Loan Mortgage Corporation | | | | | | |
FHR 188 H, 7.00%, 20211 | | | 996 | | | 1,086 |
Federal National Mortgage Association | | | | | | |
FNR 1990-68 J, 6.95%, 2020 1 | | | 2,442 | | | 2,675 |
FNR 1990-103 K, 7.50%, 20201 | | | 919 | | | 984 |
| | | | | | |
| | | | | | 4,745 |
| | | | | | |
| | | | | | 4,745 |
| | | | | | |
U.S. Government Sponsored Securities—0.0% | | | | | | |
Pass Through’s—0.0% | | | | | | |
Government National Mortgage Association | | | | | | |
#518436, 7.25%, 20291 | | | 18,389 | | | 20,595 |
| | | | | | |
| | | | | | 20,595 |
| | | | | | |
TOTAL MORTGAGE BACKED SECURITIES (cost $5,500,927) | | | | | $ | 3,706,127 |
| | | | | | |
| | |
| | | Principal
Amount | | Value |
ASSET BACKED SECURITIES—0.3% | | | | | | |
Home Equity Loans—0.3% | | | | | | |
Credit-Based Asset Servicing and Securitization LLC | | | | | | |
2005-CB5, 0.49%, 20351,2 | | $ | 427,933 | | $ | 396,870 |
| | | | | | |
TOTAL ASSET BACKED SECURITIES (cost $427,933) | | | | | $ | 396,870 |
| | | | | | |
| | |
| | | Principal
Amount | | Value |
U.S. GOVERNMENT SPONSORED AGENCY BONDS & NOTES—15.7% | | | | | | |
Federal Home Loan Bank | | | | | | |
0.80%, 4/30/20101 | | $ | 4,000,000 | | $ | 4,008,500 |
1.63%, 3/16/20111 | | | 9,000,000 | | | 9,095,876 |
3.63%, 10/18/20131 | | | 1,500,000 | | | 1,571,306 |
5.25%, 6/18/20141 | | | 1,500,000 | | | 1,666,367 |
5.00%, 12/21/20151 | | | 2,000,000 | | | 2,156,182 |
Federal Home Loan Mortgage Corporation | | | | | | |
3.75%, 3/27/20191 | | | 2,000,000 | | | 1,960,842 |
| | | | | | |
TOTAL U.S. GOVERNMENT SPONSORED AGENCY BONDS & NOTES (cost $20,463,714) | | | | | $ | 20,459,073 |
| | | | | | |
38
| | |
| Schedule of Investments | | Series E |
| December 31, 2009 | | (U.S. Intermediate Bond Series) |
| | | | | | |
| | | Principal
Amount | | Value |
U.S. GOVERNMENT SECURITIES—29.5% | | | | | | |
U.S. Treasury Notes | | | | | | |
2.00%, 2/28/2010 | | $ | 7,500,000 | | $ | 7,521,390 |
0.88%, 5/31/2011 | | | 2,250,000 | | | 2,252,725 |
1.38%, 4/15/2012 | | | 4,500,000 | | | 4,504,221 |
1.50%, 7/15/2012 | | | 6,500,000 | | | 6,510,152 |
3.63%, 12/31/2012 | | | 2,000,000 | | | 2,114,844 |
2.50%, 3/31/2013 | | | 5,500,000 | | | 5,625,037 |
3.25%, 6/30/2016 | | | 4,500,000 | | | 4,513,010 |
2.75%, 2/15/2019 | | | 3,250,000 | | | 2,992,031 |
3.13%, 5/15/2019 | | | 1,600,000 | | | 1,515,250 |
3.38%, 11/15/2019 | | | 1,000,000 | | | 961,880 |
| | | | | | |
TOTAL U.S. GOVERNMENT SECURITIES (cost $38,645,707) | | | | | $ | 38,510,540 |
| | | | | | |
Total Investments—96.9%7 (cost $127,388,937) | | | | | $ | 126,572,077 |
Cash & Other Assets, Less Liabilities—3.1% | | | | | | 3,996,558 |
| | | | | | |
Total Net Assets—100.0% | | | | | $ | 130,568,635 |
| | | | | | |
For federal income tax purposes the identified cost of investments owned at December 31, 2009 was $128,623,894.
| plc | Public Limited Company |
| 1 | Value determined based on Level 2 inputs. |
| 2 | Variable rate security. Rate indicated is rate effective at December 31, 2009. |
| 3 | Security was acquired through a private placement. |
| 4 | Security is a 144A or Section 4(2) security. The total market value of 144A or Section 4(2) securities is $1,799,569 (cost $2,526,889), or 1.4% of total net assets. |
| 5 | Value determined based on Level 3 inputs. |
| 6 | Security was fair valued by the Valuation Committee at December 31, 2009. The total market value of fair valued securities amounts to $224,706, (cost $1,205,796) or 0.2% of total net assets. |
| 7 | Unless otherwise indicated, the values of the securities of the Portfolio are determined based on Level 1 inputs. |
The accompanying notes are an integral part of the financial statements
39
| | |
| | Series E |
| | (U.S. Intermediate Bond Series) |
Statement of Assets and Liabilities
December 31, 2009
| | | | |
Assets: | | | | |
Investments, at value* | | $ | 126,572,077 | |
Cash | | | 2,430,992 | |
Receivables: | | | | |
Fund shares sold | | | 398,535 | |
Securities sold | | | 75,875 | |
Interest | | | 1,264,277 | |
Prepaid expenses | | | 2,746 | |
| | | | |
Total assets | | | 130,744,502 | |
| | | | |
| |
Liabilities: | | | | |
| |
Payable for: | | | | |
Fund shares redeemed | | | 63,602 | |
Management fees | | | 66,763 | |
Administration fees | �� | | 12,671 | |
Transfer agent/maintenance fees | | | 2,083 | |
Custodian fees | | | 941 | |
Directors’ fees | | | 1,762 | |
Professional fees | | | 13,762 | |
Other fees | | | 14,283 | |
| | | | |
Total liabilities | | | 175,867 | |
| | | | |
Net assets | | $ | 130,568,635 | |
| | | | |
| |
Net assets consist of: | | | | |
Paid in capital | | $ | 146,756,551 | |
Undistributed net investment income | | | 2,568,703 | |
Accumulated net realized loss on sale of investments | | | (17,939,759 | ) |
Net unrealized depreciation in value of investments | | | (816,860 | ) |
| | | | |
Net assets | | $ | 130,568,635 | |
| | | | |
| |
Capital shares authorized | | | unlimited | |
Capital shares outstanding | | | 10,671,548 | |
Net asset value per share (net assets divided by shares outstanding) | | $ | 12.24 | |
| | | | |
| |
* Investments, at cost | | $ | 127,388,937 | |
Statement of Operations
For Year Ended December 31, 2009
| | | | |
Investment Income: | | | | |
Dividends | | $ | 59,471 | |
Interest | | | 4,308,293 | |
| | | | |
Total investment income | | | 4,367,764 | |
| | | | |
| |
Expenses: | | | | |
Management fees | | | 850,765 | |
Administration fees | | | 115,030 | |
Transfer agent/maintenance fees | | | 25,321 | |
Custodian fees | | | 6,337 | |
Directors’ fees | | | 12,063 | |
Professional fees | | | 16,989 | |
Reports to shareholders | | | 14,667 | |
Other | | | 5,552 | |
| | | | |
Total expenses | | | 1,046,724 | |
Expenses waived | | | (170,154 | ) |
| | | | |
Net expenses | | | 876,570 | |
| | | | |
Net investment income | | | 3,491,194 | |
| | | | |
| |
Net Realized and Unrealized Gain (Loss): | | | | |
Net realized gain (loss) during the year on: | | | | |
Investments | | | (9,761,362 | ) |
| | | | |
Net realized loss | | | (9,761,362 | ) |
| | | | |
| |
Net unrealized appreciation (depreciation) during the year on: | | | | |
Investments | | | 15,320,180 | |
| | | | |
Net unrealized appreciation | | | 15,320,180 | |
| | | | |
Net realized and unrealized gain | | | 5,558,818 | |
| | | | |
Net increase in net assets resulting from operations | | $ | 9,050,012 | |
| | | | |
The accompanying notes are an integral part of the financial statements
40
| | |
| | Series E |
Statement of Changes in Net Assets | | (U.S. Intermediate Bond Series) |
| | | | | | | | |
| | | Year Ended
December 31, 2009 | | | Year Ended
December 31, 2008 | |
Increase (decrease) in net assets from operations: | | | | | | | | |
Net investment income | | $ | 3,491,194 | | | $ | 5,515,405 | |
Net realized loss during the year on investments | | | (9,761,362 | ) | | | (3,305,573 | ) |
Net unrealized appreciation (depreciation) during the year on investments | | | 15,320,180 | | | | (12,398,639 | ) |
| | | | | | | | |
Net increase (decrease) in net assets resulting from operations | | | 9,050,012 | | | | (10,188,807 | ) |
| | | | | | | | |
| | |
Capital share transactions: | | | | | | | | |
Proceeds from sale of shares | | | 71,807,375 | | | | 46,877,829 | |
Cost of shares redeemed | | | (49,358,471 | ) | | | (59,271,743 | ) |
| | | | | | | | |
Net increase (decrease) from capital share transactions | | | 22,448,904 | | | | (12,393,914 | ) |
| | | | | | | | |
Net increase (decrease) in net assets | | | 31,498,916 | | | | (22,582,721 | ) |
| | | | | | | | |
| | |
Net assets: | | | | | | | | |
Beginning of year | | | 99,069,719 | | | | 121,652,440 | |
| | | | | | | | |
End of year | | $ | 130,568,635 | | | $ | 99,069,719 | |
| | | | | | | | |
| | |
Undistributed net investment income at end of year | | $ | 2,568,703 | | | $ | 4,539,597 | |
| | | | | | | | |
| | |
Capital share activity: | | | | | | | | |
Shares sold | | | 6,109,866 | | | | 3,844,656 | |
Shares redeemed | | | (4,215,010 | ) | | | (4,911,549 | ) |
| | | | | | | | |
Total capital share activity | | | 1,894,856 | | | | (1,066,893 | ) |
| | | | | | | | |
The accompanying notes are an integral part of the financial statements
41
| | |
Financial Highlights | | Series E |
Selected data for each share of capital stock outstanding throughout each year | | (U.S. Intermediate Bond Series) |
| | | | | | | | | | | | | | | | | | | | |
| | | 2009 | | | 2008a | | | 2007 | | | 2006 | | | Year Ended
December 31,
2005 | |
Per Share Data | | | | | | | | | | | | | | | | | | | | |
Net asset value, beginning of period | | $ | 11.29 | | | $ | 12.36 | | | $ | 12.01 | | | $ | 11.57 | | | $ | 11.36 | |
| | | | | | | | | | | | | | | | | | | | |
Income (loss) from investment operations: | | | | | | | | | | | | | | | | | | | | |
Net investment incomeb | | | 0.37 | | | | 0.58 | | | | 0.60 | | | | 0.63 | | | | 0.49 | |
Net gain (loss) on securities (realized and unrealized) | | | 0.58 | | | | (1.65 | ) | | | (0.25 | ) | | | (0.19 | ) | | | (0.28 | ) |
| | | | | | | | | | | | | | | | | | | | |
Total from investment operations | | | 0.95 | | | | (1.07 | ) | | | 0.35 | | | | 0.44 | | | | 0.21 | |
| | | | | | | | | | | | | | | | | | | | |
Net asset value, end of period | | $ | 12.24 | | | $ | 11.29 | | | $ | 12.36 | | | $ | 12.01 | | | $ | 11.57 | |
| | | | | | | | | | | | | | | | | | | | |
| | | | | |
Total Returnc | | | 8.41 | % | | | (8.66 | )% | | | 2.91 | % | | | 3.80 | % | | | 1.85 | % |
| | | | | | | | | | | | | | | | | | | | |
Ratios/Supplemental Data | | | | | | | | | | | | | | | | | | | | |
Net assets, end of period (in thousands) | | $ | 130,569 | | | $ | 99,070 | | | $ | 121,652 | | | $ | 151,311 | | | $ | 159,386 | |
| | | | | | | | | | | | | | | | | | | | |
Ratios to average net assets: | | | | | | | | | | | | | | | | | | | | |
Net investment income | | | 3.08 | % | | | 4.80 | % | | | 4.90 | % | | | 4.67 | % | | | 4.23 | % |
Total expensesd | | | 0.92 | % | | | 0.93 | % | | | 0.91 | % | | | 0.93 | % | | | 0.92 | % |
Net expensese | | | 0.77 | % | | | 0.78 | % | | | 0.76 | % | | | 0.78 | % | | | 0.77 | % |
Net expenses prior to custodian earnings credits and net of expense waivers | | | 0.77 | % | | | 0.78 | % | | | 0.76 | % | | | 0.78 | % | | | 0.77 | % |
| | | | | | | | | | | | | | | | | | | | |
Portfolio turnover rate | | | 76 | %f | | | 34 | % | | | 31 | % | | | 64 | % | | | 60 | % |
| a | Effective November 24, 2008 the Series name became U.S. Intermediate Bond Series. Prior to November 24, 2008 the Series was known as the Diversified Income Series. |
| b | Net investment income (loss) was computed using average shares outstanding throughout the period. |
| c | Total return does not take into account any of the expenses associated with an investment in variable insurance products offered by Security Benefit Life Insurance Company. If total return had taken into account these expenses, performance would have been lower. Shares of a series of SBL Fund are available only through the purchase of such products. |
| d | Total expense information reflects the expense ratios absent expense reductions by the Investment Manager and custodian earnings credits, as applicable. |
| e | Net expense information reflects the expense ratios after voluntary expense waivers, reimbursements and custodian earnings credits, as applicable. |
| f | Significant variation in the portfolio turnover rate is due to Investment Manager’s appointment of new portfolio manager for the Series. |
The accompanying notes are an integral part of the financial statements
42
Manager’s Commentary
February 15, 2010
| | | | |
| | | | Advised by: |
| | |
| | | | 
|
To Our Shareholders:
Series H of the SBL Fund – Enhanced Index Series returned 26.65%1 for the year ended December 31, 2009, in line with the S&P 500 Index gain of 26.46% but less than the peer group of 27.77%.
Our investment strategy is predicated on the philosophy that, over the long-term, intrinsic value is an anchor for stock prices, but behavioral biases, trends, bubbles, and busts can cause significant short-term deviations.
Market Overview
The U.S. market rose more than 25% in 2009, providing a significant rebound from the 2008 drop. On March 9, 2009 the market fell to a valuation first reached 13 years prior, in 1996. Since 1996, the U.S. GDP had grown by more than 6 trillion dollars, more than 75%, yet the market capitalization of the S&P 500 was unchanged. Equity values conveyed expectations as low as we had recorded since our data starting point in 1963. On a normalized earnings basis we calculated a risk premium above 20%. Valuations didn’t matter; investors would not hold risky assets, so prices fell regardless of underlying assets and earning potential. Risk played a dominant role to valuations and capital preservation superseded all other motivations.
Fund Review
Accordingly, our process is anchored with our value model and incorporates other factors to measure the strength and legitimacy of different market waves and currents. In February 2009 most empirical evidence clearly pointed towards a significant dislocation of intrinsic value from stock price. We observed the largest spread between valuations and earnings power than at any point in our research, dating back to 1963. The empirical evidence supported our view that value stocks were, inexpensive and presented a significant opportunity. Meanwhile, our other alpha factors intended to provide sentiment indications appeared relatively expensive, arguing higher quality and momentum stocks were significantly overpriced relative to riskier stocks. We positioned our portfolio to take advantage of the dislocation by increasing our exposure to inexpensive stocks and decreasing our exposure to the high quality positive momentum stocks. In hindsight our timing looks fortuitous; however through March 9, 2009, it looked disastrously early. Despite early underperformance, we trusted (with verification) the empirical evidence and remained relatively over-exposed to the market rally, which led to our outperformance over the final 9 months of the year.
Calendar year 2009 presented a market with enormous risk and commensurate price dislocations exploitable primarily through factor rotation or market timing. To our benefit we realized significant positive performance from our value model but with it came disastrous performance of our other factors. While we certainly could not have predicted the magnitudes of performance spreads, we expected the divergent factor performance because the signals had reached all-time price dislocations and correlation between value and the other factors was at an all-time low, meaning virtually no attractively valued stocks exhibited improving fundamentals, quality or momentum characteristics in January 2009.
Market Outlook
We have now transitioned to a more normal environment; correlations and factor prices are not at severe dislocations. Accordingly, we expect a more normal outcome for 2010, where stocks exhibiting value characteristics along with improving fundamentals outperform the market.
Thank you for your business and the confidence you place in us.
Sincerely,
Peter C. Stournaras, Portfolio Manager,
Northern Trust Investments
| 1 | Fee waivers and/or reimbursements reduce Series expenses and in the absence of such waivers, the performance quoted would be reduced. |
43
| | |
| | Series H |
Performance Summary | | (Enhanced Index Series) |
December 31, 2009 | | (unaudited) |
PERFORMANCE
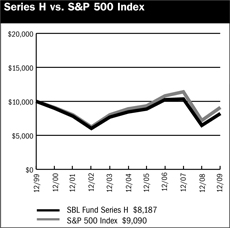
$10,000 Over 10 Years
The chart above assumes a hypothetical $10,000 investment in Series H (Enhanced Index Series) on December 31, 1999 and reflects the fees and expenses of Series H. The S&P 500 Index is a capitalization-weighted index composed of 500 selected common stocks that represent the broad domestic economy and is a widely recognized unmanaged index of market performance.
Average Annual Returns
| | | | | | | | | |
Periods Ended 12-31-091 | | 1 Year | | | 5 Years | | | 10 Years | |
Series H | | 26.65 | % | | (0.62 | )% | | (1.98 | )% |
| 1 | Performance figures do not reflect fees and expenses associated with an investment in variable insurance products offered by Security Benefit Life Insurance Company. If returns had taken into account these fees and expenses, performance would have been lower. Shares of a Series of SBL Fund are available only through the purchase of such products. |
The performance data quoted above represents past performance. Past performance is not predictive of future performance. The investment return and principal value of an investment will fluctuate so that an investor’s shares, when redeemed, may be worth more or less than their original cost.
Portfolio Composition by Sector
| | | |
Consumer Discretionary | | 9.38 | % |
Consumer Staples | | 11.02 | |
Energy | | 11.22 | |
Financials | | 13.09 | |
Health Care | | 12.44 | |
Industrials | | 10.01 | |
Information Technology | | 19.12 | |
Materials | | 3.52 | |
Telecommunication Services | | 3.15 | |
Utilities | | 3.79 | |
Preferred Stock | | 0.73 | |
U.S. Government Sponsored Securities | | 0.23 | |
Cash & Other Assets, Less Liabilities | | 2.30 | |
Total Net Assets | | 100.00 | % |
| | | |
The accompanying notes are an integral part of the financial statements
44
| | |
Schedule of Investments | | Series H |
December 31, 2009 | | (Enhanced Index Series) |
| | | | | |
| | | Shares | | Value |
COMMON STOCKS—96.8% | | | | | |
Advertising—0.6% | | | | | |
Interpublic Group of Companies, Inc.* | | 6,848 | | $ | 50,538 |
Omnicom Group, Inc. | | 5,867 | | | 229,693 |
| | | | | |
| | | | | 280,231 |
| | | | | |
Aerospace & Defense—3.2% | | | | | |
Boeing Company | | 222 | | | 12,017 |
General Dynamics Corporation | | 4,163 | | | 283,792 |
Honeywell International, Inc. | | 1,809 | | | 70,913 |
ITT Corporation | | 3,935 | | | 195,727 |
L-3 Communications Holdings, Inc. | | 1,796 | | | 156,162 |
Lockheed Martin Corporation | | 1,177 | | | 88,687 |
Raytheon Company | | 5,174 | | | 266,564 |
United Technologies Corporation | | 6,353 | | | 440,961 |
| | | | | |
| | | | | 1,514,823 |
| | | | | |
Agricultural Products—0.3% | | | | | |
Archer-Daniels-Midland Company | | 3,831 | | | 119,949 |
| | | | | |
Air Freight & Logistics—0.5% | | | | | |
FedEx Corporation | | 1,595 | | | 133,103 |
United Parcel Service, Inc. (Cl.B) | | 1,908 | | | 109,462 |
| | | | | |
| | | | | 242,565 |
| | | | | |
Apparel Retail—1.1% | | | | | |
Gap, Inc. | | 9,701 | | | 203,236 |
Ltd. Brands, Inc. | | 10,887 | | | 209,466 |
TJX Companies, Inc. | | 2,286 | | | 83,553 |
| | | | | |
| | | | | 496,255 |
| | | | | |
Apparel, Accessories & Luxury Goods—0.2% | | | | | |
V.F. Corporation | | 1,482 | | | 108,542 |
| | | | | |
Asset Management & Custody Banks—0.5% | | | | | |
Ameriprise Financial, Inc. | | 3,379 | | | 131,173 |
Franklin Resources, Inc. | | 28 | | | 2,950 |
Legg Mason, Inc. | | 3,138 | | | 94,642 |
| | | | | |
| | | | | 228,765 |
| | | | | |
Automobile Manufacturers—0.3% | | | | | |
Ford Motor Company* | | 14,309 | | | 143,090 |
| | | | | |
Biotechnology—1.3% | | | | | |
Amgen, Inc.* | | 7,773 | | | 439,719 |
Gilead Sciences, Inc.* | | 4,366 | | | 188,960 |
| | | | | |
| | | | | 628,679 |
| | | | | |
Broadcasting—0.1% | | | | | |
CBS Corporation (CI.B) | | 2,498 | | | 35,097 |
| | | | | |
Building Products—0.1% | | | | | |
Masco Corporation | | 3,751 | | | 51,801 |
| | | | | |
Cable & Satellite—0.3% | | | | | |
Comcast Corporation | | 3,728 | | | 62,854 |
DIRECTV* | | 2,713 | | | 90,479 |
| | | | | |
| | | | | 153,333 |
| | | | | |
Coal & Consumable Fuels—0.1% | | | | | |
Peabody Energy Corporation | | 1,526 | | | 68,990 |
| | | | | |
Commercial Printing—0.4% | | | | | |
RR Donnelley & Sons Company | | 9,040 | | | 201,321 |
| | | | | |
Communications Equipment—2.5% | | | | | |
Cisco Systems, Inc.* | | 33,891 | | | 811,350 |
Harris Corporation | | 4,238 | | | 201,517 |
Motorola, Inc. | | 551 | | | 4,276 |
Qualcomm, Inc. | | 4,225 | | | 195,449 |
| | | | | |
| | | | | 1,212,592 |
| | | | | |
Computer & Electronics Retail—0.4% | | | | | |
Best Buy Company, Inc. | | 1,919 | | | 75,724 |
RadioShack Corporation | | 6,806 | | | 132,717 |
| | | | | |
| | | | | 208,441 |
| | | | | |
Computer Hardware—5.7% | | | | | |
Apple, Inc.* | | 3,373 | | | 711,231 |
Dell, Inc.* | | 17,992 | | | 258,365 |
Hewlett-Packard Company | | 13,698 | | | 705,584 |
International Business Machines Corporation | | 7,494 | | | 980,964 |
Sun Microsystems, Inc.* | | 907 | | | 8,499 |
| | | | | |
| | | | | 2,664,643 |
| | | | | |
Computer Storage & Peripherals—0.7% | | | | | |
EMC Corporation* | | 10,722 | | | 187,313 |
Western Digital Corporation* | | 3,119 | | | 137,704 |
| | | | | |
| | | | | 325,017 |
| | | | | |
Construction & Engineering—0.1% | | | | | |
Fluor Corporation | | 964 | | | 43,418 |
Jacobs Engineering Group, Inc.* | | 162 | | | 6,093 |
| | | | | |
| | | | | 49,511 |
| | | | | |
Construction & Farm Machinery & Heavy Trucks—0.0% | | | | | |
Caterpillar, Inc. | | 292 | | | 16,641 |
| | | | | |
Consumer Finance—0.9% | | | | | |
American Express Company | | 3,382 | | | 137,039 |
Capital One Financial Corporation | | 6,351 | | | 243,497 |
SLM Corporation* | | 3,300 | | | 37,191 |
| | | | | |
| | | | | 417,727 |
| | | | | |
Data Processing & Outsourced Services—0.8% | | | | | |
Computer Sciences Corporation* | | 3,827 | | | 220,167 |
Convergys Corporation* | | 267 | | | 2,870 |
Fidelity National Information Services, Inc. | | 5,811 | | | 136,210 |
Total System Services, Inc. | | 1,073 | | | 18,531 |
Western Union Company | | 761 | | | 14,345 |
| | | | | |
| | | | | 392,123 |
| | | | | |
Department Stores—0.7% | | | | | |
JC Penney Company, Inc. | | 6,032 | | | 160,512 |
Sears Holdings Corporation* | | 2,326 | | | 194,104 |
| | | | | |
| | | | | 354,616 |
| | | | | |
Distributors—0.1% | | | | | |
Genuine Parts Company | | 1,518 | | | 57,623 |
| | | | | |
Diversified Banks—2.1% | | | | | |
Comerica, Inc. | | 5,309 | | | 156,987 |
U.S. Bancorp | | 2,052 | | | 46,191 |
Wells Fargo & Company | | 29,626 | | | 799,605 |
| | | | | |
| | | | | 1,002,783 |
| | | | | |
Diversified Chemicals—0.8% | | | | | |
Eastman Chemical Company | | 3,134 | | | 188,792 |
The accompanying notes are an integral part of the financial statements
45
| | |
Schedule of Investments | | Series H |
December 31, 2009 | | (Enhanced Index Series) |
| | | | | |
| | | Shares | | Value |
COMMON STOCKS—96.8% (continued) | | | | | |
Diversified Chemicals—0.8% (continued) | | | | | |
PPG Industries, Inc. | | 3,453 | | $ | 202,139 |
| | | | | |
| | | | | 390,931 |
| | | | | |
Diversified Metals & Mining—0.3% | | | | | |
Freeport-McMoRan Copper & Gold, Inc. (CI.B) | | 1,567 | | | 125,814 |
| | | | | |
Drug Retail—0.9% | | | | | |
CVS Caremark Corporation | | 8,054 | | | 259,419 |
Walgreen Company | | 4,973 | | | 182,609 |
| | | | | |
| | | | | 442,028 |
| | | | | |
Electric Utilities—1.5% | | | | | |
American Electric Power Company, Inc. | | 3,535 | | | 122,983 |
Edison International | | 6,300 | | | 219,114 |
Exelon Corporation | | 892 | | | 43,592 |
FirstEnergy Corporation | | 5,121 | | | 237,871 |
PPL Corporation | | 2,893 | | | 93,473 |
| | | | | |
| | | | | 717,033 |
| | | | | |
Electrical Components & Equipment—0.7% | | | | | |
Emerson Electric Company | | 7,326 | | | 312,088 |
| | | | | |
Electronic Manufacturing Services—0.4% | | | | | |
Jabil Circuit, Inc. | | 10,615 | | | 184,383 |
| | | | | |
Fertilizers & Agricultural Chemicals—0.5% | | | | | |
CF Industries Holdings, Inc. | | 2,207 | | | 200,351 |
Monsanto Company | | 578 | | | 47,252 |
| | | | | |
| | | | | 247,603 |
| | | | | |
Food Retail—0.2% | | | | | |
Safeway, Inc. | | 4,649 | | | 98,977 |
| | | | | |
Gas Utilities—0.4% | | | | | |
Nicor, Inc. | | 4,292 | | | 180,693 |
| | | | | |
General Merchandise Stores—0.6% | | | | | |
Big Lots, Inc.* | | 7,050 | | | 204,309 |
Target Corporation | | 2,140 | | | 103,512 |
| | | | | |
| | | | | 307,821 |
| | | | | |
Health Care Distributors—0.9% | | | | | |
AmerisourceBergen Corporation | | 7,932 | | | 206,787 |
McKesson Corporation | | 3,896 | | | 243,500 |
| | | | | |
| | | | | 450,287 |
| | | | | |
Health Care Equipment—1.9% | | | | | |
Baxter International, Inc. | | 24 | | | 1,408 |
CR Bard, Inc. | | 342 | | | 26,642 |
Hospira, Inc.* | | 3,771 | | | 192,321 |
Intuitive Surgical, Inc.* | | 254 | | | 77,043 |
Medtronic, Inc. | | 9,280 | | | 408,135 |
Stryker Corporation | | 2,793 | | | 140,683 |
| | | | | |
| | | | | 846,232 |
| | | | | |
Health Care Services—0.6% | | | | | |
Medco Health Solutions, Inc.* | | 4,774 | | | 305,106 |
| | | | | |
Health Care Technology—0.0% | | | | | |
IMS Health, Inc. | | 881 | | | 18,554 |
| | | | | |
Home Improvement Retail—0.9% | | | | | |
Home Depot, Inc. | | 14,015 | | | 405,454 |
| | | | | |
Hotels, Resorts & Cruise Lines—0.1% | | | | | |
Carnival Corporation* | | 1,578 | | | 50,007 |
| | | | | |
Household Appliances—0.4% | | | | | |
Whirlpool Corporation | | 2,513 | | | 202,699 |
| | | | | |
Household Products—2.1% | | | | | |
Colgate-Palmolive Company | | 362 | | | 29,738 |
Kimberly-Clark Corporation | | 4,644 | | | 295,869 |
Procter & Gamble Company | | 11,912 | | | 722,225 |
| | | | | |
| | | | | 1,047,832 |
| | | | | |
Hypermarkets & Super Centers—1.5% | | | | | |
Wal-Mart Stores, Inc. | | 13,073 | | | 698,752 |
| | | | | |
Independent Power Producers & Energy Traders—0.4% | | | | | |
Constellation Energy Group, Inc. | | 5,897 | | | 207,397 |
| | | | | |
Industrial Conglomerates—2.4% | | | | | |
3M Company | | 5,554 | | | 459,149 |
General Electric Company | | 46,364 | | | 701,488 |
| | | | | |
| | | | | 1,160,637 |
| | | | | |
Industrial Machinery—1.4% | | | | | |
Dover Corporation | | 4,882 | | | 203,140 |
Eaton Corporation | | 2,875 | | | 182,908 |
Illinois Tool Works, Inc. | | 3,579 | | | 171,756 |
Parker Hannifin Corporation | | 341 | | | 18,373 |
Stanley Works | | 1,569 | | | 80,819 |
| | | | | |
| | | | | 656,996 |
| | | | | |
Industrial REIT’s—0.4% | | | | | |
ProLogis | | 14,766 | | | 202,147 |
| | | | | |
Integrated Oil & Gas—7.6% | | | | | |
Chevron Corporation | | 11,527 | | | 887,464 |
ConocoPhillips | | 9,408 | | | 480,467 |
Exxon Mobil Corporation1 | | 24,898 | | | 1,697,795 |
Marathon Oil Corporation | | 2,517 | | | 78,581 |
Occidental Petroleum Corporation | | 5,864 | | | 477,036 |
| | | | | |
| | | | | 3,621,343 |
| | | | | |
Integrated Telecommunication Services—3.1% | | | | | |
AT&T, Inc. | | 33,954 | | | 951,731 |
Qwest Communications International, Inc. | | 49,367 | | | 207,835 |
Verizon Communications, Inc. | | 10,140 | | | 335,938 |
| | | | | |
| | | | | 1,495,504 |
| | | | | |
Internet Retail—0.3% | | | | | |
Amazon.com, Inc.* | | 1,234 | | | 165,998 |
| | | | | |
Internet Software & Services—2.3% | | | | | |
AOL, Inc.* | | 138 | | | 3,213 |
eBay, Inc.* | | 9,403 | | | 221,347 |
The accompanying notes are an integral part of the financial statements
46
| | |
Schedule of Investments | | Series H |
December 31, 2009 | | (Enhanced Index Series) |
| | | | | |
| | | Shares | | Value |
COMMON STOCKS—96.8% (continued) | | | | | |
Internet Software & Services—2.3% (continued) | | | | | |
Google, Inc.* | | 1,232 | | $ | 763,815 |
Yahoo!, Inc.* | | 7,272 | | | 122,024 |
| | | | | |
| | | | | 1,110,399 |
| | | | | |
Investment Banking & Brokerage—1.2% | | | | | |
Goldman Sachs Group, Inc. | | 3,339 | | | 563,757 |
| | | | | |
Life & Health Insurance—0.7% | | | | | |
Lincoln National Corporation | | 3,021 | | | 75,162 |
MetLife, Inc. | | 3,062 | | | 108,242 |
Prudential Financial, Inc. | | 248 | | | 12,340 |
Torchmark Corporation | | 81 | | | 3,560 |
Unum Group | | 6,294 | | | 122,859 |
| | | | | |
| | | | | 322,163 |
| | | | | |
Life Sciences Tools & Services—0.4% | | | | | |
Thermo Fisher Scientific, Inc.* | | 2,008 | | | 95,761 |
Waters Corporation* | | 1,512 | | | 93,684 |
| | | | | |
| | | | | 189,445 |
| | | | | |
Managed Health Care—0.7% | | | | | |
Coventry Health Care, Inc.* | | 1,173 | | | 28,492 |
UnitedHealth Group, Inc. | | 6,595 | | | 201,016 |
WellPoint, Inc.* | | 2,120 | | | 123,575 |
| | | | | |
| | | | | 353,083 |
| | | | | |
Metal & Glass Containers—0.0% | | | | | |
Ball Corporation | | 125 | | | 6,463 |
| | | | | |
Movies & Entertainment —1.4% | | | | | |
News Corporation* | | 8,591 | | | 117,611 |
Time Warner, Inc. | | 1,528 | | | 44,526 |
Viacom, Inc. (CI.B)* | | 8,074 | | | 240,039 |
Walt Disney Company | | 6,931 | | | 223,524 |
| | | | | |
| | | | | 625,700 |
| | | | | |
Multi-Line Insurance—0.6% | | | | | |
Genworth Financial, Inc.* | | 2,755 | | | 31,269 |
Loews Corporation* | | 6,572 | | | 238,892 |
| | | | | |
| | | | | 270,161 |
| | | | | |
Multi-Utilities—1.5% | | | | | |
CenterPoint Energy, Inc. | | 13,027 | | | 189,022 |
DTE Energy Company | | 4,819 | | | 210,059 |
Public Service Enterprise Group, Inc. | | 3,694 | | | 122,826 |
Sempra Energy | | 3,071 | | | 171,915 |
| | | | | |
| | | | | 693,822 |
| | | | | |
Office Services & Supplies—0.4% | | | | | |
Avery Dennison Corporation | | 4,590 | | | 167,489 |
| | | | | |
Oil & Gas Drilling—1.0% | | | | | |
Ensco International plc ADR | | 4,221 | | | 168,587 |
Nabors Industries, Ltd.* | | 9,074 | | | 198,630 |
Rowan Companies, Inc. | | 4,610 | | | 104,370 |
| | | | | |
| | | | | 471,587 |
| | | | | |
Oil & Gas Equipment & Services—1.1% | | | | | |
FMC Technologies, Inc.* | | 525 | | | 30,366 |
National Oilwell Varco, Inc. | | 5,737 | | | 252,944 |
Schlumberger, Ltd. | | 3,399 | | | 221,241 |
| | | | | |
| | | | | 504,551 |
| | | | | |
Oil & Gas Exploration & Production—0.9% | | | | | |
Anadarko Petroleum Corporation | | 484 | | | 30,211 |
Chesapeake Energy Corporation | | 4,337 | | | 112,242 |
XTO Energy, Inc. | | 6,534 | | | 304,027 |
| | | | | |
| | | | | 446,480 |
| | | | | |
Oil & Gas Storage & Transportation—0.5% | | | | | |
El Paso Corporation | | 975 | | | 9,584 |
Williams Companies, Inc. | | 10,638 | | | 224,249 |
| | | | | |
| | | | | 233,833 |
| | | | | |
Other Diversified Financial Services—3.9% | | | | | |
Bank of America Corporation | | 33,863 | | | 509,976 |
Citigroup, Inc. | | 52,093 | | | 172,428 |
JPMorgan Chase & Company | | 21,159 | | | 881,695 |
Morgan Stanley | | 11,291 | | | 334,214 |
| | | | | |
| | | | | 1,898,313 |
| | | | | |
Packaged Foods & Meats—1.8% | | | | | |
Campbell Soup Company | | 5,433 | | | 183,635 |
Kellogg Company | | 4,178 | | | 222,270 |
Kraft Foods, Inc. | | 3,224 | | | 87,628 |
Sara Lee Corporation | | 16,687 | | | 203,248 |
Tyson Foods, Inc. | | 13,084 | | | 160,541 |
| | | | | |
| | | | | 857,322 |
| | | | | |
Paper Packaging—0.5% | | | | | |
Bemis Company, Inc. | | 2,468 | | | 73,176 |
Sealed Air Corporation | | 7,895 | | | 172,585 |
| | | | | |
| | | | | 245,761 |
| | | | | |
Paper Products—0.8% | | | | | |
International Paper Company | | 9,076 | | | 243,055 |
MeadWestvaco Corporation | | 4,189 | | | 119,931 |
| | | | | |
| | | | | 362,986 |
| | | | | |
Personal Products—0.1% | | | | | |
Avon Products, Inc. | | 763 | | | 24,035 |
Mead Johnson Nutrition Company | | 876 | | | 38,291 |
| | | | | |
| | | | | 62,326 |
| | | | | |
Pharmaceuticals—6.6% | | | | | |
Abbott Laboratories | | 5,858 | | | 316,273 |
Bristol-Myers Squibb Company | | 1,188 | | | 29,997 |
Eli Lilly & Company | | 7,560 | | | 269,968 |
Forest Laboratories, Inc.* | | 3,647 | | | 117,105 |
Johnson & Johnson | | 15,489 | | | 997,646 |
Merck & Company, Inc. | | 13,783 | | | 503,631 |
Pfizer, Inc. | | 47,240 | | | 859,296 |
| | | | | |
| | | | | 3,093,916 |
| | | | | |
Property & Casualty Insurance—1.3% | | | | | |
Allstate Corporation | | 805 | | | 24,182 |
Chubb Corporation | | 2,735 | | | 134,507 |
Travelers Companies, Inc. | | 5,687 | | | 283,555 |
XL Capital, Ltd. | | 10,483 | | | 192,153 |
| | | | | |
| | | | | 634,397 |
| | | | | |
Publishing—0.8% | | | | | |
Gannett Company, Inc. | | 14,545 | | | 215,993 |
McGraw-Hill Companies, Inc. | | 4,356 | | | 145,970 |
| | | | | |
| | | | | 361,963 |
| | | | | |
Railroads—0.2% | | | | | |
CSX Corporation | | 1,591 | | | 77,148 |
| | | | | |
The accompanying notes are an integral part of the financial statements
47
| | |
Schedule of Investments | | Series H |
December 31, 2009 | | (Enhanced Index Series) |
| | | | | | |
| | | Shares | | Value |
COMMON STOCKS—96.8% (continued) | | | | | | |
Regional Banks—0.5% | | | | | | |
Fifth Third Bancorp | | | 6,145 | | $ | 59,914 |
PNC Financial Services Group, Inc. | | | 2,469 | | | 130,338 |
SunTrust Banks, Inc. | | | 1,278 | | | 25,931 |
| | | | | | |
| | | | | | 216,183 |
| | | | | | |
Restaurants—0.9% | | | | | | |
Darden Restaurants, Inc. | | | 2,709 | | | 95,005 |
McDonald’s Corporation | | | 5,109 | | | 319,006 |
| | | | | | |
| | | | | | 414,011 |
| | | | | | |
Semiconductors—2.3% | | | | | | |
Intel Corporation | | | 34,632 | | | 706,492 |
Texas Instruments, Inc. | | | 12,675 | | | 330,311 |
Xilinx, Inc. | | | 2,317 | | | 58,064 |
| | | | | | |
| | | | | | 1,094,867 |
| | | | | | |
Soft Drinks—2.2% | | | | | | |
Coca-Cola Company | | | 8,117 | | | 462,669 |
Coca-Cola Enterprises, Inc. | | | 9,511 | | | 201,633 |
Dr Pepper Snapple Group, Inc. | | | 1,829 | | | 51,761 |
Pepsi Bottling Group, Inc. | | | 673 | | | 25,238 |
PepsiCo, Inc. | | | 4,753 | | | 288,982 |
| | | | | | |
| | | | | | 1,030,283 |
| | | | | | |
Specialized Consumer Services—0.2% | | | | | | |
H&R Block, Inc. | | | 4,299 | | | 97,243 |
| | | | | | |
Specialized Finance—0.2% | | | | | | |
CME Group, Inc. | | | 286 | | | 96,082 |
| | | | | | |
Specialized REIT’s—0.8% | | | | | | |
HCP, Inc. | | | 5,183 | | | 158,289 |
Host Hotels & Resorts, Inc. | | | 18,982 | | | 221,520 |
| | | | | | |
| | | | | | 379,809 |
| | | | | | |
Specialty Chemicals—0.4% | | | | | | |
International Flavors & Fragrances, Inc. | | | 4,338 | | | 178,465 |
| | | | | | |
Steel—0.2% | | | | | | |
Nucor Corporation | | | 2,505 | | | 116,858 |
| | | | | | |
Systems Software—4.5% | | | | | | |
BMC Software, Inc.* | | | 4,949 | | | 198,455 |
Microsoft Corporation | | | 42,338 | | | 1,290,885 |
Oracle Corporation | | | 25,746 | | | 631,807 |
| | | | | | |
| | | | | | 2,121,147 |
| | | | | | |
Tobacco—2.0% | | | | | | |
Altria Group, Inc. | | | 16,317 | | | 320,303 |
Philip Morris International, Inc. | | | 8,288 | | | 399,398 |
Reynolds American, Inc. | | | 4,037 | | | 213,840 |
| | | | | | |
| | | | | | 933,541 |
| | | | | | |
Trading Companies & Distributors—0.3% | | | | | | |
W.W. Grainger, Inc. | | | 1,693 | | | 163,933 |
| | | | | | |
Trucking—0.3% | | | | | | |
Ryder System, Inc. | | | 3,813 | | | 156,981 |
| | | | | | |
Wireless Telecommunication Services—0.0% | | | | | | |
Sprint Nextel Corporation* | | | 747 | | | 2,734 |
| | | | | | |
TOTAL COMMON STOCKS (cost $42,532,216) | | | | | $ | 46,072,676 |
| | | | | | |
| | |
| | | Shares | | Value |
PREFERRED STOCK—0.7% | | | | | | |
Other Diversified Financial Services—0.7% | | | | | | |
Bank of America Corporation | | | | | | |
10.00%,2,* | | | 23,191 | | $ | 346,010 |
| | | | | | |
TOTAL PREFERRED STOCK (cost $370,691) | | | | | $ | 346,010 |
| | | | | | |
| | |
| | | Principal
Amount | | Value |
U.S. GOVERNMENT SECURITIES—0.2% | | | | | | |
U.S. Treasury Bill | | | | | | |
0.12%, 5/6/2010 | | $ | 110,000 | | $ | 109,958 |
| | | | | | |
TOTAL U.S. GOVERNMENT SECURITIES (cost $109,963) | | | | | $ | 109,958 |
| | | | | | |
Total Investments—97.7%3 (cost $43,012,870) | | | | | $ | 46,528,644 |
Cash & Other Assets, Less Liabilities—2.3% | | | | | | 1,095,943 |
| | | | | | |
Total Net Assets—100.0% | | | | | $ | 47,624,587 |
| | | | | | |
For federal income tax purposes the identified cost of investments owned at December 31, 2009 was $45,346,126.
| ADR | American Depositary Receipt |
| plc | Public Limited Company |
| * | Non-income producing security |
| 1 | Security is segregated as collateral for open futures contracts. |
| 2 | Variable rate security. Rate indicated is rate effective at December 31, 2009. |
| 3 | Unless otherwise indicated, the values of the securities of the Portfolio are determined based on Level 1 inputs. |
The accompanying notes are an integral part of the financial statements
48
| | |
| | Series H |
| | (Enhanced Index Series) |
Statement of Assets and Liabilities
December 31, 2009
| | | | |
Assets: | | | | |
Investments, at value* | | $ | 46,528,644 | |
Cash | | | 798,208 | |
Receivables: | | | | |
Fund shares sold | | | 311,671 | |
Dividends | | | 68,510 | |
Prepaid expenses | | | 820 | |
| | | | |
Total assets | | | 47,707,853 | |
| | | | |
| |
Liabilities: | | | | |
| |
Payable for: | | | | |
Fund shares redeemed | | | 26,427 | |
Variation margin on futures | | | 8,889 | |
Management fees | | | 18,838 | |
Administration fees | | | 5,079 | |
Transfer agent/maintenance fees | | | 2,083 | |
Custodian fees | | | 477 | |
Directors’ fees | | | 637 | |
Professional fees | | | 12,336 | |
Other fees | | | 8,500 | |
| | | | |
Total liabilities | | | 83,266 | |
| | | | |
Net assets | | $ | 47,624,587 | |
| | | | |
| |
Net assets consist of: | | | | |
Paid in capital | | $ | 64,157,232 | |
Undistributed net investment income | | | 681,706 | |
Accumulated net realized loss on sale of investments | | | (20,737,076 | ) |
Net unrealized appreciation in value of investments | | | 3,522,725 | |
| | | | |
Net assets | | $ | 47,624,587 | |
| | | | |
| |
Capital shares authorized | | | unlimited | |
Capital shares outstanding | | | 5,388,280 | |
Net asset value per share (net assets divided by shares outstanding) | | $ | 8.84 | |
| | | | |
| |
* Investments, at cost | | $ | 43,012,870 | |
Statement of Operations
For Year Ended December 31, 2009
| | | | |
Investment Income: | | | | |
Dividends | | $ | 1,009,875 | |
Interest | | | 749 | |
| | | | |
Total investment income | | | 1,010,624 | |
| | | | |
| |
Expenses: | | | | |
Management fees | | | 313,871 | |
Administration fees | | | 45,484 | |
Transfer agent/maintenance fees | | | 25,185 | |
Custodian fees | | | 12,376 | |
Directors’ fees | | | 4,590 | |
Professional fees | | | 20,664 | |
Reports to shareholders | | | 8,038 | |
Other | | | 3,334 | |
| | | | |
Total expenses | | | 433,542 | |
Expenses waived | | | (104,624 | ) |
| | | | |
Net expenses | | | 328,918 | |
| | | | |
Net investment income | | | 681,706 | |
| | | | |
| |
Net Realized and Unrealized Gain (Loss): | | | | |
Net realized gain (loss) during the year on: | | | | |
Investments | | | (6,964,266 | ) |
Futures | | | 205,203 | |
| | | | |
Net realized loss | | | (6,759,063 | ) |
| | | | |
| |
Net unrealized appreciation (depreciation) during the year on: | | | | |
Investments | | | 16,159,591 | |
Futures | | | (11,247 | ) |
| | | | |
Net unrealized appreciation | | | 16,148,344 | |
| | | | |
Net realized and unrealized gain | | | 9,389,281 | |
| | | | |
Net increase in net assets resulting from operations | | $ | 10,070,987 | |
| | | | |
The accompanying notes are an integral part of the financial statements
49
| | |
| | Series H |
| Statement of Changes in Net Assets | | (Enhanced Index Series) |
| | | | | | | | |
| | | Year Ended
December 31, 2009 | | | Year Ended
December 31, 2008 | |
Increase (decrease) in net assets from operations: | | | | | | | | |
Net investment income | | $ | 681,706 | | | $ | 994,450 | |
Net realized loss during the year on investments | | | (6,759,063 | ) | | | (12,878,004 | ) |
Net unrealized appreciation (depreciation) during the year on investments | | | 16,148,344 | | | | (15,946,663 | ) |
| | | | | | | | |
Net increase (decrease) in net assets resulting from operations | | | 10,070,987 | | | | (27,830,217 | ) |
| | | | | | | | |
| | |
Capital share transactions: | | | | | | | | |
Proceeds from sale of shares | | | 7,182,261 | | | | 15,012,095 | |
Cost of shares redeemed | | | (13,266,072 | ) | | | (27,073,231 | ) |
| | | | | | | | |
Net decrease from capital share transactions | | | (6,083,811 | ) | | | (12,061,136 | ) |
| | | | | | | | |
Net increase (decrease) in net assets | | | 3,987,176 | | | | (39,891,353 | ) |
| | | | | | | | |
| | |
Net assets: | | | | | | | | |
Beginning of year | | | 43,637,411 | | | | 83,528,764 | |
| | | | | | | | |
End of year | | $ | 47,624,587 | | | $ | 43,637,411 | |
| | | | | | | | |
Undistributed net investment income at end of year | | $ | 681,706 | | | $ | 994,450 | |
| | | | | | | | |
| | |
Capital share activity: | | | | | | | | |
Shares sold | | | 1,001,402 | | | | 1,623,139 | |
Shares redeemed | | | (1,867,536 | ) | | | (2,843,320 | ) |
| | | | | | | | |
Total capital share activity | | | (866,134 | ) | | | (1,220,181 | ) |
| | | | | | | | |
The accompanying notes are an integral part of the financial statements
50
| | |
| Financial Highlights | | Series H |
Selected data for each share of capital stock outstanding throughout each year | | (Enhanced Index Series) |
| | | | | | | | | | | | | | | | | | | | |
| | | 2009 | | | 2008 | | | 2007 | | | 2006a | | | Year Ended
December 31,
2005 | |
Per Share Data | | | | | | | | | | | | | | | | | | | | |
Net asset value, beginning of period | | $ | 6.98 | | | $ | 11.18 | | | $ | 11.07 | | | $ | 9.58 | | | $ | 9.12 | |
| | | | | | | | | | | | | | | | | | | | |
Income (loss) from investment operations: | | | | | | | | | | | | | | | | | | | | |
Net investment incomeb | | | 0.12 | | | | 0.15 | | | | 0.14 | | | | 0.03 | | | | 0.11 | |
Net gain (loss) on securities (realized and unrealized) | | | 1.74 | | | | (4.35 | ) | | | (0.03 | ) | | | 1.46 | | | | 0.35 | |
| | | | | | | | | | | | | | | | | | | | |
Total from investment operations | | | 1.86 | | | | (4.20 | ) | | | 0.11 | | | | 1.49 | | | | 0.46 | |
| | | | | | | | | | | | | | | | | | | | |
Net asset value, end of period | | $ | 8.84 | | | $ | 6.98 | | | $ | 11.18 | | | $ | 11.07 | | | $ | 9.58 | |
| | | | | | | | | | | | | | | | | | | | |
| | | | | |
Total Returnc | | | 26.65 | % | | | (37.57 | %) | | | 0.99 | % | | | 15.55 | % | | | 5.04 | % |
| | | | | | | | | | | | | | | | | | | | |
Ratios/Supplemental Data | | | | | | | | | | | | | | | | | | | | |
Net assets, end of period (in thousands) | | $ | 47,625 | | | $ | 43,637 | | | $ | 83,529 | | | $ | 110,030 | | | $ | 40,101 | |
| | | | | | | | | | | | | | | | | | | | |
Ratios to average net assets: | | | | | | | | | | | | | | | | | | | | |
Net investment income | | | 1.61 | % | | | 1.60 | % | | | 1.25 | % | | | 1.23 | % | | | 1.15 | % |
Total expensesd | | | 1.03 | % | | | 0.99 | % | | | 0.94 | % | | | 0.98 | % | | | 1.04 | % |
Net expensese | | | 0.78 | % | | | 0.74 | % | | | 0.69 | % | | | 0.73 | % | | | 0.79 | % |
Net expenses prior to custodian earnings credits and net of expense waivers | | | 0.78 | % | | | 0.74 | % | | | 0.69 | % | | | 0.73 | % | | | 0.79 | % |
| | | | | | | | | | | | | | | | | | | | |
Portfolio turnover rate | | | 85 | % | | | 106 | % | | | 89 | % | | | 119 | % | | | 106 | % |
| a | The financial highlights for Series H exclude the historical financial highlights for Series W. The assets of Series W were acquired by Series H on June 16, 2006. A total of $53,926,052 was excluded from purchases in the portfolio turnover calculation, which represents the cost of the securities Series H received as a result of the merger, |
| b | Net investment income (loss) was computed using average shares outstanding throughout the period. |
| c | Total return does not take into account any of the expenses associated with an investment in variable insurance products offered by Security Benefit Life Insurance Company. If total return had taken into account these expenses, performance would have been lower. Shares of a series of SBL Fund are available only through the purchase of such products, |
| d | Total expense information reflects the expense ratios absent expense reductions by the Investment Manager and custodian earnings credits, as applicable, |
| e | Net expense information reflects the expense ratios after voluntary expense waivers, reimbursements and custodian earnings credits, as applicable. |
The accompanying notes are an integral part of the financial statements
51
This page left blank intentionally.
52
|
| Managers’ Commentary |
February 15, 2010 |
| | | | |
| | Advised by: | | |
To Our Shareholders:
Series J of the SBL Fund - Mid Cap Growth Series posted a return of 43.96% for the year, underperforming its benchmark, the Russell MidCap Growth, which gained 46.29%. However, the portfolio exceeded the Series’ peer group median return of 42.07%.
Our approach to the Series is to seek securities of companies that are able to grow and/or reinvest in increasingly profitable ventures and hold them over three to five years to capture the best part of the improvements in profits. We focus on investing in securities of companies that appear likely to generate above average profitability at prices that, as of yet, do not reflect that potential.
We use a bottom-up approach to choose portfolio securities that we believe are attractively valued with the greatest potential for appreciation. We attempt to identify companies that are in the early to middle stages of growth and are valued at a reasonable price.
Information Technology, Industrials, and Consumer Discretionary Top Performers
Good stock selection allowed the portfolio to benefit from holdings in the information technology, industrials, and consumer discretionary sectors.
While an even weight, holdings in the information technology sector gained 90% against a 68% increase for the Index. Cognizant Technology Solutions Corporation and ON Semiconductor Corporation both soared over 150%. Other top holdings for the portfolio were Fairchild Semiconductor International, Inc. and Skyworks Solutions, Inc.
The industrials sector was a significant underweight position, 11% to 16%, but the holdings outperformed those in the Index 48% to 29%. Top positions for the portfolio included Precision Castparts Corporation, up 100%, and Goodrich Corporation, which gained 77% over the period.
The consumer discretionary sector was a slight overweight position that returned 54% against 49% for the benchmark. Jarden Corporation was up 144% while Life Time Fitness, Inc. increased 100%. Both companies were active positions not held in the Index. Other leading companies in the portfolio were Starwood Hotels & Resorts Worldwide, Inc. and Bed Bath & Beyond, Inc.
Health Care, Consumer Staples, and Materials Disappoint
As with the top performing sectors, those that hurt performance did so due to stock selection. Holdings in health care gained only about half that of the Index, 18% to 40%. Genzyme Corporation stock dropped 27% over the period while Gilead Sciences, Inc. lost 8%.
The portfolio positioned consumer staples as a half weighted sector but its picks lost 7% during the year compared to a gain of 31%. Kroger Company lost 15% and J.M. Smucker Company gave up 21% of its value.
The materials sector also fell short of the benchmark. Even though the portfolio gained 43% in the sector, it was outpaced by the 54% increased for the Index. Holdings detracting from portfolio performance included Airgas Inc., Ball Corporation, and Praxair, Inc.
Market Outlook
We continue to pursue opportunities with a focus on bottom-up research rather than a macro forecast. We believe that investing is a long-term pursuit that requires patience and a consistent approach. As always, we will continue to do our best to seek the potential available in mid capitalization growth companies.
On behalf of Security Global Investors, I would like to thank you for placing your trust in us.
Sincerely,
Joe O’Connor, Portfolio Manager
53
| | |
| | Series J |
| Performance Summary | | (Mid Cap Growth Series) |
| December 31, 2009 | | (unaudited) |
PERFORMANCE
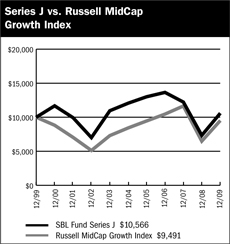
$10,000 Over 10 Years
The chart above assumes a hypothetical $10,000 investment in Series J (Mid Cap Growth Series) on December 31, 1999 and reflects the fees and expenses of Series J. The Russell MidCap Growth Index is an unmanaged capitalization-weighted Index that is designed to measure the performance of the 800 smallest companies in the Russell 1000 Index with higher price-to-book ratios and higher forecasted growth values.
Average Annual Returns
| | | | | | | | | |
Periods Ended 12-31-091 | | 1 Year | | | 5 Years | | | 10 Years | |
Series J | | 43.96 | % | | (2.62 | )% | | 0.55 | % |
| 1 | Performance figures do not reflect fees and expenses associated with an investment in variable insurance products offered by Security Benefit Life Insurance Company. If returns had taken into account these fees and expenses, performance would have been lower. Shares of a Series of SBL Fund are available only through the purchase of such products. |
The performance data quoted above represents past performance. Past performance is not predictive of future performance. The investment return and principal value of an investment will fluctuate so that an investor’s shares, when redeemed, may be worth more or less than their original cost.
Portfolio Composition by Sector
| | | |
Consumer Discretionary | | 17.59 | % |
Consumer Staples | | 1.89 | |
Energy | | 7.25 | |
Financials | | 5.32 | |
Health Care | | 10.52 | |
Industrials | | 14.53 | |
Information Technology | | 27.82 | |
Materials | | 8.86 | |
Exchange Traded Funds | | 3.04 | |
Cash & Other Assets, Less Liabilities | | 3.18 | |
Total Net Assets | | 100.00 | °% |
| | | |
The accompanying notes are an integral part of the financial statements
54
| | |
| Schedule of Investments | | Series J |
| December 31, 2009 | | (Mid Cap Growth Series) |
| | | | | |
| | | Shares | | Value |
COMMON STOCKS—96.8% | | | | | |
Advertising—2.3% | | | | | |
Omnicom Group, Inc. | | 92,120 | | $ | 3,606,498 |
| | | | | |
Aerospace & Defense—4.0% | | | | | |
Goodrich Corporation | | 55,780 | | | 3,583,865 |
Precision Castparts Corporation | | 23,395 | | | 2,581,638 |
| | | | | |
| | | | | 6,165,503 |
| | | | | |
Apparel Retail—3.4% | | | | | |
Gap, Inc. | | 126,980 | | | 2,660,231 |
TJX Companies, Inc. | | 69,420 | | | 2,537,301 |
| | | | | |
| | | | | 5,197,532 |
| | | | | |
Apparel, Accessories & Luxury Goods—2.2% | | | | | |
Phillips-Van Heusen Corporation | | 84,400 | | | 3,433,392 |
| | | | | |
Application Software—2.2% | | | | | |
Nuance Communications, Inc.* | | 216,570 | | | 3,365,498 |
| | | | | |
Asset Management & Custody Banks—3.7% | | | | | |
BlackRock, Inc. | | 10,830 | | | 2,514,726 |
T. Rowe Price Group, Inc. | | 60,300 | | | 3,210,975 |
| | | | | |
| | | | | 5,725,701 |
| | | | | |
Casinos & Gaming—1.9% | | | | | |
WMS Industries, Inc.* | | 72,385 | | | 2,895,400 |
| | | | | |
Coal & Consumable Fuels—2.2% | | | | | |
Peabody Energy Corporation | | 72,700 | | | 3,286,766 |
| | | | | |
Communications Equipment—0.7% | | | | | |
Juniper Networks, Inc.* | | 43,000 | | | 1,146,810 |
| | | | | |
Computer Storage & Peripherals—2.4% | | | | | |
QLogic Corporation* | | 193,580 | | | 3,652,855 |
| | | | | |
Data Processing & Outsourced Services—4.3% | | | | | |
Alliance Data Systems Corporation* | | 25,310 | | | 1,634,773 |
Global Payments, Inc. | | 44,475 | | | 2,395,424 |
Western Union Company | | 138,750 | | | 2,615,437 |
| | | | | |
| | | | | 6,645,634 |
| | | | | |
Electrical Components & Equipment—3.3% | | | | | |
Baldor Electric Company | | 57,400 | | | 1,612,366 |
Roper Industries, Inc. | | 65,170 | | | 3,412,953 |
| | | | | |
| | | | | 5,025,319 |
| | | | | |
Exchange Traded Funds—3.0% | | | | | |
iShares Russell Midcap Growth Index Fund | | 103,285 | | | 4,682,942 |
| | | | | |
Health Care Equipment—5.6% | | | | | |
Beckman Coulter, Inc. | | 62,710 | | | 4,103,742 |
Zimmer Holdings, Inc.* | | 75,200 | | | 4,445,072 |
| | | | | |
| | | | | 8,548,814 |
| | | | | |
Home Entertainment Software—1.3% | | | | | |
Activision Blizzard, Inc.* | | 175,750 | | | 1,952,583 |
| | | | | |
Homefurnishing Retail—2.0% | | | | | |
Bed Bath & Beyond, Inc.* | | 79,100 | | | 3,055,633 |
| | | | | |
Hotels, Resorts & Cruise Lines—1.3% | | | | | |
Royal Caribbean Cruises, Ltd.* | | 81,500 | | | 2,060,320 |
| | | | | |
Household Products—1.9% | | | | | |
Clorox Company | | 47,900 | | | 2,921,900 |
| | | | | |
Housewares & Specialties—4.5% | | | | | |
Fortune Brands, Inc. | | 63,900 | | | 2,760,480 |
Jarden Corporation | | 133,325 | | | 4,121,076 |
| | | | | |
| | | | | 6,881,556 |
| | | | | |
Industrial Gases—4.3% | | | | | |
AirGas, Inc. | | 65,075 | | | 3,097,570 |
Praxair, Inc. | | 44,130 | | | 3,544,080 |
| | | | | |
| | | | | 6,641,650 |
| | | | | |
Industrial Machinery—5.3% | | | | | |
Dover Corporation | | 120,200 | | | 5,001,522 |
Gardner Denver, Inc. | | 22,450 | | | 955,248 |
Ingersoll-Rand plc | | 66,100 | | | 2,362,414 |
| | | | | |
| | | | | 8,319,184 |
| | | | | |
IT Consulting & Other Services—4.1% | | | | | |
Amdocs, Ltd.* | | 68,460 | | | 1,953,164 |
| | | | | |
Cognizant Technology Solutions Corporation* | | 97,300 | | | 4,407,690 |
| | | | | |
| | | | | 6,360,854 |
| | | | | |
Life Sciences Tools & Services—2.1% | | | | | |
Thermo Fisher Scientific, Inc.* | | 69,385 | | | 3,308,971 |
| | | | | |
Metal & Glass Containers—2.1% | | | | | |
Ball Corporation | | 61,526 | | | 3,180,894 |
| | | | | |
Multi-Line Insurance—1.6% | | | | | |
HCC Insurance Holdings, Inc. | | 88,775 | | | 2,483,037 |
| | | | | |
Oil & Gas Drilling—1.4% | | | | | |
Noble Corporation | | 54,535 | | | 2,219,575 |
| | | | | |
Oil & Gas Equipment & Services—2.1% | | | | | |
Cameron International Corporation* | | 78,300 | | | 3,272,940 |
| | | | | |
Oil & Gas Storage & Transportation—1.6% | | | | | |
Williams Companies, Inc. | | 114,185 | | | 2,407,020 |
| | | | | |
Pharmaceuticals—2.8% | | | | | |
Teva Pharmaceutical Industries, Ltd. ADR | | 78,005 | | | 4,382,321 |
| | | | | |
Railroads—1.9% | | | | | |
Union Pacific Corporation | | 45,440 | | | 2,903,616 |
| | | | | |
Semiconductor Equipment—1.8% | | | | | |
Lam Research Corporation* | | 69,400 | | | 2,721,174 |
| | | | | |
The accompanying notes are an integral part of the financial statements
55
| | |
| Schedule of Investments | | Series J |
| December 31, 2009 | | (Mid Cap Growth Series) |
| | | | | |
| | | Shares | | Value |
COMMON STOCKS—96.8% (continued) | | | | | |
Semiconductors—4.8% | | | | | |
ON Semiconductor Corporation* | | 368,305 | | $ | 3,244,767 |
Skyworks Solutions, Inc.* | | 292,315 | | | 4,147,949 |
| | | | | |
| | | | | 7,392,716 |
| | | | | |
Specialty Chemicals—1.4% | | | | | |
International Flavors & Fragrances, Inc. | | 51,050 | | | 2,100,197 |
| | | | | |
Steel—1.1% | | | | | |
Steel Dynamics, Inc. | | 98,740 | | | 1,749,673 |
| | | | | |
Systems Software—6.2% | | | | | |
Check Point Software Technologies* | | 95,365 | | | 3,230,965 |
McAfee, Inc.* | | 49,750 | | | 2,018,358 |
Rovi Corporation* | | 65,600 | | | 2,090,672 |
Sybase, Inc.* | | 53,620 | | | 2,327,108 |
| | | | | |
| | | | | 9,667,103 |
| | | | | |
TOTAL COMMON STOCKS (cost $126,275,838) | | | | $ | 149,361,581 |
| | | | | |
| | |
| | | Shares | | Value |
WARRANTS—0.0% | | | | | |
Nova Biosource Fuels, Inc. | | | | | |
$2.40, 7/5/20111 | | 358,100 | | | 795 |
| | | | | |
TOTAL WARRANTS (cost $369,900) | | | | $ | 795 |
| | | | | |
Total Investments—96.8%2 (cost $126,645,738) | | | | $ | 149,362,376 |
Cash & Other Assets, Less Liabilities—3.2% | | | | | 4,910,893 |
| | | | | |
Total Net Assets—100.0% | | | | $ | 154,273,269 |
| | | | | |
For federal income tax purposes the identified cost of investments owned at December 31, 2009 was $127,843,396.
| | |
ADR | | American Depositary Receipt |
plc | | Public Limited Company |
| * | Non-income producing security |
| 1 | Value determined based on Level 2 inputs. |
| 2 | Unless otherwise indicated, the values of the securities of the Portfolio are determined based on Level 1 inputs. |
The accompanying notes are an integral part of the financial statements
56
| | |
| | Series J |
| | (Mid Cap Growth Series) |
Statement of Assets and Liabilities
December 31, 2009
| | | | |
Assets: | | | | |
Investments, at value* | | $ | 149,362,376 | |
Cash | | | 4,150,943 | |
Receivables: | | | | |
Fund shares sold | | | 581,622 | |
Securities sold | | | 966,464 | |
Dividends | | | 92,478 | |
Prepaid expenses | | | 3,170 | |
| | | | |
Total assets | | | 155,157,053 | |
| | | | |
Liabilities: | | | | |
| |
Payable for: | | | | |
Fund shares redeemed | | | 52,287 | |
Securities purchased | | | 667,910 | |
Management fees | | | 97,147 | |
Administration fees | | | 12,605 | |
Transfer agent/maintenance fees | | | 2,083 | |
Custodian fees | | | 684 | |
Directors’ fees | | | 2,059 | |
Professional fees | | | 21,509 | |
Other fees | | | 27,500 | |
| | | | |
Total liabilities | | | 883,784 | |
| | | | |
Net assets | | $ | 154,273,269 | |
| | | | |
| |
Net assets consist of: | | | | |
Paid in capital | | $ | 212,290,288 | |
Accumulated net realized loss on sale of investments | | | (80,733,657 | ) |
Net unrealized appreciation in value of investments | | | 22,716,638 | |
| | | | |
Net assets | | $ | 154,273,269 | |
| | | | |
| |
Capital shares authorized | | | unlimited | |
Capital shares outstanding | | | 6,374,410 | |
Net asset value per share (net assets divided by shares outstanding) | | $ | 24.20 | |
| | | | |
| |
* investments, at cost | | $ | 126,645,738 | |
Statement of Operations
For Year Ended December 31, 2009
| | | | |
| |
Investment Income: | | | | |
Dividends | | $ | 1,062,851 | |
Interest | | | 4,550 | |
| | | | |
Total investment income | | | 1,067,401 | |
| | | | |
| |
Expenses: | | | | |
Management fees | | | 1,023,840 | |
Administration fees | | | 130,109 | |
Transfer agent/maintenance fees | | | 25,280 | |
Custodian fees | | | 3,991 | |
Directors’ fees | | | 14,751 | |
Professional fees | | | 23,631 | |
Reports to shareholders | | | 21,364 | |
Other | | | 8,576 | |
Total expenses | | | 1,251,542 | |
| | | | |
Net investment loss | | | (184,141 | ) |
| | | | |
| |
Net Realized and Unrealized Gain (Loss): | | | | |
Net realized gain (loss) during the year on: | | | | |
Investments | | | (10,016,613 | ) |
| | | | |
Net realized loss | | | (10,016,613 | ) |
| | | | |
| |
Net unrealized appreciation (depreciation) during the year on: | | | | |
Investments | | | 59,381,654 | |
| | | | |
Net unrealized appreciation | | | 59,381,654 | |
| | | | |
Net realized and unrealized gain | | | 49,365,041 | |
| | | | |
Net increase in net assets resulting from operations | | $ | 49,180,900 | |
| | | | |
The accompanying notes are an integral part of the financial statements
57
| | |
| | Series J |
| Statement of Changes in Net Assets | | (Mid Cap Growth Series) |
| | | | | | | | |
| | | Year Ended
December 31, 2009 | | | Year Ended
December 31, 2008 | |
Increase (decrease) in net assets from operations: | | | | | | | | |
Net investment loss | | $ | (184,141 | ) | | $ | (105,176 | ) |
Net realized loss during the year on investments | | | (10,016,613 | ) | | | (46,515,676 | ) |
Net unrealized appreciation (depreciation) during the year on investments | | | 59,381,654 | | | | (40,063,644 | ) |
| | | | | | | | |
Net increase (decrease) in net assets resulting from operations | | | 49,180,900 | | | | (86,684,496 | ) |
| | | | | | | | |
| | |
Capital share transactions: | | | | | | | | |
Proceeds from sale of shares | | | 25,347,942 | | | | 37,579,885 | |
Cost of shares redeemed | | | (42,285,359 | ) | | | (80,932,084 | ) |
| | | | | | | | |
Net decrease from capital share transactions | | | (16,937,417 | ) | | | (43,352,199 | ) |
| | | | | | | | |
Net increase (decrease) in net assets | | | 32,243,483 | | | | (130,036,695 | ) |
| | | | | | | | |
| | |
Net assets: | | | | | | | | |
Beginning of year | | | 122,029,786 | | | | 252,066,481 | |
End of year | | $ | 154,273,269 | | | $ | 122,029,786 | |
| | | | | | | | |
Undistributed net investment income at end of year | | $ | — | | | $ | — | |
| | | | | | | | |
| | |
Capital share activity: | | | | | | | | |
Shares sold | | | 1,288,966 | | | | 1,587,753 | |
Shares redeemed | | | (2,174,470 | ) | | | (3,329,065 | ) |
| | | | | | | | |
Total capital share activity | | | (885,504 | ) | | | (1,741,312 | ) |
| | | | | | | | |
The accompanying notes are an integral part of the financial statements
58
| | |
| Financial Highlights | | Series J |
Selected data for each share of capital stock outstanding throughout each year | | (Mid Cap Growth Series) |
| | | | | | | | | | | | | | | | | | | | |
| | | 2009 | | | 2008 | | | 2007 | | | 2006 | | | Year Ended
December 31,
2005 | |
Per Share Data | | | | | | | | | | | | | | | | | | | | |
Net asset value, beginning of period | | $ | 16.81 | | | $ | 28.00 | | | $ | 31.26 | | | $ | 29.79 | | | $ | 27.63 | |
| | | | | | | | | | | | | | | | | | | | |
Income (loss) from investment operations: | | | | | | | | | | | | | | | | | | | | |
Net investment lossa | | | (0.03 | ) | | | (0.01 | ) | | | (0.04 | ) | | | (0.16 | ) | | | (0.13 | ) |
Net gain (loss) on securities (realized and unrealized) | | | 7.42 | | | | (11.18 | ) | | | (3.22 | ) | | | 1.63 | | | | 2.29 | |
| | | | | | | | | | | | | | | | | | | | |
Total from investment operations | | | 7.39 | | | | (11.19 | ) | | | (3.26 | ) | | | 1.47 | | | | 2.16 | |
| | | | | | | | | | | | | | | | | | | | |
Net asset value, end of period | | $ | 24.20 | | | $ | 16.81 | | | $ | 28.00 | | | $ | 31.26 | | | $ | 29.79 | |
| | | | | | | | | | | | | | | | | | | | |
| | | | | |
Total Returnb | | | 43.96 | % | | | (39.96 | %) | | | (10.43 | %) | | | 4.93 | % | | | 7.82 | % |
| | | | | | | | | | | | | | | | | | | | |
Ratios/Supplemental Data | | | | | | | | | | | | | | | | | | | | |
Net assets, end of period (in thousands) | | $ | 154,273 | | | $ | 122,030 | | | $ | 252,066 | | | $ | 380,664 | | | $ | 420,798 | |
| | | | | | | | | | | | | | | | | | | | |
Ratios to average net assets: | | | | | | | | | | | | | | | | | | | | |
Net investment loss | | | (0.13 | %) | | | (0.06 | %) | | | (0.14 | %) | | | (0.48 | %) | | | (0.47 | %) |
Total expensesc | | | 0.92 | % | | | 0.91 | % | | | 0.90 | % | | | 0.90 | % | | | 0.90 | % |
Net expensesd | | | 0.92 | % | | | 0.91 | % | | | 0.90 | % | | | 0.90 | % | | | 0.90 | % |
Net expenses prior to custodian earnings credits and net of expense waivers | | | 0.92 | % | | | 0.91 | % | | | 0.90 | % | | | 0.90 | % | | | 0.90 | % |
| | | | | | | | | | | | | | | | | | | | |
Portfolio turnover rate | | | 136 | % | | | 203 | %e | | | 34 | % | | | 29 | % | | | 29 | % |
| a | Net investment income (loss) was computed using average shares outstanding throughout the period. |
| b | Total return does not take into account any of the expenses associated with an investment in variable insurance products offered by Security Benefit Life Insurance Company. If total return had taken into account these expenses, performance would have been lower. Shares of a series of SBL Fund are available only through the purchase of such products, |
| c | Total expense information reflects the expense ratios absent expense reductions by the Investment Manager and custodian earnings credits, as applicable, |
| d | Net expense information reflects the expense ratios after voluntary expense waivers, reimbursements and custodian earnings credits, as applicable. |
| e | Significant variation in the portfolio turnover rate is due to Investment Manager’s appointment of new portfolio manager for the Series. |
The accompanying notes are an integral part of the financial statements
59
This page left blank intentionally.
60
|
| Managers’ Commentary |
February 15, 2009 |
| | | | |
| | Advised by: | |  |
To Our Shareholders:
The SBL Fund – Series N, Managed Asset Allocation Series, returned 25.72% for the year ended December 31, 2009, outperforming its 60% S&P 500/40% Barclays Capital U.S. Aggregate Bond Index benchmark, which returned 18.25%. The S&P 500 returned 26.46% over the period, and the Barclays Capital U.S. Aggregate Index returned 5.93%.
Market Environment
U.S. stocks produced strong gains in 2009 - the best year for U.S. equities since 2003. In the first quarter, major indexes extended 2008’s decline and plunged to 12-year lows as the economy contracted, unemployment surged, and the U.S. federal government intervened aggressively to provide liquidity to the credit markets, stabilize the banking sector, and stimulate the economy. From early March through the end of the year, share prices soared as credit market conditions improved, corporate earnings were generally better than expected, and the economy showed signs that it was emerging from the longest and deepest recession since the Great Depression.
Equities in many non-U.S. markets far surpassed domestic shares in 2009, as global economies improved and weakness in the U.S. dollar versus other currencies enhanced returns to U.S. investors. The MSCI EAFE Index, which measures the performance of mostly large-cap equities in Europe, Australia, and the Far East, returned 32.46% versus 79.02% for the MSCI Emerging Markets Index.
Most U.S. bond sectors produced excellent returns in 2009 as non-Treasury sectors, which had collapsed in the closing months of 2008, rebounded briskly and money market yields near 0% prompted yield-hungry investors to seek riskier securities with an income advantage. High yield bonds produced the strongest annual gains in the history of the sector as credit spreads narrowed significantly. Investment-grade companies and municipal bonds were less robust but still did very well. Agency mortgage-backed securities produced relatively mild gains. U.S. Treasury securities, which performed best during the flight to quality in 2008, declined as longer-term interest rates rebounded from their lowers levels amid signs of an economic recovery and heavy new issuance.
Portfolio Review
The portfolio’s outperformance relative to its blended benchmark can be attributed to strong security selection across all of the underlying strategies. The largest positive contributor to the portfolio’s relative outperformance was the strong security selection within out investment-grade bond and large-cap equity strategies. The non-U.S. equity strategy also provided a relative boost to performance, outperforming its respective benchmark, the MSCI EAFE Index. Exposure to non-U.S. equities and small-cap stocks provided a positive impact to performance as these sectors outperformed the large-cap S&P 500 Index. Additionally, the allocation to high yield bonds also aided relative returns as the high yield sector significantly outperformed the Barclays Capital U.S. Aggregate Index. Our allocation decision to overweight equities throughout the period also positively contributed to relative performance as the S&P 500 Index outperformed the Barclays Capital U.S. Aggregate Index for the year.
Outlook
We are currently overweight stocks relative to bonds but have moderated our overweight as valuations are less attractive following the equity rally from March 9, 2009, market lows. While yields on U.S. government bonds remain supported near historically low levels by the U.S. Federal Reserve’s quantitative easing program, elevated levels of new U.S. Treasury supply could provide upward pressure on interest rates. We are underweight to small-cap stocks as valuations favor large-cap stocks. We are modestly overweight in non-U.S. equity markets, based on attractive valuations in non-U.S. markets. We have increased our weighting in high yield relative to investment-grade bonds, given a gradually improving economy and expectations for a lower default rate. Within the high yield sector, spread levels remain attractive relative to their historical average. Fundamental credit research remains a critical part of the security selection process in the context of uncertainty in the current environment.
We continue to believe that our commitment to broad diversification across asset classes and our emphasis on strong fundamental research in seeking investment opportunities will continue to serve our clients well over the long term.
Sincerely,
Edmond M. Notzon, Portfolio Manager, T. Rowe Price
61
| | |
| | Series N |
| Performance Summary | | (Managed Asset Allocation Series) |
| December 31, 2009 | | (unaudited) |
PERFORMANCE
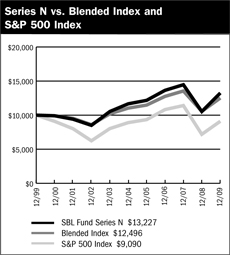
$10,000 Over 10 Years
The chart above assumes a hypothetical $10,000 investment in Series N (Managed Asset Allocation Series) on December 31, 1999 and reflects the fees and expenses of Series N. The blended index is 60% S&P 500 Index and 40% Barclays Capital U.S. Aggregate Bond Index. The S&P 500 Index is a capitalization-weighted index composed of 500 selected common stocks that represent the broad domestic economy and is a widely recognized unmanaged index of market performance. The Barclays Capital U.S. Aggregate Bond Index is an unmanaged index that tracks investment grade bonds including U.S. Treasury and agency issues, corporate bond issues, asset-backed, commercial mortgage-backed and mortgage-backed securities and Yankee issues.
Average Annual Returns
| | | | | | | | | |
Periods Ended 12-31-091 | | 1 Year | | | 5 Years | | | 10 Years | |
Series N | | 25.72 | % | | 2.55 | % | | 2.84 | % |
| 1 | Performance figures do not reflect fees and expenses associated with an investment in variable insurance products offered by Security Benefit Life Insurance Company. If returns had taken into account these fees and expenses, performance would have been lower. Shares of a Series of SBL Fund are available only through the purchase of such products. |
The performance data quoted above represents past performance. Past performance is not predictive of future performance. The investment return and principal value of an investment will fluctuate so that an investor’s shares, when redeemed, may be worth more or less than their original cost.
Portfolio Composition by Sector for Equity Holdings & Quality Ratings (Based on Standard and Poor’s Ratings) for Fixed Income Holdings
| | | |
Consumer Discretionary | | 6.96 | % |
Consumer Staples | | 6.50 | |
Energy | | 6.90 | |
Financials | | 10.37 | |
Health Care | | 7.56 | |
Industrials | | 6.99 | |
Information Technology | | 10.82 | |
Materials | | 2.82 | |
Telecommunication Services | | 2.38 | |
Utilities | | 2.35 | |
AAA | | 17.85 | |
AA | | 0.86 | |
A | | 4.07 | |
BBB | | 5.98 | |
BB | | 1.72 | |
B | | 1.41 | |
CCC | | 0.45 | |
C | | 0.02 | |
Not Rated | | 0.18 | |
Short Term Investments | | 2.97 | |
Cash & Other Assets, Less Liabilities | | 0.84 | |
Total Net Assets | | 100.00 | % |
| | | |
The accompanying notes are an integral part of the financial statements
62
| | |
| Schedule of Investment | | Series N |
| December 31, 2009 | | (Managed Asset Allocation Series) |
| | | | | |
| | | Shares | | Value |
COMMON STOCKS—51.1% | | | | | |
Advertising—0.1% | | | | | |
Lamar Advertising Company* | | 950 | | $ | 29,536 |
Omnicom Group, Inc. | | 1,600 | | | 62,640 |
| | | | | |
| | | | | 92,176 |
| | | | | |
Aerospace & Defense—1.4% | | | | | |
American Science & Engineering, Inc. | | 300 | | | 22,752 |
Boeing Company | | 2,790 | | | 151,023 |
General Dynamics Corporation | | 1,200 | | | 81,804 |
Goodrich Corporation | | 1,000 | | | 64,250 |
Honeywell International, Inc. | | 2,700 | | | 105,840 |
Lockheed Martin Corporation | | 1,900 | | | 143,165 |
Northrop Grumman Corporation | | 1,200 | | | 67,020 |
Precision Castparts Corporation | | 700 | | | 77,245 |
Raytheon Company | | 1,200 | | | 61,824 |
Rockwell Collins, Inc. | | 500 | | | 27,680 |
Teledyne Technologies, Inc.* | | 400 | | | 15,344 |
Triumph Group, Inc. | | 400 | | | 19,300 |
United Technologies Corporation | | 4,210 | | | 292,216 |
| | | | | |
| | | | | 1,129,463 |
| | | | | |
Agricultural Products—0.1% | | | | | |
Archer-Daniels-Midland Company | | 1,400 | | | 43,834 |
Bunge, Ltd. | | 400 | | | 25,532 |
| | | | | |
| | | | | 69,366 |
| | | | | |
Air Freight & Logistics—0.4% | | | | | |
CH Robinson Worldwide, Inc. | | 700 | | | 41,111 |
Expeditors International of Washington, Inc. | | 800 | | | 27,784 |
FedEx Corporation | | 900 | | | 75,105 |
United Parcel Service, Inc. (CI.B) | | 3,200 | | | 183,584 |
UTi Worldwide, Inc. | | 1,200 | | | 17,184 |
| | | | | |
| | | | | 344,768 |
| | | | | |
Airlines—0.1% | | | | | |
AirTran Holdings, Inc.* | | 1,300 | | | 6,786 |
AMR Corporation* | | 1,600 | | | 12,368 |
Skywest, Inc. | | 500 | | | 8,460 |
Southwest Airlines Company | | 5,100 | | | 58,293 |
| | | | | |
| | | | | 85,907 |
| | | | | |
Apparel Retail—0.2% | | | | | |
American Eagle Outfitters, Inc.* | | 900 | | | 15,282 |
Dress Barn, Inc.* | | 188 | | | 4,343 |
Gap, Inc. | | 5,300 | | | 111,035 |
J Crew Group, Inc.* | | 400 | | | 17,896 |
| | | | | |
| | | | | 148,556 |
| | | | | |
Apparel, Accessories & Luxury Goods—0.1% | | | | | |
Anvil Holdings, Inc.1,2,* | | 30 | | | 23 |
Coach, Inc. | | 2,400 | | | 87,672 |
Fossil, Inc.* | | 600 | | | 20,136 |
| | | | | |
| | | | | 107,831 |
| | | | | |
Application Software—0.4% | | | | | |
Autodesk, Inc.* | | 7,100 | | | 180,411 |
Cadence Design Systems, Inc.* | | 2,300 | | | 13,777 |
Factset Research Systems, Inc. | | 320 | | | 21,078 |
Intuit, Inc.* | | 2,800 | | | 85,988 |
Jack Henry & Associates, Inc. | | 1,000 | | | 23,120 |
Salary.com, Inc.* | | 2,400 | | | 5,640 |
Symyx Technologies, Inc.* | | 1,600 | | | 8,800 |
Taleo Corporation* | | 600 | | | 14,112 |
| | | | | |
| | | | | 352,926 |
| | | | | |
Asset Management & Custody Banks—0.7% | | | | | |
Bank of New York Mellon Corporation | | 3,800 | | | 106,286 |
BlackRock, Inc. | | 50 | | | 11,610 |
Eaton Vance Corporation | | 600 | | | 18,246 |
Invesco, Ltd. | | 2,900 | | | 68,121 |
Janus Capital Group, Inc. | | 3,500 | | | 47,075 |
Northern Trust Corporation | | 1,500 | | | 78,600 |
State Street Corporation | | 2,200 | | | 95,788 |
Waddell & Reed Financial, Inc. | | 600 | | | 18,324 |
| | | | | |
| | | | | 444,050 |
| | | | | |
Auto Parts & Equipment—0.2% | | | | | |
BorgWarner, Inc. | | 200 | | | 6,644 |
Gentex Corporation | | 1,500 | | | 26,775 |
Johnson Controls, Inc. | | 3,200 | | | 87,168 |
| | | | | |
| | | | | 120,587 |
| | | | | |
Automobile Manufacturers—0.1% | | | | | |
Ford Motor Company* | | 3,600 | | | 36,000 |
Thor Industries, Inc. | | 300 | | | 9,420 |
Winnebago Industries* | | 600 | | | 7,320 |
| | | | | |
| | | | | 52,740 |
| | | | | |
Automotive Retail—0.1% | | | | | |
Advance Auto Parts, Inc. | | 200 | | | 8,096 |
AutoZone, Inc.* | | 500 | | | 79,035 |
CarMax, Inc.* | | 1,000 | | | 24,250 |
| | | | | |
| | | | | 111,381 |
| | | | | |
Biotechnology—0.9% | | | | | |
Alexion Pharmaceuticals, Inc.* | | 150 | | | 7,323 |
Alkermes, Inc.* | | 1,000 | | | 9,410 |
Amgen, Inc.* | | 3,610 | | | 204,217 |
Biogen Idec, Inc.* | | 1,100 | | | 58,850 |
BioMarin Pharmaceutical, Inc.* | | 600 | | | 11,286 |
Celgene Corporation* | | 2,400 | | | 133,632 |
Cephalon, Inc.* | | 500 | | | 31,205 |
Gilead Sciences, Inc.* | | 4,000 | | | 173,120 |
Human Genome Sciences, Inc.* | | 1,900 | | | 58,140 |
Incyte Corporation, Ltd.* | | 700 | | | 6,377 |
Martek Biosciences Corporation* | | 400 | | | 7,576 |
Maxygen, Inc.* | | 1,500 | | | 9,135 |
Vertex Pharmaceuticals, Inc.* | | 970 | | | 41,565 |
| | | | | |
| | | | | 751,836 |
| | | | | |
Brewers—0.0% | | | | | |
Boston Beer Company, Inc.* | | 500 | | | 23,300 |
Compania Cervecerias Unidas S.A. ADR* | | 900 | | | 35,118 |
| | | | | |
| | | | | 58,418 |
| | | | | |
Broadcasting—0.1% | | | | | |
Discovery Communications, Inc.* | | 1,083 | | | 33,216 |
Discovery Communications, Inc. (CI. C)* | | 2,483 | | | 65,849 |
| | | | | |
| | | | | 99,065 |
| | | | | |
Building Products—0.1% | | | | | |
Masco Corporation | | 3,800 | | | 52,478 |
Universal Forest Products, Inc. | | 500 | | | 18,405 |
USG Corporation* | | 500 | | | 7,025 |
| | | | | |
| | | | | 77,908 |
| | | | | |
Cable & Satellite—0.4% | | | | | |
Cablevision Systems Corporation | | 3,300 | | | 85,206 |
DIRECTV* | | 1,200 | | | 40,020 |
DISH Network Corporation | | 700 | | | 14,539 |
The accompanying notes are an integral part of the financial statements
63
| | |
| Schedule of Investments | | Series N |
| December 31, 2008 | | (Managed Asset Allocation Series) |
| | | | | |
| | | Shares | | Value |
COMMON STOCKS—51.1% (continued) | | | | | |
Cable & Satellite—0.4% (continued) | | | | | |
Liberty Global, Inc.* | | 975 | | $ | 21,362 |
Time Warner Cable, Inc. | | 4,739 | | | 196,147 |
| | | | | |
| | | | | 357,274 |
| | | | | |
Casinos & Gaming—0.2% | | | | | |
International Game Technology | | 1,500 | | | 28,155 |
MGM Mirage* | | 9,601 | | | 87,561 |
Wynn Resorts, Ltd.* | | 300 | | | 17,469 |
| | | | | |
| | | | | 133,185 |
| | | | | |
Catalog Retail—0.1% | | | | | |
Liberty Media Corporation - Interactive* | | 4,800 | | | 52,032 |
| | | | | |
Coal & Consumable Fuels—0.3% | | | | | |
Alpha Natural Resources, Inc.* | | 350 | | | 15,183 |
Arch Coal, Inc. | | 700 | | | 15,575 |
Consol Energy, Inc. | | 1,500 | | | 74,700 |
Massey Energy Company | | 400 | | | 16,804 |
Peabody Energy Corporation | | 1,600 | | | 72,336 |
Westmoreland Coal Company* | | 900 | | | 8,019 |
| | | | | |
| | | | | 202,617 |
| | | | | |
Commodity Chemicals—0.0% | | | | | |
Koppers Holdings, Inc. | | 700 | | | 21,308 |
| | | | | |
Communications Equipment—1.3% | | | | | |
Blue Coat Systems, Inc.* | | 500 | | | 14,270 |
Cisco Systems, Inc.* | | 15,500 | | | 371,070 |
F5 Networks, Inc.* | | 800 | | | 42,384 |
Finisar Corporation* | | 1,213 | | | 10,816 |
Ixia* | | 1,900 | | | 14,136 |
JDS Uniphase Corporation* | | 5,300 | | | 43,725 |
Juniper Networks, Inc.* | | 4,300 | | | 114,681 |
Motorola, Inc. | | 8,700 | | | 67,512 |
Palm, Inc.* | | 2,400 | | | 24,096 |
Qualcomm, Inc. | | 6,800 | | | 314,568 |
| | | | | |
| | | | | 1,017,258 |
| | | | | |
Computer & Electronics Retail—0.0% | | | | | |
Rent-A-Center, Inc.* | | 1,000 | | | 17,720 |
| | | | | |
Computer Hardware—2.3% | | | | | |
Apple, Inc.* | | 3,500 | | | 738,010 |
Avid Technology, Inc.* | | 700 | | | 8,932 |
Dell, Inc.* | | 5,600 | | | 80,416 |
Hewlett-Packard Company | | 7,800 | | | 401,778 |
International Business Machines Corporation | | 4,820 | | | 630,938 |
| | | | | |
| | | | | 1,860,074 |
| | | | | |
Computer Storage & Peripherals—0.3% | | | | | |
EMC Corporation* | | 7,700 | | | 134,519 |
Isilon Systems, Inc.* | | 1,900 | | | 13,034 |
NetApp, Inc.* | | 1,200 | | | 41,268 |
SanDisk Corporation* | | 900 | | | 26,091 |
| | | | | |
| | | | | 214,912 |
| | | | | |
Construction & Engineering—0.1% | | | | | |
Fluor Corporation | | 1,100 | | | 49,544 |
Foster Wheeler AG* | | 900 | | | 26,496 |
Insituform Technologies, Inc.* | | 900 | | | 20,448 |
Quanta Services, Inc.* | | 600 | | | 12,504 |
| | | | | |
| | | | | 108,992 |
| | | | | |
Construction & Farm Machinery & Heavy Trucks—0.3% | | | | | |
Deere & Company | | 2,000 | | | 108,180 |
Joy Global, Inc. | | 500 | | | 25,795 |
Oshkosh Corporation | | 440 | | | 16,293 |
Paccar, Inc. | | 2,900 | | | 105,183 |
| | | | | |
| | | | | 255,451 |
| | | | | |
Construction Materials—0.1% | | | | | |
Martin Marietta Materials, Inc. | | 130 | | | 11,623 |
Vulcan Materials Company | | 1,200 | | | 63,204 |
| | | | | |
| | | | | 74,827 |
| | | | | |
Consumer Finance—0.2% | | | | | |
American Express Company | | 2,800 | | | 113,456 |
SLM Corporation* | | 3,700 | | | 41,699 |
| | | | | |
| | | | | 155,155 |
| | | | | |
Data Processing & Outsourced Services—0.9% | | | | | |
Automatic Data Processing, Inc. | | 2,200 | | | 94,204 |
Computer Sciences Corporation* | | 900 | | | 51,777 |
Fidelity National Information Services, Inc. | | 1,000 | | | 23,440 |
Fiserv, Inc.* | | 800 | | | 38,784 |
Global Payments, Inc. | | 500 | | | 26,930 |
Heartland Payment Systems, Inc. | | 1,000 | | | 13,130 |
Mastercard, Inc. | | 400 | | | 102,392 |
Paychex, Inc. | | 900 | | | 27,576 |
Visa, Inc. | | 2,700 | | | 236,142 |
Western Union Company | | 3,800 | | | 71,630 |
| | | | | |
| | | | | 686,005 |
| | | | | |
Department Stores—0.2% | �� | | | | |
Kohl's Corporation* | | 2,470 | | | 133,207 |
| | | | | |
Distributors—0.0% | | | | | |
Genuine Parts Company | | 500 | | | 18,980 |
| | | | | |
Diversified Banks—1.0% | | | | | |
Barclays plc ADR | | 6,100 | | | 107,360 |
U.S. Bancorp | | 8,200 | | | 184,582 |
Wells Fargo & Company | | 20,391 | | | 550,353 |
| | | | | |
| | | | | 842,295 |
| | | | | |
Diversified Chemicals—0.2% | | | | | |
Cabot Corporation | | 730 | | | 19,148 |
Dow Chemical Company | | 1,800 | | | 49,734 |
E.I. Du Pont de Nemours & Company | | 3,651 | | | 122,929 |
| | | | | |
| | | | | 191,811 |
| | | | | |
Diversified Metals & Mining—0.2% | | | | | |
Freeport-McMoRan Copper & Gold, Inc. (CI.B) | | 1,869 | | | 150,062 |
| | | | | |
Diversified Real Estate Activities—0.0% | | | | | |
St. Joe Company* | | 600 | | | 17,334 |
| | | | | |
Diversified Support Services—0.0% | | | | | |
Cintas Corporation | | 1,200 | | | 31,260 |
| | | | | |
The accompanying notes are an integral part of the financial statements
64
| | |
| Schedule of Investments | | Series N |
| December 31, 2009 | | (Management Asset Allocation Series) |
| | | | | |
| | | Shares | | Value |
COMMON STOCKS—51.1% (continued) | | | | | |
Drug Retail—0.5% | | | | | |
CVS Caremark Corporation | | 6,768 | | $ | 217,997 |
Walgreen Company | | 3,900 | | | 143,208 |
| | | | | |
| | | | | 361,205 |
| | | | | |
Education Services—0.1% | | | | | |
Apollo Group, Inc.* | | 800 | | | 48,464 |
Corinthian Colleges, Inc.* | | 1,200 | | | 16,524 |
DeVry, Inc. | | 200 | | | 11,346 |
Education Management Corporation* | | 300 | | | 6,603 |
| | | | | |
| | | | | 82,937 |
| | | | | |
Electric Utilities—1.0% | | | | | |
Allegheny Energy, Inc. | | 1,700 | | | 39,916 |
American Electric Power Company, Inc. | | 3,600 | | | 125,244 |
Duke Energy Corporation | | 1,600 | | | 27,536 |
Edison International | | 1,300 | | | 45,214 |
Entergy Corporation | | 1,400 | | | 114,576 |
Exelon Corporation | | 2,500 | | | 122,175 |
FirstEnergy Corporation | | 1,500 | | | 69,675 |
FPL Group, Inc. | | 700 | | | 36,974 |
Great Plains Energy, Inc. | | 1,400 | | | 27,146 |
Pepco Holdings, Inc. | | 2,000 | | | 33,700 |
Pinnacle West Capital Corporation | | 800 | | | 29,264 |
PPL Corporation | | 2,500 | | | 80,775 |
Progress Energy, Inc. | | 400 | | | 16,404 |
| | | | | |
| | | | | 768,599 |
| | | | | |
Electrical Components & Equipment—0.4% | | | | | |
A123 Systems, Inc.* | | 200 | | | 4,488 |
AO Smith Corporation | | 600 | | | 26,034 |
Baldor Electric Company | | 500 | | | 14,045 |
Belden, Inc. | | 280 | | | 6,138 |
BTU International, Inc.* | | 1,200 | | | 7,620 |
Cooper Industries plc | | 1,500 | | | 63,960 |
Emerson Electric Company | | 1,900 | | | 80,940 |
First Solar, Inc.* | | 100 | | | 13,540 |
General Cable Corporation* | | 400 | | | 11,768 |
Rockwell Automation, Inc. | | 2,000 | | | 93,959 |
Roper Industries, Inc. | | 50 | | | 2,619 |
| | | | | |
| | | | | 325,111 |
| | | | | |
Electronic Components—0.1% | | | | | |
AVX Corporation | | 1,300 | | | 16,471 |
Corning, Inc. | | 4,800 | | | 92,688 |
| | | | | |
| | | | | 109,159 |
| | | | | |
Electronic Equipment & Instruments—0.1% | | | | | |
Agilent Technologies, Inc.* | | 1,500 | | | 46,605 |
| | | | | |
Electronic Manufacturing Services—0.1% | | | | | |
Cyberoptics Corporation* | | 1,300 | | | 8,723 |
Plexus Corporation* | | 500 | | | 14,250 |
Tyco Electronics, Ltd. | | 2,875 | | | 70,581 |
| | | | | |
| | | | | 93,554 |
| | | | | |
Environmental & Facilities Services—0.3% | | | | | |
Covanta Holding Corporation* | | 1,000 | | | 18,090 |
Republic Services, Inc. | | 5,200 | | | 147,212 |
Stericycle, Inc.* | | 1,200 | | | 66,204 |
Waste Connections, Inc.* | | 500 | | $ | 16,660 |
| | | | | |
| | | | | 248,166 |
| | | | | |
Fertilizers & Agricultural Chemicals—0.3% | | | | | |
American Vanguard Corporation | | 1,400 | | | 11,620 |
Monsanto Company | | 2,400 | | | 196,200 |
Mosaic Company | | 450 | | | 26,879 |
Potash Corporation of Saskatchewan, Inc. | | 200 | | | 21,700 |
| | | | | |
| | | | | 256,399 |
| | | | | |
Food Distributors—0.1% | | | | | |
Sysco Corporation | | 2,900 | | | 81,026 |
| | | | | |
Food Retail—0.1% | | | | | |
Casey’s General Stores, Inc. | | 600 | | | 19,152 |
Pantry, Inc.* | | 400 | | | 5,436 |
Whole Foods Market, Inc.* | | 1,300 | | | 35,685 |
| | | | | |
| | | | | 60,273 |
| | | | | |
Footwear—0.1% | | | | | |
Nike, Inc. (CI.B) | | 1,280 | | | 84,570 |
| | | | | |
Forest Products—0.1% | | | | | |
Weyerhaeuser Company | | 1,400 | | | 60,396 |
| | | | | |
Gas Utilities—0.1% | | | | | |
National Fuel Gas Company | | 300 | | | 15,000 |
Southwest Gas Corporation | | 900 | | | 25,677 |
| | | | | |
| | | | | 40,677 |
| | | | | |
General Merchandise Stores—0.0% | | | | | |
Dollar Tree, Inc.* | | 400 | | | 19,320 |
| | | | | |
Gold—0.1% | | | | | |
Allied Nevada Gold Corporation* | | 1,400 | | | 21,112 |
Eldorado Gold Corporation* | | 2,000 | | | 28,340 |
Newmont Mining Corporation | | 1,300 | | | 61,503 |
| | | | | |
| | | | | 110,955 |
| | | | | |
Health Care Distributors—0.1% | | | | | |
Cardinal Health, Inc. | | 700 | | | 22,568 |
Henry Schein, Inc.* | | 500 | | | 26,300 |
McKesson Corporation | | 1,000 | | | 62,500 |
| | | | | |
| | | | | 111,368 |
| | | | | |
Health Care Equipment—1.2% | | | | | |
Baxter International, Inc. | | 2,600 | | | 152,568 |
Boston Scientific Corporation* | | 4,900 | | | 44,100 |
CareFusion Corporation* | | 2,000 | | | 50,020 |
Covidien plc | | 2,075 | | | 99,372 |
CR Bard, Inc. | | 700 | | | 54,530 |
Edwards Lifesciences Corporation* | | 360 | | | 31,266 |
Gen-Probe, Inc.* | | 350 | | | 15,015 |
Hologic, Inc.* | | 928 | | | 13,456 |
Hospira, Inc.* | | 600 | | | 30,600 |
Intuitive Surgical, Inc.* | | 200 | | | 60,664 |
Medtronic, Inc. | | 4,400 | | | 193,512 |
Micrus Endovascular Corporation* | | 1,000 | | | 15,010 |
ResMed, Inc.* | | 500 | | | 26,135 |
St. Jude Medical, Inc.* | | 2,000 | | | 73,560 |
The accompanying notes are an integral part of the financial statements
65
| | |
| Schedule of Investments | | Series N |
| December 31, 2009 | | (Management Asset Allocation Series) |
| | | | | |
| | | Shares | | Value |
COMMON STOCKS—51.1% (continued) | | | | | |
Health Care Equipment—1.2% (continued) | | | | | |
STERIS Corporation | | 500 | | $ | 13,985 |
Stryker Corporation | | 1,500 | | | 75,555 |
Thoratec Corporation* | | 600 | | | 16,152 |
| | | | | |
| | | | | 965,500 |
| | | | | |
Health Care Facilities—0.1% | | | | | |
Community Health Systems, Inc.* | | 500 | | | 17,800 |
Health Management Associates, Inc.* | | 500 | | | 3,635 |
Life Point Hospitals, Inc.* | | 700 | | | 22,757 |
Tenet Healthcare Corporation* | | 5,700 | | | 30,723 |
| | | | | |
| | | | | 74,915 |
| | | | | |
Health Care Services—0.4% | | | | | |
DaVita, Inc.* | | 800 | | | 46,992 |
Express Scripts, Inc.* | | 1,400 | | | 121,030 |
Healthways, Inc.* | | 300 | | | 5,502 |
Medco Health Solutions, Inc.* | | 1,600 | | | 102,256 |
Omnicare, Inc. | | 610 | | | 14,756 |
| | | | | |
| | | | | 290,536 |
| | | | | |
Health Care Supplies—0.0% | | | | | |
Dentsply International, Inc. | | 1,000 | | | 35,170 |
| | | | | |
Health Care Technology—0.0% | | | | | |
Cerner Corporation* | | 100 | | | 8,244 |
Computer Programs & Systems, Inc. | | 500 | | | 23,025 |
| | | | | |
| | | | | 31,269 |
| | | | | |
Home Entertainment Software—0.1% | | | | | |
Activision Blizzard, Inc.* | | 2,366 | | | 26,286 |
Electronic Arts, Inc.* | | 1,600 | | | 28,400 |
| | | | | |
| | | | | 54,686 |
| | | | | |
Home Furnishings—0.0% | | | | | |
Mohawk Industries, Inc.* | | 260 | | | 12,376 |
| | | | | |
Home Improvement Retail—0.6% | | | | | |
Home Depot, Inc. | | 7,550 | | | 218,422 |
Lowe’s Companies, Inc. | | 10,600 | | | 247,934 |
Sherwin-Williams Company | | 800 | | | 49,320 |
| | | | | |
| | | | | 515,676 |
| | | | | |
Homebuilding—0.1% | | | | | |
DR Horton, Inc. | | 1,500 | | | 16,305 |
Lennar Corporation | | 1,200 | | | 15,324 |
Toll Brothers, Inc.* | | 1,000 | | | 18,810 |
| | | | | |
| | | | | 50,439 |
| | | | | |
Homefurnishing Retail—0.2% | | | | | |
Bed Bath & Beyond, Inc.* | | 2,800 | | | 108,164 |
Williams-Sonoma, Inc. | | 700 | | | 14,546 |
| | | | | |
| | | | | 122,710 |
| | | | | |
Hotels, Resorts & Cruise Lines—0.2% | | | | | |
Choice Hotels International, Inc. | | 500 | | | 15,830 |
Gaylord Entertainment Company* | | 400 | | | 7,900 |
Marriott International, Inc. | | 3,638 | | | 99,136 |
Starwood Hotels & Resorts Worldwide, Inc. | | 700 | | | 25,599 |
| | | | | |
| | | | | 148,465 |
| | | | | |
Household Products—1.4% | | | | | |
Church & Dwight Company, Inc. | | 40 | | | 2,418 |
Clorox Company | | 1,700 | | | 103,700 |
Colgate-Palmolive Company | | 800 | | | 65,720 |
Energizer Holdings, Inc.* | | 300 | | | 18,384 |
Kimberly-Clark Corporation | | 2,700 | | | 172,017 |
Procter & Gamble Company | | 12,073 | | | 731,986 |
| | | | | |
| | | | | 1,094,225 |
| | | | | |
Human Resources & Employment Services—0.1% | | | | | |
Manpower, Inc. | | 500 | | | 27,290 |
Robert Half International, Inc. | | 500 | | | 13,365 |
| | | | | |
| | | | | 40,655 |
| | | | | |
Hypermarkets & Super Centers—0.6% | | | | | |
BJ’s Wholesale Club, Inc.* | | 500 | | | 16,355 |
Costco Wholesale Corporation | | 100 | | | 5,917 |
Wal-Mart Stores, Inc. | | 9,200 | | | 491,740 |
| | | | | |
| | | | | 514,012 |
| | | | | |
Independent Power Producers & Energy Traders—0.3% | | | | | |
AES Corporation* | | 1,300 | | | 17,303 |
Constellation Energy Group, Inc. | | 2,200 | | | 77,374 |
Mirant Corporation* | | 1,020 | | | 15,575 |
NRG Energy, Inc.* | | 4,500 | | | 106,245 |
RRI Energy, Inc.* | | 2,300 | | | 13,156 |
| | | | | |
| | | | | 229,653 |
| | | | | |
Industrial Conglomerates—1.1% | | | | | |
3M Company | | 3,400 | | | 281,078 |
General Electric Company | | 32,700 | | | 494,751 |
McDermott International, Inc.* | | 1,900 | | | 45,619 |
| | | | | |
| | | | | 821,448 |
| | | | | |
Industrial Gases—0.2% | | | | | |
Praxair, Inc. | | 1,800 | | | 144,558 |
| | | | | |
Industrial Machinery—0.5% | | | | | |
3D Systems Corporation* | | 700 | | | 7,910 |
Actuant Corporation | | 680 | | | 12,600 |
Clarcor, Inc. | | 100 | | | 3,244 |
Danaher Corporation | | 3,300 | | | 248,160 |
Harsco Corporation | | 560 | | | 18,049 |
Illinois Tool Works, Inc. | | 800 | | | 38,392 |
John Bean Technologies Corporation | | 308 | | | 5,239 |
Nordson Corporation | | 300 | | | 18,354 |
Stanley Works | | 400 | | | 20,604 |
| | | | | |
| | | | | 372,552 |
| | | | | |
Industrial REIT’s—0.0% | | | | | |
AMB Property Corporation | | 700 | | | 17,885 |
East Group Properties, Inc. | | 500 | | | 19,140 |
| | | | | |
| | | | | 37,025 |
| | | | | |
Insurance Brokers—0.2% | | | | | |
AON Corporation | | 2,400 | | | 92,016 |
Marsh & McLennan Companies, Inc. | | 1,700 | | | 37,536 |
| | | | | |
| | | | | 129,552 |
| | | | | |
Integrated Oil & Gas—3.8% | | | | | |
BP plc ADR | | 4,500 | | | 260,865 |
Chevron Corporation | | 7,850 | | | 604,372 |
ConocoPhillips | | 3,500 | | | 178,745 |
Exxon Mobil Corporation | | 17,880 | | | 1,219,237 |
The accompanying notes are an integral part of the financial statements
66
| | |
| Schedule of Investments | | Series N |
| December 31, 2009 | | (Management Asset Allocation Series) |
| | | | | |
| | | Shares | | Value |
COMMON STOCKS—51.1% (continued) | | | | | |
Integrated Oil & Gas—3.8% (continued) | | | | | |
Hess Corporation | | 1,300 | | $ | 78,650 |
Murphy Oil Corporation | | 2,400 | | | 130,080 |
Occidental Petroleum Corporation | | 2,600 | | | 211,510 |
Royal Dutch Shell plc (CI.B) ADR | | 3,800 | | | 220,894 |
Suncor Energy, Inc. | | 2,100 | | | 74,151 |
| | | | | |
| | | | | 2,978,504 |
| | | | | |
Integrated Telecommunication Services—0.9% | | | | | |
AT&T, Inc. | | 26,092 | | | 731,359 |
Verizon Communications, Inc. | | 400 | | | 13,252 |
| | | | | |
| | | | | 744,611 |
| | | | | |
Internet Retail—0.5% | | | | | |
Amazon.com, Inc.* | | 1,900 | | | 255,588 |
Drugstore.com, Inc.* | | 5,100 | | | 15,759 |
Expedia, Inc.* | | 3,200 | | | 82,272 |
priceline.com, Inc.* | | 200 | | | 43,700 |
| | | | | |
| | | | | 397,319 |
| | | | | |
Internet Software & Services—1.0% | | | | | |
Art Technology Group, Inc.* | | 3,300 | | | 14,883 |
Digital River, Inc.* | | 300 | | | 8,097 |
Google, Inc.* | | 1,010 | | | 626,180 |
VeriSign, Inc.* | | 2,900 | | | 70,296 |
Yahoo!, Inc.* | | 2,900 | | | 48,662 |
| | | | | |
| | | | | 768,118 |
| | | | | |
Investment Banking & Brokerage—0.9% | | | | | |
Charles Schwab Corporation | | 3,700 | | | 69,634 |
Goldman Sachs Group, Inc. | | 2,000 | | | 337,680 |
Morgan Stanley | | 6,700 | | | 198,320 |
Raymond James Financial, Inc. | | 900 | | | 21,393 |
Stifel Financial Corporation* | | 435 | | | 25,769 |
TD Ameritrade Holding Corporation* | | 2,350 | | | 45,543 |
| | | | | |
| | | | | 698,339 |
| | | | | |
IT Consulting & Other Services—0.2% | | | | | |
Accenture plc | | 2,900 | | | 120,350 |
RightNow Technologies, Inc.* | | 500 | | | 8,685 |
| | | | | |
| | | | | 129,035 |
| | | | | |
Leisure Products—0.1% | | | | | |
Hasbro, Inc. | | 1,800 | | | 57,708 |
Pool Corporation | | 912 | | | 17,401 |
| | | | | |
| | | | | 75,109 |
| | | | | |
Life & Health Insurance—0.5% | | | | | |
Aflac, Inc. | | 2,500 | | | 115,625 |
Lincoln National Corporation | | 1,200 | | | 29,856 |
MetLife, Inc. | | 3,300 | | | 116,655 |
Prudential Financial, Inc. | | 2,200 | | | 109,472 |
StanCorp Financial Group, Inc. | | 500 | | | 20,010 |
| | | | | |
| | | | | 391,618 |
| | | | | |
Life Sciences Tools & Services—0.2% | | | | | |
Charles River Laboratories International, Inc.* | | 260 | | | 8,759 |
Covance, Inc.* | | 500 | | | 27,285 |
lllumina, Inc.* | | 300 | | | 9,195 |
Life Technologies Corporation* | | 700 | | | 36,561 |
Techne Corporation | | 370 | | | 25,367 |
Thermo Fisher Scientific, Inc.* | | 800 | | | 38,153 |
Waters Corporation* | | 600 | | | 37,176 |
| | | | | |
| | | | | 182,496 |
| | | | | |
Managed Health Care—0.5% | | | | | |
Aetna, Inc. | | 1,800 | | | 57,060 |
AMERIGROUP Corporation* | | 500 | | | 13,480 |
Cigna Corporation | | 1,300 | | | 45,851 |
Humana, Inc.* | | 900 | | | 39,501 |
UnitedHealth Group, Inc. | | 3,700 | | | 112,776 |
WellPoint, Inc.* | | 2,500 | | | 145,725 |
| | | | | |
| | | | | 414,393 |
| | | | | |
Metal & Glass Containers—0.0% | | | | | |
Myers Industries, Inc. | | 1,000 | | | 9,100 |
| | | | | |
Motorcycle Manufacturers—0.1% | | | | | |
Harley-Davidson, Inc. | | 2,100 | | | 52,920 |
| | | | | |
Movies & Entertainment—0.6% | | | | | |
Ascent Media Corporation* | | 43 | | | 1,098 |
News Corporation* | | 2,600 | | | 35,594 |
Time Warner, Inc. | | 6,000 | | | 174,840 |
Walt Disney Company | | 7,200 | | | 232,200 |
| | | | | |
| | | | | 443,732 |
| | | | | |
Multi-Line Insurance—0.2% | | | | | |
Assurant, Inc. | | 1,200 | | | 35,376 |
Genworth Financial, Inc.* | | 2,100 | | | 23,835 |
Hartford Financial Services Group, Inc. | | 1,000 | | | 23,260 |
Loews Corporation* | | 1,500 | | | 54,525 |
| | | | | |
| | | | | 136,996 |
| | | | | |
Multi-Utilities—0.4% | | | | | |
Alliant Energy Corporation | | 900 | | | 27,234 |
CenterPoint Energy, Inc. | | 6,900 | | | 100,119 |
NiSource, Inc. | | 1,200 | | | 18,456 |
OGE Energy Corporation | | 700 | | | 25,830 |
Public Service Enterprise Group, Inc. | | 1,500 | | | 49,875 |
Sempra Energy | | 1,000 | | | 55,980 |
TECO Energy, Inc. | | 3,300 | | | 53,526 |
Xcel Energy, Inc. | | 600 | | | 12,738 |
| | | | | |
| | | | | 343,758 |
| | | | | |
Office REITs—0.2% | | | | | |
Boston Properties, Inc. | | 900 | | | 60,363 |
Duke Realty Corporation | | 2,300 | | | 27,991 |
SL Green Realty Corporation | | 651 | | | 32,706 |
| | | | | |
| | | | | 121,060 |
| | | | | |
Office Services & Supplies—0.0% | | | | | |
American Reprographics Company* | | 1,600 | | | 11,216 |
Herman Miller, Inc. | | 500 | | | 7,990 |
| | | | | |
| | | | | 19,206 |
| | | | | |
Oil & Gas Drilling—0.1% | | | | | |
Diamond Offshore Drilling, Inc. | | 300 | | | 29,526 |
Helmerich & Payne, Inc. | | 700 | | | 27,916 |
| | | | | |
| | | | | 57,442 |
| | | | | |
Oil & Gas Equipment & Services—0.9% | | | | | |
Baker Hughes, Inc. | | | | | |
| | 2,200 | | | 89,056 |
The accompanying notes are an integral part of the financial statements
67
| | |
| Schedule of Investments | | Series N |
| December 31, 2009 | | (Management Asset Allocation Series) |
| | | | | |
| | | Shares | | Value |
COMMON STOCKS—51.1% (continued) | | | | | |
Oil & Gas Equipment & Services—0.9% (continued) | | | | | |
BJ Services Company | | 2,800 | | $ | 52,080 |
Complete Production Services, Inc.* | | 1,300 | | | 16,900 |
FMC Technologies, Inc.* | | 1,842 | | | 106,541 |
Halliburton Company | | 1,400 | | | 42,126 |
Schlumberger, Ltd. | | 6,200 | | | 403,558 |
Smith International, Inc. | | 1,600 | | | 43,472 |
| | | | | |
| | | | | 753,733 |
| | | | | |
Oil & Gas Exploration & Production—1.0% | | | | | |
Cabot Oil & Gas Corporation | | 1,200 | | | 52,308 |
Concho Resources, Inc.* | | 600 | | | 26,940 |
Devon Energy Corporation | | 900 | | | 66,150 |
EOG Resources, Inc. | | 1,300 | | | 126,490 |
Forest Oil Corporation* | | 400 | | | 8,900 |
GeoMet, Inc.* | | 3,300 | | | 4,818 |
Mariner Energy, Inc.* | | 500 | | | 5,805 |
Newfield Exploration Company* | | 2,720 | | | 131,186 |
Petrohawk Energy Corporation* | | 100 | | | 2,399 |
Range Resources Corporation | | 800 | | | 39,880 |
Southwestern Energy Company* | | 2,500 | | | 120,500 |
Ultra Petroleum Corporation* | | 600 | | | 29,916 |
Whiting Petroleum Corporation* | | 400 | | | 28,588 |
XTO Energy, Inc. | | 3,475 | | | 161,691 |
| | | | | |
| | | | | 805,571 |
| | | | | |
Oil & Gas Refining & Marketing—0.1% | | | | | |
Holly Corporation | | 600 | | | 15,378 |
Valero Energy Corporation | | 2,900 | | | 48,575 |
| | | | | |
| | | | | 63,953 |
| | | | | |
Oil & Gas Storage & Transportation—0.2% | | | | | |
Spectra Energy Corporation | | 5,100 | | | 104,601 |
Williams Companies, Inc. | | 4,300 | | | 90,644 |
| | | | | |
| | | | | 195,245 |
| | | | | |
Other Diversified Financial Services—1.7% | | | | | |
Bank of America Corporation | | 34,178 | | | 514,721 |
Citigroup, Inc. | | 46,800 | | | 154,908 |
JPMorgan Chase & Company | | 15,636 | | | 651,552 |
| | | | | |
| | | | | 1,321,181 |
| | | | | |
Packaged Foods & Meats—0.5% | | | | | |
Campbell Soup Company | | 2,900 | | | 98,020 |
JM Smucker Company | | 549 | | | 33,901 |
Kellogg Company | | 2,500 | | | 133,000 |
Kraft Foods, Inc. | | 5,525 | | | 150,169 |
Tootsie Roll Industries, Inc. | | 708 | | | 19,385 |
| | | | | |
| | | | | 434,475 |
| | | | | |
Paper Products—0.2% | | | | | |
Clearwater Paper Corporation* | | 630 | | | 34,631 |
Domtar Corporation* | | 233 | | | 12,911 |
International Paper Company | | 2,800 | | | 74,984 |
| | | | | |
| | | | | 122,526 |
| | | | | |
Personal Products—0.0% | | | | | |
Avon Products, Inc. | | 600 | | | 18,900 |
| | | | | |
Pharmaceuticals—3.0% | | | | | |
Abbott Laboratories | | 5,000 | | | 269,950 |
Allergan, Inc. | | 1,800 | | | 113,418 |
Bristol-Myers Squibb Company | | 7,500 | | | 189,375 |
Eli Lilly & Company | | 3,640 | | | 129,984 |
GlaxoSmithKline plc ADR | | 3,900 | | | 164,775 |
Johnson & Johnson | | 9,758 | | | 628,513 |
Medicines Company* | | 600 | | | 5,004 |
Medicis Pharmaceutical Corporation | | 500 | | | 13,525 |
Merck & Company, Inc. | | 11,536 | | | 421,525 |
Pfizer, Inc. | | 25,072 | | | 456,060 |
Valeant Pharmaceuticals International* | | 600 | | | 19,074 |
| | | | | |
| | | | | 2,411,203 |
| | | | | |
Property & Casualty Insurance—0.4% | | | | | |
Allstate Corporation | | 1,600 | | | 48,064 |
Chubb Corporation | | 1,900 | | | 93,442 |
Employers Holdings, Inc. | | 600 | | | 9,204 |
Infinity Property & Casualty Corporation | | 410 | | | 16,662 |
Markel Corporation* | | 60 | | | 20,400 |
ProAssurance Corporation* | | 400 | | | 21,484 |
SeaBright Insurance Holdings, Inc.* | | 1,000 | | | 11,490 |
Selective Insurance Group | | 600 | | | 9,870 |
Travelers Companies, Inc. | | 2,314 | | | 115,376 |
W.R. Berkley Corporation | | 300 | | | 7,392 |
White Mountains Insurance Group, Ltd. | | 10 | | | 3,327 |
| | | | | |
| | | | | 356,711 |
| | | | | |
Publishing—0.1% | | | | | |
McGraw-Hill Companies, Inc. | | 1,100 | | | 36,861 |
Scholastic Corporation | | 500 | | | 14,915 |
| | | | | |
| | | | | 51,776 |
| | | | | |
Railroads—0.4% | | | | | |
CSX Corporation | | 1,200 | | | 58,188 |
Norfolk Southern Corporation | | 1,300 | | | 68,146 |
Union Pacific Corporation | | 2,400 | | | 153,360 |
| | | | | |
| | | | | 279,694 |
| | | | | |
Regional Banks—0.6% | | | | | |
Citizens Republic Bancorp, Inc.* | | 1,200 | | | 828 |
City National Corporation | | 400 | | | 18,240 |
Commerce Bancshares, Inc. | | 614 | | | 23,774 |
East West Bancorp, Inc. | | 600 | | | 9,480 |
Fifth Third Bancorp | | 6,100 | | | 59,475 |
First Horizon National Corporation* | | 1,753 | | | 23,490 |
Glacier Bancorp, Inc. | | 1,000 | | | 13,720 |
Home Bancshares, Inc. | | 656 | | �� | 15,790 |
KeyCorp | | 7,300 | | | 40,515 |
Marshall & llsley Corporation | | 7,199 | | | 39,235 |
Pinnacle Financial Partners, Inc.* | | 500 | | | 7,110 |
PNC Financial Services Group, Inc. | | 1,100 | | | 58,069 |
Popular, Inc. | | 2,100 | | | 4,746 |
Regions Financial Corporation | | 8,300 | | | 43,907 |
Sandy Spring Bancorp, Inc. | | 700 | | | 6,223 |
Signature Bank NY* | | 600 | | | 19,140 |
SunTrust Banks, Inc. | | 2,000 | | | 40,580 |
Synovus Financial Corporation | | 500 | | | 1,025 |
The accompanying notes are an integral part of the financial statements
68
| | |
| Schedule of Investments | | Series N |
| December 31, 2009 | | (Management Asset Allocation Series) |
| | | | | |
| | | Shares | | Value |
COMMON STOCKS—51.1% (continued) | | | | | |
Regional Banks—0.6% (continued) | | | | | |
TCF Financial Corporation | | 400 | | $ | 5,448 |
Texas Capital Bancshares, Inc.* | | 100 | | | 1,396 |
Westamerica Bancorporation | | 400 | | | 22,148 |
Western Alliance Bancorp* | | 700 | | | 2,646 |
Wilmington Trust Corporation | | 600 | | | 7,404 |
| | | | | |
| | | | | 464,389 |
| | | | | |
Reinsurance—0.0% | | | | | |
Everest Re Group, Ltd. | | 300 | | | 25,704 |
| | | | | |
Research & Consulting Services—0.1% | | | | | |
Advisory Board Company* | | 600 | | | 18,396 |
Corporate Executive Board Company | | 370 | | | 8,443 |
FTI Consulting, Inc.* | | 400 | | | 18,864 |
Huron Consulting Group, Inc.* | | 300 | | | 6,912 |
Navigant Consulting, Inc.* | | 900 | | | 13,374 |
Verisk Analytics, Inc.* | | 200 | | | 6,056 |
| | | | | |
| | | | | 72,045 |
| | | | | |
Residential REIT’s—0.1% | | | | | |
AvalonBay Communities, Inc. | | 600 | | | 49,266 |
Camden Property Trust | | 600 | | | 25,422 |
| | | | | |
| | | | | 74,688 |
| | | | | |
Restaurants—0.6% | | | | | |
McDonald’s Corporation | | 4,700 | | | 293,468 |
Sonic Corporation* | | 700 | | | 7,049 |
Starbucks Corporation* | | 5,500 | | | 126,830 |
Yum! Brands, Inc. | | 2,000 | | | 69,940 |
| | | | | |
| | | | | 497,287 |
| | | | | |
Retail REIT’s—0.3% | | | | | |
Kimco Realty Corporation | | 1,300 | | | 17,589 |
Regency Centers Corporation | | 500 | | | 17,530 |
Simon Property Group, Inc. | | 1,798 | | | 143,480 |
Weingarten Realty Investors | | 1,200 | | | 23,748 |
| | | | | |
| | | | | 202,347 |
| | | | | |
Semiconductor Equipment—0.3% | | | | | |
Advanced Energy Industries, Inc.* | | 1,300 | | | 19,604 |
Applied Materials, Inc. | | 7,300 | | | 101,762 |
Cymer, Inc.* | | 600 | | | 23,028 |
KLA-Tencor Corporation | | 700 | | | 25,312 |
Lam Research Corporation* | | 200 | | | 7,842 |
MEMC Electronic Materials, Inc.* | | 1,100 | | | 14,982 |
Varian Semiconductor Equipment Associates, Inc.* | | 850 | | | 30,498 |
| | | | | |
| | | | | 223,028 |
| | | | | |
Semiconductors—1.1% | | | | | |
Advanced Micro Devices, Inc.* | | 4,800 | | | 46,464 |
Intel Corporation | | 23,500 | | | 479,400 |
Intersil Corporation | | 900 | | | 13,806 |
Marvell Technology Group, Ltd.* | | 1,100 | | | 22,825 |
Maxim Integrated Products, Inc. | | 1,500 | | | 30,465 |
Micron Technology, Inc.* | | 5,200 | | | 54,912 |
National Semiconductor Corporation | | 5,500 | | | 84,480 |
NVIDIA Corporation* | | 2,500 | | | 46,700 |
Semtech Corporation* | | 1,300 | | | 22,113 |
Texas Instruments, Inc. | | 2,000 | | | 52,120 |
Zoran Corporation* | | 1,189 | | | 13,138 |
| | | | | |
| | | | | 866,423 |
| | | | | |
Soft Drinks—1.2% | | | | | |
Coca-Cola Company | | 8,000 | | | 456,000 |
Pepsi Bottling Group, Inc. | | 700 | | | 26,250 |
PepsiCo, Inc. | | 7,700 | | | 468,160 |
Reed’s, Inc.* | | 2,000 | | | 2,860 |
| | | | | |
| | | | | 953,270 |
| | | | | |
Specialized Consumer Services—0.0% | | | | | |
H&R Block, Inc. | | 600 | | | 13,572 |
Jackson Hewitt Tax Service, Inc. | | 600 | | | 2,640 |
| | | | | |
| | | | | 16,212 |
| | | | | |
Specialized Finance—0.3% | | | | | |
CME Group, Inc. | | 200 | | | 67,190 |
Interactive Brokers Group, Inc.* | | 400 | | | 7,088 |
IntercontinentalExchange, Inc.* | | 400 | | | 44,920 |
Moody’s Corporation | | 1,500 | | | 40,200 |
NASDAQ OMX Group, Inc.* | | 600 | | | 11,892 |
NYSE Euronext | | 1,500 | | | 37,950 |
| | | | | |
| | | | | 209,240 |
| | | | | |
Specialized REIT’s—0.1% | | | | | |
LaSalle Hotel Properties | | 1,300 | | | 27,599 |
Potlatch Corporation | | 655 | | | 20,881 |
| | | | | |
| | | | | 48,480 |
| | | | | |
Specialty Chemicals—0.1% | | | | | |
Albemarle Corporation | | 600 | | | 21,822 |
Arch Chemicals, Inc. | | 700 | | | 21,616 |
Senomyx, Inc.* | | 2,500 | | | 9,425 |
Sigma-Aldrich Corporation | | 100 | | | 5,053 |
| | | | | |
| | | | | 57,916 |
| | | | | |
Specialty Stores—0.0% | | | | | |
AC Moore Arts & Crafts, Inc.* | | 1,800 | | | 5,292 |
Dick’s Sporting Goods, Inc.* | | 660 | | | 16,414 |
Hibbett Sports, Inc.* | | 400 | | | 8,796 |
| | | | | |
| | | | | 30,502 |
| | | | | |
Steel—0.2% | | | | | |
Carpenter Technology Corporation | | 400 | | | 10,780 |
Cliffs Natural Resources, Inc. | | 200 | | | 9,218 |
Haynes International, Inc. | | 300 | | | 9,891 |
Nucor Corporation | | 1,400 | | | 65,310 |
Steel Dynamics, Inc. | | 1,300 | | | 23,036 |
United States Steel Corporation | | 1,300 | | | 71,656 |
| | | | | |
| | | | | 189,891 |
| | | | | |
Systems Software—1.7% | | | | | |
Ariba, Inc.* | | 1,000 | | | 12,520 |
CA, Inc. | | 6,800 | | | 152,728 |
CommVault Systems, Inc.* | | 200 | | | 4,738 |
McAfee, Inc.* | | 2,900 | | | 117,653 |
Microsoft Corporation | | 31,400 | | | 957,386 |
Red Hat, Inc.* | | 3,300 | | | 101,970 |
Websense, Inc.* | | 900 | | | 15,714 |
| | | | | |
| | | | | 1,362,709 |
| | | | | |
Technology Distributors—0.0% | | | | | |
SYNNEX Corporation* | | 700 | | | 21,462 |
Tech Data Corporation* | | 300 | | | 13,998 |
| | | | | |
| | | | | 35,460 |
| | | | | |
Textiles—0.0% | | | | | |
Culp, Inc.* | | 800 | | | 7,984 |
| | | | | |
Thrifts & Mortgage Finance—0.0% | | | | | |
BankAtlantic Bancorp, Inc. | | 1,976 | | | 2,569 |
The accompanying notes are an integral part of the financial statements
69
| | |
| Schedule of Investments | | Series N |
| December 31, 2009 | | (Management Asset Allocation Series) |
| | | | | |
| | | Shares | | Value |
COMMON STOCKS—51.1% (continued) | | | | | |
Thrifts & Mortgage Finance—0.0% (continued) | | | | | |
Brooklyn Federal Bancorp, Inc. | | 100 | | $ | 1,004 |
ESSA Bancorp, Inc. | | 300 | | | 3,510 |
First Defiance Financial Corporation | | 300 | | | 3,387 |
Kentucky First Federal Bancorp | | 300 | | | 3,300 |
Louisiana Bancorp, Inc.* | | 200 | | | 2,890 |
MutualFirst Financial, Inc. | | 100 | | | 578 |
| | | | | |
| | | | | 17,238 |
| | | | | |
Tobacco—0.7% | | | | | |
Alliance One International, Inc.* | | 2,400 | | | 11,712 |
Altria Group, Inc. | | 7,700 | | | 151,151 |
Philip Morris International, Inc. | | 8,130 | | | 391,785 |
| | | | | |
| | | | | 554,648 |
| | | | | |
Trading Companies & Distributors—0.1% | | | | | |
Applied Industrial Technologies, Inc. | | 900 | | | 19,863 |
Fastenal Company | | 600 | | | 24,984 |
H&E Equipment Services, Inc.* | | 400 | | | 4,196 |
| | | | | |
| | | | | 49,043 |
| | | | | |
Trucking—0.1% | | | | | |
Dollar Thrifty Automotive Group, Inc.* | | 700 | | | 17,927 |
Knight Transportation, Inc.* | | 1,300 | | | 25,077 |
| | | | | |
| | | | | 43,004 |
| | | | | |
Wireless Telecommunication Services—0.8% | | | | | |
America Movil SAB de CV ADR | | 1,800 | | | 84,564 |
American Tower Corporation* | | 2,730 | | | 117,963 |
Crown Castle International Corporation* | | 2,500 | | | 97,600 |
Leap Wireless International, Inc.* | | 300 | | | 5,265 |
MetroPCS Communications, Inc.* | | 4,200 | | | 32,046 |
Nil Holdings, Inc.* | | 1,300 | | | 43,654 |
NTELOS Holdings Corporation | | 900 | | | 16,038 |
SBA Communications Corporation* | | 300 | | | 10,248 |
Sprint Nextel Corporation* | | 29,800 | | | 109,068 |
Vodafone Group plc ADR | | 8,400 | | | 193,956 |
| | | | | |
| | | | | 710,402 |
| | | | | |
TOTAL COMMON STOCKS (cost $37,765,661) | | | | $ | 40,625,113 |
| | | | | |
| | |
| | Shares | | | Value |
FOREIGN STOCKS—12.3% | | | | | |
Advertising—0.1% | | | | | |
Aegis Group plc1,3 | | 10,712 | | | 20,753 |
WPP plc1,3 | | 4,374 | | | 42,735 |
| | | | | |
| | | | | 63,488 |
| | | | | |
Aerospace & Defense—0.2% | | | | | |
Finmeccanica SpA1,3,* | | 3,812 | | | 60,957 |
QinetiQ Group pic1,3 | | 17,232 | | | 45,152 |
Rolls-Royce Group plc | | 5,654 | | | 44,047 |
Rolls-Royce Group plc (Class C Entitlement)1,3,* | | 295,920 | | | 478 |
| | | | | |
| | | | | 150,634 |
| | | | | |
Apparel Retail—0.2% | | | | | |
Esprit Holdings, Ltd.1,3 | | 6,300 | | | 41,793 |
Industria de Diseno Textil S.A.1,3 | | 786 | | | 49,026 |
| | | | | |
| | | | | 90,819 |
| | | | | |
Apparel, Accessories & Luxury Goods—0.2% | | | | | |
Adidas AG1,3 | | 1,344 | | | 72,707 |
Compagnie Financiere Richemont S.A.1, 3 | | 3,133 | | | 105,246 |
| | | | | 177,953 |
| | | | | |
Application Software—0.0% | | | | | |
Autonomy Corporation plc1,3,* | | 1,351 | | | 32,828 |
| | | | | |
Auto Parts & Equipment—0.1% | | | | | |
Aisin Seiki Company, Ltd.1,3 | | 1,300 | | | 37,578 |
Autoliv, Inc.1,3 | | 724 | | | 31,622 |
GKN plc1,3 | | 18,383 | | | 34,451 |
Koito Manufacturing Company, Ltd.1,3 | | 2,000 | | | 32,118 |
| | | | | |
| | | | | 135,769 |
| | | | | |
Automobile Manufacturers—0.5% | | | | | |
Bayerische Motoren Werke AG1,3,* | | 1,275 | | | 57,968 |
Honda Motor Company, Ltd.1,3 | | 1,600 | | | 54,315 |
Toyota Motor Corporation1,3 | | 4,200 | | | 177,170 |
Volkswagen AG1,3 | | 448 | | | 42,205 |
| | | | | |
| | | | | 331,658 |
| | | | | |
Biotechnology—0.1% | | | | | |
CSL, Ltd.1,3,* | | 2,426 | | | 70,549 |
| | | | | |
Brewers—0.1% | | | | | |
Kirin Holdings Company, Ltd.1,3 | | 3,000 | | | 48,137 |
| | | | | |
Broadcasting—0.0% | | | | | |
Television Broadcasts, Ltd.1,3 | | 5,000 | | | 24,019 |
| | | | | |
Cable & Satellite—0.2% | | | | | |
British Sky Broadcasting Group plc1,3 | | 4,400 | | | 39,964 |
Jupiter Telecommunications Company, Ltd.1,3 | | 79 | | | 78,214 |
| | | | | |
| | | | | 118,178 |
| | | | | |
Catalog Retail—0.0% | | | | | |
Brown Group plc1,3 | | 9,174 | | | 36,764 |
| | | | | |
Commodity Chemicals—0.1% | | | | | |
Asahi Kasei Corporation1,3 | | 7,000 | | | 35,093 |
Tosoh Corporation1,3 | | 6,000 | | | 16,579 |
| | | | | |
| | | | | 51,672 |
| | | | | |
Communications Equipment—0.0% | | | | | |
Alcatel-Lucent1,3 | | 11,218 | | | 37,726 |
| | | | | |
Computer Storage & Peripherals—0.0% | | | | | |
Wacom Company, Ltd.1,3 | | 16 | | | 34,913 |
| | | | | |
Construction & Engineering—0.3% | | | | | |
Bouygues S.A.1,3 | | 1,542 | | | 79,772 |
Carillion plc1,3 | | 8,905 | | | 43,694 |
China Railway Construction Corporation, Ltd.1,3 | | 41,000 | | | 52,237 |
| | | | | |
| | | | | 175,703 |
| | | | | |
Construction Materials—0.0% | | | | | |
Boral, Ltd.1,3 | | 3,983 | | | 21,142 |
Cemex S.A. de CV* | | 16,243 | | | 19,252 |
| | | | | |
| | | | | 40,394 |
| | | | | |
The accompanying notes are an integral part of the financial statements
70
| | |
| Schedule of Investments | | Series N |
| December 31, 2009 | | (Management Asset Allocation Series) |
| | | | | |
| | | Shares | | Value |
FOREIGN STOCKS—12.3% (continued) | | | | | |
Data Processing & Outsourced Services—0.1% | | | | | |
Cielo S.A. | | 7,300 | | $ | 64,209 |
| | | | | |
Department Stores—0.1% | | | | | |
PPR1,3 | | 659 | | | 79,003 |
| | | | | |
Distillers & Vintners—0.1% | | | | | |
Pernod-Ricard S.A.1,3 | | 1,157 | | | 98,810 |
| | | | | |
Distributors—0.0% | | | | | |
Jardine Cycle & Carriage, Ltd.13 | | 2,000 | | | 38,179 |
| | | | | |
Diversified Banks—1.4% | | | | | |
Allied Irish Banks plc1,3 | | 8,142 | | | 13,913 |
Australia & New Zealand Banking | | | | | |
Group, Ltd.1,3 | | 5,347 | | | 108,966 |
Banco Santander S.A.1,3 | | 7,695 | | | 126,997 |
BNP Paribas1,3 | | 1,644 | | | 130,234 |
DBS Group Holdings, Ltd.1,3 | | 6,000 | | | 65,214 |
DnB NORASA1,3,* | | 10,132 | | | 109,263 |
Erste Group Bank AG1,3 | | 919 | | | 34,106 |
Intesa Sanpaolo SpA1,3 | | 18,027 | | | 81,019 |
Mitsubishi UFJ Financial Group, Inc.1,3 | | 8,400 | | | 41,399 |
National Bank of Greece S.A.1,3 | | 1,100 | | | 28,225 |
Nordea Bank AB1,3 | | 6,802 | | | 68,883 |
Societe Generale1,3 | | 1,189 | | | 82,508 |
Standard Chartered plc1,3 | | 5,544 | | | 139,380 |
Sumitomo Trust & Banking Company, Ltd.1,3 | | 10,000 | | | 49,127 |
Swedbank AB1,3 | | 7,563 | | | 74,423 |
| | | | | |
| | | | | 1,153,657 |
| | | | | |
Diversified Capital Markets—0.2% | | | | | |
Close Brothers Group plc1,3 | | 1,821 | | | 20,293 |
Credit Suisse Group AG1,3 | | 1,107 | | | 54,787 |
Deutsche Bank AG1,3,* | | 842 | | | 59,463 |
| | | | | |
| | | | | 134,543 |
| | | | | |
Diversified Chemicals—0.1% | | | | | |
BASF AG1,3 | | 1,364 | | | 84,312 |
| | | | | |
Diversified Metals & Mining—0.4% | | | | | |
BHP Billiton plc1,3 | | 2,700 | | | 86,149 |
BHP Billiton, Ltd.1,3 | | 2,325 | | | 88,972 |
Rio Tinto, Ltd.1,3 | | 2,132 | | | 142,324 |
| | | | | |
| | | | | 317,445 |
| | | | | |
Diversified Real Estate Activities—0.1% | | | | | |
Mitsui Fudosan Company, Ltd.1,3 | | 3,000 | | | 50,752 |
| | | | | |
Diversified REIT’s—0.1% | | | | | |
Mirvac Group1,3 | | 46,792 | | | 65,288 |
| | | | | |
Education Services—0.1% | | | | | |
Benesse Holdings, Inc.1,3 | | 1,200 | | | 50,200 |
| | | | | |
Electric Utilities—0.3% | | | | | |
E.ON AG1,3 | | 4,329 | | | 181,476 |
EDP - Energias do Brasil S.A. | | 1,300 | | | 25,009 |
Scottish & Southern Energy plc1,3 | | 4,093 | | | 76,525 |
| | | | | |
| | | | | 283,010 |
| | | | | |
Electrical Components & Equipment—0.1% | | | | | |
Prysmian SpA1,3 | | 2,943 | | | 51,306 |
| | | | | |
Electronic Components—0.3% | | | | | |
Hamamatsu Photonics KK1,3 | | 1,500 | | | 36,558 |
Hosiden Corporation1,3 | | 2,300 | | | 24,642 |
LG Display Company, Ltd. 1,3 | | 1,550 | | | 52,374 |
Nippon Electric Glass Company, Ltd.1,3 | | 5,000 | | | 68,857 |
| | | | | |
| | | | | 182,431 |
| | | | | |
Electronic Manufacturing Services—0.0% | | | | | |
Venture Corporation, Ltd.1,3 | | 2,000 | | | 12,544 |
| | | | | |
Fertilizers & Agricultural Chemicals—0.1% | | | | | |
Syngenta AG1,3 | | 229 | | | 64,606 |
| | | | | |
Food Retail—0.2% | | | | | |
FamilyMart Company, Ltd.1,3 | | 1,600 | | | 47,183 |
Tesco plc1,3 | | 23,680 | | | 163,271 |
| | | | | |
| | | | | 210,454 |
| | | | | |
Gas Utilities—0.2% | | | | | |
Hong Kong & China Gas Company, Ltd.1,3 | | 18,000 | | | 45,141 |
| | | | | |
Health Care Equipment—0.3% | | | | | |
Elekta AB1,3 | | 3,422 | | | 81,297 |
Fresenius SE1,3 | | 1,078 | | | 77,288 |
Terumo Corporation 1,3 | | 800 | | | 48,242 |
| | | | | |
| | | | | 206,827 |
| | | | | |
Heavy Electrical Equipment—0.2% | | | | | |
ABB, Ltd.1,3 | | 2,046 | | | 39,385 |
Alstom S.A.1,3 | | 1,149 | | | 80,255 |
Mitsubishi Electric Corporation1,3 | | 13,000 | | | 96,624 |
| | | | | |
| | | | | 216,264 |
| | | | | |
Home Entertainment Software—0.1% | | | | | |
Nintendo Company, Ltd.1,3 | | 200 | | | 47,793 |
| | | | | |
Hotels, Resorts & Cruise Lines—0.1% | | | | | |
China CITIC Bank(CI. H)1,3,* | | 125,000 | | | 105,795 |
| | | | | |
Household Appliances—0.0% | | | | | |
Makita Corporation1,3 | | 700 | | | 24,057 |
| | | | | |
Independent Power Producers & Energy Traders—0.1% | | | | | |
EDF Energies Nouvelles S.A.1,3 | | 510 | | | 26,271 |
Iberdrola Renovables S.A.1,3 | | 15,163 | | | 72,115 |
| | | | | |
| | | | | 98,386 |
| | | | | |
Industrial Conglomerates—0.4% | | | | | |
DCC plc1,3 | | 2,879 | | | 80,369 |
Hutchison Whampoa, Ltd.1,3 | | 5,700 | | | 38,994 |
Koninklijke Philips Electronics N.V.1,3 | | 2,328 | | | 68,727 |
SembCorp Industries, Ltd.1,3 | | 26,900 | | | 70,279 |
| | | | | |
| | | | | 258,369 |
| | | | | |
The accompanying notes are an integral part of the financial statements
71
| | |
| Schedule of Investments | | Series N |
| December 31, 2009 | | (Managed Asset Allocation Series) |
| | | | | |
| | | Shares | | Value |
FOREIGN STOCKS—12.3% (continued) | | | | | |
Industrial Gases—0.0% | | | | | |
Air Water, Inc.1,3 | | 2,000 | | $ | 23,571 |
| | | | | |
Industrial Machinery—0.1% | | | | | |
Cargotec Corporation (CI.B)1,3 | | 1,033 | | | 28,399 |
Charter International plc1,3 | | 3,642 | | | 42,391 |
Fanuc, Ltd.1,3 | | 300 | | | 27,976 |
Toshiba Machine Company, Ltd.1,3 | | 3,000 | | | 11,508 |
| | | | | |
| | | | | 110,274 |
| | | | | |
Integrated Oil & Gas—0.3% | | | | | |
BG Group plc1,3 | | 2,638 | | | 47,703 |
Statoil Hydro ASA1,3 | | 5,100 | | | 127,054 |
| | | | | |
| | | | | 174,757 |
| | | | | |
Integrated Telecommunication Services—0.3% | | | | | |
France Telecom S.A.1,3 | | 3,625 | | | 90,468 |
Hutchison Telecommunications Hong Kong Holdings, Ltd.1,3 | | 104,000 | | | 17,621 |
Singapore Telecommunications, Ltd.1,3 | | 14,000 | | | 30,831 |
Telefonica S.A.1,3 | | 6,637 | | | 185,529 |
Telstra Corporation, Ltd.1,3 | | 13,867 | | | 42,633 |
| | | | | |
| | | | | 367,082 |
| | | | | |
Internet Software & Services—0.0% | | | | | |
Kakaku.com, Inc.1,3 | | 9 | | | 35,003 |
| | | | | |
Investment Banking & Brokerage—0.1% | | | | | |
Macquarie Group, Ltd.1,3 | | 1,344 | | | 57,587 |
| | | | | |
IT Consulting & Other Services—0.0% | | | | | |
Logica plc1,3 | | 13,045 | | | 23,860 |
NS Solutions Corporation1,3 | | 1,100 | | | 17,357 |
| | | | | |
| | | | | 41,217 |
| | | | | |
Life & Health Insurance—0.3% | | | | | |
Prudential plc1,3 | | 6,082 | | | 62,051 |
Sony Financial Holdings, Inc.1,3 | | 25 | | | 65,096 |
Sun Life Financial, Inc. | | 3,600 | | | 103,596 |
| | | | | |
| | | | | 230,743 |
| | | | | |
Marine—0.0% | | | | | |
Nippon Yusen KK1,3 | | 5,000 | | | 15,407 |
| | | | | |
Multi-Line Insurance—0.1% | | | | | |
AXA S.A.1,3 | | 4,786 | | | 112,229 |
| | | | | |
Multi-Utilities—0.1% | | | | | |
GDF Suez1,3 | | 1,428 | | | 61,784 |
| | | | | |
Office Electronics—0.1% | | | | | |
Canon, Inc.1,3 | | 1,800 | | | 76,610 |
| | | | | |
Oil & Gas Drilling—0.0% | | | | | |
China Oilfield Services, Ltd.1,3 | | 28,000 | | | 33,206 |
| | | | | |
Oil & Gas Equipment & Services—0.2% | | | | | |
Fugro N.V.1,3 | | 464 | | | 26,618 |
Modec, Inc.1,3 | | 1,000 | | | 19,173 |
Saipem SpA1,3 | | 2,035 | | | 70,140 |
Subsea 7, Inc.1,3,* | | 3,700 | | | 61,200 |
| | | | | |
| | | | | 177,131 |
| | | | | |
Oil & Gas Exploration & Production—0.1% | | | | | |
Beach Energy, Ltd.1,3 | | 51,900 | | | 42,700 |
| | | | | |
Other Diversified Financial Services—0.0% | | | | | |
ING Groep N.V.1,3 | | 2,480 | | | 23,853 |
| | | | | |
Packaged Foods & Meats—0.6% | | | | | |
Dairy Crest Group plc 1,3 | | 6,814 | | | 39,634 |
Goodman Fielder, Ltd.1,3 | | 18,514 | | | 26,961 |
House Foods Corporation1,3 | | 1,500 | | | 21,352 |
Nestle S.A.1,3 | | 6,099 | | | 295,706 |
Unilever plc1,3 | | 2,980 | | | 95,534 |
| | | | | |
| | | | | 479,187 |
| | | | | |
Personal Products—0.1% | | | | | |
Kobayashi Pharmaceutical Company, Ltd.1,3 | | 800 | | | 32,073 |
L'Oreal S.A.1,3 | | 820 | | | 91,467 |
| | | | | |
| | | | | 123,540 |
| | | | | |
Pharmaceuticals—0.7% | | | | | |
Astellas Pharma, Inc.1,3 | | 800 | | | 29,863 |
Chugai Pharmaceutical Company, Ltd.1,3 | | 1,200 | | | 22,442 |
Roche Holding AG1,3 | | 1,233 | | | 210,645 |
Rohto Pharmaceutical Company, Ltd.1,3 | | 2,000 | | | 23,080 |
Sanofi-Aventis S.A.1,3 | | 2,152 | | | 169,026 |
| | | | | |
| | | | | 455,056 |
| | | | | |
Photographic Products—0.0% | | | | | |
Nikon Corporation1,3 | | 2,000 | | | 39,514 |
| | | | | |
Property & Casualty Insurance—0.1% | | | | | |
QBE Insurance Group, Ltd.1,3 | | 3,729 | | | 85,099 |
Suncorp-Metway, Ltd.1,3 | | 3,775 | | | 29,227 |
| | | | | |
| | | | | 114,326 |
| | | | | |
Publishing—0.1% | | | | | |
Informa plc1,3 | | 3,220 | | | 16,579 |
Sanoma Oyj1,3 | | 2,646 | | | 59,622 |
| | | | | |
| | | | | 76,201 |
| | | | | |
Railroads—0.1% | | | | | |
Central Japan Railway Company1,3 | | 9 | | | 60,272 |
| | | | | |
Real Estate Development—0.0% | | | | | |
China Overseas Land & Investment, Ltd.1,3 | | 17,760 | | | 37,207 |
Goldcrest Company, Ltd.1,3 | | 820 | | | 22,974 |
Soho China, Ltd.1,3 | | 62,000 | | | 33,304 |
| | | | | |
| | | | | 93,485 |
| | | | | |
Regional Banks—0.1% | | | | | |
Bank of Yokohama, Ltd.1,3 | | 9,000 | | | 41,057 |
| | | | | |
The accompanying notes are an integral part of the financial statements
72
| | |
| Schedule of Investments | | Series N |
| December 31, 2009 | | (Managed Asset Allocation Series) |
| | | | | | |
| | | Shares | | | Value |
FOREIGN STOCKS—12.3% (continued) | | | | | | |
Reinsurance—0.1% | | | | | | |
Muenchener Rueckversicherungs AG1,3 | | | 574 | | $ | 89,293 |
| | | | | | |
Restaurants—0.1% | | | | | | |
Compass Group plc1,3 | | | 6,631 | | | 47,675 |
Mitchells & Butlers plc1,3 | | | 7,690 | | | 30,765 |
| | | | | | |
| | | | | | 78,440 |
| | | | | | |
Retail REIT’s—0.1% | | | | | | |
Unibail-Rodamco SE1,3 | | | 466 | | | 102,242 |
| | | | | | |
Semiconductor Equipment—0.2% | | | | | | |
ASML Holding N.V. 1,3 | | | 1,687 | | | 57,525 |
Sumco Corporation1,3 | | | 3,000 | | | 53,040 |
| | | | | | |
| | | | | | 110,565 |
| | | | | | |
Semiconductors—0.1% | | | | | | |
Samsung Electronics Company, Ltd.1,3 | | | 56 | | | 38,377 |
Taiwan Semiconductor Manufacturing Company, Ltd.1,3 | | | 28,129 | | | 56,672 |
| | | | | | |
| | | | | | 95,049 |
| | | | | | |
Specialized Finance—0.1% | | | | | | |
Deutsche Boerse AG1,3 | | | 551 | | | 45,571 |
| | | | | | |
Specialty Chemicals—0.2% | | | | | | |
Hitachi Chemical Company, Ltd.1,3 | | | 1,800 | | | 36,705 |
Umicore1,3 | | | 1,536 | | | 51,174 |
Wacker Chemie AG1,3 | | | 444 | | | 77,135 |
| | | | | | |
| | | | | | 165,014 |
| | | | | | |
Steel—0.1% | | | | | | |
Kobe Steel, Ltd.1,3 | | | 21,000 | | | 38,077 |
SSAB Svenskt Stal AB1,3 | | | 3,869 | | | 65,677 |
| | | | | | |
| | | | | | 103,754 |
| | | | | | |
Switzerland—0.1% | | | | | | |
Swiss LifeHolding AG1,3 | | | 732 | | | 93,043 |
| | | | | | |
Trading Companies & Distributors—0.3% | | | | | | |
Mitsubishi Corporation1,3 | | | 3,600 | | | 89,719 |
Mitsui & Company, Ltd.1,3 | | | 5,800 | | | 82,324 |
| | | | | | |
| | | | | | 172,043 |
| | | | | | |
Trucking—0.1% | | | | | | |
Arriva plc1,3 | | | 4,990 | | | 39,736 |
| | | | | | |
Wireless Telecommunication Services—0.1% | | | | | | |
KDDI Corporation1,3 | | | 13 | | | 68,894 |
| | | | | | |
TOTAL FOREIGN STOCKS (cost $9,320,958) | | | | | $ | 9,794,021 |
| | | | | | |
| | |
| | | Shares | | Value |
PREFERRED STOCK—0.2% | | | | | | |
Other Diversified Financial Services—0.2% | | | | | | |
Bank of America Corporation | | | | | | |
10.00%, 12/31/19495 | | | 9,100 | | | 135,772 |
Thrifts & Mortgage Finance—0.0% | | | | | | |
Federal National Mortgage Association | | | | | | |
8.25%, 12/31/2010* | | | 1,050 | | | 1,155 |
| | | | | | |
TOTAL PREFERRED STOCK (cost $166,568) | | | | | | 136,927 |
| | | | | | |
| | |
| | | Shares | | Value |
WARRANTS—0.0% | | | | | | |
Anvil (Cl. A) | | | | | | |
$1.00, 2/28/20121,2 | | | 333 | | | 14 |
Anvil (Cl. B) | | | | | | |
$1.00, 2/28/20121,2 | | | 370 | | | 7 |
| | | | | | |
TOTAL WARRANTS (cost $3,850) | | | | | | 21 |
| | | | | | |
| | |
| | | Principal
Amount | | Value |
CORPORATE BONDS—13.8% | | | | | | |
Aerospace & Defense—0.2% | | | | | | |
Bombardier, Inc. | | | | | | |
6.75%, 20121,6,7 | | $ | 50,000 | | $ | 51,625 |
Delta Air Lines, Inc. | | | | | | |
12.25%, 20151,6,7 | | | 25,000 | | | 25,000 |
Lockheed Martin Corporation | | | | | | |
4.12%, 20131 | | | 25,000 | | | 26,120 |
Spirit Aerosystems, Inc. | | | | | | |
7.50%, 20171,6,7 | | | 25,000 | | | 24,625 |
| | | | | | |
| | | | | | 127,370 |
| | | | | | |
Airlines—0.0% | | | | | | |
Continental Airlines, Inc. | | | | | | |
7.25%, 20191 | | | 10,000 | | | 10,175 |
Delta Air Lines, Inc. | | | | | | |
7.75%, 20191 | | | 10,000 | | | 10,200 |
| | | | | | |
| | | | | | 20,375 |
| | | | | | |
Automotive—0.2% | | | | | | |
American Axle & Manufacturing, Inc. | | | | | | |
7.88%, 20171 | | | 25,000 | | | 21,125 |
DaimlerChrysler North America Holding Corporation | | | | | | |
6.50%, 20131 | | | 30,000 | | | 32,887 |
Erac USA Finance Company | | | | | | |
5.60%, 20151,2,6,7 | | | 40,000 | | | 40,770 |
Ford Motor Credit Company LLC | | | | | | |
12.00%, 20151 | | | 25,000 | | | 28,991 |
Hertz Corporation | | | | | | |
10.50%, 20161 | | | 25,000 | | | 26,688 |
Motors Liquidation Company | | | | | | |
8.25%, 20231,8 | | | 25,000 | | | 6,625 |
| | | | | | |
| | | | | | 157,086 |
| | | | | | |
Banking—1.4% | | | | | | |
Bank of America Corporation | | | | | | |
5.65%, 20181 | | | 105,000 | | | 106,639 |
BB&T Capital Trust II | | | | | | |
6.75%, 20361 | | | 20,000 | | | 19,075 |
The accompanying notes are an integral part of the financial statements
73
| | |
| Schedule of Investments | | Series N |
| December 31, 2009 | | (Managed Asset Allocation Series) |
| | | | | | |
| | | Principal
Amount | | Value |
CORPORATE BONDS—13.8% (continued) | | | | | | |
Banking—1.4% (continued) | | | | | | |
Citigroup, Inc. | | | | | | |
6.50%, 20131 | | $ | 120,000 | | $ | 127,824 |
Credit Suisse Guernsey, Ltd. | | | | | | |
5.86%, 20491,5 | | | 40,000 | | | 34,800 |
Credit Suisse USA, Inc. | | | | | | |
5.50%, 20111 | | | 30,000 | | | 31,872 |
Discover Financial Services | | | | | | |
10.25%, 20191 | | | 25,000 | | | 29,234 |
E*Trade Financial Corporation | | | | | | |
12.50%, 20171 | | | 32,000 | | | 36,360 |
Fifth Third Bancorp | | | | | | |
6.25%, 20131 | | | 20,000 | | | 20,592 |
Goldman Sachs Group, Inc. | | | | | | |
7.50%, 20191 | | | 40,000 | | | 46,632 |
JP Morgan Chase Capital XXII | | | | | | |
6.45%, 20371 | | | 35,000 | | | 32,121 |
JPMorgan Chase & Company | | | | | | |
4.75%, 20131 | | | 55,000 | | | 58,054 |
6.00%, 20181 | | | 205,000 | | | 220,375 |
Morgan Stanley | | | | | | |
7.30%, 20191 | | | 100,000 | | | 112,293 |
Northern Trust Company | | | | | | |
4.60%, 20131 | | | 25,000 | | | 26,242 |
Northern Trust Corporation | | | | | | |
5.30%, 20111 | | | 30,000 | | | 31,832 |
5.50%, 20131 | | | 10,000 | | | 10,939 |
PNC Funding Corporation | | | | | | |
5.63%, 20171 | | | 35,000 | | | 34,682 |
Svensk Exportkredit AB | | | | | | |
5.13%, 20171 | | | 70,000 | | | 73,921 |
U.S. Bancorp | | | | | | |
4.50%, 20101 | | | 45,000 | | | 46,113 |
Wells Fargo & Company | | | | | | |
4.88%, 20111 | | | 90,000 | | | 93,249 |
Westpac Banking Corporation | | | | | | |
4.88%, 20191 | | | 25,000 | | | 24,675 |
| | | | | | |
| | | | | | 1,217,524 |
| | | | | | |
Basic Industry—0.2% | | | | | | |
BWAY Corporation | | | | | | |
10.00%, 20141,6,7 | | | 25,000 | | | 26,437 |
Lubrizol Corporation | | | | | | |
8.88%, 20191 | | | 20,000 | | | 24,866 |
Potash Corporation of Saskatchewan, Inc. | | | | | | |
4.88%, 20201 | | | 45,000 | | | 44,398 |
Rio Tinto Finance USA, Ltd. | | | | | | |
8.95%, 20141 | | | 15,000 | | | 17,975 |
| | | | | | |
| | | | | | 113,676 |
| | | | | | |
Basic Industry—Other—0.0% | | | | | | |
Cooper US, Inc. | | | | | | |
6.10%, 20171 | | | 35,000 | | | 38,236 |
Xstrata Finance Canada, Ltd. | | | | | | |
5.50%, 20111,2,6,7 | | | 35,000 | | | 36,735 |
| | | | | | |
| | | | | | 74,971 |
| | | | | | |
Brokerage—0.9% | | | | | | |
Ameriprise Financial, Inc. | | | | | | |
7.30%, 20191 | | | 40,000 | | | 44,482 |
Citigroup, Inc. | | | | | | |
5.50%, 20121 | | | 37,000 | | | 38,675 |
5.50%, 20131 | | | 45,000 | | | 46,654 |
Goldman Sachs Group, Inc. | | | | | | |
6.15%, 20181 | | | 195,000 | | | 208,748 |
6.35%, 20341 | | | 30,000 | | | 28,088 |
Jefferies Group, Inc. | | | | | | |
6.25%, 20361 | | | 35,000 | | | 27,891 |
Merrill Lynch & Company, Inc. | | | | | | |
5.45%, 20131 | | | 35,000 | | | 36,829 |
6.88%, 20181 | | | 85,000 | | | 91,582 |
7.75%, 20381 | | | 35,000 | | | 38,456 |
Morgan Stanley | | | | | | |
6.00%, 20151 | | | 100,000 | | | 106,523 |
Nuveen Investments, Inc. | | | | | | |
10.50%, 20151 | | | 25,000 | | | 22,688 |
Willis North America, Inc. | | | | | | |
6.20%, 20171 | | | 25,000 | | | 24,783 |
| | | | | | |
| | | | | | 715,399 |
| | | | | | |
Building Materials—0.1% | | | | | | |
CRH America, Inc. | | | | | | |
6.00%, 20161 | | | 25,000 | | | 26,112 |
Freeport-McMoRan Copper & Gold, Inc. | | | | | | |
8.38%, 20171 | | | 50,000 | | | 54,750 |
Gibraltar Industries, Inc. | | | | | | |
8.00%, 20151 | | | 25,000 | | | 23,875 |
Holcim US Finance Sarl & Cie SCS | | | | | | |
6.00%, 20191,2,6,7 | | | 20,000 | | | 20,818 |
Lafarge S.A. | | | | | | |
6.15%, 20111 | | | 20,000 | | | 20,842 |
| | | | | | |
| | | | | | 146,397 |
| | | | | | |
Capital Goods—0.1% | | | | | | |
Ball Corporation | | | | | | |
7.13%, 20161 | | | 25,000 | | | 25,625 |
Goodrich Corporation | | | | | | |
4.88%, 20201 | | | 15,000 | | | 14,837 |
Republic Services, Inc. | | | | | | |
5.50%, 20191,2,6,7 | | | 20,000 | | | 20,309 |
Roper Industries, Inc. | | | | | | |
6.25%, 20191 | | | 10,000 | | | 10,411 |
| | | | | | |
| | | | | | 71,182 |
| | | | | | |
Chemicals—0.1% | | | | | | |
Praxair, Inc. | | | | | | |
4.63%, 20151 | | | 35,000 | | | 37,225 |
5.20%, 20171 | | | 35,000 | | | 36,700 |
Solutia, Inc. | | | | | | |
8.75%, 20171 | | | 25,000 | | | 26,031 |
| | | | | | |
| | | | | | 99,956 |
| | | | | | |
Communications—0.3% | | | | | | |
American Tower Corporation | | | | | | |
4.63%, 20151,2,6,7 | | | 15,000 | | | 15,172 |
7.25%, 20191,2,6,7 | | | 28,000 | | | 31,220 |
Grupo Televisa S.A. | | | | | | |
6.63%, 20401,2,6,7 | | | 15,000 | | | 14,834 |
Intelsat Jackson Holdings, Ltd. | | | | | | |
8.50%, 20191,6,7 | | | 50,000 | | | 51,500 |
QVC, Inc. | | | | | | |
7.50%, 20191,6,7 | | | 25,000 | | | 25,500 |
Telecom Italia Capital S.A. | | | | | | |
6.18%, 20141 | | | 30,000 | | | 32,517 |
The accompanying notes are an integral part of the financial statements
74
| | |
| Schedule of Investments | | Series N |
| December 31, 2009 | | (Managed Asset Allocation Series) |
| | | | | | |
| | | Principal
Amount | | Value |
CORPORATE BONDS—13.8% (continued) | | | | | | |
Communications—0.3% (continued) | | | | | | |
Telefonica Emisiones SAU | | | | | | |
5.88%, 20191 | | $ | 15,000 | | $ | 16,077 |
Thomson Reuters Corporation | | | | | | |
4.70%, 20191 | | | 10,000 | | | 9,851 |
| | | | | | |
| | | | | | 196,671 |
| | | | | | |
Communications—Other—0.3% | | | | | | |
AT&T, Inc. | | | | | | |
5.63%, 20161 | | | 50,000 | | | 53,712 |
Dun & Bradstreet Corporation | | | | | | |
5.50%, 20111 | | | 25,000 | | | 26,042 |
Hughes Network Systems LLC | | | | | | |
9.50%, 20141 | | | 25,000 | | | 25,813 |
Lamar Media Corporation | | | | | | |
6.63%, 20151 | | | 100,000 | | | 96,999 |
XM Satellite Radio, Inc. | | | | | | |
11.25%, 20131,6,7 | | | 25,000 | | | 26,875 |
| | | | | | |
| | | | | | 229,441 |
| | | | | | |
Construction Machinery—0.1% | | | | | | |
Commercial Vehicle Group | | | | | | |
13.00%, 20131,2,7 | | | 20 | | | 16,972 |
Esco Corporation | | | | | | |
8.63%, 20131,6,7 | | | 50,000 | | | 49,749 |
Honeywell International, Inc. | | | | | | |
5.30%, 20181 | | | 35,000 | | | 36,916 |
| | | | | | |
| | | | | | 103,637 |
| | | | | | |
Consumer Noncyclical—0.1% | | | | | | |
AmerisourceBergen Corporation | | | | | | |
4.88%, 20191 | | | 25,000 | | | 24,681 |
Kroger Company | | | | | | |
3.90%, 20151 | | | 20,000 | | | 20,109 |
| | | | | | |
| | | | | | 44,790 |
| | | | | | |
Consumer Noncyclical—Other—0.1% | | | | | | |
Bunge North America Finance, LP | | | | | | |
5.90%, 20171 | | | 55,000 | | | 54,445 |
| | | | | | |
Consumer Products—0.0% | | | | | | |
Visant Corporation | | | | | | |
7.63%, 20121 | | | 25,000 | | | 25,125 |
| | | | | | |
Distributors—0.0% | | | | | | |
Ferrellgas Partners, LP | | | | | | |
8.75%, 20121 | | | 25,000 | | | 25,313 |
| | | | | | |
Diversified Manufacturing—0.1% | | | | | | |
3M Company | | | | | | |
5.70%, 20371 | | | 35,000 | | | 36,525 |
Bombardier, Inc. | | | | | | |
8.00%, 20141,6,7 | | | 25,000 | | | 25,969 |
Case New Holland, Inc. | | | | | | |
7.75%, 20131,6,7 | | | 25,000 | | | 25,563 |
Hawk Corporation | | | | | | |
8.75%, 20141 | | | 25,000 | | | 24,969 |
| | | | | | |
| | | | | | 113,026 |
| | | | | | |
Electric—1.1% | | | | | | |
ACE INA Holdings, Inc. | | | | | | |
5.90%, 20191 | | | 10,000 | | | 10,758 |
AES Corporation | | | | | | |
7.75%, 20141 | | | 25,000 | | | 25,375 |
Allegheny Energy Supply Company LLC | | | | | | |
6.75%, 20391,2,6,7 | | | 30,000 | | | 28,556 |
Appalachian Power Company | | | | | | |
6.38%, 20361 | | | 25,000 | | | 25,265 |
Baltimore Gas & Electric Company | | | | | | |
5.90%, 20161 | | | 50,000 | | | 52,708 |
Black Hills Corporation | | | | | | |
6.50%, 20131 | | | 30,000 | | | 31,380 |
CenterPoint Energy, Inc. | | | | | | |
7.25%, 20101 | | | 25,000 | | | 25,790 |
Consumers Energy Company | | | | | | |
6.00%, 20141 | | | 25,000 | | | 27,479 |
El Paso Electric Company | | | | | | |
6.00%, 20351 | | | 45,000 | | | 40,468 |
Energy Future Holdings Corporation | | | | | | |
10.88%, 20171 | | | 25,000 | | | 20,438 |
11.25%, 20171 | | | 28,090 | | | 19,874 |
Entergy Gulf States Louisiana LLC | | | | | | |
5.59%, 20241 | | | 10,000 | | | 9,994 |
Entergy Louisiana LLC | | | | | | |
5.40%, 20241 | | | 10,000 | | | 9,754 |
Exelon Generation Company LLC | | | | | | |
6.25%, 20391 | | | 15,000 | | | 15,282 |
Express Scripts, Inc. | | | | | | |
6.25%, 20141 | | | 15,000 | | | 16,367 |
Illinois Power Company | | | | | | |
6.13%, 20171 | | | 15,000 | | | 15,842 |
Massachusetts Electric Company | | | | | | |
5.90%, 20391,2,6,7 | | | 25,000 | | | 25,383 |
Monongahela Power Company | | | | | | |
5.70%, 20171,2,6,7 | | | 40,000 | | | 39,319 |
Northern States Power Company | | | | | | |
5.35%, 20391 | | | 14,000 | | | 13,512 |
Pacific Gas & Electric Company | | | | | | |
4.80%, 20141 | | | 30,000 | | | 31,860 |
6.35%, 20381 | | | 20,000 | | | 21,688 |
PacifiCorp | | | | | | |
6.25%, 20371 | | | 40,000 | | | 43,157 |
Pinnacle Foods Finance LLC | | | | | | |
9.25%, 20151 | | | 25,000 | | | 25,375 |
Public Service Company of Oklahoma | | | | | | |
5.15%, 20191 | | | 15,000 | | | 14,893 |
Public Service Electric & Gas Company | | | | | | |
5.70%, 20361 | | | 50,000 | | | 50,751 |
RRI Energy, Inc. | | | | | | |
7.88%, 20171 | | | 25,000 | | | 24,563 |
Sierra Pacific Resources | | | | | | |
7.80%, 20121 | | | 25,000 | | | 25,388 |
Southern Company | | | | | | |
4.15%, 20141 | | | 20,000 | | | 20,567 |
Tampa Electric Company | | | | | | |
6.15%, 20371 | | | 40,000 | | | 40,309 |
Teck Resources, Ltd. | | | | | | |
9.75%, 20141 | | | 25,000 | | | 28,844 |
The accompanying notes are an integral part of the financial statements
75
| | |
| Schedule of Investments | | Series N |
| December 31, 2009 | | (Managed Asset Allocation Series) |
| | | | | | |
| | | Principal
Amount | | Value |
CORPORATE BONDS—13.8% (continued) | | | | | | |
Electric—1.1% (continued) | | | | | | |
Texas Competitive Electric Holdings Company LLC | | | | | | |
10.25%, 20151 | | $ | 50,000 | | $ | 40,500 |
Union Electric Company | | | | | | |
5.40%, 20161 | | | 50,000 | | | 51,447 |
Virginia Electric and Power Company | | | | | | |
4.50%, 20101 | | | 35,000 | | | 35,996 |
Westar Energy, Inc. | | | | | | |
5.10%, 20201 | | | 25,000 | �� | | 24,417 |
| | | | | | |
| | | | | | 933,299 |
| | | | | | |
Energy—0.1% | | | | | | |
Hess Corporation | | | | | | |
6.00%, 20401 | | | 15,000 | | | 14,854 |
North American Energy Alliance LLC | | | | | | |
10.88%, 20161,6,7 | | | 25,000 | | | 26,562 |
| | | | | | |
| | | | | | 41,416 |
| | | | | | |
Energy-Other—0.0% | | | | | | |
Cie Generale de Gelphysique-Veritas | | | | | | |
9.50%, 20161,7 | | | 25,000 | | | 26,750 |
| | | | | | |
Entertainment—0.1% | | | | | | |
Historic TW, Inc. | | | | | | |
6.88%, 20181 | | | 50,000 | | | 55,148 |
Ticketmaster Entertainment, Inc. | | | | | | |
10.75%, 20161 | | | 25,000 | | | 26,938 |
| | | | | | |
| | | | | | 82,086 |
| | | | | | |
Environmental—0.2% | | | | | | |
Veolia Environnement | | | | | | |
6.00%, 20181 | | | 35,000 | | | 36,957 |
Waste Management, Inc. | | | | | | |
6.10%, 20181 | | | 55,000 | | | 58,489 |
| | | | | | |
| | | | | | 95,446 |
| | | | | | |
Financial—Other—0.2% | | | | | | |
AvalonBay Communities, Inc. | | | | | | |
6.13%, 20121 | | | 16,000 | | | 16,978 |
Duke Realty, LP | | | | | | |
6.25%, 20131 | | | 20,000 | | | 20,115 |
First Data Corporation | | | | | | |
10.55%, 20151 | | | 27,760 | | | 24,636 |
Kinder Morgan Finance Company ULC | | | | | | |
5.70%, 20161 | | | 45,000 | | | 43,200 |
Nuveen Investments, Inc. | | | | | | |
5.50%, 20151 | | | 25,000 | | | 17,281 |
| | | | | | |
| | | | | | 122,210 |
| | | | | | |
Financial Companies—0.1% | | | | | | |
American General Finance Corporation | | | | | | |
6.90%, 20171 | | | 25,000 | | | 17,359 |
WEA Finance LLC | | | | | | |
7.50%, 20141,2,6,7 | | | 20,000 | | | 22,506 |
| | | | | | |
| | | | | | 39,865 |
| | | | | | |
Financial Companies—Noncaptive Consumer—0.2% | | | | | | |
American Express Credit Corporation | | | | | | |
5.88%, 20131 | | | 35,000 | | | 37,561 |
7.30%, 20131 | | | 15,000 | | | 16,858 |
Capital One Capital IV | | | | | | |
6.75%, 20371,5 | | | 50,000 | | | 41,500 |
John Deere Capital Corporation | | | | | | |
5.50%, 20171 | | | 20,000 | | | 21,201 |
SLM Corporation | | | | | | |
5.13%, 20121 | | | 15,000 | | | 14,062 |
8.45%, 20181 | | | 50,000 | | | 49,337 |
| | | | | | |
| | | | | | 180,519 |
| | | | | | |
Financial Companies—Noncaptive Diversified—0.2% | | | | | | |
Caterpillar Financial Services Corporation | | | | | | |
4.25%, 20131 | | | 35,000 | | | 36,445 |
5.85%, 20171 | | | 25,000 | | | 26,679 |
International Lease Finance Corporation | | | | | | |
6.63%, 20131 | | | 55,000 | | | 44,274 |
Wachovia Corporation | | | | | | |
5.75%, 20181 | | | 55,000 | | | 57,396 |
| | | | | | |
| | | | | | 164,794 |
| | | | | | |
Financial Institutions—0.1% | | | | | | |
Citigroup, Inc. | | | | | | |
5.50%, 20141 | | | 20,000 | | | 20,251 |
JPMorgan Chase Capital XXVII | | | | | | |
7.00%, 20391 | | | 30,000 | | | 30,255 |
SLM Corporation | | | | | | |
5.38%, 20141 | | | 25,000 | | | 23,059 |
| | | | | | |
| | | | | | 73,565 |
| | | | | | |
Food & Beverage—0.3% | | | | | | |
Anheuser-Busch InBev Worldwide, Inc. | | | | | | |
5.38%, 20141,2,6,7 | | | 60,000 | | | 63,524 |
ARAMARK Corporation | | | | | | |
3.78%, 20151,5 | | | 25,000 | | | 22,875 |
B&G Foods, Inc. | | | | | | |
8.00%, 20111 | | | 25,000 | | | 25,438 |
Coca-Cola Amatil, Ltd. | | | | | | |
3.25%, 20141,2,6,7 | | | 20,000 | | | 19,744 |
General Mills, Inc. | | | | | | |
5.25%, 20131 | | | 15,000 | | | 16,183 |
Mead Johnson Nutrition Company | | | | | | |
4.90%, 20191,2,6,7 | | | 10,000 | | | 9,915 |
Pantry, Inc. | | | | | | |
7.75%, 20141 | | | 25,000 | | | 24,000 |
SABMiller plc | | | | | | |
6.20%, 20111,2,6,7 | | | 50,000 | | | 52,915 |
Sysco Corporation | | | | | | |
5.25%, 20181 | | | 20,000 | | | 20,882 |
| | | | | | |
| | | | | | 255,476 |
| | | | | | |
Gaming—0.1% | | | | | | |
Harrah’s Operating Company, Inc. | | | | | | |
11.25%, 20171,6,7 | | | 25,000 | | | 26,156 |
The accompanying notes are an integral part of the financial statements
76
| | |
| Schedule of Investments | | Series N |
| December 31, 2009 | | (Managed Asset Allocation Series) |
| | | | | | |
| | | Principal
Amount | | Value |
CORPORATE BONDS—13.8% (continued) | | | | | | |
Gaming—0.1% (continued) | | | | | | |
MGM Mirage | | | | | | |
10.38%, 20141,6,7 | | $ | 25,000 | | $ | 27,125 |
11.38%, 20181,6,7 | | | 25,000 | | | 22,375 |
| | | | | | |
| | | | | | 75,656 |
| | | | | | |
Health Care—0.4% | | | | | | |
Genentech, Inc. | | | | | | |
4.75%, 20151 | | | 35,000 | | | 37,460 |
HCA, Inc. | | | | | | |
9.25%, 20161 | | | 50,000 | | | 53,688 |
Highmark, Inc. | | | | | | |
6.80%, 20131,2,6,7 | | | 30,000 | | | 31,389 |
Kellogg Company | | | | | | |
4.25%, 20131 | | | 25,000 | | | 26,208 |
Medtronic, Inc. | | | | | | |
4.75%, 20151 | | | 60,000 | | | 64,772 |
Talecris Biotherapeutics Holdings Corporation | | | | | | |
7.75%, 20161,6,7 | | | 25,000 | | | 25,375 |
Vanguard Health Holding Company II LLC | | | | | | |
9.00%, 20141 | | | 25,000 | | | 25,906 |
WellPoint, Inc. | | | | | | |
5.00%, 20111 | | | 30,000 | | | 31,019 |
Wyeth | | | | | | |
5.95%, 20371 | | | 35,000 | | | 36,497 |
| | | | | | |
| | | | | | 332,314 |
| | | | | | |
Home Construction—0.1% | | | | | | |
MDC Holdings, Inc. | | | | | | |
5.50%, 20131 | | | 55,000 | | | 55,258 |
NVR, Inc. | | | | | | |
5.00%, 20101 | | | 20,000 | | | 20,184 |
| | | | | | |
| | | | | | 75,442 |
| | | | | | |
Independent Energy—0.3% | | | | | | |
Canadian Natural Resources, Ltd. | | | | | | |
6.25%, 20381 | | | 35,000 | | | 36,223 |
Connacher Oil and Gas, Ltd. | | | | | | |
10.25%, 20151,6,7 | | | 25,000 | | | 22,875 |
Forest Oil Corporation | | | | | | |
8.00%, 20111 | | | 25,000 | | | 26,063 |
Hilcorp Energy I, LP | | | | | | |
7.75%, 20151,6,7 | | | 75,000 | | | 73,499 |
NRG Energy, Inc. | | | | | | |
7.25%, 20141 | | | 25,000 | | | 25,313 |
Southern Company | | | | | | |
5.30%, 20121 | | | 15,000 | | | 16,071 |
| | | | | | |
| | | | | | 200,044 |
| | | | | | |
Insurance—0.1% | | | | | | |
Aflac, Inc. | | | | | | |
6.90%, 20391 | | | 20,000 | | | 19,704 |
Genworth Financial, Inc. | | | | | | |
8.63%, 20161 | | | 10,000 | | | 10,374 |
Markel Corporation | | | | | | |
7.13%, 20191 | | | 15,000 | | | 15,488 |
Reinsurance Group of America, Inc. | | | | | | |
6.45%, 20191 | | | 15,000 | | | 14,951 |
| | | | | | |
| | | | | | 60,517 |
| | | | | | |
Insurance—Life—0.3% | | | | | | |
MetLife, Inc. | | | | | | |
6.13%, 20111 | | | 50,000 | | | 53,750 |
NLV Financial Corporation | | | | | | |
7.50%, 20331,2,6,7 | | | 30,000 | | | 25,852 |
Principal Financial Group, Inc. | | | | | | |
6.05%, 20361 | | | 30,000 | | | 27,104 |
Principal Life Global Funding I | | | | | | |
5.13%, 20131,2,6,7 | | | 45,000 | | | 45,623 |
Prudential Financial, Inc. | | | | | | |
6.20%, 20151 | | | 10,000 | | | 10,759 |
Sun Life Financial Global Funding, LP | | | | | | |
0.50%, 20131,2,5,6,7 | | | 45,000 | | | 42,174 |
| | | | | | |
| | | | | | 205,262 |
| | | | | | |
Insurance—Property & Casualty—0.1% | | | | | | |
Ace INA Holdings, Inc. | | | | | | |
5.70%, 20171 | | | 30,000 | | | 31,839 |
HUB International Holdings, Inc. | | | | | | |
10.25%, 20151,6,7 | | | 25,000 | | | 23,000 |
| | | | | | |
| | | | | | 54,839 |
| | | | | | |
Integrated Energy—0.1% | | | | | | |
Hess Corporation | | | | | | |
7.88%, 20291 | | | 20,000 | | | 23,987 |
Petrobras International Finance Company | | | | | | |
5.88%, 20181 | | | 35,000 | | | 35,294 |
Petro-Canada | | | | | | |
6.80%, 20381 | | | 10,000 | | | 11,023 |
West Penn Power Company | | | | | | |
5.95%, 20171,2,6,7 | | | 25,000 | | | 25,565 |
| | | | | | |
| | | | | | 95,869 |
| | | | | | |
Lodging—0.0% | | | | | | |
Host Hotels & Resorts, LP | | | | | | |
6.75%, 20161 | | | 25,000 | | | 24,875 |
| | | | | | |
Media-Cable—0.8% | | | | | | |
British Sky Broadcasting Group plc | | | | | | |
6.10%, 20181,2,6,7 | | | 55,000 | | | 58,264 |
Comcast Cable Communications Holdings, Inc. | | | | | | |
8.38%, 20131 | | | 11,000 | | | 12,680 |
Comcast Corporation | | | | | | |
5.70%, 20181 | | | 40,000 | | | 42,050 |
COX Communications, Inc. | | | | | | |
7.13%, 20121 | | | 20,000 | | | 22,217 |
6.25%, 20181,2,6,7 | | | 10,000 | | | 10,644 |
8.38%, 20391,2,6,7 | | | 10,000 | | | 12,452 |
CSC Holdings, Inc. | | | | | | |
8.50%, 20141,6,7 | | | 25,000 | | | 26,625 |
DirecTV Holdings LLC | | | | | | |
7.63%, 20161 | | | 25,000 | | | 27,313 |
5.88%, 20191,2,6,7 | | | 45,000 | | | 45,769 |
News America, Inc. | | | | | | |
6.15%, 20371 | | | 60,000 | | | 59,693 |
Omnicom Group, Inc. | | | | | | |
6.25%, 20191 | | | 20,000 | | | 21,577 |
Rogers Cable, Inc. | | | | | | |
5.50%, 20141 | | | 40,000 | | | 42,861 |
TCM Sub LLC | | | | | | |
3.55%, 20151,2,6,7 | | | 35,000 | | | 34,284 |
The accompanying notes are an integral part of the financial statements
77
| | |
| Schedule of Investments | | Series N |
| December 31, 2009 | | (Managed Asset Allocation Series) |
| | | | | | |
| | | Principal
Amount | | Value |
CORPORATE BONDS—13.8% (continued) | | | | | | |
Media—Cable—0.8% (continued) | | | | | | |
Time Warner Cable, Inc. | | | | | | |
5.40%, 20121 | | $ | 55,000 | | $ | 58,764 |
7.30%, 20381 | | | 90,000 | | | 99,775 |
Videotron Ltee | | | | | | |
9.13%, 20181,6,7 | | | 25,000 | | | 27,500 |
| | | | | | |
| | | | | | 602,468 |
| | | | | | |
Media—Non Cable—0.2% | | | | | | |
Affinity Group, Inc. | | | | | | |
9.00%, 20121 | | | 25,000 | | | 17,031 |
News America, Inc. | | | | | | |
6.40%, 20351 | | | 45,000 | | | 46,208 |
Thomson Reuters Corporation | | | | | | |
6.50%, 20181 | | | 25,000 | | | 28,256 |
Time Warner, Inc. | | | | | | |
7.70%, 20321 | | | 20,000 | | | 23,487 |
Univision Communications, Inc. | | | | | | |
9.75%, 20151,6,7 | | | 26,312 | | | 23,056 |
Vivendi S.A. | | | | | | |
5.75%, 20131,2,6,7 | | | 35,000 | | | 36,797 |
| | | | | | |
| | | | | | 174,835 |
| | | | | | |
Metals & Mining—0.8% | | | | | | |
ArcelorMittal | | | | | | |
5.38%, 20131 | | | 35,000 | | | 36,933 |
Barrick Gold Financeco LLC | | | | | | |
6.13%, 20131 | | | 30,000 | | | 32,976 |
BHP Billiton Finance, Ltd. | | | | | | |
5.40%, 20171 | | | 30,000 | | | 32,141 |
Novelis, Inc. | | | | | | |
11.50%, 20151,6,7 | | | 25,000 | | | 26,781 |
Placer Dome, Inc. | | | | | | |
6.45%, 20351 | | | 35,000 | | | 35,927 |
Rio Tinto Finance USA, Ltd. | | | | | | |
5.88%, 20131 | | | 35,000 | | | 37,767 |
Russel Metals, Inc. | | | | | | |
6.38%, 20141 | | | 25,000 | | | 23,750 |
Steel Dynamics, Inc. | | | | | | |
7.38%, 20121 | | | 25,000 | | | 25,750 |
Sunoco, Inc. | | | | | | |
5.75%, 20171 | | | 34,000 | | | 34,375 |
Tube City IMS Corporation | | | | | | |
9.75%, 20151 | | | 25,000 | | | 24,156 |
Vale Overseas, Ltd. | | | | | | |
6.25%, 20171 | | | 20,000 | | | 20,862 |
6.88%, 20391 | | | 25,000 | | | 25,169 |
| | | | | | |
| | | | | | 356,587 |
| | | | | | |
Natural Gas—0.1% | | | | | | |
AGL Capital Corporation | | | | | | |
5.25%, 20191 | | | 5,000 | | | 5,035 |
Enogex LLC | | | | | | |
6.25%, 20201,2,6,7 | | | 10,000 | | | 9,783 |
Enterprise Products Operating LLC | | | | | | |
5.25%, 20201 | | | 5,000 | | | 4,946 |
7.55%, 20381 | | | 15,000 | | | 16,939 |
Magellan Midstream Partners, LP | | | | | | |
6.55%, 20191 | | | 20,000 | | | 21,710 |
Plains All American Pipeline, LP | | | | | | |
5.75%, 20201 | | | 20,000 | | | 20,015 |
Spectra Energy Capital LLC | | | | | | |
5.65%, 20201 | | | 20,000 | | | 20,183 |
| | | | | | |
| | | | | | 98,611 |
| | | | | | |
Natural Gas Pipelines—0.2% | | | | | | |
Boardwalk Pipelines LLC | | | | | | |
5.50%, 20171 | | | 20,000 | | | 19,874 |
Buckeye Partners, LP | | | | | | |
6.05%, 20181 | | | 15,000 | | | 15,539 |
Dynegy Holdings, Inc. | | | | | | |
7.50%, 20151 | | | 25,000 | | | 23,375 |
El Paso Corporation | | | | | | |
12.00%, 20131 | | | 25,000 | | | 29,313 |
Plains All American Pipeline, LP | | | | | | |
6.50%, 20181 | | | 15,000 | | | 16,041 |
Texas Gas Transmission LLC | | | | | | |
5.50%, 20131,2,6,7 | | | 50,000 | | | 52,578 |
| | | | | | |
| | | | | | 156,720 |
| | | | | | |
Oil Field Services—0.4% | | | | | | |
Devon Financing Corporation ULC | | | | | | |
7.88%, 20311 | | | 25,000 | | | 31,323 |
Diamond Offshore Drilling, Inc. | | | | | | |
5.15%, 20141 | | | 25,000 | | | 26,656 |
El Paso Natural Gas Company | | | | | | |
5.95%, 20171 | | | 13,000 | | | 13,390 |
EnCana Corporation | | | | | | |
5.90%, 20171 | | | 35,000 | | | 37,641 |
6.50%, 20341 | | | 35,000 | | | 37,511 |
EOG Resources, Inc. | | | | | | |
5.88%, 20171 | | | 25,000 | | | 27,224 |
Nabors Industries, Inc. | | | | | | |
6.15%, 20181 | | | 10,000 | | | 10,393 |
Pemex Project Funding Master Trust | | | | | | |
5.75%, 20181 | | | 80,000 | | | 80,891 |
Petrobras International Finance Company | | | | | | |
7.88%, 20191 | | | 15,000 | | | 17,292 |
5.75%, 20201 | | | 10,000 | | | 10,173 |
Shell International Finance BV | | | | | | |
6.38%, 20381 | | | 25,000 | | | 28,184 |
Southern Natural Gas Company | | | | | | |
5.90%, 20171,2,6,7 | | | 13,000 | | | 13,350 |
Woodside Finance, Ltd. | | | | | | |
4.50%, 20141,2,6,7 | | | 10,000 | | | 10,089 |
XTO Energy, Inc. | | | | | | |
5.65%, 20161 | | | 30,000 | | | 32,788 |
| | | | | | |
| | | | | | 376,905 |
| | | | | | |
Paper—0.1% | | | | | | |
Boise Cascade LLC | | | | | | |
7.13%, 20141 | | | 15,000 | | | 13,519 |
Georgia-Pacific LLC | | | | | | |
7.13%, 20171,6,7 | | | 25,000 | | | 25,313 |
Nielsen Finance LLC | | | | | | |
11.63%, 20141 | | | 25,000 | | | 28,093 |
| | | | | | |
| | | | | | 66,925 |
| | | | | | |
Pharmaceuticals—0.1% | | | | | | |
Teva Pharmaceutical Finance LLC | | | | | | |
5.55%, 20161 | | | 40,000 | | | 42,223 |
| | | | | | |
The accompanying notes are an integral part of the financial statements
78
| | |
| Schedule of Investments | | Series N |
| December 31, 2009 | | (Managed Asset Allocation Series) |
| | | | | | |
| | | Principal
Amount | | Value |
CORPORATE BONDS—13.8% (continued) | | | | | | |
Pipelines—0.0% | | | | | | |
Kinder Morgan, Inc. | | | | | | |
6.50%, 20121 | | $ | 25,000 | | $ | 26,000 |
| | | | | | |
Railroads—0.0% | | | | | | |
Union Pacific Corporation | | | | | | |
5.70%, 20181 | | | 25,000 | | | 26,187 |
| | | | | | |
Refining—0.3% | | | | | | |
Diamond Offshore Drilling, Inc. | | | | | | |
4.88%, 20151 | | | 30,000 | | | 31,668 |
Enterprise Products Operating, LP | | | | | | |
6.30%, 20171 | | | 20,000 | | | 21,530 |
Marathon Oil Corporation | | | | | | |
6.00%, 20171 | | | 35,000 | | | 37,023 |
5.90%, 20181 | | | 45,000 | | | 47,400 |
6.60%, 20371 | | | 15,000 | | | 15,912 |
Valero Energy Corporation | | | | | | |
6.13%, 20171 | | | 55,000 | | | 56,289 |
| | | | | | |
| | | | | | 209,822 |
| | | | | | |
REIT’s—0.3% | | | | | | |
AMB Property, LP | | | | | | |
6.63%, 20191 | | | 20,000 | | | 19,617 |
ERP Operating, LP | | | | | | |
5.25%, 20141 | | | 25,000 | | | 25,426 |
Federal Realty Investment Trust | | | | | | |
6.00%, 20121 | | | 20,000 | | | 20,869 |
Hospitality Properties Trust | | | | | | |
5.63%, 20171 | | | 30,000 | | | 25,976 |
Mack-Cali Realty Corporation | | | | | | |
7.75%, 20191 | | | 20,000 | | | 20,695 |
Reckson Operating Partnership, LP | | | | | | |
6.00%, 20161 | | | 30,000 | | | 25,682 |
Regency Centers, LP | | | | | | |
5.88%, 20171 | | | 15,000 | | | 13,881 |
Simon Property Group, LP | | | | | | |
6.75%, 20141 | | | 5,000 | | | 5,328 |
5.75%, 20151 | | | 55,000 | | | 56,086 |
| | | | | | |
| | | | | | 213,560 |
| | | | | | |
Restaurants—0.0% | | | | | | |
Federated Retail Holdings, Inc. | | | | | | |
5.35%, 20121 | | | 20,000 | | | 20,425 |
| | | | | | |
Retailers—0.3% | | | | | | |
AmeriGas Partners, LP | | | | | | |
7.13%, 20161 | | | 100,000 | | | 100,000 |
GSC Holdings Corporation | | | | | | |
8.00%, 20121 | | | 25,000 | | | 25,906 |
Home Depot, Inc. | | | | | | |
5.40%, 20161 | | | 35,000 | | | 36,640 |
JC Penney Corporation, Inc. | | | | | | |
9.00%, 20121 | | | 30,000 | | | 33,825 |
Neiman Marcus Group, Inc. | | | | | | |
10.38%, 20151 | | | 25,000 | | | 24,500 |
Rite Aid Corporation | | | | | | |
10.25%, 20191,6,7 | | | 25,000 | | | 26,375 |
| | | | | | |
| | | | | | 247,246 |
| | | | | | |
Services—0.1% | | | | | | |
Allied Waste North America, Inc. | | | | | | |
7.25%, 20151 | | | 50,000 | | | 52,250 |
| | | | | | |
Sovereigns—0.2% | | | | | | |
Brazilian Government International Bond | | | | | | |
11.00%, 20401 | | | 35,000 | | | 46,638 |
Italian Republic | | | | | | |
5.25%, 20161 | | | 85,000 | | | 90,526 |
| | | | | | |
| | | | | | 137,164 |
| | | | | | |
Supermarkets—0.0% | | | | | | |
Kroger Company | | | | | | |
7.50%, 20141 | | | 5,000 | | | 5,706 |
| | | | | | |
Technology—0.3% | | | | | | |
Seagate Technology HDD Holdings | | | | | | |
6.80%, 20161 | | | 25,000 | | | 24,188 |
STATS ChipPAC, Ltd. | | | | | | |
6.75%, 20111 | | | 25,000 | | | 25,156 |
SunGard Data Systems, Inc. | | | | | | |
9.13%, 20131 | | | 100,000 | | | 102,500 |
Xerox Corporation | | | | | | |
5.50%, 20121 | | | 15,000 | | | 15,852 |
6.75%, 20171 | | | 100,000 | | | 107,277 |
6.35%, 20181 | | | 25,000 | | | 26,078 |
| | | | | | |
| | | | | | 301,051 |
| | | | | | |
Telecommunications—Wireless—0.6% | | | | | | |
America Movil S.A. de CV | | | | | | |
6.38%, 20351 | | | 45,000 | | | 46,453 |
British Telecommunications plc | | | | | | |
5.15%, 20131 | | | 40,000 | | | 41,711 |
CC Holdings GS V LLC | | | | | | |
7.75%, 20171,6,7 | | | 25,000 | | | 26,625 |
Cricket Communications, Inc. | | | | | | |
7.75%, 20161 | | | 25,000 | | | 24,938 |
Digicel Group, Ltd. | | | | | | |
12.00%, 20141,6,7 | | | 25,000 | | | 27,750 |
iPCS, Inc. | | | | | | |
4.28%, 20141,5 | | | 25,283 | | | 21,491 |
MetroPCS Wireless, Inc. | | | | | | |
9.25%, 20141 | | | 25,000 | | | 25,313 |
New Cingular Wireless Services, Inc. | | | | | | |
7.88%, 20111 | | | 30,000 | | | 32,232 |
NII Capital Corporation | | | | | | |
10.00%, 20161,6,7 | | | 25,000 | | | 26,188 |
Rogers Communications, Inc. | | | | | | |
6.80%, 20181 | | | 30,000 | | | 33,598 |
SBA Telecommunications, Inc. | | | | | | |
8.00%, 20161,6,7 | | | 25,000 | | | 26,125 |
Sprint Capital Corporation | | | | | | |
8.38%, 20121 | | | 25,000 | | | 25,875 |
Sprint Nextel Corporation | | | | | | |
8.38%, 20171 | | | 50,000 | | | 50,999 |
Verizon Global Funding Corporation | | | | | | |
7.75%, 20301 | | | 35,000 | | | 41,117 |
Verizon Virginia, Inc. | | | | | | |
4.63%, 20131 | | | 45,000 | | | 46,730 |
The accompanying notes are an integral part of the financial statements
79
| | |
| Schedule of Investments | | Series N |
| December 31, 2009 | | (Managed Asset Allocation Series) |
| | | | | | |
| | | Principal
Amount | | Value |
CORPORATE BONDS—13.8% (continued) | | | | | | |
Telecommunications—Wireless—0.6% (continued) | | | | | | |
Vodafone Group plc | | | | | | |
5.63%, 20171 | | $ | 35,000 | | $ | 37,176 |
Wind Acquisition Finance S.A. | | | | | | |
12.00%, 20151,6,7 | | | 25,000 | | | 26,750 |
| | | | | | |
| | | | | | 561,071 |
| | | | | | |
Telecommunications—Wirelines—0.4% | | | | | | |
AT&T Corporation | | | | | | |
7.30%, 20111 | | | 15,000 | | | 16,516 |
AT&T, Inc. | | | | | | |
6.45%, 20341 | | | 50,000 | | | 50,983 |
Cellco Partnership | | | | | | |
8.50%, 20181 | | | 40,000 | | | 49,615 |
Nordic Telephone Company Holdings ApS | | | | | | |
8.88%, 20161,6,7 | | | 100,000 | | | 105,750 |
Rogers Wireless, Inc. | | | | | | |
7.50%, 20151 | | | 15,000 | | | 17,520 |
Telecom Italia Capital S.A. | | | | | | |
5.25%, 20131 | | | 30,000 | | | 31,554 |
Telefonica Emisiones SAU | | | | | | |
6.22%, 20171 | | | 35,000 | | | 38,578 |
Windstream Corporation | | | | | | |
8.63%, 20161 | | | 25,000 | | | 25,438 |
| | | | | | |
| | | | | | 335,954 |
| | | | | | |
Textile—0.1% | | | | | | |
Invista | | | | | | |
9.25%, 20121,6,7 | | | 100,000 | | | 101,500 |
| | | | | | |
Tobacco—0.1% | | | | | | |
Altria Group, Inc. | | | | | | |
8.50%, 20131 | | | 25,000 | | | 28,891 |
9.25%, 20191 | | | 20,000 | | | 24,373 |
BAT International Finance plc | | | | | | |
8.13%, 20131,2,6,7 | | | 25,000 | | | 28,900 |
Reynolds American, Inc. | | | | | | |
7.25%, 20131 | | | 30,000 | | | 32,730 |
| | | | | | |
| | | | | | 114,894 |
| | | | | | |
U.S. Banking—0.1% | | | | | | |
Bank of America Corporation | | | | | | |
6.50%, 20161 | | | 20,000 | | | 21,506 |
Fifth Third Bancorp | | | | | | |
8.25%, 20381 | | | 25,000 | | | 23,770 |
GMAC, Inc. | | | | | | |
8.00%, 20311,6,7 | | | 25,000 | | | 22,500 |
USB Capital XIII Trust | | | | | | |
6.63%, 20391 | | | 15,000 | | | 15,245 |
| | | | | | |
| | | | | | 83,021 |
| | | | | | |
TOTAL CORPORATE BOND (cost $10,557,472) | | | | | $ | 10,987,753 |
| | | | | | |
| | |
| | | Principal
Amount | | Value |
FOREIGN BONDS—0.2% | | | | | | |
Chile—0.1% | | | | | | |
Celulosa Arauco y Constitucion S.A. | | | | | | |
5.13%, 20131 | | $ | 40,000 | | $ | 41,936 |
| | | | | | |
France—0.1% | | | | | | |
France Telecom S.A. | | | | | | |
7.75%, 20111 | | $ | 46,000 | | $ | 49,301 |
| | | | | | |
United Kingdom—0.0% | | | | | | |
HBOS plc | | | | | | |
6.00%, 20331,2,6,7 | | | 40,000 | | | 30,205 |
| | | | | | |
TOTAL FOREIGN BOND (cost $126,793) | | | | | $ | 121,442 |
| | | | | | |
| | |
| | | Principal
Amount | | Value |
FOREIGN GOVERNMENT BONDS—0.2% | | | | | | |
Mexico—0.1% | | | | | | |
Mexico Government International Bond | | | | | | |
6.38%, 20131 | | | 45,000 | | | 49,725 |
| | | | | | |
South Africa—0.1% | | | | | | |
South Africa Government International Bond | | | | | | |
6.50%, 20141 | | | 65,000 | | | 71,175 |
| | | | | | |
TOTAL FOREIGN GOVERNMENT BOND (cost $111,628) | | | | | $ | 120,900 |
| | | | | | |
| | |
| | | Principal
Amount | | Value |
MUNICIPAL BONDS—0.5% | | | | | | |
California—0.0% | | | | | | |
Bay Area Toll Authority Revenue Bonds | | | | | | |
6.26%, 20491 | | | 25,000 | | | 23,880 |
| | | | | | |
District Of Columbia—0.0% | | | | | | |
District of Columbia Revenue Bonds | | | | | | |
5.59%, 20341 | | | 10,000 | | | 9,798 |
| | | | | | |
Georgia—0.2% | | | | | | |
City of Atlanta Georgia Revenue Bonds | | | | | | |
5.50%, 20171 | | | 35,000 | | | 38,297 |
County of DeKalb Georgia Revenue Bonds | | | | | | |
5.00%, 20351 | | | 40,000 | | | 43,016 |
| | | | | | |
| | | | | | 81,313 |
| | | | | | |
Illinois—0.1% | | | | | | |
Chicago Metropolitan Water Reclamation District-Greater Chicago General Obligation Limited | | | | | | |
5.72%, 20381 | | | 15,000 | | | 14,984 |
Chicago Transit Authority Revenue Bonds | | | | | | |
6.90%, 20401 | | | 30,000 | | | 31,326 |
| | | | | | |
| | | | | | 46,310 |
| | | | | | |
Kansas—0.0% | | | | | | |
Kansas Development Finance Authority Revenue Bonds | | | | | | |
5.50%, 20341 | | | 30,000 | | | 26,870 |
| | | | | | |
The accompanying notes are an integral part of the financial statements
80
| | |
| Schedule of Investments | | Series N |
| December 31, 2009 | | (Managed Asset Allocation Series) |
| | | | | | |
| | | Principal
Amount | | Value |
MUNICIPAL BONDS—0.5% (continued) | | | | | | |
Maryland—0.0% | | | | | | |
Maryland State Transportation Authority Revenue Bonds | | | | | | |
5.89%, 20431 | | $ | 10,000 | | $ | 10,016 |
| | | | | | |
Massachusetts—0.2% | | | | | | |
Massachusetts Health & Educational Facilities Authority Revenue Bonds | | | | | | |
5.00%, 20381 | | | 45,000 | | | 47,292 |
| | | | | | |
New York—0.0% | | | | | | |
Metropolitan Transportation Authority Revenue Bonds | | | | | | |
7.34%, 20391 | | | 10,000 | | | 11,143 |
New York City Housing Development Corporation Revenue Bonds | | | | | | |
6.42%, 20271 | | | 30,000 | | | 26,502 |
| | | | | | |
| | | | | | 37,645 |
| | | | | | |
Oregon—0.0% | | | | | | |
State of Oregon General Obligation Unlimited | | | | | | |
5.89%, 20271 | | | 15,000 | | | 14,865 |
| | | | | | |
Utah—0.0% | | | | | | |
Utah Transit Authority Revenue Bonds | | | | | | |
5.25%, 20381 | | | 35,000 | | | 37,383 |
| | | | | | |
West Virginia—0.0% | | | | | | |
Tobacco Settlement Finance Authority of West Virginia Revenue Bonds | | | | | | |
7.47%, 20471 | | | 45,000 | | | 35,944 |
| | | | | | |
TOTAL MUNICIPAL BOND (cost $373,004) | | | | | $ | 371,316 |
| | | | | | |
| | |
| | | Principal
Amount | | Value |
MORTGAGE BACKED SECURITIES—10.8% | | | | | | |
Other Non-Agency—2.0% | | | | | | |
C.M.O.’s—2.0% | | | | | | |
American Tower Trust | | | | | | |
2007-1A, 5.96%, 20371,2,6,7 | | $ | 45,000 | | $ | 45,900 |
Banc of America Commercial Mortgage, Inc. | | | | | | |
2003-1, 4.65%, 20361 | | | 75,000 | | | 75,579 |
2005-3, 4.50%, 20431 | | | 201,227 | | | 201,444 |
Banc of America Mortgage Securities, Inc. | | | | | | |
2004-A, 4.48%, 20341,5 | | | 22,001 | | | 18,042 |
2004-D, 3.87%, 20341,5 | | | 2,188 | | | 2,008 |
2004-H, 3.76%, 20341,5 | | | 12,995 | | | 12,218 |
2004-I, 4.87%, 20341,5 | | | 11,097 | | | 10,596 |
2005-J, 5.24%, 20351,5 | | | 31,652 | | | 24,016 |
Bear Stearns Commercial Mortgage Securities | | | | | | |
2005-PW10, 5.09%, 20401 | | | 39,604 | | | 40,084 |
2005-PWR8, 4.67%, 20411 | | | 60,000 | | | 57,396 |
2006-PW13, 5.54%, 20411 | | | 61,000 | | | 59,410 |
2005-PWR9, 4.87%, 20421 | | | 43,000 | | | 41,223 |
Citigroup | | | | | | |
2005-CD1, 5.22%, 20441,5 | | | 175,000 | | | 179,080 |
Commercial Mortgage Loan Trust | | | | | | |
2008-LS1, 6.02%, 20171,5 | | | 175,000 | | | 154,137 |
Credit Suisse Mortgage Capital Certificates | | | | | | |
2006-C4, 5.47%, 20391 | | | 100,000 | | | 85,652 |
GMAC Commercial Mortgage Securities, Inc. | | | | | | |
2001-C2, 6.70%, 20341 | | | 119,683 | | | 125,131 |
JP Morgan Chase Commercial Mortgage Securities Corporation | | | | | | |
2001-CIBC, 6.26%, 2033 1 | | | 92,974 | | | 95,644 |
2001-CIB2, 6.24%, 20351 | | | 5,702 | | | 5,759 |
2004-LDP4, 4.82%, 20421,5 | | | 75,000 | | | 76,294 |
Morgan Stanley Capital I | | | | | | |
2007-HQ11, 5.45%, 20441,5 | | | 100,000 | | | 87,634 |
Morgan Stanley Dean Witter Capital I | | | | | | |
2002-T0P7, 5.98%, 20391 | | | 200,000 | | | 209,442 |
| | | | | | |
| | | | | | 1,606,689 |
| | | | | | |
| | | | | | 1,606,689 |
| | | | | | |
U.S. Government Sponsored | | | | | | |
Agencies—7.5% | | | | | | |
C.M.O.’s—0.1% | | | | | | |
Federal Home Loan Mortgage Corporation | | | | | | |
FHR 2614 IH, 4.50%, 20161,2,9 | | | 35,051 | | | 1,318 |
Federal National Mortgage Association | | | | | | |
FNR 2003-40 Nl, 5.50%, 20281,2,9 | | | 1,211 | | | 11 |
FNS 319 2, 6.50%, 20321,2,9 | | | 8,364 | | | 1,903 |
FNR 2006-35 GK, 6.00%, 20321 | | | 66,013 | | | 68,955 |
| | | | | | |
| | | | | | 72,187 |
| | | | | | |
Pass Through’s—7.4% | | | | | | |
Federal Home Loan Mortgage Corporation | | | | | | |
#E01341, 5.50%, 20181 | | | 4,409 | | | 4,697 |
#E99933, 5.00%, 20181 | | | 2,790 | | | 2,940 |
#E99966, 5.00%, 20181 | | | 15,373 | | | 16,201 |
#B10343, 5.00%, 20181 | | | 4,075 | | | 4,294 |
#B19214, 5.50%, 20201 | | | 14,913 | | | 15,875 |
#J02272, 5.50%, 20201 | | | 50,959 | | | 54,246 |
#J02554, 5.50%, 20201 | | | 42,421 | | | 45,157 |
#J03203, 6.00%, 20211 | | | 37,256 | | | 39,852 |
#J03254, 6.00%, 20211 | | | 10,775 | | | 11,525 |
#J03615, 6.00%, 20211 | | | 69,875 | | | 74,743 |
#J03640, 6.00%, 20211 | | | 52,010 | | | 55,633 |
#J03672, 6.00%, 20211 | | | 20,941 | | | 22,400 |
#933890, 5.00%, 20231 | | | 187,095 | | | 195,731 |
#AA0774, 4.50%, 20241 | | | 174,611 | | | 179,815 |
#C68205, 7.00%, 20321 | | | 3,429 | | | 3,774 |
#1B0527, 3.35%, 20321,5 | | | 1,082 | | | 1,114 |
The accompanying notes are an integral part of the financial statements
81
| | |
| Schedule of Investments | | Series N |
| December 31, 2009 | | (Managed Asset Allocation Series) |
| | | | | | |
| | | Principal
Amount | | Value |
MORTGAGE BACKED SECURITIES—10.8% (continued) | | | | | | |
U.S. Government Sponsored | | | | | | |
Agencies—7.5% (continued) | | | | | | |
Pass Through’s—7.4% (continued) | | | | | | |
Federal Home Loan Mortgage Corporation (continued) | | | | | | |
#A12118, 5.00%, 20331 | | $ | 35,799 | | $ | 36,858 |
#D86309, 5.00%, 20331 | | | 22,297 | | | 22,957 |
#A15907, 5.00%, 20331 | | | 18,950 | | | 19,511 |
#A15852, 5.00%, 20331 | | | 16,024 | | | 16,498 |
#A21263, 4.50%, 20341 | | | 110,405 | | | 110,797 |
#G01805, 4.50%, 20351 | | | 234,607 | | | 235,748 |
#833174, 5.17%, 20351,5 | | | 158,777 | | | 166,935 |
#1G1762, 5.05%, 20351,5 | | | 26,732 | | | 28,083 |
#1G0661, 5.33%, 20361,5 | | | 11,829 | | | 12,462 |
#745336, 5.00%, 20361 | | | 94,810 | | | 97,481 |
#1G1353, 5.98%, 20361,5 | | | 67,590 | | | 72,110 |
#AA5588, 4.50%, 20391 | | | 214,499 | | | 214,320 |
Federal National Mortgage Association | | | | | | |
#254140, 5.50%, 20171 | | | 2,822 | | | 3,000 |
#625931, 5.50%, 20171 | | | 2,422 | | | 2,575 |
#254234, 5.50%, 20171 | | | 2,915 | | | 3,099 |
#357280, 6.50%, 20171 | | | 14,100 | | | 15,308 |
#555345, 5.50%, 20181 | | | 2,800 | | | 2,977 |
#685202, 5.50%, 20181 | | | 40,990 | | | 43,711 |
#725098, 5.50%, 20181 | | | 9,992 | | | 10,655 |
#725528, 5.50%, 20191 | | | 7,398 | | | 7,889 |
#789885, 5.50%, 20191 | | | 10,084 | | | 10,753 |
#745406, 6.00%, 20211 | | | 55,968 | | | 59,980 |
#981614, 5.00%, 20231 | | | 6,367 | | | 6,661 |
#650075, 6.50%, 20321 | | | 9,047 | | | 9,776 |
#545759, 6.50%, 20321 | | | 73,605 | | | 78,896 |
#254514, 5.50%, 20321 | | | 1,815 | | | 1,909 |
#254550, 6.50%, 20321 | | | 14,704 | | | 15,889 |
#974321, 6.00%, 20331 | | | 76,780 | | | 81,386 |
#555417, 6.00%, 20331 | | | 36,896 | | | 39,479 |
#254767, 5.50%, 20331 | | | 104,142 | | | 109,458 |
#747387, 5.50%, 20331 | | | 22,799 | | | 23,963 |
#744692, 5.50%, 20331 | | | 26,504 | | | 27,857 |
#750362, 5.50%, 20331 | | | 20,179 | | | 21,209 |
#744750, 5.50%, 20331 | | | 9,647 | | | 10,140 |
#747571, 5.50%, 20331 | | | 15,314 | | | 16,096 |
#747549, 5.50%, 20331 | | | 5,880 | | | 6,180 |
#254983, 5.50%, 20331 | | | 48,024 | | | 50,475 |
#756190, 5.50%, 20331 | | | 29,236 | | | 30,728 |
#762076, 5.50%, 20341 | | | 26,455 | | | 27,805 |
#255028, 5.50%, 20341 | | | 11,983 | | | 12,555 |
#763700, 5.00%, 20341 | | | 57,820 | | | 59,521 |
#725424, 5.50%, 20341 | | | 228,879 | | | 240,561 |
#789293, 5.50%, 20341 | | | 94,270 | | | 99,214 |
#790044, 6.00%, 20341 | | | 25,254 | | | 26,935 |
#790217, 6.00%, 20341 | | | 10,291 | | | 10,976 |
#725704, 6.00%, 20341 | | | 229,696 | | | 245,344 |
#923129, 5.50%, 20341 | | | 14,590 | | | 15,335 |
#791574, 6.00%, 20341 | | | 26,474 | | | 28,237 |
#790237, 6.00%, 20341 | | | 26,821 | | | 28,606 |
#790629, 6.00%, 20341 | | | 24,501 | | | 26,132 |
| | | | |
#790788, 6.00%, 20341 | | 29,431 | | 31,390 |
#796104, 5.50%, 20341 | | 27,292 | | 28,685 |
#725946, 5.50%, 20341 | | 327,080 | | 343,776 |
#255459, 6.00%, 20341 | | 29,081 | | 31,017 |
#804395, 5.50%, 20341 | | 64,289 | | 67,570 |
#808951, 6.00%, 20351 | | 306,324 | | 325,948 |
#735502, 6.00%, 20351 | | 27,874 | | 29,729 |
#889829, 5.00%, 20351 | | 367,181 | | 378,331 |
#745216, 3.08%, 20351,5 | | 32,077 | | 32,920 |
#888884, 5.50%, 20351 | | 132,139 | | 138,884 |
#850863, 5.30%, 20351,5 | | 22,607 | | 23,815 |
#848522, 5.63%, 20351,5 | | 11,655 | | 12,289 |
#845354, 5.50%, 20361 | | 50,071 | | 52,595 |
#745554, 6.50%, 20361 | | 308,729 | | 331,498 |
#868728, 6.50%, 20361 | | 12,132 | | 13,004 |
#888010, 5.99%, 20361,5 | | 29,265 | | 31,123 |
#900362, 6.00%, 20361 | | 44,941 | | 47,735 |
#896329, 6.50%, 20361 | | 28,387 | | 30,463 |
#893353, 6.00%, 20361 | | 34,245 | | 36,375 |
#745946, 5.50%, 20361 | | 14,834 | | 15,556 |
#905196, 6.03%, 20361,5 | | 38,937 | | 41,245 |
#1B3203, 5.98%, 20371,5 | | 24,092 | | 25,508 |
#938883, 5.00%, 20371 | | 70,604 | | 72,539 |
#938089, 5.00%, 20371 | | 25,594 | | 26,295 |
#889543, 5.50%, 20371 | | 79,456 | | 83,251 |
#972155, 6.00%, 20381 | | 57,624 | | 61,081 |
#983288, 6.00%, 20381 | | 70,892 | | 75,146 |
#964926, 6.00%, 20381 | | 40,551 | | 42,984 |
#257407, 6.00%, 20381 | | 17,961 | | 19,041 |
#AA7985, 4.50%, 20391 | | 64,297 | | 64,244 |
#AD0441, 6.00%, 20391 | | 78,770 | | 83,558 |
#AC4810, 4.50%, 20391 | | 25,774 | | 25,753 |
| | | | |
| | | | 5,896,375 |
| | | | |
| | | | 5,968,562 |
| | | | |
U.S. Government Sponsored | | | | |
Securities—1.3% | | | | |
Pass Through’s—1.3% | | | | |
Government National Mortgage Association | | | | |
#780766, 7.00%, 20131 | | 73 | | 73 |
#67365, 11.50%, 20131 | | 927 | | 995 |
#781312, 7.00%, 20131 | | 8,534 | | 9,081 |
G2 2102, 8.00%, 20251 | | 712 | | 813 |
G2 3295, 5.50%, 20321 | | 7,608 | | 8,027 |
#615278, 5.00%, 20331 | | 67,692 | | 70,143 |
#612919, 5.00%, 20331 | | 29,568 | | 30,639 |
#604639, 5.00%, 20331 | | 50,940 | | 52,785 |
G2 3442, 5.00%, 20331 | | 120,943 | | 125,249 |
G2 3458, 5.00%, 20331 | | 34,053 | | 35,246 |
G2 3490, 6.50%, 20331 | | 6,012 | | 6,448 |
G2 3513, 5.00%, 20341 | | 42,460 | | 43,917 |
G2 3517, 6.00%, 20341 | | 21,841 | | 23,276 |
G2 3529, 5.00%, 20341 | | 9,977 | | 10,320 |
G2 3530, 5.50%, 20341 | | 17,071 | | 17,975 |
#605561, 5.50%, 20341 | | 36,673 | | 38,663 |
G2 4495, 4.50%, 20391 | | 130,406 | | 130,480 |
G2 4558, 4.50%, 20391 | | 302,839 | | 303,011 |
The accompanying notes are an integral part of the financial statements
82
| | |
| Schedule of Investments | | Series N |
| December 31, 2009 | | (Managed Asset Allocation Series) |
| | | | | | | |
| | | Principal
Amount | | | Value |
MORTGAGE BACKED SECURITIES—10.8% (continued) | | | | | | | |
U.S. Government Sponsored | | | | | | | |
Securities—1.3% (continued) | | | | | | | |
Pass Through’s—1.3% (continued) | | | | | | | |
Government National Mortgage Association (continued) | | | | | | | |
G2 4598, 4.50%, 20391 | | $ | 115,000 | | | $ | 115,066 |
| | | | | | | |
| | | | | | | 1,022,207 |
| | | | | | | |
| | | | | | | 1,022,207 |
| | | | | | | |
TOTAL MORTGAGE BACKED SECURITIES (cost $8,401,422) | | | | | | $ | 8,597,458 |
| | | | | | | |
| | |
| | | Principal
Amount | | | Value |
ASSET BACKED SECURITIES—1.4% | | | | | | | |
Auto—0.5% | | | | | | | |
AmeriCredit Automobile Receivables Trust | | | | | | | |
2006-RM, 5.53%, 20141 | | $ | 280,000 | | | $ | 287,418 |
Triad Auto Receivables Owner Trust | | | | | | | |
2006-B, 5.52%, 20121 | | | 100,000 | | | | 102,681 |
USAA Auto Owner Trust | | | | | | | |
2008-1, 4.16%, 20121 | | | 32,867 | | | | 33,379 |
| | | | | | | |
| | | | | | $ | 423,478 |
| | | | | | | |
Credit Cards—0.5% | | | | | | | |
Capital One Multi-Asset Execution Trust | | | | | | | |
2007-C3, 0.52%, 20131,5 | | | 70,000 | | | | 69,276 |
2005-A7, 4.70%, 20151 | | | 70,000 | | | | 73,956 |
GE Capital Credit Card Master Note Trust | | | | | | | |
2007-3, 0.53%, 20131,5 | | | 90,000 | | | | 88,279 |
2009-2, 3.69%, 20151 | | | 114,000 | | | | 116,442 |
MBNA Credit Card Master Note Trust | | | | | | | |
2006-C3, 0.52%, 20131,5 | | | 35,000 | | | | 33,257 |
| | | | | | | |
| | | | | | | 381,210 |
| | | | | | | |
Home Equity Loans—0.0% | | | | | | | |
Chase Funding Mortgage Loan Asset-Backed Certificates | | | | | | | |
2002-2, 5.60%, 20311 | | | 5,846 | | | | 2,561 |
| | | | | | | |
Other—0.3% | | | | | | | |
CNH Equipment Trust | | | | | | | |
2007-A, 5.09%, 20141 | | | 50,000 | | | | 50,859 |
CNH Wholesale Master Note Trust | | | | | | | |
2009-1A, 1.93%, 20151,2,5,6,7 | | | 100,000 | | | | 99,875 |
Greenwich Capital Commercial Funding Corporation | | | | | | | |
2007-GG9, 5.44%, 20391 | | | 50,000 | | | | 44,177 |
Marriott Vacation Club Owner Trust | | | | | | | |
2006-1A, 5.74%, 20281,2,6,7 | | | 46,056 | | | | 45,261 |
2006-2A, 5.36%, 20281,2,6,7 | | | 14,522 | | | | 14,249 |
| | | | | | | |
| | | | | | | 254,421 |
| | | | | | | |
Student Loans—0.1% | | | | | | | |
SLM Student Loan Trust | | | | | | | |
2008-4, 1.33%, 20121,5 | | | 60,000 | | | | 60,785 |
| | | | | | | |
TOTAL ASSET BACKED SECURITIES (cost $l,114,793) | | | | | | $ | 1,122,455 |
| | | | | | | |
| | |
| | | Principal
Amount | | | Value |
U.S. GOVERNMENT SPONSORED AGENCY BONDS & NOTES—0.0% | | | | | | | |
Federal Home Loan Bank | | | | | | | |
5.60%, 6/28/20111 | | $ | 10,000 | | | $ | 10,661 |
| | | | | | | |
TOTAL U.S. GOVERNMENT SPONSORED AGENCY BONDS & NOTES (cost $10,001) | | | | | | $ | 10,661 |
| | | | | | | |
| | |
| | | Principal
Amount | | | Value |
U.S. GOVERNMENT SECURITIES—5.7% | | | | | | | |
U.S. Treasury Bonds | | | | | | | |
4.75%, 2/15/2037 | | $ | 250,000 | | | $ | 255,469 |
U.S. Treasury Inflation Indexed Bonds | | | | | | | |
0.88%, 4/15/2010 | | | 228,114 | | | | 228,880 |
U.S. Treasury Note | | | | | | | |
2.38%, 8/31/2010 | | | 735,000 | | | | 744,733 |
1.75%, 8/15/2012 | | | 1,405,000 | | | | 1,414,110 |
3.13%, 9/30/2013 | | | 330,000 | | | | 342,968 |
2.25%, 5/31/2014 | | | 915,000 | | | | 908,781 |
2.63%, 7/31/2014 | | | 480,000 | | | | 482,400 |
2.63%, 4/30/2016 | | | 40,000 | | | | 38,759 |
4.00%, 8/15/2018 | | | 95,000 | | | | 97,026 |
| | | | | | | |
TOTAL U.S. GOVERNMENT SECURITIES (cost $4,523,816) | | | | | | $ | 4,513,126 |
| | | | | | | |
| | |
| | | Principal
Amount | | | Value |
SHORT TERM INVESTMENTS—3.0% | | | | | | | |
State Street GA Money Market Fund1 | | $ | 496,653 | | | $ | 496,653 |
T. Rowe Price Reserve Investment Fund1 | | | 1,866,559 | | | | 1,866,559 |
| | | | | | | |
TOTAL SHORT TERM INVESTMENTS (cost $2,363,212) | | | | | | $ | 2,363,212 |
| | | | | | | |
Total Investments—99.2% 4 (cost $74,839,178) | | | | | | $ | 78,764,405 |
Cash & Other Assets, Less Liabilities—0.8% | | | | | | | 667,204 |
| | | | | | | |
Total Net Assets—100.0% | | | | | | $ | 79,431,609 |
| | | | | | | |
|
| INVESTMENT CONCENTRATION |
|
At December 31, 2009, the investment diversification of the Series was as follows: |
Country | | % of Net
Assets | | | Value |
United States | | | 81.1 | % | | $ | 64,482,409 |
United Kingdom | | | 3.1 | | | | 2,469,433 |
Japan | | | 2.7 | | | | 2,052,638 |
France | | | 1.9 | | | | 1,412,442 |
Switzerland | | | 1.2 | | | | 995,295 |
Canada | | | 1.2 | | | | 944,090 |
Australia | | | 1.2 | | | | 923,839 |
Germany | | | 1.0 | | | | 787,418 |
Netherlands | | | 0.7 | | | | 608,465 |
Spain | | | 0.6 | | | | 488,322 |
Sweden | | | 0.5 | | | | 395,823 |
Ireland | | | 0.5 | | | | 377,964 |
Bermuda | | | 0.5 | | | | 372,347 |
Italy | | | 0.4 | | | | 353,948 |
Singapore | | | 0.3 | | | | 242,203 |
Norway | | | 0.3 | | | | 236,317 |
The accompanying notes are an integral part of the financial statements
83
| | |
| Schedule of Investments | | Series N |
| December 31, 2009 | | (Managed Asset Allocation Series) |
INVESTMENT CONCENTRATION (continued)
| | | | | | |
Country | | % of Net
Assets | | | Value |
Cayman Islands | | 0.2 | % | | $ | 220,915 |
Mexico | | 0.3 | | | | 214,828 |
Luxembourg | | 0.2 | | | | 148,572 |
Hong Kong | | 0.2 | | | | 145,361 |
Brazil | | 0.2 | | | | 135,856 |
Denmark | | 0.1 | | | | 105,750 |
Republic of Korea | | 0.1 | | | | 90,751 |
Finland | | 0.1 | | | | 88,021 |
China | | 0.1 | | | | 85,443 |
Chile | | 0.1 | | | | 77,054 |
South Africa | | 0.1 | | | | 71,175 |
Taiwan, Province of China | | 0.1 | | | | 56,672 |
Belgium | | 0.1 | | | | 51,174 |
Panama | | 0.1 | | | | 45,619 |
Austria | | 0.0 | | | | 34,106 |
Greece | | 0.0 | | | | 28,225 |
Virgin Islands (UK) | | 0.0 | | | | 17,184 |
Puerto Rico | | 0.0 | | | | 4,746 |
| | | | | | |
Total Investments | | 99.2 | | | $ | 78,764,405 |
| | | | | | |
For federal income tax purposes the identified cost of investments owned at December 31, 2009 was $76,738,965.
ADR American Depositary Receipt
plc Public Limited Company
| * | Non-income producing security |
| 1 | Value determined based on Level 2 inputs. |
| 2 | Security is deemed illiquid. The total market value of illiquid securities is $1,180,971 (cost $1,188,768), or 1.5% of total net assets. |
| 3 | Security was subject to the fair value trigger at December 31, 2009. The total market value of fair valued securities amounts to $9,581,955 (cost $9,134,560), or 12.1% of total net assets. |
| 4 | Unless otherwise indicated, the values of the securities of the Portfolio are determined based on Level 1 inputs. |
| 5 | Variable rate security. Rate indicated is rate effective at December 31, 2009. |
| 6 | Security was acquired through a private placement. |
| 7 | Security is a 144A or Section 4(2) security. The total market value of 144A or Section 4(2) securities is $2,303,093 (cost $2,237,043), or 2.9% of total net assets. |
| 8 | Security is in default of interest and/or principal obligations. |
| 9 | Security is an interest-only strip. Rate indicated is effective yield at December 31, 2009. |
The accompanying notes are an integral part of the financial statements
84
| | |
| | Series N |
| | (Managed Asset Allocation Series) |
Statement of Assets and Liabilities
December 31, 2009
| | | | |
Assets: | | | | |
Investments, at value* | | $ | 78,764,405 | |
Cash | | | 329 | |
Cash denominated in a foreign currency, at value** | | | 482 | |
Receivables: | | | | |
Fund shares sold | | | 81,201 | |
Securities sold | | | 678,604 | |
Interest | | | 254,430 | |
Dividends | | | 62,459 | |
Foreign taxes recoverable | | | 16,269 | |
Prepaid expenses | | | 1,637 | |
| | | | |
Total assets | | | 79,859,816 | |
| | | | |
| |
Liabilities: | | | | |
| |
Payable for: | | | | |
Fund shares redeemed | | | 46,783 | |
Securities purchased | | | 194,115 | |
Management fees | | | 67,468 | |
Administration fees | | | 52,120 | |
Transfer agent/maintenance fees | | | 2,083 | |
Custodian fees | | | 27,512 | |
Directors’ fees | | | 1,074 | |
Professional fees | | | 25,321 | |
Other fees | | | 11,731 | |
| | | | |
Total liabilities | | | 428,207 | |
| | | | |
Net assets | | $ | 79,431,609 | |
| | | | |
| |
Net assets consist of: | | | | |
Paid in capital | | $ | 87,883,239 | |
Undistributed net investment income | | | 976,274 | |
Accumulated net realized loss on sale of investments | | | (13,352,050 | ) |
Net unrealized appreciation in value of investments | | | 3,924,146 | |
| | | | |
Net assets | | $ | 79,431,609 | |
| | | | |
| |
Capital shares authorized | | | unlimited | |
Capital shares outstanding | | | 4,415,377 | |
Net asset value per share (net assets divided by shares outstanding) | | $ | 17.99 | |
| | | | |
| |
* investments, at cost | | $ | 74,839,178 | |
** Cash denominated in a foreign currency, at cost | | | 464 | |
Statement of Operations
For Year Ended December 31, 2009
| | | | |
Investment Income: | | | | |
Dividends (net of foreign withholding tax $41,226) | | $ | 1,211,191 | |
Interest | | | 1,299,269 | |
| | | | |
Total investment income | | | 2,510,460 | |
| | | | |
Expenses: | | | | |
Management fees | | | 743,569 | |
Administration fees | | | 277,883 | |
Transfer agent/maintenance fees | | | 25,291 | |
Custodian fees | | | 127,134 | |
Directors’ fees | | | 8,272 | |
Professional fees | | | 33,246 | |
Reports to shareholders | | | 12,141 | |
Other | | | 8,532 | |
| | | | |
Total expenses | | | 1,236,068 | |
| | | | |
Net investment income | | | 1,274,392 | |
| | | | |
| |
Net Realized and Unrealized Gain (Loss): | | | | |
Net realized gain (loss) during the year on: | | | | |
Investments | | | (6,684,465 | ) |
Foreign currency transactions | | | (10,731 | ) |
| | | | |
Net realized loss | | | (6,695,196 | ) |
| | | | |
| |
Net unrealized appreciation (depreciation) during the year on: | | | | |
Investments | | | 22,081,939 | |
Translation of assets and liabilities in foreign currencies | | | 529 | |
| | | | |
Net unrealized appreciation | | | 22,082,468 | |
| | | | |
Net realized and unrealized gain | | | 15,387,272 | |
| | | | |
Net increase in net assets resulting from operations | | $ | 16,661,664 | |
| | | | |
The accompanying notes are an integral part of the financial statements
85
| | |
| | Series N |
| Statement of Changes in Net Assets | | (Managed Asset Allocation Series) |
| | | | | | | | |
| | | Year Ended
December 31, 2009 | | | Year Ended
December 31, 2008 | |
Increase (decrease) in net assets from operations: | | | | | | | | |
Net investment income | | $ | 1,274,392 | | | $ | 1,937,569 | |
Net realized loss during the year on investments | | | (6,695,196 | ) | | | (6,196,875 | ) |
Net unrealized appreciation (depreciation) during the year on investments | | | 22,082,468 | | | | (26,102,064 | ) |
| | | | | | | | |
Net increase (decrease) in net assets resulting from operations | | | 16,661,664 | | | | (30,361,370 | ) |
| | | | | | | | |
| | |
Capital share transactions: | | | | | | | | |
Proceeds from sale of shares | | | 9,550,796 | | | | 25,871,130 | |
Cost of shares redeemed | | | (23,202,268 | ) | | | (36,511,309 | ) |
| | | | | | | | |
Net decrease from capital share transactions | | | (13,651,472 | ) | | | (10,640,179 | ) |
| | | | | | | | |
Net increase (decrease) in net assets | | | 3,010,192 | | | | (41,001,549 | ) |
| | | | | | | | |
| | |
Net assets: | | | | | | | | |
Beginning of year | | | 76,421,417 | | | | 117,422,966 | |
| | | | | | | | |
End of year | | $ | 79,431,609 | | | $ | 76,421,417 | |
| | | | | | | | |
| | |
Undistributed net investment income at end of year | | $ | 976,274 | | | $ | 1,692,780 | |
| | | | | | | | |
| | |
Capital share activity: | | | | | | | | |
Shares sold | | | 629,934 | | | | 1,491,277 | |
Shares redeemed | | | (1,553,545 | ) | | | (2,121,410 | ) |
| | | | | | | | |
Total capital share activity | | | (923,611 | ) | | | (630,133 | ) |
| | | | | | | | |
The accompanying notes are an integral part of the financial statements
86
| | |
| Financial Highlights | | Series N |
Selected data for each share of capital stock outstanding throughout each year | | (Managed Asset Allocation Series) |
| | | | | | | | | | | | | | | | | | | | |
| | | 2009 | | | 2008 | | | 2007 | | | 2006 | | | Year Ended
December 31,
2005 | |
Per Share Data | | | | | | | | | | | | | | | | | | | | |
Net asset value, beginning of period | | $ | 14.31 | | | $ | 19.67 | | | $ | 18.55 | | | $ | 16.55 | | | $ | 15.86 | |
| | | | | | | | | | | | | | | | | | | | |
Income (loss) from investment operations: | | | | | | | | | | | | | | | | | | | | |
Net investment incomea | | | 0.27 | | | | 0.34 | | | | 0.32 | | | | 0.30 | | | | 0.23 | |
Net gain (loss) on securities (realized and unrealized) | | | 3.41 | | | | (5.70 | ) | | | 0.80 | | | | 1.70 | | | | 0.46 | |
| | | | | | | | | | | | | | | | | | | | |
Total from investment operations | | | 3.68 | | | | (5.36 | ) | | | 1.12 | | | | 2.00 | | | | 0.69 | |
| | | | | | | | | | | | | | | | | | | | |
Net asset value, end of period | | $ | 17.99 | | | $ | 14.31 | | | $ | 19.67 | | | $ | 18.55 | | | $ | 16.55 | |
| | | | | | | | | | | | | | | | | | | | |
| | | | | |
Total Returnb | | | 25.72 | % | | | (27.25 | )% | | | 6.04 | % | | | 12.08 | % | | | 4.35 | % |
| | | | | | | | | | | | | | | | | | | | |
Ratios/Supplemental Data | | | | | | | | | | | | | | | | | | | | |
Net assets, end of period (in thousands) | | $ | 79,432 | | | $ | 76,421 | | | $ | 117,423 | | | $ | 105,300 | | | $ | 97,690 | |
| | | | | | | | | | | | | | | | | | | | |
Ratios to average net assets: | | | | | | | | | | | | | | | | | | | | |
Net investment income | | | 1.71 | % | | | 1.94 | % | | | 1.63 | % | | | 1.63 | % | | | 1.44 | % |
Total expensesc | | | 1.66 | % | | | 1.52 | % | | | 1.41 | % | | | 1.41 | % | | | 1.41 | % |
Net expensesd | | | 1.66 | % | | | 1.52 | % | | | 1.41 | % | | | 1.40 | % | | | 1.41 | % |
Net expenses prior to custodian earnings credits and net of expense waivers | | | 1.66 | % | | | 1.52 | % | | | 1.41 | % | | | 1.41 | % | | | 1.41 | % |
| | | | | | | | | | | | | | | | | | | | |
Portfolio turnover rate | | | 46 | % | | | 82 | % | | | 75 | % | | | 63 | % | | | 67 | % |
| a | Net investment income (loss) was computed using average shares outstanding throughout the period. |
| b | Total return does not take into account any of the expenses associated with an investment in variable insurance products offered by Security Benefit Life Insurance Company. If total return had taken into account these expenses, performance would have been lower. Shares of a series of SBL Fund are available only through the purchase of such products. |
| c | Total expense information reflects the expense ratios absent expense reductions by the Investment Manager and custodian earnings credits, as applicable. |
| d | Net expense information reflects the expense ratios after voluntary expense waivers, reimbursements and custodian earnings credits, as applicable. |
The accompanying notes are an integral part of the financial statements
87
This page left blank intentionally.
88
| | |
| Managers’ Commentary | | |
February 15, 2010 | | |
| | | | |
| | Advised by: | | |
To Our Shareholders:
Series O of the SBL Fund – All Cap Value Series returned 33.01%1 during the period, besting the benchmark Russell 3000 Value Index’s return of 19.76°% and the Series’ peer group median return of 24.28%.
Our strategy is to buy companies, across the market capitalization spectrum, trading at a significant discount to their intrinsic value. Our investment approach is a defined and disciplined process with three clear philosophical tenants that drive our investment decisions: a valuation focus, a long-term perspective and an opportunistic approach.
Our investment process is fundamentally driven and quantitatively aided. We use proprietary screens to identify potential companies for investment and then perform rigorous fundamental analysis to identify the best ideas. Through this fundamental research, we determine an estimate of intrinsic value and thus a valuation target for each idea. We construct the portfolios based on the level of conviction generated by this bottom-up analysis and the upside/downside profile associated with each company.
Industrials, Health Care, Energy Top Performers
The leading three sectors in the Series outperformed due to superior stock selection.
The Series’ industrials holdings, which were a double overweight position, gained 35% compared to the 15% return of the Index. McDermott International, Inc. and Power-One, Inc. soared 143% and 266% during the period. Union Pacific Corporation was another strong performer in the sector.
Holdings in the energy sector were an underweight position but outperformed the benchmark. Global Industries, Ltd. gained 104% while Haliburton Company and Chesapeake Energy Corporation gained 68% and 62%, respectively.
Another underweight sector in the Series was health care, but a return of 80% was significantly higher than the 23% of the Russell 3000 Value Index. Leading securities for the Series included Schering-Plough Corporation and Hospira, Inc.
Financials Disappoint
The only sector in the Series that significantly underperformed was financials. The sector held 16% of the portfolio, a material underweight to the 24% position for the Index. However, stock selection for the portfolio amounted to a loss of 4% during the period while financials in the benchmark gained 12%, a 16% advantage.
The largest drop in the portfolio was registered by Capital One Financial Corporation with a dropped of 71%. Other detractors were Wilmington Trust, down 44%, and W.R. Berkley Corporation, down 20%.
Market Outlook
Our bottom-up approach looks at market uncertainty in the context of the potential long-term impact on individual companies. We are maintaining flexibility in the portfolios to take advantage of these opportunities as they arise. Our focus is on identifying companies with the ability to be substantially better over the next three to five years or have the potential to maintain their return on capital at current levels in a difficult economic environment. We are confident in our ability to find these companies and we are pleased with the positions we own today.
We believe that investing is a long-term pursuit that requires patience and a consistent approach. We recognize there are many investment fund alternatives available today and thank you for your business and the confidence you place in us.
Sincerely,
James Schier, Portfolio Manager
Mark A. Mitchell, Portfolio Manager
| 1 | Fee waivers and/or reimbursements reduce Series expenses and in the absence of such waivers, the performance quoted would be reduced. |
89
| | |
| | Series O |
| Performance Summary | | (All Cap Value Series) |
| December 31, 2009 | | (unaudited) |
PERFORMANCE
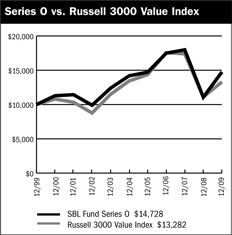
$10,000 Over 10 Years
The chart above assumes a hypothetical $10,000 investment in Series O (All Cap Value Series) on December 31, 1999, and reflects the fees and expenses of Series O. The Russell 3000 Index measures the performance of the broad value segment of the U.S equity universe. It includes those Russell 3000 companies with lower price-to-book ratios and lower forcasted growth values.
Average Annual Returns
| | | | | | | | | |
Periods Ended 12-31-091 | | 1 Year | | | 5 Years | | | 10 Years | |
Series O | | 33.01 | % | | 0.75 | % | | 3.95 | % |
| 1 | Performance figures do not reflect fees and expenses associated with an investment in variable insurance products offered by Security Benefit Life Insurance Company. If returns had taken into account these fees and expenses, performance would have been lower. Shares of a Series of SBL Fund are available only through the purchase of such products. |
The performance data quoted above represents past performance. Past performance is not predictive of future performance. The investment return and principal value of an investment will fluctuate so that an investor’s shares, when redeemed, may be worth more or less than their original cost.
Portfolio Composition by Sector
| | | |
Consumer Discretionary | | 9.79 | % |
Consumer Staples | | 8.44 | |
Energy | | 12.89 | |
Financials | | 16.25 | |
Health Care | | 6.45 | |
Industrials | | 22.83 | |
Information Technology | | 12.34 | |
Materials | | 3.43 | |
Telecommunication Services | | 1.28 | |
Utilities | | 6.58 | |
Liabilities, Less Cash & Other Assets | | (0.28 | ) |
Total Net Assets | | 100.00 | % |
| | | |
The accompanying notes are an integral part of the financial statements
90
| | |
| Schedule of Investments | | Series O |
| December 31, 2009 | | (All Cap Value Series) |
| | | | | |
| | | Shares | | Value |
COMMON STOCKS—100.3% | | | | | |
Aerospace & Defense—3.6% | | | | | |
GeoEye, Inc. * | | 42,300 | | $ | 1,179,324 |
Orbital Sciences Corporation * | | 48,821 | | | 745,008 |
Precision Castparts Corporation | | 2,410 | | | 265,944 |
United Technologies Corporation | | 53,000 | | | 3,678,730 |
| | | | | |
| | | | | 5,869,006 |
| | | | | |
Air Freight & Logistics—2.4% | | | | | |
FedEx Corporation | | 46,500 | | | 3,880,425 |
| | | | | |
Apparel Retail—1.2% | | | | | |
Brown Shoe Company, Inc. | | 74,900 | | | 739,263 |
Chico’s FAS, Inc. * | | 70,000 | | | 983,500 |
Talbots, Inc. | | 25,209 | | | 224,612 |
| | | | | |
| | | | | 1,947,375 |
| | | | | |
Apparel, Accessories & Luxury Goods—0.5% | | | | | |
Fossil, Inc. 1,* | | 4,100 | | | 137,596 |
Maidenform Brands, Inc. * | | 37,600 | | | 627,544 |
| | | | | |
| | | | | 765,140 |
| | | | | |
Application Software—0.8% | | | | | |
Synopsys, Inc. * | | 57,600 | | | 1,283,328 |
| | | | | |
Asset Management & Custody Banks—1.3% | | | | | |
Bank of New York Mellon Corporation | | 75,600 | | | 2,114,532 |
| | | | | |
Biotechnology—0.0% | | | | | |
Combinatorx, Inc. * | | 74,696 | | | 61,998 |
| | | | | |
Building Products—2.1% | | | | | |
Trex Company, Inc. * | | 34,800 | | | 682,080 |
USG Corporation * | | 192,200 | | | 2,700,410 |
| | | | | |
| | | | | 3,382,490 |
| | | | | |
Coal & Consumable Fuels—0.2% | | | | | |
Evergreen Energy, Inc. * | | 189,894 | | | 65,134 |
USEC, Inc. * | | 63,070 | | | 242,819 |
| | | | | |
| | | | | 307,953 |
| | | | | |
Communications Equipment—0.4% | | | | | |
Symmetricom, Inc. 2,* | | 129,300 | | | 672,360 |
| | | | | |
Computer Hardware—1.9% | | | | | |
Hewlett-Packard Company | | 60,400 | | | 3,111,204 |
| | | | | |
Construction & Engineering—1.8% | | | | | |
Insituform Technologies, Inc. * | | 47,900 | | | 1,088,288 |
Quanta Services, Inc. * | | 39,900 | | | 831,516 |
URS Corporation * | | 23,200 | | | 1,032,864 |
| | | | | |
| | | | | 2,952,668 |
| | | | | |
Construction & Farm Machinery & Heavy Trucks—0.2% | | | | | |
Force Protection, Inc. * | | 77,600 | | | 404,296 |
| | | | | |
Construction Materials—0.2% | | | | | |
Eagle Materials, Inc. | | 11,723 | | | 305,384 |
| | | | | |
Consumer Finance—0.3% | | | | | |
First Marblehead Corporation * | | 251,005 | | | 534,641 |
| | | | | |
Data Processing & Outsourced Services—5.6% | | | | | |
Affiliated Computer Services, Inc. * | | 16,700 | | | 996,823 |
Computer Sciences Corporation * | | 55,400 | | | 3,187,162 |
Western Union Company | | 254,100 | | | 4,789,785 |
| | | | | |
| | | | | 8,973,770 |
| | | | | |
Department Stores—1.5% | | | | | |
JC Penney Company, Inc. | | 91,400 | | | 2,432,154 |
| | | | | |
Diversified Banks—2.5% | | | | | |
U.S. Bancorp | | 62,639 | | | 1,410,004 |
Wells Fargo & Company | | 98,495 | | | 2,658,380 |
| | | | | |
| | | | | 4,068,384 |
| | | | | |
Diversified Chemicals—1.4% | | | | | |
Dow Chemical Company | | 81,000 | | | 2,238,030 |
| | | | | |
Drug Retail—1.3% | | | | | |
CVS Caremark Corporation | | 65,300 | | | 2,103,313 |
| | | | | |
Electric Utilities—4.4% | | | | | |
Allete, Inc. | | 28,098 | | | 918,243 |
Edison International | | 112,700 | | | 3,919,705 |
Great Plains Energy, Inc. | | 47,192 | | | 915,053 |
Northeast Utilities | | 27,064 | | | 697,981 |
Westar Energy, Inc. | | 25,400 | | | 551,942 |
| | | | | |
| | | | | 7,002,924 |
| | | | | |
Electrical Components & Equipment—1.0% | | | | | |
General Cable Corporation * | | 28,000 | | | 823,760 |
Power-One, Inc. * | | 172,800 | | | 751,680 |
| | | | | |
| | | | | 1,575,440 |
| | | | | |
Electronic Manufacturing Services—2.5% | | | | | |
Maxwell Technologies, Inc. * | | 68,700 | | | 1,225,608 |
Tyco Electronics, Ltd. | | 115,600 | | | 2,837,980 |
| | | | | |
| | | | | 4,063,588 |
| | | | | |
Environmental & Facilities Services—0.3% | | | | | |
Covanta Holding Corporation * | | 31,000 | | | 560,790 |
| | | | | |
Forest Products—0.7% | | | | | |
Louisiana-Pacific Corporation * | | 164,000 | | | 1,144,720 |
| | | | | |
Gas Utilities—0.5% | | | | | |
Atmos Energy Corporation | | 28,500 | | | 837,900 |
| | | | | |
Health Care Equipment—3.7% | | | | | |
Covidien plc | | 49,500 | | | 2,370,555 |
Hologic, Inc. * | | 39,593 | | | 574,099 |
Hospira, Inc. * | | 60,000 | | | 3,060,000 |
| | | | | |
| | | | | 6,004,654 |
| | | | | |
Health Care Services—1.6% | | | | | |
Amedisys, Inc. * | | 9,200 | | | 446,752 |
Medco Health Solutions, Inc. * | | 7,200 | | | 460,152 |
Mednax, Inc. * | | 17,500 | | | 1,052,100 |
RehabCare Group, Inc. * | | 18,370 | | | 558,999 |
| | | | | |
| | | | | 2,518,003 |
| | | | | |
Highways & Railtracks—0.1% | | | | | |
Quixote Corporation | | 26,100 | | | 166,257 |
| | | | | |
The accompanying notes are an integral part of the financial statements
91
| | |
| Schedule of Investments | | Series O |
| December 31, 2009 | | (All Cap Value Series) |
| | | | | |
| | | Shares | | Value |
COMMON STOCKS—100.3% (continued) | | | | | |
Home Furnishings—0.6% | | | | | |
Leggett & Platt, Inc. | | 51,200 | | $ | 1,044,480 |
| | | | | |
Home Improvement Retail—2.7% | | | | | |
Lowe’s Companies, Inc. | | 188,000 | | | 4,397,320 |
| | | | | |
Human Resources & Employment Services—0.4% | | | | | |
Administaff, Inc. | | 24,100 | | | 568,519 |
| | | | | |
Hypermarkets & Super Centers—2.6% | | | | | |
Wal-Mart Stores, Inc. | | 79,000 | | | 4,222,550 |
| | | | | |
Independent Power Producers & Energy Traders—0.8% | | | | | |
NRG Energy, Inc. * | | 53,800 | | | 1,270,218 |
| | | | | |
Industrial Conglomerates—2.2% | | | | | |
McDermott International, Inc. * | | 145,800 | | | 3,500,658 |
| | | | | |
Industrial Machinery—2.6% | | | | | |
Dover Corporation | | 30,100 | | | 1,252,461 |
Harsco Corporation | | 28,400 | | | 915,332 |
Parker Hannifin Corporation | | 37,642 | | | 2,028,151 |
| | | | | |
| | | | | 4,195,944 |
| | | | | |
Insurance Brokers—1.1% | | | | | |
AON Corporation | | 42,000 | | | 1,610,280 |
Arthur J Gallagher & Company | | 7,700 | | | 173,327 |
| | | | | |
| | | | | 1,783,607 |
| | | | | |
Integrated Oil & Gas—5.1% | | | | | |
Chevron Corporation | | 41,200 | | | 3,171,989 |
ConocoPhillips | | 45,900 | | | 2,344,113 |
Exxon Mobil Corporation | | 39,700 | | | 2,707,143 |
| | | | | |
| | | | | 8,223,245 |
| | | | | |
Integrated Telecommunication Services—1.3% | | | | | |
Windstream Corporation | | 188,000 | | | 2,066,120 |
| | | | | |
Internet Software & Services—0.1% | | | | | |
AOL, Inc. * | | 8,951 | | | 208,379 |
| | | | | |
IT Consulting & Other Services—0.2% | | | | | |
Satyam Computer Services, Ltd. ADR | | 74,036 | | | 341,306 |
| | | | | |
Managed Health Care—0.8% | | | | | |
Aetna, Inc. | | 39,900 | | | 1,264,830 |
| | | | | |
Movies & Entertainment—1.8% | | | | | |
Time Warner, Inc. | | 98,466 | | | 2,869,299 |
| | | | | |
Multi-Line Insurance—0.7% | | | | | |
American Financial Group, Inc. 1 | | 47,800 | | | 1,192,610 |
| | | | | |
Multi-Utilities—0.9% | | | | | |
Alliant Energy Corporation | | 31,400 | | | 950,164 |
Black Hills Corporation | | 22,000 | | | 585,860 |
| | | | | |
| | | | | 1,536,024 |
| | | | | |
Office Services & Supplies—0.2% | | | | | |
United Stationers, Inc. * | | 4,895 | | $ | 278,281 |
| | | | | |
Oil & Gas Equipment & Services—2.8% | | | | | |
Complete Production Services, Inc. * | | 16,200 | | | 210,600 |
Global Industries, Ltd. * | | 203,002 | | | 1,447,404 |
Halliburton Company | | 94,800 | | | 2,852,532 |
| | | | | |
| | | | | 4,510,536 |
| | | | | |
Oil & Gas Exploration & Production—2.5% | | | | | |
Chesapeake Energy Corporation | | 85,700 | | | 2,217,916 |
Goodrich Petroleum Corporation * | | 16,026 | | | 390,233 |
Gulfport Energy Corporation * | | 31,900 | | | 365,255 |
| | | | |
Petrohawk Energy Corporation 1,* | | 47,800 | | 1,146,722 |
| | | | |
| | | | 4,120,126 |
| | | | |
Oil & Gas Storage & Transportation—2.3% | | | | |
Southern Union Company | | 50,900 | | 1,155,430 |
Williams Companies, Inc. | | 121,300 | | 2,557,004 |
| | | | |
| | | | 3,712,434 |
| | | | |
Other Diversified Financial Services—1.0% | | | | |
JPMorgan Chase & Company | | 39,400 | | 1,641,798 |
| | | | |
Packaged Foods & Meats—3.0% | | | | |
Hormel Foods Corporation 1 | | 42,100 | | 1,618,745 |
JM Smucker Company | | 23,300 | | 1,438,775 |
Ralcorp Holdings, Inc. * | | 6,300 | | 376,173 |
TreeHouse Foods, Inc. * | | 37,000 | | 1,437,820 |
| | | | |
| | | | 4,871,513 |
| | | | |
Paper Packaging—0.9% | | | | |
Bemis Company, Inc. | | 21,400 | | 634,510 |
Sonoco Products Company | | 29,900 | | 874,575 |
| | | | |
| | | | 1,509,085 |
| | | | |
Pharmaceuticals—0.4% | | | | |
Merck & Company, Inc. | | 16,493 | | 602,654 |
| | | | |
Property & Casualty Insurance—6.5% | | | | |
Alleghany Corporation * | | 3,570 | | 985,320 |
Berkshire Hathaway, Inc. (CI.B) * | | 1,766 | | 5,803,076 |
Employers Holdings, Inc. | | 33,000 | | 506,220 |
Hanover Insurance Group, Inc. | | 37,700 | | 1,675,011 |
W.R. Berkley Corporation | | 58,300 | | 1,436,512 |
| | | | |
| | | | 10,406,139 |
| | | | |
Railroads—1.9% | | | | |
Union Pacific Corporation | | 49,200 | | 3,143,880 |
| | | | |
Regional Banks—2.9% | | | | |
Associated Banc-Corporation | | 46,270 | | 509,433 |
BB&T Corporation | | 62,400 | | 1,583,088 |
Fifth Third Bancorp | | 50,000 | | 487,500 |
Old National Bancorp | | 19,545 | | 242,944 |
Regions Financial Corporation | | 331,500 | | 1,753,635 |
| | | | |
| | | | 4,576,600 |
| | | | |
Research & Consulting Services—3.6% | | | | |
Equifax, Inc. | | 153,600 | | 4,744,703 |
ICF International, Inc. * | | 11,100 | | 297,480 |
The accompanying notes are an integral part of the financial statements
92
| | |
| Schedule of Investments | | Series O |
| December 31, 2009 | | (All Cap Value Series) |
| | | | | | |
| | | Shares | | Value | |
COMMON STOCKS—100.3% (continued) | | | | | | |
Research & Consulting Services—3.6% (continued) | | | | | | |
Navigant Consulting, Inc. * | | 58,500 | | $ | 869,310 | |
| | | | | | |
| | | | | 5,911,493 | |
| | | | | | |
Restaurants—0.8% | | | | | | |
Burger King Holdings, Inc. | | 46,466 | | | 874,490 | |
Jack in the Box, Inc. * | | 20,000 | | | 393,400 | |
| | | | | | |
| | | | | 1,267,890 | |
| | | | | | |
Semiconductors—0.8% | | | | | | |
IXYS Corporation 2 | | 177,900 | | | 1,320,018 | |
| | | | | | |
Specialty Chemicals—0.2% | | | | | | |
HB Fuller Company | | 2,588 | | | 58,877 | |
Zoltek Companies, Inc. * | | 30,900 | | | 293,550 | |
| | | | | | |
| | | | | 352,427 | |
| | | | | | |
Specialty Stores—0.7% | | | | | | |
Cabela’s, Inc. * | | 79,237 | | | 1,129,920 | |
| | | | | | |
Tobacco—1.5% | | | | | | |
Philip Morris International, Inc. | | 51,300 | | | 2,472,147 | |
| | | | | | |
Trucking—0.4% | | | | | | |
Saia, Inc. * | | 39,000 | | | 577,980 | |
| | | | | | |
TOTAL COMMON STOCKS (cost $170,821,820) | | | | $ | 162,372,757 | |
| | | | | | |
Total Investments—100.3% 3 (cost $170,821,820) | | | | $ | 162,372,757 | |
Liabilities, Less Cash & Other Assets—(0.3)% | | | | | (454,944 | ) |
| | | | | | |
Total Net Assets—100.0% | | | | $ | 161,917,813 | |
| | | | | | |
For federal income tax purposes the identified cost of investments owned at December 31, 2009 was $170,845,470.
| ADR | American Depositary Receipt |
| plc | Public Limited Company |
| * | Non-income producing security |
| 1 | Security is segregated as collateral for open written option contracts. |
| 2 | Security is deemed illiquid. The total market value of illiquid securities is $1,992,378 (cost $2,784,387), or 1.2% of total net assets. |
| 3 | Unless otherwise indicated, the values of the securities of the Portfolio are determined based on Level 1 inputs. |
The accompanying notes are an integral part of the financial statements
93
| | |
| | Series O |
| | (All Cap Value Series) |
Statement of Assets and Liabilities
December 31, 2009
| | | | |
Assets: | | | | |
Investments, at value* | | $ | 162,372,757 | |
Cash | | | 345,833 | |
Receivables: | | | | |
Fund shares sold | | | 192,969 | |
Securities sold | | | 385,836 | |
Dividends | | | 234,986 | |
Security Investors | | | 3,615 | |
Prepaid expenses | | | 3,001 | |
| | | | |
Total assets | | | 163,538,997 | |
| | | | |
| |
Liabilities: | | | | |
Payable for: | | | | |
Fund shares redeemed | | | 62,181 | |
Securities purchased | | | 1,207,018 | |
Written options, at value (premiums received $144,915) | | | 177,195 | |
Management fees | | | 95,518 | |
Administration fees | | | 13,113 | |
Transfer agent/maintenance fees | | | 2,083 | |
Custodian fees | | | 769 | |
Directors’ fees | | | 6,240 | |
Professional fees | | | 32,000 | |
Other fees | | | 25,067 | |
| | | | |
Total liabilities | | | 1,621,184 | |
| | | | |
Net assets | | $ | 161,917,813 | |
| | | | |
| |
Net assets consist of: | | | | |
Paid in capital | | $ | 199,564,813 | |
Undistributed net investment income | | | 1,474,436 | |
Accumulated net realized loss on sale of investments | | | (30,640,093) | |
Net unrealized depreciation in value of investments | | | (8,481,343 | ) |
| | | | |
Net assets | | $ | 161,917,813 | |
| | | | |
| |
Capital shares authorized | | | unlimited | |
Capital shares outstanding | | | 8,461,513 | |
Net asset value per share (net assets divided by shares outstanding) | | $ | 19.14 | |
| | | | |
| |
*Investments, at cost | | $ | 170,821,820 | |
Statement of Operations
For Year Ended December 31, 2009
| | | | |
Investment Income: | | | | |
Dividends | | $ | 2,727,689 | |
Interest | | | 2,237 | |
| | | | |
Total investment income | | | 2,729,926 | |
| | | | |
| |
Expenses: | | | | |
Management fees | | | 1,033,934 | |
Administration fees | | | 140,772 | |
Transfer agent/maintenance fees | | | 25,304 | |
Custodian fees | | | 3,653 | |
Directors’ fees | | | 17,653 | |
Professional fees | | | 33,652 | |
Reports to shareholders | | | 24,775 | |
Other | | | 12,736 | |
| | | | |
Total expenses | | | 1,292,479 | |
Reimbursement of expenses | | | (36,989 | ) |
| | | | |
Net expenses | | | 1,255,490 | |
| | | | |
Net investment income | | | 1,474,436 | |
| | | | |
| |
Net Realized and Unrealized Gain (Loss): | | | | |
Net realized gain (loss) during the year on: | | | | |
Investments | | | (12,511,431 | ) |
Options written | | | 288,764 | |
| | | | |
Net realized loss | | | (12,222,667 | ) |
| | | | |
| |
Net unrealized appreciation (depreciation) during the year on: | | | | |
Investments | | | 51,539,250 | |
Options written | | | (77,500 | ) |
| | | | |
Net unrealized appreciation | | | 51,461,750 | |
| | | | |
Net realized and unrealized gain | | | 39,239,083 | |
| | | | |
Net increase in net assets resulting from operations | | $ | 40,713,519 | |
| | | | |
The accompanying notes are an integral part of the financial statements
94
| | |
| | Series O |
| Statement of Changes in Net Assets | | (All Cap Value Series) |
| | | | | | | | |
| | | Year Ended
December 31,2009 | | | Year Ended
December 31,2008 | |
Increase (decrease) in net assets from operations: | | | | | | | | |
Net investment income | | $ | 1,474,436 | | | $ | 4,095,123 | |
Net realized loss during the year on investments | | | (12,222,667 | ) | | | (17,206,865 | ) |
Net unrealized appreciation (depreciation) during the year on investments | | | 51,461,750 | | | | (94,226,726 | ) |
| | | | | | | | |
Net increase (decrease) in net assets resulting from operations | | | 40,713,519 | | | | (107,338,468 | ) |
| | | | | | | | |
| | |
Capital share transactions: | | | | | | | | |
Proceeds from sale of shares | | | 18,436,280 | | | | 128,467,594 | |
Cost of shares redeemed | | | (53,865,932 | ) | | | (152,728,104 | ) |
| | | | | | | | |
Net decrease from capital share transactions | | | (35,429,652 | ) | | | (24,260,510 | ) |
| | | | | | | | |
Net increase (decrease) in net assets | | | 5,283,867 | | | | (131,598,978 | ) |
| | | | | | | | |
| | |
Net assets: | | | | | | | | |
Beginning of year | | | 156,633,946 | | | | 288,232,924 | |
| | | | | | | | |
End of year | | $ | 161,917,813 | | | $ | 156,633,946 | |
| | | | | | | | |
| | |
Undistributed net investment income at end of year | | $ | 1,474,436 | | | $ | 4,037,889 | |
| | | | | | | | |
| | |
Capital share activity: | | | | | | | | |
Shares sold | | | 1,210,470 | | | | 6,181,412 | |
Shares redeemed | | | (3,632,455 | ) | | | (7,629,934 | ) |
| | | | | | | | |
Total capital share activity | | | (2,421,985 | ) | | | (1,448,522 | ) |
| | | | | | | | |
The accompanying notes are an integral part of the financial statements
95
| | |
| Financial Highlights | | Series O |
| Selected data for each share of capital stock outstanding throughout each year | | (All Cap Value Series) |
| | | | | | | | | | | | | | | | | | | | |
| | | 2009 | | | 2008a,b | | | 2007 | | | 2006 | | | Year Ended
December 31,
2005 | |
Per Share Data | | | | | | | | | | | | | | | | | | | | |
Net asset value, beginning of period | | $ | 14.39 | | | $ | 23.37 | | | $ | 22.73 | | | $ | 19.13 | | | $ | 18.44 | |
| | | | | | | | | | | | | | | | | | | | |
Income (loss) from investment operations: | | | | | | | | | | | | | | | | | | | | |
Net investment incomec | | | 0.16 | | | | 0.34 | | | | 0.34 | | | | 0.31 | | | | 0.23 | |
Net gain (loss) on securities (realized and unrealized) | | | 4.59 | | | | (9.32 | ) | | | 0.30 | | | | 3.29 | | | | 0.46 | |
| | | | | | | | | | | | | | | | | | | | |
Total from investment operations | | | 4.75 | | | | (8.98 | ) | | | 0.64 | | | | 3.60 | | | | 0.69 | |
| | | | | | | | | | | | | | | | | | | | |
Net asset value, end of period | | $ | 19.14 | | | $ | 14.39 | | | $ | 23.37 | | | $ | 22.73 | | | $ | 19.13 | |
| | | | | | | | | | | | | | | | | | | | |
| | | | | |
Total Returnd | | | 33.01 | % | | | (38.43 | )% | | | 2.82 | % | | | 18.82 | % | | | 3.74 | % |
| | | | | | | | | | | | | | | | | | | | |
Ratios/Supplemental Data | | | | | | | | | | | | | | | | | | | | |
Net assets, end of period (in thousands) | | $ | 161,918 | | | $ | 156,634 | | | $ | 288,233 | | | $ | 295,049 | | | $ | 259,728 | |
| | | | | | | | | | | | | | | | | | | | |
Ratios to average net assets: | | | | | | | | | | | | | | | | | | | | |
Net investment income | | | 1.00 | % | | | 1.72 | % | | | 1.42 | % | | | 1.41 | % | | | 1.29 | % |
Total expenses e | | | 0.87 | % | | | 1.09 | % | | | 1.14 | % | | | 1.15 | % | | | 1.15 | % |
Net expensesf | | | 0.85 | % | | | 1.07 | % | | | 1.14 | % | | | 1.15 | % | | | 1.15 | % |
Net expenses prior to custodian earnings credits and net of expense waivers | | | 0.85 | % | | | 1.07 | % | | | 1.14 | % | | | 1.15 | % | | | 1.15 | % |
| | | | | | | | | | | | | | | | | | | | |
Portfolio turnover rate | | | 19 | % | | | 124 | %g | | | 25 | % | | | 18 | % | | | 20 | % |
| a | Security Global Investors, LLC (SGI) became the advisor of Series 0 effective August 15, 2008. Prior to August 15, 2008, SGI paid T. Rowe Price for sub-advisory services. |
| b | Effective August 15, 2008 the Series name became All Cap Value Series. Prior to August 15, 2008 the Series was known as the Equity Income Series. |
| c | Net investment income (loss) was computed using average shares outstanding throughout the period. |
| d | Total return does not take into account any of the expenses associated with an investment in variable insurance products offered by Security Benefit Life Insurance Company. If total return had taken into account these expenses, performance would have been lower. Shares of a series of SBL Fund are available only through the purchase of such products. |
| e | Total expense information reflects the expense ratios absent expense reductions by the Investment Manager and custodian earnings credits, as applicable. |
| f | Net expense information reflects the expense ratios after voluntary expense waivers, reimbursements and custodian earnings credits, as applicable. |
| g | Significant variation in the portfolio turnover rate is due to Investment Manager’s appointment of new portfolio manager for the Series. |
The accompanying notes are an integral part of the financial statements
96
| | |
| Manager’s Commentary | | |
| February 15, 2010 | | |
| | | | |
| | Advised by: | | |
To Our Shareholders:
Series P of the SBL Fund – High Yield Series recorded a gain of 73.52% for the year ended December 31, 2009, outperforming the 58.2l% performance of its benchmark, the Barclays Capital U.S. High Yield Bond Index by more than 1,500 basis points. The Series outpaced its peer group median return of 46.08% by an even greater amount.
The High Yield Series will primarily invest in a diversified portfolio consisting of a broad range of high yield, high-risk debt securities rated below the top four long-term credit rating categories and maintain a dollar-weighted average duration of 3 to 15 years.
The Series’ investment approach uses a bottom-up process in selecting high yield securities. We emphasize rigorous credit analysis and relative value in selecting securities. Credit analysis includes assessing factors such as an issuer’s management experience, its debt service coverage or ability to make interest payments on its debt, cash flow, and general economic and market factors. Relative value analysis compares the credit risk and yield of a security to that of other securities. We search for securities that appear to be inexpensive relative to comparable securities and securities that have the potential for an upgrade of their credit rating. A rating upgrade would typically increase the value of the security.
High Yield Market Review
The high yield asset class had a record year, gaining 58% compared to a 26% increase for the S&P 500 Index and -4% for U.S. treasuries. Still, high yield has the potential to outperform other asset classes again in 2010 if the economy continues to improve. Default rates peaked around 10% in late 2009 and expectations are that rates could decline to around 4% in 2010, about its long-term historical average. On the other hand, unemployment may remain stubbornly high hampering the consumer and holding back an economic recovery. An additional concern is the large budget deficits in states such as California and Illinois. At best, the imbalances will be a headwind for the markets while the effect of any state or municipal defaults could be significant. New issuance continues to help struggling companies reissue debt, thereby decreasing the default rate and lowering expectations of future defaults. The sudden collapse of market liquidity caused by the Lehman bankruptcy and the subsequent widening of credit spreads was so severe that many investors recognized the value in high yield securities. The response was massive inflows to high yield mutual funds, amounting to $5 billion in the first quarter alone, causing the market to stablize and spreads to begin to moderately tighten. Cash flows into the high-yield market were on a torrid pace throughout the year with September marking the tenth consecutive month of inflows of $1 billion.
Market Outlook
While keeping a long-term perspective, we will remain slightly aggressive given the current liquidity and momentum in the market and the economic recovery. We continue to stay fully invested as we’ve pared back on holdings that have produced solid gains. We feel that our security selection process provides the portfolio with higher quality issues with good underlying asset value, which should provide downside protection. We will be looking for whether firms are able to increase revenue rather than simply reduce costs, and whether unemployment figures will begin to show the return of jobs. We will also continue to watch the high-yield mutual fund flows closely to determine whether we should add or reduce our risk exposure. However, we will be prepared to reduce risk in the portfolio if the economy, unemployment, and earnings fail to continue to recover as the market is expecting.
We appreciate your business and thank you for being an investor in the Series.
Sincerely,
David Toussaint, Portfolio Manager
97
| | |
| | Series P |
| Performance Summary | | (High Yield Series) |
| December 31, 2009 | | (unaudited) |
PERFORMANCE
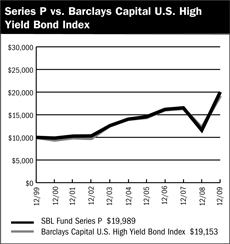
$10,000 Over 10 Years
The chart above assumes a hypothetical $10,000 investment in Series P (High Yield Series) on December 31, 1999 and reflects the fees and expenses of Series P. The Barclays Capital U.S. Corporate High Yield Bond Index is an unmanaged index that tracks below investment grade bonds.
Average Annual Returns
| | | | | | | | | |
Periods Ended 12-31-091 | | 1 Year | | | 5 Years | | | 10 Years | |
Series P | | 73.52 | % | | 7.34 | % | | 7.17 | % |
| 1 | Performance figures do not reflect fees and expenses associated with an investment in variable insurance products offered by Security Benefit Life Insurance Company. If returns had taken into account these fees and expenses, performance would have been lower. Shares of a Series of SBL Fund are available only through the purchase of such products. |
The performance data quoted above represents past performance. Past performance is not predictive of future performance. The investment return and principal value of an investment will fluctuate so that an investor’s shares, when redeemed, may be worth more or less than their original cost.
Portfolio Comparison by Quality Ratings
(Based on Standard & Poor’s Ratings)
| | | |
AA | | 0.83 | % |
A | | 0.64 | |
BBB | | 7.86 | |
BB | | 18.15 | |
B | | 35.77 | |
CCC | | 24.11 | |
CC | | 1.56 | |
C | | 0.44 | |
D | | 2.39 | |
NR | | 5.05 | |
Common Stocks | | 0.18 | |
Preferred Stocks | | 0.27 | |
Cash & Other Assets, Less Liabilities | | 2.75 | |
Total Net Assets | | 100.00 | °% |
| | | |
The accompanying notes are an integral part of the financial statements
98
| | |
| Schedule of Investments | | Series P |
| December 31, 2009 | | (High Yield Series) |
| | | | | | |
| | | Shares | | Value |
COMMON STOCKS—0.3% | | | | | | |
Air Freight & Logistics—0.0% | | | | | | |
Atlas Air Worldwide Holdings, Inc.* | | | 57 | | $ | 2,122 |
| | | | | | |
Airlines—0.0% | | | | | | |
Delta Air Lines, Inc.* | | | 2,225 | | | 25,320 |
| | | | | | |
Broadcasting—0.0% | | | | | | |
Adelphia Recovery Trust1,* | | | 5,270 | | | 264 |
| | | | | | |
Cable & Satellite—0.0% | | | | | | |
Time Warner Cable, Inc. | | | 101 | | | 4,180 |
| | | | | | |
Electronic Manufacturing Services—0.0% | | | | | | |
Viasystems Group, Inc.2,3,* | | | 1,207 | | | 3,621 |
| | | | | | |
Health Care Equipment—0.0% | | | | | | |
MEDIQ, Inc.4,* | | | 92 | | | 1 |
| | | | | | |
Mortgage REIT’s—0.0% | | | | | | |
Bimini Capital Management, Inc.4 | | | 30,450 | | | 7,308 |
| | | | | | |
Oil & Gas Equipment & Services—0.1% | | | | | | |
SemGroup Corporation2,3* | | | 4,398 | | | 96,756 |
| | | | | | |
Specialized Finance—0.2% | | | | | | |
CIT Group, Inc.* | | | 7,613 | | | 210,195 |
| | | | | | |
TOTAL COMMON STOCKS (cost $828,173) | | | | | $ | 349,767 |
| | | | | | |
| | |
| | | Shares | | Value |
PREFERRED STOCKS—0.3% | | | | | | |
Department Stores—0.2% | | | | | | |
Sears Holdings Corporation | | | | | | |
7.00%, 7/15/2042* | | | 6,510 | | $ | 73,238 |
7.40%, 2/1/2043* | | | 18,320 | | | 234,725 |
| | | | | | |
| | | | | | 307,963 |
| | | | | | |
Thrifts & Mortgage Finance—0.1% | | | | | | |
Federal Home Loan Mortgage Corporation | | | | | | |
8.38%, 12/31/2012* | | | 28,000 | | | 29,400 |
Federal National Mortgage Association | | | | | | |
8.25%, 12/31/2010* | | | 28,000 | | | 30,800 |
4.38%, 5/13/2011 | | | 7,000 | | | 12,460 |
| | | | | | |
| | | | | | 72,660 |
| | | | | | |
TOTAL PREFERRED STOCK (cost $2,345,479) | | | | | $ | 380,623 |
| | | | | | |
| | |
| | | Shares | | Value |
WARRANTS—0.0% | | | | | | |
SemGroup2,3 | | | 4,630 | | | 23,150 |
| | | | | | |
TOTAL WARRANTS (cost $23,150) | | | | | $ | 23,150 |
| | | | | | |
| | |
| | | Principal
Amount | | Value |
CONVERTIBLE BONDS—4.6% | | | | | | |
Automobiles—0.6% | | | | | | |
Sonic Automotive, Inc. | | | | | | |
5.00%, 20291 | | $ | 800,000 | | $ | 864,000 |
| | | | | | |
Brokerage—0.9% | | | | | | |
E*Trade Financial Corporation | | | | | | |
0.00%, 20191 | | | 750,000 | | | 1,264,688 |
| | | | | | |
Financial Services—0.8% | | | | | | |
Forest City Enterprises, Inc. | | | | | | |
5.00%, 20161,5 | | | 1,000,000 | | | 1,087,500 |
| | | | | | |
Health Care Services—1.8% | | | | | | |
Hologic, Inc. | | | | | | |
2.00%, 20371,6 | | | 2,450,000 | | | 2,091,687 |
Invacare Corporation | | | | | | |
4.13%, 20271 | | | 350,000 | | | 400,312 |
| | | | | | |
| | | | | | 2,491,999 |
| | | | | | |
Metals & Minerals—0.5% | | | | | | |
USEC, Inc. | | | | | | |
3.00%, 20141 | | | 1,100,000 | | | 715,000 |
| | | | | | |
TOTAL CONVERTIBLE BONDS (cost $5,783,589) | | | | | $ | 6,423,187 |
| | | | | | |
| | |
| | | Principal
Amount | | Value |
CORPORATE BONDS—89.7% | | | | | | |
Aerospace & Defense—0.1% | | | | | | |
Triumph Group, Inc. | | | | | | |
8.00%, 20171,5 | | | 100,000 | | | 100,875 |
| | | | | | |
Airlines—3.3% | | | | | | |
Continental Airlines, Inc. | | | | | | |
8.31%, 20111 | | | 541,143 | | | 505,969 |
7.03%, 20111 | | | 1,661,662 | | | 1,578,579 |
7.34%, 20142,3 | | | 600,000 | | | 535,500 |
Delta Air Lines, Inc. | | | | | | |
7.71%, 20111 | | | 530,000 | | | 522,050 |
7.78%, 20121 | | | 1,507,264 | | | 1,446,974 |
7.90%1,7 | | | 75,000 | | | 1,050 |
| | | | | | |
| | | | | | 4,590,122 |
| | | | | | |
Automotive—5.6% | | | | | | |
Ford Motor Credit Company LLC | | | | | | |
8.00%, 20141 | | | 1,600,000 | | | 1,642,860 |
8.00%, 20161 | | | 1,000,000 | | | 1,001,329 |
8.13%, 20201 | | | 400,000 | | | 393,080 |
General Motors Corporation | | | | | | |
8.38%, 20331,7 | | | 1,150,000 | | | 310,500 |
Metaldyne Corporation | | | | | | |
11.00%, 20122,3,4,7 | | | 1,000,000 | | | — |
Sonic Automotive, Inc. | | | | | | |
8.63%, 20131 | | | 1,750,000 | | | 1,741,249 |
4.25%, 20151 | | | 800,000 | | | 778,000 |
Tenneco, Inc. | | | | | | |
8.63%, 20141 | | | 800,000 | | | 807,000 |
TRW Automotive, Inc. | | | | | | |
7.25%, 20141,5,8 | | | 1,250,000 | | | 1,212,500 |
| | | | | | |
| | | | | | 7,886,518 |
| | | | | | |
Banking—1.4% | | | | | | |
FCB Capital Trust | | | | | | |
8.05%, 20281 | | | 75,000 | | | 64,326 |
The accompanying notes are an integral part of the financial statements
99
| | |
| Schedule of Investments | | Series P |
| December 31, 2009 | | (High Yield Series) |
| | | | | | |
| | | Principal
Amount | | Value |
CORPORATE BONDS—89.7% (continued) | | | | | | |
Banking—1.4% (continued) | | | | | | |
Progress Capital Trust I | | | | | | |
10.50%, 20271 | | $ | 700,000 | | $ | 733,475 |
Rabobank Capital Funding II | | | | | | |
5.26%, 20491,5,8,9 | | | 1,400,000 | | | 1,148,001 |
| | | | | | |
| | | | | | 1,945,802 |
| | | | | | |
Brokerage—3.5% | | | | | | |
E*Trade Financial Corporation | | | | | | |
7.88%, 20151 | | | 2,150,000 | | | 2,002,188 |
Nuveen Investments, Inc. | | | | | | |
5.00%, 20101 | | | 400,000 | | | 396,000 |
10.50%, 20151,5,8 | | | 2,800,000 | | | 2,541,000 |
| | | | | | |
| | | | | | 4,939,188 |
| | | | | | |
Chemicals—0.7% | | | | | | |
Methanex Corporation | | | | | | |
8.75%, 20121 | | | 5,000 | | | 5,188 |
PolyOne Corporation | | | | | | |
6.52%, 20101 | | | 330,000 | | | 329,588 |
6.58%, 20111 | | | 625,000 | | | 621,874 |
| | | | | | |
| | | | | | 956,650 |
| | | | | | |
Construction Machinery—1.5% | | | | | | |
RSC Equipment Rental, Inc. | | | | | | |
9.50%, 20141 | | | 1,100,000 | | | 1,101,375 |
United Rentals North America, Inc. | | | | | | |
6.50%, 20121 | | | 1,000,000 | | | 997,500 |
| | | | | | |
| | | | | | 2,098,875 |
| | | | | | |
Consumer Products—0.7% | | | | | | |
Hanesbrands, Inc. | | | | | | |
3.83%, 20141,8,9 | | | 150,000 | | | 141,938 |
8.00%, 20161 | | | 750,000 | | | 764,062 |
Icon Health & Fitness | | | | | | |
11.25%, 20122,3 | | | 25,000 | | | 17,500 |
| | | | | | |
| | | | | | 923,500 |
| | | | | | |
Electric— 1.2% | | | | | | |
AES Red Oak LLC | | | | | | |
8.54%, 20191 | | | 1,662,438 | | | 1,658,282 |
East Coast Power LLC | | | | | | |
7.07%, 20121 | | | 50,383 | | | 52,158 |
| | | | | | |
| | | | | | 1,710,440 |
| | | | | | |
Entertainment— 1.3% | | | | | | |
Historic TW, Inc. | | | | | | |
9.13%, 20131 | | | 30,000 | | | 34,810 |
Marquee Holdings, Inc. | | | | | | |
12.00%, 20141 | | | 1,500,000 | | | 1,246,875 |
Speedway Motorsports, Inc. | | | | | | |
6.75%, 20131 | | | 510,000 | | | 507,450 |
| | | | | | |
| | | | | | 1,789,135 |
| | | | | | |
Environmental—0.3% | | | | | | |
Casella Waste Systems, Inc. | | | | | | |
9.75%, 20131 | | | 400,000 | | | 395,000 |
| | | | | | |
Financial—Other—4.1% | | | | | | |
American Real Estate Partners, LP | | | | | | |
8.13%, 20121 | | | 2,185,000 | | | 2,228,700 |
| | |
7.13%, 20131 | | | 400,000 | | | 408,000 |
Harland Clarke Holdings Corporation | | | | | | |
9.50%, 20151 | | | 1,500,000 | | | 1,393,125 |
6.00%, 20151,9 | | | 1,900,000 | | | 1,553,250 |
| | | | | | |
| | | | | | 5,583,075 |
| | | | | | |
Financial Companies—Noncaptive Consumer—1.7% | | | | | | |
Nelnet, Inc. | | | | | | |
7.40%, 20361,9 | | | 2,000,000 | | | 1,456,622 |
Residential Capital LLC | | | | | | |
8.88%, 20151 | | | 1,300,000 | | | 910,000 |
| | | | | | |
| | | | | | 2,366,622 |
| | | | | | |
Financial Companies—Noncaptive Diversified—3.0% | | | | | | |
CIT Group, Inc. | | | | | | |
7.00%, 20131 | | | 88,448 | | | 82,478 |
7.00%, 20141 | | | 132,672 | | | 123,219 |
7.00%, 20151 | | | 132,672 | | | 118,741 |
7.00%, 20161 | | | 221,119 | | | 194,585 |
7.00%, 20171 | | | 309,567 | | | 268,549 |
General Motors Acceptance Corporation | | | | | | |
6.75%, 20141 | | | 650,000 | | | 617,401 |
8.00%, 20311 | | | 1,600,000 | | | 1,439,557 |
International Lease Finance Corporation | | | | | | |
5.65%, 20141 | | | 1,850,000 | | | 1,398,154 |
| | | | | | |
| | | | | | 4,242,684 |
| | | | | | |
Food & Beverage—1.5% | | | | | | |
Bumble Bee Foods LLC | | | | | | |
7.75%, 20151,5 | | | 200,000 | | | 200,500 |
Constellation Brands, Inc. | | | | | | |
7.25%, 20171 | | | 1,000,000 | | | 1,013,750 |
Dole Food Company, Inc. | | | | | | |
8.88%, 20111 | | | 405,000 | | | 408,038 |
Pinnacle Foods Finance LLC | | | | | | |
9.25%, 20151,5 | | | 450,000 | | | 456,750 |
| | | | | | |
| | | | | | 2,079,038 |
| | | | | | |
Gaming—6.2% | | | | | | |
Boyd Gaming Corporation | | | | | | |
7.13%, 20161 | | | 800,000 | | | 696,000 |
Galaxy Entertainment Finance Company, Ltd. | | | | | | |
9.88%, 20121,5,8 | | | 2,475,000 | | | 2,474,999 |
Mandalay Resort Group | | | | | | |
7.63%, 20131 | | | 1,000,000 | | | 760,000 |
MGM Mirage | | | | | | |
8.50%, 20101 | | | 15,000 | | | 14,925 |
8.38%, 20111 | | | 55,000 | | | 52,113 |
6.75%, 20121 | | | 625,000 | | | 557,813 |
6.75%, 20131,8 | | | 250,000 | | | 215,625 |
7.63%, 20171 | | | 500,000 | | | 388,750 |
11.13%, 20171,5,8 | | | 300,000 | | | 332,250 |
Mohegan Tribal Gaming Authority | | | | | | |
7.13%, 20141 | | | 1,750,000 | | | 1,192,188 |
Pinnacle Entertainment, Inc. | | | | | | |
7.50%, 20151 | | | 1,980,000 | | | 1,821,599 |
Station Casinos, Inc. | | | 925,000 | | | 139,906 |
6.00%, 20121,7 | | | | | | |
Turning Stone Resort Casino Enterprise | | | | | | |
9.13%, 20141,5,8 | | | 150,000 | | | 146,625 |
| | | | | | |
| | | | | | 8,792,793 |
| | | | | | |
Health Care—4.3% | | | | | | |
Apria Healthcare Group, Inc. | | | | | | |
| | |
11.25%, 20141,5,8 | | | 600,000 | | | 658,500 |
The accompanying notes are an integral part of the financial statements
100
| | |
| Schedule of Investments | | Series P |
| December 31, 2009 | | (High Yield Series) |
| | | | | | |
| | | Principal
Amount | | Value |
CORPORATE BONDS—89.7% (continued) | | | | | | |
Health Care—4.3% (continued) | | | | | | |
HCA, Inc. | | | | | | |
9.25%, 20161 | | $ | 1,750,000 | | $ | 1,879,063 |
Healthsouth Corporation | | | | | | |
8.13%, 20201 | | | 900,000 | | | 886,500 |
InvaCare Corporation | | | | | | |
9.75%, 20151,8 | | | 150,000 | | | 156,375 |
Psychiatric Solutions, Inc. | | | | | | |
7.75%, 20151,5,8 | | | 500,000 | | | 471,250 |
US Oncology, Inc. | | | | | | |
10.75%, 20141 | | | 675,000 | | | 708,750 |
9.13%, 20171 | | | 1,100,000 | | | 1,155,000 |
| | | | | | |
| | | | | | 5,915,438 |
| | | | | | |
Independent Energy—2.0% | | | | | | |
Energy XXI Gulf Coast, Inc. | | | | | | |
10.00%, 20131 | | | 2,000,000 | | | 1,850,000 |
Hilcorp Energy I, LP | | | | | | |
7.75%, 20151,5,8 | | | 250,000 | | | 245,000 |
Plains Exploration & Production Company | | | | | | |
7.00%, 20171 | | | 500,000 | | | 491,250 |
Range Resources Corporation | | | | | | |
7.38%, 20131 | | | 75,000 | | | 76,313 |
Southwestern Energy Company | | | | | | |
7.50%, 20181 | | | 150,000 | | | 159,000 |
| | | | | | |
| | | | | | 2,821,563 |
| | | | | | |
Industrial—Other—0.6% | | | | | | |
Belden, Inc. | | | | | | |
7.00%, 20171 | | | 300,000 | | | 292,125 |
Noble Group, Ltd. | | | | | | |
6.63%, 20151,5,8 | | | 550,000 | | | 583,000 |
| | | | | | |
| | | | | | 875,125 |
| | | | | | |
Insurance—Property & Casualty—2.0% | | | | | | |
Fairfax Financial Holdings, Ltd. | | | | | | |
7.75%, 20121 | | | 1,575,000 | | | 1,626,187 |
HUB International Holdings, Inc. | | | | | | |
10.25%, 20151,5,8 | | | 265,000 | | | 243,800 |
Nationwide Mutual Insurance Company | | | | | | |
8.25%, 20311,5,8 | | | 900,000 | | | 865,624 |
USI Holdings Corporation | | | | | | |
9.75%, 20151,5,8 | | | 100,000 | | | 91,125 |
| | | | | | |
| | | | | | 2,826,736 |
| | | | | | |
Media—Cable—0.1% | | | | | | |
CSC Holdings, Inc. | | | | | | |
6.75%, 20121 | | | 42,000 | | | 43,365 |
UPC Germany GmbH | | | | | | |
8.13%, 20171,5 | | | 100,000 | | | 101,125 |
| | | | | | |
| | | | | | 144,490 |
| | | | | | |
Media—Non Cable—6.0% | | | | | | |
Block Communications, Inc. | | | | | | |
8.25%, 20151,5,8 | | | 1,125,000 | | | 1,092,655 |
Bonten Media Acquisition Company | | | | | | |
9.00%, 20151,5,8 | | | 109,594 | | | 40,824 |
Clear Channel Communications, Inc. | | | | | | |
10.75%, 20161 | | | 1,250,000 | | | 981,249 |
CMP Susquehanna Corporation | | | | | | |
9.88%, 20141 | | | 1,200,000 | | | 24,000 |
Fisher Communications, Inc. | | | | | | |
8.63%, 20141 | | | 250,000 | | | 239,688 |
GeoEye, Inc. | | | | | | |
9.63%, 20151,5 | | | 900,000 | | | 925,875 |
Idearc, Inc. | | | | | | |
8.00%, 20161,7 | | | 650,000 | | | 45,500 |
Inmarsat Finance plc | | | | | | |
7.38%, 20171,5 | | | 100,000 | | | 102,250 |
Intelsat, Ltd. | | | | | | |
7.63%, 20121 | | | 1,475,000 | | | 1,460,249 |
Morris Publishing Group LLC | | | | | | |
7.00%, 20131,8 | | | 1,625,000 | | | 475,313 |
Radio One, Inc. | | | | | | |
6.38%, 20131 | | | 650,000 | | | 476,938 |
Reader’s Digest Association, Inc. | | | | | | |
9.00%, 20171,7 | | | 150,000 | | | 1,688 |
RH Donnelley Corporation | | | | | | |
8.88%, 20161,7 | | | 650,000 | | | 60,938 |
8.88%, 20171,7 | | | 3,350,000 | | | 314,063 |
Satelites Mexicanos S.A. de CV | | | | | | |
9.00%, 20111,9 | | | 2,454,175 | | | 2,230,231 |
| | | | | | |
| | | | | | 8,471,461 |
| | | | | | |
Metals & Mining—3.0% | | | | | | |
Asia Aluminum Holdings, Ltd. | | | | | | |
8.00%, 20111,5,7,8 | | | 2,800,000 | | | 437,500 |
Cloud Peak Energy Resources LLC | | | | | | |
8.50%, 20191,5 | | | 500,000 | | | 510,000 |
FMG Finance Pty, Ltd. | | | | | | |
10.63%, 20161,5,8 | | | 2,150,000 | | | 2,378,438 |
Griffin Coal Mining Company Pty, Ltd. | | | | | | |
9.50%, 20161,5,7,8 | | | 1,400,000 | | | 827,750 |
| | | | | | |
| | | | | | 4,153,688 |
| | | | | | |
Natural Gas Pipelines—1.8% | | | | | | |
El Paso Corporation | | | | | | |
8.25%, 20161 | | | 250,000 | | | 266,875 |
Regency Energy Partners, LP | | | | | | |
8.38%, 20131 | | | 2,155,000 | | | 2,230,425 |
| | | | | | |
| | | | | | 2,497,300 |
| | | | | | |
Oil Field Services—1.2% | | | | | | |
Key Energy Services, Inc. | | | | | | |
8.38%, 20141 | | | 1,250,000 | | | 1,253,125 |
Pemex Project Funding Master Trust | | | | | | |
9.13%, 20101 | | | 10,000 | | | 10,550 |
Stallion Oilfield Services | | | | | | |
9.75%, 20151,5,7,8 | | | 700,000 | | | 409,500 |
| | | | | | |
| | | | | | 1,673,175 |
| | | | | | |
Packaging—1.4% | | | | | | |
Ball Corporation | | | | | | |
6.88%, 20121 | | | 400,000 | | | 405,000 |
Solo Cup Company | | | | | | |
8.50%, 20141 | | | 1,550,000 | | | 1,515,125 |
| | | | | | |
| | | | | | 1,920,125 |
| | | | | | |
The accompanying notes are an integral part of the financial statements
101
| | |
| Schedule of Investments | | Series P |
| December 31, 2009 | | (High Yield Series) |
| | | | | | |
| | | Principal
Amount | | Value |
CORPORATE BONDS—89.7% (continued) | | | | | | |
Paper—1.8% | | | | | | |
Sino-Forest Corporation | | | | | | |
10.25%, 20141,5,8 | | $ | 2,275,000 | | $ | 2,479,750 |
| | | | | | |
Pharmaceuticals—1.6% | | | | | | |
Catalent Pharma Solutions, Inc. | | | | | | |
9.50%, 20151 | | | 2,470,438 | | | 2,229,570 |
| | | | | | |
Refining—2.5% | | | | | | |
Frontier Oil Corporation | | | | | | |
6.63%, 20111 | | | 300,000 | | | 301,875 |
Tesoro Corporation | | | | | | |
6.50%, 20171 | | | 1,900,000 | | | 1,767,000 |
9.75%, 20191 | | | 200,000 | | | 207,000 |
United Refining Company | | | | | | |
10.50%, 20121 | | | 850,000 | | | 801,125 |
VeraSun Energy Corporation | | | | | | |
9.38%, 20172,3,7 | | | 224,803 | | | 11,240 |
Western Refining, Inc. | | | | | | |
11.25%, 20171,5,8 | | | 500,000 | | | 452,500 |
| | | | | | |
| | | | | | 3,540,740 |
| | | | | | |
REIT’S—6.3% | | | | | | |
Forest City Enterprises, Inc. | | | | | | |
7.63%, 20151 | | | 1,750,000 | | | 1,566,250 |
HCP, Inc. | | | | | | |
6.70%, 20181 | | | 1,120,000 | | | 1,086,550 |
Hospitality Properties Trust | | | | | | |
6.70%, 20181 | | | 3,150,000 | | | 2,882,507 |
HRPT Properties Trust | | | | | | |
0.85%, 20111,9 | | | 1,624,000 | | | 1,508,259 |
Rouse Company, LP | | | | | | |
8.00%, 20251,7 | | | 1,550,000 | | | 1,610,063 |
| | | | | | |
| | | | | | 8,653,629 |
| | | | | | |
Restaurants—0.6% | | | | | | |
Dave & Buster’s, Inc. | | | | | | |
11.25%, 20141 | | | 800,000 | | | 830,000 |
| | | | | | |
Retailers—4.6% | | | | | | |
Duane Reade, Inc. | | | | | | |
9.75%, 20111 | | | 1,300,000 | | | 1,324,375 |
Harry & David Holdings, Inc. | | | | | | |
9.00%, 20131 | | | 900,000 | | | 616,500 |
Neiman Marcus Group, Inc. | | | | | | |
10.38%, 20151 | | | 1,750,000 | | | 1,715,000 |
Penske Auto Group, Inc. | | | | | | |
7.75%, 20161 | | | 1,750,000 | | | 1,693,125 |
Saks, Inc. | | | | | | |
9.88%, 20111 | | | 1,050,000 | | | 1,098,563 |
| | | | | | |
| | | | | | 6,447,563 |
| | | | | | |
Services—5.3% | | | | | | |
KAR Holdings, Inc. | | | | | | |
8.75%, 20141 | | | 2,300,000 | | | 2,371,874 |
Mobile Services Group, Inc. | | | | | | |
9.75%, 20141 | | | 200,000 | | | 208,000 |
Travelport LLC | | | | | | |
9.88%, 20141 | | | 1,150,000 | | | 1,187,375 |
11.88%, 20161 | | | 650,000 | | | 689,000 |
West Corporation | | | | | | |
9.50%, 20141 | | | 1,050,000 | | | 1,065,750 |
11.00%, 20161 | | | 1,750,000 | | | 1,828,750 |
| | | | | | |
| | | | | | 7,350,749 |
| | | | | | |
Technology—3.2% | | | | | | |
Amkor Technology, Inc. | | | | | | |
9.25%, 20161 | | | 2,025,000 | | | 2,151,563 |
Anixter International, Inc. | | | | | | |
5.95%, 20151 | | | 250,000 | | | 234,375 |
Seagate Technology HDD Holdings | | | | | | |
6.80%, 20161 | | | 1,400,000 | | | 1,354,500 |
SunGard Data Systems, Inc. | | | | | | |
10.63%, 20151 | | | 600,000 | | | 660,750 |
| | | | | | |
| | | | | | 4,401,188 |
| | | | | | |
Telecommunications—Wireless—4.3% | | | | | | |
Clearwire Communications LLC | | | | | | |
12.00%, 20151,5 | | | 500,000 | | | 507,500 |
iPCS, Inc. | | | | | | |
4.28%, 20141,9 | | | 1,997,986 | | | 1,698,288 |
MetroPCS Wireless, Inc. | | | | | | |
9.25%, 20141 | | | 675,000 | | | 683,438 |
SBA Telecommunications, Inc. | | | | | | |
8.00%, 20161,5,8 | | | 400,000 | | | 418,000 |
Sprint Capital Corporation | | | | | | |
6.90%, 20191 | | | 2,850,000 | | | 2,622,000 |
| | | | | | |
| | | | | | 5,929,226 |
| | | | | | |
Telecommunications—Wirelines—0.1% | | | | | | |
Qwest Corporation | | | | | | |
7.88%, 20111 | | | 150,000 | | | 157,125 |
| | | | | | |
Textile—0.8% | | | | | | |
Phillips-Van Heusen Corporation | | | | | | |
8.13%, 20131 | | | 1,050,000 | | | 1,071,000 |
| | | | | | |
Transportation Services—0.1% | | | | | | |
US Shipping Partners, LP | | | | | | |
13.00%, 20 142,3,7 | | | 625,000 | | | 93,750 |
| | | | | | |
TOTAL CORPORATE BOND (cost $119,179,485) | | | | | $ | 124,883,708 |
| | | | | | |
| | |
| | | Principal
Amount | | Value |
SENIOR FLOATING RATE INTERESTS—2.0% | | | | | | |
Business Equipment & Services—2.0% | | | | | | |
First Data Corporation, Initial Bl Term Loan | | | | | | |
3.00%, 20141,9,10 | | | 160,100 | | | 141,822 |
2.98%, 20141,9,10 | | | 1,892,650 | | | 1,676,571 |
VNU, Term Loan | | | | | | |
2.23%, 20131,9,10 | | | 1,045,829 | | | 976,543 |
| | | | | | |
| | | | | | 2,794,936 |
| | | | | | |
TOTAL SENIOR FLOATING RATE INTERESTS (cost $3,035,667) | | | | | $ | 2,794,936 |
| | | | | | |
| | |
| | | Principal
Amount | | Value |
FOREIGN BOND—0.1% | | | | | | |
Tunisia—0.1% | | | | | | |
Banque Centrale de Tunisie | | | | | | |
7.38%, 20121 | | $ | 80,000 | | $ | 86,600 |
| | | | | | |
The accompanying notes are an integral part of the financial statements
102
| | |
| Schedule of Investments | | Series P |
| December 31, 2009 | | (High Yield Series) |
| | | | | | |
| | | Principal
Amount | | Value |
FOREIGN BOND—0.1% (continued) | | | | | | |
TOTAL FOREIGN BOND (cost $79,611) | | | | | $ | 86,600 |
| | | | | | |
| | |
| | | Principal
Amount | | Value |
FOREIGN GOVERNMENT BONDS—0.3% | | | | | | |
Chile—0.0% | | | | | | |
Chile Government International Bond | | | | | | |
7.13%, 20121 | | $ | 25,000 | | $ | 27,845 |
| | | | | | |
Mexico—0.2% | | | | | | |
Mexico Government International Bond | | | | | | |
8.38%, 20111 | | | 85,000 | | | 91,486 |
7.50%, 20121 | | | 116,000 | | | 128,469 |
| | | | | | |
| | | | | | 219,955 |
| | | | | | |
Russia—0.1% | | | | | | |
Russia Government International Bond | | | | | | |
8.25%, 20101,5,8 | | | 4,057 | | | 4,139 |
Russian Ministry of Finance | | | | | | |
3.00%, 20111 | | | 80,000 | | | 80,104 |
| | | | | | |
| | | | | | 84,243 |
| | | | | | |
South Africa—0.0% | | | | | | |
South Africa Government International Bond | | | | | | |
7.38%, 20121 | | | 35,000 | | | 38,413 |
| | | | | | |
TOTAL FOREIGN GOVERNMENT B0ND (cost $337,698) | | | | | $ | 370,456 |
| | | | | | |
Total Investments—97.3%11 (cost $131,612,852) | | | | | $ | 135,312,427 |
Cash & Other Assets, Less Liabilities—2.7% | | | | | | 3,819,812 |
| | | | | | |
Total Net Assets—100.0% | | | | | $ | 139,132,239 |
| | | | | | |
For federal income tax purposes the identified cost of investments owned at December 31, 2009 was $129,623,461.
| plc | Public Limited Company |
| * | Non-income producing security |
| 1 | Value determined based on Level 2 inputs. |
| 2 | Value determined based on Level 3 inputs. |
| 3 | Security was fair valued by the Valuation Committee at December 31, 2009. The total market value of fair valued securities amounts to $781,517 (cost $2,480,344) or 0.6% of total net assets. |
| 4 | Security is deemed illiquid. The total market value of illiquid securities is $7,309 (cost $l,491,332), or 0.0% of total net assets. |
| 5 | Security was acquired through a private placement. |
| 6 | Security is a step up/step down bond. The coupon increases or decreases at regular intervals until the bond reaches full maturity. |
| 7 | Security is in default of interest and/or principal obligations. |
| 8 | Security is a 144A or Section 4(2) security. The total market value of 144A or Section 4(2) securities is $20,543,981 (cost $21,840,229), or 14.8% of total net assets. |
| 9 | Variable rate security. Rate indicated is rate effective at December 31, 2009. |
| 10 | Security is a senior floating rate interest. See Notes to Financial Statements for additional information. |
| 11 | Unless otherwise indicated, the values of the securities of the Portfolio are determined based on Level 1 inputs. |
The accompanying notes are an integral part of the financial statements
103
| | |
| | Series P |
| | (High Yield Series) |
Statement of Assets and Liabilities
December 31, 2009
| | | | |
Assets: | | | | |
Investments, at value* | | $ | 135,312,427 | |
Cash | | | 1,823,842 | |
Receivables: | | | | |
Fund shares sold | | | 48,652 | |
Interest | | | 2,131,760 | |
Dividends | | | 19,793 | |
Prepaid expenses | | | 3,048 | |
| | | | |
Total assets | | | 139,339,522 | |
| | | | |
| |
Liabilities: | | | | |
| |
Payable for: | | | | |
Fund shares redeemed | | | 75,834 | |
Management fees | | | 87,471 | |
Administration fees | | | 14,880 | |
Transfer agent/maintenance fees | | | 2,083 | |
Custodian fees | | | 126 | |
Directors’ fees | | | 1,607 | |
Professional fees | | | 17,275 | |
Other fees | | | 8,007 | |
| | | | |
Total liabilities | | | 207,283 | |
| | | | |
Net assets | | $ | 139,132,239 | |
| | | | |
| |
Net assets consist of: | | | | |
Paid in capital | | $ | 126,023,771 | |
Undistributed net investment income | | | 12,054,279 | |
Accumulated net realized loss on sale of investments | | | (2,645,386 | ) |
Net unrealized appreciation in value of investments | | | 3,699,575 | |
| | | | |
Net assets | | $ | 139,132,239 | |
| | | | |
| |
Capital shares authorized | | | unlimited | |
Capital shares outstanding | | | 5,997,533 | |
Net asset value per share
(net assets divided by shares outstanding) | | $ | 23.20 | |
| | | | |
| |
* Investments, at cost | | $ | 131,612,852 | |
Statement of Operations
For Year Ended December 31, 2009
| | | | |
Investment Income: | | | | |
Dividends | | $ | 102,534 | |
Interest | | | 12,251,798 | |
| | | | |
Total investment income | | | 12,354,332 | |
| | | | |
| |
Expenses: | | | | |
Management fees | | | 828,232 | |
Administration fees | | | 121,099 | |
Transfer agent/maintenance fees | | | 25,225 | |
Custodian fees | | | 8,139 | |
Directors’ fees | | | 12,579 | |
Professional fees | | | 23,228 | |
Reports to shareholders | | | 10,363 | |
Other | | | 5,208 | |
| | | | |
Total expenses | | | 1,034,073 | |
| | | | |
Net investment income | | | 11,320,259 | |
| | | | |
| |
Net Realized and Unrealized Gain (Loss): | | | | |
Net realized gain (loss) during the year on: | | | | |
Investments | | | (1,184,089 | ) |
| | | | |
Net realized loss | | | (1,184,089 | ) |
| | | | |
| |
Net unrealized appreciation (depreciation) during the year on: | | | | |
Investments | | | 48,718,757 | |
| | | | |
Net unrealized appreciation | | | 48,718,757 | |
| | | | |
Net realized and unrealized gain | | | 47,534,668 | |
| | | | |
Net increase in net assets resulting from operations | | $ | 58,854,927 | |
| | | | |
The accompanying notes are an integral part of the financial statements
104
| | |
| | Series P |
| Statement of Changes in Net Assets | | (High Yield Series) |
| | | | | | | | |
| | | Year Ended
December 31, 2009 | | | Year Ended
December 31, 2008 | |
Increase (decrease) in net assets from operations: | | | | | | | | |
Net investment income | | $ | 11,320,259 | | | $ | 8,617,741 | |
Net realized loss during the year on investments | | | (1,184,089 | ) | | | (475,444 | ) |
Net unrealized appreciation (depreciation) during the year on investments | | | 48,718,757 | | | | (39,644,244 | ) |
| | | | | | | | |
Net increase (decrease) in net assets resulting from operations | | | 58,854,927 | | | | (31,501,947 | ) |
| | | | | | | | |
| | |
Capital share transactions: | | | | | | | | |
Proceeds from sale of shares | �� | | 63,655,395 | | | | 102,209,457 | |
Cost of shares redeemed | | | (66,597,004 | ) | | | (102,789,673 | ) |
| | | | | | | | |
Net decrease from capital share transactions | | | (2,941,609 | ) | | | (580,216 | ) |
| | | | | | | | |
Net increase (decrease) in net assets | | | 55,913,318 | | | | (32,082,163 | ) |
| | | | | | | | |
| | |
Net assets: | | | | | | | | |
Beginning of year | | | 83,218,921 | | | | 115,301,084 | |
| | | | | | | | |
End of year | | $ | 139,132,239 | | | $ | 83,218,921 | |
| | | | | | | | |
| | |
Undistributed net investment income at end of year | | $ | 12,054,279 | | | $ | 9,103,520 | |
| | | | | | | | |
| | |
Capital share activity: | | | | | | | | |
Shares sold | | | 3,753,671 | | | | 5,951,233 | |
Shares redeemed | | | (3,982,293 | ) | | | (5,738,109 | ) |
| | | | | | | | |
Total capital share activity | | | (228,622 | ) | | | 213,124 | |
| | | | | | | | |
The accompanying notes are an integral part of the financial statements
105
| | |
| Financial Highlights | | Series P |
| Selected data for each share of capital stock outstanding throughout each year | | (High Yield Series) |
| | | | | | | | | | | | | | | | | | | | |
| | | 2009 | | | 2008 | | | 2007 | | | 2006 | | | Year Ended
December 31,
2005 | |
Per Share Data | | | | | | | | | | | | | | | | | | | | |
Net asset value, beginning of period | | $ | 13.37 | | | $ | 19.18 | | | $ | 18.79 | | | $ | 16.90 | | | $ | 16.28 | |
| | | | | | | | | | | | | | | | | | | | |
Income (loss) from investment operations: | | | | | | | | | | | | | | | | | | | | |
Net investment incomea | | | 1.89 | | | | 1.57 | | | | 1.38 | | | | 0.90 | | | | 1.09 | |
Net gain (loss) on securities (realized and unrealized) | | | 7.94 | | | | (7.38 | ) | | | (0.99 | ) | | | 0.99 | | | | (0.47 | ) |
| | | | | | | | | | | | | | | | | | | | |
Total from investment operations | | | 9.83 | | | | (5.81 | ) | | | 0.39 | | | | 1.89 | | | | 0.62 | |
| | | | | | | | | | | | | | | | | | | | |
Net asset value, end of period | | $ | 23.20 | | | $ | 13.37 | | | $ | 19.18 | | | $ | 18.79 | | | $ | 16.90 | |
| | | | | | | | | | | | | | | | | | | | |
| | | | | |
Total Returnb | | | 73.52 | % | | | (30.29 | )% | | | 2.08 | % | | | 11.18 | % | | | 3.81 | % |
| | | | | | | | | | | | | | | | | | | | |
Ratios/Supplemental Data | | | | | | | | | | | | | | | | | | | | |
Net assets, end of period (in thousands) | | $ | 139,132 | | | $ | 83,219 | | | $ | 115,301 | | | $ | 106,144 | | | $ | 77,971 | |
| | | | | | | | | | | | | | | | | | | | |
Ratios to average net assets: | | | | | | | | | | | | | | | | | | | | |
Net investment income | | | 10.24 | % | | | 9.02 | % | | | 7.19 | % | | | 7.24 | % | | | 7.13 | % |
Total expensesc | | | 0.94 | % | | | 0.94 | % | | | 0.92 | % | | | 0.93 | % | | | 0.97 | % |
Net expensesd | | | 0.94 | % | | | 0.94 | % | | | 0.92 | % | | | 0.93 | % | | | 0.97 | % |
Net expenses prior to custodian earnings credits and net of expense waivers | | | 0.94 | % | | | 0.94 | % | | | 0.92 | % | | | 0.93 | % | | | 0.97 | % |
| | | | | | | | | | | | | | | | | | | | |
Portfolio turnover rate | | | 48 | % | | | 33 | % | | | 50 | % | | | 52 | % | | | 64 | % |
| a | Net investment income (loss) was computed using average shares outstanding throughout the period, |
| b | Total return does not take into account any of the expenses associated with an investment in variable insurance products offered by Security Benefit Life Insurance Company. If total return had taken into account these expenses, performance would have been lower. Shares of a series of SBL Fund are available only through the purchase of such products. |
| c | Total expense information reflects the expense ratios absent expense reductions by the Investment Manager and custodian earnings credits, as applicable. |
| d | Net expense information reflects the expense ratios after voluntary expense waivers, reimbursements and custodian earnings credits, as applicable. |
The accompanying notes are an integral part of the financial statements
106
Manager’s Commentary
February 15, 2010
| | | | |
| | Advised by: | | |
To Our Shareholders:
For the year ended December 31, 2009, Series Q of the SBL Fund – Small Cap Value Series returned 55.93%, outperformed the Russell 2000 Value Index, which returned 20.58%, and the Series’ peer group median return of 29.40%.
Financials, Materials, and Industrials Top Performers
The Series outperformed its benchmark in nearly every sector category with the largest excess returns stemming from the financials, materials, and industrials sectors.
As a large underweight position, 9% against 35% for the Russell 2000 Value Index, in a poor performing sector, allocation to this sector made the biggest difference for the portfolio. Additionally, holdings in the portfolio gained 7% compared to a loss of 2% for the Index. Old National Bancorp increased 34% over the period while Hilltop Holdings, Inc. and Capstead Mortgage Corporation also contributed to returns.
The portfolio’s materials position was nearly a double weight relative to the Index, 11% to 6%. The Series benefited from superior stock selection as the portfolio gained 112% against a 61% gain in the benchmark. Clearwater Paper Corporation soared 445%, Louisiana-Pacific Corporation was up 240%, and Schweitzer-Mauduit International Corporation, Inc. gained 221% during the period.
An overweight position in the industrials sector actually hurt performance in the portfolio. However, good stock picking made up the difference as the Series’ holdings increased 43% versus a 13% gain in the Index. Best performing securities included Power-One, Inc., up 266%, and McDermott International, Inc., which gained 127%. Gevity HR was another contributing holding in the sector.
Utilities and Consumer Staples Disappoint
The only sectors that didn’t keep pace with the Index, utilities and consumer staples, fell short by a small margin, mostly due to allocation in the sectors rather than the securities held in the portfolio.
Still, there were several holdings that didn’t help performance in the utilities sector, which included NorthWestern Corporation, Empire District Electric Company, Allete Inc., and Westar Energy Corporation, Inc.
The same was true in the consumer staples sector for the portfolio. Holdings in Winn-Dixie Stores, Inc., Prestige Brands Holdings, Inc., and Smart Balance Inc. were a drag on returns.
The final sector that hurt the portfolio on a relative basis was telecommunication services as the manager doesn’t typically participate in the sector due its extremely low weight in the Index.
Market Outlook
The value equity team still finds it difficult to find compelling investment opportunities in today’s markets. Demand continues to be soft which will make it difficult for companies to increase earnings. In addition, earnings expectations in 2010 may be too high as it is not yet evident that consumers have changed their restrictive behavior and companies are reluctant to hire.
In such an environment, the team continues to focus on well-capitalized, high-quality companies with strong balance sheets. In the mid-capitalization space, we are finding select opportunities in insurance, government-oriented service companies, and FERC-regulated utilities while avoiding credit sensitive financial companies. The significant underweight in financials leads the portfolio to have an even or overweight position in every other sector.
We remain committed to our investment process that targets companies across a wide range of industries and sectors. We believe this broad approach will continue to allow us to identify attractive investments for future years. We thank you for your investment and your confidence in our team.
Sincerely,
James Schier, Portfolio Manager
107
| | |
| | Series Q |
| Performance Summary | | (Small Cap Value series) |
| December 31, 2009 | | (unaudited) |
PERFORMANCE
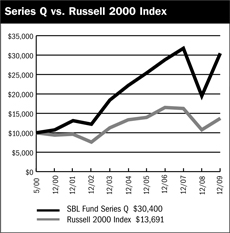
$10,000 Since Inception
The chart above assumes a hypothetical $10,000 investment in Series Q (Small Cap Value Series) on May 1, 2000 (date of inception), and reflects the fees and expenses of Series Q. The Russell 2000 Index is a capitalization-weighted index that measures the performance of the 2000 smallest companies in the Russell 3000 Index, which represents approximately 10% of the total market capitalization of the Russell 3000 Index.
Average Annual Returns
| | | | | | | | | |
Periods Ended 12-31-091 | | 1 Year | | | 5 Years | | | Since Inception
(5-1-00) | |
Series Q | | 55.93 | % | | 6.52 | % | | 12.19 | % |
| 1 | Performance figures do not reflect fees and expenses associated with an investment in variable insurance products offered by Security Benefit Life Insurance Company. If returns had taken into account these fees and expenses, performance would have been lower. Shares of a Series of SBL Fund are available only through the purchase of such products. |
The performance data quoted above represents past performance. Past performance is not predictive of future performance. The investment return and principal value of an investment will fluctuate so that an investor’s shares, when redeemed, may be worth more or less than their original cost.
Portfolio Composition by Sector
| | | |
Consumer Discretionary | | 12.24 | % |
Consumer Staples | | 8.25 | |
Energy | | 11.59 | |
Financials | | 12.44 | |
Health Care | | 4.49 | |
Industrials | | 23.38 | |
Information Technology | | 10.33 | |
Materials | | 9.69 | |
Utilities | | 6.58 | |
Cash & Other Assets, Less Liabilities | | 1.01 | |
Total Net Assets | | 100.00 | % |
| | | |
The accompanying notes are an integral part of the financial statements
108
| | |
| Schedule of Investments | | Series Q |
December 31, 2009 | | (Small Cap Value Series) |
| | | | | |
| | | Shares | | Value |
COMMON STOCKS—99.0% | | | | | |
Aerospace & Defense—5.4% | | | | | |
Ceradyne, Inc.* | | 28,000 | | $ | 537,880 |
DynCorp International, Inc.* | | 77,003 | | | 1,104,993 |
GeoEye, Inc.* | | 112,500 | | | 3,136,501 |
Orbital Sciences Corporation* | | 123,821 | | | 1,889,508 |
| | | | | |
| | | | | 6,668,882 |
| | | | | |
Apparel Retail—4.0% | | | | | |
Brown Shoe Company, Inc. | | 148,800 | | | 1,468,656 |
Chico’s FAS, Inc.* | | 209,700 | | | 2,946,285 |
Talbots, Inc. | | 53,669 | | | 478,191 |
| | | | | |
| | | | | 4,893,132 |
| | | | | |
Apparel, Accessories & Luxury Goods—2.4% | | | | | |
Fossil, Inc.1,* | | 20,400 | | | 684,624 |
Maidenform Brands, Inc.* | | 139,000 | | | 2,319,910 |
| | | | | |
| | | | | 3,004,534 |
| | | | | |
Asset Management & Custody Banks—1.5% | | | | | |
Fifth Street Finance Corporation | | 177,000 | | | 1,900,980 |
| | | | | |
Building Products—1.4% | | | | | |
Griffon Corporation* | | 27,860 | | | 340,449 |
Trex Company, Inc.* | | 71,400 | | | 1,399,440 |
| | | | | |
| | | | | 1,739,889 |
| | | | | |
Coal & Consumable Fuels—0.6% | | | | | |
Evergreen Energy, Inc.* | | 418,626 | | | 143,589 |
USEC, Inc.* | | 148,930 | | | 573,380 |
| | | | | |
| | | | | 716,969 |
| | | | | |
Communications Equipment—0.9% | | | | | |
Symmetricom, Inc.2,* | | 212,189 | | | 1,103,383 |
| | | | | |
Computer & Electronics Retail—0.6% | | | | | |
Conn’s, Inc.* | | 138,700 | | | 810,008 |
| | | | | |
Computer Hardware—1.0% | | | | | |
Silicon Graphics International Corporation* | | 180,416 | | | 1,264,716 |
| | | | | |
Computer Storage & Peripherals—1.5% | | | | | |
Adaptec, Inc.* | | 564,000 | | | 1,889,400 |
| | | | | |
Construction & Engineering—2.7% | | | | | |
Insituform Technologies, Inc.* | | 148,400 | | | 3,371,648 |
| | | | | |
Construction & Farm Machinery & Heavy Trucks—1.3% | | | | | |
Force Protection, Inc.* | | 320,000 | | | 1,667,200 |
| | | | | |
Construction Materials—0.4% | | | | | |
Eagle Materials, Inc. | | 16,998 | | | 442,798 |
| | | | | |
Diversified Chemicals—0.6% | | | | | |
LSB Industries, Inc.* | | 52,743 | | | 743,676 |
| | | | | |
Diversified REIT’s—0.9% | | | | | |
Investors Real Estate Trust | | 123,889 | | | 1,115,001 |
| | | | | |
Electric Utilities—3.4% | | | | | |
Allete, Inc. | | 52,500 | | | 1,715,700 |
Empire District Electric Company | | 68,300 | | | 1,279,259 |
Westar Energy, Inc. | | 60,400 | | | 1,312,492 |
| | | | | |
| | | | | 4,307,451 |
| | | | | |
Electrical Components & Equipment—4.0% | | | | | |
General Cable Corporation* | | 21,000 | | | 617,820 |
LaBarge, Inc.* | | 109,700 | | | 1,321,885 |
Power-One, Inc.* | | 574,975 | | | 2,501,141 |
UQM Technologies. Inc.* | | 57,560 | | | 394,286 |
| | | | | |
| | | | | 4,835,132 |
| | | | | |
Electronic Manufacturing Services—3.1% | | | | | |
Maxwell Technologies, Inc.* | | 159,274 | | | 2,841,448 |
Methode Electronics, Inc. | | 121,626 | | | 1,055,714 |
| | | | | |
| | | | | 3,897,162 |
| | | | | |
Food Retail—1.3% | | | | | |
Winn-Dixie Stores, Inc.* | | 168,400 | | | 1,690,736 |
| | | | | |
Forest Products—2.5% | | | | | |
Louisiana-Pacific Corporation* | | 453,700 | | | 3,166,826 |
| | | | | |
Gas Utilities—1.4% | | | | | |
Atmos Energy Corporation | | 59,400 | | | 1,746,360 |
| | | | | |
Health Care Equipment—0.6% | | | | | |
Delcath Systems, Inc.* | | 140,000 | | | 719,600 |
| | | | | |
Health Care Services—3.9% | | | | | |
Amedisys, Inc.* | | 22,200 | | | 1,078,032 |
Mednax, Inc.* | | 40,100 | | | 2,410,812 |
RehabCare Group, Inc.* | | 46,700 | | | 1,421,081 |
| | | | | |
| | | | | 4,909,925 |
| | | | | |
Highways & Railtracks—0.6% | | | | | |
Quixote Corporation | | 117,200 | | | 746,564 |
| | | | | |
Human Resources & Employment Services—0.9% | | | | | |
Administaff, Inc. | | 48,601 | | | 1,146,498 |
| | | | | |
Industrial Conglomerates—0.4% | | | | | |
McDermott International, Inc.* | | 23,200 | | | 557,032 |
| | | | | |
Industrial Machinery—1.0% | | | | | |
Flow International Corporation* | | 414,278 | | | 1,275,976 |
| | | | | |
Industrial REIT’s—0.5% | | | | | |
First Potomac Realty Trust | | 51,000 | | | 641,070 |
| | | | | |
Insurance Brokers—0.4% | | | | | |
Arthur J Gallagher & Company | | 22,800 | | | 513,228 |
| | | | | |
IT Consulting & Other Services—2.5% | | | | | |
CACI International, Inc.* | | 48,200 | | | 2,354,570 |
Satyam Computer Services, Ltd. ADR | | 180,052 | | | 830,040 |
| | | | | |
| | | | | 3,184,610 |
| | | | | |
The accompanying notes are an integral part of the financial statements
109
| | |
| Schedule of Investments | | Series Q |
December 31, 2009 | | (Small Cap Value Series) |
| | | | | |
| | | Shares | | Value |
COMMON STOCKS—99.0% (continued) | | | | | |
Leisure Products—1.0% | | | | | |
Smith & Wesson Holding Corporation* | | 310,500 | | $ | 1,269,945 |
| | | | | |
Metal & Glass Containers—1.0% | | | | | |
Myers Industries, Inc. | | 139,900 | | | 1,273,090 |
| | | | | |
Mortgage REIT’s—0.3% | | | | | |
Redwood Trust, Inc. | | 29,100 | | | 420,786 |
| | | | | |
Multi-Line Insurance—1.3% | | | | | |
Horace Mann Educators Corporation | | 128,600 | | | 1,607,500 |
| | | | | |
Multi-Sector Holdings—0.8% | | | | | |
Pico Holdings, Inc.1,* | | 30,100 | | | 985,173 |
| | | | | |
Multi-Utilities—1.8% | | | | | |
Northwestern Corporation | | 84,500 | | | 2,198,690 |
| | | | | |
Office Services & Supplies—0.4% | | | | | |
United Stationers, Inc.* | | 9,591 | | | 545,248 |
| | | | | |
Oil & Gas Drilling—0.7% | | | | | |
Vantage Drilling Company* | | 560,000 | | | 901,600 |
| | | | | |
Oil & Gas Equipment & Services—4.3% | | | | | |
Global Industries, Ltd.* | | 251,000 | | | 1,789,630 |
Superior Well Services, Inc.* | | 64,500 | | | 919,770 |
Tesco Corporation* | | 203,900 | | | 2,632,349 |
| | | | | |
| | | | | 5,341,749 |
| | | | | |
Oil & Gas Exploration & Production—3.2% | | | | | |
GMX Resources, Inc.* | | 72,100 | | | 990,654 |
Goodrich Petroleum Corporation* | | 70,826 | | | 1,724,613 |
Gulfport Energy Corporation* | | 60,700 | | | 695,015 |
Petrohawk Energy Corporation1,* | | 27,700 | | | 664,523 |
| | | | | |
| | | | | 4,074,805 |
| | | | | |
Oil & Gas Storage & Transportation—2.8% | | | | | |
Southern Union Company | | 154,400 | | | 3,504,880 |
| | | | | |
Packaged Foods & Meats—4.8% | | | | | |
Del Monte Foods Company | | 227,200 | | | 2,576,448 |
Smart Balance, Inc.* | | 218,600 | | | 1,311,600 |
TreeHouse Foods, Inc.* | | 54,500 | | | 2,117,870 |
| | | | | |
| | | | | 6,005,918 |
| | | | | |
Paper Packaging—0.8% | | | | | |
Bemis Company, Inc. | | 33,600 | | | 996,240 |
| | | | | |
Paper Products—1.5% | | | | | |
Clearwater Paper Corporation1,* | | 33,700 | | | 1,852,489 |
| | | | | |
Personal Products—2.1% | | | | | |
Elizabeth Arden, Inc.* | | 183,600 | | | 2,651,184 |
| | | | | |
Property & Casualty Insurance—3.4% | | | | | |
Employers Holdings, Inc. | | 76,000 | | | 1,165,840 |
Hanover Insurance Group, Inc. | | 69,800 | | | 3,101,214 |
| | | | | |
| | | | | 4,267,054 |
| | | | | |
Regional Banks—3.3% | | | | | |
Associated Banc-Corporation | | 100,022 | | | 1,101,242 |
Bancfirst Corporation | | 13,600 | | | 503,744 |
Commerce Bancshares, Inc.1 | | 9,975 | | | 386,232 |
Heritage Financial Corporation | | 46,800 | | | 644,904 |
Old National Bancorp | | 122,697 | | | 1,525,124 |
| | | | | |
| | | | | 4,161,246 |
| | | | | |
Research & Consulting Services—3.8% | | | | | |
ICF International, Inc.* | | 85,700 | | | 2,296,760 |
Navigant Consulting, Inc.* | | 123,900 | | | 1,841,154 |
School Specialty, Inc.* | | 24,800 | | | 580,072 |
| | | | | |
| | | | | 4,717,986 |
| | | | | |
Restaurants—2.2% | | | | | |
Burger King Holdings, Inc. | | 101,900 | | | 1,917,758 |
Jack in the Box, Inc.* | | 45,400 | | | 893,018 |
| | | | | |
| | | | | 2,810,776 |
| | | | | |
Semiconductors—1.3% | | | | | |
IXYS Corporation2 | | 219,179 | | | 1,626,308 |
| | | | | |
Specialty Chemicals—2.9% | | | | | |
HB Fuller Company | | 5,508 | | | 125,307 |
Landec Corporation2,* | | 292,900 | | | 1,827,696 |
Zoltek Companies, Inc.* | | 182,100 | | | 1,729,950 |
| | | | | |
| | | | | 3,682,953 |
| | | | | |
Specialty Stores—2.0% | | | | | |
Cabela’s, Inc.* | | 179,847 | | | 2,564,618 |
| | | | | |
Trucking—1.6% | | | | | |
Saia, Inc.* | | 111,200 | | | 1,647,984 |
Universal Truckload Services, Inc. | | 23,011 | | | 416,499 |
| | | | | |
| | | | | 2,064,483 |
| | | | | |
TOTAL COMMON STOCKS (cost $96,755,541) | | | | $ | 124,195,107 |
| | | | | |
Total Investments—99.0%3 (cost $96,755,541) | | | | $ | 124,195,107 |
Cash & Other Assets, Less Liabilities—1.0% | | | | | 1,264,816 |
| | | | | |
Total Net Assets—100.0% | | | | $ | 125,459,923 |
| | | | | |
For federal income tax purposes the identified cost of investments owned at December 31, 2009 was $96,808,755.
| ADR | American Depositary Receipt |
| * | Non-income producing security |
| 1 | Security is segregated as collateral for open written option contracts. |
| 2 | Security is deemed illiquid. The total market value of illiquid securities is $4,557,387 (cost $4,201,846), or 3.6% of total net assets. |
| 3 | Unless otherwise indicated, the values securities of the Portfolio are determined based on Level 1 inputs. |
The accompanying notes are an integral part of the financial statements
110
Series Q
(Small Cap Value Series)
Statement of Assets and Liabilities
December 31, 2009
| | | | |
Assets: | | | | |
Investments, at value* | | $ | 124,195,107 | |
Cash | | | 1,346,981 | |
Receivables: | | | | |
Fund shares sold | | | 290,847 | |
Securities sold | | | 10,035 | |
Dividends | | | 98,512 | |
Prepaid expenses | | | 2,474 | |
| | | | |
Total assets | | | 125,943,956 | |
| | | | |
| |
Liabilities: | | | | |
| |
Payable for: | | | | |
Fund shares redeemed | | | 80,604 | |
Securities purchased | | | 10,324 | |
Written options, at value (premiums received $243,492) | | | 247,820 | |
Management fees | | | 99,570 | |
Administration fees | | | 10,257 | |
Transfer agent/maintenance fees | | | 2,083 | |
Custodian fees | | | 1,193 | |
Directors’ fees | | | 1,653 | |
Professional fees | | | 14,029 | |
Other fees | | | 16,500 | |
| | | | |
Total liabilities | | | 484,033 | |
| | | | |
Net assets | | $ | 125,459,923 | |
| | | | |
| |
Net assets consist of: | | | | |
Paid in capital | | $ | 119,726,781 | |
Accumulated net realized loss on sale of investments | | | (21,702,096 | ) |
Net unrealized appreciation in value of investments | | | 27,435,238 | |
| | | | |
Net assets | | $ | 125,459,923 | |
| | | | |
| |
Capital shares authorized | | | unlimited | |
Capital shares outstanding | | | 4,546,316 | |
Net asset value per share (net assets divided by shares outstanding) | | $ | 27.60 | |
| | | | |
| | | | |
* Investments, at cost | | $ | 96,755,541 | |
Statement of Operations
For Year Ended December 31, 2009
| | | | |
Investment Income: | | | | |
Dividends (net of foreign withholding tax $536) | | $ | 1,115,658 | |
Interest | | | 556 | |
| | | | |
Total investment income | | | 1,116,214 | |
| | | | |
| |
Expenses: | | | | |
Management fees | | | 954,269 | |
Administration fees | | | 95,267 | |
Transfer agent/maintenance fees | | | 25,205 | |
Custodian fees | | | 13,080 | |
Directors’ fees | | | 11,297 | |
Professional fees | | | 17,589 | |
Reports to shareholders | | | 16,754 | |
Other | | | 6,547 | |
| | | | |
Total expenses | | | 1,140,008 | |
| | | | |
Net investment loss | | | (23,794 | ) |
| | | | |
| |
Net Realized and Unrealized Gain (Loss): | | | | |
Net realized gain (loss) during the year on: | | | | |
Investments | | | (21,330,743 | ) |
Options written | | | 248,403 | |
Foreign currency transactions | | | (2,247 | ) |
| | | | |
Net realized loss | | | (21,084,587 | ) |
| | | | |
| |
Net unrealized appreciation (depreciation) during the year on: | | | | |
Investments | | | 65,223,792 | |
Options written | | | (4,328 | ) |
Translation of assets and liabilities in foreign currencies | | | (24 | ) |
| | | | |
Net unrealized appreciation | | | 65,219,440 | |
| | | | |
Net realized and unrealized gain | | | 44,134,853 | |
| | | | |
Net increase in net assets resulting from operations | | $ | 44,111,059 | |
| | | | |
The accompanying notes are an integral part of the financial statements
111
| | |
| Statement of Changes in Net Assets | | Series Q |
| | (Small Cap Value Series) |
| | | | | | | | |
| | | Year Ended
December 31, 2009 | | | Year Ended
December 31, 2008 | |
Increase (decrease) in net assets from operations: | | | | | | | | |
Net investment income (loss) | | $ | (23,794 | ) | | $ | 321,708 | |
Net realized gain (loss) during the year on investments | | | (21,084,587 | ) | | | 2,997,085 | |
Net unrealized appreciation (depreciation) during the year on investments | | | 65,219,440 | | | | (64,564,682 | ) |
| | | | | | | | |
Net increase (decrease) in net assets resulting from operations | | | 44,111,059 | | | | (61,245,889 | ) |
| | | | | | | | |
| | |
Capital share transactions: | | | | | | | | |
Proceeds from sale of shares | | | 39,411,373 | | | | 51,961,281 | |
Cost of shares redeemed | | | (44,006,948 | ) | | | (71,641,951 | ) |
| | | | | | | | |
Net decrease from capital share transactions | | | (4,595,575 | ) | | | (19,680,670 | ) |
| | | | | | | | |
Net increase (decrease) in net assets | | | 39,515,484 | | | | (80,926,559 | ) |
| | | | | | | | |
| | |
Net assets: | | | | | | | | |
Beginning of year | | | 85,944,439 | | | | 166,870,998 | |
| | | | | | | | |
End of year | | $ | 125,459,923 | | | $ | 85,944,439 | |
| | | | | | | | |
| | |
Undistributed net investment income at end of year | | $ | — | | | $ | 319,962 | |
| | | | | | | | |
| | |
Capital share activity: | | | | | | | | |
Shares sold | | | 1,768,681 | | | | 2,137,129 | |
Shares redeemed | | | (2,079,337 | ) | | | (3,071,142 | ) |
| | | | | | | | |
Total capital share activity | | | (310,656 | ) | | | (934,013 | ) |
| | | | | | | | |
The accompanying notes are an integral part of the financial statements
112
| | | |
| Financial Highlights | | Series Q | |
Selected data for each share of capital stock outstanding throughout each year | | (Small Cap Value Series | ) |
| | | | | | | | | | | | | | | | | | | | |
| | | 2009a | | | 2008 | | | 2007 | | | 2006 | | | Year Ended
December 31,
2005 | |
Per Share Data | | | | | | | | | | | | | | | | | | | | |
Net asset value, beginning of period | | $ | 17.70 | | | $ | 28.82 | | | $ | 26.14 | | | $ | 23.05 | | | $ | 20.13 | |
| | | | | | | | | | | | | | | | | | | | |
Income (loss) from investment operations: | | | | | | | | | | | | | | | | | | | | |
Net investment income (loss)b | | | (0.01 | ) | | | 0.06 | | | | (0.12 | ) | | | (0.09 | ) | | | (0.11 | ) |
Net gain (loss) on securities (realized and unrealized) | | | 9.91 | | | | (11.18 | ) | | | 2.80 | | | | 3.18 | | | | 3.03 | |
| | | | | | | | | | | | | | | | | | | | |
Total from investment operations | | | 9.90 | | | | (11.12 | ) | | | 2.68 | | | | 3.09 | | | | 2.92 | |
| | | | | | | | | | | | | | | | | | | | |
Net asset value, end of period | | $ | 27.60 | | | $ | 17.70 | | | $ | 28.82 | | | $ | 26.14 | | | $ | 23.05 | |
| | | | | | | | | | | | | | | | | | | | |
| | | | | |
Total Returnc | | | 55.93 | % | | | (38.58 | %) | | | 10.25 | % | | | 13.41 | % | | | 14.51 | % |
| | | | | | | | | | | | | | | | | | | | |
Ratios/Supplemental Data | | | | | | | | | | | | | | | | | | | | |
Net assets, end of period (in thousands) | | $ | 125,460 | | | $ | 85,944 | | | $ | 166,871 | | | $ | 159,852 | | | $ | 144,166 | |
| | | | | | | | | | | | | | | | | | | | |
Ratios to average net assets: | | | | | | | | | | | | | | | | | | | | |
Net investment income (loss) | | | (0.02 | )% | | | 0.24 | % | | | (0.42 | )% | | | (0.36 | )% | | | (0.58 | )% |
Total expensesd | | | 1.14 | % | | | 1.19 | % | | | 1.18 | % | | | 1.25 | % | | | 1.22 | % |
Net expensese | | | 1.14 | % | | | 1.18 | % | | | 1.18 | % | | | 1.24 | % | | | 1.22 | % |
Net expenses prior to custodian earnings credits and net of expense waivers | | | 1.14 | % | | | 1.19 | % | | | 1.18 | % | | | 1.25 | % | | | 1.22 | % |
| | | | | | | | | | | | | | | | | | | | |
Portfolio turnover rate | | | 126 | %f | | | 25 | % | | | 42 | % | | | 46 | % | | | 37 | % |
| a | Security Global Investors, LLC (SGI) became the advisor of Series Q effective February 9, 2009. Prior to February 9, 2009, SGI paid Wells Capital Management, Inc. for sub-advisory services. |
| b | Net investment income (loss) was computed using average shares outstanding throughout the period. |
| c | Total return does not take into account any of the expenses associated with an investment in variable insurance products offered by Security Benefit Life Insurance Company. If total return had taken into account these expenses, performance would have been lower. Shares of a series of SBL Fund are available only through the purchase of such products. |
| d | Total expense information reflects the expense ratios absent expense reductions by the Investment Manager and custodian earnings credits, as applicable. |
| e | Net expense information reflects the expense ratios after voluntary expense waivers, reimbursements and custodian earnings credits, as applicable. |
| f | Significant variation in the portfolio turnover rate is due to Investment Manager’s appointment of new portfolio manager for the Series. |
The accompanying notes are an integral part of the financial statements
113
Manager’s Commentary
February 15, 2010
| | | | |
| | Advised by: | | |
To Our Shareholders:
Series V of the SBL Fund – Mid Cap Value Series posted a gain of 43.93%, more than 1,600 basis points ahead of its benchmark and 1,000 basis points better than peer competition. The Series’ benchmark, the Russell 2500 Value Index increased 27.68%, while the Series’ peer group median return was 33.42%.
Our approach with the Mid Cap Value Series is to seek companies that can increase shareholders’ return on capital. We hold such companies over three to five years to capture long-term improvements in profitability.
The investment process is fundamentally driven and quantitatively aided. We use proprietary screens to identify potential companies for investment and then perform rigorous fundamental analysis to identify the best ideas. Through this fundamental research, we determine an estimate of intrinsic value and thus a valuation target for each idea. We construct the portfolios based on the level of conviction generated by this bottom-up analysis and the upside/downside profile associated with each company.
Industrials, Health Care, Information Technology, and Energy Top Performers
The Series benefited from four exceptionally strong sectors during the calendar year 2009. Superior security selection was the leading factor in all cases although information technology and energy were also able to add to returns through overweight positions.
As an even weight position, stock picking in the industrials sector allowed the portfolio to gain 40% compared to 19% for the Index. Leaders included Power-One, Inc., which soared 266% and Gevity HR and McDermott International, Inc. which gained 165% and 143%, respectively.
Health care was another even weight against the benchmark that outperformed by 123% to 43%. Aspect Medical Systems was up 260% while Community Health Systems, Inc. and RehabCare Group, Inc. both increased by more than 100%. Another sector contributor was Menax, Inc., up 90% during the period.
The Series benefited from an overweight position and good stock selection in the information technology sector. RF Micro Devices, Inc. was up over 500% for the portfolio. Other strong performers included Maxwell Technologies, Inc. and Satyam Computer Services, Ltd.
Energy benefited the portfolio through a double weight position, 10% to 5% for the benchmark, and investing in top performing securities. Global Industries, Ltd. increased over 100%. Other leading holdings in the sector were Newfield Exploration Company, Helmerich & Payne, Inc., and Gulfport Energy Corporation.
Financials Disappoint
As usual, the financials sector was positioned as a large underweight to the Index, 14% to 31%. However, poor stock selection led to a 6% loss for the portfolio while the benchmark was up a position 5%. The largest detractors in the portfolio were W.R. Berkley Corporation, United America Indemnity Corporation, Ltd., which was down 63%, and Wilmington Trust Corporation, which lost 46%.
Market Outlook
We continue to pursue opportunities with a focus on bottom-up research rather than a macro forecast.
Our focus is on identifying companies with the ability to be substantially stronger over the next three to five years or have the potential to maintain their return on capital at current levels in a difficult economic environment. We ultimately look for companies that trade significantly below their intrinsic value. The portfolio continues to be overweight energy and information technology while being underweight financials.
On behalf of Security Global Investors, I would like to thank you for placing your trust and money with us. As always, we will continue to do our best to seek the potential available in small and mid capitalization companies.
Sincerely,
James P. Schier, Portfolio Manager
114
| | |
| | Series V |
| Performance Summary | | (Mid Cap Value Series) |
| December 31, 2009 | | (unaudited) |
PERFORMANCE
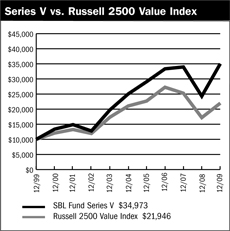
$10,000 Over 10 Years
The chart above assumes a hypothetical $10,000 investment in Series V (Mid Cap Value Series) on December 31, 1999 and reflects the fees and expenses of Series V. The Russell 2500 Value Index is an unmanaged index that measures the performance of securities of small-to-mid cap U.S. companies with greater-than-average value orientation.
Average Annual Returns
| | | | | | | | | |
Periods Ended 12-31-091 | | 1 Year | | | 5 Years | | | 10 Years | |
Series V | | 43.93 | % | | 6.92 | % | | 13.34 | % |
| 1 | Performance figures do not reflect fees and expenses associated with an investment in variable insurance products offered by Security Benefit Life Insurance Company. If returns had taken into account these fees and expenses, performance would have been lower. Shares of a Series of SBL Fund are available only through the purchase of such products. |
The performance data quoted above represents past performance. Past performance is not predictive of future performance. The investment return and principal value of an investment will fluctuate so that an investor’s shares, when redeemed, may be worth more or less than their original cost.
Portfolio Composition by Sector
| | | |
Consumer Discretionary | | 10.63 | % |
Consumer Staples | | 12.93 | |
Financials | | 13.26 | |
Health Care | | 4.59 | |
Industrials | | 21.59 | |
Information Technology | | 12.16 | |
Materials | | 6.12 | |
Utilities | | 13.19 | |
Convertible Bonds | | 0.75 | |
Cash & Other Assets, Less Liabilities | | 4.78 | |
Total Net Assets | | 100.00 | % |
| | | |
The accompanying notes are an integral part of the financial statements
115
| | |
| Schedule of Investments | | Series V |
| December 31, 2009 | | (Mid Cap Value Series) |
| | | | | |
| | | Shares | | Value |
COMMON STOCKS—94.5% | | | | | |
Aerospace & Defense—3.5% | | | | | |
GeoEye, Inc.* | | 234,190 | | $ | 6,529,217 |
Orbital Sciences Corporation* | | 275,012 | | | 4,196,683 |
| | | | | |
| | | | | 10,725,900 |
| | | | | |
Apparel Retail—3.7% | | | | | |
Brown Shoe Company, Inc. | | 294,226 | | | 2,904,011 |
Chico’s FAS, Inc.* | | 503,500 | | | 7,074,175 |
Talbots, Inc. | | 136,210 | | | 1,213,631 |
| | | | | |
| | | | | 11,191,817 |
| | | | | |
Apparel, Accessories & Luxury Goods—1.5% | | | | | |
Fossil, Inc. | | 46,700 | | | 1,567,252 |
Maidenform Brands, Inc.* | | 180,000 | | | 3,004,200 |
| | | | | |
| | | | | 4,571,452 |
| | | | | |
Application Software—0.4% | | | | | |
PLATO Learning, Inc.2,* | | 257,750 | | | 1,123,790 |
| | | | | |
Asset Management & Custody Banks—0.5% | | | | | |
Fifth Street Finance Corporation | | 144,000 | | | 1,546,560 |
| | | | | |
Auto Parts & Equipment—0.0% | | | | | |
HydroGen Corporation2,3,* | | 672,346 | | | 12,102 |
| | | | | |
Biotechnology—0.1% | | | | | |
Combinatorx, Inc.* | | 207,744 | | | 172,428 |
| | | | | |
Building Products—0.8% | | | | | |
Trex Company, Inc.* | | 118,900 | | | 2,330,440 |
| | | | | |
Coal & Consumable Fuels—0.6% | | | | | |
Evergreen Energy, Inc.* | | 1,018,609 | | | 349,383 |
USEC, Inc.* | | 404,470 | | | 1,557,209 |
| | | | | |
| | | | | 1,906,592 |
| | | | | |
Communications Equipment—1.0% | | | | | |
EF Johnson Technologies. Inc.* | | 284,000 | | | 315,240 |
Symmetricom, Inc.2,* | | 546,680 | | | 2,842,736 |
| | | | | |
| | | | | 3,157,976 |
| | | | | |
Construction & Engineering—4.9% | | | | | |
Insituform Technologies, Inc.* | | 286,800 | | | 6,516,097 |
Quanta Services, Inc.* | | 219,300 | | | 4,570,212 |
URS Corporation* | | 84,820 | | | 3,776,186 |
| | | | | |
| | | | | 14,862,495 |
| | | | | |
Construction & Farm Machinery & Heavy Trucks—0.7% | | | | | |
Force Protection, Inc.* | | 426,300 | | | 2,221,023 |
| | | | | |
Construction Materials—0.3% | | | | | |
Eagle Materials, Inc. | | 37,259 | | | 970,597 |
| | | | | |
Consumer Finance—0.1% | | | | | |
First Marblehead Corporation* | | 211,633 | | | 450,778 |
Data Processing & Outsourced Services—5.6% | | | | | |
Affiliated Computer Services, Inc.* | | 94,500 | | | 5,640,705 |
Computer Sciences Corporation* | | 195,000 | | | 11,218,350 |
| | | | | |
| | | | | 16,859,055 |
| | | | | |
Diversified REIT’s—0.9% | | | | | |
Investors Real Estate Trust | | 309,000 | | | 2,781,000 |
| | | | | |
Electric Utilities—6.4% | | | | | |
Allete, Inc. | | 115,751 | | | 3,782,743 |
Great Plains Energy, Inc. | | 264,305 | | | 5,124,874 |
Northeast Utilities | | 152,481 | | | 3,932,485 |
Pepco Holdings, Inc. | | 137,500 | | | 2,316,875 |
Westar Energy, Inc. | | 192,100 | | | 4,174,333 |
| | | | | |
| | | | | 19,331,310 |
| | | | | |
Electrical Components & Equipment—2.8% | | | | | |
General Cable Corporation* | | 51,000 | | | 1,500,420 |
Power-One, Inc.* | | 1,411,200 | | | 6,138,720 |
UQM Technologies. Inc.* | | 147,266 | | | 1,008,772 |
| | | | | |
| | | | | 8,647,912 |
| | | | | |
Electronic Manufacturing Services—2.4% | | | | | |
Maxwell Technologies, Inc.* | | 408,700 | | | 7,291,208 |
| | | | | |
Environmental & Facilities Services—1.0% | | | | | |
Covanta Holding Corporation* | | 168,500 | | | 3,048,165 |
| | | | | |
Forest Products—1.3% | | | | | |
Louisiana-Pacific Corporation* | | 573,100 | | | 4,000,238 |
| | | | | |
Gas Utilities—1.8% | | | | | |
Atmos Energy Corporation | | 140,000 | | | 4,116,000 |
UGI Corporation | | 61,700 | | | 1,492,523 |
| | | | | |
| | | | | 5,608,523 |
| | | | | |
Health Care Equipment—1.0% | | | | | |
Hologic, Inc.* | | 203,344 | | | 2,948,488 |
| | | | | |
Health Care Services—3.5% | | | | | |
Amedisys, Inc.* | | 55,000 | | | 2,670,800 |
Mednax, Inc.* | | 95,000 | | | 5,711,399 |
RehabCare Group, Inc.* | | 80,930 | | | 2,462,700 |
| | | | | |
| | | | | 10,844,899 |
| | | | | |
Highways & Railtracks—0.3% | | | | | |
Quixote Corporation | | 149,800 | | | 954,226 |
| | | | | |
Home Furnishings—1.2% | | | | | |
Leggett & Platt, Inc. | | 185,500 | | | 3,784,200 |
| | | | | |
Human Resources & Employment Services—0.9% | | | | | |
Administaff, Inc. | | 113,305 | | | 2,672,865 |
| | | | | |
Industrial Conglomerates—2.1% | | | | | |
McDermott International, Inc.* | | 266,900 | | | 6,408,269 |
| | | | | |
Industrial Machinery—1.0% | | | | | |
Harsco Corporation | | 89,700 | | | 2,891,031 |
Thermoenergy Corporation2,* | | 905,961 | | | 253,669 |
| | | | | |
| | | | | 3,144,700 |
| | | | | |
Insurance Brokers—0.5% | | | | | |
Arthur J Gallagher & Company | | 64,100 | | | 1,442,891 |
| | | | | |
IT Consulting & Other Services—0.7% | | | | | |
Satyam Computer Services, Ltd. ADR | | 449,994 | | | 2,074,472 |
| | | | | |
The accompanying notes are an integral part of the financial statements
116
| | |
| Schedule of Investments | | Series V |
| December 31, 2009 | | (Mid Cap Value Series) |
| | | | | | |
| | | Shares | | Value |
COMMON STOCKS—94.5% (continued) | | | | | | |
Mortgage REIT’s—0.5% | | | | | | |
Bimini Capital Management, Inc.2 | | | 699,155 | | $ | 167,797 |
Redwood Trust, Inc.1 | | | 94,571 | | | 1,367,497 |
| | | | | | |
| | | | | | 1,535,294 |
| | | | | | |
Multi-Line Insurance—1.5% | | | | | | |
American Financial Group, Inc.1 | | | 177,900 | | | 4,438,605 |
| | | | | | |
Multi-Utilities—5.0% | | | | | | |
Alliant Energy Corporation | | | 167,100 | | | 5,056,446 |
Black Hills Corporation | | | 120,000 | | | 3,195,600 |
Northwestern Corporation | | | 167,000 | | | 4,345,340 |
SCANA Corporation | | | 70,800 | | | 2,667,744 |
| | | | | | |
| | | | | | 15,265,130 |
| | | | | | |
Office Services & Supplies—0.5% | | | | | | |
United Stationers, Inc.* | | | 24,940 | | | 1,417,839 |
Oil & Gas Drilling—0.5% | | | | | | |
Helmerich & Payne, Inc. | | | 41,050 | | | 1,637,074 |
| | | | | | |
Oil & Gas Equipment & Services—2.9% | | | | | | |
Complete Production Services, Inc.* | | | 73,860 | | | 960,180 |
Global Industries, Ltd.* | | | 1,094,249 | | | 7,801,996 |
| | | | | | |
| | | | | | 8,762,176 |
| | | | | | |
Oil & Gas Exploration & Production—2.2% | | | | | | |
Goodrich Petroleum Corporation* | | | 55,787 | | | 1,358,413 |
Gulfport Energy Corporation* | | | 195,300 | | | 2,236,185 |
Petrohawk Energy Corporation1,* | | | 130,400 | | | 3,128,296 |
| | | | | | |
| | | | | | 6,722,894 |
| | | | | | |
Oil & Gas Storage & Transportation—1.7% | | | | | | |
Southern Union Company | | | 222,400 | | | 5,048,480 |
| | | | | | |
Packaged Foods & Meats—5.0% | | | | | | |
Del Monte Foods Company | | | 206,300 | | | 2,339,442 |
Hormel Foods Corporation1 | | | 106,200 | | | 4,083,390 |
JM Smucker Company | | | 111,200 | | | 6,866,600 |
Ralcorp Holdings, Inc.* | | | 34,000 | | | 2,030,140 |
| | | | | | |
| | | | | | 15,319,572 |
| | | | | | |
Paper Packaging—3.4% | | | | | | |
Bemis Company, Inc. | | | 199,000 | | | 5,900,350 |
Sonoco Products Company | | | 146,950 | | | 4,298,288 |
| | | | | | |
| | | | | | 10,198,638 |
| | | | | | |
Property & Casualty Insurance—6.3% | | | | | | |
Alleghany Corporation* | | | 16,235 | | | 4,480,860 |
Employers Holdings, Inc. | | | 127,800 | | | 1,960,452 |
Hanover Insurance Group, Inc. | | | 164,300 | | | 7,299,849 |
W.R. Berkley Corporation | | | 213,800 | | | 5,268,032 |
| | | | | | |
| | | | | | 19,009,193 |
| | | | | | |
Regional Banks—3.0% | | | | | | |
Associated Banc-Corporation | | | 241,668 | | | 2,660,765 |
Commerce Bancshares, Inc.1 | | | 60,354 | | | 2,336,907 |
First Horizon National Corporation* | | | 52,409 | | | 702,279 |
Old National Bancorp | | | 280,114 | | | 3,481,816 |
| | | | | | |
| | | | | | 9,181,767 |
| | | | | | |
Research & Consulting Services—2.4% | | | | | | |
ICF International, Inc.* | | | 114,400 | | | 3,065,920 |
Navigant Consulting. Inc.* | | | 291,200 | | | 4,327,232 |
| | | | | | |
| | | | | | 7,393,152 |
| | | | | | |
Restaurants—2.3% | | | | | | |
Burger King Holdings, Inc. | | | 254,635 | | | 4,792,231 |
Jack in the Box, Inc.* | | | 112,700 | | | 2,216,809 |
| | | | | | |
| | | | | | 7,009,040 |
| | | | | | |
Semiconductor Equipment—0.5% | | | | | | |
Ultratech, Inc.* | | | 105,800 | | | 1,572,188 |
| | | | | | |
Semiconductors—1.6% | | | | | | |
IXYS Corporation2 | | | 670,000 | | | 4,971,400 |
| | | | | | |
Specialty Chemicals—1.1% | | | | | | |
HB Fuller Company | | | 13,351 | | | 303,735 |
Landec Corporation2,* | | | 251,145 | | | 1,567,145 |
Zoltek Companies. Inc.* | | | 170,000 | | | 1,615,000 |
| | | | | | |
| | | | | | 3,485,880 |
| | | | | | |
Specialty Stores—1.9% | | | | | | |
Cabela’s, Inc.* | | | 410,431 | | | 5,852,746 |
| | | | | | |
Trucking—0.7% | | | | | | |
Saia, Inc.* | | | 133,690 | | | 1,981,286 |
| | | | | | |
TOTAL COMMON STOCKS (cost $275,789,225) | | | | | $ | 287,888,725 |
| | |
| | | | | | |
| | |
| | | Shares | | Value |
WARRANTS—0.0% | | | | | | |
Nova Biosource Fuels, Inc. | | | | | | |
$2.40, 7/5/20114 | | | 369,350 | | | 820 |
| | | | | | |
TOTAL WARRANTS (cost $381,520) | | | | | $ | 820 |
| | |
| | | | | | |
| | | | | | |
| | |
| | | Principal
Amount | | Value |
CONVERTIBLE BONDS—0.7% | | | | | | |
Metals & Minerals—0.7% | | | | | | |
USEC, Inc. | | | | | | |
3.00%, 20144 | | $ | 3,500,000 | | $ | 2,275,000 |
| | | | | | |
TOTAL CONVERTIBLE BONDS (cost $3,500,000) | | | | | $ | 2,275,000 |
| | | | | | |
Total Investments—95.2%5 (cost $279,670,745) | | | | | $ | 290,164,545 |
Cash & Other Assets, Less Liabilities—4.8% | | | | | | 14,565,697 |
| | | | | | |
Total Net Assets- 100.0% | | | | | $ | 304,730,242 |
| | | | | | |
For federal income tax purposes the identified cost of investments owned at December 31, 2009 was $280,333,711.
ADR American Depositary Receipt
| * | Non-income producing security |
| 1 | Security is segregated as collateral for open written option contracts. |
| 2 | Security is deemed illiquid. The total market value of illiquid securities is $10,938,639 (cost $22,470,303), or 3.6% of total net assets. |
The accompanying notes are an integral part of the financial statements
117
| | |
| Schedule of Investments | | Series V |
| December 31, 2009 | | (Mid Cap Value Series) |
| 3 | Investment in an affiliated issuer. See Note 6 in the Notes to Financial Statements. |
| 4 | Value determined based on Level 2 inputs. |
| 5 | Unless otherwise indicated, the values of the securities of the Portfolio are determined based on Level 1 inputs. |
The accompanying notes are an integral part of the financial statements
118
Series V
(Mid Cap Value Series)
Statement of Assets and Liabilities
December 31, 2009
| | | | |
Assets: | | | | |
Investments in unaffiliated issues, at value* | | $ | 290,152,443 | |
Investments in affiliated issues, at value** | | | 12,102 | |
| | | | |
Total investments | | | 290,164,545 | |
Cash | | | 5,527,277 | |
Receivables: | | | | |
Fund shares sold | | | 331,024 | |
Securities sold | | | 8,864,668 | |
Interest | | | 26,538 | |
Dividends | | | 800,448 | |
Prepaid expenses | | | 6,224 | |
| | | | |
Total assets | | | 305,720,724 | |
| | | | |
| |
Liabilities: | | | | |
Payable for: | | | | |
Fund shares redeemed | | | 88,197 | |
Securities purchased | | | 28,410 | |
Written options, at value (premiums received $440,888) | | | 369,790 | |
Management fees | | | 189,768 | |
Administration fees | | | 24,247 | |
Transfer agent/maintenance fees | | | 2,084 | |
Custodian fees | | | 1,691 | |
Directors’ fees | | | 5,786 | |
Professional fees | | | 40,000 | |
Other fees | | | 240,509 | |
| | | | |
Total liabilities | | | 990,482 | |
| | | | |
Net assets | | $ | 304,730,242 | |
| | | | |
| |
Net assets consist of: | | | | |
Paid in capital | | $ | 320,081,834 | |
Undistributed net investment income | | | 2,528,388 | |
Accumulated net realized loss on sale of investments | | | (28,444,878 | ) |
Net unrealized appreciation in value of investments | | | 10,564,898 | |
| | | | |
Net assets | | $ | 304,730,242 | |
| | | | |
| |
Capital shares authorized | | | unlimited | |
Capital shares outstanding | | | 6,213,008 | |
Net asset value per share (net assets divided by shares outstanding) | | $ | 49.05 | |
| | | | |
| |
* Investments in unaffiliated issues, at cost | | $ | 277,099,170 | |
** Investments in affiliated issues, at cost | | | 2,571,575 | |
| | | | |
Total cost | | $ | 279,670,745 | |
Statement of Operations
For Year Ended December 31, 2009
| | | | |
Investment Income: | | | | |
Dividends | | $ | 4,735,571 | |
Interest | | | 170,296 | |
| | | | |
Total investment income | | | 4,905,867 | |
| | | | |
| |
Expenses: | | | | |
Management fees | | | 1,955,255 | |
Administration fees | | | 248,238 | |
Transfer agent/maintenance fees | | | 25,234 | |
Custodian fees | | | 13,187 | |
Directors’ fees | | | 26,604 | |
Professional fees | | | 54,878 | |
Reports to shareholders | | | 37,324 | |
Other | | | 16,759 | |
| | | | |
Total expenses | | | 2,377,479 | |
| | | | |
Net investment income | | | 2,528,388 | |
| | | | |
| |
Net Realized and Unrealized Gain (Loss): | | | | |
Net realized gain (loss) during the year on: | | | | |
Investments | | | (30,680,620 | ) |
Options written | | | 2,648,685 | |
| | | | |
Net realized loss | | | (28,031,935 | ) |
| | | | |
| |
Net unrealized appreciation (depreciation) during the year on: | | | | |
Investments | | | 122,114,206 | |
Options written | | | (699,260 | ) |
| | | | |
Net unrealized appreciation | | | 121,414,946 | |
| | | | |
Net realized and unrealized gain | | | 93,383,011 | |
| | | | |
Net increase in net assets resulting from operations | | $ | 95,911,399 | |
| | | | |
The accompanying notes are an integral part of the financial statements
119
| | |
| | Series V |
| Statement of Changes in Net Assets | | (Mid Cap Value Series) |
| | | | | | | | |
| | | Year Ended
December 31, 2009 | | | Year Ended
December 31, 2008 | |
Increase (decrease) in net assets from operations: | | | | | | | | |
Net investment income | | $ | 2,528,388 | | | $ | 3,755,588 | |
Net realized gain (loss) during the year on investments | | | (28,031,935 | ) | | | 18,444,979 | |
Net unrealized appreciation (depreciation) during the year on investments | | | 121,414,946 | | | | (126,882,464 | ) |
| | | | | | | | |
Net increase (decrease) in net assets resulting from operations | | | 95,911,399 | | | | (104,681,897 | ) |
| | | | | | | | |
| | |
Capital share transactions: | | | | | | | | |
Proceeds from sale of shares | | | 45,841,863 | | | | 69,838,112 | |
Cost of shares redeemed | | | (81,907,191 | ) | | | (129,483,458 | ) |
| | | | | | | | |
Net decrease from capital share transactions | | | (36,065,328 | ) | | | (59,645,346 | ) |
| | | | | | | | |
Net increase (decrease) in net assets | | | 59,846,071 | | | | (164,327,243 | ) |
| | | | | | | | |
| | |
Net assets: | | | | | | | | |
Beginning of year | | | 244,884,171 | | | | 409,211,414 | |
| | | | | | | | |
End of year | | $ | 304,730,242 | | | $ | 244,884,171 | |
| | | | | | | | |
| | |
Undistributed net investment income at end of year | | $ | 2,528,388 | | | $ | 3,755,588 | |
| | | | | | | | |
| | |
Capital share activity: | | | | | | | | |
Shares sold | | | 1,210,944 | | | | 1,669,587 | |
Shares redeemed | | | (2,183,072 | ) | | | (3,074,205 | ) |
| | | | | | | | |
Total capital share activity | | | (972,128 | ) | | | (1,404,618 | ) |
| | | | | | | | |
The accompanying notes are an integral part of the financial statements
120
| | |
| Financial Highlights | | Series V |
Selected data for each share of capital stock outstanding throughout each year | | (Mid Cap Value Series) |
| | | | | | | | | | | | | | | | | | | | |
| | | 2009 | | | 2008 | | | 2007 | | | 2006 | | | Year Ended
December 31,
2005 | |
Per Share Data | | | | | | | | | | | | | | | | | | | | |
Net asset value, beginning of period | | $ | 34.08 | | | $ | 47.64 | | | $ | 46.78 | | | $ | 40.79 | | | $ | 35.10 | |
| | | | | | | | | | | | | | | | | | | | |
Income (loss) from investment operations: | | | | | | | | | | | | | | | | | | | | |
Net investment incomea | | | 0.38 | | | | 0.49 | | | | 0.36 | | | | 0.44 | | | | 0.14 | |
Net gain (loss) on securities (realized and unrealized) | | | 14.59 | | | | (14.05 | ) | | | 0.50 | | | | 5.55 | | | | 5.55 | |
| | | | | | | | | | | | | | | | | | | | |
Total from investment operations | | | 14.97 | | | | (13.56 | ) | | | 0.86 | | | | 5.99 | | | | 5.69 | |
| | | | | | | | | | | | | | | | | | | | |
Net asset value, end of period | | $ | 49.05 | | | $ | 34.08 | | | $ | 47.64 | | | $ | 46.78 | | | $ | 40.79 | |
| | | | | | | | | | | | | | | | | | | | |
| | | | | |
Total Returnb | | | 43.93 | % | | | (28.46 | )% | | | 1.84 | % | | | 14.66 | % | | | 16.21 | % |
| | | | | | | | | | | | | | | | | | | | |
Ratios/Supplemental Data | | | | | | | | | | | | | | | | | | | | |
Net assets, end of period (in thousands) | | $ | 304,730 | | | $ | 244,884 | | | $ | 409,211 | | | $ | 447,271 | | | $ | 384,494 | |
| | | | | | | | | | | | | | | | | | | | |
Ratios to average net assets: | | | | | | | | | | | | | | | | | | | | |
Net investment income | | | 0.97 | % | | | 1.15 | % | | | 0.73 | % | | | 1.01 | % | | | 0.44 | % |
Total expensesc | | | 0.91 | % | | | 0.91 | % | | | 0.89 | % | | | 0.89 | % | | | 0.90 | % |
Net expensesd | | | 0.91 | % | | | 0.91 | % | | | 0.89 | % | | | 0.89 | % | | | 0.90 | % |
Net expenses prior to custodian earnings credits and net of expense waivers | | | 0.91 | % | | | 0.91 | % | | | 0.89 | % | | | 0.89 | % | | | 0.90 | % |
| | | | | | | | | | | | | | | | | | | | |
Portfolio turnover rate | | | 29 | % | | | 56 | % | | | 45 | % | | | 42 | % | | | 29 | % |
| a | Net investment income (loss) was computed using average shares outstanding throughout the period. |
| b | Total return does not take into account any of the expenses associated with an investment in variable insurance products offered by Security Benefit Life Insurance Company. If total return had taken into account these expenses, performance would have been lower. Shares of a series of SBL Fund are available only through the purchase of such products. |
| c | Total expense information reflects the expense ratios absent expense reductions by the Investment Manager and earnings credits, as applicable. |
| d | Net expense information reflects the expense ratios after voluntary expense waivers, reimbursements and custodian earnings credits, as applicable. |
The accompanying notes are an integral part of the financial statements
121
This page left blank intentionally.
122
| | |
| Manager’s Commentary | | |
February 15, 2010 | | |
| | | | |
| | Advised by: | | |
To Our Shareholders:
Series X of the SBL Fund – Small Cap Growth Series gained 35.20% for the year, compared with a 34.47% increase in the Russell 2000 Growth Index and the Series’ peer group median return of 34.75%.
Information Technology and Industrials Top Performers
The information technology and industrials sectors led the Series performance. Information technology was an even weight position with the Index, but due to superior stock selection was able to outperform with gains of 91% versus 59%. Leading holdings were Skyworks Solutions, Inc. and Alliance Data Systems Corporation with returns of 183% and 171%, respectively. Fairchild Semiconductor International, Inc. also gained more than 100%. Alliance Data Systems and Fairchild Semiconductor were active positions not part of the Russell 2000 Growth benchmark.
The industrials sector added to performance through proper allocation and good stock picking. While it was a slight underweight against the benchmark, it outperformed 33% to 13%. Bucyrus International, Inc. soared 188% while BE Aerospace, Inc. was up 140%. Both were active bets as neither were part of the Index. Other securities in the sector contributing to returns included Constant Contact, Inc. and Regal-Beloit Corporation.
Health Care and Energy Disappoint
Health care was a large underweight relative to the Index, 12% to 25%. In addition, the holdings in the portfolio lost 8% against a 22% gain for the benchmark – a 30% difference – due to poor stock selection. The largest detractor was CardioNet, Inc., which dropped 76% over the period. Other holdings hurting performance included Martek Biosciences Corporation, down 37%, Psychiatric Solutions, Inc., losing 28%, and Wright Medical Group, Inc.
Holdings in the portfolios energy sector were also hurt by poor stock picks. Even though holdings in the Series gained 35% it could not keep pace with the 42% increase of the Index. Goodrich Petroleum Corporation and PetroQuest Energy, Inc. each declined approximately 20% while Comstock Resources, Inc. lost 14%.
Market Outlook
The main factors behind the strong equity markets of 2009 were the tremendous growth in risk appetite and the better than expected earnings results. We expect that earnings will continue to exceed expectations as cost cutting has led to significant margin expansion for most companies, which will now be combined with improving revenue growth. We are positive in our outlook for the equity markets but believe much of the gains, if there are gains, may be achieved during the 1st half of 2010.
Due to stronger than expected earnings in 2009, we watched earnings expectations for 2010 be revised upward. If the U.S. economy improves and the federal government continues the need to bring large levels of debt, we expect interest rates will climb limiting P/E expansion in the equity markets. We believe equity markets can achieve positive gains but that much of the gains may be achieved during the first half of 2010.
As always, we remain committed to our principles of investing in fast growing, high-margin companies with unique proprietary advantages and strong management teams. We have not changed our investment process. We continue to focus on our core expertise and investment process. As fellow investors in the strategy, we thank you for your long-term investment.
Sincerely,
Joe O’Connor, Portfolio Manager
123
| | |
| | Series X |
| Performance Summary | | (Small Cap Growth Series) |
December 31, 2009 | | (unaudited) |
PERFORMANCE

$10,000 Over 10 Years
The chart above assumes a hypothetical $10,000 investment in Series X (Small Cap Growth Series) on December 31, 1999 and reflects the fees and expenses of Series X. The Russell 2000 Growth Index measures the performance of those Russell 2000 companies with higher price-to-book ratios and higher forecasted growth values.
Average Annual Returns
| | | | | | | | | |
Periods Ended 12-31-091 | | 1 Year | | | 5 Years | | | 10 Years | |
Series X | | 35.20 | % | | (3.16 | )% | | (2.77 | )% |
| 1 | Performance figures do not reflect fees and expenses associated with an investment in variable insurance products offered by Security Benefit Life Insurance Company. If returns had taken into account these fees and expenses, performance would have been lower. Shares of a Series of SBL Fund are available only through the purchase of such products. |
The performance data quoted above represents past performance. Past performance is not predictive of future performance. The investment return and principal value of an investment will fluctuate so that an investor’s shares, when redeemed, may be worth more or less than their original cost.
Portfolio Composition by Sector
| | | |
Consumer Discretionary | | 14.31 | % |
Consumer Staples | | 3.55 | |
Energy | | 5.57 | |
Financials | | 5.94 | |
Health Care | | 12.35 | |
Industrials | | 16.56 | |
Information Technology | | 25.88 | |
Materials | | 5.15 | |
Utilities | | 2.04 | |
Exchange Traded Funds | | 5.83 | |
Cash & Other Assets, Less Liabilities | | 2.82 | |
Total Net Assets | | 100.00 | % |
| | | |
The accompanying notes are an integral part of the financial statements
124
| | |
| Schedule of Investments | | Series X |
December 31, 2009 | | (Small Cap Growth Series) |
| | | | | |
| | | Shares | | Value |
COMMON STOCKS—97.2% | | | | | |
Aerospace & Defense—2.0% | | | | | |
BE Aerospace, Inc.* | | 21,730 | | $ | 510,655 |
DigitalGlobe, Inc.* | | 8,180 | | | 197,956 |
| | | | | |
| | | | | 708,611 |
| | | | | |
Apparel, Accessories & Luxury Goods—2.2% | | | | | |
Hanesbrands, Inc.* | | 19,000 | | | 458,090 |
Lululemon Athletica, Inc.* | | 10,800 | | | 325,080 |
| | | | | |
| | | | | 783,170 |
| | | | | |
Application Software—7.9% | | | | | |
Informatica Corporation* | | 21,630 | | | 559,352 |
JDA Software Group, Inc.* | | 9,776 | | | 248,995 |
Longtop Financial Technologies, Ltd. ADR* | | 10,050 | | | 372,051 |
Nuance Communications, Inc.* | | 29,350 | | | 456,099 |
Solera Holdings, Inc. | | 22,350 | | | 804,823 |
VancelnfoTechnologies, Inc. ADR* | | 17,550 | | | 337,136 |
| | | | | |
| | | | | 2,778,456 |
| | | | | |
Auto Parts & Equipment—0.6% | | | | | |
Gentex Corporation | | 11,870 | | | 211,880 |
| | | | | |
Biotechnology—1.0% | | | | | |
Halozyme Therapeutics, Inc.* | | 29,310 | | | 172,050 |
Martek Biosciences Corporation* | | 8,700 | | | 164,778 |
| | | | | |
| | | | | 336,828 |
| | | | | |
Casinos & Gaming—1.4% | | | | | |
WMS Industries, Inc.* | | 12,630 | | | 505,200 |
| | | | | |
Coal & Consumable Fuels—1.5% | | | | | |
Massey Energy Company | | 12,700 | | | 533,527 |
| | | | | |
Communications Equipment—1.5% | | | | | |
InterDigital, Inc.* | | 19,930 | | | 528,942 |
| | | | | |
Computer Storage & Peripherals—1.9% | | | | | |
QLogic Corporation* | | 35,145 | | | 663,186 |
| | | | | |
Construction & Engineering—2.1% | | | | | |
Aecom Technology Corporation* | | 27,240 | | | 749,100 |
| | | | | |
Construction & Farm Machinery & Heavy Trucks—2.3% | | | | | |
Bucyrus International, Inc. | | 7,920 | | | 446,450 |
Wabtec Corporation | | 8,650 | | | 353,266 |
| | | | | |
| | | | | 799,716 |
| | | | | |
Data Processing & Outsourced Services—1.8% | | | | | |
Alliance Data Systems Corporation* | | 9,960 | | | 643,316 |
| | | | | |
Diversified Metals & Mining—0.9% | | | | | |
Thompson Creek Metals Company, Inc.* | | 26,800 | | | 314,096 |
| | | | | |
Education Services—1.0% | | | | | |
DeVry, Inc. | | 6,000 | | | 340,380 |
| | | | | |
Electric Utilities—1.0% | | | | | |
ITC Holdings Corporation | | 6,950 | | | 362,026 |
| | | | | |
Electrical Components & Equipment—3.9% | | | | | |
Baldor Electric Company | | 15,970 | | | 448,597 |
Regal-Beloit Corporation | | 7,550 | | | 392,147 |
Roper Industries, Inc. | | 9,580 | | | 501,705 |
| | | | | |
| | | | | 1,342,449 |
| | | | | |
Electronic Equipment & Instruments—2.2% | | | | | |
FLIR Systems, Inc.* | | 15,050 | | | 492,436 |
Rofin-SinarTechnologies.lnc.* | | 11,900 | | | 280,959 |
| | | | | |
| | | | | 773,395 |
| | | | | |
Exchange Traded Funds—5.8% | | | | | |
iShares Russell 2000 Growth Index Fund | | 30,340 | | | 2,065,244 |
| | | | | |
Fertilizers & Agricultural Chemicals—1.1% | | | | | |
Terra Industries, Inc. | | 12,440 | | | 400,444 |
| | | | | |
Health Care Equipment—2.2% | | | | | |
Integra LifeSciences Holdings Corporation* | | 10,580 | | | 389,132 |
Wright Medical Group, Inc.* | | 20,350 | | | 385,633 |
| | | | | |
| | | | | 774,765 |
| | | | | |
Health Care Services—3.3% | | | | | |
CardioNet, Inc.* | | 30,915 | | | 183,635 |
Clarient, Inc.* | | 41,000 | | | 108,650 |
LHC Group, lnc.* | | 12,560 | | | 422,142 |
Mednax, Inc.* | | 7,450 | | | 447,894 |
| | | | | |
| | | | | 1,162,321 |
| | | | | |
Health Care Supplies—1.4% | | | | | |
Haemonetics Corporation* | | 9,035 | | | 498,280 |
| | | | | |
Homebuilding—1.0% | | | | | |
Lennar Corporation | | 28,400 | | | 362,668 |
| | | | | |
Homefurnishing Retail—1.1% | | | | | |
Select Comfort Corporation* | | 61,200 | | | 399,024 |
| | | | | |
Household Products—1.7% | | | | | |
Church & Dwight Company, Inc. | | 10,325 | | | 624,146 |
| | | | | |
Housewares & Specialties—2.6% | | | | | |
Jarden Corporation | | 29,680 | | | 917,408 |
| | | | | |
Human Resources & Employment Services—0.9% | | | | | |
Watson Wyatt Worldwide, Inc. | | 6,550 | | | 311,256 |
| | | | | |
Hypermarkets & Super Centers—1.1% | | | | | |
BJ’s Wholesale Club, Inc.* | | 12,100 | | | 395,791 |
| | | | | |
Industrial Machinery—4.3% | | | | | |
IDEX Corporation | | 17,930 | | | 558,520 |
Pall Corporation | | 16,130 | | | 583,906 |
Pentair, Inc.* | | 10,900 | | | 352,070 |
| | | | | |
| | | | | 1,494,496 |
| | | | | |
The accompanying notes are an integral part of the financial statements
125
| | |
| Schedule of Investments | | Series X |
December 31, 2009 | | (Small Cap Growth Series) |
| | | | | |
| | | Shares | | Value |
COMMON STOCKS—97.2% (continued) | | | | | |
Internet Software & Services—0.6% | | | | | |
Constant Contact, Inc.* | | 13,770 | | $ | 220,320 |
| | | | | |
Investment Banking & Brokerage—3.1% | | | | | |
Knight Capital Group, Inc.* | | 30,350 | | | 467,390 |
Stifel Financial Corporation* | | 9,150 | | | 542,045 |
TradeStation Group, Inc.* | | 14,440 | | | 113,932 |
| | | | | |
| | | | | 1,123,367 |
| | | | | |
Leisure Facilities—1.8% | | | | | |
Life Time Fitness, Inc.* | | 16,355 | | | 407,730 |
Vail Resorts, Inc.* | | 6,135 | | | 231,903 |
| | | | | |
| | | | | 639,633 |
| | | | | |
Life Sciences Tools & Services—1.0% | | | | | |
Charles River Laboratories International, Inc.* | | 11,000 | | | 370,590 |
| | | | | |
Metal & Glass Containers—1.6% | | | | | |
Silgan Holdings, Inc. | | 9,800 | | | 567,224 |
| | | | | |
Movies & Entertainment—0.7% | | | | | |
Imax Corporation* | | 18,635 | | | 247,846 |
| | | | | |
Multi-Line Insurance—1.9% | | | | | |
HCC Insurance Holdings, Inc. | | 23,450 | | | 655,897 |
| | | | | |
Multi-Utilities—1.0% | | | | | |
Northwestern Corporation | | 13,920 | | | 362,198 |
| | | | | |
Oil & Gas Equipment & Services—2.5% | | | | | |
Oil States International, Inc.* | | 11,600 | | | 455,764 |
Superior Energy Services, Inc.* | | 17,090 | | | 415,116 |
| | | | | |
| | | | | 870,880 |
| | | | | |
Oil & Gas Exploration & Production—1.6% | | | | | |
Bill Barrett Corporation* | | 10,900 | | | 339,099 |
Comstock Resources, Inc.* | | 5,640 | | | 228,815 |
| | | | | |
| | | | | 567,914 |
| | | | | |
Packaged Foods & Meats—0.7% | | | | | |
Flowers Foods, Inc. | | 9,930 | | | 235,937 |
| | | | | |
Pharmaceuticals—3.4% | | | | | |
Endo Pharmaceuticals Holdings, Inc.* | | 16,950 | | | 347,645 |
Perrigo Company | | 22,100 | | | 880,463 |
| | | | | |
| | | | | 1,228,108 |
| | | | | |
Railroads—0.9% | | | | | |
Kansas City Southern* | | 10,005 | | | 333,066 |
| | | | | |
Regional Banks—0.9% | | | | | |
TCF Financial Corporation | | 23,580 | | | 321,160 |
| | | | | |
Research & Consulting Services—0.3% | | | | | |
ICF International, Inc.* | | 4,500 | | | 120,600 |
| | | | | |
Restaurants—1.9% | | | | | |
Einstein Noah Restaurant Group, Inc.* | | 14,200 | | | 139,586 |
McCormick & Schmick’s Seafood Restaurants, Inc.* | | 15,850 | | | 110,316 |
Panera Bread Company* | | 6,100 | | | 408,517 |
| | | | | |
| | | | | 658,419 |
| | | | | |
Semiconductor Equipment—2.2% | | | | | |
Formfactor, Inc.* | | 18,180 | | | 395,596 |
Tessera Technologies, Inc.* | | 16,480 | | | 383,490 |
| | | | | |
| | | | | 779,086 |
| | | | | |
Semiconductors—5.0% | | | | | |
ON Semiconductor Corporation* | | 88,565 | | | 780,258 |
Skyworks Solutions, Inc.* | | 69,265 | | | 982,870 |
| | | | | |
| | | | | 1,763,128 |
| | | | | |
Steel—1.5% | | | | | |
AK Steel Holding Corporation | | 25,235 | | | 538,767 |
| | | | | |
Systems Software—1.3% | | | | | |
Rovi Corporation* | | 14,600 | | | 465,302 |
| | | | | |
Technology Distributors—1.6% | | | | | |
SYNNEX Corporation* | | 17,900 | | | 548,814 |
| | | | | |
TOTAL COMMON STOCKS (cost $27,364,506) | | | | $ | 34,398,377 |
| | | | | |
Total Investments—97.2%1 (cost $27,364,506) | | | | $ | 34,398,377 |
Cash & Other Assets, Less Liabilities—2.8% | | | | | 997,545 |
| | | | | |
Total Net Assets—100.0% | | | | $ | 35,395,922 |
| | | | | |
For federal income tax purposes the identified cost of investments owned at December 31, 2009 was $27,454,701.
| ADR | American Depositary Receipt |
| * | Non-income producing security |
| 1 | Unless otherwise indicated, the values of the securities of the Portfolio are determined based on Level 1 inputs. |
The accompanying notes are an integral part of the financial statements
126
| | |
| | Series X |
| | (Small Cap Growth Series) |
Statement of Assets and Liabilities
December 31, 2009
| | | | |
Assets: | | | | |
Investments, at value* | | $ | 34,398,377 | |
Cash | | | 838,195 | |
Receivables: | | | | |
Fund shares sold | | | 100,136 | |
Securities sold | | | 412,610 | |
Dividends | | | 10,406 | |
Prepaid expenses | | | 611 | |
| | | | |
Total assets | | | 35,760,335 | |
| | | | |
| |
Liabilities: | | | | |
Payable for: | | | | |
Fund shares redeemed | | | 17,998 | |
Securities purchased | | | 297,367 | |
Management fees | | | 24,937 | |
Administration fees | | | 3,087 | |
Transfer agent/maintenance fees | | | 2,083 | |
Custodian fees | | | 460 | |
Directors’ fees | | | 502 | |
Professional fees | | | 9,979 | |
Other fees | | | 8,000 | |
| | | | |
Total liabilities | | | 364,413 | |
| | | | |
Net assets | | $ | 35,395,922 | |
| | | | |
| |
Net assets consist of: | | | | |
Paid in capital | | $ | 58,623,489 | |
Accumulated net realized loss on sale of investments | | | (30,261,438 | ) |
Net unrealized appreciation in value of investments | | | 7,033,871 | |
| | | | |
Net assets | | $ | 35,395,922 | |
| | | | |
| |
Capital shares authorized | | | unlimited | |
Capital shares outstanding | | | 2,438,219 | |
Net asset value per share (net assets divided by shares outstanding) | | $ | 14.52 | |
| | | | |
| |
* Investments, at cost | | $ | 27,364,506 | |
Statement of Operations
For Year Ended December 31, 2009
| | | | |
Investment Income: | | | | |
Dividends | | $ | 245,909 | |
Interest | | | 943 | |
| | | | |
Total investment income | | | 246,852 | |
| | | | |
| |
Expenses: | | | | |
Management fees | | | 262,642 | |
Administration fees | | | 30,259 | |
Transfer agent/maintenance fees | | | 25,216 | |
Custodian fees | | | 1,744 | |
Directors’ fees | | | 3,407 | |
Professional fees | | | 10,090 | |
Reports to shareholders | | | 5,147 | |
Other | | | 2,726 | |
| | | | |
Total expenses | | | 341,231 | |
Earnings credits applied | | | (287 | ) |
| | | | |
Net expenses | | | 340,944 | |
| | | | |
Net investment loss | | | (94,092 | ) |
| | | | |
| |
Net Realized and Unrealized Gain (Loss): | | | | |
Net realized gain (loss) during the year on: | | | | |
Investments | | | 3,898,637 | |
| | | | |
Net realized gain | | | 3,898,637 | |
| | | | |
| |
Net unrealized appreciation (depreciation) during the year on: | | | | |
Investments | | | 5,705,272 | |
| | | | |
Net unrealized appreciation | | | 5,705,272 | |
| | | | |
Net realized and unrealized gain | | | 9,603,909 | |
| | | | |
Net increase in net assets resulting from operations | | $ | 9,509,817 | |
| | | | |
The accompanying notes are an integral part of the financial statements
127
| | |
| | Series X |
| Statement of Changes in Net Assets | | (Small Cap Growth Series) |
| | | | | | | | |
| | | Year Ended
December 31, 2009 | | | Year Ended
December 31, 2008 | |
Increase (decrease) in net assets from operations: | | | | | | | | |
Net investment loss | | $ | (94,092 | ) | | $ | (389,974 | ) |
Net realized gain (loss) during the year on investments | | | 3,898,637 | | | | (26,722,317 | ) |
Net unrealized appreciation (depreciation) during the year on investments | | | 5,705,272 | | | | (3,538,566 | ) |
| | | | | | | | |
Net increase (decrease) in net assets resulting from operations | | | 9,509,817 | | | | (30,650,857 | ) |
| | | | | | | | |
| | |
Capital share transactions: | | | | | | | | |
Proceeds from sale of shares | | | 6,072,551 | | | | 14,256,113 | |
Cost of shares redeemed | | | (10,470,581 | ) | | | (35,153,979 | ) |
| | | | | | | | |
Net decrease from capital share transactions | | | (4,398,030 | ) | | | (20,897,866 | ) |
| | | | | | | | |
Net increase (decrease) in net assets | | | 5,111,787 | | | | (51,548,723 | ) |
| | | | | | | | |
| | |
Net assets: | | | | | | | | |
Beginning of year | | | 30,284,135 | | | | 81,832,858 | |
| | | | | | | | |
End of year | | $ | 35,395,922 | | | $ | 30,284,135 | |
| | | | | | | | |
| | |
Undistributed net investment income at end of year | | $ | — | | | $ | — | |
| | | | | | | | |
| | |
Capital share activity: | | | | | | | | |
Shares sold | | | 541,403 | | | | 931,001 | |
Shares redeemed | | | (924,076 | ) | | | (2,130,808 | ) |
| | | | | | | | |
Total capital share activity | | | (382,673 | ) | | | (1,199,807 | ) |
| | | | | | | | |
The accompanying notes are an integral part of the financial statements
128
| | |
| Financial Highlights | | Series X |
| Selected data for each share of capital stock outstanding throughout each year | | (Small Cap Growth Series) |
| | | | | | | | | | | | | | | | | | | | |
| | | 2009 | | | 2008a | | | 2007 | | | 2006 | | | Year Ended
December 31,
2005 | |
Per Share Data | | | | | | | | | | | | | | | | | | | | |
Net asset value, beginning of period | | $ | 10.74 | | | $ | 20.35 | | | $ | 19.27 | | | $ | 18.33 | | | $ | 17.05 | |
| | | | | | | | | | | | | | | | | | | | |
Income (loss) from investment operations: | | | | | | | | | | | | | | | | | | | | |
Net investment lossb | | | (0.04 | ) | | | (0.12 | ) | | | (0.17 | ) | | | (0.13 | ) | | | (0.15 | ) |
Net gain (loss) on securities (realized and unrealized) | | | 3.82 | | | | (9.49 | ) | | | 1.25 | | | | 1.07 | | | | 1.43 | |
| | | | | | | | | | | | | | | | | | | | |
Total from investment operations | | | 3.78 | | | | (9.61 | ) | | | 1.08 | | | | 0.94 | | | | 1.28 | |
| | | | | | | | | | | | | | | | | | | | |
Net asset value, end of period | | $ | 14.52 | | | $ | 10.74 | | | $ | 20.35 | | | $ | 19.27 | | | $ | 18.33 | |
| | | | | | | | | | | | | | | | | | | | |
| | | | | |
Total Returnc | | | 35.20 | % | | | (47.22 | )% | | | 5.60 | % | | | 5.13 | % | | | 7.51 | % |
| | | | | | | | | | | | | | | | | | | | |
Ratios/Supplemental Data | | | | | | | | | | | | | | | | | | | | |
Net assets, end of period (in thousands) | | $ | 35,396 | | | $ | 30,284 | | | $ | 81,833 | | | $ | 92,789 | | | $ | 90,671 | |
| | | | | | | | | | | | | | | | | | | | |
Ratios to average net assets: | | | | | | | | | | | | | | | | | | | | |
Net investment loss | | | (0.30 | )% | | | (0.80 | )% | | | (0.82 | )% | | | (0.66 | )% | | | (0.85 | )% |
Total expensesd | | | 1.10 | % | | | 1.24 | % | | | 1.20 | % | | | 1.20 | % | | | 1.19 | % |
Net expensese | | | 1.10 | % | | | 1.24 | % | | | 1.20 | % | | | 1.19 | % | | | 1.18 | % |
Net expenses prior to custodian earnings credits and net of expense waivers | | | 1.10 | % | | | 1.24 | % | | | 1.20 | % | | | 1.20 | % | | | 1.19 | % |
| | | | | | | | | | | | | | | | | | | | |
Portfolio turnover rate | | | 100 | % | | | 209 | %f | | | 137 | % | | | 149 | % | | | 116 | % |
| a | Security Global Investors, LLC (SGI) became the advisor of Series X effective December 1, 2008. Prior to December 1, 2008, SGI paid RS Investments, Inc. for sub-advisory services. |
| b | Net investment income (loss) was computed using average shares outstanding throughout the period. |
| c | Total return does not take into account any of the expenses associated with an investment in variable insurance products offered by Security Benefit Life Insurance Company. If total return had taken into account these expenses, performance would have been lower. Shares of a series of SBL Fund are available only through the purchase of such products. |
| d | Total expense information reflects the expense ratios absent expense reductions by the Investment Manager and earnings credits, as applicable. |
| e | Net expense information reflects the expense ratios after voluntary expense waivers, reimbursements and custodian earnings credits, as applicable. |
| f | Significant variation in the portfolio turnover rate is due to Investment Manager’s appointment of new portfolio manager for the Series. |
The accompanying notes are an integral part of the financial statements
129
This page left blank intentionally.
130
Manager’s Commentary
February 15, 2010
| | | | |
| | Advised by: | | |
To Our Shareholders:
Series Y of the SBL Fund – Select 25 Series returned 33.28% in the year, lagging the benchmark Russell 1000 Growth Index's return of 37.21% and the Series' peer group median return of 36.99%.
Our strategy is to buy companies that are trading at a significant discount to their intrinsic value. Our investment approach is a defined and disciplined process of three clear philosophical tenets that drive our investment decisions: a valuation focus, a long-term perspective and an opportunistic approach.
Our investment process is fundamentally driven and quantitatively aided. We use proprietary screens to identify potential companies for investment and then perform rigorous fundamental analysis to identify the best ideas. Through this fundamental research, we determine an estimate of intrinsic value and thus a valuation target for each idea. We construct the portfolios based on the level of conviction generated by this bottom-up analysis and the upside/downside profile associated with each company. We ultimately structure the portfolio with 25-30 names.
Materials and Consumer Staples Top Performers
The Series’ materials holdings benefited the portfolio from an overweight position that gained 74% due to superior stock selection against a 42% increase in the Index. Both Mosaic Company and Air Products & Chemicals, Inc. rose more than 60% during the period. Other holdings in the sector that boosted returns were Freeport-McMoRan Copper & Gold, Inc. and Monsanto Company.
The consumer staples sector benefited from an underweight allocation in one of the lower performing sectors in the marketplace. Nevertheless, several securities in the sector added to returns, including PepsiCo, Inc., CVS Caremark Corporation, and Colgate-Palmolive Company.
Consumer Discretionary and Consumer Staples Disappoint
The Series’ consumer discretionary sector was an overweight position in a market segment that did well. However, stock selection hurt relative performance as the portfolio gained only 18% compared to 43% for the benchmark. Dragging down returns was Coach, Inc., which declined 31% while the security actually gained 77% if held for the entire period. Similarly, Best Buy Company, Inc. was down 15% in the strategy while the security gained 43% for the year. Other detractors in the sector were Comcast Corporation (Cl A) and Lowe’s Companies, Inc.
The consumer staples sector was an underweight position that also underperformed the benchmark. While strategy holdings gained 14%, it was still below the 17% increase for the Russell 1000 Growth Index. The two main culprits were General Mills, Inc., down 16% for the portfolio while up 20% during the holding period, and Wal-Mart Stores, Inc.
Market Outlook
Our bottom-up approach looks at market uncertainty in the context of the potential long-term impact on individual companies. Often times, volatility provides opportunity, and the past year has been one of the most volatile markets in history. We are maintaining flexibility in the portfolios to take advantage of these opportunities as they arise. Our focus is on identifying companies with the ability to be substantially better over the next three to five years or have the potential to maintain their return on capital at current levels in a difficult economic environment. We are confident in our ability to find these companies.
We believe that investing is a long-term pursuit that requires patience and a consistent approach. We recognize there are many investment fund alternatives available today and thank you for your business and the confidence you place in us.
Sincerely,
Mark P. Bronzo, Portfolio Manager
131
| | |
Performance Summary | | Series Y (Select 25 Series) |
December 31, 2009 | | (unaudited) |
PERFORMANCE
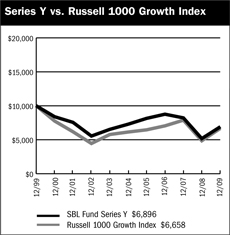
$10,000 Over 10 Years
The chart above assumes a hypothetical $10,000 investment in Series Y (Select 25 Series) on December 31, 1999 and reflects the fees and expenses of Series Y. The Russell 1000 Growth Index is an unmanaged capitalization-weighted index which includes stocks incorporated in the United States and its territories and measures the performance of the Russell 1000 companies with higher price-to-book ratios and higher forecasted growth values.
Average Annual Returns
| | | | | | | | | |
Periods Ended 12-31-091 | | 1 Year | | | 5 Years | | | 10 Years | |
Series Y | | 33.28 | % | | (1.11 | )% | | (3.65 | )% |
| 1 | Performance figures do not reflect fees and expenses associated with an investment in variable insurance products offered by Security Benefit Life Insurance Company. If returns had taken into account these fees and expenses, performance would have been lower. Shares of a Series of SBL Fund are available only through the purchase of such products. |
The performance data quoted above represents past performance. Past performance is not predictive of future performance. The investment return and principal value of an investment will fluctuate so that an investor’s shares, when redeemed, may be worth more or less than their original cost.
Portfolio Composition by Sector
| | | |
Consumer Discretionary | | 11.65 | % |
Consumer Staples | | 6.72 | |
Energy | | 9.14 | |
Financials | | 6.22 | |
Health Care | | 12.48 | |
Industrials | | 15.40 | |
Information Technology | | 28.86 | |
Materials | | 5.73 | |
Cash & Other Assets, Less Liabilities | | 3.80 | |
Total Net Assets | | 100.00 | °% |
| | | |
The accompanying notes are an integral part of the financial statements
132
| | |
| Schedule of Investments | | Series Y |
December 31, 2009 | | (Select 25 Series) |
| | | | | |
| | | Shares | | Value |
COMMON STOCKS—96.2% | | | | | |
Advertising—3.2% | | | | | |
Omnicom Group, Inc. | | 33,660 | | $ | 1,317,789 |
| | | | | |
Aerospace & Defense—6.1% | | | | | |
Boeing Company | | 21,570 | | | 1,167,584 |
Goodrich Corporation | | 21,540 | | | 1,383,944 |
| | | | | |
| | | | | 2,551,528 |
| | | | | |
Apparel Retail—3.0% | | | | | |
TJX Companies, Inc. | | 33,600 | | | 1,228,080 |
| | | | | |
Biotechnology—2.9% | | | | | |
Amgen, Inc.* | | 21,240 | | | 1,201,547 |
| | | | | |
Coal & Consumable Fuels—2.9% | | | | | |
Peabody Energy Corporation | | 26,670 | | | 1,205,751 |
| | | | | |
Communications Equipment—6.2% | | | | | |
Cisco Systems, Inc.* | | 53,800 | | | 1,287,971 |
Qualcomm, Inc. | | 27,220 | | | 1,259,197 |
| | | | | |
| | | | | 2,547,168 |
| | | | | |
Computer Hardware—4.3% | | | | | |
Apple, Inc.* | | 8,455 | | | 1,782,821 |
| | | | | |
Computer Storage & Peripherals—3.9% | | | | | |
EMC Corporation* | | 93,130 | | | 1,626,981 |
| | | | | |
Department Stores—2.7% | | | | | |
Kohl’s Corporation* | | 20,540 | | | 1,107,722 |
| | | | | |
Diversified Metals & Mining—2.8% | | | | | |
Freeport-McMoRan Copper & Gold, Inc. (Cl.B) | | 14,580 | | | 1,170,628 |
| | | | | |
Electrical Components & Equipment—6.1% | | | | | |
Cooper Industries plc | | 29,640 | | | 1,263,850 |
Emerson Electric Company | | 29,060 | | | 1,237,956 |
| | | | | |
| | | | | 2,501,806 |
| | | | | |
Fertilizers & Agricultural Chemicals—2.9% | | | | | |
Potash Corporation of Saskatchewan, Inc. | | 11,025 | | | 1,196,213 |
| | | | | |
Health Care Equipment—3.0% | | | | | |
Covidien plc | | 25,740 | | | 1,232,689 |
| | | | | |
Hotels, Resorts & Cruise Lines—2.8% | | | | | |
Carnival Corporation* | | 36,700 | | | 1,163,023 |
| | | | | |
Household Products—2.8% | | | | | |
Colgate-Palmolive Company | | 14,130 | | | 1,160,780 |
| | | | | |
Industrial Conglomerates—3.2% | | | | | |
3M Company | | 15,850 | | | 1,310,320 |
| | | | | |
Integrated Oil & Gas—2.9% | | | | | |
Occidental Petroleum Corporation | | 14,920 | | | 1,213,742 |
| | | | | |
Internet Software & Services—4.4% | | | | | |
Google, Inc.* | | 2,950 | | | 1,828,941 |
| | | | | |
Investment Banking & Brokerage—2.9% | | | | | |
Morgan Stanley | | 40,500 | | | 1,198,800 |
| | | | | |
IT Consulting & Other Services—3.0% | | | | | |
Cognizant Technology Solutions Corporation* | | 27,490 | | | 1,245,297 |
| | | | | |
Oil & Gas Drilling—3.3% | | | | | |
Transocean, Ltd.* | | 16,420 | | | 1,359,576 |
| | | | | |
Other Diversified Financial Services—3.3% | | | | | |
JPMorgan Chase & Company | | 32,965 | | | 1,373,652 |
| | | | | |
Pharmaceuticals—6.6% | | | | | |
Pfizer, Inc. | | 70,710 | | | 1,286,215 |
Teva Pharmaceutical Industries, Ltd. ADR | | 25,620 | | | 1,439,331 |
| | | | | |
| | | | | 2,725,546 |
| | | | | |
Semiconductor Equipment—3.0% | | | | | |
Lam Research Corporation* | | 31,160 | | | 1,221,784 |
| | | | | |
Semiconductors—4.1% | | | | | |
Intel Corporation | | 82,210 | | | 1,677,084 |
| | | | | |
Soft Drinks—3.9% | | | | | |
PepsiCo, Inc. | | 26,600 | | | 1,617,280 |
| | | | | |
TOTAL COMMON STOCKS (cost $34,706,007) | | | | $ | 39,766,548 |
| | | | | |
Total Investments—96.2%1 (cost $34,706,007) | | | | $ | 39,766,548 |
Cash & Other Assets, Less Liabilities—3.8% | | | | | 1,571,788 |
| | | | | |
Total Net Assets—100.0% | | | | $ | 41,338,336 |
| | | | | |
For federal income tax purposes the identified cost of investments owned at December 31, 2009 was $35,217,164.
| ADR | American Depositary Receipt |
| plc | Public Limited Company |
| * | Non-income producing security |
| 1 | Unless otherwise indicated, the values of the securities of the Portfolio are determined based on Level 1 inputs. |
The accompanying notes are an integral part of the financial statements
133
Series Y
(Select 25 Series)
Statement of Assets and Liabilities
December 31, 2009
| | | | |
Assets: | | | | |
Investments, at value* | | $ | 39,766,548 | |
Cash | | | 1,291,324 | |
Receivables: | | | | |
Fund shares sold | | | 303,044 | |
Dividends | | | 39,628 | |
Prepaid expenses | | | 701 | |
| | | | |
Total assets | | | 41,401,245 | |
| | | | |
| |
Liabilities: | | | | |
Payable for: | | | | |
Fund shares redeemed | | | 12,892 | |
Management fees | | | 25,806 | |
Administration fees | | | 3,314 | |
Transfer agent/maintenance fees | | | 2.083 | |
Custodian fees | | | 58 | |
Directors’ fees | | | 1,674 | |
Professional fees | | | 11,341 | |
Other fees | | | 5,741 | |
| | | | |
Total liabilities | | | 62,909 | |
| | | | |
Net assets | | $ | 41,338,336 | |
| | | | |
| |
Net assets consist of: | | | | |
Paid in capital | | $ | 68,585,546 | |
Undistributed net investment income | | | 126,624 | |
Accumulated net realized loss on sale of investments | | | (32,434,375 | ) |
Net unrealized appreciation in value of investments | | | 5,060,541 | |
| | | | |
Net assets | | $ | 41,338,336 | |
| | | | |
| |
Capital shares authorized | | | unlimited | |
Capital shares outstanding | | | 4,848,032 | |
Net asset value per share (net assets divided by shares outstanding) | | $ | 8.53 | |
| | | | |
| | | | |
* investments, at cost | | $ | 34,706,007 | |
Statement of Operations
For Year Ended December 31, 2009
| | | | |
Investment Income: | | | | |
Dividends | | $ | 464,540 | |
Interest | | | 685 | |
| | | | |
Total investment income | | | 465,225 | |
| | | | |
| |
Expenses: | | | | |
Management fees | | | 254,806 | |
Administration fees | | | 32,440 | |
Transfer agent/maintenance fees | | | 25,215 | |
Custodian fees | | | 2,349 | |
Directors’ fees | | | 3,874 | |
Professional fees | | | 11,710 | |
Reports to shareholders | | | 5,357 | |
Other | | | 2,850 | |
| | | | |
Total expenses | | | 338,601 | |
| | | | |
Net expenses | | | 338,601 | |
| | | | |
Net investment income | | | 126,624 | |
| | | | |
| |
Net Realized and Unrealized Gain (Loss): | | | | |
Net realized gain (loss) during the year on: | | | | |
Investments | | | (6,912,143 | ) |
| | | | |
Net realized loss | | | (6,912,143 | ) |
| | | | |
| |
Net unrealized appreciation (depreciation) during the year on: | | | | |
Investments | | | 16,699,320 | |
| | | | |
Net unrealized appreciation | | | 16,699,320 | |
| | | | |
Net realized and unrealized gain | | | 9,787,177 | |
| | | | |
Net increase in net assets resulting from operations | | $ | 9,913,801 | |
| | | | |
The accompanying notes are an integral part of the financial statements
134
| | |
| Statement of Changes in Net Assets | | Series Y (Select 25 Series) |
| | | | | | | | |
| | | Year Ended
December 31, 2009 | | | Year Ended
December 31, 2008 | |
Increase (decrease) in net assets from operations: | | | | | | | | |
Net investment income | | $ | 126,624 | | | $ | 71,213 | |
Net realized loss during the year on investments | | | (6,912,143 | ) | | | (7,958,784 | ) |
Net unrealized appreciation (depreciation) during the year on investments | | | 16,699,320 | | | | (13,376,234 | ) |
| | | | | | | | |
Net increase (decrease) in net assets resulting from operations | | | 9,913,801 | | | | (21,263,805 | ) |
| | | | | | | | |
| | |
Capital share transactions: | | | | | | | | |
Proceeds from sale of shares | | | 12,453,173 | | | | 13,661,292 | |
Cost of shares redeemed | | | (14,612,634 | ) | | | (25,136,549 | ) |
| | | | | | | | |
Net decrease from capital share transactions | | | (2,159,461 | ) | | | (11,475,257 | ) |
| | | | | | | | |
Net increase (decrease) in net assets | | | 7,754,340 | | | | (32,739,062 | ) |
| | | | | | | | |
| | |
Net assets: | | | | | | | | |
Beginning of year | | | 33,583,996 | | | | 66,323,058 | |
| | | | | | | | |
End of year | | $ | 41,338,336 | | | $ | 33,583,996 | |
| | | | | | | | |
| | |
Undistributed net investment income at end of year | | $ | 126,624 | | | $ | 71,213 | |
| | | | | | | | |
| | |
Capital share activity: | | | | | | | | |
Shares sold | | | 1,729,313 | | | | 1,592,936 | |
Shares redeemed | | | (2,125,671 | ) | | | (2,867,153 | ) |
| | | | | | | | |
Total capital share activity | | | (396,358 | ) | | | (1,274,217 | ) |
| | | | | | | | |
The accompanying notes are an integral part of the financial statements
135
| | | |
| Financial Highlights | | Series Y | |
Selected data for each share of capital stock outstanding throughout each year | | (Select 25 Series | ) |
| | | | | | | | | | | | | | | | | | | | |
| | | 2009 | | | 2008 | | | 2007 | | | 2006a | | | Year Ended
December 31,
2005 | |
Per Share Data | | | | | | | | | | | | | | | | | | | | |
Net asset value, beginning of period | | $ | 6.40 | | | $ | 10.17 | | | $ | 10.84 | | | $ | 10.08 | | | $ | 9.02 | |
| | | | | | | | | | | | | | | | | | | | |
Income (loss) from investment operations: | | | | | | | | | | | | | | | | | | | | |
Net investment incomeb | | | 0.03 | | | | 0.01 | | | | 0.06 | | | | 0.02 | | | | — | |
Net gain (loss) on securities (realized and unrealized) | | | 2.10 | | | | (3.78 | ) | | | (0.73 | ) | | | 0.74 | | | | 1.06 | |
| | | | | | | | | | | | | | | | | | | | |
Total from investment operations | | | 2.13 | | | | (3.77 | ) | | | (0.67 | ) | | | 0.76 | | | | 1.06 | |
| | | | | | | | | | | | | | | | | | | | |
Net asset value, end of period | | $ | 8.53 | | | $ | 6.40 | | | $ | 10.17 | | | $ | 10.84 | | | $ | 10.08 | |
| | | | | | | | | | | | | | | | | | | | |
| | | | | |
Total Returnc | | | 33.28 | % | | | (37.07 | )% | | | (6.18 | )% | | | 7.54 | % | | | 11.75 | % |
| | | | | | | | | | | | | | | | | | | | |
Ratios/Supplemental Data | | | | | | | | | | | | | | | | | | | | |
Net assets, end of period (in thousands) | | $ | 41,338 | | | $ | 33,584 | | | $ | 66,323 | | | $ | 85,695 | | | $ | 37,018 | |
| | | | | | | | | | | | | | | | | | | | |
Ratios to average net assets: | | | | | | | | | | | | | | | | | | | | |
Net investment income (loss) | | | 0.37 | % | | | 0.14 | % | | | 0.51 | % | | | 0.21 | % | | | (0.04 | )% |
Total expensesd | | | 1.00 | % | | | 0.97 | % | | | 0.93 | % | | | 0.95 | % | | | 0.99 | % |
Net expensese | | | 1.00 | % | | | 0.97 | % | | | 0.93 | % | | | 0.95 | % | | | 0.99 | % |
Net expenses prior to custodian earnings credits and net of expense waivers | | | 1.00 | % | | | 0.97 | % | | | 0.93 | % | | | 0.95 | % | | | 0.99 | % |
| | | | | | | | | | | | | | | | | | | | |
Portfolio turnover rate | | | 151 | % | | | 214 | %f | | | 16 | % | | | 40 | % | | | 28 | % |
| a | The financial highlights for Series Y exclude the historical financial highlights of Series G. The assets of Series G were acquired by Series Y on June 16, 2006. A total of $40,543,215 was excluded from purchases in the portfolio turnover calculation, which represents the cost of the securities Series Y received as a result of the merger. |
| b | Net investment income (loss) was computed using average shares outstanding throughout the period. |
| c | Total return does not take into account any of the expenses associated with an investment in variable insurance products offered by Security Benefit Life Insurance Company. If total return had taken into account these expenses, performance would have been lower. Shares of a series of SBL Fund are available only through the purchase of such products. |
| d | Total expense information reflects the expense ratios absent expense reductions by the Investment Manager and earnings credits, as applicable. |
| e | Net expense information reflects the expense ratios after voluntary expense waivers, reimbursements and custodian earnings credits, as applicable. |
| f | Significant variation in the portfolio turnover rate is due to Investment Manager’s appointment of new portfolio manager for the Series. |
The accompanying notes are an integral part of the financial statements
136
Managers’ Commentary
February 15, 2010
| | | | | | |
Advised by: | |  | | and Subadvised by: Mainstream Investment Advisers | |  |
To Our Shareholders:
For the year ended December 31, 2009, Series Z of the SBL Fund – Alpha Opportunity Series total return was 30.39%1, besting its benchmark, the S&P 500 Index, by nearly 350 basis points, which returned 26.46%.
Investment Philosophy
The Series’ strategy is to invest approximately 50% of its total assets according to a long/short strategy and 50% of its total assets in a portfolio of equity securities, equity derivatives, and fixed income securities with the intention of tracking the performance of the S&P 500 Index.
The fundamental investment philosophy of the active value strategy rests first upon the belief that it is critical to identify the long-term investment theme governing the equity markets. These themes may persist for 15 to 20 years.
Second, while we also believe that valuation adds important perspective to investment decisions, it is not an efficient means of timing purchase and sale decisions. We believe those decisions are best made using technical analysis. We believe technical analysis, the study of price trends, allows us to efficiently capture gains and avoid material losses.
The third tenet of our philosophy is that changes in stock prices lead changes in fundamental corporate developments. A proactive asset management approach helps to keep our investment themes fresh and our risk levels moderate.
Financials, Consumer Discretionary, and Energy Top Performers
Stock selection in the financials sector accounted for all the excess gain above the Index. While a slight overweight position, a position in one security made the difference. General Growth Properties, Inc. soared from around $2 per share to $10 per share, an increase during the year of over 1,600%. The issue was a solid 3% average weight in the portfolio. Other top performing securities included Fortis B N.V. and Genworth Financial, Inc. (Cl A), which returned over 160% and 300%, respectively.
In the consumer discretionary sector, the shorting of Volkswagen AG, which dropped more than 60%, was responsible for the largest gain. Holdings in Marvel Entertainment and Shanda Interactive Entertainment, Ltd. were the sectors’ best performing long positions.
In the energy sector, Exxon Mobil Corporation was the best relative performer against the benchmark as a short position. Walter Energy, Inc. was the leading long position gaining over 90% during the period.
Industrials and Information Technology Disappoint
The industrials sector was hurt by a relative overweight position and poor stock selection. While the S&P 500 Index gained 20%, the Series’ industrials sector increased just 2%. Largest detractors included Lockheed Martin Corporation, a 3% position that was down 8%, Watson Wyatt Worldwide, Inc., a break-even holding, and Delta Airlines, which dropped 40% over the period.
The Series’ information technology sector’s performance kept pace with the benchmark, returning approximately 60%. However, at 11%, the portfolio weight was well below the 18% for the Index. Not holding Apple, Inc. throughout the year caused the performance of the holding to significantly lag the potential return of the security. A short position in Cree, Inc., a security that soared more than 250%, hurt performance in the sector and portfolio.
Due to a previous brokerage relationship with Lehman Brothers International Europe (“LBIE”) (which was placed into administration on September 15, 2008), the Series has certain short sale positions that it is currently unable to settle and certain long positions held by its custodian that are pledged to LBIE which the Series currently cannot access. As a result, the Series is currently unable to actively pursue the global long/short portion of its investment strategy. The Series is unable to determine when it will resume its full investment program.
Market Outlook
While global banking systems and economies appear to have stabilized, significant challenges remain. Foremost among these will be removal of the extraordinary measures taken by central banks and governments around the world to stimulate and re-liquefy economies. While growth has re-emerged in many areas of the world, the recovery remains fragile and measurement somewhat suspect.
We know that the U.S. yield curve is close to the historical peak in terms of steepness and that in the past the peak spread has been a good indicator of Fed rate hikes. As a result, we have confidence in our (not unique) view that the extraordinary measures will be removed and that policy will normalize, if not in 2010 probably by early 2011. Based on historical experience we can also be reasonably sure that when markets start to discount this development the likely symptom will be stock weakness.
Our approach remains to identify the best possible investments in all phases of the market and economic cycle.
We thank you for your investment and appreciate the trust and confidence you have placed in us.
Sincerely,
Bill Jenkins, Portfolio Manager,
Mainstream Investment Advisers
David Whittall, Portfolio Manager,
Security Global Investors
Scott Klimo, Portfolio Manager,
Security Global Investors
| 1 | Fee waivers and/or reimbursements reduce Series expenses and in the absence of such waivers, the performance quoted would be reduced. |
137
| | |
Performance Summary December 31, 2009 | | Series Z (Alpha Opportunity Series) (unaudited) |
PERFORMANCE
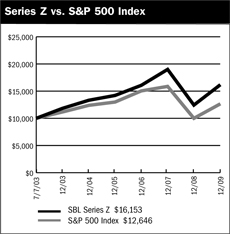
$10,000 Since Inception
The chart above assumes a hypothetical $10,000 investment in Series Z (Alpha Opportunity Series) on July 7, 2003 (date of inception), and reflects the fees and expenses of Series Z. The S&P 500 Index is a capitalization weighted index composed of 500 selected common stocks that represent the broad domestic economy and is a widely recognized unmanaged index of market performance.
Average Annual Returns
| | | | | | | | | |
Periods Ended 12-31-091 | | 1 Year | | | 5 Years | | | Since Inception
(7-7-03) | |
Series Z | | 30.39 | % | | 3.93 | % | | 7.67 | % |
| 1 | Performance figures do not reflect fees and expenses associated with an investment in variable insurance products offered by Security Benefit Life Insurance Company. If returns had taken into account these fees and expenses, performance would have been lower. Shares of a Series of SBL Fund are available only through the purchase of such products. |
The performance data quoted above represents past performance. Past performance is not predictive of future performance. The investment return and principal value of an investment will fluctuate so that an investor’s shares, when redeemed, may be worth more or less than their original cost.
Portfolio Composition by Sector*
| | | |
Consumer Discretionary | | (4.01 | )% |
Consumer Staples | | 7.30 | |
Energy | | 2.21 | |
Financials | | 2.12 | |
Health Care | | 1.88 | |
Industrials | | 6.33 | |
Information Technology | | 8.22 | |
Materials | | 10.07 | |
Telecommunications | | 0.47 | |
Utilities | | (0.32 | ) |
Exchange Traded Funds | | 4.88 | |
U.S. Government Sponsored Agencies | | 17.23 | |
Short Term Investments | | 10.07 | |
Repurchase Agreement | | 10.20 | |
Cash & Other Assets, Less Liabilities | | 23.35 | |
Total Net Assets | | 100.00 | % |
| | | |
| * | Securities sold short are netted with long positions in common stocks in the appropriate sectors. |
The accompanying notes are an integral part of the financial statements
138
| | |
| Schedule of Investments | | Series Z |
December 31, 2009 | | (Alpha Opportunity Series) |
| | | | | |
| | | Shares | | Value |
COMMON STOCKS—75.7% | | | | | |
Aerospace & Defense—1.6% | | | | | |
Lockheed Martin Corporation1,2 | | 3,993 | | $ | 300,873 |
Northrop Grumman Corporation1,2 | | 1,100 | | | 61,435 |
| | | | | |
| | | | | 362,308 |
| | | | | |
Agricultural Products—1.7% | | | | | |
Archer-Daniels-Midland Company | | 4,641 | | | 145,310 |
Bunge, Ltd.3 | | 3,822 | | | 243,958 |
| | | | | |
| | | | | 389,268 |
| | | | | |
Air Freight & Logistics—0.8% | | | | | |
FedEx Corporation | | 2,304 | | | 192,269 |
| | | | | |
Aluminum—0.9% | | | | | |
Aluminum Corporation of China, Ltd. ADR | | 7,820 | | | 213,095 |
| | | | | |
Apparel Retail—2.7% | | | | | |
Gap, Inc.1,2 | | 6,300 | | | 131,985 |
Gymboree Corporation1,2,* | | 3,200 | | | 139,168 |
Ltd. Brands, Inc.1,2 | | 5,400 | | | 103,896 |
Ross Stores, Inc.1,2 | | 2,300 | | | 98,233 |
TJX Companies, Inc.1,2 | | 3,800 | | | 138,890 |
| | | | | |
| | | | | 612,172 |
| | | | | |
Apparel, Accessories & Luxury Goods—0.2% | | | | | |
Phillips-Van Heusen Corporation1,2 | | 900 | | | 36,612 |
| | | | | |
Auto Parts & Equipment—0.0% | | | | | |
Exide Technologies* | | 1,365 | | | 9,705 |
| | | | | |
Biotechnology—0.5% | | | | | |
Amgen, Inc.1,2,* | | 1,900 | | | 107,483 |
| | | | | |
Communications Equipment—1.7% | | | | | |
ADC Telecommunications, Inc.* | | 6,730 | | | 41,793 |
Cisco Systems, Inc.* | | 7,357 | | | 176,126 |
Finisar Corporation* | | 1,642 | | | 14,647 |
Harmonic, Inc.1,2,* | | 11,700 | | | 74,061 |
Motorola, Inc. | | 2,653 | | | 20,587 |
Oplink Communications, Inc.* | | 1,748 | | | 28,650 |
Opnext, Inc.* | | 2,174 | | | 4,131 |
Plantronics, Inc. | | 636 | | | 16,523 |
| | | | | |
| | | | | 376,518 |
| | | | | |
Computer & Electronics Retail—0.5% | | | | | |
RadioShack Corporation1,2 | | 5,500 | | | 107,250 |
| | | | | |
Computer Storage & Peripherals—0.0% | | | | | |
EMC Corporation* | | 546 | | | 9,539 |
| | | | | |
Construction & Engineering—0.6% | | | | | |
Michael Baker Corporation* | | 2,102 | | | 87,023 |
Shaw Group, Inc.* | | 1,911 | | | 54,941 |
| | | | | |
| | | | | 141,964 |
| | | | | |
Construction & Farm Machinery & Heavy Trucks—4.6% | | | | | |
Joy Global, Inc.1,2 | | 13,322 | | | 687,282 |
Trinity Industries, Inc.1,2 | | 10,800 | | | 188,352 |
Wabtec Corporation | | 3,483 | | | 142,246 |
| | | | | |
| | | | | 1,017,880 |
| | | | | |
Construction Materials—0.3% | | | | | |
Eagle Materials, Inc. | | 2,805 | | | 73,070 |
| | | | | |
Diversified Banks—0.2% | | | | | |
Barclays plc ADR | | 2,925 | | | 51,480 |
| | | | | |
Diversified Capital Markets—0.1% | | | | | |
UBS AG | | 975 | | | 15,122 |
| | | | | |
Diversified Chemicals—0.9% | | | | | |
FMC Corporation | | 3,822 | | | 213,115 |
| | | | | |
Diversified Metals & Mining—4.0% | | | | | |
Compass Minerals International, Inc. | | 2,063 | | | 138,613 |
Freeport-McMoRan Copper & Gold, Inc. (Cl.B) | | 2,747 | | | 220,556 |
General Moly, Inc.* | | 14,013 | | | 29,147 |
Horsehead Holding Corporation* | | 11,617 | | | 148,117 |
Rio Tinto plc ADR | | 390 | | | 84,002 |
Sterlite Industries India, Ltd. ADR | | 1,365 | | | 24,870 |
Teck Resources, Ltd. (Cl. B)* | | 5,506 | | | 192,544 |
Thompson Creek Metals Company, Inc.* | | 7,293 | | | 85,474 |
| | | | | |
| | | | | 923,323 |
| | | | | |
Electrical Components & Equipment—0.9% | | | | | |
AO Smith Corporation1,2 | | 3,000 | | | 130,169 |
GrafTech International, Ltd.* | | 3,974 | | | 61,796 |
Harbin Electric, Inc.* | | 1,092 | | | 22,430 |
| | | | | |
| | | | | 214,395 |
| | | | | |
Electronic Components—0.1% | | | | | |
AVX Corporation | | 2,385 | | | 30,218 |
| | | | | |
Electronic Manufacturing Services—0.3% | | | | | |
Flextronics International, Ltd.* | | 8,978 | | | 65,629 |
| | | | | |
Environmental & Facilities Services—0.3% | | | | | |
Metalico, Inc.* | | 15,834 | | | 77,903 |
| | | | | |
Exchange Traded Funds—5.2% | | | | | |
Claymore/Beacon Global Timber Index ETF | | 8,183 | | | 146,967 |
iPath DowJones-UBS Coffee Subindex Total Return ETN | | 281 | | | 10,880 |
iPath MSCI India Index ETN* | | 780 | | | 49,967 |
iShares S&P Global Materials Sector Index Fund3 | | 6,997 | | | 435,353 |
Market Vectors - Russia ETF | | 7,296 | | | 227,489 |
PowerShares DB Agriculture Fund3,* | | 11,095 | | | 293,352 |
| | | | | |
| | | | | 1,164,008 |
| | | | | |
Fertilizers & Agricultural Chemicals—1.5% | | | | | |
China Green Agriculture, Inc.* | | 523 | | | 7,688 |
Intrepid Potash, Inc.* | | 1,092 | | | 31,854 |
Monsanto Company3 | | 3,549 | | | 290,130 |
| | | | | |
| | | | | 329,672 |
| | | | | |
The accompanying notes are an integral part of the financial statements
139
| | |
| Schedule of Investments | | Series Z |
December 31, 2009 | | (Alpha Opportunity Series) |
| | | | | |
| | | Shares | | Value |
COMMON STOCKS—75.7% (continued) | | | | | |
Food Distributors—0.2% | | | | | |
Andersons, Inc. | | 1,936 | | $ | 49,988 |
| | | | | |
Food Retail—0.5% | | | | | |
QKL Stores.lnc.* | | 4,737 | | | 31,738 |
Safeway, Inc.1,2 | | 4,200 | | | 89,418 |
| | | | | |
| | | | | 121,156 |
| | | | | |
General Merchandise Stores—0.5% | | | | | |
Family Dollar Stores, Inc.1,2 | | 3,900 | | | 108,537 |
| | | | | |
Gold—1.7% | | | | | |
Iamgold Corporation | | 2,925 | | | 45,747 |
Randgold Resources, Ltd. ADR3 | | 4,207 | | | 332,858 |
| | | | | |
| | | | | 378,605 |
| | | | | |
Health Care Distributors—1.0% | | | | | |
McKesson Corporation | | 1,638 | | | 102,375 |
Owens & Minor, Inc.1,2 | | 2,800 | | | 120,204 |
| | | | | |
| | | | | 222,579 |
| | | | | |
Health Care Equipment—0.5% | | | | | |
Baxter International, Inc.1,2 | | 1,900 | | | 111,492 |
| | | | | |
Health Care Facilities—0.3% | | | | | |
Kindred Healthcare, Inc.1,2,* | | 4,100 | | | 75,686 |
| | | | | |
Health Care Services—0.7% | | | | | |
Lincare Holdings, Inc.1,2,* | | 4,100 | | | 152,192 |
| | | | | |
Home Entertainment Software—3.7% | | | | | |
Shanda Interactive Entertainment, Ltd. ADR1,2,* | | 16,000 | | | 841,760 |
| | | | | |
Human Resources & Employment Services—0.6% | | | | | |
Monster Worldwide, Inc.* | | 839 | | | 14,599 |
Watson Wyatt Worldwide, Inc.1,2 | | 2,400 | | | 114,048 |
| | | | | |
| | | | | 128,647 |
| | | | | |
Hypermarkets & Super Centers—0.5% | | | | | |
Wal-Mart Stores. Inc.1,2 | | 2,300 | | | 122,935 |
| | | | | |
Independent Power Producers & Energy Traders—0.8% | | | | | |
Constellation Energy Group, Inc.1,2 | | 5,400 | | | 189,918 |
| | | | | |
Industrial Conglomerates—0.3% | | | | | |
General Electric Company1,2 | | 4,500 | | | 68,085 |
| | | | | |
Industrial Machinery—0.9% | | | | | |
Pentair, Inc.* | | 870 | | | 28,101 |
SPX Corporation | | 273 | | | 14,933 |
Timken Company | | 3,276 | | | 77,674 |
Watts Water Technologies, Inc.1,2 | | 3,000 | | | 92,760 |
| | | | | |
| | | | | 213,468 |
| | | | | |
Integrated Oil & Gas—1.5% | | | | | |
ConocoPhillips1,2 | | 1,500 | | | 76,605 |
Occidental Petroleum Corporation | | 1,786 | | | 145,291 |
Suncor Energy, Inc. | | 2,925 | | | 103,282 |
| | | | | |
| | | | | 325,178 |
| | | | | |
Integrated Telecommunication Services—1.4% | | | | | |
AT&T, Inc.1,2 | | 11,300 | | | 316,739 |
| | | | | |
Life Sciences Tools & Services—1.6% | | | | | |
Charles River Laboratories International, Inc.1,2,* | | 2,100 | | | 70,749 |
Life Technologies Corporation1,2,* | | 3,000 | | | 156,690 |
Millipore Corporation1,2,* | | 1,900 | | | 137,465 |
| | | | | |
| | | | | 364,904 |
| | | | | |
Managed Health Care—0.4% | | | | | |
WellCare Health Plans, Inc.1,2,* | | 2,400 | | | 88,224 |
| | | | | |
Marine Ports & Services—0.4% | | | | | |
DryShips, Inc. | | 17,280 | | | 100,570 |
| | | | | |
Movies & Entertainment—1.4% | | | | | |
Marvel Entertainment, Inc.1,2,* | | 5,800 | | | 313,664 |
| | | | | |
Multi-Line Insurance—0.2% | | | | | |
Genworth Financial, Inc.1,2,* | | 4,200 | | | 47,670 |
| | | | | |
Oil & Gas Drilling—0.1% | | | | | |
Precision Drilling Trust | | 1,950 | | | 14,138 |
| | | | | |
Oil & Gas Equipment & Services—1.2% | | | | | |
Halliburton Company | | 1,365 | | | 41,073 |
National Oilwell Varco, Inc. | | 3,376 | | | 148,847 |
Willbros Group, Inc.* | | 4,403 | | | 74,279 |
| | | | | |
| | | | | 264,199 |
| | | | | |
Oil & Gas Exploration & Production—1.0% | | | | | |
Anadarko Petroleum Corporation1,2 | | 2,930 | | | 182,891 |
Kodiak Oil & Gas Corporation* | | 9,282 | | | 20,606 |
Range Resources Corporation | | 273 | | | 13,609 |
| | | | | |
| | | | | 217,106 |
| | | | | |
Oil & Gas Refining & Marketing—0.6% | | | | | |
World Fuel Services Corporation | | 4,800 | | | 128,592 |
| | | | | |
Oil & Gas Storage & Transportation—0.1% | | | | | |
El Paso Corporation | | 1,911 | | | 18,785 |
| | | | | |
Packaged Foods & Meats—0.5% | | | | | |
Cal-Maine Foods, Inc. | | 3,100 | | | 105,648 |
| | | | | |
Paper Packaging—0.0% | | | | | |
Smurfit-Stone Container Corporation* | | 2,123 | | | 584 |
| | | | | |
Personal Products—0.5% | | | | | |
Herbalife, Ltd.1,2 | | 2,600 | | | 105,482 |
| | | | | |
Pharmaceuticals—2.4% | | | | | |
Forest Laboratories, Inc.1,2,* | | 3,600 | | | 115,596 |
Johnson & Johnson1,2 | | 5,300 | | | 341,373 |
The accompanying notes are an integral part of the financial statements
140
| | |
| Schedule of Investments | | Series Z |
| December 31, 2009 | | (Alpha Opportunity Series) |
| | | | | | |
| | | Shares | | Value |
COMMON STOCKS—75.7% (continued) | | | | | | |
Pharmaceuticals—2.4% (continued) | | | | | | |
Viropharma, Inc.1,2,* | | | 10,500 | | $ | 88,095 |
| | | | | | |
| | | | | | 545,064 |
| | | | | | |
Precious Metals & Minerals—1.0% | | | | | | |
Coeur d’Alene Mines Corporation* | | | 4,830 | | | 87,230 |
E-TRACS UBS Long Platinum ETN* | | | 3,003 | | | 55,255 |
Stillwater Mining Company* | | | 9,282 | | | 87,993 |
| | | | | | |
| | | | | | 230,478 |
| | | | | | |
Property & Casualty Insurance—0.3% | | | | | | |
Amtrust Financial Services, Inc.1,2 | | | 6,300 | | | 74,466 |
| | | | | | |
Railroads—0.2% | | | | | | |
Genesee & Wyoming, Inc.* | | | 1,688 | | | 55,096 |
| | | | | | |
Reinsurance—0.5% | | | | | | |
Endurance Specialty Holdings, Ltd.1,2 | | | 3,200 | | | 119,136 |
| | | | | | |
Restaurants—0.4% | | | | | | |
Jack in the Box, Inc.1,2,* | | | 4,200 | | | 82,614 |
| | | | | | |
Retail REIT’s—5.8% | | | | | | |
General Growth Properties, Inc.3 | | | 111,800 | | | 1,292,409 |
| | | | | | |
Semiconductor Equipment—0.6% | | | | | | |
Amkor Technology, Inc.1,2,* | | | 9,800 | | | 70,169 |
Brooks Automation, Inc.* | | | 819 | | | 7,027 |
KLA-Tencor Corporation | | | 546 | | | 19,743 |
Lam Research Corporation* | | | 1,092 | | | 42,817 |
| | | | | | |
| | | | | | 139,756 |
| | | | | | |
Semiconductors—2.1% | | | | | | |
Intel Corporation | | | 8,549 | | | 174,401 |
LSI Corporation* | | | 9,789 | | | 58,832 |
ON Semiconductor Corporation* | | | 6,629 | | | 58,401 |
Skyworks Solutions, Inc.* | | | 1,092 | | | 15,495 |
Texas Instruments, Inc. | | | 6,006 | | | 156,516 |
TriQuint Semiconductor, Inc.* | | | 2,143 | | | 12,858 |
| | | | | | |
| | | | | | 476,503 |
| | | | | | |
Specialized REIT’s—0.3% | | | | | | |
Rayonier, Inc. | | | 1,833 | | | 77,279 |
| | | | | | |
Specialty Chemicals—1.1% | | | | | | |
Minerals Technologies, Inc. | | | 2,067 | | | 112,589 |
OM Group, Inc.* | | | 2,730 | | | 85,695 |
Rockwood Holdings, Inc.* | | | 2,457 | | | 57,887 |
| | | | | | |
| | | | | | 256,171 |
| | | | | | |
Steel—0.6% | | | | | | |
Commercial Metals Company | | | 3,499 | | | 54,760 |
Gerdau Ameristeel Corporation | | | 5,187 | | | 42,793 |
Schnitzer Steel Industries, Inc. | | | 546 | | | 26,044 |
| | | | | | |
| | | | | | 123,597 |
| | | | | | |
Systems Software—2.5% | | | | | | |
CA, Inc.1,2 | | | 20,235 | | | 454,478 |
Symantec Corporation1,2,* | | | 6,300 | | | 112,707 |
| | | | | | |
| | | | | | 567,185 |
| | | | | | |
Technology Distributors—0.8% | | | | | | |
Arrow Electronics, Inc.1,2,* | | | 2,800 | | | 82,908 |
Avnet, Inc.1,2,* | | | 3,200 | | | 96,512 |
| | | | | | |
| | | | | | 179,420 |
| | | | | | |
Tobacco—3.9% | | | | | | |
Altria Group, Inc.1,2 | | | 17,800 | | | 349,414 |
Philip Morris International, Inc.1,2 | | | 10,500 | | | 505,995 |
| | | | | | |
| | | | | | 855,409 |
| | | | | | |
Trucking—0.3% | | | | | | |
Con-Way, Inc.1,2 | | | 1,800 | | | 62,838 |
Quality Distribution, Inc.* | | | 2,180 | | | 8,611 |
| | | | | | |
| | | | | | 71,449 |
| | | | | | |
Wireless Telecommunication Services—0.2% | | | | | | |
America Movil SAB de CV ADR | | | 1,092 | | | 51,302 |
| | | | | | |
TOTAL COMMON STOCKS (cost $16,394,752) | | | | | $ | 17,127,863 |
| | | | | | |
| | |
| | | Shares | | Value |
FOREIGN STOCKS—1.8% | | | | | | |
Diversified Banks—0.0% | | | | | | |
Anglo Irish Bank Corporation, Ltd.4,5,6,* | | | 16,638 | | $ | — |
| | | | | | |
Multi-Line Insurance—0.7% | | | | | | |
Fortis4,6 | | | 45,503 | | | 168,224 |
| | | | | | |
Pharmaceuticals—1.1% | | | | | | |
AstraZeneca plc1,2,4,6 | | | 2,800 | | | 131,580 |
GlaxoSmithKline plc1,2,4,6 | | | 5,500 | | | 116,702 |
| | | | | | |
| | | | | | 248,282 |
| | | | | | |
TOTAL FOREIGN STOCKS (cost $435,290) | | | | | $ | 416,506 |
| | | | | | |
| | |
| | | Principal
Amount | | Value |
U.S. GOVERNMENT SPONSORED AGENCY BONDS & NOTES—17.2% | | | | | | |
Federal Home Loan Bank | | | | | | |
0.04%, 1/27/20103,4 | | $ | 700,000 | | $ | 699,980 |
Federal National Mortgage Association | | | | | | |
0.04%, 2/1/20101,4 | | | 2,200,000 | | | 2,199,924 |
Federal Home Loan Mortgage Corporation | | | | | | |
0.03%, 2/23/20103,4 | | | 1,000,000 | | | 999,956 |
| | | | | | |
TOTAL U.S. GOVERNMENT SPONSORED AGENCY BONDS & NOTES (cost $3,899,860) | | | | | $ | 3,899,860 |
| | | | | | |
| | |
| | | Principal
Amount | | Value |
SHORT TERM INVESTMENTS—10.1% | | | | | | |
State Street General Account U.S. Government Fund4 | | $ | 2,278,515 | | $ | 2,278,515 |
| | | | | | |
TOTAL SHORT TERM INVESTMENTS (cost $2,278,515) | | | | | $ | 2,278,515 |
| | | | | | |
The accompanying notes are an integral part of the financial statements
141
| | |
| Schedule of Investments | | Series Z |
| December 31, 2009 | | (Alpha Opportunity Series) |
| | | | | | | |
| | | Principal
Amount | | Value | |
REPURCHASE AGREEMENT—10.2% | | | | | | | |
State Street, 0.005%, dated 12/31/09, matures 1/4/10; repurchase amount $1,099,312 (Collateralized by FHLB, 9/17/10 with a value of $1,123,524)4 | | $ | 1,099,311 | | $ | 1,099,311 | |
State Street, 0.005%, dated 12/31/09, matures 1/4/10; repurchase amount $1,208,686 (Collateralized by FHLB, 9/17/10 with a value of $1,237,957)4 | | | 1,208,685 | | | 1,208,685 | |
| | | | | | | |
TOTAL REPURCHASE AGREEMENT (cost $2,307,996) | | | | | $ | 2,307,996 | |
| | | | | | | |
Total Investments—115.0%7 (cost $25,316,413) | | | | | $ | 26,030,740 | |
Liabilities, Less Cash & Other Assets—(15.0)% | | | | | | (3,397,425 | ) |
| | | | | | | |
Total Net Assets—100.0% | | | | | $ | 22,633,315 | |
| | | | | | | |
Schedule of Securities Sold Short
| | | | | | | |
| | | Shares | | | Value | |
COMMON STOCKS—(21.3)% | | | | | | | |
Advertising—(0.4)% | | | | | | | |
Focus Media Holding, Ltd. ADR8,9,* | | (2,500 | ) | | $ | (75,000 | ) |
| | | | | | | |
Airlines—(0.1)% | | | | | | | |
Continental Airlines, Inc.* | | (613 | ) | | | (10,985 | ) |
UAL Corporation* | | (44 | ) | | | (568 | ) |
| | | | | | | |
| | | | | | (11,553 | ) |
| | | | | | | |
Alternative Carriers—(0.3)% | | | | | | | |
Clearwire Corporation8,9,* | | (2,660 | ) | | | (30,138 | ) |
Global Crossing, Ltd.8,9,* | | (2,520 | ) | | | (40,244 | ) |
| | | | | | | |
| | | | | | (70,382 | ) |
| | | | | | | |
Auto Parts & Equipment—(0.1)% | | | | | | | |
BorgWarner, Inc. | | (176 | ) | | | (5,847 | ) |
Tenneco, Inc.* | | (404 | ) | | | (7,163 | ) |
TRW Automotive Holdings Corporation * | | (404 | ) | | | (9,647 | ) |
| | | | | | | |
| | | | | | (22,657 | ) |
| | | | | | | |
Biotechnology—(2.9)% | | | | | | | |
Acorda Therapeutics, Inc.8,9,* | | (2,900 | ) | | | (77,575 | ) |
Alnylam Pharmaceuticals, Inc.8,9,* | | (3,000 | ) | | | (88,230 | ) |
AMAG Pharmaceuticals, Inc.8,9,* | | (1,900 | ) | | | (82,954 | ) |
Cepheid, Inc.8,9,* | | (5,500 | ) | | | (84,700 | ) |
Exelixis, Inc.8,9,* | | (4,700 | ) | | | (30,127 | ) |
Regeneron Pharmaceuticals, Inc.8,9,* | | (3,810 | ) | | | (82,715 | ) |
Rigel Pharmaceuticals, Inc.8,9,* | | (3,070 | ) | | | (78,838 | ) |
Savient Pharmaceuticals, Inc.8,9,* | | (3,240 | ) | | | (64,282 | ) |
Vertex Pharmaceuticals, Inc.8,9,* | | (2,700 | ) | | | (74,709 | ) |
| | | | | | | |
| | | | | | (664,130 | ) |
| | | | | | | |
Building Products—(0.7)% | | | | | | | |
USG Corporation8,9,* | | (5,580 | ) | | | (160,258 | ) |
| | | | | | | |
Casinos & Gaming—(0.1)% | | | | | | | |
Churchill Downs, Inc. | | (404 | ) | | | (15,089 | ) |
International Game Technology | | (204 | ) | | | (3,829 | ) |
| | | | | | | |
| | | | | | (18,918 | ) |
| | | | | | | |
Communications Equipment—(0.3)% | | | | | | | |
Research In Motion, Ltd.* | | (409 | ) | | | (27,624 | ) |
Riverbed Technology, Inc.8,9,* | | (4,100 | ) | | | (54,530 | ) |
| | | | | | | |
| | | | | | (82,154 | ) |
| | | | | | | |
Computer Storage & Peripherals—(0.2)% | | | | | | | |
Intermec, Inc.8,9,* | | (2,570 | ) | | | (50,937 | ) |
| | | | | | | |
Consumer Electronics—(0.1)% | | | | | | | |
Garmin, Ltd. | | (818 | ) | | | (25,113 | ) |
| | | | | | | |
Department Stores—(0.3)% | | | | | | | |
Sears Holdings Corporation* | | (825 | ) | �� | | (68,846 | ) |
| | | | | | | |
Diversified Banks—(2.5)% | | | | | | | |
Wells Fargo & Company8,9 | | (12,937 | ) | | | (565,622 | ) |
| | | | | | | |
Diversified Metals & Mining—(0.2)% | | | | | | | |
Ivanhoe Mines, Ltd.8,9,* | | (4,780 | ) | | | (39,865 | ) |
| | | | | | | |
Diversified Real Estate Activities—0.0% | | | | | | | |
Consolidated-Tomoka Land Company | | (20 | ) | | | (699 | ) |
| | | | | | | |
Electric Utilities—(1.2)% | | | | | | | |
Korea Electric Power Corporation ADR8,9 | | (19,460 | ) | | | (263,294 | ) |
| | | | | | | |
Electrical Components & Equipment—(0.1)% | | | | | | | |
First Solar, Inc.* | | (175 | ) | | | (23,695 | ) |
| | | | | | | |
Environmental & Facilities Services—(0.2)% | | | | | | | |
Stericycle, Inc.* | | (818 | ) | | | (45,129 | ) |
| | | | | | | |
Exchange Traded Funds—(0.3)% | | | | | | | |
PowerShares DB US Dollar Index Bullish Fund* | | (1,840 | ) | | | (42,467 | ) |
United States Natural Gas Fund, LP* | | (1,635 | ) | | | (16,481 | ) |
| | | | | | | |
| | | | | | (58,948 | ) |
| | | | | | | |
Footwear—(0.1)% | | | | | | | |
K-Swiss, Inc. | | (1,295 | ) | | | (12,872 | ) |
| | | | | | | |
Health Care Equipment—(0.3)% | | | | | | | |
IDEXX Laboratories, Inc.* | | (202 | ) | | | (10,795 | ) |
Intuitive Surgical, Inc.8,9,* | | (200 | ) | | | (56,100 | ) |
| | | | | | | |
| | | | | | (66,895 | ) |
| | | | | | | |
Health Care Facilities—0.0% | | | | | | | |
Kindred Healthcare, Inc.* | | (613 | ) | | | (11,316 | ) |
| | | | | | | |
Health Care Supplies—(0.3)% | | | | | | | |
Align Technology, Inc.8,9,* | | (6,300 | ) | | | (76,860 | ) |
| | | | | | | |
Health Care Technology—(0.4)% | | | | | | | |
athenahealth, Inc.8,9,* | | (2,700 | ) | | | (96,795 | ) |
| | | | | | | |
The accompanying notes are an integral part of the financial statements
142
| | |
| Schedule of Investments | | Series Z |
| December 31, 2009 | | (Alpha Opportunity Series) |
| | | | | | | |
| | | Shares | | | Value | |
COMMON STOCKS—(21.3)% (continued) | | | | | | | |
Home Entertainment Software—(0.2)% | | | | | | | |
Electronic Arts, Inc.8,9,* | | (900 | ) | | $ | (36,720 | ) |
| | | | | | | |
Home Furnishings—(0.1)% | | | | | | | |
Mohawk Industries, Inc.* | | (404 | ) | | | (19,230 | ) |
| | | | | | | |
Industrial Machinery—(0.1)% | | | | | | | |
Donaldson Company, Inc. | | (404 | ) | | | (17,186 | ) |
| | | | | | | |
Industrial REIT’s—0.0% | | | | | | | |
EastGroup Properties, Inc. | | (220 | ) | | | (8,422 | ) |
| | | | | | | |
Integrated Telecommunication Services—(0.1)% | | | | | | | |
Qwest Communications International, Inc. | | (1,008 | ) | | | (4,244 | ) |
Verizon Communications, Inc. | | (404 | ) | | | (13,384 | ) |
| | | | | | | |
| | | | | | (17,628 | ) |
| | | | | | | |
Internet Retail—0.0% | | | | | | | |
PetMed Express, Inc. | | (438 | ) | | | (7,722 | ) |
| | | | | | | |
Internet Software & Services—(1.1)% | | | | | | | |
Baidu, Inc. ADR8,9,* | | (200 | ) | | | (53,726 | ) |
Equinix, Inc.8,9,* | | (1,000 | ) | | | (79,940 | ) |
SAVVIS, Inc.8,9,* | | (5,900 | ) | | | (86,966 | ) |
VeriSign, Inc.8,9,* | | (1,300 | ) | | | (33,319 | ) |
| | | | | | | |
| | | | | | (253,951 | ) |
| | | | | | | |
Leisure Products—(1.4)% | | | | | | | |
Callaway Golf Company | | (404 | ) | | | (3,046 | ) |
Pool Corporation8,9 | | (12,350 | ) | | | (305,663 | ) |
| | | | | | | |
| | | | | | (308,709 | ) |
| | | | | | | |
Life Sciences Tools & Services—(0.7)% | | | | | | | |
Luminex Corporation8,9,* | | (2,700 | ) | | | (68,823 | ) |
Pharmaceutical Product Development, Inc. | | (1,011 | ) | | | (23,698 | ) |
Sequenom, Inc.8,9,* | | (3,140 | ) | | | (64,716 | ) |
| | | | | | | |
| | | | | | (157,237 | ) |
| | | | | | | |
Managed Health Care—(0.1)% | | | | | | | |
Centene Corporation* | | (864 | ) | | | (18,291 | ) |
| | | | | | | |
Office REIT’s—(0.1)% | | | | | | | |
Kilroy Realty Corporation | | (809 | ) | | | (24,812 | ) |
| | | | | | | |
Oil & Gas Exploration & Production—(0.5)% | | | | | | | |
BPZ Resources, Inc.8,9,* | | (6,000 | ) | | | (112,800 | ) |
| | | | | | | |
Oil & Gas Refining & Marketing—(0.1)% | | | | | | | |
Tesoro Corporation | | (818 | ) | | | (11,084 | ) |
Valero Energy Corporation | | (613 | ) | | | (10,268 | ) |
| | | | | | | |
| | | | | | (21,352 | ) |
| | | | | | | |
Pharmaceuticals—(0.8)% | | | | | | | |
Auxilium Pharmaceuticals, Inc.8,9,* | | (1,960 | ) | | | (72,167 | ) |
Sepracor, Inc.8,9,* | | (1,350 | ) | | | (23,625 | ) |
XenoPort, Inc.8,9,* | | (1,790 | ) | | | (82,036 | ) |
| | | | | | | |
| | | | | | (177,828 | ) |
| | | | | | | |
Photographic Products—0.0% | | | | | | | |
Eastman Kodak Company | | (1,107 | ) | | | (4,672 | ) |
| | | | | | | |
Publishing—(0.5)% | | | | | | | |
Gannett Company, Inc. | | (818 | ) | | | (12,147 | ) |
Interactive Data Corporation | | (362 | ) | | | (9,159 | ) |
McGraw-Hill Companies, Inc. | | (809 | ) | | | (27,110 | ) |
New York Times Company | | (818 | ) | | | (10,110 | ) |
Washington Post Company (Cl.B) | | (117 | ) | | | (51,433 | ) |
| | | | | | | |
| | | | | | (109,959 | ) |
| | | | | | | |
Regional Banks—(0.5)% | | | | | | | |
PrivateBancorp, Inc.8,9 | | (2,400 | ) | | | (103,200 | ) |
SY Bancorp, Inc. | | (180 | ) | | | (3,843 | ) |
| | | | | | | |
| | | | | | (107,043 | ) |
| | | | | | | |
Residential REIT’s—(0.1)% | | | | | | | |
Mid-America Apartment Communities, Inc. | | (607 | ) | | | (29,306 | ) |
| | | | | | | |
Restaurants—(0.2)% | | | | | | | |
Burger King Holdings, Inc. | | (664 | ) | | | (12,496 | ) |
Cheesecake Factory, Inc.* | | (1,011 | ) | | | (21,827 | ) |
PF Chang’s China Bistro, Inc.* | | (408 | ) | | | (15,467 | ) |
| | | | | | | |
| | | | | | (49,790 | ) |
| | | | | | | |
Security & Alarm Services—(0.1)% | | | | | | | |
Brink’s Company | | (838 | ) | | | (20,397 | ) |
| | | | | | | |
Semiconductor Equipment—(0.1)% | | | | | | | |
Varian Semiconductor Equipment Associates, Inc.8,9,* | | (1,270 | ) | | | (33,299 | ) |
| | | | | | | |
Semiconductors—(0.9)% | | | | | | | |
Cree, Inc.8,9,* | | (4,200 | ) | | | (115,332 | ) |
Micron Technology, Inc.* | | (2,023 | ) | | | (21,363 | ) |
NVIDIA Corporation* | | (604 | ) | | | (11,283 | ) |
Rambus, Inc.8,9,* | | (3,680 | ) | | | (56,451 | ) |
| | | | | | | |
| | | | | | (204,429 | ) |
| | | | | | | |
Soft Drinks—(0.4)% | | | | | | | |
Hansen Natural Corporation8,9,* | | (3,270 | ) | | | (96,825 | ) |
| | | | | | | |
Specialized Finance—(0.2)% | | | | | | | |
Moody’s Corporation | | (1,416 | ) | | | (37,949 | ) |
NASDAQ OMX Group, Inc.* | | (818 | ) | | | (16,213 | ) |
| | | | | | | |
| | | | | | (54,162 | ) |
| | | | | | | |
Specialized REIT’s—(0.1)% | | | | | | | |
Healthcare Realty Trust, Inc. | | (809 | ) | | | (17,361 | ) |
| | | | | | | |
Specialty Chemicals—(0.2)% | | | | | | | |
Zoltek Companies, Inc.8,9,* | | (2,900 | ) | | | (52,867 | ) |
| | | | | | | |
Steel—(0.1)% | | | | | | | |
Allegheny Technologies, Inc. | | (409 | ) | | | (18,311 | ) |
| | | | | | | |
Systems Software—(0.6)% | | | | | | | |
Red Hat, Inc.8,9,* | | (3,300 | ) | | | (58,905 | ) |
VMware, Inc.8,9,* | | (2,500 | ) | | | (71,450 | ) |
| | | | | | | |
| | | | | | (130,355 | ) |
| | | | | | | |
Thrifts & Mortgage Finance—0.0% | | | | | | | |
First Niagara Financial Group, Inc. | | (202 | ) | | | (2,810 | ) |
Hudson City Bancorp, Inc. | | (202 | ) | | | (2,773 | ) |
| | | | | | | |
| | | | | | (5,583 | ) |
| | | | | | | |
The accompanying notes are an integral part of the financial statements
143
| | |
| Schedule of Investments | | Series Z |
| December 31, 2009 | | (Alpha Opportunity Series) |
| | | | | | | |
| | | Shares | | | Value | |
COMMON STOCKS—(21.3)% (continued) | | | | | | | |
Trading Companies & Distributors—(0.1)% | | | | | | | |
Beacon Roofing Supply, Inc.* | | (202 | ) | | $ | (3,232 | ) |
Fastenal Company | | (411 | ) | | | (17,114 | ) |
| | | | | | | |
| | | | | | (20,346 | ) |
| | | | | | | |
Wireless Telecommunication Services—(0.8)% | | | | | | | |
Leap Wireless International, Inc.8,9,* | | (1,600 | ) | | | (69,440 | ) |
SBA Communications Corporation8,9,* | | (2,600 | ) | | | (74,854 | ) |
Telephone & Data Systems, Inc. | | (886 | ) | | | (30,053 | ) |
| | | | | | | |
| | | | | | (174,347 | ) |
| | | | | | | |
TOTAL COMMON STOCKS SOLD SHORT (proceeds $4,736,628) | | | | | $ | (4,822,878 | ) |
| | | | | | | |
| | |
| | | Shares | | | Value | |
FOREIGN STOCKS—(17.1)% | | | | | | | |
Airlines—(0.2)% | | | | | | | |
Ryanair Holdings plc8,9,* | | (10,200 | ) | | $ | (38,219 | ) |
| | | | | | | |
Airport Services—(0.9)% | | | | | | | |
Beijing Capital International Airport Company, Ltd.8,9 | | (232,000 | ) | | | (200,659 | ) |
| | | | | | | |
Apparel, Accessories & Luxury Goods—(0.1)% | | | | | | | |
C C Land Holdings, Ltd.8,9 | | (53,000 | ) | | | (14,782 | ) |
| | | | | | | |
Automobile Manufacturers—(2.3)% | | | | | | | |
Volkswagen AG8,9 | | (1,300 | ) | | | (539,375 | ) |
| | | | | | | |
Biotechnology—(1.0)% | | | | | | | |
Basilea Pharmaceutica8,9,* | | (500 | ) | | | (83,364 | ) |
Intercell AG8,9,* | | (2,000 | ) | | | (78,778 | ) |
Zeltia S.A.8,9 | | (8,500 | ) | | | (57,969 | ) |
| | | | | | | |
| | | | | | (220,111 | ) |
| | | | | | | |
Broadcasting—(0.1)% | | | | | | | |
Tokyo Broadcasting System Holdings, Inc.8,9 | | (1,300 | ) | | | (21,836 | ) |
| | | | | | | |
Cable & Satellite—(0.3)% | | | | | | | |
Sky Deutschland AG8,9,* | | (4,200 | ) | | | (68,951 | ) |
| | | | | | | |
Casinos & Gaming—(0.7)% | | | | | | | |
bwin Interactive Entertainment AG8,9,* | | (1,700 | ) | | | (48,431 | ) |
Genting Singapore plc8,9,* | | (132,800 | ) | | | (43,724 | ) |
PartyGaming plc8,9 | | (16,200 | ) | | | (60,974 | ) |
| | | | | | | |
| | | | | | (153,129 | ) |
| | | | | | | |
Coal & Consumable Fuels—(0.3)% | | | | | | | |
Aquila Resources, Ltd.8,9,* | | (2,860 | ) | | | (22,783 | ) |
Riversdale Mining, Ltd.8,9,* | | (7,100 | ) | | | (54,029 | ) |
| | | | | | | |
| | | | | | (76,812 | ) |
| | | | | | | |
Construction & Engineering—(0.2)% | | | | | | | |
Ausenco, Ltd.8,9 | | (2,300 | ) | | | (24,817 | ) |
China Communications Construction Company, Ltd.8,9 | | (16,000 | ) | | | (16,571 | ) |
| | | | | | | |
| | | | | | (41,388 | ) |
| | | | | | | |
Construction & Farm Machinery & Heavy Trucks—(0.1)% | | | | | | | |
China National Materials Company, Ltd.8,9 | | (37,600 | ) | | | (19,168 | ) |
| | | | | | | |
Construction Materials—(0.2)% | | | | | | | |
Anhui Conch Cement Company, Ltd.8,9 | | (5,500 | ) | | | (24,761 | ) |
China National Building Material Company, Ltd.8,9 | | (17,300 | ) | | | (23,432 | ) |
| | | | | | | |
| | | | | | (48,193 | ) |
| | | | | | | |
Department Stores—(0.9)% | | | | | | | |
Marui Group Company, Ltd.8,9 | | (31,000 | ) | | | (233,862 | ) |
| | | | | | | |
Diversified Banks—(2.1)% | | | | | | | |
Aozora Bank, Ltd.8,9 | | (17,300 | ) | | | (27,861 | ) |
Erste Group Bank AG8,9 | | (5,500 | ) | | | (337,971 | ) |
Mizuho Financial Group, Inc.8,9 | | (12,000 | ) | | | (49,593 | ) |
Mizuho Trust & Banking Company, Ltd.8,9 | | (18,800 | ) | | | (26,216 | ) |
| | | | | | | |
| | | | | | (441,641 | ) |
| | | | | | | |
Diversified Metals & Mining—(0.3)% | | | | | | | |
Fushan International Energy Group, Ltd.8,9 | | (70,000 | ) | | | (25,165 | ) |
Western Areas NL8,9,* | | (6,600 | ) | | | (47,324 | ) |
| | | | | | | |
| | | | | | (72,489 | ) |
| | | | | | | |
Diversified Real Estate Activities—(0.1)% | | | | | | | |
Franshion Properties China, Ltd.8,9 | | (84,600 | ) | | | (23,552 | ) |
| | | | | | | |
Electrical Components & Equipment—(0.1)% | | | | | | | |
Toyo Tanso Company, Ltd.8,9 | | (600 | ) | | | (32,408 | ) |
| | | | | | | |
Gold—(0.7)% | | | | | | | |
Agnico-Eagle Mines, Ltd.8,9,10 | | (1,900 | ) | | | (125,612 | ) |
Sino Gold Mining, Ltd.8,9,* | | (9,100 | ) | | | (37,425 | ) |
| | | | | | | |
| | | | | | (163,037 | ) |
| | | | | | | |
Highways & Railtracks—(2.1)% | | | | | | | |
Brisa Auto-Estradas de Portugal S.A.8,9 | | (47,200 | ) | | | (490,927 | ) |
| | | | | | | |
Household Appliances—(1.9)% | | | | | | | |
Electrolux AB8,9 | | (32,100 | ) | | | (422,058 | ) |
| | | | | | | |
Industrial Machinery—(0.3)% | | | | | | | |
Japan Steel Works, Ltd.8,9 | | (1,600 | ) | | | (22,196 | ) |
Meyer Burger Technology AG8,9,* | | (200 | ) | | | (49,879 | ) |
| | | | | | | |
| | | | | | (72,075 | ) |
| | | | | | | |
Internet Software & Services—(0.2)% | | | | | | | |
Access Company, Ltd.8,9,* | | (18 | ) | | | (34,682 | ) |
| | | | | | | |
Investment Banking & Brokerage—(0.1)% | | | | | | | |
Monex Group, Inc.8,9 | | (83 | ) | | | (29,140 | ) |
| | | | | | | |
The accompanying notes are an integral part of the financial statements
144
| | |
| Schedule of Investments | | Series Z |
| December 31, 2009 | | (Alpha Opportunity Series) |
| | | | | | | |
| | | Shares | | | Value | |
FOREIGN STOCKS—(17.1)% (continued) | | | | | | | |
Marine Ports & Services—(0.1)% | | | | | | | |
China Merchants Holdings International Company, Ltd.8,9 | | (4,900 | ) | | $ | (17,461 | ) |
| | | | | | | |
Oil & Gas Equipment & Services—(0.4)% | | | | | | | |
Modec, Inc.8,9 | | (1,000 | ) | | | (25,772 | ) |
Sevan Marine ASA8,9,* | | (6,300 | ) | | | (33,049 | ) |
Trican Well Service, Ltd.8,9 | | (2,200 | ) | | | (37,447 | ) |
| | | | | | | |
| | | | | | (96,268 | ) |
| | | | | | | |
Oil & Gas Exploration & Production—(0.8)% | | | | | | | |
Arrow Energy, Ltd.8,9,* | | (9,500 | ) | | | (24,514 | ) |
Imperial Energy Corporation plc8,9,* | | (4,200 | ) | | | (83,657 | ) |
Queensland Gas Company, Ltd.8,9,* | | (13,600 | ) | | | (52,897 | ) |
| | | | | | | |
| | | | | | (161,068 | ) |
| | | | | | | |
Precious Metals & Minerals—(0.3)% | | | | | | | |
Silver Wheaton Corporation8,9,* | | (6,500 | ) | | | (68,246 | ) |
| | | | | | | |
Real Estate Operating Companies—(0.3)% | | | | | | | |
Aeon Mall Company, Ltd.8,9 | | (1,900 | ) | | | (58,221 | ) |
| | | | | | | |
TOTAL FOREIGN STOCKS SOLD SHORT (proceeds $3,703,004) | | | | | $ | (3,859,758 | ) |
| | | | | | | |
TOTAL SECURITIES SOLD SHORT—(38.4%) (proceeds $8,439,632) | | | | | $ | (8,682,636 | ) |
| | | | | | | |
INVESTMENT CONCENTRATION
At December 31, 2009, the investment diversification of the Series was as follows:
| | | | | | | |
Country | | % of Net
Assets | | | Value | |
United States | | 82.2 | % | | $ | 18,562,374 | |
Cayman Islands | | 3.5 | | | | 793,403 | |
Jersey | | 1.5 | | | | 332,858 | |
Bermuda | | 1.3 | | | | 308,068 | |
United Kingdom | | 1.3 | | | | 300,107 | |
Canada | | 0.9 | | | | 205,790 | |
Belgium | | 0.7 | | | | 168,224 | |
Marshall Islands | | 0.4 | | | | 100,570 | |
Singapore | | 0.3 | | | | 65,629 | |
Mexico | | 0.2 | | | | 51,302 | |
India | | 0.1 | | | | 24,870 | |
Norway | | (0.1 | ) | | | (33,049 | ) |
Ireland | | (0.2 | ) | | | (38,219 | ) |
Isle Of Man | | (0.2 | ) | | | (43,724 | ) |
Spain | | (0.3 | ) | | | (57,969 | ) |
Gibraltar | | (0.3 | ) | | | (60,974 | ) |
Hong Kong | | (0.3 | ) | | | (66,178 | ) |
China | | (0.4 | ) | | | (71,496 | ) |
Switzerland | | (0.5 | ) | | | (118,121 | ) |
Republic of Korea | | (1.2 | ) | | | (263,294 | ) |
Australia | | (1.2 | ) | | | (263,789 | ) |
Sweden | | (1.9 | ) | | | (422,058 | ) |
Austria | | (2.1 | ) | | | (465,180 | ) |
Portugal | | (2.1 | ) | | | (490,927 | ) |
Japan | | (2.4 | )% | | | (561,787 | ) |
Germany | | (2.6 | ) | | | (608,326 | ) |
| | | | | | | |
Total Investments | | 76.6 | | | $ | 17,348,104 | |
| | | | | | | |
For federal income tax purposes the identified cost of investments owned at December 31, 2009 was $25,376,453.
| | |
ADR | | American Depositary Receipt |
plc | | Public Limited Company |
| * | Non-income producing security |
| 1 | Security is segregated as collateral for open short positions. |
| 2 | All or portion of security is deemed illiquid. The total market value of illiquid securities is $8,134,012 (cost $9,036,264), or 35.9% of total net assets. The securities were liquid at time of purchase. This security is deemed illiquid due to the Series exposure to Lehman Brothers International Europe (“LBIE”) prime brokerage services. See Note 11 in the Notes to Financial Statements for additional information. |
| 3 | Security is segregated as collateral for open futures contracts. |
| 4 | Value determined based on Level 2 inputs. |
| 5 | Security is deemed illiquid. The total market value of illiquid securities is $0 (cost $101,261), or 0.0% of total net assets. |
| 6 | Security was subject to the fair value trigger at December 31, 2009. The total market value of fair valued securities amounts to $416,506 (cost $435,290), or 1.8% of total net assets. |
| 7 | Unless otherwise indicated, the values of the securities of the Portfolio are determined based on Level 1 inputs. |
| 8 | Value determined based on Level 3 inputs. |
| 9 | Security is fair valued by the Valuation Committee at December 31, 2009. The total market value of fair valued securities amounts to $(7,786,655) (cost $(7,622,318)), or (34.4%) of total net assets. |
| 10 | Security was acquired through a private placement. |
The accompanying notes are an integral part of the financial statements
145
| | |
| | Series Z |
| | (Alpha Opportunity Series) |
Statement of Assets and Liabilities
December 31, 2009
| | | | |
Assets: | | | | |
Investments, at value* | | $ | 26,030,740 | |
Cash | | | 670,395 | |
Restricted cash | | | 709,418 | |
Restricted cash denominated in a foreign currency, at value**** | | | 3,725,377 | |
Receivables: | | | | |
Securities sold | | | 834,098 | |
Dividends | | | 41,795 | |
Security Investors | | | 20,084 | |
Foreign taxes recoverable | | | 606 | |
Prepaid expenses | | | 282 | |
| | | | |
Total assets | | | 32,032,795 | |
| | | | |
| |
Liabilities: | | | | |
Cash overdraft denominated in a foreign currency, at value*** | | | 474 | |
Securities sold short, at value** | | | 8,682,636 | |
Payable for: | | | | |
Fund shares redeemed | | | 1,290 | |
Securities purchased | | | 580,135 | |
Variation margin on futures | | | 45,600 | |
Dividends on short sales | | | 732 | |
Management fees | | | 23,967 | |
Administration fees | | | 7,076 | |
Transfer agent/maintenance fees | | | 2,083 | |
Custodian fees | | | 12,936 | |
Directors’ fees | | | 741 | |
Professional fees | | | 35,936 | |
Other fees | | | 5,874 | |
| | | | |
Total liabilities | | | 9,399,480 | |
| | | | |
Net assets | | $ | 22,633,315 | |
| | | | |
| |
Net assets consist of: | | | | |
Paid in capital | | $ | 35,027,220 | |
Accumulated net realized loss on sale of investments and foreign currency transactions | | | (12,983,939 | ) |
Net unrealized appreciation in value of investments and translation of assets and liabilities in foreign currencies | | | 590,034 | |
| | | | |
Net assets | | $ | 22,633,315 | |
| | | | |
| |
Capital shares authorized | | | unlimited | |
Capital shares outstanding | | | 1,613,542 | |
Net asset value per share (net assets divided by shares outstanding) | | $ | 14.03 | |
| | | | |
| |
*Investments, at cost | | $ | 25,316,413 | |
**Securities sold short, proceeds | | | 8,439,632 | |
***Cash denominated in a foreign currency, at cost | | | (471 | ) |
****Restricted cash denominated in a foreign currency, at cost | | | 3,626,604 | |
Statement of Operations
For Year Ended December 31, 2009
| | | | |
Investment Income: | | | | |
Dividends (net of foreign withholding tax $4,453) | | $ | 275,668 | |
Interest | | | (7,475 | ) |
| | | | |
Total investment income | | | 268,193 | |
| | | | |
| |
Expenses: | | | | |
Management fees | | | 276,548 | |
Administration fees | | | 49,334 | |
Transfer agent/maintenance fees | | | 25,131 | |
Custodian fees | | | 73,465 | |
Directors’ fees | | | 2,262 | |
Professional fees | | | 170,218 | |
Reports to shareholders | | | 14,109 | |
Other | | | 7,325 | |
Dividends on short sales | | | 11,608 | |
| | | | |
Total expenses | | | 630,000 | |
Reimbursement of expenses | | | (244,101 | ) |
Earnings credits applied | | | (3,374 | ) |
| | | | |
Net expenses | | | 382,525 | |
| | | | |
Net investment loss | | | (114,332 | ) |
| | | | |
| |
Net Realized and Unrealized Gain (Loss): | | | | |
Net realized gain (loss) during the year on: | | | | |
Investments | | | (538,814 | ) |
Securities sold short | | | (118,674 | ) |
Futures | | | 1,187,273 | |
Foreign currency transactions | | | 11,952 | |
| | | | |
Net realized gain | | | 541,737 | |
| | | | |
| |
Net unrealized appreciation (depreciation) during the year on: | | | | |
Investments | | | 4,863,976 | |
Securities sold short | | | (69,686 | ) |
Futures | | | (52,752 | ) |
Translation of assets and liabilities in foreign currencies | | | 142,205 | |
| | | | |
Net unrealized appreciation | | | 4,883,743 | |
| | | | |
Net realized and unrealized gain | | | 5,425,480 | |
| | | | |
Net increase in net assets resulting from operations | | $ | 5,311,148 | |
| | | | |
The accompanying notes are an integral part of the financial statements
146
| | |
| | Series Z |
| Statement of Changes in Net Assets | | (Alpha Opportunity Series) |
| | | | | | | | |
| | | Year Ended
December 31, 2009 | | | Year Ended
December 31, 2008 | |
Increase (decrease) in net assets from operations: | | | | | | | | |
Net investment loss | | $ | (114,332 | ) | | $ | (458,753 | ) |
Net realized gain (loss) during the year on investments and foreign currency transactions | | | 541,737 | | | | (12,871,877 | ) |
Net unrealized appreciation (depreciation) during the year on investments and translation of assets and liabilities in foreign currencies | | | 4,883,743 | | | | (4,160,796 | ) |
| | | | | | | | |
Net increase (decrease) in net assets resulting from operations | | | 5,311,148 | | | | (17,491,426 | ) |
| | | | | | | | |
| | |
Capital share transactions: | | | | | | | | |
Proceeds from sale of shares | | | 441,669 | | | | 25,172,030 | |
Cost of shares redeemed | | | (10,096,392 | ) | | | (29,572,908 | ) |
| | | | | | | | |
Net decrease from capital share transactions | | | (9,654,723 | ) | | | (4,400,878 | ) |
| | | | | | | | |
Net decrease in net assets | | | (4,343,575 | ) | | | (21,892,304 | ) |
| | | | | | | | |
| | |
Net assets: | | | | | | | | |
Beginning of year | | | 26,976,890 | | | | 48,869,194 | |
| | | | | | | | |
End of year | | $ | 22,633,315 | | | $ | 26,976,890 | |
| | | | | | | | |
| | |
Accumulated net investment loss at end of year | | $ | — | | | $ | (1,386 | ) |
| | | | | | | | |
| | |
Capital share activity: | | | | | | | | |
Shares sold | | | 44,054 | | | | 1,673,286 | |
Shares redeemed | | | (936,532 | ) | | | (2,129,771 | ) |
| | | | | | | | |
Total capital share activity | | | (892,478 | ) | | | (456,485 | ) |
| | | | | | | | |
The accompanying notes are an integral part of the financial statements
147
| | |
| Financial Highlights | | Series Z |
| Selected data for each share of capital stock outstanding through out the year | | (Alpha Opportunity Series) |
| | | | | | | | | | | | | | | | | | | | |
| | | 2009 | | | 2008a | | | 2007 | | | 2006 | | | Year Ended
December 31,
2005 | |
Per Share Data | | | | | | | | | | | | | | | | | | | | |
Net asset value, beginning of period | | $ | 10.76 | | | $ | 16.50 | | | $ | 13.96 | | | $ | 12.34 | | | $ | 11.57 | |
| | | | | | | | | | | | | | | | | | | | |
Income (loss) from investment operations: | | | | | | | | | | | | | | | | | | | | |
Net investment income (loss)b | | | (0.06 | ) | | | (0.16 | ) | | | 0.01 | | | | — | | | | (0.02 | ) |
Net gain (loss) on securities (realized and unrealized) | | | 3.33 | | | | (5.58 | ) | | | 2.53 | | | | 1.62 | | | | 0.79 | |
| | | | | | | | | | | | | | | | | | | | |
Total from investment operations | | | 3.27 | | | | (5.74 | ) | | | 2.54 | | | | 1.62 | | | | 0.77 | |
| | | | | | | | | | | | | | | | | | | | |
Net asset value, end of period | | $ | 14.03 | | | $ | 10.76 | | | $ | 16.50 | | | $ | 13.96 | | | $ | 12.34 | |
| | | | | | | | | | | | | | | | | | | | |
| | | | | |
Total Returnc | | | 30.39 | % | | | (34.79 | )% | | | 18.19 | % | | | 13.13 | % | | | 6.66 | % |
| | | | | | | | | | | | | | | | | | | | |
Ratios/Supplemental Data | | | | | | | | | | | | | | | | | | | | |
Net assets, end of period (in thousands) | | $ | 22,633 | | | $ | 26,977 | | | $ | 48,869 | | | $ | 36,442 | | | $ | 25,660 | |
| | | | | | | | | | | | | | | | | | | | |
Ratios to average net assets: | | | | | | | | | | | | | | | | | | | | |
Net investment income (loss) | | | (0.52 | )% | | | (1.09 | )% | | | 0.10 | % | | | (0.03 | )% | | | (0.21 | )% |
Total expensesd | | | 2.85 | % | | | 2.79 | % | | | 2.50 | % | | | 2.78 | % | | | 2.50 | % |
Net expensese | | | 1.68 | % | | | 2.64 | % | | | 2.39 | % | | | 2.62 | % | | | 2.50 | % |
Net expenses prior to custodian earnings credits and net of expense waivers | | | 1.69 | % | | | 2.79 | % | | | 2.50 | % | | | 2.78 | % | | | 2.50 | % |
| | | | | | | | | | | | | | | | | | | | |
Portfolio turnover rate | | | 555 | % | | | 990 | % | | | 1,770 | % | | | 1,285 | % | | | 1,509 | % |
| a | Security Global Investors, LLC (SGI) became the sub-advisor of 37.5% of the assets of Series Z effective August 18, 2008. Also effective August 18, 2008, Mainstream Investment Advisers, LLC (Mainstream) sub-advises 37.5% of the assets and Security Investors, LLC (SI) manages 25% of the assets. Prior to August 18, 2008, SI paid Mainstream sub-advisory fees for 60% of the assets. SI managed the remaining 40% of the assets. |
| b | Net investment income (loss) was computed using average shares outstanding through out the period. |
| c | Total return does not take into account any of the expenses associated with an investment in variable insurance products offered by Security Benefit Life Insurance Company. If total return had taken into account these expenses, performance would have been lower. Shares of a series of SBL Fund are available only through the purchase of such products. |
| d | Total expense information reflects the expense ratios absent expense reductions by the Investment Manager and earnings credits, as applicable. |
| e | Net expense information reflects the expense ratios after voluntary expense waivers, reimbursements and custodian earnings credits, as applicable. |
The accompanying notes are an integral part of the financial statements
148
Notes to Financial Statements
December 31, 2009
1. Significant Accounting Policies
SBL Fund (The Fund) is registered under the Investment Company Act of 1940 (the “1940 Act”), as amended, as an open-end management investment company of the series type. Each series, in effect, represents a separate fund. The Fund is required to account for the assets of each series separately and to allocate general liabilities of the Fund to each Series based on the net asset value of each series. Security Benefit Life Insurance Company (“SBL”) and SBL’s affiliated life insurance company as well as unaffiliated life insurance companies purchase shares of the Series for their variable annuity and variable life insurance separate accounts. The following is a summary of the significant accounting policies followed by the Fund in the preparation of its financial statements.
In June 2009, the Financial Accounting Standards Board (FASB) established the FASB Accounting Standards Codification™ (ASC) as the single source of authoritative accounting principles recognized by the FASB in the preparation of financial statements in conformity with GAAP. The ASC supersedes existing non-grandfathered, non-SEC accounting and reporting standards. The ASC did not change GAAP but rather organized it into a hierarchy where all guidance within the ASC carries an equal level of authority. The ASC became effective for financial statements issued for interim and annual periods ending after September 15, 2009. The ASC had no material effect on the Funds’ financial statements.
A. Security Valuation – Valuations of the Fund’s securities are supplied by pricing services approved by the Board of Directors. The Fund’s officers, under the general supervision of the Board of Directors, regularly review procedures used by, and valuations provided by, the pricing services. Each security owned by a Series that is listed on a securities exchange is valued at its last sale price on that exchange on the date as of which assets are valued. Where the security is listed on more than one exchange, the Series will use the price of that exchange that it generally considers to be the principal exchange on which the stock is traded. Securities listed on the Nasdaq Stock Market, Inc. (“Nasdaq”) will be valued at the Nasdaq Official Closing Price, which may not necessarily represent the last sale price. If there has been no sale on such exchange or NASDAQ on such day, the security is valued at the closing bid price on such day. Securities for which market quotations are not readily available are valued by a pricing service considering securities with similar yields, quality, type of issue, coupon, duration and rating. If there is no bid price or if the bid price is deemed to be unsatisfactory by the Board of Directors or by the Fund’s investment manager, then the securities are valued in good faith by such method as the Board of Directors determines will reflect the fair value. If events occur after the close of a foreign exchange that will affect the value of a series portfolio securities before the time as of which the NAV is calculated (a “significant event”), the security will generally be priced using a fair value procedure. If the Valuation Committee determines a significant event has occurred, it will evaluate the impact of that event on an affected security or securities, to determine whether a fair value adjustment would materially affect the Series net asset value per share. Some of the factors which may be considered by the Board of Directors in determining fair value are fundamental analytical data relating to the investment; the nature and duration of any restrictions on disposition; trading in similar securities of the same issuer or comparable companies; information from broker-dealers; and an evaluation of the forces that influence the market in which the securities are purchased and sold. The Fund generally will value short-term debt securities at prices based on market quotations for such securities or securities of similar type, yield, quality and duration, except those securities purchased with 60 days or less to maturity are valued on the basis of amortized cost which approximates market value.
Generally, trading in foreign securities markets is substantially completed each day at various times prior to the close of the New York Stock Exchange. The values of foreign securities are determined as of the close of such foreign markets or the close of the New York Stock Exchange, if earlier. All investments quoted in foreign currency are valued in U.S. dollars on the basis of the foreign currency exchange rates prevailing at the close of business. Investments in foreign securities may involve risks not present in domestic investments. The Valuation Committee will determine the current value of such foreign securities by taking into consideration certain factors which may include those discussed above, as well as the following factors, among others: the value of the securities traded on other foreign markets, ADR trading, closed-end fund trading, foreign currency exchange activity, and the trading prices of financial products that are tied to foreign securities such as WEBS®. In addition, the Board of Directors has authorized the Valuation Committee and Administrator to use prices and other information supplied by a third party pricing vendor in valuing foreign securities.
The senior floating rate interests (loans) in which Series P invests are not listed on any securities exchange or board of trade. Accordingly, determinations of the value of loans may be based on infrequent and dated trades. Typically loans are valued using information provided by an independent third party pricing service. If the pricing service cannot or does not provide a valuation for a particular loan or such valuation is deemed unreliable, such loan is fair valued. In determining fair value, consideration is given to several factors, which may include, among others, one or more of the following: the fundamental business data relating to the issuer or borrower; an evaluation of the forces which influence the market in which these loans are purchased and sold; type of holding; financial statements of the borrower; cost at date of purchase; size of holding; credit worthiness and cash flow of issuer; information as to any transactions in, or offers for, the holding; price and extent of public trading in similar securities (or equity securities) of the issuer/borrower, or comparable companies; coupon payments; quality, value and saleability of collateral securing the loan; business prospects of the issuer/borrower, including any ability to obtain money or resources from a parent or affiliate; the portfolio manager’s and/or the market’s assessment of the borrower’s management; prospects for the borrower’s industry, and multiples (of earnings and/or cash flow) being paid for similar businesses in that industry; borrower’s competitive position within the industry; borrower’s ability to access additional liquidity through public and/or private markets; and other relevant factors.
149
Notes to Financial Statements
December 31, 2009
B. Repurchase Agreements – In connection with transactions in repurchase agreements, it is the Fund’s policy that its custodian take possession of the underlying collateral and that the fair value of the collateral exceed the principal amount of the repurchase transaction, including accrued interest, at all times. If the seller defaults, and the fair value of the collateral declines, realization of the collateral by the Series may be delayed or limited.
C. Foreign Currency Transactions – The accounting records of the Fund are maintained in U.S. dollars. All assets and liabilities initially expressed in foreign currencies are converted into U.S. dollars at prevailing exchange rates. Purchases and sales of investment securities, dividend and interest income, and certain expenses are translated at the rates of exchange prevailing on the respective dates of such transactions. Changes in the relationship of these foreign currencies to the U.S. dollar can significantly affect the value of the investments and earnings of the Series. Foreign investments may also subject the Series to foreign government exchange restrictions, expropriation, taxation or other political, social or economic developments, all of which could affect the market and/or credit risk of the investments.
The Fund does not isolate that portion of the results of operations resulting from changes in the foreign exchange rates on investments from the fluctuations arising from changes in the market prices of securities held. Such fluctuations are included with the net realized and unrealized gain or loss on investments.
Net realized foreign exchange gains and losses arise from sales of portfolio securities, sales of foreign currencies, and the difference between asset and liability amounts initially stated in foreign currencies and the U.S. dollar value of the amounts actually received or paid. Net unrealized foreign exchange gains or losses arise from changes in the value of portfolio securities other assets and liabilities at the end of the reporting period, resulting from changes in the exchange rates.
D. Forward Foreign Currency Exchange Contracts – The Fund may enter into forward foreign exchange contracts in order to manage foreign currency risk from purchase or sale of securities denominated in foreign currency. A series may also enter into such contracts to manage the effect of changes in foreign currency exchange rates on portfolio positions. These contracts are marked to market daily, by recognizing the difference between the contract exchange rate and the current market rate as unrealized gains or losses. Realized gains or losses are recognized when contracts are settled and are reflected in the Statement of Operations. These contracts involve market risk in excess of the amount reflected in the Statement of Assets and Liabilities. The face or contract amount in U.S. dollars reflects the total exposure these funds have in that particular currency contract. Losses may arise due to changes in the value of the foreign currency or if the counterparty does not perform under the contract.
E. Futures – The Fund may utilize futures contracts to a limited extent, with the objectives of maintaining full exposure to the underlying stock market, enhancing returns, maintaining liquidity, minimizing transaction costs and economically hedging possible variations in foreign exchange values. The Fund may purchase or sell financial and foreign currency futures contracts to immediately position incoming cash in the market, thereby simulating a fully invested position in the underlying index while maintaining a cash balance for liquidity. In the event of redemptions, the series may pay from its cash balances and reduce its future positions accordingly. Returns may be enhanced by purchasing futures contracts instead of the underlying securities when futures are believed to be priced more attractively than the underlying securities. The primary risks associated with the use of futures contracts are imperfect correlation between changes in market values of stocks contained in the indexes and the prices of futures contracts, and the possibility of an illiquid market. Futures contracts are valued based upon their quoted daily settlement prices. Upon entering into a futures contract, the series are required to deposit and maintain as collateral either cash or securities, representing the initial margin, equal to a certain percentage of the contract value. Cash deposits are shown as restricted cash on the Statement of Assets and Liabilities; securities held as collateral are noted in the Schedule of Investments. Subsequent changes in the value of the contract are recorded as unrealized gains or losses. The variation margin is paid or received in cash daily by the series. The series realizes a gain or loss when the contract is closed or expires.
F. Options Purchased and Written – The Fund may purchase put and call options and write such options on a covered basis on securities that are traded on recognized securities exchanges and over-the-counter markets. Call and put options on securities give the holder the right to purchase or sell (and the writer the obligation to sell or purchase), respectively, a security at a specified price, until a certain date. Options may be used to economically hedge the series portfolio, to increase returns or to maintain exposure to the equity markets. The primary risks associated with the use of options are an imperfect correlation between the change in market value of the securities held by the series and the price of the option, the possibility of an illiquid market, and the inability of the counterparty to meet the terms of the contract.
The premium received for a written option is recorded as an asset with an equal liability which is marked to market based on the option’s quoted daily settlement price. Fluctuations in the value of such instruments are recorded as unrealized appreciation (depreciation) until terminated, at which time realized gains and losses are recognized.
G. Securities Sold Short – Certain of the Series may make short sales “against the box,” in which the Series enters into a short sale of a security it owns. At no time will more than 15% of the value of the Series’ net assets be in deposits on short sales against the box. If a Series makes a short sale, the Series does not immediately deliver from its own account the securities sold and does not receive the proceeds from the sale. To complete the sale, the Series must borrow the security (generally from the broker through which the short sale is made) in order to make delivery to the buyer. The Series must replace the security borrowed by purchasing it at the market price at the time of replacement or delivering the security from its own portfolio. The Series is said to have a “short position” in securities sold until it delivers them to
150
Notes to Financial Statements
December 31, 2009
the broker, at which time it receives the proceeds of the sale. Certain Series may make short sales that are not “against the box,” which create opportunities to increase the Series’ return but, at the same time, involve specific risk considerations and may be considered a speculative technique. Such short sales theoretically involve unlimited loss potential, as the market price of securities sold short may continually increase, although a Series may mitigate such losses by replacing the securities sold short before the market price has increased significantly. For financial statement purposes, an amount equal to the settlement amount is included in the Statement of Assets and Liabilities as an asset and an equivalent liability. The amount of the liability is subsequently marked-to-market to reflect the current value of the short position. Subsequent fluctuations in the market prices of securities sold, but not yet purchased, may require purchasing the securities at prices which differ from the market value reflected on the Statement of Assets and Liabilities. The Series are liable for any dividends or interest payable on securities while those securities are in a short position. As collateral for its short positions, the Series is required under the Investment Company Act of 1940 to maintain segregated assets consisting of cash, cash equivalents or liquid securities. These segregated assets are valued consistent with Note 1a above. These segregated assets are required to be adjusted daily to reflect changes in the market value of the securities sold short.
H. Senior Loans – Senior loans in which certain of the Series invests generally pay interest rates which are periodically adjusted by reference to short-term, floating rate plus a premium. These base lending rates are generally (i) the lending rate offered by one or more major European banks, such as the London Inter-Bank Offered Rate (LIBOR), (ii) the prime rate offered by one or more major United States banks, or (iii) the bank’s certificate of deposit rate. Senior floating rate interests often require prepayments from excess cash flows or permit the borrower to repay at its election. The rate at which the borrower repays cannot be predicted with accuracy. As a result, the actual remaining maturity may be substantially less than the stated maturities shown. The interest rate indicated is the rate in effect at December 31, 2009.
I. Security Transactions and Investment Income – Security transactions are accounted for on the date the securities are purchased or sold (trade date). Realized gains and losses are reported on an identified cost basis. Dividend income is accrued as of ex-dividend date, except that certain dividends for foreign securities where the ex-dividend date may have passed are recorded as soon as the Series is informed of the dividend in the exercise of reasonable diligence. Interest income is recognized on the accrual basis including the amortization of premiums and accretion of discounts on debt securities.
J. Expenses – Expenses that are directly related to one of the Series are charged directly to that Series. Other operating expenses are allocated to the Series on the basis of relative net assets within the Fund.
K. Distributions to Shareholders – The Fund is required by the Internal Revenue Code to distribute substantially all of its income and capital gains to its shareholders. Each year the Fund determines whether to declare and pay actual dividends or whether to secure consent of its shareholders to report and deduct a consent dividend. A consent dividend is treated for tax purposes as a distribution to shareholders occurring on the last day of the Fund’s taxable year and a shareholder contribution to capital occurring on the same day. It is the Fund’s current practice to utilize the consent dividend procedures. The character of any distributions made from net investment income and net realized gains may differ from their ultimate characterization for income tax purposes.
L. Taxes – The Series intend to comply with the requirements of the Internal Revenue Code applicable to regulated investment companies and distribute all of their taxable net income and net realized gains sufficient to relieve them from all, or substantially all, federal income, excise and state income taxes. Distributions may be made via consent dividends, as described in the paragraph above. Therefore, no provision for federal or state income tax is required.
The evaluation of tax positions taken or expected to be taken in the course of preparing the Series’ tax returns is required to determine whether the tax positions are “more-likely-than-not” of being sustained by the applicable tax authority. For all open tax years (December 31, 2006 - December 31, 2009) and all major taxing jurisdictions through the end of the reporting period, the Series’ management has completed a review and evaluation and has determined that no tax liability is required and no additional disclosures are needed as of December 31, 2009.
M. Earnings Credits – Under the fee agreement with the custodian, the Series’ may earn credits based on overnight custody cash balances. These credits are utilized to reduce related custodial expenses. The custodian fees disclosed in the Statement of Operations are before the reduction in expense from the related earnings credits.
N. Use of Estimates – The preparation of financial statements in conformity with U.S. generally accepted accounting principles requires management to make estimates and assumptions that affect the reported amounts of assets and liabilities and disclosure of contingent assets and liabilities at the date of the financial statements and the reported amounts of increases and decreases in net assets from operations during the reporting period. Actual results could differ from those estimates.
O. Indemnifications – Under the Fund’s organizational documents, its Officers and Directors are indemnified against certain liabilities arising out of the performance of their duties to the Fund. In addition, in the normal course of business, the Fund enters into contracts that provide general indemnification to other parties. The Fund’s maximum exposure under these arrangements is unknown as this would involve future claims that may be made against the Fund that have not yet occurred, and may not occur. However, the Fund has not had prior claims or losses pursuant to these contracts and expects the risk of loss to be remote.
P. Recent Accounting Pronouncement – On January 21, 2010, the FASB issued an ASU, Fair Value Measurements and Disclosures (Topic 820): Improving Disclosures about Fair Value Measurements which provides guidance on how
151
Notes to Financial Statements
December 31, 2009
investment assets and liabilities are to be valued and disclosed. Specifically, the amendment requires reporting entities to disclose: i) the input and valuation techniques used to measure fair value for both recurring and nonrecurring fair value measurements, for Level 2 or Level 3 positions, ii) transfers between all levels (including Level 1 and Level 2) will be required to be disclosed on a gross basis (i.e. transfers out must be disclosed separately from transfers in) as well as the reason(s) for the transfer, and iii) purchases, sales, issuances and settlements must be shown on a gross basis in the Level 3 rollforward rather than as one net number. The effective date of the amendment is for interim and annual periods beginning after December 15, 2009, however, the requirement to provide the Level 3 activity for purchases, sales, issuances and settlements on a gross basis will be effective for interim and annual periods beginning after December 15, 2010. At this time the Fund is evaluating the implications of the amendment to ASC 820 and the impact to the financial statements.
2. Management fees and other transactions with affiliates
Management fees are paid monthly to Security Investors (SI), based on the following annual rates:
| | | | | |
| | | Management
Fees (as a %
of net assets) | | | Fee Waivers
(as a % of
net assets) |
Series A (Equity Series) | | 0.75 | % | | N/A |
Series B (Large Cap Value Series) | | 0.65 | | | N/A |
Series C (Money Market Series) | | 0.50 | | | N/A |
Series D (Global Series) | | 1.00 | | | N/A |
Series E (U.S. Intermediate Bond Series) | | 0.75 | | | 0.15 |
Series H (Enhanced Index Series) | | 0.75 | | | 0.25 |
Series J (Mid Cap Growth Series) | | 0.75 | | | N/A |
Series N (Managed Asset Allocation Series) | | 1.00 | | | N/A |
Series O (All Cap Value Series) | | 0.70 | | | N/A |
Series P (High Yield Series) | | 0.75 | | | N/A |
Series Q (Small Cap Value Series) | | 0.95 | 1 | | N/A |
Series V (Mid Cap Value Series) | | 0.75 | | | N/A |
Series X (Small Cap Growth Series) | | 0.85 | | | N/A |
Series Y (Select 25 Series) | | 0.75 | | | N/A |
Series Z (Alpha Opportunity Series) | | 1.25 | | | N/A |
| 1 | Effective February 9, 2009 SI receives a management fee from Series Q at an annual rate of 0.95% of the average daily net assets. Prior to February 9, 2009, SI received a management fee from Series Q of 1.00% of the average daily net assets. |
SI also acts as the administrative agent and transfer agent for the Fund, and as such performs administrative functions, transfer agency and dividend disbursing services, and the bookkeeping, accounting and pricing functions for each series. For these services, the Investment Manager receives the following:
| | | |
| | | Administrative Fees
(as a % of net assets)* | |
Series A (Equity Series) | | 0.095 | % |
Series B (Large Cap Value Series) | | 0.095 | |
Series C (Money Market Series) | | 0.095 | |
Series D (Global Series) | | 0.150 | |
Series E (U.S. Intermediate Bond Series) | | 0.095 | |
Series H (Enhanced Index Series) | | 0.095 | |
Series J (Mid Cap Growth Series) | | 0.095 | |
Series N (Managed Asset Allocation Series) | | 0.150 | |
Series O (All Cap Value Series) | | 0.095 | |
Series P (High Yield Series) | | 0.095 | |
Series Q (Small Cap Value Series) | | 0.095 | |
Series V (Mid Cap Value Series) | | 0.095 | |
Series X (Small Cap Growth Series) | | 0.095 | |
Series Y (Select 25 Series) | | 0.095 | |
Series Z (Alpha Opportunity Series) | | 0.150 | |
| * | The minimum annual charge for administrative fees is $25,000 for Series A, B, C, E, H, J, O, P, Q, V, X, Y and Z and $60,000 for Series D and N. |
SI is paid the following for providing transfer agent services to the Fund:
| | | |
Annual charge per account | | $ | 5.00 - $8.00 |
Transaction fee | | $ | 0.60 - $1.10 |
Minimum annual charge per series | | $ | 25,000 |
Certain out-of-pocket charges | | | Varies |
Effective August 18, 2008, the investment advisory contract for Series O and Series Z provides that the total expenses be limited to 0.85% and 1.70%, respectively, of average daily net assets, exclusive of brokerage costs, dividends on securities sold short, expenses of other investment companies in which a fund invests, interest, taxes, litigation, indemnification, and extraordinary expenses (as determined under generally accepted accounting principles). These contracts are in effect through April 30, 2010.
At December 31, 2009, Security Benefit Life Insurance Company, through their insurance company separate accounts, owned 100% of the outstanding shares of each Series of the Fund, except for Series B, Series J and Series N, in which it owns 99% of each Series, Series O, Series P, Series Q, Series V, in which it owns 98% of each Series, Series E in which it owns 96% and Series Y in which it owns 94%.
152
Notes to Financial Statements
December 31, 2009
3. Unrealized Appreciation/Depreciation
For federal income tax purposes, the amounts of unrealized appreciation (depreciation) on investments at December 31, 2009, were as follows:
| | | | | | | | | | | |
| | | Gross
unrealized
appreciation | | Gross
unrealized
depreciation | | | Net unrealized
appreciation
(depreciation) | |
Series A | | | | | | | | | | | |
(Equity) | | $ | 24,742,423 | | $ | (14,495,512 | ) | | $ | 10,246,911 | |
Series B | | | | | | | | | | | |
(Large Cap Value) | | | 39,293,781 | | | (29,408,292 | ) | | | 9,885,489 | |
Series C | | | | | | | | | | | |
(Money Market) | | | 9,441 | | | (35,950 | ) | | | (26,509 | ) |
Series D | | | | | | | | | | | |
(Global) | | | 31,111,324 | | | (3,525,286 | ) | | | 27,586,038 | |
Series E | | | | | | | | | | | |
(U.S. Intermediate Bond) | | | 2,058,096 | | | (4,109,913 | ) | | | (2,051,817 | ) |
Series H | | | | | | | | | | | |
(Enhanced Index) | | | 2,568,410 | | | (1,385,892 | ) | | | 1,182,518 | |
Series J | | | | | | | | | | | |
(Mid Cap Growth) | | | 23,094,299 | | | (1,575,319 | ) | | | 21,518,980 | |
Series N | | | | | | | | | | | |
(Managed Asset Allocation) | | | 5,483,629 | | | (3,458,189 | ) | | | 2,025,440 | |
Series O | | | | | | | | | | | |
(All Cap Value) | | | 12,094,179 | | | (20,566,892 | ) | | | (8,472,713 | ) |
Series P | | | | | | | | | | | |
(High Yield) | | | 19,439,136 | | | (13,750,170 | ) | | | 5,688,966 | |
Series Q | | | | | | | | | | | |
(Small Cap Value) | | | 29,775,393 | | | (2,389,041 | ) | | | 27,386,352 | |
Series V | | | | | | | | | | | |
(Mid Cap Value) | | | 42,384,018 | | | (32,553,184 | ) | | | 9,830,834 | |
Series X | | | | | | | | | | | |
(Small Cap Growth) | | | 7,777,932 | | | (834,256 | ) | | | 6,943,676 | |
Series Y | | | | | | | | | | | |
(Select 25) | | | 5,144,478 | | | (595,094 | ) | | | 4,549,384 | |
Series Z | | | | | | | | | | | |
(Alpha Opportunity) | | | 2,372,076 | | | (1,717,789 | ) | | | 654,287 | |
4. Investment Transactions
Investment transactions for the year ended December 31, 2009, (excluding overnight investments, short-term commercial paper and U.S. government securities) were as follows:
| | | | | | |
| | | Purchases | | Proceeds from
Sales |
Series A | | | | | | |
(Equity) | | $ | 125,422,753 | | $ | 145,634,623 |
Series B | | | | | | |
(Large Cap Value) | | | 39,004,827 | | | 64,395,143 |
Series C | | | | | | |
(Money Market) | | | — | | | — |
Series D | | | | | | |
(Global) | | | 783,386,527 | | | 826,885,607 |
Series E | | | | | | |
(U.S. Intermediate Bond) | | | 102,449,200 | | | 78,057,916 |
Series H | | | | | | |
(Enhanced Index) | | | 35,199,645 | | | 40,225,084 |
Series J | | | | | | |
(Mid Cap Growth) | | | 174,966,705 | | | 187,659,251 |
Series N | | | | | | |
(Managed Asset Allocation) | | | 32,779,443 | | | 48,753,719 |
Series O | | | | | | |
(All Cap Value) | | | 27,972,830 | | | 55,744,971 |
Series P | | | | | | |
(High Yield) | | | 72,718,332 | | | 48,849,081 |
Series Q | | | | | | |
(Small Cap Value) | | | 124,971,989 | | | 121,351,651 |
Series V | | | | | | |
(Mid Cap Value) | | | 74,738,241 | | | 119,455,000 |
Series X | | | | | | |
(Small Cap Growth) | | | 29,408,803 | | | 33,091,922 |
Series Y | | | | | | |
(Select 25) | | | 49,828,845 | | | 52,662,502 |
Series Z | | | | | | |
(Alpha Opportunity) | | | 94,412,408 | | | 99,651,513 |
153
| | |
| Notes to Financial Statements | | |
| December 31, 2009 | | |
5. Open Futures Contracts
Open futures contracts for Series H and Series Z as of December 31, 2009, were as follows:
| | | | | | | | | | | | | | | |
| | | Position | | Number of
Contracts | | Expiration
Date | | Contract
Amount | | Market
Value | | Unrealized
Gain/
(Loss) |
Series H | | | | | | | | | | | | | | | |
S&P 500 E-Mini Future | | Long | | 15 | | 03/19/2010 | | $ | 826,075 | | $ | 833,025 | | $ | 6,950 |
| | | | | | |
Series Z | | | | | | | | | | | | | | | |
S&P 500 Index Future | | Long | | 16 | | 03/19/2010 | | $ | 4,422,877 | | $ | 4,442,800 | | $ | 19,923 |
6. Affiliated Issuers
Investments representing 5% or more of the outstanding voting securities of a portfolio company of a fund result in that portfolio company being considered an affiliated company of such fund, as defined in the 1940 Act. The aggregate market value of all securities of affiliated companies held in Series V as of December 31, 2009 amounted to $12,102, which represents 0.0% of net assets. There were no affiliated companies held in any other Series. Transactions in Series V during the year ended December 31, 2009 in which the portfolio company is an “affiliated person” are as follows:
| | | | | | | | | | | | | | | | | | |
| | | Balance
12/31/08 | | Gross
Additions | | Gross
Reductions | | Balance
12/31/09 | | Realized
Gain/
(Loss) | | Investment
Income |
Hydrogen Corporation (Shares) | | | 672,346 | | | — | | | — | | | 672,346 | | | — | | | — |
Hydrogen Corporation (Cost) | | $ | 2,571,575 | | $ | — | | $ | — | | $ | 2,571,575 | | $ | — | | $ | — |
| * | As a result of Series V’s beneficial ownership of the common stock of these portfolio companies, applicable regulations require that the Series state that it may be deemed an affiliate of the respective portfolio company. The Series disclaims that the “affiliated persons” are affiliates of the Distributor, Advisor, Series or any other client of the Advisor. |
154
Notes to Financial Statements
December 31, 2009
7. Options Written
Information as to options written by the Series during the period ended December 31, 2009 and options outstanding at period end is provided below.
Series O Written Call Options Outstanding
| | | | | | | | | | |
Common Stock | | Expiration
Date | | Exercise
Price | | Number of
Contracts | | Market
Value |
Fossil, Inc. | | 03-19-10 | | $ | 35.00 | | 25 | | $ | 4,000 |
Petrohawk Energy Corporation | | 03-19-10 | | $ | 23.00 | | 478 | | | 121,890 |
| | | | | | | | | | |
Total call options outstanding (premiums received, $90,964) | | | | | | | 503 | | $ | 125,890 |
| | | | | | | | | | |
Series O Written Call Options
| | | | | | | |
| | | Number of
Contracts | | | Premium
Amount | |
Balance at December 31, 2008 | | 155 | | | $ | 45,995 | |
Opened | | 3,987 | | | | 332,508 | |
Bought Back | | (56 | ) | | | (10,248 | ) |
Exercised | | (240 | ) | | | (44,775 | ) |
Expired | | (3,343 | ) | | | (232,516 | ) |
| | | | | | | |
Balance at December 31, 2009 | | 503 | | | $ | 90,964 | |
| | | | | | | |
Series O Written Put Options Outstanding
| | | | | | | | | |
Common Stock | | Expiration
Date | | Exercise
Price | | Number of
Contracts | | Market
Value |
Quanta Services | | 01-15-10 | | 22.50 | | 331 | | $ | 51,305 |
| | | | | | | | | |
Total put options outstanding (premiums received, $53,951) | | | | | | 331 | | $ | 51,305 |
| | | | | | | | | |
Series O Written Put Options
| | | | | | | |
| | | Number of
Contracts | | | Premium
Amount | |
Balance at December 31, 2008 | | — | | | $ | — | |
Opened | | 918 | | | | 117,720 | |
Exercised | | (112 | ) | | | (13,216 | ) |
Expired | | (475 | ) | | | (50,553 | ) |
| | | | | | | |
Balance at December 31, 2009 | | 331 | | | $ | 53,951 | |
| | | | | | | |
Series Q Written Call Options Outstanding
| | | | | | | | | | |
Common Stock | | Expiration
Date | | Exercise
Price | | Number of
Contracts | | Market
Value |
Clearwater Paper Corp. | | 01-15-10 | | $ | 50.00 | | 135 | | $ | 68,850 |
Commerce Bancshares, Inc. | | 03-19-10 | | | 40.00 | | 99 | | | 10,395 |
Fossil, Inc. | | 03-19-10 | | | 35.00 | | 123 | | | 19,680 |
Petrohawk Energy Corporation | | 03-19-10 | | | 23.00 | | 277 | | | 70,635 |
Pico Holdings, Inc. | | 01-15-10 | | | 30.00 | | 301 | | | 78,260 |
| | | | | | | | | | |
Total call options outstanding (premiums received, $243,492) | | | | | | | 935 | | $ | 247,820 |
| | | | | | | | | | |
Series Q Written Call Options
| | | | | | | |
| | | Number of
Contracts | | | Premium
Amount | |
Balance at December 31, 2008 | | — | | | $ | — | |
Opened | | 4,961 | | | | 691,745 | |
Bought Back | | (66 | ) | | | (12,078 | ) |
Expired | | (2,822 | ) | | | (241,692 | ) |
Exercised | | (1,138 | ) | | | (194,483 | ) |
| | | | | | | |
Balance at December 31, 2009 | | 935 | | | $ | 243,492 | |
| | | | | | | |
Series V Written Call Options Outstanding
| | | | | | | | | | |
Common Stock | | Expiration
Date | | Exercise
Price | | Number of
Contracts | | Market
Value |
Commerce Bancshares, Inc. | | 03-19-10 | | $ | 40.00 | | 360 | | $ | 37,800 |
Fossil, Inc. | | 03-19-10 | | | 35.00 | | 281 | | | 44,960 |
Petrohawk Energy Corporation | | 03-19-10 | | | 23.00 | | 750 | | | 191,250 |
Redwood Trust, Inc. | | 01-15-10 | | | 17.50 | | 405 | | | 2,025 |
| | | | | | | | | | |
Total put options outstanding (premiums received, $309,842) | | | | | | | 1,796 | | $ | 276,035 |
| | | | | | | | | | |
Series V Written Call Options
| | | | | | | |
| | | Number of
Contracts | | | Premium
Amount | |
Balance at December 31, 2008 | | 4,228 | | | $ | 803,927 | |
Opened | | 14,760 | | | | 2,077,583 | |
Bought Back | | (130 | ) | | | (23,789 | ) |
Exercised | | (4,912 | ) | | | (1,056,036 | ) |
Expired | | (12,150 | ) | | | (1,491,843 | ) |
| | | | | | | |
Balance at December 31, 2009 | | 1,796 | | | $ | 309,842 | |
| | | | | | | |
Series V Written Put Options Outstanding
| | | | | | | | | | |
Common Stock | | Expiration
Date | | Exercise
Price | | Number of
Contracts | | Market
Value |
Bemis Company, Inc. | | 01-15-10 | | $ | 25.00 | | 244 | | $ | 1,220 |
Quanta Services, Inc. | | 01-15-10 | | | 22.50 | | 597 | | | 92,535 |
| | | | | | | | | | |
Total put options outstanding (premiums received, $131,046) | | | | | | | 841 | | $ | 93,755 |
| | | | | | | | | | |
Series V Written Put Options
| | | | | | | |
| | | Number of
Contracts | | | Premium
Amount | |
Balance at December 31, 2008 | | 3,805 | | | $ | 549,517 | |
Opened | | 5,054 | | | | 749,105 | |
Exercised | | (203 | ) | | | (23,953 | ) |
Expired | | (7,815 | ) | | | (1,143,623 | ) |
| | | | | | | |
Balance at December 31, 2009 | | 841 | | | $ | 131,046 | |
| | | | | | | |
155
Notes to Financial Statements
December 31, 2009
8. Derivative Investment Holdings Categorized by Risk Exposure
The Fund adopted FASB ASC 815, Derivatives and Hedging (ASC 815), effective December 31, 2009. ASC 815 is intended to improve financial reporting about derivative instruments by requiring enhanced disclosures to enable investors to better understand how and why the Fund uses derivative instruments, how these derivative instruments are accounted for and their effects on the Funds’ financial position and results of operations. None of the derivatives currently held by the Fund are being used as hedging instruments.
The Fund seeks to gain exposure to its respective benchmark by investing in financial-linked derivative instruments, including futures and options on equity securities. The following table represents the notional amount of derivative instruments outstanding, as an approximate percentage of the Fund’s net assets on a daily basis, while the risk to the Fund is limited to the profit earned on such derivatives:
| | | |
Fund | | Approximate percentage of Fund’s
net assets on a daily basis | |
Series H | | 1.75 | % |
Series O | | 0.11 | % |
Series Q | | 0.20 | % |
Series V | | 0.12 | % |
Series Z | | 19.63 | % |
The following is a summary of the location of derivative investments on the Fund’s Statements of Assets and Liabilities as of December 31, 2009:
Location on the Statements of Assets and Liabilities
| | | | |
Derivative Investments Type | | Asset Derivatives | | Liability Derivatives |
Futures - equity contracts | | Receivable: Variation margin | | Payable: Variation margin |
Options - equity contracts | | Investments, at value | | Outstanding options written, at value |
The following table sets forth the fair value of the Fund’s derivatives contracts by primary risk exposure as of December 31, 2009:
Asset Derivative Investments Value
| | | | | | | | | |
Fund | | Futures
Equity
Contracts* | | Options
Equity
Contracts | | Total Value at
December 31, 2009 |
Series H (Enhanced Index Series) | | $ | 6,950 | | $ | — | | $ | 6,950 |
Series Z (Alpha Opportunity Series) | | | 19,923 | | | — | | | 19,923 |
Liability Derivative Investments Value
| | | | | | | | | |
Fund | | Futures
Equity
Contracts* | | Options
Equity
Contracts | | Total Value at
December 31, 2009 |
Series O (All Cap Value Series) | | $ | — | | $ | 177,195 | | $ | 177,195 |
Series Q (Small Cap Value Series) | | | — | | | 247,820 | | | 247,820 |
Series V (Mid Cap Value Series) | | | — | | | 369,790 | | | 369,790 |
| * | Includes cumulative appreciation (depreciation) of futures contracts as reported in the Notes to Financial Statements. Only current day’s variation margin is reported within the Statement of Assets and Liabilities. |
The following is a summary of the location of derivative investments on the Fund’s Statements of Operations as of December 31, 2009:
Location on the Statements of Operations
| | |
Derivative Investments Type | | Location of Gain (Loss) on Derivatives |
Futures - equity contracts | | Net realized gain (loss) on futures contracts and change in net unrealized appreciation (depreciation) on futures contracts |
Options - equity contracts | | Net realized gain (loss) on options written and change in net unrealized appreciation (depreciation) on options written |
156
Notes to Financial Statements
December 31, 2009
The following is a summary of the Fund’s realized gain (loss) and change in unrealized appreciation (depreciation) on derivative investments recognized in the Statements of Operations categorized by primary risk exposure as of December 31, 2009:
Realized Gain (Loss) on Derivative Investments Recognized in the Statement of Operations
| | | | | | | | | |
Fund | | Futures
Equity
Contracts | | Options
Equity
Contracts | | Total Value at
December 31, 2009 |
Series A (Equity Series) | | $ | — | | $ | 7,098 | | $ | 7,098 |
Series B (Large Cap Value Series) | | | — | | | 22,775 | | | 22,775 |
Series H (Enhanced Index Series) | | | 205,203 | | | — | | | 205,203 |
Series O (All Cap Value Series) | | | — | | | 288,764 | | | 288,764 |
Series Q (Small Cap Value Series) | | | — | | | 248,403 | | | 248,403 |
Series V (Mid Cap Value Series) | | | — | | | 2,648,685 | | | 2,648,685 |
Series Z (Alpha Opportunity Series) | | | 1,187,273 | | | — | | | 1,187,273 |
Change in Unrealized Appreciation (Depreciation) on Derivative Investments
Recognized in the Statement of Operations
| | | | | | | | | | | | |
Fund | | Futures
Equity
Contracts | | | Options
Equity
Contracts | | | Total Value at
December 31, 2009 | |
Series H (Enhanced Index Series) | | $ | (11,247 | ) | | $ | — | | | $ | (11,247 | ) |
Series O (All Cap Value Series) | | | — | | | | (77,500 | ) | | | (77,500 | ) |
Series Q (Small Cap Value Series) | | | — | | | | (4,328 | ) | | | (4,238 | ) |
Series V (Mid Cap Value Series) | | | — | | | | (699,260 | ) | | | (699,260 | ) |
Series Z (Alpha Opportunity Series) | | | (52,752 | ) | | | — | | | | (52,752 | ) |
157
Notes to Financial Statements
December 31, 2009
9. Fair Value of Financial Instruments
The Fund adopted FASB ASC 820, Fair Value Measurements and Disclosure (ASC 820) effective October 1, 2008. In accordance with ASC 820, fair value is defined as the price that the Fund would receive to sell an investment or pay to transfer a liability in an orderly transaction with an independent buyer in the principal market, or in the absence of a principal market the most advantageous market for the investment or liability. ASC 820 establishes a three-tier hierarchy to distinguish between (1) inputs that reflect the assumptions market participants would use in pricing an asset or liability developed based on market data obtained from sources independent of the reporting entity (observable inputs) and (2) inputs that reflect the reporting entity’s own assumptions about the assumptions market participants would use in pricing an asset or liability developed based on the best information available in the circumstances (unobservable inputs) and to establish classification of fair value measurements for disclosure purposes. Various inputs are used in determining the value of the Fund’s investments. The inputs are summarized in the three broad levels listed below:
| | | | |
Level 1 | | - | | quoted prices in active markets for identical securities. The types of assets and liabilities carried at Level 1 fair value generally are government and agency securities, equities listed in active markets, certain futures and certain options. |
| | |
Level 2 | | - | | other significant observable inputs (including quoted prices for similar securities, interest rates, prepayment speeds, credit risk, etc.). The types of assets and liabilities carried at Level 2 fair value generally are municipal bonds, certain mortgage and asset-backed securities, certain corporate debt, commercial paper and repurchase agreements. |
| | |
Level 3 | | - | | significant unobservable inputs (including the Fund’s own assumptions in determining the fair value of investments). The types of assets and liabilities carried at Level 3 fair value generally are certain mortgage and asset-backed securities, certain corporate debt and certain derivatives. |
Observable inputs are those based on market data obtained from sources independent of the Fund, and unobservable inputs reflect the Fund’s own assumptions based on the best information available.
The inputs or methodology used for valuing securities are not necessarily an indication of the risk association with investing in those securities.
158
Notes to Financial Statements
December 31, 2009
| | | | | | | | | | | | |
Description | | Total | | LEVEL 1
Quoted prices
in active
markets for
identical assets | | LEVEL 2
Significant
other
observable
inputs | | LEVEL 3
Significant
observable
inputs |
SBL Fund: | | | | | | | | | | | | |
Series A (Equity Series) | | | | | | | | | | | | |
Common Stocks | | $ | 183,412,664 | | $ | 183,412,664 | | $ | — | | $ | — |
| | | | |
Series B (Large Cap Value Series) | | | | | | | | | | | | |
Common Stocks | | | 272,244,568 | | | 272,244,568 | | | — | | | — |
Commercial Paper | | | 3,499,991 | | | — | | | 3,499,991 | | | — |
| | | | | | | | | | | | |
Total | | | 275,744,559 | | | 272,244,568 | | | 3,499,991 | | | — |
| | | | | | | | | | | | |
| | | | |
Series C (Money Market Series) | | | | | | | | | | | | |
Asset Backed Securities | | | 480,570 | | | — | | | 480,570 | | | — |
U.S. Government Sponsored Agency Bonds & Notes | | | 78,839,665 | | | — | | | 78,839,665 | | | — |
Commercial Paper | | | 73,075,520 | | | — | | | 73,075,520 | | | — |
| | | | | | | | | | | | |
Total | | | 152,395,755 | | | — | | | 152,395,755 | | | — |
| | | | | | | | | | | | |
| | | | |
Series D (Global Series) | | | | | | | | | | | | |
Common Stocks | | | 146,573,253 | | | 146,573,253 | | | — | | | — |
Foreign Stocks | | | 120,778,605 | | | 2,753,127 | | | 118,025,478 | | | — |
Short Term Investments | | | 2,109,842 | | | — | | | 2,109,842 | | | — |
| | | | | | | | | | | | |
Total | | | 269,461,700 | | | 149,326,380 | | | 120,135,320 | | | — |
| | | | | | | | | | | | |
| | | | |
Series E (U.S. Intermediate Bond Series) | | | | | | | | | | | | |
Corporate Bond | | | 63,274,761 | | | — | | | 63,274,761 | | | — |
Preferred Stock | | | 224,706 | | | — | | | — | | | 224,706 |
Mortgage Backed Securities | | | 3,706,127 | | | — | | | 3,706,127 | | | — |
Asset Backed Securities | | | 396,870 | | | — | | | 396,870 | | | — |
U.S. Government Sponsored Agency Bonds & Notes | | | 20,459,073 | | | — | | | 20,459,073 | | | — |
U.S. Government Securities | | | 38,510,540 | | | 38,510,540 | | | — | | | — |
| | | | | | | | | | | | |
Total | | | 126,572,077 | | | 38,510,540 | | | 87,836,831 | | | 224,706 |
| | | | | | | | | | | | |
| | | | |
Series H (Enhanced Index Series) | | | | | | | | | | | | |
Common Stocks | | | 46,072,676 | | | 46,072,676 | | | — | | | — |
Preferred Stock | | | 346,010 | | | 346,010 | | | — | | | — |
U.S. Government Securities | | | 109,958 | | | 109,958 | | | — | | | — |
Futures Contracts | | | 6,950 | | | 6,950 | | | — | | | — |
| | | | | | | | | | | | |
Total | | | 46,535,594 | | | 46,535,594 | | | — | | | — |
| | | | | | | | | | | | |
| | | | |
Series J (Mid Cap Growth Series) | | | | | | | | | | | | |
Common Stocks | | | 149,361,581 | | | 149,361,581 | | | — | | | — |
Warrants | | | 795 | | | — | | | 795 | | | — |
| | | | | | | | | | | | |
Total | | | 149,362,376 | | | 149,361,581 | | | 795 | | | — |
| | | | | | | | | | | | |
159
Notes to Financial Statements
December 31, 2009
| | | | | | | | | | | | | | |
Description | | Total | | | LEVEL 1
Quoted prices
in active
markets for
identical assets | | | LEVEL 2
Significant
other
observable
inputs | | LEVEL 3
Significant
observable
inputs |
Series N (Managed Asset Allocation) | | | | | | | | | | | | | | |
Common Stocks | | $ | 40,625,113 | | | $ | 40,625,090 | | | $ | 23 | | $ | — |
Foreign Stocks | | | 9,794,021 | | | | 212,066 | | | | 9,581,955 | | | — |
Preferred Stock | | | 136,927 | | | | 136,927 | | | | — | | | — |
Warrants | | | 21 | | | | — | | | | 21 | | | |
Corporate Bond | | | 10,987,753 | | | | — | | | | 10,987,753 | | | — |
Foreign Bond | | | 121,442 | | | | — | | | | 121,442 | | | — |
Foreign Government Bond | | | 120,900 | | | | — | | | | 120,900 | | | — |
Municipal Bond | | | 371,316 | | | | — | | | | 371,316 | | | — |
Mortgage Backed Securities | | | 8,597,458 | | | | — | | | | 8,597,458 | | | — |
Asset Backed Securities | | | 1,122,455 | | | | — | | | | 1,122,455 | | | — |
U.S. Government Sponsored Agency Bonds & Notes | | | 10,661 | | | | — | | | | 10,661 | | | — |
U.S. Government Securities | | | 4,513,126 | | | | 4,513,126 | | | | — | | | — |
Short Term Investments | | | 2,363,212 | | | | — | | | | 2,363,212 | | | — |
| | | | | | | | | | | | | | |
Total | | | 78,764,405 | | | | 45,487,209 | | | | 33,277,196 | | | — |
| | | | | | | | | | | | | | |
| | | | |
Series O (All Cap Value Series) | | | | | | | | | | | | | | |
ASSETS: | | | | | | | | | | | | | | |
Common Stocks | | | 162,372,757 | | | | 162,372,757 | | | | — | | | — |
| | | | |
LIABILITIES: | | | | | | | | | | | | | | |
Written Options (net of premiums received) | | | (32,280 | ) | | | (32,280 | ) | | | — | | | — |
| | | | |
Series P (High Yield Series) | | | | | | | | | | | | | | |
Common Stocks | | | 349,767 | | | | 249,126 | | | | 264 | | | 100,377 |
Preferred Stock | | | 380,623 | | | | 380,623 | | | | — | | | — |
Warrant | | | 23,150 | | | | — | | | | — | | | 23,150 |
Convertible Bonds | | | 6,423,187 | | | | — | | | | 6,423,187 | | | — |
Corporate Bond | | | 124,883,708 | | | | — | | | | 124,225,718 | | | 657,990 |
Senior Floating Rate Interests | | | 2,794,936 | | | | — | | | | 2,794,936 | | | — |
Foreign Bond | | | 86,600 | | | | — | | | | 86,600 | | | — |
Foreign Government Bond | | | 370,456 | | | | — | | | | 370,456 | | | — |
| | | | | | | | | | | | | | |
Total | | | 135,312,427 | | | | 629,749 | | | | 133,901,161 | | | 781,517 |
| | | | | | | | | | | | | | |
| | | | |
Series Q (Small Cap Value Series) | | | | | | | | | | | | | | |
ASSETS: | | | | | | | | | | | | | | |
Common Stocks | | | 124,195,107 | | | | 124,195,107 | | | | — | | | — |
| | | | |
LIABILITIES: | | | | | | | | | | | | | | |
Written Options (net of premiums received) | | | (4,328 | ) | | | (4,328 | ) | | | — | | | — |
| | | | |
Series V (Mid Cap Value Series) | | | | | | | | | | | | | | |
ASSETS: | | | | | | | | | | | | | | |
Common Stocks | | | 287,888,725 | | | | 287,888,725 | | | | — | | | — |
Warrants | | | 820 | | | | — | | | | 820 | | | — |
Convertible Bonds | | | 2,275,000 | | | | — | | | | 2,275,000 | | | — |
| | | | | | | | | | | | | | |
Total | | | 290,164,545 | | | | 287,888,725 | | | | 2,275,820 | | | — |
| | | | | | | | | | | | | | |
| | | | |
LIABILITIES: | | | | | | | | | | | | | | |
Options (net of premiums received) | | | 71,098 | | | | 71,098 | | | | — | | | — |
| | | | |
Series X (Small Cap Growth Series) | | | | | | | | | | | | | | |
Common Stocks | | | 34,398,377 | | | | 34,398,377 | | | | — | | | — |
| | | | |
Series Y (Select 25 Series) | | | | | | | | | | | | | | |
Common Stocks | | | 39,766,548 | | | | 39,766,548 | | | | — | | | — |
160
Notes to Financial Statements
December 31, 2009
| | | | | | | | | | | | | | | |
Description | | Total | | | LEVEL 1
Quoted prices
in active
markets for
identical
assets | | | LEVEL 2
Significant
other
observable
inputs | | LEVEL 3
Significant
observable
inputs | |
Series Z (Alpha Opportunity Series) | | | | | | | | | | | | | | | |
ASSETS: | | | | | | | | | | | | | | | |
Common Stocks | | $ | 17,127,863 | | | $ | 17,127,863 | | | $ | — | | $ | — | |
Foreign Stocks | | | 416,506 | | | | — | | | | 416,506 | | | — | |
U.S. Government Sponsored Agency Bonds & Notes | | | 3,899,860 | | | | — | | | | 3,899,860 | | | — | |
Short Term Investments | | | 2,278,515 | | | | — | | | | 2,278,515 | | | — | |
Repurchase Agreement | | | 2,307,996 | | | | — | | | | 2,307,996 | | | — | |
Futures Contracts | | | 19,923 | | | | 19,923 | | | | — | | | — | |
| | | | | | | | | | | | | | | |
Total | | | 26,050,663 | | | | 17,147,786 | | | | 8,902,877 | | | — | |
| | | | | | | | | | | | | | | |
| | | | |
LIABILITIES: | | | | | | | | | | | | | | | |
Common Stocks (sold short) | | | (4,822,878 | ) | | | (895,981 | ) | | | — | | | (3,926,897 | ) |
Foreign Stocks (sold short) | | | (3,859,758 | ) | | | — | | | | — | | | (3,859,758 | ) |
| | | | | | | | | | | | | | | |
Total | | | (8,682,636 | ) | | | (895,981 | ) | | | — | | | (7,786,655 | ) |
| | | | | | | | | | | | | | | |
161
Notes to Financial Statements
December 31, 2009
Following is a reconciliation of Level 3 assets for which significant unobservable inputs were used to determine fair value for the year ended December 31, 2009:
LEVEL 3 - Fair value measurement using significant unobservable inputs
| | | | | | | | |
| | | Securities | | | Total | |
Series E (U.S. Intermediate Bond Series) | | | | | | | | |
ASSETS: | | | | | | | | |
Beginning Balance | | $ | 90,205 | | | $ | 90,205 | |
Total realized gains or losses included in earnings | | | — | | | | — | |
Total unrealized gains or losses included in earnings | | | 134,501 | | | | 134,501 | |
Purchases, sales, issuances, and settlements (net) | | | — | | | | — | |
Transfers in and/or out of Level 3 | | | — | | | | — | |
| | | | | | | | |
Ending Balance | | $ | 224,706 | | | $ | 224,706 | |
| | | | | | | | |
| | |
Series N (Managed Asset Allocation Series) | | | | | | | | |
ASSETS: | | | | | | | | |
Beginning Balance | | $ | 30,793 | | | $ | 30,793 | |
Total realized gains or losses included in earnings | | | — | | | | — | |
Total unrealized gains or losses included in earnings | | | 14,207 | | | | 14,207 | |
Purchases, sales, issuances, and settlements (net) | | | — | | | | — | |
Transfers in and/or out of Level 3 | | | (45,000 | ) | | | (45,000 | ) |
| | | | | | | | |
Ending Balance | | $ | — | | | $ | — | |
| | | | | | | | |
| | |
Series P (High Yield Series) | | | | | | | | |
ASSETS: | | | | | | | | |
Beginning Balance | | $ | 450,303 | | | $ | 450,303 | |
Total realized gains or losses included in earnings | | | — | | | | — | |
Total unrealized gains or losses included in earnings | | | (1,056,176 | ) | | | (1,056,176 | ) |
Purchases, sales, issuances, and settlements (net) | | | (35,928 | ) | | | (35,928 | ) |
Transfers in and/or out of Level 3 | | | 1,423,318 | | | | 1,423,318 | |
| | | | | | | | |
Ending Balance | | $ | 781,517 | | | $ | 781,517 | |
| | | | | | | | |
| | |
Series Z (Alpha Opportunity Series) | | | | | | | | |
LIABILITIES: | | | | | | | | |
Beginning Balance | | $ | 7,786,655 | | | $ | 7,786,655 | |
Total realized gains or losses included in earnings | | | — | | | | — | |
Total unrealized gains or losses included in earnings | | | — | | | | — | |
Purchases, sales, issuances, and settlements (net) | | | — | | | | — | |
Transfers in and/or out of Level 3 | | | — | | | | — | |
| | | | | | | | |
Ending Balance | | $ | 7,786,655 | | | $ | 7,786,655 | |
| | | | | | | | |
162
Notes to Financial Statements
December 31, 2009
10. Federal Tax Matters
Net investment income and net realized gains (losses) may differ for financial statement and tax purposes because of temporary or permanent book/tax differences. These differences are primarily due to differing book and tax amortization methods for premium and market discount, consent dividends, ordinary net operating losses, realized gain/loss on foreign currency and the expiration of capital loss carryovers. To the extent these differences are permanent differences, adjustments are made to the appropriate equity accounts in the period that the differences arise. The following adjustments were made to the Statement of Assets and Liabilities at December 31, 2009 to reflect permanent differences:
| | | | | | | | | | | | |
| | | Accumulated
Net Realized
Gain/(Loss) | | | Undistributed
Net Investment
Income | | | Paid-In-Capital | |
Series A | | $ | — | | | $ | (1,665,710 | ) | | $ | 1,665,710 | |
Series B | | | 5,057,813 | | | | (4,509,471 | ) | | | (548,342 | ) |
Series C | | | — | | | | (3,769,489 | ) | | | 3,769,489 | |
Series D | | | 961,906 | | | | (8,417,121 | ) | | | 7,455,215 | |
Series E | | | (108,274 | ) | | | (5,462,088 | ) | | | 5,570,362 | |
Series H | | | — | | | | (994,450 | ) | | | 994,450 | |
Series J | | | — | | | | 184,141 | | | | (184,141 | ) |
Series N | | | 4,662 | | | | (1,990,898 | ) | | | 1,986,236 | |
Series O | | | — | | | | (4,037,889 | ) | | | 4,037,889 | |
Series P | | | 125,946 | | | | (8,369,500 | ) | | | 8,243,554 | |
Series Q | | | (3,109,534 | ) | | | (296,168 | ) | | | 3,405,702 | |
Series V | | | (18,875,628 | ) | | | (3,755,588 | ) | | | 22,631,216 | |
Series X | | | — | | | | 94,092 | | | | (94,092 | ) |
Series Y | | | 9,340,921 | | | | (71,213 | ) | | | (9,269,708 | ) |
Series Z | | | (11,952 | ) | | | 115,718 | | | | (103,766 | ) |
163
Notes to Financial Statements
December 31, 2009
10. Federal Tax Matters (continued)
At December 31, 2009, the following Series had capital loss carryovers and deferred post-October losses to offset future realized capital gains as follows:
| | | | | | | | | | | | | | |
| | | Capital Loss
Carryover
Utilized
in 2009 | | Capital Loss
Carryovers
Expired
in 2009 | | Capital Loss
Carryovers | | Expires In | | Deferred
Post-October
Losses |
Series A | | $ | — | | $ | — | | $ | 23,906,984 | | 2016 | | $ | 3,148,561 |
| | | — | | | — | | | 29,087,804 | | 2017 | | | |
| | | | | | | | | | | | | | |
| | $ | — | | $ | — | | $ | 52,994,788 | | | | | |
| | | | | | | | | | | | | | |
| | | | | |
Series B | | $ | — | | $ | 5,057,813 | | $ | — | | 2009 | | | 2,174,233 |
| | | — | | | — | | | 87,172,720 | | 2010 | | | |
| | | — | | | — | | | 26,620,854 | | 2011 | | | |
| | | — | | | — | | | 29,474,335 | | 2016 | | | |
| | | — | | | — | | | 27,901,075 | | 2017 | | | |
| | | | | | | | | | | | | | |
| | $ | — | | $ | 5,057,813 | | $ | 171,168,984 | | | | | |
| | | | | | | | | | | | | | |
| | | | | |
Series D | | $ | — | | $ | — | | $ | 57,035,385 | | 2016 | | | 6,160 |
| | | — | | | — | | | 52,931,604 | | 2017 | | | |
| | | | | | | | | | | | | | |
| | $ | — | | $ | — | | $ | 109,966,989 | | | | | |
| | | | | | | | | | | | | | |
| | | | | |
Series E | | $ | — | | $ | — | | $ | 719,015 | | 2010 | | | — |
| | | — | | | — | | | 350,320 | | 2012 | | | |
| | | — | | | — | | | 2,731,334 | | 2014 | | | |
| | | — | | | — | | | 838,194 | | 2015 | | | |
| | | — | | | — | | | 937,378 | | 2016 | | | |
| | | — | | | — | | | 12,363,518 | | 2017 | | | |
| | | | | | | | | | | | | | |
| | $ | — | | $ | — | | $ | 17,939,759 | | | | | |
| | | | | | | | | | | | | | |
| | | | | |
Series H | | $ | — | | $ | — | | $ | 7,974,428 | | 2016 | | | 444,580 |
| | | — | | | — | | | 9,977,861 | | 2017 | | | |
| | | | | | | | | | | | | | |
| | $ | — | | $ | — | | $ | 17,952,289 | | | | | |
| | | | | | | | | | | | | | |
| | | | | |
Series J | | $ | — | | $ | — | | $ | 48,891,509 | | 2016 | | | 781,987 |
| | | — | | | — | | | 29,862,503 | | 2017 | | | |
| | | | | | | | | | | | | | |
| | $ | — | | $ | — | | $ | 78,754,012 | | | | | |
| | | | | | | | | | | | | | |
| | | | | |
Series N | | $ | — | | $ | — | | $ | 2,648,702 | | 2016 | | | 110,779 |
| | | — | | | — | | | 9,066,990 | | 2017 | | | |
| | | | | | | | | | | | | | |
| | $ | — | | $ | — | | $ | 11,715,692 | | | | | |
| | | | | | | | | | | | | | |
| | | | | |
Series O | | $ | — | | $ | — | | $ | 17,818,296 | | 2016 | | | — |
| | | — | | | — | | | 12,798,147 | | 2017 | | | |
| | | | | | | | | | | | | | |
| | $ | — | | $ | — | | $ | 30,616,443 | | | | | |
| | | | | | | | | | | | | | |
| | | | | |
Series P | | $ | 52,155 | | $ | — | | $ | 1,117,474 | | 2016 | | | 1,155,379 |
| | | | | | | | | | | | | | |
| | | | | |
Series Q | | $ | — | | $ | — | | $ | 21,648,883 | | 2017 | | | — |
| | | | | | | | | | | | | | |
| | | | | |
Series V | | $ | — | | $ | — | | $ | 27,781,912 | | 2017 | | | — |
| | | | | | | | | | | | | | |
| | | | | |
Series X | | $ | — | | $ | — | | $ | 7,184,628 | | 2010 | | | — |
| | | — | | | — | | | 11,654,235 | | 2016 | | | |
| | | — | | | — | | | 11,332,381 | | 2017 | | | |
| | | | | | | | | | | | | | |
| | $ | — | | $ | — | | $ | 30,171,244 | | | | | |
| | | | | | | | | | | | | | |
| | | | | |
Series Y | | $ | — | | $ | 9,340,921 | | $ | — | | 2009 | | | 825,101 |
| | | — | | | — | | | 9,284,391 | | 2010 | | | |
| | | — | | | — | | | 6,092,310 | | 2011 | | | |
| | | — | | | — | | | 338,147 | | 2012 | | | |
| | | — | | | — | | | 9,012,784 | | 2016 | | | |
| | | — | | | — | | | 6,370,486 | | 2017 | | | |
| | | | | | | | | | | | | | |
| | $ | — | | $ | 9,340,921 | | $ | 31,098,118 | | | | | |
| | | | | | | | | | | | | | |
| | | | | |
Series Z | | $ | — | | $ | — | | $ | 10,774,584 | | 2016 | | | — |
| | | — | | | — | | | 2,129,392 | | 2017 | | | |
| | | | | | | | | | | | | | |
| | $ | — | | $ | — | | $ | 12,903,976 | | | | | |
| | | | | | | | | | | | | | |
164
Notes to Financial Statements
December 31, 2009
10. Federal Tax Matters (continued)
The Fund declared ordinary and long-term capital gain consent dividends for the year ended December 31, 2008, as shown below.
| | | | | | |
| | | Ordinary
Consent
Dividends | | Long-term
Capital Gain
Consent
Dividends |
Series A | | $ | 1,665,710 | | $ | — |
Series B | | | 4,509,471 | | | — |
Series C | | | 4,249,459 | | | — |
Series D | | | 7,455,215 | | | — |
Series E | | | 5,570,363 | | | — |
Series H | | | 994,450 | | | — |
Series N | | | 1,986,236 | | | — |
Series O | | | 4,037,889 | | | — |
Series P | | | 8,243,554 | | | — |
Series Q | | | 684,695 | | | 2,747,162 |
Series V | | | 3,755,588 | | | 18,875,628 |
Series Y | | | 71,213 | | | — |
Short term distributions are treated as ordinary distributions for federal income tax purposes.
As of December 31, 2009, the components of distributable earnings/(deficit) on a tax basis were as follows:
| | | | | | | | | | | | | | | | | | |
| | | Undistributed
Ordinary
Income | | Undistributed
Long-term
Gain | | Accumulated
Capital and
Other Losses | | | Unrealized
Appreciation
(Depreciation)* | | | Distributable
Earnings
(Deficit)** | |
Series A | | $ | 1,140,095 | | $ | — | | $ | (56,143,349 | ) | | $ | 10,246,911 | | | $ | (44,756,343 | ) |
Series B | | | 2,616,829 | | | — | | | (173,343,216 | ) | | | 9,885,489 | | | | (160,840,898 | ) |
Series C | | | — | | | — | | | — | | | | (26,509 | ) | | | (26,509 | ) |
Series D | | | 1,919,749 | | | — | | | (109,973,149 | ) | | | 27,574,243 | | | | (80,479,157 | ) |
Series E | | | 3,803,661 | | | — | | | (17,939,759 | ) | | | (2,051,817 | ) | | | (16,187,915 | ) |
Series H | | | 681,706 | | | — | | | (18,396,869 | ) | | | 1,182,518 | | | | (16,532,645 | ) |
Series J | | | — | | | — | | | (79,535,999 | ) | | | 21,518,980 | | | | (58,017,019 | ) |
Series N | | | 1,350,482 | | | — | | | (11,826,471 | ) | | | 2,024,359 | | | | (8,451,630 | ) |
Series O | | | 1,474,436 | | | — | | | (30,616,443 | ) | | | (8,504,993 | ) | | | (37,647,000 | ) |
Series P | | | 9,769,938 | | | — | | | (2,272,853 | ) | | | 5,688,966 | | | | 13,186,051 | |
Series Q | | | — | | | — | | | (21,648,883 | ) | | | 27,382,025 | | | | 5,733,142 | |
Series V | | | 2,528,388 | | | — | | | (27,781,912 | ) | | | 9,901,932 | | | | (15,351,592 | ) |
Series X | | | — | | | — | | | (30,171,244 | ) | | | 6,943,676 | | | | (23,227,568 | ) |
Series Y | | | 126,624 | | | — | | | (31,923,219 | ) | | | 4,549,384 | | | | (27,247,211 | ) |
Series Z | | | — | | | — | | | (12,903,976 | ) | | | 510,071 | | | | (12,393,905 | ) |
| * | The difference between book basis and tax basis unrealized appreciation (depreciation) is attributable primarily to the tax deferral of losses on wash sales, the realization of unrealized gains for tax purposes on futures contracts, differing book and tax methods for bond discount/premium amortization, and passive foreign investment companies. |
| ** | The difference between total distributable earnings/(deficit) for book and tax purposes is related to the interest accrued on defaulted bonds for tax purposes. |
165
Notes to Financial Statements
December 31, 2009
11. Series Z
Series Z - Alpha Opportunity Series (“Series Z”) contracted with Lehman Brothers International Europe (“LBIE”) to provide prime brokerage services related to Series Z’s short selling. On September 15, 2008, LBIE was placed into administration and a third party administrator has been named (the “Administrator”). Series Z’s exposure to LBIE consists of short sale proceeds held by LBIE, and restricted long positions held at Series Z’s custodian, as collateral for said short sales. Series Z has delivered a Notice of Termination of Loans to LBIE and the Administrator. Series Z is working to resolve these issues with LBIE and the Administrator. As of December 31, 2009, included in the statement of net assets are the value of restricted long positions of $8,134,012, restricted cash representing the value of short sale proceeds of $4,434,795 and liabilities for short sales of $7,786,655 representing the value of securities sold short at the date of termination. Until such time as the liability for short sales is settled and all restrictions are removed, Series Z cannot sell such restricted long positions and/or utilize the restricted cash balances to achieve Series Z’s investment objectives and/or meet Series Z’s redemption or other obligations. The liability for short sales recorded at December 31, 2009 may differ from the amounts ultimately due at settlement due to the inherent uncertainties in any such estimation process, including various challenges which could be made in the bankruptcy proceedings. Such differences, if any, will be reported in future periods when additional information is provided by the Administrator and the differences may be material.
12. Other Liabilities
Series A - Equity Series (“Series A”) and Series V - Mid Cap Value Series (“Series V”) each wrote put option contracts through Lehman Brothers, Inc., (“Lehman”) that were exercised prior to the option contracts expiration and prior to the bankruptcy filing by Lehman, during September 2008. However, these transactions have not settled and the securities have not been delivered to Series A or Series V as of December 31, 2009.
Although the ultimate resolution of these transactions is uncertain, Series A and Series V have recorded a liability on their respective books equal to the difference between the strike price on the put options and the market prices of the underlying security on the exercise date. The amount of liability recorded by Series A and Series V as of December 31, 2009 was $18,615 for Series A and $205,716 for Series V. Any differences will be reported in future periods when transactions have settled.
13. Subsequent Events
Management has evaluated events or transactions that may have occurred since December 31, 2009, that would merit recognition or disclosure in the financial statements. This evaluation was completed through February 25, 2010, the date the financial statements were issued.
Effective close of business April 30, 2010, SBL Fund Series H will merge into SBL Fund Series A under a plan of reorganization. This exchange will qualify as a tax free reorganization under Section (a)(i)(c) of the Internal Revenue Code.
On February 15, 2010, Security Benefit Mutual Holding Company (“SBMHC”), the parent company of Security Benefit Corporation (“SBC”) and the ultimate parent company of Security Investors entered into a Purchase and Sale Agreement whereby Guggenheim SBC Holdings LLC (“Guggenheim Holdings”) will, subject to regulatory approval, policyholder approval and approval by the shareholders of the mutual funds sponsored by affiliates of SBMHC, purchase all of the issued and outstanding stock of SBC (the “SBC Purchase Transaction”). The SBC Purchase Transaction would result in a change of control of Security Investors whereby SBC and its subsidiaries would be wholly-owned by Guggenheim Holdings. If the SBC Purchase Transaction does not close, other than as a result of a breach by Guggenheim Holdings or for certain other reasons, then SBC will sell its asset management business to Guggenheim Holdings, which would include Security Investors and would result in a change of control of the Security Investors. The sale of SBC’s asset management business, like the SBC Purchase Transaction, would be subject to regulatory approval and approval by the shareholders of the mutual funds sponsored by affiliates of SBMHC.
166
Report of Independent Registered Public Accounting Firm
To the Contractholders and Board of Directors
SBL Fund
We have audited the accompanying statements of assets and liabilities, including the schedules of investments, of SBL Fund (comprised of Series A, B, C, D, E, H, J, N, O, P, V, X, Y and Z portfolios) (the Fund) as of December 31, 2009, and the related statements of operations for the year then ended, and the statements of changes in net assets for each of the two years in the period then ended, and the financial highlights for each of the periods indicated therein. These financial statements and financial highlights are the responsibility of the Fund’s management. Our responsibility is to express an opinion on these financial statements and financial highlights based on our audits.
We conducted our audits in accordance with the standards of the Public Company Accounting Oversight Board (United States). Those standards require that we plan and perform the audit to obtain reasonable assurance about whether the financial statements and financial highlights are free of material misstatement. We were not engaged to perform an audit of the Fund’s internal control over financial reporting. Our audits included consideration of internal control over financial reporting as a basis for designing audit procedures that are appropriate in the circumstances, but not for the purpose of expressing an opinion on the effectiveness of the Fund’s internal control over financial reporting. Accordingly, we express no such opinion. An audit also includes examining, on a test basis, evidence supporting the amounts and disclosures in the financial statements and financial highlights, assessing the accounting principles used and significant estimates made by management, and evaluating the overall financial statement presentation. Our procedures included confirmation of investments owned as of December 31, 2009, by correspondence with the custodian, agent banks and brokers or by other appropriate auditing procedures where replies from brokers were not received. We believe that our audits provide a reasonable basis for our opinion.
As more fully discussed in Note 11 to the financial statements, Series Z of the SBL Fund (“Series Z”) previously utilized the services of Lehman Brothers International (Europe) (“Lehman”) to provide prime, broker services related to Series Z’s securities sold short. On September 15, 2008, Lehman was placed into administration. The financial records of Lehman are now being handled by the administrator. Management has recorded in the financial statements its best estimate of the liability for securities sold short due to Lehman, based upon management’s assessment of all available evidence, including information supplied by the administrators. Significant uncertainly exists regarding the ultimate timing of settlement, as well as the ultimate liability for securities sold short due to Lehman, and the difference between amounts currently recorded and that which may ultimately be due may be material.
In our opinion, the financial statements and financial highlights referred to above present fairly, in all material respects, the financial position of each of the respective Series constituting the Fund at December 31, 2009, and the results of their operations for each of the year then ended, the changes in their net assets for each of the two years in the period then ended, and the financial highlights for each of the periods indicated therein, in conformity with U.S. generally accepted accounting principles.
Chicago, Illinois
February 25, 2010
167
Directors’ Disclosure
(unaudited)
Director Approval of Investment Advisory Agreement
At an in-person meeting of the Fund’s Boards of Directors held on November 9-10, 2009, called for the purpose of, among other things, voting on the renewal of the investment advisory and sub-advisory agreements applicable to the Funds, the Fund’s Board of Directors, including the Independent Directors, unanimously approved the continuation for a one year period of the investment advisory agreement between the Funds and Security Investors, LLC (“SI”), as well as each investment sub-advisory agreement applicable to the Fund. In reaching this conclusion, the Directors requested and obtained from SI and each investment sub-adviser such information as the Directors deemed reasonably necessary to evaluate the proposed renewal of the agreements. The Fund’s Board of Directors carefully evaluated this information and was advised by legal counsel with respect to its deliberations.
In considering the proposed continuation of the investment advisory and sub-advisory agreements, the Independent Directors evaluated a number of considerations, including, among others, (1) the nature, extent, and quality of the advisory services to be provided by SI and the investment sub-advisers; (2) the investment performance of the Fund, SI and the various investment sub-advisers; (3) the costs of services provided by SI and the profits derived by SI from its relationship with the Funds; (4) a comparison of each Series’ expense ratios and those of similarly situated funds; (5) benefits (such as soft dollars) to SI and its affiliates from their relationship with the funds (and any corresponding benefits to the Funds); (6) the expense limitation/fee waiver agreements between SI and certain of the funds; and (7) other factors of the Board deemed to be relevant. Each Board of Directors also took into account other considerations that it believed, in light of the legal advice furnished to the Independent Directors by their independent legal counsel and the Directors” own business judgment, to be relevant. Following its review, each Fund’s Board of Directors determined that the investment advisory agreement and each investment sub-advisory agreement applicable to the Fund (if any) will enable Fund or Series shareholders to obtain high quality services at a cost that is appropriate, reasonable and in the best interests of shareholders. Accordingly, the Directors, including the Independent Directors, unanimously approved the renewal of the investment advisory and investment sub-advisory agreements based upon the following considerations, among others:
| | • | | The nature, extent and quality of the advisory services to be provided. Each Board of Directors concluded that SI and the investment sub-advisers retained to provide portfolio management services with respect to the Fund are capable of providing high quality services to the Fund, as indicated by the nature and quality of services provided in the past, SI’s management capabilities demonstrated with respect to the Funds and other mutual funds managed by SI, the professional qualifications and experience of SI’s and the various sub-advisers’ portfolio managers, and SI’s investment ad management oversight processes. The Directors also determined that SI and the sub-advisers proposed to provide investment and related services that were of the same quality and quantity as services provided to the Funds in the past and that these services are appropriate in scope and extent in light of the Fund’s operations, the competitive landscape of the investment company business and investor needs. |
| | • | | The investment performance of the Fund or Series. With respect to the Funds, the Directors concluded on the basis of information compiled by Morningstar that SI and the investment sub-advisers had achieved investment performance that was acceptable, and competitive or superior relative to comparable funds over trailing periods. |
| | • | | The cost of advisory services provided ant he level of profitability. On the basis of each Board’s review of the fees to be charged by SI for investment advisory and other services, and the estimated profitability of SI’s relationship with each Fund or Series, each Board concluded that the level of investment advisory fees and SI’s profitability are appropriate in light of the management fees and overall expense ratios of comparable investment companies and the anticipated profitability of the relationship between each Fund or Series and SI and its affiliates. On the basis of comparative information compiled by Morningstar, the Directors determined that the advisory fees and estimated overall expense ratio of each Fund or Series are consistent with, and often below, industry medians, particularly with respect to mutual funds of comparable size. |
| | • | | Whether the advisory fees reflect economies of scale. The directors concluded that the Funds’ investment advisory fees appropriately reflect the current economic environment for SI and the competitive nature of the mutual fund market. |
| | • | | The extent to which economies of scale will be realized as the Fund grows. While the Funds’ investment advisory fees do not reduce should Fund assets grow meaningfully, the Directors determined that the investment advisory fees payable by the Funds already reflect potential future economies of |
168
Directors’ Disclosure
(unaudited)
| | scale to some extent by virtue of their competitive levels (determined with reference to industry standards as reported by Lipper and SI’s estimated profitability at current or foreseeable asset levels. The Directors also considered that they will have the opportunity to periodically reexamine whether each Fund or Series has achieved economies of scale, and the appropriateness of investment advisory fees payable to SI and fees payable by SI to the investment sub-advisers, in the future. |
| | • | | Benefits (such as soft dollars) to SI from its relationship with the Funds (and any corresponding benefits to the Funds). The Directors concluded that other benefits described by SI and the investment sub-advisers from their relationships with the Funds, including “soft dollar” benefits in connection with Funds’ brokerage transactions, are reasonable and fair, and consistent with industry practice and the best interests of the Funds and their shareholders. In addition, the Directors determined that the administration, transfer agency and fund accounting fees paid by the Fund to SI are reasonable, fair and in the best interests of Funds’ shareholders in light of the nature and quality of the services provided, the associated costs, and the necessity of the services for the Funds’ operations. |
| | • | | Other considerations: In approving the investment advisory and sub-advisory agreements the Directors determined that SI has made a substantial commitment to the recruitment and retention of high quality personnel, and maintains the financial, compliance and operational resources reasonably necessary to manage the Funds in a professional manner that is consistent with the best interests of the Funds and their shareholders. In this regard, the Directors favorably considered the compliance track record of the Funds and SI. The Directors also concluded that SI has made a significant entrepreneurial commitment to the management and success of the Funds, which entails a substantial financial and professional commitment, including investment advisory fee waivers and expense limitation arrangements with respect to the Funds to the benefit of Funds’ shareholders. |
169
Directors (unaudited)
The business address of each director and officer is One Security Benefit Place, Topeka, KS 66636-0001
| | |
Name (Date of Birth) Year Elected*** | | Principal Occupation(s) During Past 5 Years |
| Donald A. Chubb, Jr.** | | Business Broker - Griffith & Blair Realtors |
| (12-14-46) | | Director - Jayhawk Area Boy Scouts Council |
| 1994 | | |
| |
| Harry W. Craig, Jr.** | | Chairman, CEO, Secretary & Director - The Martin Tractor Company, Inc. |
| (05-11-39) | | Director - Stormont-Vail Corporation |
| 2004 | | Director - Concerned Citizens for Topeka |
| | Director - Oscar S. Stauffer Executive in Residence |
| |
| Jerry B. Farley** | | President - Washburn University |
| (09-20-46) | | President - J&J Bonanza |
| 2005 | | |
| |
| Penny A. Lumpkin** | | Partner - Vivian’s Gift Shop (Corporate Retail) |
(08-20-39) 1993 | | Vice President - Palmer Companies, Inc. (Small Business and Shopping Center Development) |
| | Vice President - PLB (Real Estate Equipment Leasing) |
| | Vice President - Town Crier (Retail) |
| | Prior to 2002: |
| | Vice President - Bellaire Shopping Center (Managing and Leasing) |
| | Partner - Goodwin Enterprises (Retail) |
| |
| Maynard F. Oliverius** | | President & Chief Executive Officer - Stormont-Vail Healthcare |
| (12-18-43) | | Director - VHA Mid-America |
| 1998 | | Director - Go Topeka |
| |
Richard M. Goldman* (03-04-61) 2008 (President, Director & Chairman of the Board) | | Senior Vice President - Security Benefit Corporation |
| | President - Security Investors, LLC |
| | Director - Security Distributors, Inc. |
| | Director - First Security Benefit Life Insurance and Annuity Company of New York |
| | President & Manager - Security Global Investors, LLC |
| | President - Security Investments Corporation |
| | Managing Member - RM Goldman Partners, LLC |
| | President & CEO - ForstmannLeff |
| | Managing Director - Head of the Americas Institutional Business, Deutsch Asset Management |
| * | This director is deemed to be an “interested person” of the Funds under the Investment Company Act of 1940, as amended, by reason of his position with the Fund’s Investment Manager and/or the parent of the Investment Manager. |
| ** | These directors serve on the Fund’s joint audit committee, the purpose of which is to meet with the independent registered public accounting firm, to review the work of the independent registered public accounting firm, and to oversee the handling by Security Investors of the accounting function for the Funds. |
| *** | Each director oversees 30 Rydex|SGI Funds portfolios and serves until the next annual meeting, or until a successor has been duly elected and qualified. |
170
Officers (unaudited)
The business address of each director and officer is One Security Benefit Place, Topeka, KS 66636-0001
| | |
Name (Date of Birth) Title - Year Elected | | Principal Occupation(s) During Past 5 Years |
Mark P. Bronzo (11-01-60) Vice President - 2008 | | Portfolio Manager, Security Investors, LLC Managing Director & Chief Compliance Officer, Nationwide Separate Accounts LLC |
| |
Christina Fletcher (07-25-72) Vice President - 2005 | | Vice President & Portfolio Manager - Security Investors, LLC |
| | Credit Analyst/Portfolio Manager - Horizon Cash Management |
| | Senior Money Market Trader - Scudder Investments |
| |
Brenda M. Harwood (11-03-63) Chief Compliance Officer - 2004 Treasurer - 1988 | | Vice President, Chief Compliance Officer & Treasurer - Security Global Investors, LLC |
| | Assistant Vice President - Security Benefit Life Insurance Company |
| | Vice President, Assistant Treasurer & Director - Security Distributors, Inc. |
| |
Amy J. Lee (06-05-61) Secretary -1987 | | Secretary - Security Investors, LLC |
| | Secretary & Chief Compliance Officer - Security Distributors, Inc. |
| | Vice President, Associate General Counsel & Assistant Secretary - Security Benefit Corporation & Security Benefit Life Insurance Company |
| | Director - Brecek & Young Advisors, Inc. |
| |
Mark Mitchell (08-24-64) Vice President - 2003 | | Vice President & Portfolio Manager - Security Investors, LLC |
| | Vice President & Portfolio Manager - Security Benefit Life Insurance Company |
| | |
| |
Joseph C. O’Connor | | Portfolio Manager, Security Investors, LLC |
(07-15-60) | | Managing Director, Nationwide Separate Accounts LLC |
Vice President - 2008 | | |
| |
Christopher Phalen (11-09-70) Vice President - 2002 | | Vice President & Head of Fixed Income - Security Global Investors, LLC |
| | Assistant Vice President & Head of Fixed Income - Security Benefit Life Insurance Company |
| | Vice President & Portfolio Manager - Security Investors, LLC |
| | Vice President & Portfolio Manager - Security Benefit Life Insurance Company |
| |
Daniel W. Portanova | | Portfolio Manager, Security Investors, LLC |
(10-02-60) | | Managing Director, Nationwide Separate Accounts LLC |
Vice President - 2008 | | |
| |
James P. Schier (12-28-57) Vice President - 1998 | | Vice President & Senior Portfolio Manager - Security Investors, LLC |
| | Vice President & Senior Portfolio Manager - Security Benefit Life Insurance Company |
| |
Christopher D. Swickard (10-09-65) Assistant Secretary - 1996 | | Assistant Secretary - Security Investors, LLC |
| | Second Vice President & Assistant General Counsel - Security Benefit Corporation & Security Benefit Life Insurance Company |
| | Assistant Secretary - Security Distributors, Inc. |
| |
David G. Toussaint (10-10-66) Vice President - 2001 | | Vice President & Portfolio Manager - Security Investors, LLC |
| | Assistant Vice President & Portfolio Manager - Security Benefit Life Insurance Company |
| * | Officers serve until the next annual meeting or until a successor has been duly elected and qualified. |
171
Rydex | SGI Privacy Policies
Rydex Funds, Rydex | SGI Funds, Rydex Investments, Rydex Distributors, Inc., Security Investors, LLC, Security Global Investors, LLC, Security Distributors, Inc. and Rydex Advisory Services (Collectively “Rydex”)
Our Commitment to You
When you become a Rydex | SGI investor, you entrust us with not only your hard-earned money but also with personal and financial information about you. We recognize that your relationship with us is based on trust and that you expect us to act responsibly and in your best interests. Because we have access to this private information about you, we hold ourselves to the highest standards in its safekeeping and use. This means, most importantly, that we do not sell client information to anyone—whether it is your personal information or if you are a current or former Rydex | SGI client.
The Information We Collect About You
In the course of doing business with shareholders and investors, we collect nonpublic personal information about you. You typically provide personal information when you complete a Rydex | SGI account application or when you request a transaction that involves Rydex and Rydex | SGI funds or one of the Rydex | SGI affiliated companies. “Nonpublic personal information” is personally identifiable private information about you. For example, it includes information regarding your name and address, Social Security or taxpayer identification number, assets, income, account balance, bank account information and investment activity (e.g., purchase and redemption history).
How We Handle Your Personal Information
As emphasized above, we do not sell information about current or former clients or their accounts to third parties. Nor do we share such information, except when necessary to complete transactions at your request or to make you aware of related investment products and services that we offer. Additional details about how we handle your personal information are provided below. To complete certain transactions or account changes that you direct, it may be necessary to provide identifying information to companies, individuals or groups that are not affiliated with Rydex | SGI. For example, if you ask to transfer assets from another financial institution to Rydex | SGI, we will need to provide certain information about you to that company to complete the transaction. To alert you to other Rydex | SGI investment products and services, we may share your information within the Rydex | SGI family of affiliated companies. This would include, for example, sharing your information within Rydex | SGI so we can make you aware of new Rydex and Rydex | SGI funds or the services offered through another Rydex | SGI affiliated company. In certain instances, we may contract with nonaffiliated companies to perform services for us. Where necessary, we will disclose information we have about you to these third parties. In all such cases, we provide the third party with only the information necessary to carry out its assigned responsibilities and only for that purpose. And we require these third parties to treat your private information with the same high degree of confidentiality that we do. In certain instances, we may share information with other financial institutions regarding individuals and entities in response to the U.S.A. Patriot Act. Finally, we will release information about you if you direct us to do so, if we are compelled by law to do so or in other circumstances permitted by law.
Opt Out Provisions
We do not sell your personal information to anyone. The law allows you to “opt out” of only certain kinds of information sharing with third parties. The firm does not share personal information about you with any third parties that triggers this opt-out right. This means YOU ARE ALREADY OPTED OUT.
How We Protect Privacy Online
Our concern for the privacy of our shareholders also extends to those who use our web site, www.rydex-sgi.com. Our web site uses some of the most secure forms of online communication available, including encryption technology, Secure Socket Layer (SSL) protocol, firewalls and user names and passwords. These technologies provide a high level of security and privacy when you access your account information or initiate online transactions. The Rydex | SGI web site offers customized features that require our use of “http cookies”—tiny pieces of information that we ask your browser to store. However, we make very limited use of these cookies. We only use cookies for session management and security features on the Rydex | SGI web site. We do not use them to pull data from your hard drive, to learn your
172
Rydex | SGI Privacy Policies (continued)
email address, or to view data in cookies created by other web sites. We will not share the information in our cookies or give others access to it. See the legal information area on our web site for more details about web site security and privacy features.
How We Safeguard Your Personal Information
We restrict access to nonpublic personal information about shareholders to our employees and in some cases to third parties (for example, the service providers described above) as permitted by law. We maintain strict physical, electronic and procedural safeguards that comply with federal standards to guard your nonpublic personal information.
We’ll Keep You Informed
As required by federal law, we will notify shareholders of our privacy policy annually. We reserve the right to modify this policy at any time, but rest assured that if we do change it, we will tell you promptly. You will also be able to access our privacy policy from our web site at www.rydex-sgi.com. Should you have any questions regarding our privacy policy, contact us at 800.820.0888 or 301.296.5100.
173
Other Information
The Fund files a complete schedule of portfolio holdings with the U.S. Securities and Exchange Commission for the first and third quarters of each fiscal year on Form N-Q. The Forms N-Q of each such Fund are available on the Commission’s website at www.sec.gov. The Forms N-Q may be reviewed and copied at the Commission’s Public Reference Room in Washington, DC. Information on the operation of the Public Reference Room may be obtained by calling 1-800-SEC-0330. The portfolio holdings of the Fund are available on their website, www.securitybenefit.com and www.rydex-sgi.com or by calling 1-800-888-2461.
A description of the policies and procedures that the Fund uses to determine how to vote proxies relating to portfolio securities is available upon request, free of charge by calling 1-800-888-2461, or accessing the U.S. Securities and Exchange Commission website at www.sec.gov. Information regarding how the Funds voted proxies relating to portfolio securities during the 12 month period ended June 30, 2009 is available upon request, free of charge by calling 1-800-888-2461, or accessing the U.S. Securities and Exchange Commission website at www.sec.gov.
The statement of additional information (“SAI”) includes additional information about the Funds’ Directors and is available upon request without charge by calling 1-800-888-2461.
174
This page left blank intentionally.
175
This page left blank intentionally.
176

One Security Benefit Place • Topeka, Kansas 66636-0001 • securitybenefit.com
Security Distributors, Inc.
SDI 425
The Registrant has adopted a code of ethics that applies to its principal executive officer and principal financial officer. A copy of the Registrant’s code of ethics is filed herewith as Exhibit 10(a)(1). No amendments were made to the provisions of the code of ethics during the period covered by this report. No implicit or explicit waivers to the provisions of the code of ethics were granted during the period covered by this report. The Registrant hereby undertakes to provide any person without charge, upon request, a copy of its Code by calling the Registrant at 1-800-888-2461.
| Item 3. | Audit Committee Financial Expert. |
The Registrant’s Board of Directors has determined that Maynard Oliverius, a member of the Audit Committee of the Board, is an audit committee financial expert. Mr. Oliverius is “independent” for purposes of this item.
| Item 4. | Principal Accountant Fees and Services. |
| (a) | Audit Fees. The aggregate fees billed for each of the last two fiscal years (the “Reporting Periods”) for professional services rendered by the Registrant’s principal accountant (the “Auditor”) for the audit of the Registrant’s annual financial statements, or services that are normally provided by the Auditor in connection with the statutory and regulatory filings or engagements for the Reporting Periods, were $333,700 in 2008 and $309,850 in 2009. |
| (b) | Audit-Related Fees. The aggregate fees billed in the Reporting Periods for assurance and related services by the Auditor that are reasonably related to the performance of the audit of the Registrant’s financial statements and are not reported under paragraph (a) of this Item 4 were $5,900 in 2008 and $5,400 in 2009. These services consisted of financial reporting advisory services. |
The aggregate fees billed in the Reporting Periods for assurance and related services by the Auditor to the Registrant’s investment adviser (not including any sub-investment adviser whose role is primarily portfolio management and is subcontracted with or overseen by another investment adviser), and any entity controlling, controlled by or under common control with the investment adviser that provides ongoing services to the Registrant (“Service Affiliates”) which required pre-approval by the Audit Committee were $9,250 in 2008 and $9,250 in 2009, which related to the review of the transfer agent function.
| (c) | Tax Fees. The aggregate fees billed to the Registrant in the Reporting Periods for professional services rendered by the Auditor for tax compliance, tax advice and tax planning (“Tax Services”) were $51,600 in 2008 and $64,500 in 2009. These services consisted of (i) preparation of U.S. federal, state and excise tax returns; (ii) U.S. federal and state tax planning, advice and assistance regarding statutory, regulatory or administrative developments, (iii) tax advice regarding tax qualification matters and/or treatment of various financial instruments held or proposed to be acquired and (iv) review of U.S. federal excise distribution calculations. |
The aggregate fees billed in the Reporting Periods for Tax Services by the Auditor to Service Affiliates which required pre-approval by the Audit Committee were $0 in 2008 and $0 in 2009.
| (d) | All Other Fees. The aggregate fees billed to the Registrant in the Reporting Periods for products and services provided by the Auditor, other than the services reported in paragraphs (a) through (c) of this Item, were $0 in 2008 and $0 in 2009. |
The aggregate fees billed in the Reporting Periods for Non-Audit Services by the Auditor to Service Affiliates, other than the services reported in paragraphs (b) through (d) of this Item, which required pre-approval by the Audit Committee were $0 in 2008 and $0 in 2009.
| | | | |
(e) | | (1) | | Audit Committee Pre-Approval Policies and Procedures. The Registrant’s Audit Committee has established policies and procedures for pre-approval of the auditor’s engagements for audit and non-audit services to the Registrant. Pre-approval considerations include whether the proposed services are compatible with maintaining the auditor’s independence as specified in applicable rules. |
| | |
(e) | | (2) | | Percentage of Non-Audit Services Approved under (c)(7)(i)(C). The percentage of the services described in each of (b) through (d) of this Item 4 (only those that relate to the Registrant) that were approved by the Audit Committee pursuant to paragraph (c)(7)(i)(C) of Rule 2-01 of Regulation S-X was 0%, 0% and 0%, respectively. |
| (g) | Non-Audit Fees. The aggregate non-audit fees were for audit-related and tax services rendered to the Registrant, and rendered to Service Affiliates, for the Reporting Periods were $66,750 in 2008 and $79,150 in 2009. |
| (h) | Auditor Independence. The Registrant’s Audit Committee was provided with information relating to the provision of non-audit services by Ernst & Young LLP to the Registrant (and its affiliates) that were not pre-approved by the Audit Committee so that a determination could be made whether the provision of such services is compatible with maintaining Ernst & Young LLP’s independence. |
| Item 5. | Audit Committee of Listed Registrants. |
Not applicable.
| Item 6. | Schedule of Investments. |
The Schedule of Investments is included under Item 1 of this form.
| Item 7. | Disclosure of Proxy Voting Policies and Procedures for Closed-End Management Investment Companies. |
Not applicable.
| Item 8. | Portfolio Managers of Closed-End Management Investment Companies. |
Not applicable.
| Item 9. | Purchases of Equity Securities by Closed-End Management Investment Company and Affiliated Purchasers. |
Not applicable.
| Item 10. | Submission of Matters to a Vote of Security Holders. |
The registrant does not currently have in place procedures by which shareholders may recommend nominees to the registrant’s board.
There have been no changes to the procedures by which shareholders may recommend nominees to the registrant’s board.
| Item 11. | Controls and Procedures. |
| (a) | The registrant’s President and Treasurer have concluded that the registrant’s disclosure controls and procedures (as defined in rule 30a-3(c) under the Investment Company Act of 1940) are effective based on their evaluation of these disclosure controls and procedures within 90 days of the filing date of this report on Form N-CSR. |
| (b) | There were no significant changes in the registrant’s internal controls, or in other factors that could significantly affect these controls subsequent to the date of their evaluation, including any corrective actions with regard to significant deficiencies and material weaknesses. |
| | | | |
(a) | | (1) | | Code of Ethics pursuant to Item 2 above. |
| | |
| | (2) | | Certifications pursuant to Section 302 of the Sarbanes-Oxley Act of 2002 and required by Rule 30a-2(a) under the Investment Company Act of 1940, are attached hereto. |
| (b) | Certifications pursuant to Section 906 of the Sarbanes-Oxley Act of 2002 and required by Rule 30a-2(a) under the Investment Company Act of 1940, are attached hereto. |
SIGNATURES
Pursuant to the requirements of the Securities Exchange Act of 1934 and the Investment Company Act of 1940, the registrant has duly caused this report to be signed on its behalf by the undersigned, thereunto duly authorized.
| | |
SBL FUND |
| |
By: | | /s/ RICHARD M. GOLDMAN |
| | Richard M. Goldman, President |
| |
Date: | | March 10, 2010 |
Pursuant to the requirements of the Securities Exchange Act of 1934 and the Investment Company Act of 1940, this report has been signed below by the following persons on behalf of the registrant and in the capacities and on the dates indicated.
| | |
By: | | /s/ RICHARD M. GOLDMAN |
| | Richard M. Goldman, President |
| |
Date: | | March 10, 2010 |
| |
By: | | BRENDA M. HARWOOD |
| | Brenda M. Harwood, Treasurer |
| |
Date: | | March 10, 2010 |