Table of Contents
UNITED STATES
SECURITIES AND EXCHANGE COMMISSION
Washington, D.C. 20549
FORM N-CSR
CERTIFIED SHAREHOLDER REPORT OF REGISTERED
MANAGEMENT INVESTMENT COMPANIES
Investment Company Act file number | 811-02753 |
SBL FUND
| (Exact name of registrant as specified in charter) | ||||
| ONE SECURITY BENEFIT PLACE, TOPEKA, KANSAS | 66636-0001 | |
| (Address of principal executive offices) | (Zip code) |
RICHARD M. GOLDMAN, PRESIDENT
SBL FUND
ONE SECURITY BENEFIT PLACE
TOPEKA, KANSAS 66636-0001
| (Name and address of agent for service) |
Registrant’s telephone number, including area code: (785) 438-3000
Date of fiscal year end: December 31
Date of reporting period: December 31, 2008
Form N-CSR is to be used by management investment companies to file reports with the Commission not later than 10 days after the transmission to stockholders of any report that is required to be transmitted to stockholders under Rule 30e-1 under the Investment Company Act of 1940 (17 CFR 270.30e-1). The Commission may use the information provided on Form N-CSR in its regulatory, disclosure review, inspection, and policymaking roles.
A registrant is required to disclose the information specified by Form N-CSR, and the Commission will make this information public. A registrant is not required to respond to the collection of information contained in Form N-CSR unless the Form displays a currently valid Office of Management and Budget (“OMB”) control number. Please direct comments concerning the accuracy of the information collection burden estimate and any suggestions for reducing the burden to Secretary, Securities and Exchange Commission, 450 Fifth Street, NW, Washington, DC 20549-0609. The OMB has reviewed this collection of information under the clearance requirements of 44 U.S.C. §3507.
Table of Contents
| Item 1. | Reports to Stockholders. |
Table of Contents
Table of Contents
SBL Fund
December 31, 2008
Annual Report
| 2 | ||
| 11 | ||
| 19 | ||
| 28 | ||
| 38 | ||
| 49 | ||
| 60 | ||
| 69 | ||
| 95 | ||
| 104 | ||
| 117 | ||
| 127 | ||
| 137 | ||
| 145 | ||
| 152 | ||
| 165 | ||
| 179 | ||
| 180 | ||
| 182 | ||
| 183 | ||
Security Global Investors refers to the asset management arm of Security Benefit Corporation (“Security Benefit”) that consists of Security Investors, LLC, and for global investing, Security Global Investors, LLC. Security Distributors, Inc., Security Investors, LLC and Security Global Investors, LLC are subsidiaries of Security Benefit.
1
Table of Contents
| Manager’s Commentary | Series A | |
February 16, 2009 | (Equity Series) |
 |  |  | ||||
Mark P. Bronzo Portfolio Manager | Mark A. Mitchell Portfolio Manager | |||||
To Our Shareholders:
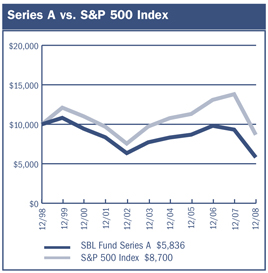
Series A of the SBL Fund – Equity Series returned –37.40% during the year, in line with the benchmark S&P 500 Index’s return of –37.00% and the Series’ peer group median return of –37.40%.
The Series’ strategy uses a blended approach, investing in growth and value stocks. Growth oriented stocks are securities of established companies that typically have a record of consistent earnings growth greater than the overall market. Value oriented stocks are securities of companies that are believed to be trading well below their intrinsic value.
Our strategy is to buy companies that are trading at a significant discount to their intrinsic value. Our investment approach is a defined and disciplined process of three clear philosophical tenets that drive our investment decisions: a valuation focus, a long-term perspective and an opportunistic approach.
This investment process is fundamentally driven and quantitatively aided. We use proprietary screens to identify potential companies for investment and then perform rigorous fundamental analysis to identify the best ideas. Through this fundamental research, we determine an estimate of intrinsic value and thus a valuation target for each idea. We construct the portfolios based on the level of conviction generated by this bottom-up analysis and the upside/downside profile associated with each company.
Financials and Consumer Discretionary Top Performers
With all sectors of the markets producing negative returns in 2008, top performing sectors for the portfolio were due to better stock selection in the portfolio or a lower exposure to the sector relative to the benchmark. The Series’ financials sector, while down –53% in the hardest hit sector of the markets, helped relative performance when compared to the –55% drop for the benchmark. Additionally, the portfolio was slightly underweight the sector against the Index. Wells Fargo & Company actually produced a positive gain during the period. Other significant holdings included JPMorgan Chase & Company and Capital One Financial Corporation, which lost only 25% and 30%, respectively.
The consumer discretionary sector was able to contribute to the Series on a relative basis, with holdings dropping –24% versus a –33% decline for the benchmark. McDonald’s Corporation gained nearly 9% over the period. Lowe’s Companies, Inc., and Home Depot, Inc. were able to hold losses to –11 and –15%, respectively.
Industrials and Energy Disappoint
The largest detractor for the Series was the industrials sector, down –48% versus –40% for the benchmark. The sector was a significant overweight for the portfolio. Our largest holding was General Electric Company, which lost –54% during the year. USG Corporation declined –78% and McDermott International, Inc. dropped –83% over the period.
While an underweight position, the energy sector pulled down performance due to stock selection. Overall, the sector was down –46% for the portfolio compared to a –35% for the benchmark. A couple of the portfolio’s largest holdings in the sector, Transocean, Ltd. and Williams Companies, Inc., lost –67% and –59%, respectively. Nabors Industries, Ltd. dropped by –71%.
Market Outlook
Our bottom-up approach looks at market uncertainty in the context of the potential long-term impact on individual companies. It is in times as these when our core philosophy and disciplined process becomes paramount. We continue to use a rigorous fundamental research process to identify strong companies from a risk perspective. We are setting the groundwork to be in a position to take advantage of opportunities that arise as companies contract
2
Table of Contents
| Manager’s Commentary | Series A | |
February 16, 2009 | (Equity Series) |
across all sectors due to not earning their cost of capital, which will improve the competitive position of the companies that can survive. Our focus is on identifying companies with the ability to be substantially better over the next three to five years or have the potential to maintain their return on capital at current levels in a difficult economic environment. We are confident in our ability to find these companies.
We believe that investing is a long-term pursuit that requires patience and a consistent approach. We recognize there are many investment fund alternatives available today and thank you for the confidence you place in us.
Sincerely,
Mark P. Bronzo, Portfolio Manager
Mark A. Mitchell, Portfolio Manager
3
Table of Contents
| Series A | ||
| Performance Summary | (Equity Series) | |
| December 31, 2008 | (unaudited) |
PERFORMANCE
$10,000 Over 10 Years
The chart above assumes a hypothetical $10,000 investment in Series A (Equity Series) on December 31, 1998 and reflects the fees and expenses of Series A. The S&P 500 Index is a capitalization-weighted index composed of 500 selected common stocks that represent the broad domestic economy and is a widely recognized unmanaged index of market performance.
Average Annual Returns
Periods Ended 12-31-081 | 1 Year | 5 Years | 10 Years | ||||||
Series A | (37.40 | )% | (5.44 | )% | (5.24 | )% |
1 | Performance figures do not reflect fees and expenses associated with an investment in variable insurance products offered by Security Benefit Life Insurance Company. If returns had taken into account these fees and expenses, performance would have been lower. Shares of a Series of SBL Fund are available only through the purchase of such products. |
The performance data quoted above represents past performance. Past performance is not predictive of future performance. The investment return and principal value of an investment will fluctuate so that an investor’s shares, when redeemed, may be worth more or less than their original cost.
Portfolio Composition by Sector
Consumer Discretionary | 10.68 | % | |
Consumer Staples | 12.59 | ||
Energy | 8.85 | ||
Financials | 11.13 | ||
Health Care | 14.56 | ||
Industrials | 16.36 | ||
Information Technology | 15.20 | ||
Materials | 6.18 | ||
Telecommunication Services | 0.55 | ||
Utilities | 1.68 | ||
Cash & Other Assets, Less Liabilities | 2.22 | ||
Total Net Assets | 100.00 | % | |
The accompanying notes are an integral part of the financial statements
4
Table of Contents
| Series A | ||
| Performance Summary | (Equity Series) | |
| December 31, 2008 | (unaudited) |
Information About Your Series Expenses
Calculating your ongoing Series expenses
Example
As a shareholder of the Series, you incur ongoing costs, including management fees and other series expenses. Performance figures and expense ratios do not reflect fees and expenses associated with an investment in variable insurance products. Shares of a Series of SBL Fund are available only through the purchase of such products. This example is intended to help you understand your ongoing costs (in dollars) of investing in the Series and to compare these costs with ongoing costs of investing in other mutual funds. The example is based on an investment of $1,000 invested at the beginning of the period and held for the entire period, July 1, 2008 through December 31, 2008.
Actual Expenses
The first line in the table provides information about actual account values and actual expenses. You may use the information in this table, together with the amount you invested, to estimate the expenses that you paid over the period. Simply divide your account value by $1,000 (for example, an $8,600 account value divided by $1,000 = 8.6), then multiply the result by the number in the table under the heading entitled “Expenses Paid During the Period” to estimate the expenses you paid on your account during this period.
Hypothetical Example for Comparison Purposes
The second line in the table provides information about hypothetical account values and hypothetical expenses based on the Series actual expense ratio and an assumed rate of return of 5% per year before expenses, which is not the Series actual return. The hypothetical account values and expenses may not be used to estimate the actual ending account balance or expenses you paid for the period. You may use this information to compare the ongoing costs of investing in the Series and other funds. To do so, compare this 5% hypothetical example with the 5% hypothetical examples that appear in the shareholder reports of the other mutual funds.
Please note that the expenses shown in the table are meant to highlight your ongoing costs only and do not reflect any fees and expenses associated with an investment in variable insurance products. Therefore, the second line is useful in comparing ongoing costs only, and will not help you determine the relative total costs of owning different funds. In addition, if these fees and expenses associated with an investment in variable insurance products were included, your costs would have been higher.
Series Expenses
| Beginning Account Value 7/1/2008 | Ending Account Value 12/31/20081 | Expenses Paid During Period2 | |||||||
Series A (Equity Series) | |||||||||
Actual | $ | 1,000.00 | $ | 684.47 | $ | 3.90 | |||
Hypothetical | 1,000.00 | 1,020.51 | 4.67 | ||||||
1 | The actual ending account value is based on the actual total return of the Series for the period July 1, 2008 to December 31, 2008 after actual expenses and will differ from the hypothetical ending account value which is based on the Series expense ratio and a hypothetical annual return of 5% before expenses. The actual cumulative return at net asset value for the period July 1, 2008 to December 31, 2008 was (31.55%). |
2 | Expenses are equal to the Series annualized expense ratio of 0.92%, net of any applicable fee waivers, multiplied by the average account value over the period, multiplied by 184/366 (to reflect the one-half year period). |
5
Table of Contents
| Schedule of Investments | Series A | |
| December 31, 2008 | (Equity Series) |
| Shares | Value | ||||
COMMON STOCKS—97.8% | |||||
Aerospace & Defense—3.0% | |||||
Honeywell International, Inc. | 78,565 | $ | 2,579,289 | ||
United Technologies Corporation | 48,100 | 2,578,160 | |||
| 5,157,449 | |||||
Air Freight & Logistics—2.0% | |||||
FedEx Corporation | 51,300 | 3,290,895 | |||
Apparel, Accessories & Luxury Goods—1.3% | |||||
Coach, Inc.* | 107,200 | 2,226,544 | |||
Asset Management & Custody Banks—1.8% | |||||
Bank of New York Mellon Corporation | 102,405 | 2,901,134 | |||
Biotechnology—3.8% | |||||
Celgene Corporation* | 47,245 | 2,611,704 | |||
Gilead Sciences, Inc.* | 72,265 | 3,695,632 | |||
| 6,307,336 | |||||
Broadcasting—0.2% | |||||
CBS Corporation | 49,700 | 409,528 | |||
Building Products—0.8% | |||||
USG Corporation* | 161,000 | 1,294,440 | |||
Cable & Satellite—1.7% | |||||
Comcast Corporation | 169,800 | 2,866,224 | |||
Communications Equipment—3.5% | |||||
Cisco Systems, Inc.* | 148,390 | 2,418,757 | |||
Qualcomm, Inc. | 89,965 | 3,223,446 | |||
| 5,642,203 | |||||
Computer Hardware—5.3% | |||||
Apple, Inc.* | 37,360 | 3,188,676 | |||
Hewlett-Packard Company | 150,770 | 5,471,443 | |||
| 8,660,119 | |||||
Construction Materials—0.9% | |||||
Vulcan Materials Company | 20,300 | 1,412,474 | |||
Consumer Finance—1.0% | |||||
Capital One Financial Corporation | 38,900 | 1,240,521 | |||
First Marblehead Corporation* | 265,730 | 342,792 | |||
| 1,583,313 | |||||
Data Processing & Outsourced Services—2.0% | |||||
Western Union Company | 231,100 | 3,313,974 | |||
Department Stores—1.0% | |||||
JC Penney Company, Inc. | 83,900 | 1,652,830 | |||
Diversified Banks—1.6% | |||||
U.S. Bancorp | 20,000 | 500,200 | |||
Wells Fargo & Company | 72,900 | 2,149,092 | |||
| 2,649,292 | |||||
Diversified Chemicals—0.5% | |||||
Dow Chemical Company | 52,500 | 792,225 | |||
Drug Retail—3.2% | |||||
CVS Caremark Corporation | 185,700 | 5,337,018 | |||
| 5,337,018 | |||||
Electric Utilities—1.7% | |||||
Edison International | 86,300 | 2,771,956 | |||
Electrical Components & Equipment—2.4% | |||||
Emerson Electric Company | 106,470 | 3,897,867 | |||
Electronic Manufacturing Services—0.8% | |||||
Tyco Electronics, Ltd. | 85,200 | 1,381,092 | |||
Fertilizers & Agricultural Chemicals—2.8% | |||||
Monsanto Company | 34,295 | 2,412,653 | |||
Mosaic Company | 61,650 | 2,133,090 | |||
| 4,545,743 | |||||
Health Care Equipment—1.7% | |||||
Covidien, Ltd. | 35,900 | 1,301,016 | |||
Hospira, Inc.* | 55,900 | 1,499,238 | |||
| 2,800,254 | |||||
Health Care Services—1.2% | |||||
Medco Health Solutions, Inc.* | 47,400 | 1,986,534 | |||
Home Improvement Retail—3.4% | |||||
Lowe’s Companies, Inc. | 252,390 | 5,431,433 | |||
| 5,431,433 | |||||
Household Products—1.1% | |||||
Colgate-Palmolive Company | 25,445 | 1,744,000 | |||
Hypermarkets & Super Centers—5.4% | |||||
Costco Wholesale Corporation | 45,100 | 2,367,750 | |||
Wal-Mart Stores, Inc. | 116,860 | 6,551,172 | |||
| 8,918,922 | |||||
Industrial Conglomerates—2.2% | |||||
General Electric Company | 143,400 | 2,323,080 | |||
McDermott International, Inc. 1,* | 125,500 | 1,239,940 | |||
| 3,563,020 | |||||
Industrial Gases—1.3% | |||||
Air Products & Chemicals, Inc. | 44,310 | 2,227,464 | |||
Industrial Machinery—0.9% | |||||
Parker Hannifin Corporation | 34,100 | 1,450,614 | |||
Insurance Brokers—0.6% | |||||
AON Corporation | 20,700 | 945,576 | |||
Integrated Oil & Gas—4.3% | |||||
Chevron Corporation | 31,700 | 2,344,849 | |||
ConocoPhillips | 15,200 | 787,360 | |||
Exxon Mobil Corporation | 48,400 | 3,863,772 | |||
| 6,995,981 | |||||
Integrated Telecommunication Services—0.5% | |||||
Windstream Corporation | 98,200 | 903,440 | |||
Internet Software & Services—2.0% | |||||
Google, Inc.* | 10,985 | 3,379,535 | |||
The accompanying notes are an integral part of the financial statements
6
Table of Contents
| Schedule of Investments | Series A | |
| December 31, 2008 | (Equity Series) |
| Shares | Value | ||||
COMMON STOCKS—97.8% (continued) | |||||
Life & Health Insurance—0.9% | |||||
MetLife, Inc. | 40,300 | $ | 1,404,858 | ||
Life Sciences Tools & Services—1.7% | |||||
Thermo Fisher Scientific, Inc.* | 84,305 | 2,872,271 | |||
Managed Health Care—0.7% | |||||
Aetna, Inc. | 39,300 | 1,120,050 | |||
Movies & Entertainment—1.2% | |||||
Time Warner, Inc. | 196,200 | 1,973,772 | |||
Oil & Gas Drilling—2.3% | |||||
Nabors Industries, Ltd.* | 132,680 | 1,588,180 | |||
Transocean, Ltd.* | 46,700 | 2,206,575 | |||
| 3,794,755 | |||||
Oil & Gas Equipment & Services—0.8% | |||||
Halliburton Company | 74,200 | 1,348,956 | |||
Oil & Gas Exploration & Production—0.6% | |||||
Chesapeake Energy Corporation | 64,200 | 1,038,114 | |||
Oil & Gas Storage & Transportation—0.9% | |||||
Williams Companies, Inc. | 99,500 | 1,440,760 | |||
Other Diversified Financial Services—2.8% | |||||
JPMorgan Chase & Company | 153,600 | 4,843,007 | |||
| 4,843,007 | |||||
Packaged Foods & Meats—1.6% | |||||
General Mills, Inc. | 44,365 | 2,695,174 | |||
Pharmaceuticals—5.5% | |||||
Johnson & Johnson | 43,385 | 2,595,725 | |||
Schering-Plough Corporation | 162,100 | 2,760,563 | |||
Teva Pharmaceutical Industries, Ltd. ADR | 84,555 | 3,599,506 | |||
| 8,955,794 | |||||
Property & Casualty Insurance—2.4% | |||||
Berkshire Hathaway, Inc.* | 42 | 4,057,200 | |||
Railroads—4.0% | |||||
Burlington Northern Santa Fe Corporation | 49,345 | 3,735,909 | |||
Union Pacific Corporation | 62,100 | 2,968,380 | |||
| 6,704,289 | |||||
Research & Consulting Services—1.0% | |||||
Equifax, Inc. | 62,600 | 1,660,152 | |||
Restaurants—1.9% | |||||
McDonald’s Corporation | 49,320 | 3,067,211 | |||
Specialty Chemicals—0.7% | |||||
Rohm & Haas Company | 19,700 | 1,217,263 | |||
Systems Software—1.6% | |||||
Oracle Corporation* | 153,285 | 2,717,743 | |||
Tobacco—1.3% | |||||
Altria Group, Inc. | 50,500 | 760,530 | |||
Philip Morris International, Inc. | 30,500 | 1,327,055 | |||
| 2,087,585 | |||||
TOTAL COMMON STOCKS (cost $220,653,638) | $ | 161,439,383 | |||
Total Investments—97.8% (cost $220,653,638) | $ | 161,439,383 | |||
Cash & Other Assets, Less Liabilities—2.2% | 3,669,501 | ||||
Total Net Assets—100.0% | $ | 165,108,884 | |||
For federal income tax purposes the identified cost of investments owned at December 31, 2008 was $222,343,747.
| * | Non-income producing security |
1 | Portion of security is delayed in delivery due to executing broker’s bankruptcy declaration. |
The accompanying notes are an integral part of the financial statements
7
Table of Contents
Series A
(Equity Series)
Statement of Assets and Liabilities
December 31, 2008
Assets: | ||||
Investments, at value* | $ | 161,439,383 | ||
Cash | 2,332,952 | |||
Receivables: | ||||
Fund shares sold | 14,218 | |||
Securities sold | 1,777,554 | |||
Dividends | 302,626 | |||
Prepaid expenses | 4,187 | |||
Total assets | 165,870,920 | |||
Liabilities: | ||||
Payable for: | ||||
Fund shares redeemed | 279,722 | |||
Securities purchased | 297,670 | |||
Management fees | 102,798 | |||
Administration fees | 13,214 | |||
Transfer agent/maintenance fees | 2,083 | |||
Custodian fees | 1,240 | |||
Directors’ fees | 8,879 | |||
Professional fees | 34,736 | |||
Other fees | 21,694 | |||
Total liabilities | 762,036 | |||
Net assets | $ | 165,108,884 | ||
Net assets consist of: | ||||
Paid in capital | $ | 252,142,601 | ||
Undistributed net investment income | 1,665,710 | |||
Accumulated net realized loss on sale of investments | (29,485,172 | ) | ||
Net unrealized depreciation in value of investments | (59,214,255 | ) | ||
Net assets | $ | 165,108,884 | ||
Capital shares authorized | unlimited | |||
Capital shares outstanding | 10,736,137 | |||
Net asset value per share (net assets divided by shares outstanding) | $ | 15.38 | ||
* Investments, at cost | $ | 220,653,638 | ||
Statement of Operations
For Year Ended December 31, 2008
Investment Income: | ||||
Dividends | $ | 3,782,169 | ||
Interest | 159,289 | |||
Total investment income | 3,941,458 | |||
Expenses: | ||||
Management fees | 1,891,460 | |||
Administration fees | 240,200 | |||
Transfer agent/maintenance fees | 25,295 | |||
Custodian fees | 14,865 | |||
Directors’ fees | 19,738 | |||
Professional fees | 45,882 | |||
Reports to shareholders | 22,191 | |||
Other | 16,117 | |||
Total expenses | 2,275,748 | |||
Net investment income | 1,665,710 | |||
Net Realized and Unrealized Gain (Loss): | ||||
Net realized gain (loss) during the year on: | ||||
Investments | (21,889,990 | ) | ||
Options written | 180,720 | |||
Net realized loss | (21,709,270 | ) | ||
Net unrealized appreciation (depreciation) during the year on: | ||||
Investments | (85,457,350 | ) | ||
Net unrealized depreciation | (85,457,350 | ) | ||
Net realized and unrealized loss | (107,166,620 | ) | ||
Net decrease in net assets resulting from operations | $ | (105,500,910 | ) | |
The accompanying notes are an integral part of the financial statements
8
Table of Contents
| Statement of Changes in Net Assets | Series A (Equity Series) |
| Year Ended December 31, 2008 | Year Ended December 31, 2007 | |||||||
Increase (decrease) in net assets from operations: | ||||||||
Net investment income | $ | 1,665,710 | $ | 2,057,542 | ||||
Net realized gain (loss) during the year on investments | (21,709,270 | ) | 39,437,041 | |||||
Net unrealized depreciation during the year on investments | (85,457,350 | ) | (57,161,369 | ) | ||||
Net decrease in net assets resulting from operations | (105,500,910 | ) | (15,666,786 | ) | ||||
Capital share transactions: | ||||||||
Proceeds from sale of shares | 24,426,853 | 34,320,140 | ||||||
Cost of shares redeemed | (82,812,481 | ) | (131,446,012 | ) | ||||
Net decrease from capital share transactions | (58,385,628 | ) | (97,125,872 | ) | ||||
Net decrease in net assets | (163,886,538 | ) | (112,792,658 | ) | ||||
Net assets: | ||||||||
Beginning of year | 328,995,422 | 441,788,080 | ||||||
End of year | $ | 165,108,884 | $ | 328,995,422 | ||||
Undistributed net investment income at end of year | $ | 1,665,710 | $ | 2,057,542 | ||||
Capital share activity: | ||||||||
Shares sold | 1,174,494 | 1,322,125 | ||||||
Shares redeemed | (3,831,105 | ) | (5,035,865 | ) | ||||
Total capital share activity | (2,656,611 | ) | (3,713,740 | ) | ||||
The accompanying notes are an integral part of the financial statements
9
Table of Contents
Financial Highlights Selected data for each share of capital stock outstanding throughout each year | Series A (Equity Series) |
| 2008 | 2007 | 2006 | 2005 | Year Ended December 31, 2004 | ||||||||||||||||
Per Share Data | ||||||||||||||||||||
Net asset value, beginning of period | $ | 24.57 | $ | 25.83 | $ | 22.88 | $ | 21.93 | $ | 20.37 | ||||||||||
Income (loss) from investment operations: | ||||||||||||||||||||
Net investment incomea | 0.14 | 0.14 | 0.11 | 0.16 | 0.18 | |||||||||||||||
Net gain (loss) on securities (realized and unrealized) | (9.33 | ) | (1.40 | ) | 2.84 | 0.79 | 1.40 | |||||||||||||
Total from investment operations | (9.19 | ) | (1.26 | ) | 2.95 | 0.95 | 1.58 | |||||||||||||
Less distributions: | ||||||||||||||||||||
Dividends from net investment income | — | — | — | — | (0.02 | ) | ||||||||||||||
Total distributions | — | — | — | — | (0.02 | ) | ||||||||||||||
Net asset value, end of period | $ | 15.38 | $ | 24.57 | $ | 25.83 | $ | 22.88 | $ | 21.93 | ||||||||||
Total Returnb | (37.40 | )% | (4.88 | )% | 12.89 | % | 4.33 | % | 7.77 | % | ||||||||||
Ratios/Supplemental Data | ||||||||||||||||||||
Net assets, end of period (in thousands) | $ | 165,109 | $ | 328,995 | $ | 441,788 | $ | 466,931 | $ | 530,096 | ||||||||||
Ratios to average net assets: | ||||||||||||||||||||
Net investment income | 0.66 | % | 0.52 | % | 0.33 | % | 0.55 | % | 0.81 | % | ||||||||||
Total expensesc | 0.90 | % | 0.89 | % | 0.90 | % | 0.89 | % | 0.87 | % | ||||||||||
Net expensesd | 0.90 | % | 0.89 | % | 0.90 | % | 0.89 | % | 0.87 | % | ||||||||||
Portfolio turnover rate | 142 | %e | 14 | % | 26 | % | 37 | % | 27 | % | ||||||||||
a | Net investment income (loss) was computed using average shares outstanding throughout the period. |
b | Total return does not take into account any of the expenses associated with an investment in variable insurance products offered by Security Benefit Life Insurance Company. If total return had taken into account these expenses, performance would have been lower. Shares of a series of SBL Fund are available only through the purchase of such products. |
c | Total expense information reflects the expense ratios absent expense reductions by the Investment Manager and earnings credits, as applicable. |
d | Net expense information reflects the expense ratios after voluntary expense waivers, reimbursements and custodian earnings credits, as applicable. |
e | Significant variation in the portfolio turnover rate is due to Investment Manager’s appointment of new portfolio managers for the Series. |
The accompanying notes are an integral part of the financial statements
10
Table of Contents
Manager’s Commentary February 16, 2009 | (Large Cap Value Series) |
![]()
 | ||||||
Mark Mitchell Portfolio Manager | ||||||
To Our Shareholders:
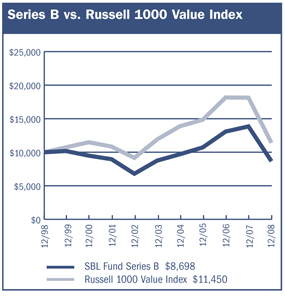
Series B of the SBL Fund - Large Cap Value Series returned –37.19% during the year, slightly lagging the benchmark Russell 1000 Value Index’s return of –36.85%. The Series’ peer group median return of –36.65% was in line with the Index.
Our strategy is to buy companies that are trading at a significant discount to their intrinsic value. Our investment approach is a defined and disciplined process with three clear philosophical tenets that drive our investment decisions: a valuation focus, a long-term perspective and an opportunistic approach.
Our investment process is fundamentally driven and quantitatively aided. We use proprietary screens to identify potential companies for investment and then perform rigorous fundamental analysis to identify the best ideas. Through this fundamental research, we determine an estimate of intrinsic value and thus a valuation target for each idea. We construct the portfolios based on the level of conviction generated by this bottom-up analysis and the upside/downside profile associated with each company. For Series B, we apply this philosophy to a broad range of value names.
Materials and Consumer Staples Top Performers
The Series’ materials holdings fared relatively well in the difficult market condition, declining –14% against a –48% drop for the benchmark. Consumer staples, an overweight position, lost –11% compared to a –17% loss for the Index.
The portfolio had two securities in the materials sector, Rohm & Haas Company and Vulcan Materials Company, which posted positive gains of 19% and 4%, respectively. Unfortunately, the only other position owned by the portfolio in the sector was Dow Chemical Company, which recorded a negative return of –59%, dragging down overall sector performance.
Consumer staples giant Wal–Mart Stores, Inc., a 4% weight in the portfolio, gained 20% during the period, making the sector a positive contributor relative to the benchmark. However, the portfolio held positions of more than 2% in CVS Caremark Corporation and Costco Wholesale Corporation which were down –27% and –23%, respectively.
Industrials and Energy Disappoint
The largest detractor from the portfolio was the industrials sector due to a combination of a double overweight and underperforming stock selection. Both USG Corporation and General Electric Company had 3% weightings, but lost –78% and –54% of their value, respectively. In addition, McDermott International, Inc. slid –83% during the period. The one bright spot for the portfolio sector was the Union Pacific Corporation railroad, a 4% position, which gained 23%.
As one of the hardest hit sectors of the economy in the latter half of 2008, none of the portfolio’s energy holdings were able to post a positive gain or contribute to performance. While slightly underweight, the holdings in the sector for the portfolio lost –36% compared to –27% for the benchmark. The largest portfolio positions in the sector, Williams Companies, Inc. and Haliburton Company, dropped –59% and –51%, respectively. Smaller positions in Sasol, Ltd., Chesapeake Energy Corporation, Chevron Corporation, and ConocoPhillips all lost ground during the period.
Market Outlook
Our bottom-up approach looks at market uncertainty in the context of the potential long-term impact on individual companies. Often times, volatility provides opportunity. We are maintaining flexibility in the portfolios to take advantage of these opportunities as they arise. Our focus is on identifying companies with the ability to be substantially better over the next three to five years or have the potential to maintain their return on capital at current levels in a difficult economic environment. We are confident in our ability to find these companies.
We believe that investing is a long-term pursuit that requires patience and a consistent approach. We recognize there are many investment fund alternatives available today and thank you for your business and the confidence you place in us.
Sincerely,
Mark A. Mitchell, Portfolio Manager
11
Table of Contents
Performance Summary December 31, 2008 | Series B (Large Cap Value Series) (unaudited) |
PERFORMANCE
$10,000 Over 10 Years
The chart above assumes a hypothetical $10,000 investment in Series B (Large Cap Value Series) on December 31, 1998 and reflects the fees and expenses of Series B. The Russell 1000 Value Index is an unmanaged index representing the performance of those Russell 1000 Index companies with lower price-to-book ratios and lower forecasted growth values.
Average Annual Returns
Periods Ended 12-31-081 | 1 Year | 5 Years | 10 Years | ||||||
Series B | (37.19 | )% | (0.14 | )% | (1.38 | )% |
1 | Performance figures do not reflect fees and expenses associated with an investment in variable insurance products offered by Security Benefit Life Insurance Company. If returns had taken into account these fees and expenses, performance would have been lower. Shares of a Series of SBL Fund are available only through the purchase of such products. |
The performance data quoted above represents past performance. Past performance is not predictive of future performance. The investment return and principal value of an investment will fluctuate so that an investor’s shares, when redeemed, may be worth more or less than their original cost.
Portfolio Composition by Sector
Consumer Discretionary | 10.47 | % | |
Consumer Staples | 11.44 | ||
Energy | 13.16 | ||
Financials | 13.18 | ||
Health Care | 10.85 | ||
Industrials | 20.41 | ||
Information Technology | 8.04 | ||
Materials | 4.35 | ||
Telecommunication Services | 1.22 | ||
Utilities | 3.46 | ||
Cash & Other Assets, Less Liabilities | 3.42 | ||
Total Net Assets | 100.00 | % | |
The accompanying notes are an integral part of the financial statements
12
Table of Contents
| Series B | ||
Performance Summary | (Large Cap Value Series) | |
| December 31, 2008 | (unaudited) |
Information About Your Series Expenses
Calculating your ongoing Series expenses
Example
As a shareholder of the Series, you incur ongoing costs, including management fees and other series expenses. Performance figures and expense ratios do not reflect fees and expenses associated with an investment in variable insurance products. Shares of a Series of SBL Fund are available only through the purchase of such products. This example is intended to help you understand your ongoing costs (in dollars) of investing in the Series and to compare these costs with ongoing costs of investing in other mutual funds. The example is based on an investment of $1,000 invested at the beginning of the period and held for the entire period, July 1, 2008 through December 31, 2008.
Actual Expenses
The first line in the table provides information about actual account values and actual expenses. You may use the information in this table, together with the amount you invested, to estimate the expenses that you paid over the period. Simply divide your account value by $1,000 (for example, an $8,600 account value divided by $1,000 = 8.6), then multiply the result by the number in the table under the heading entitled “Expenses Paid During the Period” to estimate the expenses you paid on your account during this period.
Hypothetical Example for Comparison Purposes
The second line in the table provides information about hypothetical account values and hypothetical expenses based on the Series actual expense ratio and an assumed rate of return of 5% per year before expenses, which is not the Series actual return. The hypothetical account values and expenses may not be used to estimate the actual ending account balance or expenses you paid for the period. You may use this information to compare the ongoing costs of investing in the Series and other funds. To do so, compare this 5% hypothetical example with the 5% hypothetical examples that appear in the shareholder reports of the other mutual funds.
Please note that the expenses shown in the table are meant to highlight your ongoing costs only and do not reflect any fees and expenses associated with an investment in variable insurance products. Therefore, the second line is useful in comparing ongoing costs only, and will not help you determine the relative total costs of owning different funds. In addition, if these fees and expenses associated with an investment in variable insurance products were included, your costs would have been higher.
Series Expenses
| Beginning Account Value 7/1/2008 | Ending Account Value 12/31/20081 | Expenses Paid During Period2 | |||||||
Series B (Large Cap Value Series) | |||||||||
Actual | $ | 1,000.00 | $ | 708.52 | $ | 3.48 | |||
Hypothetical | 1,000.00 | 1,021.06 | 4.12 | ||||||
1 | The actual ending account value is based on the actual total return of the Series for the period July 1, 2008 to December 31, 2008 after actual expenses and will differ from the hypothetical ending account value which is based on the Series expense ratio and a hypothetical annual return of 5% before expenses. The actual cumulative return at net asset value for the period July 1, 2008 to December 31, 2008 was (29.15%). |
2 | Expenses are equal to the Series annualized expense ratio of 0.81%, net of any applicable fee waivers, multiplied by the average account value over the period, multiplied by 184/366 (to reflect the one-half year period). |
13
Table of Contents
| Schedule of Investments | Series B | |
December 31, 2008 | (Large Cap Value Series) |
| Shares | Value | ||||
COMMON STOCKS—96.6% | |||||
Aerospace & Defense—3.2% | |||||
United Technologies Corporation | 151,200 | $ | 8,104,320 | ||
Air Freight & Logistics—3.9% | |||||
FedEx Corporation | 150,943 | 9,682,993 | |||
Broadcasting—1.1% | |||||
CBS Corporation (Cl.B) | 328,600 | 2,691,234 | |||
Building Products—1.5% | |||||
USG Corporation * | 470,000 | 3,778,800 | |||
Computer Hardware—2.3% | |||||
Hewlett-Packard Company | 159,000 | 5,770,110 | |||
Construction Materials—1.7% | |||||
Vulcan Materials Company | 63,550 | 4,421,809 | |||
Consumer Finance—2.0% | |||||
Capital One Financial Corporation | 121,600 | 3,877,824 | |||
First Marblehead Corporation * | 814,548 | 1,050,767 | |||
| 4,928,591 | |||||
Data Processing & Outsourced Services—4.0% | |||||
Western Union Company | 703,200 | 10,083,888 | |||
Department Stores—2.1% | |||||
JC Penney Company, Inc. | 263,700 | 5,194,890 | |||
Diversified Banks—2.8% | |||||
U.S. Bancorp | 62,700 | 1,568,127 | |||
Wells Fargo & Company | 187,600 | 5,530,448 | |||
| 7,098,575 | |||||
Diversified Chemicals—1.1% | |||||
Dow Chemical Company | 176,400 | 2,661,876 | |||
Drug Retail—2.8% | |||||
CVS Caremark Corporation | 245,800 | 7,064,292 | |||
Electric Utilities—3.5% | |||||
Edison International | 270,100 | 8,675,612 | |||
Electronic Manufacturing Services—1.7% | |||||
Tyco Electronics, Ltd. | 266,950 | 4,327,260 | |||
Health Care Equipment—3.2% | |||||
Covidien, Ltd. | 101,650 | 3,683,796 | |||
Hospira, Inc. * | 164,700 | 4,417,254 | |||
| 8,101,050 | |||||
Health Care Services—2.8% | |||||
Medco Health Solutions, Inc. * | 170,600 | 7,149,846 | |||
Home Improvement Retail—4.0% | |||||
Lowe’s Companies, Inc. | 471,700 | 10,150,984 | |||
Hypermarkets & Super Centers—6.5% | |||||
Costco Wholesale Corporation | 142,700 | 7,491,750 | |||
Wal-Mart Stores, Inc. | 156,800 | 8,790,208 | |||
| 16,281,958 | |||||
Industrial Conglomerates—4.2% | |||||
General Electric Company | 411,900 | 6,672,780 | |||
McDermott International, Inc. * | 394,900 | 3,901,612 | |||
| 10,574,392 | |||||
Industrial Machinery—1.8% | |||||
Parker Hannifin Corporation | 107,200 | 4,560,288 | |||
Insurance Brokers—1.2% | |||||
AON Corporation | 64,900 | 2,964,632 | |||
Integrated Oil & Gas—8.5% | |||||
Chevron Corporation | 98,600 | 7,293,442 | |||
ConocoPhillips | 41,200 | 2,134,160 | |||
Exxon Mobil Corporation | 147,400 | 11,766,942 | |||
| 21,194,544 | |||||
Integrated Telecommunication Services—1.2% | |||||
Windstream Corporation | 331,932 | 3,053,774 | |||
Managed Health Care—1.4% | |||||
Aetna, Inc. | 123,400 | 3,516,900 | |||
Movies & Entertainment—3.3% | |||||
News Corporation | 116,800 | 1,061,712 | |||
Time Warner, Inc. | 712,600 | 7,168,756 | |||
| 8,230,468 | |||||
Oil & Gas Equipment & Services—1.7% | |||||
Halliburton Company | 232,200 | 4,221,396 | |||
Oil & Gas Exploration & Production—1.3% | |||||
Chesapeake Energy Corporation | 201,000 | 3,250,170 | |||
Oil & Gas Storage & Transportation—1.7% | |||||
Williams Companies, Inc. | 300,700 | 4,354,136 | |||
Other Diversified Financial Services—2.2% | |||||
JPMorgan Chase & Company | 172,000 | 5,423,160 | |||
Pharmaceuticals—3.5% | |||||
Schering-Plough Corporation | 497,800 | 8,477,534 | |||
Property & Casualty Insurance—5.0% | |||||
Berkshire Hathaway, Inc. * | 131 | 12,654,600 | |||
Railroads—3.7% | |||||
Union Pacific Corporation | 194,900 | 9,316,220 | |||
Research & Consulting Services—2.1% | |||||
Equifax, Inc. | 196,600 | 5,213,832 | |||
Specialty Chemicals—1.5% | |||||
Rohm & Haas Company | 62,000 | 3,830,980 | |||
Tobacco—2.1% | |||||
Altria Group, Inc. | 91,800 | 1,382,508 | |||
The accompanying notes are an integral part of the financial statements
14
Table of Contents
| Schedule of Investments | Series B | |
| December 31, 2008 | (Large Cap Value Series) |
| Shares | Value | ||||
COMMON STOCKS—96.6% (continued) | |||||
Tobacco—2.1% (continued) | |||||
Philip Morris International, Inc. | 91,800 | $ | 3,994,218 | ||
| 5,376,726 | |||||
TOTAL COMMON STOCKS (cost $310,037,555) | $ | 242,381,840 | |||
Total Investments—96.6% (cost $310,037,555) | $ | 242,381,840 | |||
Cash & Other Assets, Less Liabilities—3.4% | 8,590,020 | ||||
Total Net Assets—100.0% | $ | 250,971,860 | |||
For federal income tax purposes the identified cost of investments owned at December 31, 2008 was $314,074,304.
| * | Non-income producing security |
The accompanying notes are an integral part of the financial statements
15
Table of Contents
| Series B | ||
| (Large Cap Value Series) |
Statement of Assets and Liabilities
December 31, 2008
Assets: | ||||
Investments, at value* | $ | 242,381,840 | ||
Cash | 2,968,114 | |||
Receivables: | ||||
Fund shares sold | 49,773 | |||
Securities sold | 5,487,870 | |||
Dividends | 701,393 | |||
Prepaid expenses | 6,919 | |||
Total assets | 251,595,909 | |||
Liabilities: | ||||
Payable for: | ||||
Fund shares redeemed | 386,221 | |||
Management fees | 135,825 | |||
Administration fees | 20,001 | |||
Transfer agent/maintenance fees | 2,084 | |||
Custodian fees | 1,171 | |||
Directors’ fees | 9,427 | |||
Professional fees | 44,830 | |||
Other fees | 24,490 | |||
Total liabilities | 624,049 | |||
Net assets | $ | 250,971,860 | ||
Net assets consist of: | ||||
Paid in capital | $ | 471,008,358 | ||
Undistributed net investment income | 4,509,471 | |||
Accumulated net realized loss on sale of investments | (156,890,254 | ) | ||
Net unrealized depreciation in value of investments | (67,655,715 | ) | ||
Net assets | $ | 250,971,860 | ||
Capital shares authorized | unlimited | |||
Capital shares outstanding | 14,298,563 | |||
Net asset value per share (net assets divided by shares outstanding) | $ | 17.55 | ||
| ||||
* Investments, at cost | $ | 310,037,555 | ||
Statement of Operations
For Year Ended December 31, 2008
Investment Income: | ||||
Dividends | $ | 7,180,913 | ||
Interest | 305,936 | |||
Total investment income | 7,486,849 | |||
Expenses: | ||||
Management fees | 2,422,416 | |||
Administration fees | 354,943 | |||
Transfer agent/maintenance fees | 25,307 | |||
Custodian fees | 25,392 | |||
Directors’ fees | 32,919 | |||
Professional fees | 60,160 | |||
Reports to shareholders | 35,495 | |||
Other | 20,746 | |||
Total expenses | 2,977,378 | |||
Net investment income | 4,509,471 | |||
Net Realized and Unrealized Gain (Loss): | ||||
Net realized gain (loss) during the year on: | ||||
Investments | (35,660,150 | ) | ||
Options written | 562,423 | |||
Net realized loss | (35,097,727 | ) | ||
Net unrealized appreciation (depreciation) during the year on: | ||||
Investments | (128,705,287 | ) | ||
Net unrealized depreciation | (128,705,287 | ) | ||
Net realized and unrealized loss | (163,803,014 | ) | ||
Net decrease in net assets resulting from operations | $ | (159,293,543 | ) | |
The accompanying notes are an integral part of the financial statements
16
Table of Contents
| Series B | ||
| Statement of Changes in Net Assets | (Large Cap Value Series) |
| Year Ended December 31, 2008 | Year Ended December 31, 2007 | |||||||
Increase (decrease) in net assets from operations: | ||||||||
Net investment income | $ | 4,509,471 | $ | 4,458,590 | ||||
Net realized gain (loss) during the year on investments | (35,097,727 | ) | 63,388,830 | |||||
Net unrealized depreciation during the year on investments | (128,705,287 | ) | (40,708,097 | ) | ||||
Net increase (decrease) in net assets resulting from operations | (159,293,543 | ) | 27,139,323 | |||||
Capital share transactions: | ||||||||
Proceeds from sale of shares | 97,567,905 | 117,350,624 | ||||||
Cost of shares redeemed | (167,274,870 | ) | (145,200,986 | ) | ||||
Net decrease from capital share transactions | (69,706,965 | ) | (27,850,362 | ) | ||||
Net decrease in net assets | (229,000,508 | ) | (711,039 | ) | ||||
Net assets: | ||||||||
Beginning of year | 479,972,368 | 480,683,407 | ||||||
End of year | $ | 250,971,860 | $ | 479,972,368 | ||||
Undistributed net investment income at end of year | $ | 4,509,471 | $ | 4,458,590 | ||||
Capital share activity: | ||||||||
Shares sold | 3,899,132 | 4,134,610 | ||||||
Shares redeemed | (6,778,642 | ) | (5,162,697 | ) | ||||
Total capital share activity | (2,879,510 | ) | (1,028,087 | ) | ||||
The accompanying notes are an integral part of the financial statements
17
Table of Contents
| Financial Highlights | Series B | |
Selected data for each share of capital stock outstanding throughout each year | (Large Cap Value Series) |
| Year Ended December 31, 2004 | ||||||||||||||||||||
| 2008 | 2007 | 2006 | 2005a | |||||||||||||||||
Per Share Data | ||||||||||||||||||||
Net asset value, beginning of period | $ | 27.94 | $ | 26.40 | $ | 21.64 | $ | 19.58 | $ | 17.68 | ||||||||||
Income (loss) from investment operations: | ||||||||||||||||||||
Net investment incomeb | 0.29 | 0.25 | 0.20 | 0.24 | 0.21 | |||||||||||||||
Net gain (loss) on securities (realized and unrealized) | (10.68 | ) | 1.29 | 4.56 | 1.82 | 1.70 | ||||||||||||||
Total from investment operations | (10.39 | ) | 1.54 | 4.76 | 2.06 | 1.91 | ||||||||||||||
Less distributions: | ||||||||||||||||||||
Dividends from net investment income | — | — | — | — | (0.01 | ) | ||||||||||||||
Total distributions | — | — | — | — | (0.01 | ) | ||||||||||||||
Net asset value, end of period | $ | 17.55 | $ | 27.94 | $ | 26.40 | $ | 21.64 | $ | 19.58 | ||||||||||
Total Returnc | (37.19 | )% | 5.83 | % | 22.00 | % | 10.52 | % | 10.82 | % | ||||||||||
Ratios/Supplemental Data | ||||||||||||||||||||
Net assets, end of period (in thousands) | $ | 250,972 | $ | 479,972 | $ | 480,683 | $ | 410,692 | $ | 429,493 | ||||||||||
Ratios to average net assets: | ||||||||||||||||||||
Net investment income | 1.21 | % | 0.90 | % | 0.80 | % | 0.98 | % | 1.09 | % | ||||||||||
Total expensesd | 0.80 | % | 0.79 | % | 0.79 | % | 0.84 | % | 0.92 | % | ||||||||||
Net expensese | 0.80 | % | 0.79 | % | 0.79 | % | 0.84 | % | 0.87 | % | ||||||||||
Portfolio turnover rate | 32 | % | 29 | % | 20 | % | 99 | % | 73 | % | ||||||||||
a | Security Global Investors (SGI), formerly Security Management Company, LLC, became the advisor of Series B effective June 30, 2005. Prior to June 30, 2005, SGI paid Dreyfus Corporation for sub-advisory services. |
b | Net investment income (loss) was computed using average shares outstanding throughout the period. |
c | Total return does not take into account any of the expenses associated with an investment in variable insurance products offered by Security Benefit Life Insurance Company. If total return had taken into account these expenses, performance would have been lower. Shares of a series of SBL Fund are available only through the purchase of such products. |
d | Total expense information reflects the expense ratios absent expense reductions by the Investment Manager and earnings credits, as applicable. |
e | Net expense information reflects the expense ratios after voluntary expense waivers, reimbursements and custodian earnings credits, as applicable. |
The accompanying notes are an integral part of the financial statements
18
Table of Contents
| Manager’s Commentary | Series C | |
February 16, 2009 | (Money Market Series) |
![]()

Christina Fletcher
Portfolio Manager
To Our Shareholders:
Series C of the SBL Fund – Money Market Series returned 2.10% for the year ended December 31, 2008, in line with the benchmark I-Money Net Retail Tier 1 of 2.14% and the 2.22% performance of its peer group for the same period.
The fourth quarter of 2008 ended with the Federal Reserve Board decreasing interest rates to a range of 0% to 0.25%.
Composition of Portfolio Assets
At December 31, 2008, the average maturity of the holdings in the Series was 75 days.
The Series’ assets were concentrated in commercial paper and U.S. government sponsored agency bonds and notes. At year-end, approximately 43% of the Series consisted of commercial paper and 58% in U.S. government/agency obligations, less liabilities.
Performance
The turning point in the year was an abrupt deterioration in credit markets in June as the sub-prime mortgage concerns began to unfold. The credit crunch worsened in August as the extent of the crises became more apparent.
The year presented many challenges for money market managers. Sub-prime mortgage loans became the topic of interest as defaults continued to rise, which triggered downgrades of securities backed by pools of these loans. Many money market funds had invested in investment-pooled securities or SIVs, (Structured Investment Vehicles), which boosted yields but created a liquidity problem as the rating agencies downgraded many of these programs.
The Money Market Series does not invest in these types of securities. The manager remained focused on liquidity and credit quality, and the sub-prime mortgage securities never passed these tests. While a small portion of the portfolio was invested in asset-backed commercial paper, which posed no risk to the portfolio, we chose to take the conservative approach and further reduce the exposure to this type investment.
Market Outlook
The upcoming year provides a challenging economic environment for the Federal Reserve and Treasury Department. The goal is to contain the length and depth of the recession and reintroduce growth in the US economy. While we continue to see broader contagion from the sub-prime defaults and credit crisis, the effects of the Federal Reserve rate reductions and additional fiscal stimulus by Congress should aid the economy during the second half of the year.
As always, we will continue to monitor the economic and market conditions when deciding portfolio strategies and will adjust the asset mix and maturity structure in the portfolio accordingly.
Thank you for your investment in the Money Market Series.
We appreciate the confidence that you have placed in us and continue to focus on achieving the Series’ investment goals.
Sincerely,
Christina Fletcher
Portfolio Manager
19
Table of Contents
| Series C | ||
| Performance Summary | (Money Market Series) | |
| December 31, 2008 | (unaudited) |
PERFORMANCE
Portfolio Composition by Quality Ratings
Tier 1 Investments | 101.73 | % | |
Repurchase Agreement | 0.93 | ||
Liabilities, Less Cash & Other Assets | (2.66 | ) | |
Total Net Assets | 100.00 | % | |
Average Annual Returns
Periods Ended 12-31-081 | 1 Year | 5 Years | 10 Years | ||||||
Series C | 2.10 | % | 2.92 | % | 3.06 | % |
1 | Performance figures do not reflect fees and expenses associated with an investment in variable insurance products offered by Security Benefit Life Insurance Company. If returns had taken into account these fees and expenses, performance would have been lower. Shares of a Series of SBL Fund are available only through the purchase of such products. |
The performance data quoted above represents past performance. Past performance is not predictive of future performance. The investment return and principal value of an investment will fluctuate so that an investor’s shares, when redeemed, may be worth more or less than their original cost.
The accompanying notes are an integral part of the financial statements
20
Table of Contents
| Series C | ||
| Performance Summary | (Money Market Series) | |
| December 31, 2008 | (unaudited) |
Information About Your Series Expenses
Calculating your ongoing Series expenses
Example
As a shareholder of the Series, you incur ongoing costs, including management fees and other series expenses. Performance figures and expense ratios do not reflect fees and expenses associated with an investment in variable insurance products. Shares of a Series of SBL Fund are available only through the purchase of such products. This example is intended to help you understand your ongoing costs (in dollars) of investing in the Series and to compare these costs with ongoing costs of investing in other mutual funds. The example is based on an investment of $1,000 invested at the beginning of the period and held for the entire period, July 1, 2008 through December 31, 2008.
Actual Expenses
The first line in the table provides information about actual account values and actual expenses. You may use the information in this table, together with the amount you invested, to estimate the expenses that you paid over the period. Simply divide your account value by $1,000 (for example, an $8,600 account value divided by $1,000 = 8.6), then multiply the result by the number in the table under the heading entitled “Expenses Paid During the Period” to estimate the expenses you paid on your account during this period.
Hypothetical Example for Comparison Purposes
The second line in the table provides information about hypothetical account values and hypothetical expenses based on the Series actual expense ratio and an assumed rate of return of 5% per year before expenses, which is not the Series actual return. The hypothetical account values and expenses may not be used to estimate the actual ending account balance or expenses you paid for the period. You may use this information to compare the ongoing costs of investing in the Series and other funds. To do so, compare this 5% hypothetical example with the 5% hypothetical examples that appear in the shareholder reports of the other mutual funds.
Please note that the expenses shown in the table are meant to highlight your ongoing costs only and do not reflect any fees and expenses associated with an investment in variable insurance products. Therefore, the second line is useful in comparing ongoing costs only, and will not help you determine the relative total costs of owning different funds. In addition, if these fees and expenses associated with an investment in variable insurance products were included, your costs would have been higher.
Series Expenses
| Beginning Account Value 7/1/2008 | Ending Account Value 12/31/20081 | Expenses Paid During Period2 | |||||||
Series C (Money Market Series) | |||||||||
Actual | $ | 1,000.00 | $ | 1,008.15 | $ | 3.33 | |||
Hypothetical | 1,000.00 | 1,021.82 | 3.35 | ||||||
1 | The actual ending account value is based on the actual total return of the Series for the period July 1, 2008 to December 31, 2008 after actual expenses and will differ from the hypothetical ending account value which is based on the Series expense ratio and a hypothetical annual return of 5% before expenses. The actual cumulative return at net asset value for the period July 1, 2008 to December 31, 2008 was 0.81%. |
2 | Expenses are equal to the Series annualized expense ratio of 0.66%, net of any applicable fee waivers, multiplied by the average account value over the period, multiplied by 184/366 (to reflect the one-half year period). |
21
Table of Contents
Schedule of Investments | Series C | |
| December 31, 2008 | (Money Market Series) |
| Principal Amount | Value | |||||
MORTGAGE BACKED SECURITIES—0.2% | ||||||
Other Non-Agency—0.2% | ||||||
Pass Through’s—0.2% | ||||||
Small Business Administration Pools | ||||||
#503308, 1.50%, 1/1/20091,2 | $ | 74,176 | $ | 74,176 | ||
#503343, 1.63%, 1/1/20091,2 | 133,422 | 133,422 | ||||
#503347, 1.63%, 1/1/20091,2 | 78,903 | 78,903 | ||||
#502353, 1.75%, 1/1/20091,2 | 34,898 | 34,898 | ||||
#503295, 1.50%, 1/1/20091,2 | 73,691 | 72,374 | ||||
#503303, 1.50%, 1/1/20091,2 | 185,485 | 182,168 | ||||
| 575,941 | ||||||
| 575,941 | ||||||
TOTAL MORTGAGE BACKED SECURITIES (cost $580,738) | $ | 575,941 | ||||
| Principal Amount | Value | |||||
U.S. GOVERNMENT SPONSORED AGENCY BONDS & NOTES—58.3% | ||||||
Federal Farm Credit Bank | ||||||
1.51%, 1/11/20091,2 | $ | 2,500,000 | $ | 2,499,713 | ||
0.32%, 1/14/20091 | 1,000,000 | 999,828 | ||||
0.41%, 1/20/20091,2 | 3,000,000 | 2,996,679 | ||||
0.32%, 1/23/20091 | 2,500,000 | 2,499,743 | ||||
0.42%, 1/28/20092 | 2,000,000 | 1,998,234 | ||||
0.30%, 2/4/20091 | 3,000,000 | 2,998,263 | ||||
2.75%, 6/5/2009 | 1,500,000 | 1,515,434 | ||||
0.65%, 11/18/2009 | 3,500,000 | 3,479,776 | ||||
Federal Home Loan Mortgage Corporation | ||||||
2.06%, 1/7/2009 | 3,000,000 | 3,000,000 | ||||
2.12%, 1/12/2009 | 3,300,000 | 3,299,999 | ||||
1.50%, 2/2/2009 | 2,000,000 | 1,999,982 | ||||
1.65%, 2/11/2009 | 1,500,000 | 1,499,984 | ||||
1.25%, 2/27/2009 | 2,500,000 | 2,499,960 | ||||
0.59%, 3/25/2009 | 2,687,000 | 2,686,573 | ||||
0.20%, 3/26/2009 | 1,050,000 | 1,049,831 | ||||
1.20%, 3/30/2009 | 2,000,000 | 1,999,662 | ||||
0.25%, 4/14/2009 | 1,370,000 | 1,369,418 | ||||
0.25%, 6/9/2009 | 2,000,000 | 1,997,366 | ||||
Federal Home Loan Bank | ||||||
0.35%, 1/2/20091,2 | 2,500,000 | 2,496,403 | ||||
0.38%, 1/2/20091,2 | 1,500,000 | 1,496,031 | ||||
0.66%, 1/2/20091,2 | 2,500,000 | 2,498,815 | ||||
2.30%, 1/2/2009 | 3,400,000 | 3,399,999 | ||||
2.10%, 1/5/2009 | 2,300,000 | 2,300,000 | ||||
2.15%, 1/9/2009 | 1,000,000 | 1,000,000 | ||||
4.35%, 1/10/20091,2 | 3,000,000 | 3,001,724 | ||||
2.20%, 1/16/2009 | 1,206,000 | 1,206,000 | ||||
2.30%, 1/20/2009 | 3,000,000 | 2,999,999 | ||||
1.90%, 1/26/2009 | 2,000,000 | 2,000,000 | ||||
2.75%, 2/27/2009 | 1,500,000 | 1,505,582 | ||||
1.20%, 3/13/2009 | 2,000,000 | 1,999,728 | ||||
1.20%, 3/16/2009 | 1,050,000 | 1,049,851 | ||||
1.20%, 3/30/2009 | 2,000,000 | 1,999,662 | ||||
1.20%, 3/31/2009 | 1,500,000 | 1,499,744 | ||||
2.35%, 4/7/2009 | 2,500,000 | 2,512,105 | ||||
2.40%, 4/7/2009 | 2,500,000 | 2,500,655 | ||||
1.27%, 4/16/2009 | 2,500,000 | 2,498,917 | ||||
1.20%, 4/29/2009 | 1,000,000 | 999,512 | ||||
0.36%, 4/30/2009 | 2,600,000 | 2,598,720 | ||||
0.87%, 5/13/2009 | 1,000,000 | 999,090 | ||||
0.42%, 5/18/2009 | 2,000,000 | 1,998,112 | ||||
0.36%, 5/29/2009 | 2,500,000 | 2,497,448 | ||||
0.40%, 6/8/2009 | 2,000,000 | 1,997,384 | ||||
0.33%, 6/15/2009 | 1,000,000 | 998,633 | ||||
0.50%, 6/29/2009 | 1,400,000 | 1,397,924 | ||||
0.90%, 9/8/2009 | 1,500,000 | 1,494,294 | ||||
0.60%, 9/14/2009 | 2,000,000 | 1,992,208 | ||||
0.50%, 9/17/2009 | 2,500,000 | 2,490,145 | ||||
0.50%, 9/18/2009 | 2,000,000 | 1,992,086 | ||||
0.50%, 9/23/2009 | 1,400,000 | 1,394,354 | ||||
0.55%, 10/27/2009 | 2,000,000 | 1,990,066 | ||||
1.20%, 12/4/2009 | 1,500,000 | 1,490,201 | ||||
Federal National Mortgage Association | ||||||
2.05%, 1/2/2009 | 2,000,000 | 2,000,000 | ||||
2.05%, 1/5/2009 | 1,700,000 | 1,700,000 | ||||
2.12%, 1/12/2009 | 2,000,000 | 2,000,000 | ||||
2.21%, 1/15/2009 | 3,000,000 | 3,000,000 | ||||
2.05%, 2/20/2009 | 1,000,000 | 999,986 | ||||
1.23%, 3/3/2009 | 1,000,000 | 999,883 | ||||
1.20%, 3/19/2009 | 1,985,000 | 1,984,706 | ||||
1.05%, 4/1/2009 | 1,700,000 | 1,699,369 | ||||
0.67%, 4/7/2009 | 2,000,000 | 1,999,208 | ||||
0.25%, 4/15/2009 | 2,565,000 | 2,563,900 | ||||
0.27%, 4/17/2009 | 1,100,000 | 1,099,519 | ||||
0.70%, 4/20/2009 | 1,500,000 | 1,499,325 | ||||
1.04%, 4/29/2009 | 3,000,000 | 2,998,536 | ||||
0.42%, 5/29/2009 | 2,310,000 | 2,307,641 | ||||
0.44%, 6/2/2009 | 2,000,000 | 1,997,484 | ||||
0.36%, 6/17/2009 | 3,500,000 | 3,495,160 | ||||
0.35%, 7/1/2009 | 2,500,000 | 2,495,000 | ||||
0.55%, 8/3/2009 | 1,500,000 | 1,495,563 | ||||
0.60%, 8/5/2009 | 2,000,000 | 1,994,028 | ||||
0.57%, 9/1/2009 | 2,350,000 | 2,341,312 | ||||
0.55%, 9/4/2009 | 5,000,000 | 4,981,285 | ||||
0.65%, 10/1/2009 | 1,000,000 | 995,467 | ||||
1.05%, 10/2/2009 | 1,500,000 | 1,493,175 | ||||
1.10%, 11/2/2009 | 1,500,000 | 1,491,767 | ||||
0.75%, 12/1/2009 | 1,000,000 | 993,525 | ||||
0.70%, 12/3/2009 | 1,000,000 | 993,486 | ||||
TOTAL U.S. GOVERNMENT SPONSORED AGENCY BONDS & NOTES (cost $156,155,951) | $ | 156,305,162 | ||||
| Principal Amount | Value | |||||
COMMERCIAL PAPER—43.3% | ||||||
Automotive - 7.2% | ||||||
American Honda Finance | ||||||
2.40%, 01/05/2009 | $ | 3,500,000 | $ | 3,499,067 | ||
2.50%, 01/12/2009 | 1,500,000 | 1,498,854 | ||||
2.40%, 01/26/2009 | 4,000,000 | 3,993,333 | ||||
Toyota Motor Credit Corporation | ||||||
1.75%, 01/05/2009 | 1,500,000 | 1,499,708 | ||||
1.84%, 01/09/2009 | 3,700,000 | 3,698,484 | ||||
0.45%, 01/14/2009 | 1,800,000 | 1,799,773 | ||||
1.15%, 01/16/2009 | 2,000,000 | 1,999,042 | ||||
The accompanying notes are an integral part of the financial statements
22
Table of Contents
| Schedule of Investments | Series C | |
| December 31, 2008 | (Money Market Series) |
| Principal Amount | Value | ||||||
COMMERCIAL PAPER—43.3% (continued) | |||||||
Automotive - 7.2% (continued) | |||||||
Toyota Motor Credit Corporation (continued) | |||||||
0.45%, 01/21/2009 | $ | 1,300,000 | $ | 1,299,675 | |||
| 19,287,936 | |||||||
Banking—0.6% | |||||||
JP Morgan Chase Funding | |||||||
1.50%, 01/08/20093 | 1,500,000 | 1,499,563 | |||||
Consumer Products—13.8% | |||||||
L’Oreal USA, Inc. | |||||||
1.40%, 01/07/20093 | 3,100,000 | 3,099,260 | |||||
1.20%, 01/16/20093 | 2,300,000 | 2,299,601 | |||||
1.15%, 01/22/20093 | 5,500,000 | 5,497,425 | |||||
1.25%, 01/28/20093 | 2,000,000 | 1,999,238 | |||||
Procter & Gamble Company | |||||||
1.60%, 01/06/20093 | 1,000,000 | 999,967 | |||||
1.15%, 01/08/20093 | 1,500,000 | 1,499,933 | |||||
1.30%, 01/23/20093 | 2,000,000 | 1,998,656 | |||||
1.20%, 02/19/20093 | 2,000,000 | 1,999,306 | |||||
0.90%, 02/23/20093 | 1,000,000 | 999,625 | |||||
Procter & Gamble International Funding | |||||||
1.23%, 02/03/20093 | 3,000,000 | 2,999,395 | |||||
0.30%, 03/06/20093 | 1,000,000 | 999,549 | |||||
0.30%, 03/17/20093 | 2,500,000 | 2,498,681 | |||||
Siemens Capital Company, LLC | |||||||
0.25%, 02/13/20093 | 3,000,000 | 2,997,452 | |||||
Unilever Capital Corporation | |||||||
1.00%, 02/23/20093 | 1,500,000 | 1,499,217 | |||||
0.76%, 03/16/20093 | 2,500,000 | 2,498,073 | |||||
0.53%, 03/31/20093 | 3,000,000 | 2,997,150 | |||||
| 36,882,528 | |||||||
Construction Machinery—0.7% | |||||||
Caterpillar, Inc. | |||||||
0.20%, 01/23/20093 | 1,800,000 | 1,799,780 | |||||
Electric—0.7% | |||||||
FPL Group Capital, Inc. | |||||||
0.40%, 01/16/20093 | 2,000,000 | 1,999,667 | |||||
Financial Companies—Captive—1.9% | |||||||
Caterpillar Financial Services Corporation | |||||||
0.30%, 02/26/2009 | 4,200,000 | 4,197,645 | |||||
General Electric Capital Corporation | |||||||
0.45%, 02/17/2009 | 1,000,000 | 999,667 | |||||
| 5,197,312 | |||||||
Food & Beverage—7.5% | |||||||
Coca-Cola Company | |||||||
1.35%, 01/09/2009 | 2,500,000 | 2,499,250 | |||||
1.35%, 01/13/2009 | 2,500,000 | 2,499,792 | |||||
1.25%, 01/20/2009 | 2,000,000 | 1,999,744 | |||||
1.23%, 01/21/2009 | 3,200,000 | 3,199,038 | |||||
1.25%, 01/22/2009 | 2,000,000 | 1,999,719 | |||||
1.20%, 01/27/2009 | 1,500,000 | 1,499,741 | |||||
Nestle Capital Corporation | |||||||
2.10%, 01/06/20093 | 1,100,000 | 1,099,963 | |||||
2.00%, 01/30/20093 | 1,320,000 | 1,319,780 | |||||
1.20%, 03/09/20093 | 4,000,000 | 3,998,112 | |||||
| 20,115,139 | |||||||
Oil Field Services—8.3% | |||||||
BP Capital Markets plc | |||||||
1.15%, 02/04/20093 | 7,000,000 | 6,998,522 | |||||
0.86%, 04/08/20093 | 2,000,000 | 1,998,639 | |||||
ConocoPhillips CPP Funding LLC | |||||||
1.40%, 01/06/20093 | 5,000,000 | 4,999,056 | |||||
1.30%, 01/08/20093 | 2,500,000 | 2,499,368 | |||||
1.00%, 01/13/20093 | 2,800,000 | 2,798,787 | |||||
1.40%, 01/14/20093 | 3,000,000 | 2,998,483 | |||||
| 22,292,855 | |||||||
Pharmaceuticals—2.6% | |||||||
Merck & Company, Inc. | |||||||
1.15%, 01/08/2009 | 1,500,000 | 1,499,665 | |||||
1.05%, 01/20/2009 | 2,500,000 | 2,498,615 | |||||
1.10%, 01/29/2009 | 3,000,000 | 2,999,516 | |||||
| 6,997,796 | |||||||
TOTAL COMMERCIAL PAPER (cost $116,033,548) | $ | 116,072,576 | |||||
| Principal Amount | Value | ||||||
REPURCHASE AGREEMENT—0.9% | |||||||
UMB Financial Corp, 0.05%, dated 12/31/08, matures 1/02/09; repurchase amount $2,490,007 (Collateralized by FHLB Discount Note, 1/26/09 with a value of $2,539,842) | $ | 2,490,000 | $ | 2,490,000 | |||
TOTAL REPURCHASE AGREEMENT (cost $2,490,000) | $ | 2,490,000 | |||||
Total Investments—102.7% (cost $275,260,237) | $ | 275,443,679 | |||||
Liabilities, Less Cash & Other Assets—(2.7)% | (7,125,526 | ) | |||||
Total Net Assets—100.0% | $ | 268,318,153 | |||||
For federal income tax purposes the identified cost of investments owned at December 31, 2008 was $275,260,237.
| plc | Public Limited Company |
1 | Variable rate security. Rate indicated is rate effective at December 31, 2008. |
2 | Maturity date indicated is next interest reset date. |
3 | Security is a 144A or Section 4(2) security. The total market value of 144A or Section 4(2) securities is $70,892,248 (cost $70,860,568), or 26.4% of total net assets. |
The accompanying notes are an integral part of the financial statements
23
Table of Contents
| Series C | ||
| (Money Market Series) |
Statement of Assets and Liabilities
December 31, 2008
Assets: | |||
Investments, at value* | $ | 275,443,679 | |
Receivables: | |||
Fund shares sold | 887,457 | ||
Securities sold | 149,214 | ||
Interest | 89,738 | ||
Prepaid expenses | 10,643 | ||
Total assets | 276,580,731 | ||
Liabilities: | |||
Cash overdraft | 577,523 | ||
Payable for: | |||
Fund shares redeemed | 2,537,779 | ||
Securities purchased | 4,981,208 | ||
Management fees | 116,134 | ||
Administration fees | 24,765 | ||
Transfer agent/maintenance fees | 2,083 | ||
Directors’ fees | 4,500 | ||
Professional fees | 17,602 | ||
Other fees | 984 | ||
Total liabilities | 8,262,578 | ||
Net assets | $ | 268,318,153 | |
Net assets consist of: | |||
Paid in capital | $ | 263,885,252 | |
Undistributed net investment income | 4,249,459 | ||
Net unrealized appreciation in value of investments | 183,442 | ||
Net assets | $ | 268,318,153 | |
Capital shares authorized | unlimited | ||
Capital shares outstanding | 19,709,254 | ||
Net asset value per share (net assets divided by shares outstanding) | $ | 13.61 | |
* Investments, at cost | $ | 275,260,237 | |
Statement of Operations
For Year Ended December 31, 2008
Investment Income: | ||||
Interest | 5,669,840 | |||
Total investment income | 5,669,840 | |||
Expenses: | ||||
Management fees | 1,091,650 | |||
Administration fees | 217,809 | |||
Transfer agent/maintenance fees | 25,358 | |||
Custodian fees | 18,054 | |||
Directors’ fees | 20,378 | |||
Professional fees | 26,891 | |||
Reports to shareholders | 13,538 | |||
Other | 6,707 | |||
Total expenses | 1,420,385 | |||
Less: | ||||
Earnings credits applied | (4 | ) | ||
Net expenses | 1,420,381 | |||
Net investment income | 4,249,459 | |||
Net Unrealized Gain (Loss): | ||||
Net unrealized appreciation (depreciation) during the year on: | ||||
Investments | 190,920 | |||
Net increase in net assets resulting from operations | $ | 4,440,379 | ||
The accompanying notes are an integral part of the financial statements
24
Table of Contents
| Series C | ||
| Statement of Changes in Net Assets | (Money Market Series) |
| Year Ended December 31, 2008 | Year Ended December 31, 2007 | |||||||
Increase (decrease) in net assets from operations: | ||||||||
Net investment income | $ | 4,249,459 | $ | 6,020,002 | ||||
Net unrealized appreciation (depreciation) during the year on investments | 190,920 | (11,629 | ) | |||||
Net increase in net assets resulting from operations | 4,440,379 | 6,008,373 | ||||||
Capital share transactions: | ||||||||
Proceeds from sale of shares | 533,443,332 | 457,059,370 | ||||||
Cost of shares redeemed | (438,227,047 | ) | (393,450,526 | ) | ||||
Net increase from capital share transactions | 95,216,285 | 63,608,844 | ||||||
Net increase in net assets | 99,656,664 | 69,617,217 | ||||||
Net assets: | ||||||||
Beginning of year | 168,661,489 | 99,044,272 | ||||||
End of year | $ | 268,318,153 | $ | 168,661,489 | ||||
Undistributed net investment income at end of year | $ | 4,249,459 | $ | 6,020,002 | ||||
Capital share activity: | ||||||||
Shares sold | 39,510,948 | 35,025,550 | ||||||
Shares redeemed | (32,452,086 | ) | (30,153,493 | ) | ||||
Total capital share activity | 7,058,862 | 4,872,057 | ||||||
The accompanying notes are an integral part of the financial statements
25
Table of Contents
| Financial Highlights | Series C | |
Selected data for each share of capital stock outstanding throughout each year | (Money Market Series) |
| 2008 | 2007 | 2006 | 2005 | Year Ended December 31, 2004 | ||||||||||||||||
Per Share Data | ||||||||||||||||||||
Net asset value, beginning of period | $ | 13.33 | $ | 12.73 | $ | 12.19 | $ | 11.87 | $ | 11.79 | ||||||||||
Income (loss) from investment operations: | ||||||||||||||||||||
Net investment incomea | 0.26 | 0.60 | 0.45 | 0.33 | 0.11 | |||||||||||||||
Net gain (loss) on securities (realized and unrealized) | 0.02 | — | 0.09 | (0.01 | ) | (0.02 | ) | |||||||||||||
Total from investment operations | 0.28 | 0.60 | 0.54 | 0.32 | 0.09 | |||||||||||||||
Less distributions: | ||||||||||||||||||||
Dividends from net investment income | — | — | — | — | (0.01 | ) | ||||||||||||||
Total distributions | — | — | — | — | (0.01 | ) | ||||||||||||||
Net asset value, end of period | $ | 13.61 | $ | 13.33 | $ | 12.73 | $ | 12.19 | $ | 11.87 | ||||||||||
Total Returnb | 2.10 | % | 4.71 | % | 4.43 | % | 2.70 | % | 0.72 | % | ||||||||||
Ratios/Supplemental Data | ||||||||||||||||||||
Net assets, end of period (in thousands) | $ | 268,318 | $ | 168,661 | $ | 99,044 | $ | 71,655 | $ | 66,084 | ||||||||||
Ratios to average net assets: | ||||||||||||||||||||
Net investment income | 1.94 | % | 4.59 | % | 4.43 | % | 2.63 | % | 0.70 | % | ||||||||||
Total expensesc | 0.65 | % | 0.66 | % | 0.68 | % | 0.69 | % | 0.65 | % | ||||||||||
Net expensesd | 0.65 | % | 0.66 | % | 0.68 | % | 0.69 | % | 0.65 | % | ||||||||||
Net expenses prior to custodian earnings credits and net of expense waivers | 0.65 | % | 0.66 | % | 0.68 | % | 0.69 | % | 0.65 | % | ||||||||||
a | Net investment income (loss) was computed using average shares outstanding throughout the period. |
b | Total return does not take into account any of the expenses associated with an investment in variable insurance products offered by Security Benefit Life Insurance Company. If total return had taken into account these expenses, performance would have been lower. Shares of a series of SBL Fund are available only through the purchase of such products. |
c | Total expense information reflects the expense ratios absent expense reductions by the Investment Manager and earnings credits, as applicable. |
d | Net expense information reflects the expense ratios after voluntary expense waivers, reimbursements and custodian earnings credits, as applicable. |
The accompanying notes are an integral part of the financial statements
26
Table of Contents
This page left blank intentionally.
27
Table of Contents
| Managers’ Commentary | Series D | |
February 16, 2009 | (Global Series) |
![]()
 |  |  | ||
John Boich SGI Portfolio Manager | David Whitall SGI Portfolio Manager | Scott Klimo SGI Portfolio Manager |
To Our Shareholders
Series D of the SBL Fund – Global Series returned –38.38% outperforming the benchmark, Morgan Stanley Capital International, Inc. (MSCI) World Index return of –40.71% and achieving the top quartile in its peer group, which lost –41.09% for the year ended December 31, 2008.
Security Global Investors assumed responsibility for managing all assets in the Series as of May 1, 2008. The Security Global Investors’ global equity team has more than 17 years experience in managing global equities. The team consists of portfolio managers John Boich, David Whittall, and Scott Klimo.
The SGI global team believes that excess return opportunities exist in global stock markets and that those opportunities are best identified and captured at the security level. Investing globally offers the greatest exposure to excess return opportunities while enhancing the ability to diversify risk. Successfully identifying and exploiting these opportunities requires thorough fundamental research. Superior stock selection continues to be the trademark for the team’s performance as selection effect accounts for nearly all the return of the portfolio.
The investment team employs a bottom-up approach to the global equity universe to identify and invest in the best opportunities around the world. The team melds sophisticated screening techniques, input from management meetings, and insights into global/regional trends to identify investment opportunities from around the world. Relative valuation and relative business momentum is a specific focus of the screening criteria. The team’s fundamental research is original and uses primary sources to substantiate forecasts and investment theses.
Telecommunications Services Top Performer
In a market in which there was no place to hide from the carnage, there was no sector that was able to produce positive gains during the calendar year. Cash equivalents were the only securities that were relatively safe from the market meltdown. Sectors stood out as being beneficial to a portfolio, on an absolute basis or relative to a benchmark, because of lower losses than in other sectors.
Only one sector in the portfolio lost less than –20% during the year. The telecommunications services sector, a weighting of 5%, was down –16% for the period. The securities behind the relatively limited losses in the sector were Syniverse Holdings, Inc. and NTT DoCoMo, Inc., which gained 40% and 24%, respectively.
Financials, Industrials, and Energy Disappoint
Some of the hardest hit sectors in the market were the largest detractors for the portfolio, particularly financials and energy, which were down –60% and –77%, respectively. As a much larger weight in the portfolio than energy, holdings in the industrials sector hurt performance.
In the financials sector, Anglo Irish Bank plunged –97%. Additionally, National City Corporation dropped –76% while UBI Banca lost –39%. Few banks and financial firms were able to end the year unscathed by the meltdown and subsequent government bailouts.
The industrials sector was a double-digit weight in the portfolio and several main holdings brought down performance. Joy Global, Inc. lost –60% while Suntech Power Holdings Company, Ltd. was down –57% and Avenge, Ltd. decreased –51%.
Energy was another sector that was hurt by the overall economy in 2008. The portfolio held positions in Bumi Resources, which crumbled –89%, and Consol Energy, Inc., which was down –47%.
Market Outlook
The Series’ core strategy continues to focus on identifying companies with sustainable long-term earnings and cash flow, strong economic returns on invested capital, and healthy balance sheets.
28
Table of Contents
| Managers’ Commentary | Series D | |
February 16, 2009 | (Global Series) |
The 50% decline in the U.S. market that occurred over almost three years in the wake of the dotcom bubble occurred this time in a mere 11 months. The housing market continues its rapid decline. As long as prices and sales continue to fall, mortgage-related instruments will continue to crumble and capital will evaporate. Unemployment is likely to continue to rise, thus making the recovery in the housing market even more difficult. There is a possibility that unemployment will reach double digits and not peak until 2011. These factors point to a weak economy, dismal corporate earnings, and a lackluster market in 2009.
We recognize there are many investment alternatives available today and thank you for your business and the confidence you place in us.
Sincerely,
John Boich, SGI Portfolio Manager
David Whittall, SGI Portfolio Manager
Scott Klimo, SGI Portfolio Manager
29
Table of Contents
| Series D | ||
| Performance Summary | (Global Series) | |
December 31, 2008 | (unaudited) |
PERFORMANCE
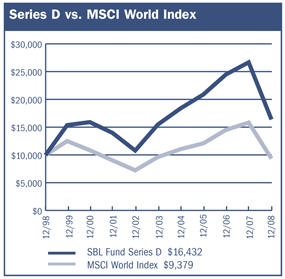
$10,000 Over Ten Years
The chart above assumes a hypothetical $10,000 investment in Series D (Global Series) on December 31, 1998 and reflects the fees and expenses of Series D. The MSCI World Index is an unmanaged capitalization-weighted index that is designed to measure global developed market equity performance.
Average Annual Returns
Periods Ended 12-31-081 | 1 Year | 5 Years | 10 Years | ||||||
Series D | (38.38 | )% | 1.20 | % | 5.09 | % |
1 | Performance figures do not reflect fees and expenses associated with an investment in variable insurance products offered by Security Benefit Life Insurance Company. If returns had taken into account these fees and expenses, performance would have been lower. Shares of a Series of SBL Fund are available only through the purchase of such products. |
The performance data quoted above represents past performance. Past performance is not predictive of future performance. The investment return and principal value of an investment will fluctuate so that an investor’s shares, when redeemed, may be worth more or less than their original cost.
Portfolio Composition by Sector
Consumer Discretionary | 14.98 | % | |
Consumer Staples | 20.96 | ||
Energy | 2.25 | ||
Financials | 3.92 | ||
Health Care | 25.58 | ||
Industrials | 5.95 | ||
Information Technology | 14.55 | ||
Materials | 0.89 | ||
Telecommunication Services | 6.46 | ||
Utilities | 1.47 | ||
Short Term Investments | 4.92 | ||
Liabilities, Less Cash & Other Assets | (1.93 | ) | |
Total Net Assets | 100.00 | % | |
The accompanying notes are an integral part of the financial statements
30
Table of Contents
| Series D | ||
| Performance Summary | (Global Series) | |
December 31, 2008 | (unaudited) |
Information About Your Series Expenses
Calculating your ongoing Series expenses
Example
As a shareholder of the Series, you incur ongoing costs, including management fees and other series expenses. Performance figures and expense ratios do not reflect fees and expenses associated with an investment in variable insurance products. Shares of a Series of SBL Fund are available only through the purchase of such products. This example is intended to help you understand your ongoing costs (in dollars) of investing in the Series and to compare these costs with ongoing costs of investing in other mutual funds. The example is based on an investment of $1,000 invested at the beginning of the period and held for the entire period, July 1, 2008 through December 31, 2008.
Actual Expenses
The first line in the table provides information about actual account values and actual expenses. You may use the information in this table, together with the amount you invested, to estimate the expenses that you paid over the period. Simply divide your account value by $1,000 (for example, an $8,600 account value divided by $1,000 = 8.6), then multiply the result by the number in the table under the heading entitled “Expenses Paid During the Period” to estimate the expenses you paid on your account during this period.
Hypothetical Example for Comparison Purposes
The second line in the table provides information about hypothetical account values and hypothetical expenses based on the Series actual expense ratio and an assumed rate of return of 5% per year before expenses, which is not the Series actual return. The hypothetical account values and expenses may not be used to estimate the actual ending account balance or expenses you paid for the period. You may use this information to compare the ongoing costs of investing in the Series and other funds. To do so, compare this 5% hypothetical example with the 5% hypothetical examples that appear in the shareholder reports of the other mutual funds.
Please note that the expenses shown in the table are meant to highlight your ongoing costs only and do not reflect any fees and expenses associated with an investment in variable insurance products. Therefore, the second line is useful in comparing ongoing costs only, and will not help you determine the relative total costs of owning different funds. In addition, if these fees and expenses associated with an investment in variable insurance products were included, your costs would have been higher.
Series Expenses
| Beginning Account Value 7/1/2008 | Ending Account Value 12/31/20081 | Expenses Paid During Period2 | |||||||
Series D (Global Series) | |||||||||
Actual | $ | 1,000.00 | $ | 690.30 | $ | 5.44 | |||
Hypothetical | 1,000.00 | 1,018.70 | 6.50 | ||||||
1 | The actual ending account value is based on the actual total return of the Series for the period July 1, 2008 to December 31, 2008 after actual expenses and will differ from the hypothetical ending account value which is based on the Series expense ratio and a hypothetical annual return of 5% before expenses. The actual cumulative return at net asset value for the period July 1, 2008 to December 31, 2008 was (30.97%). |
2 | Expenses are equal to the Series annualized expense ratio of 1.28%, net of any applicable fee waivers, multiplied by the average account value over the period, multiplied by 184/366 (to reflect the one-half year period). |
31
Table of Contents
| Schedule of Investments | Series D | |
| December 31, 2008 | (Global Series) |
| Shares | Value | ||||
COMMON STOCKS—97.0% | |||||
Belgium—0.7% | |||||
Mobistar S.A. | 27,919 | $ | 2,014,021 | ||
Bermuda—2.7% | |||||
Accenture, Ltd. | 199,524 | 6,542,392 | |||
Max Capital Group, Ltd. | 54,900 | 971,730 | |||
| 7,514,122 | |||||
Canada—1.4% | |||||
Empire Company, Ltd. | 39,504 | 1,582,628 | |||
George Weston, Ltd. | 44,308 | 2,183,351 | |||
| 3,765,979 | |||||
Cayman Islands—2.3% | |||||
Herbalife, Ltd. | 70,404 | 1,526,359 | |||
Hutchison Telecommunications International, Ltd. | 4,068,000 | 1,091,742 | |||
Netease.com ADR* | 162,900 | 3,600,090 | |||
| 6,218,191 | |||||
France—1.8% | |||||
UBISOFT Entertainment* | 261,954 | 5,104,782 | |||
Germany—0.8% | |||||
Norddeutsche Affinerie AG | 53,867 | 2,106,972 | |||
Hong Kong—0.7% | |||||
PCCW, Ltd. | 4,270,000 | 2,038,475 | |||
Israel—2.0% | |||||
Check Point Software Technologies* | 289,566 | 5,498,858 | |||
Japan—15.8% | |||||
Asahi Breweries, Ltd. | 122,300 | 2,074,618 | |||
Astellas Pharma, Inc. | 47,467 | 1,899,203 | |||
Chiba Bank, Ltd. | 345,000 | 2,091,485 | |||
Circle K Sunkus Company, Ltd. | 238,957 | 4,277,390 | |||
Hitachi High-Technologies Corporation | 63,009 | 986,892 | |||
Hokkaido Electric Power Company, Inc. | 79,100 | 1,983,494 | |||
JGC Corporation | 263,725 | 3,802,175 | |||
Kirin Holdings Company, Ltd. | 493,195 | 6,392,916 | |||
K’s Holdings Corporation | 114,905 | 1,908,645 | |||
Nintendo Company, Ltd. | 8,680 | 3,228,989 | |||
Nissha Printing Company, Ltd. | 48,959 | 1,904,935 | |||
NTT DoCoMo, Inc. | 3,967 | 7,713,186 | |||
Prima Meat Packers, Ltd. | 739,770 | 1,443,255 | |||
Ryohin Keikaku Company, Ltd. | 40,485 | 1,892,052 | |||
Takeda Pharmaceutical Company, Ltd. | 41,100 | 2,102,001 | |||
| 43,701,236 | |||||
Papua New Guinea—1.5% | |||||
Oil Search, Ltd. | 1,230,178 | 4,068,657 | |||
Singapore—2.0% | |||||
Singapore Press Holdings, Ltd. | 2,543,150 | 5,521,254 | |||
South Africa—1.0% | |||||
Aveng, Ltd. | 826,215 | 2,681,456 | |||
Switzerland—4.3% | |||||
ACE, Ltd. | 110,665 | 5,856,392 | |||
Actelion, Ltd.* | 37,948 | 2,112,767 | |||
Ciba Holding AG | 7,792 | 350,563 | |||
Lonza Group AG | 39,359 | 3,598,717 | |||
| 11,918,439 | |||||
Taiwan, Province of China—0.9% | |||||
AU Optronics Corporation ADR | 306,789 | 2,356,140 | |||
United Kingdom—6.1% | |||||
AstraZeneca plc | 50,288 | 2,059,654 | |||
Cadbury plc | 593,003 | 5,230,471 | |||
GlaxoSmithKline plc | 114,397 | 2,144,057 | |||
Imperial Tobacco Group plc | 209,649 | 5,625,513 | |||
WH Smith plc | 348,663 | 1,827,638 | |||
| 16,887,333 | |||||
United States—53.0% | |||||
99 Cents Only Stores* | 172,900 | 1,889,797 | |||
Abbott Laboratories | 98,000 | 5,230,259 | |||
Activision Blizzard, Inc.* | 314,800 | 2,719,872 | |||
Alkermes, Inc.* | 101,107 | 1,076,790 | |||
Altria Group, Inc. | 542,751 | 8,173,830 | |||
Amgen, Inc.* | 32,731 | 1,890,215 | |||
Amsurg Corporation* | 90,000 | 2,100,600 | |||
Apollo Group, Inc.* | 27,246 | 2,087,589 | |||
AT&T, Inc. | 87,338 | 2,489,133 | |||
Automatic Data Processing, Inc. | 52,700 | 2,073,218 | |||
Biogen Idec, Inc.* | 42,637 | 2,030,800 | |||
Bristol-Myers Squibb Company | 91,700 | 2,132,025 | |||
Cal-Maine Foods, Inc. | 76,000 | 2,181,200 | |||
Casey’s General Stores, Inc. | 73,500 | 1,673,595 | |||
Cephalon, Inc.* | 103,326 | 7,960,234 | |||
Charles River Laboratories International, Inc.* | 53,700 | 1,406,940 | |||
Chemed Corporation | 42,700 | 1,698,179 | |||
Comtech Telecommunications Corporation* | 42,700 | 1,956,514 | |||
Cubist Pharmaceuticals, Inc.* | 72,700 | 1,756,432 | |||
Emergency Medical Services Corporation* | 44,547 | 1,630,866 | |||
Emergent Biosolutions, Inc.* | 75,650 | 1,975,222 | |||
Endo Pharmaceuticals Holdings, Inc.* | 88,600 | 2,292,968 | |||
Family Dollar Stores, Inc. | 79,065 | 2,061,225 | |||
General Electric Company | 116,700 | 1,890,540 | |||
Gentiva Health Services, Inc.* | 31,421 | 919,378 | |||
Genuine Parts Company | 75,707 | 2,866,267 | |||
Google, Inc.* | 20,010 | 6,156,077 | |||
Harley-Davidson, Inc. | 319,208 | 5,416,960 | |||
InterDigital, Inc.* | 77,800 | 2,139,500 | |||
ITT Educational Services, Inc.* | 23,288 | 2,211,893 | |||
Jarden Corporation* | 192,756 | 2,216,694 | |||
Johnson & Johnson | 77,356 | 4,628,209 | |||
King Pharmaceuticals, Inc.* | 204,500 | 2,171,790 | |||
Kroger Company | 73,866 | 1,950,801 | |||
Laboratory Corporation of America Holdings* | 31,600 | 2,035,356 | |||
LHC Group, Inc.* | 57,400 | 2,066,400 | |||
Lincare Holdings, Inc.* | 79,408 | 2,138,458 | |||
Lockheed Martin Corporation | 47,550 | 3,998,004 | |||
Martek Biosciences Corporation | 52,610 | 1,594,609 | |||
MFA Mortgage Investments, Inc. | 322,600 | 1,900,114 | |||
Millipore Corporation* | 40,200 | 2,071,104 | |||
Mirant Corporation* | 109,818 | 2,072,266 | |||
The accompanying notes are an integral part of the financial statements
32
Table of Contents
| Schedule of Investments | Series D | |
| December 31, 2008 | (Global Series) |
| Shares | Value | |||||||
COMMON STOCKS—97.0% (continued) | ||||||||
United States—53.0% (continued) | ||||||||
NetFlix, Inc.* | 73,415 | $ | 2,194,374 | |||||
Northrop Grumman Corporation | 47,900 | 2,157,416 | ||||||
OSI Pharmaceuticals, Inc.* | 57,915 | 2,261,581 | ||||||
Pantry, Inc.* | 104,400 | 2,239,380 | ||||||
Philip Morris International, Inc. | 122,552 | 5,332,238 | ||||||
Questcor Pharmaceuticals, Inc.* | 217,200 | 2,022,132 | ||||||
RadioShack Corporation | 159,728 | 1,907,152 | ||||||
Ruddick Corporation | 76,500 | 2,115,225 | ||||||
Sherwin-Williams Company | 33,700 | 2,013,575 | ||||||
Spartan Stores, Inc. | 74,347 | 1,728,568 | ||||||
Strayer Education, Inc. | 9,731 | 2,086,424 | ||||||
Syniverse Holdings, Inc.* | 207,700 | 2,479,938 | ||||||
TiVo, Inc.* | 141,600 | 1,013,856 | ||||||
Viropharma, Inc.* | 121,400 | 1,580,628 | ||||||
Winn-Dixie Stores, Inc.* | 130,700 | 2,104,270 | ||||||
World Fuel Services Corporation | 58,150 | 2,151,550 | ||||||
| 146,320,230 | ||||||||
TOTAL COMMON STOCKS (Cost $280,908,273) | $ | 267,716,145 | ||||||
| Principal Amount | Value | |||||||
SHORT TERM INVESTMENTS—4.9% | ||||||||
State Street Treasury Money Market Fund | $ | 13,592,199 | $ | 13,592,199 | ||||
TOTAL SHORT TERM INVESTMENTS (Cost $13,592,199) | $ | 13,592,199 | ||||||
Total Investments—101.9% (cost $294,500,472) | $ | 281,308,344 | ||||||
Liabilities, Less Cash & Other Assets—(1.9%) |
| (5,342,847 | ) | |||||
Total Net Assets—100.0% | $ | 275,965,497 | ||||||
INVESTMENT CONCENTRATION | ||||||||
At December 31, 2008, the investment diversification of the Series was as follows: | ||||||||
Industry | % of Net Assets | Value | ||||||
Pharmaceuticals | 10.1 | % | $ | 28,262,926 | ||||
Biotechnology | 8.1 | 22,658,650 | ||||||
Tobacco | 6.9 | 19,131,581 | ||||||
Food Retail | 6.6 | 18,126,640 | ||||||
Money Markets | 4.9 | 13,592,199 | ||||||
Wireless Telecommunication Services | 4.8 | 13,298,887 | ||||||
Home Entertainment Software | 4.0 | 11,053,643 | ||||||
Health Care Services | 3.8 | 10,488,637 | ||||||
Internet Software & Services | 3.5 | 9,756,167 | ||||||
Packaged Foods & Meats | 3.2 | 8,854,926 | ||||||
Brewers | 3.0 | 8,467,534 | ||||||
Life Sciences Tools & Services | 2.6 | 7,076,761 | ||||||
IT Consulting & Other Services | 2.3 | 6,542,392 | ||||||
Construction & Engineering | 2.4 | 6,483,631 | ||||||
Education Services | 2.3 | 6,385,906 | ||||||
Aerospace & Defense | 2.2 | 6,155,420 | ||||||
Property & Casualty Insurance | 2.1 | 5,856,392 | ||||||
General Merchandise Stores | 2.1 | 5,843,074 | ||||||
Publishing | 2.0 | 5,521,254 | ||||||
Systems Software | 2.0 | 5,498,858 | ||||||
Motorcycle Manufacturers | 2.0 | 5,416,960 | ||||||
Integrated Telecommunication Services | 1.6 | % | 4,527,608 | |||||
Communications Equipment | 1.5 | 4,096,014 | ||||||
Oil & Gas Exploration & Production | 1.5 | 4,068,657 | ||||||
Computer & Electronics Retail | 1.4 | 3,815,797 | ||||||
Distributors | 1.0 | 2,866,267 | ||||||
Electronic Components | 0.9 | 2,356,140 | ||||||
Housewares & Specialties | 0.8 | 2,216,694 | ||||||
Internet Retail | 0.8 | 2,194,374 | ||||||
Oil & Gas Refining & Marketing | 0.8 | 2,151,550 | ||||||
Diversified Metals & Mining | 0.8 | 2,106,972 | ||||||
Health Care Facilities | 0.8 | 2,100,600 | ||||||
Regional Banks | 0.8 | 2,091,485 | ||||||
Data Processing & Outsourced Services | 0.8 | 2,073,218 | ||||||
Independent Power Producers & Energy Traders | 0.8 | 2,072,266 | ||||||
Home Improvement Retail | 0.7 | 2,013,575 | ||||||
Electric Utilities | 0.7 | 1,983,494 | ||||||
Commercial Printing | 0.7 | 1,904,935 | ||||||
Mortgage REIT’s | 0.7 | 1,900,114 | ||||||
Industrial Conglomerates | 0.7 | 1,890,540 | ||||||
Specialty Stores | 0.7 | 1,827,638 | ||||||
Food Distributors | 0.6 | 1,728,568 | ||||||
Personal Products | 0.6 | 1,526,359 | ||||||
Application Software | 0.4 | 1,013,856 | ||||||
Technology Distributors | 0.4 | 986,892 | ||||||
Reinsurance | 0.4 | 971,730 | ||||||
Specialty Chemicals | 0.1 | 350,563 | ||||||
Total Investments | 101.9 | $ | 281,308,344 | |||||
For federal income tax purposes the identified cost of investments owned at December 31, 2008 was $308,098,140.
| ADR | American Depositary Receipt |
| plc | Public Limited Company |
| * | Non-income producing security |
The accompanying notes are an integral part of the financial statements
33
Table of Contents
Series D
(Global Series)
Statement of Assets and Liabilities
December 31, 2008
Assets: | ||||
Investments, at value* | $ | 281,308,344 | ||
Cash denominated in a foreign currency, at value** | 337,998 | |||
Receivables: | ||||
Fund shares sold | 164,523 | |||
Securities sold | 373,980 | |||
Interest | 41 | |||
Dividends | 595,305 | |||
Foreign taxes recoverable | 138,043 | |||
Prepaid expenses | 8,665 | |||
| �� | ||||
Total assets | 282,926,899 | |||
Liabilities: | ||||
Cash overdraft | 336,417 | |||
Payable for: | ||||
Fund shares redeemed | 185,282 | |||
Securities purchased | 6,064,998 | |||
Management fees | 224,847 | |||
Administration fees | 35,227 | |||
Transfer agent/maintenance fees | 2,083 | |||
Custodian fees | 12,003 | |||
Directors’ fees | 5,515 | |||
Professional fees | 69,297 | |||
Other fees | 25,733 | |||
Total liabilities | 6,961,402 | |||
Net assets | $ | 275,965,497 | ||
Net assets consist of: | ||||
Paid in capital | $ | 394,100,363 | ||
Undistributed net investment income | 7,455,215 | |||
Accumulated net realized loss on sale of investments and foreign currency transactions | (112,387,794 | ) | ||
Net unrealized depreciation in value of investments and translation of assets and liabilities in foreign currencies | (13,202,287 | ) | ||
Net assets | $ | 275,965,497 | ||
Capital shares authorized | unlimited | |||
Capital shares outstanding | 37,269,678 | |||
Net asset value per share (net assets divided by shares outstanding) | $ | 7.40 | ||
* Investments, at cost | $ | 294,500,472 | ||
** Cash denominated in a foreign currency, at cost | 335,283 | |||
Statement of Operations
For Year Ended December 31, 2008
Investment Income: | ||||
Dividends (net of foreign withholding tax $378,977) | $ | 9,427,855 | ||
Interest | 325,621 | |||
Total investment income | 9,753,476 | |||
Expenses: | ||||
Management fees | 4,167,035 | |||
Administration fees | 640,532 | |||
Transfer agent/maintenance fees | 25,328 | |||
Custodian fees | 115,337 | |||
Directors’ fees | 26,845 | |||
Professional fees | 131,824 | |||
Reports to shareholders | 97,870 | |||
Other | 29,789 | |||
Total expenses | 5,234,560 | |||
Less: | ||||
Earnings credits applied | (20,688 | ) | ||
Net expenses | 5,213,872 | |||
Net investment income | 4,539,604 | |||
Net Realized and Unrealized Gain (Loss): | ||||
Net realized gain (loss) during the year on: | ||||
Investments | (106,604,782 | ) | ||
Foreign currency transactions | (571,814 | ) | ||
Net realized loss | (107,176,596 | ) | ||
Net unrealized appreciation (depreciation) during the year on: | ||||
Investments | (87,956,119 | ) | ||
Translation of assets and liabilities in foreign currencies | (28,778 | ) | ||
Net unrealized depreciation | (87,984,897 | ) | ||
Net realized and unrealized loss | (195,161,493 | ) | ||
Net decrease in net assets resulting from operations | $ | (190,621,889 | ) | |
The accompanying notes are an integral part of the financial statements
34
Table of Contents
| Series D | ||
| Statement of Changes in Net Assets | (Global Series) |
| Year Ended December 31, 2008 | Year Ended December 31, 2007 | |||||||
Increase (decrease) in net assets from operations: | ||||||||
Net investment income | $ | 4,539,604 | $ | 3,789,635 | ||||
Net realized gain (loss) during the year on investments and foreign currency transactions | (107,176,596 | ) | 145,900,561 | |||||
Net unrealized depreciation during the year on investments and translation of assets and liabilities in foreign currencies | (87,984,897 | ) | (102,415,461 | ) | ||||
Net increase (decrease) in net assets resulting from operations | (190,621,889 | ) | 47,274,735 | |||||
Capital share transactions: | ||||||||
Proceeds from sale of shares | 71,253,122 | 145,821,140 | ||||||
Cost of shares redeemed | (154,842,547 | ) | (213,924,666 | ) | ||||
Net decrease from capital share transactions | (83,589,425 | ) | (68,103,526 | ) | ||||
Net decrease in net assets | (274,211,314 | ) | (20,828,791 | ) | ||||
Net assets: | ||||||||
Beginning of year | 550,176,811 | 571,005,602 | ||||||
End of year | $ | 275,965,497 | $ | 550,176,811 | ||||
Undistributed net investment income at end of year | $ | 7,455,215 | $ | 2,748,317 | ||||
Capital share activity: | ||||||||
Shares sold | 7,091,222 | 12,428,028 | ||||||
Shares redeemed | (15,639,694 | ) | (18,362,297 | ) | ||||
Total capital share activity | (8,548,472 | ) | (5,934,269 | ) | ||||
The accompanying notes are an integral part of the financial statements
35
Table of Contents
| Financial Highlights | Series D | |
Selected data for each share of capital stock outstanding throughout each year | (Global Series) |
| 2008a | 2007b | 2006 | 2005 | Year Ended December 31, 2004 | ||||||||||||||||
Per Share Data | ||||||||||||||||||||
Net asset value, beginning of period | $ | 12.01 | $ | 11.03 | $ | 9.40 | $ | 8.28 | $ | 6.97 | ||||||||||
Income (loss) from investment operations: | ||||||||||||||||||||
Net investment incomec | 0.11 | 0.08 | 0.03 | 0.03 | 0.03 | |||||||||||||||
Net gain (loss) on securities (realized and unrealized) | (4.72 | ) | 0.90 | 1.60 | 1.09 | 1.28 | ||||||||||||||
Total from investment operations | (4.61 | ) | 0.98 | 1.63 | 1.12 | 1.31 | ||||||||||||||
Net asset value, end of period | $ | 7.40 | $ | 12.01 | $ | 11.03 | $ | 9.40 | $ | 8.28 | ||||||||||
Total Returnd | (38.38 | )% | 8.88 | % | 17.34 | % | 13.53 | % | 18.79 | % | ||||||||||
Ratios/Supplemental Data | ||||||||||||||||||||
Net assets, end of period (in thousands) | $ | 275,965 | $ | 550,177 | $ | 571,006 | $ | 516,213 | $ | 466,577 | ||||||||||
Ratios to average net assets: | ||||||||||||||||||||
Net investment income | 1.09 | % | 0.67 | % | 0.32 | % | 0.30 | % | 0.37 | % | ||||||||||
Total expensese | 1.26 | % | 1.26 | % | 1.24 | % | 1.24 | % | 1.23 | % | ||||||||||
Net expensesf | 1.25 | % | 1.26 | % | 1.24 | % | 1.24 | % | 1.23 | % | ||||||||||
Net expenses prior to custodian earnings credits and net of expense waivers | 1.26 | % | 1.26 | % | 1.24 | % | 1.24 | % | 1.23 | % | ||||||||||
Portfolio turnover rate | 302 | %g | 115 | % | 23 | % | 33 | % | 28 | % | ||||||||||
a | SGI became the sub-advisor of Series D effective May 1, 2008. Prior to May 1, 2008, Security Investors (SI) paid Oppenheimer Funds for sub-advising 50% of Series D. SGI sub-advised the remaining 50%. |
b | Security Global Investors, LLC (SGI) became sub-advisor of 50% of Series D effective August 1, 2007. OppenheimerFunds sub-advises the remaining 50%. Prior to August 1, 2007, OppenheimerFunds sub-advised the entire Series. |
c | Net investment income (loss) was computed using average shares outstanding throughout the period. |
d | Total return does not take into account any of the expenses associated with an investment in variable insurance products offered by Security Benefit Life Insurance Company. If total return had taken into account these expenses, performance would have been lower. Shares of a series of SBL Fund are available only through the purchase of such products. |
e | Total expense information reflects the expense ratios absent expense reductions by the Investment Manager and earnings credits, as applicable. |
f | Net expense information reflects the expense ratios after voluntary expense waivers, reimbursements and custodian earnings credits, as applicable. |
g | Significant variation in the portfolio turnover rate is due to the re-alignment of the Series portfolio following the appointment of SGI as sub-advisor. |
The accompanying notes are an integral part of the financial statements
36
Table of Contents
This page left blank intentionally.
37
Table of Contents
| Managers’ Commentary | Series E | |
February 16, 2009 | (U.S. Intermediate Bond Series) |
![]()
 |  |  | ||
Steven M. Bowser Co-Portfolio Manager | Christopher L. Phalen Co-Portfolio Manager | Daniel W. Portanova Co-Portfolio Manager | ||
To Our Shareholders:
Series E of the SBL Fund—U.S. Intermediate Bond Series earned a return of -8.66%1 for the year ended December 31, 2008, which lagged the benchmark Barclays Capital U.S. Aggregate Bond Index (formerly Lehman Brothers U.S. Bond Index) return of 5.24% and the median return of its peer group of –3.42% for the same period.
The U.S. Intermediate Bond Series will primarily invest in a diversified portfolio of investment grade debt securities and maintain a dollar-weighted average duration of 3 to 10 years. The Series’ investment approach uses a bottom-up process in selecting asset classes and securities. We emphasize rigorous credit analysis and relative value in selecting securities. Credit analysis includes assessing factors such as an issuer’s management experience, cash flow, position in its market, capital structure, and general economic and market factors. Relative value analysis includes earnings growth, profitability trends, the issuer’s financial strength, and valuation analysis. Relative valuation also compares the credit risk and yield of a security to that of other securities of the same or another asset class.
Composition of Portfolio Assets
At the end of the year, the Series held 39% in corporate issues, 39% in mortgage-backed securities, 12% in U.S. government securities, and 8% in a repurchase agreement. Other securities, such as asset-backed securities and preferred stock, constituted 2% of the portfolio.
Series Performance
The dominant theme in 2008 was the sub-prime mortgage effect and credit crunch throughout the financial system and securities markets. The turning point in the year was in June with an abrupt deterioration in credit markets as the sub-prime mortgage concerns began to unfold. The credit crunch worsened in August as the extent of the crisis became more apparent.
In response to sub-prime concerns, there was a flight-to-quality, which rallied Treasury securities to historic levels while corporate credit and asset-backed securities under-performed. Traditionally, the majority of return for fixed income securities is generated through the coupon income. For this reason, the Series will generally invest in high quality asset classes that generate more yield than U.S. Treasury securities. In years such as 2008, when there is a shock to the financial system and a deep economic recession, the sectors that generate more income will underperform. Historically, the strategy of overweighting the higher income asset classes will drive outperformance over the long term.
As the sub-prime and credit crisis materialized, financial companies underperformed as many surprised the market with their exposure to sub-prime investments and investors moved out of the sector due to concerns about future losses. The financial corporate bond securities in the portfolio are primarily large diversified financial institutions, which the team continues to believe have the ability to repay all their obligations.
Uncertainty negatively affected all non-Treasury related securities. The Series’ largest detractor was a victim of the mortgage market turmoil. The Series held a CDO asset backed by sub-prime collateral. While still rated AAA, the security was written down by the Series almost completely due to complete lack of liquidity in the market, making it difficult to price.
Market Outlook
The upcoming year provides a challenging economic environment. Concerns regarding a potential recession continue to increase as economic data for the 4th quarter was relatively weak. The housing market shows no signs of recovery and continues to be a significant drag on GDP growth. Consumer spending has started to slow as we witnessed the weakest holiday season since 2002 and unemployment has started to move up. Commodity prices also remain high, which could negatively affect consumers’ disposable income. With this background, 2009 will be a challenging year for the consumer and fixed income portfolio managers.
The Federal Reserve has moved aggressively to reduce interest rates to a range of 0% to 0.25% and the federal government is planning additional fiscal stimulus. While
38
Table of Contents
| Managers’ Commentary | Series E | |
| February 16, 2009 | (U.S. Intermediate Bond Series) |
we do not believe all these actions can make the world’s sub-prime problems disappear, it could help to soften the blow and the duration of the economic recession. The effects of the Federal Reserve rate reduction and an additional fiscal stimulus injection by Congress should provide support for the second half of the year. Valuations in the credit sectors are reflecting a very negative economic environment and we look to add high quality securities, as we believe the risk/return is appealing in some securities.
We will continue to monitor the economic and market conditions and will adjust the asset mix and maturity structure in the portfolio accordingly.
Thank you for your investment in the U.S. Intermediate Bond Series.
We recognize there are many investment fund alternatives available today and appreciate the confidence you place in us.
Sincerely,
Steven M. Bowser, Portfolio Manager
Christopher L. Phalen, Portfolio Manager
Daniel W. Portanova, Portfolio Manager
1 | Fee waivers and/or reimbursements reduce Series expenses and in the absence of such waiver the performance quoted would be reduced. |
39
Table of Contents
| Series E | ||
| Performance Summary | (U.S. Intermediate Bond Series) | |
| December 31, 2008 | (unaudited) |
PERFORMANCE
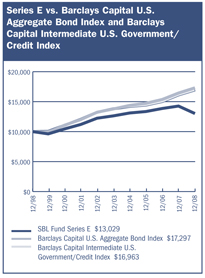
$10,000 Over 10 Years
The chart above assumes a hypothetical $10,000 investment in Series E (U.S. Intermediate Bond Series) on December 31, 1998 and reflects the fees and expenses of Series E. The Barclays Capital U.S. Aggregate Bond Index (formerly known as Lehman Brothers U.S. Aggregate Bond Index) is an unmanaged index that tracks investment grade bonds including U.S. Treasury and agency issues, corporate bond issues, asset-backed, commercial mortgage-backed and mortgage-backed securities and Yankee issues. The Barclays Capital Intermediate U.S. Government Credit Index is an unmanaged Index that tracks U.S. dollar denominated U.S. treasuries, government-related and investment grade U.S. corporate securities that have a remaining maturing of greater than or equal to 1 year and less than 10 years. The Barclays Capital Intermediate U.S. Government/Credit Index replaced the Barclays Capital U.S. Aggregate Bond Index as the Series primary benchmark effective November 24, 2008, to provide a more meaningful comparison of the Series’ performance in light of the investment strategies that it employs.
Average Annual Returns
Periods Ended 12-31-081 | 1 Year | 5 Years | 10 Years | ||||||
Series E | (8.66 | )% | 0.63 | % | 2.68 | % |
1 | Performance figures do not reflect fees and expenses associated with an investment in variable insurance products offered by Security Benefit Life Insurance Company. If returns had taken into account these fees and expenses, performance would have been lower. Shares of a Series of SBL Fund are available only through the purchase of such products. |
The performance data quoted above represents past performance. Past performance is not predictive of future performance. The investment return and principal value of an investment will fluctuate so that an investor’s shares, when redeemed, may be worth more or less than their original cost.
Portfolio Composition by Quality Ratings
(Based on Standard and Poor’s Ratings)
AAA | 58.53 | % | |
AA | 6.72 | ||
A | 7.86 | ||
BBB | 12.88 | ||
BB | 3.03 | ||
C | 0.23 | ||
D | 1.21 | ||
Preferred Stock | 0.74 | ||
Repurchase Agreement | 8.12 | ||
Cash & Other Assets, Less Liabilities | 0.68 | ||
Total Net Assets | 100.00 | % | |
The accompanying notes are an integral part of the financial statements
40
Table of Contents
| Series E | ||
| Performance Summary | (U.S. Intermediate Bond Series) | |
| December 31, 2008 | (unaudited) |
Information About Your Series Expenses
Calculating your ongoing Series expenses
Example
As a shareholder of the Series, you incur ongoing costs, including management fees and other series expenses. Performance figures and expense ratios do not reflect fees and expenses associated with an investment in variable insurance products. Shares of a Series of SBL Fund are available only through the purchase of such products. This example is intended to help you understand your ongoing costs (in dollars) of investing in the Series and to compare these costs with ongoing costs of investing in other mutual funds. The example is based on an investment of $1,000 invested at the beginning of the period and held for the entire period, July 1, 2008 through December 31, 2008.
Actual Expenses
The first line in the table provides information about actual account values and actual expenses. You may use the information in this table, together with the amount you invested, to estimate the expenses that you paid over the period. Simply divide your account value by $1,000 (for example, an $8,600 account value divided by $1,000 = 8.6), then multiply the result by the number in the table under the heading entitled “Expenses Paid During the Period” to estimate the expenses you paid on your account during this period.
Hypothetical Example for Comparison Purposes
The second line in the table provides information about hypothetical account values and hypothetical expenses based on the Series actual expense ratio and an assumed rate of return of 5% per year before expenses, which is not the Series actual return. The hypothetical account values and expenses may not be used to estimate the actual ending account balance or expenses you paid for the period. You may use this information to compare the ongoing costs of investing in the Series and other funds. To do so, compare this 5% hypothetical example with the 5% hypothetical examples that appear in the shareholder reports of the other mutual funds.
Please note that the expenses shown in the table are meant to highlight your ongoing costs only and do not reflect any fees and expenses associated with an investment in variable insurance products. Therefore, the second line is useful in comparing ongoing costs only, and will not help you determine the relative total costs of owning different funds. In addition, if these fees and expenses associated with an investment in variable insurance products were included, your costs would have been higher.
Series Expenses
| Beginning Account Value 7/1/2008 | Ending Account Value 12/31/20081 | Expenses Paid During Period2 | |||||||
Series E (U.S. Intermediate Bond Series) | |||||||||
Actual | $ | 1,000.00 | $ | 919.38 | $ | 3.76 | |||
Hypothetical | 1,000.00 | 1,021.22 | 3.96 | ||||||
1 | The actual ending account value is based on the actual total return of the Series for the period July 1, 2008 to December 31, 2008 after actual expenses and will differ from the hypothetical ending account value which is based on the Series expense ratio and a hypothetical annual return of 5% before expenses. The actual cumulative return at net asset value for the period July 1, 2008 to December 31, 2008 was (8.06%). |
2 | Expenses are equal to the Series annualized expense ratio of 0.78%, net of any applicable fee waivers, multiplied by the average account value over the period, multiplied by 184/366 (to reflect the one-half year period). |
41
Table of Contents
| Schedule of Investments | Series E | |
| December 31, 2008 | (U.S. Intermediate Bond Series) |
| Principal Amount | Value | |||||
CORPORATE BOND—38.5% | ||||||
Banking—2.8% | ||||||
BankBoston Capital Trust IV | ||||||
2.79%, 20281 | $ | 1,200,000 | $ | 664,081 | ||
BOI Capital Funding No. 2, LP | ||||||
5.57%, 20491,2,3 | �� | 650,000 | 142,875 | |||
Chase Capital III | ||||||
2.75%, 20271 | 1,200,000 | 610,924 | ||||
Rabobank Capital Funding II | ||||||
5.26%, 20491,2,3 | 1,200,000 | 634,836 | ||||
Standard Chartered plc | ||||||
6.41%, 20491,2,3 | 1,750,000 | 644,641 | ||||
US Central Federal Credit Union | ||||||
2.70%, 2009 | 113,636 | 112,274 | ||||
| 2,809,631 | ||||||
Building Materials—0.5% | ||||||
CRH America, Inc. | ||||||
6.95%, 2012 | 600,000 | 482,936 | ||||
Chemicals—0.7% | ||||||
PPG Industries, Inc. | ||||||
7.40%, 2019 | 650,000 | 693,832 | ||||
Electric—2.9% | ||||||
Arizona Public Service Company | ||||||
6.38%, 2011 | 600,000 | 564,794 | ||||
Cincinnati Gas & Electric | ||||||
5.70%, 2012 | 600,000 | 590,231 | ||||
East Coast Power LLC | ||||||
7.07%, 2012 | 114,819 | 121,985 | ||||
Oncor Electric Delivery Company | ||||||
6.38%, 2015 | 600,000 | 574,719 | ||||
Pennsylvania Electric Company | ||||||
6.05%, 2017 | 650,000 | 583,076 | ||||
WPS Resources Corporation | ||||||
6.11%, 20661 | 900,000 | 432,000 | ||||
| 2,866,805 | ||||||
Entertainment—0.7% | ||||||
Walt Disney Company | ||||||
4.50%, 2013 | 700,000 | 704,618 | ||||
Financial—Other—4.0% | ||||||
Berkshire Hathaway Finance Corporation | ||||||
4.75%, 2012 | 1,800,000 | 1,847,749 | ||||
BP Capital Markets plc | ||||||
5.25%, 2013 | 2,000,000 | 2,087,872 | ||||
| 3,935,621 | ||||||
Financial Companies—Noncaptive | ||||||
Consumer—2.0% | ||||||
Nelnet, Inc. | ||||||
7.40%, 20361 | 2,500,000 | 749,610 | ||||
Residential Capital LLC | ||||||
8.38%, 20091,2,3 | 3,000,000 | 1,095,000 | ||||
8.50%, 2012 | 650,000 | 104,000 | ||||
| 1,948,610 | ||||||
Financial Companies—Noncaptive | ||||||
Diversified—4.4% | ||||||
CIT Group Funding Company of Canada | ||||||
4.65%, 2010 | 1,800,000 | 1,580,166 | ||||
General Electric Capital Corporation | ||||||
5.88%, 2012 | 600,000 | 616,867 | ||||
6.00%, 2012 | 2,000,000 | 2,052,096 | ||||
| 4,249,129 | ||||||
Food & Beverage—1.2% | ||||||
General Mills, Inc. | ||||||
5.70%, 2017 | 1,200,000 | 1,206,103 | ||||
Health Care—0.6% | ||||||
Anthem, Inc. | ||||||
6.80%, 2012 | 600,000 | 593,099 | ||||
Independent Energy—0.6% | ||||||
Devon Financing Corporation ULC | ||||||
6.88%, 2011 | 600,000 | 605,497 | ||||
Insurance—Property & Casualty—1.1% | ||||||
Fairfax Financial Holdings, Ltd. | ||||||
7.75%, 2012 | 300,000 | 267,000 | ||||
Nationwide Mutual Insurance Company | ||||||
8.25%, 20312,3 | 650,000 | 410,695 | ||||
Navigators Group, Inc. | ||||||
7.00%, 2016 | 700,000 | 445,323 | ||||
| 1,123,018 | ||||||
Lodging—0.7% | ||||||
Starwood Hotels & Resorts Worldwide, Inc. | ||||||
6.25%, 2013 | 1,000,000 | 690,000 | ||||
Natural Gas Pipelines—0.2% | ||||||
Express Pipeline, LP | ||||||
6.47%, 20132,3 | 194,400 | 214,317 | ||||
Paper—0.4% | ||||||
Sino-Forest Corporation | ||||||
9.13%, 20112,3 | 500,000 | 400,000 | ||||
Pharmaceuticals—4.4% | ||||||
AstraZeneca plc | ||||||
5.90%, 2017 | 1,750,000 | 1,859,783 | ||||
GlaxoSmithKline Capital, Inc. | ||||||
4.85%, 2013 | 500,000 | 501,529 | ||||
Wyeth | ||||||
5.50%, 2013 | 2,000,000 | 2,037,236 | ||||
| 4,398,548 | ||||||
Railroads—2.0% | ||||||
Burlington Northern Santa Fe Corporation | ||||||
7.13%, 2010 | 1,900,000 | 1,947,508 | ||||
REIT’s—1.8% | ||||||
Hospitality Properties Trust | ||||||
6.70%, 2018 | 1,500,000 | 697,712 | ||||
Reckson Operating Partnership, LP | ||||||
5.15%, 2011 | 1,200,000 | 890,256 | ||||
The accompanying notes are an integral part of the financial statements
42
Table of Contents
| Schedule of Investments | Series E | |
| December 31, 2008 | (U.S. Intermediate Bond Series) |
| Principal Amount | Value | |||||
CORPORATE BOND—38.5% (continued) | ||||||
REIT’s—1.8% (continued) | ||||||
Rouse Company, LP | ||||||
8.00%, 2009 | $ | 550,000 | $ | 228,250 | ||
| 1,816,218 | ||||||
Transportation Services—0.6% | ||||||
TTX Company | ||||||
4.90%, 20152,3 | 650,000 | 596,629 | ||||
U.S. Banking—4.3% | ||||||
American Express Bank FSB | ||||||
3.15%, 2011 | 2,000,000 | 2,015,922 | ||||
PartnerRe Finance II | ||||||
6.44%, 20661 | 650,000 | 258,383 | ||||
Wells Fargo & Company | ||||||
4.38%, 2013 | 2,000,000 | 1,958,432 | ||||
| 4,232,737 | ||||||
Utility—Other—2.6% | ||||||
American Water Capital Corporation | ||||||
6.09%, 2017 | 3,000,000 | 2,613,120 | ||||
TOTAL CORPORATE BOND (cost $49,274,409) | $ | 38,127,976 | ||||
| Principal Amount | Value | |||||
PREFERRED STOCK—0.7% | ||||||
Insurance Brokers—0.1% | ||||||
Woodbourne Capital Trust I | ||||||
1.53%, 20491,2,4 | 300,000 | 22,552 | ||||
Woodbourne Capital Trust II | ||||||
1.53%, 20491,2,4 | 300,000 | 22,551 | ||||
Woodbourne Capital Trust III | ||||||
1.53%, 20491,2,4 | 300,000 | 22,551 | ||||
Woodbourne Capital Trust IV | ||||||
1.53%, 20491,2,4 | 300,000 | 22,551 | ||||
| 90,205 | ||||||
Property & Casualty | ||||||
Insurance—0.6% | ||||||
Aspen Insurance Holdings, Ltd. | ||||||
7.40%, 20171 | 48,000 | 604,320 | ||||
Thrifts & Mortgage Finance—0.0% | ||||||
Federal Home Loan Mortgage Corporation | ||||||
8.38%, 2012 | 16,000 | 6,240 | ||||
Federal National Mortgage Association | ||||||
8.25%, 2010 | 24,000 | 19,920 | ||||
4.38%, 2011 | 10,000 | 10,500 | ||||
| 36,660 | ||||||
TOTAL PREFERRED STOCK (cost $3,923,796) | $ | 731,185 | ||||
| Principal Amount | Value | |||||
MORTGAGE BACKED SECURITIES—39.1% | ||||||
Other Non-Agency—9.8% | ||||||
C.M.O.’s—9.8% | ||||||
Chase Mortgage Finance Corporation | ||||||
2005-A1 2A2, 5.24%, 20351 | $ | 1,475,775 | $ | 1,226,582 | ||
Chaseflex Trust | ||||||
2006-1, 5.94%, 20361 | 2,857,120 | 2,113,924 | ||||
Homebanc Mortgage Trust | ||||||
2006-1, 6.11%, 20371 | 1,340,605 | 733,505 | ||||
JP Morgan Alternative Loan Trust | ||||||
2006-S2, 5.81%, 2036 | 2,698,058 | 2,156,597 | ||||
2006-S3, 6.00%, 2036 | 3,000,000 | 2,019,827 | ||||
JP Morgan Mortgage Trust | ||||||
2006-A3, 5.24%, 20361 | 462,799 | 436,269 | ||||
Washington Mutual, Inc. | ||||||
2005-AR16 1A1, 5.10%, 20351 | 1,232,691 | 993,438 | ||||
| 9,680,142 | ||||||
| 9,680,142 | ||||||
U.S. Government Sponsored Agencies—28.0% | ||||||
C.M.O.’s—0.0% | ||||||
Federal Home Loan Mortgage Corporation | ||||||
FHR 188 H, 7.00%, 2021 | 1,257 | 1,308 | ||||
Federal National Mortgage Association | ||||||
FNR 1990-68 J, 6.95%, 2020 | 3,214 | 3,416 | ||||
FNR 1990-103 K, 7.50%, 2020 | 1,060 | 1,107 | ||||
| 5,831 | ||||||
Pass Through’s—28.0% | ||||||
Federal Home Loan Mortgage Corporation | ||||||
#E01378, 5.00%, 2018 | 1,406,133 | 1,454,124 | ||||
#E01488, 5.00%, 2018 | 1,292,766 | 1,335,644 | ||||
#E01538, 5.00%, 2018 | 1,300,947 | 1,343,331 | ||||
#C44050, 7.00%, 2030 | 39,650 | 41,670 | ||||
#C01079, 7.50%, 2030 | 15,718 | 16,683 | ||||
#C50967, 6.50%, 2031 | 12,566 | 13,127 | ||||
#C50964, 6.50%, 2031 | 65,221 | 67,809 | ||||
#C01172, 6.50%, 2031 | 54,079 | 56,225 | ||||
#C01210, 6.50%, 2031 | 67,543 | 70,562 | ||||
#C01277, 7.00%, 2031 | 95,378 | 99,025 | ||||
#C62801, 6.00%, 2032 | 128,612 | 133,099 | ||||
#C01287, 6.50%, 2032 | 159,175 | 165,492 | ||||
#C01292, 6.00%, 2032 | 287,118 | 297,135 | ||||
#A16943, 6.00%, 2033 | 936,893 | 968,261 | ||||
#A17903, 6.00%, 2034 | 1,071,049 | 1,105,736 | ||||
Federal National Mortgage Association | ||||||
#254473, 5.50%, 2017 | 1,161,039 | 1,202,027 | ||||
#839353, 5.50%, 2018 | 767,385 | 798,314 | ||||
#555549, 5.00%, 2018 | 1,476,598 | 1,517,863 | ||||
#720714, 4.50%, 2018 | 1,272,784 | 1,309,149 | ||||
#750465, 5.00%, 2018 | 1,271,080 | 1,312,163 | ||||
#780952, 4.00%, 2019 | 1,782,332 | 1,811,534 | ||||
#252806, 7.50%, 2029 | 55,742 | 59,040 | ||||
#252874, 7.50%, 2029 | 19,699 | 20,864 | ||||
#535277, 7.00%, 2030 | 27,212 | 28,526 | ||||
#190307, 8.00%, 2030 | 21,805 | 23,160 | ||||
#541735, 8.00%, 2030 | 28,897 | 30,693 | ||||
#253356, 8.00%, 2030 | 27,001 | 28,679 | ||||
#551262, 7.50%, 2030 | 13,235 | 14,012 | ||||
#535838, 6.50%, 2031 | 50,622 | 52,631 | ||||
The accompanying notes are an integral part of the financial statements
43
Table of Contents
| Schedule of Investments | Series E | |
| December 31, 2008 | (U.S. Intermediate Bond Series) |
| Principal Amount | Value | |||||
MORTGAGE BACKED SECURITIES—39.1% (continued) | ||||||
U.S. Government Sponsored Agencies—28.0% (continued) | ||||||
Pass Through’s—28.0% (continued) | ||||||
Federal National Mortgage Association (continued) | ||||||
#585348, 6.50%, 2031 | $ | 49,325 | $ | 51,283 | ||
#591381, 6.50%, 2031 | 91,563 | 95,197 | ||||
#254198, 6.00%, 2032 | 288,803 | 297,615 | ||||
#545691, 6.50%, 2032 | 189,423 | 196,941 | ||||
#254346, 6.50%, 2032 | 123,805 | 128,719 | ||||
#254377, 6.00%, 2032 | 468,759 | 484,380 | ||||
#659790, 6.50%, 2032 | 194,430 | 202,875 | ||||
#254478, 6.00%, 2032 | 219,784 | 227,108 | ||||
#254477, 5.50%, 2032 | 787,130 | 807,702 | ||||
#666750, 6.00%, 2032 | 460,339 | 474,384 | ||||
#658077, 5.50%, 2033 | 1,032,086 | 1,061,642 | ||||
#689108, 5.50%, 2033 | 935,572 | 962,364 | ||||
#688328, 5.50%, 2033 | 902,391 | 927,245 | ||||
#709748, 5.50%, 2033 | 1,507,329 | 1,550,493 | ||||
#713971, 5.50%, 2033 | 1,516,491 | 1,558,259 | ||||
#754903, 5.50%, 2033 | 886,459 | 909,625 | ||||
#725033, 6.00%, 2034 | 603,247 | 622,972 | ||||
#255554, 5.50%, 2035 | 1,696,931 | 1,742,608 | ||||
| 27,677,990 | ||||||
| 27,683,821 | ||||||
U.S. Government Sponsored Securities—1.3% | ||||||
Pass Through’s—1.3% | ||||||
Government National Mortgage Association | ||||||
G2 181907, 9.50%, 2020 | 5,630 | 6,243 | ||||
#301465, 9.00%, 2021 | 17,051 | 18,365 | ||||
#305617, 9.00%, 2021 | 8,349 | 8,992 | ||||
#313107, 7.00%, 2022 | 72,131 | 75,004 | ||||
#369303, 7.00%, 2023 | 54,446 | 56,615 | ||||
#352022, 7.00%, 2023 | 47,845 | 49,751 | ||||
#780454, 7.00%, 2026 | 79,929 | 83,113 | ||||
G2 2445, 8.00%, 2027 | 32,597 | 34,155 | ||||
#462680, 7.00%, 2028 | 48,650 | 50,588 | ||||
#482668, 7.00%, 2028 | 41,418 | 43,068 | ||||
#781079, 7.50%, 2029 | 16,395 | 17,096 | ||||
#518436, 7.25%, 2029 | 18,802 | 19,827 | ||||
#494109, 7.50%, 2029 | 22,903 | 23,881 | ||||
#510704, 7.50%, 2029 | 14,192 | 14,798 | ||||
#479229, 8.00%, 2030 | 8,885 | 9,345 | ||||
#479232, 8.00%, 2030 | 20,403 | 21,459 | ||||
G2 2909, 8.00%, 2030 | 17,677 | 18,522 | ||||
#508342, 8.00%, 2030 | 35,436 | 37,271 | ||||
#561561, 6.50%, 2031 | 107,364 | 112,849 | ||||
#564472, 6.50%, 2031 | 161,625 | 169,882 | ||||
#538285, 6.50%, 2031 | 57,447 | 59,843 | ||||
#552324, 6.50%, 2032 | 99,732 | 103,892 | ||||
#781414, 5.50%, 2032 | 273,325 | 282,143 | ||||
| 1,316,702 | ||||||
| 1,316,702 | ||||||
TOTAL MORTGAGE BACKED SECURITIES (cost $41,469,484) | $ | 38,680,665 | ||||
ASSET BACKED SECURITIES—0.7% | ||||||
Home Equity Loans—0.7% | ||||||
Credit-Based Asset Servicing and Securitization LLC | ||||||
2005-CB5, 0.73%, 20351 | $ | 808,270 | $ | 663,016 | ||
TOTAL ASSET BACKED SECURITIES (cost $808,270) | $ | 663,016 | ||||
| Principal Amount | Value | |||||
U.S. GOVERNMENT SECURITIES—12.2% | ||||||
U.S. Treasury Bonds | ||||||
5.38%, 2/15/2031 | $ | 1,000,000 | $ | 1,374,062 | ||
U.S. Treasury Notes | ||||||
2.50%, 3/31/2013 | 6,000,000 | 6,357,654 | ||||
3.50%, 5/31/2013 | 4,000,000 | 4,381,248 | ||||
TOTAL U.S. GOVERNMENT SECURITIES (cost $10,976,887) | $ | 12,112,964 | ||||
| Principal Amount | Value | |||||
REPURCHASE AGREEMENT—8.1% | ||||||
UMB Financial Corp, 0.05%, dated 12/31/08, matures 1/02/09; repurchase amount $8,050,022 (Collateralized by FNMA Discount Note, 5/15/09 with a value of $8,211,825) | $ | 8,050,000 | $ | 8,050,000 | ||
TOTAL REPURCHASE AGREEMENT (cost $8,050,000) | $ | 8,050,000 | ||||
Total Investments—99.3% (cost $114,502,846) | $ | 98,365,806 | ||||
Cash & Other Assets, Less Liabilities—0.7% | 703,913 | |||||
Total Net Assets—100.0% | $ | 99,069,719 | ||||
For federal income tax purposes the identified cost of investments owned at December 31, 2008 was $115,533,612.
| plc | Public Limited Company |
1 | Variable rate security. Rate indicated is rate effective at December 31, 2008. |
2 | Security was acquired through a private placement. |
3 | Security is a 144A or Section 4(2) security. The total market value of 144A or Section 4(2) securities is $4,138,993 (cost $8,571,841), or 4.2% of total net assets. |
4 | Security was fair valued by the Valuation Committee at December 31, 2008. The total market value of fair valued securities amounts to $90,205, (cost $1,205,796) or 0.1% of total net assets. |
The accompanying notes are an integral part of the financial statements
44
Table of Contents
| Series E | ||
| (U.S. Intermediate Bond Series) |
Statement of Assets and Liabilities
December 31, 2008
Assets: | ||||
Investments, at value* | $ | 98,365,806 | ||
Cash | 2,138 | |||
Receivables: | ||||
Fund shares sold | 108,606 | |||
Securities sold | 24 | |||
Interest | 995,124 | |||
Dividends | 22,203 | |||
Prepaid expenses | 2,329 | |||
Total assets | 99,496,230 | |||
Liabilities: | ||||
Payable for: | ||||
Fund shares redeemed | 335,489 | |||
Management fees | 50,691 | |||
Administration fees | 10,526 | |||
Transfer agent/maintenance fees | 2,083 | |||
Custodian fees | 2,177 | |||
Directors’ fees | 2,400 | |||
Professional fees | 15,362 | |||
Other fees | 7,783 | |||
Total liabilities | 426,511 | |||
Net assets | $ | 99,069,719 | ||
Net assets consist of: | ||||
Paid in capital | $ | 118,737,285 | ||
Undistributed net investment income | 4,539,597 | |||
Accumulated net realized loss on sale of investments | (8,070,123 | ) | ||
Net unrealized depreciation in value of investments | (16,137,040 | ) | ||
Net assets | $ | 99,069,719 | ||
Capital shares authorized | unlimited | |||
Capital shares outstanding | 8,776,692 | |||
Net asset value per share (net assets divided by shares outstanding) | $ | 11.29 | ||
| ||||
* Investments, at cost | $ | 114,502,846 | ||
Statement of Operations
For Year Ended December 31, 2008
Investment Income: | ||||
Dividends | $ | 222,752 | ||
Interest | 6,190,060 | |||
Total investment income | 6,412,812 | |||
Expenses: | ||||
Management fees | 862,296 | |||
Administration fees | 118,606 | |||
Transfer agent/maintenance fees | 25,288 | |||
Custodian fees | 11,861 | |||
Directors’ fees | 9,651 | |||
Professional fees | 25,263 | |||
Reports to shareholders | 11,289 | |||
Other | 5,833 | |||
Total expenses | 1,070,087 | |||
Less: | ||||
Expenses waived | (172,461 | ) | ||
Earnings credits applied | (219 | ) | ||
Net expenses | 897,407 | |||
Net investment income | 5,515,405 | |||
Net Realized and Unrealized Gain (Loss): | ||||
Net realized gain (loss) during the year on: | ||||
Investments | (3,840,953 | ) | ||
Futures | 535,380 | |||
Net realized loss | (3,305,573 | ) | ||
Net unrealized appreciation (depreciation) during the year on: | ||||
Investments | (12,356,337 | ) | ||
Futures | (42,302 | ) | ||
Net unrealized depreciation | (12,398,639 | ) | ||
Net realized and unrealized loss | (15,704,212 | ) | ||
Net decrease in net assets resulting from operations | $ | (10,188,807 | ) | |
The accompanying notes are an integral part of the financial statements
45
Table of Contents
| Series E | ||
| Statement of Changes in Net Assets | (U.S. Intermediate Bond Series) |
| Year Ended December 31, 2008 | Year Ended December 31, 2007 | |||||||
Increase (decrease) in net assets from operations: | ||||||||
Net investment income | $ | 5,515,405 | $ | 7,064,655 | ||||
Net realized loss during the year on investments | (3,305,573 | ) | (990,073 | ) | ||||
Net unrealized depreciation during the year on investments | (12,398,639 | ) | (2,196,483 | ) | ||||
Net increase (decrease) in net assets resulting from operations | (10,188,807 | ) | 3,878,099 | |||||
Capital share transactions: | ||||||||
Proceeds from sale of shares | 46,877,829 | 52,494,277 | ||||||
Cost of shares redeemed | (59,271,743 | ) | (86,030,933 | ) | ||||
Net decrease from capital share transactions | (12,393,914 | ) | (33,536,656 | ) | ||||
Net decrease in net assets | (22,582,721 | ) | (29,658,557 | ) | ||||
Net assets: | ||||||||
Beginning of year | 121,652,440 | 151,310,997 | ||||||
End of year | $ | 99,069,719 | $ | 121,652,440 | ||||
Undistributed net investment income at end of year | $ | 4,539,597 | $ | 6,116,616 | ||||
Capital share activity: | ||||||||
Shares sold | 3,844,656 | 4,315,924 | ||||||
Shares redeemed | (4,911,549 | ) | (7,075,418 | ) | ||||
Total capital share activity | (1,066,893 | ) | (2,759,494 | ) | ||||
The accompanying notes are an integral part of the financial statements
46
Table of Contents
| Financial Highlights | Series E | |
Selected data for each share of capital stock outstanding throughout each year | (U.S. Intermediate Bond Series) |
| 2008a | 2007 | 2006 | 2005 | Year Ended December 31, 2004 | ||||||||||||||||
Per Share Data | ||||||||||||||||||||
Net asset value, beginning of period | $ | 12.36 | $ | 12.01 | $ | 11.57 | $ | 11.36 | $ | 11.04 | ||||||||||
Income (loss) from investment operations: | ||||||||||||||||||||
Net investment incomeb | 0.58 | 0.60 | 0.63 | 0.49 | 0.50 | |||||||||||||||
Net loss on securities (realized and unrealized) | (1.65 | ) | (0.25 | ) | (0.19 | ) | (0.28 | ) | (0.08 | ) | ||||||||||
Total from investment operations | (1.07 | ) | 0.35 | 0.44 | 0.21 | 0.42 | ||||||||||||||
Less distributions: | ||||||||||||||||||||
Dividends from net investment income | — | — | — | — | (0.10 | ) | ||||||||||||||
Total distributions | — | — | — | — | (0.10 | ) | ||||||||||||||
Net asset value, end of period | $ | 11.29 | $ | 12.36 | $ | 12.01 | $ | 11.57 | $ | 11.36 | ||||||||||
Total Returnc | (8.66 | )% | 2.91 | % | 3.80 | % | 1.85 | % | 3.82 | % | ||||||||||
| Ratios/Supplemental Data | ||||||||||||||||||||
Net assets, end of period (in thousands) | $ | 99,070 | $ | 121,652 | $ | 151,311 | $ | 159,386 | $ | 159,527 | ||||||||||
Ratios to average net assets: | ||||||||||||||||||||
Net investment income | 4.80 | % | 4.90 | % | 4.67 | % | 4.23 | % | 4.42 | % | ||||||||||
Total expensesd | 0.93 | % | 0.91 | % | 0.93 | % | 0.92 | % | 0.89 | % | ||||||||||
Net expensese | 0.78 | % | 0.76 | % | 0.78 | % | 0.77 | % | 0.75 | % | ||||||||||
Net expenses prior to custodian earnings credits and net of expense waivers | 0.78 | % | 0.76 | % | 0.78 | % | 0.77 | % | 0.75 | % | ||||||||||
Portfolio turnover rate | 34 | % | 31 | % | 64 | % | 60 | % | 39 | % | ||||||||||
a | Effective November 24, 2008 the Series name became U.S. Intermediate Bond Series. Prior to November 24, 2008 the Series was known as the Diversified Income Series. |
b | Net investment income (loss) was computed using average shares outstanding throughout the period. |
c | Total return does not take into account any of the expenses associated with an investment in variable insurance products offered by Security Benefit Life Insurance Company. If total return had taken into account these expenses, performance would have been lower. Shares of a series of SBL Fund are available only through the purchase of such products. |
d | Total expense information reflects the expense ratios absent expense reductions by the Investment Manager and earnings credits, as applicable. |
e | Net expense information reflects the expense ratios after voluntary expense waivers, reimbursements and custodian earnings credits, as applicable. |
The accompanying notes are an integral part of the financial statements
47
Table of Contents
This page left blank intentionally.
48
Table of Contents
| Manager’s Commentary | Series H | |
February 16, 2009 | (Enhanced Index Series) |

Subadviser, Northern Trust
To Our Shareholders:
Series H of the SBL Fund—Enhanced Index Series returned –37.57%1 for the year ended December 31, 2008 versus the S&P 500 Index return of –37.00%, underperforming its benchmark by –0.57% inclusive of fees. Financial markets approached or exceeded many record levels not seen since the Great Depression, including the biggest annual decline, the largest monthly fall, the greatest daily rise, and the greatest number of high volatility days.
The Chicago Board Options Exchange Volatility Index (VIX) reached record highs above 80 in both October and November, with average volatility of 58, or 2.5 times the average volatility levels experienced in the first three quarters of the year. This dramatic rise in volatility reflected unprecedented market uncertainty and risk aversion, which amplified the flight to quality. During 2008, an equal weighted portfolio of low quality stocks in the S&P 500 (as defined by the S&P quality rating of C) fell 59.9%.
Sector Review
From a sector perspective, the year finished with few surprises. The top performing sectors were all defensive –consumer staples –15%, healthcare –22%, utilities (–29%) and telecommunication services –30%. On the other side, financials fell the most –55%, followed by the four global cyclical sectors—materials –46%, information technology –43%, industrials –40% and energy –35%. Our conservative investment process mitigated this dispersion in sector returns by controlling for sector biases in both excess return forecasts and portfolio construction methodology.
Market Outlook
The performance of individual signals within our quantitative factor model fluctuated throughout the year, with profitability and sentiment signals showing the most efficacy for most periods, at the expense of lower quality value stocks. In a late fourth quarter reversal, those stocks and signals rebounded as lower quality and value started to outperform. Looking forward, we see wider valuation spreads as an opportunity for higher quality value stocks to lead the rebound when the economy ultimately recovers from recession some time in 2009.
Crisis periods, as we have been witnessing, present both increased risk and opportunity. We feel that during such periods, our focus on thoughtful analysis of data and employment of a disciplined, quantitative process is most effective at positioning the portfolio for future investment success.
Thank you for your business and the confidence you place in us.
Sincerely,
Peter C. Stournaras, Portfolio Manager,
Northern Trust Investments
1 | Fee waivers and/or reimbursements reduce Series expenses and in the absence of such waiver the performance quoted would be reduced. |
49
Table of Contents
| Series H | ||
| Performance Summary | (Enhanced Index Series) | |
December 31, 2008 | (unaudited) |
PERFORMANCE
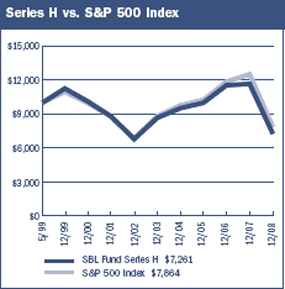
$10,000 Since Inception
The chart above assumes a hypothetical $10,000 investment in Series H (Enhanced Index Series) on May 3, 1999 (date of inception) and reflects the fees and expenses of Series H. The S&P 500 Index is a capitalization-weighted index composed of 500 selected common stocks that represent the broad domestic economy and is a widely recognized unmanaged index of market performance.
Average Annual Returns
Periods Ended 12-31-081 | 1 Year | 5 Years | Since Inception (5-3-99) | ||||||
Series H | (37.57 | )% | (3.41 | )% | (3.26 | )% |
1 | Performance figures do not reflect fees and expenses associated with an investment in variable insurance products offered by Security Benefit Life Insurance Company. If returns had taken into account these fees and expenses, performance would have been lower. Shares of a Series of SBL Fund are available only through the purchase of such products. |
The performance data quoted above represents past performance. Past performance is not predictive of future performance. The investment return and principal value of an investment will fluctuate so that an investor’s shares, when redeemed, may be worth more or less than their original cost.
Portfolio Composition by Sector
Consumer Discretionary | 8.07 | % | |
Consumer Staples | 12.60 | ||
Energy | 13.48 | ||
Financials | 13.01 | ||
Health Care | 14.14 | ||
Industrials | 10.53 | ||
Information Technology | 15.01 | ||
Materials | 2.75 | ||
Telecommunication Services | 3.46 | ||
Utilities | 3.92 | ||
U.S. Government Sponsored Securities | 0.49 | ||
Cash & Other Assets, Less Liabilities | 2.54 | ||
Total Net Assets | 100.00 | % | |
The accompanying notes are an integral part of the financial statements
50
Table of Contents
| Series H | ||
| Performance Summary | (Enhanced Index Series) | |
| December 31, 2008 | (unaudited) |
Information About Your Series Expenses
Calculating your ongoing Series expenses
Example
As a shareholder of the Series, you incur ongoing costs, including management fees and other series expenses. Performance figures and expense ratios do not reflect fees and expenses associated with an investment in variable insurance products. Shares of a Series of SBL Fund are available only through the purchase of such products. This example is intended to help you understand your ongoing costs (in dollars) of investing in the Series and to compare these costs with ongoing costs of investing in other mutual funds. The example is based on an investment of $1,000 invested at the beginning of the period and held for the entire period, July 1, 2008 through December 31, 2008.
Actual Expenses
The first line in the table provides information about actual account values and actual expenses. You may use the information in this table, together with the amount you invested, to estimate the expenses that you paid over the period. Simply divide your account value by $1,000 (for example, an $8,600 account value divided by $1,000 = 8.6), then multiply the result by the number in the table under the heading entitled “Expenses Paid During the Period” to estimate the expenses you paid on your account during this period.
Hypothetical Example for Comparison Purposes
The second line in the table provides information about hypothetical account values and hypothetical expenses based on the Series actual expense ratio and an assumed rate of return of 5% per year before expenses, which is not the Series actual return. The hypothetical account values and expenses may not be used to estimate the actual ending account balance or expenses you paid for the period. You may use this information to compare the ongoing costs of investing in the Series and other funds. To do so, compare this 5% hypothetical example with the 5% hypothetical examples that appear in the shareholder reports of the other mutual funds.
Please note that the expenses shown in the table are meant to highlight your ongoing costs only and do not reflect any fees and expenses associated with an investment in variable insurance products. Therefore, the second line is useful in comparing ongoing costs only, and will not help you determine the relative total costs of owning different funds. In addition, if these fees and expenses associated with an investment in variable insurance products were included, your costs would have been higher.
Series Expenses
| Beginning Account Value 7/1/2008 | Ending Account Value 12/31/20081 | Expenses Paid During Period2 | |||||||
Series H (Enhanced Index Series) | |||||||||
Actual | $ | 1,000.00 | $ | 716.63 | $ | 3.41 | |||
Hypothetical | 1,000.00 | 1,021.17 | 4.01 | ||||||
1 | The actual ending account value is based on the actual total return of the Series for the period July 1, 2008 to December 31, 2008 after actual expenses and will differ from the hypothetical ending account value which is based on the Series expense ratio and a hypothetical annual return of 5% before expenses. The actual cumulative return at net asset value for the period July 1, 2008 to December 31, 2008 was (28.34%). |
2 | Expenses are equal to the Series annualized expense ratio of 0.79%, net of any applicable fee waivers, multiplied by the average account value over the period, multiplied by 184/366 (to reflect the one-half year period). |
51
Table of Contents
| Schedule of Investments | Series H | |
December 31, 2008 | (Enhanced Index Series) |
| Shares | Value | ||||
COMMON STOCKS—97.0% | |||||
Advertising—0.3% | |||||
Interpublic Group of Companies, Inc.* | 13,800 | $ | 54,648 | ||
Omnicom Group, Inc. | 2,500 | 67,300 | |||
| 121,948 | |||||
Aerospace & Defense—3.3% | |||||
Boeing Company | 971 | 41,433 | |||
General Dynamics Corporation | 4,900 | 282,190 | |||
Honeywell International, Inc. | 5,000 | 164,150 | |||
L-3 Communications Holdings, Inc. | 2,000 | 147,560 | |||
Lockheed Martin Corporation | 2,347 | 197,336 | |||
Northrop Grumman Corporation | 5,322 | 239,703 | |||
Raytheon Company | 1,900 | 96,976 | |||
United Technologies Corporation | 4,665 | 250,044 | |||
| 1,419,392 | |||||
Agricultural Products—0.4% | |||||
Archer-Daniels-Midland Company | 5,400 | 155,682 | |||
Air Freight & Logistics—0.7% | |||||
CH Robinson Worldwide, Inc. | 2,600 | 143,078 | |||
Expeditors International of Washington, Inc. | 300 | 9,981 | |||
United Parcel Service, Inc. (Cl.B) | 2,893 | 159,578 | |||
| 312,637 | |||||
Airlines—0.2% | |||||
Southwest Airlines Company | 11,100 | 95,682 | |||
Apparel Retail—0.6% | |||||
Gap, Inc. | 9,700 | 129,883 | |||
Ltd. Brands, Inc. | 8,000 | 80,320 | |||
TJX Companies, Inc. | 2,400 | 49,368 | |||
| 259,571 | |||||
Apparel, Accessories & Luxury Goods—0.6% | |||||
Coach, Inc.* | 4,700 | 97,619 | |||
Jones Apparel Group, Inc. | 2,000 | 11,720 | |||
Polo Ralph Lauren Corporation | 2,300 | 104,443 | |||
V.F. Corporation | 500 | 27,385 | |||
| 241,167 | |||||
Application Software—0.4% | |||||
Adobe Systems, Inc.* | 5,600 | 119,224 | |||
Autodesk, Inc.* | 2,000 | 39,300 | |||
| 158,524 | |||||
Asset Management & Custody Banks—0.8% | |||||
American Capital, Ltd. | 4,500 | 14,580 | |||
Ameriprise Financial, Inc. | 8,300 | 193,888 | |||
Bank of New York Mellon Corporation | 2,055 | 58,218 | |||
State Street Corporation | 2,400 | 94,392 | |||
| 361,078 | |||||
Automotive Retail—0.0% | |||||
Autozone, Inc.* | 100 | 13,947 | |||
Biotechnology—1.9% | |||||
Amgen, Inc.* | 8,142 | 470,201 | |||
Biogen Idec, Inc.* | 2,800 | 133,364 | |||
Celgene Corporation* | 1,000 | 55,280 | |||
Gilead Sciences, Inc.* | 3,700 | 189,218 | |||
| 848,063 | |||||
Brewers—0.0% | |||||
Molson Coors Brewing Company | 200 | 9,784 | |||
Cable & Satellite—0.9% | |||||
Comcast Corporation | 24,336 | 410,792 | |||
Coal & Consumable Fuels—0.0% | |||||
Peabody Energy Corporation | 500 | 11,375 | |||
Commercial Printing—0.0% | |||||
RR Donnelley & Sons Company | 500 | 6,790 | |||
Communications Equipment—1.9% | |||||
Cisco Systems, Inc.* | 31,483 | 513,173 | |||
Corning, Inc. | 2,400 | 22,872 | |||
Harris Corporation | 1,100 | 41,855 | |||
JDS Uniphase Corporation* | 7,400 | 27,010 | |||
Motorola, Inc. | 4,000 | 17,720 | |||
Qualcomm, Inc. | 5,824 | 208,674 | |||
| 831,304 | |||||
Computer & Electronics Retail—0.4% | |||||
Best Buy Company, Inc. | 500 | 14,055 | |||
GameStop Corporation* | 1,900 | 41,154 | |||
RadioShack Corporation | 11,300 | 134,922 | |||
| 190,131 | |||||
Computer Hardware—4.0% | |||||
Apple, Inc.* | 3,746 | 319,721 | |||
Dell, Inc.* | 14,976 | 153,354 | |||
Hewlett-Packard Company | 16,536 | 600,091 | |||
International Business Machines Corporation | 7,716 | 649,378 | |||
TeraData Corporation* | 1,900 | 28,177 | |||
| 1,750,721 | |||||
Computer Storage & Peripherals—0.6% | |||||
EMC Corporation* | 5,600 | 58,632 | |||
Lexmark International, Inc.* | 5,200 | 139,880 | |||
QLogic Corporation* | 6,000 | 80,640 | |||
| 279,152 | |||||
Construction & Engineering—0.3% | |||||
Fluor Corporation | 2,500 | 112,175 | |||
Construction & Farm Machinery & Heavy Trucks—0.1% | |||||
Caterpillar, Inc. | 200 | 8,934 | |||
Cummins, Inc. | 900 | 24,057 | |||
| 32,991 | |||||
Consumer Electronics—0.1% | |||||
Harman International Industries, Inc. | 1,400 | 23,422 | |||
Consumer Finance—0.7% | |||||
American Express Company | 7,562 | 140,275 | |||
Capital One Financial Corporation | 4,800 | 153,072 | |||
SLM Corporation* | 800 | 7,120 | |||
| 300,467 | |||||
Data Processing & Outsourced Services—1.4% | |||||
Affiliated Computer Services, Inc.* | 2,100 | 96,495 | |||
Computer Sciences Corporation* | 4,500 | 158,130 | |||
The accompanying notes are an integral part of the financial statements
52
Table of Contents
| Schedule of Investments | Series H | |
| December 31, 2008 | (Enhanced Index Series) |
| Shares | Value | ||||
COMMON STOCKS—97.0% (continued) | |||||
Data Processing & Outsourced Services—1.4% (continued) | |||||
Fidelity National Information Services, Inc. | 5,400 | $ | 87,858 | ||
Fiserv, Inc.* | 4,100 | 149,117 | |||
Mastercard, Inc. | 100 | 14,293 | |||
Western Union Company | 6,600 | 94,644 | |||
| 600,537 | |||||
Department Stores—0.1% | |||||
Macy’s, Inc. | 5,200 | 53,820 | |||
Distillers & Vintners—0.2% | |||||
Brown-Forman Corporation | 225 | 11,585 | |||
Constellation Brands, Inc.* | 3,700 | 58,349 | |||
| 69,934 | |||||
Diversified Banks—1.8% | |||||
Comerica, Inc. | 4,300 | 85,355 | |||
U.S. Bancorp | 4,425 | 110,669 | |||
Wachovia Corporation | 2,228 | 12,343 | |||
Wells Fargo & Company | 20,138 | 593,669 | |||
| 802,036 | |||||
Diversified Chemicals—0.9% | |||||
Dow Chemical Company | 6,689 | 100,937 | |||
E.I. Du Pont de Nemours & Company | 5,600 | 141,680 | |||
PPG Industries, Inc. | 3,900 | 165,477 | |||
| 408,094 | |||||
Diversified Metals & Mining—0.1% | |||||
Freeport-McMoRan Copper & Gold, Inc. (Cl.B) | 1,600 | 39,104 | |||
Diversified REIT’s—0.1% | |||||
Vornado Realty Trust | 800 | 48,280 | |||
Drug Retail—0.5% | |||||
CVS Caremark Corporation | 8,200 | 235,668 | |||
Education Services—0.2% | |||||
Apollo Group, Inc.* | 1,200 | 91,944 | |||
Electric Utilities—2.1% | |||||
Duke Energy Corporation | 9,200 | 138,092 | |||
Edison International | 6,478 | 208,073 | |||
Entergy Corporation | 2,800 | 232,764 | |||
Exelon Corporation | 900 | 50,049 | |||
FPL Group, Inc. | 100 | 5,033 | |||
Pepco Holdings, Inc. | 9,500 | 168,720 | |||
Pinnacle West Capital Corporation | 3,600 | 115,668 | |||
| 918,399 | |||||
Electrical Components & Equipment—0.4% | |||||
Cooper Industries, Ltd. | 4,900 | 143,227 | |||
Emerson Electric Company | 300 | 10,983 | |||
Rockwell Automation, Inc. | 1,200 | 38,688 | |||
| 192,898 | |||||
Electronic Equipment & Instruments—0.2% | |||||
Agilent Technologies, Inc.* | 5,700 | 89,091 | |||
Environmental & Facilities Services—0.1% | |||||
Republic Services, Inc. | 855 | 21,195 | |||
Waste Management, Inc. | 1,100 | 36,454 | |||
| 57,649 | |||||
Fertilizers & Agricultural Chemicals—0.7% | |||||
CF Industries Holdings, Inc. | 900 | 44,244 | |||
Monsanto Company | 3,600 | 253,260 | |||
| 297,504 | |||||
Food Distributors—0.5% | |||||
SYSCO Corporation | 9,900 | 227,106 | |||
Food Retail—0.4% | |||||
Safeway, Inc. | 8,200 | 194,914 | |||
Footwear—0.1% | |||||
Nike, Inc. (Cl.B) | 700 | 35,700 | |||
General Merchandise Stores—0.2% | |||||
Big Lots, Inc.* | 5,200 | 75,348 | |||
Health Care Distributors—0.6% | |||||
AmerisourceBergen Corporation | 784 | 27,957 | |||
Cardinal Health, Inc. | 2,000 | 68,940 | |||
McKesson Corporation | 4,000 | 154,920 | |||
| 251,817 | |||||
Health Care Equipment—1.9% | |||||
Baxter International, Inc. | 3,600 | 192,924 | |||
Boston Scientific Corporation* | 6,900 | 53,406 | |||
Covidien, Ltd. | 3,900 | 141,336 | |||
CR Bard, Inc. | 500 | 42,130 | |||
Medtronic, Inc. | 9,625 | 302,418 | |||
St. Jude Medical, Inc.* | 1,800 | 59,328 | |||
Varian Medical Systems, Inc.* | 500 | 17,520 | |||
Zimmer Holdings, Inc.* | 700 | 28,294 | |||
| 837,356 | |||||
Health Care Services—0.3% | |||||
Express Scripts, Inc.* | 2,000 | 109,960 | |||
Quest Diagnostics, Inc. | 400 | 20,764 | |||
| 130,724 | |||||
Home Improvement Retail—1.0% | |||||
Home Depot, Inc. | 12,076 | 277,990 | |||
Lowe’s Companies, Inc. | 3,300 | 71,016 | |||
Sherwin-Williams Company | 1,600 | 95,600 | |||
| 444,606 | |||||
Homebuilding—0.2% | |||||
Centex Corporation | 4,100 | 43,624 | |||
Pulte Homes, Inc. | 4,700 | 51,371 | |||
| 94,995 | |||||
Hotels, Resorts & Cruise Lines—0.1% | |||||
Carnival Corporation | 2,000 | 48,640 | |||
Household Appliances—0.1% | |||||
Black & Decker Corporation | 1,000 | 41,810 | |||
Household Products—3.0% | |||||
Colgate-Palmolive Company | 800 | 54,832 | |||
Kimberly-Clark Corporation | 1,900 | 100,206 | |||
The accompanying notes are an integral part of the financial statements
53
Table of Contents
| Schedule of Investments | Series H | |
| December 31, 2008 | (Enhanced Index Series) |
| Shares | Value | ||||
COMMON STOCKS—97.0% (continued) | |||||
Household Products—3.0% (continued) | |||||
Procter & Gamble Company | 18,329 | $ | 1,133,099 | ||
| 1,288,137 | |||||
Hypermarkets & Super Centers—1.9% | |||||
Wal-Mart Stores, Inc. | 14,413 | 807,993 | |||
Industrial Conglomerates—2.7% | |||||
3M Company | 4,076 | 234,533 | |||
General Electric Company | 53,569 | 867,818 | |||
Tyco International, Ltd. | 3,700 | 79,920 | |||
| 1,182,271 | |||||
Industrial Gases—0.1% | |||||
Air Products & Chemicals, Inc. | 500 | 25,135 | |||
Praxair, Inc. | 400 | 23,744 | |||
| 48,879 | |||||
Industrial Machinery—2.0% | |||||
Danaher Corporation | 3,500 | 198,135 | |||
Dover Corporation | 6,000 | 197,520 | |||
Flowserve Corporation | 1,400 | 72,100 | |||
Illinois Tool Works, Inc. | 3,100 | 108,655 | |||
ITT Corporation | 3,300 | 151,767 | |||
Parker Hannifin Corporation | 3,100 | 131,874 | |||
| 860,051 | |||||
Insurance Brokers—0.4% | |||||
AON Corporation | 3,400 | 155,312 | |||
Integrated Oil & Gas—10.4% | |||||
Chevron Corporation | 12,268 | 907,464 | |||
ConocoPhillips | 11,317 | 586,221 | |||
Exxon Mobil Corporation1 | 29,641 | 2,366,240 | |||
Marathon Oil Corporation | 3,100 | 84,816 | |||
Murphy Oil Corporation | 2,700 | 119,745 | |||
Occidental Petroleum Corporation | 7,400 | 443,926 | |||
| 4,508,412 | |||||
Integrated Telecommunication Services—3.4% | |||||
AT&T, Inc. | 26,382 | 751,887 | |||
CenturyTel, Inc. | 6,300 | 172,179 | |||
Embarq Corporation | 800 | 28,768 | |||
Frontier Communications Corporation | 4,900 | 42,826 | |||
Verizon Communications, Inc. | 11,842 | 401,444 | |||
Windstream Corporation | 6,900 | 63,480 | |||
| 1,460,584 | |||||
Internet Retail—0.2% | |||||
Amazon.com, Inc.* | 1,400 | 71,792 | |||
Expedia, Inc.* | 2,300 | 18,952 | |||
| 90,744 | |||||
Internet Software & Services—1.3% | |||||
eBay, Inc.* | 9,200 | 128,432 | |||
Google, Inc.* | 1,075 | 330,724 | |||
Yahoo!, Inc.* | 8,274 | 100,943 | |||
| 560,099 | |||||
Investment Banking & Brokerage—0.9% | |||||
Charles Schwab Corporation | 1,700 | 27,489 | |||
Goldman Sachs Group, Inc. | 3,536 | 298,403 | |||
Merrill Lynch & Company, Inc. | 4,553 | 52,997 | |||
| 378,889 | |||||
Leisure Products—0.1% | |||||
Hasbro, Inc. | 1,200 | 35,004 | |||
Life & Health Insurance—1.2% | |||||
Lincoln National Corporation | 3,400 | 64,056 | |||
MetLife, Inc. | 5,552 | 193,543 | |||
Principal Financial Group, Inc. | 3,000 | 67,710 | |||
Prudential Financial, Inc. | 5,228 | 158,199 | |||
Unum Group | 1,000 | 18,600 | |||
| 502,108 | |||||
Life Sciences Tools & Services—0.4% | |||||
Life Technologies Corporation* | 796 | 18,555 | |||
Thermo Fisher Scientific, Inc.* | 4,700 | 160,129 | |||
| 178,684 | |||||
Managed Health Care—1.0% | |||||
Aetna, Inc. | 4,900 | 139,650 | |||
UnitedHealth Group, Inc. | 5,720 | 152,152 | |||
WellPoint, Inc.* | 3,684 | 155,207 | |||
| 447,009 | |||||
Movies & Entertainment—1.5% | |||||
News Corporation | 12,594 | 114,479 | |||
Time Warner, Inc. | 32,158 | 323,510 | |||
Viacom, Inc. (Cl.B)* | 400 | 7,624 | |||
Walt Disney Company | 7,722 | 175,212 | |||
| 620,825 | |||||
Multi-Line Insurance—0.2% | |||||
Assurant, Inc. | 1,700 | 51,000 | |||
Hartford Financial Services Group, Inc. | 1,000 | 16,420 | |||
| 67,420 | |||||
Multi-Sector Holdings—0.0% | |||||
Leucadia National Corporation | 500 | 9,900 | |||
Multi-Utilities—1.8% | |||||
Centerpoint Energy, Inc. | 12,600 | 159,012 | |||
DTE Energy Company | 4,700 | 167,649 | |||
PG&E Corporation | 4,200 | 162,582 | |||
Public Service Enterprise Group, Inc. | 4,200 | 122,514 | |||
Sempra Energy | 4,200 | 179,046 | |||
| 790,803 | |||||
Office Electronics—0.1% | |||||
Xerox Corporation | 7,600 | 60,572 | |||
Office REIT’s—0.3% | |||||
Boston Properties, Inc. | 2,400 | 132,000 | |||
Oil & Gas Drilling—0.9% | |||||
ENSCO International, Inc. | 4,500 | 127,755 | |||
Noble Corporation | 6,000 | 132,360 | |||
Transocean, Ltd.* | 2,779 | 131,308 | |||
| 391,423 | |||||
Oil & Gas Equipment & Services—0.9% | |||||
Baker Hughes, Inc. | 1,100 | 35,277 | |||
The accompanying notes are an integral part of the financial statements
54
Table of Contents
| Schedule of Investments | Series H | |
| December 31, 2008 | (Enhanced Index Series) |
| Shares | Value | ||||
COMMON STOCKS—97.0% (continued) | |||||
Oil & Gas Equipment & Services—0.9% (continued) | |||||
BJ Services Company | 2,400 | $ | 28,008 | ||
Cameron International Corporation* | 1,900 | 38,950 | |||
National Oilwell Varco, Inc.* | 4,962 | 121,271 | |||
Schlumberger, Ltd. | 4,247 | 179,776 | |||
| 403,282 | |||||
Oil & Gas Exploration & Production—1.0% | |||||
Anadarko Petroleum Corporation | 4,200 | 161,910 | |||
Apache Corporation | 900 | 67,077 | |||
Devon Energy Corporation | 3,100 | 203,701 | |||
Southwestern Energy Company* | 300 | 8,691 | |||
| 441,379 | |||||
Oil & Gas Refining & Marketing—0.3% | |||||
Sunoco, Inc. | 1,300 | 56,498 | |||
Valero Energy Corporation | 3,284 | 71,066 | |||
| 127,564 | |||||
Other Diversified Financial Services—3.1% | |||||
Bank of America Corporation | 29,529 | 415,768 | |||
Citigroup, Inc. | 26,480 | 177,681 | |||
JPMorgan Chase & Company | 19,410 | 611,998 | |||
Morgan Stanley | 9,793 | 157,080 | |||
| 1,362,527 | |||||
Packaged Foods & Meats—1.6% | |||||
Campbell Soup Company | 4,600 | 138,046 | |||
General Mills, Inc. | 1,400 | 85,050 | |||
HJ Heinz Company | 3,500 | 131,600 | |||
JM Smucker Company | 1,400 | 60,704 | |||
Kellogg Company | 1,700 | 74,545 | |||
Kraft Foods, Inc. | 8,449 | 226,856 | |||
| 716,801 | |||||
Paper Packaging—0.1% | |||||
Bemis Company, Inc. | 2,300 | 54,464 | |||
Paper Products—0.1% | |||||
International Paper Company | 1,900 | 22,420 | |||
Personal Products—0.0% | |||||
Avon Products, Inc. | 900 | 21,627 | |||
Pharmaceuticals—8.0% | |||||
Abbott Laboratories | 6,347 | 338,739 | |||
Bristol-Myers Squibb Company | 10,975 | 255,169 | |||
Eli Lilly & Company | 7,171 | 288,776 | |||
Forest Laboratories, Inc.* | 2,400 | 61,128 | |||
Johnson & Johnson | 17,383 | 1,040,025 | |||
Merck & Company, Inc. | 10,876 | 330,630 | |||
Pfizer, Inc. | 45,038 | 797,623 | |||
Schering-Plough Corporation | 5,800 | 98,774 | |||
Watson Pharmaceuticals, Inc.* | 300 | 7,971 | |||
Wyeth | 6,855 | 257,131 | |||
| 3,475,966 | |||||
Property & Casualty Insurance—1.4% | |||||
Allstate Corporation | 5,800 | 190,008 | |||
Chubb Corporation | 2,600 | 132,600 | |||
Progressive Corporation | 1,000 | 14,810 | |||
Travelers Companies, Inc. | 5,781 | 261,301 | |||
| 598,719 | |||||
Publishing—0.3% | |||||
McGraw-Hill Companies, Inc. | 5,700 | 132,183 | |||
Railroads—0.7% | |||||
Burlington Northern Santa Fe Corporation | 1,000 | 75,710 | |||
CSX Corporation | 1,900 | 61,693 | |||
Norfolk Southern Corporation | 2,200 | 103,510 | |||
Union Pacific Corporation | 1,700 | 81,260 | |||
| 322,173 | |||||
Regional Banks—1.0% | |||||
BB&T Corporation | 1,300 | 35,698 | |||
Fifth Third Bancorp | 1,500 | 12,390 | |||
Huntington Bancshares, Inc. | 12,800 | 98,048 | |||
Marshall & Ilsley Corporation | 5,200 | 70,928 | |||
PNC Financial Services Group, Inc. | 2,100 | 102,900 | |||
Regions Financial Corporation | 2,400 | 19,104 | |||
SunTrust Banks, Inc. | 3,600 | 106,344 | |||
| 445,412 | |||||
Residential REIT’s—0.3% | |||||
Apartment Investment & Management Company | 2,668 | 30,815 | |||
Equity Residential | 3,400 | 101,388 | |||
| 132,203 | |||||
Restaurants—1.1% | |||||
Darden Restaurants, Inc. | 300 | 8,454 | |||
McDonald’s Corporation | 7,675 | 477,308 | |||
| 485,762 | |||||
Semiconductors—1.6% | |||||
Analog Devices, Inc. | 800 | 15,216 | |||
Broadcom Corporation* | 3,700 | 62,789 | |||
Intel Corporation | 21,101 | 309,341 | |||
LSI Corporation* | 11,300 | 37,177 | |||
National Semiconductor Corporation | 3,200 | 32,224 | |||
Texas Instruments, Inc. | 14,594 | 226,499 | |||
Xilinx, Inc. | 800 | 14,256 | |||
| 697,502 | |||||
Soft Drinks—1.8% | |||||
Coca-Cola Company | 9,834 | 445,185 | |||
Dr Pepper Snapple Group, Inc.* | 400 | 6,500 | |||
PepsiCo, Inc. | 6,147 | 336,671 | |||
| 788,356 | |||||
Specialized Finance—0.4% | |||||
CME Group, Inc. | 600 | 124,866 | |||
NASDAQ OMX Group, Inc.* | 2,800 | 69,188 | |||
| 194,054 | |||||
Specialized REIT’s—0.4% | |||||
HCP, Inc. | 5,500 | 152,735 | |||
Host Hotels & Resorts, Inc. | 3,900 | 29,523 | |||
| 182,258 | |||||
Specialty Chemicals—0.3% | |||||
International Flavors & Fragrances, Inc. | 1,200 | 35,664 | |||
The accompanying notes are an integral part of the financial statements
55
Table of Contents
| Schedule of Investments | Series H | |
December 31, 2008 | (Enhanced Index Series) |
| Shares | Value | |||||
COMMON STOCKS—97.0% (continued) | ||||||
Specialty Chemicals—0.3% (continued) | ||||||
Sigma-Aldrich Corporation | 2,000 | $ | 84,480 | |||
| 120,144 | ||||||
Specialty Stores—0.0% | ||||||
Tiffany & Company | 400 | 9,452 | ||||
Steel—0.5% | ||||||
Nucor Corporation | 3,811 | 176,068 | ||||
United States Steel Corporation | 900 | 33,480 | ||||
| 209,548 | ||||||
Systems Software—3.5% | ||||||
Microsoft Corporation | 46,050 | 895,212 | ||||
Oracle Corporation* | 22,729 | 402,985 | ||||
Symantec Corporation* | 16,500 | 223,080 | ||||
| 1,521,277 | ||||||
Thrifts & Mortgage Finance—0.0% | ||||||
Hudson City Bancorp, Inc. | 400 | 6,384 | ||||
Tobacco—2.3% | ||||||
Altria Group, Inc. | 14,400 | 216,864 | ||||
Lorillard, Inc. | 2,400 | 135,240 | ||||
Philip Morris International, Inc. | 14,500 | 630,895 | ||||
| 982,999 | ||||||
Wireless Telecommunication Services—0.1% | ||||||
Sprint Nextel Corporation | 26,000 | 47,580 | ||||
TOTAL COMMON STOCKS (cost $54,957,820) | $ | 42,313,924 | ||||
| Principal Amount | Value | |||||
U.S. GOVERNMENT SECURITIES—0.5% | ||||||
U.S. Treasury Bill | ||||||
0.10%, 5/14/2009 | $ | 215,000 | $ | 214,945 | ||
TOTAL U.S. GOVERNMENT SECURITIES (cost $214,865) | $ | 214,945 | ||||
Total Investments—97.5% (cost $55,172,685) | $ | 42,528,869 | ||||
Cash & Other Assets, Less Liabilities—2.5% | 1,108,542 | |||||
Total Net Assets—100.0% | $ | 43,637,411 | ||||
For federal income tax purposes the identified cost of investments owned at December 31, 2008 was $56,797,563.
| * | Non-income producing security |
1 | Security is segregated as collateral for open futures contracts. |
56
Table of Contents
| Series H | ||
| (Enhanced Index Series) |
Statement of Assets and Liabilities
December 31, 2008
Assets: | ||||
Investments, at value* | $ | 42,528,869 | ||
Cash | 1,086,511 | |||
Receivables: | ||||
Fund shares sold | 42,084 | |||
Dividends | 103,154 | |||
Variation margin on futures | 16,660 | |||
Prepaid expenses | 1,055 | |||
Total assets | 43,778,333 | |||
Liabilities: | ||||
Payable for: | ||||
Fund shares redeemed | 95,352 | |||
Management fees | 17,850 | |||
Administration fees | 4,892 | |||
Transfer agent/maintenance fees | 2,083 | |||
Custodian fees | 2,159 | |||
Directors’ fees | 850 | |||
Professional fees | 14,236 | |||
Other fees | 3,500 | |||
Total liabilities | 140,922 | |||
Net assets | $ | 43,637,411 | ||
Net assets consist of: | ||||
Paid in capital | $ | 69,246,593 | ||
Undistributed net investment income | 994,450 | |||
Accumulated net realized loss on sale of investments | (13,978,013 | ) | ||
Net unrealized depreciation in value of investments | (12,625,619 | ) | ||
Net assets | $ | 43,637,411 | ||
Capital shares authorized | unlimited | |||
Capital shares outstanding | 6,254,414 | |||
Net asset value per share (net assets divided by shares outstanding) | $ | 6.98 | ||
* Investments, at cost | $ | 55,172,685 | ||
Statement of Operations
For Year Ended December 31, 2008
Investment Income: | ||||
Dividends | $ | 1,438,296 | ||
Interest | 15,545 | |||
Total investment income | 1,453,841 | |||
Expenses: | ||||
Management fees | 467,057 | |||
Administration fees | 64,417 | |||
Transfer agent/maintenance fees | 25,176 | |||
Custodian fees | 16,119 | |||
Directors’ fees | 4,191 | |||
Professional fees | 25,137 | |||
Reports to shareholders | 8,605 | |||
Other | 4,410 | |||
Total expenses | 615,112 | |||
Less: | ||||
Expenses waived | (155,686 | ) | ||
Earnings credits applied | (35 | ) | ||
Net expenses | 459,391 | |||
Net investment income | 994,450 | |||
Net Realized and Unrealized Gain (Loss): | ||||
Net realized gain (loss) during the year on: | ||||
Investments | (12,384,892 | ) | ||
Futures | (493,112 | ) | ||
Net realized loss | (12,878,004 | ) | ||
Net unrealized appreciation (depreciation) during the year on: | ||||
Investments | (15,979,285 | ) | ||
Futures | 32,622 | |||
Net unrealized depreciation | (15,946,663 | ) | ||
Net realized and unrealized loss | (28,824,667 | ) | ||
Net decrease in net assets resulting from operations | $ | (27,830,217 | ) | |
The accompanying notes are an integral part of the financial statements
57
Table of Contents
| Series H | ||
| Statement of Changes in Net Assets | (Enhanced Index Series) |
| Year Ended December 31, 2008 | Year Ended December 31, 2007 | |||||||
Increase (decrease) in net assets from operations: | ||||||||
Net investment income | $ | 994,450 | $ | 1,269,184 | ||||
Net realized gain (loss) during the year on investments | (12,878,004 | ) | 7,041,449 | |||||
Net unrealized depreciation during the year on investments | (15,946,663 | ) | (6,763,996 | ) | ||||
Net increase (decrease) in net assets resulting from operations | (27,830,217 | ) | 1,546,637 | |||||
Capital share transactions: | ||||||||
Proceeds from sale of shares | 15,012,095 | 32,238,699 | ||||||
Cost of shares redeemed | (27,073,231 | ) | (60,286,322 | ) | ||||
Net decrease from capital share transactions | (12,061,136 | ) | (28,047,623 | ) | ||||
Net decrease in net assets | (39,891,353 | ) | (26,500,986 | ) | ||||
Net assets: | ||||||||
Beginning of year | 83,528,764 | 110,029,750 | ||||||
End of year | $ | 43,637,411 | $ | 83,528,764 | ||||
Undistributed net investment income at end of year | $ | 994,450 | $ | 1,269,184 | ||||
Capital share activity: | ||||||||
Shares sold | 1,623,139 | 2,808,020 | ||||||
Shares redeemed | (2,843,320 | ) | (5,271,412 | ) | ||||
Total capital share activity | (1,220,181 | ) | (2,463,392 | ) | ||||
The accompanying notes are an integral part of the financial statements
58
Table of Contents
| Financial Highlights | Series H | |
| Selected data for each share of capital stock outstanding throughout each year | (Enhanced Index Series) |
| 2008 | 2007 | 2006a | 2005 | Year Ended December 31, 2004 | ||||||||||||||||
Per Share Data | ||||||||||||||||||||
Net asset value, beginning of period | $ | 11.18 | $ | 11.07 | $ | 9.58 | $ | 9.12 | $ | 8.31 | ||||||||||
Income (loss) from investment operations: | ||||||||||||||||||||
Net investment incomeb | 0.15 | 0.14 | 0.03 | 0.11 | 0.11 | |||||||||||||||
Net gain (loss) on securities (realized and unrealized) | (4.35 | ) | (0.03 | ) | 1.46 | 0.35 | 0.71 | |||||||||||||
Total from investment operations | (4.20 | ) | 0.11 | 1.49 | 0.46 | 0.82 | ||||||||||||||
Less distributions: | ||||||||||||||||||||
Dividends from net investment income | — | — | — | — | (0.01 | ) | ||||||||||||||
Total distributions | — | — | — | — | (0.01 | ) | ||||||||||||||
Net asset value, end of period | $ | 6.98 | $ | 11.18 | $ | 11.07 | $ | 9.58 | $ | 9.12 | ||||||||||
Total Returnc | (37.57 | %) | 0.99 | % | 15.55 | % | 5.04 | % | 9.85 | % | ||||||||||
Ratios/Supplemental Data | ||||||||||||||||||||
Net assets, end of period (in thousands) | $ | 43,637 | $ | 83,529 | $ | 110,030 | $ | 40,101 | $ | 38,822 | ||||||||||
Ratios to average net assets: | ||||||||||||||||||||
Net investment income | 1.60 | % | 1.25 | % | 1.23 | % | 1.15 | % | 1.32 | % | ||||||||||
Total expensesd | 0.99 | % | 0.94 | % | 0.98 | % | 1.04 | % | 0.99 | % | ||||||||||
Net expensese | 0.74 | % | 0.69 | % | 0.73 | % | 0.79 | % | 0.74 | % | ||||||||||
Net expenses prior to custodian earnings credits and net of expense waivers | 0.74 | % | 0.69 | % | 0.73 | % | 0.79 | % | 0.74 | % | ||||||||||
Portfolio turnover rate | 106 | % | 89 | % | 119 | % | 106 | % | 98 | % | ||||||||||
a | The financial highlights for Series H exclude the historical financial highlights for Series W. The assets of Series W were acquired by Series H on June 16, 2006. A total of $53,926,052 was excluded from purchases in the portfolio turnover calculation, which represents the cost of the securities Series H received as a result of the merger. |
b | Net investment income (loss) was computed using average shares outstanding throughout the period. |
c | Total return does not take into account any of the expenses associated with an investment in variable insurance products offered by Security Benefit Life Insurance Company. If total return had taken into account these expenses, performance would have been lower. Shares of a series of SBL Fund are available only through the purchase of such products. |
d | Total expense information reflects the expense ratios absent expense reductions by the Investment Manager and earnings credits, as applicable. |
e | Net expense information reflects the expense ratios after voluntary expense waivers, reimbursements and custodian earnings credits, as applicable. |
The accompanying notes are an integral part of the financial statements
59
Table of Contents
| Manager’s Commentary | Series J | |
| February 16, 2009 | (Mid Cap Growth Series) |
![]()

Joe O’Connor
Senior Portfolio Manager
To Our Shareholders:
Series J of the SBL Fund - Mid Cap Growth Series posted a return of –39.96% for the year. The result exceeded the benchmark, the Russell MidCap Growth Index, which lost –44.32%, and the median peer return of –44.40%.
Our approach to the Series is to seek securities of companies that are able to grow and/or reinvest in increasingly profitable ventures and hold them over three to five years to capture the best part of the improvements in profits. We focus on investing in securities of companies that appear likely to generate above average profitability at prices that, as of yet, do not reflect that potential.
We use a bottom-up approach to choose portfolio securities that we believe are attractively valued with the greatest potential for appreciation. We attempt to identify companies that are in the early to middle stages of growth and are valued at a reasonable price.
Health Care and Consumer Discretionary Top Performers
Even though every sector produced negative returns during the calendar year, superior stock selection relative to the benchmark allowed the health care and consumer discretionary sectors to keep portfolio performance ahead of the Index.
Health care, an overweight position, held losses to half of the benchmark, –16% to –33%, respectively. One of the portfolio’s largest holdings, Gilead Sciences, Inc., actually produced a positive return of 11%. Two other material positions in the sector performed significantly better than the benchmark. Teva Pharmaceutical Industries, Ltd. declined –8% while Genzyme Corporation was down –11%.
Consumer discretionary, also an overweight position, kept its loss to –32% against a –42% drop for the benchmark. Two top positions in the sector had positive returns for the portfolio. TJX Companies gained 29% while Darden Restaurants, Inc. returned 4%. Unfortunately, the portfolio’s other major positions, Activision Blizzard, Inc. and Phillips-Van Heusen Corporation, lost –42% and –58%, respectively.
Information Technology and Energy Disappoint
Poor stock selection in the information technology and energy sectors hurt relative performance of the Mid Cap Growth Series for the year. Both sectors were underweight, but selected holdings performed worse than the benchmark. The information technology sector dropped –58% compared to a –46% decline in the Index, while energy lost –66% against –56% for the benchmark.
Many material holdings in information technology were hard hit. MEMC Electronic Materials, Inc. was down –85%, ON Semiconductor Corporation declined –62%, while Cognizant Technology Solutions Corporation and Fairchild Semiconductor International, Inc. lost –47% and –66%, respectively.
A similar situation affected the portfolio’s top energy holdings. Weatherford International, Ltd. was down –68% and National Oilwell Varco, Inc. lost –67%. Adding to the carnage were positions in Williams Companies, Inc. and Peabody Energy Corporation that dropped –59% and –54%, respectively.
Market Outlook
We continue to pursue opportunities with a focus on bottom-up research rather than a macro forecast.
Factors behind the year’s market volatility were the freezing and uncertainty within the credit markets, massive losses related to sub-prime mortgages, and the dramatic slowdown in earnings. We believe the current market environment is part of a longer cycle phenomenon, which will continue in 2009 with a possible gradual recovery taking hold in the second half of the year.
While the U.S. and developed markets should continue to slow in the first half of 2009, we expect that major economies and markets should find some stability in the
60
Table of Contents
| Manager’s Commentary | Series J | |
| February 16, 2009 | (Mid Cap Growth Series) |
second half of the year. We continue to be underweight in the health care sector due to heightened headline risk with a new administration.
Security Global Investors (SGI) acquired a proven investment team specializing in domestic growth equities. The new SGI growth team began managing assets of the Mid Cap Growth portfolio on February 1, 2008.
We believe that investing is a long-term pursuit that requires patience and a consistent approach. As always, we will continue to do our best to seek the potential available in mid capitalization growth companies. On behalf of SGI, I would like to thank you for placing your trust in us.
Sincerely,
Joe O’Connor, Portfolio Manager
61
Table of Contents
| Series J | ||
| Performance Summary | (Mid Cap Growth Series) | |
| December 31, 2008 | (unaudited) |
PERFORMANCE
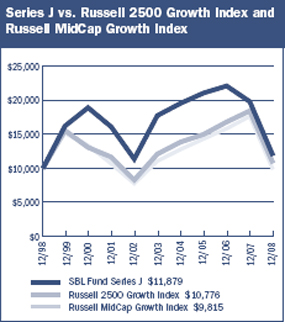
$10,000 Over 10 Years
The chart above assumes a hypothetical $10,000 investment in Series J (Mid Cap Growth Series) on December 31, 1998 and reflects the fees and expenses of Series J. The Russell 2500 Growth Index is an unmanaged index that measures the performance of securities of small-to-mid U.S. companies with greater-than-average growth orientation. The Russell MidCap Growth Index is an unmanaged capitalization-weighted Index that is designed to measure the performance of the 800 smallest companies in the Russell 1000 Index with higher price-to-book ratios and higher forecasted growth values. The Russell MidCap Growth Index replaced the Russell 2500 Growth Index as the Series’ primary benchmark effective February 1, 2008, to provide a more meaningful comparison of the Series’ performance in light of the investment strategies that it employs.
Average Annual Returns
Periods Ended 12-31-081 | 1 Year | 5 Years | 10 Years | ||||||
Series J | (39.96 | )% | (7.70 | )% | 1.74 | % |
1 | Performance figures do not reflect fees and expenses associated with an investment in variable insurance products offered by Security Benefit Life Insurance Company. If returns had taken into account these fees and expenses, performance would have been lower. Shares of a Series of SBL Fund are available only through the purchase of such products. |
The performance data quoted above represents past performance. Past performance is not predictive of future performance. The investment return and principal value of an investment will fluctuate so that an investor’s shares, when redeemed, may be worth more or less than their original cost.
Portfolio Composition by Sector
Consumer Discretionary | 19.74 | % | |
Consumer Staples | 5.00 | ||
Energy | 7.90 | ||
Financials | 9.72 | ||
Health Care | 16.42 | ||
Industrials | 8.80 | ||
Information Technology | 16.29 | ||
Materials | 8.56 | ||
Warrants | 0.02 | ||
Repurchase Agreement | 7.92 | ||
Liabilities, Less Cash & Other Assets | (0.37 | ) | |
Total Net Assets | 100.00 | % | |
The accompanying notes are an integral part of the financial statements
62
Table of Contents
| Series J | ||
| Performance Summary | (Mid Cap Growth Series) | |
| December 31, 2008 | (unaudited) |
Information About Your Series Expenses
Calculating your ongoing Series expenses
Example
As a shareholder of the Series, you incur ongoing costs, including management fees and other series expenses. Performance figures and expense ratios do not reflect fees and expenses associated with an investment in variable insurance products. Shares of a Series of SBL Fund are available only through the purchase of such products. This example is intended to help you understand your ongoing costs (in dollars) of investing in the Series and to compare these costs with ongoing costs of investing in other mutual funds. The example is based on an investment of $1,000 invested at the beginning of the period and held for the entire period, July 1, 2008 through December 31, 2008.
Actual Expenses
The first line in the table provides information about actual account values and actual expenses. You may use the information in this table, together with the amount you invested, to estimate the expenses that you paid over the period. Simply divide your account value by $1,000 (for example, an $8,600 account value divided by $1,000 = 8.6), then multiply the result by the number in the table under the heading entitled “Expenses Paid During the Period” to estimate the expenses you paid on your account during this period.
Hypothetical Example for Comparison Purposes
The second line in the table provides information about hypothetical account values and hypothetical expenses based on the Series actual expense ratio and an assumed rate of return of 5% per year before expenses, which is not the Series actual return. The hypothetical account values and expenses may not be used to estimate the actual ending account balance or expenses you paid for the period. You may use this information to compare the ongoing costs of investing in the Series and other funds. To do so, compare this 5% hypothetical example with the 5% hypothetical examples that appear in the shareholder reports of the other mutual funds.
Please note that the expenses shown in the table are meant to highlight your ongoing costs only and do not reflect any fees and expenses associated with an investment in variable insurance products. Therefore, the second line is useful in comparing ongoing costs only, and will not help you determine the relative total costs of owning different funds. In addition, if these fees and expenses associated with an investment in variable insurance products were included, your costs would have been higher.
Series Expenses
| Beginning Account Value 7/1/2008 | Ending Account Value 12/31/20081 | Expenses Paid During Period2 | |||||||
Series J (Mid Cap Growth Series) | |||||||||
Actual | $ | 1,000.00 | $ | 608.84 | $ | 3.68 | |||
Hypothetical | 1,000.00 | 1,020.56 | 4.62 | ||||||
1 | The actual ending account value is based on the actual total return of the Series for the period July 1, 2008 to December 31, 2008 after actual expenses and will differ from the hypothetical ending account value which is based on the Series expense ratio and a hypothetical annual return of 5% before expenses. The actual cumulative return at net asset value for the period July 1, 2008 to December 31, 2008 was (39.12%). |
2 | Expenses are equal to the Series annualized expense ratio of 0.91%, net of any applicable fee waivers, multiplied by the average account value over the period, multiplied by 184/366 (to reflect the one-half year period). |
63
Table of Contents
| Schedule of Investments | Series J | |
| December 31, 2008 | (Mid Cap Growth Series) |
| Shares | Value | ||||
| COMMON STOCKS—92.5% | |||||
Aerospace & Defense—3.5% | |||||
Goodrich Corporation | 117,835 | $ | 4,362,251 | ||
Application Software—1.3% | |||||
Amdocs, Ltd.* | 85,660 | 1,566,721 | |||
Asset Management & Custody Banks—1.7% | |||||
T. Rowe Price Group, Inc. | 57,925 | 2,052,862 | |||
Biotechnology—8.8% | |||||
Genzyme Corporation* | 74,190 | 4,923,990 | |||
Gilead Sciences, Inc.* | 112,535 | 5,755,041 | |||
| 10,679,031 | |||||
Casinos & Gaming—6.8% | |||||
Penn National Gaming, Inc.* | 190,110 | 4,064,552 | |||
WMS Industries, Inc.* | 157,285 | 4,230,966 | |||
| 8,295,518 | |||||
Coal & Consumable Fuels—1.4% | |||||
Peabody Energy Corporation | 77,210 | 1,756,528 | |||
Construction & Engineering—3.2% | |||||
Aecom Technology Corporation* | 33,790 | 1,038,367 | |||
Foster Wheeler, Ltd.* | 120,025 | 2,806,184 | |||
| 3,844,551 | |||||
Data Processing & Outsourced Services—2.1% | |||||
Alliance Data Systems Corporation* | 53,970 | 2,511,224 | |||
Department Stores—3.1% | |||||
Kohl’s Corporation* | 102,880 | 3,724,256 | |||
Fertilizers & Agricultural Chemicals—1.9% | |||||
Mosaic Company | 67,760 | 2,344,496 | |||
Food Retail—2.2% | |||||
Kroger Company | 103,130 | 2,723,663 | |||
Home Entertainment Software—2.8% | |||||
Activision Blizzard, Inc.* | 392,890 | 3,394,570 | |||
Hotels, Resorts & Cruise Lines—1.7% | |||||
Marriott International, Inc. | 107,965 | 2,099,919 | |||
Industrial Gases—4.6% | |||||
AirGas, Inc. | 76,325 | 2,975,911 | |||
Praxair, Inc. | 44,130 | 2,619,557 | |||
| 5,595,468 | |||||
Industrial Machinery—0.3% | |||||
Thermoenergy Corporation1,* | 792,519 | 356,634 | |||
IT Consulting & Other Services —3.3% | |||||
Cognizant Technology Solutions Corporation* | 229,090 | 4,137,365 | |||
Leisure Facilities—1.3% | |||||
Life Time Fitness, Inc.* | 118,940 | 1,540,273 | |||
Life Sciences Tools & Services—3.1% | |||||
Thermo Fisher Scientific, Inc.* | 112,530 | 3,833,897 | |||
Metal & Glass Containers—2.1% | |||||
Ball Corporation | 60,286 | 2,507,295 | |||
Multi-Line Insurance—4.9% | |||||
Assurant, Inc. | 98,855 | 2,965,650 | |||
HCC Insurance Holdings, Inc. | 113,405 | 3,033,584 | |||
| 5,999,234 | |||||
Oil & Gas Equipment & Services—3.7% | |||||
National Oilwell Varco, Inc.* | 80,550 | 1,968,642 | |||
Weatherford International, Ltd.* | 236,290 | 2,556,657 | |||
| 4,525,299 | |||||
Oil & Gas Exploration & Production—1.1% | |||||
Comstock Resources, Inc.* | 28,150 | 1,330,088 | |||
Oil & Gas Storage & Transportation—1.7% | |||||
Williams Companies, Inc. | 139,720 | 2,023,145 | |||
Packaged Foods & Meats—2.8% | |||||
Kellogg Company | 77,010 | 3,376,889 | |||
Pharmaceuticals—4.5% | |||||
Teva Pharmaceutical Industries, Ltd. ADR | 129,725 | 5,522,393 | |||
Railroads—1.8% | |||||
Union Pacific Corporation | 45,440 | 2,172,032 | |||
Regional Banks—3.1% | |||||
BB&T Corporation | 138,800 | 3,811,448 | |||
Restaurants—6.9% | |||||
Burger King Holdings, Inc. | 174,750 | 4,173,030 | |||
Darden Restaurants, Inc. | 151,200 | 4,260,817 | |||
| 8,433,847 | |||||
Semiconductors—2.4% | |||||
Fairchild Semiconductor International, Inc.* | 211,660 | 1,035,018 | |||
Microsemi Corporation* | 78,260 | 989,206 | |||
ON Semiconductor Corporation* | 283,455 | 963,747 | |||
| 2,987,971 | |||||
Systems Software—2.5% | |||||
Symantec Corporation* | 223,040 | 3,015,501 | |||
The accompanying notes are an integral part of the financial statements
64
Table of Contents
| Schedule of Investments | Series J | |
| December 31, 2008 | (Mid Cap Growth Series) |
| Shares | Value | ||||||
| COMMON STOCKS—92.5% (continued) | |||||||
| Technology Distributors—1.9% | |||||||
Avnet, Inc. * | 124,500 | $ | 2,267,145 | ||||
TOTAL COMMON STOCKS (cost $148,508,696) | $ | 112,791,514 | |||||
| Shares | Value | ||||||
| WARRANTS—0.0% | |||||||
Lime Energy Company | |||||||
$1.00, 3/19/2009 | 6,150 | 3,542 | |||||
Nova Biosource Fuels, Inc. | |||||||
$2.40, 7/5/2011 | 358,100 | 23,165 | |||||
TOTAL WARRANTS (cost $974,541) | $ | 26,707 | |||||
| Principal Amount | Value | ||||||
| REPURCHASE AGREEMENT—7.9% | |||||||
UMB Financial Corp, 0.05%, dated 12/31/08, matures 1/02/09; repurchase amount $9,669,027 (Collateralized by FHLMC, 5.40%, 2/03/12 with a value of $9,863,211) | $ | 9,669,000 | $ | 9,669,000 | |||
TOTAL REPURCHASE AGREEMENT (cost $9,669,000) | $ | 9,669,000 | |||||
Total Investments—100.4% (cost $159,152,237) | $ | 122,487,221 | |||||
Liabilities, Less Cash & Other Assets—(0.4)% | (457,435 | ) | |||||
Total Net Assets—100.0% | $ | 122,029,786 | |||||
For federal income tax purposes the identified cost of investments owned at December 31, 2008 was $161,293,579.
| ADR | American Depositary Receipt |
| * | Non-income producing security |
1 | Security is deemed illiquid. The total market value of illiquid securities is $356,634 (cost $896,877), or 0.3% of total net assets. |
The accompanying notes are an integral part of the financial statements
65
Table of Contents
| Series J | ||
| (Mid Cap Growth Series) |
Statement of Assets and Liabilities
December 31, 2008
Assets: | ||||
Investments, at value* | $ | 122,487,221 | ||
Cash | 768 | |||
Receivables: | ||||
Fund shares sold | 12,026 | |||
Dividends | 72,040 | |||
Prepaid expenses | 3,149 | |||
Total assets | 122,575,204 | |||
Liabilities: | ||||
Payable for: | ||||
Fund shares redeemed | 107,758 | |||
Securities purchased | 305,784 | |||
Management fees | 73,781 | |||
Administration fees | 9,721 | |||
Transfer agent/maintenance fees | 2,083 | |||
Custodian fees | 3,432 | |||
Directors’ fees | 2,750 | |||
Professional fees | 25,109 | |||
Other fees | 15,000 | |||
Total liabilities | 545,418 | |||
Net assets | $ | 122,029,786 | ||
Net assets consist of: | ||||
Paid in capital | $ | 229,411,846 | ||
Accumulated net realized loss on sale of investments | (70,717,044 | ) | ||
Net unrealized depreciation in value of investments | (36,665,016 | ) | ||
Net assets | $ | 122,029,786 | ||
Capital shares authorized | unlimited | |||
Capital shares outstanding | 7,259,914 | |||
Net asset value per share (net assets divided by shares outstanding) | $ | 16.81 | ||
* Investments, at cost | $ | 159,152,237 | ||
Statement of Operations
For Year Ended December 31, 2008
Investment Income: | ||||
Dividends | $ | 1,280,149 | ||
Interest | 362,778 | |||
Total investment income | 1,642,927 | |||
Expenses: | ||||
Management fees | 1,436,241 | |||
Administration fees | 182,985 | |||
Transfer agent/maintenance fees | 25,246 | |||
Custodian fees | 14,986 | |||
Directors’ fees | 12,754 | |||
Professional fees | 51,204 | |||
Reports to shareholders | 12,319 | |||
Other | 12,488 | |||
Total expenses | 1,748,223 | |||
Less: | ||||
Earnings credits applied | (120 | ) | ||
Net expenses | 1,748,103 | |||
Net investment loss | (105,176 | ) | ||
Net Realized and Unrealized Gain (Loss): | ||||
Net realized gain (loss) during the year on: | ||||
Investments | (46,515,676 | ) | ||
Net realized loss | (46,515,676 | ) | ||
Net unrealized appreciation (depreciation) during the year on: | ||||
Investments | (40,063,644 | ) | ||
Net unrealized depreciation | (40,063,644 | ) | ||
Net realized and unrealized loss | (86,579,320 | ) | ||
Net decrease in net assets resulting from operations | $ | (86,684,496 | ) | |
The accompanying notes are an integral part of the financial statements
66
Table of Contents
| Series J | ||
| Statement of Changes in Net Assets | (Mid Cap Growth Series) |
| Year Ended December 31, 2008 | Year Ended December 31, 2007 | |||||||
Increase (decrease) in net assets from operations: | ||||||||
Net investment loss | $ | (105,176 | ) | $ | (460,802 | ) | ||
Net realized gain (loss) during the year on investments | (46,515,676 | ) | 40,397,128 | |||||
Net unrealized depreciation during the year on investments | (40,063,644 | ) | (70,613,156 | ) | ||||
Net decrease in net assets resulting from operations | (86,684,496 | ) | (30,676,830 | ) | ||||
Capital share transactions: | ||||||||
Proceeds from sale of shares | 37,579,885 | 46,162,993 | ||||||
Cost of shares redeemed | (80,932,084 | ) | (144,083,682 | ) | ||||
Net decrease from capital share transactions | (43,352,199 | ) | (97,920,689 | ) | ||||
Net decrease in net assets | (130,036,695 | ) | (128,597,519 | ) | ||||
Net assets: | ||||||||
Beginning of year | 252,066,481 | 380,664,000 | ||||||
End of year | $ | 122,029,786 | $ | 252,066,481 | ||||
Undistributed net investment income at end of year | $ | — | $ | — | ||||
Capital share activity: | ||||||||
Shares sold | 1,587,753 | 1,509,177 | ||||||
Shares redeemed | (3,329,065 | ) | (4,683,979 | ) | ||||
Total capital share activity | (1,741,312 | ) | (3,174,802 | ) | ||||
The accompanying notes are an integral part of the financial statements
67
Table of Contents
| Financial Highlights | Series J | |
| Selected data for each share of capital stock outstanding throughout each year | (Mid Cap Growth Series) |
| Year Ended December 31, 2004 | ||||||||||||||||||||
| 2008 | 2007 | 2006 | 2005 | |||||||||||||||||
Per Share Data | ||||||||||||||||||||
Net asset value, beginning of period | $ | 28.00 | $ | 31.26 | $ | 29.79 | $ | 27.63 | $ | 25.09 | ||||||||||
Income (loss) from investment operations: | ||||||||||||||||||||
Net investment lossa | (0.01 | ) | (0.04 | ) | (0.16 | ) | (0.13 | ) | (0.14 | ) | ||||||||||
Net gain (loss) on securities (realized and unrealized) | (11.18 | ) | (3.22 | ) | 1.63 | 2.29 | 2.68 | |||||||||||||
Total from investment operations | (11.19 | ) | (3.26 | ) | 1.47 | 2.16 | 2.54 | |||||||||||||
Net asset value, end of period | $ | 16.81 | $ | 28.00 | $ | 31.26 | $ | 29.79 | $ | 27.63 | ||||||||||
Total Returnb | (39.96 | )% | (10.43 | )% | 4.93 | % | 7.82 | % | 10.12 | % | ||||||||||
Ratios/Supplemental Data | ||||||||||||||||||||
Net assets, end of period (in thousands) | $ | 122,030 | $ | 252,066 | $ | 380,664 | $ | 420,798 | $ | 437,789 | ||||||||||
Ratios to average net assets: | ||||||||||||||||||||
Net investment loss | (0.06 | )% | (0.14 | )% | (0.48 | )% | (0.47 | )% | (0.53 | )% | ||||||||||
Total expensesc | 0.91 | % | 0.90 | % | 0.90 | % | 0.90 | % | 0.88 | % | ||||||||||
Net expensesd | 0.91 | % | 0.90 | % | 0.90 | % | 0.90 | % | 0.88 | % | ||||||||||
Net expenses prior to custodian earnings credits and net of expense waivers | 0.91 | % | 0.90 | % | 0.90 | % | 0.90 | % | 0.88 | % | ||||||||||
Portfolio turnover rate | 203 | %e | 34 | % | 29 | % | 29 | % | 37 | % | ||||||||||
a | Net investment income (loss) was computed using average shares outstanding throughout the period. |
b | Total return does not take into account any of the expenses associated with an investment in variable insurance products offered by Security Benefit Life Insurance Company. If total return had taken into account these expenses, performance would have been lower. Shares of a series of SBL Fund are available only through the purchase of such products. |
c | Total expense information reflects the expense ratios absent expense reductions by the Investment Manager and earnings credits, as applicable. |
d | Net expense information reflects the expense ratios after voluntary expense waivers, reimbursements and custodian earnings credits, as applicable. |
e | Significant variation in the portfolio turnover rate is due to Investment Manager’s appointment of new portfolio managers for the Series. |
The accompanying notes are an integral part of the financial statements
68
Table of Contents
| Manager’s Commentary | Series N | |
February 16, 2009 | (Managed Asset Allocation Series) |

Subadviser, T. Rowe Price Associates, Inc.

Edmund M. Notzon
Portfolio Manager
To Our Shareholders:
Series N of the SBL Fund - Managed Asset Allocation Series, returned –27.25% for the year ended December 31, 2008, underperforming its 60% S&P 500/40% Barclays Capital U.S. Aggregate Index (formerly the Lehman Brothers U.S. Aggregate Index) benchmark, which returned –22.06%. The S&P 500 Index returned –37.00% over the period, and the Barclays Capital U.S. Aggregate Index returned 5.24%.
Market Environment:
U.S. stocks plunged deep into bear market territory as the economy went into its first recession since 2001. The year was marked by extreme volatility, heightened risk aversion, and intense pressures on financial companies stemming from severe mortgage losses and a credit crunch. The Federal Reserve and Treasury Department attempted to lessen the damage to the economy and the financial markets by taking extraordinary actions. These included slashing short-term interest rates to all-time lows, creating a broad range of credit facilities to encourage lending, and committing hundreds of billions of dollars to several major financial institutions to prevent them from collapsing.
In fixed income, U.S. bond returns were mixed. U.S. Treasuries soared as the weak economy and investors’ fears of losses triggered a massive flight to safety. As a result, the Federal Reserve reduced the fed funds target rate to a range of 0.00% to 0.25%. Other high-quality securities, such as agency debt and mortgage-backed securities produced moderate gains. In contrast, other fixed-income sectors declined. Municipal and investment-grade corporate bonds produced moderate losses. Asset-backed securities fell sharply, and high-yield bonds plunged.
In U.S. equity markets, small cap shares held up slightly better than larger cap issues. Growth stocks performed worse than value stocks across all market capitalizations. In the large cap universe, as measured by the S&P 500 Index, all major sectors fell sharply, but financials fared worst. Shares of materials, industrials and business services, and information technology companies, many of which depend on a healthy economy, registered deep losses. Consumer staples and health care stocks held up best. These sectors often outperform in economic downturns because the need for food, medicine, and other essentials is not cyclical.
Non-U.S. stocks fell more than U.S. shares in 2008, in part because falling foreign currencies in the second half of the year deepened overseas losses in U.S. dollar terms.
Stocks in emerging markets did the worst, led by shares in emerging Europe. Among developed markets, European equities fell sharply, but Japanese stocks held up somewhat better in U.S. dollar terms as the yen strengthened versus the dollar.
Portfolio Review:
While the portfolio maintains a broadly diversified approach with holdings across a broad range of market sectors, this strategy was not rewarded over the period. A narrow segment of high-quality bonds, primarily government issues, had solid returns while most other sectors experienced losses. The portfolio’s overweight allocation to stocks versus bonds was a negative contributor to performance. The inclusion of non-U.S. equities, for which there is no representation in the benchmark, weighed on returns as the MSCI EAFE Index underperformed the portfolio’s equity benchmark, the S&P 500 Index. It was a similar situation for the inclusion of high-yield bonds relative to the Barclays Capital U.S. Aggregate Index. Weak security selection hurt relative returns, led by underperformance in non-U.S. equities and high-grade bonds. Relative outperformance in U.S. large cap stocks and high yield bonds contributed positively to returns.
Outlook:
We continue to overweight stocks relative to bonds. We recognize that tighter credit availability and a slowing economy are weighing on corporate profitability. However, recent market movements have priced in significant weakness. We are overweight equities based on attractive valuations and the potential economic impact from lower interest rates and supportive market and economic policies. We continue to underweight small cap stocks as their valuations remain rich compared with their historical relationship with large cap stocks. Large cap stocks should benefit from more diversified sources of earnings across business lines and geography.
In this period of increased uncertainty and volatility among global equity markets, we believe that our time-tested investment process as well as the portfolio’s broad diversification will serve our shareholders well over the long term.
Sincerely,
Edmond M. Notzon, Portfolio Manager, T. Rowe Price
69
Table of Contents
| Series N | ||
| Performance Summary | (Managed Asset Allocation Series) | |
| December 31, 2008 | (unaudited) |
PERFORMANCE
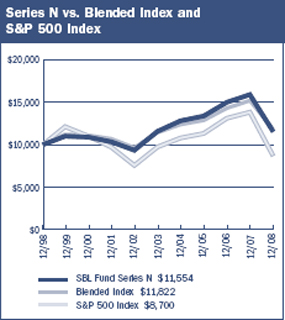
$10,000 Over 10 Years
The chart above assumes a hypothetical $10,000 investment in Series N (Managed Asset Allocation Series) on December 31, 1998 and reflects the fees and expenses of Series N. The blended index is 60% S&P 500 Index and 40% Barclays Capital U.S. Aggregate Bond Index (formerly the Lehman Brothers U.S. Aggregate Index). The S&P 500 Index is a capitalization-weighted index composed of 500 selected common stocks that represent the broad domestic economy and is a widely recognized unmanaged index of market performance. The Barclays Capital U.S. Aggregate Bond Index is an unmanaged index that tracks investment grade bonds including U.S. Treasury and agency issues, corporate bond issues, asset-backed, commercial mortgage-backed and mortgage-backed securities and Yankee issues.
Average Annual Returns
Periods Ended 12-31-081 | 1 Year | 5 Years | 10 Years | ||||||
Series N | (27.25 | )% | (0.01 | )% | 1.46 | % |
1 | Performance figures do not reflect fees and expenses associated with an investment in variable insurance products offered by Security Benefit Life Insurance Company. If returns had taken into account these fees and expenses, performance would have been lower. Shares of a Series of SBL Fund are available only through the purchase of such products. |
The performance data quoted above represents past performance. Past performance is not predictive of future performance. The investment return and principal value of an investment will fluctuate so that an investor’s shares, when redeemed, may be worth more or less than their original cost.
Portfolio Composition by Sector for Equity Holdings & Quality Ratings
(Based on Standard and Poor’s Ratings) for Fixed Income Holdings
Consumer Discretionary | 5.99 | % | |
Consumer Staples | 8.07 | ||
Energy | 8.27 | ||
Financials | 9.45 | ||
Health Care | 9.23 | ||
Industrials | 7.21 | ||
Information Technology | 8.66 | ||
Materials | 2.30 | ||
Telecommunication Services | 2.95 | ||
Utilities | 2.84 | ||
AAA | 21.66 | ||
AA | 1.27 | ||
A | 4.38 | ||
BBB | 4.91 | ||
BB | 1.26 | ||
B | 0.90 | ||
CCC | 0.20 | ||
C | 0.01 | ||
Not Rated | 0.10 | ||
Short Term Investments | 0.11 | ||
Cash & Other Assets, Less Liabilities | 0.23 | ||
Total Net Assets | 100.00 | % | |
The accompanying notes are an integral part of the financial statements
70
Table of Contents
| Series N | ||
| Performance Summary | (Managed Asset Allocation Series) | |
| December 31, 2008 | (unaudited) |
Information About Your Series Expenses
Calculating your ongoing Series expenses
Example
As a shareholder of the Series, you incur ongoing costs, including management fees and other series expenses. Performance figures and expense ratios do not reflect fees and expenses associated with an investment in variable insurance products. Shares of a Series of SBL Fund are available only through the purchase of such products. This example is intended to help you understand your ongoing costs (in dollars) of investing in the Series and to compare these costs with ongoing costs of investing in other mutual funds. The example is based on an investment of $1,000 invested at the beginning of the period and held for the entire period, July 1, 2008 through December 31, 2008.
Actual Expenses
The first line in the table provides information about actual account values and actual expenses. You may use the information in this table, together with the amount you invested, to estimate the expenses that you paid over the period. Simply divide your account value by $1,000 (for example, an $8,600 account value divided by $1,000 = 8.6), then multiply the result by the number in the table under the heading entitled “Expenses Paid During the Period” to estimate the expenses you paid on your account during this period.
Hypothetical Example for Comparison Purposes
The second line in the table provides information about hypothetical account values and hypothetical expenses based on the Series actual expense ratio and an assumed rate of return of 5% per year before expenses, which is not the Series actual return. The hypothetical account values and expenses may not be used to estimate the actual ending account balance or expenses you paid for the period. You may use this information to compare the ongoing costs of investing in the Series and other funds. To do so, compare this 5% hypothetical example with the 5% hypothetical examples that appear in the shareholder reports of the other mutual funds.
Please note that the expenses shown in the table are meant to highlight your ongoing costs only and do not reflect any fees and expenses associated with an investment in variable insurance products. Therefore, the second line is useful in comparing ongoing costs only, and will not help you determine the relative total costs of owning different funds. In addition, if these fees and expenses associated with an investment in variable insurance products were included, your costs would have been higher.
Series Expenses
| Beginning Account Value 7/1/2008 | Ending Account Value 12/31/20081 | Expenses Paid During Period2 | |||||||
Series N (Managed Asset Allocation Series) | |||||||||
Actual | $ | 1,000.00 | $ | 780.81 | $ | 7.12 | |||
Hypothetical | 1,000.00 | 1,017.14 | 8.06 | ||||||
1 | The actual ending account value is based on the actual total return of the Series for the period July 1, 2008 to December 31, 2008 after actual expenses and will differ from the hypothetical ending account value which is based on the Series expense ratio and a hypothetical annual return of 5% before expenses. The actual cumulative return at net asset value for the period July 1, 2008 to December 31, 2008 was (21.92%). |
2 | Expenses are equal to the Series annualized expense ratio of 1.59%, net of any applicable fee waivers, multiplied by the average account value over the period, multiplied by 184/366 (to reflect the one-half year period). |
71
Table of Contents
| Schedule of Investments | Series N | |
| December 31, 2008 | (Managed Asset Allocation Series) |
| Shares | Value | ||||
COMMON STOCKS—52.8% | |||||
Advertising—0.2% | |||||
Lamar Advertising Company* | 1,450 | $ | 18,212 | ||
Omnicom Group, Inc. | 4,200 | 113,064 | |||
| 131,276 | |||||
Aerospace & Defense—1.4% | |||||
American Science & Engineering, Inc. | 200 | 14,792 | |||
Boeing Company | 2,890 | 123,316 | |||
General Dynamics Corporation | 1,800 | 103,662 | |||
Goodrich Corporation | 1,000 | 37,020 | |||
Honeywell International, Inc. | 3,700 | 121,471 | |||
Lockheed Martin Corporation | 2,100 | 176,568 | |||
Northrop Grumman Corporation | 2,000 | 90,080 | |||
Precision Castparts Corporation | 400 | 23,792 | |||
Raytheon Company | 1,300 | 66,352 | |||
Rockwell Collins, Inc. | 1,900 | 74,271 | |||
Teledyne Technologies, Inc.* | 300 | 13,365 | |||
Triumph Group, Inc. | 300 | 12,738 | |||
United Technologies Corporation | 5,410 | 289,977 | |||
| 1,147,404 | |||||
Agricultural Products—0.1% | |||||
Archer-Daniels-Midland Company | 1,700 | 49,011 | |||
Bunge, Ltd. | 300 | 15,531 | |||
| 64,542 | |||||
Air Freight & Logistics—0.6% | |||||
CH Robinson Worldwide, Inc. | 700 | 38,521 | |||
Expeditors International of Washington, Inc. | 2,300 | 76,521 | |||
United Parcel Service, Inc. (Cl.B) | 5,400 | 297,864 | |||
UTi Worldwide, Inc. | 900 | 12,906 | |||
| 425,812 | |||||
Airlines—0.1% | |||||
Airtran Holdings, Inc.* | 900 | 3,996 | |||
AMR Corporation* | 700 | 7,469 | |||
Gol Linhas Aereas Inteligentes S.A. ADR | 1,300 | 5,499 | |||
Skywest, Inc. | 400 | 7,440 | |||
Southwest Airlines Company | 3,100 | 26,722 | |||
| 51,126 | |||||
Apparel Retail—0.1% | |||||
American Eagle Outfitters, Inc. | 4,400 | 41,184 | |||
J Crew Group, Inc.* | 300 | 3,660 | |||
Ross Stores, Inc. | 500 | 14,865 | |||
Tween Brands, Inc.* | 400 | 1,728 | |||
| 61,437 | |||||
Apparel, Accessories & Luxury Goods—0.1% | |||||
Anvil Holdings, Inc.1,* | 30 | 78 | |||
Coach, Inc.* | 2,400 | 49,848 | |||
Fossil, Inc.* | 200 | 3,340 | |||
| 53,266 | |||||
Application Software—0.5% | |||||
Adobe Systems, Inc.* | 3,800 | 80,902 | |||
Autodesk, Inc.* | 10,500 | 206,325 | |||
Cadence Design Systems, Inc.* | 1,000 | 3,660 | |||
Factset Research Systems, Inc. | 220 | 9,733 | |||
Jack Henry & Associates, Inc. | 500 | 9,705 | |||
Salary.com, Inc.* | 1,000 | 2,170 | |||
Salesforce.com, Inc.* | 1,800 | 57,618 | |||
Symyx Technologies* | 1,300 | 7,722 | |||
Taleo Corporation* | 500 | 3,915 | |||
| 381,750 | |||||
Asset Management & Custody Banks—0.6% | |||||
Ameriprise Financial, Inc. | 3,740 | 87,366 | |||
Bank of New York Mellon Corporation | 3,700 | 104,821 | |||
BlackRock, Inc. | 50 | 6,708 | |||
Eaton Vance Corporation | 500 | 10,505 | |||
Franklin Resources, Inc. | 500 | 31,890 | |||
Invesco, Ltd. | 7,500 | 108,300 | |||
Northern Trust Corporation | 1,500 | 78,210 | |||
State Street Corporation | 1,300 | 51,129 | |||
Waddell & Reed Financial, Inc. | 100 | 1,546 | |||
| 480,475 | |||||
Auto Parts & Equipment—0.0% | |||||
Gentex Corporation | 500 | 4,415 | |||
Johnson Controls, Inc. | 1,700 | 30,872 | |||
| 35,287 | |||||
Automobile Manufacturers—0.0% | |||||
General Motors Corporation | 6,000 | 19,200 | |||
Thor Industries, Inc. | 200 | 2,636 | |||
Winnebago Industries | 500 | 3,015 | |||
| 24,851 | |||||
Automotive Retail—0.0% | |||||
Carmax, Inc.* | 600 | 4,728 | |||
Biotechnology—1.6% | |||||
Alkermes, Inc.* | 800 | 8,520 | |||
Amgen, Inc.* | 5,410 | 312,428 | |||
Biogen Idec, Inc.* | 1,400 | 66,682 | |||
BioMarin Pharmaceutical, Inc.* | 400 | 7,120 | |||
Celgene Corporation* | 3,200 | 176,896 | |||
Cephalon, Inc.* | 500 | 38,520 | |||
Genentech, Inc.* | 1,220 | 101,150 | |||
Genzyme Corporation* | 500 | 33,185 | |||
Gilead Sciences, Inc.* | 7,600 | 388,664 | |||
Human Genome Sciences, Inc.* | 3,400 | 7,208 | |||
Incyte Corporation, Ltd.* | 800 | 3,032 | |||
Martek Biosciences Corporation | 300 | 9,093 | |||
Maxygen, Inc.* | 800 | 7,136 | |||
Senomyx, Inc.* | 1,100 | 3,069 | |||
| 1,162,703 | |||||
Brewers—0.1% | |||||
Boston Beer Company, Inc.* | 400 | 11,360 | |||
Compania Cervecerias Unidas S.A. ADR | 1,300 | 33,995 | |||
| 45,355 | |||||
Broadcasting—0.1% | |||||
Discovery Communications, Inc.* | 4,266 | 58,649 | |||
| 58,649 | |||||
Building Products—0.1% | |||||
Masco Corporation | 5,000 | 55,650 | |||
Universal Forest Products, Inc. | 400 | 10,764 | |||
USG Corporation* | 400 | 3,216 | |||
| 69,630 | |||||
Cable & Satellite—0.3% | |||||
Cablevision Systems Corporation | 3,000 | 50,520 | |||
DISH Network Corporation* | 600 | 6,654 | |||
The accompanying notes are an integral part of the financial statements
72
Table of Contents
| Schedule of Investments | Series N | |
| December 31, 2008 | (Managed Asset Allocation Series) |
| Shares | Value | ||||
COMMON STOCKS—52.8% (continued) | |||||
Cable & Satellite—0.3% (continued) | |||||
Liberty Global, Inc.* | 375 | $ | 5,970 | ||
Liberty Media Corporation - Entertainment* | 500 | 8,740 | |||
Scripps Networks Interactive, Inc. | 400 | 8,800 | |||
Sirius XM Radio, Inc.* | 25,060 | 3,007 | |||
Time Warner Cable, Inc.* | 7,100 | 152,153 | |||
| 235,844 | |||||
Casinos & Gaming—0.2% | |||||
International Game Technology | 3,500 | 41,615 | |||
MGM Mirage* | 2,201 | 30,286 | |||
Wynn Resorts, Ltd.* | 1,100 | 46,486 | |||
| 118,387 | |||||
Coal & Consumable Fuels—0.2% | |||||
Arch Coal, Inc. | 400 | 6,516 | |||
Consol Energy, Inc. | 2,700 | 77,166 | |||
Foundation Coal Holdings, Inc. | 200 | 2,804 | |||
Peabody Energy Corporation | 900 | 20,475 | |||
Westmoreland Coal Company* | 700 | 7,770 | |||
| 114,731 | |||||
Commodity Chemicals—0.0% | |||||
Koppers Holdings, Inc. | 600 | 12,972 | |||
Communications Equipment—1.3% | |||||
Alcatel-Lucent ADR* | 19,872 | 42,725 | |||
Blue Coat Systems, Inc.* | 400 | 3,360 | |||
Cisco Systems, Inc.* | 18,700 | 304,810 | |||
F5 Networks, Inc.* | 700 | 16,002 | |||
Finisar Corporation* | 4,100 | 1,558 | |||
Ixia* | 1,500 | 8,670 | |||
JDS Uniphase Corporation* | 13,100 | 47,815 | |||
Juniper Networks, Inc.* | 9,200 | 161,092 | |||
Motorola, Inc. | 15,400 | 68,222 | |||
Qualcomm, Inc. | 9,600 | 343,968 | |||
| 998,222 | |||||
Computer Hardware—2.1% | |||||
Apple, Inc.* | 4,900 | 418,215 | |||
Avid Technology, Inc.* | 600 | 6,546 | |||
Dell, Inc.* | 13,000 | 133,120 | |||
Hewlett-Packard Company | 11,000 | 399,190 | |||
International Business Machines Corporation | 6,320 | 531,891 | |||
Palm, Inc.* | 3,300 | 10,131 | |||
| 1,499,093 | |||||
Computer Storage & Peripherals—0.1% | |||||
EMC Corporation* | 9,500 | 99,465 | |||
Isilon Systems, Inc.1,* | 200 | — | |||
SanDisk Corporation* | 1,300 | 12,480 | |||
| 111,945 | |||||
Construction & Engineering—0.1% | |||||
Fluor Corporation | 1,000 | 44,870 | |||
Foster Wheeler, Ltd.* | 400 | 9,352 | |||
Insituform Technologies, Inc.* | 900 | 17,721 | |||
Quanta Services, Inc.* | 500 | 9,900 | |||
| 81,843 | |||||
Construction & Farm Machinery & Heavy Trucks—0.3% | |||||
Deere & Company | 3,900 | 149,448 | |||
Joy Global, Inc. | 400 | 9,156 | |||
Oshkosh Truck Corporation | 640 | 5,690 | |||
Terex Corporation* | 2,300 | 39,836 | |||
| 204,130 | |||||
Consumer Electronics—0.0% | |||||
Harman International Industries, Inc. | 400 | 6,692 | |||
Consumer Finance—0.2% | |||||
American Express Company | 5,300 | 98,315 | |||
Capital One Financial Corporation | 1,700 | 54,213 | |||
| 152,528 | |||||
Data Processing & Outsourced Services—0.5% | |||||
Automatic Data Processing, Inc. | 3,400 | 133,756 | |||
Computer Sciences Corporation* | 700 | 24,598 | |||
Fiserv, Inc.* | 1,000 | 36,370 | |||
Global Payments, Inc. | 400 | 13,116 | |||
Heartland Payment Systems, Inc. | 300 | 5,250 | |||
Mastercard, Inc. | 200 | 28,586 | |||
Paychex, Inc. | 1,400 | 36,792 | |||
Visa, Inc. | 500 | 26,225 | |||
Western Union Company | 3,900 | 55,926 | |||
| 360,619 | |||||
Department Stores—0.2% | |||||
Kohl’s Corporation* | 5,170 | 187,154 | |||
Diversified Banks—1.3% | |||||
Barclays plc ADR | 5,400 | 52,920 | |||
U.S. Bancorp | 8,100 | 202,581 | |||
Wachovia Corporation | 9,300 | 51,522 | |||
Wells Fargo & Company | 21,240 | 626,155 | |||
| 933,178 | |||||
Diversified Chemicals—0.3% | |||||
Cabot Corporation | 430 | 6,579 | |||
Dow Chemical Company | 1,900 | 28,671 | |||
E.I. Du Pont de Nemours & Company | 7,051 | 178,390 | |||
| 213,640 | |||||
Diversified Metals & Mining—0.1% | |||||
Freeport-McMoRan Copper & Gold, Inc. (Cl.B) | 2,969 | 72,562 | |||
Diversified Real Estate Activities—0.0% | |||||
St. Joe Company* | 500 | 12,160 | |||
Diversified Support Services—0.0% | |||||
Iron Mountain, Inc.* | 925 | 22,875 | |||
Drug Retail—0.4% | |||||
CVS Caremark Corporation | 8,268 | 237,622 | |||
Walgreen Company | 2,600 | 64,142 | |||
| 301,764 | |||||
Education Services—0.1% | |||||
Apollo Group, Inc.* | 900 | 68,958 | |||
Corinthian Colleges, Inc.* | 900 | 14,733 | |||
| 83,691 | |||||
The accompanying notes are an integral part of the financial statements
73
Table of Contents
| Schedule of Investments | Series N | |
| December 31, 2008 | (Managed Asset Allocation Series) |
| Shares | Value | ||||
COMMON STOCKS—52.8% (continued) | |||||
Electric Utilities—1.2% | |||||
Allegheny Energy, Inc. | 1,100 | $ | 37,246 | ||
American Electric Power Company, Inc. | 3,300 | 109,824 | |||
Entergy Corporation | 1,900 | 157,947 | |||
Exelon Corporation | 3,200 | 177,952 | |||
FirstEnergy Corporation | 2,700 | 131,166 | |||
FPL Group, Inc. | 2,800 | 140,924 | |||
Great Plains Energy, Inc. | 800 | 15,464 | |||
Pinnacle West Capital Corporation | 200 | 6,426 | |||
PPL Corporation | 4,300 | 131,967 | |||
Progress Energy, Inc. | 700 | 27,895 | |||
| 936,811 | |||||
Electrical Components & Equipment—0.0% | |||||
AO Smith Corporation | 400 | 11,808 | |||
Baldor Electric Company | 400 | 7,140 | |||
Belden, Inc. | 180 | 3,758 | |||
BTU International, Inc.* | 900 | 3,600 | |||
General Cable Corporation* | 300 | 5,307 | |||
| 31,613 | |||||
Electronic Components—0.0% | |||||
AVX Corporation | 1,400 | 11,116 | |||
Electronic Equipment & Instruments—0.0% | |||||
Agilent Technologies, Inc.* | 1,900 | 29,697 | |||
Flir Systems, Inc.* | 100 | 3,068 | |||
| 32,765 | |||||
Electronic Manufacturing Services—0.2% | |||||
Cyberoptics Corporation* | 1,400 | 7,280 | |||
Plexus Corporation* | 500 | 8,475 | |||
Tyco Electronics, Ltd. | 10,175 | 164,937 | |||
| 180,692 | |||||
Environmental & Facilities Services—0.3% | |||||
Covanta Holding Corporation1,* | 100 | — | |||
Republic Services, Inc. | 7,300 | 180,967 | |||
Stericycle, Inc.* | 400 | 20,832 | |||
Waste Connections, Inc.* | 300 | 9,471 | |||
| 211,270 | |||||
Fertilizers & Agricultural Chemicals—0.4% | |||||
American Vanguard Corporation | 1,100 | 12,870 | |||
Monsanto Company | 3,000 | 211,050 | |||
Mosaic Company | 750 | 25,950 | |||
Potash Corporation of Saskatchewan, Inc. | 400 | 29,288 | |||
| 279,158 | |||||
Food Distributors—0.1% | |||||
SYSCO Corporation | 3,200 | 73,408 | |||
Food Retail—0.1% | |||||
Casey’s General Stores, Inc. | 500 | 11,385 | |||
Kroger Company | 2,100 | 55,461 | |||
Pantry, Inc.* | 300 | 6,435 | |||
Supervalu, Inc. | 1,900 | 27,740 | |||
Whole Foods Market, Inc. | 600 | 5,664 | |||
| 106,685 | |||||
Footwear—0.1% | |||||
Nike, Inc. (Cl.B) | 1,180 | 60,180 | |||
Forest Products—0.0% | |||||
Weyerhaeuser Company | 1,000 | 30,610 | |||
Gas Utilities—0.0% | |||||
National Fuel Gas Company | 400 | 12,532 | |||
Southwest Gas Corporation | 700 | 17,654 | |||
| 30,186 | |||||
General Merchandise Stores—0.0% | |||||
Dollar Tree, Inc.* | 300 | 12,540 | |||
Gold—0.1% | |||||
Agnico-Eagle Mines, Ltd. | 1,100 | 56,463 | |||
Allied Nevada Gold Corporation1,* | 200 | — | |||
Newmont Mining Corporation | 1,400 | 56,980 | |||
| 113,443 | |||||
Health Care Distributors—0.2% | |||||
AmerisourceBergen Corporation | 1,800 | 64,188 | |||
Cardinal Health, Inc. | 700 | 24,129 | |||
Henry Schein, Inc.* | 200 | 7,338 | |||
McKesson Corporation | 2,400 | 92,952 | |||
| 188,607 | |||||
Health Care Equipment—1.3% | |||||
Aspect Medical Systems, Inc.* | 600 | 2,022 | |||
Baxter International, Inc. | 3,700 | 198,283 | |||
Becton Dickinson & Company | 1,100 | 75,229 | |||
Boston Scientific Corporation* | 6,800 | 52,632 | |||
Covidien, Ltd. | 3,375 | 122,310 | |||
CR Bard, Inc. | 400 | 33,704 | |||
Edwards Lifesciences Corporation* | 260 | 14,287 | |||
Gen-Probe, Inc.* | 150 | 6,426 | |||
Hologic, Inc.* | 728 | 9,515 | |||
Hospira, Inc.* | 600 | 16,092 | |||
Intuitive Surgical, Inc.* | 300 | 38,097 | |||
Medtronic, Inc. | 6,300 | 197,946 | |||
Micrus Endovascular Corporation* | 400 | 4,644 | |||
Resmed, Inc.* | 400 | 14,992 | |||
St. Jude Medical, Inc.* | 2,800 | 92,288 | |||
STERIS Corporation | 700 | 16,723 | |||
Stryker Corporation | 1,400 | 55,930 | |||
Thoratec Corporation* | 500 | 16,245 | |||
| 967,365 | |||||
Health Care Facilities—0.0% | |||||
Community Health Systems, Inc.* | 100 | 1,458 | |||
LifePoint Hospitals, Inc.* | 300 | 6,852 | |||
| 8,310 | |||||
Health Care Services—0.3% | |||||
DaVita, Inc.* | 300 | 14,871 | |||
Express Scripts, Inc.* | 900 | 49,482 | |||
Healthways, Inc.* | 200 | 2,296 | |||
Medco Health Solutions, Inc.* | 4,100 | 171,831 | |||
Omnicare, Inc. | 510 | 14,158 | |||
| 252,638 | |||||
Health Care Supplies—0.0% | |||||
Dentsply International, Inc. | 400 | 11,296 | |||
The accompanying notes are an integral part of the financial statements
74
Table of Contents
| Schedule of Investments | Series N | |
| December 31, 2008 | (Managed Asset Allocation Series) |
| Shares | Value | ||||
COMMON STOCKS—52.8% (continued) | |||||
Health Care Technology—0.0% | |||||
Computer Programs & Systems, Inc. | 600 | $ | 16,080 | ||
Home Entertainment Software—0.1% | |||||
Activision Blizzard, Inc.* | 1,866 | 16,122 | |||
Electronic Arts, Inc.* | 1,900 | 30,476 | |||
| 46,598 | |||||
Home Furnishings—0.0% | |||||
Mohawk Industries, Inc.* | 160 | 6,875 | |||
Home Improvement Retail—0.6% | |||||
Home Depot, Inc. | 9,750 | 224,445 | |||
Lowe’s Companies, Inc. | 11,100 | 238,872 | |||
Sherwin-Williams Company | 400 | 23,900 | |||
| 487,217 | |||||
Homebuilding—0.1% | |||||
Lennar Corporation | 4,600 | 39,882 | |||
Toll Brothers, Inc.* | 800 | 17,144 | |||
| 57,026 | |||||
Homefurnishing Retail—0.3% | |||||
Bed Bath & Beyond, Inc.* | 7,000 | 177,940 | |||
Rent-A-Center, Inc.* | 800 | 14,120 | |||
Williams-Sonoma, Inc. | 400 | 3,144 | |||
| 195,204 | |||||
Hotels, Resorts & Cruise Lines—0.2% | |||||
Choice Hotels International, Inc. | 400 | 12,024 | |||
Gaylord Entertainment Company* | 300 | 3,252 | |||
Marriott International, Inc. | 5,600 | 108,920 | |||
| 124,196 | |||||
Household Appliances—0.0% | |||||
Stanley Works | 600 | 20,460 | |||
Household Products—1.5% | |||||
Clorox Company | 600 | 33,336 | |||
Colgate-Palmolive Company | 900 | 61,686 | |||
Energizer Holdings, Inc.* | 200 | 10,828 | |||
Kimberly-Clark Corporation | 3,000 | 158,220 | |||
Procter & Gamble Company | 13,673 | 845,265 | |||
| 1,109,335 | |||||
Housewares & Specialties—0.1% | |||||
Fortune Brands, Inc. | 2,000 | 82,560 | |||
Human Resource & Employment Services—0.1% | |||||
Manpower, Inc. | 300 | 10,197 | |||
Monster Worldwide, Inc.* | 600 | 7,254 | |||
Robert Half International, Inc. | 1,500 | 31,230 | |||
| 48,681 | |||||
Hypermarkets & Super Centers—1.0% | |||||
BJ’s Wholesale Club, Inc.* | 400 | 13,704 | |||
Costco Wholesale Corporation | 2,200 | 115,500 | |||
Wal-Mart Stores, Inc. | 10,900 | 611,054 | |||
| 740,258 | |||||
Independent Power Producers & Energy Traders—0.3% | |||||
AES Corporation* | 3,200 | 26,368 | |||
Dynegy, Inc.* | 11,114 | 22,228 | |||
Mirant Corporation* | 620 | 11,699 | |||
NRG Energy, Inc.* | 5,400 | 125,982 | |||
Reliant Energy, Inc.* | 1,200 | 6,936 | |||
| 193,213 | |||||
Industrial Conglomerates—1.3% | |||||
3M Company | 4,300 | 247,422 | |||
General Electric Company | 40,700 | 659,340 | |||
McDermott International, Inc.* | 1,800 | 17,784 | |||
Tyco International, Ltd. | 5,475 | 118,260 | |||
| 1,042,806 | |||||
Industrial Gases—0.2% | |||||
Praxair, Inc. | 2,600 | 154,336 | |||
Industrial Machinery—0.6% | |||||
3D Systems Corporation* | 800 | 6,352 | |||
Actuant Corporation | 580 | 11,032 | |||
Danaher Corporation | 4,700 | 266,067 | |||
Harsco Corporation | 460 | 12,733 | |||
Illinois Tool Works, Inc. | 2,600 | 91,130 | |||
ITT Corporation | 900 | 41,391 | |||
John Bean Technologies Corporation | 108 | 882 | |||
Nordson Corporation | 300 | 9,687 | |||
| 439,274 | |||||
Industrial REIT’s—0.1% | |||||
AMB Property Corporation | 500 | 11,710 | |||
EastGroup Properties, Inc. | 300 | 10,674 | |||
Prologis | 1,200 | 16,668 | |||
| 39,052 | |||||
Insurance Brokers—0.2% | |||||
AON Corporation | 3,100 | 141,608 | |||
Marsh & McLennan Companies, Inc. | 1,500 | 36,405 | |||
| 178,013 | |||||
Integrated Oil & Gas—5.0% | |||||
BP plc ADR | 3,500 | 163,590 | |||
Chevron Corporation | 11,250 | 832,163 | |||
ConocoPhillips | 4,300 | 222,740 | |||
Exxon Mobil Corporation | 25,880 | 2,066,001 | |||
Murphy Oil Corporation | 3,600 | 159,660 | |||
Occidental Petroleum Corporation | 3,000 | 179,970 | |||
Royal Dutch Shell plc (Cl.B) ADR | 4,317 | 222,023 | |||
| 3,846,147 | |||||
Integrated Telecommunication Services—1.4% | |||||
AT&T, Inc. | 34,792 | 991,572 | |||
Verizon Communications, Inc. | 2,800 | 94,920 | |||
| 1,086,492 | |||||
Internet Retail—0.3% | |||||
Amazon.com, Inc.* | 4,100 | 210,248 | |||
Drugstore.com* | 4,000 | 4,960 | |||
Expedia, Inc.* | 4,300 | 35,432 | |||
| 250,640 | |||||
Internet Software & Services—0.6% | |||||
Ariba, Inc.* | 800 | 5,768 | |||
Art Technology Group, Inc.* | 2,600 | 5,018 | |||
Digital River, Inc.* | 200 | 4,960 | |||
Google, Inc.* | 1,210 | 372,257 | |||
The accompanying notes are an integral part of the financial statements
75
Table of Contents
| Schedule of Investments | Series N | |
| December 31, 2008 | (Managed Asset Allocation Series) |
| Shares | Value | ||||
COMMON STOCKS—52.8% (continued) | |||||
Internet Software & Services—0.6% (continued) | |||||
VeriSign, Inc.* | 3,700 | $ | 70,596 | ||
Websense, Inc.* | 700 | 10,479 | |||
| 469,078 | |||||
Investment Banking & Brokerage—0.7% | |||||
Charles Schwab Corporation | 3,700 | 59,829 | |||
Goldman Sachs Group, Inc. | 2,400 | 202,536 | |||
Merrill Lynch & Company, Inc. | 7,100 | 82,644 | |||
Morgan Stanley | 8,100 | 129,924 | |||
Raymond James Financial, Inc. | 700 | 11,991 | |||
Stifel Financial Corporation* | 335 | 15,360 | |||
| 502,284 | |||||
IT Consulting & Other Services—0.2% | |||||
Accenture, Ltd. | 4,400 | 144,276 | |||
RightNow Technologies, Inc.* | 500 | 3,865 | |||
| 148,141 | |||||
Leisure Products—0.1% | |||||
Mattel, Inc. | 2,500 | 40,000 | |||
Pool Corporation | 712 | 12,795 | |||
| 52,795 | |||||
Life & Health Insurance—0.3% | |||||
Aflac, Inc. | 1,300 | 59,592 | |||
Lincoln National Corporation | 800 | 15,072 | |||
MetLife, Inc. | 3,200 | 111,552 | |||
Prudential Financial, Inc. | 1,200 | 36,312 | |||
StanCorp Financial Group, Inc. | 400 | 16,708 | |||
| 239,236 | |||||
Life Sciences Tools & Services—0.1% | |||||
Charles River Laboratories International, Inc.* | 160 | 4,192 | |||
Covance, Inc.* | 100 | 4,603 | |||
Illumina, Inc.* | 500 | 13,025 | |||
Techne Corporation | 170 | 10,968 | |||
Waters Corporation* | 1,000 | 36,650 | |||
| 69,438 | |||||
Managed Health Care—0.5% | |||||
Aetna, Inc. | 1,600 | 45,600 | |||
AMERIGROUP Corporation* | 300 | 8,856 | |||
Cigna Corporation | 1,200 | 20,220 | |||
Humana, Inc.* | 1,400 | 52,192 | |||
UnitedHealth Group, Inc. | 4,300 | 114,380 | |||
WellPoint, Inc.* | 4,100 | 172,733 | |||
| 413,981 | |||||
Metal & Glass Containers—0.0% | |||||
Myers Industries, Inc. | 700 | 5,600 | |||
Owens-Illinois, Inc.* | 100 | 2,733 | |||
| 8,333 | |||||
Motorcycle Manufacturers—0.1% | |||||
Harley-Davidson, Inc. | 3,700 | 62,789 | |||
Movies & Entertainment—0.6% | |||||
Ascent Media Corporation* | 198 | 4,324 | |||
News Corporation | 4,700 | 42,723 | |||
Time Warner, Inc. | 24,800 | 249,488 | |||
Viacom, Inc. (Cl.B)* | 1,400 | 26,684 | |||
Walt Disney Company | 6,200 | 140,678 | |||
| 463,897 | |||||
Multi-Line Insurance—0.1% | |||||
Assurant, Inc. | 500 | 15,000 | |||
Hartford Financial Services Group, Inc. | 1,100 | 18,062 | |||
Loews Corporation | 1,900 | 53,675 | |||
| 86,737 | |||||
Multi-Utilities—0.6% | |||||
Alliant Energy Corporation | 500 | 14,590 | |||
Centerpoint Energy, Inc. | 1,500 | 18,930 | |||
NiSource, Inc. | 1,200 | 13,164 | |||
OGE Energy Corporation | 600 | 15,468 | |||
PG&E Corporation | 1,700 | 65,807 | |||
Public Service Enterprise Group, Inc. | 4,200 | 122,514 | |||
Sempra Energy | 3,100 | 132,153 | |||
TECO Energy, Inc. | 4,100 | 50,635 | |||
Xcel Energy, Inc. | 1,600 | 29,680 | |||
| 462,941 | |||||
Office REIT’s—0.1% | |||||
Boston Properties, Inc. | 1,300 | 71,500 | |||
Duke Realty Corporation | 1,000 | 10,960 | |||
SL Green Realty Corporation | 351 | 9,091 | |||
| 91,551 | |||||
Office Services & Supplies—0.0% | |||||
American Reprographics Company* | 500 | 3,450 | |||
Herman Miller, Inc. | 400 | 5,212 | |||
| 8,662 | |||||
Oil & Gas Drilling—0.1% | |||||
Diamond Offshore Drilling, Inc. | 200 | 11,788 | |||
Helmerich & Payne, Inc. | 600 | 13,650 | |||
Nabors Industries, Ltd.* | 1,300 | 15,561 | |||
Transocean, Ltd.* | 1,525 | 72,056 | |||
| 113,055 | |||||
Oil & Gas Equipment & Services—0.8% | |||||
Baker Hughes, Inc. | 2,900 | 93,003 | |||
BJ Services Company | 3,800 | 44,346 | |||
Complete Production Services, Inc.* | 500 | 4,075 | |||
FMC Technologies, Inc.* | 2,642 | 62,959 | |||
National Oilwell Varco, Inc.* | 990 | 24,196 | |||
Schlumberger, Ltd. | 8,600 | 364,037 | |||
Smith International, Inc. | 1,000 | 22,890 | |||
| 615,506 | |||||
Oil & Gas Exploration & Production—0.9% | |||||
Cabot Oil & Gas Corporation | 900 | 23,400 | |||
Concho Resources, Inc.* | 500 | 11,410 | |||
Devon Energy Corporation | 1,800 | 118,278 | |||
EOG Resources, Inc. | 2,600 | 173,108 | |||
Forest Oil Corporation* | 400 | 6,596 | |||
GeoMet, Inc.* | 2,600 | 4,472 | |||
Mariner Energy, Inc.* | 400 | 4,080 | |||
Newfield Exploration Company* | 1,820 | 35,945 | |||
Range Resources Corporation | 800 | 27,512 | |||
Ultra Petroleum Corporation* | 500 | 17,255 | |||
The accompanying notes are an integral part of the financial statements
76
Table of Contents
| Schedule of Investments | Series N | |
| December 31, 2008 | (Managed Asset Allocation Series) |
| Shares | Value | ||||
COMMON STOCKS—52.8% (continued) | |||||
Oil & Gas Exploration & Production—0.9% (continued) | |||||
Whiting Petroleum Corporation* | 300 | $ | 10,038 | ||
XTO Energy, Inc. | 6,275 | 221,319 | |||
| 653,413 | |||||
Oil & Gas Refining & Marketing—0.2% | |||||
Holly Corporation | 500 | 9,115 | |||
Sunoco, Inc. | 2,100 | 91,266 | |||
Valero Energy Corporation | 2,900 | 62,756 | |||
| 163,137 | |||||
Oil & Gas Storage & Transportation—0.1% | |||||
Spectra Energy Corporation | 4,700 | 73,978 | |||
Williams Companies, Inc. | 1,400 | 20,272 | |||
| 94,250 | |||||
Other Diversified Financial Services—1.4% | |||||
Bank of America Corporation | 19,276 | 271,406 | |||
Citigroup, Inc. | 17,600 | 118,096 | |||
JPMorgan Chase & Company | 20,136 | 634,887 | |||
| 1,024,389 | |||||
Packaged Foods & Meats—0.5% | |||||
JM Smucker Company | 1,449 | 62,829 | |||
Kraft Foods, Inc. | 8,325 | 223,525 | |||
Sara Lee Corporation | 8,100 | 79,299 | |||
Tootsie Roll Industries, Inc. | 591 | 15,136 | |||
| 380,789 | |||||
Paper Packaging—0.0% | |||||
Smurfit-Stone Container Corporation* | 1,600 | 408 | |||
Paper Products—0.1% | |||||
Clearwater Paper Corporation* | 930 | 7,803 | |||
Domtar Corporation* | 2,000 | 3,340 | |||
International Paper Company | 3,600 | 42,480 | |||
MeadWestvaco Corporation | 1,500 | 16,785 | |||
| 70,408 | |||||
Personal Products—0.1% | |||||
Avon Products, Inc. | 4,400 | 105,732 | |||
Pharmaceuticals—4.0% | |||||
Abbott Laboratories | 6,800 | 362,916 | |||
Allergan, Inc. | 2,200 | 88,704 | |||
Bristol-Myers Squibb Company | 10,900 | 253,425 | |||
Elan Corporation plc ADR* | 2,500 | 15,000 | |||
Eli Lilly & Company | 4,440 | 178,799 | |||
GlaxoSmithKline plc ADR | 4,464 | 166,373 | |||
Johnson & Johnson | 13,358 | 799,209 | |||
Medicines Company* | 500 | 7,365 | |||
Medicis Pharmaceutical Corporation | 400 | 5,560 | |||
Merck & Company, Inc. | 12,800 | 389,120 | |||
Pfizer, Inc. | 11,273 | 199,645 | |||
Schering-Plough Corporation | 10,000 | 170,300 | |||
Sepracor, Inc.* | 330 | 3,623 | |||
Valeant Pharmaceuticals International* | 700 | 16,030 | |||
Warner Chilcott, Ltd.* | 1,600 | 23,200 | |||
Wyeth | 8,600 | 322,586 | |||
| 3,001,855 | |||||
Property & Casualty Insurance—0.6% | |||||
ACE, Ltd. | 1,000 | 52,920 | |||
Axis Capital Holdings, Ltd. | 1,300 | 37,856 | |||
Chubb Corporation | 2,300 | 117,300 | |||
Employers Holdings, Inc. | 500 | 8,250 | |||
Infinity Property & Casualty Corporation | �� | 310 | 14,486 | ||
Markel Corporation* | 60 | 17,940 | |||
ProAssurance Corporation* | 300 | 15,834 | |||
SeaBright Insurance Holdings, Inc.* | 800 | 9,392 | |||
Selective Insurance Group | 500 | 11,465 | |||
Travelers Companies, Inc. | 3,714 | 167,873 | |||
White Mountains Insurance Group, Ltd. | 10 | 2,671 | |||
| 455,987 | |||||
Publishing—0.0% | |||||
McGraw-Hill Companies, Inc. | 800 | 18,552 | |||
Scholastic Corporation | 400 | 5,432 | |||
| 23,984 | |||||
Railroads—0.5% | |||||
Burlington Northern Santa Fe Corporation | 800 | 60,568 | |||
Canadian National Railway Company | 1,000 | 36,760 | |||
CSX Corporation | 1,700 | 55,199 | |||
Norfolk Southern Corporation | 300 | 14,115 | |||
Union Pacific Corporation | 4,000 | 191,200 | |||
| 357,842 | |||||
Regional Banks—0.8% | |||||
BB&T Corporation | 1,800 | 49,428 | |||
Citizens Republic Bancorp, Inc. | 1,300 | 3,874 | |||
City National Corporation | 300 | 14,610 | |||
Commerce Bancshares, Inc. | 385 | 16,921 | |||
East West Bancorp, Inc. | 400 | 6,388 | |||
Fifth Third Bancorp | 9,400 | 77,644 | |||
First Horizon National Corporation | 1,496.14 | 15,814 | |||
Glacier Bancorp, Inc. | 800 | 15,216 | |||
Home Bancshares, Inc. | 556 | 14,984 | |||
Keycorp | 10,000 | 85,200 | |||
Marshall & Ilsley Corporation | 4,299 | 58,638 | |||
National City Corporation | 11,100 | 20,091 | |||
Pinnacle Financial Partners, Inc.* | 400 | 11,924 | |||
PNC Financial Services Group, Inc. | 3,000 | 147,001 | |||
Popular, Inc. | 1,500 | 7,740 | |||
Provident Bankshares Corporation | 800 | 7,728 | |||
Sandy Spring Bancorp, Inc. | 600 | 13,098 | |||
Signature Bank NY* | 300 | 8,607 | |||
UCBH Holdings, Inc. | 1,100 | 7,568 | |||
Westamerica Bancorporation | 300 | 15,345 | |||
Western Alliance Bancorp* | 600 | 6,054 | |||
Wilmington Trust Corporation | 500 | 11,120 | |||
Zions Bancorporation | 800 | 19,608 | |||
| 634,601 | |||||
The accompanying notes are an integral part of the financial statements
77
Table of Contents
Schedule of Investments | Series N | |
| December 31, 2008 | (Managed Asset Allocation Series) |
| Shares | Value | ||||
COMMON STOCKS—52.8% (continued) | |||||
Reinsurance—0.0% | |||||
Everest Re Group, Ltd. | 200 | $ | 15,228 | ||
Research & Consulting Services—0.1% | |||||
Advisory Board Company* | 200 | 4,460 | |||
Corporate Executive Board Company | 170 | 3,750 | |||
FTI Consulting, Inc.* | 300 | 13,404 | |||
Huron Consulting Group, Inc.* | 200 | 11,454 | |||
Navigant Consulting, Inc.* | 700 | 11,109 | |||
| 44,177 | |||||
Residential REIT’s—0.2% | |||||
Camden Property Trust | 500 | 15,670 | |||
Equity Residential | 3,700 | 110,334 | |||
| 126,004 | |||||
Restaurants—0.7% | |||||
McDonald’s Corporation | 4,800 | 298,511 | |||
Sonic Corporation* | 500 | 6,085 | |||
Starbucks Corporation* | 7,400 | 70,004 | |||
Yum! Brands, Inc. | 4,100 | 129,150 | |||
| 503,750 | |||||
Retail REIT’s—0.2% | |||||
Regency Centers Corporation | 400 | 18,680 | |||
Simon Property Group, Inc. | 2,200 | 116,886 | |||
Weingarten Realty Investors | 600 | 12,414 | |||
| 147,980 | |||||
Semiconductor Equipment—0.1% | |||||
ASML Holding N.V. | 2 | 36 | |||
Kla-Tencor Corporation | 1,100 | 23,969 | |||
MEMC Electronic Materials, Inc.* | 1,100 | 15,708 | |||
| 39,713 | |||||
Semiconductor Equipment—0.1% | |||||
Advanced Energy Industries, Inc.* | 900 | 8,955 | |||
Applied Materials, Inc. | 6,700 | 67,871 | |||
Cymer, Inc.* | 500 | 10,955 | |||
Varian Semiconductor Equipment Associates, Inc.* | 450 | 8,154 | |||
| 95,935 | |||||
Semiconductors—0.9% | |||||
Analog Devices, Inc. | 2,700 | 51,354 | |||
Broadcom Corporation* | 2,400 | 40,728 | |||
Intel Corporation | 13,300 | 194,978 | |||
Intersil Corporation | 700 | 6,433 | |||
Marvell Technology Group, Ltd.* | 12,700 | 84,709 | |||
Maxim Integrated Products, Inc. | 1,200 | 13,632 | |||
Micron Technology, Inc.* | 11,000 | 29,040 | |||
National Semiconductor Corporation | 5,900 | 59,413 | |||
Nvidia Corporation* | 6,400 | 51,648 | |||
Semtech Corporation* | 1,000 | 11,270 | |||
Texas Instruments, Inc. | 9,700 | 150,544 | |||
Xilinx, Inc. | 1,300 | 23,166 | |||
Zoran Corporation* | 889 | 6,072 | |||
| 722,987 | |||||
Soft Drinks—1.5% | |||||
Coca-Cola Company | 11,100 | 502,498 | |||
Coca-Cola Enterprises, Inc. | 7,900 | 95,037 | |||
Dr Pepper Snapple Group, Inc.* | 3,400 | 55,250 | |||
Pepsi Bottling Group, Inc. | 2,500 | 56,275 | |||
PepsiCo, Inc. | 9,100 | 498,407 | |||
Reed’s, Inc.1,* | 200 | — | |||
| 1,207,467 | |||||
Specialized Consumer Services—0.2% | |||||
H&R Block, Inc. | 5,600 | 127,232 | |||
Jackson Hewitt Tax Service, Inc. | 400 | 6,276 | |||
| 133,508 | |||||
Specialized Finance—0.1% | |||||
CME Group, Inc. | 350 | 72,839 | |||
Interactive Brokers Group, Inc.* | 300 | 5,367 | |||
IntercontinentalExchange, Inc.* | 300 | 24,732 | |||
Moody’s Corporation | 400 | 8,036 | |||
| 110,974 | |||||
Specialized REIT’s—0.0% | |||||
LaSalle Hotel Properties | 1,000 | 11,050 | |||
Potlatch Corporation | 455 | 11,835 | |||
| 22,885 | |||||
Specialty Chemicals—0.2% | |||||
Albemarle Corporation | 400 | 8,920 | |||
Arch Chemicals, Inc. | 600 | 15,642 | |||
Ecolab, Inc. | 1,400 | 49,210 | |||
International Flavors & Fragrances, Inc. | 1,000 | 29,720 | |||
Sigma-Aldrich Corporation | 600 | 25,344 | |||
| 128,836 | |||||
Specialty Stores—0.0% | |||||
AC Moore Arts & Crafts, Inc.* | 700 | 980 | |||
Dick’s Sporting Goods, Inc.* | 260 | 3,669 | |||
Hibbett Sports, Inc.* | 700 | 10,997 | |||
| 15,646 | |||||
Steel—0.2% | |||||
Carpenter Technology Corporation | 200 | 4,108 | |||
Cliffs Natural Resources, Inc.1 | 100 | — | |||
Haynes International, Inc.* | 200 | 4,924 | |||
Nucor Corporation | 1,700 | 78,540 | |||
Steel Dynamics, Inc. | 1,000 | 11,180 | |||
United States Steel Corporation | 800 | 29,760 | |||
| 128,512 | |||||
Systems Software—1.4% | |||||
Microsoft Corporation | 44,000 | 855,360 | |||
Red Hat, Inc.* | 11,700 | 154,674 | |||
| 1,010,034 | |||||
Technology Distributors—0.0% | |||||
SYNNEX Corporation* | 600 | 6,798 | |||
Tech Data Corporation* | 500 | 8,920 | |||
| 15,718 | |||||
Textiles—0.0% | |||||
Culp, Inc.* | 900 | 1,782 | |||
Thrifts & Mortgage Finance—0.0% | |||||
BankAtlantic Bancorp, Inc. | 400 | 2,320 | |||
Brooklyn Federal Bancorp, Inc.1 | 100 | — | |||
Cooperative Bankshares, Inc.1 | 1,300 | — | |||
ESSA Bancorp, Inc.1 | 100 | — | |||
First Defiance Financial Corporation1 | 200 | — | |||
Louisiana Bancorp, Inc.1,* | 100 | — | |||
| 2,320 | |||||
Tobacco—0.9% | |||||
Alliance One International, Inc.* | 1,700 | 4,998 | |||
The accompanying notes are an integral part of the financial statements
78
Table of Contents
| Schedule of Investments | Series N | |
| December 31, 2008 | (Managed Asset Allocation Series) |
| Shares | Value | ||||
COMMON STOCKS—52.8% (continued) | |||||
Tobacco—0.9% (continued) | |||||
Altria Group, Inc. | 10,300 | $ | 155,118 | ||
Lorillard, Inc. | 1,300 | 73,255 | |||
Philip Morris International, Inc. | 11,030 | 479,915 | |||
| 713,286 | |||||
Trading Companies & Distributors—0.0% | |||||
Applied Industrial Technologies, Inc. | 500 | 9,460 | |||
H&E Equipment Services, Inc.* | 400 | 3,084 | |||
| 12,544 | |||||
Trucking—0.0% | |||||
Dollar Thrifty Automotive Group* | 600 | 654 | |||
Knight Transportation, Inc. | 1,000 | 16,120 | |||
| 16,774 | |||||
Wireless Telecommunication Services—0.9% | |||||
America Movil SAB de CV ADR | 1,900 | 58,881 | |||
American Tower Corporation* | 2,730 | 80,044 | |||
Crown Castle International Corporation* | 4,100 | 72,078 | |||
Leap Wireless International, Inc.* | 200 | 5,378 | |||
MetroPCS Communications, Inc.* | 8,300 | 123,255 | |||
NII Holdings, Inc.* | 1,300 | 23,634 | |||
NTELOS Holdings Corporation | 700 | 17,262 | |||
Sprint Nextel Corporation | 47,500 | 86,925 | |||
Vodafone Group plc ADR | 10,200 | 208,488 | |||
| 675,945 | |||||
TOTAL COMMON STOCKS (cost $52,119,527) | $ | 40,292,701 | |||
| Shares | Value | ||||
FOREIGN STOCKS—12.2% | |||||
Australia—0.5% | |||||
Australia & New Zealand Banking Group, Ltd. | 6,131 | $ | 66,676 | ||
Beach Petroleum, Ltd. | 37,800 | 25,810 | |||
BHP Billiton, Ltd. | 4,570 | 98,945 | |||
Boral, Ltd. | 7,150 | 23,495 | |||
CSL, Ltd. | 3,752 | 89,934 | |||
Goodman Fielder, Ltd. | 26,795 | 25,348 | |||
Harvey Norman Holdings, Ltd. | 14,141 | 26,654 | |||
Lion Nathan, Ltd. | 10,677 | 62,424 | |||
Macquarie Group, Ltd.2 | 1,639 | 33,586 | |||
Mirvac Group2 | 7,621 | 6,938 | |||
Pacific Brands, Ltd. | 17,296 | 5,290 | |||
QBE Insurance Group, Ltd. | 4,440 | 81,508 | |||
Rio Tinto, Ltd. | 963 | 26,028 | |||
Suncorp-Metway, Ltd. | 4,553 | 27,202 | |||
Telstra Corporation, Ltd. | 14,687 | 40,009 | |||
| 639,847 | |||||
Belgium—0.0% | |||||
KBC Groep N.V. | 604 | 18,098 | |||
Umicore | 1,155 | 22,701 | |||
| 40,799 | |||||
Bermuda—0.2% | |||||
Esprit Holdings, Ltd. | 8,500 | 48,146 | |||
Sun’s Group, Ltd. | 218,000 | 74,538 | |||
| 122,684 | |||||
Cayman Islands—0.0% | |||||
Hutchison Telecommunications International, Ltd. | 130,000 | 34,889 | |||
Subsea 7, Inc.* | 4,600 | 26,798 | |||
| 61,687 | |||||
China—0.2% | |||||
China Oilfield Services, Ltd. | 94,000 | 75,803 | |||
China Railway Construction Corporation* | 58,500 | 87,104 | |||
| 162,907 | |||||
Finland—0.2% | |||||
Cargotec Corporation (Cl.B) | 1,294 | 14,624 | |||
Nokia Oyj | 4,218 | 65,405 | |||
Sanoma-WSOY Oyj | 3,558 | 45,776 | |||
| 125,805 | |||||
France—1.8% | |||||
Alcatel-Lucent* | 13,256 | 28,388 | |||
AXA S.A. | 5,746 | 127,185 | |||
BNP Paribas | 2,051 | 86,670 | |||
Bouygues | 1,934 | 81,591 | |||
Bureau Veritas S.A. | 1,078 | 43,280 | |||
CNP Assurances | 1,163 | 84,254 | |||
EDF Energies Nouvelles S.A. | 912 | 32,169 | |||
France Telecom S.A. | 2,989 | 83,342 | |||
GDF Suez | 2,391 | 117,989 | |||
L’Oreal S.A. | 1,296 | 112,790 | |||
Pernod-Ricard S.A. | 1,645 | 121,723 | |||
PPR | 1,155 | 75,188 | |||
Sanofi-Aventis S.A. | 2,039 | 129,316 | |||
Societe Generale | 1,070 | 53,810 | |||
Total S.A. | 3,006 | 163,391 | |||
| 1,341,086 | |||||
Germany—1.0% | |||||
Adidas AG | 1,914 | 72,565 | |||
BASF AG | 2,563 | 99,283 | |||
Bayerische Motoren Werke AG | 2,528 | 76,315 | |||
Deutsche Euroshop AG2 | 1,743 | 59,167 | |||
E.ON AG | 5,049 | 200,591 | |||
Fresenius SE | 1,382 | 80,292 | |||
Merck KGAA | 1,026 | 92,460 | |||
Muenchener Rueckversicherungs AG | 727 | 112,729 | |||
Volkswagen AG | 460 | 24,431 | |||
Wacker Chemie AG | 475 | 49,574 | |||
| 867,407 | |||||
Hong Kong—0.3% | |||||
China Overseas Land & Investment, Ltd. | 44,000 | 61,199 | |||
Hong Kong & China Gas Company, Ltd. | 36,000 | 54,346 | |||
Hutchison Whampoa, Ltd. | 8,700 | 43,610 | |||
Television Broadcasts, Ltd. | 7,000 | 22,805 | |||
| 181,960 | |||||
Ireland—0.0% | |||||
Allied Irish Banks plc | 11,211 | 27,109 | |||
DCC plc | 4,609 | 67,282 | |||
| 94,391 | |||||
Italy—0.5% | |||||
Finmeccanica SpA | 5,963 | 90,713 | |||
Intesa Sanpaolo SpA | 25,140 | 89,115 | |||
Prysmian SpA | 3,428 | 53,155 | |||
Saipem SpA | 3,592 | 59,311 | |||
| 292,294 | |||||
The accompanying notes are an integral part of the financial statements
79
Table of Contents
| Schedule of Investments | Series N | |
| December 31, 2008 | (Managed Asset Allocation Series) |
| Shares | Value | ||||
FOREIGN STOCKS—12.2% (continued) | |||||
Japan—3.1% | |||||
Aisin Seiki Company, Ltd. | 1,300 | $ | 17,696 | ||
Aoyama Trading Company, Ltd. | 1,100 | 17,229 | |||
Asahi Kasei Corporation | 4,000 | 17,195 | |||
Astellas Pharma, Inc. | 900 | 36,010 | |||
Bank of Yokohama, Ltd. | 11,000 | 63,169 | |||
Benesse Corporation | 1,400 | 60,645 | |||
Canon, Inc. | 900 | 27,479 | |||
Central Japan Railway Company | 7 | 59,950 | |||
Chugai Pharmaceutical Company, Ltd. | 3,700 | 70,268 | |||
Coca-Cola West Holdings Company, Ltd. | 2,100 | 45,021 | |||
Fanuc, Ltd. | 400 | 27,732 | |||
Goldcrest Company, Ltd. | 1,410 | 34,347 | |||
Hamamatsu Photonics KK | 2,200 | 41,369 | |||
Hitachi Chemical Company, Ltd. | 2,800 | 28,456 | |||
Honda Motor Company, Ltd. | 1,200 | 25,210 | |||
Hosiden Corporation | 4,100 | 63,268 | |||
House Foods Corporation | 1,200 | 21,136 | |||
Jupiter Telecommunications Company, Ltd. | 121 | 124,834 | |||
KDDI Corporation | 16 | 111,986 | |||
Kirin Holdings Company, Ltd. | 5,000 | 64,811 | |||
Kobayashi Pharmaceutical Company, Ltd. | 1,100 | 46,558 | |||
Kobe Steel, Ltd. | 25,000 | 44,640 | |||
Koito Manufacturing Company, Ltd. | 3,000 | 18,154 | |||
Makita Corporation | 800 | 17,345 | |||
Mitsubishi Corporation | 7,500 | 102,342 | |||
Mitsubishi Electric Corporation | 12,000 | 73,012 | |||
Mitsui & Company, Ltd. | 5,000 | 49,656 | |||
Mitsui Fudosan Company, Ltd. | 4,000 | 64,414 | |||
Modec, Inc. | 1,500 | 28,272 | |||
Nikon Corporation | 2,000 | 23,323 | |||
Nintendo Company, Ltd. | 200 | 74,401 | |||
Nippon Electric Glass Company, Ltd. | 7,000 | 35,723 | |||
Nippon Yusen KK | 6,000 | 36,043 | |||
Nissha Printing Company, Ltd. | 1,200 | 46,691 | |||
NS Solutions Corporation | 2,000 | 25,704 | |||
Rohto Pharmaceutical Company, Ltd. | 4,000 | 54,803 | |||
Sony Financial Holdings, Inc. | 17 | 63,334 | |||
Sumco Corporation | 3,300 | 40,374 | |||
Sumitomo Mitsui Financial Group, Inc. | 7 | 29,011 | |||
Sumitomo Trust & Banking Company, Ltd. | 14,000 | 79,625 | |||
Terumo Corporation | 900 | 41,367 | |||
Toho Pharmaceutical Company, Ltd. | 900 | 12,331 | |||
Tokio Marine Holdings, Inc. | 1,700 | 48,344 | |||
Toshiba Machine Company, Ltd. | 5,000 | 14,439 | |||
Tosoh Corporation | 10,000 | 23,918 | |||
Toyota Motor Corporation | 2,900 | 92,859 | |||
Wacom Company, Ltd. | 16 | 13,668 | |||
| 2,158,162 | |||||
Jersey—0.1% | |||||
Charter International plc | 3,523 | 17,041 | |||
WPP plc | 6,777 | 39,529 | |||
| 56,570 | |||||
Mexico—0.0% | |||||
Cemex S.A. de CV | 11,396 | 10,408 | |||
Netherlands—0.2% | |||||
ASML Holding N.V. | 2,592 | 46,166 | |||
Fugro N.V. | 917 | 26,241 | |||
ING Groep N.V. | 5,613 | 57,475 | |||
Koninklijke Philips Electronics N.V. | 2,419 | 46,734 | |||
| 176,616 | |||||
Norway—0.4% | |||||
Orkla ASA | 5,800 | 37,918 | |||
StatoilHydro ASA | 8,200 | 134,345 | |||
Tandberg ASA | 3,600 | 39,044 | |||
Telenor ASA | 7,600 | 50,615 | |||
| 261,922 | |||||
Republic of Korea—0.0% | |||||
LG Display Company, Ltd. | 1,590 | 26,495 | |||
Samsung Electronics Company, Ltd. | 103 | 36,861 | |||
| 63,356 | |||||
Singapore—0.2% | |||||
DBS Group Holdings, Ltd. | 8,000 | 47,023 | |||
Jardine Cycle & Carriage, Ltd. | 3,000 | 19,895 | |||
SembCorp Industries, Ltd. | 25,900 | 41,946 | |||
StarHub, Ltd. | 26,250 | 35,550 | |||
Venture Corporation, Ltd. | 4,000 | 12,230 | |||
| 156,644 | |||||
Spain—0.7% | |||||
Acciona S.A. | 483 | 60,050 | |||
Banco Santander S.A. | 11,793 | 111,200 | |||
Iberdrola Renovables S.A.* | 21,960 | 93,564 | |||
Industria de Diseno Textil S.A. | 1,363 | 59,653 | |||
Telefonica S.A. | 6,069 | 134,377 | |||
| 458,844 | |||||
Sweden—0.4% | |||||
Autoliv, Inc. | 1,050 | 21,201 | |||
Elekta AB | 5,827 | 57,526 | |||
Nordea Bank AB | 7,794 | 54,484 | |||
SSAB Svenskt Stal AB | 6,046 | 52,541 | |||
Swedbank AB | 2,500 | 14,185 | |||
| 199,937 | |||||
Switzerland—1.2% | |||||
ABB, Ltd. | 3,280 | 47,898 | |||
Julius Baer Holding AG | 2,104 | 78,844 | |||
Nestle S.A. | 9,247 | 360,555 | |||
Roche Holding AG | 1,533 | 233,491 | |||
Syngenta AG | 334 | 62,737 | |||
| 783,525 | |||||
Taiwan, Province of China—0.1% | |||||
Acer, Inc. | 35,677 | 46,288 | |||
United Kingdom—1.1% | |||||
Aegis Group plc | 15,508 | 16,971 | |||
Arriva plc | 4,655 | 40,855 | |||
Aviva plc | 11,857 | 67,646 | |||
BG Group plc | 3,762 | 52,531 | |||
BHP Billiton plc | 2,700 | 50,781 | |||
The accompanying notes are an integral part of the financial statements
80
Table of Contents
| Schedule of Investments | Series N | |
| December 31, 2008 | (Managed Asset Allocation Series) |
| Shares | Value | |||||
FOREIGN STOCKS—12.2% (continued) | ||||||
United Kingdom—1.1% (continued) | ||||||
Brown Group plc | 8,729 | $ | 26,205 | |||
Carillion plc | 10,455 | 37,832 | ||||
Close Brothers Group plc | 2,632 | 20,277 | ||||
Dairy Crest Group plc | 11,032 | 34,125 | ||||
GKN plc | 12,923 | 18,149 | ||||
Informa plc | 4,655 | 16,641 | ||||
Intermediate Capital Group plc2 | 2,732 | 25,472 | ||||
Logica plc | 13,657 | 13,650 | ||||
Mitchells & Butlers plc | 7,451 | 17,395 | ||||
Prudential plc | 7,329 | 44,540 | ||||
QinetiQ plc | 14,946 | 34,511 | ||||
Rolls-Royce Group plc | 6,037 | 29,399 | ||||
Royal Bank of Scotland Group plc | 34,894 | 25,101 | ||||
Scottish & Southern Energy plc | 6,416 | 113,463 | ||||
Standard Chartered plc | 6,920 | 88,349 | ||||
Tesco plc | 29,215 | 153,247 | ||||
Unilever plc | 5,309 | 122,393 | ||||
| 1,049,533 | ||||||
TOTAL FOREIGN STOCKS (cost $14,006,211) | $ | 9,352,672 | ||||
| Shares | Value | |||||
WARRANTS—0.0% | ||||||
Anvil (Cl. A) | ||||||
$1.00, 2/28/20121 | 333 | 133 | ||||
Anvil (Cl. B) | ||||||
$1.00, 2/28/20121 | 370 | 30 | ||||
TOTAL WARRANTS (cost $3,850) | $ | 163 | ||||
| Principal Amount | Value | |||||
CORPORATE BOND—12.0% | ||||||
Aerospace & Defense—0.3% | ||||||
Bombardier, Inc. | ||||||
6.75%, 20123,4 | $ | 50,000 | $ | 44,375 | ||
L-3 Communications Corporation | ||||||
7.63%, 2012 | 25,000 | 24,437 | ||||
Lockheed Martin Corporation | ||||||
4.12%, 2013 | 25,000 | 24,371 | ||||
United Technologies Corporation | ||||||
5.38%, 2017 | 20,000 | 20,218 | ||||
5.40%, 2035 | 20,000 | 18,848 | ||||
| 132,249 | ||||||
Automotive—0.2% | ||||||
DaimlerChrysler North America Holding Corporation | ||||||
3.64%, 20095 | 55,000 | 52,096 | ||||
6.50%, 2013 | 30,000 | 23,400 | ||||
Erac USA Finance Company | ||||||
5.60%, 20151,3,4 | 40,000 | 29,510 | ||||
Ford Motor Company | ||||||
7.45%, 2031 | 25,000 | 7,000 | ||||
Ford Motor Credit Company LLC | ||||||
9.20%, 20095 | 25,000 | 24,125 | ||||
General Motors Corporation | ||||||
7.20%, 2011 | 25,000 | 5,250 | ||||
8.38%, 2033 | 25,000 | 4,375 | ||||
Hertz Corporation | ||||||
10.50%, 2016 | 100,000 | 45,625 | ||||
| 191,381 | ||||||
Banking—1.1% | ||||||
Bank of New York Mellon Corporation | ||||||
4.50%, 2013 | 35,000 | 34,801 | ||||
BB&T Capital Trust II | ||||||
6.75%, 2036 | 20,000 | 15,972 | ||||
Citigroup, Inc. | ||||||
6.50%, 2013 | 95,000 | 95,863 | ||||
Countrywide Home Loans, Inc. | ||||||
4.13%, 2009 | 70,000 | 69,180 | ||||
Credit Suisse Guernsey, Ltd. | ||||||
5.86%, 20495 | 40,000 | 18,669 | ||||
Credit Suisse USA, Inc. | ||||||
5.50%, 2011 | 30,000 | 29,825 | ||||
Fifth Third Bancorp | ||||||
6.25%, 2013 | 35,000 | 32,463 | ||||
JP Morgan Chase Capital XXII | ||||||
6.45%, 2037 | 35,000 | 28,682 | ||||
JPMorgan Chase & Company | ||||||
4.75%, 2013 | 55,000 | 54,272 | ||||
6.00%, 2018 | 75,000 | 79,164 | ||||
Mizuho Capital Investment 1, Ltd. | ||||||
6.69%, 20491,3,4,5 | 16,000 | 9,087 | ||||
Northern Trust Company | ||||||
4.60%, 2013 | 25,000 | 24,774 | ||||
Northern Trust Corporation | ||||||
5.30%, 2011 | 30,000 | 30,580 | ||||
5.50%, 2013 | 10,000 | 10,268 | ||||
PNC Funding Corporation | ||||||
5.63%, 2017 | 35,000 | 33,994 | ||||
Svensk Exportkredit AB | ||||||
5.13%, 2017 | 70,000 | 76,704 | ||||
U.S. Bancorp | ||||||
4.50%, 2010 | 45,000 | 44,850 | ||||
Wells Fargo & Company | ||||||
4.88%, 2011 | 90,000 | 90,003 | ||||
| 779,151 | ||||||
Basic Industry - Other -0.1% | ||||||
Cooper US, Inc. | ||||||
6.10%, 2017 | 35,000 | 34,840 | ||||
Xstrata Finance Canada, Ltd. | ||||||
5.50%, 20111,3,4 | 35,000 | 27,347 | ||||
| 62,187 | ||||||
Brokerage - 0.8% | ||||||
Citigroup, Inc. | ||||||
5.50%, 2012 | 37,000 | 35,917 | ||||
5.50%, 2013 | 45,000 | 43,816 | ||||
Goldman Sachs Group, Inc. | ||||||
6.15%, 2018 | 155,000 | 148,948 | ||||
6.35%, 2034 | 30,000 | 21,770 | ||||
Jefferies Group, Inc. | ||||||
5.88%, 2014 | 20,000 | 15,413 | ||||
6.25%, 2036 | 35,000 | 20,779 | ||||
Merrill Lynch & Company, Inc. | ||||||
5.45%, 2013 | 35,000 | 33,644 | ||||
6.88%, 2018 | 85,000 | 88,912 | ||||
7.75%, 2038 | 35,000 | 38,559 | ||||
Morgan Stanley | ||||||
6.00%, 2015 | 100,000 | 86,273 | ||||
The accompanying notes are an integral part of the financial statements
81
Table of Contents
| Schedule of Investments | Series N | |
| December 31, 2008 | (Managed Asset Allocation Series) |
| Principal Amount | Value | |||||
CORPORATE BOND—12.0% (continued) | ||||||
Brokerage—0.8% (continued) | ||||||
Willis North America, Inc. | ||||||
6.20%, 2017 | $ | 25,000 | $ | 17,320 | ||
| 551,351 | ||||||
Building Materials—0.1% | ||||||
CRH America, Inc. | ||||||
6.00%, 2016 | 50,000 | 31,140 | ||||
Freeport-McMoRan Copper & Gold, Inc. | ||||||
8.38%, 2017 | 50,000 | 40,999 | ||||
Gibraltar Industries, Inc. | ||||||
8.00%, 2015 | 25,000 | 14,000 | ||||
Lafarge S.A. | ||||||
6.15%, 2011 | 20,000 | 17,414 | ||||
| 103,553 | ||||||
Capital Goods—Other—0.0% | ||||||
Freescale Semiconductor, Inc. | ||||||
8.88%, 2014 | 75,000 | 33,000 | ||||
Chemicals—0.3% | ||||||
Air Products & Chemicals, Inc. | ||||||
4.15%, 2013 | 30,000 | 28,804 | ||||
E.I. Du Pont de Nemours & Company | ||||||
5.60%, 2036 | 50,000 | 47,110 | ||||
Nalco Company | ||||||
7.75%, 2011 | 75,000 | 72,000 | ||||
Praxair, Inc. | ||||||
4.63%, 2015 | 35,000 | 35,232 | ||||
5.20%, 2017 | 35,000 | 34,960 | ||||
| 218,106 | ||||||
Communications—Other—0.2% | ||||||
AT&T, Inc. | ||||||
5.63%, 2016 | 90,000 | 90,403 | ||||
CanWest MediaWorks, Inc. | ||||||
8.00%, 2012 | 34,875 | 15,345 | ||||
Dun & Bradstreet Corporation | ||||||
5.50%, 2011 | 25,000 | 24,375 | ||||
Fairpoint Communications, Inc. | ||||||
13.13%, 20183,4 | 25,000 | 12,000 | ||||
Lamar Media Corporation | ||||||
6.63%, 2015 | 100,000 | 72,250 | ||||
| 214,373 | ||||||
Construction Machinery—0.1% | ||||||
Caterpillar, Inc. | ||||||
8.25%, 2038 | 5,000 | 6,163 | ||||
Commercial Vehicle Group, Inc. | ||||||
8.00%, 2013 | 25,000 | 11,750 | ||||
Honeywell International, Inc. | ||||||
5.30%, 2018 | 35,000 | 35,710 | ||||
Owens Corning, Inc. | ||||||
6.50%, 2016 | 25,000 | 18,105 | ||||
| 71,728 | ||||||
Consumer Cyclical—Other—0.1% | ||||||
Hasbro, Inc. | ||||||
6.30%, 2017 | 20,000 | 18,911 | ||||
Procter & Gamble Company | ||||||
4.95%, 2014 | 65,000 | 68,527 | ||||
| 87,438 | ||||||
Consumer Noncyclical—Other—0.1% | ||||||
Bunge North America Finance, LP | ||||||
5.90%, 2017 | 55,000 | 40,034 | ||||
Consumer Products—0.0% | ||||||
Fortune Brands, Inc. | ||||||
5.13%, 2011 | 30,000 | 28,815 | ||||
Visant Corporation | ||||||
7.63%, 2012 | 25,000 | 20,500 | ||||
| 49,315 | ||||||
Diversified Manufacturing—0.1% | ||||||
3M Company | ||||||
5.70%, 2037 | 35,000 | 38,231 | ||||
Hawk Corporation | ||||||
8.75%, 20141 | 25,000 | 25,375 | ||||
United Technologies Corporation | ||||||
6.13%, 2019 | 25,000 | 26,747 | ||||
| 90,353 | ||||||
Electric—1.1% | ||||||
AES Corporation | ||||||
7.75%, 2014 | 25,000 | 22,000 | ||||
Alabama Power Company | ||||||
2.35%, 20095 | 20,000 | 19,594 | ||||
Appalachian Power Company | ||||||
6.38%, 2036 | 25,000 | 22,313 | ||||
Baltimore Gas & Electric Company | ||||||
5.90%, 2016 | 50,000 | 45,361 | ||||
Black Hills Corporation | ||||||
6.50%, 2013 | 30,000 | 29,290 | ||||
Centerpoint Energy, Inc. | ||||||
7.25%, 2010 | 25,000 | 24,612 | ||||
Consolidated Edison Company of New York, Inc. | ||||||
6.75%, 2038 | 20,000 | 21,369 | ||||
Consumers Energy Company | ||||||
6.00%, 2014 | 25,000 | 24,944 | ||||
Dynegy Holdings, Inc. | ||||||
7.75%, 2019 | 50,000 | 34,500 | ||||
El Paso Electric Company | ||||||
6.00%, 2035 | 45,000 | 30,845 | ||||
Energy Future Holdings Corporation | ||||||
11.25%, 20173,4 | 25,000 | 12,125 | ||||
10.88%, 20173,4 | 25,000 | 17,750 | ||||
Florida Power Corporation | ||||||
6.35%, 2037 | 35,000 | 38,793 | ||||
Illinois Power Company | ||||||
6.13%, 2017 | 15,000 | 13,457 | ||||
Monongahela Power Company | ||||||
5.70%, 20171,3,4 | 40,000 | 33,585 | ||||
Northern States Power | ||||||
5.25%, 2018 | 20,000 | 19,927 | ||||
Pacific Gas & Electric Company | ||||||
4.80%, 2014 | 30,000 | 29,462 | ||||
6.35%, 2038 | 20,000 | 21,874 | ||||
Progress Energy, Inc. | ||||||
5.63%, 2016 | 30,000 | 27,429 | ||||
Public Service Electric & Gas Company | ||||||
5.70%, 2036 | 50,000 | 46,157 | ||||
The accompanying notes are an integral part of the financial statements
82
Table of Contents
| Schedule of Investments | Series N | |
| December 31, 2008 | (Managed Asset Allocation Series) |
| Principal Amount | Value | |||||
CORPORATE BOND—12.0% (continued) | ||||||
Electric—1.1% (continued) | ||||||
Reliant Energy, Inc. | ||||||
7.88%, 2017 | $ | 25,000 | $ | 20,250 | ||
Sierra Pacific Resources | ||||||
7.80%, 20121 | 25,000 | 23,399 | ||||
Southern California Edison Company | ||||||
4.65%, 2015 | 30,000 | 29,918 | ||||
Tampa Electric Company | ||||||
6.15%, 2037 | 40,000 | 32,550 | ||||
Texas Competitive Electric Holdings Company LLC | ||||||
10.50%, 20153,4 | 50,000 | 35,500 | ||||
Union Electric Company | ||||||
5.40%, 2016 | 50,000 | 43,324 | ||||
Virginia Electric and Power Company | ||||||
4.50%, 2010 | 35,000 | 34,543 | ||||
6.00%, 2037 | 35,000 | 33,900 | ||||
8.88%, 2038 | 10,000 | 12,656 | ||||
Westar Energy, Inc. | ||||||
5.10%, 2020 | 25,000 | 21,109 | ||||
| 822,536 | ||||||
Energy—Other—0.0% | ||||||
Dresser-Rand Group, Inc. | ||||||
7.38%, 2014 | 22,000 | 16,940 | ||||
Entertainment—0.1% | ||||||
Historic TW, Inc. | ||||||
6.88%, 2018 | 50,000 | 44,644 | ||||
International Speedway Corporation | ||||||
4.20%, 2009 | 20,000 | 19,704 | ||||
| 64,348 | ||||||
Environmental—0.1% | ||||||
Casella Waste Systems, Inc. | ||||||
9.75%, 2013 | 25,000 | 20,000 | ||||
Veolia Environnement | ||||||
6.00%, 2018 | 35,000 | 31,024 | ||||
Waste Management, Inc. | ||||||
6.10%, 2018 | 55,000 | 47,572 | ||||
| 98,596 | ||||||
Financial—Other—0.1% | ||||||
AMB Property, LP | ||||||
6.30%, 2013 | 20,000 | 12,594 | ||||
AvalonBay Communities, Inc. | ||||||
6.13%, 2012 | 30,000 | 23,474 | ||||
Duke Realty, LP | ||||||
6.25%, 2013 | 20,000 | 13,767 | ||||
First Data Corporation | ||||||
9.88%, 2015 | 25,000 | 15,125 | ||||
Kinder Morgan Finance Company ULC | ||||||
5.70%, 2016 | 45,000 | 33,525 | ||||
Nuveen Investments, Inc. | ||||||
5.50%, 2015 | 25,000 | 3,781 | ||||
Sovereign Capital Trust VI | ||||||
7.91%, 2036 | 35,000 | 23,185 | ||||
| 125,451 | ||||||
Financial Companies—Noncaptive Consumer—0.2% | ||||||
American Express Credit Corporation | ||||||
5.88%, 2013 | 35,000 | 33,599 | ||||
7.30%, 2013 | 15,000 | 15,354 | ||||
Capital One Capital IV | ||||||
6.75%, 20375 | 50,000 | 22,822 | ||||
John Deere Capital Corporation | ||||||
5.50%, 2017 | 20,000 | 19,082 | ||||
SLM Corporation | ||||||
6.50%, 20095 | 35,000 | 32,530 | ||||
5.45%, 2011 | 25,000 | 19,734 | ||||
5.13%, 2012 | 15,000 | 11,225 | ||||
8.45%, 2018 | 35,000 | 27,672 | ||||
| 182,018 | ||||||
Financial Companies—Noncaptive Diversified—0.3% | ||||||
Caterpillar Financial Services Corporation | ||||||
4.25%, 2013 | 35,000 | 32,565 | ||||
5.85%, 2017 | 25,000 | 24,472 | ||||
International Lease Finance Corporation | ||||||
5.45%, 2011 | 50,000 | 36,711 | ||||
6.63%, 2013 | 55,000 | 37,058 | ||||
JPMorgan Chase & Company | ||||||
6.40%, 2038 | 35,000 | 41,404 | ||||
Wachovia Corporation | ||||||
5.75%, 2018 | 55,000 | 55,110 | ||||
| 227,320 | ||||||
Food & Beverage—0.2% | ||||||
ARAMARK Corporation | ||||||
6.69%, 20155 | 50,000 | 37,750 | ||||
B&G Foods, Inc. | ||||||
8.00%, 2011 | 25,000 | 21,250 | ||||
General Mills, Inc. | ||||||
5.25%, 2013 | 15,000 | 15,090 | ||||
Pantry, Inc. | ||||||
7.75%, 2014 | 25,000 | 17,250 | ||||
SABMiller plc | ||||||
6.20%, 20111,3,4 | 50,000 | 49,525 | ||||
SYSCO Corporation | ||||||
5.25%, 2018 | 20,000 | 20,272 | ||||
| 161,137 | ||||||
Gaming—0.1% | ||||||
Wynn Las Vegas Capital Corporation | ||||||
6.63%, 2014 | 100,000 | 75,500 | ||||
Health Care—0.6% | ||||||
Cardinal Health, Inc. | ||||||
1.71%, 20095 | 30,000 | 28,460 | ||||
Eli Lilly & Company | ||||||
5.55%, 2037 | 35,000 | 36,155 | ||||
Genentech, Inc. | ||||||
4.75%, 2015 | 35,000 | 35,213 | ||||
HCA, Inc. | ||||||
9.25%, 2016 | 50,000 | 45,875 | ||||
Highmark, Inc. | ||||||
6.80%, 20131,3,4 | 30,000 | 28,582 | ||||
The accompanying notes are an integral part of the financial statements
83
Table of Contents
| Schedule of Investments | Series N | |
| December 31, 2008 | (Managed Asset Allocation Series) |
| Principal Amount | Value | |||||
CORPORATE BOND—12.0% (continued) | ||||||
Health Care—0.6% (continued) | ||||||
Kellogg Company | ||||||
4.25%, 2013 | $ | 25,000 | $ | 24,210 | ||
Kroger Company | ||||||
8.05%, 2010 | 45,000 | 45,737 | ||||
Medtronic, Inc. | ||||||
4.75%, 2015 | 60,000 | 57,182 | ||||
Vanguard Health Holding Company II LLC | ||||||
9.00%, 2014 | 25,000 | 20,875 | ||||
WellPoint, Inc. | ||||||
5.00%, 2011 | 30,000 | 28,354 | ||||
Wyeth | ||||||
5.95%, 2037 | 35,000 | 38,860 | ||||
| 389,503 | ||||||
Home Construction—0.3% | ||||||
Lennar Corporation | ||||||
5.60%, 2015 | 55,000 | 33,550 | ||||
MDC Holdings, Inc. | ||||||
5.50%, 2013 | 55,000 | 43,049 | ||||
NVR, Inc. | ||||||
5.00%, 2010 | 20,000 | 18,895 | ||||
Pulte Homes, Inc. | ||||||
5.20%, 2015 | 50,000 | 34,000 | ||||
| 129,494 | ||||||
Independent Energy—0.1% | ||||||
Canadian Natural Resources, Ltd. | ||||||
6.25%, 2038 | 35,000 | 27,510 | ||||
Forest Oil Corporation | ||||||
8.00%, 2011 | 25,000 | 22,813 | ||||
Hilcorp Energy I, LP | ||||||
7.75%, 20153,4 | 75,000 | 52,875 | ||||
NRG Energy, Inc. | ||||||
7.25%, 2014 | 25,000 | 23,375 | ||||
Southern Company | ||||||
5.30%, 2012 | 15,000 | 15,147 | ||||
| 141,720 | ||||||
Insurance—Life—0.3% | ||||||
Hartford Financial Services Group, Inc. | ||||||
5.38%, 2017 | 45,000 | 32,781 | ||||
HUB International Holdings, Inc. | ||||||
10.25%, 20153,4 | 25,000 | 11,031 | ||||
MetLife, Inc. | ||||||
6.13%, 2011 | 50,000 | 49,317 | ||||
NLV Financial Corporation | ||||||
7.50%, 20331,3,4 | 30,000 | 35,030 | ||||
Principal Financial Group, Inc. | ||||||
6.05%, 2036 | 30,000 | 20,222 | ||||
Principal Life Global Funding I | ||||||
5.13%, 20131,3,4 | 45,000 | 42,091 | ||||
Sun Life Financial Global Funding, LP | ||||||
1.71%, 20131,3,4,5 | 45,000 | 41,283 | ||||
| 231,755 | ||||||
Insurance— Property & Casualty—0.1% | ||||||
Ace INA Holdings, Inc. | ||||||
5.70%, 2017 | 30,000 | 26,899 | ||||
Fund American Companies, Inc. | ||||||
5.88%, 2013 | 11,000 | 8,006 | ||||
Nationwide Mutual Insurance Company | ||||||
6.60%, 20341,3,4 | 25,000 | 12,502 | ||||
| 47,407 | ||||||
Integrated Energy—0.2% | ||||||
Dominion Resources, Inc. | ||||||
8.88%, 2019 | 15,000 | 16,176 | ||||
Hess Corporation | ||||||
7.88%, 2029 | 20,000 | 19,200 | ||||
Jersey Central Power & Light Company | ||||||
5.65%, 2017 | 45,000 | 41,321 | ||||
Petrobras International Finance Company | ||||||
5.88%, 2018 | 35,000 | 31,465 | ||||
Petro-Canada | ||||||
6.80%, 2038 | �� | 10,000 | 7,546 | |||
West Penn Power Company | ||||||
5.95%, 20171,3,4 | 25,000 | 21,061 | ||||
| 136,769 | ||||||
Lodging—0.0% | ||||||
Host Hotels & Resorts, LP | ||||||
6.75%, 2016 | 25,000 | 18,250 | ||||
Media—Cable—0.6% | ||||||
British Sky Broadcasting Group plc | ||||||
6.10%, 20181,3,4 | 55,000 | 45,160 | ||||
Comcast Cable Communications Holdings, Inc. | ||||||
8.38%, 2013 | 30,000 | 31,036 | ||||
Comcast Corporation | ||||||
5.70%, 2018 | 20,000 | 18,756 | ||||
COX Communications, Inc. | ||||||
7.13%, 2012 | 20,000 | 19,140 | ||||
6.25%, 20181,3,4 | 35,000 | 31,066 | ||||
CSC Holdings, Inc. | ||||||
7.63%, 2011 | 50,000 | 47,125 | ||||
DirecTV Holdings LLC | ||||||
7.63%, 20163 | 25,000 | 24,250 | ||||
News America, Inc. | ||||||
6.15%, 2037 | 60,000 | 55,982 | ||||
Rogers Cable, Inc. | ||||||
5.50%, 2014 | 40,000 | 36,902 | ||||
Time Warner Cable, Inc. | ||||||
5.40%, 2012 | 55,000 | 51,356 | ||||
7.30%, 2038 | 90,000 | 93,498 | ||||
Time Warner, Inc. | ||||||
5.50%, 2011 | 30,000 | 28,188 | ||||
Viacom, Inc. | ||||||
5.75%, 2011 | 25,000 | 22,705 | ||||
| 505,164 | ||||||
Media—Non Cable—0.1% | ||||||
Affinity Group, Inc. | ||||||
9.00%, 2012 | 25,000 | 12,500 | ||||
News America, Inc. | ||||||
6.40%, 2035 | 45,000 | 41,591 | ||||
The accompanying notes are an integral part of the financial statements
84
Table of Contents
| Schedule of Investments | Series N | |
| December 31, 2008 | (Managed Asset Allocation Series) |
| Principal Amount | Value | |||||
CORPORATE BOND—12.0% (continued) | ||||||
Media—Non Cable—0.1% (continued) | ||||||
Thomson Reuters Corporation | ||||||
6.50%, 2018 | $ | 25,000 | $ | 22,734 | ||
Vivendi | ||||||
5.75%, 20131,3,4 | 35,000 | 30,721 | ||||
| 107,546 | ||||||
Metals & Mining—0.3% | ||||||
ArcelorMittal | ||||||
5.38%, 20133 | 35,000 | 26,395 | ||||
Barrick Gold Financeco LLC | ||||||
6.13%, 2013 | 30,000 | 28,446 | ||||
BHP Billiton Finance, Ltd. | ||||||
5.40%, 2017 | 30,000 | 26,649 | ||||
Placer Dome, Inc. | ||||||
6.45%, 2035 | 35,000 | 28,118 | ||||
Rio Tinto Finance USA, Ltd. | ||||||
5.88%, 2013 | 35,000 | 27,878 | ||||
Russel Metals, Inc. | ||||||
6.38%, 2014 | 25,000 | 19,250 | ||||
Steel Dynamics, Inc. | ||||||
7.38%, 2012 | 25,000 | 18,250 | ||||
Sunoco, Inc. | ||||||
5.75%, 2017 | 34,000 | 28,256 | ||||
Vale Overseas, Ltd. | ||||||
6.25%, 2017 | 35,000 | 32,999 | ||||
| 236,241 | ||||||
Natural Gas Pipelines—0.2% | ||||||
Boardwalk Pipelines LLC | ||||||
5.50%, 2017 | 20,000 | 16,172 | ||||
Buckeye Partners, LP | ||||||
6.05%, 2018 | 15,000 | 12,574 | ||||
El Paso Corporation | ||||||
12.00%, 2013 | 25,000 | 24,500 | ||||
TEPPCO Partners, LP | ||||||
7.55%, 2038 | 45,000 | 33,674 | ||||
Texas Gas Transmission LLC | ||||||
5.50%, 20131,3,4 | 50,000 | 43,463 | ||||
| 130,383 | ||||||
Oil Field Services—0.5% | ||||||
Devon Financing Corporation ULC | ||||||
7.88%, 2031 | 25,000 | 27,528 | ||||
Diamond Offshore Drilling, Inc. | ||||||
5.15%, 2014 | 25,000 | 23,464 | ||||
El Paso Natural Gas Company | ||||||
5.95%, 2017 | 13,000 | 10,330 | ||||
EnCana Corporation | ||||||
5.90%, 2017 | 35,000 | 29,201 | ||||
6.50%, 2034 | 35,000 | 28,082 | ||||
EOG Resources, Inc. | ||||||
5.88%, 2017 | 25,000 | 25,380 | ||||
Nabors Industries, Inc. | ||||||
6.15%, 2018 | 10,000 | 8,603 | ||||
Pemex Project Funding Master Trust | ||||||
5.75%, 2018 | 80,000 | 70,599 | ||||
Shell International Finance BV | ||||||
6.38%, 2038 | 25,000 | 28,125 | ||||
Southern Natural Gas Company | ||||||
5.90%, 20171,3,4 | 13,000 | 10,302 | ||||
Transocean, Inc. | ||||||
5.25%, 2013 | 10,000 | 9,288 | ||||
XTO Energy, Inc. | ||||||
5.65%, 2016 | 30,000 | 27,523 | ||||
| 298,425 | ||||||
Packaging—0.0% | ||||||
BWAY Corporation | ||||||
10.00%, 2010 | 25,000 | 21,250 | ||||
Paper—0.0% | ||||||
Boise Cascade LLC | ||||||
7.13%, 20141 | 15,000 | 8,400 | ||||
Georgia-Pacific LLC | ||||||
7.13%, 20173,4 | 25,000 | 21,000 | ||||
| 29,400 | ||||||
Pharmaceuticals—0.1% | ||||||
Teva Pharmaceutical Finance LLC | ||||||
5.55%, 2016 | 40,000 | 39,425 | ||||
Railroads—0.1% | ||||||
Burlington Northern Santa Fe Corporation | ||||||
5.65%, 2017 | 57,000 | 54,730 | ||||
Canadian National Railway Company | ||||||
6.25%, 2034 | 20,000 | 21,507 | ||||
6.38%, 2037 | 10,000 | 10,969 | ||||
Norfolk Southern Corporation | ||||||
5.75%, 2018 | 15,000 | 14,596 | ||||
Union Pacific Corporation | ||||||
5.70%, 2018 | 25,000 | 24,068 | ||||
| 125,870 | ||||||
Refining—0.2% | ||||||
Diamond Offshore Drilling, Inc. | ||||||
4.88%, 2015 | 30,000 | 27,550 | ||||
Enterprise Products Operating, LP | ||||||
6.30%, 2017 | 20,000 | 16,927 | ||||
Marathon Oil Corporation | ||||||
6.00%, 2017 | 35,000 | 29,844 | ||||
5.90%, 2018 | 45,000 | 37,582 | ||||
6.60%, 2037 | 15,000 | 11,340 | ||||
Valero Energy Corporation | ||||||
6.13%, 2017 | 55,000 | 46,923 | ||||
| 170,166 | ||||||
REIT’s—0.1% | ||||||
ERP Operating, LP | ||||||
5.25%, 2014 | 25,000 | 16,703 | ||||
Federal Realty Investment Trust | ||||||
6.00%, 2012 | 20,000 | 16,018 | ||||
Hospitality Properties Trust | ||||||
5.63%, 2017 | 30,000 | 13,834 | ||||
Reckson Operating Partnership, LP | ||||||
6.00%, 2016 | 30,000 | 16,961 | ||||
Regency Centers, LP | ||||||
5.88%, 2017 | 15,000 | 9,500 | ||||
Simon Property Group, LP | ||||||
5.75%, 2015 | 55,000 | 35,925 | ||||
| 108,941 | ||||||
85
Table of Contents
| Schedule of Investments | Series N | |
| December 31, 2008 | (Managed Asset Allocation Series) |
| Principal Amount | Value | |||||
CORPORATE BOND—12.0% (continued) | ||||||
Restaurants—0.1% | ||||||
Federated Retail Holdings, Inc. | ||||||
5.35%, 2012 | $ | 20,000 | $ | 14,855 | ||
McDonald’s Corporation | ||||||
5.30%, 2017 | 35,000 | 35,886 | ||||
| 50,741 | ||||||
Retailers—0.3% | ||||||
AmeriGas Partners, LP | ||||||
7.13%, 2016 | 100,000 | 80,000 | ||||
Costco Wholesale Corporation | ||||||
5.30%, 2012 | 30,000 | 31,310 | ||||
GSC Holdings Corporation | ||||||
8.00%, 2012 | 25,000 | 23,250 | ||||
Home Depot, Inc. | ||||||
5.40%, 2016 | 35,000 | 31,322 | ||||
JC Penney Corporation, Inc. | ||||||
9.00%, 2012 | 30,000 | 26,635 | ||||
Walgreen Company | ||||||
4.88%, 2013 | 30,000 | 30,896 | ||||
| 223,413 | ||||||
Services—0.1% | ||||||
Allied Waste North America, Inc. | ||||||
7.25%, 2015 | 50,000 | 46,500 | ||||
Sovereigns—0.2% | ||||||
Brazilian Government International Bond | ||||||
11.00%, 2040 | 30,000 | 39,150 | ||||
Italian Republic | ||||||
5.25%, 2016 | 85,000 | 91,981 | ||||
| 131,131 | ||||||
Supermarkets—0.0% | ||||||
Kroger Company | ||||||
7.50%, 2014 | 5,000 | 5,256 | ||||
Technology—0.5% | ||||||
Avnet, Inc. | ||||||
5.88%, 2014 | 35,000 | 29,406 | ||||
Cisco Systems, Inc. | ||||||
5.25%, 2011 | 35,000 | 36,334 | ||||
Freescale Semiconductor, Inc. | ||||||
9.13%, 2014 | 25,000 | 5,750 | ||||
National Semiconductor Corporation | ||||||
6.15%, 2012 | 20,000 | 17,913 | ||||
Oracle Corporation | ||||||
5.00%, 2011 | 35,000 | 35,944 | ||||
STATS ChipPAC, Ltd. | ||||||
6.75%, 2011 | 25,000 | 18,563 | ||||
Sungard Data Systems, Inc. | ||||||
9.13%, 2013 | 100,000 | 86,500 | ||||
Xerox Corporation | ||||||
5.50%, 2012 | 15,000 | 12,571 | ||||
6.75%, 2017 | 100,000 | 72,563 | ||||
6.35%, 2018 | 25,000 | 19,552 | ||||
| 335,096 | ||||||
Telecommunications—Wireless—0.6% | ||||||
Alltel Corporation | ||||||
7.00%, 2012 | 25,000 | 24,875 | ||||
America Movil S.A. de CV | ||||||
6.38%, 2035 | 45,000 | 38,161 | ||||
America Movil SAB de CV | ||||||
5.63%, 2017 | 45,000 | 40,006 | ||||
British Telecommunications plc | ||||||
5.15%, 2013 | 40,000 | 38,104 | ||||
Centennial Communications Corporation | ||||||
7.19%, 20135 | 25,000 | 24,250 | ||||
New Cingular Wireless Services, Inc. | ||||||
7.88%, 2011 | 30,000 | 31,057 | ||||
Nortel Networks, Ltd. | ||||||
9.00%, 20115 | 25,000 | 6,250 | ||||
Rogers Communications, Inc. | ||||||
6.80%, 2018 | 30,000 | 30,313 | ||||
Sprint Capital Corporation | ||||||
7.63%, 2011 | 25,000 | 20,875 | ||||
8.38%, 2012 | 25,000 | 20,000 | ||||
6.90%, 2019 | 70,000 | 49,700 | ||||
Sprint Nextel Corporation | ||||||
6.00%, 2016 | 25,000 | 17,625 | ||||
Verizon Communications, Inc. | ||||||
4.35%, 2013 | 50,000 | 48,359 | ||||
5.50%, 2018 | 25,000 | 24,046 | ||||
6.90%, 2038 | 30,000 | 33,758 | ||||
Verizon Global Funding Corporation | ||||||
7.75%, 2030 | 35,000 | 38,811 | ||||
Vodafone Group plc | ||||||
5.63%, 2017 | 35,000 | 32,979 | ||||
Wind Acquisition Finance S.A. | ||||||
10.75%, 20153,4 | 25,000 | 21,500 | ||||
| 540,669 | ||||||
Telecommunications—Wirelines— 0.4% | ||||||
AT&T Corporation | ||||||
7.30%, 2011 | 15,000 | 15,584 | ||||
AT&T, Inc. | ||||||
6.45%, 2034 | 50,000 | 52,330 | ||||
Cellco Partnership | ||||||
8.50%, 20181,3,4 | 40,000 | 46,867 | ||||
Nordic Telephone Company Holdings ApS | ||||||
8.88%, 20163,4 | 100,000 | 70,000 | ||||
Rogers Wireless, Inc. | ||||||
7.50%, 2015 | 15,000 | 14,852 | ||||
Telecom Italia Capital S.A. | ||||||
5.25%, 2013 | 30,000 | 22,875 | ||||
Telefonica Emisiones SAU | ||||||
6.22%, 2017 | 35,000 | 34,482 | ||||
Windstream Corporation | ||||||
8.63%, 2016 | 25,000 | 22,125 | ||||
| 279,115 | ||||||
Textile—0.1% | ||||||
Invista | ||||||
9.25%, 20123,4 | 100,000 | 70,000 | ||||
The accompanying notes are an integral part of the financial statements
86
Table of Contents
| Schedule of Investments | Series N | |
| December 31, 2008 | (Managed Asset Allocation Series) |
| Principal Amount | Value | |||||
CORPORATE BOND—12.0% (continued) | ||||||
Tobacco—0.1% | ||||||
Altria Group, Inc. | ||||||
8.50%, 2013 | $ | 25,000 | $ | 25,894 | ||
BAT International Finance plc | ||||||
8.13%, 20131,3,4 | 25,000 | 25,626 | ||||
Reynolds American, Inc. | ||||||
7.25%, 2013 | 35,000 | 31,416 | ||||
| 82,936 | ||||||
U.S. Banking—0.0% | ||||||
Fifth Third Bancorp | ||||||
8.25%, 2038 | 25,000 | 20,655 | ||||
Utility—Other—0.1% | ||||||
Mirant North America LLC | ||||||
7.38%, 2013 | 25,000 | 24,000 | ||||
NRG Energy, Inc. | ||||||
7.38%, 2016 | 75,000 | 69,750 | ||||
| 93,750 | ||||||
TOTAL CORPORATE BOND (cost $10,446,067) | $ | 9,145,036 | ||||
| Principal Amount | Value | |||||
PREFERRED STOCK—0.0% | ||||||
Thrifts & Mortgage Finance—0.0% | ||||||
Federal National Mortgage Association | ||||||
8.25%, 2010 | 1,050 | 872 | ||||
TOTAL PREFERRED STOCK (cost $26,250) | $ | 872 | ||||
| Principal Amount | Value | |||||
FOREIGN BOND—0.1% | ||||||
Chile—0.0% | ||||||
Celulosa Arauco y Constitucion S.A. | ||||||
5.13%, 2013 | $ | 40,000 | $ | 38,184 | ||
France—0.1% | ||||||
France Telecom S.A. | ||||||
7.75%, 2011 | 46,000 | 48,406 | ||||
United Kingdom—0.0% | ||||||
HBOS plc | ||||||
6.00%, 20331,3,4 | 40,000 | 27,324 | ||||
TOTAL FOREIGN BOND (cost $127,820) | $ | 113,914 | ||||
| Principal Amount | Value | |||||
FOREIGN GOVERNMENT BOND—0.1% | ||||||
Mexico—0.1% | ||||||
Mexico Government International Bond | ||||||
6.38%, 2013 | 45,000 | 47,250 | ||||
South Africa—0.0% | ||||||
South Africa Government International Bond | ||||||
6.50%, 2014 | 65,000 | 61,425 | ||||
TOTAL FOREIGN GOVERNMENT BOND (cost $111,921) | $ | 108,675 | ||||
| Principal Amount | Value | |||||
MUNICIPAL BOND—1.0% | ||||||
Arizona—0.1% | ||||||
Salt River Project Agricultural Improvement & Power District Revenue Bonds | ||||||
5.00%, 2038 | $ | 50,000 | $ | 47,087 | ||
Florida—0.1% | ||||||
County of Orange Florida Revenue Bonds | ||||||
5.00%, 20184 | 50,000 | 52,934 | ||||
Georgia—0.2% | ||||||
City of Atlanta Georgia Revenue Bonds | ||||||
5.50%, 2017 | 35,000 | 36,232 | ||||
County of Baltimore Maryland General Obligation Unlimited | ||||||
5.00%, 2038 | 35,000 | 34,576 | ||||
De Kalb County Ga Revenue Bonds | ||||||
5.00%, 2035 | 40,000 | 37,854 | ||||
Metropolitan Atlanta Rapid Transit Authority Revenue Bonds | ||||||
5.00%, 2037 | 30,000 | 28,727 | ||||
| 137,389 | ||||||
Illinois—0.0% | ||||||
CHICAGO TRANSIT AUTHORITY Revenue Bonds | ||||||
6.90%, 2040 | 30,000 | 29,607 | ||||
Kansas—0.0% | ||||||
Kansas Development Finance Authority Revenue Bonds | ||||||
5.50%, 2034 | 30,000 | 27,956 | ||||
Maryland—0.1% | ||||||
State of Maryland General Obligation Unlimited | ||||||
5.00%, 2019 | 60,000 | 65,821 | ||||
Massachusetts—0.1% | ||||||
Massachusetts Bay Transportation Authority Revenue Bonds | ||||||
5.25%, 2034 | 65,000 | 65,047 | ||||
Massachusetts Health & Educational Facilities Authority Revenue Bonds | ||||||
5.25%, 2021 | 30,000 | 32,570 | ||||
5.00%, 2038 | 45,000 | 44,657 | ||||
| 142,274 | ||||||
New York—0.1% | ||||||
New York City Housing Development Corporation Revenue Bonds | ||||||
6.42%, 2027 | 30,000 | 22,928 | ||||
The accompanying notes are an integral part of the financial statements
87
Table of Contents
| Schedule of Investments | Series N | |
| December 31, 2008 | (Managed Asset Allocation Series) |
| Principal | ||||||
| Amount | Value | |||||
MUNICIPAL BOND—1.0% (continued) | ||||||
New York—0.1% (continued) | ||||||
New York State Urban Development Corporation Revenue Bonds | ||||||
5.50%, 2018 | $ | 25,000 | $ | 27,177 | ||
Triborough Bridge & Tunnel Authority Revenue Bonds | ||||||
5.00%, 2038 | 45,000 | 42,028 | ||||
| 92,133 | ||||||
North Carolina—0.1% | ||||||
City of Charlotte North Carolina Revenue Bonds | ||||||
4.75%, 2033 | 50,000 | 44,751 | ||||
Oregon—0.0% | ||||||
State of Oregon General Obligation Unlimited | ||||||
5.89%, 2027 | 15,000 | 14,419 | ||||
Texas—0.1% | ||||||
Austin Independent School District General Obligation Unlimited | ||||||
5.00%, 2033 | 45,000 | 42,800 | ||||
Utah—0.1% | ||||||
Utah Transit Authority Revenue Bonds | ||||||
4.75%, 2032 | 25,000 | 23,293 | ||||
5.25%, 2038 | 35,000 | 34,999 | ||||
| 58,292 | ||||||
West Virginia—0.0% | ||||||
Tobacco Settlement Finance Authority of West Virginia Revenue Bonds | ||||||
7.47%, 2047 | 45,000 | 25,734 | ||||
TOTAL MUNICIPAL BOND (cost $815,870) | $ | 781,197 | ||||
| Principal | ||||||
| Amount | Value | |||||
MORTGAGE BACKED SECURITIES—17.4% | ||||||
Other Non-Agency—2.5% | ||||||
C.M.O.’s—2.5% | ||||||
American Tower Trust | ||||||
2007-1A, 5.96%, 20371,3,4 | $ | 45,000 | $ | 30,793 | ||
Banc of America Commercial Mortgage, Inc. | ||||||
2003-1, 4.65%, 2036 | 75,000 | 66,563 | ||||
2005-3, 4.50%, 2043 | 235,000 | 215,682 | ||||
Banc of America Mortgage Securities, Inc. | ||||||
2004-A, 4.13%, 20345 | 34,934 | 26,347 | ||||
2004-D, 4.20%, 20345 | 3,199 | 2,305 | ||||
2004-H, 4.75%, 20345 | 18,294 | 13,152 | ||||
2004-I, 4.82%, 20345 | 18,977 | 14,247 | ||||
2005-J, 5.24%, 20355 | 39,949 | 27,448 | ||||
Bear Stearns Commercial Mortgage Securities | ||||||
2006-PW12, 5.69%, 20385 | 175,000 | 142,772 | ||||
2005-PW10, 5.09%, 2040 | 74,720 | 72,773 | ||||
2005-PWR8, 4.67%, 2041 | 60,000 | 50,690 | ||||
Citigroup | ||||||
2005-CD1, 5.23%, 20445 | 175,000 | 139,564 | ||||
Citigroup Mortgage Loan Trust, Inc. | ||||||
2004-UST1, 4.69%, 20345 | 65,671 | 46,414 | ||||
Commercial Mortgage Loan Trust | ||||||
2008-LS1, 6.02%, 20175 | 175,000 | 117,867 | ||||
Commercial Mortgage Pass Through Certificates | ||||||
2007-C9, 5.82%, 20175 | 200,000 | 151,653 | ||||
Credit Suisse Mortgage Capital Certificates | ||||||
2006-C4, 5.47%, 2039 | 100,000 | 73,576 | ||||
DLJ Commercial Mortgage Corporation | ||||||
1999-CG2, 7.30%, 20325 | 42,188 | 42,091 | ||||
GMAC Commercial Mortgage Securities, Inc. | ||||||
2001-C2, 6.70%, 2034 | 125,000 | 122,561 | ||||
JP Morgan Chase Commercial Mortgage Securities Corporation | ||||||
2001-CIBC, 6.26%, 2033 | 97,543 | 95,339 | ||||
2001-CIB2, 6.24%, 2035 | 19,769 | 19,472 | ||||
2004-LDP4, 4.82%, 20425 | 75,000 | 60,467 | ||||
JP Morgan Mortgage Trust | ||||||
2005-A7, 5.35%, 20355 | 81,050 | 60,870 | ||||
Morgan Stanley Capital I | ||||||
2007-HQ11, 5.45%, 20445 | 100,000 | 74,171 | ||||
Morgan Stanley Dean Witter Capital I | ||||||
2002-TOP7, 5.98%, 2039 | 200,000 | 189,512 | ||||
| 1,856,329 | ||||||
| 1,856,329 | ||||||
U.S. Government Sponsored | ||||||
Agencies—14.0% | ||||||
C.M.O.’s—0.2% | ||||||
Federal Home Loan Mortgage Corporation | ||||||
FHR 2614 IH, 4.50%, 20161,6 | 61,286 | 2,757 | ||||
FHR 2681 PC, 5.00%, 2019 | 85,480 | 86,648 | ||||
Federal National Mortgage Association | ||||||
FNR 2002-74 PJ, 5.00%, 2015 | 1,399 | 1,396 | ||||
FNR 2003-40 NI, 5.50%, 20281,7 | 5,131 | 186 | ||||
FNS 319 2, 6.50%, 20321,6 | 10,458 | 1,455 | ||||
FNR 2006-35 GK, 6.00%, 2032 | 88,439 | 90,573 | ||||
| 183,015 | ||||||
Pass Through’s—13.8% | ||||||
Federal Home Loan Mortgage Corporation | ||||||
#E81544, 6.00%, 2009 | 1,148 | 1,156 | ||||
#E01341, 5.50%, 2018 | 5,860 | 6,061 | ||||
#E99933, 5.00%, 2018 | 3,307 | 3,414 | ||||
#E99966, 5.00%, 2018 | 19,732 | 20,370 | ||||
#B10343, 5.00%, 2018 | 5,389 | 5,563 | ||||
The accompanying notes are an integral part of the financial statements
88
Table of Contents
| Schedule of Investments | Series N | |
| December 31, 2008 | (Managed Asset Allocation Series) |
| Principal | ||||||
| Amount | Value | |||||
MORTGAGE BACKED SECURITIES—17.4% (continued) | ||||||
U.S. Government Sponsored | ||||||
Agencies—14.0% (continued) | ||||||
Pass Through’s—13.8% (continued) | ||||||
Federal Home Loan Mortgage Corporation (continued) | ||||||
#G11759, 5.50%, 2018 | $ | 151,943 | $ | 157,260 | ||
#B19214, 5.50%, 2020 | 16,900 | 17,444 | ||||
#J02272, 5.50%, 2020 | 66,387 | 68,523 | ||||
#J02554, 5.50%, 2020 | 63,611 | 65,658 | ||||
#J03203, 6.00%, 2021 | 54,496 | 56,513 | ||||
#J03254, 6.00%, 2021 | 19,385 | 20,102 | ||||
#J03640, 6.00%, 2021 | 61,220 | 63,486 | ||||
#J03615, 6.00%, 2021 | 90,914 | 94,280 | ||||
#J03672, 6.00%, 2021 | 26,845 | 27,839 | ||||
#G12463, 5.50%, 2021 | 54,866 | 56,751 | ||||
#C68205, 7.00%, 2032 | 4,855 | 5,102 | ||||
#1B0527, 7.21%, 20325 | 1,478 | 1,483 | ||||
#C72128, 6.00%, 2032 | 51,629 | 53,381 | ||||
#A12118, 5.00%, 2033 | 47,530 | 48,691 | ||||
#A15907, 5.00%, 2033 | 21,422 | 21,945 | ||||
#A15852, 5.00%, 2033 | 17,609 | 18,039 | ||||
#D86309, 5.00%, 2033 | 25,726 | 26,355 | ||||
#G01628, 6.00%, 2033 | 105,121 | 108,641 | ||||
#A21263, 4.50%, 2034 | 137,487 | 139,655 | ||||
#G01805, 4.50%, 2035 | 272,678 | 276,761 | ||||
#833174, 5.16%, 20355 | 331,691 | 335,905 | ||||
#1G1762, 5.07%, 20355 | 33,590 | 34,119 | ||||
#1H2581, 5.13%, 20365 | 71,377 | 71,601 | ||||
#1G0661, 5.37%, 20365 | 16,143 | 16,461 | ||||
#1G1370, 5.70%, 20365 | 276,257 | 281,927 | ||||
#1G1353, 5.98%, 20365 | 77,005 | 78,911 | ||||
#1Q0342, 5.49%, 20375 | 106,130 | 108,078 | ||||
Federal National Mortgage Association | ||||||
#254140, 5.50%, 2017 | 3,757 | 3,897 | ||||
#625931, 5.50%, 2017 | 3,533 | 3,664 | ||||
#254234, 5.50%, 2017 | 4,003 | 4,151 | ||||
#357280, 6.50%, 2017 | 17,458 | 18,140 | ||||
#555345, 5.50%, 2018 | 3,868 | 4,012 | ||||
#555446, 5.50%, 2018 | 5,974 | 6,185 | ||||
#685202, 5.50%, 2018 | 51,200 | 52,975 | ||||
#555526, 5.50%, 2018 | 95,906 | 99,292 | ||||
#555693, 5.50%, 2018 | 57,246 | 59,267 | ||||
#725098, 5.50%, 2018 | 12,517 | 12,951 | ||||
#725528, 5.50%, 2019 | 9,414 | 9,740 | ||||
#789885, 5.50%, 2019 | 11,538 | 11,938 | ||||
#745392, 4.50%, 2020 | 112,834 | 115,776 | ||||
#745406, 6.00%, 2021 | 73,857 | 76,903 | ||||
#950360, 5.50%, 2022 | 233,723 | 241,121 | ||||
#963075, 5.00%, 2023 | 64,510 | 66,313 | ||||
#981614, 5.00%, 2023 | 8,700 | 8,943 | ||||
#545759, 6.50%, 2032 | 93,281 | 96,983 | ||||
#650075, 6.50%, 2032 | 11,218 | 11,706 | ||||
#254514, 5.50%, 2032 | 2,588 | 2,662 | ||||
#254550, 6.50%, 2032 | 16,486 | 17,202 | ||||
#974321, 6.00%, 2033 | 147,637 | 152,142 | ||||
#555417, 6.00%, 2033 | 47,076 | 48,689 | ||||
#254767, 5.50%, 2033 | 132,031 | 135,667 | ||||
#747387, 5.50%, 2033 | 23,357 | 24,000 | ||||
#744692, 5.50%, 2033 | 30,710 | 31,556 | ||||
#744750, 5.50%, 2033 | 13,433 | 13,803 | ||||
#747549, 5.50%, 2033 | 6,998 | 7,190 | ||||
#725027, 5.00%, 2033 | 135,653 | 138,859 | ||||
#750362, 5.50%, 2033 | 24,798 | 25,481 | ||||
#756190, 5.50%, 2033 | 32,941 | 33,849 | ||||
#254983, 5.50%, 2033 | 61,140 | 62,824 | ||||
#762076, 5.50%, 2034 | 35,386 | 36,361 | ||||
#255028, 5.50%, 2034 | 14,982 | 15,374 | ||||
#763700, 5.00%, 2034 | 64,855 | 66,347 | ||||
#725424, 5.50%, 2034 | 295,133 | 303,261 | ||||
#789293, 5.50%, 2034 | 131,476 | 135,405 | ||||
#790044, 6.00%, 2034 | 34,585 | 35,689 | ||||
#923129, 5.50%, 2034 | 19,189 | 19,706 | ||||
#791574, 6.00%, 2034 | 36,745 | 37,917 | ||||
#790217, 6.00%, 2034 | 13,357 | 13,783 | ||||
#725704, 6.00%, 2034 | 287,712 | 297,119 | ||||
#725690, 6.00%, 2034 | 34,919 | 36,033 | ||||
#790237, 6.00%, 2034 | 34,181 | 35,272 | ||||
#790629, 6.00%, 2034 | 31,335 | 32,335 | ||||
#725773, 5.50%, 2034 | 225,391 | 231,282 | ||||
#790788, 6.00%, 2034 | 36,175 | 37,329 | ||||
#796104, 5.50%, 2034 | 33,184 | 34,077 | ||||
#725946, 5.50%, 2034 | 1,057,446 | 1,085,909 | ||||
#255459, 6.00%, 2034 | 34,391 | 35,489 | ||||
#804395, 5.50%, 2034 | 75,451 | 77,482 | ||||
#808951, 6.00%, 2035 | 310,890 | 320,472 | ||||
#889829, 5.00%, 2035 | 418,340 | 428,228 | ||||
#745216, 4.81%, 20355 | 39,778 | 39,881 | ||||
#848476, 5.53%, 20355 | 51,954 | 53,167 | ||||
#846551, 5.33%, 20355 | 35,329 | 35,984 | ||||
#848522, 5.64%, 20355 | 14,232 | 14,598 | ||||
#850863, 5.32%, 20355 | 28,775 | 29,295 | ||||
#745428, 5.50%, 2036 | 193,287 | 198,338 | ||||
#745554, 6.50%, 2036 | 368,556 | 383,298 | ||||
#868728, 6.50%, 2036 | 14,561 | 15,139 | ||||
#745777, 5.54%, 20365 | 107,123 | 109,103 | ||||
#896329, 6.50%, 2036 | 33,844 | 35,193 | ||||
#888010, 5.98%, 20365 | 33,893 | 34,667 | ||||
#893353, 6.00%, 2036 | 48,562 | 50,052 | ||||
#745946, 5.50%, 2036 | 20,727 | 21,272 | ||||
#905196, 6.03%, 20365 | 45,598 | 46,919 | ||||
#1B3203, 5.93%, 20375 | 29,487 | 30,243 | ||||
#923128, 5.50%, 2037 | 22,030 | 22,609 | ||||
#924778, 5.05%, 20375 | 326,185 | 340,838 | ||||
#939416, 5.69%, 20375 | 317,473 | 323,711 | ||||
#938089, 5.00%, 2037 | 25,970 | 26,545 | ||||
#938883, 5.00%, 2037 | 72,442 | 74,048 | ||||
#889543, 5.50%, 2037 | 95,894 | 98,401 | ||||
#952502, 6.50%, 2037 | 137,503 | 142,974 | ||||
#928835, 6.50%, 2037 | 25,154 | 26,152 | ||||
#960122, 6.50%, 2037 | 164,033 | 170,560 | ||||
#952182, 5.80%, 20375 | 108,049 | 110,789 | ||||
#959818, 6.50%, 2037 | 495,329 | 515,037 | ||||
#888884, 5.50%, 2037 | 150,365 | 154,507 | ||||
#972155, 6.00%, 2038 | 67,773 | 69,840 | ||||
The accompanying notes are an integral part of the financial statements
89
Table of Contents
| Schedule of Investments | Series N | |
| December 31, 2008 | (Managed Asset Allocation Series) |
| Principal | ||||||
| Amount | Value | |||||
MORTGAGE BACKED SECURITIES—17.4% (continued) | ||||||
U.S. Government Sponsored | ||||||
Agencies—14.0% (continued) | ||||||
Pass Through’s—13.8% (continued) | ||||||
Federal National Mortgage Association (continued) | ||||||
#983288, 6.00%, 2038 | $ | 84,413 | $ | 86,989 | ||
#964926, 6.00%, 2038 | 54,502 | 56,165 | ||||
#257407, 6.00%, 2038 | 34,331 | 35,379 | ||||
| 10,555,919 | ||||||
| 10,738,934 | ||||||
U.S. Government Sponsored | ||||||
Securities—0.9% | ||||||
Pass Through’s—0.9% | ||||||
Government National Mortgage Association | ||||||
#780766, 7.00%, 2013 | 238 | 239 | ||||
#67365, 11.50%, 2013 | 1,171 | 1,348 | ||||
#781312, 7.00%, 2013 | 13,055 | 13,751 | ||||
G2 2102, 8.00%, 2025 | 802 | 850 | ||||
#427029, 8.50%, 2026 | 1,470 | 1,579 | ||||
G2 3295, 5.50%, 2032 | 10,167 | 10,484 | ||||
#612919, 5.00%, 2033 | 154,647 | 159,229 | ||||
#615278, 5.00%, 2033 | 75,971 | 78,222 | ||||
#604639, 5.00%, 2033 | 59,050 | 60,800 | ||||
G2 3442, 5.00%, 2033 | 142,904 | 146,601 | ||||
G2 3458, 5.00%, 2033 | 40,078 | 41,153 | ||||
G2 3490, 6.50%, 2033 | 7,891 | 8,274 | ||||
G2 3517, 6.00%, 2034 | 28,168 | 29,053 | ||||
G2 3513, 5.00%, 2034 | 50,335 | 51,675 | ||||
G2 3530, 5.50%, 2034 | 20,999 | 21,630 | ||||
G2 3529, 5.00%, 2034 | 12,256 | 12,582 | ||||
#605561, 5.50%, 2034 | 47,835 | 49,408 | ||||
| 686,878 | ||||||
| 686,878 | ||||||
TOTAL MORTGAGE BACKED SECURITIES (cost $13,432,347) | $ | 13,282,141 | ||||
| Principal | ||||||
| Amount | Value | |||||
ASSET BACKED SECURITIES—1.9% | ||||||
Auto—0.8% | ||||||
AmeriCredit Automobile Receivables Trust | ||||||
2006-RM, 5.53%, 2014 | $ | 280,000 | $ | 216,389 | ||
Capital Auto Receivables Asset Trust | ||||||
2006-SN1A, 5.32%, 20101,3,4 | 157,259 | 155,589 | ||||
2006-SN1A, 5.50%, 20101,3,4 | 25,000 | 24,191 | ||||
2006-1, 5.26%, 2010 | 60,000 | 58,550 | ||||
Triad Auto Receivables Owner Trust | ||||||
2006-B, 5.52%, 2012 | 100,000 | 84,803 | ||||
USAA Auto Owner Trust | ||||||
2008-1, 4.16%, 2012 | 50,000 | 47,984 | ||||
| $ | 587,506 | |||||
Credit Cards—0.4% | ||||||
Capital One Multi-Asset Execution Trust | ||||||
2007-C3, 1.49%, 20135 | 70,000 | 39,469 | ||||
2005-A7, 4.70%, 2015 | 70,000 | 63,119 | ||||
Chase Issuance Trust | ||||||
2006-C2, 1.50%, 20135 | 125,000 | 82,445 | ||||
GE Capital Credit Card Master Note Trust | ||||||
2006-1, 5.08%, 2012 | 50,000 | 48,766 | ||||
2007-3, 1.50%, 20135 | 90,000 | 50,262 | ||||
MBNA Credit Card Master Note Trust | ||||||
2006-C3, 1.49%, 20135 | 35,000 | 15,085 | ||||
| 299,146 | ||||||
Home Equity Loans—0.0% | ||||||
BankBoston Home Equity Loan Trust | ||||||
1998-1, 6.35%, 2013 | 4,257 | 3,750 | ||||
Chase Funding Mortgage Loan Asset-Backed Certificates | ||||||
2002-2, 5.60%, 2031 | 5,961 | 4,793 | ||||
| 8,543 | ||||||
Other—0.6% | ||||||
CenterPoint Energy Transition Bond Company LLC | ||||||
2001-1, 5.63%, 2015 | 75,000 | 74,232 | ||||
CNH Equipment Trust | ||||||
2007-A, 5.08%, 2014 | 50,000 | 33,660 | ||||
GE Equipment Small Ticket LLC | ||||||
2005-1A, 4.51%, 20141,3,4 | 75,104 | 74,520 | ||||
Greenwich Capital Commercial Funding Corporation | ||||||
2007-GG9, 5.44%, 2039 | 50,000 | 38,057 | ||||
John Deere Owner Trust | ||||||
2008-A, 3.82%, 2011 | 72,256 | 71,526 | ||||
Marriott Vacation Club Owner Trust | ||||||
2006-1A, 5.74%, 20281,3,4 | 67,537 | 55,164 | ||||
2006-2A, 5.36%, 20281,3,4 | 21,657 | 17,609 | ||||
Peco Energy Transition Trust | ||||||
2001-A, 6.52%, 2010 | 100,000 | 100,769 | ||||
| 465,537 | ||||||
Student Loans—0.1% | ||||||
SLM Student Loan Trust | ||||||
2008-4, 4.59%, 20125 | 60,000 | 54,195 | ||||
TOTAL ASSET BACKED SECURITIES (cost $1,682,793) | $ | 1,414,927 | ||||
| Principal | ||||||
| Amount | Value | |||||
U.S. GOVERNMENT SPONSORED AGENCY BONDS & NOTES—0.4% | ||||||
Federal Home Loan Bank | ||||||
5.60%, 6/28/2011 | $ | 10,000 | $ | 11,014 | ||
5.13%, 8/14/2013 | 165,000 | 184,028 | ||||
Federal Home Loan Mortgage Corporation | ||||||
5.13%, 2/27/2009 | 75,000 | 75,527 | ||||
TOTAL U.S. GOVERNMENT SPONSORED AGENCY BONDS & NOTES (cost $252,344) | $ | 270,569 | ||||
The accompanying notes are an integral part of the financial statements
90
Table of Contents
| Schedule of Investments | Series N | |
| December 31, 2008 | (Managed Asset Allocation Series) |
| Principal | ||||||
| Amount | Value | |||||
U.S. GOVERNMENT SECURITIES—1.8% | ||||||
U.S. Treasury Bonds | ||||||
5.50%, 8/15/2028 | $ | 150,000 | $ | 202,734 | ||
4.75%, 2/15/2037 | 175,000 | 243,852 | ||||
U.S. Treasury Inflation Indexed Bonds | ||||||
2.00%, 7/15/2014 | 301,085 | 284,737 | ||||
1.38%, 7/15/2018 | 328,985 | 307,678 | ||||
U.S. Treasury Notes | ||||||
4.75%, 2/28/2009 | 50,000 | 50,357 | ||||
4.00%, 8/15/2018 | 265,000 | 306,013 | ||||
TOTAL U.S. GOVERNMENT SECURITIES (cost $1,289,949) | $ | 1,395,371 | ||||
| Principal | ||||||
| Amount | Value | |||||
SHORT TERM INVESTMENTS—0.1% | ||||||
State Street GA Money Market Fund | $ | 7,128 | $ | 7,128 | ||
T. Rowe Price Reserve Investment Fund | 78,302 | 78,301 | ||||
TOTAL SHORT TERM INVESTMENTS (cost $85,429) | $ | 85,429 | ||||
Total Investments—99.8% (cost $94,400,378) | $ | 76,243,667 | ||||
Cash & Other Assets, Less Liabilities—0.2% | 177,750 | |||||
Total Net Assets—100.0% | $ | 76,421,417 | ||||
For federal income tax purposes the identified cost of investments owned at December 31, 2008 was $96,938,953.
| ADR | American Depositary Receipt |
| plc | Public Limited Company |
* | Non-income producing security |
1 | Security is deemed illiquid. The total market value of illiquid securities is $1,009,811 (cost $1,169,593), or 1.3% of total net assets. |
2 | Security is a PFIC (Passive Foreign Investment Company). |
3 | Security was acquired through a private placement. |
4 | Security is a 144A or Section 4(2) security. The total market value of 144A or Section 4(2) securities is $1,369,088 (cost $1,643,129), or 1.8% of total net assets. |
5 | Variable rate security. Rate indicated is rate effective at December 31, 2008. |
The accompanying notes are an integral part of the financial statements
91
Table of Contents
| Series N | ||
| (Managed Asset Allocation Series) |
Statement of Assets and Liabilities
December 31, 2008
Assets: | ||||
Investments, at value* | $ | 76,243,667 | ||
Cash denominated in a foreign currency, at value** | 8,622 | |||
Receivables: | ||||
Fund shares sold | 6,953 | |||
Securities sold | 112,549 | |||
Interest | 284,957 | |||
Dividends | 94,562 | |||
Foreign taxes recoverable | 6,356 | |||
Prepaid expenses | 1,940 | |||
Total assets | 76,759,606 | |||
Liabilities: | ||||
Cash overdraft | 4,553 | |||
Payable for: | ||||
Fund shares redeemed | 15,596 | |||
Securities purchased | 168,601 | |||
Management fees | 63,395 | |||
Administration fees | 50,009 | |||
Transfer agent/maintenance fees | 2,083 | |||
Custodian fees | 10,024 | |||
Directors’ fees | 1,278 | |||
Professional fees | 17,923 | |||
Other fees | 4,727 | |||
Total liabilities | 338,189 | |||
Net assets | $ | 76,421,417 | ||
Net assets consist of: | ||||
Paid in capital | $ | 99,548,475 | ||
Undistributed net investment income | 1,692,780 | |||
Accumulated net realized loss on sale of investments and foreign currency transactions | (6,661,516 | ) | ||
Net unrealized depreciation in value of investments and translation of assets and liabilities in foreign currencies | (18,158,322 | ) | ||
Net assets | $ | 76,421,417 | ||
Capital shares authorized | unlimited | |||
Capital shares outstanding | 5,338,988 | |||
Net asset value per share (net assets divided by shares outstanding) | $ | 14.31 | ||
* Investments, at cost | $ | 94,400,378 | ||
** Cash denominated in a foreign currency, at cost | 8,717 | |||
Statement of Operations
For Year Ended December 31, 2008
Investment Income: | ||||
Dividends (net of foreign withholding tax $55,667) | $ | 1,534,820 | ||
Interest | 1,921,487 | |||
Total investment income | 3,456,307 | |||
Expenses: | ||||
Management fees | 1,001,329 | |||
Administration fees | 314,352 | |||
Transfer agent/maintenance fees | 25,275 | |||
Custodian fees | 127,609 | |||
Directors’ fees | 7,677 | |||
Professional fees | 28,125 | |||
Reports to shareholders | 8,675 | |||
Other | 6,436 | |||
Total expenses | 1,519,478 | |||
Less: | ||||
Earnings credits applied | (740 | ) | ||
Net expenses | 1,518,738 | |||
Net investment income | 1,937,569 | |||
Net Realized and Unrealized Gain (Loss): | ||||
Net realized gain (loss) during the year on: | ||||
Investments | (6,190,156 | ) | ||
Foreign currency transactions | (6,719 | ) | ||
Net realized loss | (6,196,875 | ) | ||
Net unrealized appreciation (depreciation) during the year on: | ||||
Investments | (26,101,536 | ) | ||
Translation of assets and liabilities in foreign currencies | (528 | ) | ||
Net unrealized depreciation | (26,102,064 | ) | ||
Net realized and unrealized loss | (32,298,939 | ) | ||
Net decrease in net assets resulting from operations | $ | (30,361,370 | ) | |
The accompanying notes are an integral part of the financial statements
92
Table of Contents
| Series N | ||
| Statement of Changes in Net Assets | (Managed Asset Allocation Series) |
| Year Ended | Year Ended | |||||||
| December 31, 2008 | December 31, 2007 | |||||||
Increase (decrease) in net assets from operations: | ||||||||
Net investment income | $ | 1,937,569 | $ | 1,824,724 | ||||
Net realized gain (loss) during the year on investments and foreign currency transactions | (6,196,875 | ) | 8,789,113 | |||||
Net unrealized depreciation during the year on investments and translation of assets and liabilities in foreign currencies | (26,102,064 | ) | (4,153,978 | ) | ||||
Net increase (decrease) in net assets resulting from operations | (30,361,370 | ) | 6,459,859 | |||||
Capital share transactions: | ||||||||
Proceeds from sale of shares | 25,871,130 | 35,470,333 | ||||||
Cost of shares redeemed | (36,511,309 | ) | (29,807,539 | ) | ||||
Net increase (decrease) from capital share transactions | (10,640,179 | ) | 5,662,794 | |||||
Net increase (decrease) in net assets | (41,001,549 | ) | 12,122,653 | |||||
Net assets: | ||||||||
Beginning of year | 117,422,966 | 105,300,313 | ||||||
End of year | $ | 76,421,417 | $ | 117,422,966 | ||||
Undistributed net investment income at end of year | $ | 1,692,780 | $ | 1,631,412 | ||||
Capital share activity: | ||||||||
Shares sold | 1,491,277 | 1,827,693 | ||||||
Shares redeemed | (2,121,410 | ) | (1,536,011 | ) | ||||
Total capital share activity | (630,133 | ) | 291,682 | |||||
The accompanying notes are an integral part of the financial statements
93
Table of Contents
| Financial Highlights | Series N | |
Selected data for each share of capital stock outstanding throughout each year | (Managed Asset Allocation Series) |
| Year Ended December 31, 2004 | ||||||||||||||||||||
| 2008 | 2007 | 2006 | 2005 | |||||||||||||||||
Per Share Data | ||||||||||||||||||||
Net asset value, beginning of period | $ | 19.67 | $ | 18.55 | $ | 16.55 | $ | 15.86 | $ | 14.40 | ||||||||||
Income (loss) from investment operations: | ||||||||||||||||||||
Net investment incomea | 0.34 | 0.32 | 0.30 | 0.23 | 0.27 | |||||||||||||||
Net gain (loss) on securities (realized and unrealized) | (5.70 | ) | 0.80 | 1.70 | 0.46 | 1.27 | ||||||||||||||
Total from investment operations | (5.36 | ) | 1.12 | 2.00 | 0.69 | 1.54 | ||||||||||||||
Less distributions: | ||||||||||||||||||||
Dividends from net investment income | — | — | — | — | (0.08 | ) | ||||||||||||||
Total distributions | — | — | — | — | (0.08 | ) | ||||||||||||||
Net asset value, end of period | $ | 14.31 | $ | 19.67 | $ | 18.55 | $ | 16.55 | $ | 15.86 | ||||||||||
Total Returnb | (27.25 | )% | 6.04 | % | 12.08 | % | 4.35 | % | 10.72 | % | ||||||||||
Ratios/Supplemental Data | ||||||||||||||||||||
Net assets, end of period (in thousands) | $ | 76,421 | $ | 117,423 | $ | 105,300 | $ | 97,690 | $ | 93,087 | ||||||||||
Ratios to average net assets: | ||||||||||||||||||||
Net investment income | 1.94 | % | 1.63 | % | 1.63 | % | 1.44 | % | 1.75 | % | ||||||||||
Total expensesc | 1.52 | % | 1.41 | % | 1.41 | % | 1.41 | % | 1.39 | % | ||||||||||
Net expensesd | 1.52 | % | 1.41 | % | 1.40 | % | 1.41 | % | 1.39 | % | ||||||||||
Net expenses prior to custodian earnings credits and net of expense waivers | 1.52 | % | 1.41 | % | 1.41 | % | 1.41 | % | 1.39 | % | ||||||||||
Portfolio turnover rate | 82 | % | 75 | % | 63 | % | 67 | % | 79 | % | ||||||||||
a | Net investment income (loss) was computed using average shares outstanding throughout the period. |
b | Total return does not take into account any of the expenses associated with an investment in variable insurance products offered by Security Benefit Life Insurance Company. If total return had taken into account these expenses, performance would have been lower. Shares of a series of SBL Fund are available only through the purchase of such products. |
c | Total expense information reflects the expense ratios absent expense reductions by the Investment Manager and earnings credits, as applicable. |
d | Net expense information reflects the expense ratios after voluntary expense waivers, reimbursements and custodian earnings credits, as applicable. |
The accompanying notes are an integral part of the financial statements
94
Table of Contents
| Managers’ Commentary | Series O | |
February 16, 2009 | (All Cap Value Series) |
![]()
 |  | |
| James Schier | Mark A. Mitchell | |
| Co-Portfolio Manager | Co-Portfolio Manager |
To Our Shareholders:
Series O of the SBL Fund – All Cap Value Series, formerly the Equity Income Series, returned –38.43%1 during the period, lagging the benchmark Russell 3000 Value Index's return of –36.25%. The Series’ peer group median return of –36.65% was in line with the Index. Allocation among sectors was the main culprit for underperforming the benchmark.
Our strategy is to buy companies, across the market capitalization spectrum, trading at a significant discount to their intrinsic value. Our investment approach is a defined and disciplined process with three clear philosophical tenets that drive our investment decisions: a valuation focus, a long-term perspective and an opportunistic approach.
Our investment process is fundamentally driven and quantitatively aided. We use proprietary screens to identify potential companies for investment and then perform rigorous fundamental analysis to identify the best ideas. Through this fundamental research, we determine an estimate of intrinsic value and thus a valuation target for each idea. We construct the portfolios based on the level of conviction generated by this bottom-up analysis and the upside/downside profile associated with each company.
Financials and Materials Top Performers
The Series’ financials holdings, which were a slightly overweight position, were down –45% compared to –55% for the Index allowing the sector to add relative value to the portfolio. As one of the most devastated sectors in the year, the portfolio was able to contain losses with positions in companies such as Wells Fargo & Company, which actually posted a positive return of 2%. Other material positions in the sector that performed better than the benchmark included Berkshire Hathaway, Inc., down –17%, and JPMorgan Chase & Company, which lost –25%, less than half the Index.
The materials sector contributed to relative portfolio performance. As an overweight sector, portfolio holdings declined –28% versus a –46% loss for the benchmark. Vulcan Materials Company and International Paper Company held losses to –9% for the period while the other top holding in the sector, Rohm & Haas Company returned –17%.
Energy, Industrials, and Health Care Disappoint
The largest sector detractors from the portfolio were energy, industrials, and health care. The energy sector, while slightly overweight, lost –46% compared to –35% for the Index. The three largest weights, Chevron Corporation, Exxon Mobile Corporation, and Royal Dutch Shell PLC, performed relatively well, losing –18%, –13%, and –17%, respectively. However, the portfolio held eight smaller positions that declined more than –50% over the period.
The industrials sector was slightly overweight and performed worse than the benchmark, –45% versus –40%. The largest weighting, General Electric Company, lost –54%. The portfolio’s other large positions in the sector, Union Pacific Corporation and FedEx Corporation, declined –38% and –22%, respectively.
Health care pulled down relative performance, –30% to –23% for the benchmark, even though it was an underweight sector. The sector, consisting of 8% of total portfolio assets, was diversified over the period using 20 different securities. Several securities, Hospira, Inc., Covidien, Ltd., and Merck & Company, Inc., each lost between –30% and –40%.
Market Outlook
Our bottom-up approach looks at market uncertainty in the context of the potential long-term impact on individual companies. We are maintaining flexibility in the portfolios to take advantage of these opportunities as they arise. Our focus is on identifying companies with the ability to be substantially better over the next three to five years or have the potential to maintain their return on capital at current levels in a difficult economic environment. We are confident in our ability to find these companies and we are pleased with the positions we own today.
We believe that investing is a long-term pursuit that requires patience and a consistent approach. We recognize there are many investment fund alternatives available today and thank you for your business and the confidence you place in us.
Sincerely,
James Schier, Portfolio Manager
Mark A. Mitchell, Portfolio Manager
1 | Fee waivers and/or reimbursements reduce Series expenses and in the absence of such waiver the performance quoted would be reduced. |
95
Table of Contents
| Series O | ||
| Performance Summary | (All Cap Value Series) | |
| December 31, 2008 | (unaudited) |
PERFORMANCE
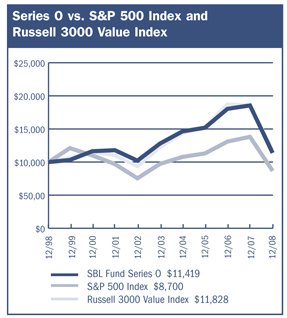
$10,000 Over 10 Years
The chart above assumes a hypothetical $10,000 investment in Series O (All Cap Value Series) on December 31, 1998, and reflects the fees and expenses of Series O. The S&P 500 Index is a capitalization-weighted index composed of 500 selected common stocks that represent the broad domestic economy and is a widely recognized unmanaged index of market performance. The Russell 3000 Index measures the performance of the broad value segment of the U.S equity universe. It includes those Russell 3000 companies with lower price-to-book ratios and lower forcasted growth values. The Russell 3000 Value Index replaced the S&P 500 Index as the Series’ primary benchmark effective August 18, 2008, to provide a more meaningful comparison of the Series’ performance in light of the investment strategies that it employs.
Average Annual Returns
Periods Ended 12-31-081 | 1 Year | 5 Years | 10 Years | ||||||
Series O | (38.43 | )% | (2.24 | )% | 1.34 | % |
1 | Performance figures do not reflect fees and expenses associated with an investment in variable insurance products offered by Security Benefit Life Insurance Company. If returns had taken into account these fees and expenses, performance would have been lower. Shares of a Series of SBL Fund are available only through the purchase of such products. |
The performance data quoted above represents past performance. Past performance is not predictive of future performance. The investment return and principal value of an investment will fluctuate so that an investor’s shares, when redeemed, may be worth more or less than their original cost.
Portfolio Composition by Sector
Consumer Discretionary | 10.60 | % | |
Consumer Staples | 9.89 | ||
Energy | 11.29 | ||
Financials | 15.21 | ||
Health Care | 7.69 | ||
Industrials | 19.79 | ||
Information Technology | 9.80 | ||
Materials | 6.58 | ||
Telecommunication Services | 1.10 | ||
Utilities | 4.66 | ||
Cash & Other Assets, Less Liabilities | 3.39 | ||
Total Net Assets | 100.00 | % | |
The accompanying notes are an integral part of the financial statements
96
Table of Contents
| Series O | ||
| Performance Summary | (All Cap Value Series) | |
| December 31, 2008 | (unaudited) |
Information About Your Series Expenses
Calculating your ongoing Series expenses
Example
As a shareholder of the Series, you incur ongoing costs, including management fees and other series expenses. Performance figures and expense ratios do not reflect fees and expenses associated with an investment in variable insurance products. Shares of a Series of SBL Fund are available only through the purchase of such products. This example is intended to help you understand your ongoing costs (in dollars) of investing in the Series and to compare these costs with ongoing costs of investing in other mutual funds. The example is based on an investment of $1,000 invested at the beginning of the period and held for the entire period, July 1, 2008 through December 31, 2008.
Actual Expenses
The first line in the table provides information about actual account values and actual expenses. You may use the information in this table, together with the amount you invested, to estimate the expenses that you paid over the period. Simply divide your account value by $1,000 (for example, an $8,600 account value divided by $1,000 = 8.6), then multiply the result by the number in the table under the heading entitled “Expenses Paid During the Period” to estimate the expenses you paid on your account during this period.
Hypothetical Example for Comparison Purposes
The second line in the table provides information about hypothetical account values and hypothetical expenses based on the Series actual expense ratio and an assumed rate of return of 5% per year before expenses, which is not the Series actual return. The hypothetical account values and expenses may not be used to estimate the actual ending account balance or expenses you paid for the period. You may use this information to compare the ongoing costs of investing in the Series and other funds. To do so, compare this 5% hypothetical example with the 5% hypothetical examples that appear in the shareholder reports of the other mutual funds.
Please note that the expenses shown in the table are meant to highlight your ongoing costs only and do not reflect any fees and expenses associated with an investment in variable insurance products. Therefore, the second line is useful in comparing ongoing costs only, and will not help you determine the relative total costs of owning different funds. In addition, if these fees and expenses associated with an investment in variable insurance products were included, your costs would have been higher.
Series Expenses
| Beginning Account Value 7/1/2008 | Ending Account Value 12/31/20081 | Expenses Paid During Period2 | |||||||
Series O (All Cap Value Series) | |||||||||
Actual | $ | 1,000.00 | $ | 715.21 | $ | 4.14 | |||
Hypothetical | 1,000.00 | 1,020.31 | 4.88 | ||||||
1 | The actual ending account value is based on the actual total return of the Series for the period July 1, 2008 to December 31, 2008 after actual expenses and will differ from the hypothetical ending account value which is based on the Series expense ratio and a hypothetical annual return of 5% before expenses. The actual cumulative return at net asset value for the period July 1, 2008 to December 31, 2008 was (28.48%). |
2 | Expenses are equal to the Series annualized expense ratio of 0.96%, net of any applicable fee waivers, multiplied by the average account value over the period, multiplied by 184/366 (to reflect the one-half year period). |
97
Table of Contents
| Schedule of Investments | Series O | |
December 31, 2008 | (All Cap Value Series) |
| Shares | Value | ||||
COMMON STOCKS—96.6% | |||||
Aerospace & Defense—2.2% | |||||
United Technologies Corporation | 65,100 | $ | 3,489,360 | ||
Air Freight & Logistics—2.7% | |||||
FedEx Corporation | 66,200 | 4,246,730 | |||
Apparel Retail—0.8% | |||||
Brown Shoe Company, Inc. | 74,900 | 634,403 | |||
Chico’s FAS, Inc.* | 84,570 | 353,503 | |||
Talbots, Inc. | 85,500 | 204,345 | |||
| 1,192,251 | |||||
Apparel, Accessories & Luxury Goods—0.6% | |||||
Fossil, Inc.* | 19,400 | 323,980 | |||
Maidenform Brands, Inc.* | 37,600 | 381,640 | |||
Oxford Industries, Inc. | 21,700 | 190,309 | |||
| 895,929 | |||||
Application Software—0.0% | |||||
EPIQ Systems, Inc.* | 1,886 | 31,515 | |||
Biotechnology—0.0% | |||||
Combinatorx, Inc.* | 100,100 | 62,062 | |||
Building Products—1.1% | |||||
Trex Company, Inc.* | 34,800 | 572,808 | |||
USG Corporation* | 135,600 | 1,090,224 | |||
| 1,663,032 | |||||
Coal & Consumable Fuels—0.5% | |||||
Evergreen Energy, Inc.* | 286,300 | 83,027 | |||
USEC, Inc.* | 165,700 | 743,993 | |||
| 827,020 | |||||
Communications Equipment—0.5% | |||||
Symmetricom, Inc. 1,* | 216,100 | 853,595 | |||
Computer Hardware—1.9% | |||||
Hewlett-Packard Company | 82,700 | 3,001,183 | |||
Computer Storage & Peripherals—0.2% | |||||
STEC, Inc.* | 83,000 | 353,580 | |||
Construction & Engineering—1.5% | |||||
Insituform Technologies, Inc.* | 69,800 | 1,374,362 | |||
URS Corporation* | 23,200 | 945,864 | |||
| 2,320,226 | |||||
Construction Materials—2.9% | |||||
Eagle Materials, Inc. | 26,100 | 480,501 | |||
Vulcan Materials Company | 58,000 | 4,035,640 | |||
| 4,516,141 | |||||
Consumer Finance—1.9% | |||||
Capital One Financial Corporation | 69,500 | 2,216,355 | |||
First Marblehead Corporation* | 644,745 | 831,721 | |||
| 3,048,076 | |||||
Data Processing & Outsourced Services—4.7% | |||||
Affiliated Computer Services, Inc.* | 32,900 | 1,511,755 | |||
Computer Sciences Corporation* | 55,400 | 1,946,756 | |||
Gevity HR, Inc. | 36,400 | 54,964 | |||
Western Union Company | 254,100 | 3,643,794 | |||
| 7,157,269 | |||||
Department Stores—2.7% | |||||
JC Penney Company, Inc. | 216,700 | 4,268,990 | |||
Diversified Banks—2.6% | |||||
Wells Fargo & Company | 135,600 | 3,997,488 | |||
Diversified Chemicals—0.9% | |||||
Dow Chemical Company | 94,000 | 1,418,460 | |||
Drug Retail—2.1% | |||||
CVS Caremark Corporation | 116,200 | 3,339,588 | |||
Electric Utilities—4.3% | |||||
Allete, Inc. | 17,598 | 567,887 | |||
Edison International | 127,200 | 4,085,664 | |||
Great Plains Energy, Inc. | 46,900 | 906,577 | |||
Northeast Utilities | 22,500 | 541,350 | |||
Westar Energy, Inc. | 25,400 | 520,954 | |||
| 6,622,432 | |||||
Electrical Components & Equipment—0.3% | |||||
Power-One, Inc.1,* | 432,100 | 514,199 | |||
Electronic Manufacturing Services—1.6% | |||||
Maxwell Technologies, Inc.1,* | 119,700 | 606,879 | |||
Tyco Electronics, Ltd. | 115,600 | 1,873,876 | |||
| 2,480,755 | |||||
Forest Products—0.1% | |||||
Louisiana-Pacific Corporation | 78,700 | 122,772 | |||
Gas Utilities—0.4% | |||||
Atmos Energy Corporation | 28,500 | 675,450 | |||
Health Care Equipment—2.9% | |||||
Aspect Medical Systems, Inc.* | 50,300 | 169,511 | |||
Covidien, Ltd. | 49,500 | 1,793,880 | |||
Hospira, Inc.* | 91,000 | 2,440,620 | |||
| 4,404,011 | |||||
Health Care Facilities—0.2% | |||||
Community Health Systems, Inc.* | 24,000 | 349,920 | |||
Health Care Services—2.0% | |||||
Medco Health Solutions, Inc.* | 53,300 | 2,233,803 | |||
Pediatrix Medical Group, Inc.* | 17,500 | 554,750 | |||
Providence Service Corporation* | 17,500 | 25,375 | |||
RehabCare Group, Inc.* | 18,370 | 278,489 | |||
| 3,092,417 | |||||
Highways & Railtracks—0.1% | |||||
Quixote Corporation1 | 26,100 | 169,650 | |||
Home Furnishings—0.5% | |||||
Leggett & Platt, Inc. | 51,200 | 777,728 | |||
Home Improvement Retail—3.6% | |||||
Lowe’s Companies, Inc. | 270,700 | 5,825,464 | |||
The accompanying notes are an integral part of the financial statements
98
Table of Contents
| Schedule of Investments | Series O | |
| December 31, 2008 | (All Cap Value Series) |
| Shares | Value | ||||
COMMON STOCKS—96.6% (continued) | |||||
Human Resource & Employment Services—0.3% | |||||
Administaff, Inc. | 24,100 | $ | 521,524 | ||
Hypermarkets & Super Centers—2.5% | |||||
Wal-Mart Stores, Inc. | 69,600 | 3,901,776 | |||
Industrial Conglomerates—2.9% | |||||
General Electric Company | 189,700 | 3,073,140 | |||
McDermott International, Inc.* | 149,100 | 1,473,108 | |||
| 4,546,248 | |||||
Industrial Machinery—1.7% | |||||
Dover Corporation | 30,100 | 990,892 | |||
Harsco Corporation | 17,200 | 476,096 | |||
Parker Hannifin Corporation | 27,600 | 1,174,104 | |||
| 2,641,092 | |||||
Integrated Oil & Gas—5.6% | |||||
Chevron Corporation | 41,200 | 3,047,564 | |||
ConocoPhillips | 45,900 | 2,377,620 | |||
Exxon Mobil Corporation | 39,700 | 3,169,251 | |||
| 8,594,435 | |||||
Integrated Telecommunication Services—1.1% | |||||
Windstream Corporation | 188,000 | 1,729,600 | |||
Investment Banking & Brokerage—0.3% | |||||
Merrill Lynch & Company, Inc. | 3,253 | 37,865 | |||
Merrill Lynch & Company, Inc. Restricted Common Stock2,* | 40,093 | 443,348 | |||
| 481,213 | |||||
Managed Health Care—0.6% | |||||
Aetna, Inc. | 35,100 | 1,000,350 | |||
Movies & Entertainment—2.2% | |||||
Time Warner, Inc. | 335,900 | 3,379,154 | |||
Multi-Line Insurance—0.8% | |||||
American Financial Group, Inc. | 57,600 | 1,317,888 | |||
Oil & Gas Drilling—0.5% | |||||
Helmerich & Payne, Inc. | 33,500 | 762,125 | |||
Oil & Gas Equipment & Services—1.4% | |||||
Global Industries, Ltd.* | 142,200 | 496,278 | |||
Halliburton Company | 94,800 | 1,723,464 | |||
| 2,219,742 | |||||
Oil & Gas Exploration & Production—1.8% | |||||
Chesapeake Energy Corporation | 85,700 | 1,385,769 | |||
Goodrich Petroleum Corporation* | 9,100 | 272,545 | |||
Gulfport Energy Corporation* | 31,900 | 126,005 | |||
Newfield Exploration Company* | 16,600 | 327,850 | |||
PetroHawk Energy Corporation* | 47,800 | 747,114 | |||
| 2,859,283 | |||||
Oil & Gas Storage & Transportation—1.5% | |||||
Southern Union Company | 50,900 | 663,736 | |||
Williams Companies, Inc. | 121,300 | 1,756,424 | |||
| 2,420,160 | |||||
Other Diversified Financial Services—2.0% | |||||
JPMorgan Chase & Company | 99,000 | 3,121,470 | |||
Packaged Foods & Meats—2.6% | |||||
Hormel Foods Corporation | 42,100 | 1,308,468 | |||
JM Smucker Company | 23,300 | 1,010,288 | |||
Smithfield Foods, Inc.* | 47,900 | 673,953 | |||
TreeHouse Foods, Inc.* | 37,000 | 1,007,880 | |||
| 4,000,589 | |||||
Paper Packaging—1.1% | |||||
Bemis Company, Inc. | 44,500 | 1,053,760 | |||
Sonoco Products Company | 29,900 | 692,484 | |||
| 1,746,244 | |||||
Paper Products—0.4% | |||||
Schweitzer-Mauduit International, Inc. | 32,400 | 648,648 | |||
Pharmaceuticals—2.0% | |||||
Schering-Plough Corporation | 184,500 | 3,142,035 | |||
Property & Casualty Insurance—6.6% | |||||
Alleghany Corporation* | 3,500 | 987,000 | |||
Assured Guaranty, Ltd. | 51,200 | 583,680 | |||
Berkshire Hathaway, Inc. (Cl.B)* | 1,766 | 5,675,923 | |||
Employers Holdings, Inc. | 33,000 | 544,500 | |||
Hanover Insurance Group, Inc. | 27,900 | 1,198,863 | |||
United America Indemnity, Ltd.* | 30,200 | 386,862 | |||
W.R. Berkley Corporation | 30,900 | 957,900 | |||
| 10,334,728 | |||||
Railroads—2.7% | |||||
Kansas City Southern* | 15,200 | 289,560 | |||
Union Pacific Corporation | 81,300 | 3,886,140 | |||
| 4,175,700 | |||||
Regional Banks—1.0% | |||||
Wilmington Trust Corporation | 68,640 | 1,526,554 | |||
Research & Consulting Services—3.4% | |||||
Equifax, Inc. | 153,600 | 4,073,473 | |||
ICF International, Inc.* | 28,100 | 690,417 | |||
Navigant Consulting, Inc.* | 49,700 | 788,739 | |||
| 5,552,629 | |||||
Restaurants—0.2% | |||||
Red Robin Gourmet Burgers, Inc.* | 15,200 | 255,816 | |||
Security & Alarm Services—0.5% | |||||
GeoEye, Inc.* | 38,400 | 738,432 | |||
Semiconductors—0.9% | |||||
IXYS Corporation1 | 177,900 | 1,469,454 | |||
Specialty Chemicals—1.2% | |||||
Rohm & Haas Company | 27,000 | 1,668,330 | |||
The accompanying notes are an integral part of the financial statements
99
Table of Contents
| Schedule of Investments | Series O | |
| December 31, 2008 | (All Cap Value Series) |
| Shares | Value | ||||
COMMON STOCKS—96.6% (continued) | |||||
Specialty Chemicals—1.2% (continued) | |||||
Zoltek Companies, Inc.* | 20,400 | $ | 183,396 | ||
| 1,851,726 | |||||
Tobacco—2.7% | |||||
Philip Morris International, Inc. | 97,500 | 4,242,225 | |||
Trucking—0.3% | |||||
Saia, Inc.* | 39,000 | 423,540 | |||
TOTAL COMMON STOCKS (cost $211,309,986) | $ | 151,321,673 | |||
Total Investments—96.6% (cost $211,309,986) | $ | 151,321,673 | |||
Cash & Other Assets, Less Liabilities—3.4% | 5,312,273 | ||||
Total Net Assets—100.0% | $ | 156,633,946 | |||
For federal income tax purposes the identified cost of investments owned at December 31, 2008 was $211,424,688.
* | Non-income producing security |
1 | Security is deemed illiquid. The total market value of illiquid securities is $3,613,777 (cost $5,904,485), or 2.3% of total net assets. |
2 | Security is restricted from resale. See Note 6 in the notes to financial statements. |
The accompanying notes are an integral part of the financial statements
100
Table of Contents
| Series O | ||
| (All Cap Value Series) |
Statement of Assets and Liabilities
December 31, 2008
Assets: | ||||
Investments, at value* | $ | 151,321,673 | ||
Cash | 2,413,649 | |||
Receivables: | ||||
Fund shares sold | 150,905 | |||
Securities sold | 2,772,533 | |||
Dividends | 335,037 | |||
Security Investors | 9,995 | |||
Prepaid expenses | 4,485 | |||
Total assets | 157,008,277 | |||
Liabilities: | ||||
Payable for: | ||||
Fund shares redeemed | 215,019 | |||
Written options, at value (premiums received $45,995) | 775 | |||
Management fees | 90,079 | |||
Administration fees | 12,555 | |||
Transfer agent/maintenance fees | 2,083 | |||
Custodian fees | 6,827 | |||
Directors’ fees | 5,352 | |||
Professional fees | 32,141 | |||
Other fees | 9,500 | |||
Total liabilities | 374,331 | |||
Net assets | $ | 156,633,946 | ||
Net assets consist of: | ||||
Paid in capital | $ | 230,956,576 | ||
Undistributed net investment income | 4,037,889 | |||
Accumulated net realized loss on sale of investments and foreign currency transactions | (18,417,426 | ) | ||
Net unrealized depreciation in value of investments and translation of assets and liabilities in foreign currencies | (59,943,093 | ) | ||
Net assets | �� | $ | 156,633,946 | |
Capital shares authorized | unlimited | |||
Capital shares outstanding | 10,883,498 | |||
Net asset value per share (net assets divided by shares outstanding) | $ | 14.39 | ||
*Investments, at cost | $ | 211,309,986 | ||
Statement of Operations
For Year Ended December 31, 2008
Investment Income: | ||||
Dividends (net of foreign withholding tax $5,186) | $ | 6,430,012 | ||
Interest | 213,011 | |||
Total investment income | 6,643,023 | |||
Expenses: | ||||
Management fees | 2,178,000 | |||
Administration fees | 229,153 | |||
Transfer agent/maintenance fees | 25,280 | |||
Custodian fees | 35,209 | |||
Directors’ fees | 19,332 | |||
Professional fees | 59,990 | |||
Reports to shareholders | 30,581 | |||
Other | 13,910 | |||
Total expenses | 2,591,455 | |||
Less: | ||||
Reimbursement of expenses | (42,237 | ) | ||
Earnings credits applied | (1,318 | ) | ||
Net expenses | 2,547,900 | |||
Net investment income | 4,095,123 | |||
Net Realized and Unrealized Gain (Loss): | ||||
Net realized gain (loss) during the year on: | ||||
Investments | (17,151,275 | ) | ||
Foreign currency transactions | (55,590 | ) | ||
Net realized loss | (17,206,865 | ) | ||
Net unrealized appreciation (depreciation) during the year on: | ||||
Investments | (94,267,366 | ) | ||
Options written | 45,220 | |||
Translation of assets and liabilities in foreign currencies | (4,580 | ) | ||
Net unrealized depreciation | (94,226,726 | ) | ||
Net realized and unrealized loss | (111,433,591 | ) | ||
Net decrease in net assets resulting from operations | $ | (107,338,468 | ) | |
The accompanying notes are an integral part of the financial statements
101
Table of Contents
| Series O | ||
| Statement of Changes in Net Assets | (All Cap Value Series) |
| Year Ended December 31, 2008 | Year Ended December 31, 2007 | |||||||
Increase (decrease) in net assets from operations: | ||||||||
Net investment income | $ | 4,095,123 | $ | 4,351,598 | ||||
Net realized gain (loss) during the year on investments and foreign currency transactions | (17,206,865 | ) | 25,059,156 | |||||
Net unrealized depreciation during the year on investments and translation of assets and liabilities in foreign currencies | (94,226,726 | ) | (20,698,057 | ) | ||||
Net increase (decrease) in net assets resulting from operations | (107,338,468 | ) | 8,712,697 | |||||
Capital share transactions: | ||||||||
Proceeds from sale of shares | 128,467,594 | 81,132,971 | ||||||
Cost of shares redeemed | (152,728,104 | ) | (96,662,088 | ) | ||||
Net decrease from capital share transactions | (24,260,510 | ) | (15,529,117 | ) | ||||
Net decrease in net assets | (131,598,978 | ) | (6,816,420 | ) | ||||
Net assets: | ||||||||
Beginning of year | 288,232,924 | 295,049,344 | ||||||
End of year | $ | 156,633,946 | $ | 288,232,924 | ||||
Undistributed net investment income at end of year | $ | 4,037,889 | $ | 4,349,961 | ||||
Capital share activity: | ||||||||
Shares sold | 6,181,412 | 3,414,048 | ||||||
Shares redeemed | (7,629,934 | ) | (4,064,045 | ) | ||||
Total capital share activity | (1,448,522 | ) | (649,997 | ) | ||||
The accompanying notes are an integral part of the financial statements
102
Table of Contents
| Financial Highlights | Series O | |
| Selected data for each share of capital stock outstanding throughout each year | (All Cap Value Series) |
| 2008a,b | 2007 | 2006 | 2005 | Year Ended December 31, 2004 | ||||||||||||||||
Per Share Data | ||||||||||||||||||||
Net asset value, beginning of period | $ | 23.37 | $ | 22.73 | $ | 19.13 | $ | 18.44 | $ | 16.14 | ||||||||||
Income (loss) from investment operations: | ||||||||||||||||||||
Net investment incomec | 0.34 | 0.34 | 0.31 | 0.23 | 0.21 | |||||||||||||||
Net gain (loss) on securities (realized and unrealized) | (9.32 | ) | 0.30 | 3.29 | 0.46 | 2.12 | ||||||||||||||
Total from investment operations | (8.98 | ) | 0.64 | 3.60 | 0.69 | 2.33 | ||||||||||||||
Less distributions: | ||||||||||||||||||||
Dividends from net investment income | — | — | — | — | (0.03 | ) | ||||||||||||||
Total distributions | — | — | — | — | (0.03 | ) | ||||||||||||||
Net asset value, end of period | $ | 14.39 | $ | 23.37 | $ | 22.73 | $ | 19.13 | $ | 18.44 | ||||||||||
Total Returnd | (38.43 | )% | 2.82 | % | 18.82 | % | 3.74 | % | 14.43 | % | ||||||||||
Ratios/Supplemental Data | ||||||||||||||||||||
Net assets, end of period (in thousands) | $ | 156,634 | $ | 288,233 | $ | 295,049 | $ | 259,728 | $ | 240,833 | ||||||||||
Ratios to average net assets: | ||||||||||||||||||||
Net investment income | 1.72 | % | 1.42 | % | 1.41 | % | 1.29 | % | 1.31 | % | ||||||||||
Total expensese | 1.09 | % | 1.14 | % | 1.15 | % | 1.15 | % | 1.13 | % | ||||||||||
Net expensesf | 1.07 | % | 1.14 | % | 1.15 | % | 1.15 | % | 1.13 | % | ||||||||||
Net expenses prior to custodian earnings credits and net of expense waivers | 1.07 | % | 1.14 | % | 1.15 | % | 1.15 | % | 1.13 | % | ||||||||||
Portfolio turnover rate | 124 | %g | 25 | % | 18 | % | 20 | % | 20 | % | ||||||||||
a | Security Global Investors, LLC (SGI) became the advisor of Series O effective August 15, 2008. Prior to August 15, 2008, SGI paid T.Rowe Price for subadvisory services. |
b | Effective August 15, 2008 the Series name became All Cap Value Series. Prior to August 15, 2008 the Series was known as the Equity Income Series. |
c | Net investment income (loss) was computed using average shares outstanding throughout the period. |
d | Total return does not take into account any of the expenses associated with an investment in variable insurance products offered by Security Benefit Life Insurance Company. If total return had taken into account these expenses, performance would have been lower. Shares of a series of SBL Fund are available only through the purchase of such products. |
e | Total expense information reflects the expense ratios absent expense reductions by the Investment Manager and earnings credits, as applicable. |
f | Net expense information reflects the expense ratios after voluntary expense waivers, reimbursements and custodian earnings credits, as applicable. |
g | Significant variation in the portfolio turnover rate is due to Investment Manager’s appointment of new portfolio managers for the Series. |
The accompanying notes are an integral part of the financial statements
103
Table of Contents
| Manager’s Commentary | Series P | |
| February 16, 2009 | (High Yield Series) |
 | ||
David Toussaint Senior Portfolio Manager | ||
To Our Shareholders:
Series P of the SBL Fund—High Yield Series recorded a loss of –30.29% for the year ended December 31, 2008, lagging the –26.16% performance of its benchmark, the Barclays Capital High Yield Bond Index (formerly known as Lehman Brothers U.S. Corporate High Yield Bond Index), and falling short of the –25.06% return for the Series’ peer group.
The High Yield Series will primarily invest in a diversified portfolio consisting of a broad range of high yield, high-risk debt securities rated below the top four long-term credit rating categories and maintain a dollar-weighted average duration of 3 to 15 years.
The Series’ investment approach uses a bottom-up process in selecting high yield securities. We emphasize rigorous credit analysis and relative value in selecting securities. Credit analysis includes assessing factors such as an issuer’s management experience, its debt service coverage or ability to make interest payments on its debt, cash flow, and general economic and market factors. Relative value analysis compares the credit risk and yield of a security to that of other securities. We search for securities that appear to be inexpensive relative to comparable securities and securities that have the potential for an upgrade of their credit rating. A rating upgrade would typically increase the value of the security.
High Yield Market Review
The high yield market was hurt during the year as the credit and financial market turmoil caused investors to shun risk and seek higher quality securities. The effects of the Lehman bankruptcy, which froze credit markets, lingered in the fixed income markets. In October, the high yield market was down 16% followed by another 9% decline in November. Combined with the 8% loss in September, it was the worst 3-month performance period in high-yield history, losing approximately 1/3rd of its total value. The economy continues to weaken and trend downward as unemployment jumps and retail sales post the worst showing in six years, even as the Federal Reserve drastically reduced rates to the 0% to 0.25% range. Banks, brokerages, and hedge funds continue to de-leverage. The Federal government entered private markets to stabilize and support the financial system with liquidity and capital infusions into some of the country's largest companies as mergers of banks and brokerages occurred between firms such as Bank of America and Merrill Lynch.
Fund Performance
Due to tight credit spreads at the start of the year, the Series was in a defensive posture of higher quality, shorter duration issues. The market was not paying investors to take risk and extend to longer duration positions. The Series maintained its defensive position as the sub-prime mortgage issues worked their way through the financial system and credit markets deteriorated.
The Series’ core holdings in shorter maturity bonds provided solid income generation and stable current yields. These shorter maturity bonds are not as sensitive to credit spread movements. Therefore, as credit spreads widened during the year, these bonds lost less of their principal value compared to longer maturity bonds, while still collecting interest payments.
Within the financial sector, a few bonds helped to produce significant performance for the Series. A foreign bank, Doral Financial Corporation, was able to refinance a maturing bond and Fairfax Financial Holdings, a property casualty insurer, generated strong profits. Also contributing to performance, the Series was able to benefit by avoiding numerous pitfalls. The consumer cyclical sector’s bonds in the Series outperformed the benchmark by holding steady performers and by avoiding homebuilding and building materials companies as these companies struggled due to the housing slowdown.
The communications sector had a negative impact on the Series due to security selection in a newspaper publisher, Morris Publishing, and a radio broadcasting company, Cumulus Media, as the slowing economy caused advertising revenue to weaken.
Market Outlook
As we enter 2009, we continue a defensive position while looking for opportunities. In mid-December, the Barclays Capital U.S. Corporate High Yield Bond Index reached a record-high 1,900 basis points spread over U.S. Treasuries while yielding 22.5%, also a record. Overall,
104
Table of Contents
| Manager’s Commentary | Series P | |
| February 16, 2009 | (High Yield Series) |
securities currently trade around 63 cents on the dollar, well below the previous low of 77 cents in 2000. Current values are looking attractive from a historical valuation and risk perspective even though defaults are expected to be at record levels in 2009. In light of historic valuations, we are adding to existing positions at lower prices and concentrating on identifying larger, more established names that should be able to weather the current economic storm
We appreciate your business and thank you for being an investor in the Series.
Sincerely,
David Toussaint, Portfolio Manager
105
Table of Contents
| Series P | ||
| Performance Summary | (High Yield Series) | |
| December 31, 2008 | (unaudited) |
PERFORMANCE
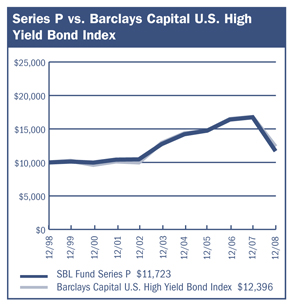
$10,000 Over 10 Years
The chart above assumes a hypothetical $10,000 investment in Series P (High Yield Series) on December 31, 1998 and reflects the fees and expenses of Series P. The Barclays Capital U.S. Corporate High Yield Bond Index (formerly known as Lehman Brothers U.S. Corporate High Yield Bond Index) is an unmanaged index that tracks below investment grade bonds.
Average Annual Returns
Periods Ended 12-31-081 | 1 Year | 5 Years | 10 Years | ||||||
Series P | (30.29 | )% | (1.64 | )% | 1.60 | % |
1 | Performance figures do not reflect fees and expenses associated with an investment in variable insurance products offered by Security Benefit Life Insurance Company. If returns had taken into account these fees and expenses, performance would have been lower. Shares of a Series of SBL Fund are available only through the purchase of such products. |
The performance data quoted above represents past performance. Past performance is not predictive of future performance. The investment return and principal value of an investment will fluctuate so that an investor’s shares, when redeemed, may be worth more or less than their original cost.
Portfolio Comparison by Quality Ratings
(Based on Standard & Poor’s Ratings)
AA | 0.01 | % | |
A | 1.04 | ||
BBB | 3.86 | ||
BB | 22.71 | ||
B | 30.99 | ||
CCC | 9.93 | ||
CC | 0.40 | ||
C | 0.24 | ||
D | 2.03 | ||
NR | 3.44 | ||
Common Stocks | 0.05 | ||
Preferred Stocks | 1.66 | ||
Repurchase Agreement | 20.46 | ||
Cash & Other Assets, Less Liabilities | 3.18 | ||
Total Net Assets | 100.00 | % | |
The accompanying notes are an integral part of the financial statements
106
Table of Contents
| Series P | ||
| Performance Summary | (High Yield Series) | |
| December 31, 2008 | (unaudited) |
Information About Your Series Expenses
Calculating your ongoing Series expenses
Example
As a shareholder of the Series, you incur ongoing costs, including management fees and other series expenses. Performance figures and expense ratios do not reflect fees and expenses associated with an investment in variable insurance products. Shares of a Series of SBL Fund are available only through the purchase of such products. This example is intended to help you understand your ongoing costs (in dollars) of investing in the Series and to compare these costs with ongoing costs of investing in other mutual funds. The example is based on an investment of $1,000 invested at the beginning of the period and held for the entire period, July 1, 2008 through December 31, 2008.
Actual Expenses
The first line in the table provides information about actual account values and actual expenses. You may use the information in this table, together with the amount you invested, to estimate the expenses that you paid over the period. Simply divide your account value by $1,000 (for example, an $8,600 account value divided by $1,000 = 8.6), then multiply the result by the number in the table under the heading entitled “Expenses Paid During the Period” to estimate the expenses you paid on your account during this period.
Hypothetical Example for Comparison Purposes
The second line in the table provides information about hypothetical account values and hypothetical expenses based on the Series actual expense ratio and an assumed rate of return of 5% per year before expenses, which is not the Series actual return. The hypothetical account values and expenses may not be used to estimate the actual ending account balance or expenses you paid for the period. You may use this information to compare the ongoing costs of investing in the Series and other funds. To do so, compare this 5% hypothetical example with the 5% hypothetical examples that appear in the shareholder reports of the other mutual funds.
Please note that the expenses shown in the table are meant to highlight your ongoing costs only and do not reflect any fees and expenses associated with an investment in variable insurance products. Therefore, the second line is useful in comparing ongoing costs only, and will not help you determine the relative total costs of owning different funds. In addition, if these fees and expenses associated with an investment in variable insurance products were included, your costs would have been higher.
Series Expenses
| Beginning Account Value 7/1/2008 | Ending Account Value 12/31/20081 | Expenses Paid During Period2 | |||||||
Series P (High Yield Series) | |||||||||
Actual | $ | 1,000.00 | $ | 708.33 | $ | 4.04 | |||
Hypothetical | 1,000.00 | 1,020.41 | 4.77 | ||||||
1 | The actual ending account value is based on the actual total return of the Series for the period July 1, 2008 to December 31, 2008 after actual expenses and will differ from the hypothetical ending account value which is based on the Series expense ratio and a hypothetical annual return of 5% before expenses. The actual cumulative return at net asset value for the period July 1, 2008 to December 31, 2008 was (29.17%). |
2 | Expenses are equal to the Series annualized expense ratio of 0.94%, net of any applicable fee waivers, multiplied by the average account value over the period, multiplied by 184/366 (to reflect the one-half year period). |
107
Table of Contents
| Schedule of Investments | Series P | |
| December 31, 2008 | (High Yield Series) |
| Shares | Value | |||||
COMMON STOCKS—0.1% | ||||||
Air Freight & Logistics—0.0% | ||||||
Atlas Air Worldwide Holdings, Inc.* | 57 | $ | 1,071 | |||
Airlines—0.1% | ||||||
Delta Air Lines, Inc.* | 2,110 | 24,180 | ||||
Broadcasting—0.0% | ||||||
Adelphia Recovery Trust* | 5,270 | 66 | ||||
Cable & Satellite—0.0% | ||||||
Time Warner Cable, Inc.* | 304 | 6,515 | ||||
Electronic Manufacturing Services—0.0% | ||||||
Viasystems Group, Inc.* | 1,207 | 9,958 | ||||
Health Care Equipment—0.0% | ||||||
MEDIQ, Inc.1,* | 92 | 1 | ||||
Mortgage REIT’s—0.0% | ||||||
Bimini Capital Management, Inc.1,* | 30,450 | 1,066 | ||||
HomeBanc Corporation1,2,* | 30,000 | — | ||||
| 1,066 | ||||||
TOTAL COMMON STOCKS (cost $746,358) | $ | 42,857 | ||||
| Principal Amount | Value | |||||
CONVERTIBLE BONDS—2.0% | ||||||
Health Care Services—0.6% | ||||||
Aspect Medical Systems, Inc. | ||||||
2.50%, 2014 | $ | 725,000 | $ | 290,906 | ||
Invacare Corporation | ||||||
4.13%, 2027 | 350,000 | 238,826 | ||||
| 529,732 | ||||||
Metals & Minerals—0.6% | ||||||
USEC, Inc. | ||||||
3.00%, 2014 | 1,100,000 | 463,375 | ||||
Telecommunications—0.8% | ||||||
Nextel Communications, Inc. | ||||||
5.25%, 2010 | 750,000 | 649,688 | ||||
TOTAL CONVERTIBLE BONDS (cost $2,877,615) | $ | 1,642,795 | ||||
| Principal Amount | Value | |||||
CORPORATE BOND—67.7% | ||||||
Aerospace & Defense—1.8% | ||||||
Esterline Technologies Corporation | ||||||
7.75%, 20133 | 610,000 | 530,700 | ||||
Vought Aircraft Industries, Inc. | ||||||
8.00%, 2011 | 1,450,000 | 978,750 | ||||
| 1,509,450 | ||||||
Airlines—2.7% | ||||||
Continental Airlines, Inc. | ||||||
8.31%, 2011 | 438,705 | 329,029 | ||||
7.03%, 2011 | 289,905 | 168,145 | ||||
Delta Air Lines, Inc. | ||||||
7.90%, 20094 | 75,000 | 1,406 | ||||
7.71%, 2011 | 530,000 | 349,800 | ||||
7.78%, 2012 | 1,642,408 | 1,420,683 | ||||
| 2,269,063 | ||||||
Automotive—2.5% | ||||||
Dura Operating Corporation | ||||||
8.63%, 20121,2,4 | 10,000 | — | ||||
Ford Motor Credit Company LLC | ||||||
9.20%, 20095 | 300,000 | 289,500 | ||||
General Motors Corporation | ||||||
8.38%, 2033 | 1,150,000 | 201,250 | ||||
Metaldyne Corporation | ||||||
11.00%, 2012 | 1,000,000 | 106,300 | ||||
Sonic Automotive, Inc. | ||||||
8.63%, 2013 | 1,750,000 | 651,875 | ||||
Tenneco, Inc. | ||||||
8.63%, 2014 | 550,000 | 209,000 | ||||
TRW Automotive, Inc. | ||||||
7.25%, 20143,6 | 1,250,000 | 637,500 | ||||
| 2,095,425 | ||||||
Banking—1.0% | ||||||
FCB Capital Trust | ||||||
8.05%, 2028 | 75,000 | 66,551 | ||||
Progress Capital Trust I | ||||||
10.50%, 2027 | 700,000 | 737,374 | ||||
Western Financial Bank | ||||||
9.63%, 2012 | 5,000 | 4,926 | ||||
| 808,851 | ||||||
Brokerage—1.3% | ||||||
E*Trade Financial Corporation | ||||||
8.00%, 2011 | 750,000 | 341,250 | ||||
7.88%, 2015 | 2,150,000 | 774,000 | ||||
| 1,115,250 | ||||||
Chemicals—1.1% | ||||||
CNA Holdings, Inc. | ||||||
7.13%, 2009 | 225,000 | 212,513 | ||||
Methanex Corporation | ||||||
8.75%, 2012 | 5,000 | 4,400 | ||||
PolyOne Corporation | ||||||
6.52%, 2010 | 330,000 | 265,650 | ||||
6.58%, 2011 | 625,000 | 404,687 | ||||
| 887,250 | ||||||
Communications—Other—0.1% | ||||||
Deluxe Corporation | ||||||
5.00%, 2012 | 100,000 | 55,000 | ||||
Construction Machinery—2.6% | ||||||
RSC Equipment Rental, Inc. | ||||||
9.50%, 2014 | 2,450,000 | 1,347,500 | ||||
United Rentals North America, Inc. | ||||||
6.50%, 2012 | 1,000,000 | 790,000 | ||||
| 2,137,500 | ||||||
Consumer Products—0.1% | ||||||
Hanesbrands, Inc. | ||||||
5.70%, 20143,5 | 150,000 | 105,750 | ||||
Icon Health & Fitness | ||||||
11.25%, 20122 | 25,000 | 17,500 | ||||
| 123,250 | ||||||
The accompanying notes are an integral part of the financial statements
108
Table of Contents
| Schedule of Investments | Series P | |
| December 31, 2008 | (High Yield Series) |
| Principal Amount | Value | |||||
CORPORATE BOND—67.7% (continued) | ||||||
Distributors—0.1% | ||||||
SemGroup, LP | ||||||
8.75%, 20153,4,6 | $ | 1,700,000 | $ | 59,500 | ||
Electric—2.3% | ||||||
AES Red Oak LLC | ||||||
8.54%, 2019 | 1,784,005 | 1,569,924 | ||||
Dynegy Holdings, Inc. | ||||||
7.75%, 2019 | 250,000 | 172,500 | ||||
East Coast Power LLC | ||||||
7.07%, 2012 | 68,891 | 73,191 | ||||
GrafTech Finance, Inc. | ||||||
10.25%, 2012 | 41,000 | 37,310 | ||||
Westar Energy, Inc. | ||||||
7.13%, 2009 | 90,000 | 89,183 | ||||
| 1,942,108 | ||||||
Environmental—0.4% | ||||||
Casella Waste Systems, Inc. | ||||||
9.75%, 2013 | 400,000 | 320,000 | ||||
Financial—Other—0.5% | ||||||
Harland Clarke Holdings Corporation | ||||||
7.55%, 20155 | 1,400,000 | 448,000 | ||||
Financial Companies—Captive—1.0% | ||||||
International Lease Finance Corporation | ||||||
4.75%, 2009 | 900,000 | 837,923 | ||||
Financial Companies—Noncaptive Consumer—1.7% | ||||||
General Motors Acceptance Corporation | ||||||
6.75%, 2014 | 650,000 | 444,370 | ||||
8.00%, 2031 | 1,350,000 | 789,884 | ||||
Residential Capital LLC | ||||||
8.88%, 2015 | 1,300,000 | 221,000 | ||||
| 1,455,254 | ||||||
Food & Beverage—2.2% | ||||||
Constellation Brands, Inc. | ||||||
7.25%, 2017 | 500,000 | 472,500 | ||||
Dole Food Company, Inc. | ||||||
7.25%, 2010 | 400,000 | 279,000 | ||||
8.88%, 2011 | 1,150,000 | 718,750 | ||||
Harry & David Holdings, Inc. | ||||||
9.00%, 2013 | 900,000 | 288,000 | ||||
Land O’ Lakes, Inc. | ||||||
8.75%, 2011 | 60,000 | 58,950 | ||||
| 1,817,200 | ||||||
Gaming—4.8% | ||||||
Boyd Gaming Corporation | ||||||
7.13%, 2016 | 800,000 | 472,000 | ||||
Galaxy Entertainment Finance Company, Ltd. | ||||||
9.88%, 20123,6 | 1,575,000 | 693,000 | ||||
Harrah’s Operating Company, Inc. | ||||||
10.75%, 20163,6 | 750,000 | 213,750 | ||||
MGM Mirage | ||||||
8.50%, 2010 | 15,000 | 12,600 | ||||
8.38%, 2011 | 55,000 | 32,725 | ||||
6.75%, 2012 | 625,000 | 437,500 | ||||
6.75%, 20133 | 250,000 | 167,500 | ||||
7.63%, 2017 | 500,000 | 322,500 | ||||
Mohegan Tribal Gaming Authority | ||||||
7.13%, 2014 | 1,750,000 | 883,750 | ||||
Pinnacle Entertainment, Inc. | ||||||
7.50%, 2015 | 750,000 | 435,000 | ||||
Station Casinos, Inc. | ||||||
6.00%, 2012 | 925,000 | 185,000 | ||||
Turning Stone Resort Casino Enterprise | ||||||
9.13%, 20143,6 | 150,000 | 114,000 | ||||
| 3,969,325 | ||||||
Health Care—3.5% | ||||||
Coventry Health Care, Inc. | ||||||
5.88%, 2012 | 400,000 | 293,732 | ||||
6.13%, 2015 | 575,000 | 341,628 | ||||
HCA, Inc. | ||||||
6.50%, 2016 | 2,600,000 | 1,599,000 | ||||
InvaCare Corporation | ||||||
9.75%, 20153 | 150,000 | 132,750 | ||||
Johnsondiversey, Inc. | ||||||
9.63%, 2012 | 5,000 | 4,100 | ||||
US Oncology, Inc. | ||||||
10.75%, 2014 | 675,000 | 550,125 | ||||
| 2,921,335 | ||||||
Home Construction—1.0% | ||||||
Meritage Homes Corporation | ||||||
7.00%, 2014 | 500,000 | 285,000 | ||||
6.25%, 2015 | 1,000,000 | 530,000 | ||||
| 815,000 | ||||||
Independent Energy—1.5% | ||||||
Forest Oil Corporation | ||||||
7.25%, 2019 | 375,000 | 273,750 | ||||
Hilcorp Energy I, LP | ||||||
7.75%, 20153,6 | 250,000 | 176,250 | ||||
MarkWest Energy Partners, LP | ||||||
8.50%, 2016 | 400,000 | 255,000 | ||||
Plains Exploration & Production Company | ||||||
7.00%, 2017 | 500,000 | 342,500 | ||||
Range Resources Corporation | ||||||
7.38%, 2013 | 75,000 | 65,438 | ||||
Southwestern Energy Company | ||||||
7.50%, 20183,6 | 150,000 | 131,250 | ||||
VeraSun Energy Corporation | ||||||
9.38%, 20174 | 250,000 | 30,000 | ||||
| 1,274,188 | ||||||
Industrial—Other—0.6% | ||||||
Anixter International, Inc. | ||||||
5.95%, 2015 | 250,000 | 162,500 | ||||
Belden, Inc. | ||||||
7.00%, 2017 | 300,000 | 225,000 | ||||
Mobile Services Group, Inc. | ||||||
9.75%, 2014 | 200,000 | 142,000 | ||||
| 529,500 | ||||||
The accompanying notes are an integral part of the financial statements
109
Table of Contents
| Schedule of Investments | Series P | |
| December 31, 2008 | (High Yield Series) |
| Principal Amount | Value | |||||
CORPORATE BOND—67.7% (continued) | ||||||
Insurance—Life—0.0% | ||||||
USI Holdings Corporation | ||||||
9.75%, 20153,6 | $ | 100,000 | $ | 39,875 | ||
Insurance - Property & Casualty—2.2% | ||||||
Fairfax Financial Holdings, Ltd. | ||||||
7.75%, 2012 | 2,075,000 | 1,846,750 | ||||
Media—Cable—0.7% | ||||||
Cablevision Systems Corporation | ||||||
8.33%, 20095 | 250,000 | 249,375 | ||||
CSC Holdings, Inc. | ||||||
8.13%, 2009 | 25,000 | 24,875 | ||||
8.13%, 2009 | 10,000 | 9,950 | ||||
6.75%, 2012 | 325,000 | 297,375 | ||||
| 581,575 | ||||||
Media—Non Cable—3.5% | ||||||
Block Communications, Inc. | ||||||
8.25%, 20153,6 | 1,125,000 | 742,500 | ||||
Bonten Media Acquisition Company | ||||||
9.00%, 20153,6 | 100,000 | 30,000 | ||||
CMP Susquehanna Corporation | ||||||
9.88%, 2014 | 1,200,000 | 48,000 | ||||
Fisher Communications, Inc. | ||||||
8.63%, 2014 | 250,000 | 192,500 | ||||
Historic TW, Inc. | ||||||
9.13%, 2013 | 30,000 | 29,730 | ||||
Idearc, Inc. | ||||||
8.00%, 2016 | 650,000 | 48,750 | ||||
Intelsat, Ltd. | ||||||
7.63%, 2012 | 725,000 | 485,750 | ||||
Morris Publishing Group LLC | ||||||
7.00%, 20133 | 1,625,000 | 146,250 | ||||
Reader’s Digest Association, Inc. | ||||||
9.00%, 2017 | 150,000 | 12,938 | ||||
RH Donnelley Corporation | ||||||
8.88%, 2016 | 650,000 | 97,500 | ||||
8.88%, 2017 | 350,000 | 52,500 | ||||
Satelites Mexicanos S.A. de CV | ||||||
12.51%, 20115 | 1,464,175 | 776,012 | ||||
Univision Communications, Inc. | ||||||
9.75%, 20153,6 | 1,950,000 | 243,750 | ||||
| 2,906,180 | ||||||
Metals & Mining—2.7% | ||||||
Asia Aluminum Holdings, Ltd. | ||||||
8.00%, 20113,6 | 2,800,000 | 868,000 | ||||
FMG Finance Pty, Ltd. | ||||||
10.63%, 20163,6 | 1,050,000 | 609,000 | ||||
Griffin Coal Mining Company Pty, Ltd. | ||||||
9.50%, 20163,6 | 1,400,000 | 469,000 | ||||
Noble Group, Ltd. | ||||||
6.63%, 20153,6 | 550,000 | 313,500 | ||||
| 2,259,500 | ||||||
Natural Gas Pipelines—0.9% | ||||||
Regency Energy Partners, LP | ||||||
8.38%, 2013 | 1,105,000 | 756,925 | ||||
Oil Field Services—0.3% | ||||||
Pemex Project Funding Master Trust | ||||||
7.88%, 2009 | 25,000 | 25,024 | ||||
9.13%, 2010 | 10,000 | 10,525 | ||||
Stallion Oilfield Services | ||||||
9.75%, 20153,6 | 700,000 | 182,000 | ||||
| 217,549 | ||||||
Packaging—0.8% | ||||||
Ball Corporation | ||||||
6.88%, 2012 | 250,000 | 247,500 | ||||
Graham Packaging Company, Inc. | ||||||
9.88%, 2014 | 625,000 | 384,375 | ||||
Owens-Illinois, Inc. | ||||||
7.50%, 2010 | 30,000 | 29,700 | ||||
| 661,575 | ||||||
Paper—2.5% | ||||||
Georgia-Pacific LLC | ||||||
7.13%, 20173,6 | 325,000 | 273,000 | ||||
Sino-Forest Corporation | ||||||
9.13%, 20113,6 | 2,275,000 | 1,820,000 | ||||
| 2,093,000 | ||||||
Refining—2.4% | ||||||
Frontier Oil Corporation | ||||||
6.63%, 2011 | 300,000 | 271,500 | ||||
Tesoro Corporation | ||||||
6.50%, 2017 | 2,250,000 | 1,234,688 | ||||
United Refining Company | ||||||
10.50%, 2012 | 850,000 | 493,000 | ||||
| 1,999,188 | ||||||
REIT’s—4.9% | ||||||
American Real Estate Partners, LP | ||||||
8.13%, 2012 | 2,185,000 | 1,682,449 | ||||
7.13%, 2013 | 400,000 | 276,000 | ||||
BF Saul Reit | ||||||
7.50%, 2014 | 1,150,000 | 1,040,750 | ||||
Reckson Operating Partnership, LP | ||||||
7.75%, 2009 | 1,000,000 | 956,162 | ||||
| 3,955,361 | ||||||
Restaurants—0.1% | ||||||
Seminole Hard Rock Entertainment, Inc. | ||||||
4.50%, 20143,5,6 | 150,000 | 76,125 | ||||
Retailers—4.4% | ||||||
Blockbuster, Inc. | ||||||
9.00%, 2012 | 850,000 | 412,250 | ||||
Duane Reade, Inc. | ||||||
9.75%, 2011 | 1,300,000 | 689,000 | ||||
General Nutrition Centers, Inc. | ||||||
7.58%, 20145 | 675,000 | 378,000 | ||||
Michaels Stores, Inc. | ||||||
11.38%, 2016 | 1,750,000 | 568,750 | ||||
Neiman Marcus Group, Inc. | ||||||
10.38%, 2015 | 1,450,000 | 623,500 | ||||
PCA LLC | ||||||
11.88%, 20091,2,4 | 30,000 | — | ||||
Saks, Inc. | ||||||
9.88%, 2011 | 1,300,000 | 1,014,000 | ||||
| 3,685,500 | ||||||
The accompanying notes are an integral part of the financial statements
110
Table of Contents
| Schedule of Investments | Series P | |
| December 31, 2008 | (High Yield Series) |
| Principal Amount | Value | |||||
CORPORATE BOND—67.7% (continued) | ||||||
Services—1.0% | ||||||
West Corporation | ||||||
11.00%, 2016 | $ | 1,750,000 | $ | 813,750 | ||
Technology—4.9% | ||||||
Amkor Technology, Inc. | ||||||
9.25%, 2016 | 2,525,000 | 1,464,500 | ||||
L-3 Communications Corporation | ||||||
6.38%, 2015 | 250,000 | 233,750 | ||||
NXP BV | ||||||
9.50%, 2015 | 650,000 | 123,500 | ||||
Seagate Technology HDD Holdings | ||||||
6.80%, 2016 | 650,000 | 338,000 | ||||
Sungard Data Systems, Inc. | ||||||
10.63%, 20153,6 | 600,000 | 513,000 | ||||
Viasystems, Inc. | ||||||
10.50%, 2011 | 2,000,000 | 1,450,000 | ||||
| 4,122,750 | ||||||
Telecommunications—Wireless—1.5% | ||||||
iPCS, Inc. | ||||||
6.44%, 20145 | 400,000 | 244,000 | ||||
MetroPCS Wireless, Inc. | ||||||
9.25%, 2014 | 675,000 | 604,125 | ||||
West Corporation | ||||||
9.50%, 2014 | 800,000 | 440,000 | ||||
| 1,288,125 | ||||||
Telecommunications—Wirelines—0.2% | ||||||
Qwest Corporation | ||||||
7.88%, 2011 | 150,000 | 138,000 | ||||
Tobacco—1.0% | ||||||
Ingles Markets, Inc. | ||||||
8.88%, 2011 | 1,000,000 | 870,000 | ||||
Transportation Services— 0.9% | ||||||
St. Acquisition Corporation | ||||||
12.50%, 20173,6 | 1,350,000 | 123,188 | ||||
Travelport LLC | ||||||
9.88%, 2014 | 1,400,000 | 525,000 | ||||
US Shipping Partners, LP | ||||||
13.00%, 20142 | 625,000 | 93,750 | ||||
| 741,938 | ||||||
TOTAL CORPORATE BOND (cost $94,310,776) | $ | 56,444,038 | ||||
| Principal Amount | Value | |||||
PREFERRED STOCK—1.7% | ||||||
Department Stores—0.3% | ||||||
Sears Holdings Corporation | ||||||
7.00%, 2042 | 6,510 | 55,132 | ||||
7.40%, 2043 | 18,320 | 171,178 | ||||
| 226,310 | ||||||
Real Estate Investment Trusts—1.4% | ||||||
Hospitality Properties Trust | ||||||
7.00%, 2012 | 85,000 | 1,112,650 | ||||
Thrifts & Mortgage Finance—0.0% | ||||||
Federal Home Loan Mortgage Corporation | ||||||
8.38%, 2012 | 28,000 | 10,920 | ||||
Federal National Mortgage Association | ||||||
8.25%, 2010 | 28,000 | 23,240 | ||||
4.38%, 2011 | 7,000 | 7,350 | ||||
| 41,510 | ||||||
TOTAL PREFERRED STOCK (cost $4,272,729) | $ | 1,380,470 | ||||
| Principal Amount | Value | |||||
SENIOR FLOATING RATE INTERESTS—4.2% | ||||||
Automotive—0.7% | ||||||
Delphi, Term Loan C | ||||||
9.75%, 20095,7 | 450,155 | 88,531 | ||||
7.75%, 20097 | 45,845 | 9,016 | ||||
Ford Motor Company, Term Loan B | ||||||
5.00%, 20135,7 | 1,274,000 | 511,192 | ||||
| 608,739 | ||||||
Business Equipment & Services—2.5% | ||||||
First Data Corporation, Initial B1 Term Loan | ||||||
3.21%, 20145,7 | 2,073,750 | 1,326,460 | ||||
VNU, Term Loan | ||||||
3.83%, 20135,7 | 310,816 | 209,218 | ||||
4.39%, 20135,7 | 911,070 | 613,264 | ||||
| 2,148,942 | ||||||
Health Care—1.0% | ||||||
DaVita, Inc., Term Loan B | ||||||
5.27%, 20125,7 | 12,472 | 10,842 | ||||
6.32%, 20125,7 | 26,996 | 23,467 | ||||
5.39%, 20125,7 | 279,267 | 242,764 | ||||
1.97%, 20125,7 | 494,324 | 429,708 | ||||
2.96%, 20125,7 | 107,985 | 93,870 | ||||
| 800,651 | ||||||
TOTAL SENIOR FLOATING RATE INTERESTS (cost $5,907,516) | $ | 3,558,332 | ||||
| Principal Amount | Value | |||||
FOREIGN BOND—0.1% | ||||||
Tunisia—0.1% | ||||||
Banque Centrale de Tunisie | ||||||
7.38%, 2012 | $ | 80,000 | $ | 78,400 | ||
TOTAL FOREIGN BOND (cost $79,463) | $ | 78,400 | ||||
| Principal Amount | Value | |||||
FOREIGN GOVERNMENT BOND—0.5% | ||||||
Chile—0.0% | ||||||
Chile Government International Bond | ||||||
7.13%, 2012 | 25,000 | 28,140 | ||||
Mexico—0.4% | ||||||
Mexico Government International Bond | ||||||
The accompanying notes are an integral part of the financial statements
111
Table of Contents
| Schedule of Investments | Series P | |
| December 31, 2008 | (High Yield Series) |
| Principal Amount | Value | |||||
FOREIGN GOVERNMENT BOND—0.5% (continued) | ||||||
Mexico—0.4% (continued) | ||||||
8.38%, 2011 | $ | 85,000 | $ | 91,800 | ||
7.50%, 2012 | 116,000 | 124,699 | ||||
| 216,499 | ||||||
Philippines—0.0% | ||||||
Philippine Government International Bond | ||||||
8.38%, 2009 | 30,000 | 30,000 | ||||
Russia—0.1% | ||||||
Russia Government International Bond | ||||||
8.25%, 20103,6 | 12,168 | 12,594 | ||||
Russian Ministry of Finance | ||||||
3.00%, 2011 | 80,000 | 76,245 | ||||
| 88,839 | ||||||
South Africa—0.0% | ||||||
South Africa Government International Bond | ||||||
7.38%, 2012 | 35,000 | 34,563 | ||||
TOTAL FOREIGN GOVERNMENT BOND (cost $369,658) | $ | 398,041 | ||||
| Principal Amount | Value | |||||
REPURCHASE AGREEMENT—20.5% | ||||||
UMB Financial Corp, 0.05%, dated 12/31/08, matures 1/02/09; repurchase amount $17,023,047 (Collateralized by FNMA, 5.40%, 10/24/12 & U.S. Treasury Note, 4.50%, 2/15/09 with values of $13,442,285 and $3,921,178 respectively) | $ | 17,023,000 | $ | 17,023,000 | ||
TOTAL REPURCHASE AGREEMENT (cost $17,023,000) | $ | 17,023,000 | ||||
Total Investments—96.8% (cost $125,587,115) | $ | 80,567,933 | ||||
Cash & Other Assets, Less Liabilities—3.2% | 2,650,988 | |||||
Total Net Assets—100.0% | $ | 83,218,921 | ||||
For federal income tax purposes the identified cost of investments owned at December 31, 2008 was $125,144,761.
| REIT | Real Estate Investment Trust |
| * | Non-income producing security |
1 | Security is deemed illiquid. The total market value of illiquid securities is $1,067 (cost $755,370), or 0.0% of total net assets. |
2 | Security was fair valued by the Valuation Committee at December 31, 2008. The total market value of fair valued securities amounts to $111,250, (cost $908,947) or 0.1% of total net assets. |
3 | Security is a 144A or Section 4(2) security. The total market value of 144A or Section 4(2) securities is $9,423,732 (cost $21,328,998), or 11.3% of total net assets. |
4 | Security is in default of interest and/or principal obligations. |
5 | Variable rate security. Rate indicated is rate effective at December 31, 2008. |
6 | Security was acquired through a private placement. |
7 | Security is a senior floating rate interest. See notes to financial statements. |
The accompanying notes are an integral part of the financial statements
112
Table of Contents
| Series P | ||
| (High Yield Series) |
Statement of Assets and Liabilities
December 31, 2008
Assets: | ||||
Investments, at value* | $ | 63,544,933 | ||
Repurchase agreement, at value** | 17,023,000 | |||
Cash | 75,117 | |||
Receivables: | ||||
Fund shares sold | 731,030 | |||
Interest | 2,063,778 | |||
Prepaid expenses | 2,604 | |||
Total assets | 83,440,462 | |||
Liabilities: | ||||
Payable for: | ||||
Fund shares redeemed | 89,933 | |||
Securities purchased | 54,500 | |||
Management fees | 46,096 | |||
Administration fees | 8,839 | |||
Transfer agent/maintenance fees | 2,083 | |||
Directors’ fees | 1,678 | |||
Professional fees | 14,712 | |||
Other fees | 3,700 | |||
Total liabilities | 221,541 | |||
Net assets | $ | 83,218,921 | ||
Net assets consist of: | ||||
Paid in capital | $ | 120,721,826 | ||
Undistributed net investment income | 9,103,520 | |||
Accumulated net realized loss on sale of investments | (1,587,243 | ) | ||
Net unrealized depreciation in value of investments | (45,019,182 | ) | ||
Net assets | $ | 83,218,921 | ||
Capital shares authorized | unlimited | |||
Capital shares outstanding | 6,226,155 | |||
Net asset value per share | $ | 13.37 | ||
| ||||
* Investments, at cost | $ | 108,564,115 | ||
** Repurchase agreement, at cost | 17,023,000 | |||
Statement of Operations
For Year Ended December 31, 2008
Investment Income: | ||||
Dividends | $ | 285,783 | ||
Interest | 9,230,484 | |||
Total investment income | 9,516,267 | |||
Expenses: | ||||
Management fees | 716,980 | |||
Administration fees | 102,712 | |||
Transfer agent/maintenance fees | 25,201 | |||
Custodian fees | 9,720 | |||
Directors’ fees | 7,679 | |||
Professional fees | 19,236 | |||
Reports to shareholders | 12,123 | |||
Other | 4,920 | |||
Total expenses | 898,571 | |||
Less: | ||||
Earnings credits applied | (45 | ) | ||
Net expenses | 898,526 | |||
Net investment income | 8,617,741 | |||
Net Realized and Unrealized Gain (Loss): | ||||
Net realized gain (loss) during the year on: | ||||
Investments | (475,444 | ) | ||
Net realized loss | (475,444 | ) | ||
Net unrealized appreciation (depreciation) during the year on: | ||||
Investments | (39,644,244 | ) | ||
Net unrealized depreciation | (39,644,244 | ) | ||
Net realized and unrealized loss | (40,119,688 | ) | ||
Net decrease in net assets resulting from operations | $ | (31,501,947 | ) | |
The accompanying notes are an integral part of the financial statements
113
Table of Contents
| Series P | ||
| Statement of Changes in Net Assets | (High Yield Series) |
| Year Ended December 31, 2008 | Year Ended December 31, 2007 | |||||||
Increase (decrease) in net assets from operations: | ||||||||
Net investment income | $ | 8,617,741 | $ | 8,538,449 | ||||
Net realized loss during the year on investments | (475,444 | ) | (182,569 | ) | ||||
Net unrealized depreciation during the year on investments | (39,644,244 | ) | (6,161,486 | ) | ||||
Net increase (decrease) in net assets resulting from operations | (31,501,947 | ) | 2,194,394 | |||||
Capital share transactions: | ||||||||
Proceeds from sale of shares | 102,209,457 | 86,289,967 | ||||||
Cost of shares redeemed | (102,789,673 | ) | (79,327,389 | ) | ||||
Net increase (decrease) from capital share transactions | (580,216 | ) | 6,962,578 | |||||
Net increase (decrease) in net assets | (32,082,163 | ) | 9,156,972 | |||||
Net assets: | ||||||||
Beginning of year | 115,301,084 | 106,144,112 | ||||||
End of year | $ | 83,218,921 | $ | 115,301,084 | ||||
Undistributed net investment income at end of year | $ | 9,103,520 | $ | 9,184,134 | ||||
Capital share activity: | ||||||||
Shares sold | 5,951,233 | 4,491,234 | ||||||
Shares redeemed | (5,738,109 | ) | (4,128,501 | ) | ||||
Total capital share activity | 213,124 | 362,733 | ||||||
The accompanying notes are an integral part of the financial statements
114
Table of Contents
| Financial Highlights | Series P | |
Selected data for each share of capital stock outstanding throughout each year | (High Yield Series) |
| 2008 | 2007 | 2006 | 2005 | Year Ended December 31, 2004 | ||||||||||||||||
Per Share Data | ||||||||||||||||||||
Net asset value, beginning of period | $ | 19.18 | $ | 18.79 | $ | 16.90 | $ | 16.28 | $ | 14.71 | ||||||||||
Income (loss) from investment operations: | ||||||||||||||||||||
Net investment incomea | 1.57 | 1.38 | 0.90 | 1.09 | 1.12 | |||||||||||||||
Net gain (loss) on securities (realized and unrealized) | (7.38 | ) | (0.99 | ) | 0.99 | (0.47 | ) | 0.58 | ||||||||||||
Total from investment operations | (5.81 | ) | 0.39 | 1.89 | 0.62 | 1.70 | ||||||||||||||
Less distributions: | ||||||||||||||||||||
Dividends from net investment income | — | — | — | — | (0.13 | ) | ||||||||||||||
Total distributions | — | — | — | — | (0.13 | ) | ||||||||||||||
Net asset value, end of period | $ | 13.37 | $ | 19.18 | $ | 18.79 | $ | 16.90 | $ | 16.28 | ||||||||||
Total Returnb | (30.29 | )% | 2.08 | % | 11.18 | % | 3.81 | % | 11.61 | % | ||||||||||
Ratios/Supplemental Data | ||||||||||||||||||||
Net assets, end of period (in thousands) | $ | 83,219 | $ | 115,301 | $ | 106,144 | $ | 77,971 | $ | 74,316 | ||||||||||
Ratios to average net assets: | ||||||||||||||||||||
Net investment income | 9.02 | % | 7.19 | % | 7.24 | % | 7.13 | % | 7.08 | % | ||||||||||
Total expensesc | 0.94 | % | 0.92 | % | 0.93 | % | 0.97 | % | 0.94 | % | ||||||||||
Net expensesd | 0.94 | % | 0.92 | % | 0.93 | % | 0.97 | % | 0.94 | % | ||||||||||
Net expenses prior to custodian earnings credits and net of expense waivers | 0.94 | % | 0.92 | % | 0.93 | % | 0.97 | % | 0.94 | % | ||||||||||
Portfolio turnover rate | 33 | % | 50 | % | 52 | % | 64 | % | 63 | % | ||||||||||
a | Net investment income (loss) was computed using average shares outstanding throughout the period. |
b | Total return does not take into account any of the expenses associated with an investment in variable insurance products offered by Security Benefit Life Insurance Company. If total return had taken into account these expenses, performance would have been lower. Shares of a series of SBL Fund are available only through the purchase of such products. |
c | Total expense information reflects the expense ratios absent expense reductions by the Investment Manager and earnings credits, as applicable. |
d | Net expense information reflects the expense ratios after voluntary expense waivers, reimbursements and custodian earnings credits, as applicable. |
The accompanying notes are an integral part of the financial statements
115
Table of Contents
This page left blank intentionally.
116
Table of Contents
| Manager’s Commentary | Series Q | |
February 16, 2009 | (Small Cap Value Series) |

Subadviser, Wells Capital Management, Inc.

I. Charles Rinaldi
Portfolio Manager
To Our Shareholders:
For the year ended December 31, 2008 Series Q of the SBL Fund - Small Cap Value Series returned –38.58%, underperforming the Russell 2000 Index, which returned –33.79%. The Series was negatively impacted by its overweight to energy holdings that declined sharply in the second half of 2008.
Materials Top Performer
On the positive end, the Series’ overweight to the materials sector, specifically gold-mining companies, contributed positively to performance. As gold prices edged higher, shares of gold-mining companies outperformed, though with substantial volatility. Despite the volatility, we continue to believe in the long-term investment case for gold. With central banks around the globe printing money to inject into the financial system, currencies over time should weaken, thus bolstering the value of hard assets such as gold. Moreover, gold has historically served as a safe haven during times of financial crisis. Randgold Resources, Ltd., the top holding in the fund, finished up 19% during the period. Led by an experienced and proven executive in Mark Bristow, Randgold is highly disciplined and has had tremendous execution during the years that we’ve owned the stock. Given the state of global affairs and monetary policies, we think gold adds a prudent element to portfolio diversification.
Energy and Financials Disappoint
Given that economic growth is a key driver of energy demand, it is not surprising that energy stocks underperformed the broad market as the economy slid into a recession. However, the precipitous drop in energy shares in the second half of the period reflected market fears as much as deterioration in fundamentals. Forced selling by hedge funds and other institutional investors exacerbated the downward trend. Our energy thesis has always been rooted in the belief that a structural supply-and-demand imbalance exists in the industry. We continue to believe that secular dynamics for energy companies are positive and that the industry will generate above average growth over the coming decade. While the short-term industry fundamentals are clearly diminished due to slowing economic activity worldwide, valuations for energy companies are attractive at current levels.
The Series’ underweight to financials negatively impacted performance despite superior stock selection in the sector. Despite financials being at the root of the credit crisis, the sector in the benchmark outperformed the broad market due to the perception that smaller financial institutions are less exposed to losses and asset write-offs. While that maybe accurate to a degree, we note that credit quality continues to deteriorate across the industry and is spreading to land development loans, commercial real estate loans, and C&I loans (commercial & industrial). This does not bold well for the sector’s performance over the short and intermediate term. The strength of financials despite their deteriorating fundamentals made 2008 a difficult year for active managers to outperform given the Index’s concentration in financials.
The Series’ financials exposure mainly consist of high quality mortgage REITs whose business is investing in mortgage-back securities fully guaranteed by the U.S. government. With borrowing cost trending lower and the return on investments steady, the spread is widening, resulting in higher profits and rising dividends. The current payout for the group averages in the mid-teens. Annaly Capital Management, Inc., our largest holding in the group, is a well-managed company that has flourished in the current environment. Its stock was flat in a down market. Factoring in dividends, the stock had a positive total return that contributed strongly to relative performance. The balance of the Series’ financial exposure is in insurance companies that generally outperformed the broad market, thus resulting in strong stock selection in financials.
Market Outlook
Even though the market has endured a great deal in 2008, we continue to be cautious given the murky economic picture. The unfolding credit crisis will likely continue to pressure the market in 2009. Despite the negative short-term economic outlook, we are seeing attractive valuations in the market. We remain committed to our investment process that target companies across a wide range of industries and sectors. We believe this broad approach will continue to allow us to identify attractive investments for future years. We thank you for your investment and your confidence in our team.
Sincerely,
I. Charles Rinaldi
Portfolio Manager, Wells Capital Management
117
Table of Contents
| Series Q | ||
| Performance Summary | (Small Cap Value Series | |
| December 31, 2008 | (unaudited) |
PERFORMANCE
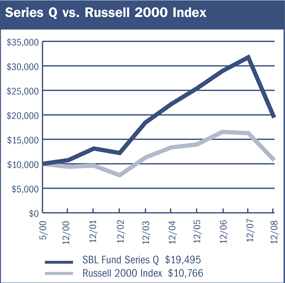
$10,000 Since Inception
The chart above assumes a hypothetical $10,000 investment in Series Q (Small Cap Value Series) on May 1, 2000 (date of inception), and reflects the fees and expenses of Series Q. The Russell 2000 Index is a capitalization-weighted index that measures the performance of the 2000 smallest companies in the Russell 3000 Index, which represents approximately 10% of the total market capitalization of the Russell 3000 Index.
Portfolio Composition by Sector
Consumer Discretionary | 2.99 | % | |
Consumer Staples | 3.15 | ||
Energy | 20.55 | ||
Financials | 16.28 | ||
Health Care | 6.14 | ||
Industrials | 13.65 | ||
Information Technology | 7.43 | ||
Materials | 16.50 | ||
Telecommunication Services | 0.73 | ||
Exchange Traded Funds | 2.12 | ||
Repurchase Agreement | 9.64 | ||
Cash & Other Assets, Less Liabilities | 0.82 | ||
Total Net Assets | 100.00 | % | |
Average Annual Returns
Periods Ended 12-31-081 | 1 Year | 5 Years | Since Inception (5-1-00) | ||||||
Series Q | (38.58 | )% | 1.14 | % | 8.01 | % |
1 | Performance figures do not reflect fees and expenses associated with an investment in variable insurance products offered by Security Benefit Life Insurance Company. If returns had taken into account these fees and expenses, performance would have been lower. Shares of a Series of SBL Fund are available only through the purchase of such products. |
The performance data quoted above represents past performance. Past performance is not predictive of future performance. The investment return and principal value of an investment will fluctuate so that an investor’s shares, when redeemed, may be worth more or less than their original cost.
The accompanying notes are an integral part of the financial statements
118
Table of Contents
| Series Q | ||
| Performance Summary | (Small Cap Value Series) | |
| December 31, 2008 | (unaudited) |
Information About Your Series Expenses
Calculating your ongoing Series expenses
Example
As a shareholder of the Series, you incur ongoing costs, including management fees and other series expenses. Performance figures and expense ratios do not reflect fees and expenses associated with an investment in variable insurance products. Shares of a Series of SBL Fund are available only through the purchase of such products. This example is intended to help you understand your ongoing costs (in dollars) of investing in the Series and to compare these costs with ongoing costs of investing in other mutual funds. The example is based on an investment of $1,000 invested at the beginning of the period and held for the entire period, July 1, 2008 through December 31, 2008.
Actual Expenses
The first line in the table provides information about actual account values and actual expenses. You may use the information in this table, together with the amount you invested, to estimate the expenses that you paid over the period. Simply divide your account value by $1,000 (for example, an $8,600 account value divided by $1,000 = 8.6), then multiply the result by the number in the table under the heading entitled “Expenses Paid During the Period” to estimate the expenses you paid on your account during this period.
Hypothetical Example for Comparison Purposes
The second line in the table provides information about hypothetical account values and hypothetical expenses based on the Series actual expense ratio and an assumed rate of return of 5% per year before expenses, which is not the Series actual return. The hypothetical account values and expenses may not be used to estimate the actual ending account balance or expenses you paid for the period. You may use this information to compare the ongoing costs of investing in the Series and other funds. To do so, compare this 5% hypothetical example with the 5% hypothetical examples that appear in the shareholder reports of the other mutual funds.
Please note that the expenses shown in the table are meant to highlight your ongoing costs only and do not reflect any fees and expenses associated with an investment in variable insurance products. Therefore, the second line is useful in comparing ongoing costs only, and will not help you determine the relative total costs of owning different funds. In addition, if these fees and expenses associated with an investment in variable insurance products were included, your costs would have been higher.
Series Expenses
| Beginning Account Value 7/1/2008 | Ending Account Value 12/31/20081 | Expenses Paid During Period2 | |||||||
Series Q (Small Cap Value Series) | |||||||||
Actual | $ | 1,000.00 | $ | 620.62 | $ | 4.93 | |||
Hypothetical | 1,000.00 | 1,019.05 | 6.14 | ||||||
1 | The actual ending account value is based on the actual total return of the Series for the period July 1, 2008 to December 31, 2008 after actual expenses and will differ from the hypothetical ending account value which is based on the Series expense ratio and a hypothetical annual return of 5% before expenses. The actual cumulative return at net asset value for the period July 1, 2008 to December 31, 2008 was (37.94%). |
2 | Expenses are equal to the Series annualized expense ratio of 1.21%, net of any applicable fee waivers, multiplied by the average account value over the period, multiplied by 184/366 (to reflect the one-half year period). |
119
Table of Contents
| Schedule of Investments | Series Q | |
| December 31, 2008 | (Small Cap Value Series) |
| Shares | Value | ||||
COMMON STOCKS—89.1% | |||||
Airlines—4.3% | |||||
Alaska Air Group, Inc.* | 28,900 | $ | 845,325 | ||
Delta Air Lines, Inc.* | 108,100 | 1,238,826 | |||
Lan Airlines S.A. ADR | 35,900 | 288,995 | |||
UAL Corporation | 127,300 | 1,402,846 | |||
| 3,775,992 | |||||
Apparel Retail—1.0% | |||||
Collective Brands, Inc.* | 76,300 | 894,236 | |||
Application Software—0.3% | |||||
Symyx Technologies* | 40,300 | 239,382 | |||
Automobile Manufacturers—0.0% | |||||
Fleetwood Enterprises, Inc.* | 213,300 | 21,330 | |||
Biotechnology—0.2% | |||||
Infinity Pharmaceuticals, Inc.* | 24,300 | 194,157 | |||
Broadcasting—0.7% | |||||
Citadel Broadcasting Corporation* | 592,367 | 94,779 | |||
Discovery Communications, Inc.* | 32,600 | 449,103 | |||
Entravision Communications Corporation* | 22,400 | 34,944 | |||
| 578,826 | |||||
Casinos & Gaming—0.1% | |||||
Empire Resorts, Inc.* | 42,300 | 46,107 | |||
Commodity Chemicals—0.6% | |||||
Calgon Carbon Corporation* | 34,600 | 531,456 | |||
Communications Equipment—2.4% | |||||
3Com Corporation* | 708,300 | 1,614,924 | |||
China GrenTech Corporation, Ltd. ADR* | 82,700 | 99,240 | |||
MRV Communications, Inc.* | 417,915 | 321,795 | |||
Powerwave Technologies, Inc.* | 115,200 | 57,600 | |||
| 2,093,559 | |||||
Computer Hardware—0.3% | |||||
Cray, Inc.* | 123,800 | 257,504 | |||
Computer Storage & Peripherals—1.8% | |||||
Intermec, Inc.* | 117,200 | 1,556,416 | |||
Construction & Engineering—1.8% | |||||
Chicago Bridge & Iron Company N.V. | 126,500 | 1,271,325 | |||
MasTec, Inc.* | 20,500 | 237,390 | |||
| 1,508,715 | |||||
Construction & Farm Machinery & Heavy Trucks—0.3% | |||||
Terex Corporation* | 12,700 | 219,964 | |||
Construction Materials—0.3% | |||||
U.S. Concrete, Inc.* | 87,500 | 294,000 | |||
Diversified Chemicals—0.2% | |||||
Ashland, Inc. | 17,400 | 182,874 | |||
Diversified Support Services—0.5% | |||||
Healthcare Services Group | 25,155 | 400,719 | |||
Electrical Components & Equipment—1.1% | |||||
Encore Wire Corporation | 5,000 | 94,800 | |||
GrafTech International, Ltd.* | 80,900 | 673,088 | |||
Power-One, Inc.1,* | 151,500 | 180,285 | |||
| 948,173 | |||||
Electronic Components—0.1% | |||||
Vishay Intertechnology, Inc.* | 21,000 | 71,820 | |||
Electronic Equipment & Instruments—2.5% | |||||
Cognex Corporation | 28,600 | 423,280 | |||
Coherent, Inc.* | 37,500 | 804,375 | |||
OSI Systems, Inc.* | 65,100 | 901,635 | |||
| 2,129,290 | |||||
Environmental & Facilities Services—1.8% | |||||
ABM Industries, Inc. | 82,300 | 1,567,815 | |||
Exchange Traded Funds—2.1% | |||||
iShares Russell 2000 Value Index Fund | 37,000 | 1,819,290 | |||
Gold—11.1% | |||||
Eldorado Gold Corporation* | 84,100 | 668,595 | |||
Goldcorp, Inc. | 122,900 | 3,875,037 | |||
Randgold Resources, Ltd. ADR | 103,900 | 4,563,288 | |||
Yamana Gold, Inc. | 49,800 | 384,456 | |||
| 9,491,376 | |||||
Health Care Equipment—0.6% | |||||
Hologic, Inc.* | 20,900 | 273,163 | |||
Symmetry Medical, Inc.* | 31,800 | 253,446 | |||
| 526,609 | |||||
Health Care Facilities—0.4% | |||||
Community Health Systems, Inc.* | 21,900 | 319,302 | |||
Health Care Services—3.6% | |||||
Amedisys, Inc.* | 16,000 | 661,440 | |||
Cross Country Healthcare, Inc.* | 98,350 | 864,497 | |||
Gentiva Health Services, Inc.* | 45,987 | 1,345,580 | |||
Healthways, Inc.* | 21,100 | 242,228 | |||
| 3,113,745 | |||||
Health Care Supplies—0.9% | |||||
OraSure Technologies, Inc.* | 208,000 | 765,440 | |||
Homebuilding—1.0% | |||||
Champion Enterprises, Inc.* | 318,495 | 178,357 | |||
Palm Harbor Homes, Inc.* | 63,500 | 316,230 | |||
Skyline Corporation | 20,300 | 405,797 | |||
| 900,384 | |||||
Human Resource & Employment Services—0.2% | |||||
Kforce, Inc.* | 21,000 | 161,280 | |||
Integrated Oil & Gas—2.1% | |||||
InterOil Corporation* | 130,300 | 1,791,625 | |||
The accompanying notes are an integral part of the financial statements
120
Table of Contents
| Schedule of Investments | Series Q | |
| December 31, 2008 | (Small Cap Value Series) |
| Shares | Value | ||||
COMMON STOCKS—89.1% (continued) | |||||
Integrated Telecommunication Services—0.7% | |||||
Cincinnati Bell, Inc.* | 327,275 | $ | 631,641 | ||
Life Sciences Tools & Services—0.4% | |||||
Life Technologies Corporation* | 3,098 | 72,214 | |||
MDS, Inc. | 46,800 | 286,884 | |||
| 359,098 | |||||
Metal & Glass Containers—0.3% | |||||
Intertape Polymer Group, Inc.* | 326,400 | 238,272 | |||
Mortgage REIT’s—10.6% | |||||
Annaly Capital Management, Inc. | 200,300 | 3,178,760 | |||
Anworth Mortgage Asset Corporation | 136,700 | 878,981 | |||
Capstead Mortgage Corporation | 169,200 | 1,822,284 | |||
Chimera Investment Corporation | 120,650 | 416,243 | |||
Hatteras Financial Corporation | 47,700 | 1,268,820 | |||
MFA Mortgage Investments, Inc. | 240,600 | 1,417,134 | |||
| 8,982,222 | |||||
Office Services & Supplies—0.2% | |||||
ACCO Brands Corporation* | 52,800 | 182,160 | |||
Oil & Gas Drilling—2.8% | |||||
Helmerich & Payne, Inc. | 49,800 | 1,132,950 | |||
Hercules Offshore, Inc.* | 39,600 | 188,100 | |||
Parker Drilling Company* | 71,600 | 207,640 | |||
Pride International, Inc.* | 25,900 | 413,882 | |||
Transocean, Ltd.* | 10,100 | 477,225 | |||
| 2,419,797 | |||||
Oil & Gas Equipment & Services—6.5% | |||||
Boots & Coots International Control, Inc.* | 44,800 | 52,864 | |||
Global Industries, Ltd.* | 307,375 | 1,072,739 | |||
Helix Energy Solutions Group, Inc.* | 45,700 | 330,868 | |||
ION Geophysical Corporation* | 31,500 | 108,045 | |||
Key Energy Services, Inc.* | 121,235 | 534,646 | |||
Matrix Service Company* | 9,700 | 74,399 | |||
Newpark Resources* | 344,400 | 1,274,280 | |||
Oceaneering International, Inc.* | 29,700 | 865,458 | |||
PHI, Inc.* | 5,640 | 92,665 | |||
PHI, Inc. (Non Voting)* | 34,900 | 488,949 | |||
Smith International, Inc. | 4,200 | 96,138 | |||
Willbros Group, Inc.* | 74,080 | 627,458 | |||
| 5,618,509 | |||||
Oil & Gas Exploration & Production—8.7% | |||||
Forest Oil Corporation* | 38,800 | 639,812 | |||
Mariner Energy, Inc.* | 27,100 | 276,420 | |||
McMoRan Exploration Company* | 149,900 | 1,469,020 | |||
Newfield Exploration Company* | 25,300 | 499,675 | |||
Noble Energy, Inc. | 11,400 | 561,108 | |||
PetroHawk Energy Corporation* | 25,500 | 398,565 | |||
Petroquest Energy, Inc.* | 21,100 | 142,636 | |||
Pioneer Natural Resources Company | 11,200 | 181,216 | |||
Range Resources Corporation | 93,900 | 3,229,221 | |||
| 7,397,673 | |||||
Other Diversified Financial Services—0.1% | |||||
Highlands Acquisition Corporation* | 12,600 | 115,290 | |||
Packaged Foods & Meats—1.8% | |||||
Del Monte Foods Company | 222,100 | 1,585,794 | |||
Paper Products—0.9% | |||||
Wausau Paper Corporation | 69,100 | 790,504 | |||
Personal Products—1.3% | |||||
Prestige Brands Holdings, Inc.* | 106,000 | 1,118,300 | |||
Precious Metals & Minerals—0.2% | |||||
Apex Silver Mines, Ltd.2,* | 159,900 | 156,702 | |||
Property & Casualty Insurance—5.1% | |||||
Argo Group International Holdings, Ltd.* | 46,400 | 1,573,888 | |||
First Acceptance Corporation* | 26,500 | 76,850 | |||
Hilltop Holdings, Inc.* | 78,390 | 763,519 | |||
Mercury General Corporation | 25,400 | 1,168,146 | |||
NYMAGIC, Inc. | 25,300 | 481,965 | |||
OneBeacon Insurance Group, Ltd. | 27,800 | 290,232 | |||
| 4,354,600 | |||||
Publishing—0.2% | |||||
RH Donnelley Corporation* | 110,200 | 40,774 | |||
Voyager Learning Company* | 61,700 | 91,316 | |||
| 132,090 | |||||
Regional Banks—0.1% | |||||
Colonial BancGroup, Inc. | 40,300 | 83,421 | |||
Research & Consulting Services—0.6% | |||||
Hill International, Inc.* | 76,000 | 535,040 | |||
Residential REIT’s—0.5% | |||||
Sun Communities, Inc. | 32,300 | 452,200 | |||
Security & Alarm Services—2.2% | |||||
Geo Group, Inc.* | 105,560 | 1,903,247 | |||
Semiconductor Equipment—0.0% | |||||
LTX-Credence Corporation* | 136,300 | 36,801 | |||
Specialty Chemicals—0.3% | |||||
OM Group, Inc.* | 11,300 | 238,543 | |||
Steel—2.7% | |||||
Carpenter Technology Corporation | 32,500 | 667,550 | |||
Steel Dynamics, Inc. | 83,000 | 927,940 | |||
United States Steel Corporation | 8,200 | 305,040 | |||
Webco Industries, Inc.* | 4,745 | 355,875 | |||
| 2,256,405 | |||||
Trucking—0.6% | |||||
Covenant Transportation Group, Inc.* | 32,500 | 65,325 | |||
The accompanying notes are an integral part of the financial statements
121
Table of Contents
| Schedule of Investments | Series Q | |
| December 31, 2008 | (Small Cap Value Series) |
| Shares | Value | |||||
COMMON STOCKS—89.1% (continued) | ||||||
Trucking—0.6% (continued) | ||||||
YRC Worldwide, Inc.* | 154,400 | $ | 443,128 | |||
| 508,453 | ||||||
TOTAL COMMON STOCKS (cost $113,401,100) | $ | 76,498,148 | ||||
| Shares | Value | |||||
FOREIGN STOCKS—0.5% | ||||||
Canada—0.5% | ||||||
Air Canada* | 13,100 | $ | 18,844 | |||
Trilogy Energy Trust | 91,900 | 436,611 | ||||
| 455,455 | ||||||
TOTAL FOREIGN STOCKS (cost $1,336,727) | $ | 455,455 | ||||
| Principal Amount | Value | |||||
REPURCHASE AGREEMENT—9.6% | ||||||
State Street, 0.01%, dated 12/31/08, matures 1/02/09; repurchase amount $8,283,590 (Collateralized by FHLMC, 9/17/09 with a value of $8,283,585) | $ | 8,283,585 | $ | 8,283,585 | ||
TOTAL REPURCHASE AGREEMENT (cost $8,283,585) | $ | 8,283,585 | ||||
Total Investments—99.2% (cost $123,021,412) | $ | 85,237,188 | ||||
Cash & Other Assets, Less Liabilities—0.8% | 707,251 | |||||
Total Net Assets—100.0% | $ | 85,944,439 | ||||
For federal income tax purposes the identified cost of investments owned at December 31, 2008 was $123,635,909.
| ADR | American Depositary Receipt |
| * | Non-income producing security |
1 | Security is deemed illiquid. The total market value of illiquid securities is $180,285 (cost $792,287), or 0.2% of total net assets. |
2 | Security is a PFIC (Passive Foreign Investment Company) |
The accompanying notes are an integral part of the financial statements
122
Table of Contents
| Series Q | ||
| (Small Cap Value Series) |
Statement of Assets and Liabilities
December 31, 2008
Assets: | ||||
Investments, at value* | $ | 85,237,188 | ||
Cash | 286,123 | |||
Receivables: | ||||
Fund shares sold | 674,036 | |||
Securities sold | 1,196,039 | |||
Dividends | 332,224 | |||
Prepaid expenses | 2,570 | |||
Total assets | 87,728,180 | |||
Liabilities: | ||||
Payable for: | ||||
Fund shares redeemed | 65,905 | |||
Securities purchased | 1,612,904 | |||
Management fees | 68,032 | |||
Administration fees | 8,563 | |||
Transfer agent/maintenance fees | 2,083 | |||
Custodian fees | 2,525 | |||
Directors’ fees | 1,600 | |||
Professional fees | 16,129 | |||
Other fees | 6,000 | |||
Total liabilities | 1,783,741 | |||
Net assets | $ | 85,944,439 | ||
Net assets consist of: | ||||
Paid in capital | $ | 120,916,654 | ||
Undistributed net investment income | 319,962 | |||
Undistributed net realized gain on sale of investments and foreign currency transactions | 2,492,025 | |||
Net unrealized depreciation in value of investments and translation of assets and liabilities in foreign currencies | (37,784,202 | ) | ||
Net assets | $ | 85,944,439 | ||
Capital shares authorized | unlimited | |||
Capital shares outstanding | 4,856,972 | |||
Net asset value per share (net assets divided by shares outstanding) | $ | 17.70 | ||
* Investments, at cost | $ | 123,021,412 | ||
Statement of Operations
For Year Ended December 31, 2008
Investment Income: | ||||
Dividends (net of foreign withholding tax $13,847) | $ | 1,875,671 | ||
Interest | 38,347 | |||
Total investment income | 1,914,018 | |||
Expenses: | ||||
Management fees | 1,347,358 | |||
Administration fees | 135,559 | |||
Transfer agent/maintenance fees | 25,186 | |||
Custodian fees | 29,975 | |||
Directors’ fees | 9,277 | |||
Professional fees | 24,736 | |||
Reports to shareholders | 17,129 | |||
Other | 7,004 | |||
Total expenses | 1,596,224 | |||
Less: | ||||
Earnings credits applied | (3,914 | ) | ||
Net expenses | 1,592,310 | |||
Net investment income | 321,708 | |||
Net Realized and Unrealized Gain (Loss): | ||||
Net realized gain (loss) during the year on: | ||||
Investments | 1,097,338 | |||
Options written | 1,901,181 | |||
Foreign currency transactions | (1,434 | ) | ||
Net realized gain | 2,997,085 | |||
Net unrealized appreciation (depreciation) during the year on: | ||||
Investments | (64,674,201 | ) | ||
Options written | 109,566 | |||
Translation of assets and liabilities in foreign currencies | (47 | ) | ||
Net unrealized depreciation | (64,564,682 | ) | ||
Net realized and unrealized loss | (61,567,597 | ) | ||
Net decrease in net assets resulting from operations | $ | (61,245,889 | ) | |
The accompanying notes are an integral part of the financial statements
123
Table of Contents
| Series Q | ||
| Statement of Changes in Net Assets | (Small Cap Value Series) |
| Year Ended December 31, 2008 | Year Ended December 31, 2007 | |||||||
Increase (decrease) in net assets from operations: | ||||||||
Net investment income (loss) | $ | 321,708 | $ | (721,499 | ) | |||
Net realized gain during the year on investments and foreign currency transactions | 2,997,085 | 26,605,357 | ||||||
Net unrealized depreciation during the year on investments and translation of assets and liabilities in foreign currencies | (64,564,682 | ) | (9,960,349 | ) | ||||
Net increase (decrease) in net assets resulting from operations | (61,245,889 | ) | 15,923,509 | |||||
Capital share transactions: | ||||||||
Proceeds from sale of shares | 51,961,281 | 81,333,559 | ||||||
Cost of shares redeemed | (71,641,951 | ) | (90,238,003 | ) | ||||
Net decrease from capital share transactions | (19,680,670 | ) | (8,904,444 | ) | ||||
Net increase (decrease) in net assets | (80,926,559 | ) | 7,019,065 | |||||
Net assets: | ||||||||
Beginning of year | 166,870,998 | 159,851,933 | ||||||
End of year | $ | 85,944,439 | $ | 166,870,998 | ||||
Undistributed net investment income at end of year | $ | 319,962 | $ | (312 | ) | |||
Capital share activity: | ||||||||
Shares sold | 2,137,129 | 2,808,779 | ||||||
Shares redeemed | (3,071,142 | ) | (3,133,435 | ) | ||||
Total capital share activity | (934,013 | ) | (324,656 | ) | ||||
The accompanying notes are an integral part of the financial statements
124
Table of Contents
| Financial Highlights | Series Q | |
Selected data for each share of capital stock outstanding throughout each year | (Small Cap Value Series) |
| 2008 | 2007 | 2006 | 2005 | Year Ended December 31, 2004 | ||||||||||||||||
Per Share Data | ||||||||||||||||||||
Net asset value, beginning of period | $ | 28.82 | $ | 26.14 | $ | 23.05 | $ | 20.13 | $ | 16.84 | ||||||||||
Income (loss) from investment operations: | ||||||||||||||||||||
Net investment income (loss)a | 0.06 | (0.12 | ) | (0.09 | ) | (0.11 | ) | (0.12 | ) | |||||||||||
Net gain (loss) on securities (realized and unrealized) | (11.18 | ) | 2.80 | 3.18 | 3.03 | 3.53 | ||||||||||||||
Total from investment operations | (11.12 | ) | 2.68 | 3.09 | 2.92 | 3.41 | ||||||||||||||
Less distributions: | ||||||||||||||||||||
Distributions from realized gains | — | — | — | — | (0.12 | ) | ||||||||||||||
Total distributions | — | — | — | — | (0.12 | ) | ||||||||||||||
Net asset value, end of period | $ | 17.70 | $ | 28.82 | $ | 26.14 | $ | 23.05 | $ | 20.13 | ||||||||||
Total Returnb | (38.58 | )% | 10.25 | % | 13.41 | % | 14.51 | % | 20.37 | % | ||||||||||
Ratios/Supplemental Data | ||||||||||||||||||||
Net assets, end of period (in thousands) | $ | 85,944 | $ | 166,871 | $ | 159,852 | $ | 144,166 | $ | 112,133 | ||||||||||
Ratios to average net assets: | ||||||||||||||||||||
Net investment income (loss) | 0.24 | % | (0.42 | )% | (0.36 | )% | (0.58 | )% | (0.68 | )% | ||||||||||
Total expensesc | 1.19 | % | 1.18 | % | 1.25 | % | 1.22 | % | 1.19 | % | ||||||||||
Net expensesd | 1.18 | % | 1.18 | % | 1.24 | % | 1.22 | % | 1.19 | % | ||||||||||
Net expenses prior to custodian earnings credits and net of expense waivers | 1.19 | % | 1.18 | % | 1.25 | % | 1.22 | % | 1.19 | % | ||||||||||
Portfolio turnover rate | 25 | % | 42 | % | 46 | % | 37 | % | 43 | % | ||||||||||
a | Net investment income (loss) was computed using average shares outstanding throughout the period. |
b | Total return does not take into account any of the expenses associated with an investment in variable insurance products offered by Security Benefit Life Insurance Company. If total return had taken into account these expenses, performance would have been lower. Shares of a series of SBL Fund are available only through the purchase of such products. |
c | Total expense information reflects the expense ratios absent expense reductions by the Investment Manager and earnings credits, as applicable. |
d | Net expense information reflects the expense ratios after voluntary expense waivers, reimbursements and custodian earnings credits, as applicable. |
The accompanying notes are an integral part of the financial statements
125
Table of Contents
This page left blank intentionally.
126
Table of Contents
| Manager’s Commentary | Series V | |
February 16, 2009 | (Mid Cap Value Series) |


James P. Schier
Senior Portfolio Manager
To Our Shareholders:
Series V of the SBL Fund - Mid Cap Value Series posted a loss of –28.46%. However, the Series’ return was more than 300 basis points ahead of its benchmark and nearly 800 basis points better than peer competition. The Series’ benchmark, the Russell 2500 Value Index was down –31.99% while the Series’ median peer fund return declined –36.30%.
Our approach with the Mid Cap Value Series is to seek companies that can increase shareholders’ return on capital. We hold such companies over three to five years to capture long-term improvements in profitability.
The investment process is fundamentally driven and quantitatively aided. We use proprietary screens to identify potential companies for investment and then perform rigorous fundamental analysis to identify the best ideas. Through this fundamental research, we determine an estimate of intrinsic value and thus a valuation target for each idea. We construct the portfolios based on the level of conviction generated by this bottom-up analysis and the upside/downside profile associated with each company.
Information Technology and Materials Top Performers
The strongest performing sectors in the portfolio were the information technology and materials sectors due to stock selection. The information technology sector had a significant overweight relative to the benchmark and held losses to –20%, far below the –45% plunge for the Index. The portfolio was underweight in the materials sector and benefited from stock selection as the –33% drop was less damaging than the benchmark’s –42% decline.
The portfolio had two leading companies in the information technology sector, Affiliated Computer Services, Inc. and IXYS Corporation. Each held a 3% position in the portfolio and finished the year with a positive gain.
In such a difficult environment, containing losses against the benchmark allows for better performance on a relative basis. Such was the case for the materials sector. The two largest holdings in the portfolio, Bemis Company, Inc. and Sonoco Products Company, lost –11% and –26%, respectively over the period. The returns were materially better than the –42% loss for the sector in the Index.
Energy and Health Care Disappoint
Energy was nearly a double weight in the portfolio, consisting of 11% of total assets. The hardest hit sector in the market during the calendar year, the holdings in the portfolio plunged –58%, more than the –51% loss in the benchmark. Surprisingly, portfolio holdings Arch Coal, Inc. and Consol Energy, Inc. posted positive gains. Unfortunately, these were the only holdings in the sector that did. Newfield Exploration Company lost –63%, USEC, Inc. –50%, and Helmerich & Payne, Inc. –43%, as few companies in the industry escaped the market’s pain.
The portfolio was underweight the Index in the health care sector, however, holdings posted a –59% loss, much worse than the –27% decline in the benchmark. The largest position in the sector over the period was Community Health Systems, Inc., which was down –60%. Other holdings in the sector pulling down portfolio performance were Pediatrix Medical Group, Inc., Aspect Medical Systems, Inc., and Combinatorx, Inc.
Market Outlook
We continue to pursue opportunities with a focus on bottom-up research rather than a macro forecast.
Our focus is on identifying companies with the ability to be substantially stronger over the next three to five years or have the potential to maintain their return on capital at current levels in a difficult economic environment. We ultimately look for companies that trade significantly below their intrinsic value. The portfolio continues to be overweight energy and information technology while being underweight financials.
On behalf of Security Global Investors, I would like to thank you for placing your trust and money with us. As always, we will continue to do our best to seek the potential available in small and mid capitalization companies.
Sincerely,
James P. Schier, Senior Portfolio Manager
127
Table of Contents
| Series V | ||
| Performance Summary | (Mid Cap Value Series) | |
| December 31, 2008 | (unaudited) |
PERFORMANCE
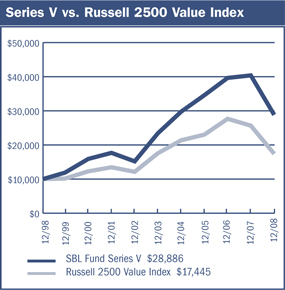
$10,000 Over 10 Years
The chart above assumes a hypothetical $10,000 investment in Series V (Mid Cap Value Series) on December 31, 1998 and reflects the fees and expenses of Series V. The Russell 2500 Value Index is an unmanaged index that measures the performance of securities of small-to-mid cap U.S. companies with greater-than-average value orientation.
Average Annual Returns
Periods Ended 12-31-081 | 1 Year | 5 Years | 10 Years | ||||||
Series V | (28.46 | )% | 4.27 | % | 11.19 | % |
1 | Performance figures do not reflect fees and expenses associated with an investment in variable insurance products offered by Security Benefit Life Insurance Company. If returns had taken into account these fees and expenses, performance would have been lower. Shares of a Series of SBL Fund are available only through the purchase of such products. |
The performance data quoted above represents past performance. Past performance is not predictive of future performance. The investment return and principal value of an investment will fluctuate so that an investor’s shares, when redeemed, may be worth more or less than their original cost.
Portfolio Composition by Sector
Consumer Discretionary | 6.64 | % | |
Consumer Staples | 8.65 | ||
Energy | 8.62 | ||
Financials | 18.58 | ||
Health Care | 3.67 | ||
Industrials | 16.81 | ||
Information Technology | 14.47 | ||
Materials | 7.50 | ||
Utilities | 13.97 | ||
Convertible Bonds | 0.95 | ||
Warrants | 0.01 | ||
Cash & Other Assets, Less Liabilities | 0.13 | ||
Total Net Assets | 100.00 | % | |
The accompanying notes are an integral part of the financial statements
128
Table of Contents
| Series V | ||
| Performance Summary | (Mid Cap Value Series) | |
| December 31, 2008 | (unaudited) |
Information About Your Series Expenses
Calculating your ongoing Series expenses
Example
As a shareholder of the Series, you incur ongoing costs, including management fees and other series expenses. Performance figures and expense ratios do not reflect fees and expenses associated with an investment in variable insurance products. Shares of a Series of SBL Fund are available only through the purchase of such products. This example is intended to help you understand your ongoing costs (in dollars) of investing in the Series and to compare these costs with ongoing costs of investing in other mutual funds. The example is based on an investment of $1,000 invested at the beginning of the period and held for the entire period, July 1, 2008 through December 31, 2008.
Actual Expenses
The first line in the table provides information about actual account values and actual expenses. You may use the information in this table, together with the amount you invested, to estimate the expenses that you paid over the period. Simply divide your account value by $1,000 (for example, an $8,600 account value divided by $1,000 = 8.6), then multiply the result by the number in the table under the heading entitled “Expenses Paid During the Period” to estimate the expenses you paid on your account during this period.
Hypothetical Example for Comparison Purposes
The second line in the table provides information about hypothetical account values and hypothetical expenses based on the Series actual expense ratio and an assumed rate of return of 5% per year before expenses, which is not the Series actual return. The hypothetical account values and expenses may not be used to estimate the actual ending account balance or expenses you paid for the period. You may use this information to compare the ongoing costs of investing in the Series and other funds. To do so, compare this 5% hypothetical example with the 5% hypothetical examples that appear in the shareholder reports of the other mutual funds.
Please note that the expenses shown in the table are meant to highlight your ongoing costs only and do not reflect any fees and expenses associated with an investment in variable insurance products. Therefore, the second line is useful in comparing ongoing costs only, and will not help you determine the relative total costs of owning different funds. In addition, if these fees and expenses associated with an investment in variable insurance products were included, your costs would have been higher.
Series Expenses
| Beginning Account Value 7/1/2008 | Ending Account Value 12/31/20081 | Expenses Paid During Period2 | |||||||
Series V (Mid Cap Value Series) | |||||||||
Actual | $ | 1,000.00 | $ | 780.76 | $ | 4.12 | |||
Hypothetical | 1,000.00 | 1,020.51 | 4.67 | ||||||
1 | The actual ending account value is based on the actual total return of the Series for the period July 1, 2008 to December 31, 2008 after actual expenses and will differ from the hypothetical ending account value which is based on the Series expense ratio and a hypothetical annual return of 5% before expenses. The actual cumulative return at net asset value for the period July 1, 2008 to December 31, 2008 was (21.92%). |
2 | Expenses are equal to the Series annualized expense ratio of 0.92%, net of any applicable fee waivers, multiplied by the average account value over the period, multiplied by 184/366 (to reflect the one-half year period). |
129
Table of Contents
| Schedule of Investments | Series V | |
December 31, 2008 | (Mid Cap Value Series) |
| Shares | Value | ||||
COMMON STOCKS—99.0% | |||||
Aerospace & Defense—0.4% | |||||
Argon ST, Inc.* | 57,475 | $ | 1,083,979 | ||
Apparel Retail—2.3% | |||||
Brown Shoe Company, Inc. | 301,800 | 2,556,246 | |||
Chico’s FAS, Inc.* | 583,800 | 2,440,284 | |||
Talbots, Inc. | 407,300 | 973,447 | |||
| 5,969,977 | |||||
Apparel, Accessories & Luxury Goods—2.1% | |||||
Fossil, Inc.* | 86,800 | 1,449,560 | |||
Maidenform Brands, Inc.* | 247,500 | 2,512,125 | |||
Oxford Industries, Inc. | 125,600 | 1,101,512 | |||
| 5,063,197 | |||||
Application Software—0.2% | |||||
EPIQ Systems, Inc.* | 8,237 | 137,640 | |||
PLATO Learning, Inc.1,* | 315,750 | 378,900 | |||
| 516,540 | |||||
Auto Parts & Equipment—0.0% | |||||
HydroGen Corporation 1,2,* | 672,346 | 6,723 | |||
Biotechnology—0.1% | |||||
Combinatorx, Inc.* | 298,400 | 185,008 | |||
Building Products—0.9% | |||||
Trex Company, Inc.* | 132,100 | 2,174,366 | |||
Coal & Consumable Fuels—1.6% | |||||
Evergreen Energy, Inc.* | 1,495,600 | 433,724 | |||
USEC, Inc.* | 771,700 | 3,464,933 | |||
| 3,898,657 | |||||
Communications Equipment—1.3% | |||||
EF Johnson Technologies, Inc.1,* | 404,000 | 541,360 | |||
Symmetricom, Inc.1,* | 680,680 | 2,688,686 | |||
| 3,230,046 | |||||
Computer Storage & Peripherals—0.3% | |||||
STEC, Inc.* | 144,650 | 616,209 | |||
Construction & Engineering—5.1% | |||||
Insituform Technologies, Inc.* | 299,300 | 5,893,216 | |||
Quanta Services, Inc.* | 162,700 | 3,221,460 | |||
URS Corporation* | 84,820 | 3,458,111 | |||
| 12,572,787 | |||||
Construction Materials—1.0% | |||||
Eagle Materials, Inc. | 128,800 | 2,371,208 | |||
Consumer Finance—0.3% | |||||
First Marblehead Corporation* | 543,607 | 701,253 | |||
Data Processing & Outsourced Services—7.1% | |||||
Affiliated Computer Services, Inc.* | 188,100 | 8,643,195 | |||
Computer Sciences Corporation* | 233,000 | 8,187,620 | |||
Gevity HR, Inc. | 366,200 | 552,962 | |||
| 17,383,777 | |||||
Electric Utilities—8.1% | |||||
Allete, Inc. | 78,351 | 2,528,387 | |||
Empire District Electric Company | 86,460 | 1,521,696 | |||
Great Plains Energy, Inc. | 307,600 | 5,945,908 | |||
Northeast Utilities | 141,700 | 3,409,302 | |||
Pepco Holdings, Inc. | 137,500 | 2,442,000 | |||
Westar Energy, Inc. | 192,100 | 3,939,971 | |||
| 19,787,264 | |||||
Electrical Components & Equipment—1.4% | |||||
Power-One, Inc.1,* | 2,543,400 | 3,026,646 | |||
UQM Technologies, Inc.1,* | 282,466 | 353,083 | |||
| 3,379,729 | |||||
Electronic Manufacturing Services—1.1% | |||||
Maxwell Technologies, Inc.1,* | 553,600 | 2,806,752 | |||
Forest Products—0.3% | |||||
Louisiana-Pacific Corporation | 399,600 | 623,376 | |||
Gas Utilities—1.5% | |||||
Atmos Energy Corporation | 155,000 | 3,673,500 | |||
Health Care Equipment—0.3% | |||||
Aspect Medical Systems, Inc.* | 203,500 | 685,795 | |||
Health Care Facilities—1.2% | |||||
Community Health Systems, Inc.* | 207,900 | 3,031,182 | |||
Health Care Services—2.1% | |||||
Pediatrix Medical Group, Inc.* | 107,500 | 3,407,750 | |||
Providence Service Corporation* | 42,700 | 61,915 | |||
RehabCare Group, Inc.* | 105,930 | 1,605,899 | |||
| 5,075,564 | |||||
Highways & Railtracks—0.6% | |||||
Quixote Corporation1 | 222,000 | 1,443,000 | |||
Home Furnishings—1.7% | |||||
Leggett & Platt, Inc. | 270,300 | 4,105,857 | |||
Human Resource & Employment Services—0.8% | |||||
Administaff, Inc.3 | 93,900 | 2,031,996 | |||
Industrial Conglomerates—1.0% | |||||
McDermott International, Inc.* | 249,200 | 2,462,096 | |||
Industrial Machinery—1.2% | |||||
Harsco Corporation | 84,600 | 2,341,728 | |||
Thermoenergy Corporation1,* | 1,271,793 | 572,307 | |||
| 2,914,035 | |||||
Mortgage REIT’s—0.0% | |||||
Bimini Capital Management, Inc.1,* | 768,100 | 26,884 | |||
Multi-Line Insurance—1.9% | |||||
American Financial Group, Inc.3 | 205,250 | 4,696,120 | |||
Multi-Utilities—4.4% | |||||
NorthWestern Corporation | 218,500 | 5,128,195 | |||
SCANA Corporation3 | 135,200 | 4,813,120 | |||
TECO Energy, Inc. | 64,300 | 794,105 | |||
| 10,735,420 | |||||
The accompanying notes are an integral part of the financial statements
130
Table of Contents
| Schedule of Investments | Series V | |
December 31, 2008 | (Mid Cap Value Series) |
| Shares | Value | |||||
COMMON STOCKS—99.0% (continued) | ||||||
Oil & Gas Drilling—1.4% | ||||||
Helmerich & Payne, Inc. | 154,550 | $ | 3,516,013 | |||
Oil & Gas Equipment & Services—1.3% | ||||||
Global Industries, Ltd.* | 893,300 | 3,117,617 | ||||
Oil & Gas Exploration & Production—2.9% | ||||||
Goodrich Petroleum Corporation* | 32,700 | 979,365 | ||||
Gulfport Energy Corporation* | 249,600 | 985,920 | ||||
Newfield Exploration Company4,* | 108,600 | 2,144,850 | ||||
PetroHawk Energy Corporation* | 194,000 | 3,032,220 | ||||
| 7,142,355 | ||||||
Oil & Gas Refining & Marketing—0.0% | ||||||
Nova Biosource Fuels, Inc.* | 1,154,800 | 115,480 | ||||
Oil & Gas Storage & Transportation—1.4% | ||||||
Southern Union Company | 255,100 | 3,326,504 | ||||
Packaged Foods & Meats—8.7% | ||||||
Del Monte Foods Company | 196,000 | 1,399,440 | ||||
Hormel Foods Corporation3 | 230,600 | 7,167,048 | ||||
JM Smucker Company | 133,500 | 5,788,560 | ||||
Smithfield Foods, Inc.* | 334,600 | 4,707,822 | ||||
TreeHouse Foods, Inc.* | 78,000 | 2,124,720 | ||||
| 21,187,590 | ||||||
Paper Packaging—4.4% | ||||||
Bemis Company, Inc. | 284,000 | 6,725,120 | ||||
Sonoco Products Company | 188,550 | 4,366,818 | ||||
| 11,091,938 | ||||||
Paper Products—1.3% | ||||||
Schweitzer-Mauduit International, Inc. | 154,400 | 3,091,088 | ||||
Property & Casualty Insurance—9.5% | ||||||
Alleghany Corporation* | 14,937 | 4,212,234 | ||||
Assured Guaranty, Ltd.3 | 157,100 | 1,790,940 | ||||
Employers Holdings, Inc. | 127,800 | 2,108,700 | ||||
Hanover Insurance Group, Inc. | 150,100 | 6,449,797 | ||||
United America Indemnity, Ltd.* | 111,740 | 1,431,389 | ||||
W.R. Berkley Corporation | 230,100 | 7,133,100 | ||||
| 23,126,160 | ||||||
Railroads—0.2% | ||||||
Kansas City Southern* | 25,000 | 476,250 | ||||
Regional Banks—6.9% | ||||||
Commerce Bancshares, Inc.3 | 115,080 | 5,057,766 | ||||
First Horizon National Corporation3 | 188,805.8 | 1,995,677 | ||||
Old National Bancorp3 | 72,350 | 1,313,876 | ||||
Wilmington Trust Corporation | 386,190 | 8,588,866 | ||||
| 16,956,185 | ||||||
Research & Consulting Services—2.8% | ||||||
ICF International, Inc.* | 137,800 | 3,385,746 | ||||
Navigant Consulting, Inc.3,* | 216,600 | 3,437,442 | ||||
| 6,823,188 | ||||||
Restaurants—0.5% | ||||||
Red Robin Gourmet Burgers, Inc.* | 66,500 | 1,119,195 | ||||
Security & Alarm Services—1.3% | ||||||
GeoEye, Inc.* | 166,260 | 3,197,180 | ||||
Semiconductor Equipment—0.9% | ||||||
Ultratech, Inc.* | 176,500 | 2,110,940 | ||||
Semiconductors—3.6% | ||||||
IXYS Corporation1 | 993,800 | 8,208,788 | ||||
RF Micro Devices, Inc.* | 724,600 | 565,188 | ||||
| 8,773,976 | ||||||
Specialty Chemicals—0.5% | ||||||
Landec Corporation* | 64,448 | 424,068 | ||||
Zoltek Companies, Inc.* | 84,500 | 759,655 | ||||
| 1,183,723 | ||||||
Trucking—1.1% | ||||||
Old Dominion Freight Line, Inc.* | 28,380 | 807,695 | ||||
Saia, Inc.* | 165,690 | 1,799,393 | ||||
| 2,607,088 | ||||||
TOTAL COMMON STOCKS (cost $350,973,931) | $ | 242,214,767 | ||||
| Shares | Value | |||||
WARRANTS—0.0% | ||||||
Electric City Corporation | ||||||
$1.00, 3/19/2009 | 3,333 | 1,920 | ||||
Nova Biosource Fuels, Inc. | ||||||
$2.40, 7/5/2011 | 369,350 | 23,892 | ||||
TOTAL WARRANTS (cost $709,239) | $ | 25,812 | ||||
| Principal Amount | Value | |||||
CONVERTIBLE BONDS—0.9% | ||||||
Electric Utilities—0.3% | ||||||
Power-One, Inc. | ||||||
8.00%, 20135,6 | $ | 1,000,000 | $ | 847,810 | ||
Metals & Minerals—0.6% | ||||||
USEC, Inc. | ||||||
3.00%, 2014 | 3,500,000 | 1,474,375 | ||||
TOTAL CONVERTIBLE BONDS (cost $4,500,000) | $ | 2,322,185 | ||||
Total Investments—99.9% (cost $356,183,170) | $ | 244,562,764 | ||||
Cash & Other Assets, Less Liabilities—0.1% | 321,407 | |||||
Total Net Assets—100.0% | $ | 244,884,171 | ||||
For federal income tax purposes the identified cost of investments owned at December 31, 2008 was $356,183,170.
| * | Non-income producing security |
1 | Security is deemed illiquid. The total market value of illiquid securities is $20,053,129 (cost $51,859,717), or 8.2% of total net assets. |
The accompanying notes are an integral part of the financial statements
131
Table of Contents
| Schedule of Investments | Series V | |
December 31, 2008 | (Mid Cap Value Series) |
2 | Investment in an affiliated issuer. The total market value of affiliated issues is $6,723 (cost $2,571,575), or 0.0% of total net assets. See Note 7 in notes to financials. |
3 | Security is segregated as collateral for open written option contracts. |
4 | Portion of security is delayed in delivery due to executing broker’s bankruptcy declaration. |
5 | Security was acquired through a private placement. |
6 | Security is a 144A or Section 4(2) security. The total market value of 144A or Section 4(2) securities is $847,810 (cost $1,000,000), or 0.3% of total net assets. |
The accompanying notes are an integral part of the financial statements
132
Table of Contents
| Series V | ||
| (Mid Cap Value Series) |
Statement of Assets and Liabilities
December 31, 2008
Assets: | ||||
Investments in unaffiliated issues, at value* | $ | 244,556,041 | ||
Investments in affiliated issues, at value** | 6,723 | |||
Total investments | 244,562,764 | |||
Cash | 1,925,757 | |||
Receivables: | ||||
Fund shares sold | 218,736 | |||
Securities sold | 518,661 | |||
Interest | 26,983 | |||
Dividends | 277,912 | |||
Prepaid expenses | 6,598 | |||
Total assets | 247,537,411 | |||
Liabilities: | ||||
Payable for: | ||||
Fund shares redeemed | 145,238 | |||
Securities purchased | 1,689,711 | |||
Written options, at value (premiums received $1,353,443) | 583,085 | |||
Management fees | 147,019 | |||
Administration fees | 19,072 | |||
Transfer agent/maintenance fees | 2,084 | |||
Custodian fees | 2,745 | |||
Directors’ fees | 8,559 | |||
Professional fees | 41,377 | |||
Other fees | 14,350 | |||
Total liabilities | 2,653,240 | |||
Net assets | $ | 244,884,171 | ||
Net assets consist of: | ||||
Paid in capital | $ | 333,515,946 | ||
Undistributed net investment income | 3,755,588 | |||
Undistributed net realized gain on sale of investments | 18,462,685 | |||
Net unrealized depreciation in value of investments | (110,850,048 | ) | ||
Net assets | $ | 244,884,171 | ||
Capital shares authorized | unlimited | |||
Capital shares outstanding | 7,185,136 | |||
Net asset value per share (net assets divided by shares outstanding) | $ | 34.08 | ||
*Investments in unaffiliated issues, at cost | $ | 353,611,595 | ||
**Investments in affiliated issues, at cost | 2,571,575 | |||
Total cost | $ | 356,183,170 | ||
Statement of Operations
For Year Ended December 31, 2008
Investment Income: | ||||
Dividends | $ | 6,378,164 | ||
Interest | 328,930 | |||
Total investment income | 6,707,094 | |||
Expenses: | ||||
Management fees | 2,444,876 | |||
Administration fees | 311,463 | |||
Transfer agent/maintenance fees | 25,199 | |||
Custodian fees | 24,295 | |||
Directors’ fees | 27,195 | |||
Professional fees | 58,585 | |||
Reports to shareholders | 40,605 | |||
Other | 19,305 | |||
Total expenses | 2,951,523 | |||
Less: | ||||
Earnings credits applied | (17 | ) | ||
Net expenses | 2,951,506 | |||
Net investment income | 3,755,588 | |||
Net Realized and Unrealized Gain (Loss): | ||||
Net realized gain (loss) during the year on: | ||||
Investments | 16,288,118 | |||
Options written | 2,156,861 | |||
Net realized gain | 18,444,979 | |||
Net unrealized appreciation (depreciation) during the year on: | ||||
Investments | (127,649,774 | ) | ||
Options written | 767,310 | |||
Net unrealized depreciation | (126,882,464 | ) | ||
Net realized and unrealized loss | (108,437,485 | ) | ||
Net decrease in net assets resulting from operations | $ | (104,681,897 | ) | |
The accompanying notes are an integral part of the financial statements
133
Table of Contents
| Series V | ||
| Statement of Changes in Net Assets | (Mid Cap Value Series) |
| Year Ended December 31, 2008 | Year Ended December 31, 2007 | |||||||
Increase (decrease) in net assets from operations: | ||||||||
Net investment income | $ | 3,755,588 | $ | 3,272,054 | ||||
Net realized gain during the year on investments | 18,444,979 | 104,209,879 | ||||||
Net unrealized depreciation during the year on investments | (126,882,464 | ) | (97,356,058 | ) | ||||
Net increase (decrease) in net assets resulting from operations | (104,681,897 | ) | 10,125,875 | |||||
Capital share transactions: | ||||||||
Proceeds from sale of shares | 69,838,112 | 122,735,639 | ||||||
Cost of shares redeemed | (129,483,458 | ) | (170,920,635 | ) | ||||
Net decrease from capital share transactions | (59,645,346 | ) | (48,184,996 | ) | ||||
Net decrease in net assets | (164,327,243 | ) | (38,059,121 | ) | ||||
Net assets: | ||||||||
Beginning of year | 409,211,414 | 447,270,535 | ||||||
End of year | $ | 244,884,171 | $ | 409,211,414 | ||||
Undistributed net investment income at end of year | $ | 3,755,588 | $ | 3,273,887 | ||||
Capital share activity: | ||||||||
Shares sold | 1,669,587 | 2,510,740 | ||||||
Shares redeemed | (3,074,205 | ) | (3,481,740 | ) | ||||
Total capital share activity | (1,404,618 | ) | (971,000 | ) | ||||
The accompanying notes are an integral part of the financial statements
134
Table of Contents
| Financial Highlights | Series V | |
Selected data for each share of capital stock outstanding throughout each year | (Mid Cap Value Series) |
| 2008 | 2007 | 2006 | 2005 | Year Ended December 31, 2004 | ||||||||||||||||
Per Share Data | ||||||||||||||||||||
Net asset value, beginning of period | $ | 47.64 | $ | 46.78 | $ | 40.79 | $ | 35.10 | $ | 28.33 | ||||||||||
Income (loss) from investment operations: | ||||||||||||||||||||
Net investment incomea | 0.49 | 0.36 | 0.44 | 0.14 | 0.11 | |||||||||||||||
Net gain (loss) on securities (realized and unrealized) | (14.05 | ) | 0.50 | 5.55 | 5.55 | 7.39 | ||||||||||||||
Total from investment operations | (13.56 | ) | 0.86 | 5.99 | 5.69 | 7.50 | ||||||||||||||
Less distributions: | ||||||||||||||||||||
Dividends from net investment income | — | — | — | — | (0.01 | ) | ||||||||||||||
Distributions from realized gains | — | — | — | — | (0.72 | ) | ||||||||||||||
Total distributions | — | — | — | — | (0.73 | ) | ||||||||||||||
Net asset value, end of period | $ | 34.08 | $ | 47.64 | $ | 46.78 | $ | 40.79 | $ | 35.10 | ||||||||||
Total Returnb | (28.46 | )% | 1.84 | % | 14.66 | % | 16.21 | % | 26.97 | % | ||||||||||
Ratios/Supplemental Data | ||||||||||||||||||||
Net assets, end of period (in thousands) | $ | 244,884 | $ | 409,211 | $ | 447,271 | $ | 384,494 | $ | 307,536 | ||||||||||
Ratios to average net assets: | ||||||||||||||||||||
Net investment income | 1.15 | % | 0.73 | % | 1.01 | % | 0.44 | % | 0.37 | % | ||||||||||
Total expensesc | 0.91 | % | 0.89 | % | 0.89 | % | 0.90 | % | 0.88 | % | ||||||||||
Net expensesd | 0.91 | % | 0.89 | % | 0.89 | % | 0.90 | % | 0.88 | % | ||||||||||
Net expenses prior to custodian earnings credits and net of expense waivers | 0.91 | % | 0.89 | % | 0.89 | % | 0.90 | % | 0.88 | % | ||||||||||
Portfolio turnover rate | 56 | % | 45 | % | 42 | % | 29 | % | 43 | % | ||||||||||
a | Net investment income (loss) was computed using average shares outstanding throughout the period. |
b | Total return does not take into account any of the expenses associated with an investment in variable insurance products offered by Security Benefit Life Insurance Company. If total return had taken into account these expenses, performance would have been lower. Shares of a series of SBL Fund are available only through the purchase of such products. |
c | Total expense information reflects the expense ratios absent expense reductions by the Investment Manager and earnings credits, as applicable. |
d | Net expense information reflects the expense ratios after voluntary expense waivers, reimbursements and custodian earnings credits, as applicable. |
The accompanying notes are an integral part of the financial statements
135
Table of Contents
This page left blank intentionally.
136
Table of Contents
| Manager’s Commentary | Series X | |
February 16, 2009 | (Small Cap Growth Series) |


Joseph C. O’Connor
Portfolio Manager
To Our Shareholders:
Series X of the SBL Fund - Small Cap Growth Series declined –47.22% for the year, compared with a –38.54% drop in the Russell 2000 Growth Index.
Overall, 2008 was a year in which investors found few safe harbors. Most major sectors of the Index experienced declines of more than 30%, with some sectors losing over 50%. Hardest hit in this environment were companies with weak balance sheets that relied on excess leverage. Investors will remember the markets of 2008 for many years, and perhaps for decades, as one of the most turbulent periods in the modern history of equity markets.
Sector Review
Health care and financial stocks detracted most significantly from relative performance. We believed that these economic sectors were in a position to weather a U.S. consumer-led recession and a global commodities-led slowdown, and they did decline by less within our benchmark than the Index in aggregate. Nonetheless, poor stock selection led to relative losses for the portfolio. On the positive side, solid stock selection in the energy sectors where we had anticipated challenges, aided relative returns.
During the year, the health care sector detracted significantly from returns on both an absolute and relative basis. Key holdings included RTI Biologics, which performed poorly as the business was hampered by the macro economic environment.
While our relative overweighting in the financial services sector aided relative results, this benefit was more than offset by poor stock selection in the sector. We had particular trouble in the area of payments processing, which we had expected to be recession-resistant. Declines in two large holdings, Cardtronics and TNS, Inc., were primarily due to currency impacts and collateral damage from the consolidation and business failures in the financial services industry. In the case of Cardtronics, self-inflicted execution issues compounded the company’s troubles.
Market Outlook
During these challenging times, and always, we remain committed to our principles of investing in fast growing, high-margin companies with unique proprietary advantages and strong management teams. While the stock market punished all sectors and styles in the fourth quarter, our style was clearly not rewarded on an absolute basis. Nonetheless, we have not changed our investment process and we believe that, once the economy recovers and investment horizons lengthen, our fundamental research may be rewarded.
In this environment, we are finding an incredible number of exciting, fast-growing companies selling, in many cases, at extremely depressed valuations. In addition, historical data strongly suggests that small-cap stocks may outperform coming out of a period of economic weakness. These factors have resulted in our having many opportunities to buy stocks of attractive companies at low prices.
Above all, we are committed to focusing on our core expertise and investment process. As fellow investors in the strategy, we thank you for your long-term investment.
Sincerely,
Joseph C. O’Connor, Portfolio Manager
137
Table of Contents
| Series X | ||
| Performance Summary | (Small Cap Growth Series) | |
December 31, 2008 | (unaudited) |
PERFORMANCE
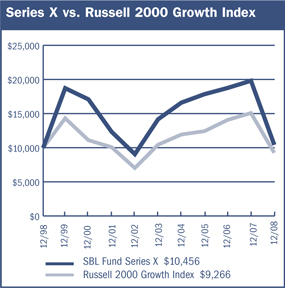
$10,000 Over 10 Years
The chart above assumes a hypothetical $10,000 investment in Series X (Small Cap Growth Series) on December 31, 1998 and reflects the fees and expenses of Series X. The Russell 2000 Growth Index measures the performance of those Russell 2000 companies with higher price-to-book ratios and higher forecasted growth values.
Average Annual Returns
Periods Ended 12-31-081 | 1 Year | 5 Years | 10 Years | ||||||
Series X | (47.22 | )% | (5.89 | )% | 0.45 | % |
1 | Performance figures do not reflect fees and expenses associated with an investment in variable insurance products offered by Security Benefit Life Insurance Company. If returns had taken into account these fees and expenses, performance would have been lower. Shares of a Series of SBL Fund are available only through the purchase of such products. |
The performance data quoted above represents past performance. Past performance is not predictive of future performance. The investment return and principal value of an investment will fluctuate so that an investor’s shares, when redeemed, may be worth more or less than their original cost.
Portfolio Composition by Sector
Consumer Discretionary | 12.69 | % | |
Consumer Staples | 4.76 | ||
Energy | 6.28 | ||
Financials | 8.70 | ||
Health Care | 14.35 | ||
Industrials | 12.97 | ||
Information Technology | 16.62 | ||
Materials | 4.71 | ||
Telecommunication Services | 1.54 | ||
Utilities | 1.41 | ||
Exchange Traded Funds | 10.18 | ||
Cash & Other Assets, Less Liabilities | 5.79 | ||
Total Net Assets | 100.00 | % | |
The accompanying notes are an integral part of the financial statements
138
Table of Contents
| Series X | ||
| Performance Summary | (Small Cap Growth Series) | |
| December 31, 2008 | (unaudited) |
Information About Your Series Expenses
Calculating your ongoing Series expenses
Example
As a shareholder of the Series, you incur ongoing costs, including management fees and other series expenses. Performance figures and expense ratios do not reflect fees and expenses associated with an investment in variable insurance products. Shares of a Series of SBL Fund are available only through the purchase of such products. This example is intended to help you understand your ongoing costs (in dollars) of investing in the Series and to compare these costs with ongoing costs of investing in other mutual funds. The example is based on an investment of $1,000 invested at the beginning of the period and held for the entire period, July 1, 2008 through December 31, 2008.
Actual Expenses
The first line in the table provides information about actual account values and actual expenses. You may use the information in this table, together with the amount you invested, to estimate the expenses that you paid over the period. Simply divide your account value by $1,000 (for example, an $8,600 account value divided by $1,000 = 8.6), then multiply the result by the number in the table under the heading entitled “Expenses Paid During the Period” to estimate the expenses you paid on your account during this period.
Hypothetical Example for Comparison Purposes
The second line in the table provides information about hypothetical account values and hypothetical expenses based on the Series actual expense ratio and an assumed rate of return of 5% per year before expenses, which is not the Series actual return. The hypothetical account values and expenses may not be used to estimate the actual ending account balance or expenses you paid for the period. You may use this information to compare the ongoing costs of investing in the Series and other funds. To do so, compare this 5% hypothetical example with the 5% hypothetical examples that appear in the shareholder reports of the other mutual funds.
Please note that the expenses shown in the table are meant to highlight your ongoing costs only and do not reflect any fees and expenses associated with an investment in variable insurance products. Therefore, the second line is useful in comparing ongoing costs only, and will not help you determine the relative total costs of owning different funds. In addition, if these fees and expenses associated with an investment in variable insurance products were included, your costs would have been higher.
Series Expenses
| Beginning Account Value 7/1/2008 | Ending Account Value 12/31/20081 | Expenses Paid During Period2 | |||||||
Series X (Small Cap Growth Series) | |||||||||
Actual | $ | 1,000.00 | $ | 647.77 | $ | 5.18 | |||
Hypothetical | 1,000.00 | 1,018.85 | 6.34 | ||||||
1 | The actual ending account value is based on the actual total return of the Series for the period July 1, 2008 to December 31, 2008 after actual expenses and will differ from the hypothetical ending account value which is based on the Series expense ratio and a hypothetical annual return of 5% before expenses. The actual cumulative return at net asset value for the period July 1, 2008 to December 31, 2008 was (35.22%). |
2 | Expenses are equal to the Series annualized expense ratio of 1.25%, net of any applicable fee waivers, multiplied by the average account value over the period, multiplied by 184/366 (to reflect the one-half year period). |
139
Table of Contents
| Schedule of Investments | Series X | |
December 31, 2008 | (Small Cap Growth Series) |
| Shares | Value | ||||
COMMON STOCKS—94.2% | |||||
Apparel, Accessories & Luxury Goods—2.5% | |||||
FGX International Holdings, Ltd. * | 37,200 | $ | 511,128 | ||
Hanesbrands, Inc. * | 19,000 | 242,250 | |||
| 753,378 | |||||
Application Software—2.9% | |||||
Informatica Corporation * | 33,400 | 458,582 | |||
Solera Holdings, Inc. * | 19,200 | 462,720 | |||
| 921,302 | |||||
Asset Management & Custody Banks—0.9% | |||||
Westwood Holdings Group, Inc. | 9,200 | 261,372 | |||
Biotechnology—2.5% | |||||
GTx, Inc. * | 18,200 | 306,488 | |||
Martek Biosciences Corporation | 15,200 | 460,712 | |||
| 767,200 | |||||
Casinos & Gaming—3.1% | |||||
Penn National Gaming, Inc. * | 20,200 | 431,876 | |||
WMS Industries, Inc. * | 19,300 | 519,170 | |||
| 951,046 | |||||
Computer Storage & Peripherals—1.8% | |||||
QLogic Corporation * | 41,200 | 553,728 | |||
Construction & Farm Machinery & Heavy Trucks—1.7% | |||||
Wabtec Corporation | 13,000 | 516,750 | |||
Data Processing & Outsourced Services—1.7% | |||||
CSG Systems International, Inc. * | 29,900 | 522,353 | |||
Diversified Chemicals—1.4% | |||||
Olin Corporation | 22,900 | 414,032 | |||
Diversified Support Services—1.5% | |||||
Ritchie Bros Auctioneers, Inc. | 20,600 | 441,252 | |||
Education Services—2.1% | |||||
Capella Education Company * | 5,000 | 293,800 | |||
DeVry, Inc. | 6,000 | 344,460 | |||
| 638,260 | |||||
Electric Utilities—1.4% | |||||
ITC Holdings Corporation | 9,800 | 428,064 | |||
Electronic Equipment & Instruments—1.7% | |||||
Rofin-Sinar Technologies, Inc. * | 24,500 | 504,210 | |||
Environmental & Facilities Services—1.8% | |||||
Clean Harbors, Inc. * | 8,500 | 539,240 | |||
Exchange Traded Funds—10.2% | |||||
iShares Russell 2000 Growth Index Fund | 60,600 | 3,082,116 | |||
Fertilizers & Agricultural Chemicals—2.0% | |||||
Agrium, Inc. | 9,200 | 313,996 | |||
Terra Industries, Inc. | 18,500 | 308,395 | |||
| 622,391 | |||||
Health Care Equipment—2.8% | |||||
NuVasive, Inc. * | 7,950 | 275,468 | |||
Wright Medical Group, Inc. * | 26,600 | 543,438 | |||
| 818,906 | |||||
Health Care Facilities—1.3% | |||||
Psychiatric Solutions, Inc. * | 13,900 | 387,115 | |||
Health Care Services—2.4% | |||||
CardioNet, Inc. * | 13,200 | 325,380 | |||
LHC Group, Inc. * | 11,300 | 406,800 | |||
| 732,180 | |||||
Homebuilding—1.0% | |||||
KB Home | 21,600 | 294,192 | |||
Household Products—1.3% | |||||
Church & Dwight Company, Inc. | 7,000 | 392,840 | |||
Human Resource & Employment Services—2.0% | |||||
Watson Wyatt Worldwide, Inc. | 12,600 | 602,532 | |||
Hypermarkets & Super Centers—1.3% | |||||
BJ’s Wholesale Club, Inc. * | 11,800 | 404,268 | |||
Industrial Machinery—3.7% | |||||
Badger Meter, Inc. | 19,000 | 551,380 | |||
CIRCOR International, Inc. | 13,800 | 379,500 | |||
Thermoenergy Corporation 1,* | 453,800 | 204,210 | |||
| 1,135,090 | |||||
Internet Software & Services—1.0% | |||||
Constant Contact, Inc. * | 22,700 | 300,775 | |||
Investment Banking & Brokerage—2.7% | |||||
Knight Capital Group, Inc. * | 20,100 | 324,615 | |||
Stifel Financial Corporation * | 11,300 | 518,105 | |||
| 842,720 | |||||
IT Consulting & Other Services—1.3% | |||||
SRA International, Inc. * | 22,000 | 379,500 | |||
Leisure Facilities—1.3% | |||||
Life Time Fitness, Inc. * | 29,400 | 380,730 | |||
Life Sciences Tools & Services—1.9% | |||||
PerkinElmer, Inc. | 22,300 | 310,193 | |||
Techne Corporation | 4,300 | 277,436 | |||
| 587,629 | |||||
Managed Health Care—1.6% | |||||
Magellan Health Services, Inc. * | 12,400 | 485,584 | |||
Multi-Line Insurance—2.7% | |||||
Assurant, Inc. | 10,400 | 312,000 | |||
The accompanying notes are an integral part of the financial statements
140
Table of Contents
| Schedule of Investments | Series X | |
| December 31, 2008 | (Small Cap Growth Series) |
| Shares | Value | ||||
COMMON STOCKS—94.2% (continued) | |||||
Multi-Line Insurance—2.7% (continued) | |||||
HCC Insurance Holdings, Inc. | 18,600 | $ | 497,550 | ||
| 809,550 | |||||
Oil & Gas Equipment & Services—1.6% | |||||
Oil States International, Inc. * | 11,600 | 216,804 | |||
Superior Energy Services, Inc. * | 17,300 | 275,589 | |||
| 492,393 | |||||
Oil & Gas Exploration & Production—4.7% | |||||
Bill Barrett Corporation * | 16,900 | 357,097 | |||
Comstock Resources, Inc. * | 8,400 | 396,900 | |||
Goodrich Petroleum Corporation * | 11,900 | 356,405 | |||
Petroquest Energy, Inc. * | 44,300 | 299,468 | |||
| 1,409,870 | |||||
Packaged Foods & Meats—2.2% | |||||
Dean Foods Company * | 18,000 | 323,460 | |||
Green Mountain Coffee Roasters, Inc. * | 8,300 | 321,210 | |||
| 644,670 | |||||
Pharmaceuticals—1.9% | |||||
Perrigo Company | 17,600 | 568,656 | |||
Property & Casualty Insurance—1.1% | |||||
ProAssurance Corporation * | 6,100 | 321,958 | |||
Railroads—1.3% | |||||
Kansas City Southern * | 20,400 | 388,620 | |||
Regional Banks—1.3% | |||||
TCF Financial Corporation | 29,200 | 398,872 | |||
Research & Consulting Services—1.0% | |||||
FTI Consulting, Inc. * | 6,800 | 303,824 | |||
Restaurants—2.7% | |||||
Burger King Holdings, Inc. | 19,800 | 472,824 | |||
Red Robin Gourmet Burgers, Inc. * | 21,000 | 353,430 | |||
| 826,254 | |||||
Semiconductor Equipment—0.6% | |||||
Tessera Technologies, Inc. * | 16,000 | 190,080 | |||
Semiconductors—2.1% | |||||
Microsemi Corporation * | 23,600 | 298,304 | |||
Silicon Laboratories, Inc. * | 13,200 | 327,096 | |||
| 625,400 | |||||
Steel—1.3% | |||||
Haynes International, Inc. * | 15,800 | 388,996 | |||
Systems Software—1.6% | |||||
Sybase, Inc. * | 20,100 | 497,877 | |||
Technology Distributors—1.8% | |||||
Avnet, Inc. * | 29,600 | 539,016 | |||
Wireless Telecommunication Services—1.5% | |||||
NII Holdings, Inc. * | 25,600 | 465,408 | |||
TOTAL COMMON STOCKS (cost $27,203,600) | $ | 28,532,199 | |||
Total Investments—94.2% (cost $27,203,600) | $ | 28,532,199 | |||
Cash & Other Assets, Less Liabilities—5.8% | 1,751,936 | ||||
Total Net Assets—100.0% | $ | 30,284,135 | |||
For federal income tax purposes the identified cost of investments owned at December 31, 2008 was $27,384,912.
| * | Non-income producing security |
1 | Security is deemed illiquid. The total market value of illiquid securities is $204,210 (cost $222,362), or 0.7% of total net assets. |
The accompanying notes are an integral part of the financial statements
141
Table of Contents
| Series X | ||
| (Small Cap Growth Series) |
Statement of Assets and Liabilities
December 31, 2008
Assets: | ||||
Investments, at value* | $ | 28,532,199 | ||
Cash | 1,855,054 | |||
Receivables: | ||||
Fund shares sold | 16,726 | |||
Dividends | 7,016 | |||
Prepaid expenses | 783 | |||
Total assets | 30,411,778 | |||
Liabilities: | ||||
Payable for: | ||||
Fund shares redeemed | 26,353 | |||
Securities purchased | 56,490 | |||
Management fees | 20,715 | |||
Administration fees | 2,855 | |||
Transfer agent/maintenance fees | 2,084 | |||
Custodian fees | 2,117 | |||
Directors’ fees | 600 | |||
Professional fees | 11,429 | |||
Other fees | 5,000 | |||
Total liabilities | 127,643 | |||
Net assets | $ | 30,284,135 | ||
Net assets consist of: | ||||
Paid in capital | $ | 63,115,611 | ||
Accumulated net realized loss on sale of investments | (34,160,075 | ) | ||
Net unrealized appreciation in value of investments | 1,328,599 | |||
Net assets | $ | 30,284,135 | ||
Capital shares authorized | unlimited | |||
Capital shares outstanding | 2,820,892 | |||
Net asset value per share (net assets divided by shares outstanding) | $ | 10.74 | ||
| ||||
* Investments, at cost | $ | 27,203,600 | ||
Statement of Operations
For Year Ended December 31, 2008
Investment Income: | ||||
Dividends | $ | 123,431 | ||
Interest | 91,171 | |||
Total investment income | 214,602 | |||
Expenses: | ||||
Management fees | 486,393 | |||
Administration fees | 48,355 | |||
Transfer agent/maintenance fees | 25,194 | |||
Custodian fees | 20,425 | |||
Directors’ fees | 3,128 | |||
Professional fees | 15,133 | |||
Reports to shareholders | 3,340 | |||
Other | 3,464 | |||
Total expenses | 605,432 | |||
Less: | ||||
Earnings credits applied | (856 | ) | ||
Net expenses | 604,576 | |||
Net investment loss | (389,974 | ) | ||
Net Realized and Unrealized Gain (Loss): | ||||
Net realized gain (loss) during the year on: | ||||
Investments | (26,722,317 | ) | ||
Net realized loss | (26,722,317 | ) | ||
Net unrealized appreciation (depreciation) during the year on: | ||||
Investments | (3,538,566 | ) | ||
Net unrealized depreciation | (3,538,566 | ) | ||
Net realized and unrealized loss | (30,260,883 | ) | ||
Net decrease in net assets resulting from operations | $ | (30,650,857 | ) | |
The accompanying notes are an integral part of the financial statements
142
Table of Contents
| Series X | ||
| Statement of Changes in Net Assets | (Small Cap Growth Series) |
| Year Ended December 31, 2008 | Year Ended December 31, 2007 | |||||||
Increase (decrease) in net assets from operations: | ||||||||
Net investment loss | $ | (389,974 | ) | $ | (718,167 | ) | ||
Net realized gain (loss) during the year on investments | (26,722,317 | ) | 10,245,858 | |||||
Net unrealized depreciation during the year on investments | (3,538,566 | ) | (4,583,460 | ) | ||||
Net increase (decrease) in net assets resulting from operations | (30,650,857 | ) | 4,944,231 | |||||
Capital share transactions: | ||||||||
Proceeds from sale of shares | 14,256,113 | 23,646,791 | ||||||
Cost of shares redeemed | (35,153,979 | ) | (39,547,658 | ) | ||||
Net decrease from capital share transactions | (20,897,866 | ) | (15,900,867 | ) | ||||
Net decrease in net assets | (51,548,723 | ) | (10,956,636 | ) | ||||
Net assets: | ||||||||
Beginning of year | 81,832,858 | 92,789,494 | ||||||
End of year | $ | 30,284,135 | $ | 81,832,858 | ||||
Undistributed net investment income at end of year | $ | — | $ | — | ||||
Capital share activity: | ||||||||
Shares sold | 931,001 | 1,148,478 | ||||||
Shares redeemed | (2,130,808 | ) | (1,943,531 | ) | ||||
Total capital share activity | (1,199,807 | ) | (795,053 | ) | ||||
The accompanying notes are an integral part of the financial statements
143
Table of Contents
| Financial Highlights | Series X | |
Selected data for each share of capital stock outstanding throughout each year | (Small Cap Growth Series) |
| 2008a | 2007 | 2006 | 2005 | Year Ended December 31, 2004 | ||||||||||||||||
Per Share Data | ||||||||||||||||||||
Net asset value, beginning of period | $ | 20.35 | $ | 19.27 | $ | 18.33 | $ | 17.05 | $ | 14.55 | ||||||||||
Income (loss) from investment operations: | ||||||||||||||||||||
Net investment lossb | (0.12 | ) | (0.17 | ) | (0.13 | ) | (0.15 | ) | (0.14 | ) | ||||||||||
Net gain (loss) on securities (realized and unrealized) | (9.49 | ) | 1.25 | 1.07 | 1.43 | 2.64 | ||||||||||||||
Total from investment operations | (9.61 | ) | 1.08 | 0.94 | 1.28 | 2.50 | ||||||||||||||
Net asset value, end of period | $ | 10.74 | $ | 20.35 | $ | 19.27 | $ | 18.33 | $ | 17.05 | ||||||||||
Total Returnc | (47.22 | )% | 5.60 | % | 5.13 | % | 7.51 | % | 17.18 | % | ||||||||||
Ratios/Supplemental Data | ||||||||||||||||||||
Net assets, end of period (in thousands) | $ | 30,284 | $ | 81,833 | $ | 92,789 | $ | 90,671 | $ | 91,868 | ||||||||||
Ratios to average net assets: | ||||||||||||||||||||
Net investment loss | (0.80 | )% | (0.82 | )% | (0.66 | )% | (0.85 | )% | (0.89 | )% | ||||||||||
Total expensesd | 1.24 | % | 1.20 | % | 1.20 | % | 1.19 | % | 1.17 | % | ||||||||||
Net expensese | 1.24 | % | 1.20 | % | 1.19 | % | 1.18 | % | 1.17 | % | ||||||||||
Net expenses prior to custodian earnings credits and net of expense waivers | 1.24 | % | 1.20 | % | 1.20 | % | 1.19 | % | 1.17 | % | ||||||||||
Portfolio turnover rate | 209 | %f | 137 | % | 149 | % | 116 | % | 146 | % | ||||||||||
a | Security Global Investors, LLC (SGI) became the advisor of Series X effective November 24, 2008. Prior to November 24, 2008, SGI paid RS Investments, Inc. for sub-advisory services. |
b | Net investment income (loss) was computed using average shares outstanding throughout the period. |
c | Total return does not take into account any of the expenses associated with an investment in variable insurance products offered by Security Benefit Life Insurance Company. If total return had taken into account these expenses, performance would have been lower. Shares of a series of SBL Fund are available only through the purchase of such products. |
d | Total expense information reflects the expense ratios absent expense reductions by the Investment Manager and earnings credits, as applicable. |
e | Net expense information reflects the expense ratios after voluntary expense waivers, reimbursements and custodian earnings credits, as applicable. |
f | Significant variation in the portfolio turnover rate is due to Investment Manager’s appointment of new portfolio manager for the Series. |
The accompanying notes are an integral part of the financial statements
144
Table of Contents
| Manager’s Commentary | Series Y | |
| February 16, 2009 | (Select 25 Series) |


Mark Bronzo
Portfolio Manager
To Our Shareholders:
Series Y of the SBL Fund – Select 25 Series returned –37.07% in the year ended December 31, 2008, besting the benchmark Russell 1000 Growth Index’s return of –38.44% and the Series’ peer group median return of –41.55%. Underperforming stock selection was offset by sector positioning in 2008. A benchmark beating return during the most difficult calendar year in decades reinforces the belief that our approach delivers performance over the long-term.
Our strategy is to buy companies that are trading at a significant discount to their intrinsic value. Our investment approach is a defined and disciplined process of three clear philosophical tenets that drive our investment decisions: a valuation focus, a long-term perspective and an opportunistic approach.
Our investment process is fundamentally driven and quantitatively aided. We use proprietary screens to identify potential companies for investment and then perform rigorous fundamental analysis to identify the best ideas. Through this fundamental research, we determine an estimate of intrinsic value and thus a valuation target for each idea. We construct the portfolios based on the level of conviction generated by this bottom-up analysis and the upside/downside profile associated with each company. We ultimately structure the portfolio with 25-30 names.
Consumer Discretionary and Heath Care Top Performers
The Series’ consumer discretionary holdings declined –16% compared to a loss of –36% for the Index. McDonald’s Corporation was a material contributor in sector performance as the 3.5% position rose more than 8% for the year.
The health care sector also held losses to about half of the Index, –14% to –25%, respectively. Gilead Sciences, Inc. and Celgene Corporation, the largest weightings for the portfolio, helped to bolster the sector with returns of 11% and 20%, respectively.
Industrials and Information Technology Disappoint
The two worst performing sectors, industrials and information technology, held 40% of total Series’ assets. The industrials sector had a slight overweight with a 15% position and lost nearly 6% more than the benchmark with a return of –46% for the year. Significant positions in the sector all posted double–digit declines. Emerson Electric Company had a position of nearly 4% and was down –34%, while Burlington Northern Santa Fe Corporation, a 3% position, declined –20%. Both Deere & Company and Honeywell International, Inc. comprised about 2.5% of the portfolio and dropped –50% and –40%, respectively.
Holdings in the information technology sector lost –48%, more than 5% worse than the Index. Four positions in the sector held weightings of nearly 4% for more than 15% of the total portfolio. Hewlett-Packard Company lost -28% during the year, Oracle Corporation dropped –21%, Apple, Inc. plunged –57%, as did Google, Inc. by –56%.
Market Outlook
Our bottom-up approach looks at market uncertainty in the context of the potential long-term impact on individual companies. Often times, volatility provides opportunity, and the past year has been one of the most volatile markets in history. We are maintaining flexibility in the portfolios to take advantage of these opportunities as they arise. Our focus is on identifying companies with the ability to be substantially better over the next three to five years or have the potential to maintain their return on capital at current levels in a difficult economic environment. We are confident in our ability to find these companies.
Security Global Investors (SGI) acquired a proven investment team specializing in domestic growth equities. The new SGI growth team began managing assets of the Select 25 portfolio on February 1, 2008.
We believe that investing is a long-term pursuit that requires patience and a consistent approach. We recognize there are many investment fund alternatives available today and thank you for your business and the confidence you place in us.
Sincerely,
Mark Bronzo, Portfolio Manager
145
Table of Contents
| Series Y | ||
| Performance Summary | (Select 25 Series) | |
| December 31, 2008 | (unaudited) |
PERFORMANCE
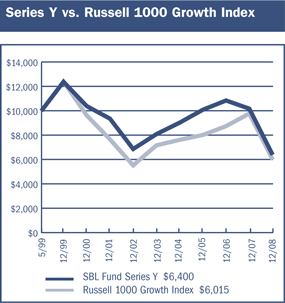
$10,000 Since Inception
The chart above assumes a hypothetical $10,000 investment in Series Y (Select 25 Series) on May 3, 1999 (date of inception), and reflects the fees and expenses of Series Y. The Russell 1000 Growth Index is an unmanaged capitalization-weighted index which includes stocks incorporated in the United States and its territories and measures the performance of the Russell 1000 companies with higher price-to-book ratios and higher forecasted growth values.
Average Annual Returns
Periods Ended 12-31-081 | 1 Year | 5 Years | Since Inception (5-3-99) | ||||||
Series Y | (37.07 | )% | (4.55 | )% | (4.51 | )% |
1 | Performance figures do not reflect fees and expenses associated with an investment in variable insurance products offered by Security Benefit Life Insurance Company. If returns had taken into account these fees and expenses, performance would have been lower. Shares of a Series of SBL Fund are available only through the purchase of such products. |
The performance data quoted above represents past performance. Past performance is not predictive of future performance. The investment return and principal value of an investment will fluctuate so that an investor’s shares, when redeemed, may be worth more or less than their original cost.
Portfolio Composition by Sector
Consumer Discretionary | 12.24 | % | |
Consumer Staples | 13.07 | ||
Energy | 4.49 | ||
Financials | 8.49 | ||
Health Care | 18.08 | ||
Industrials | 12.08 | ||
Information Technology | 21.79 | ||
Materials | 7.86 | ||
Cash & Other Assets, Less Liabilities | 1.90 | ||
Total Net Assets | 100.00 | % | |
The accompanying notes are an integral part of the financial statements
146
Table of Contents
| Series Y | ||
| Performance Summary | (Select 25 Series) | |
| December 31, 2008 | (unaudited) |
Information About Your Series Expenses
Calculating your ongoing Series expenses
Example
As a shareholder of the Series, you incur ongoing costs, including management fees and other series expenses. Performance figures and expense ratios do not reflect fees and expenses associated with an investment in variable insurance products. Shares of a Series of SBL Fund are available only through the purchase of such products. This example is intended to help you understand your ongoing costs (in dollars) of investing in the Series and to compare these costs with ongoing costs of investing in other mutual funds. The example is based on an investment of $1,000 invested at the beginning of the period and held for the entire period, July 1, 2008 through December 31, 2008.
Actual Expenses
The first line in the table provides information about actual account values and actual expenses. You may use the information in this table, together with the amount you invested, to estimate the expenses that you paid over the period. Simply divide your account value by $1,000 (for example, an $8,600 account value divided by $1,000 = 8.6), then multiply the result by the number in the table under the heading entitled “Expenses Paid During the Period” to estimate the expenses you paid on your account during this period.
Hypothetical Example for Comparison Purposes
The second line in the table provides information about hypothetical account values and hypothetical expenses based on the Series actual expense ratio and an assumed rate of return of 5% per year before expenses, which is not the Series actual return. The hypothetical account values and expenses may not be used to estimate the actual ending account balance or expenses you paid for the period. You may use this information to compare the ongoing costs of investing in the Series and other funds. To do so, compare this 5% hypothetical example with the 5% hypothetical examples that appear in the shareholder reports of the other mutual funds.
Please note that the expenses shown in the table are meant to highlight your ongoing costs only and do not reflect any fees and expenses associated with an investment in variable insurance products. Therefore, the second line is useful in comparing ongoing costs only, and will not help you determine the relative total costs of owning different funds. In addition, if these fees and expenses associated with an investment in variable insurance products were included, your costs would have been higher.
Series Expenses
| Beginning Account Value 7/1/2008 | Ending Account Value 12/31/20081 | Expenses Paid During Period2 | |||||||
Series Y (Select 25 Series) | |||||||||
Actual | $ | 1,000.00 | $ | 666.67 | $ | 4.15 | |||
Hypothetical | 1,000.00 | 1,020.16 | 5.03 | ||||||
1 | The actual ending account value is based on the actual total return of the Series for the period July 1, 2008 to December 31, 2008 after actual expenses and will differ from the hypothetical ending account value which is based on the Series expense ratio and a hypothetical annual return of 5% before expenses. The actual cumulative return at net asset value for the period July 1, 2008 to December 31, 2008 was (33.33%). |
2 | Expenses are equal to the Series annualized expense ratio of 0.99%, net of any applicable fee waivers, multiplied by the average account value over the period, multiplied by 184/366 (to reflect the one-half year period). |
147
Table of Contents
| Schedule of Investments | Series Y | |
| December 31, 2008 | (Select 25 Series) |
| Shares | Value | ||||
COMMON STOCKS—98.1% | |||||
Aerospace & Defense—3.1% | |||||
Honeywell International, Inc. | 31,530 | $ | 1,035,130 | ||
Apparel, Accessories & Luxury Goods—2.6% | |||||
Coach, Inc.* | 42,700 | 886,879 | |||
Asset Management & Custody Banks—3.2% | |||||
Bank of New York Mellon Corporation | 37,655 | 1,066,766 | |||
Biotechnology—7.4% | |||||
Celgene Corporation* | 18,520 | 1,023,786 | |||
Gilead Sciences, Inc.* | 28,880 | 1,476,923 | |||
| 2,500,709 | |||||
Cable & Satellite—3.4% | |||||
Comcast Corporation | 67,230 | 1,134,842 | |||
Communications Equipment—6.6% | |||||
Cisco Systems, Inc.* | 58,940 | 960,722 | |||
Qualcomm, Inc. | 35,460 | 1,270,532 | |||
| 2,231,254 | |||||
Computer Hardware—7.9% | |||||
Apple, Inc.* | 14,715 | 1,255,925 | |||
Hewlett-Packard Company | 38,820 | 1,408,777 | |||
| 2,664,702 | |||||
Drug Retail—3.5% | |||||
CVS Caremark Corporation | 40,795 | 1,172,448 | |||
Electrical Components & Equipment—4.7% | |||||
Emerson Electric Company | 42,690 | 1,562,881 | |||
Fertilizers & Agricultural Chemicals—5.3% | |||||
Monsanto Company | 13,205 | 928,971 | |||
Mosaic Company | 24,615 | 851,679 | |||
| 1,780,650 | |||||
Home Improvement Retail—2.6% | |||||
Lowe’s Companies, Inc. | 40,180 | 864,674 | |||
Household Products—2.0% | |||||
Colgate-Palmolive Company | 10,000 | 685,400 | |||
Hypermarkets & Super Centers—4.5% | |||||
Wal-Mart Stores, Inc. | 26,330 | 1,476,060 | |||
Industrial Gases—2.6% | |||||
Air Products & Chemicals, Inc. | 17,095 | 859,366 | |||
Internet Software & Services—4.0% | |||||
Google, Inc. * | 4,410 | 1,356,737 | |||
Life & Health Insurance—1.7% | |||||
MetLife, Inc. | 16,100 | 561,246 | |||
Life Sciences Tools & Services—3.4% | |||||
Thermo Fisher Scientific, Inc.* | 33,280 | 1,133,850 | |||
Oil & Gas Drilling—4.5% | |||||
Nabors Industries, Ltd.* | 52,385 | 627,048 | |||
Transocean, Ltd. * | 18,610 | 879,323 | |||
| 1,506,371 | |||||
Other Diversified Financial Services—3.6% | |||||
JPMorgan Chase & Company | 38,800 | 1,223,364 | |||
Packaged Foods & Meats—3.1% | |||||
General Mills, Inc. | 17,390 | 1,056,443 | |||
Pharmaceuticals—7.3% | |||||
Johnson & Johnson | 17,195 | 1,028,777 | |||
Teva Pharmaceutical Industries, Ltd. ADR | 33,115 | 1,409,705 | |||
| 2,438,482 | |||||
Railroads—4.3% | |||||
Burlington Northern Santa Fe Corporation | 19,270 | 1,458,932 | |||
Restaurants—3.6% | |||||
McDonald’s Corporation | 19,665 | 1,222,966 | |||
Systems Software—3.2% | |||||
Oracle Corporation* | 60,155 | 1,066,548 | |||
TOTAL COMMON STOCKS (cost $44,585,479) | $ | 32,946,700 | |||
Total Investments—98.1% (cost $44,585,479) | $ | 32,946,700 | |||
Cash & Other Assets, Less Liabilities—1.9% | 637,296 | ||||
Total Net Assets—100.0% | $ | 33,583,996 | |||
For federal income tax purposes the identified cost of investments owned at December 31, 2008 was $44,834,577.
| ADR | American Depositary Receipt |
| * | Non-income producing security |
The accompanying notes are an integral part of the financial statements
148
Table of Contents
| Series Y | ||
| (Select 25 Series) |
Statement of Assets and Liabilities
December 31, 2008
Assets: | ||||
Investments, at value* | $ | 32,946,700 | ||
Cash | 691,069 | |||
Receivables: | ||||
Fund shares sold | 3,263 | |||
Dividends | 33,548 | |||
Prepaid expenses | 828 | |||
Total assets | 33,675,408 | |||
Liabilities: | ||||
Payable for: | ||||
Fund shares redeemed | 49,447 | |||
Management fees | 21,052 | |||
Administration fees | 2,727 | |||
Transfer agent/maintenance fees | 2,083 | |||
Custodian fees | 683 | |||
Directors’ fees | 1,606 | |||
Professional fees | 11,189 | |||
Other fees | 2,625 | |||
Total liabilities | 91,412 | |||
Net assets | $ | 33,583,996 | ||
Net assets consist of: | ||||
Paid in capital | $ | 80,014,715 | ||
Undistributed net investment income | 71,213 | |||
Accumulated net realized loss on sale of investments | (34,863,153 | ) | ||
Net unrealized depreciation in value of investments | (11,638,779 | ) | ||
Net assets | $ | 33,583,996 | ||
Capital shares authorized | unlimited | |||
Capital shares outstanding | 5,244,390 | |||
Net asset value per share (net assets divided by shares outstanding) | $ | 6.40 | ||
| ||||
* Investments, at cost | $ | 44,585,479 | ||
Statement of Operations
For Year Ended December 31, 2008
Investment Income: | ||||
Dividends | $ | 528,092 | ||
Interest | 41,546 | |||
Total investment income | 569,638 | |||
Expenses: | ||||
Management fees | 385,731 | |||
Administration fees | 49,079 | |||
Transfer agent/maintenance fees | 25,195 | |||
Custodian fees | 4,692 | |||
Directors’ fees | 4,362 | |||
Professional fees | 18,858 | |||
Reports to shareholders | 7,305 | |||
Other | 3,217 | |||
Total expenses | 498,439 | |||
Less: | ||||
Earnings credits applied | (14 | ) | ||
Net expenses | 498,425 | |||
Net investment income | 71,213 | |||
Net Realized and Unrealized Gain (Loss): | ||||
Net realized gain (loss) during the year on: | ||||
Investments | (7,958,784 | ) | ||
Net realized loss | (7,958,784 | ) | ||
Net unrealized appreciation (depreciation) during the year on: | ||||
Investments | (13,376,234 | ) | ||
Net unrealized depreciation | (13,376,234 | ) | ||
Net realized and unrealized loss | (21,335,018 | ) | ||
Net decrease in net assets resulting from operations | $ | (21,263,805 | ) | |
The accompanying notes are an integral part of the financial statements
149
Table of Contents
| Series Y | ||
| Statement of Changes in Net Assets | (Select 25 Series) |
| Year Ended December 31, 2008 | Year Ended December 31, 2007 | |||||||
Increase (decrease) in net assets from operations: | ||||||||
Net investment income | $ | 71,213 | $ | 399,716 | ||||
Net realized gain (loss) during the year on investments | (7,958,784 | ) | 6,212,479 | |||||
Net unrealized depreciation during the year on investments | (13,376,234 | ) | (11,134,083 | ) | ||||
Net decrease in net assets resulting from operations | (21,263,805 | ) | (4,521,888 | ) | ||||
Capital share transactions: | ||||||||
Proceeds from sale of shares | 13,661,292 | 21,451,748 | ||||||
Cost of shares redeemed | (25,136,549 | ) | (36,301,850 | ) | ||||
Net decrease from capital share transactions | (11,475,257 | ) | (14,850,102 | ) | ||||
Net decrease in net assets | (32,739,062 | ) | (19,371,990 | ) | ||||
Net assets: | ||||||||
Beginning of year | 66,323,058 | 85,695,048 | ||||||
End of year | $ | 33,583,996 | $ | 66,323,058 | ||||
Undistributed net investment income at end of year | $ | 71,213 | $ | 399,716 | ||||
Capital share activity: | ||||||||
Shares sold | 1,592,936 | 1,955,454 | ||||||
Shares redeemed | (2,867,153 | ) | (3,342,541 | ) | ||||
Total capital share activity | (1,274,217 | ) | (1,387,087 | ) | ||||
The accompanying notes are an integral part of the financial statements
150
Table of Contents
| Financial Highlights | Series Y | |
| Selected data for each share of capital stock outstanding throughout each year | (Select 25 Series) |
| 2008 | 2007 | 2006a | 2005 | Year Ended December 31, 2004 | ||||||||||||||||
Per Share Data | ||||||||||||||||||||
Net asset value, beginning of period | $ | 10.17 | $ | 10.84 | $ | 10.08 | $ | 9.02 | $ | 8.08 | ||||||||||
Income (loss) from investment operations: | ||||||||||||||||||||
Net investment income (loss)b | 0.01 | 0.06 | 0.02 | – | (0.01 | ) | ||||||||||||||
Net gain (loss) on securities (realized and unrealized) | (3.78 | ) | (0.73 | ) | 0.74 | 1.06 | 0.95 | |||||||||||||
Total from investment operations | (3.77 | ) | (0.67 | ) | 0.76 | 1.06 | 0.94 | |||||||||||||
Net asset value, end of period | $ | 6.40 | $ | 10.17 | $ | 10.84 | $ | 10.08 | $ | 9.02 | ||||||||||
Total Returnc | (37.07 | )% | (6.18 | )% | 7.54 | % | 11.75 | % | 11.63 | % | ||||||||||
Ratios/Supplemental Data | ||||||||||||||||||||
Net assets, end of period (in thousands) | $ | 33,584 | $ | 66,323 | $ | 85,695 | $ | 37,018 | $ | 33,832 | ||||||||||
Ratios to average net assets: | ||||||||||||||||||||
Net investment income (loss) | 0.14 | % | 0.51 | % | 0.21 | % | (0.04 | )% | (0.15 | )% | ||||||||||
Total expensesd | 0.97 | % | 0.93 | % | 0.95 | % | 0.99 | % | 0.95 | % | ||||||||||
Net expensese | 0.97 | % | 0.93 | % | 0.95 | % | 0.99 | % | 0.95 | % | ||||||||||
Net expenses prior to custodian earnings credits and net of expense waivers | 0.97 | % | 0.93 | % | 0.95 | % | 0.99 | % | 0.95 | % | ||||||||||
Portfolio turnover rate | 214 | %f | 16 | % | 40 | % | 28 | % | 42 | % | ||||||||||
| a | The financial highlights for Series Y exclude the historical financial highlights of Series G. The assets of Series G were acquired by Series Y on June 16, 2006. A total of $40,543,215 was excluded from purchases in the portfolio turnover calculation, which represents the cost of the securities Series Y received as a result of the merger. |
| b | Net investment income (loss) was computed using average shares outstanding throughout the period. |
| c | Total return does not take into account any of the expenses associated with an investment in variable insurance products offered by Security Benefit Life Insurance Company. If total return had taken into account these expenses, performance would have been lower. Shares of a series of SBL Fund are available only through the purchase of such products. |
| d | Total expense information reflects the expense ratios absent expense reductions by the Investment Manager and earnings credits, as applicable. |
| e | Net expense information reflects the expense ratios after voluntary expense waivers, reimbursements and custodian earnings credits, as applicable. |
| f | Significant variation in the portfolio turnover rate is due to Investment Manager’s appointment of new portfolio manager for the Series. |
The accompanying notes are an integral part of the financial statements
151
Table of Contents
| Managers’ Commentary | Series Z | |
| February 16, 2009 | (Alpha Opportunity Series) |
 | and |  | Subadviser, Mainstream Investment Advisers |

To Our Shareholders:
For the year ended December 31, 2008, Series Z of the SBL Fund—Alpha Opportunity Series total return was –34.79%, besting its benchmark, the S&P 500 Index, which returned –37.00%. The portfolio’s short positions and cash softened the absolute decline in returns throughout the year.
Investment Philosophy
The Series’ strategy is to invest approximately 50% of its total assets according to a long/short strategy and 50% of its total assets in a portfolio of equity securities, equity derivatives, and fixed income securities with the intention of tracking the performance of the S&P 500 Index.
The fundamental investment philosophy of the active value strategy rests first upon the belief that it is critical to identify the long-term investment theme governing the equity markets. These themes may persist for 15 to 20 years.
Second, while we also believe that valuation adds important perspective to investment decisions, it is not an efficient means of timing purchase and sale decisions. We believe those decisions are best made using technical analysis. We believe technical analysis, the study of price trends, allows us to efficiently capture gains and avoid material losses.
The third tenet of our philosophy is that changes in stock prices lead changes in fundamental corporate developments. A proactive asset management approach helps to keep our investment themes fresh and our risk levels moderate.
Sector Performance
During a year in which there were no good investment alternatives, any benefits to the portfolio were the result of restricting losses, holding more cash, and short positions that were able to soften the decline.
The largest sector detractors over the year were financials, industrials, and energy. The financials sector was the hardest hit throughout the year with the meltdown of the country’s financial system. The government take-over of Fannie Mae and Freddie Mac, the bailout of AIG, and the collapse of Lehman Brothers were just a few of the major events decimating the sector. The energy sector peaked during mid-year as the price of oil hit an all-time high and then quickly began a steep decline.
Market Outlook
The 50% decline in the U.S. market that occurred over almost three years in the wake of the dotcom bubble occurred this time in a mere 11 months. With a new administration and the likelihood of a large fiscal stimulus and/or tax cut package passing during the first quarter, we are cognizant of the possibility of a first half of the year rally. However, markets have already rebounded 26% from the November lows and we feel confident that those lows will be re-visited at some point during the course of the current year. The housing market continues its rapid decline. As long as prices and sales continue to fall mortgage-related instruments will continue to crumble and capital will evaporate. Unemployment is expected to continue to rise, thus making the recovery in the housing market even more difficult. There is a possibility that unemployment will reach double digits and not peak until 2011. Consumers are paying down debt and saving at levels not seen in 15 years. The increased savings points to a weak economy, dismal corporate earnings, and a lackluster market in 2009.
152
Table of Contents
| Managers’ Commentary | Series Z | |
| February 16, 2009 | (Alpha Opportunity Series) |
However, events such as the bankruptcy of Lehman Brothers, which froze credit markets, and the federal government intervention of Fannie Mae, Freddie Mac, and AIG, have resulted in extreme volatility in the equity markets. The credit market freeze has made it difficult to find counterparties with which to trade, making Series management more challenging. Because of the market environment, the Series is currently unable to pursue part of its investment objective because the Series is unable to invest according to a long/short strategy with an emphasis on securities of non-U.S. issuers. The Series is unable to determine when it will resume its full investment program.
We thank you for your investment and appreciate the trust and confidence you have placed in us.
Sincerely,
Bill Jenkins, Portfolio Manager,
Mainstream Investment Advisers
John Boich, Portfolio Manager,
Security Global Investors
David Whittall, Portfolio Manager,
Security Global Investors
Scott Klimo, Portfolio Manager,
Security Global Investors
Mark Lamb, Portfolio Manager,
Security Global Investors
Steve Bowser, Portfolio Manager,
Security Global Investors
153
Table of Contents
| Series Z | ||
| Performance Summary | (Alpha Opportunity Series) | |
| December 31, 2008 | (unaudited) |
PERFORMANCE
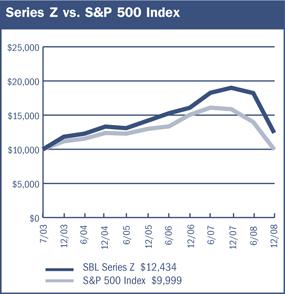
$10,000 Since Inception
The chart above assumes a hypothetical $10,000 investment in Series Z (Alpha Opportunity Series) on July 7, 2003 (date of inception), and reflects the fees and expenses of Series Z. The S&P 500 Index is a capitalization weighted index composed of 500 selected common stocks that represent the broad domestic economy and is a widely recognized unmanaged index of market performance.
Average Annual Returns
Periods Ended 12-31-081 | 1 Year | 5 Years | Since Inception (7-7-03) | ||||||
Series Y | (34.79 | )% | 1.00 | % | 4.05 | % |
1 | Performance figures do not reflect fees and expenses associated with an investment in variable insurance products offered by Security Benefit Life Insurance Company. If returns had taken into account these fees and expenses, performance would have been lower. Shares of a Series of SBL Fund are available only through the purchase of such products. |
The performance data quoted above represents past performance. Past performance is not predictive of future performance. The investment return and principal value of an investment will fluctuate so that an investor’s shares, when redeemed, may be worth more or less than their original cost.
Portfolio Composition by Sector*
Consumer Discretionary | 10.56 | % | |
Consumer Staples | 3.90 | ||
Energy | 1.90 | ||
Financials | 8.50 | ||
Health Care | 3.95 | ||
Industrials | 10.30 | ||
Information Technology | 3.48 | ||
Materials | 3.91 | ||
Telecommunications | 1.19 | ||
Utilities | (0.37 | ) | |
Exchange Traded Funds | 0.74 | ||
U.S. Government Sponsored Agencies | 15.42 | ||
Repurchase Agreement | 7.92 | ||
Other Assets in Excess of Liabilities | 28.60 | ||
Total Net Assets | 100.00 | % | |
| * | Securities sold short are netted with long positions in common stocks in the appropriate sectors. |
The accompanying notes are an integral part of the financial statements
154
Table of Contents
| Series Z | ||
| Performance Summary | (Alpha Opportunity Series) | |
| December 31, 2008 | (unaudited) |
Information About Your Series Expenses
Calculating your ongoing Series expenses
Example
As a shareholder of the Series, you incur ongoing costs, including management fees and other series expenses. Performance figures and expense ratios do not reflect fees and expenses associated with an investment in variable insurance products. Shares of a Series of SBL Fund are available only through the purchase of such products. This example is intended to help you understand your ongoing costs (in dollars) of investing in the Series and to compare these costs with ongoing costs of investing in other mutual funds. The example is based on an investment of $1,000 invested at the beginning of the period and held for the entire period, July 1, 2008 through December 31, 2008.
Actual Expenses
The first line in the table provides information about actual account values and actual expenses. You may use the information in this table, together with the amount you invested, to estimate the expenses that you paid over the period. Simply divide your account value by $1,000 (for example, an $8,600 account value divided by $1,000 = 8.6), then multiply the result by the number in the table under the heading entitled “Expenses Paid During the Period” to estimate the expenses you paid on your account during this period.
Hypothetical Example for Comparison Purposes
The second line in the table provides information about hypothetical account values and hypothetical expenses based on the Series actual expense ratio and an assumed rate of return of 5% per year before expenses, which is not the Series actual return. The hypothetical account values and expenses may not be used to estimate the actual ending account balance or expenses you paid for the period. You may use this information to compare the ongoing costs of investing in the Series and other funds. To do so, compare this 5% hypothetical example with the 5% hypothetical examples that appear in the shareholder reports of the other mutual funds.
Please note that the expenses shown in the table are meant to highlight your ongoing costs only and do not reflect any fees and expenses associated with an investment in variable insurance products. Therefore, the second line is useful in comparing ongoing costs only, and will not help you determine the relative total costs of owning different funds. In addition, if these fees and expenses associated with an investment in variable insurance products were included, your costs would have been higher.
Series Expenses
| Beginning Account Value 7/1/2008 | Ending Account Value 12/31/20081 | Expenses Paid During Period2 | |||||||
Series Z (Alpha Opportunity Series) | |||||||||
Actual | $ | 1,000.00 | $ | 682.25 | $ | 10.44 | |||
Hypothetical | 1,000.00 | 1,012.72 | 12.50 | ||||||
1 | The actual ending account value is based on the actual total return of the Series for the period July 1, 2008 to December 31, 2008 after actual expenses and will differ from the hypothetical ending account value which is based on the Series expense ratio and a hypothetical annual return of 5% before expenses. The actual cumulative return at net asset value for the period July 1, 2008 to December 31, 2008 was (31.78%). |
2 | Expenses are equal to the Series annualized expense ratio of 2.47%, net of any applicable fee waivers, multiplied by the average account value over the period, multiplied by 184/366 (to reflect the one-half year period). |
155
Table of Contents
| Schedule of Investments | Series Z | |
December 31, 2008 | (Alpha Opportunity Series) |
| Shares | Value | ||||
COMMON STOCKS—60.1% | |||||
Aerospace & Defense—1.4% | |||||
Lockheed Martin Corporation1,2 | 3,993 | $ | 335,731 | ||
Northrop Grumman Corporation1,2 | 1,100 | 49,544 | |||
| 385,275 | |||||
Airlines—3.1% | |||||
Alaska Air Group, Inc.* | 6,681 | 195,419 | |||
Allegiant Travel Company* | 1,971 | 95,731 | |||
AMR Corporation3,* | 37,791 | 403,230 | |||
Ryanair Holdings plc ADR* | 909 | 26,434 | |||
US Airways Group, Inc.* | 15,890 | 122,830 | |||
| 843,644 | |||||
Aluminum—0.1% | |||||
Aluminum Corporation of China, Ltd. ADR | 1,137 | 15,361 | |||
Apparel Retail—2.1% | |||||
Gap, Inc.1,2 | 6,300 | 84,357 | |||
Gymboree Corporation1,2,* | 3,200 | 83,488 | |||
HOT Topic, Inc.* | 3,178 | 29,460 | |||
Jos A. Bank Clothiers, Inc.* | 1,271 | 33,237 | |||
Ltd. Brands, Inc.1,2 | 5,400 | 54,216 | |||
Ross Stores, Inc.1,2 | 2,300 | 68,379 | |||
TJX Companies, Inc.1,2 | 3,800 | 78,166 | |||
Urban Outfitters, Inc.* | 8,752 | 131,105 | |||
| 562,408 | |||||
Apparel, Accessories & Luxury Goods—1.7% | |||||
Carter’s, Inc.3,* | 22,690 | 437,009 | |||
Phillips-Van Heusen Corporation1,2 | 900 | 18,117 | |||
| 455,126 | |||||
Auto Parts & Equipment—0.3% | |||||
Fuel Systems Solutions, Inc.* | 2,860 | 93,694 | |||
Biotechnology—1.5% | |||||
Amgen, Inc.1,2,* | 1,900 | 109,725 | |||
Cephalon, Inc.* | 3,175 | 244,602 | |||
Cubist Pharmaceuticals, Inc.* | 622 | 15,028 | |||
OSI Pharmaceuticals, Inc.* | 1,000 | 39,050 | |||
| 408,405 | |||||
Building Products—0.1% | |||||
Trex Company, Inc.* | 1,907 | 31,389 | |||
Coal & Consumable Fuels—0.8% | |||||
Consol Energy, Inc. | 7,348 | 210,006 | |||
Uranium Energy Corporation* | 947 | 303 | |||
| 210,309 | |||||
Communications Equipment—0.4% | |||||
Harmonic, Inc.1,2,* | 11,700 | 65,637 | |||
Research In Motion, Ltd.* | 812 | 32,951 | |||
| 98,588 | |||||
Computer & Electronics Retail—0.2% | |||||
RadioShack Corporation1,2 | 5,500 | 65,670 | |||
Construction & Engineering—2.9% | |||||
Aecom Technology Corporation* | 3,178 | 97,660 | |||
Foster Wheeler, Ltd.* | 10,500 | 245,490 | |||
Granite Construction, Inc. | 2,543 | 111,714 | |||
Quanta Services, Inc.* | 8,774 | 173,725 | |||
URS Corporation* | 3,632 | 148,077 | |||
| 776,666 | |||||
Construction & Farm Machinery & Heavy Trucks—1.5% | |||||
Joy Global, Inc.1,2 | 9,500 | 217,455 | |||
Tata Motors, Ltd. ADR | 2,152 | 9,576 | |||
Trinity Industries, Inc.1,2 | 10,800 | 170,208 | |||
| 397,239 | |||||
Construction Materials—0.8% | |||||
Vulcan Materials Company | 3,178 | 221,125 | |||
Distillers & Vintners—0.2% | |||||
Diageo plc ADR | 1,137 | 64,513 | |||
Diversified Banks—1.8% | |||||
Wells Fargo & Company3 | 17,555 | 517,520 | |||
Diversified Metals & Mining—0.1% | |||||
Anglo American plc ADR | 1,501 | 17,442 | |||
Cia Vale do Rio Doce ADR | 1,138 | 13,781 | |||
Ivanhoe Mines, Ltd.* | 109 | 294 | |||
| 31,517 | |||||
Diversified Real Estate Activities—0.4% | |||||
St. Joe Company* | 4,449 | 108,200 | |||
Education Services—0.6% | |||||
American Public Education, Inc.* | 2,225 | 82,748 | |||
Strayer Education, Inc. | 318 | 68,182 | |||
| 150,930 | |||||
Electrical Components & Equipment—0.3% | |||||
AO Smith Corporation1,2 | 3,000 | 88,560 | |||
Exchange Traded Funds—0.8% | |||||
Claymore | 9,613 | 115,260 | |||
iShares FTSE | 3,412 | 99,562 | |||
| 214,822 | |||||
Fertilizers & Agricultural Chemicals—0.7% | |||||
Scotts Miracle-Gro Company | 5,071 | 150,710 | |||
Sociedad Quimica y Minera de Chile S.A. ADR | 1,138 | 27,756 | |||
| 178,466 | |||||
Food Retail—0.4% | |||||
Safeway, Inc.1,2 | 4,200 | 99,834 | |||
General Merchandise Stores—1.3% | |||||
99 Cents Only Stores* | 21,552 | 235,563 | |||
Family Dollar Stores, Inc.1,2 | 3,900 | 101,673 | |||
| 337,236 | |||||
Gold—1.5% | |||||
Randgold Resources, Ltd. ADR3 | 9,535 | 418,777 | |||
| 418,777 | |||||
Health Care Distributors—0.4% | |||||
Owens & Minor, Inc.1,2 | 2,800 | 105,420 | |||
The accompanying notes are an integral part of the financial statements
156
Table of Contents
| Schedule of Investments | Series Z | |
December 31, 2008 | (Alpha Opportunity Series) |
| Shares | Value | ||||
COMMON STOCKS—60.1% (continued) | |||||
Health Care Equipment—0.4% | |||||
Baxter International, Inc.1,2 | 1,900 | $ | 101,821 | ||
Health Care Facilities—0.2% | |||||
Kindred Healthcare, Inc.1,2,* | 4,100 | 53,382 | |||
Health Care Services—1.0% | |||||
Chemed Corporation | 3,800 | 151,126 | |||
Lincare Holdings, Inc.1,2,* | 4,100 | 110,413 | |||
| 261,539 | |||||
Home Entertainment Software—2.0% | |||||
Shanda Interactive Entertainment, Ltd. ADR1,2,* | 16,000 | 517,759 | |||
Home Improvement Retail—2.1% | |||||
Lowe’s Companies, Inc. | 12,970 | 279,114 | |||
Sherwin-Williams Company | 5,085 | 303,829 | |||
| 582,943 | |||||
Homebuilding—0.1% | |||||
MDC Holdings, Inc. | 948 | 28,724 | |||
Housewares & Specialties—0.3% | |||||
Jarden Corporation* | 7,046 | 81,029 | |||
Human Resource & Employment Services—0.4% | |||||
Watson Wyatt Worldwide, Inc.1,2 | 2,400 | 114,768 | |||
Hypermarkets & Super Centers—1.0% | |||||
BJ’s Wholesale Club, Inc.* | 3,133 | 107,337 | |||
Wal-Mart Stores, Inc.1,2 | 2,936 | 164,592 | |||
| 271,929 | |||||
Independent Power Producers & Energy Traders—0.5% | |||||
Constellation Energy Group, Inc.1,2 | 5,400 | 135,486 | |||
Industrial Conglomerates—0.3% | |||||
General Electric Company1,2 | 4,500 | 72,900 | |||
Industrial Machinery—0.3% | |||||
Watts Water Technologies, Inc.1,2 | 3,000 | 74,910 | |||
Integrated Oil & Gas—0.4% | |||||
ConocoPhillips1,2 | 1,500 | 77,700 | |||
Suncor Energy, Inc. | 1,438 | 28,041 | |||
| 105,741 | |||||
Integrated Telecommunication Services—1.2% | |||||
AT&T, Inc.1,2 | 11,300 | 322,050 | |||
Internet Software & Services—0.1% | |||||
AsiaInfo Holdings, Inc.* | 910 | 10,774 | |||
MercadoLibre, Inc.* | 1,455 | 23,877 | |||
| 34,651 | |||||
Investment Banking & Brokerage—1.7% | |||||
Greenhill & Company, Inc. | 3,498 | 244,056 | |||
KBW, Inc.* | 6,747 | 155,181 | |||
Stifel Financial Corporation* | 1,271 | 58,275 | |||
| 457,512 | |||||
IT Consulting & Other Services—0.4% | |||||
Accenture, Ltd. | 3,247 | 106,469 | |||
CGI Group, Inc.* | 636 | 4,961 | |||
| 111,430 | |||||
Life Sciences Tools & Services—0.8% | |||||
Charles River Laboratories International, Inc.1,2,* | 2,100 | 55,020 | |||
Life Technologies Corporation1,2,* | 3,000 | 69,930 | |||
Millipore Corporation1,2,* | 1,900 | 97,888 | |||
| 222,838 | |||||
Managed Health Care—0.1% | |||||
WellCare Health Plans, Inc.1,2,* | 2,400 | 30,864 | |||
Mortgage REIT’s—1.0% | |||||
Annaly Capital Management, Inc. | 16,208 | 257,221 | |||
Movies & Entertainment—0.7% | |||||
Marvel Entertainment, Inc.1,2,* | 5,800 | 178,350 | |||
Multi-Line Insurance—0.4% | |||||
Genworth Financial, Inc.1,2 | 4,200 | 11,886 | |||
HCC Insurance Holdings, Inc. | 3,178 | 85,012 | |||
| 96,898 | |||||
Oil & Gas Equipment & Services—0.2% | |||||
Tenaris S.A. ADR | 2,211 | 46,387 | |||
WSP Holdings, Ltd. ADR* | 2,391 | 10,090 | |||
| 56,477 | |||||
Oil & Gas Exploration & Production—1.3% | |||||
Anadarko Petroleum Corporation1,2 | 2,930 | 112,952 | |||
Canadian Natural Resources, Ltd. | 615 | 24,588 | |||
Southwestern Energy Company* | 7,309 | 211,741 | |||
| 349,281 | |||||
Other Diversified Financial Services—0.4% | |||||
JPMorgan Chase & Company | 3,511 | 110,702 | |||
Packaged Foods & Meats—0.1% | |||||
American Dairy, Inc.* | 949 | 14,273 | |||
Paper Packaging—0.2% | |||||
Bemis Company, Inc. | 2,179 | 51,599 | |||
Personal Products—0.2% | |||||
Herbalife, Ltd.1,2 | 2,600 | 56,368 | |||
Pharmaceuticals—2.0% | |||||
Forest Laboratories, Inc.1,2,* | 3,600 | 91,692 | |||
Johnson & Johnson1,2 | 5,300 | 317,099 | |||
Viropharma, Inc.1,2,* | 10,500 | 136,710 | |||
| 545,501 | |||||
The accompanying notes are an integral part of the financial statements
157
Table of Contents
| Schedule of Investments | Series Z | |
December 31, 2008 | (Alpha Opportunity Series) |
| Shares | Value | |||||
COMMON STOCKS—60.1% (continued) | ||||||
Property & Casualty Insurance—1.9% | ||||||
ACE, Ltd. | 1,726 | $ | 91,340 | |||
Amtrust Financial Services, Inc.1,2 | 6,300 | 73,080 | ||||
Chubb Corporation | 4,131 | 210,681 | ||||
Cincinnati Financial Corporation | 939 | 27,297 | ||||
W.R. Berkley Corporation | 3,319 | 102,889 | ||||
| 505,287 | ||||||
Regional Banks—1.9% | ||||||
Commerce Bancshares, Inc.3 | 10,645 | 467,832 | ||||
East West Bancorp, Inc. | 2,542 | 40,596 | ||||
| 508,428 | ||||||
Reinsurance—1.4% | ||||||
Endurance Specialty Holdings, Ltd.1,2 | 3,200 | 97,696 | ||||
PartnerRe, Ltd. | 2,543 | 181,240 | ||||
Reinsurance Group of America, Inc.1,2 | 2,400 | 102,768 | ||||
| 381,704 | ||||||
Restaurants—2.2% | ||||||
Jack in the Box, Inc.1,2,* | 4,200 | 92,778 | ||||
McDonald’s Corporation | 3,496 | 217,416 | ||||
Panera Bread Company* | 5,721 | 298,866 | ||||
| 609,060 | ||||||
Semiconductor Equipment—0.1% | ||||||
Amkor Technology, Inc.1,2,* | 9,800 | 21,364 | ||||
Specialty Stores—1.1% | ||||||
Signet Jewelers, Ltd. | 2,268 | 19,664 | ||||
Staples, Inc. | 6,629 | 118,792 | ||||
Tractor Supply Company* | 4,041 | 146,041 | ||||
| 284,497 | ||||||
Steel—0.2% | ||||||
ArcelorMittal | 2,274 | 55,918 | ||||
Systems Software—1.8% | ||||||
CA, Inc.1,2 | 20,235 | 374,955 | ||||
Check Point Software Technologies* | 2,003 | 38,037 | ||||
Symantec Corporation1,2,* | 6,300 | 85,176 | ||||
| 498,168 | ||||||
Technology Distributors—0.4% | ||||||
Arrow Electronics, Inc.1,2,* | 2,800 | 52,752 | ||||
Avnet, Inc.1,2,* | 3,200 | 58,272 | ||||
| 111,024 | ||||||
Tobacco—2.7% | ||||||
Altria Group, Inc.1,2 | 17,800 | 268,068 | ||||
Philip Morris International, Inc.1,2 | 10,500 | 456,855 | ||||
| 724,923 | ||||||
Trucking—1.2% | ||||||
Con-way, Inc.1,2 | 1,800 | 47,880 | ||||
Heartland Express, Inc. | 8,263 | 130,225 | ||||
Knight Transportation, Inc.* | 9,272 | 149,465 | ||||
| 327,570 | ||||||
TOTAL COMMON STOCKS (cost $19,667,323) | $ | 16,207,583 | ||||
| Shares | Value | |||||
FOREIGN STOCKS—8.3% | ||||||
Canada—1.2% | ||||||
Agnico-Eagle Mines, Ltd. | 6,420 | $ | 331,237 | |||
France—0.3% | ||||||
UBISOFT Entertainment* | 4,624 | 90,109 | ||||
Germany—1.9% | ||||||
Adidas AG | 759 | 28,776 | ||||
Volkswagen AG3 | 1,300 | 454,006 | ||||
| 482,782 | ||||||
Indonesia—0.1% | ||||||
Bumi Resources Tbk PT | 489,124 | 40,281 | ||||
Ireland—0.0% | ||||||
Anglo Irish Bank Corporation plc | 16,638 | 3,777 | ||||
Italy—0.5% | ||||||
Maire Tecnimont SpA | 26,770 | 53,663 | ||||
Unione di Banche Italiane SCPA | 6,292 | 90,444 | ||||
| 144,107 | ||||||
Japan—1.0% | ||||||
JGC Corporation | 9,410 | 135,666 | ||||
NTT DoCoMo, Inc. | 71 | 138,048 | ||||
| 273,714 | ||||||
Norway—0.1% | ||||||
Orkla ASA | 3,400 | 22,228 | ||||
Portugal—0.5% | ||||||
BRISA | 17,446 | 130,409 | ||||
South Africa—0.2% | ||||||
Aveng, Ltd. | 18,112 | 58,782 | ||||
Switzerland—0.8% | ||||||
Basilea Pharmaceutica* | 500 | 69,782 | ||||
Lonza Group AG | 1,435 | 131,207 | ||||
| 200,989 | ||||||
United Kingdom—1.7% | ||||||
AstraZeneca plc1,2 | 2,800 | 114,680 | ||||
Cadbury plc | 10,742 | 94,748 | ||||
GlaxoSmithKline plc1,2 | 5,500 | 103,082 | ||||
Imperial Tobacco Group plc | 6,005 | 161,132 | ||||
| 473,642 | ||||||
TOTAL FOREIGN STOCKS (cost $2,943,296) | $ | 2,252,057 | ||||
| Principal Amount | Value | |||||
U.S. GOVERNMENT SPONSORED AGENCY BONDS & NOTES—15.5% | ||||||
Federal Home Loan Bank | ||||||
0.40%, 1/12/20093 | $ | 800,000 | $ | 799,902 | ||
2.30%, 1/20/20093 | 100,000 | 100,000 | ||||
Federal Home Loan Mortgage Corporation | ||||||
0.40%, 1/30/20093 | 1,000,000 | 999,678 | ||||
Federal National Mortgage Association | ||||||
2.10%, 1/14/20093 | 275,000 | 275,000 | ||||
0.50%, 2/4/20093 | 1,000,000 | 999,991 | ||||
0.50%, 2/10/20091 | 1,000,000 | 999,989 | ||||
TOTAL U.S. GOVERNMENT SPONSORED AGENCY BONDS & NOTES (cost $4,173,230) | $ | 4,174,560 | ||||
The accompanying notes are an integral part of the financial statements
158
Table of Contents
| Schedule of Investments | Series Z | |
December 31, 2008 | (Alpha Opportunity Series) |
| Principal Amount | Value | ||||||
SHORT TERM INVESTMENTS—16.2% | |||||||
State Street Treasury Money Market Fund | $ | 4,369,621 | $ | 4,369,621 | |||
TOTAL SHORT TERM INVESTMENTS (cost $4,369,621) | $ | 4,369,621 | |||||
| Principal Amount | Value | ||||||
REPURCHASE AGREEMENT—7.9% | |||||||
State Street, 0.01%, dated 12/31/08, matures 01/02/09; repurchase amount $2,142,110 (Collateralized by FHLMC, 09/17/10 with a value of $2,142,109) | $ | 2,142,109 | $ | 2,142,109 | |||
TOTAL REPURCHASE AGREEMENT (cost $2,142,109) | $ | 2,142,109 | |||||
Total Investments—108.0% (cost $33,295,579) | $ | 29,145,930 | |||||
Liabilities, Less Cash & Other Assets—(8.0)% | (2,169,040 | ) | |||||
Total Net Assets—100.0% | $ | 26,976,890 | |||||
Schedule of Securities Sold Short
| Shares | Value | ||||||
COMMON STOCKS—(15.0)% | |||||||
Advertising—(0.3)% | |||||||
Focus Media Holding, Ltd. ADR4,* | (2,500 | ) | $ | (75,000 | ) | ||
Alternative Carriers—(0.1)% | |||||||
Global Crossing, Ltd.4,* | (2,520 | ) | (40,244 | ) | |||
Biotechnology—(2.0)% | |||||||
Acorda Therapeutics, Inc.4,* | (2,900 | ) | (77,575 | ) | |||
Alnylam Pharmaceuticals, Inc.4,* | (3,000 | ) | (88,230 | ) | |||
Cepheid, Inc.4,* | (5,500 | ) | (84,700 | ) | |||
Regeneron Pharmaceuticals, Inc.4,* | (3,810 | ) | (82,715 | ) | |||
Rigel Pharmaceuticals, Inc.4,* | (3,070 | ) | (78,838 | ) | |||
Savient Pharmaceuticals, Inc.4,* | (3,240 | ) | (64,282 | ) | |||
Vertex Pharmaceuticals, Inc.4,* | (2,700 | ) | (74,709 | ) | |||
| (551,049 | ) | ||||||
Building Products—(0.6)% | |||||||
USG Corporation4,* | (5,580 | ) | (160,258 | ) | |||
Communications Equipment—(0.2)% | |||||||
Riverbed Technology, Inc.4,* | (4,100 | ) | (54,530 | ) | |||
Computer & Electronics Retail—0.0% | |||||||
RadioShack Corporation | (542 | ) | (6,471 | ) | |||
Computer Storage & Peripherals—(0.2)% | |||||||
Intermec, Inc.4,* | (2,570 | ) | (50,937 | ) | |||
Distillers & Vintners—(0.1)% | |||||||
Constellation Brands, Inc.* | (1,625 | ) | (25,626 | ) | |||
Diversified Banks—(2.1)% | |||||||
Wachovia Corporation4 | (14,155 | ) | (209,636 | ) | |||
Wells Fargo & Company4 | (10,119 | ) | (355,986 | ) | |||
| (565,622 | ) | ||||||
Diversified Metals & Mining—(0.1)% | |||||||
Ivanhoe Mines, Ltd.4,* | (4,780 | ) | (39,865 | ) | |||
Electric Utilities—(1.0)% | |||||||
Korea Electric Power Corporation ADR4 | (19,460 | ) | (263,294 | ) | |||
PPL Corporation | (354 | ) | (10,864 | ) | |||
| (274,158 | ) | ||||||
Exchange Traded Funds—(0.1)% | |||||||
PowerShares DB Agriculture Fund | (542 | ) | (14,200 | ) | |||
Health Care Equipment—(0.2)% | |||||||
Intuitive Surgical, Inc.4,* | (200 | ) | (56,100 | ) | |||
Health Care Services—(0.4)% | |||||||
athenahealth, Inc.4,* | (2,700 | ) | (96,795 | ) | |||
Health Care Supplies—(0.3)% | |||||||
Align Technology, Inc.4,* | (6,300 | ) | (76,860 | ) | |||
Home Entertainment Software—(0.1)% | |||||||
Electronic Arts, Inc.4,* | (900 | ) | (36,720 | ) | |||
Integrated Telecommunication Services—(0.1)% | |||||||
Verizon Communications, Inc. | (542 | ) | (18,374 | ) | |||
Internet Software & Services—(1.0)% | |||||||
Baidu.com ADR4,* | (200 | ) | (53,726 | ) | |||
Equinix, Inc.4,* | (1,000 | ) | (79,940 | ) | |||
SAVVIS, Inc.4,* | (5,900 | ) | (86,967 | ) | |||
VeriSign, Inc.4,* | (1,300 | ) | (33,319 | ) | |||
| (253,952 | ) | ||||||
Leisure Products—(1.1)% | |||||||
Pool Corporation4 | (12,350 | ) | (305,663 | ) | |||
Life Sciences Tools & Services—(0.9)% | |||||||
AMAG Pharmaceuticals, Inc.4,* | (1,900 | ) | (82,954 | ) | |||
Exelixis, Inc.4,* | (4,700 | ) | (30,127 | ) | |||
Luminex Corporation4,* | (2,700 | ) | (68,823 | ) | |||
Sequenom, Inc.4,* | (3,140 | ) | (64,715 | ) | |||
| (246,619 | ) | ||||||
Managed Health Care—(0.1)% | |||||||
UnitedHealth Group, Inc. | (542 | ) | (14,417 | ) | |||
Oil & Gas Exploration & Production—(0.4)% | |||||||
BPZ Resources, Inc.4,* | (6,000 | ) | (112,800 | ) | |||
Packaged Foods & Meats—(0.1)% | |||||||
Smithfield Foods, Inc.* | (1,625 | ) | (22,864 | ) | |||
Pharmaceuticals—(0.7)% | |||||||
Auxilium Pharmaceuticals, Inc.4,* | (1,960 | ) | (72,167 | ) | |||
The accompanying notes are an integral part of the financial statements
159
Table of Contents
| Schedule of Investments | Series Z | |
December 31, 2008 | (Alpha Opportunity Series) |
| Shares | Value | ||||||
COMMON STOCKS—(15.0)% (continued) | |||||||
Pharmaceuticals—(0.7)%(continued) | |||||||
Sepracor, Inc.4,* | (1,350 | ) | $ | (23,625 | ) | ||
XenoPort, Inc.4,* | (1,790 | ) | (82,036 | ) | |||
| (177,828 | ) | ||||||
Regional Banks—(0.4)% | |||||||
PrivateBancorp, Inc.4 | (2,400 | ) | (103,200 | ) | |||
Semiconductor Equipment—(0.1)% | |||||||
Varian Semiconductor Equipment Associates, Inc.4,* | (1,270 | ) | (33,299 | ) | |||
Semiconductors—(0.6)% | |||||||
Cree, Inc.4,* | (4,200 | ) | (115,332 | ) | |||
Rambus, Inc.4,* | (3,680 | ) | (56,451 | ) | |||
| (171,783 | ) | ||||||
Soft Drinks—(0.3)% | |||||||
Hansen Natural Corporation4,* | (3,270 | ) | (96,825 | ) | |||
Specialty Chemicals—(0.2)% | |||||||
Zoltek Companies, Inc.4,* | (2,900 | ) | (52,867 | ) | |||
Systems Software—(0.5)% | |||||||
Red Hat, Inc.4,* | (3,300 | ) | (58,905 | ) | |||
VMware, Inc.4,* | (2,500 | ) | (71,450 | ) | |||
| (130,355 | ) | ||||||
Wireless Telecommunication Services—(0.7)% | |||||||
Clearwire Corporation4,* | (2,660 | ) | (30,138 | ) | |||
Leap Wireless International, Inc.4,* | (1,600 | ) | (69,440 | ) | |||
SBA Communications Corporation4,* | (2,600 | ) | (74,854 | ) | |||
| (174,432 | ) | ||||||
TOTAL COMMON STOCKS SOLD SHORT (proceeds $4,023,149) | $ | (4,039,713 | ) | ||||
| Shares | Value | ||||||
FOREIGN STOCKS—(14.3)% | |||||||
Australia—(1.0)% | |||||||
Aquila Resources, Ltd.4,* | (2,600 | ) | $ | (22,783 | ) | ||
Arrow Energy, Ltd.4,* | (9,500 | ) | (24,514 | ) | |||
Ausenco, Ltd.4 | (2,300 | ) | (24,817 | ) | |||
Queensland Gas Company, Ltd.4,* | (13,600 | ) | (52,898 | ) | |||
Riversdale Mining, Ltd.4,* | (7,100 | ) | (54,029 | ) | |||
Sino Gold Mining, Ltd.4,5,* | (9,100 | ) | (37,424 | ) | |||
Western Areas NL4,* | (6,600 | ) | (47,325 | ) | |||
| (263,790 | ) | ||||||
Austria—(1.7)% | |||||||
bwin Interactive Entertainment AG4,* | (1,700 | ) | (48,431 | ) | |||
Erste Group Bank AG4 | (5,500 | ) | (337,971 | ) | |||
Intercell AG4,* | (2,000 | ) | (78,778 | ) | |||
| (465,180 | ) | ||||||
Bermuda—(0.1)% | |||||||
C C Land Holdings, Ltd.4 | (53,000 | ) | (14,782 | ) | |||
Canada—(0.9)% | |||||||
Agnico-Eagle Mines, Ltd.4 | (1,900 | ) | (125,612 | ) | |||
Silver Wheaton Corporation4,* | (6,500 | ) | (68,246 | ) | |||
Trican Well Service, Ltd.4 | (2,200 | ) | (37,448 | ) | |||
| (231,306 | ) | ||||||
China—(1.1)% | |||||||
Anhui Conch Cement Company, Ltd.4 | (5,500 | ) | (24,761 | ) | |||
Beijing Capital International Airport Company, Ltd.4 | (232,000 | ) | (200,659 | ) | |||
China Communications Construction Company, Ltd.4 | (16,000 | ) | (16,571 | ) | |||
China National Building Material Company, Ltd.4 | (17,300 | ) | (23,432 | ) | |||
China National Materials Company, Ltd.4,* | (37,600 | ) | (19,168 | ) | |||
| (284,591 | ) | ||||||
Germany—(2.2)% | |||||||
Premiere AG4,* | (4,200 | ) | (68,951 | ) | |||
Volkswagen AG4 | (1,300 | ) | (539,374 | ) | |||
| (608,325 | ) | ||||||
Gibraltar—(0.2)% | |||||||
PartyGaming plc4,* | (16,200 | ) | (60,974 | ) | |||
Hong Kong—(0.3)% | |||||||
China Merchants Holdings International Company, Ltd.4 | (4,900 | ) | (17,461 | ) | |||
Franshion Properties China, Ltd.4 | (84,600 | ) | (23,552 | ) | |||
Fushan International Energy Group, Ltd.4,* | (70,000 | ) | (25,165 | ) | |||
| (66,178 | ) | ||||||
Ireland—(0.1)% | |||||||
Ryanair Holdings plc4,* | (10,200 | ) | (38,219 | ) | |||
Isle Of Man—(0.2)% | |||||||
Genting International plc4,* | (132,800 | ) | (43,724 | ) | |||
Japan—(2.1)% | |||||||
Access Company, Ltd.4,* | (18 | ) | (34,682 | ) | |||
Aeon Mall Company, Ltd.4 | (1,900 | ) | (58,221 | ) | |||
Aozora Bank, Ltd.4 | (17,300 | ) | (27,861 | ) | |||
Japan Steel Works, Ltd.4 | (1,600 | ) | (22,196 | ) | |||
Marui Group Company, Ltd.4 | (31,000 | ) | (233,861 | ) | |||
Mizuho Financial Group, Inc.4 | (12 | ) | (49,593 | ) | |||
Mizuho Trust & Banking Company, Ltd.4 | (18,800 | ) | (26,216 | ) | |||
Modec, Inc.4 | (1,000 | ) | (25,772 | ) | |||
Monex Group, Inc.4 | (83 | ) | (29,140 | ) | |||
Tokyo Broadcasting System, Inc.4 | (1,300 | ) | (21,836 | ) | |||
Toyo Tanso Company, Ltd.4 | (600 | ) | (32,408 | ) | |||
| (561,786 | ) | ||||||
Norway—(0.1)% | |||||||
Sevan Marine ASA4,* | (6,300 | ) | (33,049 | ) | |||
Portugal—(1.8)% | |||||||
BRISA4 | (47,200 | ) | (490,927 | ) | |||
Spain—(0.2)% | |||||||
Zeltia S.A.4 | (8,500 | ) | (57,969 | ) | |||
Sweden—(1.6)% | |||||||
Electrolux AB4 | (32,100 | ) | (422,058 | ) | |||
Switzerland—(0.5)% | |||||||
Basilea Pharmaceutica4,* | (500 | ) | (83,365 | ) | |||
Meyer Burger Technology AG4,* | (200 | ) | (49,878 | ) | |||
| (133,243 | ) | ||||||
160
Table of Contents
| Schedule of Investments | Series Z | |
December 31, 2008 | (Alpha Opportunity Series) |
| Shares | Value | ||||||
FOREIGN STOCKS—(14.3)% (continued) | |||||||
United Kingdom—(0.2)% | |||||||
Imperial Energy Corporation plc4,* | (4,200 | ) | $ | (83,657 | ) | ||
TOTAL FOREIGN STOCKS SOLD SHORT (proceeds $3,703,004) | $ | (3,859,758 | ) | ||||
TOTAL SECURITIES SOLD SHORT—(29.3%) (proceeds $7,726,153) | $ | (7,899,471 | ) | ||||
For federal income tax purposes the identified cost of investments owned at December 31, 2008 was $33,823,532.
ADR | American Depositary Receipt | |
plc | Public Limited Company |
| * | Non-income producing security |
1 | Security is segregated as collateral for open short positions. |
2 | Security is deemed illiquid. The total market value of illiquid securities is $6,650,126 (cost $9,426,223), or 24.7% of total net assets. The securities were liquid at time of purchase. This security is deemed illiquid due to the Series exposure to Lehman Brothers International Europe (“LBIE”) prime brokerage services. |
3 | Security is segregated as collateral for open futures contracts. |
4 | Security is fair valued by the Valuation Committee at December 31, 2008. The total market value of fair valued securities amounts to $(7,786,655) (cost $(7,622,318)), or (28.9%) of total net assets. |
5 | Security is a PFIC (Passive Foreign Investment Company). |
161
Table of Contents
| Series Z | ||
| (Alpha Opportunity Series) |
Statement of Assets and Liabilities
December 31, 2008
Assets: | ||||
Investments, at value* | $ | 29,145,930 | ||
Cash | 1,335,149 | |||
Cash denominated in a foreign currency, at value*** | 170,384 | |||
Restricted cash | 858,039 | |||
Restricted cash denominated in a foreign currency, at value**** | 3,393,890 | |||
Receivables: | ||||
Securities sold | 600,098 | |||
Dividends | 30,062 | |||
Variation margin on futures | 79,120 | |||
Prepaid expenses | 6,674 | |||
Total assets | 35,619,346 | |||
Liabilities: | ||||
Securities sold short, at value** | 7,899,471 | |||
Payable for: | ||||
Fund shares redeemed | 35,331 | |||
Securities purchased | 647,809 | |||
Dividends on short sales | 306 | |||
Management fees | 28,252 | |||
Administration fees | 7,590 | |||
Transfer agent/maintenance fees | 2,083 | |||
Directors’ fees | 974 | |||
Professional fees | 18,480 | |||
Other fees | 2,160 | |||
Total liabilities | 8,642,456 | |||
Net assets | $ | 26,976,890 | ||
Net assets consist of: | ||||
Paid in capital | $ | 44,785,709 | ||
Accumulated net investment loss | (1,386 | ) | ||
Accumulated net realized loss on sale of investments and foreign currency transactions | (13,513,724 | ) | ||
Net unrealized depreciation in value of investments and translation of assets and liabilities in foreign currencies | (4,293,709 | ) | ||
Net assets | $ | 26,976,890 | ||
Capital shares authorized | unlimited | |||
Capital shares outstanding | 2,506,020 | |||
Net asset value per share (net assets divided by shares outstanding) | $ | 10.76 | ||
| ||||
*Investments, at cost | $ | 33,295,579 | ||
**Securities sold short, proceeds | 7,726,153 | |||
***Cash denominated in a foreign currency, at cost | 172,441 | |||
****Restricted cash denominated in a foreign currency, at cost | 3,435,112 | |||
Statement of Operations
For Year Ended December 31, 2008
Investment Income: | ||||
Dividends (net of foreign withholding tax $751) | $ | 276,770 | ||
Interest | 372,944 | |||
Total investment income | 649,714 | |||
Expenses: | ||||
Management fees | 891,815 | |||
Administration fees | 72,776 | |||
Transfer agent/maintenance fees | 25,127 | |||
Custodian fees | 68,753 | |||
Directors’ fees | 3,564 | |||
Professional fees | 62,681 | |||
Reports to shareholders | 7,264 | |||
Other | 1,960 | |||
Dividends on short sales | 39,440 | |||
Total expenses | 1,173,380 | |||
Less: | ||||
Earnings credits applied | (64,913 | ) | ||
Net expenses | 1,108,467 | |||
Net investment loss | (458,753 | ) | ||
Net Realized and Unrealized Gain (Loss): | ||||
Net realized gain (loss) during the year on: | ||||
Investments | (6,457,072 | ) | ||
Foreign currency transactions | (146,544 | ) | ||
Futures | (6,268,261 | ) | ||
Net realized loss | (12,871,877 | ) | ||
Net unrealized appreciation (depreciation) during the year on: | ||||
Investments | (4,241,617 | ) | ||
Securities sold short | (287,431 | ) | ||
Futures | 411,670 | |||
Translation of assets and liabilities in foreign currencies | (43,418 | ) | ||
Net unrealized depreciation | (4,160,796 | ) | ||
Net realized and unrealized loss | (17,032,673 | ) | ||
Net decrease in net assets resulting from operations | $ | (17,491,426 | ) | |
The accompanying notes are an integral part of the financial statements
162
Table of Contents
| Series Z | ||
| Statement of Changes in Net Assets | (Alpha Opportunity Series) |
| Year Ended December 31, 2008 | Year Ended December 31, 2007 | |||||||
Increase (decrease) in net assets from operations: | ||||||||
Net investment income (loss) | $ | (458,753 | ) | $ | 38,680 | |||
Net realized gain (loss) during the year on investments and foreign currency transactions | (12,871,877 | ) | 6,393,981 | |||||
Net unrealized appreciation (depreciation) during the year on investments and translation of assets and liabilities in foreign currencies | (4,160,796 | ) | 123,040 | |||||
Net increase (decrease) in net assets resulting from operations | (17,491,426 | ) | 6,555,701 | |||||
Capital share transactions: | ||||||||
Proceeds from sale of shares | 25,172,030 | 36,899,862 | ||||||
Cost of shares redeemed | (29,572,908 | ) | (31,028,535 | ) | ||||
Net increase (decrease) from capital share transactions | (4,400,878 | ) | 5,871,327 | |||||
Net increase (decrease) in net assets | (21,892,304 | ) | 12,427,028 | |||||
Net assets: | ||||||||
Beginning of year | 48,869,194 | 36,442,166 | ||||||
End of year | $ | 26,976,890 | $ | 48,869,194 | ||||
Undistributed net investment income/(loss) at end of year | $ | (1,386 | ) | $ | 38,680 | |||
Capital share activity: | ||||||||
Shares sold | 1,673,286 | 2,353,094 | ||||||
Shares redeemed | (2,129,771 | ) | (2,001,902 | ) | ||||
Total capital share activity | (456,485 | ) | 351,192 | |||||
The accompanying notes are an integral part of the financial statements
163
Table of Contents
| Financial Highlights | Series Z | |
| Selected data for each share of capital stock outstanding throughout each period | (Alpha Opportunity Series) |
| 2008a | 2007 | 2006 | 2005 | Year Ended December 31, 2004 | ||||||||||||||||
Per Share Data | ||||||||||||||||||||
Net asset value, beginning of period | $ | 16.50 | $ | 13.96 | $ | 12.34 | $ | 11.57 | $ | 11.18 | ||||||||||
Income (loss) from investment operations: | ||||||||||||||||||||
Net investment income (loss)b | (0.16 | ) | 0.01 | — | (0.02 | ) | (0.07 | ) | ||||||||||||
Net gain (loss) on securities (realized and unrealized) | (5.58 | ) | 2.53 | 1.62 | 0.79 | 1.42 | ||||||||||||||
Total from investment operations | (5.74 | ) | 2.54 | 1.62 | 0.77 | 1.35 | ||||||||||||||
Less distributions: | ||||||||||||||||||||
Distributions from realized gains | — | — | — | — | (0.96 | ) | ||||||||||||||
Total distributions | — | — | — | — | (0.96 | ) | ||||||||||||||
Net asset value, end of period | $ | 10.76 | $ | 16.50 | $ | 13.96 | $ | 12.34 | $ | 11.57 | ||||||||||
Total Returnc | (34.79 | )% | 18.19 | % | 13.13 | % | 6.66 | % | 12.58 | % | ||||||||||
Ratios/Supplemental Data | ||||||||||||||||||||
Net assets, end of period (in thousands) | $ | 26,977 | $ | 48,869 | $ | 36,442 | $ | 25,660 | $ | 19,161 | ||||||||||
Ratios to average net assets: | ||||||||||||||||||||
Net investment income (loss) | (1.09 | )% | 0.10 | % | (0.03 | )% | (0.21 | )% | (1.12 | )% | ||||||||||
Total expensesd | 2.79 | % | 2.50 | % | 2.78 | % | 2.50 | % | 2.78 | % | ||||||||||
Net expensese | 2.64 | % | 2.39 | % | 2.62 | % | 2.50 | % | 2.57 | % | ||||||||||
Net expenses prior to custodian earnings credits and net of expense waivers | 2.79 | % | 2.50 | % | 2.78 | % | 2.50 | % | 2.57 | % | ||||||||||
Portfolio turnover rate | 990 | % | 1,770 | % | 1,285 | % | 1,509 | % | 1,054 | % | ||||||||||
a | Security Global Investors, LLC (SGI) became the sub-advisor of 37.5% of the assets of Series Z effective August 18, 2008. Also effective August 18, 2008, Mainstream Investment Advisers, LLC (Mainstream) sub-advises 37.5% of the assets and Security Investors, LLC (SI) manages 25% of the assets. Prior to August 18, 2008, SI paid Mainstream sub-advisory fees for 60% of the assets. SI managed the remaining 40% of the assets. |
b | Net investment income (loss) was computed using average shares outstanding throughout the period. |
c | Total return does not take into account any of the expenses associated with an investment in variable insurance products offered by Security Benefit Life Insurance Company. If total return had taken into account these expenses, performance would have been lower. Shares of a series of SBL Fund are available only through the purchase of such products. |
d | Total expense information reflects the expense ratios absent expense reductions by the Investment Manager and earnings credits, as applicable. |
e | Net expense information reflects the expense ratios after voluntary expense waivers, reimbursements and custodian earnings credits, as applicable. |
The accompanying notes are an integral part of the financial statements
164
Table of Contents
December 31, 2008
1. Significant Accounting Policies
SBL Fund (The Fund) is registered under the Investment Company Act of 1940, as amended, as an open-end management investment company of the series type. Each series, in effect, represents a separate fund. The Fund is required to account for the assets of each series separately and to allocate general liabilities of the Fund to each Series based on the net asset value of each series. Security Benefit Life Insurance Company (“SBL”) and SBL’s affiliated life insurance company as well as unaffiliated life insurance companies purchase shares of the Series for their variable annuity and variable life insurance separate accounts. The following is a summary of the significant accounting policies followed by the Fund in the preparation of its financial statements.
A. Security Valuation – Valuations of the Fund’s securities are supplied by pricing services approved by the Board of Directors. The Fund’s officers, under the general supervision of the Board of Directors, regularly review procedures used by, and valuations provided by, the pricing services. Each security owned by a Series that is listed on a securities exchange is valued at its last sale price on that exchange on the date as of which assets are valued. Where the security is listed on more than one exchange, the Series will use the price of that exchange that it generally considers to be the principal exchange on which the stock is traded. Securities listed on the Nasdaq Stock Market, Inc. (“Nasdaq”) will be valued at the Nasdaq Official Closing Price, which may not necessarily represent the last sale price. If there has been no sale on such exchange or NASDAQ on such day, the security is valued at the closing bid price on such day. Securities for which market quotations are not readily available are valued by a pricing service considering securities with similar yields, quality, type of issue, coupon, duration and rating. If there is no bid price or if the bid price is deemed to be unsatisfactory by the Board of Directors or by the Fund’s investment manager, then the securities are valued in good faith by such method as the Board of Directors determines will reflect the fair value. If events occur after the close of a foreign exchange that will affect the value of a series portfolio securities before the time as of which the NAV is calculated (a “significant event”), the security will generally be priced using a fair value procedure. If the Valuation Committee determines a significant event has occurred, it will evaluate the impact of that event on an affected security or securities, to determine whether a fair value adjustment would materially affect the Series net asset value per share. Some of the factors which may be considered by the Board of Directors in determining fair value are fundamental analytical data relating to the investment; the nature and duration of any restrictions on disposition; trading in similar securities of the same issuer or comparable companies; information from broker-dealers; and an evaluation of the forces that influence the market in which the securities are purchased and sold. The Fund generally will value short-term debt securities at prices based on market quotations for such securities or securities of similar type, yield, quality and duration, except those securities purchased with 60 days or less to maturity are valued on the basis of amortized cost which approximates market value.
Generally, trading in foreign securities markets is substantially completed each day at various times prior to the close of the New York Stock Exchange. The values of foreign securities are determined as of the close of such foreign markets or the close of the New York Stock Exchange, if earlier. All investments quoted in foreign currency are valued in U.S. dollars on the basis of the foreign currency exchange rates prevailing at the close of business. Investments in foreign securities may involve risks not present in domestic investments. The Valuation Committee will determine the current value of such foreign securities by taking into consideration certain factors which may include those discussed above, as well as the following factors, among others: the value of the securities traded on other foreign markets, ADR trading, closed-end fund trading, foreign currency exchange activity, and the trading prices of financial products that are tied to foreign securities such as WEBS®. In addition, the Board of Directors has authorized the Valuation Committee and Administrator to use prices and other information supplied by a third party pricing vendor in valuing foreign securities.
The senior floating rate interests (loans) in which Series P invests are not listed on any securities exchange or board of trade. Accordingly, determinations of the value of loans may be based on infrequent and dated trades. Typically loans are valued using information provided by an independent third party pricing service. If the pricing service cannot or does not provide a valuation for a particular loan or such valuation is deemed unreliable, such loan is fair valued. In determining fair value, consideration is given to several factors, which may include, among others, one or more of the following: the fundamental business data relating to the issuer or borrower; an evaluation of the forces which influence the market in which these loans are purchased and sold; type of holding; financial statements of the borrower; cost at date of purchase; size of holding; credit worthiness and cash flow of issuer; information as to any transactions in, or offers for, the holding; price and extent of public trading in similar securities (or equity securities) of the issuer/borrower, or comparable companies; coupon payments; quality, value and saleability of collateral securing the loan; business prospects of the issuer/borrower, including any ability to obtain money or resources from a parent or affiliate; the portfolio manager’s and/or the market’s assessment of the borrower’s management; prospects for the borrower’s industry, and multiples (of earnings and/or cash flow) being paid for similar businesses in that industry; borrower’s competitive position within the industry; borrower’s ability to access additional liquidity through public and/or private markets; and other relevant factors.
Effective January 1, 2008, the Funds adopted Statement of Financial Accounting Standards No. 157, Fair Value Measurements (“SFAS 157”). SFAS 157 defines fair value, establishes a framework for measuring fair value in accordance with U.S. generally accepted accounting principles and expands disclosures about fair value measurements. SFAS 157 is applicable in conjunction with other accounting pronouncements that require or permit fair value measurements, but does not expand
165
Table of Contents
| Notes to Financial Statements | ||
| December 31, 2008 |
the use of fair value to any new circumstances. More specifically, SFAS 157 emphasizes that fair value is a market based measurement, not an entity-specific measurement, and sets out a fair value hierarchy with the highest priority given to quoted prices in active markets and the lowest priority to unobservable inputs. The Funds’ adoption of SFAS 157 did not have a material impact on its financial condition or results of operations. See Note 9 -Fair Value of Financial Instruments for further disclosure.
B. Repurchase Agreements – In connection with transactions in repurchase agreements, it is the Fund’s policy that its custodian take possession of the underlying collateral and that the fair value of the collateral exceed the principal amount of the repurchase transaction, including accrued interest, at all times. If the seller defaults, and the fair value of the collateral declines, realization of the collateral by the Series may be delayed or limited.
C. Foreign Currency Transactions – The accounting records of the Fund are maintained in U.S. dollars. All assets and liabilities initially expressed in foreign currencies are converted into U.S. dollars at prevailing exchange rates. Purchases and sales of investment securities, dividend and interest income, and certain expenses are translated at the rates of exchange prevailing on the respective dates of such transactions. Changes in the relationship of these foreign currencies to the U.S. dollar can significantly affect the value of the investments and earnings of the Series. Foreign investments may also subject the Series to foreign government exchange restrictions, expropriation, taxation or other political, social or economic developments, all of which could affect the market and/or credit risk of the investments.
The Fund does not isolate that portion of the results of operations resulting from changes in the foreign exchange rates on investments from the fluctuations arising from changes in the market prices of securities held. Such fluctuations are included with the net realized and unrealized gain or loss on investments.
Net realized foreign exchange gains and losses arise from sales of portfolio securities, sales of foreign currencies, and the difference between asset and liability amounts initially stated in foreign currencies and the U.S. dollar value of the amounts actually received or paid. Net unrealized foreign exchange gains or losses arise from changes in the value of portfolio securities other assets and liabilities at the end of the reporting period, resulting from changes in the exchange rates.
D. Forward Foreign Currency Exchange Contracts – The Fund may enter into forward foreign exchange contracts in order to manage foreign currency risk from purchase or sale of securities denominated in foreign currency. A series may also enter into such contracts to manage the effect of changes in foreign currency exchange rates on portfolio positions. These contracts are marked to market daily, by recognizing the difference between the contract exchange rate and the current market rate as unrealized gains or losses. Realized gains or losses are recognized when contracts are settled and are reflected in the Statement of Operations. These contracts involve market risk in excess of the amount reflected in the Statement of Assets and Liabilities. The face or contract amount in U.S. dollars reflects the total exposure these funds have in that particular currency contract. Losses may arise due to changes in the value of the foreign currency or if the counterparty does not perform under the contract.
E. Futures – The Fund may utilize futures contracts to a limited extent, with the objectives of maintaining full exposure to the underlying stock market, enhancing returns, maintaining liquidity, minimizing transaction costs and economically hedging possible variations in foreign exchange values. The Fund may purchase or sell financial and foreign currency futures contracts to immediately position incoming cash in the market, thereby simulating a fully invested position in the underlying index while maintaining a cash balance for liquidity. In the event of redemptions, the series may pay from its cash balances and reduce its future positions accordingly. Returns may be enhanced by purchasing futures contracts instead of the underlying securities when futures are believed to be priced more attractively than the underlying securities. The primary risks associated with the use of futures contracts are imperfect correlation between changes in market values of stocks contained in the indexes and the prices of futures contracts, and the possibility of an illiquid market. Futures contracts are valued based upon their quoted daily settlement prices. Upon entering into a futures contract, the series are required to deposit and maintain as collateral either cash or securities, representing the initial margin, equal to a certain percentage of the contract value. Cash deposits are shown as restricted cash on the Statement of Assets and Liabilities; securities held as collateral are noted in the Schedule of Investments. Subsequent changes in the value of the contract are recorded as unrealized gains or losses. The variation margin is paid or received in cash daily by the series. The series realizes a gain or loss when the contract is closed or expires.
F. Options Purchased and Written – The Fund may purchase put and call options and write such options on a covered basis on securities that are traded on recognized securities exchanges and over-the-counter markets. Call and put options on securities give the holder the right to purchase or sell (and the writer the obligation to sell or purchase), respectively, a security at a specified price, until a certain date. Options may be used to economically hedge the series portfolio, to increase returns or to maintain exposure to the equity markets. The primary risks associated with the use of options are an imperfect correlation between the change in market value of the securities held by the series and the price of the option, the possibility of an illiquid market, and the inability of the counterparty to meet the terms of the contract.
The premium received for a written option is recorded as an asset with an equal liability which is marked to market based on the option’s quoted daily settlement price. Fluctuations in the value of such instruments are recorded as unrealized appreciation (depreciation) until terminated, at which time realized gains and losses are recognized.
G. Securities Sold Short – Certain of the Series may make short sales “against the box,” in which the Series enters into a short sale of a security it owns. At no time will more than 15% of the value of the Series’ net assets be in deposits on short sales against the box. If a Series makes a short sale, the Series does not immediately deliver from its own account the securities sold and does not receive the proceeds from the sale. To complete
166
Table of Contents
| Notes to Financial Statements | ||
| December 31, 2008 |
the sale, the Series must borrow the security (generally from the broker through which the short sale is made) in order to make delivery to the buyer. The Series must replace the security borrowed by purchasing it at the market price at the time of replacement or delivering the security from its own portfolio. The Series is said to have a “short position” in securities sold until it delivers them to the broker, at which time it receives the proceeds of the sale. Certain Series may make short sales that are not “against the box,” which create opportunities to increase the Series’ return but, at the same time, involve specific risk considerations and may be considered a speculative technique. Such short sales theoretically involve unlimited loss potential, as the market price of securities sold short may continually increase, although a Series may mitigate such losses by replacing the securities sold short before the market price has increased significantly. For financial statement purposes, an amount equal to the settlement amount is included in the Statement of Assets and Liabilities as an asset and an equivalent liability. The amount of the liability is subsequently marked-to-market to reflect the current value of the short position. Subsequent fluctuations in the market prices of securities sold, but not yet purchased, may require purchasing the securities at prices which differ from the market value reflected on the Statement of Assets and Liabilities. The Series are liable for any dividends or interest payable on securities while those securities are in a short position. As collateral for its short positions, the Series is required under the Investment Company Act of 1940 to maintain segregated assets consisting of cash, cash equivalents or liquid securities. These segregated assets are valued consistent with Note 1a above. These segregated assets are required to be adjusted daily to reflect changes in the market value of the securities sold short.
H. Senior Loans – Senior loans in which certain of the Series invests generally pay interest rates which are periodically adjusted by reference to short-term, floating rate plus a premium. These base lending rates are generally (i) the lending rate offered by one or more major European banks, such as the London Inter-Bank Offered Rate (LIBOR), (ii) the prime rate offered by one or more major United States banks, or (iii) the bank’s certificate of deposit rate. Senior floating rate interests often require prepayments from excess cash flows or permit the borrower to repay at its election. The rate at which the borrower repays cannot be predicted with accuracy. As a result, the actual remaining maturity may be substantially less than the stated maturities shown. The interest rate indicated is the rate in effect at December 31, 2008.
I. Security Transactions and Investment Income – Security transactions are accounted for on the date the securities are purchased or sold (trade date). Realized gains and losses are reported on an identified cost basis. Dividend income is accrued as of ex-dividend date, except that certain dividends for foreign securities where the ex-dividend date may have passed are recorded as soon as the Series is informed of the dividend in the exercise of reasonable diligence. Interest income is recognized on the accrual basis including the amortization of premiums and accretion of discounts on debt securities.
J. Expenses – Expenses that are directly related to one of the Series are charged directly to that Series. Other operating expenses are allocated to the Series on the basis of relative net assets within the Fund.
K. Distributions to Shareholders – The Fund is required by the Internal Revenue Code to distribute substantially all of its income and capital gains to its shareholders. Each year the Fund determines whether to declare and pay actual dividends or whether to secure consent of its shareholders to report and deduct a consent dividend. A consent dividend is treated for tax purposes as a distribution to shareholders occurring on the last day of the Fund’s taxable year and a shareholder contribution to capital occurring on the same day. It is the Fund’s current practice to utilize the consent dividend procedures. The character of any distributions made from net investment income and net realized gains may differ from their ultimate characterization for income tax purposes.
L. Taxes – The Series intend to comply with the requirements of the Internal Revenue Code applicable to regulated investment companies and distribute all of their taxable net income and net realized gains sufficient to relieve them from all, or substantially all, federal income, excise and state income taxes. Therefore, no provision for federal or state income tax is required.
FIN 48 requires the evaluation of tax positions taken or expected to be taken in the course of preparing the Series’ tax returns to determine whether the tax positions are “more-likely-than-not” of being sustained by the applicable tax authority. Tax positions not deemed to meet the more-likely-than-not threshold would be recorded as tax benefit or expense in the current year. If applicable, the Fund would recognize interest and penalties accrued related to the unrecognized tax benefits in “other expenses” on the Statement of Operations. For all open tax years (December 31, 2005 - December 31, 2008) and all major taxing jurisdictions through the end of the reporting period, the Fund’s management has completed a review and evaluation in connection with the adoption of FIN 48 and has determined that no tax liability is required and no additional disclosures are needed as of December 31, 2008.
M. Earnings Credits – Under the fee agreement with the custodian, the Series’ may earn credits based on overnight custody cash balances. These credits are utilized to reduce related custodial expenses. The custodian fees disclosed in the Statement of Operations are before the reduction in expense from the related earnings credits.
N. Use of Estimates – The preparation of financial statements in conformity with U.S. generally accepted accounting principles requires management to make estimates and assumptions that affect the reported amounts of assets and liabilities and disclosure of contingent assets and liabilities at the date of the financial statements and the reported amounts of increases and decreases in net assets from operations during the reporting period. Actual results could differ from those estimates.
O. Indemnifications – Under the Fund’s organizational documents, its Officers and Directors are indemnified against certain liabilities arising out of the performance of their duties to the Fund. In addition, in the normal course of business, the Fund enters into contracts that provide general indemnification to other parties. The Fund’s maximum exposure under these
167
Table of Contents
| Notes to Financial Statements | ||
| December 31, 2008 |
arrangements is unknown as this would involve future claims that may be made against the Fund that have not yet occurred, and may not occur. However, the Fund has not had prior claims or losses pursuant to these contracts and expects the risk of loss to be remote.
P. Recent Accounting Pronouncement – In March 2008, the FASB issued Statement of Financial Accounting Standards No. 161 (SFAS “161”), “Disclosures about Derivative Instruments and Hedging Activities — an amendment of FASB Statement No. 133, “which requires enhanced disclosures about an entity’s derivative and hedging activities. Entities are required to provide enhanced disclosures about (a) how and why an entity uses derivative instruments, (b) how derivative instruments and related hedged items are accounted for under Statement 133 and its related interpretations, and (c) how derivative instruments and related hedged items affect an entity’s financial position, financial performance and cash flows. SFAS 161 is effective for financial statements issued for fiscal years and interim periods beginning after November 15, 2008. The Fund does not expect SFAS 161 to have a material impact on their financial statements.
2. Management fees and other transactions with affiliates
Management fees are paid monthly to Security Investors (SI) (formerly known as Security Management Company), based on the following annual rates:
| Management Fees (as a % of net assets) | Management Fee Waivers (as a % of net assets) | ||||
Series A (Equity Series) | 0.75 | % | N/A | ||
Series B (Large Cap Value Series) | 0.65 | N/A | |||
Series C (Money Market Series) | 0.50 | N/A | |||
Series D (Global Series) | 1.00 | N/A | |||
Series E (U.S. Intermediate Bond Series) | 0.75 | 0.15 | |||
Series H (Enhanced Index Series) | 0.75 | 0.25 | |||
Series J (Mid Cap Growth Series) | 0.75 | N/A | |||
Series N (Managed Asset Allocation Series) | 1.00 | N/A | |||
Series O (All Cap Value Series) | 0.70 | 2 | N/A | ||
Series P (High Yield Series) | 0.75 | N/A | |||
Series Q (Small Cap Value Series) | 1.00 | N/A | |||
Series V (Mid Cap Value Series) | 0.75 | N/A | |||
Series X (Small Cap Growth Series) | 0.85 | 3 | N/A | ||
Series Y (Select 25 Series) | 0.75 | N/A | |||
Series Z (Alpha Opportunity Series) | 2.12 | 1 | N/A |
1 | Effective August 18, 2008, SI receives a management fee from Series Z at an annual rate of 1.25% of the average daily net assets. Prior to August 18, 2008, SI received a management fee from Series Z that consisted of two components. The first component was an annual base fee equal to 2.00% of Series Z’s average daily net assets. The second component was a base fee adjustment that either increased or decreased the base fee, depending on how Series Z performed relative to the S&P 500 Index over the prior 12-month period (the “Measuring Period”). SI received the base fee of 2.00% without adjustment if the performance of Series Z matched the performance of the S&P 500 Index. The maximum base fee adjustment at each calculation period was 0.75% up or down in the event that Series Z outperforms or underperformed the S&P 500 Index by 15% or more. SI calculated the base fee adjustment each month based upon Series Z’s performance relative to the S&P 500 Index during the Performance Period ending on the last day of the month. If Series Z outperformed the S&P 500 Index over the Measuring Period, the base fee was adjusted upward. The upward adjustment was equal to the amount by which Series Z’s performance exceeded that of the S&P 500 Index divided by 15 and multiplied by the average daily net assets of Series Z during the Measuring Period to determine the base fee adjustment for the month. If Series Z underperformed the Index, the base fee was adjusted downward on the same basis. SGI determined the dollar amount of any performance adjustment each month by multiplying the adjustment percentage by the average daily net assets of Series Z during the Measuring Period and dividing by that number by the number of days in the Measuring Period and then multiplying that amount by the number of days in the current month. |
2 | Effective August 18, 2008, SI receives a management fee from Series O at an annual rate of 0.70% of the average daily net assets. Prior to August 18, 2008, SI received a management fee from Series O of 1.00% of he average daily net assets. |
3 | Effective November 24, 2008 SI receives a management fee from Series X at an annual rate of 0.85% of the average daily net assets. Prior to November 24, 2008, SI received a management fee from Series X of 1.00% of the average daily net assets. |
SI also acts as the administrative agent and transfer agent for the Fund, and as such performs administrative functions, transfer agency and dividend disbursing services, and the bookkeeping, accounting and pricing functions for each series. For these services, the Investment Manager receives the following:
| Administrative Fees (as a % of net assets)* | |||
Series A (Equity Series) | 0.095 | % | |
Series B (Large Cap Value Series) | 0.095 | ||
Series C (Money Market Series) | 0.095 | ||
Series D (Global Series) | 0.150 | ||
Series E (U.S. Intermediate Bond Series) | 0.095 | ||
Series H (Enhanced Index Series) | 0.095 | ||
Series J (Mid Cap Growth Series) | 0.095 | ||
Series N (Managed Asset Allocation Series) | 0.150 | ||
Series O (All Cap Value Series) | 0.095 | ||
Series P (High Yield Series) | 0.095 | ||
Series Q (Small Cap Value Series) | 0.095 | ||
Series V (Mid Cap Value Series) | 0.095 | ||
Series X (Small Cap Growth Series) | 0.095 | ||
Series Y (Select 25 Series) | 0.095 | ||
Series Z (Alpha Opportunity Series) | 0.150 |
| * | The minimum annual charge for administrative fees is $25,000 for Series A, B, C, E, H, J, O, P, Q, V, X, Y and Z and $60,000 for Series D and N. |
SI is paid the following for providing transfer agent services to the Fund:
Annual charge per account | $ | 5.00 - $8.00 | |
Transaction fee | $ | 0.60 - $1.10 | |
Minimum annual charge per series | $ | 25,000 | |
Certain out-of-pocket charges | Varies |
168
Table of Contents
Notes to Financial Statements
December 31, 2008
Effective January 1, 2007, the investment advisory contract for Series Z provides that the total other expenses be limited to 0.50% of average net assets, exclusive of interest, taxes, extraordinary expenses, brokerage fees, commissions and dividends on short sales. This contract is in effect through December 31, 2008. SI has agreed to limit the total expenses of Series H, Series Q and Series Y to 1.75% of average net assets and Series P and Series V to 2.00% of average net assets, exclusive of interest, taxes, extraordinary expenses, brokerage fees and commissions for the aforementioned Series. The expense limits are voluntary and may be terminated at any time without notice to shareholders.
At December 31, 2008, Security Benefit Life Insurance Company, through their insurance company separate accounts, owned 100% of the outstanding shares of each Series of the Fund, except for, Series N, Series P, Series V and Series X in which it owns 99% of each Series and Series O and Series Q it owns 98% of each Series.
3. Unrealized Appreciation/Depreciation
For federal income tax purposes, the amounts of unrealized appreciation (depreciation) on investments at December 31, 2008, were as follows:
| Gross unrealized appreciation | Gross unrealized depreciation | Net unrealized appreciation (depreciation) | |||||||||
Series A | |||||||||||
(Equity) | $ | 6,651,737 | $ | (67,556,101 | ) | $ | (60,904,364 | ) | |||
Series B | |||||||||||
(Large Cap Value) | 20,996,927 | (92,689,391 | ) | (71,692,464 | ) | ||||||
Series C | |||||||||||
(Money Market) | 208,534 | (25,092 | ) | 183,442 | |||||||
Series D | |||||||||||
(Global) | — | (26,789,796 | ) | (26,789,796 | ) | ||||||
Series E | |||||||||||
(U.S. Intermediate Bond) | 1,142,160 | (18,309,966 | ) | (17,167,806 | ) | ||||||
Series H | |||||||||||
(Enhanced Index) | — | (14,268,694 | ) | (14,268,694 | ) | ||||||
Series J | |||||||||||
(Mid Cap Growth) | 1,039,607 | (39,845,965 | ) | (38,806,358 | ) | ||||||
Series N | |||||||||||
(Managed Asset Allocation) | — | (20,695,286 | ) | (20,695,286 | ) | ||||||
Series O | |||||||||||
(All Cap Value) | 3,713,623 | (63,816,640 | ) | (60,103,017 | ) | ||||||
Series P | |||||||||||
(High Yield) | 703,596 | (45,280,424 | ) | (44,576,828 | ) | ||||||
Series Q | |||||||||||
(Small Cap Value) | 8,760,196 | (47,158,917 | ) | (38,398,721 | ) | ||||||
Series V | |||||||||||
(Mid Cap Value) | 11,281,533 | (122,901,939 | ) | (111,620,406 | ) | ||||||
Series X | |||||||||||
(Small Cap Growth) | 2,745,047 | (1,597,760 | ) | 1,147,287 | |||||||
Series Y | |||||||||||
(Select 25) | 216,742 | (12,104,619 | ) | (11,887,877 | ) | ||||||
Series Z | |||||||||||
(Alpha Opportunity) | 115,473 | (4,793,075 | ) | (4,677,602 | ) | ||||||
4. Investment Transactions
Investment transactions for the year ended December 31, 2008, (excluding overnight investments, short–term commercial paper and U.S. government securities) were as follows:
| Purchases | Proceeds from Sales | |||||
Series A | ||||||
(Equity) | $ | 350,694,055 | $ | 392,967,495 | ||
Series B | ||||||
(Large Cap Value) | 117,191,167 | 153,569,826 | ||||
Series C | ||||||
(Money Market) | — | — | ||||
Series D | ||||||
(Global) | 1,205,156,406 | 1,282,318,359 | ||||
Series E | ||||||
(U.S. Intermediate Bond) | 35,234,544 | 39,901,411 | ||||
Series H | ||||||
(Enhanced Index) | 65,772,368 | 76,616,457 | ||||
Series J | ||||||
(Mid Cap Growth) | 363,215,718 | 376,678,817 | ||||
Series N | ||||||
(Managed Asset Allocation) | 80,995,702 | 86,946,612 | ||||
Series O | ||||||
(All Cap Value) | 289,087,771 | 302,112,304 | ||||
Series P | ||||||
(High Yield) | 28,013,539 | 38,274,332 | ||||
Series Q | ||||||
(Small Cap Value) | 31,639,376 | 49,384,155 | ||||
Series V | ||||||
(Mid Cap Value) | 179,800,241 | 212,277,944 | ||||
Series X | ||||||
(Small Cap Growth) | 96,838,342 | 113,736,042 | ||||
Series Y | ||||||
(Select 25) | 106,396,240 | 113,812,802 | ||||
Series Z | ||||||
(Alpha Opportunity) | 230,612,967 | 226,366,987 | ||||
169
Table of Contents
Notes to Financial Statements
December 31, 2008
5. Open Futures Contracts
Open futures contracts for Series H and Series Z as of December 31, 2008, were as follows:
| Position | Number of Contracts | Expiration Date | Contract Amount | Market Value | Unrealized Loss | ||||||||||
Series H | |||||||||||||||
S&P 500 E-Mini Future | Long | 28 | 03/20/2009 | $ | 1,241,943 | $ | 1,260,140 | $ | 18,197 | ||||||
Series Z | |||||||||||||||
S&P 500 Index Future | Long | 26 | 03/20/2009 | $ | 5,777,975 | $ | 5,850,650 | $ | 72,675 | ||||||
6. Restricted Securities
As of December 31, 2008, Series O owned restricted securities. The specific market value, cost, percentage of total net assets and acquisition dates are as follows:
| Number of Shares | Price Per Share | Market Value | Cost | % of Net Assets | Acquisition Dates | |||||||
Series O | ||||||||||||
Merrill Lynch & Company, Inc. | 40,093 | 11.058 | 443,348 | 1,109,943 | 0.3 | 1-18-08 |
These securities have been valued after considering certain pertinent factors, including the results of operations since the date of purchase and the recent sales price of its common stock. No quoted market price exists for these shares. It is possible that the estimated value may differ significantly from the amount that might ultimately be realized in the near term, and the difference could be material.
7. Affiliated Issuers
Investments representing 5% or more of the outstanding voting securities of a portfolio company of a fund result in that portfolio company being considered an affiliated company of such fund, as defined in the 1940 Act. The aggregate market value of all securities of affiliated companies held in Series V as of December 31, 2008 amounted to $6,723 which represents 0.0% of net assets. There were no affiliated companies held in any other Series. Transactions in Series V during the year ended December 31, 2008 in which the portfolio company is an “affiliated person” are as follows:
| Balance 12/31/07 | Gross Additions | Gross Reductions | Balance 12/31/08 | Realized Gain/(Loss) | Investment Income | |||||||||||
Hydrogen Corporation (Shares) | 672,346 | — | — | 672,346 | — | — | ||||||||||
Hydrogen Corporation (Cost) | $ | 2,571,575 | — | — | $ | 2,571,575 | $ | — | $ | — | ||||||
| * | As a result of Series V’s beneficial ownership of the common stock of these portfolio companies, applicable regulations require that the Series state that it may be deemed an affiliate of the respective portfolio company. The Series disclaims that the “affiliated persons” are affiliates of the Distributor, Advisor, Series or any other client of the Advisor. |
170
Table of Contents
Notes to Financial Statements
December 31, 2008
8. Options Written
Information as to options written by the Series during the year ended December 31, 2008 and options outstanding at year end is provided below.
Series A Call Options Written | |||||||
| Number of Contracts | Premium Amount | ||||||
Balance at December 31, 2007 | — | $ | — | ||||
Opened | 728 | 135,736 | |||||
Expired | (728 | ) | (135,736 | ) | |||
Balance at December 31, 2008 | — | $ | — | ||||
Series A Put Options Written | |||||||
| Number of Contracts | Premium Amount | ||||||
Balance at December 31, 2007 | — | $ | — | ||||
Opened | 1,385 | 140,040 | |||||
Exercised | (964 | ) | (95,057 | ) | |||
Expired | (421 | ) | (44,983 | ) | |||
Balance at December 31, 2008 | — | $ | — | ||||
Series B Call Options Written | |||||||
| Number of Contracts | Premium Amount | ||||||
Balance at December 31, 2007 | — | $ | — | ||||
Opened | 2,259 | 421,231 | |||||
Expired | (2,259 | ) | (421,231 | ) | |||
Balance at December 31, 2008 | — | $ | — | ||||
Series B Put Options Written | |||||||
| Number of Contracts | Premium Amount | ||||||
Balance at December 31, 2007 | — | $ | — | ||||
Opened | 4,310 | 436,241 | |||||
Exercised | (2,992 | ) | (295,049 | ) | |||
Expired | (1,318 | ) | (141,192 | ) | |||
Balance at December 31, 2008 | — | $ | — | ||||
Series O Call Options Written Outstanding | ||||||||||
Common Stock | Expiration | Exercise Price | Number of Contracts | Market Value | ||||||
Adminstaff, Inc. | 01-16-09 | $ | 30.00 | 155 | $ | 775 | ||||
Total call options outstanding (premiums received $45,995) | 155 | $ | 775 | |||||||
Series O Call Options Written | |||||||
| Number of Contracts | Premium Amount | ||||||
Balance at December 31, 2007 | — | $ | — | ||||
Opened | 155 | 45,995 | |||||
Balance at December 31, 2008 | 155 | $ | 45,995 | ||||
Series Q Call Options Written | |||||||
| Number of Contracts | Premium Amount | ||||||
Balance at December 31, 2007 | 1,577 | $ | 1,242,121 | ||||
Opened | 11,728 | 4,358,210 | |||||
Bought Back | (10,479 | ) | (4,973,191 | ) | |||
Expired | (2,749 | ) | (616,391 | ) | |||
Exercised | (77 | ) | (10,749 | ) | |||
Balance at December 31, 2008 | — | $ | — | ||||
Series Q Put Options Written | |||||||
| Number of Contracts | Premium Amount | ||||||
Balance at December 31, 2007 | 130 | $ | 120,418 | ||||
Opened | 587 | 233,083 | |||||
Exercised | (5 | ) | (15,075 | ) | |||
Bought Back | (712 | ) | (338,426 | ) | |||
Balance at December 31, 2008 | — | $ | — | ||||
Series V Call Options Written Outstanding | ||||||||||
Common Stock | Expiration | Exercise Price | Number of Contracts | Market Value | ||||||
Assured Guaranty, Ltd. | 01-16-09 | $ | 15.00 | 508 | $ | 10,160 | ||||
Administaff, Inc. | 01-16-09 | 30.00 | 368 | 1,840 | ||||||
Commerce Banchsares, Inc. | 02-20-09 | 45.00 | 276 | 104,880 | ||||||
First Horizon National Corporation | 01-16-09 | 10.00 | 1,397 | 139,700 | ||||||
Navigant Consulting, Inc. | 04-17-09 | 20.00 | 606 | 45,450 | ||||||
Old National Bancorp | 03-20-09 | 17.50 | 723 | 133,755 | ||||||
SCANA Corporation | 01-16-09 | 35.00 | 350 | 52,500 | ||||||
Total call options outstanding (premiums received, $803,926) | 4,228 | $ | 488,285 | |||||||
Series V Put Options Written Outstanding | ||||||||||
Common Stock | Expiration | Exercise Price | Number of Contracts | Market Value | ||||||
Kansas City Southern | 01-16-09 | $ | 17.50 | 570 | $ | 42,750 | ||||
McDermott International, Inc. | 01-16-09 | 7.50 | 1,700 | 17,000 | ||||||
PetroHawk Energy Corporation | 03-20-09 | 7.50 | 1,095 | 32,850 | ||||||
URS Corporation | 01-16-09 | 22.50 | 440 | 2,200 | ||||||
Total put options outstanding (premiums received, $549,517) | 3,805 | $ | 94,800 | |||||||
Series V Call Options Written | |||||||
| Number of Contracts | Premium Amount | ||||||
Balance at December 31, 2007 | 2,693 | $ | 381,253 | ||||
Opened | 13,218 | 3,217,289 | |||||
Exercised | (3,184 | ) | (911,406 | ) | |||
Expired | (8,157 | ) | (1,710,726 | ) | |||
Bought Back | (342 | ) | (172,483 | ) | |||
Balance at December 31, 2008 | 4,228 | $ | 803,927 | ||||
171
Table of Contents
Notes to Financial Statements
December 31, 2008
Series V Put Options Written | |||||||
| Number of Contracts | Premium Amount | ||||||
Balance at December 31, 2007 | — | $ | — | ||||
Opened | 14,828 | 2,418,720 | |||||
Expired | (3,334 | ) | (656,857 | ) | |||
Exercised | (7,689 | ) | (1,212,346 | ) | |||
Balance at December 31, 2008 | 3,805 | $ | 549,517 | ||||
9. Fair Value of Financial Instruments
In September 2006, the Financial Accounting Standards Board (“FASB”) issued Statement of Financial Accounting Standards No. 157, “Fair Value Measurements” (FAS 157). This standard clarifies the definition of fair value for financial reporting, establishes a framework for measuring fair value and requires additional disclosure about the use of fair value requirements. FAS 157 is effective for financial statements issued for fiscal years beginning after November 15, 2007 and interim periods within those fiscal years.
The three levels of fair value hierarchy under FAS 157 are listed below:
Level 1 | - | quoted prices in active markets for identical securities. The types of assets and liabilities carried at Level 1 fair value generally are government and agency securities, equities listed in active markets, certain futures and certain options. | ||
Level 2 | - | other significant observable inputs (including quoted prices for similar securities, interest rates, prepayment speeds, credit risk, etc.). The types of assets and liabilities carried at Level 2 fair value generally are municipal bonds, certain mortgage and asset-backed securities, certain corporate debt, commercial paper and repurchase agreements. | ||
Level 3 | - | significant unobservable inputs (including the Fund’s own assumptions in determining the fair value of investments). The types of assets and liabilities carried at Level 3 fair value generally are certain mortgage and asset-backed securities, certain corporate debt and certain derivatives. | ||
Observable inputs are those based on market data obtained from sources independent of the Fund, and unobservable inputs reflect the Fund’s own assumptions based on the best information available.
The inputs or methodology used for valuing securities are not necessarily an indication of the risk association with investing in those securities.
The following table provides the fair value measurements of applicable Fund assets by level within the fair value hierarchy as of December 31, 2008. These assets are measured on a recurring basis.
172
Table of Contents
Notes to Financial Statements
December 31, 2008
Description | Total | LEVEL 1 Quoted prices in active markets for identical assets | LEVEL 2 Significant other observable units | LEVEL 3 Significant unobservable inputs | ||||||||
SBL Fund: | ||||||||||||
Series A (Equity Series) | ||||||||||||
Investments | $ | 161,439,383 | $ | 161,439,383 | $ | — | $ | — | ||||
Series B (Large Cap Value Series) | ||||||||||||
Investments | 242,381,840 | 242,381,840 | — | — | ||||||||
Series C (Money Market Series) | ||||||||||||
Investments | 275,443,679 | — | 275,443,679 | — | ||||||||
Series D (Global Series) | ||||||||||||
Investments | 281,308,344 | 267,716,145 | 13,592,199 | — | ||||||||
Series E (U.S. Intermediate Bond Series) | ||||||||||||
Investments | 98,365,806 | 12,753,944 | 85,521,657 | 90,205 | ||||||||
Series H (Enhanced Index Series) | ||||||||||||
Investments | 42,528,869 | 42,313,924 | 214,945 | — | ||||||||
Futures Contracts | 18,197 | 18,197 | — | — | ||||||||
Total | 42,547,066 | 42,332,121 | 214,945 | — | ||||||||
Series J (Mid Cap Growth Series) | ||||||||||||
Investments | 122,487,221 | 112,791,514 | 9,695,707 | — | ||||||||
Series N (Managed Asset Allocation Series) | ||||||||||||
Investments | 76,243,667 | 51,041,537 | 25,171,337 | 30,793 | ||||||||
Series O (All Cap Value Series) | ||||||||||||
ASSETS: | ||||||||||||
Investments | 151,321,673 | 150,878,325 | 443,348 | — | ||||||||
LIABILITIES: | ||||||||||||
Written Options (net of premiums received) | 45,220 | 45,220 | — | — | ||||||||
Series P (High Yield Series) | ||||||||||||
Investments | 80,567,933 | 1,413,304 | 78,704,326 | 450,303 | ||||||||
Series Q (Small Cap Value Series) | ||||||||||||
Investments | 85,237,188 | 76,953,603 | 8,283,585 | — | ||||||||
Series V (Mid Cap Value Series) | ||||||||||||
ASSETS: | ||||||||||||
Investments | 244,562,764 | 242,214,767 | 2,347,997 | — | ||||||||
LIABILITIES: | ||||||||||||
Options (net of premiums received) | 770,358 | 770,358 | — | — | ||||||||
Series X (Small Cap Growth Series) | ||||||||||||
Investments | 28,532,199 | 28,532,199 | — | — | ||||||||
Series Y (Select 25 Series) | ||||||||||||
Investments | 32,946,700 | 32,946,700 | — | — | ||||||||
Series Z (Alpha Opportunity Series) | ||||||||||||
ASSETS: | ||||||||||||
Investments | 29,145,930 | 18,459,640 | 10,686,290 | — | ||||||||
Futures Contracts | 72,675 | 72,675 | — | — | ||||||||
Total | 29,218,605 | 18,532,315 | 10,686,290 | — | ||||||||
LIABILITIES: | ||||||||||||
Securities (sold short) | 7,899,471 | 112,816 | — | 7,786,655 | ||||||||
173
Table of Contents
Notes to Financial Statements
December 31, 2008
Following is a reconciliation of Level 3 assets for which significant unobservable inputs were used to determine fair value:
LEVEL 3 - Fair value measurement using significant unobservable inputs
| For the year ended December 31, 2008 | ||||
Series E (U.S. Intermediate Bond) | ||||
ASSETS: | ||||
Fair value beginning balance | $ | 78,360 | ||
Total realized gains or losses included in earnings | (1,186,635 | ) | ||
Total unrealized gains or losses included in earnings | 48,415 | |||
Purchases, sales, issuances, and settlements (net) | 315 | |||
Transfers in and/or out of Level 3 | 1,149,750 | |||
Fair value ending balance | $ | 90,205 | ||
Series N (Managed Asset Allocation Series) | ||||
ASSETS: | ||||
Fair value beginning balance | $ | 44,608 | ||
Total realized gains or losses included in earnings | — | |||
Total unrealized gains or losses included in earnings | (13,815 | ) | ||
Purchases, sales, issuances, and settlements (net) | — | |||
Transfers in and/or out of Level 3 | — | |||
Fair value ending balance | $ | 30,793 | ||
Series P (High Yield Series) | ||||
ASSETS: | $ | — | ||
Fair value beginning balance | — | |||
Total realized gains or losses included in earnings | ||||
Total unrealized gains or losses included in earnings | (640,579 | ) | ||
Purchases, sales, issuances, and settlements (net) | (122,380 | ) | ||
Transfers in and/or out of Level 3 | 1,213,262 | |||
Fair value ending balance | $ | 450,303 | ||
Series Z (Alpha Opportunity Series) | ||||
ASSETS: | ||||
Fair value beginning balance | $ | — | ||
Total realized gains or losses included in earnings | — | |||
Total unrealized gains or losses included in earnings | — | |||
Purchases, sales, issuances, and settlements (net) | 164,337 | |||
Transfers in and/or out of Level 3 | 7,622,318 | |||
Fair value ending balance | $ | 7,786,655 | ||
174
Table of Contents
Notes to Financial Statements
December 31, 2008
10. Federal Tax Matters
Net investment income and net realized gains (losses) may differ for financial statement and tax purposes because of temporary or permanent book/tax differences. These differences are primarily due to differing book and tax amortization methods for premium and market discount, consent dividends, ordinary net operating losses and the expiration of capital loss carryovers. To the extent these differences are permanent differences, adjustments are made to the appropriate equity accounts in the period that the differences arise. The following adjustments were made to the Statement of Assets and Liabilities at December 31, 2008 to reflect permanent differences:
| Accumulated Net Realized Gain/(Loss) | Undistributed Net Investment Income | Paid-in-Capital | ||||||||||
Series A | $ | (47,074,607 | ) | $ | (2,057,542 | ) | $ | 49,132,149 | ||||
Series B | 41,927,496 | (4,458,590 | ) | (37,468,906 | ) | |||||||
Series C | — | (6,020,002 | ) | 6,020,002 | ||||||||
Series D | (148,921,434 | ) | 167,294 | 148,754,140 | ||||||||
Series E | 9,299,586 | (7,092,424 | ) | (2,207,162 | ) | |||||||
Series H | (3,342,647 | ) | (1,269,184 | ) | 4,611,831 | |||||||
Series J | (63,974,358 | ) | 105,176 | 63,869,182 | ||||||||
Series N | (8,777,848 | ) | (1,876,201 | ) | 10,654,049 | |||||||
Series O | (25,033,337 | ) | (4,407,195 | ) | 29,440,532 | |||||||
Series P | (701,925 | ) | (8,698,355 | ) | 9,400,280 | |||||||
Series Q | (26,510,032 | ) | (1,434 | ) | 26,511,466 | |||||||
Series V | (104,192,174 | ) | (3,273,887 | ) | 107,466,061 | |||||||
Series X | — | 389,974 | (389,974 | ) | ||||||||
Series Y | — | (399,716 | ) | 399,716 | ||||||||
Series Z | (6,956,592 | ) | 418,687 | 6,537,905 | ||||||||
175
Table of Contents
Notes to Financial Statements
December 31, 2008
10. Federal Tax Matters (continued)
At December 31, 2008, the following Series had capital loss carryovers and deferred post-October losses to offset future realized capital gains as follows:
| Capital Loss | Capital Loss | |||||||||||||
| Carryover | Carryovers | Deferred | ||||||||||||
| Utilized | Expired | Capital Loss | Post-October | |||||||||||
| in 2008 | in 2008 | Carryovers | Expires In | Losses | ||||||||||
Series A | $ | — | $ | — | $ | 23,906,984 | 2016 | $ | 3,888,079 | |||||
Series B | $ | — | $ | 41,927,496 | $ | — | 2008 | 4,527,784 | ||||||
| — | — | 5,057,813 | 2009 | |||||||||||
| — | — | 87,172,720 | 2010 | |||||||||||
| — | — | 26,620,854 | 2011 | |||||||||||
| — | — | 29,474,335 | 2016 | |||||||||||
| $ | — | $ | 41,927,496 | $ | 148,325,722 | |||||||||
Series D | $ | — | $ | — | $ | 57,035,385 | 2016 | 41,754,741 | ||||||
Series E | $ | — | $ | 9,322,945 | $ | — | 2008 | |||||||
| — | — | 719,015 | 2010 | 2,493,881 | ||||||||||
| — | — | 350,320 | 2012 | |||||||||||
| — | — | 2,731,334 | 2014 | |||||||||||
| — | — | 838,194 | 2015 | |||||||||||
| — | — | 937,378 | 2016 | |||||||||||
| $ | — | $ | 9,322,945 | $ | 5,576,241 | |||||||||
Series H | $ | — | $ | — | $ | 7,974,428 | 2016 | 4,360,510 | ||||||
Series J | $ | — | $ | — | $ | 48,891,509 | 2016 | 19,684,193 | ||||||
Series N | $ | — | $ | — | $ | 2,648,702 | 2016 | 1,767,696 | ||||||
Series O | $ | — | $ | — | $ | 17,818,296 | 2016 | 484,428 | ||||||
Series P | $ | — | $ | — | $ | 1,169,629 | 2016 | — | ||||||
Series Q | $ | — | $ | — | $ | — | 114 | |||||||
Series V | $ | — | $ | — | $ | — | 412,943 | |||||||
Series X | $ | — | $ | — | $ | 7,184,628 | 2010 | 15,139,901 | ||||||
| — | — | 11,654,235 | 2016 | |||||||||||
| $ | — | $ | — | $ | 18,838,863 | |||||||||
Series Y | $ | — | $ | — | $ | 9,340,921 | 2009 | 545,503 | ||||||
| — | — | 9,284,391 | 2010 | |||||||||||
| — | — | 6,092,310 | 2011 | |||||||||||
| — | — | 338,147 | 2012 | |||||||||||
| — | — | 9,012,784 | 2016 | |||||||||||
| $ | — | $ | — | $ | 34,068,553 | |||||||||
Series Z | $ | — | $ | — | $ | 10,774,584 | 2016 | 2,139,899 | ||||||
176
Table of Contents
Notes to Financial Statements
December 31, 2008
10. Federal Tax Matters (continued)
The Fund declared ordinary and long-term capital gain consent dividends for the year ended December 31, 2007, as shown below.
| Ordinary Consent Dividends | Long-term Capital Gain Consent Dividends | |||||
Series A | $ | 6,091,443 | $ | 43,040,706 | ||
Series B | 4,458,590 | — | ||||
Series C | 6,020,002 | — | ||||
Series D | 14,955,820 | 133,798,317 | ||||
Series E | 7,115,783 | — | ||||
Series H | 1,269,184 | 3,342,647 | ||||
Series J | 10,865,990 | 53,108,368 | ||||
Series N | 3,564,707 | 7,072,834 | ||||
Series O | 5,703,349 | 23,737,183 | ||||
Series P | 8,648,373 | 751,907 | ||||
Series Q | — | 26,511,466 | ||||
Series V | 4,754,292 | 102,711,769 | ||||
Series Y | 399,716 | — | ||||
Series Z | 6,546,410 | 595,406 | ||||
Short term distributions are treated as ordinary distributions for federal income tax purposes.
As of December 31, 2008, the components of distributable earnings/(deficit) on a tax basis were as follows:
| Undistributed Ordinary Income | Undistributed Long-term Gain | Accumulated Capital and Other Losses | Unrealized Appreciation (Depreciation) | Distributable Earnings (Deficit) | ||||||||||||||
Series A | $ | 1,665,710 | $ | — | $ | (27,795,063 | ) | $ | (60,904,364 | ) | $ | (87,033,717 | ) | |||||
Series B | 4,509,471 | — | (152,853,505 | ) | (71,692,464 | ) | (220,036,498 | ) | ||||||||||
Series C | 4,249,459 | — | — | 183,442 | 4,432,901 | |||||||||||||
Series D | 7,455,215 | — | (98,790,126 | ) | (26,799,955 | ) | (118,134,866 | ) | ||||||||||
Series E | 5,570,363 | — | (8,070,122 | ) | (17,167,807 | ) | (19,667,566 | ) | ||||||||||
Series H | 994,450 | — | (12,334,938 | ) | (14,268,694 | ) | (25,609,182 | ) | ||||||||||
Series J | — | — | (68,575,702 | ) | (38,806,358 | ) | (107,382,060 | ) | ||||||||||
Series N | 1,986,236 | — | (4,416,398 | ) | (20,696,896 | ) | (23,127,058 | ) | ||||||||||
Series O | 4,037,889 | — | (18,302,724 | ) | (60,057,793 | ) | (74,322,628 | ) | ||||||||||
Series P | 8,243,554 | — | (1,169,630 | ) | (44,576,829 | ) | (37,502,905 | ) | ||||||||||
Series Q | 684,695 | 2,741,903 | (114 | ) | (38,398,699 | ) | (34,972,215 | ) | ||||||||||
Series V | 3,755,588 | 18,875,628 | (412,943 | ) | (110,850,048 | ) | (88,631,775 | ) | ||||||||||
Series X | — | — | (33,978,763 | ) | 1,147,287 | (32,831,476 | ) | |||||||||||
Series Y | 71,213 | — | (34,614,056 | ) | (11,887,876 | ) | (46,430,719 | ) | ||||||||||
Series Z | — | — | (12,914,483 | ) | (4,894,336 | ) | (17,808,819 | ) | ||||||||||
The difference between book basis and tax basis unrealized appreciation (depreciation) is attributable primarily to the tax deferral of losses on wash sales, the realization of unrealized gains for tax purposes on futures contracts, differing book and tax methods for bond discount/premium amortization, and passive foreign investment companies.
177
Table of Contents
Notes to Financial Statements
December 31, 2008
11. Series Z
Series Z - Alpha Opportunity Series (“Series Z”) contracted with Lehman Brothers International Europe (“LBIE”) to provide prime brokerage services related to Series Z’s short selling. On September 15, 2008, LBIE was placed into administration and a third party administrator has been named (the “Administrator”). Series Z’s exposure to LBIE consists of short sale proceeds held by LBIE, and restricted long positions held at Series Z’s custodian, as collateral for said short sales. Series Z has delivered a Notice of Termination of Loans to LBIE and the Administrator. Series Z is working to resolve these issues with LBIE and the Administrator. As of December 31, 2008, included in the statement of net assets are the value of restricted long positions of $6,650,126, restricted cash representing the value of short sale proceeds of $4,251,929 and liabilities for short sales of $7,786,655 representing the value of securities sold short at the date of termination. Until such time as the liability for short sales is settled and all restrictions are removed, Series Z cannot sell such restricted long positions and/or utilize the restricted cash balances to achieve Series Z’s investment objectives and/or meet Series Z’s redemption or other obligations. The liability for short sales recorded at December 31, 2008 may differ from the amounts ultimately due at settlement due to the inherent uncertainties in any such estimation process, including various challenges which could be made in the bankruptcy proceedings. Such differences, if any, will be reported in future periods when additional information is provided by the Administrator and the differences may be material.
12. Subsequent Event
Effective February 9, 2009, Security Global Investors became the advisor for Series Q - Small Cap Value Series. Prior to February 9, 2009, Security Investors paid Wells Capital Management, Inc. for sub-advisory services. Also, effective February 9, 2009, the investment management fee payable by Series Q is equal to 0.95% of the average daily net assets on an annual basis.
178
Table of Contents
Report of Independent Registered Public Accounting Firm
To the Contractholders and Board of Directors
SBL Fund
We have audited the accompanying statements of assets and liabilities, including the schedules of investments, of SBL Fund (comprised of Series A, B, C, D, E, H, J, N, O, P, Q, V, X, Y and Z portfolios) (the Fund), as of December 31, 2008, and the related statements of operations for the year then ended, the statements of changes in net assets for each of the two years in the period then ended, and the financial highlights for each of the periods indicated therein. These financial statements and financial highlights are the responsibility of the Fund’s management. Our responsibility is to express an opinion on these financial statements and financial highlights based on our audits.
We conducted our audits in accordance with the standards of the Public Company Accounting Oversight Board (United States). Those standards require that we plan and perform the audit to obtain reasonable assurance about whether the financial statements and financial highlights are free of material misstatement. We were not engaged to perform an audit of the Fund’s internal control over financial reporting. Our audits included consideration of internal control over financial reporting as a basis for designing audit procedures that are appropriate in the circumstances, but not for the purpose of expressing an opinion of the effectiveness of the Fund’s internal control over financial reporting. Accordingly, we express no such opinion. An audit also includes examining, on a test basis, evidence supporting the amounts and disclosures in the financial statements and financial highlights, assessing the accounting principles used and significant estimates made by management, and evaluating the overall financial statement presentation. Our procedures included confirmation of investments owned as of December 31, 2008, by correspondence with custodians and brokers or by other appropriate auditing procedures where replies from brokers were not received. We believe that our audits provide a reasonable basis for our opinion.
As more fully discussed in Note 11 to the financial statements, Series Z of the SBL Fund (“Series Z”) previously utilized the services of Lehman Brothers International (Europe) (“Lehman”) to provide prime broker services related to Series Z’s securities sold short. On September 15, 2008, Lehman was placed into administration. The financial records of Lehman are now being handled by the administrator. Information flow to Series Z from the administrator has been limited. Management has recorded in the financial statements its best estimate of the liability for securities sold short due to Lehman, based upon management’s assessment of all available evidence, including information supplied by the administrators. Significant uncertainly exists regarding the ultimate timing of settlement, as well as the ultimate liability for securities sold short due to Lehman, and the difference between amounts currently recorded and that which may ultimately be due may be material.
In our opinion, the financial statements and financial highlights referred to above present fairly, in all material respects, the financial position of each of the respective Series constituting the Fund at December 31, 2008, the results of their operations for the year then ended, the changes in their net assets for each of the two years in the period then ended, and the financial highlights for each of the periods indicated therein, in conformity with U.S. generally accepted accounting principles.

Kansas City, Missouri
February 25, 2009
179
Table of Contents
(unaudited)
Director Approval of Investment Advisory Agreement
At an in-person meeting of the Fund’s Boards of Directors held on November 20-21, 2008, called for the purpose of, among other things, voting on the renewal of the investment advisory and sub-advisory agreements applicable to the Fund, the Fund’s Board of Directors, including the Independent Directors, unanimously approved the continuation for a one year period of the investment advisory agreement between the Fund and Security Investors, LLC (“SI”), as well as each investment sub-advisory agreement applicable to the Fund, with the exception of the sub-advisory agreement for Series Q, Small Cap Growth. At the same meeting the Board approved the termination of the Fund’s sub-advisory agreement with Wells Capital Management, Inc. In reaching this conclusion, the Directors requested and obtained from SI and each investment sub-adviser such information as the Directors deemed reasonably necessary to evaluate the proposed renewal of the agreements. The Fund’s Board of Directors carefully evaluated this information, and was advised by legal counsel with respect to its deliberations.
In considering the proposed continuation of the investment advisory and sub-advisory agreements, the Independent Directors evaluated a number of considerations, including, among others, (1) the nature, extent, and quality of the advisory services to be provided by SI and the investment sub-advisers; (2) the investment performance of the Fund, SI and the various investment sub-advisers; (3) a comparison of each series’ expense ratios and those of similarly situated funds; (4) any fall out benefits or indirect profits to the sub-advisors from their relationship to the funds (such as “soft dollars”); and (5) other factors of the Board deemed to be relevant. Each Board of Directors also took into account other considerations that it believed, in light of the legal advice furnished to the Independent Directors by their independent legal counsel and the Directors’ own business judgment, to be relevant. Following its review, the Fund’s Board of Directors determined that the investment advisory agreement and each investment sub-advisory agreement applicable to the Fund (if any) will enable Fund shareholders to obtain high quality services at a cost that is appropriate, reasonable, and in the best interests of shareholders. Accordingly, the Directors, including the Independent Directors, unanimously approved the renewal of the investment advisory and investment subadvisory agreements based upon the following considerations, among others:
| • | The nature, extent and quality of the advisory services to be provided. The Board of Directors concluded that SI and the investment sub-advisers retained to provide portfolio management services with respect to the Fund are capable of providing high quality services to the Fund, as indicated by the nature and quality of services provided in the past, SI’s management capabilities demonstrated with respect to the Fund and other mutual funds managed by SI, the professional qualifications and experience of SI’s and the various sub-advisers’ portfolio managers, and SI’s investment and management oversight processes. The Directors also determined that SI and the subadvisers proposed to provide investment and related services that were of the same quality and quantity as services provided to the Fund in the past, and that these ser vices are appropriate in scope and extent in light of the Fund’s operations, the competitive landscape of the investment company business and investor needs. |
| • | The investment performance of the Fund. With respect to the Fund, the Directors concluded on the basis of information supplied by Lipper that SI and the investment sub-advisers had achieved investment performance that was acceptable, and competitive or superior relative to comparable funds over trailing periods. On the basis of the Directors’ assessment of the nature, extent and quality of advisory services to be provided or procured by SI, the Directors concluded that SI is capable of generating a level of long-term investment performance that is appropriate in light of the Fund’s investment objectives, policies and strategies and competitive with many other investment companies. |
| • | The cost of advisory services provided and the level of profitability. On the basis of each Board’s review of the fees to be charged by SI for investment advisory and other services, and the estimated profitability of SI’s relationship with the Fund, each Board concluded that the level of investment advisory fees and SI’s profitability are appropriate in light of the management fees and overall expense ratios of comparable investment companies and the anticipated profitability of the relationship between the Fund and SI and its affiliates. On the basis of comparative information supplied by Lipper the Directors determined that the advisory fees and estimated overall expense ratio of the Fund are consistent with, and often below, industry medians, particularly with respect to mutual funds of comparable size. |
| • | Whether the advisory fees reflect economies of scale. The Directors concluded that the Fund’s investment advisory fees appropriately reflect the current economic environment for SI and the competitive nature of the mutual fund market. The Directors further determined that the Fund has yet to achieve meaningful economies of scale, which, therefore, cannot be reflected in the investment advisory fees. |
| • | The extent to which economies of scale will be realized as the Fund grows. While the Fund’s investment advisory fees do not reduce should Fund assets grow meaningfully, the Directors determined that the investment advisory fees payable by the Fund already reflect potential future economies of scale to some extent by virtue of their competitive levels (determined with reference to industry standards as reported by Lipper and SI’s estimated profitability at current or |
180
Table of Contents
| Directors’ Disclosure | ||
| (unaudited) |
foreseeable asset levels. The Directors also considered that they will have the opportunity to periodically reexamine whether a Fund has achieved economies of scale, and the appropriateness of investment advisory fees payable to SI and fees payable by SI to the investment sub-advisers, in the future. |
| • | Benefits (such as soft dollars) to SI from its relationship with the Fund (and any corresponding benefits to the Fund). The Directors concluded that other benefits described by SI and the investment sub-advisers from their relationships with the Fund, including “soft dollar” benefits in connection with Fund brokerage transactions, are reasonable and fair, and consistent with industry practice and the best interests of the Fund and their shareholders. In addition, the Directors determined that the administration, transfer agency and fund accounting fees paid by the Fund to SI are reasonable, fair and in the best interests of Fund shareholders in light of the nature and quality of the ser vices provided, the associated costs, and the necessity of the services for the Fund’s operations. |
| • | Other Considerations: In approving the investment advisory and sub-advisory agreements, the Directors determined that SI has made a substantial commitment to the recruitment and retention of high quality personnel, and maintains the financial, compliance and operational resources reasonably necessary to manage the Fund in a professional manner that is consistent with the best interests of the Fund and their shareholders. In this regard, the Directors favorably considered the compliance track record of the Fund and SI. The Directors also concluded that SI has made a significant entrepreneurial commitment to the management and success of the Fund, which entails a substantial financial and professional commitment, including investment advisory fee waivers and expense limitation arrangements with respect to the Fund to the benefit of Fund shareholders. |
181
Table of Contents
(unaudited)
A special meeting of the shareholders of Series Z of the SBL Fund was held on August 5, 2008. Each matter voted upon at the meeting, as well as the number of votes cast for, against, withheld or abstentions with respect to such matters are set forth below:
| (1) | The approval of an amended investment advisory agreement between SBL Fund - Series Z and Security Investors, LLC: |
Votes For | Votes Against/Abstentions | |
2,752,742 | 319,399 |
| (2) | The approval of a new investment sub-advisory agreement between Security Investor, LLC and Security Global Investors, LLC pursuant to which Security Global Investors, LLC will be appointed as an investment sub-advisor to SBL Fund - Series Z: |
Votes For | Votes Against/Abstentions | |
2,746,294 | 325,847 |
182
Table of Contents
The business address of each director and officer is One Security Benefit Place, Topeka, KS 66636-0001
Name (Date of Birth) Year Elected*** | Principal Occupation(s) During Past 5 Years | |
Donald A. Chubb, Jr.** (12-14-46) 1994 | Business Broker - Griffith & Blair Realtors Director - - Jayhawk Area Boy Scouts Council | |
Harry W. Craig, Jr.** (05-11-39) 2004 | Chairman, CEO, Secretary & Director - The Martin Tractor Company, Inc. Director - Stormont-Vail Corporation Director - Concerned Citizens for Topeka Director - Oscar S. Stauffer Executive in Residence | |
Jerry B. Farley** (09-20-46) 2005 | President - Washburn University President - J&J Bonanza | |
Penny A. Lumpkin** (08-20-39) 1993 | Partner - Vivian’s Gift Shop (Corporate Retail) Vice President - Palmer Companies, Inc. (Small Business and Shopping Center Development) Vice President - PLB (Real Estate Equipment Leasing) Vice President - Town Crier (Retail) Prior to 2002: Vice President - Bellaire Shopping Center (Managing and Leasing) Partner - Goodwin Enterprises (Retail) | |
Maynard F. Oliverius** (12-18-43) 1998 | President & Chief Executive Officer - Stormont-Vail HealthCare Director - VHA Mid-America Director - Go Topeka | |
Richard M. Goldman* (03-04-61) 2008 (President, Director & Chairman of the Board) | Senior Vice President - Security Benefit Corporation President - Security Investors, LLC Director - Security Distributors, Inc. Director - First Security Benefit Life Insurance and Annuity Company of New York President & Manager - Security Global Investors, LLC President - Security Investments Corporation Managing Member - RM Goldman Partners, LLC President & CEO - ForstmannLeff Managing Director - Head of the Americas Institutional Business, Deutsch Asset Management | |
| * | This director is deemed to be an “interested person” of the Funds under the Investment Company Act of 1940, as amended, by reason of his position with the Fund’s Investment Manager and/or the parent of the Investment Manager. |
| ** | These directors serve on the Fund’s joint audit committee, the purpose of which is to meet with the independent registered public accounting firm, to review the work of the independent registered public accounting firm, and to oversee the handling by Security Investors of the accounting function for the Funds. |
| *** | Each director oversees 32 Security Funds portfolios and serves until the next annual meeting, or until a successor has been duly elected and qualified. |
183
Table of Contents
Officers (unaudited)
The business address of each director and officer is One Security Benefit Place, Topeka, KS 66636-0001
Name (Date of Birth) Title - Year Elected | Principal Occupation(s) During Past 5 Years | |
Steven M. Bowser (02-11-60) Vice President - 2003 | Vice President & Senior Portfolio Manager - Security Investors, LLC Vice President & Senior Portfolio Manager - Security Benefit Life Insurance Company | |
Mark P. Bronzo (11-01-60) Vice President - 2008 | Portfolio Manager, Security Investors, LLC Managing Director & Chief Compliance Officer, Nationwide Separate Accounts LLC | |
Christina Fletcher (07-25-72) Vice President - 2005 | Vice President & Portfolio Manager - Security Investors, LLC Credit Analyst/Portfolio Manager - Horizon Cash Management Senior Money Market Trader - Scudder Investments | |
Brenda M. Harwood (11-03-63) Chief Compliance Officer - 2004 Treasurer - 1988 | Vice President, Chief Compliance Officer & Treasurer - Security Global Investors, LLC Assistant Vice President - Security Benefit Life Insurance Company Vice President, Assistant Treasurer & Director - Security Distributors, Inc. | |
Amy J. Lee (06-05-61) Secretary - 1987 | Secretary - Security Investors, LLC Secretary & Chief Compliance Officer - Security Distributors, Inc. Vice President, Associate General Counsel & Assistant Secretary -Security Benefit Corporation & Security Benefit Life Insurance Company Director - Brecek & Young Advisors, Inc. | |
Mark Mitchell (08-24-64) Vice President - 2003 | Vice President & Portfolio Manager - Security Investors, LLC Vice President & Portfolio Manager - Security Benefit Life Insurance Company | |
Joseph C. O’Connor (07-15-60) Vice President - 2008 | Portfolio Manager, Security Investors, LLC Managing Director, Nationwide Separate Accounts LLC | |
Christopher Phalen (11-09-70) Vice President - 2002 | Vice President & Head of Fixed Income - Security Global Investors, LLC Assistant Vice President & Head of Fixed Income - Security Benefit Life Insurance Company Vice President & Portfolio Manager - Security Investors, LLC Vice President & Portfolio Manager - Security Benefit Life Insurance Company | |
Daniel W. Portanova (10-02-60) Vice President - 2008 | Portfolio Manager, Security Investors, LLC Managing Director, Nationwide Separate Accounts LLC | |
James P. Schier (12-28-57) Vice President - 1998 | Vice President & Senior Portfolio Manager - Security Investors, LLC Vice President & Senior Portfolio Manager - Security Benefit Life Insurance Company | |
Christopher D. Swickard (10-09-65) Assistant Secretary - 1996 | Assistant Secretary - Security Investors, LLC Second Vice President & Assistant General Counsel - Security Benefit Corporation & Security Benefit Life Insurance Company Assistant Secretary - Security Distributors, Inc. | |
David G. Toussaint (10-10-66) Vice President - 2001 | Vice President & Portfolio Manager - Security Investors, LLC Assistant Vice President & Portfolio Manager - Security Benefit Life Insurance Company | |
| * | Officers serve until the next annual meeting or until a successor has been duly elected and qualified. |
184
Table of Contents
Other Information
Each of the Security Funds files a complete schedule of portfolio holdings with the U.S. Securities and Exchange Commission for the first and third quarters of each fiscal year on Form N-Q. The Forms N-Q of each such Fund are available on the Commission’s website at www.sec.gov. The Forms N-Q may be reviewed and copied at the Commission’s Public Reference Room in Washington, DC. Information on the operation of the Public Reference Room may be obtained by calling 1-800-SEC-0330. The portfolio holdings of each of the Security Funds are available on their website, www.securitybenefit.com or by calling 1-800-888-2461.
A description of the policies and procedures that the Security Funds use to determine how to vote proxies relating to portfolio securities is available upon request, free of charge by calling 1-800-888-2461, or accessing the U.S. Securities and Exchange Commission website at www.sec.gov. Information regarding how the Security Funds voted proxies relating to portfolio securities during the 12 month period ended June 30, 2008 is available upon request, free of charge by calling 1-800-888-2461, or accessing the U.S. Securities and Exchange Commission website at www.sec.gov.
The statement of additional information (“SAI”) includes additional information about the Funds’ Directors and is available upon request without charge by calling 1-800-888-2461.
Table of Contents
The Security Group of Mutual Funds
Security Equity Fund
| • | All Cap Value Series |
| • | Alpha Opportunity Series |
| • | Equity Series |
| • | Global Series |
| • | Global Institutional Series |
| • | Mid Cap Value Series |
| • | Mid Cap Value Institutional Series |
| • | Select 25 Series |
| • | Small Cap Growth Series |
| • | Small Cap Value Series |
Security Large Cap Value Fund
| • | Large Cap Value Institutional Series |
Security Mid Cap Growth Fund
Security Income Fund
| • | Capital Preservation Series |
| • | Diversified Income Series |
| • | High Yield Series |
Security Cash Fund
Security Funds Officers and Directors
Directors
Donald A. Chubb, Jr.
Harry W. Craig, Jr.
Jerry B. Farley
Penny A. Lumpkin
Maynard F. Oliverius
Richard M. Goldman
Officers
Richard M. Goldman, President
Steve M. Bowser, Vice President
Christina Fletcher, Vice President
Mark Mitchell, Vice President
Christopher Phalen, Vice President
James P. Schier, Vice President
David G. Toussaint, Vice President
Amy J. Lee, Secretary
Christopher D. Swickard, Assistant Secretary
Brenda M. Harwood, Chief Compliance Officer & Treasurer
This report is submitted for the general information of the shareholders of the Funds. The report is not authorized for distribution to prospective investors in the Funds unless preceded or accompanied by an effective prospectus which contains details concerning the sales charges and other pertinent information.

One Security Benefit Place — Topeka, Kansas 66636-0001 — securitybenefit.com | PRSRT STD U.S. POSTAGE PAID LANCASTER, PA PERMIT NO. 485 | |||||
Security Distributors, Inc.
| ||||||
SDI 425 | 46-04259-00 2008/12/31 |
Table of Contents
| Item 2. | Code of Ethics. |
The Registrant has adopted a code of ethics that applies to its principal executive officer and principal financial officer. A copy of the Registrant’s code of ethics is filed herewith as Exhibit 10(a)(1). No amendments were made to the provisions of the code of ethics during the period covered by this report. No implicit or explicit waivers to the provisions of the code of ethics were granted during the period covered by this report. The Registrant hereby undertakes to provide any person without charge, upon request, a copy of its Code by calling the Registrant at 1-800-888-2461.
| Item 3. | Audit Committee Financial Expert. |
The Registrant’s Board of Directors has determined that Maynard Oliverius, a member of the Audit Committee of the Board, is an audit committee financial expert. Mr. Oliverius is “independent” for purposes of this item.
| Item 4. | Principal Accountant Fees and Services. |
| (a) | Audit Fees. The aggregate fees billed for each of the last two fiscal years (the “Reporting Periods”) for professional services rendered by the Registrant’s principal accountant (the “Auditor”) for the audit of the Registrant’s annual financial statements, or services that are normally provided by the Auditor in connection with the statutory and regulatory filings or engagements for the Reporting Periods, were $341,000 in 2007 and $333,700 in 2008. |
| (b) | Audit-Related Fees. The aggregate fees billed in the Reporting Periods for assurance and related services by the Auditor that are reasonably related to the performance of the audit of the Registrant’s financial statements and are not reported under paragraph (a) of this Item 4 were $5,500 in 2007 and $5,900 in 2008. These services consisted of a review of the Registrant’s semi-annual financial statements. |
The aggregate fees billed in the Reporting Periods for assurance and related services by the Auditor to the Registrant’s investment adviser (not including any sub-investment adviser whose role is primarily portfolio management and is subcontracted with or overseen by another investment adviser), and any entity controlling, controlled by or under common control with the investment adviser that provides ongoing services to the Registrant (“Service Affiliates”) which required pre-approval by the Audit Committee were $20,000 in 2007 and $9,250 in 2008, which related to the review of the transfer agent function.
| (c) | Tax Fees. The aggregate fees billed to the Registrant in the Reporting Periods for professional services rendered by the Auditor for tax compliance, tax advice and tax planning (“Tax Services”) were $42,000 in 2007 and $51,600 in 2008. These services consisted of (i) preparation of U.S. federal, state and excise tax returns; (ii) U.S. federal and state tax planning, advice and assistance regarding statutory, regulatory or administrative developments, (iii) tax advice regarding tax qualification matters and/or treatment of various financial instruments held or proposed to be acquired and (iv) review of U.S. federal excise distribution calculations. |
Table of Contents
The aggregate fees billed in the Reporting Periods for Tax Services by the Auditor to Service Affiliates which required pre-approval by the Audit Committee were $0 in 2007 and $0 in 2008.
| (d) | All Other Fees. The aggregate fees billed to the Registrant in the Reporting Periods for products and services provided by the Auditor, other than the services reported in paragraphs (a) through (c) of this Item, were $0 in 2007 and $0 in 2008. |
The aggregate fees billed in the Reporting Periods for Non-Audit Services by the Auditor to Service Affiliates, other than the services reported in paragraphs (b) through (d) of this Item, which required pre-approval by the Audit Committee were $0 in 2007 and $0 in 2008.
(e) | (1) | Audit Committee Pre-Approval Policies and Procedures. The Registrant’s Audit Committee has established policies and procedures for pre-approval of the auditor’s engagements for audit and non-audit services to the Registrant. Pre-approval considerations include whether the proposed services are compatible with maintaining the auditor’s independence as specified in applicable rules. | ||
| (e) | (2) | Percentage of Non-Audit Services Approved under (c)(7)(i)(C). The percentage of the services described in each of (b) through (d) of this Item 4 (only those that relate to the Registrant) that were approved by the Audit Committee pursuant to paragraph (c)(7)(i)(C) of Rule 2-01 of Regulation S-X was 0%, 0% and 0%, respectively. | ||
| (f) | Not applicable. |
| (g) | Non-Audit Fees. The aggregate non-audit fees billed by the Auditor for services rendered to the Registrant, and rendered to Service Affiliates, for the Reporting Periods were $67,550 in 2007 and $66,750 in 2008. |
| (h) | Auditor Independence. The Registrant’s Audit Committee was provided with information relating to the provision of non-audit services by Ernst & Young LLP to the Registrant (and its affiliates) that were not pre-approved by the Audit Committee so that a determination could be made whether the provision of such services is compatible with maintaining Ernst & Young LLP’s independence. |
| Item 5. | Audit Committee of Listed Registrants. |
Not applicable.
| Item 6. | Schedule of Investments. |
The Schedule of Investments is included under Item 1 of this form.
| Item 7. | Disclosure of Proxy Voting Policies and Procedures for Closed-End Management Investment Companies. |
Not applicable.
Table of Contents
| Item 8. | Portfolio Managers of Closed-End Management Investment Companies. |
Not applicable.
| Item 9. | Purchases of Equity Securities by Closed-End Management Investment Company and Affiliated Purchasers. |
Not applicable.
| Item 10. | Submission of Matters to a Vote of Security Holders. |
The registrant does not currently have in place procedures by which shareholders may recommend nominees to the registrant’s board.
There have been no changes to the procedures by which shareholders may recommend nominees to the registrant’s board.
| Item 11. | Controls and Procedures. |
| (a) | The registrant’s President and Treasurer have concluded that the registrant’s disclosure controls and procedures (as defined in rule 30a-3(c) under the Investment Company Act of 1940) are effective based on their evaluation of these disclosure controls and procedures within 90 days of the filing date of this report on Form N-CSR. |
| (b) | There were no significant changes in the registrant’s internal controls, or in other factors that could significantly affect these controls subsequent to the date of their evaluation, including any corrective actions with regard to significant deficiencies and material weaknesses. |
| Item 12. | Exhibits. |
(a) | (1) | Code of Ethics pursuant to Item 2 above. | ||
| (2) | Certifications pursuant to Section 302 of the Sarbanes-Oxley Act of 2002 and required by Rule 30a-2(a) under the Investment Company Act of 1940, are attached hereto. | |||
| (b) | Certifications pursuant to Section 906 of the Sarbanes-Oxley Act of 2002 and required by Rule 30a-2(a) under the Investment Company Act of 1940, are attached hereto. |
Table of Contents
SIGNATURES
Pursuant to the requirements of the Securities Exchange Act of 1934 and the Investment Company Act of 1940, the registrant has duly caused this report to be signed on its behalf by the undersigned, thereunto duly authorized.
SBL FUND | ||
By: | /s/ RICHARD M. GOLDMAN | |
Richard M. Goldman, President | ||
Date: | March 10, 2009 | |
Pursuant to the requirements of the Securities Exchange Act of 1934 and the Investment Company Act of 1940, this report has been signed below by the following persons on behalf of the registrant and in the capacities and on the dates indicated.
By: | /s/ RICHARD M. GOLDMAN | |
Richard M. Goldman, President | ||
Date: | March 10, 2009 | |
By: | /s/ BRENDA M. HARWOOD | |
Brenda M. Harwood, Treasurer | ||
Date: | March 10, 2009 | |