UNITED STATES
SECURITIES AND EXCHANGE COMMISSION
Washington, D.C. 20549
FORM N-CSR
CERTIFIED SHAREHOLDER REPORT OF REGISTERED
MANAGEMENT INVESTMENT COMPANIES
| | |
Investment Company Act file number | | 811-02753 |
SBL FUND
|
| (Exact name of registrant as specified in charter) |
| | |
| ONE SECURITY BENEFIT PLACE, TOPEKA, KANSAS | | 66636-0001 |
| (Address of principal executive offices) | | (Zip code) |
THOMAS A. SWANK, PRESIDENT
SBL FUND
ONE SECURITY BENEFIT PLACE
TOPEKA, KANSAS 66636-0001
|
| (Name and address of agent for service) |
Registrant’s telephone number, including area code: (785) 438-3000
Date of fiscal year end: December 31
Date of reporting period: December 31, 2007
Form N-CSR is to be used by management investment companies to file reports with the Commission not later than 10 days after the transmission to stockholders of any report that is required to be transmitted to stockholders under Rule 30e-1 under the Investment Company Act of 1940 (17 CFR 270.30e-1). The Commission may use the information provided on Form N-CSR in its regulatory, disclosure review, inspection, and policymaking roles.
A registrant is required to disclose the information specified by Form N-CSR, and the Commission will make this information public. A registrant is not required to respond to the collection of information contained in Form N-CSR unless the Form displays a currently valid Office of Management and Budget (“OMB”) control number. Please direct comments concerning the accuracy of the information collection burden estimate and any suggestions for reducing the burden to Secretary, Securities and Exchange Commission, 450 Fifth Street, NW, Washington, DC 20549-0609. The OMB has reviewed this collection of information under the clearance requirements of 44 U.S.C. §3507.
| Item 1. | Reports to Stockholders. |
SBL Fund
December 31, 2007
Annual Report
Table of Contents
Security Global Investors refers to the asset management arm of Security Benefit Corporation (“Security Benefit”) that consists of Security Investors, LLC, and for global investing, Security Global Investors, LLC. Security Distributors, Inc., Security Investors, LLC and Security Global Investors, LLC are subsidiaries of Security Benefit.
1
| | |
| | |
| Manager’s Commentary | | Series A |
| February 15, 2008 | | (Equity Series) |
| | |
 | | 
Adviser, Security Global Investors |
| |
To Our Shareholders:
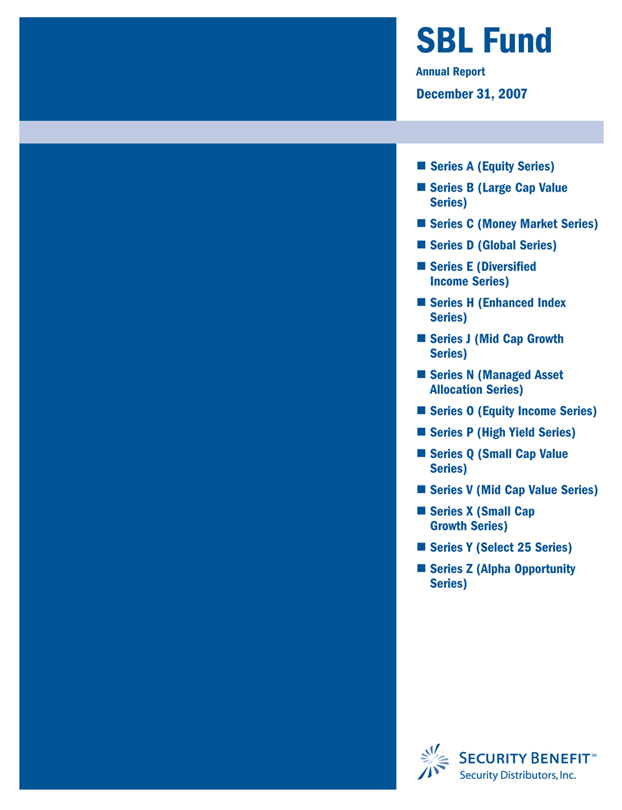
For the year ended December 31, 2007, Series A of the SBL Fund – Equity Series returned -4.88% during the year, lagging the benchmark S&P 500 Index’s return of 5.49% and the Series’ peer group median return of 5.13%. Our performance has been disappointing and we feel not indicative of our potential.
The Series’ strategy uses a blended approach, investing in growth and value stocks. Growth oriented stocks are securities of established companies that typically have a record of consistent earnings growth greater than the overall market. Value oriented stocks are securities of companies that are believed to be trading well below their intrinsic value.
Our strategy is to buy companies that are trading at a significant discount to their intrinsic value. Our investment approach is a defined and disciplined process of three clear philosophical tenets that drive our investment decisions: a valuation focus, a long-term perspective and an opportunistic approach.
This investment process is fundamentally driven and quantitatively aided. We use proprietary screens to identify potential companies for investment and then perform rigorous fundamental analysis to identify the best ideas. Through this fundamental research, we determine an estimate of intrinsic value and thus a valuation target for each idea. We construct the portfolios based on the level of conviction generated by this bottom-up analysis and the upside/downside profile associated with each company.
Top Performers
The Series’ health care holdings were up more than 18% compared to 7% for the Index. Medco Health Solutions was up 89%, benefiting from increasing mail order business and higher generic prescription penetration rates. Also contributing to the sector’s performance was Hospira, Inc., up 22% on strong execution of their business plan.
The consumer staples sector was up over 20% versus the comparable sector Index return of 14%. The largest contributors were Costco Wholesale Corporation and CVS Caremark Corporation with returns of 33% and 29%, respectively.
Disappointing Performers
The largest detractor for the Series was the financials sector, down -26% versus down -18% for the sector in the Index. Our holdings were negatively impacted as concern increased over the potential impact of a debt crisis resulting from poor lending practices in the U.S. mortgage market. A majority of these holdings have nothing to do with the mortgage market, but were viewed in the same light. For example, First Marblehead Corporation a higher education student loan provider, was down -71% and Capital One Financial Corporation, a credit card lender, was down -38%. We believe both of these companies are trading well below their intrinsic value and that they have excellent business models with sustainable competitive advantages.
Energy sector holdings in the portfolio detracted even with an overweight in an outperforming sector due to stock selection. The sector returned 3% for the portfolio versus 34% for the sector within the S&P 500 Index. Evergreen Energy, Inc., down -77% (previously known as KFx) and BJ Services Company, down -16%, both contributed negatively to the Series performance. Evergreen Energy was hurt by concerns over the viability of the initial production results of its proprietary clean coal technology. BJ Services was impacted more generally by industry challenges in their core North American pressure pumping business.
2008 Market Outlook
Our bottom-up approach looks at market uncertainty in the context of the potential long-term impact on individual companies. Often times, volatility provides opportunity. We are maintaining flexibility in the portfolios to take advantage of these opportunities as they arise. Our focus is on
| | |
| | |
| Manager’s Commentary | | Series A |
| February 15, 2008 | | (Equity Series) |
identifying companies with the ability to be substantially better over the next three to five years or have the potential to maintain their return on capital at current levels in a difficult economic environment. We are confident in our ability to find these companies and we are pleased with the positions we own today.
We believe that investing is a long-term pursuit that requires patience and a consistent approach. Dollar cost averaging is a sound way to build long-term value. We recognize there are many investment fund alternatives available today and thank you for your business and the confidence you place in us.
Sincerely,
Mark A. Mitchell, Portfolio Manager
| | |
| | Series A |
| Performance Summary | | (Equity Series) |
| December 31, 2007 | | (unaudited) |
$10,000 Over 10 Years
The chart above assumes a hypothetical $10,000 investment in Series A (Equity Series) on December 31, 1997 and reflects the fees and expenses of Series A. The S&P 500 Index is a capitalization-weighted index composed of 500 selected common stocks that represent the broad domestic economy and is a widely recognized unmanaged index of market performance.
| | | | | | | | | |
Average Annual Returns | |
| Periods Ended 12-31-071 | | 1 Year | | | 5 Years | | | 10 Years | |
Series A | | (4.88 | %) | | 8.01 | % | | 1.58 | % |
1 Performance figures do not reflect fees and expenses associated with an investment in variable insurance products offered by Security Benefit Life Insurance Company. If returns had taken into account these fees and expenses, performance would have been lower. Shares of a Series of SBL Fund are available only through the purchase of such products. | |
| |
The performance data quoted above represents past performance. Past performance is not predictive of future performance. The investment return and principal value of an investment will fluctuate so that an investor’s shares, when redeemed, may be worth more or less than their original cost. | |
| | | |
Portfolio Composition by Sector | |
Consumer Discretionary | | 10.11 | % |
Consumer Staples | | 8.71 | |
Energy | | 10.34 | |
Financials | | 23.32 | |
Health Care | | 10.35 | |
Industrials | | 17.68 | |
Information Technology | | 12.27 | |
Telecommunication Services | | 2.03 | |
Commercial Paper | | 3.73 | |
U.S. Government Sponsored Agencies | | 1.22 | |
Repurchase Agreement | | 0.30 | |
Liabilities in Excess of Other Assets | | (0.06 | ) |
Total Net Assets | | 100.00 | % |
| | | | |
| | | | |
| | |
| 4 | | The accompanying notes are an integral part of the financial statements |
| | |
| | Series A |
| Performance Summary | | (Equity Series) |
| December 31, 2007 | | (unaudited) |
Information About Your Series Expenses
Calculating your ongoing Series expenses
Example
As a shareholder of the Series, you incur ongoing costs, including management fees and other series expenses. Performance figures and expense ratios do not reflect fees and expenses associated with an investment in variable insurance products. Shares of a Series of SBL Fund are available only through the purchase of such products. This example is intended to help you understand your ongoing costs (in dollars) of investing in the Series and to compare these costs with ongoing costs of investing in other mutual funds. The example is based on an investment of $1,000 invested at the beginning of the period and held for the entire period, July 1, 2007 through December 31, 2007.
Actual Expenses
The first line in the table provides information about actual account values and actual expenses. You may use the information in this table, together with the amount you invested, to estimate the expenses that you paid over the period. Simply divide your account value by $1,000 (for example, an $8,600 account value divided by $1,000 = 8.6), then multiply the result by the number in the table under the heading entitled “Expenses Paid During the Period” to estimate the expenses you paid on your account during this period.
Hypothetical Example for Comparison Purposes
The second line in the table provides information about hypothetical account values and hypothetical expenses based on the Series actual expense ratio and an assumed rate of return of 5% per year before expenses, which is not the Series actual return. The hypothetical account values and expenses may not be used to estimate the actual ending account balance or expenses you paid for the period. You may use this information to compare the ongoing costs of investing in the Series and other funds. To do so, compare this 5% hypothetical example with the 5% hypothetical examples that appear in the shareholder reports of the other mutual funds.
Please note that the expenses shown in the table are meant to highlight your ongoing costs only and do not reflect any fees and expenses associated with an investment in variable insurance products. Therefore, the second line is useful in comparing ongoing costs only, and will not help you determine the relative total costs of owning different funds. In addition, if these fees and expenses associated with an investment in variable insurance products were included, your costs would have been higher.
| | | | | | |
Series Expenses |
| | | Beginning
Account
Value
7/1/2007 | | Ending
Account Value
12/31/20071 | | Expenses
Paid
During
Period2 |
Series A (Equity Series) |
Actual | | $1,000.00 | | $921.61 | | $4.36 |
Hypothetical | | 1,000.00 | | 1,020.67 | | 4.58 |
1 The actual ending account value is based on the actual total return of the Series for the period July 1, 2007 to December 31, 2007 after actual expenses and will differ from the hypothetical ending account value which is based on the Series expense ratio and a hypothetical annual return of 5% before expenses. The actual cumulative return at net asset value for the period July 1, 2007 to December 31, 2007 was (7.84%).
2 Expenses are equal to the Series annualized expense ratio of 0.90%, net of any applicable fee waivers or earnings credits, multiplied by the average account value over the period, multiplied by 184/365 (to reflect the one-half year period)
| | |
| | |
| Schedule of Investments | | Series A (Equity Series) |
| December 31, 2007 | | |
| | | | | |
| | | Shares | | Value |
COMMON STOCK - 94.8% |
Aerospace & Defense - 4.4% | | | | | |
General Dynamics Corporation | | 162,100 | | $ | 14,425,279 |
| | | | | |
| | |
Air Freight & Logistics - 2.9% | | | | | |
FedEx Corporation | | 106,000 | | | 9,452,020 |
| | | | | |
| | |
Broadcasting & Cable TV -1.3% | | | | | |
CBS Corporation (CI.B) | | 152,950 | | | 4,167,887 |
| | | | | |
| | |
Building Products - 2.0% | | | | | |
USG Corporation * | | 180,900 | | | 6,474,411 |
| | | | | |
| | |
Coal & Consumable Fuels - 0.3% | | | | | |
Evergreen Energy, Inc. * | | 488,700 | | | 1,089,801 |
| | | | | |
| | |
Communications Equipment - 2.1% | | | | | |
ADC Telecommunications, Inc. * | | 452,100 | | | 7,030,155 |
| | | | | |
| | |
Consumer Finance - 8.3% | | | | | |
American Express Company | | 222,700 | | | 11,584,854 |
Capital One Financial Corporation | | 181,700 | | | 8,587,142 |
Discover Financial Services | | 217,000 | | | 3,272,360 |
First Marblehead Corporation | | 248,900 | | | 3,808,170 |
| | | | | |
| | | | | 27,252,526 |
| | | | | |
Data Processing & Outsourced | | | | | |
Services - 3.5% | | | | | |
Western Union Company | | 477,600 | | | 11,596,128 |
| | | | | |
| | |
Drug Retail - 2.8% | | | | | |
CVS Caremark Corporation | | 228,500 | | | 9,082,875 |
| | | | | |
| | |
Electronic Manufacturing Services - 1.1% | | | | | |
Tyco Electronics, Ltd. | | 96,900 | | | 3,597,897 |
| | | | | |
Health Care Equipment - 3.7% | | | | | |
Covidien, Ltd. | | 96,900 | | | 4,291,701 |
Hospira, Inc. * | | 185,300 | | | 7,901,192 |
| | | | | |
| | | | | 12,192,893 |
| | | | | |
Health Care Services - 2.6% | | | | | |
Medco Health Solutions, Inc. * | | 82,900 | | | 8,406,060 |
| | | | | |
| | |
Home Improvement Retail - 3.8% | | | | | |
Home Depot, Inc. | | 467,300 | | | 12,589,062 |
| | | | | |
| | |
Hotels, Resorts & Cruise Lines - 2.3% | | | | | |
Carnival Corporation | | 172,200 | | | 7,661,178 |
| | | | | |
| | |
Hypermarkets & Super Centers - 5.9% | | | | | |
Costco Wholesale Corporation | | 92,500 | | | 6,452,800 |
Wal-Mart Stores, Inc. | | 275,800 | | | 13,108,774 |
| | | | | |
| | | | | 19,561,574 |
| | | | | |
Industrial Conglomerates - 8.5% | | | | | |
General Electric Company | | 492,700 | | | 18,264,389 |
McDermott International, Inc. * | | 97,000 | | | 5,725,910 |
Tyco International, Ltd. | | 96,900 | | | 3,842,085 |
| | | | | |
| | | | | 27,832,384 |
| | | | | |
| | | | | | |
| | | Shares | | Value |
COMMON STOCK (continued) |
Integrated Oil & Gas - 7.3% | | | | | | |
Chevron Corporation | | | 120,000 | | $ | 11,199,600 |
Exxon Mobil Corporation | | | 137,900 | | | 12,919,851 |
| | | | | | |
| | | | | | 24,119,451 |
| | | | | | |
Movies & Entertainment - 2.7% | | | | | | |
Time Warner, Inc. | | | 535,000 | | | 8,832,850 |
| | | | | | |
| | |
Multi-Line Insurance - 5.3% | | | | | | |
American International Group, Inc. | | | 300,700 | | | 17,530,810 |
| | | | | | |
| | |
Oil & Gas Equipment & Services - 2.7% | | | | | | |
Baker Hughes, Inc. | | | 32,300 | | | 2,619,530 |
BJ Services Company | | | 70,900 | | | 1,720,034 |
Halliburton Company | | | 117,700 | | | 4,462,007 |
| | | | | | |
| | | | | | 8,801,571 |
| | | | | | |
Other Diversified Financial | | | | | | |
Services - 3.5% | | | | | | |
Citigroup, Inc. | | | 95,500 | | | 2,811,520 |
JPMorgan Chase & Company | | | 197,200 | | | 8,607,780 |
| | | | | | |
| | | | | | 11,419,300 |
| | | | | | |
Pharmaceuticals - 4.1% | | | | | | |
Johnson & Johnson | | | 201,400 | | | 13,433,380 |
| | | | | | |
| | |
Property & Casualty Insurance - 6.2% | | | | | | |
Berkshire Hathaway, Inc. * | | | 145 | | | 20,532,000 |
| | | | | | |
| | |
Systems Software - 5.5% | | | | | | |
Microsoft Corporation | | | 510,200 | | | 18,163,120 |
| | | | | | |
| | |
Wireless Telecommunication | | | | | | |
Services - 2.0% | | | | | | |
Sprint Nextel Corporation | | | 508,300 | | | 6,673,979 |
| TOTAL COMMON STOCK (Cost $285,675,496) | | $ | 311,918,591 |
| | | Principal
Amount | | Value |
| U.S. GOVERNMENT SPONSORED AGENCY BONDS & NOTES 1.2% |
Federal Home Loan Bank | | | | | | |
4.24% - 2008 | | $ | 3,000,000 | | | 2,999,325 |
4.26% - 2008 | | | 1,000,000 | | | 999,078 |
| TOTAL U.S. GOVERNMENT SPONSORED AGENCY BONDS & NOTES | | | | | $ | 3,998,403 |
(Cost $3,998,403) | | | | | | |
COMMERCIAL PAPER - 3.8% |
Banking -0.8% | | | | | | |
UBS Finance (DE) LLC | | | | | | |
5.04%, 1/14/2008 | | | 1,400,000 | | | 1,397,725 |
Wells Fargo & Company, Inc. | | | | | | |
4.25%, 1/2/2008 | | | 1,100,000 | | | 1,099,870 |
| | | | | | |
| | | | | | 2,497,595 |
| | | | | | |
| | |
| 6 | | The accompanying notes are an integral part of the financial statements |
| | |
| | |
| Schedule of Investments | | Series A (Equity Series) |
| December 31, 2007 - continued | | |
| | | | | | | |
| | | Principal
Amount | | Value | |
COMMERCIAL PAPER (continued) | |
Brokerage - 0.3% | | | | | | | |
Goldman Sachs Group, Inc. | | | | | | | |
5.25%, 1/8/2008 | | | 1,000,000 | | $ | 998,979 | |
| | | | | | | |
| | |
Consumer Products - 0.7% | | | | | | | |
Unilever Capital Corporation | | | | | | | |
4.25%, 1/11/2008 | | | 1,200,000 | | | 1,198,583 | |
4.22%, 1/15/2008 | | | 1,100,000 | | | 1,098,182 | |
| | | | | | | |
| | | | | | 2,296,765 | |
| | | | | | | |
| | |
Electric - 0.6% | | | | | | | |
Florida Power & Light Company | | | | | | | |
4.25%, 1/10/2008 | | | 1,800,000 | | | 1,798,088 | |
| | | | | | | |
| | |
Financial Companies - Captive - 0.9% | | | | | | | |
Caterpillar Financial Services Corporation | | | | | | | |
4.25%, 1/7/2008 | | | 1,500,000 | | | 1,498,937 | |
International Lease Finance Company | | | | | | | |
4.38%, 1/4/2008 | | | 1,500,000 | | | 1,499,453 | |
| | | | | | | |
| | | | | | 2,998,390 | |
| | | | | | | |
| | |
Pharmaceuticals - 0.5% | | | | | | | |
Johnson & Johnson | | | | | | | |
4.08%, 1/3/2008 | | | 1,700,000 | | | 1,699,615 | |
| TOTAL COMMERCIAL PAPER (Cost $12,289,432) | | $ | 12,289,432 | |
REPURCHASE AGREEMENT - 0.3% | |
United Missouri Bank, 3.61%, dated 12/31/07, matures 1/02/08; repurchase amount $971,195 (Collateralized by FHLB Discount Note, 5/30/08 with a value of $991,338) | | $ | 971,000 | | $ | 971,000 | |
| TOTAL REPURCHASE AGREEMENT (Cost $971,000) | | $ | 971,000 | |
Total Investments (SBL A Fund) | | | | | $ | 329,177,426 | |
(Cost $302,934,331) - 100.1% | | | | | | | |
Liabilities in Excess of Other Assets - (0.1)% | | | | | | (182.004 | ) |
| | | | | | | |
TOTAL NET ASSETS - 100.0% | | | | | $ | 328,995,422 | |
| | | | | | | |
Footnotes
Percentages are stated as a percent of net assets.
For federal income tax purposes the identified cost of investments owned at 12/31/2007 was $303,072,667.
| | |
* | | - Non-income producing security |
|
| Glossary: |
FHLB | | - Federal Home Loan Bank |
|
| See notes to financial statements. |
| | |
| 7 | | The accompanying notes are an integral part of the financial statements |
Statement of Assets and Liabilities
December 31, 2007
| | | |
Assets: | | | |
Investments, at value* | | $ | 329,177,426 |
Cash | | | 483 |
Receivables: | | | |
Fund shares sold | | | 153,135 |
Securities sold | | | 245,591 |
Dividends | | | 293,350 |
Prepaid expenses | | | 7,418 |
| | | |
Total assets | | | 329,877,403 |
| | | |
Liabilities: | | | |
| |
Payable for: | | | |
Fund shares redeemed | | | 549,462 |
Management fees | | | 213,872 |
Administration fees | | | 27,240 |
Transfer agent/maintenance fees | | | 2,083 |
Custodian fees | | | 8,000 |
Directors’ fees | | | 7,525 |
Professional fees | | | 36,150 |
Other fees | | | 37,649 |
| | | |
Total liabilities | | | 881,981 |
| | | |
Net assets | | $ | 328,995,422 |
| | | |
Net assets consist of: | | | |
Paid in capital | | $ | 261,396,080 |
Undistributed net investment income | | | 2,057,542 |
Undistributed net realized gain on sale of investments | | | 39,298,705 |
Net unrealized appreciation in value of investments | | | 26,243,095 |
| | | |
Net assets | | $ | 328,995,422 |
| | | |
| |
Capital shares authorized | | | unlimited |
Capital shares outstanding | | | 13,392,748 |
Net asset value per share | | | |
(net assets divided by shares outstanding) | | $ | 24.57 |
| | | |
| |
*Investments, at cost | | $ | 302,934,331 |
Statement of Operations
For Year Ended December 31, 2007
| | | | |
Investment Income: | | | | |
Dividends | | $ | 5,107,798 | |
Interest | | | 452,331 | |
| | | | |
Total investment income | | | 5,560,129 | |
| | | | |
| |
Expenses: | | | | |
Management fees | | | 2,954,771 | |
Administration fees | | | 374,988 | |
Transfer agent/maintenance fees | | | 25,253 | |
Custodian fees | | | 25,316 | |
Directors’ fees | | | 23,512 | |
Professional fees | | | 38,964 | |
Reports to shareholders | | | 40,090 | |
Other | | | 19,693 | |
| | | | |
Total expenses | | | 3,502,587 | |
| | | | |
Net investment income | | | 2,057,542 | |
| | | | |
| |
Net Realized and Unrealized Gain (Loss): | | | | |
Net realized gain (loss) during the year on: | | | | |
Investments | | | 39,328,102 | |
Options written | | | 108,939 | |
| | | | |
Net realized gain | | | 39,437,041 | |
| | | | |
| |
Net unrealized appreciation (depreciation) during the year on: | | | | |
Investments | | | (57,218,273 | ) |
Options written | | | 56,904 | |
| | | | |
Net unrealized depreciation | | | (57,161,369 | ) |
| | | | |
Net realized and unrealized loss | | | (17,724,328 | ) |
| | | | |
Net decrease in net assets resulting from operations | | $ | (15,666,786 | ) |
| | | | |
| | |
| 8 | | The accompanying notes are an integral part of the financial statements |
| | |
| | |
| | Series A |
| Statement of Changes in Net Assets | | (Equity Series) |
| | | | | | | | |
| | | Year Ended
December 31, 2007 | | | Year Ended
December 31, 2006 | |
| | |
Increase (decrease) in net assets from operations: | | | | | | | | |
Net investment income | | $ | 2,057,542 | | | $ | 1,466,765 | |
Net realized gain during the year on investments | | | 39,437,041 | | | | 47,236,718 | |
Net unrealized appreciation (depreciation) during the year on investments | | | (57,161,369 | ) | | | 4,445,082 | |
| | | | | | | | |
Net increase (decrease) in net assets resulting from operations | | | (15,666,786 | ) | | | 53,148,565 | |
| | | | | | | | |
| | |
Capital share transactions: | | | | | | | | |
Proceeds from sale of shares | | | 34,320,140 | | | | 37,464,659 | |
Cost of shares redeemed | | | (131,446,012 | ) | | | (115,755,780 | ) |
| | | | | | | | |
Net decrease from capital share transactions | | | (97,125,872 | ) | | | (78,291,121 | ) |
| | | | | | | | |
Net decrease in net assets | | | (112,792,658 | ) | | | (25,142,556 | ) |
| | | | | | | | |
Net assets: | | | | | | | | |
Beginning of year | | | 441,788,080 | | | | 466,930,636 | |
| | | | | | | | |
End of year | | $ | 328,995,422 | | | $ | 441,788,080 | |
| | | | | | | | |
| | |
Undistributed net investment income at end of year | | $ | 2,057,542 | | | $ | 1,466,765 | |
| | | | | | | | |
| | |
Capital share activity: | | | | | | | | |
Shares sold | | | 1,322,125 | | | | 1,582,979 | |
Shares redeemed | | | (5,035,865 | ) | | | (4,888,558 | ) |
| | | | | | | | |
Total capital share activity | | | (3,713,740 | ) | | | (3,305,579 | ) |
| | | | | | | | |
| | |
| 9 | | The accompanying notes are an integral part of the financial statements |
| | |
| | |
| Financial Highlights | | Series A |
| Selected data for each share of capital stock outstanding throughout each year | | (Equity Series) |
| | | | | | | | | | |
| | | 2007 | | 2006 | | 2005 | | 2004 | | Year Ended
December 31,
2003 |
Per Share Data | | | | | | | | | | |
Net asset value, beginning of period | | $25.83 | | $22.88 | | $21.93 | | $20.37 | | $16.83 |
| |
Income (loss) from investment operations: | | | | | | | | | | |
Net investment incomea | | 0.14 | | 0.11 | | 0.16 | | 0.18 | | 0.13 |
Net gain (loss) on securities (realized and unrealized) | | (1.40) | | 2.84 | | 0.79 | | 1.40 | | 3.53 |
| | |
Total from investment operations | | (1.26) | | 2.95 | | 0.95 | | 1.58 | | 3.66 |
| |
Less distributions: | | | | | | | | | | |
Dividends from net investment income | | - | | - | | - | | (0.02) | | (0.12) |
| | |
Total distributions | | - | | - | | - | | (0.02) | | (0.12) |
| |
Net asset value, end of period | | $24.57 | | $25.83 | | $22.88 | | $21.93 | | $20.37 |
| | |
| | | | | | | | | | |
| |
Total Returnb | | (4.88%) | | 12.89% | | 4.33% | | 7.77% | | 21.74% |
| |
Ratios/Supplemental Data | | | | | | | | | | |
Net assets, end of period (in thousands) | | $328,995 | | $441,788 | | $466,931 | | $530,096 | | $559,290 |
| |
Ratios to average net assets: | | | | | | | | | | |
Net investment income | | 0.52% | | 0.33% | | 0.55% | | 0.81% | | 0.66% |
Total expensesc | | 0.89% | | 0.90% | | 0.89% | | 0.87% | | 0.82% |
Net expensesd | | 0.89% | | 0.90% | | 0.89% | | 0.87% | | 0.82% |
| |
Portfolio turnover rate | | 14% | | 26% | | 37% | | 27% | | 53% |
a Net investment income (loss) was computed using average shares outstanding throughout the period.
b Total return does not take into account any of the expenses associated with an investment in variable insurance products offered by Security Benefit Life Insurance Company. If total return had taken into account these expenses, performance would have been lower. Shares of a series of SBL Fund are available only through the purchase of such products.
c Total expense information reflects the expense ratios absent expense reductions by the Investment Manager, and earnings credits, as applicable.
d Net expense information reflects the expense ratios after voluntary expense waivers, reimbursements and custodian earnings credits, as applicable.
| | |
| 10 | | The accompanying notes are an integral part of the financial statements |
| | |
| | |
| Manager’s Commentary | | Series B |
| February 15, 2008 | | (Large Cap Value Series) |
Adviser, Security Global Investors
| | |
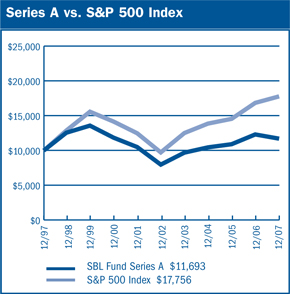
| | To Our Shareholders: For the year ended December 31, 2007, Series B of the SBL Fund -Large Cap Value series returned 5.83%, beating the benchmark Russell 1000 Value Index’s return of -0.17% by 600 basis points. The Series’ peer group median return of 2.19% was less than half of the return of the Series. Good individual stock selection and sector weightings contribution drove performance in 2007. |
Our strategy is to buy companies that are trading at a significant discount to their intrinsic value. Our investment approach is a defined and disciplined process with three clear philosophical tenets that drive our investment decisions: a valuation focus, a long-term perspective and an opportunistic approach.
This investment process is fundamentally driven and quantitatively aided. We use proprietary screens to identify potential companies for investment and then perform rigorous fundamental analysis to identify the best ideas. Through this fundamental research, we determine an estimate of intrinsic value and thus a valuation target for each idea. We construct the portfolios based on the level of conviction generated by this bottom-up analysis and the upside/downside profile associated with each company. For Series B, we apply this philosophy to a broad range of value names.
Top Performers
The Series’ Industrial holdings were up 29% compared to 12% for the Index. In addition to superior stock selection, the Series was overweight in the sector, 19% relative to 9% for the Index. McDermott International, Inc., returned 132% during the period while Union Pacific Corporation, Inc., was up 38%. McDermott benefited from strong demand in the global infrastructure market and Union Pacific experienced solid demand coupled with operational improvements.
In the health care sector, our second best performing, Medco Health Solutions, Inc., rose 90% and Hospira, Inc. gained 27%. The Consumer Staples sector was able to add value to the Series as Costco Wholesale Corporation increased 33%, Archer-Daniels-Midland 47%, and CVS Caremark Corporation by 29%.
Disappointing Performers
The largest sector detractor from the portfolio was telecommunications due mostly to stock selection although an underweight position also contributed to the relative under-performance. The portfolio’s telecommunications sector holdings declined 14%, while the Index holdings returned greater than 13%. More traditional companies like AT&T and Verizon performed better than our holdings in Sprint Nextel Corporation and Windstream Corporation.
The consumer discretionary sector in general experienced a difficult environment in 2007. The sector within the Series was down -20% versus -13% for the sector in the Russell 1000 Value Index. Home Depot, Inc. was the largest detractor, sliding over 31% in the period. This was caused by the impact of a slowing housing market. We feel confident that Home Depot still enjoys a solid competitive position and will benefit once the housing market improves.
2008 Market Outlook
Our bottom-up approach looks at market uncertainty in the context of the potential long-term impact on individual companies. Often times, volatility provides opportunity. We are maintaining flexibility in the portfolios to take advantage of these opportunities as they arise. Our focus is on identifying companies with the ability to be substantially better over the next three to five years or have the potential to maintain their return on capital at current levels in a difficult economic environment. We are confident in our ability to find these companies and we are pleased with the positions we own today.
We believe that investing is a long-term pursuit that requires patience and a consistent approach. Dollar cost averaging is a sound way to build long-term value. We recognize there are many investment fund alternatives available today and thank you for your business and the confidence you place in us.
Sincerely,
Mark A. Mitchell, Portfolio Manager
| | |
| | Series B |
| Performance Summary | | (Large Cap Value Series) |
| December 31, 2007 | | (unaudited) |
$10,000 Over 10 Years
The chart above assumes a hypothetical $10,000 investment in Series B (Large Cap Value Series) on December 31, 1997 and reflects the fees and expenses of Series B. The Russell 1000 Value Index is an unmanaged index representing the performance of those Russell 1000 Index companies with lower price-to-book ratios and lower forecasted growth values.
| | | | | | | | | |
Average Annual Returns | |
| Periods Ended 12-31-071 | | 1 Year | | | 5 Years | | | 10 Years | |
Series B | | 5.83 | % | | 15.29 | % | | 4.06 | % |
1 Performance figures do not reflect fees and expenses associated with an investment in variable insurance products offered by Security Benefit Life Insurance Company. If returns had taken into account these fees and expenses, performance would have been lower. Shares of a Series of SBL Fund are available only through the purchase of such products. The performance data quoted above represents past performance. Past performance is not predictive of future performance. The investment return and principal value of an investment will fluctuate so that an investor’s shares, when redeemed, may be worth more or less than their original cost. | |
| | |
Portfolio Composition by Sector | | |
Consumer Discretionary | | 8.88% |
Consumer Staples | | 9.86 |
Energy | | 13.02 |
Financials | | 21.16 |
Health Care | | 4.73 |
Industrials | | 17.98 |
Information Technology | | 4.57 |
Materials | | 3.35 |
Telecommunication Services | | 2.39 |
Utilities | | 2.18 |
Exchange Traded Funds | | 4.35 |
Commercial Paper | | 2.66 |
U.S. Government Sponsored Agencies | | 3.56 |
Repurchase Agreement | | 0.12 |
Other Assets in Excess of Liabilities | | 1.19 |
Total Net Assets | | 100.00% |
| | | |
| | |
| 12 | | The accompanying notes are an integral part of the financial statements |
| | |
| | Series B |
| Performance Summary | | (Large Cap Value Series) |
| December 31, 2007 | | (unaudited) |
Information About Your Series Expenses
Calculating your ongoing Series expenses
Example
As a shareholder of the Series, you incur ongoing costs, including management fees and other series expenses. Performance figures and expense ratios do not reflect fees and expenses associated with an investment in variable insurance products. Shares of a Series of SBL Fund are available only through the purchase of such products. This example is intended to help you understand your ongoing costs (in dollars) of investing in the Series and to compare these costs with ongoing costs of investing in other mutual funds. The example is based on an investment of $1,000 invested at the beginning of the period and held for the entire period, July 1, 2007 through December 31, 2007.
Actual Expenses
The first line in the table provides information about actual account values and actual expenses. You may use the information in this table, together with the amount you invested, to estimate the expenses that you paid over the period. Simply divide your account value by $1,000 (for example, an $8,600 account value divided by $1,000 = 8.6), then multiply the result by the number in the table under the heading entitled “Expenses Paid During the Period” to estimate the expenses you paid on your account during this period.
Hypothetical Example for Comparison Purposes
The second line in the table provides information about hypothetical account values and hypothetical expenses based on the Series actual expense ratio and an assumed rate of return of 5% per year before expenses, which is not the Series actual return. The hypothetical account values and expenses may not be used to estimate the actual ending account balance or expenses you paid for the period. You may use this information to compare the ongoing costs of investing in the Series and other funds. To do so, compare this 5% hypothetical example with the 5% hypothetical examples that appear in the shareholder reports of the other mutual funds.
Please note that the expenses shown in the table are meant to highlight your ongoing costs only and do not reflect any fees and expenses associated with an investment in variable insurance products. Therefore, the second line is useful in comparing ongoing costs only, and will not help you determine the relative total costs of owning different funds. In addition, if these fees and expenses associated with an investment in variable insurance products were included, your costs would have been higher.
| | | | | | |
Series Expenses |
| | | Beginning
Account
Value
7/1/2007 | | Ending
Account Value
12/31/20071 | | Expenses
Paid
During
Period2 |
Series B (Large Cap Value Series) |
Actual | | $1,000.00 | | $963.78 | | $3.91 |
Hypothetical | | 1,000.00 | | 1,021.22 | | 4.02 |
1 The actual ending account value is based on the actual total return of the Series for the period July 1, 2007 to December 31, 2007 after actual expenses and will differ from the hypothetical ending account value which is based on the Series expense ratio and a hypothetical annual return of 5% before expenses. The actual cumulative return at net asset value for the period July 1, 2007 to December 31, 2007 was (3.62%).
2 Expenses are equal to the Series annualized expense ratio of 0.79%, net of any applicable fee waivers or earnings credits, multiplied by the average account value over the period, multiplied by 184/365 (to reflect the one-half year period)
| | |
| | |
| Schedule of Investments | | Series B (Large Cap Value Series) |
| December 31, 2007 | | |
| | | | | |
| | | Shares | | Value |
COMMON STOCK - 92.5% | | | | | |
Aerospace & Defense - 3.6% | | | | | |
United Technologies Corporation | | 228,400 | | $ | 17,481,736 |
| | | | | |
| | |
Agricultural Products - 1.0% | | | | | |
Archer-Daniels-Midland Company | | 107,600 | | | 4,995,868 |
| | | | | |
| | |
Air Freight & Logistics - 1.5% | | | | | |
FedEx Corporation | | 80,800 | | | 7,204,936 |
| | | | | |
| | |
Broadcasting & Cable TV -2.3% | | | | | |
CBS Corporation (CI.B) | | 402,100 | | | 10,957,225 |
| | | | | |
| | |
Building Products -3.2% | | | | | |
USG Corporation * | | 431,100 | | | 15,429,069 |
| | | | | |
| | |
Computer Hardware -2.5% | | | | | |
Hewlett-Packard Company | | 239,200 | | | 12,074,816 |
| | | | | |
| | |
Consumer Finance -5.9% | | | | | |
Capital One Financial Corporation | | 298,700 | | | 14,116,562 |
Discover Financial Services | | 280,000 | | | 4,222,400 |
First Marblehead Corporation | | 640,950 | | | 9,806,535 |
| | | | | |
| | | | | 28,145,497 |
| | | | | |
Data Processing & Outsourced | | | | | |
Services - 1.3% | | | | | |
Western Union Company | | 250,000 | | | 6,070,000 |
| | | | | |
| | |
Diversified Banks - 1.0% | | | | | |
Wells Fargo & Company | | 162,600 | | | 4,908,894 |
| | | | | |
| | |
Diversified Chemicals - 1.5% | | | | | |
Dow Chemical Company | | 176,400 | | | 6,953,688 |
| | | | | |
| | |
Drug Retail -2.3% | | | | | |
CVS Caremark Corporation | | 280,800 | | | 11,161,800 |
| | | | | |
| | |
Electric Utilities -2.2% | | | | | |
Edison International | | 196,300 | | | 10,476,531 |
| | | | | |
| | |
Electronic Manufacturing | | | | | |
Services -0.8% | | | | | |
Tyco Electronics, Ltd. | | 101,650 | | | 3,774,265 |
| | | | | |
Exchange Traded Funds -4.4% iShares Russell 1000 Value Index Fund | | 170,600 | | | 13,707,710 |
iShares S&P 500 Value Index Fund | | 93,600 | | | 7,155,720 |
| | | | | |
| | | | | 20,863,430 |
| | | | | |
Health Care Equipment - 2.7% | | | | | |
Covidien, Ltd. | | 101,650 | | | 4,502,078 |
Hospira, Inc. * | | 200,700 | | | 8,557,848 |
| | | | | |
| | | | | 13,059,926 |
| | | | | |
Health Care Services - 2.0% | | | | | |
Medco Health Solutions, Inc. * | | 95,300 | | | 9,663,420 |
| | | | | |
| | | | | |
| | | Shares | | Value |
COMMON STOCK (continued) |
Home Improvement Retail - 3.0% | | | | | |
Home Depot, Inc. | | 540,600 | | $ | 14,563,764 |
| | | | | |
| | |
Hypermarkets & Super Centers -5.1% | | | | | |
Costco Wholesale Corporation | | 169,700 | | | 11,838,272 |
Wal-Mart Stores, Inc. | | 260,800 | | | 12,395,824 |
| | | | | |
| | | | | 24,234,096 |
| | | | | |
Industrial Conglomerates - 6.4% | | | | | |
General Electric Company | | 411,900 | | | 15,269,133 |
McDermott International, Inc. * | | 193,900 | | | 11,445,917 |
Tyco International, Ltd. | | 101,650 | | | 4,030,422 |
| | | | | |
| | | | | 30,745,472 |
| | | | | |
Integrated Oil & Gas -8.6% | | | | | |
Chevron Corporation | | 98,600 | | | 9,202,338 |
ConocoPhillips | | 41,200 | | | 3,637,960 |
Exxon Mobil Corporation | | 168,700 | | | 15,805,503 |
Sasol, Ltd. ADR | | 251,600 | | | 12,446,652 |
| | | | | |
| | | | | 41,092,453 |
| | | | | |
Integrated Telecommunication | | | | | |
Services -0.9% | | | | | |
Windstream Corporation | | 331,932 | | | 4,321,755 |
| | | | | |
| | |
Movies & Entertainment - 3.6% | | | | | |
News Corporation | | 260,800 | | | 5,343,792 |
Time Warner, Inc. | | 712,600 | | | 11,765,026 |
| | | | | |
| | | | | 17,108,818 |
| | | | | |
Multi-Line Insurance - 4.6% | | | | | |
American International Group, Inc. | | 374,400 | | | 21,827,520 |
| | | | | |
| | |
Oil & Gas Equipment & Services - 1.8% | | | | | |
Halliburton Company | | 232,600 | | | 8,817,866 |
| | | | | |
| | |
Oil & Gas Storage & Transportation -2.6% | | | | | |
Williams Companies, Inc. | | 350,800 | | | 12,551,624 |
| | | | | |
| | |
Other Diversified Financial Services -4.1% | | | | | |
Citigroup, Inc. | | 101,600 | | | 2,991,104 |
JPMorgan Chase & Company | | 384,700 | | | 16,792,155 |
| | | | | |
| | | | | 19,783,259 |
| | | | | |
Property & Casualty Insurance - 5.6% | | | | | |
Berkshire Hathaway, Inc. * | | 190 | | | 26,904,000 |
| | | | | |
| | |
Railroads -3.2% | | | | | |
Union Pacific Corporation | | 122,800 | | | 15,426,136 |
| | | | | |
| | |
Specialty Chemicals -1.9% | | | | | |
Rohm & Haas Company | | 172,200 | | | 9,138,654 |
| | | | | |
| | |
Tobacco - 1.4% | | | | | |
Altria Group, Inc. | | 91,800 | | | 6,938,244 |
| | | | | |
| | |
| 14 | | The accompanying notes are an integral part of the financial statements |
| | |
| | |
| Schedule of Investments | | Series B (Large Cap Value Series) |
| December 31, 2007 - continued | | |
| | | | | | |
| | | Shares | | | Value |
COMMON STOCK (continued) | | | | | | |
Wireless Telecommunication Services - 1.5% | | | | | | |
Sprint Nextel Corporation | | | 544,700 | | $ | 7,151,911 |
TOTAL COMMON STOCK (Cost $382,777,101) | | $ | 443,826,673 |
| | | Principal
Amount | | Value |
U.S. GOVERNMENT SPONSORED AGENCY BONDS & NOTES - 3.5% |
Federal Home Loan Bank | | | | | | |
4.24% - 2008 | | $ | 5,300,000 | | | 5,298,899 |
4.235% - 2008 | | | 1,100,000 | | | 1,099,619 |
4.26% - 2008 | | | 1,400,000 | | | 1,398,709 |
4.30% - 2008 | | | 2,000,000 | | | 1,996,417 |
Federal National Mortgage Association | | | | | | |
4.10% - 2008 | | | 1,900,000 | | | 1,898,485 |
4.15% - 2008 | | | 1,600,000 | | | 1,596,949 |
4.18% - 2008 | | | 1,800,000 | | | 1,798,119 |
4.60% - 2008 | | | 2,000,000 | | | 1,999,767 |
TOTAL U.S. GOVERNMENT SPONSORED AGENCY BONDS & NOTES (Cost $17,086,964) | | $ | 17,086,964 |
COMMERCIAL PAPER - 2.7% | | | | | | |
Banking - 1.1% | | | | | | |
Credit Suisse First Boston USA | | | | | | |
4.71%, 1/28/2008 | | | 1,900,000 | | | 1,893,288 |
UBS Finance (DE) LLC | | | | | | |
4.55%, 1/25/2008 | | | 2,000,000 | | | 1,993,934 |
Wells Fargo & Company, Inc. | | | | | | |
4.25%, 1/14/2008 | | | 1,500,000 | | | 1,497,698 |
| | | | | | |
| | | | | | 5,384,920 |
| | | | | | |
Brokerage - 0.3% | | | | | | |
Goldman Sachs Group, Inc. | | | | | | |
5.05%, 1/11/2008 | | | 1,200,000 | | | 1,198,300 |
| | | | | | |
Consumer Products - 0.7% | | | | | | |
Unilever Capital Corporation | | | | | | |
4.21%, 1/7/2008 | | | 1,800,000 | | | 1,798,737 |
4.22%, 1/15/2008 | | | 1,400,000 | | | 1,397,686 |
| | | | | | |
| | | | | | 3,196,423 |
| | | | | | |
Non U.S. Banking - 0.6% | | | | | | |
Danske Corporation | | | | | | |
4.57%, 1/22/2008 | | | 1,000,000 | | | 997,404 |
Royal Bank of Canada | | | | | | |
4.20%, 1/22/2008 | | | 2,000,000 | | | 1,995,100 |
| | | | | | |
| | | | | | 2,992,504 |
| TOTAL COMMERCIAL PAPER (Cost $12,772,147) | | $ | 12,772,147 |
| | | | | | |
| | | Principal
Amount | | Value |
REPURCHASE AGREEMENT - 0.1% | | | | | | |
United Missouri Bank, 3.61%, dated 12/31/07, matures 1/02/08; repurchase amount $581,117 (Collateralized by FHLMC, 1/12/08 & FHLB, 1/19/08 with a combined value of $592,620) | | $ | 581,000 | | $ | 581,000 |
TOTAL REPURCHASE AGREEMENT (Cost $581,000) | | $ | 581,000 |
Total Investments (SBL B Fund) | | | | | $ | 474,266,784 |
(Cost $413,217,212) - 98.8% | | | | | | |
Other Assets in Excess of Liabilities - 1.2% | | | | | | 5,705.584 |
| | | | | | |
TOTAL NET ASSETS - 100.0% | | | | | $ | 479,972,368 |
| | | | | | |
Footnotes
Percentages are stated as a percent of net assets.
For federal income tax purposes the identified cost of investments owned at 12/31/2007 was $416,158,353.
| | |
* | | - Non-income producing security |
|
| Glossary: |
ADR | | - American Depositary Receipt |
|
See notes to financial statements. |
| | |
| 15 | | The accompanying notes are an integral part of the financial statements |
| | |
| | |
| | Series B |
| | (Large Cap Value Series) |
Statement of Assets and Liabilities
December 31, 2007
| | |
Assets: | | |
Investments, at value* | | $474,266,784 |
Cash | | 1,446,478 |
Receivables: | | |
Fund shares sold | | 8,548,307 |
Dividends | | 679,178 |
Prepaid expenses | | 9,679 |
| | |
| | |
Total assets | | 484,950,426 |
| | |
| |
Liabilities: | | |
Payable for: | | |
Fund shares redeemed | | 1,699,748 |
Securities purchased | | 2,877,654 |
Management fees | | 265,960 |
Administration fees | | 39,051 |
Transfer agent/maintenance fees | | 2,083 |
Custodian fees | | 8,000 |
Directors’ fees | | 3,668 |
Professional fees | | 38,950 |
Other fees | | 42,944 |
| | |
Total liabilities | | 4,978,058 |
| | |
| | |
Net assets | | $479,972,368 |
| | |
| | |
Net assets consist of: | | |
Paid in capital | | $578,184,229 |
Undistributed net investment income | | 4,458,590 |
Accumulated net realized loss on sale of investments | | (163,720,023) |
Net unrealized appreciation in value of investments | | 61,049,572 |
| | |
Net assets | | $479,972,368 |
| | |
| | |
Capital shares authorized | | unlimited |
Capital shares outstanding | | 17,178,073 |
Net asset value per share | | |
(net assets divided by shares outstanding) | | $27.94 |
| | |
*Investments, at cost | | $413,217,212 |
Statement of Operations
For Year Ended December 31, 2007
| | |
Investment Income: | | |
Dividends | | $7,598,768 |
Interest | | 742,495 |
| | |
Total investment income | | 8,341,263 |
| | |
| |
Expenses: | | |
Management fees | | 3,213,945 |
Administration fees | | 470,657 |
Transfer agent/maintenance fees | | 25,258 |
Custodian fees | | 27,551 |
Directors’ fees | | 25,263 |
Professional fees | | 46,492 |
Reports to shareholders | | 52,849 |
Other | | 20,658 |
| | |
Total expenses | | 3,882,673 |
| | |
Net investment income | | 4,458,590 |
| | |
| |
Net Realized and Unrealized Gain (Loss): | | |
Net realized gain (loss) during the year on: | | |
Investments | | 63,209,892 |
Options written | | 178,938 |
| | |
Net realized gain | | 63,388,830 |
| | |
| |
Net unrealized appreciation (depreciation) during the year on: | | |
Investments | | (40,728,888) |
Options written | | 20,791 |
| | |
Net unrealized depreciation | | (40,708,097) |
| | |
Net realized and unrealized gain | | 22,680,733 |
| | |
Net increase in net assets resulting from operations | | $27,139,323 |
| | |
| | |
| 16 | | The accompanying notes are an integral part of the financial statements |
| | |
| | |
| | Series B |
| |
| Statement of Changes in Net Assets | | (Large Cap Value Series) |
| | | | | | | | |
| | | Year Ended
December 31, 2007 | | | Year Ended
December 31, 2006 | |
Increase (decrease) in net assets from operations: | | | | | | | | |
Net investment income | | $ | 4,458,590 | | | $ | 3,504,848 | |
Net realized gain during the year on investments | | | 63,388,830 | | | | 27,019,837 | |
Net unrealized appreciation (depreciation) during the year on investments | | | (40,708,097 | ) | | | 57,084,019 | |
| | | | | | | | |
Net increase in net assets resulting from operations | | | 27,139,323 | | | | 87,608,704 | |
| | | | | | | | |
| | |
Capital share transactions: | | | | | | | | |
Proceeds from sale of shares | | | 117,350,624 | | | | 88,964,012 | |
Cost of shares redeemed | | | (145,200,986 | ) | | | (106,581,077 | ) |
| | | | | | | | |
Net decrease from capital share transactions | | | (27,850,362 | ) | | | (17,617,065 | ) |
| | | | | | | | |
Net increase (decrease) in net assets | | | (711,039 | ) | | | 69,991,639 | |
| | | | | | | | |
| | |
Net assets: | | | | | | | | |
Beginning of year | | | 480,683,407 | | | | 410,691,768 | |
| | | | | | | | |
End of year | | $ | 479,972,368 | | | $ | 480,683,407 | |
| | | | | | | | |
| | |
Undistributed net investment income at end of year | | $ | 4,458,590 | | | $ | 3,504,848 | |
| | | | | | | | |
| | |
Capital share activity: | | | | | | | | |
Shares sold | | | 4,134,610 | | | | 3,705,999 | |
Shares redeemed | | | (5,162,697 | ) | | | (4,475,464 | ) |
| | | | | | | | |
Total capital share activity | | | (1,028,087 | ) | | | (769,465 | ) |
| | | | | | | | |
| | |
| 17 | | The accompanying notes are an integral part of the financial statements |
| | |
| | |
| Financial Highlights | | Series B |
| Selected data for each share of capital stock outstanding throughout each year | | (Large Cap Value Series) |
| | | | | | | | | | | | | | | | | |
| | | 2007 | | 2006 | | 2005a | | 2004 | | | Year Ended
December 31,
2003 | |
Per Share Data | | | | | | | | | | | | | | | | | |
Net asset value, beginning of period | | $ | 26.40 | | $ | 21.64 | | $ | 19.58 | | $ | 17.68 | | | $ | 13.84 | |
Income (loss) from investment operations: | | | | | | | | | | | | | | | | | |
Net investment incomeb | | | 0.25 | | | 0.20 | | | 0.24 | | | 0.21 | | | | 0.14 | |
Net gain on securities (realized and unrealized) | | | 1.29 | | | 4.56 | | | 1.82 | | | 1.70 | | | | 3.84 | |
| | | | |
Total from investment operations | | | 1.54 | | | 4.76 | | | 2.06 | | | 1.91 | | | | 3.98 | |
| | |
Less distributions: | | | | | | | | | | | | | | | | | |
Dividends from net investment income | | | — | | | — | | | — | | | (0.01 | ) | | | (0.14 | ) |
| | | | |
Total distributions | | | — | | | — | | | — | | | (0.01 | ) | | | (0.14 | ) |
| | |
Net asset value, end of period | | $ | 27.94 | | $ | 26.40 | | $ | 21.64 | | $ | 19.58 | | | $ | 17.68 | |
| | | | |
| | | | | | | | | | | | | | | | | |
| | |
Total Returnc | | | 5.83% | | | 22.00% | | | 10.52% | | | 10.82% | | | | 28.81% | |
| | |
Ratios/Supplemental Data | | | | | | | | | | | | | | | | | |
Net assets, end of period (in thousands) | | $ | 479,972 | | $ | 480,683 | | $ | 410,692 | | $ | 429,493 | | | $ | 434,575 | |
| | |
Ratios to average net assets: | | | | | | | | | | | | | | | | | |
Net investment income | | | 0.90% | | | 0.80% | | | 0.98% | | | 1.09% | | | | 0.93% | |
Total expensesd | | | 0.79% | | | 0.79% | | | 0.84% | | | 0.92% | | | | 0.89% | |
Net expensese | | | 0.79% | | | 0.79% | | | 0.84% | | | 0.87% | | | | 0.83% | |
| | |
Portfolio turnover rate | | | 29% | | | 20% | | | 99% | | | 73% | | | | 60% | |
a | Security Global Investors (SGI), formerly Security Management Company, LLC, became the advisor of Series B effective June 30, 2005. Prior to June 30, 2005, SGI paid Dreyfus Corporation for sub-advisory services. |
b | Net investment income (loss) was computed using average shares outstanding throughout the period. |
c | Total return does not take into account any of the expenses associated with an investment in variable insurance products offered by Security Benefit Life Insurance Company. If total return had taken into account these expenses, performance would have been lower. Shares of a series of SBL Fund are available only through the purchase of such products. |
d | Total expense information reflects the expense ratios absent expense reductions by the Investment Manager, and earnings credits, as applicable. |
e | Net expense information reflects the expense ratios after voluntary expense waivers, reimbursements and custodian earnings credits, as applicable. |
| | |
| 18 | | The accompanying notes are an integral part of the financial statements |
| | |
| | |
| Manager’s Commentary | | Series C |
| February 15, 2008 | | (Money Market Series) |

Adviser, Security Global Investors
| | |
 | | To Our Shareholders: |
| | Series C of the SBL Fund - Money Market Series returned 4.71% for the year ended December 31, 2007, which exceeded the benchmark I-Money Net Retail Tier 1 of 4.58% and the 4.68% performance of its peer group for the same period. |
| | The last four months of 2007 ended with the Federal Reserve Board decreasing interest rates on three separate occasions from 5.25% at the beginning of the year to 4.25% at the close. |
Composition of Portfolio Assets
At December 31, 2007, the average maturity of the holdings in the Series was 53 days.
The majority of the Series’ assets lie in the corporate debt sector of commercial paper. At year-end, approximately 70% of the Series consisted of Commercial Paper, 12% in Floating Rate securities (which includes corporate and U.S. government-backed), 7% in U.S. Government/Agency obligations, 7% in CD’s/Yankee CD’s, and a fraction of 1% in mortgage related products.
2007 Performance
The turning point in the year was an abrupt deterioration in credit markets in June as the sub-prime mortgage concerns began to unfold. The credit crunch worsened in August as the extent of the crisis became more apparent.
The year was far from uneventful and presented many challenges for Money Market managers. During the first half of 2007, sub-prime mortgage loans became the topic of interest as defaults continued to rise, which triggered downgrades of securities backed by pools of these loans. Many money market funds had invested in investment-pooled securities or SIVs, (Structured Investment Vehicles), which boosted yields but created a liquidity problem as the rating agencies downgraded many of these programs.
The Money Market Series does not invest in these types of securities. The manager remained focused on liquidity
and credit quality, and the sub-prime mortgage securities never passed these tests. While a small portion of the portfolio was invested in asset-backed commercial paper, which posed no risk to the portfolio, we chose to take the conservative approach and further reduce the exposure to this type investment.
2008 Market Outlook
The upcoming year provides a challenging economic environment for the Federal Reserve Board and Chairman Bernanke as they attempt to balance the fear of recession with an up-tick in inflation. As we continue to see broader contagion from the sub-prime defaults, our expectation is that we will see an increase in inflation, as companies have the pricing power to pass costs onto the consumer rather than absorbing the costs themselves.
We expect the Federal Reserve will continue its current rate cycle of reducing Federal Funds in hopes of providing liquidity to the markets while attempting to balance inflation. The goal is to eliminate the probability of recession and maintain a level of growth in the US economy.
We expect the sub-prime contagion to continue to be an ongoing concern through the first half of the year until visibility becomes clearer as to where the bottom will be, at which point the second half of the year will be a period of correction and adjustment. The effects of the Federal Reserve rate reductions and a fiscal stimulus injection by Congress should aid the growth of the economy during the second half of the year.
As always, we will continue to monitor the economic and market conditions when deciding portfolio strategies and will adjust the asset mix and maturity structure in the portfolio accordingly.
Thank you for your investment in the Money Market Series.
We appreciate the confidence that you have placed in us and continue to focus on achieving the Series’ investment goals.
Sincerely,
Christina Fletcher
Portfolio Manager
| | |
| | Series C |
| Performance Summary | | (Money Market Series) |
| December 31, 2007 | | (unaudited) |
| | |
Portfolio Composition by Quality Ratings |
| | |
Tier 1 investments | | 99.06% |
Repurchase Agreement | | 0.24 |
Other Assets in Excess of Liabilities | | 0.70 |
Total Net Assets | | 100.00% |
| | | |
| | | | | | | | | |
Average Annual Returns | |
| | | | |
| Periods Ended 12-31-071 | | 1 Year | | | 5 Years | | | 10 Years | |
Series C | | 4.71 | % | | 2.61 | % | | 3.37 | % |
1 Performance figures do not reflect fees and expenses associated with an investment in variable insurance products offered by Security Benefit Life Insurance Company. If returns had taken into account these fees and expenses, performance would have been lower. Shares of a Series of SBL Fund are available only through the purchase of such products. | |
The performance data quoted above represents past performance. Past performance is not predictive of future performance. The investment return and principal value of an investment will fluctuate so that an investor’s shares, when redeemed, may be worth more or less than their original cost. | |
| | |
| 20 | | The accompanying notes are an integral part of the financial statements |
| | |
| | Series C |
| |
| Performance Summary | | (Money Market Series) |
| December 31, 2007 | | (unaudited) |
Information About Your Series Expenses
Calculating your ongoing Series expenses
Example
As a shareholder of the Series, you incur ongoing costs, including management fees and other series expenses. Performance figures and expense ratios do not reflect fees and expenses associated with an investment in variable insurance products. Shares of a Series of SBL Fund are available only through the purchase of such products. This example is intended to help you understand your ongoing costs (in dollars) of investing in the Series and to compare these costs with ongoing costs of investing in other mutual funds. The example is based on an investment of $1,000 invested at the beginning of the period and held for the entire period, July 1, 2007 through December 31, 2007.
Actual Expenses
The first line in the table provides information about actual account values and actual expenses. You may use the information in this table, together with the amount you invested, to estimate the expenses that you paid over the period. Simply divide your account value by $1,000 (for example, an $8,600 account value divided by $1,000 = 8.6), then multiply the result by the number in the table under the heading entitled “Expenses Paid During the Period” to estimate the expenses you paid on your account during this period.
Hypothetical Example for Comparison Purposes
The second line in the table provides information about hypothetical account values and hypothetical expenses based on the Series actual expense ratio and an assumed rate of return of 5% per year before expenses, which is not the Series actual return. The hypothetical account values and expenses may not be used to estimate the actual ending account balance or expenses you paid for the period. You may use this information to compare the ongoing costs of investing in the Series and other funds. To do so, compare this 5% hypothetical example with the 5% hypothetical examples that appear in the shareholder reports of the other mutual funds.
Please note that the expenses shown in the table are meant to highlight your ongoing costs only and do not reflect any fees and expenses associated with an investment in variable insurance products. Therefore, the second line is useful in comparing ongoing costs only, and will not help you determine the relative total costs of owning different funds. In addition, if these fees and expenses associated with an investment in variable insurance products were included, your costs would have been higher.
| | | | | | |
Series Expenses |
| | | Beginning
Account
Value
7/1/2007 | | Ending
Account Value
12/31/20071 | | Expenses
Paid
During
Period2 |
Series C (Money Market Series) | | |
Actual | | $1,000.00 | | $1,023.02 | | $3.31 |
Hypothetical | | 1,000.00 | | 1,021.93 | | 3.31 |
1 | The actual ending account value is based on the actual total return of the Series for the period July 1, 2007 to December 31, 2007 after actual expenses and will differ from the hypothetical ending account value which is based on the Series expense ratio and a hypothetical annual return of 5% before expenses. The actual cumulative return at net asset value for the period July 1, 2007 to December 31, 2007 was 2.30%. |
2 | Expenses are equal to the Series annualized expense ratio of 0.65%, net of any applicable fee waivers or earnings credits, multiplied by the average account value over the period, multiplied by 184/365 (to reflect the one-half year period) |
| | |
| | |
| Schedule of Investments | | Series C (Money Market Series) |
| December 31, 2007 | | |
| | | | | | |
| | | Principal
Amount | | Value |
CERTIFICATE OF DEPOSIT - 6.6% |
Bank of America | | | | | | |
5.28%, 1/10/2008 | | | 1,500,000 | | $ | 1,500,166 |
BNP Paribas NY | | | | | | |
5.40%, 3/17/2008 | | | 1,000,000 | | | 1,001,185 |
Credit Suisse New York | | | | | | |
5.30%, 5/22/2008 | | | 3,500,000 | | | 3,506,083 |
Societe Generale NY | | | | | | |
5.17%, 1/09/2008 to | | | | | | |
1/17/2008 | | | 2,600,000 | | | 2,600,346 |
UBS AG Stamford CT | | | | | | |
5.05%, 3/20/2008 | | | 2,500,000 | | | 2,501,531 |
TOTAL CERTIFICATE OF DEPOSIT (Cost $11,098,385) | | $ | 11,109,311 |
CORPORATE BOND - 11.7% |
Automotive - 2.4% | | | | | | |
Toyota Motor Credit Corporation | | | | | | |
4.065%, 1/02/2008 (1)(2) | | $ | 2,500,000 | | | 2,496,675 |
4.961%, 3/17/2008 (1)(2) | | | 1,500,000 | | | 1,499,655 |
| | | | | | |
| | | | | | 3,996,330 |
| | | | | | |
Brokerage - 5.7% | | | | | | |
Lehman Brothers Holdings, Inc. | | | | | | |
5.092%, 2/29/2008 (1)(2) | | | 3,000,000 | | | 2,986,434 |
Merrill Lynch & Company, Inc. | | | | | | |
4.90%, 2/14/2008 (2) | | | 1,950,000 | | | 1,949,195 |
Morgan Stanley | | | | | | |
5.114%, 1/25/2008 (1)(2) | | | 1,500,000 | | | 1,497,820 |
5.201%, 3/07/2008 (2) | | | 1,000,000 | | | 999,618 |
5.334%, 1/18/2008 (2) | | | 2,200,000 | | | 2,199,540 |
| | | | | | |
| | | | | | 9,632,607 |
| | | | | | |
| | | | | | |
Financial Companies - Captive - 3.6% | | | | | | |
General Electric Capital Corporation | | | | | | |
4.955%, 2/19/2008 (1)(2) | | | 1,500,000 | | | 1,499,927 |
5.171%, 3/04/2008 (2) | | | 2,000,000 | | | 2,001,182 |
5.29%, 1/03/2008 (2) | | | 2,600,000 | | | 2,600,000 |
| | | | | | |
| | | | | | 6,101,109 |
| TOTAL CORPORATE BOND (Cost $19,752,092) | | $ | 19,730,046 |
MORTGAGE BACKED SECURITIES - 0.6% |
Other Non-Agency - 0.6% | | | | | | |
Pass-Thru’s -0.6% | | | | | | |
Small Business Administration Pools | | | | | | |
#503308, 5.00% - | | | | | | |
1/01/2008 (1)(2) | | | 141,781 | | | 141,781 |
#503176, 5.125% - | | | | | | |
1/01/2008 (1)(2) | | | 24,091 | | | 24,211 |
#503343, 5.125% - | | | | | | |
1/01/2008 (1)(2) | | | 226,982 | | | 226,982 |
#503347, 5.125% - | | | | | | |
1/01/2008 (1)(2) | | | 84,076 | | | 84,076 |
#502353, 5.25% - | | | | | | |
1/01/2008 (1)(2) | | | 37,926 | | | 37,926 |
#503295, 5.25% - | | | | | | |
1/01/2008 (1)(2) | | | 112,430 | | | 112,186 |
| | | | | | |
| | | Principal
Amount | | Value |
MORTGAGE BACKED SECURITIES (continued) |
Other Non-Agency (continued) | | | | | | |
Pass-Thru’s (continued) Small Business Administration Pools | | | | | | |
(continued) | | | | | | |
#503303, 5.25% - | | | | | | |
1/01/2008 (1)(2) | | $ | 197,557 | | $ | 197,128 |
#502163, 5.50% - | | | | | | |
1/01/2008 (1)(2) | | | 176,194 | | | 176,194 |
| | | | | | |
| | | | | | 1,000,484 |
TOTAL MORTGAGE BACKED SECURITIES
(Cost $1,001,351) | | | | | $ | 1,000,484 |
U.S. GOVERNMENT SPONSORED AGENCY BONDS & NOTES -10.1% |
Federal Home Loan Bank | | | | | | |
3.563% -1/02/2008 (1)(2) | | | 2,000,000 | | | 1,997,778 |
3.583% - 1/02/2008 (1)(2) | | | 1,500,000 | | | 1,499,552 |
4.30% - 12/18/2008 | | | 1,000,000 | | | 1,000,760 |
4.35% - 12/11/2008 | | | 3,000,000 | | | 3,002,934 |
4.47% - 12/15/2008 | | | 2,000,000 | | | 2,002,936 |
4.50% - 11/28/2008 | | | 1,500,000 | | | 1,500,925 |
4.625% - 12/04/2008 | | | 2,000,000 | | | 2,002,030 |
4.701% - 2/04/2008 (1)(2) | | | 2,000,000 | | | 1,999,856 |
4.841% - 3/17/2008 (1)(2) | | | 2,000,000 | | | 2,001,264 |
TOTAL U.S. GOVERNMENT SPONSORED AGENCY BONDS & NOTES
(Cost $16,999,040) | | $ | 17,008,035 |
COMMERCIAL PAPER - 70.1% |
Automotive -6.9% | | | | | | |
American Honda Finance | | | | | | |
4.48%, 1/4/2008 | | | 2,500,000 | | | 2,499,067 |
4.52%, 1/9/2008 | | | 1,000,000 | | | 998,996 |
4.48%, 1/25/2008 | | | 1,200,000 | | | 1,196,416 |
4.50%, 1/30/2008 | | | 1,500,000 | | | 1,494,287 |
4.51%, 2/13/2008 | | | 2,000,000 | | | 1,988,875 |
Toyota Motor Credit Corporation | | | | | | |
4.65%, 2/25/2008 | | | 1,000,000 | | | 992,900 |
4.82%, 3/31/2008 | | | 1,000,000 | | | 988,011 |
4.55%, 4/10/2008 | | | 1,600,000 | | | 1,578,575 |
| | | | | | |
| | | | | | 11,737,127 |
| | | | | | |
Banking -2.8% | | | | | | |
Bank of America | | | | | | |
5.065%, 1/22/2008 | | | 1,300,000 | | | 1,296,159 |
UBS Finance (DE) LLC | | | | | | |
5.04%, 1/14/2008 | | | 1,500,000 | | | 1,497,579 |
4.70%, 2/14/2008 | | | 2,000,000 | | | 1,988,700 |
| | | | | | |
| | | | | | 4,782,438 |
| | | | | | |
Brokerage - 11.7% | | | | | | |
Goldman Sachs Group, Inc. | | | | | | |
4.80%, 1/2/2008 | | | 1,000,000 | | | 999,867 |
5.05%, 1/11/2008 | | | 1,200,000 | | | 1,198,317 |
4.50%, 1/14/2008 | | | 1,000,000 | | | 998,375 |
| | |
| 22 | | The accompanying notes are an integral part of the financial statements |
| | |
| | |
| Schedule of Investments | | Series C (Money Market Series) |
December 31, 2007 - continued | | |
| | | | | |
| | | Principal
Amount | | Value |
COMMERCIAL PAPER (continued) |
Brokerage (continued) |
Goldman Sachs Group, Inc. (continued) | | | | | |
4.50%, 1/17/2008 | | 1,000,000 | | $ | 998,000 |
4.80%, 1/28/2008 | | 1,500,000 | | | 1,494,600 |
4.78%, 1/29/2008 | | 1,100,000 | | | 1,095,935 |
4.80%, 1/30/2008 | | 1,200,000 | | | 1,195,430 |
ING (US) Funding LLC | | | | | |
4.50%, 1/3/2008 | | 1,000,000 | | | 999,750 |
5.12%, 1/9/2008 | | 1,000,000 | | | 998,862 |
4.85%, 1/15/2008 | | 1,700,000 | | | 1,696,794 |
4.82%, 1/23/2008 | | 1,500,000 | | | 1,495,582 |
4.50%, 2/5/2008 | | 1,600,000 | | | 1,593,000 |
4.46%, 2/6/2008 | | 1,500,000 | | | 1,493,310 |
JP Morgan Chase & Company | | | | | |
5.07%, 1/3/2008 | | 1,500,000 | | | 1,499,410 |
4.80%, 1/4/2008 | | 1,000,000 | | | 999,600 |
4.67%, 1/24/2008 | | 1,000,000 | | | 996,886 |
| | | | | |
| | | | | 19,753,718 |
| | | | | |
Consumer Products - 3.6% | | | | | |
Procter & Gamble International Funding | | | | | |
4.42%, 1/4/2008 | | 1,075,000 | | | 1,074,604 |
4.20%, 1/23/2008 | | 2,000,000 | | | 1,994,867 |
4.22%, 1/25/2008 | | 1,500,000 | | | 1,495,780 |
4.50%, 2/8/2008 | | 1,500,000 | | | 1,492,642 |
| | | | | |
| | | | | 6,057,893 |
| | | | | |
Diversified Financial Services - 1.5% | | | | | |
Irish Life & Permanent | | | | | |
4.38%, 2/29/2008 | | 2,500,000 | | | 2,482,054 |
| | | | | |
| | |
Electric -0.8% | | | | | |
Florida Power & Light Company | | | | | |
4.27%, 1/7/2008 | | 1,300,000 | | | 1,299,075 |
| | | | | |
| | |
Financial Companies - Captive - 5.3% | | | | | |
General Electric Capital Corporation | | | | | |
4.62%, 2/22/2008 | | 1,000,000 | | | 993,298 |
International Lease Finance Company | | | | | |
4.67%, 1/8/2008 | | 3,900,000 | | | 3,896,532 |
4.555%, 1/10/2008 | | 2,000,000 | | | 1,997,723 |
4.76%, 1/11/2008 | | 2,000,000 | | | 1,997,356 |
| | | | | |
| | | | | 8,884,909 |
| | | | | |
Financial Companies - Noncaptive | | | | | |
Consumer -0.9% | | | | | |
American Express Credit Corporation | | | | | |
4.60%, 1/16/2008 | | 1,500,000 | | | 1,496,853 |
| | | | | |
| | |
Food & Beverage - 4.4% | | | | | |
Archer Daniels Midland Company | | | | | |
4.51%, 1/8/2008 | | 2,300,000 | | | 2,297,983 |
4.47%, 1/29/2008 | | 2,090,000 | | | 2,082,734 |
4.316%, 2/26/2008 | | 3,000,000 | | | 2,978,159 |
| | | | | |
| | | | | 7,358,876 |
| | | | | |
| | | | | |
| | | Principal
Amount | | Value |
COMMERCIAL PAPER (continued) |
Insurance -3.7% | | | | | |
Swiss Re Financial Products | | | | | |
4.95%, 1/2/2008 | | 1,700,000 | | $ | 1,699,557 |
4.95%, 1/7/2008 | | 2,000,000 | | | 1,998,176 |
5.31%, 1/28/2008 | | 1,000,000 | | | 996,444 |
4.85%, 2/27/2008 | | 1,500,000 | | | 1,488,951 |
| | | | | |
| | | | | 6,183,128 |
| | | | | |
Life Insurance - 2.9% | | | | | |
Prudential plc | | | | | |
4.77%, 1/18/2008 | | 1,500,000 | | | 1,496,482 |
4.95%, 1/23/2008 | | 1,500,000 | | | 1,495,537 |
4.82%, 2/4/2008 | | 2,000,000 | | | 1,991,186 |
| | | | | |
| | | | | 4,983,205 |
| | | | | |
Non U.S. Banking - 18.5% | | | | | |
Bank of Ireland | | | | | |
5.09%, 1/15/2008 | | 1,700,000 | | | 1,696,656 |
4.92%, 1/22/2008 | | 2,000,000 | | | 1,994,252 |
Barclays US Funding LLC | | | | | |
4.65%, 1/15/2008 | | 1,000,000 | | | 998,192 |
Danske Corporation | | | | | |
4.57%, 1/22/2008 | | 1,000,000 | | | 997,334 |
4.65%, 1/31/2008 | | 1,200,000 | | | 1,195,000 |
4.65%, 1/31/2008 | | 1,000,000 | | | 996,091 |
4.66%, 2/1/2008 | | 2,700,000 | | | 2,688,883 |
5.00%, 2/8/2008 | | 1,850,000 | | | 1,840,724 |
Royal Bank of Canada | | | | | |
4.30%, 1/28/2008 | | 1,000,000 | | | 996,475 |
4.49%, 2/12/2008 | | 1,700,000 | | | 1,691,095 |
4.30%, 2/29/2008 | | 2,500,000 | | | 2,482,382 |
4.50%, 3/6/2008 | | 1,500,000 | | | 1,487,317 |
Societe Generale | | | | | |
5.08%, 1/4/2008 | | 1,000,000 | | | 999,479 |
4.83%, 2/20/2008 | | 2,000,000 | | | 1,986,583 |
4.81%, 2/21/2008 | | 1,500,000 | | | 1,490,146 |
4.45%, 3/6/2008 | | 1,000,000 | | | 991,965 |
Westpac Banking Corporation | | | | | |
5.12%, 1/7/2008 | | 1,000,000 | | | 999,147 |
4.90%, 2/1/2008 | | 1,000,000 | | | 995,781 |
4.90%, 2/1/2008 | | 1,500,000 | | | 1,493,951 |
4.65%, 2/5/2008 | | 2,000,000 | | | 1,990,936 |
4.96%, 2/26/2008 | | 1,200,000 | | | 1,191,321 |
| | | | | |
| | | | | 31,203,710 |
| | | | | |
Oil Field Services - 2.4% | | | | | |
BP Capital Markets plc | | | | | |
4.46%, 2/6/2008 | | 2,000,000 | | | 1,990,686 |
4.45%, 2/11/2008 | | 2,000,000 | | | 1,989,444 |
| | | | | |
| | | | | 3,980,130 |
| | | | | |
Pharmaceuticals -4.7% | | | | | |
AstraZeneca plc | | | | | |
4.95%, 1/14/2008 | | 1,500,000 | | | 1,497,264 |
4.55%, 1/16/2008 | | 1,500,000 | | | 1,496,873 |
| | |
| 23 | | The accompanying notes are an integral part of the financial statements |
| | |
| | |
| Schedule of Investments | | Series C (Money Market Series) |
| December 31, 2007 - continued | | |
| | | | | | |
| | | Principal
Amount | | Value |
| COMMERCIAL PAPER (continued) |
Pharmaceuticals (continued) |
GlaxoSmithKline Finance plc | | | | | | |
4.55%, 1/22/2008 | | | 1,500,000 | | $ | 1,495,717 |
4.65%, 2/4/2008 | | | 1,500,000 | | | 1,493,389 |
4.63%, 3/3/2008 | | | 2,000,000 | | | 1,983,914 |
| | | | | | |
| | | | | | 7,967,157 |
TOTAL COMMERCIAL PAPER (Cost $118,174,759) | | $ | 118,170,273 |
REPURCHASE AGREEMENT - 0.2% | | | |
United Missouri Bank, 3.61%, dated 12/31/07, matures 1/02/08; repurchase amount $412,083 (Collateralized by FHLB Discount Note, 1/19/08 with a value of $420,240) | | $ | 412,000 | | $ | 412,000 |
| |
TOTAL REPURCHASE AGREEMENT (Cost $412,000) | | $ | 412,000 |
| |
Total Investments (SBL C Fund) | | $ | 167,430,149 |
(Cost $167,437,627) - 99.3% | | | |
Other Assets in Excess of Liabilities - 0.7% | | | 1,231,340 |
| | | | | | |
TOTAL NET ASSETS - 100.0% | | $ | 168,661,489 |
| | | | | | |
Footnotes
Percentages are stated as a percent of net assets.
For federal income tax purposes the identified cost of investments owned at 12/31/2007 was $167,437,627.
| | |
| 1 | | - Maturity date indicated is next interest reset date. |
| 2 | | - Variable rate security. Rate indicated is rate effective at December 31, 2007. |
|
| Glossary: |
FHLB | | - Federal Home Loan Bank |
plc | | - Public Limited Company |
|
| See notes to financial statements. |
| | |
| 24 | | The accompanying notes are an integral part of the financial statements |
| | |
| | |
| | Series C |
| | (Money Market Series) |
Statement of Assets and Liabilities
December 31, 2007
| | |
Assets: | | |
Investments, at value* | | $167,430,149 |
Cash | | 351 |
Receivables: | | |
Fund shares sold | | 3,144,904 |
Securities sold | | 6,256 |
Interest | | 567,140 |
Prepaid expenses | | 2,546 |
| | |
Total assets | | 171,151,346 |
| | |
| |
Liabilities: | | |
| |
Payable for: | | |
Fund shares redeemed | | 2,382,110 |
Management fees | | 69,623 |
Administration fees | | 15,403 |
Transfer agent/maintenance fees | | 2,083 |
Custodian fees | | 4,800 |
Directors’ fees | | 1,500 |
Professional fees | | 9,000 |
Other fees | | 5,338 |
| | |
Total liabilities | | 2,489,857 |
| | |
Net assets | | $168,661,489 |
| | |
| |
Net assets consist of: | | |
Paid in capital | | $162,648,965 |
Undistributed net investment income | | 6,020,002 |
Net unrealized depreciation in value of investments | | (7,478) |
| | |
Net assets | | $168,661,489 |
| | |
| |
Capital shares authorized | | unlimited |
Capital shares outstanding | | 12,650,392 |
Net asset value per share
(net assets divided by shares outstanding) | | $13.33 |
| | |
| |
*Investments, at cost | | $167,437,627 |
Statement of Operations
For Year Ended December 31, 2007
| | | |
Investment Income: | | | |
Interest | | 6,879,864 | |
| | | |
Total investment income | | 6,879,864 | |
| | | |
| |
Expenses: | | | |
Management fees | | 654,606 | |
Administration fees | | 132,443 | |
Transfer agent/maintenance fees | | 25,304 | |
Custodian fees | | 14,600 | |
Directors’ fees | | 7,556 | |
Professional fees | | 10,967 | |
Reports to shareholders | | 9,642 | |
Other | | 4,865 | |
| | | |
Total expenses | | 859,983 | |
Less: | | | |
Earnings credits applied | | (121 | ) |
| | | |
Net expenses | | 859,862 | |
| | | |
Net investment income | | 6,020,002 | |
| | | |
| |
Net Unrealized Gain (Loss): | | | |
Net unrealized appreciation (depreciation) during the year on: | | | |
Investments | | (11,629 | ) |
| | | |
Net increase in net assets resulting from operations | | $6,008,373 | |
| | | |
| | |
| 25 | | The accompanying notes are an integral part of the financial statements |
| | |
| | |
| | Series C |
| Statement of Changes in Net Assets | | (Money Market Series) |
| | | | | | | | |
| | | Year Ended
December 31, 2007 | | | Year Ended
December 31, 2006 | |
| | |
Increase (decrease) in net assets from operations: | | | | | | | | |
Net investment income | | $ | 6,020,002 | | | $ | 4,176,757 | |
Net unrealized appreciation (depreciation) during the year on investments | | | (11,629 | ) | | | 17,627 | |
| | | | | | | | |
Net increase in net assets resulting from operations | | | 6,008,373 | | | | 4,194,384 | |
| | | | | | | | |
| | |
Capital share transactions: | | | | | | | | |
Proceeds from sale of shares | | | 457,059,370 | | | | 290,303,698 | |
Cost of shares redeemed | | | (393,450,526 | ) | | | (267,108,743 | ) |
| | | | | | | | |
Net increase from capital share transactions | | | 63,608,844 | | | | 23,194,955 | |
| | | | | | | | |
Net increase in net assets | | | 69,617,217 | | | | 27,389,339 | |
| | | | | | | | |
| | |
Net assets: | | | | | | | | |
Beginning of year | | | 99,044,272 | | | | 71,654,933 | |
| | | | | | | | |
End of year | | $ | 168,661,489 | | | $ | 99,044,272 | |
| | | | | | | | |
| | |
Undistributed net investment income at end of year | | $ | 6,020,002 | | | $ | 4,176,757 | |
| | | | | | | | |
| | |
Capital share activity: | | | | | | | | |
Shares sold | | | 35,025,550 | | | | 23,327,782 | |
Shares redeemed | | | (30,153,493 | ) | | | (21,430,027 | ) |
| | | | | | | | |
Total capital share activity | | | 4,872,057 | | | | 1,897,755 | |
| | | | | | | | |
| | |
| 26 | | The accompanying notes are an integral part of the financial statements |
| | |
| | |
| Financial Highlights | | Series C |
Selected data for each share of capital stock outstanding throughout each year | | (Money Market Series) |
| | | | | | | | | | |
| | | 2007 | | 2006 | | 2005 | | 2004 | | Year Ended
December 31,
2003 |
| |
Per Share Data | | | | | | | | | | |
Net asset value, beginning of period | | $12.73 | | $12.19 | | $11.87 | | $11.79 | | $11.82 |
| |
Income (loss) from investment operations: | | | | | | | | | | |
Net investment incomea | | 0.60 | | 0.45 | | 0.33 | | 0.11 | | 0.09 |
Net gain (loss) on securities (realized and unrealized) | | – | | 0.09 | | (0.01) | | (0.02) | | (0.02) |
| | |
Total from investment operations | | 0.60 | | 0.54 | | 0.32 | | 0.09 | | 0.07 |
| |
Less distributions: | | | | | | | | | | |
Dividends from net investment income | | – | | – | | – | | (0.01) | | (0.10) |
| | |
Total distributions | | – | | – | | – | | (0.01) | | (0.10) |
| |
Net asset value, end of period | | $13.33 | | $12.73 | | $12.19 | | $11.87 | | $11.79 |
| | |
| | | | | |
| | | | | | | | | | |
| |
Total Returnb | | 4.71% | | 4.43% | | 2.70% | | 0.72% | | 0.55% |
| |
Ratios/Supplemental Data | | | | | | | | | | |
Net assets, end of period (in thousands) | | $168,661 | | $99,044 | | $71,655 | | $66,084 | | $86,458 |
| |
Ratios to average net assets: | | | | | | | | | | |
Net investment income | | 4.59% | | 4.43% | | 2.63% | | 0.70% | | 0.63% |
Total expensesc | | 0.66% | | 0.68% | | 0.69% | | 0.65% | | 0.59% |
Net expensesd | | 0.66% | | 0.68% | | 0.69% | | 0.65% | | 0.59% |
Net expenses prior to custodian earnings credits and net of expense waivers | | 0.66% | | 0.68% | | 0.69% | | 0.65% | | 0.59% |
a Net investment income (loss) was computed using average shares outstanding throughout the period.
b Total return does not take into account any of the expenses associated with an investment in variable insurance products offered by Security Benefit Life Insurance Company. If total return had taken into account these expenses, performance would have been lower. Shares of a series of SBL Fund are available only through the purchase of such products.
c Total expense information reflects the expense ratios absent expense reductions by the Investment Manager, and earnings credits, as applicable.
d Net expense information reflects the expense ratios after voluntary expense waivers, reimbursements and custodian earnings credits, as applicable.
| | |
| 27 | | The accompanying notes are an integral part of the financial statements |
| | |
| | |
| Manager’s Commentary | | Series D |
February 15, 2008 | | (Global Series) |
| | |
Advised by: | | |

To Our Shareholders
Series D of the SBL Fund – Global Series returned 8.88% underperforming the benchmark, Morgan Stanley Capital International, Inc. (MSCI) World Index return of 9.04% and its peer group of 9.81% for the year ended December 31, 2007. The year was characterized by choppy global markets and a credit crunch in the United States.
From January 1, 2007 through August 1, 2007, OppenheimerFunds, Inc. was the sole manager of the Series in a sub-advised capacity. Since August 1, 2007, OppenheimerFunds manages 50% of Series’ with the other 50% residing with Security Global Investors’ (SGI) global equities team. The SGI team has more than 17 years experience in managing global equities. The team consists of portfolio managers John Boich, David Whittall, and Scott Klimo.
The SGI team believes that excess return opportunities exist in global stock markets and that those opportunities are best identified and captured at the security level. Investing globally offers the greatest exposure to excess return opportunities while enhancing the ability to diversify risk. Successfully identifying and exploiting these opportunities requires thorough fundamental research. Superior stock selection continues to be the trademark for the team’s performance as selection effect accounts for nearly all the return of the portfolio.
The SGI global team employs a bottom-up approach to the global equity universe to identify and invest in the best opportunities around the world. The team melds sophisticated screening techniques, input from management meetings, and insights into global/regional trends to identify investment opportunities from around the world. Relative valuation and relative business momentum is a specific focus of the screening criteria. The SGI team’s
| | |
and | |  |
| | Subadviser, OppenheimerFunds |
| | |
| | |
fundamental research is original and uses primary sources to substantiate our forecasts and investment theses.
Top Performers
A focus on the long-term sustainable competitive advantage of individual companies was valuable as some of the Series’ longest and largest holdings, Vodafone Group plc and Porsche AG, had good years. Another large portfolio holding, German conglomerate Siemens AG, continues to deliver value through its restructuring process.
While underweight in the energy sector, select securities in the increasingly complex oil business were excellent investments. Transocean, Inc., the world’s largest driller, and Hyundai Heavy Industries, the world’s largest shipbuilder, both had stellar years. Energy company Anadarko Petroleum Corporation rose 29%.
Rio Tinto plc was a strong contributor to Series’ gaining 60% during the latter half of the period. Rio Tinto is an U.K. based mining group with operations and projects across four continents. Rio Tinto is a major producer in all the metals and minerals markets in which it operates.
Nintendo Company Ltd. more than doubled in the past year on the growing popularity of its new Wii gaming platform and continued domination of the handheld electronic games business.
A significant underweight to the benchmark in the Finance sector aided by good stock picking boosted performance as the managers anticipated a more difficult environment for financial stocks.
Disappointing Performers
One of the Series’ largest holdings, Telefonaktiebolaget LM Ericsson, the leading wireless network equipment producer in the world, had a particularly difficult year as order shortfalls hurt the stock price. We continue to believe that its leading technology, valuation, and the significant barriers to entry in the industry, provide the firm with excellent long-term prospects.
Comcast, the largest cable company in the US; EMCOR Group, Inc., an electrical and mechanical construction and
| | |
| | |
| Manager’s Commentary | | Series D |
February 15, 2008 | | (Global Series) |
facilities services firm, and Wavin, a building materials supplier, all entered the portfolio following steep share price declines that pushed valuations to what we felt were irresistible levels. Other investors were able to resist and stock prices continued to decline.
Geographically, Japan was the location of many of the poor performers. The lack of growth in the Japanese domestic economy hurt holdings of Japanese banks. A dramatic reduction in the maximum interest rate that finance companies could charge in Japan through a change in regulation hurt the holding in Credit Saison Company Ltd. However, the credit card opportunity in Japan is vast and the firm’s outlook should brighten in the future.
2008 Market Outlook
The Series’ core strategy continues to focus on identifying long-term stocks – companies with sustainable long-term earnings and cash flow, strong economic returns on invested capital, and healthy balance sheets.
Looking ahead to 2008, we have seen several of our economic expectations play out. Chief among these was the spike in the U.S. unemployment rate from 4.7% to 5.0%. Solid incomes due to a resilient job market, is a key pillar of claims to a fundamentally strong economy. We continue to view recession as inevitable and earnings declines - not only in the U.S - as an unavoidable consequence. Accordingly, we have adopted a defensive posture for the portfolio.
We recognize there are many investment alternatives available today and thank you for your business and the confidence you place in us.
Sincerely,
John Boich, SGI Portfolio Manager
David Whittall, SGI Portfolio Manager
Scott Klimo, SGI Portfolio Manager
Rajeev Bhaman, OppenheimerFund Portfolio Manager
| | |
| | Series D |
Performance Summary | | (Global Series) |
December 31, 2007 | | (unaudited |
$10,000 Over Ten Years
The chart above assumes a hypothetical $10,000 investment in Series D (Global Series) on December 31, 1997 and reflects the fees and expenses of Series D. The MSCI World Index is an unmanaged capitalization-weighted index that is designed to measure global developed market equity performance.
| | | | | | |
Average Annual Returns | | | | | | |
| Periods Ended 12-31-071 | | 1 Year | | 5 Years | | 10 Years |
| |
Series D | | 8.88% | | 19.84% | | 12.34% |
1 Performance figures do not reflect fees and expenses associated with an investment in variable insurance products offered by Security Benefit Life Insurance Company. If returns had taken into account these fees and expenses, performance would have been lower. Shares of a Series of SBL Fund are available only through the purchase of such products. The performance data quoted above represents past performance. Past performance is not predictive of future performance. The investment return and principal value of an investment will fluctuate so that an investor’s shares, when redeemed, may be worth more or less than their original cost. |
| | | |
Portfolio Composition by Sector | |
Consumer Discretionary | | 15.16 | % |
Consumer Staples | | 8.57 | |
Energy | | 5.66 | |
Financials | | 14.59 | |
Health Care | | 11.13 | |
Industrials | | 15.84 | |
Information Technology | | 15.84 | |
Materials | | 1.50 | |
Telecommunication Services | | 7.15 | |
Utilities | | 2.63 | |
Rights | | 0.02 | |
Repurchase Agreement | | 0.48 | |
Short Term Investments | | 0.53 | |
Other Assets in Excess of Liabilities | | 0.90 | |
Total Net Assets | | 100.00 | % |
| | | | |
| | | | |
| | |
| 30 | | The accompanying notes are an integral part of the financial statements |
| | |
| | Series D |
| |
| Performance Summary | | (Global Series) |
| December 31, 2007 | | (unaudited) |
Information About Your Series Expenses
Calculating your ongoing Series expenses
Example
As a shareholder of the Series, you incur ongoing costs, including management fees and other series expenses. Performance figures and expense ratios do not reflect fees and expenses associated with an investment in variable insurance products. Shares of a Series of SBL Fund are available only through the purchase of such products. This example is intended to help you understand your ongoing costs (in dollars) of investing in the Series and to compare these costs with ongoing costs of investing in other mutual funds. The example is based on an investment of $1,000 invested at the beginning of the period and held for the entire period, July 1, 2007 through December 31, 2007.
Actual Expenses
The first line in the table provides information about actual account values and actual expenses. You may use the information in this table, together with the amount you invested, to estimate the expenses that you paid over the period. Simply divide your account value by $1,000 (for example, an $8,600 account value divided by $1,000 = 8.6), then multiply the result by the number in the table under the heading entitled “Expenses Paid During the Period” to estimate the expenses you paid on your account during this period.
Hypothetical Example for Comparison Purposes
The second line in the table provides information about hypothetical account values and hypothetical expenses based on the Series actual expense ratio and an assumed rate of return of 5% per year before expenses, which is not the Series actual return. The hypothetical account values and expenses may not be used to estimate the actual ending account balance or expenses you paid for the period. You may use this information to compare the ongoing costs of investing in the Series and other funds. To do so, compare this 5% hypothetical example with the 5% hypothetical examples that appear in the shareholder reports of the other mutual funds.
Please note that the expenses shown in the table are meant to highlight your ongoing costs only and do not reflect any fees and expenses associated with an investment in variable insurance products. Therefore, the second line is useful in comparing ongoing costs only, and will not help you determine the relative total costs of owning different funds. In addition, if these fees and expenses associated with an investment in variable insurance products were included, your costs would have been higher.
| | | | | | |
Series Expenses |
| | | Beginning
Account
Value
7/1/2007 | | Ending
Account Value
12/31/20071 | | Expenses
Paid
During
Period2 |
Series D (Global Series) |
Actual | | $1,000.00 | | $1,006.71 | | $6.37 |
Hypothetical | | 1,000.00 | | 1,018.85 | | 6.41 |
| | | | | | | |
1 The actual ending account value is based on the actual total return of the Series for the period July 1, 2007 to December 31, 2007 after actual expenses and will differ from the hypothetical ending account value which is based on the Series expense ratio and a hypothetical annual return of 5% before expenses. The actual cumulative return at net asset value for the period July 1, 2007 to December 31, 2007 was 0.67%.
2 Expenses are equal to the Series annualized expense ratio of 1.26%, net of any applicable fee waivers or earnings credits, multiplied by the average account value over the period, multiplied by 184/365 (to reflect the one-half year period)
| | |
| | |
| Schedule of Investments | | Series D (Global Series) |
| December 31, 2007 | | |
| | | | | |
| | | Shares | | Value |
RIGHT - 0.0% |
Hong Kong - 0.0% | | | | | |
Wharf Holdings, Ltd. | | 66,487 | | $ | 91,240 |
TOTAL RIGHT (Cost $61,860) | | | | $ | 91,240 |
COMMON STOCK - 97.6% |
Australia - 0.4% | | | | | |
Aristocrat Leisure, Ltd. | | 13,700 | | | 135,091 |
Macquarie Airports | | 547,666 | | | 1,944,120 |
| | | | | |
| | | | | 2,079,211 |
| | | | | |
Bermuda - 1.8% | | | | | |
Accenture, Ltd. | | 116,290 | | | 4,189,928 |
Hiscox, Ltd. | | 741,842 | | | 4,214,258 |
TBS International, Ltd. * | | 48,430 | | | 1,601,096 |
| | | | | |
| | | | | 10,005,282 |
| | | | | |
Brazil - 0.8% | | | | | |
Companhia de Bebidas das Americas ADR | | 27,756 | | | 1,971,509 |
Empresa Brasileira de Aeronautica S.A. ADR | | 58,226 | | | 2,654,523 |
| | | | | |
| | | | | 4,626,032 |
| | | | | |
Canada - 0.6% | | | | | |
Husky Energy, Inc. | | 78,500 | | | 3,522,507 |
| | | | | |
| | |
Cayman Islands - 2.5% | | | | | |
ACE, Ltd. | | 28,099 | | | 1,735,956 |
Herbalife, Ltd. | | 51,390 | | | 2,069,989 |
Seagate Technology | | 205,340 | | | 5,236,170 |
Transocean, Inc. | | 24,696 | | | 3,535,216 |
XL Capital, Ltd. | | 22,900 | | | 1,152,099 |
| | | | | |
| | | | | 13,729,430 |
| | | | | |
China - 1.0% | | | | | |
China BlueChemical, Ltd. | | 8,036,040 | | | 5,194,449 |
| | | | | |
| | |
Finland - 1.5% | | | | | |
Fortum Oyj | | 58,600 | | | 2,635,909 |
Nokia Oyj ADR | | 145,300 | | | 5,578,067 |
| | | | | |
| | | | | 8,213,976 |
| | | | | |
France - 4.2% | | | | | |
BNP Paribas | | 9,060 | | | 981,726 |
France Telecom S.A. | | 228,994 | | | 8,231,013 |
LVMH Moet Hennessy Louis Vuitton S.A. | | 33,250 | | | 4,013,592 |
NicOx S.A. * | | 15,292 | | | 245,583 |
Sanofi-Aventis S.A. | | 32,040 | | | 2,946,024 |
Societe Generale | | 15,975 | | | 2,307,332 |
Technip S.A. | | 35,880 | | | 2,854,894 |
Total S.A. | | 20,112 | | | 1,668,684 |
| | | | | |
| | | | | 23,248,848 |
| | | | | |
Germany - 3.6% | | | | | |
Allianz AG | | 16,538 | | | 3,572,228 |
Altana AG | | 88,175 | | | 2,143,388 |
Arques Industries AG | | 38,425 | | | 1,318,326 |
Bayerische Motoren Werke AG * | | 44,347 | | | 2,741,945 |
| | | | | |
| | | Shares | | Value |
COMMON STOCK (continued) |
Germany (continued) | | | | | |
SAPAG | | 63,856 | | $ | 3,312,364 |
Siemens AG | | 43,496 | | | 6,912,876 |
| | | | | |
| | | | | 20,001,127 |
| | | | | |
Hong Kong - 2.8% | | | | | |
China Petroleum & Chemical
Corporation | | | | | |
| | 1,608,000 | | | 2,429,396 |
Link REIT (l) | | 1,946,900 | | | 4,214,858 |
New World Development, Ltd. | | 838,800 | | | 2,974,544 |
Sun Hung Kai Properties, Ltd. | | 143,800 | | | 3,054,120 |
Wharf Holdings, Ltd. | | 531,900 | | | 2,786,692 |
| | | | | |
| | | | | 15,459,610 |
| | | | | |
India - 1.5% | | | | | |
Dish TV India, Ltd. * | | 172,880 | | | 449,250 |
Hindustan Unilever, Ltd. | | 284,500 | | | 1,542,872 |
ICICI Bank, Ltd. ADR | | 16,850 | | | 1,036,275 |
Infosys Technologies, Ltd. | | 72,665 | | | 3,263,752 |
Wire and Wireless India, Ltd. * | | 155,900 | | | 392,663 |
Zee Entertainment Enterprises, Ltd. | | 178,300 | | | 1,479,819 |
| | | | | |
| | | | | 8,164,631 |
| | | | | |
Ireland - 0.8% | | | | | |
Anglo Irish Bank Corporation plc | | 274,393 | | | 4,414,645 |
| | | | | |
| | |
Italy - 2.5% | | | | | |
Bulgari SpA | | 93,400 | | | 1,303,605 |
Tod’s SpA | | 16,900 | | | 1,179,385 |
Unione di Banche Italiane SCPA | | 416,220 | | | 11,430,175 |
| | | | | |
| | | | | 13,913,165 |
| | | | | |
Japan - 10.9% | | | | | |
Astellas Pharma, Inc. | | 47,555 | | | 2,078,277 |
Chiba Bank, Ltd. | | 776,860 | | | 6,343,991 |
Chugai Pharmaceutical Company, Ltd. | | 46,800 | | | 671,961 |
Credit Saison Company, Ltd. | | 49,500 | | | 1,359,268 |
Fanuc, Ltd. | | 7,600 | | | 742,029 |
Fuji Heavy Industries, Ltd. | | 401,800 | | | 1,882,170 |
Hino Motors, Ltd. | | 293,791 | | | 1,916,687 |
Hoya Corporation | | 59,700 | | | 1,907,228 |
JGC Corporation | | 242,200 | | | 4,192,613 |
KDDI Corporation | | 383 | | | 2,859,568 |
Keyence Corporation | | 5,900 | | | 1,459,712 |
Kyocera Corporation | | 14,500 | | | 1,289,496 |
Mitsubishi Electric Corporation | | 76,000 | | | 796,590 |
Murata Manufacturing Company, Ltd. | | 36,200 | | | 2,105,048 |
Nidec Corporation | | 10,200 | | | 757,895 |
Nintendo Company, Ltd. | | 12,145 | | | 7,291,251 |
Nippon Express Company, Ltd. | | 365,527 | | | 1,886,104 |
Nippon Telegraph & Telephone Corporation | | 474 | | | 2,377,763 |
NTT DoCoMo, Inc. | | 1,326 | | | 2,213,272 |
| | |
| 32 | | The accompanying notes are an integral part of the financial statements |
| | |
| | |
| Schedule of Investments | | Series D (Global Series) |
December 31, 2007 - continued | | |
| | | | | |
| | | Shares | | Value |
COMMON STOCK (continued) | | | | | |
Japan (continued) | | | | | |
Ricoh Company, Ltd. | | 69,630 | | $ | 1,290,312 |
Secom Company, Ltd. | | 29,200 | | | 1,601,041 |
Sega Sammy Holdings, Inc. | | 37,400 | | | 467,521 |
Seven & 1 Holdings Company, Ltd. | | 30,275 | | | 885,687 |
Shionogi & Company, Ltd. | | 121,500 | | | 2,153,385 |
Sony Corporation | | 83,600 | | | 4,651,321 |
Sony Financial Holdings, Inc. | | 109 | | | 417,670 |
Square Enix Company, Ltd. | | 39,000 | | | 1,196,931 |
Sumitomo Mitsui Financial Group,
Inc. | | 209 | | | 1,569,821 |
Toyota Motor Corporation | | 32,000 | | | 1,734,464 |
| | | | | |
| | | | | 60,099,076 |
| | | | | |
Jersey - 0.1% | | | | | |
Experian Group, Ltd. | | 86,802 | | | 681,899 |
| | | | | |
| | |
Marshall Islands - 0.7% | | | | | |
Diana Shipping, Inc. | | 54,900 | | | 1,727,154 |
Quintana Maritime, Ltd. | | 81,200 | | | 1,865,976 |
| | | | | |
| | | | | 3,593,130 |
| | | | | |
Mexico - 1.0% | | | | | |
Fomento Economico Mexicano,
S.A.B. de C.V. * | | 522,400 | | | 1,999,104 |
Grupo Modelo, S.A. de C.V. (CI.C) | | 240,600 | | | 1,146,271 |
Grupo Televisa S.A. ADR | | 108,332 | | | 2,575,052 |
| | | | | |
| | | | | 5,720,427 |
| | | | | |
Netherlands - 2.3% | | | | | |
European Aeronautic Defence
and Space Company N.V. | | 87,080 | | | 2,775,322 |
Koninklijke (Royal) Philips
Electronics N.V. | | 79,800 | | | 3,439,223 |
TNT N.V. | | 34,400 | | | 1,418,790 |
Wavin N.V. * | | 361,778 | | | 4,817,016 |
| | | | | |
| | | | | 12,450,351 |
| | | | | |
Norway - 0.3% | | | | | |
Tandberg ASA | | 71,100 | | | 1,485,285 |
| | | | | |
| | |
Panama - 0.6% | | | | | |
Carnival Corporation | | 71,200 | | | 3,167,688 |
| | | | | |
| | |
Republic of Korea - 0.7% | | | | | |
Samsung Electronics Company,
Ltd.* | | 2,352 | | | 1,396,905 |
SK Telecom Company, Ltd. ADR | | 86,180 | | | 2,571,611 |
| | | | | |
| | | | | 3,968,516 |
| | | | | |
Singapore - 2.6% | | | | | |
Neptune Orient Lines, Ltd. | | 763,500 | | | 2,071,388 |
Singapore Airlines, Ltd. | | 531,400 | | | 6,408,363 |
Singapore Press Holdings, Ltd. | | 1,847,400 | | | 5,768,318 |
| | | | | |
| | | | | 14,248,069 |
| | | | | |
Spain - 0.9% | | | | | |
Gestevision Telecinco S.A. | | 84,422 | | | 2,158,156 |
| | | | | |
| | | Shares | | Value |
COMMON STOCK (continued) | | | | | |
Spain (continued) | | | | | |
Inditex S.A. | | 42,900 | | $ | 2,631,810 |
| | | | | |
| | | | | 4,789,966 |
| | | | | |
Sweden - 3.2% | | | | | |
Assa Abloy AB | | 144,400 | | | 2,898,275 |
Hennes & Mauritz AB (CI.B) | | 80,100 | | | 4,875,760 |
Investor AB (CI.B) (1) | | 91,607 | | | 2,083,104 |
Telefonaktiebolaget LM Ericsson
(CI.B) | | 3,259,600 | | | 7,654,224 |
| | | | | |
| | | | | 17,511,363 |
| | | | | |
Switzerland - 1.6% | | | | | |
Actelion, Ltd. * | | 31,315 | | | 1,438,420 |
Basilea Pharmaceutica * | | 1,508 | | | 293,442 |
Credit Suisse Group | | 63,959 | | | 3,843,805 |
Roche Holding AG | | 18,821 | | | 3,248,809 |
| | | | | |
| | | | | 8,824,476 |
| | | | | |
Taiwan - 0.9% | | | | | |
MediaTek, Inc. | | 199,260 | | | 2,586,595 |
Taiwan Semiconductor
Manufacturing Company, Ltd.
ADR | | 226,304 | | | 2,253,988 |
| | | | | |
| | | | | 4,840,583 |
| | | | | |
Thailand - 0.3% | | | | | |
PTT Aromatics & Refining PCL * | | 1,425,676 | | | 1,819,788 |
| | | | | |
| | |
United Kingdom - 8.1% | | | | | |
3i Group plc (1) | | 32,320 | | | 643,254 |
BP plc ADR | | 30,875 | | | 2,259,124 |
Burberry Group plc | | 94,134 | | | 1,066,709 |
Cadbury Schweppes plc | | 211,575 | | | 2,609,754 |
Diageo plc | | 65,856 | | | 1,412,742 |
Enterprise Inns plc | | 302,570 | | | 2,917,822 |
Game Group plc | | 1,099,039 | | | 5,468,453 |
HSBC Holdings plc | | 147,571 | | | 2,492,606 |
Next plc | | 50,155 | | | 1,611,894 |
Pearson plc | | 76,770 | | | 1,119,261 |
Prudential plc | | 174,136 | | | 2,462,704 |
Reckitt Benckiser Group plc | | 60,923 | | | 3,521,421 |
Royal Bank of Scotland Group plc | | 337,340 | | | 2,975,051 |
Smith & Nephew plc | | 116,583 | | | 1,343,095 |
Tesco plc | | 281,414 | | | 2,664,895 |
Thomas Cook Group plc * | | 382,785 | | | 2,146,014 |
Vodafone Group plc | | 1,733,227 | | | 6,465,389 |
WPP Group plc | | 97,430 | | | 1,251,137 |
| | | | | |
| | | | | 44,431,325 |
| | | | | |
United States - 39.4% | | | | | |
3M Company | | 32,600 | | | 2,748,832 |
Acadia Pharmaceuticals, Inc. * | | 21,500 | | | 238,005 |
Adobe Systems, Inc. * | | 77,300 | | | 3,303,029 |
Advanced Micro Devices, Inc. * | | 167,400 | | | 1,255,500 |
Aflac, Inc. | | 33,400 | | | 2,091,842 |
AGL Resources, Inc. | | 54,480 | | | 2,050,627 |
| | |
| 33 | | The accompanying notes are an integral part of the financial statements |
| | |
| | |
| Schedule of Investments | | Series D (Global Series) |
| December 31, 2007 - continued | | |
| | | | | |
| | | Shares | | Value |
COMMON STOCK (continued) |
United States (continued) | | | | | |
Alberto-Culver Company | | 110,700 | | $ | 2,716,578 |
Altera Corporation | | 84,000 | | | 1,622,880 |
Altria Group, Inc. | | 187,400 | | | 14,163,692 |
American International Group, Inc. | | 44,200 | | | 2,576,860 |
AMERIGROUP Corporation * | | 61,340 | | | 2,235,843 |
Amgen, Inc. * | | 29,200 | | | 1,356,048 |
Anadarko Petroleum Corporation | | 105,190 | | | 6,909,931 |
AT&T, Inc. | | 168,600 | | | 7,007,016 |
Automatic Data Processing, Inc. | | 69,000 | | | 3,072,570 |
Baxter International, Inc. | | 37,000 | | | 2,147,850 |
Boeing Company | | 14,600 | | | 1,276,916 |
Charles River Laboratories International, Inc. * | | 37,470 | | | 2,465,526 |
Chevron Corporation | | 24,954 | | | 2,328,957 |
Cisco Systems, Inc. * | | 44,600 | | | 1,207,322 |
Citizens Communications Company | | 429,580 | | | 5,468,553 |
Coach, Inc. * | | 20,600 | | | 629,948 |
Colgate-Palmolive Company | | 31,500 | | | 2,455,740 |
Corning, Inc. | | 129,400 | | | 3,104,306 |
Cree, Inc. * | | 59,000 | | | 1,620,730 |
Darden Restaurants, Inc. | | 52,500 | | | 1,454,775 |
DRS Technologies, Inc. | | 26,600 | | | 1,443,582 |
eBay, Inc. * | | 129,000 | | | 4,281,510 |
Embarq Corporation | | 35,840 | | | 1,775,155 |
EMCOR Group, Inc. * | | 168,720 | | | 3,986,854 |
Emerson Electric Company | | 60,400 | | | 3,422,264 |
Express Scripts, Inc. * | | 10,230 | | | 746,790 |
Genentech, Inc. * | | 13,500 | | | 905,445 |
Gilead Sciences, Inc. * | | 93,840 | | | 4,317,578 |
Gymboree Corporation * | | 35,560 | | | 1,083,158 |
Hershey Company | | 53,600 | | | 2,111,840 |
Hewlett-Packard Company | | 133,600 | | | 6,744,128 |
Hospira, Inc. * | | 7,400 | | | 315,536 |
Humana, Inc. * | | 27,650 | | | 2,082,321 |
Idearc, Inc. | | 40,880 | | | 717,853 |
Integrys Energy Group, Inc. | | 27,100 | | | 1,400,799 |
InterMune, Inc. * | | 19,600 | | | 261,268 |
International Game Technology | | 40,000 | | | 1,757,200 |
Intuit, Inc. * | | 96,600 | | | 3,053,526 |
Invitrogen Corporation * | | 25,250 | | | 2,358,602 |
Johnson & Johnson | | 113,070 | | | 7,541,769 |
Juniper Networks, Inc. * | | 143,600 | | | 4,767,520 |
Kinetic Concepts, Inc. * | | 57,410 | | | 3,074,880 |
Linear Technology Corporation | | 34,700 | | | 1,104,501 |
Lockheed Martin Corporation | | 89,070 | | | 9,375,508 |
Longs Drug Stores Corporation | | 26,100 | | | 1,226,700 |
Marvel Entertainment, Inc. * | | 224,010 | | | 5,983,307 |
Maxim Integrated Products, Inc. | | 77,500 | | | 2,052,200 |
McDonald’s Corporation | | 39,100 | | | 2,303,381 |
McKesson Corporation | | 108,660 | | | 7,118,317 |
| | | | | | |
| | | Shares | | Value |
COMMON STOCK (continued) | | | |
United States (continued) | | | | | | |
Merck & Company, Inc. | | | 36,300 | | $ | 2,109,393 |
Microsoft Corporation | | | 141,700 | | | 5,044,520 |
Molina Healthcare, Inc. * | | | 41,100 | | | 1,590,570 |
Nektar Therapeutics * | | | 21,368 | | | 143,379 |
Northern Trust Corporation | | | 39,600 | | | 3,032,568 |
Northrop Grumman Corporation | | | 18,300 | | | 1,439,112 |
OSI Pharmaceuticals, Inc. * | | | 50,470 | | | 2,448,300 |
Pepco Holdings, Inc. | | | 70,820 | | | 2,077,151 |
Pharmion Corporation * | | | 6,300 | | | 396,018 |
Praxair, Inc. | | | 10,400 | | | 922,584 |
RadioShack Corporation | | | 117,970 | | | 1,988,974 |
Raytheon Company | | | 30,100 | | | 1,827,070 |
Regeneron Pharmaceuticals, Inc. * | | | 12,500 | | | 301,875 |
Seattle Genetics, Inc. * | | | 29,400 | | | 335,160 |
Shuffle Master, Inc. * | | | 21,000 | | | 251,790 |
Sirius Satellite Radio, Inc. * | | | 656,800 | | | 1,990,104 |
Theravance, Inc. * | | | 20,000 | | | 390,000 |
Tiffany & Company | | | 54,700 | | | 2,517,841 |
Trinity Industries, Inc. | | | 115,520 | | | 3,206,835 |
Unisource Energy Corporation | | | 48,000 | | | 1,514,400 |
United Parcel Service, Inc. (CI.B) | | | 9,200 | | | 650,624 |
Wabtec Corporation | | | 145,740 | | | 5,019,286 |
Wal-Mart Stores, Inc. | | | 99,980 | | | 4,752,049 |
Walt Disney Company | | | 84,400 | | | 2,724,432 |
Whiting Petroleum Corporation * | | | 66,210 | | | 3,817,669 |
Xilinx, Inc. | | | 56,200 | | | 1,229,094 |
| | | | | | |
| | | | | | 216,544,166 |
| |
TOTAL COMMON STOCK (Cost $463,859,709) | | $ | 536,749,021 |
| |
PREFERRED STOCK - 0.5% |
Germany - 0.5% | | | | | | |
Bayerische Motoren Werke AG | | | 14,226 | | | 753,929 |
Porsche Automobil Holding SE | | | 1,030 | | | 2,084,045 |
| | | | | | |
| | | | | | 2,837,974 |
| |
TOTAL PREFERRED STOCK (Cost $992,675) | | $ | 2,837,974 |
| |
| | | Principal
Amount | | Value |
REPURCHASE AGREEMENT - 0.5% |
State Street, 1.75%, dated 12/31/07, matures 1/02/08; repurchase amount $2,614,126 (Collateralized by FNMA, 8/15/08 with a value of $2,666,388) | | $ | 2,613,872 | | $ | 2,613,872 |
| |
TOTAL REPURCHASE AGREEMENT (Cost $2,613,872) | | $ | 2,613,872 |
| |
SHORT TERM INVESTMENTS - 0.5 % |
State Street GA Prime Money
Market Fund | | $ | 2,924,229 | | $ | 2,924,229 |
| | |
| 34 | | The accompanying notes are an integral part of the financial statements |
| | |
| | |
| Schedule of Investments | | Series D (Global Series) |
December 31, 2007 - continued | | |
| | | | | | | |
| | | Principal
Amount | | | Value |
SHORT TERM INVESTMENTS (continued) |
State Street Treasury Money Market Fund | | $ | 1,781 | | | $ | 1,781 |
| |
TOTAL SHORT TERM INVESTMENTS | | | | | | $ | 2,926,010 |
(Cost $2,926,010) | | | | | | | |
Total Investments (SBL D Fund) | | | | | | $ | 545,218,117 |
(Cost $470,454,126) - 99.1% | | | | | | | |
Other Assets in Excess of Liabilities - 0.9% | | | | | | | 4.958.694 |
| | | | | | | |
TOTAL NET ASSETS - 100.0% | | | | | | $ | 550,176,811 |
| | | | | | | |
| | |
| | | | | | | |
INVESTMENT CONCENTRATION |
At December 31, 2007, the investment diversification of the fund was as follows: |
| | |
| Industry | | % of
Net Assets | | | Value |
|
| |
Diversified Banks | | | 5.0 | % | | $ | 27,207,632 |
Integrated Telecommunication Services | | | 4.5 | | | | 24,859,501 |
Communications Equipment | | | 4.4 | | | | 23,796,724 |
Aerospace & Defense | | | 3.8 | | | | 20,792,033 |
Pharmaceuticals | | | 3.8 | | | | 20,749,619 |
Semiconductors | | | 2.7 | | | | 15,122,392 |
Tobacco | | | 2.6 | | | | 14,163,692 |
Wireless Telecommunication Services | | | 2.6 | | | | 14,109,841 |
Industrial Conglomerates | | | 2.3 | | | | 13,100,931 |
Construction & Engineering | | | 2.4 | | | | 12,996,483 |
Biotechnology | | | 2.4 | | | | 12,927,142 |
Integrated Oil & Gas | | | 2.1 | | | | 12,208,667 |
Oil & Gas Exploration & Production | | | 2.0 | | | | 10,727,599 |
Construction & Farm Machinery & Heavy Trucks | | | 1.9 | | | | 10,142,808 |
Application Software | | | 1.7 | | | | 9,668,919 |
Automobile Manufacturers | | | 1.6 | | | | 9,196,553 |
Broadcasting & Cable TV | | | 1.7 | | | | 9,045,044 |
Real Estate Management & Development | | | 1.6 | | | | 8,815,357 |
Movies & Entertainment | | | 1.6 | | | | 8,707,739 |
Apparel Retail | | | 1.6 | | | | 8,590,728 |
Home Entertainment Software | | | 1.5 | | | | 8,488,182 |
Publishing | | | 1.4 | | | | 7,605,432 |
Household Products | | | 1.3 | | | | 7,520,033 |
Electronic Equipment Manufacturers | | | 1.4 | | | | 7,519,379 |
Computer & Electronics Retail | | | 1.4 | | | | 7,457,427 |
IT Consulting & Other Services | | | 1.3 | | | | 7,453,680 |
Marine | | | 1.4 | | | | 7,265,614 |
Health Care Distributors | | | 1.3 | | | | 7,118,317 |
Property & Casualty Insurance | | | 1.3 | | | | 7,102,313 |
Apparel, Accessories & Luxury Goods | | | 1.2 | | | | 7,013,853 |
Health Care Equipment | | | 1.3 | | | | 6,881,362 |
Computer Hardware | | | 1.2 | | | | 6,744,128 |
Restaurants | | | 1.2 | | | | 6,675,978 |
| | | | |
Airlines | | 1.1 | | 6,408,363 |
Regional Banks | | 1.2 | | 6,343,991 |
Electric Utilities | | 1.2 | | 6,227,460 |
Multi-Line Insurance | | 1.2 | | 6,149,088 |
Managed Health Care | | 1.1 | | 5,908,734 |
Hotels, Resorts & Cruise Lines | | 1.0 | | 5,313,702 |
Computer Storage & Peripherals | | 1.0 | | 5,236,170 |
Fertilizers & Agricultural Chemicals | | 0.9 | | 5,194,449 |
Systems Software | | 0.9 | | 5,044,520 |
Life & Health Insurance | | 1.0 | | 4,972,215 |
Life Sciences Tools & Services | | 0.8 | | 4,967,507 |
Personal Products | | 0.9 | | 4,786,567 |
Hypermarkets & Super Centers | | 0.9 | | 4,752,049 |
Packaged Foods & Meats | | 0.9 | | 4,721,594 |
Consumer Electronics | | 0.9 | | 4,651,321 |
Internet Software & Services | | 0.8 | | 4,281,510 |
Retail REIT’s | | 0.8 | | 4,214,858 |
Diversified Capital Markets | | 0.7 | | 3,843,805 |
Asset Management & Custody Banks | | 0.6 | | 3,675,822 |
Food Retail | | 0.7 | | 3,550,582 |
Oil & Gas Drilling | | 0.6 | | 3,535,216 |
Electrical Components & Equipment | | 0.6 | | 3,422,264 |
Brewers | | 0.5 | | 3,117,780 |
Data Processing & Outsourced Services | | 0.6 | | 3,072,570 |
Money Markets | | 0.5 | | 2,926,010 |
Building Products | | 0.5 | | 2,898,275 |
Oil & Gas Equipment & Services | | 0.5 | | 2,854,894 |
Repurchase Agreements | | 0.5 | | 2,613,872 |
Specialty Stores | | 0.4 | | 2,517,841 |
Diversified Commercial & Professional Services | | 0.4 | | 2,282,940 |
Casinos & Gaming | | 0.3 | | 2,144,081 |
Specialty Chemicals | | 0.4 | | 2,143,388 |
Multi-Sector Holdings | | 0.4 | | 2,083,104 |
Air Freight & Logistics | | 0.4 | | 2,069,414 |
Gas Utilities | | 0.4 | | 2,050,627 |
Soft Drinks | | 0.4 | | 1,999,104 |
Airport Services | | 0.4 | | 1,944,120 |
Trucking | | 0.3 | | 1,886,104 |
Oil & Gas Refining & Marketing | | 0.3 | | 1,819,788 |
Department Stores | | 0.3 | | 1,611,894 |
Distillers & Vintners | | 0.3 | | 1,412,741 |
Multi-Utilities | | 0.2 | | 1,400,799 |
Consumer Finance | | 0.2 | | 1,359,268 |
Specialized Finance | | 0.2 | | 1,318,326 |
Office Electronics | | 0.2 | | 1,290,312 |
Advertising | | 0.2 | | 1,251,137 |
Drug Retail | | 0.2 | | 1,226,700 |
Footwear | | 0.2 | | 1,179,385 |
Industrial Gases | | 0.2 | | 922,584 |
| | |
| 35 | | The accompanying notes are an integral part of the financial statements |
| | |
| | |
| Schedule of Investments | | Series D (Global Series) |
December 31, 2007 - continued | | |
| | | | | | |
Heavy Electrical Equipment | | 0.1 | | | | 796,590 |
Health Care Services | | 0.1 | | | | 746,790 |
Industrial Machinery | | 0.1 | | | | 742,029 |
Leisure Products | | 0.1 | | | | 467,521 |
Rights | | 0.0 | | | | 91,240 |
| | | | | | |
Total Investments | | 99.1 | | | | 545,218,117 |
Other Assets and Liabilities, Net | | 0.9 | | | | 4,958,694 |
| | | | | | |
Net Assets | | 100 | % | | $ | 550,176,811 |
| | | | | | |
Footnotes
| | |
| Percentages are stated as a percent of net assets. For federal income tax purposes the identified cost of investments owned at 12/31/2007 was $472,523,734. |
| |
| * | | - Non-income producing security |
| 1 | | - Security is a PFIC (Passive Foreign Investment Company) |
|
| Glossary: |
| |
| ADR | | - American Depositary Receipt |
| PCL | | - Public Company Limited |
| plc | | - Public Limited Company |
| REIT | | - Real Estate Investment Trust |
|
| See notes to financial statements. |
| | |
| 36 | | The accompanying notes are an integral part of the financial statements |
Statement of Assets and Liabilities
December 31, 2007
| | | |
Assets: | | | |
Investments, at value* | | $ | 545,218,117 |
Cash | | | 6,320 |
Cash denominated in a foreign currency, at value** | | | 457,543 |
Receivables: | | | |
Fund shares sold | | | 738,113 |
Securities sold | | | 4,332,626 |
Interest | | | 21,631 |
Dividends | | | 690,710 |
Foreign taxes recoverable | | | 122,683 |
Prepaid expenses | | | 9,912 |
| | | |
Total assets | | | 551,597,655 |
| | | |
Liabilities: | | | |
Payable for: | | | |
Fund shares redeemed | | | 731,596 |
Management fees | | | 469,721 |
Administration fees | | | 74,058 |
Transfer agent/maintenance fees | | | 2,083 |
Custodian fees | | | 46,468 |
Directors’ fees | | | 9,000 |
Professional fees | | | 53,800 |
Other fees | | | 34,118 |
| | | |
Total liabilities | | | 1,420,844 |
| | | |
Net assets | | $ | 550,176,811 |
| | | |
Net assets consist of: | | | |
Paid in capital | | $ | 328,935,648 |
Undistributed net investment income | | | 2,748,317 |
Undistributed net realized gain on sale of investments and foreign currency transactions | | | 143,710,236 |
Net unrealized appreciation in value of investments and translation of assets and liabilities in foreign currencies | | | 74,782,610 |
| | | |
Net assets | | $ | 550,176,811 |
| | | |
Capital shares authorized | | | unlimited |
Capital shares outstanding | | | 45,818,150 |
Net asset value per share
(net assets divided by shares outstanding) | | $ | 12.01 |
| | | |
| |
*Investments, at cost | | $ | 470,454,126 |
**Cash denominated in a foreign currency, at cost | | | 454,554 |
Statement of Operations
For Year Ended December 31, 2007
| | | |
Investment Income: | | | |
Dividends (net of foreign withholding tax $775,102 ) | | $ | 10,752,059 |
Interest | | | 189,930 |
| | | |
Total investment income | | | 10,941,989 |
| | | |
Expenses: | | | |
Management fees | | | 5,683,772 |
Administration fees | | | 868,728 |
Transfer agent/maintenance fees | | | 25,281 |
Custodian fees | | | 331,585 |
Directors’ fees | | | 36,405 |
Professional fees | | | 85,622 |
Reports to shareholders | | | 71,379 |
Other | | | 52,032 |
| | | |
Total expenses | | | 7,154,804 |
Less: | | | |
Earnings credits applied | | | (2,450) |
| | | |
Net expenses | | | 7,152,354 |
| | | |
Net investment income | | | 3,789,635 |
| | | |
Net Realized and Unrealized Gain (Loss): | | | |
Net realized gain (loss) during the year on: | | | |
Investments | | | 146,661,867 |
Foreign currency transactions | | | (761,306) |
| | | |
Net realized gain | | | 145,900,561 |
| | | |
Net unrealized appreciation (depreciation) during the year on: | | | |
Investments | | | (102,398,085) |
Translation of assets and liabilities in foreign currencies | | | (17,376) |
| | | |
Net unrealized depreciation | | | (102,415,461) |
| | | |
Net realized and unrealized gain | | | 43,485,100 |
| | | |
Net increase in net assets resulting from operations | | $ | 47,274,735 |
| | | |
| | |
| 37 | | The accompanying notes are an integral part of the financial statements |
| | |
| | |
| | Series D |
Statement of Changes in Net Assets | | (Global Series) |
| | | | | | |
| | | Year Ended
December 31, 2007 | | Year Ended
December 31, 2006 |
Increase (decrease) in net assets from operations: | | | | | | |
Net investment income | | $ | 3,789,635 | | $ | 1,730,545 |
Net realized gain during the year on investments and foreign currency transactions | | | 145,900,561 | | | 45,668,788 |
Net unrealized appreciation (depreciation) during the year on investments and translation of assets and liabilities in foreign currencies | | | (102,415,461) | | | 39,218,745 |
| | | | | | |
Net increase in net assets resulting from operations | | | 47,274,735 | | | 86,618,078 |
| | | | | | |
| | |
Capital share transactions: | | | | | | |
Proceeds from sale of shares | | | 145,821,140 | | | 160,312,177 |
Cost of shares redeemed | | | (213,924,666) | | | (192,137,583) |
| | | | | | |
Net decrease from capital share transactions | | | (68,103,526) | | | (31,825,406) |
| | | | | | |
Net increase (decrease) in net assets | | | (20,828,791) | | | 54,792,672 |
| | | | | | |
| | |
Net assets: | | | | | | |
Beginning of year | | | 571,005,602 | | | 516,212,930 |
| | | | | | |
End of year | | $ | 550,176,811 | | $ | 571,005,602 |
| | | | | | |
| | |
Undistributed net investment income at end of year | | $ | 2,748,317 | | $ | 709,006 |
| | | | | | |
| | |
Capital share activity: | | | | | | |
Shares sold | | | 12,428,028 | | | 16,063,388 |
Shares redeemed | | | (18,362,297) | | | (19,215,494) |
| | | | | | |
Total capital share activity | | | (5,934,269) | | | (3,152,106) |
| | | | | | |
| | |
| 38 | | The accompanying notes are an integral part of the financial statements |
| | |
| | |
| Financial Highlights | | Series D |
Selected data for each share of capital stock outstanding throughout each year | | (Global Series) |
| | | | | | | | | | |
| | | 2007a | | 2006 | | 2005 | | 2004 | | Year Ended
December 31,
2003b |
| |
Per Share Data | | | | | | | | | | |
Net asset value, beginning of period | | $11.03 | | $9.40 | | $8.28 | | $6.97 | | $4.87 |
| |
Income (loss) from investment operations: | | | | | | | | | | |
Net investment incomec | | 0.08 | | 0.03 | | 0.03 | | 0.03 | | 0.03 |
Net gain on securities (realized and unrealized) | | 0.90 | | 1.60 | | 1.09 | | 1.28 | | 2.09 |
| | |
Total from investment operations | | 0.98 | | 1.63 | | 1.12 | | 1.31 | | 2.12 |
| |
Less distributions: | | | | | | | | | | |
Dividends from net investment income | | – | | – | | – | | – | | (0.02) |
| | |
Total distributions | | – | | – | | – | | – | | (0.02) |
| |
Net asset value, end of period | | $12.01 | | $11.03 | | $9.40 | | $8.28 | | $6.97 |
| | |
| | | | | |
| | | | | | | | | | |
Total Returnd | | 8.88% | | 17.34% | | 13.53% | | 18.79% | | 43.45% |
| |
Ratios/Supplemental Data | | | | | | | | | | |
Net assets, end of period (in thousands) | | $550,177 | | $571,006 | | $516,213 | | $466,577 | | $427,609 |
| |
Ratios to average net assets: | | | | | | | | | | |
Net investment income | | 0.67% | | 0.32% | | 0.30% | | 0.37% | | 0.44% |
Total expensese | | 1.26% | | 1.24% | | 1.24% | | 1.23% | | 1.25% |
Net expensesf | | 1.26% | | 1.24% | | 1.24% | | 1.23% | | 1.25% |
Net expenses prior to custodian earnings credits and net of expense waivers | | 1.26% | | 1.24% | | 1.24% | | 1.23% | | 1.25% |
| |
Portfolio turnover rate | | 115% | | 23% | | 33% | | 28% | | 44% |
a Security Global Investors, LLC (SGI) became sub-advisor of 50% of Series D effective August 1, 2007. OppenheimerFunds sub-advises the remaining 50%. Prior to August 1, 2007, OppenheimerFunds sub-advised the entire Series.
b The financial highlights for Series D exclude the historical financial highlights of Series I. The assets of Series I were acquired by Series D on October 3, 2003.
c Net investment income (loss) was computed using average shares outstanding throughout the period.
d Total return does not take into account any of the expenses associated with an investment in variable insurance products offered by Security Benefit Life Insurance Company. If total return had taken into account these expenses, performance would have been lower. Shares of a series of SBL Fund are available only through the purchase of such products.
e Total expense information reflects the expense ratios absent expense reductions by the Investment Manager, and earnings credits, as applicable.
f Net expense information reflects the expense ratios after voluntary expense waivers, reimbursements and custodian earnings credits, as applicable.
| | |
| 39 | | The accompanying notes are an integral part of the financial statements |
| | |
| | |
| Managers’ Commentary | | Series E |
February 15, 2008 | | (Diversified Income Series) |
| | |
| |  |
| |
| | Adviser, Security Global Investors |

To Our Shareholders:
Series E of the SBL Fund - Diversified Income Series earned a return of 2.91% for the year ended December 31, 2007, which lagged the benchmark Lehman Brothers Aggregate Index return of 6.97% and the median return of its peer group of 6.03% for the same period.
The Series’ will primarily invest in a diversified portfolio of investment grade debt securities and maintain a dollar-weighted average duration of 3 to 10 years. The Series’ investment approach uses a bottom-up process in selecting asset classes and securities. We emphasize rigorous credit analysis and relative value in selecting securities. Credit analysis includes assessing factors such as an issuer’s management experience, cash flow, position in its market, capital structure, and general economic and market factors. Relative value analysis includes earnings growth, profitability trends, the issuer’s financial strength, and valuation analysis. Relative valuation also compares the credit risk and yield of a security to that of other securities of the same or another asset class.
Composition of Portfolio Assets
The portfolio composition is overweight in corporate bonds and mortgage-backed securities and underweighted in Treasury and Agency issues relative to the benchmark. At the end of the year, the Series held 39% in corporate issues, 13% in mortgage-backed securities, 38% in U.S. Treasury and Government agencies, and 6% in cash. Other securities, such as asset-backed securities and preferred stocks, constituted 4% of the portfolio.
Series Performance
The dominant theme in 2007 was the sub-prime mortgage effect throughout the financial system and securities markets. The turning point in the year was in June with an abrupt deterioration in credit markets as the sub-prime mortgage concerns began to unfold. The credit
crunch worsened in August as the extent of the crisis became more apparent.
In response to sub-prime concerns, there was a flight-to-quality, which rallied Treasury securities while corporate credit and asset-backed securities underperformed. The Series was overweight in corporate credit and underweight in Treasury and Agency issues, which negatively impacted performance in 2007. Traditionally, the majority of return for fixed income securities is generated through the coupon income. For this reason, the Series will generally invest in high quality asset classes that generate more yield than U.S. Treasury securities. In years such as 2007, when there is a shock to the financial system and concerns of an economic slow down, the sectors that generate more income will underperform. Historically, the strategy of overweighting the higher income asset classes will drive outperformance over the long term.
Earlier in the year, the Series owned large bank and brokerage corporate credit in an effort to avoid the considerable leveraged buyout (LBO) activity. LBO’s are negative for debt holders because the buyer funds their purchase of the company by having the company issue significant amounts of debt, which negatively impacts corporate credit quality and valuations. Financial companies generally are safe from LBO’s because they must maintain stronger credit quality. As the sub-prime crisis materialized, financial companies underperformed as many surprised the market with their exposure to sub-prime and investors moved out of the sector due to concerns about future losses. The financial corporate bond securities in the portfolio are primarily large diversified financial institutions, which the team continues to believe have the ability to repay all their obligations.
Sub-prime fears and uncertainty negatively affected all non-Treasury related securities. The Series’ largest detractor was caught in the mortgage market turmoil. The Series held a CDO asset backed by sub-prime collateral. While still rated AAA, the security was written down by the Series almost completely due to complete lack of liquidity in the market, making it difficult to price. Eventually, liquidity will return to the market and the security should recover some of its value.
2008 Market Outlook
The upcoming year provides a challenging economic environment. Concerns regarding a potential recession continue to increase as economic data for the 4th quarter was
| | |
| | |
| Managers’ Commentary | | Series E |
February 15, 2008 | | (Diversified Income Series) |
relatively weak. The housing market shows no signs of a recovery and continues to be a significant drag on GDP growth. Consumer spending has started to slow as we witnessed the weakest holiday season since 2002 and unemployment has started to move up. Commodity prices also remain high, which could negatively affect consumers’ disposable income. With this background, 2008 will be a challenging year for the consumer and fixed income portfolio managers.
The Federal Reserve has moved aggressively to reduce interest rates and the government is considering fiscal stimulus. While we do not believe all these actions can make the worlds sub-prime problems disappear, it could help to soften the blow and the duration of an economic slow down. Valuations in the credit sectors are reflecting a very negative economic environment and we will look to slowly add high quality securities throughout the year, as we believe the risk/return is now very appealing in some securities. If you review historic trading levels, corporate bonds are now trading as if we are in a recession. We do not pretend to be able to predict the end of the current negative environment, but we believe, at current levels, these securities represent good long-term value and could generate significant income in 2008.
We expect the sub-prime issue to continue to be an ongoing concern through the first half of the year until visibility becomes clearer as to where the bottom will be, at which point the second half of the year will be a period of correction and adjustment. The effects of the Federal Reserve rate reductions and a fiscal stimulus injection by Congress should bolster the second half of the year.
We will continue to monitor the economic and market conditions and will adjust the asset mix and maturity structure in the portfolio accordingly.
Thank you for your investment in Series E - Diversified Income Series.
We recognize there are many investment fund alternatives available today and appreciate the confidence you place in us.
|
Sincerely, |
|
Steven M. Bowser and Christopher L. Phalen |
Portfolio Managers |
| | |
| | Series E |
Performance Summary | | (Diversified Income Series) |
December 31, 2007 | | (unaudited) |
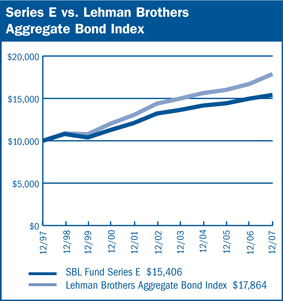
$10,000 Over 10 Years
The chart above assumes a hypothetical $10,000 investment in Series E (Diversified Income Series) on December 31, 1997 and reflects the fees and expenses of Series E. The Lehman Brothers Aggregate Bond Index is an unmanaged index that tracks investment grade bonds including U.S. Treasur y and agency issues, corporate bond issues, asset-backed, commercial mor tgage-backed and mortgage-backed securities and Yankee issues.
| | |
Portfolio Composition by Quality Ratings (Based on Standard and Poor’s Ratings) |
AAA | | 54.00% |
AA | | 3.93 |
A | | 12.60 |
BBB | | 14.76 |
BB | | 5.63 |
Preferred Stock | | 2.66 |
Commercial Paper | | 5.50 |
Repurchase Agreement | | 0.20 |
Other Assets in Excess of Liabilities | | 0.72 |
Total Net Assets | | 100.00% |
| | | |
| | | | | | | | | |
Average Annual Returns | |
| | | | |
| Periods Ended 12-31-071 | | 1 Year | | | 5 Years | | | 10 Years | |
| |
| | |
Series E | | 2.91 | % | | 3.11 | % | | 4.42 | % |
1 Per formance figures do not reflect fees and expenses associated with an investment in variable insurance products offered by Security Benefit Life Insurance Company. If returns had taken into account these fees and expenses, performance would have been lower. Shares of a Series of SBL Fund are available only through the purchase of such products. | |
| |
The per formance data quoted above represents past per formance. Past performance is not predictive of future performance. The investment return and principal value of an investment will fluctuate so that an investor’s shares, when redeemed, may be worth more or less than their original cost. | |
| | |
| 42 | | The accompanying notes are an integral part of the financial statements |
| | |
| | Series E |
Performance Summary | | (Diversified Income Series) |
December 31, 2007 | | (unaudited) |
Information About Your Series Expenses
Calculating your ongoing Series expenses
Example
As a shareholder of the Series, you incur ongoing costs, including management fees and other series expenses. Performance figures and expense ratios do not reflect fees and expenses associated with an investment in variable insurance products. Shares of a Series of SBL Fund are available only through the purchase of such products. This example is intended to help you understand your ongoing costs (in dollars) of investing in the Series and to compare these costs with ongoing costs of investing in other mutual funds. The example is based on an investment of $1,000 invested at the beginning of the period and held for the entire period, July 1, 2007 through December 31, 2007.
Actual Expenses
The first line in the table provides information about actual account values and actual expenses. You may use the information in this table, together with the amount you invested, to estimate the expenses that you paid over the period. Simply divide your account value by $1,000 (for example, an $8,600 account value divided by $1,000 = 8.6), then multiply the result by the number in the table under the heading entitled “Expenses Paid During the Period” to estimate the expenses you paid on your account during this period.
Hypothetical Example for Comparison Purposes
The second line in the table provides information about hypothetical account values and hypothetical expenses based on the Series actual expense ratio and an assumed rate of return of 5% per year before expenses, which is not the Series actual return. The hypothetical account values and expenses may not be used to estimate the actual ending account balance or expenses you paid for the period. You may use this information to compare the ongoing costs of investing in the Series and other funds. To do so, compare this 5% hypothetical example with the 5% hypothetical examples that appear in the shareholder reports of the other mutual funds.
Please note that the expenses shown in the table are meant to highlight your ongoing costs only and do not reflect any fees and expenses associated with an investment in variable insurance products. Therefore, the second line is useful in comparing ongoing costs only, and will not help you determine the relative total costs of owning different funds. In addition, if these fees and expenses associated with an investment in variable insurance products were included, your costs would have been higher.
| | | | | | |
Series Expenses |
| | | Beginning
Account
Value
7/1/2007 | | Ending
Account
Value
12/31/20071 | | Expenses
Paid
During
Period2 |
| |
Series E (Diversified Income Series) |
Actual | | $1,000.00 | | $1,021.49 | | $3.92 |
Hypothetical | | 1,000.00 | | 1,021.32 | | 3.92 |
1 The actual ending account value is based on the actual total return of the Series for the period July 1, 2007 to December 31, 2007 after actual expenses and will differ from the hypothetical ending account value which is based on the Series expense ratio and a hypothetical annual return of 5% before expenses. The actual cumulative return at net asset value for the period July 1, 2007 to December 31, 2007 was 2.15%.
2 Expenses are equal to the Series annualized expense ratio of 0.76%, net of any applicable fee waivers or earnings credits, multiplied by the average account value over the period, multiplied by 184/365 (to reflect the one-half year period)
| | |
| | |
| Schedule of Investments | | Series E (Diversified Income Series) |
| December 31, 2007 | | |
| | | | | | |
| | | Principal
Amount | | Value |
CORPORATE BOND - 38.5% |
Automotive - 2.1% | | | | | | |
GMAC LLC | | | | | | |
6.034%, 2008 (1)(2) | | $ | 2,600,000 | | $ | 2,511,779 |
| | | | | | |
Banking - 4.7% | | | | | | |
BankBoston Capital Trust IV
5.746%, 2028 (1)(2) | | | 1,200,000 | | | 1,102,549 |
BOI Capital Funding No. 2, LP
5.571%, 2049 (2)(3)(4) | | | 650,000 | | | 561,457 |
Chase Capital III
5.674%, 2027 (1)(2) | | | 1,200,000 | | | 1,086,195 |
Rabobank Capital Funding II
5.26%, 2049 (1)(2)(3)(4) | | | 1,200,000 | | | 1,118,016 |
Standard Chartered plc
6.409%, 2049 (1)(2)(3)(4) | | | 1,750,000 | | | 1,584,980 |
US Central Federal Credit Union
2.70%, 2009 | | | 227,273 | | | 224,375 |
| | | | | | |
| | | | | | 5,677,572 |
| | | | | | |
Building Materials - 1.3% | | | | | | |
Cemex
6.64%, 2049 (2)(3)(4) | | | 1,000,000 | | | 947,640 |
CRH America, Inc.
6.95%, 2012 | | | 600,000 | | | 634,447 |
| | | | | | |
| | | | | | 1,582,087 |
| | | | | | |
Chemicals - 0.6% | | | | | | |
PPG Industries, Inc.
7.40%, 2019 | | | 650,000 | | | 741,167 |
| | | | | | |
Electric - 3.4% | | | | | | |
Arizona Public Service Company
6.38%, 2011 | | | 600,000 | | | 620,759 |
Cincinnati Gas & Electric
5.70%, 2012 | | | 600,000 | | | 623,725 |
East Coast Power LLC
6.74%, 2008 | | | 12,593 | | | 12,639 |
7.07%, 2012 | | | 140,867 | | | 146,128 |
Kansas Gas & Electric
5.65%, 2021 | | | 639,044 | | | 641,779 |
Oncor Electric Delivery Company
6.38%, 2015 | | | 600,000 | | | 614,324 |
Pennsylvania Electric Company
6.05%, 2017 (3)(4) | | | 650,000 | | | 646,000 |
WPS Resources Corporation
6.11%, 2066 (2) | | | 900,000 | | | 828,793 |
| | | | | | |
| | | | | | 4,134,147 |
| | | | | | |
Financial - Other - 2.5% | | | | | | |
Berkshire Hathaway Finance Corporation
4.75%, 2012 (1) | | | 1,800,000 | | | 1,822,567 |
Willis North America, Inc.
5.63%, 2015 (1) | | | 1,200,000 | | | 1,168,970 |
| | | | | | |
| | | | | | 2,991,537 |
| | | | | | |
| | | | | | |
| | | Principal
Amount | | Value |
CORPORATE BOND (continued) |
Financial Companies - Captive - 1.4% | | | | | | |
CIT Group Funding Company of Canada
4.65%, 2010 (1) | | $ | 1,800,000 | | $ | 1,711,838 |
| | | | | | |
Financial Companies - Noncaptive Consumer - 3.5% | | | | | | |
Nelnet, Inc.
7.40%, 2036 (1)(2) | | | 2,500,000 | | | 2,401,728 |
Residential Capital LLC
8.544%, 2009 (1)(2)(3)(4) | | | 3,000,000 | | | 1,477,500 |
8.00%, 2012 | | | 650,000 | | | 399,750 |
| | | | | | |
| | | | | | 4,278,978 |
| | | | | | |
Financial Companies - Noncaptive Diversified - 0.5% | | | | | | |
General Electric Capital Corporation 5.88%, 2012 | | | 600,000 | | | 625,142 |
| | | | | | |
Food & Beverage - 1.0% | | | | | | |
General Mills, Inc.
5.70%, 2017 (1) | | | 1,200,000 | | | 1,184,839 |
| | | | | | |
Healthcare - 0.5% | | | | | | |
Anthem, Inc.
6.80%, 2012 | | | 600,000 | | | 654,935 |
| | | | | | |
Independent Energy - 0.5% | | | | | | |
Devon Financing Corporation ULC
6.88%, 2011 | | | 600,000 | | | 642,535 |
| | | | | | |
Insurance - Life - 2.7% | | | | | | |
AIG SunAmerica Global Financing X
6.90%, 2032 (1)(3)(4) | | | 1,200,000 | | | 1,318,841 |
Lincoln National Corporation
7.00%, 2066 (1)(2) | | | 2,000,000 | | | 2,008,046 |
| | | | | | |
| | | | | | 3,326,887 |
| | | | | | |
Insurance - Properly & Casually - 1.3% | | | | | | |
Nationwide Mutual Insurance Company
8.25%, 2031 (3)(4) | | | 650,000 | | | 817,810 |
Navigators Group, Inc.
7.00%, 2016 | | | 700,000 | | | 744,794 |
| | | | | | |
| | | | | | 1,562,604 |
| | | | | | |
Integrated Energy - 1.7% | | | | | | |
Petrobras International Finance Company
6.125%, 2016 (1) | | | 2,000,000 | | | 2,040,000 |
| | | | | | |
Media - Cable - 0.4% | | | | | | |
Jones Intercable, Inc.
7.63%, 2008 | | | 500,000 | | | 502,951 |
| | | | | | |
Metals & Mining - 0.5% | | | | | | |
United States Steel Corporation
6.05%, 2017 | | | 650,000 | | | 610,891 |
| | | | | | |
| | |
| 44 | | The accompanying notes are an integral part of the financial statements |
| | |
| | |
| Schedule of Investments | | Series E (Diversified Income Series) |
| December 31, 2007 - continued | | |
| | | | | | |
| | | Principal
Amount | | Value |
CORPORATE BOND (continued) |
Natural Gas Pipelines - 0.2% | | | | | | |
Express Pipeline, LP
6.47%, 2013 (3)(4) | | $ | 285,600 | | $ | 300,977 |
| | | | | | |
Pharmaceuticals - 1.5% | | | | | | |
AstraZeneca plc
5.90%, 2017 (1) | | | 1,750,000 | | | 1,837,596 |
| | | | | | |
Railroads - 1.0% | | | | | | |
Canadian National Railway Company
6.25%, 2034 (1) | | | 1,200,000 | | | 1,210,510 |
| | | | | | |
REIT’s - 2.2% | | | | | | |
Hospitality Properties Trust
6.70%, 2018 (1) | | | 1,500,000 | | | 1,481,409 |
Reckson Operating Partnership, LP
5.15%, 2011 (1) | | | 1,200,000 | | | 1,209,617 |
| | | | | | |
| | | | | | 2,691,026 |
| | | | | | |
Technology - 0.5% | | | | | | |
Science Applications International Corporation
7.13%, 2032 | | | 600,000 | | | 633,466 |
| | | | | | |
Telecommunications - Wireless - 1.0% | | | | | | |
Nextel Communications, Inc.
6.88%, 2013 (1) | | | 1,200,000 | | | 1,182,146 |
| | | | | | |
Transportation Services - 0.5% | | | | | | |
TTX Company
4.90%, 2015 (3)(4) | | | 650,000 | | | 657,415 |
| | | | | | |
U.S. Banking - 0.5% | | | | | | |
PartnerRe Finance II
6.44%, 2066 (2) | | | 650,000 | | | 571,732 |
| | | | | | |
Utility - Other - 2.5% | | | | | | |
American Water Capital Corporation
6.085%, 2017 (1)(3) | | | 3,000,000 | | | 2,989,899 |
| |
TOTAL CORPORATE BOND (Cost $49,167,122) | | $ | 46,854,656 |
| |
PREFERRED STOCK - 2.7% |
Insurance - Life - 0.9% | | | | | | |
WoodBourne Pass-Through Trust
5.343%, 2008 (1)(3)(4) | | | 12 | | | 1,149,750 |
| | | | | | |
Property & Casualty Insurance - 0.9% | | | | | | |
Aspen Insurance Holdings, Ltd.
7.401%, 2017 (1) | | | 48,000 | | | 1,048,800 |
| | | | | | |
Thrifts & Mortgage Finance - 0.9% | | | | | | |
Federal Home Loan Mortgage Corporation
8.375%, 2012 | | | 16,000 | | | 418,400 |
Federal National Mortgage Association
8.25%, 2010 | | | 24,000 | | | 618,000 |
| | | | | | |
| | | | | | 1,036,400 |
| |
TOTAL PREFERRED STOCK (Cost $3,423,796) | | $ | 3,234,950 |
| |
| | | | | | |
| | | Principal
Amount | | Value |
MORTGAGE BACKED SECURITIES - 47.2% |
Other Non-Agency - 13.1% | | | | | | |
CMO’s - 13.1% | | | | | | |
Chase Commercial Mortgage Securities Corporation
1998-1, 6.56% - 2030 | | $ | 500,000 | | $ | 500,743 |
Chase Mortgage Finance Corporation
2005-A1 2A2, 5.237% - 2035 (1)(2) | | | 1,924,068 | | | 1,917,335 |
Chaseflex Trust
2006-1, 5.935% - 2036 (1)(2) | | | 3,000,000 | | | 2,954,682 |
Homebanc Mortgage Trust
2006-1, 6.02% - 2037 (1)(2) | | | 1,768,214 | | | 1,812,596 |
JP Morgan Alternative Loan Trust
2006-S2, 5.81% - 2036 (1) | | | 3,007,000 | | | 2,997,458 |
2006-S3, 6.00% - 2036 (1) | | | 3,000,000 | | | 2,982,142 |
JP Morgan Mortgage Trust
2006-A3, 5.308% - 2036 (1)(2) | | | 1,403,212 | | | 1,402,428 |
Washington Mutual, Inc.
2005-AR16 1A1, 5.102% - 2035 (1)(2) | | | 1,457,123 | | | 1,450,268 |
| | | | | | |
| | | | | | 16,017,652 |
| | | | | | |
U.S. Government Sponsored Agencies -29.5% | | | | | | |
CMO’s - 1.3% | | | | | | |
Federal Home Loan Mortgage Corporation
FHR 2520 AG, 5.00% - 2016 (1) | | | 1,625,450 | | | 1,627,540 |
FHR 188 H, 7.00% - 2021 | | | 1,694 | | | 1,686 |
Federal National Mortgage Association | | | | | | |
FNR 1990-68 J, 6.95% - 2020 | | | 3,972 | | | 4,195 |
FNR 1990-103 K, 7.50% - 2020 | | | 1,243 | | | 1,283 |
| | | | | | |
| | | | | | 1,634,704 |
| | | | | | |
Pass-Thru’s -28.2% | | | | | | |
Federal Home Loan Mortgage Corporation | | | | | | |
#E01378, 5.00% - 2018 (1) | | | 1,685,828 | | | 1,689,964 |
#E01488, 5.00% - 2018 (1) | | | 1,525,390 | | | 1,529,147 |
#E01538, 5.00% - 2018 (1) | | | 1,549,810 | | | 1,553,628 |
#C44050, 7.00% - 2030 | | | 44,648 | | | 46,920 |
#C01079, 7.50% - 2030 | | | 19,430 | | | 20,752 |
#C01172, 6.50% - 2031 | | | 64,065 | | | 65,856 |
#C01210, 6.50% - 2031 | | | 79,605 | | | 82,320 |
#C50964, 6.50% - 2031 | | | 81,655 | | | 83,938 |
#C50967, 6.50% - 2031 | | | 15,157 | | | 15,674 |
#C01277, 7.00% - 2031 | | | 106,327 | | | 110,510 |
#C01292, 6.00% - 2032 | | | 339,011 | | | 345,612 |
#C62801, 6.00% - 2032 | | | 139,098 | | | 141,806 |
#C01287, 6.50% - 2032 | | | 185,228 | | | 190,405 |
#A16943, 6.00% - 2033 (1) | | | 1,042,367 | | | 1,060,126 |
#A17903, 6.00% - 2034 (1) | | | 1,255,855 | | | 1,276,531 |
Federal National Mortgage Association | | | | | | |
#254473, 5.50% - 2017 (1) | | | 1,443,837 | | | 1,465,667 |
#720714, 4.50% - 2018 (1) | | | 1,532,614 | | | 1,507,974 |
#555549, 5.00% - 2018 (1) | | | 1,769,344 | | | 1,770,586 |
| | |
| 45 | | The accompanying notes are an integral part of the financial statements |
| | |
| | |
| Schedule of Investments | | Series E (Diversified Income Series) |
| December 31, 2007 - continued | | |
| | | | | | |
| | | Principal
Amount | | Value |
MORTGAGE BACKED SECURITIES (continued) |
U.S. Government Sponsored Agencies (continued) | | | | | | |
Pass-Thru's (continued) | | | | | | |
Federal National Mortgage Association (continued) | | | | | | |
#750465, 5.00% - 2018 (1) | | $ | 1,543,936 | | $ | 1,547,796 |
#839353, 5.50% - 2018 (1) | | | 1,035,442 | | | 1,050,275 |
#780952, 4.00% - 2019 (1) | | | 2,032,798 | | | 1,949,836 |
#252806, 7.50% - 2029 | | | 63,757 | | | 68,156 |
#252874, 7.50% - 2029 | | | 22,840 | | | 24,416 |
#535277, 7.00% - 2030 | | | 32,857 | | | 34,181 |
#551262, 7.50% - 2030 | | | 13,753 | | | 14,679 |
#190307, 8.00% - 2030 | | | 25,199 | | | 26,903 |
#253356, 8.00% - 2030 | | | 30,717 | | | 32,794 |
#541735, 8.00% - 2030 | | | 39,492 | | | 42,162 |
#535838, 6.50% - 2031 | | | 61,160 | | | 62,869 |
#585348, 6.50% - 2031 | | | 54,697 | | | 56,226 |
#591381, 6.50% - 2031 | | | 100,677 | | | 103,491 |
#254477, 5.50% - 2032 | | | 897,175 | | | 896,010 |
#254198, 6.00% - 2032 | | | 334,056 | | | 339,245 |
#254377, 6.00% - 2032 | | | 550,933 | | | 561,284 |
#254478, 6.00% - 2032 | | | 257,950 | | | 262,796 |
#666750, 6.00% - 2032 | | | 606,109 | | | 615,523 |
#254346, 6.50% - 2032 | | | 148,230 | | | 152,373 |
#545691, 6.50% - 2032 | | | 221,063 | | | 227,242 |
#659790, 6.50% - 2032 | | | 225,178 | | | 232,791 |
#702879, 5.00% - 2033 (1) | | | 1,244,486 | | | 1,216,116 |
#709805, 5.00% - 2033 (1) | | | 1,766,291 | | | 1,726,027 |
#658077, 5.50% - 2033 (1) | | | 1,138,393 | | | 1,140,419 |
#688328, 5.50% - 2033 (1) | | | 1,018,385 | | | 1,019,140 |
#689108, 5.50% - 2033 (1) | | | 1,025,504 | | | 1,027,329 |
#709748, 5.50% - 2033 (1) | | | 1,631,982 | | | 1,634,888 |
#713971, 5.50%- 2033 (1) | | | 1,682,375 | | | 1,683,622 |
#754903, 5.50% - 2033 | | | 962,962 | | | 960,272 |
#725033, 6.00% - 2034 | | | 693,073 | | | 705,195 |
#255554, 5.50% - 2035 (1) | | | 1,885,449 | | | 1,885,553 |
| | | | | | |
| | | 34,257,025 |
| | | | | | |
| | | 35,891,729 |
| | | | | | |
U.S. Government Sponsored Securities - 4.6% | | | | | | |
CMO's - 3.3% | | | | | | |
Government National Mortgage Association | | | | | | |
GNR 2006-23 A, 6.00%-2033 (1) | | | 4,005,616 | | | 4,003,289 |
| | | | | | |
Pass-Thru's - 1.3% | | | | | | |
Government National Mortgage Association | | | | | | |
G2 181907, 9.50% - 2020 | | | 10,244 | | | 11,275 |
#301465, 9.00% - 2021 | | | 19,278 | | | 20,728 |
#305617, 9.00% - 2021 | | | 8,683 | | | 9,336 |
| | | | | | |
| | | Principal
Amount | | Value |
MORTGAGE BACKED SECURITIES (continued) |
U.S. Government Sponsored Securities (continued) | | | | | | |
Pass-Thru's (continued) | | | | | | |
Government National Mortgage Association (continued) | | | | | | |
#313107, 7.00% - 2022 | | $ | 79,308 | | $ | 82,923 |
#352022, 7.00% - 2023 | | | 58,651 | | | 61,324 |
#369303, 7.00% - 2023 | | | 104,045 | | | 108,787 |
#780454, 7.00% - 2026 | | | 92,836 | | | 97,067 |
G2 2445, 8.00% -2027 | | | 40,045 | | | 42,340 |
#462680, 7.00% - 2028 | | | 54,186 | | | 56,656 |
#482668, 7.00% - 2028 | | | 43,098 | | | 45,062 |
#518436, 7.25% - 2029 | | | 19,184 | | | 20,290 |
#494109, 7.50% - 2029 | | | 23,337 | | | 24,542 |
#510704, 7.50% - 2029 | | | 19,915 | | | 20,943 |
#781079, 7.50% - 2029 | | | 19,397 | | | 20,398 |
#479229, 8.00% - 2030 | | | 12,431 | | | 13,193 |
#479232, 8.00% - 2030 | | | 20,820 | | | 22,097 |
#508342, 8.00% - 2030 | | | 41,811 | | | 44,375 |
G2 2909, 8.00% -2030 | | | 20,725 | | | 21,913 |
#538285, 6.50% - 2031 | | | 65,069 | | | 67,209 |
#561561, 6.50% - 2031 | | | 132,138 | | | 136,999 |
#564472, 6.50% - 2031 | | | 197,930 | | | 205,211 |
#781414, 5.50% - 2032 | | | 306,862 | | | 309,126 |
#552324, 6.50% - 2032 | | | 122,373 | | | 126,397 |
| | | | | | |
| | | | | | 1,568,191 |
| | | | | | |
| | | | | | 5,571,480 |
| |
TOTAL MORTGAGE BACKED SECURITIES (Cost $57,737,198) | | $ | 57,480,861 |
| |
U.S. GOVERNMENT SPONSORED AGENCY BONDS & NOTES - 2.7% | | | |
Federal Home Loan Bank
4.24% - 2008 (1) | | | 1,300,000 | | | 1,299,693 |
Federal Home Loan Mortgage Corporation
3.95% - 2008 (1) | | | 1,000,000 | | | 999,781 |
Federal National Mortgage Association
6.63% - 2030 | | | 750,000 | | | 925,516 |
| |
TOTAL U.S. GOVERNMENT SPONSORED AGENCY BONDS & NOTES | | $ | 3,224,990 |
(Cost $3,102,018) | | | | | | |
| |
U.S. GOVERNMENT SECURITIES- 1.2% | | | | | | |
U.S. Treasury Bill | | | | | | |
3.10%, 2008 | | | 190,000 | | | 187,358 |
3.945%, 2008 | | | 100,000 | | | 98,923 |
U.S. Treasury Bonds
5.38%, 2031 (1) | | | 1,000,000 | | | 1,126,641 |
| |
TOTAL U.S. GOVERNMENT SECURITIES (Cost $1,387,330) | | | | | $ | 1,412,922 |
| |
| | |
| 46 | | The accompanying notes are an integral part of the financial statements |
| | |
| | |
| Schedule of Investments | | Series E (Diversified Income Series) |
December 31, 2007- continued | | |
| | | | | | |
| | | Principal
Amount | | Value |
ASSET BACKED SECURITIES - 1.3% |
Home Equity Loans - 1.3% | | | | | | |
Credit-Based Asset Servicing and Securitization LLC
2005-CB5, 5.125%, 2035 (1)(2) | | $ | 1,612,349 | | $ | 1,548,883 |
| | | | | | |
Other - 0.0% | | | | | | |
Squared CDO, Ltd.
2007-1A, 6.04%,
2057 (2)(3)(5)(6) | | | 1,200,000 | | | 78,360 |
| TOTAL ASSET BACKED SECURITIES (Cost $2,798,861) | | $ | 1,627,243 |
COMMERCIAL PAPER - 5.5% |
Banking -2.2% | | | | | | |
UBS Finance (DE) LLC
4.33%, 1/10/2008 (1) | | | 1,300,000 | | | 1,298,593 |
Wells Fargo & Company, Inc.
4.25%, 1/2/2008 (1) | | | 1,400,000 | | | 1,399,834 |
| | | | | | |
| | | | | | 2,698,427 |
| | | | | | |
Brokerage - 1.2% | | | | | | |
Goldman Sachs Group, Inc.
5.25%, 1/7/2008 (1) | | | 1,500,000 | | | 1,498,688 |
| | | | | | |
Electric - 1.3% | | | | | | |
Florida Power & Light Company
4.25%, 1/8/2008 (1) | | | 1,500,000 | | | 1,498,760 |
| | | | | | |
Financial Companies - Captive - 0.8% | | | | | | |
International Lease Finance Company
4.38%, 1/4/2008 | | | 1,000,000 | | | 999,635 |
| TOTAL COMMERCIAL PAPER (Cost $6,695,510) | | $ | 6,695,510 |
REPURCHASE AGREEMENT - 0.2% |
United Missouri Bank, 3.61%,
dated 12/31/07, matures 1/02/08; repurchase amount $243,049 (Collateralized by FHLB Discount Note, 1/12/08 with a value of $248,675) | | $ | 243,000 | | $ | 243,000 |
| TOTAL REPURCHASE AGREEMENT (Cost 243,000) | | $ | 243,000 |
Total Investments (SBL E Fund) | | | | | | 120,774,132 |
(Cost $124,554,835) - 99.3% Other Assets in Excess of Liabilities - 0.7% | | | | | | 878,308 |
| | | | | | |
TOTAL NET ASSETS - 100.0% | | | | | | 121,652,440 |
| | | | | | |
Footnotes
Percentages are stated as a percent of net assets.
For federal income tax purposes the identified cost of investments owned at 12/31/2007 was $125,554,002.
| | | | |
1 | | - | | Security is segregated as collateral for open futures contracts. |
2 | | - | | Variable rate security. Rate indicated is rate effective at December 31, 2007. |
3 | | - | | Security was acquired through a private placement. |
| | | | |
4 | | - | | Security is a 144A security. The total market value of 144A securities is $10,580,386 (cost $12,442,123), or 8.7% of total interests. |
5 | | - | | Security is deemed illiquid. The total market value of illiquid securities is$78,360 (cost $1,186,512), or 0.1% of total net assets. |
6 | | - | | Security is fair valued by the Board of Directors. The total market value of fair valued securities amounts to $78,360, (cost $1,186,512) or 0.1% of total net assets. |
| | | | |
| Glossary: |
FHLB | | - | | Federal Home Loan Bank |
plc | | - | | Public Limited Company |
|
| See notes to financial statements. |
| | |
| 47 | | The accompanying notes are an integral part of the financial statements |
| | |
| | Series E |
| | (Diversified Income Series) |
Statement of Assets and Liabilities
December 31, 2007
| | | | |
Assets: | | | | |
Investments, at value* | | $ | 120,774,132 | |
Cash | | | 11,967 | |
Receivables: | | | | |
Fund shares sold | | | 79,164 | |
Interest | | | 1,005,025 | |
Dividends | | | 25,497 | |
Variation margin on futures | | | 71,359 | |
Prepaid expenses | | | 2,870 | |
| | | | |
Total assets | | | 121,970,014 | |
| | | | |
| |
Liabilities: | | | | |
| |
Payable for: | | | | |
Fund shares redeemed | | | 206,043 | |
Management fees | | | 62,241 | |
Administration fees | | | 12,405 | |
Transfer agent/maintenance fees | | | 2,083 | |
Custodian fees | | | 4,800 | |
Directors’ fees | | | 1,700 | |
Professional fees | | | 16,100 | |
Other fees | | | 12,202 | |
| | | | |
Total liabilities | | | 317,574 | |
| | | | |
Net assets | | $ | 121,652,440 | |
| | | | |
| |
Net assets consist of: | | | | |
Paid in capital | | $ | 133,338,361 | |
Undistributed net investment income | | | 6,116,616 | |
Accumulated net realized loss on sale of investments | | | (14,064,136 | ) |
Net unrealized depreciation in value of investments | | | (3,738,401 | ) |
| | | | |
Net assets | | $ | 121,652,440 | |
| | | | |
| |
Capital shares authorized | | | unlimited | |
Capital shares outstanding | | | 9,843,585 | |
Net asset value per share
(net assets divided by shares outstanding) | | | $12.36 | |
| | | | |
| |
*Investments, at cost | | $ | 124,554,835 | |
Statement of Operations
For Year Ended December 31, 2007
| | | | |
| |
Investment Income: | | | | |
Dividends | | $ | 174,660 | |
Interest | | | 7,987,894 | |
| | | | |
Total investment income | | | 8,162,554 | |
| | | | |
| |
Expenses: | | | | |
Management fees | | | 1,080,906 | |
Administration fees | | | 146,504 | |
Transfer agent/maintenance fees | | | 25,247 | |
Custodian fees | | | 16,336 | |
Directors’ fees | | | 7,062 | |
Professional fees | | | 17,967 | |
Reports to shareholders | | | 13,252 | |
Other | | | 7,015 | |
| | | | |
Total expenses | | | 1,314,289 | |
Less: | | | | |
Expenses waived | | | (216,182 | ) |
Earnings credits applied | | | (208 | ) |
| | | | |
Net expenses | | | 1,097,899 | |
| | | | |
Net investment income | | | 7,064,655 | |
| | | | |
| |
Net Realized and Unrealized Gain (Loss): | | | | |
Net realized gain (loss) during the year on: | | | | |
Investments | | | (1,800,129 | ) |
Futures | | | 810,056 | |
| | | | |
Net realized loss | | | (990,073 | ) |
| | | | |
| |
Net unrealized appreciation (depreciation) | | | | |
during the year on: | | | | |
Investments | | | (2,342,634 | ) |
Futures | | | 146,151 | |
| | | | |
Net unrealized depreciation | | | (2,196,483 | ) |
| | | | |
Net realized and unrealized loss | | | (3,186,556 | ) |
| | | | |
Net increase in net assets resulting from operations | | $ | 3,878,099 | |
| | | | |
| | |
| 48 | | The accompanying notes are an integral part of the financial statements |
| | |
| | Series E |
| Statement of Changes in Net Assets | | (Diversified Income Series) |
| | | | | | | | |
| | | Year Ended
December 31, 2007 | | | Year Ended
December 31, 2006 | |
| | |
Increase (decrease) in net assets from operations: | | | | | | | | |
Net investment income | | $ | 7,064,655 | | | $ | 7,374,273 | |
Net realized (loss) during the year on investments | | | (990,073 | ) | | | (1,511,726 | ) |
Net unrealized depreciation during the year on investments | | | (2,196,483 | ) | | | (286,787 | ) |
| | | | | | | | |
Net increase in net assets resulting from operations | | | 3,878,099 | | | | 5,575,760 | |
| | | | | | | | |
| | |
Capital share transactions: | | | | | | | | |
Proceeds from sale of shares | | | 52,494,277 | | | | 61,806,779 | |
Cost of shares redeemed | | | (86,030,933 | ) | | | (75,457,709 | ) |
| | | | | | | | |
Net decrease from capital share transactions | | | (33,536,656 | ) | | | (13,650,930 | ) |
| | | | | | | | |
Net decrease in net assets | | | (29,658,557 | ) | | | (8,075,170 | ) |
| | | | | | | | |
| | |
Net assets: | | | | | | | | |
Beginning of year | | | 151,310,997 | | | | 159,386,167 | |
| | | | | | | | |
End of year | | $ | 121,652,440 | | | $ | 151,310,997 | |
| | | | | | | | |
| | |
Undistributed net investment income at end of year | | $ | 6,116,616 | | | $ | 6,546,424 | |
| | | | | | | | |
| | |
Capital share activity: | | | | | | | | |
Shares sold | | | 4,315,924 | | | | 5,337,585 | |
Shares redeemed | | | (7,075,418 | ) | | | (6,512,120 | ) |
| | | | | | | | |
Total capital share activity | | | (2,759,494 | ) | | | (1,174,535 | ) |
| | | | | | | | |
| | |
| 49 | | The accompanying notes are an integral part of the financial statements |
| | |
| | |
| Financial Highlights | | Series E |
| Selected data for each share of capital stock outstanding throughout each year | | (Diversified Income Series) |
| | | | | | | | | | |
| | | 2007 | | 2006 | | 2005 | | 2004 | | Year Ended
December 31, 2003 |
| |
Per Share Data | | | | | | | | | | |
Net asset value, beginning of period | | $12.01 | | $11.57 | | $11.36 | | $11.04 | | $11.83 |
| |
Income (loss) from investment operations: | | | | | | | | | | |
Net investment incomea | | 0.60 | | 0.63 | | 0.49 | | 0.50 | | 0.68 |
Net loss on securities (realized and unrealized) | | (0.25) | | (0.19) | | (0.28) | | (0.08) | | (0.31) |
| | |
Total from investment operations | | 0.35 | | 0.44 | | 0.21 | | 0.42 | | 0.37 |
| |
Less distributions: | | | | | | | | | | |
Dividends from net investment income | | - | | - | | - | | (0.10) | | (1.16) |
| | |
Total distributions | | - | | - | | - | | (0.10) | | (1.16) |
| |
Net asset value, end of period | | $12.36 | | $12.01 | | $11.57 | | $11.36 | | $11.04 |
| | |
| | | | | | | | | | |
| |
Total Returnb | | 2.91% | | 3.80% | | 1.85% | | 3.82% | | 3.19% |
| |
Ratios/Supplemental Data | | | | | | | | | | |
Net assets, end of period (in thousands) | | $121,652 | | $151,311 | | $159,386 | | $159,527 | | $159,472 |
| |
Ratios to average net assets: | | | | | | | | | | |
Net investment income | | 4.90% | | 4.67% | | 4.23% | | 4.42% | | 4.39% |
Total expensesc | | 0.91% | | 0.93% | | 0.92% | | 0.89% | | 0.84% |
Net expensesd | | 0.76% | | 0.78% | | 0.77% | | 0.75% | | 0.84% |
Net expenses prior to custodian earnings credits and net of expense waivers | | 0.76% | | 0.78% | | 0.77% | | 0.75% | | 0.84% |
| |
Portfolio turnover rate | | 31% | | 64% | | 60% | | 39% | | 45% |
a Net investment income (loss) was computed using average shares outstanding throughout the period.
b Total return does not take into account any of the expenses associated with an investment in variable insurance products offered by Security Benefit Life Insurance Company. If total return had taken into account these expenses, performance would have been lower. Shares of a series of SBL Fund are available only through the purchase of such products.
c Total expense information reflects the expense ratios absent expense reductions by the Investment Manager, and earnings credits, as applicable.
d Net expense information reflects the expense ratios after voluntary expense waivers, reimbursements and custodian earnings credits, as applicable.
| | |
| 50 | | The accompanying notes are an integral part of the financial statements |
| | |
| Manager’s Commentary | | Series H |
| February 15, 2008 | | (Enhanced Index Series) |

Subadviser, Northern Trust
To Our Shareholders:
For the year ended December 31, 2007, Series H of the SBL Fund—Enhanced Index Series returned 0.99%. Its benchmark, the S&P 500 Index, was up 5.49% (including dividends).
The U.S. equity market ended up for the fifth straight year in 2007. The year’s returns are not surprising at the surface but, when looked at more closely, exhibit very different characteristics from those of recent years. Growth significantly outperformed value as the market continued to reward companies with higher P/Es without regard for valuation. The second half of 2007 proved to be especially challenging for many equity managers, us included. The credit problems brought to light risks that had been mis-estimated by the market bringing turmoil and volatility.
Series Management Criteria
We believe that certain security characteristics tend to be rewarded in the market, and that building a portfolio that emphasizes these characteristics will lead to superior performance. The Series is structured to capture a combination of these characteristics, organized into four broad categories: valuation, momentum, profitability and management signals. A factor must be intuitive and have economic validity or we will not use it. These are similar to the fundamental criteria employed by traditional fundamental managers. We take a more disciplined approach on how to apply these fundamental criteria to selecting securities.
Series Performance
The Series underperformed the S&P 500 benchmark in 2007 by 3.67%. The characteristics that we emphasized in portfolios did not perform as expected. Book/Price is a good example. Splitting the S&P 500 into quintiles, the quintile with the lowest book/price (expensive relative to peers) outperformed the highest book/price (cheap relative to peers) by 25% (source: Factset Research Systems). Since the portfolios emphasize fundamental characteristics including value, they suffered in this market.
Momentum in stock returns and analyst revisions was the best performing factor in our model during the period. Our momentum and quality factors added value but not sufficient to compensate for value’s poor performance.
Our overweight to National Oilwell Varco, Inc., added value as it returned nearly 140% over the year. In this case, consistency of the fundamentals and good valuation were rewarded. Over the same time period, our underweight to Freddie Mac, benefitted us as it lost nearly 50% in value over the year. Apple, Inc., and Google, Inc., which returned over 50% each, detracted significant amounts as they scored poorly on our value metrics, yet were rewarded by the market.
The performance of the Series in 2007 was disappointing. While the market’s departure from emphasizing strong fundamentals at attractive prices might continue for a while, we believe that these characteristics are the best indicators of stock returns in the long run. We continue to believe that our investment approach is sound: rigorous research into identifying mispriced assets; a disciplined quantitative approach to structuring the portfolios; continuous risk analysis; and performance attribution. We remain confident and committed to our conviction that the best way to achieve investment success is through investing on the principles of discipline, research and the primacy of data over intuition. We recognize the most profitable time to maintain discipline is the hardest while the most ruinous time to abandon discipline is most tempting.
We express our gratitude to our shareholders for their confidence in the Series and assure them that we will continue to apply our disciplined, quantitative approach while adhering to our strict risk control process.
Sincerely,
Enhanced Index Team
| | |
| | Series H |
| Performance Summary | | (Enhanced Index Series) |
| December 31, 2007 | | (unaudited) |
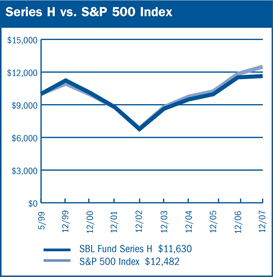
$10,000 Since Inception
The chart above assumes a hypothetical $10,000 investment in Series H (Enhanced Index Series) on May 3, 1999 (date of inception) and reflects the fees and expenses of Series H. The S&P 500 Index is a capitalization-weighted index composed of 500 selected common stocks that represent the broad domestic economy and is a widely recognized unmanaged index of market performance.
| | | | | | |
Average Annual Returns | | |
| | | | |
| | | 1 Year | | 5 Years | | Since Inception (5-3-99) |
| Periods Ended 12-31-071 | | | |
Series H | | 0.99% | | 11.47% | | 1.76% |
| | | | | | | |
1 Performance figures do not reflect fees and expenses associated with an investment in variable insurance products offered by Security Benefit Life Insurance Company. If returns had taken into account these fees and expenses, performance would have been lower. Shares of a Series of SBL Fund are available only through the purchase of such products. |
| |
The performance data quoted above represents past performance. Past performance is not predictive of future performance. The investment return and principal value of an investment will fluctuate so that an investor’s shares, when redeemed, may be worth more or less than their original cost. |
| | |
Portfolio Composition by Sector |
Consumer Discretionary | | 8.04% |
Consumer Staples | | 9.77 |
Energy | | 12.83 |
Financials | | 16.90 |
Health Care | | 11.97 |
Industrials | | 11.19 |
Information Technology | | 16.59 |
Materials | | 3.48 |
Telecommunication Services | | 3.55 |
Utilities | | 3.36 |
U.S. Government Sponsored Securities | | 0.17 |
Repurchase Agreement | | 0.75 |
Other Assets in Excess of Liabilities | | 1.40 |
Total Net Assets | | 100.00% |
| | |
| 52 | | The accompanying notes are an integral part of the financial statements |
| | |
| | Series H |
| |
| Performance Summary | | (Enhanced Index Series) |
December 31, 2007 | | (unaudited) |
Information About Your Series Expenses
Calculating your ongoing Series expenses
Example
As a shareholder of the Series, you incur ongoing costs, including management fees and other series expenses. Performance figures and expense ratios do not reflect fees and expenses associated with an investment in variable insurance products. Shares of a Series of SBL Fund are available only through the purchase of such products. This example is intended to help you understand your ongoing costs (in dollars) of investing in the Series and to compare these costs with ongoing costs of investing in other mutual funds. The example is based on an investment of $1,000 invested at the beginning of the period and held for the entire period, July 1, 2007 through December 31, 2007.
Actual Expenses
The first line in the table provides information about actual account values and actual expenses. You may use the information in this table, together with the amount you invested, to estimate the expenses that you paid over the period. Simply divide your account value by $1,000 (for example, an $8,600 account value divided by $1,000 = 8.6), then multiply the result by the number in the table under the heading entitled “Expenses Paid During the Period” to estimate the expenses you paid on your account during this period.
Hypothetical Example for Comparison Purposes
The second line in the table provides information about hypothetical account values and hypothetical expenses based on the Series actual expense ratio and an assumed rate of return of 5% per year before expenses, which is not the Series actual return. The hypothetical account values and expenses may not be used to estimate the actual ending account balance or expenses
you paid for the period. You may use this information to compare the ongoing costs of investing in the Series and other funds. To do so, compare this 5% hypothetical example with the 5% hypothetical examples that appear in the shareholder reports of the other mutual funds.
Please note that the expenses shown in the table are meant to highlight your ongoing costs only and do not reflect any fees and expenses associated with an investment in variable insurance products. Therefore, the second line is useful in comparing ongoing costs only, and will not help you determine the relative total costs of owning different funds. In addition, if these fees and expenses associated with an investment in variable insurance products were included, your costs would have been higher.
| | | | | | | | | |
| Series Expenses | | | | |
| | | Beginning
Account
Value
7/1/2007 | | Ending
Account
Value
12/31/20071 | | Expenses
Paid
During
Period2 |
Series H (Enhanced Index Series) | | | |
Actual | | $ | 1,000.00 | | $ | 958.83 | | $ | 3.46 |
Hypothetical | | | 1,000.00 | | | 1,021.68 | | | 3.57 |
1 The actual ending account value is based on the actual total return of the Series for the period July 1, 2007 to December 31, 2007 after actual expenses and will differ from the hypothetical ending account value which is based on the Series expense ratio and a hypothetical annual return of 5% before expenses. The actual cumulative return at net asset value for the period July 1, 2007 to December 31, 2007 was (4.12%).
2 Expenses are equal to the Series annualized expense ratio of 0.70%, net of any applicable fee waivers or earnings credits, multiplied by the average account value over the period, multiplied by 184/365 (to reflect the one-half year period)
| | |
| Schedule of Investments | | Series H (Enhanced Index Series) |
| December 31, 2007 | | |
| | | | | |
| | | Shares | | Value |
COMMON STOCK - 97.7% | | | | | |
Aerospace & Defense - 3.0% | | | | | |
Boeing Company | | 8,171 | | $ | 714,636 |
L-3 Communications Holdings, Inc. | | 3,500 | | | 370,790 |
Lockheed Martin Corporation | | 4,847 | | | 510,195 |
Northrop Grumman Corporation | | 3,622 | | | 284,834 |
Raytheon Company | | 7,500 | | | 455,250 |
United Technologies Corporation | | 2,465 | | | 188,671 |
| | | | | |
| | | | | 2,524,376 |
| | | | | |
Air Freight & Logistics - 0.7% | | | | | |
United Parcel Service, Inc. (CI.B) | | 8,293 | | | 586,481 |
| | | | | |
| | |
Apparel, Accessories & Luxury Goods - 0.3% | | | | | |
V.F. Corporation | | 3,500 | | | 240,310 |
| | | | | |
| | |
Application Software - 0.4% | | | | | |
Compuware Corporation * | | 34,600 | | | 307,248 |
| | | | | |
| | |
Asset Management & Custody Banks - 0.6% | | | | | |
Ameriprise Financial, Inc. | | 6,633 | | | 365,544 |
Bank of New York Mellon Corporation | | 1,055 | | | 51,442 |
Janus Capital Group, Inc. | | 2,300 | | | 75,555 |
| | | | | |
| | | | | 492,541 |
| | | | | |
Automobile Manufacturers - 0.1% | | | | | |
Ford Motor Company * | | 7,700 | | | 51,821 |
| | | | | |
| | |
Automotive Retail - 0.1% | | | | | |
Autozone, Inc. * | | 400 | | | 47,964 |
| | | | | |
| | |
Biotechnology - 1.0% | | | | | |
Amgen, Inc. * | | 842 | | | 39,103 |
Biogen Idee, Inc. * | | 4,200 | | | 239,064 |
Gilead Sciences, Inc. * | | 12,400 | | | 570,524 |
| | | | | |
| | | | | 848,691 |
| | | | | |
Broadcasting & Cable TV - 0.6% | | | | | |
CBS Corporation (CI.B) | | 14,700 | | | 400,575 |
Comcast Corporation * | | 3,436 | | | 62,741 |
| | | | | |
| | | | | 463,316 |
| | | | | |
Building Products - 0.1% | | | | | |
Masco Corporation | | 3,800 | | | 82,118 |
| | | | | |
| | |
Communications Equipment - 2.5% | | | | | |
Cisco Systems, Inc. * | | 48,983 | | | 1,325,970 |
Juniper Networks, Inc. * | | 500 | | | 16,600 |
Qualcomm, Inc. | | 18,124 | | | 713,179 |
| | | | | |
| | | | | 2,055,749 |
| | | | | |
Computer & Electronics Retail - 0.3% | | | | | |
RadioShack Corporation | | 17,500 | | | 295,050 |
| | | | | |
| | |
Computer Hardware - 4.1% | | | | | |
Apple, Inc. * | | 4,946 | | | 979,704 |
Dell, Inc. * | | 4,176 | | | 102,354 |
Hewlett-Packard Company | | 22,236 | | | 1,122,473 |
| | | | | |
| | | Shares | | Value |
COMMON STOCK (continued) | | | | | |
Computer Hardware (continued) | | | | | |
International Business Machines Corporation | | 11,416 | | $ | 1,234,069 |
| | | | | |
| | | | | 3,438,600 |
| | | | | |
Computer Storage & Peripherals - 0.1% | | | | | |
EMC Corporation * | | 1,900 | | | 35,207 |
SanDisk Corporation * | | 1,800 | | | 59,706 |
| | | | | |
| | | | | 94,913 |
| | | | | |
Construction & Farm Machinery & Heavy Trucks - 0.7% | | | | | |
Caterpillar, Inc. | | 7,994 | | | 580,045 |
| | | | | |
| | |
Consumer Finance - 0.5% | | | | | |
American Express Company | | 2,262 | | | 117,669 |
Capital One Financial Corporation | | 5,400 | | | 255,204 |
Discover Financial Services | | 1,346 | | | 20,298 |
| | | | | |
| | | | | 393,171 |
| | | | | |
Data Processing & Outsourced Services - 0.9% | | | | | |
Automatic Data Processing, Inc. | | 9,800 | | | 436,394 |
Fidelity National Information Services, Inc. | | 8,000 | | | 332,720 |
| | | | | |
| | | | | 769,114 |
| | | | | |
Distillers & Vintners - 0.1% | | | | | |
Brown-Forman Corporation | | 600 | | | 44,466 |
| | | | | |
| | |
Diversified Banks - 1.5% | | | | | |
U.S. Bancorp | | 1,825 | | | 57,926 |
Wachovia Corporation | | 7,228 | | | 274,881 |
Wells Fargo & Company | | 30,538 | | | 921,942 |
| | | | | |
| | | | | 1,254,749 |
| | | | | |
Diversified Chemicals - 1.5% | | | | | |
Dow Chemical Company | | 13,089 | | | 515,968 |
E.I. Du Pont de Nemours & Company | | 9,905 | | | 436,712 |
Hercules, Inc. | | 15,200 | | | 294,120 |
| | | | | |
| | | | | 1,246,800 |
| | | | | |
Diversified Metals & Mining - 0.6% | | | | | |
Freeport-McMoRan Copper & Gold, Inc. (CI.B) | | 5,300 | | | 542,932 |
| | | | | |
| | |
Drug Retail - 0.7% | | | | | |
CVS Caremark Corporation | | 14,400 | | | 572,400 |
| | | | | |
| | |
Electric Utilities - 2.0% | | | | | |
Duke Energy Corporation | | 18,200 | | | 367,094 |
Edison International | | 7,478 | | | 399,101 |
Exelon Corporation | | 600 | | | 48,984 |
FirstEnergy Corporation | | 6,300 | | | 455,742 |
Progress Energy, Inc. | | 7,527 | | | 364,532 |
| | | | | |
| | | | | 1,635,453 |
| | | | | |
| | |
| 54 | | The accompanying notes are an integral part of the financial statements |
| | |
| Schedule of Investments | | Series H (Enhanced Index Series) |
December 31, 2007 - continued | | |
| | | | | |
| | | Shares | | Value |
COMMON STOCK (continued) | | | | | |
Electrical Components & Equipment - 0.7% | | | | | |
Cooper Industries, Ltd. | | 6,500 | | $ | 343,720 |
Rockwell Automation, Inc. | | 3,847 | | | 265,289 |
| | | | | |
| | | | | 609,009 |
| | | | | |
Electronic Equipment Manufacturers - 0.0% | | | | | |
Agilent Technologies, Inc. * | | 600 | | | 22,044 |
| | | | | |
| | |
Electronic Manufacturing Services - 0.0% | | | | | |
Tyco Electronics, Ltd. | | 746 | | | 27,699 |
| | | | | |
| | |
Environmental & Facilities Services - 0.7% | | | | | |
Allied Waste Industries, Inc. * | | 16,800 | | | 185,136 |
Waste Management, Inc. | | 11,673 | | | 381,357 |
| | | | | |
| | | | | 566,493 |
| | | | | |
Fertilizers & Agricultural Chemicals - 0.1% | | | | | |
Monsanto Company | | 900 | | | 100,521 |
| | | | | |
| | |
Food Retail - 0.9% | | | | | |
Kroger Company | | 15,600 | | | 416,676 |
Supervalu, Inc. | | 9,100 | | | 341,432 |
| | | | | |
| | | | | 758,108 |
| | | | | |
Footwear - 0.3% | | | | | |
Nike, Inc. (CI.B) | | 4,200 | | | 269,808 |
| | | | | |
| | |
General Merchandise Stores - 0.7% | | | | | |
Big Lots, Inc. * | | 18,900 | | | 302,211 |
Family Dollar Stores, Inc. | | 16,000 | | | 307,680 |
| | | | | |
| | | | | 609,891 |
| | | | | |
Health Care Distributors - 0.5% | | | | | |
AmerisourceBergen Corporation | | 7,884 | | | 353,755 |
McKesson Corporation | | 1,100 | | | 72,061 |
| | | | | |
| | | | | 425,816 |
| | | | | |
Health Care Equipment - 1.4% | | | | | |
Baxter International, Inc. | | 9,400 | | | 545,670 |
Covidien, Ltd. | | 9,600 | | | 425,184 |
Medtronic, Inc. | | 4,725 | | | 237,526 |
| | | | | |
| | | | | 1,208,380 |
| | | | | |
Health Care Services - 0.0% | | | | | |
Medco Health Solutions, Inc. * | | 100 | | | 10,140 |
| | | | | |
| | |
Home Improvement Retail - 0.5% | | | | | |
Home Depot, Inc. | | 2,076 | | | 55,927 |
Sherwin-Williams Company | | 5,600 | | | 325,024 |
| | | | | |
| | | | | 380,951 |
| | | | | |
Household Appliances - 0.7% | | | | | |
Black & Decker Corporation | | 3,800 | | | 264,670 |
Stanley Works | | 6,300 | | | 305,424 |
| | | | | |
| | | | | 570,094 |
| | | | | |
| | | | | |
| | | Shares | | Value |
COMMON STOCK (continued) | | | | | |
Household Products - 2.3% | | | | | |
Clorox Company | | 2,600 | | $ | 169,442 |
Procter & Gamble Company | | 23,629 | | | 1,734,841 |
| | | | | |
| | | | | 1,904,283 |
| | | | | |
Hypermarkets & Super Centers - 1.0% | | | | | |
Wal-Mart Stores, Inc. | | 17,113 | | | 813,381 |
| | | | | |
| | |
Independent Power Producers & Energy Traders - 0.0% | | | | | |
Dynegy, Inc. * | | 3,700 | | | 26,418 |
| | | | | |
| | |
Industrial Conglomerates - 3.3% | | | | | |
3M Company | | 7,776 | | | 655,672 |
General Electric Company | | 57,669 | | | 2,137,790 |
| | | | | |
| | | | | 2,793,462 |
| | | | | |
Industrial Machinery - 1.4% | | | | | |
Illinois Tool Works, Inc. | | 8,000 | | | 428,320 |
Ingersoll-Rand Company, Ltd. | | 7,900 | | | 367,113 |
Parker Hannifin Corporation | | 4,900 | | | 369,019 |
| | | | | |
| | | | | 1,164,452 |
| | | | | |
Industrial REIT’s - 0.2% | | | | | |
Prologis | | 2,600 | | | 164,788 |
| | | | | |
| | |
Integrated Oil & Gas - 8.6% | | | | | |
Chevron Corporation | | 16,768 | | | 1,564,958 |
ConocoPhillips | | 13,417 | | | 1,184,721 |
Exxon Mobil Corporation (1) | | 37,741 | | | 3,535,954 |
Marathon Oil Corporation | | 9,200 | | | 559,912 |
Occidental Petroleum Corporation | | 4,000 | | | 307,960 |
| | | | | |
| | | | | 7,153,505 |
| | | | | |
Integrated Telecommunication Services - 3.4% | | | | | |
AT&T, Inc. | | 41,282 | | | 1,715,680 |
CenturyTel, Inc. | | 7,600 | | | 315,096 |
Qwest Communications International, Inc. | | 38,827 | | | 272,177 |
Verizon Communications, Inc. | | 11,842 | | | 517,377 |
| | | | | |
| | | | | 2,820,330 |
| | | | | |
Internet Retail - 0.5% | | | | | |
Amazon.com, Inc. * | | 2,100 | | | 194,544 |
Expedia, Inc. * | | 8,400 | | | 265,608 |
| | | | | |
| | | | | 460,152 |
| | | | | |
Internet Software & Services - 1.8% eBay, Inc. * | | 15,800 | | | 524,402 |
Google, Inc. * | | 1,375 | | | 950,785 |
| | | | | |
| | | | | 1,475,187 |
| | | | | |
Investment Banking & Brokerage - 2.8% | | | | | |
Charles Schwab Corporation | | 17,500 | | | 447,125 |
Goldman Sachs Group, Inc. | | 3,936 | | | 846,437 |
Lehman Brothers Holdings, Inc. | | 7,900 | | | 516,976 |
Merrill Lynch & Company, Inc. | | 9,353 | | | 502,069 |
| | | | | |
| | | | | 2,312,607 |
| | | | | |
| | |
| 55 | | The accompanying notes are an integral part of the financial statements |
| | |
| Schedule of Investments | | Series H (Enhanced Index Series) |
December 31, 2007 - continued | | |
| | | | | |
| | | Shares | | Value |
COMMON STOCK (continued) | | | | | |
Leisure Products - 0.4% | | | | | |
Hasbro, Inc. | | 12,000 | | $ | 306,960 |
| | | | | |
Life & Health Insurance - 1.4% | | | | | |
MetLife, Inc. | | 9,364 | | | 577,010 |
Prudential Financial, Inc. | | 6,000 | | | 558,240 |
| | | | | |
| | | | | 1,135,250 |
| | | | | |
Life Sciences Tools & Services - 0.5% | | | | | |
Thermo Fisher Scientific, Inc. * | | 7,700 | | | 444,136 |
| | | | | |
| | |
Managed Health Care - 2.1% | | | | | |
Aetna, Inc. | | 3,300 | | | 190,509 |
Cigna Corporation | | 7,400 | | | 397,602 |
Humana, Inc. * | | 4,900 | | | 369,019 |
UnitedHealth Group, Inc. | | 3,320 | | | 193,224 |
WellPoint, Inc. * | | 6,584 | | | 577,614 |
| | | | | |
| | | | | 1,727,968 |
| | | | | |
Metal & Glass Containers - 0.4% | | | | | |
Ball Corporation | | 7,000 | | | 315,000 |
| | | | | |
| | |
Movies & Entertainment - 1.7% | | | | | |
News Corporation | | 794 | | | 16,269 |
Time Warner, Inc. | | 27,958 | | | 461,587 |
Viacom, Inc. (CI.B) * | | 6,700 | | | 294,264 |
Walt Disney Company | | 21,422 | | | 691,502 |
| | | | | |
| | | | | 1,463,622 |
| | | | | |
Multi-Line Insurance - 1.2% | | | | | |
American International Group, Inc. | | 13,965 | | | 814,160 |
Genworth Financial, Inc. | | 6,665 | | | 169,624 |
| | | | | |
| | | | | 983,784 |
| | | | | |
Multi-Utilities - 1.4% | | | | | |
PG&E Corporation | | 8,916 | | | 384,190 |
Public Service Enterprise Group, Inc. | | 4,600 | | | 451,904 |
Sempra Energy | | 5,000 | | | 309,400 |
| | | | | |
| | | | | 1,145,494 |
| | | | | |
Office Electronics - 0.3% | | | | | |
Xerox Corporation | | 17,800 | | | 288,182 |
| | | | | |
| | |
Oil & Gas Drilling - 1.1% | | | | | |
ENSCO International, Inc. | | 5,000 | | | 298,100 |
Transocean, Inc. | | 4,079 | | | 583,972 |
| | | | | |
| | | | | 882,072 |
| | | | | |
Oil & Gas Equipment & Services - 1.7% | | | | | |
Halliburton Company | | 13,200 | | | 500,412 |
National Oilwell Varco, Inc. * | | 6,262 | | | 460,007 |
Schlumberger, Ltd. | | 4,547 | | | 447,288 |
| | | | | |
| | | | | 1,407,707 |
| | | | | |
Oil & Gas Refining & Marketing - 1.5% | | | | | |
Sunoco, Inc. | | 5,100 | | | 369,444 |
Tesoro Corporation | | 7,200 | | | 343,440 |
| | | | | |
| | | Shares | | Value |
COMMON STOCK (continued) | | | | | |
Oil & Gas Refining & Marketing (continued) | | | | | |
Valero Energy Corporation | | 7,984 | | $ | 559,120 |
| | | | | |
| | | | | 1,272,004 |
| | | | | |
Other Diversified Financial Services - 3.7% | | | | | |
Bank of America Corporation | | 21,428 | | | 884,119 |
Citigroup, Inc. | | 30,380 | | | 894,387 |
JPMorgan Chase & Company | | 28,310 | | | 1,235,732 |
Morgan Stanley | | 1,393 | | | 73,982 |
| | | | | |
| | | | | 3,088,220 |
| | | | | |
Packaged Foods & Meats - 1.3% | | | | | |
ConAgra Foods, Inc. | | 14,500 | | | 344,955 |
General Mills, Inc. | | 7,400 | | | 421,800 |
Kraft Foods, Inc. | | 949 | | | 30,966 |
Tyson Foods, Inc. | | 21,000 | | | 321,930 |
| | | | | |
| | | | | 1,119,651 |
| | | | | |
Paper Products - 0.2% | | | | | |
International Paper Company | | 6,100 | | | 197,518 |
| | | | | |
| | |
Pharmaceuticals -6.4% | | | | | |
Abbott Laboratories | | 4,747 | | | 266,544 |
Bristol-Myers Squibb Company | | 10,175 | | | 269,841 |
Eli Lilly & Company | | 9,371 | | | 500,318 |
Forest Laboratories, Inc. * | | 9,200 | | | 335,340 |
Johnson & Johnson | | 13,883 | | | 925,996 |
King Pharmaceuticals, Inc. * | | 11,700 | | | 119,808 |
Merck & Company, Inc. | | 18,776 | | | 1,091,073 |
Pfizer, Inc. | | 55,938 | | | 1,271,471 |
Schering-Plough Corporation | | 6,282 | | | 167,353 |
Watson Pharmaceuticals, Inc. * | | 11,300 | | | 306,682 |
Wyeth | | 1,855 | | | 81,972 |
| | | | | |
| | | | | 5,336,398 |
| | | | | |
Property & Casualty Insurance - 1.9% | | | | | |
ACE, Ltd. | | 6,900 | | | 426,282 |
AMBAC Financial Group, Inc. | | 1,900 | | | 48,963 |
Chubb Corporation | | 4,500 | | | 245,610 |
Travelers Companies, Inc. | | 9,881 | | | 531,598 |
XL Capital, Ltd. | | 6,700 | | | 337,077 |
| | | | | |
| | | | | 1,589,530 |
| | | | | |
Publishing -0.2% | | | | | |
McGraw-Hill Companies, Inc. | | 3,100 | | | 135,811 |
Meredith Corporation | | 900 | | | 49,482 |
| | | | | |
| | | | | 185,293 |
| | | | | |
Railroads - 0.5% | | | | | |
CSX Corporation | | 9,100 | | | 400,218 |
Union Pacific Corporation | | 345 | | | 43,339 |
| | | | | |
| | | | | 443,557 |
| | | | | |
Regional Banks - 1.2% | | | | | |
Fifth Third Bancorp | | 1,000 | | | 25,130 |
Keycorp | | 9,565 | | | 224,299 |
| | |
| 56 | | The accompanying notes are an integral part of the financial statements |
| | |
| Schedule of Investments | | Series H (Enhanced Index Series) |
December 31, 2007 - continued | | |
| | | | | |
| | | Shares | | Value |
COMMON STOCK (continued) | | | | | |
Regional Banks (continued) | | | | | |
M&T Bank Corporation | | 600 | | $ | 48,942 |
Marshall & llsley Corporation | | 12,500 | | | 331,000 |
National City Corporation | | 400 | | | 6,584 |
SunTrust Banks, Inc. | | 6,200 | | | 387,438 |
| | | | | |
| | | | | 1,023,393 |
| | | | | |
Restaurants - 1.2% | | | | | |
Darden Restaurants, Inc. | | 11,389 | | | 315,589 |
McDonald's Corporation | | 12,275 | | | 723,120 |
| | | | | |
| | | | | 1,038,709 |
| | | | | |
Retail REIPs - 0.2% | | | | | |
Simon Property Group, Inc. | | 1,858 | | | 161,386 |
| | | | | |
Semiconductor Equipment - 0.9% | | | | | |
Applied Materials, Inc. | | 24,807 | | | 440,572 |
Kla-Tencor Corporation | | 7,000 | | | 337,120 |
| | | | | |
| | | | | 777,692 |
| | | | | |
Semiconductors -2.0% | | | | | |
Intel Corporation | | 32,591 | | | 868,876 |
National Semiconductor Corporation | | 6,700 | | | 151,688 |
Texas Instruments, Inc. | | 18,394 | | | 614,360 |
| | | | | |
| | | | | 1,634,924 |
| | | | | |
Soft Drinks - 2.3% | | | | | |
Coca-Cola Company | | 8,734 | | | 536,006 |
Pepsi Bottling Group, Inc. | | 8,100 | | | 319,626 |
PepsiCo, Inc. | | 13,547 | | | 1,028,217 |
| | | | | |
| | | | | 1,883,849 |
| | | | | |
Specialized Finance - 0.8% | | | | | |
CIT Group, Inc. | | 12,300 | | | 295,569 |
IntercontinentalExchange, Inc. * | | 1,800 | | | 346,500 |
| | | | | |
| | | | | 642,069 |
| | | | | |
Specialized REIPs - 0.3% | | | | | |
Host Hotels & Resorts, Inc. | | 16,900 | | | 287,976 |
| | | | | |
Specialty Stores - 0.4% | | | | | |
Tiffany & Company | | 7,200 | | | 331,416 |
| | | | | |
Steel - 0.6% | | | | | |
Nucor Corporation | | 6,711 | | | 397,425 |
United States Steel Corporation | | 900 | | | 108,819 |
| | | | | |
| | | | | 506,244 |
| | | | | |
Systems Software - 3.5% | | | | | |
BMC Software, Inc. * | | 5,308 | | | 189,177 |
CA, Inc. | | 4,300 | | | 107,285 |
Microsoft Corporation | | 42,650 | | | 1,518,340 |
Novell, Inc. * | | 40,300 | | | 276,861 |
Oracle Corporation * | | 38,629 | | | 872,243 |
| | | | | |
| | | | | 2,963,906 |
| | | | | |
Thrifts & Mortgage Finance - 0.7% | | | | | |
Federal National Mortgage Association | | 8,769 | | | 350,585 |
| | | | | | |
| | | Shares | | Value |
COMMON STOCK (continued) | | | | | | |
Thrifts & Mortgage Finance (continued) | | | | | | |
Washington Mutual, Inc. | | | 17,159 | | $ | 233,534 |
| | | | | | |
| | | | | | 584,119 |
| | | | | | |
Tobacco - 1.3% | | | | | | |
Altria Group, Inc. | | | 9,400 | | | 710,452 |
Reynolds American, Inc. | | | 5,400 | | | 356,184 |
| | | | | | |
| | | | | | 1,066,636 |
| | | | | | |
Wireless Telecommunication Services - 0.2% | | | | | | |
American Tower Corporation * | | | 2,200 | | | 93,720 |
Sprint Nextel Corporation | | | 3,854 | | | 50,603 |
| | | | | | |
| | | | | | 144,323 |
| |
TOTAL COMMON STOCK (Cost $78,259,451) | | | | | $ | 81,594,815 |
| |
SHORT TERM INVESTMENTS - 0.2% | | | | | | |
U.S. Treasury Bill, 4.865%, 1/17/2008 | | $ | 140,000 | | $ | 139,846 |
| |
TOTAL SHORT TERM INVESTMENTS (Cost $ 139,742) | | | | | $ | 139,846 |
| |
REPURCHASE AGREEMENT - 0.7% | | | | | | |
United Missouri Bank, 3.61%, dated 12/31/07, matures 1/02/08; repurchase amount $627,126 (Collateralized by FHLMC, 1/12/08 with a value of $640,182) | | $ | 627,000 | | $ | 627,000 |
| |
TOTAL REPURCHASE AGREEMENT (Cost $627,000) | | | | | $ | 627,000 |
| |
Total Investments (SBL H Fund) | | | | | $ | 82,361,661 |
(Cost $79,026,193) - 98.6% Other Assets in Excess of Liabilities - 1.4% | | | | | | 1.167.103 |
| | | | | | |
TOTAL NET ASSETS - 100.0% | | | | | $ | 83,528,764 |
| | | | | | |
Footnotes
Percentages are stated as a percent of net assets.
For federal income tax purposes the identified cost of investments owned at 12/31/2007 was $80,141,614.
| | |
* | | - Non-income producing security |
1 | | - Security is segregated as collateral for open futures contracts. |
See notes to financial statements.
| | |
| 57 | | The accompanying notes are an integral part of the financial statements |
| | |
| | Series H |
| | (Enhanced Index Series) |
Statement of Assets and Liabilities
December 31, 2007
| | |
Assets: | | |
Investments, at value* | | $82,361,661 |
Cash | | 424 |
Receivables: | | |
Fund shares sold | | 41,712 |
Securities sold | | 5,108,027 |
Dividends | | 105,895 |
Prepaid expenses | | 2,266 |
| | |
Total assets | | 87,619,985 |
| | |
| |
Liabilities: | | |
| |
Payable for: | | |
Fund shares redeemed | | 60,850 |
Securities purchased | | 3,943,041 |
Variation margin on futures | | 9,960 |
Management fees | | 36,161 |
Administration fees | | 8,520 |
Transfer agent/maintenance fees | | 2,083 |
Custodian fees | | 10,000 |
Directors' fees | | 1,200 |
Professional fees | | 14,600 |
Other fees | | 4,806 |
| | |
Total liabilities | | 4,091,221 |
| | |
Net assets | | $83,528,764 |
| | |
| |
Net assets consist of: | | |
Paid in capital | | $76,695,898 |
Undistributed net investment income | | 1,269,184 |
Undistributed net realized gain on sale of investments | | 2,242,638 |
Net unrealized appreciation in value of investments | | 3,321,044 |
| | |
Net assets | | $83,528,764 |
| | |
| |
Capital shares authorized | | unlimited |
Capital shares outstanding | | 7,474,595 |
Net asset value per share | | |
(net assets divided by shares outstanding) | | $11.18 |
| | |
| |
*Investments, at cost | | $79,026,193 |
Statement of Operations
For Year Ended December 31, 2007
| | | | |
Investment Income: | | | | |
Dividends | | $ | 1,907,378 | |
Interest | | | 60,411 | |
| | | | |
Total investment income | | | 1,967,789 | |
| | | | |
| |
Expenses: | | | | |
Management fees | | | 761,436 | |
Administration fees | | | 102,649 | |
Transfer agent/maintenance fees | | | 25,165 | |
Custodian fees | | | 25,468 | |
Directors' fees | | | 5,987 | |
Professional fees | | | 16,496 | |
Reports to shareholders | | | 10,634 | |
Other | | | 4,582 | |
| | | | |
Total expenses | | | 952,417 | |
Less: | | | | |
Expenses waived | | | (253,812 | ) |
| | | | |
Net expenses | | | 698,605 | |
| | | | |
Net investment income | | | 1,269,184 | |
| | | | |
| |
Net Realized and Unrealized Gain (Loss): | | | | |
Net realized gain (loss) during the year on: | | | | |
Investments | | | 6,993,522 | |
Futures | | | 47,927 | |
| | | | |
Net realized gain | | | 7,041,449 | |
| | | | |
| |
Net unrealized appreciation (depreciation) during the year on: | | | | |
Investments | | | (6,750,132 | ) |
Futures | | | (13,864 | ) |
| | | | |
Net unrealized depreciation | | | (6,763,996 | ) |
| | | | |
Net realized and unrealized gain | | | 277,453 | |
| | | | |
Net increase in net assets resulting from operations | | $ | 1,546,637 | |
| | | | |
| | |
| 58 | | The accompanying notes are an integral part of the financial statements |
| | |
| | Series H |
Statement of Changes in Net Assets | | (Enhanced Index Series) |
| | | | | | | | |
| | | Year Ended
December 31, 2007 | | | Year Ended
December 31, 2006 | |
Increase (decrease) in net assets from operations: | | | | | | | | |
Net investment income | | $ | 1,269,184 | | | $ | 914,052 | |
Net realized gain during the year on investments | | | 7,041,449 | | | | 5,896,138 | |
Net unrealized appreciation (depreciation) during the year on investments | | | (6,763,996 | ) | | | 8,183,250 | |
| | | | | | | | |
Net increase in net assets resulting from operations | | | 1,546,637 | | | | 14,993,440 | |
| | | | | | | | |
| | |
Capital share transactions: | | | | | | | | |
Proceeds from sale of shares | | | 32,238,699 | | | | 42,070,411 | |
Issuance of shares in connection with merger (Note 10) | | | – | | | | 52,171,107 | |
Cost of shares redeemed | | | (60,286,322 | ) | | | (39,306,280 | ) |
| | | | | | | | |
Net increase (decrease) from capital share transactions | | | (28,047,623 | ) | | | 54,935,238 | |
| | | | | | | | |
Net increase (decrease) in net assets | | | (26,500,986 | ) | | | 69,928,678 | |
| | | | | | | | |
| | |
Net assets: | | | | | | | | |
Beginning of year | | | 110,029,750 | | | | 40,101,072 | |
| | | | | | | | |
End of year | | $ | 83,528,764 | | | $ | 110,029,750 | |
| | | | | | | | |
| | |
Undistributed net investment income at end of year | | $ | 1,269,184 | | | $ | 914,052 | |
| | | | | | | | |
| | |
Capital share activity: | | | | | | | | |
Shares sold | | | 2,808,020 | | | | 4,166,677 | |
Shares issued in connection with merger (Note 10) | | | – | | | | 5,481,948 | |
Shares redeemed | | | (5,271,412 | ) | | | (3,896,675 | ) |
| | | | | | | | |
Total capital share activity | | | (2,463,392 | ) | | | 5,751,950 | |
| | | | | | | | |
| | |
| 59 | | The accompanying notes are an integral part of the financial statements |
| | | | |
| Financial Highlights | | | | Series H |
Selected data for each share of capital stock outstanding throughout each year | | (Enhanced Index Series) |
| | | | | | | | | | | | | | | | | | | | |
| | | 2007 | | | 2006a | | | 2005 | | | 2004 | | | Year Ended
December 31,
2003b | |
| | |
Per Share Data | | | | | | | | | | | | | | | | | | | | |
Net asset value, beginning of period | | $ | 11.07 | | | $ | 9.58 | | | $ | 9.12 | | | $ | 8.31 | | | $ | 6.55 | |
| | |
Income (loss) from investment operations: | | | | | | | | | | | | | | | | | | | | |
Net investment incomec | | | 0.14 | | | | 0.03 | | | | 0.11 | | | | 0.11 | | | | 0.07 | |
Net gain (loss) on securities (realized and unrealized) | | | (0.03 | ) | | | 1.46 | | | | 0.35 | | | | 0.71 | | | | 1.75 | |
| | | | |
Total from investment operations | | | 0.11 | | | | 1.49 | | | | 0.46 | | | | 0.82 | | | | 1.82 | |
| | |
Less distributions: | | | | | | | | | | | | | | | | | | | | |
Dividends from net investment income | | | – | | | | – | | | | – | | | | (0.01 | ) | | | (0.06 | ) |
Total distributions | | | – | | | | – | | | | – | | | | (0.01 | ) | | | (0.06 | ) |
| | | | |
Net asset value, end of period | | $ | 11.18 | | | $ | 11.07 | | | $ | 9.58 | | | $ | 9.12 | | | $ | 8.31 | |
| | | | |
| | | | | | | | | | | | | | | | | | | | |
| | |
Total Returnd | | | 0.99 | % | | | 15.55 | % | | | 5.04 | % | | | 9.85 | % | | | 27.78 | % |
| | |
Ratios/Supplemental Data | | | | | | | | | | | | | | | | | | | | |
Net assets, end of period (in thousands) | | $ | 83,529 | | | $ | 110,030 | | | $ | 40,101 | | | $ | 38,822 | | | $ | 33,371 | |
| | |
Ratios to average net assets: | | | | | | | | | | | | | | | | | | | | |
Net investment income | | | 1.25 | % | | | 1.23 | % | | | 1.15 | % | | | 1.32 | % | | | 0.94 | % |
Total expensese | | | 0.94 | % | | | 0.98 | % | | | 1.04 | % | | | 0.99 | % | | | 0.96 | % |
Net expensesf | | | 0.69 | % | | | 0.73 | % | | | 0.79 | % | | | 0.74 | % | | | 0.77 | % |
Net expenses prior to custodian earnings credits and net of expense waivers | | | 0.69 | % | | | 0.73 | % | | | 0.79 | % | | | 0.74 | % | | | 0.77 | % |
| | |
Portfolio turnover rate | | | 89 | % | | | 119 | % | | | 106 | % | | | 98 | % | | | 44 | % |
a The financial highlights for Series H exclude the historical financial highlights for Series W. The assets of Series W were acquired by Series H on June 16, 2006. A total of $53,926,052 was excluded from purchases in the portfolio turnover calculation, which represents the cost of the securities Series H received as a result of the merger.
b Northern Trust became the sub-adviser of Series H effective May 1, 2003. Prior to May 1, 2003, Security Global Investors, formerly Security
Management Company, LLC, paid Deutsche Asset Management for sub-advisory services.
c Net investment income (loss) was computed using average shares outstanding throughout the period.
d Total return does not take into account any of the expenses associated with an investment in variable insurance products offered by Security Benefit Life Insurance Company. If total return had taken into account these expenses, performance would have been lower. Shares of a series of SBL Fund are available only through the purchase of such products.
e Total expense information reflects the expense ratios absent expense reductions by the Investment Manager, and earnings credits, as applicable.
f Net expense information reflects the expense ratios after voluntary expense waivers, reimbursements and custodian earnings credits, as applicable.
| | |
| 60 | | The accompanying notes are an integral part of the financial statements |
This page left blank intentionally.
| | |
| | |
| Manager’s Commentary | | Series J |
| February 15, 2008 | | (Mid Cap Growth Series) |
Adviser, Security Global Investors
| | |
 | | To Our Shareholders: For the year ended December 31, 2007, Series J of the SBL Fund—Mid Cap Growth Series posted a return of -10.43% for the year. These results lagged the benchmark, the Russell 2500 Growth, which gained 9.69%, and the median peer return of 16.34%. |
Our approach to the Series is to seek securities of companies that are able to grow and/or reinvest in increasingly profitable ventures and hold them over three to five years to capture the best part of the improvements in profits or profitability. We focus on investing in securities of companies that appear likely to generate above average profitability at prices that, as of yet, do not reflect that potential.
We use a “bottom-up” approach to choose portfolio securities that we believe are attractively valued with the greatest potential for appreciation. We attempt to identify companies that are in the early to middle stages of growth and are valued at a reasonable price.
Top Performers
While the portfolio had several strong performers, the holdings were sprinkled throughout different industries and in many cases were not held in positions large enough to make a material impact.
Incyte Corporation in the health care sector returned 72%, Shaw Group, Inc., in the industrials sector increased 80%, and Northern Trust Corporation was up 28%. However, none had the ability to counter-balance other holdings to an extent that would allow the sectors to add to portfolio value.
Disappointing Performers
For the most part, it was poor stock selection across a variety of industry sectors that hurt performance of the Series for the year. The largest detracting sectors were energy and information technology. While information technology
had a comparable weight relative to the benchmark, the Series’ had a large overweight position in the energy sector.
Security selection hit the portfolio hard in the energy sector even though the Series’ had nearly a triple weight in one of the best performing sectors, 18% to 7%. As a whole the energy sector in the portfolio lost -22%. In contrast, the energy sector in the Index returned a positive 30%, a performance spread of more than 50%. Evergreen Energy, Inc., slid -78% while Rentech, Inc., gave up -52%; each held more than a 3% average weight in the portfolio for the year. Both companies are involved in alternative energy production. Evergreen is in the process of bringing a clean coal technology to market while Rentech is commercializing a coal-to-liquids technology. The carbon dioxide controversy hurt both companies since CO2 is a significant byproduct of each firm’s process. These issues are more perceptual than material as Evergreen can reduce CO2 from coal. Rentech has CO2 sequestration and disposal plans for the projects under development.
Stock selection in the information technology sector hurt performance. While the Series’ weighting was 3% greater than the Index, holdings of the Series’ portfolio dropped -16% as the securities in the Index’s sector rose 8%. Symmerticom, Inc., lost -47% and Maxwell Technologies, Inc., declined -45% during the period as business developed at a slower rate than anticipated.
2008 Market Outlook
We continue to pursue opportunities with a focus on bottom-up research rather than any global macro forecast.
The causes of market volatility are factors of both the uncertainty within the credit markets, as the losses related to sub-prime mortgages and collateralized debt obligations worsened, and the slowdown in earnings growth. We believe the markets recognize that the tighter lending standards and asset write-downs will continue, and are part of a longer cycle phenomenon that will also continue in 2008. We believe that a gradual recovery will take root in the second half, as the easing policy of the Federal Reserve progresses.
| | |
| | |
| Manager’s Commentary | | Series J |
| February 15, 2008 | | (Mid Cap Growth Series) |
While the U.S. and developed markets should slow in the first half of 2008, we expect developing economies to remain healthy. For this reason, we will continue to favor global companies that have exposure to these developing economics. Finally, we continue to be underweight health-care as we head into an election year and fear heightened headline risk.
Security Global Investors (SGI) recently acquired a proven investment team specializing in domestic growth equities. The new SGI growth team will begin managing assets of the Mid Cap Growth portfolio on February 1, 2008.
We believe that investing is a long-term pursuit that requires patience and a consistent approach. As always, we will continue to do our best to seek the potential available in small- and mid- capitalization companies. On behalf of Security Global Investors, I would like to thank you for placing your trust and money with us.
|
Sincerely, |
|
James P. Schier, Senior Portfolio Manager |
| | |
| | Series J |
| Performance Summary | | (Mid Cap Growth Series) |
| December 31, 2007 | | (unaudited) |
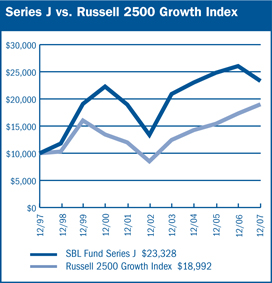
$10,000 Over 10 Years
The chart above assumes a hypothetical $10,000 investment in Series J (Mid Cap Growth Series) on December 31, 1997 and reflects the fees and expenses of Series J. The Russell 2500 Growth Index is an unmanaged index that measures the per formance of securities of small-to-mid U.S. companies with greater-than-average growth orientation.
| | | | | | | | | |
Periods Ended 12-31-071 | | 1 Year | | | 5 Years | | | 10 Years | |
Series J | | (10.43 | %) | | 11.77 | % | | 8.84 | % |
1 Per formance figures do not reflect fees and expenses associated with an investment in variable insurance products offered by Security Benefit Life Insurance Company. If returns had taken into account these fees and expenses, performance would have been lower. Shares of a Series of SBL Fund are available only through the purchase of such products. The per formance data quoted above represents past per formance. Past performance is not predictive of future performance. The investment return and principal value of an investment will fluctuate so that an investor’s shares, when redeemed, may be worth more or less than their original cost. | |
| | | |
Portfolio Composition by Sector | | | |
Consumer Discretionary | | 3.73% | |
Consumer Staples | | 5.37 | |
Energy | | 11.39 | |
Financials | | 7.62 | |
Health Care | | 10.20 | |
Industrials | | 12.06 | |
Information Technology | | 14.87 | |
Materials | | 2.42 | |
Utilities | | 3.26 | |
Exchange Traded Funds | | 13.57 | |
Warrants | | 0.34 | |
U.S. Government Sponsored Agencies | | 11.66 | |
Commercial Paper | | 7.88 | |
Liabilities in Excess of Other Assets | | (4.37 | ) |
Total Net Assets | | 100.00% | |
| | | | |
| | | | |
| | |
| 64 | | The accompanying notes are an integral part of the financial statements |
| | |
| | Series J |
| Performance Summary | | (Mid Cap Growth Series) |
| December 31, 2007 | | Unaudited |
Information About Your Series Expenses
Calculating your ongoing Series expenses
Example
As a shareholder of the Series, you incur ongoing costs, including management fees and other series expenses. Performance figures and expense ratios do not reflect fees and expenses associated with an investment in variable insurance products. Shares of a Series of SBL Fund are available only through the purchase of such products. This example is intended to help you understand your ongoing costs (in dollars) of investing in the Series and to compare these costs with ongoing costs of investing in other mutual funds. The example is based on an investment of $1,000 invested at the beginning of the period and held for the entire period, July 1, 2007 through December 31, 2007.
Actual Expenses
The first line in the table provides information about actual account values and actual expenses. You may use the information in this table, together with the amount you invested, to estimate the expenses that you paid over the period. Simply divide your account value by $1,000 (for example, an $8,600 account value divided by $1,000 = 8.6), then multiply the result by the number in the table under the heading entitled “Expenses Paid During the Period” to estimate the expenses you paid on your account during this period.
Hypothetical Example for Comparison Purposes
The second line in the table provides information about hypothetical account values and hypothetical expenses based on the Series actual expense ratio and an assumed rate of return of 5% per year before expenses, which is not the Series actual return. The hypothetical account values and expenses may not be used to estimate the actual ending account balance or expenses you paid for the period. You may use this information to compare the ongoing costs of investing in the Series and other funds. To do so, compare this 5% hypothetical example with the 5% hypothetical examples that appear in the shareholder reports of the other mutual funds.
Please note that the expenses shown in the table are meant to highlight your ongoing costs only and do not reflect any fees and expenses associated with an investment in variable insurance products. Therefore, the second line is useful in comparing ongoing costs only, and will not help you determine the relative total costs of owning different funds. In addition, if these fees and expenses associated with an investment in variable insurance products were included, your costs would have been higher.
| | | | | | | | | |
Series Expenses | | | | | | | | | |
| | |
| Beginning
Account
Value
7/1/2007 | |
| Ending
Account Value
12/31/20071 | |
| Expenses
Paid
During
Period2 |
Series J(Mid Cap Growth Series) | | | | | | |
Actual | | $ | 1,000.00 | | $ | 894.57 | | $ | 4.25 |
Hypothetical | | | 1,000.00 | | | 1,020.72 | | | 4.53 |
1 | The actual ending account value is based on the actual total return of the Series for the period July 1, 2007 to December 31, 2007 after actual expenses and will differ from the hypothetical ending account value which is based on the Series expense ratio and a hypothetical annual return of 5% before expenses. The actual cumulative return at net asset value for the period July 1, 2007 to December 31, 2007 was (10.54%). |
2 | Expenses are equal to the Series annualized expense ratio of 0.89%, net of any applicable fee waivers or earnings credits, multiplied by the average account value over the period, multiplied by 184/365 (to reflect the one-half year period) |
| | |
| | |
| Schedule of Investments | | Series J (Mid Cap Growth Series) |
| December 31, 2007 | | |
| | | | | |
| | | Shares | | Value |
COMMON STOCK - 84.2% | | | | | |
Aerospace & Defense - 1.1% | | | | | |
Argon ST, Inc. * | | 147,900 | | $ | 2,745,024 |
| | | | | |
Apparel Retail - 0.8% | | | | | |
Chico’s FAS, Inc. * | | 83,000 | | | 749,490 |
Collective Brands, Inc. * | | 79,000 | | | 1,373,810 |
| | | | | |
| | | | | 2,123,300 |
| | | | | |
Application Software - 0.8% | | | | | |
TIBCO Software, Inc. * | | 240,000 | | | 1,936,800 |
| | | | | |
Asset Management & Custody | | | | | |
Banks - 3.1% | | | | | |
Northern Trust Corporation | | 102,700 | | | 7,864,766 |
| | | | | |
Automotive Retail - 0.6% | | | | | |
Carmax, Inc. * | | 38,000 | | | 750,500 |
O’Reilly Automotive, Inc. * | | 26,900 | | | 872,367 |
| | | | | |
| | | | | 1,622,867 |
| | | | | |
Biotechnology - 4.4% | | | | | |
Human Genome Sciences, Inc. * | | 312,700 | | | 3,264,588 |
Incyte Corporation * | | 598,400 | | | 6,013,920 |
lomai Corporation * | | 307,200 | | | 325,632 |
Isis Pharmaceuticals, Inc. * | | 24,450 | | | 385,088 |
Zymogenetics, Inc. * | | 102,600 | | | 1,197,342 |
| | | | | |
| | | | | 11,186,570 |
| | | | | |
Broadcasting & Cable TV - 0.8% | | | | | |
Salem Communications Corporation | | 208,600 | | | 1,374,674 |
WorldSpace, Inc. * | | 307,100 | | | 515,928 |
| | | | | |
| | | | | 1,890,602 |
| | | | | |
Coal & Consumable Fuels - 2.4% | | | | | |
Arch Coal, Inc. | | 88,200 | | | 3,962,826 |
Evergreen Energy, Inc. * | | 909,500 | | | 2,028,185 |
| | | | | |
| | | | | 5,991,011 |
| | | | | |
Communications Equipment - 3.2% | | | | | |
Finisar Corporation * | | 944,500 | | | 1,369,525 |
PC-Tel, Inc. * | | 449,100 | | | 3,080,826 |
Symmetricom, Inc. * | | 751,700 | | | 3,540,507 |
| | | | | |
| | | | | 7,990,858 |
| | | | | |
Construction & Engineering - 2.8% | | | | | |
Insituform Technologies, Inc. * | | 306,600 | | | 4,537,680 |
Shaw Group, Inc. * | | 40,400 | | | 2,441,776 |
| | | | | |
| | | | | 6,979,456 |
| | | | | |
Construction Materials - 0.4% | | | | | |
Martin Marietta Materials, Inc. | | 7,400 | | | 981,240 |
| | | | | |
Data Processing & Outsourced Services -1.9% | | | | | |
Euronet Worldwide, Inc. * | | 157,000 | | | 4,710,000 |
| | | | | |
Diversified Commercial & Professional Services - 1.8% | | | | | |
ChoicePoint, Inc. * | | 15,500 | | | 564,510 |
| | | | | |
COMMON STOCK (continued) | | | | | |
Diversified Commercial & Professional Services (continued) | | | | | |
Navigant Consulting, Inc. * | | 292,600 | | $ | 3,999,842 |
| | | | | |
| | | | | 4,564,352 |
| | | | | |
Education Services - 0.3% | | | | | |
ITT Educational Services, Inc. * | | 7,500 | | | 639,525 |
| | | | | |
Electrical Components & Equipment - 4.9% | | | | | |
Brady Corporation | | 46,000 | | | 1,614,140 |
Lime Energy Company * | | 68,900 | | | 93,015 |
Roper Industries, Inc. | | 129,000 | | | 8,067,660 |
UQM Technologies, Inc. * (1) | | 722,272 | | | 2,448,502 |
| | | | | |
| | | | | 12,223,317 |
| | | | | |
Electronic Manufacturing Services - 0.2% | | | | | |
Trimble Navigation, Ltd. * | | 20,600 | | | 622,944 |
| | | | | |
Exchange Traded Funds - 13.6% iShares Russell 2000 Growth Index Fund | | 120,000 | | | 10,041,600 |
iShares S&P MidCap 400 Growth Index Fund | | 270,000 | | | 24,151,500 |
| | | | | |
| | | | | 34,193,100 |
| | | | | |
Gas Utilities - 2.0% | | | | | |
Questar Corporation | | 92,000 | | | 4,977,200 |
| | | | | |
General Merchandise Stores - 0.2% | | | | | |
Dollar Tree Stores, Inc. * | | 18,600 | | | 482,112 |
| | | | | |
Health Care Distributors - 1.4% | | | | | |
Henry Schein, Inc. * | | 46,300 | | | 2,842,820 |
Patterson Companies, Inc. * | | 23,300 | | | 791,035 |
| | | | | |
| | | | | 3,633,855 |
| | | | | |
Health Care Facilities - 0.4% | | | | | |
US Physical Therapy, Inc. * | | 76,100 | | | 1,093,557 |
| | | | | |
Health Care Services - 0.5% | | | | | |
Hythiam, Inc. * | | 161,700 | | | 473,781 |
Providence Service Corporation * | | 25,400 | | | 714,756 |
| | | | | |
| | | | | 1,188,537 |
| | | | | |
Health Care Supplies - 1.7% | | | | | |
Dentsply International, Inc. | | 77,000 | | | 3,466,540 |
Regeneration Technologies, Inc. * | | 98,400 | | | 854,112 |
| | | | | |
| | | | | 4,320,652 |
| | | | | |
Human Resource & Employment Services - 0.4% | | | | | |
Administaff, Inc. | | 37,900 | | | 1,071,812 |
| | | | | |
Industrial Machinery - 0.8% | | | | | |
Basin Water, Inc. * | | 153,700 | | | 1,271,099 |
Donaldson Company, Inc. | | 18,400 | | | 853,392 |
| | | | | |
| | | | | 2,124,491 |
| | | | | |
| | |
| 66 | | The accompanying notes are an integral part of the financial statements |
| | |
| | |
| Schedule of Investments | | Series J (Mid Cap Growth Series) |
| December 31, 2007 - continued | | |
| | | | | |
| | | Shares | | Value |
COMMON STOCK (continued) | | | | | |
Life Sciences Tools & Services - 1.4% | | | | | |
Covance, Inc. * | | 11,700 | | $ | 1,013,454 |
Millipore Corporation * | | 13,200 | | | 965,976 |
Waters Corporation * | | 19,300 | | | 1,526,051 |
| | | | | |
| | | | | 3,505,481 |
| | | | | |
Metal & Glass Containers - 2.0% | | | | | |
Owens-Illinois, Inc. * | | 24,600 | | | 1,217,700 |
Pactiv Corporation * | | 146,000 | | | 3,887,980 |
| | | | | |
| | | | | 5,105,680 |
| | | | | |
Multi-Line Insurance - 0.7% | | | | | |
Assurant, Inc. | | 27,700 | | | 1,853,130 |
| | | | | |
Multi-Utilities - 1.3% | | | | | |
Alliant Energy Corporation | | 80,000 | | | 3,255,200 |
| | | | | |
Oil & Gas Drilling - 3.0% | | | | | |
ENSCO International, Inc. | | 27,000 | | | 1,609,740 |
Helmerich & Payne, Inc. | | 147,800 | | | 5,922,346 |
| | | | | |
| | | | | 7,532,086 |
| | | | | |
Oil & Gas Equipment & Services - 1.8% | | | | | |
BJ Services Company | | 143,000 | | | 3,469,180 |
Superior Energy Services, Inc. * | | 31,300 | | | 1,077,346 |
| | | | | |
| | | | | 4,546,526 |
| | | | | |
Oil & Gas Refining & Marketing - 1.9% | | | | | |
Nova Biosource Fuels, Inc. * | | 716,200 | | | 2,076,980 |
Rentech, Inc. * | | 1,390,300 | | | 2,516,443 |
Syntroleum Corporation * | | 311,100 | | | 261,324 |
| | | | | |
| | | | | 4,854,747 |
| | | | | |
Oil & Gas Storage & Transportation - 2.3% | | | | | |
Williams Companies, Inc. | | 162,000 | | | 5,796,360 |
| | | | | |
Packaged Foods & Meats - 5.4% | | | | | |
Hormel Foods Corporation | | 201,000 | | | 8,136,480 |
McCormick & Company, Inc. | | 17,300 | | | 655,843 |
Smithfield Foods, Inc. * | | 164,000 | | | 4,742,880 |
| | | | | |
| | | | | 13,535,203 |
| | | | | |
Pharmaceuticals - 0.3% | | | | | |
Artes Medical, Inc. * | | 16,100 | | | 36,547 |
Mylan, Inc. | | 53,300 | | | 749,398 |
| | | | | |
| | | | | 785,945 |
| | | | | |
Real Estate Management & Development - 0.5% | | | | | |
Forest City Enterprises, Inc. | | 15,300 | | | 679,932 |
Jones Lang LaSalle, Inc. | | 8,000 | | | 569,280 |
| | | | | |
| | | | | 1,249,212 |
| | | | | |
Regional Banks - 1.6% | | | | | |
Boston Private Financial Holdings,
Inc. | | 145,600 | | | 3,942,848 |
| | | | | |
Residential REIT’s - 0.2% | | | | | |
UDR, Inc. | | 29,500 | | | 585,575 |
| | | | | |
| | | | | | |
| | | Shares | | Value |
COMMON STOCK (continued) | | | | | | |
Retail REIT’s - 1.1% | | | | | | |
Macerich Company | | | 40,000 | | $ | 2,842,400 |
| | | | | | |
Semiconductors - 6.3% | | | | | | |
Applied Micro Circuits
Corporation * | | | 441,250 | | | 3,856,525 |
IXYS Corporation * (1) | | | 943,900 | | | 7,570,078 |
Microchip Technology, Inc. | | | 47,000 | | | 1,476,740 |
Mindspeed Technologies, Inc. * | | | 1,531,800 | | | 1,868,796 |
QuickLogic Corporation * | | | 334,000 | | | 1,102,200 |
| | | | | | |
| | | | | | 15,874,339 |
| | | | | | |
Specialized REITs - 0.3% | | | | | | |
Ventas, Inc. | | | 18,700 | | | 846,175 |
| | | | | | |
Specialty Stores - 1.1% | | | | | | |
PetSmart, Inc. | | | 66,800 | | | 1,571,804 |
Tiffany & Company | | | 23,600 | | | 1,086,308 |
| | | | | | |
| | | | | | 2,658,112 |
| | | | | | |
Systems Software - 2.5% | | | | | | |
BMC Software, Inc. * | | | 35,900 | | | 1,279,476 |
Progress Software Corporation * | | | 150,000 | | | 5,052,000 |
| | | | | | |
| | | | | | 6,331,476 |
TOTAL COMMON STOCK (Cost $207,507 ,254) | | | | | $ | 212,258,443 |
| | | | | | |
PREFERRED STOCK - 0.3% | | | | | | |
Environmental & Facilities Services - 0.3% | | | | | | |
ThermoEnergy Corporation PIPE * (1)(2)(3) | | | 1,380,000 | | | 676,200 |
TOTAL PREFERRED STOCK (Cost) $1,302,103) | | | | | $ | 676,200 |
WARRANTS - 0.3% | | | | | | |
Warrants - 0.3% | | | | | | |
Lime Energy Company
$ 1.00, 3/19/2009 | | | 43,050 | | | 36,835 |
Nova Biosource Fuels, Inc.
$ 2.40, 7/5/2011 | | | 358,100 | | | 618,766 |
Orthovita, Inc.
$ 4.00, 6/26/2008 | | | 175,000 | | | 36,147 |
Syntroleum Corporation
$ 7.60, 5/26/2008 | | | 29,100 | | | 8,730 |
ThermoEnergy Corporation
$ 0.75, 7/14/2008 (1)(2) | | | 1,380,000 | | | 147,108 |
| | | | | | |
| | | | | | 847,586 |
TOTAL WARRANTS (Cost $1,574,244) | | | | | $ | 847,586 |
| | | Principal
Amount | | Value |
U.S. GOVERNMENT SPONSORED) AGENCY BONDS & NOTES - 11.7% | | | |
Federal Home Loan Bank | | | | | | |
4.21% - 2008 | | $ | 1,043,000 | | | 1,041,780 |
4.211% - 2008 | | | 3,100,000 | | | 3,089,484 |
4.22% - 2008 | | | 2,000,000 | | | 1,994,842 |
| | |
| 67 | | The accompanying notes are an integral part of the financial statements |
| | |
| | |
| Schedule of Investments | | Series J (Mid Cap Growth Series) |
| December 31, 2007 - continued | | |
| | | | | | |
| | | Principal
Amount | | Value |
U.S. GOVERNMENT SPONSORED AGENCY BONDS & NOTES (continued) |
Federal Home Loan Bank (continued) | | | | | | |
4.22% – 2008 | | $ | 2,000,000 | | $ | 1,994,608 |
4.24% – 2008 | | | 4,000,000 | | | 3,999,145 |
4.26% – 2008 | | | 1,300,000 | | | 1,298,801 |
4.30% – 2008 | | | 2,000,000 | | | 1,996,408 |
Federal National Mortgage Association |
4.18% – 2008 | | | 2,000,000 | | | 1,997,910 |
4.207% – 2008 | | | 2,800,000 | | | 2,798,040 |
4.28% – 2008 | | | 2,300,000 | | | 2,292,344 |
4.28% – 2008 | | | 2,400,000 | | | 2,391,440 |
4.29% – 2008 | | | 1,800,000 | | | 1,796,354 |
4.29% – 2008 | | | 2,700,000 | | | 2,693,243 |
TOTAL U.S. GOVERNMENT SPONSORED AGENCY BONDS & NOTES
(Cost $29,384,399) | | $ | 29,384,399 |
COMMERCIAL PAPER - 7.9% | | | | | | |
Banking - 2.5% | | | | | | |
Credit Suisse First Boston USA
4.71%, 1/28/2008 | | | 1,500,000 | | | 1,494,701 |
UBS Finance (DE) LLC
4.28%, 1/17/2008 | | | 1,145,000 | | | 1,142,619 |
4.65%, 1/28/2008 | | | 1,600,000 | | | 1,594,420 |
Wells Fargo Company, Inc.
4.25%, 1/8/2008 | | | 2,000,000 | | | 1,998,347 |
| | | | | | |
| | | | | | 6,230,087 |
| | | | | | |
Brokerage - 0.6% | | | | | | |
Goldman Sachs Group, Inc.
4.83%, 1/3/2008 | | | 1,500,000 | | | 1,499,598 |
| | | | | | |
Consumer Products - 2.2% | | | | | | |
Unilever Capital Corporation
4.22%, 1/15/2008 | | | 2,000,000 | | | 1,996,718 |
4.25%, 1/17/2008 | | | 2,000,000 | | | 1,996,222 |
4.22%, 1/25/2008 | | | 1,500,000 | | | 1,495,780 |
| | | | | | 5,488,720 |
| | | | | | |
Electric - 0.7% | | | | | | |
Southern Company
4.25%, 1/23/2008 | | | 1,900,000 | | | 1,895,065 |
| | | | | | |
Financial Companies - Captive - 0.7% | | | | | | |
General Electric Capital Corporation
4.42%, 1/2/2008 | | | 1,700,000 | | | 1,699,791 |
| | | | | | |
Food & Beverage - 0.8% | | | | | | |
Archer Daniels Midland Company
4.30%, 1/14/2008 | | | 2,000,000 | | | 1,996,894 |
| | | | | | |
| | | | | | |
| | | Principal
Amount | | Value | |
COMMERCIAL PAPER (continued) | | | | | | |
Pharmaceuticals - 0.4% | | | | | | |
AstraZeneca plc
4.20%, 1/25/2008 | | 1,100,000 | | $ | 1,096,920 | |
TOTAL COMMERCIAL PAPER (Cost $19,907,075) | | $ | 19,907,075 | |
Total Investments (SBLJ Fund) | | | | $ | 263,073,703 | |
(Cost $259,675,075) - 104.4% | | | | | | |
Liabilities in Excess of Other Assets - (4.4)% | | | | | (11,007,222 | ) |
| | | | | | |
TOTAL NET ASSETS - 100.0% | | | | $ | 252,066,481 | |
| | | | | | |
Footnotes
Percentages are stated as a percent of net assets. For federal income tax purposes the identified cost of investments owned at 12/31/2007 was $259,675,075.
| * | - Non-income producing security |
| 1 | - Security is deemed illiquid. The total market value of illiquid securities is $10,841,888 (cost $15,828,021), or 4.3% of total net assets. |
| 2 | - Security is restricted from resale. See Note 4 in notes to financial statements. |
| 3 | - PIPE (Private Investment in Public Equity) – Stock issued by a company in the secondary market as a means of raising capital more quickly and less expensively than through registration of a secondary public offering. |
Glossary:
plc – Public Limited Company
See notes to financial statements.
| | |
| 68 | | The accompanying notes are an integral part of the financial statements |
| | |
| | Series J |
| | (Mid Cap Growth Series) |
| | |
Statement of Assets and Liabilities
December 31, 2007
| | | |
| Assets: | | |
Investments, at value* | | $ | 263,073,703 |
Cash | | | 109,494 |
Receivables: | | | |
Fund shares sold | | | 148,138 |
Securities sold | | | 1,454,024 |
Dividends | | | 46,717 |
Prepaid expenses | | | 5,847 |
| | | |
Total assets | | | 264,837,923 |
| | | |
Liabilities: | | | |
| |
Payable for: | | | |
Fund shares redeemed | | | 310,712 |
Securities purchased | | | 12,193,497 |
Management fees | | | 162,541 |
Administration fees | | | 21,188 |
Transfer agent/maintenance fees | | | 2,083 |
Custodian fees | | | 6,800 |
Directors’ fees | | | 4,000 |
Professional fees | | | 37,000 |
Other fees | | | 33,621 |
| | | |
Total liabilities | | | 12,771,442 |
| | | |
Net assets | | $ | 252,066,481 |
| | | |
Net assets consist of: | | | |
Paid in capital | | $ | 208,894,863 |
Undistributed net realized gain on sale of investments | | | 39,772,990 |
Net unrealized appreciation in value ofinvestments | | | 3,398,628 |
| | | |
Net assets | | $ | 252,066,481 |
| | | |
Capital shares authorized | | | unlimited |
Capital shares outstanding | | | 9,001,226 |
Net asset value per share (net assets divided by shares outstanding) | | $ | 28.00 |
| | | |
*Investments, at cost | | $ | 259,675,075 |
Statement of Operations
For Year Ended December 31, 2007
| | | | |
| Investment Income: | | | |
Dividends | | $ | 1,382,466 | |
Interest | | | 1,021,534 | |
| | | | |
Total investment income | | | 2,404,000 | |
| | | | |
| |
Expenses: | | | | |
Management fees | | | 2,395,771 | |
Administration fees | | | 305,683 | |
Transfer agent/maintenance fees | | | 25,213 | |
Custodian fees | | | 27,062 | |
Directors’ fees | | | 15,439 | |
Professional fees | | | 40,901 | |
Reports to shareholders | | | 36,506 | |
Other | | | 18,227 | |
| | | | |
Total expenses | | | 2,864,802 | |
| | | | |
Net investment loss | | | (460,802 | ) |
| | | | |
| |
Net Realized and Unrealized Gain (Loss): | | | | |
Net realized gain (loss) during the year on: | | | | |
Investments | | | 39,958,673 | |
Options written | | | 438,455 | |
| | | | |
Net realized gain | | | 40,397,128 | |
| | | | |
| |
Net unrealized appreciation (depreciation) during the year on: | | | | |
Investments | | | (70,706,613 | ) |
Options written | | | 93,457 | |
| | | | |
Net unrealized depreciation | | | (70,613,156 | ) |
| | | | |
Net realized and unrealized loss | | | (30,216,028 | ) |
| | | | |
Net decrease in net assets resulting from operations | | $ | (30,676,830 | ) |
| | | | |
| | |
| 69 | | The accompanying notes are an integral part of the financial statements |
| | |
| | |
| | Series J |
| Statement of Changes in Net Assets | | (Mid Cap Growth Series) |
| | | | | | |
| | | Year Ended
December 31, 2007 | | Year Ended
December 31, 2006 |
Increase (decrease) in net assets from operations: | | | | | | |
Net investment loss | | $ | (460,802) | | $ | (1,992,402) |
Net realized gain during the year on investments | | | 40,397,128 | | | 42,907,786 |
Net unrealized depreciation during the year on investments | | | (70,613,156) | | | (21,074,608) |
| | | | | | |
Net increase (decrease) in net assets resulting from operations | | | (30,676,830) | | | 19,840,776 |
| | | | | | |
| | |
Capital share transactions: | | | | | | |
Proceeds from sale of shares | | | 46,162,993 | | | 76,838,640 |
Cost of shares redeemed | | | (144,083,682) | | | (136,813,260) |
| | | | | | |
Net decrease from capital share transactions | | | (97,920,689) | | | (59,974,620) |
| | | | | | |
Net decrease in net assets | | | (128,597,519) | | | (40,133,844) |
| | | | | | |
| | |
Net assets: | | | | | | |
Beginning of year | | | 380,664,000 | | | 420,797,844 |
| | | | | | |
End of year | | $ | 252,066,481 | | $ | 380,664,000 |
| | | | | | |
| | |
Undistributed net investment income at end of year | | $ | – | | $ | – |
| | | | | | |
| | |
Capital share activity: | | | | | | |
Shares sold | | | 1,509,177 | | | 2,485,919 |
Shares redeemed | | | (4,683,979) | | | (4,435,068) |
| | | | | | |
Total capital share activity | | | (3,174,802) | | | (1,949,149) |
| | | | | | |
| | |
| 70 | | The accompanying notes are an integral part of the financial statements |
| | |
| | |
| Financial Highlights | | Series J |
| Selected data for each share of capital stock outstanding throughout each year | | (Mid Cap Growth Series) |
| | | | | | | | | | |
| | | 2007 | | 2006 | | 2005 | | 2004 | | Year Ended
December 31,
2003a |
Per Share Data | | | | | | | | | | |
Net asset value, beginning of period | | $31.26 | | $29.79 | | $27.63 | | $25.09 | | $16.05 |
| |
Income (loss) from investment operations: | | | | | | | | | | |
Net investment lossb | | (0.04) | | (0.16) | | (0.13) | | (0.14) | | (0.11) |
Net gain (loss) on securities (realized and unrealized) | | (3.22) | | 1.63 | | 2.29 | | 2.68 | | 9.15 |
| | |
Total from investment operations | | (3.26) | | 1.47 | | 2.16 | | 2.54 | | 9.04 |
| |
Net asset value, end of period | | $28.00 | | $31.26 | | $29.79 | | $27.63 | | $25.09 |
| | |
| | | | | |
| | | | | | | | | | | |
Total Returnc | | (10.43%) | | 4.93% | | 7.82% | | 10.12% | | 56.32% |
Ratios/Supplemental Data | | | | | | | | | | |
Net assets, end of period (in thousands) | | $252,066 | | $380,664 | | $420,798 | | $437,789 | | $447,928 |
| |
Ratios to average net assets: | | | | | | | | | | |
Net investment loss | | (0.14%) | | (0.48%) | | (0.47%) | | (0.53%) | | (0.55%) |
Total expensesd | | 0.90% | | 0.90% | | 0.90% | | 0.88% | | 0.83% |
Net expensese | | 0.90% | | 0.90% | | 0.90% | | 0.88% | | 0.83% |
| |
Portfolio turnover rate | | 34% | | 29% | | 29% | | 37% | | 61% |
a The financial highlights for Series J exclude the historical financial highlights of Series T. The assets of Series T were acquired by Series J on October 3, 2003.
b Net investment income (loss) was computed using average shares outstanding throughout the period.
c Total return does not take into account any of the expenses associated with an investment in variable insurance products offered by Security Benefit Life Insurance Company. If total return had taken into account these expenses, performance would have been lower. Shares of a series of SBL Fund are available only through the purchase of such products.
d Total expense information reflects the expense ratios absent expense reductions by the Investment Manager, and earnings credits, as applicable.
e Net expense information reflects the expense ratios after voluntary expense waivers, reimbursements and custodian earnings credits, as applicable.
| | |
| 71 | | The accompanying notes are an integral part of the financial statements |
This page left blank intentionally.
| | |
| | |
| Manager’s Commentary | | Series N |
| February 15, 2008 | | (Managed Asset Allocation Series) |

Subadviser, T. Rowe Price Associates, Inc.
| | |

| | Performance For the year ended December 31, 2007, Series N of the SBL Fund -Managed Asset Allocation Series posted a 6.04% total return versus the 6.22% return for its custom benchmark. |
Market Environment
Widespread risk aversion pushed broad fixed income indexes ahead of stocks for the year, with higher-quality sectors leading the way. The high-yield market struggled through the last three months of 2007 and posted disappointing results for the full year. The second round of the current credit crisis began in November and quickly wiped out the positive momentum generated in September and October. While the high-yield market produced negative absolute returns in the fourth quarter, our relatively conservative strategy limited our downside in a period where risk appetite decreased significantly.
In the equity markets, the momentum turned toward large-cap and growth-oriented stocks after years of outperformance by small-cap and value-oriented issues. Global demand lifted the energy, materials and technology sectors during the year, while financials and consumer discretionary stocks suffered the effects of the sub-prime mortgage crisis.
Portfolio Review
The portfolio’s overweight to equity was a slight detractor to performance as bonds outpaced U.S. stocks for the year. However, the portfolio’s allocation to international equities was beneficial as this sector outperformed U.S. stocks and U.S. bonds over the same time period. Underweighting small-cap stocks in favor of large-caps was also a positive contributor to outperformance.
Security selection contributed positively for the period, especially for large-cap stocks, the portfolio’s largest component. Standout performers included Google, Inc., and Merck & Company, Inc. The portfolio also benefited from a substantial overweight to the internet and catalog retail group as well as underweights and favorable stock selection in both commercial banks and media.
Within fixed income, an underweight to high-yield securities versus the portfolio’s neutral allocation contributed positively for the year. Security selection for both investment grade and high yield bonds was a positive contributor.
Among non-U.S. equities, security selection contributed positively for the year even after a downturn in the third and fourth quarters. The growing allocation to this category remained a benefit through year end.
Outlook
We have begun to moderate our overweight to equities in light of lower U.S. economic growth expectations. Within the equity segment, we are underweighting small-cap stocks as valuations remain rich relative to large-cap stocks. Large-cap should benefit from greater exposure to faster growing regions outside the U.S. In developed international markets, we consider valuations to be reasonable, though export-oriented earnings growth for non-U.S. firms faces the headwind of stronger currencies. Finally, while yield spreads have widened to more attractive levels from their lows in June, fundamentals for the high yield sector are likely to prove more challenging in 2008.
|
Sincerely, |
|
Edmund M. Notzon, Portfolio Manager |
| | |
| | Series N |
| Performance Summary | | (Managed Asset Allocation Series) |
| December 31, 2007 | | (unaudited) |
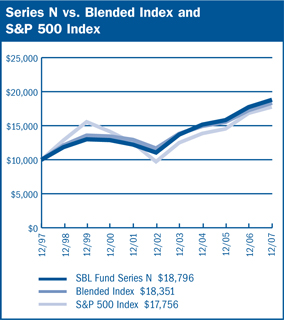
$10,000 Over 10 Years
The chart above assumes a hypothetical $10,000 investment in Series N (Managed Asset Allocation Series) on December 31, 1997 and reflects the fees and expenses of Series N. The blended index is 60% S&P 500 Index and 40% Lehman Brothers Aggregate Bond Index. The S&P 500 Index is a capitalization-weighted index composed of 500 selected common stocks that represent the broad domestic economy and is a widely recognized unmanaged index of market performance. The Lehman Brothers Aggregate Bond Index is an unmanaged index that tracks investment grade bonds including U.S. Treasury and agency issues, corporate bond issues, asset-backed, commercial mortgage-backed and mortgage-backed securities and Yankee issues.
| | | | | | |
Average Annual Returns | | | | | | |
Periods Ended 12-31-071 | | 1 Year | | 5 Years | | 10 Years |
Series N | | 6.04% | | 11.21% | | 6.51% |
1 Performance figures do not reflect fees and expenses associated with an investment in variable insurance products offered by Security Benefit Life Insurance Company. If returns had taken into account these fees and expenses, performance would have been lower. Shares of a Series of SBL Fund are available only through the purchase of such products. The performance data quoted above represents past performance. Past performance is not predictive of future performance. The investment return and principal value of an investment will fluctuate so that an investor’s shares, when redeemed, may be worth more or less than their original cost. |
| | | |
Portfolio Composition by Sector for Equity Holdings & Quality Ratings (Based on Standard and Poor’s Ratings) for Fixed Income Holdings | |
Consumer Discretionary | | 5.92 | % |
Consumer Staples | | 5.74 | |
Energy | | 7.60 | |
Financials | | 11.25 | |
Health Care | | 7.10 | |
Industrials | | 7.86 | |
Information Technology | | 9.25 | |
Materials | | 2.14 | |
Telecommunication Services | | 2.61 | |
Utilities | | 2.63 | |
AAA | | 25.11 | |
AA | | 0.79 | |
A | | 2.52 | |
BBB | | 3.68 | |
BB | | 0.94 | |
B | | 1.76 | |
CCC | | 0.18 | |
Not Rated | | 0.08 | |
Short Term Investments | | 2.42 | |
Other Assets in Excess of Liabilities | | 0.42 | |
Total Net Assets | | 100.00 | % |
| | | | |
| | | | |
| | |
| 74 | | The accompanying notes are an integral part of the financial statements |
| | |
| | Series N |
| Performance Summary | | (Managed Asset Allocation Series) |
| December 31, 2007 | | (unaudited) |
Information About Your Series Expenses
Calculating your ongoing Series expenses
Example
As a shareholder of the Series, you incur ongoing costs, including management fees and other series expenses. Performance figures and expense ratios do not reflect fees and expenses associated with an investment in variable insurance products. Shares of a Series of SBL Fund are available only through the purchase of such products. This example is intended to help you understand your ongoing costs (in dollars) of investing in the Series and to compare these costs with ongoing costs of investing in other mutual funds. The example is based on an investment of $1,000 invested at the beginning of the period and held for the entire period, July 1, 2007 through December 31, 2007.
Actual Expenses
The first line in the table provides information about actual account values and actual expenses. You may use the information in this table, together with the amount you invested, to estimate the expenses that you paid over the period. Simply divide your account value by $1,000 (for example, an $8,600 account value divided by $1,000 = 8.6), then multiply the result by the number in the table under the heading entitled “Expenses Paid During the Period” to estimate the expenses you paid on your account during this period.
Hypothetical Example for Comparison Purposes
The second line in the table provides information about hypothetical account values and hypothetical expenses based on the Series actual expense ratio and an assumed rate of return of 5% per year before expenses, which is not the Series actual return. The hypothetical account values and expenses may not be used to estimate the actual ending account balance or expenses you paid for the period. You may use this information to compare the ongoing costs of investing in the Series and other funds. To do so, compare this 5% hypothetical example with the 5% hypothetical examples that appear in the shareholder reports of the other mutual funds.
Please note that the expenses shown in the table are meant to highlight your ongoing costs only and do not reflect any fees and expenses associated with an investment in variable insurance products. Therefore, the second line is useful in comparing ongoing costs only, and will not help you determine the relative total costs of owning different funds. In addition, if these fees and expenses associated with an investment in variable insurance products were included, your costs would have been higher.
| | | | | | |
Series Expenses | | | | | | |
| | | Beginning
Account
Value
7/1/2007 | | Ending
Account Value
12/31/20071 | | Expenses
Paid
During
Period2 |
Series N (Managed Asset Allocation Series) |
Actual | | $1,000.00 | | $1,007.68 | | $7.24 |
Hypothetical | | 1,000.00 | | 1,018.00 | | 7.27 |
1 The actual ending account value is based on the actual total return of the Series for the period July 1, 2007 to December 31, 2007 after actual expenses and will differ from the hypothetical ending account value which is based on the Series expense ratio and a hypothetical annual return of 5% before expenses. The actual cumulative return at net asset value for the period July 1, 2007 to December 31, 2007 was 0.77%.
2 Expenses are equal to the Series annualized expense ratio of 1.43%, net of any applicable fee waivers or earnings credits, multiplied by the average account value over the period, multiplied by 184/365 (to reflect the one-half year period)
| | |
| | |
| Schedule of Investments | | Series N (Managed Asset Allocation Series) |
| December 31, 2007 | | |
| | | | | |
| | | Shares | | Value |
COMMON STOCK - 51.7% | | | | | |
Advertising - 0.2% | | | | | |
Lamar Advertising Company | | 2,150 | | $ | 103,351 |
Omnicom Group, Inc. | | 2,500 | | | 118,825 |
| | | | | |
| | | | | 222,176 |
| | | | | |
Aerospace & Defense - 1.6% | | | | | |
American Science & Engineering,
Inc. | | 100 | | | 5,675 |
Boeing Company | | 3,890 | | | 340,219 |
General Dynamics Corporation | | 3,700 | | | 329,263 |
Honeywell International, Inc. | | 2,600 | | | 160,082 |
Lockheed Martin Corporation | | 1,900 | | | 199,994 |
MTC Technologies, Inc. * | | 400 | | | 9,400 |
Northrop Grumman Corporation | | 1,200 | | | 94,368 |
Precision Castparts Corporation | | 600 | | | 83,220 |
Raytheon Company | | 1,200 | | | 72,840 |
Rockwell Collins, Inc. | | 1,800 | | | 129,546 |
Teledyne Technologies, Inc. * | | 300 | | | 15,999 |
Triumph Group, Inc. | | 300 | | | 24,705 |
United Technologies Corporation | | 5,510 | | | 421,736 |
| | | | | |
| | | | | 1,887,047 |
| | | | | |
Agricultural Products - 0.1% | | | | | |
Archer-Daniels-Midland Company | | 1,700 | | | 78,931 |
Bunge, Ltd. | | 300 | | | 34,923 |
| | | | | |
| | | | | 113,854 |
| | | | | |
Air Freight & Logistics - 0.1% | | | | | |
Expediters International
Washington, Inc. | | 3,200 | | | 142,976 |
UTi Worldwide, Inc. | | 900 | | | 17,640 |
| | | | | |
| | | | | 160,616 |
| | | | | |
Airlines - 0.2% | | | | | |
Airtran Holdings, Inc. * | | 900 | | | 6,444 |
AMR Corporation * | | 400 | | | 5,612 |
Gol Linhas Aereas Inteligentes
S.A. ADR | | 1,300 | | | 32,266 |
Skywest, Inc. | | 400 | | | 10,740 |
Southwest Airlines Company | | 10,500 | | | 128,100 |
| | | | | |
| | | | | 183,162 |
| | | | | |
Apparel Retail - 0.2% | | | | | |
American Eagle Outfitters, Inc. | | 400 | | | 8,308 |
J Crew Group, Inc. * | | 100 | | | 4,821 |
Ross Stores, Inc. | | 4,200 | | | 107,394 |
TJX Companies, Inc. | | 4,500 | | | 129,285 |
Tween Brands, Inc. * | | 100 | | | 2,648 |
| | | | | |
| | | | | 252,456 |
| | | | | |
Apparel, Accessories & Luxury Goods - 0.1% | | | | | |
Anvil Holdings, Inc. * (1) | | 30 | | | 240 |
Coach, Inc. * | | 3,100 | | | 94,798 |
Fossil, Inc. * | | 400 | | | 16,792 |
Quiksilver, Inc. * | | 600 | | | 5,148 |
| | | | | |
| | | | | 116,978 |
| | | | | |
| | | | | |
| | | Shares | | Value |
COMMON STOCK (continued) | | | | | |
Application Software - 0.2% | | | | | |
Cadence Design Systems, Inc. * | | 500 | | $ | 8,505 |
Factset Research Systems, Inc. | | 220 | | | 12,254 |
Intuit, Inc. * | | 4,100 | | | 129,601 |
Jack Henry & Associates, Inc. | | 300 | | | 7,302 |
NAVTEQ Corporation * | | 300 | | | 22,680 |
Taleo Corporation * | | 500 | | | 14,890 |
| | | | | |
| | | | | 195,232 |
| | | | | |
Asset Management & Custody Banks - 0.8% | | | | | |
Affiliated Managers Group, Inc. * | | 100 | | | 11,746 |
Ameriprise Financial, Inc. | | 840 | | | 46,292 |
Bank of New York Mellon Corporation | | 6,000 | | | 292,560 |
BlackRock, Inc. | | 50 | | | 10,840 |
Eaton Vance
Corporation | | 500 | | | 22,705 |
Federated Investors, Inc. | | 2,100 | | | 86,436 |
Franklin Resources, Inc. | | 1,200 | | | 137,316 |
Northern Trust Corporation | | 700 | | | 53,606 |
State Street Corporation | | 2,800 | | | 227,360 |
Waddell & Reed Financial, Inc. | | 200 | | | 7,218 |
| | | | | |
| | | | | 896,079 |
| | | | | |
Auto Parts & Equipment - 0.0% | | | | | |
Gentex Corporation | | 600 | | | 10,662 |
Johnson Controls, Inc. | | 1,000 | | | 36,040 |
WABCO Holdings, Inc. | | 100 | | | 5,009 |
| | | | | |
| | | | | 51,711 |
| | | | | |
Automobile Manufacturers - 0.1% | | | | | |
Ford Motor Company * | | 14,100 | | | 94,893 |
Thor Industries, Inc. | | 200 | | | 7,602 |
Winnebago Industries | | 200 | | | 4,204 |
| | | | | |
| | | | | 106,699 |
| | | | | |
Automotive Retail - 0.0% | | | | | |
Carmax, Inc. * | | 600 | | | 11,850 |
| | | | | |
| | |
Biotechnology - 0.8% | | | | | |
Alkermes, Inc. * | | 800 | | | 12,472 |
Amgen, Inc. * | | 5,010 | | | 232,664 |
BioMarin Pharmaceutical, Inc. * | | 300 | | | 10,620 |
Celgene Corporation * | | 3,100 | | | 143,251 |
Cephalon, Inc. * | | 845 | | | 60,637 |
Genentech, Inc. * | | 1,220 | | | 81,826 |
Genzyme Corporation * | | 800 | | | 59,552 |
Gilead Sciences, Inc. * | | 6,300 | | | 289,863 |
Human Genome Sciences, Inc. * | | 700 | | | 7,308 |
Incyte Corporation * | | 800 | | | 8,040 |
Martek Biosciences Corporation * | | 300 | | | 8,874 |
Maxygen, Inc. * | | 500 | | | 4,015 |
Senomyx, Inc. * | | 1,100 | | | 8,239 |
| | | | | |
| | | | | 927,361 |
| | | | | |
Brewers - 0.3% | | | | | |
Anheuser-Busch Companies, Inc. | | 5,800 | | | 303,572 |
| | |
| 76 | | The accompanying notes are an integral part of the financial statements |
| | |
| | |
| Schedule of Investments | | Series N (Managed Asset Allocation Series) |
| December 31, 2007 - continued | | |
| | | | | |
| | | Shares | | Value |
| COMMON STOCK (continued) | | | | | |
Brewers (continued) | | | | | |
Boston Beer Company, Inc. * | | 400 | | $ | 15,060 |
Compania Cervecerias Unidas
S.A. ADR | | 1,100 | | | 39,336 |
| | | | | |
| | | | | 357,968 |
| | | | | |
Broadcasting & Cable TV - 0.5% | | | | | |
Cablevision Systems Corporation * | | 2,500 | | | 61,250 |
Discovery Holding Company * | | 866 | | | 21,771 |
EchoStar Communications
Corporation * | | 2,100 | | | 79,212 |
EW Scripps Company | | 1,500 | | | 67,515 |
Liberty Global, Inc. * | | 775 | | | 30,372 |
Shaw Communications, Inc. (CI.B) | | 5,800 | | | 137,344 |
Sirius Satellite Radio, Inc. * | | 4,400 | | | 13,332 |
Time Warner Cable, Inc. * | | 4,900 | | | 134,995 |
| | | | | |
| | | | | 545,791 |
| | | | | |
| Building Products - 0.1% | | | | | |
Masco Corporation | | 2,700 | | | 58,347 |
Universal Forest Products, Inc. | | 200 | | | 5,892 |
USG Corporation * | | 300 | | | 10,737 |
| | | | | |
| | | | | 74,976 |
| | | | | |
Casinos & Gaming - 0.5% | | | | | |
Harrah’s Entertainment, Inc. | | 800 | | | 71,000 |
International Game Technology | | 5,300 | | | 232,829 |
Las Vegas Sands Corporation * | | 260 | | | 26,793 |
Melco PBL Entertainment Macau,
Ltd. ADR * | | 8,600 | | | 99,416 |
MGM Mirage * | | 1,180 | | | 99,144 |
Wynn Resorts, Ltd. | | 140 | | | 15,698 |
| | | | | |
| | | | | 544,880 |
| | | | | |
Coal & Consumable Fuels - 0.4% | | | | | |
Arch Coal, Inc. | | 2,300 | | | 103,339 |
Consol Energy, Inc. | | 2,000 | | | 143,040 |
Foundation Coal Holdings, Inc. | | 200 | | | 10,500 |
GeoMet, Inc. * | | 1,400 | | | 7,280 |
Peabody Energy Corporation | | 2,300 | | | 141,772 |
Westmoreland Coal Company * | | 500 | | | 6,950 |
| | | | | |
| | | | | 412,881 |
| | | | | |
Commodity Chemicals - 0.0% | | | | | |
Koppers Holdings, Inc. | | 300 | | | 12,972 |
| | | | | |
| | |
Communications Equipment - 1.4% | | | | | |
Alcatel-Lucent ADR | | 13,972 | | | 102,275 |
Blue Coat Systems, Inc. * | | 800 | | | 26,296 |
Cisco Systems, Inc. * | | 12,800 | | | 346,496 |
Corning, Inc. | | 12,200 | | | 292,678 |
F5 Networks, Inc. * | | 700 | | | 19,964 |
Finisar Corporation * | | 3,100 | | | 4,495 |
Ixia * | | 400 | | | 3,792 |
JDS Uniphase Corporation * | | 3,900 | | | 51,870 |
Juniper Networks, Inc. * | | 7,400 | | | 245,680 |
Motorola, Inc. | | 13,800 | | | 221,352 |
| | | | | |
| | | Shares | | Value |
| COMMON STOCK (continued) | | | | | |
Communications Equipment (continued) | | | | | |
Qualcomm, Inc. | | 8,800 | | $ | 346,280 |
Starent Networks Corporation * | | 200 | | | 3,650 |
| | | | | |
| | | | | 1,664,828 |
| | | | | |
Computer & Electronics Retail - 0.0% | | | | | |
Best Buy Company, Inc. | | 525 | | | 27,641 |
| | | | | |
| | |
Computer Hardware - 1.8% | | | | | |
Apple, Inc. * | | 3,000 | | | 594,240 |
Avid Technology, Inc. * | | 600 | | | 17,004 |
Dell, Inc. * | | 17,700 | | | 433,827 |
Hewlett-Packard Company | | 12,100 | | | 610,808 |
International Business Machines
Corporation | | 2,920 | | | 315,652 |
Palm, Inc. | | 3,300 | | | 20,922 |
Sun Microsystems, Inc. * | | 8,425 | | | 152,745 |
| | | | | |
| | | | | 2,145,198 |
| | | | | |
Computer Storage & Peripherals - 0.3% | | | | | |
EMC Corporation * | | 7,600 | | | 140,828 |
Network Appliance, Inc. * | | 2,800 | | | 69,888 |
Seagate Technology | | 3,200 | | | 81,600 |
| | | | | |
| | | | | 292,316 |
| | | | | |
| | |
Construction & Engineering - 0.2% | | | | | |
Fluor Corporation | | 600 | | | 87,432 |
Foster Wheeler, Ltd. * | | 600 | | | 93,012 |
Insituform Technologies, Inc. * | | 500 | | | 7,400 |
Quanta Services, Inc. * | | 900 | | | 23,616 |
| | | | | |
| | | | | 211,460 |
| | | | | |
Construction & Farm Machinery & Heavy Trucks - 0.3% | | | | | |
Joy Global, Inc. | | 1,900 | | | 125,058 |
Oshkosh Truck Corporation | | 340 | | | 16,068 |
Paccar, Inc. | | 1,500 | | | 81,720 |
Terex Corporation * | | 2,500 | | | 163,925 |
| | | | | |
| | | | | 386,771 |
| | | | | |
Consumer Electronics - 0.0% | | | | | |
Harman International Industries,
Inc. | | 600 | | | 44,226 |
| | | | | |
| | |
Consumer Finance - 0.3% | | | | | |
American Express Company | | 2,900 | | | 150,858 |
Capital One Financial Corporation | | 3,200 | | | 151,232 |
SLM Corporation | | 700 | | | 14,098 |
| | | | | |
| | | | | 316,188 |
| | | | | |
Data Processing & Outsourced Services - 0.4% | | | | | |
Automatic Data Processing, Inc. | | 3,400 | | | 151,402 |
DST Systems, Inc. * | | 400 | | | 33,020 |
Electronic Data Systems
Corporation | | 3,700 | | | 76,701 |
Global Payments, Inc. | | 300 | | | 13,956 |
Heartland Payment Systems, Inc. | | 300 | | | 8,040 |
| | |
| 77 | | The accompanying notes are an integral part of the financial statements |
| | |
| | |
| Schedule of Investments | | Series N (Managed Asset Allocation Series) |
| December 31, 2007 - continued | | |
| | | | | |
| | | Shares | | Value |
COMMON STOCK (continued) | | | | | |
Data Processing & Outsourced Services (continued) | | | | | |
Iron Mountain, Inc. * | | 1,025 | | $ | 37,945 |
Mastercard, Inc. | | 100 | | | 21,520 |
Metavante Technologies, Inc. * | | 1 | | | 8 |
Western Union Company | | 3,900 | | | 94,692 |
| | | | | |
| | | | | 437,284 |
| | | | | |
Department Stores - 0.3% | | | | | |
Kohl’s Corporation * | | 7,370 | | | 337,546 |
| | | | | |
| | |
Diversified Banks - 0.7% | | | | | |
U.S. Bancorp | | 9,000 | | | 285,660 |
Wachovia Corporation | | 3,500 | | | 133,105 |
Wells Fargo & Company | | 15,240 | | | 460,096 |
| | | | | |
| | | | | 878,861 |
| | | | | |
Diversified Chemicals - 0.2% | | | | | |
Cabot Corporation | | 330 | | | 11,002 |
Dow Chemical Company | | 2,800 | | | 110,376 |
E.I. Du Pont de Nemours & Company | | 3,151 | | | 138,928 |
| | | | | |
| | | | | 260,306 |
| | | | | |
Diversified Commercial & Professional Services - 0.1% | | | | | |
Advisory Board Company * | | 300 | | | 19,257 |
ChoicePoint, Inc. * | | 266 | | | 9,688 |
Corporate Executive Board Company | | 370 | | | 22,237 |
Dun & Bradstreet Corporation | | 100 | | | 8,863 |
FTI Consulting, Inc. * | | 100 | | | 6,164 |
Huron Consulting Group, Inc. * | | 100 | | | 8,063 |
Navigant Consulting, Inc. * | | 300 | | | 4,101 |
| | | | | |
| | | | | 78,373 |
| | | | | |
Diversified Metals & Mining - 0.5% | | | | | |
Freeport-McMoRan Copper & Gold, Inc. (CI.B) | | 3,169 | | | 324,632 |
RioTinto plc ADR | | 400 | | | 167,960 |
Teck Cominco, Ltd. (CI.B) | | 1,500 | | | 53,565 |
| | | | | |
| | | | | 546,157 |
| | | | | |
Drug Retail - 0.4% | | | | | |
CVS Caremark Corporation | | 7,968 | | | 316,728 |
Walgreen Company | | 3,500 | | | 133,280 |
| | | | | |
| | | | | 450,008 |
| | | | | |
Education Services - 0.0% | | | | | |
Apollo Group, Inc. * | | 400 | | | 28,060 |
Corinthian Colleges, Inc. * | | 600 | | | 9,240 |
| | | | | |
| | | | | 37,300 |
| | | | | |
Electric Utilities - 1.0% | | | | | |
American Electric Power Company, Inc. | | 1,600 | | | 74,496 |
Edison International | | 2,100 | | | 112,077 |
Entergy Corporation | | 1,300 | | | 155,376 |
Exelon Corporation | | 4,260 | | | 347,786 |
| | | | | |
| | | Shares | | Value |
COMMON STOCK (continued) | | | | | |
Electric Utilities (continued) | | | | | |
FirstEnergy Corporation | | 2,500 | | $ | 180,850 |
Great Plains Energy, Inc. | | 800 | | | 23,456 |
Pinnacle West Capital Corporation | | 700 | | | 29,687 |
PPL Corporation | | 3,100 | | | 161,479 |
Reliant Energy, Inc. * | | 4,900 | | | 128,576 |
| | | | | |
| | | | | 1,213,783 |
| | | | | |
Electrical Components & Equipment - 0.1% | | | | | |
AO Smith Corporation | | 200 | | | 7,010 |
Baldor Electric Company | | 200 | | | 6,732 |
Belden, Inc. | | 380 | | | 16,910 |
BTU International, Inc. * | | 500 | | | 6,660 |
Cooper Industries, Ltd. | | 1,100 | | | 58,168 |
General Cable Corporation * | | 100 | | | 7,328 |
| | | | | |
| | | | | 102,808 |
| | | | | |
Electronic Equipment Manufacturers - 0.1% | | | | | |
Agilent Technologies, Inc. * | | 1,900 | | | 69,806 |
AVX Corporation | | 800 | | | 10,736 |
Flir Systems, Inc. * | | 1,000 | | | 31,300 |
| | | | | |
| | | | | 111,842 |
| | | | | |
Electronic Manufacturing Services - 0.2% | | | | | |
Cyberoptics Corporation * | | 700 | | | 8,400 |
Flextronics International, Ltd. * | | 4,300 | | | 51,858 |
Plexus Corporation * | | 500 | | | 13,130 |
Tyco Electronics, Ltd. | | 5,575 | | | 207,000 |
| | | | | |
| | | | | 280,388 |
| | | | | |
Environmental & Facilities Services - 0.2% | | | | | |
Allied Waste Industries, Inc. * | | 13,300 | | | 146,566 |
Republic Services, Inc. | | 2,000 | | | 62,700 |
Waste Connections, Inc. * | | 300 | | | 9,270 |
| | | | | |
| | | | | 218,536 |
| | | | | |
Fertilizers & Agricultural Chemicals - 0.2% | | | | | |
Monsanto Company | | 1,700 | | | 189,873 |
Mosaic Company * | | 500 | | | 47,170 |
| | | | | |
| | | | | 237,043 |
| | | | | |
Food Distributors - 0.1% | | | | | |
SYSCO Corporation | | 3,000 | | | 93,630 |
| | | | | |
| | |
Food Retail - 0.1% | | | | | |
Casey’s General Stores, Inc. | | 300 | | | 8,883 |
Kroger Company | | 2,100 | | | 56,091 |
Pantry, Inc. * | | 300 | | | 7,839 |
Supervalu, Inc. | | 1,400 | | | 52,528 |
Whole Foods Market, Inc. | | 900 | | | 36,720 |
| | | | | |
| | | | | 162,061 |
| | | | | |
| | |
| 78 | | The accompanying notes are an integral part of the financial statements |
| | |
| | |
| Schedule of Investments | | Series N (Managed Asset Allocation Series) |
| December 31, 2007 - continued | | |
| | | | | |
| | | Shares | | Value |
COMMON STOCK (continued) | | | | | |
Footwear - 0.0% | | | | | |
Nike, Inc. (CI.B) | | 880 | | $ | 56,531 |
| | | | | |
| | |
Forest Products - 0.1% | | | | | |
Weyerhaeuser Company | | 800 | | | 58,992 |
| | | | | |
| | |
Gas Utilities - 0.0% | | | | | |
National Fuel Gas Company | | 400 | | | 18,672 |
Southwest Gas Corporation | | 400 | | | 11,908 |
| | | | | |
| | | | | 30,580 |
| | | | | |
General Merchandise Stores - 0.2% | | | | | |
Dollar Tree Stores, Inc. * | | 200 | | | 5,184 |
Target Corporation | | 4,400 | | | 220,000 |
| | | | | |
| | | | | 225,184 |
| | | | | |
Gold - 0.0% | | | | | |
Barrick Gold Corporation | | 800 | | | 33,640 |
| | | | | |
| | |
Health Care Distributors - 0.2% | | | | | |
Cardinal Health, Inc. | | 3,100 | | | 179,025 |
Henry Schein, Inc. * | | 200 | | | 12,280 |
McKesson Corporation | | 1,200 | | | 78,612 |
| | | | | |
| | | | | 269,917 |
| | | | | |
Health Care Equipment - 1.1% | | | | | |
Aspect Medical Systems, Inc. * | | 500 | | | 7,000 |
Baxter International, Inc. | | 2,300 | | | 133,515 |
Becton Dickinson & Company | | 1,400 | | | 117,012 |
Covidien, Ltd. | | 5,275 | | | 233,630 |
CR Bard, Inc. | | 900 | | | 85,320 |
Edwards Lifesciences
Corporation * | | 260 | | | 11,957 |
Hologic, Inc. * | | 364 | | | 24,985 |
Medtronic, Inc. | | 7,000 | | | 351,890 |
Micrus Endovascular
Corporation * | | 200 | | | 3,936 |
Resmed, Inc. * | | 100 | | | 5,253 |
Respironics, Inc. * | | 140 | | | 9,167 |
St. Jude Medical, Inc. * | | 3,500 | | | 142,240 |
STERIS Corporation | | 700 | | | 20,188 |
Stryker Corporation | | 1,200 | | | 89,664 |
Thoratec Corporation * | | 500 | | | 9,095 |
Zimmer Holdings, Inc. * | | 1,000 | | | 66,150 |
| | | | | |
| | | | | 1,311,002 |
| | | | | |
Health Care Facilities - 0.0% | | | | | |
Community Health Systems, Inc. * | | 400 | | | 14,744 |
LifePoint Hospitals, Inc. * | | 200 | | | 5,948 |
| | | | | |
| | | | | 20,692 |
| | | | | |
Health Care Services - 0.2% | | | | | |
DaVita, Inc. * | | 280 | | | 15,778 |
Healthways, Inc. * | | 100 | | | 5,844 |
Laboratory Corporation of
America Holdings * | | 1,100 | | | 83,083 |
Matria Healthcare, Inc. * | | 200 | | | 4,754 |
Medco Health Solutions, Inc. * | | 1,300 | | | 131,820 |
| | | | | |
COMMON STOCK (continued) | | | | | |
Health Care Services (continued) | | | | | |
Omnicare, Inc. | | 410 | | $ | 9,352 |
| | | | | |
| | | | | 250,631 |
| | | | | |
Health Care Supplies - 0.1% | | | | | |
Alcon, Inc. | | 500 | | | 71,520 |
Dentsply International, Inc. | | 500 | | | 22,510 |
| | | | | |
| | | | | 94,030 |
| | | | | |
Health Care Technology - 0.0% | | | | | |
Computer Programs & Systems,
Inc. | | 700 | | | 15,918 |
| | | | | |
| | |
Home Entertainment Software - 0.1% | | | | | |
Activision, Inc. * | | 933 | | | 27,710 |
Electronic Arts, Inc. * | | 1,700 | | | 99,297 |
| | | | | |
| | | | | 127,007 |
| | | | | |
Home Furnishings - 0.0% | | | | | |
Mohawk Industries, Inc. * | | 160 | | | 11,904 |
| | | | | |
| | |
Home Improvement Retail - 0.4% | | | | | |
Home Depot, Inc. | | 8,950 | | | 241,113 |
Lowe’s Companies, Inc. | | 7,400 | | | 167,388 |
Sherwin-Williams Company | | 500 | | | 29,020 |
| | | | | |
| | | | | 437,521 |
| | | | | |
Homebuilding- 0.1% | | | | | |
DR Horton, Inc. | | 3,100 | | | 40,827 |
KB Home | | 2,500 | | | 54,000 |
Lennar Corporation | | 2,400 | | | 42,936 |
Toll Brothers, Inc. * | | 500 | | | 10,030 |
| | | | | |
| | | | | 147,793 |
| | | | | |
Homefurnishing Retail - 0.2% | | | | | |
Bed Bath & Beyond, Inc. * | | 9,200 | | | 270,388 |
Rent-A-Center, Inc. * | | 800 | | | 11,616 |
Williams-Sonoma, Inc. | | 300 | | | 7,770 |
| | | | | |
| | | | | 289,774 |
| | | | | |
Hotels, Resorts & Cruise Lines - 0.3% | | | | | |
Carnival Corporation | | 2,100 | | | 93,429 |
Choice Hotels International, Inc. | | 200 | | | 6,640 |
Gaylord Entertainment Company * | | 100 | | | 4,047 |
Marriott International, Inc. | | 4,600 | | | 157,228 |
Wyndham Worldwide Corporation | | 1,300 | | | 30,628 |
| | | | | |
| | | | | 291,972 |
| | | | | |
Household Products - 1.2% | | | | | |
Clorox Company | | 2,100 | | | 136,857 |
Colgate-Palmolive Company | | 1,400 | | | 109,144 |
Energizer Holdings, Inc. * | | 100 | | | 11,213 |
Kimberly-Clark Corporation | | 1,500 | | | 104,010 |
Procter & Gamble Company | | 14,615 | | | 1,073,033 |
| | | | | |
| | | | | 1,434,257 |
| | | | | |
Housewares & Specialties - 0.1% | | | | | |
Fortune Brands, Inc. | | 700 | | | 50,652 |
| | |
| 79 | | The accompanying notes are an integral part of the financial statements |
| | |
| | |
| Schedule of Investments | | Series N (Managed Asset Allocation Series) |
| December 31, 2007 - continued | | |
| | | | | |
| | | Shares | | Value |
COMMON STOCK (continued) | | | | | |
Housewares & Specialties (continued) | | | | | |
Newell Rubbermaid, Inc. | | 1,100 | | $ | 28,468 |
| | | | | |
| | | | | 79,120 |
| | | | | |
Human Resource & Employment Services -0.1% | | | | | |
Manpower, Inc. | | 200 | | | 11,380 |
Monster Worldwide, Inc. * | | 3,000 | | | 97,200 |
Robert Half International, Inc. | | 1,200 | | | 32,448 |
| | | | | |
| | | | | 141,028 |
| | | | | |
Hypermarkets & Super Centers - 0.6% | | | | | |
BJ’s Wholesale Club, Inc. * | | 200 | | | 6,766 |
Costco Wholesale Corporation | | 1,600 | | | 111,616 |
Wal-Mart Stores, Inc. | | 12,700 | | | 603,631 |
| | | | | |
| | | | | 722,013 |
| | | | | |
Independent Power Producers & Energy Traders - 0.6% | | | | | |
AES Corporation * | | 10,300 | | | 220,317 |
Constellation Energy Group, Inc. | | 1,500 | | | 153,795 |
Dynegy, Inc. * | | 16,314 | | | 116,482 |
Mirant Corporation * | | 620 | | | 24,168 |
NRG Energy, Inc. * | | 3,200 | | | 138,688 |
| | | | | |
| | | | | 653,450 |
| | | | | |
Industrial Conglomerates - 1.9% | | | | | |
3M Company | | 2,900 | | | 244,528 |
General Electric Company | | 46,200 | | | 1,712,634 |
McDermott International, Inc. * | | 1,200 | | | 70,836 |
Tyco International, Ltd. | | 6,275 | | | 248,804 |
| | | | | |
| | | | | 2,276,802 |
| | | | | |
Industrial Gases - 0.2% | | | | | |
Praxair, Inc. | | 3,000 | | | 266,130 |
| | | | | |
Industrial Machinery - 0.6% | | | | | |
3D Systems Corporation * | | 300 | | | 4,632 |
Actuant Corporation | | 1,180 | | | 40,132 |
Danaher Corporation | | 3,300 | | | 289,542 |
Dover Corporation | | 2,000 | | | 92,180 |
Harsco Corporation | | 560 | | | 35,879 |
Illinois Tool Works, Inc. | | 1,200 | | | 64,248 |
Ingersoll-Rand Company, Ltd. | | 3,700 | | | 171,939 |
Nordson Corporation | | 200 | | | 11,592 |
| | | | | |
| | | | | 710,144 |
| | | | | |
Industrial REITs - 0.1% | | | | | |
AMB Property Corporation | | 200 | | | 11,512 |
EastGroup Properties, Inc. | | 300 | | | 12,555 |
Prologis | | 1,700 | | | 107,746 |
| | | | | |
| | | | | 131,813 |
| | | | | |
Insurance Brokers - 0.1% | | | | | |
AON Corporation | | 2,900 | | | 138,301 |
Marsh & McLennan Companies,
Inc. | | 1,300 | | | 34,411 |
| | | | | |
| | | | | 172,712 |
| | | | | |
| | | | | |
| | | Shares | | Value |
COMMON STOCK (continued) | | | | | |
Integrated Oil & Gas - 4.0% | | | | | |
BP plc ADR | | 2,600 | | $ | 190,242 |
Chevron Corporation | | 6,250 | | | 583,313 |
ConocoPhillips | | 4,800 | | | 423,840 |
Exxon Mobil Corporation | | 27,380 | | | 2,565,232 |
Murphy Oil Corporation | | 2,900 | | | 246,036 |
Occidental Petroleum Corporation | | 2,600 | | | 200,174 |
Royal Dutch Shell plc (CI.B) ADR | | 3,117 | | | 258,711 |
Total S.A. ADR | | 2,700 | | | 223,020 |
| | | | | |
| | | | | 4,690,568 |
| | | | | |
Integrated Telecommunication Services - 1.1% | | | | | |
AT&T, Inc. | | 30,492 | | | 1,267,248 |
| | | | | |
Internet Retail - 0.4% | | | | | |
Amazon.com, Inc. * | | 3,800 | | | 352,032 |
Drugstore.com * | | 4,000 | | | 13,200 |
Expedia, Inc. * | | 2,700 | | | 85,374 |
| | | | | |
| | | | | 450,606 |
| | | | | |
Internet Software & Services - 1.0% | | | | | |
Ariba, Inc. * | | 300 | | | 3,345 |
Art Technology Group, Inc. * | | 800 | | | 3,456 |
CNET Networks, Inc. * | | 700 | | | 6,398 |
Digital River, Inc. * | | 200 | | | 6,614 |
eBay, Inc. * | | 1,700 | | | 56,423 |
Google, Inc. * | | 1,210 | | | 836,691 |
VeriSign, Inc. * | | 4,200 | | | 157,962 |
Websense, Inc. * | | 400 | | | 6,792 |
Yahoo!, Inc. * | | 4,000 | | | 93,040 |
| | | | | |
| | | | | 1,170,721 |
| | | | | |
Investment Banking & Brokerage - 1.0% | | | | | |
Bear Stearns Companies, Inc. | | 200 | | | 17,650 |
Goldman Sachs Group, Inc. | | 1,700 | | | 365,585 |
Lehman Brothers Holdings, Inc. | | 2,900 | | | 189,776 |
Merrill Lynch & Company, Inc. | | 5,000 | | | 268,400 |
Morgan Stanley | | 5,800 | | | 308,038 |
Raymond James Financial, Inc. | | 200 | | | 6,532 |
Stifel Financial Corporation * | | 330 | | | 17,348 |
| | | | | |
| | | | | 1,173,329 |
| | | | | |
IT Consulting & Other Services - 0.1% | | | | | |
Accenture, Ltd. | | 3,800 | | | 136,914 |
RightNow Technologies, Inc. * | | 200 | | | 3,170 |
| | | | | |
| | | | | 140,084 |
| | | | | |
Leisure Products - 0.1% | | | | | |
Hasbro, Inc. | | 2,500 | | | 63,950 |
Pool Corporation | | 512 | | | 10,153 |
| | | | | |
| | | | | 74,103 |
| | | | | |
Life & Health Insurance - 0.7% | | | | | |
Lincoln National Corporation | | 2,900 | | | 168,838 |
MetLife, Inc. | | 5,100 | | | 314,262 |
Prudential Financial, Inc. | | 2,800 | | | 260,512 |
| | |
| 80 | | The accompanying notes are an integral part of the financial statements |
| | |
| | |
| Schedule of Investments | | Series N (Managed Asset Allocation Series) |
| December 31, 2007 - continued | | |
| | | | | |
| | | Shares | | Value |
COMMON STOCK (continued) | | | | | |
Life & Health Insurance (continued) | | | | | |
StanCorp Financial Group, Inc. | | 400 | | $ | 20,152 |
| | | | | |
| | | | | 763,764 |
| | | | | |
Life Sciences Tools & Services - 0.2% | | | | | |
Affymetrix, Inc. * | | 500 | | | 11,570 |
Applera Corporation - Applied Biosystems Group | | 1,300 | | | 44,096 |
Charles River Laboratories International, Inc.* | | 260 | | | 17,108 |
Covance, Inc. * | | 100 | | | 8,662 |
Illumina, Inc. * | | 100 | | | 5,926 |
Invitrogen Corporation * | | 246 | | | 22,979 |
Millipore Corporation * | | 500 | | | 36,590 |
Techne Corporation * | | 170 | | | 11,228 |
Thermo Fisher Scientific, Inc. * | | 1,800 | | | 103,824 |
| | | | | |
| | | | | 261,983 |
| | | | | |
Managed Health Care - 0.7% | | | | | |
Aetna, Inc. | | 2,700 | | | 155,871 |
AMERIGROUP Corporation * | | 200 | | | 7,290 |
Cigna Corporation | | 2,000 | | | 107,460 |
Humana, Inc. * | | 1,300 | | | 97,903 |
UnitedHealth Group, Inc. | | 3,900 | | | 226,980 |
WellPoint, Inc. * | | 3,100 | | | 271,963 |
| | | | | |
| | | | | 867,467 |
| | | | | |
Metal & Glass Containers - 0.0% | | | | | |
Owens-Illinois, Inc. * | | 300 | | | 14,850 |
| | | | | |
Motorcycle Manufacturers - 0.1% | | | | | |
Harley-Davidson, Inc. | | 1,300 | | | 60,723 |
| | | | | |
Movies & Entertainment - 0.6% | | | | | |
News Corporation | | 10,500 | | | 215,145 |
Time Warner, Inc. | | 10,200 | | | 168,402 |
Walt Disney Company | | 8,300 | | | 267,924 |
| | | | | |
| | | | | 651,471 |
| | | | | |
Multi-Line Insurance - 1.1% | | | | | |
American International Group, Inc. | | 13,675 | | | 797,253 |
Assurant, Inc. | | 1,300 | | | 86,970 |
Genworth Financial, Inc. | | 5,300 | | | 134,885 |
Hartford Financial Services Group, Inc. | | 1,600 | | | 139,504 |
Loews Corporation | | 1,900 | | | 95,646 |
| | | | | |
| | | | | 1,254,258 |
| | | | | |
Multi-Utilities - 0.5% | | | | | |
Alliant Energy Corporation | | 400 | | | 16,276 |
Centerpoint Energy, Inc. | | 3,400 | | | 58,242 |
Energy East Corporation | | 800 | | | 21,768 |
NiSource, Inc. | | 1,200 | | | 22,668 |
OGE Energy Corporation | | 500 | | | 18,145 |
Public Service Enterprise Group, Inc. | | 2,500 | | | 245,600 |
Sempra Energy | | 2,500 | | | 154,700 |
| | | | | |
| | | Shares | | Value |
COMMON STOCK (continued) | | | | | |
Multi-Utilities (continued) | | | | | |
TECO Energy, Inc. | | 5,200 | | $ | 89,492 |
| | | | | |
| | | | | 626,891 |
| | | | | |
Office REIT’s - 0.1% | | | | | |
Boston Properties, Inc. | | 1,200 | | | 110,172 |
Duke Realty Corporation | | 500 | | | 13,040 |
SL Green Realty Corporation | | 351 | | | 32,804 |
| | | | | |
| | | | | 156,016 |
| | | | | |
Office Services & Supplies - 0.1% | | | | | |
American Reprographics Company * | | 300 | | | 4,944 |
Avery Dennison Corporation | | 1,500 | | | 79,710 |
Herman Miller, Inc. | | 500 | | | 16,195 |
| | | | | |
| | | | | 100,849 |
| | | | | |
Oil & Gas Drilling - 0.3% | | | | | |
Diamond Offshore Drilling, Inc. | | 100 | | | 14,200 |
Helmerich & Payne, Inc. | | 400 | | | 16,028 |
Nabors Industries, Ltd. * | | 1,300 | | | 35,607 |
Transocean, Inc. | | 1,826 | | | 261,426 |
| | | | | |
| | | | | 327,261 |
| | | | | |
Oil & Gas Equipment & Services - 1.4% | | | | | |
Baker Hughes, Inc. | | 2,900 | | | 235,190 |
BJ Services Company | | 3,200 | | | 77,632 |
Cameron International Corporation * | | 740 | | | 35,616 |
Complete Production Services, Inc. * | | 400 | | | 7,188 |
FMC Technologies, Inc. * | | 4,042 | | | 229,182 |
Grant Prideco, Inc. * | | 2,900 | | | 160,979 |
Schlumberger, Ltd. | | 9,000 | | | 885,330 |
| | | | | |
| | | | | 1,631,117 |
| | | | | |
Oil & Gas Exploration & Production - 0.5% | | | | | |
Devon Energy Corporation | | 1,400 | | | 124,474 |
EOG Resources, Inc. | | 1,600 | | | 142,800 |
Forest Oil Corporation * | | 500 | | | 25,420 |
Mariner Energy, Inc. * | | 600 | | | 13,728 |
Newfield Exploration Company * | | 520 | | | 27,404 |
Southwestern Energy Company * | | 260 | | | 14,487 |
Ultra Petroleum Corporation * | | 500 | | | 35,750 |
Whiting Petroleum Corporation * | | 100 | | | 5,766 |
XTO Energy, Inc. | | 2,875 | | | 147,660 |
| | | | | |
| | | | | 537,489 |
| | | | | |
Oil & Gas Refining & Marketing - 0.3% | | | | | |
Sunoco, Inc. | | 3,400 | | | 246,296 |
Valero Energy Corporation | | 2,000 | | | 140,060 |
| | | | | |
| | | | | 386,356 |
| | | | | |
Oil & Gas Storage & Transportation - 0.1% | | | | | |
Spectra Energy Corporation | | 6,600 | | | 170,412 |
| | | | | |
| | |
| 81 | | The accompanying notes are an integral part of the financial statements |
| | |
| | |
| Schedule of Investments | | Series N (Managed Asset Allocation Series) |
| December 31, 2007 - continued | | |
| | | | | |
| | | Shares | | Value |
COMMON STOCK (continued) | | | | | |
Other Diversified Financial Services - 1.8% | | | | | |
Bank of America Corporation | | 12,576 | | $ | 518,886 |
Citigroup, Inc. | | 25,873 | | | 761,701 |
JPMorgan Chase & Company | | 18,136 | | | 791,636 |
| | | | | |
| | | | | 2,072,223 |
| | | | | |
Packaged Foods & Meats - 0.6% | | | | | |
Campbell Soup Company | | 800 | | | 28,584 |
ConAgra Foods, Inc. | | 3,200 | | | 76,128 |
General Mills, Inc. | | 3,100 | | | 176,700 |
Kraft Foods, Inc. | | 10,725 | | | 349,957 |
Tootsie Roll Industries, Inc. | | 574 | | | 15,739 |
| | | | | |
| | | | | 647,108 |
| | | | | |
Paper Packaging - 0.0% | | | | | |
Smurfit-Stone Container
Corporation * | | 1,600 | | | 16,896 |
Temple-Inland, Inc. | | 1,100 | | | 37,444 |
| | | | | |
| | | | | 54,340 |
| | | | | |
Paper Products - 0.1% | | | | | |
AbitibiBowater, Inc. | | 1,724 | | | 35,532 |
Domtar Corporation * | | 1,300 | | | 9,997 |
International Paper Company | | 3,400 | | | 110,092 |
| | | | | |
| | | | | 155,621 |
| | | | | |
Personal Products - 0.2% | | | | | |
Alberto-Culver Company | | 400 | | | 9,816 |
Avon Products, Inc. | | 4,300 | | | 169,979 |
Estee Lauder Companies, Inc. | | 1,200 | | | 52,332 |
| | | | | |
| | | | | 232,127 |
| | | | | |
Pharmaceuticals - 3.0% | | | | | |
Abbott Laboratories | | 5,000 | | | 280,750 |
Allergan, Inc. | | 2,700 | | | 173,448 |
Bristol-Myers Squibb Company | | 8,800 | | | 233,376 |
Eli Lilly & Company | | 5,240 | | | 279,764 |
GlaxoSmithKline plc ADR | | 2,364 | | | 119,122 |
Johnson & Johnson | | 12,258 | | | 817,609 |
Medicines Company * | | 200 | | | 3,832 |
Medicis Pharmaceutical
Corporation | | 200 | | | 5,194 |
Merck & Company, Inc. | | 11,300 | | | 656,643 |
MGI Pharma, Inc. * | | 300 | | | 12,159 |
Pfizer, Inc. | | 15,273 | | | 347,155 |
Schering-Plough Corporation | | 9,600 | | | 255,744 |
Sepracor, Inc. * | | 330 | | | 8,662 |
Valeant Pharmaceuticals
International * | | 300 | | | 3,591 |
Warner Chilcott, Ltd. * | | 1,600 | | | 28,368 |
Wyeth | | 6,500 | | | 287,235 |
| | | | | |
| | | | | 3,512,652 |
| | | | | |
Property & Casualty Insurance - 0.4% | | | | | |
ACE, Ltd. | | 2,600 | | | 160,628 |
Employers Holdings, Inc. | | 400 | | | 6,684 |
| | | | | |
| | | Shares | | Value |
COMMON STOCK (continued) | | | | | |
Property & Casualty Insurance (continued) | | | | | |
Infinity Property & Casualty
Corporation | | 310 | | $ | 11,201 |
Markel Corporation * | | 60 | | | 29,466 |
ProAssurance Corporation * | | 100 | | | 5,492 |
Progressive Corporation | | 3,000 | | | 57,480 |
SeaBright Insurance Holdings,
Inc. * | | 400 | | | 6,032 |
Selective Insurance Group | | 200 | | | 4,598 |
Travelers Companies, Inc. | | 2,614 | | | 140,633 |
White Mountains Insurance
Group, Ltd. | | 25 | | | 12,851 |
| | | | | |
| | | | | 435,065 |
| | | | | |
Publishing - 0.1% | | | | | |
McGraw-Hill Companies, Inc. | | 1,800 | | | 78,858 |
Meredith Corporation | | 600 | | | 32,988 |
Scholastic Corporation * | | 300 | | | 10,467 |
| | | | | |
| | | | | 122,313 |
| | | | | |
Railroads - 0.2% | | | | | |
Canadian National Railway
Company | | 1,100 | | | 51,623 |
Norfolk Southern Corporation | | 3,900 | | | 196,716 |
Union Pacific Corporation | | 200 | | | 25,124 |
| | | | | |
| | | | | 273,463 |
| | | | | |
Real Estate Management & Development - 0.0% | | | | | |
St. Joe Company | | 400 | | | 14,204 |
| | | | | |
Regional Banks - 0.6% | | | | | |
Citizens Republic Bancorp, Inc. | | 600 | | | 8,706 |
City National Corporation | | 200 | | | 11,910 |
Commerce Bancshares, Inc. | | 462 | | | 20,725 |
East West Bancorp, Inc. | | 500 | | | 12,115 |
First Horizon National Corporation | | 4,800 | | | 87,120 |
Glacier Bancorp, Inc. | | 400 | | | 7,496 |
Home Bancshares, Inc. | | 200 | | | 4,194 |
Marshall & llsley Corporation | | 3,700 | | | 97,976 |
Pinnacle Financial Partners, Inc. * | | 200 | | | 5,084 |
PNC Financial Services Group, Inc. | | 1,500 | | | 98,475 |
Popular, Inc. | | 1,000 | | | 10,600 |
Provident Bankshares Corporation | | 400 | | | 8,556 |
Sandy Spring Bancorp, Inc. | | 100 | | | 2,782 |
Signature Bank NY * | | 100 | | | 3,375 |
SunTrust Banks, Inc. | | 2,900 | | | 181,221 |
Synovus Financial Corporation | | 3,700 | | | 89,096 |
UCBH Holdings, Inc. | | 1,100 | | | 15,576 |
Westamerica Bancorporation | | 100 | | | 4,455 |
Western Alliance Bancorp * | | 300 | | | 5,631 |
Wilmington Trust Corporation | | 500 | | | 17,600 |
| | | | | |
| | | | | 692,693 |
| | | | | |
| | |
| 82 | | The accompanying notes are an integral part of the financial statements |
| | |
| | |
| Schedule of Investments | | Series N (Managed Asset Allocation Series) |
| December 31, 2007 - continued | | |
| | | | | |
| | | Shares | | Value |
COMMON STOCK (continued) | | | | | |
Reinsurance - 0.0% | | | | | |
Everest Re Group, Ltd. | | 100 | | $ | 10,040 |
| | | | | |
Residential REIT’s - 0.1% | | | | | |
Camden Property Trust | | 400 | | | 19,260 |
Equity Residential | | 3,100 | | | 113,057 |
| | | | | |
| | | | | 132,317 |
| | | | | |
Restaurants - 0.1% | | | | | |
Sonic Corporation * | | 600 | | | 13,140 |
Starbucks Corporation * | | 2,400 | | | 49,128 |
| | | | | |
| | | | | 62,268 |
| | | | | |
Retail REIT’s - 0.2% | | | | | |
Regency Centers Corporation | | 500 | | | 32,245 |
Simon Property Group, Inc. | | 2,300 | | | 199,778 |
Weingarten Realty Investors | | 700 | | | 22,008 |
| | | | | |
| | | | | 254,031 |
| | | | | |
Semiconductor Equipment - 0.2% | | | | | |
Advanced Energy Industries, Inc. * | | 500 | | | 6,540 |
Applied Materials, Inc. | | 9,400 | | | 166,944 |
ASML Holding N.V.* | | 1,955 | | | 61,172 |
ATMI, Inc. * | | 400 | | | 12,900 |
Cymer, Inc. * | | 200 | | | 7,786 |
Varian Semiconductor Equipment Associates, Inc.* | | 450 | | | 16,650 |
| | | | | |
| | | | | 271,992 |
| | | | | |
Semiconductors - 1.0% | | | | | |
Advanced Micro Devices, Inc. * | | 30,800 | | | 231,000 |
Broadcom Corporation * | | 4,600 | | | 120,244 |
Intel Corporation | | 7,700 | | | 205,282 |
Intersil Corporation | | 900 | | | 22,032 |
Marvell Technology Group, Ltd. * | | 18,300 | | | 255,834 |
Maxim Integrated Products, Inc. | | 4,800 | | | 127,104 |
Semtech Corporation * | | 800 | | | 12,416 |
Virage Logic Corporation * | | 700 | | | 5,845 |
Xilinx, Inc. | | 9,500 | | | 207,765 |
Zoran Corporation * | | 889 | | | 20,011 |
| | | | | |
| | | | | 1,207,533 |
| | | | | |
Soft Drinks - 0.9% | | | | | |
Coca-Cola Company | | 7,800 | | | 478,686 |
PepsiCo, Inc. | | 7,000 | | | 531,300 |
| | | | | |
| | | | | 1,009,986 |
| | | | | |
Specialized Consumer Services - 0.2% | | | | | |
H&R Block, Inc. | | 8,900 | | | 165,273 |
Jackson Hewitt Tax Service, Inc. | | 500 | | | 15,875 |
| | | | | |
| | | | | 181,148 |
| | | | | |
Specialized Finance - 0.5% | | | | | |
CIT Group, Inc. | | 3,900 | | | 93,717 |
CME Group, Inc. | | 250 | | | 171,500 |
Interactive Brokers Group, Inc. * | | 3,200 | | | 103,424 |
IntercontinentalExchange, Inc. * | | 600 | | | 115,500 |
Moody’s Corporation | | 1,400 | | | 49,980 |
| | | | | |
| | | Shares | | Value |
COMMON STOCK (continued) | | | | | |
Specialized Finance (continued) | | | | | |
Nasdaq Stock Market, Inc. * | | 100 | | $ | 4,949 |
Nymex Holdings, Inc. | | 100 | | | 13,361 |
| | | | | |
| | | | | 552,431 |
| | | | | |
Specialized REIT’s - 0.096 | | | | | |
LaSalle Hotel Properties | | 1,000 | | | 31,900 |
Potlatch Corporation | | 455 | | | 20,220 |
| | | | | |
| | | | | 52,120 |
| | | | | |
Specialty Chemicals - 0.1% | | | | | |
Arch Chemicals, Inc. | | 600 | | | 22,050 |
Sigma-Aldrich Corporation | | 600 | | | 32,760 |
Symyx Technologies * | | 600 | | | 4,608 |
| | | | | |
| | | | | 59,418 |
| | | | | |
Specialty Stores - 0.0% | | | | | |
AC Moore Arts & Crafts, Inc. * | | 700 | | | 9,625 |
Dick’s Sporting Goods, Inc. * | | 260 | | | 7,218 |
Hibbett Sports, Inc. * | | 700 | | | 13,986 |
| | | | | |
| | | | | 30,829 |
| | | | | |
Steel - 0.2% | | | | | |
Allegheny Technologies, Inc. | | 700 | | | 60,480 |
Carpenter Technology Corporation | | 200 | | | 15,034 |
Haynes International, Inc. * | | 200 | | | 13,900 |
Nucor Corporation | | 2,440 | | | 144,497 |
Steel Dynamics, Inc. | | 500 | | | 29,785 |
| | | | | |
| | | | | 263,696 |
| | | | | |
Systems Software - 1.7% | | | | | |
McAfee, Inc. * | | 400 | | | 15,000 |
Microsoft Corporation | | 39,600 | | | 1,409,760 |
Oracle Corporation * | | 12,600 | | | 284,508 |
Red Hat, Inc. * | | 12,000 | | | 250,080 |
| | | | | |
| | | | | 1,959,348 |
| | | | | |
Technology Distributors - 0.0% | | | | | |
Insight Enterprises, Inc. * | | 600 | | | 10,944 |
SYNNEX Corporation * | | 200 | | | 3,920 |
Tech Data Corporation * | | 300 | | | 11,316 |
| | | | | |
| | | | | 26,180 |
| | | | | |
Textiles - 0.0% | | | | | |
Culp, Inc. * | | 600 | | | 4,182 |
| | | | | |
Thrifts & Mortgage Finance - 0.2% | | | | | |
BankAtlantic Bancorp, Inc. | | 1,400 | | | 5,740 |
Countrywide Financial Corporation | | 8,800 | | | 78,672 |
Federal Home Loan Mortgage Corporation | | 4,500 | | | 153,315 |
Washington Mutual, Inc. | | 1,700 | | | 23,137 |
| | | | | |
| | | | | 260,864 |
| | | | | |
Tobacco - 0.3% | | | | | |
Alliance One International, Inc. * | | 900 | | | 3,663 |
Altria Group, Inc. | | 4,130 | | | 312,145 |
| | | | | |
| | | | | 315,808 |
| | | | | |
| | |
| 83 | | The accompanying notes are an integral part of the financial statements |
| | |
| Schedule of Investments | | Series N (Managed Asset Allocation Series) |
| December 31, 2007 - continued | | |
| | | | | |
| | | Shares | | Value |
COMMON STOCK (continued) | | | | | |
Trading Companies & Distributors - 0.0% | | | | | |
Applied Industrial Technologies, Inc. | | 200 | | $ | 5,804 |
Fastenal Company | | 800 | | | 32,336 |
H&E Equipment Services, Inc. * | | 400 | | | 7,552 |
Nuco2, Inc. * | | 200 | | | 4,980 |
| | | | | |
| | | | | 50,672 |
| | | | | |
Trucking - 0.0% | | | | | |
Dollar Thrifty Automotive Group * | | 600 | | | 14,208 |
Knight Transportation, Inc. | | 300 | | | 4,443 |
| | | | | |
| | | | | 18,651 |
| | | | | |
Wireless Telecommunication Services - 1.0% | | | | | |
America Movil S.A. de CV ADR | | 1,400 | | | 85,946 |
American Tower Corporation * | | 6,230 | | | 265,398 |
Crown Castle International Corporation * | | 5,400 | | | 224,640 |
Leap Wireless International, Inc. * | | 100 | | | 4,664 |
MetroPCS Communications, Inc. * | | 6,400 | | | 124,480 |
Nll Holdings, Inc. * | | 900 | | | 43,488 |
NTELOS Holdings Corporation | | 800 | | | 23,752 |
Rogers Communications, Inc. (CI.B) | | 3,900 | | | 176,475 |
Vodafone Group plc ADR | | 5,300 | | | 197,796 |
| | | | | |
| | | | | 1,146,639 |
| |
TOTAL COMMON STOCK (Cost $54,872,978) | | | | $ | 60,729,328 |
| |
FOREIGN STOCK - 10.4% | | | | | |
Australia - 0.8% | | | | | |
Australia & New Zealand Banking Group, Ltd. | | 4,895 | | | 117,816 |
Babcock & Brown, Ltd. | | 2,435 | | | 57,946 |
Boart Longyear Group * | | 13,693 | | | 28,204 |
Boral, Ltd. | | 7,400 | | | 39,695 |
Centre Retail Group (2) | | 21,728 | | | 18,093 |
CSL, Ltd. | | 3,450 | | | 109,950 |
Goodman Fielder, Ltd. | | 23,800 | | | 39,531 |
Harvey Norman Holdings, Ltd. | | 13,666 | | | 81,452 |
Lion Nathan, Ltd. | | 3,400 | | | 28,639 |
Macquarie Group, Ltd. (2) | | 870 | | | 58,107 |
Mirvac Group (2) | | 7,936 | | | 41,735 |
Pacific Brands, Ltd. | | 11,900 | | | 33,899 |
QBE Insurance Group, Ltd. | | 3,257 | | | 95,178 |
Rio Tinto, Ltd. | | 1,175 | | | 137,954 |
Suncorp-Metway, Ltd. | | 4,393 | | | 65,150 |
Telstra Corporation, Ltd. | | 10,209 | | | 41,967 |
| | | | | |
| | | | | 995,316 |
| | | | | |
Austria - 0.1% | | | | | |
Erste Bank der Oesterreichischen Sparkassen AG | | 1,543 | | | 109,257 |
| | | | | |
| | | | | |
| | | Shares | | Value |
FOREIGN STOCK (continued) | | | | | |
Belgium - 0.1% | | | | | |
KBC Groep N.V. | | 531 | | $ | 74,578 |
| | | | | |
Bermuda - 0.1% | | | | | |
Esprit Holdings, Ltd. | | 6,700 | | | 99,678 |
Sun’s Group, Ltd. * | | 51,000 | | | 31,985 |
| | | | | |
| | | | | 131,663 |
| | | | | |
Denmark - 0.1% | | | | | |
Bang & Olufsen A | | 630 | | | 59,200 |
Danske Bank A/S | | 2,000 | | | 78,209 |
| | | | | |
| | | | | 137,409 |
| | | | | |
Finland - 0.3% | | | | | |
Cargotec Corporation (CI.B) | | 1,225 | | | 56,604 |
Nokia Oyj | | 5,405 | | | 209,272 |
Sanoma-WSOY Oyj | | 1,522 | | | 43,619 |
| | | | | |
| | | | | 309,495 |
| | | | | |
France - 1.2% | | | | | |
Alcatel-Lucent | | 5,000 | | | 36,134 |
AXA S.A. | | 4,099 | | | 163,912 |
BNP Paribas | | 1,281 | | | 138,807 |
Bouygues | | 1,464 | | | 121,831 |
Bureau Veritas S.A. * | | 1,076 | | | 63,622 |
France Telecom S.A. | | 2,020 | | | 72,607 |
L’Oreal S.A. | | 877 | | | 125,452 |
Pernod-Ricard S.A. | | 599 | | | 138,261 |
PPR | | 368 | | | 59,099 |
Sanofi-Aventis S.A. | | 1,761 | | | 161,921 |
Societe Generale | | 409 | | | 59,074 |
Technip S.A. | | 1,325 | | | 105,427 |
Total S.A. | | 2,471 | | | 205,018 |
| | | | | |
| | | | | 1,451,165 |
| | | | | |
Germany - 1.0% | | | | | |
Adidas AG | | 1,091 | | | 81,648 |
Allianz AG | | 361 | | | 77,976 |
BASF AG | | 841 | | | 124,514 |
Bayerische Motoren Werke AG | | 2,048 | | | 126,626 |
Deutsche Euroshop AG (2) | | 1,612 | | | 55,306 |
E.ON AG | | 1,694 | | | 360,069 |
Fresenius SE | | 1,183 | | | 98,274 |
Hypo Real Estate Holding AG | | 1,186 | | | 62,508 |
Muenchener Rueckversicherungs AG | | 558 | | | 108,301 |
Wacker Chemie AG | | 172 | | | 49,645 |
| | | | | |
| | | | | 1,144,867 |
| | | | | |
Hong Kong - 0.2% | | | | | |
China Overseas Land & Investment, Ltd. | | 38,000 | | | 78,563 |
Hong Kong & China Gas Company | | 30,000 | | | 91,957 |
Hutchison Whampoa, Ltd. | | 5,700 | | | 64,661 |
Television Broadcasts, Ltd. | | 7,000 | | | 42,060 |
| | |
| 84 | | The accompanying notes are an integral part of the financial statements |
| | |
| Schedule of Investments | | Series N (Managed Asset Allocation Series) |
| December 31, 2007 - continued | | |
| | | | | |
| | | Shares | | Value |
FOREIGN STOCK (continued) | | | | | |
Hong Kong (continued) | | | | | |
Uni-President China Holdings, Ltd.* | | 9,000 | | $ | 7,087 |
| | | | | |
| | | | | 284,328 |
| | | | | |
India - 0.0% | | | | | |
Idea Cellular, Ltd. * | | 15,200 | | | 53,656 |
| | | | | |
Ireland - 0.2% | | | | | |
Allied Irish Banks plc | | 4,333 | | | 99,135 |
DCC plc | | 3,274 | | | 92,118 |
| | | | | |
| | | | | 191,253 |
| | | | | |
Italy - 0.6% | | | | | |
Banco Popolare Scarl * | | 2,097 | | | 46,413 |
Benetton Group SpA | | 5,179 | | | 92,926 |
Enel SpA | | 8,901 | | | 105,715 |
Finmeccanica SpA | | 2,663 | | | 85,417 |
Intesa Sanpaolo SpA | | 14,553 | | | 114,945 |
Milano Assicurazioni SPA | | 3,172 | | | 24,776 |
Piaggio & C SpA | | 4,278 | | | 14,537 |
Prysmian SpA * | | 2,200 | | | 54,249 |
Saipem SpA | | 3,204 | | | 128,310 |
| | | | | |
| | | | | 667,288 |
| | | | | |
Japan - 1.9% | | | | | |
Aisin Seiki Company, Ltd. | | 1,000 | | | 41,818 |
All Nippon Airways Company, Ltd. | | 7,000 | | | 25,943 |
Aoyama Trading Company, Ltd. | | 700 | | | 18,280 |
Asahi Kasei Corporation | | 4,000 | | | 26,706 |
Atrium Company, Ltd. | | 1,300 | | | 27,007 |
Bank of Yokohama, Ltd. | | 9,000 | | | 63,319 |
Benesse Corporation | | 1,100 | | | 47,086 |
Canon, Inc. | | 1,700 | | | 79,329 |
Chugai Pharmaceutical Company, Ltd. | | 2,500 | | | 35,895 |
Fanuc, Ltd. | | 600 | | | 58,581 |
Goldcrest Company, Ltd. | | 910 | | | 27,275 |
Hamamatsu Photonics KK | | 1,800 | | | 59,766 |
Hitachi Chemical Company, Ltd. | | 2,900 | | | 67,012 |
Honda Motor Company, Ltd. | | 1,700 | | | 57,208 |
JS Group Corporation | | 1,100 | | | 17,660 |
KDDI Corporation | | 9 | | | 67,196 |
Kobayashi Pharmaceutical Company, Ltd. | | 600 | | | 22,506 |
Kobe Steel, Ltd. | | 20,000 | | | 65,330 |
Koito Manufacturing Company, Ltd. | | 3,000 | | | 41,082 |
Makita Corporation | | 1,000 | | | 42,536 |
Mitsubishi Electric Corporation | | 9,000 | | | 94,333 |
Mitsubishi UFJ Financial Group, Inc. | | 5,000 | | | 46,978 |
Mitsui & Company, Ltd. | | 6,000 | | | 127,339 |
Namco Bandai Holdings, Inc. | | 3,300 | | | 51,735 |
Nikon Corporation | | 2,000 | | | 69,458 |
| | | | | |
| | | Shares | | Value |
FOREIGN STOCK (continued) | | | | | |
Japan (continued) | | | | | |
Nippon Oil Corporation | | 4,000 | | $ | 32,629 |
Nippon Yusen KK | | 5,000 | | | 39,844 |
Nissha Printing Company, Ltd. | | 1,000 | | | 39,575 |
NS Solutions Corporation | | 1,200 | | | 35,429 |
Seven & I Holdings Company, Ltd. | | 1,800 | | | 52,658 |
Sony Corporation | | 1,800 | | | 100,148 |
Sony Financial Holdings, Inc. * | | 10 | | | 38,318 |
Star Micronics Company, Ltd. | | 1,300 | | | 28,640 |
Sumco Corporation | | 2,000 | | | 57,792 |
Sumitomo Corporation | | 3,100 | | | 44,149 |
Sumitomo Trust & Banking Company, Ltd. | | 14,000 | | | 93,974 |
Takara Holdings, Inc. | | 5,000 | | | 30,197 |
Takeda Pharmaceutical Company, Ltd. | | 1,000 | | | 58,958 |
Terumo Corporation | | 800 | | | 42,213 |
Tokyo Electron, Ltd. | | 700 | | | 43,092 |
Toshiba Machine Company, Ltd. | | 4,000 | | | 33,167 |
Tosoh Corporation | | 7,000 | | | 30,215 |
Toyota Motor Corporation | | 2,500 | | | 135,505 |
Wacom Company, Ltd. | | 11 | | | 23,099 |
Yusen Air & Sea Service Company, Ltd. | | 1,000 | | | 22,659 |
| | | | | |
| | | | | 2,263,639 |
| | | | | |
Mexico - 0.1% | | | | | |
Cemex S.A. de CV * | | 7,796 | | | 20,210 |
Grupo Financiero Banorte S.A. de CV | | 12,216 | | | 50,487 |
| | | | | |
| | | | | 70,697 |
| | | | | |
Netherlands - 0.3% | | | | | |
ASML Holding N.V.* | | 2,574 | | | 81,397 |
ING Groep N.V. | | 1,799 | | | 70,258 |
Koninklijke (Royal) Philips Electronics N.V. | | 1,680 | | | 72,405 |
Ordina N.V. | | 2,856 | | | 50,870 |
TomTom N.V. * | | 896 | | | 67,368 |
| | | | | |
| | | | | 342,298 |
| | | | | |
Norway - 0.3% | | | | | |
Orkla ASA | | 5,700 | | | 110,418 |
StatoilHydro ASA | | 4,450 | | | 138,418 |
Telenor ASA | | 4,600 | | | 109,853 |
TGS Nopec Geophysical Company ASA* | | 2,150 | | | 29,520 |
| | | | | |
| | | | | 388,209 |
| | | | | |
Singapore - 0.3% | | | | | |
DBS Group Holdings, Ltd. | | 7,000 | | | 100,541 |
Jardine Cycle & Carriage, Ltd. | | 3,000 | | | 45,379 |
SembCorp Industries, Ltd. | | 24,900 | | | 100,208 |
StarHub, Ltd. | | 23,250 | | | 45,332 |
| | |
| 85 | | The accompanying notes are an integral part of the financial statements |
| | |
| Schedule of Investments | | Series N (Managed Asset Allocation Series) |
| December 31, 2007 - continued | | |
| | | | | |
| | | Shares | | Value |
FOREIGN STOCK (continued) | | | | | |
Singapore (continued) | | | | | |
Venture Corporation, Ltd. | | 3,000 | | $ | 26,645 |
| | | | | |
| | | | | 318,105 |
| | | | | |
Spain - 0.6% | | | | | |
Acciona S.A. | | 536 | | | 169,694 |
ACS Actividades de Construccion y Servicios S.A. | | 1,320 | | | 78,339 |
Banco Santander Central Hispano S.A. | | 5,077 | | | 109,627 |
Iberdrola Renovables * | | 6,500 | | | 53,617 |
Industrie de Diseno Textil S.A. | | 674 | | | 41,348 |
Telefonica S.A. | | 7,886 | | | 255,824 |
| | | | | |
| | | | | 708,449 |
| | | | | |
Sweden - 0.4% | | | | | |
Atlas Copco AB | | 4,168 | | | 62,219 |
Atlas Copco AB | | 800 | | | 10,921 |
Elekta AB | | 2,400 | | | 40,003 |
Nordea Bank AB | | 5,527 | | | 92,337 |
SSAB Svenskt Stal AB | | 4,259 | | | 115,954 |
Swedbank AB | | 1,200 | | | 33,970 |
Volvo AB | | 3,603 | | | 60,473 |
| | | | | |
| | | | | 415,877 |
| | | | | |
Switzerland - 0.6% | | | | | |
ABB, Ltd. | | 1,738 | | | 50,032 |
Holcim, Ltd. | | 917 | | | 98,162 |
Nestle S.A. | | 721 | | | 330,865 |
Panalpina Welttransport Holding AG | | 333 | | | 57,687 |
Roche Holding AG | | 911 | | | 157,253 |
| | | | | |
| | | | | 693,999 |
| | | | | |
Taiwan, Province of China - 0.0% | | | | | |
Acer, Inc. | | 30,150 | | | 59,032 |
| | | | | |
United Kingdom - 1.2% | | | | | |
Aegis Group plc | | 16,187 | | | 37,457 |
Arriva plc | | 2,864 | | | 45,282 |
Associated British Foods plc | | 3,800 | | | 67,894 |
Aviva plc | | 6,247 | | | 83,508 |
BBA Aviation plc | | 9,123 | | | 37,193 |
British Airways plc * | | 3,183 | | | 19,536 |
Carillion plc | | 6,332 | | | 44,115 |
Centrica plc | | 14,325 | | | 102,078 |
Close Brothers Group plc | | 1,592 | | | 29,993 |
DSG International plc | | 11,897 | | | 23,572 |
GKN plc | | 7,943 | | | 44,492 |
HSBC Holdings plc | | 5,910 | | | 98,784 |
Informa plc | | 4,204 | | | 38,307 |
LogicaCMG plc | | 7,744 | | | 18,112 |
Persimmon plc | | 1,819 | | | 28,941 |
Rolls-Royce Group plc (B Shr Ent)* | | 228,340 | | | 499 |
Rolls-Royce Group plc * | | 5,052 | | | 54,689 |
| | | | | | |
| | | Shares | | Value |
FOREIGN STOCK (continued) | | | | | | |
United Kingdom (continued) | | | | | | |
Royal Bank of Scotland Group plc | | | 17,336 | | $ | 152,889 |
Standard Chartered plc | | | 2,923 | | | 107,062 |
Tesco plc | | | 19,278 | | | 182,556 |
Tomkins plc | | | 5,577 | | | 19,580 |
Unilever plc | | | 2,620 | | | 98,461 |
WPP Group plc | | | 1,820 | | | 23,371 |
| | | | | | |
| | | | | | 1,358,371 |
| |
TOTAL FOREIGN STOCK (Cost $10,298,779) | | | | | $ | 12,168,951 |
| |
WARRANTS - 0.0% | | | | | | |
Warrants - 0.0% | | | | | | |
Anvil (Cl. A)0 | | | | | | |
$ 1.00, 2/28/2012 * (1) | | | 333 | | | 200 |
Anvil (Cl. B) | | | | | | |
$ 1.00, 2/28/2012 * (1) | | | 370 | | | 74 |
| | | | | | |
| | | | | | 274 |
| |
TOTAL WARRANTS (Cost $3,850) | | | | | $ | 274 |
| |
| | | Principal
Amount | | Value |
CORPORATE BOND - 9.5% | | | | | | |
Aerospace & Defense - 0.1% | | | | | | |
Bombardier, Inc. | | | | | | |
6.75%, 2012 (3)(4) | | $ | 50,000 | | | 50,625 |
United Technologies Corporation | | | | | | |
5.375%, 2017 | | | 20,000 | | | 20,174 |
5.40%, 2035 | | | 20,000 | | | 18,590 |
| | | | | | |
| | | | | | 89,389 |
| | | | | | |
Automotive - 0.4% | | | | | | |
AutoNation, Inc. | | | | | | |
7.243%, 2013 (5) | | | 25,000 | | | 23,063 |
7.00%, 2014 | | | 25,000 | | | 23,687 |
DaimlerChrysler North America Holding Corporation | | | | | | |
5.328%, 2009 (5) | | | 30,000 | | | 29,796 |
6.50%, 2013 | | | 40,000 | | | 41,800 |
Erac USA Finance Company | | | | | | |
5.60%, 2015 (1)(3)(4) | | | 40,000 | | | 38,036 |
Ford Motor Credit Company LLC | | | | | | |
5.80%, 2009 | | | 65,000 | | | 61,698 |
9.693%, 2012 (5) | | | 100,000 | | | 98,337 |
Hertz Corporation | | | | | | |
8.88%, 2014 | | | 75,000 | | | 76,031 |
10.50%, 2016 | | | 50,000 | | | 51,750 |
| | | | | | |
| | | | | | 444,198 |
| | | | | | |
Banking - 0.6% | | | | | | |
BAC Capital Trust VI | | | | | | |
5.63%, 20350 | | | 55,000 | | | 46,974 |
Bank of America Corporation | | | | | | |
5.75%, 2016 | | | 40,000 | | | 40,071 |
6.00%, 2017 | | | 90,000 | | | 91,951 |
| | |
| 86 | | The accompanying notes are an integral part of the financial statements |
| | |
| Schedule of Investments | | Series N (Managed Asset Allocation Series) |
| December 31, 2007 - continued | | |
| | | | | | |
| | | Principal
Amount | | Value |
CORPORATE BOND (continued) | | | | | | |
Banking (continued) | | | | | | |
Bank One Corporation | | | | | | |
5.25%, 2013 | | $ | 70,000 | | $ | 69,794 |
BB&T Capital Trust II | | | | | | |
6.75%, 2036 | | | 50,000 | | | 48,691 |
Countrywide Home Loans, Inc. | | | | | | |
4.125%, 2009 | | | 70,000 | | | 51,346 |
Credit Suisse Guernsey, Ltd. | | | | | | |
5.86%, 2049 (5) | | | 40,000 | | | 35,808 |
Credit Suisse USA, Inc. | | | | | | |
5.50%, 2011 | | | 30,000 | | | 30,826 |
JP Morgan Chase Capital XXII | | | | | | |
6.45%, 2037 | | | 35,000 | | | 31,157 |
Mizuho Capital Investment 1, Ltd. | | | | | | |
6.686%, 2049 (1)(3)(4)(5) | | | 16,000 | | | 14,970 |
Northern Trust Company | | | | | | |
4.60%, 2013 | | | 25,000 | | | 24,581 |
Northern Trust Corporation | | | | | | |
5.30%, 2011 | | | 30,000 | | | 30,613 |
PNC Funding Corporation | | | | | | |
5.63%, 2017 | | | 35,000 | | | 34,064 |
Svensk Exportkredit AB | | | | | | |
5.13%, 2017 | | | 70,000 | | | 72,168 |
U.S. Bancorp | | | | | | |
4.50%, 2010 | | | 45,000 | | | 45,390 |
Wells Fargo & Company | | | | | | |
4.88%, 2011 | | | 90,000 | | | 91,210 |
| | | | | | |
| | | | | | 759,614 |
| | | | | | |
Basic Industry - Other - 0.1% | | | | | | |
Cooper US, Inc. | | | | | | |
6.10%, 2017 | | | 35,000 | | | 37,309 |
Xstrata Finance Canada, Ltd. | | | | | | |
5.50%, 2011 (1)(3)(4) | | | 35,000 | | | 35,607 |
| | | | | | |
| | | | | | 72,916 |
| | | | | | |
Brokerage -0.3% | | | | | | |
Citigroup, Inc. | | | | | | |
5.50%, 2012 | | | 37,000 | | | 37,734 |
5.00%, 2014 | | | 75,000 | | | 71,463 |
Franklin Resources, Inc.
3.70%, 2008 | | | 15,000 | | | 14,964 |
Goldman Sachs Group, Inc.
6.35%, 2034 | | | 30,000 | | | 27,094 |
6.75%, 2037 | | | 100,000 | | | 97,978 |
Jefferies Group, Inc.
5.875%, 2014 | | | 20,000 | | | 20,117 |
6.25%, 2036 | | | 35,000 | | | 31,285 |
Lehman Brothers Holdings, Inc.
6.75%, 2017 | | | 10,000 | | | 10,307 |
Willis North America, Inc.
6.20%, 2017 | | | 25,000 | | | 24,945 |
| | | | | | |
| | | | | | 335,887 |
| | | | | | |
| | | | | | |
| | | Principal
Amount | | Value |
CORPORATE BOND (continued) | | | | | | |
Building Materials -0.2% | | | | | | |
Centex Corporation
5.45%, 2012 | | $ | 40,000 | | $ | 35,182 |
CRH America, Inc.
6.00%, 2016 | | | 50,000 | | | 48,900 |
Freeport-McMoRan Copper & Gold, Inc.
8.38%, 2017 | | | 100,000 | | | 107,250 |
Lafarge S.A.
6.15%, 2011 | | | 20,000 | | | 20,573 |
| | | | | | |
| | | | | | 211,905 |
| | | | | | |
Capital Goods - Other - 0.1% | | | | | | |
Freescale Semiconductor, Inc.
8.875%, 2014 | | | 100,000 | | | 89,250 |
| | | | | | |
Chemicals - 0.2% | | | | | | |
El Du Pont de Nemours & Company
5.60%, 2036 | | | 50,000 | | | 47,071 |
Hercules, Inc.
6.75%, 2029 | | | 50,000 | | | 48,125 |
Nalco Company
7.75%, 2011 | | | 50,000 | | | 50,625 |
Praxair, Inc.
5.20%, 2017 | | | 35,000 | | | 34,846 |
| | | | | | |
| | | | | | 180,667 |
| | | | | | |
Communications - Other - 0.2% | | | | | | |
AT&T, Inc.
5.63%, 2016 | | | 90,000 | | | 91,027 |
CanWest MediaWorks, Inc.
8.00%, 2012 | | | 34,875 | | | 32,913 |
Dun & Bradstreet Corporation
5.50%, 2011 | | | 25,000 | | | 25,799 |
Lamar Media Corporation
6.63%, 2015 | | | 100,000 | | | 97,250 |
RH Donnelley Corporation
8.875%, 2017 (3)(4) | | | 25,000 | | | 23,125 |
| | | | | | |
| | | | | | 270,114 |
| | | | | | |
Construction Machinery - 0.0% | | | | | | |
Owens Corning, Inc.
6.50%, 2016 | | | 25,000 | | | 22,894 |
| | | | | | |
Consumer Cyclical - Other - 0.1% | | | | | | |
Hasbro, Inc.
6.30%, 2017 | | | 20,000 | | | 20,464 |
Procter & Gamble Company
4.95%, 2014 | | | 65,000 | | | 65,868 |
| | | | | | |
| | | | | | 86,332 |
| | | | | | |
Consumer Noncyclical - Other - 0.0% | | | | | | |
Bunge North America Finance, LP
5.90%, 2017 | | | 55,000 | | | 53,032 |
| | | | | | |
Consumer Products - 0.0% | | | | | | |
Fortune Brands, Inc.
5.13%, 2011 | | | 30,000 | | | 29,939 |
| | |
| 87 | | The accompanying notes are an integral part of the financial statements |
| | |
| Schedule of Investments | | Series N (Managed Asset Allocation Series) |
| December 31, 2007 - continued | | |
| | | | | | |
| | | Principal
Amount | | Value |
CORPORATE BOND (continued) | | | | | | |
Consumer Products (continued) | | | | | | |
Visant Corporation
7.63%, 2012 | | $ | 25,000 | | $ | 25,125 |
| | | | | | |
| | | | | | 55,064 |
| | | | | | |
Distributors - 0.1% | | | | | | |
Atmos Energy Corporation
4.00%, 2009 | | | 45,000 | | | 44,341 |
Southern California Gas Company
5.75%, 2035 | | | 45,000 | | | 43,589 |
Williams Companies, Inc.
7.75%, 2031 | | | 25,000 | | | 27,375 |
| | | | | | |
| | | | | | 115,305 |
| | | | | | |
Diversified Manufacturing - 0.1% | | | | | | |
3M Company
5.70%, 2037 | | | 40,000 | | | 40,800 |
Hawk Corporation
8.75%, 2014 (1) | | | 25,000 | | | 25,375 |
| | | | | | |
| | | | | | 66,175 |
| | | | | | |
Electric - 0.8% | | | | | | |
Alabama Power Company
5.22%, 2009 (5) | | | 20,000 | | | 19,998 |
Appalachian Power Company
6.38%, 2036 | | | 25,000 | | | 24,399 |
Baltimore Gas & Electric Company
5.90%, 2016 | | | 50,000 | | | 50,218 |
Black Hills Corporation
6.50%, 2013 | | | 30,000 | | | 30,056 |
Centerpoint Energy, Inc.
7.25%, 2010 | | | 25,000 | | | 26,491 |
Consumers Energy Company
6.00%, 2014 | | | 25,000 | | | 25,661 |
Dynegy Holdings, Inc.
7.75%, 2019 (3)(4) | | | 50,000 | | | 46,125 |
El Paso Electric Company
6.00%, 2035 | | | 45,000 | | | 42,070 |
Energy Future Holdings Corporation
10.875%, 2017 (3)(4) | | | 25,000 | | | 25,125 |
11.25%, 2017 (3) | | | 25,000 | | | 25,250 |
Florida Power & Light Company
6.20%, 2036 | | | 20,000 | | | 20,928 |
Florida Power Corporation
6.35%, 2037 | | | 35,000 | | | 36,876 |
Illinois Power Company
6.125%, 2017 (1)(3)(4) | | | 15,000 | | | 15,155 |
Midamerican Energy Holdings Company
6.13%, 2036 | | | 35,000 | | | 34,917 |
Monongahela Power Company
5.70%, 2017 (1)(3)(4) | | | 40,000 | | | 39,479 |
Pacific Gas & Electric Company
4.80%, 2014 | | | 30,000 | | | 29,166 |
Pacificorp
6.25%, 2037 | | | 15,000 | | | 15,490 |
| | | | | | |
| | | Principal
Amount | | Value |
CORPORATE BOND (continued) | | | | | | |
Electric (continued) | | | | | | |
Progress Energy, Inc.
5.63%, 2016 | | $ | 30,000 | | $ | 29,982 |
Public Service Company of New Mexico
4.40%, 2008 | | | 40,000 | | | 39,738 |
Public Service Electric & Gas Company
5.70%, 20360 | | | 50,000 | | | 48,202 |
Sierra Pacific Resources
7.80%, 2012 (1) | | | 25,000 | | | 26,084 |
Southern California Edison Company
4.65%, 2015 | | | 30,000 | | | 28,831 |
Tampa Electric Company
6.15%, 2037 | | | 40,000 | | | 39,135 |
Texas Competitive Electric Holdings Company LLC
10.25%, 2015 (3)(4) | | | 50,000 | | | 49,500 |
Union Electric Company
5.40%, 2016 | | | 50,000 | | | 49,247 |
Virginia Electric and Power Company
4.50%, 2010 | | | 35,000 | | | 34,877 |
6.00%, 2037 | | | 35,000 | | | 34,232 |
Westar Energy, Inc.
5.10%, 2020 | | | 25,000 | | | 23,384 |
| | | | | | |
| | | | | | 910,616 |
| | | | | | |
Energy - Other - 0.0% | | | | | | |
Dresser-Rand Group, Inc.
7.375%, 2014 | | | 22,000 | | | 21,945 |
| | | | | | |
Entertainment - 0.1% | | | | | | |
International Speedway Corporation
4.20%, 2009 | | | 20,000 | | | 19,904 |
MGM Mirage
6.00%, 2009 | | | 50,000 | | | 49,750 |
| | | | | | |
| | | | | | 69,654 |
| | | | | | |
Environmental - 0.0% | | | | | | |
Casella Waste Systems, Inc.
9.75%, 2013 | | | 25,000 | | | 25,500 |
| | | | | | |
Financial - Other - 0.2% | | | | | | |
AvalonBay Communities, Inc.
6.13%, 2012 | | | 30,000 | | | 30,751 |
First Data Corporation
9.875%, 2015 (3)(4) | | | 100,000 | | | 93,000 |
Kinder Morgan Finance Company
5.70%, 2016 | | | 45,000 | | | 40,734 |
Orion Power Holdings, Inc.
12.00%, 2010 | | | 25,000 | | | 27,250 |
Sovereign Capital Trust VI
7.91%, 2036 | | | 35,000 | | | 33,833 |
| | | | | | |
| | | | | | 225,568 |
| | | | | | |
| | |
| 88 | | The accompanying notes are an integral part of the financial statements |
| | |
| Schedule of Investments | | Series N (Managed Asset Allocation Series) |
| December 31, 2007 - continued | | |
| | | | | | |
| | | Principal
Amount | | Value |
CORPORATE BOND (continued) | | | | | | |
| Financial Companies - Noncaptive Consumer -0.2% | | | | | | |
American General Finance Corporation
5.40%, 2015 | | $ | 50,000 | | $ | 46,109 |
Capital One Capital IV
6.745%, 2037 (5) | | | 50,000 | | | 37,181 |
CIT Group, Inc.
7.625%, 2012 | | | 27,000 | | | 27,368 |
John Deere Capital Corporation
4.95%, 2012 | | | 40,000 | | | 40,055 |
5.50%, 2017 | | | 20,000 | | | 20,157 |
SLM Corporation
3.88%, 2009 (5) | | | 35,000 | | | 32,375 |
| | | | | | |
| | | | | | 203,245 |
| | | | | | |
| Financial Companies - Noncaptive Diversified -0.3% | | | | | | |
Caterpillar Financial Services Corporation
5.85%, 2017 | | | 25,000 | | | 25,715 |
FIA Card Services North America
4.63%, 2009 | | | 45,000 | | | 44,987 |
General Electric Capital Corporation
5.88%, 2012 | | | 70,000 | | | 72,933 |
6.00%, 2012 | | | 140,000 | | | 146,767 |
5.625%, 2017 | | | 65,000 | | | 66,689 |
International Lease Finance Corporation
5.45%, 2011 | | | 50,000 | | | 50,387 |
| | | | | | |
| | | | | | 407,478 |
| | | | | | |
| Food & Beverage - 0.2% | | | | | | |
Anheuser-Busch Companies, Inc.
5.50%, 2018 | | | 8,000 | | | 8,167 |
ARAMARK Corporation
8.411%, 2015 (5) | | | 100,000 | | | 97,500 |
B&G Foods, Inc.
8.00%, 2011 | | | 25,000 | | | 24,500 |
McCormick & Company, Inc.
5.20%, 2015 | | | 20,000 | | | 19,244 |
Pantry, Inc.
7.75%, 2014 | | | 25,000 | | | 23,000 |
SABMiller plc
6.20%, 2011 (1)(3)(4) | | | 50,000 | | | 52,308 |
WM Wrigley Jr Company
4.65%, 2015 | | | 15,000 | | | 14,440 |
| | | | | | |
| | | | | | 239,159 |
| | | | | | |
| Gaming - 0.1% | | | | | | |
Harrah’s Operating Company, Inc.
5.50%, 2010 | | | 45,000 | | | 41,850 |
Wynn Las Vegas Capital Corporation
6.63%, 2014 | | | 100,000 | | | 98,250 |
| | | | | | |
| | | | | | 140,100 |
| | | | | | |
Health Care - 0.4% | | | | | | |
Cardinal Health, Inc.
5.50%, 2009 (1)(3)(4)(5) | | | 30,000 | | | 30,048 |
| | | | | | |
| | | Principal
Amount | | Value |
CORPORATE BOND (continued) | | | | | | |
Health Care (continued) | | | | | | |
Eli Lilly & Company
5.55%, 2037 | | $ | 35,000 | | $ | 33,906 |
Genentech, Inc.
4.75%, 2015 | | | 35,000 | | | 34,442 |
HCA, Inc.
9.25%, 2016 | | | 50,000 | | | 52,500 |
Highmark, Inc.
6.80%, 2013 (1)(3)(4) | | | 30,000 | | | 32,876 |
Kroger Company
8.05%, 2010 | | | 45,000 | | | 47,907 |
Medtronic, Inc.
4.75%, 2015 | | | 55,000 | | | 53,073 |
UnitedHealth Group, Inc.
5.375%, 2016 | | | 55,000 | | | 53,908 |
Vanguard Health Holding Company II LLC
9.00%, 2014 | | | 25,000 | | | 24,062 |
WellPoint, Inc.
5.00%, 2011 | | | 30,000 | | | 30,043 |
Wyeth
5.95%, 2037 | | | 35,000 | | | 35,093 |
| | | | | | |
| | | | | | 427,858 |
| | | | | | |
Home Construction - 0.2% | | | | | | |
DR Horton, Inc.
6.50%, 2016 | | | 35,000 | | | 30,367 |
Lennar Corporation
5.60%, 2015 | | | 55,000 | | | 41,911 |
MDC Holdings, Inc.
5.50%, 2013 | | | 55,000 | | | 52,616 |
NVR, Inc.
5.00%, 2010 | | | 20,000 | | | 20,059 |
Pulte Homes, Inc.
5.20%, 2015 | | | 50,000 | | | 41,358 |
| | | | | | |
| | | | | | 186,311 |
| | | | | | |
Independent Energy - 0.1% | | | | | | |
Devon Financing Corporation ULC
6.88%, 2011 | | | 38,000 | | | 40,694 |
Forest Oil Corporation
8.00%, 2011 | | | 25,000 | | | 26,000 |
Hilcorp Energy I, LP
7.75%, 2015 (3)(4) | | | 75,000 | | | 73,688 |
NRG Energy, Inc.
7.25%, 2014 | | | 25,000 | | | 24,375 |
Southern Company
5.30%, 2012 | | | 15,000 | | | 15,272 |
| | | | | | |
| | | | | | 180,029 |
| | | | | | |
Insurance - Life - 0.3% | | | | | | |
Genworth Financial, Inc.
5.75%, 2014 | | | 55,000 | | | 55,200 |
6.15%, 2066 (5) | | | 18,000 | | | 16,354 |
Hartford Financial Services Group, Inc. | | | | | | |
5.38%, 2017 | | | 45,000 | | | 43,483 |
| | |
| 89 | | The accompanying notes are an integral part of the financial statements |
| | |
| Schedule of Investments | | Series N (Managed Asset Allocation Series) |
| December 31, 2007 - continued | | |
| | | | | | |
| | | Principal
Amount | | Value |
CORPORATE BOND (continued) | | | |
Insurance - Life (continued) | | | | | | |
Lincoln National Corporation
6.05%, 2067 (5) | | $ | 20,000 | | $ | 18,671 |
MetLife, Inc.
6.13%, 2011 | | | 50,000 | | | 51,848 |
NLV Financial Corporation
7.50%, 2033 (1)(3)(4) | | | 30,000 | | | 31,949 |
Principal Financial Group, Inc.
6.05%, 2036 | | | 30,000 | | | 28,548 |
Principal Life Global Funding I
5.13%, 2013 (1)(3)(4) | | | 45,000 | | | 45,576 |
Sun Life Financial Global Funding, LP
5.08%, 2013 (1)(3)(4)(5) | | | 45,000 | | | 45,092 |
Torchmark Corporation
6.38%, 2016 | | | 30,000 | | | 30,976 |
| | | | | | |
| | | | | | 367,697 |
| | | | | | |
Insurance - Property & Casualty - 0.1% | | | | | | |
Ace INA Holdings, Inc.
5.88%, 2014 | | | 35,000 | | | 35,847 |
5.70%, 2017 | | | 30,000 | | | 29,730 |
Fund American Companies, Inc.
5.88%, 2013 | | | 45,000 | | | 45,097 |
Nationwide Mutual Insurance Company
6.60%, 2034 (1)(3)(4) | | | 25,000 | | | 24,659 |
| | | | | | |
| | | | | | 135,333 |
| | | | | | |
Integrated Energy - 0.2% | | | | | | |
ConocoPhillips
5.90%, 2032 | | | 40,000 | | | 40,943 |
Hess Corporation
7.88%, 2029 | | | 20,000 | | | 23,672 |
Jersey Central Power & Light Company
5.65%, 2017 (3)(4) | | | 45,000 | | | 44,086 |
Petrobras International Finance Company
5.875% 2018 | | | 35,000 | | | 34,808 |
Petro-Canada
5.95%, 2035 | | | 40,000 | | | 38,575 |
West Penn Power Company
5.95%, 2017 (1)(3)(4) | | | 25,000 | | | 25,122 |
| | | | | | |
| | | | | | 207,206 |
| | | | | | |
Media - Cable - 0.4% | | | | | | |
Charter Communications Operating LLC
8.00%, 2012 (3)(4) | | | 25,000 | | | 24,125 |
Comcast Cable Communications Holdings, Inc.
8.38%, 2013 | | | 45,000 | | | 50,485 |
Comcast Corporation
5.88%, 2018 | | | 45,000 | | | 44,864 |
6.95%, 2037 | | | 7,000 | | | 7,555 |
COX Communications, Inc.
7.13%, 2012 | | | 20,000 | | | 21,330 |
CSC Holdings, Inc.
7.25%, 2008 | | | 100,000 | | | 100,125 |
| | | | | | |
| | | Principal
Amount | | Value |
CORPORATE BOND (continued) | | | |
Media - Cable (continued) | | | | | | |
News America, Inc.
6.15%, 2037 | | $ | 60,000 | | $ | 57,959 |
Rogers Cable, Inc.
5.50%, 2014 | | | 40,000 | | | 39,412 |
Time Warner Cable, Inc.
5.40%, 2012 | | | 35,000 | | | 35,070 |
Time Warner Entertainment Company, LP
7.25%, 2008 | | | 40,000 | | | 40,537 |
Time Warner, Inc.
5.50%, 2011 | | | 30,000 | | | 30,123 |
Viacom, Inc.
6.25%, 2016 | | | 30,000 | | | 30,182 |
6.125%, 2017 | | | 15,000 | | | 14,999 |
| | | | | | |
| | | | | | 496,766 |
| | | | | | |
Media - Non Cable - 0.3% | | | | | | |
Affinity Group, Inc.
9.00%, 2012 | | | 25,000 | | | 23,750 |
Clear Channel Communications, Inc.
6.25%, 2011 | | | 100,000 | | | 90,500 |
Idearc, Inc.
8.00%, 2016 | | | 100,000 | | | 91,750 |
News America, Inc.
6.40%, 2035 | | | 45,000 | | | 45,524 |
6.65%, 2037 (1)(3)(4) | | | 40,000 | | | 41,259 |
Time Warner Entertainment Company, LP
8.375%, 2033 | | | 25,000 | | | 30,115 |
| | | | | | |
| | | | | | 322,898 |
| | | | | | |
Metals & Mining - 0.1% | | | | | | |
BHP Billiton Finance, Ltd.
5.40%, 2017 | | | 30,000 | | | 28,853 |
Placer Dome, Inc.
6.45%, 2035 | | | 35,000 | | | 35,395 |
Russel Metals, Inc.
6.38%, 2014 | | | 25,000 | | | 23,156 |
Sunoco, Inc.
5.75%, 2017 | | | 34,000 | | | 33,787 |
Vale Overseas, Ltd.
6.25%, 2017 | | | 55,000 | | | 55,171 |
| | | | | | |
| | | | | | 176,362 |
| | | | | | |
Natural Gas Pipelines - 0.1% | | | | | | |
Boardwalk Pipelines LLC | | | | | | |
5.50%, 2017 | | | 10,000 | | | 9,908 |
Enterprise Products Operating, LP
4.95%, 2010 | | | 35,000 | | | 35,023 |
Williams Companies, Inc.
8.75%, 2032 | | | 25,000 | | | 30,563 |
| | | | | | |
| | | | | | 75,494 |
| | | | | | |
Oil Field Services - 0.6% | | | | | | |
Baker Hughes, Inc.
6.88%, 2029 | | | 55,000 | | | 59,600 |
| | |
| 90 | | The accompanying notes are an integral part of the financial statements |
| | |
| Schedule of Investments | | Series N (Managed Asset Allocation Series) |
| December 31, 2007 - continued | | |
| | | | | | |
| | | Principal
Amount | | Value |
CORPORATE BOND (continued) | | | | | | |
Oil Field Services (continued) | | | | | | |
Chesapeake Energy Corporation
6.50%, 2017 | | $ | 100,000 | | $ | 96,500 |
Denbury Resources, Inc.
7.50%, 2015 | | | 50,000 | | | 50,500 |
Devon Financing Corporation ULC
7.88%, 2031 | | | 25,000 | | | 30,236 |
Diamond Offshore Drilling, Inc.
5.15%, 2014 | | | 25,000 | | | 24,280 |
El Paso Natural Gas Company
5.95%, 2017 | | | 13,000 | | | 12,831 |
Enbridge, Inc.
5.60%, 2017 | | | 35,000 | | | 33,932 |
EnCana Corporation
5.90%, 2017 | | | 25,000 | | | 25,575 |
EOG Resources, Inc.
5.875%, 2017 | | | 25,000 | | | 25,631 |
Halliburton Company
5.50%, 2010 | | | 60,000 | | | 61,677 |
Pemex Project Funding Master Trust
6.291%, 2010 (1)(3)(4)(5) | | | 45,000 | | | 45,630 |
5.75%, 2018 | | | 40,000 | | | 40,037 |
Range Resources Corporation
7.50%, 2017 | | | 100,000 | | | 101,000 |
Southern Natural Gas Company
5.90%, 2017 (1)(3)(4) | | | 13,000 | | | 12,786 |
Transocean, Inc.
5.25%, 2013 | | | 10,000 | | | 10,022 |
XTO Energy, Inc.
5.65%, 2016 | | | 25,000 | | | 25,178 |
6.75%, 2037 | | | 15,000 | | | 16,090 |
| | | | | | |
| | | | | | 671,505 |
| | | | | | |
Packaging - 0.1% | | | | | | |
BWAY Corporation
10.00%, 2010 | | | 25,000 | | | 24,750 |
Graphic Packaging International Corporation | | | | | | |
8.50%, 2011 | | | 25,000 | | | 24,750 |
Owens Brockway Glass Container, Inc.
8.88%, 2009 | | | 25,000 | | | 25,094 |
| | | | | | |
| | | | | | 74,594 |
| | | | | | |
Paper - 0.1% | | | | | | |
Boise Cascade LLC
7.13%, 2014 | | | 25,000 | | | 24,188 |
Georgia-Pacific Corporation
7.13%, 2017 (3)(4) | | | 100,000 | | | 97,250 |
Sealed Air Corporation
5.38%, 2008 (1)(3)(4) | | | 40,000 | | | 39,977 |
| | | | | | |
| | | | | | 161,415 |
| | | | | | |
| | | | | | |
| | | Principal
Amount | | Value |
CORPORATE BOND (continued) | | | | | | |
Pharmaceuticals - 0.0% | | | | | | |
Teva Pharmaceutical Finance LLC
5.55%, 2016 | | $ | 40,000 | | $ | 39,528 |
| | | | | | |
Pipelines - 0.0% | | | | | | |
Panhandle Eastern Pipeline Company
4.80%, 2008 | | | 20,000 | | | 19,908 |
| | | | | | |
Railroads - 0.2% | | | | | | |
Burlington Northern Santa Fe Corporation
5.65%, 2017 | | | 57,000 | | | 56,669 |
6.15%, 2037 | | | 53,000 | | | 51,523 |
Canadian National Railway Company
6.25%, 2034 | | | 20,000 | | | 20,175 |
6.375%, 2037 | | | 10,000 | | | 10,233 |
Norfolk Southern Corporation
6.00%, 2008 | | | 50,000 | | | 50,176 |
| | | | | | |
| | | | | | 188,776 |
| | | | | | |
Refining - 0.1% | | | | | | |
Denbury Resources, Inc.
7.50%, 2013 | | | 25,000 | | | 25,250 |
Diamond Offshore Drilling, Inc.
4.88%, 2015 | | | 30,000 | | | 29,356 |
Enterprise Products Operating, LP
6.30%, 2017 | | | 20,000 | | | 20,463 |
Marathon Oil Corporation
6.60%, 2037 | | | 15,000 | | | 15,641 |
Valero Energy Corporation
6.125%, 2017 | | | 55,000 | | | 55,895 |
| | | | | | |
| | | | | | 146,605 |
| | | | | | |
REIPs - 0.1% | | | | | | |
ERP Operating, LP
5.25%, 2014 | | | 25,000 | | | 23,820 |
Federal Realty Investment Trust
6.00%, 2012 | | | 20,000 | | | 20,527 |
Hospitality Properties Trust
5.625%, 2017 | | | 30,000 | | | 27,762 |
Reckson Operating Partnership, LP
6.00%, 2016 | | | 30,000 | | | 28,001 |
Regency Centers, LP
5.875%, 2017 | | | 15,000 | | | 14,495 |
Simon Property Group, LP
5.75%, 2015 | | | 50,000 | | | 48,563 |
| | | | | | |
| | | | | | 163,168 |
| | | | | | |
Restaurants - 0.0% | | | | | | |
Federated Retail Holdings, Inc.
5.35%, 2012 | | | 20,000 | | | 19,486 |
McDonald’s Corporation
5.30%, 2017 | | | 35,000 | | | 34,896 |
| | | | | | |
| | | | | | 54,382 |
| | | | | | |
| | |
| 91 | | The accompanying notes are an integral part of the financial statements |
| | |
| Schedule of Investments | | Series N (Managed Asset Allocation Series) |
| December 31, 2007 - continued | | |
| | | | | | |
| | | Principal
Amount | | Value |
CORPORATE BOND (continued) | | | | | | |
Retailers - 0.2% | | | | | | |
AmeriGas Partners, LP
7.13%, 2016 | | $ | 100,000 | | $ | 97,000 |
Costco Wholesale Corporation
5.30%, 2012 | | | 30,000 | | | 30,791 |
Home Depot, Inc.
5.40%, 2016 | | | 35,000 | | | 33,161 |
JC Penney Corporation, Inc.
9.00%, 2012 | | | 30,000 | | | 33,730 |
| | | | | | |
| | | | | | 194,682 |
| | | | | | |
Sovereigns - 0.1% | | | | | | |
Italy Government International Bond
5.25%, 2016 | | | 85,000 | | | 89,396 |
| | | | | | |
Technology - 0.3% | | | | | | |
Cisco Systems, Inc.
5.25%, 2011 | | | 45,000 | | | 46,137 |
National Semiconductor Corporation
6.15%, 2012 | | | 20,000 | | | 20,388 |
Oracle Corporation and Ozark Holding, Inc.
5.00%, 2011 | | | 50,000 | | | 50,661 |
STATS ChipPAC, Ltd.
6.75%, 2011 | | | 25,000 | | | 25,062 |
Sungard Data Systems, Inc.
9.13%, 2013 | | | 100,000 | | | 101,750 |
Xerox Corporation
5.50%, 2012 | | | 15,000 | | | 15,249 |
6.75%, 2017 | | | 100,000 | | | 104,232 |
| | | | | | |
| | | | | | 363,479 |
| | | | | | |
Telecommunications - Wireless - 0.3% | | | | | | |
America Movil S.A. de CV
6.38%, 2035 | | | 45,000 | | | 44,497 |
America Movil SAB de CV
5.625%, 2017 | | | 45,000 | | | 43,969 |
British Telecommunications plc
5.15%, 2013 | | | 40,000 | | | 39,914 |
New Cingular Wireless Services, Inc.
7.88%, 2011 | | | 30,000 | | | 32,489 |
Rogers Wireless, Inc.
9.63%, 2011 | | | 100,000 | | | 113,833 |
Sprint Capital Corporation
6.90%, 2019 | | | 55,000 | | | 54,635 |
Verizon Global Funding Corporation
7.75%, 2030 | | | 30,000 | | | 35,186 |
Vodafone Group plc
5.63%, 2017 | | | 35,000 | | | 34,851 |
| | | | | | |
| | | | | | 399,374 |
| | | | | | |
Telecommunications - Wirelines - 0.6% | | | | | | |
AT&T Corporation
7.30%, 2011 | | | 15,000 | | | 16,253 |
AT&T, Inc.
5.30%, 2010 | | | 100,000 | | | 101,777 |
| | | | | | |
| | | Principal
Amount | | Value |
CORPORATE BOND (continued) | | | | | | |
Telecommunications - Wirelines (continued) | | | | | | |
AT&T, Inc. (continued)
6.45%, 2034 | | $ | 60,000 | | $ | 61,840 |
Citizens Communications Company
7.125%, 2019 | | | 100,000 | | | 95,000 |
Nordic Telephone Company Holdings ApS
8.88%, 2016(3)(4) | | | 100,000 | | | 102,000 |
Qwest Corporation
7.50%, 2014 | | | 50,000 | | | 50,750 |
Rogers Wireless, Inc.
7.50%, 2015 | | | 15,000 | | | 16,404 |
Telecom Italia Capital S.A.
5.25%, 2013 | | | 55,000 | | | 54,358 |
Telefonica Emisiones SAU
6.42%, 2016 | | | 75,000 | | | 78,927 |
Windstream Corporation
8.63%, 2016 | | | 100,000 | | | 105,000 |
| | | | | | |
| | | | | | 682,809 |
| | | | | | |
Textile - 0.1% | | | | | | |
Invista
9.25%, 2012 (3)(4) | | | 100,000 | | | 103,500 |
| | | | | | |
Utility - Other - 0.1% | | | | | | |
NRG Energy, Inc.
7.38%, 2016 | | | 75,000 | | | 73,125 |
| |
TOTAL CORPORATE BOND (Cost $11,237,581) | | | | | $ | 11,098,207 |
| |
FOREIGN BOND - 0.1% | | | | | | |
Chile - 0.0% | | | | | | |
Celulosa Arauco y Constitucion S.A.
5.13%, 2013 | | | 40,000 | | | 39,102 |
| | | | | | |
France - 0.1% | | | | | | |
France Telecom S.A.
7.75%, 2011 | | | 46,000 | | | 49,442 |
| | | | | | |
United Kingdom - 0.0% | | | | | | |
HBOS plc
6.00%, 2033 (1)(3)(4) | | | 40,000 | | | 41,267 |
| |
TOTAL FOREIGN BOND (Cost $128,794 ) | | | | | $ | 129,811 |
| |
FOREIGN GOVERNMENT BOND – 0.1% | | | |
Mexico - 0.0% | | | | | | |
Mexico Government International Bond
6.38%, 2013 | | | 45,000 | | | 47,857 |
| | | | | | |
South Africa - 0.1% | | | | | | |
South Africa Government International Bond
6.50%, 2014 | | | 65,000 | | | 68,738 |
| |
TOTAL FOREIGN GOVERNMENT BOND | | | | | $ | 116,595 |
(Cost $112,200) | | | | | | |
| |
| | |
| 92 | | The accompanying notes are an integral part of the financial statements |
| | |
| | |
| Schedule of Investments | | Series N (Managed Asset Allocation Series) |
| December 31, 2007 - continued | | |
| | | | | | |
| | | Principal
Amount | | Value |
PREFERRED STOCK - 0.0% | | | | | | |
Thrifts & Mortgage Finance - 0.0% | | | | | | |
Federal National Mortgage Association
8.25%, 2010 | | $ | 1,050 | | $ | 27,038 |
TOTAL PREFERRED STOCK (Cost $26,250) | | | | | $ | 27,038 |
MUNICIPAL BOND - 0.2% | | | | | | |
Georgia - 0.1% | | | | | | |
State of Georgia General Obligation Unlimited
5.00%, 2019 | | | 40,000 | | | 43,932 |
| | | | | | |
Kansas - 0.0% | | | | | | |
Kansas Development Finance Authority Revenue Bonds
5.50%, 2034 | | | 30,000 | | | 30,555 |
| | | | | | |
Maryland - 0.1% | | | | | | |
County of Baltimore Maryland General Obligation Unlimited
5.00%, 2038 | | | 35,000 | | | 36,838 |
State of Maryland General Obligation Unlimited
5.00%, 2019 | | | 60,000 | | | 65,939 |
| | | | | | |
| | | | | | 102,777 |
| | | | | | |
New York - 0.0% | | | | | | |
New York City Housing Development Corporation Revenue Bonds
6.42%, 2027 | | | 30,000 | | | 30,985 |
| | | | | | |
Oregon - 0.0% | | | | | | |
State of Oregon General Obligation Unlimited
5.89%, 2027 | | | 15,000 | | | 15,790 |
| | | | | | |
West Virginia - 0.0% | | | | | | |
Tobacco Settlement Finance Authority of West Virginia Revenue Bonds
7.467%, 2047 | | | 45,000 | | | 43,218 |
TOTAL MUNICIPAL BOND (Cost $264,395) | | | | | $ | 267,257 |
MORTGAGE BACKED SECURITIES –15.6% | | | |
Federal Home Loan Mortgage | | | | | | |
Corporation -1.6% | | | | | | |
Pass-Thru’s -1.6% | | | | | | |
Federal Home Loan Mortgage Corporation
# 833174, 5.164% - 2035 (5)
#1G1370, 5.744% - 2036 (5) | |
| 374,800
355,755 | |
| 377,669
361,430 |
Federal National Mortgage Association
#745279, 5.00% - 2021
#950360, 5.50% - 2022 | |
| 735,877
348,550 | |
| 736,599
353,072 |
| | | | | | |
| | | | | | 1,828,770 |
| | | | | | |
Other Non-Agency - 1.7% | | | | | | |
CMC’s - 1.7% | | | | | | |
American Tower Trust
2007-1A, 5.96% - 2037 (1)(3)(4) | | | 45,000 | | | 44,608 |
| | | | | | |
| | | Principal
Amount | | Value |
MORTGAGE BACKED SECURITIES (continued) |
Other Non-Agency (continued) | | | | | | |
CMC’s (continued) | | | | | | |
Banc of America Commercial Mortgage, Inc.
2003-1, 4.65% - 2036
2005-3, 4.501% - 2043 | | $
| 75,000
235,000 | | $
| 74,152
232,115 |
Banc of America Mortgage Securities, Inc.
2004-A, 4.091% - 2034 (5)
2004-D, 4.197% - 2034 (5)
2004-H, 4.745% - 2034 (5)
2004-1, 4.874% - 2034 (5)
2005-J, 5.258% - 2035 (5) | |
| 48,358
4,003
22,345
23,860
45,745 | |
| 47,988
3,975
22,322
23,673
45,030 |
Bear Stearns Commercial Mortgage Securities
2006-PW12, 5.87% - 2038 (5)
2005-PW10, 5.09% - 2040
2005-PWR8, 4.67% - 2041 | |
| 175,000
111,482
60,000 | |
| 179,239
111,528
57,336 |
Citigroup 2005-CD1,
5.40% - 2044 (5) | | | 175,000 | | | 175,488 |
DLJ Commercial Mortgage Corporation
1999-CG2, 7.30% - 2032 (5) | | | 71,022 | | | 73,003 |
GMAC Commercial Mortgage Securities Inc.
2001-C2, 6.70% - 2034 | | | 125,000 | | | 132,214 |
JP Morgan Chase Commercial Mortgage Securities, Corporation
2001-CIBC, 6.26% - 2033
2001-CIB2, 6.24% - 2035
2004-LDP4, 4.824% - 2042 (5) | |
| 101,697
40,672
75,000 | |
| 105,492
41,101
73,667 |
LB-UBS Commercial Mortgage Trust
2004-C4, 4.567% - 2029 (5)
2005-C1, 4.742% - 2030
2006-C1, 5.16% - 2031 | |
| 75,000
195,000
150,000 | |
| 74,796
187,143
148,311 |
Morgan Stanley Dean Witter Capital I
2002-TOP7, 5.98% - 2039 | | | 200,000 | | | 208,507 |
| | | | | | |
| | | | | | 2,061,688 |
| | | | | | |
U.S. Government Sponsored | | | | | | |
Agencies - 11.7% | | | | | | |
CMO’s - 0.3% | | | | | | |
Federal Home Loan Mortgage Corporation
FHR 2614 IH, 4.50% - 2016 (1)(6)
FHR 2681 PC, 5.00% - 2019 | |
| 86,778
100,000 | |
| 6,820
100,354 |
Federal National Mortgage Association
FNR 2003-92 NM, 3.50% - 2013
FNR 2002-74 PJ, 5.00% - 2015
FNR 2003-40 Nl, 5.50%-2028 (1)(6)
FNR 2006-35 GK, 6.00% - 2032
FNS 319 2, 6.50% - 2032 (1)(6) | |
| 26,340
78,610
8,773
108,578
12,326 | |
| 26,158
78,475 389
110,541
2,840 |
| | | | | | |
| | | | | | 325,577 |
| | | | | | |
| | |
| 93 | | The accompanying notes are an integral part of the financial statements |
| | |
| | |
| Schedule of Investments | | Series N (Managed Asset Allocation Series) |
| December 31, 2007 - continued | | |
| | | | | | |
| | | Principal
Amount | | Value |
MORTGAGE BACKED SECURITIES (continued) |
U.S. Government Sponsored Agencies (continued) | | | | | | |
Pass-Thru’s - 11.4% | | | | | | |
Federal Home Loan Mortgage Corporation
#M80714, 5.00% - 2008
#E81544, 6.00% - 2009
#B10343, 5.00% - 2018
#E99933, 5.00% - 2018
#E99966, 5.00% - 2018
#E01341, 5.50% - 2018
#G11759, 5.50% - 2018
#B19214, 5.50% - 2020
#J02272, 5.50% - 2020
#J02554, 5.50% - 2020
#G12463, 5.50% -2021
#J03203, 6.00% -2021
#J03254, 6.00% - 2021
#J03615, 6.00% - -2021
#J03640, 6.00% -2021
#J03672, 6.00% -2021
#C72128, 6.00% - 2032
#C68205, 7.00% - 2032
#1B0527, 7.189% - 2032 (5)
#A12118, 5.00% -2033
#A15852, 5.00% - 2033
#A15907, 5.00% - 2033
#D86309, 5.00% - 2033
#G01628, 6.00% - 2033
#A21263, 4.50% - 2034
#G01805, 4.50% - 2035
#1G1762, 5.052%- 2035 (5)
#1H2581, 5.13% - 2036 (5)
#1G0661, 5.388% - 2036 (5)
#1G1353, 5.98% - 2036 (5) | | $
| 18,791
37,341
6,523
3,876
23,732
7,167
187,187
24,321
77,039
78,625
67,158
78,162
23,764
110,841
70,130
30,922
60,250
5,391
3,201
52,470
18,810
24,636
28,646
121,209
140,333
294,190
38,296
80,929
18,452
134,599 | | $
| 18,759
37,384
6,539
3,886
23,791
7,268
189,825
24,621
77,990
79,595
68,086
79,959
24,310
113,391
71,743
31,633
61,354
5,648
3,218
51,273
18,381
24,074
27,992
123,274
132,711
278,619
38,467
81,431
18,438
136,210 |
Federal National Mortgage Association
#254140, 5.50% - 2017
#254234, 5.50% - 2017
#625931, 5.50% - 2017
#357280, 6.50% - 2017
#254720, 4.50% - 2018
#555345, 5.50% - 2018
#555446, 5.50% - 2018
#555526, 5.50% - 2018
#555693, 5.50% - 2018
#685202, 5.50% - 2018
#725098, 5.50% - 2018
#357475, 4.50% - 2019
#725528, 5.50% - 2019
#789885, 5.50% - 2019
#745392, 4.50% - 2020
#829028, 4.50% - 2020 | |
| 4,878
4,942
4,337
21,666
101,627
4,820
7,380
114,973
68,081
63,190
14,962
105,638
11,509
14,069
132,383
173,727 | |
| 4,953
5,018
4,404
22,413
99,993
4,895
7,491
116,711
69,110
64,129
15,184
103,940
11,680
14,278
130,203
170,820 |
| | | | | | |
| | | Principal
Amount | | Value |
MORTGAGE BACKED SECURITIES (continued) |
U.S. Government Sponsored Agencies (continued) | | | | | | |
Pass-Thru’s (continued) | | | | | | |
Federal National Mortgage Association (continued)
#888564, 5.00% - 2021
#256353, 5.50% - 2021
#745453, 5.50% - 2021
#893404, 5.50% - 2021
#900999, 5.50% - 2021
#901000, 5.50% - 2021
#745406, 6.00% - 2021
#254514, 5.50% - 2032
#254550, 6.50% - 2032
#545759, 6.50% - 2032
#650075, 6.50% - 2032
#725027, 5.00% - 2033
#254767, 5.50% - 2033
#254983, 5.50% - 2033
#744692, 5.50% - 2033
#744750, 5.50% - 2033
#747387, 5.50% - 2033
#747549, 5.50% - 2033
#750362, 5.50% - 2033
#756190, 5.50% - 2033
#555417, 6.00% - 2033
TBA, 6.00% - 2033
#763700, 5.00% - 2034
#255028, 5.50% - 2034
#725424, 5.50% - 2034
#725773, 5.50% - 2034
#762076, 5.50% - 2034
#789293, 5.50% - 2034
#796104, 5.50% - 2034
#804395, 5.50% - 2034
#923129, 5.50% - 2034
#255459, 6.00% - 2034
#725690, 6.00% - 2034
#725704, 6.00% - 2034
#790044, 6.00% - 2034
#790217, 6.00% - 2034
#790237, 6.00% - 2034
#790629, 6.00% - 2034
#790788, 6.00% - 2034
#791574, 6.00% - 2034
#745216, 4.788% - 2035 (5)
#850863, 5.321% - 2035 (5)
#846551, 5.343% - 2035 (5)
#735500, 5.50% - 2035
#848476, 5.518% - 2035 (5)
#848522, 5.697% - 2035 (5) | | $
| 281,402
191,960
22,762
21,381
31,915
20,694
98,001
2,956
18,629
109,855
15,099
148,034
146,903
68,777
37,252
16,689
23,868
7,162
29,746
36,336
54,306
550,000
70,134
16,926
328,857
251,066
42,717
147,692
36,516
90,378
20,686
39,014
40,162
331,134
40,440
16,025
39,224
36,252
42,020
42,011
58,271
34,055
38,374
149,766
57,277
17,101 | | $
| 281,678
194,416
23,066
21,661
32,332
20,965
100,463
2,962
19,258
112,926
15,609
144,659
147,012
68,828
37,279
16,702
23,886
7,167
29,768
36,363
55,392
558,422
68,508
16,904
329,101
250,740
42,749
147,954
36,518
90,383
20,687
39,671
40,839
336,926
41,122
16,295
39,885
36,863
42,728
42,719
58,391
34,067
38,386
149,675
57,027
17,178 |
| | |
| 94 | | The accompanying notes are an integral part of the financial statements |
| | |
| Schedule of Investments | | Series N (Managed Asset Allocation Series) |
| December 31, 2007 - continued | | |
| | | | | | |
| | | Principal
Amount | | Value |
MORTGAGE BACKED SECURITIES (Continued) |
U.S. Government Sponsored Agencies (continued) | | | | | | |
Pass-Thru’s (continued) | | | | | | |
Federal National Mortgage Association (continued) | | | | | | |
#808951, 6.00% - 2035 | | $ | 374,629 | | $ | 380,643 |
#745418, 5.50% - 2036 | | | 1,353,026 | | | 1,352,201 |
#745887, 5.50% - 2036 | | | 177,924 | | | 177,732 |
#745946, 5.50% - 2036 | | | 23,507 | | | 23,482 |
#745777, 5.54% - 2036 (5) | | | 123,392 | | | 124,947 |
#888010, 5.984% - 2036 (5) | | | 38,747 | | | 39,084 |
#893353, 6.00% - 2036 | | | 55,984 | | | 56,862 |
#905196, 6.034% - 2036 (5) | | | 53,567 | | | 54,427 |
#745554, 6.50% - 2036 | | | 421,400 | | | 433,691 |
#896329, 6.50% - 2036 | | | 44,458 | | | 45,705 |
#918657, 5.00% - 2037 | | | 256,714 | | | 250,488 |
#938089, 5.00% - 2037 | | | 26,332 | | | 25,694 |
#938883, 5.00% - 2037 | | | 947,519 | | | 924,540 |
#943436, 5.00% - 2037 | | | 292,589 | | | 285,493 |
#924778, 5.098% - 2037 (5) | | | 362,350 | | | 364,288 |
#888884, 5.50% - 2037 | | | 168,969 | | | 169,094 |
#899871, 5.50% - 2037 | | | 274,676 | | | 274,366 |
#923128, 5.50% - 2037 | | | 24,774 | | | 24,748 |
#939416, 5.705% - 2037 (5) | | | 358,268 | | | 363,680 |
#1B3203, 5.936% - 2037 (5) | | | 34,782 | | | 35,281 |
#899859, 6.50% - 2037 | | | 243,592 | | | 250,401 |
#928835, 6.50% - 2037 | | | 27,973 | | | 28,755 |
#928843, 6.50% - 2037 | | | 72,550 | | | 74,578 |
#948050, 6.50% - 2037 | | | 28,599 | | | 29,398 |
#952502, 6.50% - 2037 | | | 169,156 | | | 173,882 |
#959818, 6.50% - 2037 | | | 549,544 | | | 564,896 |
#960122, 6.50% - 2037 | | | 179,855 | | | 184,879 |
| | | | | | |
| | | | | | 13,364,457 |
| | | | | | |
| | | | | | 13,690,034 |
| | | | | | |
U.S. Government Sponsored Securities -0.6% | | | | | | |
Pass-Thru’s -0.6% | | | | | | |
Government National Mortgage Association | | | | | | |
#780766, 7.00% - 2013 | | | 1,795 | | | 1,811 |
#781312, 7.00% - 2013 | | | 18,682 | | | 19,470 |
#67365, 11.50% - 2013 | | | 1,380 | | | 1,579 |
G2 2102, 8.00% -2025 | | | 935 | | | 1,007 |
#427029, 8.50% - 2026 | | | 1,505 | | | 1,638 |
G2 3295, 5.50% -2032 | | | 11,772 | | | 11,809 |
#604639, 5.00% - 2033 | | | 65,494 | | | 64,555 |
#612919, 5.00% - 2033 | | | 173,987 | | | 171,494 |
#615278, 5.00% - 2033 | | | 82,720 | | | 81,535 |
G2 3442, 5.00% -2033 | | | 158,591 | | | 154,958 |
G2 3458, 5.00% -2033 | | | 44,649 | | | 43,618 |
G2 3490, 6.50% -2033 | | | 9,629 | | | 9,974 |
| | | | | | |
| | | Principal
Amount | | Value |
MORTGAGE BACKED SECURITIES (continued) |
U.S. Government Sponsored Securities (continued) | | | | | | |
Pass-Thru’s (continued) | | | | | | |
Government National Mortgage Association (continued) | | | | | | |
G2 3513,5.00% -2034 | | $ | 56,614 | | $ | 55,310 |
G2 3529, 5.00% -2034 | | | 13,796 | | | 13,478 |
#605561, 5.50% - 2034 | | | 53,356 | | | 53,762 |
G2 3530, 5.50% -2034 | | | 23,973 | | | 24,028 |
G2 3517, 6.00% -2034 | | | 32,771 | | | 33,473 |
| | | | | | |
| | | | | | 743,499 |
| |
TOTAL MORTGAGE BACKED SECURITIES | | | | | $ | 18,323,991 |
(Cost $18,274,010) | | | | | | |
| |
U.S. GOVERNMENT SPONSORED AGENCY BONDS & NOTES - 2.4% | | | |
Federal Home Loan Bank | | | | | | |
5.60% - 2011 | | | 10,000 | | | 10,620 |
5.13% - 2013 | | | 165,000 | | | 173,923 |
5.25% - 2014 | | | 135,000 | | | 143,524 |
Federal Home Loan Mortgage Corporation | | | | | | |
5.13% - 2009 | | | 75,000 | | | 76,029 |
4.13% - 2010 | | | 145,000 | | | 146,939 |
6.00% - 2011 | | | 200,000 | | | 214,887 |
Federal National Mortgage Association | | | | | | |
3.25% - 2008 | | | 490,000 | | | 486,797 |
6.63% - 2010 | | | 140,000 | | | 151,371 |
6.00% - 2011 | | | 362,000 | | | 388,464 |
4.38% - 2012 | | | 630,000 | | | 642,846 |
4.38% - 2015 | | | 150,000 | | | 151,234 |
4.88% - 2016 | | | 165,000 | | | 169,617 |
| |
TOTAL U.S. GOVERNMENT SPONSORED AGENCY BONDS & NOTES | | | | | $ | 2,756,251 |
(Cost $2,676,718) | | | | | | |
| |
U.S. GOVERNMENT SECURITIES - 5. 0% |
U.S. Treasury Bonds | | | | | | |
4.25%, 2014 | | | 1,285,000 | | | 1,325,659 |
8.00%, 2021 | | | 110,000 | | | 150,545 |
5.50%, 2028 | | | 210,000 | | | 237,792 |
4.75%, 2037 | | | 490,000 | | | 512,816 |
U.S. Treasury Inflation Indexed Bonds | | | | | | |
2.00%, 2014 | | | 388,399 | | | 401,295 |
U.S. Treasury Notes | | | | | | |
2.625%, 2008 | | | 130,000 | | | 129,665 |
3.375%, 2008 | | | 25,000 | | | 25,002 |
4.25%, 2017 | | | 10,000 | | | 10,174 |
4.75%, 2017 | | | 2,920,000 | | | 3,084,022 |
| |
TOTAL U.S. GOVERNMENT SECURITIES | | | | | $ | 5,876,970 |
(Cost $5,659,266) | | | | | | |
| |
| | |
| 95 | | The accompanying notes are an integral part of the financial statements |
| | |
| Schedule of Investments | | Series N (Managed Asset Allocation Series) |
| December 31, 2007 - continued | | |
| | | | | | |
| | | Principal
Amount | | Value |
ASSET BACKED SECURITIES - 2.2% | | | | | | |
Auto - 1.0% | | | | | | |
AmeriCredit Automobile Receivables Trust
2006-RM 5.53% 2014 | | $ | 280,000 | | $ | 285,078 |
Capital Auto Receivables Asset Trust
2006-1, 5.26%, 2010 | | | 60,000 | | | 60,681 |
2006-SN1A, 5.32%, 2010 (1)(3)(4) | | | 175,000 | | | 175,945 |
2006-SN1A, 5.50%, 2010 (1)(3)(4) | | | 25,000 | | | 25,202 |
Capital One Prime Auto Receivables Trust
2006-2, 4.94%, 2012 | | | 75,000 | | | 75,544 |
Hyundai Auto Receivables Trust
2007-A, 5.04%, 2012 | | | 50,000 | | | 50,236 |
2006-A, 5.26%, 2012 | | | 70,000 | | | 70,672 |
Triad Auto Receivables Owner Trust
2006-B, 5.52%, 2012 | | | 100,000 | | | 101,678 |
USAA Auto Owner Trust
2007-2, 4.90%, 2012 | | | 150,000 | | | 150,993 |
2007-1, 5.55%, 2013 | | | 130,000 | | | 132,778 |
| | | | | | |
| | | | | | 1,128,807 |
| | | | | | |
Credit Cards -0.8% | | | | | | |
BA Credit Card Trust
2006-A9, 5.038%, 2013 (5) | | | 175,000 | | | 173,773 |
2007-C1, 5.318%, 2014 (5) | | | 175,000 | | | 162,121 |
Capital One Multi-Asset Execution Trust
2007-C3, 5.318%, 2013 (5) | | | 70,000 | | | 66,659 |
2005-A7, 4.70%, 2015 | | | 70,000 | | | 70,480 |
Citibank Credit Card Issuance Trust
2007-A5, 5.50%, 2012 | | | 175,000 | | | 179,847 |
GE Capital Credit Card Master Note Trust
2006-1, 5.08%, 2012 | | | 50,000 | | | 50,655 |
2007-3, 5.328%, 2013 (5) | | | 90,000 | | | 86,650 |
MBNA Credit Card Master Note Trust
2005-A3, 4.10%, 2012 | | | 185,000 | | | 184,623 |
2006-C3, 5.318%, 2013 (5) | | | 35,000 | | | 32,908 |
| | | | | | |
| | | | | | 1,007,716 |
| | | | | | |
Home Equity Loans - 0.0% | | | | | | |
BankBoston Home Equity Loan Trust
1998-1, 6.35%, 2013 | | | 7,004 | | | 6,992 |
Chase Funding Mortgage Loan Asset-Backed Certificates 2002-2, 5.60%, 2031 | | | 7,155 | | | 6,194 |
| | | | | | |
| | | | | | 13,186 |
| | | | | | |
Other - 0.4% | | | | | | |
CenterPoint Energy Transition Bond Company LLC
2001-1, 5.63%, 2015 | | | 75,000 | | | 78,031 |
CNH Equipment Trust
2007-A, 5.08%, 2014 | | | 50,000 | | | 48,822 |
GE Equipment Small Ticket LLC
2005-1A, 4.51%, 2014 (1)(3)(4) | | | 100,000 | | | 99,936 |
| | | | | | |
| | | Principal
Amount | | Value |
ASSET BACKED SECURITIES (continued) |
Other (continued) | | | | | | |
Marriott Vacation Club Owner Trust
2006-2A, 5.36%, 2028 (1)(3)(4) | | $ | 25,578 | | $ | 26,057 |
2006-1A, 5.74%, 2028 (1)(3)(4) | | | 91,656 | | | 92,898 |
Peco Energy Transition Trust
2001-A, 6.52%, 2010 | | | 100,000 | | | 106,023 |
| | | | | | |
| | | | | | 451,767 |
| |
TOTAL ASSET BACKED SECURITIES (Cost $2,596,503) | | | | | $ | 2,601,476 |
| |
SHORT TERM INVESTMENTS - 2.4% | | | | | | |
State Street GA Money Market Fund | | $ | 741,962 | | $ | 741,962 |
T. Rowe Price Reserve Investment Fund | | | 2,093,586 | | | 2,093,586 |
| |
TOTAL SHORT TERM INVESTMENTS | | | | | $ | 2,835,548 |
(Cost $2,835,548) | | | | | | |
| |
Total Investments (SBL N Fund) | | | | | $ | 116,931,697 |
(Cost $108,986,872) - 99.6% | | | | | | |
Other Assets in Excess of Liabilities - 0.4% | | | | | | 491,269 |
| | | | | | |
TOTAL NET ASSETS - 100.0% | | | | | $ | 117,422,966 |
| | | | | | |
Footnotes
Percentages are stated as a percent of net assets. For federal income tax purposes the identified cost of investments owned at 12/31/2007 was $109,676,626.
| | |
* | | - Non-income producing security |
1 | | - Security is deemed illiquid. The total market value of illiquid securities is $1,138,463 (cost $1,150,779), or 1.0% of total net assets. |
2 | | - Security is a PFIC (Passive Foreign Investment Company) |
3 | | - Security was acquired through a private placement. |
4 | | - Security is a 144A security. The total market value of 144A securities is $1,809,090 (cost $1,814,024), or 1.5% of total net assets. |
5 | | - Variable rate security. Rate indicated is rate effective at December 31, 2007. |
6 | | - Security is an interest-only strip. Rate indicated is effective yield at December 31, 2007. |
| | |
|
Glossary: |
ADR | | - American Depositary Receipt |
plc | | - Public Limited Company |
See notes to financial statements.
| | |
| 96 | | The accompanying notes are an integral part of the financial statements |
| | |
| | |
| | Series N |
| | (Managed Asset Allocation Series) |
Statement of Assets and Liabilities
December 31, 2007
| | | |
Assets: | | | |
Investments, at value* | | | $116,931,697 |
Cash denominated in a foreign currency, at value** | | | 80,102 |
Receivables: | | | |
Fund shares sold | | | 950,112 |
Securities sold | | | 654,791 |
Interest | | | 395,986 |
Dividends | | | 86,895 |
Foreign taxes recoverable | | | 2,765 |
Prepaid expenses | | | 2,141 |
| | | |
Total assets | | | 119,104,489 |
| | | |
Liabilities: | | | |
Payable for: | | | |
Fund shares redeemed | | | 282,782 |
Securities purchased | | | 1,215,751 |
Management fees | | | 98,729 |
Administration fees | | | 47,809 |
Transfer agent/maintenance fees | | | 2,083 |
Custodian fees | | | 9,698 |
Directors’ fees | | | 1,044 |
Professional fees | | | 13,875 |
Other fees | | | 9,752 |
| | | |
Total liabilities | | | 1,681,523 |
| | | |
Net assets | | | $117,422,966 |
| | | |
Net assets consist of: | | | |
Paid in capital | | | $99,534,605 |
Undistributed net investment income | | | 1,631,412 |
Undistributed net realized gain on sale of investments and foreign currency transactions | | | 8,313,207 |
Net unrealized appreciation in value of investments and translation of assets and liabilities in foreign currencies | | | 7,943,742 |
| | | |
Net assets | | | $117,422,966 |
| | | |
| |
Capital shares authorized | | | unlimited |
Capital shares outstanding | | | 5,969,121 |
Net asset value per share | | | |
(net assets divided by shares outstanding) | | | $19.67 |
| | | |
*Investments, at cost | | $ | 108,986,872 |
**Cash denominated in a foreign currency, at cost | | | 79,864 |
Statement of Operations
For Year Ended December 31, 2007
| | | | |
Investment Income: | | | | |
Dividends (net of foreign withholding tax $37,697) | | $ | 1,286,300 | |
Interest | | | 2,116,643 | |
| | | | |
Total investment income | | | 3,402,943 | |
| | | | |
| |
Expenses: | | | | |
Management fees | | | 1,116,302 | |
Administration fees | | | 304,727 | |
Transfer agent/maintenance fees | | | 25,236 | |
Custodian fees | | | 89,858 | |
Directors’ fees | | | 5,718 | |
Professional fees | | | 16,335 | |
Reports to shareholders | | | 12,978 | |
Other | | | 7,822 | |
| | | | |
Total expenses | | | 1,578,976 | |
Less: | | | | |
Earnings credits applied | | | (757 | ) |
| | | | |
Net expenses | | | 1,578,219 | |
| | | | |
Net investment income | | | 1,824,724 | |
| | | | |
| |
Net Realized and Unrealized Gain (Loss): | | | | |
Net realized gain (loss) during the year on: | | | | |
Investments | | | 8,791,109 | |
Foreign currency transactions | | | (1,996 | ) |
| | | | |
Net realized gain | | | 8,789,113 | |
| | | | |
| |
Net unrealized appreciation (depreciation) during the year on: | | | | |
Investments | | | (4,154,168 | ) |
Translation of assets and liabilities in foreign currencies | | | 190 | |
| | | | |
Net unrealized depreciation | | | (4,153,978 | ) |
| | | | |
Net realized and unrealized gain | | | 4,635,135 | |
| | | | |
Net increase in net assets resulting from operations | | $ | 6,459,859 | |
| | | | |
| | |
| 97 | | The accompanying notes are an integral part of the financial statements |
| | |
| | |
| | Series N |
| Statement of Changes in Net Assets | | (Managed Asset Allocation Series) |
| | | | | | | | |
| | | Year Ended December 31, 2007 | | | Year Ended December 31, 2006 | |
Increase (decrease) in net assets from operations: | | | | | | | | |
Net investment income | | $ | 1,824,724 | | | $ | 1,656,115 | |
Net realized gain during the year on investments and foreign currency transactions | | | 8,789,113 | | | | 6,320,266 | |
Net unrealized appreciation (depreciation) during the year on investments and translation of assets and liabilities in foreign currencies | | | (4,153,978 | ) | | | 3,605,084 | |
| | | | | | | | |
Net increase in net assets resulting from operations | | | 6,459,859 | | | | 11,581,465 | |
| | | | | | | | |
| | |
Capital share transactions: | | | | | | | | |
Proceeds from sale of shares | | | 35,470,333 | | | | 28,766,803 | |
Cost of shares redeemed | | | (29,807,539 | ) | | | (32,737,523 | ) |
| | | | | | | | |
Net increase (decrease) from capital share transactions | | | 5,662,794 | | | | (3,970,720 | ) |
| | | | | | | | |
Net increase in net assets | | | 12,122,653 | | | | 7,610,745 | |
| | | | | | | | |
| | |
Net assets: | | | | | | | | |
Beginning of year | | | 105,300,313 | | | | 97,689,568 | |
| | | | | | | | |
End of year | | $ | 117,422,966 | | | $ | 105,300,313 | |
| | | | | | | | |
Undistributed net investment income at end of year | | $ | 1,631,412 | | | $ | 1,461,148 | |
| | | | | | | | |
| | |
Capital share activity: | | | | | | | | |
Shares sold | | | 1,827,693 | | | | 1,670,487 | |
Shares redeemed | | | (1,536,011 | ) | | | (1,896,770 | ) |
| | | | | | | | |
Total capital share activity | | | 291,682 | | | | (226,283 | ) |
| | | | | | | | |
| | |
| 98 | | The accompanying notes are an integral part of the financial statements |
| | |
| | |
| Financial Highlights | | Series N |
Selected data for each share of capital stock outstanding throughout each year | | (Managed Asset Allocation Series) |
| | | | | | | | | | | | | | | | |
| | | 2007 | | | 2006 | | | 2005 | | | 2004 | | | | Year Ended December 31, 2003 | |
| | | | | |
| | | | | |
Per Share Data | | | | | | | | | | | | | | | | |
Net asset value, beginning of period | | $18.55 | | $ | 16.55 | | $ | 15.86 | | $ | 14.40 | | | $ | 11.80 | |
| | |
Income (loss) from investment operations: | | | | | | | | | | | | | | | | |
Net investment incomea | | 0.32 | | | 0.30 | | | 0.23 | | | 0.27 | | | | 0.23 | |
Net gain on securities (realized and unrealized) | | 0.80 | | | 1.70 | | | 0.46 | | | 1.27 | | | | 2.59 | |
| | | |
Total from investment operations | | 1.12 | | | 2.00 | | | 0.69 | | | 1.54 | | | | 2.82 | |
| | |
Less distributions: | | | | | | | | | | | | | | | | |
Dividends from net investment income | | – | | | – | | | – | | | (0.08 | ) | | | (0.22 | ) |
| | | |
Total distributions | | – | | | – | | | – | | | (0.08 | ) | | | (0.22 | ) |
| | |
Net asset value, end of period | | $19.67 | | $ | 18.55 | | $ | 16.55 | | $ | 15.86 | | | $ | 14.40 | |
| | | |
| | | | | | | | | | | | | | | | |
| | |
Total Returnb | | 6.04% | | | 12.08% | | | 4.35% | | | 10.72% | | | | 23.90% | |
| | |
Ratios/Supplemental Data | | | | | | | | | | | | | | | | |
Net assets, end of period (in thousands) | | $117,423 | | $ | 105,300 | | $ | 97,690 | | $ | 93,087 | | | $ | 86,383 | |
| | |
Ratios to average net assets: | | | | | | | | | | | | | | | | |
Net investment income | | 1.63% | | | 1.63% | | | 1.44% | | | 1.75% | | | | 1.86% | |
Total expensesc | | 1.41% | | | 1.41% | | | 1.41% | | | 1.39% | | | | 1.23% | |
Net expensesd | | 1.41% | | | 1.40% | | | 1.41% | | | 1.39% | | | | 1.23% | |
Net expenses prior to custodian earnings credits and net of expense waivers | | 1.41% | | | 1.41% | | | 1.41% | | | 1.39% | | | | 1.23% | |
| | |
Portfolio turnover rate | | 75% | | | 63% | | | 67% | | | 79% | | | | 98% | |
a Net investment income (loss) was computed using average shares outstanding throughout the period.
b Total return does not take into account any of the expenses associated with an investment in variable insurance products offered by Security Benefit Life Insurance Company. If total return had taken into account these expenses, performance would have been lower. Shares of a series of SBL Fund are available only through the purchase of such products.
c Total expense information reflects the expense ratios absent expense reductions by the Investment Manager, and earnings credits, as applicable.
d Net expense information reflects the expense ratios after voluntary expense waivers, reimbursements and custodian earnings credits, as applicable.
| | |
| 99 | | The accompanying notes are an integral part of the financial statements |
This page left blank intentionally.
| | |
| | |
| Manager’s Commentary | | Series O |
| February 15, 2008 | | (Equity Income Series) |
Subadviser, T. Rowe Price Associates, Inc.
| | |
 | | Performance The portfolio managed a positive return in 2007, but trailed the Standard & Poor’s 500 Stock Index. Underperformance was primarily a result of positioning among information technology shares. The largest contribution to relative results came from stock picks among financials shares. |
Market Environment
Stocks hit record highs in 2007, before the housing, credit and liquidity crises ultimately brought the party to a halt. For the year, value stocks produced negative returns across all capitalization ranges, lagging growth-oriented shares, as measured by the S&P indexes. In the S&P 500 Stock Index, energy (+34%) was the best-performing sector, followed by materials and utilities (+23% and +19%, respectively). Financial (–19%) and consumer discretionary (–13%) shares were the worst performers, weighed down by worry about fallout from ongoing financial and credit problems.
Portfolio Review
The main sources of weakness compared with the Index were stock selection and an underweight position in information technology stocks. Stock selection hurt in the computers and peripherals industry, where an underweight to Apple was the leading detractor. Positioning in the Internet software and services industry also detracted behind an overweight to Yahoo! and underweight to Google.
In materials, paper and forest products, International Paper was a notable detractor because of a poor economic outlook and estimates of higher-than-expected costs and working capital use going forward. Stock picks had a negative effect in chemicals, where it hurt to be underweight Monsanto and overweight International Flavors & Fragrances and Dupont.
Stock selection limited relative results in utilities, though it helped to be overweight one of the best-performing sectors in the Index. These stocks were attractive during a period of economic and market uncertainty because of their steady-to-improving fundamentals. Multi-utility NiSource underperformed as a result of disappointing earnings, and after a lengthy strategic review turned up no ways to unlock shareholder value.
Looking at positive contributors, the main source of strength relative to the Index was positioning in the financial sector, where it helped to be underweight the hard-hit banking and diversified financial services stocks—an underweight to Citigroup was a key source of relative strength. Capital market-related shares also helped relative results behind custody banks State Street and Bank of New York Mellon. In addition, Charles Schwab performed well on new client acquisition and asset growth.
An overweight position and stock selection among energy shares were further sources of relative strength. Stock picks contributed most among oil, gas, and consumable fuels shares, led by Hess, Murphy Oil, and ExxonMobil.
Outlook
It is important for investors be patient through this period of transition and adjustment as the market corrects the excesses created by the strong economic environment over the last five years. The Federal Reserve’s emerging focus on market stability and relative attractiveness of equities versus fixed-income securities is a positive development. As we look at valuations, we see some great opportunities for those with a higher tolerance for risk, making this arguably a great time to invest in some of the more troubled sectors of the market. That is what our value funds will be doing.
We look forward to better times ahead.
|
Sincerely, |
|
Brian C. Rogers, Portfolio Manager |
101
| | |
| | Series O |
| Performance Summary | | (Equity Income Series) |
| December 31, 2007 | | (unaudited) |
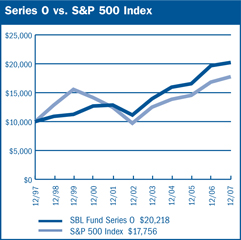
$10,000 Over 10 Years
The chart above assumes a hypothetical $10,000 investment in Series O (Equity Income Series) on December 31, 1997, and reflects the fees and expenses of Series O. The S&P 500 Index is a capitalization-weighted index composed of 500 selected common stocks that represent the broad domestic economy and is a widely recognized unmanaged index of market performance.
| | | | | | |
Average Annual Returns | | | | | | |
Periods Ended 12-31-071 | | 1 Year | | 5 Years | | 10 Years |
Series O | | 2.82% | | 12.68% | | 7.29% |
1 Performance figures do not reflect fees and expenses associated with an investment in variable insurance products offered by Security Benefit Life Insurance Company. If returns had taken into account these fees and expenses, performance would have been lower. Shares of a Series of SBL Fund are available only through the purchase of such products. The performance data quoted above represents past performance. Past performance is not predictive of future performance. The investment return and principal value of an investment will fluctuate so that an investor’s shares, when redeemed, may be worth more or less than their original cost. |
| | |
Portfolio Composition by Sector | | |
Consumer Discretionary | | 12.82% |
Consumer Staples | | 9.62 |
Energy | | 13.11 |
Financials | | 19.06 |
Health Care | | 8.99 |
Industrials | | 10.95 |
Information Technology | | 6.64 |
Materials | | 4.92 |
Telecommunication Services | | 4.45 |
Utilities | | 5.01 |
Convertible Bond | | 0.13 |
Short Term Investments | | 4.07 |
Other Assets in Excess of Liabilities | | 0.23 |
Total Net Assets | | 100.00% |
| | | |
| | |
| 102 | | The accompanying notes are an integral part of the financial statements |
| | |
| | Series O |
| Performance Summary | | (Equity Income Series) |
| December 31, 2007 | | (unaudited) |
Information About Your Series Expenses
Calculating your ongoing Series expenses
Example
As a shareholder of the Series, you incur ongoing costs, including management fees and other series expenses. Performance figures and expense ratios do not reflect fees and expenses associated with an investment in variable insurance products. Shares of a Series of SBL Fund are available only through the purchase of such products. This example is intended to help you understand your ongoing costs (in dollars) of investing in the Series and to compare these costs with ongoing costs of investing in other mutual funds. The example is based on an investment of $1,000 invested at the beginning of the period and held for the entire period, July 1, 2007 through December 31, 2007.
Actual Expenses
The first line in the table provides information about actual account values and actual expenses. You may use the information in this table, together with the amount you invested, to estimate the expenses that you paid over the period. Simply divide your account value by $1,000 (for example, an $8,600 account value divided by $1,000 = 8.6), then multiply the result by the number in the table under the heading entitled “Expenses Paid During the Period” to estimate the expenses you paid on your account during this period.
Hypothetical Example for Comparison Purposes
The second line in the table provides information about hypothetical account values and hypothetical expenses based on the Series actual expense ratio and an assumed rate of return of 5% per year before expenses, which is not the Series actual return. The hypothetical account values and expenses may not be used to estimate the actual ending account balance or expenses you paid for the period. You may use this information to compare the ongoing costs of investing in the Series and other funds. To do so, compare this 5% hypothetical example with the 5% hypothetical examples that appear in the shareholder reports of the other mutual funds.
Please note that the expenses shown in the table are meant to highlight your ongoing costs only and do not reflect any fees and expenses associated with an investment in variable insurance products. Therefore, the second line is useful in comparing ongoing costs only, and will not help you determine the relative total costs of owning different funds. In addition, if these fees and expenses associated with an investment in variable insurance products were included, your costs would have been higher.
| | | | | | |
Series Expenses | | | | | | |
| | | Beginning
Account
Value
7/1/2007 | | Ending
Account
Value
12/31/20071 | | Expenses
Paid
During
Period2 |
| |
Series O (Equity Income Series) | | | | |
Actual | | $1,000.00 | | $953.10 | | $5.66 |
Hypothetical | | 1,000.00 | | 1,019.41 | | 5.85 |
| | | | | | | |
1 The actual ending account value is based on the actual total return of the Series for the period July 1, 2007 to December 31, 2007 after actual expenses and will differ from the hypothetical ending account value which is based on the Series expense ratio and a hypothetical annual return of 5% before expenses. The actual cumulative return at net asset value for the period July 1, 2007 to December 31, 2007 was (4.69%).
2 Expenses are equal to the Series annualized expense ratio of 1.15%, net of any applicable fee waivers or earnings credits, multiplied by the average account value over the period, multiplied by 184/365 (to reflect the one-half year period)
| | |
| | |
| Schedule of Investments | | Series O (Equity Income Series) |
| December 31, 2007 | | |
| | | | | |
| | | Shares | | Value |
COMMON STOCK -94.5% | | | | | |
| Aerospace & Defense - 1.2% | | | | | |
| Honeywell International, Inc. | | 40,000 | | $ | 2,462,800 |
| Raytheon Company | | 15,400 | | | 934,780 |
| | | | | |
| | | | | 3,397,580 |
| | | | | |
| | |
| Air Freight & Logistics - 0.3% | | | | | |
| United Parcel Service, Inc. (CI.B) | | 12,500 | | | 884,000 |
| | | | | |
| | |
| Airlines - 0.3% | | | | | |
| Southwest Airlines Company | | 62,700 | | | 764,940 |
| | | | | |
| | |
| Aluminum - 0.6% | | | | | |
| Alcoa, Inc. | | 50,100 | | | 1,831,155 |
| | | | | |
| | |
| Asset Management & Custody | | | | | |
| Banks - 2.9% | | | | | |
| Bank of New York Mellon | | | | | |
Corporation | | 79,200 | | | 3,861,792 |
| Legg Mason, Inc. | | 27,700 | | | 2,026,255 |
| State Street Corporation | | 31,500 | | | 2,557,800 |
| | | | | |
| | | | | 8,445,847 |
| | | | | |
| | |
| Automobile Manufacturers - 0.2% | | | | | |
| Ford Motor Company * | | 93,000 | | | 625,890 |
| | | | | |
| | |
| Biotechnology - 0.8% | | | | | |
| Amgen, Inc. * | | 52,300 | | | 2,428,812 |
| | | | | |
| | |
| Brewers - 1.1% | | | | | |
| Anheuser-Busch Companies, Inc. | | 62,200 | | | 3,255,548 |
| | | | | |
| | |
| Broadcasting & Cable TV - 1.1% | | | | | |
| Cablevision Systems Corporation * | | 43,100 | | | 1,055,950 |
| CBS Corporation (CI.B) | | 70,200 | | | 1,912,950 |
| Comcast Corporation * | | 12,300 | | | 224,598 |
| | | | | |
| | | | | 3,193,498 |
| | | | | |
| | |
| Building Products - 1.1% | | | | | |
| Masco Corporation | | 97,600 | | | 2,109,136 |
| USG Corporation * | | 31,500 | | | 1,127,385 |
| | | | | |
| | | | | 3,236,521 |
| | | | | |
| | |
| Communications Equipment - 0.9% | | | | | |
| Alcatel-Lucent ADR | | 141,600 | | | 1,036,512 |
| Motorola, Inc. | | 89,800 | | | 1,440,392 |
| | | | | |
| | | | | 2,476,904 |
| | | | | |
| | |
| Computer Hardware - 0.9% | | | | | |
| Dell, Inc. * | | 102,900 | | | 2,522,079 |
| | | | | |
| | |
| Construction Materials - 0.6% | | | | | |
| Vulcan Materials Company | | 21,300 | | | 1,684,617 |
| | | | | |
| | |
| Consumer Finance - 1.1% | | | | | |
| Capital One Financial Corporation | | 36,900 | | | 1,743,894 |
| SLM Corporation | | 73,300 | | | 1,476,262 |
| | | | | |
| | | | | 3,220,156 |
| | | | | |
| | |
| Data Processing & Outsourced | | | | | |
| Services -0.6% | | | | | |
| Computer Sciences Corporation * | | 25,200 | | | 1,246,644 |
| | | | | |
| | | Shares | | Value |
COMMON STOCK (continued) | | | | | |
| Data Processing & Outsourced Services | | | | | |
| (continued) | | | | | |
| Electronic Data Systems | | | | | |
Corporation | | 27,700 | | $ | 574,221 |
| | | | | |
| | | | | 1,820,865 |
| | | | | |
| | |
| Distributors - 0.5% | | | | | |
| Genuine Parts Company | | 33,300 | | | 1,541,790 |
| | | | | |
| | |
| Diversified Banks - 1.7% | | | | | |
| U.S. Bancorp | | 116,600 | | | 3,700,884 |
| Wells Fargo & Company | | 43,100 | | | 1,301,189 |
| | | | | |
| | | | | 5,002,073 |
| | | | | |
| | |
| Diversified Chemicals - 0.9% | | | | | |
| E.I. Du Pont de Nemours & | | | | | |
Company | | 56,800 | | | 2,504,312 |
| | | | | |
| | |
| Drug Retail - 0.0% | | | | | |
| Walgreen Company | | 3,100 | | | 118,048 |
| | | | | |
| | |
| Electric Utilities - 3.3% | | | | | |
| Duke Energy Corporation | | 88,400 | | | 1,783,028 |
| Entergy Corporation | | 21,500 | | | 2,569,680 |
| FirstEnergy Corporation | | 27,557 | | | 1,993,473 |
| Pinnacle West Capital Corporation | | 27,800 | | | 1,178,998 |
| Progress Energy, Inc. | | 43,000 | | | 2,082,490 |
| | | | | |
| | | | | 9,607,669 |
| | | | | |
| | |
| Electrical Components & | | | | | |
| Equipment - 0.5% | | | | | |
| Cooper Industries, Ltd. | | 27,676 | | | 1,463,507 |
| | | | | |
| | |
| Environmental & Facilities | | | | | |
| Services - 0.5% | | | | | |
| Waste Management, Inc. | | 47,322 | | | 1,546,010 |
| | | | | |
| | |
| Health Care Distributors - 0.1% | | | | | |
| Cardinal Health, Inc. | | 3,100 | | | 179,025 |
| | | | | |
| | |
| Health Care Equipment - 0.7% | | | | | |
| Baxter International, Inc. | | 25,900 | | | 1,503,495 |
| Boston Scientific Corporation * | | 37,300 | | | 433,799 |
| | | | | |
| | | | | 1,937,294 |
| | | | | |
| | |
| Home Improvement Retail - 1.0% | | | | | |
| Home Depot, Inc. | | 101,800 | | | 2,742,492 |
| | | | | |
| | |
| Homebuilding - 0.3% | | | | | |
| DR Horton, Inc. | | 60,700 | | | 799,419 |
| | | | | |
| | |
| Homefurnishing Retail - 0.6% | | | | | |
| Bed Bath & Beyond, Inc. * | | 63,000 | | | 1,851,570 |
| | | | | |
| | |
| Household Appliances - 0.2% | | | | | |
| Whirlpool Corporation | | 8,600 | | | 702,018 |
| | | | | |
| | |
| Household Products - 2.4% | | | | | |
| Colgate-Palmolive Company | | 27,700 | | | 2,159,492 |
| Kimberly-Clark Corporation | | 25,200 | | | 1,747,368 |
| | |
| 104 | | The accompanying notes are an integral part of the financial statements |
| | |
| | |
| Schedule of Investments | | Series 0 (Equity Income Series) |
| December 31, 2007 - continued | | |
| | | | | |
| | | Shares | | Value |
COMMON STOCK (continued) | | | | | |
| Household Products (continued) | | | | | |
| Procter & Gamble Company | | 40,100 | | $ | 2,944,142 |
| | | | | |
| | | | | 6,851,002 |
| | | | | |
| Housewares & Specialties - 1.6% | | | | | |
| Fortune Brands, Inc. | | 30,000 | | | 2,170,800 |
| Newell Rubbermaid, Inc. | | 92,600 | | | 2,396,488 |
| | | | | |
| | | | | 4,567,288 |
| | | | | |
| Hypermarkets & Super Centers - 1.0% | | | | | |
| Wal-Mart Stores, Inc. | | 63,100 | | | 2,999,143 |
| | | | | |
| Industrial Conglomerates - 4.5% | | | | | |
| 3M Company | | 44,100 | | | 3,718,512 |
| General Electric Company | | 252,700 | | | 9,367,589 |
| | | | | |
| | | | | 13,086,101 |
| | | | | |
| Industrial Machinery - 1.0% | | | | | |
| Illinois Tool Works, Inc. | | 52,400 | | | 2,805,496 |
| | | | | |
| Insurance Brokers - 1.3% | | | | | |
| Marsh & McLennan Companies, Inc. | | 146,600 | | | 3,880,502 |
| | | | | |
| Integrated Oil & Gas - 10.1% | | | | | |
| BP plc ADR | | 34,384 | | | 2,515,877 |
| Chevron Corporation | | 78,332 | | | 7,310,726 |
| Exxon Mobil Corporation | | 75,968 | | | 7,117,442 |
| Hess Corporation | | 37,000 | | | 3,731,820 |
| Murphy Oil Corporation | | 37,800 | | | 3,206,952 |
| Royal Dutch Shell plc ADR | | 62,300 | | | 5,245,660 |
| | | | | |
| | | | | 29,128,477 |
| | | | | |
| Integrated Telecommunication | | | | | |
| Services - 3.9% | | | | | |
| AT&T, Inc. | | 150,201 | | | 6,242,353 |
| Qwest Communications International, Inc. | | 289,901 | | | 2,032,206 |
| Verizon Communications, Inc. | | 66,236 | | | 2,893,851 |
| | | | | |
| | | | | 11,168,410 |
| | | | | |
| Internet Software & Services - 0.7% | | | | | |
| Yahoo!, Inc. * | | 90,700 | | | 2,109,682 |
| | | | | |
| Investment Banking & Brokerage - 1.2% | | | | | |
| Charles Schwab Corporation | | 12,300 | | | 314,265 |
| Merrill Lynch & Company, Inc. | | 59,000 | | | 3,167,120 |
| | | | | |
| | | | | 3,481,385 |
| | | | | |
| Leisure Products - 0.5% | | | | | |
| Mattel, Inc. | | 72,900 | | | 1,388,016 |
| | | | | |
| Life & Health Insurance - 1.0% | | | | | |
| Lincoln National Corporation | | 47,324 | | | 2,755,203 |
| | | | | |
| Motorcycle Manufacturers - 0.6% | | | | | |
| Harley-Davidson, Inc. | | 36,900 | | | 1,723,599 |
| | | | | |
| Movies & Entertainment - 2.0% | | | | | |
| Time Warner, Inc. | | 191,200 | | | 3,156,712 |
| | | | | |
| | | Shares | | Value |
COMMON STOCK (continued) | | | | | |
| Movies & Entertainment (continued) | | | | | |
| Walt Disney Company | | 78,300 | | $ | 2,527,524 |
| | | | | |
| | | | | 5,684,236 |
| | | | | |
| Multi-Line Insurance - 1.6% | | | | | |
| American International Group, Inc. | | 58,000 | | | 3,381,400 |
| Genworth Financial, Inc. | | 46,200 | | | 1,175,790 |
| | | | | |
| | | | | 4,557,190 |
| | | | | |
| Multi-Utilities - 1.7% | | | | | |
| NiSource, Inc. | | 132,400 | | | 2,501,036 |
| TECO Energy, Inc. | | 30,800 | | | 530,068 |
| Xcel Energy, Inc. | | 79,200 | | | 1,787,544 |
| | | | | |
| | | | | 4,818,648 |
| | | | | |
| Office Services & Supplies - 0.9% | | | | | |
| Avery Dennison Corporation | | 46,200 | | | 2,455,068 |
| | | | | |
| Oil & Gas Equipment & Services - 1.3% | | | | | |
| BJ Services Company | | 49,900 | | | 1,210,574 |
| Schlumberger, Ltd. | | 25,200 | | | 2,478,924 |
| | | | | |
| | | | | 3,689,498 |
| | | | | |
| Oil & Gas Exploration & | | | | | |
| Production - 1.1% | | | | | |
| Anadarko Petroleum Corporation | | 48,600 | | | 3,192,534 |
| | | | | |
| Oil & Gas Storage & | | | | | |
| Transportation - 0.5% | | | | | |
| Spectra Energy Corporation | | 50,200 | | | 1,296,164 |
| | | | | |
| Other Diversified Financial | | | | | |
| Services - 3.1% | | | | | |
| Citigroup, Inc. | | 71,733 | | | 2,111,820 |
| JPMorgan Chase & Company | | 154,462 | | | 6,742,266 |
| | | | | |
| | | | | 8,854,086 |
| | | | | |
| Packaged Foods & Meats - 3.1% | | | | | |
| Campbell Soup Company | | 25,200 | | | 900,396 |
| General Mills, Inc. | | 42,500 | | | 2,422,500 |
| Hershey Company | | 61,800 | | | 2,434,920 |
| Kraft Foods, Inc. | | 56,200 | | | 1,833,806 |
| McCormick & Company, Inc. | | 32,100 | | | 1,216,911 |
| | | | | |
| | | | | 8,808,533 |
| | | | | |
| Paper Products - 2.0% | | | | | |
| International Paper Company | | 122,920 | | | 3,980,150 |
| MeadWestvaco Corporation | | 56,700 | | | 1,774,710 |
| | | | | |
| | | | | 5,754,860 |
| | | | | |
| Personal Products - 0.7% | | | | | |
| Avon Products, Inc. | | 52,400 | | | 2,071,372 |
| | | | | |
| Pharmaceuticals - 7.4% | | | | | |
| Abbott Laboratories | | 37,300 | | | 2,094,395 |
| Bristol-Myers Squibb Company | | 80,400 | | | 2,132,208 |
| Eli Lilly & Company | | 72,300 | | | 3,860,097 |
| Johnson & Johnson | | 56,700 | | | 3,781,890 |
| Merck & Company, Inc. | | 67,700 | | | 3,934,047 |
| Pfizer, Inc. | | 140,400 | | | 3,191,292 |
| | |
| 105 | | The accompanying notes are an integral part of the financial statements |
| | |
| | |
| Schedule of Investments | | Series 0 (Equity Income Series) |
| December 31, 2007 - continued | | |
| | | | | |
| | | Shares | | Value |
COMMON STOCK (continued) | | | | | |
| Pharmaceuticals (continued) | | | | | |
| Wyeth | | 53,700 | | $ | 2,373,003 |
| | | | | |
| | | | | 21,366,932 |
| | | | | |
| Photographic Products - 0.6% | | | | | |
| Eastman Kodak Company | | 81,500 | | | 1,782,405 |
| | | | | |
| Property & Casualty Insurance - 1.7% | | | | | |
| Chubb Corporation | | 23,600 | | | 1,288,088 |
| Progressive Corporation | | 65,500 | | | 1,254,980 |
| Travelers Companies, Inc. | | 44,184 | | | 2,377,099 |
| | | | | |
| | | | | 4,920,167 |
| | | | | |
| Publishing - 2.4% | | | | | |
| Gannett Company, Inc. | | 61,600 | | | 2,402,400 |
| McGraw-Hill Companies, Inc. | | 61,600 | | | 2,698,696 |
| New York Times Company | | 100,900 | | | 1,768,777 |
| | | | | |
| | | | | 6,869,873 |
| | | | | |
| Railroads - 0.7% | | | | | |
| Union Pacific Corporation | | 15,400 | | | 1,934,548 |
| | | | | |
| Regional Banks - 2.2% | | | | | |
| Fifth Third Bancorp | | 83,100 | | | 2,088,303 |
| Keycorp | | 12,300 | | | 288,435 |
| National City Corporation | | 44,000 | | | 724,240 |
| SunTrust Banks, Inc. | | 52,400 | | | 3,274,476 |
| | | | | |
| | | | | 6,375,454 |
| | | | | |
| Semiconductor Equipment - 0.2% | | | | | |
| Applied Materials, Inc. | | 36,900 | | | 655,344 |
| | | | | |
| Semiconductors - 1.3% | | | | | |
| Analog Devices, Inc. | | 68,400 | | | 2,168,280 |
| Intel Corporation | | 62,400 | | | 1,663,584 |
| | | | | |
| | | | | 3,831,864 |
| | | | | |
| Soft Drinks - 0.8% | | | | | |
| Coca-Cola Company | | 37,400 | | | 2,295,238 |
| | | | | |
| Specialized Consumer Services - 0.7% | | | | | |
| H&R Block, Inc. | | 103,800 | | | 1,927,566 |
| | | | | |
| Specialty Chemicals - 0.8% | | | | | |
| International Flavors & | | | | | |
Fragrances, Inc. | | 49,800 | | | 2,396,874 |
| | | | | |
| Systems Software - 2.0% | | | | | |
| Microsoft Corporation | | 160,400 | | | 5,710,240 |
| | | | | |
| Thrifts & Mortgage Finance - 0.8% | | | | | |
| Countrywide Financial Corporation | | 59,900 | | | 535,506 |
| Federal National Mortgage | | | | | |
Association | | 45,300 | | | 1,811,094 |
| | | | | |
| | | | | 2,346,600 |
| | | | | |
| Tobacco - 0.5% | | | | | |
| UST, Inc. | | 24,500 | | | 1,342,600 |
| | | | | |
| | | | | | |
| | | Shares | | Value |
COMMON STOCK (continued) | | | | | | |
| Wireless Telecommunication | | | | | | |
| Services - 0.6% | | | | | | |
| Sprint Nextel Corporation | | | 127,300 | | $ | 1,671,449 |
| |
| TOTAL COMMON STOCK (Cost $238,243,962) | | | | | $ | 272,337,286 |
| |
FOREIGN STOCK - 1.0% | | | | | | |
| Japan - 0.5% | | | | | | |
| Sony Corporation | | | 27,700 | | | 1,541,167 |
| | | | | | |
| Norway - 0.2% | | | | | | |
| StatoilHydro ASA | | | 15,400 | | | 479,018 |
| | | | | | |
| United Kingdom - 0.3% | | | | | | |
| Royal Bank of Scotland Group plc | | | 101,500 | | | 895,144 |
| |
| TOTAL FOREIGN STOCK (Cost $2,733,926) | | | | | $ | 2,915,329 |
| |
PREFERRED STOCK - 0.1% | | | | | | |
| Diversified Financial Services - 0.1% | | | | | | |
| SLM Corporation * | | | 200 | | | 206,701 |
| |
| TOTAL PREFERRED STOCK (Cost $200,000) | | | | | $ | 206,701 |
| |
| | |
| | | Principal
Amount | | Value |
CONVERTIBLE BOND - 0.1% | | | | | | |
| Automotive - 0.1% | | | | | | |
| Ford Motor Company | | | | | | |
4.25%, 2036 | | $ | 380,000 | | | 377,625 |
| |
| TOTAL CONVERTIBLE BOND (Cost $380,000) | | | | | $ | 377,625 |
| |
SHORT TERM INVESTMENTS - 4.1% | | | | | | |
State Street GA Money Market
Fund | | $ | 4,367,715 | | $ | 4,367,715 |
T. Rowe Price Reserve Investment
Fund | | | 7,367,430 | | | 7,367,430 |
| |
| TOTAL SHORT TERM INVESTMENTS | | | | | $ | 11,735,145 |
| (Cost $11,735,145) | | | | | | |
| |
| Total Investments (SBL 0 Fund) | | | | | $ | 287,572,086 |
| (Cost $253,293,033) - 99.8% | | | | | | |
| Other Assets in Excess of Liabilities - 0.2% | | | | | | 660,838 |
| | | | | | |
| TOTAL NET ASSETS - 100.0% | | | | | $ | 288,232,924 |
| | | | | | |
Footnotes
Percentages are stated as a percent of net assets.
For federal income tax purposes the identified cost of investments owned at 12/31/2007 was $254,559,184.
| | | | |
* | | - | | Non-income producing security |
| Glossary: |
| ADR | | - | | American Depositary Receipt |
| plc | | - | | Public Limited Company |
See notes to financial statements.
| | |
| 106 | | The accompanying notes are an integral part of the financial statements |
| | |
| | |
| | Series O |
| | (Equity Income Series) |
Statement of Assets and Liabilities
December 31, 2007
| | | |
Assets: | | | |
Investments, at value* | | | $287,572,086 |
Cash denominated in a foreign currency, at value** | | | 3,923 |
Receivables: | | | |
Fund shares sold | | | 217,001 |
Securities sold | | | 1,265,168 |
Interest | | | 47,487 |
Dividends | | | 447,143 |
Prepaid expenses | | | 6,100 |
| | | |
Total assets | | | 289,558,908 |
| | | |
| |
Liabilities: | | | |
| |
Payable for: | | | |
Fund shares redeemed | | | 315,348 |
Securities purchased | | | 691,840 |
Management fees | | | 247,287 |
Administration fees | | | 24,302 |
Transfer agent/maintenance fees | | | 2,083 |
Custodian fees | | | 2,906 |
Directors’ fees | | | 3,362 |
Professional fees | | | 25,500 |
Other fees | | | 13,356 |
| | | |
Total liabilities | | | 1,325,984 |
| | | |
Net assets | | | $288,232,924 |
| | | |
| |
Net assets consist of: | | | |
Paid in capital | | | $225,776,554 |
Undistributed net investment income | | | 4,349,961 |
Undistributed net realized gain on sale of
investments | | | 23,822,776 |
Net unrealized appreciation in value of
investments | | | 34,283,633 |
| | | |
Net assets | | | $288,232,924 |
| | | |
| |
Capital shares authorized | | | unlimited |
Capital shares outstanding | | | 12,332,020 |
Net asset value per share | | | |
(net assets divided by shares outstanding) | | $ | 23.37 |
| | | |
| |
*Investments, at cost | | | $253,293,033 |
**Cash denominated in a foreign currency, at cost | | | 3,818 |
Statement of Operations
For Year Ended December 31, 2007
| | | | |
Investment Income: | | | | |
Dividends (net of foreign withholding tax $ 11,302) | | $ | 7,100,659 | |
Interest | | | 751,504 | |
| | | | |
Total investment income | | | 7,852,163 | |
| | | | |
| |
Expenses: | | | | |
Management fees | | | 3,063,716 | |
Administration fees | | | 294,203 | |
Transfer agent/maintenance fees | | | 25,242 | |
Custodian fees | | | 29,602 | |
Directors’ fees | | | 18,038 | |
Professional fees | | | 32,635 | |
Reports to shareholders | | | 25,850 | |
Other | | | 12,695 | |
| | | | |
Total expenses | | | 3,501,981 | |
Less: | | | | |
Earnings credits applied | | | (1,416 | ) |
| | | | |
Net expenses | | | 3,500,565 | |
| | | | |
Net investment income | | | 4,351,598 | |
| | | | |
| |
Net Realized and Unrealized Gain (Loss): | | | | |
Net realized gain (loss) during the year on: | | | | |
Investments | | | 25,067,274 | |
Foreign currency transactions | | | (8,118 | ) |
| | | | |
Net realized gain | | | 25,059,156 | |
| | | | |
| |
Net unrealized appreciation (depreciation) during the year on: | | | | |
Investments | | | (20,702,751 | ) |
Translation of assets and liabilities in foreign currencies | | | 4,694 | |
| | | | |
Net unrealized depreciation | | | (20,698,057 | ) |
| | | | |
Net realized and unrealized gain | | | 4,361,099 | |
| | | | |
Net increase in net assets resulting from operations | | $ | 8,712,697 | |
| | | | |
| | |
| 107 | | The accompanying notes are an integral part of the financial statements |
| | |
| | |
| | Series O |
| Statement of Changes in Net Assets | | (Equity Income Series) |
| | | | | | | | |
| | |
| Year Ended
December 31, 2007 |
| |
| Year Ended
December 31, 2006 |
|
| | |
Increase (decrease) in net assets from operations: | | | | | | | | |
Net investment income | | $ | 4,351,598 | | | $ | 3,876,902 | |
Net realized gain during the year on investments | | | 25,059,156 | | | | 14,010,226 | |
Net unrealized appreciation (depreciation) during the year on investments | | | (20,698,057 | ) | | | 29,953,403 | |
| | | | | | | | |
Net increase in net assets resulting from operations | | | 8,712,697 | | | | 47,840,531 | |
| | | | | | | | |
| | |
Capital share transactions: | | | | | | | | |
Proceeds from sale of shares | | | 81,132,971 | | | | 67,270,515 | |
Cost of shares redeemed | | | (96,662,088 | ) | | | (79,789,663 | ) |
| | | | | | | | |
Net decrease from capital share transactions | | | (15,529,117 | ) | | | (12,519,148 | ) |
| | | | | | | | |
Net increase (decrease) in net assets | | | (6,816,420 | ) | | | 35,321,383 | |
| | | | | | | | |
| | |
Net assets: | | | | | | | | |
Beginning of year | | | 295,049,344 | | | | 259,727,961 | |
| | | | | | | | |
End of year | | $ | 288,232,924 | | | $ | 295,049,344 | |
| | | | | | | | |
| | |
Undistributed net investment income at end of year | | $ | 4,349,961 | | | $ | 3,879,221 | |
| | | | | | | | |
| | |
Capital share activity: | | | | | | | | |
Shares sold | | | 3,414,048 | | | | 3,278,641 | |
Shares redeemed | | | (4,064,045 | ) | | | (3,873,880 | ) |
| | | | | | | | |
Total capital share activity | | | (649,997 | ) | | | (595,239 | ) |
| | | | | | | | |
| | |
| 108 | | The accompanying notes are an integral part of the financial statements |
| | |
| | |
| Financial Highlights | | Series O |
Selected data for each share of capital stock outstanding throughout each year | | (Equity Income Series) |
| | | | | | | | | | | | |
| | | | | | | | | | | Year Ended
December 31, |
|
| | | 2007 | | 2006 | | 2005 | | 2004 | | | 2003 | |
Per Share Data | | | | | | | | | | | | |
Net asset value, beginning of period | | $22.73 | | $19.13 | | $18.44 | | $16.14 | | | $13.17 | |
| | |
Income (loss) from investment operations: | | | | | | | | | | | | |
Net investment incomea | | 0.34 | | 0.31 | | 0.23 | | 0.21 | | | 0.22 | |
Net gain on securities (realized and unrealized) | | 0.30 | | 3.29 | | 0.46 | | 2.12 | | | 3.09 | |
| | | |
Total from investment operations | | 0.64 | | 3.60 | | 0.69 | | 2.33 | | | 3.31 | |
| | |
Less distributions: | | | | | | | | | | | | |
Dividends from net investment income | | – | | – | | – | | (0.03 | ) | | (0.20 | ) |
Distributions from realized gains | | – | | – | | – | | – | | | (0.14 | ) |
| | | |
Total distributions | | – | | – | | – | | (0.03 | ) | | (0.34 | ) |
| | |
Net asset value, end of period | | $23.37 | | $22.73 | | $19.13 | | $18.44 | | | $16.14 | |
| | | |
| | | | | | | | | | | | |
| | |
Total Returnb | | 2.82% | | 18.82% | | 3.74% | | 14.43% | | | 25.25% | |
| | |
Ratios/Supplemental Data | | | | | | | | | | | | |
Net assets, end of period (in thousands) | | $288,233 | | $295,049 | | $259,728 | | $240,833 | | | $196,720 | |
| | |
Ratios to average net assets: | | | | | | | | | | | | |
Net investment income | | 1.42% | | 1.41% | | 1.29% | | 1.31% | | | 1.55% | |
Total expensesc | | 1.14% | | 1.15% | | 1.15% | | 1.13% | | | 1.09% | |
Net expensesd | | 1.14% | | 1.15% | | 1.15% | | 1.13% | | | 1.08% | |
Net expenses prior to custodian earnings credits and net of expense waivers | | 1.14% | | 1.15% | | 1.15% | | 1.13% | | | 1.09% | |
| | |
Portfolio turnover rate | | 25% | | 18% | | 20% | | 20% | | | 19% | |
a Net investment income (loss) was computed using average shares outstanding throughout the period.
b Total return does not take into account any of the expenses associated with an investment in variable insurance products offered by Security Benefit Life Insurance Company. If total return had taken into account these expenses, performance would have been lower. Shares of a series of SBL Fund are available only through the purchase of such products.
c Total expense information reflects the expense ratios absent expense reductions by the Investment Manager, and earnings credits, as applicable.
d Net expense information reflects the expense ratios after voluntary expense waivers, reimbursements and custodian earnings credits, as applicable.
| | |
| 109 | | The accompanying notes are an integral part of the financial statements |
This page left blank intentionally.
| | |
| | |
| Manager’s Commentary | | Series P |
| February 15, 2008 | | (High Yield Series) |

Adviser, Security Global Investors
| | |

| | To Our Shareholders: Series P of the SBL Fund - High Yield Series recorded a gain of 2.08% for the year ended December 31, 2007, outdistancing the 1.87% peraformance of its benchmark, the Lehman High Yield Index, while falling short of the 2.51% return for theSeries’ peer group. |
The High Yield Fund will primarily invest in a diversified portfolio consisting of a broad range of high yield, high-risk debt securities rated below the top four long-term credit rating categories and maintain a dollar-weighted average duration of 3 to 15 years. |
The Series’ investment approach uses a bottom-up process in selecting high yield securities. We emphasize rigorous credit analysis and relative value in selecting securities. Credit analysis includes assessing factors such as an issuer’s management experience, its debt service coverage or ability to make interest payments on its debt, cash flow, and general economic and market factors. Relative value analysis compares the credit risk and yield of a security to that of other securities. We search for securities that appear to be inexpensive relative to comparable securities and securities that have the potential for an upgrade of their credit rating. A rating upgrade would typically increase the value of the security.
High Yield Market Review
The high yield market produced lackluster results during the year as the credit and financial market turmoil caused investors to shun risk and seek higher quality securities. The high yield market reached historically tight spread levels on June 1 and then widened materially throughout the second half. Additionally, LBO-related activity slowed dramatically from its record 2006 pace as risk aversion took hold of the market. Although spreads widened and bond issuance slowed, the high yield corporate default rate fell to a record low of 0.9% at year-end.
Fund Performance
Due to tight credit spreads at the start of the year, the Series was in a defensive posture of higher quality, shorter duration issues. The market was not paying investors to take risk and extend to longer duration positions. The Series maintained its defensive position as the sub-prime
mortgage issues worked their way through the financial system and credit markets deteriorated.
The Series’ core holdings in shorter maturity bonds provided solid income generation and stable current yields. These shorter maturity bonds are not as sensitive to credit spread movements. Therefore, as credit spreads widened during the year, these bonds lost less of their principal value compared to longer maturity bonds, while still collecting interest payments.
Within the financial sector, a few bonds helped to produce significant performance for the Series. A foreign bank, Doral Financial Corporation, was able to refinance a maturing bond and Fairfax Financial Holdings, a property casualty insurer, generated strong profits. Also contributing to performance, the Series was able to benefit by avoiding numerous pitfalls. The consumer cyclical sector’s bonds in the Series outperformed the benchmark by holding steady performers and by avoiding homebuilding and building materials companies as these companies struggled due to the housing slowdown.
The communications sector had a negative impact on the Fund due to security selection in a newspaper publisher, Morris Publishing, and a radio broadcasting company, Cumulus Media, as the slowing economy caused advertising revenue to weaken.
2008 Market Outlook
As we enter 2008, we remain cautious and defensive on the market given the continued concern about a potential recession and higher corporate default rates. Although default rates reached historic lows, it is expected to increase closer to its long-run average in 2008. Therefore, the Series will continue to hold higher quality, shorter maturity securities. As mentioned earlier, spreads widened materially during the second half of 2007 and now more appropriately reflect the risk associated with high yield securities. While not cheap, we believe current spreads reflect a more fair valuation considering the risk. We will continue to monitor the ongoing credit and financial market dislocations and incrementally add risk to the Series when it is appropriate.
We appreciate your business and thank you for being an investor in the Series.
Sincerely,
David Toussaint, Portfolio Manager
| | |
| Performance Summary | | Series P (High Yield Series) |
December 31, 2007 | | (unaudited) |
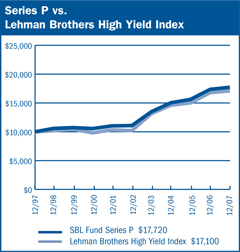
$10,000 Over 10 Years
The chart above assumes a hypothetical $10,000 investment in Series P (High Yield Series) on December 31, 1997 and reflects the fees and expenses of Series P. The Lehman Brothers High Yield Index is an unmanaged index that tracks below investment grade bonds.
| | | | | | |
| Average Annual Returns |
Periods Ended 12-31-071 | | 1 Year | | 5 Years | | 10 Years |
| |
Series P | | 2.08% | | 9.86% | | 5.89% |
1 Performance figures do not reflect fees and expenses associated with an investment in variable insurance products offered by Security Benefit Life Insurance Company. If returns had taken into account these fees and expenses, performance would have been lower. Shares of a Series of SBL Fund are available only through the purchase of such products. The performance data quoted above represents past performance. Past performance is not predictive of future performance. The investment return and principal value of an investment will fluctuate so that an investor’s shares, when redeemed, may be worth more or less than their original cost. |
| |
| | |
Portfolio Comparison by Quality Ratings (Based on Standard & Poor’s Ratings) |
AAA | | 3.56% |
A | | 0.03 |
BBB | | 4.59 |
BB | | 23.41 |
B | | 40.81 |
CCC | | 17.47 |
CC | | 1.04 |
D | | 0.01 |
NR | | 5.30 |
Common Stocks | | 0.05 |
Preferred Stocks | | 3.04 |
Commercial Paper | | 3.90 |
Repurchase Agreement | | 0.16 |
Liabilities in Excess of Other Assets | | (3.37) |
Total Net Assets | | 100.00% |
| | | |
| | |
| 112 | | The accompanying notes are an integral part of the financial statements |
| | |
| | Series P |
| Performance Summary | | (High Yield Series) |
December 31, 2007 | | (unaudited) |
Information About Your Series Expenses
Calculating your ongoing Series expenses
Example
As a shareholder of the Series, you incur ongoing costs, including management fees and other series expenses. Performance figures and expense ratios do not reflect fees and expenses associated with an investment in variable insurance products. Shares of a Series of SBL Fund are available only through the purchase of such products. This example is intended to help you understand your ongoing costs (in dollars) of investing in the Series and to compare these costs with ongoing costs of investing in other mutual funds. The example is based on an investment of $1,000 invested at the beginning of the period and held for the entire period, July 1, 2007 through December 31, 2007.
Actual Expenses
The first line in the table provides information about actual account values and actual expenses. You may use the information in this table, together with the amount you invested, to estimate the expenses that you paid over the period. Simply divide your account value by $1,000 (for example, an $8,600 account value divided by $1,000 = 8.6), then multiply the result by the number in the table under the heading entitled “Expenses Paid During the Period” to estimate the expenses you paid on your account during this period.
Hypothetical Example for Comparison Purposes
The second line in the table provides information about hypothetical account values and hypothetical expenses based on the Series actual expense ratio and an assumed rate of return of 5% per year before expenses, which is not the Series actual return. The hypothetical account values and expenses may not be used to estimate the actual ending account balance or expenses you paid for the period. You may use this information to compare the ongoing costs of investing in the Series and other funds. To do so, compare this 5% hypothetical example with the 5% hypothetical examples that appear in the shareholder reports of the other mutual funds.
Please note that the expenses shown in the table are meant to highlight your ongoing costs only and do not reflect any fees and expenses associated with an investment in variable insurance products. Therefore, the second line is useful in comparing ongoing costs only, and will not help you determine the relative total costs of owning different funds. In addition, if these fees and expenses associated with an investment in variable insurance products were included, your costs would have been higher.
| | | | | | |
Series Expenses |
| | | Beginning
Account
Value
7/1/2007 | | Ending
Account
Value
12/31/20071 | | Expenses
Paid
During
Period2 |
| |
Series P (High Yield Series) | | | | | | |
Actual | | $1,000.00 | | $993.78 | | $4.62 |
Hypothetical | | 1,000.00 | | 1,020.57 | | 4.69 |
1 The actual ending account value is based on the actual total return of the Series for the period July 1, 2007 to December 31, 2007 after actual expenses and will differ from the hypothetical ending account value which is based on the Series expense ratio and a hypothetical annual return of 5% before expenses. The actual cumulative return at net asset value for the period July 1, 2007 to December 31, 2007 was (0.62%).
2 Expenses are equal to the Series annualized expense ratio of 0.92%, net of any applicable fee waivers or earnings credits, multiplied by the average account value over the period, multiplied by 184/365 (to reflect the one-half year period)
| | |
| | |
| Schedule of Investments | | Series P (High Yield Series) |
| December 31, 2007 | | |
| | | | | | |
| | | Shares | | Value |
COMMON STOCK -0.0% | | | | | | |
| Air Freight & Logistics - 0.0% | | | | | | |
| Atlas Air Worldwide Holdings, | | | | | | |
Inc. * | | | 57 | | $ | 3,090 |
| | | | | | |
| Airlines - 0.0% | | | | | | |
| ACE Aviation Holdings, Inc. * | | | 32 | | | 919 |
| Delta Air Lines, Inc. * | | | 1,719 | | | 25,596 |
| Northwest Airlines Corporation * | | | 291 | | | 4,223 |
| | | | | | |
| | | | | | 30,738 |
| | | | | | |
| Broadcasting & Cable TV - 0.0% | | | | | | |
| Adelphia Recovery Trust * | | | 5,270 | | | 356 |
| Time Warner Cable, Inc. * | | | 304 | | | 8,375 |
| | | | | | |
| | | | | | 8,731 |
| | | | | | |
| Electronic Manufacturing | | | | | | |
| Services - 0.0% | | | | | | |
| Viasystems Group, Inc. * | | | 1,207 | | | 10,561 |
| | | | | | |
| | |
| Health Care Equipment - 0.0% | | | | | | |
| MEDIQ, Inc. * (1) | | | 92 | | | 1 |
| | | | | | |
| | |
| Mortgage REIT’s - 0.0% | | | | | | |
| Bimini Capital Management, | | | | | | |
Inc. (2) | | | 30,450 | | | 7,003 |
| HomeBanc Corporation | | | 30,000 | | | 60 |
| | | | | | |
| | | | | | 7,063 |
| |
| TOTAL COMMON STOCK (Cost $746,358) | | | | | $ | 60,184 |
| |
| | | Principal
Amount | | Value |
CONVERTIBLE BOND - 4.5% | | | | | | |
| Aerospace & Defense - 0.8% | | | | | | |
| DRS Technologies, Inc. | | | | | | |
2.00%, 2026 (3)(4) | | $ | 800,000 | | | 869,000 |
| | | | | | |
| Automotive - 0.6% | | | | | | |
| Sonic Automotive, Inc. | | | | | | |
5.25%, 2009 | | | 650,000 | | | 637,000 |
| | | | | | |
| Broadcast Media - 0.7% | | | | | | |
| Sinclair Broadcast Group, Inc. | | | | | | |
4.875%, 2018 (5) | | | 850,000 | | | 776,688 |
| | | | | | |
| Health Care Services - 0.9% | | | | | | |
| Aspect Medical Systems, Inc. | | | | | | |
2.50%, 2014 | | | 725,000 | | | 661,562 |
| InvaCare Corporation | | | | | | |
4.125%, 2027 (3)(4) | | | 350,000 | | | 420,735 |
| | | | | | |
| | | | | | 1,082,297 |
| | | | | | |
| Petroleum - 0.9% | | | | | | |
| USEC, Inc. | | | | | | |
3.00%, 2014 | | | 1,100,000 | | | 1,075,250 |
| | | | | | |
| | | | | | |
| | | Principal
Amount | | Value |
CONVERTIBLE BOND (continued) | | | | | | |
| Telecommunications - 0.6% | | | | | | |
| Nextel Communications, Inc. | | | | | | |
5.25%, 2010 | | $ | 750,000 | | $ | 742,500 |
| |
| TOTAL CONVERTIBLE BOND (Cost $5,104,276) | | | | | $ | 5,182,735 |
| |
CORPORATE BOND - 82.2% | | | | | | |
| Aerospace & Defense - 3.8% | | | | | | |
| Bombardier, Inc. | | | | | | |
6.75%, 2012 (3)(4) | | | 1,075,000 | | | 1,088,438 |
| Esterline Technologies Corporation | | | | | | |
7.75%, 2013 (4) | | | 610,000 | | | 625,250 |
| L-3 Communications Corporation | | | | | | |
7.63%, 2012 | | | 1,275,000 | | | 1,305,281 |
| Vought Aircraft Industries, Inc. | | | | | | |
8.00%, 2011 | | | 1,450,000 | | | 1,373,875 |
| | | | | | |
| | | | | | 4,392,844 |
| | | | | | |
| Airlines - 2.6% | | | | | | |
| Calair Capital Corporation | | | | | | |
8.13%, 2008 | | | 675,000 | | | 675,000 |
| Continental Airlines, Inc. | | | | | | |
7.03%, 2011 | | | 296,573 | | | 287,861 |
8.31%, 2011 | | | 571,944 | | | 561,935 |
| Delta Air Lines, Inc. | | | | | | |
7.90%, 2009 (6) | | | 75,000 | | | 3,562 |
7.71%, 2011 | | | 530,000 | | | 508,800 |
7.78%, 2012 | | | 979,081 | | | 959,500 |
| Northwest Airlines, Inc. | | | | | | |
9.88%, 2008 | | | 10,000 | | | 338 |
| | | | | | |
| | | | | | 2,996,996 |
| | | | | | |
| Automotive - 5.5% | | | | | | |
| Dura Operating Corporation | | | | | | |
8.625%, 2012 (6) | | | 10,000 | | | 1,450 |
| Ford Motor Credit Company LLC | | | | | | |
9.693%, 2012 (7) | | | 300,000 | | | 295,012 |
| General Motors Acceptance Corporation | | | | | | |
6.75%, 2014 | | | 650,000 | | | 524,257 |
8.00%, 2031 | | | 1,350,000 | | | 1,132,481 |
| Group 1 Automotive, Inc. | | | | | | |
8.25%, 2013 | | | 1,050,000 | | | 1,013,250 |
| Metaldyne Corporation | | | | | | |
11.00%, 2012 | | | 1,000,000 | | | 645,000 |
| Sonic Automotive, Inc. | | | | | | |
8.63%, 2013 | | | 600,000 | | | 583,500 |
| Tenneco, Inc. | | | | | | |
8.63%, 2014 | | | 550,000 | | | 540,375 |
| TRW Automotive, Inc. | | | | | | |
7.00%, 2014 (3)(4) | | | 500,000 | | | 460,000 |
7.25%, 2014 (3)(4) | | | 1,250,000 | | | 1,121,875 |
| | | | | | |
| | | | | | 6,317,200 |
| | | | | | |
| Banking - 0.8% | | | | | | |
| Cardtronics, Inc. | | | | | | |
9.25%, 2013 | | | 900,000 | | | 877,500 |
| | |
| 114 | | The accompanying notes are an integral part of the financial statements |
| | |
| | |
| Schedule of Investments | | Series P (High Yield Series) |
| December 31, 2007 - continued | | |
| | | | | | |
| | | Principal
Amount | | Value |
| CORPORATE BOND (continued) | | | | | | |
Banking (continued) | | | | | | |
FCB Capital Trust | | | | | | |
8.05%, 2028 | | $ | 75,000 | | $ | 78,296 |
Western Financial Bank | | | | | | |
9.625%, 2012 | | | 5,000 | | | 5,378 |
| | | | | | |
| | | | | | 961,174 |
| | | | | | |
Brokerage - 2.8% | | | | | | |
E*Trade Financial Corporation | | | | | | |
8.00%, 2011 | | | 1,650,000 | | | 1,431,375 |
7.875%, 2015 | | | 2,300,000 | | | 1,753,750 |
| | | | | | |
| | | | | | 3,185,125 |
| | | | | | |
Chemicals - 1.0% | | | | | | |
CNA Holdings, Inc. | | | | | | |
7.13%, 2009 | | | 225,000 | | | 218,250 |
Methanex Corporation | | | | | | |
8.75%, 2012 | | | 5,000 | | | 5,362 |
PolyOne Corporation | | | | | | |
6.52%, 2010 | | | 330,000 | | | 313,500 |
6.58%, 2011 | | | 625,000 | | | 578,125 |
| | | | | | |
| | | | | | 1,115,237 |
| | | | | | |
Construction Machinery - 1.0% | | | | | | |
Neff Corporation | | | | | | |
10.00%, 2015 | | | 100,000 | | | 54,500 |
United Rentals North America, Inc. | | | | | | |
6.50%, 2012 | | | 625,000 | | | 567,188 |
7.00%, 2014 | | | 625,000 | | | 523,437 |
| | | | | | |
| | | | | | 1,145,125 |
| | | | | | |
Consumer Products - 0.2% | | | | | | |
Hanesbrands, Inc. | | | | | | |
8.204%, 2014 (4)(7) | | | 150,000 | | | 148,500 |
Hasbro, Inc. | | | | | | |
6.15%, 2008 | | | 56,000 | | | 56,190 |
Icon Health & Fitness | | | | | | |
11.25%, 2012 | | | 25,000 | | | 25,500 |
| | | | | | |
| | | | | | 230,190 |
| | | | | | |
Distributors - 1.2% | | | | | | |
SemGroup, LP | | | | | | |
8.75%, 2015 (3)(4) | | | 1,200,000 | | | 1,140,000 |
Williams Partners, LP | | | | | | |
7.25%, 2017 | | | 250,000 | | | 257,500 |
| | | | | | |
| | | | | | 1,397,500 |
| | | | | | |
Diversified Manufacturing - 1.1% | | | | | | |
Briggs & Stratton Corporation | | | | | | |
8.88%, 2011 | | | 1,250,000 | | | 1,328,125 |
| | | | | | |
Electric - 3.3% | | | | | | |
AES Red Oak LLC | | | | | | |
8.54%, 2019 | | | 1,134,851 | | | 1,214,290 |
Avista Corporation | | | | | | |
9.75%, 2008 | | | 50,000 | | | 51,029 |
| | | | | | |
| | | Principal
Amount | | Value |
| CORPORATE BOND (continued) | | | | | | |
Electric (continued) | | | | | | |
Dynegy Holdings, Inc. | | | | | | |
7.75%, 2019 | | $ | 250,000 | | $ | 230,625 |
East Coast Power LLC | | | | | | |
6.74%, 2008 | | | 7,556 | | | 7,584 |
7.07%, 2012 | | | 84,520 | | | 87,677 |
Edison Mission Energy | | | | | | |
7.20%, 2019 | | | 700,000 | | | 687,750 |
GrafTech Finance, Inc. | | | | | | |
10.25%, 2012 | | | 415,000 | | | 427,969 |
Reliant Energy, Inc. | | | | | | |
6.75%, 2014 | | | 1,000,000 | | | 1,002,500 |
Westar Energy, Inc. | | | | | | |
7.125%, 2009 | | | 90,000 | | | 92,444 |
| | | | | | |
| | | | | | 3,801,868 |
| | | | | | |
Entertainment - 1.2% | | | | | | |
AMC Entertainment, Inc. | | | | | | |
11.00%, 2016 | | | 500,000 | | | 526,250 |
Speedway Motorsports, Inc. | | | | | | |
6.75%, 2013 | | | 900,000 | | | 886,500 |
| | | | | | |
| | | | | | 1,412,750 |
| | | | | | |
Environmental - 0.4% | | | | | | |
Casella Waste Systems, Inc. | | | | | | |
9.75%, 2013 | | | 400,000 | | | 408,000 |
| | | | | | |
Financial - Other - 1.7% | | | | | | |
Harland Clarke Holdings Corporation | | | | | | |
9.619%, 2015 (7) | | | 1,400,000 | | | 1,172,500 |
Progress Capital Trust I | | | | | | |
10.50%, 2027 | | | 700,000 | | | 737,594 |
| | | | | | |
| | | | | | 1,910,094 |
| | | | | | |
Food & Beverage - 2.8% | | | | | | |
Constellation Brands, Inc. | | | | | | |
8.375%, 2014 | | | 900,000 | | | 902,250 |
Dole Food Company, Inc. | | | | | | |
7.25%, 2010 | | | 400,000 | | | 364,000 |
8.88%, 2011 | | | 1,150,000 | | | 1,063,750 |
Harry & David Holdings, Inc. | | | | | | |
9.00%, 2013 | | | 900,000 | | | 828,000 |
Land O' Lakes, Inc. | | | | | | |
8.75%, 2011 | | | 60,000 | | | 61,500 |
| | | | | | |
| | | | | | 3,219,500 |
| | | | | | |
Gaming - 3.5% | | | | | | |
American Casino & Entertainment | | | | | | |
Properties LLC | | | | | | |
7.85%, 2012 | | | 300,000 | | | 309,225 |
Galaxy Entertainment Finance Comp Ltd. | | | | | | |
9.88%, 2012 (3)(4) | | | 975,000 | | | 1,028,625 |
Mandalay Resort Group | | | | | | |
6.50%, 2009 | | | 300,000 | | | 300,000 |
| | |
| 115 | | The accompanying notes are an integral part of the financial statements |
| | |
| | |
| Schedule of Investments | | Series P (High Yield Series) |
| December 31, 2007 - continued | | |
| | | | | | |
| | | Principal
Amount | | Value |
CORPORATE BOND (continued) | | | | | | |
Gaming (continued) | | | | | | |
MGM Mirage | | | | | | |
8.50%, 2010 | | $ | 15,000 | | $ | 15,562 |
8.375%, 2011 | | | 55,000 | | | 56,238 |
6.75%, 2012 | | | 625,000 | | | 608,594 |
6.75%, 2013 (4) | | | 500,000 | | | 485,000 |
Pinnacle Entertainment, Inc. | | | | | | |
7.50%, 2015 (3)(4) | | | 250,000 | | | 226,875 |
Station Casinos, Inc. | | | | | | |
6.00%, 2012 | | | 925,000 | | | 823,250 |
Turning Stone Resort Casino Enterprise | | | | | | |
9.13%, 2014 (3)(4) | | | 150,000 | | | 153,000 |
| | | | | | |
| | | | | | 4,006,369 |
| | | | | | |
Healthcare - 3.7% | | | | | | |
Coventry Health Care, Inc. | | | | | | |
6.13%, 2015 | | | 575,000 | | | 577,003 |
HCA, Inc. | | | | | | |
6.50%, 2016 | | | 2,100,000 | | | 1,774,500 |
IASIS Healthcare LLC | | | | | | |
8.75%, 2014 | | | 1,050,000 | | | 1,050,000 |
InvaCare Corporation | | | | | | |
9.75%, 2015 (4) | | | 150,000 | | | 151,875 |
Johnsondiversey, Inc. | | | | | | |
9.625%, 2012 | | | 5,000 | | | 5,112 |
US Oncology, Inc. | | | | | | |
10.75%, 2014 | | | 675,000 | | | 666,563 |
| | | | | | |
| | | | | | 4,225,053 |
| | | | | | |
Independent Energy - 2.6% | | | | | | |
Forest Oil Corporation | | | | | | |
8.00%, 2008 | | | 15,000 | | | 15,150 |
7.25%, 2019 (3)(4) | | | 375,000 | | | 376,875 |
Hilcorp Energy I, LP | | | | | | |
7.75%, 2015 (3)(4) | | | 250,000 | | | 245,625 |
MarkWest Energy Partners, LP | | | | | | |
8.50%, 2016 | | | 400,000 | | | 402,000 |
Plains Exploration & Production Company | | | | | | |
7.00%, 2017 | | | 500,000 | | | 478,125 |
Range Resources Corporation | | | | | | |
7.38%, 2013 | | | 75,000 | | | 76,125 |
Transmeridian Exploration, Inc. | | | | | | |
12.00%, 2010 | | | 1,225,000 | | | 1,212,750 |
VeraSun Energy Corporation | | | | | | |
9.375%, 2017 (3)(4) | | | 250,000 | | | 218,125 |
| | | | | | |
| | | | | | 3,024,775 |
| | | | | | |
Industrial - Other - 1.5% | | | | | | |
Anixter International, Inc. | | | | | | |
5.95%, 2015 | | | 250,000 | | | 225,312 |
Belden, Inc. | | | | | | |
7.00%, 2017 | | | 300,000 | | | 292,500 |
Corrections Corporation of America | | | | | | |
7.50%, 2011 | | | 200,000 | | | 202,500 |
| | | | | | |
| | | Principal
Amount | | Value |
CORPORATE BOND (continued) | | | | | | |
Industrial - Other (continued) | | | | | | |
Iron Mountain, Inc. | | | | | | |
8.25%, 2011 | | $ | 800,000 | | $ | 796,000 |
Mobile Services Group, Inc. | | | | | | |
9.75%, 2014 | | | 200,000 | | | 184,000 |
| | | | | | |
| | | | | | 1,700,312 |
| | | | | | |
Insurance - Life - 0.1% | | | | | | |
USI Holdings Corporation | | | | | | |
9.75%, 2015 (3)(4) | | | 100,000 | | | 80,500 |
| | | | | | |
Insurance - Property & Casually - 2.7% | | | | | | |
Fairfax Financial Holdings, Ltd. | | | | | | |
7.75%, 2012 | | | 3,075,000 | | | 3,075,000 |
| | | | | | |
Media - Cable - 2.6% | | | | | | |
Cablevision Systems Corporation | | | | | | |
9.644%, 2009 (7) | | | 250,000 | | | 252,813 |
CSC Holdings, Inc. | | | | | | |
7.25%, 2008 | | | 375,000 | | | 375,469 |
8.125%, 2009 to 2009 | | | 35,000 | | | 35,581 |
6.75%, 2012 | | | 325,000 | | | 310,781 |
Jones Intercable, Inc. | | | | | | |
7.63%, 2008 | | | 200,000 | | | 201,180 |
Satelites Mexicanos S.A. de CV | | | | | | |
13.58%, 2011 (7) | | | 1,464,175 | | | 1,497,119 |
Shaw Communications, Inc. | | | | | | |
7.25%, 2011 | | | 375,000 | | | 385,313 |
| | | | | | |
| | | | | | 3,058,256 |
| | | | | | |
Media - Non Cable - 5.2% | | | | | | |
Block Communications, Inc. | | | | | | |
8.25%, 2015 (3)(4) | | | 1,125,000 | | | 1,126,406 |
Bonten Media Acquisition Company | | | | | | |
9.00%, 2015 (3)(4) | | | 100,000 | | | 87,250 |
CMP Susquehanna Corporation | | | | | | |
9.875%, 2014 | | | 1,200,000 | | | 900,000 |
Fisher Communications, Inc. | | | | | | |
8.63%, 2014 | | | 250,000 | | | 255,313 |
Historic TW, Inc. | | | | | | |
9.125%, 2013 | | | 30,000 | | | 34,082 |
Intelsat, Ltd. | | | | | | |
7.63%, 2012 | | | 725,000 | | | 594,500 |
Lamar Media Corporation | | | | | | |
6.625% to 6.63%, 2015 to 2015 | | | 500,000 | | | 486,250 |
Morris Publishing Group LLC | | | | | | |
7.00%, 2013 (4) | | | 1,625,000 | | | 1,180,156 |
Reader's Digest Association, Inc. | | | | | | |
9.00%, 2017 (3)(4) | | | 150,000 | | | 125,625 |
Univision Communications, Inc. | | | | | | |
9.75%, 2015 (3)(4) | | | 1,350,000 | | | 1,230,188 |
| | | | | | |
| | | | | | 6,019,770 |
| | | | | | |
Metals & Mining - 4.5% | | | | | | |
Asia Aluminum Holdings, Ltd. | | | | | | |
8.00%, 2011 (3)(4) | | | 2,800,000 | | | 2,702,000 |
| | |
| 116 | | The accompanying notes are an integral part of the financial statements |
| | |
| | |
| Schedule of Investments | | Series P (High Yield Series) |
| December 31, 2007 - continued | | |
| | | | | | |
| | | Principal
Amount | | Value |
| CORPORATE BOND (continued) | | | | | | |
Metals & Mining (continued) | | | | | | |
Noble Group, Ltd. | | | | | | |
6.63%, 2015 (3)(4) | | $ | 550,000 | | $ | 513,836 |
PNA Group, Inc. | | | | | | |
10.75%, 2016 (4) | | | 500,000 | | | 470,000 |
US EC, Inc. | | | | | | |
6.75%, 2009 | | | 1,625,000 | | | 1,547,813 |
| | | | | | |
| | | | | | 5,233,649 |
| | | | | | |
Natural Gas Pipelines - 1.2% | | | | | | |
Regency Energy Partners, LP | | | | | | |
8.375%, 2013 | | | 1,105,000 | | | 1,138,150 |
Williams Companies, Inc. | | | | | | |
6.38%, 2010 (3)(4) | | | 200,000 | | | 202,250 |
| | | | | | |
| | | | | | 1,340,400 |
| | | | | | |
Oil Field Services - 1.8% | | | | | | |
Calfrac Holdings LP | | | | | | |
7.75%, 2015 (3)(4) | | | 250,000 | | | 239,375 |
Helix Energy Solutions Group, Inc. | | | | | | |
9.50%, 2016 (3) | | | 400,000 | | | 407,000 |
Key Energy Services, Inc. | | | | | | |
8.375%, 2014 (3)(4) | | | 725,000 | | | 741,312 |
Pemex Project Funding Master Trust | | | | | | |
8.50%, 2008 | | | 20,000 | | | 20,050 |
7.875%, 2009 | | | 29,000 | | | 29,810 |
9.125%, 2010 | | | 10,000 | | | 11,050 |
Stallion Oilfield Services | | | | | | |
9.75%, 2015 (3)(4) | | | 700,000 | | | 644,000 |
| | | | | | |
| | | | | | 2,092,597 |
| | | | | | |
Packaging - 0.7% | | | | | | |
Ball Corporation | | | | | | |
6.88%, 2012 | | | 250,000 | | | 253,750 |
Graham Packaging Company, Inc. | | | | | | |
9.88%, 2014 | | | 625,000 | | | 575,000 |
Owens-Illinois, Inc. | | | | | | |
7.50%, 2010 | | | 30,000 | | | 30,375 |
| | | | | | |
| | | | | | 859,125 |
| | | | | | |
Paper - 1.5% | | | | | | |
Georgia-Pacific Corporation | | | | | | |
7.13%, 2017 (3)(4) | | | 325,000 | | | 316,063 |
Sino-Forest Corporation | | | | | | |
9.13%, 2011 (3)(4) | | | 1,375,000 | | | 1,448,906 |
| | | | | | |
| | | | | | 1,764,969 |
| | | | | | |
Pharmaceuticals - 1.3% | | | | | | |
Valeant Pharmaceuticals International | | | | | | |
7.00%, 2011 | | | 1,550,000 | | | 1,489,937 |
| | | | | | |
| | |
Refining - 1.4% | | | | | | |
Frontier Oil Corporation | | | | | | |
6.63%, 2011 | | | 300,000 | | | 298,500 |
| | | | | | |
| | | Principal
Amount | | Value |
| CORPORATE BOND (continued) | | | | | | |
Refining (continued) | | | | | | |
United Refining Company | | | | | | |
10.50%, 2012 | | $ | 1,350,000 | | $ | 1,363,500 |
| | | | | | |
| | | | | | 1,662,000 |
| | | | | | |
REIT’s - 3.1% | | | | | | |
American Real Estate Partners, LP | | | | | | |
8.13%, 2012 | | | 2,185,000 | | | 2,116,719 |
7.13%, 2013 | | | 400,000 | | | 376,000 |
BF Saul Reit | | | | | | |
7.50%, 2014 | | | 1,150,000 | | | 1,058,000 |
| | | | | | |
| | | | | | 3,550,719 |
| | | | | | |
Restaurants - 0.1% | | | | | | |
Seminole Hard Rock Entertainment, lnc. | | | | | | |
7.491%, 2014 (3)(4)(7) | | | 150,000 | | | 143,250 |
| | | | | | |
| | |
Retailers - 5.6% | | | | | | |
Blockbuster, Inc. | | | | | | |
9.00%, 2012 | | | 1,100,000 | | | 940,500 |
Duane Reade, Inc. | | | | | | |
9.75%, 2011 | | | 1,300,000 | | | 1,173,250 |
General Nutrition Centers, Inc. | | | | | | |
10.009%, 2014 (7) | | | 675,000 | | | 637,875 |
GSC Holdings Corporation | | | | | | |
8.00%, 2012 | | | 625,000 | | | 650,781 |
JC Penney Corporation, Inc. | | | | | | |
7.375%, 2008 | | | 40,000 | | | 40,465 |
Michaels Stores, Inc. | | | | | | |
11.375%, 2016 | | | 1,750,000 | | | 1,605,625 |
PCA LLC | | | | | | |
11.875%, 2009 (6) | | | 30,000 | | | 900 |
Saks, Inc. | | | | | | |
9.875%, 2011 | | | 1,300,000 | | | 1,378,000 |
| | | | | | |
| | | | | | 6,427,396 |
| | | | | | |
Technology - 4.9% | | | | | | |
Amkor Technology, Inc. | | | | | | |
9.25%, 2016 | | | 2,675,000 | | | 2,681,687 |
NXP BV | | | | | | |
9.50%, 2015 | | | 650,000 | | | 595,563 |
Seagate Technology HDD Holdings | | | | | | |
6.80%, 2016 | | | 650,000 | | | 633,750 |
Viasystems, Inc. | | | | | | |
10.50%, 2011 | | | 1,700,000 | | | 1,691,500 |
| | | | | | |
| | | | | | 5,602,500 |
| | | | | | |
Telecommunications - Wireless - 2.8% | | | | | | |
iPCS, Inc. | | | | | | |
8.161%, 2014 (7) | | | 400,000 | | | 370,000 |
Level 3 Financing, Inc. | | | | | | |
8.75%, 2017 | | | 1,050,000 | | | 900,375 |
MetroPCS Wireless, Inc. | | | | | | |
9.25%, 2014 | | | 675,000 | | | 634,500 |
Rural Cellular Corporation | | | | | | |
10.661%, 2012 (7) | | | 650,000 | | | 663,000 |
| | |
| 117 | | The accompanying notes are an integral part of the financial statements |
| | |
| | |
| Schedule of Investment | | Series P (High Yield Series) |
| December 31, 2007 - continued | | |
| | | | | | |
| | | Principal
Amount | | Value |
| CORPORATE BOND (continued) | | | | | | |
Telecommunications - Wireless (continued) | | | | | | |
Rural Cellular Corporation (continued) | | | | | | |
8.124%, 2013 (7) | | $ | 675,000 | | $ | 685,125 |
| | | | | | |
| | | | | | 3,253,000 |
| | | | | | |
| | |
Telecommunications - Wirelines - 0.1% | | | | | | |
Qwest Corporation | | | | | | |
7.88%, 2011 | | | 150,000 | | | 156,000 |
| | | | | | |
| | |
Textile - 0.2% | | | | | | |
Invista | | | | | | |
9.25%, 2012 (3)(4) | | | 250,000 | | | 258,750 |
| | | | | | |
| | |
Transportation Services - 1.7% | | | | | | |
American Railcar Industries, Inc. | | | | | | |
7.50%, 2014 | | | 250,000 | | | 236,250 |
Overseas Shipholding Group, Inc. | | | | | | |
8.25%, 2013 | | | 400,000 | | | 406,000 |
St. Acquisition Corporation | | | | | | |
12.50%, 2017 (3)(4) | | | 1,350,000 | | | 696,937 |
US Shipping Partners, LP | | | | | | |
13.00%, 2014 | | | 625,000 | | | 612,500 |
| | | | | | |
| | | | | | 1,951,687 |
TOTAL CORPORATE BOND (Cost $98,955,137) | | | | | $ | 94,797,742 |
| FOREIGN BOND - 0.1% | | | | | | |
Tunisia - 0.1% | | | | | | |
Banque Centrale de Tunisie | | | | | | |
7.375%, 2012 | | | 80,000 | | | 86,944 |
TOTAL FOREIGN BOND (Cost $79,325) | | | | | $ | 86,944 |
| FOREIGN GOVERNMENT BOND - 0.4% |
Chile - 0.0% | | | | | | |
Chile Government International Bond | | | | | | |
7.125%, 2012 | | | 25,000 | | | 27,522 |
| | | | | | |
| | |
Mexico - 0.2% | | | | | | |
Mexico Government International Bond | | | | | | |
8.375%, 2011 | | | 85,000 | | | 94,052 |
7.50%, 2012 | | | 116,000 | | | 127,368 |
| | | | | | |
| | | | | | 221,420 |
| | | | | | |
| | |
Philippines - 0.0% | | | | | | |
Philippine Government International Bond | | | | | | |
8.375%, 2009 | | | 30,000 | | | 31,050 |
| | | | | | |
| | |
Russia - 0.1% | | | | | | |
Russia Government International Bond | | | | | | |
8.25%, 2010 (3)(4) | | | 20,279 | | | 21,039 |
Russian Ministry of Finance | | | | | | |
3.00%, 2011 | | | 80,000 | | | 74,011 |
| | | | | | |
| | | | | | 95,050 |
| | | | | | |
| | | | |
| | | Principal
Amount | | Value |
| FOREIGN GOVERNMENT BOND (continued) |
| | | | | | |
South Africa - 0.1% | | | | | | |
South Africa Government International Bond | | | | | | |
7.375%, 2012 | | $ | 35,000 | | $ | 37,888 |
TOTAL FOREIGN GOVERNMENT BOND (Cost $370,608) | | | | | $ | 412,930 |
| PREFERRED STOCK - 3.0% | | | | | | |
Department Stores - 0.4% | | | | | | |
Sears Holdings Corporation (amount in shares) | | | | | | |
7.00%, 2042 | | | 24,830 | | | 524,549 |
| | | | | | |
| | |
Real Estate Investment Trusts - 1.3% | | | | | | |
Hospitality Properties Trust (amount in shares) | | | | | | |
7.00%, 2012 | | | 85,000 | | | 1,530,000 |
| | | | | | |
| | |
Thrifts & Mortgage Finance - 1.3% | | | | | | |
Federal Home Loan Mortgage Corporation (amount in shares) | | | | | | |
8.375%, 2012 | | | 28,000 | | | 732,200 |
Federal National Mortgage Association (amount in shares) | | | | | | |
8.25%, 2010 | | | 28,000 | | | 721,000 |
| | | | | | |
| | | | | | 1,453,200 |
| TOTAL PREFERRED STOCK (Cost $3,922,729) | | | | | $ | 3,507,749 |
| SENIOR FLOATING RATE INTERESTS - 5.5% |
Automotive - 1.6% | | | | | | |
Delphi, Term Loan C | | | | | | |
9.12%, 2008 (7)(8) | | | 650,000 | | | 647,698 |
Ford Motor Company, Term Loan B | | | | | | |
8.00%, 2013 (7)(8) | | | 1,287,000 | | | 1,189,305 |
| | | | | | |
| | | | | | 1,837,003 |
| | | | | | |
| | |
Business Equipment & Services - 2.1% | | | | | | |
First Data Corporation, Initial Bl Term | | | | | | |
Loan | | | | | | |
7.58%, 2014 (7)(8) | | | 2,094,750 | | | 1,985,955 |
VNU, Term Loan | | | | | | |
7.24%, 2013 (7)(8) | | | 463,301 | | | 438,656 |
| | | | | | |
| | | | | | 2,424,611 |
| | | | | | |
| | |
Healthcare - 0.8% | | | | | | |
DaVita, Inc., Term Loan B | | | | | | |
6.35%, 2012 (7)(8) | | | 398,415 | | | 383,067 |
6.49%, 2012 (7)(8) | | | 26,996 | | | 25,956 |
6.52%, 2012 (7)(8) | | | 40,494 | | | 38,934 |
6.74%, 2012 (7)(8) | | | 409,245 | | | 393,480 |
6.75%, 2012 (7)(8) | | | 45,894 | | | 44,126 |
| | | | | | |
| | | | | | 885,563 |
| | | | | | |
| | |
Media - Non Cable -0.6% | | | | | | |
VNU, Term Loan | | | | | | |
7.15%, 2013 (7)(8) | | | 771,078 | | | 730,061 |
| | | | | | |
| | |
| 118 | | The accompanying notes are an integral part of the financial statements |
| | |
| | |
| Schedule of Investment | | Series P (High Yield Series) |
| December 31, 2007 | | |
| | | | | | | |
| | | Principal
Amount | | Value | |
SENIOR FLOATING RATE INTERESTS (continued) | | | | | | | |
Utilities - 0.4% | | | | | | | |
LS Power/Broadway General Funding LLC, | | | | | | | |
Term Loan B | | | | | | | |
8.58%, 2015 (7)(8) | | $ | 500,000 | | $ | 478,750 | |
TOTAL SENIOR FLOATING RATE INTERESTS (Cost $6,600,777) | | $ | 6,355,988 | |
| U.S. GOVERNMENT SPONSORED AGENCY BONDS & NOTES - 3.6% | | | | |
Federal Home Loan Bank | | | | | | | |
4.22% - 2008 | | | 1,400,000 | | | 1,399,835 | |
4.24% - 2008 | | | 2,700,000 | | | 2,699,393 | |
TOTAL U.S. GOVERNMENT SPONSORED AGENCY BONDS & NOTES
(Cost $4,099,228) | | | | | $ | 4,099,228 | |
COMMERCIAL PAPER - 3.9% | | | | | | | |
Banking - 1.3% | | | | | | | |
UBS Finance (DE) LLC | | | | | | | |
4.24%, 1/2/2008 | | | 1,500,000 | | | 1,499,823 | |
| | | | | | | |
Electric - 1.3% | | | | | | | |
Florida Power & Light Company | | | | | | | |
4.35%, 1/3/2008 | | | 1,500,000 | | | 1,499,638 | |
| | | | | | | |
Non U.S. Banking - 1.3% | | | | | | | |
Danske Corporation | | | | | | | |
4.675%, 1/7/2008 | | | 1,500,000 | | | 1,498,900 | |
TOTAL COMMERCIAL PAPER (Cost $4,498,361) | | | | | $ | 4,498,361 | |
REPURCHASE AGREEMENT - 0.2% | | | | | | | |
United Missouri Bank, 3.61%, dated 12/31/07, matures 1/02/08; repurchase amount $180,036 (Collateralized by FHLB Discount Note, 1/12/08 with a value of $183,760) | | $ | 180,000 | | $ | 180,000 | |
TOTAL REPURCHASE AGREEMENT (Cost $180,000) | | $ | 180,000 | |
Total Investments (SBL P Fund) | | | | | $ | 119,181,861 | |
(Cost $124,556,799) - 103.4% | | | | | | | |
Liabilities in Excess of Other Assets - (3.4)% | | | | | | (3,880,777 | ) |
| | | | | | | |
TOTAL NET ASSETS - 100.0% | | | | | $ | 115,301,084 | |
| | | | | | | |
Footnotes
Percentages are stated as a percent of net assets.
For federal income tax purposes the identified cost of investments owned at 12/31/2007 was $124,022,052.
| * | - Non-income producing security |
| 1 | - Security is fair valued by the Board of Directors. The total market value of fair valued securities amounts to $1, (cost $45,087) or 0.0% of total net assets. |
| 2 | - Security is deemed illiquid. The total market value of illiquid securities is $7,004 (cost $451,175), or 0.0% of total net assets. |
| 3 | - Security was acquired through a private placement. |
| 4 | - Security is a 144A security. The total market value of 144A securities is $21,230,767 (cost $22,299,819), or 18.4% of total net assets. |
| 5 | - Security is a step-up bond. Rate indicated is rate effective at December 31, 2007. |
| 6 | - Security is in default of interest and/or principal obligations. |
| 7 | - Variable rate security. Rate indicated is rate effective at December 31, 2007. |
| 8 | - Security is a senior floating rate interest. See notes to financial statements. |
Glossary:
| FHLB | - Federal Home Loan Bank |
See notes to financial statements.
| | |
| 119 | | The accompanying notes are an integral part of the financial statements |
| | |
| | |
| | Series P |
| | (High Yield Series) |
Statement of Assets and Liabilities
December 31, 2007
| | | |
Assets: | | | |
Investments, at value* | | $119,181,861 | |
Cash | | 85,739 | |
Receivables: | | | |
Fund shares sold | | 539,457 | |
Interest | | 1,978,794 | |
Prepaid expenses | | 2,341 | |
| | | |
Total assets | | 121,788,192 | |
| | | |
| |
Liabilities: | | | |
| |
Payable for: | | | |
Fund shares redeemed | | 6,373,195 | |
Management fees | | 77,738 | |
Administration fees | | 13,747 | |
Transfer agent/maintenance fees | | 2,083 | |
Custodian fees | | 2,800 | |
Directors’ fees | | 1,400 | |
Professional fees | | 11,050 | |
Other fees | | 5,095 | |
| | | |
Total liabilities | | 6,487,108 | |
| | | |
Net assets | | $115,301,084 | |
| | | |
| |
Net assets consist of: | | | |
Paid in capital | | $111,901,762 | |
Undistributed net investment income | | 9,184,134 | |
Accumulated net realized loss on sale of investments | | (409,874 | ) |
Net unrealized depreciation in value of investments | | (5,374,938 | ) |
| | | |
Net assets | | $115,301,084 | |
| | | |
| |
Capital shares authorized | | unlimited | |
Capital shares outstanding | | 6,013,031 | |
Net asset value per share | | | |
(net assets divided by shares outstanding) | | $19.18 | |
| | | |
| |
*Investments, at cost | | $124,556,799 | |
Statement of Operations
For Year Ended December 31, 2007
| | | |
Investment Income: | | | |
Dividends | | $ | 205,804 |
Interest | | | 9,419,646 |
| | | |
Total investment income | | | 9,625,450 |
| | | |
| |
Expenses: | | | |
Management fees | | | 890,421 |
Administration fees | | | 128,020 |
Transfer agent/maintenance fees | | | 25,172 |
Custodian fees | | | 11,748 |
Directors’ fees | | | 7,356 |
Professional fees | | | 11,871 |
Reports to shareholders | | | 9,222 |
Other | | | 4,156 |
| | | |
Total expenses | | | 1,087,966 |
Less: | | | |
Earnings credits applied | | | (965) |
| | | |
Net expenses | | | 1,087,001 |
| | | |
Net investment income | | | 8,538,449 |
| | | |
| |
Net Realized and Unrealized Gain (Loss): | | | |
| |
Net realized gain (loss) during the year on: | | | |
Investments | | | (182,569) |
| | | |
Net realized loss | | | (182,569) |
| | | |
Net unrealized appreciation (depreciation) during the year on: | | | |
Investments | | | (6,161,486) |
| | | |
Net unrealized depreciation | | | (6,161,486) |
| | | |
Net realized and unrealized loss | | | (6,344,055) |
| | | |
Net increase in net assets resulting from operations | | $ | 2,194,394 |
| | | |
| | |
| 120 | | The accompanying notes are an integral part of the financial statements |
| | |
| | Series P |
| | |
| Statement of Changes in Net Assets | | (High Yield Series) |
| | | | | | | | |
| | | Year Ended
December 31, 2007 | | | Year Ended
December 31, 2006 | |
| | |
Increase (decrease) in net assets from operations: | | | | | | | | |
Net investment income | | $ | 8,538,449 | | | $ | 6,360,571 | |
Net realized gain (loss) during the year on investments | | | (182,569 | ) | | | 1,004,753 | |
Net unrealized appreciation (depreciation) during the year on investments | | | (6,161,486 | ) | | | 1,995,013 | |
| | | | | | | | |
Net increase in net assets resulting from operations | | | 2,194,394 | | | | 9,360,337 | |
| | | | | | | | |
| | |
Capital share transactions: | | | | | | | | |
Proceeds from sale of shares | | | 86,289,967 | | | | 63,798,723 | |
Cost of shares redeemed | | | (79,327,389 | ) | | | (44,986,293 | ) |
| | | | | | | | |
Net increase from capital share transactions | | | 6,962,578 | | | | 18,812,430 | |
| | | | | | | | |
Net increase in net assets | | | 9,156,972 | | | | 28,172,767 | |
| | | | | | | | |
| | |
Net assets: | | | | | | | | |
Beginning of year | | | 106,144,112 | | | | 77,971,345 | |
| | | | | | | | |
End of year | | $ | 115,301,084 | | | $ | 106,144,112 | |
| | | | | | | | |
| | |
Undistributed net investment income at end of year | | $ | 9,184,134 | | | $ | 6,964,398 | |
| | | | | | | | |
| | |
Capital share activity: | | | | | | | | |
Shares sold | | | 4,491,234 | | | | 3,584,516 | |
Shares redeemed | | | (4,128,501 | ) | | | (2,547,382 | ) |
| | | | | | | | |
Total capital share activity | | | 362,733 | | | | 1,037,134 | |
| | | | | | | | |
| | |
| 121 | | The accompanying notes are an integral part of the financial statements |
| | |
| | |
| Financial Highlights | | Series P |
| Selected data for each share of capital stock outstanding throughout each year | | (High Yield Series) |
| | | | | | | | | | |
| | | 2007 | | 2006 | | 2005 | | 2004 | | Year Ended
December 31, 2003 |
| |
Per Share Data | | | | | | | | | | |
Net asset value, beginning of period | | $18.79 | | $16.90 | | $16.28 | | $14.71 | | $12.79 |
| |
Income (loss) from investment operations: | | | | | | | | | | |
Net investment incomea | | 1.38 | | 0.90 | | 1.09 | | 1.12 | | 0.90 |
Net gain (loss) on securities (realized and unrealized) | | (0.99) | | 0.99 | | (0.47) | | 0.58 | | 1.87 |
| | |
Total from investment operations | | 0.39 | | 1.89 | | 0.62 | | 1.70 | | 2.77 |
| |
Less distributions: | | | | | | | | | | |
Dividends from net investment income | | – | | – | | – | | (0.13) | | (0.85) |
| | |
Total distributions | | – | | – | | – | | (0.13) | | (0.85) |
| |
Net asset value, end of period | | $19.18 | | $18.79 | | $16.90 | | $16.28 | | $14.71 |
| | |
| | | | | |
| | | | | | | | | | |
| |
Total Returnb | | 2.08% | | 11.18% | | 3.81% | | 11.61% | | 21.71% |
| |
Ratios/Supplemental Data | | | | | | | | | | |
Net assets, end of period (in thousands) | | $115,301 | | $106,144 | | $77,971 | | $74,316 | | $78,491 |
| |
Ratios to average net assets: | | | | | | | | | | |
Net investment income | | 7.19% | | 7.24% | | 7.13% | | 7.08% | | 7.53% |
Total expensesc | | 0.92% | | 0.93% | | 0.97% | | 0.94% | | 0.87% |
Net expensesd | | 0.92% | | 0.93% | | 0.97% | | 0.94% | | 0.87% |
Net expenses prior to custodian earnings credits and net of expense waivers | | 0.92% | | 0.93% | | 0.97% | | 0.94% | | 0.87% |
Portfolio turnover rate | | 50% | | 52% | | 64% | | 63% | | 52% |
a Net investment income (loss) was computed using average shares outstanding throughout the period.
b Total return does not take into account any of the expenses associated with an investment in variable insurance products offered by Security Benefit Life Insurance Company. If total return had taken into account these expenses, performance would have been lower. Shares of a series of SBL Fund are available only through the purchase of such products.
c Total expense information reflects the expense ratios absent expense reductions by the Investment Manager, and earnings credits, as applicable.
d Net expense information reflects the expense ratios after voluntary expense waivers, reimbursements and custodian earnings credits, as applicable.
| | |
| 122 | | The accompanying notes are an integral part of the financial statements |
This page left blank intentionally.
| | |
| | |
| Manager’s Commentary | | Series Q |
| February 15, 2008 | | (Small Cap Value Series) |

Subadviser, Wells Capital Management, Inc.
| | |
 | | To Our Shareholders: For the year ended December 31, 2007 the Series Q - Small Cap Value Series Fund returned 10.25% in 2007, significantly outperforming the Russell 2000 Index, which finished with a return of -1.57%. For the full year, Fund holdings in the energy and industrials sectors paced the way for strong gains. The Fund also benefited from strong stock selection and its underweight to the maligned financial services sector. |
Volatility spiked upward in the second half of the year, spurred by escalating losses tied to the sub-prime mortgage sector that first materialized in July 2007. The subsequent and continued impact put unprecedented pressure on the credit markets and led to an increasingly tight liquidity environment that permeated the entire financial system. As the year drew to a close, the possibility of recession in the U.S. economy was clearly on the mind of investors. Despite the best efforts of the Federal Reserve and discussion of other fiscal stimuli, the market is sorting through the ramifications of a recession and will likely remain volatile in the weeks and months ahead.
Looking back, our decision to stay with our energy positions despite the sell-off in 2006 was proven a wise position for our shareholders. Our view on energy is positive and has remained consistent because, quite frankly, it is difficult to pick the exact points of entry and exit. While we do trade around our positions, we’ve remained overweight because, on a secular basis, there continues to be a substantial supply and demand imbalance. The lack of capacity on the supply side cannot be reversed in the short run as exploration-and-development projects are capital intensive and have long lead times. Demand has remained high despite persistently high energy prices, driven by strong demand from developing countries such as China and India. Oil consumption in these countries continues to exhibit strong growth. Moreover, roughly half of the world’s oil consumption is tied to transportation functions, for which there is no viable alternative. This makes oil demand relatively price resilient.
Gains in our energy stocks were significantly ahead of those in the benchmark. Our exposure is more leveraged
to the oil services group, which includes long-time holdings, such as Global Industries and Willbros Group. Global Industries is trading at a reasonable P/E multiple in the teens. It is increasingly diversifying its business away from the Gulf of Mexico and key customer PEMEX. Fast growing regions like the Middle East and West Africa now comprise over 40 percent of its revenue. The company is in excellent shape financially and carries a near-record backlog at year-end. The stock is up significantly and we’ve reduced our position, but we continue to hold it because of its strong fundamentals, reasonable valuation and above market growth profile. In the exploration side, we’re overweight toward natural gas producers such as Range Resources. The company’s recent acquisitions in the Barnett Shale area will enable the company to maintain strong production growth for years to come.
Within the financial services sector, the story is about what we avoided and what we owned, reflecting our emphasis on individual stock selection. We thought many companies in the sector had inadequate reserves, were vulnerable to losses, and their valuations were not appealing. With these considerations, we chose to avoid many of the regional banks and other finance companies involved with sub-prime, despite the fact that financials is a big part of the benchmark. What happened in the sector is now obvious to everyone, but we had been cautious long before the sub-prime problems and were fortunate to avoid the blowups in the sector. Our limited exposure in the sector was mostly isolated to insurance and specialty finance names with a few mortgage REITs. Companies like Annaly Capital Management, Capstead Mortgage Corp and Anworth Mortgage Asset Corp invest primarily in securities fully backed by the GSEs, which meant little, if any, credit risk. With the Federal Reserve aggressively lowering rates, their net interest margin will widen and their book value will rise. Despite the headlines, these stocks have been terrific performers.
The main blemish for the year came in the materials sectors. Our holdings in precious metals and other commodity-related companies performed well, but weren’t enough to offset weakness from specialty chemicals stocks. We underestimated the impact on margins from higher cost at some companies. Despite cheap valuations, the stocks continued to slide. We are patient investors, but if a positive dynamic fails to materialize, we will exit the positions. As for gold and other precious metals, we still like the group even though prices have risen in recent months.
| | |
| | |
| Manager’s Commentary | | Series Q |
| February 15, 2008 | | (Small Cap Value Series) |
With interest rates likely headed lower, the dollar will continue to devalue. Investor interest will increasingly turn to hard assets as volatility persists. There are a number of scenarios where we can see prices head higher from current levels. Randgold Resources, an intermediate producer with mines in Mali, Africa, is one of the best operators and is well positioned to capture returns from higher gold prices.
We are cautious on the market and nothing that transpired during the second half of the year has changed our view for the better. In fact, the turbulent fourth quarter only confirms our fear that the market is more vulnerable than perhaps at any other point in the last several years. Housing may indeed end up being the lighting rod that slams the economy into a recession. The liquidity environment has changed dramatically. It remains to be seen if lower rates are enough to support a slowing economy.
It is important to be diversified in this type of market. Our investment discipline ensures that we capture a broad range of companies across our intrinsic value, relative value and contrarian value screens. Our most important focus is always on finding companies that have positive dynamics overlooked by the market. The macroeconomic picture aside, we are confident that the large universe combined with our flexible investment process will allow us to continue to find good names that will perform well over the long term. We believe that our out-performance and consistency across a number of different market environments is a result of our broadly-defined process which allows us to pursue opportunities across a wide range of sectors in the market. In the current market environment, it is more important than ever to stick to the tenets of this process. We thank you for your continued confidence in our team.
Sincerely,
I. Charles Rinaldi
Portfolio Manager
| | |
| | Series Q |
| Performance Summary | | (Small Cap Value Series) |
| December 31, 2007 | | (unaudited) |
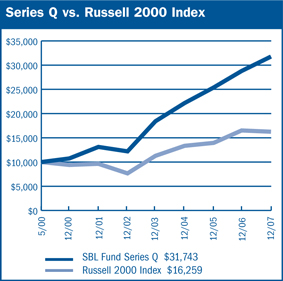
$10,000 Since Inception
The chart above assumes a hypothetical $10,000 investment in Series Q (Small Cap Value Series) on May 1, 2000 (date of inception), and reflects the fees and expenses of Series Q. The Russell 2000 Index is a capitalization-weighted index that measures the performance of the 2000 smallest companies in the Russell 3000 Index, which represents approximately 10% of the total market capitalization of the Russell 3000 Index.
| | |
Portfolio Composition by Sector |
Consumer Discretionary | | 6.95% |
Consumer Staples | | 2.74 |
Energy | | 27.59 |
Financials | | 7.82 |
Health Care | | 5.46 |
Industrials | | 12.80 |
Information Technology | | 10.61 |
Materials | | 19.34 |
Telecommunication Services | | 1.09 |
Exchange Traded Funds | | 0.47 |
Repurchase Agreement | | 4.80 |
Other Assets in Excess of Liabilities | | 0.33 |
Total Net Assets | | 100.00% |
| | | |
| | | |
| | | | | | |
Average Annual Returns |
Periods Ended 12-31-071 | | 1 Year | | 5 Years | | Since Inception
(5-1-00) |
Series Q | | 10.25% | | 21.06% | | 16.26% |
1 Performance figures do not reflect fees and expenses associated with an investment in variable insurance products offered by Security Benefit Life Insurance Company. If returns had taken into account these fees and expenses, performance would have been lower. Shares of a Series of SBL Fund are available only through the purchase of such products. |
The performance data quoted above represents past performance. Past performance is not predictive of future performance. The investment return and principal value of an investment will fluctuate so that an investor’s shares, when redeemed, may be worth more or less than their original cost. |
| |
| | |
| 126 | | The accompanying notes are an integral part of the financial statements |
| | |
| | Series Q |
| Performance Summary | | (Small Cap Value Series) |
| December 31, 2007 | | (unaudited) |
Information About Your Series Expenses
Calculating your ongoing Series expenses
Example
As a shareholder of the Series, you incur ongoing costs, including management fees and other series expenses. Performance figures and expense ratios do not reflect fees and expenses associated with an investment in variable insurance products. Shares of a Series of SBL Fund are available only through the purchase of such products. This example is intended to help you understand your ongoing costs (in dollars) of investing in the Series and to compare these costs with ongoing costs of investing in other mutual funds. The example is based on an investment of $1,000 invested at the beginning of the period and held for the entire period, July 1, 2007 through December 31, 2007.
Actual Expenses
The first line in the table provides information about actual account values and actual expenses. You may use the information in this table, together with the amount you invested, to estimate the expenses that you paid over the period. Simply divide your account value by $1,000 (for example, an $8,600 account value divided by $1,000 = 8.6), then multiply the result by the number in the table under the heading entitled “Expenses Paid During the Period” to estimate the expenses you paid on your account during this period.
Hypothetical Example for Comparison Purposes
The second line in the table provides information about hypothetical account values and hypothetical expenses based on the Series actual expense ratio and an assumed rate of return of 5% per year before expenses, which is not the Series actual return. The hypothetical account values and expenses may not be used to estimate the actual ending account balance or expenses you paid for the period. You may use this information to compare the ongoing costs of investing in the Series and other funds. To do so, compare this 5% hypothetical example with the 5% hypothetical examples that appear in the shareholder reports of the other mutual funds.
Please note that the expenses shown in the table are meant to highlight your ongoing costs only and do not reflect any fees and expenses associated with an investment in variable insurance products. Therefore, the second line is useful in comparing ongoing costs only, and will not help you determine the relative total costs of owning different funds. In addition, if these fees and expenses associated with an investment in variable insurance products were included, your costs would have been higher.
| | | | | | | |
Series Expenses | |
| | | Beginning
Account
Value
7/1/2007 | | Ending
Account
Value
12/31/20071 | | Expenses
Paid
During
Period2 |
|
Series Q (Small Cap Value Series) | | | | | |
Actual | | $1,000.00 | | $966.79 | | $5.85 | |
Hypothetical | | 1,000.00 | | 1,019.26 | | 6.01 | |
| | | | | | | | |
1 The actual ending account value is based on the actual total return of the Series for the period July 1, 2007 to December 31, 2007 after actual expenses and will differ from the hypothetical ending account value which is based on the Series expense ratio and a hypothetical annual return of 5% before expenses. The actual cumulative return at net asset value for the period July 1, 2007 to December 31, 2007 was (3.32%).
2 Expenses are equal to the Series annualized expense ratio of 1.18%, net of any applicable fee waivers or earnings credits, multiplied by the average account value over the period, multiplied by 184/365 (to reflect the one-half year period)
| | |
| | |
| Schedule of Investments | | Series Q (Small Cap Value Series) |
| December 31, 2007 | | |
| | | | | |
| | | Shares | | Value |
COMMON STOCK - 94.4% | | | | | |
Airlines - 0.7% | | | | | |
Alaska Air Group, Inc. * (1) | | 31,900 | | $ | 797,819 |
Lan Airlines S.A. ADR | | 30,600 | | | 410,346 |
| | | | | |
| | | | | 1,208,165 |
| | | | | |
Apparel Retail - 0.8% | | | | | |
Collective Brands, Inc. * | | 52,500 | | | 912,975 |
Foot Locker, Inc. | | 36,100 | | | 493,126 |
| | | | | |
| | | | | 1,406,101 |
| | | | | |
Application Software - 0.0% | | | | | |
Evans & Sutherland Computer Company * | | 400 | | | 500 |
| | | | | |
Automobile Manufacturers - 1.1% | | | | | |
Fleetwood Enterprises, Inc. * | | 295,300 | | | 1,765,894 |
| | | | | |
Biotechnology - 0.1% | | | | | |
Infinity Pharmaceuticals, Inc. * | | 25,300 | | | 241,615 |
| | | | | |
Broadcasting & Cable TV - 1.3% | | | | | |
Citadel Broadcasting Corporation | | 446,700 | | | 920,202 |
Discovery Holding Company * | | 38,300 | | | 962,862 |
Entravision Communications Corporation * | | 39,400 | | | 308,502 |
| | | | | |
| | | | | 2,191,566 |
| | | | | |
Casinos & Gaming - 0.2% | | | | | |
Empire Resorts, Inc. * | | 85,800 | | | 292,578 |
| | | | | |
Commercial Printing - 0.7% | | | | | |
Deluxe Corporation | | 35,200 | | | 1,157,728 |
| | | | | |
Commodity Chemicals - 0.4% | | | | | |
Calgon Carbon Corporation * | | 36,600 | | | 581,574 |
Wellman, Inc. | | 95,000 | | | 10,450 |
| | | | | |
| | | | | 592,024 |
| | | | | |
Communications Equipment - 4.4% | | | | | |
3Com Corporation * | | 720,700 | | | 3,257,564 |
China GrenTech Corporation, Ltd. ADR* | | 130,700 | | | 1,155,388 |
CommScope, Inc. * | | 1,277 | | | 62,865 |
MasTec, Inc. * | | 87,000 | | | 884,790 |
MRV Communications, Inc. * | | 465,380 | | | 1,079,682 |
Nortel Networks Corporation * | | 25,400 | | | 383,286 |
Powerwave Technologies, Inc. * | | 142,100 | | | 572,663 |
| | | | | |
| | | | | 7,396,238 |
| | | | | |
Computer Hardware - 0.6% | | | | | |
Cray, Inc. * | | 157,500 | | | 943,425 |
| | | | | |
Computer Storage & Peripherals - 2.1% | | | | | |
Intermec, Inc. * | | 169,900 | | | 3,450,669 |
| | | | | |
Construction & Engineering - 4.5% | | | | | |
Chicago Bridge & Iron Company N.V. (1) | | 124,400 | | | 7,518,736 |
| | | | | |
| | | | | |
| | | Shares | | Value |
COMMON STOCK (continued) | | | | | |
Construction Materials - 0.3% | | | | | |
U.S. Concrete, Inc. * | | 139,900 | | $ | 465,867 |
| | | | | |
Diversified Chemicals - 0.5% | | | | | |
Ashland, Inc. | | 17,700 | | | 839,511 |
| | | | | |
Diversified Commercial & Professional Services - 2.2% | | | | | |
Geo Group, Inc. * (1) | | 110,800 | | | 3,102,400 |
Healthcare Services Group | | 28,500 | | | 603,630 |
| | | | | |
| | | | | 3,706,030 |
| | | | | |
Electrical Components & Equipment - 1.8% | | | | | |
Encore Wire Corporation (1) | | 7,000 | | | 111,440 |
GrafTech International, Ltd. * | | 108,400 | | | 1,924,100 |
Power-One, Inc. * (2) | | 260,400 | | | 1,038,996 |
| | | | | |
| | | | | 3,074,536 |
| | | | | |
Electronic Equipment Manufacturers - 2.8% | | | | | |
Cognex Corporation | | 59,775 | | | 1,204,466 |
Coherent, Inc. * | | 46,500 | | | 1,165,755 |
OSI Systems, Inc. * | | 63,400 | | | 1,678,198 |
Vishay Intertechnology, Inc. * | | 53,300 | | | 608,153 |
| | | | | |
| | | | | 4,656,572 |
| | | | | |
Environmental & Facilities Services - 1.3% | | | | | |
ABM Industries, Inc. | | 108,900 | | | 2,220,471 |
| | | | | |
Exchange Traded Funds - 0.5% iShares Russell 2000 Value Index Fund | | 11,100 | | | 784,215 |
| | | | | |
Gold - 9.5% | | | | | |
Goldcorp, Inc. (1) | | 194,400 | | | 6,595,992 |
Meridian Gold, Inc. * | | 43,500 | | | 1,544,250 |
Randgold Resources, Ltd. ADR | | 206,300 | | | 7,659,919 |
| | | | | |
| | | | | 15,800,161 |
| | | | | |
Health Care Equipment - 0.3% | | | | | |
Symmetry Medical, Inc. * | | 31,100 | | | 542,073 |
| | | | | |
Health Care Services - 1.7% | | | | | |
Cross Country Healthcare, Inc. * | | 111,050 | | | 1,581,352 |
Gentiva Health Services, Inc. * | | 70,300 | | | 1,338,512 |
| | | | | |
| | | | | 2,919,864 |
| | | | | |
Health Care Supplies - 1.2% | | | | | |
OraSure Technologies, Inc. * | | 221,900 | | | 1,972,691 |
| | | | | |
Homebuilding - 2.2% | | | | | |
Champion Enterprises, Inc. * | | 331,500 | | | 3,122,730 |
Palm Harbor Homes, Inc. * | | 19,200 | | | 202,560 |
Skyline Corporation | | 12,000 | | | 352,200 |
| | | | | |
| | | | | 3,677,490 |
| | | | | |
| | |
| 128 | | The accompanying notes are an integral part of the financial statements |
| | |
| | |
| Schedule of Investments | | Series Q (Small Cap Value Series) |
| December 31, 2007 - continued | | |
| | | | | |
| | | Shares | | Value |
COMMON STOCK (continued) | | | | | |
Human Resource & Employment | | | | | |
Services - 0.4% | | | | | |
CDI Corporation | | 1,900 | | $ | 46,094 |
Kforce, Inc. * | | 56,800 | | | 553,800 |
| | | | | |
| | | | | 599,894 |
| | | | | |
Integrated Oil & Gas - 1.4% | | | | | |
InterOil Corporation * (1) | | 119,200 | | | 2,295,792 |
SandRidge Energy, Inc. * | | 1,050 | | | 37,653 |
| | | | | |
| | | | | 2,333,445 |
| | | | | |
Integrated Telecommunication Services - 1.1% | | | | | |
Cincinnati Bell, Inc. * | | 382,900 | | | 1,818,775 |
| | | | | |
IT Consulting & Other Services - 0.3% | | | | | |
MRS Group, Inc. * | | 32,300 | | | 353,362 |
SRA International, Inc. * (1) | | 3,900 | | | 114,855 |
| | | | | |
| | | | | 468,217 |
| | | | | |
Life Sciences Tools & Services - 1.0% | | | | | |
Applera Corporation - Applied Biosystems Group | | 24,500 | | | 831,040 |
MDS, Inc. | | 46,700 | | | 908,315 |
| | | | | |
| | | | | 1,739,355 |
| | | | | |
Metal & Glass Containers - 0.8% | | | | | |
Constar International, Inc. * | | 45,700 | | | 186,456 |
Intertape Polymer Group, Inc. * | | 384,100 | | | 1,206,074 |
| | | | | |
| | | | | 1,392,530 |
| | | | | |
Mortgage REIP’s - 3.3% | | | | | |
Annaly Capital Management, Inc. | | 206,600 | | | 3,755,988 |
Capstead Mortgage Corporation | | 24,400 | | | 321,836 |
MFA Mortgage Investments, Inc. | | 152,600 | | | 1,411,550 |
| | | | | |
| | | | | 5,489,374 |
| | | | | |
Office Services & Supplies - 0.8% | | | | | |
ACCO Brands Corporation * | | 87,400 | | | 1,401,896 |
| | | | | |
Oil & Gas Drilling - 3.5% | | | | | |
Helmerich & Payne, Inc. (1) | | 74,300 | | | 2,977,201 |
Parker Drilling Company * | | 83,900 | | | 633,445 |
Pride International, Inc. * | | 33,700 | | | 1,142,430 |
Transocean, Inc. (1) | | 7,766 | | | 1,111,640 |
| | | | | |
| | | | | 5,864,716 |
| | | | | |
Oil & Gas Equipment & Services - 12.1% | | | | | |
Boots & Coots International Control, Inc. * | | 44,000 | | | 71,720 |
Global Industries, Ltd. * (1) | | 269,305 | | | 5,768,513 |
Helix Energy Solutions Group, Inc.* | | 51,800 | | | 2,149,700 |
ION Geophysical Corporation * (1) | | 36,400 | | | 574,392 |
Key Energy Services, Inc. * | | 160,035 | | | 2,302,904 |
Matrix Service Company * | | 6,300 | | | 137,466 |
Newpark Resources * | | 365,300 | | | 1,990,885 |
Oceaneering International, Inc. * | | 37,200 | | | 2,505,420 |
PHI, Inc. (Non Voting) * | | 34,900 | | | 1,082,598 |
| | | | | |
| | | Shares | | Value |
COMMON STOCK (continued) | | | | | |
Oil & Gas Equipment & Services (continued) | | | | | |
PHI, Inc. * | | 6,400 | | $ | 202,240 |
Smith International, Inc. | | 5,000 | | | 369,250 |
Willbros Group, Inc. * (1) | | 81,400 | | | 3,116,806 |
| | | | | |
| | | | | 20,271,894 |
| | | | | |
Oil & Gas Exploration & Production - 10.0% | | | | | |
Forest Oil Corporation * (1) | | 40,700 | | | 2,069,188 |
Mariner Energy, Inc. * | | 35,500 | | | 812,240 |
McMoRan Exploration Company * | | 167,800 | | | 2,196,502 |
Newfield Exploration Company * | | 27,000 | | | 1,422,900 |
Noble Energy, Inc. (1) | | 15,700 | | | 1,248,464 |
PetroHawk Energy Corporation * | | 19,500 | | | 337,545 |
Petroquest Energy, Inc. * | | 31,600 | | | 451,880 |
Pioneer Natural Resources Company | | 14,600 | | | 713,064 |
Range Resources Corporation (1) | | 146,345 | | | 7,516,279 |
| | | | | |
| | | | | 16,768,062 |
| | | | | |
Oil & Gas Storage & Transportation - 0.1% | | | | | |
El Paso Corporation | | 5,800 | | | 99,992 |
| | | | | |
Other Diversified Financial Services - 0.1% | | | | | |
Highlands Acquisition Corporation * | | 12,600 | | | 122,220 |
| | | | | |
Packaged Foods & Meats - 2.1% | | | | | |
Del Monte Foods Company | | 365,400 | | | 3,456,684 |
| | | | | |
Paper Packaging - 0.1% | | | | | |
Chesapeake Corporation | | 46,000 | | | 238,740 |
| | | | | |
Paper Products - 0.4% | | | | | |
Wausau Paper Corporation | | 70,200 | | | 631,098 |
| | | | | |
Personal Products - 0.7% | | | | | |
Prestige Brands Holdings, Inc. * | | 149,600 | | | 1,119,008 |
| | | | | |
Pharmaceuticals - 1.0% | | | | | |
Alpharma, Inc. * | | 61,700 | | | 1,243,255 |
Salix Pharmaceuticals, Ltd. * | | 57,900 | | | 456,252 |
| | | | | |
| | | | | 1,699,507 |
| | | | | |
Precious Metals & Minerals - 2.1% | | | | | |
Apex Silver Mines, Ltd. * | | 228,900 | | | 3,488,436 |
| | | | | |
Property & Casualty Insurance - 3.9% | | | | | |
Argo Group International Holdings, Ltd. * | | 72,900 | | | 3,071,277 |
Hilltop Holdings, Inc. * | | 159,000 | | | 1,736,280 |
Mercury General Corporation | | 26,600 | | | 1,324,946 |
NYMAGIC, Inc. | | 16,200 | | | 374,706 |
| | | | | |
| | | | | 6,507,209 |
| | | | | |
| | |
| 129 | | The accompanying notes are an integral part of the financial statements |
| | |
| | |
| Schedule of Investments | | Series Q (Small Cap Value Series) |
| December 31, 2007 - continued | | |
| | | | | | |
| | | Shares | | Value |
COMMON STOCK (continued) | | | | | | |
Publishing - 1.4% | | | | | | |
McClatchy Company | | | 42,300 | | $ | 529,596 |
RH Donnelley Corporation * | | | 35,700 | | | 1,302,336 |
Voyager Learning Company * | | | 61,700 | | | 431,900 |
| | | | | | |
| | | | | | 2,263,832 |
| | | | | | |
Regional Banks - 0.2% | | | | | | |
Colonial BancGroup, Inc. | | | 23,500 | | | 318,190 |
| | | | | | |
Residential REIT’s - 0.4% | | | | | | |
Sun Communities, Inc. | | | 29,200 | | | 615,244 |
| | | | | | |
Semiconductor Equipment - 0.5% | | | | | | |
Credence Systems Corporation * | | | 325,724 | | | 788,252 |
| | | | | | |
Specialty Chemicals - 0.9% | | | | | | |
OM Group, Inc. * (1) | | | 20,300 | | | 1,168,062 |
Symyx Technologies * | | | 33,200 | | | 254,976 |
| | | | | | |
| | | | | | 1,423,038 |
| | | | | | |
Steel - 4.4% | | | | | | |
Carpenter Technology Corporation (1) | | | 40,200 | | | 3,021,834 |
Steel Dynamics, Inc. (1) | | | 56,600 | | | 3,371,662 |
United States Steel Corporation (1) | | | 4,000 | | | 483,640 |
Webco Industries, Inc. * | | | 4,740 | | | 530,880 |
| | | | | | |
| | | | | | 7,408,016 |
| | | | | | |
Trucking - 0.2% | | | | | | |
Covenant Transportation Group, Inc. * | | | 48,700 | | | 327,264 |
TOTAL COMMON STOCK (Cost $129,778,813) | | | | | $ | 157,479,608 |
FOREIGN STOCK - 0.5% | | | | | | |
Canada - 0.5% | | | | | | |
Air Canada * | | | 11,100 | | | 134,045 |
Trilogy Energy Trust | | | 101,525 | | | 703,942 |
| | | | | | |
| | | | | | 837,987 |
TOTAL FOREIGN STOCK (Cost $1,648,805) | | | | | $ | 837,987 |
| |
| Principal
Amount | | | Value |
REPURCHASE AGREEMENT - 4.8% | | | |
State Street, 1.75%, dated 12/31/07, matures 1/02/08; repurchase amount of $8,005,581 (Collateralized by FHLB, 4/18/08 with a value of $8,167,703) | | $ | 8,004,803 | | $ | 8,004,803 |
TOTAL REPURCHASE AGREEMENT (Cost $8,004,803) | | | | | $ | 8,004,803 |
Total Investments (SBL Q Fund) (Cost $139,432,421) - 99.7% | | | | | $ | 166,322,398 |
Other Assets in Excess of Liabilities - 0.3% | | | | | | 548.600 |
| | | | | | |
TOTAL NET ASSETS - 100.0% | | | | | $ | 166,870,998 |
| | | | | | |
Footnotes
Percentages are stated as a percent of net assets.
For federal income tax purposes the identified cost of investments owned at 12/31/2007 was $139,938,915.
| | | | |
* | | - | | Non-income producing security |
1 | | - | | Security is segregated as collateral for open written option contracts. |
2 | | - | | Security is deemed illiquid. The total market value of illiquid securities is $1,038,996 (cost $1,647,794), or 0.6% of total net assets. |
|
| Glossary: |
| | |
| ADR | | - | | American Depositary Receipt |
See notes to financial statements.
.
| | |
| 130 | | The accompanying notes are an integral part of the financial statements |
| | |
| | |
| | Series Q |
| | (Small Cap Value Series) |
Statement of Assets and Liabilities
December 31, 2007
| | | |
Assets: | | | |
Investments, at value* | | $ | 166,322,398 |
Cash | | | 1,211,749 |
Cash denominated in a foreign currency, at value** | | | 6,079 |
Receivables: | | | |
Fund shares sold | | | 151,112 |
Securities sold | | | 2,066,503 |
Dividends | | | 118,847 |
Prepaid expenses | | | 3,485 |
| | | |
Total assets | | | 169,880,173 |
| | | |
Liabilities: | | | |
Payable for: | | | |
Fund shares redeemed | | | 76,681 |
Securities purchased | | | 1,271,916 |
Written options, at value (premiums received $ 1,362,539) | | | 1,472,105 |
Management fees | | | 140,791 |
Administration fees | | | 15,775 |
Transfer agent/maintenance fees | | | 2,083 |
Custodian fees | | | 6,522 |
Directors’ fees | | | 2,000 |
Professional fees | | | 11,650 |
Other fees | | | 9,652 |
| | | |
Total liabilities | | | 3,009,175 |
| | | |
Net assets | | $ | 166,870,998 |
| | | |
Net assets consist of: | | | |
Paid in capital | | $ | 114,085,858 |
Accumulated net investment loss | | | (312) |
Undistributed net realized gain on sale of investments and foreign currency transactions | | | 26,004,972 |
Net unrealized appreciation in value of investments and translation of assets and liabilities in foreign currencies | | | 26,780,480 |
| | | |
Net assets | | $ | 166,870,998 |
| | | |
Capital shares authorized | | | unlimited |
Capital shares outstanding | | | 5,790,985 |
Net asset value per share (net assets divided by shares outstanding) | | $ | 28.82 |
| | | |
*Investments, at cost | | $ | 139,432,421 |
**Cash denominated in a foreign currency, at cost | | | 6,008 |
Statement of Operations
For Year Ended December 31, 2007
| | | |
Investment Income: | | | |
Dividends (net of foreign withholding tax $12,801) | | $ | 921,924 |
Interest | | | 371,623 |
| | | |
Total investment income | | | 1,293,547 |
| | | |
| |
Expenses: | | | |
Management fees | | | 1,708,260 |
Administration fees | | | 170,144 |
Transfer agent/maintenance fees | | | 25,161 |
Custodian fees | | | 63,296 |
Directors’ fees | | | 10,436 |
Professional fees | | | 15,289 |
Reports to shareholders | | | 18,133 |
Other | | | 7,387 |
| | | |
Total expenses | | | 2,018,106 |
Less: | | | |
Earnings credits applied | | | (3,060) |
| | | |
Net expenses | | | 2,015,046 |
| | | |
Net investment loss | | | (721,499) |
| | | |
| |
Net Realized and Unrealized Gain (Loss): | | | |
Net realized gain (loss) during the year on: | | | |
Investments | | | 29,071,753 |
Foreign currency transactions | | | 890 |
Options written | | | (2,467,286) |
| | | |
Net realized gain | | | 26,605,357 |
| | | |
| |
Net unrealized appreciation (depreciation) during the year on: | | | |
Investments | | | (9,248,976) |
Options written | | | (711,651) |
Translation of assets and liabilities in foreign currencies | | | 278 |
| | | |
Net unrealized depreciation | | | (9,960,349) |
| | | |
Net realized and unrealized gain | | | 16,645,008 |
| | | |
Net increase in net assets resulting from operations | | $ | 15,923,509 |
| | | |
| | |
| 131 | | The accompanying notes are an integral part of the financial statements |
| | |
| | Series Q |
| Statement of Changes in Net Assets | | (Small Cap Value Series) |
| | | | | | | | |
| | | Year Ended
December 31, 2007 | | | Year Ended
December 31, 2006 | |
| | |
Increase (decrease) in net assets from operations: | | | | | | | | |
Net investment loss | | $ | (721,499 | ) | | $ | (563,661 | ) |
Net realized gain during the year on investments and foreign currency transactions | | | 26,605,357 | | | | 14,882,354 | |
Net unrealized appreciation (depreciation) during the year on investments and translation of assets and liabilities in foreign currencies | | | (9,960,349 | ) | | | 4,610,904 | |
| | | | | | | | |
Net increase in net assets resulting from operations | | | 15,923,509 | | | | 18,929,597 | |
| | | | | | | | |
| | |
Capital share transactions: | | | | | | | | |
Proceeds from sale of shares | | | 81,333,559 | | | | 72,004,481 | |
Cost of shares redeemed | | | (90,238,003 | ) | | | (75,248,438 | ) |
| | | | | | | | |
Net decrease from capital share transactions | | | (8,904,444 | ) | | | (3,243,957 | ) |
| | | | | | | | |
Net increase in net assets | | | 7,019,065 | | | | 15,685,640 | |
| | | | | | | | |
| | |
Net assets: | | | | | | | | |
Beginning of year | | | 159,851,933 | | | | 144,166,293 | |
| | | | | | | | |
End of year | | $ | 166,870,998 | | | $ | 159,851,933 | |
| | | | | | | | |
| | |
Accumulated net investment loss at end of year | | $ | (312 | ) | | $ | (152 | ) |
| | | | | | | | |
| | |
Capital share activity: | | | | | | | | |
Shares sold | | | 2,808,779 | | | | 2,918,282 | |
Shares redeemed | | | (3,133,435 | ) | | | (3,057,766 | ) |
| | | | | | | | |
Total capital share activity | | | (324,656 | ) | | | (139,484 | ) |
| | | | | | | | |
| | |
| 132 | | The accompanying notes are an integral part of the financial statements |
| | |
| | |
| Financial Highlights | | Series Q |
| Selected data for each share of capital stock outstanding throughout each year | | (Small Cap Value Series) |
| | | | | | | | | | |
| | | 2007 | | 2006 | | 2005 | | 2004 | | Year Ended
December 31,
2003 |
Per Share Data | | | | | | | | | | |
Net asset value, beginning of period | | $26.14 | | $23.05 | | $20.13 | | $16.84 | | $11.24 |
| |
Income (loss) from investment operations: | | | | | | | | | | |
Net investment lossa | | (0.12) | | (0.09) | | (0.11) | | (0.12) | | (0.03) |
Net gain on securities (realized and unrealized) | | 2.80 | | 3.18 | | 3.03 | | 3.53 | | 5.73 |
| | |
Total from investment operations | | 2.68 | | 3.09 | | 2.92 | | 3.41 | | 5.70 |
| |
Less distributions: | | | | | | | | | | |
Distributions from realized gains | | – | | – | | – | | (0.12) | | (0.10) |
| | |
Total distributions | | – | | – | | – | | (0.12) | | (0.10) |
| |
Net asset value, end of period | | $28.82 | | $26.14 | | $23.05 | | $20.13 | | $16.84 |
| | |
| | | | | | | | | | |
| |
Total Returnb | | 10.25% | | 13.41% | | 14.51% | | 20.37% | | 50.90% |
| |
Ratios/Supplemental Data | | | | | | | | | | |
Net assets, end of period (in thousands) | | $166,871 | | $159,852 | | $144,166 | | $112,133 | | $87,297 |
| |
Ratios to average net assets: | | | | | | | | | | |
Net investment loss | | (0.42%) | | (0.36%) | | (0.58%) | | (0.68%) | | (0.28%) |
Total expensesc | | 1.18% | | 1.25% | | 1.22% | | 1.19% | | 1.22% |
Net expensesd | | 1.18% | | 1.24% | | 1.22% | | 1.19% | | 1.22% |
Net expenses prior to custodian earnings credits and net of expense waivers | | 1.18% | | 1.25% | | 1.22% | | 1.19% | | 1.22% |
| |
Portfolio turnover rate | | 42% | | 46% | | 37% | | 43% | | 37% |
a Net investment income (loss) was computed using average shares outstanding throughout the period.
b Total return does not take into account any of the expenses associated with an investment in variable insurance products offered by Security Benefit Life Insurance Company. If total return had taken into account these expenses, performance would have been lower. Shares of a series of SBL Fund are available only through the purchase of such products.
c Total expense information reflects the expense ratios absent expense reductions by the Investment Manager, and earnings credits, as applicable.
d Net expense information reflects the expense ratios after voluntary expense waivers, reimbursements and custodian earnings credits, as applicable.
| | |
| 133 | | The accompanying notes are an integral part of the financial statements |
This page left blank intentionally.
| | |
| | |
| Manager’s Commentary | | Series V |
| February 15, 2008 | | (Mid Cap Value Series) |

Adviser, Security Global Investors
| | |
| | To Our Shareholders: For the year ended December 31, 2007, Series V of the SBL Fund - Mid Cap Value Series posted a solid return year gaining 1.84%. The Series’ return was more than 900 basis points ahead of its benchmark while in line with peer competitors. The Series’ benchmark, the Russell 2500 Value Iindex was down -7.27%, while the Series’ median peer fund return was 1.89%. |
Our approach with the Mid Cap Value Series is to seek companies that can increase shareholders’ return on capital. We hold such companies over three to five years to capture long-term improvements in profitability.
The investment process is fundamentally driven and quantitatively aided. We use proprietary screens to identify potential companies for investment and then perform rigorous fundamental analysis to identify the best ideas. Through this fundamental research, we determine an estimate of intrinsic value and thus a valuation target for each idea. We construct the portfolios based on the level of conviction generated by this bottom-up analysis and the upside/downside profile associated with each company.
Top Performers
The industrials and energy sectors contributed nearly all of the gain for the Series for the year. The Series’ industrials weight was 19% compared to 11% for the Index. The overweight added to performance, as the return for the sector in the Series exceeded 30%, versus just 4% for the Index.
McDermott International, an energy company, gained 114% during the year. The company benefited from strong end markets in marine oil drilling construction and nuclear power. The company was also the beneficiary of a favorable resolution and settlement of its asbestos liabilities. Additional top performers from the industrials sector were FTI Consulting with a 101% gain and Shaw Group returning 96%.
While performance of the Series’ energy holdings were less than the benchmark’s, the large overweight bet of 19% to the Index’s 5% provided an advantage for shareholders. Consol Energy, Inc., led sector holdings, returning 124% for the year. Helmerich & Payne, Inc., Murphy Oil Corporation, and Arch Coal, Inc., all soared more than 50% for the period.
Finally, the financials sector helped relative performance of the Series simply due to the large underweight in
comparison to the Index as the sub-prime contagion worked its way through the financial system.
Disappointing Performers
Stock selection in the materials sector hurt the Series’ performance but an underweight of nearly 50% in the sector provided a limit to the detraction. Sonoco Products Company and Bemis Company, Inc., together comprised an average weight of more than 3% in the portfolio and declined -12% and -17%, respectively. Both of these packaging companies faced margin pressures as pricing could not entirely offset input costs.
Poor stock selection and an overweight in the under-performing information technology sector hurt relative performance of the portfolio. Merix Corporation gave back -50% of its value while Maxwell Technologies, Inc., declined -41% for the year.
2008 Market Outlook
We continue to pursue opportunities with a focus on bottom-up research rather than any global macro forecast.
The euphoria around the benefits of a Fed easing appear to have given way to fears of stagflation as concerns mounted over just how much latitude the Fed possesses to smooth over economic weakness.
While all domestic equity indices are in decline, there has been a pronounced preference for safety and stability in the market as larger cap indices have performed better than mid and small cap indices. Our focus is on identifying companies with the ability to be substantially stronger over the next three to five years or have the potential to maintain their return on capital at current levels in a difficult economic environment. We ultimately look for companies that trade significantly below their intrinsic value. The portfolio continues to be overweight in energy and underweight in financials.
On behalf of Security Global Investors, I would like to thank you for placing your trust and money with us. As always, we will continue to do our best to seek the potential available in small and mid capitalization companies.
|
Sincerely, |
|
| James P. Schier, Senior Portfolio Manager |
| | |
| | Series V |
| Performance Summary | | (Mid Cap Value Series) |
| December 31, 2007 | | (unaudited) |
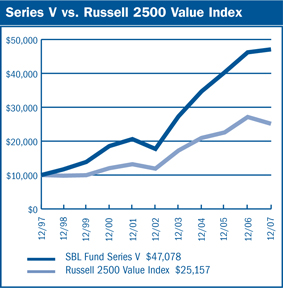
$10,000 Over 10 Years
The chart above assumes a hypothetical $10,000 investment in Series V (Mid Cap Value Series) on December 31, 1997 and reflects the fees and expenses of Series V. The Russell 2500 Value Index is an unmanaged index that measures the performance of securities of small-to-mid cap U.S. companies with greater-than-average value orientation.
| | | | | | | | | |
Average Annual Returns | | | | |
| Periods Ended 12-31-071 | | 1 Year | | | 5 Years | | | 10 Years | |
| | | | |
Series V | | 1.84 | % | | 21.60 | % | | 16.76 | % |
| |
1 Performance figures do not reflect fees and expenses associated with an investment in variable insurance products offered by Security Benefit Life Insurance Company. If returns had taken into account these fees and expenses, performance would have been lower. Shares of a Series of SBL Fund are available only through the purchase of such products. The performance data quoted above represents past performance. Past performance is not predictive of future performance. The investment return and principal value of an investment will fluctuate so that an investor’s shares, when redeemed, may be worth more or less than their original cost. | |
| | | |
Portfolio Composition by Sector | |
Consumer Discretionary | | 9.34 | % |
Consumer Staples | | 7.04 | |
Energy | | 14.83 | |
Financials | | 17.86 | |
Health Care | | 1.97 | |
Industrials | | 11.30 | |
Information Technology | | 13.66 | |
Materials | | 4.58 | |
Utilities | | 13.46 | |
Convertible Bonds | | 1.24 | |
Commercial Paper | | 2.05 | |
Warrants | | 0.19 | |
U.S. Government Sponsored Agencies | | 2.71 | |
Repurchase Agreement | | 0.49 | |
Liabilities in Excess of Other Assets | | (0.72 | ) |
Total Net Assets | | 100.00 | % |
| | | | |
| | |
| 136 | | The accompanying notes are an integral part of the financial statements |
| | |
| | Series V |
| Performance Summary | | (Mid Cap Value Series) |
| December 31, 2007 | | (unaudited) |
Information About Your Series Expenses
Calculating your ongoing Series expenses
Example
As a shareholder of the Series, you incur ongoing costs, including management fees and other series expenses. Performance figures and expense ratios do not reflect fees and expenses associated with an investment in variable insurance products. Shares of a Series of SBL Fund are available only through the purchase of such products. This example is intended to help you understand your ongoing costs (in dollars) of investing in the Series and to compare these costs with ongoing costs of investing in other mutual funds. The example is based on an investment of $1,000 invested at the beginning of the period and held for the entire period, July 1, 2007 through December 31, 2007.
Actual Expenses
The first line in the table provides information about actual account values and actual expenses. You may use the information in this table, together with the amount you invested, to estimate the expenses that you paid over the period. Simply divide your account value by $1,000 (for example, an $8,600 account value divided by $1,000 = 8.6), then multiply the result by the number in the table under the heading entitled “Expenses Paid During the Period” to estimate the expenses you paid on your account during this period.
Hypothetical Example for Comparison Purposes
The second line in the table provides information about hypothetical account values and hypothetical expenses based on the Series actual expense ratio and an assumed rate of return of 5% per year before expenses, which is not the Series actual return. The hypothetical account values and expenses may not be used to estimate the actual ending account balance or expenses you paid for the period. You may use this information to compare the ongoing costs of investing in the Series and other funds. To do so, compare this 5% hypothetical example with the 5% hypothetical examples that appear in the shareholder reports of the other mutual funds.
Please note that the expenses shown in the table are meant to highlight your ongoing costs only and do not reflect any fees and expenses associated with an investment in variable insurance products. Therefore, the second line is useful in comparing ongoing costs only, and will not help you determine the relative total costs of owning different funds. In addition, if these fees and expenses associated with an investment in variable insurance products were included, your costs would have been higher.
| | | | | | |
Series Expenses | | | | | | |
| | | Beginning
Account
Value
7/1/2007 | | Ending
Account Value
12/31/20071 | | Expenses
Paid
During
Period2 |
Series V (Mid Cap Value Series) | | |
Actual | | $1,000.00 | | $918.80 | | $4.30 |
Hypothetical | | 1,000.00 | | 1,020.72 | | 4.53 |
| | | | | | | |
1 The actual ending account value is based on the actual total return of the Series for the period July 1, 2007 to December 31, 2007 after actual expenses and will differ from the hypothetical ending account value which is based on the Series expense ratio and a hypothetical annual return of 5% before expenses. The actual cumulative return at net asset value for the period July 1, 2007 to December 31, 2007 was (8.12%).
2 Expenses are equal to the Series annualized expense ratio of 0.89%, net of any applicable fee waivers or earnings credits, multiplied by the average account value over the period, multiplied by 184/365 (to reflect the one-half year period)
| | |
| | |
| Schedule of Investments | | Series V (Mid Cap Value Series) |
| December 31, 2007 | | |
| | | | | |
| | | Shares | | Value |
COMMON STOCK-93.5% | | | | | |
| Aerospace & Defense - 2.1% | | | | | |
| Orbital Sciences Corporation * | | 350,000 | | $ | 8,582,000 |
| | | | | |
| Apparel Retail - 2.9% | | | | | |
| Brown Shoe Company, Inc. | | 182,400 | | | 2,767,008 |
| Collective Brands, Inc. * | | 260,200 | | | 4,524,878 |
| Stein Mart, Inc. | | 265,000 | | | 1,256,100 |
| Talbots, Inc. | | 282,900 | | | 3,343,878 |
| | | | | |
| | | | | 11,891,864 |
| | | | | |
| Apparel, Accessories & Luxury Goods - 1.4% | | | |
| Maidenform Brands, Inc. * | | 247,500 | | | 3,348,675 |
| Oxford Industries, Inc. | | 100,000 | | | 2,577,000 |
| | | | | |
| | | | | 5,925,675 |
| | | | | |
| Application Software - 1.7% | | | | | |
| EPIQ Systems, Inc. * | | 302,600 | | | 5,268,266 |
| PLATO Learning, Inc. * (1) | | 440,000 | | | 1,746,800 |
| | | | | |
| | | | | 7,015,066 |
| | | | | |
| Auto Parts & Equipment - 0.5% | | | | | |
| HydroGen Corporation * (1)(2) | | 672,346 | | | 1,996,868 |
| | | | | |
| | |
| Biotechnology - 0.2% | | | | | |
| Combinatorx, Inc. * | | 155,600 | | | 690,864 |
| | | | | |
| | |
| Building Products - 0.3% | | | | | |
| Trex Company, Inc. * | | 122,000 | | | 1,034,560 |
| | | | | |
| | |
| Coal & Consumable Fuels - 8.4% | | | | | |
| Arch Coal, Inc. | | 300,000 | | | 13,479,000 |
| Consol Energy, Inc. | | 145,400 | | | 10,399,008 |
| Evergreen Energy, Inc. * | | 1,451,000 | | | 3,235,730 |
| USEC, Inc. * | | 824,000 | | | 7,416,000 |
| | | | | |
| | | | | 34,529,738 |
| | | | | |
| Communications Equipment - 2.0% | | | | | |
| EFJ, Inc. * | | 404,000 | | | 1,106,960 |
| MasTec, Inc. * | | 500,000 | | | 5,085,000 |
| Symmetricom, Inc. * | | 440,000 | | | 2,072,400 |
| | | | | |
| | | | | 8,264,360 |
| | | | | |
| Computer Storage & Peripherals - 0.3% | | | | | |
| STEC, Inc. * | | 144,650 | | | 1,264,241 |
| | | | | |
| | |
| Construction & Engineering - 3.6% | | | | | |
| Insituform Technologies, Inc. * | | 196,000 | | | 2,900,800 |
| Quanta Services, Inc. * | | 452,600 | | | 11,876,224 |
| | | | | |
| | | | | 14,777,024 |
| | | | | |
| Consumer Finance - 0.7% | | | | | |
| First Marblehead Corporation | | 188,000 | | | 2,876,400 |
| | | | | |
| |
| Data Processing & Outsourced Services - 5.6% | | | |
| Affiliated Computer Services, Inc.* | | 225,000 | | | 10,147,500 |
| Computer Sciences Corporation * | | 250,000 | | | 12,367,500 |
| | | | | |
| | | Shares | | Value |
COMMON STOCK (continued) | | | | | |
Data Processing & Outsourced Services (continued) | | | | | |
| Gevity HR, Inc. | | 65,000 | | $ | 499,850 |
| | | | | |
| | | | | 23,014,850 |
| | | | | |
| Diversified Commercial & Professional Services - 1.6% | | | |
| Navigant Consulting, Inc. * | | 465,000 | | | 6,356,550 |
| | | | | |
| | |
| Drug Retail - 1.396 | | | | | |
| Longs Drugstores Corporation | | 115,000 | | | 5,405,000 |
| | | | | |
| | |
| Electric Utilities - 8.7% | | | | | |
| Allete, Inc. | | 147,900 | | | 5,853,882 |
| Empire District Electric Company | | 88,100 | | | 2,006,918 |
| Great Plains Energy, Inc. (3) | | 726,000 | | | 21,286,320 |
| Northeast Utilities (3) | | 125,300 | | | 3,923,143 |
| Westar Energy, Inc. | | 100,000 | | | 2,594,000 |
| | | | | |
| | | | | 35,664,263 |
| | | | | |
| Electrical Components & Equipment - 2.2% | | | |
| Lime Energy Company * | | 25,100 | | | 33,885 |
| Power-One, Inc. * (1) | | 2,249,200 | | | 8,974,308 |
| | | | | |
| | | | | 9,008,193 |
| | | | | |
| Electronic Manufacturing Services - 2.0% | | | |
| Maxwell Technologies, Inc. * | | 674,300 | | | 5,576,461 |
| Merix Corporation * (1) | | 522,300 | | | 2,428,695 |
| | | | | |
| | | | | 8,005,156 |
| | | | | |
| Forest Products - 0.4% | | | | | |
| Louisiana-Pacific Corporation | | 135,000 | | | 1,846,800 |
| | | | | |
| | |
| Gas Utilities - 1.1% | | | | | |
| Atmos Energy Corporation | | 155,000 | | | 4,346,200 |
| | | | | |
| | |
| Health Care Equipment - 0.5% | | | | | |
| Aspect Medical Systems, Inc. * | | 151,800 | | | 2,125,200 |
| | | | | |
| | |
| Health Care Facilities - 1.3% | | | | | |
| Community Health Systems, Inc. * | | 142,300 | | | 5,245,178 |
| | | | | |
| | |
| Highways & Railtracks - 1.0% | | | | | |
| Quixote Corporation (1) | | 222,000 | | | 4,215,780 |
| | | | | |
| | |
| Home Furnishings - 1.4% | | | | | |
| Leggett& Platt, Inc. | | 339,500 | | | 5,920,880 |
| | | | | |
| | |
| Household Appliances - 1.5% | | | | | |
| Whirlpool Corporation | | 75,200 | | | 6,138,576 |
| | | | | |
| | |
| Industrial Machinery - 0.2% | | | | | |
| Briggs & Stratton Corporation | | 38,650 | | | 875,809 |
| | | | | |
| | |
| Mortgage REIPs - 3.1% | | | | | |
| Bimini Capital Management, Inc. (1) | | 768,100 | | | 176,663 |
| Luminent Mortgage Capital, Inc. | | 328,300 | | | 256,074 |
| | |
| 138 | | The accompanying notes are an integral part of the financial statements |
| | |
| | |
| Schedule of Investments | | Series V (Mid Cap Value Series) |
| December 31, 2007 - continued | | |
| | | | | |
| | | Shares | | Value |
COMMON STOCK (continued) | | | | | |
| Mortgage REIPs (continued) | | | | | |
| MFA Mortgage Investments, Inc. | | 580,000 | | $ | 5,365,000 |
| Redwood Trust, Inc. | | 200,000 | | | 6,848,000 |
| | | | | |
| | | | | 12,645,737 |
| | | | | |
| Multi-Line Insurance - 1.4% | | | | | |
| American Financial Group, Inc. | | 198,000 | | | 5,718,240 |
| | | | | |
| | |
| Multi-Utilities - 3.7% | | | | | |
| Northwestern Corporation | | 165,100 | | | 4,870,450 |
| SCANA Corporation (3) | | 185,000 | | | 7,797,750 |
| TECO Energy, Inc. | | 140,000 | | | 2,409,400 |
| | | | | |
| | | | | 15,077,600 |
| | | | | |
| Oil & Gas Drilling - 2.2% | | | | | |
| Helmerich & Payne, Inc. | | 224,200 | | | 8,983,694 |
| | | | | |
| | |
| Oil & Gas Exploration & Production - 2.4% | | | | | |
| Edge Petroleum Corporation * | | 40,350 | | | 239,275 |
| Gulfport Energy Corporation * | | 155,300 | | | 2,835,778 |
| Newfield Exploration Company * | | 129,000 | | | 6,798,300 |
| | | | | |
| | | | | 9,873,353 |
| | | | | |
| | |
| Oil & Gas Refining & Marketing - 0.5% | | | | | |
| Nova Biosource Fuels, Inc. * | | 738,700 | | | 2,142,230 |
| | | | | |
| | |
| Oil & Gas Storage & Transportation - 1.3% | | | | | |
| Williams Companies, Inc. (3) | | 144,000 | | | 5,152,320 |
| | | | | |
| | |
| Packaged Foods & Meats - 5.7% | | | | | |
| Hormel Foods Corporation | | 233,000 | | | 9,431,840 |
| JM Smucker Company | | 150,000 | | | 7,716,000 |
| Smithfield Foods, Inc. * | | 216,000 | | | 6,246,720 |
| | | | | |
| | | | | 23,394,560 |
| | | | | |
| Paper Packaging - 3.4% | | | | | |
| Bemis Company, Inc. | | 284,000 | | | 7,775,920 |
| Sonoco Products Company | | 184,700 | | | 6,035,996 |
| | | | | |
| | | | | 13,811,916 |
| | | | | |
| Property & Casualty Insurance - 5.0% | | | | | |
| Allegheny Corporation * | | 14,644 | | | 5,886,944 |
| Employers Holdings, Inc. | | 127,800 | | | 2,135,538 |
| Hanover Insurance Group, Inc. | | 101,200 | | | 4,634,960 |
| North Pointe Holdings Corporation * (1) | | 254,000 | | | 2,794,000 |
| United America Indemnity, Ltd. * | | 80,500 | | | 1,603,560 |
| W.R. Berkley Corporation | | 115,900 | | | 3,454,979 |
| | | | | |
| | | | | 20,509,981 |
| | | | | |
| Railroads - 0.2% | | | | | |
| Kansas City Southern * | | 25,000 | | | 858,250 |
| | | | | |
| | |
| Regional Banks - 6.8% | | | | | |
| Commerce Bancshares, Inc. | | 168,000 | | | 7,536,480 |
| Hancock Holding Company | | 110,800 | | | 4,232,560 |
| Old National Bancorp | | 128,500 | | | 1,922,360 |
| | | | | | |
| | | Shares | | Value |
COMMON STOCK (continued) | | | |
| Regional Banks (continued) | | | | | | |
| Whitney Holding Corporation | | | 265,000 | | $ | 6,929,750 |
| Wilmington Trust Corporation | | | 206,400 | | | 7,265,280 |
| | | | | | |
| | | | | | 27,886,430 |
| | | | | | |
| Restaurants - 0.5% | | | | | | |
| Red Robin Gourmet Burgers, Inc. * | | | 67,600 | | | 2,162,524 |
| | | | | | |
| | |
| Semiconductor Equipment - 0.7% | | | | | | |
| Ultratech, Inc. * | | | 244,500 | | | 2,772,630 |
| | | | | | |
| | |
| Semiconductors - 1.4% | | | | | | |
| Applied Micro Circuits Corporation * | | | 115,000 | | | 1,005,100 |
| IXYS Corporation * (1) | | | 570,000 | | | 4,571,400 |
| | | | | | |
| | | | | | 5,576,500 |
| | | | | | |
| Specialized Consumer Services - 1.0% | | | | | | |
| Regis Corporation | | | 147,300 | | | 4,118,508 |
| | | | | | |
| | |
| Specialty Chemicals - 0.4% | | | | | | |
| Minerals Technologies, Inc. | | | 24,150 | | | 1,616,843 |
| | | | | | |
| | |
| Thrifts & Mortgage Finance - 0.9% | | | | | | |
| Clayton Holdings, Inc. * (1) | | | 676,600 | | | 3,498,022 |
TOTAL COMMON STOCK (Cost $366,901,783) | | $ | 382,816,433 |
PREFERRED STOCK-0.5% | | | | | | |
| Diversified Metals & Mining - 0.3% | | | | | | |
| Arch Coal, Inc. | | | 5,200 | | | 1,131,000 |
| | | | | | |
| |
| Environmental & Facilities Services - 0.1% | | | |
| ThermoEnergy Corporation PIPE * (1)(4)(5) | | | 1,130,000 | | | 553,700 |
| | | | | | |
| | |
| Metal & Glass Containers - 0.1% | | | | | | |
| Owens-Illinois, Inc. | | | 5,500 | | | 274,890 |
TOTAL PREFERRED STOCK (Cost $1,528,598) | | $ | 1,959,590 |
WARRANTS -0.2% | | | | | | |
| Warrants - 0.2% | | | | | | |
| Electric City Corporation $ 1.00, 3/19/2009 | | | 23,333 | | | 19,965 |
| Nova Biosource Fuels, Inc. $ 2.40, 7/5/2011 | | | 369,350 | | | 638,205 |
| ThermoEnergy Corporation $ 0.75, 7/14/2008 (1)(4) | | | 1,130,000 | | | 120,458 |
| | | | | | |
| | | | | | 778,628 |
TOTAL WARRANTS (Cost $999,024) | | | | | $ | 778,628 |
| | | Principal
Amount | | Value |
CONVERTIBLE BOND-1.2% | | | | | | |
| Natural Gas - 0.4% | | | | | | |
| Hanover Compressor Company 4.75%, 2008 | | $ | 1,700,000 | | | 1,678,750 |
| | | | | | |
| | |
| 139 | | The accompanying notes are an integral part of the financial statements |
| | |
| | |
| Schedule of Investments | | Series V (Mid Cap Value Series) |
| December 31, 2007 - continued | | |
| | | | | | | |
| | | Principal
Amount | | Value | |
CONVERTIBLE BOND (continued) | |
| Petroleum - 0.8% | | | | | | | |
| USEC, Inc. 3.00%, 2014 | | $ | 3,500,000 | | $ | 3,421,250 | |
TOTAL CONVERTIBLE BOND (Cost $5,195,878) | | | | | $ | 5,100,000 | |
U.S. GOVERNMENT SPONSORED AGENCY BONDS NOTES - 2.7% | |
| Federal Home Loan Bank | | | | | | | |
4.00% - 2008 | | | 1,600,000 | | | 1,598,296 | |
4.24% - 2008 | | | 1,700,000 | | | 1,699,617 | |
4.235% - 2008 | | | 1,100,000 | | | 1,099,612 | |
4.26% - 2008 | | | 2,000,000 | | | 1,998,107 | |
| Federal National Mortgage Association | | | | | | | |
4.10% - 2008 | | | 1,100,000 | | | 1,099,123 | |
4.20% - 2008 | | | 1,800,000 | | | 1,799,580 | |
4.22% - 2008 | | | 1,800,000 | | | 1,799,367 | |
TOTAL U.S. GOVERNMENT SPONSORED AGENCY BONDS & NOTES (Cost $11,093,702) | | $ | 11,093,702 | |
COMMERCIAL PAPER - 2.1% | |
| Banking - 0.8% | | | | | | | |
| UBS Finance (DE) LLC 4.28%, 1/17/2008 | | | 1,200,000 | | | 1,197,718 | |
| Wells Fargo & Company, Inc. 4.25%, 1/7/2008 | | | 2,000,000 | | | 1,998,583 | |
| | | | | | | |
| | | | | | 3,196,301 | |
| | | | | | | |
| Brokerage - 0.5% | | | | | | | |
| Goldman Sachs Group, Inc. 4.80%, 1/2/2008 | | | 2,000,000 | | | 1,999,733 | |
| | | | | | | |
| | |
| Consumer Products - 0.5% | | | | | | | |
| Unilever Capital Corporation 4.25%, 1/11/2008 | | | 2,000,000 | | | 1,997,639 | |
| | | | | | | |
| | |
| Non U.S. Banking - 0.3% | | | | | | | |
| Bank of Ireland 4.88%, 1/14/2008 | | | 1,200,000 | | | 1,197,885 | |
TOTAL COMMERCIAL PAPER (Cost $8,391,558) | | $ | 8,391,558 | |
REPURCHASE AGREEMENT - 0.5% | |
| United Missouri Bank, 3.61%, dated 12/31/07, matures 1/02/08; repurchase amount $2,022,406 (Collateralized by FHLB Discount Note, 5/30/08 with a value of $2,063,240) | | $ | 2,022,000 | | $ | 2,022,000 | |
TOTAL REPURCHASE AGREEMENT (Cost $2,022,000) | | $ | 2,022,000 | |
| Total Investments (SBL V Fund) (Cost $396,132,543) - 100.7% | | $ | 412,161,911 | |
| Liabilities in Excess of Other Assets - (0.7)% | | | (2,950,497 | ) |
| | | | | | | |
| TOTAL NET ASSETS-100.0% | | | | | $ | 409,211,414 | |
| | | | | | | |
Footnotes
Percentages are stated as a percent of net assets. For federal income tax purposes the identified cost of investments owned at 12/31/2007 was $396,114,837.
| * | -Non-income producing security |
| 1 | -Security is deemed illiquid. The total market value of illiquid securities is $31,076,694 (cost $49,605,774), or 7.6% of total net assets. |
| 2 | -Investment in an affiliated issuer. See Note 9 in notes to financial statements. |
| 3 | -Security is segregated as collateral for open written option contracts. |
| 4 | -Security is restricted from resale. See Note 4 in notes to financial statements. |
| 5 | -PIPE (Private Investment in Public Equity)-Stock issued by a company in the secondary market as a means of raising capital more quickly and less expensively than through registration of a secondary public offering. |
Glossary:
| FHLB | -Federal Home Loan Bank |
See notes to financial statements.
| | |
| 140 | | The accompanying notes are an integral part of the financial statements |
| | |
| | |
| | Series V |
| | (Mid Cap Value Series) |
Statement of Assets and Liabilities
December 31, 2007
| | | |
Assets: | | | |
Investments in unaffiliated issues, at value* | | $ | 410,165,043 |
Investments in affiliated issues, at value** | | | 1,996,868 |
| | | |
Total investments | | | 412,161,911 |
Receivables: | | | |
Fund shares sold | | | 2,181,358 |
Securities sold | | | 91,022 |
Interest | | | 51,227 |
Dividends | | | 585,323 |
Prepaid expenses | | | 9,098 |
| | | |
Total assets | | | 415,079,939 |
| | | |
Liabilities: | | | |
Cash overdraft | | | 1,851,231 |
Payable for: | | | |
Fund shares redeemed | | | 575,203 |
Securities purchased | | | 2,695,557 |
Written options, at value | | | |
(premiums received $ 381,253) | | | 378,205 |
Management fees | | | 260,978 |
Administration fees | | | 33,822 |
Transfer agent/maintenance fees | | | 2,083 |
Custodian fees | | | 10,800 |
Directors’ fees | | | 5,311 |
Professional fees | | | 33,800 |
Other fees | | | 21,535 |
| | | |
Total liabilities | | | 5,868,525 |
| | | |
Net assets | | $ | 409,211,414 |
| | | |
Net assets consist of: | | | |
Paid in capital | | $ | 285,695,231 |
Undistributed net investment income | | | 3,273,887 |
Undistributed net realized gain on sale of investments | | | 104,209,880 |
Net unrealized appreciation in value of investments | | | 16,032,416 |
| | | |
Net assets | | $ | 409,211,414 |
| | | |
| |
Capital shares authorized | | | unlimited |
Capital shares outstanding | | | 8,589,754 |
Net asset value per share (net assets divided by shares outstanding) | | $ | 47.64 |
| | | |
| |
*Investments in unaffiliated issues, at cost | | $ | 393,560,968 |
**Investments in affiliated issues, at cost | | | 2,571,575 |
| | | |
Total cost | | | 396,132,543 |
Statement of Operations
For Year Ended December 31, 2007
| | | | |
Investment Income: | | | | |
Dividends | | $ | 5,704,435 | |
Interest | | | 1,569,338 | |
| | | | |
Total investment income | | | 7,273,773 | |
| | | | |
| |
Expenses: | | | | |
Management fees | | | 3,379,654 | |
Administration fees | | | 431,278 | |
Transfer agent/maintenance fees | | | 25,167 | |
Custodian fees | | | 32,300 | |
Directors’ fees | | | 27,151 | |
Professional fees | | | 45,664 | |
Reports to shareholders | | | 40,557 | |
Other | | | 20,263 | |
| | | | |
Total expenses | | | 4,002,034 | |
Less: | | | | |
Earnings credits applied | | | (315 | ) |
| | | | |
Net expenses | | | 4,001,719 | |
| | | | |
Net investment income | | | 3,272,054 | |
| | | | |
|
Net Realized and Unrealized Gain (Loss): | |
Net realized gain (loss) during the year on: | | | | |
Investments | | | 103,253,471 | |
Options written | | | 956,408 | |
| | | | |
Net realized gain | | | 104,209,879 | |
| | | | |
| |
Net unrealized appreciation (depreciation)during the year on: | | | | |
Investments | | | (97,312,500 | ) |
Options written | | | (43,558 | ) |
| | | | |
Net unrealized depreciation | | | (97,356,058 | ) |
| | | | |
Net realized and unrealized gain | | | 6,853,821 | |
| | | | |
Net increase in net assets resulting from operations | | $ | 10,125,875 | |
| | | | |
| | |
| 141 | | The accompanying notes are an integral part of the financial statements |
| | |
| | |
| | Series V |
| Statement of Changes in Net Assets | | (Mid Cap Value Series) |
| | | | | | | | |
| | | Year Ended
December 31, 2007 | | | Year Ended
December 31, 2006 | |
Increase (decrease) in net assets from operations: | | | | | | | | |
Net investment income | | $ | 3,272,054 | | | $ | 4,271,958 | |
Net realized gain during the year on investments | | | 104,209,879 | | | | 44,172,408 | |
Net unrealized appreciation (depreciation) during the year on investments | | | (97,356,058 | ) | | | 8,528,375 | |
| | | | | | | | |
Net increase in net assets resulting from operations | | | 10,125,875 | | | | 56,972,741 | |
| | | | | | | | |
| | |
Capital share transactions: | | | | | | | | |
Proceeds from sale of shares | | | 122,735,639 | | | | 138,329,829 | |
Cost of shares redeemed | | | (170,920,635 | ) | | | (132,525,763 | ) |
| | | | | | | | |
Net increase (decrease) from capital share transactions | | | (48,184,996 | ) | | | 5,804,066 | |
| | | | | | | | |
Net increase (decrease) in net assets | | | (38,059,121 | ) | | | 62,776,807 | |
| | | | | | | | |
| | |
Net assets: | | | | | | | | |
Beginning of year | | | 447,270,535 | | | | 384,493,728 | |
| | | | | | | | |
End of year | | $ | 409,211,414 | | | $ | 447,270,535 | |
| | | | | | | | |
Undistributed net investment income at end of year | | $ | 3,273,887 | | | $ | 4,271,958 | |
| | | | | | | | |
| | |
Capital share activity: | | | | | | | | |
Shares sold | | | 2,510,740 | | | | 3,124,489 | |
Shares redeemed | | | (3,481,740 | ) | | | (2,988,899 | ) |
| | | | | | | | |
Total capital share activity | | | (971,000 | ) | | | 135,590 | |
| | | | | | | | |
| | |
| 142 | | The accompanying notes are an integral part of the financial statements |
| | |
| | |
| Financial Highlights | | Series V |
Selected data for each share of capital stock outstanding throughout each year | | (Mid Cap Value Series) |
| | | | | | | | | | |
| | | 2007 | | 2006 | | 2005 | | 2004 | | Year Ended
December 31,
2003 |
Per Share Data | | | | | | | | | | |
Net asset value, beginning of period | | $46.78 | | $40.79 | | $35.10 | | $28.33 | | $18.68 |
| |
Income (loss) from investment operations: | | | | | | | | | | |
Net investment incomea | | 0.36 | | 0.44 | | 0.14 | | 0.11 | | 0.07 |
Net gain on securities (realized and unrealized) | | 0.50 | | 5.55 | | 5.55 | | 7.39 | | 10.03 |
| | |
Total from investment operations | | 0.86 | | 5.99 | | 5.69 | | 7.50 | | 10.10 |
| |
Less distributions: | | | | | | | | | | |
Dividends from net investment income | | – | | – | | – | | (0.01) | | (0.06) |
Distributions from realized gains | | – | | – | | – | | (0.72) | | (0.39) |
| | |
Total distributions | | – | | – | | – | | (0.73) | | (0.45) |
| |
Net asset value, end of period | | $47.64 | | $46.78 | | $40.79 | | $35.10 | | $28.33 |
| | |
| | | | | | | | | | | |
Total Returnb | | 1.84% | | 14.66% | | 16.21% | | 26.97% | | 54.27% |
| |
Ratios/Supplemental Data | | | | | | | | | | |
Net assets, end of period (in thousands) | | $409,211 | | $447,271 | | $384,494 | | $307,536 | | $223,658 |
| |
Ratios to average net assets: | | | | | | | | | | |
Net investment income | | 0.73% | | 1.01% | | 0.44% | | 0.37% | | 0.36% |
Total expensesc | | 0.89% | | 0.89% | | 0.90% | | 0.88% | | 0.83% |
Net expensesd | | 0.89% | | 0.89% | | 0.90% | | 0.88% | | 0.83% |
Net expenses prior to custodian earnings credits and net of expense waivers | | 0.89% | | 0.89% | | 0.90% | | 0.88% | | 0.83% |
| |
Portfolio turnover rate | | 45% | | 42% | | 29% | | 43% | | 59% |
a Net investment income (loss) was computed using average shares outstanding throughout the period.
b Total return does not take into account any of the expenses associated with an investment in variable insurance products offered by Security Benefit Life Insurance Company. If total return had taken into account these expenses, performance would have been lower. Shares of a series of SBL Fund are available only through the purchase of such products.
c Total expense information reflects the expense ratios absent expense reductions by the Investment Manager, and earnings credits, as applicable.
d Net expense information reflects the expense ratios after voluntary expense waivers, reimbursements and custodian earnings credits, as applicable.
| | |
| 143 | | The accompanying notes are an integral part of the financial statements |
| | |
| | |
| Managers’ Commentary | | Series X |
| February 15, 2008 | | (Small Cap Growth Series) |

To Our Shareholders:
For the year ended December 31, 2007, Series X of the SBL Fund - Small Cap Growth Series had a total return of 5.60% compared with 7.05% for the benchmark. The stock market and small-cap stocks in general encountered major turbulence in the fourth quarter of 2007. The downward pressure ended the six-year record of the Russell 2000® Growth Index for posting positive fourth quarter returns. The Index ended its run with a negative 2.10% for the fourth quarter. Amid the turmoil, the portfolio finished down for the quarter, which muted what had been a solid year through the third quarter.
The fourth quarter was one of the more challenging periods in recent history, marked by extraordinary volatility, widespread fear about the strength of the economy and the financial system, and a slight resurgence in inflation. All these effects weighed heavily on small-cap stocks, and the portfolio did not fare well during the quarter. After a strong October supported by a favorable period of quarterly earnings reports, November proved to be a challenging month for the portfolio. The effects of high commodity prices and fears about future economic growth caused the consumer to moderate and the market to vote against most stocks in the consumer segment. Our weighting in the broad consumer sector during the quarter was approximately 22%, only slightly overweight the index. But a number of company specific problems, combined with a bearish tilt from the market, made consumer our primary source of underperformance. On the plus side, financials and industrials shined in the quarter and throughout most of the year, contributing relative outperformance.
Although the portfolio performed well during the third quarter of 2007 through a period of extreme volatility, this did not continue into the fourth quarter. The portfolio’s two largest areas of focus, healthcare and consumer discretionary stocks, were the two worst performers during the period. Stock selection in these two sectors more than explained our underperformance for the year. On a more encouraging note, the financial services sector reversed course in the fourth quarter and strong stock picking contributed significantly to performance for both the fourth quarter and the year. Producer durables also extended

their leadership in the portfolio in the fourth quarter and ended 2007 as the best-performing sector for the year due almost entirely to positive stock selection.
Our positions in financial services contributed significantly to 2007 performance. We averaged a slight overweight in the sector throughout the year. CyberSource Corporation, an online payment-processing company focused on medium-sized e-commerce customers, paced the performance with a 52% advance. During the period, CyberSource closed a transformational acquisition of Authorize.net, a competitor in the small business channel of online e-commerce. We think that the combined company can attack the two largest channels of distribution more effectively and that the new company has significant earnings potential. After announcing the transaction, the market provided an attractive opportunity to increase our position significantly this summer and the portfolio reaped the reward in the fourth quarter.
We also experienced strong gains in optionsXpress Holdings, Inc., a leading online options brokerage company, which rose 30% during the fourth quarter. This helped offset soft performance in long-time holdings Online Resources and Portfolio Recovery, which suffered pull-backs during the fourth quarter. Online Resources executed poorly during the period and significantly changed its business strategy, prompting us to exit the position. Portfolio Recovery continued to suffer from collector productivity as it ramps a new collection facility. However, we are maintaining a position as the company works through these growing pains.
The producer durables sector continued its strong performance throughout the year, and our stock selection again outpaced the benchmark while we maintained equal weighting to the index. Two dominant trends that remain pervasive in this sector are lengthy and sustained cycles in aerospace and commodities. Longtime favorite, BE Aerospace, Inc., again produced solid returns on strong fundamentals in the commercial aerospace market. Continued robust demand for services and equipment from Team, Inc., and new addition Bucyrus International, Inc., renewed confidence that the energy services and coal equipment cycles are prolonged. We are pleased that our stock selection generated significant alpha for the portfolio.
Our successes in financials and producer durables were overshadowed by poor stock selection in consumer discretionary, where we were slightly overweight in comparison to the Index. Despite an emphasis on less discretionary portions of the consumer sector and service oriented com-
| | |
| | |
| Managers’ Commentary | | Series X |
| February 15, 2008 | | (Small Cap Growth Series) |
panies, our stock selection throughout the year was inconsistent. Volcom, Inc., was among the worst-performing consumer stocks for the portfolio during the year. Volcom suffered from a softer environment for teen retailing in the all-important back-to-school and holiday seasons. As we look to 2008, we think that Volcom’s international franchise can boost its prospects and that its strong domestic franchise is bruised, but not broken. Thus, we remain invested. Also weak in the fourth quarter were Perficient, a provider of technology consulting services to small business, and Barrett Business Services. Both stocks exhibited cracks in their fundamental business execution. We elected to cut our losses in both stocks and to re-allocate capital to better businesses that we believe have less risk in this volatile market.
Better performing in consumer discretionary was DeVry, Inc., a post-secondary education company that posted strong gains and added significantly to performance given our large position size. Devry’s cost-cutting initiatives proved to have a large impact on operating margins; and the company posted strong third quarter results and a solid outlook, which caused the shares to outperform nicely during the last quarter.
Our stock picking within the technology sector improved dramatically over 2006, and our picks in 2007 outpaced the benchmark. The challenging fourth quarter negated some of our large outperformance gained during the first three quarters, and several long-term favorites gave back some of their gains. j2 Global Communications, Inc., was our worst technology performer in the fourth quarter. J2 Global’s exposure to the financial services vertical, particularly the real estate industry crimped results. We continue to believe in the long-term prospects of this company and seized the opportunity to add to the position.
We are encouraged that 2007 was an improvement over 2006 performance relative to the benchmark. We are, however, not satisfied with the relative underperformance for the year. Looking ahead, we believe that we are entering an environment that will benefit our small-cap growth style and our keen focus on companies with unique business models, strong competitive advantages, and superior management teams; strengths that can help them weather an economic slowdown. Although we expect the economic slowdown to be brief, we are not banking on a big rebound. We have positioned the
portfolio for a neutral to slightly positive longer-term bias to gross domestic product, which is more conservative than we have been for many years. We believe that a potentially lower interest rate environment in the future should benefit the fast-growing small companies in our portfolio and that the compounding effects of a longer-term investment horizon will help us achieve our goals. As fellow investors in the strategy, we thank you for your continued confidence and support.
|
Sincerely, |
|
Bill Wolfenden, Co-Portfolio Manager D. Scott Tracy, Co-Portfolio Manager |
| | |
| | Series X |
| Performance Summary | | (Small Cap Growth Series ) |
| December 31, 2007 | | (unaudited) |
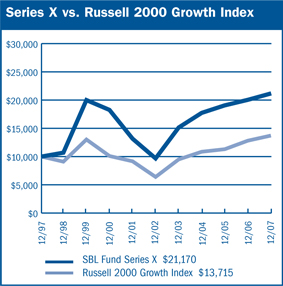
$10,000 Over 10 Years
The chart above assumes a hypothetical $10,000 investment in Series X (Small Cap Growth Series) on December 31, 1997 and reflects the fees and expenses of Series X. The Russell 2000 Growth Index measures the performance of those Russell 2000 companies with higher price-to-book ratios and higher forecasted growth values.
| | | | | | |
Average Annual Returns |
| | | | |
Periods Ended 12-31-071 | | 1 Year | | 5 Years | | 10 Years |
|
Series X | | 5.60% | | 16.95% | | 8.25% |
| |
1 Performance figures do not reflect fees and expenses associated with an investment in variable insurance products offered by Security Benefit Life Insurance Company. If returns had taken into account these fees and expenses, performance would have been lower. Shares of a Series of SBL Fund are available only through the purchase of such products. The performance data quoted above represents past performance. Past performance is not predictive of future performance. The investment return and principal value of an investment will fluctuate so that an investor’s shares, when redeemed, may be worth more or less than their original cost. |
| | |
Portfolio Composition by Sector | | |
Consumer Discretionary | | 15.36% |
Consumer Staples | | 2.55 |
Energy | | 5.64 |
Financials | | 8.97 |
Health Care | | 17.81 |
Industrials | | 13.70 |
Information Technology | | 23.83 |
Materials | | 2.16 |
Telecommunication Services | | 1.23 |
Exchange Traded Funds | | 1.49 |
Repurchase Agreement | | 9.79 |
Liabilities in Excess of Other Assets | | (2.53) |
Total Net Assets | | 100.00% |
| | | |
| | | |
| | |
| 146 | | The accompanying notes are an integral part of the financial statements |
| | |
| | Series X |
| Performance Summary | | (Small Cap Growth Series) |
| December 31, 2007 | | (unaudited) |
Information About Your Series Expenses
Calculating your ongoing Series expenses
Example
As a shareholder of the Series, you incur ongoing costs, including management fees and other series expenses. Performance figures and expense ratios do not reflect fees and expenses associated with an investment in variable insurance products. Shares of a Series of SBL Fund are available only through the purchase of such products. This example is intended to help you understand your ongoing costs (in dollars) of investing in the Series and to compare these costs with ongoing costs of investing in other mutual funds. The example is based on an investment of $1,000 invested at the beginning of the period and held for the entire period, July 1, 2007 through December 31, 2007.
Actual Expenses
The first line in the table provides information about actual account values and actual expenses. You may use the information in this table, together with the amount you invested, to estimate the expenses that you paid over the period. Simply divide your account value by $1,000 (for example, an $8,600 account value divided by $1,000 = 8.6), then multiply the result by the number in the table under the heading entitled “Expenses Paid During the Period” to estimate the expenses you paid on your account during this period.
Hypothetical Example for Comparison Purposes
The second line in the table provides information about hypothetical account values and hypothetical expenses based on the Series actual expense ratio and an assumed rate of return of 5% per year before expenses, which is not the Series actual return. The hypothetical account values and expenses may not be used to estimate the actual ending account balance or expenses you paid for the period. You may use this information to compare the ongoing costs of investing in the Series and other funds. To do so, compare this 5% hypothetical example with the 5% hypothetical examples that appear in the shareholder reports of the other mutual funds.
Please note that the expenses shown in the table are meant to highlight your ongoing costs only and do not reflect any fees and expenses associated with an investment in variable insurance products. Therefore, the second line is useful in comparing ongoing costs only, and will not help you determine the relative total costs of owning different funds. In addition, if these fees and expenses associated with an investment in variable insurance products were included, your costs would have been higher.
| | | | | | |
Series Expenses | | | | | | |
| | | Beginning
Account
Value
7/1/2007 | | Ending
Account Value
12/31/20071 | | Expenses
Paid
During
Period2 |
Series X (Small Cap Value Series) |
Actual | | $1,000.00 | | $964.91 | | $5.89 |
Hypothetical | | 1,000.00 | | 1,019.21 | | 6.06 |
| | | | | | | |
1 The actual ending account value is based on the actual total return of the Series for the period July 1, 2007 to December 31, 2007 after actual expenses and will differ from the hypothetical ending account value which is based on the Series expense ratio and a hypothetical annual return of 5% before expenses. The actual cumulative return at net asset value for the period July 1, 2007 to December 31, 2007 was (3.51%).
2 Expenses are equal to the Series annualized expense ratio of 1.19%, net of any applicable fee waivers or earnings credits, multiplied by the average account value over the period, multiplied by 184/365 (to reflect the one-half year period)
| | |
| | |
| Schedule of Investments | | Series X (Small Cap Value Series) |
| December 31, 2007 | | |
| | | | | |
| | | Shares | | Value |
| COMMON STOCK - 92.7% | | | | | |
Aerospace & Defense - 6.5% | | | | | |
Aerovironment, Inc.* | | 37,270 | | $ | 901,934 |
BE Aerospace, Inc. * | | 14,090 | | | 745,361 |
Heico Corporation | | 24,420 | | | 1,330,401 |
Ladish Company, Inc. * | | 25,280 | | | 1,091,843 |
Orbital Sciences Corporation * | | 52,430 | | | 1,285,584 |
| | | | | |
| | | | | 5,355,123 |
| | | | | |
Agricultural Products - 0.7% | | | | | |
Darling International, Inc. * | | 48,900 | | | 565,284 |
| | | | | |
| | |
Airlines - 1.9% | | | | | |
Allegiant Travel Company * | | 48,020 | | | 1,543,363 |
| | | | | |
| | |
Apparel Retail - 0.8% | | | | | |
Jos A. Bank Clothiers, Inc. * | | 23,177 | | | 659,386 |
| | | | | |
| | |
Apparel, Accessories & Luxury Goods - 1.8% | | | | | |
FGX International Holdings, Ltd. * | | 64,780 | | | 767,643 |
Volcom Inc. * | | 30,200 | | | 665,306 |
| | | | | |
| | | | | 1,432,949 |
| | | | | |
Application Software - 4.3% | | | | | |
Advent Software, Inc. * | | 10,680 | | | 577,788 |
Concur Technologies, Inc. * | | 11,800 | | | 427,278 |
Magma Design Automation, Inc. * | | 51,150 | | | 624,542 |
Nuance Communications, Inc. * | | 48,990 | | | 915,133 |
PROS Holdings, Inc. * | | 49,320 | | | 967,658 |
| | | | | |
| | | | | 3,512,399 |
| | | | | |
Asset Management & Custody Banks - 2.0% | | | | | |
Affiliated Managers Group, Inc. * | | 13,620 | | | 1,599,805 |
| | | | | |
| | |
Auto Parts & Equipment - 1.1% | | | | | |
Amerigon, Inc. * | | 41,360 | | | 874,350 |
| | | | | |
| | |
Broadcasting & Cable TV - 1.9% | | | | | |
DG FastChannel, Inc. * | | 61,650 | | | 1,580,706 |
| | | | | |
| | |
Casinos & Gaming - 2.1% | | | | | |
Scientific Games Corporation * | | 51,350 | | | 1,707,388 |
| | | | | |
| | |
Communications Equipment - 0.8% | | | | | |
Riverbed Technology, Inc. * | | 25,690 | | | 686,951 |
| | | | | |
| | |
Computer Storage & Peripherals - 1.0% | | | | | |
Hutchinson Technology, Inc. * | | 30,650 | | | 806,708 |
| | | | | |
| | |
Construction & Farm Machinery & Heavy Trucks - 1.1% | | | | | |
Bucyrus International, Inc | | 8,820 | | | 876,620 |
| | | | | |
| | |
Consumer Finance - 0.6% | | | | | |
Cardtronics, Inc. * | | 52,204 | | | 527,782 |
| | | | | |
| | | | | |
| | | Shares | | Value |
| COMMON STOCK (continued) | | | | | |
Data Processing & Outsourced Services - 2.2% | | | | | |
Cybersource Corporation * | | 102,070 | | $ | 1,813,784 |
| | | | | |
| | |
Diversified Commercial & Professional Services - 0.6% | | | | | |
GeoEye, Inc. * | | 14,710 | | | 494,992 |
| | | | | |
| | |
Education Services - 2.5% | | | | | |
American Public Education, Inc. * | | 14,194 | | | 593,025 |
DeVry, Inc. | | 27,190 | | | 1,412,793 |
| | | | | |
| | | | | 2,005,818 |
| | | | | |
Electronic Manufacturing Services -1.1% | | | | | |
IPG Photonics Corporation * | | 42,980 | | | 859,170 |
| | | | | |
| | |
Environmental & Facilities Services - 1.9% | | | | | |
Rollins, Inc. | | 40,890 | | | 785,088 |
Team, Inc. * | | 20,330 | | | 743,671 |
| | | | | |
| | | | | 1,528,759 |
| | | | | |
Exchange Traded Funds - 1.5% iShares Russell 2000 Growth Index Fund | | 14,590 | | | 1,220,891 |
| | | | | |
| | |
Footwear - 1.1% | | | | | |
Iconix Brand Group, Inc. * | | 47,480 | | | 933,457 |
| | | | | |
| | |
Health Care Equipment - 6.5% | | | | | |
LeMaitre Vascular, Inc. * | | 159,510 | | | 988,962 |
Micrus Endovascular Corporation * | | 62,710 | | | 1,234,133 |
NuVasive, Inc. * | | 27,490 | | | 1,086,405 |
Spectranetics Corporation * | | 95,230 | | | 1,459,876 |
Volcano Corporation * | | 43,020 | | | 538,180 |
| | | | | |
| | | | | 5,307,556 |
| | | | | |
Health Care Facilities - 1.5% | | | | | |
NovaMed, Inc. * | | 127,380 | | | 541,365 |
RadNet, Inc. * | | 71,350 | | | 724,202 |
| | | | | |
| | | | | 1,265,567 |
| | | | | |
Health Care Services - 4.0% | | | | | |
Healthways, Inc. * | | 25,320 | | | 1,479,701 |
HMS Holdings Corporation * | | 18,250 | | | 606,082 |
Pediatrix Medical Group, Inc. * | | 17,980 | | | 1,225,337 |
| | | | | |
| | | | | 3,311,120 |
| | | | | |
Health Care Supplies - 0.5% | | | | | |
Immucor, Inc. * | | 11,990 | | | 407,540 |
| | | | | |
| | |
Health Care Technology - 2.1% | | | | | |
Phase Forward, Inc. * | | 32,150 | | | 699,263 |
Trizetto Group * | | 58,490 | | | 1,015,971 |
| | | | | |
| | | | | 1,715,234 |
| | | | | |
Home Entertainment Software - 1.0% | | | | | |
THQ, Inc. * | | 28,590 | | | 805,952 |
| | | | | |
| | |
| 148 | | The accompanying notes are an integral part of the financial statements |
| | |
| | |
| Schedule of Investments | | Series X (Small Cap Value Series) |
| December 31, 2007 - continued | | |
| | | | | |
| | | Shares | | Value |
| COMMON STOCK (continued) | | | | | |
Hotels, Resorts & Cruise Lines - 1.2% | | | | | |
Home Inns & Hotels
Management, Inc. ADR * | | 27,970 | | $ | 996,851 |
| | | | | |
| | |
Industrial Machinery - 0.9% | | | | | |
Dynamic Materials Corporation | | 13,040 | | | 768,056 |
| | | | | |
| | |
Insurance Brokers - 0.6% | | | | | |
eHealth, Inc. * | | 15,910 | | | 510,870 |
| | | | | |
| | |
Integrated Telecommunication Services - 1.2% | | | | | |
Cbeyond, Inc. * | | 25,860 | | | 1,008,281 |
| | | | | |
| | |
Internet Retail - 1.9% | | | | | |
NutriSystem, Inc. * | | 35,040 | | | 945,379 |
Shutterfly, Inc. * | | 23,920 | | | 612,831 |
| | | | | |
| | | | | 1,558,210 |
| | | | | |
Internet Software & Services - 8.6% | | | | | |
Digital River, Inc. * | | 31,190 | | | 1,031,453 |
Equinix, Inc. * | | 11,790 | | | 1,191,615 |
Internet Brands, Inc. * | | 91,401 | | | 642,549 |
J2 Global Communications, Inc. * | | 69,750 | | | 1,476,608 |
NaviSite, Inc. * | | 168,230 | | | 851,244 |
TheStreet.com, Inc. | | 73,380 | | | 1,168,210 |
Valueclick, Inc. * | | 30,950 | | | 677,805 |
| | | | | |
| | | | | 7,039,484 |
| | | | | |
Investment Banking & Brokerage - 2.1% | | | | | |
Investment Technology Group, Inc.* | | 21,910 | | | 1,042,697 |
optionsXpress Holdings, Inc. | | 19,510 | | | 659,828 |
| | | | | |
| | | | | 1,702,525 |
| | | | | |
Leisure Facilities - 1.0% | | | | | |
Life Time Fitness, Inc. * | | 16,430 | | | 816,242 |
| | | | | |
| | |
Marine - 0.8% | | | | | |
Excel Maritime Carriers, Ltd. | | 16,100 | | | 647,059 |
| | | | | |
| | |
Oil & Gas Equipment & Services - 5.0% | | | | | |
Core Laboratories N.V. * | | 9,430 | | | 1,176,110 |
Dril-Quip, Inc. * | | 21,950 | | | 1,221,737 |
Oil States International, Inc. * | | 20,940 | | | 714,473 |
Superior Energy Services, Inc. * | | 28,710 | | | 988,198 |
| | | | | |
| | | | | 4,100,518 |
| | | | | |
Oil & Gas Exploration & Production - 0.6% | | | | | |
Arena Resources, Inc. * | | 12,400 | | | 517,204 |
| | | | | |
| | |
Packaged Foods & Meats - 0.8% | | | | | |
SunOpta, Inc. * | | 48,530 | | | 647,876 |
| | | | | |
| | |
Personal Products - 1.1% | | | | | |
Bare Escentuals, Inc. * | | 35,870 | | | 869,847 |
| | | | | |
| | |
Pharmaceuticals -3.1% | | | | | |
KV Pharmaceutical Company * | | 63,110 | | | 1,801,159 |
| | | | | |
| | | Shares | | Value |
| COMMON STOCK (continued) | | | | | |
Pharmaceuticals (continued) | | | | | |
Sciele Pharma, Inc. * | | 37,270 | | $ | 762,172 |
| | | | | |
| | | | | 2,563,331 |
| | | | | |
Property & Casualty Insurance - 1.7% | | | | | |
Amtrust Financial Services, Inc. | | 99,550 | | | 1,370,803 |
| | | | | |
| | |
Real Estate Management & Development - 0.8% | | | | | |
FirstService Corporation * | | 20,930 | | | 638,993 |
| | | | | |
| | |
Semiconductors - 2.4% | | | | | |
Atheros Communications, Inc. * | | 27,530 | | | 840,766 |
02Micro International, Ltd. ADR * | | 58,800 | | | 678,552 |
Silicon Motion Technology
Corporation ADR * | | 23,200 | | | 412,496 |
| | | | | |
| | | | | 1,931,814 |
| | | | | |
Specialized Finance - 1.2% | | | | | |
MarketAxess Holdings, Inc. * | | 31,430 | | | 403,247 |
Portfolio Recovery Associates, Inc. | | 14,810 | | | 587,513 |
| | | | | |
| | | | | 990,760 |
| | | | | |
Specialty Chemicals - 0.8% | | | | | |
Zoltek Companies, Inc. * | | 15,890 | | | 681,204 |
| | | | | |
| | |
Steel - 1.3% | | | | | |
Haynes International, Inc. * | | 9,470 | | | 658,165 |
Schnitzer Steel Industries, Inc. | | 6,200 | | | 428,606 |
| | | | | |
| | | | | 1,086,771 |
| | | | | |
Systems Software - 1.8% | | | | | |
Aladdin Knowledge Systems, Ltd. * | | 30,530 | | | 797,749 |
FalconStor Software, Inc. * | | 56,530 | | | 636,528 |
| | | | | |
| | | | | 1,434,277 |
| | | | | |
Technology Distributors - 0.7% | | | | | |
Mellanox Technologies, Ltd. * | | 33,350 | | | 607,637 |
TOTAL COMMON STOCK (Cost $71,020,102) | | | | $ | 75,887,267 |
| | | | | | | |
| | | Principal
Amount | | Value | |
| REPURCHASE AGREEMENT - 9.8% | | | | | | | |
United Missouri Bank, 3.61%, dated 12/31/07, matures 1/02/08; repurchase amount $8,014,607 (Collateralized by FNSM, 6.50%, 11/01/37 with a value of $8,173,933) | | $ | 8,013,000 | | $ | 8,013,000 | |
TOTAL REPURCHASE AGREEMENT (Cost $8,013,000) | | $ | 8,013,000 | |
Total Investments (SBL X Fund) | | | | | $ | 83,900,267 | |
(Cost $79,033,102) - 102.5% | | | | | | | |
Liabilities in Excess of Other Assets - (2.5)% | | | | | | (2,067,409 | ) |
| | | | | | | |
TOTAL NET ASSETS -100.0% | | | | | $ | 81,832,858 | |
| | | | | | | |
Footnotes
| | |
| 149 | | The accompanying notes are an integral part of the financial statements |
| | |
| | |
| Schedule of Investments | | Series X (Small Cap Value Series) |
| December 31, 2007 - continued | | |
| | | | |
Percentages are stated as a percent of net assets. For federal income tax purposes the identified cost of investments
owned at 12/31/2007 was $79,159,517. |
| | |
* | | - | | Non-income producing security |
|
| Glossary: |
ADR | | - | | American Depositary Receipt |
See notes to financial statements.
| | |
| 150 | | The accompanying notes are an integral part of the financial statements |
| | |
| | |
| | Series X |
| | (Small Cap Growth Series) |
Statement of Assets and Liabilities
December 31, 2007
| | | |
Assets: | | | |
Investments, at value* | | $83,900,267 | |
Receivables: | | | |
Fund shares sold | | 34,330 | |
Securities sold | | 498,215 | |
Dividends | | 5,779 | |
Prepaid expenses | | 1,707 | |
| | | |
Total assets | | 84,440,298 | |
| | | |
Liabilities: | | | |
Cash overdraft | | 1,511 | |
| |
Payable for: | | | |
Fund shares redeemed | | 89,365 | |
Securities purchased | | 2,408,501 | |
Management fees | | 70,206 | |
Administration fees | | 7,209 | |
Transfer agent/maintenance fees | | 2,083 | |
Custodian fees | | 7,440 | |
Directors’ fees | | 1,000 | |
Professional fees | | 9,925 | |
Other fees | | 10,200 | |
| | | |
Total liabilities | | 2,607,440 | |
| | | |
Net assets | | $81,832,858 | |
| | | |
| |
Net assets consist of: | | | |
Paid in capital | | $84,403,451 | |
Accumulated net realized loss on sale of investments | | (7,437,758 | ) |
Net unrealized appreciation in value of investments | | 4,867,165 | |
| | | |
Net assets | | $81,832,858 | |
| | | |
| |
Capital shares authorized | | unlimited | |
Capital shares outstanding | | 4,020,699 | |
Net asset value per share
(net assets divided by shares outstanding) | | $20.35 | |
| | | |
| |
*Investments, at cost | | $79,033,102 | |
Statement of Operations
For Year Ended December 31, 2007
| | | | |
Investment Income: | | | | |
Dividends | | $ | 139,787 | |
Interest | | | 193,165 | |
| | | | |
Total investment income | | | 332,952 | |
| | | | |
| |
Expenses: | | | | |
Management fees | | | 878,276 | |
Administration fees | | | 85,410 | |
Transfer agent/maintenance fees | | | 25,167 | |
Custodian fees | | | 23,666 | |
Directors’ fees | | | 4,787 | |
Professional fees | | | 19,265 | |
Reports to shareholders | | | 13,709 | |
Other | | | 4,066 | |
| | | | |
Total expenses | | | 1,054,346 | |
Less: | | | | |
Earnings credits applied | | | (3,227 | ) |
| | | | |
Net expenses | | | 1,051,119 | |
| | | | |
Net investment loss | | | (718,167 | ) |
| | | | |
| |
Net Realized and Unrealized Gain (Loss): | | | | |
Net realized gain (loss) during the year on: | | | | |
Investments | | | 10,245,858 | |
| | | | |
Net realized gain | | | 10,245,858 | |
| | | | |
| |
Net unrealized appreciation (depreciation) during the year on: | | | | |
Investments | | | (4,583,460 | ) |
| | | | |
Net unrealized depreciation | | | (4,583,460 | ) |
| | | | |
Net realized and unrealized gain | | | 5,662,398 | |
| | | | |
Net increase in net assets resulting from operations | | $ | 4,944,231 | |
| | | | |
| | |
| 151 | | The accompanying notes are an integral part of the financial statements |
| | |
| | |
| | Series X |
| Statement of Changes in Net Assets | | (Small Cap Growth Series) |
| | | | | | | | |
| | | Year Ended
December 31, 2007 | | | Year Ended
December 31, 2006 | |
| | |
Increase (decrease) in net assets from operations: | | | | | | | | |
Net investment loss | | $ | (718,167 | ) | | $ | (617,351 | ) |
Net realized gain during the year on investments | | | 10,245,858 | | | | 7,308,120 | |
Net unrealized depreciation during the year on investments | | | (4,583,460 | ) | | | (2,144,750 | ) |
| | | | | | | | |
Net increase in net assets resulting from operations | | | 4,944,231 | | | | 4,546,019 | |
| | | | | | | | |
| | |
Capital share transactions: | | | | | | | | |
Proceeds from sale of shares | | | 23,646,791 | | | | 40,950,861 | |
Cost of shares redeemed | | | (39,547,658 | ) | | | (43,378,540 | ) |
| | | | | | | | |
Net decrease from capital share transactions | | | (15,900,867 | ) | | | (2,427,679 | ) |
| | | | | | | | |
Net increase (decrease) in net assets | | | (10,956,636 | ) | | | 2,118,340 | |
| | | | | | | | |
| | |
Net assets: | | | | | | | | |
Beginning of year | | | 92,789,494 | | | | 90,671,154 | |
| | | | | | | | |
End of year | | $ | 81,832,858 | | | $ | 92,789,494 | |
| | | | | | | | |
Undistributed net investment income at end of year | | $ | – | | | $ | – | |
| | | | | | | | |
| | |
Capital share activity: | | | | | | | | |
Shares sold | | | 1,148,478 | | | | 2,187,874 | |
Shares redeemed | | | (1,943,531 | ) | | | (2,319,526 | ) |
| | | | | | | | |
Total capital share activity | | | (795,053 | ) | | | (131,652 | ) |
| | | | | | | | |
| | |
| 152 | | The accompanying notes are an integral part of the financial statements |
| | | | |
| | | | |
| Financial Highlights | | | | Series X |
| Selected data for each share of capital stock outstanding throughout each year | | (Small Cap Growth Series) |
| | | | | | | | | | |
| | | 2007 | | 2006 | | 2005 | | 2004 | | Year Ended
December 31,
2003 |
Per Share Data | | | | | | | | | | |
Net asset value, beginning of period | | $19.27 | | $18.33 | | $17.05 | | $14.55 | | $9.30 |
Income (loss) from investment operations: | | | | | | | | | | |
Net investment lossa | | (0.17) | | (0.13) | | (0.15) | | (0.14) | | (0.10) |
Net gain on securities (realized and unrealized) | | 1.25 | | 1.07 | | 1.43 | | 2.64 | | 5.35 |
| | |
Total from investment operations | | 1.08 | | 0.94 | | 1.28 | | 2.50 | | 5.25 |
Net asset value, end of period | | $20.35 | | $19.27 | | $18.33 | | $17.05 | | $14.55 |
| | |
| | |
Total Returnb | | 5.60% | | 5.13% | | 7.51% | | 17.18% | | 56.45% |
Ratios/Supplemental Data | | | | | | | | | | |
Net assets, end of period (in thousands) | | $81,833 | | $92,789 | | $90,671 | | $91,868 | | $89,740 |
Ratios to average net assets: | | | | | | | | | | |
Net investment loss | | (0.82%) | | (0.66%) | | (0.85%) | | (0.89%) | | (1.00%) |
Total expensesc | | 1.20% | | 1.20% | | 1.19% | | 1.17% | | 1.17% |
Net expensesd | | 1.20% | | 1.19% | | 1.18% | | 1.17% | | 1.16% |
Net expenses prior to custodian earnings credits and net of expense waivers | | 1.20% | | 1.20% | | 1.19% | | 1.17% | | 1.17% |
Portfolio turnover rate | | 137% | | 149% | | 116% | | 146% | | 208% |
a Net investment income (loss) was computed using average shares outstanding throughout the period.
b Total return does not take into account any of the expenses associated with an investment in variable insurance products offered by Security Benefit Life Insurance Company. If total return had taken into account these expenses, performance would have been lower. Shares of a series of SBL Fund are available only through the purchase of such products.
c Total expense information reflects the expense ratios absent expense reductions by the Investment Manager, and earnings credits, as applicable.
d Net expense information reflects the expense ratios after voluntary expense waivers, reimbursements and custodian earnings credits, as applicable.
| | |
| 153 | | The accompanying notes are an integral part of the financial statements |
| | |
| | |
| Manager’s Commentary | | Series Y |
| February 15, 2008 | | (Select 25 Series) |
Adviser, Security Global Investors
| | |
| | To Our Shareholders: For the year ended December 31, 2007, Series Y of the SBL Fund – Select 25 Series returned -6.18%, lagging the benchmark Russell 1000 Growth Index’s return of 11.81% and the Series’ peer group median return of 12.71%. Poor stock selection was partially off set by solid sector positioning in 2007. While disappointed that our results were below the benchmark and competitors, we believe that our approach delivers performance over the long-term. |
Our strategy is to buy companies that are trading at a significant discount to their intrinsic value. Our investment approach is a defined and disciplined process of three clear philosophical tenets that drive our investment decisions: a valuation focus, a long-term perspective and an opportunistic approach.
This investment process is fundamentally driven and quantitatively aided. We use proprietary screens to identify potential companies for investment and then perform rigorous fundamental analysis to identify the best ideas. Through this fundamental research, we determine an estimate of intrinsic value and thus a valuation target for each idea. We construct the portfolios based on the level of conviction generated by this bottom-up analysis and the upside/downside profile associated with each company.
We ultimately structure the portfolio with 25-30 names. This philosophy is applied to a broad range of growth names.
Top Performers
The Series’ health care holdings were up 16% compared to 9% for the Index. A material contributor in sector performance was a 6% weight in Covance, Inc., which surged 47% for the year. Health care sector holding Johnson & Johnson, a 5% average portfolio weight, was able to keep pace with the Index.
Disappointing Performers
The three worst performing sectors, financials, energy, and information technology, held nearly 50% of total Series’ assets. Financials consisted of 20% of portfolio assets compared to just 8% for the Index and lost -41% of their value in comparison to less than a -1% loss for the Index. A similar pattern held for the energy sector where the Series’ weight doubled that of the Index, 12% to 6%, and holdings declined 9% while securities in the Index surged 39%.
Our financial sector holdings were negatively impacted as concern increased over the potential impact of a debt crisis resulting from poor lending practices in the U.S. mortgage market. A majority of these holdings have nothing to do with the mortgage market, but were viewed in the same light. For example, First Marblehead Corporation, a higher education student loan provider, was down -71% and Capital One Financial Corporation, a credit card lender, was down -38%. We believe both of these companies are trading well below their intrinsic value and that they have excellent business models with sustainable competitive advantages.
The largest impact to the Energy sector was the -78% drop in the value of shares of Evergreen Energy, Inc. (previously known as KFx). Evergreen Energy was hurt by concerns over the viability of the initial production results of its proprietary clean coal technology.
2008 Market Outlook
Our bottom-up approach looks at market uncertainty in the context of the potential long-term impact on individual companies. Often times, volatility provides opportunity. We are maintaining flexibility in the portfolios to take advantage of these opportunities as they arise. Our focus is on identifying companies with the ability to be substantially better over the next three to five years or have the potential to maintain their return on capital at current levels in a difficult economic environment. We are confident in our ability to find these companies and we are pleased with the positions we own today.
| | |
| | |
| Manager’s Commentary | | Series Y |
| February 15, 2008 | | (Select 25 Series) |
Security Global Investors (SGI) acquired a proven investment team specializing in domestic growth equities. The new SGI growth team will begin managing assets of the Select 25 portfolio on February 1, 2008.
We believe that investing is a long-term pursuit that requires patience and a consistent approach. Dollar cost averaging is a sound way to build long-term value. We recognize there are many investment fund alternatives available today and thank you for your business and the confidence you place in us.
Sincerely,
Mark A. Mitchell, Portfolio Manager
| | |
| | Series Y |
| Performance Summary | | (Select 25 Series) |
| December 31, 2007 | | (unaudited) |
|
Series Y vs. Russell 1000 Growth Index |
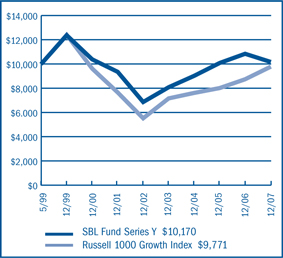
$10,000 Since Inception
The chart above assumes a hypothetical $10,000 investment in Series Y (Select 25 Series) on May 3, 1999 (date of inception), and reflects the fees and expenses of Series Y. The Russell 1000 Growth Index is an unmanaged capitalization-weighted index which includes stocks incorporated in the United States and its territories and measures the performance of the Russell 1000 companies with higher price-to-book ratios and higher forecasted growth values.
| | | | | | |
| Periods Ended 12-31-071 | | 1 Year | | 5 Years | | Since Inception (5-3-99) |
|
Series Y | | (6.18%) | | 8.19% | | 0.19% |
1 Performance figures do not reflect fees and expenses associated with an investment in variable insurance products offered by Security Benefit Life Insurance Company. If returns had taken into account these fees and expenses, performance would have been lower. Shares of a Series of SBL Fund are available only through the purchase of such products. The performance data quoted above represents past performance. Past performance is not predictive of future performance. The investment return and principal value of an investment will fluctuate so that an investor’s shares, when redeemed, may be worth more or less than their original cost. |
| | |
Portfolio Composition by Sector | | |
Consumer Discretionary | | 11.08% |
Consumer Staples | | 8.29 |
Energy | | 10.00 |
Financials | | 13.69 |
Health Care | | 12.42 |
Industrials | | 11.94 |
Information Technology | | 15.15 |
Materials | | 1.59 |
Exchange Traded Funds | | 8.91 |
Commercial Paper | | 4.97 |
Repurchase Agreement | | 0.32 |
U.S. Government Sponsored Agencies | | 1.66 |
Liabilities in Excess of Other Assets | | (0.02) |
Total Net Assets | | 100.00% |
| | | |
| | |
| 156 | | The accompanying notes are an integral part of the financial statements |
| | |
| | Series Y |
| Performance Summary | | (Select 25 Series) |
| December 31, 2007 | | (unaudited) |
Information About Your Series Expenses
Calculating your ongoing Series expenses
Example
As a shareholder of the Series, you incur ongoing costs, including management fees and other series expenses. Performance figures and expense ratios do not reflect fees and expenses associated with an investment in variable insurance products. Shares of a Series of SBL Fund are available only through the purchase of such products. This example is intended to help you understand your ongoing costs (in dollars) of investing in the Series and to compare these costs with ongoing costs of investing in other mutual funds. The example is based on an investment of $1,000 invested at the beginning of the period and held for the entire period, July 1, 2007 through December 31, 2007.
Actual Expenses
The first line in the table provides information about actual account values and actual expenses. You may use the information in this table, together with the amount you invested, to estimate the expenses that you paid over the period. Simply divide your account value by $1,000 (for example, an $8,600 account value divided by $1,000 = 8.6), then multiply the result by the number in the table under the heading entitled “Expenses Paid During the Period” to estimate the expenses you paid on your account during this period.
Hypothetical Example for Comparison Purposes
The second line in the table provides information about hypothetical account values and hypothetical expenses based on the Series actual expense ratio and an assumed rate of return of 5% per year before expenses, which is not the Series actual return. The hypothetical account values and expenses may not be used to estimate the actual ending account balance or expenses you paid for the period. You may use this information to compare the ongoing costs of investing in the Series and other funds. To do so, compare this 5% hypothetical example with the 5% hypothetical examples that appear in the shareholder reports of the other mutual funds.
Please note that the expenses shown in the table are meant to highlight your ongoing costs only and do not reflect any fees and expenses associated with an investment in variable insurance products. Therefore, the second line is useful in comparing ongoing costs only, and will not help you determine the relative total costs of owning different funds. In addition, if these fees and expenses associated with an investment in variable insurance products were included, your costs would have been higher.
| | | | | | | | | |
Series Expenses | | | | | | | | | |
| | | Beginning
Account
Value
7/1/2007 | | Ending
Account
Value
12/31/20071 | | Expenses
Paid
During
Period2 |
Series Y (Select 25 Series) |
Actual | | $ | 1,000.00 | | $ | 910.47 | | $ | 4.57 |
Hypothetical | | | 1,000.00 | | | 1,020.42 | | | 4.84 |
1 The actual ending account value is based on the actual total return of the Series for the period July 1, 2007 to December 31, 2007 after actual expenses and will differ from the hypothetical ending account value which is based on the Series expense ratio and a hypothetical annual return of 5% before expenses. The actual cumulative return at net asset value for the period July 1, 2007 to December 31, 2007 was (8.95%).
2 Expenses are equal to the Series annualized expense ratio of 0.94%, net of any applicable fee waivers or earnings credits, multiplied by the average account value over the period, multiplied by 184/365 (to reflect the one-half year period)
| | |
| | |
| Schedule of Investments | | Series Y (Select 25 Series) |
| December 31, 2007 | | |
| | | | | |
| | | Shares | | Value |
COMMON STOCK - 93.1% | | | | | |
Air Freight & Logistics - 4.8% | | | | | |
FedEx Corporation | | 35,600 | | $ | 3,174,452 |
| | | | | |
| | |
Broadcasting & Cable TV - 1.7% | | | | | |
CBS Corporation (CI.B) | | 40,300 | | | 1,098,175 |
| | | | | |
| | |
Coal & Consumable Fuels - 0.4% | | | | | |
Evergreen Energy, Inc. * | | 125,500 | | | 279,865 |
| | | | | |
| | |
Communications Equipment - 7.2% | | | | | |
ADC Telecommunications, Inc. * | | 155,070 | | | 2,411,338 |
Cisco Systems, Inc. * | | 86,800 | | | 2,349,676 |
| | | | | |
| | | | | 4,761,014 |
| | | | | |
Consumer Finance - 6.8% | | | | | |
American Express Company | | 32,600 | | | 1,695,852 |
Capital One Financial Corporation | | 42,100 | | | 1,989,646 |
First Marblehead Corporation | | 52,700 | | | 806,310 |
| | | | | |
| | | | | 4,491,808 |
| | | | | |
Data Processing & Outsourced Services - 4.1% | | | | | |
Western Union Company | | 113,300 | | | 2,750,924 |
| | | | | |
| | |
Exchange Traded Funds - 8.9% iShares Russell 1000 Growth Index Fund | | 50,000 | | | 3,045,500 |
iShares S&P 500 Growth Index Fund | | 41,000 | | | 2,865,900 |
| | | | | |
| | | | | 5,911,400 |
| | | | | |
Home Improvement Retail - 4.7% | | | | | |
Home Depot, Inc. | | 115,800 | | | 3,119,652 |
| | | | | |
| | |
Hotels, Resorts & Cruise Lines - 3.4% | | | | | |
Carnival Corporation | | 50,700 | | | 2,255,643 |
| | | | | |
| | |
Hypermarkets & Super Centers - 5.3% | | | | | |
Wal-Mart Stores, Inc. | | 74,000 | | | 3,517,220 |
| | | | | |
| | |
Industrial Gases - 1.6% | | | | | |
Praxair, Inc. | | 11,900 | | | 1,055,649 |
| | | | | |
| | |
Life Sciences Tools & Services -6.7% | | | | | |
Covance, Inc. * | | 51,600 | | | 4,469,592 |
| | | | | |
| | |
Movies & Entertainment - 1.3% | | | | | |
Viacom, Inc. (CI.B) * | | 20,000 | | | 878,400 |
| | | | | |
| | |
Multi-Line Insurance - 6.2% | | | | | |
American International Group, Inc. | | 71,000 | | | 4,139,300 |
| | | | | |
| | |
Oil & Gas Equipment & Services - 4.4% | | | | | |
Baker Hughes, Inc. | | 6,200 | | | 502,820 |
BJ Services Company | | 98,600 | | | 2,392,036 |
| | | | | |
| | | | | 2,894,856 |
| | | | | |
Oil & Gas Storage &
Transportation - 5.2% | | | | | |
Williams Companies, Inc. | | 96,800 | | | 3,463,504 |
| | | | | |
| | | | | |
| | | Shares | | Value |
COMMON STOCK (continued) | | | | | |
Other Diversified Financial Services - 0.7% | | | | | |
Citigroup, Inc. | | 15,400 | | $ | 453,376 |
| | | | | |
| | |
Pharmaceuticals - 5.7% | | | | | |
Johnson & Johnson | | 56,500 | | | 3,768,550 |
| | | | | |
| | |
Soft Drinks - 3.0% | | | | | |
PepsiCo, Inc. | | 26,100 | | | 1,980,990 |
| | | | | |
| | |
Systems Software - 3.8% | | | | | |
Microsoft Corporation | | 70,800 | | | 2,520,480 |
| | | | | |
| | |
Trading Companies & Distributors - 7.2% | | | | | |
W.W. Grainger, Inc. | | 54,200 | | | 4,743,584 |
TOTAL COMMON STOCK (Cost $59,990,979) | | | | $ | 61,728,434 |
| | | | | | | |
| | | Principal
Amount | | Value | |
|
U.S GOVERNMENT SPONSORED AGENCY BONDS & NOTES - 1.6% | |
Federal Home Loan Bank 4.24% - 2008 | | $ | 1,100,000 | | | 1,099,741 | |
TOTAL U.S. GOVERNMENT SPONSORED AGENCY BONDS & NOTES (Cost $1,099,741) | | | | | $ | 1,099,741 | |
COMMERCIAL PAPER - 5.0% | | | | | | | |
Banking - 2.7% | | | | | | | |
Wells Fargo & Company, Inc. 4.25%, 1/9/2008 | | | 1,800,000 | | | 1,798,300 | |
| | | | | | | |
Financial Companies - Captive - 2.3% | | | | | | | |
Caterpillar Financial Services Corporation 4.25%, 1/7/2008 | | | 1,500,000 | | | 1,498,938 | |
TOTAL COMMERCIAL PAPER (Cost $3,297,238) | | $ | 3,297,238 | |
REPURCHASE AGREEMENT - 0.39% | | | | | | | |
United Missouri Bank, 3.61%, dated 12/31/07, matures 1/02/08; repurchase amount $211,042 (Collateralized by FHLB Discount Note, 1/12/08 with a value of $215,718) | | $ | 211,000 | | $ | 211,000 | |
TOTAL REPURCHASE AGREEMENT (Cost $211,000) | | $ | 211,000 | |
Total Investments (SBL Y Fund) | | | | | | 66,336,413 | |
(Cost $64,598,958) - 100.0% Liabilities in Excess of Other Assets - 0.0% | | | | | | (13,355 | ) |
| | | | | | | |
TOTAL NET ASSETS - 100.0% | | | | | | 66,323,058 | |
| | | | | | | |
Footnotes
Percentages are stated as a percent of net assets. For federal income tax purposes the identified cost of investments owned at 12/31/2007 was $64,980,964.
| * | -Non-income producing security |
| | |
| 158 | | The accompanying notes are an integral part of the financial statements |
| | |
| | |
| Schedule of Investments | | Series Y (Select 25 Series) |
| December 31, 2007—continued | | |
Glossary:
| FHLB | - Federal Home Loan Bank |
See notes to financial statements.
| | |
| 159 | | The accompanying notes are an integral part of the financial statements |
| | |
| | |
| | Series Y |
| | (Select 25 Series) |
Statement of Assets and Liabilities
December 31, 2007
| | | | |
Assets: | | | | |
Investments, at value* | | $ | 66,336,413 | |
Cash | | | 507 | |
Receivables: | | | | |
Fund shares sold | | | 58,246 | |
Securities sold | | | 62,992 | |
Dividends | | | 44,632 | |
Prepaid expenses | | | 1,473 | |
| | | | |
Total assets | | | 66,504,263 | |
| | | | |
Liabilities: | | | | |
Payable for: | | | | |
Fund shares redeemed | | | 113,485 | |
Management fees | | | 42,958 | |
Administration fees | | | 5,531 | |
Transfer agent/maintenance fees | | | 2,083 | |
Custodian fees | | | 2,400 | |
Directors’ fees | | | 1,027 | |
Professional fees | | | 10,550 | |
Other fees | | | 3,171 | |
| | | | |
Total liabilities | | | 181,205 | |
| | | | |
Net assets | | $ | 66,323,058 | |
| | | | |
Net assets consist of: | | | | |
Paid in capital | | $ | 91,090,256 | |
Undistributed net investment income | | | 399,716 | |
Accumulated net realized loss on sale of investments | | | (26,904,369 | ) |
Net unrealized appreciation in value of investments | | | 1,737,455 | |
| | | | |
Net assets | | $ | 66,323,058 | |
| | | | |
| |
Capital shares authorized | | | unlimited | |
Capital shares outstanding | | | 6,518,607 | |
Net asset value per share (net assets divided by shares outstanding) | | $ | 10.17 | |
| | | | |
| |
*Investments, at cost | | $ | 64,598,958 | |
Statement of Operations
For Year Ended December 31, 2007
| | | | |
Investment Income: | | | | |
Dividends | | $ | 891,087 | |
Interest | | | 228,999 | |
| | | | |
Total investment income | | | 1,120,086 | |
| | | | |
| |
Expenses: | | | | |
Management fees | | | 584,431 | |
Administration fees | | | 74,463 | |
Transfer agent/maintenance fees | | | 25,167 | |
Custodian fees | | | 7,817 | |
Directors’ fees | | | 4,756 | |
Professional fees | | | 11,769 | |
Reports to shareholders | | | 7,663 | |
Other | | | 4,304 | |
| | | | |
Total expenses | | | 720,370 | |
| | | | |
Net investment income | | | 399,716 | |
| | | | |
| |
Net Realized and Unrealized Gain (Loss): | | | | |
Net realized gain (loss) during the year on: | | | | |
Investments | | | 6,212,479 | |
| | | | |
Net realized gain | | | 6,212,479 | |
| | | | |
| |
Net unrealized appreciation (depreciation)during the year on: | | | | |
Investments | | | (11,326,717 | ) |
Options written | | | 192,634 | |
| | | | |
Net unrealized depreciation | | | (11,134,083 | ) |
| | | | |
Net realized and unrealized loss | | | (4,921,604 | ) |
| | | | |
Net decrease in net assets resulting from operations | | $ | (4,521,888 | ) |
| | | | |
| | |
| 160 | | The accompanying notes are an integral part of the financial statements |
| | |
| | |
| | Series Y |
| Statement of Changes in Net Assets | | (Select 25 Series) |
| | | | | | | | |
| | | Year Ended
December 31, 2007 | | | Year Ended
December 31, 2006 | |
Increase (decrease) in net assets from operations: | | | | | | | | |
Net investment income | | $ | 399,716 | | | $ | 140,430 | |
Net realized gain during the year on investments | | | 6,212,479 | | | | 3,857,230 | |
Net unrealized appreciation (depreciation) during the year on investments | | | (11,134,083 | ) | | | 5,517,073 | |
| | | | | | | | |
Net increase (decrease) in net assets resulting from operations | | | (4,521,888 | ) | | | 9,514,733 | |
| | | | | | | | |
| | |
Capital share transactions: | | | | | | | | |
Proceeds from sale of shares | | | 21,451,748 | | | | 37,946,575 | |
Issuance of shares in connection with merger (Note 11) | | | – | | | | 42,870,151 | |
Cost of shares redeemed | | | (36,301,850 | ) | | | (41,654,270 | ) |
| | | | | | | | |
Net increase (decrease) from capital share transactions | | | (14,850,102 | ) | | | 39,162,456 | |
| | | | | | | | |
Net increase (decrease) in net assets | | | (19,371,990 | ) | | | 48,677,189 | |
| | | | | | | | |
| | |
Net assets: | | | | | | | | |
Beginning of year | | | 85,695,048 | | | | 37,017,859 | |
| | | | | | | | |
End of year | | $ | 66,323,058 | | | $ | 85,695,048 | |
| | | | | | | | |
| | |
Undistributed net investment income at end of year | | $ | 399,716 | | | $ | 140,430 | |
| | | | | | | | |
| | |
Capital share activity: | | | | | | | | |
Shares sold | | | 1,955,454 | | | | 3,680,058 | |
Shares issued in connection with merger (Note 11) | | | – | | | | 4,606,863 | |
Shares redeemed | | | (3,342,541 | ) | | | (4,055,072 | ) |
| | | | | | | | |
Total capital share activity | | | (1,387,087 | ) | | | 4,231,849 | |
| | | | | | | | |
| | |
| 161 | | The accompanying notes are an integral part of the financial statements |
| | | | |
| | | | |
| Financial Highlights | | | | Series Y |
| Selected data for each share of capital stock outstanding throughout each year | | (Series 25 Series) |
| | | | | | | | | | | |
| | | 2007 | | 2006 | a | | 2005 | | 2004 | | Year Ended
December 31,
2003 |
Per Share Data | | | | | | | | | | | |
Net asset value, beginning of period | | $10.84 | | $10.08 | | | $9.02 | | $8.08 | | $6.86 |
| |
Income (loss) from investment operations: | | | | | | | | | | | |
Net investment income (loss)b | | 0.06 | | 0.02 | | | – | | (0.01) | | – |
Net gain (loss) on securities (realized and unrealized) | | (0.73) | | 0.74 | | | 1.06 | | 0.95 | | 1.22 |
| | |
Total from investment operations | | (0.67) | | 0.76 | | | 1.06 | | 0.94 | | 1.22 |
| |
Net asset value, end of period | | $10.17 | | $10.84 | | | $10.08 | | $9.02 | | $8.08 |
| | |
| | | | | | | | | | | |
Total Returnc | | (6.18%) | | 7.54% | | | 11.75% | | 11.63% | | 17.78% |
Ratios/Supplemental Data | | | | | | | | | | | |
Net assets, end of period (in thousands) | | $66,323 | | $85,695 | | | $37,018 | | $33,832 | | $34,790 |
Ratios to average net assets: | | | | | | | | | | | |
Net investment income (loss) | | 0.51% | | 0.21% | | | (0.04%) | | (0.15%) | | (0.01%) |
Total expensesd | | 0.93% | | 0.95% | | | 0.99% | | 0.95% | | 0.93% |
Net expensese | | 0.93% | | 0.95% | | | 0.99% | | 0.95% | | 0.93% |
| |
Portfolio turnover rate | | 16% | | 40% | | | 28% | | 42% | | 49% |
a The financial highlights for Series Y exclude the historical financial highlights of Series G. The assets of Series G were acquired by Series Y on June 16, 2006. A total of $40,543,215 was excluded from purchases in the portfolio turnover calculation, which represents the cost of the securities Series Y received as a result of the merger.
b Net investment income (loss) was computed using average shares outstanding throughout the period.
c Total return does not take into account any of the expenses associated with an investment in variable insurance products offered by Security Benefit Life Insurance Company. If total return had taken into account these expenses, performance would have been lower. Shares of a series of SBL Fund are available only through the purchase of such products.
d Total expense information reflects the expense ratios absent expense reductions by the Investment Manager, and earnings credits, as applicable.
e Net expense information reflects the expense ratios after voluntary expense waivers, reimbursements and custodian earnings credits, as applicable.
| | |
| 162 | | The accompanying notes are an integral part of the financial statements |
This page left blank intentionally.
| | |
| | |
| Managers’ Commentary | | Series Z |
| February 15, 2008 | | (Alpha Opportunity Series) |


To Our Shareholders:
For the year ended December 31, 2007, Series Z of the SBL Fund - Alpha Opportunity Series total return was 18.19%, besting its benchmark, the S&P 500 Index, by more than 1,270 basis points, which returned 5.49%. The performance of the portfolio more than doubled that of other long/short equity managers when using the Credit Suisse/Tremont Log/Short Equity Index for the same period. Enhanced results versus other long/short managers were due to the relatively low level of short positions in the portfolio for most of the year.
The Series’ strategy is to invest approximately 50% of its total assets according to a long/short strategy and 50% of its total assets in a portfolio of equity securities, equity derivatives, and fixed income securities with the intention of tracking the performance of the S&P 500 Index.
The fundamental investment philosophy of the active value strategy rests first upon the belief that it is critical to identify the long-term investment theme governing the equity markets. These themes may persist for 15 to 20 years.
Second, while we also believe that valuation adds important perspective to investment decisions, it is not an efficient means of timing purchase and sale decisions. We believe those decisions are best made using technical analysis. We believe technical analysis, the study of price trends, allows us to efficiently capture gains and avoid material losses.
The third tenet of our philosophy is that changes in stock prices lead changes in fundamental corporate developments. A proactive asset management approach helps to keep our investment themes fresh and our risk levels moderate.
Top Performers
The better performing sectors of the market in the fourth quarter included several consistent with our long-term themes: energy, materials, and technology (+32.4%, 20.0% and 15.5% respectively, based on the Index’s sector performance). During the year oil prices rose dramatically to new nominal highs, touching $100 a barrel, almost exceeding the inflation adjusted levels of $102.81 set in April 1980. Industry watchers have begun raising their estimates of average prices expected for 2008 to $80 a barrel and more. Schlumberger, the large oil services firm, was one of our best performers. In the materials sectors, gold rose to new highs in 2007, exceeding nominal levels set almost 30 years ago and agriculturally- related investments performed well. Potlash Corporation, a Canadian fertilizer company, was one of the better performers in that sector for the portfolio. Stocks within these theme sectors continue to have attractive fundamentals and reasonable valuations.
Disappointing Performers
Conversely, the financial and consumer durables sectors, proved to be the two worst performers in 2007 with declines of -20.8% and -14.3% respectively, based on the Index’s sector performance. These two broad sectors constitute almost 28% of the Index. Fortunately, not only did we have little exposure to either, we took advantage of their weakness to short stocks in the sectors. The financial sector, particularly the banks and brokerage houses, continue to labor under the weight of the sub-prime mortgage debacle here in the United States. New revelations of further write-offs persist and are likely to continue into the first half of 2008. Those with good credit are likely to be more cautious in their borrowing. When they do borrow, there will be more scrutiny by lenders. As in the latter part of 4th quarter of 2007, we may be increasingly active on the short side of the strategy in 2008.
| | |
| | |
| Managers’ Commentary | | Series Z |
| February 15, 2008 | | (Alpha Opportunity Series) |
2008 Market Outlook
On balance, we remain generally positive in our outlook for the World’s equity markets in 2008. However, with the world economy slowing and inflation inching up, it is easy to be pessimistic. Fundamentally, market weakness in the second half of 2007 was the result of difficulties in the sub-prime mortgage market and related credit market concerns. Although investors should expect more bad news regarding the issue, we believe the Federal Reserve and U.S. Treasury will continue taking steps to soften the impact on the U.S. consumer and financial institutions.
Valuation levels for the equity markets overall, and most sectors within them, appear to be attractive to fair. Many investors are expecting a modest return for U.S. equities in 2008. We would agree.
We feel the stage has been set to make profitable short transactions in select industries within the broader financial and consumer durables sectors. Price strength in both areas may present further shorting opportunities. In the long portion of our portfolio, we will continue to seek opportunities in the energy, materials, industrials and technology sectors.
We appreciate your business and the confidence you place in us.
Sincerely,
Mark Lamb
Co-Portfolio Manager
Security Global Investors
William H. Jenkins
Mainstream Investment Advisers, LLC
(Sub-adviser for the active value portion of the Series)
| | |
| | Series Z |
| Performance Summary | | (Alpha Opportunity Series) |
| December 31, 2007 | | (unaudited) |
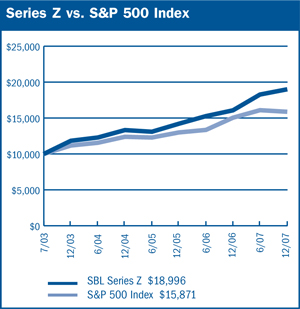
$10,000 Since Inception
The chart above assumes a hypothetical $10,000 investment in Series Z (Alpha Opportunity Series) on July 7, 2003 (date of inception), and reflects the fees and expenses of Series Z. The S&P 500 Index is a capitalization weighted index composed of 500 selected common stocks that represent the broad domestic economy and is a widely recognized unmanaged index of market performance.
| | | | |
Average Annual Returns |
| | | |
| Periods Ended 12-31-071 | | 1 Year | | Since Inception (7-7-03) |
|
Series Z | | 18.19% | | 15.38% |
1 Performance figures do not reflect fees and expenses associated with an investment in variable insurance products offered by Security Benefit Life Insurance Company. If returns had taken into account these fees and expenses, performance would have been lower. Shares of a Series of SBL Fund are available only through the purchase of such products. The performance data quoted above represents past performance. Past performance is not predictive of future performance. The investment return and principal value of an investment will fluctuate so that an investor’s shares, when redeemed, may be worth more or less than their original cost. |
| | | |
Portfolio Composition by Sector* | | | |
Consumer Discretionary | | (0.58 | )% |
Consumer Staples | | 2.59 | |
Energy | | 11.29 | |
Financials | | 6.51 | |
Health Care | | 0.60 | |
Industrials | | 14.76 | |
Information Technology | | 5.22 | |
Materials | | 4.24 | |
Utilities | | 1.35 | |
Exchange Traded Funds | | (0.47 | ) |
U.S. Government Sponsored Agencies | | 38.98 | |
Repurchase Agreement | | 2.15 | |
Other Assets in Excess of Liabilities | | 13.36 | |
Total Net Assets | | 100.00 | % |
| | | | |
| | | | |
| * | Securities sold short are netted with long positions in common stocks in the appropriate sectors. |
| | |
| 166 | | The accompanying notes are an integral part of the financial statements |
| | |
| | Series Z |
| Performance Summary | | (Alpha Opportunity Series) |
| December 31, 2007 | | (unaudited) |
Information About Your Series Expenses
Calculating your ongoing Series expenses
Example
As a shareholder of the Series, you incur ongoing costs, including management fees and other series expenses. Performance figures and expense ratios do not reflect fees and expenses associated with an investment in variable insurance products. Shares of a Series of SBL Fund are available only through the purchase of such products. This example is intended to help you understand your ongoing costs (in dollars) of investing in the Series and to compare these costs with ongoing costs of investing in other mutual funds. The example is based on an investment of $1,000 invested at the beginning of the period and held for the entire period, July 1, 2007 through December 31, 2007.
Actual Expenses
The first line in the table provides information about actual account values and actual expenses. You may use the information in this table, together with the amount you invested, to estimate the expenses that you paid over the period. Simply divide your account value by $1,000 (for example, an $8,600 account value divided by $1,000 = 8.6), then multiply the result by the number in the table under the heading entitled “Expenses Paid During the Period” to estimate the expenses you paid on your account during this period.
Hypothetical Example for Comparison Purposes
The second line in the table provides information about hypothetical account values and hypothetical expenses based on the Series actual expense ratio and an assumed rate of return of 5% per year before expenses, which is not the Series actual return. The hypothetical account values and expenses may not be used to estimate the actual ending account balance or expenses
you paid for the period. You may use this information to compare the ongoing costs of investing in the Series and other funds. To do so, compare this 5% hypothetical example with the 5% hypothetical examples that appear in the shareholder reports of the other mutual funds.
Please note that the expenses shown in the table are meant to highlight your ongoing costs only and do not reflect any fees and expenses associated with an investment in variable insurance products. Therefore, the second line is useful in comparing ongoing costs only, and will not help you determine the relative total costs of owning different funds. In addition, if these fees and expenses associated with an investment in variable insurance products were included, your costs would have been higher.
| | | | | | | | | |
Series Expenses | | | | | | | | | |
| | | Beginning
Account
Value
7/1/2007 | | Ending
Account Value
12/31/20071 | | Expenses
Paid
During
Period2 |
Series Z (Alpha Opportunity Series) |
Actual | | $ | 1,000.00 | | $ | 1,039.70 | | $ | 12.90 |
Hypothetical | | | 1,000.00 | | | 1,012.55 | | | 12.73 |
1 The actual ending account value is based on the actual total return of the Series for the period July 1, 2007 to December 31, 2007 after actual expenses and will differ from the hypothetical ending account value which is based on the Series expense ratio and a hypothetical annual return of 5% before expenses. The actual cumulative return at net asset value for the period July 1, 2007 to December 31, 2007 was 3.97%.
2 Expenses are equal to the Series annualized expense ratio of 2.51%, net of any applicable fee waivers or earnings credits, multiplied by the average account value over the period, multiplied by 184/365 (to reflect the one-half year period)
| | |
| | |
| Schedule of Investments | | Series Z (Alpha Opportunity Series) |
| December 31, 2007 | | |
| | | | | |
| | | Shares | | Value |
COMMON STOCK - 51.6% | | | | | |
Aerospace & Defense - 0.2% | | | | | |
Hexcel Corporation * | | 4,152 | | $ | 100,811 |
| | | | | |
| | |
Agricultural Products - 1.8% | | | | | |
Bunge, Ltd. (1) | | 7,672 | | | 893,098 |
| | | | | |
| | |
Airlines - 1.1% | | | | | |
Allegiant Travel Company * | | 4,994 | | | 160,507 |
Delta Air Lines, Inc. * | | 9,617 | | | 143,197 |
Northwest Airlines Corporation * | | 17,301 | | | 251,038 |
| | | | | |
| | | | | 554,742 |
| | | | | |
Apparel Retail - 0.3% | | | | | |
Urban Outfitters, Inc. * | | 6,228 | | | 169,775 |
| | | | | |
| | |
Asset Management & Custody Banks - 2.8% | | | | | |
Bank of New York Mellon Corporation | | 9,808 | | | 478,238 |
Northern Trust Corporation | | 5,576 | | | 427,010 |
State Street Corporation | | 5,606 | | | 455,207 |
| | | | | |
| | | | | 1,360,455 |
| | | | | |
Auto Parts & Equipment - 0.1% | | | | | |
WABCO Holdings, Inc. | | 1,384 | | | 69,325 |
| | | | | |
| | |
Biotechnology - 0.7% | | | | | |
Genzyme Corporation * | | 4,884 | | | 363,565 |
| | | | | |
| | |
Coal & Consumable Fuels - 0.4% | | | | | |
International Coal Group, Inc. * | | 28,151 | | | 150,889 |
Peabody Energy Corporation | | 692 | | | 42,655 |
| | | | | |
| | | | | 193,544 |
| | | | | |
Communications Equipment - 1.2% | | | | | |
Black Box Corporation | | 9,968 | | | 360,543 |
Research In Motion, Ltd. * | | 2,006 | | | 227,480 |
| | | | | |
| | | | | 588,023 |
| | | | | |
Computer Hardware - 0.9% | | | | | |
Hewlett-Packard Company | | 8,614 | | | 434,835 |
| | | | | |
| | |
Construction & Engineering - 1.8% | | | | | |
Foster Wheeler, Ltd. * (1) | | 4,854 | | | 752,467 |
Jacobs Engineering Group, Inc. * | | 1,404 | | | 134,236 |
| | | | | |
| | | | | 886,703 |
| | | | | |
Construction & Farm Machinery & Heavy Trucks - 1.1% | | | | | |
AGCO Corporation * | | 4,182 | | | 284,292 |
CNH Global N.V. | | 3,881 | | | 255,448 |
| | | | | |
| | | | | 539,740 |
| | | | | |
Diversified Banks - 0.3% | | | | | |
Banco Bradesco S.A. ADR | | 5,014 | | | 160,448 |
| | | | | |
| | |
Diversified Chemicals - 0.4% | | | | | |
FMC Corporation | | 3,551 | | | 193,707 |
| | | | | |
| | | | | |
| | | Shares | | Value |
COMMON STOCK (continued) | | | | | |
Diversified Commercial & Professional | | | | | |
Services - 0.2% | | | | | |
Pike Electric Corporation * | | 5,415 | | $ | 90,755 |
| | | | | |
| | |
Diversified Metals & Mining - 1.7% | | | | | |
Anglo American plc ADR | | 3,009 | | | 91,383 |
Fording Canadian Coal Trust | | 2,507 | | | 96,770 |
Freeport-McMoRan Copper & | | | | | |
Gold, Inc. (CI.B) | | 2,076 | | | 212,666 |
General Moly, Inc. * | | 2,366 | | | 27,611 |
Rio Tinto plc ADR | | 1,011 | | | 424,519 |
| | | | | |
| | | | | 852,949 |
| | | | | |
| | |
Electrical Components & | | | | | |
Equipment - 4.3% | | | | | |
American Superconductor Corporation * | | 2,808 | | | 76,771 |
Ametek, Inc. | | 2,076 | | | 97,240 |
Cooper Industries, Ltd. | | 1,384 | | | 73,186 |
Emerson Electric Company | | 2,798 | | | 158,535 |
FuelCell Energy, Inc. * | | 3,460 | | | 34,323 |
General Cable Corporation * | | 4,255 | | | 311,806 |
GrafTech International, Ltd. * | | 14,113 | | | 250,506 |
Powell Industries, Inc. * | | 9,356 | | | 412,319 |
Rockwell Automation, Inc. | | 4,302 | | | 296,666 |
Sunpower Corporation * | | 2,799 | | | 364,961 |
| | | | | |
| | | | | 2,076,313 |
| | | | | |
| | |
Electronic Equipment Manufacturers - 0.4% | | | | | |
Amphenol Corporation | | 2,798 | | | 129,743 |
Rofin-Sinar Technologies, Inc. * | | 1,384 | | | 66,584 |
| | | | | |
| | | | | 196,327 |
| | | | | |
| | |
Exchange Traded Funds -0.7% | | | | | |
iShares MSCI Taiwan Index Fund | | 2,966 | | | 44,668 |
iShares Silver Trust * | | 692 | | | 101,551 |
SPDR S&P Metals & Mining ETF | | 2,768 | | | 192,708 |
| | | | | |
| | | | | 338,927 |
| | | | | |
| | |
Fertilizers & Agricultural Chemicals - 0.3% | | | | | |
Sociedad Quimica y Minera de Chile S.A. ADR | | 752 | | | 132,916 |
| | | | | |
| | |
Food Distributors - 0.1% | | | | | |
Andersons, Inc. | | 738 | | | 33,062 |
Zhongpin, Inc. * | | 1,384 | | | 18,020 |
| | | | | |
| | | | | 51,082 |
| | | | | |
Gold -0.1% | | | | | |
Yamana Gold, Inc. | | 5,014 | | | 64,881 |
| | | | | |
| | |
Heavy Electrical Equipment - 1.2% | | | | | |
ABB, Ltd. ADR | | 20,056 | | | 577,613 |
| | | | | |
| | |
Hypermarkets & Super Centers - 0.7% | | | | | |
BJ’s Wholesale Club, Inc. * | | 9,827 | | | 332,447 |
| | | | | |
| | |
| 168 | | The accompanying notes are an integral part of the financial statements |
| | |
| | |
| Schedule of Investments | | Series Z (Alpha Opportunity Series) |
| December 31, 2007 - continued | | |
| | | | | |
| | | Shares | | Value |
COMMON STOCK (continued) | | | | | |
Independent Power Producers & Energy | | | | | |
Traders - 1.3% | | | | | |
AES Corporation * | | 13,970 | | $ | 298,818 |
Ormat Technologies, Inc. | | 6,538 | | | 359,656 |
| | | | | |
| | | | | 658,474 |
| | | | | |
| | | | | |
Industrial Conglomerates - 1.1% | | | | | |
McDermott International, Inc. * | | 4,172 | | | 246,273 |
Textron, Inc. | | 2,768 | | | 197,358 |
Walter Industries, Inc. | | 2,076 | | | 74,591 |
| | | | | |
| | | | | 518,222 |
| | | | | |
| | | | | |
Industrial Machinery - 3.0% | | | | | |
Donaldson Company, Inc. | | 3,055 | | | 141,691 |
Flowserve Corporation | | 4,884 | | | 469,841 |
Harsco Corporation | | 4,292 | | | 274,988 |
SPX Corporation | | 5,655 | | | 581,617 |
| | | | | |
| | | | | 1,468,137 |
| | | | | |
| | | | | |
Integrated Oil & Gas - 0.9% | | | | | |
Petroleo Brasileiro S.A. ADR | | 3,510 | | | 404,492 |
Sasol, Ltd. ADR | | 1,008 | | | 49,866 |
| | | | | |
| | | | | 454,358 |
| | | | | |
| | | | | |
Internet Software & Services - 3.0% | | | | | |
Google, Inc. * (1) | | 2,106 | | | 1,456,257 |
| | | | | |
| | | | | |
Investment Banking & Brokerage - 1.1% | | | | | |
Charles Schwab Corporation | | 16,065 | | | 410,461 |
Raymond James Financial, Inc. | | 3,480 | | | 113,657 |
| | | | | |
| | | | | 524,118 |
| | | | | |
| | | | | |
IT Consulting & Other Services - 0.0% | | | | | |
EnerNOC, Inc. * | | 307 | | | 15,074 |
| | | | | |
| | |
Marine - 0.3% | | | | | |
Kirby Corporation * | | 3,520 | | | 163,610 |
| | | | | |
| | | | | |
Metal & Glass Containers - 0.5% | | | | | |
Crown Holdings, Inc. * | | 2,076 | | | 53,249 |
Owens-Illinois, Inc. * | | 3,460 | | | 171,270 |
| | | | | |
| | | | | 224,519 |
| | | | | |
| | | | | |
Multi-Line Insurance - 0.9% | | | | | |
Assurant, Inc. | | 6,859 | | | 458,867 |
| | | | | |
| | | | | |
Oil & Gas Drilling - 0.6% | | | | | |
Noble Corporation | | 4,914 | | | 277,690 |
| | | | | |
| | | | | |
Oil & Gas Equipment & Services - 4.8% | | | | | |
Cameron International Corporation * | | 8,404 | | | 404,485 |
Dril-Quip, Inc. * | | 3,517 | | | 195,756 |
Hornbeck Offshore Services, Inc. * | | 7,261 | | | 326,382 |
National Oilwell Varco, Inc. * | | 4,152 | | | 305,006 |
Schlumberger, Ltd. | | 3,500 | | | 344,295 |
Willbros Group, Inc. * | | 19,635 | | | 751,824 |
| | | | | |
| | | | | 2,327,748 |
| | | | | |
| | | | | |
| | | | | | |
| | | Shares | | Value |
COMMON STOCK (continued) | | | | | | |
Oil & Gas Exploration & Production - 3.9% | | | | | | |
Apache Corporation (1) | | | 11,231 | | $ | 1,207,782 |
Denbury Resources, Inc. * | | | 10,028 | | | 298,333 |
Harvest Natural Resources, Inc. * | | | 30,770 | | | 384,625 |
| | | | | | |
| | | | | | 1,890,740 |
| | | | | | |
Oil & Gas Storage & Transportation - 0.8% | | | | | | |
Williams Companies, Inc. | | | 10,480 | | | 374,974 |
| | | | | | |
| | |
Precious Metals & Minerals - 0.2% | | | | | | |
Coeur d’Alene Mines Corporation * | | | 1,977 | | | 9,766 |
Silver Wheaton Corporation * | | | 3,710 | | | 62,959 |
| | | | | | |
| | | | | | 72,725 |
| | | | | | |
Regional Banks - 0.1% | | | | | | |
BancorpSouth, Inc. | | | 1,384 | | | 32,676 |
| | | | | | |
| | |
Specialized REITs - 3.7% | | | | | | |
Plum Creek Timber Company, Inc. | | | 12,114 | | | 557,729 |
Potlatch Corporation | | | 14,060 | | | 624,826 |
Rayonier, Inc. | | | 13,327 | | | 629,567 |
| | | | | | |
| | | | | | 1,812,122 |
| | | | | | |
Specialty Chemicals - 0.9% | | | | | | |
OM Group, Inc. * | | | 4,362 | | | 250,990 |
Rohm & Haas Company | | | 3,460 | | | 183,622 |
| | | | | | |
| | | | | | 434,612 |
| | | | | | |
Steel - 0.8% | | | | | | |
Nucor Corporation | | | 2,076 | | | 122,941 |
Ternium S.A. ADR | | | 6,719 | | | 269,499 |
| | | | | | |
| | | | | | 392,440 |
| | | | | | |
Systems Software - 0.1% | | | | | | |
Aladdin Knowledge Systems, Ltd.* | | | 1,397 | | | 36,504 |
| | | | | | |
| | |
Trading Companies & Distributors - 0.8% | | | | | | |
UAP Holding Corporation | | | 9,827 | | | 379,322 |
TOTAL COMMON STOCK (Cost $25,108,093) | | | | | $ | 25,196,170 |
| | | Principal
Amount | | Value |
| U.S. GOVERNMENT SPONSORED AGENCY BONDS & NOTES - 39.0% | | | | | | |
Federal Home Loan Bank | | | | | | |
4.12% - 2008(1) | | $ | 850,000 | | | 843,692 |
4.25% - 2008 (1) | | | 450,000 | | | 446,044 |
4.275%- 2008 (1) | | | 150,000 | | | 149,279 |
4.29% - 2008 (1) | | | 222,000 | | | 220,577 |
4.30% - 2008 (1) | | | 500,000 | | | 499,102 |
4.32% - 2008 (1) | | | 400,000 | | | 398,627 |
4.35% - 2008 (2) | | | 1,100,000 | | | 1,097,484 |
Federal Home Loan Mortgage Corporation | | | | | | |
4.22% - 2008 (2) | | | 2,000,000 | | | 1,992,446 |
4.241% - 2008 (1) | | | 850,000 | | | 847,098 |
| | |
| 169 | | The accompanying notes are an integral part of the financial statements |
| | |
| | |
| Schedule of Invesments | | Series Z (Alpha Opportunity Series) |
| December 31, 2007 | | |
| | | | | | |
| | | Principal
Amount | | Value |
U.S. GOVERNMENT SPONSORED AGENCY BONDS & NOTES (continued) |
Federal Home Loan Mortgage Corporation (continued) | | | | | | |
4.30% - 2008 (1) | | $ | 650,000 | | $ | 648,137 |
4.32% - 2008 (1) | | | 675,000 | | | 671,292 |
4.57% - 2008 (1) | | | 30,000 | | | 29,961 |
4.61% - 2008 (1) | | | 635,000 | | | 634,655 |
Federal National Mortgage Association | | | | | | |
4.10% - 2008(1) | | | 800,000 | | | 795,330 |
4.14% - 2008(1) | | | 850,000 | | | 843,207 |
4.16% - 2008(1) | | | 975,000 | | | 966,652 |
4.19% - 2008(1) | | | 500,000 | | | 494,306 |
4.207% - 2008 (1) | | | 1,700,000 | | | 1,698,793 |
4.21% -2008(1) | | | 450,000 | | | 445,080 |
4.22% - 2008 (1) | | | 800,000 | | | 796,613 |
4.234% - 2008 (1) | | | 990,000 | | | 985,241 |
4.34% - 2008 (1) | | | 600,000 | | | 598,171 |
4.56% - 2008 (1) | | | 450,000 | | | 449,314 |
4.60% - 2008 (1) | | | 2,050,000 | | | 2,050,000 |
4.66% - 2008 (1) | | | 450,000 | | | 449,657 |
TOTAL U.S. GOVERNMENT SPONSORED AGENCY BONDS& NOTES | | $ | 19,050,758 |
(Cost $19,046,866) | | | | | | |
| | | | | | |
REPURCHASE AGREEMENT - 2.1% |
United Missouri Bank, 1.75%, dated 12/31/07, matures 1/02/08; repurchase amount $1,051,500 (Collateralized by FNMA Discount Note, 8/15/08 with a value of $1,076,617) | | $ | 1,051,3968 | | $ | 1,051,398 |
TOTAL REPURCHASE AGREEMENT (Cost $1,051,398) | | $ | 1,051,398 |
Total Investments (SBL Z Fund) | | | | | $ | 45,298,326 |
(Cost $45,206,357) - 92.7% Other Assets in Excess of Liabilities - 7.3% | | | | | | 3.570.868 |
| | | | | | |
TOTAL NET ASSETS - 100.0% | | | | | $ | 48,869,194 |
| | | | | | |
Schedule of Securities Sold Short
December 31, 2007
| | | | | |
| SBL Z FUND |
| | | Shares | | Value |
COMMON STOCK -(6.1)% | | | | | |
Department Stores - 0.0% | | | | | |
Nordstrom, Inc. | | (702) | | $ | (25,784) |
| | | | | |
| | |
Diversified Banks - (0.2)% | | | | | |
Comerica, Inc. | | (1,114) | | | (48,493) |
Wachovia Corporation | | (1,404) | | | (53,394) |
| | | | | |
| | | | | (101,887) |
| | | | | |
Diversified Chemicals - (0.6)% | | | | | |
E.I. Du Pont de Nemours & | | (1,114) | | | (49,116) |
| | | | | | | |
| | | Shares | | | Value | |
COMMON STOCK (continued) | | | | | | | |
Diversified Chemicals (continued) | | | | | | | |
PPG Industries, Inc. | | (3,510 | ) | | $ | (246,508 | ) |
| | | | | | | |
| | | | | | (295,624 | ) |
| | | | | | | |
Diversified Commercial & | | | | | | | |
Professional Services - (0.3)% | | | | | | | |
China Security & Surveillance | | (2,406 | ) | | | (144,601 | ) |
| | | | | | | |
| | |
Electronic Equipment Manufacturers - (0.2)% | | | | | | | |
Littelfuse, Inc. * | | (2,885 | ) | | | (95,090 | ) |
| | | | | | | |
| | |
Exchange Traded Funds - (1.2)% | | | | | | | |
Consumer Discretionary Select | | (702 | ) | | | (23,011 | ) |
Financial Select Sector SPDR Fund | | (2,106 | ) | | | (61,074 | ) |
KBW Bank ETF | | (2,808 | ) | | | (122,148 | ) |
Regional Bank HOLDRs Trust | | (2,738 | ) | | | (360,321 | ) |
| | | | | | | |
| | | | | | (566,554 | ) |
| | | | | | | |
Food Retail - 0.0% | | | | | | | |
Winn-Dixie Stores, Inc. * | | (557 | ) | | | (9,397 | ) |
| | | | | | | |
| | |
Health Care Technology - (0.1)% | | | | | | | |
Allscripts Healthcare Solutions, Inc. | | (2,227 | ) | | | (43,248 | ) |
| | | | | | | |
Homebuilding-(0.1)% | | | | | | | |
Toll Brothers, Inc. * | | (2,808 | ) | | | (56,328 | ) |
| | | | | | | |
| | |
Internet Retail - (0.1)% | | | | | | | |
IAC * | | (2,106 | ) | | | (56,694 | ) |
| | | | | | | |
| | |
Investment Banking & Brokerage - (1.0)% | | | | | | | |
Goldman Sachs Group, Inc. | | (702 | ) | | | (150,965 | ) |
KBW, Inc. * | | (557 | ) | | | (14,254 | ) |
Lehman Brothers Holdings, Inc. | | (2,772 | ) | | | (181,400 | ) |
Merrill Lynch & Company, Inc. | | (2,106 | ) | | | (113,050 | ) |
Morgan Stanley | | (557 | ) | | | (29,582 | ) |
| | | | | | | |
| | | | | | (489,251 | ) |
| | | | | | | |
Leisure Products - (0.2)% | | | | | | | |
MarineMax, Inc. * | | (1,572 | ) | | | (24,366 | ) |
Mattel, Inc. | | (3,261 | ) | | | (62,089 | ) |
| | | | | | | |
| | | | | | (86,455 | ) |
| | | | | | | |
| | |
Life & Health Insurance - (0.1)% | | | | | | | |
MetLife, Inc. | | (648 | ) | | | (39,930 | ) |
| | | | | | | |
| | |
Movies & Entertainment - (0.2)% | | | | | | | |
News Corporation | | (2,235 | ) | | | (45,795 | ) |
Walt Disney Company | | (1,114 | ) | | | (35,960 | ) |
| | | | | | | |
| | | | | | (81,755 | ) |
| | | | | | | |
Multi-Line Insurance - (0.3)% | | | | | | | |
American International Group, Inc. | | (2,227 | ) | | | (129,834 | ) |
| | | | | | | |
| | |
Other Diversified Financial | | | | | | | |
Services -(0.3)% | | | | | | | |
JPMorgan Chase & Company | | (3,341 | ) | | | (145,835 | ) |
| | | | | | | |
| | |
| 170 | | The accompanying notes are an integral part of the financial statements |
| | |
| | |
| Schedule of Investments | | Series Z (Alpha Opportunity Series) |
| December 31, 2007 - continued | | |
| | | | | | | |
| | | Shares | | | Value | |
| | |
COMMON STOCK (continued) | | | | | | | |
| | |
Pharmaceuticals - (0.1)% | | | | | | | |
Eli Lilly & Company | | (557 | ) | | $ | (29,738 | ) |
| | | | | | | |
| | |
Publishing - 0.0% | | | | | | | |
Gannett Company, Inc. | | (557 | ) | | | (21,723 | ) |
| | | | | | | |
| | |
Regional Banks - (0.1)% | | | | | | | |
Fifth Third Bancorp | | (548 | ) | | | (13,771 | ) |
Regions Financial Corporation | | (548 | ) | | | (12,960 | ) |
Susquehanna Bancshares, Inc. | | (557 | ) | | | (10,271 | ) |
Synovus Financial Corporation | | (557 | ) | | | (13,413 | ) |
| | | | | | | |
| | | | | | (50,415 | ) |
| | | | | | | |
| | |
Restaurants - (0.2)% | | | | | | | |
California Pizza Kitchen, Inc. * | | (3,986 | ) | | | (62,062 | ) |
Panera Bread Company * | | (1,643 | ) | | | (58,852 | ) |
| | | | | | | |
| | | | | | (120,914 | ) |
| | | | | | | |
| | |
Retail REITs - (0.4)% | | | | | | | |
Federal Realty Invs Trust | | (2,227 | ) | | | (182,948 | ) |
| | | | | | | |
| | |
Semiconductors - (0.2)% | | | | | | | |
National Semiconductor | | (3,510 | ) | | | (79,466 | ) |
| | | | | | | |
| | |
Specialty Stores - (0.1)% | | | | | | | |
Tiffany & Company | | (1,643 | ) | | | (75,627 | ) |
| | | | | | | |
| | |
Thrifts & Mortgage Finance - (0.1)% | | | | | | | |
BankUnited Financial Corporation | | (4,212 | ) | | | (29,063 | ) |
TOTAL COMMON STOCK (Proceeds $3,072,274) | | | | | $ | (2,958,161 | ) |
Total Securities Sold Short (SBL Z Fund) (Proceeds $3,072,274) | | | | | $ | (2,958,161 | ) |
| | | | | | | |
Footnotes
| Percentages | are stated as a percent of net assets. |
| For | federal income tax purposes the identified cost of investments owned at 12/31/2007 was $45,448,810. |
| | |
| * | | - Non-income producing security |
| 1 | | - Security is segregated as collateral for open futures contracts. |
| 2 | | - Security is segregated as collateral for snort positions. |
|
| Glossary: |
ADR | | - American Depositary Receipt |
FNMA | | - Federal National Mortgage Association |
plc | | - Public Limited Company |
| See notes to financial statements. |
| | |
| 171 | | The accompanying notes are an integral part of the financial statements |
| | |
| | |
| | Series Z (Alpha Opportunity Series) |
| | | |
Statement of Assets and Liabilities December 31, 2007 | |
| |
Assets: | | | |
Investments, at value* | | $45,298,326 | |
Cash | | 5,454,437 | |
Receivables: | | | |
Fund shares sold | | 119,073 | |
Securities sold | | 4,119,033 | |
Dividends | | 6,642 | |
Prepaid expenses | | 772 | |
| | | |
Total assets | | 54,998,283 | |
| | | |
Liabilities: | | | |
Common stock sold short, at value** | | 2,958,161 | |
| |
Payable for: | | | |
Fund shares redeemed | | 9,124 | |
Securities purchased | | 2,926,786 | |
Variation margin on futures | | 109,975 | |
Dividends on short sales | | 5,779 | |
Management fees | | 93,575 | |
Administration fees | | 7,191 | |
Transfer agent/maintenance fees | | 2,084 | |
Directors’ fees | | 500 | |
Professional fees | | 14,775 | |
Other fees | | 1,139 | |
| | | |
Total liabilities | | 6,129,089 | |
| | | |
Net assets | | $48,869,194 | |
| | | |
| |
Net assets consist of: | | | |
Paid in capital | | $42,648,682 | |
Undistributed net investment income | | 38,680 | |
Undistributed net realized gain on sale of investments | | 6,314,745 | |
Net unrealized depreciation in value of investments | | (132,913 | ) |
| | | |
Net assets | | $48,869,194 | |
| | | |
| |
Capital shares authorized | | unlimited | |
Capital shares outstanding | | 2,962,505 | |
Net asset value per share (net assets divided by shares outstanding) | | $16.50 | |
| | | |
| |
*Investments, at cost | | $45,206,357 | |
**Common stock sold short, at proceeds | | 3,072,274 | |
| | | | |
Statement of Operations For Year Ended December 31, 2007 | |
| |
Investment Income: | | | | |
Dividends | | $ | 167,364 | |
Interest | | | 839,640 | |
| | | | |
Total investment income | | | 1,007,004 | |
| | | | |
| |
Expenses: | | | | |
Management fees | | | 828,638 | |
Administration fees | | | 64,213 | |
Transfer agent/maintenance fees | | | 25,112 | |
Custodian fees | | | 45,537 | |
Directors’ fees | | | 2,532 | |
Professional fees | | | 17,688 | |
Reports to shareholders | | | 3,367 | |
Other | | | 1,468 | |
Dividends on short sales | | | 24,424 | |
| | | | |
Total expenses | | | 1,012,979 | |
Less: | | | | |
Earnings credits applied | | | (44,655 | ) |
| | | | |
Net expenses | | | 968,324 | |
| | | | |
Net investment income | | | 38,680 | |
| | | | |
| |
Net Realized and Unrealized Gain (Loss): | | | | |
Net realized gain (loss) during the year on: | | | | |
Investments | | | 6,194,911 | |
Securities sold short | | | 30,168 | |
Futures | | | 168,902 | |
| | | | |
Net realized gain | | | 6,393,981 | |
| | | | |
| |
Net unrealized appreciation (depreciation) during the year on: | | | | |
Investments | | | 339,873 | |
Securities sold short | | | 119,151 | |
Futures | | | (335,984 | ) |
| | | | |
Net unrealized appreciation | | | 123,040 | |
| | | | |
Net realized and unrealized gain | | | 6,517,021 | |
| | | | |
Net increase in net assets resulting from operations | | $ | 6,555,701 | |
| | | | |
| | |
| 172 | | The accompanying notes are an integral part of the financial statements |
| | |
| | Series Z |
| | |
| Statement of Changes in Net Assets | | (Alpha Opportunity Series) |
| | | | | | | | |
| | | Year Ended
December 31, 2007 | | | Year Ended
December 31, 2006 | |
| | |
Increase (decrease) in net assets from operations: | | | | | | | | |
Net investment income (loss) | | $ | 38,680 | | | $ | (7,755 | ) |
Net realized gain during the year on investments | | | 6,393,981 | | | | 3,712,720 | |
Net unrealized appreciation (depreciation) during the year on investments | | | 123,040 | | | | (41,602 | ) |
| | | | | | | | |
Net increase in net assets resulting from operations | | | 6,555,701 | | | | 3,663,363 | |
| | | | | | | | |
| | |
Capital share transactions: | | | | | | | | |
Proceeds from sale of shares | | | 36,899,862 | | | | 19,973,403 | |
Cost of shares redeemed | | | (31,028,535 | ) | | | (12,854,101 | ) |
| | | | | | | | |
Net increase from capital share transactions | | | 5,871,327 | | | | 7,119,302 | |
| | | | | | | | |
Net increase in net assets | | | 12,427,028 | | | | 10,782,665 | |
| | | | | | | | |
| | |
Net assets: | | | | | | | | |
Beginning of year | | | 36,442,166 | | | | 25,659,501 | |
| | | | | | | | |
End of year | | $ | 48,869,194 | | | $ | 36,442,166 | |
| | | | | | | | |
| | |
Undistributed net investment income at end of year | | $ | 38,680 | | | $ | – | |
| | | | | | | | |
| | |
Capital share activity: | | | | | | | | |
Shares sold | | | 2,353,094 | | | | 1,505,711 | |
Shares redeemed | | | (2,001,902 | ) | | | (973,096 | ) |
| | | | | | | | |
Total capital share activity | | | 351,192 | | | | 532,615 | |
| | | | | | | | |
| | |
| 173 | | The accompanying notes are an integral part of the financial statements |
| | |
| | |
| Financial Highlights | | Series Z |
| Selected data for each share of capital stock outstanding throughout each period | | (Alpha Opportunity Series) |
| | | | | | | | | | | | | | | |
| | | | | | | | | | | | | | Year Ended | |
| | | | | | | | | | | | | | December 31, | |
| | 2007 | | | 2006 | | | 2005 | | | 2004 | | | 2003 | a |
Per Share Data | | | | | | | | | | | | | | | |
Net asset value, beginning of period | | $13.96 | | | $12.34 | | | $11.57 | | | $11.18 | | | $10.00 | |
Income (loss) from investment operations: | | | | | | | | | | | | | | | |
Net investment income (loss)b | | 0.01 | | | – | | | (0.02 | ) | | (0.07 | ) | | (0.06 | ) |
Net gain on securities (realized and unrealized) | | 2.53 | | | 1.62 | | | 0.79 | | | 1.42 | | | 1.88 | |
| | | |
Total from investment operations | | 2.54 | | | 1.62 | | | 0.77 | | | 1.35 | | | 1.82 | |
Less distributions: | | | | | | | | | | | | | | | |
Distributions from realized gains | | – | | | – | | | – | | | (0.96 | ) | | (0.64 | ) |
| | | |
Total distributions | | – | | | – | | | – | | | (0.96 | ) | | (0.64 | ) |
Net asset value, end of period | | $16.50 | | | $13.96 | | | $12.34 | | | $11.57 | | | $11.18 | |
| | | |
| | | | | |
| | | | | | | | | | | | | | | | |
Total Returnc | | 18.19 | % | | 13.13 | % | | 6.66 | % | | 12.58 | % | | 18.33 | % |
Ratios/Supplemental Data | | | | | | | | | | | | | | | |
Net assets, end of period (in thousands) | | $48,869 | | | $36,442 | | | $25,660 | | | $19,161 | | | $6,738 | |
Ratios to average net assets: | | | | | | | | | | | | | | | |
Net investment income (loss) | | 0.10 | % | | (0.03 | %) | | (0.21 | %) | | (1.12 | %) | | (1.33 | %) |
Total expensesd | | 2.50 | % | | 2.78 | % | | 2.50 | % | | 2.78 | % | | 2.62 | % |
Net expensese | | 2.39 | % | | 2.62 | % | | 2.50 | % | | 2.57 | % | | 2.50 | % |
Net expenses prior to custodian earnings credits and net of expense waivers | | 2.50 | % | | 2.78 | % | | 2.50 | % | | 2.57 | % | | 2.52 | % |
Net expenses prior to performance fee adjustmentsf | | 2.34 | % | | 2.47 | % | | 2.47 | % | | – | % | | – | % |
Portfolio turnover rate | | 1,770 | % | | 1,285 | % | | 1,509 | % | | 1,054 | % | | 966 | % |
a Series Z was initially capitalized on July 7, 2003 with a net asset value of $10 per share. Percentage amounts for the period, except for total return, have been annualized.
b Net investment income (loss) was computed using average shares outstanding throughout the period.
c Total return does not take into account any of the expenses associated with an investment in variable insurance products offered by Security Benefit Life Insurance Company. If total return had taken into account these expenses, performance would have been lower. Shares of a series of SBL Fund are available only through the purchase of such products. Additionally, total return is not annualized for periods less than one year.
d Total expense information reflects the expense ratios absent expense reductions by the Investment Manager, and earnings credits, as applicable.
e Net expense information reflects the expense ratios after voluntary expense waivers, reimbursements and custodian earnings credits, as applicable.
f Net expenses prior to performance fee adjustments reflect ratios after voluntary expense waivers, reimbursements, custodian earnings credits, and before performance fee adjustments, as applicable.
| | |
| 174 | | The accompanying notes are an integral part of the financial statements |
| | |
| | |
| Notes to Financial Statements | | |
| December 31, 2007 | | |
1.Significant Accounting Policies
SBL Fund (The Fund) is registered under the Investment Company Act of 1940, as amended, as an open-end management investment company of the series type. Each series, in effect, represents a separate fund. The Fund is required to account for the assets of each series separately and to allocate general liabilities of the Fund to each series based on the net asset value of each series. Shares of the Fund will be sold only to separate accounts of Security Benefit Life Insurance Company (SBL). The following is a summary of the significant accounting policies followed by the Fund in the preparation of its financial statements.
A. Security Valuation - Valuations of the Fund’s securities are supplied by pricing ser vices approved by the Board of Directors. The Fund’s officers, under the general supervision of the Board of Directors, regularly review procedures used by, and valuations provided by, the pricing services. Each security owned by a Series that is listed on a securities exchange is valued at its last sale price on that exchange on the date as of which assets are valued. Where the security is listed on more than one exchange, the Series will use the price of that exchange that it generally considers to be the principal exchange on which the stock is traded. Securities listed on the Nasdaq Stock Market, Inc. (“Nasdaq”) will be valued at the Nasdaq Official Closing Price, which may not necessarily represent the last sale price. If there has been no sale on such exchange or NASDAQ on such day, the security is valued at the closing bid price on such day. Securities for which market quotations are not readily available are valued by a pricing service considering securities with similar yields, quality, type of issue, coupon, duration and rating. If there is no bid price or if the bid price is deemed to be unsatisfactory by the Board of Directors or by the Fund’s investment manager, then the securities are valued in good faith by such method as the Board of Directors determines will reflect the fair value. If events occur after the close of a foreign exchange that will affect the value of a series portfolio securities before the time as of which the NAV is calculated (a “significant event”), the security will generally be priced using a fair value procedure. If the Valuation Committee determines a significant event has occurred, it will evaluate the impact of that event on an affected security or securities, to determine whether a fair value adjustment would materially affect the Series net asset value per share. Some of the factors which may be considered by the Board of Directors in determining fair value are fundamental analytical data relating to the investment; the nature and duration of any restrictions on disposition; trading in similar securities of the same issuer or comparable companies; information from broker-dealers; and an evaluation of the forces that influence the market in which the securities are purchased and sold. The Fund generally will value short-term debt securities at prices based on market quotations for such securities or securities of similar type, yield, quality and duration, except those securities purchased with 60 days or less to maturity are valued on the basis of amortized cost which approximates market value.
Generally, trading in foreign securities markets is substantially completed each day at various times prior to the
close of the New York Stock Exchange. The values of foreign securities are determined as of the close of such foreign markets or the close of the New York Stock Exchange, if earlier. All investments quoted in foreign currency are valued in U.S. dollars on the basis of the foreign currency exchange rates prevailing at the close of business. Investments in foreign securities may involve risks not present in domestic investments. The Valuation Committee will determine the current value of such foreign securities by taking into consideration certain factors which may include those discussed above, as well as the following factors, among others: the value of the securities traded on other foreign markets, ADR trading, closed-end fund trading, foreign currency exchange activity, and the trading prices of financial products that are tied to foreign securities such as WEBS®. In addition, the Board of Directors has authorized the Valuation Committee and Administrator to use prices and other information supplied by Interactive Data Corporation’s Fair Value Information Service in valuing foreign securities.
The senior floating rate interests (loans) in which Series P invests are not listed on any securities exchange or board of trade. Accordingly, determinations of the value of loans may be based on infrequent and dated trades. Typically loans are valued using information provided by an independent third party pricing service. If the pricing service cannot or does not provide a valuation for a particular loan or such valuation is deemed unreliable, such loan is fair valued. In determining fair value, consideration is given to several factors, which may include, among others, one or more of the following: the fundamental business data relating to the issuer or borrower; an evaluation of the forces which influence the market in which these loans are purchased and sold; type of holding; financial statements of the borrower; cost at date of purchase; size of holding; credit worthiness and cash flow of issuer; information as to any transactions in, or offers for, the holding; price and extent of public trading in similar securities (or equity securities) of the issuer/borrower, or comparable companies; coupon payments; quality, value and saleability of collateral securing the loan; business prospects of the issuer/borrower, including any ability to obtain money or resources from a parent or affiliate; the portfolio manager’s and/or the market’s assessment of the borrower’s management; prospects for the borrower’s industry, and multiples (of earnings and/or cash flow) being paid for similar businesses in that industry; borrower’s competitive position within the industry; borrower’s ability to access additional liquidity through public and/or private markets; and other relevant factors.
B. Repurchase Agreements - In connection with transactions in repurchase agreements, it is the Fund’s policy that its custodian take possession of the underlying collateral and that the fair value of the collateral exceed the principal amount of the repurchase transaction, including accrued interest, at all times. If the seller defaults, and the fair value of the collateral declines, realization of the collateral by the Series may be delayed or limited.
C. Foreign Currency Transactions - The accounting records of the Fund are maintained in U.S. dollars. All assets and liabilities
| | |
| | |
| Notes to Financial Statements | | |
| December 31, 2007 | | |
initially expressed in foreign currencies are converted into U.S. dollars at prevailing exchange rates. Purchases and sales of investment securities, dividend and interest income, and certain expenses are translated at the rates of exchange prevailing on the respective dates of such transactions. Changes in the relationship of these foreign currencies to the U.S. dollar can significantly affect the value of the investments and earnings of the Series. Foreign investments may also subject the Series to foreign government exchange restrictions, expropriation, taxation or other political, social or economic developments, all of which could affect the market and/or credit risk of the investments.
The Fund does not isolate that portion of the results of operations resulting from changes in the foreign exchange rates on investments from the fluctuations arising from changes in the market prices of securities held. Such fluctuations are included with the net realized and unrealized gain or loss on investments.
Net realized foreign exchange gains and losses arise from sales of portfolio securities, sales of foreign currencies, and the difference between asset and liability amounts initially stated in foreign currencies and the U.S. dollar value of the amounts actually received or paid. Net unrealized foreign exchange gains or losses arise from changes in the value of portfolio securities other assets and liabilities at the end of the reporting period, resulting from changes in the exchange rates.
D. Forward Foreign Currency Exchange Contracts - The Fund may enter into forward foreign exchange contracts in order to manage foreign currency risk from purchase or sale of securities denominated in foreign currency. A series may also enter into such contracts to manage the effect of changes in foreign currency exchange rates on portfolio positions. These contracts are marked to market daily, by recognizing the difference between the contract exchange rate and the current market rate as unrealized gains or losses. Realized gains or losses are recognized when contracts are settled and are reflected in the Statement of Operations. These contracts involve market risk in excess of the amount reflected in the Statement of Assets and Liabilities. The face or contract amount in U.S. dollars reflects the total exposure these funds have in that particular currency contract. Losses may arise due to changes in the value of the foreign currency or if the counterparty does not perform under the contract.
E. Futures - The Fund may utilize futures contracts to a limited extent, with the objectives of maintaining full exposure to the underlying stock market, enhancing returns, maintaining liquidity, minimizing transaction costs and economically hedging possible variations in foreign exchange values. The Fund may purchase or sell financial and foreign currency futures contracts to immediately position incoming cash in the market, thereby simulating a fully invested position in the underlying index while maintaining a cash balance for liquidity. In the event of redemptions, the series may pay from its cash balances and reduce its future positions accordingly. Returns may be enhanced by purchasing futures contracts instead of the underlying securities when futures are believed to be priced more attractively than the underlying securities. The primary risks associated with the use of futures contracts are imperfect correlation between changes in market values of stocks contained in the indexes and the prices of futures contracts,
and the possibility of an illiquid market. Futures contracts are valued based upon their quoted daily settlement prices. Upon entering into a futures contract, the series are required to deposit and maintain as collateral either cash or securities, representing the initial margin, equal to a certain percentage of the contract value. Cash deposits are shown as restricted cash on the Statement of Assets and Liabilities; securities held as collateral are noted in the Schedule of Investments. Subsequent changes in the value of the contract are recorded as unrealized gains or losses. The variation margin is paid or received in cash daily by the series. The series realizes a gain or loss when the contract is closed or expires.
F. Options Purchased and Written - The Fund may purchase put and call options and write such options on a covered basis on securities that are traded on recognized securities exchanges and over-the-counter markets. Call and put options on securities give the holder the right to purchase or sell (and the writer the obligation to sell or purchase), respectively, a security at a specified price, until a certain date. Options may be used to economically hedge the series portfolio, to increase returns or to maintain exposure to the equity markets. The primary risks associated with the use of options are an imperfect correlation between the change in market value of the securities held by the series and the price of the option, the possibility of an illiquid market, and the inability of the counterparty to meet the terms of the contract.
The premium received for a written option is recorded as an asset with an equal liability which is marked to market based on the option’s quoted daily settlement price. Fluctuations in the value of such instruments are recorded as unrealized appreciation (depreciation) until terminated, at which time realized gains and losses are recognized.
G. Securities Sold Short - Certain of the Series may make short sales “against the box,” in which the Series enters into a short sale of a security it owns. At no time will more than 15% of the value of the Series’ net assets be in deposits on short sales against the box. If a Series makes a short sale, the Series does not immediately deliver from its own account the securities sold and does not receive the proceeds from the sale. To complete the sale, the Series must borrow the security (generally from the broker through which the short sale is made) in order to make delivery to the buyer. The Series must replace the security borrowed by purchasing it at the market price at the time of replacement or delivering the security from its own portfolio. The Series is said to have a “short position” in securities sold until it delivers them to the broker, at which time it receives the proceeds of the sale. Certain Series may make short sales that are not “against the box,” which create opportunities to increase the Series’ return but, at the same time, involve specific risk considerations and may be considered a speculative technique. Such short sales theoretically involve unlimited loss potential, as the market price of securities sold short may continually increase, although a Series may mitigate such losses by replacing the securities sold short before the market price has increased significantly. For financial statement purposes, an amount equal to the settlement amount is included in the Statement of Assets and Liabilities as an asset and an equivalent liability.
| | |
| | |
| Notes to Financial Statements | | |
| December 31, 2007 | | |
The amount of the liability is subsequently marked-to-market to reflect the current value of the short position. Subsequent fluctuations in the market prices of securities sold, but not yet purchased, may require purchasing the securities at prices which differ from the market value reflected on the Statement of Assets and Liabilities. The Series are liable for any dividends or interest payable on securities while those securities are in a short position. As collateral for its short positions, the Series is required under the Investment Company Act of 1940 to maintain segregated assets consisting of cash, cash equivalents or liquid securities. These segregated assets are valued consistent with Note 1a above. These segregated assets are required to be adjusted daily to reflect changes in the market value of the securities sold short.
H. Senior Loans - Senior loans in which certain of the Series invests generally pay interest rates which are periodically adjusted by reference to short-term, floating rate plus a premium. These base lending rates are generally (i) the lending rate offered by one or more major European banks, such as the London Inter-Bank Offered Rate (LIBOR), (ii) the prime rate offered by one or more major United States banks, or (iii) the bank’s certificate of deposit rate. Senior floating rate interests often require prepayments from excess cash flows or permit the borrower to repay at its election. The rate at which the borrower repays cannot be predicted with accuracy. As a result, the actual remaining maturity may be substantially less than the stated maturities shown. The interest rate indicated is the rate in effect at December 31, 2007.
I. Security Transactions and Investment Income - Security transactions are accounted for on the date the securities are purchased or sold (trade date). Realized gains and losses are reported on an identified cost basis. Dividend income is accrued as of ex-dividend date, except that certain dividends for foreign securities where the ex-dividend date may have passed are recorded as soon as the Series is informed of the dividend in the exercise of reasonable diligence. Interest income is recognized on the accrual basis including the amortization of premiums and accretion of discounts on debt securities.
J. Expenses - Expenses that are directly related to one of the Series are charged directly to that Series. Other operating expenses are allocated to the Series on the basis of relative net assets within the Fund.
K. Distributions to Shareholders - The Fund is required by the Internal Revenue Code to distribute substantially all of its income and capital gains to its shareholders. Each year the Fund determines whether to declare and pay actual dividends or whether to secure consent of its shareholders to report and deduct a consent dividend. A consent dividend is treated for tax purposes as a distribution to shareholders occurring on the last day of the Fund’s taxable year and a shareholder contribution to capital occurring on the same day. It is the Fund’s current practice to utilize the consent dividend procedures. The character of any distributions made from net investment income and net realized gains may differ from their ultimate characterization for income tax purposes.
L. Taxes - The Series intend to comply with the requirements of the Internal Revenue Code applicable to regulated
investment companies and distribute all of their taxable net income and net realized gains sufficient to relieve them from all, or substantially all, federal income, excise and state income taxes. Therefore, no provision for federal or state income tax is required.
M. Earnings Credits - Under the fee agreement with the custodian, the Series’ may earn credits based on overnight custody cash balances. These credits are utilized to reduce related custodial expenses. The custodian fees disclosed in the Statement of Operations are before the reduction in expense from the related earnings credits.
N. Use of Estimates - The preparation of financial statements in conformity with U.S. generally accepted accounting principles requires management to make estimates and assumptions that affect the reported amounts of assets and liabilities and disclosure of contingent assets and liabilities at the date of the financial statements and the reported amounts of increases and decreases in net assets from operations during the reporting period. Actual results could differ from those estimates.
O. Indemnifications - Under the Fund’s organizational documents, its Officers and Directors are indemnified against certain liabilities arising out of the performance of their duties to the Fund. In addition, in the normal course of business, the Fund enters into contracts that provide general indemnification to other parties. The Fund’s maximum exposure under these arrangements is unknown as this would involve future claims that may be made against the Fund that have not yet occurred, and may not occur. However, the Fund has not had prior claims or losses pursuant to these contracts and expects the risk of loss to be remote.
P. Recent Accounting Pronouncements - On July 13, 2006, the Financial Accounting Standards Board (“FASB”) released FASB interpretation No. 48, “Accounting for Uncertainty in Income Taxes” (“FIN 48”). FIN 48 provides guidance for how uncertain tax positions should be recognized, measured, presented and disclosed in the financial statements. FIN 48 requires the evaluation of tax positions taken or expected to be taken in the course of preparing the Series’ tax returns to determine whether the tax positions are “more-likely-than-not” to be sustained by the applicable tax authority. Tax positions not deemed to meet a more-likely-than-not threshold would be deemed to be uncertain and would be recorded as tax expense in the current year. For all open tax years (December 31, 2004 - December 31, 2007) and all major taxing jurisdictions through the end of the reporting period, the Fund’s management has completed a review and evaluation in connection with the adoption of FIN 48 and has determined that no tax liability is required and no additional disclosures are needed as of December 31, 2007.
In September 2006, FASB issued Statement of Financial Accounting Standards No. 157, “Fair Value Measurements” (FAS 157). This standard clarifies the definition of fair value for financial reporting, establishes a framework for measuring fair value and requires additional disclosure about the use of fair value requirements. FAS 157 is effective for financial statements issued for fiscal years beginning after November
| | |
| | |
| Notes to Financial Statements | | |
| December 31, 2007 | | |
15, 2007 and interim periods within those fiscal years. As of December 31, 2007, the Fund does not believe the adoption of FAS 157 will impact the amounts reported in the financial statements, however, additional disclosures will be required about the inputs used to develop the measurements of fair value and the effect of certain of the measurements reported in the Statement of Operations for a fiscal period.
2. Management fees and other transactions with affiliates
Management fees are paid monthly to Security Investors (SI) (formerly known as Security Management Company), based on the following annual rates:
| | | | |
| | | Management Fees (as a % of net assets) | | Management Fee Waivers (as a % of net assets) |
| | |
| | |
| | |
Series A (Equity Series) | | 0.75% | | N/A |
Series B (Large Cap Value Series) | | 0.65 | | N/A |
Series C (Money Market Series) | | 0.50 | | N/A |
Series D (Global Series) | | 1.00 | | N/A |
Series E (Diversified Income Series) | | 0.75 | | 0.15 |
Series H (Enhanced Index Series) | | 0.75 | | 0.25 |
Series J (Mid Cap Growth Series) | | 0.75 | | N/A |
Series N (Managed Asset Allocation Series) | | 1.00 | | N/A |
Series O (Equity Income Series) | | 1.00 | | N/A |
Series P (High Yield Series) | | 0.75 | | N/A |
Series Q (Small Cap Value Series) | | 1.00 | | N/A |
Series V (Mid Cap Value Series) | | 0.75 | | N/A |
Series X (Small Cap Growth Series) | | 1.00 | | N/A |
Series Y (Select 25 Series) | | 0.75 | | N/A |
Series Z (Alpha Opportunity Series)* | | 2.051 | | N/A |
* Series Z’s management fee will range from 1.25% to 2.75% of aver-age daily net assets as discussed below. |
1SI receives a management fee from Series Z that consists of two components. The first component is an annual base fee equal to 2.00% of Series Z’s average daily net assets. The second component is a base fee adjustment that either increases or decreases the base fee, depending on how Series Z performed relative to the S&P 500 Index over the prior 12-month period (the “Measuring Period”). SI will receive the base fee of 2.00% without adjustment if the performance of Series Z matches the performance of the S&P 500 Index. The maximum base fee adjustment at each calculation period is 0.75% up or down in the event that Series Z outperforms or underperforms the S&P 500 Index by 15% or more. SI calculates the base fee adjustment each month based upon Series Z’s performance relative to the S&P 500 Index during the Performance Period ending on the last day of the month. If Series Z outperforms the S&P 500 Index over the Measuring Period, the base fee is adjusted upward. The upward adjustment is equal to the amount by which Series Z’s performance exceeds that of the S&P 500 Index divided by 15 and multiplied by the average daily net assets of Series Z during the Measuring Period to determine the base fee adjustment for the month. If Series Z underperforms the Index, the base fee is adjusted downward on the same basis. SGI will determine the dollar amount of any performance adjustment each month by multiplying the adjustment percentage by the average daily net assets of Series Z during the Measuring Period and dividing by that
number by the number of days in the Measuring Period and then multiplying that amount by the number of days in the current month.
SI also acts as the administrative agent and transfer agent for the Fund, and as such performs administrative functions, transfer agency and dividend disbursing services, and the bookkeeping, accounting and pricing functions for each series. For these services, the Investment Manager receives the following:
| | |
| | | Administrative Fees
(as a % of net assets)* |
Series A (Equity Series) | | 0.095% |
Series B (Large Cap Value Series) | | 0.095 |
Series C (Money Market Series) | | 0.095 |
Series D (Global Series) | | 0.150 |
Series E (Diversified Income Series) | | 0.095 |
Series H (Enhanced Index Series) | | 0.095 |
Series J (Mid Cap Growth Series) | | 0.095 |
Series N (Managed Asset Allocation Series) | | 0.150 |
Series O (Equity Income Series) | | 0.095 |
Series P (High Yield Series) | | 0.095 |
Series Q (Small Cap Value Series) | | 0.095 |
Series V (Mid Cap Value Series) | | 0.095 |
Series X (Small Cap Growth Series) | | 0.095 |
Series Y (Select 25 Series) | | 0.095 |
Series Z (Alpha Opportunity Series) | | 0.150 |
* The minimum annual charge for administrative fees is $25,000 for Series A, B, C, E, H, J, O, P, Q, V, X, Y and Z and $60,000 for Series D and N. |
SI is paid the following for providing transfer agent services to the Fund:
| | |
Annual charge per account | | $5.00 - $ 8.00 |
Transaction fee | | $0.60 - $ 1.10 |
Minimum annual charge per series | | $25,000 |
Certain out-of-pocket charges | | Varies |
Effective January 1, 2007, the investment advisory contract for Series Z provides that the total other expenses be limited to 0.50% of average net assets, exclusive of interest, taxes, extraordinary expenses, brokerage fees, commissions and dividends on short sales. This contract is in effect through December 31, 2008. SI has agreed to limit the total expenses of Series H, Series Q and Series Y to 1.75% of average net assets and Series P, Series V and Series X to 2.00% of average net assets, exclusive of interest, taxes, extraordinary expenses, brokerage fees and commissions for the aforementioned Series. The expense limits are voluntary and may be terminated at any time without notice to shareholders.
In connection with the change in sub-advisors of Series D, SI reimbursed the Series for a portion of the commissions resulting from transaction costs. Such commissions which are included in realized gains, amounted to $172,667.
At December 31, 2007, Security Benefit Life Insurance Company, through their insurance company separate accounts, owned 100% of the outstanding shares of each Series of the
| | |
| | |
| Notes to Financial Statements | | |
| December 31, 2007 | | |
Fund, except for, Series N, Series O, Series P, Series Q and Series V in which it owns 99% of each Series.
3. Unrealized Appreciation/Depreciation
For federal income tax purposes, the amounts of unrealized appreciation (depreciation) on investments at December 31, 2007, were as follows:
| | | | | | | | | | | |
| | | Gross
unrealized
appreciation | | Gross
unrealized
(depreciation) | | | Net unrealized
appreciation
(depreciation) | |
Series A | | | | | | | | | | | |
(Equity) | | $ | 68,909,429 | | $ | (42,804,670 | ) | | $ | 26,104,759 | |
Series B | | | | | | | | | | | |
(Large Cap Value) | | | 96,500,098 | | | (38,391,667 | ) | | | 58,108,431 | |
Series C | | | | | | | | | | | |
(Money Market) | | | 26,385 | | | (33,863 | ) | | | (7,478 | ) |
Series D | | | | | | | | | | | |
(Global) | | | 95,414,131 | | | (22,719,748 | ) | | | 72,694,383 | |
Series E | | | | | | | | | | | |
(Diversified Income) | | | 115,591 | | | (4,895,461 | ) | | | (4,779,870 | ) |
Series H | | | | | | | | | | | |
(Enhanced Index) | | | 7,146,744 | | | (4,926,697 | ) | | | 2,220,047 | |
Series J | | | | | | | | | | | |
(Mid Cap Growth) | | | 36,773,045 | | | (33,374,417 | ) | | | 3,398,628 | |
Series N | | | | | | | | | | | |
(Managed Asset
Allocation) | | | 12,249,804 | | | (4,994,733 | ) | | | 7,255,071 | |
Series O | | | | | | | | | | | |
(Equity Income) | | | 53,193,022 | | | (20,180,120 | ) | | | 33,012,902 | |
Series P | | | | | | | | | | | |
(High Yield) | | | 1,712,145 | | | (6,552,336 | ) | | | (4,840,191 | ) |
Series Q | | | | | | | | | | | |
(Small Cap Value) | | | 43,696,515 | | | (17,313,032 | ) | | | 26,383,483 | |
Series V | | | | | | | | | | | |
(Mid Cap Value) | | | 69,272,266 | | | (53,225,192 | ) | | | 16,047,074 | |
Series X | | | | | | | | | | | |
(Small Cap Growth) | | | 10,436,024 | | | (5,695,274 | ) | | | 4,740,750 | |
Series Y | | | | | | | | | | | |
(Select 25) | | | 9,026,725 | | | (7,671,276 | ) | | | 1,355,449 | |
Series Z | | | | | | | | | | | |
(Alpha Opportunity) | | | 598,507 | | | (448,023 | ) | | | (150,484 | ) |
4. Restricted Securities
As of December 31, 2007, the following Series contained restricted securities. Market value, cost, percentage of total net assets and acquisition dates are as follows:
| | | | | | | | | | | | | | | |
| | | Number of
Shares | | Price Per
Share | | Market
Value | | Cost | | % of
Net Assets | | Acquisition
Date |
Series J | | | | | | | | | | | | | | | |
ThermoEnergy Corporation PIPE | | 1,380,000 | | $ | 0.49 | | $ | 676,200 | | $ | 1,302,103 | | 0.3% | | 07-14-05 |
ThermoEnergy Corporation Warrant | | 1,380,000 | | | 0.1066 | | | 147,108 | | | 353,897 | | 0.1% | | 07-14-05 |
Series V | | | | | | | | | | | | | | | |
ThermoEnergy Corporation PIPE | | 1,130,000 | | | 0.49 | | | 553,700 | | | 1,066,215 | | 0.1% | | 07-14-05 |
ThermoEnergy Corporation Warrant | | 1,130,000 | | | 0.1066 | | | 120,458 | | | 289,785 | | 0.0% | | 07-14-05 |
These securities have been valued after considering certain pertinent factors, including the results of operations since the date of purchase, and the recent sales price of its common stock. No quoted market price exists for these shares. It is possible that the estimated fair value may differ significantly from the amount that might ultimately be realized in the near term, and difference could be material.
| | |
| | |
| Notes to Financial Statements | | |
| December 31, 2007 | | |
5. Investment Transactions
Investment transactions for the year ended December 31, 2007, (excluding overnight investments, short–term commercial paper and U.S. government securities) were as follows:
| | | | | | |
| | | Purchases | | Proceeds from Sales |
| | |
Series A | | | | | | |
(Equity) | | $ | 55,233,860 | | $ | 159,100,894 |
Series B | | | | | | |
(Large Cap Value) | | | 137,338,381 | | | 183,844,560 |
Series C | | | | | | |
(Money Market) | | | – | | | – |
Series D | | | | | | |
(Global) | | | 645,087,091 | | | 717,505,760 |
Series E | | | | | | |
(Diversified Income) | | | 42,442,013 | | | 71,470,309 |
Series H | | | | | | |
(Enhanced Index) | | | 89,185,131 | | | 116,949,446 |
Series J | | | | | | |
(Mid Cap Growth) | | | 102,483,170 | | | 236,695,743 |
Series N | | | | | | |
(Managed Asset Allocation) | | | 87,041,328 | | | 81,643,859 |
Series O | | | | | | |
(Equity Income) | | | 73,568,437 | | | 84,000,098 |
Series P | | | | | | |
(High Yield) | | | 71,301,015 | | | 51,969,635 |
Series Q | | | | | | |
(Small Cap Value) | | | 67,216,351 | | | 75,355,629 |
Series V | | | | | | |
(Mid Cap Value) | | | 191,032,097 | | | 227,283,514 |
Series X | | | | | | |
(Small Cap Growth) | | | 114,194,544 | | | 130,904,087 |
Series Y | | | | | | |
(Select 25) | | | 11,918,156 | | | 28,273,833 |
Series Z | | | | | | |
(Alpha Opportunity) | | | 347,598,818 | | | 344,312,052 |
6. Open Futures Contracts
Open futures contracts for Series E, Series H and Series Z as of December 31, 2007, were as follows:
| | | | | | | | | | | | | | | | | | |
| | | Position | | Number of
Contracts | | Expiration
Date | | Contract
Amount | | | Market Value | | | Unrealized
Gain/
(Loss) | |
| | | | | | | |
Series E | | | | | | | | | | | | | | | | | | |
U.S. 2-Year Note Future | | Long | | 380 | | 03/21/2008 | | $ | 79,842,893 | | | $ | 79,895,000 | | | $ | 52,107 | |
U.S. 5-Year Note Future | | Long | | 15 | | 03/21/2008 | | | 1,650,990 | | | | 1,654,219 | | | | 3,229 | |
U.S. 10-Year Note Future | | Short | | 108 | | 03/21/2008 | | | (12,233,153 | ) | | | (12,246,187 | ) | | | (13,034 | ) |
| | | | | | | | | | | | | | | | | | | |
| | | | | | | | | $ | 69,260,730 | | | $ | 69,303,032 | | | $ | 42,302 | |
| | | | | | | | | | | | | | | | | | | |
| | | | | | | |
Series H | | | | | | | | | | | | | | | | | | |
S&P 500 E-Mini Future | | Long | | 24 | | 03/21/2008 | | $ | 1,788,052 | | | $ | 1,772,640 | | | $ | (15,412 | ) |
| | | | | | | |
Series Z | | | | | | | | | | | | | | | | | | |
S&P 500 Index Future | | Long | | 53 | | 03/21/2008 | | $ | 19,911,895 | | | $ | 19,572,900 | | | $ | (338,995 | ) |
| | |
| | |
| Notes to Financial Statements | | |
| December 31, 2007 | | |
7. Options Written
Information as to options written by the Series during the year ended December 31, 2007 and options outstanding at year end is provided below.
Series A Call Options Written
| | | | | | | |
| | | Number of
Contracts | | | Premium
Amount | |
Balance at December 31, 2006 | | 775 | | | $ | 121,596 | |
Opened | | 1,354 | | | | 101,620 | |
Expired | | (804 | ) | | | (108,939 | ) |
Exercised | | (1,325 | ) | | | (114,277 | ) |
| | | | | | | |
Balance at December 31, 2007 | | – | | | $ | – | |
| | | | | | | |
Series A Put Options Written
| | | | | | | |
| | | Number of
Contracts | | | Premium
Amount | |
Balance at December 31, 2006 | | – | | | $ | – | |
Opened | | 499 | | | | 91,316 | |
Exercised | | (499 | ) | | | (91,316 | ) |
| | | | | | | |
Balance at December 31, 2007 | | – | | | $ | – | |
| | | | | | | |
Series B Call Options Written
| | | | | | | |
| | | Number of
Contracts | | | Premium
Amount | |
Balance at December 31, 2006 | | 611 | | | $ | 101,419 | |
Opened | | 2,402 | | | | 240,384 | |
Expired | | (782 | ) | | | (105,957 | ) |
Exercised | | (2,231 | ) | | | (235,846 | ) |
| | | | | | | |
Balance at December 31, 2007 | | – | | | $ | – | |
| | | | | | | |
Series B Put Options Written
| | | | | | | |
| | | Number of
Contracts | | | Premium
Amount | |
Balance at December 31, 2006 | | – | | | $ | – | |
Opened | | 1,216 | | | | 178,020 | |
Expired | | (642 | ) | | | (72,980 | ) |
Exercised | | (574 | ) | | | (105,040 | ) |
| | | | | | | |
Balance at December 31, 2007 | | – | | | $ | – | |
| | | | | | | |
Series J Call Options Written
| | | | | | | |
| | | Number of
Contracts | | | Premium
Amount | |
Balance at December 31, 2006 | | 1,074 | | | $ | 273,293 | |
Opened | | 2,906 | | | | 497,691 | |
Expired | | (2,608 | ) | | | (438,455 | ) |
Exercised | | (1,372 | ) | | | (332,529 | ) |
| | | | | | | |
Balance at December 31, 2007 | | – | | | $ | – | |
| | | | | | | |
Series Q Call Options Outstanding
| | | | | | | | | | |
Common Stock | | Expiration Date | | Exercise Price | | Number of Contracts | | Market Value |
| | | | |
Alaska Air Group, Inc. | | 1-18-08 | | $ | 25.00 | | 50 | | $ | 6,500 |
Carpenter Technology Corporation | | 1-18-08 | | | 65.00 | | 70 | | | 71,400 |
| | 1-18-08 | | | 70.00 | | 40 | | | 24,000 |
| | 2-15-08 | | | 70.00 | | 10 | | | 7,600 |
| | 3-21-08 | | | 55.00 | | 115 | | | 238,050 |
| | 3-21-08 | | | 60.00 | | 80 | | | 131,200 |
| | 3-21-08 | | | 65.00 | | 20 | | | 25,000 |
| | 3-21-08 | | | 70.00 | | 40 | | | 37,200 |
| | 3-21-08 | | | 75.00 | | 5 | | | 3,300 |
Chicago Bridge & Iron Company N.V. | | 1-18-08 | | | 50.00 | | 15 | | | 15,600 |
| | 4-18-08 | | | 50.00 | | 45 | | | 57,600 |
Encore Wire Corporation | | 1-18-08 | | | 12.50 | | 70 | | | 23,100 |
Forest Oil Corporation | | 1-18-08 | | | 45.00 | | 15 | | | 8,850 |
| | 1-18-08 | | | 50.00 | | 35 | | | 6,300 |
Geo Group, Inc. | | 6-20-08 | | | 30.00 | | 15 | | | 3,225 |
Global Industries, Ltd. | | 3-21-08 | | | 30.00 | | 15 | | | 75 |
Goldcorp, Inc. | | 4-18-08 | | | 37.50 | | 15 | | | 3,375 |
Helmerich & Payne, Inc. | | 2-15-08 | | | 40.00 | | 25 | | | 5,375 |
| | 3-21-08 | | | 35.00 | | 25 | | | 14,750 |
| | 3-21-08 | | | 40.00 | | 15 | | | 4,050 |
| | 6-20-08 | | | 40.00 | | 25 | | | 9,500 |
ION Geophysical Corporation | | 1-18-08 | | | 15.00 | | 10 | | | 1,100 |
Noble Energy, Inc. | | 2-15-08 | | | 65.00 | | 10 | | | 14,700 |
| | 2-15-08 | | | 70.00 | | 60 | | | 60,600 |
| | 2-15-08 | | | 75.00 | | 25 | | | 15,250 |
| | 2-15-08 | | | 100.00 | | 25 | | | 7,750 |
| | 5-16-08 | | | 70.00 | | 5 | | | 6,100 |
OM Group, Inc. | | 2-15-08 | | | 55.00 | | 35 | | | 19,600 |
| | 2-15-08 | | | 60.00 | | 35 | | | 10,850 |
| | 2-15-08 | | | 65.00 | | 35 | | | 5,600 |
| | 3-21-08 | | | 50.00 | | 50 | | | 51,000 |
| | 3-21-08 | | | 55.00 | | 38 | | | 26,980 |
Range Resources Corporation | | 3-21-08 | | | 50.00 | | 10 | | | 4,700 |
| | 3-21-08 | | | 55.00 | | 5 | | | 1,050 |
SRA International, Inc | | 2-15-08 | | | 30.00 | | 9 | | | 1,080 |
| | 3-21-08 | | | 25.00 | | 20 | | | 10,000 |
| | 3-21-08 | | | 30.00 | | 10 | | | 1,750 |
Steel Dynamics, Inc | | 1-18-08 | | | 50.00 | | 45 | | | 43,650 |
| | 1-18-08 | | | 55.00 | | 15 | | | 8,400 |
| | 1-18-08 | | | 60.00 | | 20 | | | 4,500 |
| | 2-15-08 | | | 50.00 | | 100 | | | 107,000 |
| | 2-15-08 | | | 55.00 | | 90 | | | 58,500 |
| | 2-15-08 | | | 60.00 | | 60 | | | 24,000 |
| | 5-16-08 | | | 50.00 | | 20 | | | 25,400 |
| | 5-16-08 | | | 55.00 | | 20 | | | 18,600 |
| | 5-16-08 | | | 60.00 | | 5 | | | 3,350 |
| | 5-16-08 | | | 65.00 | | 5 | | | 2,300 |
Transocean, Inc. | | 1-18-08 | | | 135.00 | | 10 | | | 1,950 |
| | 2-15-08 | | | 140.00 | | 5 | | | 4,745 |
| | 2-15-08 | | | 145.00 | | 5 | | | 3,500 |
United States Steel
Corporation | | 2-15-08 | | | 95.00 | | 20 | | | 52,800 |
| | 2-15-08 | | | 100.00 | | 15 | | | 33,150 |
| | 4-18-08 | | | 90.00 | | 5 | | | 16,550 |
Willbros Group, Inc. | | 6-20-08 | | | 45.00 | | 10 | | | 2,900 |
| | | | | | | | | | |
Total call options outstanding | | | | | | | | | | |
(premiums received $1,242,121) | | | | | | | 1,577 | | $ | 1,345,455 |
| | | | | | | | | | |
| | |
| | |
| Notes to Financial Statements | | |
| December 31, 2007 | | |
Series Q Put Options Outstanding
| | | | | | | | | | |
| Common Stock | | Expiration
Date | | Exercise
Price | | Number of
Contracts | | Market
Value |
InterOil Corporation | | 1-18-08 | | $ | 25.00 | | 45 | | $ | 27,000 |
| | 1-18-08 | | | 30.00 | | 20 | | | 21,000 |
| | 3-21-08 | | | 25.00 | | 20 | | | 16,000 |
| | 3-21-08 | | | 30.00 | | 25 | | | 30,250 |
| | 3-21-08 | | | 35.00 | | 20 | | | 32,400 |
| | | | | | | | | | |
Total put options outstanding (premiums received, $120,418) | | | | | | | 130 | | $ | 126,650 |
| | | | | | | | | | |
Series Q Call Options Written
| | | | | | | |
| | | Number of
Contracts | | | Premium
Amount | |
Balance at December 31, 2006 | | 4,315 | | | $ | 2,865,200 | |
Opened | | 21,448 | | | | 11,898,113 | |
Bought Back | | (22,362 | ) | | | (12,308,083 | ) |
Expired | | (800 | ) | | | (191,910 | ) |
Exercised | | (1,024 | ) | | | (1,021,199 | ) |
| | | | | | | |
Balance at December 31, 2007 | | 1,577 | | | $ | 1,242,121 | |
| | | | | | | |
Series Q Put Options Written
| | | | | | | |
| | | Number of
Contracts | | | Premium
Amount | |
Balance at December 31, 2006 | | 40 | | | $ | 4,380 | |
Opened | | 800 | | | | 338,382 | |
Bought Back | | (550 | ) | | | (191,485 | ) |
Expired | | (160 | ) | | | (30,859 | ) |
| | | | | | | |
Balance at December 31, 2007 | | 130 | | | $ | 120,418 | |
| | | | | | | |
Series V Call Options Outstanding
| | | | | | | | | | |
| Common Stock | | Expiration
Date | | Exercise
Price | | Number of
Contracts | | Market
Value |
Great Plains Energy, Inc. | | 1-18-08 | | $ | 30.00 | | 720 | | $ | 7,200 |
Northeast Utilities | | 4-18-08 | | | 35.00 | | 83 | | | 2,905 |
SCANA Corporation | | 2-15-08 | | | 45.00 | | 450 | | | 4,500 |
Williams Companies, Inc. | | 1-18-08 | | | 32.50 | | 720 | | | 237,600 |
| | 2-15-08 | | | 35.00 | | 720 | | | 126,000 |
| | | | | | | | | | |
Total call options outstanding (premiums received, $381,253) | | | | | | | 2,693 | | $ | 378,205 |
| | | | | | | | | | |
Series V Call Options Written
| | | | | | | |
| | | Number of
Contracts | | | Premium
Amount | |
Balance at December 31, 2006 | | 1,492 | | | $ | 305,606 | |
Opened | | 13,155 | | | | 2,196,538 | |
Expired | | (5,655 | ) | | | (876,061 | ) |
Exercised | | (6,299 | ) | | | (1,244,830 | ) |
| | | | | | | |
Balance at December 31, 2007 | | 2,693 | | | $ | 381,253 | |
| | | | | | | |
Series V Put Options Written
| | | | | | | |
| | | Number of
Contracts | | | Premium
Amount | |
Balance at December 31, 2006 | | – | | | $ | – | |
Opened | | 545 | | | | 80,347 | |
Expired | | (545 | ) | | | (80,347 | ) |
| | | | | | | |
Balance at December 31, 2007 | | – | | | $ | – | |
| | | | | | | |
Series Y Call Options Written
| | | | | | | |
| | | Number of
Contracts | | | Premium
Amount | |
Balance at December 31, 2006 | | 796 | | | $ | 93,926 | |
Opened | | 414 | | | | 48,520 | |
Exercised | | (1,210 | ) | | | (142,446 | ) |
| | | | | | | |
Balance at December 31, 2007 | | – | | | $ | – | |
| | | | | | | |
Series Y Put Options Written
| | | | | | | |
| | | Number of
Contracts | | | Premium
Amount | |
Balance at December 31, 2006 | | – | | | $ | – | |
Opened | | 115 | | | | 21,045 | |
Exercised | | (115 | ) | | | (21,045 | ) |
| | | | | | | |
Balance at December 31, 2007 | | – | | | $ | – | |
| | | | | | | |
8. Federal Tax Matters
Net investment income and net realized gains (losses) may differ for financial statement and tax purposes because of temporary or permanent book/tax differences. These differences are primarily due to differing book and tax amortization methods for premium and market discount, consent dividends, ordinary net operating losses and the expiration of capital loss carryovers. To the extent these differences are permanent differences, adjustments are made to the appropriate equity accounts in the period that the differences arise. The following adjustments were made to the Statement of Assets and Liabilities at December 31, 2007 to reflect permanent differences:
| | | | | | | | | | | | | | | |
| | | | | Accumulated
Net Realized
Gain/(Loss) | | | | Undistributed
Net Investment
Income | | | | Paid-in-Capital |
Series A | | | | $ | (47,375,054) | | | | $ | (1,466,765) | | | | $ | 48,841,819 |
Series B | | | | | – | | | | | (3,504,848) | | | | | 3,504,848 |
Series C | | | | | – | | | | | (4,176,757) | | | | | 4,176,757 |
Series D | | | | | (46,970,474) | | | | | (1,750,324) | | | | | 48,720,798 |
Series E | | | | | 335,410 | | | | | (7,494,463) | | | | | 7,159,053 |
Series H | | | | | – | | | | | (914,052) | | | | | 914,052 |
Series J | | | | | (40,726,332) | | | | | 460,802 | | | | | 40,265,530 |
Series N | | | | | (6,235,139) | | | | | (1,654,460) | | | | | 7,889,599 |
Series O | | | | | (13,608,383) | | | | | (3,880,858) | | | | | 17,489,241 |
Series P | | | | | (782,674) | | | | | (6,318,713) | | | | | 7,101,387 |
Series Q | | | | | (14,992,245) | | | | | 721,339 | | | | | 14,270,906 |
Series V | | | | | (44,172,409) | | | | | (4,270,125) | | | | | 48,442,534 |
Series X | | | | | 1 | | | | | 718,167 | | | | | (718,168) |
Series Y | | | | | – | | | | | (140,430) | | | | | 140,430 |
Series Z | | | | | (3,860,797) | | | | | – | | | | | 3,860,797 |
| | |
| | |
| Notes to Financial Statements | | |
| December 31, 2007 | | |
8. Federal Tax Matters (continued)
At December 31, 2007, the following Series had capital loss carryovers and deferred post-October losses to offset future realized capital gains as follows:
| | | | | | | | | | | | | | | | | | | | | | | | |
| | | | | Capital Loss
Carryover
Utilized in 2007 | | | | Capital Loss
Carryovers
Expired in 2007 | | | | Capital Loss
Carryovers | | | | Expires In | | | | Deferred Post-October
Losses |
Series A | | | | $ | – | | | | $ | – | | | | $ | – | | | | | | | | $ | 7,637,566 |
| | | | | | | | | | | | | | | | | | | | | | | | | |
Series B | | | | $ | 66,283,004 | | | | $ | – | | | | $ | 41,927,496 | | | | 2008 | | | | | – |
| | | | | | – | | | | | – | | | | | 5,057,813 | | | | 2009 | | | | | |
| | | | | | – | | | | | – | | | | | 87,172,720 | | | | 2010 | | | | | |
| | | | | | – | | | | | – | | | | | 26,620,854 | | | | 2011 | | | | | |
| | | | | | | | | | | | | | | | | | | | | | | | | |
| | | | | $ | 66,283,004 | | | | $ | – | | | | $ | 160,778,883 | | | | | | | | | |
| | | | | | | | | | | | | | | | | | | | | | | | | |
Series D | | | | $ | – | | | | $ | – | | | | $ | – | | | | | | | | | 225,977 |
| | | | | | | | | | | | | | | | | | | | | | | | | |
Series E | | | | $ | – | | | | $ | 389,008 | | | | $ | – | | | | | | | | | 60,025 |
| | | | | | – | | | | | – | | | | | 9,322,945 | | | | 2008 | | | | | |
| | | | | | – | | | | | – | | | | | 719,015 | | | | 2010 | | | | | |
| | | | | | – | | | | | – | | | | | 350,320 | | | | 2012 | | | | | |
| | | | | | – | | | | | – | | | | | 2,731,334 | | | | 2014 | | | | | |
| | | | | | – | | | | | – | | | | | 838,194 | | | | 2015 | | | | | |
| | | | | | | | | | | | | | | | | | | | | | | | | |
| | | | | $ | – | | | | $ | 389,008 | | | | $ | 13,961,808 | | | | | | | | | |
| | | | | | | | | | | | | | | | | | | | | | | | | |
Series H | | | | $ | 3,036,601 | | | | $ | – | | | | | – | | | | 2011 | | | | | – |
| | | | | | | | | | | | | | | | | | | | | | | | | |
Series J | | | | $ | – | | | | $ | – | | | | $ | – | | | | | | | | | 24,201,368 |
| | | | | | | | | | | | | | | | | | | | | | | | | |
Series N | | | | $ | – | | | | $ | – | | | | $ | – | | | | | | | | | 3,169 |
| | | | | | | | | | | | | | | | | | | | | | | | | |
Series O | | | | $ | – | | | | $ | – | | | | $ | – | | | | | | | | | 1,644 |
| | | | | | | | | | | | | | | | | | | | | | | | | |
Series P | | | | $ | – | | | | $ | – | | | | $ | – | | | | | | | | | 1,160,767 |
| | | | | | | | | | | | | | | | | | | | | | | | | |
Series Q | | | | $ | – | | | | $ | – | | | | $ | – | | | | | | | | | 312 |
| | | | | | | | | | | | | | | | | | | | | | | | | |
Series X | | | | $ | 7,775,955 | | | | $ | – | | | | $ | – | | | | 2009 | | | | | 126,715 |
| | | | | | 2,587,625 | | | | | – | | | | | 7,184,628 | | | | 2010 | | | | | |
| | | | | | | | | | | | | | | | | | | | | | | | | |
| | | | | $ | 10,363,580 | | | | | – | | | | $ | 7,184,628 | | | | | | | | | |
| | | | | | | | | | | | | | | | | | | | | | | | | |
Series Y | | | | $ | 6,578,402 | | | | $ | – | | | | $ | – | | | | 2008 | | | | | 1,466,594 |
| | | | | | 1,094,985 | | | | | – | | | | | 9,340,921 | | | | 2009 | | | | | |
| | | | | | – | | | | | – | | | | | 9,284,391 | | | | 2010 | | | | | |
| | | | | | – | | | | | – | | | | | 6,092,310 | | | | 2011 | | | | | |
| | | | | | – | | | | | – | | | | | 338,147 | | | | 2012 | | | | | |
| | | | | | | | | | | | | | | | | | | | | | | | | |
| | | | | $ | 7,673,387 | | | | | – | | | | $ | 25,055,769 | | | | | | | | | |
| | | | | | | | | | | | | | | | | | | | | | | | | |
Series Z | | | | $ | – | | | | $ | – | | | | $ | – | | | | | | | | | 884,934 |
| | | | | | | | | | | | | | | | | | | | | | | | | |
| | | | | | | | | | | | | | | | | | | | | | | | | |
| | |
| | |
| Notes to Financial Statements | | |
| December 31, 2007 | | |
8. Federal Tax Matters (continued)
The Fund declared ordinary and long-term capital gain consent dividends for the year ended December 31, 2006, as shown below.
| | | | | | |
| | | Ordinary Consent
Dividends | | Long-term Capital Gain
Consent Dividends |
Series A | | $ | 13,085,742 | | $ | 35,756,077 |
Series B | | | 3,504,848 | | | – |
Series C | | | 4,176,757 | | | – |
Series D | | | 4,908,631 | | | 43,812,167 |
Series E | | | 7,548,062 | | | – |
Series H | | | 914,052 | | | – |
Series J | | | 6,393,748 | | | 33,871,774 |
Series N | | | 3,036,928 | | | 4,852,672 |
Series O | | | 4,582,353 | | | 12,904,424 |
Series P | | | 6,792,790 | | | 308,596 |
Series Q | | | – | | | 14,989,436 |
Series V | | | 14,196,620 | | | 34,245,913 |
Series Y | | | 140,430 | | | – |
Series Z | | | 3,099,744 | | | 761,053 |
Short term distributions are treated as ordinary distributions for federal income tax purposes.
As of December 31, 2007, the components of distributable earnings/(deficit) on a tax basis were as follows:
| | | | | | | | | | |
| | | Undistributed Ordinary
Income | | Undistributed Long-term Gain | | Accumulated Capital and Other Losses | | Unrealized Appreciation
(Depreciation) | | Distributable
Earnings (Deficit) |
Series A | | $6,091,443 | | $43,040,706 | | $(7,637,566) | | $26,104,759 | | $67,599,342 |
Series B | | 4,458,590 | | – | | (160,778,883) | | 58,108,431 | | (98,211,862) |
Series C | | 6,020,002 | | – | | – | | (7,478) | | 6,012,524 |
Series D | | 14,955,820 | | 133,798,317 | | (225,977) | | 72,713,002 | | 221,241,162 |
Series E | | 7,115,783 | | – | | (14,021,834) | | (4,779,870) | | (11,685,921) |
Series H | | 1,269,184 | | 3,342,647 | | – | | 2,221,035 | | 6,832,866 |
Series J | | 10,865,990 | | 53,108,368 | | (24,201,368) | | 3,398,628 | | 43,171,618 |
Series N | | 3,564,707 | | 7,072,834 | | (3,169) | | 7,253,988 | | 17,888,360 |
Series O | | 5,703,349 | | 23,737,183 | | (1,644) | | 33,017,482 | | 62,456,370 |
Series P | | 8,648,373 | | 751,907 | | (1,160,767) | | (4,840,191) | | 3,399,322 |
Series Q | | – | | 26,511,466 | | (312) | | 26,273,986 | | 52,785,140 |
Series V | | 4,754,292 | | 102,711,769 | | – | | 16,050,122 | | 123,516,183 |
Series X | | – | | – | | (7,311,343) | | 4,740,750 | | (2,570,593) |
Series Y | | 399,716 | | – | | (26,522,363) | | 1,355,449 | | (24,767,198) |
Series Z | | 6,546,410 | | 595,406 | | (884,934) | | (36,370) | | 6,220,512 |
The difference between book basis and tax basis unrealized appreciation (depreciation) is attributable primarily to the tax deferral of losses on wash sales, the realization of unrealized gains for tax purposes on futures contracts, differing book and tax methods for bond discount/premium amortization, and passive foreign investment companies.
| | |
| | |
| Notes to Financial Statements | | |
| December 31, 2007 | | |
9. Affiliated Issuers
Investments representing 5% or more of the outstanding voting securities of a portfolio company of a fund result in that portfolio company being considered an affiliated company of such fund, as defined in the 1940 Act. The aggregate market value of all securities of affiliated companies held in Series V as of December 31, 2007 amounted to $1,996,868 which represents 0.5% of net assets. There were no affiliated companies held in any other Series. Transactions in Series V during the year ended December 31, 2007 in which the portfolio company is an “affiliated person” are as follows:
| | | | | | | | | | | | | | | | | | |
| | | Balance 12/31/2006 | | Gross Additions | | Gross Reductions | | Balance 12/31/2007 | | Realized Gain/(Loss) | | Investment Income |
| | | | | | |
HydroGen Corporation (Shares) | | | 403,000 | | | 269,346 | | | – | | | 672,346 | | | – | | | – |
HydroGen Corporation (Cost) | | $ | 1,820,100 | | $ | 751,475 | | $ | – | | $ | 2,571,575 | | $ | – | | $ | – |
| | | | | | | | | | | | | | | | | | | |
* As a result of Series V’s beneficial ownership of the common stock of these portfolio companies, applicable regulations require that the Series state that it may be deemed an affiliate of the respective portfolio company. The Series disclaims that the “affliated persons” are affiliates of the Distributor, Advisor, Series or any other client of the Advisor.
10. Acquisition of Series W of SBL Fund
Pursuant to a plan of reorganization approved by the stockholders of Series W of SBL Fund, Series H of SBL Fund acquired all of the net assets of Series W on June 16, 2006 which totaled $52,914,356. A total of 5,615,796 shares of Series W were exchanged for 5,481,948 shares of Series H immediately after the closing date. This exchange qualified as a tax-free reorganization under Section 368(a)(1)(c) of the Internal Revenue Code. Series W’s net assets included $743,249 of unrealized appreciation. The aggregate net assets of Series H immediately before the acquisition totaled $43,263,368 and following the acquisition, the combined net assets of Series H totalled $96,177,724.
11. Acquisition of Series G of SBL Fund
Pursuant to a plan of reorganization approved by the stockholders of Series G of SBL Fund, Series Y of SBL Fund acquired all of the net assets of Series G on June 16, 2006 which totaled $46,089,706. A total of 7,094,570 shares of Series G were exchanged for 4,606,863 shares of Series Y immediately after the closing date. This exchange qualified as a tax-free reorganization under Section 368(a)(1)(c) of the Internal Revenue Code. Series G’s net assets included $3,219,555 of unrealized appreciation and $16,205,387 of accumulated realized loss on sale of investments. The aggregate net assets of Series Y immediately before the acquisition totaled $45,276,152 and following the acquisition, the combined net assets of Series Y totalled $91,365,858.
Report of Independent Registered Public Accounting Firm
To the Contractholders and Board of Directors
SBL Fund
We have audited the accompanying statements of assets and liabilities, including the schedules of investments, of SBL Fund (comprised of Series A, B, C, D, E, H, J, N, O, P, Q, V, X, Y and Z portfolios) (the Fund), as of December 31, 2007, and the related statements of operations for the year then ended, the statement of changes in net assets for each of the two years in the period then ended, and the financial highlights for each of the periods indicated therein. These financial statements and financial highlights are the responsibility of the Fund’s management. Our responsibility is to express an opinion on these financial statements and financial highlights based on our audits.
We conducted our audits in accordance with the standards of the Public Company Accounting Oversight Board (United States). Those standards require that we plan and perform the audit to obtain reasonable assurance about whether the financial statements and financial highlights are free of material misstatement. We were not engaged to perform an audit of the Fund’s internal control over financial reporting. Our audits included consideration of internal control over financial reporting as a basis for designing audit procedures that are appropriate in the circumstances, but not for the purpose of expressing an opinion of the effectiveness of the Fund’s internal control over financial reporting. Accordingly, we express no such opinion. An audit also includes examining, on a test basis, evidence supporting the amounts and disclosures in the financial statements and financial highlights, assessing the accounting principles used and significant estimates made by management, and evaluating the overall financial statement presentation. Our procedures included confirmation of investments owned as of December 31, 2007, by correspondence with custodians and brokers or by other appropriate auditing procedures where replies from brokers were not received. We believe that our audits provide a reasonable basis for our opinion.
In our opinion, the financial statements and financial highlights referred to above present fairly, in all material respects, the financial position of each of the respective Series constituting the Fund at December 31, 2007, the results of their operations for the year then ended, the changes in their net assets for each of the two years in the period then ended, and the financial highlights for each of the periods indicated therein, in conformity with U.S. generally accepted accounting principles.
Kansas City, Missouri
February 27, 2008
186
| | |
| | |
| Directors’ Disclosure | | |
| (unaudited) | | |
Director Approval of Investment Advisory Agreement
At an in-person meeting of the Fund’s Boards of Directors held on November 8-9, 2007, called for the purpose of, among other things, voting on the renewal of the investment advisory and sub-advisory agreements applicable to the Fund, the Fund’s Board of Directors, including the Independent Directors, unanimously approved the continuation for a one year period of the investment advisory agreement between the Fund and Security Investors, LLC (“SI”), as well as each investment sub-advisory agreement applicable to the Fund. In reaching this conclusion, the Directors requested and obtained from SI and each investment sub-adviser such information as the Directors deemed reasonably necessary to evaluate the proposed renewal of the agreements. The Fund’s Board of Directors carefully evaluated this information, and was advised by legal counsel with respect to its deliberations.
In considering the proposed continuation of the investment advisory and sub-advisory agreements, the Independent Directors evaluated a number of considerations, including, among others, (1) the nature, extent, and quality of the advisory services to be provided by SI and the investment sub-advisers; (2) the investment performance of the Fund, SI and the various investment sub-advisers; (3) a comparison of each series’ expense ratios and those of similarly situated funds; (4) any fall out benefits or indirect profits to the sub-advisors from their relationship to the funds (such as “soft dollars”); and (5) other factors of the Board deemed to be relevant. Each Board of Directors also took into account other considerations that it believed, in light of the legal advice furnished to the Independent Directors by their independent legal counsel and the Directors’ own business judgment, to be relevant. Following its review, the Fund’s Board of Directors determined that the investment advisory agreement and each investment sub-advisory agreement applicable to the Fund (if any) will enable Fund shareholders to obtain high quality services at a cost that is appropriate, reasonable, and in the best interests of shareholders. Accordingly, the Directors, including the Independent Directors, unanimously approved the renewal of the investment advisory and investment subadvisory agreements based upon the following considerations, among others:
| | • | | The nature, extent and quality of the advisory services to be provided. The Board of Directors concluded that SI and the investment sub-advisers retained to provide portfolio management services with respect to the Fund are capable of providing high quality services to the Fund, as indicated by the nature and quality of services provided in the past, SI’s management capabilities demonstrated with respect to the Fund and other mutual funds managed by SI, the professional qualifications and experience of SI’s and the various sub-advisers’ portfolio managers, and SI’s investment and management oversight processes. The Directors also determined that SI and the subadvisers proposed to provide investment and related services that were of the same quality and quantity as services provided to the |
| | Fund in the past, and that these ser vices are appropriate in scope and extent in light of the Fund’s operations, the competitive landscape of the investment company business and investor needs. |
| | • | | The investment performance of the Fund. With respect to the Fund, the Directors concluded on the basis of information supplied by Lipper that SI and the investment sub-advisers had achieved investment performance that was acceptable, and competitive or superior relative to comparable funds over trailing periods. On the basis of the Directors’ assessment of the nature, extent and quality of advisory services to be provided or procured by SI, the Directors concluded that SI is capable of generating a level of long-term investment performance that is appropriate in light of the Fund’s investment objectives, policies and strategies and competitive with many other investment companies. |
| | • | | The cost of advisory services provided and the level of profitability. On the basis of each Board’s review of the fees to be charged by SI for investment advisory and other services, and the estimated profitability of SI’s relationship with the Fund, each Board concluded that the level of investment advisory fees and SI’s profitability are appropriate in light of the management fees and overall expense ratios of comparable investment companies and the anticipated profitability of the relationship between the Fund and SI and its affiliates. On the basis of comparative information supplied by Lipper the Directors determined that the advisory fees and estimated overall expense ratio of the Fund are consistent with, and often below, industry medians, particularly with respect to mutual funds of comparable size. |
| | • | | Whether the advisory fees reflect economies of scale. The Directors concluded that the Fund’s investment advisory fees appropriately reflect the current economic environment for SI and the competitive nature of the mutual fund market. The Directors further determined that the Fund has yet to achieve meaningful economies of scale, which, therefore, cannot be reflected in the investment advisory fees. |
| | • | | The extent to which economies of scale will be realized as the Fund grows. While the Fund’s investment advisory fees do not reduce should Fund assets grow meaningfully, the Directors determined that the investment advisory fees payable by the Fund other than Series Z (Alpha Opportunity Series) (whose investment advisory fee varies depending on that Fund’s performance relative to its benchmark index) already reflect potential future economies of scale to some extent by virtue of their competitive levels (determined with reference to industry standards as reported by |
| | |
| | |
| Directors’ Disclosure | | |
| (unaudited) | | |
| | Lipper and SI’s estimated profitability at current or foreseeable asset levels. The Directors also considered that they will have the opportunity to periodically reexamine whether a Fund has achieved economies of scale, and the appropriateness of investment advisory fees payable to SI and fees payable by SI to the investment sub-advisers, in the future. |
| | • | | Benefits (such as soft dollars) to SI from its relationship with the Fund (and any corresponding benefits to the Fund). The Directors concluded that other benefits described by SI and the investment sub-advisers from their relationships with the Fund, including “soft dollar” benefits in connection with Fund brokerage transactions, are reasonable and fair, and consistent with industry practice and the best interests of the Fund and their shareholders. In addition, the Directors determined that the administration, transfer agency and fund accounting fees paid by the Fund to SI are reasonable, fair and in the best interests of Fund shareholders in light of the nature and quality of the ser vices provided, the associated costs, and the necessity of the services for the Fund’s operations. |
| | • | | Other Considerations: In approving the investment advisory and sub-advisory agreements, the Directors determined that SI has made a substantial commitment to the recruitment and retention of high quality personnel, and maintains the financial, compliance and operational resources reasonably necessary to manage the Fund in a professional manner that is consistent with the best interests of the Fund and their shareholders. In this regard, the Directors favorably considered the compliance track record of the Fund and SI. The Directors also concluded that SI has made a significant entrepreneurial commitment to the management and success of the Fund, which entails a substantial financial and professional commitment, including investment advisory fee waivers and expense limitation arrangements with respect to the Fund to the benefit of Fund shareholders. |
| | |
| | |
| Special Shareholders’ Meeting | | |
| (unaudited) | | |
A special meeting of the shareholders of Series D of the SBL Fund was held on July 27, 2007. Each matter voted upon at the meeting, as well as the number of votes cast for, against, withheld or abstentions with respect to such matters are set forth below:
| | (1) | The approval of an investment sub-advisory agreement between Security Investors and Security Global Investors, LLC pursuant to which Security Global Investors, LLC will be appointed as an investment sub-adviser to Series D of the SBL Fund. The following votes were cast regarding this matter: |
| | | | |
| | | Votes For | | Votes Against/Abstentions |
SBL Fund, | | | | |
Series D | | 44,191,536 | | 4,799,734 |
| | |
| | |
| Directors (unaudited) | | |
| The business address of each director and officer is One Security Benefit Place, Topeka, KS 66636-0001 |
| | |
Name (Date of Birth) Year Elected*** | | Principal Occupation(s) During Past 5 Years |
| |
| |
Donald A. Chubb, Jr.** | | Business Broker - Griffith & Blair Realtors |
(12-14-46) | | Director - Jayhawk Area Boy Scouts Council |
1994 | | |
Harry W. Craig, Jr.** | | Chairman, CEO, Secretary & Director - The Martin Tractor Company, Inc. |
(05-11-39) | | Director - Stormont-Vail Corporation |
2004 | | Director - Concerned Citizens for Topeka |
| | Director - Oscar S. Stauffer Executive in Residence |
Jerry B. Farley** | | President - Washburn University |
(09-20-46) | | President - J&J Bonanza |
2005 | | |
Penny A. Lumpkin** | | Partner – Vivian’s Gift Shop (Corporate Retail) |
(08-20-39) | | Vice President - Palmer Companies, Inc. (Small Business and Shopping |
1993 | | Center Development) |
| | Vice President - PLB (Real Estate Equipment Leasing) |
| | Vice President - Town Crier (Retail) |
| | Prior to 2002: |
| | Vice President - Bellaire Shopping Center (Managing and Leasing) |
| | Partner - Goodwin Enterprises (Retail) |
Maynard F. Oliverius** | | President & Chief Executive Officer - Stormont-Vail HealthCare |
(12-18-43) | | Director - VHA Mid-America |
1998 | | Director - Go Topeka |
Thomas A. Swank* | | Senior Vice President - Security Benefit Corporation and |
(01-10-60) | | Security Benefit Life Insurance Company |
2007 (President, Director & | | Chief Operating Officer - Security Benefit Life Insurance Company |
Chairman of the Board) | | President - First Security Benefit Life Insurance & Annuity Company of New York |
| | Chief Financial Officer & Treasurer - Security Benefit Corporation, Security |
| | Benefit Life Insurance Company and First Security Benefit Life Insurance & |
| | | Annuity Company of New York |
*This director is deemed to be an “interested person” of the Funds under the Investment Company Act of 1940, as amended, by reason of his position with the Fund’s Investment Manager and/or the parent of the Investment Manager.
**These directors serve on the Fund’s joint audit committee, the purpose of which is to meet with the independent registered public accounting firm, to review the work of the independent registered public accounting firm, and to oversee the handling by Security Investors of the accounting function for the Funds.
***Each director oversees 28 Security Funds portfolios and serves until the next annual meeting, or until a successor has been duly elected and qualified.
Effective August 17, 2007, Michael Odlum resigned his position as President and Acting Chairman of the Board of the Security Funds.
| | |
| | |
| Officers (unaudited) | | |
| The business address of each director and officer is One Security Benefit Place, Topeka, KS 66636-0001 |
| | |
Name (Date of Birth) Title - Year Elected | | Principal Occupation(s) During Past 5 Years |
| |
| |
Steven M. Bowser | | Vice President & Senior Portfolio Manager - Security Investors, LLC |
(02-11-60) | | Vice President & Senior Portfolio Manager - Security Benefit Life Insurance |
Vice President - 2003 | | Company |
Christina Fletcher | | Vice President & Portfolio Manager - Security Investors, LLC |
(07-25-72) | | Credit Analyst/Portfolio Manager - Horizon Cash Management |
Vice President - 2005 | | Senior Money Market Trader - Scudder Investments |
Brenda M. Harwood | | Vice President, Chief Compliance Officer & Treasurer - Security Global |
(11-03-63) | | Investors, LLC |
Chief Compliance Officer - 2004 | | Assistant Vice President - Security Benefit Life Insurance Company |
Treasurer – 1988 | | Vice President, Assistant Treasurer & Director - Security Distributors, Inc. |
Mark Lamb | | Vice President - Security Investors, LLC |
(02-03-60) | | Vice President - Security Benefit Life Insurance Company |
Vice President - 2003 | | |
Amy J. Lee | | Secretary - Security Investors, LLC |
(06-05-61) | | Secretary & Chief Compliance Officer - Security Distributors, Inc. |
Secretary - 1987 | | Vice President, Associate General Counsel & Assistant Secretary -Security Benefit |
| | Corporation & Security Benefit Life Insurance Company |
| | Director - Brecek & Young Advisors, Inc. |
Mark Mitchell | | Vice President & Portfolio Manager - Security Investors, LLC |
(08-24-64) | | Vice President & Portfolio Manager - Security Benefit Life Insurance Company |
Vice President – 2003 | | |
Christopher Phalen | | Vice President & Head of Fixed Income - Security Global Investors, LLC |
(11-9-70) | | Assistant Vice President & Head of Fixed Income - Security Benefit Life Insurance |
Vice President – 2002 | | Company |
| | Vice President & Portfolio Manager - Security Investors, LLC |
| | Vice President & Portfolio Manager - Security Benefit Life Insurance Company |
James P. Schier | | Vice President & Senior Portfolio Manager - Security Investors, LLC |
(12-28-57) | | Vice President & Senior Portfolio Manager - Security Benefit Life Insurance |
Vice President – 1998 | | Company |
Cindy L. Shields | | Vice President & Head of Operations - Security Global Investors |
(06-05-67) | | Vice President & Head of Equity Asset Management - Security Investors, LLC |
Vice President - 1988 | | Vice President & Head of Equity Asset Management - Security Benefit Life |
| | Insurance Company |
Christopher D. Swickard | | Assistant Secretary - Security Investors, LLC |
(10-09-65) | | Second Vice President & Assistant General Counsel - Security Benefit |
Assistant Secretary – 1996 | | Corporation & Security Benefit Life Insurance Company |
| | Assistant Secretary - Security Distributors, Inc. |
David G. Toussaint | | Vice President & Portfolio Manager - Security Investors, LLC |
(10-10-66) | | Assistant Vice President & Portfolio Manager - Security Benefit Life Insurance |
Vice President – 2001 | | Company |
* Officers serve until the next annual meeting or until a successor has been duly elected and qualified.
This page left blank intentionally.
Other Information
Each of the Security Funds files a complete schedule of portfolio holdings with the U.S. Securities and Exchange Commission for the first and third quarters of each fiscal year on Form N-Q. The Forms N-Q of each such Fund are available on the Commission’s website at www.sec.gov. The Forms N-Q may be reviewed and copied at the Commission’s Public Reference Room in Washington, DC. Information on the operation of the Public Reference Room may be obtained by calling 1-800-SEC-0330. The portfolio holdings of each of the Security Funds are available on their website, www.securitybenefit.com or by calling 1-800-888-2461.
A description of the policies and procedures that the Security Funds use to determine how to vote proxies relating to portfolio securities is available upon request, free of charge by calling 1-800-888-2461, or accessing the U.S. Securities and Exchange Commission website at www.sec.gov. Information regarding how the Security Funds voted proxies relating to portfolio securities during the 12 month period ended June 30, 2007 is available upon request, free of charge by calling 1-800-888-2461, or accessing the U.S. Securities and Exchange Commission website at www.sec.gov.
The statement of additional information (“SAI”) includes additional information about the Funds’ Directors and is available upon request without charge by calling 1-800-888-2461.
|
The Security Group of Mutual Funds Security Equity Fund • Alpha Opportunity Series • Equity Series • Global Series • Mid Cap Value Series • Select 25 Series • Small Cap Growth Series Security Large Cap Value Fund Security Mid Cap Growth Fund Security Income Fund • Capital Preservation Series • Diversified Income Series • High Yield Series • Income Opportunity Series Security Cash Fund |
| | | | |
| Security Funds Officers and Directors |
| | |
Directors Donald A. Chubb, Jr. Harry W. Craig, Jr. Jerry B. Farley. Penny A. Lumpkin Maynard F. Oliverius Thomas A. Swank Officers Thomas A. Swank, President Steve M. Bowser, Vice President Christina Fletcher, Vice President Mark Lamb, Vice President Mark Mitchell, Vice President Christopher Phalen, Vice President James P. Schier, Vice President Cindy L. Shields, Vice President David G. Toussaint, Vice President Amy J. Lee, Secretary Christopher D. Swickard, Assistant Secretary Brenda M. Harwood, Chief Compliance Officer & Treasurer | | |
This report is submitted for the general information of the shareholders of the Funds. The report is not authorized for distribution to prospective investors in the Funds unless preceded or accompanied by an effective prospectus which contains details concerning the sales charges and other pertinent information.
| | |
 | | 
|
The Registrant has adopted a code of ethics that applies to its principal executive officer and principal financial officer. A copy of the Registrant’s code of ethics is filed herewith as Exhibit 10(a)(1). No amendments were made to the provisions of the code of ethics during the period covered by this report. No implicit or explicit waivers to the provisions of the code of ethics were granted during the period covered by this report. The Registrant hereby undertakes to provide any person without charge, upon request, a copy of its Code by calling the Registrant at 1-800-888-2461.
| Item 3. | Audit Committee Financial Expert. |
The Registrant’s Board of Directors has determined that Maynard Oliverius, a member of the Audit Committee of the Board, is an audit committee financial expert. Mr. Oliverius is “independent” for purposes of this item.
| Item 4. | Principal Accountant Fees and Services. |
| (a) | Audit Fees. The aggregate fees billed for each of the last two fiscal years (the “Reporting Periods”) for professional services rendered by the Registrant’s principal accountant (the “Auditor”) for the audit of the Registrant’s annual financial statements, or services that are normally provided by the Auditor in connection with the statutory and regulatory filings or engagements for the Reporting Periods, were $327,000 in 2006 and $341,000 in 2007. |
| (b) | Audit-Related Fees. The aggregate fees billed in the Reporting Periods for assurance and related services by the Auditor that are reasonably related to the performance of the audit of the Registrant’s financial statements and are not reported under paragraph (a) of this Item 4 were $5,000 in 2006 and $5,500 in 2007. These services consisted of a review of the Registrant’s semi-annual financial statements. |
The aggregate fees billed in the Reporting Periods for assurance and related services by the Auditor to the Registrant’s investment adviser (not including any sub-investment adviser whose role is primarily portfolio management and is subcontracted with or overseen by another investment adviser), and any entity controlling, controlled by or under common control with the investment adviser that provides ongoing services to the Registrant (“Service Affiliates”) which required pre-approval by the Audit Committee were $18,000 in 2006 and $20,000 in 2007, which related to the review of the transfer agent function.
| (c) | Tax Fees. The aggregate fees billed to the Registrant in the Reporting Periods for professional services rendered by the Auditor for tax compliance, tax advice and tax planning (“Tax Services”) were $45,000 in 2006 and $42,000 in 2007. These services consisted of (i) preparation of U.S. federal, state and excise tax returns; (ii) U.S. federal and state tax planning, advice and assistance regarding statutory, regulatory or administrative developments, (iii) tax advice regarding tax qualification matters and/or treatment of various financial instruments held or proposed to be acquired and (iv) review of U.S. federal excise distribution calculations. |
The aggregate fees billed in the Reporting Periods for Tax Services by the Auditor to Service Affiliates which required pre-approval by the Audit Committee were $0 in 2006 and $0 in 2007.
| (d) | All Other Fees. The aggregate fees billed to the Registrant in the Reporting Periods for products and services provided by the Auditor, other than the services reported in paragraphs (a) through (c) of this Item, were $0 in 2006 and $0 in 2007. |
The aggregate fees billed in the Reporting Periods for Non-Audit Services by the Auditor to Service Affiliates, other than the services reported in paragraphs (b) through (d) of this Item, which required pre-approval by the Audit Committee were $0 in 2006 and $0 in 2007.
| | | | |
| (e) | | (1) | | Audit Committee Pre-Approval Policies and Procedures. The Registrant’s Audit Committee has established policies and procedures for pre-approval of the auditor’s engagements for audit and non-audit services to the Registrant. Pre-approval considerations include whether the proposed services are compatible with maintaining the auditor’s independence as specified in applicable rules. |
| | |
| (e) | | (2) | | Percentage of Non-Audit Services Approved under (c)(7)(i)(C). The percentage of the services described in each of (b) through (d) of this Item 4 (only those that relate to the Registrant) that were approved by the Audit Committee pursuant to paragraph (c)(7)(i)(C) of Rule 2-01 of Regulation S-X was 0%, 0% and 0%, respectively. |
| (g) | Non-Audit Fees. The aggregate non-audit fees billed by the Auditor for services rendered to the Registrant, and rendered to Service Affiliates, for the Reporting Periods were $68,000 in 2006 and $67,500 in 2007. |
| (h) | Auditor Independence. The Registrant’s Audit Committee was provided with information relating to the provision of non-audit services by Ernst & Young LLP to the Registrant (and its affiliates) that were not pre-approved by the Audit Committee so that a determination could be made whether the provision of such services is compatible with maintaining Ernst & Young LLP’s independence. |
| Item 5. | Audit Committee of Listed Registrants. |
Not applicable.
| Item 6. | Schedule of Investments. |
The Schedule of Investments is included under Item 1 of this form.
| Item 7. | Disclosure of Proxy Voting Policies and Procedures for Closed-End Management Investment Companies. |
Not applicable.
| Item 8. | Portfolio Managers of Closed-End Management Investment Companies. |
Not applicable.
| Item 9. | Purchases of Equity Securities by Closed-End Management Investment Company and Affiliated Purchasers. |
Not applicable.
| Item 10. | Submission of Matters to a Vote of Security Holders. |
The registrant does not currently have in place procedures by which shareholders may recommend nominees to the registrant’s board.
There have been no changes to the procedures by which shareholders may recommend nominees to the registrant’s board.
| Item 11. | Controls and Procedures. |
| (a) | The registrant’s President and Treasurer have concluded that the registrant’s disclosure controls and procedures (as defined in rule 30a-3(c) under the Investment Company Act of 1940) are effective based on their evaluation of these disclosure controls and procedures within 90 days of the filing date of this report on Form N-CSR. |
| (b) | There were no significant changes in the registrant’s internal controls, or in other factors that could significantly affect these controls subsequent to the date of their evaluation, including any corrective actions with regard to significant deficiencies and material weaknesses. |
| | | | |
| (a) | | (1) | | Code of Ethics pursuant to Item 2 above. |
| | |
| | (2) | | Certifications pursuant to Section 302 of the Sarbanes-Oxley Act of 2002 and required by Rule 30a-2(a) under the Investment Company Act of 1940, are attached hereto. |
| (b) | Certifications pursuant to Section 906 of the Sarbanes-Oxley Act of 2002 and required by Rule 30a-2(a) under the Investment Company Act of 1940, are attached hereto. |
SIGNATURES
Pursuant to the requirements of the Securities Exchange Act of 1934 and the Investment Company Act of 1940, the registrant has duly caused this report to be signed on its behalf by the undersigned, thereunto duly authorized.
| | |
| SBL FUND |
| |
| By: | | /s/ THOMAS A. SWANK |
| | Thomas A. Swank, President |
| |
| Date: | | March 7, 2008 |
Pursuant to the requirements of the Securities Exchange Act of 1934 and the Investment Company Act of 1940, this report has been signed below by the following persons on behalf of the registrant and in the capacities and on the dates indicated.
| | |
| By: | | /s/ THOMAS A. SWANK |
| | Thomas A. Swank, President |
| |
| Date: | | March 7, 2008 |
| |
| By: | | /s/ BRENDA M. HARWOOD |
| | Brenda M. Harwood, Treasurer |
| |
| Date: | | March 7, 2008 |