Indefinite-lived intangible assets principally comprise trademarks.
Finite-lived intangible assets, which have a weighted average life of 10 years, principally comprise technologies and licences. Amortisation expense recorded in the period in respect of finite-lived intangible assets was €48 million (2003: €30 million; 2002: €36 million). This is expected to increase to approximately €60 million for 2005 and subsequent years.
Costs related to excess lease costs are reduced by assumed sub-lease income for the periods impacted.
Back to Contents
Additional information for US investors (continued)
Unilever Group
Derivative financial instruments
Transition adjustment
Unilever applied the provisions of SFAS 133 ‘Accounting for Derivative Instruments and Hedging Activities’ in this divergence statement as from 1 January 2001. In accordance with the transition provisions of SFAS 133, an adjustment of €6 million (net of tax of €3 million) was recorded as the cumulative effect of a change in accounting principle to recognise the fair value of all the Group’s derivative financial instruments and hedge items under US GAAP. In addition, Unilever recorded a one-time unrealised loss of €85 million (net of tax of €37 million) to consolidated other comprehensive income under US GAAP.
Hedging policy
Unilever’s accounting policies in respect of derivative financial instruments are described in the accounting information and policies on page 98. In particular, under its accounting policies, Unilever applies hedge accounting to its portfolio of derivative financial instruments, meaning that changes in the value of forward foreign exchange contracts are recognised in the results in the same period as changes in the values of the assets and liabilities they are intended to hedge. Interest payments and receipts arising from interest rate derivatives such as swaps and forward rate agreements are matched to those arising from underlying debt and investment positions. Payments made or received in respect of the early termination of derivative instruments are spread over the original life of the instrument so long as the underlying exposure continues to exist.
Under US GAAP, Unilever has not designated any of its derivative instruments as qualifying hedge instruments under SFAS 133 and, accordingly, under US GAAP, all derivative financial instruments are valued at fair value, and changes in their fair value are reflected in earnings. All gains and losses arising on derivative financial instruments are recognised immediately; payments made or received in respect of the early termination of derivative instruments represent cash realisation of these gains and losses and therefore have no further impact on earnings.
Pensions
Under FRS 17, the expected costs of providing retirement benefits are charged to the profit and loss account over the periods benefiting from the employees’ services. Variations from the expected cost are recognised as they occur in the statement of total recognised gains and losses. The assets and liabilities of pension plans are included in the Group balance sheet at fair value. Under US GAAP, pensions costs and liabilities are accounted for in accordance with the prescribed actuarial method and measurement principles of SFAS 87. The most significant difference is that variations from the expected costs are recognised in the profit and loss account over the expected service lives of the employees.
Under US GAAP, an additional minimum liability is recognised and a charge made to other comprehensive income when the accumulated benefit obligation exceeds the fair value of plan assets to the extent that this amount is not covered by the net liability recognised in the balance sheet.
Investments
Unilever accounts for current investments, which are liquid funds temporarily invested, at their market value, which is consistent with UK GAAP.
Unilever accounts for changes in the market value of current investments as interest receivable in the profit and loss account for the year. Under US GAAP, such current asset investments are classified as ‘available for sale securities’ and changes in market values, which represent unrealised gains or losses, are excluded from earnings and taken to stockholders’ equity unless such losses are deemed to be other than temporary at which time they are recognised through the profit and loss account. Unrealised gains and losses arising from changes in the market values of securities available for sale are not material.
Unilever accounts for fixed investments other than in joint ventures and associates at cost less any amounts written off to reflect a permanent impairment. Under US GAAP such investments are held at fair value. The difference is not material.
Dividends
The proposed final ordinary dividends are provided for in the Unilever accounts in the financial year to which they relate. Under US GAAP such dividends are not provided for until they become irrevocable.
Deferred taxation
Under FRS 19, deferred tax is not recognised on fair value adjustments made to assets acquired; under US GAAP, deferred tax is recorded on all fair value adjustments and on any differences between the assigned values and tax bases of assets and liabilities. Also, FRS 19 changed the treatment of deferred tax on tax-deductible goodwill previously written off to reserves. Such goodwill is reinstated, net of amortisation, under US GAAP, and the tax effect of such restatement has been adjusted accordingly.
Classification differences between UK and US GAAP
Revenue recognition
Under US GAAP, certain sales incentive expenses which have been included in operating costs under Unilever’s accounting would be deducted from turnover. The decrease in turnover for the years to 31 December 2004, 2003 and 2002 is €1 061million, €1 238 million and €1 337 million respectively. There is no impact on Unilever’s net profit.
Cash flow statement
Under US GAAP, various items would be reclassified within the consolidated cash flow statement. In particular, interest received, interest paid and taxation would be part of net cash flow from operating activities, and dividends paid would be included within net cash flow from financing. In addition, under US GAAP, cash and cash equivalents comprise cash balances and current investments with an original maturity at the date of investment of less than three months. Under Unilever’s presentation, cash includes only cash in hand or available on demand less bank overdrafts. Cash flows from movements in bank overdrafts would be classified as part of cash flows from financing activities under US GAAP. Cash flows from movements in bank overdrafts were €(134) million for the year ended 31 December 2004 (2003: €58 million; 2002: €(86) million). Movements in those current investments which are included under the heading of cash and cash equivalents under US GAAP form part of the movement entitled ‘Management of liquid resources’ in the cash flow statement. At 31 December 2004, the balance of such investments was €91 million (2003: €3 million).
158 Unilever Annual Report and Accounts 2004
Back to Contents
Additional information for US investors (continued)
Unilever Group
Long leasehold interests in land
Under UK GAAP, Unilever treats the cost of acquiring a long leasehold interest in land as a fixed asset, and depreciates the cost of that asset over the lease term. Under US GAAP, the cost of long leasehold interests would be deferred within ‘Other assets’ and recognised on a straight-line basis over the lives of the leases as operating lease rentals. The balance of such assets were €43 million as at 31 December 2004 (2003: €58 million). In all other respects, there are no differences in accounting for these arrangements between UK and US GAAP.
Equity in earnings related to investments in joint ventures and associated companies
Under US GAAP, equity in earnings related to investments in joint ventures and associated companies would be disclosed on a single line within the income statement. In particular, our share of the interest and taxation arising in respect of joint ventures and associated companies would be reported on this line, rather than as part of the total interest and taxation charge for the Group. US GAAP equity in earnings related to investments in joint ventures and associated companies were €(57) million for the year ended 31 December 2004 (2003: €(48) million; 2002: €(54) million).
Recently issued accounting pronouncements
In January 2003, the FASB issued Financial Interpretation No. 46 (FIN 46), ’Consolidation of Variable Interest Entities’ and in December 2003 issued a revised interpretation FIN 46(R). Under these interpretations, certain entities known as variable interest entities must be consolidated by the primary beneficiary of the entity. During 2004, Unilever reviewed its contractual arrangements with potential variable interest entities and identified certain arrangements that qualify as variable interest entities under FIN 46(R). These variable interest entities relate to certain leasing, manufacturing and distribution agreements. Unilever is not the primary beneficiary of any of these entities. The total maximum loss exposure relating to these entities is not material.
In December 2003, the Medicare Prescription Drug Improvement and Modernization Act of 2003 (the Medicare Act) became law in the United States. The Medicare Act provides for two new prescription drug benefit features under Medicare. Unilever provides post-retirement healthcare benefits to its United States employees so the benefits provided are impacted by the Medicare Act. In May 2004, the FASB issued FSP 106-2, ‘Accounting and Disclosure Modernization Act of 2003’ to provide guidance on accounting for the effects of the Medicare Act. FSP 106-2 is effective for Unilever’s 2004 financial statements. The expected subsidy reduced Unilever’s accumulated benefit obligation by approximately €52 million, which Unilever recognised in the statement of total recognised gains and losses. The impact on the ongoing service cost is a reduction by an immaterial amount.
In December 2004, the FASB issued FASB Statement No.123 (Revised), ‘Share-Based Payments’ which provides guidance on how companies must measure compensation cost relating to share-based payment transactions in their financial statements. FASB No.123 (Revised) is effective for Unilever’s 2005 financial statements. FASB No.123 (Revised) is not expected to have a significant impact on the consolidated results of operations or financial position of Unilever as Unilever adopted the fair value measurement provisions of FASB Statement No.123 in 2003.
In November 2004, the FASB issued FASB Statement No.151, ‘Inventory Costs – an amendment of ARB 43’ to clarify the existing requirements in ARB No. 43 by adopting language similar to that used in IAS 2. The guidance is effective for inventory costs incurred during fiscal years beginning after 15 June 2003. FAS 151 does not have an impact on the results of operations or financial position of Unilever since the key elements are already applied in Unilever’s financial statements.
In March 2004, the EITF reached consensus on Issue No. 03-01, ’The Meaning of Other-Than-Temporary Impairment and its Application to Certain Investments’ (EITF 03-01). EITF 03-01 provides guidance on other-than-temporary impairment models for marketable debt and equity securities and non-marketable securities accounted for under the cost method. In September 2004, the FASB delayed the effective date for the recognition and measurement guidance in EITF 03-01, until certain implementation issues are addressed. The disclosure requirements in EITF 03-01 remain effective. When issued, EITF 03-01 is not expected to have a material impact on Unilever’s financial position or results of operations.
Documents on display in the United States
Unilever files and furnishes reports and information with the United States Securities and Exchange Commission (SEC), and such reports and information can be inspected and copied at the SEC’s public reference facilities in Washington DC, Chicago and New York. Certain of our reports and other information that we file or furnish to the SEC are also available to the public over the internet on the SEC’s website at www.sec.gov.
Unilever Annual Report and Accounts 2004 159
Back to Contents
Additional information for US investors (continued)
Unilever Group
Guarantor statements
On 2 October 2000, NV and Unilever Capital Corporation (UCC) filed a US $15 billion Shelf registration, which is unconditionally and fully guaranteed, jointly and severally, by NV, PLC and Unilever United States, Inc. (UNUS). Of the US $15 billion Shelf registration, US $4.25 billion of Notes were outstanding at 31 December 2004 (2003: US $4.25 billion) with coupons ranging from 5.90% to 7.125%. These Notes are to be repaid between 1 November 2005 and 15 November 2032.
Provided below are the profit and loss accounts, cash flow statements and balance sheets of each of the companies discussed above, together with the profit and loss account, cash flow statement and balance sheet of non-guarantor subsidiaries. These have been prepared under the historical cost convention, and, aside from the basis of accounting for investments at net asset value (equity accounting), comply in all material respects with Netherlands and United Kingdom law and with United Kingdom GAAP. Divergences from US GAAP are disclosed on pages 154 to 159. We have not provided reconciliations from the accounting principles used by Unilever to US GAAP for the columns relating to the guarantor entities, as such reconciliations would not materially affect an investor’s understanding of the nature of this guarantee. The financial information in respect of NV, PLC and UNUS has been prepared with all subsidiaries accounted for on an equity basis. The financial information in respect of the non-guarantor subsidiaries has been prepared on a consolidated basis.
| | | | | | | | | | | | | | € million | |
| |
|
|
|
|
|
|
|
|
|
|
|
|
| |
| | Unilever | | Unilever | | | | Unilever | | | | | | | |
| | Capital | | N.V. | | | | United | | | | | | | |
| | Corporation | | parent | | Unilever PLC | | States Inc. | | Non- | | | | | |
| | subsidiary | | issuer/ | | parent | | subsidiary | | guarantor | | | | Unilever | |
| | issuer | | guarantor | | guarantor | | guarantor | | subsidiaries | | Eliminations | | Group | |
|
|
|
|
|
|
|
|
|
|
|
|
|
| |
| Profit and loss account | | | | | | | | | | | | | | |
| for the year ended 31 December 2004 | | | | | | | | | | | | | | |
| | | | | | | | | | | | | | | |
| Group turnover | – | | – | | – | | – | | 40 169 | | – | | 40 169 | |
| Operating costs | – | | 50 | | 31 | | 6 | | (36 845 | ) | – | | (36 758 | ) |
| |
|
|
|
|
|
|
|
|
|
|
|
|
| |
| Group operating profit | – | | 50 | | 31 | | 6 | | 3 324 | | – | | 3 411 | |
| Share of operating profit of joint ventures | – | | – | | – | | – | | 44 | | – | | 44 | |
| |
|
|
|
|
|
|
|
|
|
|
|
|
| |
| Operating profit | – | | 50 | | 31 | | 6 | | 3 368 | | – | | 3 455 | |
| Share of operating profit of associates | – | | – | | – | | – | | 42 | | – | | 42 | |
| Dividends | – | | 1 960 | | 770 | | – | | (2 730 | ) | – | | – | |
| Other income from fixed investments | – | | – | | – | | – | | 31 | | – | | 31 | |
| Interest | (282 | ) | (134 | ) | 5 | | (3 | ) | (214 | ) | – | | (628 | ) |
| Other finance income/(cost) – pensions and similar | | | | | | | | | | | | | | |
| obligations | – | | (6 | ) | – | | (10 | ) | (45 | ) | – | | (61 | ) |
| Intercompany finance costs | 296 | | 211 | | (3 | ) | (22 | ) | (482 | ) | – | | – | |
| |
|
|
|
|
|
|
|
|
|
|
|
|
| |
| Profit on ordinary activities before taxation | 14 | | 2 081 | | 803 | | (29 | ) | (30 | ) | – | | 2 839 | |
| Taxation | (5 | ) | 37 | | 17 | | 11 | | (842 | ) | – | | (782 | ) |
| |
|
|
|
|
|
|
|
|
|
|
|
|
| |
| Profit on ordinary activities after taxation | 9 | | 2 118 | | 820 | | (18 | ) | (872 | ) | – | | 2 057 | |
| Minority interests | – | | – | | – | | – | | (181 | ) | – | | (181 | ) |
| Equity earnings of subsidiaries | – | | (242 | ) | 1 056 | | (288 | ) | – | | (526 | ) | – | |
| |
|
|
|
|
|
|
|
|
|
|
|
|
| |
| Net profit | 9 | | 1 876 | | 1 876 | | (306 | ) | (1 053 | ) | (526 | ) | 1 876 | |
|
|
|
|
|
|
|
|
|
|
|
|
|
| |
160 Unilever Annual Report and Accounts 2004
Back to Contents
Additional information for US investors (continued)
Unilever Group
| Guarantor statements (continued) | |
| | | | | | | | | | | | | | € million | |
| |
|
|
|
|
|
|
|
|
|
|
|
|
| |
| | Unilever | | Unilever | | | | Unilever | | | | | | | |
| | Capital | | N.V. | | | | United | | | | | | | |
| | Corporation | | parent | | Unilever PLC | | State Inc. | | Non- | | | | | |
| | subsidiary | | issuer/ | | parent | | subsidiary | | guarantor | | | | Unilever | |
| | issuer | | guarantor | | guarantor | | guarantors | | subsidiaries | | Eliminations | | Group | |
|
|
|
|
|
|
|
|
|
|
|
|
|
| |
| Profit and loss account | | | | | | | | | | | | | | |
| for the year ended 31 December 2003 | | | | | | | | | | | | | | |
| | | | | | | | | | | | | | | |
| Group turnover | – | | – | | – | | – | | 42 693 | | – | | 42 693 | |
| Operating costs | – | | 127 | | (26 | ) | (8 | ) | (37 303 | ) | – | | (37 210 | ) |
| |
|
|
|
|
|
|
|
|
|
|
|
|
| |
| Group operating profit | – | | 127 | | (26 | ) | (8 | ) | 5 390 | | – | | 5 483 | |
| Share of operating profit of joint ventures | – | | – | | – | | – | | 46 | | – | | 46 | |
| |
|
|
|
|
|
|
|
|
|
|
|
|
| |
| Operating profit | – | | 127 | | (26 | ) | (8 | ) | 5 436 | | – | | 5 529 | |
| Share of operating profit of associates | – | | – | | – | | – | | 25 | | – | | 25 | |
| Dividends | – | | 1 235 | | 946 | | – | | (2 181 | ) | – | | – | |
| Other income from fixed investments | – | | – | | – | | – | | (3 | ) | – | | (3 | ) |
| Interest | (453 | ) | (84 | ) | (30 | ) | (3 | ) | (277 | ) | – | | (847 | ) |
| Other finance income/(cost) – pensions and similar | | | | | | | | | | | | | | |
| obligations | – | | (6 | ) | – | | (24 | ) | (136 | ) | – | | (166 | ) |
| Intercompany finance costs | 469 | | 533 | | (18 | ) | (51 | ) | (933 | ) | – | | – | |
| |
|
|
|
|
|
|
|
|
|
|
|
|
| |
| Profit on ordinary activities before taxation | 16 | | 1 805 | | 872 | | (86 | ) | 1 931 | | – | | 4 538 | |
| Taxation | (6 | ) | (93 | ) | (53 | ) | 56 | | (1 431 | ) | – | | (1 527 | ) |
| |
|
|
|
|
|
|
|
|
|
|
|
|
| |
| Profit on ordinary activities after taxation | 10 | | 1 712 | | 819 | | (30 | ) | 500 | | – | | 3 011 | |
| Minority interests | – | | – | | – | | – | | (249 | ) | – | | (249 | ) |
| Equity earnings of subsidiaries | – | | 1 050 | | 1 943 | | 86 | | – | | (3 079 | ) | – | |
| |
|
|
|
|
|
|
|
|
|
|
|
|
| |
| Net profit | 10 | | 2 762 | | 2 762 | | 56 | | 251 | | (3 079 | ) | 2 762 | |
|
|
|
|
|
|
|
|
|
|
|
|
|
| |
| Profit and loss account | | | | | | | | | | | | | | |
| for the year ended 31 December 2002 | | | | | | | | | | | | | | |
| | | | | | | | | | | | | | | |
| Group turnover | – | | – | | – | | – | | 48 270 | | – | | 48 270 | |
| Operating costs | – | | 89 | | (53 | ) | (21 | ) | (43 278 | ) | – | | (43 263 | ) |
| |
|
|
|
|
|
|
|
|
|
|
|
|
| |
| Group operating profit | – | | 89 | | (53 | ) | (21 | ) | 4 992 | | – | | 5 007 | |
| Share of operating profit of joint ventures | – | | – | | – | | – | | 84 | | – | | 84 | |
| |
|
|
|
|
|
|
|
|
|
|
|
|
| |
| Operating profit | – | | 89 | | (53 | ) | (21 | ) | 5 076 | | – | | 5 091 | |
| Share of operating profit of associates | | | – | | – | | – | | 34 | | – | | 34 | |
| Dividends | – | | 3 779 | | 1 011 | | – | | (4 790 | ) | – | | – | |
| Other income from fixed investments | – | | – | | – | | – | | (7 | ) | – | | (7 | ) |
| Interest | (395 | ) | (206 | ) | (83 | ) | (1 | ) | (488 | ) | – | | (1 173 | ) |
| Other finance income/(cost) – pensions and similar | | | | | | | | | | | | | | |
| obligations | – | | – | | – | | 28 | | 80 | | – | | 108 | |
| Intercompany finance costs | 403 | | 450 | | (3 | ) | (89 | ) | (761 | ) | – | | – | |
| |
|
|
|
|
|
|
|
|
|
|
|
|
| |
| Profit on ordinary activities before taxation | 8 | | 4 112 | | 872 | | (83 | ) | (856 | ) | – | | 4 053 | |
| Taxation | (3 | ) | (41 | ) | (3 | ) | 31 | | (1 589 | ) | – | | (1 605 | ) |
| |
|
|
|
|
|
|
|
|
|
|
|
|
| |
| Profit on ordinary activities after taxation | 5 | | 4 071 | | 869 | | (52 | ) | (2 445 | ) | – | | 2 448 | |
| Minority interests | – | | – | | – | | – | | (312 | ) | – | | (312 | ) |
| Equity earnings of subsidiaries | – | | (1 935 | ) | 1 267 | | 110 | | – | | 558 | | – | |
| |
|
|
|
|
|
|
|
|
|
|
|
|
| |
| Net profit | 5 | | 2 136 | | 2 136 | | 58 | | (2 757 | ) | 558 | | 2 136 | |
|
|
|
|
|
|
|
|
|
|
|
|
|
| |
Unilever Annual Report and Accounts 2004 161
Back to Contents
Additional information for US investors (continued)
Unilever Group
| Guarantor statements (continued) | |
| | | | | | | | | | | | | | € million | |
| |
|
|
|
|
|
|
|
|
|
|
|
|
| |
| | Unilever | | Unilever | | | | Unilever | | | | | | | |
| | Capital | | N.V. | | | | United | | | | | | | |
| | Corporation | | parent | | Unilever PLC | | States Inc. | | Non- | | | | | |
| | subsidiary | | issuer/ | | parent | | subsidiary | | guarantor | | | | Unilever | |
| | issuer | | guarantor | | guarantor | | guarantor | | subsidiaries | | Eliminations | | Group | |
|
|
|
|
|
|
|
|
|
|
|
|
|
| |
| Cash flow statement | | | | | | | | | | | | | | |
| for the year ended 31 December 2004 | | | | | | | | | | | | | | |
| | | | | | | | | | | | | | | |
| Cash flow from group operating activities | 6 | | 49 | | 43 | | (200 | ) | 6 955 | | – | | 6 853 | |
| Dividends from joint ventures | – | | – | | – | | – | | 60 | | – | | 60 | |
| Returns on investments and servicing of finance | 13 | | 107 | | 3 | | (24 | ) | (906 | ) | – | | (807 | ) |
| Taxation | – | | (96 | ) | (126 | ) | (145 | ) | (1 011 | ) | – | | (1 378 | ) |
| Capital expenditure and financial investment | – | | (212 | ) | (35 | ) | (3 | ) | (794 | ) | – | | (1 044 | ) |
| Acquisitions and disposals | – | | – | | – | | – | | 316 | | – | | 316 | |
| Dividends paid on ordinary share capital | – | | (983 | ) | (770 | ) | – | | – | | 33 | | (1 720 | ) |
| |
|
|
|
|
|
|
|
|
|
|
|
|
| |
| Cash flow before management of liquid resources | | | | | | | | | | | | | |
| and financing | 19 | | (1 135 | ) | (885 | ) | (372 | ) | 4 620 | | 33 | | 2 280 | |
| Management of liquid resources | (9 | ) | (37 | ) | – | | – | | 15 | | – | | (31 | ) |
| Financing | (9 | ) | 985 | | 885 | | 372 | | (5 154 | ) | – | | (2 921 | ) |
| |
|
|
|
|
|
|
|
|
|
|
|
|
| |
| Increase/(decrease) in cash in the period | 1 | | (187 | ) | – | | – | | (519 | ) | 33 | | (672 | ) |
|
|
|
|
|
|
|
|
|
|
|
|
|
| |
| Cash flow statement | | | | | | | | | | | | | | |
| for the year ended 31 December 2003 | | | | | | | | | | | | | | |
| | | | | | | | | | | | | | | |
| Cash flow from group operating activities | 14 | | 56 | | (44 | ) | (18 | ) | 6 772 | | – | | 6 780 | |
| Dividends from joint ventures | – | | – | | – | | – | | 52 | | – | | 52 | |
| Returns on investments and servicing of finance | 4 | | 468 | | (49 | ) | (40 | ) | (1 563 | ) | – | | (1 180 | ) |
| Taxation | – | | (54 | ) | 51 | | (100 | ) | (1 320 | ) | – | | (1 423 | ) |
| Capital expenditure and financial investment | – | | (7 | ) | (74 | ) | (4 | ) | (939 | ) | – | | (1 024 | ) |
| Acquisitions and disposals | – | | – | | – | | – | | 622 | | – | | 622 | |
| Dividends paid on ordinary share capital | – | | (1 039 | ) | (703 | ) | – | | – | | 27 | | (1 715 | ) |
| |
|
|
|
|
|
|
|
|
|
|
|
|
| |
| Cash flow before management of liquid resources | | | | | | | | | | | | | |
| and financing | 18 | | (576 | ) | (819 | ) | (162 | ) | 3 624 | | 27 | | 2 112 | |
| Management of liquid resources | 8 | | 144 | | – | | – | | (193 | ) | – | | (41 | ) |
| Financing | (25 | ) | 217 | | 771 | | 162 | | (4 042 | ) | – | | (2 917 | ) |
| |
|
|
|
|
|
|
|
|
|
|
|
|
| |
| Increase/(decrease) in cash in the period | 1 | | (215 | ) | (48 | ) | – | | (611 | ) | 27 | | (846 | ) |
|
|
|
|
|
|
|
|
|
|
|
|
|
| |
| Cash flow statement | | | | | | | | | | | | | | |
| for the year ended 31 December 2002 | | | | | | | | | | | | | | |
| | | | | | | | | | | | | | | |
| Cash flow from group operating activities | 34 | | 222 | | (52 | ) | (45 | ) | 7 724 | | – | | 7 883 | |
| Dividends from joint ventures | – | | – | | – | | – | | 83 | | – | | 83 | |
| Returns on investments and servicing of finance | 16 | | 155 | | (105 | ) | (50 | ) | (1 402 | ) | – | | (1 386 | ) |
| Taxation | – | | (6 | ) | 142 | | (335 | ) | (1 618 | ) | – | | (1 817 | ) |
| Capital expenditure and financial investment | – | | (554 | ) | (42 | ) | 16 | | (1 126 | ) | – | | (1 706 | ) |
| Acquisitions and disposals | – | | – | | – | | – | | 1 755 | | – | | 1 755 | |
| Dividends paid on ordinary share capital | – | | (910 | ) | (689 | ) | – | | – | | 19 | | (1 580 | ) |
| |
|
|
|
|
|
|
|
|
|
|
|
|
| |
| Cash flow before management of liquid resources | | | | | | | | | | | | | |
| and financing | 50 | | (1 093 | ) | (746 | ) | (414 | ) | 5 416 | | 19 | | 3 232 | |
| Management of liquid resources | 2 | | (126 | ) | – | | – | | (468 | ) | – | | (592 | ) |
| Financing | (53 | ) | 1 060 | | 578 | | 419 | | (5 082 | ) | – | | (3 078 | ) |
| |
|
|
|
|
|
|
|
|
|
|
|
|
| |
| Increase/(decrease) in cash in the period | (1 | ) | (159 | ) | (168 | ) | 5 | | (134 | ) | 19 | | (438 | ) |
|
|
|
|
|
|
|
|
|
|
|
|
|
| |
162 Unilever Annual Report and Accounts 2004
Back to Contents
Additional information for US investors (continued)
Unilever Group
| Guarantor statements (continued) | |
| | | | | | | | | | | | | | € million | |
| |
|
|
|
|
|
|
|
|
|
|
|
|
| |
| | Unilever | | Unilever | | | | Unilever | | | | | | | |
| | Capital | | N.V. | | | | United | | | | | | | |
| | Corporation | | parent | | Unilever PLC | | States Inc. | | Non- | | | | | |
| | subsidiary | | issuer/ | | parent | | subsidiary | | guarantor | | | | Unilever | |
| | issuer | | guarantor | | guarantor | | guarantor | | subsidiaries | | Eliminations | | Group | |
|
|
|
|
|
|
|
|
|
|
|
|
|
| |
| Balance sheet | | | | | | | | | | | | | | |
| as at 31 December 2004 | | | | | | | | | | | | | | |
| Goodwill and intangible assets | – | | – | | 44 | | – | | 15 294 | | – | | 15 338 | |
| Tangible fixed assets | – | | – | | – | | 4 | | 6 267 | | – | | 6 271 | |
| Fixed investments | – | | 445 | | – | | 13 077 | | (250 | ) | (13 070 | ) | 202 | |
| Net assets of subsidiaries (equity accounted) | – | | 7 542 | | 7 323 | | (4 057 | ) | (14 004 | ) | 3 196 | | – | |
| |
|
|
|
|
|
|
|
|
|
|
|
|
| |
| Total fixed assets | – | | 7 987 | | 7 367 | | 9 024 | | 7 307 | | (9 874 | ) | 21 811 | |
| |
|
|
|
|
|
|
|
|
|
|
|
|
| |
| | | | | | | | | | | | | | | |
| Stocks | – | | – | | – | | – | | 3 758 | | – | | 3 758 | |
| Amounts due from group companies | 3 811 | | 17 763 | | 338 | | 678 | | (22 590 | ) | – | | – | |
| Debtors due within one year | – | | 135 | | 48 | | 241 | | 4 081 | | – | | 4 505 | |
| Debtors due after more than one year | 17 | | – | | 27 | | 4 | | 1 150 | | – | | 1 198 | |
| Cash and current investments | 10 | | 280 | | – | | (3 | ) | 2 316 | | – | | 2 603 | |
| |
|
|
|
|
|
|
|
|
|
|
|
|
| |
| Total current assets | 3 838 | | 18 178 | | 413 | | 920 | | (11 285 | ) | – | | 12 064 | |
| |
|
|
|
|
|
|
|
|
|
|
|
|
| |
| | | | | | | | | | | | | | | |
| Borrowings | (1 618 | ) | (2 149 | ) | (71 | ) | – | | (1 317 | ) | – | | (5 155 | ) |
| Amounts due to group companies | – | | (14 443 | ) | (1 549 | ) | – | | 15 992 | | – | | – | |
| Trade and other creditors | (40 | ) | (900 | ) | (612 | ) | (58 | ) | (7 805 | ) | – | | (9 415 | ) |
| |
|
|
|
|
|
|
|
|
|
|
|
|
| |
| Creditors due within one year | (1 658 | ) | (17 492 | ) | (2 232 | ) | (58 | ) | 6 870 | | – | | (14 570 | ) |
| |
|
|
|
|
|
|
|
|
|
|
|
|
| |
| | | | | | | | | | | | | | | |
| |
|
|
|
|
|
|
|
|
|
|
|
|
| |
| Total assets less current liabilities | 2 180 | | 8 673 | | 5 548 | | 9 886 | | 2 892 | | (9 874 | ) | 19 305 | |
|
|
|
|
|
|
|
|
|
|
|
|
|
| |
| | | | | | | | | | | | | | | |
| Borrowings | 1 999 | | 2 844 | | – | | – | | 2 050 | | – | | 6 893 | |
| Trade and other creditors | – | | 41 | | – | | 184 | | 492 | | – | | 717 | |
| |
|
|
|
|
|
|
|
|
|
|
|
|
| |
| Creditors due after more than one year | 1 999 | | 2 885 | | – | | 184 | | 2 542 | | – | | 7 610 | |
| |
|
|
|
|
|
|
|
|
|
|
|
|
| |
| | | | | | | | | | | | | | | |
| Provisions for liabilities and charges | | | | | | | | | | | | | | |
| (excluding pensions and similar obligations) | – | | 102 | | 14 | | 4 | | 1 761 | | – | | 1 881 | |
| | | | | | | | | | | | | | | |
| Net liabilities for pensions and similar obligations | – | | 152 | | – | | 66 | | 3 700 | | – | | 3 918 | |
| | | | | | | | | | | | | | | |
| Minority interests | – | | – | | – | | – | | 362 | | – | | 362 | |
| Capital and reserves attributable to: | | | | | | | | | | | | | | |
| PLC | – | | (1 529 | ) | – | | – | | – | | 1 529 | | – | |
| NV | – | | – | | 7 060 | | – | | – | | (7 060 | ) | – | |
| Called up share capital | – | | 421 | | 222 | | – | | (1 | ) | – | | 642 | |
| Share premium account | – | | 1 399 | | 133 | | – | | (2 | ) | – | | 1 530 | |
| Other reserves | – | | (2 035 | ) | (700 | ) | (448 | ) | (823 | ) | 1 271 | | (2 735 | ) |
| Profit retained | 181 | | 7 278 | | (1 181 | ) | 10 080 | | (4 647 | ) | (5 614 | ) | 6 097 | |
| |
|
|
|
|
|
|
|
|
|
|
|
|
| |
| Total capital and reserves | 181 | | 5 534 | | 5 534 | | 9 632 | | (5 473 | ) | (9 874 | ) | 5 534 | |
| |
|
|
|
|
|
|
|
|
|
|
|
|
| |
| | | | | | | | | | | | | | | |
| |
|
|
|
|
|
|
|
|
|
|
|
|
| |
| Total capital employed | 2 180 | | 8 673 | | 5 548 | | 9 886 | | 2 892 | | (9 874 | ) | 19 305 | |
|
|
|
|
|
|
|
|
|
|
|
|
|
| |
Unilever Annual Report and Accounts 2004 163
Back to Contents
Additional information for US investors (continued)
Unilever Group
| Guarantor statements (continued) | |
| | | | | | | | | | | | | | € million | |
| |
|
|
|
|
|
|
|
|
|
|
|
|
| |
| | Unilever | | Unilever | | | | Unilever | | | | | | | |
| | Capital | | N.V. | | | | United | | | | | | | |
| | Corporation | | parent | | Unilever PLC | | States Inc. | | Non- | | | | | |
| | subsidiary | | issuer/ | | parent | | subsidiary | | guarantor | | | | Unilever | |
| | issuer | | guarantor | | guarantor | | guarantor | | subsidiaries | | Eliminations | | Group | |
|
|
|
|
|
|
|
|
|
|
|
|
|
| |
| Balance sheet | | | | | | | | | | | | | | |
| as at 31 December 2003 | | | | | | | | | | | | | | |
| | | | | | | | | | | | | | | |
| Goodwill and intangible assets | – | | – | | 34 | | – | | 17 679 | | – | | 17 713 | |
| Tangible fixed assets | – | | – | | – | | 3 | | 6 652 | | – | | 6 655 | |
| Fixed investments | – | | 381 | | – | | 12 384 | | (191 | ) | (12 375 | ) | 199 | |
| Net assets of subsidiaries (equity accounted) | – | | 8 819 | | 7 699 | | (4 250 | ) | (13 996 | ) | 1 728 | | – | |
| |
|
|
|
|
|
|
|
|
|
|
|
|
| |
| Total fixed assets | – | | 9 200 | | 7 733 | | 8 137 | | 10 144 | | (10 647 | ) | 24 567 | |
| |
|
|
|
|
|
|
|
|
|
|
|
|
| |
| | | | | | | | | | | | | | | |
| Stocks | – | | – | | – | | – | | 4 175 | | – | | 4 175 | |
| Amounts due from group companies | 3 821 | | 19 619 | | 649 | | 1 049 | | (25 138 | ) | – | | – | |
| Debtors due within one year | – | | 215 | | 29 | | 154 | | 4 684 | | – | | 5 082 | |
| Debtors due after more than one year | 24 | | – | | 41 | | 2 | | 732 | | – | | 799 | |
| Cash and current investments | 1 | | 430 | | – | | – | | 2 914 | | – | | 3 345 | |
| |
|
|
|
|
|
|
|
|
|
|
|
|
| |
| Total current assets | 3 846 | | 20 264 | | 719 | | 1 205 | | (12 633 | ) | – | | 13 401 | |
| |
|
|
|
|
|
|
|
|
|
|
|
|
| |
| | | | | | | | | | | | | | | |
| Borrowings | (269 | ) | (5 216 | ) | – | | (3 | ) | (1 946 | ) | – | | (7 434 | ) |
| Amounts due to group companies | – | | (13 587 | ) | (1 819 | ) | – | | 15 406 | | – | | – | |
| Trade and other creditors | (43 | ) | (962 | ) | (699 | ) | – | | (7 936 | ) | – | | (9 640 | ) |
| |
|
|
|
|
|
|
|
|
|
|
|
|
| |
| Creditors due within one year | (312 | ) | (19 765 | ) | (2 518 | ) | (3 | ) | 5 524 | | – | | (17 074 | ) |
| |
|
|
|
|
|
|
|
|
|
|
|
|
| |
| | | | | | | | | | | | | | | |
| |
|
|
|
|
|
|
|
|
|
|
|
|
| |
| Total assets less current liabilities | 3 534 | | 9 699 | | 5 934 | | 9 339 | | 3 035 | | (10 647 | ) | 20 894 | |
|
|
|
|
|
|
|
|
|
|
|
|
|
| |
| | | | | | | | | | | | | | | |
| Borrowings | 3 352 | | 3 393 | | – | | – | | 1 721 | | – | | 8 466 | |
| Trade and other creditors | – | | 88 | | – | | 303 | | 273 | | – | | 664 | |
| |
|
|
|
|
|
|
|
|
|
|
|
|
| |
| Creditors due after more than one year | 3 352 | | 3 481 | | – | | 303 | | 1 994 | | – | | 9 130 | |
| |
|
|
|
|
|
|
|
|
|
|
|
|
| |
| | | | | | | | | | | | | | | |
| Provisions for liabilities and charges | | | | | | | | | | | | | | |
| (excluding pensions and similar obligations) | – | | 156 | | 14 | | – | | 1 475 | | – | | 1 645 | |
| | | | | | | | | | | | | | | |
| Net liabilities for pensions and similar obligations | – | | 142 | | – | | 33 | | 3 584 | | – | | 3 759 | |
| | | | | | | | | | | | | | | |
| Minority interests | – | | – | | – | | – | | 440 | | – | | 440 | |
| Capital and reserves attributable to: | | | | | | | | | | | | | | |
| PLC | – | | (952 | ) | – | | – | | – | | 952 | | – | |
| NV | – | | – | | 6 869 | | – | | – | | (6 869 | ) | – | |
| Called up share capital | – | | 421 | | 222 | | – | | (1 | ) | – | | 642 | |
| Share premium account | – | | 1 399 | | 133 | | – | | (2 | ) | – | | 1 530 | |
| Other reserves | – | | (1 783 | ) | (659 | ) | (464 | ) | (694 | ) | 1 158 | | (2 442 | ) |
| Profit retained | 182 | | 6 835 | | (645 | ) | 9 467 | | (3 761 | ) | (5 888 | ) | 6 190 | |
| |
|
|
|
|
|
|
|
|
|
|
|
|
| |
| Total capital and reserves | 182 | | 5 920 | | 5 920 | | 9 003 | | (4 458 | ) | (10 647 | ) | 5 920 | |
| |
|
|
|
|
|
|
|
|
|
|
|
|
| |
| | | | | | | | | | | | | | | |
| |
|
|
|
|
|
|
|
|
|
|
|
|
| |
| Total capital employed | 3 534 | | 9 699 | | 5 934 | | 9 339 | | 3 035 | | (10 647 | ) | 20 894 | |
|
|
|
|
|
|
|
|
|
|
|
|
|
| |
164 Unilever Annual Report and Accounts 2004
Back to Contents
Principal group companies and fixed investments
Unilever Group as at 31 December 2004
The companies listed below and on pages 166 to 168 are those which, in the opinion of the Directors, principally affect the amount of profit and assets shown in the Unilever Group accounts. The Directors consider that those companies not listed are not significant in relation to Unilever as a whole.Full information as required by Articles 379 and 414 of Book 2 of the Civil Code in the Netherlands has been filed by Unilever N.V. with the Commercial Registry in Rotterdam.
Particulars of PLC group companies and other significant holdings as required by the United Kingdom Companies Act 1985 will be annexed to the next Annual Return of Unilever PLC.
| The main activities of the companies listed below are indicated according to the following key: |
|
| Holding companies | H |
| Foods | F |
| Home and Personal Care | P |
| Other Operations | O |
|
| Unless otherwise indicated, the companies are incorporated and principally operate in the countries under which they are shown. |
| |
| The aggregate percentage of equity capital directly or indirectly held by NV or PLC is shown in the margin, except where it is 100%. All these percentages are rounded down to the nearest whole number. |
| |
| The percentage of Unilever’s shareholdings held either directly or indirectly by NV and PLC are identified in the tables according to the following code: |
|
| NV 100% | a |
| PLC 100% | b |
| NV 73%; PLC 27% | c |
| NV 89%; PLC 11% | d |
| NV 21%; PLC 79% | e |
| NV 57%; PLC 43% | f |
| NV 93%; PLC 7% | g |
|
| |
|
| Principal group companies |
|
| % | Europe | Ownership | Activity |
|
| | Austria | | |
| | Unilever Austria GmbH. | d | FP |
|
| | Belgium | | |
| | Unilever Belgium BVBA/SPRL (Unibel) | d | FP |
|
| | Bulgaria | | |
| | Unilever Bulgaria E.O.O.D. | a | FP |
|
| | Croatia | | |
| | Unilever Croatia d.o.o. | a | FP |
|
| | Czech Republic | | |
| | Unilever CR, spol. s r.o. | a | FP |
|
| | Denmark | | |
| | Unilever Bestfoods A/S | a | F |
| | Unilever Danmark A/S | a | FP |
|
| | Estonia | | |
| | Unilever Eesti OU | a | FP |
|
| | Finland | | |
| | Suomen Unilever Oy | a | FP |
| |
|
|
|
|
| % | Europe continued | Ownership | Activity |
|
| | France | | |
| | Amora Maille Société Industrielle | d | F |
| 99 | Bestfoods France Société Industrielle S.A. | d | F |
| | Cogesal-Miko | d | F |
| | Fralib Sourcing Unit | d | F |
| 99 | Lever Fabergé France | d | P |
| | Unilever Bestfoods France | d | F |
| | Unilever France | d | H |
|
| | Germany | | |
| | Langnese-Iglo GmbH | d | F |
| | Lever Fabergé Deutschland GmbH | d | P |
| | Maizena Grundstücksverwaltungs | | |
| | GmbH & Co. OHG(1) | d | F |
| | Monda Beteiligungs GmbH | d | F |
| | Monda IPR GmbH & Co. OHG(1) | d | F |
| | Monda Vermögensverwaltungs | | |
| | GmbH & Co. OHG(1) | d | F |
| | Pfanni GmbH & Co. OHG Stavenhagen(1) | d | F |
| | Pfanni Werke Grundstücksverwaltungs | | |
| | GmbH & Co. OHG(1) | d | F |
| | PW Vermietungs GmbH & Co. KG(1) | d | F |
| | UBG Vermietungs GmbH & Co. OHG(1) | d | H |
| | Unilever Bestfoods Deutschland GmbH | d | F |
| | Unilever Beteiligungs GmbH | d | H |
| | Unilever Deutschland GmbH | d | H |
| | Unilever Deutschland Holding GmbH | d | H |
|
| | Greece | | |
| 67 | ‘Elais’ Oleaginous Products A.E. | a | F |
| | Unilever Hellas A.E.B.E. | a | FP |
|
| | Hungary | | |
| | Unilever Magyarország Kft | a | FP |
|
| | Ireland | | |
| | Lever Fabergé Ireland Ltd. | b | P |
| | Unilever Foods (Ireland) Limited | b | F |
|
| | Italy | | |
| | Lever Fabergé Italia Srl | g | P |
| | Sagit Srl | g | F |
| | Unilever Bestfoods Italia Srl | g | F |
| | Unilever Italia SpA | g | H |
|
| | Latvia | | |
| | Unilever Baltic LLC | a | FP |
|
| | Lithuania | | |
| | Unilever Lietuva UAB | a | FP |
|
| | The Netherlands | | |
| | Iglo Mora Groep B.V. | a | F |
| | Lever Fabergé Nederland B.V. | a | P |
| | Mixhold B.V. | d | H |
| | Unilever Bestfoods Nederland B.V. | d | F |
| | Unilever N.V.(2) | | H |
| | Unilever Nederland B.V. | a | H |
|
| | Norway | | |
| | Unilever Norge AS | a | F |
|
| | Poland | | |
| 99 | Unilever Polska S.A. | d | FP |
|
| (1) | Due to the inclusion of the partnerships in the consolidated group accounts of Unilever, para 264(b) of the German trade law grants an exemption from the duty to prepare individual statutory financial statements and management reports in accordance with the requirements for limited liability companies and to have these audited. |
| (2) | See ‘Basis of consolidation’ on page 96. |
Unilever Annual Report and Accounts 2004 165
Back to Contents
Principal group companies and fixed investments (continued)
Unilever Group as at 31 December 2004
| Principal group companies (continued) |
|
| % | Europe continued | Ownership | Activity |
|
| | Portugal | | |
| 74 | IgloOlá-Distribuição de Gelados e de | | |
| | Ultracongelados Lda. | a | F |
| 60 | LeverElida-Distribuição de Produtos de | | |
| | Limpeza e Higiene Pessoal Lda. | a | P |
| | Unilever Bestfoods Portugal-Produtos | | |
| | Alimentares S.A. | a | F |
|
| | Romania | | |
| 99 | Unilever South Central Europe S.R.L | a | FP |
|
| | Russia | | |
| | OOO Unilever SNG | a | FP |
|
| | Serbia | | |
| | Unilever Belgrade | a | FP |
|
| | Slovakia | | |
| | Unilever Slovensko spol. s r.o. | a | FP |
|
| | Slovenia | | |
| | Unilever Slovenia d.o.o. | a | FP |
|
| | Spain | | |
| | Unilever España S.A. | a | HP |
| | Unilever Foods España S.A. | a | F |
|
| | Sweden | | |
| | GB Glace AB | a | F |
| | Lever Fabergé AB | a | P |
| | Unilever Bestfoods AB | a | F |
|
| | Switzerland | | |
| | Knorr-Nährmittel AG | d | H |
| | Lever Fabergé GmbH | d | P |
| | Meina Holding AG | d | H |
| | Lusso Foods AG | d | F |
| | Palma Re AG | a | O |
| | Sunlight AG | a | O |
| | Unilever Schweiz GmbH | d | F |
| | Unilever Cosmetics International S.A. | a | P |
| | Unilever Schweiz Service AG | a | O |
| | Unilever Swiss Holdings AG | a | H |
| | Unilever Raw Materials AG | a | F |
|
| | Ukraine | | |
| | Unilever Ukraine LLC | a | FP |
|
| | United Kingdom | | |
| | Ben & Jerry’s Homemade Ltd. | e | F |
| | Lever Fabergé Ltd. | b | P |
| | Lipton Ltd. | b | F |
| | Unilever Bestfoods UK Ltd. | e | F |
| | Unilever Cosmetics International (UK) Ltd. | b | P |
| | Unilever Ice Cream & Frozen Food Ltd. | e | F |
| | Unilever PLC(2) | | H |
| | Unilever UK Central Resources Ltd. | b | O |
| | Unilever UK Holdings Ltd. | b | H |
| | Unilever UK & CN Holdings Ltd. | e | H |
|
| % | North America | Ownership | Activity |
|
| | Canada | | |
| | Unilever Canada Inc. | e | FP |
|
| | United States of America | | |
| | Ben & Jerry’s Homemade, Inc. | c | F |
| | Good Humor-Breyers Ice Cream(3) | c | F |
| | Slim•Fast Foods Company(3) | c | F |
| | Unilever Bestfoods(3) | c | F |
| | Unilever Bestfoods Foodsolutions(3) | c | F |
| | Unilever Capital Corporation | c | O |
| | Unilever Cosmetics International(3) | c | P |
| | Unilever Home and Personal Care(3) | c | P |
| | Unilever Ice Cream(3) | c | F |
| | Unilever United States, Inc. | c | H |
|
|
| % | Africa, Middle East and Turkey | Ownership | Activity |
|
| | Algeria | | |
| 60 | Unilever Algérie SPA | a | P |
|
| | Côte d’Ivoire | | |
| 90 | Unilever-Côte d’Ivoire | b | FPO |
|
| | Democratic Republic of Congo | | |
| 76 | Plantations et Huileries du Congo s.a.r.l. | a | O |
|
| | Egypt | | |
| 60 | Fine Food Products SAE | b | F |
| 60 | Lever Egypt SAE | b | P |
|
| | Ghana | | |
| 67 | Unilever Ghana Ltd. | b | FPO |
|
| | Israel | | |
| 51 | Glidat Strauss Ltd. | b | F |
| 59 | Unilever Bestfoods Israel Ltd. | f | F |
| | Lever Israel Ltd. | b | P |
|
| | Kenya | | |
| 88 | Unilever Tea Kenya Ltd. | b | O |
| | Unilever Kenya Ltd. | b | FP |
|
| | Malawi | | |
| | Unilever South East Africa (Private) Ltd. | b | FP |
|
| | Morocco | | |
| | Unilever Bestfoods Maghreb S.A. | a | FP |
|
| | Nigeria | | |
| 50 | Unilever Nigeria Plc | b | FP |
|
| | Saudi Arabia | | |
| 49 | Binzagr Lever Ltd.(4) | b | P |
| 49 | Lever Arabia Ltd.(4) | b | P |
|
| | South Africa | | |
| 59 | Unilever South Africa Foods (Pty) Limited | f | F |
| | Unilever South Africa Home and | | |
| | Personal Care (Pty) Ltd. | b | P |
|
| | Tanzania | | |
| | Unilever Tea Tanzania Ltd. | b | O |
|
| | Tunisia | | |
| 99 | CODEPAR Tunisia | a | P |
| 52 | Maghreb Alimentation S.A. | a | F |
| 99 | Société de Produits Chimiques Détergents | a | P |
|
| | Turkey | | |
| | Unilever Sanayi ve Ticaret Türk A.S,. | a | FP |
|
| | Uganda | | |
| | Unilever Uganda Ltd. | b | FP |
|
| | United Arab Emirates | | |
| | Unilever Gulf Free Zone Establishment | b | FP |
|
| | Zambia | | |
| | Unilever South East Africa Zambia Limited | b | FP |
|
| | Zimbabwe | | |
| | Unilever South East Africa (Pte) Ltd. | b | FP |
|
| (2) | See ‘Basis of consolidation’ on page 96. |
| (3) | A division of Conopco, Inc., a subsidiary of Unilever United States, Inc. |
| (4) | These companies are consolidated on the basis that Unilever exercises a dominant influence. |
166 Unilever Annual Report and Accounts 2004
Back to Contents
Principal group companies and fixed investments (continued)
Unilever Group as at 31 December 2004
| Principal group companies (continued) |
|
| % | Asia and Pacific | Ownership | Activity |
|
| | Australia | | |
| | Unilever Australia Ltd. | b | FP |
|
| | Bangladesh | | |
| 61 | Unilever Bangladesh Ltd. | b | FP |
|
| | Cambodia | | |
| | Unilever (Cambodia) Limited | a | FP |
|
| | China | | |
| | Bestfoods Guangzhou Foods Ltd. | a | F |
| | Unilever (China) Ltd. | a | H |
| 90 | Unilever Company Ltd. | a | P |
| | Unilever Foods (China) Ltd. | a | F |
| | Unilever Services (Hefei) Limited | a | FP |
| | Wall’s (China) Company Ltd. | a | F |
|
| | China S.A.R. | | |
| | Unilever Bestfoods Hong Kong Ltd. | d | F |
| | Unilever Hong Kong Ltd. | d | FP |
|
| | India | | |
| 51 | Hindustan Lever Ltd. | b | FPO |
|
| | Indonesia | | |
| 85 | P.T. Unilever Indonesia Tbk | a | FP |
|
| | Japan | | |
| | Nippon Lever KK | a | FP |
|
| | Malaysia | | |
| | Unilever Foods (Malaysia) Sdn. Bhd. | e | F |
| 70 | Unilever (Malaysia) Holdings Sdn. Bhd. | e | FP |
|
| | New Zealand | | |
| | Unilever New Zealand Ltd. | b | FP |
|
| | Pakistan | | |
| 67 | Unilever Pakistan Ltd. | b | FP |
|
| | Philippines | | |
| 50 | Unilever Foods Philippines (CMC) Inc. | d | F |
| | Unilever Philippines, Inc. | d | FP |
|
| | Singapore | | |
| | Unilever Singapore Foods Pte. Ltd. | e | F |
| | Unilever Singapore Pte Ltd. | e | FP |
|
| | South Korea | | |
| | Unilever Korea Chusik Hoesa | a | FP |
|
| | Sri Lanka | | |
| | Unilever Sri Lanka Ltd. | b | FPO |
|
| | Taiwan | | |
| 75 | Unilever Taiwan Foods Ltd. | d | F |
| | Unilever Taiwan Ltd. | d | FP |
|
| | Thailand | | |
| | Unilever Thai Holdings Ltd. | d | FP |
| | Unilever Thai Trading Ltd. | d | FP |
|
| | Vietnam | | |
| 66 | Lever Vietnam JVC | a | P |
| | Unilever Bestfoods and Elida P/S (Vietnam) Ltd | a | FP |
|
|
| % | Latin America | Ownership | Activity |
|
| | Argentina | | |
| | Unilever Bestfoods de Argentina S.A. | d | F |
| | Unilever de Argentina S.A. | d | FP |
|
| | Bolivia | | |
| | Unilever Andina Bolivia S.A. | a | FP |
|
| | Brazil | | |
| | Mavibel Brasil Ltda. | d | H |
| | Unilever Brasil Ltda. | d | FP |
| | Unilever Bestfoods Brasil Ltda. | d | F |
|
| | Chile | | |
| | Unilever Chile Home and Personal Care Ltda. | d | FP |
|
| | Colombia | | |
| | Unilever Andina Colombia Ltda. | d | FP |
|
| | Costa Rica | | |
| | Productos Agroindustriales del Caribe S.A. | c | F |
| | Unilever de Centroamerica S.A. | a | FP |
|
| | Dominican Republic | | |
| | Knorr Alimentaria S.A. | a | F |
| | Unilever Caribe, S.A. | a | P |
|
| | Ecuador | | |
| | Unilever Andina Ecuador S.A. | a | FP |
|
| | El Salvador | | |
| | Unilever de Centroamerica S.A. | a | FP |
|
| | Guatemala | | |
| | Unilever de Centroamerica S.A. | a | FP |
|
| | Honduras | | |
| | Unilever de Centroamerica S.A. | a | FP |
|
| | Mexico | | |
| | Circulo Esmeralda S.de R.L. de C.V. | d | F |
| | Corporativo Unilever de México S.de R.L. de C.V. | d | H |
| | Unilever de México, S. de R.L. de C.V. | d | FP |
|
| | Netherlands Antilles | | |
| | Unilever Becumij N.V. | a | O |
|
| | Nicaragua | | |
| | Unilever de Centroamerica S.A. | a | FP |
|
| | Panama | | |
| | Unilever de Centroamerica S.A. | a | FP |
|
| | Paraguay | | |
| | Unilever de Paraguay S.A. | a | FP |
|
| | Peru | | |
| | Alimentos y Productos del Maíz S.A. | b | F |
| 99 | Industrias Pacocha S.A. | a | FP |
|
| | Trinidad & Tobago | | |
| 50 | Unilever Caribbean Ltd. | b | FP |
|
| | Uruguay | | |
| | Unilever del Uruguay S.A. | c | F |
| | Sudy Lever S.A. | a | P |
|
| | Venezuela | | |
| | Unilever Andina Venezuela S.A. | a | FP |
|
Unilever Annual Report and Accounts 2004 167
Back to Contents
Principal group companies and fixed investments (continued)
Unilever Group as at 31 December 2004
| Principal fixed investments |
| Joint ventures |
|
| % | Europe | Ownership | Activity |
|
| | Portugal | | |
| 40 | FIMA/VG-Distribuição de Produtos | | |
| | Alimentares, Lda. | a | F |
|
| % | North America | | |
|
| | United States of America | | |
| 50 | Pepsi/Lipton Partnership | c | F |
|
| | | |
| | | |
| Associated companies | | |
|
| % | Europe | Ownership | Activity |
|
| | United Kingdom | | |
| 33 | Langholm Capital Partners | b | O |
|
| % | North America | | |
|
| | United States of America | | |
| 33 | JohnsonDiversey Holdings, Inc | a | P |
|
| % | Africa | | |
|
| | Côte d’Ivoire | | |
| 40 | Palmci | b | O |
|
168 Unilever Annual Report and Accounts 2004
Back to Contents
Company accounts
Unilever N.V.
| Balance sheet as at 31 December | | | | |
| € million | | € million | |
| 2004 | | 2003 | |
| |
| Fixed assets | | | | |
| Fixed investments | 11 233 | | 11 161 | |
| | | | | |
| Current assets | | | | |
| Debtors | 17 898 | | 19 834 | |
| Cash at bank and in hand | 280 | | 430 | |
| |
| |
| Total current assets | 18 178 | | 20 264 | |
| Creditors due within one year | (17 492 | ) | (19 765 | ) |
| Net current assets | 686 | | 499 | |
| |
| |
| Total assets less current liabilities | 11 919 | | 11 660 | |
| |
| Creditors due after more than one year | 2 885 | | 3 481 | |
| | | | | |
| Provisions for liabilities and charges (excluding pensions and similar obligations) | 102 | | 156 | |
| | | | | |
| Net pension liability for unfunded schemes | 152 | | 142 | |
| | | | | |
| Capital and reserves | 8 780 | | 7 881 | |
| Called up share capital: | | | | |
| Preferential share capital 22 | 130 | | 130 | |
| Ordinary share capital 22 | 291 | | 291 | |
| |
| |
| | 421 | | 421 | |
| Share premium account | 1 399 | | 1 399 | |
| Other reserves | (1 379 | ) | (1 243 | ) |
| Profit retained | 8 339 | | 7 304 | |
| | | | | |
| |
| |
| Total capital employed | 11 919 | | 11 660 | |
| |
| |
| Profit and loss account for the year ended 31 December | | | | |
| € million | | € million | |
| 2004 | | 2003 | |
| |
| Income from fixed investments after taxation | 1 960 | | 1 235 | |
| Other income and expenses | 158 | | 477 | |
| |
| |
| Profit for the year | 2 118 | | 1 712 | |
| |
Pages 96 to 148, 165 to 168 and 170 contain the notes to the NV company accounts. For the information required by Article 392 of Book 2 of the Civil Code in the Netherlands, refer to page 171.
In accordance with Article 402 of Book 2 of the Civil Code in the Netherlands, the accounts of NV have been included in the consolidated accounts. The profit and loss account mentions only income from fixed investments after taxation as a separate item. The balance sheet includes the proposed profit appropriation.
As indicated on page 96, the company accounts of Unilever N.V. comply in all material respects with legislation in the Netherlands. As allowed by Article 362.1 of Book 2 of the Civil Code in the Netherlands, the company accounts are prepared in accordance with United Kingdom accounting standards.
The Board of Directors
1 March 2005
Unilever Annual Report and Accounts 2004 169
Back to Contents
Notes to the company accounts
Unilever N.V.
| Fixed investments | € million | | € million | |
| | 2004 | | 2003 | |
| |
| Shares in group companies | 11 024 | | 11 008 | |
| Book value of PLC shares held in | | | | |
| connection with share options | 445 | | 381 | |
| Less NV shares held by group companies | (236 | ) | (228 | ) |
| |
| |
| | 11 233 | | 11 161 | |
| |
| |
| Movements during the year: | | | | |
| 1 January | 11 161 | | | |
| Movement in PLC shares held in connection | | | | |
| with share options | 64 | | | |
| Movement in NV shares held by group companies | (8 | ) | | |
| Additions | 16 | | | |
| |
| | | |
| 31 December | 11 233 | | | |
| |
Shares in group companies are stated at cost in accordance with international accounting practice in various countries, in particular the United Kingdom. In accordance with Article 385.5 of the Civil Code in the Netherlands, Unilever N.V. shares held by Unilever N.V. subsidiaries are deducted from the carrying value of those subsidiaries.| Debtors | € million | | € million | |
| | 2004 | | 2003 | |
| |
| Loans to group companies | 14 056 | | 17 088 | |
| Other amounts owed by group companies | 3 707 | | 2 531 | |
| Amounts owed by undertakings in which | | | | |
| the company has a participating interest | 15 | | – | |
| Other | 120 | | 215 | |
| |
| |
| | 17 898 | | 19 834 | |
| |
| |
| Of which due after more than one year | 710 | | 819 | |
| |
| |
| Cash at bank and in hand | € million | | € million | |
| | 2004 | | 2003 | |
| |
| This includes amounts for which repayment | | | | |
| notice is required of: | 80 | | 43 | |
| |
| | | | | |
| Creditors | € million | | € million | |
| | 2004 | | 2003 | |
| |
| Due within one year: | | | | |
| Bank loans and overdrafts | 1 | | 7 | |
| Bonds and other loans | 2 148 | | 5 209 | |
| Loans from group companies | 310 | | 311 | |
| Other amounts owed to group companies | 14 133 | | 13 276 | |
| Taxation and social security | 22 | | 76 | |
| Accruals and deferred income | 173 | | 232 | |
| Dividends | 700 | | 642 | |
| Other | 5 | | 12 | |
| |
| |
| | 17 492 | | 19 765 | |
| |
| |
| Due after more than one year: | | | | |
| Accruals and deferred income | 41 | | 88 | |
| Bonds and other loans | 2 844 | | 3 393 | |
| |
In accordance with the UK Companies Act 1985 the Group presents the final dividend which is proposed after the balance sheet date as a creditor. There are no creditors due after more than five years.| Provisions for liabilities and charges (excluding pensions | | | |
| and similar obligations) | | | | |
| € million | | € million | |
| 2004 | | 2003 | |
| |
| Deferred taxation and other provisions | 102 | | 156 | |
| |
| |
| Of which due within one year | 55 | | 68 | |
| |
Ordinary share capital
Shares numbered 1 to 2 400 are held by a subsidiary of NV and a subsidiary of PLC, each holding 50%. Additionally, 24 898 145 €0.51 ordinary shares are held by NV and other group companies.
Share premium account
The share premium shown in the balance sheet is not available for the issue of bonus shares or for repayment without incurring withholding tax payable by the company. This is despite the change in the Netherlands tax law, as a result of which dividends received from 2001 onwards by individual shareholders who are Netherlands residents are no longer taxed.
| Other reserves | € million | | € million | |
| | 2004 | | 2003 | |
| |
| 1 January | (1 243 | ) | (1 041 | ) |
| Change in book value of shares or certificates | | | | |
| held in connection with share options | (136 | ) | (202 | ) |
| |
| |
| 31 December | (1 379 | ) | (1 243 | ) |
| |
|
| | | | | |
| Profit retained | € million | | € million | |
| | 2004 | | 2003 | |
| |
| Profit retained at 31 December | 8 339 | | 7 304 | |
| |
Profit retained shown in the company accounts and the notes thereto is greater than the amount shown in the consolidated balance sheet, mainly because of certain intercompany transactions which are eliminated in the consolidated accounts.| | | | | |
| € million | | | |
| | 2004 | | | |
| |
| Difference as at 1 January 2004 | 469 | | | |
| Changes in equity value of the | | | | |
| consolidated participants | (1 766) | | | |
| Changes in the accumulated | | | | |
| intercompany results | 2 358 | | | |
| |
| |
| Difference as at 31 December 2004 | 1 061 | | | |
| |
| |
| Contingent liabilities | € million | | € million | |
| | 2004 | | 2003 | |
| |
| Guarantees given for group companies | 6 822 | | 6 278 | |
| |
| |
| Of which also guaranteed by PLC | 5 010 | | 4 946 | |
| |
Other contingent liabilities are not expected to give rise to material loss.NV has issued joint and several liability undertakings, as defined in Article 403 of Book 2 of the Civil Code in the Netherlands, for almost all Dutch group companies. These written undertakings have been filed with the office of the Company Registry in whose area of jurisdiction the group company concerned has its registered office.
170 Unilever Annual Report and Accounts 2004
Back to Contents
Further statutory information
Unilever N.V.
The rules for profit appropriation in the Articles of Association
(summary of Article 38)
The profit for the year is applied firstly to the reserves required by law or by the Equalisation Agreement, secondly to cover losses of previous years, if any, and thirdly to the reserves deemed necessary by the Board of Directors. Dividends due to the holders of the Cumulative Preference Shares, including any arrears in such dividends, are then paid; if the profit is insufficient for this purpose, the amount available is distributed to them in proportion to the dividend percentages of their shares. Any profit remaining thereafter is at the disposal of the General Meeting. Distributions from this remaining profit are made to the holders of the ordinary shares pro rata to the nominal amounts of their holdings. The General Meeting can only decide to make distributions from reserves on the basis of a proposal by the Board and in compliance with the law and the Equalisation Agreement.
| € million | | € million | |
| 2004 | | 2003 | |
| |
| Proposed profit appropriation | | | | |
| Profit for the year | 2 118 | | 1 712 | |
| Preference dividends | (28 | ) | (27 | ) |
| |
| |
| Profit at disposal of the Annual General | | | | |
| Meeting of shareholders | 2 090 | | 1 685 | |
| Ordinary dividends | (1 042 | ) | (962 | ) |
| |
| |
| Profit for the year retained | 1 048 | | 723 | |
| Changes in present value of net pension liability | (4 | ) | – | |
| Realised profit/(loss) on shares/certificates held | | | | |
| to meet employee share options | (9 | ) | – | |
| Profit retained – 1 January | 7 304 | | 6 581 | |
| |
| |
| Profit retained – 31 December | 8 339 | | 7 304 | |
| |
Special controlling rights under the Articles of Association
See note 22 on page 132.
Auditors
A resolution will be proposed at the Annual General Meeting on 10 May 2005 for the re-appointment of PricewaterhouseCoopers Accountants N.V. as auditors of NV. The present appointment will end at the conclusion of the Annual General Meeting.
Corporate Centre
Unilever N.V.
Weena 455
PO Box 760
3000 DK Rotterdam
J A A van der Bijl
S G Williams
Joint Secretaries of Unilever N.V.
1 March 2005
Unilever Annual Report and Accounts 2004 171
Back to Contents
Company accounts
Unilever PLC
| Balance sheet as at 31 December | | | | |
| £ million | | £ million | |
| 2004 | | 2003 | |
| |
| Fixed assets | | | | |
| Intangible assets | 31 | | 24 | |
| Fixed investments | 2 237 | | 2 237 | |
| | | | | |
| Current assets | | | | |
| Debtors | | | | |
| Debtors due within one year | 227 | | 359 | |
| Debtors due after more than one year | 65 | | 152 | |
| Cash and current investments | – | | – | |
| |
| |
| Total current assets | 292 | | 511 | |
| Creditors due within one year | (1 578 | ) | (1 784 | ) |
| |
| |
| Net current assets/(liabilities) | (1 286 | ) | (1 273 | ) |
| |
| |
| Total assets less current liabilities | 982 | | 988 | |
| |
| | | | | |
| Provision for liabilities and charges (excluding pensions and similar obligations) | 10 | | 10 | |
| | | | | |
| Capital and reserves | 972 | | 978 | |
| | | | | |
| Called up share capital 22 | 41 | | 41 | |
| Share premium account | 94 | | 94 | |
| Capital redemption reserve 24 | 11 | | 11 | |
| Other reserves | (268 | ) | (254 | ) |
| Profit retained | 1 094 | | 1 086 | |
| |
| |
| Total capital employed | 982 | | 988 | |
| |
All amounts included in capital and reserves are classified as equity as defined under United Kingdom Financial Reporting Standard 4.As permitted by Section 230 of the United Kingdom Companies Act 1985, an entity profit and loss account is not included as part of the published company accounts for PLC.
On behalf of the Board of Directors
P J Cescau Chairman
A Burgmans Vice-Chairman
1 March 2005
172 Unilever Annual Report and Accounts 2004
Back to Contents
Notes to the company accounts
Unilever PLC
| Fixed investments | £ million | | £ million | |
| | 2004 | | 2003 | |
| |
| | | | | |
| Shares in group companies | 2 237 | | 2 237 | |
| |
| Shares in group companies are stated at cost or valuation, less | | | |
| amounts written off. | | | | |
| £ million | | | |
| | 2004 | | | |
| |
| Movements during the year: | | | | |
| 1 January | 2 237 | | | |
| Additions | – | | | |
| Disposals | – | | | |
| |
| |
| 31 December | 2 237 | | | |
| |
| |
| Debtors | £ million | | £ million | |
| | 2004 | | 2003 | |
| |
| Due within one year: | | | | |
| Amounts owed by group companies | 193 | | 335 | |
| Other | 34 | | 24 | |
| |
| |
| | 227 | | 359 | |
| |
| |
| Due after more than one year: | | | | |
| Amounts owed by group companies | 46 | | 124 | |
| Other | 19 | | 28 | |
| |
| |
| | 65 | | 152 | |
| |
| | | | | |
| Cash and current investments | £ million | | £ million | |
| | 2004 | | 2003 | |
| |
| This includes amounts for which repayment | | | | |
| notice is required of: | – | | – | |
| |
| |
| Creditors | £ million | | £ million | |
| | 2004 | | 2003 | |
| |
| Due within one year: | | | | |
| Bonds and other loans | 50 | | – | |
| Amounts owed to group companies | 1 095 | | 1 287 | |
| Taxation and social security | 64 | | 153 | |
| Dividends | 367 | | 341 | |
| Other | 1 | | 4 | |
| Accruals and deferred income | 1 | | (1 | ) |
| |
| |
| | 1 578 | | 1 784 | |
| |
| |
Provisions for liabilities and charges (excluding pensions and
similar obligations) |
| £ million | | £ million | |
| 2004 | | 2003 | |
| |
| | | | | |
| Deferred Taxation | 10 | | 10 | |
| |
The deferred tax liability arises following a reclassification from creditors. The 2003 figures have been adjusted for this amount.| Other reserves | £ million | | £ million | |
| | 2004 | | 2003 | |
| |
| | | | | |
| 1 January | (254 | ) | (224 | ) |
| Change in book value of shares held in | | | | |
| connection with share options | (14 | ) | (30 | ) |
| |
| |
| 31 December | (268 | ) | (254 | ) |
| |
| |
| Profit retained | £ million | | £ million | |
| | 2004 | | 2003 | |
| |
| | | | | |
| 1 January | 1 086 | | 1 039 | |
| Profit for the year | 556 | | 563 | |
| Dividends on ordinary and deferred shares | (548 | ) | (516 | ) |
| |
| |
| 31 December | 1 094 | | 1 086 | |
| |
| |
| Contingent liabilities | £ million | | £ million | |
| | 2004 | | 2003 | |
| |
| Guarantees given for group companies | 5 883 | | 6 608 | |
| |
| |
| Of which guaranteed also by NV | 3 542 | | 3 500 | |
| |
| Other contingent liabilities are not expected to give rise to material loss. | |
| | | | | |
| Remuneration of auditors | £ million | | £ million | |
| | 2004 | | 2003 | |
| |
| Parent company statutory audit fee | 1.6 | | 1.6 | |
| Other audit services | – | | 0.2 | |
| Other payments by the parent company for | | | | |
| non-audit services provided by | | | | |
| PricewaterhouseCoopers LLP United Kingdom(a) | | | | |
| Audit-related services | 1.3 | | 0.1 | |
| Tax | – | | 0.4 | |
| General consulting | – | | 1.5 | |
| Other services | 0.5 | | 0.4 | |
| |
| (a) See also note 2 on page 108. | | | | |
| | | | | |
| Profit appropriation | £ million | | £ million | |
| | 2004 | | 2003 | |
| |
| The proposed appropriation of the profit | | | | |
| of PLC is as follows: | | | | |
| Interim and recommended final dividends | 548 | | 516 | |
| |
| |
| Profit for the year retained | 8 | | 47 | |
| |
| |
Unilever Annual Report and Accounts 2004 173
Back to Contents
Further statutory information and other information
Unilever PLC
Employee involvement and communication
Unilever’s UK companies maintain formal processes to inform, consult and involve employees and their representatives. Most of the United Kingdom sites are accredited to the Investors in People standard. Our sites also use tools such as Total Productive Maintenance which rely heavily on employee involvement, contribution and commitment.
A European Works Council, embracing employee and management representatives from 15 countries of Western Europe, has been in existence for several years and provides a forum for discussing issues that extend across national boundaries.
The directors’ reports of the United Kingdom group companies contain more details about how they have communicated with their employees during 2004.
Equal opportunities and diversity
The heads of all operating companies and units in the UK have committed their businesses to achieving greater diversity. Every Unilever company in the United Kingdom has an equal opportunities policy and actively pursues equality of opportunity for all employees.
The company carries out an annual employee monitoring survey and has also conducted an equal pay audit. The company continues to review ways in which greater diversity can be achieved in recruitment and selection.
A new flexible working policy was introduced in 2003, offering every employee the opportunity to request a flexible working option. Training workshops were run for line managers to maximise understanding and commitment to the policy.
Charitable and other contributions
Unilever collates the cost of its community involvement activities using the London Benchmarking Group model. The model recommends the separation of charitable donations, community investment, commercial initiatives in the community and management costs relating to the programme of activity.
During 2004 UK group companies made a total contribution of £8.2 million, analysed as follows:
Charitable donations: £1.1 million
Community investment: £1.9 million
Commercial initiatives in the community: £4.4 million
Management costs: £0.8 million
No donation or contribution was made or expenditure incurred for political purposes.
Supplier payment policies
Individual operating companies are responsible for agreeing the terms and conditions under which business transactions with their suppliers are conducted. The directors’ reports of the United Kingdom operating companies give information about their supplier payment policies as required by the United Kingdom Companies Act 1985. PLC, as a holding company, does not itself make any relevant payments in this respect.
Auditors
A resolution will be proposed at the Annual General Meeting on 11 May 2005 for the re-appointment of PricewaterhouseCoopers LLP as auditors of PLC. The present appointment will end at the conclusion of the Annual General Meeting.
Authority to purchase own shares
At the Annual General Meeting of PLC held on 12 May 2004, authority was given pursuant to Article 64 of the PLC Articles of Association to make market purchases of PLC ordinary shares of 1.4p each, to a maximum of 290 million shares. This authority will expire at the Annual General Meeting on 11 May 2005, and a resolution will be proposed to renew it. The company has not exercised this authority during the year.
Details of shares purchased by an employee share trust and Unilever group companies to satisfy options granted under PLC’s employee share schemes are given in the Remuneration report on page 85 and in note 30 to the consolidated accounts on pages 138 to 147.
Directors’ report of PLC
For the purposes of Section 234 of the Companies Act 1985, the Directors’ Report of Unilever PLC for the year ended 31 December 2004 comprises this page and the information contained in the Report of the Directors on pages 2 to 89, the Remuneration report in respect of Directors’ interests in shares or debentures of the Group on page 85, Dividends on page 181 and Principal group companies and fixed investments on pages 165 to 168.
Corporate Centre
Unilever PLC
PO Box 68 Unilever House
Blackfriars
London EC4P 4BQ
Unilever PLC Registered Office
Port Sunlight
Wirral
Merseyside CH62 4ZD
Unilever PLC Registrars
Lloyds TSB Registrars
The Causeway
Worthing
West Sussex BN99 6DA
By Order of the Board
J A A van der Bijl
S G Williams
Joint Secretaries of Unilever PLC
1 March 2005
174 Unilever Annual Report and Accounts 2004
Back to Contents
Analysis of shareholding
Significant shareholders of NV
As far as we are aware the only holders of more than 5% (as referred to in the Disclosure of Major Holdings in Listed Companies Act 1996 in the Netherlands) of any class of NV shares (apart from Nedamtrust, see page 61) are ING Verzekeringen N.V. and Aegon Levensverzekering N.V. The voting rights of such shareholders are the same as for other holders of the class of share indicated. We have to rely on the information we receive from the holders about the details of their holdings. The information we give below is the numbers we hold on 25 February 2005. This information was provided by ING Verzekeringen N.V. at various dates over the preceding six months and by Aegon Levensverzekering N.V. on 23 February 2005.
ING Verzekeringen N.V. |
| | |
| • | 7 669 455 (1.34%) ordinary shares (€3 897 877) |
| • | 20 670 (71.26%) 7% Cumulative Preference Shares (€9 377 595) |
| • | 120 092 (74.56%) 6% Cumulative Preference Shares (€54 493 740) |
| • | 504 440 (67.26%) 4% Cumulative Preference Shares (€22 890 489) |
| • | 16 013 355 (7.57%) 5 euro cents Cumulative Preference Shares (€726 654) |
| |
| Aegon Levensverzekering N.V. |
| | |
| • | 340 346 (0.05%) ordinary shares (€172 975) |
| • | 4 998 (17.23%) 7% Cumulative Preference Shares (€2 266 768) |
| • | 29 540 (18.34%) 6% Cumulative Preference Shares (€13 404 668) |
| • | 157 106 (20.95%) 4% Cumulative Preference Shares (€7 129 159) |
Some of the above holdings are in the form of depositary receipts against NV shares issued by Nedamtrust (see page 61). There have been no material changes to the holdings of significant shareholders of NV during the three years up to and including 2004.
Significant shareholders of PLC
The following table gives details of shareholders who held more than 3% of PLC’s shares or deferred stock on 25 February 2005. The voting rights of such shareholders are the same as for other holders of the class of share indicated. We take this information from the register we hold under section 211 of the UK Companies Act 1985.
| | | Number of | Approximate | |
| Title of class | Name of holder | shares held | % held | |
|
|
|
| |
| Deferred Stock | Naamlooze Vennootschap Elma | £50 000 | 50 | |
| | United Holdings Limited | £50 000 | 50 | |
| Ordinary shares | Trustees of the Leverhulme Trust and the | | | |
| | Leverhulme Trade Charities Trust | 156 815 034 | 5 | |
| | The Capital Group Companies, Inc. | 144 557 853 | 5 | |
|
|
|
| |
The holding by The Capital Group Companies, Inc. is on behalf of affiliated investment management companies and was first notified to PLC in November 2000. On 28 February 2004 the Fidelity Management and Research Company held more than 3% of PLC’s ordinary shares, but as at 29 March 2004 the holding fell below 3%. After 28 February 2004 Barclays PLC became a significant shareholder with over 3% of PLC’s ordinary shares on three occasions, each time subsequently falling back below 3%. On 6 October 2004 their holding fell below 3% and there have been no further movements since. There have been no other reportable changes to the holdings of significant shareholders of PLC during the three years up to and including 2004.
Analysis of PLC registered holdings
At 31 December 2004 PLC had 86 566 ordinary shareholdings.
The following table analyses the registered holdings of PLC’s 1.4p ordinary shares at 31 December 2004:
| | | Number | | | | Total | | | |
| Number of shares | of holdings | | % | | shares held | | % | |
|
|
|
|
|
|
|
|
| |
| 1 – | 1 000 | 33 165 | | 38.31 | | 18 190 424 | | 0.62 | |
| 1 001 – | 2 500 | 25 072 | | 28.96 | | 41 524 017 | | 1.43 | |
| 2 501 – | 5 000 | 13 887 | | 16.04 | | 49 725 269 | | 1.71 | |
| 5 001 – | 10 000 | 8 057 | | 9.31 | | 56 728 685 | | 1.95 | |
| 10 001 – | 25 000 | 3 996 | | 4.62 | | 60 156 095 | | 2.07 | |
| 25 001 – | 50 000 | 908 | | 1.05 | | 31 212 940 | | 1.07 | |
| 50 001 – | 100 000 | 443 | | 0.51 | | 30 988 253 | | 1.06 | |
| 100 001 – | 1 000 000 | 739 | | 0.85 | | 257 392 995 | | 8.84 | |
| Over | 1 000 000 | 299 | | 0.35 | | 2 365 539 902 | | 81.25 | |
|
|
|
|
|
|
|
|
| |
| | | 86 566 | | 100.00 | | 2 911 458 580 | | 100.00 | |
|
|
|
|
|
|
|
|
| |
Unilever Annual Report and Accounts 2004 175
Back to Contents
Analysis of shareholding
(continued)
Share purchases during 2004
The following share purchases were made in respect of share-based compensation plans, in order to satisfy future exercises of options and vesting of awards. These numbers are not adjusted for sales of shares on exercises of options or vesting of share awards. The maximum number of shares that may be purchased under the plans is determined by the number of new options granted and by our hedging practice.
| | | | | | | Total number of | |
| | | | | | | shares purchased | |
| | | Total number of | | Average price | | as part of publicly | |
| | | shares purchased | (a) | paid per share | | announced plans | |
|
|
|
|
|
|
| |
| January | NV shares | – | | – | | – | |
| | PLC shares | 554 000 | | £5.33 | | 554 000 | |
|
|
|
|
|
|
| |
| February | NV shares | 462 682 | | €59.71 | | 462 682 | |
| | PLC shares | 2 345 512 | | £5.70 | | 2 345 512 | |
|
|
|
|
|
|
| |
| March | NV shares | 2 549 286 | | €55.32 | | 2 549 286 | |
| | PLC shares | 16 141 894 | | £5.39 | | 16 141 894 | |
|
|
|
|
|
|
| |
| April | NV shares | 74 148 | | €55.08 | | 74 148 | |
| | PLC shares | 518 940 | | £5.34 | | 518 940 | |
|
|
|
|
|
|
| |
| May | NV shares | 1 008 205 | | €55.77 | | 1 008 205 | |
| | PLC shares | 62 752 | | £5.08 | | 62 752 | |
|
|
|
|
|
|
| |
| June | NV shares | – | | – | | – | |
| | PLC shares | – | | – | | – | |
|
|
|
|
|
|
| |
| July | NV shares | 9 802 | | €48.98 | | 9 802 | |
| | PLC shares | 17 344 | | £4.83 | | 17 344 | |
|
|
|
|
|
|
| |
| August | NV shares | 5 907 | | €49.28 | | 5 907 | |
| | PLC shares | 42 644 | | £4.86 | | 42 644 | |
|
|
|
|
|
|
| |
| September | NV shares | – | | – | | – | |
| | PLC shares | – | | – | | – | |
|
|
|
|
|
|
| |
| October | NV shares | 21 772 | | €47.48 | | 21 772 | |
| | PLC shares | 30 940 | | £4.66 | | 30 940 | |
|
|
|
|
|
|
| |
| November | NV shares | 145 036 | | €49.60 | | 145 036 | |
| | PLC shares | 24 872 | | £4.85 | | 24 872 | |
|
|
|
|
|
|
| |
| December | NV shares | – | | – | | – | |
| | PLC shares | – | | – | | – | |
|
|
|
|
|
|
| |
(a) When under a North American plan, in the form of NV New York shares or PLC ADRs.
176 Unilever Annual Report and Accounts 2004
Back to Contents
Information about exchange controls affecting security holders
Unilever N.V.
Under the Dutch External Financial Relations Act of 25 March 1994 the Minister of Finance is authorised to issue regulations relating to financial transactions concerning the movement of capital to or from third countries with respect to direct investments, establishment, the performing of financial services, the admission of negotiable instruments or goods with respect to which regulations have been issued under the Import and Export Act in the interest of the international legal system or an arrangement relevant thereto. These regulations may contain a prohibition to perform any of the actions indicated in those regulations without a licence. To date no regulations of this type have been issued which are applicable to Unilever N.V.
The Central Bank of the Netherlands is authorised to issue regulations with respect to reporting obligations. Pursuant to this authorisation it has issued the Reporting Obligations Balance of Payments 2003 (the ‘RR 2003’). Unilever N.V. has been appointed by the Central Bank as an institution subject to the reporting obligations and Unilever N.V. complies with such obligations.
Nature of the trading market
The principal trading markets upon which Unilever shares are listed are Euronext Amsterdam for NV ordinary shares and the London Stock Exchange for PLC ordinary shares. NV ordinary shares mainly trade in the form of Nedamtrust Certificates and almost all the shares are in bearer form. PLC ordinary shares are all in registered form.
In the United States, NV ordinary shares in registered form and PLC American Depositary Receipts, each representing four PLC ordinary shares, are traded on the New York Stock Exchange. JPMorgan Chase Bank NA acts for NV and PLC as issuer, transfer agent and, in respect of the American Depositary Receipts, depositary.
The NV ordinary shares are also listed on the stock exchanges in Frankfurt and Zürich.
There have not been any significant trading suspensions in the past three years.
At 25 February 2005 there were 7 542 registered holders of NV ordinary shares and 1 129 registered holders of PLC American Depositary Receipts in the United States. We estimate that approximately 27% of NV’s ordinary shares were held in the United States (approximately 23% in 2003), based on the distribution of the 2004 interim dividend payments, while most holders of PLC ordinary shares are registered in the United Kingdom – approximately 99% in both 2004 and 2003.
The high and low trading prices for the separate stock exchange listings are shown in the tables on the following page.
NV and PLC are separate companies with separate stock exchange listings and different shareholders. You cannot convert or exchange the shares of one for shares of the other and the relative share prices on the various markets can, and do, fluctuate. This happens for various reasons, including changes in exchange rates. However, over time the prices of NV and PLC shares do stay in close relation to each other, in particular because of our equalisation arrangements.
If you are a shareholder of NV, you have an interest in a Netherlands legal entity, your dividends will be paid in euros (converted into US dollars if you have shares registered in the United States) and you will be subject to Netherlands tax. If you are a shareholder of PLC, your interest is in a United Kingdom legal entity, your dividends will be paid in sterling (converted into US dollars if you have American Depositary Receipts) and you will be subject to United Kingdom tax. Nevertheless, the Equalisation Agreement means that as a shareholder of either company you effectively have an interest in the whole of Unilever. You have largely equal rights over our combined net profit and capital reserves as shown in the consolidated accounts. See Taxation for US residents on pages 179 and 180 and Equalisation Agreement on pages 52 and 53.
Unilever Annual Report and Accounts 2004 177
Back to Contents
Nature of the trading market
(continued)
Share prices at 31 December 2004:
The share price of the ordinary shares at the end of the year was for NV €49.33 and $66.71 and for PLC 512p and $39.52.
| Monthly high and low prices for the last six months of 2004: | |
| | | July | | August | | September | | October | | November | | December | |
|
|
|
|
|
|
|
|
|
|
|
|
| |
| NV per €0.51 ordinary share in Amsterdam (in €) | High | 56 | | 51 | | 51 | | 47 | | 48 | | 49 | |
| | Low | 51 | | 48 | | 46 | | 44 | | 46 | | 48 | |
|
|
|
|
|
|
|
|
|
|
|
|
| |
| NV per €0.51 ordinary share in New York (in $) | High | 68 | | 61 | | 62 | | 59 | | 63 | | 67 | |
| | Low | 61 | | 59 | | 58 | | 57 | | 59 | | 63 | |
|
|
|
|
|
|
|
|
|
|
|
|
| |
| PLC per 1.4p ordinary share in London (in pence) | High | 534 | | 482 | | 492 | | 464 | | 490 | | 513 | |
| | Low | 486 | | 465 | | 450 | | 443 | | 468 | | 479 | |
|
|
|
|
|
|
|
|
|
|
|
|
| |
| PLC per American Depositary Receipt in New York (in $) | High | 39 | | 36 | | 36 | | 34 | | 37 | | 40 | |
| | Low | 36 | | 34 | | 33 | | 33 | | 35 | | 37 | |
|
|
|
|
|
|
|
|
|
|
|
|
| |
| | |
| Quarterly high and low prices for 2004 and 2003: | |
| | 2004 | | 1st | | 2nd | | 3rd | | 4th | |
|
|
|
|
|
|
|
|
|
| |
| NV per €0.51 ordinary share in Amsterdam (in €) | High | | 59 | | 60 | | 56 | | 49 | |
| | Low | | 52 | | 52 | | 46 | | 44 | |
|
|
|
|
|
|
|
|
|
| |
| NV per €0.51 ordinary share in New York (in $) | High | | 74 | | 71 | | 68 | | 67 | |
| | Low | | 65 | | 62 | | 58 | | 57 | |
|
|
|
|
|
|
|
|
|
| |
| PLC per 1.4p ordinary share in London (in pence) | High | | 576 | | 573 | | 534 | | 513 | |
| | Low | | 518 | | 501 | | 450 | | 443 | |
|
|
|
|
|
|
|
|
|
| |
| PLC per American Depositary Receipt in New York (in $) | High | | 44 | | 41 | | 39 | | 40 | |
| | Low | | 38 | | 37 | | 33 | | 33 | |
|
|
|
|
|
|
|
|
|
| |
| | 2003 | | 1st | | 2nd | | 3rd | | 4th | |
|
|
|
|
|
|
|
|
|
| |
| NV per €0.51 ordinary share in Amsterdam (in €) | High | | 60 | | 59 | | 54 | | 52 | |
| | Low | | 48 | | 46 | | 46 | | 49 | |
|
|
|
|
|
|
|
|
|
| |
| NV per €0.51 ordinary share in New York (in $) | High | | 62 | | 64 | | 61 | | 65 | |
| | Low | | 53 | | 54 | | 54 | | 57 | |
|
|
|
|
|
|
|
|
|
| |
| PLC per 1.4p ordinary share in London (in pence) | High | | 605 | | 628 | | 546 | | 527 | |
| | Low | | 505 | | 481 | | 475 | | 487 | |
|
|
|
|
|
|
|
|
|
| |
| PLC per American Depositary Receipt in New York (in $) | High | | 39 | | 39 | | 35 | | 38 | |
| | Low | | 33 | | 32 | | 31 | | 33 | |
|
|
|
|
|
|
|
|
|
| |
| | |
| Annual high and low prices for 2002, 2001 and 2000: | |
| | | | 2002 | | 2001 | | 2000 | |
|
|
|
|
|
|
|
| |
| NV per €0.51 ordinary share in Amsterdam (in €) | High | | 72 | | 71 | | 71 | |
| | Low | | 50 | | 55 | | 42 | |
|
|
|
|
|
|
|
| |
| NV per €0.51 ordinary share in New York (in $) | High | | 67 | | 65 | | 64 | |
| | Low | | 50 | | 50 | | 40 | |
|
|
|
|
|
|
|
| |
| PLC per 1.4p ordinary share in London (in pence) | High | | 659 | | 610 | | 584 | |
| | Low | | 473 | | 478 | | 335 | |
|
|
|
|
|
|
|
| |
| PLC per American Depositary Receipt in New York (in $) | High | | 39 | | 35 | | 35 | |
| | Low | | 30 | | 28 | | 22 | |
|
|
|
|
|
|
|
| |
178 Unilever Annual Report and Accounts 2004
Back to Contents
Taxation for US residents holding shares in NV
The following notes are provided for guidance. US residents should consult their local tax advisers, particularly in connection with potential liability to pay US taxes on disposal, lifetime gift or bequest of their shares.
Netherlands taxation on dividends
Dividends of companies in the Netherlands are in principle subject to dividend withholding tax of 25%. Where a shareholder is entitled to the benefits of the current Income Tax Convention (‘the Convention’) concluded on 18 December 1992 between the United States and the Netherlands, when dividends are paid by NV to:
| • | a United States resident; |
| • | a corporation organised under the laws of the United States (or any territory of it) having no permanent establishment in the Netherlands of which such shares form a part of the business property; or |
| • | any other legal person subject to United States Federal income tax with respect to its worldwide income, having no permanent establishment in the Netherlands of which such shares form a part of the business property; |
these dividends qualify for a reduction of Netherlands withholding tax on dividends from 25% to 15% (to 5% if the beneficial owner is a company which directly holds at least 10% of the voting power of NV shares and to 0% if the beneficial owner is a qualified ‘Exempt Organisation’ as defined in Article 36 of the Convention).
Where a United States resident or corporation has a permanent establishment in the Netherlands, which has shares in NV forming part of its business property, dividends it receives on those shares are included in that establishment’s profit. They are subject to the Netherlands income tax or corporation tax, as appropriate, and the Netherlands tax on dividends will generally be applied at the full rate of 25%. This tax will be treated as foreign income tax eligible for credit against the shareholder’s United States income taxes.
Under the Convention, qualifying United States organisations that are generally exempt from United States taxes and that are constituted and operated exclusively to administer or provide pension, retirement or other employee benefits may be exempt at source from withholding tax on dividends received from a Netherlands corporation. An agreement published by the US Internal Revenue Service on 20 April 2000 in release IR-INT-2000-9 between the United States and the Netherlands tax authorities describes the eligibility of these US organisations for benefits under the Convention.
A United States trust, company or organisation that is operated exclusively for religious, charitable, scientific, educational or public purposes, is now subject to an initial 25% withholding tax rate. Such an exempt organisation is entitled to reclaim from the Netherlands Tax Authorities a refund of the Netherlands dividend tax, if and to the extent that it is exempt from United States Federal Income Tax and it would be exempt from tax in the Netherlands if it were organised and carried on all its activities there.
If you are an NV shareholder resident in any country other than the United States or the Netherlands, any exemption from, or reduction or refund of, the Netherlands dividend withholding tax may be governed by the ‘Tax Regulation for the Kingdom of the Netherlands’ or by the tax convention, if any, between the Netherlands and your country of residence.
United States taxation on dividends
If you are a United States shareholder, the dividend (including the withheld amount) up to the amount of our earnings and profits for United States Federal income tax purposes will be ordinary dividend income. Dividends received by an individual during taxable years before 2009 will be taxed at a maximum rate of 15%, provided the individual has held the shares for more than 60 days during the 121-day period beginning 60 days before the ex-dividend date, that NV is a qualified foreign corporation and that certain other conditions are satisfied. NV is a qualified foreign corporation for this purpose. Dividends received by an individual for taxable years after 2008 will be subject to tax at ordinary income rates. The dividends are not eligible for the dividends received deduction allowed to corporations.
For US foreign tax credit purposes, the dividend is foreign source income, and the Netherlands withholding tax is a foreign income tax that is eligible for credit against the shareholder’s United States income taxes. However, the rules governing the US foreign tax credit are complex, and additional limitations on the credit apply to individuals receiving dividends eligible for the 15% maximum tax rate on dividends described above.
Any portion of the dividend that exceeds our United States earnings and profits is subject to different rules. This portion is a tax free return of capital to the extent of your basis in our shares, and thereafter is treated as a gain on a disposition of the shares.
Under a provision of the Netherlands Dividend Tax Act, NV is entitled to a credit (up to a maximum of 3% of the gross dividend from which dividend tax is withheld) against the amount of dividend tax withheld before remittance to the Netherlands tax authorities. For dividends paid on or after 1 January 1995, the United States tax authority may take the position that the Netherlands withholding tax eligible for credit should be limited accordingly.
Netherlands taxation on capital gains
Under the Convention, if you are a United States resident or corporation and you have capital gains on the sale of shares of a Netherlands company, these are generally not subject to taxation by the Netherlands. An exception to this rule generally applies if you have a permanent establishment in the Netherlands and the capital gain is derived from the sale of shares which form part of that permanent establishment’s business property.
Netherlands succession duty and gift taxes
Under the Estate and Inheritance Tax Convention between the United States and the Netherlands of 15 July 1969, United States individual residents who are not Dutch citizens who have shares will generally not be subject to succession duty in the Netherlands on the individual’s death, unless the shares are part of the business property of a permanent establishment situated in the Netherlands.
A gift of shares of a Netherlands company by a person who is not a resident or a deemed resident of the Netherlands is generally not subject to Netherlands gift tax. A non-resident Netherlands citizen, however, is still treated as a resident of the Netherlands for gift tax purposes for ten years and any other non-resident person for one year after leaving the Netherlands.
Unilever Annual Report and Accounts 2004 179
Back to Contents
Taxation for US residents holding shares in PLC
The following notes are provided for guidance. US residents should consult their local tax advisers, particularly in connection with potential liability to pay US taxes on disposal, lifetime gift or bequest of their shares.
United Kingdom taxation on dividends
Under United Kingdom law, income tax is not withheld from dividends paid by United Kingdom companies. Shareholders, whether resident in the United Kingdom or not, receive the full amount of the dividend actually declared.
United States taxation on dividends
If you are a shareholder resident in the US, the dividend up to the amount of our earnings and profits for United States Federal income tax purposes will be ordinary dividend income. Dividends received by an individual during taxable years before 2009 will be taxed at a maximum rate of 15%, provided the individual has held the shares for more than 60 days during the 121-day period beginning 60 days before the ex-dividend date, that PLC is a qualified foreign corporation and certain other conditions are satisfied. PLC is a qualified foreign corporation for this purpose. Dividends received by an individual for taxable years after 2008 will be subject to tax at ordinary income rates. The dividend is not eligible for the dividends received deduction allowable to corporations. The dividend is foreign source income for US foreign tax credit purposes.
Any portion of the dividend that exceeds our United States earnings and profits is subject to different rules. This portion is a tax free return of capital to the extent of your basis in our shares, and thereafter is treated as a gain on a disposition of the shares.
UK taxation on capital gains
Under United Kingdom law, when you sell shares you may be liable to pay capital gains tax. However, if you are either:
| • | an individual who is neither resident nor ordinarily resident in the United Kingdom; or |
| • | a company which is not resident in the United Kingdom; |
you will not be liable to United Kingdom tax on any capital gains made on disposal of your shares.
The exception is if the shares are held in connection with a trade or business which is conducted in the United Kingdom through a branch or an agency.
UK inheritance tax
Under the current estate and gift tax convention between the United States and the United Kingdom, ordinary shares held by an individual shareholder who is:
| • | domiciled for the purposes of the convention in the United States; and |
| • | is not for the purposes of the convention a national of the United Kingdom; |
will not be subject to United Kingdom inheritance tax on:
| • | the individual’s death; or |
| • | on a gift of the shares during the individual’s lifetime. |
The exception is if the shares are part of the business property of a permanent establishment of the individual in the United Kingdom or, in the case of a shareholder who performs independent personal services, pertain to a fixed base situated in the United Kingdom.
180 Unilever Annual Report and Accounts 2004
Back to Contents
Dividends
Our interim ordinary dividends are normally announced in November and paid in December. Final ordinary dividends are normally proposed in February and, if approved by shareholders at the Annual General Meetings, paid in May or June.
The following tables show the dividends paid by NV and PLC for the last five years. NV dividends are per €0.51 ordinary share and PLC dividends are per 1.4p ordinary share and per depositary receipt of 5.6p. Dividends for NV have been translated into US dollars at the exchange rates prevailing on the dates of declaration. Dividends for PLC up to and including the interim dividend for 2001 have been translated into US dollars at the exchange rates prevailing on the date of payment of the sterling dividends. Following a change in practice, starting with the final dividend for 2001, PLC dividends have been translated into US dollars at the rate prevailing on the date of declaration of the dividend.
The interim dividend is normally 35% of the previous year’s total normal dividend per share, based on the stronger of our two parent currencies over the first nine months of the year. Equalisation of the interim dividend in the other currency takes place at the average exchange rate of the third quarter. Equalisation of the final dividend takes place at the average exchange rate for the full year.
The dividend timetable for 2005 is shown on page 184.
| NV Dividends | |
| | 2004 | | 2003 | | 2002 | | 2001 | | 2000 | |
|
|
|
|
|
|
|
|
|
| |
| Interim dividend per €0.51 | €0.63 | | €0.59 | | €0.55 | | €0.50 | | €0.48 | |
| Exchange rate € to $ | 1.2784 | | 1.1673 | | 0.9820 | | 0.9097 | | 0.8646 | |
| Interim dividend per €0.51 (US registry) | $0.805392 | | $0.688707 | | $0.540100 | | $0.454850 | | $0.415008 | |
| | | | | | | | | | | |
| Final dividend per €0.51 | €1.26 | | €1.15 | | €1.15 | | €1.06 | | €0.95 | |
| Final exchange rate € to $ | 1.2762 | | 1.1857 | | 1.1427 | | 0.9088 | | 0.8827 | |
| Final dividend per €0.51 (US registry) | $1.608012 | | $1.363555 | | $1.314105 | | $0.963328 | | $0.838565 | |
|
|
|
|
|
|
|
|
|
| |
For the purposes of illustration, the US dollar dividends shown above are those paid on the €0.51 ordinary shares of NV registered in New York. The above exchange rates were those ruling on the dates of declaration of the dividend.
The final euro dividend for 2004 is payable on 13 June 2005. The dollar dividend will be calculated with reference to the exchange rates prevailing on 10 May 2005.
| PLC Dividends | |
| | 2004 | | 2003 | | 2002 | | 2001 | | 2000 | |
|
|
|
|
|
|
|
|
|
| |
| Interim dividend per 1.4p | 6.33p | | 6.16p | | 5.21p | | 4.65p | | 4.40p | |
| Exchange rate $ to £1 | 1.8382 | | 1.6910 | | 1.5580 | | 1.4527 | | 1.4622 | |
| Interim dividend per 5.6p | $0.4654 | | $0.4167 | | $0.3247 | | $0.2702 | | $0.2573 | |
| | | | | | | | | | | |
| Final dividend per 1.4p | 12.82p | | 11.92p | | 10.83p | | 9.89p | | 8.67p | |
| Final exchange rate $ to £1 | 1.8618 | | 1.7722 | | 1.6065 | | 1.4591 | | 1.4355 | |
| Final dividend per 5.6p | $0.9547 | | $0.8449 | | $0.6959 | | $0.5772 | | $0.4978 | |
|
|
|
|
|
|
|
|
|
| |
The final sterling dividend for 2004 is payable on 13 June 2005. The dollar dividend will be calculated with reference to the exchange rates prevailing on 11 May 2005.
Unilever Annual Report and Accounts 2004 181
Back to Contents
Cross reference to Form 20-F
| PART I | |
| | | |
| 1 | Identity of directors, senior management | |
| | and advisers | n/a |
| | | |
| 2 | Offer statistics and expected timetable | n/a |
| | | |
| 3 | Key information | |
| 3A | Selected financial data | 132, 149-153, 181 |
| 3B | Capitalization and indebtedness | n/a |
| 3C | Reasons for the offer and use of proceeds | n/a |
| 3D | Risk factors | 50-51 |
| | | |
| 4 | Information on the company | |
| 4A | History and development of | |
| | the company | 2, 20-21, 52, 137, 184 |
| 4B | Business overview | 10-16, 24-49 |
| 4C | Organisational structure | 52-53, 165-168 |
| 4D | Property, plant and equipment | 16 |
| | | |
| 5 | Operating and financial review and prospects |
| 5A | Operating results | 17-49 |
| 5B | Liquidity and capital resources | 22, 92 |
| 5C | Research and development, patents and | |
| | licences, etc. | 11-12, 16 |
| 5D | Trend information | 8-9, 24-49 |
| 5E | Off balance sheet arrangements | 22, 120-121 |
| 5F | Tabular disclosure of contractual obligations | 21 |
| 5G | Safe harbour | 3 |
| | | |
| 6 | Directors, senior management and employees |
| 6A | Directors and senior management | 54-55, 57, 68-70 |
| 6B | Compensation | 71-89, 122-129 |
| 6C | Board practices | 52-70, 85-88 |
| 6D | Employees | 15 |
| 6E | Share ownership | 79-88, 138-147 |
| | | |
| 7 | Major shareholders and related party transactions |
| 7A | Major shareholders | 60-61, 175 |
| 7B | Related party transactions | 15, 147 |
| 7C | Interests of experts and counsel | n/a |
| | | |
| 8 | Financial information | |
| 8A | Consolidated statements | |
| | and other financial information | 91-148, 171, 181 |
| 8B | Significant changes | 23 |
| | | |
| 9 | The offer and listing | |
| 9A | Offer and listing details | 178 |
| 9B | Plan of distribution | n/a |
| 9C | Markets | 2, 177 |
| 9D | Selling shareholders | n/a |
| 9E | Dilution | n/a |
| 9F | Expenses of the issue | n/a |
| 10 | Additional information | |
| 10A | Share capital | n/a |
| 10B | Memorandum and articles of association | 52-61, 132, 171 |
| 10C | Material contracts | 60 |
| 10D | Exchange controls | 177 |
| 10E | Taxation | 179-180 |
| 10F | Dividends and paying agents | n/a |
| 10G | Statement by experts | n/a |
| 10H | Documents on display | 159 |
| 10I | Subsidiary information | n/a |
| | | |
| 11 | Quantitative and qualitative disclosures about | |
| | market risk | 50-51 |
| | | |
| 12 | Description of securities other than equity securities | n/a |
| | | |
| PART II | |
| | | |
| 13 | Defaults, dividend arrearages and delinquencies | n/a |
| | | |
| 14 | Material modifications to the rights of security | |
| | holders and use of proceeds | n/a |
| | | |
| 15 | Controls and procedures | 92 |
| | | |
| 16 | Reserved | |
| 16A | Audit Committee financial expert | 56 |
| 16B | Code of Ethics | 65 |
| 16C | Principal accountant fees and services | 67, 108 |
| 16D | Exemptions from the Listing Standards for | |
| | Audit Committees | n/a |
| 16E | Purchases of equity securities by the issuer and | |
| | affiliated purchasers | 176 |
| | | |
| PART III | |
| | | |
| 17 | Financial statements | n/a |
| | | |
| 18 | Financial statements | 91-148, 154-164 |
| | | |
| 19 | Exhibits* | |
| |
| *Filed with the United States Securities and Exchange Commission. |
| |
Unilever’s agent in the United States is Mr R Soiefer, Senior Vice-President, General Counsel and Secretary, Unilever United States, Inc., 700 Sylvan Avenue, Englewood Cliffs, NJ 07632. |
182 Unilever Annual Report and Accounts 2004
Back to Contents
Glossary
The following is intended to provide a general guide, particularly for United States readers, as to the meanings of various terms which may be used in this report. Please refer also to page 149 for definitions of specific accounting measures as they are applied by Unilever.
| Term used in this report | US equivalent or brief description |
|
| Accounts | Financial statements |
|
| Associate/Associated company | A business which is not a subsidiary or a joint venture, but in which the Group has |
| | a shareholding and exercises significant influence |
|
| Called up share capital | Ordinary shares, issued and fully paid |
|
| Creditors | Accounts payable/Payables |
|
| Creditors: amounts due after more than one year | Long-term accounts payable |
|
| Creditors: amounts due within one year | Current accounts payable |
|
| Debtors | Accounts receivable/Receivables |
|
| Finance lease | Capital lease |
|
| Freehold | Ownership with absolute rights in perpetuity |
|
| Gearing | Leverage |
|
| Group, or consolidated, accounts | Consolidated financial statements |
|
| Group operating margin | Group operating profit expressed as a percentage of group turnover |
|
| Interest payable | Interest expense |
|
| Interest receivable | Interest income |
|
| Joint venture | A business which is jointly controlled by the Group and one or more |
| | external partners |
|
| Nominal value | Par value |
|
| Operating margin | Operating profit expressed as a percentage of turnover |
|
| Operating profit | Net operating income |
|
| Profit | Income (or earnings) |
|
| Profit and loss account | Income statement |
|
| Profit attributable to ordinary shareholders | Net income attributable to ordinary shareholders |
|
| Profit retained | Retained earnings |
|
| Provisions | Long-term liabilities other than debt and specific accounts payable |
|
| Reconciliation of movements in | |
| shareholders’ funds | Statement of changes in stockholders’ equity |
|
| Reserves | Stockholders’ equity other than paid-up capital |
|
| Share capital | Capital stock or common stock |
|
| Share option | Stock option |
|
| Share premium account | Additional paid-in capital relating to proceeds of sale of stock in excess of par value |
| | or paid-in surplus |
|
| Shareholders’ funds | Stockholders’ equity |
|
| Shares in issue | Shares outstanding |
|
| Statement of total recognised gains and losses | Statement of comprehensive income |
|
| Stocks | Inventories |
|
| Tangible fixed assets | Property, plant and equipment |
|
| Turnover | Sales revenues |
|
Unilever Annual Report and Accounts 2004 183
Back to Contents
Financial calendar and addresses
| Annual General Meetings |
|
| NV | 09:30 am Tuesday 10 May 2005 Rotterdam |
|
| PLC | 11:00 am Wednesday 11 May 2005 London |
|
| |
| Announcements of results |
|
| First Quarter | 06 May 2005 | | Third Quarter | 03 November 2005 | |
| First Half Year | 04 August 2005 | | Final for Year | 09 February 2006 | |
|
| |
| Dividends on ordinary capital |
|
| Final for 2004 – announced 10 February 2005 and to be declared 10 May 2005 (NV) and 11 May 2005 (PLC) |
| | | | |
| | Ex-dividend | Record | Payment |
| | date | date | date |
|
| NV | 12 May 2005 | 11 May 2005 | 13 June 2005 |
| PLC | 18 May 2005 | 20 May 2005 | 13 June 2005 |
| NV – New York Shares | 12 May 2005 | 16 May 2005 | 13 June 2005 |
| PLC – American Depositary Receipts | 18 May 2005 | 20 May 2005 | 13 June 2005 |
|
| | | | |
| Interim for 2005 – to be announced 3 November 2005 | | | |
| | Ex-dividend | Record | Payment |
| | date | date | date |
|
| NV | 04 November 2005 | 03 November 2005 | 02 December 2005 |
| PLC | 16 November 2005 | 18 November 2005 | 02 December 2005 |
| NV – New York Shares | 04 November 2005 | 08 November 2005 | 02 December 2005 |
| PLC – American Depositary Receipts | 16 November 2005 | 18 November 2005 | 02 December 2005 |
|
| |
| Preferential dividends – NV |
|
| | | | Ex-dividend | | Record | | Payment | |
| | Announced | | date | | date | | date | |
|
| 4% Cumulative Preference | 09 December 2005 | | 12 December 2005 | | 09 December 2005 | | 02 January 2006 | |
| 6% Cumulative Preference | 09 September 2005 | | 12 September 2005 | | 09 September 2005 | | 03 October 2005 | |
| 7% Cumulative Preference | 09 September 2005 | | 12 September 2005 | | 09 September 2005 | | 03 October 2005 | |
| €0.05 (Fl.0.10) Cumulative Preference | 27 May 2005 | | 30 May 2005 | | 27 May 2005 | | 09 June 2005 | |
| | 25 November 2005 | * | 28 November 2005 | * | 25 November 2005 | * | 09 December 2005 | * |
|
|
|
|
|
|
|
|
|
*On 15 February 2005 after close of trading NV converted the €0.05 cumulative preference shares. As a consequence, the notional value of the shares reduced to €0.05. A proposal will be put to the Annual General Meeting of NV on 10 May 2005 to cancel the preference shares upon repayment of the notional amount in accordance with NV’s Articles of Association. Upon adoption of the proposal to cancel these preference shares, it is intended that the payment of accrued dividends on the preference shares for the relevant part of the second period of 2005 will occur at the time of the repayment of the notional value of the cancelled cumulative preference shares.
| Contact details | | |
| Rotterdam | London | New York |
|
| | | |
| Unilever N.V. | Unilever PLC | Unilever United States, Inc. |
| Corporate Relations Department | Corporate Relations Department | Corporate Affairs Department |
| Weena 455, PO Box 760 | PO Box 68, Unilever House | 700 Sylvan Avenue, Englewood Cliffs |
| 3000 DK Rotterdam | Blackfriars, London EC4P 4BQ | NY 07632 |
| | | |
| Telephone | | +31 (0)10 217 4000 | Telephone | | +44 (0)20 7822 5252 | Telephone | | +1 (0)201 894 7760 |
| Telefax | | +31 (0)10 217 4798 | Telefax | | +44 (0)20 7822 6191 | Telefax | | +1 (0)201 871 8257 |
| | | | | | | | | |
| Any queries can also be sent to us electronically via www.unilever.com/resources/contactus.asp |
|
184 Unilever Annual Report and Accounts 2004
Back to Contents
Index
| Accounting policies | 17-18, 53, 96-98, 122, 155-159 |
| Africa, Middle East and Turkey | 44-45, 69, 166, 168 |
| Amortisation | 2, 4, 7, 19-20, 24-49, 97, 99, 102-106, |
| | 108, 112-114, 150, 155-157 |
| Annual General Meeting (or AGM) | 53-54, 58-59, 132, |
| | 171, 174, 181, 184 |
| Asia and Pacific | 46-47, 69, 167 |
| Associates | 15, 97-99, 101-103, 106, 109-111, 115, |
| | 133, 147, 158-161, 168 |
| Auditors | 56, 67, 90, 92, 95, 108, 171, 173-174 |
| Axe | 11, 35, 38-39, 41-43, 49 |
| | |
| Balance sheet | 17, 21-22, 96-99, 101, 148, 150, 155, |
| | 163-164, 169, 172 |
| Becel | 10, 13, 28-29, 40-41, 43 |
| BEIA | 2, 4, 7, 19-20, 24-49 |
| Bertolli | 10, 12, 26, 41, 43 |
| Bestfoods | 18, 20, 109, 133, 156 |
| Borrowings | 21-22, 51, 53, 57, 100-101, 118-119, |
| | 138, 148, 163-164 |
| Breyers | 10, 12, 32-33, 42-43 |
| | |
| Capital and reserves | 18, 21, 96, 101, 121, 131, 148, 150-151, 155, 163-164, 169, 172 |
| Capital expenditure | 22, 100, 105, 114, 137, 151-152, 162 |
| Cash | 21-22, 51, 100-101, 117, 121, 138, 148, |
| | 150-151, 162-164, 169-170, 172-173 |
| Cash flow | 3, 6, 9, 17, 21-22, 51, 96, 100, 136-137, |
| | 151, 158, 162 |
| Chairman | 8-9, 15, 53-56, 58, 62, 64-66, 68, 70, 73-74, 147 |
| Code of Business Principles | 14, 56-57, 90, 92 |
| Contingent liabilities | 134, 170, 173 |
| Corporate governance | 52-71, 84, 90 |
| Creditors | 98, 101, 121-122, 148, 150, 163-164, |
| | 169-170, 172-173 |
| Current investments | 21-22, 97, 101, 117, 121, 137-138, |
| | 148, 150, 158, 163-164, 172-173 |
| Debtors | 97, 101, 116, 121, 148, 150, 163-164, |
| | 169-170, 172-173 |
| Deferred tax | 18, 21, 97, 100-101, 110-111, 116, 130, |
| | 154-155, 158, 170, 173 |
| Depreciation | 97, 105, 108, 114 |
| Disposals | 20-21, 100, 135, 137, 151, 155, 162 |
| Dividends | 7, 18, 21-22, 52-53, 60, 96, 99-100, 113, 122, |
| | 132-133, 137, 150-151, 155, 158, 160-162, |
| | 170-171, 173-174, 177, 179-181, 184 |
| Dove | 10-11, 35, 38-41, 43, 45 |
| | |
| Earnings per share | 7, 19-20, 66-67, 99, 112, 150-151, 154 |
| Environment | 12-14, 16-17, 50, 109, 130, 134 |
| Equalisation Agreement | 17, 52-53, 59-60, 66, 96, 112, |
| | 132, 171, 177 |
| Europe | 40-41, 69, 165-166, 168 |
| Exceptional items | 2, 4, 7, 19-20, 24-49, 98-99, 102-104, |
| | 106, 109, 112, 136, 150 |
| Exchange rates | 2, 17, 51, 60, 96-97, 153 |
| Executive Director | 53-54, 56-57, 68, 70-85, 89, 108 |
| | |
| Financial instruments | 18, 22, 51, 98, 120-121, 154-155, 158 |
| Fixed investments | 97, 99, 101, 115-116, 121, 137, 148, 150, |
| | 158, 160-161, 163-164, 168-170, 172-173 |
| Flora | 10, 13, 28-29, 40-41 |
| Foods | 10, 24-33, 52, 68-70 |
| Foreign currency | 17, 22, 51, 96-98, 117-121, 153, 155, 158 |
| Free cash flow | 3, 6, 22, 51, 149 |
| | |
| Goodwill | 2, 4, 7, 17-21, 24-49, 90, 97, 99, 101, 108-109, |
| | 113-115, 131, 133-135, 148, 150, 154-158, 163-164 |
| | |
| Hellmann’s | 10, 12, 26-27, 41, 43, 48 |
| Home and Personal Care | 10-11, 34-39, 52, 68-70 |
| Home care | 10-11, 36-37, 102 |
| | |
| Ice cream and frozen foods | 10, 32-33, 102 |
| Impairment | 9, 17-19, 30, 42, 90, 97-98, 105, 108-109, |
| | 113-114, 136, 149, 151, 154-157 |
| Intangible assets | 2, 4, 7, 17-20, 24-50, 97, 99, 101, 108, |
| | 113-114, 135, 137, 148, 150, 154-157, |
| | 163-164, 172 |
| Interest | 4, 6, 19-20, 22, 51, 96-99, 109, 115, 117-121, |
| | 137, 148-150, 154-155, 157-158, 160-161 |
| Internal control | 56-57, 63, 67, 90, 92 |
| | |
| Joint ventures | 3, 15, 19-20, 97-100, 102-103, 106, 109-111, |
| | 115, 133, 137, 147, 151, 158-162, 168 |
| | |
| Klondike | 10, 12, 32-33, 42 |
Unilever Annual Report and Accounts 2004 185
Back to Contents
Index
| Knorr | 10-11, 26-27, 33, 41, 45, 47-49 |
| | |
| Leases | 16, 21, 97-98, 100, 108, 114, 118, 121-122, |
| | 134, 137-138, 159 |
| Legal | 16-17, 52, 56, 90, 130, 177 |
| Lipton | 10, 12, 20, 25, 27, 30-31, 41, 43, 45, 47 |
| Lux | 10-11, 35, 38-39, 45, 47, 49 |
| | |
| Margin | 4, 7, 19-20, 24-49, 151 |
| Minority interests | 19-20, 96, 99, 101, 137, 148, 150, |
| | 160-161, 163-164 |
| | |
| Net debt | 9, 19-22, 100, 120, 138, 151 |
| Net profit | 4, 19-20, 96, 99-100, 133, 148, 150-151, |
| | 154, 160-161 |
| Netherlands | 2, 17, 19, 52, 55-56, 58, 60-66, 71-72, |
| | 74-76, 78-79, 84, 89-90, 92, 96, 99, 132, |
| | 169-171, 175, 177, 179, 187 |
| Non-Executive Director | 53-56, 58, 61-62, 64-66, 68-70, 86-90 |
| North America | 42-43, 69, 166, 168 |
| | |
| Omo | 10-11, 36-37, 44-45, 48-49 |
| Operating profit | 2-4, 7, 19-20, 24-49, 96, 98-99, 102-104, |
| | 106, 109, 136, 148, 150, 152, 160-161 |
| | |
| Path to Growth | 2-3, 8, 19-21, 50, 71, 73-74, 98, 109, |
| | 112, 130, 135 |
| Pensions | 17, 19-21, 23, 50, 57, 71, 74-76, 83-84, 89, 97, |
| | 99-101, 108, 122-129, 131, 133, 148, 150, |
| | 154-155, 158, 160-161, 163-164, 169-173 |
| Personal care | 10, 38-39, 102 |
| Preference shares and dividends | 16, 18, 59-61, 63, 66, 85, |
| | 99, 101, 112, 131-133, 137, |
| | 147, 150, 169, 171, 175, 184 |
| Prestige | 10-11, 14, 38-41, 43 |
| Profit and loss account | 96-99, 148, 150, 154, 160-161, |
| | 169, 172 |
| Provisions | 16-17, 19, 97, 101, 109, 116, 130, 148, |
| | 150, 163-164, 169-170, 172-173 |
| | |
| Related party transactions | 15, 147 |
| Remuneration | 53, 55-56, 63, 71-89, 108, 139 |
| Research and development | 11, 50, 98, 108 |
| Restructuring | 19-20, 98, 101, 109, 130, 154-155, 157 |
| Return on invested capital (ROIC) | 3, 5, 19-20, 149, 151 |
| Risk management | 50-51, 53, 56-57, 63, 90, 92 |
| | |
| Sarbanes-Oxley | 56, 64, 67, 90, 92 |
| Savoury and dressings | 10, 24-27, 102 |
| Share-based compensation | 17, 56, 71, 73-75, 77-82, 98, |
| | 138-147, 154, 159, 176 |
| Share capital | 7, 18, 53, 58-60, 66, 85, 88, 96, 100-101, |
| | 131-132, 163-164, 169-170, 172 |
| Shareholders | 52-67, 71, 95-96, 132, 175, 177, 179-181, 187 |
| Slim•Fast | 6, 9-10, 12, 18-19, 22, 25, 30-31, 42-43, |
| | 90, 104, 109, 113, 156 |
| Spreads and cooking products | 10, 28-29, 102 |
| Statement of total recognised gains and losses | 100 |
| Stocks | 97, 101, 116, 148, 150, 163-164 |
| Sunsilk | 11, 35, 38-39, 41, 45, 49 |
| Surf | 10-11, 13, 45, 47, 49 |
| | |
| Tangible fixed assets | 16-17, 97, 101, 107-108, 114, 118, |
| | 134, 137, 148, 163-164 |
| Taxation | 4, 19-20, 51, 99-100, 110-111, 122, 148, 151, |
| | 154-155, 160-162, 170, 173, 179-180 |
| Total shareholder return (TSR) | 23, 76 |
| Turnover | 3-5, 7, 19-20, 24-51, 98-99, 102-104, 106-107, |
| | 148, 150-152, 158, 160-161 |
| | |
| Unilever Foodsolutions | 10, 24 |
| United Kingdom (UK) | 2, 17, 52, 55-56, 58-61, 64-66, 71-72, |
| | 74-76, 78-79, 84-85, 89-90, 92, |
| | 96, 110, 172-175, 177, 180, 187 |
| Website | 2, 13-14, 18, 53-56, 58-59, 61-62, 64-66, |
| | 90, 92, 184, 187 |
186 Unilever Annual Report and Accounts 2004
Back to Contents
Website
Shareholders are encouraged to visit our website www.unilever.com, which has a wealth of information about Unilever.
There is a section designed specifically for investors at www.unilever.com/ourcompany/investorcentre. It includes detailed coverage of the Unilever share price, our quarterly and annual results, performance charts, financial news and investor relations speeches and presentations. It also includes conference and investor/analyst presentations.
You can also view this year’s and prior years’ Annual Review and Annual Report and Accounts documents at www.unilever.com/ourcompany/investorcentre/financial_reports.
PLC shareholders can elect not to receive paper copies of the Annual Review, the Annual Report and Accounts and other shareholder documents by registering at www.unilever.com/shareholderservices if they prefer to view these on our website.
Share registration
| Netherlands |
| N.V. Algemeen Nederlands Trustkantoor ANT |
| PO Box 11063 |
| 1001 GB Amsterdam |
| |
| Telephone | +31 (0)20 522 2555 |
| Telefax | +31 (0)20 522 2500 |
| e-mail | registers@ant-trust.nl |
| |
| |
| UK |
| Lloyds TSB Registrars |
| The Causeway |
| Worthing |
| West Sussex BN99 6DA |
| |
| Telephone | | +44 (0)870 600 3977 |
| Telefax | | +44 (0)870 600 3980 |
| Website | www.unilever.com/shareholderservices |
| |
| |
| USA |
| JPMorgan Service Center |
| PO Box 43013 |
| Providence RI 02940-3013 |
| |
| Toll free phone (inside US) | 888 502 6356 |
| Toll phone (outside US) | +1 (0)781 575 4328 |
| Website | www.adr.com |
Publications
Copies of the following publications can be accessed directly or ordered through www.unilever.com/ourcompany/investorcentre/financial_reports.
Unilever Annual Review 2004
Including Summary Financial Statement. Available in English or Dutch, with financial information in euros, sterling and US dollars.
Unilever Annual Report and Accounts 2004
Available in English or Dutch, with figures in euros. It forms the basis for the Form 20-F that is filed with the United States Securities and Exchange Commission.
Quarterly Results Announcements
Available in English or Dutch, with figures in euros; supplements in English, with sterling or US dollar figures, are available.
Unilever Annual Report and Accounts 2004 187
Back to Contents
Unilever N.V.
Weena 455, PO Box 760
3000 DK Rotterdam
The Netherlands | |
| T | +31 (0)10 217 4000 |
| F | +31 (0)10 217 4798 |
| |
Unilever PLC
PO Box 68, Unilever House
Blackfriars, London EC4P 4BQ
United Kingdom |
| T | +44 (0)20 7822 5252 |
| F | +44 (0)20 7822 5951 |
| |
Unilever PLC registered office
Unilever PLC
Port Sunlight
Wirral
Merseyside CH62 4ZD
United Kingdom |
| |
| www.unilever.com |
Item 19. Exhibits
| Exhibit Number | | Description of Exhibit |
| | | |
| 1.1 | | Memorandum and Articles of Association of Unilever PLC, as amended |
| 2.1 | | Indenture dated as of August 1, 2000, among Unilever Capital Corporation, Unilever N.V., Unilever PLC, Unilever United States, Inc. and The Bank of New York, as Trustee, relating to Guaranteed Debt Securities 1 |
| 2.2 | | Trust Deed dated as of July 22, 1994, among Unilever N.V., Unilever PLC, Unilever Capital Corporation, Unilever United States, Inc. and The Law Debenture Trust Corporation p.l.c., relating to Guaranteed Debt Securities 2 |
| 4.1 | | Equalisation Agreement between Unilever N.V. and Unilever PLC 3 |
| 4.2 | | Service Contracts of the Executive Directors of Unilever PLC |
| 4.3 | | Letters regarding compensation of Executive Directors of Unilever PLC |
| 4.4 | | Unilever North America 2002 Omnibus Equity Compensation Plan 4 |
| 4.5 | | The Unilever PLC International 1997 Executive Share Option Scheme 5 |
| 4.6 | | The Unilever Long Term Incentive Plan 6 |
| 7.1 | | Computation of Ratio of Earnings to Fixed Charges, Net Interest Cover and Net Interest Cover Based on EBITDA (Before Exceptional Items) 7 |
| 8.1 | | List of Subsidiaries 8 |
| 10.1 | | Consent of PricewaterhouseCoopers Accountants N.V. and PricewaterhouseCoopers LLP |
| 12.1 | | Certifications of the Chairman and Joint Chief Executive, Vice-Chairman and Joint Chief Executive and Financial Director/Chief Financial Officer pursuant to Section 302 of the Sarbanes-Oxley Act of 2002. |
| 13.1 | | Certifications of the Chairman and Joint Chief Executive, Vice-Chairman and Joint Chief Executive and Financial Director/Chief Financial Officer pursuant to Section 906 of the Sarbanes-Oxley Act of 2002. |
Certain instruments which define rights of holders of long-term debt of the Company and its subsidiaries are not being filed because the total amount of securities authorized under each such instrument does not exceed 10% of the total consolidated assets of the Company and its subsidiaries. The Company and its subsidiaries hereby agree to furnish a copy of each such instrument to the Securities and Exchange Commission upon request.
|
| 1 | | Incorporated by reference to the Form 6-K furnished to the SEC on October 23, 2000. |
| 2 | | Incorporated by reference to Exhibit 2.2 of Form 20-F filed with the SEC on March 28, 2002. |
| 3 | | Incorporated by reference to Exhibit 4.1 of Form 20-F filed with the SEC on March 27, 2003. |
| 4 | | Incorporated by reference to Exhibit 99.1 of Form S-8 filed with the SEC on February 27, 2003. |
| 5 | | Incorporated by reference to Exhibit 4.5 of Form 20-F filed with the SEC on March 28, 2002. |
| 6 | | Incorporated by reference to Exhibit 4.7 of Form 20-F filed with the SEC on March 28, 2002. |
| 7 | | The required information is set forth on page 149 of the Annual Report and Accounts on Form 20-F. |
| 8 | | The required information is set forth on pages 165-168 of the Annual Report and Accounts on Form 20-F. |
| | | |
SIGNATURES
The registrant hereby certifies that it meets all of the requirements for filing on Form 20-F and that it has duly caused and authorised the undersigned to sign this Annual Report on its behalf.
Unilever PLC
(Registrant)
/s/ S G Williams
___________________________________
(Signature)
S G Williams, Joint Secretary
Date: 24 March 2005


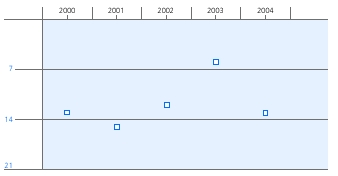
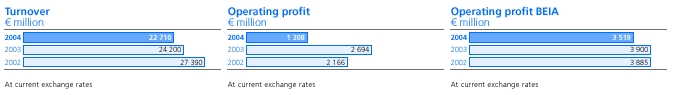
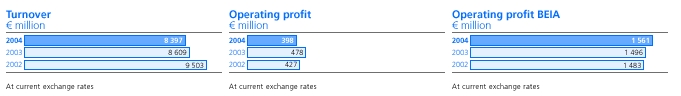

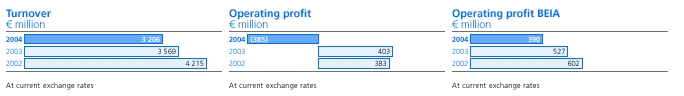
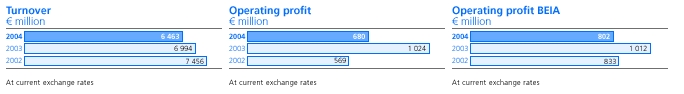
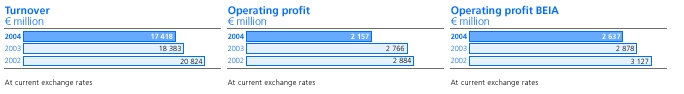

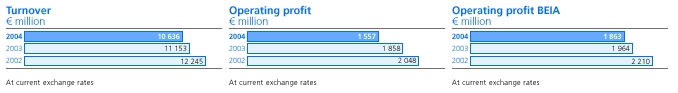
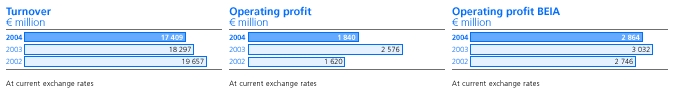


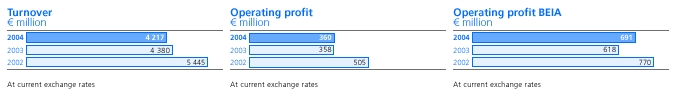
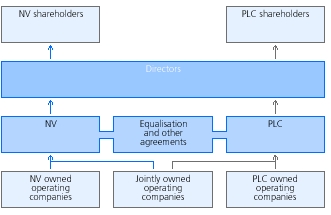
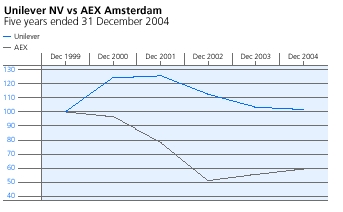

 The reference group, including Unilever, consists of 21 companies. Unilever’s position is based on TSR over a three-year rolling period.