The table below shows the expected benefit payments from defined benefit plans. The benefits paid from funded plans include amounts funded by employee contributions. The benefits paid in respect of unfunded plans are made from the Group’s cash resources.
Under IFRS, deferred tax on share-based compensation is provided based on the actual tax credit expected to be received using the fair market value of the share price at the year end (the intrinsic value). The deferred tax is credited to the income statement to the extent of the tax recognised on the share-based compensation charge with the excess recognised directly in equity. Under US GAAP, upon adoption of FAS 123(R), ‘Share Based Payments’, deferred tax is recognised to the extent of the cumulative amount of compensation cost recognised through the income statement. Upon exercise, the deferred tax adjustment required is recognised in the income statement or equity, dependent on whether a windfall pool exists or not.
Back to Contents
| | |
| | Financial Statements (continued) |
| | |
| Notes to the consolidated accountsUnilever Group |
|
34 Divergences from United States GAAP(continued)
Profit or loss on disposal of group companies
Under both IFRS and US GAAP, Unilever calculates profit or loss on sale of group companies net of goodwill included on the balance sheet and after the write-back of cumulative currency retranslation differences. Under previous GAAP, goodwill and intangible assets purchased prior to 1 January 1998 were written off in the year of acquisition as a movement in profits retained. Under US GAAP, such goodwill and intangible assets were capitalised and, prior to 1 January 2002, were amortised over their useful lives. These different accounting treatments give rise to differences between net profit or loss calculated under IFRS and that calculated under US GAAP. In 2006, the additional goodwill and intangibles recorded under US GAAP for disposals during the year means that the disposal profit was €167 million (2005: €217 million; 2004: €11 million) lower than that reported under IFRS.
Under IFRS, cumulative currency retranslation differences arising from the transition date to IFRS of 1 January 2004 are included in the calculation whereas under US GAAP the profit or loss on disposal includes cumulative currency retranslation differences which have arisen since the date that the businesses were originally acquired.
Currency retranslation
Under IFRS, the gain from cumulative translation differences arising from the partial repayment of capital of a subsidiary is recognised within the income statement. Under US GAAP, currency translation gains and losses are only recycled to the income statement on the sale or upon the complete or substantially complete liquidation of the investment.
Financial instruments
From 1 January 2005, Unilever recognises all derivative financial instruments on the balance sheet at fair value and applies hedge accounting to a portion of its portfolio of derivative financial instruments, meaning that changes in the fair value of derivative financial instruments that are designated and effective as hedges of future cash flows are recognised directly in equity and any ineffective portion is recognised immediately in the income statement. This is similar to requirements under FAS 133, ‘Accounting for Derivatives and Hedging Activities’.
Prior to the adoption of IAS 32 and IAS 39 on 1 January 2005, Unilever applied hedge accounting to its portfolio of derivative financial instruments, meaning that changes in the value of forward exchange contracts were recognised in the results in the same period as changes in the values of the assets and liabilities they were intended to hedge. Interest payments and receipts arising from interest rate derivatives such as swaps and forward rate agreements were matched to those arising from underlying debt and investment positions. Payments made or received in respect of the early termination of derivative instruments were spread over the original life of the instrument so long as the underlying exposure continues to exist.
Prior to 1 January 2005, Unilever had not designated any of its derivative financial instruments as qualifying hedge instruments under FAS 133 and accordingly, under US GAAP, all derivative financial instruments were valued at fair value with changes in fair value reflected in the income statement.
Sale and leaseback
The test for determining if an asset qualifies for treatment as a sale in a sale and leaseback transaction is stricter under US GAAP than that under IFRS, in particular where the lessee has continuing involvement. As a result, certain sale and leaseback transactions entered into by Unilever are reversed for the purposes of US GAAP reporting.
Other
Other equity differences relate to joint ventures and associates, biological assets, preference shares, borrowing costs, outsourcing contracts, sale and leaseback and financial instruments. Other net profit differences relate to biological assets, dividends on preference shares, joint ventures and associates, borrowing costs and outsourcing contracts.
Share-based payments
Unilever has adopted FAS 123(R) as of 1 January 2006 on a prospective basis. Since the Group had already voluntarily adopted the fair value measurements from FAS 123 in prior years, the adoption of this Standard has had no material impact on the consolidated results from operations and financial position of Unilever.
Recent accounting developments
In June 2006, the FASB issued FASB Interpretation No. 48 (FIN 48), ‘Accounting for Uncertainty in Income Taxes’. The provisions of FIN 48 will be effective for all outstanding tax positions on adoption, which for Unilever is 1 January 2007. FIN 48 prescribes a recognition threshold and measurement attribute for the financial statement recognition and measurement of a tax position taken or expected to be taken in a tax return. The impact of FIN 48 on the consolidated results of the operations and financial position of Unilever is currently being assessed by the Group.
In October 2006, FASB issued FAS 157, ‘Fair Value Measurement’. The standard addresses how companies should measure fair value when they are required to use a fair value measure for recognition or disclosure purposes, and move toward a market-based measure instead of an entity-based measure, and expands disclosure requirements about fair value measurements. The standard is effective for fiscal years beginning after 15 November 2007 and will be adopted by Unilever as at 1 January 2008. The impact of FAS 157 on the consolidated results of operations and financial position of Unilever is currently being assessed by the Group.
In February 2006, the FASB issued FAS 155, ‘Accounting for Certain Hybrid Financial Instruments, an amendment of FAS 133 and FAS 140’. This statement simplifies accounting for certain hybrid financial instruments by permitting fair value remeasurement for any hybrid financial instrument that contains an embedded derivative that otherwise would require bifurcation. FAS 155 is effective for Unilever for all financial instruments acquired, issued, or subject to a remeasurement (new basis) event occurring after 1 January 2007. The adoption is not expected to have a material effect on the consolidated results of operations or financial position of Unilever.
In February 2007, the FASB issued FAS 159 ‘The Fair Value Option for Financial Assets and Financial Liabilities’. The standard provides companies with an option to report selected financial assets and liabilities at fair value. FAS 159 is effective for fiscal years beginning after 15 November 2007, and will be adopted by Unilever as at 1 January 2008. The impact on the consolidated results of operations and financial position of Unilever is currently being assessed by the Group.
Documents on display in the United States
Unilever files and furnishes reports and information with the United States Securities and Exchange Commission (SEC). Such reports and information can be inspected and copied at the SEC’s public reference facilities in Washington DC, Chicago and New York. Certain of our reports and other information that we file or furnish to the SEC are also available to the public over the internet on the SEC’s website at www.sec.gov.
| Unilever Annual Report on Form 20-F 2006 | 131 |
Back to Contents
| | |
| Financial Statements (continued) | |
| | |
| Notes to the consolidated accounts Unilever Group |
|
35 Additional information for US investors
Presented below is additional information required for reporting in the United States, prepared on an IFRS basis:
(i) Segment information; (ii) Summarised presentation of the NV and PLC parts of the Group; and (iii) Guarantor statements.
(i) Segment information (prepared on an IFRS basis)
Unilever has reviewed the extent of its business with major customers, and has concluded that it has no customers that would require separate disclosure during the reporting periods covered by this filing.
For management reporting purposes, Unilever uses a number of measures of segment performance at constant average rates of exchange (that is, the same rates as in the preceding year). The internal management measure of profit that is most consistent with operating profit reported in the accounts is ‘Trading Result’. This differs from operating profit, mainly because Trading Result includes a number of statistical and other adjustments including the application of an inflation charge on working capital which is added back to arrive at operating profit.
| | € million | | € million | | € million | | € million | |
| | | | The | | Asia | | | |
| Analysis by geographical segment | Europe | | Americas | | Africa | | Total | |
|
|
|
|
|
|
|
| |
| 2006 | | | | | | | | |
| Turnover | | | | | | | | |
| At constant 2005 exchange rates | 14 967 | | 13 591 | | 10 983 | | 39 541 | |
| Exchange rate adjustments | 33 | | 188 | | (120 | ) | 101 | |
| |
|
|
|
|
|
|
| |
| At current 2006 exchange rates | 15 000 | | 13 779 | | 10 863 | | 39 642 | |
| | | | | | | | | |
| Trading result | | | | | | | | |
| At constant 2005 exchange rates | 1 966 | | 2 096 | | 1 320 | | 5 382 | |
| Exchange rate adjustments | 5 | | 20 | | (9 | ) | 16 | |
| |
|
|
|
|
|
|
| |
| At current 2006 exchange rates | 1 971 | | 2 116 | | 1 311 | | 5 398 | |
| Other adjustments | | | | | | | 10 | |
| | | | | | | |
| |
| Operating profit | | | | | | | 5 408 | |
|
|
|
|
|
|
|
| |
| 2005 | | | | | | | | |
| Turnover | | | | | | | | |
| At constant 2004 exchange rates | 14 879 | | 12 715 | | 10 281 | | 37 875 | |
| Exchange rate adjustments | 61 | | 464 | | 1 | | 526 | |
| |
|
|
|
|
|
|
| |
| At current 2005 exchange rates | 14 940 | | 13 179 | | 10 282 | | 38 401 | |
| | | | | | | | | |
| Trading result | | | | | | | | |
| At constant 2004 exchange rates | 2 101 | | 1 942 | | 1 234 | | 5 277 | |
| Exchange rate adjustments | 6 | | 58 | | (3 | ) | 61 | |
| |
|
|
|
|
|
|
| |
| At current 2005 exchange rates | 2 107 | | 2 000 | | 1 231 | | 5 338 | |
| Other adjustments | | | | | | | (264 | ) |
| | | | | | | |
| |
| Operating profit | | | | | | | 5 074 | |
|
|
|
|
|
|
|
| |
| 2004 | | | | | | | | |
| Turnover | | | | | | | | |
| At constant 2003 exchange rates | 15 246 | | 13 380 | | 10 122 | | 38 748 | |
| Exchange rate adjustments | 6 | | (1 084 | ) | (502 | ) | (1 580 | ) |
| |
|
|
|
|
|
|
| |
| At current 2004 exchange rates | 15 252 | | 12 296 | | 9 620 | | 37 168 | |
| | | | | | | | | |
| Trading result | | | | | | | | |
| At constant 2003 exchange rates | 2 236 | | 2 153 | | 1 090 | | 5 479 | |
| Exchange rate adjustments | 5 | | (186 | ) | (57 | ) | (238 | ) |
| |
|
|
|
|
|
|
| |
| At current 2004 exchange rates | 2 241 | | 1 967 | | 1 033 | | 5 241 | |
| Other adjustments | | | | | | | (1 260 | ) |
| | | | | | | |
| |
| Operating profit | | | | | | | 3 981 | |
|
|
|
|
|
|
|
| |
| Depreciation, amortisation and impairment | | | | | | | | |
| 2006 | | | | | | | | |
| At constant 2005 exchange rates | (442 | ) | (313 | ) | (200 | ) | (955 | ) |
| Exchange rate adjustments | (1 | ) | (4 | ) | 2 | | (3 | ) |
| |
|
|
|
|
|
|
| |
| At current 2006 exchange rates | (443 | ) | (317 | ) | (198 | ) | (958 | ) |
| | | | | | | | | |
| 2005 | | | | | | | | |
| At constant 2004 exchange rates | (442 | ) | (630 | ) | (184 | ) | (1 256 | ) |
| Exchange rate adjustments | – | | (8 | ) | (2 | ) | (10 | ) |
| |
|
|
|
|
|
|
| |
| At current 2005 exchange rates | (442 | ) | (638 | ) | (186 | ) | (1 266 | ) |
| | | | | | | | | |
| 2004 | | | | | | | | |
| At constant 2003 exchange rates | (613 | ) | (1 236 | ) | (297 | ) | (2 146 | ) |
| Exchange rate adjustments | – | | 116 | | 14 | | 130 | |
| |
|
|
|
|
|
|
| |
| At current 2004 exchange rates | (613 | ) | (1 120 | ) | (283 | ) | (2 016 | ) |
|
|
|
|
|
|
|
| |
| 132 | Unilever Annual Report on Form 20-F 2006 |
Back to Contents
| | |
| | Financial Statements (continued) |
| | |
| Notes to the consolidated accountsUnilever Group |
|
35 Additional information for US investors(continued)
(i) Segment information(continued)
| | € million | | € million | | € million | | € million | |
| | | | The | | Asia | | | |
| Capital expenditure | Europe | | Americas | | Africa | | Total | |
|
|
|
|
|
|
|
| |
| 2006 | | | | | | | | |
| At constant 2005 exchange rates | 507 | | 389 | | 296 | | 1 192 | |
| Exchange rate adjustments | 4 | | 7 | | (2 | ) | 9 | |
| |
|
|
|
|
|
|
| |
| At current 2006 exchange rates | 511 | | 396 | | 294 | | 1 201 | |
| | | | | | | | | |
| 2005 | | | | | | | | |
| At constant 2004 exchange rates | 446 | | 291 | | 298 | | 1 035 | |
| Exchange rate adjustments | 1 | | 14 | | – | | 15 | |
| |
|
|
|
|
|
|
| |
| At current 2005 exchange rates | 447 | | 305 | | 298 | | 1 050 | |
|
|
|
|
|
|
|
| |
| | | | | | | | | |
| | € million | | € million | | € million | | € million | |
| | United | | | | | | | |
| | Kingdom & | | United | | | | | |
| Analysis by geographical area(a) | Netherlands | | States | | Other | | Total | |
|
|
|
|
|
|
|
| |
| Turnover | | | | | | | | |
| 2006 | | | | | | | | |
| At constant 2005 exchange rates | 3 703 | | 7 688 | | 28 150 | | 39 541 | |
| Exchange rate adjustments | 7 | | (61 | ) | 155 | | 101 | |
| |
|
|
|
|
|
|
| |
| At current 2006 exchange rates | 3 710 | | 7 627 | | 28 305 | | 39 642 | |
| |
|
|
|
|
|
|
| |
| 2005 | | | | | | | | |
| At constant 2004 exchange rates | 3 700 | | 7 587 | | 26 588 | | 37 875 | |
| Exchange rate adjustments | (21 | ) | (37 | ) | 584 | | 526 | |
| |
|
|
|
|
|
|
| |
| At current 2005 exchange rates | 3 679 | | 7 550 | | 27 172 | | 38 401 | |
| |
|
|
|
|
|
|
| |
| 2004 | | | | | | | | |
| At constant 2003 exchange rates | 3 779 | | 8 093 | | 26 876 | | 38 748 | |
| Exchange rate adjustments | 52 | | (732 | ) | (900 | ) | (1 580 | ) |
| |
|
|
|
|
|
|
| |
| At current 2004 exchange rates | 3 831 | | 7 361 | | 25 976 | | 37 168 | |
|
|
|
|
|
|
|
| |
| Property, plant and equipment | | | | | | | | |
| 2006 | 967 | | 1 060 | | 4 249 | | 6 276 | |
| 2005 | 1 018 | | 1 140 | | 4 334 | | 6 492 | |
|
|
|
|
|
|
|
| |
| (a) | For the United Kingdom and the Netherlands, which are the home countries of the parent companies, the combined operating profit in 2006 was €555 million (2005: €648 million; 2004: €667 million). |
| Unilever Annual Report on Form 20-F 2006 | 133 |
Back to Contents
| | |
| Financial Statements (continued) | |
| | |
| Notes to the consolidated accounts Unilever Group |
|
35 Additional information for US investors(continued)
(ii) Summarised presentation of the NV and PLC parts of the Group (prepared on an IFRS basis)
NV and PLC and their group companies constitute a single reporting entity for the purposes of presenting consolidated accounts. The following supplemental information shows the consolidated income statement and balance sheet of the Group analysed according to the relative legal ownership of individual entities by NV or PLC.
| | € million | | € million | | € million | | € million | | € million | | € million | |
| | NV | | NV | | NV | | PLC | | PLC | | PLC | |
| Income statementfor the year ended 31 December | 2006 | | 2005 | | 2004 | | 2006 | | 2005 | | 2004 | |
|
|
|
|
|
|
|
|
|
|
|
| |
| Continuing operations: | | | | | | | | | | | | |
| | | | | | | | | | | | | |
| Turnover | 27 376 | | 26 479 | | 25 328 | | 12 266 | | 11 922 | | 11 840 | |
| | | | | | | | | | | | | |
| Operating profit | 3 608 | | 3 552 | | 2 666 | | 1 800 | | 1 522 | | 1 315 | |
| Net finance costs | (686 | ) | (470 | ) | (375 | ) | (35 | ) | (143 | ) | (248 | ) |
| Share in net profit of joint ventures | 59 | | 35 | | 30 | | 19 | | 12 | | 9 | |
| Share in net profit of associates | – | | (12 | ) | 8 | | 36 | | (13 | ) | (6 | ) |
| Other income from non-current investments | 13 | | 20 | | 35 | | 17 | | 13 | | 19 | |
| |
|
|
|
|
|
|
|
|
|
|
| |
| Profit before taxation | 2 994 | | 3 125 | | 2 364 | | 1 837 | | 1 391 | | 1 089 | |
| Taxation | (727 | ) | (774 | ) | (471 | ) | (419 | ) | (407 | ) | (254 | ) |
| |
|
|
|
|
|
|
|
|
|
|
| |
| Net profit from continuing operations | 2 267 | | 2 351 | | 1 893 | | 1 418 | | 984 | | 835 | |
| Net profit from discontinued operations | 836 | | 455 | | 131 | | 494 | | 185 | | 82 | |
| |
|
|
|
|
|
|
|
|
|
|
| |
| Net profit | 3 103 | | 2 806 | | 2 024 | | 1 912 | | 1 169 | | 917 | |
| |
|
|
|
|
|
|
|
|
|
|
| |
| Attributable to: | | | | | | | | | | | | |
| Minority interest | 66 | | 57 | | 56 | | 204 | | 152 | | 130 | |
| Shareholders’ equity | 3 037 | | 2 749 | | 1 968 | | 1 708 | | 1 017 | | 787 | |
|
|
|
|
|
|
|
|
|
|
|
| |
| | € million | | € million | | | | € million | | € million | |
| | NV | | NV | | | | PLC | | PLC | |
| Balance sheetas at 31 December | 2006 | | 2005 | | | | 2006 | | 2005 | |
|
|
|
|
|
|
|
|
|
| |
| Goodwill and intangible assets | 12 569 | | 14 152 | | | | 4 637 | | 3 903 | |
| Property, plant and equipment | 3 642 | | 4 321 | | | | 2 634 | | 2 171 | |
| Pension asset for funded schemes in surplus | 1 484 | | 966 | | | | 213 | | 70 | |
| Deferred tax assets | 755 | | 961 | | | | 511 | | 742 | |
| Other non-current assets | 723 | | 695 | | | | 403 | | 377 | |
| |
|
|
| | | |
|
|
| |
| Total non-current assets | 19 173 | | 21 095 | | | | 8 398 | | 7 263 | |
| | | | | | | | | | | |
| Inventories | 2 141 | | 2 661 | | | | 1 655 | | 1 446 | |
| Trade and other current receivables | 2 744 | | 3 628 | | | | 1 546 | | 1 202 | |
| Cash and cash equivalents | 565 | | 941 | | | | 474 | | 588 | |
| Other financial assets | 143 | | 317 | | | | 219 | | 142 | |
| Assets held for sale | 7 | | 166 | | | | 7 | | 51 | |
| |
|
|
| | | |
|
|
| |
| Total current assets | 5 600 | | 7 713 | | | | 3 901 | | 3 429 | |
| | | | | | | | | | | |
| Borrowings due within one year | (3 925 | ) | (5 506 | ) | | | (437 | ) | (436 | ) |
| Trade payables and other current liabilities | (5 469 | ) | (6 114 | ) | | | (3 044 | ) | (2 668 | ) |
| Provisions | (806 | ) | (460 | ) | | | (203 | ) | (184 | ) |
| Liabilities associated with assets held for sale | – | | (16 | ) | | | – | | (10 | ) |
| |
|
|
| | | |
|
|
| |
| Total current liabilities | (10 200 | ) | (12 096 | ) | | | (3 684 | ) | (3 298 | ) |
| |
|
|
| | | |
|
|
| |
| Net current assets/(liabilities) | (4 600 | ) | (4 383 | ) | | | 217 | | 131 | |
| |
|
|
| | | |
|
|
| |
| Total assets less current liabilities | 14 573 | | 16 712 | | | | 8 615 | | 7 394 | |
|
|
|
|
|
|
|
|
|
| |
| | | | | | | | | | | |
| Borrowings due after more than one year | 3 172 | | 5 484 | | | | 1 067 | | 973 | |
| Pension and post-retirement healthcare liabilities: | | | | | | | | | | |
| Funded schemes in deficit | 465 | | 757 | | | | 914 | | 1 658 | |
| Unfunded schemes | 2 097 | | 3 040 | | | | 1 301 | | 1 162 | |
| Provisions | 674 | | 635 | | | | 152 | | 97 | |
| Deferred tax liabilities | 888 | | 770 | | | | 115 | | 163 | |
| Other non-current liabilities | 247 | | 338 | | | | 424 | | 264 | |
| |
|
|
| | | |
|
|
| |
| Total non-current liabilities | 7 543 | | 11 024 | | | | 3 973 | | 4 317 | |
| Intra-group – NV/PLC | (368 | ) | (1 932 | ) | | | 368 | | 1 932 | |
| | | | | | | | | | | |
| Shareholders’ equity | 7 360 | | 7 571 | | | | 3 870 | | 790 | |
| Minority interests | 38 | | 49 | | | | 404 | | 355 | |
| |
|
|
| | | |
|
|
| |
| Total equity | 7 398 | | 7 620 | | | | 4 274 | | 1 145 | |
| |
|
|
| | | |
|
|
| |
| Total capital employed | 14 573 | | 16 712 | | | | 8 615 | | 7 394 | |
|
|
|
|
|
|
|
|
|
| |
| 134 | Unilever Annual Report on Form 20-F 2006 |
Back to Contents
| | |
| | Financial Statements (continued) |
| | |
| Notes to the consolidated accounts Unilever Group |
|
35 Additional information for US investors(continued)
(iii) Guarantor statements (prepared on an IFRS basis)
On 2 October 2000, NV and Unilever Capital Corporation (UCC) filed a US $15 billion Shelf registration, which is unconditionally and fully guaranteed, jointly and severally, by NV, PLC and Unilever United States, Inc. (UNUS). Of the US $15 billion Shelf registration, US $2.75 billion of Notes were outstanding at 31 December 2006 (2005: US $2.75 billion; 2004: US $4.25 billion) with coupons ranging from 5.90% to 7.125%. These Notes are repayable between 1 November 2010 and 15 November 2032.
Provided below are the income statements, cash flow statements and balance sheets of each of the companies discussed above, together with the income statement, cash flow statement and balance sheet of non-guarantor subsidiaries. These have been prepared under the historical cost convention, and, aside from the basis of accounting for investments at net asset value (equity accounting), comply in all material respects with International Financial Reporting Standards. We have not provided reconciliations from the accounting principles used by Unilever to US GAAP for the columns relating to the guarantor entities, as such reconciliations would not materially affect an investor’s understanding of the nature of this guarantee. The financial information in respect of NV, PLC and UNUS has been prepared with all subsidiaries accounted for on an equity basis. The financial information in respect of the non-guarantor subsidiaries has been prepared on a consolidated basis.
| | €million | | €million | | €million | | €million | | €million | | €million | | €million | |
| | Unilever | | Unilever | | | | Unilever | | | | | | | |
| | Capital | | N.V. | | | | United | | | | | | | |
| | Corporation | | parent | | Unilever PLC | | States Inc. | | Non- | | | | | |
| Income statement | subsidiary | | issuer/ | | parent | | subsidiary | | guarantor | | | | Unilever | |
| for the year ended 31 December 2006 | issuer | | guarantor | | guarantor | | guarantor | | subsidiaries | | Eliminations | | Group | |
|
|
|
|
|
|
|
|
|
|
|
|
|
| |
| Continuing operations: | | | | | | | | | | | | | | |
| | | | | | | | | | | | | | | |
| Turnover | – | | – | | – | | – | | 39 642 | | – | | 39 642 | |
| |
|
|
|
|
|
|
|
|
|
|
|
|
| |
| Operating profit | (1 | ) | (126 | ) | (108 | ) | (16 | ) | 5 659 | | – | | 5 408 | |
| |
|
|
|
|
|
|
|
|
|
|
|
|
| |
| Finance income | – | | 38 | | 5 | | 1 | | 84 | | – | | 128 | |
| Finance costs | (169 | ) | (662 | ) | – | | – | | (59 | ) | – | | (890 | ) |
| Pensions and similar obligations | – | | (5 | ) | – | | (61 | ) | 107 | | – | | 41 | |
| Intercompany finance costs | 187 | | 805 | | (20 | ) | (29 | ) | (943 | ) | – | | – | |
| Dividends | – | | 1 916 | | 1 337 | | – | | (3 253) | | – | | – | |
| Share of net profit/(loss) of joint ventures | – | | – | | – | | – | | 78 | | – | | 78 | |
| Share of net profit/(loss) of associates | – | | – | | – | | – | | 36 | | – | | 36 | |
| Other income from non-current investments | – | | – | | – | | – | | 30 | | – | | 30 | |
| |
|
|
|
|
|
|
|
|
|
|
|
|
| |
| Profit before taxation | 17 | | 1 966 | | 1 214 | | (105 | ) | 1 739 | | – | | 4 831 | |
| Taxation | (6 | ) | (119 | ) | 16 | | 76 | | (1 113 | ) | – | | (1 146 | ) |
| |
|
|
|
|
|
|
|
|
|
|
|
|
| |
| Net profit from continuing operations | 11 | | 1 847 | | 1 230 | | (29 | ) | 626 | | – | | 3 685 | |
| Net profit from discontinued operations | – | | – | | 180 | | – | | 1 150 | | – | | 1 330 | |
| Equity earnings of subsidiaries | – | | 2 898 | | 3 335 | | 567 | | – | | (6 800 | ) | – | |
| |
|
|
|
|
|
|
|
|
|
|
|
|
| |
| Net profit | 11 | | 4 745 | | 4 745 | | 538 | | 1 776 | | (6 800 | ) | 5 015 | |
| |
|
|
|
|
|
|
|
|
|
|
|
|
| |
| Attributable to: | | | | | | | | | | | | | | |
| Minority interest | – | | – | | – | | – | | 270 | | – | | 270 | |
| Shareholders’ equity | 11 | | 4 745 | | 4 745 | | 538 | | 1 506 | | (6 800 | ) | 4 745 | |
|
|
|
|
|
|
|
|
|
|
|
|
|
| |
| | | | | | | | | | | | | | | |
| Income statement | | | | | | | | | | | | | | |
| for the year ended 31 December 2005 | | | | | | | | | | | | | | |
|
|
|
|
|
|
|
|
|
|
|
|
|
| |
| Continuing operations: | | | | | | | | | | | | | | |
| | | | | | | | | | | | | | | |
| Turnover | – | | – | | – | | – | | 38 401 | | – | | 38 401 | |
| |
|
|
|
|
|
|
|
|
|
|
|
|
| |
| Operating profit | – | | 87 | | (61 | ) | (3 | ) | 5 051 | | – | | 5 074 | |
| |
|
|
|
|
|
|
|
|
|
|
|
|
| |
| Finance income | – | | 61 | | 11 | | – | | 57 | | – | | 129 | |
| Finance costs | (241 | ) | (274 | ) | (2 | ) | (3 | ) | (169 | ) | – | | (689 | ) |
| Pensions and similar obligations | – | | (5 | ) | – | | (61 | ) | 13 | | – | | (53 | ) |
| Intercompany finance costs | 256 | | 509 | | (11 | ) | (40 | ) | (714 | ) | – | | – | |
| Dividends | – | | 1 043 | | 856 | | – | | (1 899 | ) | – | | – | |
| Share of net profit/(loss) of joint ventures | – | | – | | – | | – | | 47 | | – | | 47 | |
| Share of net profit/(loss) of associates | – | | – | | – | | – | | (25 | ) | – | | (25 | ) |
| Other income from non-current investments | – | | – | | – | | – | | 33 | | – | | 33 | |
| |
|
|
|
|
|
|
|
|
|
|
|
|
| |
| Profit before taxation | 15 | | 1 421 | | 793 | | (107 | ) | 2 394 | | – | | 4 516 | |
| Taxation | (5 | ) | (118 | ) | 36 | | 45 | | (1 139 | ) | – | | (1 181 | ) |
| |
|
|
|
|
|
|
|
|
|
|
|
|
| |
| Net profit from continuing operations | 10 | | 1 303 | | 829 | | (62 | ) | 1 255 | | – | | 3 335 | |
| | | | | | | | | | | | | | | |
| Net profit from discontinued operations | – | | – | | – | | – | | 640 | | – | | 640 | |
| Equity earnings of subsidiaries | – | | 2 463 | | 2 937 | | 732 | | – | | (6 132 | ) | – | |
| |
|
|
|
|
|
|
|
|
|
|
|
|
| |
| Net profit | 10 | | 3 766 | | 3 766 | | 670 | | 1 895 | | (6 132 | ) | 3 975 | |
| |
|
|
|
|
|
|
|
|
|
|
|
|
| |
| Attributable to: | | | | | | | | | | | | | | |
| Minority interest | – | | – | | – | | – | | 209 | | – | | 209 | |
| Shareholders’ equity | 10 | | 3 766 | | 3 766 | | 670 | | 1 686 | | (6 132 | ) | 3 766 | |
|
|
|
|
|
|
|
|
|
|
|
|
|
| |
| Unilever Annual Report on Form 20-F 2006 | 135 |
Back to Contents
| | |
| Financial Statements (continued) | |
| | |
| Notes to the consolidated accounts Unilever Group |
|
35 Additional information for US investors(continued)
(iii) Guarantor statements(continued)
| | € million | | € million | | € million | | € million | | € million | | € million | | € million | |
| | Unilever | | Unilever | | | | Unilever | | | | | | | |
| | Capital | | N.V. | | | | United | | | | | | | |
| | Corporation | | parent | | Unilever PLC | | States Inc. | | Non- | | | | | |
| Income statement | subsidiary | | issuer/ | | parent | | subsidiary | | guarantor | | | | Unilever | |
| for the year ended 31 December 2004 | issuer | | guarantor | | guarantor | | guarantor | | subsidiaries | | Eliminations | | Group | |
|
|
|
|
|
|
|
|
|
|
|
|
|
| |
| Continuing operations: | | | | | | | | | | | | | | |
| | | | | | | | | | | | | | | |
| Turnover | – | | – | | – | | – | | 37 168 | | – | | 37 168 | |
| |
|
|
|
|
|
|
|
|
|
|
|
|
| |
| Operating profit | – | | 59 | | 33 | | 6 | | 3 883 | | – | | 3 981 | |
| |
|
|
|
|
|
|
|
|
|
|
|
|
| |
| Finance income | – | | 26 | | 6 | | – | | 113 | | – | | 145 | |
| Finance costs | (282 | ) | (160 | ) | (2 | ) | (3 | ) | (267 | ) | – | | (714 | ) |
| Pensions and similar obligations | – | | (6 | ) | – | | (10 | ) | (38 | ) | – | | (54 | ) |
| Intercompany finance costs | 296 | | 211 | | (3 | ) | (22 | ) | (482 | ) | – | | | |
| Dividends | – | | 1 960 | | 770 | | – | | (2 730 | ) | – | | – | |
| Share of net profit/(loss) of joint ventures | – | | – | | – | | – | | 39 | | – | | 39 | |
| Share of net profit/(loss) of associates | – | | – | | – | | – | | 2 | | – | | 2 | |
| Other income from non-current investments | – | | – | | – | | – | | 54 | | – | | 54 | |
| |
|
|
|
|
|
|
|
|
|
|
|
|
| |
| Profit before taxation | 14 | | 2 090 | | 804 | | (29 | ) | 574 | | – | | 3 453 | |
| Taxation | (5 | ) | 35 | | 16 | | 11 | | (782 | ) | – | | (725 | ) |
| |
|
|
|
|
|
|
|
|
|
|
|
|
| |
| Net profit from continuing operations | 9 | | 2 125 | | 820 | | (18 | ) | (208 | ) | – | | 2 728 | |
| | | | | | | | | | | | | | | |
| Net profit from discontinued operations | – | | – | | – | | – | | 213 | | – | | 213 | |
| Equity earnings of subsidiaries | – | | 630 | | 1 935 | | (76 | ) | – | | (2 489 | ) | – | |
| |
|
|
|
|
|
|
|
|
|
|
|
|
| |
| Net profit | 9 | | 2 755 | | 2 755 | | (94 | ) | 5 | | (2 489 | ) | 2 941 | |
| |
|
|
|
|
|
|
|
|
|
|
|
|
| |
| Attributable to: | | | | | | | | | | | | | | |
| Minority interest | – | | – | | – | | – | | 186 | | – | | 186 | |
| Shareholders’ equity | 9 | | 2 755 | | 2 755 | | (94 | ) | (181 | ) | (2 489 | ) | 2 755 | |
|
|
|
|
|
|
|
|
|
|
|
|
|
| |
| 136 | Unilever Annual Report on Form 20-F 2006 |
Back to Contents
| | |
| | Financial Statements (continued) |
| | |
| Notes to the consolidated accounts Unilever Group |
|
35 Additional information for US investors(continued)
(iii) Guarantor statements(continued)
| | € million | | € million | | € million | | € million | | € million | | € million | | € million | |
| | Unilever | | Unilever | | | | Unilever | | | | | | | |
| | Capital | | N.V. | | | | United | | | | | | | |
| | Corporation | | parent | | Unilever PLC | | States Inc. | | Non- | | | | | |
| | subsidiary | | issuer/ | | parent | | subsidiary | | guarantor | | | | Unilever | |
| Balance sheetas at 31 December 2006 | issuer | | guarantor | | guarantor | | guarantor | | subsidiaries | | Eliminations | | Group | |
|
|
|
|
|
|
|
|
|
|
|
|
|
| |
| Goodwill and intangible assets | – | | 53 | | 46 | | – | | 17 107 | | – | | 17 206 | |
| Property, plant and equipment | – | | – | | – | | 8 | | 6 268 | | – | | 6 276 | |
| Pension asset for funded schemes in surplus | – | | – | | – | | 83 | | 1 614 | | – | | 1 697 | |
| Deferred tax assets | – | | – | | – | | 941 | | 325 | | – | | 1 266 | |
| Other non-current assets | – | | – | | – | | 9 | | 1 117 | | – | | 1 126 | |
| Amounts due from group companies after one year | 2 567 | | 2 269 | | 67 | | – | | (4 903 | ) | – | | – | |
| Net assets of subsidiaries (equity accounted) | – | | 28 775 | | 12 453 | | 5 946 | | (29 790 | ) | (17 384 | ) | – | |
| |
|
|
|
|
|
|
|
|
|
|
|
|
| |
| Total non-current assets | 2 567 | | 31 097 | | 12 566 | | 6 987 | | (8 262 | ) | (17 384 | ) | 27 571 | |
| |
|
|
|
|
|
|
|
|
|
|
|
|
| |
| Inventories | – | | – | | – | | – | | 3 796 | | – | | 3 796 | |
| Amounts due from group companies within one year | – | | 3 289 | | 163 | | – | | (3 452 | ) | – | | – | |
| Trade and other current receivables | – | | 445 | | 34 | | 7 | | 3 804 | | – | | 4 290 | |
| Current tax assets | – | | – | | – | | 40 | | 85 | | – | | 125 | |
| Other financial assets | – | | – | | – | | – | | 237 | | – | | 237 | |
| Cash and cash equivalents | – | | 7 | | – | | (5 | ) | 1 037 | | – | | 1 039 | |
| Assets held for sale | – | | – | | – | | – | | 14 | | – | | 14 | |
| |
|
|
|
|
|
|
|
|
|
|
|
|
| |
| Total current assets | – | | 3 741 | | 197 | | 42 | | 5 521 | | – | | 9 501 | |
| |
|
|
|
|
|
|
|
|
|
|
|
|
| |
| Borrowings due within one year | (258 | ) | (1 503 | ) | – | | – | | (2 601 | ) | – | | (4 362 | ) |
| Amounts due to group companies within one year | – | | (18 490 | ) | (1 363 | ) | – | | 19 853 | | – | | – | |
| Provisions | – | | – | | – | | (1 | ) | (1 008 | ) | – | | (1 009 | ) |
| Trade payables and other current liabilities | (22 | ) | (612 | ) | (39 | ) | (7 | ) | (7 254 | ) | – | | (7 934 | ) |
| Current tax liabilities | (6 | ) | (38 | ) | (121 | ) | – | | (414 | ) | – | | (579 | ) |
| Liabilities held for sale | – | | – | | – | | – | | – | | – | | – | |
| |
|
|
|
|
|
|
|
|
|
|
|
|
| |
| Total current liabilities | (286 | ) | (20 643 | ) | (1 523 | ) | (8 | ) | 8 576 | | – | | (13 884 | ) |
| |
|
|
|
|
|
|
|
|
|
|
|
|
| |
| Net current assets/(liabilities) | (286 | ) | (16 902 | ) | (1 326 | ) | 34 | | 14 097 | | – | | (4 383 | ) |
| |
|
|
|
|
|
|
|
|
|
|
|
|
| |
| Total assets less current liabilities | 2 281 | | 14 195 | | 11 240 | | 7 021 | | 5 835 | | (17 384 | ) | 23 188 | |
|
|
|
|
|
|
|
|
|
|
|
|
|
| |
| Borrowings due after one year | 2 066 | | 866 | | – | | – | | 1 307 | | – | | 4 239 | |
| Amounts due to group companies after one year | – | | 1 522 | | – | | 279 | | (1 801 | ) | – | | – | |
| Pension liability for funded schemes in deficit | – | | – | | – | | 133 | | 1 246 | | – | | 1 379 | |
| Pension liability for unfunded schemes | – | | 149 | | – | | 879 | | 2 370 | | – | | 3 398 | |
| Provisions | – | | 340 | | – | | 2 | | 484 | | – | | 826 | |
| Deferred tax liabilities | – | | 27 | | 10 | | 62 | | 904 | | – | | 1 003 | |
| Other non-current liabilities | – | | 61 | | – | | 193 | | 417 | | – | | 671 | |
| |
|
|
|
|
|
|
|
|
|
|
|
|
| |
| Total non-current liabilities | 2 066 | | 2 965 | | 10 | | 1 548 | | 4 927 | | – | | 11 516 | |
| |
|
|
|
|
|
|
|
|
|
|
|
|
| |
| Shareholders’ equity attributable to: | | | | | | | | | | | | | | |
| PLC | – | | 3 807 | | – | | – | | – | | (3 807 | ) | – | |
| NV | – | | – | | 7 423 | | – | | – | | (7 423 | ) | – | |
| Called up share capital | – | | 274 | | 210 | | – | | – | | – | | 484 | |
| Share premium account | – | | 25 | | 140 | | – | | – | | – | | 165 | |
| Other reserves | (4 | ) | (1 280 | ) | (863 | ) | (467 | ) | (418 | ) | 889 | | (2 143 | ) |
| Retained profit | 219 | | 8 404 | | 4 320 | | 5 940 | | 884 | | (7 043 | ) | 12 724 | |
| |
|
|
|
|
|
|
|
|
|
|
|
|
| |
| Total shareholders’ equity | 215 | | 11 230 | | 11 230 | | 5 473 | | 466 | | (17 384 | ) | 11 230 | |
| Minority interests | – | | – | | – | | – | | 442 | | – | | 442 | |
| |
|
|
|
|
|
|
|
|
|
|
|
|
| |
| Total equity | 215 | | 11 230 | | 11 230 | | 5 473 | | 908 | | (17 384 | ) | 11 672 | |
| |
|
|
|
|
|
|
|
|
|
|
|
|
| |
| Total capital employed | 2 281 | | 14 195 | | 11 240 | | 7 021 | | 5 835 | | (17 384 | ) | 23 188 | |
|
|
|
|
|
|
|
|
|
|
|
|
|
| |
| Unilever Annual Report on Form 20-F 2006 | 137 |
Back to Contents
| | |
| Financial Statements (continued) | |
| | |
| Notes to the consolidated accounts Unilever Group |
|
35 Additional information for US investors(continued)
(iii) Guarantor statements(continued)
| | € million | | € million | | € million | | € million | | € million | | € million | | € million | |
| | Unilever | | Unilever | | | | Unilever | | | | | | | |
| | Capital | | N.V. | | | | United | | | | | | | |
| | Corporation | | parent | | Unilever PLC | | States Inc. | | Non- | | | | | |
| | subsidiary | | issuer/ | | parent | | subsidiary | | guarantor | | | | Unilever | |
| Balance sheetas at 31 December 2005 | issuer | | guarantor | | guarantor | | guarantor | | subsidiaries | | Eliminations | | Group | |
|
|
|
|
|
|
|
|
|
|
|
|
|
| |
| Goodwill and intangible assets | – | | 32 | | 54 | | – | | 17 969 | | – | | 18 055 | |
| Property, plant and equipment | – | | – | | – | | 6 | | 6 486 | | – | | 6 492 | |
| Pension asset for funded schemes in surplus | – | | – | | – | | 67 | | 969 | | – | | 1 036 | |
| Deferred tax assets | – | | – | | – | | 1 012 | | 691 | | – | | 1 703 | |
| Other non-current assets | – | | 16 | | – | | 11 | | 1 045 | | – | | 1 072 | |
| Amounts due from group companies after one year | 2 512 | | 6 628 | | 102 | | 1 281 | | (10 523 | ) | – | | – | |
| Net assets of subsidiaries (equity accounted) | – | | 11 176 | | 9 823 | | 6 234 | | (14 593 | ) | (12 640 | ) | – | |
| |
|
|
|
|
|
|
|
|
|
|
|
|
| |
| Total non-current assets | 2 512 | | 17 852 | | 9 979 | | 8 611 | | 2 044 | | (12 640 | ) | 28 358 | |
| |
|
|
|
|
|
|
|
|
|
|
|
|
| |
| Inventories | – | | – | | – | | – | | 4 107 | | – | | 4 107 | |
| Amounts due from group companies within one year | – | | 19 619 | | 294 | | – | | (19 913 | ) | – | | – | |
| Trade and other current receivables | – | | 635 | | 1 | | 34 | | 4 160 | | – | | 4 830 | |
| Current tax assets | – | | – | | – | | 43 | | 81 | | – | | 124 | |
| Other financial assets | – | | – | | – | | – | | 335 | | – | | 335 | |
| Cash and cash equivalents | 35 | | 163 | | – | | (3 | ) | 1 334 | | – | | 1 529 | |
| Assets held for sale | – | | – | | – | | – | | 217 | | – | | 217 | |
| |
|
|
|
|
|
|
|
|
|
|
|
|
| |
| Total current assets | 35 | | 20 417 | | 295 | | 74 | | (9 679 | ) | – | | 11 142 | |
| |
|
|
|
|
|
|
|
|
|
|
|
|
| |
| Borrowings due within one year | – | | (4 548 | ) | – | | – | | (1 394 | ) | – | | (5 942 | ) |
| Amounts due to group companies within one year | – | | (22 027 | ) | (1 871 | ) | – | | 23 898 | | – | | – | |
| Provisions | – | | (16 | ) | – | | (5 | ) | (623 | ) | – | | (644 | ) |
| Trade payables and other current liabilities | (31 | ) | (514 | ) | (4 | ) | (100 | ) | (7 579 | ) | – | | (8 228 | ) |
| Current tax liabilities | – | | (20 | ) | (26 | ) | – | | (508 | ) | – | | (554 | ) |
| Liabilities held for sale | – | | – | | – | | – | | (26 | ) | – | | (26 | ) |
| |
|
|
|
|
|
|
|
|
|
|
|
|
| |
| Total current liabilities | (31 | ) | (27 125 | ) | (1 901 | ) | (105 | ) | 13 768 | | – | | (15 394 | ) |
| |
|
|
|
|
|
|
|
|
|
|
|
|
| |
| Net current assets/(liabilities) | 4 | | (6 708 | ) | (1 606 | ) | (31 | ) | 4 089 | | – | | (4 252 | ) |
| |
|
|
|
|
|
|
|
|
|
|
|
|
| |
| Total assets less current liabilities | 2 516 | | 11 144 | | 8 373 | | 8 580 | | 6 133 | | (12 640 | ) | 24 106 | |
|
|
|
|
|
|
|
|
|
|
|
|
|
| |
| Borrowings due after one year | 2 296 | | 2 442 | | – | | – | | 1 719 | | – | | 6 457 | |
| Amounts due to group companies after one year | – | | – | | – | | – | | – | | – | | – | |
| Pension liability for funded schemes in deficit | – | | – | | – | | 372 | | 2 043 | | – | | 2 415 | |
| Pension liability for unfunded schemes | – | | 159 | | – | | 1 260 | | 2 783 | | – | | 4 202 | |
| Provisions | – | | 32 | | – | | 3 | | 697 | | – | | 732 | |
| Deferred tax liabilities | – | | 94 | | 12 | | – | | 827 | | – | | 933 | |
| Other non-current liabilities | – | | 56 | | – | | 202 | | 344 | | – | | 602 | |
| |
|
|
|
|
|
|
|
|
|
|
|
|
| |
| Total non-current liabilities | 2 296 | | 2 783 | | 12 | | 1 837 | | 8 413 | | – | | 15 341 | |
| |
|
|
|
|
|
|
|
|
|
|
|
|
| |
| Shareholders’ equity attributable to: | | | | | | | | | | | | | | |
| PLC | – | | 790 | | – | | – | | – | | (790 | ) | – | |
| NV | – | | – | | 7 571 | | – | | – | | (7 571 | ) | – | |
| Called up share capital | – | | 290 | | 222 | | – | | – | | – | | 512 | |
| Share premium account | – | | 25 | | 137 | | – | | – | | – | | 162 | |
| Other reserves | (5 | ) | (1 465 | ) | (863 | ) | (291 | ) | (393 | ) | 689 | | (2 328 | ) |
| Retained profit | 225 | | 8 721 | | 1 294 | | 7 034 | | (2 291 | ) | (4 968 | ) | 10 015 | |
| |
|
|
|
|
|
|
|
|
|
|
|
|
| |
| Total shareholders’ equity | 220 | | 8 361 | | 8 361 | | 6 743 | | (2 684 | ) | (12 640 | ) | 8 361 | |
| Minority interests | – | | – | | – | | – | | 404 | | – | | 404 | |
| |
|
|
|
|
|
|
|
|
|
|
|
|
| |
| Total equity | 220 | | 8 361 | | 8 361 | | 6 743 | | (2 280 | ) | (12 640 | ) | 8 765 | |
| |
|
|
|
|
|
|
|
|
|
|
|
|
| |
| Total capital employed | 2 516 | | 11 144 | | 8 373 | | 8 580 | | 6 133 | | (12 640 | ) | 24 106 | |
|
|
|
|
|
|
|
|
|
|
|
|
|
| |
| 138 | Unilever Annual Report on Form 20-F 2006 |
Back to Contents
| | |
| | Financial Statements(continued) |
| | |
| Notes to the consolidated accountsUnilever Group |
|
35 Additional information for US investors(continued)
(iii) Guarantor statements(continued)
| | € million | | € million | | € million | | € million | | € million | | € million | | € million | |
| | Unilever | | Unilever | | | | Unilever | | | | | | | |
| | Capital | | N.V. | | | | United | | | | | | | |
| | Corporation | | parent | | Unilever PLC | | States Inc. | | Non- | | | | | |
| Cash flow statement | subsidiary | | issuer/ | | parent | | subsidiary | | guarantor | | | | Unilever | |
| for the year ended 31 December 2006 | issuer | | guarantor | | guarantor | | guarantor | | subsidiaries | | Eliminations | | Group | |
|
|
|
|
|
|
|
|
|
|
|
|
|
| |
| Cash flow from operating activities | 1 | | (336 | ) | (17 | ) | (408 | ) | 6 334 | | – | | 5 574 | |
| Income tax paid | – | | (163 | ) | 42 | | (33 | ) | (909 | ) | – | | (1 063 | ) |
| |
|
|
|
|
|
|
|
|
|
|
|
|
| |
| Net cash flow from operating activities | 1 | | (499 | ) | 25 | | (441 | ) | 5 425 | | – | | 4 511 | |
| |
|
|
|
|
|
|
|
|
|
|
|
|
| |
| Interest received | 187 | | 995 | | 5 | | – | | 33 | | (1 095 | ) | 125 | |
| Net capital expenditure | – | | (28 | ) | – | | (3 | ) | (903 | ) | – | | (934 | ) |
| Acquisitions and disposals | – | | – | | 212 | | – | | 1 565 | | – | | 1 777 | |
| Other investing activities | (324 | ) | 3 799 | | – | | 480 | | (7 302 | ) | 3 534 | | 187 | |
| |
|
|
|
|
|
|
|
|
|
|
|
|
| |
| Net cash flow from/(used in) investing activities | (137 | ) | 4 766 | | 217 | | 477 | | (6 607 | ) | 2 439 | | 1 155 | |
| |
|
|
|
|
|
|
|
|
|
|
|
|
| |
| Dividends paid on ordinary share capital | – | | 460 | | 154 | | – | | (3 216 | ) | – | | (2 602 | ) |
| Interest and preference dividends paid | (170 | ) | (349 | ) | (20 | ) | (28 | ) | (1 133 | ) | 1 095 | | (605 | ) |
| Change in borrowings and finance leases | 274 | | (4 621 | ) | (420 | ) | – | | 5 020 | | (3 534 | ) | (3 281 | ) |
| Movement on treasury stock | – | | 88 | | 48 | | 15 | | 23 | | – | | 98 | |
| Other finance activities | – | | – | | – | | – | | (182 | ) | – | | (182 | ) |
| |
|
|
|
|
|
|
|
|
|
|
|
|
| |
| Net cash flow from/(used in) financing activities | 104 | | (4 422 | ) | (238 | ) | (43 | ) | 466 | | (2 439 | ) | (6 572 | ) |
| |
|
|
|
|
|
|
|
|
|
|
|
|
| |
| Net increase/(decrease) in cash and | | | | | | | | | | | | | | |
| cash equivalents | (32 | ) | (155 | ) | 4 | | (7 | ) | (716 | ) | – | | (906 | ) |
| Cash and cash equivalents at the beginning | | | | | | | | | | | | | | |
| of the year | 35 | | 162 | | – | | (3 | ) | 1 071 | | – | | 1 265 | |
| | | | | | | | | | | | | | | |
| Effect of foreign exchange rate changes | (3 | ) | – | | – | | 5 | | 349 | | – | | 351 | |
| |
|
|
|
|
|
|
|
|
|
|
|
|
| |
| Cash and cash equivalents at the end of the year | – | | 7 | | 4 | | (5 | ) | 704 | | – | | 710 | |
|
|
|
|
|
|
|
|
|
|
|
|
|
| |
| | | | | | | | | | | | | | | |
| Cash flow statement | | | | | | | | | | | | | | |
| for the year ended 31 December 2005 | | | | | | | | | | | | | | |
|
|
|
|
|
|
|
|
|
|
|
|
|
| |
| Cash flow from operating activities | – | | (5 | ) | (156 | ) | 33 | | 6 052 | | – | | 5 924 | |
| Income tax paid | – | | (86 | ) | (19 | ) | (177 | ) | (1 289 | ) | – | | (1 571 | ) |
| |
|
|
|
|
|
|
|
|
|
|
|
|
| |
| Net cash flow from operating activities | – | | (91 | ) | (175 | ) | (144 | ) | 4 763 | | – | | 4 353 | |
| |
|
|
|
|
|
|
|
|
|
|
|
|
| |
| Interest received | 253 | | 285 | | 10 | | – | | (106 | ) | (312 | ) | 130 | |
| Net capital expenditure | – | | (24 | ) | (3 | ) | (2 | ) | (784 | ) | – | | (813 | ) |
| Acquisitions and disposals | – | | – | | – | | – | | 784 | | – | | 784 | |
| Other investing activities | 1 796 | | (689 | ) | – | | 189 | | 443 | | (1 325 | ) | 414 | |
| |
|
|
|
|
|
|
|
|
|
|
|
|
| |
| Net cash flow from/(used in) investing activities | 2 049 | | (428 | ) | 7 | | 187 | | 337 | | (1 637 | ) | 515 | |
| |
|
|
|
|
|
|
|
|
|
|
|
|
| |
| Dividends paid on ordinary share capital | – | | 28 | | 37 | | – | | (1 869 | ) | – | | (1 804 | ) |
| Interest and preference dividends paid | (253 | ) | (181 | ) | (7 | ) | (43 | ) | (471 | ) | 312 | | (643 | ) |
| Change in borrowings and finance leases | (1 774 | ) | 1 623 | | 309 | | – | | (2 363 | ) | 1 325 | | (880 | ) |
| Movement on treasury stock | – | | (1 068 | ) | (171 | ) | – | | (37 | ) | – | | (1 276 | ) |
| Other finance activities | – | | – | | – | | – | | (218 | ) | – | | (218 | ) |
| |
|
|
|
|
|
|
|
|
|
|
|
|
| |
| Net cash flow from/(used in) financing activities | (2 027 | ) | 402 | | 168 | | (43 | ) | (4 958 | ) | 1 637 | | (4 821 | ) |
| |
|
|
|
|
|
|
|
|
|
|
|
|
| |
| Net increase/(decrease) in cash and | | | | | | | | | | | | | | |
| cash equivalents | 22 | | (117 | ) | – | | – | | 142 | | – | | 47 | |
| | | | | | | | | | | | | | | |
| Cash and cash equivalents at the beginning | | | | | | | | | | | | | | |
| of the year | 10 | | 279 | | – | | (3 | ) | 1 120 | | – | | 1 406 | |
| | | | | | | | | | | | | | | |
| Effect of foreign exchange rate changes | 3 | | – | | – | | – | | (191 | ) | – | | (188 | ) |
| |
|
|
|
|
|
|
|
|
|
|
|
|
| |
| Cash and cash equivalents at the end of the year | 35 | | 162 | | – | | (3 | ) | 1 071 | | – | | 1 265 | |
|
|
|
|
|
|
|
|
|
|
|
|
|
| |
| Unilever Annual Report on Form 20-F 2006 | 139 |
Back to Contents
| | |
| Financial Statements (continued) | |
| | |
| Notes to the consolidated accountsUnilever Group |
|
35 Additional information for US investors(continued)
(iii) Guarantor statements(continued)
| | € million | | € million | | € million | | € million | | € million | | € million | | € million | |
| | Unilever | | Unilever | | | | Unilever | | | | | | | |
| | Capital | | N.V. | | | | United | | | | | | | |
| | Corporation | | parent | | Unilever PLC | | States Inc. | | Non- | | | | | |
| Cash flow statement | subsidiary | | issuer/ | | parent | | subsidiary | | guarantor | | | | Unilever | |
| for the year ended 31 December 2004 | issuer | | guarantor | | guarantor | | guarantor | | subsidiaries | | Eliminations | | Group | |
|
|
|
|
|
|
|
|
|
|
|
|
|
| |
| Cash flow from operating activities | 6 | | 58 | | 45 | | (200 | ) | 7 016 | | – | | 6 925 | |
| Income tax paid | – | | (96 | ) | (126 | ) | (145 | ) | (1 011 | ) | – | | (1 378 | ) |
| |
|
|
|
|
|
|
|
|
|
|
|
|
| |
| Net cash flow from operating activities | 6 | | (38 | ) | (81 | ) | (345 | ) | 6 005 | | – | | 5 547 | |
| |
|
|
|
|
|
|
|
|
|
|
|
|
| |
| Interest received | 295 | | 356 | | 6 | | – | | 106 | | (595 | ) | 168 | |
| Net capital expenditure | – | | (9 | ) | (17 | ) | (1 | ) | (842 | ) | – | | (869 | ) |
| Acquisitions and disposals | – | | – | | – | | – | | 316 | | – | | 316 | |
| Other investing activities | (311 | ) | 2 375 | | – | | 372 | | 288 | | (2 459 | ) | 265 | |
| |
|
|
|
|
|
|
|
|
|
|
|
|
| |
| Net cash flow from/(used in) investing activities | (16 | ) | 2 722 | | (11 | ) | 371 | | (132 | ) | (3 054 | ) | (120 | ) |
| |
|
|
|
|
|
|
|
|
|
|
|
|
| |
| Dividends paid on ordinary share capital | – | | 971 | | – | | – | | (2 691 | ) | – | | (1 720 | ) |
| Interest and preference dividends paid | (282 | ) | (249 | ) | (3 | ) | (24 | ) | (824 | ) | 595 | | (787 | ) |
| Change in borrowings and finance leases | 302 | | (3 402 | ) | 116 | | – | | (2 365 | ) | 2 459 | | (2 890 | ) |
| Movement on treasury stock | – | | (148 | ) | (21 | ) | (2 | ) | (161 | ) | – | | (332 | ) |
| Other finance activities | – | | – | | – | | – | | (209 | ) | – | | (209 | ) |
| |
|
|
|
|
|
|
|
|
|
|
|
|
| |
| Net cash flow from/(used in) financing activities | 20 | | (2 828 | ) | 92 | | (26 | ) | (6 250 | ) | 3 054 | | (5 938 | ) |
| |
|
|
|
|
|
|
|
|
|
|
|
|
| |
| Net increase/(decrease) in cash and | | | | | | | | | | | | | | |
| cash equivalents | 10 | | (144 | ) | – | | – | | (377 | ) | – | | (511 | ) |
| | | | | | | | | | | | | | | |
| Cash and cash equivalents at the beginning | | | | | | | | | | | | | | |
| of the year | 1 | | 423 | | – | | (3 | ) | 1 007 | | – | | 1 428 | |
| | | | | | | | | | | | | | | |
| Effect of foreign exchange rate changes | (1 | ) | – | | – | | – | | 490 | | – | | 489 | |
| |
|
|
|
|
|
|
|
|
|
|
|
|
| |
| Cash and cash equivalents at the end of the year | 10 | | 279 | | – | | (3 | ) | 1 120 | | – | | 1 406 | |
|
|
|
|
|
|
|
|
|
|
|
|
|
| |
| 140 | Unilever Annual Report on Form 20-F 2006 |
Back to Contents
| | |
| | Financial Statements(continued) |
| | |
| Selected financial dataUnilever Group |
|
Selected financial data under IFRS
In the schedules below, figures within the income statement and for earnings per share reflect the classification between continuing and discontinued operations which is applicable for our 2006 reporting. This classification differs from that which would have applied under our reporting basis for 2005.
| | € million | | € million | | € million | |
| Consolidated income statement | 2006 | | 2005 | | 2004 | |
|
|
|
|
|
| |
| Continuing operations: | | | | | | |
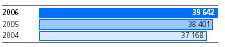
| Turnover | 39 642 | | 38 401 | | 37 168 | |
| | | | | | | |
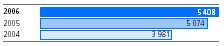
| Operating profit | 5 408 | | 5 074 | | 3 981 | |
| | | | | | | |
| Net finance costs | (721 | ) | (613 | ) | (623 | ) |
| Income from non-current investments | 144 | | 55 | | 95 | |
| |
|
|
|
|
| |
| Profit before taxation | 4 831 | | 4 516 | | 3 453 | |
| Taxation | (1 146 | ) | (1 181 | ) | (725 | ) |
| |
|
|
|
|
| |
| Net profit from continuing operations | 3 685 | | 3 335 | | 2 728 | |
| Net profit from discontinued operations | 1 330 | | 640 | | 213 | |
| |
|
|
|
|
| |
| Net profit | 5 015 | | 3 975 | | 2 941 | |
| Attributable to: | | | | | | |
| Minority interests | 270 | | 209 | | 186 | |
| Shareholders’ equity | 4 745 | | 3 766 | | 2 755 | |
|
|
|
|
|
| |
| | | | | | | |
| | € | | € | | € | |
| Combined earnings per share(a) | 2006 | | 2005 | | 2004 | |
|
|
|
|
|
| |
| Continuing operations | | | | | | |
| Basic earnings per share | 1.19 | | 1.07 | | 0.87 | |
| Diluted earnings per share | 1.15 | | 1.04 | | 0.84 | |
| Total operations | | | | | | |
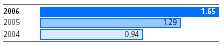
| Basic earnings per share | 1.65 | | 1.29 | | 0.94 | |
| Diluted earnings per share | 1.60 | | 1.25 | | 0.91 | |
|
|
|
|
|
| |
| | | | | | | |
| | € million | | € million | | € million | |
| Consolidated balance sheet | 2006 | | 2005 | | 2004 | |
|
|
|
|
|
| |
| Non-current assets | 27 571 | | 28 358 | | 26 368 | |
| Current assets | 9 501 | | 11 142 | | 10 490 | |
| Current liabilities | (13 884 | ) | (15 394 | ) | (14 186 | ) |
| |
|
|
|
|
| |
| Total assets less current liabilities | 23 188 | | 24 106 | | 22 672 | |
| |
|
|
|
|
| |
| Non-current liabilities | 11 516 | | 15 341 | | 15 043 | |
| | | | | | | |
| Shareholders’ equity | 11 230 | | 8 361 | | 7 264 | |
| Minority interests | 442 | | 404 | | 365 | |
| |
|
|
|
|
| |
| Total equity | 11 672 | | 8 765 | | 7 629 | |
| |
|
|
|
|
| |
| Total capital employed | 23 188 | | 24 106 | | 22 672 | |
|
|
|
|
|
| |
| | | | | | | |
| | € million | | € million | | € million | |
| Consolidated cash flow statement | 2006 | | 2005 | | 2004 | |
|
|
|
|
|
| |
| Net cash flow from operating activities | 4 511 | | 4 353 | | 5 547 | |
| Net cash flow from/(used in) investing activities | 1 155 | | 515 | | (120 | ) |
| Net cash flow from/(used in) financing activities | (6 572 | ) | (4 821 | ) | (5 938 | ) |
| |
|
|
|
|
| |
| Net increase/(decrease) in cash and cash equivalents | (906 | ) | 47 | | (511 | ) |
| Cash and cash equivalents at the beginning of the year | 1 265 | | 1 406 | | 1 428 | |
| Effect of foreign exchange rates | 351 | | (188 | ) | 489 | |
| |
|
|
|
|
| |
| Cash and cash equivalents at the end of the year | 710 | | 1 265 | | 1 406 | |
|
|
|
|
|
| |
| | | | | | | |
| Ratios and other metrics | 2006 | | 2005 | | 2004 | |
|
|
|
|
|
| |
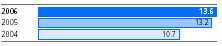
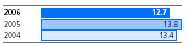
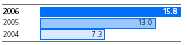
| Operating margin (%) | 13.6 | | 13.2 | | 10.7 | |
| Net profit margin (%)(b) | 12.0 | | 9.8 | | 7.4 | |
| Ungeared free cash flow (€ million)(c) | 4 222 | | 4 011 | | 5 346 | |
| Return on invested capital (%)(c) | 14.6 | | 12.5 | | 10.7 | |
| Ratio of earnings to fixed charges (times)(d) | 7.5 | | 6.5 | | 5.1 | |
|
|
|
|
|
| |
| (a) | For the basis of the calculations of combined earnings per share see note 7 on page 87. |
| (b) | Net profit margin is expressed as net profit attributable to shareholders’ equity as a percentage of turnover from continuing operations. |
| (c) | As defined on page 25. |
| (d) | In the ratio of earnings to fixed charges, earnings consist of net profit from continuing operations excluding net profit or loss of joint ventures and associates increased by fixed charges, income taxes and dividends received from joint ventures and associates. Fixed charges consist of interest payable on debt and a portion of lease costs determined to be representative of interest. This ratio takes no account of interest receivable although Unilever’s treasury operations involve both borrowing and depositing funds. |
| Unilever Annual Report on Form 20-F 2006 | 141 |
Back to Contents
| | |
| Financial Statements (continued) | |
| | |
| Selected financial data (continued)Unilever Group |
|
Selected financial data under IFRS(continued)
| | € million | | € million | | € million | |
| By geographical area | 2006 | | 2005 | | 2004 | |
|
|
|
|
|
| |
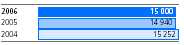
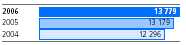
| Turnover | | | | | | |
| Europe | 15 000 | | 14 940 | | 15 252 | |
| The Americas | 13 779 | | 13 179 | | 12 296 | |
| Asia Africa | 10 863 | | 10 282 | | 9 620 | |
| |
|
|
|
|
| |
| | 39 642 | | 38 401 | | 37 168 | |
|
|
|
|
|
| |
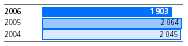
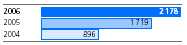
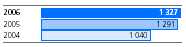
| Operating profit | | | | | | |
| Europe | 1 903 | | 2 064 | | 2 045 | |
| The Americas | 2 178 | | 1 719 | | 896 | |
| Asia Africa | 1 327 | | 1 291 | | 1 040 | |
| |
|
|
|
|
| |
| | 5 408 | | 5 074 | | 3 981 | |
|
|
|
|
|
| |
| Total assets | | | | | | |
| Europe | 14 523 | | 15 164 | | 15 586 | |
| The Americas | 11 566 | | 12 569 | | 11 486 | |
| Asia Africa | 5 884 | | 6 320 | | 4 369 | |
| Corporate | 5 099 | | 5 447 | | 5 417 | |
| |
|
|
|
|
| |
| | 37 072 | | 39 500 | | 36 858 | |
|
|
|
|
|
| |
| Capital expenditure | | | | | | |
| Europe | 511 | | 447 | | 497 | |
| The Americas | 396 | | 305 | | 297 | |
| Asia Africa | 294 | | 298 | | 305 | |
| |
|
|
|
|
| |
| | 1 201 | | 1 050 | | 1 099 | |
|
|
|
|
|
| |
| | | | | | | |
| | € million | | € million | | € million | |
| By operation | 2006 | | 2005 | | 2004 | |
|
|
|
|
|
| |
| Turnover | | | | | | |
| Foods | 21 345 | | 20 889 | | 20 566 | |
| Home and Personal Care | 18 297 | | 17 512 | | 16 602 | |
| |
|
|
|
|
| |
| | 39 642 | | 38 401 | | 37 168 | |
|
|
|
|
|
| |
| Operating profit | | | | | | |
| Foods | 2 893 | | 2 635 | | 1 850 | |
| Home and Personal Care | 2 515 | | 2 439 | | 2 131 | |
| |
|
|
|
|
| |
| | 5 408 | | 5 074 | | 3 981 | |
|
|
|
|
|
| |
| Total assets | | | | | | |
| Foods | 24 972 | | 26 798 | | 25 382 | |
| Home and Personal Care | 7 001 | | 7 255 | | 6 059 | |
| Corporate | 5 099 | | 5 447 | | 5 417 | |
| |
|
|
|
|
| |
| | 37 072 | | 39 500 | | 36 858 | |
|
|
|
|
|
| |
| Capital expenditure | | | | | | |
| Foods | 714 | | 572 | | 588 | |
| Home and Personal Care | 487 | | 478 | | 511 | |
| |
|
|
|
|
| |
| | 1 201 | | 1 050 | | 1 099 | |
|
|
|
|
|
| |
| 142 | Unilever Annual Report on Form 20-F 2006 |
Back to Contents
| | |
| | Financial Statements(continued) |
| | |
| Selected financial data (continued)Unilever Group |
|
Selected financial data under previous GAAP
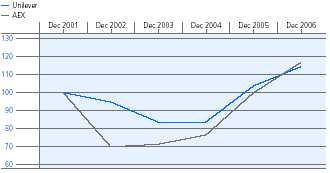
Unilever adopted International Financial Reporting Standards as adopted by the EU with effect from 1 January 2005, with a transition date of 1 January 2004. Information for the period from 2002 to 2004 as reported under our previous accounting policies (which is not directly comparable with IFRS) is set out below and on pages 144 and 145.
This information is derived from the audited consolidated accounts of the Unilever Group for the years 2002 to 2004, and should be read in the context of those accounts and notes. Those accounts were prepared under the accounting policies which the Group applied prior to its adoption of IFRS. These were based on United Kingdom accounting standards and applicable Dutch and UK law. Further information can be found in the ‘Accounting information and policies’ sections of the Report and Accounts for the years in question.
The adoption, in 2003, of UK Financial Reporting Standard 17 on pensions accounting was reflected by restating the consolidated profit and loss accounts for the years ended and the balance sheets as at 31 December 2002 and 31 December 2001.
| | € million | | € million | | € million | |
| Consolidated profit and loss account | 2004 | | 2003 | | 2002 | |
|
|
|
|
|
| |
| Group turnover | 40 169 | | 42 693 | | 48 270 | |
| |
|
|
|
|
| |
| Group operating profit | 3 411 | | 5 483 | | 5 007 | |
| After charging: | | | | | | |
| Exceptional items | (1 595 | ) | (97 | ) | (707 | ) |
| Amortisation of goodwill and intangible assets | (1 086 | ) | (1 139 | ) | (1 245 | ) |
| Income from fixed investments | 117 | | 68 | | 111 | |
| Interest | (689 | ) | (1 013 | ) | (1 065 | ) |
| |
|
|
|
|
| |
| Profit on ordinary activities before taxation | 2 839 | | 4 538 | | 4 053 | |
| |
|
|
|
|
| |
| Profit on ordinary activities after taxation | 2 057 | | 3 011 | | 2 448 | |
| |
|
|
|
|
| |
| Net profit | 1 876 | | 2 762 | | 2 136 | |
| |
|
|
|
|
| |
| Preference dividends | (28 | ) | (27 | ) | (42 | ) |
| Dividends on ordinary capital | (1 815 | ) | (1 682 | ) | (1 659 | ) |
| |
|
|
|
|
| |
| Result for the year retained | 33 | | 1 053 | | 435 | |
|
|
|
|
|
| |
| Combined earnings per share | €0.64 | | €0.94 | | €0.71 | |
|
|
|
|
|
| |
| Ordinary dividends | | | | | | |
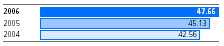
| NV – euros per €0.16 of ordinary capital | 0.6300 | | 0.5800 | | 0.5666 | |
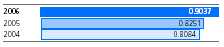
| PLC – pounds per 31/9p of ordinary capital | 0.4256 | | 0.4018 | | 0.3565 | |
|
|
|
|
|
| |
| | | | | | | |
| | € million | | € million | | € million | |
| Consolidated balance sheet | 2004 | | 2003 | | 2002 | |
|
|
|
|
|
| |
| Goodwill and intangible assets | 15 338 | | 17 713 | | 20 274 | |
| Other fixed assets and investments | 6 473 | | 6 854 | | 8 115 | |
| Stocks | 3 758 | | 4 175 | | 4 500 | |
| Debtors | 5 703 | | 5 881 | | 6 571 | |
| Total cash and current investments | 2 603 | | 3 345 | | 2 904 | |
| |
|
|
|
|
| |
| Total assets | 33 875 | | 37 968 | | 42 364 | |
| | | | | | | |
| Creditors due within one year | (14 570 | ) | (17 074 | ) | (19 955 | ) |
| |
|
|
|
|
| |
| Total assets less current liabilities | 19 305 | | 20 894 | | 22 409 | |
|
|
|
|
|
| |
| Creditors due after one year | 7 610 | | 9 130 | | 11 574 | |
| Provisions for liabilities and charges | 5 799 | | 5 404 | | 5 514 | |
| |
|
|
|
|
| |
| Total long-term liabilities | 13 409 | | 14 534 | | 17 088 | |
| | | | | | | |
| Minority interests | 362 | | 440 | | 619 | |
| Capital and reserves | 5 534 | | 5 920 | | 4 702 | |
| |
|
|
|
|
| |
| Total capital employed | 19 305 | | 20 894 | | 22 409 | |
|
|
|
|
|
| |
| Unilever Annual Report on Form 20-F 2006 | 143 |
Back to Contents
| | |
| Financial Statements (continued) | |
| | |
| Selected financial data (continued) Unilever Group |
|
Selected financial data under previous GAAP(continued)
| | € million | | € million | | € million | |
| By geographical area | 2004 | | 2003 | | 2002 | |
|
|
|
|
|
| |
| Group turnover | | | | | | |
| Europe | 17 314 | | 18 208 | | 19 573 | |
| The Americas | 13 120 | | 14 146 | | 17 879 | |
| Asia Africa | 9 735 | | 10 339 | | 10 818 | |
| |
|
|
|
|
| |
| | 40 169 | | 42 693 | | 48 270 | |
|
|
|
|
|
| |
| Group operating profit | | | | | | |
| Europe | 1 827 | | 2 563 | | 1 598 | |
| The Americas | 617 | | 1 429 | | 2 046 | |
| Asia Africa | 967 | | 1 491 | | 1 363 | |
| |
|
|
|
|
| |
| | 3 411 | | 5 483 | | 5 007 | |
|
|
|
|
|
| |
| Net operating assets | | | | | | |
| Europe | 9 748 | | 11 306 | | 12 301 | |
| The Americas | 8 869 | | 11 033 | | 13 441 | |
| Asia Africa | 2 294 | | 2 582 | | 2 445 | |
| |
|
|
|
|
| |
| | 20 911 | | 24 921 | | 28 187 | |
|
|
|
|
|
| |
| Capital expenditure | | | | | | |
| Europe | 461 | | 471 | | 552 | |
| The Americas | 262 | | 316 | | 468 | |
| Asia Africa | 282 | | 251 | | 278 | |
| |
|
|
|
|
| |
| | 1 005 | | 1 038 | | 1 298 | |
|
|
|
|
|
| |
| | | | | | | |
| | € million | | € million | | € million | |
| By operation | 2004 | | 2003 | | 2002 | |
|
|
|
|
|
| |
| Group turnover | | | | | | |
| Foods | 22 530 | | 23 971 | | 26 937 | |
| Home and Personal Care | 17 639 | | 18 722 | | 21 333 | |
| |
|
|
|
|
| |
| | 40 169 | | 42 693 | | 48 270 | |
|
|
|
|
|
| |
| Group operating profit | | | | | | |
| Foods | 1 267 | | 2 648 | | 2 083 | |
| Home and Personal Care | 2 144 | | 2 835 | | 2 924 | |
| |
|
|
|
|
| |
| | 3 411 | | 5 483 | | 5 007 | |
|
|
|
|
|
| |
| Net operating assets | | | | | | |
| Foods | 19 014 | | 22 469 | | 25 156 | |
| Home and Personal Care | 1 897 | | 2 452 | | 3 031 | |
| |
|
|
|
|
| |
| | 20 911 | | 24 921 | | 28 187 | |
|
|
|
|
|
| |
| Capital expenditure | | | | | | |
| Foods | 532 | | 602 | | 805 | |
| Home and Personal Care | 473 | | 436 | | 493 | |
| |
|
|
|
|
| |
| | 1 005 | | 1 038 | | 1 298 | |
|
|
|
|
|
| |
| 144 | Unilever Annual Report on Form 20-F 2006 |
Back to Contents
| | |
| | Financial Statements (continued) |
| | |
| Selected financial data (continued) Unilever Group |
|
Selected financial data under previous GAAP(continued)
| | € million | | € million | | € million | |
| Consolidated cash flow statement | 2004 | | 2003 | | 2002 | |
|
|
|
|
|
| |
| Cash flow from operating activities | 6 853 | | 6 780 | | 7 883 | |
| Dividends from joint ventures | 60 | | 52 | | 83 | |
| Returns on investments and servicing of finance | (807 | ) | (1 180 | ) | (1 386 | ) |
| Taxation | (1 378 | ) | (1 423 | ) | (1 817 | ) |
| Capital expenditure and financial investment | (1 044 | ) | (1 024 | ) | (1 706 | ) |
| Acquisitions and disposals | 316 | | 622 | | 1 755 | |
| Dividends paid on ordinary share capital | (1 720 | ) | (1 715 | ) | (1 580 | ) |
| |
|
|
|
|
| |
| Cash flow before management of liquid resources and financing | 2 280 | | 2 112 | | 3 232 | |
| Management of liquid resources | (31 | ) | (41 | ) | (592 | ) |
| Financing | (2 921 | ) | (2 917 | ) | (3 078 | ) |
| |
|
|
|
|
| |
| Increase/(decrease) in cash in the period | (672 | ) | (846 | ) | (438 | ) |
|
|
|
|
|
| |
| Ratios | 2004 | | 2003 | | 2002 | |
|
|
|
|
|
| |
| Net profit margin (%)(b) | 4.7 | | 6.5 | | 4.4 | |
| Return on invested capital (%)(c) | 10.8 | | 12.5 | | 9.8 | |
| Ratio of earnings to fixed charges (times)(d) | 4.3 | | 4.6 | | 3.6 | |
|
|
|
|
|
| |
| (b) | As defined on page 141. |
| (c) | As defined on page 25. |
| (d) | As defined on page 141. |
Selected financial data and key ratios on a US GAAP basis
| | € million | | € million | | € million | | € million | | € million | |
| | 2006 | | 2005 | | 2004 | | 2003 | | 2002 | |
|
|
|
|
|
|
|
|
|
| |
| Turnover (total operations)(a) | 40 675 | | 39 902 | | 39 108 | | 41 455 | | 46 933 | |
| Net profit attributable to shareholders’ equity (total operations) | 4 115 | | 2 646 | | 2 686 | | 3 807 | | 4 210 | |
| Net profit (continuing operations) | 3 055 | | 2 215 | | 2 654 | | n/a | | n/a | |
| Shareholders’ equity | 16 626 | | 14 992 | | 14 012 | | 13 349 | | 11 772 | |
| Total assets | 42 467 | | 45 296 | | 41 625 | | 44 145 | | 48 146 | |
| |
|
|
|
|
|
|
|
|
| |
| Basic earnings per share (total operations) – (Euros)(b)(c) | 1.45 | | 0.90 | | 0.92 | | 1.30 | | 1.42 | |
| Diluted earnings per share (total operations) – (Euros) | 1.38 | | 0.88 | | 0.87 | | 1.26 | | 1.38 | |
| |
|
|
|
|
|
|
|
|
| |
| Return on invested capital (%) | 12.4 | | 10.0 | | 10.5 | | 11.4 | | 11.3 | |
| Net profit margin (%)(d) | 10.1 | | 6.6 | | 6.9 | | 9.2 | | 9.0 | |
| Ratio of earnings to fixed charges(e) | 6.3 | | 5.0 | | 4.7 | | n/a | | n/a | |
|
|
|
|
|
|
|
|
|
| |
| (a) | Turnover from continuing operations for the year was €39 642 million (2005: €38 401 million; 2004: €37 168 million). |
| (b) | For the basis of the calculation of earnings per share see note 7 on page 87. |
| (c) | For information on earnings per share for continuing operations, please refer to note 34 on page 124. |
| (d) | Net profit margin is expressed as net profit attributable to shareholders’ equity as a percentage of turnover from total operations. |
| (e) | In the ratio of earnings to fixed charges, earnings consist of net profit from continuing operations excluding net profit or loss of joint ventures and associates increased by fixed charges, income taxes and dividends received from joint ventures and associates. Fixed charges consist of interest payable on debt and a portion of lease costs determined to be representative of interest. This ratio takes no account of interest receivable although Unilever’s treasury operations involve both borrowing and depositing funds. |
| Unilever Annual Report on Form 20-F 2006 | 145 |
Back to Contents
| | |
| Financial Statements (continued) | |
| | |
| Selected financial data (continued) Unilever Group |
|
Exchange rates
The information in the following table is based on exchange rates between euros and US dollars and euros and sterling. These translation rates were used in preparation of the accounts:
| | 2006 | | 2005 | | 2004 | | 2003 | | 2002 | |
|
|
|
|
|
|
|
|
|
| |
| Year end | | | | | | | | | | |
| € 1 = $ | 1.317 | | 1.184 | | 1.366 | | 1.261 | | 1.049 | |
| € 1 = £ | 0.671 | | 0.686 | | 0.707 | | 0.708 | | 0.651 | |
|
|
|
|
|
|
|
|
|
| |
| Annual average | | | | | | | | | | |
| € 1 = $ | 1.254 | | 1.244 | | 1.238 | | 1.126 | | 0.940 | |
| € 1 = £ | 0.682 | | 0.684 | | 0.678 | | 0.691 | | 0.628 | |
|
|
|
|
|
|
|
|
|
| |
Noon Buying Rates in New York for cable transfers in foreign currencies as certified for customs purposes by the Federal Reserve Bank of New York were as follows:
| | 2006 | | 2005 | | 2004 | | 2003 | | 2002 | |
|
|
|
|
|
|
|
|
|
| |
| Year end | | | | | | | | | | |
| €1 = $ | 1.320 | | 1.184 | | 1.354 | | 1.260 | | 1.049 | |
|
|
|
|
|
|
|
|
|
| |
| Annual average | | | | | | | | | | |
| €1 = $ | 1.256 | | 1.245 | | 1.239 | | 1.132 | | 0.945 | |
|
|
|
|
|
|
|
|
|
| |
| High | | | | | | | | | | |
| €1 = $ | 1.333 | | 1.348 | | 1.363 | | 1.260 | | 1.049 | |
|
|
|
|
|
|
|
|
|
| |
| Low | | | | | | | | | | |
| €1 = $ | 1.186 | | 1.167 | | 1.180 | | 1.036 | | 0.859 | |
|
|
|
|
|
|
|
|
|
| |
High and low exchange rate values for each of the last six months:
| | September | | October | | November | | December | | January | | February | |
| | 2006 | | 2006 | | 2006 | | 2006 | | 2007 | | 2007 | |
|
|
|
|
|
|
|
|
|
|
|
| |
| High | | | | | | | | | | | | |
| €1 = $ | 1.283 | | 1.277 | | 1.326 | | 1.333 | | 1.329 | | 1.325 | |
|
|
|
|
|
|
|
|
|
|
|
| |
| Low | | | | | | | | | | | | |
| €1 = $ | 1.265 | | 1.250 | | 1.271 | | 1.307 | | 1.290 | | 1.293 | |
|
|
|
|
|
|
|
|
|
|
|
| |
On 1 March 2007, the exchange rates between euros and US dollars and euros and sterling were as follows: €1.00 = US $1.322 and €1.00 = £0.674.
| 146 | Unilever Annual Report on Form 20-F 2006 |
Back to Contents
| | |
| | Financial Statements (continued) |
| | |
| Principal group companies and non-current investments Unilever Group |
|
| as at 31 December 2006 |
The companies listed below and on page 148 are those which, in the opinion of the Directors, principally affect the amount of profit and assets shown in the Unilever Group accounts. The Directors consider that those companies not listed are not significant in relation to Unilever as a whole.
Full information as required by Articles 379 and 414 of Book 2 of the Civil Code in the Netherlands has been filed by Unilever N.V. with the Commercial Registry in Rotterdam.
Particulars of PLC group companies and other significant holdings as required by the United Kingdom Companies Act 1985 will be annexed to the next Annual Return of Unilever PLC.
Unless otherwise indicated, the companies are incorporated and principally operate in the countries under which they are shown.
The aggregate percentage of equity capital directly or indirectly held by NV or PLC is shown in the margin, except where it is 100%. All these percentages are rounded down to the nearest whole number.
The percentage of Unilever’s shareholdings held either directly or indirectly by NV and PLC are identified in the tables according to the following code:
|
|
| NV 100% | a |
| PLC 100% | b |
| NV 60%; PLC 40% | c |
| NV 85%; PLC 15% | d |
| NV 19%; PLC 81% | e |
| NV 46%; PLC 54% | f |
| NV 24%; PLC 76% | g |
| NV 56%; PLC 44% | h |
|
|
Due to the inclusion of certain partnerships in the consolidated group accounts of Unilever, para 264(b) of the German trade law grants an exemption from the duty to prepare individual statutory financial statements and management reports in accordance with the requirements for limited liability companies and to have these audited and published.
| Group companies | |
|
|
| % | | Ownership |
|
|
|
| | Argentina | |
| | Unilever de Argentina S.A. | d |
|
|
|
| | Australia | |
| | Unilever Australia Ltd. | b |
|
|
|
| | Belgium | |
| | Unilever Belgium BVBA/SPRL (Unibel) | d |
|
|
|
| | Brazil | |
| | Unilever Brasil Ltda. | d |
|
|
|
| | Canada | |
| | Unilever Canada Inc. | e |
|
|
|
| | Chile | |
| | Unilever Chile Home and Personal Care Ltda. | d |
|
|
|
| | China | |
| | Unilever (China) Investing Company Ltd. | a |
| | Unilever Services (Hefei) Limited | a |
|
|
|
| | France | |
| | Amora Maille Société Industrielle S.A.S | d |
| | Cogesal-Miko S.A.S | d |
| 99 | Lever Fabergé France S.A.S | d |
| | Unilever France Holdings S.A.S | d |
|
|
|
| Group companies(continued) | |
|
|
| % | | Ownership |
|
|
|
| | Germany | |
| | Maizena Grundstücksverwaltungs | |
| | GmbH & Co. OHG | d |
| | Pfanni GmbH & Co. OHG Stavenhagen | d |
| | Pfanni Werke Grundstücksverwaltungs | |
| | GmbH & Co. OHG | d |
| | UBG Vermietungs GmbH & Co. OHG | d |
| | Unilever Deutschland GmbH | d |
| | Unilever Deutschland Holding GmbH | d |
| | Unilever Deutschland Immobilien Leasing | |
| | GmbH & Co. OHG | d |
| | Wizona IPR GmbH & Co. OHG | d |
|
|
|
| | Greece | |
| 84 | Elais-Unilever S.A. | a |
| | Unilever Hellas A.E.B.E. | a |
|
|
|
| | India | |
| 51 | Hindustan Lever Ltd. | b |
|
|
|
| | Indonesia | |
| 85 | P.T. Unilever Indonesia Tbk | a |
|
|
|
| | Italy | |
| | Unilever Italia SrL | d |
|
|
|
| | Japan | |
| | Unilever Japan KK | a |
|
|
|
| | Mexico | |
| | Unilever de México S. de R.L. de C.V. | d |
|
|
|
| | The Netherlands | |
| | Mixhold B.V. | d |
| | Unilever Finance International B.V. | a |
| | Unilever N.V.(a) | |
| | Unilever Nederland B.V. | d |
| | UNUS Holding B.V. | h |
|
|
|
| | Poland | |
| | Unilever Polska S.A. | d |
|
|
|
| | Russia | |
| | Unilever SNG | g |
|
|
|
| | South Africa | |
| 59 | Unilever South Africa Foods (Pty) Limited | f |
| | Unilever South Africa Home and | |
| | Personal Care (Pty) Ltd. | b |
|
|
|
| | Spain | |
| | Unilever España S.A. | a |
| | Unilever Foods España S.A. | a |
|
|
|
| | Sweden | |
| | Unilever Sverige AB | a |
|
|
|
| | Switzerland | |
| | Unilever Supply Chain Company AG | a |
| | Unilever Schweiz GmbH | d |
|
|
|
| | Thailand | |
| | Unilever Thai Trading Ltd. | d |
|
|
|
| (a) | See ‘Basis of consolidation’ in note 1 on page 74 |
| |
| Unilever Annual Report on Form 20-F 2006 | 147 |
Back to Contents
| | |
| Financial Statements (continued) | |
| | |
| Principal group companies and non-current investments (continued) Unilever Group |
|
| as at 31 December 2006 |
| Group companies(continued) | |
|
|
|
| | Turkey | |
| | Unilever Sanayi ve Ticaret Türk A.S,. | b |
|
|
|
| | United Kingdom | |
| | Lever Fabergé Ltd. | e |
| | Unilever Bestfoods UK Ltd. | e |
| | Unilever PLC(a) | |
| | Unilever UK Holdings Ltd. | b |
| | Unilever UK & CN Holdings Ltd. | e |
|
|
|
| | United States of America | |
| | Conopco, Inc. | c |
| | Unilever Capital Corporation | c |
| | Unilever United States, Inc. | c |
|
|
|
| (a) See ‘Basis of consolidation’ in note 1 on page 74 | |
| Joint ventures | |
|
|
| % | | Ownership |
|
|
|
| | Portugal | |
| 49 | FIMA/VG-Distribuição de Produtos | |
| | Alimentares, Lda. | a |
|
|
|
| | United States of America | |
| 50 | Pepsi/Lipton Partnership | c |
|
|
|
| | |
| Associates | |
|
|
| % | | Ownership |
|
|
|
| | Côte d’Ivoire | |
| 40 | Palmci | b |
|
|
|
| | United Kingdom | |
| 40 | Langholm Capital Partners L.P. | b |
|
|
|
| | United States of America | |
| 33 | JohnsonDiversey Holdings, Inc. | a |
|
|
|
In addition, we have revenues from operations in the following locations: Abu Dhabi, Algeria, Austria, Bahrain, Bangladesh, Bolivia, Bulgaria, Cambodia, Cameroon, Colombia, Costa Rica, Côte d’Ivoire, Croatia, Cuba, Cyprus, Czech Republic, Democratic Republic of Congo, Denmark, Dominican Republic, Dubai, Ecuador, Egypt, El Salvador, Estonia, Finland, Ghana, Guatemala, Honduras, Hong Kong, Hungary, Iran, Ireland, Israel, Jordan, Kenya, Latvia, Lebanon, Lithuania, Malawi, Malaysia, Morocco, Mozambique, Namibia, Nepal, Netherlands Antilles, New Zealand, Nicaragua, Niger, Nigeria, Norway, Oman, Pakistan, Palestine, Panama, Paraguay, Peru, Philippines, Portugal, Puerto Rico, Romania, Saudi Arabia, Senegal, Serbia, Singapore, Slovakia, Slovenia, South Korea, Sri Lanka, Sudan, Syria, Taiwan, Tanzania, Trinidad & Tobago, Tunisia, Uganda, Ukraine, United Arab Emirates, Uruguay, Venezuela, Vietnam, Zambia and Zimbabwe.
| 148 | Unilever Annual Report on Form 20-F 2006 |
Back to Contents
Analysis of shareholding
Significant shareholders of NV
As far as we are aware the only holders of more than 5% (as referred to in the Act on Financial Supervision in the Netherlands) in the NV share capital (apart from the Foundation Unilever NV Trust Office, see page 41) are ING Groep N.V. and Aegon N.V. The voting rights of such shareholders are the same as for other holders of the class of share indicated. ING Groep N.V. and Aegon N.V. have each notified the Netherlands Authority for the Financial Markets (AFM) that as of 1 November 2006 respectively ING Groep N.V. holds indirectly an interest in the NV issued share capital of 22.17% and Aegon N.V. holds indirectly an interest of 5.57% . Both interests are mainly held in cumulative preference shares as shown hereunder.
ING Groep N.V.
| • | 26 828 546 (1.57%) ordinary shares (€4 292 567) |
| • | 20 665 (71.26%) 7% cumulative preference shares (€8 856 399) |
| • | 120 088 (74.56%) 6% cumulative preference shares (€51 466 114) |
| • | 504 440 (67.26%) 4% cumulative preference shares (€21 620 298) |
Aegon N.V.
| • | 836 409 (0.05%) ordinary shares (€133 825) |
| • | 4 995 (17.22%) 7% cumulative preference shares (€2 140 707) |
| • | 29 540 (18.34%) 6% cumulative preference shares (€12 659 957) |
| • | 157 106 (20.95%) 4% cumulative preference shares (€6 733 563) |
There have been no material changes to the holdings of significant shareholders of NV during the three years up to and including 2006.
Significant shareholders of PLC
The following table gives notified details of shareholders who held more than 3% of, or 3% of voting rights attributable to, PLC’s shares or deferred stock (excluding treasury shares) on 1 March 2007. The voting rights of such shareholders are the same as for other holders of the class of share indicated.
| | | Number of | | Approximate | |
| Title of class | Name of holder | shares held | | % held | |
|
|
|
|
| |
| Deferred Stock | Naamlooze Vennootschap Elma | 50 000 | | 50 | |
| | United Holdings Limited | 50 000 | | 50 | |
| Ordinary shares | Trustees of the Leverhulme Trust and the | | | | |
| | Leverhulme Trade Charities Trust | 70 566 764 | | 5 | |
| | Legal & General Group plc | 45 027 609 | | 3 | |
| | Barclays PLC | 40 319 254 | | 3 | |
|
|
|
|
| |
Between 1 January 2004 and 31 December 2006, Barclays PLC, The Capital Group Companies, inc., Fidelity Management and Research Company, and Legal & General Group plc have held more than 3% of, or 3% of voting rights attributable to, PLC’s ordinary shares. During this period, and as notified, certain of these holdings reduced to below the reporting 3% threshold. The table above sets out the notifiable interest of shares or voting rights attributable to PLC as at 1 March 2007.
| Unilever Annual Report on Form 20-F 2006 | 149 |
Back to Contents
| | |
| Shareholder information (continued) | |
| | |
| Shareholder information(continued) |
|
Analysis of PLC registered holdings
At 31 December 2006 PLC had 67 462 ordinary shareholdings.
The following table analyses the registered holdings of PLC’s 31/9p ordinary shares at 31 December 2006:
| | Number | | | | Total | | | |
| Number of shares | of holdings | | % | | shares held | | % | |
|
|
|
|
|
|
|
| |
| 1 | – | 1 000 | | 43 107 | | 63.90 | | 17 802 194 | | 1.36 | |
| 1 001 | – | 2 500 | | 14 326 | | 21.24 | | 22 820 193 | | 1.74 | |
| 2 501 | – | 5 000 | | 5 637 | | 8.36 | | 19 850 051 | | 1.52 | |
| 5 001 | – | 10 000 | | 2 256 | | 3.34 | | 15 431 690 | | 1.18 | |
| 10 001 | – | 25 000 | | 970 | | 1.44 | | 14 471 304 | | 1.10 | |
| 25 001 | – | 50 000 | | 307 | | 0.45 | | 10 773 983 | | 0.82 | |
| 50 001 | – | 100 000 | | 209 | | 0.31 | | 14 935 085 | | 1.14 | |
| 100 001 | – | 1 000 000 | | 488 | | 0.72 | | 166 272 636 | | 12.69 | |
| Over 1 000 000 | | 162 | | 0.24 | | 1 027 799 225 | | 78.45 | |
|
|
|
|
|
|
|
| |
| | | | | 67 462 | | 100.00 | | 1 310 156 361 | | 100.00 | |
|
|
|
|
|
|
|
| |
Share purchases during 2006
| | | | | | | | € million | |
| | | | | | Total number of | | Maximum value that | |
| | | | | | shares purchased | | may yet be purchased | |
| | Total number of | | Average price | | as part of publicly | | as part of publicly | |
| | shares purchased | | paid per share | | announced plans | | announced plans | (a) |
|
|
|
|
|
|
|
| |
| January | – | | – | | – | | – | |
| February | 2 175 461 | | €19.56 | | – | | – | |
| March | 933 604 | | €19.31 | | – | | – | |
| April | 25 941 | | €18.77 | | – | | – | |
| May | 1 236 949 | | €18.38 | | – | | – | |
| June | 66 932 | | €17.08 | | – | | – | |
| July | – | | – | | – | | – | |
| August | 237 632 | | €17.92 | | – | | – | |
| September | 320 446 | | €19.28 | | – | | – | |
| October | – | | – | | – | | – | |
| November | 707 025 | | €20.26 | | – | | – | |
| December | 317 141 | | €20.49 | | – | | – | |
|
|
|
|
|
|
|
| |
| Total | 6 021 131 | | €19.30 | | – | | – | |
|
|
|
|
|
|
|
| |
| (a) | The above share purchases were made to satisfy commitments to deliver shares under our Share Based Plans which are described in note 29 on page 117. In 2006, we replaced the originally planned share buy back of €500 million for 2006 by a one-off dividend of €750 million, paid at the time of and in addition to the normal interim dividend. |
Exchange controls affecting security holders
Under the Dutch External Financial Relations Act of 25 March 1994 the Minister of Finance is authorised to issue regulations relating to financial transactions concerning the movement of capital to or from third countries with respect to direct investments, establishment, the performing of financial services, the admission of negotiable instruments or goods with respect to which regulations have been issued under the Import and Export Act in the interest of the international legal system or an arrangement relevant thereto. These regulations may contain a prohibition to perform any of the actions indicated in those regulations without a licence. To date no regulations of this type have been issued which are applicable to Unilever N.V.
The Central Bank of the Netherlands is authorised to issue regulations with respect to reporting obligations. Pursuant to this authorisation it has issued the Reporting Obligations Balance of Payments 2003 (the ‘RR 2003’). Unilever N.V. has been appointed by the Central Bank as an institution subject to the reporting obligations and Unilever N.V. complies with such obligations.
There are currently no exchange controls affecting PLC shareholders.
| 150 | Unilever Annual Report on Form 20-F 2006 |
Back to Contents
| | |
| | Shareholder information (continued) |
| | |
| Shareholder information(continued) |
|
Nature of the trading market
The principal trading markets upon which Unilever shares are listed are Euronext Amsterdam for NV ordinary and preference shares and the London Stock Exchange for PLC ordinary shares. NV ordinary shares mainly trade in the form of depositary receipts for shares.
In the United States, NV ordinary shares and PLC American Depositary Receipts, are traded on the New York Stock Exchange. Citibank, N.A. acts for NV and PLC as issuer, transfer agent and, in respect of the American Depositary Receipts, depositary.
There have not been any significant trading suspensions in the past three years.
At 1 March 2007 there were 6 269 registered holders of NV New York Registry shares and 747 registered holders of PLC American Depositary Receipts in the United States. We estimate that approximately 21% of NV’s ordinary shares were held in the United States (approximately 28% in 2005), based on the distribution of the 2006 interim dividend payments, while most holders of PLC ordinary shares are registered in the United Kingdom – approximately 99% in 2006 and in 2005.
NV and PLC are separate companies with separate stock exchange listings and different shareholders. Shareholders cannot convert or exchange the shares of one for shares of the other and the relative share prices on the various markets can, and do, fluctuate. Following the decisions taken at the NV AGM held on 8 May 2006 and the PLC AGM held on 9 May 2006 to simplify the relationship between the NV and PLC ordinary shares, each NV ordinary share now represents the same underlying economic interest in the Unilever Group as each PLC ordinary share (save for exchange rate fluctuations).
If you are a shareholder of NV, you have an interest in a Dutch legal entity, your dividends will be paid in euros (converted into US dollars if you have shares registered in the United States) and you will be subject to tax in the Netherlands. If you are a shareholder of PLC, your interest is in a United Kingdom legal entity, your dividends will be paid in sterling (converted into US dollars if you have American Depositary Receipts) and you will be subject to United Kingdom tax. Nevertheless, the Equalisation Agreement means that as a shareholder of either company you effectively have an interest in the whole of Unilever. You have largely equal rights over our combined net profit and capital reserves as shown in the consolidated accounts. See Taxation for US residents on pages 153 and 154 and Equalisation Agreement on pages 39 and 40.
The high and low trading prices for the separate stock exchange listings are shown in the tables on the following page.
| Unilever Annual Report on Form 20-F 2006 | 151 |
Back to Contents
| | |
| Shareholder information (continued) | |
| | |
| Shareholder information(continued) |
|
Nature of the trading market (continued)
Share prices at 31 December 2006
The share price of the ordinary shares at the end of the year were as follows:
|
|
| NV per €0.16 ordinary share in Amsterdam | €20.70 |
|
|
| NV per €0.16 ordinary share in New York | $27.25 |
|
|
| PLC per 31/9p ordinary share in London | £14.28 |
|
|
| PLC per American Depositary Receipt in New York | $27.82 |
|
|
Monthly high and low prices for the most recent six months:
| | | | September | | October | | November | | December | | January | | February | |
|
|
|
|
|
|
|
|
|
|
|
|
|
| |
| NV per €0.16 ordinary share in Amsterdam (in €) | High | | 19.59 | | 19.69 | | 20.62 | | 20.84 | | 21.04 | | 20.96 | |
| | Low | | 18.56 | | 19.22 | | 19.22 | | 19.67 | | 20.29 | | 19.59 | |
|
|
|
|
|
|
|
|
|
|
|
|
|
| |
| NV per €0.16 ordinary share in New York (in $) | High | | 24.90 | | 24.93 | | 26.49 | | 27.32 | | 27.43 | | 27.21 | |
| | Low | | 23.74 | | 24.20 | | 24.49 | | 26.13 | | 26.27 | | 25.94 | |
|
|
|
|
|
|
|
|
|
|
|
|
|
| |
| PLC per 31/9p ordinary share in London (in £) | High | | 13.25 | | 13.29 | | 14.12 | | 14.28 | | 14.42 | | 14.24 | |
| | Low | | 12.55 | | 12.97 | | 12.94 | | 13.47 | | 13.78 | | 13.61 | |
|
|
|
|
|
|
|
|
|
|
|
|
|
| |
| PLC per American Depositary Receipt in New York (in $) | High | | 25.19 | | 25.11 | | 26.93 | | 27.95 | | 28.06 | | 28.02 | |
| | Low | | 23.85 | | 24.28 | | 24.68 | | 26.79 | | 26.94 | | 26.66 | |
|
|
|
|
|
|
|
|
|
|
|
|
|
| |
Quarterly high and low prices for 2006 and 2005
| | 2006 | | 1st | | 2nd | | 3rd | | 4th | |
|
|
|
|
|
|
|
|
|
| |
| NV per €0.16 ordinary share in Amsterdam (in €) | High | | 19.78 | | 19.27 | | 19.59 | | 20.84 | |
| | Low | | 18.53 | | 16.53 | | 17.26 | | 19.22 | |
|
|
|
|
|
|
|
|
|
| |
| NV per €0.16 ordinary share in New York (in $) | High | | 23.86 | | 24.34 | | 24.90 | | 27.32 | |
| | Low | | 22.69 | | 20.72 | | 21.74 | | 24.20 | |
|
|
|
|
|
|
|
|
|
| |
| PLC per 31/9p ordinary share in London (in £) | High | | 13.54 | | 13.16 | | 13.25 | | 14.28 | |
| | Low | | 12.74 | | 11.25 | | 11.84 | | 12.94 | |
|
|
|
|
|
|
|
|
|
| |
| PLC per American Depositary Receipt in New York (in $) | High | | 23.79 | | 24.31 | | 25.19 | | 27.95 | |
| | Low | | 22.45 | | 20.66 | | 21.77 | | 24.28 | |
|
|
|
|
|
|
|
|
|
| |
| | 2005 | | 1st | | 2nd | | 3rd | | 4th | |
|
|
|
|
|
|
|
|
|
|
|
| NV per €0.16 ordinary share in Amsterdam (in €) | High | | 17.58 | | 18.32 | | 19.93 | | 20.27 | |
| | Low | | 16.13 | | 16.59 | | 17.72 | | 18.88 | |
|
|
|
|
|
|
|
|
|
|
|
| NV per €0.16 ordinary share in New York (in $) | High | | 22.89 | | 22.98 | | 23.97 | | 24.02 | |
| | Low | | 20.89 | | 21.38 | | 21.55 | | 22.18 | |
|
|
|
|
|
|
|
|
|
|
|
| PLC per 31/9p ordinary share in London (in £) | High | | 11.71 | | 12.30 | | 13.26 | | 13.39 | |
| | Low | | 10.83 | | 11.01 | | 11.96 | | 12.43 | |
|
|
|
|
|
|
|
|
|
|
|
| PLC per American Depositary Receipt in New York (in $) | High | | 22.32 | | 22.85 | | 23.67 | | 23.60 | |
| | Low | | 20.34 | | 21.16 | | 21.20 | | 21.55 | |
|
|
|
|
|
|
|
|
|
| |
Annual high and low prices
| | | | 2006 | | 2005 | | 2004 | | 2003 | | 2002 | |
|
|
|
|
|
|
|
|
|
|
|
| |
| NV per €0.16 ordinary share in Amsterdam (in €) | High | | 20.84 | | 20.27 | | 19.92 | | 19.98 | | 24.01 | |
| | Low | | 16.53 | | 16.13 | | 14.80 | | 15.27 | | 16.55 | |
|
|
|
|
|
|
|
|
|
|
|
| |
| NV per €0.16 ordinary share in New York (in $) | High | | 27.32 | | 24.02 | | 24.80 | | 21.63 | | 22.30 | |
| | Low | | 20.72 | | 20.89 | | 18.94 | | 17.65 | | 16.70 | |
|
|
|
|
|
|
|
|
|
|
|
| |
| PLC per 31/9p ordinary share in London (in £) | High | | 14.28 | | 13.39 | | 12.80 | | 13.96 | | 14.64 | |
| | Low | | 11.25 | | 10.83 | | 9.85 | | 10.56 | | 10.50 | |
|
|
|
|
|
|
|
|
|
|
|
| |
| PLC per American Depositary Receipt in New York (in $) | High | | 27.95 | | 23.67 | | 24.17 | | 21.93 | | 21.91 | |
| | Low | | 20.66 | | 20.34 | | 18.22 | | 17.46 | | 16.58 | |
|
|
|
|
|
|
|
|
|
|
|
| |
| 152 | Unilever Annual Report on Form 20-F 2006 |
Back to Contents
| | |
| | Shareholder information (continued) |
| | |
| Shareholder information(continued) |
|
Taxation for US residents holding shares in NV
The following notes are provided for guidance. US residents should consult their local tax advisers, particularly in connection with potential liability to pay US taxes on disposal, lifetime gift or bequest of their shares.
Taxation on dividends in the Netherlands
Until the end of 2006 dividends of companies in the Netherlands were in principle subject to dividend withholding tax of 25%. Where a shareholder is entitled to the benefits of the current Income Tax Convention (‘the Convention’) concluded on 18 December 1992 between the United States and the Netherlands, when dividends are paid by NV to:
| • | a United States resident; |
| • | a corporation organised under the laws of the United States(or any territory of it) having no permanent establishment in theNetherlands of which such shares form a part of the businessproperty; or |
| • | any other legal person subject to United States Federal incometax with respect to its worldwide income, having no permanentestablishment in the Netherlands of which such shares form a partof the business property; |
these dividends qualify for a reduction of withholding tax on dividends in the Netherlands from 25% to 15% (to 5% if the beneficial owner is a company which directly holds at least 10% of the voting power of NV shares and to 0% if the beneficial owner is a qualified ‘Exempt Organisation’ as defined in Article 36 of the Convention). As of 1 January 2007 dividends of companies in the Netherlands are in principle subject to dividend withholding tax of 15%.
Where a United States resident or corporation has a permanent establishment in the Netherlands, which has shares in NV forming part of its business property, dividends it receives on those shares are included in that establishment’s profit. They are subject to income tax or corporation tax in the Netherlands, as appropriate, and tax on dividends in the Netherlands will generally be applied at the full rate of 25% until the end of 2006 and 15% as from 1 January 2007. This tax will be treated as foreign income tax eligible for credit against the shareholder’s United States income taxes.
Under the Convention, qualifying United States organisations that are generally exempt from United States taxes and that are constituted and operated exclusively to administer or provide pension, retirement or other employee benefits may be exempt at source from withholding tax on dividends received from a Dutch corporation. An agreement published by the US Internal Revenue Service on 20 April 2000 in release IR-INT-2000-9 between the United States and tax authorities in the Netherlands describes the eligibility of these US organisations for benefits under the Convention.
A United States trust, company or organisation that is operated exclusively for religious, charitable, scientific, educational or public purposes was subject to an initial 25% withholding tax rate until the end of 2006 and 15% as from 1 January 2007. Such an exempt organisation is entitled to reclaim from Tax Authorities in the Netherlands a refund of the Dutch dividend tax, if and to the extent that it is exempt from United States Federal Income Tax and it would be exempt from tax in the Netherlands if it were organised and carried on all its activities there.
If you are an NV shareholder resident in any country other than the United States or the Netherlands, any exemption from, or reduction or
refund of, dividend withholding tax in the Netherlands may be governed by the ‘Tax Regulation for the Kingdom of the Netherlands’ or by the tax convention, if any, between the Netherlands and your country of residence.
United States taxation on dividends
If you are a United States shareholder, the dividend (including the withheld amount) up to the amount of our earnings and profits for United States Federal income tax purposes will be ordinary dividend income. Dividends received by an individual during taxable years before 2011 will be taxed at a maximum rate of 15%, provided the individual has held the shares for more than 60 days during the 121-day period beginning 60 days before the ex-dividend date, that NV is a qualified foreign corporation and that certain other conditions are satisfied. NV is a qualified foreign corporation for this purpose. Dividends received by an individual for taxable years after 2010 will be subject to tax at ordinary income rates. The dividends are not eligible for the dividends received deduction allowed to corporations.
For US foreign tax credit purposes, the dividend is foreign source income, and withholding tax in the Netherlands is a foreign income tax that is eligible for credit against the shareholder’s United States income taxes. However, the rules governing the US foreign tax credit are complex, and additional limitations on the credit apply to individuals receiving dividends eligible for the 15% maximum tax rate on dividends described above.
Any portion of the dividend that exceeds our United States earnings and profits is subject to different rules. This portion is a tax free return of capital to the extent of your basis in our shares, and thereafter is treated as a gain on a disposition of the shares.
Under a provision of the Dividend Tax Act in the Netherlands, NV is entitled to a credit (up to a maximum of 3% of the gross dividend from which dividend tax is withheld) against the amount of dividend tax withheld before remittance to tax authorities in the Netherlands. The United States tax authority may take the position that withholding tax in the Netherlands eligible for credit should be limited accordingly.
Taxation on capital gains in the Netherlands
Under the Convention, if you are a United States resident or corporation and you have capital gains on the sale of shares of a Dutch company, these are generally not subject to taxation by the Netherlands. An exception to this rule generally applies if you have a permanent establishment in the Netherlands and the capital gain is derived from the sale of shares which form part of that permanent establishment’s business property.
Succession duty and gift taxes in the Netherlands
Under the Estate and Inheritance Tax Convention between the United States and the Netherlands of 15 July 1969, United States individual residents who are not Dutch citizens who have shares will generally not be subject to succession duty in the Netherlands on the individual’s death, unless the shares are part of the business property of a permanent establishment situated in the Netherlands.
A gift of shares of a Dutch company by a person who is not a resident or a deemed resident of the Netherlands is generally not subject to gift tax in the Netherlands. A non-resident Netherlands citizen, however, is still treated as a resident of the Netherlands for gift tax purposes for ten years and any other non-resident person for one year after leaving the Netherlands.
| Unilever Annual Report on Form 20-F 2006 | 153 |
Back to Contents
| | |
| Shareholder information (continued) | |
| | |
| Shareholder information (continued) |
|
Taxation for US residents holding shares in PLC
The following notes are provided for guidance. US residents should consult their local tax advisers, particularly in connection with potential liability to pay US taxes on disposal, lifetime gift or bequest of their shares.
United Kingdom taxation on dividends
Under United Kingdom law, income tax is not withheld from dividends paid by United Kingdom companies. Shareholders, whether resident in the United Kingdom or not, receive the full amount of the dividend actually declared.
United States taxation on dividends
If you are a shareholder resident in the US, the dividend up to the amount of our earnings and profits for United States Federal income tax purposes will be ordinary dividend income. Dividends received by an individual during taxable years before 2011 will be taxed at a maximum rate of 15%, provided the individual has held the shares for more than 60 days during the 121-day period beginning 60 days before the ex-dividend date, that PLC is a qualified foreign corporation and certain other conditions are satisfied. PLC is a qualified foreign corporation for this purpose. Dividends received by an individual for taxable years after 2010 will be subject to tax at ordinary income rates. The dividend is not eligible for the dividends received deduction allowable to corporations. The dividend is foreign source income for US foreign tax credit purposes.
Any portion of the dividend that exceeds our United States earnings and profits is subject to different rules. This portion is a tax free return of capital to the extent of your basis in our shares, and thereafter is treated as a gain on a disposition of the shares.
UK taxation on capital gains
Under United Kingdom law, when you sell shares you may be liable to pay capital gains tax. However, if you are either:
| • | an individual who is neither resident nor ordinarily resident in theUnited Kingdom; or |
| • | a company which is not resident in the United Kingdom; |
you will not be liable to United Kingdom tax on any capital gains made on disposal of your shares.
The exception is if the shares are held in connection with a trade or business which is conducted in the United Kingdom through a branch or an agency.
UK inheritance tax
Under the current estate and gift tax convention between the United States and the United Kingdom, ordinary shares held by an individual shareholder who is:
| • | domiciled for the purposes of the convention in the UnitedStates; and |
| • | is not for the purposes of the convention a national of theUnited Kingdom; |
will not be subject to United Kingdom inheritance tax on:
| • | the individual’s death; or |
| • | on a gift of the shares during the individual’s lifetime. |
The exception is if the shares are part of the business property of a permanent establishment of the individual in the United Kingdom or, in the case of a shareholder who performs independent personal services, pertain to a fixed base situated in the United Kingdom.
| 154 | Unilever Annual Report on Form 20-F 2006 |
Back to Contents
| | |
| | Shareholder information (continued) |
| | |
| Shareholder information (continued) |
|
Dividend record
Our interim ordinary dividends are normally announced in November and paid in December. Final ordinary dividends are normally proposed in February and, if approved by shareholders at the Annual General Meetings, paid in June.
The following tables show the dividends paid by NV and PLC for the last five years, expressed in terms of the revised share denominations which became effective from 22 May 2006. Dividends have been translated into US dollars at the exchange rates prevailing on the dates of declaration of the dividend. Differences between the amounts ultimately received by US holders of NV and PLC shares are the result of changes in exchange rate between the equalisation of the dividends and the date of payment.
The interim dividend is normally 35% of the previous year’s total normal dividend per share, based on the stronger of our two parent currencies over the first nine months of the year. Equalisation of the interim dividend in the other currency takes place at the average exchange rate of the third quarter. Equalisation of the final dividend takes place at the average exchange rate for the full year.
Final dividends for 2006 are payable on 21 June 2007, subject to approval at the AGMs. For purposes of illustration, the amounts payable in respect of NV New York Registry Shares and PLC ADRs have been translated in the table below at rates of exchange on 8 February 2007, which is the date on which the proposed dividends were announced. The actual amounts payable in US dollars will be calculated by reference to the exchange rates on the day on which the dividends are approved (15 May 2007 in the case of NV and 16 May 2007 in the case of PLC).
The dividend timetable for 2007 is shown on page 158.
| NV Dividends | | | | | | | | | | | | |
| | | | 2006 | | 2005 | | 2004 | | 2003 | | 2002 | |
|
|
|
|
|
|
|
|
|
|
|
| |
| Interim dividend per €0.16 | (Euros) | | 0.2300 | | 0.2200 | | 0.2100 | | 0.1967 | | 0.1833 | |
| Final dividend per €0.16 | (Euros) | | – | | 0.4400 | | 0.4200 | | 0.3833 | | 0.3833 | |
| Proposed final dividend per €0.16 | (Euros) | | 0.4700 | | – | | – | | – | | – | |
| One-off dividend per €0.16 | (Euros) | | 0.2600 | | – | | – | | – | | – | |
| | | | | | | | | | | | | |
| Interim dividend per €0.16 (US Registry) | (Dollars) | | 0.2934 | | 0.2638 | | 0.2685 | | 0.2296 | | 0.1800 | |
| Final dividend per €0.16 (US Registry) | (Dollars) | | – | | 0.5613 | | 0.5399 | | 0.4545 | | 0.4380 | |
| Proposed final dividend per €0.16 (US Registry) | (Dollars) | | 0.6103 | | – | | – | | – | | – | |
| One-off dividend per €0.16 (US Registry) | (Dollars) | | 0.3316 | | – | | – | | – | | – | |
|
|
|
|
|
|
|
|
|
|
|
| |
| | | | | | | | | | | | | |
| PLC Dividends | | | | | | | | | | | | |
| | | | 2006 | | 2005 | | 2004 | | 2003 | | 2002 | |
|
|
|
|
|
|
|
|
|
|
|
| |
| Interim dividend per 31/9p | (Pounds) | | 0.1562 | | 0.1504 | | 0.1407 | | 0.1369 | | 0.1158 | |
| Final dividend per 31/9p | (Pounds) | | – | | 0.3009 | | 0.2849 | | 0.2649 | | 0.2407 | |
| Proposed final dividend per 31/9p | (Pounds) | | 0.3204 | | – | | – | | – | | – | |
| One-off dividend per 31/9p | (Pounds) | | 0.1766 | | – | | – | | – | | – | |
| | | | | | | | | | | | | |
| Interim dividend per 31/9p (US Registry) | (Dollars) | | 0.2983 | | 0.2655 | | 0.2586 | | 0.2315 | | 0.1804 | |
| Final dividend per 31/9p (US Registry) | (Dollars) | | – | | 0.5583 | | 0.5366 | | 0.4694 | | 0.3866 | |
| Proposed final dividend per 31/9p (US Registry) | (Dollars) | | 0.6317 | | – | | – | | – | | – | |
| One-off dividend per 31/9p (US Registry) | (Dollars) | | 0.3372 | | – | | – | | – | | – | |
|
|
|
|
|
|
|
|
|
|
|
| |
| Unilever Annual Report on Form 20-F 2006 | 155 |
Back to Contents
| | |
| Shareholder information (continued) | |
| | |
| Shareholder information (continued) |
|
Glossary
The following is intended to provide a general guide to the meanings of various terms which may be used in this report.
| Term used in this report | US equivalent or brief description |
|
|
| Accounts | Financial statements |
|
|
| Associate | A business which is not a subsidiary or a joint venture, but in which the Group has |
| | a shareholding and exercises significant influence |
|
|
| Called up share capital | Ordinary shares, issued and fully paid |
|
|
| Creditors | Accounts payable/Payables |
|
|
| Creditors: amounts due after more than one year | Long-term accounts payable |
|
|
| Creditors: amounts due within one year | Current accounts payable |
|
|
| Debtors | Accounts receivable/Receivables |
|
|
| Finance cost | Interest expense |
|
|
| Finance income | Interest income |
|
|
| Finance lease | Capital lease |
|
|
| Freehold | Ownership with absolute rights in perpetuity |
|
|
| Gearing | Leverage |
|
|
| Group, or consolidated, accounts | Consolidated financial statements |
|
|
| Joint venture | A business which is jointly controlled by the Group and one or more |
| | external partners |
|
|
| Nominal value | Par value |
|
|
| Operating margin | Operating profit expressed as a percentage of turnover |
|
|
| Operating profit | Net operating income |
|
|
| Profit | Income (or earnings) |
|
|
| Profit and loss account | Income statement |
|
|
| Profit attributable to ordinary shareholders | Net income attributable to ordinary stockholders |
|
|
| Profit retained | Retained earnings |
|
|
| Provisions | Liabilities other than debt and specific accounts payable |
|
|
| Reserves | Stockholders’ equity other than paid-up capital |
|
|
| Share capital | Capital stock or common stock |
|
|
| Share option | Stock option |
|
|
| Share premium account | Additional paid-in capital relating to proceeds of sale of stock in excess of par value or |
| | paid-in surplus |
|
|
| Shareholders’ equity | Stockholders’ equity |
|
|
| Shares in issue | Shares outstanding |
|
|
| Statement of recognised income and expense | Statement of comprehensive income |
|
|
| Turnover | Sales revenues |
|
|
| Weighted average cost of capital | The cost of equity multiplied by the market capitalisation, plus the after taxation interest |
| | cost of debt multiplied by the market value of the net debt, divided by the sum of the |
| | market values of debt and equity |
|
| 156 | Unilever Annual Report on Form 20-F 2006 |
Back to Contents
| | |
| | Shareholder information (continued) |
| | |
| Shareholder information (continued) |
|
Cross reference to Form 20-F
| PART I |
| | | | |
| 1 | | Identity of directors, senior management and advisers | n/a |
| | | | |
| 2 | | Offer statistics and expected timetable | n/a |
| | | | |
| 3 | | Key information | |
| 3A | | Selected financial data | 109, 141-146, 155 |
| 3B | | Capitalisation and indebtedness | n/a |
| 3C | | Reasons for the offer and use of proceeds | n/a |
| 3D | | Risk factors | 9-10, 100-101 |
| | | | |
| 4 | | Information on the company | |
| 4A | | History and development of the company | 1, 5-10, 13-32, 113, 170 |
| 4B | | Business overview | 5-10, 13-32, 79-82 |
| 4C | | Organisational structure | 33, 147-148 |
| 4D | | Property, plant and equipment | 8, 90 |
| | | | |
| 4A | | Unresolved staff comments | n/a |
| | | | |
| 5 | | Operating and financial review and prospects | |
| 5A | | Operating results | 13-32, 76, 99-101 |
| 5B | | Liquidity and capital resources | 23-32, 66-67, 90, 95-102, 112 |
| 5C | | Research and development, patents and licences, etc. | 5-10, 13-22, 83 |
| 5D | | Trend information | 3-4, 11-32 |
| 5E | | Off balance sheet arrangements | 31, 99-101 |
| 5F | | Tabular disclosure of contractual obligations | 30-32 |
| 5G | | Safe harbour | 1, Inside back cover |
| | | | |
| 6 | | Directors, senior management and employees | |
| 6A | | Directors and senior management | 33-47 |
| 6B | | Compensation | 49-62, 84, 103-107, 117-122 |
| 6C | | Board practices | 3, 33-64 |
| 6D | | Employees | 6-7 |
| 6E | | Share ownership | 49-62, 117-121 |
| | | | |
| 7 | | Major shareholders and related party transactions | |
| 7A | | Major shareholders | 41-42, 149-152 |
| 7B | | Related party transactions | 6, 122 |
| 7C | | Interests of experts and counsel | n/a |
| | | | |
| 8 | | Financial information | |
| 8A | | Consolidated statementsand other financial information | 69-146, 155 |
| 8B | | Significant changes | 32, 123 |
| | | | |
| 9 | | The offer and listing | |
| 9A | | Offer and listing details | 151-152 |
| 9B | | Plan of distribution | n/a |
| 9C | | Markets | Inside front cover, 151-152 |
| 9D | | Selling shareholders | n/a |
| 9E | | Dilution | n/a |
| 9F | | Expenses of the issue | n/a |
| 10 | | Additional information | |
| 10A | | Share capital | n/a |
| 10B | | Memorandum and articles of association | 33-47, 96, 109 |
| 10C | | Material contracts | 29, 33, 39-41 |
| 10D | | Exchange controls | 150 |
| 10E | | Taxation | 153-154 |
| 10F | | Dividends and paying agents | n/a |
| 10G | | Statement by experts | n/a |
| 10H | | Documents on display | 131 |
| 10I | | Subsidiary information | n/a |
| | | | |
| 11 | | Quantitative and qualitative disclosures aboutmarket risk | 9-10, 94-102 |
| | | | |
| 12 | | Description of securities other than equity securities | n/a |
| |
| PART II |
| | | | |
| 13 | | Defaults, dividend arrearages and delinquencies | n/a |
| | | | |
| 14 | | Material modifications to the rights of security holders and use of proceeds | n/a |
| | | | |
| 15 | | Controls and procedures | 66-69 |
| | | | |
| 16 | | Reserved | |
| 16A | | Audit Committee financial expert | 37 |
| 16B | | Code of Ethics | 33, 45 |
| 16C | | Principal accountant fees and services | 63, 123 |
| 16D | | Exemptions from the Listing Standards forAudit Committees | n/a |
| 16E | | Purchases of equity securities by the issuer andaffiliated purchasers | 150 |
| |
| PART III |
| | | | |
| 17 | | Financial statements | n/a |
| | | | |
| 18 | | Financial statements | 69-140 |
| | | | |
| 19 | | Exhibits* | |
| | | | |
| | | | |
| | | | |
| | | | |
| * | Filed with the United States Securities and Exchange Commission. |
| | |
| | Unilever’s agent in the United States is Mr R Soiefer, Senior Vice-President, General Counsel and Secretary, Unilever United States, Inc., 700 Sylvan Avenue, Englewood Cliffs, NJ 07632. |
| Unilever Annual Report on Form 20-F 2006 | 157 |
Back to Contents
| | |
| Shareholder information (continued) | |
| | |
| Shareholder information (continued) |
|
Financial calendar
| Annual General Meetings | | |
|
| |
| NV | 10:30 am Tuesday 15 May 2007 Rotterdam | |
|
| |
| PLC | 11:00 am Wednesday 16 May 2007 London | |
|
| |
| | | | | | | |
| Announcements of results | | | | | | |
|
|
|
|
|
| |
| First Quarter | 3 May 2007 | | Third Quarter | | 1 November 2007 | |
| First Half Year | 2 August 2007 | | Final for Year | | 7 February 2008 | |
|
|
|
|
|
| |
Final ordinary dividends for 2006
Announced 8 February 2007 and to be declared 15 May 2007 (NV) and 16 May 2007 (PLC).
| | Ex-dividend | | Record | | Payment | |
| | date | | date | | date | |
|
|
|
|
|
| |
| NV | 17 May 2007 | | 21 May 2007 | | 21 June 2007 | |
| PLC | 23 May 2007 | | 25 May 2007 | | 21 June 2007 | |
| NV – New York Registry Shares | 17 May 2007 | | 21 May 2007 | | 21 June 2007 | |
| PLC – American Depositary Receipts | 23 May 2007 | | 25 May 2007 | | 21 June 2007 | |
|
|
|
|
|
| |
Interim dividends for 2007
To be announced 1 November 2007.
| | Ex-dividend | | Record | | Payment | |
| | date | | date | | date | |
|
|
|
|
|
| |
| NV | 2 November 2007 | | 6 November 2007 | | 5 December 2007 | |
| PLC | 7 November 2007 | | 9 November 2007 | | 5 December 2007 | |
| NV – New York Registry Shares | 2 November 2007 | | 6 November 2007 | | 5 December 2007 | |
| PLC – American Depositary Receipts | 7 November 2007 | | 9 November 2007 | | 5 December 2007 | |
|
|
|
|
|
| |
Preferential dividends – NV
| | | | | Ex-dividend | | Record | | Payment | |
| | | Announced | | date | | date | | date | |
|
|
|
|
|
|
|
|
| |
| 4%Cumulative Preference | | 7 December 2007 | | 10 December 2007 | | 12 December 2007 | | 2 January 2008 | |
| 6%Cumulative Preference | | 7 September 2007 | | 10 September 2007 | | 12 September 2007 | | 1 October 2007 | |
| 7%Cumulative Preference | | 7 September 2007 | | 10 September 2007 | | 12 September 2007 | | 1 October 2007 | |
|
|
|
|
|
|
|
|
| |
| | | | | |
| | | | | |
| Contact details | | | | |
| Rotterdam | London | | New York | |
|
|
|
| |
| Unilever N.V. | Unilever PLC | | Unilever United States, Inc. | |
| Investor Relations Department | Investor Relations Department | | Investor Relations Department | |
| Weena 455, PO Box 760 | PO Box 68, Unilever House | | 700 Sylvan Avenue, Englewood Cliffs | |
| 3000 DK Rotterdam | 100 Victoria Embankment | | NJ 07632 | |
| The Netherlands | London EC4P 4BQ | | USA | |
| | United Kingdom | | | |
| | | | | |
| Telephone +44 (0)20 7822 6830 | Telephone +44 (0)20 7822 6830 | | Telephone +1 (0)201 894 2615 | |
| Telefax +44 (0)20 7822 5754 | Telefax +44(0)20 7822 5754 | | Telefax +1 (0)201 894 2222 | |
| | | | | |
| Any queries can also be sent to us electronically via www.unilever.com/contactus. | | | |
|
|
| |
| 158 | Unilever Annual Report on Form 20-F 2006 |
Back to Contents
| | |
| | Shareholder information (continued) |
| | |
| Shareholder information (continued) |
|
Website
Shareholders are encouraged to visit our website www.unilever.com, which has a wealth of information about Unilever.
There is a section designed specifically for investors at www.unilever.com/investorcentre. It includes detailed coverage of the Unilever share price, our quarterly and annual results, performance charts, financial news and investor relations speeches and presentations. It also includes conference and investor/analyst presentations.
You can also view this year’s and prior years’ Annual Review and Annual Report and Accounts documents at www.unilever.com/investorcentre.
PLC shareholders can elect not to receive paper copies of the Annual Review, the Annual Report and Accounts and other shareholder documents by registering at www.unilever.com/shareholderservices if they prefer to view these on our website.
Share registration
The Netherlands
N.V. Algemeen Nederlands
Trustkantoor ANT
PO Box 11063
1001 GB Amsterdam
| Telephone | | + 31 (0) 20 522 2555 | |
| Telefax | | + 31 (0) 20 522 2500 | |
| Email | registers@ant-trust.nl | |
UK
Computershare Investor Services PLC
PO Box 82
The Pavilions
Bridgwater Road
Bristol BS99 7NH
| Telephone | | + 44(0)870600 3977 | |
| Telefax | | + 44(0)870703 6119 | |
| Website | www.unilever.com/shareholderservices | |
| Email | web-queries@computershare.co.uk | |
USA
Citibank Shareholder Services
PO Box 43077
Providence RI 02940-3077
| Toll free phone (inside US) | 888 502 6356 |
| Toll phone (outside US) | + | 1 816 843 4281 |
| Website | www.citibank.com/adr |
| Email | citibank@shareholders-online.com |
Publications
Copies of the following publications can be accessed directly or ordered through www.unilever.com/investorcentre or www.unilever.nl/onsbedrijf/beleggers.
Unilever Annual Review 2006
Including Summary Financial Statement. Available in English or Dutch, with financial information in euros, pounds sterling and US dollars.
Unilever Annual Report and Accounts 2006
Available in English or Dutch, with figures in euros. It forms the basis for the Form 20-F that is filed with the United States Securities and Exchange Commission.
Quarterly Results Announcements
Available in English or Dutch, with figures in euros; supplements in English, with pounds sterling or US dollar figures, are also available.
Unilever Annual Report on Form 20-F
Filed with the SEC at www.sec.gov. Printed copies are available, free of charge, upon request to Unilever United States, Inc., Investor Relations Department, 700 Sylvan Avenue, Englewood Cliffs, NJ 07632, USA.
| Unilever Annual Report on Form 20-F 2006 | 159 |
Back to Contents
| | |
| Shareholder information (continued) | |
| | |
| Accounting policies | 1, 23-24, 74-78 |
| Acquisitions | 29, 74, 113 |
| Advertising and promotion | 24 |
| Americas, The | 16-17, 79-81 |
| Annual General Meetings | 38, 158 |
| Asia Africa | 18-19, 79-81 |
| Associates | 92, 122 |
| Audit Committee | 37, 63 |
| Auditors | 63, 69, 123 |
| Balance sheet | 30, 72 |
| Biographical details | 46-47 |
| Biological assets | 92 |
| Board committees | 37-38 |
| Board remuneration | 49-62 |
| Boards | 34 |
| Borrowings | 76, 96-98 |
| Brands | 6, 20 |
| Capital expenditure | 80, 82, 90-91 |
| Cash | 76, 95 |
| Cash flow | 31, 73, 116 |
| Categories | 5 |
| Chairman | 3-4, 35 |
| Commitments | 112 |
| Competition | 5 |
| Contingent liabilities | 112 |
| Corporate governance | 33-47 |
| Corporate responsibility | 9 |
| Corporate Responsibility and Reputation Committee | 37, 64 |
| Deferred tax | 24, 93 |
| Depreciation | 80, 90-91 |
| Directors’ responsibilities | 66-67 |
| Discontinued operations | 114-115 |
| Disposals | 29, 113 |
| Distribution | 5 |
| Diversity | 7 |
| Dividends | 29, 88, 155, 158 |
| Earnings per share | 41, 70, 87 |
| Employees | 6-7 |
| Equalisation Agreement | 39-40 |
| Equity | 108 |
| Europe | 14-15, 79-81 |
| Exchange rates | 24, 74, 146 |
| Executive Directors | 35-36, 46, 51-53, 55-60 |
| Exports | 6 |
| Finance and liquidity | 31 |
| Finance costs and income | 84 |
| Financial calendar | 158 |
| Financial instruments | 23, 75-76, 99-101 |
| Financial review | 23-32 |
| Foods | 6, 81-82 |
| Functions | 5 |
| Goodwill | 23, 75, 88-89 |
| Gross profit | 83 |
| Group Chief Executive | 11-12, 35 |
| Group structure | 1 |
| Guarantor statements | 135-140 |
| Home and Personal Care | 6, 81-82 |
| Home care | 6, 81-82 |
| Ice cream and beverages | 6, 81-82 |
| Impairment | 88-89 |
| Income statement | 70 |
| Information technology | 7 |
| Innovation | 20-22 |
| Intangible assets | 23, 75, 88-89 |
| Intellectual property | 7 |
| Internal and disclosure controls | 66 |
| International Financial Reporting Standards (IFRS) | 1, 74, 141-142 |
| Inventories | 76, 94 |
| Joint ventures | 92, 122 |
| Key management | 122 |
| Key performance indicators | 5 |
| Laws and regulation | 8 |
| Leases | 77, 112 |
| Legal proceedings | 8-9 |
| Market capitalisation | 29 |
| Net debt | 27 |
| Nomination Committee | 37, 48 |
| Non-Executive Directors | 36, 46, 53, 61-62 |
| Non-GAAP measures | 24 |
| Off-balance sheet arrangements | 31 |
| Operating costs | 83 |
| Operating profit | 79-82 |
| Operating review | 13-22 |
| Payables | 102 |
| Pensions and similar obligations | 23-24, 32, 76, 103-107, 126-130 |
| Personal care | 6, 81-82 |
| Post balance sheet events | 32, 123 |
| Preference shares and dividends | 96, 158 |
| Principal group companies | 147-148 |
| Property, plant and equipment | 8, 75, 90-91 |
| Provisions | 24, 77, 102 |
| Receivables | 94 |
| Regions | 5, 13-19 |
| Related party transactions | 6, 122 |
| Remuneration Committee | 37, 49-62 |
| Research and development | 20-21 |
| Reserves | 110 |
| Restructuring | 83, 102 |
| Retained profit | 111 |
| Return on invested capital (ROIC) | 24-26 |
| Revenue recognition | 77 |
| Risk management | 9, 63, 100-101 |
| Sarbanes-Oxley | 68 |
| Savoury, dressings and spreads | 6, 81-82 |
| Seasonality | 6 |
| Segment information | 77, 79-82, 132-133 |
| Share-based payments | 77, 117-121 |
| Share capital | 41, 109 |
| Shareholders | 38-39, 149-150 |
| Share prices | 152 |
| Share registration | 159 |
| Staff costs | 84 |
| Statement of recognised income and expense | 71 |
| Strategy | 5 |
| Taxation | 76-77, 85-86 |
| Total shareholder return (TSR) | 24, 27 |
| Treasury | 31 |
| Turnover | 79-82 |
| Unilever Executive (UEx) | 47 |
| UnileverFoodsolutions | 6 |
| Underlying sales growth (USG) | 25 |
| Ungeared free cash flow (UFCF) | 24-26 |
| US GAAP | 124-140, 145 |
| Ventures | 6 |
| Vitality | 21 |
| Voting | 39 |
| Website | 159 |
| 160 | Unilever Annual Report on Form 20-F 2006 |
Back to Contents
Cautionarystatement
This document may contain forward-looking statements, including ‘forward-looking statements’ within the meaning of the United States Private Securities Litigation Reform Act of 1995. Words such as ‘expects’, ‘anticipates’, ‘intends’ or the negative of these terms and other similar expressions of future performance or results, including financial objectives to 2010, and their negatives are intended to identify such forward-looking statements. These forward-looking statements are based upon current expectations and assumptions regarding anticipated developments and other factors affecting the Group. They are not historical facts, nor are they guarantees of future performance. Because these forward-looking statements involve risks and uncertainties, there are important factors that could cause actual results to differ materially from those expressed or implied by these forward-looking statements, including, among others, competitive pricing and activities, consumption levels, costs, the ability to maintain and manage key customer relationships and supply chain sources, currency values, interest rates, the ability to integrate acquisitions and complete planned divestitures, physical risks, environmental risks, the ability to manage regulatory, tax and legal matters and resolve pending matters within current estimates, legislative, fiscal and regulatory developments, political, economic and social conditions in the geographic markets where the Group operates and new or changed priorities of the Boards. Further details of potential risks and uncertainties affecting the Group are described in the Group’s filings with the London Stock Exchange, Euronext Amsterdam and the US Securities and Exchange Commission, including the Annual Report on Form 20-F. These forward-looking statements speak only as of the date of this document. Except as required by any applicable law or regulation, the Group expressly disclaims any obligation or undertaking to release publicly any updates or revisions to any forward-looking statements contained herein to reflect any change in the Group’s expectations with regard thereto or any change in events, conditions or circumstances on which any such statement is based.
Designed and produced by Unilever Communications in conjunction with Addison Corporate Marketing Photography by Igor Emmerich
Typeset by Pauffley, London
Printed by St Ives Westerham Press Ltd.
ISO 14001:2004
This document is printed on Greencoat Plus Velvet which has been independently certified according to the rules of the Forest Stewardship Council (FSC). Greencoat Plus Velvet contains 80% recycled fibre. The manufacturing mill is accredited with the ISO 14001 Environmental Standard. In recognition of its recycled content Greencoat Plus Velvet has also been awarded the NAPM recycled mark. This document is completely recyclable. If you have finished with it and no longer wish to retain it, please pass it on to other interested readers or dispose of it in your recycled paper waste, thank you.
 | |
Back to Contents
Unilever N.V.
Weena 455, PO Box 760
3000 DK Rotterdam
The Netherlands
T +31 (0)10 217 4000
F +31 (0)10 217 4798
Commercial Register Rotterdam
Number: 24051830
Unilever PLC
PO Box 68, Unilever House
100 Victoria Embankment
London EC4P 4BQ
United Kingdom
T +44 (0)20 7822 5252
F +44 (0)20 7822 5951
Unilever PLC registered office
Unilever PLC
Port Sunlight
Wirral
Merseyside CH62 4ZD
United Kingdom
Registered in England and Wales
Company Number: 41424
Unilever United States, Inc.
Investor Relations Department
700 Sylvan Avenue
Englewood Cliffs
NJ 07632
USA
T +1 201 894 2615
F +1 201 894 2222
www.unilever.com
Back to Contents
SIGNATURES
The registrant hereby certifies that it meets all of the requirements for filing on Form 20-F and that it has duly caused and authorised the undersigned to sign this Annual Report on its behalf.
Unilever PLC.
(Registrant)
| /s/ S G Williams | |
| |
| (Signature) | |
| S G Williams, Joint Secretary | |
Date: 26 March 2007
Back to Contents
UNILEVER PLC – 20-F EXHIBIT LIST
Item 19. Exhibits
Exhibit Number Description of Exhibit
| 1.1 | Memorandum and Articles of Association of Unilever PLC, as amended |
| 2.1 | Indenture dated as of August 1, 2000, among Unilever Capital Corporation, Unilever N.V., Unilever PLC, Unilever United States, Inc. and The Bank of New York, as Trustee, relating to Guaranteed Debt Securities 1 |
| 2.2 | Trust Deed dated as of July 22, 1994, among Unilever N.V., Unilever PLC, Unilever Capital Corporation, Unilever United States, Inc. and The Law Debenture Trust Corporation p.l.c., relating to Guaranteed Debt Securities 2 |
| 4.1 | Equalisation Agreement between Unilever N.V. and Unilever PLC |
| 4.2 | Service Contracts of the Executive Directors of Unilever PLC 3 |
| 4.3 | Letters regarding compensation of Executive Directors of Unilever PLC |
| 4.4 | Unilever North America 2002 Omnibus Equity Compensation Plan 4 |
| 4.5 | The Unilever PLC International 1997 Executive Share Option Scheme 5 |
| 4.6 | The Unilever Long Term Incentive Plan 6 |
| 4.7 | The Global Performance Share Plan 2005 |
| 7.1 | Computation of Ratio of earnings to fixed charges and Return on invested capital 7 |
| 8.1 | List of Subsidiaries 8 |
| 10.1 | Consent of PricewaterhouseCoopers Accountants N.V. and PricewaterhouseCoopers LLP |
| 12.1 | Certifications of the Group Chief Executive and Financial Director/Chief Financial Officer pursuant to Section 302 of the Sarbanes-Oxley Act of 2002 |
| 13.1 | Certifications of the Group Chief Executive and Financial Director/Chief Financial Officer pursuant to Section 906 of the Sarbanes-Oxley Act of 2002 |
Certain instruments which define rights of holders of long-term debt of the Company and its subsidiaries are not being filed because the total amount of securities authorized under each such instrument does not exceed 10% of the total consolidated assets of the Company and its subsidiaries. The Company and its subsidiaries hereby agree to furnish a copy of each such instrument to the Securities and Exchange Commission upon request.
| 1 | Incorporated by reference to the Form 6-K furnished to the SEC on October 23, 2000. |
| 2 | Incorporated by reference to Exhibit 2.2 of Form 20-F filed with the SEC on March 28, 2002. |
| 3 | Incorporated by reference to Exhibit 4.2 of Form 20-F filed with the SEC on March 29, 2006. |
| 4 | Incorporated by reference to Exhibit 99.1 of Form S-8 filed with the SEC on February 27, 2003. |
| 5 | Incorporated by reference to Exhibit 4.5 of Form 20-F filed with the SEC on March 28, 2002. |
| 6 | Incorporated by reference to Exhibit 4.7 of Form 20-F filed with the SEC on March 28, 2002. |
| 7 | The required information is set forth on page 141 of the Annual Report on Form 20-F. |
| 8 | The required information is set forth on pages 147-148 of the Annual Report on Form 20-F. |