Provisions related to excess lease costs for onerous contracts are reduced by assumed sub-lease income for the periods impacted.
The lease for this transaction is payable from 30 March 2007 until the lease expiry date of 29 September 2027.
Back to Contents
Additional information for US investors(continued)
Unilever Group
Financial Instruments
Under the rules governing the transition to IFRSs, Unilever has adopted IAS 32/39 on financial instruments from 1 January 2005. Unilever’s accounting policies in respect of derivative financial instruments under IFRSs are described in note 1 on page 83. There are minor differences between these and the application of US GAAP from 1 January 2005.
In particular, from 1 January 2005, Unilever recognises all derivative financial instruments on balance sheet at fair value and applies hedge accounting to a portion of its portfolio of derivative financial instruments, meaning that changes in the fair value of derivative financial instruments that are designated and effective as hedges of future cash flows are recognised directly in equity and any ineffective portion is recognised immediately in the income statement.
Prior to the adoption of IAS 32/39 on 1 January 2005, Unilever applied hedge accounting to its portfolio of derivative financial instruments, meaning that changes in the value of forward exchange contracts were recognised in the results in the same period as changes in the values of the assets and liabilities they were intended to hedge. Interest payments and receipts arising from interest rate derivatives such as swaps and forward rate agreements were matched to those arising from underlying debt and investment positions. Payments made or received in respect of the early termination of derivative instruments were spread over the original life of the instrument so long as the underlying exposure continues to exist.
Prior to 1 January 2005, Unilever had not designated any of its derivative financial instruments as qualifying hedge instruments under US FAS 133 and accordingly, under US GAAP, all derivative financial instruments were valued at fair value with changes in fair value reflected in the income statement.
Investments
The adoption of IAS 32/39 eliminates any previous divergence between Unilever’s accounting for non-derivative financial instruments and US GAAP. A divergence therefore only exists in the 2004 comparative figures.
Prior to 1 January 2005 Unilever accounted for changes in the market value of current investments as interest receivable in the income statement for the year. Non-current investments, other than interests in joint ventures and associates, are stated at cost less any amounts written off to reflect a permanent impairment. Under US GAAP, such current asset investments are generally classified as ‘available for sale securities’ and changes in market values, which represent unrealised gains or losses, are excluded from earnings and taken to stockholders’ equity unless such losses are deemed to be other than temporary at which time they are recognised through the income statement. Unrealised gains and losses arising from changes in the market values of securities available for sale are not material at 31 December 2004.
Preference shares
Under IAS 32, Unilever recognises preference shares that provide a fixed preference dividend as borrowings with preference dividends recognised in the income statement. Under US GAAP such preference shares are classified in shareholders’ equity with dividends treated as a deduction to shareholder’s equity.
Pensions
Under IAS 19, the expected costs of providing retirement benefits are charged to the income statement over the periods benefiting from the employees’ services. Variations from the expected cost are recognised as they occur in the statement of recognised income and expense . The assets and liabilities of pension plans are included in the Group balance sheet at fair value. Under US GAAP, pensions costs and liabilities are accounted for in accordance with the prescribed actuarial method and measurement principles of FAS 87. The most significant difference is that variations from the expected costs are recognised in the income statement over the expected service lives of the employees.
Under US GAAP, an additional minimum liability is recognised and a charge made to other comprehensive income when the accumulated benefit obligation exceeds the fair value of plan assets to the extent that this amount is not covered by the net liability recognised in the balance sheet.
Deferred tax
Under IFRSs, a provision is made on unremitted earnings of controlled group companies to the extent that the distributions are considered probable. US GAAP requires full provision to be made assuming all earnings will be distributed, unless those earnings can be recovered tax-free or will be permanently reinvested in the controlled group company.
Under IFRSs, deferred tax on share-based compensation is provided based on the actual tax credit expected to be received using the fair market value of the share price at the year end (the intrinsic value). The deferred tax is credited to the income statement to the extent of the tax recognised on the share-based compensation charge with the excess recognised directly in equity. Under US GAAP, deferred tax on the share-based awards that ordinarily result in future tax deductions is recognised to the extent of the cumulative amount of compensation cost recognised through the income statement. Tax deductions inherent in the current fair value of the entity’s stock are not taken into account.
Profit or loss on disposal of businesses
Under both IFRSs and US GAAP, Unilever calculates profit or loss on sale of businesses net of goodwill included on the balance sheet and after the write-back of cumulative currency retranslation differences. Under previous GAAP, goodwill and intangible assets purchased prior to 1 January 1998 were written off in the year of acquisition as a movement in profits retained. Under US GAAP, such goodwill and intangible assets were capitalised and, prior to 1 January 2002, were amortised over their useful lives. These different accounting treatments give rise to differences between net profit or loss calculated under IFRSs and that calculated under US GAAP. The additional goodwill and intangibles recorded under US GAAP for our UCI business means that the US GAAP profit on disposal of this business is €217 million lower than that reported under IFRSs. Under IFRSs, cumulative currency retranslation differences arising from the transition date to IFRSs of 1 January 2004 are included in the calculation whereas under US GAAP the profit or loss on disposal includes cumulative currency retranslation differences which have arisen since the date that the businesses were originally acquired.
Currency Recycling
Under IFRSs, the gain from cumulative translation differences arising from the partial repayment of capital of a subsidiary is recognised within the income statement. Under US GAAP, currency translation gains and losses are only recycled to the income statement on the sale or upon the complete or substantially complete liquidation of the investment.
| 160 | Unilever Annual Report and Accounts 2005 |
Back to Contents
Financial Statements |
Additional information for US investors (continued)
Unilever Group
Classification differences between IFRSs and US GAAP
Cash flow statement
Under US GAAP, various items would be reclassified within the consolidated cash flow statement. In particular, interest received and interest paid would be part of net cash flow from operating activities. In addition, under US GAAP, cash and cash equivalents comprise cash balances and cash equivalents with an original maturity at the date of investment of less than three months. Under Unilever’s presentation, cash and cash equivalents are net of bank overdrafts. Cash flows from movements in bank overdrafts would be classified as part of cash flows from financingactivities under US GAAP. Cash flows from movements in bank overdrafts were €61 million for the year ended 31 December 2005 (2004: €(134) million).
Recent accounting developments
In November 2004, the Financial Accounting Standards Board (FASB) issued FASB Statement No. 151 ‘Inventory Costs – an amendment ofARB 43’ (FAS 151). The standard clarifies that abnormal amounts of idle facility expense, freight, handling costs, and wasted materials (spoilage)should be recognised as current-period charges. In addition, FAS 151 requires that the allocation of fixed production overheads to inventory values be based on the normal capacity of the production facilities. The provisions of FAS 151 will be effective for inventory costs incurredduring reporting periods beginning after 15 June 2005. FAS 151 does not have an impact on the results of operations or financial position ofUnilever since the key elements are already applied in Unilever’s financial statements.
In December 2004, the FASB issued a revision of FASB Statement No. 123 – ‘Share-Based Payments’ (FAS 123(R)) which also supersedes APB Opinion No. 25 – ‘Accounting for Stock Issued to Employees’. Generally the valuation methods contained in FAS 123(R) are similar to those in FAS 123, but FAS 123(R) requires all share-based payments to employees, including grants of employee share options, to be charged to thestatement of income. Pro forma disclosure is no longer an alternative. With limited exceptions, the amount charged to the statement of incomefor share options will be measured based on the grant date fair value of the option amortised over the period to the date of vesting of theaward. FAS 123(R) is effective for annual reporting periods beginning after 15 June 2005. The company is currently evaluating the provisions of this Statement. The adoption of FAS 123(R) is not expected to have a significant impact on the consolidated results of operations or financialposition of Unilever as Unilever adopted the fair value measurement provisions of FAS 123 in 2003.
In March 2005 the FASB issued Financial Interpretation No. 47 ‘Accounting for Conditional Asset Retirement Obligations’ (FIN 47), whichclarifies the term conditional asset retirement obligation used in FAS 143. Unilever will apply the standard to the financial year beginning on1 January 2006; this is not expected to have a material impact on the consolidated results of operations or financial position of Unilever.
In May 2005 the FASB issued FASB Statement No. 154 ‘Accounting changes and error corrections’ (FAS 154) as a replacement of APB OpinionNo. 20 ‘Accounting changes’ and FASB Statement No. 3 ‘Reporting Accounting Changes in Interim Financial Statements’, which has to beapplied for financial years beginning on or after 15 December 2005. It requires retrospective application, and Unilever will apply the standard tothe financial year beginning on 1 January 2006. The adoption is not expected to have a material effect on the consolidated results of operations or financial position of Unilever.
Documents on display in the United States
Unilever files and furnishes reports and information with the United States Securities and Exchange Commission (SEC). Such reports andinformation can be inspected and copied at the SEC’s public reference facilities in Washington DC, Chicago and New York. Certain of ourreports and other information that we file or furnish to the SEC are also available to the public over the internet on the SEC’s website atwww.sec.gov.
| Unilever Annual Report and Accounts 2005 | 161 |
Back to Contents
Additional information for US investors(continued)
Unilever Group
Summarised presentation of the NV and PLC parts of the Group
NV and PLC and their group companies constitute a single reporting entity for the purposes of presenting consolidated accounts. The following supplemental information shows the consolidated income statement and balance sheet of the Group analysed according to the relative legal ownership of individual entities by NV or PLC.
| | € million | | € million | | € million | | € million | | € million | | € million | |
| | NV | | NV | | PLC | | PLC | | Total | | Total | |
| Income statementfor the year ended 31 December | 2005 | | 2004 | | 2005 | | 2004 | | 2005 | | 2004 | |
|
|
|
|
|
|
|
|
|
|
|
| |
| Continuing operations: | | | | | | | | | | | | |
| | | | | | | | | | | | | |
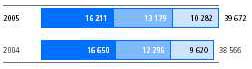
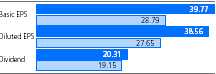
| Turnover | 27 159 | | 26 078 | | 12 513 | | 12 488 | | 39 672 | | 38 566 | |
| | | | | | | | | | | | | |
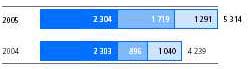
| Operating profit | 3 682 | | 2 814 | | 1 632 | | 1 425 | | 5 314 | | 4 239 | |
| Net finance costs | (472 | ) | (379 | ) | (146 | ) | (251 | ) | (618 | ) | (630 | ) |
| Share in net profit of joint ventures | 35 | | 30 | | 12 | | 9 | | 47 | | 39 | |
| Share in net profit of associates | (12 | ) | 8 | | (13 | ) | (6 | ) | (25 | ) | 2 | |
| Other income from non-current investments | 20 | | 35 | | 13 | | 19 | | 33 | | 54 | |
| |
|
|
|
|
|
|
|
|
|
|
| |
| Profit before taxation | 3 253 | | 2 508 | | 1 498 | | 1 196 | | 4 751 | | 3 704 | |
| Taxation | (814 | ) | (520 | ) | (435 | ) | (290 | ) | (1 249 | ) | (810 | ) |
| |
|
|
|
|
|
|
|
|
|
|
| |
| Net profit from continuing operations | 2 439 | | 1 988 | | 1 063 | | 906 | | 3 502 | | 2 894 | |
| Net profit from discontinued operations | 367 | | 36 | | 106 | | 11 | | 473 | | 47 | |
| |
|
|
|
|
|
|
|
|
|
|
| |
| Net profit | 2 806 | | 2 024 | | 1 169 | | 917 | | 3 975 | | 2 941 | |
| | | | | | | | | | | | | |
| Attributable to: | | | | | | | | | | | | |
| Minority interest | 57 | | 56 | | 152 | | 130 | | 209 | | 186 | |
| Shareholders’ equity | 2 749 | | 1 968 | | 1 017 | | 787 | | 3 766 | | 2 755 | |
|
|
|
|
|
|
|
|
|
|
|
| |
| | | | | | | | | | | | | |
| | € million | | € million | | € million | | € million | | € million | | € million | |
| | NV | | NV | | PLC | | PLC | | Total | | Total | |
| Balance sheetas at 31 December | 2005 | | 2004 | | 2005 | | 2004 | | 2005 | | 2004 | |
|
|
|
|
|
|
|
|
|
|
|
| |
| Goodwill and intangible assets | 14 152 | | 13 268 | | 3 903 | | 3 739 | | 18 055 | | 17 007 | |
| Property, plant and equipment | 4 321 | | 4 115 | | 2 171 | | 2 066 | | 6 492 | | 6 181 | |
| Pension asset for funded schemes in surplus | 966 | | 558 | | 70 | | 67 | | 1 036 | | 625 | |
| Deferred tax assets | 961 | | 948 | | 742 | | 543 | | 1 703 | | 1 491 | |
| Other non-current assets | 695 | | 721 | | 377 | | 343 | | 1 072 | | 1 064 | |
| |
|
|
|
|
|
|
|
|
|
|
| |
| Total non-current assets | 21 095 | | 19 610 | | 7 263 | | 6 758 | | 28 358 | | 26 368 | |
| | | | | | | | | | | | | |
| Assets held for sale | 166 | | n/a | | 51 | | n/a | | 217 | | n/a | |
| | | | | | | | | | | | | |
| Inventories | 2 661 | | 2 436 | | 1 446 | | 1 320 | | 4 107 | | 3 756 | |
| Trade and other current receivables | 3 628 | | 3 026 | | 1 202 | | 1 105 | | 4 830 | | 4 131 | |
| Other financial assets | 235 | | 707 | | 100 | | 306 | | 335 | | 1 013 | |
| Cash and cash equivalents | 941 | | 1 109 | | 588 | | 481 | | 1 529 | | 1 590 | |
| |
|
|
|
|
|
|
|
|
|
|
| |
| Total current assets | 7 465 | | 7 278 | | 3 336 | | 3 212 | | 10 801 | | 10 490 | |
| | | | | | | | | | | | | |
| Borrowings due within one year | (5 506 | ) | (4 101 | ) | (436 | ) | (1 054 | ) | (5 942 | ) | (5 155 | ) |
| Trade payables and other current liabilities | (6 032 | ) | (5 720 | ) | (2 626 | ) | (2 512 | ) | (8 658 | ) | (8 232 | ) |
| Restructuring and other provisions | (460 | ) | (555 | ) | (184 | ) | (244 | ) | (644 | ) | (799 | ) |
| |
|
|
|
|
|
|
|
|
|
|
| |
| Total current liabilities | (11 998 | ) | (10 376 | ) | (3 246 | ) | (3 810 | ) | (15 244 | ) | (14 186 | ) |
| |
|
|
|
|
|
|
|
|
|
|
| |
| Net current assets/(liabilities) | (4 533 | ) | (3 098 | ) | 90 | | (598 | ) | (4 443 | ) | (3 696 | ) |
| |
|
|
|
|
|
|
|
|
|
|
| |
| Total assets less current liabilities | 16 728 | | 16 512 | | 7 404 | | 6 160 | | 24 132 | | 22 672 | |
|
|
|
|
|
|
|
|
|
|
|
| |
| Borrowings due after one year | 5 484 | | 5 969 | | 973 | | 924 | | 6 457 | | 6 893 | |
| Pension liability for funded schemes in deficit | 757 | | 698 | | 1 658 | | 1 641 | | 2 415 | | 2 339 | |
| Pension liability for unfunded schemes | 3 040 | | 2 726 | | 1 162 | | 1 014 | | 4 202 | | 3 740 | |
| Restructuring and other provisions | 635 | | 480 | | 97 | | 85 | | 732 | | 565 | |
| Deferred tax liabilities | 770 | | 693 | | 163 | | 96 | | 933 | | 789 | |
| Other non-current liabilities | 338 | | 428 | | 264 | | 289 | | 602 | | 717 | |
| |
|
|
|
|
|
|
|
|
|
|
| |
| Total non-current liabilities | 11 024 | | 10 994 | | 4 317 | | 4 049 | | 15 341 | | 15 043 | |
| | | | | | | | | | | | | |
| Liabilities held for sale | 16 | | n/a | | 10 | | n/a | | 26 | | n/a | |
| | | | | | | | | | | | | |
| Intra-group – NV/PLC | (1 932 | ) | (2 779 | ) | 1 932 | | 2 779 | | – | | – | |
| | | | | | | | | | | | | |
| Shareholders’ equity | 7 571 | | 8 243 | | 790 | | (979 | ) | 8 361 | | 7 264 | |
| Minority interests | 49 | | 54 | | 355 | | 311 | | 404 | | 365 | |
| |
|
|
|
|
|
|
|
|
|
|
| |
| Total equity | 7 620 | | 8 297 | | 1 145 | | (668 | ) | 8 765 | | 7 629 | |
| |
|
|
|
|
|
|
|
|
|
|
| |
| Total capital employed | 16 728 | | 16 512 | | 7 404 | | 6 160 | | 24 132 | | 22 672 | |
|
|
|
|
|
|
|
|
|
|
|
| |
The negative reserves shown for the PLC part of this analysis for 2004 arise largely because of an accounting policy of writing off goodwill in previous years. These write-offs do not have an impact on distributable reserves. See also note 26 on page 126 in connection with the impact of the implementation of IAS 32 and IAS 39 in 2005.
| 162 | Unilever Annual Report and Accounts 2005 |
Back to Contents
Financial Statements |
Additional information for US investors(continued)
Unilever Group
Guarantor statements
On 2 October 2000, NV and Unilever Capital Corporation (UCC) filed a US $15 billion Shelf registration, which is unconditionally and fully guaranteed, jointly and severally, by NV, PLC and Unilever United States, Inc. (UNUS). Of the US $15 billion Shelf registration, US $2.75 billion of Notes were outstanding at 31 December 2005 (2004: US $4.25 billion) with coupons ranging from 5.90% to 7.125%. These Notes are repayable between 1 November 2010 and 15 November 2032.
Provided below are the income statements, cash flow statements and balance sheets of each of the companies discussed above, together with the income statement, cash flow statement and balance sheet of non-guarantor subsidiaries. These have been prepared under the historical cost convention, and, aside from the basis of accounting for investments at net asset value (equity accounting), comply in all material respects with International Financial Reporting Standards. Divergences from US GAAP are disclosed on pages 157 to 161. We have not provided reconciliations from the accounting principles used by Unilever to US GAAP for the columns relating to the guarantor entities, as such reconciliations would not materially affect an investor’s understanding of the nature of this guarantee. The financial information in respect of NV, PLC and UNUS has been prepared with all subsidiaries accounted for on an equity basis. The financial information in respect of the non-guarantor subsidiaries has been prepared on a consolidated basis.
| | € million | | € million | | € million | | € million | | € million | | € million | | € million | |
| | Unilever | | Unilever | | | | Unilever | | | | | | | |
| | Capital | | N.V. | | | | United | | | | | | | |
| | Corporation | | parent | | Unilever PLC | | States Inc. | | Non- | | | | | |
| Income statement | subsidiary | | issuer/ | | parent | | subsidiary | | guarantor | | | | Unilever | |
| for the year ended 31 December 2005 | issuer | | guarantor | | guarantor | | guarantor | | subsidiaries | | Eliminations | | Group | |
|
|
|
|
|
|
|
|
|
|
|
|
|
| |
| Continuing operations: | | | | | | | | | | | | | | |
| | | | | | | | | | | | | | | |
| Turnover | – | | – | | – | | – | | 39 672 | | – | | 39 672 | |
| |
|
|
|
|
|
|
|
|
|
|
|
|
| |
| Operating profit | – | | 87 | | (61 | ) | (3 | ) | 5 291 | | – | | 5 314 | |
| |
|
|
|
|
|
|
|
|
|
|
|
|
| |
| Finance income | – | | 61 | | 11 | | – | | 58 | | – | | 130 | |
| Finance costs | (241 | ) | (274 | ) | (2 | ) | (3 | ) | (173 | ) | – | | (693 | ) |
| Pensions and similar obligations | – | | (5 | ) | – | | (61 | ) | 11 | | – | | (55 | ) |
| Intercompany finance costs | 256 | | 509 | | (11 | ) | (40 | ) | (714 | ) | – | | – | |
| Dividends | – | | 1 043 | | 856 | | – | | (1 899 | ) | – | | – | |
| Share of net profit/(loss) of joint ventures | – | | – | | – | | – | | 47 | | – | | 47 | |
| Share of net profit/(loss) of associates | – | | – | | – | | – | | (25 | ) | – | | (25 | ) |
| Other income from non-current investments | – | | – | | – | | – | | 33 | | – | | 33 | |
| |
|
|
|
|
|
|
|
|
|
|
|
|
| |
| Profit before taxation | 15 | | 1 421 | | 793 | | (107 | ) | 2 629 | | – | | 4 751 | |
| Taxation | (5 | ) | (118 | ) | 36 | | 45 | | (1 207 | ) | – | | (1 249 | ) |
| |
|
|
|
|
|
|
|
|
|
|
|
|
| |
| Net profit from continuing operations | 10 | | 1 303 | | 829 | | (62 | ) | 1 422 | | – | | 3 502 | |
| | | | | | | | | | | | | | | |
| Net profit from discontinued operations | – | | – | | – | | – | | 473 | | – | | 473 | |
| Equity earnings of subsidiaries | – | | 2 463 | | 2 937 | | 732 | | – | | (6 132 | ) | – | |
| |
|
|
|
|
|
|
|
|
|
|
|
|
| |
| Net profit | 10 | | 3 766 | | 3 766 | | 670 | | 1 895 | | (6 132 | ) | 3 975 | |
| |
|
|
|
|
|
|
|
|
|
|
|
|
| |
| Attributable to: | | | | | | | | | | | | | | |
| Minority interest | – | | – | | – | | – | | 209 | | – | | 209 | |
| Shareholders’ equity | 10 | | 3 766 | | 3 766 | | 670 | | 1 686 | | (6 132 | ) | 3 766 | |
|
|
|
|
|
|
|
|
|
|
|
|
|
| |
| | | | | | | | | | | | | | | |
| Income statement | | | | | | | | | | | | | | |
| for the year ended 31 December 2004 | | | | | | | | | | | | | | |
|
|
|
|
|
|
|
|
|
|
|
|
|
| |
| Continuing operations: | | | | | | | | | | | | | | |
| | | | | | | | | | | | | | | |
| Turnover | – | | – | | – | | – | | 38 566 | | – | | 38 566 | |
| |
|
|
|
|
|
|
|
|
|
|
|
|
| |
| Operating profit | – | | 59 | | 33 | | 6 | | 4 141 | | – | | 4 239 | |
| |
|
|
|
|
|
|
|
|
|
|
|
|
| |
| Finance income | – | | 26 | | 6 | | – | | 113 | | – | | 145 | |
| Finance costs | (282 | ) | (160 | ) | (2 | ) | (3 | ) | (270 | ) | – | | (717 | ) |
| Pensions and similar obligations | – | | (6 | ) | – | | (10 | ) | (42 | ) | – | | (58 | ) |
| Intercompany finance costs | 296 | | 211 | | (3 | ) | (22 | ) | (482 | ) | – | | – | |
| Dividends | – | | 1 960 | | 770 | | – | | (2 730 | ) | – | | – | |
| Share of net profit/(loss) of joint ventures | – | | – | | – | | – | | 39 | | – | | 39 | |
| Share of net profit/(loss) of associates | – | | – | | – | | – | | 2 | | – | | 2 | |
| Other income from non-current investments | – | | – | | – | | – | | 54 | | – | | 54 | |
| |
|
|
|
|
|
|
|
|
|
|
|
|
| |
| Profit before taxation | 14 | | 2 090 | | 804 | | (29 | ) | 825 | | – | | 3 704 | |
| Taxation | (5 | ) | 35 | | 16 | | 11 | | (867 | ) | – | | (810 | ) |
| |
|
|
|
|
|
|
|
|
|
|
|
|
| |
| Net profit from continuing operations | 9 | | 2 125 | | 820 | | (18 | ) | (42 | ) | – | | 2 894 | |
| | | | | | | | | | | | | | | |
| Net profit from discontinued operations | – | | – | | – | | – | | 47 | | – | | 47 | |
| Equity earnings of subsidiaries | – | | 630 | | 1 935 | | (76 | ) | – | | (2 489 | ) | – | |
| |
|
|
|
|
|
|
|
|
|
|
|
|
| |
| Net profit | 9 | | 2 755 | | 2 755 | | (94 | ) | 5 | | (2 489 | ) | 2 941 | |
| |
|
|
|
|
|
|
|
|
|
|
|
|
| |
| Attributable to: | | | | | | | | | | | | | | |
| Minority interest | – | | – | | – | | – | | 186 | | – | | 186 | |
| Shareholders’ equity | 9 | | 2 755 | | 2 755 | | (94 | ) | (181 | ) | (2 489 | ) | 2 755 | |
|
|
|
|
|
|
|
|
|
|
|
|
|
| |
| Unilever Annual Report and Accounts 2005 | 163 |
Back to Contents
Additional information for US investors(continued)
Unilever Group
| Guarantor statements(continued) | | | | | | | | | | | | | | |
| | € million | | € million | | € million | | € million | | € million | | € million | | € million | |
| | Unilever | | Unilever | | | | Unilever | | | | | | | |
| | Capital | | N.V. | | | | United | | | | | | | |
| | Corporation | | parent | | Unilever PLC | | States Inc. | | Non- | | | | | |
| | subsidiary | | issuer/ | | parent | | subsidiary | | guarantor | | | | Unilever | |
| Balance sheetas at 31 December 2005 | issuer | | guarantor | | guarantor | | guarantor | | subsidiaries | | Eliminations | | Group | |
|
|
|
|
|
|
|
|
|
|
|
|
|
| |
| | | | | | | | | | | | | | | |
| Goodwill and intangible assets | – | | 32 | | 54 | | – | | 17 969 | | – | | 18 055 | |
| Property, plant and equipment | – | | – | | – | | 6 | | 6 486 | | – | | 6 492 | |
| Pension asset for funded schemes in surplus | – | | – | | – | | 67 | | 969 | | – | | 1 036 | |
| Deferred tax assets | – | | – | | – | | 1 012 | | 691 | | – | | 1 703 | |
| Other non-current assets | – | | 16 | | – | | 11 | | 1 045 | | – | | 1 072 | |
| Amounts due from group companies after one year | 2 512 | | 6 628 | | 102 | | 1 281 | | (10 523 | ) | – | | – | |
| Net assets of subsidiaries (equity accounted) | – | | 11 176 | | 9 823 | | 6 234 | | (14 593 | ) | (12 640 | ) | – | |
| |
|
|
|
|
|
|
|
|
|
|
|
|
| |
| Total non-current assets | 2 512 | | 17 852 | | 9 979 | | 8 611 | | 2 044 | | (12 640 | ) | 28 358 | |
| |
|
|
|
|
|
|
|
|
|
|
|
|
| |
| Assets held for sale | – | | – | | – | | – | | 217 | | – | | 217 | |
| | | | | | | | | | | | | | | |
| Inventories | – | | – | | – | | – | | 4 107 | | – | | 4 107 | |
| Amounts due from group companies within one year | – | | 19 619 | | 294 | | – | | (19 913 | ) | – | | – | |
| Trade and other current receivables | – | | 635 | | 35 | | 34 | | 4 126 | | – | | 4 830 | |
| Other financial assets | – | | – | | – | | – | | 335 | | – | | 335 | |
| Cash and cash equivalents | 35 | | 163 | | – | | (3 | ) | 1 334 | | – | | 1 529 | |
| |
|
|
|
|
|
|
|
|
|
|
|
|
| |
| Total current assets | 35 | | 20 417 | | 329 | | 31 | | (10 011 | ) | – | | 10 801 | |
| |
|
|
|
|
|
|
|
|
|
|
|
|
| |
| Borrowings due within one year | – | | (4 548 | ) | – | | – | | (1 394 | ) | – | | (5 942 | ) |
| Amounts due to group companies within one year | – | | (22 027 | ) | (1 871 | ) | – | | 23 898 | | – | | – | |
| Restructuring and other provisions | – | | (16 | ) | – | | (5 | ) | (623 | ) | – | | (644 | ) |
| Trade payables and other current liabilities | (31 | ) | (534 | ) | (64 | ) | (57 | ) | (7 972 | ) | – | | (8 658 | ) |
| |
|
|
|
|
|
|
|
|
|
|
|
|
| |
| Total current liabilities | (31 | ) | (27 125 | ) | (1 935 | ) | (62 | ) | 13 909 | | – | | (15 244 | ) |
| |
|
|
|
|
|
|
|
|
|
|
|
|
| |
| Net current assets/(liabilities) | 4 | | (6 708 | ) | (1 606 | ) | (31 | ) | 3 898 | | – | | (4 443 | ) |
| |
|
|
|
|
|
|
|
|
|
|
|
|
| |
| Total assets less current liabilities | 2 516 | | 11 144 | | 8 373 | | 8 580 | | 6 159 | | (12 640 | ) | 24 132 | |
|
|
|
|
|
|
|
|
|
|
|
|
|
| |
| | | | | | | | | | | | | | | |
| Borrowings due after one year | 2 296 | | 2 442 | | – | | – | | 1 719 | | – | | 6 457 | |
| Amounts due to group companies after one year | – | | – | | – | | – | | – | | – | | – | |
| Pension liability for funded schemes in deficit | – | | – | | – | | 372 | | 2 043 | | – | | 2 415 | |
| Pension liability for unfunded schemes | – | | 159 | | – | | 1 260 | | 2 783 | | – | | 4 202 | |
| Restructuring and other provisions | – | | 32 | | – | | 3 | | 697 | | – | | 732 | |
| Deferred tax liabilities | – | | 94 | | 12 | | – | | 827 | | – | | 933 | |
| Other non-current liabilities | – | | 56 | | – | | 202 | | 344 | | – | | 602 | |
| |
|
|
|
|
|
|
|
|
|
|
|
|
| |
| Total non-current liabilities | 2 296 | | 2 783 | | 12 | | 1 837 | | 8 413 | | – | | 15 341 | |
| |
|
|
|
|
|
|
|
|
|
|
|
|
| |
| Liabilities held for sale | – | | – | | – | | – | | 26 | | – | | 26 | |
| | | | | | | | | | | | | | | |
| Shareholders equity attributable to: | | | | | | | | | | | | | | |
| PLC | – | | 790 | | – | | – | | – | | (790 | ) | – | |
| NV | – | | – | | 7 571 | | – | | – | | (7 571 | ) | – | |
| Called up share capital | – | | 290 | | 222 | | – | | – | | – | | 512 | |
| Share premium account | – | | 25 | | 137 | | – | | – | | – | | 162 | |
| Other reserves | (5 | ) | (1 465 | ) | (863 | ) | (291 | ) | (393 | ) | 689 | | (2 328 | ) |
| Retained profit | 225 | | 8 721 | | 1 294 | | 7 034 | | (2 291 | ) | (4 968 | ) | 10 015 | |
| |
|
|
|
|
|
|
|
|
|
|
|
|
| |
| Total shareholders’ equity | 220 | | 8 361 | | 8 361 | | 6 743 | | (2 684 | ) | (12 640 | ) | 8 361 | |
| Minority interests | – | | – | | – | | – | | 404 | | – | | 404 | |
| |
|
|
|
|
|
|
|
|
|
|
|
|
| |
| Total equity | 220 | | 8 361 | | 8 361 | | 6 743 | | (2 280 | ) | (12 640 | ) | 8 765 | |
| |
|
|
|
|
|
|
|
|
|
|
|
|
| |
| Total capital employed | 2 516 | | 11 144 | | 8 373 | | 8 580 | | 6 159 | | (12 640 | ) | 24 132 | |
|
|
|
|
|
|
|
|
|
|
|
|
|
| |
| 164 | Unilever Annual Report and Accounts 2005 |
Back to Contents
Financial Statements |
Additional information for US investors(continued)
Unilever Group
| Guarantor statements(continued) | | | | | | | | | | | | | | |
| | € million | | € million | | € million | | € million | | € million | | € million | | € million | |
| | Unilever | | Unilever | | | | Unilever | | | | | | | |
| | Capital | | N.V. | | | | United | | | | | | | |
| | Corporation | | parent | | Unilever PLC | | States Inc. | | Non- | | | | | |
| | subsidiary | | issuer/ | | parent | | subsidiary | | guarantor | | | | Unilever | |
| Balance sheetas at 31 December 2004 | issuer | | guarantor | | guarantor | | guarantor | | subsidiaries | | Eliminations | | Group | |
|
|
|
|
|
|
|
|
|
|
|
|
|
| |
| Goodwill and intangible assets | – | | 10 | | 49 | | – | | 16 948 | | – | | 17 007 | |
| Property, plant and equipment | – | | – | | – | | 4 | | 6 177 | | – | | 6 181 | |
| Pension asset for funded schemes in surplus | – | | – | | – | | 70 | | 555 | | – | | 625 | |
| Deferred tax assets | – | | – | | – | | 585 | | 906 | | – | | 1 491 | |
| Other non-current assets(a) | 17 | | 445 | | 27 | | 11 | | 564 | | – | | 1 064 | |
| Amounts due from group companies after one year | 3 811 | | 710 | | 65 | | 678 | | (5 264 | ) | – | | – | |
| Net assets of subsidiaries (equity accounted)(a) | – | | 8 578 | | 8 528 | | 7 898 | | (14 004 | ) | (11 000 | ) | – | |
| |
|
|
|
|
|
|
|
|
|
|
|
|
| |
| Total non-current assets | 3 828 | | 9 743 | | 8 669 | | 9 246 | | 5 882 | | (11 000 | ) | 26 368 | |
| |
|
|
|
|
|
|
|
|
|
|
|
|
| |
| Assets held for sale | n/a | | n/a | | n/a | | n/a | | n/a | | n/a | | n/a | |
| Inventories | – | | – | | – | | – | | 3 756 | | – | | 3 756 | |
| Amounts due from group companies within one year | – | | 17 053 | | 273 | | – | | (17 326 | ) | – | | – | |
| Trade and other current receivables | – | | 135 | | 48 | | 116 | | 3 832 | | – | | 4 131 | |
| Other financial assets | – | | – | | – | | – | | 1 013 | | – | | 1 013 | |
| Cash and cash equivalents | 10 | | 280 | | – | | (3 | ) | 1 303 | | – | | 1 590 | |
| |
|
|
|
|
|
|
|
|
|
|
|
|
| |
| Total current assets | 10 | | 17 468 | | 321 | | 113 | | (7 422 | ) | – | | 10 490 | |
| |
|
|
|
|
|
|
|
|
|
|
|
|
| |
| Borrowings due within one year | (1 618 | ) | (2 149 | ) | (71 | ) | – | | (1 317 | ) | – | | (5 155 | ) |
| Amounts due to group companies within one year | – | | (14 443 | ) | (1 549 | ) | – | | 15 992 | | – | | – | |
| Restructuring and other provisions | – | | (49 | ) | – | | (4 | ) | (746 | ) | – | | (799 | ) |
| Trade payables and other current liabilities | (40 | ) | (203 | ) | (93 | ) | (58 | ) | (7 838 | ) | – | | (8 232 | ) |
| |
|
|
|
|
|
|
|
|
|
|
|
|
| |
| Total current liabilities | (1 658 | ) | (16 844 | ) | (1 713 | ) | (62 | ) | 6 091 | | – | | (14 186 | ) |
| |
|
|
|
|
|
|
|
|
|
|
|
|
| |
| Net current assets/(liabilities) | (1 648 | ) | 624 | | (1 392 | ) | 51 | | (1 331 | ) | – | | (3 696 | ) |
| |
|
|
|
|
|
|
|
|
|
|
|
|
| |
| Total assets less current liabilities | 2 180 | | 10 367 | | 7 277 | | 9 297 | | 4 551 | | (11 000 | ) | 22 672 | |
|
|
|
|
|
|
|
|
|
|
|
|
|
| |
| Borrowings due after one year | 1 999 | | 2 844 | | – | | – | | 2 050 | | – | | 6 893 | |
| Amounts due to group companies after one year | – | | – | | – | | – | | – | | – | | – | |
| Pension liability for funded schemes in deficit | – | | – | | – | | 245 | | 2 094 | | – | | 2 339 | |
| Pension liability for unfunded schemes | – | | 156 | | – | | 356 | | 3 228 | | – | | 3 740 | |
| Restructuring and other provisions | – | | – | | – | | – | | 565 | | – | | 565 | |
| Deferred tax liabilities | – | | 59 | | 14 | | – | | 716 | | – | | 789 | |
| Other non-current liabilities | – | | 44 | | – | | 184 | | 489 | | – | | 717 | |
| |
|
|
|
|
|
|
|
|
|
|
|
|
| |
| Total non-current liabilities | 1 999 | | 3 103 | | 14 | | 785 | | 9 142 | | – | | 15 043 | |
| |
|
|
|
|
|
|
|
|
|
|
|
|
| |
| Liabilities held for sale | n/a | | n/a | | n/a | | n/a | | n/a | | n/a | | n/a | |
| | | | | | | | | | | | | | | |
| Shareholders equity attributable to: | | | | | | | | | | | | | | |
| PLC | – | | (982 | ) | – | | – | | – | | 982 | | – | |
| NV | – | | – | | 8 242 | | – | | – | | (8 242 | ) | – | |
| Called up share capital | – | | 421 | | 222 | | – | | (1 | ) | – | | 642 | |
| Share premium account | – | | 1 399 | | 133 | | – | | (2 | ) | – | | 1 530 | |
| Other reserves | – | | (1 905 | ) | (650 | ) | (448 | ) | (643 | ) | 1 091 | | (2 555 | ) |
| Retained profit | 181 | | 8 331 | | (684 | ) | 8 960 | | (4 310 | ) | (4 831 | ) | 7 647 | |
| |
|
|
|
|
|
|
|
|
|
|
|
|
| |
| Total shareholders’ equity | 181 | | 7 264 | | 7 263 | | 8 512 | | (4 956 | ) | (11 000 | ) | 7 264 | |
| Minority interests | – | | – | | – | | – | | 365 | | – | | 365 | |
| |
|
|
|
|
|
|
|
|
|
|
|
|
| |
| Total equity | 181 | | 7 264 | | 7 263 | | 8 512 | | (4 591 | ) | (11 000 | ) | 7 629 | |
| |
|
|
|
|
|
|
|
|
|
|
|
|
| |
| Total capital employed | 2 180 | | 10 367 | | 7 277 | | 9 297 | | 4 551 | | (11 000 | ) | 22 672 | |
|
|
|
|
|
|
|
|
| |
| (a) | Certain prior year balances have been reclassified to conform with current year presentation. |
| Unilever Annual Report and Accounts 2005 | 165 |
Back to Contents
Additional information for US investors(continued)
Unilever Group
Guarantor statements(continued)
| | € million | | € million | | € million | | € million | | € million | | € million | | € million | |
| | Unilever | | Unilever | | | | Unilever | | | | | | | |
| | Capital | | N.V. | | | | United | | | | | | | |
| | Corporation | | parent | | Unilever PLC | | States Inc. | | Non- | | | | | |
| Cash flow statement | subsidiary | | issuer/ | | parent | | subsidiary | | guarantor | | | | Unilever | |
| for the year ended 31 December 2005 | issuer | | guarantor | | guarantor | | guarantor | | subsidiaries | | Eliminations | | Group | |
|
|
|
|
|
|
|
|
|
|
|
|
|
| |
| Cash flow from operating activities | – | | (5 | ) | (156 | ) | 33 | | 6 052 | | – | | 5 924 | |
| Income tax paid | – | | (86 | ) | (19 | ) | (177 | ) | (1 289 | ) | – | | (1 571 | ) |
| |
|
|
|
|
|
|
|
|
|
|
|
|
| |
| Net cash flow from operating activities | – | | (91 | ) | (175 | ) | (144 | ) | 4 763 | | – | | 4 353 | |
| |
|
|
|
|
|
|
|
|
|
|
|
|
| |
| Interest received | 253 | | 285 | | 10 | | – | | (106 | ) | (312 | ) | 130 | |
| Net capital expenditure | – | | (24 | ) | (3 | ) | (2 | ) | (784 | ) | – | | (813 | ) |
| Acquisitions and disposals | – | | – | | – | | – | | 784 | | – | | 784 | |
| Other investing activities | 1 796 | | (689 | ) | – | | 189 | | 443 | | (1 325 | ) | 414 | |
| |
|
|
|
|
|
|
|
|
|
|
|
|
| |
| Net cash flow from/(used in) investing activities | 2 049 | | (428 | ) | 7 | | 187 | | 337 | | (1 637 | ) | 515 | |
| |
|
|
|
|
|
|
|
|
|
|
|
|
| |
| Dividends paid on ordinary share capital | – | | 28 | | 37 | | – | | (1 869 | ) | – | | (1 804 | ) |
| Interest and preference dividends paid | (253 | ) | (181 | ) | (7 | ) | (43 | ) | (471 | ) | 312 | | (643 | ) |
| Change in borrowings and finance leases | (1 774 | ) | 1 623 | | 309 | | – | | (2 363 | ) | 1 325 | | (880 | ) |
| Purchase of treasury stock | – | | (1 068 | ) | (171 | ) | – | | (37 | ) | – | | (1 276 | ) |
| Other finance activities | – | | – | | – | | – | | (218 | ) | – | | (218 | ) |
| |
|
|
|
|
|
|
|
|
|
|
|
|
| |
| Net cash flow from/(used in) financing activities | (2 027 | ) | 402 | | 168 | | (43 | ) | (4 958 | ) | 1 637 | | (4 821 | ) |
| |
|
|
|
|
|
|
|
|
|
|
|
|
| |
| Net increase/(decrease) in cash and cash equivalents | 22 | | (117 | ) | – | | – | | 142 | | – | | 47 | |
| | | | | | | | | | | | | | | |
| Cash and cash equivalents at the beginning of the year | 10 | | 279 | | – | | (3 | ) | 1 120 | | – | | 1 406 | |
| | | | | | | | | | | | | | | |
| Effect of foreign exchange rate changes | 3 | | – | | – | | – | | (191 | ) | – | | (188 | ) |
| |
|
|
|
|
|
|
|
|
|
|
|
|
| |
| Cash and cash equivalents at the end of the year | 35 | | 162 | | – | | (3 | ) | 1 071 | | – | | 1 265 | |
|
|
|
|
|
|
|
|
|
|
|
|
|
| |
| Cash flow statement | | | | | | | | | | | | | | |
| for the year ended 31 December 2004 | | | | | | | | | | | | | | |
|
|
|
|
|
|
|
|
|
|
|
|
|
| |
| Cash flow from operating activities | 6 | | 58 | | 45 | | (200 | ) | 7 016 | | – | | 6 925 | |
| Income tax paid | – | | (96 | ) | (126 | ) | (145 | ) | (1 011 | ) | – | | (1 378 | ) |
| |
|
|
|
|
|
|
|
|
|
|
|
|
| |
| Net cash flow from operating activities | 6 | | (38 | ) | (81 | ) | (345 | ) | 6 005 | | – | | 5 547 | |
| |
|
|
|
|
|
|
|
|
|
|
|
|
| |
| Interest received | 295 | | 356 | | 6 | | – | | 106 | | (595 | ) | 168 | |
| Net capital expenditure | – | | (9 | ) | (17 | ) | (1 | ) | (842 | ) | – | | (869 | ) |
| Acquisitions and disposals | – | | – | | – | | – | | 316 | | – | | 316 | |
| Other investing activities | (311 | ) | 2 375 | | – | | 372 | | 288 | | (2 459 | ) | 265 | |
| |
|
|
|
|
|
|
|
|
|
|
|
|
| |
| Net cash flow from/(used in) investing activities | (16 | ) | 2 722 | | (11 | ) | 371 | | (132 | ) | (3 054 | ) | (120 | ) |
| |
|
|
|
|
|
|
|
|
|
|
|
|
| |
| Dividends paid on ordinary share capital | – | | 971 | | – | | – | | (2 691 | ) | – | | (1 720 | ) |
| Interest and preference dividends paid | (282 | ) | (249 | ) | (3 | ) | (24 | ) | (824 | ) | 595 | | (787 | ) |
| Change in borrowings and finance leases | 302 | | (3 402 | ) | 116 | | – | | (2 365 | ) | 2 459 | | (2 890 | ) |
| Purchase of treasury stock | – | | (148 | ) | (21 | ) | (2 | ) | (161 | ) | – | | (332 | ) |
| Other finance activities | – | | – | | – | | – | | (209 | ) | – | | (209 | ) |
| |
|
|
|
|
|
|
|
|
|
|
|
|
| |
| Net cash flow from/(used in) financing activities | 20 | | (2 828 | ) | 92 | | (26 | ) | (6 250 | ) | 3 054 | | (5 938 | ) |
| |
|
|
|
|
|
|
|
|
|
|
|
|
| |
| Net increase/(decrease) in cash and cash equivalents | 10 | | (144 | ) | – | | – | | (377 | ) | – | | (511 | ) |
| | | | | | | | | | | | | | | |
| Cash and cash equivalents at the beginning of the year | 1 | | 423 | | – | | (3 | ) | 1 007 | | – | | 1 428 | |
| | | | | | | | | | | | | | | |
| Effect of foreign exchange rate changes | (1 | ) | – | | – | | – | | 490 | | – | | 489 | |
| |
|
|
|
|
|
|
|
|
|
|
|
|
| |
| Cash and cash equivalents at the end of the year | 10 | | 279 | | – | | (3 | ) | 1 120 | | – | | 1 406 | |
|
|
|
|
|
|
|
|
|
|
|
|
|
| |
| 166 | Unilever Annual Report and Accounts 2005 |
Back to Contents
Financial Statements |
Principal group companies and non-current investments
Unilever Groupas at 31 December 2005
|
| The companies listed below and on page 168 are those which, in the opinion of the Directors, principally affect the amount of profit and assets shown in the Unilever Group accounts. The Directors consider that those companies not listed are not significant in relation toUnilever as a whole. |
| |
| Full information as required by Articles 379 and 414 of Book 2 of the Civil Code in the Netherlands has been filed by Unilever N.V. with theCommercial Registry in Rotterdam. |
| |
| Particulars of PLC group companies and other significant holdings as required by the United Kingdom Companies Act 1985 will beannexed to the next Annual Return of Unilever PLC. |
| |
| Unless otherwise indicated, the companies are incorporated and principally operate in the countries under which they are shown. |
| |
| The aggregate percentage of equity capital directly or indirectly held by NV or PLC is shown in the margin, except where it is 100%. All thesepercentages are rounded down to the nearest whole number. |
| |
| The percentage of Unilever’s shareholdings held either directly orindirectly by NV and PLC are identified in the tables according to the following code: |
|
|
| NV 100% | a |
| PLC 100% | b |
| NV 73%; PLC 27% | c |
| NV 90%; PLC 10% | d |
| NV 19%; PLC 81% | e |
| NV 57%; PLC 43% | f |
|
|
Due to the inclusion of certain partnerships in the consolidated group accounts of Unilever, para 264(b) of the German trade law grants an exemption from the duty to prepare individual statutory financial statements and management reports in accordance with the requirements for limited liability companies and to have these audited.
|
|
| Principal group companies | |
|
|
| % | Europe | Ownership |
|
|
| | Austria | |
| | Unilever Austria GmbH | d |
|
|
| | Belgium | |
| | Unilever Belgium BVBA/SPRL (Unibel) | d |
|
|
| | France | |
| | Amora Maille Société Industrielle S.A.S | d |
| | Cogesal-Miko S.A.S | d |
| 99 | Lever Fabergé France S.A.S | d |
| | Unilever France S.A.S | d |
|
|
| | Germany | |
| | Maizena Grundstücksverwaltungs | |
| | GmbH & Co. OHG | d |
| | Pfanni GmbH & Co. OHG Stavenhagen | d |
| | Pfanni Werke Grundstücksverwaltungs | |
| | GmbH & Co. OHG | d |
| | PW Vermietungs GmbH & Co. KG | d |
| | UBG Vermietungs GmbH & Co. OHG | d |
| | Unilever Deutschland GmbH | d |
| | Unilever Deutschland Holding GmbH | d |
| | Unilever Deutschland Immobilien Leasing | |
| | GmbH & Co. OHG | d |
| | Wizona IPR GmbH & Co. OHG | d |
| | Wizona Vermögensverwaltugs GmbH & Co. | |
| | OHG | d |
|
|
| | Greece | |
| 67 | Elais-Unilever S.A. | a |
| | Unilever Hellas A.E.B.E. | a |
|
|
| | Italy | |
| | Unilever Italia SrL | d |
|
|
| | The Netherlands | |
| | Mixhold B.V. | d |
| | Unilever N.V.(a) | |
| | Unilever Nederland B.V. | d |
|
|
| | Poland | |
| 99 | Unilever Polska S.A. | d |
|
|
| | Spain | |
| | Unilever España S.A. | a |
| | Unilever Foods España S.A. | a |
|
|
| | Sweden | |
| | Unilever Sverige | a |
|
|
| | Switzerland | |
| | Unilever Raw Materials AG | a |
| | Unilever Schweiz GmbH | d |
|
|
| | United Kingdom | |
| | Lever Fabergé Ltd. | e |
| | Unilever Bestfoods UK Ltd. | e |
| | Unilever Ice Cream & Frozen Food Ltd. | e |
| | Unilever PLC(a) | |
| | Unilever UK Holdings Ltd. | b |
| | Unilever UK & CN Holdings Ltd. | e |
|
|
| (a) See ‘Basis of consolidation’ in note 1 on page 82 | |
In addition, we have operations in the following countries: Bulgaria,
Croatia, Cyprus, Czech Republic, Denmark, Estonia, Finland, Hungary,
Ireland, Latvia, Lithuania, Norway, Portugal, Romania, Russia, Serbia,
Slovakia, Slovenia and Ukraine.
| Unilever Annual Report and Accounts 2005 | 167 |
Back to Contents
Principal group companies and fixed investments
Unilever Groupas at 31 December 2005
|
|
| Principal group companies(continued) | |
|
|
|
| % | The Americas | Ownership |
|
|
|
| | Argentina | |
| | Unilever de Argentina S.A. | d |
|
|
|
| | Brazil | |
| | Unilever Brasil Ltda. | d |
|
|
|
| | Canada | |
| | Unilever Canada Inc. | e |
|
|
|
| | Chile | |
| | Unilever Chile Home and Personal Care Ltda. | d |
|
|
|
| | Mexico | |
| | Unilever de México S. de R.L. de C.V. | d |
| | Unilever Holding México, S. de R.L. de C.V. | d |
|
|
|
| | United States of America | |
| | Conopco, Inc. | c |
| | Unilever Capital Corporation | c |
| | Unilever United States, Inc. | c |
|
|
In addition, we have operations in the following countries: Bolivia, Colombia, Costa Rica, Dominican Republic, Ecuador, El Salvador, Guatemala, Honduras, Netherlands Antilles, Nicaragua, Panama, Paraguay, Peru, Trinidad & Tobago, Uruguay and Venezuela.
|
|
|
| % | Asia Africa | Ownership |
|
|
|
| | Australia | |
| | Unilever Australia Ltd. | b |
|
|
|
| | China | |
| | Unilever (China) Investing Company Ltd. | a |
| | Unilever Services (Hefei) Limited | a |
|
|
|
| | India | |
| 51 | Hindustan Lever Ltd. | b |
|
|
|
| | Indonesia | |
| 85 | P.T. Unilever Indonesia Tbk | a |
|
|
|
| | Japan | |
| | Unilever Japan KK | a |
|
|
|
| | Thailand | |
| | Unilever Thai Trading Ltd. | d |
|
|
|
| | South Africa | |
| 59 | Unilever South Africa Foods (Pty) Limited | f |
| | Unilever South Africa Home and | |
| | Personal Care (Pty) Ltd. | b |
|
|
|
| | Turkey | |
| | Unilever Sanayi ve Ticaret Türk A.S. | a |
|
|
|
In addition, we have operations in the following countries: Abu Dhabi, Algeria, Bahrain, Bangladesh, Cambodia, Cameroon, Côte d’Ivoire, Democratic Republic of Congo, Dubai, Egypt, Ghana, Israel, Jordan, Kenya, Lebanon, Malawi, Malaysia, Morocco, Mozambique, Namibia, New Zealand, Niger, Nigeria, Oman, Pakistan, Palestine, Philippines, Saudi Arabia, Senegal, Singapore, South Korea, Sri Lanka, Syria, Taiwan, Tanzania, Tunisia, Uganda, United Arab Emirates, Vietnam, Zambia and Zimbabwe.
|
|
| Principal non-current investments | |
|
|
| Joint ventures | |
|
|
|
| % | Europe | Ownership |
|
|
|
| | Portugal | |
| 49 | FIMA/VG-Distribuição de Produtos | |
| | Alimentares, Lda. | a |
|
|
|
| % | The Americas | |
|
|
|
| | United States of America | |
| 50 | Pepsi/Lipton Partnership | c |
|
|
|
| Associates | |
|
|
|
| % | Europe | Ownership |
|
|
|
| | United Kingdom | |
| 40 | Langholm Capital Partners L.P. | b |
|
|
|
| % | The Americas | |
|
|
|
| | United States of America | |
| 33 | JohnsonDiversey Holdings, Inc. | a |
|
|
|
| % | Asia Africa | |
|
|
|
| | Côte d’Ivoire | |
| 40 | Palmci | b |
|
|
|
| 168 | Unilever Annual Report and Accounts 2005 |
Back to Contents
[THIS PAGE HAS BEEN DELIBERATELY LEFT BLANK]
| Unilever Annual Report and Accounts 2005 | 169 |
Back to Contents
Company accounts
Unilever N.V.
Balance sheetas at 31 December
| | € million | | € million | |
| | 2005 | | 2004 | |
| | | | Restated | |
|
|
|
| |
| Fixed assets | | | | |
| Fixed investments | 11 276 | | 11 233 | |
| | | | | |
| Current assets | | | | |
| Debtors | 26 898 | | 16 623 | |
| Cash at bank and in hand | 163 | | 280 | |
| |
|
|
| |
| Total current assets | 27 061 | | 16 903 | |
| Creditors due within one year | (27 109 | ) | (16 863 | ) |
| | | | | |
| Net current assets/(liabilities) | (48 | ) | 40 | |
| |
|
|
| |
| Total assets less current liabilities | 11 228 | | 11 273 | |
|
|
|
| |
| Creditors due after more than one year | 2 503 | | 2 885 | |
| | | | | |
| Provisions for liabilities and charges (excluding pensions and similar obligations) | 115 | | 102 | |
| | | | | |
| Net pension liability for unfunded schemes | 157 | | 152 | |
| | | | | |
| Capital and reserves | 8 453 | | 8 134 | |
| Called up share capital: | | | | |
| Preferential share capital | – | | 130 | |
| Ordinary share capital | 291 | | 291 | |
| |
|
|
| |
| | 291 | | 421 | |
| Share premium account | 20 | | 1 399 | |
| Other reserves | (1 321 | ) | (1 379 | ) |
| Profit retained | 9 463 | | 7 693 | |
| | | | | |
| Total capital employed | 11 228 | | 11 273 | |
|
|
|
| |
Profit and loss account for the year ended 31 December
| | € million | | € million | |
| | 2005 | | 2004 | |
| | | | Restated | |
|
|
|
| |
| Income from fixed investments after taxation | 2 347 | | 618 | |
| Other income and expenses | 289 | | 158 | |
| |
|
|
| |
| Profit for the year | 2 636 | | 776 | |
|
|
|
| |
For the information required by Article 392 of Book 2 of the Civil Code in the Netherlands, refer to pages 169 and 173. Pages 167 and 168 are part of the notes to the Unilever N.V. company accounts.
The company accounts of Unilever N.V. are included in the consolidated accounts of the Unilever Group. Therefore, and in accordance with Article 402 of Book 2 of the Civil Code in the Netherlands, the profit and loss account only reflects the income from fixed investments after taxation and other income and expenses after taxes. The company accounts of Unilever N.V. do not contain a cash flow statement as this is not required by book 2 of the Civil Code in the Netherlands.
The company accounts of Unilever N.V. comply in all material respects with legislation in the Netherlands. As allowed by Article 362.1 of Book 2 of the Civil Code in the Netherlands, the company accounts are prepared in accordance with United Kingdom accounting standards, unless such standards conflict with the Civil Code in the Netherlands which would in such case prevail.
The Board of Directors
28 February 2006
| 170 | Unilever Annual Report and Accounts 2005 |
Back to Contents
Financial Statements |
Notes to the company accounts
Unilever N.V.
Accounting information and policies
Basis of preparation
The accounts have been prepared in accordance with applicable United Kingdom accounting standards as allowed by Article 362.1 of Book 2 of the Civil Code in the Netherlands.
The accounts are prepared under the historical cost convention as modified by the revaluation of financial assets classified as 'available-for-sale investments', 'financial assets at fair value through profit or loss', and 'derivative financial instruments' in accordance with the accounting policies set out below which have been consistently applied except as highlighted in the ‘Prior year adjustment’ note below.
Accounting policies
The principal accounting policies are as follows:
Fixed investments
Shares in group companies are stated at cost less any amounts written off to reflect a permanent impairment. Any impairment is charged to the profit and loss account as it arises. In accordance with Article 385.5 of Book 2 of the Civil Code in the Netherlands, Unilever N.V. shares held by Unilever N.V. subsidiaries are deducted from the carrying value of those subsidiaries. This differs from the accounting treatment under UK GAAP (UITF 37) which would require these amounts to be included within fixed investments.
Financial instruments and derivative financial instruments
The company’s accounting policies under United Kingdom generally accepted accounting principles (UK GAAP) namely FRS 25 ‘Financial Instruments: Disclosure and Presentation’ and FRS 26 ‘Financial Instruments: Measurement’ are the same as the Unilever Group’s accounting policies under International Financial Reporting Standards (IFRSs) namely IAS 32 ‘Financial Instruments: Disclosure and Presentation’ and IAS 39 ‘Financial Instruments: Recognition and Measurement’. These standards are effective from 1 January 2005 and the policies are set out under the heading ‘Financial instruments’ in note 1 to the consolidated accounts on page 83. Unilever NV is taking the exemption for not providing all the financial instruments disclosures, because IAS 32 disclosures are given in note 19 to the consolidated accounts on pages 110 to 113. The changes to preference share capital, share premium account and profit retained in this regard are set out in the following notes and further described in the notes to the consolidated accounts.
Deferred taxation
Full provision is made for deferred taxation on all significant timing differences arising from the recognition of items for taxation purposes in different periods from those in which they are included in the company's accounts. Full provision is made at the rates of tax prevailing at the year end unless future rates have been enacted or substantively enacted. Deferred tax assets and liabilities have not been discounted.
Own shares held
Own shares held by the company are accounted for in accordance with Netherlands law and United Kingdom UITF 37. All differences between the purchase price of the shares held to satisfy options granted and the proceeds received for the shares, whether on exercise or lapse, are charged to reserves.
Retirement benefits
Unilever N.V. has accounted for pensions and similar benefits under the United Kingdom Financial Reporting Standard 17 'Retirement benefits' (FRS 17). The operating and financing costs of defined benefit plans are recognised separately in the profit and loss account; service costs are systematically spread over the service lives of employees, and financing costs are recognised in the periods in which
they arise. Variations from expected costs, arising from the experience of the plans or changes in actuarial assumptions, are recognised immediately in the statement of total recognised gains and losses. The costs of individual events such as past service benefit enhancements, settlements and curtailments are recognised immediately in the profit and loss account. The liabilities and, where applicable, the assets of defined benefit plans are recognised at fair value in the balance sheet. The charges to the profit and loss account for defined contribution plans are the company contributions payable and the assets of such plans are not included in the company balance sheet.
Prior year adjustment
Financial Reporting Standard 21 (FRS 21) 'Events after the Balance Sheet Date' has been adopted for the first time in the year ended 31 December 2005. Under FRS 21, proposed dividends do not meet the definition of a liability until such time as they have been approved by shareholders at the Annual General Meeting. Therefore, Unilever N.V. no longer recognises a liability in any period for dividends that have been proposed but will not be approved until after the balance sheet date. This holds for external dividends as well as intra-group dividends paid to the parent company.
The effect for the company of implementing FRS 21 has been to increase retained profits by €729 million in the current period (2004: decrease of €646 million), decrease dividend creditors due within one year by €729 million (2004: decrease by €696 million), decrease intergroup debtors due within one year by € nil (2004: €1 274 million) and increase inter-group creditors due within one year by € nil (2004: €67 million). The impact of the FRS 21 implementation on profits for the years 2004 and 2005 is explained in the notes under the heading ‘Profit retained’.
The comparative amounts for the year ended 31 December 2004 have been restated accordingly.
| Fixed investments | € million | | € million | |
| | 2005 | | 2004 | |
|
|
|
| |
| Shares in group companies | 11 082 | | 11 024 | |
| Book value of PLC shares held in | | | | |
| connection with share options | 432 | | 445 | |
| Less NV shares held by group companies | (238 | ) | (236 | ) |
| |
|
|
| |
| | 11 276 | | 11 233 | |
| |
|
|
| |
| Movements during the year: | | | | |
| 1 January | 11 233 | | 11 161 | |
| Movement in PLC shares held in connection | | | | |
| with share options | (13 | ) | 64 | |
| Movement in NV shares held by group companies | (2 | ) | (8 | ) |
| Additions | 89 | | 16 | |
| Decreases | (31 | ) | – | |
| |
|
|
| |
| 31 December | 11 276 | | 11 233 | |
|
|
|
| |
| Debtors | € million | | € million | |
| | 2005 | | 2004 | |
| | | | Restated | |
|
|
|
| |
| Loans to group companies | 22 460 | | 14 056 | |
| Other amounts owed by group companies | 3 771 | | 2 433 | |
| Amounts owed by undertakings in which | | | | |
| the company has a participating interest | 15 | | 15 | |
| Prepayments and accrued income | 587 | | 98 | |
| Other | 65 | | 21 | |
| |
|
|
| |
| | 26 898 | | 16 623 | |
| |
|
|
| |
| Of which due after more than one year | 6 645 | | 710 | |
|
|
|
| |
| Unilever Annual Report and Accounts 2005 | 171 |
Back to Contents
Notes to the company accounts(continued)
Unilever N.V.
| Cash at bank and in hand | € million | | € million | |
| | 2005 | | 2004 | |
|
|
|
| |
| This includes amounts for which repayment notice is required of: | 38 | | 80 | |
|
|
|
| |
| | | | | |
| Creditors | € million | | € million | |
| | 2005 | | 2004 | |
| | | | Restated | |
|
|
|
| |
| Due within one year: | | | | |
| Bank loans and overdrafts | – | | 1 | |
| Bonds and other loans | 4 548 | | 2 148 | |
| Loans from group companies | 3 328 | | 310 | |
| Other amounts owed to group companies | 18 699 | | 14 200 | |
| Taxation and social security | 20 | | 22 | |
| Accruals and deferred income | 405 | | 173 | |
| Other | 109 | | 9 | |
| |
|
|
| |
| | 27 109 | | 16 863 | |
| |
|
|
| |
| Due after more than one year: | | | | |
| Accruals and deferred income | 56 | | 41 | |
| Preference shares | 124 | | – | |
| Bonds and other loans | 2 323 | | 2 844 | |
| |
|
|
| |
| | 2 503 | | 2 885 | |
|
|
|
| |
From 1 January 2005, Unilever N.V. has adopted FRS 25 ‘Financial Instruments: Disclosure and Presentation’ which requires preference shares that provide for a fixed preference dividend to be classified as borrowings. In accordance with the transitional rules for FRS 25, 2004 comparatives have not been restated.
Creditors due after 5 years amount to €870 million (Article 375.2 of Book 2 of the Civil Code in the Netherlands).
| Provisions for liabilities and charges (excluding pensions | | | |
| and similar obligations) | | | | |
| | € million | | € million | |
| | 2005 | | 2004 | |
|
|
|
| |
| Deferred taxation and other provisions | 115 | | 102 | |
| |
|
|
| |
| Of which due within one year | 34 | | 55 | |
|
|
|
| |
| | | | | |
| Preference share capital | | | € million | |
|
|
|
| |
| At 31 December 2004 | | | 130 | |
| FRS 25/26 adjustments | | | (130 | ) |
| | | |
| |
| At 1 January 2005 and 31 December 2005 | | | – | |
|
|
|
| |
Ordinary share capital
Shares numbered 1 to 2 400 are held by a subsidiary of NV and a subsidiary of PLC, each holding 50%. Additionally, 24 603 661 (2004: 24 898 145) €0.51 ordinary shares are held by NV and other group companies. Full details are given in note 24 to the consolidated accounts on page 124, and note 31 on page 141.
| Share premium account | € million | |
|
| |
| At 31 December 2004 | 1 399 | |
| FRS 25/26 adjustments | (1 379 | ) |
| |
| |
| At 1 January 2005 and 31 December 2005 | 20 | |
|
| |
The share premium shown in the balance sheet is not available for the issue of bonus shares or for repayment without incurring withholding tax payable by the company. This is despite the change in the Netherlands tax law, as a result of which dividends received from 2001 onwards by individual shareholders who are Netherlands residents are no longer taxed.
| Other reserves | € million | | € million | |
| | 2005 | | 2004 | |
|
|
|
| |
| 1 January | (1 379 | ) | (1 243 | ) |
| Change in own shares held | 58 | | (136 | ) |
| |
|
|
| |
| 31 December | (1 321 | ) | (1 379 | ) |
|
|
|
| |
| Profit retained | € million | | € million | |
| | 2005 | | 2004 | |
| | | | Restated | |
|
|
|
| |
| Balance brought forward | 8 339 | | 7 304 | |
| FRS 21 adjustments | (646 | ) | 638 | |
| |
|
|
| |
| Balance brought forward – restated | 7 693 | | 7 942 | |
| FRS 25/26 adjustments | 412 | | n/a | |
| |
|
|
| |
| 1 January – restated | 8 105 | | 7 942 | |
| Profit for the year(a) | 2 636 | | 776 | |
| Preference dividends | – | | (28 | ) |
| Ordinary dividends – final 2003 | – | | (638 | ) |
| Ordinary dividends – interim 2004 | – | | (346 | ) |
| Ordinary dividends – final 2004 | (716 | ) | – | |
| Ordinary dividends – interim 2005 | (367 | ) | – | |
| Conversion of preference shares | (199 | ) | – | |
| Fair value adjustments for cash flow hedges | 4 | | – | |
| Realised profit/(loss) on shares/certificates held | | | | |
| to meet employee share options | (1 | ) | (9 | ) |
| Changes in present value of net pension liability | 1 | | (4 | ) |
| |
|
|
| |
| 31 December | 9 463 | | 7 693 | |
|
|
|
| |
| (a) | Profit for the year as reported in 2004 was €2 118 million. This includes intra-group dividends of €1 342 million which under FRS 21 are not recognised until they have been approved by shareholders at the Annual General Meeting. This €1 342 million has now been added to the 2005 profit for the year. |
Profit retained shown in the company accounts and the notes thereto differs from the amount shown in note 26 to the consolidated accounts on page 126 mainly because of certain inter-company transactions which are eliminated in the consolidated accounts.
| | € million | |
|
| |
| Difference as at 31 December 2004 as previously reported | 1 061 | |
| Accounting policy change | 214 | |
| |
| |
| Difference as at 31 December 2004 as restated | 1 275 | |
| Changes in equity value of the consolidated participations | (3 580 | ) |
| Change in the accumulated intercompany results | 3 047 | |
| |
| |
| Difference as at 31 December 2005 | 742 | |
|
| |
| | | | | |
| Contingent liabilities | € million | | € million | |
| | 2005 | | 2004 | |
|
|
|
| |
These are not expected to give rise to any material loss and include guarantees given for group companies, under which amounts outstanding at 31 December were: | 5 416 | | 6 822 | |
| |
|
|
| |
| Of the above, guaranteed also by PLC | 3 705 | | 5 010 | |
|
|
|
| |
The guarantees given to other companies were immaterial.
NV has issued joint and several liability undertakings, as defined in Article 403 of Book 2 of the Civil Code in the Netherlands, for almost all Dutch group companies. These written undertakings have been filed with the office of the Company Registry in whose area of jurisdiction the group company concerned has its registered office.
| 172 | Unilever Annual Report and Accounts 2005 |
Back to Contents
Financial Statements |
Further statutory and other information
Unilever N.V.
The rules for profit appropriation in the Articles of Association
(summary of Article 38)
The profit for the year is applied firstly to the reserves required by law or by the Equalisation Agreement, secondly to cover losses of previous years, if any, and thirdly to the reserves deemed necessary by the Board of Directors. Dividends due to the holders of the Cumulative Preference Shares, including any arrears in such dividends, are then paid; if the profit is insufficient for this purpose, the amount available is distributed to them in proportion to the dividend percentages of their shares. Any profit remaining thereafter shall be distributed to them in proportion to the dividend percentages of their shares. The General Meeting can only decide to make distributions from reserves on the basis of a proposal by the Board and in compliance with the law and the Equalisation Agreement.
| | € million | |
| | 2005 | |
|
| |
| Proposed profit appropriation | | |
| Profit for the year | 2 636 | |
| Of which already appropriated in 2004 | (1 342 | ) |
| |
| |
| Available for distribution | 1 294 | |
| Interim dividend 2005 already paid | (367 | ) |
| |
| |
| To profit retained | 927 | |
|
| |
Post balance sheet event
The directors propose a final dividend of €1.32 per share (totalling
€729 million) out of the profits retained for the year ended
31 December 2005. The dividend will be submitted for formal
approval at the Annual General Meeting to be held on 8 May 2006.
In accordance with FRS 21, these financial statements do not reflect
this dividend payable, which will be accounted for in shareholders’
equity as an appropriation of retained earnings in the year ended
31 December 2006. During 2005, a final dividend of €1.26 per share
(totalling €716 million) was paid in respect of the dividend declared
for the year ended 31 December 2004.
Special controlling rights under the Articles of Association
See note 24 to the consolidated accounts on page 124.
Auditors
A resolution will be proposed at the Annual General Meeting on
8 May 2006 for the re-appointment of PricewaterhouseCoopers
Accountants N.V. as auditors of NV. The present appointment will
end at the conclusion of the Annual General Meeting.
Corporate Centre
Unilever N.V.
Weena 455
PO Box 760
3000 DK Rotterdam
J A A van der Bijl
S G Williams
Joint Secretaries of Unilever N.V.
28 February 2006
| Unilever Annual Report and Accounts 2005 | 173 |
Back to Contents
[THIS PAGE HAS BEEN DELIBERATELY LEFT BLANK]
| 174 | Unilever Annual Report and Accounts 2005 |
Back to Contents
Financial Statements |
Company accounts
Unilever PLC
Balance sheetas at 31 December
| | | | | |
| | £ million | | £ million | |
| | 2005 | | 2004 | |
| | | | Restated | |
|
|
|
| |
| Fixed assets | | | | |
| Intangible assets | 28 | | 31 | |
| Fixed investments | 2 237 | | 2 237 | |
| | | | | |
| Current assets | | | | |
| Debtors | | | | |
| Debtors due within one year | 226 | | 227 | |
| Debtors due after more than one year | 70 | | 65 | |
| |
|
|
| |
| Total current assets | 296 | | 292 | |
| Creditors due within one year | (1 328 | ) | (1 681 | ) |
| |
|
|
| |
| Net current liabilities | (1 032 | ) | (1 389 | ) |
| |
|
|
| |
| Total assets less current liabilities | 1 233 | | 879 | |
|
|
|
| |
| Provision for liabilities and charges (excluding pensions and similar obligations) | 6 | | 10 | |
| | | | | |
| Capital and reserves | 1 227 | | 869 | |
| Called up share capital 24 | 41 | | 41 | |
| Share premium account | 94 | | 94 | |
| Capital redemption reserve | 11 | | 11 | |
| Other reserves | (385 | ) | (268 | ) |
| Profit retained | 1 466 | | 991 | |
| Total capital employed | 1 233 | | 879 | |
|
|
|
| |
As permitted by Section 230 of the United Kingdom Companies Act 1985, an entity profit and loss account is not included as part of the published company accounts for PLC.
On behalf of the Board of Directors
A BurgmansChairman
P CescauGroup Chief Executive
28 February 2006
| Unilever Annual Report and Accounts 2005 | 175 |
Back to Contents
Notes to the company accounts
Unilever PLC
Accounting information and policies
Basis of preparation
The accounts have been prepared in accordance with applicable United Kingdom accounting standards and the United Kingdom Companies Act 1985.
The accounts are prepared under the historical cost convention as modified by the revaluation of financial assets classified as 'available-for-sale investments', 'financial assets at fair value through profit or loss', and 'derivative financial instruments' in accordance with the accounting policies set out below which have been consistently applied except as described below.
Accounting policies
The principal accounting policies are as follows:
Intangible assets
Intangible assets comprise trademarks purchased after 1 January 1998 and are amortised in the profit and loss account over their expected useful lives of up to maximum of 20 years. They are subject to review for impairment in accordance with United Kingdom Financial Reporting Standard 11 'Impairment of Fixed Assets and Goodwill' (FRS 11). Any impairment is charged to the profit and loss account as it arises.
Fixed investments
Shares in group companies are stated at cost less any amounts written off to reflect a permanent impairment. Any impairment is charged to the profit and loss account as it arises.
Deferred taxation
Full provision is made for deferred taxation on all significant timing differences arising from the recognition of items for taxation purposes in different periods from those in which they are included in the company's accounts. Full provision is made at the rates of tax prevailing at the year end unless future rates have been enacted or substantively enacted. Deferred tax assets and liabilities have not been discounted.
Shares held by employee share trusts
Shares held to satisfy options are accounted for in accordance with United Kingdom law and UITF 37 and UITF 38. All differences between the purchase price of the shares held to satisfy options granted and the proceeds received for the shares, whether on exercise or lapse, are charged to reserves.
Prior year adjustment
Financial Reporting Standard 21 (FRS 21) 'Events after the Balance Sheet Date' has been adopted for the first time in the year ended 31 December 2005. Under FRS 21, proposed dividends do not meet the definition of a liability until such time as they have been approved by shareholders at the Annual General Meeting. Therefore, we no longer recognise a liability in any period for dividends that have been proposed but will not be approved until after the balance sheet date. This applies for external dividends as well as intra-group dividends paid to the parent company.
The effect for the company of implementing FRS 21 has been to increase retained profits by £385 million in the current period (2004: decrease of £103 million), decrease dividends creditors due within one year by £385 million (2004: decrease by £367 million), and increase inter-group creditors due within one year by £nil (2004: increase of £470 million).
The comparative amounts for the year ended 31 December 2004 have been restated accordingly.
| 176 | Unilever Annual Report and Accounts 2005 |
Back to Contents
Financial Statements |
Notes to the company accounts(continued)
Unilever PLC
| Fixed investments | £ million | | £ million | |
| | 2005 | | 2004 | |
|
|
|
| |
| Shares in group companies | 2 237 | | 2 237 | |
|
|
|
| |
| Debtors | £ million | | £ million | |
| | 2005 | | 2004 | |
|
|
|
| |
| Due within one year: | | | | |
| Amounts owed by group companies | 180 | | 193 | |
| Other | 24 | | 34 | |
| Amounts owed by undertakings in which | | | | |
| the company has a participating interest | 22 | | – | |
| |
|
|
| |
| | 226 | | 227 | |
| |
|
|
| |
| Due after more than one year: | | | | |
| Amounts owed by group companies | 44 | | 46 | |
| Other | – | | 19 | |
| Amounts owed by undertakings in which | | | | |
| the company has a participating interest | 26 | | – | |
| |
|
|
| |
| | 70 | | 65 | |
|
|
|
| |
| Creditors | £ million | | £ million | |
| | 2005 | | 2004 | |
| | | | Restated | |
|
|
|
| |
| Due within one year: | | | | |
| Bonds and other loans | – | | 50 | |
| Amounts owed to group companies | 1 285 | | 1 565 | |
| Taxation and social security | 41 | | 64 | |
| Other | 1 | | 1 | |
| Accruals and deferred income | 1 | | 1 | |
| |
|
|
| |
| | 1 328 | | 1 681 | |
|
|
|
| |
Provisions for liabilities and charges (excluding pensions and similar obligations)
| | £ million | | £ million | |
| | 2005 | | 2004 | |
|
|
|
| |
| Deferred Taxation | 6 | | 10 | |
|
|
|
| |
| | | | | |
| Other reserves | £ million | | £ million | |
| | 2005 | | 2004 | |
|
|
|
| |
| 1 January | (268 | ) | (254 | ) |
| Change in book value of shares | (117 | ) | (14 | ) |
| |
|
|
| |
| 31 December | (385 | ) | (268 | ) |
|
|
|
| |
| Remuneration of auditors | £ million | | £ million | |
| | 2005 | | 2004 | |
|
|
|
| |
| Parent company statutory audit fee | 1.8 | | 1.6 | |
| Other audit services | – | | – | |
| Other payments by the parent company for | | | | |
| non-audit services provided by | | | | |
| PricewaterhouseCoopers LLP United Kingdom(a) | | | | |
| Audit-related services | 0.7 | | 1.3 | |
| Other services | 0.2 | | 0.5 | |
|
|
|
| |
| (a) See also note 4 on page 93. |
| Profit retained | £ million | | £ million | |
| | 2005 | | 2004 | |
| | | | Restated | |
|
|
|
| |
| Balance brought forward | 1 094 | | 1 086 | |
| FRS 21 adjustments | (103 | ) | (180 | ) |
| |
|
|
| |
| 1 January – restated | 991 | | 906 | |
| Profit for the year(b) | 1 035 | | 607 | |
| Final dividend 2003 on ordinary and | | | | |
| deferred shares | – | | (341 | ) |
| Interim dividend 2004 on ordinary and | | | | |
| deferred shares | – | | (181 | ) |
| Final dividend 2004 on ordinary and | | | | |
| deferred shares | (367 | ) | – | |
| Interim dividend 2005 on ordinary and | | | | |
| deferred shares | (193 | ) | – | |
| |
|
|
| |
| 31 December | 1 466 | | 991 | |
|
|
|
| |
| (b) | Profit for the year as reported in 2004 was £556 million. This includes intra-group dividends of £470 million which under FRS 21 are not recognised until they have been approved by shareholders at the Annual General Meeting. It also excludes the £521 million of intra- group dividends that would have previously been recognised in 2003 but under FRS 21 are recognised in 2004 following Annual General Meeting approval. |
| |
| Contingent liabilities | £ million | | £ million | |
| | 2005 | | 2004 | |
|
|
|
| |
| Guarantees given for group companies | 5 099 | | 5 883 | |
| |
|
|
| |
| Of which guaranteed also by NV | 2 544 | | 3 542 | |
|
|
|
| |
| Other contingent liabilities are not expected to give rise to material loss. |
| Profit appropriation | £ million | |
| | 2005 | |
|
|
|
| The appropriation of the profit of PLC | | |
| is as follows: | | |
| Profit for the year | 1 035 | |
| Of which already appropriated in 2004 | | |
| (accounting policy change) | (470 | ) |
| |
| |
| Available for distribution | 565 | |
| Interim dividend 2005 already paid | (193 | ) |
| |
| |
| To profit retained | 372 | |
|
| |
Post balance sheet event
The directors propose a final dividend of 13.54p per share (totalling £385 million) for the year ended 31 December 2005. The dividend will be submitted for formal approval at the Annual General Meeting to be held on 9 May 2006. In accordance with FRS 21, these financial statements do not reflect this dividend payable, which will be accounted for in shareholders’ equity as an appropriation of retained earnings in the year ending 31 December 2006. During 2005, a final dividend of 12.82p per share (totalling £367 million) was paid in respect of the dividend declared for the year ended 31 December 2004.
| Unilever Annual Report and Accounts 2005 | 177 |
Back to Contents
Further statutory and other information
Unilever PLC
Employee involvement and communication
Unilever’s UK companies maintain formal processes to inform, consult and involve employees and their representatives. Most of the United Kingdom sites are accredited to the Investors in People standard. Our sites also use tools such as Total Productive Maintenance which rely heavily on employee involvement, contribution and commitment.
A European Works Council, embracing employee and management representatives from 15 countries of Western Europe, has been in existence for several years and provides a forum for discussing issues that extend across national boundaries.
The directors’ reports of the United Kingdom group companies contain more details about how they have communicated with their employees during 2005.
Equal opportunities and diversity
The heads of all operating companies and units in the UK have committed their businesses to achieving greater diversity. Every Unilever company in the United Kingdom has an equal opportunities policy and actively pursues equality of opportunity for all employees.
The company carries out an annual employee monitoring survey and has also conducted an equal pay audit. The company continues to review ways in which greater diversity can be achieved in recruitment and selection.
The company continues to put in place policies which promote the achievement of diversity in the business. We have policies on home working, flexible working, maternity and paternity leave, child care provision and career breaks, which help us to meet this objective.
Charitable and other contributions
Unilever collates the cost of its community involvement activities using the London Benchmarking Group model. The model recommends the separation of charitable donations, community investment, commercial initiatives in the community and management costs relating to the programme of activity.
During 2005 UK group companies made a total contribution of £7.4 million, analysed as follows:
| • | Charitable donations: £1.5 million |
| • | Community investment: £1.3 million |
| • | Commercial initiatives in the community: £3.9 million |
| • | Management costs: £0.7 million |
No donation or contribution was made or expenditure incurred for political purposes.
Supplier payment policies
Individual operating companies are responsible for agreeing the terms and conditions under which business transactions with their suppliers are conducted. The directors’ reports of the United Kingdom operating companies give information about their supplier payment policies as required by the United Kingdom Companies Act 1985. PLC, as a holding company, does not itself make any relevant payments in this respect.
Auditors
A resolution will be proposed at the Annual General Meeting on 9 May 2006 for the re-appointment of PricewaterhouseCoopers LLP as auditors of PLC. The present appointment will end at the conclusion of the Annual General Meeting.
Authority to purchase own shares
At the Annual General Meeting of PLC held on 11 May 2005, authority was given pursuant to Article 64 of the PLC Articles of Association to make market purchases of PLC ordinary shares of 1.4p each, to a maximum of 290 million shares. This authority will expire at the Annual General Meeting on 9 May 2006, and a resolution will be proposed to renew it. On 9 December 2005, Unilever PLC announced that it had purchased 25 680 479 Unilever PLC ordinary shares under this authority.
Details of shares purchased by an employee share trust and Unilever group companies to satisfy options granted under PLC’s employee share schemes are given in the report of the Remuneration Committee on page 67 and in note 31 to the consolidated accounts on pages 132 to 141.
Directors’ report of PLC
For the purposes of Section 234 of the Companies Act 1985, the Directors’ Report of Unilever PLC for the year ended 31 December 2005 comprises this page and the information contained in the report of the Directors on pages 09 to 72, the report of the Remuneration Committee in respect of Directors’ interests in shares or debentures of the Group on page 69, Dividends on page 187 and Principal group companies and fixed investments on pages 167 and 168.
Corporate Centre
Unilever PLC
PO Box 68 Unilever House
Blackfriars
London EC4P 4BQ
Unilever PLC Registered Office
Port Sunlight
Wirral
Merseyside CH62 4ZD
Unilever PLC Registrars
Computershare Investor Services PLC
PO Box 82
The Pavilions
Bridgwater Road
Bristol BS99 7NH
By Order of the Board
J A A van der Bijl
S G Williams
Joint Secretaries of Unilever PLC
28 February 2006
| 178 | Unilever Annual Report and Accounts 2005 |
Back to Contents
Financial Statements |
Shareholder information
| Unilever Annual Report and Accounts 2005 | 179 |
Back to Contents
Analysis of shareholding
Significant shareholders of NV
As far as we are aware the only holders of more than 5% (as referred to in the Disclosure of Major Holdings in Listed Companies Act 1996 in the Netherlands) of any class of NV shares (apart from Stichting Administratiekantoor Unilever N.V., see page 43) are ING Verzekeringen N.V. and Aegon Levensverzekering N.V. The voting rights of such shareholders are the same as for other holders of the class of share indicated. We have to rely on the information we receive from the holders about the details of their holdings. The information we give below is the numbers we hold on 28 February 2006. This information was provided by ING Verzekeringen N.V. at various dates over the preceding six months and by Aegon Levensverzekering N.V. on 28 February 2006.
ING Verzekeringen N.V.
| • | 8 504 215 (1.49%) ordinary shares (€4 322 130) |
| • | 20 665 (71.26%) 7% cumulative preference shares (€9 377 368) |
| • | 120 088 (74.56%) 6% cumulative preference shares (€54 493 559) |
| • | 504 440 (67.26%) 4% cumulative preference shares (€22 890 489) |
Aegon Levensverzekering N.V.
| • | 461 548 (0.08%) ordinary shares (€234 574) |
| • | 4 995 (17.22%) 7% cumulative preference shares (€2 266 632) |
| • | 29 540 (18.34%) 6% cumulative preference shares (€13 404 668) |
| • | 157 106 (20.95%) 4% cumulative preference shares (€7 129 159) |
Some of the above holdings are in the form of depositary receipts against NV shares issued by Stichting Administratiekantoor Unilever N.V. (see page 43). There have been no material changes to the holdings of significant shareholders of NV during the three years up to and including 2005.
Significant shareholders of PLC
The following table gives details of shareholders who held more than 3% of PLC’s shares or deferred stock (excluding treasury shares) on 28 February 2006. The voting rights of such shareholders are the same as for other holders of the class of share indicated. We take this information from the register we hold under section 211 of the UK Companies Act 1985.
| | | Number of | | Approximate | |
| Title of class | Name of holder | shares held | | % held | |
|
|
|
|
| |
| Deferred Stock | Naamlooze Vennootschap Elma | 50 000 | | 50 | |
| | United Holdings Limited | 50 000 | | 50 | |
| Ordinary shares | Trustees of the Leverhulme Trust and the | | | | |
| | Leverhulme Trade Charities Trust | 156 815 034 | | 5 | |
| | Legal & General Group plc | 116 106 618 | | 4 | |
| | The Capital Group Companies, Inc. | 115 155 283 | | 4 | |
|
|
|
|
| |
On 21 April 2005, Barclays PLC became a significant shareholder with over 3% (87 704 743), however, on 8 June 2005 their holding fell back below 3%. On 30 June 2005, Legal & General Group plc became a significant shareholder with over 3% (116 470 237), this dropped to 116 106 618 on 5 July 2005 but still remained above 3%. The holding by The Capital Group Companies, Inc. is on behalf of affiliated investment management companies and was first notified to PLC in November 2000. On 13 December 2005, The Capital Group Companies holding fell from 144 557 853 to 115 155 283. There have been no material changes to the holdings of significant shareholders of PLC during the three years up to and including 2005.
Analysis of PLC registered holdings
At 31 December 2005 PLC had 73 356 ordinary shareholdings.
The following table analyses the registered holdings of PLC’s 1.4p ordinary shares at 31 December 2005:
| | Number | | | | Total | | | |
| Number of shares | of holdings | | % | | shares held | | % | |
|
|
|
|
|
|
|
| |
| 1 – 1 000 | 29 056 | | 39.61 | | 15 564 071 | | 0.53 | |
| 1 001 – 2 500 | 20 300 | | 27.67 | | 33 628 187 | | 1.16 | |
| 2 501 – 5 000 | 11 800 | | 16.09 | | 42 260 752 | | 1.45 | |
| 5 001 – 10 000 | 6 832 | | 9.31 | | 48 023 527 | | 1.65 | |
| 10 001 – 25 000 | 3 407 | | 4.65 | | 51 089 523 | | 1.76 | |
| 25 001 – 50 000 | 707 | | 0.96 | | 24 372 847 | | 0.84 | |
| 50 001 – 100 000 | 365 | | 0.50 | | 25 694 543 | | 0.88 | |
| 100 001 – 1 000 000 | 593 | | 0.81 | | 206 247 609 | | 7.08 | |
| Over1 000 000 | 296 | | 0.40 | | 2 464 577 521 | | 84.65 | |
|
|
|
|
|
|
|
| |
| 73 356 | | 100.00 | | 2 911 458 580 | | 100.00 | |
|
|
|
|
|
|
|
| |
| 180 | Unilever Annual Report and Accounts 2005 |
Back to Contents
Shareholder information |
Analysis of shareholding
(continued)
Share purchases during 2005
Between October and December we purchased 4 934 960 NV and 25 680 479 PLC shares under the share buy-back programme amounting to €500 million in total, which was announced on 3 October 2005 and completed on 9 December 2005.
| | | | | | | | | € million | |
| | | | | | | Total number of | | Maximum value that | |
| | | | | | | shares purchased | | may yet be purchased | |
| | | Total number of | | Average price | | as part of publicly | | as part of publicly | |
| | | shares purchased | (a) | paid per share | | announced plans | | announced plans | |
|
|
|
|
|
|
|
|
| |
| January | NV shares | – | | – | | – | | } | – | |
| | PLC shares | – | | – | | – | | |
|
|
|
|
|
|
|
|
| |
| February | NV shares | 777 844 | | €50.60 | | – | | } | – | |
| | PLC shares | 692 568 | | £5.30 | | – | | |
|
|
|
|
|
|
|
|
|
| |
| March | NV shares | 2 066 014 | | €51.58 | | – | | } | – | |
| | PLC shares | 2 744 432 | | £5.38 | | – | | |
|
|
|
|
|
|
|
|
|
| |
| April | NV shares | – | | – | | – | | } | – | |
| | PLC shares | – | | – | | – | | |
|
|
|
|
|
|
|
|
|
| |
| May | NV shares | 606 878 | | € 53.08 | | – | | } | – | |
| | PLC shares | 1 076 912 | | £5.56 | | – | | |
|
|
|
|
|
|
|
|
|
| |
| June | NV shares | 1 900 000 | | €54.30 | | – | | } | – | |
| | PLC shares | – | | – | | – | | |
|
|
|
|
|
|
|
|
|
| |
| July | NV shares | 3 413 557 | | € 54.93 | | – | | } | – | |
| | PLC shares | – | | – | | – | | |
|
|
|
|
|
|
|
|
|
| |
| August | NV shares | 4 217 999 | | €56.12 | | – | | } | – | |
| | PLC shares | 734 996 | | £5.63 | | – | | |
|
|
|
|
|
|
|
|
|
| |
| September | NV shares | 2 031 319 | | €57.10 | | – | | } | 500 | |
| | PLC shares | – | | – | | – | | |
|
|
|
|
|
|
|
|
|
| |
| October | NV shares | 1 876 698 | | €58.55 | | 1 876 698 | | } | 318 | |
| | PLC shares | 8 434 294 | | £5.81 | | 8 434 294 | | |
|
|
|
|
|
|
|
|
|
| |
| November | NV shares | 2 575 481 | | €57.05 | | 2 429 193 | | } | 69 | |
| | PLC shares | 14 182 645 | | £5.67 | | 13 362 293 | | |
|
|
|
|
|
|
|
|
|
| |
| December | NV shares | 629 069 | | €57.89 | | 629 069 | | } | – | |
| | PLC shares | 3 883 892 | | £5.73 | | 3 883 892 | | |
|
|
|
|
|
|
|
|
|
| |
| Total | NV shares | 20 094 859 | | €55.47 | | 4 934 960 | | } | – | |
| | PLC shares | 31 749 739 | | £5.67 | | 25 680 479 | | |
|
|
|
|
|
|
|
|
|
| |
| (a) | When under a North American plan, in the form of NV New York shares or PLC ADRs. |
During the year, 15 159 899 NV and 6 069 260 PLC shares at a total cost of €879 million were purchased to maintain our hedging of share-based plan commitments in line with our hedging practice (see also page 87).
| Unilever Annual Report and Accounts 2005 | 181 |
Back to Contents
Information about exchange controls affecting security holders
Unilever N.V.
Under the Dutch External Financial Relations Act of 25 March 1994 the Minister of Finance is authorised to issue regulations relating to financial transactions concerning the movement of capital to or from third countries with respect to direct investments, establishment, the performing of financial services, the admission of negotiable instruments or goods with respect to which regulations have been issued under the Import and Export Act in the interest of the international legal system or an arrangement relevant thereto. These regulations may contain a prohibition to perform any of the actions indicated in those regulations without a licence. To date no regulations of this type have been issued which are applicable to Unilever N.V.
The Central Bank of the Netherlands is authorised to issue regulations with respect to reporting obligations. Pursuant to this authorisation it has issued the Reporting Obligations Balance of Payments 2003 (the ‘RR 2003’). Unilever N.V. has been appointed by the Central Bank as an institution subject to the reporting obligations and Unilever N.V. complies with such obligations.
| 182 | Unilever Annual Report and Accounts 2005 |
Back to Contents
Shareholder information |
Nature of the trading market
The principal trading markets upon which Unilever shares are listed are Euronext Amsterdam for NV ordinary shares and the London Stock Exchange for PLC ordinary shares. NV ordinary shares mainly trade in the form of depositary receipts for shares and almost all the shares and depositary receipts thereof are in bearer form. PLC ordinary shares are all in registered form.
In the United States, NV ordinary shares in registered form and PLC American Depositary Receipts, each representing four PLC ordinary shares, are traded on the New York Stock Exchange. Citibank, NA acts for NV and PLC as issuer, transfer agent and, in respect of the American Depositary Receipts, depositary.
The NV depositary receipts for ordinary shares are also listed on the stock exchanges in Frankfurt and Zürich.
There have not been any significant trading suspensions in the past three years.
At 28 February 2006 there were 7 060 registered holders of NV ordinary shares and 1 176 registered holders of PLC American Depositary Receipts in the United States. We estimate that approximately 28% of NV’s ordinary shares were held in the United States (approximately 27% in 2004), based on the distribution of the 2005 interim dividend payments, while most holders of PLC ordinary shares are registered in the United Kingdom – approximately 99% in both 2005 and 2004.
The high and low trading prices for the separate stock exchange listings are shown in the tables on the following page.
NV and PLC are separate companies with separate stock exchange listings and different shareholders. Shareholders cannot convert or exchange the shares of one for shares of the other and the relative share prices on the various markets can, and do, fluctuate. This happens for various reasons, including changes in exchange rates. However, over time the prices of NV and PLC shares do stay in close relation to each other, in particular because of our equalisation arrangements.
If you are a shareholder of NV, you have an interest in a Netherlands legal entity, your dividends will be paid in euros (converted into US dollars if you have shares registered in the United States) and you will be subject to Netherlands tax. If you are a shareholder of PLC, your interest is in a United Kingdom legal entity, your dividends will be paid in sterling (converted into US dollars if you have American Depositary Receipts) and you will be subject to United Kingdom tax. Nevertheless, the Equalisation Agreement means that as a shareholder of either company you effectively have an interest in the whole of Unilever. You have largely equal rights over our combined net profit and capital reserves as shown in the consolidated accounts. See Taxation for US residents on pages 184 and 185 and Equalisation Agreement on pages 41 and 42.
| Unilever Annual Report and Accounts 2005 | 183 |
Back to Contents
Nature of the trading market
(continued)
Share prices at 31 December 2005
The share price of the ordinary shares at the end of the year was for NV €57.85 and $68.65 and for PLC 576.5p and $40.12.
Monthly high and low prices for the most recent six months:
| | | | September | | October | | November | | December | | January | | February | |
|
|
|
|
|
|
|
|
|
|
|
|
|
| |
| NV per €0.51 ordinary share in Amsterdam (in €) | High | | 60 | | 61 | | 59 | | 59 | | 58 | | 59 | |
| | Low | | 56 | | 57 | | 57 | | 57 | | 56 | | 58 | |
|
|
|
|
|
|
|
|
|
|
|
|
|
| |
| NV per €0.51 ordinary share in New York (in $) | High | | 72 | | 72 | | 71 | | 71 | | 70 | | 72 | |
| | Low | | 70 | | 69 | | 67 | | 68 | | 68 | | 70 | |
|
|
|
|
|
|
|
|
|
|
|
|
|
| |
| PLC per 1.4p ordinary share in London (in pence) | High | | 597 | | 603 | | 581 | | 583 | | 592 | | 610 | |
| | Low | | 556 | | 564 | | 560 | | 566 | | 574 | | 588 | |
|
|
|
|
|
|
|
|
|
|
|
|
|
| |
| PLC per American Depositary Receipt in New York (in $) | High | | 43 | | 42 | | 41 | | 41 | | 42 | | 43 | |
| | Low | | 41 | | 40 | | 39 | | 40 | | 40 | | 42 | |
|
|
|
|
|
|
|
|
|
|
|
|
|
| |
Quarterly high and low prices for 2005 and 2004
| | 2005 | | 1st | | 2nd | | 3rd | | 4th | |
|
|
|
|
|
|
|
|
|
| |
| NV per €0.51 ordinary share in Amsterdam (in €) | High | | 53 | | 55 | | 60 | | 61 | |
| | Low | | 48 | | 50 | | 53 | | 57 | |
|
|
|
|
|
|
|
|
|
| |
| NV per €0.51 ordinary share in New York (in $) | High | | 69 | | 69 | | 72 | | 72 | |
| | Low | | 63 | | 64 | | 64 | | 67 | |
|
|
|
|
|
|
|
|
|
| |
| PLC per 1.4p ordinary share in London (in pence) | High | | 527 | | 554 | | 597 | | 603 | |
| | Low | | 488 | | 496 | | 538 | | 560 | |
|
|
|
|
|
|
|
|
|
| |
| PLC per American Depositary Receipt in New York (in $) | High | | 40 | | 41 | | 43 | | 42 | |
| | Low | | 37 | | 38 | | 38 | | 39 | |
|
|
|
|
|
|
|
|
|
| |
| | 2004 | | 1st | | 2nd | | 3rd | | 4th | |
|
|
|
|
|
|
|
|
|
| |
| NV per €0.51 ordinary share in Amsterdam (in €) | High | | 59 | | 60 | | 56 | | 49 | |
| | Low | | 52 | | 52 | | 46 | | 44 | |
|
|
|
|
|
|
|
|
|
| |
| NV per €0.51 ordinary share in New York (in $) | High | | 74 | | 71 | | 68 | | 67 | |
| | Low | | 65 | | 62 | | 58 | | 57 | |
|
|
|
|
|
|
|
|
|
| |
| PLC per 1.4p ordinary share in London (in pence) | High | | 576 | | 573 | | 534 | | 513 | |
| | Low | | 518 | | 501 | | 450 | | 443 | |
|
|
|
|
|
|
|
|
|
| |
| PLC per American Depositary Receipt in New York (in $) | High | | 44 | | 41 | | 39 | | 40 | |
| | Low | | 38 | | 37 | | 33 | | 33 | |
|
|
|
|
|
|
|
|
|
| |
Annual high and low prices for 2003, 2002 and 2001
| | | | | | 2003 | | 2002 | | 2001 | |
|
|
|
|
|
|
|
|
|
| |
| NV per €0.51 ordinary share in Amsterdam (in €) | High | | | | 60 | | 72 | | 71 | |
| | Low | | | | 46 | | 50 | | 55 | |
|
|
|
|
|
|
|
|
|
| |
| NV per €0.51 ordinary share in New York (in $) | High | | | | 65 | | 67 | | 65 | |
| | Low | | | | 53 | | 50 | | 50 | |
|
|
|
|
|
|
|
|
|
| |
| PLC per 1.4p ordinary share in London (in pence) | High | | | | 628 | | 659 | | 610 | |
| | Low | | | | 475 | | 473 | | 478 | |
|
|
|
|
|
|
|
|
|
| |
| PLC per American Depositary Receipt in New York (in $) | High | | | | 39 | | 39 | | 35 | |
| | Low | | | | 31 | | 30 | | 28 | |
|
|
|
|
|
|
|
|
|
| |
| 184 | Unilever Annual Report and Accounts 2005 |
Back to Contents
Shareholder information |
Taxation for US residents holding shares in NV
The following notes are provided for guidance. US residents should consult their local tax advisers, particularly in connection with potential liability to pay US taxes on disposal, lifetime gift or bequest of their shares.
Netherlands taxation on dividends
Dividends of companies in the Netherlands are in principle subject to dividend withholding tax of 25%. Where a shareholder is entitled to the benefits of the current Income Tax Convention (‘the Convention’) concluded on 18 December 1992 between the United States and the Netherlands, when dividends are paid by NV to:
| • | a United States resident; |
| | |
| • | a corporation organised under the laws of the United States (or any territory of it) having no permanent establishment in the Netherlands of which such shares form a part of the business property; or |
| | |
| • | any other legal person subject to United States Federal income tax with respect to its worldwide income, having no permanent establishment in the Netherlands of which such shares form a part of the business property; |
these dividends qualify for a reduction of Netherlands withholding tax on dividends from 25% to 15% (to 5% if the beneficial owner is a company which directly holds at least 10% of the voting power of NV shares and to 0% if the beneficial owner is a qualified ‘Exempt Organisation’ as defined in Article 36 of the Convention).
Where a United States resident or corporation has a permanent establishment in the Netherlands, which has shares in NV forming part of its business property, dividends it receives on those shares are included in that establishment’s profit. They are subject to the Netherlands income tax or corporation tax, as appropriate, and the Netherlands tax on dividends will generally be applied at the full rate of 25%. This tax will be treated as foreign income tax eligible for credit against the shareholder’s United States income taxes.
Under the Convention, qualifying United States organisations that are generally exempt from United States taxes and that are constituted and operated exclusively to administer or provide pension, retirement or other employee benefits may be exempt at source from withholding tax on dividends received from a Netherlands corporation. An agreement published by the US Internal Revenue Service on 20 April 2000 in release IR-INT-2000-9 between the United States and the Netherlands tax authorities describes the eligibility of these US organisations for benefits under the Convention.
A United States trust, company or organisation that is operated exclusively for religious, charitable, scientific, educational or public purposes, is now subject to an initial 25% withholding tax rate. Such an exempt organisation is entitled to reclaim from the Netherlands Tax Authorities a refund of the Netherlands dividend tax, if and to the extent that it is exempt from United States Federal Income Tax and it would be exempt from tax in the Netherlands if it were organised and carried on all its activities there.
If you are an NV shareholder resident in any country other than the United States or the Netherlands, any exemption from, or reduction or refund of, the Netherlands dividend withholding tax
may be governed by the ‘Tax Regulation for the Kingdom of the Netherlands’ or by the tax convention, if any, between the Netherlands and your country of residence.
United States taxation on dividends
If you are a United States shareholder, the dividend (including the withheld amount) up to the amount of our earnings and profits for United States Federal income tax purposes will be ordinary dividend income. Dividends received by an individual during taxable years before 2009 will be taxed at a maximum rate of 15%, provided the individual has held the shares for more than 60 days during the 121-day period beginning 60 days before the ex-dividend date, that NV is a qualified foreign corporation and that certain other conditions are satisfied. NV is a qualified foreign corporation for this purpose. Dividends received by an individual for taxable years after 2008 will be subject to tax at ordinary income rates. The dividends are not eligible for the dividends received deduction allowed to corporations.
For US foreign tax credit purposes, the dividend is foreign source income, and the Netherlands withholding tax is a foreign income tax that is eligible for credit against the shareholder’s United States income taxes. However, the rules governing the US foreign tax credit are complex, and additional limitations on the credit apply to individuals receiving dividends eligible for the 15% maximum tax rate on dividends described above.
Any portion of the dividend that exceeds our United States earnings and profits is subject to different rules. This portion is a tax free return of capital to the extent of your basis in our shares, and thereafter is treated as a gain on a disposition of the shares.
Under a provision of the Netherlands Dividend Tax Act, NV is entitled to a credit (up to a maximum of 3% of the gross dividend from which dividend tax is withheld) against the amount of dividend tax withheld before remittance to the Netherlands tax authorities. For dividends paid on or after 1 January 1995, the United States tax authority may take the position that the Netherlands withholding tax eligible for credit should be limited accordingly.
Netherlands taxation on capital gains
Under the Convention, if you are a United States resident or corporation and you have capital gains on the sale of shares of a Netherlands company, these are generally not subject to taxation by the Netherlands. An exception to this rule generally applies if you have a permanent establishment in the Netherlands and the capital gain is derived from the sale of shares which form part of that permanent establishment’s business property.
Netherlands succession duty and gift taxes
Under the Estate and Inheritance Tax Convention between the United States and the Netherlands of 15 July 1969, United States individual residents who are not Dutch citizens who have shares will generally not be subject to succession duty in the Netherlands on the individual’s death, unless the shares are part of the business property of a permanent establishment situated in the Netherlands.
A gift of shares of a Netherlands company by a person who is not a resident or a deemed resident of the Netherlands is generally not subject to Netherlands gift tax. A non-resident Netherlands citizen, however, is still treated as a resident of the Netherlands for gift tax purposes for ten years and any other non-resident person for one year after leaving the Netherlands.
| Unilever Annual Report and Accounts 2005 | 185 |
Back to Contents
Taxation for US residents holding shares in PLC
The following notes are provided for guidance. US residents should consult their local tax advisers, particularly in connection with potential liability to pay US taxes on disposal, lifetime gift or bequest of their shares.
United Kingdom taxation on dividends
Under United Kingdom law, income tax is not withheld from dividends paid by United Kingdom companies. Shareholders, whether resident in the United Kingdom or not, receive the full amount of the dividend actually declared.
United States taxation on dividends
If you are a shareholder resident in the US, the dividend up to the amount of our earnings and profits for United States Federal income tax purposes will be ordinary dividend income. Dividends received by an individual during taxable years before 2009 will be taxed at a maximum rate of 15%, provided the individual has held the shares for more than 60 days during the 121-day period beginning 60 days before the ex-dividend date, that PLC is a qualified foreign corporation and certain other conditions are satisfied. PLC is a qualified foreign corporation for this purpose. Dividends received by an individual for taxable years after 2008 will be subject to tax at ordinary income rates. The dividend is not eligible for the dividends received deduction allowable to corporations. The dividend is foreign source income for US foreign tax credit purposes.
Any portion of the dividend that exceeds our United States earnings and profits is subject to different rules. This portion is a tax free return of capital to the extent of your basis in our shares, and thereafter is treated as a gain on a disposition of the shares.
UK taxation on capital gains
Under United Kingdom law, when you sell shares you may be liable to pay capital gains tax. However, if you are either:
| • | an individual who is neither resident nor ordinarily resident in the United Kingdom; or |
| | |
| • | a company which is not resident in the United Kingdom; |
you will not be liable to United Kingdom tax on any capital gains made on disposal of your shares.
The exception is if the shares are held in connection with a trade or business which is conducted in the United Kingdom through a branch or an agency.
UK inheritance tax
Under the current estate and gift tax convention between the United States and the United Kingdom, ordinary shares held by an individual shareholder who is:
| • | domiciled for the purposes of the convention in the United States; and |
| • | is not for the purposes of the convention a national of the United Kingdom; |
will not be subject to United Kingdom inheritance tax on:
| • | the individual’s death; or |
| • | on a gift of the shares during the individual’s lifetime. |
The exception is if the shares are part of the business property of a permanent establishment of the individual in the United Kingdom or, in the case of a shareholder who performs independent personal services, pertain to a fixed base situated in the United Kingdom.
| 186 | Unilever Annual Report and Accounts 2005 |
Back to Contents
Shareholder information |
Dividends
Our interim ordinary dividends are normally announced in November and paid in December. Final ordinary dividends are normally proposed in February and, if approved by shareholders at the Annual General Meetings, paid in June.
The following tables show the dividends paid by NV and PLC for the last five years. NV dividends are per €0.51 ordinary share and PLC dividends are per 1.4p ordinary share and per depositary receipt of 5.6p. Dividends for NV have been translated into US dollars at the exchange rates prevailing on the dates of declaration. The PLC interim dividend for 2001 was translated into US dollars at the exchange rates prevailing on the date of payment of the sterling dividend. Following a change in practice, starting with the final dividend for 2001, PLC dividends have been translated into US dollars at the rate prevailing on the date of declaration of the dividend.
The interim dividend is normally 35% of the previous year’s total normal dividend per share, based on the stronger of our two parent currencies over the first nine months of the year. Equalisation of the interim dividend in the other currency takes place at the average exchange rate of the third quarter. Equalisation of the final dividend takes place at the average exchange rate for the full year.
Final dividends for 2005 are payable on 12 June 2006, subject to approval at the AGMs. For purposes of illustration, the amounts payable in respect of NV New York shares and PLC ADRs have been translated in the table below at rates of exchange on 9 February 2006, which is the date on which the proposed dividends were announced. The actual amounts payable in US dollars will be calculated by reference to the exchange rates on the day on which the dividends are approved (8 May 2006 in the case of NV and 9 May 2006 in the case of PLC).
The dividend timetable for 2006 is shown on page 189.
| NV Dividends | | | | | | | | | | |
| | 2005 | | 2004 | | 2003 | | 2002 | | 2001 | |
|
|
|
|
|
|
|
|
|
| |
| Interim dividend per €0.51 | €0.66 | | €0.63 | | €0.59 | | €0.55 | | €0.50 | |
| Exchange rate $ to €1 | 1.1992 | | 1.2784 | | 1.1673 | | 0.9820 | | 0.9097 | |
| Interim dividend per €0.51 (US registry) | $0.791472 | | $0.805392 | | $0.688707 | | $0.540100 | | $0.454850 | |
| | | | | | | | | | | |
| Final dividend per €0.51 | €1.32 | | €1.26 | | €1.15 | | €1.15 | | €1.06 | |
| Final exchange rate $ to €1 | 1.1948 | | 1.2854 | | 1.1857 | | 1.1427 | | 0.9088 | |
| Final dividend per €0.51 (US registry) | $1.577136 | | $1.619604 | | $1.363555 | | $1.314105 | | $0.963328 | |
|
|
|
|
|
|
|
|
|
| |
| PLC Dividends | | | | | | | | | | |
| | 2005 | | 2004 | | 2003 | | 2002 | | 2001 | |
|
|
|
|
|
|
|
|
|
| |
| Interim dividend per 1.4p | 6.77p | | 6.33p | | 6.16p | | 5.21p | | 4.65p | |
| Exchange rate $ to £1 | 1.7648 | | 1.8382 | | 1.6910 | | 1.5580 | | 1.4527 | |
| Interim dividend per 5.6p | $0.4779 | | $0.4654 | | $0.4167 | | $0.3247 | | $0.2702 | |
| | | | | | | | | | | |
| Final dividend per 1.4p | 13.54p | | 12.82p | | 11.92p | | 10.83p | | 9.89p | |
| Final exchange rate $ to £1 | 1.7427 | | 1.8835 | | 1.7722 | | 1.6065 | | 1.4591 | |
| Final dividend per 5.6p | $0.9438 | | $0.9658 | | $0.8449 | | $0.6959 | | $0.5772 | |
|
|
|
|
|
|
|
|
|
| |
| Unilever Annual Report and Accounts 2005 | 187 |
Back to Contents
Glossary
The following is intended to provide a general guide, particularly for United States readers, as to the meanings of various terms which may be used in this report.
| Term used in this report | US equivalent or brief description |
|
|
| Accounts | Financial statements |
|
|
| Associate | A business which is not a subsidiary or a joint venture, but in which the Group has |
| | a shareholding and exercises significant influence |
|
|
| Called up share capital | Ordinary shares, issued and fully paid |
|
|
| Creditors | Accounts payable/Payables |
|
|
| Creditors: amounts due after more than one year | Long-term accounts payable |
|
|
| Creditors: amounts due within one year | Current accounts payable |
|
|
| Debtors | Accounts receivable/Receivables |
|
|
| Finance lease | Capital lease |
|
|
| Freehold | Ownership with absolute rights in perpetuity |
|
|
| Gearing | Leverage |
|
|
| Group, or consolidated, accounts | Consolidated financial statements |
|
|
| Finance cost | Interest expense |
|
|
| Finance income | Interest income |
|
|
| Joint venture | A business which is jointly controlled by the Group and one or more |
| | external partners |
|
|
| Nominal value | Par value |
|
|
| Operating margin | Operating profit expressed as a percentage of turnover |
|
|
| Operating profit | Net operating income |
|
|
| Profit | Income (or earnings) |
|
|
| Profit and loss account | Income statement |
|
|
| Profit attributable to ordinary shareholders | Net income attributable to ordinary stockholders |
|
|
| Profit retained | Retained earnings |
|
|
| Provisions | Liabilities other than debt and specific accounts payable |
|
|
| Reserves | Stockholders’ equity other than paid-up capital |
|
|
| Share capital | Capital stock or common stock |
|
|
| Share option | Stock option |
|
|
| Share premium account | Additional paid-in capital relating to proceeds of sale of stock in excess of par value |
| | or paid-in surplus |
|
|
| Shareholders’ equity | Stockholders’ equity |
|
|
| Shares in issue | Shares outstanding |
|
|
| Statement of recognised income and expense | Statement of comprehensive income |
|
|
| Turnover | Sales revenues |
|
|
| Weighted average cost of capital | The cost of equity multiplied by the market capitalisation, plus the after taxation |
| | interest cost of debt multiplied by the market value of the net debt, divided by the |
| | sum of the market values of debt and equity |
|
|
| 188 | Unilever Annual Report and Accounts 2005 |
Back to Contents
Shareholder information |
Financial calendar and addresses
| Annual General Meetings | |
|
|
| NV | 09:30 am Monday 8 May 2006 Rotterdam |
|
|
| PLC | 11:00 am Tuesday 9 May 2006 London |
|
|
| Announcements of results | | | | |
|
|
|
|
|
| First Quarter | 4 May 2006 | | Third Quarter | 2 November 2006 |
| First Half Year | 3 August 2006 | | Final for Year | 8 February 2007 |
|
|
|
|
|
| |
| Dividends on ordinary capital |
|
| Final for 2005 |
Announced 9 February 2006 and to be declared 8 May 2006 (NV) and 9 May 2006 (PLC). |
| |
| | Ex-dividend | Record | Payment |
| | date | date | date |
|
|
|
|
| NV | 10 May 2006 | 9 May2006 | 12 June2006 |
| PLC | 17 May2006 | 19 May2006 | 12 June2006 |
| NV – New York Shares | 10 May2006 | 12 May2006 | 12 June2006 |
| PLC – American Depositary Receipts | 17 May2006 | 19 May2006 | 12 June2006 |
|
|
|
|
| | | | |
| Interim for 2006 | | | |
| To be announced 02 November 2006. | | | |
| | Ex-dividend | Record | Payment |
| | date | date | date |
|
|
|
|
| NV | 3 November2006 | 2 November2006 | 4 December2006 |
| PLC | 8 November2006 | 10 November2006 | 4 December2006 |
| NV – New York Shares | 3 November2006 | 7 November2006 | 4 December2006 |
| PLC – American Depositary Receipts | 8 November2006 | 10 November2006 | 4 December2006 |
|
|
|
|
| | | | | |
| Preferential dividends - NV | | | | |
|
|
|
|
|
|
| | | | Ex-dividend | Record | Payment |
| | | Announced | date | date | date |
|
|
|
|
|
|
| 4% | Cumulative Preference | 8 December2006 | 11 December2006 | 8 December2006 | 2 January2007 |
| 6% | Cumulative Preference | 8 September2006 | 11 September2006 | 8 September2006 | 2 October2006 |
| 7% | Cumulative Preference | 8 September2006 | 11 September2006 | 8 September2006 | 2 October2006 |
|
|
|
|
|
|
| | | |
| Contact details | | |
| Rotterdam | London | New York |
|
|
|
| Unilever N.V. | Unilever PLC | Unilever United States, Inc. |
| Corporate Relations Department | Corporate Relations Department | Investor Relations Department |
| Weena 455, PO Box 760 | PO Box 68, Unilever House | 700 Sylvan Avenue, Englewood Cliffs |
| 3000 DK Rotterdam | Blackfriars, London EC4P 4BQ | NJ 07632 |
| | | |
| Telephone +31 (0)10 217 4000 | Telephone +44 (0)20 7822 5252 | Telephone +1 (0)201 894 2806 |
| Telefax +31 (0)10 217 4798 | Telefax + 44 (0)20 7822 6191 | Telefax + 1 (0)201 894 2222 |
| | | |
| Any queries can also be sent to us electronically via www.unilever.com/resources/contactus.asp. | |
|
|
|
| Unilever Annual Report and Accounts 2005 | 189 |
Back to Contents
Website
Shareholders are encouraged to visit our website www.unilever.com, which has a wealth of information about Unilever.
There is a section designed specifically for investors at www.unilever.com/investorcentre. It includes detailed coverage of the Unilever share price, our quarterly and annual results, performance charts, financial news and investor relations speeches and presentations. It also includes conference and investor/analyst presentations.
You can also view this year’s and prior years’ Annual Review and Annual Report and Accounts documents at www.unilever.com/investorcentre.
PLC shareholders can elect not to receive paper copies of the Annual Review, the Annual Report and Accounts and other shareholder documents by registering at www.unilever.com/shareholderservices if they prefer to view these on our website.
PublicationsCopies of the following publications can be accessed directly or ordered through www.unilever.com/investorcentre or www.unilever.nl/onsbedrijf/beleggers.
Unilever Annual Review 2005
Including Summary Financial Statement. Available in English or Dutch, with financial information in euros, pounds sterling and US dollars.
Unilever Annual Report and Accounts 2005
Available in English or Dutch, with figures in euros. It forms the basis for the Form 20-F that is filed with the United States Securities and Exchange Commission.
Quarterly Results Announcements
Available in English or Dutch, with figures in euros; supplements in English, with pounds sterling or US dollar figures, are also available.
Share registration
The Netherlands
N.V. Algemeen Nederlands Trustkantoor ANT
PO Box 11063
1001 GB Amsterdam
| Telephone | + 31(0) 20522 2555 |
| Telefax | +31(0) 20522 2500 |
| e-mail | registers@ant-trust.nl |
UK
Computershare Investor Services PLC
PO Box 82
The Pavilions
Bridgwater Road
Bristol BS99 7NH
| Telephone | + 44(0) 8706003977 |
| Telefax | + 44(0) 8707036119 |
| Website | www.unilever.com/shareholderservices |
USA
Citibank Shareholder Services
PO Box 43077
Providence RI 02940-3077
| Toll free phone (inside US) | 888 502 6356 |
| Toll phone (outside US) | +1(0)816 843 4281 |
| Website | www.citibank.com/adr |
| 190 | Unilever Annual Report and Accounts 2005 |
Back to Contents
Cross reference to Form 20-F
| PART I | |
| | | |
| 1 | Identity of directors, senior management and advisers | n/a |
| | | |
| 2 | Offer statistics and expected timetable | n/a |
| | | |
| 3 | Key information | |
| 3A | Selected financial data | 124, 152-156, 188 |
| 3B | Capitalization and indebtedness | n/a |
| 3C | Reasons for the offer and use of proceeds | n/a |
| 3D | Risk factors | 31-32 |
| | | |
| 4 | Information on the company | |
| 4A | History and development of | 4, 10-14, 34, 188 |
| | the company | |
| 4B | Business overview | 10-14, 26-30 |
| 4C | Organisational structure | 34-40, 167-168 |
| 4D | Property, plant and equipment | 14 |
| | | |
| 4A | Unresolved staff comments | n/a |
| | | |
| 5 | Operating and financial review and prospects | |
| 5A | Operating results | 16-30 |
| 5B | Liquidity and capital resources | 16-25, 74, 105-114 |
| 5C | Research and development, patents and | |
| | licences, etc. | 10-14, 26-30, 93 |
| 5D | Trend information | 5-7, 16-30 |
| 5E | Off balance sheet arrangements | 24, 110-113 |
| 5F | Tabular disclosure of contractual obligations | 23-24 |
| 5G | Safe harbour | 4 |
| | | |
| 6 | Directors, senior management and employees | |
| 6A | Directors and senior management | 34-50 |
| 6B | Compensation | 53-69, 114-122, 132-143 |
| 6C | Board practices | 34-50, 52-69 |
| 6D | Employees | 10-11 |
| 6E | Share ownership | 53-69, 132-141 |
| | | |
| 7 | Major shareholders and related party transactions | |
| 7A | Major shareholders | 44, 180 |
| 7B | Related party transactions | 13, 142 |
| 7C | Interests of experts and counsel | n/a |
| | | |
| 8 | Financial information | |
| 8A | Consolidated statements | |
| | and other financial information | 78-166, 186 |
| 8B | Significant changes | 25, 143 |
| | | |
| 9 | The offer and listing | |
| 9A | Offer and listing details | 182-183 |
| 9B | Plan of distribution | n/a |
| 9C | Markets | 2, 182-183 |
| 9D | Selling shareholders | n/a |
| 9E | Dilution | n/a |
| 9F | Expenses of the issue | n/a |
| 10 | Additional information | |
| 10A | Share capital | n/a |
| 10B | Memorandum and articles of association | 34-44, 124-125, 173 |
| 10C | Material contracts | 34, 41-43 |
| 10D | Exchange controls | 182 |
| 10E | Taxation | 184-185 |
| 10F | Dividends and paying agents | n/a |
| 10G | Statement by experts | n/a |
| 10H | Documents on display | 161 |
| 10I | Subsidiary information | n/a |
| | | |
| 11 | Quantitative and qualitative disclosures about market risk | 32, 86-87, 105-113 |
| | | |
| 12 | Description of securities other than equity securities | n/a |
| | |
| PART II | |
| | | |
| 13 | Defaults, dividend arrearages and delinquencies | n/a |
| | | |
| 14 | Material modifications to the rights of security holders and use of proceeds | n/a |
| | | |
| 15 | Controls and procedures | 74 |
| | | |
| 16 | Reserved | |
| 16A | Audit Committee financial expert | 39 |
| 16B | Code of Ethics | 34, 47-48 |
| 16C | Principal accountant fees and services | 70-71, 93 |
| 16D | Exemptions from the Listing Standards for | |
| | Audit Committees | n/a |
| 16E | Purchases of equity securities by the issuer and affiliated purchasers | 181 |
| | | |
| PART III |
| | | |
| 17 | Financial statements | n/a |
| | | |
| 18 | Financial statements | 78-151, 157-166 |
| | | |
| 19 | Exhibits* | |
*Filed with the United States Securities and Exchange Commission.
Unilever’s agent in the United States is Mr R Soiefer, Senior Vice-President, General Counsel and Secretary, Unilever United States, Inc., 700 Sylvan Avenue, Englewood Cliffs, NJ 07632.
| Unilever Annual Report and Accounts 2005 | 191 |
Back to Contents
| | |
| | |
| | |
| | |
| | |
| | |
| | |
| | |
| | |
| | |
| | |
| | |
| | |
| | |
| | |
| | |
| | |
| | |
| | |
| | |
| | |
| | |
| | Designed and produced by Addison Corporate Marketing
Photography by Igor Emmerich
Typeset by Pauffley, London
Printed by St Ives Westerham Press under ISO 14001 environmental accreditation.
All paper used in the production of this report is recyclable and bio degradable and
contains 50% recovered fibre. The paper was manufactured under ISO 9002 and
ISO 14001 environmental accreditation. |
Back to Contents
Unilever N.V.
Weena 455, PO Box 760
3000 DK Rotterdam
The Netherlands
T +31 (0)10 217 4000
F +31 (0)10 217 4798
Unilever PLC
PO Box 68, Unilever House
Blackfriars, London EC4P 4BQ
United Kingdom
T +44 (0)20 7822 5252
F +44 (0)20 7822 5951
Unilever PLC registered office
Unilever PLC
Port Sunlight
Wirral
Merseyside CH62 4ZD
United Kingdom
www.unilever.com

Back to Contents
SIGNATURES
The registrant hereby certifies that it meets all of the requirements for filing on Form 20-F and that it has duly caused and authorised the undersigned to sign this Annual Report on its behalf.
Unilever PLC.
(Registrant)
| /s/ S G Williams | |
| |
| (Signature) | |
| S G Williams, Joint Secretary | |
Date: 29 March 2006
Back to Contents
Item 19. Exhibits
Exhibit Number Description of Exhibit
| 1.1 | Memorandum and Articles of Association of Unilever PLC, as amended |
| |
| 2.1 | Indenture dated as of August 1, 2000, among Unilever Capital Corporation, Unilever N.V., Unilever PLC, Unilever United States, Inc. and The Bank of New York, as Trustee, relating to Guaranteed Debt Securities1 |
| |
| 2.2 | Trust Deed dated as of July 22, 1994, among Unilever N.V., Unilever PLC, Unilever Capital Corporation, Unilever United States, Inc. and The Law Debenture Trust Corporation p.l.c., relating to Guaranteed Debt Securities2 |
| |
| 4.1 | Equalisation Agreement between Unilever N.V. and Unilever PLC3 |
| |
| 4.2 | Service Contracts of the Executive Directors of Unilever PLC |
| |
| 4.3 | Letters regarding compensation of Executive Directors for Unilever PLC |
| |
| 4.4 | Unilever North America 2002 Omnibus Equity Compensation Plan4 |
| |
| 4.5 | The Unilever PLC International 1997 Executive Share Option Scheme5 |
| |
| 4.6 | The Unilever Long Term Incentive Plan6 |
| |
| 7.1 | Computation of Ratio of earnings to fixed charges and Return on invested capital7 |
| |
| 8.1 | List of Subsidiaries8 |
| |
| 10.1 | Consent of PricewaterhouseCoopers Accountants N.V. and PricewaterhouseCoopers LLP |
| |
| 12.1 | Certifications of the Group Chief Executive and Financial Director/Chief Financial Officer pursuant to Section 302 of the Sarbanes-Oxley Act of 2002. |
| |
| 13.1 | Certifications of the Group Chief Executive and Financial Director/Chief Financial Officer pursuant to Section 906 of the Sarbanes-Oxley Act of 2002. |
Certain instruments which define rights of holders of long-term debt of the Company and its subsidiaries are not being filed because the total amount of securities authorized under each such instrument does not exceed 10% of the total consolidated assets of the Company and its subsidiaries. The Company and its subsidiaries hereby agree to furnish a copy of each such instrument to the Securities and Exchange Commission upon request.
|
| | |
| 1 | Incorporated by reference to the Form 6-K furnished to the SEC on October 23, 2000. |
| 2 | Incorporated by reference to Exhibit 2.2 of Form 20-F filed with the SEC on March 28, 2002. |
| 3 | Incorporated by reference to Exhibit 4.1 of Form 20-F filed with the SEC on March 27, 2003. |
| 4 | Incorporated by reference to Exhibit 99.1 of Form S-8 filed with the SEC on February 27, 2003. |
| 5 | Incorporated by reference to Exhibit 4.5 of Form 20-F filed with the SEC on March 28, 2002. |
| 6 | Incorporated by reference to Exhibit 4.7 of Form 20-F filed with the SEC on March 28, 2002. |
| 7 | The required information is set forth on page 152 of the Annual Report and Accounts on Form 20-F. |
| 8 | The required information is set forth on pages 167-168 of the Annual Report and Accounts on Form 20-F. |