UNITED STATES
SECURITIES AND EXCHANGE COMMISSION
Washington, D.C. 20549
FORM N-CSR
CERTIFIED SHAREHOLDER REPORT OF REGISTERED MANAGEMENT
INVESTMENT COMPANIES
Investment Company Act File Number: 811-3493
American Federation of Labor –
Congress of Industrial Organizations
Housing Investment Trust
(Exact name of registrant as specified in charter)
2401 Pennsylvania Avenue, N.W., Suite 200
Washington, D.C. 20037
(Address of principal executive offices) (Zip code)
Kenneth G. Lore, Esq.
Bingham McCutchen LLP
2020 K Street, N.W., Washington, DC 20006
(Name and address of agent for service)
(202) 331-8055
(Registrant’s telephone number, including area code)
Date of fiscal year end: December 31
Date of reporting period: January 1, 2011 - December 31, 2011
Item 1. Reports to Stockholders.
A copy of the 2011 Annual Report (the “Report”) of the AFL-CIO Housing Investment Trust (the “Trust”) transmitted to Trust participants pursuant to Rule 30e-1 under the Investment Company Act of 1940, as amended (17 CFR 270.30e-1) (the “Act”), is included herewith.

 | | MESSAGE FROM THE AFL-CIO President
“I urge pension plans to consider increasing participation in the HIT, given its powerful record of job-generating investments.”
Richard L. Trumka President, AFL-CIO |
| | | |
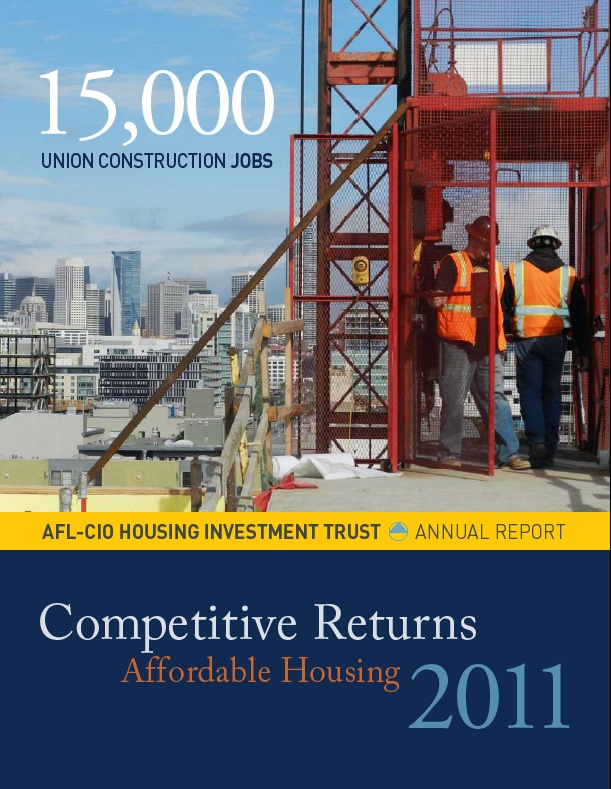
I commend the AFL-CIO Housing Investment Trust and its investors for putting pension capital to work so effectively in 2011. Funds invested by the HIT grew workers’ pension assets, created jobs, and financed affordable housing. In a bad economy, the HIT sets a shining example of responsible investing that few others can equal. The HIT once again proved its value to investors by generating fixed-income returns that exceeded its benchmark for the year. The HIT’s Construction Jobs Initiative also proved its ability to put union members back to work. Early in 2011, this Initiative surpassed its initial goal of creating 10,000 union construction jobs, and it is now on track to reach 15,000 jobs by the end of 2012. The AFL-CIO also welcomed the HIT as part of our innovative partnership to generate jobs through investments in energy-efficient retrofit projects. America wants to work. The HIT is helping to make that happen in cities from San Francisco to Boston. I see the HIT and its Construction Jobs Initiative as a paradigm for responsible pension investing. These construction-related investments are, first of all, good for | | the HIT portfolio and pension beneficiaries. But they are also part of the solution to the greatest economic crisis of our generation. Union members want jobs, and the HIT is creating thousands of union construction jobs with family-supporting wages and benefits. Union members want housing they can afford, and the HIT is increasing the supply of affordable housing through the union-built projects it finances. The economy needs to grow, and HIT-financed construction projects are spurring employment and economic growth in the community at large. That is a win-win for workers and their communities – and it is happening because workers’ pension capital is invested in the HIT. The HIT is realizing the dreams of the AFL-CIO’s early leadership, who first conceived of workers directing the investment of their pension capital more than four decades ago. I urge pension plans to consider increasing participation in the HIT, given its powerful record of job-generating investments.
|
A N N U A L R E P O R T 2 0 1 1 1
 | | MESSAGE FROM THE Chairman “The HIT works every day to make life better for this and future generations through its sound investments.”
John J. Sweeney
Chairman, AFL-CIO Housing Investment Trust
|
| | | |
As a young union organizer in New York City in 1962, I had the opportunity to attend the dedication of the Penn South Cooperative, a union-developed limited-equity co-op in midtown Manhattan. This 10-building community has stood for 50 years as a model for making housing affordable to working families in high-cost cities. Developed by the International Ladies’ Garment Workers Union, a forerunner of UNITE HERE, Penn South has been home to thousands of working New Yorkers. In 2011, Penn South was in need of new financing to maintain its affordability and refurbish aging facilities, and it turned to the AFL-CIO Housing Investment Trust. The result was the HIT’s largest investment to date: $134 million that will keep Penn South affordable for another 20 years, and also finance renovation work that should generate more than 600 much-needed union construction jobs. President John F. Kennedy gave a memorable speech at Penn South’s dedication. In his ringing tones, he challenged labor unions to tackle the unfinished business of building and preserving affordable housing for working people today and for those who come after us. “It is a task of every generation to build a road for the next generation,” he told us. | | Just two years after President Kennedy spoke those words, the AFL-CIO laid the groundwork for creating the HIT, which would help meet that challenge. To date, the HIT has invested more than $6.3 billion of union and public employee pension capital – which is $10.9 billion in today’s dollars – to build or preserve more than 100,000 units of housing nationwide and create more than 69,000 union construction jobs. I was honored to return to Penn South in 2011 as HIT’s Chairman to announce our investment in the future of this venerable model of affordable housing. So much has happened since President Kennedy spoke to us 50 years ago, both in our own lives and in the nation’s history. One thing remains constant: the labor movement continues to work to provide a better life for working people and for all Americans by promoting job security, safe and affordable housing, and vibrant communities. While there is still much to be done, the AFL-CIO Housing Investment Trust works every day to make life better for this and future generations through its sound investments. |
2 A F L - C I O H O U S I N G I N V E S T M E N T T R U S T
Overview of 2011 Performance
The HIT outperformed its benchmark with gross and net returns of 8.34% and 7.86% for the year, while creating affordable housing and union jobs.
The AFL-CIO Housing Investment Trust distinguished itself with strong gross and net returns of 8.34% and 7.86% for the year ended December 31, 2011, outperforming its benchmark in a year of considerable economic volatility and market uncertainty. This made 2011 the HIT’s 19th consecutive calendar year of outperforming the benchmark – the Barclays Capital Aggregate Bond Index (Barclays Aggregate) – on a gross basis. It was also the 12th calendar year in that 19-year period in which the HIT exceeded the benchmark on a net basis. The HIT’s return for the one-year period ending December 31 topped the benchmark’s 7.84% by 50 basis points gross and 2 basis points net, in a year when many fixed-income funds underperformed.
In addition to providing strong returns to its investors, the HIT marked other significant milestones in 2011. It grew its net assets past $4 billion for the first time while also financing needed affordable housing and meeting its two-year goal of creating 10,000 union jobs through its Construction Jobs Initiative at a time when employment remains a top national | | concern. The HIT is now working to finance additional projects and has raised its target to 15,000 union construction jobs by the end of 2012, which should also generate an estimated 7,800 jobs in other sectors of the economy.
These 2011 accomplishments result from the HIT’s specialization in high credit quality multifamily mortgage-backed securities (MBS), which produce superior risk-adjusted returns relative to the benchmark and provide diversification benefits for investors. New multifamily commitments of $291 million in 2011 should contribute to future performance and also move the HIT’s Construction Jobs Initiative toward its job creation goal.
Investors showed their confidence in the HIT’s strong performance and successful job creation by bringing $347 million of new capital to the HIT in 2011. This included $187 million of new investments and a dividend reinvestment rate of nearly 90%. Eighteen new participants invested in the HIT in 2011, the largest number since 1998. |
| | | |
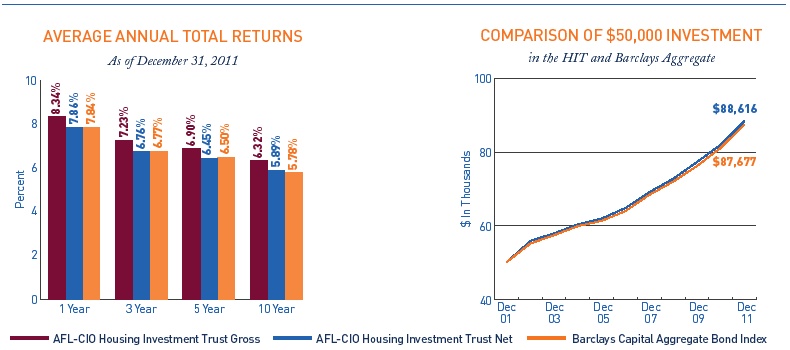 Past performance is no guarantee of future results. Economic and market conditions change, and both will cause investment return, principal value, and yield to fluctuate so that a participant’s units, when redeemed, may be worth more or less than their original cost. Current performance may be lower or higher than the performance data quoted. Performance data current to the most recent month-end is available at www.aflcio-hit.com. Gross performance figures do not reflect the deduction of HIT expenses. Net performance figures reflect the deduction of HIT expenses and are the performance figures investors experience in the HIT. Information about HIT expenses can be found on page 1 of the HIT’s current prospectus. The Barclays Aggregate is an unmanaged index and is not available for direct investment, although certain funds attempt to replicate this index. Returns for the index would be lower if they reflected the actual trading costs or expenses associated with management of an actual portfolio. |
A N N U A L R E P O R T 2 0 1 1 3
Strategy and Performance
The HIT’s multifamily focus offers investors diversification, a high degree of capital security, and an income advantage over the benchmark.
The HIT continued to serve investors well by generating higher real income than the benchmark with less credit risk. Investors once again benefited from the HIT’s investment strategy, which seeks competitive risk-adjusted returns relative to the Barclays Aggregate by investing in assets with superior credit quality and yield, as compared to the benchmark, while maintaining a similar interest rate risk profile. A significant portion of the HIT’s multifamily mortgage investments are insured or guaranteed by a U.S. government agency or a government-sponsored enterprise (GSE). In constructing its portfolio, the HIT substitutes these agency multifamily MBS for corporate debt and some U.S. Treasury and GSE debt securities in the benchmark. The HIT’s specialization in these agency multifamily securities helps investors achieve diversification, a high degree of capital security, prepayment protection, and an ongoing income advantage compared to the benchmark, since these MBS typically generate higher income than Treasuries while reflecting similar credit quality. The HIT manages its interest rate risk by targeting its duration to be similar to the benchmark.
Over 93% of the HIT portfolio at year-end consisted of securities that were insured or guaranteed by the U.S. government or a GSE. This compared to less than 74% in the benchmark. The HIT’s current yield was 60 basis points higher than the benchmark at December 31, up slightly from 57 basis points a year earlier.
The HIT achieved its 2011 performance advantage over the benchmark by adhering to its investment strategy, which enabled it to capture higher real income and strong price appreciation. Helping the HIT to offset its relative underweight in Treasuries, which were the benchmark’s best performing sector, was the fact that the HIT does not invest in corporate bonds, which underperformed the benchmark. The HIT’s ability to capture higher yields while minimizing its exposure to the extremely volatile credit markets proved successful again. During 2011, the HIT increased its investments in Fannie Mae multifamily MBS and Treasuries, which performed very well. | | DIVERSIFICATION BENEFITS
Fixed-income investments such as the HIT can be an important part of a balanced portfolio. The HIT’s returns provide desired diversification as seen in the growth comparisons and correlations below.
 Source: Haver Analytics, Bloomberg L.P., Barclays Aggregate, and the HIT The performance data quoted represents past performance and is no guarantee of future results. Investment results and principal value will fluctuate so that units in the HIT, when redeemed, may be worth more or less than the original cost. The HIT’s current performance may be lower or higher than the performance data quoted. Performance data current to the most recent month-end is available at www.aflcio-hit.com. |
4 A F L - C I O H O U S I N G I N V E S T M E N T T R U S T
Market Conditions
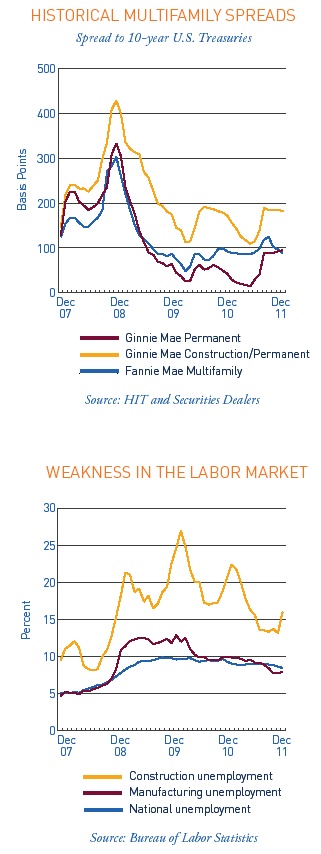
The HIT was a strong performer in a year of considerable market uncertainty. Again, flight to safety was the theme in 2011. The European debt crisis and other geopolitical uncertainties abroad drove investors to safety in U.S. Treasuries. Treasury rates fell to record levels, with 2-year and 10-year Treasury yields dropping in 2011 by 35 and 142 basis points, respectively, despite Standard & Poors’ downgrade of U.S. credit. The market’s actions showed that the U.S. is still seen as a great refuge in periods of uncertainty, despite the difficulties experienced in the U.S. economy with high unemployment and a weak housing market. Inflation expectations subsided as excess capacity persisted and growth projections in the U.S., Europe, and China were revised down. The Federal Reserve acknowledged the risks to growth by an unprecedented commitment to keep overnight interest rates historically low for an extended time. The markets also reacted to uncertainties resulting from the natural disasters in Japan, uprisings in the Middle East, and gridlock in Washington. This instability caused corporate bonds to underperform Treasuries by 367 basis points. Multifamily MBS spreads relative to Treasuries were mixed in 2011. Spreads widened on Ginnie Mae permanent loan and construction/permanent loan certificates, while Fannie Mae multifamily spreads generally tightened. With their wide spreads, Ginnie Mae construction/permanent loan certificates remained particularly attractive to the HIT, which has continued to work with its financing networks to develop investments that will benefit the portfolio and create needed jobs and housing. 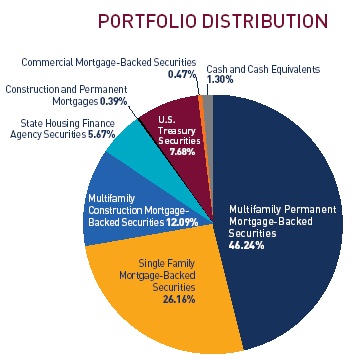
Based on value of total investments, including unfunded commitments, as of December 31, 2011.
| |  |
A N N U A L R E P O R T 2 0 1 1 5
Housing and Jobs
“We value the HIT’s effectiveness in generating family-sustaining jobs that have brought so many thousands of our members back to work.”
—Mark H. Ayers, President, Building and Construction Trades Department, AFL-CIO
The HIT committed $291 million in 2011 for investments in seven multifamily projects. These projects, with total development value exceeding $508 million, will create or preserve 3,820 units of housing and are expected to generate nearly 2,500 union construction jobs. In all, 29 new or previously committed projects were in construction during 2011, representing $1.6 billion of total development value.
The HIT is working to generate 15,000 union construction jobs by the end of 2012 through its Construction Jobs Initiative, the job-creation effort launched in 2009 in response to the unemployment crisis. At the end of 2011, the Initiative had created 11,488 jobs in 18 cities on 35 projects that will build or preserve 12,855 housing or healthcare units. The HIT has invested nearly $1 billion in these projects to leverage over $2 billion of development. These investments helped union members find work as the | | national unemployment rate for construction workers stood at 16% at year-end.
Early in 2011, the HIT’s wholly owned subsidiary, Building America CDE, Inc., was selected by the U.S. Treasury Department’s Community Development Financial Institutions Fund to participate in the New Markets Tax Credit program. This federal program uses tax credits to attract equity investors for job-generating projects in underserved communities – a goal that complements the work of the HIT. Building America was awarded $35 million in tax credits through this program and used its financing networks to identify five high-impact projects to receive the credits. Four of these were committed to or prefunded by year-end. The HIT intends to provide debt financing for Building America’s projects when appropriate – as it is doing in the Boston project described on the next page.
|
| | | |
| | | |
Shown clockwise from left: Lawndale Terrace, Chicago; Penn South Cooperative, New York; 225 Centre Street, Boston. Opposite page: Potrero Launch, San Francisco. |
6 A F L - C I O H O U S I N G I N V E S T M E N T T R U S T
 |
| | | |
| | | |
The HIT’s investment of union and public employee capital to build or preserve needed housing has provided a welcome stimulus for communities across the country at a time when credit for construction remains tight. Highlights of the HIT’s 2011 investments include:
New York: In its largest investment to date, the HIT has provided $134 million to preserve the affordability of housing at the historic Penn South Cooperative and to finance capital improvements at the 50-year-old development. The investment in this 2,820-unit, union-developed cooperative will preserve an important affordable housing resource in high-cost Manhattan by extending its affordability for moderate-income families for another 20 years. Repairs to Penn South’s 10 buildings will generate an estimated 610 union construction jobs.
Boston: The HIT and its subsidiary, Building America, are working together to support the development of 225 Centre Street, a $53.2 million mixed-use development in an | | economically neglected Boston neighborhood. The HIT has committed $9.9 million in financing, while Building America will provide $5.5 million of New Markets Tax Credits to help assure the project’s financial viability. With 103 housing units and nearly 17,000 square feet of commercial space, 225 Centre Street should create approximately 300 union construction jobs. San Francisco: The HIT currently has three construction projects underway in San Francisco – the newest being 333 Harrison Apartments, a 326-unit development near a new regional transit center in Rincon Hill. The HIT has committed $70 million to help finance the $105 million project, which is expected to generate over 600 union construction jobs.
Twin Cities Area: In Roseville, Minnesota, the HIT committed $4.7 million in financing for the development of an $11.2 million senior cooperative known as Applewood Pointe of Roseville at Langton Lake. The cooperative will offer 48 housing units, and its construction is expected to generate 70 union construction jobs. |
A N N U A L R E P O R T 2 0 1 1 7
Economists forecast robust demand for rental housing. The HIT can help meet this need through its multifamily
investments that generate competitive returns and union jobs.
The HIT enters 2012 well-positioned for further investment success. Through superior portfolio fundamentals, the HIT will continue to seek to offer investors higher income, higher credit quality, and similar interest rate risk relative to the benchmark while maintaining strong liquidity. A large pipeline of prospective multifamily projects includes many investments that are expected to be committed during 2012.
With tight credit, weak job growth, and the U.S. housing market in turmoil, economists forecast a robust demand for rental housing. The household formation rate is expected to grow significantly. Americans are increasingly shifting from owning homes to renting, by necessity or choice. As aging multifamily housing deteriorates, a growing need is projected for new construction and substantial rehabilitation. The HIT, with its focus on multifamily finance, can help meet these needs.
Although the U.S. economy has been struggling, a positive note for fixed-income investors is the expectation of diminishing inflationary pressure and continued low interest rates. The Federal Reserve has stated its commitment to maintain short-term interest rates near zero at least through 2014.
In this environment, multifamily investments provide opportunities for the HIT to continue to earn superior yield on government-guaranteed construction loans. These investments will have the collateral benefits of putting union members to work, creating affordable housing, and meeting the development needs of local communities. The HIT is actively seeking capital so it can fund more of these income- and job-generating investments in the coming year.
| | |
8 A F L - C I O H O U S I N G I N V E S T M E N T T R U S T
EXPENSE EXAMPLE (unaudited) Participants in the HIT incur ongoing expenses related to the management and distribution activities of the HIT, as well as certain other expenses. The expense example in the table below is intended to help participants understand the ongoing costs (in dollars) of investing in the HIT and to compare these costs with the ongoing costs of investing in other mutual funds. The example is based on an investment of $1,000 invested at the beginning of the period, July 1, 2011, and held for the entire period ended December 31, 2011.
Actual Expenses: The first line of the table below provides information about actual account values and actual expenses. Participants may use the information in this line, together with the amount they invested, to estimate the expenses that they paid over the period. Simply divide the account value by $1,000 (for example, an $800,000 account value divided by $1,000 = 800), then multiply the result by the number in the first line under the heading entitled “Expenses Paid During Six-Month Period Ended December 31, 2011” to estimate the expenses paid on a particular account during this period. Hypothetical Expenses (for Comparison Purposes Only):
The second line of the table below provides information about hypothetical account values and hypothetical expenses based on the HIT’s actual expense ratio and an assumed rate of return of 5% per year before expenses, which is not the HIT’s actual return. The hypothetical account values and expenses may not be used to estimate the actual ending account balance or expenses a participant paid for the period. Participants may use this information to compare the ongoing costs of investing in the HIT and other mutual funds. To do so, compare this 5% hypothetical example with the 5% hypothetical examples that appear in the shareholder reports of the other mutual funds. | | Please note that this example is useful in comparing funds’ ongoing costs only. It does not include any transactional costs, such as sales charges (loads), redemption fees, or exchange fees. The HIT does not have such transactional costs, but many other funds do.
AVAILABILITY OF QUARTERLY
PORTFOLIO SCHEDULES
In addition to disclosure in the Annual and Semi-Annual Reports to Participants, the HIT also files its complete schedule of portfolio holdings with the Securities and Exchange Commission (SEC) for the first and third quarters of each fiscal year on Form N-Q. The HIT’s reports on Form N-Q are made available on the SEC’s website at http://www. sec.gov and may be reviewed and copied at the SEC’s Public Reference Room in Washington, D.C. (Information relating to the hours and operation of the SEC’s Public Reference Room may be obtained by calling 1-800-SEC-0330.) Participants may also obtain copies of the HIT’s Form N-Q reports, without charge, upon request, by calling the HIT collect at 202-331-8055.
PROXY VOTING
Except for its shares in its wholly owned subsidiary, Building America CDE, Inc., the HIT invests exclusively in non-voting securities and has not deemed it necessary to adopt policies and procedures for the voting of portfolio securities. During the twelve-month period ended June 30, 2011, the HIT held in its portfolio no securities of issuers that considered matters at a shareholder meeting. The HIT has reported this information in its most recent filing with the SEC on Form N-PX. This filing is available on the SEC’s website at http:// www.sec.gov. Participants may also obtain a copy of the HIT’s report on Form N-PX, without charge, upon request, by calling the HIT collect at 202-331-8055. |
| | | |
| | | |
| | Beginning | Ending | Expenses Paid During |
| | Account Value | Account Value | Six-Month Period Ended |
| | July 1, 2011 | December 31, 2011 | December 31, 2011* |
| | $ 1,000 | $ 1,048.40 | $ 2.17 |
| Actual expenses |
| | | | |
Hypothetical expenses (5% annual return before expenses) | $ 1,000 | $ 1,023.09 | $ 2.14 |
*Expenses are equal to the HIT’s annualized expense ratio of 0.42%, as of December 31, 2011, multiplied by the average account value over the period, multiplied by 184/365 (to reflect the one-half year period).
A N N U A L R E P O R T 2 0 1 1 9
2011 Participants Meeting
The 2011 Annual Meeting of Participants was held in Washington, D.C., on Wednesday, December 14, 2011. The following matters were put to a vote of the Participants at the meeting through the solicitation of proxies:
John J. Sweeney was elected to chair the Board of Trustees by: votes for 2,363,099.083; votes against 1,034.326; votes abstaining 114,440.690; votes not cast 1,110,595.677. | | The following Trustees were not up for reelection and their terms of office continued after the meeting: Mark Ayers, James Boland, Frank Hurt, Elizabeth Shuler, Stephen Frank, Richard Ravitch, Marlyn J. Spear, and Tony Stanley.
Ernst & Young LLP was ratified as the HIT’s Independent Registered Public Accounting Firm by: votes for 2,390,334.559; votes against 136.661; votes abstaining 88,102.879; votes not cast 1,110,595.677. |
The table below details votes pertaining to Trustees who were elected at the meeting.
| Trustee | Votes For: | Votes Against: | Votes Abstaining: |
| | | | |
| Richard L. Trumka | 2,274,104.030 | 90,029.379 | 114,440.690 |
| | | | |
| Arlene Holt Baker | 2,363,996.748 | 136.661 | 114,440.690 |
| | | | |
| Kenneth E. Rigmaiden | 2,363,996.748 | 136.661 | 114,440.690 |
| | | | |
| Jack Quinn | 2,363,430.888 | 136.661 | 115,006.550 |
| | | | |
| Votes not cast: 1,110,595.677 | | | |
Opposite page: HIT-financed Back of the Hill Apartments, Boston.
10 A F L - C I O H O U S I N G I N V E S T M E N T T R U S T
Report of Independent Registered Public Accounting Firm
The Board of Trustees and Participants of American Federation of Labor and Congress of Industrial Organizations Housing Investment Trust:
We have audited the accompanying statement of assets and liabilities of American Federation of Labor and Congress of Industrial Organizations Housing Investment Trust (the Trust), including the schedule of portfolio investments, as of December 31, 2011, and the related statement of operations for the year then ended, the statements of changes in net assets for each of the two years in the period then ended, and the financial highlights for each of the five years in the period then ended. These financial statements and financial highlights are the responsibility of the Trust’s management. Our responsibility is to express an opinion on these financial statements and financial highlights based on our audits.
We conducted our audits in accordance with the standards of the Public Company Accounting Oversight Board (United States). Those standards require that we plan and perform the audit to obtain reasonable assurance about whether the financial statements and financial highlights are free of material misstatement. We were not engaged to perform an audit of the Trust’s internal control over financial reporting. Our audits included consideration of internal control over financial reporting as a basis for designing audit procedures that are appropriate in the circumstances, but not for the purpose of expressing an opinion on the effectiveness of the Trust’s internal control over financial reporting. Accordingly, we express no such opinion. An audit also includes examining, on a test basis, evidence supporting the amounts and disclosures in the financial statements and financial highlights, assessing the accounting principles used and significant estimates made by management, as well as evaluating the overall financial statement presentation. Our procedures included confirmation of securities owned as of December 31, 2011, by correspondence with the custodian and brokers. We believe that our audits provide a reasonable basis for our opinion.
In our opinion, the financial statements and financial highlights referred to above present fairly, in all material respects, the financial position of American Federation of Labor and Congress of Industrial Organizations Housing Investment Trust as of December 31, 2011, the results of its operations for the year then ended, the changes in its net assets for each of the two years in the period then ended, and the financial highlights for each of the five years in the period then ended, in conformity with U.S. generally accepted accounting principles.
McLean, Virginia
February 24, 2012
12 A F L - C I O H O U S I N G I N V E S T M E N T T R U S T
Statement of Assets and Liabilities
December 31, 2011 (Dollars in thousands, except per share data)
Assets
| Investments, at value (cost $4,077,180) | $ | 4,351,833 |
| Cash | | 515 |
| Accrued interest receivable | | 17,521 |
| Receivables for investments sold | | 153 |
| Other assets | | 1,875 |
| Total assets | | 4,371,897 |
| | | |
| Liabilities | | |
| Payables for investments purchased | | 91,952 |
| Redemptions payable | | 10,105 |
| Income distribution and capital gains payable, net of dividends reinvested of $30,280 | | 3,596 |
| Refundable deposits | | 31 |
| Accrued expenses | | 3,742 |
| Total liabilities | | 109,426 |
| | | |
| Net assets applicable to participants’ equity — | | |
| Certificates of participation—authorized unlimited; | | |
| Outstanding 3,642,485 units | $ | 4,262,471 |
| | | |
| Net asset value per unit of participation (in dollars) | $ | 1,170.21 |
| | | |
| | | |
| Participants’ equity | | |
| Participants’ equity consisted of the following: | | |
| Amount invested and reinvested by current participants | $ | 3,991,545 |
| Net unrealized appreciation of investments | | 274,653 |
| Distribution in excess of net investment income | | (2,867) |
| Accumulated net realized losses, net of distributions | | (860) |
| Total participants’ equity | $ | 4,262,471 |
See accompanying Notes to Financial Statements.
A N N U A L R E P O R T 2 0 1 1 13
FHA Permanent Securities (2.4% of net assets)
| | | | Commitment | | | | | | |
| | Interest Rate | Maturity Date | | Amount | Face Amount | Amortized Cost | | Value |
| Single Family | 7.75% | Jul-2021 | $ | - | $ | 19 | $ | 19 | $ | 19 |
Multifamily1 | 5.25% | Mar-2024 | | - | | 4,095 | | 4,091 | | 4,252 |
| | 5.35% | Mar-2047 | | - | | 7,739 | | 7,749 | | 8,303 |
| | 5.55% | Aug-2042 | | - | | 8,524 | | 8,520 | | 9,227 |
| | 5.60% | Jun-2038 | | - | | 2,685 | | 2,683 | | 2,747 |
| | 5.62% | Jun-2014 | | - | | 276 | | 274 | | 284 |
| | 5.65% | Oct-2038 | | - | | 2,073 | | 2,122 | | 2,155 |
| | 5.87% | Jun-2044 | | - | | 1,884 | | 1,882 | | 2,071 |
| | 5.89% | Apr-2038 | | - | | 5,031 | | 5,043 | | 5,523 |
| | 6.02% | Jun-2035 | | - | | 5,799 | | 5,786 | | 6,198 |
| | 6.40% | Jul-2046 | | - | | 3,974 | | 3,971 | | 4,425 |
| | 6.60% | Jan-2050 | | - | | 3,477 | | 3,519 | | 3,846 |
| | 6.66% | May-2040 | | - | | 5,475 | | 5,461 | | 5,479 |
| | 6.70% | Dec-2042 | | - | | 5,774 | | 5,757 | | 5,942 |
| | 6.75% | Apr-2040 - Jul-2040 | | - | | 5,170 | | 5,136 | | 5,672 |
| | 7.05% | Jul-2043 | | - | | 5,142 | | 5,142 | | 5,428 |
| | 7.13% | Mar-2040 | | - | | 7,538 | | 7,521 | | 8,285 |
| | 7.20% | Dec-2033 - Oct-2039 | | - | | 9,428 | | 9,424 | | 10,147 |
| | 7.50% | Sep-2032 | | - | | 1,499 | | 1,492 | | 1,705 |
| | 7.75% | Oct-2038 | | - | | 1,336 | | 1,325 | | 1,338 |
| | 7.93% | Apr-2042 | | - | | 2,802 | | 2,802 | | 3,211 |
| | 8.15% | Mar-2037 | | - | | 1,137 | | 1,233 | | 1,139 |
| | 8.27% | Jun-2042 | | - | | 2,458 | | 2,460 | | 2,515 |
| | 8.40% | Apr-2012 | | - | | 26 | | 26 | | 26 |
| | 8.75% | Aug-2036 | | - | | 3,537 | | 3,540 | | 3,545 |
| | | | | - | | 96,879 | | 96,959 | | 103,463 |
Forward Commitments1 | 5.80% | Mar-2052 | | 2,100 | | - | | (11) | | 171 |
| Total FHA Permanent Securities | | | $ | 2,100 | $ | 96,898 | $ | 96,967 | $ | 103,653 |
FHA Construction Securities (0.3% of net assets)
| | Interest Rates2 | | Commitment | | | | | | |
| | Permanent | Construction | Maturity Date | Amount | Face Amount | Amortized Cost | | Value |
Multifamily1 | 6.20% | 6.20% | Aug-2051 | $ | 11,900 | $ | 11,900 | $ | 11,895 | $ | 13,072 |
| Total FHA Construction Securities | | | | $ | 11,900 | $ | 11,900 | $ | 11,895 | $ | 13,072 |
14 A F L - C I O H O U S I N G I N V E S T M E N T T R U S T
Ginnie Mae Securities (20.4% of net assets)
| | Interest Rate | Maturity Date | Face Amount | Amortized Cost | | Value |
| Single Family | 4.00% | Feb-2040 - Jun-2040 | $ | 18,874 | $ | 19,188 | $ | 20,282 |
| | 4.50% | Aug-2040 | | 13,272 | | 13,666 | | 14,501 |
| | 5.50% | Jan-2033 - Jun-2037 | | 14,194 | | 14,117 | | 15,928 |
| | 6.00% | Jan-2032 - Aug-2037 | | 7,662 | | 7,667 | | 8,669 |
| | 6.50% | Jul-2028 | | 117 | | 117 | | 134 |
| | 7.00% | Nov-2016 - Jan-2030 | | 3,072 | | 3,097 | | 3,483 |
| | 7.50% | Apr-2013 - Aug-2030 | | 2,141 | | 2,169 | | 2,436 |
| | 8.00% | Jun-2023 - Nov-2030 | | 1,180 | | 1,206 | | 1,387 |
| | 8.50% | Jun-2022 - Aug-2027 | | 1,165 | | 1,183 | | 1,358 |
| | 9.00% | May-2016 - Jun-2025 | | 333 | | 339 | | 385 |
| | 9.50% | Sep-2021 - Sep-2030 | | 129 | | 130 | | 150 |
| | 10.00% | Jun-2019 | | 1 | | 1 | | 1 |
| | 13.25% | Dec-2014 | | 1 | | 1 | | 1 |
| | | | | 62,141 | | 62,881 | | 68,715 |
Multifamily1 | 2.11% | Apr-2033 | | 24,663 | | 24,899 | | 24,962 |
| | 2.18% | May-2039 | | 24,876 | | 25,170 | | 25,178 |
| | 2.34% | Aug-2034 | | 24,493 | | 24,708 | | 24,922 |
| | 2.41% | May-2030 | | 13,318 | | 13,448 | | 13,525 |
| | 3.12% | Apr-2038 | | 4,818 | | 4,994 | | 4,973 |
| | 3.17% | Oct-2043 | | 39,482 | | 40,114 | | 41,240 |
| | 3.22% | Oct-2051 | | 13,406 | | 13,406 | | 13,879 |
| | 3.30% | Jul-2046 | | 9,280 | | 9,371 | | 9,629 |
| | 3.31% | Nov-2037 | | 19,510 | | 20,415 | | 20,379 |
| | 3.45% | Nov-2041 | | 7,284 | | 7,457 | | 7,669 |
| | 3.49% | Mar-2042 | | 10,000 | | 10,049 | | 10,487 |
| | 3.52% | Dec-2046 | | 17,600 | | 17,776 | | 18,594 |
| | 3.61% | Aug-2027 | | 2,601 | | 2,645 | | 2,623 |
| | 3.67% | Oct-2043 | | 25,000 | | 25,254 | | 26,638 |
| | 3.86% | Feb-2039 | | 804 | | 764 | | 817 |
| | 3.90% | Dec-2039 | | 3,408 | | 3,447 | | 3,681 |
| | 4.15% | Apr-2046 | | 8,433 | | 8,597 | | 9,147 |
| | 4.22% | Nov-2035 | | 22,462 | | 23,052 | | 23,697 |
| | 4.26% | Jul-2029 | | 1,627 | | 1,622 | | 1,662 |
| | 4.42% | Feb-2031 | | 36,679 | | 36,948 | | 39,368 |
| | 4.43% | Apr-2034 | | 757 | | 748 | | 758 |
| | 4.43% | Jun-2034 | | 62,175 | | 61,058 | | 65,672 |
| | 4.50% | Aug-2049 | | 2,338 | | 2,350 | | 2,521 |
| | 4.62% | Sep-2034 | | 9,000 | | 9,280 | | 9,695 |
| | 4.63% | Sep-20373 | | 1,500 | | 1,457 | | 1,421 |
| | 4.66% | Apr-2029 - Dec-2030 | | 8,697 | | 8,977 | | 8,880 |
| | 4.68% | Aug-2032 | | 5,594 | | 5,574 | | 5,734 |
| | 4.70% | Dec-2024 | | 4,024 | | 3,960 | | 4,082 |
| | 4.73% | Nov-2045 | | 3,000 | | 3,056 | | 3,269 |
| | 4.76% | Apr-2045 | | 7,834 | | 8,169 | | 8,131 |
| | 4.82% | Oct-2029 | | 4,017 | | 4,227 | | 4,122 |
| | 4.83% | May-20463 | | 5,320 | | 5,321 | | 5,308 |
| | 4.90% | Mar-20443 | | 1,000 | | 990 | | 967 |
| | | | | | | | | |
| | | | | | | | | continued |
A N N U A L R E P O R T 2 0 1 1 15
SCHEDULE OF PORTFOLIO INVESTMENTS December 31, 2011 (Dollars in thousands) | | | | |
| | | | | |
| | | | | |
Ginnie Mae Securities (20.4% of net assets) continued | | | | |
| | | | | |
| | | | | |
| | Interest Rate | Maturity Date | Face Amount | Amortized Cost | | Value |
| | 4.92% | May-2034 | $ | 43,830 | $ | 43,680 | $ | 46,130 |
| | 4.94% | Jun-20463 | | 3,814 | | 3,819 | | 3,865 |
| | 4.98% | Feb-2037 | | 10,000 | | 10,150 | | 10,920 |
| | 4.99% | Mar-2030 | | 9,750 | | 10,527 | | 10,696 |
| | 5.00% | Dec-2033 | | 4,827 | | 4,858 | | 4,833 |
| | 5.01% | Mar-2038 | | 25,000 | | 26,069 | | 27,513 |
| | 5.05% | Apr-20493 | | 2,895 | | 2,900 | | 2,910 |
| | 5.17% | Sep-2045 | | 35,457 | | 37,862 | | 37,873 |
| | 5.19% | May-2045 | | 8,864 | | 8,654 | | 9,551 |
| | 5.25% | Apr-2039 | | 8,392 | | 8,269 | | 8,654 |
| | 5.32% | Aug-2030 | | 5,074 | | 5,055 | | 5,145 |
| | 5.34% | Jul-2040 | | 18,000 | | 17,691 | | 20,477 |
| | 5.50% | Jul-2033 | | 8,905 | | 9,258 | | 9,225 |
| | 5.55% | May-20493 | | 10,520 | | 10,524 | | 10,421 |
| | 5.58% | May-2031 | | 80,581 | | 81,111 | | 87,840 |
| | 5.58% | Oct-2031 | | 14,000 | | 13,751 | | 14,789 |
| | 5.68% | Jul-2027 | | 4,325 | | 4,312 | | 4,410 |
| | 6.15% | Nov-2039 | | 5,373 | | 5,385 | | 6,073 |
| | 6.22% | Aug-2035 | | 13,762 | | 13,761 | | 15,558 |
| | 6.26% | Apr-2027 | | 5,305 | | 5,567 | | 5,475 |
| | | | | 743,674 | | 752,506 | | 785,988 |
Forward Commitments1 | 3.20% | Jan-2047 | | 15,640 | | 15,640 | | 15,876 |
| Total Ginnie Mae Securities | | | $ | 821,455 | $ | 831,027 | $ | 870,579 |
Ginnie Mae Construction Securities (9.2% of net assets)
| | Interest Rates2 | | Commitment | | | | | | |
| | Permanent | Construction | Maturity Date | Amount | Face Amount | Amortized Cost | | Value |
Multifamily1 | 3.40% | 3.40% | Apr-2017 | $ | 2,250 | $ | 2,250 | $ | 2,249 | $ | 2,331 |
| | 4.15% | 4.15% | Apr-2053 | | 70,000 | | 12,082 | | 13,505 | | 14,358 |
| | 4.49% | 8.25% | Jun-2052 | | 44,954 | | 34,382 | | 33,945 | | 38,730 |
| | 4.75% | 4.75% | Mar-20523 | | 32,463 | | 24,733 | | 24,752 | | 27,546 |
| | 4.75% | 6.50% | Oct-2051 | | 63,008 | | 63,008 | | 63,014 | | 69,420 |
| | 4.80% | 4.80% | Feb-2052 | | 11,940 | | 9,772 | | 10,150 | | 10,902 |
| | 4.86% | 4.86% | Jan-2053 | | 42,358 | | 14,026 | | 14,350 | | 17,458 |
| | 4.87% | 4.87% | Apr-2042 | | 100,000 | | 70,677 | | 71,556 | | 79,773 |
| | 4.98% | 4.98% | Feb-2052 | | 4,700 | | 3,348 | | 3,494 | | 3,806 |
| | 5.00% | 5.00% | Nov-2051 | | 13,543 | | 12,657 | | 12,930 | | 14,099 |
| | 5.10% | 7.00% | Dec-20503 | | 15,862 | | 11,114 | | 10,952 | | 12,610 |
| | 5.21% | 4.95% | Mar-20533 | | 49,950 | | 47,026 | | 47,067 | | 51,785 |
| | 5.25% | 5.25% | Apr-2037 | | 19,750 | | 19,750 | | 19,742 | | 21,657 |
| | 5.39% | 5.39% | Feb-2052 | | 26,094 | | 25,562 | | 26,090 | | 28,487 |
| Total Ginnie Mae Construction Securities | | | $ 496,872 | $ 350,387 | $ 353,796 | $ 392,962 |
16 A F L - C I O H O U S I N G I N V E S T M E N T T R U S T
Fannie Mae Securities (42.8% of net assets)
| | Interest Rate | Maturity Date | Face Amount | Amortized Cost | | Value |
| Single Family | 0.54% 4 | Mar-2037 | $ | 2,758 | $ | 2,718 | $ | 2,746 |
| | 0.69% 4 | Apr-2037 | | 4,455 | | 4,432 | | 4,439 |
| | 0.79% 4 | Dec-2040 | | 60,416 | | 59,863 | | 60,327 |
| | 1.98% 4 | Aug-2033 | | 341 | | 340 | | 356 |
| | 2.03% 4 | Nov-2033 | | 5,696 | | 5,700 | | 5,969 |
| | 2.23% 4 | Sep-2035 | | 1,485 | | 1,479 | | 1,557 |
| | 2.30% 4 | May-2033 | | 1,299 | | 1,306 | | 1,349 |
| | 2.33% 4 | Jul-2033 | | 1,147 | | 1,138 | | 1,208 |
| | 2.34% 4 | Aug-2033 | | 2,070 | | 2,067 | | 2,178 |
| | 2.37% 4 | Apr-2034 | | 2,893 | | 2,998 | | 3,081 |
| | 2.39% 4 | Aug-2033 | | 4,487 | | 4,477 | | 4,686 |
| | 2.41% 4 | Jul-2033 | | 4,549 | | 4,570 | | 4,754 |
| | 2.50% 4 | Nov-2034 | | 3,519 | | 3,648 | | 3,749 |
| | 4.00% | Jul-2040 | | 22,574 | | 23,314 | | 23,708 |
| | 4.00% | Jul-2024 - Jul-2041 | | 136,222 | | 138,002 | | 143,266 |
| | 4.50% | Jun-2018 - Sep-2040 | | 98,257 | | 100,482 | | 104,807 |
| | 5.00% | Jul-2018 - Apr-2041 | | 94,161 | | 96,691 | | 101,653 |
| | 5.00% | Jul-2040 | | 20,465 | | 21,815 | | 22,099 |
| | 5.50% | Jul-2017 - Jun-2038 | | 79,853 | | 80,526 | | 86,952 |
| | 6.00% | Apr-2016 - Nov-2038 | | 62,759 | | 63,494 | | 69,175 |
| | 6.50% | Nov-2016 - Jul-2036 | | 7,354 | | 7,579 | | 8,198 |
| | 7.00% | Nov-2013 - May-2032 | | 3,078 | | 3,088 | | 3,506 |
| | 7.50% | Nov-2016 - Sep-2031 | | 1,088 | | 1,069 | | 1,253 |
| | 8.00% | Jun-2012 - May-2031 | | 220 | | 223 | | 248 |
| | 8.50% | Mar-2015 - Apr-2031 | | 295 | | 295 | | 328 |
| | 9.00% | Jan-2024 - May-2025 | | 131 | | 132 | | 155 |
| | | | | 621,572 | | 631,446 | | 661,747 |
Multifamily1 | 3.54% | Oct-2021 | | 7,766 | | 7,898 | | 8,299 |
| | 3.61% 4 | Apr-2020 | | 9,154 | | 9,154 | | 9,131 |
| | 3.66% | Jul-2021 | | 132,324 | | 132,936 | | 142,275 |
| | 3.82% | Jul-2016 | | 21,254 | | 21,282 | | 23,030 |
| | 4.00% | Sep-2021 | | 16,405 | | 16,480 | | 17,667 |
| | 4.03% | Oct-2021 | | 7,484 | | 7,527 | | 8,145 |
| | 4.06% | Oct-2025 | | 26,491 | | 26,792 | | 28,418 |
| | 4.08% 4 | Jun-2020 | | 3,795 | | 3,804 | | 3,784 |
| | 4.15% | Jun-2021 | | 9,559 | | 9,642 | | 10,438 |
| | 4.22% | Jul-2018 | | 3,149 | | 3,061 | | 3,411 |
| | 4.25% | May-2021 | | 4,468 | | 4,487 | | 4,912 |
| | 4.27% | Nov-2019 | | 6,327 | | 6,361 | | 6,979 |
| | 4.32% | Nov-2019 | | 3,130 | | 3,161 | | 3,462 |
| | 4.33% | Nov-2019 - Mar-2021 | | 6,335 | | 6,394 | | 6,987 |
| | 4.33% | Mar-2020 | | 20,000 | | 20,058 | | 22,459 |
| | 4.38% | Apr-2020 | | 10,752 | | 10,904 | | 11,879 |
| | 4.44% | May-2020 | | 6,364 | | 6,426 | | 7,060 |
| | 4.48% | Oct-2031 | | 728 | | 728 | | 731 |
| | 4.49% | Jun-2021 | | 1,025 | | 1,054 | | 1,134 |
| | | | | | | | | |
| | | | | | | | | continued |
A N N U A L R E P O R T 2 0 1 1 17
| SCHEDULE OF PORTFOLIO INVESTMENTS December 31, 2011 (Dollars in thousands) | | | | | |
| | | | | | |
| | | | | | |
| Fannie Mae Securities (42.8% of net assets) continued | | | | |
| | | | | |
| | | | | |
| Interest Rate | Maturity Date | Face Amount | Amortized Cost | | Value |
| 4.50% | Feb-2020 | $ | 4,439 | $ | 4,479 | $ | 4,865 |
| 4.52% | Nov-2019 - May-2021 | | 7,522 | | 7,690 | | 8,355 |
| 4.55% | Nov-2019 | | 2,974 | | 3,008 | | 3,306 |
| 4.56% | Jul-2019 - May-2021 | | 8,822 | | 8,866 | | 9,831 |
| 4.64% | Aug-2019 | | 18,927 | | 19,260 | | 21,131 |
| 4.66% | Jul-2021 - Sep-2033 | | 7,888 | | 7,945 | | 8,306 |
| 4.67% | Aug-2033 | | 9,600 | | 9,589 | | 9,999 |
| 4.68% | Jul-2019 | | 13,780 | | 13,862 | | 15,413 |
| 4.69% | Jan-2020 - Jun-2035 | | 14,711 | | 14,772 | | 16,383 |
| 4.71% | Mar-2021 | | 6,146 | | 6,345 | | 6,829 |
| 4.73% | Feb-2021 | | 1,607 | | 1,653 | | 1,787 |
| 4.80% | Jun-2019 | | 2,256 | | 2,276 | | 2,529 |
| 4.86% | May-2019 | | 1,508 | | 1,528 | | 1,696 |
| 4.89% | Nov-2019 - May-2021 | | 2,827 | | 2,969 | | 3,168 |
| 4.93% | Nov-2013 | | 44,991 | | 44,990 | | 47,182 |
| 4.94% | Apr-2019 | | 3,500 | | 3,551 | | 3,939 |
| 5.00% | Jun-2019 | | 1,964 | | 1,994 | | 2,216 |
| 5.02% | Jun-2019 | | 853 | | 854 | | 963 |
| 5.04% | Jun-2019 | | 1,941 | | 1,989 | | 2,195 |
| 5.05% | Jun-2019 - Jul-2019 | | 3,298 | | 3,376 | | 3,725 |
| 5.08% | Apr-2021 | | 40,000 | | 40,003 | | 44,294 |
| 5.09% | Jun-2018 | | 6,584 | | 6,772 | | 7,387 |
| 5.11% | Jul-2019 | | 908 | | 912 | | 1,026 |
| 5.12% | Jul-2019 | | 9,032 | | 9,110 | | 10,220 |
| 5.13% | Jul-2019 | | 922 | | 927 | | 1,045 |
| 5.15% | Oct-2022 | | 3,763 | | 3,766 | | 4,158 |
| 5.16% | Jan-2018 | | 5,374 | | 5,309 | | 5,986 |
| 5.25% | Jan-2020 | | 7,051 | | 7,053 | | 8,015 |
| 5.29% | May-2022 | | 5,400 | | 5,400 | | 6,053 |
| 5.34% | Apr-2016 | | 6,239 | | 6,233 | | 6,946 |
| 5.35% | Apr-2012 - Jun-2018 | | 2,050 | | 2,056 | | 2,267 |
| 5.36% | Feb-2016 | | 4,216 | | 4,219 | | 4,329 |
| 5.37% | Jun-2017 | | 1,426 | | 1,504 | | 1,606 |
| 5.43% | Nov-2018 | | 1,283 | | 1,283 | | 1,287 |
| 5.44% | Mar-2016 | | 3,680 | | 3,685 | | 4,130 |
| 5.45% | May-2033 | | 2,987 | | 3,010 | | 3,328 |
| 5.46% | Feb-2017 | | 46,494 | | 46,590 | | 52,817 |
| 5.47% | Aug-2024 | | 8,561 | | 8,677 | | 9,592 |
| 5.52% | Mar-2018 | | 603 | | 633 | | 688 |
| 5.53% | Apr-2017 | | 63,909 | | 63,903 | | 72,895 |
| 5.59% | May-2017 | | 7,058 | | 7,064 | | 8,034 |
| 5.60% | Feb-2018 - Jan-2024 | | 11,759 | | 11,761 | | 13,288 |
| 5.63% | Dec-2019 | | 10,275 | | 10,335 | | 11,575 |
| 5.69% | Jun-2041 | | 4,990 | | 5,166 | | 5,555 |
| 5.70% | Jun-2016 | | 1,391 | | 1,399 | | 1,580 |
| | | | | | | | |
| | | | | | | | continued |
18 A F L - C I O H O U S I N G I N V E S T M E N T T R U S T
Fannie Mae Securities (42.8% of net assets) continued | | | | | |
| | | | | | |
| | | | | | |
| Interest Rate | Maturity Date | Face Amount | Amortized Cost | | Value |
| 5.75% | Jun-2041 | $ | 2,417 | $ | 2,515 | $ | 2,688 |
| 5.80% | Jun-2018 | | 70,217 | | 69,858 | | 80,988 |
| 5.86% | Dec-2016 | | 242 | | 242 | | 269 |
| 5.91% | Mar-2037 | | 2,060 | | 2,115 | | 2,328 |
| 5.92% | Dec-2016 | | 227 | | 227 | | 252 |
| 5.93% | Apr-2012 | | 319 | | 329 | | 320 |
| 5.96% | Jan-2029 | | 434 | | 438 | | 491 |
| 6.03% | Jun-2017 - Jun-2036 | | 5,528 | | 5,618 | | 6,264 |
| 6.06% | Jul-2034 | | 9,898 | | 10,211 | | 11,223 |
| 6.11% | Aug-2017 | | 6,769 | | 6,776 | | 7,850 |
| 6.13% | Dec-2016 | | 3,472 | | 3,476 | | 4,010 |
| 6.14% | Sep-2033 | | 303 | | 321 | | 345 |
| 6.15% | Jan-2019 | | 33,700 | | 33,714 | | 39,087 |
| 6.15% | Jan-2023 - Oct-2032 | | 7,335 | | 7,397 | | 8,297 |
| 6.16% | Aug-2013 | | 162 | | 163 | | 163 |
| 6.19% | Jul-2013 | | 5,000 | | 5,091 | | 5,037 |
| 6.22% | Aug-2032 | | 1,763 | | 1,805 | | 2,009 |
| 6.23% | Sep-2034 | | 1,444 | | 1,510 | | 1,647 |
| 6.27% | Jan-2012 | | 1,971 | | 1,970 | | 1,980 |
| 6.28% | Nov-2028 | | 3,067 | | 3,252 | | 3,499 |
| 6.35% | Jun-2020 - Aug-2032 | | 13,061 | | 13,216 | | 14,584 |
| 6.38% | Jul-2021 | | 5,609 | | 5,698 | | 6,521 |
| 6.39% | Apr-2019 | | 955 | | 979 | | 1,096 |
| 6.44% | Apr-2014 | | 5,673 | | 5,731 | | 6,220 |
| 6.44% | Dec-2018 | | 37,787 | | 37,787 | | 44,257 |
| 6.52% | May-2029 | | 5,452 | | 5,916 | | 6,282 |
| 6.63% | Jun-2014 - Apr-2019 | | 3,669 | | 3,669 | | 4,089 |
| 6.80% | Jul-2016 | | 521 | | 521 | | 582 |
| 6.85% | Aug-2014 | | 42,415 | | 42,415 | | 47,058 |
| 6.88% | Feb-2028 | | 4,462 | | 4,848 | | 4,667 |
| 7.00% | Jun-2018 | | 2,820 | | 2,820 | | 3,080 |
| 7.01% | Apr-2031 | | 3,252 | | 3,266 | | 3,727 |
| 7.07% | Feb-2031 | | 16,368 | | 16,581 | | 18,722 |
| 7.18% | Aug-2016 | | 331 | | 331 | | 373 |
| 7.20% | Aug-2029 | | 8,154 | | 7,951 | | 9,000 |
| 7.25% | Jul-2012 | | 6,753 | | 6,753 | | 6,814 |
| 7.26% | Dec-2018 | | 9,412 | | 9,859 | | 10,735 |
| 7.50% | Dec-2014 | | 835 | | 836 | | 914 |
| 7.75% | Dec-2012 - Dec-2024 | | 1,917 | | 1,916 | | 2,151 |
| 8.13% | Sep-2012 | | 330 | | 330 | | 335 |
| 8.38% | Jan-2022 | | 773 | | 770 | | 776 |
| 8.40% | Jul-2023 | | 441 | | 433 | | 479 |
| 8.50% | Nov-2019 | | 3,135 | | 3,206 | | 3,793 |
| 8.63% | Sep-2028 | | 6,226 | | 6,226 | | 6,847 |
| | | | 1,048,698 | | 1,055,001 | | 1,163,969 |
| Total Fannie Mae Securities | | $ | 1,670,270 | $ | 1,686,447 | $ | 1,825,716 |
A N N U A L R E P O R T 2 0 1 1 19
Freddie Mac Securities (11.9% of net assets)
| | | | | Commitment | | | | | | |
| | Interest Rate | | Maturity Date | Amount | Face Amount | Amortized Cost | | Value |
| Single Family | 0.58% 4 | Feb-2036 | $ | - | $ | 7,589 | $ | 7,589 | $ | 7,605 |
| | 0.63% | 4 | Apr-2036 | | - | | 5,000 | | 4,994 | | 4,992 |
| | 0.78% | 4 | Nov-2040 | | - | | 13,069 | | 12,982 | | 13,042 |
| | 0.78% | 4 | Nov-2040 | | - | | 28,016 | | 27,812 | | 27,984 |
| | 2.14% | 4 | Apr-2035 | | - | | 97 | | 97 | | 101 |
| | 2.35% | 4 | Oct-2033 | | - | | 2,745 | | 2,714 | | 2,888 |
| | 2.47% | 4 | Jun-2033 | | - | | 1,175 | | 1,171 | | 1,227 |
| | 2.52% | 4 | Jul-2035 | | - | | 697 | | 695 | | 743 |
| | 3.50% | | Dec-2041 | | - | | 15,000 | | 15,177 | | 15,420 |
| | 4.00% | | Nov-2013 - Jan-2041 | | - | | 70,845 | | 72,273 | | 74,312 |
| | 4.00% | | Aug-2039 | | - | | 23,748 | | 24,732 | | 24,901 |
| | 4.00% | | Jan-2041 | | - | | 20,000 | | 20,745 | | 20,970 |
| | 4.50% | | Aug-2018 - Sep-2040 | | - | | 35,710 | | 35,837 | | 38,050 |
| | 5.00% | | Jan-2019 - Mar-2041 | | - | | 51,653 | | 51,588 | | 55,534 |
| | 5.50% | | Oct-2017 - Jul-2038 | | - | | 62,289 | | 61,572 | | 67,518 |
| | 6.00% | | Mar-2014 - Feb-2038 | | - | | 34,948 | | 35,506 | | 38,559 |
| | 6.50% | | Oct-2013 - Nov-2037 | | - | | 12,986 | | 13,464 | | 14,358 |
| | 7.00% | | Oct-2012 - Mar-2030 | | - | | 276 | | 259 | | 305 |
| | 7.50% | | Sep-2012 - Apr-2031 | | - | | 301 | | 290 | | 349 |
| | 8.00% | | Jul-2012 - Feb-2030 | | - | | 91 | | 88 | | 103 |
| | 8.50% | | Jun-2015 - Jan-2025 | | - | | 209 | | 210 | | 248 |
| | 9.00% | | Mar-2025 | | - | | 107 | | 107 | | 128 |
| | | | | | - | | 386,551 | | 389,902 | | 409,337 |
Multifamily1 | 5.38% | | Dec-2028 | | - | | 20,000 | | 20,004 | | 21,317 |
| | 5.42% | | Apr-2016 | | - | | 10,000 | | 9,950 | | 10,942 |
| | 5.65% | | Apr-2016 | | - | | 6,790 | | 6,790 | | 7,460 |
| | | | | | - | | 36,790 | | 36,744 | | 39,719 |
TBA5 | 3.50% | | Feb-2042 | | - | | 15,000 | | 15,288 | | 15,366 |
| | 3.50% | | Feb-2042 | | - | | 20,000 | | 20,431 | | 20,488 |
| | 3.50% | | Feb-2042 | | - | | 20,000 | | 20,356 | | 20,488 |
| | | | | | - | | 55,000 | | 56,075 | | 56,342 |
Forward Commitments1 | 2.95% | | Aug-2017 | | 2,585 | | - | | (84) | | 21 |
| Total Freddie Mac Securities | | | | $ | 2,585 | $ | 478,341 | $ | 482,637 | $ | 505,419 |
Commercial Mortgage-Backed Securities1 (0.5% of net assets)
| Issuer | Interest Rate | Maturity Date | Face Amount | Amortized Cost | | Value |
| Deutsche Bank | 5.00% | Nov-2046 | $ | 18,990 | $ | 19,545 | $ | 21,228 |
| Mizuho | 6.58% | Mar-2034 | | 289 | | 295 | | 274 |
| Total Commercial Mortgage-Backed Securities | | | $ | 19,279 | $ | 19,840 | $ | 21,502 |
20 A F L - C I O H O U S I N G I N V E S T M E N T T R U S T
State Housing Finance Agency Securities (4.5% of net assets)
| | | Interest Rates2 | | Commitment | | | | | | | |
| | Issuer | Permanent | Construction | Maturity Date | Amount | Face Amount | | Amortized Cost | | Value | |
Multifamily1 | NYC Housing Development Corp | - | 3.45% | May-2013 | $ | - | $ | 9,500 | | $ 9,516 | $ | 9,504 | |
| | MassHousing | - | 3.83% | Apr-20156 | | 5,000 | | 50 | | 38 | | 53 | |
| | MassHousing | - | 3.85% | Dec-20126 | | - | | 13,500 | | 13,498 | | 13,500 | |
| | MassHousing | - | 4.15% | Dec-20136 | | 26,700 | | 26,560 | | 26,558 | | 26,560 | |
| | MassHousing | - | 4.30% | Jun-20156 | | 34,700 | | 50 | | (38) | | 393 | |
| | NYC Housing Development Corp | 2.00% | - | Sep-2013 | | - | | 7,500 | | 7,500 | | 7,527 | |
| | NYC Housing Development Corp | 4.25% | - | Nov-2025 | | - | | 1,150 | | 1,150 | | 1,199 | |
| | NYC Housing Development Corp | 4.40% | - | Nov-2024 | | - | | 4,120 | | 4,120 | | 4,226 | |
| | NYC Housing Development Corp | 4.50% | - | Nov-2030 | | - | | 1,680 | | 1,682 | | 1,738 | |
| | NYC Housing Development Corp | 4.60% | - | Nov-2030 | | - | | 4,665 | | 4,665 | | 4,823 | |
| | NYC Housing Development Corp | 4.70% | - | Nov-2035 | | - | | 1,685 | | 1,685 | | 1,716 | |
| | NYC Housing Development Corp | 4.78% | - | Aug-2026 | | - | | 12,500 | | 12,500 | | 12,651 | |
| | NYC Housing Development Corp | 4.80% | - | Nov-2040 | | - | | 2,860 | | 2,862 | | 2,934 | |
| | NYC Housing Development Corp | 4.90% | - | Nov-2034 - Nov-2041 | | - | | 8,800 | | 8,800 | | 8,999 | |
| | NYC Housing Development Corp | 4.95% | - | Nov-2039 - May-2047 | | - | | 13,680 | | 13,682 | | 13,863 | |
| | NYC Housing Development Corp | 5.55% | - | Nov-2039 | | - | | 5,000 | | 4,979 | | 5,185 | |
| | | MassHousing | 5.69% | - | Nov-2018 | | - | | 5,930 | | 5,934 | | 6,616 | |
| | | MassHousing | 5.70% | - | Jun-2040 | | - | | 14,420 | | 14,422 | | 14,633 | |
| | | MassHousing | 5.92% | - | Dec-2037 | | - | | 6,370 | | 6,373 | | 6,833 | |
| | NYC Housing Development Corp | 6.42% | - | Nov-2039 | | - | | 22,000 | | 22,000 | | 23,276 | |
| | | MassHousing | 6.50% | - | Dec-2039 | | - | | 740 | | 745 | | 775 | |
| | | MassHousing | 6.58% | - | Dec-2039 | | - | | 11,385 | | 11,386 | | 11,845 | |
| | | MassHousing | 6.70% | - | Jun-2040 | | - | | 11,750 | | 11,750 | | 12,050 | |
| | | | | | | | $ | 66,400 | $ | 185,895 | | $185,807 | $ | 190,899 | |
Forward Commitments1 | MassHousing | - | 3.98% | April-20156 | | 4,915 | | - | | (12) | | (10) | |
| | | MassHousing | - | 4.37% | Jun-20146 | | 23,500 | | - | | (59) | | 266 | |
| | | | | | | | | 28,415 | | - | | (71) | | 256 | |
Total State Housing Finance Agency Securities | | | | | $ | 94,815 | $ 185,895 | $ 185,736 | $191,155 | |
Other Multifamily Investments (0.4% of net assets)
| | Interest Rates2 | Maturity | Commitment | | Face | Amortized | | |
| Issuer | Permanent | Construction | Date | Amount | | Amount | | Cost | | Value |
Multifamily Construction/Permanent Mortgages1 | | | | | | | | | | | |
| Prudential | 8.63% | - | Jun-2025 | $ | 1,469 | $ | 1,096 | $ | 1,091 | $ | 1,092 |
| | | | | | 1,469 | | 1,096 | | 1,091 | | 1,092 |
Privately Insured Construction/Permanent Mortgages1,7 | | | | | | | | | | | |
| IL Housing Development Authority | 5.40% | 5.40% | Mar-2047 | | 9,000 | | 8,656 | | 8,663 | | 7,828 |
| IL Housing Development Authority | 5.73% | 5.73% | Aug-2047 | | 5,575 | | 5,398 | | 5,399 | | 4,935 |
| IL Housing Development Authority | 6.20% | - | Dec-2047 | | 3,325 | | 3,239 | | 3,255 | | 3,036 |
| IL Housing Development Authority | 6.40% | 6.40% | Nov-2048 | | 993 | | 974 | | 990 | | 910 |
| | | | | | 18,893 | | 18,267 | | 18,307 | | 16,709 |
| Total Other Multifamily Investments | | | | $ | 20,362 | $ | 19,363 | $ | 19,398 | $ | 17,801 |
A N N U A L R E P O R T 2 0 1 1 21
SCHEDULE OF PORTFOLIO INVESTMENTS December 31, 2011 (Dollars in thousands) | | | | |
| | | | | |
| | | | | |
United States Treasury Securities (8.2% of net assets) | | | | |
| | | | | |
| Interest Rate | Maturity Date | Face Amount | Amortized Cost | | Value |
| 2.00% | Nov-2021 | $ | 30,000 | $ | 30,117 | $ | 30,345 |
| 2.13% | Aug-2021 | | 35,000 | | 34,517 | | 35,901 |
| 3.13% | May-2021 | | 105,000 | | 107,731 | | 117,251 |
| 3.13% | Nov-2041 | | 10,000 | | 10,260 | | 10,479 |
| 3.63% | Feb-2021 | | 15,000 | | 15,506 | | 17,417 |
| 3.75% | Aug-2041 | | 102,000 | | 115,220 | | 119,992 |
| 4.38% | May-2041 | | 15,000 | | 16,511 | | 19,550 |
| Total United States Treasury Securities | | $ | 312,000 | $ | 329,862 | $ | 350,935 |
| | | | | | | | |
| Total Fixed-Income Investments | | $ | 3,965,788 | $ | 4,017,605 | $ | 4,292,794 |
Equity Investment in Wholly-Owned Subsidiary (0.0% of net assets)
| Issuer | Number of Shares | Face Amount (Cost) | Amount of Dividends or Interest | | Value |
Building America CDE, Inc.8 | 1,000 | $ | 1 | $ | - | $ | (535) |
| Total Equity Investment | 1,000 | $ | 1 | $ | - | $ | (535) |
Short-Term Investments (1.4% of net assets)
| Issuer | Interest Rate | Maturity Date | Face Amount | Amortized Cost | | Value |
| Blackrock Federal Funds 30 | 0.01% | January 3, 2012 | $ | 59,574 | $ | 59,574 | $ | 59,574 |
| Total Short-Term Investments | | | $ | 59,574 | $ | 59,574 | $ | 59,574 |
| | | | | | | | | |
| Total Investments | | | $ | 4,025,363 | $ | 4,077,180 | $ | 4,351,833 |
1 | Valued by the HIT’s management in accordance with the fair value procedures adopted by the HIT’s Board of Trustees. |
2 | Construction interest rates are the rates charged to the borrower during the construction phase of the project. The permanent interest rates are charged to the borrower during the amortization period of the loan, unless the U.S. Department of Housing and Urban Development requires that such rates be charged earlier. |
3 | Tax-exempt bonds collateralized by Ginnie Mae securities. |
4 | The coupon rate shown on floating or adjustable rate securities represents the rate at period end. |
5 | Represents to be announced (TBA) securities: the particular securities to be delivered are not identified at the trade date. However, delivered securities must meet specified terms, including issuer, rate, and mortgage term, and be within industry-accepted “good delivery” standards. Until settlement, the HIT maintains cash reserves and liquid assets sufficient to settle its TBA commitments. |
6 | Security exempt from registration under the Securities Act of 1933. The construction notes were privately placed directly by MassHousing (a not-for-profit public agency) with the HIT. The notes are for construction only and will mature on or prior to June 1, 2015. The notes are general obligations of MassHousing and are secured by the full faith and credit of MassHousing. These securities may be resold in transactions exempt from registration, normally to qualified institutional buyers. These securities are considered liquid, under procedures established by and under the general supervision of the HIT’s Board of Trustees. |
7 | Loans insured by Ambac Assurance Corporation, which are additionally backed by a repurchase option from the mortgagee for the benefit of the HIT. The repurchase price is defined as the unpaid principal balance of the loan plus all accrued unpaid interest due through the remittance date.The repurchase option can be exercised by the HIT in the event of a payment failure by Ambac Assurance Corporation. |
8 | The HIT holds the shares of Building America CDE, Inc. (BACDE), a wholly owned subsidiary of the HIT. BACDE is a Community Development Entity, certified by the Community Development Financial Institutions Fund of the U.S. Department of the Treasury, which can facilitate the generation of investments. The fair value of the HIT’s investment in BACDE approximates its carrying value. |
See accompanying Notes to Financial Statements.
22 A F L - C I O H O U S I N G I N V E S T M E N T T R U S T
For the Year Ended December 31, 2011 (Dollars in thousands)
| Investment income | $ | 170,490 |
| | | |
| Expenses | | |
| Non-officer salaries and fringe benefits | | 8,256 |
| Officer salaries and fringe benefits | | 3,963 |
| Investment management | | 811 |
| Legal fees | | 392 |
| Consulting fees | | 631 |
| Auditing, tax and accounting fees | | 393 |
| Marketing and sales promotion (12b-1) | | 480 |
| Insurance | | 334 |
| Trustee expenses | | 48 |
| Rental expenses | | 915 |
| General expenses | | 1,479 |
| Total expenses | | 17,702 |
| | | |
| Net investment income | | 152,788 |
| Net realized gain on investments | | 33,589 |
| Net change in unrealized appreciation on investments | | 120,362 |
| Net realized and unrealized gain on investments | | 153,951 |
| | | |
| Net increase in net assets resulting from operations | $ | 306,739 |
See accompanying Notes to Financial Statements.
A N N U A L R E P O R T 2 0 1 1 23
Statements of Changes in Net Assets | | | | |
| | | | | |
| For the Years Ended December 31, 2011 and 2010 (Dollars in thousands) | | | | |
| | | | | |
| | | | | |
| Increase in net assets from operations | | 2011 | | 2010 |
| Net investment income | $ | 152,788 | $ | 156,440 |
| Net realized gain on investments | | 33,589 | | 13,686 |
| Net change in unrealized appreciation on investments | | 120,362 | | 53,641 |
| Net increase in net assets resulting from operations | | 306,739 | | 223,767 |
| | | | | |
| Decrease in net assets from distributions | | | | |
| Distributions to participants or reinvested from: | | | | |
| Net investment income | | (159,575) | | (161,898) |
| Net realized gains on investments | | (19,721) | | - |
| Net decrease in net assets from distributions | | (179,296) | | (161,898) |
| | | | | |
| Increase (decrease) in net assets from unit transactions | | | | |
| Proceeds from the sale of units of participation | | 186,650 | | 166,042 |
| Dividend reinvestment of units of participation | | 160,096 | | 144,935 |
| Payments for redemption of units of participation | | (101,557) | | (106,444) |
| Net increase from unit transactions | | 245,189 | | 204,533 |
| | | | | |
| Total increase in net assets | | 372,632 | | 266,402 |
| | | | | |
| Net assets | | | | |
| Beginning of period | $ | 3,889,839 | $ | 3,623,437 |
| End of period | $ | 4,262,471 | $ | 3,889,839 |
| | | | | |
| Distribution in excess of net investment income | $ | (2,867) | $ | (2,893) |
| | | | | |
| Unit information | | | | |
| Units sold | | 161,499 | | 146,163 |
| Distributions reinvested | | 138,701 | | 126,833 |
| Units redeemed | | (88,452) | | (92,808) |
| Increase in units outstanding | | 211,748 | | 180,188 |
See accompanying Notes to Financial Statements.
24 A F L - C I O H O U S I N G I N V E S T M E N T T R U S T
Notes to Financial Statements
Note 1. Summary of Significant Accounting Policies
The American Federation of Labor and Congress of Industrial Organizations (AFL- CIO) Housing Investment Trust (HIT) is a common law trust created under the laws of the District of Columbia and is registered under the Investment Company Act of 1940, as amended (the Investment Company Act), as a no-load, open-end investment company. The HIT has obtained certain exemptions from the requirements of the Investment Company Act that are described in the HIT’s Prospectus and Statement of Additional Information.
Participation in the HIT is limited to eligible pension plans and labor organizations, including health and welfare, annuity, general, and other funds, that have beneficiaries who are represented by labor organizations.
The following is a summary of significant accounting policies followed by the HIT in the preparation of its financial statements. The policies are in conformity with generally accepted accounting principles (GAAP) in the United States.
INVESTMENT VALUATION
Net asset value per share (NAV) is calculated as of the close of business of the major bond markets in New York City on the last business day of the month. A description of the valuation techniques applied to the HIT’s major categories of assets and liabilities measured at fair value on a recurring basis follows.
Portfolio securities for which market quotations are readily available (U.S. Treasury securities, government-sponsored enterprise debt securities, single family mortgage-backed securities, and state housing finance agency securities) are valued by using independent pricing services, published prices, market quotes, and bids from dealers who make markets in such securities. For U.S. Treasury securities, pricing services generally base prices on actual transactions as well as dealer supplied prices. For government-sponsored enterprise securities and single family mortgage-backed securities, pricing services generally base prices on discounted cash flow models and examine reference data such as issue name, issue size, ratings, maturity, call type, spread/benchmark yields, and conditional prepayment rates, as well as dealer supplied prices. For state housing finance agency securities, pricing services generally base prices on trading spreads, new issue scales, verified bid information, and credit ratings.
Portfolio investments for which market quotations are not readily available (for example, multifamily mortgage-backed securities, and construction mortgage securities and loans) are valued at their fair value determined in good faith under consistently applied procedures adopted by the HIT’s Board of Trustees using dealer quotes and discounted cash flow models. The respective cash flow models utilize inputs from matrix pricing which considers observable market-based discount and prepayment rates, attributes of the collateral, and yield or price of bonds of comparable quality, coupon, maturity, and type. The market-based discount rate is composed of a risk-free yield (i.e., a U.S. Treasury note) adjusted for an appropriate risk premium. The risk premium reflects premiums in the marketplace over the yield on U.S. Treasury securities of comparable risk and average life to the security being valued as adjusted for other market considerations, such as significant market or security specific events, changes in interest rates, and credit quality. On investments for which the HIT finances the construction and permanent securities or participation interests, value is determined based upon the total amount, funded and/or unfunded, of the commitment.
The HIT has also retained an independent firm to determine the fair market value of securities for which market quotations are not readily available. In accordance with the procedures adopted by the HIT’s Board of Trustees, the monthly third-party valuation is reviewed by the HIT staff to determine whether valuation adjustments are appropriate based on any material impairments in value arising from specific facts and circumstances of the investment (e.g., prepayment speed). All such adjustments must be reviewed and reconciled with the independent valuation firm prior to incorporation in the NAV.
Commercial mortgage-backed securities are valued using dealer quotes in a discounted cash flow model and/or independent pricing services. Pricing services generally base prices on a single cash flow model, determine a benchmark yield, and utilize available trade information, dealer quotes, and market color.
Real estate mortgage conduits are valued using a dealer quote and/or independent pricing services. Pricing services generally base prices on a single cash flow model or an option-adjusted spread model, determine a benchmark yield, and utilize available trade information, dealer quotes, market color, and prepayment speed.
The HIT holds the shares of Building America CDE, Inc. (BACDE), a wholly owned subsidiary of the HIT. The shares of BACDE are valued at their fair value determined in good faith under consistently applied procedures adopted by the HIT’s Board of Trustees, which approximates BACDE’s carrying value.
Investments in registered open-end investment management companies are valued based upon the NAVs of such investments.
Short-term investments having a maturity of 60 days or less are generally valued at amortized cost which approximates fair market value.
GAAP establishes a disclosure hierarchy that categorizes the inputs to valuation techniques used to value assets and liabilities at measurement date. The HIT classifies its assets and liabilities into three levels based on the method used to value the assets or liabilities. Level 1 values are based on quoted prices in active markets for identical securities. Level 2 values are based on significant observable market inputs, such as quoted prices for similar securities, interest rates, prepayment speeds, credit risk, and quoted prices in inactive markets. Level 3 values are based on significant unobservable inputs that reflect the HIT’s determination of assumptions that market participants might reasonably use in valuing the securities.
The following table presents the HIT’s valuation levels as of December 31, 2011:
| | Investment Securities ($ in thousands) |
| | | Level 1 | | Level 2 | | Level 3 | Total |
| FHA Permanent Securities | | $ - | | $ 103,463 | | $ 19 | $ 103,482 |
| FHA Construction Securities | | - | | 13,072 | | - | 13,072 |
| Ginnie Mae Securities | | - | | 854,703 | | - | 854,703 |
| Ginnie Mae Construction Securities | | - | | 392,962 | | - | 392,962 |
| Fannie Mae Securities | | - | | 1,825,716 | | - | 1,825,716 |
| Freddie Mac Securities | | - | | 449,056 | | - | 449,056 |
| Commercial Mortgage-Backed Securities | | - | | 21,502 | | - | 21,502 |
| State Housing Finance Agency Securities | | - | | 190,899 | | - | 190,899 |
| Other Multifamily Investments | | - | | 17,801 | | - | 17,801 |
| United States Treasury Securities | | - | | 350,935 | | - | 350,935 |
| Equity Investments | | - | | - | | (535) | (535) |
| Short-Term Investments | | 59,574 | | - | | - | 59,574 |
| Other Financial Instruments* | | - | | 72,666 | | - | 72,666 |
| Total | | $ 59,574 | | $4,292,775 | | $ (516) | $4,351,833 |
* Other financial instruments include forward commitments.
A N N U A L R E P O R T 2 0 1 1 25
The following table reconciles the valuation of the HIT’s Level 3 investment securities and related transactions for the year ended December 31, 2011.
Investments in Securities ($ in thousands)
| | FHA Permanent | Equity Investment | Total |
| Beginning Balance, 12/31/2010 | $20 | $(351) | $(331) |
| Total Unrealized Gain (Loss)* | - | (184) | (184) |
| Amortization/Accretion | (1) | - | (1) |
| Ending Balance, 12/31/2011 | $19 | $(535) | $(516) |
* Net change in unrealized loss attributable to Level 3 securities held at December 31, 2011, totaled $184,000 and is included on the accompanying Statement of Operations.
Level 3 investments in securities are not considered a significant portion of the HIT’s portfolio. The HIT’s policy is to recognize transfers between levels at the end of the reporting period. For the year ended December 31, 2011, there were no transfers between levels.
The preparation of financial statements in conformity with GAAP requires management to make estimates and assumptions that affect the reported amounts of assets and liabilities at the date of the financial statements and the reported amounts of revenues and expenses during the period. Actual results could differ from those estimates.
FEDERAL INCOME TAXES
The HIT’s policy is to comply with the requirements of the Internal Revenue Code of 1986, as amended (the Internal Revenue Code), that are applicable to regulated investment companies and to distribute all of its taxable income to its participants. Therefore, no federal income tax provision is required.
Tax positions taken or expected to be taken in the course of preparing the HIT’s tax returns are evaluated to determine whether the tax positions are “more-likely-than-not” of being sustained by the applicable tax authority. Tax positions not deemed to meet the more-likely-than-not threshold would be recorded as a tax benefit or expense in the current year. Management has analyzed for all open years the HIT’s tax positions taken on federal income tax returns and has concluded that no provision for income tax is required in the HIT’s financial statements.
The HIT files U.S. federal, state, and local tax returns as required. The HIT’s tax returns are subject to examination by the relevant tax authorities until the expiration of the applicable statutes of limitations, which is generally three years after the filing of the tax return but could be longer in certain circumstances.
DISTRIBUTIONS TO PARTICIPANTS
At the end of each calendar month, a pro-rata distribution is made to participants of the net investment income earned during the month. This pro-rata distribution is based on the participant’s number of units held as of the immediately preceding month-end and excludes realized gains (losses) which are distributed at year-end.
Participants redeeming their investments are paid their pro-rata share of undistributed net income accrued through the month-end of the month in which they redeem.
The HIT offers an income reinvestment plan that permits current participants automatically to reinvest their income distributions into HIT units of participation. Total reinvestment was approximately 89% of distributed income for the year ended December 31, 2011.
INVESTMENT TRANSACTIONS AND INCOME
For financial reporting purposes, security transactions are accounted for as of the trade date. Gains and losses on securities sold are determined on the basis of amortized cost. Realized gains (losses) on paydowns of mortgage-and asset-backed securities are classified as interest income. Interest income, which includes amortization of premium and accretion of discount on debt securities, is accrued as earned.
12B-1 PLAN OF DISTRIBUTION
The HIT’s Board of Trustees annually considers a Plan of Distribution under Rule 12b-1 under the Investment Company Act to pay for marketing and sales promotion expenses incurred in connection with the offer and sale of units and related distribution activities (12b-1 expenses). For the year 2011, the HIT was authorized to pay 12b-1 expenses in an amount up to $600,000 or 0.05% of its average monthly net assets on an annualized basis, whichever is greater. During the year ended December 31, 2011, the HIT incurred approximately $480,000 of 12b-1 expenses.
Note 2. Investment Risks
INTEREST RATE RISK
As with any fixed -income investment, the market value of the HIT’s investments will fall below the principal amount of those investments at times when market interest rates rise above the interest rates of the investments.Rising interest rates may also reduce prepayment rates, causing the average life of the HIT’s investments to increase. This could in turn further reduce the value of the HIT’s portfolio.
PREPAYMENT AND EXTENSION RISK
The HIT invests in certain fixed-income securities whose value is derived from an underlying pool of mortgage loans that are subject to prepayment and extension risk.
Prepayment risk is the risk that a security will pay more quickly than its assumed payment rate, shortening its expected average life. In such an event, the HIT may be required to reinvest the proceeds of such prepayments in other investments bearing lower interest rates. The majority of the HIT’s securities backed by loans for multifamily projects include restrictions on prepayments for specified periods to mitigate this risk.
Extension risk is the risk that a security will pay more slowly than its assumed payment rate, extending its expected average life. When this occurs, the HIT’s ability to reinvest principal repayments in higher returning investments may be limited.
These two risks may increase the sensitivity of the HIT’s portfolio to fluctuations in interest rates and negatively affect the value of the HIT’s portfolio.
26 A F L - C I O H O U S I N G I N V E S T M E N T T R U S T
Notes to Financial Statements
Note 3. Transactions with Related Entities
BACDE is a Community Development Entity, certified by the Community Development Financial Institutions Fund (“CDFI Fund”) of the U.S. Department of the Treasury, which can facilitate the generation of investments. BACDE is accounted for as an investment of the HIT.
The New Markets Tax Credit (NMTC) program1, which is run by the CDFI Fund, provides tax credits to equity investors that invest in businesses operating in low-income areas, including those that engage in creation of housing and other construction activities. BACDE received an allocation of $35 million in NMTCs in the 2010 allocation round, which can be committed to qualified transactions. BACDE receives fees for committing NMTCs to such qualified transactions. BACDE committed to or prefunded four qualified transactions in 2011, none of which obligates the assets of the HIT.
Summarized financial information for the BACDE on a historical cost basis is included in the table below:
$ in Thousands
| As of December 31, 2011 | |
| Assets | $558 |
| Liabilities | 900 |
| Equity | ($342) |
| For the year ended December 31, 2011 | |
| Income | $496 |
| Expenses | (698) |
| Tax Benefit | 68 |
| Net Loss | ($134) |
A rollforward of advances to BACDE by the HIT as of December 31, 2011, is included in the table below:
Advances to BACDE by HIT $ in Thousands
| Beginning Balance, 12/31/2010 | $331 |
| Advances in 2011 | $632 |
| Repayment by BACDE in 2011 | ($200) |
| Ending Balance, 12/31/2011 | $763 |
1The NMTC Program, enacted by Congress as part of the Community Renewal Tax Relief Act of 2000, is incorporated as section 45D of the Internal Revenue Code.
Note 4. Commitments
Certain assets of the HIT are invested in short-term investments until they are required to fund purchase commitments for long-term investments. As of December 31, 2011, the HIT had outstanding unfunded purchase commitments of approximately $229.9 million. The HIT maintains a reserve, in the form of securities, of no less than the total of the outstanding unfunded purchase commitments, less short-term investments. As of December 31, 2011, the value of the publicly traded mortgage-backed securities maintained for the reserve in a segregated account was approximately $4.07 billion.
The commitment amounts disclosed on the Schedule of Portfolio Investments represent the original commitment amount, which includes both funded and unfunded commitments.
Note 5. Investment Transactions
Purchases and sales of investments, excluding short-term securities and U.S. Treasury securities, for the year ended December 31, 2011, were $1.4 billion and $442.3 million, respectively.
Note 6. Income Taxes
The RIC Modernization Act of 2010 was signed into law on December 22, 2010, and seeks to simplify some of the tax provisions applicable to regulated investment companies and the tax reporting to their shareholders, and to improve the tax efficiency of certain fund structures. The greatest impact to the disclosure in the financial reports for the HIT will be seen on the treatment of capital loss carryforwards.
The HIT will be permitted to carry forward capital losses incurred in taxable years beginning after December 22, 2010, for an unlimited period. Under pre-enactment law, capital losses could be carried forward for eight years, and carried forward as short-term capital, irrespective of the character of the original loss. Post-enactment capital losses that are carried forward will retain their character as either short-term or long-term capital losses rather than being considered all short-term as under previous law. As of December 31, 2011, the HIT does not have a capital loss carryforward.
No provision for federal income taxes is required since the HIT intends to continue to qualify as a regulated investment company under Subchapter M of the Internal Revenue Code and distribute to shareholders all of its taxable income and gains. Federal income tax regulations differ from GAAP; therefore, distributions determined in accordance with tax regulations may differ in amount or character from net investment income and realized gains for financial reporting purposes. Financial reporting records are adjusted for permanent book/tax differences to reflect tax character.
The tax character of distributions paid during 2011 and 2010 was as follows (dollars in thousands):
| | 2011 | 2010 |
| Ordinary investment income | $ 163,242 | $ 161,898 |
| Long-term capital gain on investments | 16,054 | -- |
| Total distributions paid to participants or reinvested | $ 179,296 | $ 161,898 |
As of December 31, 2011, the components of accumulated earnings on a tax basis were as follows (dollars in thousands):
| | 2011 |
| Unrealized appreciation | $ 273,792 |
| Undistributed ordinary income | 497 |
| Other temporary differences | (3,364) |
| Total accumulated earnings | $270,925 |
The differences between book basis and tax basis components of net assets are primarily attributable to tax deferral of losses on wash sales and tax treatment of deferred compensation plans.
A N N U A L R E P O R T 2 0 1 1 27
Notes to Financial Statements
In 2011 the HIT utilized its entire accumulated capital loss carryforward from prior years of $7,094,000 to offset current year capital gains.
For financial reporting purposes, capital accounts are adjusted to reflect the tax character of permanent book/tax differences. These reclassifications are primarily due to the different book and tax treatment of paydowns and distributions. Results of operations and net assets were not affected by these reclassifications.
For the year ended December 31, 2011, the HIT recorded the following permanent reclassifications (dollars in thousands):
| | 2011 |
| Accumulated net investment loss | $ 6,815 |
| Accumulated net realized losses | (6,774) |
| Amount invested and reinvested by current participants | (41) |
At December 31, 2011, the cost of investments for federal income tax purposes was $4,078,040,000, which approximated book cost at amortized cost adjusted for wash sales. Net unrealized gain aggregated $273,793,000 at period-end, of which $278,020,000 related to appreciated investments and $4,227,000 related to depreciated investments.
Note 7. Retirement and Deferred Compensation Plans
The HIT participates in the AFL-CIO Staff Retirement Plan (Plan), which is a multiemployer defined benefit pension plan, under the terms of a collective-bargaining agreement. The Plan covers substantially all employees, including non-bargaining unit employees. The risks of participating in a multiemployer plan are different from a single-employer plan in the following aspects:
| a. | Assets contributed to a multiemployer plan by one employer may be used to provide benefits to employees of other participating employers. |
| b. | If a participating employer stops contributing to the plan, the unfunded obligations of the plan may be borne by the remaining participating employers based on their level of contributions to the plan. |
| c. | If the HIT chooses to stop participating in its multiemployer plan, the HIT may be required to pay the plan an amount based on the HIT’s share of the underfunded status of the plan, referred to as a withdrawal liability. |
The HIT’s participation in the Plan for the annual period ended December 31, 2011, is outlined in the table below. The “EIN/Pension Plan Number” line provides the Employee Identification Number (EIN) and the three-digit plan number. The most recent Pension Protection Act (PPA) zone status available in 2011 is for the Plan’s year -end at June 30, 2011. The zone status is based on information that the HIT received from the Plan and is certified by the Plan’s actuary. Among other factors, plans in the red zone are generally less than 65% funded, plans in the yellow zone are less than 80% funded, and plans in the green zone are at least 80% funded. The “FIP/RP Status Pending/Implemented” line indicates whether a financial improvement plan (FIP) or a rehabilitation plan (RP) is either pending or has been implemented.
Pension Fund: AFL-CIO Staff Retirement Plan
| EIN/Pension Plan Number | 53-0228172 / 001 |
| 2011 PPA Zone Status | Green |
| FIP/RP Status Pending/ Implemented | No |
| 2011 Contributions | $1,878,775 |
| 2011 Contribution Rate | 26% |
| Surcharge Imposed | No |
| Expiration Date of Collective Bargaining Agreement | 03/31/2012 |
The Plan utilized three provisions provided by Public Law 111-192, Section 211: (1) to spread investment losses from 2008 and 2009 over a period of 10 years, (2) to amortize 2008 and 2009 losses over a 29- year period, and (3) to temporarily allow actuarial value of assets to be as high as 130% of market value.
The HIT was listed in the Plan’s Form 5500 as providing more than 5% of the total contributions for the following plan year:
| | Year Contributions to Plan Exceeded More Than |
| Pension Fund | 5% of Total Contributions |
| AFL-CIO Staff Retirement Plan | 20091 |
1 The 2009 plan year ended at June 30, 2010.
At the date the financial statements were issued, Form 5500 was not available for the plan year ended June 30, 2011.
The HIT also sponsors a deferred compensation plan, referred to as a 401(k) plan, covering substantially all employees. This plan permits employees to defer the lesser of 100% of their total compensation or the applicable Internal Revenue Service limit. During 2011, the HIT matched dollar for dollar the first $4,800 of each employee’s contributions. The HIT’s 401(k) contribution for the year ended December 31, 2011, was approximately $237,500.
Note 8. Loan Facility
The HIT has a $15 million uncommitted loan facility which expires on March 30, 2012. Under this facility, borrowings bear interest per annum equal to 1.25% plus the highest of (a) the Federal Funds rate, (b) the Overnight Eurodollar Rate, or (c) the one- month LIBOR. The HIT had no outstanding balance under the facility for the year ended December 31, 2011. No compensating balances are required.
Note 9. Contract Obligations
In the ordinary course of business, the HIT enters into contracts that contain a variety of indemnifications. The HIT’s maximum exposure under these arrangements is unknown. However, the HIT has not had prior claims or losses pursuant to these contracts and expects the risk of loss to be low.
28 A F L - C I O H O U S I N G I N V E S T M E N T T R U S T
| | | | | | | | | | |
| | | | | | | | | |
| Selected Per Share Data and Ratios for the Years Ended December 31 (Dollars in thousands) | | | | | | | | |
| | | | | | | | | |
| | | | | | | | | |
| Per share data | | 2011 | | 2010 | | 2009 | | 2008 | | 2007 |
| Net asset value, beginning of period | $ | 1,133.82 | $ | 1,114.72 | $ | 1,098.48 | $ | 1,097.01 | $ | 1,081.27 |
| | | | | | | | | | | |
| | | | | | | | | | | |
| Income from investment operations: | | | | | | | | | | |
| Net investment income | | 43.58* | | 47.27* | | 50.68* | | 53.64* | | 52.72 |
| Net realized and unrealized gains on investments | | 43.81 | | 20.75 | | 17.15 | | 1.91 | | 17.54 |
| Total income from investment operations | | 87.39 | | 68.02 | | 67.83 | | 55.55 | | 70.26 |
| Less distributions from: | | | | | | | | | | |
| Net investment income | | (45.52) | | (48.92) | | (51.59) | | (54.08) | | (54.52) |
| Net realized gains on investments | | (5.48) | | - | | - | | - | | - |
| Total distributions | | (51.00) | | (48.92) | | (51.59) | | (54.08) | | (54.52) |
| | | | | | | | | | | |
| | | | | | | | | | | |
| Net asset value, end of period | $ | 1,170.21 | $ | 1,133.82 | $ | 1,114.72 | $ | 1,098.48 | $ | 1,097.01 |
| | | | | | | | | | | |
| Ratios/supplemental data | | | | | | | | | | |
| Ratio of expenses to average net assets | | 0.44% | | 0.44% | | 0.43% | | 0.41% | | 0.41% |
| Ratio of net investment income to average net assets | | 3.8% | | 4.1% | | 4.5% | | 5.0% | | 5.0% |
| Portfolio turnover rate | | 33.9% | | 42.2% | | 28.5% | | 23.8% | | 42.1% |
| | | | | | | | | | | |
| Number of outstanding units at end of period | | 3,642,485 | | 3,430,737 | | 3,250,549 | | 3,156,720 | | 3,388,107 |
| | | | | | | | | | | |
| | | | | | | | | | | |
| Net assets, end of period (in thousands) | $ | 4,262,471 | $ | 3,889,839 | $ | 3,623,437 | $ | 3,467,603 | $ | 3,716,773 |
| | | | | | | | | | | |
| | | | | | | | | | | |
| Total return | | 7.86% | | 6.16% | | 6.28% | | 5.25% | | 6.70% |
*The average shares outstanding method has been applied for this per share information.
See accompanying Notes to Financial Statements.
A N N U A L R E P O R T 2 0 1 1 29
Board of Trustees
Overall responsibility for the management of the HIT, the establishment of policies, and the oversight of activities is vested in its Board of Trustees. The list below provides the following information for each of the Trustees: name, age, address, term of office, length of time served, principal occupations during the past five years and other directorships held.* The HIT’s Statement of Additional Information includes additional information about the Trustees and is available without charge, upon request, by placing a collect call to the HIT’s Investor Relations Office at (202) 331-8055, or by viewing the HIT’s website at www.aflcio-hit.com.
John J. Sweeney,** age 77; 815 16th Street, NW, Washington, DC 20006; Chairman of the Board; service commenced 1981, expires 2012; President Emeritus, AFL-CIO; formerly President, AFL-CIO; formerly Chairman, AFL-CIO Staff Retirement Plan. Richard L. Trumka,** age 62; 815 16th Street, NW, Washington, DC 20006; Union Trustee; service commenced 1995, expires 2014; President, AFL-CIO; Chairman, AFL-CIO Staff Retirement Plan; formerly Secretary-Treasurer, AFL-CIO. Liz Shuler, age 41; 815 16th Street, NW, Washington, DC 20006; Union Trustee; service commenced 2009, expires 2012; Secretary-Treasurer, AFL-CIO; Trustee, AFL-CIO Staff Retirement Plan; formerly Executive Assistant to the President, IBEW. Arlene Holt Baker, age 61; 815 16th Street, NW, Washington, DC 20006; Union Trustee; service commenced 2008, expires 2014; Executive Vice President, AFL-CIO; Trustee, AFL-CIO Staff Retirement Plan; formerly President, Voices for Working Families and Executive Assistant to the President, AFL-CIO. Mark Ayers, age 63; 815 16th Street, NW, Suite 600, Washington, DC 20006; Union Trustee; service commenced 2008, expires 2012; President, Building and Construction Trades Department, AFL-CIO; Trustee and Secretary-Treasurer of ULLICO; formerly Director, IBEW Construction & Maintenance Division. | | James Boland, age 61; 620 F Street, NW, Suite 700, Washington, DC 20004; Union Trustee; service commenced 2010, expires 2012; President, International Union of Bricklayers and Allied Craftworkers (BAC); Co-Chair, International Masonry Institute; Co-Chair, International Trowel Trades Pension Fund and International Health Fund; Executive Member, BAC Staff Health Plan; Trustee, BAC Local Union Officers and Employees Pension Fund and BAC Salaried Employees Pension Fund; President, Trowel Trades Industry Insurance Company; formerly Executive Vice President and Secretary Treasurer, BAC. Frank Hurt, age 73; 10401 Connecticut Avenue, Kensington, MD 20895; Union Trustee; service commenced 1993, expires 2013; International President, Bakery, Confectionery & Tobacco Workers and Grain Millers International Union; Chairman, Bakery & Confectionery Union Industry Pension and Health Benefits Fund. Stephen Frank, age 71; 8584 Via Avellino, Lake Worth, FL 33467; Management Trustee; service commenced 2003, expires 2012; retired; formerly Vice President and Chief Financial Officer, The Small Business Funding Corporation. Jack Quinn, age 60; 121 Ellicott Street, Buffalo, NY 14203; Management Trustee; service commenced 2005, expires 2014; President, Erie County Community College; Director, Kaiser Aluminum Corporation; formerly President, Cassidy & Associates; Member of Congress, 27th District, New York. | | Richard Ravitch,** age 78; 610 5th Avenue, Suite 420, New York, NY 10020; Management Trustee; service commenced 1991, expires 2012; Principal, Ravitch Rice & Co. LLC; formerly Lieutenant Governor, State of New York; Director, Parsons, Brinckerhoff Inc.; Co-Chair, Millennial Housing Commission; President and Chief Executive Officer, Player Relations Committee of Major League Baseball. Kenneth E. Rigmaiden, age 58; 7234 Parkway Drive, Hanover, MD 21076; Union Trustee; service commenced 2011, expires 2014; Executive General Vice President, International Union of Painters and Allied Trades of the United States and Canada (IUPAT); Director, Coalition of Black Trade Unionists and Board for Partnership for Working Families; Trustee, IUPAT International Pension Fund; formerly Assistant to the General President, IUPAT; National Project Coordinator, IUPAT Job Corps Program; Director, United Way. Marlyn J. Spear,** CFA, age 58; 500 Elm Grove Road, Elm Grove, WI 53122; Management Trustee; service commenced 1995, expires 2012; Chief Investment Officer, Building Trades United Pension Trust Fund (Milwaukee and Vicinity); Director, Baird Funds, Inc. Tony Stanley,** age 78; 191 SE Bella Strano, Port St. Lucie, FL 34984; Management Trustee; service commenced 1983, expires 2013; Director, TransCon Builders, Inc.; formerly Executive Vice President, TransCon Builders, Inc. |
| * | Includes any directorships in a corporation or trust having securities registered pursuant to Section 12 of the Securities Exchange Act of 1934, as amended, or subject to the requirements of Section 15(d) of such Act, or a company registered as an investment company under the Investment Company Act of 1940, as amended. |
| ** | Executive Committee member. |
30 A F L - C I O H O U S I N G I N V E S T M E N T T R U S T
All officers of the HIT are located at 2401 Pennsylvania Avenue, NW, Suite 200, Washington, DC 20037.*
Stephen Coyle,† age 66; Chief Executive Officer, AFL-CIO Housing Investment Trust since 1992. Theodore S. Chandler,† age 52; Chief Operating Officer, AFL-CIO Housing Investment Trust since 2009; formerly Vice President, Fannie Mae. Erica Khatchadourian,† age 44; Chief Financial Officer, AFL-CIO Housing Investment Trust since 2001; formerly Controller, Chief of Staff and Director of Operations, AFL-CIO Housing Investment Trust; Senior Consultant, Price Waterhouse. Chang Suh,† CFA, CPA, age 40; Executive Vice President and Chief Portfolio Manager, AFL-CIO Housing Investment Trust since 2005; formerly Chief Portfolio Manager, Assistant Portfolio Manager, and Senior Portfolio Analyst, AFL-CIO Housing Investment Trust; Senior Auditor, Arthur Andersen. Saul A. Schapiro,† age 66; General Counsel, AFL-CIO Housing Investment Trust since 2009; formerly Partner, Rosenberg, Schapiro, Englander, | | Chicoine & Leggett, P.C.; Outside Counsel to the AFL-CIO Housing Investment Trust. Debbie Cohen,† age 61; Chief Development Officer, AFL-CIO Housing Investment Trust since 2009; formerly Chief Director of Marketing and Investor Relations and Assistant Portfolio Manager, AFL-CIO Housing Investment Trust; Realtor, Coldwell Banker Realty and Weichert Realty; Senior Director of Planning and Research, Federal Home Loan Banks. Christopher Kaiser,† age 47; Deputy General Counsel (since 2008) and Chief Compliance Officer (since 2007), AFL-CIO Housing Investment Trust; formerly Associate General Counsel, AFL-CIO Housing Investment Trust; Branch Chief, Division of Investment Management, U.S. Securities and Exchange Commission. Harpreet Singh Peleg,† CPA, age 38; Controller, AFL-CIO Housing Investment Trust since 2005; formerly Chief Financial Officer, AFL-CIO Investment Trust Corporation; Financial | | Analyst, Goldman Sachs & Co.; Senior Associate, Pricewaterhouse Coopers. Eric W. Price,† age 50; Executive Vice President, AFL-CIO Housing Investment Trust since 2010; formerly Senior Vice President, Abdo Development; Senior Vice President, Local Initiative Support Corporation; Deputy Mayor for Planning and Economic Development, District of Columbia. Lesyllee White, age 49; Director of Marketing, AFL-CIO Housing Investment Trust since 2004; formerly Regional Marketing Director and Senior Marketing Associate, AFL-CIO Housing Investment Trust; Vice President, Northern Trust Company. Stephanie H. Wiggins,† age 46; Executive Vice President and Chief Investment Officer, position formerly titled Chief Investment Officer – Multifamily Finance, AFL-CIO Housing Investment Trust since 2001; formerly Director of Fannie Mae Finance, AFL-CIO Housing Investment Trust; Director, Prudential Mortgage Capital Company; Vice President/Multifamily Transaction Manager, WMF Capital Corporation. |
* No officer of the HIT serves as a trustee or director in any corporation or trust having securities registered pursuant to Section 12 of the Securities Exchange Act of 1934, as amended, or subject to the requirements of Section 15(d) of such Act, or any company registered as an investment company under the Investment Company Act of 1940, as amended.
† Board-appointed officer. These officers are appointed annually, serving for a period of approximately one year or until their respective successors are duly appointed and qualified.
A N N U A L R E P O R T 2 0 1 1 31
AFL-CIO Housing Investment Trust | | Service Providers |
| | | |
National Office 2401 Pennsylvania Avenue, N.W. Suite 200 Washington, D.C. 20037 (202) 331-8055 www.aflcio-hit.com New York City Office Carol Nixon, Director 1270 Avenue of the Americas Suite 210 New York, New York 10020 (212) 554-2750 Western Regional Office Liz Diamond, Director 101 California Street, Suite 2450 San Francisco, California 94111 (415) 433-3044 New England Regional Office Thomas O’Malley, Director Ten Post Office Square, Suite 800 Boston, Massachusetts 02109 (617) 850-9071 Gulf Coast Office 935 Gravier Street, Suite 640 New Orleans, Louisiana 70112 (504) 599-8750 | | Independent Registered Public Accounting Firm Ernst & Young LLP McLean, Virginia Corporate Counsel Bingham McCutchen LLP Washington, D.C. Securities Counsel Perkins Coie LLP Washington, D.C. Transfer Agent BNY Mellon Investment Servicing (US) Inc. Wilmington, Delaware Custodian Bank of New York Mellon New York, New York |
Investors should consider the HIT’s investment objectives, risks, and expenses carefully before investing. A prospectus containing more complete information may be obtained from the HIT by calling the Marketing and Investor Relations Department collect at (202) 331-8055 or by viewing the HIT’s website at www.aflcio-hit.com. The prospectus should be read carefully before investing.
32 A F L - C I O H O U S I N G I N V E S T M E N T T R U S T

Item 2. Code of Ethics.
| (a) | The Trust has adopted a Code of Ethics to comply with Section 406 of the Sarbanes-Oxley Act of 2002, as of December 31, 2011. This Code of Ethics applies to the Trust’s principal executive officer, principal financial officer, and principal accounting officer or controller or persons performing similar functions. |
| (b) | For purposes of this Item, the term “Code of Ethics” means written standards that are reasonably designed to deter wrongdoing and to promote: |
| | (1) | Honest and ethical conduct, including the ethical handling of actual or apparent conflicts of interest between personal and professional relationships; |
| | (2) | Full, fair, accurate, timely, and understandable disclosure in reports and documents that a registrant files with, or submits to, the Commission and in other public communications made by the registrant; |
| | (3) | Compliance with applicable governmental laws, rules, and regulations; |
| | (4) | The prompt internal reporting of violations of the code to an appropriate person or persons identified in the code; and |
| | (5) | Accountability for adherence to the code. |
| (c) | The Trust’s Code of Ethics was not amended during the period covered by the Report. |
| (d) | There have been no waivers granted from any provision of the Trust’s Code of Ethics during the period covered by the Report. |
| (f) | (1) A copy of the Trust’s Code of Ethics is filed herewith as an Exhibit pursuant to Item 12(a)(1). |
Item 3. Audit Committee Financial Expert.
| (a) | (1) | The Trust’s Board of Trustees has determined that Marlyn Spear and Stephen Frank possess the attributes to qualify as audit committee financial experts and has designated Ms. Spear and Mr. Frank as the Audit Committee’s financial experts. |
| | (2) | Ms. Spear and Mr. Frank are both are independent for purposes of this Item 3. |
Item 4. Principal Accountant Fees and Services.
| | The aggregate fees billed for services provided to the Registrant by its independent auditors for the audit of the Registrant’s annual financial statements and for services normally provided by the independent auditors in connection |
with statutory and regulatory filings or engagements were $343,500 for the fiscal year ended December 31, 2011.
The aggregate fees billed for services provided to the Registrant by its independent auditors for the audit of the Registrant’s annual financial statements and for services normally provided by the independent auditors in connection with statutory and regulatory filings or engagements were $319,000 for the fiscal year ended December 31, 2010.
(b) Audit-related fees.
The aggregate fees billed by the Registrant’s independent auditors for services relating to the performance of the audit of the Registrant’s financial statements and not reported under paragraph (a) of this Item were $0 for the fiscal year ended December 31, 2011. The percentage of these fees relating to services approved by the Registrant’s Audit Committee pursuant to the de minimis exception from the pre-approval requirement in Rule 2-01(c)(7)(i)(C) of Regulation S-X was 0%.
The aggregate fees billed for services by the Registrant relating to the performance of the audit of the financial statements of the Registrant’s investment adviser(s) and other service providers under common control with the adviser(s) and that relate directly to the operations or financial reporting of the Registrant were $0 for the Registrant’s fiscal year ended December 31, 2011. The percentage of these fees relating to services approved by the Registrant’s Audit Committee pursuant to the de minimis exception from the pre-approval requirement in Rule 2-01(c)(7)(i)(C) of Regulation S-X was 0%.
The aggregate fees billed by the Registrant’s independent auditors for services relating to the performance of the audit of the Registrant’s financial statements and not reported under paragraph (a) of this Item were $0 for the fiscal year ended December 31, 2010. The percentage of these fees relating to services approved by the Registrant’s Audit Committee pursuant to the de minimis exception from the pre-approval requirement in Rule 2-01(c)(7)(i)(C) of Regulation S-X was 0%.
The aggregate fees billed by the Registrant’s independent auditors for services relating to the performance of the audit of the financial statements of the Registrant’s investment adviser(s) and other service providers under common control with the adviser(s) and that relate directly to the operations or financial reporting of the Registrant were $0 for the Registrant’s fiscal year ended December 31, 2010. The percentage of these fees relating to services approved by the Registrant’s Audit Committee pursuant to the de minimis exception from the pre-approval requirement in Rule 2-01(c)(7)(i)(C) of Regulation S-X was 0%.
(c) Tax fees.
The aggregate fees billed by the Registrant’s independent auditors for tax-related services provided to the Registrant were $24,500 for the fiscal year ended December 31, 2011. The percentage of these fees relating to services approved by the Registrant’s Audit Committee pursuant to the de minimis exception from the pre-approval requirement in Rule 2-01(c)(7)(i)(C) of Regulation S-X was 0%.
The aggregate fees billed by the Registrant’s independent auditors for tax-related services provided to the Registrant’s adviser(s) and other service providers under common control with the adviser(s) and that relate directly to the operations or financial reporting of the Registrant were $0 for the Registrant’s fiscal year ended December 31, 2011. The percentage of these fees relating to services approved by the Registrant’s Audit Committee pursuant to the de minimis exception from the pre-approval requirement in Rule 2-01(c)(7)(i)(C) of Regulation S-X was 0%.
The aggregate fees billed by the Registrant’s independent auditors for tax-related services provided to the Registrant were $21,500 for the fiscal year ended December 31, 2010. The percentage of these fees relating to services approved by the Registrant’s Audit Committee pursuant to the de minimis exception from the pre-approval requirement in Rule 2-01(c)(7)(i)(C) of Regulation S-X was 0%.
The aggregate fees billed by the Registrant’s independent auditors for tax-related services provided to the Registrant’s investment adviser(s) and other service providers under common control with the adviser(s) and that relate directly to the operations or financial reporting of the Registrant were $0 for the Registrant’s fiscal year ended December 31, 2010. The percentage of these fees relating to services approved by the Registrant’s Audit Committee pursuant to the de minimis exception from the pre-approval requirement in Rule 2-01(c)(7)(i)(C) of Regulation S-X was 0%.
The aggregate fees billed for all services provided by the independent auditors to the Registrant other than those set forth in paragraphs (a), (b) and (c) of this Item were $13,000 for the fiscal year ended December 31, 2011. The percentage of these fees relating to services approved by the Registrant’s Audit Committee pursuant to the de minimis exception from the pre-approval requirement in Rule 2-01(c)(7)(i)(C) of Regulation S-X was 0%.
The aggregate fees billed for all services other than those set forth in paragraphs (b) and (c) of this Item provided by the Registrant’s independent auditors to the Registrant’s adviser(s) and other service providers under common control with the adviser(s) and that relate directly to the operations or financial reporting of the Registrant were $0 for the Registrant’s fiscal year ended December 31, 2011. The percentage of these fees relating to services approved by the Registrant’s Audit Committee pursuant to the de minimis exception from the pre-approval requirement in Rule 2-01(c)(7)(i)(C) of Regulation S-X was 0%.
The aggregate fees billed for all services provided by the independent auditors to the Registrant other than those set forth in paragraphs (a), (b) and (c) of this Item were $12,000 for the fiscal year ended December 31, 2010. The percentage of these fees relating to services approved by the Registrant’s Audit Committee pursuant to the de minimis exception from the pre-approval requirement in Rule 2-01(c)(7)(i)(C) of Regulation S-X was 0%.
The aggregate fees billed for all services other than those set forth in paragraphs (b) and (c) of this Item provided by the Registrant’s independent auditors to the Registrant’s adviser(s) and other service providers under common control with the adviser(s) and that relate directly to the operations or financial reporting of the Registrant were $0 for the Registrant’s fiscal year ended December 31, 2010. The percentage of these fees relating to services approved by the Registrant’s Audit Committee pursuant to the de minimis exception from the pre-approval requirement in Rule 2-01(c)(7)(i)(C) of Regulation S-X was 0%.
| (e) | (1) | The Charter of the Trust’s Audit Committee provides that the Audit Committee shall review and, if appropriate, approve in advance all audit and non-audit services (as such term may be from time to time defined in the Securities Exchange Act of 1934, as amended) to be provided to the Trust by the Trust’s independent auditor; provided, however, that the Audit Committee shall only approve the following non-audit services: tax preparation and the Association for Investment Management Research (AIMR) Level 2 Compliance Review. In making a determination, the Audit Committee considers whether the services are consistent with maintaining the principal accountant’s independence. If such a service is required between regularly scheduled audit committee meetings, pre-approval may be authorized by a majority of the audit committee members at a special meeting called for such purposes or by unanimous written consent. The Audit Committee’s Charter does not permit waiver of pre-approval for audit or non-audit services requiring fees of a de minimis amount. |
| | (2) | No percentage of the services included in (b)-(d) above were approved by the audit committee pursuant to paragraph (c)(7)(i)(C) of Rule 2-01 of Regulation S-X. |
| (f) | For the most recent fiscal year, less than 50% of the hours expended by the Trust’s principal accountant were performed by persons other than the accountant’s full-time permanent employees. |
| (g) | The Trust’s accountant performed no non-audit services for the Trust’s investment adviser during each of the last two fiscal years. |
| (h) | Not applicable. The Trust’s accountant performed no non-audit services for the Trust’s investment adviser during each of the last two fiscal years. |
Item 5. Audit Committee of Listed Registrants.
Not Applicable.
Item 6. Schedule of Investments.
Included herein under Item 1.
Item 7. Disclosure of Proxy Voting Policies and Procedures for Closed-End Management Investment Companies.
Not Applicable.
Item 8. Portfolio Managers of Closed-End Management Investment Companies.
Not Applicable.
Item 9. Purchases of Equity Securities by Closed-End Management Investment Company and Affiliated Purchasers.
Not Applicable.
Item 10. Submission of Matters to a Vote of Security Holders.
No material changes have been made to the procedures by which participants may recommend nominees to the Board of Trustees of the Trust, where those changes were implemented after the Trust last provided disclosure in response to the requirements of Item 7(d)(2)(ii)(G) of Schedule 14A (17 CFR 240.14a-101) or this Item 10.
Item 11. Controls and Procedures.
| (a) | The Trust’s Chief Executive Officer (the principal executive officer) and Chief Financial Officer (the principal financial officer) have concluded that the Trust’s disclosure controls and procedures (as defined in Rule 30a-3(c) under the Act (17 CFR 270.30a-3(c)) are effective to ensure that material information relating to the Trust is made known to them by appropriate persons, based on their evaluation of such controls and procedures as of December 31, 2011. |
| (b) | There was no change in the Trust’s internal control over financial reporting (as defined in Rule 30a-3(d) under the Act (17 CFR 270.30a-3(d)) that occurred during the Trust’s last fiscal quarter of the period covered by this report that has materially affected, or is reasonably likely to materially affect, the Trust’s internal control over financial reporting. |
Item 12. Exhibits.
| (a) | (1) | The Trust’s Code of Ethics applicable to its principal executive officer, principal financial officer, and principal accounting officer or persons performing similar functions is attached hereto. |
| | (2) | A separate certification for each principal executive officer and principal financial officer of the registrant as required by Rule 30a-2(a) under the Act (17 CFR 270.30a-2(a)). |
| (b) | A separate certification for each principal executive officer and principal financial officer of the registrant as required by Rule 30a-2(b) under the Act. |
SIGNATURES
Pursuant to the requirements of the Securities Exchange Act of 1934 and the Investment Company Act of 1940, the AFL-CIO Housing Investment Trust has duly caused this report to be signed on its behalf by the undersigned, thereunto duly authorized.
AFL-CIO HOUSING INVESTMENT TRUST
By: /s/ Stephen Coyle
Stephen Coyle
Chief Executive Officer
Date: March 1, 2012
Pursuant to the requirements of the Securities Exchange Act of 1934 and the Investment Company Act of 1940, this report has been signed below by the following persons on behalf of the AFL-CIO Housing Investment Trust and in the capacities and on the dates indicated.
/s/ Stephen Coyle
Stephen Coyle
Chief Executive Officer
(Principal Executive Officer)
Date: March 1, 2012
/s/ Erica Khatchadourian
Erica Khatchadourian
Chief Financial Officer
(Principal Financial Officer)
Date: March 1, 2012