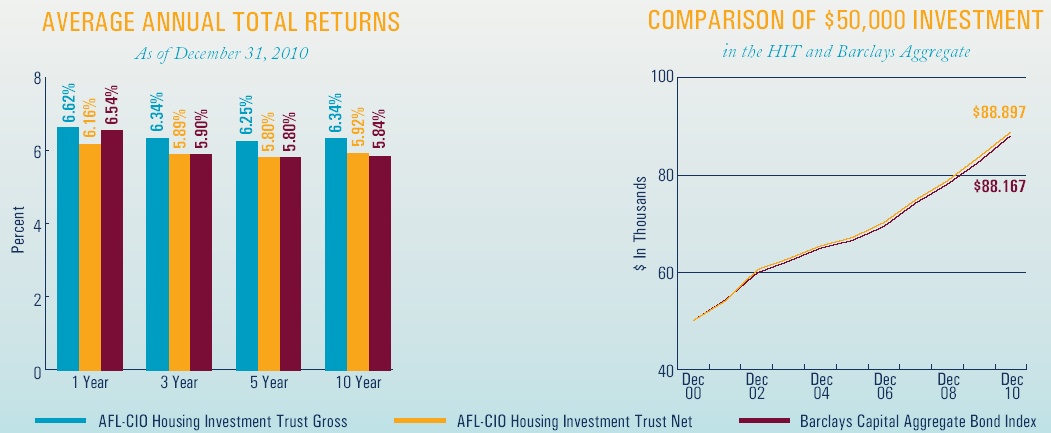
The performance data quoted represents past performance and is no guarantee of future results. Investment results and principal value will fluctuate so that units in the HIT, when redeemed, may be worth more or less than the original cost. The HIT’s current performance may be lower or higher than the performance data quoted. Performance data current to the most recent month-end is available at www.aflcio-hit.com.
MARKET CONDITIONS
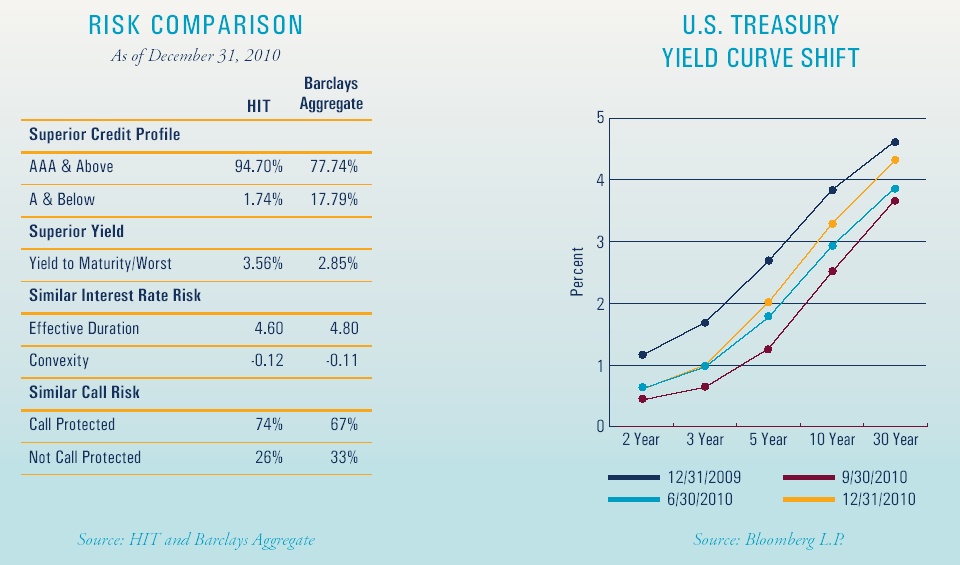
The HIT maintained its steady performance in a year of considerable volatility resulting from concerns that ranged from the European sovereign debt crisis to domestic issues such as lagging economic growth, high unemployment, poor housing performance, tight credit, and possible deflation.
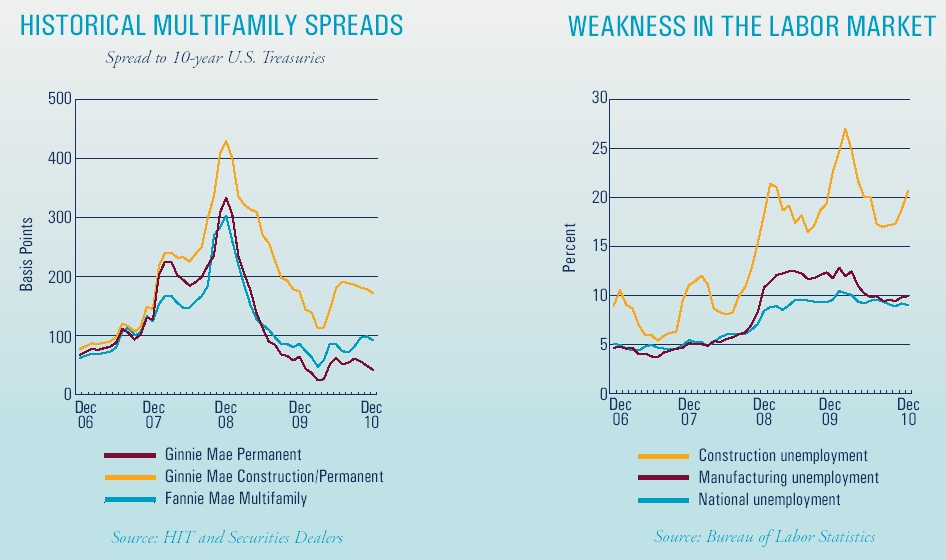
Despite rising interest rates during the last two months of 2010, Treasury rates were significantly lower at the end of the year than they were at the beginning. Riskier assets performed well during the year, with lower quality investments generally outperforming those of higher quality. Overall, multifamily MBS spreads relative to Treasuries were slightly tighter for the year. Spreads on Ginnie Mae construction/permanent loan certificates, however, remained historically wide, as investors required higher yields for construction-related investments. This was a favorable market for the HIT to pursue its investments in new multifamily production.
A N N U A L R E P O R T 2 0 1 0 5

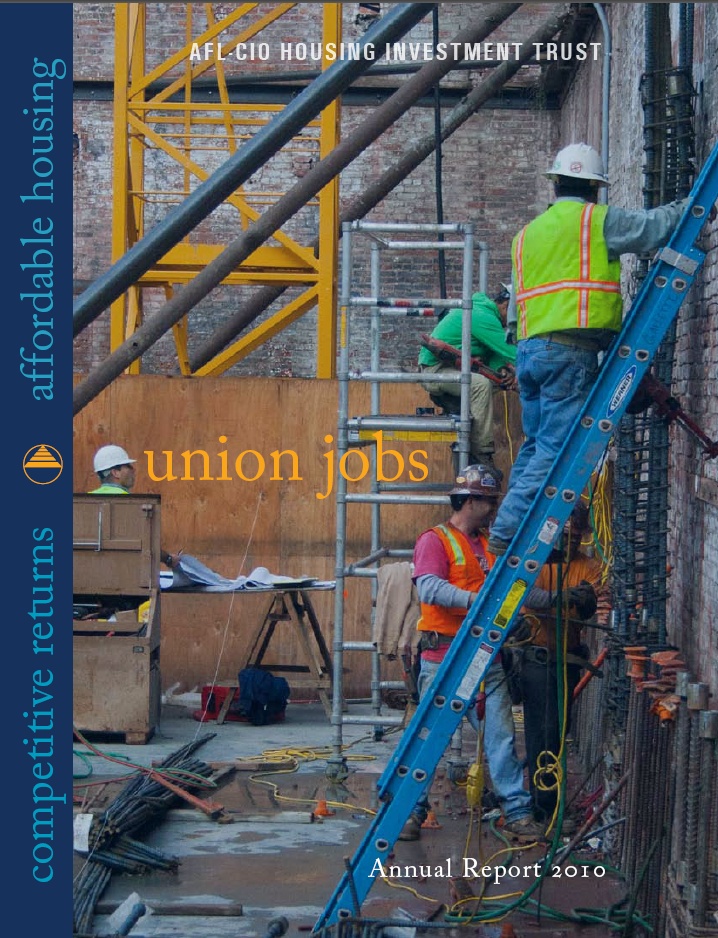
“These aren’t low-road jobs. They are family and community sustaining careers that advance the American dream.”
– Mark H. Ayers, President,
Building and Construction Trades Department, AFL-CIO
HOUSING AND JOBS
The HIT added a record $613 million of new housing investments to the portfolio in 2010. This project financing will generate union construction work, create affordable and workforce housing, and spur secondary job creation and economic development – moving the HIT toward the goals of its Construction Jobs Initiative. The commitments made in 2010 helped finance 21 projects in 11 cities, representing over $1.3 billion of total development value and more than 6,800 union construction jobs. The projects will create or preserve nearly 8,200 multifamily units, including over 150 healthcare beds. Approximately 80% of the housing units will be affordable to low or moderate-income residents.
The new investments were welcomed in communities across the country at a time when development financing remained scarce and construction unemployment hovered around 20%. Many of the HIT’s 2010 investments will help major urban areas meet important development needs, as seen in the following examples:
Boston: In cooperation with MassHousing, the HIT invested over $65 million to build or renovate 392 units of affordable housing at three projects, Old Colony, Washington Beech, and Franklin Park, with total development investments of $116 million. The work is expected to generate over 650 union construction jobs.
This page, above: Topping out at Elizabeth Seton Pediatric Center, Yonkers, NY. Opposite page, clockwise from top left: The Laurel, St. Louis; Park Pacific, St. Louis; Riverside Plaza, Minneapolis; Potrero Launch, San Francisco.
6 A F L - C I O H O U S I N G I N V E S T M E N T T R U S T
Chicago: A total of $32 million in financing was committed for two Chicago rehabilitation projects, Randolph Tower City Apartments and Lawndale Terrace/Plaza Court, to provide 508 housing units. The projects, with total development value of $167 million, are expected to generate approximately 780 union jobs.
Minneapolis: The HIT invested a combined $63.5 million for the substantial rehabilitation of the 1,303-unit Riverside Plaza and the new construction of the 84-unit FloCo Fusion apartments. The two projects represent $139 million in total development investments and an estimated 730 union jobs.
New York City: The HIT committed $121 million for affordable and workforce housing projects involving over 340 jobs, including construction of the $29 million CUNY Graduate Center Housing project, preservation of 490 units of affordable housing at Lands End II, and the purchase of NYC Housing Authority bonds to rehabilitate 3,726 units of affordable housing.
San Francisco: The HIT invested $35 million in the construction of two LEED-designed mixed-use developments, Arc Light Co. and Potrero Launch, with combined development investment of $128 million. The projects will bring 290 new housing units and an estimated 730 union jobs to San Francisco.
St. Louis: Supporting the city’s downtown redevelopment are two HIT-financed projects, the Laurel and Park Pacific apartments, with combined development value of $273 million. The HIT invested $108 million in the two projects, which will provide 435 housing units while creating approximately 2,000 union jobs. The HIT also is helping finance Council Tower Senior Apartments, a $30 million development in the city.
With the addition of these and other investments, the number of union construction jobs created by the HIT’s Construction Jobs Initiative since early 2009 reached nearly 9,000 by year-end 2010. This put the HIT well on its way to surpassing its goal of 10,000 jobs by the spring of 2011. Through this special initiative, the HIT is working to finance much-needed union construction jobs throughout the country in support of the AFL-CIO’s priority of job creation.
The HIT is well-positioned in the coming year to achieve competitive returns while producing collateral benefits of affordable housing and union construction jobs.
OPPORTUNITIES AHEAD
Despite some guarded signs of improving economic conditions, the weak labor market and housing sector are expected to remain a drag on the economy’s recovery in the period ahead. Default concerns related to Europe’s sovereign debt markets and U.S. municipal debt markets could also hamper recovery. U.S. inflation, however, was extremely tame in 2010 and appears unlikely to pick up significantly in 2011. Excess capacity still existed at year-end, and productivity gains may continue.
The HIT enters 2011 with a strong pipeline of potential housing investments and a highly liquid portfolio that is structured to produce higher income and higher credit quality with similar interest rate risk relative to its benchmark. The HIT is well-positioned in the coming year to achieve competitive returns while also producing collateral benefits of affordable housing and union construction jobs. It remains an attractive investment choice for Taft-Hartley and public pension plans.
8 A F L - C I O H O U S I N G I N V E S T M E N T T R U S T
Other Important Information
EXPENSE EXAMPLE
Participants in the HIT incur ongoing expenses related to the management and distribution activities of the HIT, as well as certain other expenses. This example is intended to help participants understand the ongoing costs (in dollars) of investing in the HIT and to compare these costs with the ongoing costs of investing in other mutual funds. The example is based on an investment of $1,000 invested at the beginning of the period, July 1, 2010, and held for the entire period ended December 31, 2010.
Actual Expenses: The first line of the table below provides information about actual account values and actual expenses. Participants may use the information in this line, together with the amount they invested, to estimate the expenses that they paid over the period. Simply divide the account value by $1,000 (for example, an $800,000 account value divided by $1,000 = 800), then multiply the result by the number in the first line under the heading entitled “Expenses Paid During Six-Month Period Ended December 31, 2010” to estimate the expenses paid on a particular account during this period.
Hypothetical Expenses (for Comparison Purposes Only): The second line of the table below provides information about hypothetical account values and hypothetical expenses based on the HIT’s actual expense ratio and an assumed rate of return of 5% per year before expenses, which is not the HIT’s actual return. The hypothetical account values and expenses may not be used to estimate the actual ending account balance or expenses a participant paid for the period. Participants may use this information to compare the ongoing costs of investing in the HIT and other mutual funds. To do so, compare this 5% hypothetical example with the 5% hypothetical examples that appear in the shareholder reports of the other mutual funds.
AVAILABILITY OF QUARTERLY PORTFOLIO SCHEDULES
In addition to disclosure in the Annual and Semi-Annual Reports to Participants, the HIT also files its complete schedule of portfolio holdings with the Securities and Exchange Commission (SEC) for the first and third quarters of each fiscal year on Form N-Q. The HIT’s reports on Form N-Q are made available on the SEC’s website at http://www.sec.gov and may be reviewed and copied at the SEC’s Public Reference Room in Washington, D.C. (Information relating to the hours and operation of the SEC’s Public Reference Room may be obtained by calling 1-800-SEC-0330.) Participants may also obtain copies of the HIT’s Form N-Q reports, without charge, upon request, by calling the HIT collect at 202-331-8055.
PROXY VOTING
Except for its shares in its wholly-owned subsidiary, acquired in July 2010, the HIT invests exclusively in non-voting securities and has not deemed it necessary to adopt policies and procedures for the voting of portfolio securities. During the most recent twelve-month period ended June 30, 2010, the HIT held no voting securities in its portfolio and has reported this information in its most recent filing with the SEC on Form N-PX. This filing is available on the SEC’s website at http://www.sec.gov. Participants may also obtain a copy of the HIT’s report on Form N-PX, without charge, upon request, by calling the HIT collect at 202-331-8055.
| | Beginning | Ending | Expenses Paid During | |
| | Account Value | Account Value | Six-Month Period Ended | |
| | July 1, 2010 | December 31, 2010 | December 31, 2010* | |
| | | | | |
| Actual expenses | $ 1,000 | $ 1,013.20 | $ 2.23 | |
| | | | | |
| Hypothetical expenses (5% annual return before expenses) | $ 1,000 | $ 1,022.99 | $ 2.24 | |
*Expenses are equal to the HIT’s annualized expense ratio of 0.44%, as of December 31, 2010, multiplied by the average account value over the period, multiplied by 184/365 (to reflect the one-half year period).
A N N U A L R E P O R T 2 0 1 0 9
2010 PARTICIPANTS MEETING
The 2010 Meeting of Participants was held in Washington, D.C., on Tuesday, December 21, 2010. The following matters were put to a vote of the Participants at the meeting through the solicitation of proxies:
John J. Sweeney was elected to chair the Board of Trustees by: votes for 2,398,930.643; votes against 13,057.460; votes abstaining 94,632.090; votes not cast 844,418.435.
The table below details votes pertaining to Trustees who were elected at the meeting.
| Trustee | Votes For: | Votes Against: | Votes Abstaining: |
| | | | |
| Frank Hurt | 2,414,066.425 | 313.865 | 92,239.903 |
| | | | |
| Tony Stanley | 2,413,059.876 | 774.778 | 92,785.539 |
| | | |
| Votes not cast: 844,418.435 | | |
The following Trustees were not up for reelection and their terms of office continued after the meeting: Richard L. Trumka, Elizabeth Shuler, Arlene Holt Baker, Mark Ayers, James Boland, Lindell Lee, Stephen Frank, George Latimer, Richard Ravitch, Marlyn J. Spear, and Jack Quinn.
Ernst & Young LLP was ratified as the HIT’s Independent Registered Public Accounting Firm by: votes for 2,505,496.636; votes against 0.000; votes abstaining 1,123.557; votes not cast 844,418.435.
An amendment was approved to Section 3.3(d) of the Declaration of Trust to authorize the HIT to provide leverage loans in New Markets Tax Credit transactions in which the HIT’s wholly-owned community development entity, Building America CDE, Inc., is a participant; subject to a limit, which, when combined with investments currently permitted under Sections 3.3(d)(ii) and (d)(iii) of the Declaration of Trust, does not exceed four percent (4%) of the total value of the HIT’s assets by: votes for 2,471,304.243; votes against 12,282.682; votes abstaining 23,033.268; votes not cast 844,418.435.
10 A F L - C I O H O U S I N G I N V E S T M E N T T R U S T

Report of Independent Registered Public Accounting Firm
The Board of Trustees and Participants of American Federation of Labor and Congress of Industrial Organizations Housing Investment Trust:
We have audited the accompanying statement of assets and liabilities of American Federation of Labor and Congress of Industrial Organizations Housing Investment Trust (the Trust), including the schedule of portfolio investments, as of December 31, 2010, and the related statement of operations for the year then ended, the statements of changes in net assets for each of the two years in the period then ended, and the financial highlights for each of the five years in the period then ended. These financial statements and financial highlights are the responsibility of the Trust’s management. Our responsibility is to express an opinion on these financial statements and financial highlights based on our audits.
We conducted our audits in accordance with the standards of the Public Company Accounting Oversight Board (United States). Those standards require that we plan and perform the audit to obtain reasonable assurance about whether the financial statements and financial highlights are free of material misstatement. We were not engaged to perform an audit of the Fund’s internal control over financial reporting. Our audits included consideration of internal control over financial reporting as a basis for designing audit procedures that are appropriate in the circumstances, but not for the purpose of expressing an opinion on the effectiveness of the Trust’s internal control over financial reporting. Accordingly, we express no such opinion. An audit also includes examining, on a test basis, evidence supporting the amounts and disclosures in the financial statements and financial highlights, assessing the accounting principles used and significant estimates made by management, as well as evaluating the overall financial statement presentation. Our procedures included confirmation of securities owned as of December 31, 2010, by correspondence with the custodian and brokers. We believe that our audits provide a reasonable basis for our opinion.
In our opinion, the financial statements and financial highlights referred to above present fairly, in all material respects, the financial position of American Federation of Labor and Congress of Industrial Organizations Housing Investment Trust as of December 31, 2010, the results of its operations for the year then ended, the changes in its net assets for each of the two years in the period then ended, and the financial highlights for each of the five years in the period then ended, in conformity with U.S. generally accepted accounting principles.
McLean, Virginia
February 18, 2011
12 A F L - C I O H O U S I N G I N V E S T M E N T T R U S T
Statements of Assets and Liabilities
December 31, 2010 (Dollars in thousands, except per share data)
| Assets | | |
| Investments, at value (cost $3,500,588) | $ | 3,654,879 |
| Cash and cash equivalents | | 258,961 |
| Accrued interest receivable | | 15,717 |
| Receivables for investments sold | | 1,006 |
| Other assets | | 1,677 |
| Total assets | | 3,932,240 |
| | | |
| Liabilities | | |
| Payables for investments purchased | | 23,998 |
| Redemptions payable | | 13,231 |
| Income distribution payable, net of dividends reinvested of $11,882 | | 1,383 |
| Refundable deposits | | 413 |
| Accrued expenses | | 3,376 |
| Total liabilities | | 42,401 |
| | | |
| Net assets applicable to participants’ equity — | | |
| Certificates of participation — authorized unlimited; | | |
| Outstanding 3,430,737 units | $ | 3,889,839 |
| | | |
| Net asset value per unit of participation (in dollars) | $ | 1,133.82 |
| | | |
| Participants’ equity | | |
| Participants’ equity consisted of the following: | | |
| Amount invested and reinvested by current participants | $ | 3,746,396 |
| Net unrealized appreciation of investments | | 154,291 |
| Distribution in excess of net investment income | | (2,893) |
| Accumulated net realized losses | | (7,955) |
| Total participants’ equity | $ | 3,889,839 |
See accompanying Notes to Financial Statements.
A N N U A L R E P O R T 2 0 1 0 13
SCHEDULE OF PORTFOLIO INVESTMENTS December 31, 2010 (Dollars in thousands)
FHA Permanent Securities (3.4% of net assets)
| | Interest Rate | Maturity Date | Face Amount | Amortized Cost | | Value |
| Single Family | 7.75% | Jul-2021 | $ | 20 | $ | 20 | $ | 20 |
Multifamily1 | 5.25% | Mar-2024 | | 4,323 | | 4,325 | | 4,474 |
| | 5.35% | Mar-2047 | | 7,811 | | 7,821 | | 7,977 |
| | 5.55% | May-2042 | | 8,628 | | 8,625 | | 8,895 |
| | 5.60% | Jun-2038 | | 2,728 | | 2,727 | | 2,841 |
| | 5.62% | Jun-2014 | | 376 | | 374 | | 389 |
| | 5.65% | Oct-2038 | | 2,103 | | 2,157 | | 2,198 |
| | 5.87% | Jun-2044 | | 1,902 | | 1,901 | | 1,990 |
| | 5.89% | Apr-2038 | | 5,109 | | 5,123 | | 5,354 |
| | 6.02% | Jun-2035 | | 6,060 | | 6,049 | | 6,447 |
| | 6.40% | Aug-2046 | | 4,004 | | 4,003 | | 4,283 |
| | 6.60% | Jan-2040 | | 3,497 | | 3,541 | | 3,755 |
| | 6.66% | May-2040 | | 5,538 | | 5,527 | | 5,540 |
| | 6.70% | Dec-2042 | | 5,828 | | 5,814 | | 6,158 |
| | 6.75% | Apr-2040 - Jul-2040 | | 5,229 | | 5,197 | | 5,637 |
| | 6.88% | Apr-2031 | | 26,671 | | 26,350 | | 26,916 |
| | 7.05% | Jul-2043 | | 5,184 | | 5,184 | | 5,572 |
| | 7.13% | Mar-2040 | | 7,618 | | 7,575 | | 8,273 |
| | 7.20% | Nov-2033 - Oct-2039 | | 9,574 | | 9,547 | | 10,374 |
| | 7.50% | Sep-2032 | | 1,528 | | 1,522 | | 1,683 |
| | 7.75% | Oct-2038 | | 1,350 | | 1,340 | | 1,352 |
| | 7.93% | Apr-2042 | | 2,824 | | 2,824 | | 3,146 |
| | 8.15% | Mar-2037 | | 1,150 | | 1,250 | | 1,152 |
| | 8.27% | Jun-2042 | | 2,476 | | 2,476 | | 2,641 |
| | 8.40% | Apr-2012 | | 101 | | 101 | | 101 |
| | 8.75% | Aug-2036 | | 3,574 | | 3,560 | | 3,582 |
| | | | | 125,186 | | 124,913 | | 130,730 |
| Total FHA Permanent Securities | | | $ | 125,206 | $ | 124,933 | $ | 130,750 |
FHA Construction Securities (0.3% of net assets)
| | Interest Rates2 | | Commitment | | | | | | |
| | Permanent | Construction | Maturity Date | Amount | Face Amount | Amortized Cost | | Value |
Multifamily1 | 6.20% | 6.20% | Aug-2051 | $ | 11,900 | $ | 11,900 | $ | 11,895 | $ | 12,666 |
| Total FHA Construction Securities | | | $ | 11,900 | $ | 11,900 | $ | 11,895 | $ | 12,666 |
14 A F L - C I O H O U S I N G I N V E S T M E N T T R U S T
Ginnie Mae Securities (27.1% of net assets)
| | Interest Rate | Maturity Date | | Face Amount | | Amortized Cost | | Value | |
| Single Family | 4.00% | Feb-2040 - Jun-2040 | $ | 19,751 | $ | 20,100 | $ | 19,922 | |
| | 5.50% | Jan-2033 - Jun-2037 | | 17,474 | | 17,378 | | 18,938 | |
| | 6.00% | Jan-2032 - Aug-2037 | | 9,874 | | 9,877 | | 10,854 | |
| | 6.50% | Jul-2028 | | 120 | | 120 | | 136 | |
| | 7.00% | Nov-2016 - Jan-2030 | | 3,624 | | 3,666 | | 4,061 | |
| | 7.50% | Apr-2013 - Aug-2030 | | 2,786 | | 2,827 | | 3,099 | |
| | 8.00% | Jun-2023 - Nov-2030 | | 1,355 | | 1,386 | | 1,545 | |
| | 8.50% | Jun-2022 - Aug-2027 | | 1,291 | | 1,312 | | 1,464 | |
| | 9.00% | May-2016 - Jun-2025 | | 398 | | 405 | | 456 | |
| | 9.50% | Sep-2021 - Sep-2030 | | 149 | | 151 | | 172 | |
| | 10.00% | Jun-2019 | | 1 | | 1 | | 1 | |
| | 13.00% | Jul-2014 | | 1 | | 1 | | 1 | |
| | 13.25% | Dec-2014 | | 1 | | 1 | | 1 | |
| | | | | 56,825 | | 57,225 | | 60,650 | |
Multifamily1 | 3.31% | Nov-2037 | | 39,808 | | 41,710 | | 41,255 | |
| | 3.35% | Oct-2045 | | 3,891 | | 3,992 | | 3,770 | |
| | 3.49% | Mar-2042 | | 10,000 | | 10,053 | | 9,745 | |
| | 3.61% | Nov-2027 | | 4,833 | | 4,925 | | 4,923 | |
| | 3.65% | Oct-2027 | | 2,845 | | 2,773 | | 2,896 | |
| | 3.83% | Nov-2045 | | 28,074 | | 28,351 | | 28,316 | |
| | 4.22% | Nov-2035 | | 24,492 | | 25,180 | | 25,987 | |
| | 4.25% | Feb-2039 | | 3,560 | | 3,376 | | 3,727 | |
| | 4.25% | Sep-2034 | | 9,000 | | 9,297 | | 9,526 | |
| | 4.26% | Jul-2029 | | 3,000 | | 2,991 | | 3,137 | |
| | 4.43% | Apr-2034 - Jun-2034 | | 99,033 | | 97,252 | | 104,318 | |
| | 4.49% | Apr-2023 | | 5,643 | | 5,643 | | 5,702 | |
| | 4.63% | Sep-20373 | | 1,500 | | 1,456 | | 1,275 | |
| | 4.66% | Apr-2029 - Dec-2030 | | 20,160 | | 20,829 | | 21,236 | |
| | 4.68% | Aug-2032 | | 7,311 | | 7,284 | | 7,588 | |
| | 4.70% | Dec-2024 | | 9,341 | | 9,179 | | 9,701 | |
| | 4.71% | May-2025 | | 10,290 | | 10,274 | | 10,418 | |
| | 4.73% | Nov-2045 | | 3,000 | | 3,058 | | 3,126 | |
| | 4.76% | Apr-2045 | | 7,950 | | 8,299 | | 8,486 | |
| | 4.81% | Jan-2047 | | 5,834 | | 5,845 | | 6,143 | |
| | 4.82% | Oct-2029 | | 4,100 | | 4,329 | | 4,331 | |
| | 4.83% | May-20463 | | 5,390 | | 5,390 | | 4,641 | |
| | 4.88% | Mar-2036 | | 8,981 | | 8,862 | | 9,294 | |
| | 4.90% | Mar-20443 | | 1,000 | | 990 | | 870 | |
| | 4.92% | Feb-2034 - May-2034 | | 53,317 | | 53,087 | | 56,375 | |
| | 4.94% | Jun-20463 | | 3,855 | | 3,859 | | 3,655 | |
| | 4.99% | Mar-2030 - Feb-2037 | | 19,750 | | 20,727 | | 21,398 | |
| | 5.00% | Dec-2033 | | 4,937 | | 4,974 | | 4,945 | |
| | 5.01% | Mar-2038 | | 25,000 | | 26,116 | | 26,773 | |
| | 5.05% | Apr-20493 | | 2,930 | | 2,936 | | 2,599 | |
| | 5.14% | Jul-2024 | | 266 | | 265 | | 267 | |
| | 5.15% | Jun-2023 | | 30,020 | | 30,318 | | 31,572 | |
| | | | | | | | | |
| | | | | | | | | continued |
| |
A N N U A L R E P O R T 2 0 1 0 15
SCHEDULE OF PORTFOLIO INVESTMENTS December 31, 2010 (Dollars in thousands) |
| |
| |
| |
| | Ginnie Mae Securities (27.1% of net assets) continued |
| | |
| | |
| | Interest Rate | Maturity Date | Face Amount | Amortized Cost | | Value |
| | 5.17% | Sep-2045 | $ | 50,000 | $ | 53,487 | $ | 54,462 |
| 5.18% | May-2042 | | 2,165 | | 2,187 | | 2,311 |
| 5.19% | May-2045 | | 8,865 | | 8,648 | | 9,587 |
| 5.21% | Jan-2045 | | 5,498 | | 5,495 | | 5,859 |
| 5.25% | Feb-2031 | | 37,755 | | 37,645 | | 39,785 |
| 5.30% | Apr-2039 | | 48,404 | | 47,678 | | 51,734 |
| 5.32% | Aug-2030 | | 19,707 | | 19,631 | | 20,655 |
| 5.34% | Jul-2040 | | 18,000 | | 17,680 | | 19,100 |
| 5.38% | Apr-2025 | | 434 | | 442 | | 467 |
| 5.40% | Feb-2049 - Mar-2049 | | 13,611 | | 13,553 | | 14,712 |
| 5.45% | May-2042 | | 2,249 | | 2,318 | | 2,420 |
| 5.46% | Feb-2047 | | 3,045 | | 3,064 | | 3,274 |
| 5.49% | Aug-2027 | | 7,510 | | 7,919 | | 7,786 |
| 5.50% | Sep-2023 - Jul-2033 | | 26,939 | | 27,870 | | 27,913 |
| 5.55% | Mar-2045 | | 8,894 | | 8,888 | | 9,573 |
| 5.55% | May-20493 | | 10,590 | | 10,595 | | 9,265 |
| 5.58% | May-2031 - Oct-2031 | | 94,582 | | 94,877 | | 103,759 |
| 5.68% | Jul-2027 | | 15,152 | | 15,111 | | 16,143 |
| 5.70% | Mar-2037 - Feb-2043 | | 10,611 | | 11,294 | | 11,329 |
| 5.75% | Dec-2026 | | 3,497 | | 3,537 | | 3,785 |
| 5.85% | Nov-2045 | | 1,887 | | 1,889 | | 2,055 |
| 5.88% | Oct-2043 | | 5,470 | | 5,645 | | 5,970 |
| 6.00% | Jan-2046 | | 3,570 | | 3,572 | | 3,888 |
| 6.22% | Aug-2035 | | 14,001 | | 14,004 | | 15,407 |
| 6.25% | Feb-2034 | | 4,665 | | 4,921 | | 5,138 |
| 6.26% | Apr-2027 | | 10,000 | | 10,555 | | 10,960 |
| 7.75% | Aug-2035 | | 50,130 | | 49,871 | | 57,539 |
| | | | | 936,342 | | 945,996 | | 992,871 |
| | Total Ginnie Mae Securities | | $ | 993,167 | $ | 1,003,221 | $ | 1,053,521 |
16 A F L - C I O H O U S I N G I N V E S T M E N T T R U S T
Ginnie Mae Construction Securities (4.9% of net assets)
| | Interest Rates2 | | Commitment | | | | | | |
| | Permanent | Construction | Maturity Date | Amount | Face Amount | Amortized Cost | | Value |
Multifamily1 | 3.40% | 3.40% | Apr-2017 | $ | 2,250 | $ | 2,250 | $ | 2,250 | $ | 2,291 |
| | 4.49% | 8.25% | Jun-2052 | | 44,954 | | 2,380 | | 1,943 | | 1,383 |
| | 4.75% | 4.75% | Mar-20523 | | 32,463 | | 9,326 | | 9,344 | | 9,847 |
| | 4.80% | 4.80% | Feb-2052 | | 11,940 | | 7,495 | | 7,872 | | 8,068 |
| | 4.87% | 4.87% | Apr-2042 | | 100,000 | | 24,097 | | 24,977 | | 23,488 |
| | 4.90% | 6.50% | Oct-2051 | | 63,132 | | 36,614 | | 36,620 | | 39,903 |
| | 5.00% | 5.00% | Nov-2051 | | 13,543 | | 2,280 | | 2,551 | | 2,792 |
| | 5.10% | 7.00% | Dec-20503 | | 15,862 | | 1,616 | | 1,457 | | 2,055 |
| | 5.25% | 5.25% | Apr-2037 | | 19,750 | | 19,750 | | 19,750 | | 20,317 |
| | 5.35% | 6.75% | May-2051 | | 24,030 | | 20,318 | | 20,761 | | 22,246 |
| | 5.39% | 5.39% | Feb-2042 | | 26,094 | | 5,987 | | 6,515 | | 7,418 |
| | 5.68% | 4.80% | Dec-2050 | | 17,598 | | 16,088 | | 16,268 | | 16,897 |
| | 5.80% | 7.75% | Feb-2051 | | 25,805 | | 24,792 | | 24,800 | | 27,296 |
| | 6.15% | 6.15% | Nov-2039 | | 5,508 | | 5,150 | | 5,163 | | 5,794 |
| | | | | | 402,929 | | 178,143 | | 180,271 | | 189,795 |
Forward Commitments1 | 2.95% | -- | Aug-2017 | | 2,585 | | -- | | (84) | | (29) |
| | 4.86% | 4.86% | Jan-2053 | | 42,358 | | -- | | 424 | | (1,091) |
| | 5.21% | 4.95% | Mar-20533 | | 49,950 | | -- | | -- | | 1,175 |
| | | | | | 94,893 | | -- | | 340 | | 55 |
| Total Ginnie Mae Construction Securities | | | $ | 497,822 | $ | 178,143 | $ | 180,611 | $ | 189,850 |
Fannie Mae Securities (39.7% of net assets)
| | Interest Rate | Maturity Date | Commitment
Amount | Face Amount | Amortized Cost | | Value | |
| Single Family | 0.51%4 | Mar-2037 | $ | -- | $ | 3,438 | $ | 3,386 | $ | 3,410 |
| | 2.07%4 | Nov-2033 | | -- | | 6,220 | | 6,225 | | 6,420 | |
| | 2.36%4 | Aug-2033 | | -- | | 391 | | 390 | | 406 | |
| | 2.39%4 | Nov-2034 | | -- | | 3,886 | | 4,033 | | 4,064 | |
| | 2.41%4 | Sep-2035 | | -- | | 1,534 | | 1,527 | | 1,594 | |
| | 2.44%4 | May-2033 | | -- | | 1,468 | | 1,477 | | 1,525 | |
| | 2.50%4 | Apr-2034 | | -- | | 3,122 | | 3,239 | | 3,265 | |
| | 2.59%4 | Aug-2033 | | -- | | 2,209 | | 2,205 | | 2,308 | |
| | 2.60%4 | Aug-2033 | | -- | | 5,090 | | 5,078 | | 5,312 | |
| | 2.62%4 | Jul-2033 | | -- | | 1,295 | | 1,285 | | 1,354 | |
| | 2.66%4 | Jul-2033 | | -- | | 5,280 | | 5,308 | | 5,515 | |
| | 4.00% | Jul-2024 - Nov-2040 | | -- | | 128,181 | | 131,035 | | 128,703 | |
| | 4.50% | Jun-2018 - Aug-2040 | | -- | | 109,819 | | 112,626 | | 114,103 | |
| | 5.00% | Jul-2018 - Jul-2040 | | -- | | 88,625 | | 90,909 | | 93,452 | |
| | 5.50% | Jul-2017 - Jun-2038 | | -- | | 112,353 | | 113,514 | | 120,590 | |
| | 6.00% | Apr-2016 - Nov-2038 | | -- | | 82,750 | | 83,792 | | 90,163 | |
| | 6.50% | Nov-2016 - Jul-2036 | | -- | | 9,599 | | 9,912 | | 10,684 | |
| | 7.00% | Nov-2013 - May-2032 | | -- | | 3,587 | | 3,604 | | 4,012 | |
| | 7.50% | Nov-2016 - Sep-2031 | | -- | | 1,380 | | 1,360 | | 1,543 | |
| | 8.00% | Jun-2012 - May-2031 | | -- | | 385 | | 388 | | 415 | |
| | 8.50% | Jan-2012 - Apr-2031 | | -- | | 425 | | 426 | | 470 | |
| | 9.00% | Jan-2024 - May-2025 | | -- | | 139 | | 140 | | 159 | |
| | | | | -- | | 571,176 | | 581,859 | | 599,467 | |
| | | | | | | | | | | | |
| | | | | | | | | | | continued | |
A N N U A L R E P O R T 2 0 1 0 17
| SCHEDULE OF PORTFOLIO INVESTMENTS December 31, 2010 (Dollars in thousands) |
| |
| |
| | Fannie Mae Securities (39.7% of net assets) continued |
| | |
| | | | | | Commitment | | | | | | |
| | | Interest Rate | Maturity Date | | Amount | Face Amount | Amortized Cost | | Value |
| | Multifamily1 | 3.64%4 | Apr-2020 | $ | -- | | $ | 9,342 | $ | 9,347 | $ | 9,319 |
| | | 3.82% | Jul-2016 | | -- | | | 21,551 | | 21,647 | | 22,665 |
| | | 4.06% | Oct-2025 | | -- | | | 26,844 | | 27,200 | | 26,281 |
| | | 4.10% | Jun-2027 | | -- | | | 536 | | 527 | | 538 |
| | | 4.11%4 | Jun-2020 | | -- | | | 3,867 | | 3,876 | | 3,855 |
| | | 4.22% | Jul-2018 | | -- | | | 3,548 | | 3,417 | | 3,767 |
| | | 4.27% | Nov-2019 | | -- | | | 6,415 | | 6,465 | | 6,619 |
| | | 4.32% | Nov-2019 | | -- | | | 3,175 | | 3,218 | | 3,286 |
| | | 4.33% | Nov-2019 - Mar-2020 | | -- | | | 22,957 | | 23,084 | | 23,452 |
| | | 4.38% | Apr-2020 | | -- | | | 10,904 | | 11,107 | | 11,288 |
| | | 4.44% | May-2020 | | -- | | | 6,452 | | 6,536 | | 6,702 |
| | | 4.48% | Oct-2031 | | -- | | | 3,051 | | 3,050 | | 3,119 |
| | | 4.50% | Feb-2020 | | -- | | | 4,495 | | 4,550 | | 4,664 |
| | | 4.52% | Nov-2019 | | -- | | | 3,191 | | 3,229 | | 3,343 |
| | | 4.55% | Nov-2019 | | -- | | | 3,012 | | 3,058 | | 3,155 |
| | | 4.56% | Jul-2019 | | -- | | | 7,695 | | 7,707 | | 8,087 |
| | | 4.64% | Aug-2019 | | -- | | | 19,000 | | 19,456 | | 20,048 |
| | | 4.66% | Jul-2021 - Sep-2033 | | -- | | | 8,060 | | 8,132 | | 8,477 |
| | | 4.67% | Aug-2033 | | -- | | | 9,600 | | 9,579 | | 10,207 |
| | | 4.68% | Jul-2019 | | -- | | | 13,962 | | 14,092 | | 14,754 |
| | | 4.69% | Jan-2020 | | -- | | | 14,137 | | 14,186 | | 14,924 |
| | | 4.80% | Jun-2019 | | -- | | | 2,287 | | 2,317 | | 2,443 |
| | | 4.86% | May-2019 | | -- | | | 1,529 | | 1,557 | | 1,640 |
| | | 4.89% | Nov-2019 | | -- | | | 894 | | 935 | | 952 |
| | | 4.93% | Nov-2013 | | -- | | | 45,600 | | 45,470 | | 49,040 |
| | | 4.94% | Apr-2019 | | -- | | | 3,500 | | 3,574 | | 3,769 |
| | | 4.99% | Apr-2021 | | -- | | | 40,000 | | 40,004 | | 42,191 |
| | | 5.00% | Jun-2019 | | -- | | | 1,989 | | 2,033 | | 2,144 |
| | | 5.02% | Jun-2019 | | -- | | | 864 | | 867 | | 932 |
| | | 5.04% | Jun-2019 | | -- | | | 1,966 | | 2,032 | | 2,124 |
| | | 5.05% | Jun-2019 - Jul-2019 | | -- | | | 3,330 | | 3,438 | | 3,586 |
| | | 5.07% | Feb-2012 | | -- | | | 2,705 | | 2,801 | | 2,761 |
| | | 5.09% | Jun-2018 | | -- | | | 6,663 | | 6,883 | | 7,235 |
| | | 5.11% | Jul-2019 | | -- | | | 919 | | 927 | | 993 |
| | | 5.12% | Jul-2019 | | -- | | | 9,140 | | 9,258 | | 9,880 |
| | | 5.13% | Jul-2019 | | -- | | | 934 | | 943 | | 1,005 |
| | | 5.15% | Oct-2022 | | -- | | | 3,984 | | 3,993 | | 4,240 |
| | | 5.16% | Jan-2018 | | -- | �� | | 5,458 | | 5,379 | | 5,937 |
| | | 5.25% | Jan-2020 | | -- | | | 7,131 | | 7,141 | | 7,712 |
| | | 5.29% | Apr-2017 - May-2022 | | -- | | | 9,093 | | 9,079 | | 9,792 |
| | | 5.34% | Apr-2016 | | -- | | | 6,347 | | 6,322 | | 6,994 |
| | | 5.35% | Apr-2012 - Jun-2018 | | -- | | | 2,625 | | 2,633 | | 2,842 |
| | | 5.36% | Mar-2036 | | -- | | | 5,000 | | 5,008 | | 5,325 |
| | | 5.37% | Jun-2017 | | -- | | | 1,445 | | 1,545 | | 1,578 |
| | | 5.43% | Nov-2018 | | -- | | | 1,312 | | 1,307 | | 1,316 |
| | | 5.44% | Mar-2016 | | -- | | | 3,744 | | 3,762 | | 4,139 |
| | | 5.45% | May-2033 | | -- | | | 3,051 | | 3,078 | | 3,271 |
| | | 5.46% | Feb-2017 | | -- | | | 47,210 | | 47,506 | | 51,982 |
| | | 5.47% | Aug-2024 | | -- | | | 8,657 | | 8,799 | | 9,259 |
18 A F L - C I O H O U S I N G I N V E S T M E N T T R U S T continued
Fannie Mae Securities (39.7% of net assets) continued |
| |
| | | | Commitment | | | | | | |
| | Interest Rate | Maturity Date | | Amount | Face Amount | Amortized Cost | | Value |
| | 5.52% | Mar-2018 | $ | -- | $ | 603 | $ | 641 | $ | 664 |
| | 5.53% | Apr-2017 | | -- | | 64,889 | | 64,718 | | 71,684 |
| | 5.59% | May-2017 | | -- | | 7,170 | | 7,163 | | 7,956 |
| | 5.60% | Feb-2018 - Jan-2024 | | -- | | 12,026 | | 11,999 | | 12,976 |
| | 5.63% | Dec-2019 | | -- | | 11,300 | | 11,373 | | 12,429 |
| | 5.70% | Jun-2016 | | -- | | 1,414 | | 1,431 | | 1,576 |
| | 5.80% | Jun-2018 | | -- | | 71,140 | | 70,774 | | 78,931 |
| | 5.86% | Dec-2016 | | -- | | 282 | | 283 | | 312 |
| | 5.88% | Apr-2012 | | -- | | 1,245 | | 1,299 | | 1,291 |
| | 5.91% | Mar-2037 | | -- | | 2,093 | | 2,153 | | 2,256 |
| | 5.92% | Dec-2016 | | -- | | 270 | | 271 | | 299 |
| | 5.96% | Jan-2029 | | -- | | 447 | | 452 | | 488 |
| | 6.03% | Jun-2017 - Jun-2036 | | -- | | 5,614 | | 5,736 | | 6,194 |
| | 6.06% | Jul-2034 | | -- | | 10,080 | | 10,426 | | 10,985 |
| | 6.11% | Aug-2017 | | -- | | 6,862 | | 6,895 | | 7,684 |
| | 6.13% | Dec-2016 | | -- | | 3,532 | | 3,593 | | 3,963 |
| | 6.14% | Sep-2033 | | -- | | 308 | | 328 | | 338 |
| | 6.15% | Jan-2019 - Oct-2032 | | -- | | 41,468 | | 41,548 | | 45,984 |
| | 6.16% | Aug-2013 | | -- | | 2,132 | | 2,178 | | 2,139 |
| | 6.19% | Jul-2013 | | -- | | 5,000 | | 5,147 | | 5,271 |
| | 6.22% | Aug-2032 | | -- | | 1,796 | | 1,844 | | 1,979 |
| | 6.23% | Sep-2034 | | -- | | 1,470 | | 1,544 | | 1,608 |
| | 6.27% | Jan-2012 | | -- | | 2,009 | | 1,986 | | 2,051 |
| | 6.28% | Nov-2028 | | -- | | 3,160 | | 3,366 | | 3,483 |
| | 6.35% | Jun-2020 - Aug-2032 | | -- | | 14,036 | | 14,259 | | 15,245 |
| | 6.38% | Jul-2021 | | -- | | 5,692 | | 5,808 | | 6,311 |
| | 6.39% | Apr-2019 | | -- | | 974 | | 1,010 | | 1,089 |
| | 6.44% | Apr-2014 - Dec-2018 | | -- | | 44,358 | | 44,510 | | 49,775 |
| | 6.52% | May-2029 | | -- | | 5,580 | | 6,091 | | 6,200 |
| | 6.63% | Jun-2014 - Apr-2019 | | -- | | 4,115 | | 4,125 | | 4,537 |
| | 6.80% | Jul-2016 | | -- | | 612 | | 612 | | 687 |
| | 6.85% | Aug-2014 | | -- | | 43,028 | | 43,029 | | 48,598 |
| | 6.88% | Feb-2028 | | -- | | 4,600 | | 5,026 | | 4,992 |
| | 7.00% | Jun-2018 | | -- | | 3,140 | | 3,140 | | 3,482 |
| | 7.01% | Apr-2031 | | -- | | 3,320 | | 3,339 | | 3,736 |
| | 7.07% | Feb-2031 | | -- | | 16,725 | | 16,973 | | 18,850 |
| | 7.18% | Aug-2016 | | -- | | 386 | | 386 | | 437 |
| | 7.20% | Aug-2029 | | -- | | 8,357 | | 8,145 | | 9,264 |
| | 7.25% | Jul-2012 | | -- | | 6,982 | | 6,982 | | 7,083 |
| | 7.26% | Dec-2018 | | -- | | 10,392 | | 11,000 | | 11,784 |
| | 7.50% | Dec-2014 | | -- | | 1,070 | | 1,064 | | 1,192 |
| | 7.75% | Dec-2012 - Dec-2024 | | -- | | 2,165 | | 2,164 | | 2,427 |
| | 8.13% | Sep-2012 | | -- | | 737 | | 737 | | 747 |
| | 8.38% | Jan-2022 | | -- | | 817 | | 814 | | 820 |
| | 8.40% | Jul-2023 | | -- | | 460 | | 452 | | 521 |
| | 8.50% | Nov-2019 | | -- | | 3,387 | | 3,519 | | 4,015 |
| | 8.63% | Sep-2028 | | -- | | 6,370 | | 6,370 | | 7,237 |
| | | | | -- | | 872,784 | | 878,757 | | 945,202 |
Forward Commitments1 | 3.85% | Jan-2021 | | 90,000 | | -- | | (218) | | (1,272) |
| Total Fannie Mae Securities | | | $ | 90,000 | $ | 1,443,960 | $ | 1,460,398 | $ | 1,543,397 |
A N N U A L R E P O R T 2 0 1 0 19
SCHEDULE OF PORTFOLIO INVESTMENTS December 31, 2010 (Dollars in thousands)
Freddie Mac Securities (10.3% of net assets)
| | Interest Rate | Maturity Date | Face Amount | Amortized Cost | | Value |
| Single Family | 0.56%4 | Feb-2036 | $ | 9,365 | $ | 9,365 | $ | 9,389 |
| | 0.61%4 | Apr-2036 | | 6,097 | | 6,090 | | 6,067 |
| | 2.30%4 | Apr-2035 | | 480 | | 480 | | 497 |
| | 2.49%4 | Oct-2033 | | 3,132 | | 3,095 | | 3,269 |
| | 2.60%4 | Jun-2033 | | 1,282 | | 1,278 | | 1,339 |
| | 2.83%4 | Jul-2035 | | 1,037 | | 1,033 | | 1,091 |
| | 4.00% | Dec-2024 - Sep-2040 | | 62,755 | | 64,146 | | 63,184 |
| | 4.50% | Aug-2018 - Dec-2039 | | 27,706 | | 27,541 | | 28,758 |
| | 5.00% | Jan-2019 - Aug-2040 | | 58,898 | | 58,448 | | 61,991 |
| | 5.50% | Oct-2017 - Jul-2038 | | 85,060 | | 84,047 | | 90,774 |
| | 6.00% | Mar-2014 - Feb-2038 | | 46,603 | | 47,414 | | 50,727 |
| | 6.50% | Oct-2013 - Nov-2037 | | 20,001 | | 20,759 | | 22,118 |
| | 7.00% | Mar-2011 - Mar-2030 | | 443 | | 425 | | 482 |
| | 7.50% | Sep-2012 - Apr-2031 | | 419 | | 406 | | 465 |
| | 8.00% | Jul-2012 - Feb-2030 | | 145 | | 140 | | 156 |
| | 8.50% | Jun-2015 - Jan-2025 | | 230 | | 231 | | 262 |
| | 9.00% | Mar-2025 | | 112 | | 112 | | 128 |
| | | | | 323,765 | | 325,010 | | 340,697 |
Multifamily1 | 5.38% | Dec-2028 | | 20,000 | | 20,000 | | 20,161 |
| | 5.42% | Apr-2016 | | 10,000 | | 9,940 | | 11,038 |
| | 5.65% | Apr-2016 | | 8,227 | | 8,203 | | 9,072 |
| | | | | 38,227 | | 38,143 | | 40,271 |
TBA5 | 4.00% | Jan-2038 | | 20,000 | | 19,985 | | 19,888 |
| Total Freddie Mac Securities | | | $ | 381,992 | $ | 383,138 | $ | 400,856 |
Commercial Mortgage-Backed Securities1 (0.1% of net assets) | | |
| | | |
| | | |
| Issuer | Interest Rate | Maturity Date | Face Amount | Amortized Cost | | Value |
| Mizuho | 6.58% | Mar-2034 | $ | 5,100 | $ | 5,226 | $ | 5,116 |
| Total Commercial Mortgage-Backed Securities | | | $ | 5,100 | $ | 5,226 | $ | 5,116 |
20 A F L - C I O H O U S I N G I N V E S T M E N T T R U S T
State Housing Finance Agency Securities (4.1% of net assets)
| | | Interest Rates2 | | Commitment | | Face | Amortized | | |
| | Issuer | Permanent | Construction | Maturity Date | Amount | | Amount | | Cost | | Value |
Multifamily1 | NYC Housing Development Corp | 2.00% | -- | May-2045 | $ | -- | $ | 7,500 | $ | 7,500 | $ | 7,516 |
| | NYC Housing Development Corp | -- | 3.45% | May-2013 | | -- | | 9,500 | | 9,516 | | 9,513 |
| | NYC Housing Development Corp | 4.25% | -- | Nov-2025 | | -- | | 1,150 | | 1,150 | | 1,124 |
| | NYC Housing Development Corp | 4.40% | -- | Nov-2024 | | -- | | 4,120 | | 4,120 | | 4,024 |
| | MA Housing Finance Agency | 4.45% | -- | Dec-2011 | 6 | -- | | 30,240 | | 30,240 | | 30,248 |
| | NYC Housing Development Corp | 4.50% | -- | Nov-2030 | | -- | | 1,680 | | 1,682 | | 1,620 |
| | NYC Housing Development Corp | 4.60% | -- | Nov-2030 | | -- | | 4,665 | | 4,665 | | 4,494 |
| | NYC Housing Development Corp | 4.70% | -- | Nov-2035 | | -- | | 1,685 | | 1,685 | | 1,575 |
| | NYC Housing Development Corp | 4.80% | -- | Nov-2040 | | -- | | 2,860 | | 2,862 | | 2,717 |
| | NYC Housing Development Corp | 4.90% | -- | Nov-2034 - Nov-2041 | | -- | | 8,800 | | 8,800 | | 8,410 |
| | NYC Housing Development Corp | 4.95% | -- | Nov-2039 - May-2047 | | -- | | 13,680 | | 13,683 | | 12,800 |
| | NYC Housing Development Corp | 5.55% | -- | Nov-2039 | | -- | | 5,000 | | 4,979 | | 4,968 |
| | NYC Housing Development Corp | 5.69% | -- | Nov-2018 | | -- | | 6,605 | | 6,610 | | 6,778 |
| | MA Housing Finance Agency | 5.70% | -- | Jun-2040 | | -- | | 14,640 | | 14,642 | | 13,939 |
| | MA Housing Finance Agency | 5.92% | -- | Dec-2037 | | -- | | 6,475 | | 6,479 | | 6,056 |
| | NYC Housing Development Corp | 6.42% | -- | Nov-2039 | | -- | | 22,000 | | 22,000 | | 21,356 |
| | MA Housing Finance Agency | 6.50% | -- | Dec-2039 | | -- | | 745 | | 749 | | 674 |
| | MA Housing Finance Agency | 6.58% | -- | Dec-2039 | | -- | | 11,385 | | 11,386 | | 10,922 |
| | MA Housing Finance Agency | 6.70% | -- | Jun-2040 | | -- | | 11,955 | | 11,955 | | 10,892 |
| | | | | | | -- | | 164,685 | | 164,703 | | 159,626 |
Forward Commitments1 | MA Housing Finance Agency | -- | 3.85% | Dec-2012 | 6 | 13,500 | | 275 | | 275 | | 275 |
| | MA Housing Finance Agency | -- | 4.15% | Dec-2013 | 6 | 26,700 | | -- | | -- | | (121) |
| | | | | | | 40,200 | | 275 | | 275 | | 154 |
| Total State Housing Finance Agency Securities | | | | $ | 40,200 | $ 164,960 | $ 164,978 | $ 159,780 |
Other Multifamily Investments (0.4% of net assets)
Interest Rates2 | | Commitment | | | | | | |
| Permanent | Construction | Maturity Date | Amount | Face Amount | Amortized Cost | | Value |
Multifamily Construction/Permanent Mortgages1 | | | | | | | | | |
7.63%7 | -- | Jan-2011 | $ | 813 | $ | 39 | $ | 39 | $ | 39 |
| 8.63% | -- | Jun-2025 | | 1,469 | | 1,137 | | 1,133 | | 1,130 |
| | | | | 2,282 | | 1,176 | | 1,172 | | 1,169 |
Privately Insured Construction/Permanent Mortgages1,8 | | | | | | | | | |
| 5.40% | 5.40% | Mar-2047 | | 9,000 | | 8,736 | | 8,744 | | 7,354 |
| 5.73% | 5.73% | Aug-2047 | | 5,575 | | 5,442 | | 5,445 | | 4,635 |
| 6.20% | -- | Dec-2047 | | 3,325 | | 3,263 | | 3,281 | | 2,852 |
| 6.40% | 6.40% | Nov-2048 | | 993 | | 981 | | 997 | | 851 |
| | | | | 18,893 | | 18,422 | | 18,467 | | 15,692 |
| Total Other Multifamily Investments | | | $ | 21,175 | $ | 19,598 | $ | 19,639 | $ | 16,861 |
A N N U A L R E P O R T 2 0 1 0 21
| SCHEDULE OF PORTFOLIO INVESTMENTS December 31, 2010 (Dollars in thousands) |
| |
| |
United States Treasury Securities (3.7% of net assets)
|
| | | | | | |
| Interest Rate | Maturity Date | Face Amount | Amortized Cost | | Value |
| 1.88% | Jun-2015 | $ | 25,000 | $ | 25,092 | $ | 25,103 |
| 2.63% | Aug-2020 - Nov-2020 | | 70,000 | | 69,416 | | 66,299 |
| 3.50% | May-2020 | | 40,000 | | 41,235 | | 40,981 |
| 4.38% | May-2040 | | 10,000 | | 10,805 | | 10,050 |
| Total United States Treasury Securities | | $ | 145,000 | $ | 146,548 | $ | 142,433 |
| | | | | | | | |
| Total Fixed-Income Investments | | $ | 3,469,026 | $ | 3,500,587 | $ | 3,655,230 |
Equity Investment in Wholly-Owned Subsidiary (0.0% of net assets)
| | | | Face Amount | Amount of Dividends | | |
| | Issuer | Number of Shares | (Cost) | | or Interest | | Value |
| | Building America CDE, Inc.9 | 1,000 | $ | 1 | $ | -- | $ | (351) |
| | Total Equity Investment | 1,000 | $ | 1 | $ | -- | $ | (351) |
| | | | | | | | | |
| | | | | | | | | |
| | | | | | | | | |
| | | | | | | | | |
| | | | | | | | | |
| | | | Face Amount | Amortized Cost | | Value |
| | Total Fixed-Income and Equity Investments | $ | 3,469,027 | $ | 3,500,588 | $ | 3,654,879 |
| 1 | Valued by the HIT’s management in accordance with the fair value procedures adopted by the HIT’s Board of Trustees. |
| Construction interest rates are the rates charged to the borrower during the construction phase of the project. The permanent interest rates are charged to the borrower during the amortization period of the loan, unless the U.S. Department of Housing and Urban Development requires that such rates be charged earlier. |
| 3 | Tax-exempt bonds collateralized by Ginnie Mae securities. |
| 4 | The coupon rate shown on floating or adjustable rate securities represents the rate at period end. |
| 5 | Represents to be announced (TBA) securities: the particular securities to be delivered are not identified at the trade date. However, delivered securities must meet specified terms, including issuer, rate, and mortgage term, and be within industry-accepted “good delivery” standards. Until settlement, the HIT maintains cash reserves and liquid assets sufficient to settle its TBA commitments. |
| 6 | Securities exempt from registration under the Securities Act of 1933. The construction notes were privately placed directly by MassHousing with the HIT. The notes are for construction only and will mature on or prior to December 1, 2013. The notes are general obligations of MassHousing and are secured by the full faith and credit of MassHousing. These securities may be resold in transactions exempt from the registration requirements of the Securities Act of 1933, normally to qualified institutional buyers. These securities are considered liquid, under procedures established by and under the general supervision of the HIT’s Board of Trustees. |
| 7 | Non-income producing security; security is delinquent. |
| 8 | Loans insured by Ambac Assurance Corporation, which are additionally backed by repurchase option from the mortgagee for the benefit of the HIT. The repurchase option can be exercised by the HIT in the event of a payment failure by Ambac Assurance Corporation. |
| 9 | In July 2010 the HIT acquired the shares of Building America CDE, Inc. (BACDE), a wholly-owned subsidiary of the HIT formed to facilitate potential investments principally through New Markets Tax Credit transactions. The fair value, determined in good faith under consistently applied procedures adopted by the HIT’s Board of Trustees, currently represents the net asset value of BACDE. This security is considered illiquid. |
See accompanying Notes to Financial Statements.
22 A F L - C I O H O U S I N G I N V E S T M E N T T R U S T
| Statement of Operations | | |
| For the Year Ended December 31, 2010 (Dollars in thousands) | | |
| | | | |
| Investment income | | $ | 173,162 |
| | | | |
| Expenses | | | |
| | Non-officer salaries and fringe benefits | | 7,817 |
| | Officer salaries and fringe benefits | | 3,874 |
| | Legal fees | | 425 |
| | Consulting fees | | 444 |
| | Auditing, tax and accounting fees | | 353 |
| | Insurance | | 325 |
| | Marketing and sales promotion (12b-1) | | 406 |
| | Investment management | | 730 |
| | Trustee expenses | | 45 |
| | Rental expenses | | 947 |
| | General expenses | | 1,356 |
| Total expenses | | | 16,722 |
| | | | |
| Net investment income | | | 156,440 |
| | Net realized gain on investments | | 13,686 |
| | Net unrealized appreciation investments | | 53,641 |
| Net realized and unrealized gain on investments | | 67,327 |
| | | | |
| Net increase in net assets from operations | | $ | 223,767 |
See accompanying Notes to Financial Statements.
A N N U A L R E P O R T 2 0 1 0 23
| Statements of Changes in Net Assets | | | | |
| | | | | |
| For the Years Ended December 31, 2010 and 2009 (Dollars in thousands) | | | | |
| | | | | |
| | | | | |
| Increase in net assets from operations | | 2010 | | 2009 |
| Net investment income | $ | 156,440 | $ | 161,840 |
| Net realized gain (loss) on investments | | 13,686 | | (5,104) |
| Net unrealized appreciation on investments | | 53,641 | | 58,692 |
| Net increase in net assets resulting from operations | | 223,767 | | 215,428 |
| | | | | |
| Decrease in net assets from distributions | | | | |
| Distributions to participants or reinvested from: | | | | |
| Net investment income | | (161,898) | | (164,753) |
| Net decrease in net assets from distributions | | (161,898) | | (164,753) |
| | | | | |
| Increase (decrease) in net assets from unit transactions | | | | |
| Proceeds from the sale of units of participation | | 166,042 | | 213,962 |
| Dividend reinvestment of units of participation | | 144,935 | | 147,839 |
| Payments for redemption of units of participation | | (106,444) | | (256,642) |
| Net increase from unit transactions | | 204,533 | | 105,159 |
| Total increase in net assets | | 266,402 | | 155,834 |
| Net assets | | | | |
| Beginning of period | $ | 3,623,437 | $ | 3,467,603 |
| End of period | $ | 3,889,839 | $ | 3,623,437 |
| | | | | |
| Distribution in excess of net investment income | $ | (2,893) | $ | (2,928) |
| | | | | |
| Unit information | | | | |
| Units sold | | 146,163 | | 191,963 |
| Distributions reinvested | | 126,833 | | 132,600 |
| Units redeemed | | (92,808) | | (230,734) |
| Increase in units outstanding | | 180,188 | | 93,829 |
See accompanying Notes to Financial Statements.
24 A F L - C I O H O U S I N G I N V E S T M E N T T R U S T
Notes to Financial Statements
Note 1. Summary of Significant Accounting Policies
The American Federation of Labor and Congress of Industrial Organizations (AFL-CIO) Housing Investment Trust (HIT) is a common law trust created under the laws of the District of Columbia and is registered under the Investment Company Act of 1940, as amended (the Investment Company Act), as a no-load, open-end investment company. The HIT has obtained certain exemptions from the requirements of the Investment Company Act that are described in the HIT’s Prospectus and Statement of Additional Information.
In July 2010, the HIT acquired the shares of Building America CDE, Inc. (BACDE), a wholly-owned subsidiary of the HIT formed to generate potential investments, principally through New Markets Tax Credit transactions.
Participation in the HIT is limited to pension plans and eligible labor organizations, including health and welfare, annuity, general and other funds, that have beneficiaries who are represented by labor organizations.
The following is a summary of significant accounting policies followed by the HIT in the preparation of its financial statements. The policies are in conformity with generally accepted accounting principles (GAAP) in the United States.
INVESTMENT VALUATION
Net asset value per share (NAV) is calculated as of the close of business of the major bond markets in New York City on the last business day of the month. A description of the valuation techniques applied to the HIT’s major categories of assets and liabilities measured at fair value on a recurring basis follows.
Portfolio securities for which market quotations are readily available (U.S. Treasury securities, government-sponsored enterprise debt securities, single family mortgage-backed securities, and state housing finance agency securities) are valued by using independent pricing services, published prices, market quotes and bids from dealers who make markets in such securities. For U.S. Treasury securities, pricing services generally base prices on actual transactions as well as dealer supplied prices. For government-sponsored enterprise securities and single family mortgage-backed securities, pricing services generally base prices on discounted cash flow models and examine reference data such as issue name, issue size, ratings, maturity, call type, spread/benchmark yields and conditional prepayment rates, as well as, dealer supplied prices. For state housing finance agency securities, pricing services generally base prices on trading spreads, new issue scales, verified bid information, and credit ratings.
Portfolio investments for which market quotations are not readily available (multifamily mortgage-backed securities, mortgage securities, and construction mortgage securities and loans) are valued at their fair value determined in good faith under consistently applied procedures adopted by the Board of Trustees using dealer quotes and discounted cash flow models. The respective cash flow models utilize inputs from matrix pricing which considers market-based discount and prepayment rates, attributes of the collateral, and yield or price of bonds of comparable quality, coupon, maturity and type. The market-based discount rate is composed of a risk-free yield (i.e., a U.S. Treasury note) adjusted for an appropriate risk premium. The risk premium reflects premiums in the marketplace over the yield on U.S. Treasury securities of comparable risk and average life to the security being valued as adjusted for other market considerations, such as: significant market or security specific events, changes in interest rates and credit quality. On investments for which the HIT finances the construction and permanent securities or participation interests, value is determined based upon the total amount, funded and/or unfunded, of the commitment. Commercial mortgage-backed securities and real estate mortgage investment conduits are valued by using a dealer quote. The HIT has also retained an independent firm to determine the fair market value of securities for which market quotations are not readily available. In accordance with the procedures adopted by the HIT’s Board of Trustees, the monthly third-party valuation is reviewed by the HIT staff to determine whether valuation adjustments are appropriate based on any material impairments in value arising from specific facts and circumstances of the investment (e.g., prepayment speed). All such adjustments must be reviewed and reconciled with the independent valuation firm prior to incorporation in the NAV.
The shares of BACDE are valued at their fair value determined in good faith under consistently applied procedures adopted by the HIT’s Board of Trustees, which currently represents the net asset value of BACDE.
Short-term investments with remaining maturities of sixty days or less are valued at amortized cost, which approximates value. Cash and cash equivalents include overnight money market funds, which are also carried at cost.
GAAP establishes a disclosure hierarchy that categorizes the inputs to valuation techniques used to value assets and liabilities at measurement date. The HIT classifies its assets and liabilities into three levels based on the method used to value the assets or liabilities. Level 1 values are based on quoted prices in active markets for identical securities. Level 2 values are based on significant observable market inputs, such as quoted prices for similar securities, interest rates, prepayment speeds, credit risk and quoted prices in inactive markets. Level 3 values are based on significant unobservable inputs that reflect the HIT’s determination of assumptions that market participants might reasonably use in valuing the securities.
A N N U A L R E P O R T 2 0 1 0 25
NOTES TO FINANCIAL STATEMENTS
The following table presents the HIT’s valuation levels as of December 31, 2010:
| Investment securities: | | | | | | | | |
| ($ in thousands) | Level 1 | | | Level 2 | Level 3 | | Total |
| FHA Permanent Securities | $ | - | $ | 130,730 | $ | 20 | | $ 130,750 |
| FHA Construction Securities | | - | | 12,666 | | - | | 12,666 |
| Ginnie Mae Securities | | - | | 1,053,521 | | - | | 1,053,521 |
| Ginnie Mae Construction Securities | | - | | 189,795 | | - | | 189,795 |
| Fannie Mae Securities | | - | | 1,544,669 | | - | | 1,544,669 |
| Freddie Mac Securities | | - | | 400,856 | | - | | 400,856 |
| Commercial Mortgage-Backed Securities | | - | | 5,116 | | - | | 5,116 |
| State Housing Finance Agency Securities | | - | | 159,626 | | - | | 159,626 |
| Other Multifamily Investments | | - | | 16,861 | | - | | 16,861 |
| United States Treasury Securities | | - | | 142,433 | | - | | 142,433 |
| Equity Investments | | - | | - | | (351) | | (351) |
| Other Financial Instruments* | | - | | (1,063) | | - | | (1,063) |
| Total | $ | - | $ | 3,655,210 | $ | (331) | $ 3,654,879 |
*Other financial instruments include forward commitments.
The following table reconciles the valuation of the HIT’s Level 3 investment securities and related transactions for the year ended December 31, 2010.
| | | Investments in Securities ($ in thousands) | | |
| ($ in thousands) | FHA Permanent | Ginnie Mae | Equity Investment | | Total |
| Beginning Balance, 12/31/2009 | $ | 22 | $ | 53,293 | $ | - | $ | 53,315 |
| Total Unrealized Gain (Loss) * | | - | | 4,879 | | (351) | | 4,528 |
| Amortization/Accretion | | (2) | | (633) | | - | | (635) |
| Transfers in/out of Level 3 | | - | | (57,539) | | - | | (57,539) |
| Ending Balance, 12/31/2010 | $ | 20 | $ | - | $ | (351) | $ | (331) |
* Net change in unrealized loss attributable to Level 3 securities held at December 31, 2010, totaled $351,000 and is included on the accompanying Statement of Operations.
Level 3 investments in securities are not considered a significant portion of the HIT’s portfolio. The HIT’s policy is to recognize transfers between levels at the end of the reporting period. Securities were transferred out of level 3 due to the removal of management’s qualitative assessment as a result of improved asset fundamentals, including the issuance of a Certificate of Occupancy by the New York City Building Department, which is a prerequisite to final endorsement by the United States Department of Housing and Urban Development.
USE OF ESTIMATES
The preparation of financial statements in conformity with GAAP requires management to make estimates and assumptions that affect the reported amounts of assets and liabilities at the date of the financial statements and the reported amounts of revenues and expenses during the period. Actual results could differ from those estimates.
FEDERAL INCOME TAXES
The HIT’s policy is to comply with the requirements of the Internal Revenue Code of 1986, as amended (the Internal Revenue Code), that are applicable to regulated investment companies and to distribute all of its taxable income to its participants. Therefore, no federal income tax provision is required.
Tax positions taken or expected to be taken in the course of preparing the HIT’s tax returns are evaluated to determine whether the tax positions are “more-likely-than-not” of being sustained by the applicable tax authority. Tax positions not deemed to meet the more-likely-than-not threshold would be recorded as a tax benefit or expense in the current year. Management has analyzed the HIT’s tax positions taken on federal income tax returns and has concluded that no provision for income tax is required in the HIT’s financial statements.
The HIT files U.S. federal, state, and local tax returns as required. The HIT’s tax returns are subject to examination by the relevant tax authorities until the expiration of the applicable statutes of limitations, which is generally three years after the filing of the tax return but could be longer in certain circumstances.
DISTRIBUTIONS TO PARTICIPANTS
At the end of each calendar month, a pro rata distribution is made to participants of the net investment income earned during the month. This pro-rata distribution is based on the participant’s number of units held as of the immediately preceding month-end and excludes realized gains (losses) which are distributed at year-end.
Participants redeeming their investments are paid their pro rata share of undistributed net income accrued through the month-end of the month in which they redeem.
The HIT offers an income reinvestment plan that permits current participants automatically to reinvest their income distributions into HIT units of participation. Total reinvestment was approximately 90 percent of distributable income for the year ended December 31, 2010.
INVESTMENT TRANSACTIONS AND INCOME
For financial reporting purposes, security transactions are accounted for as of the trade date. Gains and losses on securities sold are determined on the basis of amortized cost. Realized gains (losses) on paydowns of mortgage- and asset-backed securities are classified as interest income. Interest income, which includes amortization of premium and accretion of discount on debt securities, is accrued as earned.
26 A F L - C I O H O U S I N G I N V E S T M E N T T R U S T
12B-1 PLAN OF DISTRIBUTION
The HIT’s Board of Trustees annually considers a 12b-1 Plan of Distribution to pay for marketing and sales promotion expenses incurred in connection with the offer and sale of units and related distribution activities (12b- 1 expenses). For the year 2010, the HIT was authorized to pay 12b -1 expenses in an amount up to $600,000 or 0.05 percent of its average monthly net assets on an annualized basis, whichever is greater. During the year ended December 31, 2010, the HIT incurred approximately $406,300 of 12b-1 expenses.
Note 2. Investment Risks
INTEREST RATE RISK
As with any fixed-income investment, the market value of the HIT’s investments will fall below the principal amount of those investments at times when market interest rates rise above the interest rates of the investments. Rising interest rates may also reduce prepayment rates, causing the average life of the HIT’s investments to increase. This could in turn further reduce the value of the HIT’s portfolio.
PREPAYMENT AND EXTENSION RISK
The HIT invests in certain fixed-income securities whose value is derived from an underlying pool of mortgage loans that are subject to prepayment and extension risk.
Prepayment risk is the risk that a security will pay more quickly than its assumed payment rate, shortening its expected average life, resulting in a lower return from the security. In such an event, the HIT may be required to reinvest the proceeds of such prepayments in other investments bearing lower interest rates. The majority of the HIT’s securities backed by loans for multifamily projects include restrictions on prepayments for specified periods to mitigate this risk.
Extension risk is the risk that a security will pay more slowly than its assumed payment rate, extending its expected average life, resulting in a lower return from the security. When this occurs, the HIT’s ability to reinvest principal repayments in higher returning investments may be limited.
These two risks may increase the sensitivity of the HIT’s portfolio to fluctuations in interest rates and negatively affect the value of the HIT’s portfolio.
Note 3. Transactions with Related Entities
During the year ended December 31, 2010, the HIT provided the time of certain personnel to the AFL-CIO Investment Trust Corporation (ITC), a District of Columbia not-for-profit corporation, on a cost-reimbursement basis. During the period, an employee of the HIT also served as an officer of the ITC. The total cost for such personnel and related expenses for the year ended December 31, 2010, amounted to approximately $183,800. During the year ended December 31, 2010, the HIT was reimbursed for approximately $149,000 of current year costs. As of December 31, 2010, approximately $34,800 is included within the accounts receivable in the accompanying financial statements for amounts outstanding under the arrangement.
The ITC provided the time of certain personnel to the HIT on a cost-reimbursement basis. The total cost for such personnel and related expenses for the year ended December 31, 2010, was approximately $45,300. During the year ended December 31, 2010, the HIT paid the ITC approximately $45,300 of current costs.
In addition, during the year ended December 31, 2010, the HIT advanced approximately $331,000 to BACDE.
Note 4. Commitments
Certain assets of the HIT are invested in short-term investments until they are required to fund purchase commitments for long-term investments. As of December 31, 2010, the HIT had outstanding unfunded purchase commitments of approximately $451.8 million. The HIT maintains a reserve, in the form of securities, of no less than the total of the outstanding unfunded purchase commitments, less short-term investments. As of December 31, 2010, the value of the publicly traded mortgage-backed securities maintained for the reserve in a segregated account was approximately $3.47 billion.
The commitment amounts disclosed on the Schedule of Portfolio Investments represent the original commitment amount, which includes both funded and unfunded commitments.
A N N U A L R E P O R T 2 0 1 0 27
NOTES TO FINANCIAL STATEMENTS
Note 5. Investment Transactions
Purchases and sales of investments, excluding short-term securities and U.S. Treasury securities, for the year ended December 31, 2010, were $1,221.1 million and $586.5 million, respectively.
Note 6. Distributions
No provision for federal income taxes is required since the HIT intends to continue to qualify as a regulated investment company under Subchapter M of the Internal Revenue Code and distribute to shareholders all of its taxable income and gains. Federal income tax regulations differ from U.S. generally accepted accounting principles; therefore, distributions determined in accordance with tax regulations may differ in amount or character from net investment income and realized gains for financial reporting purposes. Financial reporting records are adjusted for permanent book/tax differences to reflect tax character.
The tax character of distributions paid during 2010 and 2009 was as follows (dollars in thousands):
| | 2010 | 2009 |
| Ordinary investment income | $161,898 | $164,753 |
| Total distributions paid to participants or reinvested | $161,898 | $164,753 |
As of December 31, 2010, the components of accumulated earnings on a tax basis were as follows (dollars in thousands):
| | 2010 |
| Accumulated capital loss carryforward | $ | (7,094) |
| Unrealized appreciation | | 153,432 |
| Other temporary differences | | (2,893) |
| Total accumulated earnings | $143,445 |
The differences between book basis and tax basis components of net assets are primarily attributable to tax deferral of losses on wash sales and tax treatment of deferred compensation plans.
In 2010 the HIT utilized $8,256,000 of accumulated capital loss carryforward from prior years to offset current year capital gains. The unused total accumulated capital loss carryforward of $7,094,000 may be used to offset future capital gain recognized by the HIT through December 31, 2017.
For financial reporting purposes, capital accounts are adjusted to reflect the tax character of permanent book/tax differences. These reclassifications are primarily due to the different book and tax treatment of paydowns and distributions. Results of operations and net assets were not affected by these reclassifications.
For the year ended December 31, 2010, the HIT recorded the following permanent reclassifications (dollars in thousands):
| | 2010 |
| Accumulated net investment loss | $5,492 |
| Accumulated net realized losses | (5,458) |
| Amount invested and reinvested by current participants | (34) |
At December 31, 2010, the cost of investments for federal income tax purposes approximated book cost at amortized cost of $3,501,447,000. Net unrealized gain aggregated $153,432,000 at period-end, of which $182,017,000 related to appreciated investments and $28,585,000 related to depreciated investments.
Note 7. Retirement and Deferred Compensation Plans
The HIT participates in the AFL-CIO Staff Retirement Plan, which is a multiple employer defined benefit pension plan, covering substantially all employees. This plan was funded by employer contributions, at rates approximating 26 percent of employees’ salaries for the year ended December 31, 2010. The total HIT pension expense for the year ended December 31, 2010, was approximately $1,792,200.
The HIT also participates in a deferred compensation plan, referred to as a 401(k) plan, covering substantially all employees. This plan permits employees to defer the lesser of 100 percent of their total compensation or the applicable IRS limit. During 2010, the HIT matched dollar for dollar the first $4,600 of each employee’s contributions. The HIT’s 401(k) contribution for the year ended December 31, 2010, was approximately $236,000.
Note 8. Loan Facility
The HIT has a $15 million uncommitted loan facility which expired on January 29, 2011. This facility was subsequently extended to February 27, 2011. Under this facility, borrowings bear interest per annum as offered by the lender. The HIT had no outstanding balance under the facility for the year ended December 31, 2010. No compensating balances are required.
Note 9. Contract Obligations
In the ordinary course of business, the HIT enters into contracts that contain a variety of indemnifications. The HIT’s maximum exposure under these arrangements is unknown. However, the HIT has not had prior claims or losses pursuant to these contracts and expects the risk of loss to be low.
28 A F L - C I O H O U S I N G I N V E S T M E N T T R U S T
| | | | | | | | | | | |
| | | | | | | | | | | | |
| Selected Per Data and Ratios for the Years Ended December 31 (Dollars in thousands) | | | | | | | |
| | | | | | | | | | |
| Per share data | | 2010 | | 2009 | | 2008 | | 2007 | | 2006 | |
| Net asset value, beginning of period | $ | 1,114.72 | $ | 1,098.48 | $ | 1,097.01 | $ | 1,081.27 | $ | 1,086.97 | |
| | | | | | | | | | | | |
| | | | | | | | | | | | |
| Income from investment operations: | | | | | | | | | | | |
| Net investment income | | 47.27* | | 50.68* | | 53.64* | | 52.72 | | 53.55 | |
| Net realized and unrealized gains (losses) on investments | | 20.75 | | 17.15 | | 1.91 | | 17.54 | | (4.60) | |
| Total income from investment operations | | 68.02 | | 67.83 | | 55.55 | | 70.26 | | 48.95 | |
| Less distributions from: | | | | | | | | | | | |
| Net investment income | | (48.92) | | (51.59) | | (54.08) | | (54.52) | | (54.65) | |
| Net realized gains on investments | | -- | | -- | | -- | | -- | | -- | |
| Total distributions | | (48.92) | | (51.59) | | (54.08) | | (54.52) | | (54.65) | |
| | | | | | | | | | | | |
| Net asset value, end of period | $ | 1,133.82 | $ | 1,114.72 | $ | 1,098.48 | $ | 1,097.01 | $ | 1,081.27 | |
| |
| |
| | |
| Ratios/supplemental data | | | | | | | | | | | |
| Ratio of expenses to average net assets | | 0.44% | | 0.43% | | 0.41% | | 0.41% | | 0.41% | |
| Ratio of net investment income to average net assets | | 4.1% | | 4.5% | | 5.0% | | 5.0% | | 5.0% | |
| Portfolio turnover rate | | 42.2% | | 28.5% | | 23.8% | | 42.1% | | 65.0% | |
| | | | | | | | | | | | |
| Number of outstanding units at end of period | | 3,430,737 | | 3,250,549 | | 3,156,720 | | 3,388,107 | | 3,334,684 | |
| | | | | | | | | |
| Net assets, end of period (in thousands) | $ 3,889,839 | $ 3,623,437 | $ 3,467,603 | $ | 3,716,773 | $ | 3,605,679 | |
| | | | | | | | | | | | |
| Total return | | 6.16% | | 6.28% | | 5.25% | | 6.70% | | 4.65% | |
*The average shares outstanding method has been applied for this per share information.
See accompanying Notes to Financial Statements.
A N N U A L R E P O R T 2 0 1 0 29
Overall responsibility for the management of the HIT, the establishment of policies and the oversight of activities is vested in its Board of Trustees. The list below provides the following information for each of the Trustees: name, age, address, term of office, length of time served, principal occupations during the past five years and other directorships held.* The HIT’s Statement of Additional Information includes additional information about the Trustees and is available, without charge, upon request, by placing a collect call to the HIT’s Investor Relations Office at (202) 331-8055, or by viewing the HIT’s website at www.aflcio-hit.com.
John J. Sweeney,** age 77; 815 16th Street, NW, Washington, DC 20006; Chairman of the Board; service commenced 1981, expires 2011; President Emeritus, AFL-CIO; formerly President, AFL-CIO; formerly Chairman, AFL-CIO Staff Retirement Plan.
Richard L. Trumka,** age 61; 815 16th Street, NW, Washington, DC 20006; Union Trustee; service commenced 1995, expires 2011; President, AFL-CIO; Chairman, AFL-CIO Staff Retirement Plan; formerly Secretary-Treasurer, AFL-CIO.
Liz Shuler, age 40; 815 16th Street, NW, Washington, DC 20006; Union Trustee; service commenced 2009, expires 2012; Secretary-Treasurer, AFL-CIO; Trustee, AFL-CIO Staff Retirement Plan; formerly Executive Assistant to the President, IBEW.
Arlene Holt Baker, age 60; 815 16th Street, NW, Washington, DC 20006; Union Trustee; service commenced 2008, expires 2011; Executive Vice President, AFL-CIO; Trustee, AFL-CIO Staff Retirement Plan; formerly President, Voices for Working Families and Executive Assistant to the President, AFL-CIO.
Mark Ayers, age 62; 815 16th Street, NW, Suite 600, Washington, DC 20006; Union Trustee; service commenced 2008, expires 2012; President, Building and Construction Trades Department, AFL-CIO; Trustee and Secretary-Treasurer of ULLICO; formerly Director, IBEW Construction & Maintenance Division.
James Boland, age 60; 620 F Street, N.W., Suite 700, Washington, DC, 20004; Union Trustee; service commenced 2010, expires 2012; President, International Union of Bricklayers and Allied Craftworkers (BAC); Co-Chair, International Masonry Institute; Co-Chair, International Trowel Trades Pension Fund and International Health Fund; Executive Member, BAC Staff Health Plan; Trustee, BAC Local Union Officers and Employees Pension Fund and BAC Salaried Employees Pension Fund; President, Trowel Trades Industry Insurance Company; formerly Executive Vice President and Secretary Treasurer, BAC.
Frank Hurt, age 72; 10401 Connecticut Avenue, Kensington, MD 20895; Union Trustee; service commenced 1993, expires 2013; International President, Bakery, Confectionery & Tobacco Workers and Grain Millers International Union; Chairman, Bakery & Confectionery Union Industry Pension and Health Benefits Fund.
Stephen Frank, age 70; 8584 Via Avellino, Lake Worth, FL 33467; Management Trustee; service commenced 2003, expires 2012; retired; formerly Vice President and Chief Financial Officer, The Small Business Funding Corporation.
George Latimer, age 75; 1600 Grand Avenue, St. Paul, MN 55105; Management Trustee; service commenced 1996, expires 2011; Adjunct Professor of Urban Studies and Geography, Macalester College; formerly Director, Special Actions Office, Department of Housing and Urban Development; Mayor, City of St. Paul, Minnesota; labor arbitrator.
Lindell K. Lee, age 64; 900 7th Street, NW, Washington, DC 20001; Union Trustee; service commenced 2008, expires 2011; International Secretary-Treasurer, International Brotherhood of Electrical Workers (IBEW); formerly International Vice President, IBEW.
Jack Quinn, age 59; 121 Ellicott Street, Buffalo, NY 14203; Management Trustee; service commenced 2005, expires 2011; President, Erie County Community College; formerly President, Cassidy & Associates; Member of Congress, 27th District, New York.
Richard Ravitch,** age 77; 610 5th Avenue, Ste. 420, New York, NY 10020; Management Trustee; service commenced 1991, expires 2012; Principal, Ravitch Rice & Co. LLC; former Lieutenant Governor, State of New York; formerly Director, Parsons, Brinckerhoff Inc.; Co-Chair, Millennial Housing Commission; President and Chief Executive Officer, Player Relations Committee of Major League Baseball.
Kenneth E. Rigmaiden, age 56; 7234 Parkway Drive, Hanover, MD 21076; Union Trustee; service commenced 2011, term expires 2011; Executive General Vice President, International Union of Painters and Allied Trades of the United States and Canada (IUPAT); Director, Coalition of Black Trade Unionists and Board for Partnership for Working Families; Trustee, IUPAT International Pension Fund; formerly Assistant to the General President, IUPAT; National Project Coordinator, IUPAT Job Corps Program; Director, United Way.
Marlyn J. Spear,** CFA, age 57; 500 Elm Grove Road, Elm Grove, WI 53122; Management Trustee; service commenced 1995, expires 2012; Chief Investment Officer, Building Trades United Pension Trust Fund (Milwaukee and Vicinity); Director, Baird Funds, Inc.
Tony Stanley,** age 77; 191 SE Bella Strano, Port St. Lucie, FL 34984; Management Trustee; service commenced 1983, expires 2013; Director, TransCon Builders, Inc.; formerly Executive Vice President, TransCon Builders, Inc.
| * | Only directorships in a corporation or trust having securities registered pursuant to Section 12 of the Securities Exchange Act of 1934, as amended, or subject to the requirements of Section 15(d) of such Act or a company registered as an investment company under the Investment Company Act of 1940, as amended, are listed. |
| ** | Executive Committee member. |
30 A F L - C I O H O U S I N G I N V E S T M E N T T R U S T
Leadership
All officers of the HIT are located at 2401 Pennsylvania Avenue, NW, Suite 200, Washington, DC 20037.*
Stephen Coyle,† age 65; Chief Executive Officer, AFL-CIO Housing Investment Trust since 1992.
Theodore S. Chandler,† age 51; Chief Operating Officer, AFL-CIO Housing Investment Trust since 2009; formerly Vice President, Fannie Mae.
Erica Khatchadourian,† age 43; Chief Financial Officer, AFL-CIO Housing Investment Trust since 2001; formerly Controller, Chief of Staff and Director of Operations, AFL-CIO Housing Investment Trust; Senior Consultant, Price Waterhouse.
Chang Suh,† CFA, CPA, age 39; Executive Vice President and Chief Portfolio Manager, AFL-CIO Housing Investment Trust since January 2005; formerly Chief Portfolio Manager, Assistant Portfolio Manager and Senior Portfolio Analyst, AFL-CIO Housing Investment Trust; Senior Auditor, Arthur Andersen.
Saul A. Schapiro,† age 65; General Counsel, AFL-CIO Housing Investment Trust since 2009; formerly Partner, Rosenberg, Schapiro, Englander, Chicoine & Leggett, P.C.; Outside Counsel to the AFL-CIO Housing Investment Trust.
Debbie Cohen,† age 60; Chief Development Officer, AFL-CIO Housing Investment Trust since 2009, formerly Chief Director of Marketing and Investor Relations and Assistant Portfolio Manager, AFL-CIO Housing Investment Trust; Realtor, Coldwell Banker Realty and Weichert Realty; Senior Director of Planning and Research, Federal Home Loan Banks.
Christopher Kaiser,† age 46; Deputy General Counsel (since 2008) and Chief Compliance Officer (since 2007), AFL-CIO Housing Investment Trust; formerly Associate General Counsel, AFL-CIO Housing Investment Trust; Branch Chief, Division of Investment Management, U.S. Securities and Exchange Commission.
Harpreet Peleg,† CPA, age 37; Controller, AFL-CIO Housing Investment Trust since 2005; formerly Chief Financial Officer, AFL-CIO Investment Trust Corporation; Financial Analyst, Goldman Sachs & Co.; Senior Associate, PricewaterhouseCoopers.
Eric W. Price,† age 49; Executive Vice President, AFL-CIO Housing Investment Trust since 2010; formerly Senior Vice President, Abdo Development; Senior Vice President, Local Initiative Support Corporation; Deputy Mayor for Planning and Economic Development, District of Columbia.
Lesyllee White, age 48; Director of Marketing, AFL-CIO Housing Investment Trust since 2004; formerly Regional Marketing Director and Senior Marketing Associate, AFL-CIO Housing Investment Trust; Vice President, Northern Trust Company.
Stephanie H. Wiggins,† age 45; Executive Vice President and Chief Investment Officer, position formerly titled Chief Investment Officer – Multifamily Finance, AFL-CIO Housing Investment Trust since 2001; formerly Director of Fannie Mae Finance, AFL-CIO Housing Investment Trust; Director, Prudential Mortgage Capital Company; Vice President/Multifamily Transaction Manager, WMF Capital Corporation.
* No officer of the HIT serves as a trustee or director in any corporation or trust having securities registered pursuant to Section 12 of the Securities Exchange Act of 1934, as amended, or subject to the requirements of Section 15(d) of such Act, or any company registered as an investment company under the Investment Company Act of 1940, as amended.
† Board-appointed officer. These officers are appointed annually, serving for a period of approximately one year or until their respective successors are duly appointed and qualified.
A N N U A L R E P O R T 2 0 1 0 31
AFL-CIO Housing Investment Trust
National Office
2401 Pennsylvania Avenue, N.W.
Suite 200
Washington, D.C. 20037
(202) 331-8055
www.aflcio-hit.com
New York City Office
Carol Nixon, Director
1270 Avenue of the Americas
Suite 210
New York, New York 10020
(212) 554-2750
Western Regional Office
Liz Diamond, Director
235 Montgomery Street
Suite 1001
San Francisco, California 94104
(415) 433-3044
New England Regional Office
Thomas O’Malley, Director
Ten Post Office Square, Suite 800
Boston, Massachusetts 02109
(617) 850-9071
Gulf Coast Office
1100 Poydras Street, Suite 2990
New Orleans, LA 70163
(504) 599-8750
Service Providers
Independent Registered Public Accounting Firm
Ernst & Young LLP
McLean, Virginia
Corporate Counsel
Bingham McCutchen LLP
Washington, D.C.
Securities Counsel
Perkins Coie LLP
Washington, D.C.
Transfer Agent
BNY Mellon Investment Servicing (US) Inc.
King of Prussia, Pennsylvania
Custodian
PFPC Trust Company
Philadelphia, Pennsylvania
Investors should consider the HIT’s investment objectives, risks and expenses carefully before investing. A prospectus containing more complete information may be obtained from the HIT by calling the Marketing and Investor Relations Department collect at 202-331-8055 or by viewing the HIT’s website at www.aflcio-hit.com. The prospectus should be read carefully before investing.
32 A F L - C I O H O U S I N G I N V E S T M E N T T R U S T
Photos on front cover, inside cover, and page 11 were taken at the Arc Light Co. construction site, San Francisco.