Washington, D.C. 20549
Washington, D.C. 20037
Kenneth G. Lore, Esq.
A copy of the 2009 Annual Report (the “Report”) of the AFL-CIO Housing Investment Trust (the “Trust”) transmitted to Trust participants pursuant to Rule 30e-1 under the Investment Company Act of 1940, as amended (17 CFR 270.30e-1) (the “Act”), is included herewith.
The AFL-CIO Housing Investment Trust (“HIT” or the “Trust”) invests in high credit quality fixed-income securities. The HIT seeks to provide current income while preserving capital over time and obtaining returns competitive with its industry benchmark. The HIT also endeavors through its investments to increase the supply of housing affordable to working families, to generate union jobs, and to strengthen the communities where union members live and work. The HIT is one of the earliest and most successful practitioners of responsible, economically targeted investing, with a track record that demonstrates the value derived from union-friendly investments.
 | John J. Sweeney Chairman AFL-CIO Housing Investment Trust | “We deeply appreciate the investor confidence that has contributed significantly to the HIT’s success over the years and that brought more than $360 million in new capital to the HIT in 2009.” |
Message from the Chairman
I am pleased to report that the AFL-CIO Housing Investment Trust delivered competitive returns to its participants as it outperformed its benchmark in 2009. Once again, the strong performance and growing assets of the HIT demonstrate the value of its investment strategy, with its focus on high credit quality multifamily securities and avoidance of risky investments. This approach has made the HIT a steady performer through periods of market volatility such as those experienced in the past year. Besides generating competitive returns for pension beneficiaries, the HIT’s 2009 investments provided a welcome stimulus for communities in need of jobs and housing to help with economic recovery.
The HIT is able to achieve a performance advantage over its benchmark because of its expertise in multifamily housing. The government- and agency-insured multifamily securities in which it invests continued to help produce higher returns than the benchmark for 2009. These investments enabled the HIT to generate higher income for the portfolio without increasing credit risk. In a year when many investors had pulled back from the housing market, the HIT was able to use its growing assets to finance new apartment construction and to preserve the affordability of housing for working families. Its ability to identify these sound investments stems from its years of experience in housing finance and its working relationships across the finance community. Expertise in this market has enabled the HIT to establish a large pipeline of potential proj ects that should lead to continuing investment success in the coming year.
We deeply appreciate the investor confidence that has contributed significantly to the HIT’s success over the years and that brought more than $360 million in new capital to the HIT in 2009. It has been a privilege for me personally to participate in the HIT’s growth from just over $100 million in 1981, when I first joined the HIT Board of Trustees, to the thriving $3.6 billion fund it is today. As Chairman, I am committed to maintaining the HIT’s record of competitive performance and the high level of integrity and transparency in fund management that serve as an example for the responsible investment of workers’ pension capital. The HIT is well-positioned to continue its strong performance in the year ahead and bring HIT investors competitive risk-adjusted returns.
John J. Sweeney
 | Richard L. Trumka President, AFL-CIO | “The HIT’s job-generating investments remain a bright spot on a blighted economic landscape.” |
Message from the AFL-CIO President
For more than 40 years, the AFL-CIO Housing Investment Trust has been a leader in prudently investing union pension capital for the benefit of America’s working men and women. In the difficult economic climate of 2009, the HIT once again lived up to this responsibility, acting as a positive force for working families in a year overshadowed by severe unemployment and an uncertain economic recovery.
During 2009, the HIT consistently delivered competitive returns for the investors whose pension capital it manages, helping protect the well-deserved retirement security of millions of hard-working union members. Its investments had the added benefit of supporting the creation of good union construction jobs in communities around the country. Not only are these jobs helping drive America’s recovery, they are a lifeline to families struggling to keep their heads above water in today’s economy.
The HIT’s job-generating investments and strong pipeline of future housing projects remain a bright spot on an economic landscape blighted by financial hardship. Its financing translates into the creation or preservation of much-needed affordable housing. In 2009, the HIT further increased its commitment to workforce housing with efforts to expand the housing options available to middle-income workers in high-cost cities such as New York.
Union pension beneficiaries can be proud of the HIT’s success in fulfilling the labor movement’s vision of responsible investing. The HIT’s prudent investment policies have guided it unfailingly through this volatile period and protected the security of union members’ pension assets. Its record in weathering this financial storm demonstrates the benefits to working people and retirees of the HIT’s responsible approach to investing pension capital. For its dedication to the financial security of pension beneficiaries, the HIT deserves our continuing support.
Richard L. Trumka
AFL-CIO HOUSING INVESTMENT TRUST
Discussion of Fund Performance
“In a period of scarce capital for development, the HIT made new investments...that are expected to generate more than 1,100 union construction jobs.”
OVERVIEW OF 2009
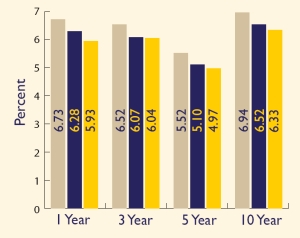
The AFL-CIO Housing Investment Trust outperformed its benchmark, the Barclays Capital Aggregate Bond Index (Barclays Aggregate) on a gross and net basis in 2009 for the one-, three-, five-, and ten-year periods. The HIT’s gross and net returns for the one-year period ending December 31, 2009, were 6.73% and 6.28%, respectively, compared to 5.93% for the benchmark. The HIT’s strategy of investing in high credit quality multifamily mortgage-backed securities (MBS) generated competitive risk-adjusted returns while mitigating risk, as it has done consistently in the extremely volatile market of the past two years. The HIT was able to outperform its benchmark again in 2009 despite the record performance of corporate bonds in the benchmark, which are not held by the HIT. The HIT’s superior portfolio fundamentals of higher credit quality and higher yield, with similar interest rate risk as compared to the benchmark, along with strong liquidity, served investors well and put the HIT in a favorable position for 2010.
Job creation was an important part of the HIT’s success in 2009. In a period of scarce capital for development, the HIT made new investments in housing projects whose total development costs are expected to approach a quarter billion dollars. These new projects are expected to generate more than 1,100 union construction jobs, providing a local stimulus as the nation’s workforce struggles with a jobless recovery.
Investors responded to the HIT’s combination of fund performance and job creation by bringing $362 million in new capital to the HIT, with $214 million in new investments and $148 million in reinvested earnings, representing a 90% reinvestment rate. A substantial pipeline of future projects was under review at year-end. The HIT will seek additional capital from Taft-Hartley and public employee pension plans in order to expand its investments in projects it deems appropriate for the portfolio in the year ahead. In particular, its focus on construction-related investments and its ability to source these investments directly can increase expected risk-adjusted returns for the HIT portfolio, as construction mortgage securities have significantly higher relative yields than bonds of comparable duration and credit quality.
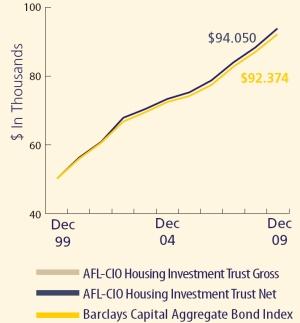
Average Annual Total Returns As of December 31, 2009 | | Comparison of $50,000 Investment in the HIT and Barclays Aggregate |
| Past performance is no guarantee of future results. Economic and market conditions change, and both will cause investment return, principal value, and yield to fluctuate so that a participant’s units, when redeemed, may be worth more or less than their original cost. Current performance may be lower or higher than the performance data quoted. Performance data current to the most recent month-end is available at www.aflcio-hit.com. Gross performance figures do not reflect the deduction of HIT expenses. Net performance figures reflect the deduction of HIT expenses and are the performance figures investors experience in the HIT. Information about HIT expenses can be found on page 6 of the HITR 17;s current prospectus. The Barclays Aggregate is an unmanaged index and is not available for direct investment, although certain funds attempt to replicate this index. Returns for the index would be lower if they reflected the actual trading costs or expenses associated with management of an actual portfolio. |
COMPETITIVE PERFORMANCE
For the 17th consecutive calendar year, the HIT outperformed its benchmark on a gross basis, and for 11 of those years it has outperformed on a net basis as well. The HIT’s 2009 performance was enhanced by its ongoing income advantage versus the benchmark and by significant spread tightening1 in agency multifamily MBS. These multifamily investments had better price performance than U.S. Treasury securities with comparable average lives, and they also generated additional income relative to Treasuries while reflecting similar credit quality. The HIT held its performance advantage even in the face of the strong rebound in the benchmark’s corporate bond sector, which outperformed Treasuries by a record 2,276 basis points.
“Superior fundamentals of higher credit quality, higher yield and similar interest rate risk, along with strong liquidity, served investors well.”
Morningstar ranked the HIT as one of the nation’s “Top 10 Managers” in its fixed-income category for each of the three quarters of 2009 for which rankings were available by year-end.2 The HIT’s rankings were in the category of U.S. intermediate duration collective trusts based on one-year and/or five-year returns.
1Spread is the difference in yield between Treasuries and comparable non-Treasury securities. Spread tightening is significant because it represents the market’s acceptance of a lower risk premium to invest in non-Treasury securities. Conversely, spread widening reflects a market requirement for a higher risk premium for non-Treasury securities.
2Rankings were based on gross returns self-reported to Morningstar’s Principia Separate Account database, which reflect no deduction for expenses. Rankings compared fixed-income investment vehicles with a similar risk profile, comprising funds in Morningstar’s Intermediate Government Bond and Intermediate-Term Bond categories. Morningstar gave the HIT a top 10 managers ranking for the one-year and five-year periods ended March 31 and June 30, 2009, and for the five-year period ended September 30, 2009. The Morningstar database included 49 funds for the one-year period and 41 funds for the five-year period ending March 31; 45 funds for the one-year period and 38 funds for the five-year period ending June 30; and 33 funds for the five-year period endi ng September 30, 2009. Pensions & Investments reported the Morningstar rankings for each of the three quarters on May 4, August 24, and November 16, 2009, respectively. Rankings for the fourth quarter of 2009 were not available when this report was printed.
DIVERSIFICATION BENEFITS
Fixed-income investments such as the HIT are an important part of a balanced portfolio. The HIT’s returns provide desired diversification as seen in the growth comparisons and correlations below.
Ten-Year Growth Comparison 10 years ending December 31, 2009 | | Correlation to HIT: Monthly Year-over-Year Changes in Indices 10 years ending December 31, 2009 |
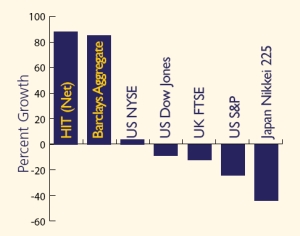 | | Barclays Capital Aggregate Bond Index | 0.97 |
| | U.S. New York Stock Exchange | -0.36 |
| | U.S. Dow Jones Industrial Average | -0.32 |
| | United Kingdom FTSE | -0.48 |
| | U.S. Standard & Poors | -0.45 |
| | Japan Nikkei 225 | -0.62 |
| | | |
| | Source: Haver Analytics and the HIT | |
| | | |
| The performance data quoted represents past performance and is no guarantee of future results. Investment results and principal value will fluctuate so that units in the HIT, when redeemed, may be worth more or less than the original cost. The HIT’s current performance maybe lower or higher than the performance data quoted. Performance data current to the most recent month-end is available at www.aflcio-hit.com. |
AFL-CIO HOUSING INVESTMENT TRUST
PORTFOLIO STRATEGY
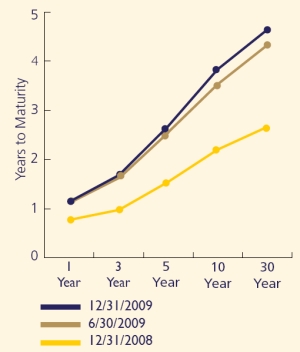
The HIT seeks competitive risk-adjusted returns by investing in assets with superior credit quality and yield relative to the benchmark, while maintaining a similar interest rate risk profile. The high credit quality assets in which the HIT invests are primarily multifamily MBS that are insured or guaranteed by a U.S. government agency or a government-sponsored enterprise (GSE). The HIT substitutes these assets for corporate debt and some Treasury and GSE debt securities in the benchmark. Nearly 96% of the HIT portfolio at December 31, 2009, consisted of investments that were insured or guaranteed by the U.S. government or a GSE. This compared to 74.6% in the benchmark. As of December 31, the HIT’s yield advantage over the benchmark was 64 basis points. The HIT portfolio is actively managed to have similar interest rate risk as t he benchmark.
In late December, the Obama administration made more explicit the government’s support of Fannie Mae and Freddie Mac, taking two actions that should be favorable to the HIT portfolio. First, the government committed to cover all losses of Fannie Mae and Freddie Mac through 2012. Second, it dropped the requirement that the
PORTFOLIO DISTRIBUTION
Based on value of total investments, including unfunded commitments, as of December 31, 2009.
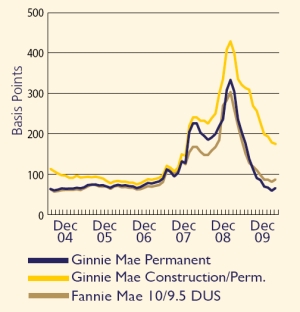
Historical Multifamily Spreads Spread to 10-year Treasuries | | Risk Comparison As of December 31, 2009 |
| | | HIT | Barclays Aggregate |
| | Superior Credit Profile | | |
| | AAA & Above | 96.91% | 78.06% |
| | A & Below | 0.42% | 17.83% |
| | Superior Yield | | |
| | Yield to Maturity/Worst | 4.26% | 3.61% |
| | Similar Interest Rate Risk | | |
| | Effective Duration | 4.4 | 4.6 |
| | Convexity | -0.12 | -0.12 |
| | Similar Call Risk | | |
| | Call Protected | 66% | 63% |
| | Not Call Protected | 34% | 37% |
| | | | |
| | Source: HIT and Barclays Aggregate | | |
| | | | |
| | | | |
| Source: HIT and Wall Street Brokers | | | | |
ANNUAL REPORT 2009
two GSEs must shrink their portfolios by 10% from year-end 2009 levels.3 Permitting portfolio growth may allow Fannie Mae and Freddie Mac to support the market for MBS without forcing them to sell securities. At December 31, 56.6% of the HIT portfolio was invested in Fannie Mae and Freddie Mac MBS.
THE MARKET LANDSCAPE
During the second half of 2009, credit and equity markets showed weak improvement as economic growth resumed modestly in the third quarter. The Federal Reserve, along with many analysts, voiced cautious optimism for 2010. In the financial markets, that increased optimism spurred demand for riskier assets, including equities, corporate bonds, and commercial MBS (CMBS), continuing a trend that began in March. Lower credit quality investments, in general, outperformed those of higher credit quality as investors felt more confident. Improved corporate earnings enhanced the performance of corporate bonds.
The modest economic expansion appeared to slow the nation’s job losses, but it did not translate into the job growth needed for a sustainable recovery. The weak housing market benefited from the Federal Reserve’s purchase of MBS and the resulting decline in mortgage rates. The lower rates, together with the federal government’s tax credit for first-time home buyers, helped stabilize home prices in many areas of the country. Nevertheless, elevated unemployment contributed to a rise in mortgage delinquencies and foreclosures for prime fixed-rate loans during 2009.
The U.S. government has continued to issue record amounts of debt to finance the federal deficit, which reached an unprecedented $1.4 trillion in fiscal year 2009 and is estimated to continue to grow in 2010. Overseas demand for U.S. debt and record amounts of excess reserves by commercial banks buying the newly issued Treasury securities have helped to keep interest rates from rising further.
Treasury rates rose in 2009, with yields up 163 basis points for the 10-year Treasury but only 37 basis points for the 2-year Treasury. The steepness of the yield curve remained close to all-time highs. Although the Federal Reserve had indicated no plans to raise the federal funds rate, by year-end 2009 many analysts were anticipating increases in the second half of 2010. The Federal Reserve was scheduled to end its successful GSE single family MBS purchase program, which provided liquidity and lowered mortgage rates, at the end of the first quarter of 2010. Removing this major source of demand for MBS may pressure single family mortgage spreads wider relative to Treasuries.
___________________________
3 The HIT notes that there is no guarantee that these government policies will not change.
Weakness in the Labor Market Source: Bureau of Labor Statistics | | U.S. Treasury Yield Curve Shift Source: Bloomberg L.P. |
AFL-CIO HOUSING INVESTMENT TRUST
“Multifamily investments should provide opportunities to earn superior yield [with] the added benefits of putting union members to work, creating affordable housing, and strengthening local communities.”
INVESTING IN HOUSING AND JOBS
The HIT’s investments in multifamily MBS provided a performance advantage over the benchmark in 2009. The tightening of multifamily spreads during the year reflected rising demand from market participants and improving liquidity in the multifamily sector. Since the beginning of the year, spreads on Federal Housing Administration (FHA) multifamily permanent loans wrapped by Ginnie Mae permanent loan certificates and Fannie Mae multifamily MBS tightened significantly relative to Treasuries.
At the same time, spreads on Ginnie Mae construction loan certificates remained historically wide, as investors required higher yields for construction-related investments. This is why the HIT continued to aggressively source new multifamily construction loan production.
During 2009, the HIT made nine investments totaling $162.6 million for multifamily projects in seven cities, with total development costs exceeding $226 million. Six of these investments were for new development projects that will create an estimated 1,100 union construction jobs at a time when workers face a staggering 22% unemployment rate in the construction industry. Together with eight earlier investments that were under construction at year-end, HIT-financed projects currently represent a total of more than 2,500 union jobs. The HIT’s 2009 investments are expected to create or preserve approximately 3,200 units of housing, including more than 2,000 units of workforce housing for middle-income households.
The HIT has a growing pipeline of prospective investments, many of which it expects to finance in 2010. To identify these investments, the HIT continues to draw on nearly 45 years of experience in affordable housing finance and particularly its expertise in FHA programs, which account for a substantial share of the new construction multifamily market. These multifamily investments should provide opportunities for the HIT to earn superior yield on government-guaranteed construction loans and have the added benefits of putting union members to work, creating affordable housing, and strengthening local communities.
 | | Applewood Pointe of Bloomington at Southtown Bloomington, Minnesota Construction is underway at this new cooperative residence for seniors in the Minneapolis suburb of Bloomington. The HIT is financing $17.6 million of the $20.3 million total development cost. The project is expected to generate some 130 union jobs. The 101-unit cooperative will help fill a market demand among Minnesota seniors seeking to downsize their homes. The HIT has provided over $90 million to finance 12 senior cooperatives in Minnesota since the mid-1990s. |
| | | |
 | | The Dempsey New York, New York The HIT is helping to finance construction of this $23.4 million affordable housing development in Central Harlem by purchasing $15 million of fixed-rate tax exempt bonds issued by New York City’s Housing Development Corporation. The Dempsey will offer 79 units of housing for families earning between 40% and 60% of the area median income. The project is part of the city’s revitalization plan for Central Harlem and is expected to generate approximately 135 union construction jobs. |
OPPORTUNITIES AHEAD
Despite some encouraging indicators, the U.S. economy in 2010 is expected to struggle under the weight of continued high unemployment, excess capacity, low levels of consumption, stress in the residential and commercial real estate markets, and the unstable condition of U.S. and global financial systems. More worrisome may be the risk of the government prematurely ending the liquidity it is providing to the markets and reducing its stimulus spending. Overall, it appears that inflation is not a major near-term concern.
The HIT enters 2010 well-positioned for continued investment success due to its strong liquidity and superior portfolio fundamentals, which are expected to offer higher income and higher credit quality, while maintaining similar interest rate risk compared to the benchmark. The HIT expects to further improve these fundamentals in the period ahead by increasing its investments in FHA-insured construction loans in order to take advantage of the historically wide spreads these construction-related investments are experiencing relative to Treasuries.
The prospects for these investments are strong, given the HIT’s experience in multifamily finance and its pipeline of construction projects that meet its prudent investment criteria. Pension capital invested in the HIT should enable it to take advantage of these investment opportunities, which are expected to provide higher income than the benchmark without additional credit risk. These construction-related investments would also have a stimulus effect by increasing the supply of affordable housing and creating good union jobs – collateral benefits that are important to union pension beneficiaries in this challenging economy.
“Pension capital invested in the HIT should enable it to take advantage of construction-related investment opportunities, helping the HIT provide higher income than the benchmark without additional credit risk.”
 | |  |
| Framing and waterproofing work at Applewood Pointe of Bloomington at Southtown, MN. |
 | | The Moderne Milwaukee, Wisconsin The HIT’s $41.5 million commitment for this 30-story residential tower should bring a major construction project to downtown Milwaukee. The $48.4 million project includes 203 apartments and is expected to create more than 300 union construction jobs. The prospect of those jobs and related economic activity helped generate strong support from the City of Milwaukee. |
| | | |
 | | Mitchell-Lama Workforce Housing New York, New York A $22 million investment by the HIT helped maintain the affordability of 2,245 units of housing at five developments that are home to middle-income individuals in Brooklyn, Queens, and Manhattan, including the East Midtown Plaza (above). The HIT’s purchase of bonds issued by the City’s Housing Development Corporation has enabled the five properties to remain in New York’s Mitchell-Lama program, which provides affordable rental and co-op housing for moderate- and middle-income families. The investment is part of the HIT’s workforce housing initiative, which seeks to expand housing opportunities for middle-income households in high-cost cities |
AFL-CIO HOUSING INVESTMENT TRUST
Other Important Information
EXPENSE EXAMPLE
Participants in the HIT incur ongoing expenses related to the management and distribution activities of the HIT, as well as certain other expenses. This example is intended to help participants understand the ongoing costs (in dollars) of investing in the HIT and to compare these costs with the ongoing costs of investing in other mutual funds. The example is based on an investment of $1,000 invested at the beginning of the period, July 1, 2009, and held for the entire period ended December 31, 2009.
Actual Expenses: The first line of the table below provides information about actual account values and actual expenses. Participants may use the information in this line, together with the amount they invested, to estimate the expenses that they paid over the period. Simply divide the account value by $1,000 (for example, an $800,000 account value divided by $1,000 = 800), then multiply the result by the number in the first line under the heading entitled “Expenses Paid During Six-Month Period Ended December 31, 2009” to estimate the expenses paid on a particular account during this period.
Hypothetical Expenses (for Comparison Purposes Only): The second line of the table below provides information about hypothetical account values and hypothetical expenses based on the HIT’s actual expense ratio and an assumed rate of return of 5% per year before expenses, which is not the HIT’s actual return. The hypothetical account values and expenses may not be used to estimate the actual ending account balance or expenses a participant paid for the period. Participants may use this information to compare the ongoing costs of investing in the HIT and other mutual funds. To do so, compare this 5% hypothetical example with the 5% hypothetical examples that appear in the shareholder reports of the other mutual funds.
AVAILABILITY OF QUARTERLY PORTFOLIO SCHEDULES
In addition to disclosure in the Annual and Semi-Annual Reports to Participants, the HIT also files its complete schedule of portfolio holdings with the Securities and Exchange Commission (SEC) for the first and third quarters of each fiscal year on Form N-Q. The HIT’s reports on Form N-Q are made available on the SEC’s website at http://www.sec.gov and may be reviewed and copied at the SEC’s Public Reference Room in Washington, D.C. (Information relating to the hours and operation of the SEC’s Public Reference Room may be obtained by calling 1-800-SEC-0330.) Participants may also obtain copies of the HIT’s Form N-Q reports, without charge, upon request, by calling the HIT collect at 202-331-8055.
PROXY VOTING
Through 2009, the HIT invested exclusively in non-voting securities and has not deemed it necessary to adopt policies and procedures for the voting of portfolio securities. During the most recent twelve-month period ended June 30, 2009, the HIT held no voting securities in its portfolio and has reported this information in its most recent filing with the SEC on Form N-PX. This filing is available on the SEC’s website at http://www.sec.gov. Participants may also obtain a copy of the HIT’s report on Form N-PX, without charge, upon request, by calling the HIT collect at 202-331-8055.
EXPENSE EXAMPLE
| | Beginning Account Value July 1, 2009 | | Ending Account Value December 31, 2009 | | Expenses Paid During Six-Month Period Ended December 31, 2009 * |
| Actual expenses | $1,000 | | $1,027.20 | | $2.20 |
| Hypothetical expenses | $1,000 | | $1,023.04 | | $2.19 |
| (5% annual return before expenses) | | | | | |
*Expenses are equal to the HIT’s annualized expense ratio of 0.43%, as of December 31, 2009, multiplied by the average account value over the period, multiplied by 184/365 (to reflect the one-half year period).
2009 Participants Meeting
The 2009 Meeting of Participants was held in Washington, D.C., on Tuesday, November 24, 2009. The following matters were put to a vote of the Participants at the meeting through the solicitation of proxies:
John J. Sweeney was elected to chair the Board of Trustees by: votes for 2,309,816.527; votes against 59,069.724; votes abstaining 961.902; votes not cast 896,556.455.
The table below details votes pertaining to Trustees who were elected at the Meeting.
The following Trustees were not up for reelection and their terms of office continued after the Meeting: Richard L. Trumka, Arlene Holt Baker, Frank Hurt, James A. Williams, George Latimer, Tony Stanley, and Jack Quinn.
Ernst & Young LLP was ratified as the HIT’s Independent Registered Public Accounting Firm by: votes for 2,332,330.964; votes against 35,535.839; votes abstaining 1,981.350; votes not cast 896,556.455.
| Trustee | Votes For: | Votes Against: | Votes Abstaining: |
| Mark Ayers | 2,228,778.115 | 141,070.038 | 0 |
| John J. Flynn | 2,318,670.833 | 51,177.320 | 0 |
| Lindell Lee | 2,318,670.833 | 51,177.320 | 0 |
| Elizabeth H. Shuler | 2,317,788.962 | 51,177.320 | 881.871 |
| Stephen Frank | 2,307,980.655 | 51,177.320 | 10,690.178 |
| Richard Ravitch | 2,316,604.066 | 50,981.734 | 2,262.353 |
| Marlyn J. Spear | 2,307,980.655 | 51,177.320 | 10,690.178 |
| Votes not cast: 896,556.455 | | | |
AFL-CIO HOUSING INVESTMENT TRUST
AMERICAN FEDERATION OF LABOR AND CONGRESS OF INDUSTRIAL ORGANIZATIONS HOUSING INVESTMENT TRUST
Financial Statements 2009
Report of Independent Registered Public Accounting Firm
The Board of Trustees and Participants of American Federation of Labor and Congress of Industrial Organizations Housing Investment Trust:
We have audited the accompanying statement of assets and liabilities of American Federation of Labor and Congress of Industrial Organizations Housing Investment Trust (the Trust), including the schedule of portfolio investments, as of December 31, 2009, and the related statements of operations for the year then ended, the statements of changes in net assets for each of the two years in the period then ended, and the financial highlights for each of the five years in the period then ended. These financial statements and financial highlights are the responsibility of the Trust’s management. Our responsibility is to express an opinion on these financial statements and financial highlights based on our audits.
We conducted our audits in accordance with the standards of the Public Company Accounting Oversight Board (United States). Those standards require that we plan and perform the audit to obtain reasonable assurance about whether the financial statements and financial highlights are free of material misstatement. The Trust is not required to have, nor were we engaged to perform, an audit of its internal control over financial reporting. Our audits included consideration of internal control over financial reporting as a basis for designing audit procedures that are appropriate in the circumstances, but not for the purpose of expressing an opinion on the effectiveness of the Trust’s internal control over financial reporting. Accordingly, we express no such opinion. An audit also includes examining, on a test basis, evidence supporting th e amounts and disclosures in the financial statements and financial highlights, assessing the accounting principles used and significant estimates made by management, as well as evaluating the overall financial statement presentation. Our procedures included confirmation of securities owned as of December 31, 2009, by correspondence with the custodian and brokers. We believe that our audits provide a reasonable basis for our opinion.
In our opinion, the financial statements and financial highlights referred to above present fairly, in all material respects, the financial position of American Federation of Labor and Congress of Industrial Organizations Housing Investment Trust as of December 31, 2009, the results of its operations for the year then ended, the changes in its net assets for each of the two years in the period then ended, and the financial highlights for each of the five years in the period then ended, in conformity with accounting principles generally accepted in the United States of America.
McLean, Virginia
February 18, 2010
AFL-CIO HOUSING INVESTMENT TRUST
Statements of Assets and Liabilities
December 31, 2009 (Dollars in thousands)
| Assets | |
| Investments, at value (cost $3,500,131) | | $ | 3,600,781 | |
| Cash and cash equivalents | | | 31,733 | |
| Accrued interest receivable | | | 16,391 | |
| Receivables for investments sold | | | 24,814 | |
| Other assets | | | 1,609 | |
| Total assets | | | 3,675,328 | |
| | | | | |
| Liabilities | | | | |
| Payables for investments purchased | | | 25,456 | |
| Redemptions payable | | | 20,987 | |
| Income distribution payable, net of dividends reinvested of $12,705 | | | 1,412 | |
| Refundable deposits | | | 966 | |
| Accrued expenses | | | 3,070 | |
| Total liabilities | | | 51,891 | |
| | | | | |
| Net assets applicable to participants’ equity — | | | | |
| Certificates of participation — authorized unlimited; | | | | |
| Outstanding 3,250,549 units | | $ | 3,623,437 | |
| | | | | |
| Net asset value per unit of participation (in dollars) | | $ | 1,114.72 | |
| | | | | |
| Participants’ equity | | | | |
| Participants’ equity consisted of the following: | | | | |
| Amount invested and reinvested by current participants | | $ | 3,541,897 | |
| Net unrealized appreciation of investments | | | 100,650 | |
| Distribution in excess of net investment income | | | (2,928 | ) |
| Accumulated net realized losses | | | (16,182 | ) |
| Total participants’ equity | | $ | 3,623,437 | |
See accompanying Notes to Financial Statements.
Schedule of Portfolio Investments December 31, 2009 (Dollars in thousands)
FHA Permanent Securities (3.6% of net assets)
| | Interest Rate | | Maturity Date | | | | | Face Amount | | | Amortized Cost | | | Value | |
| Single Family | | | 7.75 | % | Jul-2021-Aug-2021 | | $ | | | | $ | 22 | | | $ | 22 | | | $ | 22 | |
Multifamily1 | | | 5.25 | % | Mar-2024 | | | | | | | 4,538 | | | | 4,546 | | | | 4,558 | |
| | | | 5.35 | % | Mar-2047 | | | | | | | 7,879 | | | | 7,890 | | | | 7,615 | |
| | | | 5.55 | % | May-2042 | | | | | | | 8,726 | | | | 8,727 | | | | 8,521 | |
| | | | 5.60 | % | Jun-2038 | | | | | | | 2,769 | | | | 2,769 | | | | 2,855 | |
| | | | 5.62 | % | Jun-2014 | | | | | | | 471 | | | | 468 | | | | 482 | |
| | | | 5.65 | % | Oct-2038 | | | | | | | 2,132 | | | | 2,190 | | | | 2,172 | |
| | | | 5.87 | % | Jun-2044 | | | | | | | 1,920 | | | | 1,919 | | | | 1,897 | |
| | | | 5.89 | % | Apr-2038 | | | | | | | 5,182 | | | | 5,198 | | | | 5,151 | |
| | | | 6.02 | % | Jun-2035 | | | | | | | 6,305 | | | | 6,296 | | | | 6,505 | |
| | | | 6.40 | % | Aug-2046 | | | | | | | 4,032 | | | | 4,032 | | | | 4,138 | |
| | | | 6.60 | % | Jan-2040 | | | | | | | 3,514 | | | | 3,514 | | | | 3,661 | |
| | | | 6.65 | % | Apr-2040 | | | | | | | 915 | | | | 919 | | | | 957 | |
| | | | 6.66 | % | May-2040 | | | | | | | 5,597 | | | | 5,588 | | | | 5,628 | |
| | | | 6.70 | % | Dec-2042 | | | | | | | 5,878 | | | | 5,868 | | | | 6,161 | |
| | | | 6.75 | % | Feb-2039-Jul-2040 | | | | | | | 5,389 | | | | 5,345 | | | | 5,588 | |
| | | | 6.88 | % | Apr-2031 | | | | | | | 27,211 | | | | 26,891 | | | | 28,071 | |
| | | | 7.05 | % | Jul-2043 | | | | | | | 5,224 | | | | 5,224 | | | | 5,533 | |
| | | | 7.13 | % | Mar-2040 | | | | | | | 7,693 | | | | 7,654 | | | | 8,152 | |
| | | | 7.20 | % | Nov-2033-Oct-2039 | | | | | | | 9,711 | | | | 9,691 | | | | 10,318 | |
| | | | 7.50 | % | Sep-2032 | | | | | | | 1,555 | | | | 1,549 | | | | 1,664 | |
| | | | 7.75 | % | Oct-2038 | | | | | | | 1,362 | | | | 1,353 | | | | 1,363 | |
| | | | 7.93 | % | Apr-2042 | | | | | | | 2,843 | | | | 2,843 | | | | 3,067 | |
| | | | 8.15 | % | Mar-2037 | | | | | | | 1,162 | | | | 1,266 | | | | 1,162 | |
| | | | 8.27 | % | Jun-2042 | | | | | | | 2,492 | | | | 2,492 | | | | 2,688 | |
| | | | 8.40 | % | Apr-2012 | | | | | | | 169 | | | | 169 | | | | 169 | |
| | | | 8.75 | % | Aug-2036 | | | | | | | 3,608 | | | | 3,598 | | | | 3,612 | |
| | | | | | | | | | | | | 128,277 | | | | 127,999 | | | | 131,688 | |
Forward Commitments1 | | | 6.65 | % | Jun-2049 | | | 1,120 | | | | - | | | | - | | | | - | |
| Total FHA Permanent Securities | | | | | | | $ | 1,120 | | | $ | 128,299 | | | $ | 128,021 | | | $ | 131,710 | |
AFL-CIO HOUSING INVESTMENT TRUST
Ginnie Mae Securities (28.0% of net assets)
| | | Interest Rate | | Maturity Date | | Commitment Amount | | | Face Amount | | | Amortized Cost | | | Value | |
| Single Family | | | 5.50 | % | Jan-2033-Jun-2037 | | $ | | | | $ | 24,719 | | | $ | 24,570 | | | $ | 26,030 | |
| | | | 6.00 | % | Jan-2032-Aug-2037 | | | | | | | 12,258 | | | | 12,264 | | | | 13,032 | |
| | | | 6.50 | % | Jul-2028-Dec-2028 | | | | | | | 147 | | | | 147 | | | | 158 | |
| | | | 7.00 | % | Nov-2016-Jan-2030 | | | | | | | 4,430 | | | | 4,489 | | | | 4,836 | |
| | | | 7.50 | % | Apr-2013-Aug-2030 | | | | | | | 3,672 | | | | 3,728 | | | | 3,981 | |
| | | | 8.00 | % | Jul-2010-Nov-2030 | | | | | | | 1,562 | | | | 1,599 | | | | 1,725 | |
| | | | 8.50 | % | May-2010-Aug-2027 | | | | | | | 1,456 | | | | 1,483 | | | | 1,631 | |
| | | | 9.00 | % | May-2016-Jun-2025 | | | | | | | 446 | | | | 454 | | | | 500 | |
| | | | 9.50 | % | Sep-2021-Sep-2030 | | | | | | | 169 | | | | 171 | | | | 192 | |
| | | | 10.00 | % | Jun-2019 | | | | | | | 1 | | | | 1 | | | | 1 | |
| | | | 13.00 | % | Jul-2014 | | | | | | | 1 | | | | 1 | | | | 1 | |
| | | | 13.25 | % | Dec-2014 | | | | | | | 1 | | | | 1 | | | | 1 | |
| | | | | | | | | | | | | 48,862 | | | | 48,908 | | | | 52,088 | |
Multifamily1 | | | 2.91 | % | Aug-2020 | | | | | | | 5,045 | | | | 5,026 | | | | 5,078 | |
| | | | 3.37 | % | Jan-2032 | | | | | | | 515 | | | | 495 | | | | 521 | |
| | | | 3.61 | % | May-2018 | | | | | | | 2,711 | | | | 2,680 | | | | 2,718 | |
| | | | 3.65 | % | Oct-2027 | | | | | | | 7,000 | | | | 6,804 | | | | 7,068 | |
| | | | 3.96 | % | May-2032 | | | | | | | 452 | | | | 431 | | | | 458 | |
| | | | 4.25 | % | Sep-2034-Feb-2039 | | | | | | | 14,000 | | | | 14,045 | | | | 14,160 | |
| | | | 4.22 | % | Nov-2035 | | | | | | | 24,962 | | | | 25,707 | | | | 25,524 | |
| | | | 4.26 | % | Jul-2029 | | | | | | | 3,000 | | | | 2,992 | | | | 3,082 | |
| | | | 4.40 | % | Jan-2024 | | | | | | | 9,677 | | | | 9,681 | | | | 9,773 | |
| | | | 4.43 | % | Apr-2034-Jun-2034 | | | | | | | 109,470 | | | | 107,462 | | | | 109,691 | |
| | | | 4.49 | % | Apr-2023 | | | | | | | 8,531 | | | | 8,531 | | | | 8,835 | |
| | | | 4.59 | % | May-2033 | | | | | | | 3,064 | | | | 3,062 | | | | 3,099 | |
| | | | 4.66 | % | Dec-2030 | | | | | | | 8,617 | | | | 8,674 | | | | 8,874 | |
| | | | 4.70 | % | Dec-2024 | | | | | | | 11,606 | | | | 11,386 | | | | 12,022 | |
| | | | 4.70 | % | Jan-2047 | 3 | | | | | | 5,910 | | | | 5,921 | | | | 5,911 | |
| | | | 4.71 | % | May-2025 | | | | | | | 33,294 | | | | 33,253 | | | | 34,260 | |
| | | | 4.74 | % | Feb-2045 | 3 | | | | | | 5,947 | | | | 5,770 | | | | 5,994 | |
| | | | 4.76 | % | Apr-2045 | | | | | | | 7,950 | | | | 8,309 | | | | 8,230 | |
| | | | 4.78 | % | Aug-2044 | 3 | | | | | | 9,835 | | | | 9,932 | | | | 9,958 | |
| | | | 4.83 | % | May-2046 | | | | | | | 5,460 | | | | 5,460 | | | | 4,942 | |
| | | | 4.84 | % | Dec-2044 | | | | | | | 6,732 | | | | 7,070 | | | | 6,895 | |
| | | | 4.88 | % | Mar-2036 | | | | | | | 11,749 | | | | 11,589 | | | | 12,124 | |
| | | | 4.92 | % | Feb-2034-May-2034 | | | | | | | 60,821 | | | | 60,524 | | | | 63,725 | |
| | | | 4.94 | % | Jun-2046 | 3 | | | | | | 3,895 | | | | 3,899 | | | | 3,774 | |
| | | | 5.00 | % | Dec-2033 | | | | | | | 5,041 | | | | 5,083 | | | | 5,047 | |
| | | | 5.04 | % | Aug-2032 | | | | | | | 11,420 | | | | 11,376 | | | | 11,853 | |
| | | | 5.05 | % | Apr-2049 | 3 | | | | | | 2,950 | | | | 2,957 | | | | 2,717 | |
| | | | 5.12 | % | Feb-2037 | | | | | | | 10,000 | | | | 10,161 | | | | 10,387 | |
| | | | 5.13 | % | Jul-2024 | | | | | | | 2,934 | | | | 2,924 | | | | 3,001 | |
| | | | 5.15 | % | Jun-2023 | | | | | | | 31,661 | | | | 32,053 | | | | 32,612 | |
continued
Schedule of Portfolio Investments December 31, 2009 (Dollars in thousands)
Ginnie Mae Securities (28.0% of net assets) continued
| | | Interest | | Maturity | | Commitment | | | Face | | | Amortized | | | | |
| | | Rate | | Date | | Amount | | | Amount | | | Cost | | | Value | |
| | | | 5.18 | % | May-2042 | | | $ | | | | $ | 2,190 | | | $ | 2,213 | | | $ | 2,255 | |
| | | | 5.19 | % | May-2045 | | | | | | | | 8,865 | | | | 8,641 | | | | 9,190 | |
| | | | 5.20 | % | Jan-2047 | | | | | | | | 25,711 | | | | 25,946 | | | | 25,711 | |
| | | | 5.21 | % | Jan-2045-Jan-2047 | | | | | | | | 21,418 | | | | 21,291 | | | | 22,027 | |
| | | | 5.25 | % | Feb-2031 | 3 | | | | | | | 38,751 | | | | 38,643 | | | | 38,947 | |
| | | | 5.30 | % | Apr-2039 | | | | | | | | 55,000 | | | | 54,155 | | | | 58,091 | |
| | | | 5.32 | % | Aug-2030 | | | | | | | | 34,888 | | | | 34,746 | | | | 36,541 | |
| | | | 5.34 | % | Jul-2040-Mar-2046 | | | | | | | | 29,023 | | | | 28,712 | | | | 28,826 | |
| | | | 5.38 | % | Apr-2025 | 3 | | | | | | | 453 | | | | 463 | | | | 468 | |
| | | | 5.40 | % | Mar-2049 | | | | | | | | 4,088 | | | | 4,134 | | | | 4,293 | |
| | | | 5.45 | % | Mar-2042 | | | | | | | | 2,274 | | | | 2,348 | | | | 2,374 | |
| | | | 5.46 | % | Feb-2047 | | | | | | | | 3,079 | | | | 3,099 | | | | 3,211 | |
| | | | 5.49 | % | Aug-2027 | | | | | | | | 13,364 | | | | 14,132 | | | | 13,989 | |
| | | | 5.50 | % | Sep-2023-Jul-2033 | | | | | | | | 37,814 | | | | 39,268 | | | | 39,524 | |
| | | | 5.55 | % | May-2026-Mar-2045 | | | | | | | | 14,778 | | | | 14,806 | | | | 15,289 | |
| | | | 5.58 | % | May-2031-Oct-2031 | | | | | | | | 94,582 | | | | 94,892 | | | | 99,706 | |
| | | | 5.68 | % | Jul-2027 | | | | | | | | 15,152 | | | | 15,118 | | | | 16,136 | |
| | | | 5.70 | % | Mar-2037 | | | | | | | | 2,403 | | | | 2,414 | | | | 2,420 | |
| | | | 5.75 | % | Dec-2026 | | | | | | | | 3,622 | | | | 3,667 | | | | 3,795 | |
| | | | 5.85 | % | Nov-2045 | | | | | | | | 1,931 | | | | 1,935 | | | | 2,035 | |
| | | | 5.88 | % | Oct-2038 | | | | | | | | 5,520 | | | | 5,706 | | | | 5,888 | |
| | | | 6.00 | % | Jan-2046 | | | | | | | | 3,597 | | | | 3,600 | | | | 3,801 | |
| | | | 6.22 | % | Sep-2038 | | | | | | | | 14,224 | | | | 14,233 | | | | 14,935 | |
| | | | 6.25 | % | Nov-2038 | | | | | | | | 4,749 | | | | 5,013 | | | | 5,085 | |
| | | | 6.26 | % | Apr-2027 | | | | | | | | 10,000 | | | | 10,612 | | | | 10,736 | |
| | | | 6.37 | % | Mar-2026 | | | | | | | | 8,727 | | | | 8,938 | | | | 9,181 | |
| | | | 6.41 | % | Aug-2023 | | | | | | | | 1,376 | | | | 1,376 | | | | 1,408 | |
| | | | 7.75 | % | Aug-2035 | | | | | | | | 50,755 | | | | 50,504 | | | | 53,293 | |
| | | | | | | | | | | | | | 932,583 | | | | 933,862 | | | | 961,488 | |
Forward Commitments1 | | | 4.25 | % | Feb-2050 | | | | 26,059 | | | | - | | | | - | | | | (662 | ) |
| | | | 4.50 | % | Feb-2045 | | | | 3,600 | | | | - | | | | 9 | | | | (42 | ) |
| | | | | | | | | | 29,659 | | | | - | | | | 9 | | | | (704 | ) |
| Total Ginnie Mae Securities | | | | | | | | $ | 29,659 | | | $ | 981,445 | | | $ | 982,779 | | | $ | 1,012,872 | |
AFL-CIO HOUSING INVESTMENT TRUST
Ginnie Mae Construction Securities (1.8% of net assets)
| | | Interest Rates2 | | | | | | | | | | | | | | |
| | | Permanent | | | Construction | | Maturity Date | | Commitment Amount | | | Face Amount | | | Amortized Cost | | | Value | |
Multifamily1 | | | 4.63 | % | | | 4.63 | % | Sep-20373 | | $ | 1,500 | | | $ | 1,500 | | | $ | 1,456 | | | $ | 1,326 | |
| | | | 4.90 | % | | | 4.90 | % | Mar-20443 | | | 1,000 | | | | 1,000 | | | | 990 | | | | 909 | |
| | | | 5.35 | % | | | 6.75 | % | May-2051 | | | 24,030 | | | | 2,884 | | | | 3,325 | | | | 3,038 | |
| | | | 5.40 | % | | | 5.40 | % | Feb-2049 | | | 9,683 | | | | 9,614 | | | | 9,512 | | | | 9,614 | |
| | | | 5.55 | % | | | 5.55 | % | May-20493 | | | 10,685 | | | | 10,685 | | | | 10,689 | | | | 9,890 | |
| | | | 5.68 | % | | | 4.80 | % | Dec-2050 | | | 17,598 | | | | 1,730 | | | | 1,910 | | | | 1,977 | |
| | | | 5.80 | % | | | 5.80 | % | Dec-2049 | | | 10,715 | | | | 9,260 | | | | 9,263 | | | | 9,986 | |
| | | | 5.80 | % | | | 7.75 | % | Feb-2051 | | | 25,805 | | | | 8,243 | | | | 8,251 | | | | 9,469 | |
| | | | 6.15 | % | | | 6.15 | % | Nov-2039 | | | 5,508 | | | | 4,603 | | | | 4,616 | | | | 4,878 | |
| | | | 6.57 | % | | | 6.57 | % | Mar-2050 | | | 15,084 | | | | 14,228 | | | | 14,266 | | | | 15,254 | |
| | | | | | | | | | | | | 121,608 | | | | 63,747 | | | | 64,278 | | | | 66,341 | |
Forward Commitments1 | | | 5.35 | % | | | 5.35 | % | Apr-2052 | | | 41,525 | | | | - | | | | 415 | | | | (2,011 | ) |
| Total Ginnie Mae Construction Securities | | | | $ | 163,133 | | | $ | 63,747 | | | $ | 64,693 | | | $ | 64,330 | |
Fannie Mae Securities (42.5% of net assets)
| | | Interest Rate | | | | Maturity Date | | | | | Face Amount | | | Amortized Cost | | | Value | |
| Single Family | | | 0.63 | % | 4 | | Jun-2036 | | $ | | | | $ | 23,196 | | | $ | 22,614 | | | $ | 22,795 | |
| | | | 2.69 | % | 4 | | Nov-2033 | | | | | | | 7,589 | | | | 7,594 | | | | 7,796 | |
| | | | 2.62 | % | 4 | | Sep-2035 | | | | | | | 2,620 | | | | 2,608 | | | | 2,701 | |
| | | | 2.63 | % | 4 | | Aug-2034 | | | | | | | 148 | | | | 149 | | | | 153 | |
| | | | 2.72 | % | 4 | | Aug-2033 | | | | | | | 2,448 | | | | 2,444 | | | | 2,540 | |
| | | | 2.76 | % | 4 | | May-2033 | | | | | | | 1,517 | | | | 1,526 | | | | 1,565 | |
| | | | 2.80 | % | 4 | | Jul-2033 | | | | | | | 5,912 | | | | 5,945 | | | | 6,134 | |
| | | | 2.87 | % | 4 | | Aug-2033 | | | | | | | 5,949 | | | | 5,934 | | | | 6,166 | |
| | | | 3.23 | % | 4 | | Aug-2033 | | | | | | | 408 | | | | 406 | | | | 424 | |
| | | | 3.38 | % | 4 | | Jul-2033 | | | | | | | 1,939 | | | | 1,924 | | | | 2,005 | |
| | | | 4.00 | % | | | Mar-2039-Apr-2039 | | | | | | | 19,350 | | | | 19,449 | | | | 18,720 | |
| | | | 4.50 | % | | | Jun-2018-Aug-2039 | | | | | | | 82,004 | | | | 82,178 | | | | 82,326 | |
| | | | 5.00 | % | | | Jul-2018-Jul-2039 | | | | | | | 91,428 | | | | 91,198 | | | | 94,516 | |
| | | | 5.50 | % | | | Jul-2017-Jun-2038 | | | | | | | 175,109 | | | | 177,162 | | | | 184,244 | |
| | | | 6.00 | % | | | Apr-2016-Nov-2038 | | | | | | | 154,528 | | | | 156,685 | | | | 164,522 | |
| | | | 6.50 | % | | | Nov-2016-Jul-2036 | | | | | | | 46,755 | | | | 47,934 | | | | 50,260 | |
| | | | 7.00 | % | | | Nov-2013-May-2032 | | | | | | | 4,765 | | | | 4,796 | | | | 5,245 | |
| | | | 7.50 | % | | | Nov-2016-Sep-2031 | | | | | | | 1,660 | | | | 1,641 | | | | 1,822 | |
| | | | 8.00 | % | | | Jun-2012-May-2031 | | | | | | | 630 | | | | 636 | | | | 674 | |
| | | | 8.50 | % | | | Jan-2012-Apr-2031 | | | | | | | 586 | | | | 590 | | | | 642 | |
| | | | 9.00 | % | | | Jan-2024-May-2025 | | | | | | | 147 | | | | 148 | | | | 166 | |
| | | | | | | | | | | | | | | 628,688 | | | | 633,561 | | | | 655,416 | |
Multifamily1 | | | 4.10 | % | | | Jun-2027 | | | | | | | 2,635 | | | | 2,588 | | | | 2,654 | |
| | | | 4.22 | % | | | Jul-2018 | | | | | | | 3,930 | | | | 3,751 | | | | 4,057 | |
| | | | 4.27 | % | | | Nov-2019 | | | | | | | 6,497 | | | | 6,565 | | | | 6,406 | |
| | | | 4.32 | % | | | Nov-2019 | | | | | | | 3,216 | | | | 3,273 | | | | 3,182 | |
| | | | 4.33 | % | | | Nov-2019 | | | | | | | 2,997 | | | | 3,052 | | | | 2,966 | |
| | | | 4.48 | % | | | Oct-2031 | | | | | | | 3,400 | | | | 3,400 | | | | 3,464 | |
Schedule of Portfolio Investments December 31, 2009 (Dollars in thousands)
Fannie Mae Securities (42.5% of net assets) continued
| | | Interest | | Maturity | | Commitment | | | Face | | | Amortized | | | | |
| | | Rate | | Date | | Amount | | | Amount | | | Cost | | | Value | |
| | | | 4.52 | % | Nov-2019 | | $ | | | | $ | 3,229 | | | $ | 3,278 | | | $ | 3,240 | |
| | | | 4.55 | % | Nov-2019 | | | | | | | 3,047 | | | | 3,107 | | | | 3,064 | |
| | | | 4.56 | % | Jul-2019 | | | | | | | 7,695 | | | | 7,717 | | | | 7,763 | |
| | | | 4.64 | % | Aug-2019 | | | | | | | 19,000 | | | | 19,571 | | | | 19,231 | |
| | | | 4.66 | % | Jul-2021-Sep-2033 | | | | | | | 8,223 | | | | 8,308 | | | | 8,423 | |
| | | | 4.67 | % | Aug-2033 | | | | | | | 9,600 | | | | 9,580 | | | | 9,926 | |
| | | | 4.68 | % | Jul-2019 | | | | | | | 14,134 | | | | 14,309 | | | | 14,374 | |
| | | | 4.80 | % | Jun-2019 | | | | | | | 2,316 | | | | 2,356 | | | | 2,376 | |
| | | | 4.86 | % | May-2019 | | | | | | | 1,549 | | | | 1,586 | | | | 1,596 | |
| | | | 4.89 | % | Nov-2019 | | | | | | | 900 | | | | 949 | | | | 924 | |
| | | | 4.93 | % | Nov-2013 | | | | | | | 46,174 | | | | 46,110 | | | | 49,170 | |
| | | | 4.94 | % | Apr-2019 | | | | | | | 3,500 | | | | 3,596 | | | | 3,608 | |
| | | | 4.99 | % | Apr-2021 | | | | | | | 40,000 | | | | 40,005 | | | | 40,334 | |
| | | | 5.00 | % | Jun-2019 | | | | | | | 2,014 | | | | 2,070 | | | | 2,088 | |
| | | | 5.02 | % | Jun-2019 | | | | | | | 875 | | | | 880 | | | | 906 | |
| | | | 5.04 | % | Jun-2019 | | | | | | | 1,989 | | | | 2,074 | | | | 2,062 | |
| | | | 5.05 | % | Jun-2019-Jul-2019 | | | | | | | 3,352 | | | | 3,489 | | | | 3,475 | |
| | | | 5.09 | % | Jun-2018 | | | | | | | 6,700 | | | | 6,943 | | | | 7,044 | |
| | | | 5.11 | % | Jul-2019 | | | | | | | 931 | | | | 941 | | | | 969 | |
| | | | 5.12 | % | Jul-2019 | | | | | | | 9,242 | | | | 9,398 | | | | 9,632 | |
| | | | 5.13 | % | Jul-2019 | | | | | | | 946 | | | | 957 | | | | 986 | |
| | | | 5.15 | % | Oct-2022 | | | | | | | 4,188 | | | | 4,205 | | | | 4,276 | |
| | | | 5.16 | % | Jan-2018 | | | | | | | 5,535 | | | | 5,442 | | | | 5,845 | |
| | | | 5.25 | % | Jan-2020 | | | | | | | 7,200 | | | | 7,218 | | | | 7,531 | |
| | | | 5.29 | % | Apr-2017-May-2022 | | | | | | | 9,093 | | | | 9,081 | | | | 9,573 | |
| | | | 5.34 | % | Apr-2016 | | | | | | | 6,448 | | | | 6,425 | | | | 6,883 | |
| | | | 5.35 | % | Apr-2012-Jun-2018 | | | | | | | 3,166 | | | | 3,176 | | | | 3,355 | |
| | | | 5.36 | % | Mar-2036 | | | | | | | 5,000 | | | | 5,011 | | | | 5,328 | |
| | | | 5.43 | % | Nov-2018 | | | | | | | 1,340 | | | | 1,335 | | | | 1,342 | |
| | | | 5.44 | % | Mar-2016 | | | | | | | 3,804 | | | | 3,836 | | | | 4,077 | |
| | | | 5.45 | % | May-2033 | | | | | | | 3,111 | | | | 3,142 | | | | 3,206 | |
| | | | 5.46 | % | Feb-2017 | | | | | | | 47,882 | | | | 48,370 | | | | 51,189 | |
| | | | 5.47 | % | Aug-2024 | | | | | | | 8,747 | | | | 8,913 | | | | 8,976 | |
| | | | 5.53 | % | Apr-2017 | | | | | | | 65,812 | | | | 65,695 | | | | 70,310 | |
| | | | 5.55 | % | Apr-2018 | | | | | | | 31,000 | | | | 31,009 | | | | 32,997 | |
| | | | 5.59 | % | May-2017 | | | | | | | 7,275 | | | | 7,276 | | | | 7,800 | |
| | | | 5.60 | % | Feb-2018-Jan-2024 | | | | | | | 12,276 | | | | 12,257 | | | | 12,825 | |
| | | | 5.62 | % | Jun-2011 | | | | | | | 28,946 | | | | 28,902 | | | | 28,974 | |
| | | | 5.63 | % | Dec-2019 | | | | | | | 12,260 | | | | 12,347 | | | | 13,093 | |
| | | | 5.70 | % | Jun-2016 | | | | | | | 1,435 | | | | 1,461 | | | | 1,545 | |
| | | | 5.80 | % | Jun-2018 | | | | | | | 72,006 | | | | 71,642 | | | | 77,014 | |
| | | | 5.86 | % | Dec-2016 | | | | | | | 319 | | | | 321 | | | | 346 | |
| | | | 5.91 | % | Mar-2037 | | | | | | | 2,124 | | | | 2,188 | | | | 2,225 | |
| | | | 5.92 | % | Dec-2016 | | | | | | | 310 | | | | 312 | | | | 336 | |
| | | | 5.93 | % | Apr-2012 | | | | | | | 1,728 | | | | 1,823 | | | | 1,845 | |
continued
AFL-CIO HOUSING INVESTMENT TRUST
Fannie Mae Securities (42.5% of net assets) continued
| | | | | | | | | | | | | | | | | |
| | | Interest Rate | | Maturity Date | | | | | Face Amount | | | Amortized Cost | | | Value | |
| | | | 5.96 | % | Jan-2029 | | $ | | | | $ | 459 | | | $ | 465 | | | $ | 484 | |
| | | | 6.03 | % | Jun-2017-Jun-2036 | | | | | | | 5,695 | | | | 5,849 | | | | 6,077 | |
| | | | 6.06 | % | Jul-2034 | | | | | | | 10,251 | | | | 10,628 | | | | 10,807 | |
| | | | 6.10 | % | Apr-2011 | | | | | | | 2,652 | | | | 2,666 | | | | 2,727 | |
| | | | 6.11 | % | Aug-2017 | | | | | | | 6,949 | | | | 7,009 | | | | 7,521 | |
| | | | 6.13 | % | Dec-2016 | | | | | | | 3,587 | | | | 3,706 | | | | 3,870 | |
| | | | 6.14 | % | Sep-2033 | | | | | | | 313 | | | | 307 | | | | 331 | |
| | | | 6.15 | % | Jan-2023-Oct-2032 | | | | | | | 7,547 | | | | 7,626 | | | | 8,038 | |
| | | | 6.16 | % | Aug-2013 | | | | | | | 9,287 | | | | 9,602 | | | | 9,308 | |
| | | | 6.19 | % | Jul-2013 | | | | | | | 5,000 | | | | 5,201 | | | | 5,402 | |
| | | | 6.22 | % | Aug-2032 | | | | | | | 1,828 | | | | 1,881 | | | | 1,954 | |
| | | | 6.23 | % | Sep-2034 | | | | | | | 1,494 | | | | 1,576 | | | | 1,606 | |
| | | | 6.27 | % | Jan-2012 | | | | | | | 2,045 | | | | 2,033 | | | | 2,171 | |
| | | | 6.28 | % | Nov-2028 | | | | | | | 3,247 | | | | 3,474 | | | | 3,463 | |
| | | | 6.35 | % | Jun-2020-Aug-2032 | | | | | | | 15,196 | | | | 15,507 | | | | 16,101 | |
| | | | 6.38 | % | Jul-2021 | | | | | | | 5,770 | | | | 5,912 | | | | 6,138 | |
| | | | 6.39 | % | Apr-2019 | | | | | | | 993 | | | | 1,039 | | | | 1,069 | |
| | | | 6.44 | % | Apr-2014-Dec-2018 | | | | | | | 45,196 | | | | 45,444 | | | | 48,945 | |
| | | | 6.52 | % | May-2029 | | | | | | | 5,698 | | | | 6,256 | | | | 6,106 | |
| | | | 6.63 | % | Jun-2014-Apr-2019 | | | | | | | 4,302 | | | | 4,315 | | | | 4,646 | |
| | | | 6.65 | % | Aug-2011 | | | | | | | 1,671 | | | | 1,688 | | | | 1,755 | |
| | | | 6.80 | % | Jul-2016 | | | | | | | 698 | | | | 698 | | | | 768 | |
| | | | 6.85 | % | Aug-2014 | | | | | | | 43,598 | | | | 43,390 | | | | 48,299 | |
| | | | 6.88 | % | Feb-2028 | | | | | | | 4,728 | | | | 5,193 | | | | 5,120 | |
| | | | 7.00 | % | Jun-2018 | | | | | | | 3,436 | | | | 3,436 | | | | 3,768 | |
| | | | 7.01 | % | Apr-2031 | | | | | | | 3,384 | | | | 3,407 | | | | 3,680 | |
| | | | 7.07 | % | Feb-2031 | | | | | | | 17,055 | | | | 17,338 | | | | 18,598 | |
| | | | 7.18 | % | Aug-2016 | | | | | | | 437 | | | | 437 | | | | 483 | |
| | | | 7.20 | % | Apr-2010-Aug-2029 | | | | | | | 8,598 | | | | 8,379 | | | | 9,328 | |
| | | | 7.25 | % | Jul-2012 | | | | | | | 7,194 | | | | 7,194 | | | | 7,327 | |
| | | | 7.26 | % | Dec-2018 | | | | | | | 11,300 | | | | 12,078 | | | | 12,408 | |
| | | | 7.50 | % | Dec-2014 | | | | | | | 1,286 | | | | 1,281 | | | | 1,425 | |
| | | | 7.75 | % | Dec-2012-Dec-2024 | | | | | | | 3,004 | | | | 3,003 | | | | 3,279 | |
| | | | 8.00 | % | Nov-2019 | | | | | | | 1,897 | | | | 1,887 | | | | 1,902 | |
| | | | 8.13 | % | Sep-2012-Aug-2020 | | | | | | | 7,102 | | | | 7,064 | | | | 7,133 | |
| | | | 8.38 | % | Jan-2022 | | | | | | | 857 | | | | 855 | | | | 859 | |
| | | | 8.40 | % | Jul-2023 | | | | | | | 479 | | | | 470 | | | | 536 | |
| | | | 8.50 | % | Nov-2019 | | | | | | | 3,616 | | | | 3,812 | | | | 4,067 | |
| | | | 8.63 | % | Sep-2028 | | | | | | | 6,501 | | | | 6,501 | | | | 7,285 | |
| | | | | | | | | | | | | 813,446 | | | | 819,847 | | | | 859,595 | |
Forward Commitments1/TBA5 | | | 4.50 | % | Jan-2040 | 5 | | | | | | 10,000 | | | | 10,086 | | | | 9,988 | |
| | | | 4.69 | % | Jan-2020 | 5 | | | | | | 14,288 | | | | 14,359 | | | | 14,438 | |
| | | | 6.15 | % | Jan-2019 | | | 31,087 | | | | - | | | | - | | | | - | |
| | | | | | | | | 31,087 | | | | 24,288 | | | | 24,445 | | | | 24,426 | |
| Total Fannie Mae Securities | | | | | | | $ | 31,087 | | | $ | 1,466,422 | | | $ | 1,477,853 | | | $ | 1,539,437 | |
Schedule of Portfolio Investments December 31, 2009 (Dollars in thousands)
Freddie Mac Securities (14.3% of net assets)
| | | Interest Rate | | | | Maturity Date | | Face Amount | | | Amortized Cost | | | Value | |
| Single Family | | | 0.53 | % | 4 | | Dec-2035-Feb-2036 | | $ | 35,220 | | | $ | 35,208 | | | $ | 34,757 | |
| | | | 0.58 | % | 4 | | Apr-2036 | | | 7,026 | | | | 7,017 | | | | 6,902 | |
| | | | 0.63 | % | 4 | | Jul-2036 | | | 45,324 | | | | 44,215 | | | | 44,402 | |
| | | | 2.82 | % | 4 | | Oct-2033 | | | 4,126 | | | | 4,074 | | | | 4,277 | |
| | | | 2.96 | % | 4 | | Jun-2033 | | | 1,574 | | | | 1,570 | | | | 1,633 | |
| | | | 3.36 | % | 4 | | Apr-2035 | | | 892 | | | | 892 | | | | 916 | |
| | | | 3.56 | % | 4 | | Jul-2035 | | | 1,345 | | | | 1,339 | | | | 1,397 | |
| | | | 4.00 | % | | | Apr-2039 | | | 34,207 | | | | 34,388 | | | | 33,029 | |
| | | | 4.50 | % | | | Aug-2018-Dec-2039 | | | 58,318 | | | | 58,150 | | | | 58,836 | |
| | | | 5.00 | % | | | Jan-2019-Feb-2039 | | | 83,071 | | | | 81,516 | | | | 86,099 | |
| | | | 5.50 | % | | | Oct-2017-Jul-2038 | | | 130,037 | | | | 128,476 | | | | 136,658 | |
| | | | 6.00 | % | | | Mar-2014-Feb-2038 | | | 68,239 | | | | 69,484 | | | | 72,821 | |
| | | | 6.50 | % | | | Oct-2013-Nov-2037 | | | 36,124 | | | | 37,535 | | | | 38,730 | |
| | | | 7.00 | % | | | Mar-2011-Mar-2030 | | | 801 | | | | 777 | | | | 854 | |
| | | | 7.50 | % | | | Jul-2010-Apr-2031 | | | 640 | | | | 622 | | | | 690 | |
| | | | 8.00 | % | | | Jul-2012-Feb-2030 | | | 250 | | | | 243 | | | | 270 | |
| | | | 8.50 | % | | | Jun-2010-Jan-2025 | | | 258 | | | | 259 | | | | 288 | |
| | | | 9.00 | % | | | Sep-2010-Mar-2025 | | | 118 | | | | 118 | | | | 133 | |
| | | | | | | | | | | | | | | | | | | | |
| | | | | | | | | | | 507,570 | | | | 505,883 | | | | 522,692 | |
Multifamily1 | | | 5.42 | % | | | Apr-2016 | | | 10,000 | | | | 9,930 | | | | 10,367 | |
| | | | 5.65 | % | | | Apr-2016 | | | 9,846 | | | | 9,838 | | | | 10,383 | |
| | | | | | | | | | | 19,846 | | | | 19,768 | | | | 20,750 | |
TBA5 | | | 4.00 | % | | | Jan-2040 | | | (25,000 | ) | | | (24,648 | ) | | | (24,117 | ) |
| Total Freddie Mac Securities | | | | | | | | | $ | 502,416 | | | $ | 501,003 | | | $ | 519,325 | |
Commercial Mortgage-Backed Securities1 (1.4% of net assets)
| Issuer | | Interest Rate | | Maturity Date | Face Amount | | | Amortized Cost | | | Value |
| Credit Suisse | | | 5.10 | % | Aug-2038 | | $ | 10,000 | | | $ | 10,039 | | | $ | 9,655 | |
| Lehman Brothers | | | 5.16 | % | Feb-2031 | | | 19,500 | | | | 19,157 | | | | 18,556 | |
| Credit Suisse | | | 5.61 | % | Feb-2039 | | | 25,000 | | | | 25,165 | | | | 24,200 | |
| Total Commercial Mortgage-Backed Securities | | | | $ | 54,500 | | | $ | 54,361 | | | $ | 52,411 | | |
AFL-CIO HOUSING INVESTMENT TRUST
Government-Sponsored Enterprise Securities (1.6% of net assets)
| Issuer | | Interest Rate | | Maturity Date | | Face Amount | | | Amortized Cost | | | Value | |
| Freddie Mac | | | 3.75 | % | Mar-2019 | | $ | 30,000 | | | $ | 29,608 | | | $ | 29,432 | |
| Freddie Mac | | | 5.00 | % | Apr-2017 | | $ | 25,000 | | | $ | 25,432 | | | $ | 27,085 | |
| Total Government-Sponsored Enterprise Securities | | | | $ | 55,000 | | | $ | 55,040 | | | $ | 56,517 | |
State Housing Finance Agency Securities (2.8% of net assets)
| | | Interest Rates2 | | Maturity | | Face | | | Amortized | | | | |
| | Issuer | | Permanent | | | Construction | | Date | | Amount | | | Cost | | | Value | |
Multifamily1 | NYC Housing Development Corp | | | N/A | | | | 3.45 | % | May-2013 | | $ | 9,500 | | | $ | 9,513 | | | $ | 9,532 | |
| | MA Housing Finance Agency | | | 4.20 | % | | | | | Jun-2010 | | | 300 | | | | 301 | | | | 305 | |
| | MA Housing Finance Agency | | | 4.40 | % | | | | | Nov-2024 | | | 4,120 | | | | 4,120 | | | | 4,098 | |
| | MA Housing Finance Agency | | | 4.90 | % | | | | | Nov-2034 | | | 5,000 | | | | 5,000 | | | | 4,978 | |
| | MA Housing Finance Agency | | | 4.95 | % | | | | | Nov-2039 | | | 5,880 | | | | 5,880 | | | | 5,852 | |
| | NYC Housing Development Corp | | | 5.55 | % | | | | | Nov-2039 | | | 5,000 | | | | 4,978 | | | | 5,187 | |
| | NYC Housing Development Corp | | | 5.69 | % | | | | | Nov-2018 | | | 7,245 | | | | 7,250 | | | | 7,114 | |
| | MA Housing Finance Agency | | | 5.70 | % | | | | | Jun-2040 | | | 14,885 | | | | 14,886 | | | | 14,673 | |
| | MA Housing Finance Agency | | | 5.92 | % | | | | | Dec-2037 | | | 6,575 | | | | 6,579 | | | | 5,036 | |
| | NYC Housing Development Corp | | | 6.42 | % | | | | | Nov-2039 | | | 22,000 | | | | 22,000 | | | | 21,103 | |
| | MA Housing Finance Agency | | | 6.50 | % | | | | | Dec-2039 | | | 755 | | | | 759 | | | | 679 | |
| | MA Housing Finance Agency | | | 6.58 | % | | | | | Dec-2039 | | | 11,385 | | | | 11,386 | | | | 10,848 | |
| | MA Housing Finance Agency | | | 6.70 | % | | | | | Jun-2040 | | | 12,145 | | | | 12,146 | | | | 10,988 | |
| Total State Housing Finance Agency Securities | | | | | | | | $ | 104,790 | | | $ | 104,798 | | | $ | 100,393 | |
Other Multifamily Investments (0.4% of net assets)
| | Interest Rates4 | | Maturity | | Commitment | | | Face | | | Amortized | | | | |
| | Permanent | | Construction | | Date | | Amount | | | Amount | | | Cost | | | Value | |
Multifamily Construction/Permanent Mortgages1 | | | | | | | | | | | | | | |
| | 7.63 | % | 6 | | | N/A | | Jan-2011 | | $ | 813 | | | $ | 69 | | | $ | 69 | | | $ | 70 | |
| | 8.63 | % | | | | N/A | | Jun-2025 | | | 1,469 | | | | 1,175 | | | | 1,171 | | | | 1,164 | |
| | 9.50 | % | | | | N/A | | Apr-2024 | | | 760 | | | | 633 | | | | 633 | | | | 633 | |
| | | | | | | | | | | | 3,042 | | | | 1,877 | | | | 1,873 | | | | 1,867 | |
| | | | | | | | | | | | | | | | | | | | | | | | | |
Privately Insured Construction/Permanent Mortgages1,7 | | | | | | | | | | | | | | | | | | |
| | 5.40 | % | | | | 5.40 | % | Mar-2047 | | | 9,000 | | | | 8,811 | | | | 8,823 | | | | 6,507 | |
| | 5.73 | % | | | | 5.73 | % | Aug-2047 | | | 5,575 | | | | 5,484 | | | | 5,488 | | | | 4,097 | |
| | N/A | | | | | 6.20 | % | Dec-2047 | | | 3,325 | | | | 3,285 | | | | 3,304 | | | | 2,517 | |
| | 6.40 | % | | | | 6.40 | % | Nov-2048 | | | 993 | | | | 987 | | | | 1,003 | | | | 747 | |
| | | | | | | | | | | | 18,893 | | | | 18,567 | | | | 18,618 | | | | 13,868 | |
| Total Other Multifamily Investments | | | | | | | | | $ | 21,935 | | | $ | 20,444 | | | $ | 20,491 | | | $ | 15,735 | |
Schedule of Portfolio Investments December 31, 2009 (Dollars in thousands)
United States Treasury Securities (3.0% of net assets)
| | | Interest Rate | | Maturity Date | | Face Amount | | | Amortized Cost | | | Value | |
| | | | 2.63 | % | Jun-2014 | | $ | 25,000 | | | $ | 25,318 | | | $ | 25,186 | |
| | | | 3.38 | % | Nov-2019 | | | 50,000 | | | | 49,408 | | | | 48,102 | |
| | | | 3.63 | % | Aug-2019 | | | 15,000 | | | | 14,863 | | | | 14,750 | |
| | | | 4.00 | % | Aug-2018 | | | 10,000 | | | | 10,035 | | | | 10,215 | |
| | | | 4.50 | % | May-2038 | | | 10,000 | | | | 11,468 | | | | 9,798 | |
| Total United States Treasury Securities | | $ | 110,000 | | | $ | 111,092 | | | $ | 108,051 | |
| | | | | | | | | | | | | | | | | | |
| Total Investments | | | $ | 3,487,063 | | | $ | 3,500,131 | | | $ | 3,600,781 | |
1 | Valued by the HIT’s management in accordance with the fair value procedures adopted by the HIT’s Board of Trustees. |
2 | Construction interest rates are the rates charged to the borrower during the construction phase of the project. The permanent interest rates are charged to the borrower during the amortization period of the loan, unless the U.S. Department of Housing and Urban Development requires that such rates be charged earlier. |
3 | Tax-exempt bonds collateralized by Ginnie Mae securities. |
| 4 | The coupon rate shown on floating or adjustable rate securities represents the rate at period end. |
5 | Represents to be announced (TBA) securities: the particular securities to be delivered are not identified at the trade date. However, delivered securities must meet specified terms, including issuer, rate, and mortgage term, and be within industry-accepted “good delivery” standards. Until settlement, the HIT maintains cash reserves and liquid assets sufficient to settle its TBA commitments. |
6 | Non-income producing security; security is delinquent. |
7 | Loans insured by Ambac Assurance Corporation, which are additionally backed by a repurchase option from the mortgagee for the benefit of the HIT. The repurchase option can be exercised by the HIT in the event of a payment failure by Ambac Assurance Corporation. |
See accompanying Notes to Financial Statements.
AFL-CIO HOUSING INVESTMENT TRUST
Statement of Operations
For the Year Ended December 31, 2009 (Dollars in thousands)
| Investment income | | $ | 177,201 | |
| | | | | |
| Expenses | | | | |
| Non-officer salaries and fringe benefits | | | 6,974 | |
| Officer salaries and fringe benefits | | | 3,519 | |
| Legal fees | | | 426 | |
| Consulting fees | | | 308 | |
| Auditing, tax and accounting fees | | | 323 | |
| Insurance | | | 323 | |
| Marketing and sales promotion (12b-1) | | | 405 | |
| Investment management | | | 696 | |
| Trustee expenses | | | 33 | |
| Rental expenses | | | 989 | |
| General expenses | | | 1,365 | |
| Total expenses | | | 15,361 | |
| | | | | |
| Net investment income | | | 161,840 | |
| Net realized loss on investments | | | (5,104 | ) |
| Net change in unrealized appreciation investments | | | 58,692 | |
| Realized and unrealized net gain on investments | | | 53,588 | |
| | | | | |
| Increase in net assets from operations | | $ | 215,428 | |
See accompanying Notes to Financial Statements
Statements of Changes in Net Assets
For the Years Ended December 31, 2009 and 2008 (Dollars in thousands)
| Increase in net assets from operations | | 2009 | | | 2008 | |
| Net investment income | | $ | 161,840 | | | $ | 178,085 | |
| Net realized gain (loss) on investments | | | (5,104 | ) | | | 22,522 | |
| Net change in unrealized appreciation (depreciation) on investments | | | 58,692 | | | | (21,683 | ) |
| Net increase in net assets resulting from operations | | | 215,428 | | | | 178,924 | |
| | | | | | | | | |
| Decrease in net assets from distributions | | | | | | | | |
| Distributions to participants or reinvested from: | | | | | | | | |
| Net investment income | | | (164,753 | ) | | | (180,299 | ) |
| Net decrease in net assets from distributions | | | (164,753 | ) | | | (180,299 | ) |
| | | | | | | | | |
| Increase (decrease) in net assets from unit transactions | | | | | | | | |
| Proceeds from the sale of units of participation | | | 213,962 | | | | 24,419 | |
| Dividend reinvestment of units of participation | | | 147,839 | | | | 158,864 | |
| Payments for redemption of units of participation | | | (256,642 | ) | | | (431,078 | ) |
| Net increase (decrease) from unit transactions | | | 105,159 | | | | (247,795 | ) |
| | | | | | | | | |
| Total increase (decrease) in net assets | | | 155,834 | | | | (249,170 | ) |
| Net assets | | | | | | | | |
| Beginning of period | | $ | 3,467,603 | | | $ | 3,716,773 | |
| End of period | | $ | 3,623,437 | | | $ | 3,467,603 | |
| | | | | | | | | |
| Distribution in excess of net investment income | | $ | (2,928 | ) | | $ | (2,965 | ) |
| | | | | | | | | |
| Unit information | | | | | | | | |
| Units sold | | | 191,963 | | | | 22,566 | |
| Distributions reinvested | | | 132,600 | | | | 146,668 | |
| Units redeemed | | | (230,734 | ) | | | (400,621 | ) |
| Increase (decrease) in units outstanding | | | 93,829 | | | | (231,387 | ) |
See accompanying Notes to Financial Statements.
AFL-CIO HOUSING INVESTMENT TRUST
Notes to Financial Statements
Note 1. Summary of Significant Accounting Policies
The American Federation of Labor and Congress of Industrial Organizations (AFL-CIO) Housing Investment Trust (HIT) is a common law trust created under the laws of the District of Columbia and is registered under the Investment Company Act of 1940, as amended (the Investment Company Act), as a no-load, open-end investment company. The HIT has obtained certain exemptions from the requirements of the Investment Company Act that are described in the HIT’s Prospectus and Statement of Additional Information.
Participation in the HIT is limited to eligible labor organizations and pension, welfare and retirement plans that have beneficiaries who are represented by labor organizations.
The following is a summary of significant accounting policies followed by the HIT in the preparation of its financial statements. The policies are in conformity with generally accepted accounting principles (GAAP) in the United States.
INVESTMENT VALUATION
Net asset value per share (NAV) is calculated as of the close of business of the major bond markets in New York City on the last business day of the month. A description of the valuation techniques applied to the HIT’s major categories of assets and liabilities measured at fair value on a recurring basis follows.
Portfolio securities for which market quotations are readily available (U.S. Treasury securities, government-sponsored enterprise securities, single family mortgage-backed securities, and state housing finance agency securities) are valued by independent pricing services, published prices, market quotes and bids from dealers who make markets in such securities. For U.S. Treasury securities, pricing services generally base prices on actual transactions as well as dealer supplied prices. For government-sponsored enterprise securities and single family mortgage-backed securities, pricing services generally base prices on discounted cash flow models and examine reference data such as issue name, issue size, ratings, maturity, call type, spread/benchmark yields and conditional prepayme nt rates, as well as, dealer supplied prices. For state housing finance agency securities, pricing services generally base prices on trading spreads, new issue scales, verified bid information, and credit ratings.
Portfolio investments for which market quotations are not readily available (multifamily mortgage-backed securities, mortgage securities, and construction mortgage securities and loans) are valued at their fair value determined in good faith under consistently applied procedures adopted by the Board of Trustees using dealer quotes and discounted cash flow models. The respective cash flow models utilize inputs from matrix pricing which considers market-based discount and prepayment rates, attributes of the collateral, and yield or price of bonds of comparable quality, coupon, maturity and type. The market-based discount rate is composed of a risk-free yield (i.e., a U.S. Treasury note) adjusted for an appropriate risk premium. The risk premium reflects premiums in the marketplace over the yield on U.S. Treasury securities of comparable ris k and average life to the security being valued as adjusted for other market considerations, such as: significant market or security specific events, changes in interest rates and credit quality. On investments for which the HIT finances the construction and permanent securities or participation interests, value is determined based upon the total amount, funded and/or unfunded, of the commitment. Commercial mortgage-backed securities and real estate mortgage investment conduits are valued by using a dealer quote. The HIT has retained an independent firm to determine the fair market value of such securities. In accordance with the procedures adopted by the HIT’s Board of Trustees, the monthly third-party valuation is reviewed by the HIT staff to determine whether valuation adjustments are appropriate based on any material impairments in value arising from specific facts and circumstances of the investment (e.g., prepayment speed). All such adjustments must be reviewed and reconciled with the independent valuation firm prior to incorporation in the NAV.
Short-term investments with remaining maturities of sixty days or less are valued at amortized cost, which approximates value. Cash and cash equivalents include overnight money market funds, which are also carried at cost.
Notes to Financial Statements
GAAP establishes a disclosure hierarchy that categorizes the inputs to valuation techniques used to value assets and liabilities at measurement date. The HIT classifies its assets and liabilities into three levels based on the method used to value the assets or liabilities. Level 1 values are based on quoted prices in active markets for identical securities. Level 2 values are based on significant observable market inputs, such as quoted prices for similar securities, interest rates, prepayment speeds, credit risk and quoted prices in inactive markets. Level 3 values are based on significant unobservable inputs that reflect the HIT’s determination of assumptions that market participants might reasonably use in valuing the securities.
The following table presents the HIT’s valuation levels as of December 31, 2009:
Investment securities: ($ in thousands) | | Level 1 | | | Level 2 | | | Level 3 | | | Total | |
| FHA Permanent Securities | | $ | - | | | $ | 131,688 | | | $ | 22 | | | $ | 131,710 | |
| Ginnie Mae Securities | | | - | | | | 960,283 | | | | 53,293 | | | | 1,013,576 | |
| Ginnie Mae Construction Securities | | | - | | | | 66,341 | | | | - | | | | 66,341 | |
| Fannie Mae Securities | | | - | | | | 1,539,437 | | | | - | | | | 1,539,437 | |
| Freddie Mac Securities | | | - | | | | 519,325 | | | | - | | | | 519,325 | |
| Commercial Mortgage-Backed Securities | | | - | | | | 52,411 | | | | - | | | | 52,411 | |
| Government-Sponsored Enterprise Securities | | | - | | | | 56,517 | | | | - | | | | 56,517 | |
| State Housing Finance Agency Securities | | | - | | | | 100,393 | | | | - | | | | 100,393 | |
| Other Multifamily Investments | | | - | | | | 15,735 | | | | - | | | | 15,735 | |
| United States Treasury Securities | | | - | | | | 108,051 | | | | - | | | | 108,051 | |
| Other Financial Instruments* | | | - | | | | (2,715 | ) | | | - | | | | (2,715 | ) |
| Total | | $ | - | | | $ | 3,547,466 | | | $ | 53,315 | | | $ | 3,600,781 | |
*Other financial instruments include forward commitments.
The following table reconciles the valuation of the HIT’s Level 3 investment securities and related transactions for the year ended December 31, 2009.
Investments in Securities ($ in thousands)
| | | FHA Permanent | | | Ginnie Mae | | | Other Multifamily | | | Total | |
| Beginning Balance, 12/31/2008 | | $ | 27 | | | $ | - | | | $ | 1,857 | | | $ | 1,884 | |
| Total Unrealized Gain (Loss) * | | | - | | | | - | | | | (10 | ) | | | (10 | ) |
| Amortization/Accretion | | | (5 | ) | | | - | | | | (50 | ) | | | (55 | ) |
| Transfers in/out of Level 3 | | | - | | | | 53,293 | | | | (1,797 | ) | | | 51,496 | |
| Ending Balance, 12/31/2009 | | $ | 22 | | | $ | 53,293 | | | $ | - | | | $ | 53,315 | |
*Net change in unrealized loss attributable to Level 3 securities still held as of December 31, 2009, was $2,151,000.
USE OF ESTIMATES
The preparation of financial statements in conformity with GAAP requires management to make estimates and assumptions that affect the reported amounts of assets and liabilities at the date of the financial statements and the reported amounts of revenues and expenses during the period. Actual results could differ from those estimates.
FEDERAL INCOME TAXES
The HIT’s policy is to comply with the requirements of the Internal Revenue Code of 1986, as amended (the Internal Revenue Code), that are applicable to regulated investment companies and to distribute all of its taxable income to its participants. Therefore, no federal income tax provision is required.
Tax positions taken or expected to be taken in the course of preparing the HIT’s tax returns are evaluated to determine whether the tax positions are “more-likely-than-not” of being sustained by the applicable tax authority. Tax positions not deemed to meet the more-likely-than-not threshold would be recorded as a tax benefit or expense in the current year. Management has analyzed the HIT’s tax positions taken on federal income tax returns and has concluded that no provision for income tax is required in the HIT’s financial statements.
The HIT files U.S. federal, state, and local tax returns as required. The HIT’s tax returns are subject to examination by the relevant tax authorities until the expiration of the applicable statutes of limitations, which is generally three years after the filing of the tax return but could be longer in certain circumstances.
DISTRIBUTIONS TO PARTICIPANTS
At the end of each calendar month, a pro rata distribution is made to participants of the net investment income earned during the month. This pro-rata distribution is based on the participant’s number of units held as of the immediately preceding month-end and excludes realized gains (losses) which are distributed at year-end.
Participants redeeming their investments are paid their pro rata share of undistributed net income accrued through the month-end of the month in which they redeem.
The HIT offers an income reinvestment plan that permits current participants automatically to reinvest their income distributions into HIT units of participation. Total reinvestment was approximately 90 percent of distributable income for the year ended December 31, 2009.
AFL-CIO HOUSING INVESTMENT TRUST
INVESTMENT TRANSACTIONS AND INCOME
For financial reporting purposes, security transactions are accounted for as of the trade date. Gains and losses on securities sold are determined on the basis of amortized cost. Realized gains (losses) on paydowns of mortgage- and asset-backed securities are classified as interest income. Interest income, which includes amortization of premium and accretion of discount on debt securities, is accrued as earned.
12B-1 PLAN OF DISTRIBUTION
The Board of Trustees annually considers a 12b-1 Plan of Distribution to pay for marketing and sales promotion expenses incurred in connection with the offer and sale of units and related distribution activities (12b-1 expenses). For the year 2009, the HIT was authorized to pay 12b-1 expenses in an amount up to $600,000 or 0.05 percent of its average monthly net assets on an annualized basis, whichever is greater. During the year ended December 31, 2009, the HIT incurred approximately $404,600 of 12b-1 expenses.
Note 2. Investment Risks
INTEREST RATE RISK
As with any fixed-income investment, the market value of the HIT’s investments will fall below the principal amount of those investments at times when market interest rates rise above the interest rates of the investments. Rising interest rates may also reduce prepayment rates, causing the average life of the HIT’s investments to increase. This could in turn further reduce the value of the HIT’s portfolio.
PREPAYMENT AND EXTENSION RISK
The HIT invests in certain fixed-income securities whose value is derived from an underlying pool of mortgage loans that are subject to prepayment and extension risk.
Prepayment risk is the risk that a security will pay more quickly than its assumed payment rate, shortening its expected average life, resulting in a lower return from the security. In such an event, the HIT may be required to reinvest the proceeds of such prepayments in other investments bearing lower interest rates. The majority of the HIT’s securities backed by loans for multifamily projects include restrictions on prepayments for specified periods to mitigate this risk.
Extension risk is the risk that a security will pay more slowly than its assumed payment rate, extending its expected average life, resulting in a lower return from the security. When this occurs, the HIT’s ability to reinvest principal repayments in higher returning investments may be limited.
These two risks may increase the sensitivity of the HIT’s portfolio to fluctuations in interest rates and negatively affect the value of the HIT’s portfolio.
Note 3. Transactions with Related Entities
During the year ended December 31, 2009, the HIT provided the time of certain personnel to the AFL-CIO Investment Trust Corporation (ITC), a District of Columbia not-for-profit corporation, on a cost-reimbursement basis. During the period, an employee of the HIT also served as an officer of the ITC. The total cost for such personnel and related expenses for the year ended December 31, 2009, amounted to approximately $309,300. During the year ended December 31, 2009, the HIT was reimbursed for approximately $288,300 of current year costs. As of December 31, 2009, approximately $21,000 is included within the accounts receivable in the accompanying financial statements for amounts outstanding under the arrangement.
The ITC provided the time of certain personnel to the HIT on a cost-reimbursement basis. The total cost for such personnel and related expenses for the year ended December 31, 2009, was approximately $27,000. During the year ended December 31, 2009, the HIT paid the ITC approximately $24,800 of current costs.
Note 4. Commitments
Certain assets of the HIT are invested in short-term investments until they are required to fund purchase commitments for long-term investments. As of December 31, 2009, the HIT had outstanding unfunded purchase commitments of approximately $159.9 million. The HIT maintains a reserve, in the form of securities, of no less than the total of the outstanding unfunded purchase commitments, less short-term investments. As of December 31, 2009, the value of the publicly traded mortgage-backed securities maintained for the reserve in a segregated account was approximately $3.45 billion.
The commitment amounts disclosed on the Schedule of Portfolio Investments represent the original commitment amount, which includes both funded and unfunded commitments.
Note 5. Investment Transactions
Purchases and sales of investments, excluding short-term securities and U.S. Treasury securities, for the year ended December 31, 2009, were $857.9 million and $383.9 million, respectively.
Note 6. Distributions
No provision for federal income taxes is required since the HIT intends to continue to qualify as a regulated investment company under Subchapter M of the Internal Revenue Code and distribute to shareholders all of its taxable income and gains. Federal income tax regulations differ from U.S. generally accepted accounting principles; therefore, distributions determined in accordance with tax regulations may differ in amount or character from net investment income and realized gains for financial reporting purposes. Financial reporting records are adjusted for permanent book/ tax differences to reflect tax character.
The tax character of distributions paid during 2009 and 2008 was as follows (dollars in thousands):
| | | 2009 | | | 2008 | |
| Ordinary investment income | | $ | 164,753 | | | $ | 180,299 | |
| Total distributions paid to participants or reinvested | | $ | 164,753 | | | $ | 180,299 | |
As of December 31, 2009, the components of accumulated earnings on a tax basis were as follows (dollars in thousands):
| | | 2009 | |
| Accumulated capital loss carryforward | | $ | (15,350 | ) |
| Unrealized appreciation | | | 99,818 | |
| Other temporary differences | | | (2,928 | ) |
| Total accumulated earnings | | $ | 81,540 | |
The differences between book basis and tax basis components of net assets are primarily attributable to tax deferral of losses on wash sales and tax treatment of deferred compensation plans.
Of the total accumulated capital loss carryforward of $15,350,000, $28,000 may be used to offset future capital gain recognized by the HIT through December 31, 2014, $7,304,000 through 2015, and $8,018,000 through 2016.
For financial reporting purposes, capital accounts are adjusted to reflect the tax character of permanent book/ tax differences. These reclassifications are primarily due to the different book and tax treatment of paydowns and distributions. Results of operations and net assets were not affected by these reclassifications.
For the year ended December 31, 2009, the HIT recorded the following permanent reclassifications (dollars in thousands):
| | | 2009 | |
| Accumulated net investment loss | | $ | 2,950 | |
| Accumulated net realized losses | | | (2,914 | ) |
| Amount invested and reinvested by current participants | | | (36 | ) |
At December 31, 2009, the cost of investments for federal income tax purposes approximated book cost at amortized cost of $3,500,963,000. Net unrealized gain aggregated $99,818,000 at period-end, of which $127,398,000 related to appreciated investments and $27,580,000 million related to depreciated investments.
Note 7. Retirement and Deferred Compensation Plans
The HIT participates in the AFL-CIO Staff Retirement Plan, which is a multiple employer defined benefit pension plan, covering substantially all employees. This plan was funded by employer contributions, at rates approximating 21 percent of employees’ salaries for the year ended December 31, 2009. The total HIT pension expense for the year ended December 31, 2009, was approximately $1,311,600.
The HIT also participates in a deferred compensation plan, referred to as a 401(k) plan, covering substantially all employees. This plan permits employees to defer the lesser of 100 percent of their total compensation or the applicable IRS limit. During 2009, the HIT matched dollar for dollar the first $4,400 of each employee’s contributions. The HIT’s 401(k) contribution for the year ended December 31, 2009, was approximately $215,900.
Note 8. Loan Facility
The HIT has a $15 million uncommitted loan facility which expired on January 29, 2010. Under this facility, borrowings bear interest per annum as offered by the lender. The HIT had no outstanding balance under the facility for the year ended December 31, 2009. No compensating balances are required. This facility was subsequently extended to January 28, 2011.
Note 9. Contract Obligations
In the ordinary course of business, the HIT enters into contracts that contain a variety of indemnifications. The HIT’s maximum exposure under these arrangements is unknown. However, the HIT has not had prior claims or losses pursuant to these contracts and expects the risk of loss to be low.
Note 10. Subsequent Events
As of February 18, 2010, the date the financial statements were available to be issued, no subsequent events or transactions had occurred that would have materially impacted the financial statements as presented.
AFL-CIO HOUSING INVESTMENT TRUST
Financial Highlights
Selected Per Data and Ratios for the Years Ended December 31 (Dollars in thousands)
| Per share data | | 2009 | | | 2008 | | | 2007 | | | 2006 | | | 2005 | |
| Net asset value, beginning of period | | $ | 1,098.48 | | | $ | 1,097.01 | | | $ | 1,081.27 | | | $ | 1,086.97 | | | $ | 1,110.61 | |
| Income from investment operations: Net investment income | | | 50.68 | * | | | 53.64 | * | | | 52.72 | | | | 53.55 | | | | 50.08 | |
| Net realized and unrealized gains (losses) on investments | | | 17.15 | | | | 1.91 | | | | 17.54 | | | | (4.60 | ) | | | (21.25 | ) |
| Total income from investment operations | | | 67.83 | | | | 55.55 | | | | 70.26 | | | | 48.95 | | | | 28.83 | |
| Less distributions from: | | | | | | | | | | | | | | | | | | | | |
| Net investment income | | | (51.59 | ) | | | (54.08 | ) | | | (54.52 | ) | | | (54.65 | ) | | | (52.47 | ) |
| Net realized gains on investments | | | | | | | - | | | | - | | | | - | | | | - | |
| Total distributions | | | (51.59 | ) | | | (54.08 | ) | | | (54.52 | ) | | | (54.65 | ) | | | (52.47 | ) |
| | | | | | | | | | | | | | | | | | | | | |
| Net asset value, end of period | | $ | 1,114.72 | | | $ | 1,098.48 | | | $ | 1,097.01 | | | $ | 1,081.27 | | | $ | 1,086.97 | |
| Ratios/supplemental data | |
| Ratio of expenses to average net assets | | | 0.43 | % | | | 0.41 | % | | | 0.41 | % | | | 0.41 | % | | | 0.37 | % |
| Ratio of net investment income to average net assets | | | 4.5 | % | | | 5.0 | % | | | 5.0 | % | | | 5.0 | % | | | 4.5 | % |
| Portfolio turnover rate | | | 28.5 | % | | | 23.8 | % | | | 42.1 | % | | | 65.0 | % | | | 68.4 | % |
| | | | | | | | | | | | | | | | | | | | | |
| Number of outstanding units at end of period | | | 3,250,549 | | | | 3,156,720 | | | | 3,388,107 | | | | 3,334,684 | | | | 3,290,698 | |
| | | | | | | | | | | | | | | | | | | | | |
| Net assets, end of period (in thousands) | | $ | 3,623,437 | | | $ | 3,467,603 | | | $ | 3,716,773 | | | $ | 3,605,679 | | | $ | 3,576,875 | |
| | | | | | | | | | | | | | | | | | | | | |
| Total return | | | 6.28 | % | | | 5.25 | % | | | 6.70 | % | | | 4.65 | % | | | 2.64 | % |
*The average shares outstanding method has been applied for this per share information.
See accompanying Notes to Financial Statements.
Board of Trustees
Overall responsibility for the management of the HIT, the establishment of policies and the oversight of activities is vested in its Board of Trustees. The list below provides the following information for each of the Trustees: name, age, address, term of office, length of time served, principal occupations during the past five years and other directorships held.* The HIT’s Statement of Additional Information includes additional information about the Trustees and is available, without charge, upon request, by placing a collect call directed to the HIT’s Investor Relations Office at (202) 331-8055, or by viewing the HIT’s website at www.aflcio-hit.com.
John J. Sweeney,** age 75; 815 16th Street, NW, Washington, DC 20006; Chairman of the Board; service as Trustee commenced 1981, term expires 2010; President Emeritus, AFL-CIO; formerly President, AFL-CIO.
Richard L. Trumka,** age 60; 815 16th Street, NW, Washington, DC 20006; Union Trustee; commenced 1995, term expires 2011; President, AFL-CIO; formerly Secretary- Treasurer, AFL-CIO.
Liz Shuler, age 39, 815 16th Street, NW, Washington, DC 20006; Union Trustee; commenced 2009, term expires 2012; Secretary-Treasurer, AFL-CIO; formerly Executive Assistant to the President, International Brotherhood of Electrical Workers.
Arlene Holt Baker, age 58; 815 16th Street, NW, Washington, DC 20006; Union Trustee; commenced 2008, term expires 2011; Executive Vice-President, AFL-CIO; formerly President, Voices for Working Families and Executive Assistant to the President, AFL-CIO.
Mark Ayers, age 61; 815 16th Street, NW, Suite 600, Washington, DC 20006; Union Trustee; commenced 2008, term expires 2012; President, Building and Construction Trades Department, AFL-CIO; formerly Director, IBEW Construction & Maintenance Division.
John J. Flynn, age 75; 1776 Eye Street, NW, Washington, DC 20006; Union Trustee; commenced 2000, term expires 2012; President, International Union of Bricklayers and Allied Craftworkers.
Stephen Frank, age 69; 8584 Via Avellino, Lake Worth, FL 33467; Management Trustee; commenced 2003, term expires 2012; retired; formerly Vice President and Chief Financial Officer, The Small Business Funding Corporation.
Frank Hurt, age 70; 10401 Connecticut Avenue, Kensington, MD 20895; Union Trustee; commenced 1993, term expires 2010; International President, Bakery, Confectionery & Tobacco Workers and Grain Millers International Union.
George Latimer, age 74; 1600 Grand Avenue, St. Paul, MN 55105; Management Trustee; commenced 1996, term expires 2011; Distinguished Visiting Professor of Urban Land Studies at Macalester College; Director, Identix Incorporated; formerly Director, Special Actions Office, Department of Housing and Urban Development.
Lindell K. Lee, age 67; 900 7th Street, NW, Washington, DC 20001; Union Trustee; commenced 2008, term expires 2012; International Secretary-Treasurer, International Brotherhood of Electrical Workers; formerly International Vice President, IBEW.
Jack Quinn, age 58; 121 Ellicott Street, Buffalo, NY 14203; Management Trustee; commenced 2005, term expires 2011; President, Erie Community College, State University of New York; Director, Kaiser Aluminum Corporation; formerly President, Cassidy & Associates; Member of Congress, 27th District, New York.
Richard Ravitch,** age 76; 610 5th Avenue, Ste. 420, New York, NY 10020; Management Trustee; commenced 1991, term expires 2012; Lieutenant Governor, State of New York; Managing Director, Ravitch Rice & Co. LLC; formerly Co-Chair, Millennial Housing Commission; President and Chief Executive Officer, Player Relations Committee of Major League Baseball.
Marlyn J. Spear,** CFA, age 56; 500 Elm Grove Road, Elm Grove, WI 53122; Management Trustee; commenced 1995, term expires 2012; Chief Investment Officer, Building Trades United Pension Trust Fund (Milwaukee and Vicinity); Director, Baird Funds, Inc.
Tony Stanley,** age 76; 2221 Stonehaven Road, Port St. Lucie, FL 34952; Management Trustee; commenced 1983, term expires 2010; Director, TransCon Builders, Inc.; formerly Executive Vice President, TransCon Builders, Inc.
James A. Williams, age 59; 1750 New York Avenue, NW, Washington, DC 20006; Union Trustee; commenced 2005, term expires 2011; General President, International Union of Painters and Allied Trades of the United States and Canada (IUPAT); formerly General Secretary-Treasurer, IUPAT.
* Only directorships in a corporation or trust having securities registered pursuant to Section 12 of the Securities Exchange Act of 1934, as amended, or subject to the requirements of Section 15(d) of such Act or a company registered as an investment company under the Investment Company Act of 1940, as amended, are listed.
** Executive Committee member.
AFL-CIO HOUSING INVESTMENT TRUST
Leadership
All officers of the HIT are located at 2401 Pennsylvania Avenue, NW, Suite 200, Washington, DC 20037.*
Stephen Coyle,† age 64; Chief Executive Officer, AFL-CIO Housing Investment Trust since 1992.
Theodore S. Chandler,† age 50; Chief Operating Officer, AFL-CIO Housing Investment Trust since 2009; formerly Vice President, Fannie Mae.
Erica Khatchadourian,† age 42; Chief Financial Officer, AFL-CIO Housing Investment Trust since 2001; formerly Controller, Chief of Staff and Director of Operations, AFL-CIO Housing Investment Trust.
Chang Suh,† CFA, age 38; Executive Vice President and Chief Portfolio Manager, AFL-CIO Housing Investment Trust since January 2005; formerly Chief Portfolio Manager, Assistant Portfolio Manager and Senior Portfolio Analyst, AFL-CIO Housing Investment Trust.
Saul A. Schapiro,† age 64; General Counsel, AFL-CIO Housing Investment Trust since 2009; formerly Partner, Rosenberg, Schapiro, Englander, Chicoine & Leggett, P.C.; Outside Counsel to the AFL-CIO Housing Investment Trust.
Debbie Cohen, † age 59; Chief Development Officer, AFL-CIO Housing Investment Trust since 2009, formerly Chief Director of Marketing and Investor Relations and Assistant Portfolio Manager, AFL-CIO Housing Investment Trust; Realtor, Coldwell Banker Realty and Weichert Realty; Senior Director of Planning and Research, Federal Home Loan Banks.
Stephanie H. Wiggins,† age 44; Chief Investment Officer – Multifamily Finance, AFL-CIO Housing Investment Trust since 2001; formerly Director, Fannie Mae Finance, AFL-CIO Housing Investment Trust; Director, Prudential Mortgage Capital Company; Vice President/Multifamily Transaction Manager, WMF Capital Corporation.
Marcie Cohen,† age 62; Senior Vice President and Chief Housing Policy Adviser, AFL-CIO Housing Investment Trust since 2002; formerly Director of the New York Office and Director of Development, AFL-CIO Housing Investment Trust.
Harpreet Peleg,† age 36; Controller, AFL-CIO Housing Investment Trust since 2005; formerly Chief Financial Officer, AFL-CIO Investment Trust Corporation; Financial Analyst, Goldman Sachs & Co.; Senior Associate, PricewaterhouseCoopers.
Christopher Kaiser,† age 45; Deputy General Counsel (since 2008) and Chief Compliance Officer (since 2007), AFL-CIO Housing Investment Trust; formerly Associate General Counsel, AFL-CIO Housing Investment Trust; Branch Chief, Division of Investment Management, U.S. Securities and Exchange Commission.
Lesyllee White, age 47; Director of Marketing, AFL-CIO Housing Investment Trust since 2004; formerly Regional Marketing Director and Senior Marketing Associate, AFL-CIO Housing Investment Trust.
* No officer of the HIT serves as a trustee or director in any corporation or trust having securities registered pursuant to Section 12 of the Securities Exchange Act of 1934, as amended, or subject to the requirements of Section 15(d) of such Act, or any company registered as an investment company under the Investment Company Act of 1940, as amended.
† Board-appointed officer. These officers are appointed annually, serving for a period of approximately one year or until their respective successors are duly appointed and qualified.
| AFL-CIO Housing | |
| Investment Trust | Service Providers |
| | |
| National Office | Independent Registered Public Accounting Firm |
| 2401 Pennsylvania Avenue, N.W. | Ernst & Young LLP |
| Suite 200 | McLean, Virginia |
| Washington, D.C. 20037 | |
| (202) 331-8055 | Corporate Counsel |
| www.aflcio-hit.com | Bingham McCutchen LLP |
| | Washington, D.C. |
| New York City Office | |
| Carol Nixon, Director | Securities Counsel |
| 1270 Avenue of the Americas | Wilmer Cutler Pickering Hale and Dorr LLP |
| Suite 210 | Washington, D.C. |
| New York, New York 10020 | |
| (212) 554-2750 | Transfer Agent |
| | PNC Global Investment Servicing |
| Western Regional Office | Wilmington, Delaware |
| Liz Diamond, Director | |
| 235 Montgomery Street | Custodian |
| Suite 1001 | PFPC Trust Company, which will be named PNC |
| San Francisco, California 94104 | Trust Company effective June 7, 2010 |
| (415) 433-3044 | Philadelphia, Pennsylvania |
| | |
| Boston Office | |
| 655 Summer Street | |
| Boston, Massachusetts 02210 | |
| (617) 261-4444 | |
| | |
Investors should consider the HIT’s investment objectives, risks and expenses carefully before investing. A prospectus containing more complete information may be obtained from the HIT by calling the Marketing and Investor Relations Department collect at 202-331-8055 or by viewing the HIT’s website at www.aflcio-hit.com. The prospectus should be read carefully before investing.
AFL-CIO HOUSING INVESTMENT TRUST
 | AFL-CIO Housing Investment Trust 2401 Pennsylvania Avenue, NW Suite 200 Washington, D.C. 20037 Phone: 202-331-8055 www.aflcio-hit.com |
(3) Compliance with applicable governmental laws, rules, and regulations;
(5) Accountability for adherence to the code.
The aggregate fees billed for services provided to the Registrant by its independent auditors for the audit of the Registrant’s annual financial statements and for services normally provided by the independent auditors in connection with statutory and regulatory filings or engagements were $293,000 for the fiscal year ended December 31, 2009.
The aggregate fees billed for services provided to the Registrant by its independent auditors for the audit of the Registrant’s annual financial statements and for services normally provided by the independent auditors in connection with statutory and regulatory filings or engagements were $286,000 for the fiscal year ended December 31, 2008.
Not Applicable.
Included herein under Item 1.
Item 7. Disclosure of Proxy Voting Policies and Procedures for Closed-End Management Investment Companies.
Not Applicable.
Item 8. Portfolio Managers of Closed-End Management Investment Companies.
Not Applicable.
Item 9. Purchases of Equity Securities by Closed-End Management Investment Company and Affiliated Purchasers.
Not Applicable.
Item 10. Submission of Matters to a Vote of Security Holders.
No material changes have been made to the procedures by which participants may recommend nominees to the Board of Trustees of the Trust, where those changes were implemented after the Trust last provided disclosure in response to the requirements of Item 7(d)(2)(ii)(G) of Schedule 14A (17 CFR 240.14a-101) or this Item 10.
Item 11. Controls and Procedures.
Item 12. Exhibits.
Pursuant to the requirements of the Securities Exchange Act of 1934 and the Investment Company Act of 1940, the AFL-CIO Housing Investment Trust has duly caused this report to be signed on its behalf by the undersigned, thereunto duly authorized.
Pursuant to the requirements of the Securities Exchange Act of 1934 and the Investment Company Act of 1940, this report has been signed below by the following persons on behalf of the AFL-CIO Housing Investment Trust and in the capacities and on the dates indicated.