UNITED STATES
SECURITIES AND EXCHANGE COMMISSION
Washington, D.C. 20549
FORM N-CSR
CERTIFIED SHAREHOLDER REPORT OF REGISTERED MANAGEMENT INVESTMENT COMPANIES
Investment Company Act file number: 811-02688
Name of Fund: BlackRock Municipal Bond Fund, Inc.
BlackRock High Yield Municipal Fund
BlackRock National Municipal Fund
BlackRock Short-Term Municipal Fund
Fund Address: 100 Bellevue Parkway, Wilmington, DE 19809
Name and address of agent for service: John M. Perlowski, Chief Executive Officer, BlackRock Municipal Bond Fund, Inc., 55 East 52nd Street, New York, NY 10055
Registrant’s telephone number, including area code: (800) 441-7762
Date of fiscal year end: 06/30/2015
Date of reporting period: 12/31/2014
Item 1 – Report to Stockholders
| SEMI-ANNUAL REPORT (UNAUDITED) |  |
> | BlackRock High Yield Municipal Fund |
> | BlackRock National Municipal Fund |
> | BlackRock Short-Term Municipal Fund |
> | BlackRock New York Municipal Bond Fund |
Not FDIC Insured • May Lose Value • No Bank Guarantee |
Table of Contents
| Page | |||||
The Markets in Review | 3 | ||||
Semi-Annual Report: | |||||
Fund Summaries | 4 | ||||
About Fund Performance | 12 | ||||
Disclosure of Expenses | 13 | ||||
The Benefits and Risks of Leveraging | 14 | ||||
Derivative Financial Instruments | 14 | ||||
Financial Statements: | |||||
Schedules of Investments | 15 | ||||
Statements of Assets and Liabilities | 42 | ||||
Statements of Operations | 44 | ||||
Statements of Changes in Net Assets | 45 | ||||
Financial Highlights | 49 | ||||
Notes to Financial Statements | 69 | ||||
Officers and Directors | 82 | ||||
Additional Information | 83 |

| 2 | SEMI-ANNUAL REPORT | DECEMBER 31, 2014 |
| The Markets in Review |

President, BlackRock Advisors, LLC

Total Returns as of December 31, 2014
| 6-month | 12-month | |||||||||
U.S. large cap equities (S&P 500® Index) | 6.12 | % | 13.69 | % | ||||||
U.S. small cap equities (Russell 2000® Index) | 1.65 | 4.89 | ||||||||
International equities (MSCI Europe, Australasia, Far East Index) | (9.24 | ) | (4.90 | ) | ||||||
Emerging market equities (MSCI Emerging Markets Index) | (7.84 | ) | (2.19 | ) | ||||||
3-month Treasury bill (BofA Merrill Lynch 3-Month U.S. Treasury Bill Index) | 0.01 | 0.03 | ||||||||
U.S. Treasury securities (BofA Merrill Lynch 10-Year U.S. Treasury Index) | 4.33 | 10.72 | ||||||||
U.S. investment grade bonds (Barclays U.S. Aggregate Bond Index) | 1.96 | 5.97 | ||||||||
Tax-exempt municipal bonds (S&P Municipal Bond Index) | 3.00 | 9.25 | ||||||||
U.S. high yield bonds (Barclays U.S. Corporate High Yield 2% Issuer Capped Index) | (2.84 | ) | 2.46 | |||||||
| THIS PAGE NOT PART OF YOUR FUND REPORT | 3 |
| Fund Summary as of December 31, 2014 | BlackRock High Yield Municipal Fund |
Investment Objective
Portfolio Management Commentary
• For the six-month period ended December 31, 2014, the Fund outperformed its primary benchmark, the S&P® Municipal Bond Index. The Fund’s Institutional and Investor A Shares outperformed the secondary benchmark, the S&P® Customized High Yield Municipal Bond Index (“Custom Index”) customized to represent only issues with maturities of five years or longer, while the Investor C Shares underperformed the secondary benchmark. The following discussion of relative performance pertains to the Customized Index.
• The Fund’s overweight allocations in the development district, health care and education sectors had a positive impact on performance. Above-market weightings in AA and BB rated bonds, as well as in unrated bonds, made more significant relative performance contributions than the Fund’s allocations to other rating categories. The Fund’s yield curve positioning, along with its emphasis on long-dated bonds, also had a positive impact on returns as longer-term yields declined. (Bond prices and yields move in opposite directions). Security selection, led by holdings in tobacco and state tax-backed sectors, further contributed to the Fund’s six-month results.
• Below-market weightings in bonds rated between CCC and C, which outperformed, detracted from performance. The Fund’s defensive duration posture (below-market interest rate sensitivity) also detracted from performance, as did its use of U.S. Treasury futures contracts to manage interest rate risk.
• The Fund held an above-average weighting in cash reserves as of the close of the period, which reflects both strong year-end flows into the fund as well as a lack of attractive investment opportunities. The elevated cash position did not have a material impact on performance.
• Given the strong, positive inflows that occurred during the six-month period, the Fund’s activity reflected its efforts to stay invested and maintain a stable cash position. The Fund increased its exposure to the tobacco, tax-backed and development district sectors, while reducing positions in the transportation and health care sectors. The Fund maintained an above-average credit quality and above-market weightings in longer-dated bonds.
• At period end, the Fund’s duration posture was below that of the secondary benchmark but slightly higher than that of its primary benchmark. Relative to the S&P® Customized High Yield Municipal Bond Index, the Fund was overweight in the tobacco, education, development district and health care sectors, and underweight in the tax-backed, corporate, utilities and transportation sectors. In terms of credit quality, the Fund held overweights in the AA, BB and unrated credit tiers, while it was underweight in bonds rated A and BBB. The Fund remained positioned for a flatter yield curve, favoring long-dated securities that could gain a greater benefit from an environment of stable-to-lower long-term rates than their short- and intermediate-term counterparts.
Overview of the Fund’s Long-Term Investments
| Sector Allocation | ||||||||
Health | 23 | % | ||||||
Tobacco | 14 | |||||||
Transportation | 12 | |||||||
Education | 12 | |||||||
County/City/Special District/School District | 11 | |||||||
Utilities | 9 | |||||||
State | 9 | |||||||
Corporate | 9 | |||||||
Housing | 1 | |||||||
| For Fund compliance purposes, the Fund’s sector classifications refer to any one or more of the sector sub-classifications used by one or more widely recognized market indexes or rating group indexes, and/or as defined by the investment advisor. These definitions may not apply for purposes of this report, which may combine such sector sub-classifications for reporting ease. |
| Call/Maturity Schedule3 | ||||||||
Calendar Year Ended December 31, | ||||||||
2015 | 7 | % | ||||||
2016 | 4 | |||||||
2017 | 8 | |||||||
2018 | 3 | |||||||
2019 | 6 | |||||||
| 3 | Scheduled maturity dates and/or bonds that are subject to potential calls by issuers over the next five years. |
| Credit Quality Allocation1 | | Percent of Long-Term Investments | ||||
AA/Aa | 16 | % | ||||
A | 11 | |||||
BBB/Baa | 25 | |||||
BB/Ba | 13 | |||||
B | 8 | |||||
N/R2 | 27 | |||||
| 1 | For financial reporting purposes, credit quality ratings shown above reflect the highest rating assigned by either Standard & Poor’s (“S&P”) or Moody’s Investors Service (“Moody’s”) if ratings differ. These rating agencies are independent, nationally recognized statistical rating organizations and are widely used. Investment grade ratings are credit ratings of BBB/Baa or higher. Below investment grade ratings are credit ratings of BB/Ba or lower. Investments designated N/R are not rated by either rating agency. Unrated investments do not necessarily indicate low credit quality. Credit quality ratings are subject to change. |
| 2 | The investment advisor evaluates the credit quality of unrated investments based upon certain factors including, but not limited to, credit ratings for similar investments and financial analysis of sectors and individual investments. Using this approach, the investment advisor has deemed certain of these unrated securities as investment grade quality. As of December 31, 2014, the market value of unrated securities deemed by the investment advisor to be investment grade was $7,350,432, representing 1% of the Fund’s long-term investments. |
| 4 | SEMI-ANNUAL REPORT | DECEMBER 31, 2014 |
| BlackRock High Yield Municipal Fund |
Total Return Based on a $10,000 Investment
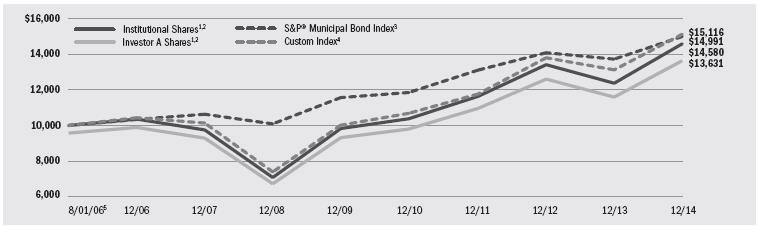
| 1 | Assuming maximum sales charge, if any, transaction costs and other operating expenses, including advisory fees. Institutional Shares do not have a sales charge. |
| 2 | The Fund may invest in municipal bonds rated in any rating category or in unrated municipal bonds. The Fund will usually invest in municipal bonds that have a maturity of five years or longer. |
| 3 | The S&P® Municipal Bond Index is composed of bonds held by managed municipal bond fund customers of Standard & Poor’s Securities Pricing, Inc. that are priced daily. Bonds in the S&P® Municipal Bond Index must have an outstanding par value of at least $2 million and a remaining maturity of not less than one month. |
| 4 | The S&P® Customized High Yield Municipal Bond Index is a blended subset of the S&P® Municipal Bond Index that includes non-insured bonds rated below BBB—or non-rated (85%) and bonds rated BBB (15%), excluding those that are in default, are pre-refunded, or are escrowed to maturity. Effective as of January 1, 2013, the Fund’s secondary benchmark, the S&P® Customized High Yield Municipal Bond Index, includes only those high yield bonds in the S&P® Municipal Bond Index that have maturities greater than 5 years. |
| 5 | Commencement of operations. |
Performance Summary for the Period Ended December 31, 2014
| Average Annual Total Returns6 | ||||||||||||||||||||||||||||||||||||||
| 1 Year | 5 Years | Since Inception7 | ||||||||||||||||||||||||||||||||||||
| | Standardized 30-Day Yields | | Unsubsidized 30-Day Yields | | 6-Month Total Returns | | w/o sales charge | | w/sales charge | | w/o sales charge | | w/sales charge | | w/o sales charge | | w/sales charge | |||||||||||||||||||||
| Institutional | 3.67 | % | 3.66 | % | 5.78 | % | 17.85 | % | N/A | 8.21 | % | N/A | 4.58 | % | N/A | |||||||||||||||||||||||
| Investor A | 3.24 | 3.24 | 5.65 | 17.59 | 12.59 | % | 7.91 | 6.97 | % | 4.29 | 3.75 | % | ||||||||||||||||||||||||||
| Investor C | 2.63 | 2.63 | 5.24 | 16.67 | 15.67 | 7.08 | 7.08 | 3.53 | 3.53 | |||||||||||||||||||||||||||||
S&P® Municipal Bond Index | — | — | 3.00 | 9.25 | N/A | 5.32 | N/A | 4.93 | N/A | |||||||||||||||||||||||||||||
Custom Index | — | — | 5.50 | 15.20 | N/A | 8.58 | N/A | 5.03 | N/A | |||||||||||||||||||||||||||||
| 6 | Assuming maximum sales charges, if any. Average annual total returns with and without sales charges reflect reductions for distribution and service fees. See “About Fund Performance” on page 12 for a detailed description of share classes, including any related sales charges and fees. |
| 7 | The Fund commenced operations on 8/01/06. |
Expense Example
| Actual | | Hypothetical10 | ||||||||||||||||||||||||||||||||||||
| During the Period | | Including Interest Expense and Fees | Excluding Interest Expense and Fees | |||||||||||||||||||||||||||||||||||
| | Beginning Account Value July 1, 2014 | | Ending Account Value December 31, 2014 | | Including Interest Expense and Fees8 | | Excluding Interest Expense and Fees9 | | Beginning Account Value July 1, 2014 | | Ending Account Value December 31, 2014 | | Expenses Paid During the Period8 | | Ending Account Value December 31, 2014 | | Expenses Paid During the Period9 | |||||||||||||||||||||
| Institutional | $ | 1,000.00 | $ | 1,057.80 | $ | 3.53 | $ | 3.32 | $ | 1,000.00 | $ | 1,021.78 | $ | 3.47 | $ | 1,021.98 | $ | 3.26 | ||||||||||||||||||||
| Investor A | $ | 1,000.00 | $ | 1,056.50 | $ | 4.92 | $ | 4.72 | $ | 1,000.00 | $ | 1,020.42 | $ | 4.84 | $ | 1,020.62 | $ | 4.63 | ||||||||||||||||||||
| Investor C | $ | 1,000.00 | $ | 1,052.40 | $ | 8.85 | $ | 8.64 | $ | 1,000.00 | $ | 1,016.59 | $ | 8.69 | $ | 1,016.79 | $ | 8.49 | ||||||||||||||||||||
| 8 | For each class of the Fund, expenses are equal to the annualized net expense ratio for the class (0.68% for Institutional, 0.95% for Investor A and 1.71% for Investor C), multiplied by the average account value over the period, multiplied by 184/365 (to reflect the one-half year period shown). |
| 9 | For each class of the Fund, expenses are equal to the annualized net expense ratio for the class (0.64% for Institutional, 0.91% for Investor A and 1.67% for Investor C), multiplied by the average account value over the period, multiplied by 184/365 (to reflect the one-half year period shown). |
| 10 | Hypothetical 5% annual return before expenses is calculated by pro rating the number of days in the most recent fiscal half year divided by 365. |
| See “Disclosure of Expenses” on page 13 for further information on how expenses were calculated. |
| SEMI-ANNUAL REPORT | DECEMBER 31, 2014 | 5 |
| Fund Summary as of December 31, 2014 | BlackRock National Municipal Fund |
Investment Objective
Portfolio Management Commentary
• For the six-month period ended December 31, 2014, the Fund underperformed its benchmark, the S&P® Municipal Bond Index, and its secondary benchmark, Custom National Index. The following discussion of relative performance pertains to the Fund’s secondary benchmark, the Custom National Index.
• The Fund’s shorter duration posture (lower sensitivity to interest rate movements) relative to the benchmark index detracted from performance as interest rates declined. The Fund’s cash reserves, held for the purpose of providing liquidity, detracted from relative results, as longer-maturity investments benefited from spread tightening or interest rate movements. Positions in bonds issued by tax-backed state and local school districts and education sectors underperformed the benchmark, although their absolute returns were positive. The Fund maintained a short position in 10-year U.S. Treasury futures contracts in order to manage interest rate risk. With interest rates falling during the period, as prices rose, this position had a small negative impact on performance. The Fund’s high quality bias also had a negative impact on relative results. Although high quality issues provided positive returns, significant fund flows caused yield spreads to tighten more dramatically in lower-rated bonds (which indicates outperformance).
• The Fund’s overweight (above-benchmark) positions in the health care, corporate-backed, utilities and transportation sectors added value relative to the benchmark. In addition, the Fund’s position in longer-maturity bonds performed well given the decline in longer-term rates. (Bond prices rise as yields fall).
• Cash reserves were reduced as it became apparent rates were going to remain low and yield spreads did not appear to be at risk of widening. A portion of the Fund’s cash reserves were converted to short-term investments in floating rate notes (FRNs) and municipal notes with maturities under two years. Near the end of the period, the fund purchased blocks of high grade, long maturity primary issue notes in order to move to a more neutral duration posture and to commit excess cash reserves.
• As of period end, the Fund was positioned defensively. Relative to the S&P® Municipal Bond Index, the Fund maintained a short duration posture (or a sensitivity to interest rate movements below that of the benchmark), and it held overweight positions in the health care, transportation and utilities sectors. At the period end, the Fund maintained a low degree of leverage through the use of tender option bond (“TOB”) transactions.
Overview of the Fund’s Long-Term Investments
| Sector Allocation | |||||||
Utilities | 24 | % | |||||
Transportation | 20 | ||||||
Health | 19 | ||||||
County/City/Special District/School District | 12 | ||||||
State | 10 | ||||||
Education | 9 | ||||||
Corporate | 5 | ||||||
Housing | 1 | ||||||
| For Fund compliance purposes, the Fund’s sector classifications refer to any one or more of the sector sub-classifications used by one or more widely recognized market indexes or rating group indexes, and/or as defined by the investment advisor. These definitions may not apply for purposes of this report, which may combine such sector sub-classifications for reporting ease. |
| Call/Maturity Schedule3 | ||||||||
Calendar Year Ended December 31, | ||||||||
2015 | 2 | % | ||||||
2016 | 8 | |||||||
2017 | 9 | |||||||
2018 | 16 | |||||||
2019 | 24 | |||||||
| 3 | Scheduled maturity dates and/or bonds that are subject to potential calls by issuers over the next five years. |
| Credit Quality Allocation1 | | Percent of Long-Term Investments | ||||
AAA/Aaa | 19 | % | ||||
AA/Aa | 48 | |||||
A | 23 | |||||
BBB/Baa | 5 | |||||
BB/Ba | 2 | |||||
N/R2 | 3 | |||||
| 1 | For financial reporting purposes, credit quality ratings shown above reflect the highest rating assigned by either S&P or Moody’s if ratings differ. These rating agencies are independent, nationally recognized statistical rating organizations and are widely used. Investment grade ratings are credit ratings of BBB/Baa or higher. Below investment grade ratings are credit ratings of BB/Ba or lower. Investments designated N/R are not rated by either rating agency. Unrated investments do not necessarily indicate low credit quality. Credit quality ratings are subject to change. |
| 2 | The investment advisor evaluates the credit quality of unrated investments based upon certain factors including, but not limited to, credit ratings for similar investments and financial analysis of sectors and individual investments. Using this approach, the investment advisor has deemed certain of these unrated securities as investment grade quality. As of December 31, 2014, the market value of unrated securities deemed by the investment advisor to be investment grade was $70,996,821, representing 1% of the Fund’s long-term investments. |
| 6 | SEMI-ANNUAL REPORT | DECEMBER 31, 2014 |
| BlackRock National Municipal Fund |
Total Return Based on a $10,000 Investment
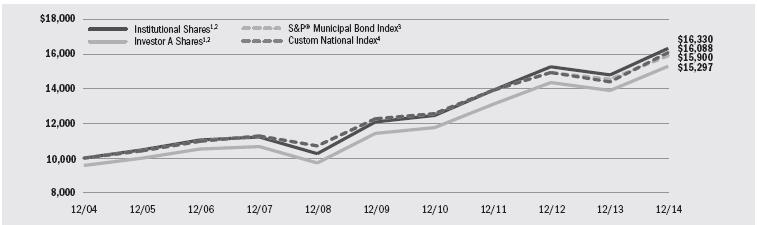
| 1 | Assuming maximum sales charge, if any, transaction costs and other operating expenses, including advisory fees. Institutional Shares do not have a sales charge. |
| 2 | The Fund may invest in municipal bonds rated in any rating category or in unrated municipal bonds. The Fund will usually invest in municipal bonds that have a maturity of five years or longer. |
| 3 | The S&P® Municipal Bond Index is composed of bonds held by managed municipal bond fund customers of Standard & Poor’s Securities Pricing, Inc. that are priced daily. Bonds in the S&P® Municipal Bond Index must have an outstanding par value of at least $2 million and a remaining maturity of not less than one month. |
| 4 | Effective as of September 1, 2014, the Fund’s secondary benchmark, S&P® Municipal Bond Index, was added with a customized benchmark. Custom National Index is a customized benchmark that reflects the returns of the S&P® Municipal Bond Index for periods prior to January 1, 2013, and the returns of only those bonds in the S&P® Municipal Bond Index that have maturities greater than 5 years for periods subsequent to January 1, 2013. |
Performance Summary for the Period Ended December 31, 2014
| Average Annual Total Returns5 | ||||||||||||||||||||||||||||||||||||||
| 1 Year | 5 Years | 10 Years | ||||||||||||||||||||||||||||||||||||
| | Standardized 30-Day Yields | | Unsubsidized 30-Day Yields | | 6-Month Total Returns | | w/o sales charge | | w/sales charge | | w/o sales charge | | w/sales charge | | w/o sales charge | | w/sales charge | |||||||||||||||||||||
| BlackRock | 2.01 | % | 1.93 | % | 2.93 | % | 10.45 | % | N/A | 6.32 | % | N/A | 5.15 | % | N/A | |||||||||||||||||||||||
| Institutional | 1.91 | 1.86 | 2.88 | 10.35 | N/A | 6.20 | N/A | 5.03 | N/A | |||||||||||||||||||||||||||||
| Service | 1.72 | 1.67 | 2.87 | 10.15 | N/A | 5.89 | N/A | 4.74 | N/A | |||||||||||||||||||||||||||||
| Investor A | 1.68 | 1.54 | 2.79 | 10.06 | 5.38 | % | 6.01 | 5.10 | % | 4.80 | 4.34 | % | ||||||||||||||||||||||||||
| Investor B | 1.25 | 1.11 | 2.53 | 9.52 | 5.52 | 5.50 | 5.17 | 4.27 | 4.27 | |||||||||||||||||||||||||||||
| Investor C | 1.01 | 0.92 | 2.50 | 9.35 | 8.35 | 5.25 | 5.25 | 4.02 | 4.02 | |||||||||||||||||||||||||||||
| Investor C1 | 1.20 | 1.12 | 2.50 | 9.45 | 8.45 | 5.43 | 5.43 | 4.23 | 4.23 | |||||||||||||||||||||||||||||
S&P® Municipal Bond Index | — | — | 3.00 | 9.25 | N/A | 5.32 | N/A | 4.75 | N/A | |||||||||||||||||||||||||||||
Custom National Index | — | — | 3.80 | 11.76 | N/A | 5.57 | N/A | 4.87 | N/A | |||||||||||||||||||||||||||||
| 5 | Assuming maximum sales charges, if any. Average annual total returns with and without sales charges reflect reductions for distribution and service fees. See “About Fund Performance” on page 12 for a detailed description of share classes, including any related sales charges and fees. |
Expense Example
| Actual | | Hypothetical8 | ||||||||||||||||||||||||||||||||||||
During the Period | | Including Interest Expense and Fees | Excluding Interest Expense and Fees | |||||||||||||||||||||||||||||||||||
| | Beginning Account Value July 1, 2014 | | Ending Account Value December 31, 2014 | | Including Interest Expense and Fees6 | | Excluding Interest Expense and Fees7 | | Beginning Account Value July 1, 2014 | | Ending Account Value December 31, 2014 | | Expenses Paid During the Period6 | | Ending Account Value December 31, 2014 | | Expenses Paid During the Period7 | |||||||||||||||||||||
| BlackRock | $ | 1,000.00 | $ | 1,029.30 | $ | 2.56 | $ | 2.35 | $ | 1,000.00 | $ | 1.022.68 | $ | 2.55 | $ | 1,029.30 | $ | 2.35 | ||||||||||||||||||||
| Institutional | $ | 1,000.00 | $ | 1,028.80 | $ | 3.02 | $ | 2.86 | $ | 1,000.00 | $ | 1,022.23 | $ | 3.01 | $ | 1,028.80 | $ | 2.86 | ||||||||||||||||||||
| Service | $ | 1,000.00 | $ | 1,028.70 | $ | 4.04 | $ | 3.84 | $ | 1,000.00 | $ | 1,021.22 | $ | 4.02 | $ | 1,028.70 | $ | 3.84 | ||||||||||||||||||||
| Investor A | $ | 1,000.00 | $ | 1,027.90 | $ | 3.88 | $ | 3.68 | $ | 1,000.00 | $ | 1,021.37 | $ | 3.87 | $ | 1,027.90 | $ | 3.68 | ||||||||||||||||||||
| Investor B | $ | 1,000.00 | $ | 1,025.30 | $ | 6.48 | $ | 6.28 | $ | 1,000.00 | $ | 1,018.80 | $ | 6.46 | $ | 1,025.30 | $ | 6.28 | ||||||||||||||||||||
| Investor C | $ | 1,000.00 | $ | 1,025.00 | $ | 7.71 | $ | 7.50 | $ | 1,000.00 | $ | 1,017.59 | $ | 7.68 | $ | 1,025.00 | $ | 7.50 | ||||||||||||||||||||
| Investor C1 | $ | 1,000.00 | $ | 1,025.00 | $ | 6.74 | $ | 6.53 | $ | 1,000.00 | $ | 1,018.55 | $ | 6.72 | $ | 1,025.00 | $ | 6.53 | ||||||||||||||||||||
| 6 | For each class of the Fund, expenses are equal to the annualized net expense ratio for the class (0.50% for BlackRock, 0.59% for Institutional, 0.79% for Service, 0.76% for Investor A, 1.27% for Investor B, 1.51% for Investor C and 1.32% for Investor C1), multiplied by the average account value over the period, multiplied by 184/365 (to reflect the one-half year period shown). |
| 7 | For each class of the Fund, expenses are equal to the annualized net expense ratio for the class (0.46% for BlackRock, 0.56% for Institutional, 0.75% for Service, 0.72% for Investor A, 1.23% for Investor B, 1.47% for Investor C and 1.28% for Investor C1), multiplied by the average account value over the period, multiplied by 184/365 (to reflect the one-half year period shown). |
| 8 | Hypothetical 5% annual return before expenses is calculated by prorating the number of days in the most recent fiscal half year divided by 365. |
| See “Disclosure of Expenses” on page 13 for further information on how expenses were calculated. |
| SEMI-ANNUAL REPORT | DECEMBER 31, 2014 | 7 |
| Fund Summary as of December 31, 2014 | BlackRock Short-Term Municipal Fund |
Investment Objective
Portfolio Management Commentary
• For the six-month period ended December 31, 2014, the Fund underperformed its primary benchmark, the S&P® Municipal Bond Index, and its secondary benchmark, the S&P® Limited Maturity Municipal Bond Index. The following discussion of relative performance pertains to the Fund’s secondary benchmark, the S&P® Limited Maturity Municipal Bond Index.
• The Fund’s underperformance relative to the benchmark index was attributable in part to its duration positioning (management of interest rate risk). Specifically, the Fund was underweight in its exposure to the three- to four-year area of the yield curve relative to its benchmark, which outperformed during the period. An underweight exposure to the utilities sector, together with security selection in the group, also played a part in the Fund’s underperformance. The Fund’s underweight exposure to the tax-backed state sector, along with security selection in the sector, detracted from returns. An underweight position pre-refunded issues also hindered results.
• Conversely, the Fund’s overall yield curve positioning had a positive impact on performance. In addition, its use of U.S. Treasury futures contracts to manage interest rate risk had a positive impact on performance given the increase in yields on short-term bonds. (Bond prices and yields move in opposite directions).
• The Fund adjusted its positioning quite actively during the period. The investment manager reduced the portfolio’s duration (interest rate sensitivity) during the first half of the period, as the balance of supply and demand in the municipal market became less positive given the increase in new-issue supply. Later in the period, the Fund began increasing duration while taking advantage of attractive yield concessions in the new-issue market.
• Short-term municipal yields rose along with the increase in the yields of U.S. Treasuries of similar maturities. The Fund took advantage of market volatility by reducing the extent of its underweight in the three- to four-year portion of the yield curve as rates rose.
• Relative to the S&P® Limited Maturity Municipal Bond Index, the Fund had a neutral duration positioning at period end. However, the Fund maintained an underweight exposure to the three- to four-year segment of the yield curve given its potential vulnerability to rising interest rates. The Fund remained underweight to the pre-refunded sector because of the difficulty of sourcing bonds represented in the benchmark. In lieu of these bonds, the Fund has a roughly identical overweight exposure to the dedicated tax-backed sector, a market segment that featured strong credit fundamentals. Conversely, the Fund was underweight in bonds issued by local governments. The Fund closed the period with an overweight positions in “A” rated securities, which provide attractive yields relative to the associated risks. As of period end, the Fund held a minimal level of cash reserves.
Overview of the Fund’s Long-Term Investments
| Sector Allocation | | |||||
State | 37 | % | ||||
County/City/Special District/School District | 22 | |||||
Transportation | 14 | |||||
Utilities | 9 | |||||
Corporate | 8 | |||||
Education | 5 | |||||
Health | 4 | |||||
Tobacco | 1 | |||||
| For Fund compliance purposes, the Fund’s sector classifications refer to any one or more of the sector sub-classifications used by one or more widely recognized market indexes or rating group indexes, and/or as defined by the investment advisor. These definitions may not apply for purposes of this report, which may combine such sector sub-classifications for reporting ease. |
| Call/Maturity Schedule2 | ||||||||
Calendar Year Ended December 31, | ||||||||
2015 | 13 | % | ||||||
2016 | 40 | |||||||
2017 | 26 | |||||||
2018 | 14 | |||||||
2019 | — | |||||||
| 2 | Scheduled maturity dates and/or bonds that are subject to potential calls by issuers over the next five years. |
| Credit Quality Allocation1 | | Percent of Long-Term Investments | ||||
AAA/Aaa | 22 | % | ||||
AA/Aa | 46 | |||||
A | 30 | |||||
BBB/Baa | 1 | |||||
N/R | 1 | |||||
| 1 | For financial reporting purposes, credit quality ratings shown above reflect the highest rating assigned by either S&P or Moody’s if ratings differ. These rating agencies are independent, nationally recognized statistical rating organizations and are widely used. Investment grade ratings are credit ratings of BBB/Baa or higher. Below investment grade ratings are credit ratings of BB/Ba or lower. Investments designated N/R are not rated by either rating agency. Unrated investments do not necessarily indicate low credit quality. Credit quality ratings are subject to change. |
| 8 | SEMI-ANNUAL REPORT | DECEMBER 31, 2014 |
| BlackRock Short-Term Municipal Fund |
Total Return Based on a $10,000 Investment

| 1 | Assuming maximum sales charge, if any, transaction costs and other operating expenses, including advisory fees. Institutional Shares do not have a sales charge. |
| 2 | The Fund invests primarily in investment grade municipal bonds or municipal notes, including variable rate demand obligations. The Fund will maintain a dollar-weighted maturity of no more than 2 years. |
| 3 | The S&P® Municipal Bond Index is composed of bonds held by managed municipal bond fund customers of Standard & Poor’s Securities Pricing, Inc. that are priced daily. Bonds in the S&P® Municipal Bond Index must have an outstanding par value of at least $2 million and a remaining maturity of not less than one month. |
| 4 | The S&P® Limited Maturity Municipal Bond Index includes all bonds in the S&P® Municipal Bond Index with a remaining maturity of less than 4 years. |
Performance Summary for the Period Ended December 31, 2014
| Average Annual Total Returns5 | ||||||||||||||||||||||||||||||||||||||
| 1 Year | 5 Years | 10 Years | ||||||||||||||||||||||||||||||||||||
| | Standardized 30-Day Yields | | Unsubsidized 30-Day Yields | | 6-Month Total Returns | | w/o sales charge | | w/sales charge | | w/o sales charge | | w/sales charge | | w/o sales charge | | w/sales charge | |||||||||||||||||||||
| BlackRock | 0.17 | % | 0.17 | % | (0.01 | )% | 0.24 | % | N/A | 0.74 | % | N/A | 1.93 | % | N/A | |||||||||||||||||||||||
| Institutional | 0.17 | 0.06 | (0.11 | ) | 0.24 | N/A | 0.76 | N/A | 1.94 | N/A | ||||||||||||||||||||||||||||
| Investor A | (0.11 | ) | (0.12 | ) | (0.25 | ) | (0.04 | ) | (3.04 | )% | 0.49 | (0.13 | )% | 1.68 | 1.37 | % | ||||||||||||||||||||||
| Investor A1 | 0.06 | 0.03 | (0.17 | ) | 0.12 | (0.88 | ) | 0.64 | 0.44 | 1.83 | 1.73 | |||||||||||||||||||||||||||
| Investor C | (0.87 | ) | (0.87 | ) | (0.70 | ) | (0.79 | ) | (1.79 | ) | (0.30 | ) | (0.30 | ) | 0.90 | 0.90 | ||||||||||||||||||||||
S&P® Municipal Bond Index | — | — | 3.00 | 9.25 | N/A | 5.32 | N/A | 4.75 | N/A | |||||||||||||||||||||||||||||
S&P® Limited Maturity Municipal Bond Index | — | — | 0.27 | 0.94 | N/A | 1.45 | N/A | 2.59 | N/A | |||||||||||||||||||||||||||||
| 5 | Assuming maximum sales charges, if any. Average annual total returns with and without sales charges reflect reductions for distribution and service fees. See “About Fund Performance” on page 12 for a detailed description of share classes, including any related sales charges and fees. |
Expense Example
| Actual | Hypothetical7 | | ||||||||||||||||||||||||||||
| | Beginning Account Value July 1, 2014 | | Ending Account Value December 31, 2014 | | Expenses Paid During the Period6 | | Beginning Account Value July 1, 2014 | | Ending Account Value December 31, 2014 | | Expenses Paid During the Period6 | | Annualized Expense Ratio | |||||||||||||||||
| Blackrock | $ | 1,000.00 | $ | 999.90 | $ | 2.02 | $ | 1,000.00 | $ | 1,023.19 | $ | 2.04 | 0.40 | % | ||||||||||||||||
| Institutional | $ | 1,000.00 | $ | 998.90 | $ | 2.02 | $ | 1,000.00 | $ | 1,023.19 | $ | 2.04 | 0.40 | % | ||||||||||||||||
| Investor A | $ | 1,000.00 | $ | 997.50 | $ | 3.47 | $ | 1,000.00 | $ | 1,021.73 | $ | 3.52 | 0.69 | % | ||||||||||||||||
| Investor A1 | $ | 1,000.00 | $ | 998.30 | $ | 2.62 | $ | 1,000.00 | $ | 1,022.58 | $ | 2.65 | 0.52 | % | ||||||||||||||||
| Investor C | $ | 1,000.00 | $ | 993.00 | $ | 7.38 | $ | 1,000.00 | $ | 1,017.80 | $ | 7.48 | 1.47 | % | ||||||||||||||||
| 6 | For each class of the Fund, expenses are equal to the annualized net expense ratio for the class, multiplied by the average account value over the period, multiplied by 184/365 (to reflect the one-half year period shown). |
| 7 | Hypothetical 5% return before expenses is calculated by prorating the number of days in the most recent fiscal half year divided by 365. |
| See “Disclosure of Expenses” on page 13 for further information on how expenses were calculated. |
| SEMI-ANNUAL REPORT | DECEMBER 31, 2014 | 9 |
| Fund Summary as of December 31, 2014 | BlackRock New York Municipal Bond Fund |
Investment Objective
Portfolio Management Commentary
• For the six-month period ended December 31, 2014, the Fund outperformed its primary benchmark, the S&P® Municipal Bond Index, and its secondary benchmark, the S&P® Customized New York Municipal Bond Index (“Custom Index”), customized to represent only issues with maturities of five years or longer. The following discussion of relative performance pertains to the Fund’s secondary benchmark, the Customized Index.
• The Fund’s performance benefited from income generated in the form of coupon payments from its portfolio of municipal bond holdings. In addition, the Fund’s limited use of leverage provided both incremental return and income in an environment of declining interest rates. (Bond prices rise as yields fall.) The Fund’s positioning along the yield curve, which favored longer-dated bonds, aided performance as longer-term bonds generally outperformed those with shorter maturities. Positions in lower-coupon bonds, which tend to have longer durations and more capital appreciation potential than bonds with higher coupons, helped performance as yields fell during the period. (Duration is a measure of interest-rate sensitivity.) The Fund’s positions in zero-coupon bonds also aided returns, as these securities generated strong price performance due to their relatively long durations for their respective maturities. Fund performance was also bolstered by a heavier concentration in the middle range of the credit spectrum (specifically, A and BBB+ rated
• The Fund’s overall duration posture was shorter than that of the benchmark index, which detracted from performance as interest rates declined in the period. An underweight allocation to tax-backed local and state credits was also detrimental to relative performance as these sectors outperformed. The Fund’s use of U.S. Treasury futures contracts to manage interest rate risk had a slightly negative impact on performance.
• Greater than expected new-issue supply approaching year-end provided investment opportunities and enhanced the Fund’s ability to diversify into some new and lesser-held assets. Where feasible, the purchases were weighted toward the longer end of the yield curve and into lower-rated investment-grade bonds, as long rates appear well anchored and higher yielding bonds are expected to experience continued strong demand.
• Relative to the S&P® Customized New York Municipal Bond Index, the Fund remained overweight to longer-term bonds. This included overweighting the middle-to-lower end of the credit spectrum and holding higher exposure to the health, education and housing sectors.
Overview of the Fund’s Long-Term Investments
| Sector Allocation | ||||||||
County/City/Special District/School District | 23 | % | ||||||
Education | 17 | |||||||
Transportation | 16 | |||||||
Health | 13 | |||||||
Utilities | 11 | |||||||
State | 10 | |||||||
Corporate | 6 | |||||||
Housing | 3 | |||||||
Tobacco | 1 | |||||||
| For Fund compliance purposes, the Fund’s sector classifications refer to any one or more of the sector sub-classifications used by one or more widely recognized market indexes or rating group indexes, and/or as defined by the investment advisor. These definitions may not apply for purposes of this report, which may combine such sector sub-classifications for reporting ease. |
| Call/Maturity Schedule3 | ||||||||
Calendar Year Ended December 31, | ||||||||
2015 | 7 | % | ||||||
2016 | 3 | |||||||
2017 | 6 | |||||||
2018 | 2 | |||||||
2019 | 11 | |||||||
| 3 | Scheduled maturity dates and/or bonds that are subject to potential calls by issuers over the next five years. |
| Credit Quality Allocation1 | | Percent of Long-Term Investments | ||||
AAA/Aaa | 12 | % | ||||
AA/Aa | 42 | |||||
A | 31 | |||||
BBB/Baa | 5 | |||||
BB/Ba | 2 | |||||
N/R2 | 8 | |||||
| 1 | For financial reporting purposes, credit quality ratings shown above reflect the highest rating assigned by either S&P or Moody’s if ratings differ. These rating agencies are independent, nationally recognized statistical rating organizations and are widely used. Investment grade ratings are credit ratings of BBB/Baa or higher. Below investment grade ratings are credit ratings of BB/Ba or lower. Investments designated N/R are not rated by either rating agency. Unrated investments do not necessarily indicate low credit quality. Credit quality ratings are subject to change. |
| 2 | The investment advisor evaluates the credit quality of unrated investments based upon certain factors including, but not limited to, credit ratings for similar investments and financial analysis of sectors and individual investments. Using this approach, the investment advisor has deemed certain of these unrated securities as investment grade quality. As of December 31, 2014, the market value of unrated securities deemed by the investment advisor to be investment grade was $5,242,305, representing 2% of the Fund’s long-term investments. |
| 10 | SEMI-ANNUAL REPORT | DECEMBER 31, 2014 |
| BlackRock New York Municipal Bond Fund |
Total Return Based on a $10,000 Investment
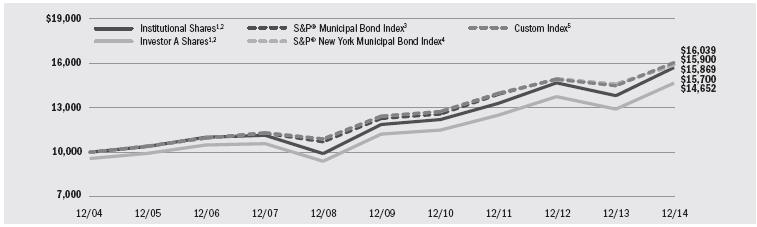
| 1 | Assuming maximum sales charges, if any, transaction costs and other operating expenses, including advisory fees. Institutional Shares do not have a sales charge. |
| 2 | The Fund will invest at least 80% of its assets in a portfolio of investment grade New York municipal bonds. |
| 3 | The S&P® Municipal Bond Index is composed of bonds held by managed municipal bond fund customers of Standard & Poor’s Securities Pricing, Inc. that are priced daily. Bonds in the S&P® Municipal Bond Index must have an outstanding par value of at least $2 million and a remaining maturity of not less than one month. |
| 4 | The S&P® New York Municipal Bond Index includes all New York bonds in the S&P® Municipal Bond Index. Effective as of January 1, 2014, the Fund’s secondary benchmark, the S&P® New York Municipal Bond Index, was replaced with the Custom Index. |
| 5 | The Custom Index reflects the returns of the S&P® New York Municipal Bond Index for periods prior to January 1, 2013, and the returns of only those New York bonds in the S&P® New York Municipal Bond Index that have maturities greater than five years for periods subsequent to January 1, 2013. |
Performance Summary for the Period Ended December 31, 2014
| Average Annual Total Returns6 | ||||||||||||||||||||||||||||||||||||||
| 1 Year | 5 Years | 10 Years | ||||||||||||||||||||||||||||||||||||
| | Standardized 30-Day Yields | | Unsubsidized 30-Day Yields | | 6-Month Total Returns | | w/o sales charge | | w/sales charge | | w/o sales charge | | w/sales charge | | w/o sales charge | | w/sales charge | |||||||||||||||||||||
| Institutional | 2.50 | % | 2.46 | % | 4.74 | % | 13.72 | % | N/A | 5.76 | % | N/A | 4.61 | % | N/A | |||||||||||||||||||||||
| Investor A | 2.17 | 2.10 | 4.62 | 13.55 | 8.73 | % | 5.48 | 4.57 | % | 4.35 | 3.89 | % | ||||||||||||||||||||||||||
| Investor A1 | 2.27 | 2.25 | 4.67 | 13.69 | 9.15 | 5.65 | 4.79 | 4.52 | 4.09 | |||||||||||||||||||||||||||||
| Investor C | 1.52 | 1.46 | 4.22 | 12.71 | 11.71 | 4.73 | 4.73 | 3.58 | 3.58 | |||||||||||||||||||||||||||||
| Investor C1 | 1.88 | 1.86 | 4.41 | 13.14 | 12.14 | 5.13 | 5.13 | 3.99 | 3.99 | |||||||||||||||||||||||||||||
S&P® Municipal Bond Index | — | — | 3.00 | 9.25 | N/A | 5.32 | N/A | 4.75 | N/A | |||||||||||||||||||||||||||||
S&P® New York Municipal Bond Index | — | — | 2.90 | 8.68 | N/A | 5.00 | N/A | 4.73 | N/A | |||||||||||||||||||||||||||||
Custom Index | — | — | 3.61 | 10.82 | N/A | 5.23 | N/A | 4.84 | N/A | |||||||||||||||||||||||||||||
| 6 | Assuming maximum sales charges, if any. Average annual total returns with and without sales charges reflect reductions for distribution and service fees. See “About Fund Performance” on page 12 for a detailed description of share classes, including any related sales charges and fees. |
Expense Example
| Actual | Hypothetical9 | |||||||||||||||||||||||||||||||||||||
| Expenses Paid During the Period | Including Interest Expense and Fees | Excluding Interest Expense and Fees | ||||||||||||||||||||||||||||||||||||
| | Beginning Account Value July 1, 2014 | | Ending Account Value December 31, 2014 | | Including Interest Expense and Fees7 | | Excluding Interest Expense and Fees8 | | Beginning Account Value July 1, 2014 | | Ending Account Value December 31, 2014 | | Expenses Paid During the Period7 | | Ending Account Value December 31, 2014 | | Expenses Paid During the Period8 | |||||||||||||||||||||
| Institutional | $ | 1,000.00 | $ | 1,047.40 | $ | 3.56 | $ | 3.35 | $ | 1,000.00 | $ | 1,021.73 | $ | 3.52 | $ | 1,021.93 | $ | 3.31 | ||||||||||||||||||||
| Investor A | $ | 1,000.00 | $ | 1,046.20 | $ | 4.80 | $ | 4.59 | $ | 1,000.00 | $ | 1,020.52 | $ | 4.74 | $ | 1,020.72 | $ | 4.53 | ||||||||||||||||||||
| Investor A1 | $ | 1,000.00 | $ | 1,046.70 | $ | 4.28 | $ | 4.08 | $ | 1,000.00 | $ | 1,021.02 | $ | 4.23 | $ | 1,021.22 | $ | 4.02 | ||||||||||||||||||||
| Investor C | $ | 1,000.00 | $ | 1,042.20 | $ | 8.65 | $ | 8.44 | $ | 1,000.00 | $ | 1,016.74 | $ | 8.54 | $ | 1,016.94 | $ | 8.34 | ||||||||||||||||||||
| Investor C1 | $ | 1,000.00 | $ | 1,044.10 | $ | 6.80 | $ | 6.59 | $ | 1,000.00 | $ | 1,018.55 | $ | 6.72 | $ | 1,018.75 | $ | 6.51 | ||||||||||||||||||||
| 7 | For each class of the Fund, expenses are equal to the annualized net expense ratio for the class (0.69% for Institutional, 0.93% for Investor A, 0.83% for Investor A1, 1.68% for Investor C and 1.32% for Investor C1), multiplied by the average account value over the period, multiplied by 184/365 (to reflect the one-half year period shown). |
| 8 | For each class of the Fund, expenses are equal to the annualized net expense ratio for the class (0.65% for Institutional, 0.89% for Investor A, 0.79% for Investor A1, 1.64% for Investor C and 1.28% for Investor C1), multiplied by the average account value over the period, multiplied by 184/365 (to reflect the one-half year period shown). |
| 9 | Hypothetical 5% annual return before expenses is calculated by prorating the number of days in the most recent fiscal half year divided by 365. |
| See “Disclosure of Expenses” on page 13 for further information on how expenses were calculated. |
| SEMI-ANNUAL REPORT | DECEMBER 31, 2014 | 11 |
| About Fund Performance | |
• BlackRock and Institutional Shares (BlackRock Shares are available only in BlackRock Short-Term Municipal Fund and BlackRock National Municipal Fund) are not subject to any sales charge. These shares bear no ongoing distribution or service fees and are available only to certain eligible investors. Prior to October 2, 2006 for BlackRock Short-Term Municipal Fund and July 18, 2011 for BlackRock National Municipal Fund, BlackRock Share performance results are those of the Institutional Shares restated to reflect BlackRock Share fees.
• Service Shares (available only in BlackRock National Municipal Fund) are not subject to any sales charge (front-end load) or deferred sales charge. These shares are subject to a service fee of 0.25% per year (but no distribution fee) and are available only to certain eligible investors. Prior to July 18, 2011, Service Share performance results are those of the Institutional Shares restated to reflect Service Share fees.
• Investor A Shares are subject to a maximum initial sales charge (front-end load) of 4.25% for all Funds except BlackRock Short-Term Municipal Fund, which incurs a 3.00% maximum initial sales charge, and all Funds incur a service fee of 0.25% per year (but no distribution fee). Certain redemptions of these shares may be subject to a contingent deferred sales charge (“CDSC”) where no initial sales charge was paid at the time of purchase. These shares are generally available through financial intermediaries. Prior to October 2, 2006 for BlackRock Short-Term Municipal Fund and BlackRock New York Municipal Bond Fund, Investor A Share performance results are those of the Institutional Shares (which have no distribution or service fees) restated to reflect Investor A Share fees.
• Investor A1 Shares (available only in BlackRock Short-Term Municipal Fund and BlackRock New York Municipal Bond Fund) are subject to a maximum initial sales charge (front-end load) of 1.00% for BlackRock Short-Term Municipal Fund and 4.00% for BlackRock New York Municipal Bond Fund; and a service fee of 0.10% per year (but no distribution fee).
• Investor B Shares (available only in BlackRock National Municipal Fund) are subject to a maximum CDSC of 4.00%, declining to 0% after six years. In addition, these shares are subject to a distribution fee of 0.50% per year and a service fee of 0.25% per year. These shares automatically convert to Investor A Shares after approximately 10 years. (There is no initial sales charge for automatic share conversions.) On June 10, 2013, all issued and outstanding Investor B Shares of BlackRock Short-Term Municipal Fund and BlackRock New York Municipal Bond Fund were converted into Investor A1 Shares with the same relative aggregate net asset value (“NAV”).
• Investor C Shares are subject to a 1.00% CDSC if redeemed within one year of purchase. In addition, these shares are subject to a distribution fee of 0.75% per year and a service fee of 0.25% per year. Prior to October 2, 2006 (for all Funds except BlackRock High Yield Municipal Fund), Investor C Share performance results are those of the Institutional Shares (which have no distribution or service fees) restated to reflect Investor C Share fees.
• Investor C1 Shares (available only in BlackRock National Municipal Fund and BlackRock New York Municipal Bond Fund) are subject to a 1.00% CDSC if redeemed within one year of purchase. In addition, these shares are subject to a distribution and service fees per year as follows:
| | Distribution Fee | | Service Fee | |||||||
BlackRock National Municipal Fund | 0.55 | % | 0.25 | % | ||||||
BlackRock New York Municipal Bond Fund | 0.35 | % | 0.25 | % | ||||||
| 12 | SEMI-ANNUAL REPORT | DECEMBER 31, 2014 |
| Disclosure of Expenses |
| SEMI-ANNUAL REPORT | DECEMBER 31, 2014 | 13 |
| The Benefits and Risks of Leveraging |
| Derivative Financial Instruments |
| 14 | SEMI-ANNUAL REPORT | DECEMBER 31, 2014 |
| Schedule of Investments December 31, 2014 (Unaudited) | BlackRock High Yield Municipal Fund (Percentages shown are based on Net Assets) |
| Municipal Bonds | Par (000) | Value | ||||||||
Alabama — 1.5% | ||||||||||
City of Phenix Alabama IDB, Refunding RB, Meadwestvaco Coated Board Project, Series A, AMT, 4.13%, 5/15/35 | $ | 1,750 | $ | 1,722,647 | ||||||
County of Jefferson Alabama, RB, Limited Obligation School, Series A, 4.75%, 1/01/25 | 2,180 | 2,171,433 | ||||||||
County of Jefferson Alabama Sewer, Refunding RB: | ||||||||||
Senior Lien, Series A (AGM), 5.00%, 10/01/44 | 365 | 398,854 | ||||||||
Senior Lien, Series A (AGM), 5.25%, 10/01/48 | 1,010 | 1,116,656 | ||||||||
Sub-Lien, Series D, 7.00%, 10/01/51 | 2,355 | 2,808,620 | ||||||||
State of Alabama Docks Department, Refunding RB, 6.00%, 10/01/40 | 710 | 826,575 | ||||||||
| 9,044,785 | ||||||||||
Alaska — 0.9% | ||||||||||
Northern Tobacco Securitization Corp., Refunding RB, Tobacco Settlement, Asset-Backed, Series A: | ||||||||||
4.63%, 6/01/23 | 980 | 979,961 | ||||||||
5.00%, 6/01/32 | 1,500 | 1,289,085 | ||||||||
5.00%, 6/01/46 | 4,120 | 3,312,644 | ||||||||
| 5,581,690 | ||||||||||
Arizona — 0.8% | ||||||||||
City of Phoenix Arizona IDA, ERB, Eagle College Prep Project, Series A, 5.00%, 7/01/43 | 1,445 | 1,383,674 | ||||||||
City of Phoenix Arizona IDA, RB: | ||||||||||
Great Hearts Academies — Veritas Project, 6.40%, 7/01/47 | 415 | 443,038 | ||||||||
Legacy Traditional Schools, Series A, 6.50%, 7/01/34 (a) | 465 | 525,501 | ||||||||
Legacy Traditional Schools, Series A, 6.75%, 7/01/44 (a) | 810 | 924,388 | ||||||||
County of Maricopa Arizona IDA, RB, Arizona Charter Schools Project, Series A, 6.75%, 7/01/29 | 70 | 66,591 | ||||||||
Town of Florence, Inc. Arizona, IDA, ERB, Legacy Traditional School Project, Queen Creek and Casa Grande Campuses, 6.00%, 7/01/43 | 1,375 | 1,483,089 | ||||||||
University Medical Center Corp., RB, 6.25%, 7/01/29 | 180 | 208,643 | ||||||||
| 5,034,924 | ||||||||||
Arkansas — 0.1% | ||||||||||
County of Benton Arkansas Public Facilities Board, RB, BCCSO Project, Series A, 6.00%, 6/01/40 | 750 | 834,330 | ||||||||
California — 8.0% | ||||||||||
California County Tobacco Securitization Agency, RB, 5.45%, 6/01/28 | 500 | 483,585 | ||||||||
| Municipal Bonds | Par (000) | Value | ||||||||
California (continued) | ||||||||||
California Health Facilities Financing Authority, RB: | ||||||||||
St. Joseph Health System, Series A, 5.75%, 7/01/39 | $ | 1,000 | $ | 1,158,530 | ||||||
Sutter Health, Series B, 6.00%, 8/15/42 | 1,000 | 1,199,310 | ||||||||
California Health Facilities Financing Authority, Refunding RB, Catholic Healthcare West, Series A, 6.00%, 7/01/39 | 265 | 309,032 | ||||||||
California HFA, RB, S/F, Home Mortgage, Series I, AMT, 4.80%, 8/01/36 | 1,500 | 1,507,800 | ||||||||
California Municipal Finance Authority, Urban Discovery Academy Project (a): | ||||||||||
5.50%, 8/01/34 | 310 | 317,406 | ||||||||
6.00%, 8/01/44 | 655 | 670,772 | ||||||||
6.13%, 8/01/49 | 570 | 583,150 | ||||||||
California Pollution Control Financing Authority, RB, Poseidon Resources (Channel Side) LP Desalination Project, AMT, 5.00%, 11/21/45 (a) | 3,100 | 3,344,993 | ||||||||
California School Finance Authority, RB, Value Schools: | ||||||||||
6.65%, 7/01/33 | 295 | 323,450 | ||||||||
6.90%, 7/01/43 | 650 | 717,626 | ||||||||
California Statewide Communities Development Authority, RB, Series A: | ||||||||||
American Baptist Homes of the West, 5.00%, 10/01/43 | 1,000 | 1,083,340 | ||||||||
Sutter Health, 6.00%, 8/15/42 | 400 | 479,724 | ||||||||
California Statewide Communities Development Authority, Refunding RB: | ||||||||||
American Baptist Homes of the West, 6.25%, 10/01/39 | 2,575 | 2,936,659 | ||||||||
Loma Linda University Medical Center, 5.50%, 12/01/54 | 2,460 | 2,689,961 | ||||||||
California Statewide Financing Authority, RB, Tobacco Settlement: | ||||||||||
Series A, 6.00%, 5/01/43 | 2,500 | 2,495,350 | ||||||||
Series B, 6.00%, 5/01/43 | 3,485 | 3,484,791 | ||||||||
City of Chula Vista California, Refunding RB, San Diego Gas & Electric, Series A, 5.88%, 2/15/34 | 500 | 592,145 | ||||||||
City of San Jose California Hotel Tax, RB, Convention Center Expansion & Renovation Project: | ||||||||||
6.50%, 5/01/36 | 310 | 380,165 | ||||||||
6.50%, 5/01/42 | 760 | 924,092 | ||||||||
City of Stockton California Public Financing Authority, RB, Delta Water Supply Project, Series A, 6.25%, 10/01/40 | 240 | 283,015 | ||||||||
Portfolio Abbreviations
ACA AGC AGM AMBAC AMT ARB BAM BARB BHAC CAB CIFG COP EDA | American Capital Access Holding Ltd. Assured Guarantee Corp. Assured Guaranty Municipal Corp. American Municipal Bond Assurance Corp. Alternative Minimum Tax (subject to) Airport Revenue Bonds Build America Mutual Assurance Co. Building Aid Revenue Bonds Berkshire Hathaway Assurance Corp. Capital Appreciation Bonds CDC IXIS Financial Guaranty Certificates of Participation Economic Development Authority | EDC ERB ERS FHA GAN GARB GO HDA HFA HRB IDA IDB IDRB | Economic Development Corp. Education Revenue Bonds Extendible Reset Securities Federal Housing Administration Grant Anticipation Notes General Airport Revenue Bonds General Obligation Bonds Housing Development Authority Housing Finance Agency Housing Revenue Bonds Industrial Development Authority Industrial Development Board Industrial Development Revenue Bonds | ISD LRB M/F MRB NPFGC PILOT PSF-GTD Radian RB S/F SONYMA Syncora VRDN | Independent School District Lease Revenue Bonds Multi-Family Mortgage Revenue Bonds National Public Finance Guarantee Corp. Payment in Lieu of Taxes Public School Fund Guaranteed Radian Guaranty, Inc. Revenue Bonds Single-Family State of New York Mortgage Agency Syncora Guarantee Variable Rate Demand Note | |||||||||||||
| SEMI-ANNUAL REPORT | DECEMBER 31, 2014 | 15 |
| Schedule of Investments (continued) | BlackRock High Yield Municipal Fund (Percentages shown are based on Net Assets) |
| Municipal Bonds | Par (000) | Value | ||||||||
California (concluded) | ||||||||||
County of Riverside California Transportation Commission, RB, Senior Lien, Series A, 5.75%, 6/01/48 | $ | 2,115 | $ | 2,420,110 | ||||||
County of San Marcos California Unified School District, GO, CAB, Election of 2010, Series B, 0.00%, 8/01/51 (b) | 4,425 | 854,202 | ||||||||
Golden State Tobacco Securitization Corp., Refunding RB, Asset-Backed, Senior, Series A-1, 5.75%, 6/01/47 | 9,680 | 8,021,042 | ||||||||
Inland Empire Tobacco Securitization Authority, RB, CAB, Series C-1, 0.00%, 6/01/36 (b) | 15,575 | 2,923,272 | ||||||||
Lammersville School District Community Facilities District, Special Tax Bonds, District No. 2002, Mountain House, 5.13%, 9/01/35 | 325 | 339,264 | ||||||||
State of California, GO, Various Purpose, 5.00%, 4/01/43 | 5,000 | 5,671,100 | ||||||||
Successor Agency to the San Francisco City & County Redevelopment Agency, Special Tax Bonds, Community Facilities District No. 6 (Mission Bay South Public Improvements), Series C, CAB, 0.00%, 8/01/43 (b) | 3,000 | 598,440 | ||||||||
Temecula Public Financing Authority, Refunding, Special Tax Bonds, Harveston, Sub-Series B, 5.10%, 9/01/36 | 165 | 167,153 | ||||||||
Tobacco Securitization Authority of Southern California, Refunding RB, Tobacco Settlement, Asset-Backed, Senior Series A-1, 4.75%, 6/01/25 | 1,280 | 1,270,502 | ||||||||
| 48,229,981 | ||||||||||
Colorado — 2.7% | ||||||||||
Central Platte Valley Metropolitan District, GO, 5.00%, 12/01/43 | 1,250 | 1,298,238 | ||||||||
Colorado Educational & Cultural Facilities Authority, RB, Littleton Preparatory Charter School Project: | ||||||||||
5.00%, 12/01/33 | 450 | 458,523 | ||||||||
5.00%, 12/01/42 | 545 | 545,681 | ||||||||
Denver Convention Center Hotel Authority, Refunding RB, Senior (Syncora), 5.00%, 12/01/30 | 1,175 | 1,218,910 | ||||||||
Denver Health & Hospital Authority, RB, Series A: | ||||||||||
5.00%, 12/01/39 | 900 | 977,463 | ||||||||
5.25%, 12/01/45 | 1,350 | 1,496,839 | ||||||||
Foothills Metropolitan District, Special Assessment Bonds, 6.00%, 12/01/38 | 5,995 | 6,259,679 | ||||||||
Regional Transportation District, RB, Denver Transit Partners Eagle P3 Project: | ||||||||||
6.00%, 1/15/34 | 1,500 | 1,701,030 | ||||||||
6.00%, 1/15/41 | 1,000 | 1,123,270 | ||||||||
Tallyn’s Reach Metropolitan District No. 3, GO, Refunding, Limited Tax, 5.13%, 11/01/38 | 1,035 | 1,062,904 | ||||||||
| 16,142,537 | ||||||||||
Connecticut — 0.4% | ||||||||||
Mohegan Tribe of Indians of Connecticut, Refunding RB, Public Improvement, Priority Distribution, 6.25%, 1/01/31 | 2,505 | 2,504,800 | ||||||||
Delaware — 0.5% | ||||||||||
Delaware State EDA, RB, Exempt Facilities, Indian River Power LLC Project, 5.38%, 10/01/45 | 2,775 | 3,034,657 | ||||||||
District of Columbia — 1.3% | ||||||||||
District of Columbia, RB, Methodist Home District of Columbia, Series A: | ||||||||||
7.38%, 1/01/30 | 310 | 310,282 | ||||||||
7.50%, 1/01/39 | 500 | 500,350 | ||||||||
| Municipal Bonds | Par (000) | Value | ||||||||
District of Columbia (concluded) | ||||||||||
District of Columbia Tobacco Settlement Financing Corp., Refunding RB, Asset-Backed: | ||||||||||
6.50%, 5/15/33 | $ | 2,520 | $ | 3,068,604 | ||||||
6.75%, 5/15/40 | 385 | 384,965 | ||||||||
Metropolitan Washington Airports Authority, Refunding RB: | ||||||||||
CAB, 2nd Senior Lien, Series B (AGC), 0.00%, 10/01/30 (b) | 3,005 | 1,560,497 | ||||||||
Dulles Toll Road, 1st Senior Lien, Series A, 5.00%, 10/01/39 | 185 | 202,508 | ||||||||
Dulles Toll Road, 1st Senior Lien, Series A, 5.25%, 10/01/44 | 1,610 | 1,807,467 | ||||||||
| 7,834,673 | ||||||||||
Florida — 7.6% | ||||||||||
Boggy Creek Improvement District, Refunding RB, Special Assessment Bonds, 5.13%, 5/01/43 | 1,465 | 1,521,754 | ||||||||
Capital Trust Agency, Inc., RB: | ||||||||||
1st Mortgage, Silver Creek St. Augustine Project, 8.25%, 1/01/44 | 445 | 474,348 | ||||||||
1st Mortgage, Silver Creek St. Augustine Project, 8.25%, 1/01/49 | 950 | 1,011,360 | ||||||||
Faulk Senior Services, 6.50%, 12/01/34 | 500 | 500,325 | ||||||||
Faulk Senior Services, 6.75%, 12/01/49 | 580 | 578,562 | ||||||||
Celebration Pointe Community Development District, Special Assessment Bonds: | ||||||||||
4.75%, 5/01/24 | 625 | 619,156 | ||||||||
5.00%, 5/01/34 | 1,250 | 1,234,662 | ||||||||
5.13%, 5/01/45 | 1,720 | 1,697,709 | ||||||||
County of Alachua Florida Health Facilities Authority, RB, East Ridge Retirement Village, Inc. Project, 6.25%, 11/15/44 | 2,000 | 2,205,900 | ||||||||
County of Collier Florida IDA, Refunding RB, Arlington of Naples Project, Series A, 8.13%, 5/15/44 (a) | 1,490 | 1,700,522 | ||||||||
County of Hillsborough Florida IDA, RB, Tampa General Hospital Project, 5.25%, 10/01/41 | 895 | 939,526 | ||||||||
County of Martin Florida Health Facilities Authority, RB, 5.50%, 11/15/42 | 1,000 | 1,103,200 | ||||||||
County of Martin Florida IDA, Refunding RB, Indiantown Cogeneration, L.P. Project, AMT, 4.20%, 12/15/25 | 1,750 | 1,795,885 | ||||||||
County of Palm Beach Florida Health Facilities Authority, RB, Acts Retirement Life Community, 5.50%, 11/15/33 | 1,500 | 1,668,030 | ||||||||
County of Palm Beach Florida Health Facilities Authority, Refunding RB, 7.50%, 6/01/49 | 1,000 | 1,143,000 | ||||||||
Florida Development Finance Corp., RB, Series A: | ||||||||||
Miami Arts Charter School Project, 5.88%, 6/15/34 (a) | 830 | 845,031 | ||||||||
Miami Arts Charter School Project, 6.00%, 6/15/44 (a) | 2,800 | 2,826,040 | ||||||||
Renaissance Charter School, 5.75%, 6/15/29 | 695 | 699,511 | ||||||||
Renaissance Charter School, 6.00%, 6/15/34 | 835 | 840,352 | ||||||||
Renaissance Charter School, 6.13%, 6/15/44 | 3,225 | 3,209,617 | ||||||||
Greater Orlando Aviation Authority Florida, Refunding RB, Special Purpose, Jetblue Airways Corp. Project, AMT, 5.00%, 11/15/36 | 2,000 | 1,998,560 | ||||||||
Greeneway Improvement District, RB, Special Assessment Bonds, 5.13%, 5/01/43 | 1,475 | 1,532,141 | ||||||||
Highland Meadows Community Development District Florida, Special Assessment Bonds, Series A, 5.50%, 5/01/36 (c)(d) | 445 | 176,763 | ||||||||
| 16 | SEMI-ANNUAL REPORT | DECEMBER 31, 2014 |
| Schedule of Investments (continued) | BlackRock High Yield Municipal Fund (Percentages shown are based on Net Assets) |
| Municipal Bonds | Par (000) | Value | ||||||||
Florida (concluded) | ||||||||||
Jacksonville Economic Development Commission, RB, Gerdau Ameristeel U.S. Inc., AMT, 5.30%, 5/01/37 | $ | 3,300 | $ | 3,304,587 | ||||||
Lakewood Ranch Stewardship District, Refunding, Special Assessment Bonds, Lakewood Center & New Sector Projects, 8.00%, 5/01/40 | 515 | 656,347 | ||||||||
Mid-Bay Bridge Authority, RB, Springing Lien, Series A, 7.25%, 10/01/40 | 1,450 | 1,771,349 | ||||||||
Midtown Miami Community Development District, Refunding, Special Assessment Bonds, Series A: | ||||||||||
5.00%, 5/01/29 | 1,750 | 1,887,042 | ||||||||
5.00%, 5/01/37 | 900 | 960,570 | ||||||||
Pine Island Community Development District, RB, 5.30%, 11/01/10 (c)(d) | 1,355 | 759,925 | ||||||||
Santa Rosa Bay Bridge Authority, RB, 6.25%, 7/01/28 (c)(d) | 438 | 183,835 | ||||||||
Tolomato Community Development District, Refunding, Special Assessment Bonds: | ||||||||||
Series A2, 6.61%, 5/01/39 (e) | 40 | 29,291 | ||||||||
Series A3, 6.61%, 5/01/40 (e) | 90 | 53,698 | ||||||||
Series A4, 6.61%, 5/01/40 (e) | 50 | 22,081 | ||||||||
Series A1, 6.65%, 5/01/40 | 140 | 142,841 | ||||||||
Tolomato Community Development District, Convertible CAB (c)(d): | ||||||||||
Series 1, 6.65%, 5/01/40 | 5 | 5,135 | ||||||||
Series 2, 6.65%, 5/01/40 | 330 | 195,317 | ||||||||
Series 3, 6.65%, 5/01/40 | 105 | 1 | ||||||||
Viera East Community Development District, Refunding, Special Assessment Bonds, 5.00%, 5/01/26 | 640 | 666,938 | ||||||||
Village Community Development District No. 9, Special Assessment Bonds: | ||||||||||
7.00%, 5/01/41 | 1,525 | 1,874,393 | ||||||||
5.50%, 5/01/42 | 555 | 644,910 | ||||||||
Village Community Development District No. 10, Special Assessment Bonds, 5.13%, 5/01/43 | 1,740 | 1,895,556 | ||||||||
| 45,375,770 | ||||||||||
Georgia — 0.5% | ||||||||||
County of Clayton Georgia, Tax Allocation Bonds, Ellenwood Project, 7.50%, 7/01/33 | 125 | 132,094 | ||||||||
County of Clayton Georgia Development Authority, Refunding RB, Delta Air Lines, Inc. Project, Series A, 8.75%, 6/01/29 | 635 | 792,124 | ||||||||
County of Gainesville & Hall Georgia Development Authority, Refunding RB, Acts Retirement Life Community, Series A-2, 6.63%, 11/15/39 | 220 | 254,432 | ||||||||
County of Gainesville Georgia & Hall Hospital Authority, Refunding RB, Series A, Northeast Georgia Health System, Inc. Project, 5.50%, 8/15/54 | 555 | 646,331 | ||||||||
Private Colleges & Universities Authority, RB, Savannah College of Art & Design, 5.00%, 4/01/44 | 1,075 | 1,170,385 | ||||||||
| 2,995,366 | ||||||||||
Guam — 1.3% | ||||||||||
Guam Government Waterworks Authority, RB, Water & Wastewater System: | ||||||||||
5.25%, 7/01/33 | 910 | 1,035,534 | ||||||||
5.50%, 7/01/43 | 1,520 | 1,752,712 | ||||||||
| Municipal Bonds | Par (000) | Value | ||||||||
Guam (concluded) | ||||||||||
Territory of Guam, GO, Series A: | ||||||||||
6.00%, 11/15/19 | $ | 100 | $ | 110,586 | ||||||
6.75%, 11/15/29 | 1,650 | 1,892,187 | ||||||||
7.00%, 11/15/39 | 2,660 | 3,128,559 | ||||||||
| 7,919,578 | ||||||||||
Idaho — 0.0% | ||||||||||
County of Power Idaho Industrial Development Corp., RB, FMC Corp. Project, AMT, 6.45%, 8/01/32 | 265 | 265,517 | ||||||||
Illinois — 6.0% | ||||||||||
City of Chicago Illinois, GO, Refunding, Series A, 5.00%, 1/01/36 | 3,000 | 3,096,540 | ||||||||
City of Chicago Illinois, GO, Series A, 5.25%, 1/01/35 | 4,500 | 4,694,985 | ||||||||
City of Chicago Illinois Board of Education, GO, Series A, 5.25%, 12/01/41 | 7,300 | 7,591,270 | ||||||||
City of Chicago Illinois Waterworks, Refunding RB, 2nd Lien Project, 5.00%, 11/01/42 | 3,040 | 3,323,784 | ||||||||
Illinois Finance Authority, RB, Lake Forest College, Series A, 6.00%, 10/01/48 | 1,700 | 1,899,325 | ||||||||
Illinois Finance Authority, Refunding RB: | ||||||||||
Central Dupage Health, Series B, 5.50%, 11/01/39 | 1,400 | 1,583,232 | ||||||||
Friendship Village of Schaumburg, 7.13%, 2/15/39 | 1,000 | 1,075,060 | ||||||||
Lutheran Home & Services Obligated Group, 5.63%, 5/15/42 | 2,805 | 2,936,021 | ||||||||
Rogers Park Montessori School Project, Series 2014, 6.00%, 2/01/34 | 335 | 348,286 | ||||||||
Rogers Park Montessori School Project, Series 2014, 6.13%, 2/01/45 | 790 | 810,690 | ||||||||
Roosevelt University Project, 6.50%, 4/01/44 | 830 | 909,497 | ||||||||
Swedish Covenant, Series A, 6.00%, 8/15/38 | 1,000 | 1,131,280 | ||||||||
Metropolitan Pier & Exposition Authority, Refunding RB, CAB, McCormick Place Expansion Project, Series B (AGM), 0.00%, 6/15/44 (b) | 3,455 | 864,303 | ||||||||
Quad Cities Regional EDA, Refunding RB, Augustana College, 4.75%, 10/01/32 | 675 | 713,482 | ||||||||
Railsplitter Tobacco Settlement Authority, RB, 6.00%, 6/01/28 | 390 | 459,065 | ||||||||
State of Illinois, GO: | ||||||||||
5.00%, 2/01/39 | 500 | 528,385 | ||||||||
Series A, 5.00%, 4/01/35 | 1,460 | 1,554,258 | ||||||||
Series A, 5.00%, 4/01/38 | 2,190 | 2,310,954 | ||||||||
| 35,830,417 | ||||||||||
Indiana — 1.3% | ||||||||||
City of Carmel Indiana, RB, Barrington Carmel Project, Series A: | ||||||||||
7.13%, 11/15/42 | 1,500 | 1,669,110 | ||||||||
7.13%, 11/15/47 | 1,500 | 1,664,025 | ||||||||
City of Valparaiso Indiana, RB, Exempt Facilities, Pratt Paper LLC Project, AMT: | ||||||||||
6.75%, 1/01/34 | 525 | 615,237 | ||||||||
7.00%, 1/01/44 | 1,270 | 1,497,076 | ||||||||
Indiana Finance Authority, RB, Private Activity Bond, Ohio River Bridges East End Crossing Project, Series A, AMT: | ||||||||||
5.00%, 7/01/44 | 370 | 393,151 | ||||||||
5.00%, 7/01/48 | 1,230 | 1,304,243 | ||||||||
Indiana Finance Authority, Refunding RB, Marquette Project, 5.00%, 3/01/39 | 725 | 761,909 | ||||||||
| 7,904,751 | ||||||||||
| SEMI-ANNUAL REPORT | DECEMBER 31, 2014 | 17 |
| Schedule of Investments (continued) | BlackRock High Yield Municipal Fund (Percentages shown are based on Net Assets) |
| Municipal Bonds | Par (000) | Value | ||||||||
Iowa — 3.1% | ||||||||||
Iowa Finance Authority, Refunding RB: | ||||||||||
Development, Care Initiatives Project, Series A, 5.00%, 7/01/19 | $ | 500 | $ | 516,830 | ||||||
Midwestern Disaster Area, Iowa Fertilizer Co. Project, 5.50%, 12/01/22 | 3,295 | 3,479,751 | ||||||||
Sunrise Retirement Community Project, 5.50%, 9/01/37 | 890 | 902,140 | ||||||||
Sunrise Retirement Community Project, 5.75%, 9/01/43 | 1,385 | 1,418,046 | ||||||||
Iowa Student Loan Liquidity Corp., Refunding RB, AMT, Senior Series A-1, 5.00%, 12/01/21 | 3,710 | 4,026,648 | ||||||||
Iowa Tobacco Settlement Authority, Refunding RB: | ||||||||||
Asset-Backed, CAB, Series B, 5.60%, 6/01/34 | 1,200 | 1,095,936 | ||||||||
Asset-Backed, Series C, 5.50%, 6/01/42 | 2,000 | 1,668,960 | ||||||||
Asset-Backed, Series C, 5.63%, 6/01/46 | 3,345 | 2,839,035 | ||||||||
Series C, 5.38%, 6/01/38 | 3,075 | 2,571,623 | ||||||||
| 18,518,969 | ||||||||||
Kentucky — 0.6% | ||||||||||
Kentucky Economic Development Finance Authority, Refunding RB, Norton Healthcare, Inc., Series B (NPFGC), 0.00%, 10/01/24 (b) | 250 | 178,202 | ||||||||
Kentucky Public Transportation Infrastructure Authority, RB, 6.00%, 7/01/53 | 3,000 | 3,472,830 | ||||||||
| 3,651,032 | ||||||||||
Louisiana — 1.5% | ||||||||||
Louisiana Local Government Environmental Facilities & Community Development Authority, RB, Westlake Chemical Corp., Series A-2, 6.50%, 11/01/35 | 1,630 | 1,960,205 | ||||||||
Louisiana Public Facilities Authority, RB, Belle Chasse Educational Foundation Project, 6.75%, 5/01/41 | 645 | 727,941 | ||||||||
Parish of St. John the Baptist Louisiana, RB, Marathon Oil Corp., Series A, 5.13%, 6/01/37 | 1,905 | 2,019,776 | ||||||||
Tobacco Settlement Financing Corp., Refunding RB, Asset-Backed, Series A, 5.25%, 5/15/35 | 3,910 | 4,311,674 | ||||||||
| 9,019,596 | ||||||||||
Maine — 0.2% | ||||||||||
Maine Health & Higher Educational Facilities Authority, RB, Maine General Medical Center, 6.75%, 7/01/41 | 1,075 | 1,229,520 | ||||||||
Maryland — 1.1% | ||||||||||
City of Gaithersburg Maryland, Refunding RB, Asbury Maryland Obligation, Series B, 6.00%, 1/01/23 | 750 | 843,008 | ||||||||
County of Frederick Maryland, RB, Jefferson Technology Park Project, Series B, 7.13%, 7/01/43 | 2,910 | 3,261,848 | ||||||||
County of Howard Maryland, Refunding RB, Vantage House Facility, Series A, 5.25%, 4/01/33 | 500 | 485,390 | ||||||||
Maryland EDC, RB: | ||||||||||
Term Project, Series B, 5.75%, 6/01/35 | 1,500 | 1,620,585 | ||||||||
Transportation Facilities Project, Series A, 5.75%, 6/01/35 | 265 | 286,303 | ||||||||
| 6,497,134 | ||||||||||
Massachusetts — 1.3% | ||||||||||
Massachusetts Development Finance Agency, RB: | ||||||||||
Foxborough Regional Charter School, Series A, 7.00%, 7/01/42 | 350 | 398,604 | ||||||||
Linden Ponds, Inc. Facility, Series A-1, 6.25%, 11/15/39 | 353 | 298,849 | ||||||||
| Municipal Bonds | Par (000) | Value | ||||||||
Massachusetts (concluded) | ||||||||||
Massachusetts Development Finance Agency, RB (concluded): | ||||||||||
Linden Ponds, Inc. Facility, Series A-2, 5.50%, 11/15/46 | $ | 19 | $ | 15,155 | ||||||
Linden Ponds, Inc. Facility, Series B, 0.00%, 11/15/56 (b) | 94 | 94 | ||||||||
North Hill Communities Issue, Series A, 6.50%, 11/15/43 (a) | 1,480 | 1,575,208 | ||||||||
Massachusetts Development Finance Agency, Refunding RB: | ||||||||||
Covanta Energy Project, Series C, AMT, 5.25%, 11/01/42 (a) | 3,000 | 3,084,750 | ||||||||
Seven Hills Foundation & Affiliates (Radian), 5.00%, 9/01/35 | 1,500 | 1,506,840 | ||||||||
Tufts Medical Center, Series I, 6.75%, 1/01/36 | 510 | 608,129 | ||||||||
| 7,487,629 | ||||||||||
Michigan — 2.0% | ||||||||||
City of Detroit Michigan, GO, Financial Recovery (f): | ||||||||||
Series B-1, 4.00%, 4/01/44 | 170 | 101,720 | ||||||||
Series B-2, 4.00%, 4/01/44 | 54 | 32,379 | ||||||||
City of Detroit Michigan Sewage Disposal System, Refunding RB, Senior Lien, Series A, 5.25%, 7/01/39 | 1,660 | 1,794,427 | ||||||||
County of Monroe Michigan Hospital Finance Authority, Refunding RB, Mercy Memorial Hospital Corp. Obligation, 5.50%, 6/01/35 | 1,565 | 1,612,670 | ||||||||
Kentwood EDC, Refunding RB, Limited Obligation, Holland Home, 5.63%, 11/15/41 | 1,000 | 1,055,580 | ||||||||
Michigan Finance Authority, RB, Detroit Water & Sewage Disposal System, Senior Lien, Series 2014 C-2, AMT, 5.00%, 7/01/44 | 350 | 364,199 | ||||||||
Michigan Finance Authority, Refunding RB, Detroit Water & Sewage Department Project, Senior Lien, Series C-1, 5.00%, 7/01/44 | 800 | 847,144 | ||||||||
Michigan Tobacco Settlement Finance Authority, Refunding RB, Series A, 6.88%, 6/01/42 | 3,180 | 3,032,798 | ||||||||
Royal Oak Hospital Finance Authority, Refunding RB, William Beaumont Hospital, Series V, 8.25%, 9/01/18 (g) | 915 | 1,151,061 | ||||||||
State of Michigan Hospital Finance Authority, Refunding RB, Henry Ford Health, 5.75%, 11/15/39 | 1,710 | 1,910,104 | ||||||||
| 11,902,082 | ||||||||||
Minnesota — 0.6% | ||||||||||
City of Cologne Minnesota Charter School, LRB, Cologne Academy Project, Series A, 5.00%, 7/01/45 | 2,065 | 2,137,647 | ||||||||
St. Paul Housing & Redevelopment Authority, RB, Nova Classical Academy, Series A, 6.63%, 9/01/42 | 500 | 570,220 | ||||||||
Woodbury Housing & Redevelopment Authority, RB, St. Therese of Woodbury, 5.13%, 12/01/44 | 955 | 963,270 | ||||||||
| 3,671,137 | ||||||||||
Missouri — 0.9% | ||||||||||
City of Kansas Missouri, Tax Allocation Bonds, Kansas City MainCor Project, Series A, 5.25%, 3/01/18 (h) | 400 | 431,504 | ||||||||
Kirkwood IDA Missouri, RB, Aberdeen Heights, Series A, 8.25%, 5/15/39 | 435 | 502,843 | ||||||||
Lees Summit Industrial Development Authority, RB, John Knox Obligated Group, 5.25%, 8/15/39 | 1,890 | 1,938,705 | ||||||||
| 18 | SEMI-ANNUAL REPORT | DECEMBER 31, 2014 |
| Schedule of Investments (continued) | BlackRock High Yield Municipal Fund (Percentages shown are based on Net Assets) |
| Municipal Bonds | Par (000) | Value | ||||||||
Missouri (concluded) | ||||||||||
Poplar Bluff Regional Transportation Development District, RB, 4.75%, 12/01/42 | $ | 2,200 | $ | 2,274,712 | ||||||
| 5,147,764 | ||||||||||
Nebraska — 0.1% | ||||||||||
Central Plains Energy Project Nebraska, RB, Gas Project No. 3, 5.00%, 9/01/42 | 780 | 846,027 | ||||||||
Nevada — 0.2% | ||||||||||
County of Clark Nevada, RB, Southwest Gas Corp. Project, Series A, AMT (NPFGC), 4.75%, 9/01/36 | 20 | 20,235 | ||||||||
County of Clark Nevada, Refunding, Special Assessment, Special Improvement District No. 142, Mountain’s Edge: | ||||||||||
4.00%, 8/01/22 | 815 | 832,645 | ||||||||
4.00%, 8/01/23 | 510 | 513,774 | ||||||||
| 1,366,654 | ||||||||||
New Hampshire — 0.1% | ||||||||||
New Hampshire Health & Education Facilities Authority, Refunding RB, Dartmouth-Hitchcock, 6.00%, 8/01/38 | 435 | 503,191 | ||||||||
New Jersey — 5.2% | ||||||||||
Casino Reinvestment Development Authority, Refunding RB, 5.25%, 11/01/44 | 1,750 | 1,905,505 | ||||||||
County of Gloucester New Jersey Pollution Control Financing Authority, Refunding RB, AMT, 5.00%, 12/01/24 | 1,500 | 1,685,640 | ||||||||
New Jersey EDA, RB: | ||||||||||
AMT, ACR Energy Partners, Series A, 10.50%, 6/01/32 (a)(c)(d) | 1,660 | 747,000 | ||||||||
Continental Airlines, Inc. Project, AMT, 5.13%, 9/15/23 | 1,965 | 2,116,933 | ||||||||
Continental Airlines, Inc. Project, AMT, 5.25%, 9/15/29 | 840 | 894,113 | ||||||||
Kapkowski Road Landfill Project, Series B, AMT, 6.50%, 4/01/31 | 3,000 | 3,686,100 | ||||||||
Private Activity Bond, The Goethals Bridge Replacement Project, AMT, 5.38%, 1/01/43 | 1,360 | 1,491,553 | ||||||||
Team Academy Charter School Project, 6.00%, 10/01/43 | 970 | 1,101,241 | ||||||||
New Jersey Health Care Facilities Financing Authority, Refunding RB, St. Joseph’s Healthcare System, 6.63%, 7/01/38 | 725 | 812,087 | ||||||||
New Jersey Transportation Trust Fund Authority, RB, Transportation Program, Series AA, 5.00%, 6/15/44 | 3,755 | 4,048,153 | ||||||||
South Jersey Transportation Authority LLC, Refunding RB, Series A, 5.00%, 11/01/39 | 3,250 | 3,545,035 | ||||||||
Tobacco Settlement Financing Corp. New Jersey, Refunding RB, Series 1A: | ||||||||||
4.50%, 6/01/23 | 5,885 | 5,881,116 | ||||||||
5.00%, 6/01/29 | 3,730 | 3,178,594 | ||||||||
| 31,093,070 | ||||||||||
New Mexico — 0.3% | ||||||||||
New Mexico Hospital Equipment Loan Council, Refunding RB, Gerald Champion Regional Medical Center Project, 5.50%, 7/01/42 | 2,030 | 1,998,880 | ||||||||
New York — 13.1% | ||||||||||
Build New York City Resource Corp., RB: | ||||||||||
5.50%, 11/01/44 | 1,970 | 2,110,461 | ||||||||
South Bronx Charter School for International Cultures and the Arts Project, Series A, 5.00%, 4/15/43 | 2,750 | 2,770,212 | ||||||||
| Municipal Bonds | Par (000) | Value | ||||||||
New York (concluded) | ||||||||||
Build New York City Resource Corp., Refunding RB, Pratt Paper, Inc. Project, AMT, 5.00%, 1/01/35 (a) | $ | 710 | $ | 731,989 | ||||||
Chautauqua Tobacco Asset Securitization Corp., Refunding RB, 5.00%, 6/01/48 | 10,750 | 10,583,052 | ||||||||
City of New York New York Industrial Development Agency, ARB, AMT: | ||||||||||
American Airlines, Inc., JFK International Airport, 8.00%, 8/01/28 (f) | 235 | 258,230 | ||||||||
British Airways PLC Project, 7.63%, 12/01/32 | 1,500 | 1,508,295 | ||||||||
City of New York New York Industrial Development Agency, RB, Queens Baseball Stadium, PILOT (AMBAC), 5.00%, 1/01/46 | 2,000 | 2,061,760 | ||||||||
City of New York New York Water & Sewer System, Refunding RB, 2nd General Resolution, Series CC, 5.00%, 6/15/47 | 8,535 | 9,624,663 | ||||||||
County of Chautauqua New York Industrial Development Agency, RB, NRG Dunkirk Power Project, 5.88%, 4/01/42 | 3,115 | 3,456,373 | ||||||||
County of Dutchess New York Industrial Development Agency, Refunding RB, Bard College Civic Facility, 5.00%, 8/01/46 | 5,000 | 5,058,900 | ||||||||
County of Westchester New York Healthcare Corp., RB, Senior Lien, Series A, 5.00%, 11/01/44 | 1,552 | 1,738,853 | ||||||||
County of Westchester New York Local Development Corp., RB, Pace University, Series A, 5.50%, 5/01/42 | 2,000 | 2,288,620 | ||||||||
New York Counties Tobacco Trust II, RB, 5.75%, 6/01/43 | 2,905 | 2,918,770 | ||||||||
New York Liberty Development Corp., RB, Goldman Sachs Headquarters, 5.25%, 10/01/35 | 3,775 | 4,543,477 | ||||||||
New York Liberty Development Corp., Refunding RB: | ||||||||||
2nd Priority, Bank of America Tower at One Bryant Park Project, Class 3, 6.38%, 7/15/49 | 375 | 424,774 | ||||||||
3 World Trade Center Project, Class 1, 5.00%, 11/15/44 (a) | 6,650 | 6,901,569 | ||||||||
3 World Trade Center Project, Class 2, 5.15%, 11/15/34 (a) | 450 | 477,508 | ||||||||
3 World Trade Center Project, Class 2, 5.38%, 11/15/40 (a) | 1,070 | 1,149,298 | ||||||||
3 World Trade Center Project, Class 3, 7.25%, 11/15/44 (a) | 3,115 | 3,682,304 | ||||||||
New York State Dormitory Authority, Refunding RB, 5.00%, 9/01/38 | 2,500 | 2,514,300 | ||||||||
Niagara Area Development Corp., Refunding RB, Solid Waste Disposal Facility, Covanta Energy Project, Series A, AMT, 5.25%, 11/01/42 (a) | 3,895 | 4,022,912 | ||||||||
Onondaga Civic Development Corp., Refunding RB, St. Joseph’s Hospital Health Center Project, 5.00%, 7/01/42 | 1,220 | 1,242,912 | ||||||||
Rensselaer Tobacco Asset Securitization Corp., RB, Asset-Backed, Series A, 5.75%, 6/01/43 | 2,500 | 2,499,875 | ||||||||
Rockland Tobacco Asset Securitization Corp., RB, Asset-Backed, 5.75%, 8/15/43 | 690 | 689,952 | ||||||||
TSASC, Inc., Refunding RB, 5.00%, 6/01/26 | 5,000 | 5,000,800 | ||||||||
| 78,259,859 | ||||||||||
North Carolina — 0.8% | ||||||||||
North Carolina Medical Care Commission, Refunding RB: | ||||||||||
1st Mortgage, Retirement Facilities Whitestone Project, Series A, 7.75%, 3/01/41 | 3,055 | 3,466,356 | ||||||||
Carolina Village Project, 6.00%, 4/01/38 | 1,000 | 1,064,770 | ||||||||
| 4,531,126 | ||||||||||
| SEMI-ANNUAL REPORT | DECEMBER 31, 2014 | 19 |
| Schedule of Investments (continued) | BlackRock High Yield Municipal Fund (Percentages shown are based on Net Assets) |
| Municipal Bonds | Par (000) | Value | ||||||||
North Dakota — 0.2% | ||||||||||
City of Williston North Dakota, RB, Eagle Crest Apartments LLC Project, 7.75%, 9/01/38 | $ | 1,345 | $ | 1,421,140 | ||||||
Ohio — 0.6% | ||||||||||
Buckeye Tobacco Settlement Financing Authority, RB, Asset-Backed Bonds, Series A-2, 5.75%, 6/01/34 | 4,460 | 3,585,305 | ||||||||
Oklahoma — 0.1% | ||||||||||
Oklahoma Development Finance Authority, Refunding RB, Inverness Village Community, 6.00%, 1/01/32 | 695 | 734,789 | ||||||||
Oregon — 1.0% | ||||||||||
City of Forest Grove Oregon, Refunding RB, Pacific University Project, Series A: | ||||||||||
4.50%, 5/01/29 | 1,000 | 1,087,060 | ||||||||
5.00%, 5/01/40 | 1,570 | 1,738,210 | ||||||||
Hospital Facilities Authority of Multnomah County Oregon, Refunding RB, Mirabella at South Waterfront: | ||||||||||
5.40%, 10/01/44 | 1,145 | 1,214,753 | ||||||||
5.50%, 10/01/49 | 1,620 | 1,713,895 | ||||||||
| 5,753,918 | ||||||||||
Pennsylvania — 5.1% | ||||||||||
Allentown Neighborhood Improvement Zone Development Authority, Refunding RB, Series A: | ||||||||||
5.00%, 5/01/35 | 1,185 | 1,295,833 | ||||||||
5.00%, 5/01/42 | 2,730 | 2,955,989 | ||||||||
City of Philadelphia Pennsylvania Hospitals & Higher Education Facilities Authority, RB, Temple University Health System, Series A, 5.63%, 7/01/36 | 3,000 | 3,210,870 | ||||||||
County of Cumberland Pennsylvania Municipal Authority, Refunding RB, Diakon Lutheran, 6.38%, 1/01/39 | 2,680 | 2,976,890 | ||||||||
County of Lancaster Pennsylvania Hospital Authority, Refunding RB, Brethren Village Project, Series A, 6.50%, 7/01/40 | 835 | 874,070 | ||||||||
County of Lehigh Pennsylvania General Purpose Authority, Refunding RB, Bible Fellowship Church Homes, 5.13%, 7/01/32 | 2,095 | 2,182,655 | ||||||||
County of Montgomery Pennsylvania IDA, RB, NHS III Properties Project, 6.50%, 10/01/37 | 3,300 | 3,339,171 | ||||||||
County of Northampton Pennsylvania IDA, Route 33 Project, Tax Allocation Bonds, 7.00%, 7/01/32 | 1,345 | 1,472,022 | ||||||||
East Hempfield Township Industrial Development Authority, RB: | ||||||||||
5.00%, 7/01/34 | 1,000 | 1,073,490 | ||||||||
5.00%, 7/01/46 | 1,750 | 1,848,910 | ||||||||
Pennsylvania Economic Development Financing Authority, RB, US Airways Group, Series A, 7.50%, 5/01/20 | 1,200 | 1,404,852 | ||||||||
Pennsylvania Economic Development Financing Authority, Refunding RB, National Gypson Co., 5.50%, 11/01/44 | 5,390 | 5,477,534 | ||||||||
Township of East Hempfield IDA, RB, Student Services, Inc., Student Housing Project at Millersville University of Pennsylvania, 5.00%, 7/01/45 | 2,600 | 2,734,108 | ||||||||
| 30,846,394 | ||||||||||
Puerto Rico — 0.9% | ||||||||||
Commonwealth of Puerto Rico, GO, Refunding, Series A, 8.00%, 7/01/35 | 6,500 | 5,655,000 | ||||||||
Rhode Island — 0.2% | ||||||||||
Tobacco Settlement Financing Corp, RB, Asset-Backed, Series A, 6.25%, 6/01/42 | 1,360 | 1,363,332 | ||||||||
| Municipal Bonds | Par (000) | Value | ||||||||
South Carolina — 1.5% | ||||||||||
State of South Carolina Public Service Authority, RB, Santee Cooper, Series A, 5.50%, 12/01/54 | $ | 7,530 | $ | 8,689,846 | ||||||
Texas — 6.6% | ||||||||||
Brazos River Authority, RB, TXU Electric, Series A, AMT, 8.25%, 10/01/30 (c)(d) | 750 | 39,375 | ||||||||
Central Texas Regional Mobility Authority, Refunding RB: | ||||||||||
CAB, 0.00%, 1/01/28 (b) | 3,000 | 1,718,970 | ||||||||
CAB, 0.00%, 1/01/29 (b) | 500 | 273,730 | ||||||||
CAB, 0.00%, 1/01/30 (b) | 1,330 | 694,380 | ||||||||
CAB, 0.00%, 1/01/31 (b) | 4,000 | 1,984,240 | ||||||||
Senior Lien, 6.25%, 1/01/46 | 765 | 891,914 | ||||||||
City of Houston Texas Airport System, RB, Special Facilities, Continental Airlines, Inc., AMT, Series A, 6.63%, 7/15/38 | 1,110 | 1,252,690 | ||||||||
City of Houston Texas Airport System, Refunding ARB: | ||||||||||
Senior Lien, Series A, 5.50%, 7/01/39 | 120 | 134,998 | ||||||||
United Airlines, Inc. Terminal E Project, AMT, 5.00%, 7/01/29 | 1,000 | 1,066,980 | ||||||||
Clifton Higher Education Finance Corp., ERB, Idea Public Schools: | ||||||||||
5.50%, 8/15/31 | 255 | 285,863 | ||||||||
5.75%, 8/15/41 | 280 | 316,938 | ||||||||
5.00%, 8/15/42 | 1,310 | 1,412,232 | ||||||||
County of Bexar Texas Health Facilities Development Corp., RB, Army Retirement Residence Project, 6.20%, 7/01/45 | 1,320 | 1,519,703 | ||||||||
County of Fort Bend Texas Industrial Development Corp., RB, NRG Energy, Inc. Project, Series A, 4.75%, 5/01/38 | 3,250 | 3,372,265 | ||||||||
County of Harris Texas Cultural Education Facilities Finance Corp., Refunding, MRB, Brazos Presbyterian Homes, Inc. Project, Series A: | ||||||||||
5.00%, 1/01/38 | 510 | 517,385 | ||||||||
5.00%, 1/01/43 | 520 | 524,779 | ||||||||
5.13%, 1/01/48 | 1,535 | 1,546,512 | ||||||||
County of Harris Texas Houston Sports Authority, Refunding RB, CAB, Senior Lien, Series G (NPFGC), 0.00%, 11/15/41 (b) | 350 | 89,131 | ||||||||
County of Matagorda Texas Navigation District No. 1, Refunding RB, Central Power & Light Co. Project, Series A, 6.30%, 11/01/29 | 290 | 334,147 | ||||||||
County of Tarrant Texas Cultural Education Facilities Finance Corp., RB, Series A: | ||||||||||
CC Young Memorial Home, 8.00%, 2/15/38 | 330 | 371,527 | ||||||||
Senior Living Center Project, 8.25%, 11/15/44 | 800 | 800,192 | ||||||||
County of Tarrant Texas Cultural Education Facilities Finance Corp., Refunding RB: | ||||||||||
Northwest Senior Housing, Edgemere Project, Series A, 6.00%, 11/15/36 | 1,500 | 1,579,590 | ||||||||
Trinity Terrace Project, 5.00%, 10/01/44 | 440 | 467,896 | ||||||||
Trinity Terrace Project, 5.00%, 10/01/49 | 885 | 931,020 | ||||||||
County of Travis Texas Health Facilities Development Corp., Refunding RB, 7.13%, 1/01/46 | 1,920 | 2,088,346 | ||||||||
Danbury Higher Education Authority, Inc., RB, A.W. Brown Fellowship Charter, Series A (ACA), 5.00%, 8/15/16 (g) | 355 | 380,943 | ||||||||
Houston Higher Education Finance Corp., RB, Cosmos Foundation, Inc., Series A, 6.50%, 5/15/31 | 1,000 | 1,239,560 | ||||||||
Mesquite Health Facility Development Corp., Refunding RB, 5.13%, 2/15/42 | 690 | 706,884 | ||||||||
| 20 | SEMI-ANNUAL REPORT | DECEMBER 31, 2014 |
| Schedule of Investments (continued) | BlackRock High Yield Municipal Fund (Percentages shown are based on Net Assets) |
| Municipal Bonds | Par (000) | Value | ||||||||
Texas (concluded) | ||||||||||
New Hope Cultural Education Facilities Corp., RB, Stephenville LLC Tarleton State University Project: | ||||||||||
5.88%, 4/01/36 | $ | 890 | $ | 1,028,546 | ||||||
6.00%, 4/01/45 | 1,355 | 1,566,407 | ||||||||
North Texas Tollway Authority, RB, CAB, Special Project System, Series B, 0.00%, 9/01/37 (b) | 725 | 240,011 | ||||||||
North Texas Tollway Authority, Refunding RB, 2nd Tier System, Series F, 6.13%, 1/01/16 (g) | 1,150 | 1,217,195 | ||||||||
Red River Health Facilities Development Corp., First MRB, Project: | ||||||||||
Eden Home, Inc., 7.25%, 12/15/42 | 1,330 | 1,255,799 | ||||||||
Wichita Falls Retirement Foundation, 5.13%, 1/01/41 | 600 | 614,256 | ||||||||
State of Texas Turnpike Authority, RB, CAB (AMBAC), 0.00%, 8/15/30 (b) | 5,200 | 2,051,348 | ||||||||
Texas Private Activity Bond Surface Transportation Corp., RB, Senior Lien: | ||||||||||
LBJ Infrastructure Group LLC, LBJ Freeway Managed Lanes Project, 7.00%, 6/30/40 | 1,000 | 1,205,640 | ||||||||
NTE Mobility Partners LLC, North Tarrant Express Managed Lanes Project, 6.88%, 12/31/39 | 1,740 | 2,058,611 | ||||||||
Town of Flower Mound Texas, Special Assessment Bonds, 6.50%, 9/01/36 | 1,500 | 1,576,710 | ||||||||
| 39,356,713 | ||||||||||
U.S. Virgin Islands — 0.8% | ||||||||||
Virgin Islands Public Finance Authority, Refunding RB, Series C, 5.00%, 10/01/39 | 4,515 | 4,857,418 | ||||||||
Utah — 0.6% | ||||||||||
State of Utah Charter School Finance Authority, RB, Navigator Pointe Academy, Series A, 5.63%, 7/15/40 | 1,000 | 1,069,240 | ||||||||
State of Utah Charter School Finance Authority, Refunding RB, 6.75%, 10/15/43 | 2,050 | 2,195,960 | ||||||||
| 3,265,200 | ||||||||||
Virginia — 4.5% | ||||||||||
County of Fairfax Virginia EDA, Refunding RB: | ||||||||||
Goodwin House, Inc., 5.13%, 10/01/37 | 1,800 | 1,870,686 | ||||||||
Goodwin House, Inc., 5.13%, 10/01/42 | 1,185 | 1,226,819 | ||||||||
Vinson Hall LLC, Series A, 5.00%, 12/01/47 | 1,265 | 1,304,911 | ||||||||
County of Fairfax Virginia IDA, RB, Series A, 4.00%, 5/15/44 | 7,000 | 7,125,860 | ||||||||
County of Hanover Virginia EDA, Refunding RB, Covenant Woods, Series A: | ||||||||||
5.00%, 7/01/42 | 2,000 | 2,051,540 | ||||||||
Residential Care Facility, 5.00%, 7/01/47 | 1,015 | 1,038,974 | ||||||||
County of York Virginia EDA, Refunding RB, Series A, 1.88%, 5/01/33 (f) | 2,945 | 2,991,295 | ||||||||
Mosaic District Community Development Authority, Special Assessment, Series A: | ||||||||||
6.63%, 3/01/26 | 515 | 596,422 | ||||||||
6.88%, 3/01/36 | 450 | 520,452 | ||||||||
Virginia Small Business Financing Authority, RB, Senior Lien, AMT: | ||||||||||
Elizabeth River Crossings OpCo LLC Project, 6.00%, 1/01/37 | 4,095 | 4,692,542 | ||||||||
Express Lanes LLC, 5.00%, 7/01/34 | 3,300 | 3,497,670 | ||||||||
| 26,917,171 | ||||||||||
Washington — 0.3% | ||||||||||
County of King Washington Public Hospital District No. 4, GO, Refunding, Snoqualmie Valley Hospital, 7.00%, 12/01/40 | 545 | 599,691 | ||||||||
| Municipal Bonds | Par (000) | Value | |||||||||
Washington (concluded) | |||||||||||
Greater Wenatchee Regional Events Center Public Facilities District, Refunding RB, Series A, 5.50%, 9/01/42 | $ | 1,005 | $ | 1,054,868 | |||||||
| 1,654,559 | |||||||||||
Wisconsin — 1.1% | |||||||||||
Public Finance Authority, RB, Series A: | |||||||||||
Rose Villa Project, 5.75%, 11/15/44 | 380 | 398,194 | |||||||||
Rose Villa Project, 6.00%, 11/15/49 | 235 | 249,737 | |||||||||
Voyager Foundation, Inc. Project, 5.13%, 10/01/45 | 1,850 | 1,859,250 | |||||||||
Public Finance Authority, Refunding RB, Senior Obligated Group, Series B, AMT, 5.00%, 7/01/42 | 1,500 | 1,591,380 | |||||||||
Wisconsin Health & Educational Facilities Authority, Refunding RB: | |||||||||||
Mile Bluff Medical Center, 5.50%, 5/01/34 | 875 | 921,926 | |||||||||
Mile Bluff Medical Center, 5.75%, 5/01/39 | 1,065 | 1,118,644 | |||||||||
St. Johns Communities, Inc., Series A, 7.25%, 9/15/29 | 75 | 88,592 | |||||||||
St. Johns Communities, Inc., Series A, 7.63%, 9/15/39 | 145 | 172,882 | |||||||||
| 6,400,605 | |||||||||||
Total Municipal Bonds — 87.5% | 524,758,836 | ||||||||||
Municipal Bonds Transferred to Tender Option Bond Trusts (i) | |||||||||||
California — 0.4% | |||||||||||
Bay Area Toll Authority, Refunding RB, San Francisco Bay Area, Series F-1, 5.63%, 4/01/19 (g) | 480 | 570,023 | |||||||||
City of Los Angeles California Department of Airports, Refunding ARB, Los Angeles International Airport, Senior Series A, 5.00%, 5/15/40 | 1,679 | 1,904,082 | |||||||||
| 2,474,105 | |||||||||||
Colorado — 1.0% | |||||||||||
Colorado Health Facilities Authority, Refunding RB, Sisters of Leavenworth Health System, Series A, 5.00%, 1/01/40 | 5,595 | 6,182,083 | |||||||||
District of Columbia — 0.2% | |||||||||||
District of Columbia Water & Sewer Authority, Refunding RB, Senior Lien, Series A, 6.00%, 10/01/18 (g)(j) | 940 | 1,112,480 | |||||||||
Florida — 0.7% | |||||||||||
County of Miami-Dade Florida, RB, Water & Sewer System, 5.00%, 10/01/34 | 3,500 | 3,957,191 | |||||||||
Illinois — 1.1% | |||||||||||
City of Chicago Illinois, GARB, O’Hare International Airport, 3rd Lien, Series A (NPFGC), 5.00%, 1/01/33 (j) | 3,495 | 3,649,164 | |||||||||
Illinois Finance Authority, RB, The Carle Foundation, Series A (AGM), 6.00%, 8/15/41 | 2,480 | 2,888,109 | |||||||||
| 6,537,273 | |||||||||||
New York — 3.6% | |||||||||||
City of New York New York Municipal Water Finance Authority, Refunding RB, Water & Sewer System, 2nd General Resolution: | |||||||||||
Series EE, 5.50%, 6/15/43 | 3,795 | �� | 4,457,645 | ||||||||
Series HH, 5.00%, 6/15/31 (j) | 3,015 | 3,466,150 | |||||||||
Hudson Yards Infrastructure Corp., RB, Fiscal 2012, Series A, 5.75%, 2/15/47 (j) | 1,720 | 1,987,919 | |||||||||
| SEMI-ANNUAL REPORT | DECEMBER 31, 2014 | 21 |
| Schedule of Investments (continued) | BlackRock High Yield Municipal Fund (Percentages shown are based on Net Assets) |
| Municipal Bonds Transferred to Tender Option Bond Trusts (i) | Par (000) | Value | ||||||||
New York (concluded) | ||||||||||
New York Liberty Development Corp., RB, 1 World Trade Center Port Authority Consolidated Bonds, 5.25%, 12/15/43 | $ | 7,725 | $ | 8,908,238 | ||||||
New York Liberty Development Corp., Refunding RB, 4 World Trade Center Project, 5.75%, 11/15/51 (j) | 2,520 | 2,949,081 | ||||||||
| 21,769,033 | ||||||||||
Ohio — 0.4% | ||||||||||
State of Ohio, Refunding RB, Cleveland Clinic Health System Obligated Group, Series A, 5.50%, 1/01/39 | 2,010 | 2,261,483 | ||||||||
South Carolina — 0.1% | ||||||||||
State of South Carolina Housing Finance & Development Authority, Refunding RB, S/F Housing, Series B-1, 5.55%, 7/01/39 | 876 | 894,275 | ||||||||
Virginia — 0.5% | ||||||||||
Virginia Small Business Financing Authority, Refunding RB, Sentara Healthcare, 5.00%, 11/01/40 | 2,501 | 2,748,280 | ||||||||
Washington — 0.5% | ||||||||||
City of Bellingham Washington, RB, Water & Sewer, 5.00%, 8/01/40 | 2,999 | 3,343,047 | ||||||||
| Municipal Bonds | Par (000) | Value | |||||||||
Wisconsin — 0.4% | |||||||||||
Wisconsin Health & Educational Facilities Authority, Refunding RB, Froedtert & Community Health, Inc., Obligated Group, Series C, 5.25%, 4/01/39 (j) | $ | 2,179 | $ | 2,394,486 | |||||||
Total Municipal Bonds Transferred to Tender Option Bond Trusts — 8.9% | 53,673,736 | ||||||||||
Total Long-Term Investments (Cost — $541,662,306) — 96.4% | 578,432,572 | ||||||||||
Short-Term Securities | Shares | ||||||||||
FFI Institutional Tax-Exempt Fund, 0.03% (k)(l) | 42,944,517 | 42,944,517 | |||||||||
Total Short-Term Securities (Cost — $42,944,517) — 7.2% | 42,944,517 | ||||||||||
Total Investments (Cost — $584,606,823) — 103.6% | 621,377,089 | ||||||||||
Other Assets Less Liabilities — 1.2% | 7,264,736 | ||||||||||
Liability for TOB Trust Certificates, Including Interest Expense and Fees Payable — (4.8%) | (28,813,998 | ) | |||||||||
Net Assets — 100.0% | $ | 599,827,827 | |||||||||
Notes to Schedule of Investments
| (a) | Security exempt from registration pursuant to Rule 144A under the Securities Act of 1933, as amended. These securities may be resold in transactions exempt from registration to qualified institutional investors. | |||
| (b) | Zero-coupon bond. | |||
| (c) | Issuer filed for bankruptcy and/or is in default of principal and/or interest payments. | |||
| (d) | Non-income producing security. | |||
| (e) | Represents a step-up bond that pays an initial coupon rate for the first period and then a higher coupon rate for the following periods. Rate shown is as of report date. | |||
| (f) | Variable rate security. Rate shown is as of report date. | |||
| (g) | U.S. government securities, held in escrow, are used to pay interest on this security, as well as to retire the bond in full at the date indicated, typically at a premium to par. | |||
| (h) | Security is collateralized by municipal or U.S. Treasury obligations. | |||
| (i) | Represent bonds transferred to a TOB. In exchange for which the Fund received cash and residual interest certificates. These bonds serve as collateral in a financing transaction. See Note 3 of the Notes to Financial Statements for details of municipal bonds transferred to TOBs. | |||
| (j) | All or a portion of security is subject to a recourse agreement, which may require the Fund to pay the liquidity provider in the event there is a shortfall between the TOB trust certificates and proceeds received from the sale of the security contributed to the TOB trust. In the case of a shortfall, the aggregate maximum potential amount the Fund could ultimately be required to pay under the agreement, which expire from January 1, 2015 to November 15, 2019, is $8,645,316. | |||
| (k) | During the six months ended December 31, 2014, Investments in issuers considered to be an affiliate of the Fund for purposes of Section 2(a)(3) of the Investment Company Act of 1940, as amended, were as follows: |
| Affiliate | Shares Held at June 30, 2014 | Net Activity | Shares Held at December 31, 2014 | Income | ||||||||||||||
FFI Institutional Tax-Exempt Fund | 34,830,577 | 8,113,940 | 42,944,517 | $7,019 | ||||||||||||||
| (l) | Represents the current yield as of report date. | |||
| • | As of December 31, 2014, financial futures contracts outstanding were as follows: |
| Contracts Sold | Issue | Exchange | Expiration | Notional Value | Unrealized Appreciation | |||||||||||||||||
(359) | 10-Year U.S. Treasury Note | Chicago Board of Trade | March 2015 | $ 45,520,078 | $ | (65,011 | ) | |||||||||||||||
| 22 | SEMI-ANNUAL REPORT | DECEMBER 31, 2014 |
| Schedule of Investments (concluded) | BlackRock High Yield Municipal Fund |
| • | Fair Value Measurements — Various inputs are used in determining the fair value of investments and derivative financial instruments. These inputs to valuation techniques are categorized into a disclosure hierarchy consisting of three broad levels for financial statement purposes. The hierarchy gives the highest priority to unadjusted quoted prices in active markets for identical assets or liabilities (Level 1 measurements) and the lowest priority to unobservable inputs (Level 3 measurements). Accordingly, the degree of judgment exercised in determining fair value is greatest for instruments categorized in Level 3. The inputs used to measure fair value may fall into different levels of the fair value hierarchy. In such cases, for disclosure purposes, the fair value hierarchy classification is determined based on the lowest level input that is significant to the fair value measurement in its entirety. The categorization of a value determined for investments and derivative financial instruments is based on the pricing transparency of the investment and derivative financial instruments and is not necessarily an indication of the risks associated with investing in those securities. The three levels of the fair value hierarchy are as follows: |
| • | Level 1 — unadjusted quoted prices in active markets/exchanges for identical assets or liabilities that the Fund has the ability to access | |||
| • | Level 2 — other observable inputs (including, but not limited to, quoted prices for similar assets or liabilities in markets that are active, quoted prices for identical or similar assets or liabilities in markets that are not active, inputs other than quoted prices that are observable for the assets or liabilities (such as interest rates, yield curves, volatilities, prepayment speeds, loss severities, credit risks and default rates) or other market-corroborated inputs) | |||
| • | Level 3 — unobservable inputs based on the best information available in the circumstances, to the extent observable inputs are not available (including the Fund’s own assumptions used in determining the fair value of investments and derivative financial instruments) |
Changes in valuation techniques may result in transfers into or out of an assigned level within the disclosure hierarchy. In accordance with the Fund’s policy, transfers between different levels of the fair value disclosure hierarchy are deemed to have occurred as of the beginning of the reporting period. For information about the Fund’s policy regarding valuation of investments, refer to Note 2 of the Notes to Financial Statements. | ||||
As of December 31, 2014, the following tables summarize the Fund’s investments and derivative financial instruments categorized in the disclosure hierarchy: |
| Level 1 | Level 2 | Level 3 | Total | |||||||||||||||
Assets: | ||||||||||||||||||
Investments: | ||||||||||||||||||
Long-Term Investments1 | — | $ | 578,432,572 | — | $ | 578,432,572 | ||||||||||||
Short-Term Securities | $ | 42,944,517 | — | — | 42,944,517 | |||||||||||||
Total | $ | 42,944,517 | $ | 578,432,572 | — | $ | 621,377,089 | |||||||||||
| 1 | See above Schedule of Investments for values in each state or political subdivision. |
| Level 1 | Level 2 | Level 3 | Total | |||||||||||||||
Derivative Financial Instruments2 | ||||||||||||||||||
Liabilities: | ||||||||||||||||||
Interest rate contracts | $ | (65,011 | ) | — | — | $ | (65,011 | ) | ||||||||||
| 2 | Derivative financial instruments are financial futures contracts, which are valued at the unrealized appreciation/depreciation on the instrument. |
The Fund may hold assets and/or liabilities in which the fair value approximates the carrying amount for financial statement purposes. As of December 31, 2014, such assets and/or liabilities are categorized within the disclosure hierarchy as follows: |
| Level 1 | Level 2 | Level 3 | Total | |||||||||||||||
Assets: | ||||||||||||||||||
Cash | $ | 73,031 | — | — | $ | 73,031 | ||||||||||||
Cash pledged for financial futures contracts | 453,000 | — | — | 453,000 | ||||||||||||||
Liabilities: | ||||||||||||||||||
TOB trust certificates | — | $ | (28,807,610 | ) | — | (28,807,610 | ) | |||||||||||
Total | $ | 526,031 | $ | (28,807,610 | ) | — | $ | (28,281,579 | ) | |||||||||
During the six months ended December 31, 2014, there were no transfers between levels. |
| SEMI-ANNUAL REPORT | DECEMBER 31, 2014 | 23 |
| Schedule of Investments December 31, 2014 (Unaudited) | BlackRock National Municipal Fund (Percentages shown are based on Net Assets) |
| Municipal Bonds | Par (000) | Value | ||||||||
Alabama — 0.9% | ||||||||||
City of Birmingham Alabama Special Care Facilities Financing Authority, RB, Children’s Hospital (AGC), 6.00%, 6/01/39 | $ | 15,955 | $ | 18,529,654 | ||||||
Courtland IDB Alabama, Refunding RB, International Paper Co., Series B, AMT, 6.25%, 8/01/25 | 750 | 750,877 | ||||||||
Prattville IDB Alabama, RB, Recovery Zone Facility, Series C, 6.25%, 11/01/33 | 3,380 | 3,920,800 | ||||||||
State of Alabama Docks Department, Refunding RB, 6.00%, 10/01/40 | 15,945 | 18,563,010 | ||||||||
| 41,764,341 | ||||||||||
Alaska — 0.2% | ||||||||||
Borough of Matanuska-Susitna Alaska, RB, Goose Creek Correctional Center (AGC): | ||||||||||
6.00%, 9/01/28 | 2,000 | 2,396,460 | ||||||||
6.00%, 9/01/32 | 5,250 | 6,224,768 | ||||||||
| 8,621,228 | ||||||||||
Arizona — 2.8% | ||||||||||
City of Phoenix & County of Maricopa Arizona IDA, Refunding RB, S/F, Series A-2, AMT (Fannie Mae), 5.80%, 7/01/40 | 200 | 203,426 | ||||||||
City of Phoenix Arizona IDA, RB: | ||||||||||
Candeo School, Inc. Project, 6.88%, 7/01/44 | 3,440 | 3,914,754 | ||||||||
Legacy Traditional Schools, Series A, 6.50%, 7/01/34 (a) | 2,000 | 2,260,220 | ||||||||
Legacy Traditional Schools, Series A, 6.75%, 7/01/44 (a) | 3,500 | 3,994,270 | ||||||||
County of Maricopa Arizona IDA, RB, Arizona Charter Schools Project, Series A, 6.75%, 7/01/29 | 2,000 | 1,902,600 | ||||||||
County of Pinal Arizona, RB, Electric District No. 4, 6.00%, 12/01/38 | 1,200 | 1,332,684 | ||||||||
County of Pinal Arizona IDA, RB, San Manuel Facility Project, AMT, 6.25%, 6/01/26 | 500 | 511,480 | ||||||||
Salt River Project Agricultural Improvement & Power District, RB, Series A, 5.00%, 1/01/37 | 98,935 | 103,015,079 | ||||||||
Salt River Project Agricultural Improvement & Power District, Refunding RB, Series A, 5.00%, 1/01/35 | 13,700 | 14,264,988 | ||||||||
Vistancia Community Facilities District Arizona, GO: | ||||||||||
6.75%, 7/15/22 | 2,760 | 2,768,584 | ||||||||
5.75%, 7/15/24 | 2,125 | 2,154,453 | ||||||||
| 136,322,538 | ||||||||||
California — 15.6% | ||||||||||
ABAG Finance Authority for Nonprofit Corps., Refunding RB, Sharp Healthcare, Series B, 6.25%, 8/01/39 | 11,525 | 13,543,719 | ||||||||
California Health Facilities Financing Authority, RB: | ||||||||||
Catholic Healthcare West, Series J, 5.63%, 7/01/15 (b) | 10,000 | 10,271,000 | ||||||||
Sutter Health, Series A, 5.25%, 11/15/46 | 10,500 | 11,194,575 | ||||||||
Sutter Health, Series B, 6.00%, 8/15/42 | 21,340 | 25,593,275 | ||||||||
California Health Facilities Financing Authority, Refunding RB: | ||||||||||
Catholic Healthcare West, Series A, 6.00%, 7/01/39 | 26,655 | 31,083,995 | ||||||||
Stanford Hospital, Series A-3, 5.50%, 11/15/40 | 8,000 | 9,584,720 | ||||||||
California Statewide Communities Development Authority, RB, Series A: | ||||||||||
Kaiser Permanente, 5.00%, 4/01/42 | 30,000 | 33,166,200 | ||||||||
Sutter Health, 6.00%, 8/15/42 | 10,190 | 12,220,969 | ||||||||
| Municipal Bonds | Par (000) | Value | ||||||||
California (continued) | ||||||||||
California Statewide Communities Development Authority, Refunding RB, Catholic Healthcare West: | ||||||||||
Series B, 5.50%, 7/01/30 | $ | 2,915 | $ | 3,225,098 | ||||||
Series E, 5.50%, 7/01/31 | 1,920 | 2,125,248 | ||||||||
City & County of San Francisco California Airports Commission, ARB, Series E, 6.00%, 5/01/39 | 24,300 | 28,736,694 | ||||||||
City & County of San Francisco California Airports Commission, Refunding ARB, 2nd Series 34E, AMT (AGM): | ||||||||||
5.75%, 5/01/21 | 8,220 | 9,313,671 | ||||||||
5.75%, 5/01/23 | 17,000 | 19,190,960 | ||||||||
City of Chula Vista California, Refunding RB, San Diego Gas & Electric, Series A, 5.88%, 2/15/34 | 5,850 | 6,928,097 | ||||||||
City of Los Angeles California Department of Water & Power, Refunding RB, Series A, 5.25%, 7/01/39 | 40,000 | 45,260,000 | ||||||||
City of Los Angeles California Municipal Improvement Corp., RB, Real Property, Series E: | ||||||||||
6.00%, 9/01/34 | 4,890 | 5,766,728 | ||||||||
6.00%, 9/01/39 | 9,450 | 11,098,175 | ||||||||
City of San Jose California, Refunding ARB, AMT: | ||||||||||
Series A (AMBAC), 5.50%, 3/01/32 | 6,530 | 7,068,921 | ||||||||
Series A-1, 5.75%, 3/01/34 | 7,010 | 8,015,514 | ||||||||
Series A-1, 6.25%, 3/01/34 | 5,250 | 6,181,193 | ||||||||
City of San Jose California Hotel Tax, RB, Convention Center Expansion & Renovation Project: | ||||||||||
6.50%, 5/01/36 | 1,510 | 1,851,773 | ||||||||
6.50%, 5/01/42 | 5,130 | 6,237,618 | ||||||||
City of San Juan California Water District, COP, Series A, 6.00%, 2/01/39 | 10,000 | 11,615,000 | ||||||||
County of Alameda & City of Oakland California, GO, Election of 2012, 6.63%, 8/01/38 | 3,750 | 4,616,963 | ||||||||
County of Orange California Sanitation District, COP: | ||||||||||
Series A, 5.00%, 2/01/35 | 10,000 | 11,282,500 | ||||||||
Series B (AGM), 5.00%, 2/01/37 | 25,000 | 26,935,500 | ||||||||
County of Orange California Water District, COP, Refunding: | ||||||||||
5.00%, 8/15/39 | 15,000 | 17,224,950 | ||||||||
Series A, 5.00%, 8/15/41 | 7,110 | 8,069,566 | ||||||||
County of Sacramento California, RB, Subordinated & Passenger Facility Charges/Grant, Series C: | ||||||||||
6.00%, 7/01/39 | 16,920 | 19,326,532 | ||||||||
6.00%, 7/01/41 | 13,280 | 15,168,814 | ||||||||
County of San Diego California Water Authority, COP, Refunding, Series A (AGM), 5.00%, 5/01/33 | 4,500 | 4,967,955 | ||||||||
County of San Joaquin California Transportation Authority, Refunding RB, Limited Tax, Measure K, Series A: | ||||||||||
6.00%, 3/01/36 | 12,830 | 15,643,234 | ||||||||
5.50%, 3/01/41 | 26,390 | 31,068,947 | ||||||||
Cucamonga Valley Water District, Refunding RB, Series A (AGM), 5.38%, 9/01/35 | 26,315 | 31,631,419 | ||||||||
Gilroy Public Facilities Financing Authority, Refunding RB, 6.00%, 11/01/33 | 6,535 | 8,149,602 | ||||||||
Grossmont Healthcare District, GO, Election of 2006, Series B, 6.13%, 7/15/40 | 3,500 | 4,308,395 | ||||||||
Metropolitan Water District of Southern California, RB, Series A: | ||||||||||
5.00%, 7/01/37 | 10,000 | 10,973,600 | ||||||||
Authorization, 5.00%, 1/01/39 | 10,000 | 11,291,600 | ||||||||
Metropolitan Water District of Southern California, Refunding RB, Series B, 5.00%, 7/01/35 | 13,170 | 13,946,372 | ||||||||
| 24 | SEMI-ANNUAL REPORT | DECEMBER 31, 2014 |
| Schedule of Investments (continued) | BlackRock National Municipal Fund (Percentages shown are based on Net Assets) |
| Municipal Bonds | Par (000) | Value | ||||||||
California (concluded) | ||||||||||
Modesto Irrigation District, COP, Capital Improvements, Series A, 6.00%, 10/01/39 | $ | 11,755 | $ | 13,507,435 | ||||||
Port of Oakland California, Refunding RB, Senior Lien, Series P, AMT: | ||||||||||
5.00%, 5/01/27 | 12,480 | 14,285,482 | ||||||||
5.00%, 5/01/31 | 12,750 | 14,336,482 | ||||||||
South San Francisco Unified School District, GO, Series G, 3.50%, 7/01/18 | 14,535 | 15,828,906 | ||||||||
State of California, GO, Various Purposes, 6.00%, 4/01/38 | 33,925 | 40,698,465 | ||||||||
State of California, Refunding, GO, Various Purposes, 6.50%, 4/01/33 | 34,000 | 41,634,020 | ||||||||
State of California Public Works Board, LRB, Various Capital Projects: | ||||||||||
Sub-Series A-1, 6.00%, 3/01/35 | 14,125 | 16,860,871 | ||||||||
Sub-Series I-1, 6.13%, 11/01/29 | 10,000 | 12,259,000 | ||||||||
Sub-Series I-1, 6.38%, 11/01/34 | 11,680 | 14,321,666 | ||||||||
Tuolumne Wind Project Authority, RB, Tuolumne Co. Project, Series A, 5.88%, 1/01/29 | 19,355 | 22,803,867 | ||||||||
University of California, RB, Series O, 5.75%, 5/15/34 | 1,450 | 1,696,065 | ||||||||
| 762,111,351 | ||||||||||
Colorado — 0.1% | ||||||||||
Colorado Health Facilities Authority, RB, Catholic Health Initiatives, Series D, 6.25%, 10/01/33 | 4,385 | 5,108,481 | ||||||||
Colorado Health Facilities Authority, Refunding RB, Catholic Health Initiative, Series A, 5.50%, 7/01/34 | 1,580 | 1,805,529 | ||||||||
| 6,914,010 | ||||||||||
Connecticut — 1.6% | ||||||||||
State of Connecticut Health & Educational Facility Authority, RB, Series A, 0.80%, 7/01/48 (c) | 30,000 | 30,060,300 | ||||||||
State of Connecticut Health & Educational Facility Authority, Refunding RB, Series B, 0.65%, 7/01/49 (c) | 50,000 | 50,176,000 | ||||||||
| 80,236,300 | ||||||||||
Delaware — 0.7% | ||||||||||
County of Sussex Delaware, RB, NRG Energy, Inc., Indian River Power LLC Project, 6.00%, 10/01/40 | 31,500 | 35,892,045 | ||||||||
District of Columbia — 1.1% | ||||||||||
District of Columbia, RB, Series A, 5.50%, 12/01/30 | 20,530 | 24,163,399 | ||||||||
District of Columbia Water & Sewer Authority, Refunding RB, Series A: | ||||||||||
6.00%, 10/01/18 (b) | 12,630 | 14,950,763 | ||||||||
5.50%, 10/01/39 | 7,475 | 8,406,759 | ||||||||
Metropolitan Washington Airports Authority, Refunding RB, Dulles Toll Road, 1st Senior Lien, Series A, 5.25%, 10/01/44 | 5,765 | 6,472,077 | ||||||||
| 53,992,998 | ||||||||||
Florida — 5.3% | ||||||||||
Anthem Park Community Development District, Special Assessment Bonds, 5.80%, 5/01/36 (d)(e) | 1,240 | 1,241,897 | ||||||||
City of St. Augustine, RB, 5.75%, 10/01/41 | 1,120 | 1,346,296 | ||||||||
County of Escambia Florida, RB, International Paper Co. Projects, Series B, 6.25%, 11/01/33 | 7,500 | 8,700,000 | ||||||||
County of Highlands Florida Health Facilities Authority, RB, Adventist Health System/Sunbelt, Series B, 6.00%, 11/15/37 | 4,990 | 5,856,064 | ||||||||
County of Miami-Dade Florida, GO, Building Better Communities Program: | ||||||||||
Series B, 6.38%, 7/01/28 | 9,300 | 10,828,269 | ||||||||
Series B-1, 5.75%, 7/01/33 | 2,400 | 2,726,328 | ||||||||
| Municipal Bonds | Par (000) | Value | ||||||||
Florida (concluded) | ||||||||||
County of Miami-Dade Florida, GO, Building Better Communities Program (concluded): | ||||||||||
Series B-1, 6.00%, 7/01/38 | $ | 30,000 | $ | 34,354,800 | ||||||
County of Miami-Dade Florida, RB, Seaport Department: | ||||||||||
Series A, 6.00%, 10/01/38 | 6,175 | 7,506,145 | ||||||||
Series A, 5.50%, 10/01/42 | 5,375 | 6,200,815 | ||||||||
Series B, AMT, 6.25%, 10/01/38 | 5,000 | 6,146,950 | ||||||||
County of Miami-Dade Florida, Refunding ARB, Miami International Airport, Series A, AMT (AGC): | ||||||||||
5.50%, 10/01/26 | 7,000 | 7,988,680 | ||||||||
5.50%, 10/01/27 | 5,495 | 6,262,487 | ||||||||
County of Miami-Dade Florida, Refunding RB, Water & Sewer Systems, Series C, 6.00%, 10/01/23 | 25,000 | 29,212,750 | ||||||||
East Central Regional Wastewater Treatment Facilities Operation Board, RB, Green Bond Biosolids Project, 5.50%, 10/01/44 | 29,160 | 35,446,896 | ||||||||
Florida Housing Finance Corp., Refunding RB, S/F Housing, Homeowner Mortgage, Series 1 AMT, (Ginnie Mae), 6.00%, 7/01/39 | 1,590 | 1,697,166 | ||||||||
Florida Ports Financing Commission, Refunding RB, State Transportation Trust Fund, Series B, AMT, 5.13%, 6/01/27 | 10,000 | 11,394,000 | ||||||||
Harbor Bay Community Development District Florida, Special Assessment Bonds, Series A, 7.00%, 5/01/33 | 900 | 903,015 | ||||||||
Highland Meadows Community Development District Florida, Special Assessment Bonds, Series A, 5.50%, 5/01/36 (d)(e) | 990 | 393,248 | ||||||||
Jacksonville Electric Authority Florida, RB, Sub-Series A, 5.63%, 10/01/32 | 10,525 | 11,900,617 | ||||||||
Mid-Bay Bridge Authority, RB, Springing Lien, Series A, 7.25%, 10/01/40 | 14,350 | 17,530,247 | ||||||||
State of Florida, GO, Board of Education, Series A: | ||||||||||
5.38%, 6/01/33 | 3,950 | 4,477,483 | ||||||||
5.50%, 6/01/38 | 4,790 | 5,449,487 | ||||||||
State of Florida, RB, Board of Education Lottery Revenue, Series A, 5.75%, 7/01/28 | 3,890 | 4,530,022 | ||||||||
State of Florida Turnpike Authority, RB, Series B, 5.00%, 7/01/40 | 32,700 | 37,103,709 | ||||||||
Sterling Hill Community Development District, Refunding RB, Special Assessment Bonds, Series B, 5.50%, 11/01/10 (d)(e) | 160 | 102,485 | ||||||||
Watergrass Community Development District Florida, Special Assessment Bonds, Series B, 6.96%, 11/01/17 | 345 | 328,968 | ||||||||
| 259,628,824 | ||||||||||
Georgia — 1.8% | ||||||||||
City of Atlanta Georgia Department of Aviation, Refunding GARB, Series C, 6.00%, 1/01/30 | 30,000 | 36,150,600 | ||||||||
County of DeKalb Georgia Hospital Authority, Refunding RB, DeKalb Medical Center, Inc. Project, 6.13%, 9/01/40 | 2,000 | 2,202,100 | ||||||||
County of Richmond Georgia Development Authority, RB, Recovery Zone Facility, International Paper Co., Series B, 6.25%, 11/01/33 | 3,625 | 4,205,000 | ||||||||
County of Rockdale Georgia Development Authority, RB, Visy Paper Project, Series A, AMT, 6.13%, 1/01/34 | 5,000 | 5,135,000 | ||||||||
Municipal Electric Authority of Georgia, Refunding RB: | ||||||||||
Project One, Sub-Series D, 6.00%, 1/01/23 | 10,000 | 11,704,800 | ||||||||
Series EE (AMBAC), 7.00%, 1/01/25 | 20,000 | 27,641,400 | ||||||||
| 87,038,900 | ||||||||||
| SEMI-ANNUAL REPORT | DECEMBER 31, 2014 | 25 |
| Schedule of Investments (continued) | BlackRock National Municipal Fund (Percentages shown are based on Net Assets) |
| Municipal Bonds | Par (000) | Value | ||||||||
Illinois — 5.9% | ||||||||||
Bolingbrook Special Service Area No. 1, Special Tax Bonds, Forest City Project, 5.90%, 3/01/27 | $ | 1,000 | $ | 1,005,930 | ||||||
City of Chicago Illinois, GARB, O’Hare International Airport, 3rd Lien: | ||||||||||
Series B-2, AMT (NPFGC), 6.00%, 1/01/27 | 2,125 | 2,134,669 | ||||||||
Series B-2, AMT (Syncora), 6.00%, 1/01/29 | 40,905 | 41,078,437 | ||||||||
Series C, 6.50%, 1/01/41 | 24,835 | 29,999,686 | ||||||||
City of Chicago Illinois, Refunding GARB, O’Hare International Airport, Senior Lien, Series C, AMT, 5.50%, 1/01/34 | 5,380 | 6,214,438 | ||||||||
City of Chicago Illinois Transit Authority, RB, Federal Transit Administration, Section 5309, Series A (AGC), 6.00%, 6/01/26 | 15,000 | 17,365,800 | ||||||||
City of Chicago Illinois Wastewater Transmission, RB, Series A (BHAC), 5.50%, 1/01/38 | 3,000 | 3,301,500 | ||||||||
City of Chicago Illinois Waterworks, Refunding RB, 2nd Lien (AGM), 5.25%, 11/01/33 | 5,000 | 5,477,650 | ||||||||
Illinois Finance Authority, RB: | ||||||||||
Advocate Health Care Network, Series D, 6.50%, 11/01/18 (b) | 7,020 | 8,431,933 | ||||||||
Carle Foundation, Series A, 6.00%, 8/15/41 | 6,500 | 7,544,420 | ||||||||
Carle Foundation, Series A (AGM), 6.00%, 8/15/41 | 3,675 | 4,279,758 | ||||||||
Community Rehabilitation Providers Facilities, Series A, 6.50%, 7/01/22 | 735 | 738,396 | ||||||||
DePaul University, Series A, 6.13%, 10/01/40 | 11,735 | 13,913,016 | ||||||||
Memorial Health System, 5.50%, 4/01/34 | 150 | 166,368 | ||||||||
Memorial Health System, Series A, 5.25%, 7/01/44 | 8,370 | 9,193,524 | ||||||||
Rush University Medical Center, Series B, 7.25%, 11/01/30 | 5,280 | 6,287,002 | ||||||||
Rush University Medical Center, Series C, 6.38%, 11/01/29 | 2,860 | 3,314,883 | ||||||||
University of Chicago, Series B, 6.25%, 7/01/18 (b) | 25,035 | 29,497,238 | ||||||||
Illinois Finance Authority, Refunding RB: | ||||||||||
Central Dupage Health, Series B, 5.50%, 11/01/39 | 4,205 | 4,755,350 | ||||||||
Northwestern Memorial Hospital, Series A, 6.00%, 8/15/39 | 29,905 | 35,030,418 | ||||||||
OSF Healthcare System, Series A, 6.00%, 5/15/39 | 11,515 | 13,143,106 | ||||||||
Roosevelt University Project, 6.50%, 4/01/39 | 8,000 | 8,791,440 | ||||||||
Rush University Medical Center Obligation Group, Series A, 7.25%, 11/01/30 | 6,900 | 8,215,968 | ||||||||
Railsplitter Tobacco Settlement Authority, RB, 6.00%, 6/01/28 | 13,865 | 16,320,353 | ||||||||
University of Illinois, RB, Series A, 5.75%, 4/01/38 | 275 | 314,790 | ||||||||
Village of Hodgkins Illinois, RB, Metropolitan Biosolids Management LLC Project, AMT, 6.00%, 11/01/23 | 10,000 | 10,016,800 | ||||||||
Village of Wheeling Illinois, Tax Allocation Bonds, North Milwaukee/Lake-Cook TIF Project, 6.00%, 1/01/25 | 1,150 | 1,150,471 | ||||||||
| 287,683,344 | ||||||||||
Indiana — 3.8% | ||||||||||
City of Valparaiso Indiana, RB, Exempt Facilities, Pratt Paper LLC Project, AMT: | ||||||||||
6.75%, 1/01/34 | 3,870 | 4,535,176 | ||||||||
7.00%, 1/01/44 | 7,330 | 8,640,604 | ||||||||
Indiana Finance Authority, RB, CWA Authority Project, 1st Lien, Series A, 5.25%, 10/01/38 | 17,500 | 20,157,200 | ||||||||
Indiana Finance Authority, Refunding RB: | ||||||||||
Duke Energy Indiana Project, Series B, 6.00%, 8/01/39 | 11,000 | 12,553,970 | ||||||||
| Municipal Bonds | Par (000) | Value | ||||||||
Indiana (concluded) | ||||||||||
Indiana Finance Authority, Refunding RB (concluded): | ||||||||||
Parkview Health System, Series A, 5.75%, 5/01/31 | $ | 1,570 | $ | 1,772,750 | ||||||
Trinity Health, Series A, 5.63%, 12/01/38 | 12,000 | 13,839,480 | ||||||||
U.S. Steel Corp. Project, 6.00%, 12/01/26 | 105 | 117,512 | ||||||||
Indiana Municipal Power Agency, RB, Series B, 6.00%, 1/01/39 | 19,620 | 22,395,249 | ||||||||
Indianapolis Local Public Improvement Bond Bank, RB, Pilot Infrastructure Project, Series F, 5.00%, 1/01/35 | 23,550 | 26,301,111 | ||||||||
Indianapolis Local Public Improvement Bond Bank, Refunding RB, Waterworks Project, Series A: | ||||||||||
5.75%, 1/01/38 | 12,800 | 14,541,312 | ||||||||
(AGC), 5.50%, 1/01/38 | 56,725 | 63,739,613 | ||||||||
| 188,593,977 | ||||||||||
Iowa — 1.7% | ||||||||||
Iowa Finance Authority, RB, Iowa Health Care Facilities: | ||||||||||
Genesis Health System, 5.50%, 7/01/33 | 17,250 | 20,210,272 | ||||||||
Series A (AGC), 5.63%, 8/15/37 | 5,600 | 6,396,880 | ||||||||
Iowa Finance Authority, Refunding RB, Midwestern Disaster Area, Iowa Fertilizer Co. Project, 5.50%, 12/01/22 | 35,000 | 36,962,450 | ||||||||
Iowa Student Loan Liquidity Corp., RB, Senior Series A-2, AMT: | ||||||||||
5.40%, 12/01/24 | 11,135 | 12,064,773 | ||||||||
5.50%, 12/01/25 | 7,395 | 8,038,291 | ||||||||
| 83,672,666 | ||||||||||
Kansas — 0.0% | ||||||||||
Counties of Sedgwick & Shawnee Kansas, RB, AMT (Ginnie Mae), 6.95%, 6/01/29 | 285 | 300,424 | ||||||||
Louisiana — 2.0% | ||||||||||
City of New Orleans Louisiana Aviation Board, Refunding GARB, Restructuring, Series A-2 (AGC), 6.00%, 1/01/23 | 1,370 | 1,589,967 | ||||||||
Louisiana Local Government Environmental Facilities & Community Development Authority, RB, Westlake Chemical Corp. Project: | ||||||||||
6.75%, 11/01/32 | 7,080 | 8,117,786 | ||||||||
Series A, 6.50%, 8/01/29 | 11,195 | 13,367,950 | ||||||||
Series A-1, 6.50%, 11/01/35 | 17,185 | 20,635,576 | ||||||||
State of Louisiana Gasoline & Fuels Tax, RB, Series A (AGM), 5.00%, 5/01/16 (b) | 11,950 | 12,692,932 | ||||||||
State of Louisiana Gasoline & Fuels Tax, Refunding RB, 2nd Lien, Series B (c): | ||||||||||
0.58%, 5/01/43 | 32,000 | 32,200,960 | ||||||||
0.66%, 5/01/43 | 10,000 | 10,065,200 | ||||||||
| 98,670,371 | ||||||||||
Maine — 0.4% | ||||||||||
Maine Health & Higher Educational Facilities Authority, RB, Maine General Medical Center: | ||||||||||
7.50%, 7/01/32 | 12,365 | 15,033,738 | ||||||||
6.95%, 7/01/41 | 2,235 | 2,583,660 | ||||||||
| 17,617,398 | ||||||||||
Maryland — 0.8% | ||||||||||
Maryland Health & Higher Educational Facilities Authority, RB, University of Maryland Medical System, Series B (NPFGC), 7.00%, 7/01/22 | 3,785 | 4,558,616 | ||||||||
Maryland Health & Higher Educational Facilities Authority, Refunding RB, Charlestown Community Project, 6.25%, 1/01/41 | 11,000 | 12,477,960 | ||||||||
State of Maryland, GO, Series A, 4.15%, 3/01/16 (b) | 21,880 | 22,855,411 | ||||||||
| 39,891,987 | ||||||||||
| 26 | SEMI-ANNUAL REPORT | DECEMBER 31, 2014 |
| Schedule of Investments (continued) | BlackRock National Municipal Fund (Percentages shown are based on Net Assets) |
| Municipal Bonds | Par (000) | Value | ||||||||
Massachusetts — 4.7% | ||||||||||
Commonwealth of Massachusetts, GO, Series D-2, 0.34%, 8/01/43 (c) | $ | 35,000 | $ | 34,993,700 | ||||||
Commonwealth of Massachusetts, RB, Master Transportation Fund Accelerated Bridge Program, Series A, 5.00%, 6/01/44 | 50,000 | 58,462,500 | ||||||||
Massachusetts Development Finance Agency, RB, Foxborough Regional Charter School, Series A, 7.00%, 7/01/42 | 1,375 | 1,565,946 | ||||||||
Massachusetts Health & Educational Facilities Authority, RB, Series N, 5.00%, 7/01/17 (b) | 31,000 | 34,346,760 | ||||||||
Massachusetts Health & Educational Facilities Authority, Refunding RB, Harvard University, Series A, 5.50%, 11/15/36 | 69,710 | 80,845,476 | ||||||||
Massachusetts HFA, RB, M/F Housing, Series B, 7.00%, 12/01/38 | 4,585 | 5,084,169 | ||||||||
Massachusetts School Building Authority, RB, Series A (AGM), 5.00%, 8/15/15 (b) | 10,000 | 10,299,000 | ||||||||
Massachusetts Water Resources Authority, Refunding RB, Series C, 5.25%, 8/01/42 | 5,000 | 5,731,700 | ||||||||
| 231,329,251 | ||||||||||
Michigan — 1.3% | ||||||||||
City of Lansing Michigan, RB, Board of Water & Light Utilities System, Series A, 5.50%, 7/01/41 | 6,485 | 7,692,507 | ||||||||
Michigan State Building Authority, Refunding RB, Facilities Program, Series I, 6.00%, 10/15/38 | 12,455 | 14,334,459 | ||||||||
Royal Oak Hospital Finance Authority, Refunding RB, William Beaumont Hospital: | ||||||||||
Series V, 8.25%, 9/01/18 (b) | 18,130 | 22,807,359 | ||||||||
Series W, 6.00%, 8/01/39 | 5,145 | 5,857,943 | ||||||||
State of Michigan Building Authority, Refunding RB, Facilities Program, Series I, 6.25%, 10/15/38 | 7,500 | 8,700,075 | ||||||||
State of Michigan HDA, RB, S/F Housing, Series C, AMT, 5.50%, 12/01/28 | 1,300 | 1,390,155 | ||||||||
State of Michigan Hospital Finance Authority, Refunding RB, Henry Ford Health, 5.75%, 11/15/39 | 4,285 | 4,786,431 | ||||||||
| 65,568,929 | ||||||||||
Minnesota — 0.6% | ||||||||||
City of Minneapolis Minnesota, Refunding RB, Fairview Health Services: | ||||||||||
Series A, 6.75%, 11/15/32 | 5,940 | 7,008,072 | ||||||||
Series B (AGC), 6.50%, 11/15/38 | 18,015 | 21,057,553 | ||||||||
County of Ramsey Minnesota Housing & Redevelopment Authority, RB, Hanover Townhouses Project, M/F Housing, AMT, 6.00%, 7/01/31 | 1,110 | 1,111,798 | ||||||||
| 29,177,423 | ||||||||||
Mississippi — 0.0% | ||||||||||
County of Warren Mississippi, RB, International Paper Co. Project, Series A, 6.50%, 9/01/32 | 1,890 | 2,175,428 | ||||||||
Missouri — 0.0% | ||||||||||
City of St. Louis Missouri, RB, Lambert-St. Louis International Airport, Series A-1, 6.25%, 7/01/29 | 1,175 | 1,360,638 | ||||||||
Nebraska — 0.1% | ||||||||||
Central Plains Energy Project Nebraska, RB, Gas Project No. 3, 5.25%, 9/01/37 | 2,500 | 2,786,500 | ||||||||
Nevada — 2.4% | ||||||||||
City of Las Vegas Nevada, GO, Limited Tax, Performing Arts Center, 6.00%, 4/01/34 | 12,925 | 15,016,911 | ||||||||
County of Clark Nevada Airport System, ARB, Series B, 5.75%, 7/01/42 | 51,700 | 60,612,563 | ||||||||
| Municipal Bonds | Par (000) | Value | ||||||||
Nevada (concluded) | ||||||||||
County of Clark Nevada Water Reclamation District, GO, Series B: | ||||||||||
5.75%, 7/01/34 | $ | 3,125 | $ | 3,674,844 | ||||||
5.75%, 7/01/38 | 32,685 | 38,373,824 | ||||||||
| 117,678,142 | ||||||||||
New Hampshire — 0.4% | ||||||||||
New Hampshire Health & Education Facilities Authority, Refunding RB, Dartmouth-Hitchcock, 6.00%, 8/01/38 | 15,590 | 18,033,888 | ||||||||
New Jersey — 5.0% | ||||||||||
County Cape May New Jersey Industrial Pollution Control Financing Authority, Refunding RB, Atlantic City Electric Co., Series A (NPFGC), 6.80%, 3/01/21 | 5,000 | 6,103,850 | ||||||||
County of Monmouth New Jersey Improvement Authority, RB, Brookdale Community College Project, 6.00%, 8/01/38 | 3,600 | 4,155,804 | ||||||||
New Jersey EDA, RB, Motor Vehicle Surcharge, Series A (NPFGC), 5.25%, 7/01/33 | 26,500 | 26,978,325 | ||||||||
New Jersey EDA, Refunding RB, New Jersey American Water Co., Inc. Project, Series B, AMT, 5.60%, 11/01/34 | 8,280 | 9,343,318 | ||||||||
New Jersey Educational Facilities Authority, Refunding RB, University of Medicine & Dentistry, Series B (b): | ||||||||||
7.13%, 6/01/19 | 2,870 | 3,592,035 | ||||||||
7.50%, 6/01/19 | 9,200 | 11,662,288 | ||||||||
New Jersey Health Care Facilities Financing Authority, Refunding RB, AHS Hospital Corp.: | ||||||||||
6.00%, 7/01/37 | 1,200 | 1,435,428 | ||||||||
6.00%, 7/01/41 | 33,185 | 39,455,969 | ||||||||
New Jersey Higher Education Student Assistance Authority, Refunding RB, Series 1, AMT: | ||||||||||
5.75%, 12/01/27 | 500 | 564,090 | ||||||||
5.75%, 12/01/28 | 450 | 506,119 | ||||||||
New Jersey Housing & Mortgage Finance Agency, RB, S/F Housing, Series AA: | ||||||||||
6.38%, 10/01/28 | 630 | 655,150 | ||||||||
6.50%, 10/01/38 | 1,035 | 1,075,706 | ||||||||
New Jersey State Turnpike Authority, Refunding RB (c): | ||||||||||
Series D, 0.66%, 1/01/23 | 17,000 | 17,074,460 | ||||||||
Series D, 0.72%, 1/01/24 | 15,000 | 15,106,950 | ||||||||
Series E, 0.66%, 1/01/23 | 10,000 | 10,044,100 | ||||||||
New Jersey Transportation Trust Fund Authority, RB: | ||||||||||
Transportation Program, Series AA, 5.50%, 6/15/39 | 34,760 | 39,645,866 | ||||||||
Transportation System, Series A, 5.13%, 6/15/29 | 10,000 | 11,148,500 | ||||||||
Transportation System, Series A, 5.88%, 12/15/38 | 14,255 | 16,467,233 | ||||||||
Transportation System, Series B, 5.25%, 6/15/36 | 25,000 | 27,477,750 | ||||||||
| 242,492,941 | ||||||||||
New Mexico — 0.0% | ||||||||||
County of Santa Fe New Mexico, RB, (AGM), 6.00%, 2/01/27 | 250 | 303,888 | ||||||||
New York — 6.8% | ||||||||||
City of New York New York, GO: | ||||||||||
0.62%, 8/01/27 (c) | 39,000 | 38,896,260 | ||||||||
Series E-1, 6.25%, 10/15/28 | 13,450 | 16,012,360 | ||||||||
City of New York New York Housing Development Corp., RB, M/F Housing, Series M: | ||||||||||
6.50%, 11/01/28 | 4,300 | 4,788,136 | ||||||||
6.88%, 11/01/38 | 7,785 | 8,665,561 | ||||||||
| SEMI-ANNUAL REPORT | DECEMBER 31, 2014 | 27 |
| Schedule of Investments (continued) | BlackRock National Municipal Fund (Percentages shown are based on Net Assets) |
| Municipal Bonds | Par (000) | Value | ||||||||
New York (concluded) | ||||||||||
City of New York New York Municipal Water Finance Authority, Refunding RB, Water & Sewer System, 2nd General Resolution, Series EE: | ||||||||||
Fiscal 2009, 5.25%, 6/15/40 | $ | 5,000 | $ | 5,671,550 | ||||||
Fiscal 2011, 5.38%, 6/15/43 | 7,125 | 8,319,791 | ||||||||
City of New York Water & Sewer System, Refunding RB, Series DD, 5.00%, 6/15/36 | 12,605 | 14,655,707 | ||||||||
Hudson Yards Infrastructure Corp., RB, Senior, Fiscal 2012, Series A, 5.75%, 2/15/47 | 9,025 | 10,431,637 | ||||||||
Long Island Power Authority, Refunding RB, Electric System, Series A, 6.00%, 5/01/33 | 49,450 | 57,800,127 | ||||||||
Metropolitan Transportation Authority, RB: | ||||||||||
Series A-1, 5.25%, 11/15/39 | 33,035 | 38,311,681 | ||||||||
Series C, 6.50%, 11/15/28 | 23,465 | 28,254,910 | ||||||||
Series D, 5.25%, 11/15/41 | 12,720 | 14,476,505 | ||||||||
Metropolitan Transportation Authority, Refunding RB, Sub-Series B (AGM), 0.71%, 11/01/32 (c) | 15,000 | 15,121,200 | ||||||||
Niagara Area Development Corp., Refunding RB, Solid Waste Disposal Facility, Covanta Energy Project, Series A, AMT, 5.25%, 11/01/42 | 5,000 | 5,164,200 | ||||||||
Port Authority of New York & New Jersey, ARB, 56th Series, AMT, 5.00%, 5/01/39 | 6,600 | 7,423,812 | ||||||||
Port Authority of New York & New Jersey, Refunding ARB, Consolidated, 152nd Series, AMT, 5.75%, 11/01/30 | 4,695 | 5,279,856 | ||||||||
State of New York Dormitory Authority, ERB, Series B, 5.75%, 3/15/36 | 19,270 | 22,347,419 | ||||||||
State of New York Dormitory Authority, RB, Columbia University, 5.00%, 7/01/38 | 21,400 | 23,782,462 | ||||||||
Triborough Bridge & Tunnel Authority, RB, General, Series A-2, 5.38%, 11/15/38 | 5,715 | 6,510,299 | ||||||||
| 331,913,473 | ||||||||||
North Carolina — 0.2% | ||||||||||
County of Columbus North Carolina Industrial Facilities & Pollution Control Financing Authority, RB, International Paper Co. Projects, Series B, 6.25%, 11/01/33 | 3,000 | 3,480,000 | ||||||||
State of North Carolina, RB, Series A, 5.25%, 5/01/31 | 4,000 | 4,629,640 | ||||||||
| 8,109,640 | ||||||||||
Ohio — 1.4% | ||||||||||
County of Lucas Ohio, Refunding RB, Promedica Healthcare, Series A: | ||||||||||
5.75%, 11/15/31 | 500 | 600,610 | ||||||||
6.50%, 11/15/37 | 12,140 | 14,981,124 | ||||||||
6.00%, 11/15/41 | 4,400 | 5,253,248 | ||||||||
County of Montgomery Ohio, Refunding RB, Catholic Health, Series A, 5.50%, 5/01/34 | 10,595 | 12,079,571 | ||||||||
Northeast Ohio Regional Sewer District, Refunding RB, 5.00%, 11/15/44 | 13,000 | 15,014,610 | ||||||||
State of Ohio, RB, Cleveland Health Clinic, 5.50%, 1/01/34 | 1,000 | 1,135,550 | ||||||||
State of Ohio, Refunding RB, Cleveland Clinic Health, Series A, 5.50%, 1/01/39 | 10,195 | 11,472,332 | ||||||||
State of Ohio Turnpike Commission, RB, Junior Lien, Series A, 5.25%, 2/15/39 | 7,500 | 8,673,075 | ||||||||
| 69,210,120 | ||||||||||
Oregon — 0.0% | ||||||||||
City of Portland Oregon, M/F HRB, Lovejoy Station Apartments Project, AMT (NPFGC), 5.90%, 7/01/23 | 390 | 390,944 | ||||||||
Pennsylvania — 1.8% | ||||||||||
City of Philadelphia Pennsylvania Gas Works, RB, 12th Series B (NPFGC), 7.00%, 5/15/20 (f) | 3,110 | 3,628,997 | ||||||||
| Municipal Bonds | Par (000) | Value | ||||||||
Pennsylvania (concluded) | ||||||||||
County of Allegheny Pennsylvania IDA, Refunding RB, Environmental Improvement, U.S. Steel Corp. Project: | ||||||||||
6.75%, 11/01/24 | $ | 5,785 | $ | 6,564,471 | ||||||
6.75%, 12/01/27 | 5,000 | 5,843,200 | ||||||||
6.88%, 5/01/30 | 5,000 | 5,732,100 | ||||||||
County of Cumberland Pennsylvania Municipal Authority, Refunding RB, Diakon Lutheran, 6.38%, 1/01/39 | 10,575 | 11,746,498 | ||||||||
County of Dauphin Pennsylvania General Authority, Refunding RB, Pinnacle Health System Project, Series A: | ||||||||||
6.00%, 6/01/29 | 12,565 | 14,820,543 | ||||||||
6.00%, 6/01/36 | 3,325 | 3,902,952 | ||||||||
County of Lancaster Pennsylvania Hospital Authority, Refunding RB, Brethren Village Project, Series A, 6.25%, 7/01/26 | 1,160 | 1,223,626 | ||||||||
County of Northampton Pennsylvania IDA, Route 33 Project, Tax Allocation Bonds, 7.00%, 7/01/32 | 2,455 | 2,686,850 | ||||||||
Pennsylvania Economic Development Financing Authority, RB, American Water Co. Project, 6.20%, 4/01/39 | 3,475 | 4,042,467 | ||||||||
Pennsylvania Turnpike Commission, RB: | ||||||||||
5.25%, 6/01/39 | 24,900 | 27,556,830 | ||||||||
Subordinate, Special Motor License Fund, 6.00%, 12/01/36 | 1,195 | 1,410,399 | ||||||||
| 89,158,933 | ||||||||||
South Carolina — 0.8% | ||||||||||
South Carolina Jobs EDA, Refunding RB, Palmetto Health, Series A (AGM): | ||||||||||
6.50%, 8/01/39 | 4,455 | 5,234,625 | ||||||||
6.25%, 8/01/34 | 1,525 | 1,782,328 | ||||||||
State of South Carolina Public Service Authority, Refunding RB, Santee Cooper, Series A: | ||||||||||
5.50%, 12/01/33 | 6,465 | 7,765,952 | ||||||||
5.50%, 1/01/38 | 2,390 | 2,712,985 | ||||||||
5.75%, 12/01/43 | 19,875 | 23,710,875 | ||||||||
| 41,206,765 | ||||||||||
Texas — 13.1% | ||||||||||
City of Austin TX Airport System Revenue, ARB, AMT, 5.00%, 11/15/39 (g) | 9,000 | 10,086,390 | ||||||||
City of Austin TX Airport System Revenue, RB, 5.00%, 11/15/44 (g) | 8,500 | 9,451,150 | ||||||||
City of Houston Texas Utility System, Refunding RB, Series A, 1st Lien: | ||||||||||
5.25%, 11/15/30 | 24,305 | 28,666,289 | ||||||||
Combined (AGC), 6.00%, 11/15/35 | 32,350 | 38,389,421 | ||||||||
Combined (AGC), 5.38%, 11/15/38 | 5,000 | 5,683,850 | ||||||||
City of San Antonio Texas Water System, Refunding RB, Junior Lien, 0.44%, 5/01/44 (c) | 23,000 | 23,125,350 | ||||||||
County of Harris Texas Cultural Education Facilities Finance Corp., RB, 1st Mortgage, Brazos Presbyterian Homes, Inc. Project, Series B: | ||||||||||
6.38%, 1/01/33 | 465 | 539,284 | ||||||||
7.00%, 1/01/43 | 1,075 | 1,258,610 | ||||||||
7.00%, 1/01/48 | 2,625 | 3,040,800 | ||||||||
County of Lamar Texas Consolidated, GO, Series A (ISD/PSF-GTD), 2.00%, 8/15/47 (c) | 70,000 | 71,545,600 | ||||||||
County of Matagorda Texas Navigation District No. 1, Refunding RB, Central Power & Light Co. Project, Series A, 6.30%, 11/01/29 | 9,775 | 11,263,048 | ||||||||
| 28 | SEMI-ANNUAL REPORT | DECEMBER 31, 2014 |
| Schedule of Investments (continued) | BlackRock National Municipal Fund (Percentages shown are based on Net Assets) |
| Municipal Bonds | Par (000) | Value | ||||||||
Texas (concluded) | ||||||||||
County of Tarrant Texas Cultural Education Facilities Finance Corp., RB, Scott & White Healthcare, 6.00%, 8/15/45 | $ | 50,000 | $ | 59,528,500 | ||||||
County of Tarrant Texas Cultural Education Facilities Finance Corp., Refunding RB, Northwest Senior Housing, Edgemere Project, Series A, 6.00%, 11/15/26 | 2,200 | 2,332,792 | ||||||||
Cypress-Fairbanks Independent School District, GO, Refunding Series C, 5.00%, 2/15/44 | 65,530 | 75,862,770 | ||||||||
Lower Colorado River Authority, Refunding RB, 5.50%, 5/15/30 | 6,085 | 7,313,501 | ||||||||
North East Independent School District, GO (PSF-GTD), 2.00%, 8/01/44 (c) | 51,300 | 52,069,500 | ||||||||
North Texas Tollway Authority, RB, Special Projects System, Series A, 6.00%, 9/01/41 | 4,815 | 5,830,628 | ||||||||
North Texas Tollway Authority, Refunding RB: | ||||||||||
1st Tier System, 6.00%, 1/01/34 | 11,490 | 13,486,962 | ||||||||
1st Tier System, 0.84%, 1/01/50 (c) | 15,000 | 15,001,650 | ||||||||
1st Tier System, Series A, 6.00%, 1/01/28 | 1,000 | 1,172,370 | ||||||||
1st Tier System, Series A (NPFGC), 5.75%, 1/01/40 | 7,720 | 8,604,249 | ||||||||
1st Tier System, Series B (NPFGC), 5.75%, 1/01/40 | 9,870 | 11,000,510 | ||||||||
1st Tier System, Series K-2 (AGC), 6.00%, 1/01/38 | 2,245 | 2,587,632 | ||||||||
2nd Tier System, Series F, 6.13%, 1/01/16 (b) | 25,615 | 27,111,684 | ||||||||
Port of Bay City Authority Texas, RB, Hoechst Celanese Corp. Project, AMT, 6.50%, 5/01/26 | 4,000 | 4,019,880 | ||||||||
State of Texas, GO, Refunding Series A, 5.00%, 10/01/44 | 50,500 | 59,027,430 | ||||||||
State of Texas Transportation Commission State Highway Fund, RB, 1st Tier System, Series B, 0.39%, 4/01/32 (c) | 36,000 | 36,086,040 | ||||||||
Texas Private Activity Bond Surface Transportation Corp., RB, Senior Lien: | ||||||||||
LBJ Infrastructure Group LLC, LBJ Freeway Managed Lanes Project, 7.00%, 6/30/40 | 24,695 | 29,773,280 | ||||||||
NTE Mobility Partners LLC, North Tarrant Express Managed Lanes Project, 6.88%, 12/31/39 | 23,000 | 27,211,530 | ||||||||
| 641,070,700 | ||||||||||
Utah — 2.3% | ||||||||||
City of Salt Lake Utah, Refunding RB, IHC Hospital, Inc., Series A, 8.13%, 5/15/15 (f) | 5 | 5,131 | ||||||||
County of Utah Utah, RB: | ||||||||||
IHC Health Services, Inc., 5.00%, 5/15/43 | 70,000 | 77,763,000 | ||||||||
Series A, 5.00%, 5/15/45 | 30,000 | 34,315,500 | ||||||||
| 112,083,631 | ||||||||||
Virginia — 1.4% | ||||||||||
City of Winchester Virginia IDA, Refunding RB, Valley Health (BHAC) (AMBAC), 5.25%, 1/01/37 | 31,970 | 34,198,948 | ||||||||
Virginia HDA, RB, M/F Housing, Rental Housing, Series A, 5.25%, 5/01/41 | 2,865 | 3,083,485 | ||||||||
Virginia Small Business Financing Authority, RB, Senior Lien, Elizabeth River Crossings OpCo LLC Project, AMT, 6.00%, 1/01/37 | 28,085 | 32,183,163 | ||||||||
| 69,465,596 | ||||||||||
Washington — 1.3% | ||||||||||
City of Seattle Washington Housing Authority, RB, M/F Housing, Newholly Project, AMT, 6.25%, 12/01/35 | 2,750 | 2,759,323 | ||||||||
Washington Health Care Facilities Authority, RB: | ||||||||||
Catholic Health Initiatives, Series A, 5.75%, 1/01/45 | 21,355 | 25,023,789 | ||||||||
| Municipal Bonds | Par (000) | Value | |||||||||
Washington (concluded) | |||||||||||
Washington Health Care Facilities Authority, RB (concluded): | |||||||||||
MultiCare Health System, Series B (AGC), 6.00%, 8/15/39 | $ | 2,000 | $ | 2,299,000 | |||||||
Swedish Health Services, Series A, 6.75%, 5/15/21 (b) | 16,000 | 21,036,640 | |||||||||
Washington Health Care Facilities Authority, Refunding RB, Catholic Health Initiatives, Series D, 6.38%, 10/01/36 | 10,000 | 11,695,100 | |||||||||
| 62,813,852 | |||||||||||
Wisconsin — 0.3% | |||||||||||
City of Superior Wisconsin, Refunding RB, Midwest Energy Resources, Series E (NPFCG), 6.90%, 8/01/21 | 7,000 | 8,993,250 | |||||||||
Public Finance Authority, Refunding RB, AMT, National Gypsum Co., 5.25%, 4/01/30 | 5,900 | 5,996,524 | |||||||||
| 14,989,774 | |||||||||||
Total Municipal Bonds — 88.6% | 4,340,273,158 | ||||||||||
Municipal Bonds Transferred to Tender Option Bond Trusts (h) | |||||||||||
Arizona — 1.9% | |||||||||||
City of Mesa Arizona, RB, Utility System, 5.00%, 7/01/35 | 30,000 | 33,632,400 | |||||||||
Salt River Project Agricultural Improvement & Power District, RB, Electric System, Series A, 5.00%, 1/01/38 | 54,015 | 58,991,028 | |||||||||
| 92,623,428 | |||||||||||
Arkansas — 0.5% | |||||||||||
University of Arkansas, RB, Various Facilities, UAMS Campus (NPFGC), 5.00%, 3/01/36 | 21,290 | 22,450,305 | |||||||||
California — 3.0% | |||||||||||
City & County of San Francisco California Public Utilities Commission, Refunding RB, Series A, 5.13%, 11/01/39 | 23,000 | 26,391,810 | |||||||||
County of Orange California, ARB, Series B, 5.25%, 7/01/34 | 13,045 | 14,310,323 | |||||||||
Los Angeles Department of Water & Power, RB, Power System, Sub-Series A-1 (AMBAC), 5.00%, 7/01/37 | 27,500 | 29,899,375 | |||||||||
Metropolitan Water District of Southern California, Refunding RB, Series C, 5.00%, 7/01/35 | 13,375 | 15,263,918 | |||||||||
San Diego Community College District California, GO, Election of 2006 (AGM), 5.00%, 8/01/32 | 18,000 | 19,701,360 | |||||||||
San Diego Public Facilities Financing Authority, Refunding RB, Series B, 5.38%, 8/01/34 | 15,000 | 17,393,700 | |||||||||
University of California, RB, General, Series O, 5.25%, 5/15/39 | 20,695 | 23,482,763 | |||||||||
| 146,443,249 | |||||||||||
Florida — 2.7% | |||||||||||
City of Tallahassee Florida, RB, Energy System (NPFGC), 5.00%, 10/01/37 | 10,000 | 10,872,100 | |||||||||
Jacksonville Electric Authority Florida, RB, Sub-Series A, 5.63%, 10/01/32 | 6,300 | 7,123,788 | |||||||||
State of Florida, GO, Board of Education: | |||||||||||
Capital Outlay, Series E, 5.00%, 6/01/37 | 39,730 | 45,337,095 | |||||||||
Series C, 5.00%, 6/01/37 | 65,545 | 71,797,800 | |||||||||
| 135,130,783 | |||||||||||
Illinois — 0.4% | |||||||||||
Illinois Finance Authority, RB, The Carle Foundation, Series A (AGM), 6.00%, 8/15/41 | 15,600 | 18,167,136 | |||||||||
| SEMI-ANNUAL REPORT | DECEMBER 31, 2014 | 29 |
| Schedule of Investments (continued) | BlackRock National Municipal Fund (Percentages shown are based on Net Assets) |
| Municipal Bonds Transferred to Tender Option Bond Trusts (h) | Par (000) | Value | ||||||||
Indiana — 0.7% | ||||||||||
Indiana Finance Authority, RB, Sisters of St. Francis Health, 5.25%, 11/01/39 | $ | 31,460 | $ | 34,860,511 | ||||||
Massachusetts — 0.2% | ||||||||||
Massachusetts School Building Authority, RB, Series A (AMBAC), 5.00%, 8/15/37 | 10,000 | 10,886,900 | ||||||||
Ohio — 0.4% | ||||||||||
County of Hamilton Ohio, Refunding RB, Sub-Series A (AGM), 5.00%, 12/01/32 | 20,000 | 21,373,000 | ||||||||
Texas — 2.3% | ||||||||||
City of Houston Texas, Refunding RB, Combined, 1st Lien, Series A (AGC), 5.38%, 11/15/38 | 26,160 | 29,737,903 | ||||||||
City of San Antonio Texas, Refunding RB, Electric and Gas Revenue: | ||||||||||
5.00%, 2/01/17 | 218 | 239,336 | ||||||||
5.00%, 2/01/32 | 28,772 | 30,979,560 | ||||||||
County of Harris Texas Cultural Education Facilities Finance Corp., RB, Texas Children’s Hospital Project, 5.50%, 10/01/39 | 8,500 | 9,782,055 | ||||||||
Cypress-Fairbanks ISD, GO, Refunding, Schoolhouse (PSF-GTD), 5.00%, 2/15/32 | 10,000 | 10,848,600 | ||||||||
Dallas Area Rapid Transit: | ||||||||||
5.00%, 12/01/36 | 27,860 | 12,317,130 | ||||||||
5.00%, 12/01/36 | 16,230 | 17,433,148 | ||||||||
| 111,337,732 | ||||||||||
Washington — 0.5% | ||||||||||
Central Puget Sound Regional Transit Authority, RB, Series A: | ||||||||||
5.00%, 11/01/34 | 8,500 | 9,296,790 | ||||||||
5.00%, 11/01/36 | 15,715 | 17,174,281 | ||||||||
| 26,471,071 | ||||||||||
Total Municipal Bonds Transferred to Tender Option Bond Trusts — 12.6% | $ | 619,744,115 | ||||||||
| U.S. Government Sponsored Agency Securities | Shares | Value | |||||||||
Mortgage-Backed Securities — 0.0% | |||||||||||
Ginnie Mae Mortgage-Backed Securities, 6.00%, 11/15/31 | —(i) | $ | 187 | ||||||||
Total Long-Term Investments (Cost — $4,548,813,556) — 101.2% | 4,960,017,460 | ||||||||||
Short-Term Securities | Par (000 | ) | |||||||||
Municipal Bonds — 2.2% | |||||||||||
California — 1.1% | |||||||||||
County of Tulare California, GO, 2.00%, 6/30/15 | $ | 56,000 | 56,525,840 | ||||||||
Massachusetts — 1.1% | |||||||||||
State of Idaho, GO, 2.00%, 6/30/15 | 53,000 | 53,497,670 | |||||||||
Money Market Funds — 1.2% | Shares | ||||||||||
FFI Institutional Tax-Exempt Fund, 0.03% (j)(k) | 56,677,286 | 56,677,286 | |||||||||
Total Short-Term Securities (Cost — $166,691,576) — 3.4% | 166,700,796 | ||||||||||
Total Investments (Cost — $4,715,505,132) — 104.6% | 5,126,718,256 | ||||||||||
Other Assets Less Liabilities — 1.1% | 53,459,191 | ||||||||||
Liability for TOB Trust Certificates, Including Interest Expense and Fees Payable — (5.7%) | (280,169,448 | ) | |||||||||
Net Assets — 100.0% | $ | 4,900,007,999 | |||||||||
Notes to Schedule of Investments
| (a) | Security exempt from registration pursuant to Rule 144A under the Securities Act of 1933, as amended. These securities may be resold in transactions exempt from registration to qualified institutional investors. | |||
| (b) | U.S. government securities, held in escrow, are used to pay interest on this security, as well as to retire the bond in full at the date indicated, typically at a premium to par. | |||
| (c) | Variable rate security. Rate shown is as of report date. | |||
| (d) | Non-income producing security. | |||
| (e) | Issuer filed for bankruptcy and/or is in default of principal and/or interest payments. | |||
| (f) | Security is collateralized by municipal or U.S. Treasury obligations. | |||
| (g) | When-issued security. Unsettled when-issued transactions were as follows: |
| Counterparty | Value | Unrealized Depreciation | ||||||||
Citigroup Global Markets, Inc. | $ | 19,537,540 | $ | 52,437 | ||||||
| (h) | Represent bonds transferred to a TOB. In exchange for which the Fund received cash and residual interest certificates. These bonds serve as collateral in a financing transaction. See Note 3 of the Notes to Financial Statements for details of municipal bonds transferred to TOBs. | |||
| (i) | Amount is less than $500. | |||
| (k) | During the six months ended December 31, 2014, investments in issuers considered to be an affiliate of the Fund for purposes of Section 2(a)(3) of the Investment Company Act of 1940, as amended, were as follows: |
| Affiliate | Shares Held at June 30, 2014 | Net Activity | Shares Held at December 31, 2014 | Income | ||||||||||||||
FFI Institutional Tax-Exempt Fund | 94,354,491 | (37,677,205) | 56,677,286 | $13,643 | ||||||||||||||
| (j) | Represents the current yield as of report date. |
| 30 | SEMI-ANNUAL REPORT | DECEMBER 31, 2014 |
| Schedule of Investments (concluded) | BlackRock National Municipal Fund |
| • | As of December 31, 2014, financial futures contracts outstanding were as follows: |
| Contracts Sold | Issue | Exchange | Expiration | Notional Value | Unrealized Appreciation | |||||||||||||||||
(1,000) | 10-Year U.S. Treasury Note | Chicago Board of Trade | March 2015 | $126,796,875 | $ | (131,886 | ) | |||||||||||||||
| • | Fair Value Measurements — Various inputs are used in determining the fair value of investments and derivative financial instruments. These inputs to valuation techniques are categorized into a disclosure hierarchy consisting of three broad levels for financial statement purposes. The hierarchy gives the highest priority to unadjusted quoted prices in active markets for identical assets or liabilities (Level 1 measurements) and the lowest priority to unobservable inputs (Level 3 measurements). Accordingly, the degree of judgment exercised in determining fair value is greatest for instruments categorized in Level 3. The inputs used to measure fair value may fall into different levels of the fair value hierarchy. In such cases, for disclosure purposes, the fair value hierarchy classification is determined based on the lowest level input that is significant to the fair value measurement in its entirety. The categorization of a value determined for investments and derivative financial instruments is based on the pricing transparency of the investment and derivative financial instruments and is not necessarily an indication of the risks associated with investing in those securities. The three levels of the fair value hierarchy are as follows: |
| • | Level 1 — unadjusted quoted prices in active markets/exchanges for identical assets or liabilities that the Fund has the ability to access | |||
| • | Level 2 — other observable inputs (including, but not limited to, quoted prices for similar assets or liabilities in markets that are active, quoted prices for identical or similar assets or liabilities in markets that are not active, inputs other than quoted prices that are observable for the assets or liabilities (such as interest rates, yield curves, volatilities, prepayment speeds, loss severities, credit risks and default rates) or other market-corroborated inputs) | |||
| • | Level 3 — unobservable inputs based on the best information available in the circumstances, to the extent observable inputs are not available (including the Fund’s own assumptions used in determining the fair value of investments and derivative financial instruments) |
Changes in valuation techniques may result in transfers into or out of an assigned level within the disclosure hierarchy. In accordance with the Fund’s policy, transfers between different levels of the fair value disclosure hierarchy are deemed to have occurred as of the beginning of the reporting period. For information about the Fund’s policy regarding valuation of investments and derivative financial instruments, refer to Note 2 of the Notes to Financial Statements. | ||||
As of December 31, 2014, the following tables summarize the Fund’s investments and derivative financial instruments categorized in the disclosure hierarchy: |
| Level 1 | Level 2 | Level 3 | Total | |||||||||||||||
Assets: | ||||||||||||||||||
Investments: | ||||||||||||||||||
Long-Term Investments1 | — | $ | 4,960,017,460 | — | $ | 4,960,017,460 | ||||||||||||
Short-Term Securities | $ | 56,677,286 | 110,023,510 | — | 166,700,796 | |||||||||||||
Total | $ | 56,677,286 | $ | 5,070,040,970 | — | $ | 5,126,718,256 | |||||||||||
| 1 | See above Schedule of Investments for values in each state or political subdivision. |
| Level 1 | Level 2 | Level 3 | Total | |||||||||||||||
Derivative Financial Instruments2 | ||||||||||||||||||
Liabilities: | ||||||||||||||||||
Interest rate contracts | $ | (131,886 | ) | — | — | $ | (131,886 | ) | ||||||||||
| 2 | Derivative financial instruments are financial futures contracts, which are valued at the unrealized appreciation/depreciation on the instrument. |
The Fund may hold assets and/or liabilities in which the fair value approximates the carrying amount for financial statement purposes. As of December 31, 2014, such assets and/or liabilities are categorized within the disclosure hierarchy as follows: |
| Level 1 | Level 2 | Level 3 | Total | |||||||||||||||
Assets: | ||||||||||||||||||
Cash | $ | 790,626 | — | — | $ | 790,626 | ||||||||||||
Cash pledged for financial futures contracts | 1,260,000 | — | — | 1,260,000 | ||||||||||||||
Liabilities: | ||||||||||||||||||
TOB trust certificates | — | $ | (280,119,931 | ) | — | (280,119,931 | ) | |||||||||||
Total | $ | 2,050,626 | $ | (280,119,931 | ) | — | $ | (278,069,305 | ) | |||||||||
| SEMI-ANNUAL REPORT | DECEMBER 31, 2014 | 31 |
| Schedule of Investments December 31, 2014 (Unaudited) | BlackRock Short-Term Municipal Fund (Percentages shown are based on Net Assets) |
| Municipal Bonds | Par (000) | Value | ||||||||
Alabama — 1.0% | ||||||||||
Alabama 21st Century Authority, Refunding RB, Series A, 4.00%, 6/01/15 | $ | 2,000 | $ | 2,030,780 | ||||||
Alabama Federal Aid Highway Finance Authority, RB, Grant Appreciation, 5.00%, 9/01/16 | 5,130 | 5,514,391 | ||||||||
| 7,545,171 | ||||||||||
Alaska — 0.3% | ||||||||||
Alaska Student Loan Corp., RB, Senior Series A, AMT, 5.00%, 6/01/16 | 2,000 | 2,039,060 | ||||||||
Arizona — 0.3% | ||||||||||
Arizona Health Facilities Authority, Refunding RB, Series D, 5.00%, 1/01/17 | 1,080 | 1,173,204 | ||||||||
City of Phoenix Civic Improvement Corp., Refunding RB, Transit Excise Tax, Light Rail Project, 5.00%, 7/01/16 | 1,000 | 1,068,880 | ||||||||
| 2,242,084 | ||||||||||
California — 7.0% | ||||||||||
California Pollution Control Financing Authority, RB, Waste Management Inc. Project, Series A-1 AMT, 1.88%, 4/01/25 (a) | 5,000 | 5,016,300 | ||||||||
City of Long Beach CA Harbor Revenue, Refunding RB, AMT, Series A, 5.00%, 5/15/17 | 1,500 | 1,643,595 | ||||||||
City of Los Angeles Department of Airports, Refunding RB, AMT, 4.00%, 5/15/17 | 1,220 | 1,308,828 | ||||||||
East Bay Municipal Utility District, Refunding RB, Wastewater System, 0.36%, 6/01/38 (a) | 300 | 299,922 | ||||||||
Los Angeles Unified School District, GO, Refunding: | ||||||||||
Series A, 3.00%, 7/01/16 | 3,765 | 3,914,697 | ||||||||
Series A, 5.00%, 7/01/17 | 18,145 | 20,108,833 | ||||||||
Series A-1, 5.00%, 7/01/15 | 6,000 | 6,146,340 | ||||||||
State of California, GO, Refunding: | ||||||||||
(NPFGC), 5.00%, 9/01/16 | 1,380 | 1,483,873 | ||||||||
Various Purpose, 5.00%, 4/01/16 | 10,000 | 10,581,400 | ||||||||
Various Purpose, 5.00%, 9/01/16 | 3,000 | 3,225,810 | ||||||||
| 53,729,598 | ||||||||||
Colorado — 0.6% | ||||||||||
Colorado Health Facilities Authority, Refunding RB: | ||||||||||
Catholic Health Initiatives, Series C, 4.00%, 10/01/40 (a) | 1,000 | 1,031,690 | ||||||||
Series B, 5.00%, 1/01/18 | 3,335 | 3,735,667 | ||||||||
| 4,767,357 | ||||||||||
Connecticut — 4.9% | ||||||||||
Connecticut Resources Recovery Authority, Refunding RB, Covanta Southeastern Connecticut Co. Project, Series A, AMT, 4.00%, 11/15/15 | 2,635 | 2,723,852 | ||||||||
Connecticut State Development Authority, RB, Connecticut Light & Power Co., Series A, Mandatory Put Bonds, AMT, 1.55%, 5/01/31 (a) | 13,200 | 13,234,716 | ||||||||
State of Connecticut, Special Tax Revenue, RB, Series A, 4.00%, 9/01/17 | 19,825 | 21,520,632 | ||||||||
| 37,479,200 | ||||||||||
Delaware — 3.0% | ||||||||||
Delaware Transportation Authority, Refunding RB, Senior, 5.00%, 7/01/15 | 1,945 | 1,992,536 | ||||||||
State of Delaware, GO, Refunding Series B, 5.00%, 7/01/18 | 10,000 | 11,387,200 | ||||||||
University of Delaware, Refunding RB, Series C, 0.70%, 11/01/37 (a) | 10,000 | 10,027,500 | ||||||||
| 23,407,236 | ||||||||||
| Municipal Bonds | Par (000) | Value | ||||||||
District of Columbia — 0.6% | ||||||||||
Metropolitan Washington Airports Authority, Refunding RB, Series A AMT, 5.00%, 10/01/17 | $ | 4,000 | $ | 4,427,080 | ||||||
Florida — 9.6% | ||||||||||
Citizens Property Insurance Corp., RB, Senior Secured, Series A-1, Personal Lines & Commercial Lines Account, 5.00%, 6/01/16 | 10,000 | 10,629,900 | ||||||||
City of Jacksonville Florida, Refunding RB, Series C, 5.00%, 10/01/16 | 1,280 | 1,380,800 | ||||||||
County of Broward Florida Airport System, ARB, Series Q-1, 5.00%, 10/01/15 | 1,000 | 1,035,760 | ||||||||
County of Miami-Dade Florida, Refunding ARB, Series A, AMT: | ||||||||||
4.00%, 10/01/15 | 2,750 | 2,829,228 | ||||||||
5.00%, 10/01/16 | 1,750 | 1,874,583 | ||||||||
Florida Department of Environmental Protection, Refunding RB, Series A: | ||||||||||
5.00%, 7/01/16 | 3,865 | 4,127,588 | ||||||||
5.00%, 7/01/18 | 17,985 | 20,366,933 | ||||||||
Florida State Board of Education, GO, Refunding, Series B, 5.00%, 6/01/16 | 8,200 | 8,741,528 | ||||||||
Florida State Department of Environmental Protection, Refunding RB, Everglades Restoration, Series A (AGC), 5.00%, 7/01/16 | 1,205 | 1,286,868 | ||||||||
Highlands County Health Facilities Authority, Refunding RB, Adventist Health System/Sunbelt Obligated Group, Series I, 5.00%, 11/15/16 | 1,035 | 1,120,563 | ||||||||
State of Florida, GO, Refunding, Department of Transportation, Full Faith and Credit, Right-of-Way Acquisition and Bridge Construction, Series B, 5.00%, 7/01/16 | 3,375 | 3,609,596 | ||||||||
State of Florida, GO, Refunding Series B, 5.00%, 1/01/18 | 15,000 | 16,840,050 | ||||||||
| 73,843,397 | ||||||||||
Georgia — 2.7% | ||||||||||
City of Atlanta Georgia Department of Aviation, RB, Series B, 5.00%, 1/01/17 | 7,000 | 7,609,910 | ||||||||
City of Atlanta Georgia Department of Aviation, Refunding RB, Series C AMT, 5.00%, 1/01/17 | 1,500 | 1,629,135 | ||||||||
Municipal Gas Authority of Georgia, Refunding RB, 4.00%, 10/01/16 | 10,615 | 11,260,392 | ||||||||
| 20,499,437 | ||||||||||
Hawaii — 0.2% | ||||||||||
State of Hawaii, GO, Refunding, Series DG (AMBAC), 5.00%, 7/01/15 (b) | 1,290 | 1,321,063 | ||||||||
Illinois — 2.0% | ||||||||||
City of Chicago Illinois, Refunding GARB, O’Hare International Airport, Senior Lien, Series A, AMT: | ||||||||||
5.00%, 1/01/16 | 4,500 | 4,703,580 | ||||||||
5.00%, 1/01/16 | 3,000 | 3,135,720 | ||||||||
Illinois Finance Authority, Refunding RB, Hospital Sisters Services, Inc., Series C, 5.00%, 8/15/15 | 1,000 | 1,029,190 | ||||||||
Illinois State Toll Highway Authority, Refunding RB, Series D, 5.00%, 1/01/18 | 1,250 | 1,398,200 | ||||||||
State of Illinois, GO, 4.00%, 2/01/17 | 2,000 | 2,109,960 | ||||||||
State of Illinois, RB, Unemployment Insurance Fund Building Receipts, Series A, 5.00%, 6/15/16 | 2,500 | 2,667,400 | ||||||||
| 15,044,050 | ||||||||||
Indiana — 2.9% | ||||||||||
City of Whiting, RB, 5.00%, 1/01/16 | 12,000 | 12,536,760 | ||||||||
Indiana Finance Authority, Refunding RB, Marquette Project, 5.00%, 3/01/16 | 1,425 | 1,454,027 | ||||||||
| 32 | SEMI-ANNUAL REPORT | DECEMBER 31, 2014 |
| Schedule of Investments (continued) | BlackRock Short-Term Municipal Fund (Percentages shown are based on Net Assets) |
| Municipal Bonds | Par (000) | Value | ||||||||
Indiana (concluded) | ||||||||||
Indiana Health Facility Financing Authority, RB, 4.00%, 11/01/27 (a) | $ | 8,000 | $ | 8,645,280 | ||||||
| 22,636,067 | ||||||||||
Kentucky — 1.9% | ||||||||||
Counties of Louisville & Jefferson Kentucky Metropolitan Government, GO, Refunding Series E, 4.00%, 11/15/16 | 4,450 | 4,743,744 | ||||||||
Counties of Louisville & Jefferson Kentucky Metropolitan Government, RB, AMT, 1.35%, 11/01/27 (a) | 5,000 | 4,982,750 | ||||||||
Kentucky Public Transportation Infrastructure Authority, RB, Downtown Crossing Project, Series A, 5.00%, 7/01/17 | 4,500 | 4,924,575 | ||||||||
| 14,651,069 | ||||||||||
Louisiana — 0.4% | ||||||||||
Tobacco Settlement Financing Corp., Refunding RB, Series A, 5.00%, 5/15/16 | 3,000 | 3,155,610 | ||||||||
Maryland — 1.1% | ||||||||||
Maryland State Transportation Authority, Refunding RB, Baltimore/Washington Thurgood Marshall Airport Project, AMT, 5.00%, 3/01/16 | 8,315 | 8,753,117 | ||||||||
Massachusetts — 1.4% | ||||||||||
Commonwealth of Massachusetts, GO, Consolidated Loan, Series B, 5.00%, 8/01/15 | 2,500 | 2,570,975 | ||||||||
Massachusetts Health & Educational Facilities Authority, RB, 0.80%, 11/01/33 (a) | 1,000 | 996,850 | ||||||||
Massachusetts Port Authority, RB, Series A, AMT, 5.00%, 7/01/16 | 1,625 | 1,732,364 | ||||||||
Massachusetts State Educational Financing Authority, RB, AMT: | ||||||||||
4.00%, 1/01/17 | 800 | 845,112 | ||||||||
4.00%, 1/01/18 | 1,750 | 1,870,960 | ||||||||
Massachusetts Water Pollution Abatement Trust, Refunding RB, 2.00%, 8/01/16 | 2,600 | 2,665,910 | ||||||||
| 10,682,171 | ||||||||||
Michigan — 3.3% | ||||||||||
Michigan Finance Authority, Refunding RB: | ||||||||||
AMT, 5.00%, 11/01/16 | 1,400 | 1,490,958 | ||||||||
Unemployment Obligation Assessment, Series A, 5.00%, 1/01/16 | 13,525 | 14,176,093 | ||||||||
State of Michigan Trunk Line, Refunding RB, Series B (AGM), 5.00%, 9/01/15 | 4,000 | 4,128,560 | ||||||||
State of Michigan Trunk Line Revenue, Refunding RB, 5.00%, 11/15/16 | 5,200 | 5,636,020 | ||||||||
| 25,431,631 | ||||||||||
Missouri — 0.4% | ||||||||||
University of Missouri, Refunding RB, Series A, 4.00%, 11/01/17 | 2,555 | 2,785,282 | ||||||||
Nebraska — 0.1% | ||||||||||
Nebraska Public Power District, Refunding RB, General, Series A, 5.00%, 1/01/16 | 1,000 | 1,048,140 | ||||||||
Nevada — 7.1% | ||||||||||
County of Clark Nevada School District, GO, Refunding: | ||||||||||
Limited Tax, Series A, 5.00%, 6/15/16 | 11,000 | 11,716,870 | ||||||||
Series B, 5.50%, 6/15/16 | 5,885 | 6,311,133 | ||||||||
Series B, 5.50%, 6/15/17 | 13,760 | 15,311,715 | ||||||||
State of Nevada, Refunding RB: | ||||||||||
5.00%, 12/01/16 | 5,000 | 5,430,950 | ||||||||
5.00%, 6/01/17 | 14,000 | 15,442,980 | ||||||||
| 54,213,648 | ||||||||||
| Municipal Bonds | Par (000) | Value | ||||||||
New Hampshire — 1.6% | ||||||||||
State of New Hampshire, GO, Refunding, Series B, 5.00%, 6/01/16 | $ | 10,000 | $ | 10,655,000 | ||||||
State of New Hampshire, RB, Federal Highway, GAN, 5.00%, 9/01/16 | 1,250 | 1,343,288 | ||||||||
| 11,998,288 | ||||||||||
New Jersey — 11.3% | ||||||||||
Cherry Hill Township School District, GO, Refunding: | ||||||||||
4.00%, 2/15/16 | 1,500 | 1,560,225 | ||||||||
4.00%, 2/15/17 | 3,455 | 3,694,950 | ||||||||
County of Ocean New Jersey, GO, Refunding, 5.00%, 8/01/16 | 1,235 | 1,324,735 | ||||||||
New Jersey Building Authority, Refunding RB, Series A, 5.00%, 6/15/15 | 13,880 | 14,172,035 | ||||||||
New Jersey EDA, Refunding RB, School Facilities Construction: | ||||||||||
Series DD-1, 5.00%, 12/15/16 | 5,075 | 5,457,249 | ||||||||
Series EE, 5.00%, 9/01/15 (c) | 1,650 | 1,703,147 | ||||||||
New Jersey Educational Facilities Authority, RB, 5.00%, 6/01/17 | 12,910 | 14,063,638 | ||||||||
New Jersey Health Care Facilities Financing Authority, Refunding RB: | ||||||||||
Barnabas Health, Series A, 5.00%, 7/01/16 | 1,000 | 1,063,120 | ||||||||
Meridian Health System, 5.00%, 7/01/17 | 2,000 | 2,197,040 | ||||||||
New Jersey Housing & Mortgage Finance Agency, Refunding RB, M/F Housing, Series 4, AMT, 0.90%, 5/01/15 | 1,690 | 1,690,777 | ||||||||
New Jersey State Turnpike Authority, Refunding RB, Series C, 0.52%, 1/01/17 (a) | 8,000 | 8,012,800 | ||||||||
New Jersey Transportation Trust Fund Authority, RB: | ||||||||||
Series AA, 4.00%, 6/15/16 | 2,850 | 2,982,069 | ||||||||
Series B, 5.00%, 6/15/15 | 1,825 | 1,863,799 | ||||||||
Transportation System, 5.75%, 6/15/16 | 6,275 | 6,724,353 | ||||||||
New Jersey Transportation Trust Fund Authority, Refunding RB, Transportation System: | ||||||||||
Series A, 5.00%, 12/15/15 | 1,640 | 1,712,127 | ||||||||
Series B (NPFGC), 5.50%, 12/15/15 | 2,745 | 2,879,642 | ||||||||
State of New Jersey, GO, Refunding, Series O, 5.00%, 8/01/16 | 2,300 | 2,462,679 | ||||||||
State of New Jersey, GO, Tax-Exempt, Various Purposes, 5.00%, 6/01/16 | 12,075 | 12,849,249 | ||||||||
| 86,413,634 | ||||||||||
New Mexico — 0.1% | ||||||||||
County of Albuquerque Bernalillo New Mexico Water Utility Authority, Refunding RB, Series B, 5.00%, 7/01/16 | 1,000 | 1,069,190 | ||||||||
New York — 11.7% | ||||||||||
Metropolitan Transportation Authority, Refunding RB, Series D, 4.00%, 11/15/15 | 1,400 | 1,445,892 | ||||||||
New York City Transitional Finance Authority Future Tax Secured Revenue, RB: | ||||||||||
5.00%, 8/01/16 (c) | 930 | 997,983 | ||||||||
5.00%, 8/01/16 | 3,950 | 4,242,142 | ||||||||
New York City Transitional Finance Authority Future Tax Secured Revenue, Refunding RB, Series B, 5.00%, 11/01/18 | 3,605 | 4,138,504 | ||||||||
New York City Transitional Finance Authority, RB, Future Tax Secured, Sub-Series F-1, 5.00%, 5/01/15 | 2,000 | 2,032,460 | ||||||||
New York State Dormitory Authority, RB: | ||||||||||
Series A, 4.00%, 3/15/17 | 4,000 | 4,303,160 | ||||||||
Series A, 5.00%, 2/15/17 | 2,495 | 2,726,137 | ||||||||
Series A, 5.00%, 3/15/17 | 2,000 | 2,195,360 | ||||||||
Series A, 5.00%, 3/15/18 | 7,125 | 8,058,874 | ||||||||
Series B, 5.00%, 3/15/17 | 3,600 | 3,944,988 | ||||||||
| SEMI-ANNUAL REPORT | DECEMBER 31, 2014 | 33 |
| Schedule of Investments (continued) | BlackRock Short-Term Municipal Fund (Percentages shown are based on Net Assets) |
| Municipal Bonds | Par (000) | Value | ||||||||
New York (concluded) | ||||||||||
New York State Dormitory Authority, Refunding RB, Series A: | ||||||||||
NYU Hospital Center, 5.00%, 7/01/16 | $ | 1,000 | $ | 1,066,070 | ||||||
4.00%, 7/01/16 (d) | 1,210 | 1,270,040 | ||||||||
New York State Thruway Authority, Refunding RB, Series I: | ||||||||||
5.00%, 1/01/16 (c) | 115 | 120,428 | ||||||||
5.00%, 1/01/16 | 385 | 403,053 | ||||||||
New York State Urban Development Corp., RB, Personal Income Tax, Series C, 5.00%, 3/15/17 | 6,470 | 7,090,020 | ||||||||
Port Authority of New York & New Jersey, RB, Consolidated, 169th Series, AMT, 5.00%, 10/15/15 | 2,680 | 2,779,937 | ||||||||
Port Authority of New York & New Jersey, Refunding RB, AMT: | ||||||||||
5.00%, 9/01/16 | 5,000 | 5,361,000 | ||||||||
5.00%, 9/01/17 | 3,750 | 4,144,312 | ||||||||
Sales Tax Asset Receivable Corp., Refunding RB, Series A, 3.00%, 10/15/16 | 24,055 | 25,139,880 | ||||||||
State of New York, GO, Refunding, Series C, 5.00%, 4/15/16 | 7,675 | 8,145,094 | ||||||||
| 89,605,334 | ||||||||||
North Carolina — 1.5% | ||||||||||
North Carolina Capital Facilities Finance Agency, Refunding RB, High Point University, 4.00%, 5/01/16 | 1,770 | 1,844,959 | ||||||||
North Carolina Medical Care Commission, Refunding RB, Healthcare Facilities Revenue, WakeMed, Series A, 4.00%, 10/01/15 | 730 | 750,243 | ||||||||
North Carolina Municipal Power Agency No. 1, Refunding RB, Catawba Electric, Series A: | ||||||||||
5.00%, 1/01/16 | 3,500 | 3,665,935 | ||||||||
5.25%, 1/01/17 | 5,000 | 5,454,200 | ||||||||
| 11,715,337 | ||||||||||
Ohio — 0.8% | ||||||||||
City of Cleveland Ohio, Public Power System, Refunding RB: | ||||||||||
5.00%, 11/15/15 (c) | 155 | 161,526 | ||||||||
5.00%, 11/15/15 | 2,180 | 2,269,903 | ||||||||
State of Ohio, Refunding RB, AMT, 2.25%, 11/01/22 (a) | 3,500 | 3,555,230 | ||||||||
| 5,986,659 | ||||||||||
Oklahoma — 0.7% | ||||||||||
County of Cleveland Oklahoma Educational Facilities Authority, LRB: | ||||||||||
Moore Public Schools Project, 5.00%, 6/01/15 | 2,050 | 2,090,795 | ||||||||
Moore Public Schools Project, 5.00%, 6/01/16 | 845 | 898,226 | ||||||||
Norman Public Schools Project, 5.00%, 7/01/16 | 1,000 | 1,066,070 | ||||||||
Norman Public Schools Project, 5.00%, 7/01/17 | 1,520 | 1,673,718 | ||||||||
| 5,728,809 | ||||||||||
Oregon — 0.9% | ||||||||||
Portland Community College District, GO, Refunding, 5.00%, 6/15/17 | 6,105 | 6,744,499 | ||||||||
Pennsylvania — 1.8% | ||||||||||
City of Philadelphia Pennsylvania, Refunding ARB, Series A, AMT: | ||||||||||
5.00%, 6/15/15 | 2,550 | 2,606,482 | ||||||||
5.00%, 6/15/17 | 2,000 | 2,201,200 | ||||||||
| Municipal Bonds | Par (000) | Value | ||||||||
Pennsylvania (concluded) | ||||||||||
Pennsylvania Economic Development Financing Authority, RB, Waste Management, Inc. Project, 1.75%, 12/01/33 (a) | $ | 4,500 | $ | 4,549,005 | ||||||
Pennsylvania IDA, Refunding RB, Economic Development, 5.00%, 7/01/15 | 2,500 | 2,559,675 | ||||||||
State Public School Building Authority, RB, School District of Philadelphia Project, 5.00%, 4/01/15 | 1,710 | 1,730,452 | ||||||||
| 13,646,814 | ||||||||||
South Carolina — 1.3% | ||||||||||
South Carolina Transportation Infrastructure Bank, Refunding RB: | ||||||||||
(AMBAC), Series A, 5.00%, 10/01/15 | 5,440 | 5,636,602 | ||||||||
Series B, 5.00%, 10/01/17 | 4,200 | 4,653,894 | ||||||||
| 10,290,496 | ||||||||||
Texas — 4.8% | ||||||||||
City of Corpus Christi Texas Utility System, Refunding RB, 4.00%, 7/15/17 | 2,000 | 2,159,000 | ||||||||
City of Houston, GO, Refunding Series A, 5.00%, 3/01/17 | 4,550 | 4,975,516 | ||||||||
City Public Service Board of San Antonio, Refunding RB, 5.00%, 2/01/18 | 6,000 | 6,735,180 | ||||||||
County of Comal Texas ISD, GO, Refunding, Unlimited Tax, Series A (PSF-GTD), 4.00%, 2/01/16 | 1,500 | 1,561,050 | ||||||||
County of Harris Texas Cultural Education Facilities Finance Corp., Refunding RB, Memorial Hermann Health System, Series A, 4.00%, 12/01/16 | 525 | 558,595 | ||||||||
Houston Independent School District, GO, Refunding, 5.00%, 2/15/18 | 5,000 | 5,630,550 | ||||||||
Lower Colorado River Authority, Refunding RB, 5.00%, 5/15/16 | 2,490 | 2,645,052 | ||||||||
Northside Texas ISD, GO, Refunding, 5.00%, 2/15/17 | 6,910 | 7,541,298 | ||||||||
Texas A&M University System Board of Regents, Refunding RB, 5.00%, 7/01/16 | 5,005 | 5,351,296 | ||||||||
| 37,157,537 | ||||||||||
Virginia — 4.1% | ||||||||||
Commonwealth of Virginia, GO, Series B, 4.00%, 6/01/16 | 5,000 | 5,258,350 | ||||||||
Virginia College Building Authority, RB, Series A: | ||||||||||
21st Century College & Equipment Programs, 5.00%, 2/01/16 | 11,910 | 12,523,365 | ||||||||
5.00%, 2/01/17 | 4,800 | 5,234,592 | ||||||||
Virginia Public School Authority, RB, 5.00%, 7/15/18 | 4,080 | 4,649,446 | ||||||||
Wise County Industrial Development Authority, RB, Series A, 2.38%, 11/01/40 (a) | 4,000 | 4,063,520 | ||||||||
| 31,729,273 | ||||||||||
Washington — 2.4% | ||||||||||
City of Seattle WA Municipal Light & Power Revenue, Refunding RB, 5.00%, 9/01/18 | 15,715 | 17,915,257 | ||||||||
Washington Health Care Facilities Authority, Refunding RB, 5.00%, 3/01/18 | 290 | 320,836 | ||||||||
| 18,236,093 | ||||||||||
Wisconsin — 2.4% | ||||||||||
State of Wisconsin, Refunding RB, Series 1, 5.00%, 7/01/16 | 10,000 | 10,685,700 | ||||||||
Wisconsin Health & Educational Facilities Authority, Refunding RB, Series B, 5.13%, 8/15/27 (a) | 7,500 | 8,039,100 | ||||||||
| 18,724,800 | ||||||||||
| 34 | SEMI-ANNUAL REPORT | DECEMBER 31, 2014 |
| Schedule of Investments (concluded) | BlackRock Short-Term Municipal Fund (Percentages shown are based on Net Assets) |
| Municipal Bonds | Par (000) | Value | |||||||||
Total Long-Term Investments (Cost — $737,560,591) — 96.2% | $ | 738,748,231 | |||||||||
Short-Term Securities | |||||||||||
Illinois — 1.9% | |||||||||||
Regional Transportation Authority, GO, Refunding, ERS, VRDN, Series B, 0.40%, 1/02/15 (e) | $ | 15,000 | 15,000,000 | ||||||||
| Money Market Funds — 0.9% | Shares | Value | ||||||||
FFI Institutional Tax-Exempt Fund, 0.03% (f)(g) | 6,613,443 | $ | 6,613,443 | |||||||
Total Short-Term Securities (Cost — $21,613,443) — 2.8% | 21,613,443 | |||||||||
Total Investments (Cost — $759,174,034) — 99.0% | 760,361,674 | |||||||||
Other Assets Less Liabilities — 1.0% | 7,352,590 | |||||||||
Net Assets — 100.0% | $ | 767,714,264 | ||||||||
Notes to Schedule of Investments
| (a) | Variable rate security. Rate shown is as of report date. | |||
| (b) | U.S. government securities, held in escrow, are used to pay interest on this security, as well as to retire the bond in full at the date indicated, typically at a premium to par. | |||
| (c) | Security is collateralized by municipal or U.S. Treasury obligations. | |||
| (d) | When-issued security. Unsettled when-issued transactions were as follows: |
| Counterparty | Value | Unrealized Depreciation | ||||||||
Janney Montgomery Scott LLC | $ | 1,270,040 | $ | (980 | ) | |||||
| (e) | Variable rate security. Rate shown is as of report date and maturity shown is the date the principal owed can be recovered through demand. | |||
| (f) | Represents the current yield as of report date. | |||
| (g) | Investments in issuers considered to be an affiliate of the Fund during the period ended December 31, 2014, for purposes of Section 2(a)(3) of the Investment Company Act of 1940, as amended, were as follows: |
| Affiliate | Shares Held at June 30, 2014 | Net Activity | Shares Held at December 31, 2014 | Income | ||||||||||||||
FFI Institutional Tax-Exempt Fund | 3,454,392 | 3,159,051 | 6,613,443 | $1,191 | ||||||||||||||
| • | Fair Value Measurements — Various inputs are used in determining the fair value of investments. These inputs to valuation techniques are categorized into a disclosure hierarchy consisting of three broad levels for financial statement purposes. The hierarchy gives the highest priority to unadjusted quoted prices in active markets for identical assets or liabilities (Level 1 measurements) and the lowest priority to unobservable inputs (Level 3 measurements). Accordingly, the degree of judgment exercised in determining fair value is greatest for instruments categorized in Level 3. The inputs used to measure fair value may fall into different levels of the fair value hierarchy. In such cases, for disclosure purposes, the fair value hierarchy classification is determined based on the lowest level input that is significant to the fair value measurement in its entirety. The categorization of a value determined for investments is based on the pricing transparency of the investment and is not necessarily an indication of the risks associated with investing in those securities. The three levels of the fair value hierarchy are as follows: |
| • | Level 1 — unadjusted quoted prices in active markets/exchanges for identical assets or liabilities that the Fund has the ability to access | ||||
| • | Level 2 — other observable inputs (including, but not limited to, quoted prices for similar assets or liabilities in markets that are active, quoted prices for identical or similar assets or liabilities in markets that are not active, inputs other than quoted prices that are observable for the assets or liabilities (such as interest rates, yield curves, volatilities, prepayment speeds, loss severities, credit risks and default rates) or other market-corroborated inputs) | ||||
| • | Level 3 — unobservable inputs based on the best information available in the circumstances, to the extent observable inputs are not available (including the Fund’s own assumptions used in determining the fair value of investments) |
Changes in valuation techniques may result in transfers into or out of an assigned level within the disclosure hierarchy. In accordance with the Fund’s policy, transfers between different levels of the fair value disclosure hierarchy are deemed to have occurred as of the beginning of the reporting period. For information about the Fund’s policy regarding valuation of investments, refer to Note 2 of the Notes to Financial Statements. |
As of December 31, 2014, the following table summarizes the Fund’s investments categorized in the disclosure hierarchy: |
| Level 1 | Level 2 | Level 3 | Total | |||||||||||||||
Assets: | ||||||||||||||||||
Investments: | ||||||||||||||||||
Long-Term Investments1 | — | $ | 738,748,231 | — | $ | 738,748,231 | ||||||||||||
Short-Term Securities | $ | 6,613,443 | 15,000,000 | — | 21,613,443 | |||||||||||||
Total | $ | 6,613,443 | $ | 753,748,231 | — | $ | 760,361,674 | |||||||||||
| 1 | See above Schedule of Investments for values in each state or political subdivision. |
During the six months ended December 31, 2014, there were no transfers between levels. |
| SEMI-ANNUAL REPORT | DECEMBER 31, 2014 | 35 |
| Schedule of Investments December 31, 2014 (Unaudited) | BlackRock New York Municipal Bond Fund (Percentages shown are based on Net Assets) |
| Municipal Bonds | Par (000) | Value | |||||||||
New York — 89.1% | |||||||||||
Corporate — 5.9% | |||||||||||
City of New York New York Industrial Development Agency, ARB, AMT: | |||||||||||
American Airlines, Inc., JFK International Airport, 7.75%, 8/01/31 (a) | $ | 2,000 | $ | 2,187,880 | |||||||
British Airways PLC Project, 5.25%, 12/01/32 | 1,000 | 1,002,110 | |||||||||
City of New York New York Industrial Development Agency, Refunding RB, AMT: | |||||||||||
Terminal One Group Association Project, 5.50%, 1/01/24 (a) | 2,500 | 2,614,475 | |||||||||
Transportation Infrastructure Properties LLC, Series A, 5.00%, 7/01/28 | 1,520 | 1,669,781 | |||||||||
County of Chautauqua New York Industrial Development Agency, RB, NRG Dunkirk Power Project, 5.88%, 4/01/42 | 750 | 832,192 | |||||||||
County of Essex New York Industrial Development Agency, RB, International Paper Co. Project, Series A, AMT, 6.63%, 9/01/32 | 350 | 395,154 | |||||||||
County of Suffolk New York Industrial Development Agency, RB, KeySpan Generation LLC, Port Jefferson, AMT, 5.25%, 6/01/27 | 1,000 | 1,004,500 | |||||||||
New York Liberty Development Corp., RB, Goldman Sachs Headquarters: | |||||||||||
5.25%, 10/01/35 | 4,500 | 5,416,065 | |||||||||
5.50%, 10/01/37 | 780 | 967,044 | |||||||||
Niagara Area Development Corp., Refunding RB, Solid Waste Disposal Facility, Covanta Energy Project, Series A, AMT, 5.25%, 11/01/42 (b) | 1,400 | 1,445,976 | |||||||||
| 17,535,177 | |||||||||||
County/City/Special District/School District — 20.6% | |||||||||||
Buffalo & County of Erie New York Industrial Land Development Corp., Refunding RB, Buffalo State College Foundation Housing Corp. Project, Series A, 5.38%, 10/01/41 | 620 | 690,054 | |||||||||
City of New York New York, GO, Fiscal 2014 Sub-Series D-1, 5.00%, 8/01/31 | 690 | 803,374 | |||||||||
City of New York New York, GO, Refunding, Series E, 5.50%, 8/01/25 | 1,280 | 1,593,613 | |||||||||
City of New York New York, GO: | |||||||||||
Series A-1, 5.00%, 8/01/35 | 400 | 455,732 | |||||||||
Sub-Series A-1, 5.00%, 10/01/34 | 600 | 685,974 | |||||||||
Sub-Series I-1, 5.38%, 4/01/36 | 2,650 | 3,035,045 | |||||||||
City of New York New York Convention Center Development Corp., RB, Hotel Unit Fee Secured (AMBAC): | |||||||||||
5.00%, 11/15/35 | 3,200 | 3,304,512 | |||||||||
5.00%, 11/15/44 | 1,500 | 1,550,865 | |||||||||
City of New York New York Housing Development Corp., RB, Fund Grant Program, New York City Housing Authority Program, Series B1: | |||||||||||
5.25%, 7/01/32 | 915 | 1,066,213 | |||||||||
5.00%, 7/01/33 | 400 | 453,852 | |||||||||
City of New York New York Industrial Development Agency, RB, PILOT: | |||||||||||
CAB, Yankee Stadium Project, Series A (AGC), 0.00%, 3/01/42 (c) | 5,000 | 1,615,200 | |||||||||
CAB, Yankee Stadium Project, Series A (AGC), 0.00%, 3/01/45 (c) | 1,500 | 422,760 | |||||||||
Queens Baseball Stadium (AGC), 6.50%, 1/01/46 | 700 | 811,741 | |||||||||
Queens Baseball Stadium (AMBAC), 5.00%, 1/01/39 | 2,600 | 2,686,398 | |||||||||
Yankee Stadium Project (NPFGC), 4.75%, 3/01/46 | 670 | 684,392 | |||||||||
City of New York New York Industrial Development Agency, Refunding ARB, Transportation Infrastructure Properties LLC, Series A, AMT, 5.00%, 7/01/22 | 500 | 557,120 | |||||||||
| Municipal Bonds | Par (000) | Value | |||||||||
New York (continued) | |||||||||||
County/City/Special District/School District (concluded) | |||||||||||
City of New York New York Transitional Finance Authority, BARB, Fiscal 2009, Series S-1, 5.63%, 7/15/38 | $ | 200 | $ | 227,324 | |||||||
City of New York New York Transitional Finance Authority, RB, Future Tax Secured Bonds, Fiscal 2012, Sub-Series E-1, 5.00%, 2/01/42 | 650 | 728,422 | |||||||||
City of New York New York Transitional Finance Authority Future Tax Secured, RB: | |||||||||||
Sub-Series A-1, 5.00%, 11/01/38 | 1,000 | 1,153,310 | |||||||||
Sub-Series B-1, 5.00%, 11/01/36 | 680 | 791,778 | |||||||||
City of Syracuse New York, GO, Airport Terminal Security & Access, Series A, AMT (AGM), 4.75%, 11/01/31 | 500 | 540,830 | |||||||||
Hudson Yards Infrastructure Corp., RB, Series A: | |||||||||||
Senior, Fiscal 2012, 5.75%, 2/15/47 | 100 | 115,586 | |||||||||
5.00%, 2/15/47 | 5,970 | 6,359,363 | |||||||||
(AGC), 5.00%, 2/15/47 | 1,000 | 1,066,940 | |||||||||
(AGM), 5.00%, 2/15/47 | 1,050 | 1,120,287 | |||||||||
(NPFGC), 4.50%, 2/15/47 | 2,315 | 2,424,800 | |||||||||
New York Liberty Development Corp., Refunding RB: | |||||||||||
2nd Priority, Bank of America Tower at One Bryant Park Project, Class 2, 5.63%, 7/15/47 | 9,305 | 10,616,726 | |||||||||
2nd Priority, Bank of America Tower at One Bryant Park Project, Class 3, 6.38%, 7/15/49 | 1,200 | 1,359,276 | |||||||||
3 World Trade Center Project, Class 2, 5.38%, 11/15/40 (b) | 400 | 429,644 | |||||||||
4 World Trade Center Project, 5.00%, 11/15/31 | 860 | 972,909 | |||||||||
4 World Trade Center Project, 5.00%, 11/15/44 | 1,500 | 1,665,330 | |||||||||
4 World Trade Center Project, 5.75%, 11/15/51 | 1,340 | 1,568,162 | |||||||||
7 World Trade Center Project, Class 1, 4.00%, 9/15/35 | 425 | 463,271 | |||||||||
7 World Trade Center Project, Class 2, 5.00%, 9/15/43 | 5,085 | 5,645,418 | |||||||||
7 World Trade Center Project, Class 3, 5.00%, 3/15/44 | 1,720 | 1,869,279 | |||||||||
North Country Development Authority, Refunding RB (AGM), 6.00%, 5/15/15 | 175 | 177,755 | |||||||||
State of New York Dormitory Authority, RB, State University Dormitory Facilities, Series A, 5.25%, 7/01/29 | 5 | 5,670 | |||||||||
State of New York State Dormitory Authority, RB, Series C, 5.00%, 10/01/42 | 1,695 | 1,933,486 | |||||||||
| 61,652,411 | |||||||||||
Education — 16.2% | |||||||||||
Amherst Development Corp., Refunding RB, University at Buffalo Foundation Faculty-Student Housing Corp., Series A (AGM), 4.63%, 10/01/40 | 305 | 325,828 | |||||||||
Build New York City Resource Corp., RB, South Bronx Charter School for International Cultures and the Arts Project, Series A, 5.00%, 4/15/43 | 1,000 | 1,007,350 | |||||||||
Build New York City Resource Corp., Refunding RB, Series A, 5.00%, 6/01/43 | 325 | 371,095 | |||||||||
City of New York New York Trust for Cultural Resources, RB, Juilliard School, Series A, 5.00%, 1/01/39 | 500 | 556,775 | |||||||||
City of New York New York Trust for Cultural Resources, Refunding RB, Series A: | |||||||||||
American Museum of National History, 5.00%, 7/01/37 | 885 | 1,036,760 | |||||||||
Carnegie Hall, 4.75%, 12/01/39 | 1,550 | 1,665,862 | |||||||||
Carnegie Hall, 5.00%, 12/01/39 | 1,325 | 1,472,419 | |||||||||
City of Troy New York Capital Resource Corp., Refunding RB, Rensselaer Polytechnic Institute Project, Series A, 5.13%, 9/01/40 | 4,280 | 4,705,218 | |||||||||
City of Yonkers New York Industrial Development Agency, RB, Sarah Lawrence College Project, Series A, 6.00%, 6/01/41 | 1,000 | 1,106,630 | |||||||||
| 36 | SEMI-ANNUAL REPORT | DECEMBER 31, 2014 |
| Schedule of Investments (continued) | BlackRock New York Municipal Bond Fund (Percentages shown are based on Net Assets) |
| Municipal Bonds | Par (000) | Value | |||||||||
New York (continued) | |||||||||||
Education (continued) | |||||||||||
County of Cattaraugus New York, St. Bonaventure University Project, 5.00%, 5/01/39 | $ | 165 | $ | 177,073 | |||||||
County of Cattaraugus New York, RB, St. Bonaventure University Project, 5.00%, 5/01/34 | 130 | 141,409 | |||||||||
County of Madison New York Industrial Development Agency, RB, Commons II LLC, Student Housing, Series A (CIFG), 5.00%, 6/01/33 | 400 | 417,188 | |||||||||
County of Monroe New York Industrial Development Corp., Refunding RB, University of Rochester Project, Series A, 5.00%, 7/01/38 | 240 | 274,423 | |||||||||
County of Nassau New York Industrial Development Agency, Refunding RB, New York Institute of Technology Project, Series A, 4.75%, 3/01/26 | 1,000 | 1,059,130 | |||||||||
County of Orange New York Funding Corp., Refunding RB, Mount St. Mary College Project, Series A: | |||||||||||
5.00%, 7/01/37 | 360 | 386,507 | |||||||||
5.00%, 7/01/42 | 220 | 233,110 | |||||||||
County of Saratoga New York, Refunding RB, Series B, 4.00%, 7/01/33 | 1,000 | 1,045,720 | |||||||||
County of Schenectady New York Industrial Development Agency, Refunding RB, Union College Project, 5.00%, 7/01/31 | 1,000 | 1,057,250 | |||||||||
County of St. Lawrence New York Industrial Development Agency, RB, Clarkson University Project, 5.38%, 9/01/41 | 500 | 564,320 | |||||||||
County of Tompkins New York Development Corp., RB, Ithaca College Project (AGM), 5.50%, 7/01/33 | 450 | 509,243 | |||||||||
Dobbs Ferry Local Development Corp., RB, Mercy College Project: | |||||||||||
5.00%, 7/01/39 | 1,000 | 1,128,100 | |||||||||
5.00%, 7/01/44 | 2,000 | 2,245,840 | |||||||||
State of New York Dormitory Authority, RB: | |||||||||||
New School (AGM), 5.50%, 7/01/43 | 1,000 | 1,148,020 | |||||||||
New York University, Series 1 (AMBAC), 5.50%, 7/01/40 | 500 | 674,075 | |||||||||
New York University, Series 1 (AMBAC, BHAC), 5.50%, 7/01/31 | 230 | 298,701 | |||||||||
Personal Income Tax, Series G, 5.00%, 8/15/32 | 1,975 | 2,288,413 | |||||||||
Series A, 5.50%, 1/01/44 | 2,000 | 2,250,320 | |||||||||
State University Dormitory Facilities, Series A, 5.00%, 7/01/39 | 750 | 832,680 | |||||||||
Teachers College, Series B, 5.00%, 7/01/42 | 450 | 497,939 | |||||||||
Touro College & University System Obligation Group, Series A, 4.13%, 1/01/30 | 600 | 618,636 | |||||||||
University of Rochester, Series A, 0.00%, 7/01/39 (d) | 1,000 | 1,151,560 | |||||||||
University of Rochester, Series B, 5.00%, 7/01/39 | 550 | 589,143 | |||||||||
State of New York Dormitory Authority, Refunding RB: | |||||||||||
3rd General Resolution, State University Educational Facilities Issue, Series A, 5.00%, 5/15/29 | 2,000 | 2,343,920 | |||||||||
Brooklyn Law School, 5.75%, 7/01/33 | 475 | 534,831 | |||||||||
Culinary Institute of America, 5.00%, 7/01/42 | 300 | 320,676 | |||||||||
Fordham University, 5.00%, 7/01/44 | 850 | 964,053 | |||||||||
New York University, Series A, 5.00%, 7/01/42 | 1,000 | 1,131,280 | |||||||||
Rochester Institute of Technology, 5.00%, 7/01/34 | 750 | 841,507 | |||||||||
Rochester Institute of Technology, 5.00%, 7/01/38 | 310 | 346,289 | |||||||||
Rochester Institute of Technology, 5.00%, 7/01/42 | 1,460 | 1,622,688 | |||||||||
Skidmore College, Series A, 5.25%, 7/01/29 | 135 | 157,851 | |||||||||
St. John’s University, Series A, 5.00%, 7/01/27 | 450 | 517,707 | |||||||||
State University Dormitory Facilities, Series A, 5.25%, 7/01/30 | 2,095 | 2,517,729 | |||||||||
State University Dormitory Facilities, Series A, 5.25%, 7/01/32 | 2,095 | 2,505,369 | |||||||||
| Municipal Bonds | Par (000) | Value | |||||||||
New York (continued) | |||||||||||
Education (concluded) | |||||||||||
State of New York Dormitory Authority, Refunding RB (concluded): | |||||||||||
State University Dormitory Facilities, Series A, 5.00%, 7/01/42 | $ | 895 | $ | 1,007,385 | |||||||
Teachers College, 5.50%, 3/01/39 | 850 | 948,336 | |||||||||
Town of Hempstead New York Local Development Corp., Refunding RB: | |||||||||||
Adelphi University Project, 5.00%, 10/01/35 | 265 | 303,473 | |||||||||
Adelphini University Project, 5.00%, 10/01/34 | 465 | 534,606 | |||||||||
| 48,434,437 | |||||||||||
Health — 13.6% | |||||||||||
Build New York City Resource Corp., Refunding RB, Pratt Paper, Inc. Project, AMT, 5.00%, 1/01/35 (b) | 280 | 288,672 | |||||||||
Build NYC Resource Corp., Refunding RB, 5.00%, 7/01/30 | 600 | 683,130 | |||||||||
City of New York New York Health & Hospital Corp., Refunding RB, Health System, Series A, 5.00%, 2/15/30 | 1,000 | 1,109,310 | |||||||||
City of New York New York Industrial Development Agency, RB: | |||||||||||
PSCH, Inc. Project, 6.38%, 7/01/33 | 2,555 | 2,555,945 | |||||||||
Special Needs Facilities Pooled Program, Series A-1, 6.50%, 7/01/17 | 380 | 380,175 | |||||||||
Special Needs Facilities Pooled Program, Series C-1, 6.50%, 7/01/17 | 1,400 | 1,400,644 | |||||||||
City of New York New York Industrial Development Agency, Refunding RB, Special Needs Facilities Pooled Program: | |||||||||||
Series A-1 (ACA), 4.38%, 7/01/20 | 845 | 785,934 | |||||||||
Series A-1 (ACA), 4.50%, 7/01/30 | 210 | 172,307 | |||||||||
Series C-1 (ACA), 5.10%, 7/01/31 | 525 | 506,000 | |||||||||
County of Dutchess New York Local Development Corp., RB, Series A, 5.00%, 7/01/34 | 750 | 838,972 | |||||||||
County of Dutchess New York Local Development Corp., Refunding RB, Health Quest System, Inc., Series A, 5.75%, 7/01/40 | 300 | 336,372 | |||||||||
County of Erie New York Industrial Development Agency, RB, Episcopal Church Home, Series A: | |||||||||||
5.88%, 2/01/18 | 85 | 85,243 | |||||||||
6.00%, 2/01/28 | 185 | 185,294 | |||||||||
County of Genesee New York Industrial Development Agency, Refunding RB, United Memorial Medical Center Project: | |||||||||||
5.00%, 12/01/27 | 500 | 500,430 | |||||||||
5.00%, 12/01/32 | 580 | 580,389 | |||||||||
County of Monroe New York Industrial Development Corp., Refunding RB: | |||||||||||
Rochester General Hospital Project, Series B, 3.60%, 12/01/32 | 330 | 334,036 | |||||||||
Unity Hospital of Rochester Project (FHA), 5.50%, 8/15/40 | 1,050 | 1,233,624 | |||||||||
County of Nassau New York Industrial Development Agency, Refunding RB, Special Needs Facilities Pooled Program, Series F-1 (ACA), 4.90%, 7/01/21 | 525 | 527,226 | |||||||||
County of Orange New York Industrial Development Agency, RB, Special Needs Facilities Pooled Program, Series G-1 (ACA), 4.90%, 7/01/21 | 845 | 848,583 | |||||||||
County of Suffolk New York Economic Development Corp., RB, Catholic Health Services, Series C, 5.00%, 7/01/32 | 305 | 345,660 | |||||||||
County of Suffolk New York Industrial Development Agency, RB, Special Needs Facilities Pooled Program, Series D-1: | |||||||||||
6.50%, 7/01/17 | 95 | 95,044 | |||||||||
(ACA), 4.90%, 7/01/21 | 330 | 331,399 | |||||||||
| SEMI-ANNUAL REPORT | DECEMBER 31, 2014 | 37 |
| Schedule of Investments (continued) | BlackRock New York Municipal Bond Fund (Percentages shown are based on Net Assets) |
| Municipal Bonds | Par (000) | Value | |||||||||
New York (continued) | |||||||||||
Health (concluded) | |||||||||||
County of Sullivan New York Industrial Development Agency, RB, Special Needs Facilities Pooled Program, Series H-1 (ACA), 4.90%, 7/01/21 | $ | 330 | $ | 331,399 | |||||||
County of Westchester New York Healthcare Corp., Refunding RB, Senior Lien: | |||||||||||
Remarketing, Series A, 5.00%, 11/01/30 | 4,075 | 4,506,013 | |||||||||
Series B, 6.00%, 11/01/30 | 375 | 437,175 | |||||||||
County of Westchester New York Industrial Development Agency, RB, Special Needs Facilities Pooled Program, Series E-1 (ACA), 4.90%, 7/01/21 | 350 | 351,484 | |||||||||
County of Westchester New York Local Development Corp., Refunding RB, Kendal On Hudson Project: | |||||||||||
4.00%, 1/01/23 | 650 | 685,295 | |||||||||
5.00%, 1/01/28 | 930 | 1,010,380 | |||||||||
5.00%, 1/01/34 | 875 | 948,106 | |||||||||
State of New York Dormitory Authority, RB: | |||||||||||
Healthcare, Series A, 5.00%, 3/15/38 | 250 | 279,562 | |||||||||
Hudson Valley Hospital (BHAC) (FHA), 5.00%, 8/15/36 | 750 | 815,910 | |||||||||
Mental Health Services (AGM), 5.00%, 8/15/18 (e) | 5 | 5,722 | |||||||||
Mental Health Services (AGM), 5.00%, 8/15/18 (e) | 5 | 5,722 | |||||||||
Mental Health Services (AGM), 5.00%, 2/15/22 | 990 | 1,120,482 | |||||||||
New York State Association for Retarded Children, Inc., Series B (AMBAC), 6.00%, 7/01/32 | 700 | 806,239 | |||||||||
New York University Hospitals Center, Series A, 5.75%, 7/01/31 | 1,055 | 1,216,404 | |||||||||
New York University Hospitals Center, Series B, 5.63%, 7/01/17 (e) | 530 | 596,128 | |||||||||
North Shore-Long Island Jewish Obligated Group, Series A, 5.50%, 5/01/37 | 1,675 | 1,859,719 | |||||||||
North Shore-Long Island Jewish Obligated Group, Series A, 5.75%, 5/01/37 | 1,725 | 1,935,726 | |||||||||
State of New York Dormitory Authority, Refunding RB: | |||||||||||
Miriam Osborn Memorial Home Association, 5.00%, 7/01/29 | 290 | 312,220 | |||||||||
Mount Sinai Hospital, Series A, 5.00%, 7/01/26 | 1,635 | 1,865,470 | |||||||||
New York University Hospitals Center, Series A, 5.00%, 7/01/17 (e) | 1,500 | 1,578,030 | |||||||||
North Shore-Long Island Jewish Obligated Group, Series A, 5.00%, 5/01/32 | 2,500 | 2,781,775 | |||||||||
North Shore-Long Island Jewish Obligated Group, Series E, 5.50%, 5/01/33 | 1,000 | 1,117,650 | |||||||||
St. Luke’s Roosevelt Hospital (FHA), 4.90%, 8/15/15 (e) | 500 | 514,615 | |||||||||
Tompkins County Development Corp., Refunding RB, 5.00%, 7/01/44 | 1,250 | 1,344,925 | |||||||||
| 40,550,540 | |||||||||||
Housing — 3.2% | |||||||||||
City of New York New York Housing Development Corp., RB, M/F Housing: | |||||||||||
Class F, 4.50%, 2/15/48 | 770 | 782,913 | |||||||||
Series C, AMT, 5.05%, 11/01/36 | 1,220 | 1,245,766 | |||||||||
City of Yonkers New York Industrial Development Agency, RB, AMT (SONYMA): | |||||||||||
Monastery Manor Associates LP Project, 5.25%, 4/01/37 | 585 | 587,206 | |||||||||
Sacred Heart Association Project, Series A, 5.00%, 10/01/37 | 1,640 | 1,689,774 | |||||||||
County of Monroe New York Industrial Development Agency, IDRB, Southview Towers Project, AMT (SONYMA), 6.25%, 2/01/31 | 1,000 | 1,002,230 | |||||||||
State of New York HFA, RB, M/F Housing, Series A, AMT: | |||||||||||
Division Street (SONYMA), 5.10%, 2/15/38 | 875 | 885,325 | |||||||||
Highland Avenue Senior Apartments (SONYMA), 5.00%, 2/15/39 | 2,000 | 2,036,540 | |||||||||
| Municipal Bonds | Par (000) | Value | |||||||||
New York (continued) | |||||||||||
Housing (concluded) | |||||||||||
State of New York HFA, RB, M/F Housing, Series A, AMT (concluded): | |||||||||||
Kensico Terrace Apartments (SONYMA), 4.90%, 2/15/38 | $ | 645 | $ | 652,482 | |||||||
Watergate II, 4.75%, 2/15/34 | 580 | 580,394 | |||||||||
| 9,462,630 | |||||||||||
State — 8.8% | |||||||||||
Sales Tax Asset Receivable Corp., Refunding RB, Series A: | |||||||||||
Fiscal 2015, 4.00%, 10/15/32 | 1,445 | 1,597,736 | |||||||||
5.00%, 10/15/31 | 1,625 | 1,974,180 | |||||||||
State of New York, GO, Series A, 5.00%, 2/15/39 | 750 | 845,288 | |||||||||
State of New York Dormitory Authority, RB: | |||||||||||
General Purpose, Series B, 5.00%, 3/15/42 | 2,250 | 2,542,657 | |||||||||
General Purpose, Series E, 5.00%, 2/15/29 | 1,715 | 2,006,499 | |||||||||
State Personal Income Tax, Series A, 5.00%, 2/15/43 | 5,000 | 5,692,750 | |||||||||
State Supported Debt, Series A, 5.00%, 3/15/44 | 1,805 | 2,107,662 | |||||||||
State of New York Dormitory Authority, Refunding RB, General Purpose, Series D, 5.00%, 2/15/33 | 750 | 861,593 | |||||||||
State of New York Thruway Authority, Refunding RB, Series A-1, 5.00%, 4/01/29 | 1,000 | 1,132,430 | |||||||||
State of New York Urban Development Corp., RB, State Personal Income Tax, Series A, 3.50%, 3/15/28 | 1,750 | 1,825,372 | |||||||||
State of New York Urban Development Corp., Refunding RB: | |||||||||||
Clarkson Center Advance Materials, 5.50%, 1/01/20 | 1,685 | 1,890,604 | |||||||||
University Facilities Grants, 5.50%, 1/01/19 | 3,500 | 3,906,315 | |||||||||
| 26,383,086 | |||||||||||
Tobacco — 1.3% | |||||||||||
Chautauqua Tobacco Asset Securitization Corp., Refunding RB, 4.75%, 6/01/39 | 750 | 734,055 | |||||||||
Niagara Tobacco Asset Securitization Corp., Refunding RB: | |||||||||||
5.25%, 5/15/34 | 1,750 | 1,994,335 | |||||||||
5.25%, 5/15/40 | 1,080 | 1,217,894 | |||||||||
| 3,946,284 | |||||||||||
Transportation — 12.7% | |||||||||||
Metropolitan Transportation Authority, RB: | |||||||||||
Dedicated Tax Fund, Series A, 5.63%, 11/15/39 | 500 | 567,605 | |||||||||
Series A-1, 5.25%, 11/15/33 | 540 | 636,773 | |||||||||
Series B, 5.25%, 11/15/44 | 2,125 | 2,452,930 | |||||||||
Series C, 6.50%, 11/15/28 | 1,760 | 2,119,269 | |||||||||
Series E, 5.00%, 11/15/38 | 2,350 | 2,668,566 | |||||||||
Series H, 5.00%, 11/15/25 | 1,000 | 1,191,600 | |||||||||
Series H, 5.00%, 11/15/30 | 400 | 465,764 | |||||||||
Metropolitan Transportation Authority, Refunding RB, Series F: | |||||||||||
5.00%, 11/15/30 | 1,000 | 1,164,410 | |||||||||
(AGM), 4.00%, 11/15/30 | 1,985 | 2,103,187 | |||||||||
New York State Thruway Authority, Refunding RB, 5.00%, 1/01/32 | 1,500 | 1,760,355 | |||||||||
Niagara Falls Bridge Commission, RB, Series A (BAM), 4.00%, 10/01/44 | 1,330 | 1,362,133 | |||||||||
Port Authority of New York & New Jersey, ARB: | |||||||||||
Consolidated, 169th Series, AMT, 5.00%, 10/15/41 | 1,000 | 1,088,000 | |||||||||
Special Project, JFK International Air Terminal LLC Project, Series 8, 6.00%, 12/01/42 | 2,000 | 2,320,660 | |||||||||
Port Authority of New York & New Jersey, Refunding ARB, Consolidated, AMT: | |||||||||||
177th Series, 3.50%, 7/15/37 | 2,000 | 1,908,500 | |||||||||
177th Series, 4.00%, 1/15/43 | 3,850 | 3,876,296 | |||||||||
178th Series, 5.00%, 12/01/43 | 285 | 315,424 | |||||||||
| 38 | SEMI-ANNUAL REPORT | DECEMBER 31, 2014 |
| Schedule of Investments (continued) | BlackRock New York Municipal Bond Fund (Percentages shown are based on Net Assets) |
| Municipal Bonds | Par (000) | Value | |||||||||
New York (concluded) | |||||||||||
Transportation (concluded) | |||||||||||
Port Authority of New York & New Jersey, Refunding RB, 178th Series, AMT, 5.00%, 12/01/32 | $ | 1,000 | $ | 1,143,650 | |||||||
State of New York Thruway Authority, Refunding RB: | |||||||||||
General, Series I, 5.00%, 1/01/37 | 920 | 1,023,730 | |||||||||
General, Series I, 5.00%, 1/01/42 | 280 | 309,352 | |||||||||
Series J, 5.00%, 1/01/41 | 5,000 | 5,661,350 | |||||||||
Triborough Bridge & Tunnel Authority, Refunding RB: | |||||||||||
CAB, General, Series B, 0.00%, 11/15/32 (c) | 1,520 | 821,606 | |||||||||
CAB, Sub-Series A, 0.00%, 11/15/32 (c) | 2,480 | 1,292,080 | |||||||||
Series A, 5.00%, 11/15/24 | 1,375 | 1,657,246 | |||||||||
| 37,910,486 | |||||||||||
Utilities — 6.8% | |||||||||||
City of New York New York Municipal Water & Sewer System, Refunding RB, Fiscal 2013, Series BB, 5.00%, 6/15/47 | 2,000 | 2,243,600 | |||||||||
City of New York New York Municipal Water Finance Authority, RB, Water & Sewer System, Fiscal 2009, Series A, 5.75%, 6/15/40 | 500 | 572,160 | |||||||||
City of New York New York Municipal Water Finance Authority, Refunding RB, Water & Sewer System, 2nd General Resolution: | |||||||||||
Series FF-2, 5.50%, 6/15/40 | 800 | 920,696 | |||||||||
Series GG, 5.00%, 6/15/43 | 1,000 | 1,117,190 | |||||||||
Series HH, 5.00%, 6/15/32 | 950 | 1,090,534 | |||||||||
Long Island Power Authority, RB, General, Electric Systems: | |||||||||||
Series A (AGM), 5.00%, 5/01/36 | 500 | 556,355 | |||||||||
Series C (CIFG), 5.25%, 9/01/29 | 3,000 | 3,739,290 | |||||||||
Long Island Power Authority, Refunding RB, Electric System, Series A: | |||||||||||
5.50%, 4/01/24 | 875 | 986,160 | |||||||||
6.00%, 5/01/33 | 2,450 | 2,863,707 | |||||||||
5.75%, 4/01/39 | 300 | 340,401 | |||||||||
State of New York Environmental Facilities Corp., Refunding RB, Revolving Funds New York City Municipal Water, 2nd General Resolution, Series B, 5.00%, 6/15/36 | 1,000 | 1,146,230 | |||||||||
Utility Debt Securitization Authority, Refunding RB, Restructuring, Series E, 5.00%, 12/15/41 | 4,225 | 4,934,842 | |||||||||
| 20,511,165 | |||||||||||
Total Municipal Bonds in New York | 266,386,216 | ||||||||||
Puerto Rico — 0.4% | |||||||||||
Housing — 0.4% | |||||||||||
Puerto Rico Housing Finance Authority, Refunding RB, M/F Housing, Subordinate, Capital Fund Modernization, 5.13%, 12/01/27 | 1,000 | 1,067,650 | |||||||||
Total Municipal Bonds — 89.5% | 267,453,866 | ||||||||||
Municipal Bonds Transferred to Tender Option Bond Trusts (f) | |||||||||||
New York — 11.7% | |||||||||||
County/City/Special District/School District — 2.4% | |||||||||||
City of New York New York, GO: | |||||||||||
Sub-Series G-1, 5.00%, 4/01/29 | 750 | 871,980 | |||||||||
Sub-Series I-1, 5.00%, 3/01/36 | 1,500 | 1,732,305 | |||||||||
| Municipal Bonds Transferred to Tender Option Bond Trusts (f) | Par (000) | Value | |||||||||
New York (concluded) | |||||||||||
County/City/Special District/School District (concluded) | |||||||||||
City of New York New York Transitional Finance Authority, RB, Future Tax Secured, Sub-Series D-1, 5.00%, 11/01/38 | $ | 1,650 | $ | 1,877,584 | |||||||
Hudson Yards Infrastructure Corp., RB, Fiscal 2012, Series A, 5.75%, 2/15/47 (g) | 2,250 | 2,600,476 | |||||||||
| 7,082,345 | |||||||||||
Education — 0.5% | |||||||||||
State of New York Dormitory Authority, LRB, State University Dormitory Facilities, New York University, Series A, 5.25%, 7/01/29 | 1,350 | 1,530,779 | |||||||||
State — 1.2% | |||||||||||
City of New York New York Transitional Finance Authority, BARB, Fiscal 2009, Series S-3, 5.25%, 1/15/39 | 2,100 | 2,351,280 | |||||||||
State of New York Dormitory Authority, RB, General Purpose, Series C, 5.00%, 3/15/41 | 1,000 | 1,133,220 | |||||||||
| 3,484,500 | |||||||||||
Transportation — 3.7% | |||||||||||
New York Liberty Development Corp., RB, 1 World Trade Center Port Authority Consolidated Bonds, 5.25%, 12/15/43 | 6,495 | 7,489,839 | |||||||||
Port Authority of New York & New Jersey, ARB, Consolidated, 169th Series, AMT, 5.00%, 10/15/26 | 1,500 | 1,705,920 | |||||||||
State of New York Thruway Authority, Refunding RB, Transportation, Personal Income Tax, Series A, 5.00%, 3/15/31 | 1,560 | 1,817,915 | |||||||||
| 11,013,674 | |||||||||||
Utilities — 3.9% | |||||||||||
City of New York New York Municipal Water Finance Authority, Refunding RB, Water & Sewer System: | |||||||||||
2nd General Resolution, Fiscal 2011, Series HH, 5.00%, 6/15/32 | 2,790 | 3,202,724 | |||||||||
2nd General Resolution, Fiscal 2012, Series BB, 5.00%, 6/15/44 | 3,751 | 4,213,964 | |||||||||
Series A, 4.75%, 6/15/30 | 4,000 | 4,339,360 | |||||||||
| 11,756,048 | |||||||||||
Total Municipal Bonds Transferred to Tender Option Bond Trusts — 11.7% | 34,867,346 | ||||||||||
Total Long-Term Investments (Cost — $278,538,764) — 101.2% | 302,321,212 | ||||||||||
Short-Term Securities | |||||||||||
BIF New York Municipal Money Fund, 0.00%, 12/31/49 (h)(i) | 11,232 | 11,231,764 | |||||||||
Total Short-Term Securities (Cost — $11,231,764) — 3.7% | 11,231,764 | ||||||||||
Total Investments (Cost — $289,770,528) — 104.9% | 313,552,976 | ||||||||||
Other Assets Less Liabilities — 1.4% | 3,970,129 | ||||||||||
Liability for TOB Trust Certificates, Including Interest Expense and Fees Payable — (6.3%) | (18,712,861 | ) | |||||||||
Net Assets — 100.0% | $ | 298,810,244 | |||||||||
| SEMI-ANNUAL REPORT | DECEMBER 31, 2014 | 39 |
| Schedule of Investments (continued) | BlackRock New York Municipal Bond Fund |
Notes to Schedule of Investments
| (a) | Variable rate security. Rate shown is as of report date. | |||
| (b) | Security exempt from registration pursuant to Rule 144A under the Securities Act of 1933, as amended. These securities may be resold in transactions exempt from registration to qualified institutional investors. | |||
| (c) | Zero-coupon bond. | |||
| (d) | Represents a step-up bond that pays an initial coupon rate for the first period and then a higher coupon rate for the following periods. Rate shown is as of report date. | |||
| (e) | U.S. government securities, held in escrow, are used to pay interest on this security, as well as to retire the bond in full at the date indicated, typically at a premium to par. | |||
| (f) | Represent bonds transferred to a TOB. In exchange for which the Fund received cash and residual interest certificates. These bonds serve as collateral in a financing transaction. See Note 3 of the Notes to Financial Statements for details of municipal bonds transferred to TOBs. | |||
| (g) | All or a portion of security is subject to a recourse agreement, which may require the Fund to pay the liquidity provider in the event there is a shortfall between the TOB trust certificates and proceeds received from the sale of the security contributed to the TOB trust. In the case of a shortfall, the aggregate maximum potential amount the Fund could ultimately be required to pay under the agreement, which expires on February 15, 2019, is $1,191,479. | |||
| (h) | Represents the current yield as of report date. | |||
| (i) | During the six months ended December 31, 2014, investments in issuers considered to be an affiliate of the Fund for purposes of Section 2(a)(3) of the Investment Company Act of 1940, as amended, were as follows: |
| Affiliate | Shares Held at June 30, 2014 | Net Activity | Shares Held at December 31, 2014 | Income | ||||||||||||||
BIF New York Municipal Money Fund | 2,338,409 | 8,893,355 | 11,231,764 | $1 | ||||||||||||||
| • | As of December 31, 2014, financial futures contracts outstanding were as follows: |
| Contracts Sold | Issue | Exchange | Expiration | Notional Value | Unrealized Appreciation | |||||||||||||||||
(294) | 10-Year U.S. Treasury Note | Chicago Board of Trade | March 2015 | $37,278,281 | $ | (38,774 | ) | |||||||||||||||
For Fund compliance purposes, the Fund’s sector classifications refer to any one or more of the sector sub-classifications used by one or more widely recognized market indexes or rating group indexes, and/or as defined by the investment advisor. These definitions may not apply for purposes of this report, which may combine such sector sub-classifications for reporting ease. | ||||
| • | Fair Value Measurements — Various inputs are used in determining the fair value of investments and derivative financial instruments. These inputs to valuation techniques are categorized into a disclosure hierarchy consisting of three broad levels for financial statement purposes. The hierarchy gives the highest priority to unadjusted quoted prices in active markets for identical assets or liabilities (Level 1 measurements) and the lowest priority to unobservable inputs (Level 3 measurements). Accordingly, the degree of judgment exercised in determining fair value is greatest for instruments categorized in Level 3. The inputs used to measure fair value may fall into different levels of the fair value hierarchy. In such cases, for disclosure purposes, the fair value hierarchy classification is determined based on the lowest level input that is significant to the fair value measurement in its entirety. The categorization of a value determined for investments and derivative financial instruments is based on the pricing transparency of the investment and derivative financial instruments and is not necessarily an indication of the risks associated with investing in those securities. The three levels of the fair value hierarchy are as follows: |
| • | Level 1 — unadjusted quoted prices in active markets/exchanges for identical assets or liabilities that the Fund has the ability to access | |||
| • | Level 2 — other observable inputs (including, but not limited to, quoted prices for similar assets or liabilities in markets that are active, quoted prices for identical or similar assets or liabilities in markets that are not active, inputs other than quoted prices that are observable for the assets or liabilities (such as interest rates, yield curves, volatilities, prepayment speeds, loss severities, credit risks and default rates) or other market-corroborated inputs) | |||
| • | Level 3 — unobservable inputs based on the best information available in the circumstances, to the extent observable inputs are not available (including the Fund’s own assumptions used in determining the fair value of investments and derivative financial instruments) |
Changes in valuation techniques may result in transfers into or out of an assigned level within the disclosure hierarchy. In accordance with the Fund’s policy, transfers between different levels of the fair value disclosure hierarchy are deemed to have occurred as of the beginning of the reporting period. For information about the Fund’s policy regarding valuation of investments and derivative financial instruments, refer to Note 2 of the Notes to Financial Statements. |
| 40 | SEMI-ANNUAL REPORT | DECEMBER 31, 2014 |
| Schedule of Investments (concluded) | BlackRock New York Municipal Bond Fund |
As of December 31, 2014, the following tables summarize the Fund’s investments and derivative financial instruments categorized in the disclosure hierarchy: |
| Level 1 | Level 2 | Level 3 | Total | |||||||||||||||
Assets: | ||||||||||||||||||
Investments: | ||||||||||||||||||
Long-Term Investments1 | — | $ | 302,321,212 | — | $ | 302,321,212 | ||||||||||||
Short-Term Securities | $ | 11,231,764 | — | — | 11,231,764 | |||||||||||||
Total | $ | 11,231,764 | $ | 302,321,212 | — | $ | 313,552,976 | |||||||||||
| 1 | See above Schedule of Investments for values in each sector. |
| Level 1 | Level 2 | Level 3 | Total | |||||||||||||||
Derivative Financial Instruments2 | ||||||||||||||||||
Liabilities: | ||||||||||||||||||
Other contracts | $ | (38,774 | ) | — | — | $ | (38,774 | ) | ||||||||||
| 2 | Derivative financial instruments are financial futures contracts, which are valued at the unrealized appreciation/depreciation on the instrument. |
The Fund may hold assets and/or liabilities in which the fair value approximates the carrying amount for financial statement purposes. As of December 31, 2014, such assets and/or liabilities are categorized within the disclosure hierarchy as follows: |
| Level 1 | Level 2 | Level 3 | Total | |||||||||||||||
Assets: | ||||||||||||||||||
Cash pledged for financial futures contracts | $ | 356,000 | — | — | $ | 356,000 | ||||||||||||
Liabilities: | ||||||||||||||||||
TOB trust certificates | — | $ | (18,710,577 | ) | — | (18,710,577 | ) | |||||||||||
Total | $ | 356,000 | $ | (18,710,577 | ) | — | $ | (18,354,577 | ) | |||||||||
During the six months ended December 31, 2014, there were no transfers between levels. |
| SEMI-ANNUAL REPORT | DECEMBER 31, 2014 | 41 |
| Statements of Assets and Liabilities |
| December 31, 2014 (Unaudited) | BlackRock High Yield Municipal Fund | BlackRock National Municipal Fund | BlackRock Short-Term Municipal Fund | BlackRock New York Municipal Bond Fund | |||||||||||||||
Assets | |||||||||||||||||||
Investments at value — unaffiliated1 | $ | 578,432,572 | $ | 5,070,040,970 | $ | 753,748,231 | $ | 302,321,212 | |||||||||||
Investments at value — affiliated2 | 42,944,517 | 56,677,286 | 6,613,443 | 11,231,764 | |||||||||||||||
Cash | 73,031 | 790,626 | — | — | |||||||||||||||
Cash pledged for financial futures contracts | 453,000 | 1,260,000 | — | 356,000 | |||||||||||||||
Interest receivable | 6,780,169 | 66,849,107 | 7,720,263 | 4,143,874 | |||||||||||||||
Capital shares sold receivable | 2,964,643 | 11,255,600 | 2,905,121 | 486,581 | |||||||||||||||
Investments sold receivable | 30,000 | 11,925,588 | — | 160,000 | |||||||||||||||
Prepaid expenses | 67,949 | 164,758 | 64,701 | 39,712 | |||||||||||||||
Total assets | 631,745,881 | 5,218,963,935 | 771,051,759 | 318,739,143 | |||||||||||||||
Liabilities | |||||||||||||||||||
Investments purchased payable | — | 20,069,758 | 1,271,020 | — | |||||||||||||||
Capital shares redeemed payable | 1,715,177 | 9,412,161 | 1,523,016 | 456,785 | |||||||||||||||
Income dividends payable | 915,446 | 5,818,183 | 134,686 | 471,546 | |||||||||||||||
Investment advisory fees payable | 263,219 | 1,761,474 | 216,237 | 132,666 | |||||||||||||||
Variation margin payable on financial futures contracts | 78,531 | 218,750 | — | 64,313 | |||||||||||||||
Service and distribution fees payable | 74,453 | 837,527 | 58,491 | 55,085 | |||||||||||||||
Officer’s and Directors’ fees payable | 6,557 | 21,844 | 8,909 | 6,419 | |||||||||||||||
Interest expense and fees payable | 6,388 | 49,517 | — | 2,284 | |||||||||||||||
Other affiliates payable | 1,255 | 22,046 | 4,740 | 1,176 | |||||||||||||||
Other accrued expenses payable | 49,418 | 624,745 | 120,396 | 28,048 | |||||||||||||||
Total accrued liabilities | 3,110,444 | 38,836,005 | 3,337,495 | 1,218,322 | |||||||||||||||
Other Liabilities | |||||||||||||||||||
TOB trust certificates | 28,807,610 | 280,119,931 | — | 18,710,577 | |||||||||||||||
Total liabilities | 31,918,054 | 318,955,936 | 3,337,495 | 19,928,899 | |||||||||||||||
Net Assets | $ | 599,827,827 | $ | 4,900,007,999 | $ | 767,714,264 | $ | 298,810,244 | |||||||||||
Net Assets Consist of | |||||||||||||||||||
Paid-in capital | $ | 583,585,926 | $ | 4,607,669,841 | $ | 768,508,262 | $ | 285,936,984 | |||||||||||
Undistributed net investment income | 604,964 | 1,051,320 | 491,010 | 494,699 | |||||||||||||||
Accumulated net realized loss | (21,068,318 | ) | (119,794,400 | ) | (2,472,648 | ) | (11,365,113 | ) | |||||||||||
Net unrealized appreciation/depreciation | 36,705,255 | 411,081,238 | 1,187,640 | 23,743,674 | |||||||||||||||
Net Assets | $ | 599,827,827 | $ | 4,900,007,999 | $ | 767,714,264 | $ | 298,810,244 | |||||||||||
1 Investments at cost — unaffiliated | $ | 541,662,306 | $ | 4,658,827,846 | $ | 737,560,591 | $ | 278,538,763 | |||||||||||
2 Investments at cost — affiliated | $ | 42,944,517 | $ | 56,677,286 | $ | 21,613,443 | $ | 11,231,764 | |||||||||||
| 42 | SEMI-ANNUAL REPORT | DECEMBER 31, 2014 |
| Statements of Assets and Liabilities (concluded) |
| December 31, 2014 (Unaudited) | BlackRock High Yield Municipal Fund | BlackRock National Municipal Fund | BlackRock Short-Term Municipal Fund | BlackRock New York Municipal Bond Fund | |||||||||||||||
Net Asset Value | |||||||||||||||||||
BlackRock | |||||||||||||||||||
Net assets | — | $ | 355,980,074 | $ | 8,821,098 | — | |||||||||||||
Shares outstanding, $0.10 par value | — | 32,364,266 | 871,204 | — | |||||||||||||||
Net asset value | — | $ | 11.00 | $ | 10.13 | — | |||||||||||||
Shares authorized | 375 Million | 150 Million | |||||||||||||||||
Institutional | |||||||||||||||||||
Net assets | $ | 393,803,070 | $ | 1,897,824,128 | $ | 582,895,314 | $ | 64,872,345 | |||||||||||
Shares outstanding, $0.10 par value | 41,714,052 | 172,561,377 | 57,554,521 | 5,847,200 | |||||||||||||||
Net asset value | $ | 9.44 | $ | 11.00 | $ | 10.13 | $ | 11.09 | |||||||||||
Shares authorized | 100 Million | 375 Million | 150 Million | Unlimited | |||||||||||||||
Service | |||||||||||||||||||
Net assets | — | $ | 1,003,826 | — | — | ||||||||||||||
Shares outstanding, $0.10 par value | — | 91,369 | — | — | |||||||||||||||
Net asset value | — | $ | 10.99 | — | — | ||||||||||||||
Shares authorized | 375 Million | ||||||||||||||||||
Investor A | |||||||||||||||||||
Net assets | $ | 154,372,644 | $ | 2,180,059,914 | $ | 102,054,584 | $ | 60,838,253 | |||||||||||
Shares outstanding, $0.10 par value | 16,390,280 | 198,106,059 | 10,071,124 | 5,479,123 | |||||||||||||||
Net asset value | $ | 9.42 | $ | 11.00 | $ | 10.13 | $ | 11.10 | |||||||||||
Shares authorized | 100 Million | 375 Million | 150 Million | Unlimited | |||||||||||||||
Investor A1 | |||||||||||||||||||
Net assets | — | — | $ | 35,407,390 | $ | 132,022,036 | |||||||||||||
Shares outstanding, $0.10 par value | — | — | 3,493,168 | 11,891,520 | |||||||||||||||
Net asset value | — | — | $ | 10.14 | $ | 11.10 | |||||||||||||
Shares authorized | 150 Million | Unlimited | |||||||||||||||||
Investor B | |||||||||||||||||||
Net assets | — | $ | 3,360,787 | — | — | ||||||||||||||
Shares outstanding, $0.10 par value | — | 305,704 | — | — | |||||||||||||||
Net asset value | — | $ | 10.99 | — | — | ||||||||||||||
Shares authorized | 375 Million | ||||||||||||||||||
Investor C | |||||||||||||||||||
Net assets | $ | 51,652,113 | $ | 393,071,661 | $ | 38,535,878 | $ | 32,647,362 | |||||||||||
Shares outstanding, $0.10 par value | 5,469,842 | 35,716,512 | 3,852,877 | 2,941,791 | |||||||||||||||
Net asset value | $ | 9.44 | $ | 11.01 | $ | 10.00 | $ | 11.10 | |||||||||||
Shares authorized | 100 Million | 375 Million | 150 Million | Unlimited | |||||||||||||||
Investor C1 | |||||||||||||||||||
Net assets | — | $ | 68,707,609 | — | $ | 8,430,248 | |||||||||||||
Shares outstanding, $0.10 par value | — | 6,245,818 | — | 759,435 | |||||||||||||||
Net asset value | — | $ | 11.00 | — | $ | 11.10 | |||||||||||||
Shares authorized | 375 Million | Unlimited | |||||||||||||||||
| SEMI-ANNUAL REPORT | DECEMBER 31, 2014 | 43 |
| Statements of Operations |
| Six Months Ended December 31, 2014 (Unaudited) | BlackRock High Yield Municipal Fund | BlackRock National Municipal Fund | BlackRock Short-Term Municipal Fund | BlackRock New York Municipal Bond Fund | |||||||||||||||
Investment Income | |||||||||||||||||||
Interest | $ | 12,909,361 | $ | 97,063,615 | $ | 3,257,360 | $ | 6,165,277 | |||||||||||
Income — affiliated | 7,019 | 13,643 | 1,191 | 1 | |||||||||||||||
Total income | 12,916,380 | 97,077,258 | 3,258,551 | 6,165,278 | |||||||||||||||
Expenses | |||||||||||||||||||
Investment advisory | 1,382,043 | 11,410,016 | 1,341,543 | 760,899 | |||||||||||||||
Service — Service | — | 1,328 | — | — | |||||||||||||||
Service — Investor A | 189,805 | 2,604,335 | 149,662 | 67,202 | |||||||||||||||
Service — Investor A1 | — | — | 18,348 | 66,705 | |||||||||||||||
Service and distribution — Investor B | — | 14,445 | — | — | |||||||||||||||
Service and distribution — Investor C | 240,929 | 1,970,263 | 188,383 | 150,719 | |||||||||||||||
Service and distribution — Investor C1 | — | 282,571 | — | 25,626 | |||||||||||||||
Transfer agent — BlackRock | — | 67,770 | 196 | — | |||||||||||||||
Transfer agent — Institutional | 37,154 | 911,324 | 343,953 | 9,506 | |||||||||||||||
Transfer agent — Service | — | 223 | — | — | |||||||||||||||
Transfer agent — Investor A | 30,557 | 994,762 | 29,956 | 13,067 | |||||||||||||||
Transfer agent — Investor A1 | — | — | 9,189 | 31,747 | |||||||||||||||
Transfer agent — Investor B | — | 2,435 | — | — | |||||||||||||||
Transfer agent — Investor C | 13,262 | 90,432 | 13,802 | 5,959 | |||||||||||||||
Transfer agent — Investor C1 | — | 18,523 | — | 1,661 | |||||||||||||||
Registration | 68,685 | 113,414 | 61,485 | 33,549 | |||||||||||||||
Accounting services | 48,300 | 358,156 | 89,792 | 28,612 | |||||||||||||||
Professional | 37,444 | 79,856 | 31,280 | 42,780 | |||||||||||||||
Custodian | 12,788 | 86,094 | 26,786 | 9,016 | |||||||||||||||
Officer and Directors | 11,040 | 36,800 | 13,616 | 9,844 | |||||||||||||||
Printing | 8,924 | 44,988 | 17,940 | 13,064 | |||||||||||||||
Miscellaneous | 23,214 | 54,285 | 21,959 | 19,277 | |||||||||||||||
Total expenses excluding interest expense and fees | 2,104,145 | 19,142,020 | 2,357,890 | 1,289,233 | |||||||||||||||
Interest expense and fees1 | 99,539 | 864,514 | — | 57,538 | |||||||||||||||
Total expenses | 2,203,684 | 20,006,534 | 2,357,890 | 1,346,771 | |||||||||||||||
Less fees waived by Manager | (2,013 | ) | (1,158,169 | ) | (370 | ) | (30,630 | ) | |||||||||||
Less transfer agent fees waived and/or reimbursed — class specific | — | (1,043,963 | ) | (336,406 | ) | (25,990 | ) | ||||||||||||
Less fees paid indirectly | — | (718 | ) | (14 | ) | — | |||||||||||||
Total expenses after fees waived and/or reimbursed and paid indirectly | 2,201,671 | 17,803,684 | 2,021,100 | 1,290,151 | |||||||||||||||
Net investment income | 10,714,709 | 79,273,574 | 1,237,451 | 4,875,127 | |||||||||||||||
Realized and Unrealized Gain (Loss) | |||||||||||||||||||
Net realized gain (loss) from: | |||||||||||||||||||
Investments | 447,057 | 8,847,033 | 693,987 | 271,531 | |||||||||||||||
Financial futures contracts | (521,121 | ) | (4,780,382 | ) | 143,520 | (509,256 | ) | ||||||||||||
| (74,064 | ) | 4,066,651 | 837,507 | (237,725 | ) | ||||||||||||||
Net change in unrealized appreciation/depreciation on: | |||||||||||||||||||
Investments | 18,198,180 | 48,191,811 | (3,202,642 | ) | 7,825,815 | ||||||||||||||
Financial futures contracts | (308,754 | ) | 589,252 | — | (1,866 | ) | |||||||||||||
| 17,889,426 | 48,781,063 | (3,202,642 | ) | 7,823,949 | |||||||||||||||
Net realized and unrealized gain (loss) | 17,815,362 | 52,847,714 | (2,365,135 | ) | 7,586,224 | ||||||||||||||
Net Increase in Net Assets Resulting from Operations | $ | 28,530,071 | $ | 132,121,288 | $ | (1,127,684 | ) | $ | 12,461,351 | ||||||||||
| 1 | Related to TOBs. |
| 44 | SEMI-ANNUAL REPORT | DECEMBER 31, 2014 |
| Statements of Changes in Net Assets | BlackRock High Yield Municipal Fund |
| Increase (Decrease) in Net Assets: | Six Months Ended December 31, 2014 (Unaudited) | Year Ended June 30, 2014 | |||||||||
Operations | |||||||||||
Net investment income | $ | 10,714,709 | $ | 16,137,149 | |||||||
Net realized loss | (74,064 | ) | (11,173,067 | ) | |||||||
Net change in unrealized appreciation/depreciation | 17,889,426 | 21,497,734 | |||||||||
Net increase in net assets resulting from operations | 28,530,071 | 26,461,816 | |||||||||
Distributions to Shareholders From1 | |||||||||||
Net investment income: | |||||||||||
Institutional | (6,832,245 | ) | (8,755,988 | ) | |||||||
Investor A | (3,099,210 | ) | (5,537,396 | ) | |||||||
Investor C | (797,407 | ) | (1,802,489 | ) | |||||||
Decrease in net assets resulting from distributions to shareholders | (10,728,862 | ) | (16,095,873 | ) | |||||||
Capital Share Transactions | |||||||||||
Net increase in net assets derived from capital share transactions | 126,002,252 | 91,901,895 | |||||||||
Net Assets | |||||||||||
Total increase in net assets | 143,803,461 | 102,267,838 | |||||||||
Beginning of period | 456,024,366 | 353,756,528 | |||||||||
End of period | $ | 599,827,827 | $ | 456,024,366 | |||||||
Undistributed net investment income, end of period | $ | 604,964 | $ | 619,117 | |||||||
| 1 | Distributions for annual periods determined in accordance with federal income tax regulations. |
| SEMI-ANNUAL REPORT | DECEMBER 31, 2014 | 45 |
| Statements of Changes in Net Assets | BlackRock National Municipal Fund |
| Increase (Decrease) in Net Assets: | Six Months Ended December 31, 2014 (Unaudited) | Year Ended June 30, 2014 | |||||||||
Operations | |||||||||||
Net investment income | $ | 79,273,574 | $ | 170,950,198 | |||||||
Net realized gain (loss) | 4,066,651 | (41,354,608 | ) | ||||||||
Net change in unrealized appreciation/depreciation | 48,781,063 | 166,560,917 | |||||||||
Net increase in net assets resulting from operations | 132,121,288 | 296,156,507 | |||||||||
Distributions to Shareholders From1 | |||||||||||
Net investment income: | |||||||||||
BlackRock | (6,465,084 | ) | (15,268,768 | ) | |||||||
Institutional | (32,463,920 | ) | (73,538,187 | ) | |||||||
Service | (17,351 | ) | (36,974 | ) | |||||||
Investor A | (34,313,279 | ) | (66,764,964 | ) | |||||||
Investor B | (53,972 | ) | (228,752 | ) | |||||||
Investor C | (5,016,874 | ) | (12,440,707 | ) | |||||||
Investor C1 | (966,773 | ) | (2,418,004 | ) | |||||||
Decrease in net assets resulting from distributions to shareholders | (79,297,253 | ) | (170,696,356 | ) | |||||||
Capital Share Transactions | |||||||||||
Net increase (decrease) in net assets derived from capital share transactions | 227,063,770 | (303,804,548 | ) | ||||||||
Net Assets | |||||||||||
Total increase (decrease) in net assets | 279,887,805 | (178,344,397 | ) | ||||||||
Beginning of period | 4,620,120,194 | 4,798,464,591 | |||||||||
End of period | $ | 4,900,007,999 | $ | 4,620,120,194 | |||||||
Undistributed net investment income, end of period | $ | 1,051,320 | $ | 1,074,999 | |||||||
| 1 | Distributions for annual periods determined in accordance with federal income tax regulations. |
| 46 | SEMI-ANNUAL REPORT | DECEMBER 31, 2014 |
| Statements of Changes in Net Assets | BlackRock Short-Term Municipal Fund |
| Increase (Decrease) in Net Assets: | Six Months Ended December 31, 2014 (Unaudited) | Year Ended June 30, 2014 | |||||||||
Operations | |||||||||||
Net investment income | $ | 1,237,451 | $ | 3,661,596 | |||||||
Net realized gain | 837,507 | 666,810 | |||||||||
Net change in unrealized appreciation/depreciation | (3,202,642 | ) | 2,495,173 | ||||||||
Net increase (decrease) in net assets resulting from operations | (1,127,684 | ) | 6,823,579 | ||||||||
Distributions to Shareholders From1 | |||||||||||
Net investment income: | |||||||||||
BlackRock | (16,465 | ) | (46,398 | ) | |||||||
Institutional | (1,124,761 | ) | (3,081,629 | ) | |||||||
Investor A | (49,644 | ) | (375,597 | ) | |||||||
Investor A1 | (45,801 | ) | (157,972 | ) | |||||||
Decrease in net assets resulting from distributions to shareholders | (1,236,671 | ) | (3,661,596 | ) | |||||||
Capital Share Transactions | |||||||||||
Net increase (decrease) in net assets derived from capital share transactions | (71,864,541 | ) | 32,237,349 | ||||||||
Net Assets | |||||||||||
Total increase (decrease) in net assets | (74,228,896 | ) | 35,399,332 | ||||||||
Beginning of period | 841,943,160 | 806,543,828 | |||||||||
End of period | $ | 767,714,264 | $ | 841,943,160 | |||||||
Undistributed net investment income, end of period | $ | 491,010 | $ | 490,230 | |||||||
| 1 | Distributions for annual periods determined in accordance with federal income tax regulations. |
| SEMI-ANNUAL REPORT | DECEMBER 31, 2014 | 47 |
| Statements of Changes in Net Assets | BlackRock New York Municipal Bond Fund |
| Increase (Decrease) in Net Assets: | Six Months Ended December 31, 2014 (Unaudited) | Year Ended June 30, 2014 | |||||||||||||
Operations | |||||||||||||||
Net investment income | $ | 4,875,127 | $ | 9,481,550 | |||||||||||
Net realized loss | (237,725 | ) | (6,539,042 | ) | |||||||||||
Net change in unrealized appreciation/depreciation | 7,823,949 | 13,373,706 | |||||||||||||
Net increase in net assets resulting from operations | 12,461,351 | 16,316,214 | |||||||||||||
Distributions to Shareholders From1 | |||||||||||||||
Net investment income: | |||||||||||||||
Institutional | (950,797 | ) | (1,340,266 | ) | |||||||||||
Investor A | (945,899 | ) | (1,717,229 | ) | |||||||||||
Investor A1 | (2,420,373 | ) | (5,344,715 | ) | |||||||||||
Investor C | (417,720 | ) | (771,138 | ) | |||||||||||
Investor C1 | (134,079 | ) | (322,487 | ) | |||||||||||
Decrease in net assets resulting from distributions to shareholders | (4,868,868 | ) | (9,495,835 | ) | |||||||||||
Capital Share Transactions | |||||||||||||||
Net increase (decrease) in net assets derived from capital share transactions | 41,750,907 | (19,191,360 | ) | ||||||||||||
Net Assets | |||||||||||||||
Total increase (decrease) in net assets | 49,343,390 | (12,370,981 | ) | ||||||||||||
Beginning of period | 249,466,854 | 261,837,835 | |||||||||||||
End of period | $ | 298,810,244 | $ | 249,466,854 | |||||||||||
Undistributed net investment income, end of period | $ | 494,699 | $ | 488,440 | |||||||||||
| 1 | Distributions for annual periods determined in accordance with federal income tax regulations. |
| 48 | SEMI-ANNUAL REPORT | DECEMBER 31, 2014 |
| Financial Highlights | BlackRock High Yield Municipal Fund |
| Institutional | | ||||||||||||||||||||||||||
| Six Months Ended December 31, 2014 (Unaudited) | Year Ended June 30, | | |||||||||||||||||||||||||
| 2014 | 2013 | 2012 | 2011 | 2010 | |||||||||||||||||||||||
Per Share Operating Performance | |||||||||||||||||||||||||||
Net asset value, beginning of period | $ | 9.12 | $ | 8.86 | $ | 9.26 | $ | 8.35 | $ | 8.47 | $ | 7.29 | |||||||||||||||
Net investment income1 | 0.20 | 0.44 | 0.44 | 0.46 | 0.46 | 0.46 | |||||||||||||||||||||
Net realized and unrealized gain (loss) | 0.32 | 0.26 | (0.40 | ) | 0.90 | (0.13 | ) | 1.18 | |||||||||||||||||||
Net increase from investment operations | 0.52 | 0.70 | 0.04 | 1.36 | 0.33 | 1.64 | |||||||||||||||||||||
Distributions from net investment income2 | (0.20 | ) | (0.44 | ) | (0.44 | ) | (0.45 | ) | (0.45 | ) | (0.46 | ) | |||||||||||||||
Net asset value, end of period | $ | 9.44 | $ | 9.12 | $ | 8.86 | $ | 9.26 | $ | 8.35 | $ | 8.47 | |||||||||||||||
Total Return3 | |||||||||||||||||||||||||||
Based on net asset value | 5.78% | 4 | 8.31% | 0.17% | 16.72% | 4.14% | 22.88% | ||||||||||||||||||||
Ratios to Average Net Assets | |||||||||||||||||||||||||||
Total expenses | 0.68% | 5,6 | 0.76% | 0.76% | 0.79% | 0.78% | 0.83% | ||||||||||||||||||||
Total expenses after fees waived | 0.68% | 5,6 | 0.76% | 0.76% | 0.79% | 0.78% | 0.83% | ||||||||||||||||||||
Total expenses after fees waived and excluding interest expense and fees7 | 0.64% | 5,6 | 0.69% | 0.66% | 0.70% | 0.72% | 0.79% | ||||||||||||||||||||
Net investment income | 4.32% | 5 | 5.02% | 4.63% | 0.46% | 0.46% | 0.46% | ||||||||||||||||||||
Supplemental Data | |||||||||||||||||||||||||||
Net assets, end of period (000) | $ | 393,803 | $ | 242,949 | $ | 198,416 | $ | 176,895 | $ | 111,669 | $ 94,146 | ||||||||||||||||
Portfolio turnover rate | 5% | 40% | 21% | 17% | 31% | 32% | |||||||||||||||||||||
| 1 | Based on average shares outstanding. |
| 2 | Distributions for annual periods determined in accordance with federal income tax regulations. |
| 3 | Where applicable, assumes the reinvestment of distributions. |
| 4 | Aggregate total return. |
| 5 | Annualized. |
| 6 | Ratios do not include expense incurred indirectly as a result of investments in underlying funds of approximately 0.01%. |
| 7 | Interest expense and fees relate to TOBs. See Note 3 of the Notes to Financial Statements for details of municipal bonds transferred to TOBs. |
| SEMI-ANNUAL REPORT | DECEMBER 31, 2014 | 49 |
| Financial Highlights (continued) | BlackRock High Yield Municipal Fund |
| Investor A | | ||||||||||||||||||||||||||
| Six Months Ended December 31, 2014 (Unaudited) | Year Ended June 30, | | |||||||||||||||||||||||||
| 2014 | 2013 | 2012 | 2011 | 2010 | |||||||||||||||||||||||
Per Share Operating Performance | |||||||||||||||||||||||||||
Net asset value, beginning of period | $ | 9.10 | $ | 8.84 | $ | 9.24 | $ | 8.33 | $ | 8.46 | $ | 7.28 | |||||||||||||||
Net investment income1 | 0.19 | 0.41 | 0.42 | 0.43 | 0.43 | 0.43 | |||||||||||||||||||||
Net realized and unrealized gain (loss) | 0.32 | 0.26 | (0.41 | ) | 0.91 | (0.13 | ) | 1.18 | |||||||||||||||||||
Net increase from investment operations | 0.51 | 0.67 | 0.01 | 1.34 | 0.30 | 1.61 | |||||||||||||||||||||
Distributions from net investment income2 | (0.19 | ) | (0.41 | ) | (0.41 | ) | (0.43 | ) | (0.43 | ) | (0.43 | ) | |||||||||||||||
Net asset value, end of period | $ | 9.42 | $ | 9.10 | $ | 8.84 | $ | 9.24 | $ | 8.33 | $ | 8.46 | |||||||||||||||
Total Return3 | |||||||||||||||||||||||||||
Based on net asset value | 5.65% | 4 | 8.05% | (0.09)% | 16.44% | 3.73% | 22.58% | ||||||||||||||||||||
Ratios to Average Net Assets | |||||||||||||||||||||||||||
Total expenses | 0.95% | 5,6 | 1.01% | 1.01% | 1.06% | 1.05% | 1.09% | ||||||||||||||||||||
Total expenses after fees waived | 0.95% | 5,6 | 1.01% | 1.01% | 1.06% | 1.05% | 1.09% | ||||||||||||||||||||
Total expenses after fees waived excluding interest expense and fees7 | 0.91% | 5,6 | 0.94% | 0.91% | 0.97% | 0.99% | 1.05% | ||||||||||||||||||||
Net investment income | 4.07% | 5 | 4.80% | 4.38% | 4.85% | 5.21% | 5.33% | ||||||||||||||||||||
Supplemental Data | |||||||||||||||||||||||||||
Net assets, end of period (000) | $ | 154,373 | $ | 161,218 | $ | 104,693 | $ | 83,840 | $ | 27,993 | $ | 25,105 | |||||||||||||||
Portfolio turnover rate | 5% | 40% | 21% | 17% | 31% | 32% | |||||||||||||||||||||
| 1 | Based on average shares outstanding. |
| 2 | Distributions for annual periods determined in accordance with federal income tax regulations. |
| 3 | Where applicable, excludes the effects of any sales charges and assumes the reinvestment of distributions. |
| 4 | Aggregate total return. |
| 5 | Annualized. |
| 6 | Ratios do not include expense incurred indirectly as a result of investments in underlying funds of approximately 0.01%. |
| 7 | Interest expense and fees relate to TOBs. See Note 3 of the Notes to Financial Statements for details of municipal bonds transferred to TOBs. |
| 50 | SEMI-ANNUAL REPORT | DECEMBER 31, 2014 |
| Financial Highlights (concluded) | BlackRock High Yield Municipal Fund |
| Investor C | | ||||||||||||||||||||||||||
| Six Months Ended December 31, 2014 (Unaudited) | Year Ended June 30, | | |||||||||||||||||||||||||
| 2014 | 2013 | 2012 | 2011 | 2010 | |||||||||||||||||||||||
Per Share Operating Performance | |||||||||||||||||||||||||||
Net asset value, beginning of period | $ | 9.12 | $ | 8.87 | $ | 9.27 | $ | 8.35 | $ | 8.47 | $ | 7.29 | |||||||||||||||
Net investment income1 | 0.15 | 0.35 | 0.34 | 0.36 | 0.37 | 0.37 | |||||||||||||||||||||
Net realized and unrealized gain (loss) | 0.32 | 0.25 | (0.40 | ) | 0.92 | (0.12 | ) | 1.18 | |||||||||||||||||||
Net increase (decrease) from investment operations | 0.47 | 0.60 | (0.06 | ) | 1.28 | 0.25 | 1.55 | ||||||||||||||||||||
Distributions from net investment income2 | (0.15 | ) | (0.35 | ) | (0.34 | ) | (0.36 | ) | (0.37 | ) | (0.37 | ) | |||||||||||||||
Net asset value, end of period | $ | 9.44 | $ | 9.12 | $ | 8.87 | $ | 9.27 | $ | 8.35 | $ | 8.47 | |||||||||||||||
Total Return3 | |||||||||||||||||||||||||||
Based on net asset value | 5.24% | 4 | 7.11% | (0.84)% | 15.65% | 3.07% | 21.61% | ||||||||||||||||||||
Ratios to Average Net Assets | |||||||||||||||||||||||||||
Total expenses | 1.71% | 5,6 | 1.78% | 1.78% | 1.82% | 1.82% | 1.88% | ||||||||||||||||||||
Total expenses after fees waived | 1.71% | 5,6 | 1.78% | 1.78% | 1.82% | 1.82% | 1.88% | ||||||||||||||||||||
Total expenses after fees waived and excluding interest expense and fees7 | 1.67% | 5,6 | 1.70% | 1.68% | 1.73% | 1.77% | 1.84% | ||||||||||||||||||||
Net investment income | 3.31% | 5 | 4.08% | 3.62% | 0.36% | 0.37% | 0.37% | ||||||||||||||||||||
Supplemental Data | |||||||||||||||||||||||||||
Net assets, end of period (000) | $ | 51,652 | $ | 51,858 | $ | 50,647 | $ | 36,987 | $ | 17,945 | $ | 14,560 | |||||||||||||||
Portfolio turnover rate | 5% | 40% | 21% | 17% | 31% | 32% | |||||||||||||||||||||
| 1 | Based on average shares outstanding. |
| 2 | Distributions for annual periods determined in accordance with federal income tax regulations. |
| 3 | Where applicable, excludes the effects of any sales charges and assumes the reinvestment of distributions. |
| 4 | Aggregate total return. |
| 5 | Annualized. |
| 6 | Ratios do not include expense incurred indirectly as a result of investments in underlying funds of approximately 0.01%. |
| 7 | Interest expense and fees relate to TOBs. See Note 3 of the Notes to Financial Statements for details of municipal bonds transferred to TOBs. |
| SEMI-ANNUAL REPORT | DECEMBER 31, 2014 | 51 |
| Financial Highlights | BlackRock National Municipal Fund |
| BlackRock | | ||||||||||||||||||
| Six Months Ended December 31, 2014 (Unaudited) | Year Ended June 30, | Period July 18, 20111 to June 30, 2012 | |||||||||||||||||
| 2014 | 2013 | ||||||||||||||||||
Per Share Operating Performance | |||||||||||||||||||
Net asset value, beginning of period | $ | 10.88 | $ | 10.56 | $ | 10.91 | $ | 10.11 | |||||||||||
Net investment income2 | 0.20 | 0.43 | 0.41 | 0.45 | |||||||||||||||
Net realized and unrealized gain (loss) | 0.12 | 0.32 | (0.34 | ) | 0.79 | ||||||||||||||
Net increase from investment operations | 0.32 | 0.75 | 0.07 | 1.24 | |||||||||||||||
Distributions from net investment income3 | (0.20 | ) | (0.43 | ) | (0.42 | ) | (0.44 | ) | |||||||||||
Net asset value, end of period | $ | 11.00 | $ | 10.88 | $ | 10.56 | $ | 10.91 | |||||||||||
Total Return4 | |||||||||||||||||||
Based on net asset value | 2.93% | 5 | 7.30% | 0.47% | 12.48% | 5 | |||||||||||||
Ratio to Average Net Assets | |||||||||||||||||||
Total expenses | 0.58% | 6 | 0.61% | 0.61% | 0.62% | 6 | |||||||||||||
Total expenses after fees waived and/or reimbursed and paid indirectly | 0.50% | 6 | 0.52% | 0.52% | 0.54% | 6 | |||||||||||||
Total expenses after fees waived and/or reimbursed and paid indirectly and excluding interest expense and fees and reorganization costs7 | 0.46% | 6 | 0.46% | 0.46% | 0.46% | 6 | |||||||||||||
Net investment income | 3.59% | 6 | 4.09% | 3.69% | 4.41% | 6 | |||||||||||||
Supplemental Data | |||||||||||||||||||
Net assets, end of period (000) | $ | 355,980 | $ | 366,179 | $ | 401,538 | $ | 446,620 | |||||||||||
Portfolio turnover rate | 13% | 35% | 37% | 39% | |||||||||||||||
| 1 | Commencement of operations. |
| 2 | Based on average shares outstanding. |
| 3 | Distributions for annual periods determined in accordance with federal income tax regulations. |
| 4 | Where applicable, assumes the reinvestment of distributions. |
| 5 | Aggregate total return. |
| 6 | Annualized. |
| 7 | Interest expense and fees relate to TOBs. See Note 3 of the Notes to Financial Statements for details of municipal bonds transferred to TOBs. |
| 52 | SEMI-ANNUAL REPORT | DECEMBER 31, 2014 |
| Financial Highlights (continued) | BlackRock National Municipal Fund |
| Institutional | | ||||||||||||||||||||||||||
| Six Months Ended December 31, 2014 (Unaudited) | Year Ended June 30, | | |||||||||||||||||||||||||
| 2014 | 2013 | 2012 | 2011 | 2010 | |||||||||||||||||||||||
Per Share Operating Performance | |||||||||||||||||||||||||||
Net asset value, beginning of period | $ | 10.88 | $ | 10.56 | $ | 10.91 | $ | 10.05 | $ | 10.19 | $ | 9.61 | |||||||||||||||
Net investment income1 | 0.19 | 0.42 | 0.40 | 0.46 | 0.49 | 0.48 | |||||||||||||||||||||
Net realized and unrealized gain (loss) | 0.12 | 0.32 | (0.35 | ) | 0.85 | (0.14 | ) | 0.57 | |||||||||||||||||||
Net increase from investment operations | 0.31 | 0.74 | 0.05 | 1.31 | 0.35 | 1.05 | |||||||||||||||||||||
Distributions from net investment income2 | (0.19 | ) | (0.42 | ) | (0.40 | ) | (0.45 | ) | (0.49 | ) | (0.47 | ) | |||||||||||||||
Net asset value, end of period | $ | 11.00 | $ | 10.88 | $ | 10.56 | $ | 10.91 | $ | 10.05 | $ | 10.19 | |||||||||||||||
Total Return3 | |||||||||||||||||||||||||||
Based on net asset value | 2.88% | 4 | 7.19% | 0.37% | 13.28% | 3.49% | 11.16% | ||||||||||||||||||||
Ratios to Average Net Assets | |||||||||||||||||||||||||||
Total expenses | 0.64% | 5 | 0.68% | 0.68% | 0.69% | 0.69% | 0.62% | ||||||||||||||||||||
Total expenses after fees waived and/or reimbursed and paid indirectly | 0.59% | 5 | 0.63% | 0.62% | 0.65% | 0.69% | 0.62% | ||||||||||||||||||||
Total expenses after fees waived and/or reimbursed and paid indirectly and excluding interest expense and fees and reorganization costs6 | 0.56% | 5 | 0.57% | 0.56% | 0.57% | 0.60% | 0.59% | ||||||||||||||||||||
Net investment income | 3.46% | 5 | 3.98% | 3.59% | 4.31% | 4.83% | 4.76% | ||||||||||||||||||||
Supplemental Data | |||||||||||||||||||||||||||
Net assets, end of period (000) | $ | 1,897,824 | $ | 1,796,660 | $ | 2,029,739 | $ | 2,037,090 | $ | 1,207,501 | $ | 1,103,381 | |||||||||||||||
Portfolio turnover rate | 13% | 35% | 37% | 39% | 51% | 70% | |||||||||||||||||||||
| 1 | Based on average shares outstanding. |
| 2 | Distributions for annual periods determined in accordance with federal income tax regulations. |
| 3 | Where applicable, assumes the reinvestment of distributions. |
| 4 | Aggregate total return. |
| 5 | Annualized. |
| 6 | Interest expense and fees relate to TOBs. See Note 3 of the Notes to Financial Statements for details of municipal bonds transferred to TOBs. |
| SEMI-ANNUAL REPORT | DECEMBER 31, 2014 | 53 |
| Financial Highlights (continued) | BlackRock National Municipal Fund |
| Service | | ||||||||||||||||||
| Six Months Ended December 31, 2014 (Unaudited) | Year Ended June 30, | Period July 18, 20111 to June 30, 2012 | |||||||||||||||||
| 2014 | 2013 | ||||||||||||||||||
Per Share Operating Performance | |||||||||||||||||||
Net asset value, beginning of period | $ | 10.86 | $ | 10.55 | $ | 10.90 | $ | 10.11 | |||||||||||
Net investment income2 | 0.18 | 0.43 | 0.38 | 0.42 | |||||||||||||||
Net realized and unrealized gain (loss) | 0.13 | 0.27 | (0.37 | ) | 0.77 | ||||||||||||||
Net increase from investment operations | 0.31 | 0.70 | 0.01 | 1.19 | |||||||||||||||
Distributions from net investment income3 | (0.18 | ) | (0.39 | ) | (0.36 | ) | (0.40 | ) | |||||||||||
Net asset value, end of period | $ | 10.99 | $ | 10.86 | $ | 10.55 | $ | 10.90 | |||||||||||
Total Return4 | |||||||||||||||||||
Based on net asset value | 2.87% | 5 | 6.85% | (0.05)% | 11.97% | 5 | |||||||||||||
Ratios to Average Net Assets | |||||||||||||||||||
Total expenses | 0.84% | 6 | 0.90% | 1.09% | 0.91% | 6 | |||||||||||||
Total expenses after fees waived and/or reimbursed and paid indirectly | 0.79% | 6 | 0.85% | 1.04% | 0.86% | 6 | |||||||||||||
Total expenses after fees waived and/or reimbursed and paid indirectly and excluding interest expense and fees and reorganization costs7 | 0.75% | 6 | 0.79% | 0.97% | 0.78% | 6 | |||||||||||||
Net investment income | 3.30% | 6 | 4.04% | 3.42% | 4.11% | 6 | |||||||||||||
Supplemental Data | |||||||||||||||||||
Net assets, end of period (000) | $ | 1,004 | $ | 1,089 | $ | 1,171 | $ | 1,214 | |||||||||||
Portfolio turnover rate | 13% | 35% | 37% | 39% | |||||||||||||||
| 1 | Commencement of operations. |
| 2 | Based on average shares outstanding. |
| 3 | Distributions for annual periods determined in accordance with federal income tax regulations. |
| 4 | Where applicable, assumes the reinvestment of distributions. |
| 5 | Aggregate total return. |
| 6 | Annualized. |
| 7 | Interest expense and fees relate to TOBs. See Note 1 of the Notes to Financial Statements for details of municipal bonds transferred to TOBs. |
| 54 | SEMI-ANNUAL REPORT | DECEMBER 31, 2014 |
| Financial Highlights (continued) | BlackRock National Municipal Fund |
| Investor A | | ||||||||||||||||||||||||||
| Six Months Ended December 31, 2014 (Unaudited) | Year Ended June 30, | | |||||||||||||||||||||||||
| 2014 | 2013 | 2012 | 2011 | 2010 | |||||||||||||||||||||||
Per Share Operating Performance | |||||||||||||||||||||||||||
Net asset value, beginning of period | $ | 10.88 | $ | 10.57 | $ | 10.92 | $ | 10.06 | $ | 10.19 | $ | 9.62 | |||||||||||||||
Net investment income1 | 0.18 | 0.40 | 0.38 | 0.44 | 0.46 | 0.45 | |||||||||||||||||||||
Net realized and unrealized gain (loss) | 0.12 | 0.31 | (0.34 | ) | 0.85 | (0.13 | ) | 0.57 | |||||||||||||||||||
Net increase from investment operations | 0.30 | 0.71 | 0.04 | 1.29 | 0.33 | 1.02 | |||||||||||||||||||||
Distributions from net investment income2 | (0.18 | ) | (0.40 | ) | (0.39 | ) | (0.43 | ) | (0.46 | ) | (0.45 | ) | |||||||||||||||
Net asset value, end of period | $ | 11.00 | $ | 10.88 | $ | 10.57 | $ | 10.92 | $ | 10.06 | $ | 10.19 | |||||||||||||||
Total Return3 | |||||||||||||||||||||||||||
Based on net asset value | 2.79% | 4 | 6.93% | 0.21% | 13.10% | 3.36% | 10.77% | ||||||||||||||||||||
Ratios to Average Net Assets | |||||||||||||||||||||||||||
Total expenses | 0.89% | 5 | 0.90% | 0.92% | 0.91% | 0.92% | 0.87% | ||||||||||||||||||||
Total expenses after fees waived and/or reimbursed and paid indirectly | 0.76% | 5 | 0.78% | 0.78% | 0.80% | 0.92% | 0.87% | ||||||||||||||||||||
Total expenses after fees waived and/or reimbursed and paid indirectly and excluding interest expense and fees and reorganization costs6 | 0.72% | 5 | 0.72% | 0.72% | 0.72% | 0.83% | 0.84% | ||||||||||||||||||||
Net investment income | 3.29% | 5 | 3.81% | 3.42% | 4.15% | 4.60% | 4.52% | ||||||||||||||||||||
Supplemental Data | |||||||||||||||||||||||||||
Net assets, end of period (000) | $ | 2,180,060 | $ | 1,990,729 | $ | 1,791,782 | $ | 1,688,258 | $ | 855,849 | $ | 820,009 | |||||||||||||||
Portfolio turnover rate | 13% | 35% | 37% | 39% | 51% | 70% | |||||||||||||||||||||
| 1 | Based on average shares outstanding. |
| 2 | Distributions for annual periods determined in accordance with federal income tax regulations. |
| 3 | Where applicable, excludes the effects of any sales charges and assumes the reinvestment of distributions. |
| 4 | Aggregate total return. |
| 5 | Annualized. |
| 6 | Interest expense and fees relate to TOBs. See Note 3 of the Notes to Financial Statements for details of municipal bonds transferred to TOBs. |
| SEMI-ANNUAL REPORT | DECEMBER 31, 2014 | 55 |
| Financial Highlights (continued) | BlackRock National Municipal Fund |
| Investor B | | ||||||||||||||||||||||||||
| Six Months Ended December 31, 2014 (Unaudited) | Year Ended June 30, | | |||||||||||||||||||||||||
| 2014 | 2013 | 2012 | 2011 | 2010 | |||||||||||||||||||||||
Per Share Operating Performance | |||||||||||||||||||||||||||
Net asset value, beginning of period | $ | 10.87 | $ | 10.56 | $ | 10.91 | $ | 10.05 | $ | 10.18 | $ | 9.61 | |||||||||||||||
Net investment income1 | 0.16 | 0.36 | 0.33 | 0.39 | 0.41 | 0.40 | |||||||||||||||||||||
Net realized and unrealized gain (loss) | 0.11 | 0.30 | (0.35 | ) | 0.85 | (0.12 | ) | 0.57 | |||||||||||||||||||
Net increase (decrease) from investment operations | 0.27 | 0.66 | (0.02 | ) | 1.24 | 0.29 | 0.97 | ||||||||||||||||||||
Distributions from net investment income2 | (0.15 | ) | (0.35 | ) | (0.33 | ) | (0.38 | ) | (0.42 | ) | (0.40 | ) | |||||||||||||||
Net asset value, end of period | $ | 10.99 | $ | 10.87 | $ | 10.56 | $ | 10.91 | $ | 10.05 | $ | 10.18 | |||||||||||||||
Total Return3 | |||||||||||||||||||||||||||
Based on net asset value | 2.53% | 4 | 6.41% | (0.30)% | 12.56% | 2.89% | 10.21% | ||||||||||||||||||||
Ratios to Average Net Assets | |||||||||||||||||||||||||||
Total expenses | 1.42% | 5 | 1.40% | 1.41% | 1.44% | 1.44% | 1.39% | ||||||||||||||||||||
Total expenses after fees waived and/or reimbursed and paid indirectly | 1.27% | 5 | 1.28% | 1.29% | 1.30% | 1.38% | 1.38% | ||||||||||||||||||||
Total expenses after fees waived and/or reimbursed and paid indirectly and excluding interest expense and fees and reorganization costs6 | 1.23% | 5 | 1.22% | 1.23% | 1.22% | 1.30% | 1.36% | ||||||||||||||||||||
Net investment income | 2.82% | 5 | 3.38% | 2.96% | 3.69% | 4.10% | 3.99% | ||||||||||||||||||||
Supplemental Data | |||||||||||||||||||||||||||
Net assets, end of period (000) | $ | 3,361 | $ | 4,705 | $ | 10,260 | $ | 27,169 | $ | 30,346 | $ | 46,152 | |||||||||||||||
Portfolio turnover rate | 13% | 35% | 37% | 39% | 51% | 70% | |||||||||||||||||||||
| 1 | Based on average shares outstanding. |
| 2 | Distributions for annual periods determined in accordance with federal income tax regulations. |
| 3 | Where applicable, excludes the effects of any sales charges and assumes the reinvestment of distributions. |
| 4 | Aggregate total return. |
| 5 | Annualized. |
| 6 | Interest expense and fees relate to TOBs. See Note 3 of the Notes to Financial Statements for details of municipal bonds transferred to TOBs. |
| 56 | SEMI-ANNUAL REPORT | DECEMBER 31, 2014 |
| Financial Highlights (continued) | BlackRock National Municipal Fund |
| Investor C | | ||||||||||||||||||||||||||
| Six Months Ended December 31, 2014 (Unaudited) | Year Ended June 30, | | |||||||||||||||||||||||||
| 2014 | 2013 | 2012 | 2011 | 2010 | |||||||||||||||||||||||
Per Share Operating Performance | |||||||||||||||||||||||||||
Net asset value, beginning of period | $ | 10.88 | $ | 10.57 | $ | 10.92 | $ | 10.06 | $ | 10.19 | $ | 9.62 | |||||||||||||||
Net investment income1 | 0.14 | 0.32 | 0.30 | 0.36 | 0.39 | 0.38 | |||||||||||||||||||||
Net realized and unrealized gain (loss) | 0.13 | 0.31 | (0.35 | ) | 0.86 | (0.13 | ) | 0.57 | |||||||||||||||||||
Net increase (decrease) from investment operations | 0.27 | 0.63 | (0.05 | ) | 1.22 | 0.26 | 0.95 | ||||||||||||||||||||
Distributions from net investment income2 | (0.14 | ) | (0.32 | ) | (0.30 | ) | (0.36 | ) | (0.39 | ) | (0.38 | ) | |||||||||||||||
Net asset value, end of period | $ | 11.01 | $ | 10.88 | $ | 10.57 | $ | 10.92 | $ | 10.06 | $ | 10.19 | |||||||||||||||
Total Return3 | |||||||||||||||||||||||||||
Based on net asset value | 2.50% | 4 | 6.13% | (0.53)% | 12.26% | 2.60% | 9.95% | ||||||||||||||||||||
Ratios to Average Net Assets | |||||||||||||||||||||||||||
Total expenses | 1.59% | 5 | 1.62% | 1.62% | 1.64% | 1.66% | 1.61% | ||||||||||||||||||||
Total expenses after fees waived and/or reimbursed and paid indirectly | 1.51% | 5 | 1.53% | 1.53% | 1.55% | 1.66% | 1.61% | ||||||||||||||||||||
Total expenses after fees waived and/or reimbursed and paid indirectly and excluding interest expense and fees and reorganization costs6 | 1.47% | 5 | 1.47% | 1.47% | 1.47% | 1.58% | 1.58% | ||||||||||||||||||||
Net investment income | 2.55% | 5 | 3.08% | 2.67% | 3.40% | 3.85% | 3.77% | ||||||||||||||||||||
Supplemental Data | |||||||||||||||||||||||||||
Net assets, end of period (000) | $ | 393,072 | $ | 389,612 | $ | 480,207 | $ | 483,092 | $ | 281,024 | $ | 292,132 | |||||||||||||||
Portfolio turnover rate | 13% | 35% | 37% | 39% | 51% | 70% | |||||||||||||||||||||
| 1 | Based on average shares outstanding. |
| 2 | Distributions for annual periods determined in accordance with federal income tax regulations. |
| 3 | Where applicable, excludes the effects of any sales charges and assumes the reinvestment of distributions. |
| 4 | Aggregate total return. |
| 5 | Annualized. |
| 6 | Interest expense and fees relate to TOBs. See Note 3 of the Notes to Financial Statements for details of municipal bonds transferred to TOBs. |
| SEMI-ANNUAL REPORT | DECEMBER 31, 2014 | 57 |
| Financial Highlights (concluded) | BlackRock National Municipal Fund |
| Investor C1 | | ||||||||||||||||||||||||||
| Six Months Ended December 31, 2014 (Unaudited) | Year Ended June 30, | | |||||||||||||||||||||||||
| 2014 | 2013 | 2012 | 2011 | 2010 | |||||||||||||||||||||||
Per Share Operating Performance | |||||||||||||||||||||||||||
Net asset value, beginning of period | $ | 10.88 | $ | 10.56 | $ | 10.91 | $ | 10.06 | $ | 10.19 | $ | 9.61 | |||||||||||||||
Net investment income1 | 0.15 | 0.34 | 0.32 | 0.38 | 0.41 | 0.40 | |||||||||||||||||||||
Net realized and unrealized gain (loss) | 0.12 | 0.32 | (0.35 | ) | 0.85 | (0.13 | ) | 0.57 | |||||||||||||||||||
Net increase (decrease) from investment operations | 0.27 | 0.66 | (0.03 | ) | 1.23 | 0.28 | 0.97 | ||||||||||||||||||||
Distributions from net investment income2 | (0.15 | ) | (0.34 | ) | (0.32 | ) | (0.38 | ) | (0.41 | ) | (0.39 | ) | |||||||||||||||
Net asset value, end of period | $ | 11.00 | $ | 10.88 | $ | 10.56 | $ | 10.91 | $ | 10.06 | $ | 10.19 | |||||||||||||||
Total Return3 | |||||||||||||||||||||||||||
Based on net asset value | 2.50% | 4 | 6.43% | (0.35)% | 12.37% | 2.80% | 10.28% | ||||||||||||||||||||
Ratios to Average Net Assets | |||||||||||||||||||||||||||
Total expenses | 1.40% | 5 | 1.42% | 1.42% | 1.44% | 1.47% | 1.42% | ||||||||||||||||||||
Total expenses after fees waived and/or reimbursed and paid indirectly | 1.32% | 5 | 1.34% | 1.34% | 1.36% | 1.46% | 1.42% | ||||||||||||||||||||
Total expenses after fees waived and/or reimbursed and paid indirectly and excluding interest expense and fees and reorganization costs6 | 1.28% | 5 | 1.28% | 1.28% | 1.28% | 1.38% | 1.39% | ||||||||||||||||||||
Net investment income | 2.77% | 5 | 3.27% | 2.88% | 3.60% | 4.04% | 3.96% | ||||||||||||||||||||
Supplemental Data | |||||||||||||||||||||||||||
Net assets, end of period (000) | $ | 68,708 | $ | 71,147 | $ | 83,766 | $ | 100,161 | $ | 73,302 | $ | 88,427 | |||||||||||||||
Portfolio turnover rate | 13% | 35% | 37% | 39% | 51% | 70% | |||||||||||||||||||||
| 1 | Based on average shares outstanding. |
| 2 | Distributions for annual periods determined in accordance with federal income tax regulations. |
| 3 | Where applicable, excludes the effects of any sales charges and assumes the reinvestment of distributions. |
| 4 | Aggregate total return. |
| 5 | Annualized. |
| 6 | Interest expense and fees relate to TOBs. See Note 3 of the Notes to Financial Statements for details of municipal bonds transferred to TOBs. |
| 58 | SEMI-ANNUAL REPORT | DECEMBER 31, 2014 |
| Financial Highlights | BlackRock Short-Term Municipal Fund |
| BlackRock | | ||||||||||||||||||||||||||
| Six Months Ended December 31, 2014 (Unaudited) | Year Ended June 30, | | |||||||||||||||||||||||||
| 2014 | 2013 | 2012 | 2011 | 2010 | |||||||||||||||||||||||
Per Share Operating Performance | |||||||||||||||||||||||||||
Net asset value, beginning of period | $ | 10.15 | $ | 10.11 | $ | 10.18 | $ | 10.18 | $ | 10.19 | $ | 10.14 | |||||||||||||||
Net investment income1 | 0.02 | 0.04 | 0.07 | 0.09 | 0.12 | 0.15 | |||||||||||||||||||||
Net realized and unrealized gain (loss) | (0.02 | ) | 0.05 | (0.07 | ) | 0.02 | (0.00 | )2 | 0.06 | ||||||||||||||||||
Net increase (decrease) from investment operations | — | 0.09 | — | 0.11 | 0.12 | 0.21 | |||||||||||||||||||||
Distributions from net investment income3 | (0.02 | ) | (0.05 | ) | (0.07 | ) | (0.11 | ) | (0.13 | ) | (0.16 | ) | |||||||||||||||
Net asset value, end of period | $ | 10.13 | $ | 10.15 | $ | 10.11 | $ | 10.18 | $ | 10.18 | $ | 10.19 | |||||||||||||||
Total Return4 | |||||||||||||||||||||||||||
Based on net asset value | (0.01)% | 5 | 0.91% | 0.00% | 1.07% | 1.17% | 2.04% | ||||||||||||||||||||
Ratios to Average Net Assets | |||||||||||||||||||||||||||
Total expenses | 0.40% | 6 | 0.39% | 0.39% | 0.39% | 0.40% | 0.41% | ||||||||||||||||||||
Total expenses after fees waived and/or reimbursed and paid indirectly | 0.40% | 6 | 0.39% | 0.39% | 0.39% | 0.39% | 0.40% | ||||||||||||||||||||
Net investment income | 0.40% | 6 | 0.35% | 0.79% | 0.93% | 1.25% | 1.42% | ||||||||||||||||||||
Supplemental Data | |||||||||||||||||||||||||||
Net assets, end of period (000) | $ | 8,821 | $ | 8,814 | $ | 10,372 | $ | 63,503 | $ | 43,941 | $ | 17,244 | |||||||||||||||
Portfolio turnover rate | 36% | 56% | 41% | 51% | 44% | 36% | |||||||||||||||||||||
| 1 | Based on average shares outstanding. |
| 2 | Amount is greater than $(0.005) per share. |
| 3 | Distributions for annual periods determined in accordance with federal income tax regulations. |
| 4 | Where applicable, assumes the reinvestment of distributions. |
| 5 | Aggregate total return. |
| 6 | Annualized. |
| SEMI-ANNUAL REPORT | DECEMBER 31, 2014 | 59 |
| Financial Highlights (continued) | BlackRock Short-Term Municipal Fund |
| Institutional | | ||||||||||||||||||||||||||
| Six Months Ended December 31, 2014 (Unaudited) | Year Ended June 30, | | |||||||||||||||||||||||||
| 2014 | 2013 | 2012 | 2011 | 2010 | |||||||||||||||||||||||
Per Share Operating Performance | |||||||||||||||||||||||||||
Net asset value, beginning of period | $ | 10.16 | $ | 10.12 | $ | 10.17 | $ | 10.18 | $ | 10.18 | $ | 10.13 | |||||||||||||||
Net investment income1 | 0.02 | 0.05 | 0.07 | 0.09 | 0.13 | 0.15 | |||||||||||||||||||||
Net realized and unrealized gain (loss) | (0.03 | ) | 0.04 | (0.05 | ) | 0.01 | (0.00 | )2 | 0.06 | ||||||||||||||||||
Net increase (decrease) from investment operations | (0.01 | ) | 0.09 | 0.02 | 0.10 | 0.13 | 0.21 | ||||||||||||||||||||
Distributions from net investment income3 | (0.02 | ) | (0.05 | ) | (0.07 | ) | (0.11 | ) | (0.13 | ) | (0.16 | ) | |||||||||||||||
Net asset value, end of period | $ | 10.13 | $ | 10.16 | $ | 10.12 | $ | 10.17 | $ | 10.18 | $ | 10.18 | |||||||||||||||
Total Return4 | |||||||||||||||||||||||||||
Based on net asset value | (0.11)% | 5 | 0.90% | 0.19% | 0.96% | 1.27% | 2.04% | ||||||||||||||||||||
Ratios to Average Net Assets | |||||||||||||||||||||||||||
Total expenses | 0.51% | 6 | 0.51% | 0.51% | 0.50% | 0.49% | 0.48% | ||||||||||||||||||||
Total expenses after fees waived and/or reimbursed and paid indirectly | 0.40% | 6 | 0.40% | 0.40% | 0.40% | 0.40% | 0.40% | ||||||||||||||||||||
Net investment income | 0.40% | 6 | 0.54% | 0.82% | 0.93% | 1.26% | 1.50% | ||||||||||||||||||||
Supplemental Data | |||||||||||||||||||||||||||
Net assets, end of period (000) | $ | 582,895 | $ | 619,700 | $ | 529,687 | $ | 643,910 | $ | 603,837 | $ | 628,194 | |||||||||||||||
Portfolio turnover rate | 36% | 56% | 41% | 51% | 44% | 36% | |||||||||||||||||||||
| 1 | Based on average shares outstanding. |
| 2 | Amount is greater than $(0.005) per share. |
| 3 | Distributions for annual periods determined in accordance with federal income tax regulations. |
| 4 | Where applicable, assumes the reinvestment of distributions. |
| 5 | Aggregate total return. |
| 6 | Annualized. |
| 60 | SEMI-ANNUAL REPORT | DECEMBER 31, 2014 |
| Financial Highlights (continued) | BlackRock Short-Term Municipal Fund |
| Investor A | | ||||||||||||||||||||||||||
| Six Months Ended December 31, 2014 (Unaudited) | Year Ended June 30, | | |||||||||||||||||||||||||
| 2014 | 2013 | 2012 | 2011 | 2010 | |||||||||||||||||||||||
Per Share Operating Performance | |||||||||||||||||||||||||||
Net asset value, beginning of period | $ | 10.16 | $ | 10.12 | $ | 10.18 | $ | 10.19 | $ | 10.19 | $ | 10.13 | |||||||||||||||
Net investment income1 | 0.01 | 0.03 | 0.04 | 0.07 | 0.10 | 0.12 | |||||||||||||||||||||
Net realized and unrealized gain (loss) | (0.04 | ) | 0.03 | (0.06 | ) | 0.002 | (0.00 | )3 | 0.07 | ||||||||||||||||||
Net increase (decrease) from investment operations | (0.03 | ) | 0.06 | (0.02 | ) | 0.07 | 0.10 | 0.19 | |||||||||||||||||||
Distributions from net investment income4 | (0.00 | )3 | (0.02 | ) | (0.04 | ) | (0.08 | ) | (0.10 | ) | (0.13 | ) | |||||||||||||||
Net asset value, end of period | $ | 10.13 | $ | 10.16 | $ | 10.12 | $ | 10.18 | $ | 10.19 | $ | 10.19 | |||||||||||||||
Total Return5 | |||||||||||||||||||||||||||
Based on net asset value | (0.25)% | 6 | 0.64% | (0.18)% | 0.69% | 0.99% | 1.86% | ||||||||||||||||||||
Ratios to Average Net Assets | |||||||||||||||||||||||||||
Total expenses | 0.69% | 7 | 0.67% | 0.68% | 0.66% | 0.67% | 0.68% | ||||||||||||||||||||
Total expenses after fees waived and/or reimbursed and paid indirectly | 0.69% | 7 | 0.67% | 0.68% | 0.66% | 0.67% | 0.67% | ||||||||||||||||||||
Net investment income | 0.11% | 7 | 0.26% | 0.54% | 0.67% | 1.00% | 1.20% | ||||||||||||||||||||
Supplemental Data | |||||||||||||||||||||||||||
Net assets, end of period (000) | $ | 102,055 | $ | 137,629 | $ | 172,314 | $ | 204,729 | $ | 221,827 | $ | 297,336 | |||||||||||||||
Portfolio turnover rate | 36% | 56% | 41% | 51% | 44% | 36% | |||||||||||||||||||||
| 1 | Based on average shares outstanding. |
| 2 | Amount is less than $0.005 per share. |
| 3 | Amount is greater than $(0.005) per share. |
| 4 | Distributions for annual periods determined in accordance with federal income tax regulations. |
| 5 | Where applicable, excludes the effects of any sales charges and assumes the reinvestment of distributions. |
| 6 | Aggregate total return. |
| 7 | Annualized. |
| SEMI-ANNUAL REPORT | DECEMBER 31, 2014 | 61 |
| Financial Highlights (continued) | BlackRock Short-Term Municipal Fund |
| Investor A1 | | ||||||||||||||||||||||||||
| Six Months Ended December 31, 2014 (Unaudited) | Year Ended June 30, | | |||||||||||||||||||||||||
| 2014 | 2013 | 2012 | 2011 | 2010 | |||||||||||||||||||||||
Per Share Operating Performance | |||||||||||||||||||||||||||
Net asset value, beginning of period | $ | 10.17 | $ | 10.12 | $ | 10.18 | $ | 10.19 | $ | 10.19 | $ | 10.14 | |||||||||||||||
Net investment income1 | 0.01 | 0.04 | 0.06 | 0.08 | 0.12 | 0.14 | |||||||||||||||||||||
Net realized and unrealized gain (loss) | (0.03 | ) | 0.05 | (0.06 | ) | 0.01 | (0.00 | )2 | 0.05 | ||||||||||||||||||
Net increase (decrease) from investment operations | (0.02 | ) | 0.09 | — | 0.09 | 0.12 | 0.19 | ||||||||||||||||||||
Distributions from net investment income3 | (0.01 | ) | (0.04 | ) | (0.06 | ) | (0.10 | ) | (0.12 | ) | (0.14 | ) | |||||||||||||||
Net asset value, end of period | $ | 10.14 | $ | 10.17 | $ | 10.12 | $ | 10.18 | $ | 10.19 | $ | 10.19 | |||||||||||||||
Total Return4 | |||||||||||||||||||||||||||
Based on net asset value | (0.17)% | 5 | 0.88% | (0.03)% | 0.84% | 1.14% | 1.91% | ||||||||||||||||||||
Ratios to Average Net Assets | |||||||||||||||||||||||||||
Total expenses | 0.55% | 6 | 0.54% | 0.54% | 0.54% | 0.54% | 0.55% | ||||||||||||||||||||
Total expenses after fees waived and/or reimbursed and paid indirectly | 0.52% | 6 | 0.52% | 0.52% | 0.51% | 0.52% | 0.52% | ||||||||||||||||||||
Net investment income | 0.28% | 6 | 0.42% | 0.70% | 0.81% | 1.14% | 1.41% | ||||||||||||||||||||
Supplemental Data | |||||||||||||||||||||||||||
Net assets, end of period (000) | $ | 35,407 | $ | 37,280 | $ | 44,139 | $ | 48,377 | $ | 53,141 | $ | 66,404 | |||||||||||||||
Portfolio turnover rate | 36% | 56% | 41% | 51% | 44% | 36% | |||||||||||||||||||||
| 1 | Based on average shares outstanding. |
| 2 | Amount is greater than $(0.005) per share. |
| 3 | Distributions for annual periods determined in accordance with federal income tax regulations. |
| 4 | Where applicable, excludes the effects of any sales charges and assumes the reinvestment of distributions. |
| 5 | Aggregate total return. |
| 6 | Annualized. |
| 62 | SEMI-ANNUAL REPORT | DECEMBER 31, 2014 |
| Financial Highlights (concluded) | BlackRock Short-Term Municipal Fund |
| Investor C | | ||||||||||||||||||||||||||
| Six Months Ended December 31, 2014 (Unaudited) | Year Ended June 30, | | |||||||||||||||||||||||||
| 2014 | 2013 | 2012 | 2011 | 2010 | |||||||||||||||||||||||
Per Share Operating Performance | |||||||||||||||||||||||||||
Net asset value, beginning of period | $ | 10.07 | $ | 10.08 | $ | 10.18 | $ | 10.18 | $ | 10.18 | $ | 10.13 | |||||||||||||||
Net investment income (loss)1 | (0.03 | ) | (0.06 | ) | (0.04 | ) | (0.01 | ) | 0.02 | 0.05 | |||||||||||||||||
Net realized and unrealized gain (loss) | (0.04 | ) | 0.05 | (0.06 | ) | 0.01 | (0.00 | )2 | 0.05 | ||||||||||||||||||
Net increase (decrease) from investment operations | (0.07 | ) | (0.01 | ) | (0.10 | ) | — | 0.02 | 0.10 | ||||||||||||||||||
Distributions from net investment income3 | — | — | — | (0.00 | )2 | (0.02 | ) | (0.05 | ) | ||||||||||||||||||
Net asset value, end of period | $ | 10.00 | $ | 10.07 | $ | 10.08 | $ | 10.18 | $ | 10.18 | $ | 10.18 | |||||||||||||||
Total Return4 | |||||||||||||||||||||||||||
Based on net asset value | (0.70)% | 5 | (0.10)% | (0.98)% | 0.01% | 0.21% | 0.97% | ||||||||||||||||||||
Ratios to Average Net Assets | |||||||||||||||||||||||||||
Total expenses | 1.47% | 6 | 1.45% | 1.46% | 1.44% | 1.45% | 1.46% | ||||||||||||||||||||
Total expenses after fees waived and/or reimbursed and paid indirectly | 1.47% | 6 | 1.45% | 1.46% | 1.44% | 1.45% | 1.45% | ||||||||||||||||||||
Net investment income (loss) | (0.67)% | 6 | (0.55)% | (0.27)% | (0.11)% | 0.22% | 0.44% | ||||||||||||||||||||
Supplemental Data | |||||||||||||||||||||||||||
Net assets, end of period (000) | $ | 38,536 | $ | 38,520 | $ | 50,033 | $ | 68,693 | $ | 86,264 | $ | 117,792 | |||||||||||||||
Portfolio turnover rate | 36% | 56% | 41% | 51% | 44% | 36% | |||||||||||||||||||||
| 1 | Based on average shares outstanding. |
| 2 | Amount is greater than $(0.005) per share. |
| 3 | Distributions for annual periods determined in accordance with federal income tax regulations. |
| 4 | Where applicable, excludes the effects of any sales charges and assumes the reinvestment of distributions. |
| 5 | Aggregate total return. |
| 6 | Annualized. |
| SEMI-ANNUAL REPORT | DECEMBER 31, 2014 | 63 |
| Financial Highlights | BlackRock New York Municipal Bond Fund |
| Institutional | | ||||||||||||||||||||||||||
| Six Months Ended December 31, 2014 (Unaudited) | Year Ended June 30, | | |||||||||||||||||||||||||
| 2014 | 2013 | 2012 | 2011 | 2010 | |||||||||||||||||||||||
Per Share Operating Performance | |||||||||||||||||||||||||||
Net asset value, beginning of period | $ | 10.79 | $ | 10.46 | $ | 11.01 | $ | 10.36 | $ | 10.55 | $ | 9.81 | |||||||||||||||
Net investment income1 | 0.21 | 0.43 | 0.46 | 0.47 | 0.50 | 0.49 | |||||||||||||||||||||
Net realized and unrealized gain (loss) | 0.30 | 0.33 | (0.55 | ) | 0.65 | (0.20 | ) | 0.74 | |||||||||||||||||||
Net increase (decrease) from investment operations | 0.51 | 0.76 | (0.09 | ) | 1.12 | 0.30 | 1.23 | ||||||||||||||||||||
Distributions from net investment income2 | (0.21 | ) | (0.43 | ) | (0.46 | ) | (0.47 | ) | (0.49 | ) | (0.49 | ) | |||||||||||||||
Net asset value, end of period | $ | 11.09 | $ | 10.79 | $ | 10.46 | $ | 11.01 | $ | 10.36 | $ | 10.55 | |||||||||||||||
Total Return3 | |||||||||||||||||||||||||||
Based on net asset value | 4.74% | 4 | 7.52% | (1.06)% | 11.06% | 2.97% | 12.74% | ||||||||||||||||||||
Ratios to Average Net Assets | |||||||||||||||||||||||||||
Total expenses | 0.74% | 5 | 0.80% | 0.77% | 0.80% | 0.72% | 0.76% | ||||||||||||||||||||
Total expenses after fees waived and paid indirectly | 0.69% | 5 | 0.79% | 0.77% | 0.80% | 0.72% | 0.76% | ||||||||||||||||||||
Total expenses after fees waived and paid indirectly and excluding interest expense and fees6 | 0.65% | 5 | 0.74% | 0.71% | 0.76% | 0.70% | 0.75% | ||||||||||||||||||||
Net investment income | 3.75% | 5 | 4.16% | 4.07% | 4.43% | 4.78% | 4.77% | ||||||||||||||||||||
Supplemental Data | |||||||||||||||||||||||||||
Net assets, end of period (000) | $ | 64,872 | $ | 34,777 | $ | 34,029 | $ | 31,875 | $ | 25,864 | $ | 23,841 | |||||||||||||||
Portfolio turnover rate | 3% | 18% | 24% | 19% | 17% | 19% | |||||||||||||||||||||
| 1 | Based on average shares outstanding. |
| 2 | Distributions for annual periods determined in accordance with federal income tax regulations. |
| 3 | Where applicable, assumes the reinvestment of distributions. |
| 4 | Aggregate total return. |
| 5 | Annualized. |
| 6 | Interest expense and fees relate to TOBs. See Note 3 of the Notes to Financial Statements for details of municipal bonds transferred to TOBs. |
| 64 | SEMI-ANNUAL REPORT | DECEMBER 31, 2014 |
| Financial Highlights (continued) | BlackRock New York Municipal Bond Fund |
| Investor A | | ||||||||||||||||||||||||||
| Six Months Ended December 31, 2014 (Unaudited) | Year Ended June 30, | | |||||||||||||||||||||||||
| 2014 | 2013 | 2012 | 2011 | 2010 | |||||||||||||||||||||||
Per Share Operating Performance | |||||||||||||||||||||||||||
Net asset value, beginning of period | $ | 10.80 | $ | 10.47 | $ | 11.02 | $ | 10.37 | $ | 10.55 | $ | 9.82 | |||||||||||||||
Net investment income1 | 0.19 | 0.41 | 0.43 | 0.45 | 0.47 | 0.47 | |||||||||||||||||||||
Net realized and unrealized gain (loss) | 0.30 | 0.33 | (0.55 | ) | 0.65 | (0.19 | ) | 0.72 | |||||||||||||||||||
Net increase (decrease) from investment operations | 0.49 | 0.74 | (0.12 | ) | 1.10 | 0.28 | 1.19 | ||||||||||||||||||||
Distributions from net investment income2 | (0.19 | ) | (0.41 | ) | (0.43 | ) | (0.45 | ) | (0.46 | ) | (0.46 | ) | |||||||||||||||
Net asset value, end of period | $ | 11.10 | $ | 10.80 | $ | 10.47 | $ | 11.02 | $ | 10.37 | $ | 10.55 | |||||||||||||||
Total Return3 | |||||||||||||||||||||||||||
Based on net asset value | 4.62% | 4 | 7.26% | (1.30)% | 10.77% | 2.76% | 12.33% | ||||||||||||||||||||
Ratios to Average Net Assets | |||||||||||||||||||||||||||
Total expenses | 1.00% | 5 | 1.03% | 1.02% | 1.06% | 1.02% | 1.02% | ||||||||||||||||||||
Total expenses after fees waived and paid indirectly | 0.93% | 5 | 1.03% | 1.02% | 1.06% | 1.01% | 1.02% | ||||||||||||||||||||
Total expenses after fees waived and paid indirectly and excluding interest expense and fees6 | 0.89% | 5 | 0.98% | 0.95% | 1.02% | 1.00% | 1.01% | ||||||||||||||||||||
Net investment income | 3.52% | 5 | 3.92% | 3.82% | 4.17% | 4.47% | 4.50% | ||||||||||||||||||||
Supplemental Data | |||||||||||||||||||||||||||
Net assets, end of period (000) | $ | 60,838 | $ | 46,084 | $ | 50,220 | $ | 43,030 | $ | 35,751 | $ | 37,736 | |||||||||||||||
Portfolio turnover rate | 3% | 18% | 24% | 19% | 17% | 19% | |||||||||||||||||||||
| 1 | Based on average shares outstanding. |
| 2 | Distributions for annual periods determined in accordance with federal income tax regulations. |
| 3 | Where applicable, excludes the effects of any sales charges and assumes the reinvestment of distributions. |
| 4 | Aggregate total return. |
| 5 | Annualized. |
| 6 | Interest expense and fees relate to TOBs. See Note 3 of the Notes to Financial Statements for details of municipal bonds transferred to TOBs. |
| SEMI-ANNUAL REPORT | DECEMBER 31, 2014 | 65 |
| Financial Highlights (continued) | BlackRock New York Municipal Bond Fund |
| Investor A1 | | ||||||||||||||||||||||||||
| Six Months Ended December 31, 2014 (Unaudited) | Year Ended June 30, | | |||||||||||||||||||||||||
| 2014 | 2013 | 2012 | 2011 | 2010 | |||||||||||||||||||||||
Per Share Operating Performance | |||||||||||||||||||||||||||
Net asset value, beginning of period | $ | 10.80 | $ | 10.46 | $ | 11.02 | $ | 10.37 | $ | 10.55 | $ | 9.82 | |||||||||||||||
Net investment income1 | 0.20 | 0.42 | 0.44 | 0.47 | 0.49 | 0.48 | |||||||||||||||||||||
Net realized and unrealized gain (loss) | 0.30 | 0.34 | (0.56 | ) | 0.65 | (0.19 | ) | 0.73 | |||||||||||||||||||
Net increase (decrease) from investment operations | 0.50 | 0.76 | (0.12 | ) | 1.12 | 0.30 | 1.21 | ||||||||||||||||||||
Distributions from net investment income2 | (0.20 | ) | (0.42 | ) | (0.44 | ) | (0.47 | ) | (0.48 | ) | (0.48 | ) | |||||||||||||||
Net asset value, end of period | $ | 11.10 | $ | 10.80 | $ | 10.46 | $ | 11.02 | $ | 10.37 | $ | 10.55 | |||||||||||||||
Total Return3 | |||||||||||||||||||||||||||
Based on net asset value | 4.67% | 4 | 7.53% | (1.24)% | 10.97% | 2.95% | 12.49% | ||||||||||||||||||||
Ratios to Average Net Assets | |||||||||||||||||||||||||||
Total expenses | 0.85% | 5 | 0.88% | 0.87% | 0.88% | 0.84% | 0.88% | ||||||||||||||||||||
Total expenses after fees waived and paid indirectly | 0.83% | 5 | 0.88% | 0.87% | 0.88% | 0.83% | 0.87% | ||||||||||||||||||||
Total expenses after fees waived and paid indirectly and excluding interest expense and fees6 | 0.79% | 5 | 0.83% | 0.80% | 0.84% | 0.82% | 0.86% | ||||||||||||||||||||
Net investment income | 3.63% | 5 | 4.07% | 3.98% | 4.36% | 4.66% | 4.65% | ||||||||||||||||||||
Supplemental Data | |||||||||||||||||||||||||||
Net assets, end of period (000) | $ | 132,022 | $ | 132,184 | $ | 140,469 | $ | 154,473 | $ | 151,327 | $ | 162,305 | |||||||||||||||
Portfolio turnover rate | 3% | �� | 18% | 24% | 19% | 17% | 19% | ||||||||||||||||||||
| 1 | Based on average shares outstanding. |
| 2 | Distributions for annual periods determined in accordance with federal income tax regulations. |
| 3 | Where applicable, excludes the effects of any sales charges and assumes the reinvestment of distributions. |
| 4 | Aggregate total return. |
| 5 | Annualized. |
| 6 | Interest expense and fees relate to TOBs. See Note 3 of the Notes to Financial Statements for details of municipal bonds transferred to TOBs. |
| 66 | SEMI-ANNUAL REPORT | DECEMBER 31, 2014 |
| Financial Highlights (continued) | BlackRock New York Municipal Bond Fund |
| Investor C | | ||||||||||||||||||||||||||
| Six Months Ended December 31, 2014 (Unaudited) | Year Ended June 30, | | |||||||||||||||||||||||||
| 2014 | 2013 | 2012 | 2011 | 2010 | |||||||||||||||||||||||
Per Share Operating Performance | |||||||||||||||||||||||||||
Net asset value, beginning of period | $ | 10.80 | $ | 10.46 | $ | 11.01 | $ | 10.37 | $ | 10.55 | $ | 9.81 | |||||||||||||||
Net investment income1 | 0.15 | 0.33 | 0.34 | 0.37 | 0.39 | 0.39 | |||||||||||||||||||||
Net realized and unrealized gain (loss) | 0.30 | 0.34 | (0.55 | ) | 0.64 | (0.18 | ) | 0.74 | |||||||||||||||||||
Net increase (decrease) from investment operations | 0.45 | 0.67 | (0.21 | ) | 1.01 | 0.21 | 1.13 | ||||||||||||||||||||
Distributions from net investment income2 | (0.15 | ) | (0.33 | ) | (0.34 | ) | (0.37 | ) | (0.39 | ) | (0.39 | ) | |||||||||||||||
Net asset value, end of period | $ | 11.10 | $ | 10.80 | $ | 10.46 | $ | 11.01 | $ | 10.37 | $ | 10.55 | |||||||||||||||
Total Return3 | |||||||||||||||||||||||||||
Based on net asset value | 4.22% | 4 | 6.57% | (2.04)% | 9.89% | 2.03% | 11.62% | ||||||||||||||||||||
Ratios to Average Net Assets | |||||||||||||||||||||||||||
Total expenses | 1.74% | 5 | 1.78% | 1.77% | 1.77% | 1.73% | 1.77% | ||||||||||||||||||||
Total expenses after fees waived and paid indirectly | 1.68% | 5 | 1.77% | 1.77% | 1.77% | 1.73% | 1.76% | ||||||||||||||||||||
Total expenses after fees waived and paid indirectly and excluding interest expense and fees6 | 1.64% | 5 | 1.72% | 1.70% | 1.73% | 1.72% | 1.75% | ||||||||||||||||||||
Net investment income | 2.78% | 5 | 3.17% | 3.07% | 3.45% | 3.76% | 3.76% | ||||||||||||||||||||
Supplemental Data | |||||||||||||||||||||||||||
Net assets, end of period (000) | $ | 32,647 | $ | 27,595 | $ | 27,082 | $ | 25,201 | $ | 17,180 | $ | 17,597 | |||||||||||||||
Portfolio turnover rate | 3% | 18% | 24% | 19% | 17% | 19% | |||||||||||||||||||||
| 1 | Based on average shares outstanding. |
| 2 | Distributions for annual periods determined in accordance with federal income tax regulations. |
| 3 | Where applicable, excludes the effects of any sales charges and assumes the reinvestment of distributions. |
| 4 | Aggregate total return. |
| 5 | Annualized. |
| 6 | Interest expense and fees relate to TOBs. See Note 3 of the Notes to Financial Statements for details of municipal bonds transferred to TOBs. |
| SEMI-ANNUAL REPORT | DECEMBER 31, 2014 | 67 |
| Financial Highlights (concluded) | BlackRock New York Municipal Bond Fund |
| Investor C1 | | ||||||||||||||||||||||||||
| Six Months Ended December 31, 2014 (Unaudited) | Year Ended June 30, | | |||||||||||||||||||||||||
| 2014 | 2013 | 2012 | 2011 | 2010 | |||||||||||||||||||||||
Per Share Operating Performance | |||||||||||||||||||||||||||
Net asset value, beginning of period | $ | 10.80 | $ | 10.46 | $ | 11.02 | $ | 10.37 | $ | 10.55 | $ | 9.81 | |||||||||||||||
Net investment income1 | 0.17 | 0.37 | 0.39 | 0.42 | 0.43 | 0.43 | |||||||||||||||||||||
Net realized and unrealized gain (loss) | 0.30 | 0.34 | (0.56 | ) | 0.64 | (0.18 | ) | 0.74 | |||||||||||||||||||
Net increase (decrease) from investment operations | 0.47 | 0.71 | (0.17 | ) | 1.06 | 0.25 | 1.17 | ||||||||||||||||||||
Distributions from net investment income2 | (0.17 | ) | (0.37 | ) | (0.39 | ) | (0.41 | ) | (0.43 | ) | (0.43 | ) | |||||||||||||||
Net asset value, end of period | $ | 11.10 | $ | 10.80 | $ | 10.46 | $ | 11.02 | $ | 10.37 | $ | 10.55 | |||||||||||||||
Total Return3 | |||||||||||||||||||||||||||
Based on net asset value | 4.41% | 4 | 7.00% | (1.73)% | 10.43% | 2.44% | 12.06% | ||||||||||||||||||||
Ratios to Average Net Assets | |||||||||||||||||||||||||||
Total expenses | 1.34% | 5 | 1.37% | 1.36% | 1.37% | 1.33% | 1.37% | ||||||||||||||||||||
Total expenses after fees waived and paid indirectly | 1.32% | 5 | 1.36% | 1.36% | 1.37% | 1.33% | 1.37% | ||||||||||||||||||||
Total expenses after fees waived and paid indirectly and excluding interest expense and fees6 | 1.28% | 5 | 1.31% | 1.29% | 1.33% | 1.32% | 1.36% | ||||||||||||||||||||
Net investment income | 3.14% | 5 | 3.58% | 3.49% | 3.86% | 4.16% | 4.16% | ||||||||||||||||||||
Supplemental Data | |||||||||||||||||||||||||||
Net assets, end of period (000) | $ | 8,430 | $ | 8,827 | $ | 0,038 | $ | 11,093 | $ | 10,694 | $ | 12,391 | |||||||||||||||
Portfolio turnover rate | 3% | 18% | 24% | 19% | 17% | 19% | |||||||||||||||||||||
| 1 | Based on average shares outstanding. |
| 2 | Distributions for annual periods determined in accordance with federal income tax regulations. |
| 3 | Where applicable, excludes the effects of any sales charges and assumes the reinvestment of distributions. |
| 4 | Aggregate total return. |
| 5 | Annualized. |
| 6 | Interest expense and fees relate to TOBs. See Note 3 of the Notes to Financial Statements for details of municipal bonds transferred to TOBs. |
| 68 | SEMI-ANNUAL REPORT | DECEMBER 31, 2014 |
| Notes to Financial Statements (Unaudited) |
| Registrant | | Fund Name | | Herein referred to as | | Diversification Classification |
BlackRock Municipal Bond Fund, Inc. | BlackRock High Yield Municipal Fund | High Yield Municipal | Diversified | |||
BlackRock National Municipal Fund | National Municipal | Diversified | ||||
BlackRock Short-Term Municipal Fund | Short-Term Municipal | Diversified | ||||
BlackRock Multi-State Municipal Series Trust | BlackRock New York Municipal Bond Fund | New York Municipal | Diversified |
| Share Name | Initial Sales Charge | | CDSC | | Conversion | |
BlackRock Shares | No | No | None | |||
Institutional Shares | No | No | None | |||
Service Shares | No | Yes | None | |||
Investor A Shares | Yes | Yes | None | |||
Investor A1 Shares | Yes | Yes | None | |||
Investor B Shares | No | Yes | None | |||
Investor C Shares | No | Yes | None | |||
Investor C1 Shares | No | Yes | None |
| SEMI-ANNUAL REPORT | DECEMBER 31, 2014 | 69 |
| Notes to Financial Statements (continued) |
| 70 | SEMI-ANNUAL REPORT | DECEMBER 31, 2014 |
| Notes to Financial Statements (continued) |
ruling that interest on the municipal bond is subject to federal income taxation. Upon the occurrence of a termination event, the TOB would generally be liquidated in full with the proceeds typically applied first to any accrued fees owed to the trustee, remarketing agent and liquidity provider, and then to the holders of the TOB Trust Certificates up to par plus accrued interest owed on the TOB Trust Certificates, with the balance paid out to the TOB Residual holder. During the six months ended December 31, 2014, no TOBs in which the Funds participated were terminated without the consent of the Funds.
| Underlying Municipal Bonds Transferred to TOBs | | Liability for TOB Trust Certificates | | Range of Interest Rates | |||||||||
High Yield Municipal | $ | 28,813,998 | $ | 28,807,610 | 0.04% - 0.24% | ||||||||
National Municipal | $ | 280,169,448 | $ | 280,119,931 | 0.04% - 0.19% | ||||||||
New York Municipal | $ | 18,712,861 | $ | 18,710,577 | 0.04% - 0.14% | ||||||||
| Average TOB Trust Certificates Outstanding | | Daily Weighted Average Interest Rate | ||||||||||||
High Yield Municipal | $ | 28,929,353 | 0.68% | |||||||||||
National Municipal | $ | 283,951,725 | 0.60% | |||||||||||
New York Municipal | $ | 18,710,577 | 0.61% | |||||||||||
| SEMI-ANNUAL REPORT | DECEMBER 31, 2014 | 71 |
| Notes to Financial Statements (continued) |
| Fair Values of Derivative Financial Instruments as of December 31, 2014 | ||||||||||||||||||||
| Value | | |||||||||||||||||||
| Derivative Liabilities | | |||||||||||||||||||
| | Statements of Assets and Liabilities Location | | High Yield Municipal | | National Municipal | | New York Municipal | |||||||||||||
Interest rate contracts | Net unrealized depreciation1 | $ | (65,011 | ) | $ | (131,886 | ) | $ | (38,774 | ) | ||||||||||
| 1 | Includes cumulative appreciation/depreciation on financial futures contracts, if any, as reported in the Schedules of Investments. Only current day’s variation margin is reported within the Statements of Assets and Liabilities. |
| The Effect of Derivative Financial Instruments in the Statements of Operations Six Months Ended December 31, 2014 | ||||||||||||||||||||||||||||||||
| Net Realized Gain (Loss) From | Net Change in Unrealized Appreciation/Depreciation On | | ||||||||||||||||||||||||||||||
| | High Yield Municipal | | National Municipal | | Short-Term Municipal | | New York Municipal | | High Yield Municipal | | National Municipal | | New York Municipal | |||||||||||||||||||
Interest rate contracts: | ||||||||||||||||||||||||||||||||
Financial Futures Contracts | $ | (521,121 | ) | $ | (4,780,382 | ) | $ | 143,520 | $ | (509,256 | ) | $ | (308,754 | ) | $ | 589,252 | $ | (1,866 | ) | |||||||||||||
| | High Yield Municipal | | National Municipal | | Short-Term Municipal | | New York Municipal | |||||||||||
Financial Futures Contracts: | ||||||||||||||||||
Average notional value of contracts sold | $ | 45,133,031 | $ | 156,878,906 | $ | 12,087,5001 | $ | 31,913,367 | ||||||||||
| 1 | Actual amounts for the period are shown due to limited outstanding derivative financial instruments as of each quarter. |
| 72 | SEMI-ANNUAL REPORT | DECEMBER 31, 2014 |
| Notes to Financial Statements (continued) |
| Portion of Average Daily Net Assets | | Investment Advisory Fee | ||||
First $250 Million | 0.550 | % | ||||
$250 - $500 Million | 0.525 | % | ||||
Greater than $500 Million | 0.500 | % | ||||
| Rate of Investment Advisory Fee | | ||||||||||
| Aggregate of Average Daily Net Assets of the Two Combined Funds1 | | National Municipal | | Short-Term Municipal | |||||||
First $250 Million | 0.500 | % | 0.400 | % | |||||||
$250 Million - $400 Million | 0.475 | % | 0.375 | % | |||||||
$400 Million - $550 Million | 0.475 | % | 0.350 | % | |||||||
Greater than $550 Million | 0.475 | % | 0.325 | % | |||||||
| 1 | The portion of the assets of a Fund to which the rate of each breakpoint level applies will be determined on a “uniform percentage” basis. The uniform percentage applicable to a breakpoint level is determined by dividing the amount of the aggregate average daily net assets of the two combined Funds that falls within that breakpoint level by the aggregate average daily net assets of the two combined Funds. The amount of the fee for a Fund at each breakpoint level is determined by multiplying the average daily net assets of that Fund by the uniform percentage applicable to that breakpoint level and multiplying the product by the advisory fee rate. |
| | Investment Advisory Fee | |||||
Portion of Average Daily Net Assets | 0.550 | % | ||||
| Portion of Average Daily Net Assets | | Investment Advisory Fee | ||||
First $500 Million | 0.550 | % | ||||
$500 - $1 Billion | 0.525 | % | ||||
Greater than $1 Billion | 0.500 | % | ||||
High Yield Municipal | $2,013 | |||
National Municipal | $4,076 | |||
Short-Term Municipal | $ 370 | |||
New York Municipal | $1,580 |
| SEMI-ANNUAL REPORT | DECEMBER 31, 2014 | 73 |
| Notes to Financial Statements (continued) |
| | National Municipal | | Short-Term Municipal1 | New York Municipal2 | | |||||||||
BlackRock | 0.46 | % | — | — | ||||||||||
Institutional | — | 0.40 | % | 0.65% | ||||||||||
Investor A | 0.72 | % | 0.69 | % | 0.89% | |||||||||
Investor A1 | — | 0.52 | % | — | ||||||||||
Investor B | 1.23 | % | — | — | ||||||||||
Investor C | 1.47 | % | 1.55 | % | 1.64% | |||||||||
Investor C1 | 1.28 | % | — | — | ||||||||||
| 1 | Contractual waiver became effective on November 1, 2014. |
| 2 | Contractual waiver became effective on June 1, 2014. |
| | National Municipal | | Short-Term Municipal | New York Municipal | | |||||||||
BlackRock | $ | 67,769 | — | — | ||||||||||
Institutional | — | $ | 328,115 | $6,965 | ||||||||||
Investor A | $ | 892,163 | $ | 3,721 | $13,066 | |||||||||
Investor A1 | — | $ | 4,570 | — | ||||||||||
Investor B | $ | 1,998 | — | — | ||||||||||
Investor C | $ | 70,652 | — | $5,959 | ||||||||||
Investor C1 | $ | 11,381 | — | — | ||||||||||
| | Fees Waived by Manager | |||||
National Municipal | $ | 1,154,093 | ||||
New York Municipal | $ | 29,050 | ||||
| 74 | SEMI-ANNUAL REPORT | DECEMBER 31, 2014 |
| Notes to Financial Statements (continued) |
| | Expiring June 30, 2016 | |||||
Fund level | $ | 5,627 | ||||
Institutional | $ | 2,003 | ||||
Investor A | $ | 1,026 | ||||
Class C | $ | 633 | ||||
High Yield Municipal | $ 1,748 | |||||
National Municipal | $22,448 | |||||
Short-Term Municipal | $ 4,600 | |||||
New York Municipal | $ 1,196 | |||||
| Service Fees | | ||||||||||||||||||
| | High Yield Municipal | | National Municipal | | Short-Term Municipal | | New York Municipal | ||||||||||||
Service | — | 0.25 | % | — | — | ||||||||||||||
Investor A | 0.25 | % | 0.25 | % | 0.25 | % | 0.25 | % | |||||||||||
Investor A1 | — | — | 0.10 | % | 0.10 | % | |||||||||||||
Investor B | — | 0.25 | % | — | — | ||||||||||||||
Investor C | 0.25 | % | 0.25 | % | 0.25 | % | 0.25 | % | |||||||||||
Investor C1 | — | 0.25 | — | 0.25 | % | ||||||||||||||
| Distribution Fees | | ||||||||||||||||||
| | High Yield Municipal | | National Municipal | | Short-Term Municipal | | New York Municipal | ||||||||||||
Investor B | — | 0.50 | % | — | — | ||||||||||||||
Investor C | 0.75 | % | 0.75 | % | 0.75 | % | 0.75 | % | |||||||||||
Investor C1 | — | 0.55 | % | — | 0.35 | % | |||||||||||||
| | High Yield Municipal | | National Municipal | Short-Term Municipal | | |||||||||
Institutional | $ | 337 | $ | 499,643 | $230,987 | |||||||||
Service | — | $ | 88 | — | ||||||||||
Investor A | — | $ | 689 | — | ||||||||||
| SEMI-ANNUAL REPORT | DECEMBER 31, 2014 | 75 |
| Notes to Financial Statements (continued) |
| Call Center Fees | | ||||||||||||||||||
| | High Yield Municipal | | National Municipal | | Short-Term Municipal | | New York Municipal | ||||||||||||
BlackRock | — | $ | 6,829 | — | — | ||||||||||||||
Institutional | $ | 298 | $ | 28,227 | $ | 1,516 | $ | 172 | |||||||||||
Service | — | — | — | — | |||||||||||||||
Investor A | $ | 356 | — | $ | 504 | $ | 172 | ||||||||||||
Investor A1 | — | — | $ | 166 | $ | 1,516 | |||||||||||||
Investor B | — | — | — | — | |||||||||||||||
Investor C | $ | 356 | $ | 832 | $ | 254 | $ | 45 | |||||||||||
Investor C1 | — | $ | 161 | — | $ | 12 | |||||||||||||
| | High Yield Municipal | | National Municipal | | Short-Term Municipal | | New York Municipal | |||||||||||
Investor A | $ | 20,892 | $ | 48,696 | $ | 1,641 | $ | 10,803 | ||||||||||
| | High Yield Municipal | | National Municipal | Short-Term Municipal | | |||||||||
Investor A | $ | 226,244 | $ | 46,571 | $4,474 | |||||||||
Investor B | — | $ | 52 | — | ||||||||||
Investor C | $ | 2,661 | $ | 7,659 | $2,682 | |||||||||
| | Purchases | | Sales | |||||||
High Yield Municipal | — | $ | 4,458,825 | |||||||
National Municipal | $ | 1,391,513 | — | |||||||
| | Purchases | | Sales | |||||||
High Yield Municipal | $ | 138,240,584 | $ | 27,132,321 | ||||||
National Municipal | $ | 707,784,041 | $ | 610,736,006 | ||||||
Short-Term Municipal | $ | 280,714,660 | $ | 370,931,105 | ||||||
New York Municipal | $ | 41,338,790 | $ | 8,329,302 | ||||||
| 76 | SEMI-ANNUAL REPORT | DECEMBER 31, 2014 |
| Notes to Financial Statements (continued) |
| Expires June 30, | | High Yield Municipal | | National Municipal | | Short-Term Municipal | | New York Municipal | ||||||||||
2015 | — | $ | 244,021 | $ | 2,987,949 | — | ||||||||||||
2016 | — | 9,699,108 | 322,206 | — | ||||||||||||||
2017 | $ | 2,901,962 | 29,857,944 | — | $ | 2,020,225 | ||||||||||||
2018 | 4,665,271 | 41,255,757 | — | 367,311 | ||||||||||||||
2019 | 1,973,257 | — | — | 1,028,212 | ||||||||||||||
No Expiration Date1 | 5,287,351 | 31,554,489 | — | 4,620,308 | ||||||||||||||
Total | $ | 14,827,841 | $ | 112,611,319 | $ | 3,310,155 | $ | 8,036,056 | ||||||||||
| 1 | Must be utilized prior to losses subject to expiration. |
| | High Yield Municipal | | National Municipal | | Short-Term Municipal | | New York Municipal | |||||||||||
Tax cost | $ | 555,723,705 | $ | 4,433,750,901 | $ | 759,174,034 | $ | 271,352,387 | ||||||||||
Gross unrealized appreciation | $ | 40,594,579 | $ | 428,433,473 | $ | 2,129,239 | $ | 24,262,886 | ||||||||||
Gross unrealized depreciation | (3,748,805 | ) | (15,586,049 | ) | (941,599 | ) | (772,874 | ) | ||||||||||
Net unrealized appreciation | $ | 36,845,774 | $ | 412,847,424 | $ | 1,187,640 | $ | 23,490,012 | ||||||||||
| SEMI-ANNUAL REPORT | DECEMBER 31, 2014 | 77 |
| Notes to Financial Statements (continued) |
| Six Months Ended December 31, 2014 | Year Ended June 30, 2014 | | |||||||||||||||||||||||||
| High Yield Municipal | | Shares | | Amount | | | Shares | | Amount | ||||||||||||||||||
Institutional | |||||||||||||||||||||||||||
Shares sold | 22,638,175 | $ | 209,824,128 | 22,111,723 | $ | 193,425,855 | |||||||||||||||||||||
Shares issued in reinvestment of distributions | 476,413 | 4,437,434 | 424,651 | 3,711,250 | |||||||||||||||||||||||
Shares redeemed | (8,041,420 | ) | (74,524,451 | ) | (18,280,566 | ) | (157,703,835 | ) | |||||||||||||||||||
Net increase | 15,073,168 | $ | 139,737,111 | 4,255,808 | $ | 39,433,270 | |||||||||||||||||||||
Investor A | |||||||||||||||||||||||||||
Shares sold and automatic conversion of shares | 5,607,437 | $ | 51,883,531 | 13,709,875 | $ | 118,692,761 | |||||||||||||||||||||
Shares issued in reinvestment of distributions | 207,792 | 1,926,944 | 469,959 | 4,060,261 | |||||||||||||||||||||||
Shares redeemed | (7,145,132 | ) | (65,723,718 | ) | (8,296,628 | ) | (70,472,448 | ) | |||||||||||||||||||
Net increase (decrease) | (1,329,903 | ) | $ | (11,913,243 | ) | 5,883,206 | $ | 52,280,574 | |||||||||||||||||||
Investor C | |||||||||||||||||||||||||||
Shares sold | 949,019 | $ | 8,811,439 | 2,468,642 | $ | 21,499,873 | |||||||||||||||||||||
Shares issued in reinvestment of distributions | 64,611 | 600,597 | 158,913 | 1,375,505 | |||||||||||||||||||||||
Shares redeemed | (1,229,006 | ) | (11,233,652 | ) | (2,654,565 | ) | (22,687,327 | ) | |||||||||||||||||||
Net increase (decrease) | (215,376 | ) | $ | (1,821,616 | ) | (27,010 | ) | $ | 188,051 | ||||||||||||||||||
Total Net Increase | 13,527,889 | $ | 126,002,252 | 10,112,004 | $ | 91,901,895 | |||||||||||||||||||||
| 78 | SEMI-ANNUAL REPORT | DECEMBER 31, 2014 |
| Notes to Financial Statements (continued) |
| Six Months Ended December 31, 2014 | Year Ended June 30, 2014 | | |||||||||||||||||||||||||
| National Municipal | | Shares | | Amount | | | Shares | | Amount | ||||||||||||||||||
BlackRock | |||||||||||||||||||||||||||
Shares sold | 73,029 | $ | 799,599 | 653,406 | $ | 6,840,872 | |||||||||||||||||||||
Shares issued in reinvestment of distributions | 254,133 | 2,785,925 | 590,959 | 6,231,682 | |||||||||||||||||||||||
Shares redeemed | (1,626,963 | ) | (17,813,299 | ) | (5,603,671 | ) | (58,592,586 | ) | |||||||||||||||||||
Net decrease | (1,299,801 | ) | $ | (14,227,775 | ) | (4,359,306 | ) | $ | (45,520,032 | ) | |||||||||||||||||
Institutional | |||||||||||||||||||||||||||
Shares sold | 23,456,247 | $ | 256,640,411 | 53,765,479 | $ | 567,206,685 | |||||||||||||||||||||
Shares issued in reinvestment of distributions | 1,661,298 | 18,213,364 | 3,977,043 | 41,893,557 | |||||||||||||||||||||||
Shares redeemed | (17,746,103 | ) | (194,507,063 | ) | (84,758,106 | ) | (890,267,542 | ) | |||||||||||||||||||
Net increase (decrease) | 7,371,442 | $ | 80,346,712 | (27,015,584 | ) | $ | (281,167,300 | ) | |||||||||||||||||||
Service | |||||||||||||||||||||||||||
Shares sold | 3,322 | $ | 36,500 | 14,023 | $ | 150,000 | |||||||||||||||||||||
Shares issued in reinvestment of distributions | 1,182 | 12,942 | 2,582 | 27,213 | |||||||||||||||||||||||
Shares redeemed | (13,326 | ) | (146,501 | ) | (27,472 | ) | (287,465 | ) | |||||||||||||||||||
Net decrease | (8,822 | ) | $ | (97,059 | ) | (10,867 | ) | $ | (110,252 | ) | |||||||||||||||||
Investor A | |||||||||||||||||||||||||||
Shares sold | 31,176,410 | $ | 341,629,806 | 89,597,628 | $ | 938,450,279 | |||||||||||||||||||||
Shares issued in reinvestment of distributions | 2,760,732 | 30,285,413 | 5,331,350 | 56,353,095 | |||||||||||||||||||||||
Shares redeemed | (18,755,990 | ) | (205,380,354 | ) | (81,591,783 | ) | (851,467,417 | ) | |||||||||||||||||||
Net increase | 15,181,152 | $ | 166,534,865 | 13,337,195 | $ | 143,335,957 | |||||||||||||||||||||
Investor B | |||||||||||||||||||||||||||
Shares sold | 1,694 | $ | 18,682 | 4,625 | $ | 48,206 | |||||||||||||||||||||
Shares issued in reinvestment of distributions | 3,344 | 36,635 | 13,200 | 138,757 | |||||||||||||||||||||||
Shares redeemed | (132,075 | ) | (1,440,688 | ) | (557,055 | ) | (5,826,570 | ) | |||||||||||||||||||
Net decrease | (127,037 | ) | $ | (1,385,371 | ) | (539,230 | ) | $ | (5,639,607 | ) | |||||||||||||||||
Investor C | |||||||||||||||||||||||||||
Shares sold | 2,345,709 | $ | 25,718,404 | 4,143,872 | $ | 43,768,735 | |||||||||||||||||||||
Shares issued in reinvestment of distributions | 357,827 | 3,925,647 | 877,759 | 9,257,367 | |||||||||||||||||||||||
Shares redeemed | (2,785,295 | ) | (30,531,561 | ) | (14,670,639 | ) | (153,237,791 | ) | |||||||||||||||||||
Net decrease | (81,759 | ) | $ | (887,510 | ) | (9,649,008 | ) | $ | (100,211,689 | ) | |||||||||||||||||
Investor C1 | |||||||||||||||||||||||||||
Shares sold | 128 | $ | 1,400 | 17,667 | $ | 185,673 | |||||||||||||||||||||
Shares issued in reinvestment of distributions | 50,761 | 556,625 | 122,085 | 1,287,779 | |||||||||||||||||||||||
Shares redeemed | (345,046 | ) | (3,778,117 | ) | (1,530,816 | ) | (15,965,077 | ) | |||||||||||||||||||
Net decrease | (294,157 | ) | $ | (3,220,092 | ) | (1,391,064 | ) | $ | (14,491,625 | ) | |||||||||||||||||
Total Net Increase (Decrease) | 20,741,018 | $ | 227,063,770 | (29,627,864 | ) | $ | (303,804,548 | ) | |||||||||||||||||||
| SEMI-ANNUAL REPORT | DECEMBER 31, 2014 | 79 |
| Notes to Financial Statements (continued) |
| Six Months Ended December 31, 2014 | Year Ended June 30, 2014 | | |||||||||||||||||||||
| Short-Term Municipal | | Shares | | Amount | | | Shares | | Amount | ||||||||||||||
BlackRock | |||||||||||||||||||||||
Shares sold | 1,576 | $ | 16,000 | 50,739 | $ | 515,000 | |||||||||||||||||
Shares issued in reinvestment of distributions | 1,618 | 16,420 | 4,572 | 46,397 | |||||||||||||||||||
Shares redeemed | (1 | ) | (12 | ) | (212,896 | ) | (2,154,805 | ) | |||||||||||||||
Net increase (decrease) | 3,193 | $ | 32,408 | (157,585 | ) | $ | (1,593,408 | ) | |||||||||||||||
Institutional | |||||||||||||||||||||||
Shares sold | 7,732,175 | $ | 78,473,249 | 32,446,080 | $ | 329,066,164 | |||||||||||||||||
Shares issued in reinvestment of distributions | 55,036 | 558,557 | 130,850 | 1,328,426 | |||||||||||||||||||
Shares redeemed | (11,246,743 | ) | (114,162,193 | ) | (23,920,867 | ) | (242,734,657 | ) | |||||||||||||||
Net increase (decrease) | (3,459,532 | ) | $ | (35,130,387 | ) | 8,656,063 | $ | 87,659,933 | |||||||||||||||
Investor A | |||||||||||||||||||||||
Shares sold and automatic conversion of shares | 1,990,201 | $ | 20,205,827 | 5,828,230 | $ | 59,180,899 | |||||||||||||||||
Shares issued in reinvestment of distributions | 4,060 | 41,217 | 29,792 | 302,576 | |||||||||||||||||||
Shares redeemed | (5,466,207 | ) | (55,501,430 | ) | (9,338,269 | ) | (94,822,899 | ) | |||||||||||||||
Net decrease | (3,471,946 | ) | $ | (35,254,386 | ) | (3,480,247 | ) | $ | (35,339,424 | ) | |||||||||||||
Investor A1 | |||||||||||||||||||||||
Shares sold and automatic conversion of shares | 2 | $ | 24 | 739 | $ | 7,500 | |||||||||||||||||
Shares issued in reinvestment of distributions | 2,586 | 26,274 | 8,375 | 85,087 | |||||||||||||||||||
Shares redeemed | (176,826 | ) | (1,796,266 | ) | (701,166 | ) | (7,119,964 | ) | |||||||||||||||
Net decrease | (174,238 | ) | $ | (1,769,968 | ) | (692,052 | ) | $ | (7,027,377 | ) | |||||||||||||
Investor C | |||||||||||||||||||||||
Shares sold | 1,007,104 | $ | 10,102,543 | 1,150,996 | $ | 11,610,619 | |||||||||||||||||
Shares issued in reinvestment of distributions | — | — | — | — | |||||||||||||||||||
Shares redeemed and automatic conversion of shares | (980,871 | ) | (9,844,751 | ) | (2,287,397 | ) | (23,072,994 | ) | |||||||||||||||
Net increase (decrease) | 26,233 | $ | 257,792 | (1,136,401 | ) | $ | (11,462,375 | ) | |||||||||||||||
Total Net Increase (Decrease) | (7,076,290 | ) | $ | (71,864,541 | ) | 3,189,778 | $ | 32,237,349 | |||||||||||||||
| 80 | SEMI-ANNUAL REPORT | DECEMBER 31, 2014 |
| Notes to Financial Statements (concluded) |
| Six Months Ended December 31, 2014 | Year Ended June 30, 2014 | | |||||||||||||||||||||||||
| New York Municipal | | Shares | | Amount | | | Shares | | Amount | ||||||||||||||||||
Institutional | |||||||||||||||||||||||||||
Shares sold | 2,888,206 | $ | 31,558,072 | 1,112,340 | $ | 11,495,688 | |||||||||||||||||||||
Shares issued in reinvestment of distributions | 61,928 | 681,614 | 69,907 | 725,328 | |||||||||||||||||||||||
Shares redeemed | (325,015 | ) | (3,561,426 | ) | (1,214,472 | ) | (12,383,156 | ) | |||||||||||||||||||
Net increase (decrease) | 2,625,119 | $ | 28,678,260 | (32,225 | ) | $ | (162,140 | ) | |||||||||||||||||||
Investor A | |||||||||||||||||||||||||||
Shares sold and automatic conversion of shares | 1,641,942 | $ | 17,939,916 | 1,063,443 | $ | 11,017,524 | |||||||||||||||||||||
Shares issued in reinvestment of distributions | 70,901 | 779,714 | 127,334 | 1,320,723 | |||||||||||||||||||||||
Shares redeemed | (499,729 | ) | (5,452,903 | ) | (1,723,525 | ) | (17,595,277 | ) | |||||||||||||||||||
Net increase (decrease) | 1,213,114 | $ | 13,266,727 | (532,748 | ) | $ | (5,257,030 | ) | |||||||||||||||||||
Investor A1 | |||||||||||||||||||||||||||
Shares sold and automatic conversion of shares | 185 | $ | 1,889 | 32,965 | $ | 336,873 | |||||||||||||||||||||
Shares issued in reinvestment of distributions | 148,155 | 1,627,800 | 326,848 | 3,392,820 | |||||||||||||||||||||||
Shares redeemed | (494,527 | ) | (5,431,032 | ) | (1,546,165 | ) | �� | (15,878,378 | ) | ||||||||||||||||||
Net decrease | (346,187 | ) | $ | (3,801,343 | ) | (1,186,352 | ) | $ | (12,148,685 | ) | |||||||||||||||||
Investor C | |||||||||||||||||||||||||||
Shares sold | 437,575 | $ | 4,798,029 | 821,464 | $ | 8,573,753 | |||||||||||||||||||||
Shares issued in reinvestment of distributions | 29,818 | 327,675 | 52,465 | 545,056 | |||||||||||||||||||||||
Shares redeemed | (81,367 | ) | (888,877 | ) | (907,328 | ) | (9,288,233 | ) | |||||||||||||||||||
Net increase (decrease) | 386,026 | $ | 4,236,827 | (33,399 | ) | $ | (169,424 | ) | |||||||||||||||||||
Investor C1 | |||||||||||||||||||||||||||
Shares sold | — | — | 1,379 | $ | 14,081 | ||||||||||||||||||||||
Shares issued in reinvestment of distributions | 7,620 | $ | 83,706 | 17,577 | 182,299 | ||||||||||||||||||||||
Shares redeemed | (65,506 | ) | (713,270 | ) | (161,003 | ) | (1,650,461 | ) | |||||||||||||||||||
Net decrease | (57,886 | ) | $ | (629,564 | ) | (142,047 | ) | $ | (1,454,081 | ) | |||||||||||||||||
Total Net Increase (Decrease) | 3,820,186 | $ | 41,750,907 | (1,926,771 | ) | $ | (19,191,360 | ) | |||||||||||||||||||
| SEMI-ANNUAL REPORT | DECEMBER 31, 2014 | 81 |
| Officers and Directors |
Anti-Money Laundering Officer
Effective September 10, 2014, Brendan Kyne resigned as a Vice President of each Fund and Jennifer McGovern became a Vice President of each Fund. Effective December 31, 2014, Paul L. Audet and Lawrence D. Fink resigned as Directors of each Fund, and Mr. Audet resigned as President of BlackRock Multi-State Municipal Series Trust. Effective January 1, 2015, Robert Fairbairn and John M. Perlowski were appointed to serve as Directors of each Fund, and Mr. Perlowski was appointed to serve as President of BlackRock Multi-State Municipal Series Trust. |
Investment Advisor BlackRock Advisors, LLC Wilmington, DE 19809 Sub-Advisor BlackRock Investment Management, LLC Princeton, NJ 08540 Custodian State Street Bank and Trust Company Boston, MA 02110 | Transfer Agent BNY Mellon Investment Servicing (US) Inc. Wilmington, DE 19809 Accounting Agent State Street Bank and Trust Company Boston, MA 02110 | Distributor BlackRock Investments, LLC New York, NY 10022 Legal Counsel Willkie Farr & Gallagher LLP New York, NY 10019 | Independent Registered Public Accounting Firm Deloitte & Touche LLP Boston, MA 02116 Address of Funds 100 Bellevue Parkway Wilmington, DE 19809 | ||||||||||||
| 82 | SEMI-ANNUAL REPORT | DECEMBER 31, 2014 |
| Additional Information |
General Information
| SEMI-ANNUAL REPORT | DECEMBER 31, 2014 | 83 |
| Additional Information (concluded) |
Shareholder Privileges
BlackRock Privacy Principles
| 84 | SEMI-ANNUAL REPORT | DECEMBER 31, 2014 |
 |
MBNYMB-12/14-SAR |  |
| Item 2 – | Code of Ethics – Not Applicable to this semi-annual report |
| Item 3 – | Audit Committee Financial Expert – Not Applicable to this semi-annual report |
| Item 4 – | Principal Accountant Fees and Services – Not Applicable to this semi-annual report |
| Item 5 – | Audit Committee of Listed Registrants – Not Applicable |
| Item 6 – | Investments (a) The registrant’s Schedule of Investments is included as part of the Report to Stockholders filed under Item 1 of this Form. (b) Not Applicable due to no such divestments during the semi-annual period covered since the previous Form N-CSR filing. |
| Item 7 – | Disclosure of Proxy Voting Policies and Procedures for Closed-End Management Investment Companies – Not Applicable |
| Item 8 – | Portfolio Managers of Closed-End Management Investment Companies – Not Applicable |
| Item 9 – | Purchases of Equity Securities by Closed-End Management Investment Company and Affiliated Purchasers – Not Applicable |
| Item 10 – | Submission of Matters to a Vote of Security Holders –There have been no material changes to these procedures. |
| Item 11 – | Controls and Procedures |
| (a) – The registrant’s principal executive and principal financial officers, or persons performing similar functions, have concluded that the registrant’s disclosure controls and procedures (as defined in Rule 30a-3(c) under the Investment Company Act of 1940, as amended (the “1940 Act”)) are effective as of a date within 90 days of the filing of this report based on the evaluation of these controls and procedures required by Rule 30a-3(b) under the 1940 Act and Rule 15d-15(b) under the Securities Exchange Act of 1934, as amended. | |
| (b) – There were no changes in the registrant’s internal control over financial reporting (as defined in Rule 30a-3(d) under the 1940 Act) that occurred during the second fiscal quarter of the period covered by this report that have materially affected, or are reasonably likely to materially affect, the registrant’s internal control over financial reporting. | |
| Item 12 – | Exhibits attached hereto |
| (a)(1) – Code of Ethics – Not Applicable to this semi-annual report | |
| (a)(2) – Certifications – Attached hereto | |
| (a)(3) – Not Applicable | |
| (b) – Certifications – Attached hereto |
| 2 |
Pursuant to the requirements of the Securities Exchange Act of 1934 and the Investment Company Act of 1940, the registrant has duly caused this report to be signed on its behalf by the undersigned, thereunto duly authorized.
BlackRock Municipal Bond Fund, Inc.
| By: | /s/ John M. Perlowski | |
| John M. Perlowski | ||
| Chief Executive Officer (principal executive officer) of | ||
| BlackRock Municipal Bond Fund, Inc. |
Date: February 27, 2015
Pursuant to the requirements of the Securities Exchange Act of 1934 and the Investment Company Act of 1940, this report has been signed below by the following persons on behalf of the registrant and in the capacities and on the dates indicated.
| By: | /s/ John M. Perlowski | |
| John M. Perlowski | ||
| Chief Executive Officer (principal executive officer) of | ||
| BlackRock Municipal Bond Fund, Inc. |
Date: February 27, 2015
| By: | /s/ Neal J. Andrews | |
| Neal J. Andrews | ||
| Chief Financial Officer (principal financial officer) of | ||
| BlackRock Municipal Bond Fund, Inc. |
Date: February 27, 2015
| 3 |