UNITED STATES
SECURITIES AND EXCHANGE COMMISSION
Washington, D.C. 20549
FORM N-CSR
CERTIFIED SHAREHOLDER REPORT OF REGISTERED MANAGEMENT INVESTMENT COMPANIES
Investment Company Act file number: 811-02688
Name of Fund: BlackRock Municipal Bond Fund, Inc.
BlackRock High Yield Municipal Fund
BlackRock National Municipal Fund
BlackRock Short-Term Municipal Fund
Fund Address: 100 Bellevue Parkway, Wilmington, DE 19809
Name and address of agent for service: John M. Perlowski, Chief Executive Officer, BlackRock Municipal Bond
Fund, Inc., 55 East 52nd Street, New York, NY 10055
Registrant’s telephone number, including area code: (800) 441-7762
Date of fiscal year end: 06/30/2016
Date of reporting period: 12/31/2015
Item 1 – Report to Stockholders
DECEMBER 31, 2015
SEMI-ANNUAL REPORT (UNAUDITED)
|  |
BlackRock Municipal Bond Fund, Inc.
| Ø | BlackRock High Yield Municipal Fund |
| Ø | BlackRock National Municipal Fund |
| Ø | BlackRock Short-Term Municipal Fund |
BlackRock Multi-State Municipal Series Trust
| Ø | BlackRock New York Municipal Opportunities Fund |
| Not FDIC Insured • May Lose Value • No Bank Guarantee |
| Table of Contents | ||||
| Page | ||||
| 3 | ||||
Semi-Annual Report: | ||||
| 4 | ||||
| 12 | ||||
| 13 | ||||
| 14 | ||||
| 14 | ||||
| Financial Statements: | ||||
| 15 | ||||
| 43 | ||||
| 45 | ||||
| 46 | ||||
| 50 | ||||
| 70 | ||||
| 82 | ||||
| 83 | ||||
| 2 | SEMI-ANNUAL REPORT | DECEMBER 31, 2015 |
| The Markets in Review |
Dear Shareholder,
Diverging monetary policies and shifting economic outlooks across regions have been the overarching themes driving financial markets over the past couple of years. With U.S. growth outpacing the global economic recovery in 2015 while inflationary pressures remained low, investors spent most of the year anticipating a short-term rate hike from the Federal Reserve (the “Fed”), which ultimately came to fruition in December. In contrast, the European Central Bank (“ECB”) and the Bank of Japan moved to a more accommodative stance during the year. In this environment, the U.S. dollar strengthened considerably, causing profit challenges for U.S. exporters and high levels of volatility in emerging market currencies and commodities. Oil prices were particularly volatile and below the historical norm due to an ongoing imbalance in global supply and demand.
Market volatility broadly increased in the middle of 2015, beginning with a sharp, but temporary, selloff in June as Greece’s long-brewing debt troubles came to an impasse. Just as these concerns abated, Chinese equities tumbled amid weakness in the country’s economy. This, combined with a depreciation of the yuan and declining confidence in China’s policymakers, stoked worries about the potential impact to the broader world economy, causing heightened volatility to spread throughout markets globally. Given a dearth of meaningful growth across most of the world, financial markets became more reliant on central bank policies to drive performance. In that vein, risk assets (such as equities and high yield bonds) rallied in October when China’s central bank provided more stimulus, the ECB hinted at further easing, and soft U.S. data pushed back expectations for a Fed rate hike. As the period came to a close, however, the ECB disappointed investors with its subdued policy changes. The Fed’s December rate hike had a positive impact on the markets as it removed a source of uncertainty, but this was counteracted by the dampening effect of a stronger U.S. dollar, falling oil prices and tighter credit conditions.
At BlackRock, we believe investors need to think globally, extend their scope across a broad array of asset classes and be prepared to move freely as market conditions change over time. We encourage you to talk with your financial advisor and visit blackrock.com for further insight about investing in today’s markets.
Sincerely,

Rob Kapito
President, BlackRock Advisors, LLC

Rob Kapito
President, BlackRock Advisors, LLC
| Total Returns as of December 31, 2015 | ||||||||
| 6-month | 12-month | |||||||
U.S. large cap equities | 0.15 | % | 1.38 | % | ||||
U.S. small cap equities | (8.75 | ) | (4.41 | ) | ||||
International equities | (6.01 | ) | (0.81 | ) | ||||
Emerging market equities | (17.35 | ) | (14.92 | ) | ||||
3-month Treasury bills | 0.04 | 0.05 | ||||||
U.S. Treasury securities | 1.43 | 0.91 | ||||||
U.S. investment-grade bonds | 0.65 | 0.55 | ||||||
Tax-exempt municipal | 3.31 | 3.32 | ||||||
U.S. high yield bonds | (6.79 | ) | (4.43 | ) | ||||
| Past performance is no guarantee of future results. Index performance is shown for illustrative purposes only. You cannot invest directly in an index. | ||||||||
| THIS PAGE NOT PART OF YOUR FUND REPORT | 3 |
| Fund Summary as of December 31, 2015 | BlackRock High Yield Municipal Fund | |||
| Investment Objective |
BlackRock High Yield Municipal Fund’s (the “Fund”) investment objective is to provide shareholders with as high a level of income exempt from federal income taxes as is consistent with the investment policies of the Fund.
| Portfolio Management Commentary |
How did the Fund perform?
| • | For the six-month period ended December 31, 2015, the Fund outperformed its primary benchmark, the S&P® Municipal Bond Index. The Fund’s Institutional and Investor A Shares outperformed the secondary benchmark, the Custom High Yield Index, which is customized to represent only issues in the S&P® Customized High Yield Bond Index that have maturities greater than five years. The Fund’s Investor C Shares underperformed the secondary benchmark. The following discussion of relative performance pertains to the Custom High Yield Index. |
What factors influenced performance?
| • | The Fund’s overweight position in bonds with maturities of 25 years and longer benefited performance, as longer-dated bonds outpaced the broader market during the period. The Fund’s concentrations in BBB and AA rated securities, which outperformed, also aided performance. Sector allocation decisions, led by overweight positions in transportation, corporate and other industries (ranging from development districts to various project specific financings) were an additional plus. The Fund’s relative performance also continued to benefit from its lack of a position in distressed Puerto Rico bonds, which declined in value during the period. |
| • | The Fund’s underweight position relative to its benchmark in the utilities sector detracted from performance. In addition, the investment advisor’s higher-quality bias led it to hold below-market weightings in single-B, CCC and unrated securities, meaning that the Fund was unable to participate |
fully in the outperformance of these market segments. The Fund’s underweight exposure to local tax-backed sector, which outpaced the broader market, detracted as well. In addition, the Fund’s below-benchmark duration (interest rate sensitivity) was a modest drag on performance in the declining rate environment. |
Describe recent portfolio activity.
| • | The Fund continued to add exposure in the tobacco sector. While tobacco bonds were the best-performing sector of the market in 2015, the investment advisor believes this group continues to exhibit value compared to other high yield investments. The Fund’s new purchases were concentrated in the transportation, utilities, health care and education sectors, while it trimmed its position in the local tax-backed sector. The investment advisor increased leverage as a means of enhancing portfolio yield and capturing the performance of long-dated, high-quality bonds. The Fund’s cash position was above its usual level at the end of the period, reflecting an increase in investment inflows. |
Describe portfolio positioning at period end.
| • | The Fund’s duration posture was below that of the secondary benchmark at year-end. The Fund maintained a higher-quality bias, as the investment advisor preferred to have a high degree of liquidity at a time when narrow credit spreads offered only marginal relative value. The investment advisor continued to emphasize the tobacco, health care and transportation sectors. |
The views expressed reflect the opinions of BlackRock as of the date of this report and are subject to change based on changes in market, economic or other conditions. These views are not intended to be a forecast of future events and are no guarantee of future results.
| Overview of the Fund’s Total Investments* |
| Sector Allocation | Percent of Total Investments |
Health | 18 | % | ||
Tobacco | 17 | |||
County/City/Special District/School District | 16 | |||
Transportation | 15 | |||
Education | 12 | |||
Corporate | 9 | |||
Utilities | 7 | |||
State | 6 |
For Fund compliance purposes, the Fund’s sector classifications refer to one or more of the sector sub-classifications used by one or more widely recognized market indexes or rating group indexes, and/or as defined by the investment advisor. These definitions may not apply for purposes of this report, which may combine such sector sub-classifications for reporting ease.
| Call/Maturity Schedule3 | Percent of Total Investments |
| Calendar Year Ended December 31, | ||||
2016 | 8 | % | ||
2017 | 7 | |||
2018 | 3 | |||
2019 | 5 | |||
2020 | 9 |
| 3 | Scheduled maturity dates and/or bonds that are subject to potential calls by issuers over the next five years. |
| * | Excludes short-term securities. |
| Credit Quality Allocation1 | Percent of Total Investments |
AAA/Aaa | 4 | % | ||
AA/Aa | 13 | |||
A | 9 | |||
BBB/Baa | 26 | |||
BB/Ba | 11 | |||
B | 10 | |||
N/R2 | 27 |
| 1 | For financial reporting purposes, credit quality ratings shown above reflect the highest rating assigned by either Standard & Poor’s (“S&P”) or Moody’s Investors Service (“Moody’s”) if ratings differ. These rating agencies are independent, nationally recognized statistical rating organizations and are widely used. Investment grade ratings are credit ratings of BBB/Baa or higher. Below investment grade ratings are credit ratings of BB/Ba or lower. Investments designated N/R are not rated by either rating agency. Unrated investments do not necessarily indicate low credit quality. Credit quality ratings are subject to change. |
| 2 | The investment advisor evaluates the credit quality of unrated investments based upon certain factors including, but not limited to, credit ratings for similar investments and financial analysis of sectors and individual investments. Using this approach, the investment advisor has deemed certain of these unrated securities as investment grade quality. As of December 31, 2015, the market value of unrated securities deemed by the investment advisor to be investment grade represents 2% of the Fund’s total investments. |
| 4 | SEMI-ANNUAL REPORT | DECEMBER 31, 2015 |
| BlackRock High Yield Municipal Fund | ||||||
| Total Return Based on a $10,000 Investment |
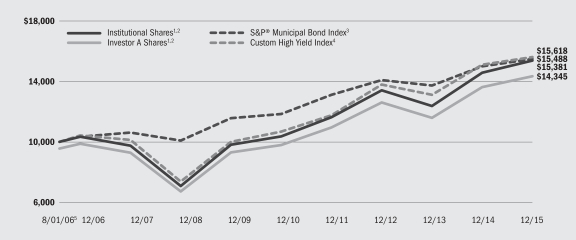
| 1 | Assuming maximum sales charge, if any, transaction costs and other operating expenses, including advisory fees. Institutional Shares do not have a sales charge. |
| 2 | The Fund may invest in municipal bonds rated in any rating category or in unrated municipal bonds. The Fund will usually invest in municipal bonds that have a maturity of five years or longer. |
| 3 | The S&P® Municipal Bond Index is composed of bonds held by managed municipal bond fund customers of Standard & Poor’s Securities Pricing, Inc. that are priced daily. Bonds in the S&P® Municipal Bond Index must have an outstanding par value of at least $2 million and a remaining maturity of not less than one month. |
| 4 | The Custom High Yield Index is a customized benchmark that reflects the returns of the S&P® Customized High Yield Municipal Bond Index for periods prior to January 1, 2013, and the returns of only those bonds in the S&P® Customized High Yield Municipal Bond Index that have maturities greater than 5 years for periods subsequent to January 1, 2013. |
| 5 | Commencement of operations. |
| Performance Summary for the Period Ended December 31, 2015 |
| Average Annual Total Returns6 | ||||||||||||||||||||||||||||||||||||
| 1 Year | 5 Years | Since Inception7 | ||||||||||||||||||||||||||||||||||
| Standardized 30-Day Yields | Unsubsidized 30-Day Yields | 6-Month Total Returns | w/o sales charge | w/sales charge | w/o sales charge | w/sales charge | w/o sales charge | w/sales charge | ||||||||||||||||||||||||||||
Institutional | 3.71 | % | 3.71 | % | 5.01 | % | 5.50 | % | N/A | 8.19 | % | N/A | 4.68 | % | N/A | |||||||||||||||||||||
Investor A | 3.31 | 3.31 | 4.88 | 5.23 | 0.76 | % | 7.92 | 6.98 | % | 4.39 | 3.91 | % | ||||||||||||||||||||||||
Investor C | 2.70 | 2.70 | 4.48 | 4.45 | 3.45 | 7.10 | 7.10 | 3.63 | 3.63 | |||||||||||||||||||||||||||
S&P® Municipal Bond Index | — | — | 3.31 | 3.32 | N/A | 5.50 | N/A | 4.76 | N/A | |||||||||||||||||||||||||||
Custom High Yield Index | — | — | 4.64 | 3.33 | N/A | 7.89 | N/A | 4.85 | N/A | |||||||||||||||||||||||||||
| 6 | Assuming maximum sales charges, if any. Average annual total returns with and without sales charges reflect reductions for distribution and service fees. See “About Fund Performance” on page 12 for a detailed description of share classes, including any related sales charges and fees. |
| 7 | The Fund commenced operations on 8/01/06. |
| N/A — Not applicable as share class and index do not have a sales charge. |
| Past performance is not indicative of future results. |
| Expense Example |
| Actual | Hypothetical10 | |||||||||||||||||||||||||||||||||||
| During the Period | Including Interest Expense and Fees | Excluding Interest Expense and Fees | ||||||||||||||||||||||||||||||||||
| Beginning Account Value July 1, 2015 | Ending Account Value December 31, 2015 | Including Interest Expense and Fees8 | Excluding Interest Expense and Fees9 | Beginning Account Value July 1, 2015 | Ending Account Value December 31, 2015 | Expenses Paid During the Period8 | Ending Account Value December 31, 2015 | Expenses Paid During the Period9 | ||||||||||||||||||||||||||||
Institutional | $ | 1,000.00 | $ | 1,050.10 | $ | 3.66 | $ | 3.40 | $ | 1,000.00 | $ | 1,021.57 | $ | 3.61 | $ | 1,021.82 | $ | 3.35 | ||||||||||||||||||
Investor A | $ | 1,000.00 | $ | 1,048.80 | $ | 5.00 | $ | 4.74 | $ | 1,000.00 | $ | 1,020.26 | $ | 4.93 | $ | 1,020.51 | $ | 4.67 | ||||||||||||||||||
Investor C | $ | 1,000.00 | $ | 1,044.80 | $ | 8.89 | $ | 8.58 | $ | 1,000.00 | $ | 1,016.44 | $ | 8.77 | $ | 1,016.74 | $ | 8.47 | ||||||||||||||||||
| 8 | For each class of the Fund, expenses are equal to the annualized net expense ratio for the class (0.71% for Institutional, 0.97% for Investor A and 1.73% for Investor C), multiplied by the average account value over the period, multiplied by 184/366 (to reflect the one-half year period shown). |
| 9 | For each class of the Fund, expenses are equal to the annualized net expense ratio for the class (0.66% for Institutional, 0.92% for Investor A and 1.67% for Investor C), multiplied by the average account value over the period, multiplied by 184/366 (to reflect the one-half year period shown). |
| 10 | Hypothetical 5% annual return before expenses is calculated by prorating the number of days in the most recent fiscal half year divided by 366. |
| See “Disclosure of Expenses” on page 13 for further information on how expenses were calculated. |
| SEMI-ANNUAL REPORT | DECEMBER 31, 2015 | 5 |
| Fund Summary as of December 31, 2015 | BlackRock National Municipal Fund | |||
| Investment Objective |
BlackRock National Municipal Fund’s (the “Fund”) investment objective is to provide shareholders with as high a level of income exempt from federal income taxes as is consistent with the investment policies of the Fund.
| Portfolio Management Commentary |
How did the Fund perform?
| • | For the six-month period ended December 31, 2015, the Fund underperformed both its benchmark, the S&P® Municipal Bond Index, and its secondary benchmark, the Custom National Index. The following discussion of relative performance pertains to the Fund’s secondary benchmark, the Custom National Index. |
What factors influenced performance?
| • | The primary cause of the Fund’s underperformance relative to its benchmark was that its duration (interest rate sensitivity) was below that of the benchmark at a time when yields fell. (Prices and yields move in opposite directions.) In addition, the Fund’s above-average weighting in cash detracted from returns given that longer-maturity bonds and higher-yielding sectors generally outperformed. The large cash position stemmed from the significant inflows into the Fund during the period. In an environment characterized by less attractive valuations, low absolute yields and a tighter yield gap between municipal bonds and other fixed-income asset classes, the investment advisor was patient in putting these cash inflows to work. |
| • | On the positive side, the Fund was helped by its long maturity bias, which enabled it to capitalize on the outperformance of longer-term bonds rela- |
tive to short-term debt. In addition, its positions in higher-rated bonds rose in price amid healthy buying interest. The Fund’s exposure to the tobacco sector, the top performing segment of the market, was also a plus. Holding no exposure to Puerto Rico bonds, which continued to lose ground on concerns about the growing likelihood of a default, was an additional positive as related to Fund performance. |
Describe recent portfolio activity.
| • | The Fund’s purchases were concentrated in new issues rather than those already trading in the secondary market. The investment advisor generally focused its purchases on the longer end of the yield curve to maximize yield and bring the Fund’s duration closer to a neutral posture. The Fund pared down its use of leverage during the period, and it initiated a position in tobacco bonds. |
Describe portfolio positioning at period end.
| • | The Fund was positioned defensively, with an above-average cash position and an average credit quality of AA-. The Fund maintained a duration below that of the S&P® Municipal Bond Index, and its weighting in pre-refunded securities increased as lower interest rates prompted municipal issuers to refinance older-dated, higher-yielding debt. |
The views expressed reflect the opinions of BlackRock as of the date of this report and are subject to change based on changes in market, economic or other conditions. These views are not intended to be a forecast of future events and are no guarantee of future results.
| Overview of the Fund’s Total Investments* |
| Sector Allocation | Percent of Total Investments |
Transportation | 22 | % | ||
Utilities | 22 | |||
Education | 17 | |||
Health | 15 | |||
State | 8 | |||
County/City/Special District/School District | 8 | |||
Corporate | 4 | |||
Tobacco | 3 | |||
Housing | 1 |
For Fund compliance purposes, the Fund’s sector classifications refer to one or more of the sector sub-classifications used by one or more widely recognized market indexes or rating group indexes, and/or as defined by the investment advisor. These definitions may not apply for purposes of this report, which may combine such sector sub-classifications for reporting ease.
| Call/Maturity Schedule3 | Percent of Total Investments |
| Calendar Year Ended December 31, | ||||
2016 | 6 | % | ||
2017 | 8 | |||
2018 | 15 | |||
2019 | 20 | |||
2020 | 10 |
| 3 | Scheduled maturity dates and/or bonds that are subject to potential calls by issuers over the next five years. |
| * | Excludes short-term securities. |
| Credit Quality Allocation1 | Percent of Total Investments |
AAA/Aaa | 18 | % | ||
AA/Aa | 45 | |||
A | 23 | |||
BBB/Baa | 6 | |||
BB/Ba | 1 | |||
B | 1 | |||
N/R2 | 6 |
| 1 | For financial reporting purposes, credit quality ratings shown above reflect the highest rating assigned by either S&P or Moody’s if ratings differ. These rating agencies are independent, nationally recognized statistical rating organizations and are widely used. Investment grade ratings are credit ratings of BBB/Baa or higher. Below investment grade ratings are credit ratings of BB/Ba or lower. Investments designated N/R are not rated by either rating agency. Unrated investments do not necessarily indicate low credit quality. Credit quality ratings are subject to change. |
| 2 | The investment advisor evaluates the credit quality of unrated investments based upon certain factors including, but not limited to, credit ratings for similar investments and financial analysis of sectors and individual investments. Using this approach, the investment advisor has deemed certain of these unrated securities as investment grade quality. As of December 31, 2015, the market value of unrated securities deemed by the investment advisor to be investment grade represents 4% of the Fund’s total investments. |
| 6 | SEMI-ANNUAL REPORT | DECEMBER 31, 2015 |
| BlackRock National Municipal Fund |
| Total Return Based on a $10,000 Investment |
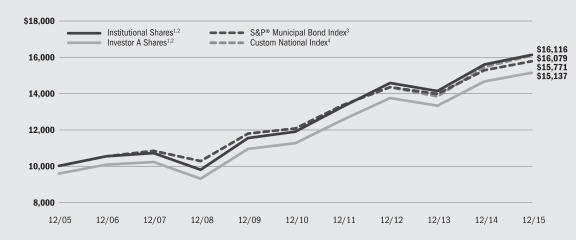
| 1 | Assuming maximum sales charge, if any, transaction costs and other operating expenses, including advisory fees. Institutional Shares do not have a sales charge. |
| 2 | The Fund may invest in municipal bonds rated in any rating category or in unrated municipal bonds. The Fund will usually invest in municipal bonds that have a maturity of five years or longer. |
| 3 | The S&P® Municipal Bond Index is composed of bonds held by managed municipal bond fund customers of Standard & Poor’s Securities Pricing, Inc. that are priced daily. Bonds in the S&P® Municipal Bond Index must have an outstanding par value of at least $2 million and a remaining maturity of not less than one month. |
| 4 | The Custom National Index reflects the returns of the S&P Municipal Bond Index for periods prior to 1/1/13, and the returns of only those bonds in the S&P Municipal Bond Index that have maturities greater than 5 years for periods subsequent to 1/1/13. |
| Performance Summary for the Period Ended December 31, 2015 |
| Average Annual Total Returns5 | ||||||||||||||||||||||||||||||||||||
| 1 Year | 5 Years | 10 Years | ||||||||||||||||||||||||||||||||||
| Standardized 30-Day Yields | Unsubsidized 30-Day Yields | 6-Month Total Returns | w/o sales charge | w/sales charge | w/o sales charge | w/sales charge | w/o sales charge | w/sales charge | ||||||||||||||||||||||||||||
BlackRock | 1.76 | % | 1.73 | % | 2.93 | % | 3.52 | % | N/A | 6.38 | % | N/A | 5.01 | % | N/A | |||||||||||||||||||||
Institutional | 1.65 | 1.65 | 2.98 | 3.43 | N/A | 6.27 | N/A | 4.89 | N/A | |||||||||||||||||||||||||||
Service | 1.46 | 1.46 | 2.87 | 3.23 | N/A | 5.97 | N/A | 4.61 | N/A | |||||||||||||||||||||||||||
Investor A | 1.44 | 1.34 | 2.89 | 3.35 | (1.04 | )% | 6.10 | 5.18 | % | 4.69 | 4.23 | % | ||||||||||||||||||||||||
Investor B | 1.00 | 0.89 | 2.63 | 2.83 | (1.17 | ) | 5.58 | 5.26 | 4.16 | 4.16 | ||||||||||||||||||||||||||
Investor C | 0.76 | 0.73 | 2.51 | 2.49 | 1.49 | 5.31 | 5.31 | 3.89 | 3.89 | |||||||||||||||||||||||||||
Investor C1 | 0.95 | 0.93 | 2.60 | 2.78 | N/A | 5.53 | N/A | 4.11 | N/A | |||||||||||||||||||||||||||
S&P® Municipal Bond Index | — | — | 3.31 | 3.32 | N/A | 5.50 | N/A | 4.66 | N/A | |||||||||||||||||||||||||||
Custom National Index | — | — | 4.21 | 4.10 | N/A | 5.91 | N/A | 4.86 | N/A | |||||||||||||||||||||||||||
| 5 | Assuming maximum sales charges, if any. Average annual total returns with and without sales charges reflect reductions for distribution and service fees. See “About Fund Performance” on page 12 for a detailed description of share classes, including any related sales charges and fees. |
| N/A — Not applicable as share class and index do not have a sales charge. |
| Past performance is not indicative of future results. |
| Expense Example |
| Actual | Hypothetical8 | |||||||||||||||||||||||||||||||||||
| During the Period | Including Interest Expense and Fees | Excluding Interest Expense and Fees | ||||||||||||||||||||||||||||||||||
| Beginning Account Value July 1, 2015 | Ending Account Value December 31, 2015 | Expenses Including Interest Expense and Fees6 | Excluding Interest Expense and Fees7 | Beginning Account Value July 1, 2015 | Ending Account Value December 31, 2015 | Expenses Paid During the Period6 | Ending Account Value December 31, 2015 | Expenses Paid During the Period7 | ||||||||||||||||||||||||||||
Blackrock | $ | 1,000.00 | $ | 1,029.30 | $ | 2.50 | $ | 2.35 | $ | 1,000.00 | $ | 1,022.67 | $ | 2.49 | $ | 1,022.82 | $ | 2.34 | ||||||||||||||||||
Institutional | $ | 1,000.00 | $ | 1,029.80 | $ | 3.01 | $ | 2.86 | $ | 1,000.00 | $ | 1,022.17 | $ | 3.00 | $ | 1,022.32 | $ | 2.85 | ||||||||||||||||||
Investor A | $ | 1,000.00 | $ | 1,028.90 | $ | 3.82 | $ | 3.67 | $ | 1,000.00 | $ | 1,021.37 | $ | 3.81 | $ | 1,021.52 | $ | 3.66 | ||||||||||||||||||
Investor B | $ | 1,000.00 | $ | 1,026.30 | $ | 6.42 | $ | 6.26 | $ | 1,000.00 | $ | 1,018.80 | $ | 6.39 | $ | 1,018.95 | $ | 6.24 | ||||||||||||||||||
Investor C | $ | 1,000.00 | $ | 1,025.10 | $ | 7.64 | $ | 7.48 | $ | 1,000.00 | $ | 1,017.60 | $ | 7.61 | $ | 1,017.75 | $ | 7.46 | ||||||||||||||||||
Investor C1 | $ | 1,000.00 | $ | 1,026.00 | $ | 6.67 | $ | 6.52 | $ | 1,000.00 | $ | 1,018.55 | $ | 6.65 | $ | 1,018.70 | $ | 6.50 | ||||||||||||||||||
Service Class | $ | 1,000.00 | $ | 1,028.70 | $ | 4.08 | $ | 3.93 | $ | 1,000.00 | $ | 1,021.11 | $ | 4.06 | $ | 1,021.27 | $ | 3.91 | ||||||||||||||||||
| 6 | For each class of the Fund, expenses are equal to the annualized net expense ratio for the class (0.49% for BlackRock, 0.59% for Institutional, 0.80% for Service, 0.75% for Investor A, 1.26% for Investor B, 1.50% for Investor C and 1.31% for Investor C1), multiplied by the average account value over the period, multiplied by 184/366 (to reflect the one-half year period shown). |
| 7 | For each class of the Fund, expenses are equal to the annualized net expense ratio for the class (0.46% for BlackRock, 0.56% for Institutional, 0.77% for Service, 0.72% for Investor A, 1.23% for Investor B, 1.47% for Investor C and 1.28% for Investor C1), multiplied by the average account value over the period, multiplied by 184/366 (to reflect the one-half year period shown). |
| 8 | Hypothetical 5% annual return before expenses is calculated by prorating the number of days in the most recent fiscal half year divided by 366. |
| SEMI-ANNUAL REPORT | DECEMBER 31, 2015 | 7 |
| Fund Summary as of December 31, 2015 | BlackRock Short-Term Municipal Fund | |||
| Investment Objective |
BlackRock Short-Term Municipal Fund’s (the “Fund”) investment objective is to provide shareholders with as high a level of income exempt from federal income taxes as is consistent with the investment policies of the Fund.
| Portfolio Management Commentary |
How did the Fund perform?
| • | For the six-month period ended December 31, 2015, the Fund underperformed its primary benchmark, the S&P® Municipal Bond Index, as well as its secondary benchmark, the S&P® Limited Maturity Municipal Bond Index. The following discussion of relative performance pertains to the Fund’s secondary benchmark, the S&P® Limited Maturity Municipal Bond Index. |
What factors influenced performance?
| • | The Fund’s yield curve positioning was the primary detractor from performance relative to its benchmark during the second half of 2015. Specifically, the Fund’s holdings in the utilities and tax-backed states sectors had an adverse impact on results. In addition, security selection in the utilities, tax-backed state and local and education sectors hindered returns. |
| • | The Fund was helped by its overweight position in the utilities sector, which outperformed, as well as its underweight position in pre-refunded bonds, which lagged. The investment advisor continued to trade the portfolio actively, which had a net positive impact on returns. |
Describe recent portfolio activity.
| • | The investment advisor reduced the Fund’s exposure to securities with maturities inside of 13 months, as they were most vulnerable to both a change in Federal Reserve policy and money market reform in 2016. The investment advisor reinvested the proceeds of these sales primarily into AA rated securities, as the yield spreads on single A rated securities had become too narrow. In addition, investments were made in securities with maturities closely approximating the benchmark in an effort to minimize portfolio volatility. |
Describe portfolio positioning at period end.
| • | Relative to the benchmark, the Fund was underweight in AAA rated securities and overweight in those rated AA. The Fund maintained a significant underweight in pre-refunded securities, as many of the recently pre-refunded issues did not meet the investment advisor’s credit criteria. The Fund’s largest sector overweight was to the dedicated tax-backed sectors at both the state and local levels. |
The views expressed reflect the opinions of BlackRock as of the date of this report and are subject to change based on changes in market, economic or other conditions. These views are not intended to be a forecast of future events and are no guarantee of future results.
| Overview of the Fund’s Total Investments* |
| Sector Allocation | Percent of Total Investments |
State | 28 | % | ||
County/City/Special District/School District | 21 | |||
Utilities | 17 | |||
Education | 17 | |||
Transportation | 11 | |||
Health | 4 | |||
Tobacco | 1 | |||
Housing | 1 |
For Fund compliance purposes, the Fund’s sector classifications refer to one or more of the sector sub-classifications used by one or more widely recognized market indexes or rating group indexes, and/or as defined by the investment advisor. These definitions may not apply for purposes of this report, which may combine such sector sub-classifications for reporting ease.
| Call/Maturity Schedule2 | Percent of Total Investments |
| Calendar Year Ended December 31, | ||||
2016 | 26 | % | ||
2017 | 37 | |||
2018 | 25 | |||
2019 | — | |||
2020 | — |
| 2 | Scheduled maturity dates and/or bonds that are subject to potential calls by issuers over the next five years. |
| * | Excludes short-term securities. |
| Credit Quality Allocation1 | Percent of Total Investments |
AAA/Aaa | 29 | % | ||
AA/Aa | 58 | |||
A | 12 | |||
BBB/Baa | 1 |
| 1 | For financial reporting purposes, credit quality ratings shown above reflect the highest rating assigned by either S&P or Moody’s if ratings differ. These rating agencies are independent, nationally recognized statistical rating organizations and are widely used. Investment grade ratings are credit ratings of BBB/Baa or higher. Below investment grade ratings are credit ratings of BB/Ba or lower. Investments designated N/R are not rated by either rating agency. Unrated investments do not necessarily indicate low credit quality. Credit quality ratings are subject to change. |
| 8 | SEMI-ANNUAL REPORT | DECEMBER 31, 2015 |
| BlackRock Short-Term Municipal Fund |
| Total Return Based on a $10,000 Investment |
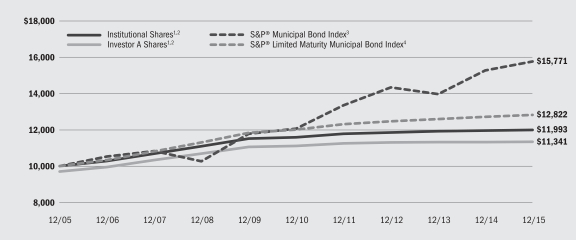
| 1 | Assuming maximum sales charge, if any, transaction costs and other operating expenses, including advisory fees. Institutional Shares do not have a sales charge. |
| 2 | The Fund invests primarily in investment grade municipal bonds or municipal notes, including variable rate demand obligations. The Fund will maintain a dollar-weighted maturity of no more than 2 years. |
| 3 | The S&P® Municipal Bond Index is composed of bonds held by managed municipal bond fund customers of Standard & Poor’s Securities Pricing, Inc. that are priced daily. Bonds in the S&P® Municipal Bond Index must have an outstanding par value of at least $2 million and a remaining maturity of not less than one month. |
| 4 | The S&P® Limited Maturity Municipal Bond Index includes all bonds in the S&P® Municipal Bond Index with a remaining maturity of less than 4 years. |
| Performance Summary for the Period Ended December 31, 2015 |
| Average Annual Total Returns5 | ||||||||||||||||||||||||||||||||||||
| 1 Year | 5 Years | 10 Years | ||||||||||||||||||||||||||||||||||
| Standardized 30-Day Yields | Unsubsidized 30-Day Yields | 6-Month Total Returns | w/o sales charge | w/sales charge | w/o sales charge | w/sales charge | w/o sales charge | w/sales charge | ||||||||||||||||||||||||||||
Institutional | 0.49 | % | 0.37 | % | 0.31 | % | 0.31 | % | N/A | 0.69 | % | N/A | 1.83 | % | N/A | |||||||||||||||||||||
Investor A | 0.20 | 0.18 | 0.17 | 0.14 | (2.87 | )% | 0.42 | (0.19 | )% | 1.58 | 1.27 | % | ||||||||||||||||||||||||
Investor A1 | 0.37 | 0.33 | 0.25 | 0.19 | N/A | 0.57 | N/A | 1.73 | N/A | |||||||||||||||||||||||||||
Investor C | (0.57 | ) | (0.58 | ) | (0.20 | ) | (0.69 | ) | (1.69 | ) | (0.38 | ) | (0.38 | ) | 0.79 | 0.79 | ||||||||||||||||||||
Class K | 0.47 | 0.46 | 0.31 | 0.31 | N/A | 0.67 | N/A | 1.82 | N/A | |||||||||||||||||||||||||||
S&P® Municipal Bond Index | — | — | 3.31 | 3.32 | N/A | 5.50 | N/A | 4.66 | N/A | |||||||||||||||||||||||||||
S&P® Limited Maturity Municipal Bond Index | — | — | 0.56 | 0.82 | N/A | 1.31 | N/A | 2.52 | N/A | |||||||||||||||||||||||||||
| 5 | Assuming maximum sales charges, if any. Average annual total returns with and without sales charges reflect reductions for distribution and service fees. See “About Fund Performance” on page 12 for a detailed description of share classes, including any related sales charges and fees. |
| N/A — Not applicable as share class and index do not have a sales charge. |
| Past performance is not indicative of future results. |
| Expense Example |
| Actual | Hypothetical7 | |||||||||||||||||||||||||||
| Beginning Account Value July 1, 2015 | Ending Account Value December 31, 2015 | Expenses Paid During the Period6 | Beginning Account Value July 1, 2015 | Ending Account Value December 31, 2015 | Expenses Paid During the Period6 | Annualized Expense Ratio | ||||||||||||||||||||||
Institutional | $ | 1,000.00 | $ | 1,003.10 | $ | 2.01 | $ | 1,000.00 | $ | 1,023.13 | $ | 2.03 | 0.40 | % | ||||||||||||||
Investor A | $ | 1,000.00 | $ | 1,001.70 | $ | 3.42 | $ | 1,000.00 | $ | 1,021.72 | $ | 3.46 | 0.68 | % | ||||||||||||||
Investor A1 | $ | 1,000.00 | $ | 1,002.50 | $ | 2.62 | $ | 1,000.00 | $ | 1,022.52 | $ | 2.64 | 0.52 | % | ||||||||||||||
Investor C | $ | 1,000.00 | $ | 998.00 | $ | 7.43 | $ | 1,000.00 | $ | 1,017.70 | $ | 7.51 | 1.48 | % | ||||||||||||||
Class K | $ | 1,000.00 | $ | 1,003.10 | $ | 2.06 | $ | 1,000.00 | $ | 1,023.08 | $ | 2.08 | 0.41 | % | ||||||||||||||
| 6 | For each class of the Fund, expenses are equal to the annualized net expense ratio for the class, multiplied by the average account value over the period, multiplied by 184/366 (to reflect the one-half year period shown). |
| 7 | Hypothetical 5% return before expenses is calculated by prorating the number of days in the most recent fiscal half year divided by 366. |
| See “Disclosure of Expenses” on page 13 for further information on how expenses were calculated. |
| SEMI-ANNUAL REPORT | DECEMBER 31, 2015 | 9 |
| Fund Summary as of December 31, 2015 | BlackRock New York Municipal Opportunities Fund | |||
| Investment Objective |
BlackRock New York Municipal Opportunities Fund’s (the “Fund”) (formerly known as BlackRock New York Municipal Bond Fund) investment objective is to provide shareholders with income exempt from federal income tax and New York State and New York City personal income taxes.
| Portfolio Management Commentary |
How did the Fund perform?
| • | For the six-month period ended December 31, 2015, the Fund outperformed its primary benchmark, the S&P® Municipal Bond Index. The Fund also outperformed its secondary benchmark, the S&P New York Municipal Bond Index. The following discussion of relative performance pertains to the Fund’s secondary benchmark, the S&P New York Municipal Bond. |
What factors influenced performance?
| • | The Fund’s positioning along the yield curve, which favored longer-dated bonds, aided performance given that longer-term bonds generally outperformed those with shorter maturities. Overweight positions in the education, health care, and transportation sectors, which outperformed the benchmark, also aided performance. The Fund was further bolstered by its heavier concentration in the middle range of the credit spectrum (specifically, A and BBB+ rated credits) at a time in which higher yielding credits, sectors and structures generally outperformed. |
| • | Income in the form of coupon payments made up a meaningful portion of the Fund’s total return for the period. In addition, the Fund’s limited use of leverage provided both incremental return and income in an environment of declining long-term yields. (Bonds prices rise as yields fall.) |
| • | Exposure to lower-coupon bonds (bonds priced at a discount) also benefited from declining longer-term interest rates, since such bonds tend to have longer durations and more capital appreciation potential than bonds with larger coupons. (Duration is a measure of interest-rate sensitivity.) These bonds tend to offer additional incremental yield, which also aided performance. |
| • | The Fund’s exposure to the tax-backed (state and local) sector detracted from performance during the period, as did its exposure to AAA and AA-rated issues. |
| • | The Fund uses U.S. Treasury futures contracts to manage interest rate risk. While these positions detracted from performance in isolation, they allowed the Fund to invest further out the yield curve and maintain a higher duration within the underlying tax-exempt bond portfolio. |
Describe recent portfolio activity.
| • | Fund activity centered on investing cash flows from investment inflows and bond calls, as well as continued re-balancing in order to align with the change to the flexible-fund mandate that was enacted earlier in the year. The investment advisor relied on the opportunities presented in the new-issue market in order to invest cash, diversify into different issuers, and structure the portfolio for the optimum mix of yield and total return. Where feasible, purchases were weighted toward the longer end of the yield curve and into lower-rated investment-grade bonds, as long rates seemed well anchored and higher yielding bonds continued to experience strong demand. The Fund also increased its exposure to the tobacco sector, bringing it to a slight overweight. |
| • | The Fund’s cash position temporarily rose to nearly 10% during the period and closed closer to 4% toward the end of the period. This did not have a material impact on performance, as the Fund’s above-average yield and interest-rate sensitivity resulted in a strong total return for the period. |
Describe portfolio positioning at period end.
| • | Relative to the S&P New York Municipal Bond Index, the Fund remained biased toward longer-term bonds in order to capture additional yield and capitalize on the robust retail demand for long-dated bonds. The Fund’s new mandate involves an increased exposure to high yield credits. As a result, the investment advisor remained on the lookout for opportunities in this area. |
The views expressed reflect the opinions of BlackRock as of the date of this report and are subject to change based on changes in market, economic or other conditions. These views are not intended to be a forecast of future events and are no guarantee of future results.
| Overview of the Fund’s Total Investments* |
| Sector Allocation | Percent of Total Investments | |||
County/City/Special District/School District | 26 | % | ||
Transportation | 17 | |||
Education | 15 | |||
Utilities | 12 | |||
Health | 9 | |||
Corporate | 7 | |||
State | 6 | |||
Tobacco | 5 | |||
Housing | 3 | |||
For Fund compliance purposes, the Fund’s sector classifications refer to one or more of the sector sub-classifications used by one or more widely recognized market indexes or rating group indexes, and/or as defined by the investment advisor. These definitions may not apply for purposes of this report, which may combine such sector sub-classifications for reporting ease.
| Call/Maturity Schedule3 | Percent of Total Investments | |||
| Calendar Year Ended December 31, | ||||
2016 | 6 | % | ||
2017 | 4 | |||
2018 | 3 | |||
2019 | 9 | |||
2020 | 7 | |||
| 3 | Scheduled maturity dates and/or bonds that are subject to potential calls by issuers over the next five years. |
| * | Excludes short-term securities. |
| Credit Quality Allocation1 | Percent of Total Investments |
AAA/Aaa | 13 | % | ||
AA/Aa | 39 | |||
A | 28 | |||
BBB/Baa | 4 | |||
BB/Ba | 3 | |||
B | 1 | |||
N/R2 | 12 |
| 1 | For financial reporting purposes, credit quality ratings shown above reflect the highest rating assigned by either S&P or Moody’s if ratings differ. These rating agencies are independent, nationally recognized statistical rating organizations and are widely used. Investment grade ratings are credit ratings of BBB/Baa or higher. Below investment grade ratings are credit ratings of BB/Ba or lower. Investments designated N/R are not rated by either rating agency. Unrated investments do not necessarily indicate low credit quality. Credit quality ratings are subject to change. |
| 2 | The investment advisor evaluates the credit quality of unrated investments based upon certain factors including, but not limited to, credit ratings for similar investments and financial analysis of sectors and individual investments. Using this approach, the investment advisor has deemed certain of these unrated securities as investment grade quality. As of December 31, 2015, the market value of unrated securities deemed by the investment advisor to be investment grade represents 2% of the Fund’s total investments. |
| 10 | SEMI-ANNUAL REPORT | DECEMBER 31, 2015 |
| BlackRock New York Municipal Opportunities Fund |
| Total Return Based on a $10,000 Investment |
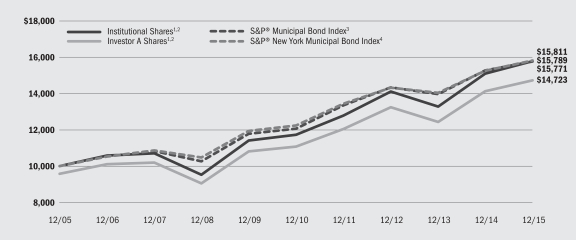
| 1 | Assuming maximum sales charges, if any, transaction costs and other operating expenses, including advisory fees. Institutional Shares do not have a sales charge. |
| 2 | The Fund will invest at least 80% of its assets in a portfolio of investment grade New York municipal bonds. |
| 3 | The S&P® Municipal Bond Index is composed of bonds held by managed municipal bond fund customers of Standard & Poor’s Securities Pricing, Inc. that are priced daily. Bonds in the S&P® Municipal Bond Index must have an outstanding par value of at least $2 million and a remaining maturity of not less than 1 month. |
| 4 | The S&P® New York Municipal Bond Index includes all New York bonds in the S&P® Municipal Bond Index. |
| Performance Summary for the Period Ended December 31, 2015 |
| Average Annual Total Returns5 | ||||||||||||||||||||||||||||||||||||
| 1 Year | 5 Years | 10 Years | ||||||||||||||||||||||||||||||||||
| Standardized 30-Day Yields | Unsubsidized 30-Day Yields | 6-Month Total Returns | w/o sales charge | w/sales charge | w/o sales charge | w/sales charge | w/o sales charge | w/sales charge | ||||||||||||||||||||||||||||
Institutional | 2.38 | % | 2.31 | % | 4.45 | % | 4.57 | % | N/A | 6.12 | % | N/A | 4.67 | % | N/A | |||||||||||||||||||||
Investor A | 2.05 | 1.97 | 4.23 | 4.23 | (0.20 | )% | 5.85 | 4.93 | % | 4.40 | 3.94 | % | ||||||||||||||||||||||||
Investor A1 | 2.16 | 2.13 | 4.29 | 4.34 | N/A | 6.00 | N/A | 4.56 | N/A | |||||||||||||||||||||||||||
Investor C | 1.40 | 1.32 | 3.94 | 3.45 | 2.45 | 5.08 | 5.08 | 3.63 | 3.63 | |||||||||||||||||||||||||||
Investor C1 | 1.76 | 1.73 | 4.13 | 3.82 | N/A | 5.49 | N/A | 4.04 | N/A | |||||||||||||||||||||||||||
S&P® Municipal Bond Index | — | — | 3.31 | 3.32 | N/A | 5.50 | N/A | 4.66 | N/A | |||||||||||||||||||||||||||
S&P® New York Municipal Bond Index | — | — | 3.34 | 3.66 | N/A | 5.24 | N/A | 4.69 | N/A | |||||||||||||||||||||||||||
| 5 | Assuming maximum sales charges, if any. Average annual total returns with and without sales charges reflect reductions for distribution and service fees. See “About Fund Performance” on page 12 for a detailed description of share classes, including any related sales charges and fees. |
| N/A — Not applicable as share class and index do not have a sales charge. |
| Past performance is not indicative of future results. |
| Expense Example |
| Actual | Hypothetical9 | |||||||||||||||||||||||||||||||||||
| Expenses Paid During the Period | Including Interest Expense and Fees | Excluding Interest Expense and Fees | ||||||||||||||||||||||||||||||||||
| Beginning Account Value July 1, 2015 | Ending Account Value December 31, 2015 | Including Interest Expense and Fees7 | Excluding Interest Expense and Fees8 | Beginning Account Value July 1, 2015 | Ending Account Value December 31, 2015 | Expenses Paid During the Period7 | Ending Account Value December 31, 2015 | Expenses Paid During the Period8 | ||||||||||||||||||||||||||||
Institutional | $ | 1,000.00 | $ | 1,044.50 | $ | 3.55 | $ | 3.34 | $ | 1,000.00 | $ | 1,021.67 | $ | 3.51 | $ | 1,021.87 | $ | 3.30 | ||||||||||||||||||
Investor A | $ | 1,000.00 | $ | 1,042.30 | $ | 4.77 | $ | 4.57 | $ | 1,000.00 | $ | 1,020.46 | $ | 4.72 | $ | 1,020.66 | $ | 4.52 | ||||||||||||||||||
Investor A1 | $ | 1,000.00 | $ | 1,042.90 | $ | 4.21 | $ | 4.06 | $ | 1,000.00 | $ | 1,021.01 | $ | 4.17 | $ | 1,021.17 | $ | 4.01 | ||||||||||||||||||
Investor C | $ | 1,000.00 | $ | 1,039.40 | $ | 8.61 | $ | 8.41 | $ | 1,000.00 | $ | 1,016.69 | $ | 8.52 | $ | 1,016.89 | $ | 8.31 | ||||||||||||||||||
Investor C1 | $ | 1,000.00 | $ | 1,041.30 | $ | 6.77 | $ | 6.57 | $ | 1,000.00 | $ | 1,018.50 | $ | 6.70 | $ | 1,018.70 | $ | 6.50 | ||||||||||||||||||
| 7 | For each class of the Fund, expenses are equal to the annualized net expense ratio for the class (0.69% for Institutional, 0.93% for Investor A, 0.82% for Investor A1, 1.68% for Investor C and 1.32% for Investor C1), multiplied by the average account value over the period, multiplied by 184/366 (to reflect the one-half year period shown). |
| 8 | For each class of the Fund, expenses are equal to the annualized net expense ratio for the class (0.65% for Institutional, 0.89% for Investor A, 0.79% for Investor A1, 1.64% for Investor C and 1.28% for Investor C1), multiplied by the average account value over the period, multiplied by 184/366 (to reflect the one-half year period shown). |
| 9 | Hypothetical 5% annual return before expenses is calculated by prorating the number of days in the most recent fiscal half year divided by 366. |
| See “Disclosure of Expenses” on page 13 for further information on how expenses were calculated. |
| SEMI-ANNUAL REPORT | DECEMBER 31, 2015 | 11 |
| About Fund Performance | ||||
| • | BlackRock, Institutional and Class K Shares (BlackRock Shares are available only in BlackRock National Municipal Fund, and Class K Shares available only in BlackRock Short-Term Municipal Fund) are not subject to any sales charge. These shares bear no ongoing distribution or service fees and are available only to certain eligible investors. Prior to July 18, 2011 for BlackRock National Municipal Fund, BlackRock Share performance results are those of the Institutional Shares restated to reflect BlackRock Share fees. Prior to October 2, 2006 for BlackRock Short-Term Municipal Fund, Class K Share performance results are those of the Institutional Shares restated to reflect Class K Share fees. On the close of business on September 1, 2015, all of the issued and outstanding BlackRock Shares of BlackRock Short-Term Municipal Fund were redesignated as Class K Shares. |
| • | Service Shares (available only in BlackRock National Municipal Fund) are not subject to any sales charge (front-end load) or deferred sales charge. These shares are subject to a service fee of 0.25% per year (but no distribution fee) and are available only to certain eligible investors. Prior to July 18, 2011, Service Share performance results are those of the Institutional Shares restated to reflect Service Share fees. |
| • | Investor A Shares are subject to a maximum initial sales charge (front-end load) of 4.25% for all Funds except BlackRock Short-Term Municipal Fund, which incurs a 3.00% maximum initial sales charge, and all Funds incur a service fee of 0.25% per year (but no distribution fee). Certain redemptions of these shares may be subject to a contingent deferred sales charge (“CDSC”) where no initial sales charge was paid at the time of purchase. These shares are generally available through financial intermediaries. Prior to October 2, 2006 for BlackRock Short-Term Municipal Fund and BlackRock New York Municipal Opportunities Fund, Investor A Share performance results are those of the Institutional Shares (which have no distribution or service fees) restated to reflect Investor A Share fees. |
| • | Investor A1 Shares (available only in BlackRock Short-Term Municipal Fund and BlackRock New York Municipal Opportunities Fund) are subject to a maximum initial sales charge (front-end load) of 1.00% for BlackRock Short-Term Municipal Fund and 4.00% for BlackRock New York Municipal Opportunities Fund; and a service fee of 0.10% per year (but no distribution fee). Maximum initial sales charge does not apply to current shareholders of Investor A1 Shares of the Funds. |
| • | Investor B Shares (available only in BlackRock National Municipal Fund) are subject to a maximum CDSC of 4.00%, declining to 0% after six years. In addition, these shares are subject to a distribution fee of 0.50% per year and a service fee of 0.25% per year. These shares automatically convert to Investor A Shares after approximately 10 years. (There is no initial sales charge for automatic share conversions.) |
| • | Investor C Shares are subject to a 1.00% CDSC if redeemed within one year of purchase. In addition, these shares are subject to a distribution fee of 0.75% per year and a service fee of 0.25% per year. Prior to October 2, 2006 (for all Funds except BlackRock High Yield Municipal Fund), Investor C Share performance results are those of the Institutional |
Shares (which have no distribution or service fees) restated to reflect Investor C Share fees. |
| • | Investor C1 Shares (available only in BlackRock National Municipal Fund and BlackRock New York Municipal Opportunities Fund) are subject to a 1.00% CDSC if redeemed within one year of purchase. A CDSC does not apply to the current shareholders of Investor C1 Shares of the Funds. In addition, these shares are subject to a distribution and service fees per year as follows: |
| Distribution Fee | Service Fee | |||||||
BlackRock National Municipal Fund | 0.55 | % | 0.25 | % | ||||
BlackRock New York Municipal Opportunities Fund | 0.35 | % | 0.25 | % | ||||
Investor B Shares of their respective Funds are only available through exchanges and dividend and capital gain reinvestment by existing shareholders, and for purchase by certain employer-sponsored retirement plans.
Investor A1 and Investor C1 Shares of their respective Funds are only available for dividend and capital gain reinvestment by existing shareholders, and for purchase by certain employer-sponsored retirement plans, and for National Municipal Fund only, fee based programs previously approved by the Fund.
Performance information reflects past performance and does not guarantee future results. Current performance may be lower or higher than the performance data quoted. Refer to www.blackrock.com/funds to obtain performance data current to the most recent month end. Performance results do not reflect the deduction of taxes that a shareholder would pay on fund distributions or the redemption of fund shares. Figures shown in each of the performance tables on the previous pages assume reinvestment of all distributions, if any, at net asset value (“NAV”) on the ex-dividend date/payable date. Investment return and principal value of shares will fluctuate so that shares, when redeemed, may be worth more or less than their original cost. Distributions paid to each class of shares will vary because of the different levels of service, distribution and transfer agency fees applicable to each class, which are deducted from the income available to be paid to shareholders.
BlackRock Advisors, LLC (the “Manager”), the Funds’ investment advisor, voluntarily reimbursed a portion of the Funds’ expenses. Without such reimbursement, the Funds’ performance would have been lower. The Manager is under no obligation to reimburse or to continue reimbursing its fees and such voluntary waiver may be reduced or discontinued at any time. See Note 6 of the Notes to Financial Statements for additional information on reimbursements.
The standardized 30-day yield includes the effects of any waivers and/or reimbursements. The unsubsidized 30-day yield excludes the effects of any waivers and/or reimbursements.
| 12 | SEMI-ANNUAL REPORT | DECEMBER 31, 2015 |
| Disclosure of Expenses |
Shareholders of these Funds may incur the following charges:
(a) transactional expenses such as sales charges; and (b) operating expenses, including investment advisory fees, service and distribution fees including 12b-1 fees, and other Fund expenses. The expense examples on the previous pages (which are based on a hypothetical investment of $1,000 invested on July 1, 2015 and held through December 31, 2015) are intended to assist shareholders both in calculating expenses based on an investment in each Fund and in comparing these expenses with similar costs of investing in other mutual funds.
The expense examples provide information about actual account values and actual expenses. In order to estimate the expenses a shareholder paid during the period covered by this report, shareholders can divide their account value by $1,000 and then multiply the result by the number corresponding to their Fund and share class under the headings entitled “Expenses Paid During the Period.”
The expense examples also provide information about hypothetical account values and hypothetical expenses based on a Fund’s actual expense ratio and an assumed rate of return of 5% per year before expenses. In order to assist shareholders in comparing the ongoing expenses of investing in these Funds and other funds, compare the 5% hypothetical examples with the 5% hypothetical examples that appear in shareholder reports of other funds.
The expenses shown in the expense examples are intended to highlight shareholders’ ongoing costs only and do not reflect any transactional expenses, such as sales charges, if any. Therefore, the hypothetical examples are useful in comparing ongoing expenses only, and will not help shareholders determine the relative total expenses of owning different funds. If these transactional expenses were included, shareholder expenses would have been higher.
| SEMI-ANNUAL REPORT | DECEMBER 31, 2015 | 13 |
| The Benefits and Risks of Leveraging | ||||
The Funds may utilize leverage to seek to enhance yield and net asset value (“NAV”). However, these objectives cannot be achieved in all interest rate environments.
Each Fund may leverage its assets through the use of proceeds received in tender option bond (“TOB”) transactions, as described in the Notes to Financial Statements. In a TOB transaction, the Funds transfer municipal bonds or other municipal securities into a special purpose entity (a “TOB Trust”). TOB investments generally provide the Funds with economic benefits in periods of declining short-term interest rates, but expose the Funds to risks during periods of rising short-term interest rates. Additionally, fluctuations in the market value of municipal bonds deposited into a TOB Trust may adversely affect the Funds’ NAV per share.
In general, the concept of leveraging is based on the premise that the financing cost of leverage, which is based on short-term interest rates, is normally lower than the income earned by each Fund on its longer-term portfolio investments purchased with the proceeds from leverage. To the extent that the total assets of each Fund (including the assets obtained from leverage) are invested in higher-yielding portfolio investments, the Funds’ shareholders benefit from the incremental net income.
The interest earned on securities purchased with the proceeds from leverage is distributed to the Funds’ shareholders, and the value of these portfolio holdings is reflected in the Funds’ per share NAV. However, in order to benefit shareholders, the return on assets purchased with
leverage proceeds must exceed the ongoing costs associated with the leverage. If interest and other ongoing costs of leverage exceed the Fund’s return on assets purchased with leverage proceeds, income to shareholders is lower than if the Funds had not used leverage.
Furthermore, the value of each Fund’s portfolio investments generally varies inversely with the direction of long-term interest rates, although other factors can also influence the value of portfolio investments. As a result, changes in interest rates can influence each Fund’s NAV positively or negatively in addition to the impact on each Fund’s performance from leverage. Changes in the direction of interest rates are difficult to predict accurately, and there is no assurance that a Fund’s leveraging strategy will be successful.
The use of leverage also generally causes greater changes in each Fund’s NAV and distribution rates than it would in a comparable fund that does not use leverage. In a declining market, leverage is likely to cause a greater decline in the NAV of a Fund’s shares than if the Fund were not leveraged. In addition, each Fund may be required to sell portfolio securities at inopportune times or at distressed values in order to comply with regulatory requirements applicable to the use of leverage or as required by the terms of the leverage instruments, which may cause the Funds to incur losses. The use of leverage may limit a Fund’s ability to invest in certain types of securities or use certain types of hedging strategies. Each Fund incurs expenses in connection with the use of leverage, all of which are borne by the Funds’ shareholders and may reduce income.
| Derivative Financial Instruments | ||||
The Funds may invest in various derivative financial instruments. Derivative financial instruments are used to obtain exposure to a security, index and/or market without owning or taking physical custody of securities or to manage market, equity, credit, interest rate, foreign currency exchange rate, commodity and/or other risks. Derivative financial instruments may give rise to a form of economic leverage. Derivative financial instruments also involve risks, including the imperfect correlation between the value of a derivative financial instrument and the underlying asset,
possible default of the counterparty to the transaction or illiquidity
of the derivative financial instrument. The Funds’ ability to use a derivative financial instrument successfully depends on the investment advisor’s ability to predict pertinent market movements accurately, which cannot be assured. The use of derivative financial instruments may result in losses greater than if they had not been used, may limit the amount of appreciation a Fund can realize on an investment and/or may result in lower distributions paid to shareholders. The Funds’ investments, if any, in these instruments are discussed in detail in the Notes to Financial Statements.
| 14 | SEMI-ANNUAL REPORT | DECEMBER 31, 2015 |
BlackRock High Yield Municipal Fund (Percentages shown are based on Net Assets) |
| Municipal Bonds | Par (000) | Value | ||||||
Alabama — 1.4% | ||||||||
Alabama Special Care Facilities Financing Authority-Birmingham, RB (a): | ||||||||
5.75%, 6/01/35 | $ | 200 | $ | 202,564 | ||||
5.75%, 6/01/45 | 355 | 357,602 | ||||||
6.00%, 6/01/50 | 450 | 458,685 | ||||||
County of Jefferson Alabama Sewer, Refunding RB: | ||||||||
Senior Lien, Series A (AGM), 5.00%, 10/01/44 | 365 | 399,598 | ||||||
Series D, 6.50%, 10/01/53 | 3,465 | 4,054,223 | ||||||
Sub-Lien, Series D, 7.00%, 10/01/51 | 2,355 | 2,867,166 | ||||||
State of Alabama Docks Department, Refunding RB, 6.00%, 10/01/40 | 710 | 825,624 | ||||||
|
| |||||||
| 9,165,462 | ||||||||
Alaska — 0.4% | ||||||||
Northern Tobacco Securitization Corp., Refunding RB, Tobacco Settlement, Asset-Backed, Series A: | ||||||||
4.63%, 6/01/23 | 870 | 870,278 | ||||||
5.00%, 6/01/32 | 1,510 | 1,367,668 | ||||||
|
| |||||||
| 2,237,946 | ||||||||
Arizona — 1.4% | ||||||||
City of Phoenix Arizona IDA, ERB, Eagle College Prep Project, Series A, 5.00%, 7/01/43 | 1,445 | 1,455,361 | ||||||
City of Phoenix Arizona IDA, RB: | ||||||||
Great Hearts Academies — Veritas Project, 6.40%, 7/01/47 | 415 | 448,623 | ||||||
Legacy Traditional Schools Project, Series A, 6.50%, 7/01/34 (b) | 465 | 520,335 | ||||||
Legacy Traditional Schools Project, Series A, 6.75%, 7/01/44 (b) | 810 | 912,263 | ||||||
City of Phoenix Arizona IDA, Refunding RB (b): | ||||||||
Basis Schools, Inc. Projects, Series A, 5.00%, 7/01/35 | 300 | 313,617 | ||||||
Basis Schools, Inc. Projects, Series A, 5.00%, 7/01/45 | 895 | 919,532 | ||||||
Legacy Traditional School Projects, 5.00%, 7/01/35 | 315 | 318,084 | ||||||
Legacy Traditional School Projects, 5.00%, 7/01/45 | 250 | 244,715 | ||||||
Series A, 5.00%, 7/01/35 (a) | 295 | 308,608 | ||||||
Series A, 5.00%, 7/01/46 (a) | 325 | 333,821 | ||||||
County of Maricopa Arizona IDA, RB, Arizona Charter Schools Project, Series A, 6.75%, 7/01/29 | 70 | 67,367 | ||||||
Florence Town, Inc. Arizona, IDA, ERB, Legacy Traditional School Project, Queen Creek and Casa Grande Campuses, 6.00%, 7/01/43 | 1,375 | 1,487,791 | ||||||
Salt Verde Financial Corp., RB, Senior, 5.00%, 12/01/37 | 1,625 | 1,881,457 | ||||||
|
| |||||||
| 9,211,574 | ||||||||
| Municipal Bonds | Par (000) | Value | ||||||
Arkansas — 0.1% | ||||||||
County of Benton Arkansas Public Facilities Board, RB, BCCSO Project, Series A, 6.00%, 6/01/40 | $ | 750 | $ | 829,320 | ||||
California — 6.1% | ||||||||
County of California Tobacco Securitization Agency, RB, Asset-Backed, Los Angeles: | ||||||||
5.60%, 6/01/36 | 1,385 | 1,384,931 | ||||||
5.70%, 6/01/46 | 1,495 | 1,469,899 | ||||||
County of California Tobacco Securitization Agency, Refunding RB, Series A, 5.00%, 6/01/36 | 1,665 | 1,547,168 | ||||||
California Health Facilities Financing Authority, RB: | ||||||||
St. Joseph Health System, Series A, 5.75%, 7/01/39 | 1,000 | 1,145,490 | ||||||
Sutter Health, Series B, 6.00%, 8/15/42 | 1,000 | 1,200,700 | ||||||
California Health Facilities Financing Authority, Refunding RB, Catholic Healthcare West, Series A, 6.00%, 7/01/39 | 265 | 303,852 | ||||||
California Municipal Finance Authority, RB, Urban Discovery Academy Project (b): | ||||||||
5.50%, 8/01/34 | 310 | 323,553 | ||||||
6.00%, 8/01/44 | 655 | 688,097 | ||||||
6.13%, 8/01/49 | 570 | 599,463 | ||||||
California School Finance Authority, RB, Value Schools: | ||||||||
6.65%, 7/01/33 | 295 | 329,488 | ||||||
6.90%, 7/01/43 | 650 | 732,862 | ||||||
California Statewide Communities Development Authority, RB, Sutter Health, Series A, 6.00%, 8/15/42 | 400 | 475,944 | ||||||
California Statewide Communities Development Authority, Refunding RB, American Baptist Homes of the West, 6.25%, 10/01/39 | 2,575 | 2,849,340 | ||||||
California Statewide Financing Authority, RB, Asset-Backed, Tobacco Settlement: | ||||||||
Series A, 6.00%, 5/01/43 | 2,500 | 2,542,500 | ||||||
Series B, 6.00%, 5/01/43 | 3,485 | 3,544,245 | ||||||
City of Chula Vista California, Refunding RB, San Diego Gas & Electric, Series A, 5.88%, 2/15/34 | 500 | 571,105 | ||||||
City of San Jose California Hotel Tax, RB, Convention Center Expansion & Renovation Project: | ||||||||
6.50%, 5/01/36 | 310 | 375,856 | ||||||
6.50%, 5/01/42 | 760 | 914,668 | ||||||
City of Stockton California Public Financing Authority, RB, Delta Water Supply Project, Series A, 6.25%, 10/01/40 | 240 | 296,184 | ||||||
County of California Tobacco Securitization Agency, RB, 5.45%, 6/01/28 | 500 | 502,715 | ||||||
County of Riverside California Transportation Commission, RB, Senior Lien, Series A, 5.75%, 6/01/48 | 2,115 | 2,426,984 | ||||||
Golden State Tobacco Securitization Corp., Refunding RB, Asset-Backed, Senior, Series A-1, 5.75%, 6/01/47 | 10,955 | 10,285,978 | ||||||
| Portfolio Abbreviations |
| AGC | Assured Guarantee Corp. | EDC | Economic Development Corp. | IDRB | Industrial Development Revenue Bonds | |||||
| ACA | American Capital Access Holding Ltd. | ERB | Education Revenue Bonds | ISD | Independent School District | |||||
| AGC | Assured Guarantee Corp. | ERS | Extendible Reset Securities | LRB | Lease Revenue Bonds | |||||
| AGM | Assured Guaranty Municipal Corp. | FHA | Federal Housing Administration | M/F | Multi-Family | |||||
| AMBAC | American Municipal Bond Assurance Corp. | GAN | Grant Anticipation Notes | MRB | Mortgage Revenue Bonds | |||||
| AMT | Alternative Minimum Tax (subject to) | GARB | General Airport Revenue Bonds | NPFGC | National Public Finance Guarantee Corp. | |||||
| ARB | Airport Revenue Bonds | GARB | General Airport Revenue Bonds | OTC | Over-the-Counter | |||||
| BARB | Building Aid Revenue Bonds | GO | General Obligation Bonds | PILOT | Payment in Lieu of Taxes | |||||
| BHAC | Berkshire Hathaway Assurance Corp. | HDA | Housing Development Authority | RB | Revenue Bonds | |||||
| CAB | Capital Appreciation Bonds | HFA | Housing Finance Agency | S/F | Single-Family | |||||
| CIFG | CDC IXIS Financial Guaranty | HRB | Housing Revenue Bonds | SONYMA | State of New York Mortgage Agency | |||||
| COP | Certificates of Participation | IDA | Industrial Development Authority | Syncora | Syncora Guarantee | |||||
| EDA | Economic Development Authority | IDB | Industrial Development Board |
See Notes to Financial Statements.
| SEMI-ANNUAL REPORT | DECEMBER 31, 2015 | 15 |
Schedule of Investments (continued) | BlackRock High Yield Municipal Fund |
| Municipal Bonds | Par (000) | Value | ||||||
California (continued) | ||||||||
Lammersville School District Community Facilities District, Special Tax Bonds, District No. 2002, Mountain House, 5.13%, 9/01/35 | $ | 325 | $ | 330,262 | ||||
Successor Agency to the San Francisco City & County Redevelopment Agency, Special Tax Bonds, Community Facilities District No. 6 (Mission Bay South Public Improvements), Series C, CAB, 0.00%, 8/01/43 (c) | 3,000 | 661,710 | ||||||
Temecula Public Financing Authority, Refunding, Special Tax Bonds, Harveston, Sub-Series B, 5.10%, 9/01/36 | 165 | 165,964 | ||||||
Tobacco Securitization Authority of Southern California, Refunding RB: | ||||||||
Senior Series A1, 5.13%, 6/01/46 | 2,590 | 2,352,704 | ||||||
Tobacco Settlement, Asset-Backed, Senior Series A-1, 4.75%, 6/01/25 | 955 | 955,172 | ||||||
|
| |||||||
| 38,976,834 | ||||||||
Colorado — 2.9% |
| |||||||
Castle Oaks Metropolitan District No. 3, GO, 6.25%, 12/01/44 | 535 | 538,280 | ||||||
Central Platte Valley Metropolitan District, GO, 5.00%, 12/01/43 | 1,250 | 1,297,100 | ||||||
Colorado Educational & Cultural Facilities Authority, RB, Littleton Preparatory Charter School Project: | ||||||||
5.00%, 12/01/33 | 450 | 460,809 | ||||||
5.00%, 12/01/42 | 545 | 549,414 | ||||||
Colorado Health Facilities Authority, Refunding RB, Series A: | ||||||||
6.13%, 12/01/45 | 375 | 380,400 | ||||||
6.25%, 12/01/50 | 1,235 | 1,253,142 | ||||||
Copperleaf Metropolitan District No 2, GO, Refunding, 5.75%, 12/01/45 | 780 | 815,591 | ||||||
Denver Convention Center Hotel Authority, Refunding RB, Senior (Syncora), 5.00%, 12/01/30 | 1,175 | 1,196,608 | ||||||
Denver Health & Hospital Authority, RB, Series A: | ||||||||
5.00%, 12/01/39 | 900 | 981,567 | ||||||
5.25%, 12/01/45 | 1,350 | 1,491,453 | ||||||
Foothills Metropolitan District, Special Assessment Bonds, 6.00%, 12/01/38 | 5,995 | 6,415,130 | ||||||
Regional Transportation District, RB, Denver Transit Partners Eagle P3 Project: | ||||||||
6.00%, 1/15/34 | 1,500 | 1,693,680 | ||||||
6.00%, 1/15/41 | 1,000 | 1,125,140 | ||||||
|
| |||||||
| 18,198,314 | ||||||||
Connecticut — 0.8% |
| |||||||
Mohegan Tribal Finance Authority, RB, 7.00%, 2/01/45 (b) | 1,515 | 1,388,528 | ||||||
Mohegan Tribe of Indians of Connecticut, RB, Series A, 6.75%, 2/01/45 (b) | 1,435 | 1,466,656 | ||||||
Mohegan Tribe of Indians of Connecticut, Refunding RB, Public Improvement, Priority Distribution, Series C, 6.25%, 2/01/30 (b) | 2,045 | 2,040,317 | ||||||
|
| |||||||
| 4,895,501 | ||||||||
Delaware — 0.8% |
| |||||||
Delaware State EDA, RB, Exempt Facilities, Indian River Power LLC Project, 5.38%, 10/01/45 | 5,115 | 5,288,859 | ||||||
District of Columbia — 1.2% |
| |||||||
District of Columbia Tobacco Settlement Financing Corp., Refunding RB, Asset-Backed: | ||||||||
6.50%, 5/15/33 | 3,050 | 3,771,234 | ||||||
6.75%, 5/15/40 | 385 | 385,073 | ||||||
| Municipal Bonds | Par (000) | Value | ||||||
District of Columbia (continued) |
| |||||||
Metropolitan Washington Airports Authority, Refunding RB: | ||||||||
CAB, 2nd Senior Lien, Series B (AGC), 0.00%, 10/01/30 (c) | $ | 3,005 | $ | 1,706,299 | ||||
Dulles Toll Road, 1st Senior Lien, Series A, 5.00%, 10/01/39 | 185 | 204,862 | ||||||
Dulles Toll Road, 1st Senior Lien, Series A, 5.25%, 10/01/44 | 1,610 | 1,790,368 | ||||||
|
| |||||||
| 7,857,836 | ||||||||
Florida — 7.4% |
| |||||||
Boggy Creek Improvement District, Refunding RB, Special Assessment Bonds, 5.13%, 5/01/43 | 1,435 | 1,493,132 | ||||||
Capital Trust Agency, Inc., RB, 1st Mortgage, Silver Creek St. Augustine Project: | ||||||||
8.25%, 1/01/44 | 445 | 408,127 | ||||||
8.25%, 1/01/49 | 950 | 871,653 | ||||||
Celebration Pointe Community Development District, Special Assessment Bonds: | ||||||||
4.75%, 5/01/24 | 625 | 633,119 | ||||||
5.00%, 5/01/34 | 1,250 | 1,266,925 | ||||||
County of Alachua Florida Health Facilities Authority, RB: | ||||||||
5.00%, 12/01/44 | 2,720 | 2,995,074 | ||||||
East Ridge Retirement Village, Inc. Project, 6.25%, 11/15/44 | 2,000 | 2,219,600 | ||||||
County of Collier Florida IDA, Refunding RB, Arlington of Naples Project, Series A, 8.13%, 5/15/44 (b) | 1,490 | 1,763,758 | ||||||
County of Hillsborough Florida IDA, RB, Tampa General Hospital Project, 5.25%, 10/01/41 | 895 | 914,824 | ||||||
County of Martin Florida Health Facilities Authority, RB, 5.50%, 11/15/42 | 1,000 | 1,112,580 | ||||||
County of Miami-Dade Florida IDA, RB, Series A: | ||||||||
5.00%, 6/01/35 | 1,425 | 1,460,440 | ||||||
5.00%, 6/01/40 | 1,945 | 1,975,595 | ||||||
5.00%, 6/01/48 | 2,825 | 2,854,493 | ||||||
County of Palm Beach Florida Health Facilities Authority, RB, Acts Retirement Life Community, 5.50%, 11/15/33 | 1,500 | 1,650,885 | ||||||
County of Palm Beach Florida Health Facilities Authority, Refunding RB, Sinai Residences Boca Raton Project, 7.50%, 6/01/49 | 1,000 | 1,196,070 | ||||||
Florida Development Finance Corp., RB, Renaissance Charter School, Series A: | ||||||||
5.75%, 6/15/29 | 695 | 712,743 | ||||||
6.00%, 6/15/34 | 835 | 858,923 | ||||||
6.13%, 6/15/44 | 3,225 | 3,292,015 | ||||||
Greater Orlando Aviation Authority Florida, Refunding RB, Special Purpose, Jetblue Airways Corp. Project, AMT, 5.00%, 11/15/36 | 2,000 | 2,064,200 | ||||||
Greeneway Improvement District, RB, Special Assessment Bonds, 5.13%, 5/01/43 | 1,450 | 1,508,739 | ||||||
Jacksonville Economic Development Commission, RB, Gerdau Ameristeel U.S. Inc., AMT, 5.30%, 5/01/37 | 3,300 | 3,306,006 | ||||||
Lakewood Ranch Stewardship District, Refunding, Special Assessment Bonds, Lakewood Center & New Sector Projects, 8.00%, 5/01/40 | 515 | 638,425 | ||||||
Lakewood Ranch Stewardship District, Special Assessment Bonds: | ||||||||
4.25%, 5/01/25 | 195 | 199,659 | ||||||
4.88%, 5/01/35 | 290 | 295,780 | ||||||
4.88%, 5/01/45 | 580 | 587,256 | ||||||
Mid-Bay Bridge Authority, RB, Springing Lien, Series A, 7.25%, 10/01/21 (d) | 1,450 | 1,900,152 | ||||||
Midtown Miami Community Development District, Refunding, Special Assessment Bonds, Series A: | ||||||||
5.00%, 5/01/29 | 1,750 | 1,867,057 | ||||||
5.00%, 5/01/37 | 890 | 940,819 | ||||||
See Notes to Financial Statements.
| 16 | SEMI-ANNUAL REPORT | DECEMBER 31, 2015 |
Schedule of Investments (continued) | BlackRock High Yield Municipal Fund |
| Municipal Bonds | Par (000) | Value | ||||||
Florida (continued) |
| |||||||
Pine Island Community Development District, RB, 5.30%, 11/01/10 (e)(f) | $ | 1,355 | $ | 760,074 | ||||
Santa Rosa Bay Bridge Authority, RB, 6.25%, 7/01/28 (e)(f) | 421 | 172,318 | ||||||
Tolomato Community Development District, Refunding, Special Assessment Bonds: | ||||||||
Convertible CAB, Series A2, 0.00%, 5/01/39 (g) | 40 | 30,000 | ||||||
Convertible CAB, Series A3, 0.00%, 5/01/40 (g) | 90 | 53,807 | ||||||
Convertible CAB, Series A4, 0.00%, 5/01/40 (g) | 50 | 22,133 | ||||||
Series 2, 0.00%, 5/01/40 | 125 | 65,164 | ||||||
Series A1, 6.65%, 5/01/40 | 140 | 141,824 | ||||||
Tolomato Community Development District: | ||||||||
Series 1, 0.00%, 5/01/40 (g) | 205 | 126,358 | ||||||
Series 1, 6.65%, 5/01/40 (e)(f) | 5 | 5,107 | ||||||
Series 3, 6.61%, 5/01/40 (e)(f) | 135 | 1 | ||||||
Series 3, 6.65%, 5/01/40 (e)(f) | 105 | 1 | ||||||
Viera East Community Development District, Refunding, Special Assessment Bonds, 5.00%, 5/01/26 | 640 | 670,720 | ||||||
Village Community Development District No. 10, Special Assessment Bonds, 5.13%, 5/01/43 | 1,690 | 1,871,016 | ||||||
Village Community Development District No. 9, Special Assessment Bonds: | ||||||||
7.00%, 5/01/41 | 1,430 | 1,750,735 | ||||||
5.50%, 5/01/42 | 530 | 608,191 | ||||||
|
| |||||||
| 47,265,498 | ||||||||
Georgia — 0.8% |
| |||||||
County of Clayton Georgia, Tax Allocation Bonds, Ellenwood Project, 7.50%, 7/01/33 | 120 | 124,822 | ||||||
County of Clayton Georgia Development Authority, Refunding RB, Delta Air Lines, Inc. Project, Series A, 8.75%, 6/01/29 | 635 | 776,707 | ||||||
County of Gainesville & Hall Georgia Development Authority, Refunding RB, Acts Retirement Life Community, Series A-2, 6.63%, 11/15/39 | 225 | 255,082 | ||||||
County of Gainesville Georgia & Hall Hospital Authority, Refunding RB, Northeast Georgia Health System, Inc. Project, Series A, 5.50%, 8/15/54 | 555 | 655,277 | ||||||
Municipal Electric Authority of Georgia, RB, Plant Vogtle Units 3 & 4 Project, Series A, 5.00%, 7/01/60 | 1,635 | 1,773,828 | ||||||
Private Colleges & Universities Authority, RB, Savannah College of Art & Design, 5.00%, 4/01/44 | 1,075 | 1,180,737 | ||||||
|
| |||||||
| 4,766,453 | ||||||||
Guam — 1.1% |
| |||||||
Guam Government Waterworks Authority, RB, Water & Wastewater System, 5.50%, 7/01/43 | 1,520 | 1,728,681 | ||||||
Territory of Guam, GO, Series A: | ||||||||
6.00%, 11/15/19 | 80 | 88,662 | ||||||
6.75%, 11/15/19 (d) | 1,650 | 1,997,028 | ||||||
7.00%, 11/15/19 (d) | 2,660 | 3,244,535 | ||||||
|
| |||||||
| 7,058,906 | ||||||||
Hawaii — 0.2% |
| |||||||
State of Hawaii Department of Budget & Finance, Refunding RB, 5.00%, 1/01/45 (b) | 1,345 | 1,355,666 | ||||||
Idaho — 0.2% |
| |||||||
County of Power Idaho Industrial Development Corp., RB, FMC Corp. Project, AMT, 6.45%, 8/01/32 | 265 | 265,541 | ||||||
Idaho Housing & Finance Association, 5.00%, 12/01/46 (b) | 1,000 | 1,011,540 | ||||||
|
| |||||||
| 1,277,081 | ||||||||
Illinois — 5.0% |
| |||||||
Chicago O’Hare International Airport, Refunding RB, AMT, 5.00%, 1/01/46 | 3,000 | 3,281,820 | ||||||
| Municipal Bonds | Par (000) | Value | ||||||
Illinois (continued) |
| |||||||
City of Chicago Illinois, GO, Refunding, Series A, 5.00%, 1/01/36 | $ | 3,000 | $ | 2,970,090 | ||||
City of Chicago Illinois, GO, Series A, 5.25%, 1/01/35 | 4,500 | 4,547,250 | ||||||
Illinois Finance Authority, RB, Lake Forest College, Series A, 6.00%, 10/01/48 | 1,700 | 1,861,381 | ||||||
Illinois Finance Authority, Refunding RB: | ||||||||
Central Dupage Health, Series B, 5.50%, 11/01/39 | 1,400 | 1,598,268 | ||||||
Friendship Village of Schaumburg, 7.13%, 2/15/39 | 1,000 | 1,068,420 | ||||||
Lutheran Home & Services Obligated Group, 5.63%, 5/15/42 | 2,805 | 2,964,857 | ||||||
Rogers Park Montessori School Project, Series 2014, 6.00%, 2/01/34 | 335 | 350,464 | ||||||
Rogers Park Montessori School Project, Series 2014, 6.13%, 2/01/45 | 790 | 817,144 | ||||||
Roosevelt University Project, 6.50%, 4/01/44 | 830 | 905,455 | ||||||
Swedish Covenant, Series A, 6.00%, 8/15/38 | 1,000 | 1,113,420 | ||||||
Metropolitan Pier & Exposition Authority, RB, McCormick Place Expansion Project, Series A, 5.50%, 6/15/53 | 3,925 | 4,312,555 | ||||||
Metropolitan Pier & Exposition Authority, Refunding RB, CAB, McCormick Place Expansion Project, Series B (AGM), 0.00%, 6/15/44 (c) | 3,455 | 895,916 | ||||||
Quad Cities Regional EDA, Refunding RB, Augustana College, 4.75%, 10/01/32 | 675 | 715,304 | ||||||
Railsplitter Tobacco Settlement Authority, RB, 6.00%, 6/01/28 | 390 | 465,262 | ||||||
State of Illinois, GO: | ||||||||
5.00%, 2/01/39 | 500 | 522,280 | ||||||
Series A, 5.00%, 4/01/35 | 1,460 | 1,534,124 | ||||||
Series A, 5.00%, 4/01/38 | 2,190 | 2,284,477 | ||||||
|
| |||||||
| 32,208,487 | ||||||||
Indiana — 1.8% |
| |||||||
City of Carmel Indiana, RB, Barrington Carmel Project, Series A: | ||||||||
7.13%, 11/15/42 | 1,500 | 1,686,120 | ||||||
7.13%, 11/15/47 | 1,500 | 1,681,485 | ||||||
City of Valparaiso Indiana, RB, Exempt Facilities, Pratt Paper LLC Project, AMT: | ||||||||
6.75%, 1/01/34 | 525 | 637,849 | ||||||
7.00%, 1/01/44 | 1,270 | 1,554,975 | ||||||
City of Vincennes Indiana, Refunding RB, Southwest Indiana Regional Youth Village, 6.25%, 1/01/24 | 650 | 609,005 | ||||||
Indiana Finance Authority, RB, Private Activity Bond, Ohio River Bridges East End Crossing Project, AMT, Series A: | ||||||||
5.25%, 1/01/51 | 2,500 | 2,696,750 | ||||||
5.00%, 7/01/44 | 370 | 395,874 | ||||||
5.00%, 7/01/48 | 1,230 | 1,310,503 | ||||||
Indiana Finance Authority, Refunding RB, Marquette Project, 5.00%, 3/01/39 | 725 | 761,808 | ||||||
|
| |||||||
| 11,334,369 | ||||||||
Iowa — 3.0% |
| |||||||
Iowa Finance Authority, Refunding RB: | ||||||||
Development, Care Initiatives Project, Series A, 5.00%, 7/01/19 | 500 | 505,985 | ||||||
Midwestern Disaster Area, Iowa Fertilizer Co. Project, 5.50%, 12/01/22 | 3,295 | 3,476,126 | ||||||
Sunrise Retirement Community Project, 5.50%, 9/01/37 | 890 | 907,827 | ||||||
Sunrise Retirement Community Project, 5.75%, 9/01/43 | 1,385 | 1,427,866 | ||||||
Iowa Student Loan Liquidity Corp., Refunding RB, AMT, Senior Series A-1, 5.00%, 12/01/21 | 3,355 | 3,528,185 | ||||||
See Notes to Financial Statements.
| SEMI-ANNUAL REPORT | DECEMBER 31, 2015 | 17 |
Schedule of Investments (continued) | BlackRock High Yield Municipal Fund |
| Municipal Bonds | Par (000) | Value | ||||||
Iowa (continued) |
| |||||||
Iowa Tobacco Settlement Authority, Refunding RB: | ||||||||
Asset-Backed, CAB, Series B, 5.60%, 6/01/34 | $ | 1,200 | $ | 1,200,096 | ||||
Asset-Backed, Series C, 5.50%, 6/01/42 | 2,000 | 1,916,160 | ||||||
Asset-Backed, Series C, 5.63%, 6/01/46 | 3,345 | 3,274,253 | ||||||
Series C, 5.38%, 6/01/38 | 3,075 | 2,949,263 | ||||||
|
| |||||||
| 19,185,761 | ||||||||
Kentucky — 0.6% |
| |||||||
Kentucky Economic Development Finance Authority, Refunding RB, Norton Healthcare, Inc., Series B (NPFGC), 0.00%, 10/01/24 (c) | 250 | 189,935 | ||||||
Kentucky Public Transportation Infrastructure Authority, RB, 6.00%, 7/01/53 | 3,000 | 3,458,430 | ||||||
|
| |||||||
| 3,648,365 | ||||||||
Louisiana — 1.3% |
| |||||||
Juban Crossing Economic Development District, Refunding RB, General Infrastructure Project, Series C, 7.00%, 9/15/44 (b) | 1,125 | 1,137,746 | ||||||
Louisiana Local Government Environmental Facilities & Community Development Authority, RB, Westlake Chemical Corp., Series A-2, 6.50%, 11/01/35 | 1,630 | 1,930,751 | ||||||
Louisiana Public Facilities Authority, RB, Belle Chasse Educational Foundation Project, 6.75%, 5/01/41 | 645 | 719,549 | ||||||
Tobacco Settlement Financing Corp., Refunding RB, Asset-Backed, Series A, 5.25%, 5/15/35 | 3,910 | 4,370,481 | ||||||
|
| |||||||
| 8,158,527 | ||||||||
Maine — 0.2% |
| |||||||
Maine Health & Higher Educational Facilities Authority, RB, Maine General Medical Center, 6.75%, 7/01/41 | 1,075 | 1,219,663 | ||||||
Maryland — 1.1% |
| |||||||
City of Gaithersburg Maryland, Refunding RB, Asbury Maryland Obligation, Series B, 6.00%, 1/01/23 | 750 | 837,817 | ||||||
County of Frederick Maryland, RB, Jefferson Technology Park Project, Series B, 7.13%, 7/01/43 | 2,910 | 3,286,816 | ||||||
Maryland EDC, RB: | ||||||||
Term Project, Series B, 5.75%, 6/01/35 | 1,500 | 1,638,885 | ||||||
Transportation Facilities Project, Series A, 5.75%, 6/01/35 | 265 | 289,841 | ||||||
Maryland EDC, Refunding RB, University of Maryland Project, 5.00%, 7/01/39 | 950 | 1,013,631 | ||||||
|
| |||||||
| 7,066,990 | ||||||||
Massachusetts — 2.3% |
| |||||||
Massachusetts Development Finance Agency, RB: | ||||||||
Boston Medical Center, Series D, 4.00%, 7/01/45 | 2,015 | 2,034,062 | ||||||
Boston Medical Center, Series D, 5.00%, 7/01/44 | 5,865 | 6,426,750 | ||||||
Foxborough Regional Charter School, Series A, 7.00%, 7/01/42 | 350 | 395,311 | ||||||
Linden Ponds, Inc. Facility, Series A-1, 6.25%, 11/15/39 | 353 | 338,634 | ||||||
Linden Ponds, Inc. Facility, Series A-2, 5.50%, 11/15/46 | 19 | 16,148 | ||||||
Linden Ponds, Inc. Facility, Series B, 0.00%, 11/15/56 (c) | 94 | 543 | ||||||
North Hill Communities Issue, Series A, 6.50%, 11/15/43 (b) | 1,480 | 1,612,859 | ||||||
Massachusetts Development Finance Agency, Refunding RB: | ||||||||
Covanta Energy Project, Series C, AMT, 5.25%, 11/01/42 (b) | 3,000 | 3,013,800 | ||||||
Tufts Medical Center, Series I, 6.75%, 1/01/36 | 510 | 599,740 | ||||||
|
| |||||||
| 14,437,847 | ||||||||
| Municipal Bonds | Par (000) | Value | ||||||
Michigan — 1.4% |
| |||||||
City of Detroit Michigan, GO, Financial Recovery (h): | ||||||||
Series B-1, 4.00%, 4/01/44 | $ | 170 | $ | 93,240 | ||||
Series B-2, 4.00%, 4/01/44 | 54 | 24,674 | ||||||
County of Monroe Michigan Hospital Finance Authority, Refunding RB, Mercy Memorial Hospital Corp., Obligation, 5.50%, 6/01/16 (d) | 1,565 | 1,598,554 | ||||||
Kentwood EDC, Refunding RB, Limited Obligation, Holland Home, 5.63%, 11/15/41 | 1,000 | 1,059,250 | ||||||
Michigan Finance Authority, RB, Detroit Water & Sewage Disposal System, Senior Lien, Series 2014 C-2, AMT, 5.00%, 7/01/44 | 350 | 371,297 | ||||||
Michigan Finance Authority, Refunding RB, Detroit Water & Sewage Department Project, Senior Lien, Series C-1, 5.00%, 7/01/44 | 800 | 862,952 | ||||||
Michigan State Hospital Finance Authority, Refunding RB, Henry Ford Health System, 5.75%, 11/15/39 | 1,710 | 1,945,689 | ||||||
Michigan Tobacco Settlement Finance Authority, Refunding RB, Series A, 6.88%, 6/01/42 | 3,180 | 3,254,412 | ||||||
|
| |||||||
| 9,210,068 | ||||||||
Minnesota — 0.7% |
| |||||||
City of Cologne Minnesota Charter School, LRB, Cologne Academy Project, Series A, 5.00%, 7/01/45 | 2,065 | 2,112,949 | ||||||
City of Deephaven Minnesota, Refunding RB, Eagle Ridge Academy Project, Series A, 5.25%, 7/01/40 | 500 | 513,930 | ||||||
City of Rochester Minnesota, RB, Health Care And Facility Homestead Rochester Incorporate, 5.00%, 12/01/49 | 1,445 | 1,483,625 | ||||||
St. Paul Housing & Redevelopment Authority, RB, Nova Classical Academy, Series A, 6.63%, 9/01/42 | 500 | 565,455 | ||||||
|
| |||||||
| 4,675,959 | ||||||||
Missouri — 1.2% |
| |||||||
City of Kansas Missouri IDA (a)(b): | ||||||||
5.75%, 11/15/36 | 1,400 | 1,402,072 | ||||||
6.00%, 11/15/46 | 1,000 | 1,010,660 | ||||||
6.00%, 11/15/51 | 560 | 560,817 | ||||||
City of Kirkwood Missouri IDA, RB, Aberdeen Heights, Series A, 8.25%, 5/15/39 | 435 | 493,151 | ||||||
Lees Summit Industrial Development Authority, RB, John Knox Obligated Group, 5.25%, 8/15/39 | 1,890 | 1,950,707 | ||||||
Poplar Bluff Regional Transportation Development District, RB, 4.75%, 12/01/42 | 2,200 | 2,286,636 | ||||||
|
| |||||||
| 7,704,043 | ||||||||
Nebraska — 0.1% |
| |||||||
Central Plains Energy Project Nebraska, RB, Gas Project No. 3, 5.00%, 9/01/42 | 780 | 846,097 | ||||||
Nevada — 0.2% |
| |||||||
County of Clark Nevada, RB, Southwest Gas Corp. Project, Series A, AMT (NPFGC), 4.75%, 9/01/36 | 20 | 20,110 | ||||||
County of Clark Nevada, Refunding, Special Assessment, Special Improvement District No. 142, Mountain’s Edge: | ||||||||
4.00%, 8/01/22 | 775 | 794,382 | ||||||
4.00%, 8/01/23 | 485 | 490,985 | ||||||
|
| |||||||
| 1,305,477 | ||||||||
New Hampshire — 0.1% |
| |||||||
New Hampshire Health & Education Facilities Authority, Refunding RB, Dartmouth-Hitchcock, 6.00%, 8/01/38 | 435 | 498,119 | ||||||
New Jersey — 5.4% |
| |||||||
Casino Reinvestment Development Authority, Refunding RB, 5.25%, 11/01/44 | 5,750 | 5,888,345 | ||||||
County of Essex New Jersey Improvement Authority, RB, AMT, 5.25%, 7/01/45 (b) | 1,155 | 1,197,077 | ||||||
See Notes to Financial Statements.
| 18 | SEMI-ANNUAL REPORT | DECEMBER 31, 2015 |
Schedule of Investments (continued) | BlackRock High Yield Municipal Fund |
| Municipal Bonds | Par (000) | Value | ||||||
New Jersey (continued) |
| |||||||
County of Gloucester New Jersey Pollution Control Financing Authority, Refunding RB, Logan Project, Series A, AMT, 5.00%, 12/01/24 | $ | 1,500 | $ | 1,693,080 | ||||
New Jersey EDA, RB: | ||||||||
Continental Airlines, Inc. Project, AMT, 4.88%, 9/15/19 | 850 | 895,237 | ||||||
Continental Airlines, Inc. Project, AMT, 5.13%, 9/15/23 | 1,965 | 2,158,356 | ||||||
Continental Airlines, Inc. Project, AMT, 5.25%, 9/15/29 | 840 | 918,027 | ||||||
Kapkowski Road Landfill Project, Series B, AMT, 6.50%, 4/01/31 | 3,000 | 3,578,190 | ||||||
Team Academy Charter School Project, 6.00%, 10/01/43 | 970 | 1,095,363 | ||||||
Goethals Bridge Replacement Project, AMT, 5.38%, 1/01/43 | 1,360 | 1,499,672 | ||||||
New Jersey Health Care Facilities Financing Authority, Refunding RB, St. Joseph’s Healthcare System, 6.63%, 7/01/38 | 725 | 801,879 | ||||||
New Jersey Transportation Trust Fund Authority, RB, Transportation Program, Series AA: | ||||||||
5.25%, 6/15/41 | 1,265 | 1,358,559 | ||||||
5.00%, 6/15/44 | 3,755 | 3,912,560 | ||||||
Tobacco Settlement Financing Corp., New Jersey, Refunding RB, Series 1A: | ||||||||
5.00%, 6/01/29 | 3,730 | 3,396,128 | ||||||
5.00%, 6/01/41 | 7,495 | 6,213,355 | ||||||
|
| |||||||
| 34,605,828 | ||||||||
New Mexico — 0.3% |
| |||||||
New Mexico Hospital Equipment Loan Council, Refunding RB, Gerald Champion Regional Medical Center Project, 5.50%, 7/01/42 | 2,030 | 2,153,871 | ||||||
New York — 10.9% |
| |||||||
Build New York City Resource Corp., RB: | ||||||||
5.50%, 11/01/44 | 1,970 | 2,104,748 | ||||||
South Bronx Charter School for International Cultures and the Arts Project, Series A, 5.00%, 4/15/43 | 2,750 | 2,796,833 | ||||||
Chautauqua Tobacco Asset Securitization Corp., Refunding RB, 5.00%, 6/01/48 | 4,475 | 4,474,105 | ||||||
City of New York New York Industrial Development Agency, ARB, American Airlines, Inc., JFK International Airport Project, AMT (h): | ||||||||
8.00%, 8/01/28 | 235 | 245,982 | ||||||
Series B, 2.00%, 8/01/28 | 7,170 | 7,183,838 | ||||||
Counties of New York Tobacco Trust II, RB, Settlement Pass-Through, 5.75%, 6/01/43 | 2,905 | 2,920,977 | ||||||
Counties of New York Tobacco Trust IV, Refunding RB, Settlement Pass-Through Turbo, Series A, 6.25%, 6/01/41 (b) | 8,300 | 8,659,141 | ||||||
County of Dutchess New York Industrial Development Agency, Refunding RB, Bard College Civic Facility, 5.00%, 8/01/46 | 3,400 | 3,221,670 | ||||||
County of Westchester New York Healthcare Corp., RB, Senior Lien, Series A, 5.00%, 11/01/44 | 1,448 | 1,611,193 | ||||||
Erie Tobacco Asset Securitization Corp., Refunding RB, Asset-Backed, Series A, 5.00%, 6/01/45 | 3,110 | 3,003,047 | ||||||
New York Liberty Development Corp., Refunding RB: | ||||||||
2nd Priority, Bank of America Tower at One Bryant Park Project, Class 3, 6.38%, 7/15/49 | 375 | 423,180 | ||||||
3 World Trade Center Project, Class 1, 5.00%, 11/15/44 (b) | 7,365 | 7,603,773 | ||||||
3 World Trade Center Project, Class 2, 5.15%, 11/15/34 (b) | 450 | 473,873 | ||||||
| Municipal Bonds | Par (000) | Value | ||||||
New York (continued) |
| |||||||
New York Liberty Development Corp., Refunding RB (continued): | ||||||||
3 World Trade Center Project, Class 2, 5.38%, 11/15/40 (b) | $ | 1,070 | $ | 1,136,201 | ||||
3 World Trade Center Project, Class 3, 7.25%, 11/15/44 (b) | 3,115 | 3,761,082 | ||||||
Goldman Sachs Headquarters, 5.25%, 10/01/35 | 3,775 | 4,553,896 | ||||||
Niagara Area Development Corp., Refunding RB, Solid Waste Disposal Facility, Covanta Energy Project, Series A, AMT, 5.25%, 11/01/42 (b) | 3,895 | 3,927,445 | ||||||
Onondaga Civic Development Corp., Refunding RB, St. Joseph’s Hospital Health Center Project, 5.00%, 7/01/22 (d) | 1,220 | 1,464,293 | ||||||
Rensselaer Tobacco Asset Securitization Corp., RB, Asset-Backed, Series A, 5.75%, 6/01/43 | 2,500 | 2,500,575 | ||||||
Rockland Tobacco Asset Securitization Corp., RB, Asset-Backed, 5.75%, 8/15/43 | 690 | 690,159 | ||||||
TSASC, Inc., Refunding RB, Series 1, 5.00%, 6/01/34 | 1,245 | 1,197,117 | ||||||
Westchester Tobacco Asset Securitization, Refunding RB, 5.13%, 6/01/45 | 5,600 | 5,599,776 | ||||||
|
| |||||||
| 69,552,904 | ||||||||
North Carolina — 0.9% |
| |||||||
North Carolina Department of Transportation, RB, I-77 Hot Lanes Project, 5.00%, 6/30/54 | 1,385 | 1,454,998 | ||||||
North Carolina Medical Care Commission, Refunding RB: | ||||||||
1st Mortgage, Retirement Facilities Whitestone Project, Series A, 7.75%, 3/01/41 | 3,055 | 3,501,855 | ||||||
Carolina Village Project, 6.00%, 4/01/38 | 1,000 | 1,048,310 | ||||||
|
| |||||||
| 6,005,163 | ||||||||
Ohio — 2.9% |
| |||||||
County of Allen Ohio, Refunding RB, Series A, 4.00%, 11/01/44 | 2,410 | 2,438,558 | ||||||
Buckeye Tobacco Settlement Financing Authority, RB, Series A-2, Asset-Backed: | ||||||||
Bonds, 5.75%, 6/01/34 | 4,460 | 3,889,254 | ||||||
Senior Turbo Term, 5.88%, 6/01/47 | 8,555 | 7,391,606 | ||||||
City of Cleveland Ohio, Refunding RB, AMT, 5.70%, 12/01/19 | 1,240 | 1,243,336 | ||||||
Port of Greater Cincinnati Development Authority, 5.25%, 12/01/50 | 740 | 738,786 | ||||||
State of Ohio, RB, Portsmouth Bypass Project, AMT, 5.00%, 6/30/53 | 2,410 | 2,612,247 | ||||||
|
| |||||||
| 18,313,787 | ||||||||
Oklahoma — 0.4% |
| |||||||
Oklahoma Development Finance Authority, Refunding RB, Inverness Village Community, 6.00%, 1/01/32 | 695 | 733,962 | ||||||
Tulsa Airports Improvement Trust, Refunding RB, American Airlines Inc., AMT, 5.00%, 6/01/35 (h) | 1,425 | 1,583,944 | ||||||
|
| |||||||
| 2,317,906 | ||||||||
Oregon — 0.3% |
| |||||||
Polk County Hospital Facility Authority, RB, Dallas Retirement Village Project, Series A: | ||||||||
5.13%, 7/01/35 | 620 | 625,574 | ||||||
5.38%, 7/01/45 | 1,445 | 1,457,831 | ||||||
|
| |||||||
| 2,083,405 | ||||||||
Pennsylvania — 4.3% |
| |||||||
Allentown Neighborhood Improvement Zone Development Authority, Refunding RB, Series A: | ||||||||
5.00%, 5/01/35 | 1,185 | 1,262,712 | ||||||
5.00%, 5/01/42 | 2,730 | 2,878,130 | ||||||
See Notes to Financial Statements.
| SEMI-ANNUAL REPORT | DECEMBER 31, 2015 | 19 |
Schedule of Investments (continued) | BlackRock High Yield Municipal Fund |
| Municipal Bonds | Par (000) | Value | ||||||
Pennsylvania (continued) |
| |||||||
City of Philadelphia Pennsylvania Hospitals & Higher Education Facilities Authority, RB, Temple University Health System, Series A, 5.63%, 7/01/36 | $ | 3,000 | $ | 3,246,300 | ||||
County of Cumberland Pennsylvania Municipal Authority, Refunding RB, Diakon Lutheran: | ||||||||
6.38%, 1/01/19 (d) | 2,415 | 2,785,268 | ||||||
6.38%, 1/01/39 | 265 | 302,005 | ||||||
County of Lancaster Pennsylvania Hospital Authority, Refunding RB, Brethren Village Project, Series A, 6.50%, 7/01/40 | 835 | 861,653 | ||||||
County of Lehigh Pennsylvania General Purpose Authority, Refunding RB, Bible Fellowship Church Homes, 5.13%, 7/01/32 | 745 | 777,281 | ||||||
County of Montgomery Pennsylvania IDA, RB, New Hampshire School III Properties Project, 6.50%, 10/01/37 | 3,000 | 3,033,750 | ||||||
County of Northampton Pennsylvania IDA, Route 33 Project, Tax Allocation Bond, 7.00%, 7/01/32 | 1,345 | �� | 1,468,579 | |||||
East Hempfield Township Industrial Development Authority, RB: | ||||||||
5.00%, 7/01/34 | 1,000 | 1,055,960 | ||||||
5.00%, 7/01/46 | 1,750 | 1,825,057 | ||||||
Pennsylvania Economic Development Financing Authority, RB: | ||||||||
AMT, Pennsylvania Bridge Finco LP, 5.00%, 6/30/42 | 895 | 975,935 | ||||||
U.S. Airways Group, Series A, 7.50%, 5/01/20 | 1,200 | 1,377,312 | ||||||
Pennsylvania Economic Development Financing Authority, Refunding RB, National Gypson Co., AMT, 5.50%, 11/01/44 | 5,390 | 5,595,736 | ||||||
|
| |||||||
| 27,445,678 | ||||||||
Puerto Rico — 0.1% | ||||||||
Children’s Trust Fund, Refunding RB, Series A, 0.00%, 5/15/50 (c) | 3,935 | 325,385 | ||||||
Puerto Rico Commonwealth Aqueduct & Sewer Authority, RB, Series A, 6.00%, 7/01/44 | 400 | 269,048 | ||||||
|
| |||||||
| 594,433 | ||||||||
Rhode Island — 1.9% | ||||||||
Tobacco Settlement Financing Corp., Refunding RB: | ||||||||
Series A, 5.00%, 6/01/40 | 1,000 | 1,044,250 | ||||||
Series B, 4.50%, 6/01/45 | 4,705 | 4,744,428 | ||||||
Series B, 5.00%, 6/01/50 | 5,900 | 6,042,249 | ||||||
|
| |||||||
| 11,830,927 | ||||||||
South Carolina — 1.8% | ||||||||
South Carolina State Public Service Authority, Refunding RB, Series E, 5.25%, 12/01/55 | 10,200 | 11,511,108 | ||||||
Texas — 6.9% | ||||||||
Arlington Higher Education Finance Corp., RB, Series A, 5.88%, 3/01/24 | 500 | 515,475 | ||||||
Brazos River Authority, RB, TXU Electric, Series A, AMT, 8.25%, 10/01/30 (e)(f) | 750 | 26,250 | ||||||
Central Texas Regional Mobility Authority, Refunding RB: | ||||||||
CAB, 0.00%, 1/01/28 (c) | 3,000 | 1,878,390 | ||||||
CAB, 0.00%, 1/01/29 (c) | 500 | 298,790 | ||||||
CAB, 0.00%, 1/01/30 (c) | 1,330 | 761,824 | ||||||
CAB, 0.00%, 1/01/31 (c) | 4,000 | 2,188,880 | ||||||
Senior Lien, 6.25%, 1/01/46 | 765 | 883,873 | ||||||
Central Texas Transportation Commission Turnpike System, Refunding RB, Series C, 5.00%, 8/15/42 | 12,995 | 14,383,516 | ||||||
City of Houston Texas Airport System, Refunding ARB: | ||||||||
Senior Lien, Series A, 5.50%, 7/01/39 | 120 | 131,891 | ||||||
Special Facilities, Continental Airlines, Inc., Series A, AMT, 6.63%, 7/15/38 | 1,110 | 1,283,260 | ||||||
| Municipal Bonds | Par (000) | Value | ||||||
Texas (continued) | ||||||||
City of Houston Texas Airport System, Refunding ARB (continued): | ||||||||
United Airlines, Inc. Terminal E Project, AMT, 5.00%, 7/01/29 | $ | 1,000 | $ | 1,082,700 | ||||
Clifton Higher Education Finance Corp., ERB, Idea Public Schools: | ||||||||
5.50%, 8/15/31 | 255 | 282,458 | ||||||
5.75%, 8/15/41 | 280 | 313,404 | ||||||
County of Bexar Texas Health Facilities Development Corp., RB, Army Retirement Residence Project, 6.20%, 7/01/45 | 1,320 | 1,492,418 | ||||||
County of Harris Texas Cultural Education Facilities Finance Corp., Refunding, MRB, Brazos Presbyterian Homes, Inc. Project, Series A: | ||||||||
5.00%, 1/01/38 | 510 | 519,343 | ||||||
5.00%, 1/01/43 | 520 | 527,046 | ||||||
5.13%, 1/01/48 | 1,535 | 1,553,451 | ||||||
County of Harris Texas Houston Sports Authority, Refunding RB, CAB, Senior Lien, Series G (NPFGC), 0.00%, 11/15/41 (c) | 350 | 98,837 | ||||||
County of Matagorda Texas Navigation District No. 1, Refunding RB, Central Power & Light Co., Project, Series A, 6.30%, 11/01/29 | 290 | 329,890 | ||||||
County of Tarrant Texas Cultural Education Facilities Finance Corp., RB: | ||||||||
Buckingham Senior Living Community, Inc. Project, 5.50%, 11/15/45 | 410 | 423,534 | ||||||
CC Young Memorial Home, Series A, 8.00%, 2/15/38 | 330 | 371,537 | ||||||
Senior Living Center Project, Series A, 8.25%, 11/15/44 | 800 | 808,088 | ||||||
County of Travis Texas Health Facilities Development Corp., Refunding RB, 7.13%, 1/01/46 | 1,920 | 2,147,520 | ||||||
Danbury Higher Education Authority, Inc., RB, A.W. Brown Fellowship Charter, Series A (ACA), 5.00%, 8/15/16 (d) | 20 | 20,573 | ||||||
Houston Higher Education Finance Corp., RB, Cosmos Foundation, Inc., 6.50%, 5/15/21 (d) | 535 | 677,171 | ||||||
Mesquite Health Facility Development Corp., Refunding RB, 5.13%, 2/15/42 | 690 | 719,987 | ||||||
New Hope Cultural Education Facilities Corp., RB, Stephenville LLC Tarleton State University Project: | ||||||||
5.88%, 4/01/36 | 890 | 1,003,609 | ||||||
6.00%, 4/01/45 | 1,355 | 1,534,930 | ||||||
Newark Higher Education Finance Corp., RB, Series A (b): | ||||||||
5.50%, 8/15/35 | 325 | 331,055 | ||||||
5.75%, 8/15/45 | 645 | 653,991 | ||||||
Red River Health Facilities Development Corp., First MRB, Project: | ||||||||
Eden Home, Inc., 7.25%, 12/15/42 | 1,330 | 1,171,730 | ||||||
Wichita Falls Retirement Foundation, 5.13%, 1/01/41 | 600 | 618,174 | ||||||
Tarrant County Cultural Education Facilities Finance Corp., Refunding RB, 4.75%, 11/15/35 | 110 | 109,854 | ||||||
Texas Private Activity Bond Surface Transportation Corp., RB, Senior Lien: | ||||||||
LBJ Infrastructure Group LLC, LBJ Freeway Managed Lanes Project, 7.00%, 6/30/40 | 1,000 | 1,213,240 | ||||||
NTE Mobility Partners LLC, North Tarrant Express Managed Lanes Project, 6.88%, 12/31/39 | 1,740 | 2,042,551 | ||||||
Town of Flower Mound Texas, Special Assessment Bonds, 6.50%, 9/01/36 | 1,500 | 1,571,280 | ||||||
|
| |||||||
| 43,970,520 | ||||||||
See Notes to Financial Statements.
| 20 | SEMI-ANNUAL REPORT | DECEMBER 31, 2015 |
Schedule of Investments (continued) | BlackRock High Yield Municipal Fund |
| Municipal Bonds | Par (000) | Value | ||||||
Utah — 0.8% | ||||||||
State of Utah Charter School Finance Authority, RB, Navigator Pointe Academy, Series A, 5.63%, 7/15/40 | $ | 1,000 | $ | 1,065,110 | ||||
State of Utah Charter School Finance Authority, Refunding RB, 6.75%, 10/15/43 | 2,050 | 2,152,725 | ||||||
Utah Charter School Finance Authority, RB, 6.00%, 4/15/45 (b) | 2,000 | 2,087,140 | ||||||
|
| |||||||
| 5,304,975 | ||||||||
Virginia — 3.7% | ||||||||
County of Fairfax Virginia EDA, Refunding RB, Goodwin House, Inc., 5.13%, 10/01/42 | 1,185 | 1,228,999 | ||||||
County of Hanover Virginia EDA, Refunding RB, Covenant Woods, Series A: | ||||||||
5.00%, 7/01/42 | 2,000 | 2,053,560 | ||||||
Residential Care Facility, 5.00%, 7/01/47 | 1,015 | 1,040,243 | ||||||
Lower Magnolia Green Community Development Authority, Special Assessment Bonds (b): | ||||||||
5.00%, 3/01/35 | 505 | 509,772 | ||||||
5.00%, 3/01/45 | 520 | 521,482 | ||||||
Mosaic District Community Development Authority, Special Assessment, Series A: | ||||||||
6.63%, 3/01/26 | 515 | 594,645 | ||||||
6.88%, 3/01/36 | 450 | 518,112 | ||||||
Virginia College Building Authority, RB, Marymount University Project, Series B, 5.00%, 7/01/45 (b) | 535 | 545,952 | ||||||
Virginia College Building Authority, Refunding RB, Marymount University Project, Series A (b): | ||||||||
Series A, 5.00%, 7/01/35 | 125 | 129,985 | ||||||
5.00%, 7/01/45 | 375 | 382,676 | ||||||
Virginia Small Business Financing Authority, RB, Senior Lien, AMT: | ||||||||
Elizabeth River Crossings OpCo LLC Project, 6.00%, 1/01/37 | 4,095 | 4,718,996 | ||||||
Express Lanes LLC, 5.00%, 7/01/34 | 3,300 | 3,539,943 | ||||||
Wise County Industrial Development Authority, RB, 1.88%, 11/01/40 (h) | 7,800 | 7,864,428 | ||||||
|
| |||||||
| 23,648,793 | ||||||||
Washington — 0.5% | ||||||||
County of King Washington Public Hospital District No. 4, GO, Refunding, Snoqualmie Valley Hospital, 7.00%, 12/01/40 | 545 | 598,160 | ||||||
Greater Wenatchee Regional Events Center Public Facilities District, Refunding RB, Series A, 5.50%, 9/01/42 | 1,005 | 1,056,064 | ||||||
Washington State Housing Finance Commission, RB, Heron’s Key, Series A (b): | ||||||||
6.75%, 7/01/35 | 100 | 104,196 | ||||||
7.00%, 7/01/45 | 100 | 103,790 | ||||||
Washington State Housing Finance Commission, Refunding RB (b): | ||||||||
5.75%, 1/01/35 | 355 | 358,724 | ||||||
6.00%, 1/01/45 | 940 | 949,757 | ||||||
|
| |||||||
| 3,170,691 | ||||||||
Wisconsin — 1.7% | ||||||||
Public Finance Authority, RB, Series A: | ||||||||
4.75%, 12/01/35 | 870 | 867,747 | ||||||
5.00%, 12/01/45 | 2,100 | 2,101,533 | ||||||
5.15%, 12/01/50 | 1,315 | 1,307,754 | ||||||
Voyager Foundation, Inc. Project, 5.13%, 10/01/45 | 1,850 | 1,875,123 | ||||||
Public Finance Authority, Refunding RB, Senior Obligated Group, Series B, AMT, 5.00%, 7/01/42 | 2,150 | 2,238,279 | ||||||
| Municipal Bonds | Par (000) | Value | ||||||
Wisconsin (continued) | ||||||||
Wisconsin Health & Educational Facilities Authority, Refunding RB: | ||||||||
Mile Bluff Medical Center, 5.50%, 5/01/34 | $ | 875 | $ | 925,216 | ||||
Mile Bluff Medical Center, 5.75%, 5/01/39 | 1,065 | 1,126,621 | ||||||
St. Johns Communities, Inc., Series A, 7.25%, 9/15/19 (d) | 75 | 89,893 | ||||||
St. Johns Communities, Inc., Series A, 7.63%, 9/15/19 (d) | 145 | 177,731 | ||||||
|
| |||||||
| 10,709,897 | ||||||||
| Total Municipal Bonds — 86.6% | 553,104,908 | |||||||
| Municipal Bonds Transferred to Tender Option Bond Trusts (i) | ||||||||
California — 0.4% | ||||||||
Bay Area Toll Authority, Refunding RB, San Francisco Bay Area, Series F-1, 5.63%, 4/01/19 (d) | 480 | 550,396 | ||||||
City of Los Angeles California Department of Airports, Refunding ARB, Los Angeles International Airport, Senior Series A, 5.00%, 5/15/40 | 1,678 | 1,894,938 | ||||||
|
| |||||||
| 2,445,334 | ||||||||
Colorado — 1.0% | ||||||||
Colorado Health Facilities Authority, Refunding RB, Sisters of Leavenworth Health System, Series A, 5.00%, 1/01/40 | 5,592 | 6,172,650 | ||||||
District of Columbia — 0.2% | ||||||||
District of Columbia Water & Sewer Authority, Refunding RB, Senior Lien, Series A, 6.00%, 10/01/18 (d)(j) | 939 | 1,066,081 | ||||||
Florida — 0.6% | ||||||||
County of Miami-Dade Florida, RB, Water & Sewer System, 5.00%, 10/01/34 | 3,499 | 3,969,010 | ||||||
Illinois — 1.9% | ||||||||
Illinois Finance Authority, RB, The Carle Foundation, Series A (AGM), 6.00%, 8/15/41 | 2,480 | 2,933,989 | ||||||
City of Chicago Illinois, GARB, O’Hare International Airport, 3rd Lien, Series A (NPFGC), 5.00%, 1/01/33 (j) | 3,493 | 3,493,252 | ||||||
State of Illinois Toll Highway Authority, RB, Senior Priority, Series A, 5.00%, 1/01/40 | 5,011 | 5,731,422 | ||||||
|
| |||||||
| 12,158,663 | ||||||||
New York — 7.3% | ||||||||
Hudson Yards Infrastructure Corp., RB, Fiscal 2012, Series A, 5.75%, 2/15/47 (j) | 1,720 | 1,993,801 | ||||||
New York State Dormitory Authority, Refunding RB, Series E, 5.00%, 3/15/36 | 21,671 | 25,575,922 | ||||||
New York Liberty Development Corp., RB, 1 World Trade Center Port Authority Consolidated Bonds, 5.25%, 12/15/43 | 7,725 | 8,935,059 | ||||||
New York Liberty Development Corp., Refunding RB, 4 World Trade Center Project, 5.75%, 11/15/51 (j) | 2,520 | 2,925,946 | ||||||
Port Authority of New York & New Jersey, Refunding ARB, 194th Series, 5.25%, 10/15/55 | 2,925 | 3,438,835 | ||||||
City of New York New York Municipal Water Finance Authority, Refunding RB, Water & Sewer System, 2nd General Resolution, Series HH, 5.00%, 6/15/31 (j) | 3,015 | 3,481,330 | ||||||
|
| |||||||
| 46,350,893 | ||||||||
See Notes to Financial Statements.
| SEMI-ANNUAL REPORT | DECEMBER 31, 2015 | 21 |
Schedule of Investments (continued) | BlackRock High Yield Municipal Fund |
Municipal Bonds Transferred to | Par (000) | Value | ||||||
North Carolina — 0.5% | ||||||||
North Carolina Capital Facilities Finance Agency, Refunding RB, Duke University Project, 5.00%, 10/01/55 | $ | 2,930 | $ | 3,392,530 | ||||
Ohio — 0.3% | ||||||||
State of Ohio, Refunding RB, Cleveland Clinic Health System Obligated Group, Series A, 5.50%, 1/01/39 | 2,010 | 2,263,574 | ||||||
South Carolina — 0.0% | ||||||||
State of South Carolina Housing Finance & Development Authority, Refunding RB, S/F Housing, Series B-1, 5.55%, 7/01/39 | 40 | 40,293 | ||||||
Virginia — 0.4% | ||||||||
Virginia Small Business Financing Authority, Refunding RB, Sentara Healthcare, 5.00%, 11/01/40 | 2,501 | 2,775,688 | ||||||
Washington — 2.1% | ||||||||
City of Bellingham Washington, RB, Water & Sewer, 5.00%, 8/01/40 | 2,999 | 3,424,167 | ||||||
Snohomish County Public Utility District No 1, 5.00%, 12/01/45 | 8,664 | 9,955,740 | ||||||
|
| |||||||
| 13,379,907 | ||||||||
Municipal Bonds Transferred to | Par (000) | Value | ||||||
Wisconsin — 0.4% | ||||||||
Wisconsin Health & Educational Facilities Authority, Refunding RB, Froedtert & Community Health, Inc., Obligated Group, Series C, 5.25%, 4/01/39 (j) | $ | 2,179 | $ | 2,362,342 | ||||
| Total Municipal Bonds Transferred to Tender Option Bond Trusts — 15.1% | 96,376,965 | |||||||
| Total Long-Term Investments (Cost — $609,857,446) — 101.7% | 649,481,873 | |||||||
| Short-Term Securities | ||||||||
FFI Institutional Tax-Exempt Fund, 0.02% (k)(l) | 38,438,476 | 38,438,476 | ||||||
Total Short-Term Securities (Cost — $38,438,476) — 6.0% |
| 38,438,476 | ||||||
| Total Investments (Cost — $648,295,922) — 107.7% | 687,920,349 | |||||||
| Other Assets Less Liabilities — 0.5% | 3,396,388 | |||||||
Liability for TOB Trust Certificates, Including |
| (52,634,940 | ) | |||||
|
| |||||||
| Net Assets — 100.0% | $ | 638,681,797 | ||||||
|
| |||||||
| Notes to Schedule of Investments |
| (a) | When-issued security. |
| (b) | Security exempt from registration pursuant to Rule 144A under the Securities Act of 1933, as amended. These securities may be resold in transactions exempt from registration to qualified institutional investors. |
| (c) | Zero-coupon bond. |
| (d) | U.S. Government securities, held in escrow, are used to pay interest on this security, as well as to retire the bond in full at the date indicated, typically at a premium to par. |
| (e) | Issuer filed for bankruptcy and/or is in default of interest payments. |
| (f) | Non-income producing security. |
| (g) | Step-up bond that pays an initial coupon rate for the first period and then a higher coupon rate for the following periods. Rate as of period end. |
| (h) | Variable rate security. Rate as of period end. |
| (i) | Represent bonds transferred to a TOB Trust in exchange of cash and residual certificates received by the Fund. These bonds serve as collateral in a secured borrowing. See Note 4 of the Notes to Financial Statements for details. |
| (j) | All or a portion of security is subject to a recourse agreement. The aggregate maximum potential amount the Fund could ultimately be required to pay under the agreements, which expire between October 1, 2016 to January 1, 2033 is $8,645,273. See Note 4 of the Notes to Financial Statements for details. |
| (k) | During the period ended December 31, 2015, investments in issuers considered to be an affiliate of the Fund for purposes of Section 2(a)(3) of the Investment Company Act of 1940, as amended, were as follows: |
| Affiliate | Shares Held at June 30, 2015 | Net Activity | Shares Held at December 31, 2015 | Income | ||||||||||||
FFI Institutional Tax-Exempt Fund | 22,850,559 | 15,587,917 | 38,438,476 | $ | 2,220 | |||||||||||
| (l) | Current yield as of period end. |
| Derivative Financial Instruments Outstanding as of Period End |
Financial Futures Contracts
| Contracts Short | Issue | Expiration | Notional Value | Unrealized Appreciation | ||||||||||
| (29 | ) | 5-Year U.S. Treasury Note | March 2016 | $3,431,289 | $ | 19,402 | ||||||||
| (44 | ) | 10-Year U.S. Treasury Note | March 2016 | $5,539,875 | 41,805 | |||||||||
| (23 | ) | Long U.S. Treasury Bond | March 2016 | $3,536,250 | 38,800 | |||||||||
| (8 | ) | Ultra U.S. Treasury Bond | March 2016 | $1,269,500 | 9,943 | |||||||||
| Total | $ | 109,950 | ||||||||||||
|
| |||||||||||||
See Notes to Financial Statements.
| 22 | SEMI-ANNUAL REPORT | DECEMBER 31, 2015 |
Schedule of Investments (concluded) | BlackRock High Yield Municipal Fund |
| Derivative Financial Instruments Categorized by Risk Exposure |
As of period end, the fair values of derivative financial instruments located in the Statements of Assets and Liabilities were as follows:
| Assets — Derivative Financial Instruments | Commodity Contracts | Credit Contracts | Equity Contracts | Foreign Currency Exchange Contracts | Interest Rate Contracts | Other Contacts | Total | |||||||||||||||||||||||
Financial futures contracts | Net unrealized appreciation1 | — | — | — | — | $ | 109.950 | — | $ | 109.950 | ||||||||||||||||||||
1 Includes cumulative appreciation (depreciation) on financial futures contracts, as reported in the Schedule of Investments. Only current day’s variation margin is reported within the Statements of Assets and Liabilities. |
| |||||||||||||||||||||||||||||
For the six months ended December 31, 2015, the effect of derivative financial instruments in the Statements of Operations was as follows:
| Net Realized Gain (Loss) from: | Commodity Contracts | Credit Contracts | Equity Contracts | Foreign Currency Exchange Contracts | Interest Rate Contracts | Other Contacts | Total | |||||||||||||||||||
Financial futures contracts | — | — | — | — | $ | (254,379 | ) | — | $ | (254,379 | ) | |||||||||||||||
| ||||||||||||||||||||||||||
. | ||||||||||||||||||||||||||
| Net Change in Unrealized Appreciation (Depreciation) on: | Commodity Contracts | Credit Contracts | Equity Contracts | Foreign Currency Exchange Contracts | Interest Rate Contracts | Other Contacts | Total | |||||||||||||||||||
Financial futures contracts | — | — | — | — | $ | (141,589 | ) | — | $ | (141,589 | ) | |||||||||||||||
| ||||||||||||||||||||||||||
| Average Quarterly Balances of Outstanding Derivative Financial Instruments |
For the six months ended December 31, 2015, the average quarterly balances of outstanding derivative financial instruments were as follows:
Financial futures contracts: | ||||
Average notional value of contracts — short | $ | 17,267,066 |
For more information about the Fund’s investment risks regarding derivative financial instruments, refer to the Notes to Financial Statements.
| Fair Value Hierarchy as of Period End |
Various inputs are used in determining the fair value of investments and derivative financial instruments. For information about the Fund’s policy regarding valuation of investments and derivative financial instruments, refer to the Notes to Financial Statements.
The following tables summarize the Fund’s investments and derivative financial instruments categorized in the disclosure hierarchy:
| Level 1 | Level 2 | Level 3 | Total | |||||||||||||
Assets: | ||||||||||||||||
| Investments: | ||||||||||||||||
Long-Term Investments1 | — | $ | 649,481,873 | — | $ | 649,481,873 | ||||||||||
Short-Term Securities | $ | 38,438,476 | — | — | 38,438,476 | |||||||||||
|
|
|
|
|
|
|
| |||||||||
Total | $ | 38,438,476 | $ | 649,481,873 | — | $ | 687,920,349 | |||||||||
|
|
|
|
|
|
|
| |||||||||
1 See above Schedule of Investments for values in each state or political subdivision.
|
| |||||||||||||||
| Level 1 | Level 2 | Level 3 | Total | |||||||||||||
| Derivative Financial Instruments1 | ||||||||||||||||
Assets: | ||||||||||||||||
Interest rate contracts | $ | 109,950 | — | — | 109,950 | |||||||||||
1 Derivative financial instruments are financial futures contracts, which are valued at the unrealized appreciation (depreciation) on the instrument. |
| |||||||||||||||
The Fund may hold assets and/or liabilities in which the fair value approximates the carrying amount for financial statement purposes. As of period end, such assets and/or liabilities are categorized within the disclosure hierarchy as follows:
|
| |||||||||||||||
| Level 1 | Level 2 | Level 3 | Total | |||||||||||||
Assets: | ||||||||||||||||
Cash | $ | 189,795 | — | — | $ | 189,795 | ||||||||||
Cash pledged for financial futures contracts | 203,500 | — | — | 203,500 | ||||||||||||
Liabilities: | ||||||||||||||||
TOB Trust Certificates | — | $ | (52,625,555 | ) | — | (52,625,555 | ) | |||||||||
|
|
|
|
|
|
|
| |||||||||
Total | $ | 393,295 | $ | (52,625,555 | ) | — | $ | (52,232,260 | ) | |||||||
|
|
|
|
|
|
|
| |||||||||
During the six months ended December 31, 2015, there were no transfers between levels.
See Notes to Financial Statements.
| SEMI-ANNUAL REPORT | DECEMBER 31, 2015 | 23 |
Schedule of Investments December 31, 2015 (Unaudited) | BlackRock National Municipal Fund (Percentages shown are based on Net Assets) |
| Municipal Bonds | Par (000) | Value | ||||||
Alabama — 0.7% | ||||||||
City of Birmingham Alabama Special Care Facilities Financing Authority, RB, Children’s Hospital (AGC), 6.00%, 6/01/19 (a) | $ | 15,955 | $ | 18,544,018 | ||||
Prattville Alabama IDB, RB, Recovery Zone Facility, Series C, 6.25%, 11/01/33 | 3,380 | 3,900,655 | ||||||
State of Alabama Docks Department, Refunding RB, 6.00%, 10/01/40 | 16,330 | 18,989,341 | ||||||
|
| |||||||
| 41,434,014 | ||||||||
Alaska — 0.1% |
| |||||||
Borough of Matanuska-Susitna Alaska, RB, Goose Creek Correctional Center (AGC): | ||||||||
6.00%, 9/01/19 (a) | 5,250 | 6,163,500 | ||||||
6.00%, 9/01/19 (a) | 1,270 | 1,490,980 | ||||||
6.00%, 9/01/28 | 730 | 847,581 | ||||||
|
| |||||||
| 8,502,061 | ||||||||
Arizona — 3.0% |
| |||||||
City of Phoenix & County of Maricopa Arizona IDA, Refunding RB, S/F Housing, Series A-2, AMT (Fannie Mae), 5.80%, 7/01/40 | 170 | 177,745 | ||||||
City of Phoenix Arizona IDA, RB: | ||||||||
Candeo School, Inc. Project, 6.88%, 7/01/44 | 3,440 | 3,905,432 | ||||||
Legacy Traditional Schools Project, Series A, 6.50%, 7/01/34 (b) | 2,000 | 2,238,000 | ||||||
Legacy Traditional Schools Project, Series A, 6.75%, 7/01/44 (b) | 3,500 | 3,941,875 | ||||||
City of Phoenix Arizona IDA, Refunding RB, Basis Schools, Inc. Projects, Series A, 5.00%, 7/01/45 (b) | 2,280 | 2,342,495 | ||||||
County of Maricopa Arizona IDA, RB, Arizona Charter Schools Project, Series A, 6.75%, 7/01/29 | 665 | 639,989 | ||||||
County of Pinal Arizona, RB, Electric District No. 4, 6.00%, 12/01/18 (a) | 1,200 | 1,369,416 | ||||||
County of Pinal Arizona IDA, RB, San Manuel Facility Project, AMT, 6.25%, 6/01/26 | 500 | 516,235 | ||||||
Salt River Project Agricultural Improvement & Power District, RB, Series A, 5.00%, 1/01/38 | 54,015 | 57,560,545 | ||||||
Salt River Project Agricultural Improvement & Power District, Refunding RB, Series A (a): | ||||||||
5.00%, 1/01/16 | 98,935 | 98,935,000 | ||||||
5.00%, 1/01/16 | 13,700 | 13,700,000 | ||||||
|
| |||||||
| 185,326,732 | ||||||||
Arkansas — 0.3% |
| |||||||
University of Arkansas, RB, Various Facilities, UAMS Campus, 5.00%, 3/01/16 (a) | 21,290 | 21,456,488 | ||||||
California — 13.9% |
| |||||||
ABAG Finance Authority for Nonprofit Corps., Refunding RB, Sharp Healthcare, Series B, 6.25%, 8/01/39 | 11,525 | 13,397,006 | ||||||
California Health Facilities Financing Authority, RB, Sutter Health: | ||||||||
Series A, 5.25%, 11/15/46 | 10,500 | 10,874,955 | ||||||
Series B, 6.00%, 8/15/42 | 21,340 | 25,622,938 | ||||||
California Health Facilities Financing Authority, Refunding RB: | ||||||||
Catholic Healthcare West, Series A, 6.00%, 7/01/39 | 26,655 | 30,562,890 | ||||||
Stanford Hospital, Series A-3, 5.50%, 11/15/40 | 8,000 | 9,563,440 | ||||||
California Statewide Communities Development Authority, RB, Sutter Health, Series A, 6.00%, 8/15/42 | 10,190 | 12,124,673 | ||||||
| Municipal Bonds | Par (000) | Value | ||||||
California (continued) |
| |||||||
California Statewide Communities Development Authority, Refunding RB, Catholic Healthcare West: | ||||||||
Series B, 5.50%, 7/01/30 | $ | 2,895 | $ | 3,079,064 | ||||
Series E, 5.50%, 7/01/31 | 1,920 | 2,042,515 | ||||||
City & County of San Francisco California Airports Commission, ARB, Series E, 6.00%, 5/01/39 | 24,300 | 28,048,275 | ||||||
City & County of San Francisco California Airports Commission, Refunding ARB, 2nd Series 34E, AMT (AGM): | ||||||||
5.75%, 5/01/21 | 8,220 | 9,105,705 | ||||||
5.75%, 5/01/23 | 17,000 | 18,831,750 | ||||||
City of Chula Vista California, Refunding RB, San Diego Gas & Electric, Series A, 5.88%, 2/15/34 | 5,850 | 6,681,929 | ||||||
City of Los Angeles California Department of Water & Power, Refunding RB, Series A, 5.25%, 7/01/39 | 40,000 | 46,074,000 | ||||||
City of Los Angeles California Municipal Improvement Corp., RB, Real Property, Series E: | ||||||||
6.00%, 9/01/34 | 4,890 | 5,653,085 | ||||||
6.00%, 9/01/39 | 9,450 | 10,906,434 | ||||||
City of Los Angeles Department of Airports, Refunding RB, AMT, 5.50%, 5/15/22 | 11,300 | 12,441,187 | ||||||
City of San Jose California, Refunding ARB, AMT: | ||||||||
Series A (AGM), 5.00%, 3/01/37 | 35,000 | 36,426,950 | ||||||
Series A (AMBAC), 5.50%, 3/01/32 | 6,530 | 6,840,110 | ||||||
Series A-1, 5.75%, 3/01/34 | 7,010 | 8,142,676 | ||||||
Series A-1, 6.25%, 3/01/34 | 5,250 | 6,188,753 | ||||||
City of San Jose California Hotel Tax, RB, Convention Center Expansion & Renovation Project: | ||||||||
6.50%, 5/01/36 | 1,510 | 1,830,784 | ||||||
6.50%, 5/01/42 | 5,130 | 6,174,006 | ||||||
City of San Juan California Water District, COP, Series A, 6.00%, 2/01/39 | 10,000 | 11,464,100 | ||||||
County of Alameda & City of Oakland California, GO, Election of 2012, 6.63%, 8/01/38 | 3,750 | 4,593,525 | ||||||
County of Orange California Sanitation District, COP: | ||||||||
Series A, 5.00%, 2/01/35 | 10,000 | 11,100,900 | ||||||
Series B (AGM), 5.00%, 2/01/17 (a) | 25,000 | 26,182,500 | ||||||
County of Orange California Water District, COP, Refunding: | ||||||||
5.00%, 8/15/39 | 15,000 | 16,870,500 | ||||||
Series A, 5.00%, 8/15/41 | 7,110 | 7,967,182 | ||||||
County of Sacramento California, RB, Subordinated & Passenger Facility Charges/Grant, Series C: | ||||||||
6.00%, 7/01/39 | 16,920 | 18,812,502 | ||||||
6.00%, 7/01/41 | 13,285 | 14,770,927 | ||||||
County of San Diego Water Authority Financing Corp., COP, Refunding, Series A (AGM): | ||||||||
5.00%, 5/01/18 (a) | 745 | 815,365 | ||||||
5.00%, 5/01/33 | 3,755 | 4,081,122 | ||||||
County of San Joaquin California Transportation Authority, Refunding RB, Limited Tax, Measure K, Series A: | ||||||||
6.00%, 3/01/36 | 12,830 | 15,459,380 | ||||||
5.50%, 3/01/41 | 26,390 | 30,852,549 | ||||||
Cucamonga Valley Water District, Refunding RB, Series A (AGM), 5.38%, 9/01/35 | 26,315 | 31,439,057 | ||||||
Gilroy Public Facilities Financing Authority, Refunding RB, 6.00%, 11/01/33 | 6,535 | 8,110,719 | ||||||
Golden State Tobacco Securitization Corp., Refunding RB, Asset-Backed, Senior, Series A-1, 5.75%, 6/01/47 | 50,520 | 47,434,744 | ||||||
Grossmont Healthcare District, GO, Election of 2006, Series B, 6.13%, 7/15/21 (a) | 3,500 | 4,396,595 | ||||||
Los Angeles Department of Water & Power, RB (AMBAC), 5.00%, 7/01/37 (c) | 27,500 | 29,167,875 | ||||||
See Notes to Financial Statements.
| 24 | SEMI-ANNUAL REPORT | DECEMBER 31, 2015 |
Schedule of Investments (continued) | BlackRock National Municipal Fund |
| Municipal Bonds | Par (000) | Value | ||||||
California (continued) |
| |||||||
Metropolitan Water District of Southern California, RB, Series A: | ||||||||
Authorization, 5.00%, 1/01/39 | $ | 10,000 | $ | 11,075,800 | ||||
5.00%, 7/01/37 | 10,000 | 10,602,600 | ||||||
Metropolitan Water District of Southern California, Refunding RB: | ||||||||
Series B, 5.00%, 7/01/35 | 13,170 | 13,476,071 | ||||||
Series C, 5.00%, 7/01/35 | 13,375 | 15,090,076 | ||||||
Modesto Irrigation District, COP, Capital Improvements, Series A, 6.00%, 10/01/39 | 11,755 | 13,403,521 | ||||||
Port of Oakland California, Refunding RB, Senior Lien, Series P, AMT, 5.00%, 5/01/31 | 13,535 | 15,226,604 | ||||||
San Diego Community College District California, GO, Election of 2002 (AGM), 5.00%, 8/01/32 | 18,000 | 19,097,100 | ||||||
San Francisco City & County California Public Utilities Commission, Refunding RB, Series A, 5.13%, 11/01/39 | 23,000 | 25,878,680 | ||||||
State of California, GO, Various Purposes: | ||||||||
6.50%, 4/01/33 | 33,550 | 39,400,113 | ||||||
6.00%, 4/01/38 | 33,925 | 39,275,990 | ||||||
State of California Public Works Board, LRB, Various Capital Projects: | ||||||||
Sub-Series A-1, 6.00%, 3/01/35 | 14,125 | 16,663,121 | ||||||
Sub-Series I-1, 6.13%, 11/01/29 | 10,000 | 11,924,600 | ||||||
Sub-Series I-1, 6.38%, 11/01/34 | 11,680 | 14,008,058 | ||||||
Tuolumne Wind Project Authority, RB, Tuolumne Co. Project, Series A, 5.88%, 1/01/29 | 19,355 | 22,062,764 | ||||||
|
| |||||||
| 861,317,765 | ||||||||
Colorado — 0.1% |
| |||||||
Colorado Health Facilities Authority, RB, Catholic Health Initiatives, Series D, 6.25%, 10/01/33 | 4,385 | 4,931,283 | ||||||
Colorado Health Facilities Authority, Refunding RB, Catholic Health Initiative, Series A, 5.50%, 7/01/34 | 1,580 | 1,777,168 | ||||||
|
| |||||||
| 6,708,451 | ||||||||
Connecticut — 1.3% |
| |||||||
State of Connecticut Health & Educational Facility Authority, RB, Series A, 0.80%, 7/01/48 (d) | 30,000 | 29,955,900 | ||||||
State of Connecticut Health & Educational Facility Authority, Refunding RB, Series B, 0.84%, 7/01/49 (d) | 50,000 | 50,327,500 | ||||||
|
| |||||||
| 80,283,400 | ||||||||
Delaware — 0.6% |
| |||||||
County of Sussex Delaware, RB, NRG Energy, Inc., Indian River Power LLC Project, 6.00%, 10/01/40 | 31,500 | 34,105,050 | ||||||
District of Columbia — 1.8% |
| |||||||
District of Columbia, RB, Series A, 5.50%, 12/01/30 | 20,530 | 23,873,926 | ||||||
District of Columbia Water & Sewer Authority, Refunding RB: | ||||||||
Series A, 6.00%, 10/01/18 (a) | 12,630 | 14,332,903 | ||||||
Series A, 5.50%, 10/01/39 | 7,475 | 8,284,842 | ||||||
Series B, 5.25%, 10/01/40 | 25,000 | 29,933,750 | ||||||
Series B, 5.25%, 10/01/44 | 26,500 | 31,580,845 | ||||||
Metropolitan Washington Airports Authority, Refunding RB, Dulles Toll Road, 1st Senior Lien, Series A, 5.25%, 10/01/44 | 5,765 | 6,410,853 | ||||||
|
| |||||||
| 114,417,119 | ||||||||
Florida — 5.2% |
| |||||||
Anthem Park Community Development District, Special Assessment Bonds, 5.80%, 5/01/36 | 1,240 | 1,240,670 | ||||||
City of Saint Augustine, RB, 5.75%, 10/01/41 | 1,345 | 1,606,132 | ||||||
City of Tallahassee Florida Energy System Revenue, RB, 5.00%, 10/01/37 | 10,000 | 10,625,800 | ||||||
| Municipal Bonds | Par (000) | Value | ||||||
Florida (continued) |
| |||||||
County of Broward Florida Airport System, RB, Series A, AMT, 5.00%, 10/01/45 | $ | 10,000 | $ | 11,159,500 | ||||
County of Escambia Florida, RB, International Paper Co. Projects, Series B, 6.25%, 11/01/33 | 7,500 | 8,655,300 | ||||||
County of Highlands Florida Health Facilities Authority, RB, Adventist Health System/Sunbelt, Series B, 6.00%, 11/15/37 | 4,990 | 5,758,011 | ||||||
County of Miami-Dade Florida Educational Facilities Authority, Refunding RB, University of Miami, Series A, 5.00%, 4/01/45 | 35,000 | 39,292,750 | ||||||
County of Miami-Dade Florida, GO, Building Better Communities Program: | ||||||||
Series B, 6.38%, 7/01/28 | 9,300 | 10,494,492 | ||||||
Series B-1, 5.75%, 7/01/33 | 2,400 | 2,667,552 | ||||||
Series B-1, 6.00%, 7/01/38 | 30,000 | 33,782,100 | ||||||
County of Miami-Dade Florida, RB, Seaport: | ||||||||
Series A, 6.00%, 10/01/38 | 6,175 | 7,513,925 | ||||||
Series A, 5.50%, 10/01/42 | 5,375 | 6,265,476 | ||||||
Series B, AMT, 6.25%, 10/01/38 | 5,000 | 6,186,150 | ||||||
Series B, AMT, 6.00%, 10/01/42 | 2,340 | 2,786,425 | ||||||
County of Miami-Dade Florida, Refunding ARB, Miami International Airport, Series A, AMT (AGC): | ||||||||
5.50%, 10/01/27 | 5,495 | 6,057,688 | ||||||
5.50%, 10/01/26 | 7,000 | 7,724,780 | ||||||
County of Miami-Dade Florida, Refunding RB: | ||||||||
Miami International Airport, Series B, 5.50%, 10/01/36 | 14,745 | 16,718,618 | ||||||
Water & Sewer Systems, Series C, 6.00%, 10/01/18 (a) | 25,000 | 28,374,500 | ||||||
East Central Regional Wastewater Treatment Facilities Operation Board, RB, Green Bond Biosolids Project: | ||||||||
5.00%, 10/01/39 | 4,695 | 5,428,359 | ||||||
5.50%, 10/01/44 | 29,160 | 35,764,448 | ||||||
Florida Housing Finance Corp., Refunding RB, S/F Housing, Homeowner Mortgage, Series 1 (Ginnie Mae), AMT, 6.00%, 7/01/39 | 1,515 | 1,566,071 | ||||||
Florida Ports Financing Commission, Refunding RB, State Transportation Trust Fund, Series B, AMT, 5.13%, 6/01/27 | 10,000 | 11,593,800 | ||||||
Harbor Bay Community Development District Florida, Special Assessment Bonds, Series A, 7.00%, 5/01/33 | 900 | 903,078 | ||||||
Jacksonville Electric Authority Florida, RB, Sub-Series A, 5.63%, 10/01/32 | 16,825 | 18,573,791 | ||||||
Mid-Bay Bridge Authority, RB, Springing Lien, Series A, 7.25%, 10/01/21 (a) | 11,125 | 14,578,756 | ||||||
State of Florida, GO, Board of Education, Series A: | ||||||||
5.38%, 6/01/33 | 3,950 | 4,373,835 | ||||||
5.50%, 6/01/38 | 4,790 | 5,315,703 | ||||||
State of Florida, RB, Board of Education Lottery Revenue, Series A, 5.75%, 7/01/28 | 3,890 | 4,351,237 | ||||||
State of Florida Turnpike Authority, RB, Series B, 5.00%, 7/01/40 | 10,000 | 11,378,800 | ||||||
Sterling Hill Community Development District, Refunding RB, Special Assessment Bonds, Series B, 5.50%, 11/01/2010 (e)(f) | 155 | 108,492 | ||||||
Watergrass Community Development District Florida, Special Assessment Bonds, Series B, 6.96%, 11/01/17 | 205 | 204,920 | ||||||
|
| |||||||
| 321,051,159 | ||||||||
Georgia — 1.8% |
| |||||||
City of Atlanta Georgia Department of Aviation, Refunding GARB, Series C, 6.00%, 1/01/30 | 30,000 | 36,254,400 | ||||||
See Notes to Financial Statements.
| SEMI-ANNUAL REPORT | DECEMBER 31, 2015 | 25 |
Schedule of Investments (continued) | BlackRock National Municipal Fund |
| Municipal Bonds | Par (000) | Value | ||||||
Georgia (continued) |
| |||||||
City of Atlanta Georgia Water & Wastewater, Refunding RB, 5.00%, 11/01/40 | $ | 15,000 | $ | 17,359,650 | ||||
County of DeKalb Georgia Hospital Authority, Refunding RB, DeKalb Medical Center, Inc. Project, 6.13%, 9/01/40 | 2,000 | 2,188,360 | ||||||
County of Gainesville Georgia & Hall Hospital Authority, Refunding RB, Northeast Georgia Health System, Inc. Project, Series A, 5.50%, 8/15/54 | 4,950 | 5,844,366 | ||||||
County of Richmond Georgia Development Authority, RB, Recovery Zone Facility, International Paper Co., Series B, 6.25%, 11/01/33 | 3,625 | 4,183,395 | ||||||
County of Rockdale Georgia Development Authority, RB, Visy Paper Project, Series A, AMT, 6.13%, 1/01/34 | 5,000 | 5,136,850 | ||||||
Municipal Electric Authority of Georgia, Refunding RB: | ||||||||
Project One, Sub-Series D, 6.00%, 1/01/23 | 10,000 | 11,219,900 | ||||||
Series EE (AMBAC), 7.00%, 1/01/25 | 20,000 | 27,504,600 | ||||||
|
| |||||||
| 109,691,521 | ||||||||
Illinois — 7.7% |
| |||||||
Bolingbrook Special Service Area No. 1, Special Tax Bonds, Forest City Project, 5.90%, 3/01/27 | 1,000 | 1,004,360 | ||||||
Chicago O’Hare International Airport, Refunding RB: | ||||||||
5.00%, 1/01/31 | 30,450 | 35,118,594 | ||||||
5.00%, 1/01/32 | 23,410 | 26,899,729 | ||||||
City of Chicago Illinois, GARB, O’Hare International Airport, 3rd Lien, Series C, 6.50%, 1/01/41 | 29,835 | 35,909,406 | ||||||
City of Chicago Illinois, Refunding GARB, Senior Lien, O’Hare International Airport, Series C, AMT: | ||||||||
5.50%, 1/01/34 | 5,380 | 6,128,842 | ||||||
General, 5.38%, 1/01/39 | 1,650 | 1,840,608 | ||||||
City of Chicago Illinois Transit Authority, RB, Federal Transit Administration, Section 5309, Series A (AGC), 6.00%, 12/01/18 (a) | 15,000 | 17,121,600 | ||||||
City of Chicago Illinois Wastewater Transmission, RB, Series A (BHAC), 5.50%, 1/01/38 | 3,000 | 3,201,180 | ||||||
City of Chicago Illinois Waterworks, Refunding RB, 2nd Lien (AGM), 5.25%, 11/01/33 | 5,000 | 5,267,000 | ||||||
Illinois Finance Authority, RB: | ||||||||
Advocate Health Care Network, Series D, 6.50%, 11/01/18 (a) | 7,020 | 8,086,549 | ||||||
Carle Foundation, Series A, 6.00%, 8/15/41 | 6,500 | 7,667,465 | ||||||
Carle Foundation, Series A (AGM), 6.00%, 8/15/41 | 3,675 | 4,347,745 | ||||||
DePaul University, Series A, 6.13%, 10/01/40 | 11,790 | 14,099,661 | ||||||
Memorial Health System, 5.50%, 4/01/34 | 150 | 165,240 | ||||||
Memorial Health System, Series A, 5.25%, 7/01/44 | 8,370 | 9,172,767 | ||||||
Rush University Medical Center, Series B, 7.25%, 11/01/18 (a) | 5,280 | 6,192,437 | ||||||
Rush University Medical Center, Series C, 6.38%, 5/01/19 (a) | 2,860 | 3,351,720 | ||||||
University of Chicago, Series B, 6.25%, 7/01/18 (a) | 25,035 | 28,278,785 | ||||||
Illinois Finance Authority, Refunding RB: | ||||||||
5.75%, 4/01/24 | 500 | 539,645 | ||||||
6.25%, 4/01/29 | 260 | 285,386 | ||||||
Central Dupage Health, Series B, 5.50%, 11/01/39 | 4,205 | 4,800,512 | ||||||
Northwestern Memorial Hospital, Series A, 6.00%, 8/15/39 | 29,925 | 34,758,187 | ||||||
OSF Healthcare System, Series A, 6.00%, 5/15/39 | 11,870 | 13,697,268 | ||||||
Roosevelt University Project, 6.50%, 4/01/39 | 7,000 | 7,649,110 | ||||||
Rush University Medical Center Obligation Group, Series A, 7.25%, 11/01/18 (a) | 6,900 | 8,092,389 | ||||||
Illinois State Toll Highway Authority, RB, Series B, 5.00%, 1/01/40 | 53,280 | 61,186,219 | ||||||
| Municipal Bonds | Par (000) | Value | ||||||
Illinois (continued) |
| |||||||
Illinois State Toll Highway Authority, Refunding RB, Series A, 5.00%, 12/01/32 | $ | 4,500 | $ | 5,312,655 | ||||
Metropolitan Pier & Exposition Authority, RB, McCormick Place Expansion Project, Series A: | ||||||||
5.50%, 6/15/50 | 10,000 | 10,614,800 | ||||||
5.50%, 6/15/53 | 23,565 | 25,891,808 | ||||||
Metropolitan Pier & Exposition Authority, Refunding RB, 5.25%, 6/15/50 | 62,500 | 65,217,500 | ||||||
Railsplitter Tobacco Settlement Authority, RB, 6.00%, 6/01/28 | 13,865 | 16,540,668 | ||||||
Village of Hodgkins Illinois, RB, Metropolitan Biosolids Management LLC Project, AMT, 6.00%, 11/01/23 | 10,000 | 10,017,700 | ||||||
Village of Wheeling Illinois, Tax Allocation Bonds, North Milwaukee/Lake-Cook TIF Project, 6.00%, 1/01/25 | 1,075 | 1,075,537 | ||||||
|
| |||||||
| 479,533,072 | ||||||||
Indiana — 4.0% |
| |||||||
City of Valparaiso Indiana, RB, Exempt Facilities, Pratt Paper LLC Project, AMT: | ||||||||
6.75%, 1/01/34 | 3,870 | 4,701,856 | ||||||
7.00%, 1/01/44 | 7,330 | 8,974,779 | ||||||
Indiana Finance Authority, RB, 1st Lien, Series A: | ||||||||
CWA Authority Project, 5.25%, 10/01/38 | 17,510 | 20,593,861 | ||||||
Wastewater, 5.25%, 10/01/31 | 10,875 | 12,751,590 | ||||||
Indiana Finance Authority, Refunding RB: | ||||||||
Duke Energy Indiana Project, Series B, 6.00%, 8/01/39 | 11,000 | 12,613,700 | ||||||
Parkview Health System, Series A, 5.75%, 5/01/31 | 1,660 | 1,885,611 | ||||||
Trinity Health, Series A, 5.63%, 12/01/38 | 12,000 | 13,654,920 | ||||||
Indiana Municipal Power Agency, RB: | ||||||||
Series A, 5.00%, 1/01/42 (c) | 39,000 | 44,901,870 | ||||||
Series B, 6.00%, 1/01/39 | 19,620 | 22,225,340 | ||||||
Indianapolis Local Public Improvement Bond Bank, RB, Pilot Infrastructure Project, Series F, 5.00%, 1/01/35 | 23,550 | 26,301,111 | ||||||
Indianapolis Local Public Improvement Bond Bank, Refunding RB, Waterworks Project, Series A: | ||||||||
5.75%, 1/01/38 | 12,945 | 14,663,190 | ||||||
(AGC), 5.50%, 1/01/38 | 56,725 | 63,891,069 | ||||||
|
| |||||||
| 247,158,897 | ||||||||
Iowa — 1.5% |
| |||||||
Iowa Finance Authority, RB, Iowa Health Care Facilities: | ||||||||
Genesis Health System, 5.50%, 7/01/33 | 18,750 | 22,014,750 | ||||||
Series A (AGC), 5.63%, 8/15/37 | 5,600 | 6,302,240 | ||||||
Iowa Finance Authority, Refunding RB, Midwestern Disaster Area, Iowa Fertilizer Co. Project: | ||||||||
5.50%, 12/01/22 | 35,000 | 36,923,950 | ||||||
5.25%, 12/01/25 | 9,950 | 10,779,532 | ||||||
Iowa Student Loan Liquidity Corp., RB, Senior Series A-2, AMT: | ||||||||
5.40%, 12/01/24 | 10,065 | 10,756,566 | ||||||
5.50%, 12/01/25 | 6,690 | 7,201,785 | ||||||
|
| |||||||
| 93,978,823 | ||||||||
Kansas — 0.0% |
| |||||||
Counties of Sedgwick & Shawnee Kansas, RB, AMT (Ginnie Mae), 6.95%, 6/01/29 | 230 | 241,259 | ||||||
Louisiana — 1.6% |
| |||||||
City of New Orleans Louisiana Aviation Board, Refunding GARB, Restructuring, Series A-2 (AGC), 6.00%, 1/01/23 | 1,370 | 1,534,756 | ||||||
See Notes to Financial Statements.
| 26 | SEMI-ANNUAL REPORT | DECEMBER 31, 2015 |
Schedule of Investments (continued) | BlackRock National Municipal Fund |
| Municipal Bonds | Par (000) | Value | ||||||
Louisiana (continued) |
| |||||||
Louisiana Local Government Environmental Facilities & Community Development Authority, RB, Westlake Chemical Corp. Project: | ||||||||
6.75%, 11/01/32 | $ | 8,030 | $ | 8,700,826 | ||||
Series A, 6.50%, 8/01/29 | 11,470 | 13,559,375 | ||||||
Series A-1, 6.50%, 11/01/35 | 17,185 | 20,355,804 | ||||||
State of Louisiana Gasoline & Fuels Tax, RB, Series A (AGM), 5.00%, 5/01/16 (a) | 11,950 | 12,134,628 | ||||||
State of Louisiana Gasoline & Fuels Tax, Refunding RB, 2nd Lien, Series B (d): | ||||||||
0.77%, 5/01/43 | 32,000 | 32,070,400 | ||||||
0.85%, 5/01/43 | 10,000 | 10,009,700 | ||||||
|
| |||||||
| 98,365,489 | ||||||||
Maine — 0.3% |
| |||||||
Maine Health & Higher Educational Facilities Authority, RB, Maine General Medical Center: | ||||||||
7.50%, 7/01/32 | 12,365 | 14,806,346 | ||||||
6.95%, 7/01/41 | 2,235 | 2,559,544 | ||||||
|
| |||||||
| 17,365,890 | ||||||||
Maryland — 0.6% |
| |||||||
Maryland Health & Higher Educational Facilities Authority, RB, University of Maryland Medical System, Series B (NPFGC), 7.00%, 7/01/22 | 3,540 | 4,217,591 | ||||||
Maryland Health & Higher Educational Facilities Authority, Refunding RB, Charlestown Community Project, 6.25%, 1/01/41 | 11,000 | 12,317,690 | ||||||
State of Maryland, GO, Series A, 4.15%, 3/01/16 (a) | 21,880 | 22,020,032 | ||||||
|
| |||||||
| 38,555,313 | ||||||||
Massachusetts — 3.4% |
| |||||||
Commonwealth of Massachusetts, GO, Series D-2, 0.31%, 8/01/43 (d) | 35,000 | 34,970,600 | ||||||
Commonwealth of Massachusetts, RB, Master Transportation Fund Accelerated Bridge Program, Series A, 5.00%, 6/01/44 | 15,000 | 17,373,600 | ||||||
Massachusetts Development Finance Agency, RB, Foxborough Regional Charter School, Series A, 7.00%, 7/01/42 | 1,375 | 1,553,008 | ||||||
Massachusetts Development Finance Agency, Refunding RB, Emerson College, 5.00%, 1/01/41 | 12,180 | 13,392,519 | ||||||
Massachusetts Health & Educational Facilities Authority, RB, Series N, 5.00%, 7/01/17 (a) | 31,000 | 32,961,370 | ||||||
Massachusetts Health & Educational Facilities Authority, Refunding RB, Harvard University, Series A, 5.50%, 11/15/36 | 85,925 | 96,982,688 | ||||||
Massachusetts HFA, RB, M/F Housing, Series B, 7.00%, 12/01/38 | 4,585 | 4,957,302 | ||||||
Massachusetts Water Resources Authority, Refunding RB, Series C, 5.25%, 8/01/42 | 5,000 | 5,878,200 | ||||||
|
| |||||||
| 208,069,287 | ||||||||
Michigan — 1.0% |
| |||||||
City of Lansing Michigan, RB, Board of Water & Light Utilities System, Series A, 5.50%, 7/01/41 | 6,485 | 7,644,972 | ||||||
Royal Oak Hospital Finance Authority Michigan, Refunding RB, William Beaumont Hospital (a): | ||||||||
Series V, 8.25%, 9/01/18 | 18,130 | 21,563,822 | ||||||
Series W, 6.00%, 8/01/19 | 5,145 | 6,019,393 | ||||||
State of Michigan Building Authority, Refunding RB, Facilities Program Series: | ||||||||
6.00%, 10/15/18 (a) | 7,550 | 8,580,046 | ||||||
6.00%, 10/15/38 | 4,905 | 5,512,877 | ||||||
| Municipal Bonds | Par (000) | Value | ||||||
Michigan (continued) |
| |||||||
State of Michigan Building Authority, Refunding RB, Facilities Program Series I: | ||||||||
6.25%, 10/15/18 (a) | $ | 4,540 | $ | 5,190,491 | ||||
6.25%, 10/15/38 | 2,960 | 3,346,990 | ||||||
State of Michigan HDA, RB, S/F Housing, Series C, AMT, 5.50%, 12/01/28 | 1,300 | 1,385,449 | ||||||
State of Michigan Hospital Finance Authority, Refunding RB, Henry Ford Health System, 5.75%, 11/15/39 | 4,285 | 4,875,602 | ||||||
|
| |||||||
| 64,119,642 | ||||||||
Minnesota — 0.5% |
| |||||||
City of Minneapolis Minnesota, Refunding RB, Fairview Health Services: | ||||||||
Series A, 6.75%, 11/15/18 (a) | 5,940 | 6,885,292 | ||||||
Series B (AGC), 6.50%, 11/15/18 (a) | 2,775 | 3,197,077 | ||||||
Series B (AGC), 6.50%, 11/15/38 | 15,240 | 17,250,765 | ||||||
County of Ramsey Minnesota Housing & Redevelopment Authority, RB, Hanover Townhouses Project, M/F Housing, AMT, 6.00%, 7/01/31 | 1,110 | 1,111,976 | ||||||
|
| |||||||
| 28,445,110 | ||||||||
Mississippi — 0.0% |
| |||||||
County of Warren Mississippi, RB, International Paper Co. Project, Series A, 6.50%, 9/01/32 | 1,890 | 2,125,475 | ||||||
Missouri — 0.0% |
| |||||||
City of St. Louis Missouri, RB, Lambert-St. Louis International Airport, Series A-1, 6.25%, 7/01/29 | 1,175 | 1,333,402 | ||||||
Nebraska — 0.5% |
| |||||||
Omaha Public Power District, Refunding RB, Series A, 5.25%, 2/01/42 | 14,265 | 16,738,123 | ||||||
Omaha Public Power District, Seperate Electric System, Refunding RB, Series A, 5.25%, 2/01/46 | 14,670 | 17,187,372 | ||||||
|
| |||||||
| 33,925,495 | ||||||||
Nevada — 1.9% |
| |||||||
City of Las Vegas Nevada, GO, Limited Tax, Performing Arts Center, 6.00%, 4/01/34 | 12,925 | 14,960,558 | ||||||
County of Clark Nevada Airport System, ARB, Series B, 5.75%, 7/01/42 | 51,700 | 59,850,505 | ||||||
County of Clark Nevada Water Reclamation District, GO, Series B: | ||||||||
5.75%, 7/01/34 | 3,125 | 3,595,313 | ||||||
5.75%, 7/01/38 | 32,685 | 37,555,392 | ||||||
|
| |||||||
| 115,961,768 | ||||||||
New Hampshire — 0.3% |
| |||||||
New Hampshire Health & Education Facilities Authority, Refunding RB, Dartmouth-Hitchcock, 6.00%, 8/01/38 | 15,590 | 17,852,109 | ||||||
New Jersey — 5.2% |
| |||||||
County of Cape May New Jersey Industrial Pollution Control Financing Authority, Refunding RB, Atlantic City Electric Co., Series A (NPFGC), 6.80%, 3/01/21 | 5,000 | 6,025,200 | ||||||
County of Essex New Jersey Improvement Authority, RB, AMT, 5.25%, 7/01/45 (b) | 3,180 | 3,295,847 | ||||||
County of Monmouth New Jersey Improvement Authority, RB, Brookdale Community College Project, 6.00%, 8/01/18 (a) | 3,600 | 4,058,856 | ||||||
New Jersey EDA, RB: | ||||||||
Motor Vehicle Surcharge, Series A (NPFGC), 5.25%, 7/01/33 | 26,500 | 26,798,390 | ||||||
Series WW, 5.25%, 6/15/40 | 15,565 | 16,716,188 | ||||||
See Notes to Financial Statements.
| SEMI-ANNUAL REPORT | DECEMBER 31, 2015 | 27 |
Schedule of Investments (continued) | BlackRock National Municipal Fund |
| Municipal Bonds | Par (000) | Value | ||||||
New Jersey (continued) |
| |||||||
New Jersey EDA, Refunding RB, New Jersey American Water Co., Inc. Project, Series B, AMT, 5.60%, 11/01/34 | $ | 8,280 | $ | 9,303,325 | ||||
New Jersey Educational Facilities Authority, Refunding RB, University of Medicine & Dentistry, Series B (a): | ||||||||
7.13%, 6/01/19 | 2,870 | 3,430,769 | ||||||
7.50%, 6/01/19 | 9,200 | 11,112,588 | ||||||
New Jersey Health Care Facilities Financing Authority, Refunding RB: | ||||||||
AHS Hospital Corp., 6.00%, 7/01/37 | 1,200 | 1,432,944 | ||||||
AHS Hospital Corp., 6.00%, 7/01/41 | 33,185 | 39,419,134 | ||||||
St. Joseph’s Healthcare System, 6.63%, 7/01/38 | 200 | 221,208 | ||||||
New Jersey Higher Education Student Assistance Authority, Refunding RB, Series 1, AMT: | ||||||||
5.75%, 12/01/27 | 500 | 561,220 | ||||||
5.75%, 12/01/28 | 410 | 457,663 | ||||||
New Jersey Housing & Mortgage Finance Agency, RB, S/F Housing, Series AA: | ||||||||
6.38%, 10/01/28 | 405 | 419,446 | ||||||
6.50%, 10/01/38 | 445 | 460,277 | ||||||
New Jersey State Turnpike Authority, Refunding RB, Series D, 0.63%, 1/01/23 (d) | 17,000 | 16,982,660 | ||||||
New Jersey Transportation Trust Fund Authority, RB, Transportation System: | ||||||||
Series A, 6.00%, 6/15/35 | 2,000 | 2,268,620 | ||||||
Series A, 5.88%, 12/15/38 | 14,255 | 15,600,244 | ||||||
Series AA, 5.50%, 6/15/39 | 39,800 | 43,454,436 | ||||||
Series B, 5.50%, 6/15/31 | 300 | 328,623 | ||||||
Series B, 5.25%, 6/15/36 | 19,190 | 20,364,620 | ||||||
New Jersey Turnpike Authority, RB, Series E, 5.00%, 1/01/45 | 89,500 | 101,413,345 | ||||||
|
| |||||||
| 324,125,603 | ||||||||
New Mexico — 0.0% |
| |||||||
County of Santa Fe New Mexico, RB (AGM), 6.00%, 2/01/27 | 250 | 311,000 | ||||||
New York — 9.5% |
| |||||||
City of New York New York, GO: | ||||||||
0.59%, 8/01/27 (d) | 39,000 | 38,907,570 | ||||||
Sub-Series E-1, 6.25%, 10/15/18 (a) | 12,875 | 14,745,351 | ||||||
Sub-Series E-1, 6.25%, 10/15/28 | 575 | 655,897 | ||||||
City of New York New York Housing Development Corp., RB, M/F Housing, Series M: | ||||||||
6.50%, 11/01/28 | 4,300 | 4,797,424 | ||||||
6.88%, 11/01/38 | 7,785 | 8,719,667 | ||||||
City of New York New York Industrial Development Agency, ARB, American Airlines, Inc., JFK International Airport Project, AMT, Series B, 2.00%, 8/01/28 (d) | 30,570 | 30,629,000 | ||||||
City of New York New York Municipal Water Finance Authority, RB, Water & Sewer System, Fiscal 2009, Series A, 5.75%, 6/15/40 | 6,200 | 6,894,090 | ||||||
City of New York New York Municipal Water Finance Authority, Refunding RB, 2nd General Resolution, Series EE: | ||||||||
Fiscal 2009, 5.25%, 6/15/40 | 5,000 | 5,649,300 | ||||||
Water & Sewer System, 5.38%, 6/15/43 | 7,125 | 8,293,714 | ||||||
Counties of New York Tobacco Trust IV, Refunding RB, Settlement Pass-Through Turbo, Series A, 6.25%, 6/01/41 (b) | 20,000 | 20,865,400 | ||||||
Hudson Yards Infrastructure Corp., RB, Series A, 5.75%, 2/15/47 | 9,025 | 10,462,592 | ||||||
| Municipal Bonds | Par (000) | Value | ||||||
New York (continued) |
| |||||||
Long Island Power Authority, Refunding RB, Electric System, Series A: | ||||||||
6.00%, 5/01/19 (a) | $ | 49,450 | $ | 57,558,811 | ||||
5.50%, 5/01/33 | 1,500 | 1,710,675 | ||||||
Metropolitan Transportation Authority, RB: | ||||||||
Series A-1, 5.25%, 11/15/39 | 30,000 | 35,345,100 | ||||||
Series C, 6.50%, 11/15/28 | 23,465 | 27,044,820 | ||||||
Series D, 5.25%, 11/15/41 | 8,030 | 9,470,823 | ||||||
Sub-Series D-1, 5.25%, 11/15/44 | 40,000 | 46,895,600 | ||||||
Metropolitan Transportation Authority, Refunding RB, SubSeries C-1, 5.25%, 11/15/31 | 14,000 | 17,061,660 | ||||||
New York State Urban Development Corp., Refunding RB, Series D, 5.63%, 1/01/28 | 3,000 | 3,371,100 | ||||||
Niagara Area Development Corp., Refunding RB, Solid Waste Disposal Facility, Covanta Energy Project, Series A, AMT, 5.25%, 11/01/42 (b) | 5,000 | 5,041,650 | ||||||
Port Authority of New York & New Jersey, ARB, 56th Series, AMT, 5.00%, 5/01/39 | 6,600 | 7,362,036 | ||||||
Port Authority of New York & New Jersey, Refunding ARB, Consolidated, AMT: | ||||||||
151th Series, 6.00%, 9/15/28 | 74,780 | 82,682,751 | ||||||
152nd Series, 5.75%, 11/01/30 | 4,695 | 5,160,650 | ||||||
Port Authority of New York & New Jersey, Refunding RB: | ||||||||
5.00%, 10/15/41 | 25,000 | 29,120,750 | ||||||
5.25%, 10/15/55 | 40,375 | 47,467,676 | ||||||
State of New York Dormitory Authority, RB: | ||||||||
Columbia University, 5.00%, 7/01/38 | 21,400 | 23,519,670 | ||||||
Series B, 5.75%, 3/15/36 | 19,270 | 22,057,984 | ||||||
Triborough Bridge & Tunnel Authority, RB, General, Series A-2, 5.38%, 11/15/38 | 5,715 | 6,385,312 | ||||||
Triborough Bridge & Tunnel Authority, Refunding RB, General, Series A, 5.25%, 11/15/45 | 7,805 | 9,209,276 | ||||||
|
| |||||||
| 587,086,349 | ||||||||
North Carolina — 0.1% |
| |||||||
County of Columbus North Carolina Industrial Facilities & Pollution Control Financing Authority, RB, International Paper Co. Projects, Series B, 6.25%, 11/01/33 | 3,000 | 3,462,120 | ||||||
State of North Carolina, RB, Series A, 5.25%, 5/01/31 | 4,000 | 4,617,920 | ||||||
|
| |||||||
| 8,080,040 | ||||||||
Ohio — 1.3% |
| |||||||
County of Lucas Ohio, Refunding RB, Promedica Healthcare, Series A: | ||||||||
5.75%, 11/15/31 | 500 | 600,125 | ||||||
6.50%, 11/15/37 | 12,690 | 15,688,012 | ||||||
6.00%, 11/15/41 | 4,415 | 5,302,018 | ||||||
County of Montgomery Ohio, Refunding RB, Catholic Health, Series A, 5.50%, 5/01/34 | 10,595 | 11,875,936 | ||||||
Hamilton County Ohio Sales Tax Revenue, Refunding RB, Sub-Series A (AGM), 5.00%, 12/01/32 | 20,000 | 20,720,800 | ||||||
State of Ohio, Refunding RB, Cleveland Clinic Health, Series A, 5.50%, 1/01/39 | 15,170 | 17,086,426 | ||||||
State of Ohio Turnpike Commission, RB, Junior Lien, Series A, 5.25%, 2/15/39 | 7,500 | 8,610,975 | ||||||
|
| |||||||
| 79,884,292 | ||||||||
Oregon — 0.0% |
| |||||||
City of Portland Oregon, M/F HRB, Lovejoy Station Apartments Project, AMT (NPFGC), 5.90%, 7/01/23 | 355 | 355,951 | ||||||
See Notes to Financial Statements.
| 28 | SEMI-ANNUAL REPORT | DECEMBER 31, 2015 |
Schedule of Investments (continued) | BlackRock National Municipal Fund |
| Municipal Bonds | Par (000) | Value | ||||||
Pennsylvania — 1.6% |
| |||||||
City of Philadelphia Pennsylvania Gas Works, RB, 12th Series B (NPFGC), 7.00%, 5/15/20 (g) | $ | 2,665 | $ | 3,025,122 | ||||
County of Cumberland Pennsylvania Municipal Authority, Refunding RB, Diakon Lutheran: | ||||||||
6.38%, 1/01/19 (a) | 9,520 | 10,979,607 | ||||||
6.38%, 1/01/39 | 1,055 | 1,202,320 | ||||||
County of Dauphin Pennsylvania General Authority, Refunding RB, Pinnacle Health System Project, Series A: | ||||||||
6.00%, 6/01/29 | 12,760 | 14,644,142 | ||||||
6.00%, 6/01/36 | 3,895 | 4,441,624 | ||||||
County of Lancaster Pennsylvania Hospital Authority, Refunding RB, Brethren Village Project, Series A, 6.25%, 7/01/26 | 1,160 | 1,201,493 | ||||||
County of Northampton Pennsylvania IDA, Route 33 Project, Tax Allocation Bond, 7.00%, 7/01/32 | 2,455 | 2,680,565 | ||||||
Pennsylvania Economic Development Financing Authority, RB: | ||||||||
6.00%, 7/01/53 | 4,400 | 5,279,912 | ||||||
American Water Co. Project, 6.20%, 4/01/39 | 3,475 | 3,955,801 | ||||||
Pennsylvania Turnpike Commission, RB: | ||||||||
5.25%, 6/01/39 | 24,900 | 27,315,051 | ||||||
Subordinate, Special Motor License Fund, 6.00%, 12/01/36 | 1,195 | 1,398,544 | ||||||
Pennsylvania Turnpike Commission, Refunding RB, Sub-Series A-1, 5.25%, 12/01/45 | 22,000 | 25,261,280 | ||||||
|
| |||||||
| 101,385,461 | ||||||||
South Carolina — 1.7% | ||||||||
South Carolina Jobs EDA, Refunding RB, Palmetto Health, Series A (AGM): | ||||||||
6.50%, 8/01/39 | 4,455 | 5,417,013 | ||||||
6.25%, 8/01/34 | 1,525 | 1,830,046 | ||||||
South Carolina State Public Service Authority, Refunding RB, Series E, 5.25%, 12/01/55 | 23,700 | 26,746,398 | ||||||
State of South Carolina Public Service Authority, RB, Series A, 5.50%, 12/01/54 | 32,085 | 36,702,031 | ||||||
State of South Carolina Public Service Authority, Refunding RB, Series A: | ||||||||
Santee Cooper, 5.50%, 12/01/33 | 6,465 | 7,793,364 | ||||||
Santee Cooper, 5.75%, 12/01/43 | 19,875 | 23,840,062 | ||||||
5.50%, 1/01/19 (a) | 2,200 | 2,448,974 | ||||||
|
| |||||||
| 104,777,888 | ||||||||
Texas — 12.5% | ||||||||
City of Houston Texas Utility System, Refunding RB, Series A, 1st Lien: | ||||||||
Combined (AGC), 6.00%, 11/15/35 | 32,350 | 37,670,604 | ||||||
Combined (AGC), 5.38%, 11/15/38 | 31,160 | 35,197,713 | ||||||
5.25%, 11/15/30 | 24,305 | 28,552,785 | ||||||
City Public Service Board of San Antonio Texas, Refunding RB, 5.00%, 2/01/17 (a)(c) | 28,990 | 30,348,181 | ||||||
County of Harris Texas Cultural Education Facilities Finance Corp., RB, 1st Mortgage, Brazos Presbyterian Homes, Inc. Project, Series B: | ||||||||
6.38%, 1/01/33 | 465 | 538,921 | ||||||
7.00%, 1/01/43 | 1,075 | 1,274,972 | ||||||
7.00%, 1/01/48 | 2,625 | 3,092,565 | ||||||
County of Matagorda Texas Navigation District No. 1, Refunding RB, Central Power & Light Co., Project, Series A, 6.30%, 11/01/29 | 9,775 | 11,119,551 | ||||||
County of Tarrant Texas Cultural Education Facilities Finance Corp., RB, Scott & White Healthcare: | ||||||||
6.00%, 8/15/20 (a) | 3,700 | 4,458,759 | ||||||
6.00%, 8/15/45 | 46,300 | 55,090,518 | ||||||
| Municipal Bonds | Par (000) | Value | ||||||
Texas (continued) | ||||||||
Cypress-Fairbanks Independent School District, GO, Refunding Series C, 5.00%, 2/15/44 | $ | 53,280 | $ | 61,615,656 | ||||
Dallas Area Rapid Transit, Refunding RB (AMBAC): | ||||||||
5.00%, 12/01/16 (a) | 16,230 | 16,896,728 | ||||||
5.00%, 12/01/36 | 11,630 | 12,073,801 | ||||||
Dallas-Fort Worth International Airport, ARB, Joint Improvement, Series D, AMT, 5.00%, 11/01/38 | 3,500 | 3,832,675 | ||||||
Dallas-Fort Worth International Airport, Refunding RB, Joint Improvement, AMT: | ||||||||
Series A, 5.00%, 11/01/32 | 2,600 | 2,931,500 | ||||||
Series E, 5.00%, 11/01/35 | 11,180 | 12,372,906 | ||||||
Harris County Cultural Education Facilities Finance Corp., RB, 5.50%, 10/01/39 | 8,500 | 9,637,725 | ||||||
Katy Independent School District, GO, Series A: | ||||||||
5.00%, 2/15/40 | 28,725 | 33,730,044 | ||||||
5.00%, 2/15/45 | 39,125 | 45,770,381 | ||||||
Lower Colorado River Authority, Refunding RB, 5.50%, 5/15/30 | 6,085 | 7,285,449 | ||||||
North Texas Tollway Authority, RB, Special Projects System, Series A, 6.00%, 9/01/41 | 4,815 | 5,830,339 | ||||||
North Texas Tollway Authority, Refunding RB: | ||||||||
5.75%, 1/01/18 (a) | 8,425 | 9,210,210 | ||||||
5.75%, 1/01/40 | 1,445 | 1,569,140 | ||||||
1st Tier System, 6.00%, 1/01/34 | 11,490 | 13,594,394 | ||||||
1st Tier System, Series A, 6.00%, 1/01/28 | 1,000 | 1,133,730 | ||||||
1st Tier System, Series K-2 (AGC), 6.00%, 1/01/38 | 2,245 | 2,529,688 | ||||||
1st Tier System, Series S, 5.75%, 1/01/18 (a) | 3,890 | 4,252,548 | ||||||
1st Tier System, Series SE, 5.75%, 1/01/40 | 3,830 | 4,139,273 | ||||||
2nd Tier System, Series F, 6.13%, 1/01/31 | 25,615 | 25,615,000 | ||||||
Series B, 5.00%, 1/01/40 | 10,000 | 11,154,100 | ||||||
Port of Bay City Authority Texas, RB, Hoechst Celanese Corp. Project, AMT, 6.50%, 5/01/26 | 4,000 | 4,013,320 | ||||||
State of Texas, GO, Refunding Series A, 5.00%, 10/01/44 | 129,955 | 150,470,996 | ||||||
State of Texas Transportation Commission State Highway Fund, RB, 1st Tier System, Series B, 0.36%, 4/01/32 (d) | 36,000 | 36,002,880 | ||||||
Texas Private Activity Bond Surface Transportation Corp., RB, Senior Lien: | ||||||||
LBJ Infrastructure Group LLC, LBJ Freeway Managed Lanes Project, 7.00%, 6/30/40 | 24,825 | 30,118,683 | ||||||
NTE Mobility Partners LLC, North Tarrant Express Managed Lanes Project, 6.88%, 12/31/39 | 23,000 | 26,999,240 | ||||||
Texas Water Development Board, RB, Series A, 5.00%, 10/15/45 | 32,500 | 38,127,375 | ||||||
|
| |||||||
| 778,252,350 | ||||||||
Virginia — 1.4% | ||||||||
City of Winchester Virginia IDA, Refunding RB, Valley Health (BHAC) (AMBAC), 5.25%, 1/01/17 (a) | 31,970 | 33,436,784 | ||||||
Virginia HDA, RB, M/F Housing, Rental Housing, Series A, 5.25%, 5/01/41 | 2,865 | 3,078,127 | ||||||
Virginia Small Business Financing Authority, RB, Senior Lien, Elizabeth River Crossings OpCo LLC Project, AMT, 6.00%, 1/01/37 | 31,085 | 35,821,732 | ||||||
Wise County IDA, RB, Series A, 2.15%, 10/01/40 (d) | 17,000 | 17,351,730 | ||||||
|
| |||||||
| 89,688,373 | ||||||||
Washington — 2.5% | ||||||||
Central Puget Sound Regional Transit Authority, RB: | ||||||||
Refunding and Improvement Series S-1, 5.00%, 11/01/45 | 55,830 | 65,953,654 | ||||||
Series A, 5.00%, 11/01/17 (a) | 8,500 | 9,144,470 | ||||||
Series A, 5.00%, 11/01/17 (a) | 15,715 | 16,906,511 | ||||||
See Notes to Financial Statements.
| SEMI-ANNUAL REPORT | DECEMBER 31, 2015 | 29 |
Schedule of Investments (continued) | BlackRock National Municipal Fund |
| Municipal Bonds | Par (000) | Value | ||||||
Washington (continued) | ||||||||
City of Seattle Washington Housing Authority, RB, M/F Housing, Newholly Project, AMT, 6.25%, 12/01/35 | $ | 2,750 | $ | 2,760,917 | ||||
Washington Health Care Facilities Authority, RB: | ||||||||
Catholic Health Initiatives, Series A, 5.75%, 1/01/45 | 21,355 | 25,141,455 | ||||||
MultiCare Health System, Series B (AGC), 6.00%, 8/15/19 (a) | 2,000 | 2,342,980 | ||||||
Swedish Health Services, Series A, 6.75%, 5/15/21 (a) | 16,000 | 20,420,320 | ||||||
Washington Health Care Facilities Authority, Refunding RB, Catholic Health Initiatives, Series D, 6.38%, 10/01/36 | 10,085 | 11,386,873 | ||||||
|
| |||||||
| 154,057,180 | ||||||||
Wisconsin — 0.2% | ||||||||
City of Superior Wisconsin, Refunding RB, Midwest Energy Resources, Series E (NPFGC), 6.90%, 8/01/21 | 7,000 | 8,866,900 | ||||||
Public Finance Authority, Refunding RB, AMT, National Gypsum Co., 5.25%, 4/01/30 | 5,900 | 6,125,085 | ||||||
|
| |||||||
| 14,991,985 | ||||||||
| Total Municipal Bonds — 88.1% | 5,474,321,263 | |||||||
| Municipal Bonds Transferred to Tender Option Bond Trusts (h) | ||||||||
Arizona — 0.6% | ||||||||
City of Mesa Arizona, RB, Utility System, 5.00%, 7/01/35 | 30,000 | 34,826,700 | ||||||
California — 0.9% | ||||||||
County of Orange California, ARB, Series B, 5.25%, 7/01/34 | 13,045 | 13,861,338 | ||||||
San Diego Public Facilities Financing Authority, Refunding RB, Series B, 5.38%, 8/01/34 | 15,000 | 17,078,100 | ||||||
University of California, RB, General, Series O, 5.25%, 5/15/39 | 20,695 | 23,269,760 | ||||||
|
| |||||||
| 54,209,198 | ||||||||
Florida — 1.8% | ||||||||
State of Florida, GO, Board of Education: | ||||||||
Capital Outlay, Series E, 5.00%, 6/01/37 | 39,730 | 45,178,175 | ||||||
Series C, 5.00%, 6/01/37 | 65,545 | 69,776,566 | ||||||
|
| |||||||
| 114,954,741 | ||||||||
| Municipal Bonds Transferred to Tender Option Bond Trusts (h) | Par (000) | Value | ||||||
Illinois — 0.3% | ||||||||
Illinois Finance Authority, RB, The Carle Foundation, Series A (AGM), 6.00%, 8/15/41 | $ | 15,600 | $ | 18,455,736 | ||||
Indiana — 0.6% | ||||||||
Indiana Finance Authority, RB, Sisters of St. Francis Health, 5.25%, 11/01/39 | 31,460 | 35,016,868 | ||||||
Massachusetts — 0.2% | ||||||||
Massachusetts School Building Authority, RB, Series A (AMBAC), 5.00%, 8/15/37 | 10,000 | 10,671,150 | ||||||
North Carolina — 0.8% | ||||||||
North Carolina Capital Facilities Finance Agency, Refunding RB, Duke University Project, 5.00%, 10/01/55 | 46,000 | 53,261,560 | ||||||
Utah — 1.2% | ||||||||
County of Utah Utah, RB, IHC Health Services Inc., 5.00%, 5/15/43 | 70,000 | 77,739,900 | ||||||
| Total Municipal Bonds Transferred to Tender Option Bond Trusts - 6.4% | 399,135,853 | |||||||
| Total Long-Term Investments (Cost — $5,467,491,291) — 94.5% | 5,873,457,116 | |||||||
| Short-Term Securities | Shares | |||||||
FFI Institutional Tax-Exempt Fund, | 421,366,094 | 421,366,094 | ||||||
Par (000) | ||||||||
Metropolitan Transportation Authority New York, | 60,000 | 60,000,000 | ||||||
Total Short-Term Securities (Cost — $481,366,094) — 7.8% |
| 481,366,094 | ||||||
| Total Investments (Cost — $5,948,857,385) — 102.3% | 6,354,823,210 | |||||||
| Other Assets Less Liabilities — 0.6% | 32,942,845 | |||||||
Liability for TOB Trust Certificates, Including Interest |
| (178,541,726 | ) | |||||
|
| |||||||
| Net Assets — 100.0% | $ | 6,209,224,329 | ||||||
|
| |||||||
| Notes to Schedule of Investments |
| (a) | U.S. Government securities, held in escrow, are used to pay interest on this security, as well as to retire the bond in full at the date indicated, typically at a premium to par. |
| (b) | Security exempt from registration pursuant to Rule 144A under the Securities Act of 1933, as amended. These securities may be resold in transactions exempt from registration to qualified institutional investors. |
| (c) | When-issued security. |
| (d) | Variable rate security. Rate as of period end. |
| (e) | Issuer filed for bankruptcy and/or is in default of interest payments. |
| (f) | Non-income producing security. |
| (g) | Security is collateralized by municipal bonds or U.S. Treasury obligations. |
| (h) | Represent bonds transferred to a TOB Trust in exchange of cash and residual certificates received by the Fund. These bonds serve as collateral in a secured borrowing. See Note 4 of the Notes to Financial Statements for details. |
See Notes to Financial Statements.
| 30 | SEMI-ANNUAL REPORT | DECEMBER 31, 2015 |
Schedule of Investments (continued) | BlackRock National Municipal Fund |
| (i) | During the six months ended December 31, 2015, investments in issuers considered to be an affiliate of the Fund for purposes of Section 2(a)(3) of the Investment Company Act of 1940, as amended, were as follows: |
| Affiliate | Shares Held at June 30, 2015 | Net Activity | Shares Held at December 31, 2015 | Income | ||||||||||||
FFI Institutional Tax-Exempt Fund | 212,819,220 | 208,546,874 | 421,366,094 | $ | 34,689 | |||||||||||
| (j) | Current yield as of period end. |
| Derivative Financial Instruments Outstanding as of Period End |
Financial Futures Contracts
| Contracts Short | Issue | Expiration | Notional Value | Unrealized Appreciation | ||||||||||||||
| (493 | ) | 5-Year U.S. Treasury Note | March 2016 | $ | 58,331,915 | $ | 307,680 | |||||||||||
| (325 | ) | 10-Year U.S. Treasury Note | March 2016 | $ | 40,919,531 | 350,001 | ||||||||||||
| (150 | ) | Long U.S. Treasury Bond | March 2016 | $ | 23,062,500 | 276,382 | ||||||||||||
| (40 | ) | Ultra U.S. Treasury Bond | March 2016 | $ | 6,347,500 | 62,646 | ||||||||||||
| Total | $ | 996,709 | ||||||||||||||||
|
| |||||||||||||||||
| Derivative Financial Instruments Categorized by Risk Exposure |
As of period end, the fair values of derivative financial instruments located in the Statements of Assets and Liabilities were as follows:
| Assets — Derivative Financial Instruments | Commodity Contracts | Credit Contracts | Equity Contracts | Foreign Currency Exchange Contracts | Interest Rate Contracts | Other Contacts | Total | |||||||||||||||||||||||
Financial futures contracts | Net unrealized appreciation1 | — | — | — | — | $ | 996,709 | — | $ | 996,709 | ||||||||||||||||||||
1 Includes cumulative appreciation (depreciation) on financial futures contracts, as reported in the Schedule of Investments. Only current day’s variation margin is reported within the Statements of Assets and Liabilities. |
| |||||||||||||||||||||||||||||
For the six months ended December 31, 2015, the effect of derivative financial instruments in the Statements of Operations was as follows:
| Net Realized Gain (Loss) from: | Commodity Contracts | Credit Contracts | Equity Contracts | Foreign Currency Exchange Contracts | Interest Rate Contracts | Other Contacts | Total | |||||||||||||||||||||
Financial futures contracts | — | — | — | — | $ | 954,259 | — | $ | 954,259 | |||||||||||||||||||
| Net Change in Unrealized Appreciation (Depreciation) on: | Commodity Contracts | Credit Contracts | Equity Contracts | Foreign Currency Exchange Contracts | Interest Rate Contracts | Other Contacts | Total | |||||||||||||||||||||
Financial futures contracts | — | — | — | — | $ | 788,087 | — | $ | 788,087 | |||||||||||||||||||
| Average Quarterly Balances of Outstanding Derivative Financial Instruments |
For the six months ended December 31, 2015, the average quarterly balances of outstanding derivative financial instruments were as follows:
| Financial futures contracts: | ||||
Average notional value of contracts — short | $ | 164,033,973 |
For more information about the Fund’s investment risks regarding derivative financial instruments, refer to the Notes to Financial Statements.
| Fair Value Hierarchy as of Period End |
Various inputs are used in determining the fair value of investments and derivative financial instruments. For information about the Fund’s policy regarding valuation of investments and derivative financial instruments, refer to the Notes to Financial Statements.
See Notes to Financial Statements.
| SEMI-ANNUAL REPORT | DECEMBER 31, 2015 | 31 |
Schedule of Investments (concluded) | BlackRock National Municipal Fund |
The following tables summarize the Fund’s investments and derivative financial instruments categorized in the disclosure hierarchy:
| Level 1 | Level 2 | Level 3 | Total | |||||||||||
Assets: | ||||||||||||||
| Investments: | ||||||||||||||
Long-Term Investments 1 | — | $ | 5,873,457,116 | — | $ | 5,873,457,116 | ||||||||
Short-Term Securities | $ | 421,366,094 | 60,000,000 | — | 481,366,094 | |||||||||
|
| |||||||||||||
Total | $ | 421,366,094 | $ | 5,933,457,116 | — | $ | 6,354,823,210 | |||||||
|
| |||||||||||||
1 See above Schedule of Investments for values in each state or political subdivision. |
| |||||||||||||
| Level 1 | Level 2 | Level 3 | Total | |||||||||||
| Derivative Financial Instruments 2 | ||||||||||||||
Assets: | ||||||||||||||
Interest rate contracts | $ | 996,709 | — | — | $ | 996,709 | ||||||||
2 Derivative financial instruments are financial futures contracts, which are valued at the unrealized appreciation (depreciation) on the instrument. |
| |||||||||||||
The Fund may hold assets and/or liabilities in which the fair value approximates the carrying amount for financial statement purposes. As of period end, such assets and/or liabilities are categorized within the disclosure hierarchy as follows:
|
| |||||||||||||
| Level 1 | Level 2 | Level 3 | Total | |||||||||||
Assets: | ||||||||||||||
Cash | $ | 578,252 | — | — | $ | 578,252 | ||||||||
Cash pledged for financial futures contracts | 1,597,000 | — | — | 1,597,000 | ||||||||||
Liabilities: | ||||||||||||||
TOB Trust Certificates | — | $ | (178,529,971 | ) | — | $ | (178,529,971 | ) | ||||||
|
| |||||||||||||
Total | $ | 2,175,252 | $ | (178,529,971 | ) | — | $ | (176,354,719 | ) | |||||
|
| |||||||||||||
During the six months ended December 31, 2015, there were no transfers between levels.
See Notes to Financial Statements.
| 32 | SEMI-ANNUAL REPORT | DECEMBER 31, 2015 |
Schedule of Investments December 31, 2015 (Unaudited) | BlackRock Short-Term Municipal Fund (Percentages shown are based on Net Assets) |
| Municipal Bonds | Par (000) | Value | ||||||
Arizona — 1.8% | ||||||||
Arizona Health Facilities Authority, Refunding RB: | ||||||||
5.00%, 1/01/19 | $ | 2,735 | $ | 3,042,059 | ||||
Series D, 5.00%, 1/01/17 | 1,080 | 1,126,202 | ||||||
City of Peoria AZ, GO, Refunding Series E, 4.00%, 7/15/19 | 5,325 | 5,840,833 | ||||||
City of Phoenix Civic Improvement Corp., Refunding RB, Transit Excise Tax, Light Rail Project, 5.00%, 7/01/16 | 1,000 | 1,023,260 | ||||||
|
| |||||||
| 11,032,354 | ||||||||
California — 14.1% |
| |||||||
California Municipal Finance Authority, RB, Series A, 0.85%, 11/01/17 | 3,000 | 2,991,000 | ||||||
California State Department of Water Resources, Refunding RB, Series L, 5.00%, 5/01/19 | 6,360 | 7,182,984 | ||||||
California State University, Refunding RB, Series A, 5.00%, 11/01/18 | 1,800 | 2,004,876 | ||||||
California Statewide Communities Development Authority, RB, 5.00%, 11/01/29 (a) | 3,570 | 3,770,099 | ||||||
City & County of San Francisco, GO, Refunding, 5.00%, 6/15/18 | 5,835 | 6,421,476 | ||||||
City of Long Beach California Harbor Revenue, Refunding RB, AMT, Series A, 5.00%, 5/15/17 | 1,500 | 1,584,975 | ||||||
City of Los Angeles Department of Airports, Refunding RB, AMT, 4.00%, 5/15/17 | 1,220 | 1,272,850 | ||||||
City of Riverside California Sewer Revenue, Refunding RB, Series A, 4.00%, 8/01/18 | 1,020 | 1,096,612 | ||||||
Los Angeles Community College District, GO, Refunding Series C, 5.00%, 8/01/17 | 2,500 | 2,667,925 | ||||||
Los Angeles Department of Water & Power, Refunding RB, Series B, 5.00%, 12/01/18 | 10,000 | 11,120,400 | ||||||
Los Angeles Unified School District, GO, Refunding, Series A, 5.00%, 7/01/17 | 18,145 | 19,304,466 | ||||||
San Diego Unified School District, GO, Series E, 3.00%, 7/01/17 | 5,000 | 5,169,800 | ||||||
San Francisco Bay Area Rapid Transit District, Refunding RB, Series A: | ||||||||
4.00%, 7/01/18 | 2,000 | 2,156,020 | ||||||
5.00%, 7/01/19 | 1,055 | 1,198,617 | ||||||
State of California, GO, Refunding: | ||||||||
4.00%, 8/01/17 | 10,000 | 10,518,900 | ||||||
5.00%, 8/01/18 | 2,000 | 2,203,840 | ||||||
Series A, 5.00%, 7/01/19 (b) | 5,500 | 6,250,750 | ||||||
|
| |||||||
| 86,915,590 | ||||||||
Colorado — 0.8% |
| |||||||
Colorado Health Facilities Authority, Refunding RB, Sisters of Charity of Leavenworth Health System, Series B, 5.00%, 1/01/18 | 4,440 | 4,792,625 | ||||||
Connecticut — 1.5% |
| |||||||
State of Connecticut, Special Tax Revenue, RB, Series A, 5.00%, 8/01/19 | 3,000 | 3,397,110 | ||||||
State of Connecticut, Special Tax Revenue, Refunding RB: | ||||||||
5.00%, 8/01/18 | 1,360 | 1,498,734 | ||||||
5.00%, 8/01/19 | 2,665 | 3,017,766 | ||||||
University of Connecticut, RB, Series A, 5.00%, 2/15/18 | 1,000 | 1,084,550 | ||||||
|
| |||||||
| 8,998,160 | ||||||||
Delaware — 2.4% |
| |||||||
University of Delaware, Refunding RB, Series C, 0.70%, 11/01/37 (a) | 15,000 | 15,001,650 | ||||||
District of Columbia — 0.7% |
| |||||||
Metropolitan Washington Airports Authority, Refunding RB, Series A AMT, 5.00%, 10/01/17 | 4,000 | 4,276,080 | ||||||
| Municipal Bonds | Par (000) | Value | ||||||
Florida — 5.1% |
| |||||||
City of Jacksonville Florida, Refunding RB, Series C, 5.00%, 10/01/16 | $ | 1,280 | $ | 1,323,443 | ||||
County of Miami-Dade Florida, Refunding ARB, Series A, AMT, 5.00%, 10/01/16 | 1,750 | 1,807,645 | ||||||
Florida Department of Environmental Protection, Refunding RB, Series A, 5.00%, 7/01/18 | 17,985 | 19,752,206 | ||||||
Florida State Department of Environmental Protection, Refunding RB, Everglades Restoration, Series A (AGC), 5.00%, 7/01/16 | 205 | 209,779 | ||||||
Highlands County Health Facilities Authority, Refunding RB, Adventist Health System/Sunbelt Obligated Group, Series I, 5.00%, 11/15/16 | 1,035 | 1,075,572 | ||||||
State of Florida, GO, Refunding, Series A, 5.00%, 7/01/19 | 6,500 | 7,372,820 | ||||||
|
| |||||||
| 31,541,465 | ||||||||
Georgia — 1.4% |
| |||||||
City of Atlanta Georgia Department of Aviation, RB, Series B, 5.00%, 1/01/17 | 7,000 | 7,308,070 | ||||||
City of Atlanta Georgia Department of Aviation, Refunding RB, Series C, AMT, 5.00%, 1/01/17 | 1,500 | 1,564,320 | ||||||
|
| |||||||
| 8,872,390 | ||||||||
Illinois — 4.3% |
| |||||||
City of Chicago Illinois Waterworks Revenue, Refunding RB, 5.00%, 11/01/17 | 1,075 | 1,133,598 | ||||||
Illinois State Toll Highway Authority, Refunding RB, Series D, 5.00%, 1/01/18 | 1,250 | 1,347,213 | ||||||
Metropolitan Water Reclamation District of Greater Chicago, GO, Refunding Series A, 5.00%, 12/01/17 | 1,005 | 1,083,008 | ||||||
Regional Transportation Authority, GO, Refunding, ERS, Series B, 0.60%, 6/01/25 (a) | 14,375 | 14,375,000 | ||||||
State of Illinois, GO, 4.00%, 2/01/17 | 2,000 | 2,052,220 | ||||||
State of Illinois, RB, Unemployment Insurance Fund Building Receipts, Series A, 5.00%, 6/15/16 | 2,500 | 2,553,575 | ||||||
State of Illinois, Refunding RB, 5.00%, 6/15/19 | 3,715 | 4,161,171 | ||||||
|
| |||||||
| 26,705,785 | ||||||||
Indiana — 0.1% |
| |||||||
Indiana Finance Authority, Refunding RB, Marquette Project, 5.00%, 3/01/16 | 730 | 733,708 | ||||||
Iowa — 0.7% |
| |||||||
Iowa Finance Authority, Refunding RB, 5.00%, 8/01/17 | 4,250 | 4,535,345 | ||||||
Kentucky — 1.6% |
| |||||||
Counties of Louisville & Jefferson Kentucky Metropolitan Government, GO, Refunding Series E, 4.00%, 11/15/16 | 4,450 | 4,587,060 | ||||||
Kentucky Public Transportation Infrastructure Authority, RB, Downtown Crossing Project, Series A, 5.00%, 7/01/17 | 5,000 | 5,277,750 | ||||||
|
| |||||||
| 9,864,810 | ||||||||
Louisiana — 0.5% |
| |||||||
Tobacco Settlement Financing Corp., Refunding RB, Series A, 5.00%, 5/15/16 | 3,000 | 3,045,270 | ||||||
Massachusetts — 4.3% |
| |||||||
Commonwealth of Massachusetts, GO, Refunding, Series B, 5.00%, 8/01/19 | 7,595 | 8,623,287 | ||||||
Massachusetts Clean Water Trust, Refunding RB, 5.00%, 8/01/18 | 3,500 | 3,862,250 | ||||||
Massachusetts Health & Educational Facilities Authority, RB, 0.80%, 11/01/33 (a) | 1,000 | 994,170 | ||||||
Massachusetts Port Authority, RB, Series A, AMT, 5.00%, 7/01/16 | 1,625 | 1,661,644 | ||||||
See Notes to Financial Statements.
| SEMI-ANNUAL REPORT | DECEMBER 31, 2015 | 33 |
Schedule of Investments (continued) | BlackRock Short-Term Municipal Fund |
| Municipal Bonds | Par (000) | Value | ||||||
Massachusetts (continued) |
| |||||||
Massachusetts State Educational Financing Authority, RB, AMT: | ||||||||
4.00%, 1/01/17 | $ | 800 | $ | 819,456 | ||||
4.00%, 1/01/18 | 1,750 | 1,823,185 | ||||||
University of Massachusetts Building Authority, RB, 5.00%, 11/01/17 | 8,000 | 8,605,520 | ||||||
|
| |||||||
| 26,389,512 | ||||||||
Michigan — 0.2% |
| |||||||
Michigan Finance Authority, Refunding RB, AMT, 5.00%, 11/01/16 | 1,400 | 1,441,412 | ||||||
Missouri — 0.4% |
| |||||||
University of Missouri, Refunding RB, Series A, 4.00%, 11/01/17 | 2,555 | 2,705,387 | ||||||
Nevada — 5.2% |
| |||||||
County of Clark Department of Aviation, Refunding RB, Series B, 5.00%, 7/01/18 | 2,250 | 2,466,382 | ||||||
County of Clark Nevada School District, GO, Refunding, Series B, 5.50%, 6/15/17 | 13,760 | 14,693,341 | ||||||
State of Nevada, Refunding RB, 5.00%, 6/01/17 | 14,000 | 14,838,460 | ||||||
|
| |||||||
| 31,998,183 | ||||||||
New Hampshire — 0.2% |
| |||||||
State of New Hampshire, RB, Federal Highway, GAN, 5.00%, 9/01/16 | 1,250 | 1,287,625 | ||||||
New Jersey — 5.3% |
| |||||||
New Jersey EDA, Refunding RB, 5.00%, 12/15/16 | 1,925 | 1,994,242 | ||||||
New Jersey Educational Facilities Authority, RB, 5.00%, 6/01/17 | 12,910 | 13,477,653 | ||||||
New Jersey Educational Facilities Authority, Refunding RB, Series A, 5.00%, 7/01/17 | 2,345 | 2,497,027 | ||||||
New Jersey Health Care Facilities Financing Authority, Refunding RB: | ||||||||
Barnabas Health, Series A, 5.00%, 7/01/16 | 1,000 | 1,020,360 | ||||||
Meridian Health System, 5.00%, 7/01/17 | 2,000 | 2,121,600 | ||||||
New Jersey Transportation Trust Fund Authority, RB: | ||||||||
Series AA, 4.00%, 6/15/16 | 2,850 | 2,890,185 | ||||||
Transportation System, 5.75%, 6/15/16 | 6,275 | 6,413,238 | ||||||
State of New Jersey, GO, Refunding, Series O, 5.00%, 8/01/16 | 2,300 | 2,360,766 | ||||||
|
| |||||||
| 32,775,071 | ||||||||
New Mexico — 0.9% |
| |||||||
County of Albuquerque Bernalillo Water Utility Authority, Refunding RB, 5.00%, 7/01/18 | 3,470 | 3,818,214 | ||||||
New Mexico Finance Authority, Refunding RB, 5.00%, 6/15/18 | 1,330 | 1,461,750 | ||||||
|
| |||||||
| 5,279,964 | ||||||||
New York — 16.5% |
| |||||||
City of New York, GO, Refunding, Series A, 5.00%, 8/01/19 | 10,000 | 11,323,700 | ||||||
Erie County Industrial Development Agency, Refunding RB, 5.00%, 5/01/18 | 2,000 | 2,182,260 | ||||||
New York City Transitional Finance Authority Future Tax Secured Revenue, RB, Series E-1: | ||||||||
5.00%, 2/01/18 | 4,655 | 5,044,251 | ||||||
5.00%, 2/01/19 | 5,000 | 5,584,900 | ||||||
New York City Transitional Finance Authority Future Tax Secured Revenue, Refunding RB, Series B, 5.00%, 11/01/18 | 3,605 | 3,998,197 | ||||||
New York State Dormitory Authority, RB: | ||||||||
Series A, 4.00%, 3/15/17 | 4,000 | 4,161,600 | ||||||
Series A, 5.00%, 2/15/17 | 2,495 | 2,615,359 | ||||||
Series A, 5.00%, 3/15/18 | 7,125 | 7,753,211 | ||||||
Series B, 5.00%, 3/15/17 | 3,600 | 3,785,436 | ||||||
| Municipal Bonds | Par (000) | Value | ||||||
New York (continued) |
| |||||||
New York State Dormitory Authority, Refunding RB: | ||||||||
4.00%, 2/15/18 | $ | 2,200 | $ | 2,333,210 | ||||
NYU Hospital Center, Series A, 5.00%, 7/01/16 | 1,000 | 1,021,730 | ||||||
Series A, 4.00%, 7/01/16 | 1,210 | 1,231,248 | ||||||
Series A, 5.00%, 3/15/18 | 20,000 | 21,763,400 | ||||||
New York State Environmental Facilities Corp., Refunding RB, Series A, 5.00%, 6/15/18 | 5,000 | 5,488,900 | ||||||
New York State Thruway Authority, Refunding RB, Series I: | ||||||||
5.00%, 1/01/16 (c) | 115 | 115,000 | ||||||
5.00%, 1/01/16 | 385 | 385,000 | ||||||
New York State Urban Development Corp., RB, Personal Income Tax, Series C, 5.00%, 3/15/17 | 6,470 | 6,803,270 | ||||||
Port Authority of New York & New Jersey, RB, 5.00%, 9/15/19 | 5,000 | 5,634,650 | ||||||
State of New York, GO, Refunding Series C, 5.00%, 4/15/17 | 10,000 | 10,576,500 | ||||||
|
| |||||||
| 101,801,822 | ||||||||
North Carolina — 1.8% |
| |||||||
City of Charlotte North Carolina Water & Sewer System Revenue, Refunding RB, 5.00%, 7/01/18 | 3,500 | 3,852,135 | ||||||
North Carolina Capital Facilities Finance Agency, Refunding RB, High Point University, 4.00%, 5/01/16 | 1,770 | 1,790,001 | ||||||
North Carolina Municipal Power Agency No 1, Refunding RB, Series A: | ||||||||
5.25%, 1/01/17 | 3,210 | 3,356,954 | ||||||
5.25%, 1/01/17 (c) | 1,790 | 1,871,570 | ||||||
|
| |||||||
| 10,870,660 | ||||||||
Ohio — 3.4% |
| |||||||
City of Columbus, GO: | ||||||||
Series 1, 5.00%, 7/01/17 | 2,175 | 2,313,634 | ||||||
Series A, 5.00%, 2/15/18 | 10,000 | 10,867,600 | ||||||
State of Ohio, GO: | ||||||||
Series B, 5.00%, 3/15/19 | 5,000 | 5,612,450 | ||||||
Refunding Series A, 5.00%, 9/15/17 | 2,000 | 2,142,080 | ||||||
|
| |||||||
| 20,935,764 | ||||||||
Oklahoma — 0.6% |
| |||||||
County of Cleveland Oklahoma Educational Facilities Authority, LRB: | ||||||||
Moore Public Schools Project, 5.00%, 6/01/16 | 845 | 861,241 | ||||||
Norman Public Schools Project, 5.00%, 7/01/16 | 1,000 | 1,022,800 | ||||||
Norman Public Schools Project, 5.00%, 7/01/17 | 1,520 | 1,613,115 | ||||||
|
| |||||||
| 3,497,156 | ||||||||
Oregon — 3.5% |
| |||||||
City of Portland OR Sewer System Revenue, Refunding RB, Series A: | ||||||||
1st Lien, 5.00%, 6/01/19 | 10,000 | 11,317,900 | ||||||
5.00%, 6/15/18 | 3,750 | 4,123,050 | ||||||
Portland Community College District, GO, Refunding, 5.00%, 6/15/17 | 6,105 | 6,482,167 | ||||||
|
| |||||||
| 21,923,117 | ||||||||
Pennsylvania — 2.1% |
| |||||||
City of Philadelphia Pennsylvania, Refunding ARB, Series A, AMT, 5.00%, 6/15/17 | 2,000 | 2,112,960 | ||||||
Commonwealth of Pennsylvania, GO, Refunding, 5.00%, 8/15/17 | 3,000 | 3,201,030 | ||||||
Pennsylvania Economic Development Financing Authority, Refunding RB, Series A, 5.00%, 7/01/18 | 5,000 | 5,501,750 | ||||||
See Notes to Financial Statements.
| 34 | SEMI-ANNUAL REPORT | DECEMBER 31, 2015 |
Schedule of Investments (concluded) | BlackRock Short-Term Municipal Fund |
| Municipal Bonds | Par (000) | Value | ||||||
Pennsylvania (continued) |
| |||||||
Pennsylvania Intergovernmental Cooperation Authority, Refunding, Special Tax Bonds, Philadelphia Funding Program, 5.00%, 6/15/18 | $ | 2,000 | $ | 2,194,340 | ||||
|
| |||||||
| 13,010,080 | ||||||||
Rhode Island — 0.8% |
| |||||||
Tobacco Settlement Financing Corp., Refunding RB, Series A, 4.00%, 6/01/17 | 5,000 | 5,218,650 | ||||||
Tennessee — 2.1% |
| |||||||
State of Tennessee, GO: | ||||||||
Refunding Series A, 5.00%, 8/01/18 | 5,000 | 5,517,500 | ||||||
Refunding Series A, 5.00%, 8/01/19 | 4,565 | 5,193,692 | ||||||
Refunding Series B, 5.00%, 8/01/19 | 2,165 | 2,463,164 | ||||||
|
| |||||||
| 13,174,356 | ||||||||
Texas — 6.5% |
| |||||||
City of Corpus Christi Texas Utility System, Refunding RB, 4.00%, 7/15/17 | 2,000 | 2,093,040 | ||||||
City of San Antonio, GO, Refunding: | ||||||||
4.00%, 2/01/17 | 5,000 | 5,183,300 | ||||||
5.00%, 2/01/18 | 2,475 | 2,685,004 | ||||||
City Public Service Board of San Antonio, Refunding RB: | ||||||||
Junior Lien, 5.00%, 2/01/18 | 6,000 | 6,509,100 | ||||||
Series D, 5.00%, 2/01/19 | 6,485 | 7,252,046 | ||||||
County of Harris Texas Cultural Education Facilities Finance Corp., Refunding RB, Memorial Hermann Health System, Series A, 4.00%, 12/01/16 | 525 | 539,768 | ||||||
Lower Colorado River Authority, Refunding RB, Series D, 5.00%, 5/15/17 | 2,000 | 2,111,200 | ||||||
North Texas Municipal Water District, Refunding RB, 5.00%, 9/01/18 | 5,910 | 6,528,718 | ||||||
Northside Texas ISD, GO, Refunding, 5.00%, 2/15/17 | 6,910 | 7,249,695 | ||||||
|
| |||||||
| 40,151,871 | ||||||||
| Municipal Bonds | Par (000) | Value | ||||||
Virginia — 1.5% |
| |||||||
Virginia College Building Authority, RB, Series A, 5.00%, 2/01/17 | $ | 4,800 | $ | 5,027,184 | ||||
Virginia Public School Authority, RB, 5.00%, 7/15/18 | 4,080 | 4,496,038 | ||||||
|
| |||||||
| 9,523,222 | ||||||||
Washington — 4.6% |
| |||||||
City of Seattle Washington Municipal Light & Power Revenue, Refunding RB, 5.00%, 9/01/18 | 15,715 | 17,360,203 | ||||||
State of Washington, GO: | ||||||||
5.00%, 7/01/18 (b) | 2,625 | 2,884,980 | ||||||
5.00%, 7/01/18 | 7,005 | 7,704,239 | ||||||
Washington Health Care Facilities Authority, Refunding RB, 5.00%, 3/01/18 | 290 | 311,301 | ||||||
|
| |||||||
| 28,260,723 | ||||||||
Wisconsin — 1.2% |
| |||||||
Wisconsin Health & Educational Facilities Authority, Refunding RB, Series B, 5.13%, 8/15/27 (a) | 7,500 | 7,703,624 | ||||||
| Total Long-Term Investments (Cost — $594,491,883) — 96.1% | 594,263,431 | |||||||
| Short-Term Securities | Shares | |||||||
FFI Institutional Tax-Exempt Fund, 0.02% (d)(e) | 9,414,759 | $ | 9,414,759 | |||||
| Total Short-Term Securities (Cost — $9,414,759) — 1.5% | 9,414,759 | |||||||
| Total Investments (Cost — $603,906,642) — 97.6% | 603,678,190 | |||||||
| Other Assets Less Liabilities — 2.4% | 14,777,964 | |||||||
|
| |||||||
| Net Assets — 100.0% | $ | 618,456,154 | ||||||
|
| |||||||
| Notes to Schedule of Investments |
| (a) | Variable rate security. Rate as of period end. |
| (b) | U.S. Government securities, held in escrow, are used to pay interest on this security, as well as to retire the bond in full at the date indicated, typically at a premium to par. |
| (c) | Security is collateralized by municipal bonds or U.S. Treasury obligations. |
| (d) | During the six months ended December 31, 2015, investments in issuers considered to be an affiliate of the Fund for purposes of Section 2(a)(3) of the Investment Company Act of 1940, as amended, were as follows: |
| Affiliate | Shares Held at June 30, 2015 | Net Activity | Shares Held at December 31, 2015 | Income | ||||||||||||
FFI Institutional Tax-Exempt Fund | 8,207,246 | 1,207,513 | 9,414,759 | $ | 769 | |||||||||||
| (e) | Current yield as of period end. |
| Fair Value Hierarchy as of Period End |
Various inputs are used in determining the fair value of investments. For information about the Fund’s policy regarding valuation of investments, refer to the Notes to Financial Statements.
The following table summarizes the Fund’s investments categorized in the disclosure hierarchy:
| Level 1 | Level 2 | Level 3 | Total | |||||||||||
Assets: | ||||||||||||||
| Investments: | ||||||||||||||
Long-Term Investments 1 | — | $ | 594,263,431 | — | $ | 594,263,431 | ||||||||
Short-Term Securities | $ | 9,414,759 | — | — | 9,414,759 | |||||||||
|
| |||||||||||||
Total | $ | 9,414,759 | $ | 594,263,431 | — | $ | 603,678,190 | |||||||
|
| |||||||||||||
1 See above Schedule of Investments for values in each state or political sub-division. |
| |||||||||||||
During the six months ended December 31, 2015, there were no transfers between levels.
See Notes to Financial Statements.
| SEMI-ANNUAL REPORT | DECEMBER 31, 2015 | 35 |
Schedule of Investments December 31, 2015 (Unaudited) | BlackRock New York Municipal Opportunities Fund (Percentages shown are based on Net Assets) |
| Corporate Bonds | Par (000) | Value | ||||||
New York — 0.4% | ||||||||
American Museum of Natural History, 4.37%, 7/15/45 | $ | 1,000 | $ | 989,303 | ||||
New York Public Library Astor Lenox & Tilden Foundations, 4.31%, 7/01/45 | 1,000 | 939,620 | ||||||
| Total Corporate Bonds — 0.4% | 1,928,923 | |||||||
| Municipal Bonds | ||||||||
New York — 88.4% | ||||||||
Corporate — 6.8% | ||||||||
City of New York New York Build Resource Corp., Refunding RB, Pratt Paper, Inc. Project, AMT, 5.00%, 1/01/35 (a) | 280 | 300,748 | ||||||
City of New York New York Industrial Development Agency, ARB, American Airlines, Inc., JFK International Airport Project, AMT (b): | ||||||||
7.75%, 8/01/31 | 2,000 | 2,087,520 | ||||||
Series B, 2.00%, 8/01/28 | 10,200 | 10,219,686 | ||||||
City of New York New York Industrial Development Agency, Refunding RB: | ||||||||
Special Needs FAS Pool, 4.38%, 7/01/20 | 590 | 558,883 | ||||||
Terminal One Group Association Project, AMT, 5.50%, 1/01/24 (b) | 2,500 | 2,504,325 | ||||||
Transportation Infrastructure Properties LLC, Series A, AMT, 5.00%, 7/01/28 | 1,520 | 1,640,886 | ||||||
County of Essex New York Industrial Development Agency, RB, International Paper Co. Project, Series A, AMT, 6.63%, 9/01/32 | 350 | 387,387 | ||||||
New York Liberty Development Corp., RB, Goldman Sachs Headquarters, 5.50%, 10/01/37 | 780 | 972,356 | ||||||
New York Liberty Development Corp., Refunding RB, Goldman Sachs Headquarters, 5.25%, 10/01/35 | 5,155 | 6,218,631 | ||||||
Niagara Area Development Corp., Refunding RB, Solid Waste Disposal Facility, Covanta Energy Project, Series A, AMT, 5.25%, 11/01/42 (a) | 2,150 | 2,167,909 | ||||||
Onondaga County Industrial Development Agency, RB, AMT, 5.75%, 3/01/24 | 750 | 940,268 | ||||||
Southold Local Development Corp., RB, Peconic Landing Inc., Project, 4.00%, 12/01/45 | 1,900 | 1,886,814 | ||||||
|
| |||||||
| 29,885,413 | ||||||||
County/City/Special District/School District — 24.2% |
| |||||||
City of New York New York, GO, Fiscal 2014, Sub-Series D-1, 5.00%, 8/01/31 | 690 | 821,066 | ||||||
City of New York New York, GO, Refunding: | ||||||||
5.00%, 8/01/29 | 1,940 | 2,348,545 | ||||||
5.00%, 8/01/30 | 2,250 | 2,709,292 | ||||||
Series B, 5.00%, 8/01/31 | 1,250 | 1,495,975 | ||||||
Series C, 5.00%, 8/01/34 | 500 | 585,485 | ||||||
Series E, 5.50%, 8/01/25 | 1,280 | 1,625,907 | ||||||
City of New York New York, GO, Series A: | ||||||||
Series A-1, 5.00%, 8/01/35 | 400 | 466,136 | ||||||
Sub-Series I-1, 5.38%, 4/01/36 | 2,650 | 2,982,840 | ||||||
City of New York New York Convention Center Development Corp., Refunding RB: | ||||||||
5.00%, 11/15/35 | 3,500 | 4,110,505 | ||||||
Hotel Unit Fee Secured, 5.00%, 11/15/40 | 3,345 | 3,869,128 | ||||||
Hotel Unit Fee Secured, 4.00%, 11/15/45 | 2,205 | 2,301,844 | ||||||
Hotel Unit Fee Secured, 5.00%, 11/15/45 | 8,490 | 9,759,085 | ||||||
City of New York New York Housing Development Corp., RB, M/F Housing, Fund Grant Program, New York City Housing Authority Program, Series B1: | ||||||||
5.25%, 7/01/32 | 2,020 | 2,357,158 | ||||||
5.00%, 7/01/33 | 400 | 455,100 | ||||||
| Municipal Bonds | Par (000) | Value | ||||||
New York (continued) | ||||||||
County/City/Special District/School District (continued) |
| |||||||
City of New York New York Industrial Development Agency, RB, PILOT: | ||||||||
CAB, Yankee Stadium Project, Series A (AGC), 0.00%, 3/01/42 (c) | $ | 5,000 | $ | 1,732,600 | ||||
CAB, Yankee Stadium Project, Series A (AGC), 0.00%, 3/01/45 (c) | 1,500 | 457,575 | ||||||
Queens Baseball Stadium (AMBAC), 5.00%, 1/01/39 | 1,850 | 1,897,434 | ||||||
Queens Baseball Stadium (AGC), 6.50%, 1/01/46 | 700 | 796,544 | ||||||
Queens Baseball Stadium (AMBAC), 5.00%, 1/01/46 | 790 | 808,691 | ||||||
Yankee Stadium Project (NPFGC), 5.00%, 3/01/46 | 1,000 | 1,018,400 | ||||||
Yankee Stadium Project (NPFGC), 4.75%, 3/01/46 | 250 | 255,453 | ||||||
City of New York New York Industrial Development Agency, Refunding ARB, Transportation Infrastructure Properties LLC, Series A, AMT, 5.00%, 7/01/22 | 500 | 564,640 | ||||||
City of New York New York Transitional Finance Authority, BARB, Fiscal 2009, Series S-1, 5.63%, 7/15/38 | 200 | 221,620 | ||||||
City of New York New York Transitional Finance Authority, RB, Fiscal 2012, Sub-Series E-1, 5.00%, 2/01/42 | 650 | 731,400 | ||||||
City of New York New York Transitional Finance Authority Future Tax Secured, RB: | ||||||||
3.15%, 11/01/25 | 2,000 | 1,974,920 | ||||||
Fiscal 2015, Sub-Series B-1, 5.00%, 8/01/42 | 3,000 | 3,441,210 | ||||||
Fiscal 2015, Sub-Series E-1, 5.00%, 2/01/41 | 3,000 | 3,466,140 | ||||||
Sub-Series A-1, 5.00%, 11/01/38 | 1,000 | 1,146,170 | ||||||
Sub-Series B-1, 5.00%, 11/01/36 | 680 | 791,030 | ||||||
Sub-Series B-1, 5.00%, 11/01/38 | 5,000 | 5,873,850 | ||||||
City of Syracuse New York, GO, Airport Terminal Security & Access, Series A, AMT (AGM), 4.75%, 11/01/31 | 500 | 540,645 | ||||||
City of Yonkers, GO, Refunding, Series B (AGM), 5.00%, 8/01/23 | 100 | 119,986 | ||||||
Counties of Buffalo & Erie New York Industrial Land Development Corp., Refunding RB, Buffalo State College Foundation Housing Corp. Project, Series A, 5.38%, 10/01/41 | 620 | 690,525 | ||||||
Haverstraw-Stony Point Central School District, GO, Refunding: | ||||||||
3.00%, 10/15/34 | 900 | 869,751 | ||||||
5.00%, 10/15/35 | 160 | 186,544 | ||||||
5.00%, 10/15/36 | 140 | 162,690 | ||||||
Hudson Yards Infrastructure Corp., RB, Series A: | ||||||||
5.00%, 2/15/47 | 5,970 | 6,186,890 | ||||||
5.75%, 2/15/47 | 100 | 115,929 | ||||||
(AGC), 5.00%, 2/15/47 | 1,000 | 1,039,520 | ||||||
(AGM), 5.00%, 2/15/47 | 800 | 831,616 | ||||||
(NPFGC), 4.50%, 2/15/47 | 2,315 | 2,389,427 | ||||||
New York Liberty Development Corp., Refunding RB: | ||||||||
2nd Priority, Bank of America Tower at One Bryant Park Project, Class 2, 5.63%, 7/15/47 | 9,305 | 10,588,066 | ||||||
2nd Priority, Bank of America Tower at One Bryant Park Project, Class 3, 6.38%, 7/15/49 | 1,200 | 1,354,176 | ||||||
3 World Trade Center Project, Class 1, 5.00%, 11/15/44 (a) | 5,000 | 5,162,100 | ||||||
3 World Trade Center Project, Class 2, 5.38%, 11/15/40 (a) | 400 | 424,748 | ||||||
4 World Trade Center Project, 5.00%, 11/15/31 | 860 | 988,372 | ||||||
4 World Trade Center Project, 5.00%, 11/15/44 | 1,500 | 1,675,785 | ||||||
See Notes to Financial Statements.
| 36 | SEMI-ANNUAL REPORT | DECEMBER 31, 2015 |
Schedule of Investments (continued) | BlackRock New York Municipal Opportunities Fund |
| Municipal Bonds | Par (000) | Value | ||||||
New York (continued) | ||||||||
County/City/Special District/School District (continued) |
| |||||||
New York Liberty Development Corp., Refunding RB (continued): | ||||||||
4 World Trade Center Project, 5.75%, 11/15/51 | $ | 1,250 | $ | 1,451,288 | ||||
7 World Trade Center Project, Class 1, 4.00%, 9/15/35 | 425 | 465,260 | ||||||
7 World Trade Center Project, Class 2, 5.00%, 9/15/43 | 5,085 | 5,653,656 | ||||||
7 World Trade Center Project, Class 3, 5.00%, 3/15/44 | 1,720 | 1,886,823 | ||||||
State of New York State Dormitory Authority, RB, Series C, 5.00%, 10/01/42 | 1,695 | 1,930,317 | ||||||
|
| |||||||
| 105,779,857 | ||||||||
Education — 13.8% | ||||||||
Amherst Development Corp., Refunding RB, University at Buffalo Foundation Faculty-Student Housing Corp., Series A (AGM), 4.63%, 10/01/40 | 305 | 324,898 | ||||||
Build New York City Resource Corp., RB, South Bronx Charter School for International Cultures and the Arts Project, Series A, 5.00%, 4/15/43 | 1,000 | 1,017,030 | ||||||
Build New York City Resource Corp., Refunding RB: | ||||||||
3.75%, 6/01/34 | 550 | 563,068 | ||||||
Series A, 5.00%, 6/01/43 | 325 | 365,560 | ||||||
City of New York New York Trust for Cultural Resources, RB, Juilliard School, Series A, 5.00%, 1/01/39 | 500 | 552,390 | ||||||
City of New York New York Trust for Cultural Resources, Refunding RB, Series A: | ||||||||
American Museum of Natural History, 5.00%, 7/01/37 | 885 | 1,024,839 | ||||||
Carnegie Hall, 4.75%, 12/01/39 | 1,550 | 1,712,393 | ||||||
Carnegie Hall, 5.00%, 12/01/39 | 1,325 | 1,482,622 | ||||||
City of Troy New York Capital Resource Corp., Refunding RB: | ||||||||
5.00%, 8/01/28 | 2,000 | 2,378,520 | ||||||
Rensselaer Polytechnic Institute Project, Series A, 5.13%, 9/01/40 | 4,280 | 4,812,603 | ||||||
Rensselaer Polytechnic Institute Project, Series B, 4.00%, 8/01/35 | 1,000 | 1,042,980 | ||||||
City of Yonkers New York Industrial Development Agency, RB, Sarah Lawrence College Project, Series A, 6.00%, 6/01/41 | 1,000 | 1,128,540 | ||||||
County of Cattaraugus New York, RB, St. Bonaventure University Project: | ||||||||
5.00%, 5/01/34 | 130 | 142,604 | ||||||
5.00%, 5/01/39 | 165 | 177,557 | ||||||
County of Madison New York Industrial Development Agency, RB, Commons II LLC, Student Housing, Series A (CIFG), 5.00%, 6/01/18 (d) | 400 | 436,644 | ||||||
County of Monroe New York Industrial Development Corp., Refunding RB, University of Rochester Project, Series A, 5.00%, 7/01/38 | 240 | 274,274 | ||||||
County of Nassau New York Industrial Development Agency, Refunding RB, New York Institute of Technology Project, Series A, 4.75%, 3/01/26 | 1,000 | 1,065,680 | ||||||
County of Orange New York Funding Corp., Refunding RB, Mount St. Mary College Project, Series A: | ||||||||
5.00%, 7/01/37 | 360 | 386,820 | ||||||
5.00%, 7/01/42 | 220 | 233,387 | ||||||
County of Saratoga New York, Refunding RB, Series B, 4.00%, 7/01/33 | 1,000 | 1,053,640 | ||||||
County of Schenectady New York Industrial Development Agency, Refunding RB, Union College Project, 5.00%, 7/01/16 (d) | 1,000 | 1,023,210 | ||||||
| Municipal Bonds | Par (000) | Value | ||||||
New York (continued) | ||||||||
Education (continued) |
| |||||||
County of St. Lawrence New York Industrial Development Agency, RB, Clarkson University Project, 5.38%, 9/01/41 | $ | 500 | $ | 561,025 | ||||
County of Tompkins New York Development Corp., RB, Ithaca College Project (AGM), 5.50%, 7/01/33 | 450 | 518,108 | ||||||
Dobbs Ferry Local Development Corp., RB, Mercy College Project: | ||||||||
5.00%, 7/01/39 | 1,000 | 1,120,390 | ||||||
5.00%, 7/01/44 | 2,000 | 2,229,820 | ||||||
State of New York Dormitory Authority, Refunding RB, Barnard College, Series A, 5.00%, 7/01/33 | 470 | 553,580 | ||||||
State of New York Dormitory Authority, RB: | ||||||||
Icahn Shool of Medicine at Mount Sinai, 5.00%, 7/01/40 | 3,000 | 3,394,710 | ||||||
New School (AGM), 5.50%, 7/01/43 | 1,000 | 1,146,440 | ||||||
New York University, Series 1 (AMBAC), 5.50%, 7/01/40 | 500 | 680,480 | ||||||
New York University, Series 1 (AMBAC) (BHAC), 5.50%, 7/01/31 | 230 | 295,700 | ||||||
Personal Income Tax, Series G, 5.00%, 8/15/32 | 1,975 | 2,310,473 | ||||||
Series A, 5.50%, 1/01/44 | 2,000 | 2,193,240 | ||||||
State University Dormitory Facilities, Series A, 5.25%, 7/01/19 (d) | 5 | 5,724 | ||||||
State University Dormitory Facilities, Series A, 5.00%, 7/01/39 | 750 | 832,012 | ||||||
Teachers College, Series B, 5.00%, 7/01/42 | 360 | 405,630 | ||||||
Touro College & University System Obligation Group, Series A, 4.13%, 1/01/30 | 600 | 625,350 | ||||||
University of Rochester, Series A, 5.75%, 7/01/39 (e) | 1,000 | 1,136,880 | ||||||
University of Rochester, Series B, 5.00%, 1/01/17 (d) | 550 | 573,920 | ||||||
State of New York Dormitory Authority, Refunding RB: | ||||||||
Barnard College, Series A, 4.00%, 7/01/36 | 470 | 497,824 | ||||||
Barnard College, Series A, 5.00%, 7/01/43 | 1,000 | 1,145,570 | ||||||
Brooklyn Law School, 5.75%, 7/01/33 | 475 | 531,425 | ||||||
Culinary Institute of America, 5.00%, 7/01/42 | 300 | 320,742 | ||||||
Fordham University, 5.00%, 7/01/44 | 850 | 963,075 | ||||||
Icahn School of Medicine at Mount Sinai, Series A, 5.00%, 7/01/35 | 800 | 909,440 | ||||||
Icahn School of Medicine at Mount Sinai, Series A, 4.00%, 7/01/40 | 1,750 | 1,804,477 | ||||||
New York University, Series A, 5.00%, 7/01/42 | 1,000 | 1,142,040 | ||||||
Pratt Institute, Series A, 5.00%, 7/01/44 | 1,000 | 1,118,040 | ||||||
Rochester Institute of Technology, 5.00%, 7/01/34 | 750 | 857,490 | ||||||
Rochester Institute of Technology, 5.00%, 7/01/42 | 1,460 | 1,639,522 | ||||||
Skidmore College, Series A, 5.25%, 7/01/29 | 135 | 158,090 | ||||||
St. John’s University, Series A, 5.00%, 7/01/37 | 350 | 400,334 | ||||||
State University Dormitory Facilities, Series A, 5.25%, 7/01/30 | 2,095 | 2,512,135 | ||||||
State University Dormitory Facilities, Series A, 5.25%, 7/01/32 | 2,095 | 2,488,357 | ||||||
State University Dormitory Facilities, Series A, 5.00%, 7/01/42 | 895 | 1,014,116 | ||||||
State University Dormitory Facilities, Series B, 3.50%, 7/01/34 | 1,280 | 1,291,354 | ||||||
Teachers College, 5.50%, 3/01/39 | 850 | 950,419 | ||||||
Town of Hempstead New York Local Development Corp., Refunding RB: | ||||||||
Adelphi University Project, 5.00%, 10/01/35 | 265 | 305,071 | ||||||
Adelphini University Project, 5.00%, 10/01/34 | 465 | 536,856 | ||||||
|
| |||||||
| 60,369,118 | ||||||||
See Notes to Financial Statements.
| SEMI-ANNUAL REPORT | DECEMBER 31, 2015 | 37 |
Schedule of Investments (continued) | BlackRock New York Municipal Opportunities Fund |
| Municipal Bonds | Par (000) | Value | ||||||
New York (continued) | ||||||||
Health — 8.8% | ||||||||
Buffalo & Erie County Industrial Land Development Corp., RB, 5.25%, 7/01/35 | $ | 500 | $ | 575,000 | ||||
Build NYC Resource Corp., Refunding RB, New York Methodist Hospital Project, 5.00%, 7/01/30 | 600 | 680,058 | ||||||
City of New York New York Health & Hospital Corp., Refunding RB, Health System, Series A, 5.00%, 2/15/30 | 1,000 | 1,106,410 | ||||||
City of New York New York Industrial Development Agency, RB, Special Needs Facilities Pooled Program: | ||||||||
Series A-1, 6.50%, 7/01/17 | 260 | 260,156 | ||||||
Series C-1, 6.50%, 7/01/17 | 1,055 | 1,055,633 | ||||||
City of New York New York Industrial Development Agency, Refunding RB, Special Needs Facilities Pooled Program, Series C-1 (ACA), 5.10%, 7/01/31 | 525 | 515,356 | ||||||
County of Dutchess New York Local Development Corp., RB, Series A, 5.00%, 7/01/34 | 750 | 837,937 | ||||||
County of Dutchess New York Local Development Corp., Refunding RB, Health Quest System, Inc., Series A, 5.75%, 7/01/40 | 300 | 339,072 | ||||||
County of Erie New York Industrial Development Agency, RB, Episcopal Church Home, Series A: | ||||||||
5.88%, 2/01/18 | 85 | 85,239 | ||||||
6.00%, 2/01/28 | 185 | 185,311 | ||||||
County of Genesee New York Industrial Development Agency, Refunding RB, United Memorial Medical Center Project: | ||||||||
5.00%, 12/01/27 | 465 | 465,451 | ||||||
5.00%, 12/01/32 | 580 | 580,441 | ||||||
County of Monroe New York Industrial Development Corp., Refunding RB, Unity Hospital of Rochester Project (FHA), 5.50%, 8/15/40 | 1,050 | 1,225,056 | ||||||
County of Nassau New York Industrial Development Agency, Refunding RB, Special Needs Facility Pooled Program (ACA), 4.90%, 7/01/21 | 330 | 330,736 | ||||||
County of Orange New York Industrial Development Agency, RB, Special Needs Facilities Pooled Program, Series G-1 (ACA), 4.90%, 7/01/21 | 845 | 846,884 | ||||||
County of Suffolk New York EDC, RB, Catholic Health Services, Series C, 5.00%, 7/01/32 | 305 | 341,957 | ||||||
County of Suffolk New York Industrial Development Agency, RB, Special Needs Facilities Pooled Program, Series D-1, 6.50%, 7/01/17 | 75 | 75,154 | ||||||
County of Sullivan New York Industrial Development Agency, RB, Special Needs Facilities Pooled Program, Series H-1 (ACA), 4.90%, 7/01/21 | 330 | 330,736 | ||||||
County of Tompkins New York Development Corp., Refunding RB: | ||||||||
5.00%, 7/01/44 | 1,250 | 1,352,425 | ||||||
Kendal at Ithaca, Inc. Project, 4.25%, 7/01/44 | 1,595 | 1,595,781 | ||||||
County of Westchester New York Healthcare Corp., Refunding RB, Senior Lien: | ||||||||
Remarketing, Series A, 5.00%, 11/01/30 | 3,645 | 4,061,551 | ||||||
Series B, 6.00%, 11/01/30 | 375 | 429,821 | ||||||
County of Westchester New York Local Development Corp., Refunding RB: | ||||||||
Kendal On Hudson Project, 5.00%, 1/01/28 | 930 | 1,022,609 | ||||||
Kendal on Hudson Project, 5.00%, 1/01/34 | 875 | 945,709 | ||||||
State of New York Dormitory Authority, RB: | ||||||||
Healthcare, Series A, 5.00%, 3/15/38 | 250 | 278,110 | ||||||
Hudson Valley Hospital (BHAC) (FHA), 5.00%, 8/15/36 | 750 | 794,505 | ||||||
Mental Health Services (AGM), 5.00%, 8/15/18 (d) | 5 | 5,522 | ||||||
| Municipal Bonds | Par (000) | Value | ||||||
New York (continued) | ||||||||
Health (continued) | ||||||||
State of New York Dormitory Authority, RB (continued): | ||||||||
Mental Health Services (AGM), 5.00%, 2/15/22 | $ | 990 | $ | 1,090,911 | ||||
Mental Health Services, 2nd Series (AGM), 5.00%, 8/15/18 (d) | 5 | 5,522 | ||||||
New York State Association for Retarded Children, Inc., Series B (AMBAC), 6.00%, 7/01/32 | 700 | 804,174 | ||||||
New York University Hospitals Center, Series A, 5.75%, 7/01/31 | 1,055 | 1,214,875 | ||||||
North Shore-Long Island Jewish Obligated Group, Series A, 5.50%, 5/01/19 (d) | 1,675 | 1,919,299 | ||||||
North Shore-Long Island Jewish Obligated Group, Series A, 5.75%, 5/01/19 (d) | 1,725 | 1,990,684 | ||||||
Orange Regional Medical Center, 5.00%, 12/01/40 (a) | 1,300 | 1,374,971 | ||||||
Orange Regional Medical Center, 5.00%, 12/01/45 (a) | 1,700 | 1,769,904 | ||||||
State of New York Dormitory Authority, Refunding RB: | ||||||||
Miriam Osborn Memorial Home Association, 5.00%, 7/01/29 | 290 | 308,737 | ||||||
Mount Sinai Hospital, Series A, 5.00%, 7/01/26 | 1,635 | 1,860,205 | ||||||
North Shore-Long Island Jewish Obligated Group, 5.00%, 5/01/43 | 1,570 | 1,756,061 | ||||||
North Shore-Long Island Jewish Obligated Group, Series A, 5.00%, 5/01/32 | 2,500 | 2,766,725 | ||||||
North Shore-Long Island Jewish Obligated Group, Series E, 5.50%, 5/01/33 | 1,000 | 1,109,220 | ||||||
|
| |||||||
| 38,293,908 | ||||||||
Housing — 2.5% | ||||||||
City of New York New York Housing Development Corp., Refunding RB: | ||||||||
3.85%, 11/01/45 | 1,915 | 1,926,337 | ||||||
M/F Housing, 8 Spruce Street, Class F, 4.50%, 2/15/48 | 770 | 797,204 | ||||||
City of Yonkers New York Industrial Development Agency, RB, AMT (SONYMA): | ||||||||
Monastery Manor Associates LP Project, 5.25%, 4/01/37 | 585 | 586,872 | ||||||
Sacred Heart Association Project, Series A, 5.00%, 10/01/37 | 1,640 | 1,663,829 | ||||||
County of Monroe New York Industrial Development Agency, IDRB, Southview Towers Project, AMT (SONYMA), 6.25%, 2/01/31 | 1,000 | 1,002,380 | ||||||
County Westchester Local Development Corp., Refunding RB, Waterburg Senior Housing, Series A, 5.00%, 6/01/30 (a) | 965 | 985,313 | ||||||
State of New York HFA, RB, M/F Housing, Series A, AMT: | ||||||||
Division Street (SONYMA), 5.10%, 2/15/38 | 875 | 876,243 | ||||||
Highland Avenue Senior Apartments (SONYMA), 5.00%, 2/15/39 | 2,000 | 2,022,740 | ||||||
Kensico Terrace Apartments (SONYMA), 4.90%, 2/15/38 | 645 | 649,057 | ||||||
Watergate II, 4.75%, 2/15/34 | 580 | 580,481 | ||||||
|
| |||||||
| 11,090,456 | ||||||||
State — 4.6% | ||||||||
Sales Tax Asset Receivable Corp., Refunding RB, Series A: | ||||||||
5.00%, 10/15/31 | 1,625 | 1,963,650 | ||||||
4.00%, 10/15/32 | 1,445 | 1,604,196 | ||||||
State of New York, GO, Series A, 5.00%, 2/15/39 | 750 | 835,883 | ||||||
State of New York Dormitory Authority, RB: | ||||||||
Series B, 5.00%, 3/15/37 | 1,500 | 1,774,500 | ||||||
State Supported Debt, Series A, 5.00%, 3/15/44 | 3,305 | 3,790,240 | ||||||
See Notes to Financial Statements.
| 38 | SEMI-ANNUAL REPORT | DECEMBER 31, 2015 |
Schedule of Investments (continued) | BlackRock New York Municipal Opportunities Fund |
| Municipal Bonds | Par (000) | Value | ||||||
New York (continued) | ||||||||
State (continued) | ||||||||
State of New York Thruway Authority, Refunding RB, Series A-1, 5.00%, 4/01/29 | $ | 1,000 | $ | 1,108,610 | ||||
State of New York Urban Development Corp., RB, State Personal Income Tax, Series C, 5.00%, 3/15/32 | 4,000 | 4,675,600 | ||||||
State of New York Urban Development Corp., Refunding RB: | ||||||||
Clarkson Center Advance Materials, 5.50%, 1/01/20 | 1,380 | 1,494,526 | ||||||
University Facilities Grants, 5.50%, 1/01/19 | 2,695 | 2,887,719 | ||||||
|
| |||||||
| 20,134,924 | ||||||||
Tobacco — 4.9% | ||||||||
Counties of New York Tobacco Trust IV, Refunding RB, Series A: | ||||||||
5.00%, 6/01/42 | 305 | 279,905 | ||||||
5.00%, 6/01/45 | 170 | 153,602 | ||||||
Settlement Pass-Through Turbo, 6.25%, 6/01/41 (a) | 4,800 | 5,007,696 | ||||||
County of Chautauqua New York Tobacco Asset Securitization Corp., Refunding RB, 4.75%, 6/01/39 | 750 | 740,573 | ||||||
County of Niagara New York Tobacco Asset Securitization Corp., Refunding RB, Asset-Backed: | ||||||||
5.25%, 5/15/34 | 1,750 | 1,997,782 | ||||||
5.25%, 5/15/40 | 1,080 | 1,216,922 | ||||||
Erie Tobacco Asset Securitization Corp., Refunding RB, Asset-Backed, Series A, 5.00%, 6/01/45 | 4,595 | 4,436,978 | ||||||
TSASC, Inc., Refunding RB, Series 1, 5.00%, 6/01/34 | 3,620 | 3,480,775 | ||||||
Westchester Tobacco Asset Securitization, Refunding RB, 5.13%, 6/01/45 | 4,145 | 4,144,834 | ||||||
|
| |||||||
| 21,459,067 | ||||||||
Transportation — 13.8% | ||||||||
Metropolitan Transportation Authority, RB: | ||||||||
Dedicated Tax Fund, Series A, 5.63%, 11/15/39 | 500 | 562,160 | ||||||
Series A-1, 5.25%, 11/15/33 | 540 | 646,358 | ||||||
Series B, 5.25%, 11/15/44 | 2,125 | 2,473,181 | ||||||
Series C, 6.50%, 11/15/28 | 1,760 | 2,028,506 | ||||||
Series E, 5.00%, 11/15/38 | 2,350 | 2,695,027 | ||||||
Series H, 5.00%, 11/15/25 | 1,000 | 1,195,520 | ||||||
Metropolitan Transportation Authority, Refunding RB: | ||||||||
5.00%, 11/15/35 | 1,500 | 1,760,250 | ||||||
Series F, 5.00%, 11/15/30 | 1,000 | 1,178,360 | ||||||
Port Authority of New York & New Jersey, ARB: | ||||||||
Consolidated, 169th Series, 5.00%, 10/15/41 | 1,000 | 1,098,820 | ||||||
Special Project, JFK International Air Terminal LLC Project, Series 8, 6.00%, 12/01/42 | 2,000 | 2,339,080 | ||||||
Port Authority of New York & New Jersey, RB, Series 192, 4.81%, 10/15/65 | 2,000 | 2,031,740 | ||||||
Port Authority of New York & New Jersey, Refunding ARB, Consolidated: | ||||||||
177th Series, AMT, 3.50%, 7/15/37 | 2,000 | 1,992,780 | ||||||
177th Series, AMT, 4.00%, 1/15/43 | 1,255 | 1,279,686 | ||||||
178th Series, AMT, 5.00%, 12/01/43 | 285 | 318,505 | ||||||
186th Series, AMT, 5.00%, 10/15/44 | 6,000 | 6,748,020 | ||||||
189th Series, 5.00%, 5/01/45 | 1,150 | 1,325,858 | ||||||
Port Authority of New York & New Jersey, Refunding RB, 178th Series, AMT, 5.00%, 12/01/32 | 1,000 | 1,152,150 | ||||||
State of New York Thruway Authority, Refunding RB: | ||||||||
5.00%, 1/01/29 | 5,000 | 6,033,150 | ||||||
5.00%, 1/01/31 | 2,500 | 2,972,100 | ||||||
General, Series I, 5.00%, 1/01/42 | 280 | 314,628 | ||||||
General, Series K, 5.00%, 1/01/32 | 2,000 | 2,367,120 | ||||||
Series J, 5.00%, 1/01/41 | 5,750 | 6,479,732 | ||||||
| Municipal Bonds | Par (000) | Value | ||||||
New York (continued) | ||||||||
Transportation (continued) | ||||||||
Triborough Bridge & Tunnel Authority, RB, Series B: | ||||||||
5.00%, 11/15/40 | $ | 1,290 | $ | 1,504,192 | ||||
5.00%, 11/15/45 | 2,000 | 2,313,600 | ||||||
Triborough Bridge & Tunnel Authority, Refunding RB: | ||||||||
CAB, Sub-Series A, 0.00%, 11/15/32 (c) | 2,480 | 1,428,951 | ||||||
General, CAB, Series B, 0.00%, 11/15/32 (c) | 6,020 | 3,387,032 | ||||||
General, Series A, 5.00%, 11/15/50 | 1,000 | 1,144,720 | ||||||
Series A, 5.00%, 11/15/24 | 1,375 | 1,670,474 | ||||||
|
| |||||||
| 60,441,700 | ||||||||
Utilities — 9.0% | ||||||||
City of New York New York Municipal Water & Sewer System, Refunding RB, Fiscal 2013, Series BB, 5.00%, 6/15/47 | 2,000 | 2,259,640 | ||||||
City of New York New York Municipal Water Finance Authority, RB, Water & Sewer System, Fiscal 2009, Series A, 5.75%, 6/15/40 | 500 | 555,975 | ||||||
City of New York New York Municipal Water Finance Authority, Refunding RB, Water & Sewer System, Series FF-2, 5.50%, 6/15/40 | 800 | 912,360 | ||||||
Long Island Power Authority, RB, General, Electric Systems: | ||||||||
Series A (AGM), 5.00%, 5/01/36 | 500 | 557,010 | ||||||
Series B, 5.00%, 9/01/45 | 890 | 1,008,014 | ||||||
Series C (CIFG), 5.25%, 9/01/29 | 3,000 | 3,715,260 | ||||||
Long Island Power Authority, Refunding RB, Series A: | ||||||||
Electric System, 5.50%, 4/01/19 (d) | 875 | 1,001,193 | ||||||
Electric System, 6.00%, 5/01/19 (d) | 2,450 | 2,851,751 | ||||||
Electric System, 5.75%, 4/01/39 | 300 | 336,354 | ||||||
5.00%, 9/01/34 | 4,280 | 4,907,748 | ||||||
New York City Water & Sewer System, Refunding RB, Water & Sewer System, 2nd General Resolution: | ||||||||
Fiscal 2015, Series HH, 5.00%, 6/15/39 | 1,000 | 1,164,480 | ||||||
Fiscal 2016, Series BB, 4.00%, 6/15/46 | 3,830 | 4,023,568 | ||||||
State of New York Environmental Facilities Corp., RB, 5.00%, 3/15/45 | 2,535 | 2,931,246 | ||||||
State of New York Environmental Facilities Corp., Refunding RB: | ||||||||
Series A, 5.00%, 6/15/45 | 3,000 | 3,480,030 | ||||||
Series B, Revolving Funds, New York City Municipal Water, 5.00%, 6/15/36 | 1,000 | 1,165,360 | ||||||
Utility Debt Securitization Authority, Refunding RB, Restructuring: | ||||||||
3.00%, 12/15/32 | 3,430 | 3,476,922 | ||||||
Series E, 5.00%, 12/15/41 | 4,225 | 4,916,463 | ||||||
|
| |||||||
| 39,263,374 | ||||||||
| Total Municipal Bonds in New York | 386,717,817 | |||||||
Puerto Rico — 1.0% | ||||||||
Housing — 0.4% |
| |||||||
Puerto Rico Housing Finance Authority, Refunding RB, M/F Housing, Subordinate, Capital Fund Modernization, 5.13%, 12/01/27 | 1,415 | 1,537,129 | ||||||
Utilities — 0.6% |
| |||||||
Children’s Trust Fund, Refunding RB, Asset-Backed, 5.63%, 5/15/43 | 2,570 | 2,574,086 | ||||||
Puerto Rico Commonwealth Aqueduct & Sewer Authority, RB, Series A, 6.00%, 7/01/44 | 265 | 178,244 | ||||||
|
| |||||||
| 2,752,330 | ||||||||
| Total Municipal Bonds in Puerto Rico | 4,289,459 | |||||||
| Total Municipal Bonds — 89.4% | 391,007,276 | |||||||
See Notes to Financial Statements.
| SEMI-ANNUAL REPORT | DECEMBER 31, 2015 | 39 |
Schedule of Investments (continued) | BlackRock New York Municipal Opportunities Fund |
| Municipal Bonds Transferred to Tender Option Bond Trusts (f) | Par (000) | Value | ||||||
New York — 8.5% | ||||||||
County/City/Special District/School District — 1.0% |
| |||||||
City of New York New York, GO: | ||||||||
Sub-Series G-1, 5.00%, 4/01/29 | $ | 750 | $ | 878,918 | ||||
Sub-Series I-1, 5.00%, 3/01/36 | 1,500 | 1,729,890 | ||||||
City of New York New York Transitional Finance Authority, RB, Future Tax Secured, Sub-Series D-1, 5.00%, 11/01/38 | 1,650 | 1,860,144 | ||||||
|
| |||||||
| 4,468,952 | ||||||||
Education — 0.3% | ||||||||
State of New York Dormitory Authority, LRB, State University Dormitory Facilities, Series A, 5.25%, 7/01/19 (d) | 1,350 | 1,545,345 | ||||||
State — 1.4% |
| |||||||
City of New York New York Transitional Finance Authority, BARB, Fiscal 2009, Series S-3, 5.25%, 1/15/39 | 2,100 | 2,325,602 | ||||||
Hudson Yards Infrastructure Corp., RB, Fiscal 2012, Series A, 5.75%, 2/15/47 (f)(g) | 2,250 | 2,608,171 | ||||||
State of New York Dormitory Authority, RB, General Purpose, Series C, 5.00%, 3/15/41 | 1,000 | 1,148,330 | ||||||
|
| |||||||
| 6,082,103 | ||||||||
Transportation — 3.1% | ||||||||
New York Liberty Development Corp., RB, 1 World Trade Center Port Authority Consolidated Bonds, 5.25%, 12/15/43 | 6,495 | 7,512,390 | ||||||
Port Authority of New York & New Jersey, ARB, Consolidated, 169th Series, AMT, 5.00%, 10/15/26 | 1,500 | 1,755,945 | ||||||
Port Authority of New York & New Jersey, Refunding ARB, 194th Series, 5.25%, 10/15/55 | 1,950 | 2,292,556 | ||||||
State of New York Thruway Authority, Refunding RB, Transportation, Personal Income Tax, Series A, 5.00%, 3/15/31 | 1,560 | 1,833,078 | ||||||
|
| |||||||
| 13,393,969 | ||||||||
| Municipal Bonds Transferred to Tender Option Bond Trusts (f) | Par (000) | Value | ||||||
New York (continued) | ||||||||
Utilities — 2.7% | ||||||||
City of New York New York Municipal Water Finance Authority, Refunding RB, Water & Sewer System: | ||||||||
2nd General Resolution, Fiscal 2011, Series HH, 5.00%, 6/15/32 | $ | 2,790 | $ | 3,216,870 | ||||
2nd General Resolution, Fiscal 2012, Series BB, 5.00%, 6/15/44 | 3,751 | 4,280,651 | ||||||
Series A, 4.75%, 6/15/30 | 4,000 | 4,217,200 | ||||||
|
| |||||||
| 11,714,721 | ||||||||
| Total Municipal Bonds Transferred to Tender Option Bond Trusts — 8.5% | 37,205,090 | |||||||
| Total Long-Term Investments (Cost — $403,239,911) — 98.3% | 430,141,289 | |||||||
| Short-Term Securities | Shares | |||||||
BIF New York Municipal Money Fund, | 18,183,164 | 18,183,164 | ||||||
| Total Short-Term Securities (Cost — $18,183,164) — 4.2% | 18,183,164 | |||||||
| Total Investments (Cost — $421,423,075) — 102.5% | 448,324,453 | |||||||
| Other Assets Less Liabilities — 2.1% | 8,965,231 | |||||||
Liability for TOB Trust Certificates, Including Interest |
| (20,013,108 | ) | |||||
|
| |||||||
| Net Assets — 100.0% | $ | 437,276,576 | ||||||
|
| |||||||
| Notes to Schedule of Investments |
| (a) | Security exempt from registration pursuant to Rule 144A under the Securities Act of 1933, as amended. These securities may be resold in transactions exempt from registration to qualified institutional investors. |
| (b) | Variable rate security. Rate as of period end. |
| (c) | Zero-coupon bond. |
| (d) | U.S. Government securities, held in escrow, are used to pay interest on this security, as well as to retire the bond in full at the date indicated, typically at a premium to par. |
| (e) | Step-up bond that pays an initial coupon rate for the first period and then a higher coupon rate for the following periods. Rate as of period end. |
| (f) | Represent bonds transferred to a TOB Trust in exchange of cash and residual certificates received by the Fund. These bonds serve as collateral in a secured borrowing. See Note 4 of the Notes to Financial Statements for details. |
| (g) | All or a portion of security is subject to a recourse agreement. The aggregate maximum potential amount the Fund could ultimately be required to pay under the agreement, which expires on February 15, 2019, is $1,191,479. See Note 4 of the Notes to Financial Statements for details. |
| (h) | During the six months ended December 31, 2015, investments in issuers considered to be an affiliate of the Fund for purposes of Section 2(a)(3) of the Investment Company Act of 1940, as amended, were as follows: |
| Affiliate | Shares Held at June 30, 2015 | Net Activity | Shares Held at December 31, 2015 | Income | ||||||||||||
BIF New York Municipal Money Fund | 10,358,839 | 7,824,325 | 18,183,164 | $ | 2 | |||||||||||
| (i) | Current yield as of period end. |
See Notes to Financial Statements.
| 40 | SEMI-ANNUAL REPORT | DECEMBER 31, 2015 |
Schedule of Investments (continued) | BlackRock New York Municipal Opportunities Fund |
| Derivative Financial Instruments Outstanding as of Period End |
Financial Futures Contracts
| Contracts Short | Issue | Expiration | Notional Value | Unrealized Appreciation | ||||||||||||
| (74 | ) | 5-Year U.S. Treasury Note | March 2016 | $ | 8,755,703 | $ | 33,802 | |||||||||
| (281 | ) | 10-Year U.S. Treasury Note | March 2016 | $ | 35,379,656 | 178,366 | ||||||||||
| (189 | ) | Long U.S. Treasury Bond | March 2016 | $ | 29,058,750 | 75,351 | ||||||||||
| (45 | ) | Ultra U.S. Treasury Bond | March 2016 | $ | 7,140,938 | 3,845 | ||||||||||
| Total | $ | 291,364 | ||||||||||||||
|
| |||||||||||||||
| Derivative Financial Instruments Categorized by Risk Exposure |
As of period end, the fair values of derivative financial instruments located in the Statements of Assets and Liabilities were as follows:
| Assets — Derivative Financial Instruments | Commodity Contracts | Credit Contracts | Equity Contracts | Foreign Currency Exchange Contracts | Interest Rate Contracts | Other Contacts | Total | |||||||||||||||||||||||
Financial futures contracts | Net unrealized appreciation1 | — | — | — | — | $ | 291,364 | — | $ | 291,364 | ||||||||||||||||||||
|
|
|
|
|
|
|
|
|
|
|
|
|
|
|
| |||||||||||||||
1 Includes cumulative appreciation (depreciation) on financial futures contracts, if any, as reported in the Schedule of Investments. Only current day’s variation margin is reported within the Statements of Assets and Liabilities. |
| |||||||||||||||||||||||||||||
For the six months ended December 31, 2015, the effect of derivative financial instruments in the Statements of Operations was as follows:
| Net Realized Gain (Loss) From: | Commodity Contracts | Credit Contracts | Equity Contracts | Foreign Currency Exchange Contracts | Interest Rate Contracts | Other Contacts | Total | |||||||||||||||||||||
Financial futures contracts | — | — | — | — | $ | (289,167 | ) | — | $ | (289,167 | ) | |||||||||||||||||
|
|
|
|
|
|
|
|
|
|
|
|
|
| |||||||||||||||
| Net Change in Unrealized Appreciation (Depreciation) on: | ||||||||||||||||||||||||||||
Financial futures contracts | — | — | — | — | $ | (501,369 | ) | — | $ | (501,369 | ) | |||||||||||||||||
|
|
|
|
|
|
|
|
|
|
|
|
|
| |||||||||||||||
| Average Quarterly Balances of Outstanding Derivative Financial Instruments |
| Financial futures contracts: | ||||
Average notional value of contracts — short | $ | 82,420,813 |
For information about the Fund’s investment risks regarding derivative financial instruments, refer to the Notes to Financial Statements.
| Fair Value Hierarchy as of Period End |
Various inputs are used in determining the fair value of investments and derivative financial instruments. For information about the Fund’s policy regarding valuation of investments and derivative financial instruments, refer to the Notes to Financial Statements.
The following tables summarize the Fund’s investments and derivative financial instruments categorized in the disclosure hierarchy:
| Level 1 | Level 2 | Level 3 | Total | |||||||||||
Assets: | ||||||||||||||
| Investments: | ||||||||||||||
Long-Term Investments1 | — | $ | 430,141,289 | — | $ | 430,141,289 | ||||||||
Short-Term Securities | $ | 18,183,164 | — | — | 18,183,164 | |||||||||
|
|
|
|
|
|
| ||||||||
Total | $ | 18,183,164 | $ | 430,141,289 | — | $ | 448,324,453 | |||||||
|
|
|
|
|
|
| ||||||||
1 See above Schedule of Investments for values in each sector. | ||||||||||||||
| Level 1 | Level 2 | Level 3 | Total | |||||||||||
| Derivative Financial Instruments1 | ||||||||||||||
Assets: | ||||||||||||||
Interest rate contracts | $ | 291,364 | — | — | $ | 291,364 | ||||||||
1 Derivative financial instruments are financial futures contracts, which are valued at the unrealized appreciation (depreciation) on the instrument. |
| |||||||||||||
See Notes to Financial Statements.
| SEMI-ANNUAL REPORT | DECEMBER 31, 2015 | 41 |
Schedule of Investments (concluded) | BlackRock New York Municipal Opportunities Fund |
The Fund may hold assets and/or liabilities in which the fair value approximates the carrying amount for financial statement purposes. As of period end, such assets and/or liabilities are categorized within the disclosure hierarchy as follows:
| Level 1 | Level 2 | Level 3 | Total | |||||||||||||
Assets: | ||||||||||||||||
Cash pledged for financial futures contracts | $ | 1,322,350 | — | — | $ | 1,322,350 | ||||||||||
Liabilities: | ||||||||||||||||
TOB Trust Certificates | — | $ | (20,010,373 | ) | — | (20,010,373 | ) | |||||||||
|
|
|
|
|
|
|
| |||||||||
Total | $ | 1,322,350 | $ | (20,010,373 | ) | — | $ | (18,688,023 | ) | |||||||
|
|
|
|
|
|
|
| |||||||||
During the six months ended December 31, 2015, there were no transfers between levels.
See Notes to Financial Statements.
| 42 | SEMI-ANNUAL REPORT | DECEMBER 31, 2015 |
| Statements of Assets and Liabilities |
| December 31, 2015 (Unaudited) | BlackRock High Yield Municipal Fund | BlackRock National Municipal Fund | BlackRock Short-Term Municipal Fund | BlackRock New York Municipal Opportunities Fund | ||||||||||||
| Assets | ||||||||||||||||
Investments at value — unaffiliated1 | $ | 649,481,873 | $ | 5,933,457,116 | $ | 594,263,431 | $ | 430,141,289 | ||||||||
Investments at value — affiliated2 | 38,438,476 | 421,366,094 | 9,414,759 | 18,183,164 | ||||||||||||
Cash | 189,795 | 578,252 | — | — | ||||||||||||
Cash pledged for financial futures contracts | 203,500 | 1,597,000 | — | 1,322,350 | ||||||||||||
| Receivables: | ||||||||||||||||
Interest | 7,213,272 | 75,154,661 | 7,520,802 | 5,421,428 | ||||||||||||
Capital shares sold | 2,702,373 | 19,478,200 | 8,635,483 | 3,036,288 | ||||||||||||
Investments sold | 225,000 | 37,444,369 | — | 1,110,000 | ||||||||||||
Prepaid expenses | 42,426 | 264,098 | 60,317 | 42,422 | ||||||||||||
|
| |||||||||||||||
Total assets | 698,496,715 | 6,489,339,790 | 619,894,792 | 459,256,941 | ||||||||||||
|
| |||||||||||||||
| Liabilities | ||||||||||||||||
Payables: | ||||||||||||||||
Investments purchased | 4,607,259 | 79,277,421 | — | — | ||||||||||||
Income dividends | 1,083,303 | 5,484,995 | 129,630 | 532,827 | ||||||||||||
Capital shares redeemed | 931,646 | 12,890,638 | 1,016,663 | 869,487 | ||||||||||||
Investment advisory fees | 273,087 | 2,212,459 | 165,390 | 183,324 | ||||||||||||
Service and distribution fees | 84,912 | 941,512 | 48,968 | 81,510 | ||||||||||||
Interest expense and fees | 9,385 | 11,755 | — | 2,735 | ||||||||||||
Officer’s and Directors’ fees | 5,516 | 18,699 | 6,382 | 4,470 | ||||||||||||
Other affiliates | 1,365 | 7,948 | 2,687 | 348 | ||||||||||||
Other accrued expenses | 156,250 | 459,255 | 68,918 | 61,965 | ||||||||||||
Variation margin payable on financial futures contracts | 36,640 | 280,808 | — | 233,326 | ||||||||||||
|
| |||||||||||||||
Total accrued liabilities | 7,189,363 | 101,585,490 | 1,438,638 | 1,969,992 | ||||||||||||
|
| |||||||||||||||
| Other Liabilities | ||||||||||||||||
TOB Trust Certificates | 52,625,555 | 178,529,971 | — | 20,010,373 | ||||||||||||
|
| |||||||||||||||
Total liabilities | 59,814,918 | 280,115,461 | 1,438,710 | 21,980,365 | ||||||||||||
|
| |||||||||||||||
Net Assets | $ | 638,681,797 | $ | 6,209,224,329 | $ | 618,456,154 | $ | 437,276,576 | ||||||||
|
| |||||||||||||||
| Net Assets Consist of | ||||||||||||||||
Paid-in capital | $ | 617,480,793 | $ | 5,906,017,224 | $ | 618,213,929 | $ | 419,742,984 | ||||||||
Undistributed net investment income | 500,855 | 1,299,832 | 491,173 | 520,932 | ||||||||||||
Accumulated net realized loss | (19,034,228 | ) | (105,055,261 | ) | (20,496 | ) | (10,180,082 | ) | ||||||||
Net unrealized appreciation (depreciation) | 39,734,377 | 406,962,534 | (228,452 | ) | 27,192,742 | |||||||||||
|
| |||||||||||||||
Net Assets | $ | 638,681,797 | $ | 6,209,224,329 | $ | 618,456,154 | $ | 437,276,576 | ||||||||
|
| |||||||||||||||
1 Investments at cost — unaffiliated | $ | 609,857,446 | $ | 5,527,491,291 | $ | 594,491,883 | $ | 403,239,911 | ||||||||
2 Investments at cost — affiliated | $ | 38,438,476 | $ | 421,366,094 | $ | 9,414,759 | $ | 18,183,164 | ||||||||
| See Notes to Financial Statements. | ||||||
| SEMI-ANNUAL REPORT | DECEMBER 31, 2015 | 43 | ||||
| Statements of Assets and Liabilities (concluded) |
| December 31, 2015 (Unaudited) | BlackRock High Yield Municipal Fund | BlackRock National Municipal Fund | BlackRock Short-Term Municipal Fund | BlackRock New York Municipal Opportunities Fund | ||||||||||||
| Net Asset Value | ||||||||||||||||
| BlackRock | ||||||||||||||||
Net assets | — | $ | 332,918,413 | — | — | |||||||||||
|
| |||||||||||||||
Shares outstanding, $0.10 par value | — | 30,256,968 | — | — | ||||||||||||
|
| |||||||||||||||
Net asset value | — | $ | 11.00 | — | — | |||||||||||
|
| |||||||||||||||
Shares authorized | — | 375 million | — | — | ||||||||||||
|
| |||||||||||||||
| Institutional | ||||||||||||||||
Net assets | $ | 397,140,772 | $ | 2,784,367,333 | $ | 453,086,268 | $ | 122,244,490 | ||||||||
|
| |||||||||||||||
Shares outstanding, $0.10 par value | 41,678,556 | 253,093,081 | 44,764,720 | 10,928,724 | ||||||||||||
|
| |||||||||||||||
Net asset value | $ | 9.53 | $ | 11.00 | $ | 10.12 | $ | 11.19 | ||||||||
|
| |||||||||||||||
Shares authorized | 100 million | 375 Million | 150 million | Unlimited | ||||||||||||
|
| |||||||||||||||
| Service | ||||||||||||||||
Net assets | — | $ | 1,985,928 | — | — | |||||||||||
|
| |||||||||||||||
Shares outstanding, $0.10 par value | — | 180,667 | — | — | ||||||||||||
|
| |||||||||||||||
Net asset value | — | $ | 10.99 | — | — | |||||||||||
|
| |||||||||||||||
Shares authorized | — | 375 million | — | — | ||||||||||||
|
| |||||||||||||||
| Investor A | ||||||||||||||||
Net assets | $ | 183,891,142 | $ | 2,595,106,736 | $ | 92,222,990 | $ | 128,843,077 | ||||||||
|
| |||||||||||||||
Shares outstanding, $0.10 par value | 19,341,431 | 235,735,058 | 9,106,426 | 11,511,746 | ||||||||||||
|
| |||||||||||||||
Net asset value | $ | 9.51 | $ | 11.01 | $ | 10.13 | $ | 11.19 | ||||||||
|
| |||||||||||||||
Shares authorized | 100 million | 375 Million | 150 Million | Unlimited | ||||||||||||
|
| |||||||||||||||
| Investor A1 | ||||||||||||||||
Net assets | — | — | $ | 31,193,199 | $ | 124,578,453 | ||||||||||
|
| |||||||||||||||
Shares outstanding, $0.10 par value | — | — | 3,079,410 | 11,131,408 | ||||||||||||
|
| |||||||||||||||
Net asset value | — | — | $ | 10.13 | $ | 11.19 | ||||||||||
|
| |||||||||||||||
Shares authorized | — | — | 150 Million | Unlimited | ||||||||||||
|
| |||||||||||||||
| Investor B | ||||||||||||||||
Net assets | — | $ | 2,026,441 | — | — | |||||||||||
|
| |||||||||||||||
Shares outstanding, $0.10 par value | — | 184,261 | — | — | ||||||||||||
|
| |||||||||||||||
Net asset value | — | $ | 11.00 | — | — | |||||||||||
|
| |||||||||||||||
Shares authorized | — | 375 million | — | — | ||||||||||||
|
| |||||||||||||||
| Investor C | ||||||||||||||||
Net assets | $ | 57,649,883 | $ | 430,513,414 | $ | 36,701,412 | $ | 53,839,289 | ||||||||
|
| |||||||||||||||
Shares outstanding, $0.10 par value | 6,046,946 | 39,104,778 | 3,696,487 | 4,812,463 | ||||||||||||
|
| |||||||||||||||
Net asset value | $ | 9.53 | $ | 11.01 | $ | 9.93 | $ | 11.19 | ||||||||
|
| |||||||||||||||
Shares authorized | 100 million | 375 Million | 150 Million | Unlimited | ||||||||||||
|
| |||||||||||||||
| Investor C1 | ||||||||||||||||
Net assets | — | $ | 62,306,064 | — | $ | 7,771,267 | ||||||||||
|
| |||||||||||||||
Shares outstanding, $0.10 par value | — | 5,661,894 | — | 694,480 | ||||||||||||
|
| |||||||||||||||
Net asset value | — | $ | 11.00 | — | $ | 11.19 | ||||||||||
|
| |||||||||||||||
Shares authorized | — | 375 Million | — | Unlimited | ||||||||||||
|
| |||||||||||||||
| Class K | ||||||||||||||||
Net assets | — | — | $ | 5,252,285 | — | |||||||||||
|
| |||||||||||||||
Shares outstanding, $0.10 par value | — | — | 519,020 | — | ||||||||||||
|
| |||||||||||||||
Net asset value | — | — | $ | 10.12 | — | |||||||||||
|
| |||||||||||||||
Shares authorized | — | — | 150 million | — | ||||||||||||
|
| |||||||||||||||
| See Notes to Financial Statements. | ||||||
| 44 | SEMI-ANNUAL REPORT | DECEMBER 31, 2015 | ||||
| Statements of Operations |
| Six Months Ended December 31, 2015 (Unaudited) | BlackRock High Yield Municipal Fund | BlackRock National Municipal Fund | BlackRock Short-Term Municipal Fund | BlackRock New York Municipal Opportunities Fund | ||||||||||||
| Investment Income | ||||||||||||||||
Interest | $ | 14,532,790 | $ | 111,564,035 | $ | 2,660,845 | $ | 7,921,188 | ||||||||
Interest — affiliated | 2,220 | 34,689 | 769 | 2 | ||||||||||||
|
| |||||||||||||||
Total income | 14,535,010 | 111,598,724 | 2,661,614 | 7,921,190 | ||||||||||||
|
| |||||||||||||||
| Expenses | ||||||||||||||||
Investment advisory | 1,505,637 | 12,921,134 | 1,039,033 | 1,050,389 | ||||||||||||
Service — Service | — | 2,355 | — | — | ||||||||||||
Service — Investor A | 204,592 | 3,136,976 | 105,976 | 130,569 | ||||||||||||
Service — Investor A1 | — | — | 16,543 | 62,756 | ||||||||||||
Service and distribution — Investor B | — | 8,638 | — | — | ||||||||||||
Service and distribution — Investor C | 273,534 | 2,047,675 | 156,233 | 222,555 | ||||||||||||
Service and distribution — Investor C1 | — | 253,863 | — | 23,346 | ||||||||||||
Transfer agent — BlackRock | — | 64,862 | — | — | ||||||||||||
Transfer agent — Institutional | 69,843 | 1,189,904 | 286,697 | 17,209 | ||||||||||||
Transfer agent — Service | — | 580 | — | — | ||||||||||||
Transfer agent — Investor A | 39,219 | 1,288,381 | 17,055 | 23,768 | ||||||||||||
Transfer agent — Investor A1 | — | — | 8,013 | 29,323 | ||||||||||||
Transfer agent — Investor B | — | 1,773 | — | — | ||||||||||||
Transfer agent — Investor C | 14,556 | 95,342 | 12,761 | 9,076 | ||||||||||||
Transfer agent — Investor C1 | — | 16,099 | — | 1,534 | ||||||||||||
Transfer agent — Class K | — | — | 356 | — | ||||||||||||
Accounting services | 65,412 | 395,232 | 75,992 | 34,960 | ||||||||||||
Professional | 57,408 | 101,660 | 47,196 | 92,828 | ||||||||||||
Registration | 44,274 | 178,741 | 49,215 | 38,599 | ||||||||||||
Custodian | 16,100 | 92,184 | 17,756 | 10,304 | ||||||||||||
Officer and Directors | 15,824 | 47,196 | 16,744 | 14,352 | ||||||||||||
Printing | 10,856 | 41,768 | 14,996 | 24,840 | ||||||||||||
Miscellaneous | 27,897 | 62,362 | 21,550 | 24,472 | ||||||||||||
|
|
|
|
|
|
|
| |||||||||
Total expenses excluding interest expense and fees | 2,345,152 | 21,946,725 | 1,886,116 | 1,810,880 | ||||||||||||
Interest expense and fees1 | 157,583 | 877,628 | — | 67,148 | ||||||||||||
|
|
|
|
|
|
|
| |||||||||
Total expenses | 2,502,735 | 22,824,353 | 1,886,116 | 1,878,028 | ||||||||||||
| Less: | ||||||||||||||||
Fees waived by the Manager | — | (654,966 | ) | (21,549 | ) | (66,147 | ) | |||||||||
Transfer agent fees waived and/or reimbursed — class specific | — | (1,306,109 | ) | (293,838 | ) | (45,058 | ) | |||||||||
|
| |||||||||||||||
Total expenses after fees waived and/or reimbursed | — | 20,863,278 | 1,570,729 | 1,766,823 | ||||||||||||
|
| |||||||||||||||
Net investment income | 12,032,275 | 90,735,446 | 1,090,885 | 6,154,367 | ||||||||||||
|
| |||||||||||||||
| Realized and Unrealized Gain (Loss) | ||||||||||||||||
Net realized gain (loss) from: | ||||||||||||||||
Investments | (535,912 | ) | 8,397,003 | 430,675 | 729,723 | |||||||||||
Financial futures contracts | (254,379 | ) | 954,259 | — | (289,167 | ) | ||||||||||
|
| |||||||||||||||
| (790,291 | ) | 9,351,262 | 430,675 | 440,556 | ||||||||||||
|
| |||||||||||||||
| Net change in unrealized appreciation (depreciation) on: | ||||||||||||||||
Investments | 16,353,987 | 65,443,279 | 216,437 | 10,434,701 | ||||||||||||
Financial futures contracts | (141,589 | ) | 788,087 | — | (501,369 | ) | ||||||||||
|
| |||||||||||||||
| 16,212,398 | 66,231,366 | 216,437 | 9,933,332 | |||||||||||||
|
| |||||||||||||||
Net realized and unrealized gain | 15,422,107 | 75,582,628 | 647,112 | 10,373,888 | ||||||||||||
|
| |||||||||||||||
Net Increase in Net Assets Resulting from Operations | $ | 27,454,382 | $ | 166,318,074 | $ | 1,737,997 | $ | 16,528,255 | ||||||||
|
|
|
|
|
|
|
| |||||||||
1 Related to TOB Trusts. |
| |||||||||||||||
| See Notes to Financial Statements. | ||||||
| SEMI-ANNUAL REPORT | DECEMBER 31, 2015 | 45 | ||||
| Statements of Changes in Net Assets | BlackRock High Yield Municipal Fund |
| Increase (Decrease) in Net Assets: | Six Months Ended December 31, 2015 (Unaudited) | Year Ended 2015 | ||||||
| Operations | ||||||||
Net investment income | $ | 12,032,275 | $ | 22,931,482 | ||||
Net realized gain (loss) | (790,291 | ) | 2,644,892 | |||||
Net change in unrealized appreciation (depreciation) | 16,212,398 | 4,706,150 | ||||||
|
| |||||||
Net increase in net assets resulting from operations | 27,454,382 | 30,282,524 | ||||||
|
| |||||||
| Distributions to Shareholders1 | ||||||||
| From net investment income: | ||||||||
Institutional | (7,735,346 | ) | (14,850,178 | ) | ||||
Investor A | (3,434,663 | ) | (6,262,478 | ) | ||||
Investor C | (944,418 | ) | (1,749,511 | ) | ||||
|
| |||||||
Decrease in net assets resulting from distributions to shareholders | (12,114,427 | ) | (22,862,167 | ) | ||||
|
| |||||||
| Capital Share Transactions | ||||||||
Net increase in net assets derived from capital share transactions | 85,332,391 | 74,564,728 | ||||||
|
| |||||||
| Net Assets | ||||||||
Total increase in net assets | 100,672,346 | 81,985,085 | ||||||
Beginning of period | 538,009,451 | 456,024,366 | ||||||
|
| |||||||
End of period | $ | 638,681,797 | $ | 538,009,451 | ||||
|
| |||||||
Undistributed net investment income, end of period | $ | 500,855 | $ | 583,007 | ||||
|
| |||||||
1 Distributions for annual periods determined in accordance with federal income tax regulations. |
| |||||||
| See Notes to Financial Statements. | ||||||
| 46 | SEMI-ANNUAL REPORT | DECEMBER 31, 2015 | ||||
| Statements of Changes in Net Assets | BlackRock National Municipal Fund |
| Increase (Decrease) in Net Assets: | Six Months Ended 2015 (Unaudited) | Year Ended June 30, 2015 | ||||||
| Operations | ||||||||
Net investment income | $ | 90,735,446 | $ | 163,831,248 | ||||
Net realized gain | 9,351,262 | 9,204,623 | ||||||
Net change in unrealized appreciation (depreciation) | 66,231,366 | (21,569,007 | ) | |||||
|
| |||||||
Net increase in net assets resulting from operations | 166,318,074 | 151,466,864 | ||||||
|
| |||||||
| Distributions to Shareholders1 | ||||||||
| From net investment income: | ||||||||
BlackRock | (5,720,421 | ) | (12,645,467 | ) | ||||
Institutional | (39,935,293 | ) | (67,573,453 | ) | ||||
Service | (28,947 | ) | (40,889 | ) | ||||
Investor A | (39,178,049 | ) | (71,446,493 | ) | ||||
Investor B | (30,239 | ) | (94,965 | ) | ||||
Investor C | (4,864,910 | ) | (10,084,877 | ) | ||||
Investor C1 | (814,559 | ) | (1,877,415 | ) | ||||
|
| |||||||
Decrease in net assets resulting from distributions to shareholders | (90,572,418 | ) | (163,763,559 | ) | ||||
|
| |||||||
| Capital Share Transactions | ||||||||
Net increase in net assets derived from capital share transactions | 848,805,926 | 676,849,248 | ||||||
|
| |||||||
| Net Assets | ||||||||
Total increase in net assets | 924,551,582 | 664,552,553 | ||||||
Beginning of period | 5,284,672,747 | 4,620,120,194 | ||||||
|
| |||||||
End of period | $ | 6,209,224,329 | $ | 5,284,672,747 | ||||
|
| |||||||
Undistributed net investment income, end of period | $ | 1,299,832 | $ | 1,136,804 | ||||
|
| |||||||
1 Distributions for annual periods determined in accordance with federal income tax regulations. |
| |||||||
| See Notes to Financial Statements. | ||||||
| SEMI-ANNUAL REPORT | DECEMBER 31, 2015 | 47 | ||||
| Statements of Changes in Net Assets | BlackRock Short-Term Municipal Fund |
| Increase (Decrease) in Net Assets: | Six Months Ended (Unaudited) | Year Ended 2015 | ||||||
| Operations | ||||||||
Net investment income | $ | 1,090,885 | $ | 2,408,170 | ||||
Net realized gain | 430,675 | 1,378,395 | ||||||
Net change in unrealized appreciation (depreciation) | 216,437 | (4,835,171 | ) | |||||
|
| |||||||
Net increase (decrease) in net assets resulting from operations | 1,737,997 | (1,048,606 | ) | |||||
|
| |||||||
| Distributions to Shareholders1 | ||||||||
| From net investment income: | ||||||||
Institutional | (974,826 | ) | (2,172,738 | ) | ||||
Investor A | (52,563 | ) | (108,894 | ) | ||||
Investor A1 | (48,194 | ) | (93,162 | ) | ||||
Class K | (13,327 | ) | (33,376 | ) | ||||
| From net realized gain: | ||||||||
Institutional | (26,930 | ) | — | |||||
Investor A | (4,825 | ) | — | |||||
Investor A1 | (1,931 | ) | — | |||||
Investor C | (1,931 | ) | — | |||||
Class K | (398 | ) | — | |||||
|
| |||||||
Decrease in net assets resulting from distributions to shareholders | (1,124,925 | ) | (2,408,170 | ) | ||||
|
| |||||||
| Capital Share Transactions | ||||||||
Net decrease in net assets from capital share transactions | (46,984,886 | ) | (173,658,416 | ) | ||||
|
| |||||||
| Net Assets | ||||||||
Total decrease in net assets | (46,371,814 | ) | (177,115,192 | ) | ||||
Beginning of period | 664,827,968 | 841,943,160 | ||||||
|
| |||||||
End of period | $ | 618,456,154 | $ | 664,827,968 | ||||
|
| |||||||
Undistributed net investment income, end of period | $ | 491,173 | $ | 489,198 | ||||
|
| |||||||
1 Distributions for annual periods determined in accordance with federal income tax regulations. |
| |||||||
| See Notes to Financial Statements. | ||||||
| 48 | SEMI-ANNUAL REPORT | DECEMBER 31, 2015 | ||||
| Statements of Changes in Net Assets | BlackRock New York Municipal Opportunities Fund |
| Increase (Decrease) in Net Assets: | Six Months Ended December 31, 2015 (Unaudited) | Year Ended 2015 | ||||||
| Operations | ||||||||
Net investment income | $ | 6,154,367 | $ | 10,346,967 | ||||
Net realized gain | 440,556 | 506,451 | ||||||
Net change in unrealized appreciation (depreciation) | 9,933,332 | 1,339,685 | ||||||
|
| |||||||
Net increase in net assets resulting from operations | 16,528,255 | 12,193,103 | ||||||
|
| |||||||
| Distributions to Shareholders1 | ||||||||
| From net investment income: | ||||||||
Institutional | (1,725,550 | ) | (2,226,972 | ) | ||||
Investor A | (1,678,231 | ) | (2,244,869 | ) | ||||
Investor A1 | (2,082,946 | ) | (4,708,256 | ) | ||||
Investor C | (548,460 | ) | (885,991 | ) | ||||
Investor C1 | (109,956 | ) | (257,312 | ) | ||||
|
| |||||||
Decrease in net assets resulting from distributions to shareholders | (6,145,143 | ) | (10,323,400 | ) | ||||
|
| |||||||
| Capital Share Transactions | ||||||||
Net increase in net assets derived from capital share transactions | 93,862,223 | 81,694,684 | ||||||
|
| |||||||
| Net Assets | ||||||||
Total increase in net assets | 104,245,335 | 83,564,387 | ||||||
Beginning of period | 333,031,241 | 249,466,854 | ||||||
|
| |||||||
End of period | $ | 437,276,576 | $ | 333,031,241 | ||||
|
| |||||||
Undistributed net investment income, end of period | $ | 520,932 | $ | 511,708 | ||||
|
| |||||||
1 Distributions for annual periods determined in accordance with federal income tax regulations. |
| |||||||
| See Notes to Financial Statements. | ||||||
| SEMI-ANNUAL REPORT | DECEMBER 31, 2015 | 49 | ||||
| Financial Highlights | BlackRock High Yield Municipal Fund |
| Institutional | ||||||||||||||||||||||||
| Six Months Ended December 31, 2015 (Unaudited) | Year Ended June 30, | |||||||||||||||||||||||
| 2015 | 2014 | 2013 | 2012 | 2011 | ||||||||||||||||||||
| Per Share Operating Performance | ||||||||||||||||||||||||
Net asset value, beginning of period | $ | 9.28 | $ | 9.12 | $ | 8.86 | $ | 9.26 | $ | 8.35 | $ | 8.47 | ||||||||||||
|
| |||||||||||||||||||||||
Net investment income1 | 0.21 | 0.41 | 0.44 | 0.44 | 0.46 | 0.46 | ||||||||||||||||||
Net realized and unrealized gain (loss) | 0.25 | 0.16 | 0.26 | (0.40 | ) | 0.90 | (0.13 | ) | ||||||||||||||||
|
| |||||||||||||||||||||||
Net increase from investment operations | 0.46 | 0.57 | 0.70 | 0.04 | 1.36 | 0.33 | ||||||||||||||||||
|
| |||||||||||||||||||||||
Distributions from net investment income2 | (0.21 | ) | (0.41 | ) | (0.44 | ) | (0.44 | ) | (0.45 | ) | (0.45 | ) | ||||||||||||
|
| |||||||||||||||||||||||
Net asset value, end of period | $ | 9.53 | $ | 9.28 | $ | 9.12 | $ | 8.86 | $ | 9.26 | $ | 8.35 | ||||||||||||
|
| |||||||||||||||||||||||
| Total Return3 | ||||||||||||||||||||||||
Based on net asset value | 5.01% | 4 | 6.27% | 8.31% | 0.17% | 16.72% | 4.14% | |||||||||||||||||
|
| |||||||||||||||||||||||
| Ratios to Average Net Assets | ||||||||||||||||||||||||
Total expenses | 0.71% | 5 | 0.70% | 0.76% | 6 | 0.76% | 0.79% | 0.78% | ||||||||||||||||
|
| |||||||||||||||||||||||
Total expenses after fees waived and paid indirectly | 0.71% | 5 | 0.70% | 0.76% | 6 | 0.76% | 0.79% | 0.78% | ||||||||||||||||
|
| |||||||||||||||||||||||
Total expenses after fees waived and excluding interest expense and fees7 | 0.66% | 5 | 0.66% | 0.69% | 6 | 0.66% | 0.70% | 0.72% | ||||||||||||||||
|
| |||||||||||||||||||||||
Net investment income | 4.44% | 5 | 4.37% | 5.02% | 4.63% | 5.18% | 5.49% | |||||||||||||||||
|
| |||||||||||||||||||||||
| Supplemental Data | ||||||||||||||||||||||||
Net assets, end of period (000) | $ | 397,141 | $ | 327,422 | $ | 242,949 | $ | 198,416 | $ | 176,895 | $ | 111,669 | ||||||||||||
|
| |||||||||||||||||||||||
Borrowings outstanding, end of period (000) | $ | 52,626 | $ | 26,216 | $ | 28,976 | $ | 46,417 | $ | 33,861 | $ | 16,039 | ||||||||||||
|
| |||||||||||||||||||||||
Portfolio turnover rate | 10% | 41% | 40% | 21% | 17% | 31% | ||||||||||||||||||
|
| |||||||||||||||||||||||
| 1 | Based on average shares outstanding. |
| 2 | Distributions for annual periods determined in accordance with federal income tax regulations. |
| 3 | Where applicable, assumes the reinvestment of distributions. |
| 4 | Aggregate total return. |
| 5 | Annualized. |
| 6 | Does not include expenses incurred indirectly as a result of investments in underlying funds of approximately 0.01%. |
| 7 | Interest expense and fees relate to TOB Trusts. See Note 4 of the Notes to Financial Statements for details. |
| See Notes to Financial Statements. | ||||||
| 50 | SEMI-ANNUAL REPORT | DECEMBER 31, 2015 | ||||
| Financial Highlights (continued) | BlackRock High Yield Municipal Fund |
| Investor A | ||||||||||||||||||||||||
| Six Months Ended December 31, 2015 (Unaudited) | Year Ended June 30, | |||||||||||||||||||||||
| 2015 | 2014 | 2013 | 2012 | 2011 | ||||||||||||||||||||
| Per Share Operating Performance | ||||||||||||||||||||||||
Net asset value, beginning of period | $ | 9.26 | $ | 9.10 | $ | 8.84 | $ | 9.24 | $ | 8.33 | $ | 8.46 | ||||||||||||
|
| |||||||||||||||||||||||
Net investment income1 | 0.20 | 0.38 | 0.41 | 0.42 | 0.43 | 0.43 | ||||||||||||||||||
Net realized and unrealized gain (loss) | 0.25 | 0.16 | 0.26 | (0.41 | ) | 0.91 | (0.13 | ) | ||||||||||||||||
|
| |||||||||||||||||||||||
Net increase from investment operations | 0.45 | 0.54 | 0.67 | 0.01 | 1.34 | 0.30 | ||||||||||||||||||
|
| |||||||||||||||||||||||
Distributions from net investment income:2 | (0.20 | ) | (0.38 | ) | (0.41 | ) | (0.41 | ) | (0.43 | ) | (0.43 | ) | ||||||||||||
|
| |||||||||||||||||||||||
Net asset value, end of period | $ | 9.51 | $ | 9.26 | $ | 9.10 | $ | 8.84 | $ | 9.24 | $ | 8.33 | ||||||||||||
|
| |||||||||||||||||||||||
| Total Return3 | ||||||||||||||||||||||||
Based on net asset value | 4.88% | 4 | 6.00% | 8.05% | (0.09)% | 16.44% | 3.73% | |||||||||||||||||
|
| |||||||||||||||||||||||
| Ratios to Average Net Assets | ||||||||||||||||||||||||
Total expenses | 0.97% | 5 | 0.97% | 1.01% | 6 | 1.01% | 1.06% | 1.05% | ||||||||||||||||
|
| |||||||||||||||||||||||
Total expenses after fees waived and paid indirectly | 0.97% | 5 | 0.97% | 1.01% | 6 | 1.01% | 1.06% | 1.05% | ||||||||||||||||
|
| |||||||||||||||||||||||
Total expenses after fees waived and excluding interest expense and fees7 | 0.92% | 5 | 0.93% | 0.94% | 6 | 0.91% | 0.97% | 0.99% | ||||||||||||||||
|
| |||||||||||||||||||||||
Net investment income | 4.18% | 5 | 4.11% | 4.80% | 4.38% | 4.85% | 5.21% | |||||||||||||||||
|
| |||||||||||||||||||||||
| Supplemental Data | ||||||||||||||||||||||||
Net assets, end of period (000) | $ | 183,891 | $ | 156,348 | $ | 161,218 | $ | 104,693 | $ | 83,840 | $ | 27,993 | ||||||||||||
|
| |||||||||||||||||||||||
Borrowings outstanding, end of period (000) | $ | 52,626 | $ | 26,216 | $ | 28,976 | $ | 46,417 | $ | 33,861 | $ | 16,039 | ||||||||||||
|
| |||||||||||||||||||||||
Portfolio turnover rate | 10% | 41% | 40% | 21% | 17% | 31% | ||||||||||||||||||
|
| |||||||||||||||||||||||
| 1 | Based on average shares outstanding. |
| 2 | Distributions for annual periods determined in accordance with federal income tax regulations. |
| 3 | Where applicable, excludes the effects of any sales charges and assumes the reinvestment of distributions. |
| 4 | Aggregate total return. |
| 5 | Annualized. |
| 6 | Does not include expenses incurred indirectly as a result of investments in underlying funds of approximately 0.01%. |
| 7 | Interest expense and fees relate to TOB Trusts. See Note 4 of the Notes to Financial Statements for details. |
| See Notes to Financial Statements. | ||||||
| SEMI-ANNUAL REPORT | DECEMBER 31, 2015 | 51 | ||||
| Financial Highlights (concluded) | BlackRock High Yield Municipal Fund |
| Investor C | ||||||||||||||||||||||||
| Six Months Ended December 31, 2015 (Unaudited) | Year Ended June 30, | |||||||||||||||||||||||
| 2015 | 2014 | 2013 | 2012 | 2011 | ||||||||||||||||||||
| Per Share Operating Performance | ||||||||||||||||||||||||
Net asset value, beginning of period | $ | 9.28 | $ | 9.12 | $ | 8.87 | $ | 9.27 | $ | 8.35 | $ | 8.47 | ||||||||||||
|
| |||||||||||||||||||||||
Net investment income1 | 0.16 | 0.31 | 0.35 | 0.34 | 0.36 | 0.37 | ||||||||||||||||||
Net realized and unrealized gain (loss) | 0.25 | 0.16 | 0.25 | (0.40 | ) | 0.92 | (0.12 | ) | ||||||||||||||||
|
| |||||||||||||||||||||||
Net increase (decrease) from investment operations | 0.41 | 0.47 | 0.60 | (0.06 | ) | 1.28 | 0.25 | |||||||||||||||||
|
| |||||||||||||||||||||||
Distributions from net investment income:2 | (0.16 | ) | (0.31 | ) | (0.35 | ) | (0.34 | ) | (0.36 | ) | (0.37 | ) | ||||||||||||
|
| |||||||||||||||||||||||
Net asset value, end of period | $ | 9.53 | $ | 9.28 | $ | 9.12 | $ | 8.87 | $ | 9.27 | $ | 8.35 | ||||||||||||
|
| |||||||||||||||||||||||
| Total Return3 | ||||||||||||||||||||||||
Based on net asset value | 4.48% | 4 | 5.20% | 7.11% | (0.84)% | 15.65% | 3.07% | |||||||||||||||||
|
| |||||||||||||||||||||||
| Ratios to Average Net Assets | ||||||||||||||||||||||||
Total expenses | 1.73% | 5 | 1.72% | 1.78% | 6 | 1.78% | 1.82% | 1.82% | ||||||||||||||||
|
| |||||||||||||||||||||||
Total expenses after fees waived and paid indirectly | 1.73% | 5 | 1.72% | 1.78% | 6 | 1.78% | 1.82% | 1.82% | ||||||||||||||||
|
| |||||||||||||||||||||||
Total expenses after fees waived and excluding interest expense and fees7 | 1.67% | 5 | 1.68% | 1.70% | 6 | 1.68% | 1.73% | 1.77% | ||||||||||||||||
|
| |||||||||||||||||||||||
Net investment income | 3.42% | 5 | 3.36% | 4.08% | 3.62% | 4.12% | 4.45% | |||||||||||||||||
|
| |||||||||||||||||||||||
| Supplemental Data | ||||||||||||||||||||||||
Net assets, end of period (000) | $ | 57,650 | $ | 54,239 | $ | 51,858 | $ | 50,647 | $ | 36,987 | $ | 17,945 | ||||||||||||
|
| |||||||||||||||||||||||
Borrowings outstanding, end of period (000) | $ | 52,626 | $ | 26,216 | $ | 28,976 | $ | 46,417 | $ | 33,861 | $ | 16,039 | ||||||||||||
|
| |||||||||||||||||||||||
Portfolio turnover rate | 10% | 41% | 40% | 21% | 17% | 31% | ||||||||||||||||||
|
| |||||||||||||||||||||||
| 1 | Based on average shares outstanding. |
| 2 | Distributions for annual periods determined in accordance with federal income tax regulations. |
| 3 | Where applicable, excludes the effects of any sales charges and assumes the reinvestment of distributions. |
| 4 | Aggregate total return. |
| 5 | Annualized. |
| 6 | Does not include expenses incurred indirectly as a result of investments in underlying funds of approximately 0.01%. |
| 7 | Interest expense and fees relate to TOB Trusts. See Note 4 of the Notes to Financial Statements for details. |
| See Notes to Financial Statements. | ||||||
| 52 | SEMI-ANNUAL REPORT | DECEMBER 31, 2015 | ||||
| Financial Highlights | BlackRock National Municipal Fund |
| BlackRock | ||||||||||||||||||||||
Six Months Ended (Unaudited) | Year Ended June 30, | Period to June 30, | ||||||||||||||||||||
| 2015 | 2014 | 2013 | ||||||||||||||||||||
| Per Share Operating Performance | ||||||||||||||||||||||
Net asset value, beginning of period | $ | 10.87 | $ | 10.88 | $ | 10.56 | $ | 10.91 | $ | 10.11 | ||||||||||||
|
| |||||||||||||||||||||
Net investment income2 | 0.19 | 0.39 | 0.43 | 0.41 | 0.45 | |||||||||||||||||
Net realized and unrealized gain (loss) | 0.13 | (0.01 | ) | 0.32 | (0.34 | ) | 0.79 | |||||||||||||||
|
| |||||||||||||||||||||
Net increase from investment operations | 0.32 | 0.38 | 0.75 | 0.07 | 1.24 | |||||||||||||||||
|
| |||||||||||||||||||||
Distributions from net investment income3 | (0.19 | ) | (0.39 | ) | (0.43 | ) | (0.42 | ) | (0.44 | ) | ||||||||||||
|
| |||||||||||||||||||||
Net asset value, end of period | $ | 11.00 | $ | 10.87 | $ | 10.88 | $ | 10.56 | $ | 10.91 | ||||||||||||
|
| |||||||||||||||||||||
| Total Return4 | ||||||||||||||||||||||
Based on net asset value | 2.93% | 5 | 3.53% | 7.30% | 0.47% | 12.48% | 5 | |||||||||||||||
|
| |||||||||||||||||||||
| Ratios to Average Net Assets | ||||||||||||||||||||||
Total expenses | 0.55% | 6 | 0.58% | 0.61% | 0.61% | 0.62% | 6 | |||||||||||||||
|
| |||||||||||||||||||||
Total expenses after fees waived and/or reimbursed and paid indirectly | 0.49% | 6 | 0.49% | 0.52% | 0.52% | 0.54% | 6 | |||||||||||||||
|
| |||||||||||||||||||||
Total expenses after fees waived and/or reimbursed and paid indirectly and excluding interest expense and fees and reorganization costs7 | 0.46% | 6 | 0.46% | 0.46% | 0.46% | 0.46% | 6 | |||||||||||||||
|
| |||||||||||||||||||||
Net investment income | 3.40% | 6 | 3.56% | 4.09% | 3.69% | 4.41% | 6 | |||||||||||||||
|
| |||||||||||||||||||||
| Supplemental Data | ||||||||||||||||||||||
Net assets, end of period (000) | $ | 332,918 | $ | 341,071 | $ | 366,179 | $ | 401,538 | $ | 446,620 | ||||||||||||
|
| |||||||||||||||||||||
Borrowings outstanding, end of period (000) | $ | 178,530 | $ | 275,550 | $ | 286,095 | $ | 489,432 | $ | 468,586 | ||||||||||||
|
| |||||||||||||||||||||
Portfolio turnover rate | 31% | 28% | 35% | 37% | 39% | |||||||||||||||||
|
| |||||||||||||||||||||
| 1 | Commencement of operations. |
| 2 | Based on average shares outstanding. |
| 3 | Distributions for annual periods determined in accordance with federal income tax regulations. |
| 4 | Where applicable, assumes the reinvestment of distributions. |
| 5 | Aggregate total return. |
| 6 | Annualized. |
| 7 | Interest expense and fees relate to TOB Trusts. See Note 4 of the Notes to Financial Statements for details. |
| See Notes to Financial Statements. | ||||||
| SEMI-ANNUAL REPORT | DECEMBER 31, 2015 | 53 | ||||
| Financial Highlights (continued) | BlackRock National Municipal Fund |
| Institutional | ||||||||||||||||||||||||
| Six Months Ended December 31, 2015 (Unaudited) | Year Ended June 30, | |||||||||||||||||||||||
| 2015 | 2014 | 2013 | 2012 | 2011 | ||||||||||||||||||||
| Per Share Operating Performance | ||||||||||||||||||||||||
Net asset value, beginning of period | $ | 10.86 | $ | 10.88 | $ | 10.56 | $ | 10.91 | $ | 10.05 | $ | 10.19 | ||||||||||||
|
| |||||||||||||||||||||||
Net investment income1 | 0.18 | 0.38 | 0.42 | 0.40 | 0.46 | 0.49 | ||||||||||||||||||
Net realized and unrealized gain (loss) | 0.14 | (0.02 | ) | 0.32 | (0.35 | ) | 0.85 | (0.14 | ) | |||||||||||||||
|
| |||||||||||||||||||||||
Net increase from investment operations | 0.32 | 0.36 | 0.74 | 0.05 | 1.31 | 0.35 | ||||||||||||||||||
|
| |||||||||||||||||||||||
Distributions from net investment income2 | (0.18 | ) | (0.38 | ) | (0.42 | ) | (0.40 | ) | (0.45 | ) | (0.49 | ) | ||||||||||||
|
| |||||||||||||||||||||||
Net asset value, end of period | $ | 11.00 | $ | 10.86 | $ | 10.88 | $ | 10.56 | $ | 10.91 | $ | 10.05 | ||||||||||||
|
| |||||||||||||||||||||||
| Total Return3 | ||||||||||||||||||||||||
Based on net asset value | 2.98% | 4 | 3.33% | 7.19% | 0.37% | 13.28% | 3.49% | |||||||||||||||||
|
| |||||||||||||||||||||||
| Ratios to Average Net Assets | ||||||||||||||||||||||||
Total expenses | 0.61% | 5 | 0.64% | 0.68% | 0.68% | 0.69% | 0.69% | |||||||||||||||||
|
| |||||||||||||||||||||||
Total expenses after fees waived and/or reimbursed and paid indirectly | 0.59% | 5 | 0.59% | 0.63% | 0.62% | 0.65% | 0.69% | |||||||||||||||||
|
| |||||||||||||||||||||||
Total expenses after fees waived and/or reimbursed and paid indirectly and excluding interest expense and fees and reorganization costs6 | 0.56% | 5 | 0.55% | 0.57% | 0.56% | 0.57% | 0.60% | |||||||||||||||||
|
| |||||||||||||||||||||||
Net investment income | 3.29% | 5 | 3.47% | 3.98% | 3.59% | 4.31% | 4.83% | |||||||||||||||||
|
| |||||||||||||||||||||||
| Supplemental Data | ||||||||||||||||||||||||
Net assets, end of period (000) | $ | 2,784,367 | $ | 2,088,580 | $ | 1,796,660 | $ | 2,029,739 | $ | 2,037,090 | $ | 1,207,501 | ||||||||||||
|
| |||||||||||||||||||||||
Borrowings outstanding, end of period (000) | $ | 178,530 | $ | 275,550 | $ | 286,095 | $ | 489,432 | $ | 468,586 | $ | 321,402 | ||||||||||||
|
| |||||||||||||||||||||||
Portfolio turnover rate | 31% | 28% | 35% | 37% | 39% | 51% | ||||||||||||||||||
|
| |||||||||||||||||||||||
| 1 | Based on average shares outstanding. |
| 2 | Distributions for annual periods determined in accordance with federal income tax regulations. |
| 3 | Where applicable, assumes the reinvestment of distributions. |
| 4 | Aggregate total return. |
| 5 | Annualized. |
| 6 | Interest expense and fees relate to TOB Trusts. See Note 4 of the Notes to Financial Statements for details. |
| See Notes to Financial Statements. | ||||||
| 54 | SEMI-ANNUAL REPORT | DECEMBER 31, 2015 | ||||
| Financial Highlights (continued) | BlackRock National Municipal Fund |
| Service | ||||||||||||||||||||||
Six Months Ended 2015 (Unaudited) | Year Ended June 30, | Period July 18, 20111 to June 30, 2012 | ||||||||||||||||||||
| 2015 | 2014 | 2013 | ||||||||||||||||||||
| Per Share Operating Performance | ||||||||||||||||||||||
Net asset value, beginning of period | $ | 10.85 | $ | 10.86 | $ | 10.55 | $ | 10.90 | $ | 10.11 | ||||||||||||
|
| |||||||||||||||||||||
Net investment income2 | 0.19 | 0.38 | 0.43 | 0.38 | 0.42 | |||||||||||||||||
Net realized and unrealized gain (loss) | 0.12 | (0.03 | ) | 0.27 | (0.37 | ) | 0.77 | |||||||||||||||
|
| |||||||||||||||||||||
Net increase from investment operations | 0.31 | 0.35 | 0.70 | 0.01 | 1.19 | |||||||||||||||||
|
| |||||||||||||||||||||
Distributions from net investment income3 | (0.17 | ) | (0.36 | ) | (0.39 | ) | (0.36 | ) | (0.40 | ) | ||||||||||||
|
| |||||||||||||||||||||
Net asset value, end of period | $ | 10.99 | $ | 10.85 | $ | 10.86 | $ | 10.55 | $ | 10.90 | ||||||||||||
|
| |||||||||||||||||||||
| Total Return4 | ||||||||||||||||||||||
Based on net asset value | 2.87% | 5 | 3.23% | 6.85% | (0.05)% | 11.97% | 5 | |||||||||||||||
|
| |||||||||||||||||||||
| Ratios to Average Net Assets | ||||||||||||||||||||||
Total expenses | 0.83% | 6 | 0.82% | 0.90% | 1.09% | 0.91% | 6 | |||||||||||||||
|
| |||||||||||||||||||||
Total expenses after fees waived and/or reimbursed and paid indirectly | 0.80% | 6 | 0.77% | 0.85% | 1.04% | 0.86% | 6 | |||||||||||||||
|
| |||||||||||||||||||||
Total expenses after fees waived and/or reimbursed and paid indirectly and excluding interest expense and fees and reorganization costs7 | 0.77% | 6 | 0.74% | 0.79% | 0.97% | 0.78% | 6 | |||||||||||||||
|
| |||||||||||||||||||||
Net investment income | 3.08% | 6 | 3.52% | 4.04% | 3.42% | 4.11% | 6 | |||||||||||||||
|
| |||||||||||||||||||||
| Supplemental Data | ||||||||||||||||||||||
Net assets, end of period (000) | $ | 1,986 | $ | 1,739 | $ | 1,089 | $ | 1,171 | $ | 1,214 | ||||||||||||
|
| |||||||||||||||||||||
Borrowings outstanding, end of period (000) | $ | 178,530 | $ | 275,550 | $ | 286,095 | $ | 489,432 | $ | 468,586 | ||||||||||||
|
| |||||||||||||||||||||
Portfolio turnover rate | 31% | 28% | 35% | 37% | 39% | |||||||||||||||||
|
| |||||||||||||||||||||
| 1 | Commencement of operations. |
| 2 | Based on average shares outstanding. |
| 3 | Distributions for annual periods determined in accordance with federal income tax regulations. |
| 4 | Where applicable, assumes the reinvestment of distributions. |
| 5 | Aggregate total return. |
| 6 | Annualized. |
| 7 | Interest expense and fees relate to TOB Trusts. See Note 4 of the Notes to Financial Statements for details. |
| See Notes to Financial Statements. | ||||||
| SEMI-ANNUAL REPORT | DECEMBER 31, 2015 | 55 | ||||
| Financial Highlights (continued) | BlackRock National Municipal Fund |
| Investor A | ||||||||||||||||||||||||
| Six Months Ended December 31, 2015 (Unaudited) | Year Ended June 30, | |||||||||||||||||||||||
| 2015 | 2014 | 2013 | 2012 | 2011 | ||||||||||||||||||||
| Per Share Operating Performance | ||||||||||||||||||||||||
Net asset value, beginning of period | $ | 10.87 | $ | 10.88 | $ | 10.57 | $ | 10.92 | $ | 10.06 | $ | 10.19 | ||||||||||||
|
| |||||||||||||||||||||||
Net investment income1 | 0.17 | 0.36 | 0.40 | 0.38 | 0.44 | 0.46 | ||||||||||||||||||
Net realized and unrealized gain (loss) | 0.14 | (0.01 | ) | 0.31 | (0.34 | ) | 0.85 | (0.13 | ) | |||||||||||||||
|
| |||||||||||||||||||||||
Net increase from investment operations | 0.31 | 0.35 | 0.71 | 0.04 | 1.29 | 0.33 | ||||||||||||||||||
|
| |||||||||||||||||||||||
Distributions from net investment income2 | (0.17 | ) | (0.36 | ) | (0.40 | ) | (0.39 | ) | (0.43 | ) | (0.46 | ) | ||||||||||||
|
| |||||||||||||||||||||||
Net asset value, end of period | $ | 11.01 | $ | 10.87 | $ | 10.88 | $ | 10.57 | $ | 10.92 | $ | 10.06 | ||||||||||||
|
| |||||||||||||||||||||||
| Total Return3 | ||||||||||||||||||||||||
Based on net asset value | 2.89% | 4 | 3.26% | 6.93% | 0.21% | 13.10% | 3.36% | |||||||||||||||||
|
| |||||||||||||||||||||||
| Ratios to Average Net Assets | ||||||||||||||||||||||||
Total expenses | 0.87% | 5 | 0.90% | 0.90% | 0.92% | 0.91% | 0.92% | |||||||||||||||||
|
| |||||||||||||||||||||||
Total expenses after fees waived and/or reimbursed and paid indirectly | 0.75% | 5 | 0.75% | 0.78% | 0.78% | 0.80% | 0.92% | |||||||||||||||||
|
| |||||||||||||||||||||||
Total expenses after fees waived and/or reimbursed and paid indirectly and excluding interest expense and fees and reorganization costs6 | 0.72% | 5 | 0.72% | 0.72% | 0.72% | 0.72% | 0.83% | |||||||||||||||||
|
| |||||||||||||||||||||||
Net investment income | 3.14% | 5 | 3.30% | 3.81% | 3.42% | 4.15% | 4.60% | |||||||||||||||||
|
| |||||||||||||||||||||||
| Supplemental Data | ||||||||||||||||||||||||
Net assets, end of period (000) | $ | 2,595,107 | $ | 2,388,743 | $ | 1,990,729 | $ | 1,791,782 | $ | 1,688,258 | $ | 855,849 | ||||||||||||
|
| |||||||||||||||||||||||
Borrowings outstanding, end of period (000) | $ | 178,530 | $ | 275,550 | $ | 286,095 | $ | 489,432 | $ | 468,586 | $ | 321,402 | ||||||||||||
|
| |||||||||||||||||||||||
Portfolio turnover rate | 31% | 28% | 35% | 37% | 39% | 51% | ||||||||||||||||||
|
| |||||||||||||||||||||||
| 1 | Based on average shares outstanding. |
| 2 | Distributions for annual periods determined in accordance with federal income tax regulations. |
| 3 | Where applicable, excludes the effects of any sales charges and assumes the reinvestment of distributions. |
| 4 | Aggregate total return. |
| 5 | Annualized. |
| 6 | Interest expense and fees relate to TOB Trusts. See Note 4 of the Notes to Financial Statements for details. |
| See Notes to Financial Statements. | ||||||
| 56 | SEMI-ANNUAL REPORT | DECEMBER 31, 2015 | ||||
| Financial Highlights (continued) | BlackRock National Municipal Fund |
| Investor B | ||||||||||||||||||||||||
| Six Months Ended December 31, 2015 (Unaudited) | Year Ended June 30, | |||||||||||||||||||||||
| 2015 | 2014 | 2013 | 2012 | 2011 | ||||||||||||||||||||
| Per Share Operating Performance | ||||||||||||||||||||||||
Net asset value, beginning of period | $ | 10.86 | $ | 10.87 | $ | 10.56 | $ | 10.91 | $ | 10.05 | $ | 10.18 | ||||||||||||
|
| |||||||||||||||||||||||
Net investment income1 | 0.16 | 0.32 | 0.36 | 0.33 | 0.39 | 0.41 | ||||||||||||||||||
Net realized and unrealized gain (loss) | 0.12 | (0.02 | ) | 0.30 | (0.35 | ) | 0.85 | (0.12 | ) | |||||||||||||||
|
| |||||||||||||||||||||||
Net increase from investment operations | 0.28 | 0.30 | 0.66 | (0.02 | ) | 1.24 | 0.29 | |||||||||||||||||
|
| |||||||||||||||||||||||
Distributions from net investment income2 | (0.14 | ) | (0.31 | ) | (0.35 | ) | (0.33 | ) | (0.38 | ) | (0.42 | ) | ||||||||||||
|
| |||||||||||||||||||||||
Net asset value, end of period | $ | 11.00 | $ | 10.86 | $ | 10.87 | $ | 10.56 | $ | 10.91 | $ | 10.05 | ||||||||||||
|
| |||||||||||||||||||||||
| Total Return3 | ||||||||||||||||||||||||
Based on net asset value | 2.63% | 4 | 2.73% | 6.41% | (0.30)% | 12.56% | 2.89% | |||||||||||||||||
|
| |||||||||||||||||||||||
| Ratios to Average Net Assets | ||||||||||||||||||||||||
Total expenses | 1.42% | 5 | 1.40% | 1.40% | 1.41% | 1.44% | 1.44% | |||||||||||||||||
|
| |||||||||||||||||||||||
Total expenses after fees waived and/or reimbursed and paid indirectly | 1.26% | 5 | 1.26% | 1.28% | 1.29% | 1.30% | 1.38% | |||||||||||||||||
|
| |||||||||||||||||||||||
Total expenses after fees waived and/or reimbursed and paid indirectly and excluding interest expense and fees and reorganization costs6 | 1.23% | 5 | 1.23% | 1.22% | 1.23% | 1.22% | 1.30% | |||||||||||||||||
|
| |||||||||||||||||||||||
Net investment income | 2.63% | 5 | 2.87% | 3.38% | 2.96% | 3.69% | 4.10% | |||||||||||||||||
|
| |||||||||||||||||||||||
| Supplemental Data | ||||||||||||||||||||||||
Net assets, end of period (000) | $ | 2,026 | $ | 2,546 | $ | 4,705 | $ | 10,260 | $ | 27,169 | $ | 30,346 | ||||||||||||
|
| |||||||||||||||||||||||
Borrowings outstanding, end of period (000) | $ | 178,530 | $ | 275,550 | $ | 286,095 | $ | 489,432 | $ | 468,586 | $ | 321,402 | ||||||||||||
|
| |||||||||||||||||||||||
Portfolio turnover rate | 31% | 28% | 35% | 37% | 39% | 51% | ||||||||||||||||||
|
| |||||||||||||||||||||||
| 1 | Based on average shares outstanding. |
| 2 | Distributions for annual periods determined in accordance with federal income tax regulations. |
| 3 | Where applicable, excludes the effects of any sales charges and assumes the reinvestment of distributions. |
| 4 | Aggregate total return. |
| 5 | Annualized. |
| 6 | Interest expense and fees relate to TOB Trusts. See Note 4 of the Notes to Financial Statements for details. |
| See Notes to Financial Statements. | ||||||
| SEMI-ANNUAL REPORT | DECEMBER 31, 2015 | 57 | ||||
| Financial Highlights (continued) | BlackRock National Municipal Fund |
| Investor C | ||||||||||||||||||||||||
| Six Months Ended December 31, 2015 (Unaudited) | Year Ended June 30, | |||||||||||||||||||||||
| 2015 | 2014 | 2013 | 2012 | 2011 | ||||||||||||||||||||
| Per Share Operating Performance | ||||||||||||||||||||||||
Net asset value, beginning of period | $ | 10.87 | $ | 10.88 | $ | 10.57 | $ | 10.92 | $ | 10.06 | $ | 10.19 | ||||||||||||
|
| |||||||||||||||||||||||
Net investment income1 | 0.13 | 0.28 | 0.32 | 0.30 | 0.36 | 0.39 | ||||||||||||||||||
Net realized and unrealized gain (loss) | 0.14 | (0.01 | ) | 0.31 | (0.35 | ) | 0.86 | (0.13 | ) | |||||||||||||||
|
| |||||||||||||||||||||||
Net increase from investment operations | 0.27 | 0.27 | 0.63 | (0.05 | ) | 1.22 | 0.26 | |||||||||||||||||
|
| |||||||||||||||||||||||
Distributions from net investment income2 | (0.13 | ) | (0.28 | ) | (0.32 | ) | (0.30 | ) | (0.36 | ) | (0.39 | ) | ||||||||||||
|
| |||||||||||||||||||||||
Net asset value, end of period | $ | 11.01 | $ | 10.87 | $ | 10.88 | $ | 10.57 | $ | 10.92 | $ | 10.06 | ||||||||||||
|
| |||||||||||||||||||||||
| Total Return3 | ||||||||||||||||||||||||
Based on net asset value | 2.51% | 4 | 2.49% | 6.13% | (0.53)% | 12.26% | 2.60% | |||||||||||||||||
|
| |||||||||||||||||||||||
| Ratios to Average Net Assets | ||||||||||||||||||||||||
Total expenses | 1.56% | 5 | 1.59% | 1.62% | 1.62% | 1.64% | 1.66% | |||||||||||||||||
|
| |||||||||||||||||||||||
Total expenses after fees waived and/or reimbursed and paid indirectly | 1.50% | 5 | 1.50% | 1.53% | 1.53% | 1.55% | 1.66% | |||||||||||||||||
|
| |||||||||||||||||||||||
Total expenses after fees waived and/or reimbursed and paid indirectly and excluding interest expense and fees and reorganization costs6 | 1.47% | 5 | 1.47% | 1.47% | 1.47% | 1.47% | 1.58% | |||||||||||||||||
|
| |||||||||||||||||||||||
Net investment income | 2.39% | 5 | 2.55% | 3.08% | 2.67% | 3.40% | 3.85% | |||||||||||||||||
|
| |||||||||||||||||||||||
| Supplemental Data | ||||||||||||||||||||||||
Net assets, end of period (000) | $ | 430,513 | $ | 397,945 | $ | 389,612 | $ | 480,207 | $ | 483,092 | $ | 281,024 | ||||||||||||
|
| |||||||||||||||||||||||
Borrowings outstanding, end of period (000) | $ | 178,530 | $ | 275,550 | $ | 286,095 | $ | 489,432 | $ | 468,586 | $ | 321,402 | ||||||||||||
|
| |||||||||||||||||||||||
Portfolio turnover rate | 31% | 28% | 35% | 37% | 39% | 51% | ||||||||||||||||||
|
| |||||||||||||||||||||||
| 1 | Based on average shares outstanding. |
| 2 | Distributions for annual periods determined in accordance with federal income tax regulations. |
| 3 | Where applicable, excludes the effects of any sales charges and assumes the reinvestment of distributions. |
| 4 | Aggregate total return. |
| 5 | Annualized. |
| 6 | Interest expense and fees relate to TOB Trusts. See Note 4 of the Notes to Financial Statements for details. |
| See Notes to Financial Statements. | ||||||
| 58 | SEMI-ANNUAL REPORT | DECEMBER 31, 2015 | ||||
| Financial Highlights (concluded) | BlackRock National Municipal Fund |
| Investor C1 | ||||||||||||||||||||||||
| Six Months Ended December 31, 2015 (Unaudited) | Year Ended June 30, | |||||||||||||||||||||||
| 2015 | 2014 | 2013 | 2012 | 2011 | ||||||||||||||||||||
| Per Share Operating Performance | ||||||||||||||||||||||||
Net asset value, beginning of period | $ | 10.87 | $ | 10.88 | $ | 10.56 | $ | 10.91 | $ | 10.06 | $ | 10.19 | ||||||||||||
|
| |||||||||||||||||||||||
Net investment income1 | 0.14 | 0.30 | 0.34 | 0.32 | 0.38 | 0.41 | ||||||||||||||||||
Net realized and unrealized gain (loss) | 0.13 | (0.01 | ) | 0.32 | (0.35 | ) | 0.85 | (0.13 | ) | |||||||||||||||
|
| |||||||||||||||||||||||
Net increase from investment operations | 0.27 | 0.29 | 0.66 | (0.03 | ) | 1.23 | 0.28 | |||||||||||||||||
|
| |||||||||||||||||||||||
Distributions from net investment income2 | (0.14 | ) | (0.30 | ) | (0.34 | ) | (0.32 | ) | (0.38 | ) | (0.41 | ) | ||||||||||||
|
| |||||||||||||||||||||||
Net asset value, end of period | $ | 11.00 | $ | 10.87 | $ | 10.88 | $ | 10.56 | $ | 10.91 | $ | 10.06 | ||||||||||||
|
| |||||||||||||||||||||||
| Total Return3 | ||||||||||||||||||||||||
Based on net asset value | 2.60% | 4 | 2.68% | 6.43% | (0.35)% | 12.37% | 2.80% | |||||||||||||||||
|
| |||||||||||||||||||||||
| Ratios to Average Net Assets | ||||||||||||||||||||||||
Total expenses | 1.37% | 5 | 1.39% | 1.42% | 1.42% | 1.44% | 1.47% | |||||||||||||||||
|
| |||||||||||||||||||||||
Total expenses after fees waived and/or reimbursed and paid indirectly | 1.31% | 5 | 1.31% | 1.34% | 1.34% | 1.36% | 1.46% | |||||||||||||||||
|
| |||||||||||||||||||||||
Total expenses after fees waived and/or reimbursed and paid indirectly and excluding interest expense and fees and reorganization costs6 | 1.28% | 5 | 1.28% | 1.28% | 1.28% | 1.28% | 1.38% | |||||||||||||||||
|
| |||||||||||||||||||||||
Net investment income | 2.58% | 5 | 2.74% | 3.27% | 2.88% | 3.60% | 4.04% | |||||||||||||||||
|
| |||||||||||||||||||||||
| Supplemental Data | ||||||||||||||||||||||||
Net assets, end of period (000) | $ | 62,306 | $ | 64,049 | $ | 71,147 | $ | 83,766 | $ | 100,161 | $ | 73,302 | ||||||||||||
|
| |||||||||||||||||||||||
Borrowings outstanding, end of period (000) | $ | 178,530 | $ | 275,550 | $ | 286,095 | $ | 489,432 | $ | 468,586 | $ | 321,402 | ||||||||||||
|
| |||||||||||||||||||||||
Portfolio turnover rate | 31% | 28% | 35% | 37% | 39% | 51% | ||||||||||||||||||
|
| |||||||||||||||||||||||
| 1 | Based on average shares outstanding. |
| 2 | Distributions for annual periods determined in accordance with federal income tax regulations. |
| 3 | Where applicable, excludes the effects of any sales charges and assumes the reinvestment of distributions. |
| 4 | Aggregate total return. |
| 5 | Annualized. |
| 6 | Interest expense and fees relate to TOB Trusts. See Note 4 of the Notes to Financial Statements for details. |
| See Notes to Financial Statements. | ||||||
| SEMI-ANNUAL REPORT | DECEMBER 31, 2015 | 59 | ||||
| Financial Highlights | BlackRock Short-Term Municipal Fund |
| Institutional | ||||||||||||||||||||||||
| Six Months Ended December 31, 2015 (Unaudited) | Year Ended June 30, | |||||||||||||||||||||||
| 2015 | 2014 | 2013 | 2012 | 2011 | ||||||||||||||||||||
| Per Share Operating Performance | ||||||||||||||||||||||||
Net asset value, beginning of period | $ | 10.11 | $ | 10.16 | $ | 10.12 | $ | 10.17 | $ | 10.18 | $ | 10.18 | ||||||||||||
|
| |||||||||||||||||||||||
Net investment income1 | 0.02 | 0.04 | 0.05 | 0.07 | 0.09 | 0.13 | ||||||||||||||||||
Net realized and unrealized gain (loss) | 0.01 | (0.05 | ) | 0.04 | (0.05 | ) | 0.01 | (0.00 | )2 | |||||||||||||||
|
| |||||||||||||||||||||||
Net increase (decrease) from investment operations | 0.03 | (0.01 | ) | 0.09 | 0.02 | 0.10 | 0.13 | |||||||||||||||||
|
| |||||||||||||||||||||||
| Distributions:3 | ||||||||||||||||||||||||
From net investment income | (0.02 | ) | (0.04 | ) | (0.05 | ) | (0.07 | ) | (0.11 | ) | (0.13 | ) | ||||||||||||
From net realized gain | (0.00 | )2 | — | — | — | — | — | |||||||||||||||||
|
| |||||||||||||||||||||||
Total distributions | (0.02 | ) | (0.04 | ) | (0.05 | ) | (0.07 | ) | (0.11 | ) | (0.13 | ) | ||||||||||||
|
| |||||||||||||||||||||||
Net asset value, end of period | $ | 10.12 | $ | 10.11 | $ | 10.16 | $ | 10.12 | $ | 10.17 | $ | 10.18 | ||||||||||||
|
| |||||||||||||||||||||||
| Total Return4 | ||||||||||||||||||||||||
Based on net asset value | 0.31% | 5 | (0.11)% | 0.90% | 0.19% | 0.96% | 1.27% | |||||||||||||||||
|
| |||||||||||||||||||||||
| Ratios to Average Net Assets | ||||||||||||||||||||||||
Total expenses | 0.53% | 6 | 0.51% | 0.51% | 0.51% | 0.50% | 0.49% | |||||||||||||||||
|
| |||||||||||||||||||||||
Total expenses after fees waived and/or reimbursed and paid indirectly | 0.40% | 6 | 0.40% | 0.40% | 0.40% | 0.40% | 0.40% | |||||||||||||||||
|
| |||||||||||||||||||||||
Net investment income | 0.44% | 6 | 0.42% | 0.54% | 0.82% | 0.93% | 1.26% | |||||||||||||||||
|
| |||||||||||||||||||||||
| Supplemental Data | ||||||||||||||||||||||||
Net assets, end of period (000) | $ | 453,086 | $ | 492,702 | $ | 619,700 | $ | 529,687 | $ | 643,910 | $ | 603,837 | ||||||||||||
|
| |||||||||||||||||||||||
Portfolio turnover rate | 36% | 72% | 56% | 41% | 51% | 44% | ||||||||||||||||||
|
| |||||||||||||||||||||||
| 1 | Based on average shares outstanding. |
| 2 | Amount is greater than $(0.005) per share. |
| 3 | Distributions for annual periods determined in accordance with federal income tax regulations. |
| 4 | Where applicable, assumes the reinvestment of distributions. |
| 5 | Aggregate total return. |
| 6 | Annualized. |
| See Notes to Financial Statements. | ||||||
| 60 | SEMI-ANNUAL REPORT | DECEMBER 31, 2015 | ||||
| Financial Highlights (continued) | BlackRock Short-Term Municipal Fund |
| Investor A | ||||||||||||||||||||||||
| Six Months Ended December 31, 2015 (Unaudited) | Year Ended June 30, | |||||||||||||||||||||||
| 2015 | 2014 | 2013 | 2012 | 2011 | ||||||||||||||||||||
| Per Share Operating Performance | ||||||||||||||||||||||||
Net asset value, beginning of period | $ | 10.12 | $ | 10.16 | $ | 10.12 | $ | 10.18 | $ | 10.19 | $ | 10.19 | ||||||||||||
|
| |||||||||||||||||||||||
Net investment income1 | 0.01 | 0.01 | 0.03 | 0.04 | 0.07 | 0.10 | ||||||||||||||||||
Net realized and unrealized gain (loss) | 0.01 | (0.04 | ) | 0.03 | (0.06 | ) | 0.00 | 2 | (0.00 | )3 | ||||||||||||||
|
| |||||||||||||||||||||||
Net increase (decrease) from investment operations | 0.02 | (0.03 | ) | 0.06 | (0.02 | ) | 0.07 | 0.10 | ||||||||||||||||
|
| |||||||||||||||||||||||
| Distributions:4 | ||||||||||||||||||||||||
From net investment income | (0.01 | ) | (0.01 | ) | (0.02 | ) | (0.04 | ) | (0.08 | ) | (0.10 | ) | ||||||||||||
From net realized gain | (0.00 | )3 | — | — | — | — | — | |||||||||||||||||
|
| |||||||||||||||||||||||
Total distributions | (0.01 | ) | (0.01 | ) | (0.02 | ) | (0.04 | ) | (0.08 | ) | (0.10 | ) | ||||||||||||
|
| |||||||||||||||||||||||
Net asset value, end of period | $ | 10.13 | $ | 10.12 | $ | 10.16 | $ | 10.12 | $ | 10.18 | $ | 10.19 | ||||||||||||
|
| |||||||||||||||||||||||
| Total Return5 | ||||||||||||||||||||||||
Based on net asset value | 0.17% | 6 | (0.29)% | 0.64% | (0.18)% | 0.69% | 0.99% | |||||||||||||||||
|
| |||||||||||||||||||||||
| Ratios to Average Net Assets | ||||||||||||||||||||||||
Total expenses | 0.70% | 7 | 0.70% | 0.67% | 0.68% | 0.66% | 0.67% | |||||||||||||||||
|
| |||||||||||||||||||||||
Total expenses after fees waived and/or reimbursed and paid indirectly | 0.68% | 7 | 0.69% | 0.67% | 0.68% | 0.66% | 0.67% | |||||||||||||||||
|
| |||||||||||||||||||||||
Net investment income | 0.16% | 7 | 0.13% | 0.26% | 0.54% | 0.67% | 1.00% | |||||||||||||||||
|
| |||||||||||||||||||||||
| Supplemental Data | ||||||||||||||||||||||||
Net assets, end of period (000) | $ | 92,223 | $ | 100,980 | $ | 137,629 | $ | 172,314 | $ | 204,729 | $ | 221,827 | ||||||||||||
|
| |||||||||||||||||||||||
Portfolio turnover rate | 36% | 72% | 56% | 41% | 51% | 44% | ||||||||||||||||||
|
| |||||||||||||||||||||||
| 1 | Based on average shares outstanding. |
| 2 | Amount is less than $0.005 per share. |
| 3 | Amount is greater than $(0.005) per share. |
| 4 | Distributions for annual periods determined in accordance with federal income tax regulations. |
| 5 | Where applicable, excludes the effects of any sales charges and assumes the reinvestment of distributions. |
| 6 | Aggregate total return. |
| 7 | Annualized. |
| See Notes to Financial Statements. | ||||||
| SEMI-ANNUAL REPORT | DECEMBER 31, 2015 | 61 | ||||
| Financial Highlights (continued) | BlackRock Short-Term Municipal Fund |
| Investor A1 | ||||||||||||||||||||||||
| Six Months Ended December 31, 2015 (Unaudited) | Year Ended June 30, | |||||||||||||||||||||||
| 2015 | 2014 | 2013 | 2012 | 2011 | ||||||||||||||||||||
| Per Share Operating Performance | ||||||||||||||||||||||||
Net asset value, beginning of period | $ | 10.12 | $ | 10.17 | $ | 10.12 | $ | 10.18 | $ | 10.19 | $ | 10.19 | ||||||||||||
|
| |||||||||||||||||||||||
Net investment income1 | 0.02 | 0.03 | 0.04 | 0.06 | 0.08 | 0.12 | ||||||||||||||||||
Net realized and unrealized gain (loss) | (0.00 | )2 | (0.05 | ) | 0.05 | (0.06 | ) | 0.01 | (0.00 | )2 | ||||||||||||||
|
| |||||||||||||||||||||||
Net increase (decrease) from investment operations | 0.02 | (0.02 | ) | 0.09 | — | 0.09 | 0.12 | |||||||||||||||||
|
| |||||||||||||||||||||||
| Distributions:3 | ||||||||||||||||||||||||
From net investment income | (0.01 | ) | — | (0.04 | ) | (0.06 | ) | (0.10 | ) | (0.12 | ) | |||||||||||||
From net realized gain | (0.00 | )2 | (0.03 | ) | — | — | — | — | ||||||||||||||||
|
| |||||||||||||||||||||||
Total dividends and distributions | (0.01 | ) | (0.03 | ) | (0.04 | ) | (0.06 | ) | (0.10 | ) | (0.12 | ) | ||||||||||||
|
| |||||||||||||||||||||||
Net asset value, end of period | $ | 10.13 | $ | 10.12 | $ | 10.17 | $ | 10.12 | $ | 10.18 | $ | 10.19 | ||||||||||||
|
| |||||||||||||||||||||||
| Total Return4 | ||||||||||||||||||||||||
Based on net asset value | 0.25% | 5 | (0.23)% | 0.88% | (0.03)% | 0.84% | 1.14% | |||||||||||||||||
|
| |||||||||||||||||||||||
| Ratios to Average Net Assets | ||||||||||||||||||||||||
Total expenses | 0.56% | 6 | 0.55% | 0.54% | 0.54% | 0.54% | 0.54% | |||||||||||||||||
|
| |||||||||||||||||||||||
Total expenses after fees waived and/or reimbursed and paid indirectly | 0.52% | 6 | 0.52% | 0.52% | 0.52% | 0.51% | 0.52% | |||||||||||||||||
|
| |||||||||||||||||||||||
Net investment income | 0.33% | 6 | 0.30% | 0.42% | 0.70% | 0.81% | 1.14% | |||||||||||||||||
|
| |||||||||||||||||||||||
| Supplemental Data | ||||||||||||||||||||||||
Net assets, end of period (000) | $ | 31,193 | $ | 33,292 | $ | 37,280 | $ | 44,139 | $ | 48,377 | $ | 53,141 | ||||||||||||
|
| |||||||||||||||||||||||
Portfolio turnover rate | 36% | 72% | 56% | 41% | 51% | 44% | ||||||||||||||||||
|
| |||||||||||||||||||||||
| 1 | Based on average shares outstanding. |
| 2 | Amount is greater than $(0.005) per share. |
| 3 | Distributions for annual periods determined in accordance with federal income tax regulations. |
| 4 | Where applicable, excludes the effects of any sales charges and assumes the reinvestment of distributions. |
| 5 | Aggregate total return. |
| 6 | Annualized. |
| See Notes to Financial Statements. | ||||||
| 62 | SEMI-ANNUAL REPORT | DECEMBER 31, 2015 | ||||
| Financial Highlights (continued) | BlackRock Short-Term Municipal Fund |
| Investor C | ||||||||||||||||||||||||
| Six Months Ended December 31, 2015 (Unaudited) | Year Ended June 30, | |||||||||||||||||||||||
| 2015 | 2014 | 2013 | 2012 | 2011 | ||||||||||||||||||||
| Per Share Operating Performance | ||||||||||||||||||||||||
Net asset value, beginning of period | $ | 9.95 | $ | 10.07 | $ | 10.08 | $ | 10.18 | $ | 10.18 | $ | 10.18 | ||||||||||||
|
| |||||||||||||||||||||||
Net investment income (loss)1 | (0.03 | ) | (0.07 | ) | (0.06 | ) | (0.04 | ) | (0.01 | ) | 0.02 | |||||||||||||
Net realized and unrealized gain (loss) | 0.02 | (0.05 | ) | 0.05 | (0.06 | ) | 0.01 | (0.00 | )2 | |||||||||||||||
|
| |||||||||||||||||||||||
Net increase (decrease) from investment operations | (0.02 | ) | (0.12 | ) | (0.01 | ) | (0.10 | ) | — | 0.02 | ||||||||||||||
|
| |||||||||||||||||||||||
| Distributions:3 | ||||||||||||||||||||||||
From net investment income | — | — | — | — | (0.00 | )2 | (0.02 | ) | ||||||||||||||||
From net realized gain | (0.00 | )2 | — | — | — | — | — | |||||||||||||||||
|
| |||||||||||||||||||||||
Total distributions | (0.00 | ) | — | — | — | (0.00 | ) | (0.02 | ) | |||||||||||||||
|
| |||||||||||||||||||||||
Net asset value, end of period | $ | 9.93 | $ | 9.95 | $ | 10.07 | $ | 10.08 | $ | 10.18 | $ | 10.18 | ||||||||||||
|
| |||||||||||||||||||||||
| Total Return4 | ||||||||||||||||||||||||
Based on net asset value | (0.20)% | 5 | (1.19)% | (0.10)% | (0.98)% | 0.01% | 0.21% | |||||||||||||||||
|
| |||||||||||||||||||||||
| Ratios to Average Net Assets | ||||||||||||||||||||||||
Total expenses | 1.49% | 6 | 1.47% | 1.45% | 1.46% | 1.44% | 1.45% | |||||||||||||||||
|
| |||||||||||||||||||||||
Total expenses after fees waived and/or reimbursed and paid indirectly | 1.48% | 6 | 1.47% | 1.45% | 1.46% | 1.44% | 1.45% | |||||||||||||||||
|
| |||||||||||||||||||||||
Net investment income (loss) | (0.63)% | 6 | (0.70)% | (0.55)% | (0.27)% | (0.11)% | 0.22% | |||||||||||||||||
|
| |||||||||||||||||||||||
| Supplemental Data | ||||||||||||||||||||||||
Net assets, end of period (000) | $ | 36,701 | $ | 31,121 | $ | 38,520 | $ | 50,033 | $ | 68,693 | $ | 86,264 | ||||||||||||
|
| |||||||||||||||||||||||
Portfolio turnover rate | 36% | 72% | 56% | 41% | 51% | 44% | ||||||||||||||||||
|
| |||||||||||||||||||||||
| 1 | Based on average shares outstanding. |
| 2 | Amount is greater than $(0.005) per share. |
| 3 | Distributions for annual periods determined in accordance with federal income tax regulations. |
| 4 | Where applicable, excludes the effects of any sales charges and assumes the reinvestment of distributions. |
| 5 | Aggregate total return. |
| 6 | Annualized. |
| See Notes to Financial Statements. | ||||||
| SEMI-ANNUAL REPORT | DECEMBER 31, 2015 | 63 | ||||
| Financial Highlights (concluded) | BlackRock Short-Term Municipal Fund |
| Class K | ||||||||||||||||||||||||
| Six Months Ended December 31, 2015 (Unaudited) | Year Ended June 30, | |||||||||||||||||||||||
| 2015 | 2014 | 2013 | 2012 | 2011 | ||||||||||||||||||||
| Per Share Operating Performance | ||||||||||||||||||||||||
Net asset value, beginning of period | $ | 10.11 | $ | 10.15 | $ | 10.11 | $ | 10.18 | $ | 10.18 | $ | 10.19 | ||||||||||||
|
| |||||||||||||||||||||||
Net investment income1 | 0.02 | 0.02 | 0.04 | 0.07 | 0.09 | 0.12 | ||||||||||||||||||
Net realized and unrealized gain (loss) | 0.01 | (0.02 | ) | 0.05 | (0.07 | ) | 0.02 | (0.00 | )2 | |||||||||||||||
|
| |||||||||||||||||||||||
Net increase (decrease) from investment operations | 0.03 | — | 0.09 | — | 0.11 | 0.12 | ||||||||||||||||||
|
| |||||||||||||||||||||||
| Distributions:3 | ||||||||||||||||||||||||
From net investment income | (0.02 | ) | (0.04 | ) | (0.05 | ) | (0.07 | ) | (0.11 | ) | (0.13 | ) | ||||||||||||
From net realized gain | (0.00 | )2 | — | — | — | — | — | |||||||||||||||||
|
| |||||||||||||||||||||||
Total distributions | (0.02 | ) | (0.04 | ) | (0.05 | ) | (0.07 | ) | (0.11 | ) | (0.13 | ) | ||||||||||||
|
| |||||||||||||||||||||||
Net asset value, end of period | $ | 10.12 | $ | 10.11 | $ | 10.15 | $ | 10.11 | $ | 10.18 | $ | 10.18 | ||||||||||||
|
| |||||||||||||||||||||||
| Total Return4 | ||||||||||||||||||||||||
Based on net asset value | 0.31% | 5 | (0.01)% | 0.91% | 0.00% | 1.07% | 1.17% | |||||||||||||||||
|
| |||||||||||||||||||||||
| Ratios to Average Net Assets | ||||||||||||||||||||||||
Total expenses | 0.42% | 6 | 0.41% | 0.39% | 0.39% | 0.39% | 0.40% | |||||||||||||||||
|
| |||||||||||||||||||||||
Total expenses after fees waived and/or reimbursed and paid indirectly | 0.41% | 6 | 0.40% | 0.39% | 0.39% | 0.39% | 0.39% | |||||||||||||||||
|
| |||||||||||||||||||||||
Net investment income | 0.44% | 6 | 0.21% | 0.35% | 0.79% | 0.93% | 1.25% | |||||||||||||||||
|
| |||||||||||||||||||||||
| Supplemental Data | ||||||||||||||||||||||||
Net assets, end of period (000) | $ | 5,252 | $ | 6,732 | $ | 8,814 | $ | 10,372 | $ | 63,503 | $ | 43,941 | ||||||||||||
|
| |||||||||||||||||||||||
Portfolio turnover rate | 36% | 72% | 56% | 41% | 51% | 44% | ||||||||||||||||||
|
| |||||||||||||||||||||||
| 1 | Based on average shares outstanding. |
| 2 | Amount is greater than $(0.005) per share. |
| 3 | Distributions for annual periods determined in accordance with federal income tax regulations. |
| 4 | Where applicable, assumes the reinvestment of distributions. |
| 5 | Aggregate total return. |
| 6 | Annualized. |
| See Notes to Financial Statements. | ||||||
| 64 | SEMI-ANNUAL REPORT | DECEMBER 31, 2015 | ||||
| Financial Highlights | BlackRock New York Municipal Opportunities Fund |
| Institutional | ||||||||||||||||||||||||
| Six Months Ended December 31, 2015 (Unaudited) | Year Ended June 30, | |||||||||||||||||||||||
| 2015 | 2014 | 2013 | 2012 | 2011 | ||||||||||||||||||||
| Per Share Operating Performance | ||||||||||||||||||||||||
Net asset value, beginning of period | $ | 10.90 | $ | 10.79 | $ | 10.46 | $ | 11.01 | $ | 10.36 | $ | 10.55 | ||||||||||||
|
| |||||||||||||||||||||||
Net investment income1 | 0.19 | 0.41 | 0.43 | 0.46 | 0.47 | 0.50 | ||||||||||||||||||
Net realized and unrealized gain (loss) | 0.29 | 0.11 | 0.33 | (0.55 | ) | 0.65 | (0.20 | ) | ||||||||||||||||
|
| |||||||||||||||||||||||
Net increase (decrease) from investment operations | 0.48 | 0.52 | 0.76 | (0.09 | ) | 1.12 | 0.30 | |||||||||||||||||
|
| |||||||||||||||||||||||
Distributions from net investment income2 | (0.19 | ) | (0.41 | ) | (0.43 | ) | (0.46 | ) | (0.47 | ) | (0.49 | ) | ||||||||||||
|
| |||||||||||||||||||||||
Net asset value, end of period | $ | 11.19 | $ | 10.90 | $ | 10.79 | $ | 10.46 | $ | 11.01 | $ | 10.36 | ||||||||||||
|
| |||||||||||||||||||||||
| Total Return3 | ||||||||||||||||||||||||
Based on net asset value | 4.45% | 4 | 4.86% | 7.52% | (1.06)% | 11.06% | 2.97% | |||||||||||||||||
|
| |||||||||||||||||||||||
| Ratios to Average Net Assets | ||||||||||||||||||||||||
Total expenses | 0.75% | 5 | 0.78% | 0.80% | 0.77% | 0.80% | 0.72% | |||||||||||||||||
|
| |||||||||||||||||||||||
Total expenses after fees waived and/or reimbursed and paid indirectly | 0.69% | 5 | 0.69% | 0.79% | 0.77% | 0.80% | 0.72% | |||||||||||||||||
|
| |||||||||||||||||||||||
Total expenses after fees waived and/or reimbursed and paid indirectly and excluding interest expense and fees6 | 0.65% | 5 | 0.65% | 0.74% | 0.71% | 0.76% | 0.70% | |||||||||||||||||
|
| |||||||||||||||||||||||
Net investment income | 3.46% | 5 | 3.73% | 4.16% | 4.07% | 4.43% | 4.78% | |||||||||||||||||
|
| |||||||||||||||||||||||
| Supplemental Data | ||||||||||||||||||||||||
Net assets, end of period (000) | $ | 122,244 | $ | 79,506 | $ | 34,777 | $ | 34,029 | $ | 31,875 | $ | 25,864 | ||||||||||||
|
| |||||||||||||||||||||||
Borrowings outstanding, end of period (000) | $ | 20,010 | $ | 18,711 | $ | 18,711 | $ | 23,852 | $ | 22,007 | $ | 3,575 | ||||||||||||
|
| |||||||||||||||||||||||
Portfolio turnover rate | 11% | 22% | 18% | 24% | 19% | 17% | ||||||||||||||||||
|
| |||||||||||||||||||||||
| 1 | Based on average shares outstanding. |
| 2 | Distributions for annual periods determined in accordance with federal income tax regulations. |
| 3 | Where applicable, assumes the reinvestment of distributions. |
| 4 | Aggregate total return. |
| 5 | Annualized. |
| 6 | Interest expense and fees relate to TOB Trusts. See Note 4 of the Notes to Financial Statements for details. |
| See Notes to Financial Statements. | ||||||
| SEMI-ANNUAL REPORT | DECEMBER 31, 2015 | 65 | ||||
| Financial Highlights (continued) | BlackRock New York Municipal Opportunities Fund |
| Investor A | ||||||||||||||||||||||||
| Six Months Ended December 31, 2015 (Unaudited) | Year Ended June 30, | |||||||||||||||||||||||
| 2015 | 2014 | 2013 | 2012 | 2011 | ||||||||||||||||||||
| Per Share Operating Performance | ||||||||||||||||||||||||
Net asset value, beginning of period | $ | 10.91 | $ | 10.80 | $ | 10.47 | $ | 11.02 | $ | 10.37 | $ | 10.55 | ||||||||||||
|
| |||||||||||||||||||||||
Net investment income1 | 0.18 | 0.38 | 0.41 | 0.43 | 0.45 | 0.47 | ||||||||||||||||||
Net realized and unrealized gain (loss) | 0.28 | 0.11 | 0.33 | (0.55 | ) | 0.65 | (0.19 | ) | ||||||||||||||||
|
| |||||||||||||||||||||||
Net increase (decrease) from investment operations | 0.46 | 0.49 | 0.74 | (0.12 | ) | 1.10 | 0.28 | |||||||||||||||||
|
| |||||||||||||||||||||||
Distributions from net investment income2 | (0.18 | ) | (0.38 | ) | (0.41 | ) | (0.43 | ) | (0.45 | ) | (0.46 | ) | ||||||||||||
|
| |||||||||||||||||||||||
Net asset value, end of period | $ | 11.19 | $ | 10.91 | $ | 10.80 | $ | 10.47 | $ | 11.02 | $ | 10.37 | ||||||||||||
|
| |||||||||||||||||||||||
| Total Return3 | ||||||||||||||||||||||||
Based on net asset value | 4.23% | 4 | 4.61% | 7.26% | (1.30)% | 10.77% | 2.76% | |||||||||||||||||
|
| |||||||||||||||||||||||
| Ratios to Average Net Assets | ||||||||||||||||||||||||
Total expenses | 1.01% | 5 | 1.04% | 1.03% | 1.02% | 1.06% | 1.02% | |||||||||||||||||
|
| |||||||||||||||||||||||
Total expenses after fees waived and/or reimbursed and paid indirectly | 0.93% | 5 | 0.93% | 1.03% | 1.02% | 1.06% | 1.01% | |||||||||||||||||
|
| |||||||||||||||||||||||
Total expenses after fees waived and/or reimbursed and paid indirectly and excluding interest expense and fees6 | 0.89% | 5 | 0.89% | 0.98% | 0.95% | 1.02% | 1.00% | |||||||||||||||||
|
| |||||||||||||||||||||||
Net investment income | 3.22% | 5 | 3.50% | 3.92% | 3.82% | 4.17% | 4.47% | |||||||||||||||||
|
| |||||||||||||||||||||||
| Supplemental Data | ||||||||||||||||||||||||
Net assets, end of period (000) | $ | 128,843 | $ | 82,376 | $ | 46,084 | $ | 50,220 | $ | 43,030 | $ | 35,751 | ||||||||||||
|
| |||||||||||||||||||||||
Borrowings outstanding, end of period (000) | $ | 20,010 | $ | 18,711 | $ | 18,711 | $ | 23,852 | $ | 22,007 | $ | 3,575 | ||||||||||||
|
| |||||||||||||||||||||||
Portfolio turnover rate | 11% | 22% | 18% | 24% | 19% | 17% | ||||||||||||||||||
|
| |||||||||||||||||||||||
| 1 | Based on average shares outstanding. |
| 2 | Distributions for annual periods determined in accordance with federal income tax regulations. |
| 3 | Where applicable, excludes the effects of any sales charges and assumes the reinvestment of distributions. |
| 4 | Aggregate total return. |
| 5 | Annualized. |
| 6 | Interest expense and fees relate to TOB Trusts. See Note 4 of the Notes to Financial Statements for details. |
| See Notes to Financial Statements. | ||||||
| 66 | SEMI-ANNUAL REPORT | DECEMBER 31, 2015 | ||||
| Financial Highlights (continued) | BlackRock New York Municipal Opportunities Fund |
| Investor A1 | ||||||||||||||||||||||||
| Six Months Ended December 31, 2015 (Unaudited) | Year Ended June 30, | |||||||||||||||||||||||
| 2015 | 2014 | 2013 | 2012 | 2011 | ||||||||||||||||||||
| Per Share Operating Performance | ||||||||||||||||||||||||
Net asset value, beginning of period | $ | 10.91 | $ | 10.80 | $ | 10.46 | $ | 11.02 | $ | 10.37 | $ | 10.55 | ||||||||||||
|
| |||||||||||||||||||||||
Net investment income1 | 0.18 | 0.40 | 0.42 | 0.44 | 0.47 | 0.49 | ||||||||||||||||||
Net realized and unrealized gain (loss) | 0.28 | 0.11 | 0.34 | (0.56 | ) | 0.65 | (0.19 | ) | ||||||||||||||||
|
| |||||||||||||||||||||||
Net increase (decrease) from investment operations | 0.46 | 0.51 | 0.76 | (0.12 | ) | 1.12 | 0.30 | |||||||||||||||||
|
| |||||||||||||||||||||||
Distributions from net investment income2 | (0.18 | ) | (0.40 | ) | (0.42 | ) | (0.44 | ) | (0.47 | ) | (0.48 | ) | ||||||||||||
|
| |||||||||||||||||||||||
Net asset value, end of period | $ | 11.19 | $ | 10.91 | $ | 10.80 | $ | 10.46 | $ | 11.02 | $ | 10.37 | ||||||||||||
|
| |||||||||||||||||||||||
| Total Return3 | ||||||||||||||||||||||||
Based on net asset value | 4.29% | 4 | 4.71% | 7.53% | (1.24)% | 10.97% | 2.95% | |||||||||||||||||
|
| |||||||||||||||||||||||
| Ratios to Average Net Assets | ||||||||||||||||||||||||
Total expenses | 0.86% | 5 | 0.88% | 0.88% | 0.87% | 0.88% | 0.84% | |||||||||||||||||
|
| |||||||||||||||||||||||
Total expenses after fees waived and/or reimbursed and paid indirectly | 0.82% | 5 | 0.83% | 0.88% | 0.87% | 0.88% | 0.83% | |||||||||||||||||
|
| |||||||||||||||||||||||
Total expenses after fees waived and/or reimbursed and paid indirectly and excluding interest expense and fees6 | 0.79% | 5 | 0.79% | 0.83% | 0.80% | 0.84% | 0.82% | |||||||||||||||||
|
| |||||||||||||||||||||||
Net investment income | 3.33% | 5 | 3.61% | 4.07% | 3.98% | 4.36% | 4.66% | |||||||||||||||||
|
| |||||||||||||||||||||||
| Supplemental Data | ||||||||||||||||||||||||
Net assets applicable, end of period (000) | $ | 124,578 | $ | 125,718 | $ | 132,184 | $ | 140,469 | $ | 154,473 | $ | 151,327 | ||||||||||||
|
| |||||||||||||||||||||||
Borrowings outstanding, end of period (000) | $ | 20,010 | $ | 18,711 | $ | 18,711 | $ | 23,852 | $ | 22,007 | $ | 3,575 | ||||||||||||
|
| |||||||||||||||||||||||
Portfolio turnover rate | 11% | 22% | 18% | 24% | 19% | 17% | ||||||||||||||||||
|
| |||||||||||||||||||||||
| 1 | Based on average shares outstanding. |
| 2 | Distributions for annual periods determined in accordance with federal income tax regulations. |
| 3 | Where applicable, excludes the effects of any sales charges and assumes the reinvestment of distributions. |
| 4 | Aggregate total return. |
| 5 | Annualized. |
| 6 | Interest expense and fees relate to TOB Trusts. See Note 4 of the Notes to Financial Statements for details. |
| See Notes to Financial Statements. | ||||||
| SEMI-ANNUAL REPORT | DECEMBER 31, 2015 | 67 | ||||
| Financial Highlights (continued) | BlackRock New York Municipal Opportunities Fund |
| Investor C | ||||||||||||||||||||||||
| Six Months Ended December 31, 2015 (Unaudited) | Year Ended June 30, | |||||||||||||||||||||||
| 2015 | 2014 | 2013 | 2012 | 2011 | ||||||||||||||||||||
| Per Share Operating Performance | ||||||||||||||||||||||||
Net asset value, beginning of period | $ | 10.90 | $ | 10.80 | $ | 10.46 | $ | 11.01 | $ | 10.37 | $ | 10.55 | ||||||||||||
|
| |||||||||||||||||||||||
Net investment income1 | 0.14 | 0.30 | 0.33 | 0.34 | 0.37 | 0.39 | ||||||||||||||||||
Net realized and unrealized gain (loss) | 0.29 | 0.10 | 0.34 | (0.55 | ) | 0.64 | (0.18 | ) | ||||||||||||||||
|
| |||||||||||||||||||||||
Net increase (decrease) from investment operations | 0.43 | 0.40 | 0.67 | (0.21 | ) | 1.01 | 0.21 | |||||||||||||||||
|
| |||||||||||||||||||||||
Distributions from net investment income2 | (0.14 | ) | (0.30 | ) | (0.33 | ) | (0.34 | ) | (0.37 | ) | (0.39 | ) | ||||||||||||
|
| |||||||||||||||||||||||
Net asset value, end of period | $ | 11.19 | $ | 10.90 | $ | 10.80 | $ | 10.46 | $ | 11.01 | $ | 10.37 | ||||||||||||
|
| |||||||||||||||||||||||
| Total Return3 | ||||||||||||||||||||||||
Based on net asset value | 3.94% | 4 | 3.74% | 6.57% | (2.04)% | 9.89% | 2.03% | |||||||||||||||||
|
| |||||||||||||||||||||||
| Ratios to Average Net Assets | ||||||||||||||||||||||||
Total expenses | 1.75% | 5 | 1.78% | 1.78% | 1.77% | 1.77% | 1.73% | |||||||||||||||||
|
| |||||||||||||||||||||||
Total expenses after fees waived and/or reimbursed and paid indirectly | 1.68% | 5 | 1.68% | 1.77% | 1.77% | 1.77% | 1.73% | |||||||||||||||||
|
| |||||||||||||||||||||||
Total expenses after fees waived and/or reimbursed and paid indirectly and excluding interest expense and fees6 | 1.64% | 5 | 1.64% | 1.72% | 1.70% | 1.73% | 1.72% | |||||||||||||||||
|
| |||||||||||||||||||||||
Net investment income | 2.47% | 5 | 2.75% | 3.17% | 3.07% | 3.45% | 3.76% | |||||||||||||||||
|
| |||||||||||||||||||||||
| Supplemental Data | ||||||||||||||||||||||||
Net assets, end of period (000) | $ | 53,839 | $ | 37,670 | $ | 27,595 | $ | 27,082 | $ | 25,201 | $ | 17,180 | ||||||||||||
|
| |||||||||||||||||||||||
Borrowings outstanding, end of period (000) | $ | 20,010 | $ | 18,711 | $ | 18,711 | $ | 23,852 | $ | 22,007 | $ | 3,575 | ||||||||||||
|
| |||||||||||||||||||||||
Portfolio turnover rate | 11% | 22% | 18% | 24% | 19% | 17% | ||||||||||||||||||
|
| |||||||||||||||||||||||
| 1 | Based on average shares outstanding. |
| 2 | Distributions for annual periods determined in accordance with federal income tax regulations. |
| 3 | Where applicable, excludes the effects of any sales charges and assumes the reinvestment of distributions. |
| 4 | Aggregate total return. |
| 5 | Annualized. |
| 6 | Interest expense and fees relate to TOB Trusts. See Note 4 of the Notes to Financial Statements for details. |
| See Notes to Financial Statements. | ||||||
| 68 | SEMI-ANNUAL REPORT | DECEMBER 31, 2015 | ||||
| Financial Highlights (concluded) | BlackRock New York Municipal Opportunities Fund |
| Investor C1 | ||||||||||||||||||||||||
| Six Months Ended December 31, 2015 (Unaudited) | Year Ended June 30, | |||||||||||||||||||||||
| 2015 | 2014 | 2013 | 2012 | 2011 | ||||||||||||||||||||
| Per Share Operating Performance | ||||||||||||||||||||||||
Net asset value, beginning of period | $ | 10.90 | $ | 10.80 | $ | 10.46 | $ | 11.02 | $ | 10.37 | $ | 10.55 | ||||||||||||
|
| |||||||||||||||||||||||
Net investment income1 | 0.16 | 0.34 | 0.37 | 0.39 | 0.42 | 0.43 | ||||||||||||||||||
Net realized and unrealized gain (loss) | 0.29 | 0.10 | 0.34 | (0.56 | ) | 0.64 | (0.18 | ) | ||||||||||||||||
|
| |||||||||||||||||||||||
Net increase (decrease) from investment operations | 0.45 | 0.44 | 0.71 | (0.17 | ) | 1.06 | 0.25 | |||||||||||||||||
|
| |||||||||||||||||||||||
Distributions from net investment income2 | (0.16 | ) | (0.34 | ) | (0.37 | ) | (0.39 | ) | (0.41 | ) | (0.43 | ) | ||||||||||||
|
| |||||||||||||||||||||||
Net asset value, end of period | $ | 11.19 | $ | 10.90 | $ | 10.80 | $ | 10.46 | $ | 11.02 | $ | 10.37 | ||||||||||||
|
| |||||||||||||||||||||||
| Total Return3 | ||||||||||||||||||||||||
Based on net asset value | 4.13% | 4 | 4.11% | 7.00% | (1.73)% | 10.43% | 2.44% | |||||||||||||||||
|
| |||||||||||||||||||||||
| Ratios to Average Net Assets | ||||||||||||||||||||||||
Total expenses | 1.35% | 5 | 1.37% | 1.37% | 1.36% | 1.37% | 1.33% | |||||||||||||||||
|
| |||||||||||||||||||||||
Total expenses after fees waived and/or reimbursed and paid indirectly | 1.32% | 5 | 1.32% | 1.36% | 1.36% | 1.37% | 1.33% | |||||||||||||||||
|
| |||||||||||||||||||||||
Total expenses after fees waived and/or reimbursed and paid indirectly and excluding interest expense and fees6 | 1.28% | 5 | 1.28% | 1.31% | 1.29% | 1.33% | 1.32% | |||||||||||||||||
|
| |||||||||||||||||||||||
Net investment income | 2.84% | 5 | 3.12% | 3.58% | 3.49% | 3.86% | 4.16% | |||||||||||||||||
|
| |||||||||||||||||||||||
| Supplemental Data | ||||||||||||||||||||||||
Net assets, end of period (000) | $ | 7,771 | $ | 7,762 | $ | 8,827 | $ | 10,038 | $ | 11,093 | $ | 10,694 | ||||||||||||
|
| |||||||||||||||||||||||
Borrowings outstanding, end of period (000) | $ | 20,010 | $ | 18,711 | $ | 18,711 | $ | 23,852 | $ | 22,007 | $ | 3,575 | ||||||||||||
|
| |||||||||||||||||||||||
Portfolio turnover rate | 11% | 22% | 18% | 24% | 19% | 17% | ||||||||||||||||||
|
| |||||||||||||||||||||||
| 1 | Based on average shares outstanding. |
| 2 | Distributions for annual periods determined in accordance with federal income tax regulations. |
| 3 | Where applicable, excludes the effects of any sales charges and assumes the reinvestment of distributions. |
| 4 | Aggregate total return. |
| 5 | Annualized. |
| 6 | Interest expense and fees relate to TOB Trusts. See Note 4 of the Notes to Financial Statements for details. |
| See Notes to Financial Statements. | ||||||
| SEMI-ANNUAL REPORT | DECEMBER 31, 2015 | 69 | ||||
| Notes to Financial Statements (Unaudited) | ||||
1. Organization:
BlackRock Municipal Bond Fund, Inc. (the “Corporation”) and BlackRock Multi-State Municipal Series Trust (the “Trust”) are each registered under the Investment Company Act of 1940, as amended (the “1940 Act”), as open-end management investment companies. The Corporation is organized as a Maryland corporation. The Trust is organized as a Massachusetts business trust. The Board of Directors of the Corporation and the Board of Trustees of the Trust are referred to throughout this report as the “Board of Directors” or the “Board.” The following are referred to herein collectively as the “Funds” or individually, a “Fund”:
| Registrant Name | Fund Name | Herein Referred To As | Diversification Classification | |||
BlackRock Municipal Bond Fund, Inc. | BlackRock High Yield Municipal Fund | High Yield Municipal | Diversified | |||
| BlackRock National Municipal Fund | National Municipal | Diversified | ||||
| BlackRock Short-Term Municipal Fund | Short-Term Municipal | Diversified | ||||
BlackRock Multi-State Municipal Series Trust | BlackRock New York Municipal Opportunities Fund | New York Municipal | Diversified |
Each Fund offers multiple classes of shares. All classes of shares have identical voting, dividend, liquidation and other rights and are subject to the same terms and conditions, except that certain classes bear expenses related to the shareholder servicing and distribution of such shares. BlackRock, Institutional, Service, and Class K Shares are sold only to certain eligible investors. Investor A1, Investor B, Investor C1 Shares are only available through exchanges and distribution reinvestments by current holders and for purchase by certain employer-sponsored retirement plans. Investor A and Investor C Shares are generally available through financial intermediaries. Each class has exclusive voting rights with respect to matters relating to its shareholder servicing and distribution expenditures (except that Investor B shareholders may vote on material changes to the Investor A distribution and service plan).
| Share Class | Initial Sales Charge | CDSC | Conversion Privilege | |||
BlackRock, Institutional, Service Shares and Class K | No | No | None | |||
Investor A and Investor A1 Shares | Yes | No1 | None | |||
Investor B Shares | No | Yes | To Investor A Shares after 10 years | |||
Investor C and Investor C1 Shares | No | Yes | None |
| 1 | Investor A Shares may be subject to a CDSC where no initial sales charge was paid at the time of purchase. |
The Funds, together with certain other registered investment companies advised by BlackRock Advisors, LLC (the “Manager”) or its affiliates, are included in a complex of open-end funds referred to as the Equity-Bond Complex.
2. Significant Accounting Policies:
The financial statements are prepared in conformity with accounting principles generally accepted in the United States of America (“U.S. GAAP”), which may require management to make estimates and assumptions that affect the reported amounts of assets and liabilities in the financial statements, disclosure of contingent assets and liabilities at the date of the financial statements and the reported amounts of increases and decreases in net assets from operations during the reporting period. Actual results could differ from those estimates. Each Fund is considered an investment company under U.S. GAAP and follows the accounting and reporting guidance applicable to investment companies. Below is a summary of significant accounting policies:
Segregation and Collateralization: In cases where a Fund enters into certain investments (e.g., financial futures contracts) or certain borrowings (e.g., TOB transactions) that would be treated as “senior securities” for 1940 Act purposes, a Fund may segregate or designate on its books and records cash or liquid assets having a market value at least equal to the amount of its future obligations under such investments or borrowings. Doing so allows the investment or borrowing to be excluded from treatment as a “senior security.” Furthermore, if required by an exchange or counterparty agreement, the Funds may be required to deliver/deposit cash and/or securities to/with an exchange, or broker-dealer or custodian as collateral for certain investments or obligations.
Investment Transactions and Investment Income: For financial reporting purposes, investment transactions are recorded on the dates the transactions are entered into (the trade dates). Realized gains and losses on investment transactions are determined on the identified cost basis. Interest income, including amortization and accretion of premiums and discounts on debt securities, is recognized on the accrual basis. Income, expenses and realized and unrealized gains and losses are allocated daily to each class based on its relative net assets.
Distributions: Distributions from net investment income are declared monthly and paid monthly. Distributions of capital gains are recorded on the ex-dividend date. The character and timing of distributions are determined in accordance with federal income tax regulations, which may differ from U.S. GAAP.
Indemnifications: In the normal course of business, a Fund enters into contracts that contain a variety of representations that provide general indemnification. A Fund’s maximum exposure under these arrangements is unknown because it involves future potential claims against the Fund, which cannot be predicted with any certainty.
Other: Expenses directly related to a Fund or its classes are charged to that Fund or the applicable class. Other operating expenses shared by several funds, including other funds managed by the Manager, are prorated among those funds on the basis of relative net assets or other appropriate methods. Expenses directly related to the Funds and other shared expenses prorated to the Funds are allocated daily to each class based on its relative net assets or other appropriate methods.
| 70 | SEMI-ANNUAL REPORT | DECEMBER 31, 2015 |
| Notes to Financial Statements (continued) | ||||
The Funds have an arrangement with their custodian whereby fees may be reduced by credits earned on uninvested cash balances, which, if applicable, are shown as fees paid indirectly in the Statements of Operations. The custodian imposes fees on overdrawn cash balances, which can be offset by accumulated credits earned or may result in additional custody charges. Effective September 2015, the arrangement with their custodian for earning credits on uninvested cash balances has ceased and the custodian will be imposing fees on certain uninvested cash balances.
3. Investment Valuation and Fair Value Measurements:
Investment Valuation Policies: The Funds’ investments are valued at fair value (also referred to as “market value” within the financial statements) as of the close of trading on the New York Stock Exchange (“NYSE”) (generally 4:00 p.m., Eastern time). U.S. GAAP defines fair value as the price the Funds would receive to sell an asset or pay to transfer a liability in an orderly transaction between market participants at the measurement date. The Funds determine the fair values of their financial instruments using independent dealers or pricing services under policies approved by the Board of Directors of each Fund (the “Board”). The BlackRock Global Valuation Methodologies Committee (the “Global Valuation Committee”) is the committee formed by management to develop global pricing policies and procedures and to provide oversight of the pricing function for the Funds for all financial instruments.
Fair Value Inputs and Methodologies: The following methods (or “techniques”) and inputs are used to establish the fair value of each Fund’s assets and liabilities:
| • | Municipal investments (including commitments to purchase such investments on a “when-issued” basis) are valued on the basis of prices provided by dealers or pricing services. In determining the value of a particular investment, pricing services may use certain information with respect to transactions in such investments, quotations from dealers, pricing matrixes, market transactions in comparable investments and information with respect to various relationships between investments. |
| • | Investments in open-end U.S. mutual funds are valued at NAV each business day. |
| • | Financial futures contracts traded on exchanges are valued at their last sale price. |
If events (e.g., a company announcement, market volatility or a natural disaster) occur that are expected to materially affect the value of such instruments, or in the event that the application of these methods of valuation results in a price for an investment that is deemed not to be representative of the market value of such investment, or if a price is not available, the investment will be valued by the Global Valuation Committee, or its delegate, in accordance with a policy approved by the Board as reflecting fair value (“Fair Valued Investments”). When determining the price for Fair Valued Investments, the Global Valuation Committee, or its delegate, seeks to determine the price that each Fund might reasonably expect to receive or pay from the current sale or purchase of that asset or liability in an arm’s-length transaction. Fair value determinations shall be based upon all available factors that the Global Valuation Committee, or its delegate, deems relevant consistent with the principles of fair value measurement. The pricing of all Fair Valued Investments is subsequently reported to the Board or a committee thereof on a quarterly basis.
Fair Value Hierarchy: Various inputs are used in determining the fair value of investments and derivative financial instruments. These inputs to valuation techniques are categorized into a fair value hierarchy consisting of three broad levels for financial statement purposes as follows:
| • | Level 1 — unadjusted price quotations in active markets/exchanges for identical assets or liabilities that each Fund has the ability to access |
| • | Level 2 — other observable inputs (including, but not limited to, quoted prices for similar assets or liabilities in markets that are active, quoted prices for identical or similar assets or liabilities in markets that are not active, inputs other than quoted prices that are observable for the assets or liabilities (such as interest rates, yield curves, volatilities, prepayment speeds, loss severities, credit risks and default rates) or other market–corroborated inputs) |
| • | Level 3 — unobservable inputs based on the best information available in the circumstances, to the extent observable inputs are not available (including each Fund’s own assumptions used in determining the fair value of investments [and derivative financial instruments]) |
The hierarchy gives the highest priority to unadjusted quoted prices in active markets for identical assets or liabilities (Level 1 measurements) and the lowest priority to unobservable inputs (Level 3 measurements). Accordingly, the degree of judgment exercised in determining fair value is greatest for instruments categorized in Level 3. The inputs used to measure fair value may fall into different levels of the fair value hierarchy. In such cases, for disclosure purposes, the fair value hierarchy classification is determined based on the lowest level input that is significant to the fair value measurement in its entirety. The significant unobservable inputs used by the Global Valuation Committee in determining the price for Fair Valued Investments are typically categorized as Level 3. The fair value hierarchy for each Fund’s investments and derivative financial instruments has been included in the Schedules of Investments.
Changes in valuation techniques may result in transfers into or out of an assigned level within the hierarchy. In accordance with each Fund’s policy, transfers between different levels of the fair value hierarchy are deemed to have occurred as of the beginning of the reporting period. The categorization of a value determined for investments and derivative financial instruments is based on the pricing transparency of the investments and derivative financial instruments and is not necessarily an indication of the risks associated with investing in those securities.
| SEMI-ANNUAL REPORT | DECEMBER 31, 2015 | 71 |
| Notes to Financial Statements (continued) |
4. Securities and Other Investments:
Zero-Coupon Bonds: Zero-coupon bonds are normally issued at a significant discount from face value and do not provide for periodic interest payments. These bonds may experience greater volatility in market value than other debt obligations of similar maturity which provide for regular interest payments.
Forward Commitments and When-Issued Delayed Delivery Securities: Certain Funds may purchase securities on a when-issued basis and may purchase or sell securities on a forward commitment basis. Settlement of such transactions normally occurs within a month or more after the purchase or sale commitment is made. The Funds may purchase securities under such conditions with the intention of actually acquiring them, but may enter into a separate agreement to sell the securities before the settlement date. Since the value of securities purchased may fluctuate prior to settlement, the Funds may be required to pay more at settlement than the security is worth. In addition, the Funds are not entitled to any of the interest earned prior to settlement. When purchasing a security on a delayed delivery basis, the Funds assume the rights and risks of ownership of the security, including the risk of price and yield fluctuations. In the event of default by the counterparty, the Funds’ maximum amount of loss is the unrealized appreciation of unsettled when-issued transactions.
Municipal Bonds Transferred to TOB Trusts: Certain Funds leverage their assets through the use of TOB transactions. The Funds transfer municipal bonds into a special purpose trust (a “TOB Trust”). A TOB Trust generally issues two classes of beneficial interests: short-term floating rate interests (“TOB Trust Certificates”), which are sold to third party investors, and residual inverse floating rate interests (“TOB Residuals”), which are generally issued to the participating funds that contributed the municipal bonds to the TOB Trust. The TOB Trust Certificates have interest rates that generally reset weekly and their holders have the option to tender such certificates to the TOB Trust for redemption at par and any accrued interest at each reset date. The TOB Residuals held by a Fund generally provide the Fund with the right to cause the holders of a proportional share of the TOB Trust Certificates to tender their certificates to the TOB Trust at par plus accrued interest. The Funds may withdraw a corresponding share of the municipal bonds from the TOB Trust. Other funds managed by the investment advisor may also contribute municipal bonds to a TOB Trust into which a Fund has contributed bonds. If multiple BlackRock advised funds participate in the same TOB Trust, the economic rights and obligations under the TOB Residual will be shared among the funds ratably in proportion to their participation in the TOB Trust.
TOB Trusts are generally supported by a liquidity facility provided by a third party bank or other financial institution (the “Liquidity Provider”) that allows the holders of the TOB Trust Certificates to tender their certificates in exchange for payment of par plus accrued interest on any business day. The tendered TOB Trust Certificates may be purchased by the Liquidity Provider and are usually remarketed by a Remarketing Agent, which is typically an affiliated entity of the Liquidity Provider. The Remarketing Agent may also purchase the tendered TOB Trust Certificates for its own account in the event of a failed remarketing.
The TOB Trust may be collapsed without the consent of the Fund, upon the occurrence of tender option termination events (“TOTEs”) or mandatory termination events (“MTEs”), as defined in the TOB Trust agreements. TOTEs include the bankruptcy or default of the issuer of the municipal bonds held in the TOB Trust, a substantial downgrade in the credit quality of the issuer of the municipal bonds held in the TOB Trust, failure of any scheduled payment of principal or interest on the municipal bonds, and/or a judgment or ruling that interest on the municipal bond is subject to federal income taxation. MTEs may include, among other things, a failed remarketing of the TOB Trust Certificates, the inability of the TOB Trust to obtain renewal of the liquidity support agreement and a substantial decline in the market value of the municipal bonds held in the TOB Trust. Upon the occurrence of a TOTE or an MTE, the TOB Trust would be liquidated with the proceeds applied first to any accrued fees owed to the trustee of the TOB Trust, the Remarketing Agent and the Liquidity Provider (defined below). In the case of an MTE, after the payment of fees, the TOB Trust Certificate holders would be paid before the TOB Residual holders (i.e., the Funds). In contrast, in the case of a TOTE, after payment of fees, the TOB Trust Certificate holders and the TOB Residual holders would be paid pro rata in proportion to the respective face values of their certificates. During the six months ended December 31, 2015, no TOB Trusts in which the Funds participated were terminated without the consent of the Funds.
While the Funds’ investment policies and restrictions expressly permit investments in inverse floating rate securities, such as TOB Residuals, they generally do not allow the Funds to borrow money for purposes of making investments. The Funds’ management believes that the Fund’s restrictions on borrowings do not apply to the secured borrowings. A Fund’s transfer of the municipal bonds to a TOB Trust is considered a secured borrowing for financial reporting purposes. The cash received by the TOB Trust from the sale of the TOB Trust Certificates, less certain transaction expenses, is paid to the Fund. The Fund typically invests the cash received in additional municipal bonds. The municipal bonds deposited into a TOB Trust are presented in the Funds’ Schedules of Investments and the TOB Trust Certificates are shown in Other Liabilities in the Statements of Assets and Liabilities. Any loans drawn by the TOB Trust to purchase tendered TOB Trust Certificates would be shown as Loan for TOB Trust Certificates.
| • | Volcker Rule Impact: On December 10, 2013, regulators published final rules implementing section 619 of the Dodd-Frank Wall Street Reform and Consumer Protection Act (the “Volcker Rule”), which precludes banking entities and their affiliates from sponsoring and investing in TOB Trusts. Banking entities subject to the Volcker Rule were required to fully comply by July 21, 2015, with respect to investments in and relationships with TOB Trusts established after December 31, 2013 (“Non-Legacy TOB Trusts”), and by July 21, 2016, with respect to investments in and relationships with TOB Trusts established prior to December 31, 2013 (“Legacy TOB Trusts”). |
As a result, a new structure for TOB Trusts has been designed to ensure that no banking entity is sponsoring the TOB Trust. Specifically, the Fund will establish, structure and “sponsor” the TOB Trusts in which it holds TOB Residuals. In such a structure, certain responsibilities that previously belonged to a third
| 72 | SEMI-ANNUAL REPORT | DECEMBER 31, 2015 |
| Notes to Financial Statements (continued) | ||||
party bank will be performed by, or on behalf of, the Funds. The Funds have restructured any Non-Legacy TOB Trusts and are in the process of restructuring Legacy TOB Trusts in conformity with regulatory guidelines. Until all restructurings are completed, a Fund may, for a period of time, hold TOB Residuals in both Legacy TOB Trusts and non-bank sponsored restructured TOB Trusts.
Under the new TOB Trust structure, the Liquidity Provider or Remarketing Agent will no longer purchase the tendered TOB Trust Certificates even in the event of failed remarketing. This may increase the likelihood that a TOB Trust will need to be collapsed and liquidated in order to purchase the tendered TOB Trust Certificates. The TOB Trust may draw upon a loan from the Liquidity Provider to purchase the tendered TOB Trust Certificates. Any loans made by the Liquidity Provider will be secured by the purchased TOB Trust Certificates held by the TOB Trust and will be subject to an increased interest rate based on the number of days the loan is outstanding.
Accounting for TOB Trusts: The municipal bonds deposited into a TOB Trust are presented in the Funds’ Schedules of Investments and the TOB Trust Certificates are shown in Other Liabilities in the Statements of Assets and Liabilities. Any loans drawn by the TOB Trust to purchase tendered TOB Trust Certificates are shown as Loan for TOB Trust Certificates. The carrying amount of the Funds’ payable to the holder of the TOB Trust Certificates, as reported in the Statements of Assets and Liabilities as TOB Trust Certificates, approximates its fair value.
Interest income, including amortization and accretion of premiums and discounts, from the underlying municipal bonds is recorded by the Funds on an accrual basis. Interest expense incurred on the TOB transaction and other expenses related to remarketing, administration, trustee, liquidity and other services to a TOB Trust are shown as interest expense, fees and amortization of offering costs in the Statements of Operations. Fees paid upon creation of the TOB Trust are recorded as debt issuance costs and are amortized to interest expense, fees and amortization of offering costs in the Statements of Operations to the expected maturity of the TOB Trust. In connection with the restructurings of the TOB Trusts to comply with the Volcker Rule, the Funds incurred non-recurring, legal and restructuring fees, which are recorded as interest expense, fees and amortization of deferred offering costs in the Statements of Operations.
For the six months ended December 31, 2015, the following table is a summary of the Funds’ TOB Trusts:
| Underlying Municipal Bonds Transferred to TOB Trusts1 | Liability for TOB Trust Certificates2 | Range of Interest Rates | Average TOB Trust Certificates Outstanding | Daily Weighted Average Interest Rate | ||||||||||||||||
High Yield Municipal | $ | 96.376.965 | $ | 52,625,555 | 0.01% - 0.21% | $ | 41,650,410 | 0.69% | ||||||||||||
National Municipal | $ | 399,135,853 | $ | 178,529,971 | 0.01% - 0.13% | $ | 267,729,724 | 0.59% | ||||||||||||
New York Municipal | $ | 37,205,090 | $ | 20,010,373 | 0.01% - 0.14% | $ | 19,233,328 | 0.63% | ||||||||||||
| 1 | The municipal bonds transferred to a TOB Trust are generally high grade municipal bonds. In certain cases, when municipal bonds transferred are lower grade municipal bonds, the TOB transaction may include a credit enhancement feature that provides for the timely payment of principal and interest on the bonds to the TOB Trust by a credit enhancement provider in the event of default of the municipal bond. The TOB Trust would be responsible for the payment of the credit enhancement fee and the Funds, as TOB Residual holders, would be responsible for reimbursement of any payments of principal and interest made by the credit enhancement provider. The municipal bonds transferred to TOB Trusts with a credit enhancement are identified in the Schedules of Investments including the maximum potential amounts owed by the Funds. |
| 2 | The Funds may invest in TOB Trusts on either a non-recourse or recourse basis. When a Fund invests in TOB Trusts on a non-recourse basis, and the Liquidity Provider is required to make a payment under the liquidity facility, the Liquidity Provider will typically liquidate all or a portion of the municipal bonds held in the TOB Trust and then fund the balance, if any, of the amount owed under the liquidity facility over the liquidation proceeds (the “Liquidation Shortfall”). If the Funds invest in a TOB Trust on a recourse basis, the Funds will usually enter into a reimbursement agreement with the Liquidity Provider where the Funds are required to reimburse the Liquidity Provider the amount of any Liquidation Shortfall. As a result, if the Funds invest in a recourse TOB Trust, the Fund will bear the risk of loss with respect to any Liquidation Shortfall. If multiple funds participate in any such TOB Trust, these losses will be shared ratably, including the maximum potential amounts owed by the Funds at December 31, 2015, in proportion to their participation in the TOB Trust. The recourse TOB Trusts are identified in the Schedules of Investments including the maximum potential amounts owed by the Funds at December 31, 2015. |
5. Derivative Financial Instruments:
The Funds engage in various portfolio investment strategies using derivative contracts both to increase the returns of the Funds and/or to manage economically their exposure to certain risks such as interest rate risk. These contracts may be transacted on an exchange.
Financial Futures Contracts: Certain Funds invest in long and/or short positions in financial futures contracts and options on financial futures contracts to gain exposure to, or economically hedge against, changes in interest rates (interest rate risk). Financial futures contracts are agreements between the Funds and a counterparty to buy or sell a specific quantity of an underlying instrument at a specified price and at a specified date. Depending on the terms of the particular contract, financial futures contracts are settled either through physical delivery of the underlying instrument on the settlement date or by payment of a cash settlement amount on the settlement date.
Upon entering into a financial futures contract, the Funds are required to deposit initial margin with the broker in the form of cash or securities in an amount that varies depending on a contract’s size and risk profile. The initial margin deposit must then be maintained at an established level over the life of the contract. Securities deposited as initial margin are designated on the Schedules of Investments and cash deposited, if any, is recorded on the Statements of Assets and Liabilities as cash pledged for financial futures contracts. Pursuant to the contract, the Funds agree to receive from or pay to the
| SEMI-ANNUAL REPORT | DECEMBER 31, 2015 | 73 |
| Notes to Financial Statements (continued) |
broker an amount of cash equal to the daily fluctuation in value of the contract. Such receipts or payments are known as variation margin. Variation margin is recorded by the Funds as unrealized appreciation (depreciation) and, if applicable, as a receivable or payable for variation margin in the Statements of Assets and Liabilities.
When the contract is closed, the Funds record a realized gain or loss equal to the difference between the value of the contract at the time it was opened and the value at the time it was closed. The use of financial futures contracts involves the risk of an imperfect correlation in the movements in the price of financial futures contracts, interest or foreign currency exchange rates and the underlying assets.
6. Investment Advisory Agreement and Other Transactions with Affiliates:
The PNC Financial Services Group, Inc. is the largest stockholder and an affiliate of BlackRock, Inc. (“BlackRock”) for 1940 Act purposes.
The Corporation and the Trust, on behalf of the the Funds, entered into an Investment Advisory Agreement with the Manager, the Funds’ investment advisor, an indirect, wholly owned subsidiary of BlackRock, to provide investment advisory and administration services. The Manager is responsible for the management of each Fund’s portfolio and provides the personnel, facilities, equipment and certain other services necessary to the operations of each Fund. For such services, each Fund pays the Manager a monthly fee based on a percentage of each Fund’s average daily net assets at the following annual rates:
| High Yield Municipal: | ||||
| Portion of Average Daily Net Assets | Investment Advisory Fee | |||
First $250 Million | 0.550 | % | ||
$250 — $500 Million | 0.525 | % | ||
Greater than $500 Million | 0.500 | % | ||
| National Municipal and Short-Term Municipal: | ||||||||
| Rate of Investment Advisory Fee | ||||||||
| Aggregate of Average Daily Net Assets of the Two Combined Funds1 | National Municipal2 | Short-Term Municipal | ||||||
First $250 Million | 0.450 | % | 0.400 | % | ||||
$250 Million — $400 Million | 0.425 | % | 0.375 | % | ||||
$400 Million — $550 Million | 0.425 | % | 0.350 | % | ||||
Greater than $550 Million | 0.425 | % | 0.325 | % | ||||
| 2 | Effective October 1, 2015. |
Prior to October 1, 2015, the investment advisory fee rate for National Municipal was as follows:
| Aggregate of Average Daily Net Assets of the Two Combined Funds1 | ||||
First $250 Million | 0.500 | % | ||
Greater than $250 Million | 0.475 | % | ||
| 1 | The portion of the assets of a Fund to which the rate of each breakpoint level applies will be determined on a “uniform percentage” basis. The uniform percentage applicable to a breakpoint level is determined by dividing the amount of the aggregate average daily net assets of the two combined Funds that falls within that breakpoint level by the aggregate average daily net assets of the two combined Funds. The amount of the fee for a Fund at each breakpoint level is determined by multiplying the average daily net assets of that Fund by the uniform percentage applicable to that breakpoint level and multiplying the product by the advisory fee rate. |
| New York Municipal: | ||||
| Investment Advisory Fee | ||||
Portion of Average Daily Net Assets | 0.550% | |||
The Manager voluntarily agreed to waive a portion of its fees payable by New York Municipal, which is included in fees waived by Manager in the Statements of Operations, so that such fee is reduced for average daily net assets of the Fund as follows:
| Portion of Average Daily Net Assets | Rate | |||
First $500 Million | 0.550% | |||
$500 — $1 Billion | 0.525% | |||
Greater than $1 Billion | 0.500% | |||
The Manager voluntarily agreed to waive its investment advisory fees by the amount of investment advisory fees each Fund pays to the Manager indirectly through its investment in affiliated money market funds. These amounts are included in fees waived by the Manager in the Statements of Operations. However, the Manager does not waive its investment advisory fees by the amount of investment advisory fees paid in connection with each Fund’s investments in other affiliated investment companies, if any. For the six months ended December 31, 2015, the amounts waived were as follows:
| High Yield Municipal | National Municipal | Short-Term Municipal | New York Municipal | |||||||||||||
Amounts waived | — | $ | 3 | — | $ | 2,158 | ||||||||||
| 74 | SEMI-ANNUAL REPORT | DECEMBER 31, 2015 |
| Notes to Financial Statements (continued) | ||||
For National Municipal, Short-Term Municipal and New York Municipal, the Manager contractually agreed to waive and/or reimburse fees or expenses in order to limit expenses, excluding interest expense, dividend expense, tax expense, acquired fund fees and expenses and certain other fund expenses, which constitute extraordinary expenses not incurred in the ordinary course of each Fund’s business. The current expense limitations as a percentage of average daily net assets are as follows:
National Municipal | Short-Term Municipal | New York Municipal | ||||||||||
BlackRock | 0.46% | — | — | |||||||||
Institutional | — | 0.40% | 0.65% | |||||||||
Investor A | 0.72% | 0.69% | 0.89% | |||||||||
Investor A1 | — | 0.52% | — | |||||||||
Investor B | 1.23% | — | — | |||||||||
Investor C | 1.47% | 1.55% | 1.64% | |||||||||
Investor C1 | 1.28% | — | — | |||||||||
Class K | — | — | — | |||||||||
The Manager has agreed not to reduce or discontinue this contractual expense limitation prior to prior to November 1, 2016, unless approved by the Board, including a majority of the independent directors.
As a result, for National Municipal, Short-Term Municipal and New York Municipal, the Manager waived or reimbursed the following amounts which are shown as transfer agent fees waived and/or reimbursed — class specific in the Statements of Operations:
National Municipal | Short-Term Municipal | New York Municipal | ||||||||||
BlackRock | $ | 62,862 | — | — | ||||||||
Institutional | — | $ | 286,696 | $ | 12,213 | |||||||
Investor A | $ | 1,155,838 | $ | 2,386 | $ | 23,767 | ||||||
Investor A1 | — | — | — | |||||||||
Investor B | $ | 1,536 | — | — | ||||||||
Investor C | $ | 76,012 | $ | 13 | $ | 9,078 | ||||||
Investor C1 | $ | 9,861 | $ | 4,743 | — | |||||||
Class K | — | — | — | |||||||||
In addition, the following Funds had a waiver of investment advisory fees, which are included in fees waived by Manager in the Statements of Operations. For the six months ended December 31, 2015, the amounts waived were as follows:
National Municipal | Short-Term Municipal | New York Municipal | ||||||||||
Amounts | $ | 654,963 | $ | 21,549 | $ | 63,989 | ||||||
If during the Funds’ fiscal year the operating expenses of a share class, that at any time during the prior two fiscal years received a waiver or reimbursement from the Manager, are less than the expense limit for that share class, the Manager is entitled to be reimbursed by such share class up to the lesser of (a) the amount of fees waived or expenses reimbursed during those prior two fiscal years under the agreement and (b) the amount by which the expense limit for that share class exceeds the operating expenses of the share class for the current fiscal year, provided that: (1) the Funds, of which the share class is a part, has more than $50 million in assets for the fiscal year and (2) the Manager or an affiliate continues to serve as the Funds’ investment advisor or administrator. In the event the expense limit for a share class is changed subsequent to a fiscal year in which the Manager becomes entitled to reimbursement for fees waived or reimbursed, the amount available to reimburse the Manager shall be calculated by reference to the expense limit for that share class in effect at the time the Manager became entitled to receive such reimbursement, rather than the subsequently changed expense limit for that share class.
For the six months ended December 31, 2015, the Manager did not recoup any of New York Municipal’s fund level and class specific waivers and/or reimbursements.
On December 31, 2015, for New York Municipal, the Fund level and class specific waivers and/or reimbursements subject to possible future recoupment under the expense limitation agreement are as follows:
| Expiring June 30, 2017 | Expiring June 30, 2016 | |||||||
Fund level | $ | 63,989 | $ | 5,627 | ||||
Institutional | $ | 12,213 | $ | 2,003 | ||||
Investor A | $ | 23,767 | $ | 1,026 | ||||
Investor C | $ | 9,078 | $ | 633 | ||||
| SEMI-ANNUAL REPORT | DECEMBER 31, 2015 | 75 |
| Notes to Financial Statements (continued) |
For the six months ended December 31, 2015, the Funds reimbursed the Manager for certain accounting services, which is included in accounting services in the Statements of Operations. The reimbursements were as follows:
High Yield Municipal | National Municipal | Short-Term Municipal | New York Municipal | |||||||||||||
Amounts | $ | 62,468 | $ | 370,392 | $ | 71,944 | $ | 33,488 | ||||||||
The Corporation and the Trust, on behalf of their respective Funds, entered into a Distribution Agreement and Distribution and Service Plan with BlackRock Investments, LLC (“BRIL”), an affiliate of the Manager. Pursuant to the Distribution and Service Plan and in accordance with Rule 12b-1 under the 1940 Act, each Fund pays BRIL ongoing service and distribution fees. The fees are accrued daily and paid monthly at annual rates based upon the average daily net assets of the relevant share class of each Fund as follows:
| Service Fees | ||||||||||||||||
High Yield Municipal | National Municipal | Short-Term Municipal | New York Municipal | |||||||||||||
Service | — | 0.25% | — | — | ||||||||||||
Investor A | 0.25% | 0.25% | 0.25% | 0.25% | ||||||||||||
Investor A1 | — | — | 0.10% | 0.10% | ||||||||||||
Investor B | — | 0.25% | — | — | ||||||||||||
Investor C | 0.25% | 0.25% | 0.25% | 0.25% | ||||||||||||
Investor C1 | — | 0.25% | — | 0.25% | ||||||||||||
| Distribution Fees | ||||||||||||||||
High Yield Municipal | National Municipal | Short-Term Municipal | New York Municipal | |||||||||||||
Investor B | — | 0.50% | — | — | ||||||||||||
Investor C | 0.75% | 0.75% | 0.75% | 0.75% | ||||||||||||
Investor C1 | — | 0.55% | — | 0.35% | ||||||||||||
Pursuant to sub-agreements with BRIL, broker-dealers and BRIL provide shareholder servicing and distribution services to the Funds. The ongoing service and/or distribution fee compensates BRIL and each broker-dealer for providing shareholder servicing and/or distribution related services to Service, Investor A, Investor A1, Investor B, Investor C and Investor C1 shareholders.
Pursuant to written agreements, certain financial intermediaries, some of which may be affiliates, provide the Funds with sub-accounting, recordkeeping, sub-transfer agency and other administrative services with respect to sub-accounts they service. For these services, these entities receive an asset-based fee or an annual fee per shareholder account, which will vary depending on share class and/or net assets. For the six months ended December 31, 2015, the Funds paid the following amounts to affiliates of BlackRock in return for these services, which are included in transfer agent — class specific in the Statements of Operations:
High Yield Municipal | National Municipal | Short-Term Municipal | ||||||||||
Institutional | $ | 107 | $ | 531,683 | $ | 177,013 | ||||||
Service | — | $ | 87 | — | ||||||||
Investor A | — | $ | 905 | — | ||||||||
Investor C | — | $ | 15 | — | ||||||||
The Manager maintains a call center, which is responsible for providing certain shareholder services to the Funds, such as responding to shareholder inquiries and processing transactions based upon instructions from shareholders with respect to the subscription and redemption of Fund shares. For the six months ended December 31, 2015, each Fund reimbursed the Manager the following amounts for costs incurred in running the call center, which are included in transfer agent — class specific in the Statements of Operations:
| Call Center Fees | ||||||||||||||||
| High Yield Municipal | National Municipal | Short-Term Municipal | New York Municipal | |||||||||||||
BlackRock | — | $ | 52 | — | — | |||||||||||
Institutional | — | — | $ | 1,320 | $ | 184 | ||||||||||
Service | — | — | — | — | ||||||||||||
Investor A | — | $ | 6,908 | $ | 225 | $ | 242 | |||||||||
Investor A1 | — | — | $ | 145 | — | |||||||||||
Investor B | — | — | — | — | ||||||||||||
Investor C | — | $ | 1,472 | $ | 1 | $ | 126 | |||||||||
Investor C1 | — | $ | 184 | — | — | |||||||||||
Class K | — | — | — | — | ||||||||||||
| 76 | SEMI-ANNUAL REPORT | DECEMBER 31, 2015 |
| Notes to Financial Statements (continued) | ||||
Certain officers and/or directors of the Funds are officers and/or directors of BlackRock or its affiliates. The Funds reimburse the Manager for a portion of the compensation paid to the Funds’ Chief Compliance Officer, which is included in officer and directors in the Statements of Operations.
For the six months ended December 31, 2015, affiliates earned underwriting discounts, direct commissions and dealer concessions on sales of the Funds’ Investor A Shares as follows:
High Yield Municipal | National Municipal | Short-Term Municipal | New York Municipal | |||||||||||||
Investor A | $ | 11,919 | $ | 50,428 | $ | 3,457 | $ | 10,172 | ||||||||
For the six months ended December 31, 2015, affiliates received CDSCs as follows:
High Yield Municipal | National Municipal | Short-Term Municipal | New York Municipal | |||||||||||||
Investor A | $ | 9,993 | $ | 19,055 | $ | 17,407 | $ | 6,583 | ||||||||
Investor B | — | $ | 2 | — | — | |||||||||||
Investor C | $ | 4,429 | $ | 20,278 | $ | 2,099 | $ | 4,737 | ||||||||
Investor C1 | — | $ | 766 | — | — | |||||||||||
The Funds may purchase securities from, or sell securities to, an affiliated fund, provided the affiliation is due solely to having a common investment advisor, common officers, or common directors. For the six months ended December 31, 2015, the purchase and sale transactions with an affiliated fund in compliance with Rule 17a-7 under the 1940 Act were as follows:
| Purchases | Sales | |||||||
New York Municipal | $ | 3,113,845 | — | |||||
7. Purchases and Sales:
For the six months ended December 31, 2015, purchases and sales of investments, excluding short-term securities, were as follows:
| Purchases | Sales | |||||||
High Yield Municipal | $ | 155,548,078 | $ | 55,687,848 | ||||
National Municipal | $ | 2,334,779,847 | $ | 1,769,606,006 | ||||
Short-Term Municipal | $ | 218,717,367 | $ | 261,128,943 | ||||
New York Municipal | $ | 123,274,113 | $ | 38,065,341 | ||||
8. Income Tax Information:
It is the Funds’ policy to comply with the requirements of the Internal Revenue Code of 1986, as amended, applicable to regulated investment companies, and to distribute substantially all of their taxable income to their shareholders. Therefore, no federal income tax provision is required.
The Funds file U.S. federal and various state and local tax returns. No income tax returns are currently under examination. The statute of limitations on the Funds’ U.S. federal tax returns remains open for each of the four years ended June 30, 2015. The statutes of limitations on the Funds’ state and local tax returns may remain open for an additional year depending upon the jurisdiction.
Management has analyzed tax laws and regulations and their application to the Funds as of December 31, 2015, inclusive of the open tax return years, and does not believe there are any uncertain tax positions that require recognition of a tax liability in the Funds’ financial statements.
As of period end, the Funds had capital loss carryforwards available to offset future realized capital gains through the indicated expiration dates as follows:
| Expires June 30, | High Yield Municipal | National Municipal | Short-Term Municipal | New York Municipal | ||||||||||||||||
No expiration date1 | $ | 8,146,428 | $ | 34,524,810 | — | $ | 5,893,033 | |||||||||||||
2016 | — | 9,699,108 | $ | 322,206 | — | |||||||||||||||
2017 | 2,901,962 | 29,857,944 | — | 2,020,225 | ||||||||||||||||
2018 | 4,665,271 | 41,255,757 | — | 367,311 | ||||||||||||||||
2019 | 1,973,257 | — | — | 1,028,212 | ||||||||||||||||
|
| |||||||||||||||||||
Total | $ | 17,686,918 | $ | 115,337,619 | $ | 322,206 | $ | 9,308,781 | ||||||||||||
|
| |||||||||||||||||||
| 1 | Must be utilized prior to losses subject to expiration. |
As of period end, gross unrealized appreciation and depreciation based on cost for federal income tax purposes were as follows:
| High Yield Municipal | National Municipal | Short-Term Municipal | New York Municipal | |||||||||||||||||
Tax cost | $ | 595,654,150 | $ | 5,770,485,033 | $ | 603,906,642 | $ | 401,627,840 | ||||||||||||
|
| |||||||||||||||||||
Gross unrealized appreciation | $ | 42,024,636 | $ | 406,585,510 | $ | 539,892 | $ | 27,227,247 | ||||||||||||
Gross unrealized depreciation | (2,383,992 | ) | (777,304 | ) | (768,343 | ) | (541,007 | ) | ||||||||||||
|
| |||||||||||||||||||
Net unrealized appreciation (depreciation) | $ | $39,640,644 | $ | 405,808,206 | $ | (228,451 | ) | $ | 26,686,240 | |||||||||||
|
| |||||||||||||||||||
| SEMI-ANNUAL REPORT | DECEMBER 31, 2015 | 77 |
| Notes to Financial Statements (continued) |
9. Bank Borrowings:
The Corporation and the Trust, on behalf of the Funds, along with certain other funds managed by the Manager and its affiliates (“Participating Funds”), is a party to a 364-day, $2.1 billion credit agreement with a group of lenders, under which the Funds may borrow to fund shareholder redemptions. Excluding commitments designated for certain funds, the Participating Funds, including the Funds, can borrow up to an aggregate commitment amount of $1.6 billion at any time outstanding, subject to asset coverage and other limitations as specified in the agreement. The credit agreement has the following terms: a fee of 0.06% per annum on unused commitment amounts and interest at a rate equal to the higher of (a) one-month LIBOR (but, in any event, not less than 0.00%) on the date the loan is made plus 0.80% per annum or (b) the Fed Funds rate (but, in any event, not less than 0.00%) in effect from time to time plus 0.80% per annum on amounts borrowed. The agreement expires in April 2016 unless extended or renewed. Participating Funds paid administration, legal and arrangement fees, which, if applicable, are included in miscellaneous expenses in the Statements of Operations, and along with commitment fees, were allocated among such funds based upon portions of the aggregate commitment available to them and relative net assets of Participating Funds. During the six months ended December 31, 2015, the Funds did not borrow under the credit agreement.
10. Principal Risks:
Many municipalities insure repayment of their bonds, which may reduce the potential for loss due to credit risk. The market value of these bonds may fluctuate for other reasons, including market perception of the value of such insurance, and there is no guarantee that the insurer will meet its obligation.
Inventories of municipal bonds held by brokers and dealers may decrease, which would lessen their ability to make a market in these securities. Such a reduction in market making capacity could potentially decrease a Fund’s ability to buy or sell bonds. As a result, a Fund may sell a security at a lower price, sell other securities to raise cash, or give up an investment opportunity, any of which could have a negative impact on performance. If a Fund needed to sell large blocks of bonds, those sales could further reduce the bonds’ prices and impact performance.
In the normal course of business, the Funds invest in securities and enter into transactions where risks exist due to fluctuations in the market (market risk) or failure of the issuer to meet all its obligations, including the ability to pay principal and interest when due (issuer credit risk). The value of securities held by the Funds may decline in response to certain events, including those directly involving the issuers of securities owned by the Funds. Changes arising from the general economy, the overall market and local, regional or global political and/or social instability, as well as currency, interest rate and price fluctuations, may also affect the securities’ value.
TOB Trusts
The Funds may hold a significant amount of bonds subject to calls by the issuers at defined dates and prices. When bonds are called by issuers and the Funds reinvest the proceeds received, such investments may be in securities with lower yields than the bonds originally held, and correspondingly, could adversely impact the yield and total return performance of a Fund.
The new TOB Trust structure resulting from the compliance with Volcker Rule remains untested. It is possible that regulators could take positions that could limit the market for such newly structured TOB Trust transactions or the Funds’ ability to hold TOB Residuals. Under the new TOB Trust structure, the Funds will have certain additional duties and responsibilities, which may give rise to certain additional risks including, but not limited to, compliance, securities law and operational risks.
There can be no assurance that the Funds can successfully enter into restructured TOB Trust transactions in order to refinance their existing TOB Residual holdings prior to the compliance date for the Volcker Rule, which may require that the Funds unwind existing TOB Trusts.
Should short-term interest rates rise, the Funds’ investments in TOB transactions may adversely affect the Funds’ net investment income and dividends to shareholders. Also, fluctuations in the market value of municipal bonds deposited into the TOB Trust may adversely affect the Funds’ NAVs per share.
The SEC and various federal banking and housing agencies recently adopted credit risk retention rules for securitizations (the “Risk Retention Rules”), which take effect in December 2016. The Risk Retention Rules would require the sponsor of a TOB Trust to retain at least 5% of the credit risk of the underlying assets supporting the TOB Trust’s Municipal Bonds. The Risk Retention Rules may adversely affect the Funds’ ability to engage in TOB Trust transactions or increase the costs of such transactions in certain circumstances.
TOB Trust transactions constitute an important component of the municipal bond market. Accordingly, implementation of the Volcker Rule may adversely impact the municipal market, including through reduced demand for and liquidity of municipal bonds and increased financing costs for municipal issuers. Any such developments could adversely affect the Funds. The ultimate impact of these rules on the TOB market and the overall municipal market is not yet certain.
Counterparty Credit Risk: Similar to issuer credit risk, the Funds may be exposed to counterparty credit risk, or the risk that an entity may fail to or be unable to perform on its commitments related to unsettled or open transactions. The Funds manage counterparty credit risk by entering into transactions only with counterparties that the Manager believes have the financial resources to honor their obligations and by monitoring the financial stability of those counterparties. Financial assets, which potentially expose the Funds to market, issuer and counterparty credit risks, consist principally of financial instruments and receivables due from counterparties. The extent of the Funds’ exposure to market, issuer and counterparty credit risks with respect to these financial assets is approximately their value recorded in the Statements of Assets and Liabilities, less any collateral held by the Funds.
| 78 | SEMI-ANNUAL REPORT | DECEMBER 31, 2015 |
| Notes to Financial Statements (continued) | ||||
A derivative contract may suffer a mark-to-market loss if the value of the contract decreases due to an unfavorable change in the market rates or values of the underlying instrument. Losses can also occur if the counterparty does not perform under the contract.
With exchange-traded futures, there is less counterparty credit risk to the Funds since the exchange or clearinghouse, as counterparty to such instruments, guarantees against a possible default. The clearinghouse stands between the buyer and the seller of the contract; therefore, credit risk is limited to failure of the clearinghouse. While offset rights may exist under applicable law, a Fund does not have a contractual right of offset against a clearing broker or clearinghouse in the event of a default (including the bankruptcy or insolvency). Additionally, credit risk exists in exchange-traded futures with respect to initial and variation margin that is held in a clearing broker’s customer accounts. While clearing brokers are required to segregate customer margin from their own assets, in the event that a clearing broker becomes insolvent or goes into bankruptcy and at that time there is a shortfall in the aggregate amount of margin held by the clearing broker for all its clients, typically the shortfall would be allocated on a pro rata basis across all the clearing broker’s customers, potentially resulting in losses to the Funds.
Concentration Risk: New York Municipal invests a substantial amount of its assets in issuers located in a single state or limited number of states. This may subject the Fund to the risk that economic, political or social issues impacting a particular state or group of states could have an adverse and disproportionate impact on the income from, or the value or liquidity of, the Fund’s respective portfolio. Investment percentages in specific states or U.S. territories are presented in the Schedule of Investments.
As of period end, Short-Term Municipal invested a significant portion of its assets in securities in the state sector. New York Municipal invested a significant portion of its assets in securities in the county, city, special district, and school district sectors. Changes in economic conditions affecting such sectors would have a greater impact on the Funds and could affect the value, income and/or liquidity of positions in such securities.
Certain Funds may invest in municipal bonds below investment grade quality (sometimes called “junk bonds”), which are predominantly speculative, have greater credit risk and generally are less liquid and have more volatile prices than higher quality securities.
The Funds invest a significant portion of their assets in fixed-income securities and/or use derivatives tied to the fixed-income markets. Changes in market interest rates or economic conditions may affect the value and/or liquidity of such investments. Interest rate risk is the risk that prices of bonds and other fixed-income securities will increase as interest rates fall and decrease as interest rates rise. The Funds may be subject to a greater risk of rising interest rates due to the current period of historically low rates.
11. Capital Share Transactions:
Transactions in capital shares for each class were as follows:
| Six Months Ended December 31, 2015 | Year Ended June 30, 2015 | |||||||||||||||||
| High Yield Municipal | Shares | Amount | Shares | Amount | ||||||||||||||
| Institutional | ||||||||||||||||||
Shares sold | 10,569,079 | $ | 99,247,074 | 45,102,954 | $ | 423,065,828 | ||||||||||||
Shares issued in reinvestment of distributions | 456,546 | 4,287,368 | 1,000,744 | 9,390,641 | ||||||||||||||
Shares redeemed | (4,633,026 | ) | (43,241,877 | ) | (37,458,625 | ) | (352,592,076 | ) | ||||||||||
|
|
|
| |||||||||||||||
Net increase | 6,392,599 | $ | 60,292,565 | 8,645,073 | $ | 79,864,393 | ||||||||||||
|
|
|
| |||||||||||||||
| Investor A | ||||||||||||||||||
Shares sold | 4,923,058 | $ | 46,121,028 | 9,254,843 | $ | 86,320,049 | ||||||||||||
Shares issued in reinvestment of distributions | 270,146 | 2,532,300 | 455,687 | 4,259,873 | ||||||||||||||
Shares redeemed | (2,737,509 | ) | (25,566,740 | ) | (10,544,977 | ) | (97,769,831 | ) | ||||||||||
|
|
|
| |||||||||||||||
Net increase (decrease) | 2,455,695 | $ | 23,086,588 | (834,447 | ) | $ | (7,189,909 | ) | ||||||||||
|
|
|
| |||||||||||||||
| Investor C | ||||||||||||||||||
Shares sold | 680,366 | $ | 6,399,825 | 2,559,556 | $ | 24,094,275 | ||||||||||||
Shares issued in reinvestment of distributions | 76,365 | 717,179 | 142,625 | 1,336,310 | ||||||||||||||
Shares redeemed | (551,886 | ) | (5,163,766 | ) | (2,545,298 | ) | (23,540,341 | ) | ||||||||||
|
|
|
| |||||||||||||||
Net increase (decrease) | 204,845 | $ | 1,953,238 | 156,883 | $ | 1,890,244 | ||||||||||||
|
|
|
| |||||||||||||||
Total Net Increase | 9,053,139 | $ | 85,332,391 | 7,967,509 | $ | 74,564,728 | ||||||||||||
|
|
|
| |||||||||||||||
| National Municipal | ||||||||||||||||||
| BlackRock | ||||||||||||||||||
Shares sold | 67,597 | $ | 738,319 | 172,837 | $ | 1,900,188 | ||||||||||||
Shares issued in reinvestment of distributions | 238,059 | 2,602,997 | 502,814 | 5,518,768 | ||||||||||||||
Shares redeemed | (1,440,158 | ) | (15,698,036 | ) | (2,948,248 | ) | (32,361,822 | ) | ||||||||||
|
|
|
| |||||||||||||||
Net decrease | (1,134,502 | ) | $ | (12,356,720 | ) | (2,272,597 | ) | $ | (24,942,866 | ) | ||||||||
|
|
|
| |||||||||||||||
| SEMI-ANNUAL REPORT | DECEMBER 31, 2015 | 79 |
| Notes to Financial Statements (continued) |
| Six Months Ended December 31, 2015 | Year Ended June 30, 2015 | |||||||||||||||||
| National Municipal (concluded) | Shares | Amount | Shares | Amount | ||||||||||||||
| Institutional | ||||||||||||||||||
Shares sold | 75,184,784 | $ | 818,570,395 | 55,833,740 | $ | 613,105,629 | ||||||||||||
Shares issued in reinvestment of distributions | 2,315,308 | 25,324,575 | 3,523,411 | 38,668,413 | ||||||||||||||
Shares redeemed | (16,654,451 | ) | (181,805,701 | ) | (32,299,646 | ) | (354,184,923 | ) | ||||||||||
|
|
|
| |||||||||||||||
Net increase | 60,845,641 | $ | 662,089,269 | 27,057,505 | $ | 297,589,119 | ||||||||||||
|
|
|
| |||||||||||||||
| Service | ||||||||||||||||||
Shares sold | 41,962 | $ | 457,305 | 113,954 | $ | 1,251,903 | ||||||||||||
Shares issued in reinvestment of distributions | 1,729 | 18,890 | 2,857 | 31,287 | ||||||||||||||
Shares redeemed | (23,236 | ) | (253,680 | ) | (56,790 | ) | (618,780 | ) | ||||||||||
|
|
|
| |||||||||||||||
Net increase | 20,455 | $ | 222,515 | 60,021 | $ | 664,410 | ||||||||||||
|
|
|
| |||||||||||||||
| Investor A | ||||||||||||||||||
Shares sold | 37,335,367 | $ | 407,627,685 | 80,144,915 | $ | 879,503,968 | ||||||||||||
Shares issued in reinvestment of distributions | 3,250,825 | 35,563,891 | 5,786,719 | 63,549,696 | ||||||||||||||
Shares redeemed | (24,596,530 | ) | (268,653,411 | ) | (49,111,145 | ) | (539,239,530 | ) | ||||||||||
|
|
|
| |||||||||||||||
Net increase | 15,989,662 | $ | 174,538,165 | 36,820,489 | $ | 403,814,134 | ||||||||||||
|
|
|
| |||||||||||||||
| Investor B | ||||||||||||||||||
Shares sold | 3,733 | $ | 40,828, | 3,438 | $ | 37,908 | ||||||||||||
Shares issued in reinvestment of distributions | 1,754 | 19,168 | 5,828 | 63,943 | ||||||||||||||
Shares redeemed | (55,638 | ) | (606,533 | ) | (207,595 | ) | (2,270,700 | ) | ||||||||||
|
|
|
| |||||||||||||||
Net decrease | (50,151 | ) | $ | (546,537 | ) | (198,329 | ) | $ | (2,168,849 | ) | ||||||||
|
|
|
| |||||||||||||||
| Investor C | ||||||||||||||||||
Shares sold | 4,650,010 | $ | 50,871,270 | 5,941,576 | $ | 65,316,455 | ||||||||||||
Shares issued in reinvestment of distributions | 356,319 | 3,898,046 | 722,056 | 7,930,234 | ||||||||||||||
Shares redeemed | (2,507,001 | ) | (27,376,128 | ) | (5,856,453 | ) | (64,270,673 | ) | ||||||||||
|
|
|
| |||||||||||||||
Net increase | 2,499,328 | $ | 27,393,188 | 807,179 | $ | 8,976,016 | ||||||||||||
|
|
|
| |||||||||||||||
| Investor C1 | ||||||||||||||||||
Shares sold | 107 | $ | 1,166 | 16,455 | $ | 178,738 | ||||||||||||
Shares issued in reinvestment of distributions | 44,023 | 481,418 | 98,884 | 1,085,699 | ||||||||||||||
Shares redeemed | (276,382 | ) | (3,016,538 | ) | (761,168 | ) | (8,347,153 | ) | ||||||||||
|
|
|
| |||||||||||||||
Net decrease | (232,252 | ) | $ | (2,533,954 | ) | (645,829 | ) | $ | (7,082,716 | ) | ||||||||
|
|
|
| |||||||||||||||
Total Net Increase | 77,938,181 | $ | 848,805,926 | 61,628,439 | $ | 676,849,248 | ||||||||||||
|
|
|
| |||||||||||||||
| Short-Term Municipal | ||||||||||||||||||
| Institutional | ||||||||||||||||||
Shares sold | 5,751,080 | $ | 58,270,180 | 15,259,025 | $ | 154,700,384 | ||||||||||||
Shares issued in reinvestment of distributions | 44,023 | 446,272 | 104,379 | 1,058,434 | ||||||||||||||
Shares redeemed | (9,755,086 | ) | (98,872,524 | ) | (27,652,754 | ) | (280,338,097 | ) | ||||||||||
|
|
|
| |||||||||||||||
Net decrease | (3,959,983 | ) | $ | (40,156,072 | ) | (12,289,350 | ) | $ | (124,579,279 | ) | ||||||||
|
|
|
| |||||||||||||||
| Investor A | ||||||||||||||||||
Shares sold | 3,411,258 | $ | 34,569,005 | 5,017,051 | $ | 50,843,007 | ||||||||||||
Shares issued in reinvestment of distributions | 4,608 | 46,756 | 8,784 | 89,117 | ||||||||||||||
Shares redeemed | (4,290,740 | ) | (43,482,506 | ) | (8,587,605 | ) | (87,128,142 | ) | ||||||||||
|
|
|
| |||||||||||||||
Net decrease | (874,874 | ) | $ | (8,866,745 | ) | (3,561,770 | ) | $ | (36,196,018 | ) | ||||||||
|
|
|
| |||||||||||||||
| 80 | SEMI-ANNUAL REPORT | DECEMBER 31, 2015 |
| Notes to Financial Statements (continued) | ||||
| Six Months Ended December 31, 2015 | Year Ended June 30, 2015 | |||||||||||||||||
| Short-Term Municipal (concluded) | Shares | Amount | Shares | Amount | ||||||||||||||
| Investor A1 | ||||||||||||||||||
Shares sold | 3 | $ | 34 | 822 | $ | 8,350 | ||||||||||||
Shares issued in reinvestment of distributions | 2,854 | 28,954 | 5,245 | 53,234 | ||||||||||||||
Shares redeemed | (213,165 | ) | (2,160,949 | ) | (383,755 | ) | (3,894,078 | ) | ||||||||||
|
|
|
| |||||||||||||||
Net decrease | (210,308 | ) | $ | (2,131,961 | ) | (377,688 | ) | $ | (3,832,494 | ) | ||||||||
|
|
|
| |||||||||||||||
| Investor C | ||||||||||||||||||
Shares sold | 1,255,271 | $ | 12,481,137 | 1,325,819 | $ | 13,280,247 | ||||||||||||
Shares issued in reinvestment of distributions | 165 | 1,639 | — | — | ||||||||||||||
Shares redeemed | (685,883 | ) | (6,826,111 | ) | (2,025,529 | ) | (20,290,134 | ) | ||||||||||
|
|
|
| |||||||||||||||
Net increase (decrease) | 569,553 | $ | 5,656,665 | (699,710 | ) | $ | (7,009,887 | ) | ||||||||||
|
|
|
| |||||||||||||||
| Class K | ||||||||||||||||||
Shares sold | — | — | 7,841 | $ | 79,399 | |||||||||||||
Shares issued in reinvestment of distributions | 1,355 | $ | 13,742 | 3,287 | 33,323 | |||||||||||||
Shares redeemed | (148,272 | ) | (1,500,515 | ) | (213,202 | ) | (2,153,460 | ) | ||||||||||
|
|
|
| |||||||||||||||
Net decrease | (146,917 | ) | $ | (1,486,773 | ) | (202,074 | ) | $ | (2,040,738 | ) | ||||||||
|
|
|
| |||||||||||||||
Total Net Decrease | (4,622,529 | ) | $ | (46,984,886 | ) | (17,130,592 | ) | $ | (173,658,416 | ) | ||||||||
|
|
|
| |||||||||||||||
| New York Municipal Opportunities | ||||||||||||||||||
| Institutional | ||||||||||||||||||
Shares sold | 4,260,871 | $ | 46,858,261 | 6,829,410 | $ | 74,757,900 | ||||||||||||
Shares issued in reinvestment of distributions | 120,209 | 1,324,993 | 148,603 | 1,636,295 | ||||||||||||||
Shares redeemed | (746,139 | ) | (8,229,163 | ) | (2,906,311 | ) | (31,813,541 | ) | ||||||||||
|
|
|
| |||||||||||||||
Net increase | 3,634,941 | $ | 39,954,091 | 4,071,702 | $ | 44,580,654 | ||||||||||||
|
|
|
| |||||||||||||||
| Investor A | ||||||||||||||||||
Shares sold | 4,534,379 | $ | 49,850,788 | 5,313,915 | $ | 58,535,084 | ||||||||||||
Shares issued in reinvestment of distributions | 133,121 | 1,468,242 | 172,179 | 1,895,701 | ||||||||||||||
Shares redeemed | (708,472 | ) | (7,809,261 | ) | (2,199,385 | ) | (24,210,035 | ) | ||||||||||
|
|
|
| |||||||||||||||
Net increase | 3,959,028 | $ | 43,509,769 | 3,286,709 | $ | 36,220,750 | ||||||||||||
|
|
|
| |||||||||||||||
| Investor A1 | ||||||||||||||||||
Shares sold | 506 | $ | 5,856 | 10,627 | $ | 116,434 | ||||||||||||
Shares issued in reinvestment of distributions | 128,846 | 1,419,493 | 288,948 | 3,179,983 | ||||||||||||||
Shares redeemed | (525,158 | ) | (5,772,126 | ) | (1,010,068 | ) | (11,121,792 | ) | ||||||||||
|
|
|
| |||||||||||||||
Net decrease | (395,806 | ) | $ | (4,346,777 | ) | (710,493 | ) | $ | (7,825,375 | ) | ||||||||
|
|
|
| |||||||||||||||
| Investor C | ||||||||||||||||||
Shares sold | 1,540,343 | $ | 16,940,991 | 1,150,240 | $ | 12,623,904 | ||||||||||||
Shares issued in reinvestment of distributions | 42,120 | 464,355 | 63,969 | 703,690 | ||||||||||||||
Shares redeemed | (225,333 | ) | (2,469,885 | ) | (314,641 | ) | (3,451,754 | ) | ||||||||||
|
|
|
| |||||||||||||||
Net increase | 1,357,130 | $ | 14,935,461 | 899,568 | $ | 9,875,840 | ||||||||||||
|
|
|
| |||||||||||||||
| Investor C1 | ||||||||||||||||||
Shares sold | — | $ | — | 6 | $ | 65 | ||||||||||||
Shares issued in reinvestment of distributions | 6,493 | 71,533 | 14,812 | 162,982 | ||||||||||||||
Shares redeemed | (23,829 | ) | (261,854 | ) | (120,323 | ) | (1,320,232 | ) | ||||||||||
|
|
|
| |||||||||||||||
Net decrease | (17,336 | ) | $ | (190,321 | ) | (105,505 | ) | $ | (1,157,185 | ) | ||||||||
|
|
|
| |||||||||||||||
Total Net Increase | 8,537,957 | $ | 93,862,223 | 7,441,981 | $ | 81,694,684 | ||||||||||||
|
|
|
| |||||||||||||||
12. Subsequent Events:
Management has evaluated the impact of all subsequent events on the Funds through the date the financial statements were issued and has determined that there were no subsequent events requiring adjustment or additional disclosure in the financial statements.
| SEMI-ANNUAL REPORT | DECEMBER 31, 2015 | 81 |
| Officers and Directors |
Robert M. Hernandez, Chair of the Board and Director
Fred G. Weiss, Vice Chair of the Board and Director
James H. Bodurtha, Director
Bruce R. Bond, Director
Valerie G. Brown, Director
Donald W. Burton, Director
Honorable Stuart E. Eizenstat, Director
Robert Fairbairn, Director
Kenneth A. Froot, Director
Henry Gabbay, Director
John F. O’Brien, Director
Donald C. Opatrny, Director
Roberta Cooper Ramo, Director
David H. Walsh, Director
John M. Perlowski, Director, President and Chief Executive Officer
Jennifer McGovern, Vice President
Neal Andrews, Chief Financial Officer
Jay Fife, Treasurer
Charles Park, Chief Compliance Officer
Fernanda Piedra, Anti-Money Laundering Compliance Officer
Benjamin Archibald, Secretary
Investment Advisor BlackRock Advisors, LLC Wilmington, DE 19809 | Distributor BlackRock Investments, LLC New York, NY 10022 | Accounting Agent and Custodian State Street Bank and Trust Company Boston, MA 02110 | Legal Counsel Willkie Farr & Gallagher LLP New York, NY 10019 | Address of the Funds 100 Bellevue Parkway Wilmington, DE 19809 | ||||
Transfer Agent BNY Mellon Investment Servicing (US) Inc. Wilmington, DE 19809 | Independent Registered Public Accounting Firm Deloitte & Touche LLP Boston, MA 02116 | |||||||
| 82 | SEMI-ANNUAL REPORT | DECEMBER 31, 2015 |
| Additional Information |
| General Information |
Householding
The Funds will mail only one copy of shareholder documents, including prospectuses, annual and semi-annual reports and proxy statements, to shareholders with multiple accounts at the same address. This practice is commonly called “householding” and it is intended to reduce expenses and eliminate duplicate mailings of shareholder documents. Mailings of your shareholder documents may be householded indefinitely unless you instruct us otherwise. If you do not want the mailing of these documents to be combined with those for other members of your household, please call the Funds at (800) 441-7762.
Availability of Quarterly Schedule of Investments
The Funds file their complete schedules of portfolio holdings with the SEC for the first and third quarters of each fiscal year on Form N-Q. The Funds’ Forms N-Q are available on the SEC’s website at http://www.sec.gov and may also be reviewed and copied at the SEC’s Public Reference Room in Washington, D.C. Information on how to access documents on the SEC’s website without charge may be obtained by calling (800) SEC-0330. The Funds’ Forms N-Q may also be obtained upon request and without charge by calling (800) 441-7762.
Availability of Proxy Voting Policies and Procedures
A description of the policies and procedures that the Funds use to determine how to vote proxies relating to portfolio securities is available upon request and without charge (1) by calling (800) 441-7762; (2) at http://www.blackrock.com; and (3) on the SEC’s website at http://www.sec.gov.
Availability of Proxy Voting Record
Information about how the Funds voted proxies relating to securities held in the Funds’ portfolios during the most recent 12-month period ended June 30 is available upon request and without charge (1) at http://www.blackrock.com; or by calling (800) 441-7762; and (2) on the SEC’s website at http://www.sec.gov.
BlackRock’s Mutual Fund Family
BlackRock offers a diverse lineup of open-end mutual funds crossing all investment styles and managed by experts in equity, fixed income and tax-exempt investing. Visit http://www.blackrock.com for more information.
| SEMI-ANNUAL REPORT | DECEMBER 31, 2015 | 83 |
| Additional Information (concluded) |
| Shareholder Privileges |
Account Information
Call us at (800) 441-7762 from 8:00 AM to 6:00 PM EST on any business day to get information about your account balances, recent transactions and share prices. You can also reach us on the Web at http://www.blackrock.com/funds.
Automatic Investment Plans
Investor Class shareholders who want to invest regularly can arrange to have $50 or more automatically deducted from their checking or savings account and invested in any of the BlackRock funds.
Systematic Withdrawal Plans
Investor Class shareholders can establish a systematic withdrawal plan and receive periodic payments of $50 or more from their BlackRock funds, as long as their account balance is at least $10,000.
Retirement Plans
Shareholders may make investments in conjunction with Traditional, Rollover, Roth, Coverdell, Simple IRAs, SEP IRAs and 403(b) Plans.
| BlackRock Privacy Principles |
BlackRock is committed to maintaining the privacy of its current and former fund investors and individual clients (collectively, “Clients”) and to safeguarding their non-public personal information. The following information is provided to help you understand what personal information BlackRock collects, how we protect that information and why in certain cases we share such information with select parties.
If you are located in a jurisdiction where specific laws, rules or regulations require BlackRock to provide you with additional or different privacy-related rights beyond what is set forth below, then BlackRock will comply with those specific laws, rules or regulations.
BlackRock obtains or verifies personal non-public information from and about you from different sources, including the following: (i) information we receive from you or, if applicable, your financial intermediary, on applications, forms or other documents; (ii) information about your transactions with us, our affiliates, or others; (iii) information we receive from a consumer reporting agency; and (iv) from visits to our websites.
BlackRock does not sell or disclose to non-affiliated third parties any non-public personal information about its Clients, except as permitted by law or as is necessary to respond to regulatory requests or to service Client accounts. These non-affiliated third parties are required to protect the confidentiality and security of this information and to use it only for its intended purpose.
We may share information with our affiliates to service your account or to provide you with information about other BlackRock products or services that may be of interest to you. In addition, BlackRock restricts access to non-public personal information about its Clients to those BlackRock employees with a legitimate business need for the information. BlackRock maintains physical, electronic and procedural safeguards that are designed to protect the non-public personal information of its Clients, including procedures relating to the proper storage and disposal of such information.
| 84 | SEMI-ANNUAL REPORT | DECEMBER 31, 2015 |
This report is intended for current holders. It is not authorized for use as an offer of sale or a solicitation of an offer to buy shares of the Funds unless preceded or accompanied by the Funds’ current prospectus. Past performance results shown in this report should not be considered a representation of future performance. Investment returns and principal value of shares will fluctuate so that shares, when redeemed, may be worth more or less than their original cost. Statements and other information herein are as dated and are subject to change.

| MBNYMB-12/15-SAR |  |
| Item 2 – | Code of Ethics – Not Applicable to this semi-annual report | |
| Item 3 – | Audit Committee Financial Expert – Not Applicable to this semi-annual report | |
| Item 4 – | Principal Accountant Fees and Services – Not Applicable to this semi-annual report | |
| Item 5 – | Audit Committee of Listed Registrants – Not Applicable | |
| Item 6 – | Investments (a) The registrant’s Schedule of Investments is included as part of the Report to Stockholders filed under Item 1 of this Form. (b) Not Applicable due to no such divestments during the semi-annual period covered since the previous Form N-CSR filing. | |
| Item 7 – | Disclosure of Proxy Voting Policies and Procedures for Closed-End Management Investment Companies – Not Applicable | |
| Item 8 – | Portfolio Managers of Closed-End Management Investment Companies – Not Applicable | |
| Item 9 – | Purchases of Equity Securities by Closed-End Management Investment Company and Affiliated Purchasers – Not Applicable | |
| Item 10 – | Submission of Matters to a Vote of Security Holders –There have been no material changes to these procedures. | |
| Item 11 – | Controls and Procedures | |
| (a) – The registrant’s principal executive and principal financial officers, or persons performing similar functions, have concluded that the registrant’s disclosure controls and procedures (as defined in Rule 30a-3(c) under the Investment Company Act of 1940, as amended (the “1940 Act”)) are effective as of a date within 90 days of the filing of this report based on the evaluation of these controls and procedures required by Rule 30a-3(b) under the 1940 Act and Rule 15d-15(b) under the Securities Exchange Act of 1934, as amended. | ||
| (b) – There were no changes in the registrant’s internal control over financial reporting (as defined in Rule 30a-3(d) under the 1940 Act) that occurred during the second fiscal quarter of the period covered by this report that have materially affected, or are reasonably likely to materially affect, the registrant’s internal control over financial reporting. | ||
| Item 12 – | Exhibits attached hereto | |
| (a)(1) – Code of Ethics – Not Applicable to this semi-annual report | ||
| (a)(2) – Certifications – Attached hereto | ||
| (a)(3) – Not Applicable | ||
| (b) – Certifications – Attached hereto | ||
2
Pursuant to the requirements of the Securities Exchange Act of 1934 and the Investment Company Act of 1940, the registrant has duly caused this report to be signed on its behalf by the undersigned, thereunto duly authorized.
BlackRock Municipal Bond Fund, Inc.
| By: | /s/ John M. Perlowski | |||
| John M. Perlowski | ||||
| Chief Executive Officer (principal executive officer) of | ||||
| BlackRock Municipal Bond Fund, Inc. | ||||
Date: March 1, 2016
Pursuant to the requirements of the Securities Exchange Act of 1934 and the Investment Company Act of 1940, this report has been signed below by the following persons on behalf of the registrant and in the capacities and on the dates indicated.
| By: | /s/ John M. Perlowski | |||
| John M. Perlowski | ||||
| Chief Executive Officer (principal executive officer) of | ||||
| BlackRock Municipal Bond Fund, Inc. | ||||
| Date: March 1, 2016 | ||||
By: | /s/ Neal J. Andrews | |||
| Neal J. Andrews | ||||
| Chief Financial Officer (principal financial officer) of | ||||
| BlackRock Municipal Bond Fund, Inc. | ||||
| Date: March 1, 2016 | ||||
3