UNITED STATES
SECURITIES AND EXCHANGE COMMISSION
Washington, D.C. 20549
FORM N-CSR
CERTIFIED SHAREHOLDER REPORT OF REGISTERED
MANAGEMENT INVESTMENT COMPANIES
Investment Company Act file number 811-02884
Barrett Opportunity Fund, Inc.
(Exact name of registrant as specified in charter)
90 Park Avenue
New York, NY 10016
(Address of principal executive offices) (Zip code)
Peter Shriver
90 Park Avenue
New York, NY 10016
(Name and address of agent for service)
(212) 983-5080
Registrant's telephone number, including area code
Date of fiscal year end: August 31
Date of reporting period: February 28, 2013
Item 1. Reports to Stockholders.
BARRETT
OPPORTUNITY FUND, INC.
February 28, 2013
| INVESTMENT PRODUCTS: NOT FDIC INSURED • NO BANK GUARANTEE • MAY LOSE VALUE |
OPPORTUNITY FUND, INC.
Semi-Annual Report • February 28, 2013
| Fund Objectives | The Fund seeks to achieve above average long-term capital appreciation. Current income is a secondary objective. The Fund invests primarily in common stocks and securities convertible into or exchangeable for common stock such as convertible preferred stock or convertible debt securities. |
| What’s Inside | Letter from the Chairperson | | | 1 | |
| | | | | | |
| | Manager Overview | | | 1 | |
| | | | | | |
| | Fund at a Glance | | | 4 | |
| | | | | | |
| | Fund Expenses | | | 5 | |
| | | | | | |
| | Schedule of Investments | | | 6 | |
| | | | | | |
| | Statement of Assets & Liabilities | | | 8 | |
| | | | | | |
| | Statement of Operations | | | 9 | |
| | | | | | |
| | Statements of Changes in Net Assets | | | 10 | |
| | | | | | |
| | Financial Highlights | | | 11 | |
| | | | | | |
| | Notes to Financial Statements | | | 12 | |
| | | | | | |
| | Additional Information | | | 18 | |
| | | | | | |
| | Important Tax Information | | | 20 | |
| Letter from the Chairperson | Dear Shareholder, |
| | |
| | We are pleased to provide the semi-annual report of the Barrett Opportunity Fund, Inc.1 (the “Fund”) for the six-month period ended February 28th, 2013. |
| | |
| | The management team at Barrett Asset Management, LLC has prepared the enclosed Manager’s Overview, which includes a brief market overview, as well as a performance review. I urge you to read it as well as the accompanying financial statements. A detailed summary of the Fund’s performance and other pertinent information are also included in this report. I am sure you will find this report informative and useful. |
| | |
| | On behalf of the Directors and the officers of the Fund, I thank you for your ongoing confidence in the Fund and its investment policies. |
| | |
| | Sincerely, |
| |  |
| | Rosalind A. Kochman |
| | Chairperson |
| | April 1, 2013 |
| | 1 | The Fund was formerly known as the Salomon Brothers Opportunity Fund Inc. The Fund name, investment manager and certain investment policies were changed effective December 1, 2006. |
| Manager | Market Overview |
| Overview | The U.S. stock market sold off in the month prior to the elections in November and continued to sell off for a brief period post the elections. However, by mid-November the market shook off the post election blahs and rallied through year end and well into the New Year. |
| | |
| | Since the market is now approaching the highs reached in 2000 and 2007, it is reasonable to question whether it will finally break through decisively to all-time highs or follow the pattern of the prior two periods and suffer a material decline. We think the market has moved from undervalued at its bottom in March, 2009 to more neutral territory currently. We expect stocks to most likely work higher over the remainder of 2013. The following factors are the major reasons that the market is likely to show continued strength: |
| | • | Although the S&P 500 has advanced some 120% from its bottom, earnings have roughly doubled during this period. |
OPPORTUNITY FUND, INC.
| | • | Central bankers around the globe are keeping interest rates low in an attempt to accelerate economic activity. Monetary policy will likely remain accommodative into 2014. |
| | • | U.S. investors are just starting to move money into stock funds and individual investors have only 36% of their financial assets in stocks. Low interest rates on cash and bonds are likely to perpetuate this new trend. |
| | • | U.S. corporations are buying back stocks and increasing dividends at aggressive rates. |
| | • | The broad market is selling at 13.4 times earnings, considerably below prior peaks and an average price/earnings ratio of 14.5 times earnings. |
| | • | The U.S. budget deficit has improved from its worst point, and investors are becoming immune to the histrionics in Washington. |
| | There are some less positive developments that we are monitoring. For one, the European economy is at best flat and is susceptible to further weakness. Due to the lackluster global growth, companies are not sufficiently increasing revenues and are resorting to price cutting to maintain their market share. This trend is most apparent in technology, where budgets are flat versus last year. Profit margins are already at peak levels and earnings growth going forward is slowing. We are also watching to see how new onerous regulations will affect profitability in health care and how well the defense sector can withstand budget cuts. There are other signs that signal caution including increases in management selling their company stock. All in all, we think the positives outweigh the negatives and the market can move higher but is likely to become more discriminating going forward. |
| | |
| | Performance Review |
| | For the six months ended February 28, 2013, the Fund gained +11.91% compared to a gain of +8.95% for the S&P 500 and +11.49% for the Lipper Large-Cap Value Fund Index. The best performing major segments of the market during this period were financial and industrial stocks. The worst performing sectors were technology and consumer staples. The largest capitalization stocks in the S&P 500 underperformed the broad market, to some extent due to the decline in Apple, which is the largest holding in the Index. During the six month period, the best performers in the Fund relative to the broader market included Leucadia National, Murphy Oil, Philips Electronics, and Bank of New York Mellon. Chubb, which is the largest holding in the Fund, also outpaced the market. The underperformers during the period included Royal Dutch, Forest City Enterprises, and General Dynamics. |
| | |
| | Thank you for your continued interest in the Fund. |
| |  |  |
| | | |
| | Robert Milnamow | E. Wells Beck, CFA |
| | Portfolio Manager | Portfolio Manager |
| | Past performance is not a guarantee of future results. |
| | |
| | The outlook, views, and opinions presented are those of the Adviser as of April 10, 2013. These are not intended to be a forecast of future events, a guarantee of future results, nor investment advice. |
| | |
| | The Fund is non-diversified, which means that it can invest a higher percentage of its assets in any one issuer. Investing in a non-diversified fund may entail greater risks than is normally associated with more widely diversified funds. The Fund may use derivatives, such as options and futures, which can be illiquid, may disproportionately increase losses, and have a potentially large impact on fund performance. Investing in foreign securities is subject to certain risks not associated with domestic investing, such as currency fluctuations, and changes in political and economic conditions. These risks are magnified in emerging or developing markets. The Fund may use leverage, which may adversely impact performance. Investments in debt securities typically decrease when interest rates rise. These risks are greater for longer-term debt securities. |
| | |
| | Lipper Large-Cap Value Funds Index includes funds that, by portfolio practice, invest at least 75% of their equity assets in companies with market capitalizations (on a three year weighted basis) above Lipper’s U.S. Diversified Equity large-cap floor. The S&P 500® Index is a market value weighted index comprised of 500 widely held common stocks. It is not possible to invest directly in an Index. A price/earnings ratio is a valuation ratio of a security’s current share price compared to its per-share earnings. |
| | |
| | Fund holdings and sector allocations are subject to change and should not be considered a recommendation to buy or sell any security. For a complete list of portfolio holdings, please refer the Schedule of Investments provided in this report. |
| | |
| | The Barrett Opportunity Fund is distributed by Quasar Distributors, LLC. |
Fund at a Glance (Unaudited)
Top Ten Holdings - as of 2/28/2013
(As a percentage of Total Investments)
| | The Chubb Corp. | | | 20.3 | % | |
| | Royal Dutch Shell PLC - Class A - ADR | | | 13.5 | % | |
| | The Bank of New York Mellon Corp. | | | 10.5 | % | |
| | General Dynamics Corp. | | | 9.0 | % | |
| | Murphy Oil Corp. | | | 8.7 | % | |
| | Koninklijke Philips Elections N.V. | | | 7.6 | % | |
| | Rayonier, Inc. | | | 7.4 | % | |
| | Leucadia National Corp. | | | 5.6 | % | |
| | Monsanto Co. | | | 3.3 | % | |
| | Forest City Enterprises, Inc. - Class B | | | 2.9 | % | |
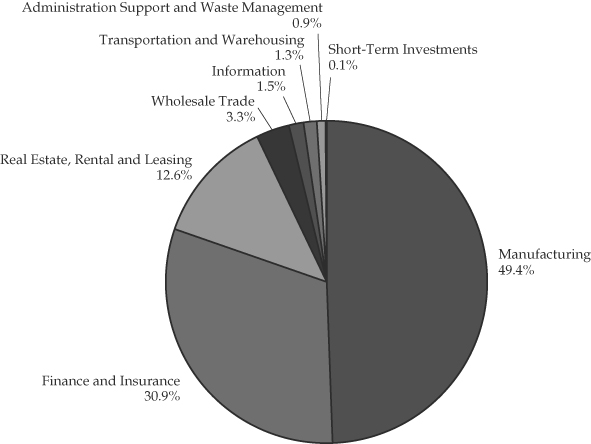
Sector Weightings - as of 2/28/2013
(As a percentage of Total Investments)
Fund Expenses (Unaudited)
Example
��
As a shareholder of the Fund, you may incur two types of costs: (1) transaction costs; and (2) ongoing costs, including management fees and other Fund expenses. This example is intended to help you understand your ongoing costs (in dollars) of investing in the Fund and to compare these costs with the ongoing costs of investing in other mutual funds.
This example is based on an investment of $1,000 invested on September 1, 2012 and held for the six months ended February 28, 2013.
Actual Expenses
The first line of the table below provides information about actual account values and actual expenses. You may use the information provided in this table, together with the amount you invested, to estimate the expenses that you paid over the period. To estimate the expenses you paid on your account, divide your ending account value by $1,000 (for example, an $8,600 ending account value divided by $1,000 = 8.6), then multiply the result by the number under the heading entitled “Expenses Paid During the Period”.
Hypothetical Example for Comparison Purposes
The second line of the table below provides information about hypothetical account values and hypothetical expenses based on the actual expense ratio and an assumed rate of return of 5.00% per year before expenses, which is not the Fund’s actual return. The hypothetical account values and expenses may not be used to estimate the actual ending account balance or expenses you paid for the period. You may use the information provided in this table to compare the ongoing costs of investing in the Fund and other funds. To do so, compare the 5.00% hypothetical example relating to the Fund with the 5.00% hypothetical examples that appear in the shareholder reports of the other funds.
Please note that the expenses shown in the table below are meant to highlight your ongoing costs only and do not reflect any transactional costs. Therefore, the table is useful in comparing ongoing costs only, and will not help you determine the relative total costs of owning different funds. In addition, if these transaction costs were included, your costs would have been higher.
| | | | Expenses Paid |
| | Beginning | Ending | During the Period* |
| | Account | Account | September 1, 2012 to |
| | Value | Value | February 28, 2013 |
| Actual Barrett Opportunity Fund, Inc. Expenses | $1,000.00 | $1,119.10 | $6.31 |
| Hypothetical Expenses | | | |
| (5% return per year before expenses) | $1,000.00 | $1,018.84 | $6.01 |
| * | Expenses are equal to the Fund’s annualized six-month expense ratio of 1.20% (which reflects fee waivers in place during the period), multiplied by the average account value over the period, multiplied by 181/365 (to reflect the one-half year period). |
Schedule of Investments
February 28, 2013 (Unaudited)
| Shares | | | | Value | |
| | | COMMON STOCKS - 92.41% | | | |
| | | | | | |
| | | Beverage and | | | |
| | | Tobacco Product | | | |
| | | Manufacturing - 1.40% | | | |
| | 12,680 | | Crimson Wine Group Ltd. (a) | | $ | 102,074 | |
| | 10,000 | | PepsiCo, Inc. | | | 757,700 | |
| | | | | | | 859,774 | |
| | | | Chemical | | | | |
| | | | Manufacturing - 2.00% | | | | |
| | 12,000 | | Abbott Laboratories | | | 405,480 | |
| | 12,000 | | AbbVie, Inc. | | | 443,040 | |
| | 5,000 | | Johnson & Johnson | | | 380,550 | |
| | | | | | | 1,229,070 | |
| | | | Computer and | | | | |
| | | | Electronic Product | | | | |
| | | | Manufacturing - 7.58% | | | | |
| | 164,710 | | Koninklijke Philips Electronics | | | | |
| | | | NV - NY Registered | | | | |
| | | | Shares - ADR | | | 4,661,293 | |
| | | | | | | | |
| | | | Credit Intermediation and | | | | |
| | | | Related Activities - 10.53% | | | | |
| | 238,471 | | The Bank of New York | | | | |
| | | | Mellon Corp. | | | 6,472,103 | |
| | | | | | | | |
| | | | Data Processing, Hosting | | | | |
| | | | and Related Services - 1.50% | | | | |
| | 15,000 | | Automatic Data Processing, Inc. | | | 920,400 | |
| | | | | | | | |
| | | | Insurance Carriers and | | | | |
| | | | Related Activities - 20.29% | | | | |
| | 148,500 | | The Chubb Corp. | | | 12,478,455 | |
| | | | | | | | |
| | | | Merchant Wholesalers, | | | | |
| | | | Nondurable Goods - 3.32% | | | | |
| | 20,242 | | Monsanto Co. | | | 2,045,049 | |
| | | | | | | | |
| | | | Miscellaneous | | | | |
| | | | Manufacturing - 1.69% | | | | |
| | 10,000 | | 3M Co. | | | 1,040,000 | |
| | | | | | | | |
| | | | Petroleum and Coal Products | | | | |
| | | | Manufacturing - 22.11% | | | | |
| | 87,300 | | Murphy Oil Corp. | | | 5,314,824 | |
| | 126,100 | | Royal Dutch Shell PLC - | | | | |
| | | | Class A - ADR | | | 8,278,465 | |
| | | | | | | 13,593,289 | |
| | | | Real Estate - 6.51% | | | | |
| | 22,800 | | Alexander & Baldwin, Inc. (a) | | | 803,244 | |
| | 87,400 | | Forest City Enterprises, | | | | |
| | | | Inc. - Class A (a) | | | 1,401,896 | |
| | 112,500 | | Forest City Enterprises, | | | | |
| | | | Inc. - Class B (a)(b) | | | 1,797,750 | |
| | | | | | | 4,002,890 | |
| | | | Transportation Equipment | | | | |
| | | | Manufacturing - 9.02% | | | | |
| | 81,600 | | General Dynamics Corp. | | | 5,546,352 | |
| | | | | | | | |
| | | | Waste Management and | | | | |
| | | | Remediation Services - 0.91% | | | | |
| | 86,850 | | TRC Cos, Inc. (a) | | | 559,314 | |
| | | | | | | | |
| | | | Wood Product | | | | |
| | | | Manufacturing - 5.55% | | | | |
| | 126,800 | | Leucadia National Corp. | | | 3,410,920 | |
| | | | Total Common Stocks | | | | |
| | | | Cost ($6,967,038) | | | 56,818,909 | |
| | | | | | | | |
The accompanying notes are an integral part of these financial statements.
Schedule of Investments
February 28, 2013 (Unaudited)
| | | | | | |
| Shares | | | | Value | |
| | | REAL ESTATE INVESTMENT | | | |
| | | TRUSTS (REITS) - 7.40% | | | |
| | | | | | |
| | | Real Estate - 7.40% | | | |
| | 81,485 | | Rayonier, Inc. | | $ | 4,552,567 | |
| | | | Total Real Estate Investment | | | | |
| | | | Trusts Cost ($761,460) | | | 4,552,567 | |
| | | | | | | | |
| | | | | | | | |
| | | | SHORT-TERM | | | | |
| | | | INVESTMENTS - 0.09% | | | | |
| | | | | | | | |
| | | | Money Market Fund - 0.09% | | | | |
| | 52,371 | | Fidelity Institutional Money | | | | |
| | | | Market Fund - Government | | | | |
| | | | Portfolio - Class I, 0.01% (c) | | $ | 52,371 | |
| | | | Total Short-Term Investments | | | | |
| | | | Cost ($52,371) | | | 52,371 | |
| | | | | | | | |
| | | | Total Investments | | | | |
| | | | (Cost $7,780,869) - 99.90% | | | 61,423,847 | |
| | | | Other Assets in Excess | | | | |
| | | | of Liabilities - 0.10% | | | 60,029 | |
| | | | Total Net Assets - 100.00% | | $ | 61,483,876 | |
| | | | | | | | |
Percentages are stated as a percent of net assets.
ADR - American Depository Receipt
(a)Non-income producing security.
(b)Convertible into Forest City Enterprises, Inc. - Class A shares.
(c)Variable rate security. The rate listed is as of February 28, 2013.
The accompanying notes are an integral part of these financial statements.
Statement of Assets & Liabilities
February 28, 2013 (Unaudited)
| ASSETS: | | | |
| Investments, at value (cost $7,780,869) | | $ | 61,423,847 | |
| Dividend and interest receivable | | | 134,236 | |
| Other assets | | | 13,130 | |
| Total Assets | | | 61,571,213 | |
| | | | | |
| LIABILITIES: | | | | |
| Payable to adviser | | | 33,106 | |
| Payable for Fund shares redeemed | | | 26 | |
| Payable to directors | | | 9,127 | |
| Other accrued expenses | | | 45,078 | |
| Total Liabilities | | | 87,337 | |
| | | | | |
| NET ASSETS | | $ | 61,483,876 | |
| | | | | |
| NET ASSETS CONSIST OF: | | | | |
| Capital stock | | $ | 3,449,905 | |
| Accumulated undistributed net investment income | | | 79,436 | |
| Accumulated undistributed net realized gain | | | 4,311,557 | |
| Net unrealized appreciation on investments | | | 53,642,978 | |
| Total Net Assets | | $ | 61,483,876 | |
| | | | | |
| Shares outstanding | | | 1,942,218 | |
| Net asset value, offering price and redemption price | | | | |
| per share (15,000,000 shares authorized, $0.01 par value) | | $ | 31.66 | |
The accompanying notes are an integral part of these financial statements.
Statement of Operations
Period Ended February 28, 2013 (Unaudited)
| INVESTMENT INCOME: | | | |
| Dividend income* | | $ | 942,013 | |
| Interest income | | | 15 | |
| | | | 942,028 | |
| EXPENSES: | | | | |
| Investment advisory fees (see Note 2) | | | 214,805 | |
| Legal fees | | | 34,620 | |
| Directors’ fees and expenses | | | 27,151 | |
| Administration fees | | | 20,395 | |
| Transfer agent fees and expenses | | | 13,874 | |
| Fund accounting fees | | | 13,321 | |
| Federal and state registration fees | | | 12,833 | |
| Audit fees | | | 7,791 | |
| Reports to shareholders | | | 4,652 | |
| Custody fees | | | 3,059 | |
| Other | | | 17,175 | |
| Net expenses | | | 369,676 | |
| Net investment income | | | 572,352 | |
| | | | | |
| REALIZED AND UNREALIZED GAIN ON INVESTMENTS: | | | | |
| Net realized gain on investments | | | 5,141,484 | |
| Change in net unrealized appreciation on investments | | | 1,164,181 | |
| Net realized and unrealized gain on investments | | | 6,305,665 | |
| NET INCREASE IN NET ASSETS RESULTING FROM OPERATIONS | | $ | 6,878,017 | |
| * | Net of $33,824 of foreign taxes withheld. |
The accompanying notes are an integral part of these financial statements.
Statements of Changes in Net Assets
| | | Period Ended | | | Year Ended | |
| | | February 28, 2013 | | | August 31, 2012 | |
| | | (Unaudited) | | | | |
| OPERATIONS: | | | | | | |
| Net investment income | | $ | 572,352 | | | $ | 774,867 | |
| Net realized gain on investments | | | 5,141,484 | | | | 8,104,113 | |
| Change in net unrealized | | | | | | | | |
| appreciation/(depreciation) on investments | | | 1,164,181 | | | | (3,184,160 | ) |
| Net increase in net assets resulting from operations | | | 6,878,017 | | | | 5,694,820 | |
| | | | | | | | | |
| DIVIDENDS AND DISTRIBUTIONS TO SHAREHOLDERS: | | | | | | | | |
| Net investment income | | | (1,021,537 | ) | | | (597,335 | ) |
| Net realized gains on investment | | | (5,547,157 | ) | | | (5,425,499 | ) |
| Total dividends and distributions | | | (6,568,694 | ) | | | (6,022,834 | ) |
| | | | | | | | | |
| CAPITAL SHARE TRANSACTIONS: | | | | | | | | |
| Shares sold | | | 10,409 | | | | 81,640 | |
| Shares issued in reinvestment of dividends | | | 3,669,304 | | | | 3,279,278 | |
| Shares redeemed | | | (3,954,832 | ) | | | (5,821,101 | ) |
| Net decrease in net assets from capital share transactions | | | (275,119 | ) | | | (2,460,183 | ) |
| | | | | | | | | |
| TOTAL INCREASE/(DECREASE) IN NET ASSETS | | | 34,204 | | | | (2,788,197 | ) |
| | | | | | | | | |
| NET ASSETS: | | | | | | | | |
| Beginning of period | | | 61,449,672 | | | | 64,237,869 | |
| End of period (including accumulated undistributed net | | | | | | | | |
| investment income of $79,436 and $528,621, respectively) | | $ | 61,483,876 | | | $ | 61,449,672 | |
The accompanying notes are an integral part of these financial statements.
Financial Highlights
| | | Period Ended | | | | | | | | | | | | | | | | |
| | | February 28, | | | Year Ended August 31, | |
| | | 2013 | | | 2012 | | | 2011 | | | 2010 | | | 2009 | | | 2008 | |
| | | (Unaudited) | | | | | | | | | | | | | | | | |
| Per Share Data: | | | | | | | | | | | | | | | | | | |
| Net asset value, | | | | | | | | | | | | | | | | | | |
| beginning of period | | $ | 31.65 | | | $ | 31.87 | | | $ | 30.53 | | | $ | 32.72 | | | $ | 50.14 | | | $ | 60.62 | |
| | | | | | | | | | | | | | | | | | | | | | | | | |
| Income (loss) from | | | | | | | | | | | | | | | | | | | | | | | | |
| investment operations: | | | | | | | | | | | | | | | | | | | | | | | | |
| Net investment income | | | 0.33 | | | | 0.40 | | | | 0.47 | | | | 0.39 | | | | 0.49 | | | | 0.48 | |
| Net realized and unrealized | | | | | | | | | | | | | | | | | | | | | | | | |
| gain (loss) on investments | | | 3.26 | | | | 2.41 | | | | 3.09 | | | | (0.74 | ) | | | (13.02 | ) | | | (7.55 | ) |
| Total from | | | | | | | | | | | | | | | | | | | | | | | | |
| investment operations | | | 3.59 | | | | 2.81 | | | | 3.56 | | | | (0.35 | ) | | | (12.53 | ) | | | (7.07 | ) |
| | | | | | | | | | | | | | | | | | | | | | | | | |
| Less distributions: | | | | | | | | | | | | | | | | | | | | | | | | |
| Net investment income | | | (0.56 | ) | | | (0.30 | ) | | | (0.44 | ) | | | (0.48 | ) | | | (0.59 | ) | | | (0.37 | ) |
| Net realized gain | | | | | | | | | | | | | | | | | | | | | | | | |
| on investments | | | (3.02 | ) | | | (2.73 | ) | | | (1.78 | ) | | | (1.36 | ) | | | (4.30 | ) | | | (3.04 | ) |
| Total distributions | | | (3.58 | ) | | | (3.03 | ) | | | (2.22 | ) | | | (1.84 | ) | | | (4.89 | ) | | | (3.41 | ) |
| Net asset value, end of period | | $ | 31.66 | | | $ | 31.65 | | | $ | 31.87 | | | $ | 30.53 | | | $ | 32.72 | | | $ | 50.14 | |
Total return1 | | | 11.91 | %2 | | | 9.40 | % | | | 11.07 | % | | | (1.38 | )% | | | (23.37 | )% | | | (12.55 | )% |
| | | | | | | | | | | | | | | | | | | | | | | | | |
| Supplemental data and ratios: | | | | | | | | | | | | | | | | | | | | | | | | |
| Net assets, end | | | | | | | | | | | | | | | | | | | | | | | | |
| of period (000,000’s) | | $ | 61 | | | $ | 61 | | | $ | 64 | | | $ | 63 | | | $ | 70 | | | $ | 114 | |
| Ratio of net expenses | | | | | | | | | | | | | | | | | | | | | | | | |
| to average net assets | | | 1.20 | %4 | | | 1.19 | %3 | | | 1.10 | %3 | | | 1.20 | % | | | 1.31 | % | | | 1.03 | % |
| Ratio of net investment income | | | | | | | | | | | | | | | | | | | | | | | | |
| to average net assets | | | 1.87 | %4 | | | 1.25 | %3 | | | 1.32 | %3 | | | 1.15 | % | | | 1.50 | % | | | 0.83 | % |
| Portfolio turnover rate | | | 0 | %2 | | | 4 | % | | | 0 | % | | | 3 | % | | | 0 | %5,6 | | | 3 | %5 |
| 1 | Performance figures may reflect compensating balance arrangements fee waivers and/or expense reimbursements. In the absence of these arrangements, total returns would have been lower. |
| 2 | Not annualized for the six months ended February 28, 2013. |
| 3 | Such percentages are after advisory fee waiver. Effective April 29, 2011, the adviser voluntarily agreed to waive 0.05% of average net assets of its advisory fee for the period of one year, this equals 0.03% and 0.02% of average net assets for the years ended August 31, 2012 and August 31, 2011, respectively. In the absence of these waivers, the ratio of net expenses to average net assets would be 0.03% and 0.02% higher for the years ended August 31, 2012 and August 31, 2011, respectively. |
| 4 | Annualized for the six months ended February 28, 2013. |
| 5 | Excludes the value of portfolio securities delivered as a result of in-kind redemptions of Fund’s capital shares. |
| 6 | Amount represents less than 1%. |
The accompanying notes are an integral part of these financial statements.
Notes to Financial Statements (Unaudited)
1. ORGANIZATION AND SIGNIFICANT | Barrett Opportunity Fund, Inc. (the “Fund”), a Maryland corporation organized in 1978, is registered as a non-diversified, open-end management investment company under the Investment Company Act of 1940, as amended (the “1940 Act”). The Fund’s investment objective is to achieve above average long-term capital appreciation. |
| POLICIES | |
| | The following are significant accounting policies consistently followed by the Fund and are in conformity with generally accepted accounting principles in the United States of America (“GAAP”). |
| | |
| | (a) Investment Valuation |
| | Equity securities, including common stocks and REITs, for which market quotations are available are valued at the last reported sales price or official closing price on the primary market or exchange on which they trade. |
| | |
| | Redeemable securities issued by open-end, registered investment companies, including money market funds, are valued at the net asset value (“NAV”) of such companies for purchase and/or redemption orders placed on that day. |
| | |
| | When prices are not readily available, or are determined not to reflect fair value, such as when the value of a security has been significantly affected by events after the close of the exchange or market on which the security is principally traded, but before the Fund calculates its net asset value, the Fund values these securities at fair value as determined in accordance with procedures approved by the Fund’s Board of Directors. |
| | |
| | The Fund uses valuation techniques to measure fair value that are consistent with the market approach and/or income approach, depending on the type of the security and the particular circumstance. The market approach uses prices and other relevant information generated by market transactions involving identical or comparable securities. The income approach uses valuation techniques to discount estimated future cash flows to present value. |
| | |
| | Financial Accounting Standards Board (“FASB”) Accounting Standards Codification, “Fair Value Measurements and Disclosures” Topic 820 (“ASC Topic 820”), establishes a single definition of fair value, creates a three-tier hierarchy as a framework for measuring fair value based on inputs used to value the Fund’s investments, and requires additional disclosure about fair value. The hierarchy of inputs is summarized below. |
| | • | Level 1 – quoted prices in active markets for identical investments as of the measurement date |
| | • | Level 2 – other significant observable inputs (including quoted prices for similar investments, interest rates, prepayment speeds, credit risk, etc.) |
| | • | Level 3 – significant unobservable inputs (including the Fund’s own assumptions in determining the fair value of investments) |
| | Inputs refer broadly to the assumptions that market participants use to make valuation decisions, including assumptions about risk. Inputs may include price information, volatility statistics, specific and broad credit data, liquidity statistics, and other factors. A financial instrument’s level within the fair value hierarchy is based on the lowest level of input that is significant to the fair value measurement. However, the determination of what constitutes “observable” requires significant judgment by the Fund. The Fund considers observable data to be that market data which is readily available, regularly distributed or updated, reliable and verifiable, not proprietary, and provided by independent sources that are actively involved in the relevant market. The categorization of a financial instrument within the hierarchy is based upon the pricing transparency of the instrument and does not necessarily correspond to the Fund’s perceived risk of that instrument. |
| | |
| | Investments whose values are based on quoted market prices in active markets include listed equities, including common stocks and REITs, and certain money market securities, and are classified within Level 1. Investments that trade in markets that are not considered to be active, but are valued based on quoted market prices, dealer quotations or alternative pricing sources supported by observable inputs, are classified within Level 2. Investments classified within Level 3 have significant unobservable inputs, as they trade infrequently or not at all. |
| | |
| | The following is a summary of the inputs used in valuing the Fund’s assets carried at fair value as of February 28, 2013. The inputs and methodologies used to value securities may not be an indication of the risk associated with investing in these securities. |
| | | | | | | Other | | | | | | | |
| | | | | | | Significant | | | Significant | | | | |
| | | | Quoted | | | Observable | | | Unobservable | | | | |
| | | | Prices | | | Inputs | | | Inputs | | | | |
| | Description | | (Level 1) | | | (Level 2) | | | (Level 3) | | | Total | |
| | Common Stocks† | | $ | 56,818,909 | | | $ | — | | | $ | — | | | $ | 56,818,909 | |
| | REITs | | | 4,552,567 | | | | — | | | | — | | | | 4,552,567 | |
| | Money Market Funds | | | 52,371 | | | | — | | | | — | | | | 52,371 | |
| | Total Fund | | $ | 61,423,847 | | | $ | — | | | $ | — | | | $ | 61,423,847 | |
| | † | See Schedule of Investments for additional industry classifications. |
| | There were no transfers of securities between levels during the reporting period. The Fund did not hold any Level 3 securities during the period. It is the Fund’s policy to record transfers between levels as of the end of the reporting period. The Fund did not hold any derivative instruments during the reporting period. |
| | |
| | (b) Security Transactions and Investment Income |
| | Security transactions are accounted for on a trade date basis. Interest income, adjusted for amortization of premium and accretion of discount, is recorded on the accrual basis. Dividend income is recorded on the ex-dividend date. Under applicable tax laws, a withholding tax may be imposed on interest, dividends and capital gains at various rates and withholding taxes on foreign dividends have been provided for in accordance with the Fund’s understanding of the applicable country’s tax rules and rates. The cost of investments sold is determined by use of the specific identification method for computing the gain/loss on the transaction. It is the Fund’s policy to recognize a loss on a worthless security once it is determined beyond a reasonable doubt that there is no possibility of future worth. Proceeds from bankruptcy settlements will generally be recognized as a realized gain if the security is no longer held and as a return of capital if the security is still held. |
| | |
| | (c) Distributions to Shareholders |
| | The Fund will distribute any net investment income and any net realized long or short-term capital gains at least annually. Distributions from net realized gains for book purposes may include short-term capital gains. All short-term capital gains are included in ordinary income for tax purposes. Distributions to shareholders are recorded on the ex-dividend date. The Fund may also pay a special distribution at the end of the calendar year to comply with federal tax requirements. |
| | |
| | (d) REIT Distributions |
| | The character of distributions received from REITs held by the Fund is generally comprised of net investment income, capital gains, and return of capital. It is the policy of the Fund to estimate the character of distributions received from underlying REITs based on historical data provided by the REITs. After each calendar year end, REITs report the actual tax character of these distributions. Differences between the estimated and actual amounts reported by the REITs are reflected in the Fund’s records in the year in which they are reported by the REITs by adjusting related investment cost basis, capital gains and income, as necessary. |
| | |
| | (e) Federal Income Taxes |
| | It is the Fund’s policy to comply with the federal income and excise tax requirements of subchapter M of the Internal Revenue Code of 1986, as amended (the “Code”), necessary to qualify as a regulated investment company. Accordingly, the Fund intends to distribute its taxable income and net realized gains, if any, to shareholders in accordance with timing requirements imposed by the Code. Therefore, no federal income tax provision is provided in the Fund’s financial statements. |
| | As of and during the year ended August 31, 2012, the Fund did not have a liability of any unrecognized tax benefits. The Fund recognizes interest and penalties, in any, related to uncertain tax benefits as income tax expense in the Statement of Operations. During the period, the Fund did not incur any interest or penalties. The Fund is not subject to examination by U.S. taxing authorities for tax periods prior to 2008. |
| | |
| | (f) Use of Estimates |
| | The preparation of financial statements in conformity with GAAP requires management to make estimates and assumptions that affect the reported amounts of assets and liabilities and disclosure of contingent assets and liabilities at the date of the financial statements and the reported amounts of revenues and expenses during the reporting period. Actual results could differ from those estimates. |
| | |
| | (g) Indemnification |
| | In the normal course of business the Fund enters into contracts that contain general indemnification clauses. The Fund’s maximum exposure under these agreements is unknown, as this would involve future claims against the Fund that have not yet occurred. Based on experience, the Fund expects the risk of loss to be remote. |
| The Fund has an Investment Advisory Agreement with Barrett Asset Management, LLC (“Barrett”). Under the Investment Advisory Agreement, the Fund pays an advisory fee, calculated daily and paid monthly, in accordance with the following breakpoint schedule: |
| AGREEMENT | |
| AND OTHER | |
| TRANSACTIONS | |
| WITH AFFILIATES | |
| | Average Daily Net Assets | Annual Rate |
| | First $1 billion | 0.700% |
| | Next $1 billion | 0.675% |
| | Next $3 billion | 0.650% |
| | Next $5 billion | 0.625% |
| | Over $10 billion | 0.600% |
| | |
| | For the six months ended February 28, 2013, the advisory fee totaled $214,805. |
| | |
| | The officers of the Fund are also officers and employees of Barrett and do not receive compensation from the Fund. |
| | |
| 3. INVESTMENTS | During the period ended February 28, 2013, the aggregate cost of purchases and proceeds from sales of investments (excluding short-term investments) were as follows: |
| | | |
| | Purchases | Sales |
| | $— | $6,268,988 |
4. CAPITAL SHARES | At February 28, 2013, the Fund had 15,000,000 shares of capital stock authorized with a par value of $0.01 per share. Transactions in shares of the Fund were as follows: |
| | | | | | | | |
| | | | Period Ended | | | Year Ended | |
| | | | February 28, 2013 | | | August 31, 2012 | |
| | Shares sold | | | 324 | | | | 2,651 | |
| | Shares issued on reinvestment | | | 121,702 | | | | 109,932 | |
| | Shares redeemed | | | (121,062 | ) | | | (186,964 | ) |
| | Net increase (decrease) | | | 964 | | | | (74,381 | ) |
| | |
| 5. INCOME TAX | The tax character of distributions paid during the fiscal years ended August 31, were as follows: |
| INFORMATION | |
| AND | |
| DISTRIBUTIONS | |
| TO | |
| SHAREHOLDERS | |
| | | | 2012 | | | 2011 | |
| | Distributions Paid From: | | | | | | |
| | Ordinary income | | $ | 597,335 | | | $ | 900,000 | |
| | Net long-term capital gains | | | 5,425,499 | | | | 3,569,540 | |
| | Total distributions paid | | $ | 6,022,834 | | | $ | 4,469,540 | |
| | The Fund designated as long-term capital gain dividend, pursuant to Internal Revenue Code Section 852(b)(3), the amount necessary to reduce the earnings and profits of the Fund related to net capital gain to zero for the tax year ended August 31, 2012. The Fund utilized earnings and profits distributed to shareholders on redemption of shares as part of the dividend paid deduction. The amount designated as long-term capital gain for the fiscal years ended August 31, 2012 and 2011 was $296,410 and $173,810, respectively. |
| | |
| | At August 31, 2012, the aggregate gross unrealized appreciation and depreciation of investments for federal income tax purposes were as follows: |
| | | | | |
| | Tax cost of investments | | $ | 8,916,792 | |
| | Gross unrealized appreciation | | $ | 52,478,797 | |
| | Gross unrealized depreciation | | | — | |
| | Net unrealized appreciation | | $ | 52,478,797 | |
| | | | | | |
| | As of August 31, 2012, the components of accumulated earnings on a tax basis were as follows: |
| | Undistributed operating income | | $ | 559,134 | |
| | Undistributed long-term gains | | | 4,717,230 | |
| | Distributable earnings | | | 5,276,364 | |
| | Unrealized appreciation | | | 52,478,797 | |
| | Other accumulated losses* | | | (30,513 | ) |
| | Total accumulated gains | | $ | 57,724,648 | |
| * | Other temporary differences are primarily attributable to the timing of certain expenses. |
| | |
| | GAAP requires that certain components of net assets be reclassified to reflect permanent differences between financial and tax reporting. These reclassifications have no effect on net assets or net asset values per share. During the current year, accumulated net realized gain was decreased by $296,410 and paid-in-capital was increased by $296,410 for permanent book to tax differences. |
(Unaudited)
1. INFORMATION ABOUT DIRECTORS AND OFFICERS
The business and affairs of the Fund are conducted by management under the supervision and subject to the direction of its Board of Directors. The business address of each Director is c/o Barrett Asset Management, LLC, the Fund’s investment manager (“Barrett Asset Management”), 90 Park Avenue, 34th Floor, New York, New York 10016. Information pertaining to the Directors and officers of the Fund is set forth below.
The Statement of Additional Information includes additional information about Directors and is available, without charge, upon request by calling the Fund at 1-877-363-6333.
| | | | | Number of | |
| | | | | Portfolios | |
| | | | | in Fund | Other Board |
| | Position(s) | Term of Office* | | Complex | Memberships |
| Name, Address | Held with | and Length of | Principal Occupation(s) | Overseen | Held by |
| and Birth Year | Fund | Time Served** | During Past 5 Years | by Director | Director |
| | | | | | |
INDEPENDENT DIRECTORS†: | | | | | |
| | | | | | |
| Barry Handel, CPA | Director | Since 2005 | Partner, Shalik, Morris & | 1 | None |
| Birth Year: 1951 | | | Company, LLP (accounting | | |
| | | | firm) (since 2010); formerly, | | |
| | | | Partner, Falk & Handel LLP | | |
| | | | (accounting firm) | | |
| | | | | | |
David H. Kochman(1) | Director | Since 2011 | Member, Harris Beach PLLC | 1 | None |
| Birth Year: 1959 | | | (law firm) | | |
| | | | | | |
Rosalind A. Kochman(2) | Director | Since 1990 | Retired (since 2002); formerly, | 1 | None |
| Birth Year: 1937 | | | Chief Executive Officer, | | |
| | Chairperson | Since 2005 | Brooklyn Eye Surgery Center, | | |
| | | | and Administrator, Kochman, | | |
| | | | Lebowitz & Mogil, MDs | | |
| | | | | | |
| William Morris, Jr., CPA | Director | Since 2005 | President, William Morris & | 1 | None |
| Birth Year: 1948 | | | Associates P.C. (accounting | | |
| | | | firm) | | |
| | | | | | |
| Irving Sonnenschein | Director | Since 1994 | Partner in the law firm of | 1 | None |
| Birth Year: 1920 | | | Sonnenschein, Sherman & | | |
| | | | Deutsch | | |
| | | | | | |
| OFFICERS: | | | | | |
| | | | | | |
| Peter H. Shriver, CFA | President | Since 2006 | President and Chief | N/A | N/A |
| Barrett Asset Management | and Chief | | Executive Officer of Barrett | | |
| 90 Park Avenue | Executive | | Asset Management (since | | |
| New York, NY 10016 | Officer | | 2011); President of Barrett | | |
| Birth Year: 1952 | | | Associates, Inc. (2004-2011) | | |
| (1) | Mr. Kochman is Ms. Kochman’s son. |
| (2) | Ms. Kochman is Mr. Kochman’s mother. |
| | | | | Number of | |
| | | | | Portfolios | |
| | | | | in Fund | Other Board |
| | Position(s) | Term of Office* | | Complex | Memberships |
| Name, Address | Held with | and Length of | Principal Occupation(s) | Overseen | Held by |
| and Birth Year | Fund | Time Served** | During Past 5 Years | by Director | Director |
| | | | | | |
| OFFICERS (Continued): | | | | | |
| | | | | | |
| E. Wells Beck, CFA | Vice | Since 2010 | Managing Director and | N/A | N/A |
| Barrett Asset Management | President | | Director of Research, Barrett | | |
| 90 Park Avenue | and | | Asset Management (since | | |
| New York, NY 10016 | Investment | | 2011); Managing Director, | | |
| Birth Year: 1968 | Officer | | Barrett Associates (2006-2011); | | |
| | | | Analyst and Portfolio | | |
| | | | Manager at Haven Capital | | |
| | | | Management (2001-2006) | | |
| | | | | | |
| Robert J. Milnamow | Vice | Since 2006 | Executive Vice President | N/A | N/A |
| Barrett Asset Management | President | | and Chief Investment | | |
| 90 Park Avenue | and Chief | | Officer, Barrett Asset | | |
| New York, NY 10016 | Investment | | Management (since 2011); | | |
| Birth Year: 1950 | Officer | | Managing Director, Barrett | | |
| | | | Associates (2003-2011) | | |
| | | | | | |
| Madeleine Morreale | Chief | Since 2011 | Chief Compliance Officer, | N/A | N/A |
| Barrett Asset Management | Compliance | | Barrett Asset Management | | |
| 90 Park Avenue | Officer | | (2011-Present); Compliance | | |
| New York, NY 10016 | and | | Officer, Barrett Associates | | |
| Birth Year: 1956 | Anti-Money | | (2010-2011); Head Trader, | | |
| | Laundering | | Barrett Associates | | |
| | Officer | | (2003-2010) | | |
| | | | | | |
| John G. Youngman | Chief | Since 2011 | Managing Director, | N/A | N/A |
| Barrett Asset Management | Financial | | Barrett Asset Management | | |
| 90 Park Avenue | Officer | | (2011-Present); Managing | | |
| New York, NY 10016 | and | | Director, Barrett Associates | | |
| Birth Year: 1968 | Treasurer | | (2010-2011); Managing | | |
| | | | Director, Griffin Asset | | |
| | | | Management (1994-2010) | | |
| † | Directors who are not “interested persons” of the Fund within the meaning of Section 2(a)(19) of the 1940 Act. |
| * | Each Director and officer serves until his respective successor has been duly elected and qualified or until his earlier death, resignation, retirement or removal. |
| ** | Indicates the earliest year in which the Director became a board member or the officer took such office. |
2. IMPORTANT TAX INFORMATION (UNAUDITED)
The following information is provided with respect to the distributions paid during the taxable year ended August 31, 2012:
| Record Date: | 12/21/2011 |
| Payable Date: | 12/22/2011 |
| Ordinary Income: | |
| Qualified Dividend Income for Individuals | 100.00% |
| Dividends Qualifying for the Dividends | |
| Received Deduction for Corporations | 100.00% |
| Long-Term Capital Gain Dividend | $2.73131 |
Please retain this information for your records.
The Fund files its complete schedule of portfolio holdings with the Securities and Exchange Commission (“SEC”) for the first and third quarters of each fiscal year on Form N-Q. The Fund’s Forms N-Q are available on the SEC’s website at www.sec.gov. The Fund’s Forms N-Q may be reviewed and copied at the SEC’s Public Reference Room in Washington, D.C., and information on the operation of the Public Reference Room may be obtained by calling 1-800-SEC-0330. To obtain information on Form N-Q from the Fund, shareholders can call the Fund at 1-877-363-6333.
Information on how the Fund voted proxies relating to portfolio securities during the prior 12-month period ended June 30th of each year and a description of the policies and procedures that the Fund uses to determine how to vote proxies related to portfolio transactions are available (1) without charge, upon request, by calling the Fund at 1-877-363-6333 and (2) on the SEC’s website at www.sec.gov.
(This Page Intentionally Left Blank.)
BARRETT OPPORTUNITY FUND, INC.
c/o U.S. Bancorp Fund Services, LLC
615 E. Michigan Street
Milwaukee, WI 53202
DIRECTORS
Barry Handel, CPA
David H. Kochman
Rosalind A. Kochman, Chairperson
William Morris, Jr., CPA
Irving Sonnenschein
INVESTMENT MANAGER
Barrett Asset Management, LLC
90 Park Avenue
New York, NY 10016
ADMINISTRATOR, FUND ACCOUNTANT & TRANSFER AGENT
U.S. Bancorp Fund Services, LLC
615 E. Michigan Street
Milwaukee, WI 53202
DISTRIBUTOR
Quasar Distributors, LLC
615 E. Michigan Street
Milwaukee, WI 53202
CUSTODIAN
U.S. Bank, N.A.
Custody Operations
1555 River Center Drive, Suite 302
Milwaukee, WI 53212
LEGAL COUNSEL
Simpson Thatcher & Bartlett, LLP
425 Lexington Avenue
New York, NY 10017
INDEPENDENT REGISTERED PUBLIC ACCOUNTING FIRM
Cohen Fund Audit Services, Ltd.
1350 Euclid Avenue, Suite 800
Cleveland, OH 44115
This report is transmitted to the shareholders of Barrett Opportunity Fund, Inc. for their information. This is not a prospectus, circular or representation intended for use in the purchase of shares of the Fund or any securities mentioned in this report.
This report must be preceded or accompanied by a free prospectus. Investors should consider the Fund’s investment objective, risks, charges and expenses carefully before investing. The prospectus contains this and other important information about the Fund. Please read the prospectus carefully before investing.
Item 2. Code of Ethics.
Not applicable for semi-annual reports.
Item 3. Audit Committee Financial Expert.
Not applicable for semi-annual reports.
Item 4. Principal Accountant Fees and Services.
Not applicable for semi-annual reports.
Item 5. Audit Committee of Listed Registrants.
Not applicable to registrants who are not listed issuers (as defined in Rule 10A-3 under the Securities Exchange Act of 1934).
Item 6. Investments.
Schedule of Investments is included as part of the report to shareholders filed under Item 1 of this Form.
Item 7. Disclosure of Proxy Voting Policies and Procedures for Closed-End Management Investment Companies.
Not applicable to open-end investment companies.
Item 8. Portfolio Managers of Closed-End Management Investment Companies.
Not applicable to open-end investment companies.
Item 9. Purchases of Equity Securities by Closed-End Management Investment Company and Affiliated Purchasers.
Not applicable to open-end investment companies.
Item 10. Submission of Matters to a Vote of Security Holders.
Not Applicable.
Item 11. Controls and Procedures.
| (a) | The Registrant’s President and Treasurer have reviewed the Registrant's disclosure controls and procedures (as defined in Rule 30a-3(c) under the Investment Company Act of 1940 (the “Act”)) as of a date within 90 days of the filing of this report, as required by Rule 30a-3(b) under the Act and Rules 13a-15(b) or 15d-15(b) under the Securities Exchange Act of 1934. Based on their review, such officers have concluded that the disclosure controls and procedures are effective in ensuring that information required to be disclosed in this report is appropriately recorded, processed, summarized and reported and made known to them by others within the Registrant and by the Registrant’s service provider. |
| (b) | There were no changes in the Registrant's internal control over financial reporting (as defined in Rule 30a-3(d) under the Act) that occurred during the second fiscal quarter of the period covered by this report that has materially affected, or is reasonably likely to materially affect, the Registrant's internal control over financial reporting. |
Item 12. Exhibits.
| (a) | (1) Any code of ethics or amendment thereto, that is the subject of the disclosure required by Item 2, to the extent that the registrant intends to satisfy Item 2 requirements through filing an exhibit. Not Applicable. |
(2) A separate certification for each principal executive and principal financial officer pursuant to Section 302 of the Sarbanes-Oxley Act of 2002. Filed herewith.
(3) Any written solicitation to purchase securities under Rule 23c-1 under the Act sent or given during the period covered by the report by or on behalf of the registrant to 10 or more persons. Not applicable to open-end investment companies.
| (b) | Certifications pursuant to Section 906 of the Sarbanes-Oxley Act of 2002. Furnished herewith. |
SIGNATURES
Pursuant to the requirements of the Securities Exchange Act of 1934 and the Investment Company Act of 1940, the registrant has duly caused this report to be signed on its behalf by the undersigned, thereunto duly authorized.
(Registrant) Barrett Opportunity Fund
By (Signature and Title)* /s/ Peter Shriver
Peter Shriver, President
Date April 29, 2013
Pursuant to the requirements of the Securities Exchange Act of 1934 and the Investment Company Act of 1940, this report has been signed below by the following persons on behalf of the registrant and in the capacities and on the dates indicated.
By (Signature and Title)* /s/ Peter Shriver
Peter Shriver, President
Date April 29, 2013
By (Signature and Title)* /s/ John Youngman
John Youngman, Treasurer
* Print the name and title of each signing officer under his or her signature.