UNITED STATES
SECURITIES AND EXCHANGE COMMISSION
Washington, D.C. 20549
FORM N-CSR
CERTIFIED SHAREHOLDER REPORT OF REGISTERED
MANAGEMENT INVESTMENT COMPANIES
Investment Company Act file number 811-02884
Barrett Opportunity Fund, Inc.
(Exact name of registrant as specified in charter)
55 Water Street, New York, NY 10041
(Address of principal executive offices) (Zip code)
Robert I. Frenkel, Esq.
Legg Mason & Co., LLC
100 First Stamford Place
Stamford, CT 06902
(Name and address of agent for service)
Registrant’s telephone number, including area code: 1-877-721-1926
Date of fiscal year end: August 31
Date of reporting period: February 28, 2011
| ITEM 1. | REPORT TO STOCKHOLDERS. |
The Semi-Annual Report to Stockholders is filed herewith.

Semi-Annual Report
February 28, 2011
INVESTMENT PRODUCTS: NOT FDIC INSURED Ÿ NO BANK GUARANTEE Ÿ MAY LOSE VALUE

BARRETT
OPPORTUNITY FUND, INC.
Semi-Annual Report • February 28, 2011
Fund Objectives | The Fund seeks to achieve above average long-term capital appreciation. Current income is a secondary objective. The Fund invests primarily in common stocks and securities convertible into or exchangeable for common stock such as convertible preferred stock or convertible debt securities. |
BARRETT
OPPORTUNITY FUND, INC.
Letter from the Chairperson | Dear Shareholder, |
We are pleased to provide the semi-annual report of Barrett Opportunity Fund, Inc. for the six-month reporting period ended February 28, 2011.
The management team at Barrett Associates, Inc. (“Barrett Associates”) has prepared the enclosed Manager Overview, which includes a brief market overview as well as a performance review. I urge you to read it as well as the accompanying financial statements. A detailed summary of the Fund’s performance and other pertinent information are also included in this report. I am sure you will find this report informative and useful.
On behalf of the Directors and the officers of the Fund, I thank you for your ongoing confidence in the Fund and its investment policies.
Sincerely,

Rosalind A. Kochman
Chairperson
March 25, 2011
Special Shareholder Notice
On December 6, 2010, Legg Mason, Inc. (“Legg Mason”), Barrett Associates and Barrett Asset Management, LLC (“Barrett Asset Management”) signed a definitive agreement under which Barrett Associates and its parent company, Legg Mason, agreed to sell substantially all of the property and assets of Barrett Associates to Barrett Asset Management, a newly-formed company controlled by the current management team of Barrett Associates. The transaction was subject to certain regulatory approvals, as well as other customary conditions to closing. The transaction is expected to close during the first half of 2011.
Under the Investment Company Act of 1940, consummation of the transaction results in the automatic termination of Barrett Opportunity Fund, Inc.’s investment management contract with Barrett Associates. Therefore, the Fund’s Board was asked to approve a new investment management arrangement between the Fund and Barrett Asset Management. In February 2011, the Board approved new investment advisory, distribution and other service provider agreements for the Fund. The new investment advisory agreement with Barrett Asset Management will be presented to Fund shareholders for their approval on March 30, 2011.
The portfolio managers responsible for managing the Fund’s assets are not expected to change as a result of the transaction.
1
BARRETT
OPPORTUNITY FUND, INC.
Manager Overview | Market Overview |
The U.S. stock market recovery that started in March of 2009 continued through February of 2011. During the six months ended February 28, 2011, the S&P 500® Index (the “Index”) gained 27.73%, capping off an 80% run since it bottomed nearly two years ago. Despite the market’s surge, the Index remains well below the highs of 2007. The Index’s advance has been driven by greater investor confidence in a sustained economic recovery as well as strong corporate earnings reports. Another positive factor for the U.S. stock market has been the reversal in mutual fund money flows, with flows now going from bond funds into stock funds.
The past six months have also been marked by a dramatic shift in the relative strength of the two main U.S. political parties. Investors appear to have been bolstered by the ascendancy of the Republican Party, as well as the apparent shift by the Obama administration toward a more pro-business approach. Equity investors have been further encouraged by Congress’ decision to maintain existing capital gain and dividend tax rates for two more years. We continue to see dividend increases by a large number of companies in a broad cross-section of industries.
Aggressive monetary policy by the Federal Reserve Board (“Fed”) has also played a role in the economic recovery and the stock market gains. The Fed’s zero interest rate policy on short-term loans has helped restore profitability to the banking sector and obviously is an impetus for investors to seek higher return assets, such as stocks, rather than money market funds. The Fed has been able to keep this policy in place for such a prolonged period because there have been few, if any, signs of inflation pressures in the United States. With the housing market slow to recover and unemployment remaining high, the Fed has been able to use the slack in the economy to stick to its aggressive policy that includes large-scale buying of Treasury securities.
For the stock market to continue its ascent, it may need more than the combination of low interest rates and booming corporate profits driven by cost cutting. Stronger revenue growth would provide a welcome boost, but there has not been a vibrant enough recovery in developed markets to enable better top line growth. Austerity programs at state and local governments in the United States and in Europe are restraining growth. The tragic earthquake in Japan has just added a whole new host of problems onto an economy that has been struggling for decades. Developments in the emerging economies are causing central banks in these regions to raise interest rates in an effort to cool inflationary pressures driven by higher food prices. Finally, the recent uprisings in the North African countries are causing havoc in oil markets and political circles around the world. Upheaval in the North Africa/Middle East region has typically stopped stock market rallies in their tracks. It will surely take investors time to sort out the ramifications of the volatile and fluid situation in North Africa.
Performance Review
During the six-month period ended February 28, 2011, the Fund gained 28.19%, compared to a gain of 27.73% for its unmanaged benchmark, the S&P 500® Index, and 26.81% for the Lipper Large-Cap Value Funds Category Average. Cyclical stocks that are more leveraged to an economic recovery outperformed during the reporting period. As a result of the rise in oil prices, the major Energy holdings in the Fund, Royal Dutch Shell PLC and Murphy Oil Corp., were the leading contributors to the outperformance of the Fund over the past six months. The Energy weighting in the Fund was also significantly higher than the broad market weighting. In the Financials sector, where the Fund is also overweighted, real estate developer Forest City Enterprises Inc. and Leucadia National Corp. outpaced the market. Offsetting the Fund’s outperformance was Chubb Corp., which advanced but far less than the broader market. A few
2
BARRETT
OPPORTUNITY FUND, INC.
of the smaller positions that did well in the six-month period included Omnicom Group Inc., Monsanto Co. and Automatic Data Processing Inc.
| | | | | | | | | | | | | | | | | | | | |
Total Returns for Periods Ended February 28, 2011 (unaudited) | |
| | | Total Returns | | | Average Annual Total Returns | |
| | | 6 Months | | | 1 Year | | | 3 Year | | | 5 Year | | | 10 Year | |
Barrett Opportunity Fund, Inc. | | | 28.19% | | | | 21.27% | | | | -3.31% | | | | 0.21% | | | | 2.84% | |
S&P 500® Index1 | | | 27.73% | | | | 22.57% | | | | 2.19% | | | | 2.87% | | | | 2.62% | |
Lipper Large-Cap Value Funds Category Average2 | | | 26.81% | | | | 19.63% | | | | 0.14% | | | | 1.29% | | | | 3.28% | |
The performance data quoted represent past performance. Past performance does not guarantee future results and current performance may be lower or higher than the performance data shown above. The investment return and principal value of an investment will fluctuate. An investor’s shares, when redeemed, may be worth more or less than their original cost. As economic and market conditions change frequently, there can be no assurance that trends described will continue or that forecasts will come to pass. Fund returns assume the reinvestment of all distributions, including returns of capital, if any, at net asset value and the deduction of all Fund expenses. Returns have not been adjusted to include the deduction of taxes that a shareholder would pay on Fund distributions. Performance data current to the most recent month-end may be obtained by calling the Fund at 1-877-721-1926. Shares of the Fund are distributed by Legg Mason Investor Services, LLC (“LMIS”) (Member SIPC/FINRA). LMIS and Barrett Associates, Inc., the Fund’s investment manager, are both wholly-owned subsidiaries of Legg Mason, Inc.
The Fund’s total annual operating expense ratio as of the Fund’s most current prospectus dated December 31, 2010 was 1.20%.
All investing entails risk, including the possible loss of principal. The Fund is non-diversified, which means that it can invest a higher percentage of its assets in any one issuer than a diversified fund. Being non-diversified may magnify the Fund’s losses from events affecting a particular issuer. Please see the Fund’s current prospectus for a more complete discussion of these and other risks, and the Fund’s investment strategies.
| | 1 | The S&P 500® Index is a market-value weighted index comprised of 500 widely held common stocks. It is not possible to invest directly in the Index. The Index does not reflect deductions for fees, expenses or taxes. |
| | 2 | Lipper Large-Cap Value Funds Category Average includes funds that, by portfolio practice, invest at least 75% of their equity assets in companies with market capitalizations (on a three-year weighted basis) above Lipper’s U.S. Diversified Equity large-cap floor. Large-cap value funds typically have a below average price-to-earnings ratio, price-to-book ratio, and three-year sales-per-share growth value, compared to the S&P 500 Index. |
Thank you for your continued interest in the Fund.
Sincerely,
| | |
| |

Robert Milnamow Portfolio Manager | | 
E. Wells Beck, CFA Portfolio Manager |
March 14, 2011
3
BARRETT
OPPORTUNITY FUND, INC.
The outlook and views presented are those of the Fund’s portfolio managers as of March 14, 2011 and are subject to change. This information is intended for the shareholders of the Fund and is not for distribution to prospective investors unless preceded or accompanied by a current prospectus. Investors should consider the risks, investment objective, charges and expenses of the Fund carefully before investing. The prospectus, which contains this and other information about the Fund, is available at www.barrettassociates.com. Investors should read the prospectus carefully before investing.
4
BARRETT
OPPORTUNITY FUND, INC.
Fund at a Glance (Unaudited)
| | | | | | |
Top Ten Holdings - as of 2/28/2011
(As a percentage of Total Investments) | | | | | Sector Weightings - as of 2/28/2011
(As a percentage of Total Investments) |
Chubb Corp. | | | 16.1% | | | 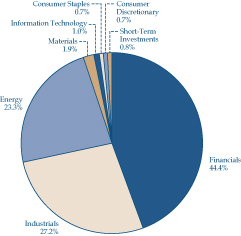 |
Royal Dutch Shell PLC, ADR, Class A Shares | | | 14.8% | | |
Bank of New York Mellon Corp. | | | 12.6% | | |
Koninklijke Philips Electronics NV, New York Registered Shares | | | 11.3% | | |
General Dynamics Corp. | | | 9.6% | | |
Murphy Oil Corp. | | | 8.5% | | |
Leucadia National Corp. | | | 5.6% | | |
Rayonier Inc. | | | 4.8% | | |
Ameron International Corp. | | | 3.7% | | |
Forest City Enterprises Inc., Class B Shares | | | 2.8% | | |
| | | | | |
| | | | | |
| | | | | |
| | | | | |
| | | | | |
| | | | | |
5
BARRETT
OPPORTUNITY FUND, INC.
Fund Expenses (Unaudited)
Example
As a shareholder of the Fund, you may incur two types of costs: (1) transaction costs; and (2) ongoing costs, including management fees and other Fund expenses. This example is intended to help you understand your ongoing costs (in dollars) of investing in the Fund and to compare these costs with the ongoing costs of investing in other mutual funds.
This example is based on an investment of $1,000 invested on September 1, 2010 and held for the six months ended February 28, 2011.
Actual Expenses
The table below titled “Based on Actual Total Return” provides information about actual account values and actual expenses. You may use the information provided in this table, together with the amount you invested, to estimate the expenses that you paid over the period. To estimate the expenses you paid on your account, divide your ending account value by $1,000 (for example, an $8,600 ending account value divided by $1,000 = 8.6), then multiply the result by the number under the heading entitled “Expenses Paid During the Period”.
Based on Actual Total Return1
| | | | | | | | | | | | | | | | | | | | |
| | | Actual
Total Return2 | | | Beginning
Account
Value | | | Ending
Account
Value | | | Annualized
Expense
Ratio | | | Expenses
Paid During
the Period3 | |
Barrett Opportunity Fund, Inc. | | | 28.19% | | | $ | 1,000.00 | | | $ | 1,281.90 | | | | 1.06 | % | | $ | 6.00 | |
| 1 | | For the six months ended February 28, 2011. |
| 2 | | Assumes the reinvestment of all distributions, including returns of capital, if any, at net asset value. Total return is not annualized, as it may not be representative of the total return for the year. Performance figures may reflect compensating balance arrangements, fee waivers and/or expense reimbursements. In the absence of compensating balance arrangements, fee waivers and/or expense reimbursements, the total return would have been lower. Past performance is no guarantee of future results. |
| 3 | | Expenses (net of compensating balance arrangements, fee waivers and/or expense reimbursements) are equal to the Fund’s annualized expense ratio, multiplied by the average account value over the period, multiplied by the number of days in the most recent fiscal half-year (181), then divided by 365. |
6
BARRETT
OPPORTUNITY FUND, INC.
Fund Expenses (Unaudited) (Continued)
Hypothetical Example for Comparison Purposes
The table below titled “Based on Hypothetical Total Return” provides information about hypothetical account values and hypothetical expenses based on the actual expense ratio and an assumed rate of return of 5.00% per year before expenses, which is not the Fund’s actual return. The hypothetical account values and expenses may not be used to estimate the actual ending account balance or expenses you paid for the period. You may use the information provided in this table to compare the ongoing costs of investing in the Fund and other funds. To do so, compare the 5.00% hypothetical example relating to the Fund with the 5.00% hypothetical examples that appear in the shareholder reports of the other funds.
Please note that the expenses shown in the table below are meant to highlight your ongoing costs only and do not reflect any transactional costs. Therefore, the table is useful in comparing ongoing costs only, and will not help you determine the relative total costs of owning different funds. In addition, if these transaction costs were included, your costs would have been higher.
Based on Hypothetical Total Return1
| | | | | | | | | | | | | | | | | | | | |
| | | Hypothetical
Annualized
Total Return | | | Beginning
Account
Value | | | Ending
Account
Value | | | Annualized
Expense
Ratio | | | Expenses
Paid During
the Period2 | |
Barrett Opportunity Fund, Inc. | | | 5.00 | % | | $ | 1,000.00 | | | $ | 1,019.54 | | | | 1.06 | % | | $ | 5.31 | |
| 1 | | For the six months ended February 28, 2011. |
| 2 | | Expenses (net of compensating balance arrangements, fee waivers and/or expense reimbursements) are equal to the Fund’s annualized expense ratio, multiplied by the average account value over the period, multiplied by the number of days in the most recent fiscal half-year (181), then divided by 365. |
7
BARRETT
OPPORTUNITY FUND, INC.
Schedule of Investments
February 28, 2011
(Unaudited)
| | | | | | | | |
| | |
Shares | | | Security | | Value | |
| | | | COMMON STOCKS - 99.1% | |
| | | | CONSUMER DISCRETIONARY - 0.7% | |
| | | | Media - 0.7% | |
| | 9,800 | | | Omnicom Group Inc. | | $ | 498,820 | |
| | | | | | | | |
| |
| | | | CONSUMER STAPLES - 0.7% | |
| | | | Food & Staples Retailing - 0.0% | |
| | 96,000 | | | FHC Delaware Inc. | | | 0 | *(a)(b) |
| | | | | | | | |
| | | | Food Products - 0.7% | |
| | 10,000 | | | Hershey Co. | | | 523,200 | |
| | | | | | | | |
| | | | Total Consumer Staples | | | 523,200 | |
| | | | | | | | |
| |
| | | | ENERGY - 23.3% | |
| | | | Oil, Gas & Consumable Fuels - 23.3% | |
| | 87,300 | | | Murphy Oil Corp. | | | 6,419,169 | |
| | 155,100 | | | Royal Dutch Shell PLC, ADR, Class A Shares | | | 11,205,975 | |
| | | | | | | | |
| | | | Total Energy | | | 17,625,144 | |
| | | | | | | | |
| |
| | | | FINANCIALS - 44.3% | |
| | | | Capital Markets - 12.6% | |
| | 312,971 | | | Bank of New York Mellon Corp. | | | 9,511,189 | |
| | | | | | | | |
| | | | Diversified Financial Services - 5.5% | |
| | 126,800 | | | Leucadia National Corp. | | | 4,200,884 | |
| | | | | | | | |
| | | | Insurance - 16.1% | |
| | 200,500 | | | Chubb Corp. | | | 12,166,340 | |
| | | | | | | | |
| | | | Real Estate Investment Trusts
(REITs) - 4.8% | |
| | 58,990 | | | Rayonier Inc. | | | 3,617,857 | |
| | | | | | | | |
| | | | Real Estate Management & Development - 5.3% | |
| | 100,400 | | | Forest City Enterprises Inc., Class A Shares | | | 1,897,560 | * |
| | | | | | | | |
| | |
Shares | | | Security | | Value | |
| | 112,500 | | | Forest City Enterprises Inc., Class B Shares | | $ | 2,130,750 | *(c) |
| | | | | | | | |
| | | | Total Real Estate Management & Development | | | 4,028,310 | |
| | | | | | | | |
| | | | Total Financials | | | 33,524,580 | |
| | | | | | | | |
| | | | INDUSTRIALS - 27.2% | |
| | | | Aerospace & Defense - 9.6% | |
| | 95,300 | | | General Dynamics Corp. | | | 7,254,236 | |
| | | | | | | | |
| | | | Building Products - 3.7% | |
| | 39,500 | | | Ameron International Corp. | | | 2,791,070 | |
| | | | | | | | |
| | | | Commercial Services & Supplies - 0.5% | |
| | 93,850 | | | TRC Cos. Inc. | | | 382,908 | * |
| | | | | | | | |
| | | | Industrial Conglomerates - 12.1% | |
| | 7,000 | | | 3M Co. | | | 645,610 | |
| | 260,210 | | | Koninklijke Philips Electronics NV, New York Registered Shares | | | 8,508,867 | |
| | | | | | | | |
| | | | Total Industrial Conglomerates | | | 9,154,477 | |
| | | | | | | | |
| | | | Marine - 1.3% | |
| | 22,800 | | | Alexander & Baldwin Inc. | | | 956,232 | |
| | | | | | | | |
| | | | Total Industrials | | | 20,538,923 | |
| | | | | | | | |
| |
| | | | INFORMATION TECHNOLOGY - 1.0% | |
| | | | IT Services - 1.0% | |
| | 15,000 | | | Automatic Data Processing Inc. | | | 750,000 | |
| | | | | | | | |
| |
| | | | MATERIALS - 1.9% | |
| | | | Chemicals - 1.9% | |
| | 20,242 | | | Monsanto Co. | | | 1,455,197 | |
| | | | | | | | |
| | | | Total Investments Before
Short-Term Investments
(Cost - $8,332,350) | | | 74,915,864 | |
| | | | | | | | |
See Notes to Financial Statements.
8
BARRETT
OPPORTUNITY FUND, INC.
Schedule of Investments
February 28, 2011
(Unaudited) (Continued)
| | | | | | | | |
| | |
Face
Amount | | | Security | | Value | |
| | | | SHORT-TERM INVESTMENTS - 0.8% | |
| | | | Repurchase Agreements - 0.8% | |
| | $602,000 | | | State Street Bank & Trust Co., repurchase agreement dated 2/28/11, 0.010% due 3/1/11; Proceeds at maturity - $602,000; (Fully collateralized by U.S. Treasury Notes, 1.000% due 4/30/12;
Market Value - $616,621)
(Cost - $602,000) | | $ | 602,000 | |
| | | | | | | | |
| | | | Total Investments - 99.9%
(Cost - $8,934,350#) | | | 75,517,864 | |
| | | | | | | | |
| | | | Other Assets in Excess of Liabilities - 0.1% | | | 56,877 | |
| | | | | | | | |
| | | | Total Net Assets - 100.0% | | $ | 75,574,741 | |
| | | | | | | | |
| * | Non-income producing security. |
| (b) | Security is valued in good faith at fair value in accordance with procedures approved by the Board of Directors (See Note 1). |
| (c) | Convertible into Forest City Enterprises Inc., Class A Shares. |
| # | Aggregate cost for federal income tax purposes is substantially the same. |
Abbreviation used in this schedule:
ADR—American Depositary Receipt
See Notes to Financial Statements.
9
BARRETT
OPPORTUNITY FUND, INC.
Statement of Assets and Liabilities
February 28, 2011
(Unaudited)
| | | | |
ASSETS: | | | | |
Investments, at value
(Cost - $8,934,350) | | $ | 75,517,864 | |
Cash | | | 229 | |
Dividends receivable | | | 149,231 | |
Receivable for Fund shares sold | | | 450 | |
Prepaid expenses | | | 13,449 | |
| | | | |
Total assets | | | 75,681,223 | |
| | | | |
LIABILITIES: | | | | |
Investment management fee payable | | | 43,038 | |
Directors’ fees payable | | | 2,359 | |
Payable for Fund shares repurchased | | | 1,477 | |
Accrued expenses | | | 59,608 | |
| | | | |
Total liabilities | | | 106,482 | |
| | | | |
Total net assets | | $ | 75,574,741 | |
| | | | |
NET ASSETS: | | | | |
Par value (Note 5) | | $ | 20,547 | |
Paid-in capital in excess of par value | | | 7,023,129 | |
Overdistributed net investment income | | | (156,741 | ) |
Accumulated net realized gain on investments | | | 2,104,292 | |
Net unrealized appreciation on investments | | | 66,583,514 | |
| | | | |
Total net assets | | $ | 75,574,741 | |
| | | | |
Shares outstanding | | | 2,054,726 | |
| | | | |
Net asset value | | | $36.78 | |
| | | | |
Statement of Operations
For the Six Months Ended February 28, 2011
(Unaudited)
| | | | |
INVESTMENT INCOME: | | | | |
Dividends | | $ | 852,367 | |
Interest | | | 27 | |
Less: Foreign taxes withheld | | | (39,085 | ) |
| | | | |
Total investment income | | | 813,309 | |
| | | | |
| |
EXPENSES: | | | | |
Investment management fee (Note 2) | | | 265,969 | |
Directors’ fees | | | 25,731 | |
Legal fees | | | 21,658 | |
Audit and tax | | | 20,877 | |
Shareholder reports | | | 15,747 | |
Transfer agent fees | | | 12,420 | |
Registration fees | | | 12,324 | |
Insurance | | | 1,192 | |
Custody fees | | | 154 | |
Miscellaneous expenses | | | 883 | |
| | | | |
Total expenses | | | 376,955 | |
| | | | |
Net investment income | | | 436,354 | |
| | | | |
| |
REALIZED AND UNREALIZED GAIN ON INVESTMENTS
(NOTES 1 and 3): | | | | |
Net realized gain from investment transactions | | | 2,054,783 | |
Change in net unrealized appreciation (depreciation) from investments | | | 14,883,008 | |
| | | | |
Net gain on investments | | | 16,937,791 | |
| | | | |
Increase in net assets from operations | | $ | 17,374,145 | |
| | | | |
See Notes to Financial Statements.
10
BARRETT
OPPORTUNITY FUND, INC.
Statements of Changes in Net Assets
For the Six Months Ended February 28, 2011 (Unaudited) and the Year Ended August 31, 2010
| | | | | | | | |
| | | 2011 | | | 2010 | |
OPERATIONS: | | | | | | | | |
Net investment income | | $ | 436,354 | | | $ | 799,572 | |
Net realized gain | | | 2,054,783 | | | | 3,656,284 | |
Change in net unrealized appreciation (depreciation) | | | 14,883,008 | | | | (5,120,732 | ) |
| | | | | | | | |
Increase (decrease) in net assets from operations | | | 17,374,145 | | | | (664,876 | ) |
| | | | | | | | |
| | | | | | | | |
DISTRIBUTIONS TO SHAREHOLDERS FROM (NOTE 1): | | | | | | | | |
Net investment income | | | (900,000 | ) | | | (1,000,003 | ) |
Net realized gains | | | (3,569,540 | ) | | | (2,850,011 | ) |
| | | | | | | | |
Decrease in net assets from distributions to shareholders | | | (4,469,540 | ) | | | (3,850,014 | ) |
| | | | | | | | |
| | | | | | | | |
FUND SHARE TRANSACTIONS (NOTE 5): | | | | | | | | |
Net proceeds from sale of shares | | | 43,388 | | | | 103,345 | |
Reinvestment of distributions | | | 2,660,712 | | | | 2,241,652 | |
Cost of shares repurchased | | | (3,071,842 | ) | | | (4,442,673 | ) |
| | | | | | | | |
Decrease in net assets from fund share transactions | | | (367,742 | ) | | | (2,097,676 | ) |
| | | | | | | | |
Increase (decrease) in net assets | | | 12,536,863 | | | | (6,612,566 | ) |
| | | | | | | | |
NET ASSETS: | | | | | | | | |
Beginning of period | | | 63,037,878 | | | | 69,650,444 | |
| | | | | | | | |
End of period* | | $ | 75,574,741 | | | $ | 63,037,878 | |
| | | | | | | | |
* Includes (overdistributed) undistributed net investment income, respectively, of: | | | $(156,741 | ) | | | $306,905 | |
| | | | | | | | |
See Notes to Financial Statements.
11
BARRETT
OPPORTUNITY FUND, INC.
Financial Highlights
For a share of capital stock outstanding throughout each year ended August 31, unless otherwise noted:
| | | | | | | | | | | | | | | | | | | | | | | | |
| | | 20111 | | | 2010 | | | 2009 | | | 2008 | | | 2007 | | | 2006 | |
NET ASSET VALUE | | | | | | | | | | | | | | | | | | | | | | | | |
Beginning of period | | | $30.53 | | | | $32.72 | | | | $50.14 | | | | $60.62 | | | | $56.71 | | | | $50.98 | |
| | | | | | | | | | | | | | | | | | | | | | | | |
INCOME (LOSS) FROM OPERATIONS: | | | | | | | | | | | | | | | | | | | | | | | | |
Net investment income | | | 0.22 | | | | 0.39 | | | | 0.49 | | | | 0.48 | | | | 0.45 | | | | 0.32 | |
Net realized and unrealized gain (loss) | | | 8.26 | | | | (0.74 | ) | | | (13.02 | ) | | | (7.55 | ) | | | 5.67 | | | | 7.04 | |
| | | | | | | | | | | | | | | | | | | | | | | | |
Total Income (Loss) From Operations | | | 8.48 | | | | (0.35 | ) | | | (12.53 | ) | | | (7.07 | ) | | | 6.12 | | | | 7.36 | |
| | | | | | | | | | | | | | | | | | | | | | | | |
LESS DISTRIBUTIONS FROM: | | | | | | | | | | | | | | | | | | | | | | | | |
Net investment income | | | (0.45 | ) | | | (0.48 | ) | | | (0.59 | ) | | | (0.37 | ) | | | (0.35 | ) | | | (0.46 | ) |
Net realized gains | | | (1.78 | ) | | | (1.36 | ) | | | (4.30 | ) | | | (3.04 | ) | | | (1.86 | ) | | | (1.17 | ) |
| | | | | | | | | | | | | | | | | | | | | | | | |
Total Distributions | | | (2.23 | ) | | | (1.84 | ) | | | (4.89 | ) | | | (3.41 | ) | | | (2.21 | ) | | | (1.63 | ) |
| | | | | | | | | | | | | | | | | | | | | | | | |
NET ASSET VALUE | | | | | | | | | | | | | | | | | | | | | | | | |
End of period | | | $36.78 | | | | $30.53 | | | | $32.72 | | | | $50.14 | | | | $60.62 | | | | $56.71 | |
| | | | | | | | | | | | | | | | | | | | | | | | |
Total return2 | | | 28.19 | % | | | (1.38 | )% | | | (23.37 | )% | | | (12.55 | )% | | | 10.92 | % | | | 14.79 | % |
Net Assets, end of period (millions) | | | $76 | | | | $63 | | | | $70 | | | | $114 | | | | $148 | | | | $158 | |
RATIOS TO AVERAGE NET ASSETS: | | | | | | | | | | | | | | | | | | | | | | | | |
Gross expenses | | | 1.06 | %3 | | | 1.20 | % | | | 1.31 | % | | | 1.03 | % | | | 1.01 | % | | | 1.04 | % |
Net expenses | | | 1.06 | 3 | | | 1.20 | | | | 1.31 | | | | 1.03 | | | | 1.01 | | | | 1.04 | 4 |
Net investment income | | | 1.23 | 3 | | | 1.15 | | | | 1.50 | | | | 0.83 | | | | 0.70 | | | | 0.66 | |
Portfolio Turnover Rate | | | 0 | % | | | 3 | % | | | 0 | %5,6 | | | 3 | %6 | | | 6 | % | | | 0 | %5,6 |
| 1 | For the six months ended February 28, 2011 (unaudited). |
| 2 | Performance figures may reflect compensating balance arrangements, fee waivers and/or expense reimbursements. In the absence of compensating balance arrangements, fee waivers and/or expense reimbursements, the total return would have been lower. Past performance is no guarantee of future results. Total returns for periods of less than one year are not annualized. |
| 4 | Reflects fee waivers and/or expense reimbursements. |
| 5 | Amount represents less than 1%. |
| 6 | Excludes the value of portfolio securities delivered as a result of in-kind redemptions of the Fund’s capital shares. |
See Notes to Financial Statements.
12
BARRETT
OPPORTUNITY FUND, INC.
Notes to Financial Statements (Unaudited)
| 1. | | ORGANIZATION AND SIGNIFICANT ACCOUNTING POLICIES | Barrett Opportunity Fund, Inc. (the “Fund”) is registered as a non-diversified, open-end management investment company under the Investment Company Act of 1940, as amended (the “1940 Act”). |
The following are significant accounting policies consistently followed by the Fund and are in conformity with U.S. generally accepted accounting principles (“GAAP”). Estimates and assumptions are required to be made regarding assets, liabilities and changes in net assets resulting from operations when financial statements are prepared. Changes in the economic environment, financial markets and any other parameters used in determining these estimates could cause actual results to differ. Subsequent events have been evaluated through the date the financial statements were issued.
(a) Investment Valuation
Equity securities for which market quotations are available are valued at the last reported sales price or official closing price on the primary market or exchange on which they trade. Debt securities are valued at the mean between the last quoted bid and asked prices provided by an independent pricing service, which are based on transactions in debt obligations, quotations from bond dealers, market transactions in comparable securities and various other relationships between securities. When reliable prices are not readily available, such as when the value of a security has been significantly affected by events after the close of the exchange or market on which the security is principally traded, but before the Fund calculates its net asset value, the Fund values these securities as determined in accordance with procedures approved by the Fund’s Board of Directors. Short-term obligations with maturities of 60 days or less are valued at amortized cost, which approximates fair value.
The Fund has adopted Financial Accounting Standards Board Codification Topic 820 (“ASC Topic 820”). ASC Topic 820 establishes a single definition of fair value, creates a three-tier hierarchy as a framework for measuring fair value based on inputs used to value the Fund’s investments, and requires additional disclosure about fair value. The hierarchy of inputs is summarized below.
| | • | | Level 1 - quoted prices in active markets for identical investments |
| | • | | Level 2 - other significant observable inputs (including quoted prices for similar investments, interest rates, prepayment speeds, credit risk, etc.) |
| | • | | Level 3 - significant unobservable inputs (including the Fund’s own assumptions in determining the fair value of investments) |
The inputs or methodology used for valuing securities are not necessarily an indication of the risk associated with investing in those securities.
The Fund uses valuation techniques to measure fair value that are consistent with the market approach and/or income approach, depending on the type of security and the particular circumstance. The market approach uses prices and other relevant information generated by market transactions involving identical
13
BARRETT
OPPORTUNITY FUND, INC.
or comparable securities. The income approach uses valuation techniques to discount estimated future cash flows to present value.
The following is a summary of the inputs used in valuing the Fund’s assets carried at fair value:
| | | | | | | | | | | | | | | | |
Assets | |
Description | | Quoted
Prices
(Level 1) | | | Other
Significant
Observable
Inputs
(Level 2) | | | Significant
Unobservable
Inputs
(Level 3) | | | Total | |
Common stocks† | | $ | 74,915,864 | | | | — | | | $ | 0 | * | | $ | 74,915,864 | |
Short-term investments† | | | — | | | $ | 602,000 | | | | — | | | | 602,000 | |
| | | | | | | | | | | | | | | | |
Total investments | | $ | 74,915,864 | | | $ | 602,000 | | | $ | 0 | * | | $ | 75,517,864 | |
| | | | | | | | | | | | | | | | |
| | † | See Schedule of Investments for additional detailed categorizations. |
The following is a reconciliation of investments in which significant unobservable inputs (Level 3) were used in determining fair value:
| | | | |
| | | Common
Stocks | |
| Investments in securities | | Consumer
Staples | |
Balance as of August 31, 2010 | | $ | 0 | † |
Accrued premium/discounts | | | — | |
Realized gain (loss) | | | — | |
Change in unrealized appreciation (depreciation)‡ | | | — | |
Net purchases (sales) | | | — | |
Transfers into Level 3 | | | — | |
Transfers out of Level 3 | | | — | |
| | | | |
Balance as of February 28, 2011 | | $ | 0 | † |
| | | | |
Net change in unrealized appreciation (depreciation) for investments in securities still held at February 28, 2011‡ | | | — | |
| | | | |
| | ‡ | This amount is included in the change in net unrealized appreciation (deprecation) in the accompanying Statement of Operations. Change in unrealized appreciation (depreciation) includes net unrealized appreciation (depreciation) resulting from changes in investment values during the reporting period and the reversal of previously recorded unrealized appreciation (depreciation) when gains or losses are realized. |
(b) Repurchase Agreements
The Fund may enter into repurchase agreements with institutions that its investment adviser has determined are creditworthy. Each repurchase agreement
14
BARRETT
OPPORTUNITY FUND, INC.
is recorded at cost. Under the terms of a typical repurchase agreement, the Fund acquires a debt security subject to an obligation of the seller to repurchase, and of the Fund to resell, the security at an agreed-upon price and time, thereby determining the yield during the Fund’s holding period. When entering into repurchase agreements, it is the Fund’s policy that its custodian or a third party custodian, acting on the Fund’s behalf, take possession of the underlying collateral securities, the market value of which, at all times, at least equals the principal amount of the repurchase transaction, including accrued interest. To the extent that any repurchase transaction maturity exceeds one business day, the value of the collateral is marked-to-market and measured against the value of the agreement in an effort to ensure the adequacy of the collateral. If the counterparty defaults, the Fund generally has the right to use the collateral to satisfy the terms of the repurchase transaction. However, if the market value of the collateral declines during the period in which the Fund seeks to assert its rights or if bankruptcy proceedings are commenced with respect to the seller of the security, realization of the collateral by the Fund may be delayed or limited.
(c) Security Transactions and Investment Income
Security transactions are accounted for on a trade date basis. Interest income, adjusted for amortization of premium and accretion of discount, is recorded on the accrual basis. Dividend income is recorded on the ex-dividend date. Foreign dividend income is recorded on the ex-dividend date or as soon as practicable after the Fund determines the existence of a dividend declaration after exercising reasonable due diligence. The cost of investments sold is determined by use of the specific identification method. To the extent any issuer defaults or a credit event occurs that impacts the issuer, the Fund may halt any additional interest income accruals and consider the realizability of interest accrued up to the date of default or credit event.
(d) Distributions to Shareholders
Distributions from net investment income and distributions of net realized gains, if any, are declared at least annually. Distributions to shareholders of the Fund are recorded on the ex-dividend date and are determined in accordance with income tax regulations, which may differ from GAAP.
(e) REIT Distributions
The character of distributions received from Real Estate Investment Trusts (“REITs”) held by the Fund is generally comprised of net investment income, capital gains, and return of capital. It is the policy of the Fund to estimate the character of distributions received from underlying REITs based on historical data provided by the REITs. After each calendar year end, REITs report the actual tax character of these distributions. Differences between the estimated and actual amounts reported by the REITs are reflected in the Fund’s records in the year in which they are reported by the REITs by adjusting related investment cost basis, capital gains and income, as necessary.
15
BARRETT
OPPORTUNITY FUND, INC.
(f) Federal and Other Taxes
It is the Fund’s policy to comply with the federal income and excise tax requirements of the Internal Revenue Code of 1986 (the “Code”), as amended, applicable to regulated investment companies. Accordingly, the Fund intends to distribute its taxable income and net realized gains, if any, to shareholders in accordance with timing requirements imposed by the Code. Therefore, no federal or state income tax provision is required in the Fund’s financial statements.
Management has analyzed the Fund’s tax positions taken on income tax returns for all open tax years and has concluded that as of February 28, 2011, no provision for income tax is required in the Fund’s financial statements. The Fund’s federal and state income and federal excise tax returns for tax years for which the applicable statutes of limitations have not expired are subject to examination by Internal Revenue Service and state departments of revenue.
Under the applicable foreign tax laws, a withholding tax may be imposed on interest, dividends and capital gains at various rates.
(g) Reclassification
GAAP requires that certain components of net assets be reclassified to reflect permanent differences between financial and tax reporting. These reclassifications have no effect on net assets or net asset value per share.
| 2. | | INVESTMENT MANAGEMENT AGREEMENT AND OTHER TRANSACTIONS WITH AFFILIATES | Barrett Associates, Inc. (“Barrett”) is the Fund’s investment manager. Barrett is a wholly-owned subsidiary of Legg Mason, Inc. (“Legg Mason”). Under the investment management agreement, the Fund pays an investment management fee, calculated daily and paid monthly, in accordance with the following breakpoint schedule: |
| | | | |
Average Daily Net Assets | | Annual Rate | |
| First $1 billion | | | 0.750 | % |
| Next $1 billion | | | 0.725 | |
| Next $3 billion | | | 0.700 | |
| Next $5 billion | | | 0.675 | |
| Over $10 billion | | | 0.650 | |
Legg Mason Fund Advisor, LLC (“LMPFA”) serves as the sub-administrator of the Fund, providing certain administrative services to the Fund pursuant to a sub-administration agreement between Barrett and LMPFA. LMPFA is an affiliate of Legg Mason and Barrett. Barrett, and not the Fund, pays LMPFA for its services as sub-administrator.
Legg Mason Investor Services, LLC, a wholly-owned broker-dealer subsidiary of Legg Mason, serves as the Fund’s sole and exclusive distributor.
The officers of the Fund are employees of Legg Mason or its affiliates and do not receive compensation from the Fund.
16
BARRETT
OPPORTUNITY FUND, INC.
| 3. | | INVESTMENTS | During the six months ended February 28, 2011, the aggregate cost of purchases and proceeds from sales of investments (excluding short-term investments) were as follows: |
| | | | |
| Purchases | | | — | |
| Sales | | | $4,148,016 | |
At February 28, 2011, the aggregate gross unrealized appreciation and depreciation of investments for federal income tax purposes were substantially as follows:
| | | | |
Gross unrealized appreciation | | $ | 66,774,923 | |
Gross unrealized depreciation | | | (191,409 | ) |
| | | | |
Net unrealized appreciation | | $ | 66,583,514 | |
| | | | |
| 4. | | DERIVATIVE INSTRUMENTS AND HEDGING ACTIVITIES | Financial Accounting Standards Board Codification Topic 815 requires enhanced disclosure about an entity’s derivative and hedging activities. |
During the six months ended February 28, 2011, the Fund did not invest in any derivative instruments.
| 5. | | CAPITAL SHARES | At February 28, 2011, the Fund had 15,000,000 shares of capital stock authorized with a par value of $0.01 per share. Transactions in shares of the Fund were as follows: |
| | | | | | | | |
| | | Six Months Ended
February 28, 2011 | | | Year Ended
August 31, 2010 | |
Shares sold | | | 1,238 | | | | 3,117 | |
Shares issued on reinvestment | | | 76,567 | | | | 69,315 | |
Shares repurchased | | | (87,767 | ) | | | (136,595 | ) |
| | | | | | | | |
Net decrease | | | (9,962 | ) | | | (64,163 | ) |
| | | | | | | | |
| 6. | | REDEMPTIONS- IN-KIND | The Fund may make payment for Fund shares redeemed wholly or in part by distributing portfolio securities to shareholders. During the six months ended February 28, 2011 and the year ended August 31, 2010, the Fund did not have any redemptions-in-kind. |
| 7. | | LEGAL MATTERS | Beginning in May 2004, class action lawsuits alleging violations of the federal securities laws were filed against Citigroup Global Markets Inc. (“CGM”), a former distributor of the Fund, and other affiliated funds (collectively, the “Funds”) and a number of its then affiliates, including Smith Barney Fund Management LLC (“SBFM”) and Salomon Brothers Asset Management Inc. (“SBAM”), which were then investment adviser or manager to certain of the Funds (the “Managers”), substantially all of the mutual funds then managed by the Managers (the “Defendant Funds”), and Board members of the Defendant Funds (collectively, the “Defendants”). The complaints alleged, among other things, that CGM created various undisclosed incentives for its brokers to sell Smith Barney and Salomon Brothers funds. In addition, according to the |
17
BARRETT
OPPORTUNITY FUND, INC.
| | complaints, the Managers caused the Defendant Funds to pay excessive brokerage commissions to CGM for steering clients towards proprietary funds. The complaints also alleged that the Defendants breached their fiduciary duty to the Defendant Funds by improperly charging Rule 12b-1 fees and by drawing on fund assets to make undisclosed payments of soft dollars and excessive brokerage commissions. The complaints also alleged that the Defendant Funds failed to adequately disclose certain of the allegedly wrongful conduct. The complaints sought injunctive relief and compensatory and punitive damages, rescission of the Defendant Funds’ contracts with the Managers, recovery of all fees paid to the Managers pursuant to such contracts and an award of attorneys’ fees and litigation expenses. |
On December 15, 2004, a consolidated amended complaint (the “Complaint”) was filed alleging substantially similar causes of action. On May 27, 2005, all of the Defendants filed motions to dismiss the Complaint. On July 26, 2006, the court issued a decision and order (1) finding that plaintiffs lacked standing to sue on behalf of the shareholders of the Funds in which none of the plaintiffs had invested and dismissing those Funds from the case (although stating that they could be brought back into the case if standing as to them could be established), and (2) other than one stayed claim, dismissing all of the causes of action against the remaining Defendants, with prejudice, except for the cause of action under Section 36(b) of the 1940 Act, which the court granted plaintiffs leave to replead as a derivative claim.
On October 16, 2006, plaintiffs filed their Second Consolidated Amended Complaint (“Second Amended Complaint”) which alleges derivative claims on behalf of nine funds identified in the Second Amended Complaint, under Section 36(b) of the 1940 Act, against Citigroup Asset Management, SBAM and SBFM as investment advisers to the identified funds, as well as CGM as a distributor for the identified funds (collectively, the “Second Amended Complaint Defendants”). The Fund was not identified in the Second Amended Complaint. The Second Amended Complaint alleges no claims against any of the funds or any of their Board Members. Under Section 36(b), the Second Amended Complaint alleges similar facts and seeks similar relief against the Second Amended Complaint Defendants as the Complaint.
On December 3, 2007, the court granted the Defendants’ motion to dismiss, with prejudice. On January 2, 2008, the plaintiffs filed a notice of appeal to the Second Circuit Court of Appeals. The appeal was fully briefed and oral argument before the U.S. Court of Appeals for the Second Circuit took place on March 5, 2009. The parties currently are awaiting a decision from the U.S. Court of Appeals for the Second Circuit.
Additional lawsuits arising out of these circumstances and presenting similar allegations and requests for relief may be filed in the future.
18
BARRETT
OPPORTUNITY FUND, INC.
| 8. | | OTHER TAX INFORMATION | On December 22, 2010, President Obama signed into law the Regulated Investment Company Modernization Act of 2010 (the “Act”). The Act updates certain tax rules applicable to regulated investment companies (“RICs”). The various provisions of the Act will generally be effective for RICs with taxable years beginning after December 22, 2010. Additional information regarding the impact of the Act on the Fund, if any, will be contained within the relevant sections of the notes to the financial statements for the fiscal year ending August 31, 2012. |
19
BARRETT
OPPORTUNITY FUND, INC.
Basis for Approval of the Fund’s Management Agreement (Unaudited)
Background
The Investment Company Act of 1940, as amended (the “1940 Act”), requires that the Board of Directors (the “Board”) of Barrett Opportunity Fund, Inc. (the “Fund”), including a majority of its members that are not considered to be “interested persons” under the 1940 Act (the “Independent Directors”) voting separately, approve on an annual basis the continuation of the investment management contract (the “Management Agreement”) with the Fund’s manager, Barrett Associates, Inc. (the “Manager”). At a meeting (the “Contract Renewal Meeting”) held in-person on December 16, 2010, the Board, including the Independent Directors, considered and approved continuation of the Management Agreement for an additional one-year term. To assist in its consideration of the renewal of the Management Agreement, the Board received and considered a variety of information about the Manager and affiliates of the Manager that provide services to the Fund, as well as the investment advisory and other management arrangements for the Fund (together with the information provided at the Contract Renewal Meeting, the “Contract Renewal Information”), certain portions of which are discussed below. In addition to the Contract Renewal Information, the Board received performance and other information throughout the year related to the services rendered by the Manager and its affiliates to the Fund. The Board’s evaluation took into account the information received throughout the year and also reflected the knowledge and familiarity gained as Board members of the Fund with respect to the services provided to the Fund by the Manager and its affiliates.
The discussion below covers both the investment advisory and administrative functions being rendered to the Fund by the Manager directly and through its affiliates pursuant to the Management Agreement.
Board Approval of Management Agreement
In its deliberations regarding renewal of the Management Agreement, the Board, including the Independent Directors, considered the factors below.
Possible Termination of Management Agreement
In executive session with the Board at the start of the Contract Renewal Meeting, Peter H. Shriver, President of the Manager, reported to the Board that on December 6, 2010, Legg Mason, Inc. (“Legg Mason”), the ultimate corporate parent of the Manager, and the Manager signed a definitive agreement under which the assets of the Manager would be sold to a new company, Barrett Asset Management, LLC, controlled by the current management team of the Manager (hereinafter referred to as the “Transaction”). Mr. Shriver stated that completion of the Transaction was subject to certain regulatory approvals, as well as other customary conditions. He also reported that, under the 1940 Act, completion of the Transaction would result in the automatic termination of the Management Agreement. The Board, he said, therefore would be asked at a later date prior to completion of the Transaction to approve new investment advisory arrangements for the Fund and, if approved by the Board, the new arrangements would be presented to shareholders for their approval. Completion of the Transaction also would necessitate engagement of new service providers to supply administrative and certain other services currently provided by an affiliate of the Manager, Legg Mason Partners Advisor, LLC (“LMPFA”), to the Fund. The Board, after excusing Mr. Shriver, met in private with counsel to the Independent Directors and determined to consider continuation of the Management Agreement based upon the need to provide uninterrupted investment advisory services to the Fund and the uncertainty that conditions necessary for completion of the Transaction would be satisfied.
20
BARRETT
OPPORTUNITY FUND, INC.
Nature, Extent and Quality of the Services under the Management Agreement
The Board received and considered Contract Renewal Information regarding the nature, extent and quality of the investment advisory services provided to the Fund by the Manager and its affiliates under the Management Agreement during the past year. The Board also reviewed Contract Renewal Information regarding the Fund’s compliance policies and procedures established pursuant to Rule 38a-1 under the 1940 Act.
The Board reviewed the qualifications, backgrounds and responsibilities of the Fund’s senior personnel and the portfolio management team primarily responsible for the day-to-day portfolio management of the Fund. The Board also considered, based on its knowledge of the Manager and its affiliates and the Contract Renewal Information, the financial resources available to Legg Mason to support its activities in respect of the Fund. The Board also considered the uncertain availability of alternative investment advisory arrangements for the Fund under its current circumstances.
The Board concluded that, overall, the nature, extent and quality of the investment advisory and other services provided (and expected to be provided) to the Fund under the Management Agreement have been satisfactory under the circumstances.
Fund Performance
The Board received and considered performance information and analyses (the “Lipper Performance Information”) for the Fund, as well as for a group of funds (the “Performance Universe”) selected by Lipper, Inc. (“Lipper”), an independent provider of investment company data. The Board was provided with a description of the methodology Lipper used to determine the similarity of the Fund with the funds included in the Performance Universe. The Performance Universe consisted of the Fund and all retail and institutional large-cap value funds, as classified by Lipper, regardless of asset size or primary channel of distribution.
The Lipper Performance Information comparing the Fund’s performance to that of the Performance Universe based on net asset value per share showed, among other things, that the Fund’s performance for the 1-, 5- and 10-year periods ended September 30, 2010 in each case was ranked in the fourth quintile of funds in the Performance Universe for that period; and the Fund’s Performance for the 3-year period ended September 30, 2010 was ranked in the fifth (bottom) quintile of the Performance Universe for that period. The Board considered the Manager’s explanation for the Fund’s relative underperformance for the 1-, 3-, 5- and 10-year periods that the Fund is typically concentrated in a few securities and industries, with the result that the Fund’s overall performance can be significantly impacted by a small number of positions. For example, two positions, accounting for 25% of the Fund, declined in value during the past year while the S&P 500® increased by almost 8%. Moreover, the energy sector represented over 20% of the Fund’s portfolio and trailed the broad market as well. The Board also considered the Fund’s performance in relation to its benchmarks and in absolute terms. In evaluating the Fund’s performance, the Board noted the adverse market conditions during 2008 and early 2009 and that the Fund’s investment portfolio is managed in a tax-aware manner.
Based on its review of the Fund’s performance, which included consideration of the need to provide for continuity of investment advisory services to the Fund and all of the other factors noted above, the Board concluded that, under the circumstances, continuation of the Management Agreement for an additional period not to exceed one year would be in the best interests of the Fund and its shareholders.
21
BARRETT
OPPORTUNITY FUND, INC.
Management Fees and Expense Ratios
The Board reviewed and considered the management fee (the “Management Fee”) payable by the Fund to the Manager in light of the nature, extent and overall quality of the management and other services provided by the Manager and its affiliates under the Management Agreement.
Additionally, the Board received and considered information and analyses prepared by Lipper (the “Lipper Expense Information”) comparing the Management Fee and the Fund’s overall expenses for the Fund’s latest fiscal year with those of funds in an expense universe (the “Expense Group”) selected and provided by Lipper. The comparison was based upon the constituent funds’ latest fiscal years. The Expense Group consisted of the Fund and ten other retail no-load large-cap value funds, as classified by Lipper. The eleven funds in the Expense Group had average net assets ranging from $34.2 million to $349.7 million. Six of the Expense Group funds were larger than the Fund and four funds were smaller.
The Lipper Expense Information comparing the Management Fee as well as the Fund’s actual total expenses to the Fund’s Expense Group showed that the Fund’s contractual Management Fee was ranked fourth among the funds in the Expense Group and was better than the Expense Group median. The Lipper Expense Information also showed that the Fund’s actual Management Fee (i.e., giving effect to any voluntary fee waivers implemented by the Manager with respect to the Fund and by the managers of the other Expense Group funds) was ranked seventh among the funds in the Expense Group and was worse than the Expense Group median. The Lipper Expense Information showed that the Fund’s actual total expenses ranked sixth among the funds in the Expense Group and were at the Expense Group median. The Board noted that the small number of funds in the Expense Group, which included funds varying widely in size, made meaningful comparisons difficult.
The Board also reviewed Contract Renewal Information regarding fees charged by the Manager to other U.S. clients investing primarily in an asset class similar to that of the Fund, including, where applicable, separate accounts. The Board was advised that the fees paid by such other clients generally are lower, and may be significantly lower, than the Management Fee. The Contract Renewal Information discussed the significant differences in scope of services provided to the Fund and to these other clients, noting that the Fund is provided with administrative services, office facilities, Fund officers (including the Fund’s chief executive, chief financial and chief compliance officers), and that the Manager and its affiliates coordinate and oversee the provision of services to the Fund by other fund service providers. The Board considered the fee comparisons in light of the different services provided in managing these other types of clients and funds.
Taking all of the above into consideration, the Board determined that the Management Fee was reasonable in light of the nature, extent and overall quality of the investment advisory and other services provided to the Fund under the Management Agreement.
Manager Profitability
The Board, as part of the Contract Renewal Information, received an analysis of the profitability to the Manager and its affiliates in providing services to the Fund. The Board also received profitability information with respect to the Legg Mason fund complex as a whole. In addition, the Board received Contract Renewal Information with respect to the revenue and cost allocation methodologies used in preparing such profitability data. The Manager noted that its methodologies were reviewed by an outside consultant in 2007 and the Board was assured at the Contract Renewal Meeting that there had been no significant changes in those methodologies since the report was rendered. The profitability analysis
22
BARRETT
OPPORTUNITY FUND, INC.
presented to the Board as part of the Contract Renewal Information indicated that the arrangements for providing investment advisory, administrative and other services to the Fund were unprofitable overall to the Manager and its affiliates, as a group, although the degree of unprofitability had decreased significantly during the period. The Manager acknowledged that while information as to its own profitability from providing investment advisory services only to the Fund was not available, the relationship with the Fund was profitable to the Manager on a standalone basis.
Economies of Scale
The Board received and discussed Contract Renewal Information concerning whether the Manager realizes economies of scale if the Fund’s assets grow. The Board noted that the Fund’s contractual Management Fee and actual Management Fee were ranked in the second and third quintiles of funds in the Fund’s Expense Group in the Lipper Expense Information, respectively. The Board noted further that the Management Fee provides for fee reductions as Fund assets grow but that Fund assets have not grown in recent years. The Board determined that the Management Fee structure was appropriate under present circumstances.
Other Benefits to the Manager
The Board considered other benefits received by the Manager and its affiliates as a result of their relationship with the Fund, including the opportunity to obtain research services from brokers who effect Fund portfolio transactions but did not regard such benefits as excessive.
* * * * * *
In light of all of the foregoing and other relevant factors, the Board determined that, under the circumstances, continuation of the Management Agreement would be in the interests of the Fund and its shareholders and unanimously voted to continue the Agreement for a period of one additional year.
No single factor reviewed by the Board was identified by the Board as the principal factor in determining whether to approve continuation of the Management Agreement, and each Board member attributed different weights to the various factors. The Independent Directors were advised by separate independent legal counsel throughout the process. Prior to the Contract Renewal Meeting, the Board received a memorandum prepared by the Manager discussing its responsibilities in connection with the proposed continuation of the Management Agreement as part of the Contract Renewal Information and the Independent Directors separately received a memorandum discussing such responsibilities from their independent counsel. Prior to voting, the Independent Directors also discussed the proposed continuation of the Management Agreement in private sessions with their independent legal counsel at which no representatives of the Manager were present.
23
BARRETT OPPORTUNITY FUND, INC.
DIRECTORS
Irving G. Brilliant
Barry Handel, CPA
Rosalind A. Kochman
Chairperson
William Morris, Jr., CPA
Irving Sonnenschein
INVESTMENT MANAGER
Barrett Associates, Inc.
90 Park Avenue
New York, NY 10016
SUB-ADMINISTRATOR
Legg Mason Partners Fund Advisor, LLC
620 Eighth Avenue
New York, NY 10018
DISTRIBUTOR
Legg Mason Investor Services, LLC (LMIS)
100 International Drive
Baltimore, MD 21202
CUSTODIAN
State Street Bank and Trust Company
1 Lincoln Street
Boston, MA 02111
CO-TRANSFER AGENTS
Boston Financial Data Services, Inc.
2000 Crown Colony Drive
Quincy, MA 02169
BNY Mellon Asset Servicing
4400 Computer Drive
Westborough, MA 01581
INDEPENDENT REGISTERED PUBLIC ACCOUNTING FIRM
KPMG LLP
345 Park Avenue
New York, NY 10154
PRIVACY POLICY
We are committed to keeping nonpublic personal information about you secure and confidential. This notice is intended to help you understand how we fulfill this commitment. From time to time, we may collect a variety of personal information about you, including:
| | • | | Information we receive from you on applications and forms, via the telephone, and through our websites; |
| | • | | Information about your transactions with us, our affiliates, or others (such as your purchases, sales, or account balances); and |
| | • | | Information we receive from consumer reporting agencies. |
We do not disclose nonpublic personal information about our customers or former customers, except to our affiliates (such as broker-dealers or investment advisers within the Legg Mason family of companies) or as is otherwise permitted by applicable law or regulation. For example, we may share this information with others in order to process your transactions or service an account. We may also provide this information to companies that perform marketing services on our behalf, such as printing and mailing, or to other financial institutions with whom we have joint marketing agreements. When we enter into such agreements, we will require these companies to protect the confidentiality of this information and to use it only to perform the services for which we hired them.
With respect to our internal security procedures, we maintain physical, electronic, and procedural safeguards to protect your nonpublic personal information, and we restrict access to this information.
If you decide at some point either to close your account(s) or become an inactive customer, we will continue to adhere to our privacy policies and practices with respect to your nonpublic personal information.
NOT PART OF THE SEMI-ANNUAL REPORT
Barrett Opportunity Fund, Inc.
55 Water Street
New York, New York 10041
This report is transmitted to the shareholders of Barrett Opportunity Fund, Inc. for their information. This is not a prospectus, circular or representation intended for use in the purchase of shares of the Fund or any securities mentioned in this report.
This report must be preceded or accompanied by a free prospectus. Investors should consider the Fund’s investment objectives, risks, charges and expenses carefully before investing. The prospectus contains this and other important information about the Fund. Please read the prospectus carefully before investing.
www.barrettassociates.com
©2011 Legg Mason
Investor Services, LLC
Member FINRA, SIPC
BARX010341
The Fund files its complete schedule of portfolio holdings with the Securities and Exchange Commission (“SEC”) for the first and third quarters of each fiscal year on Form N-Q. The Fund’s Forms N-Q are available on the SEC’s website at www.sec.gov. The Fund’s Forms N-Q may be reviewed and copied at the SEC’s Public Reference Room in Washington, D.C., and information on the operation of the Public Reference Room may be obtained by calling 1-800-SEC-0330. To obtain information on Form N-Q from the Fund, shareholders can call the Fund at 1-877-721-1926.
Information on how the Fund voted proxies relating to portfolio securities during the prior 12-month period ended June 30th of each year and a description of the policies and procedures that the Fund uses to determine how to vote proxies related to portfolio transactions are available (1) without charge, upon request, by calling the Fund at 1-877-721-1926 and (2) on the SEC’s website at www.sec.gov.
Not applicable.
| ITEM 3. | AUDIT COMMITTEE FINANCIAL EXPERT. |
Not applicable.
| ITEM 4. | PRINCIPAL ACCOUNTANT FEES AND SERVICES. |
Not applicable.
| ITEM 5. | AUDIT COMMITTEE OF LISTED REGISTRANTS. |
Not applicable.
| ITEM 6. | SCHEDULE OF INVESTMENTS. |
Included herein under Item 1.
| ITEM 7. | DISCLOSURE OF PROXY VOTING POLICIES AND PROCEDURES FOR CLOSED-END MANAGEMENT INVESTMENT COMPANIES. |
Not applicable.
| ITEM 8. | PORTFOLIO MANAGERS OF CLOSED-END MANAGEMENT INVESTMENT COMPANIES. |
Not applicable.
| ITEM 9. | PURCHASES OF EQUITY SECURITIES BY CLOSED-END MANAGEMENT INVESTMENT COMPANY AND AFFILIATED PURCHASERS. |
Not applicable.
| ITEM 10. | SUBMISSION OF MATTERS TO A VOTE OF SECURITY HOLDERS. |
Not applicable.
| ITEM 11. | CONTROLS AND PROCEDURES. |
| | (a) | The registrant’s principal executive officer and principal financial officer have concluded that the registrant’s disclosure controls and procedures (as defined in Rule 30a- 3(c) under the Investment Company Act of 1940, as amended (the “1940 Act”)) are effective as of a date within 90 days of the filing date of this report that includes the disclosure required by this paragraph, based on their evaluation of the disclosure controls and procedures required by Rule 30a-3(b) under the 1940 Act and 15d-15(b) under the Securities Exchange Act of 1934. |
| | (b) | There were no changes in the registrant’s internal control over financial reporting (as defined in Rule 30a-3(d) under the 1940 Act) that occurred during the registrant’s last fiscal half-year (the registrant’s second fiscal half-year in the case of an annual report) that have materially affected, or are likely to materially affect the registrant’s internal control over financial reporting. |
Exhibit 99.CODE ETH
| | (a) (2) | Certifications pursuant to section 302 of the Sarbanes-Oxley Act of 2002 attached hereto. |
Exhibit 99.CERT
| | (b) | Certifications pursuant to Section 906 of the Sarbanes-Oxley Act of 2002 attached hereto. |
Exhibit 99.906CERT
SIGNATURES
Pursuant to the requirements of the Securities Exchange Act of 1934 and the Investment Company Act of 1940, the registrant has duly caused this Report to be signed on its behalf by the undersigned, there unto duly authorized.
| | |
| Barrett Opportunity Fund, Inc. |
| |
| By: | | /S/ PETER H. SHRIVER |
| | Peter H. Shriver |
| | Chief Executive Officer of Barrett Opportunity Fund, Inc. |
| |
| Date: | | April 5, 2011 |
Pursuant to the requirements of the Securities Exchange Act of 1934 and the Investment Company Act of 1940, this report has been signed below by the following persons on behalf of the registrant and in the capacities and on the dates indicated.
| | |
| By: | | /S/ PETER H. SHRIVER |
| | Peter H. Shriver |
| | Chief Executive Officer of Barrett Opportunity Fund, Inc. |
| |
| Date: | | April 5, 2011 |
| |
| By: | | /S/ KAPREL OZSOLAK |
| | Kaprel Ozsolak |
| | Chief Financial Officer of Barrett Opportunity Fund, Inc. |
| |
| Date: | | April 5, 2011 |